
TESTING STABILITY WITHOUT PENDULUMS - Defense ...
87
NAVAL POSTGRADUATE SCHOOL MONTEREY, CALIFORNIA THESIS TESTING STABILITY WITHOUT PENDULUMS: A FEASIBILITY ANALYSIS by Patrick B. Frain Jr. June 2018 Thesis Advisor: Fotis A. Papoulias Second Reader: Matthew G. Boensel Approved for public release. Distribution is unlimited.
-
Upload
khangminh22 -
Category
Documents
-
view
1 -
download
0
Transcript of TESTING STABILITY WITHOUT PENDULUMS - Defense ...
NAVAL POSTGRADUATE
SCHOOLMONTEREY, CALIFORNIA
THESIS
TESTING STABILITY WITHOUT PENDULUMS: A FEASIBILITY ANALYSIS
by
Patrick B. Frain Jr.
June 2018
Thesis Advisor: Fotis A. Papoulias Second Reader: Matthew G. Boensel
Approved for public release. Distribution is unlimited.

THIS PAGE INTENTIONALLY LEFT BLANK

REPORT DOCUMENTATION PAGE Form Approved OMB No. 0704-0188
Public reporting burden for this collection of information is estimated to average 1 hour per response, including the time for reviewing instruction, searching existing data sources, gathering and maintaining the data needed, and completing and reviewing the collection of information. Send comments regarding this burden estimate or any other aspect of this collection of information, including suggestions for reducing this burden, to Washington headquarters Services, Directorate for Information Operations and Reports, 1215 Jefferson Davis Highway, Suite 1204, Arlington, VA 22202-4302, and to the Office of Management and Budget, Paperwork Reduction Project (0704-0188) Washington, DC 20503.
1. AGENCY USE ONLY(Leave blank)
2. REPORT DATEJune 2018
3. REPORT TYPE AND DATES COVEREDMaster's thesis
4. TITLE AND SUBTITLETESTING STABILITY WITHOUT PENDULUMS: A FEASIBILITY ANALYSIS
5. FUNDING NUMBERS
6. AUTHOR(S) Patrick B. Frain Jr.
7. PERFORMING ORGANIZATION NAME(S) AND ADDRESS(ES)Naval Postgraduate School Monterey, CA 93943-5000
8. PERFORMINGORGANIZATION REPORT NUMBER
9. SPONSORING / MONITORING AGENCY NAME(S) ANDADDRESS(ES) N/A
10. SPONSORING /MONITORING AGENCY REPORT NUMBER
11. SUPPLEMENTARY NOTES The views expressed in this thesis are those of the author and do not reflect theofficial policy or position of the Department of Defense or the U.S. Government.
12a. DISTRIBUTION / AVAILABILITY STATEMENT Approved for public release. Distribution is unlimited.
12b. DISTRIBUTION CODE A
13. ABSTRACT (maximum 200 words) Current International Maritime Organization (IMO) and U.S. Coast Guard regulations require inclining tests of vessels to use three heel-measuring devices, one of which must be a pendulum. This is a problem since pendulums are required to be at least 10 feet in height and newer vessel designs are constrained by overhead clearance and deck space. To investigate this problem, this thesis examines five different stability test results that were submitted to the U.S. Coast Guard Marine Safety Center (MSC). The author identified and inputted random error into the independent variables used to calculate each vessel’s metacentric height (GM). The independent variables were then used in a Design of Experiment (DOE) to examine which factors had the strongest effect on GM. Of the factors analyzed, the device used to measure heel angle proved to be the most significant. The author then constructed three different miniature models to conduct inclining experiments in a controlled environment. The heel-measuring devices used during these experiments were a smartphone and pendulum. In all three miniature model experiments, the smartphone demonstrated better precision over the pendulum. This thesis recommends keeping current standards and regulations intact until further data and research are gathered.
14. SUBJECT TERMSincline experiment, stability test, metacentric height, pendulum, digital inclinometer
15. NUMBER OFPAGES
16. PRICE CODE
17. SECURITYCLASSIFICATION OF REPORT Unclassified
18. SECURITYCLASSIFICATION OF THIS PAGE Unclassified
19. SECURITYCLASSIFICATION OF ABSTRACT Unclassified
20. LIMITATION OFABSTRACT
UU
NSN 7540-01-280-5500 Standard Form 298 (Rev. 2-89) Prescribed by ANSI Std. 239-18
i
87

THIS PAGE INTENTIONALLY LEFT BLANK
ii

Approved for public release. Distribution is unlimited.
TESTING STABILITY WITHOUT PENDULUMS: A FEASIBILITY ANALYSIS
Patrick B. Frain Jr. Lieutenant, United States Coast Guard
BS, U.S. Merchant Marine Academy, 2008
Submitted in partial fulfillment of the requirements for the degree of
MASTER OF SCIENCE IN SYSTEMS ENGINEERING
from the
NAVAL POSTGRADUATE SCHOOL June 2018
Approved by: Fotis A. Papoulias Advisor
Matthew G. Boensel Second Reader
Ronald E. Giachetti Chair, Department of Systems Engineering
iii

THIS PAGE INTENTIONALLY LEFT BLANK
iv

ABSTRACT
Current International Maritime Organization (IMO) and U.S. Coast Guard
regulations require inclining tests of vessels to use three heel-measuring devices, one of
which must be a pendulum. This is a problem since pendulums are required to be at least
10 feet in height and newer vessel designs are constrained by overhead clearance and
deck space. To investigate this problem, this thesis examines five different stability test
results that were submitted to the U.S. Coast Guard Marine Safety Center (MSC). The
author identified and inputted random error into the independent variables used
to calculate each vessel’s metacentric height (GM). The independent variables were
then used in a Design of Experiment (DOE) to examine which factors had the strongest
effect on GM. Of the factors analyzed, the device used to measure heel angle proved to
be the most significant. The author then constructed three different miniature models to
conduct inclining experiments in a controlled environment. The heel-measuring
devices used during these experiments were a smartphone and pendulum. In all three
miniature model experiments, the smartphone demonstrated better precision over the
pendulum. This thesis recommends keeping current standards and regulations intact
until further data and research are gathered.
v

THIS PAGE INTENTIONALLY LEFT BLANK
vi
vii
TABLE OF CONTENTS
I. INTRODUCTION..................................................................................................1 A. BACKGROUND ........................................................................................1 B. PROBLEM DEFINITION ........................................................................6 D. THESIS ORGANIZATION ......................................................................9
II. LITERATURE REVIEW AND CURRENT REGULATIONS ......................11 A. LITERATURE REVIEW .......................................................................11 B. INTERNATIONAL STANDARDS ........................................................13 C. DOMESTIC REGULATIONS ...............................................................14
III. RAW DATA FOR DESIGN OF EXPERIMENT ANALYSIS ........................15 A. RAW DATA .............................................................................................15
1. Vessel One Raw Data Analysis ...................................................16 2. Vessel Two Raw Data Analysis ...................................................17 3. Vessel Three Raw Data Analysis ................................................18 4. Vessel Four Raw Data Analysis ..................................................19 5. Vessel Five Raw Data Analysis ...................................................20
B. RAW DATA CONCLUSION .................................................................21
IV. INCLINING EXPERIMENT UNCERTAINTY ...............................................23 A. TEST WEIGHT ERROR ........................................................................23 B. TEST WEIGHT SHIFT DISTANCE ERROR .....................................23 C. LIGHTWEIGHT DISPLACEMENT ERROR .....................................24 D. HEEL ANGLE ERROR ..........................................................................25
1. Pendulum Error ...........................................................................25 2. Digital Inclinometer Error ..........................................................26
V. DESIGN OF EXPERIMENT ANALYSIS AND RESULTS ...........................29 A. ANALYSIS SETUP .................................................................................29 B. DOE ANALYSIS ......................................................................................30 C. NON-PARAMETRIC DEVICE DATA .................................................34
1. Vessel One Non-parametric Analysis .........................................35 2. Vessel Two Non-parametric Analysis ........................................36 3. Vessel Three Non-parametric Analysis ......................................37 4. Vessel Four Non-parametric Analysis .......................................38 5. Vessel Five Non-parametric Analysis.........................................39
D. OVERALL NON-PARAMETRIC ANALYSIS ....................................40

viii
VI. PHYSICAL EXPERIMENTATION ..................................................................41 A. INITIAL SET-UP AND PROCEDURE.................................................41 B. PHYSICAL EXPERIMENT DATA AND ANALYSIS........................45
1. V-Hull Model ................................................................................45 2. Pontoon Hull Model .....................................................................49 3. Barge Hull Model .........................................................................53
VII. CONCLUSIONS ..................................................................................................59 A. CONCLUSIONS ......................................................................................59 B. RECOMMENDATIONS .........................................................................60 C. FUTURE WORK .....................................................................................60
LIST OF REFERENCES ................................................................................................61
INITIAL DISTRIBUTION LIST ...................................................................................63

ix
LIST OF FIGURES
Figure 1. Illustration of the Metacenter as the Center of Buoyancy Shifts. Source: ASTM (2014).................................................................................2
Figure 2. Illustration of the Relationship of GM, KM, and KG. Adapted from ASTM (2014). ..............................................................................................3
Figure 3. Illustration of Shifting a Test Weight in the Transverse Direction with a Resulting Heel Angle. Source: ASTM (2014). .................................4
Figure 4. A Depiction of a Typical Moment-Tangent following an IE. Source: ASTM (2014)..................................................................................5
Figure 5. An Illustration of a Tub that would Hold Viscous Liquid to Dampen Pendulum Oscillations. Source: Dalrymple-Smith (2016). .........................7
Figure 6. Results from the “Uncertainty Analysis Procedure for the Ship Inclining Experiment” Article for Component Uncertainty in KG. Source: Woodward et al. (2016). ...............................................................12
Figure 7. Experimental Set-up of BRSA Trawler for the Experiment. Source: Djebli et al. (2015). ....................................................................................13
Figure 8. Moment-Tangent Plot of Vessel One Raw Data ........................................16
Figure 9. Moment-Tangent Plot of Vessel One Raw Data ........................................17
Figure 10. Moment-Tangent Plot of Vessel Three Raw Data .....................................18
Figure 11. Moment-Tangent Plot of Vessel Four Raw Data .......................................19
Figure 12. Moment-Tangent Plot of Vessel Four Raw Data .......................................20
Figure 13. Illustration of a Pendulum Used during IE. ...............................................25
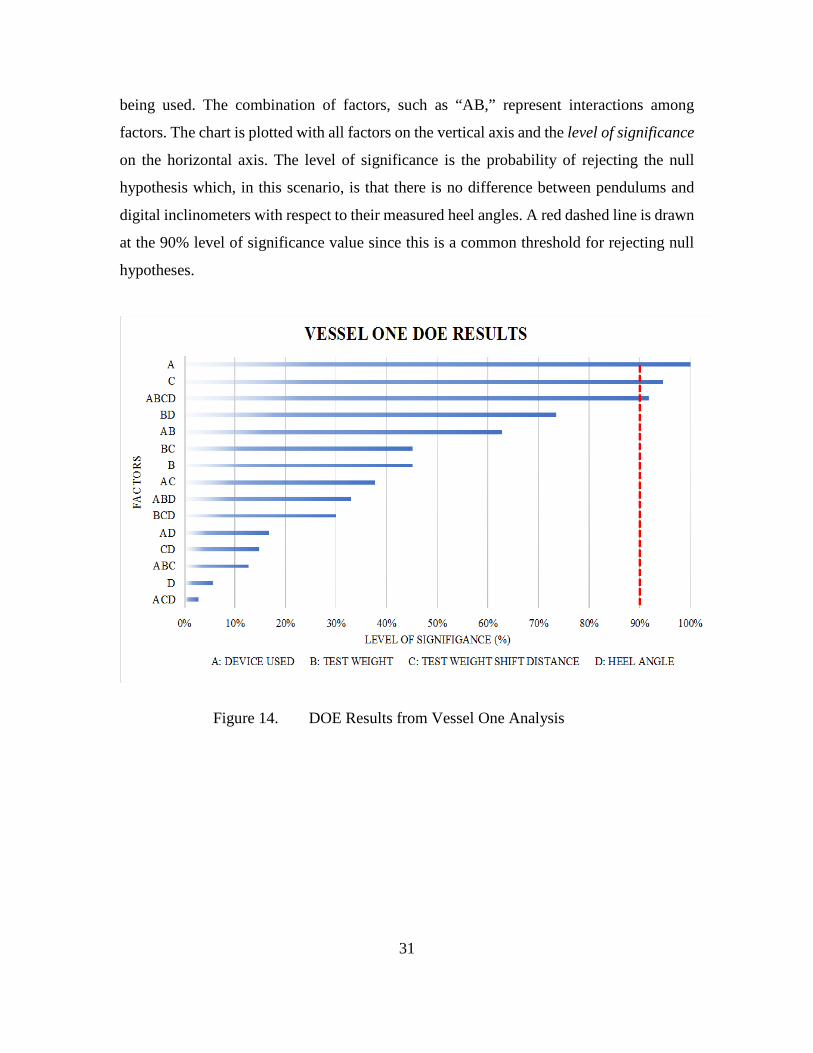
Figure 14. DOE Results from Vessel One Analysis ...................................................31
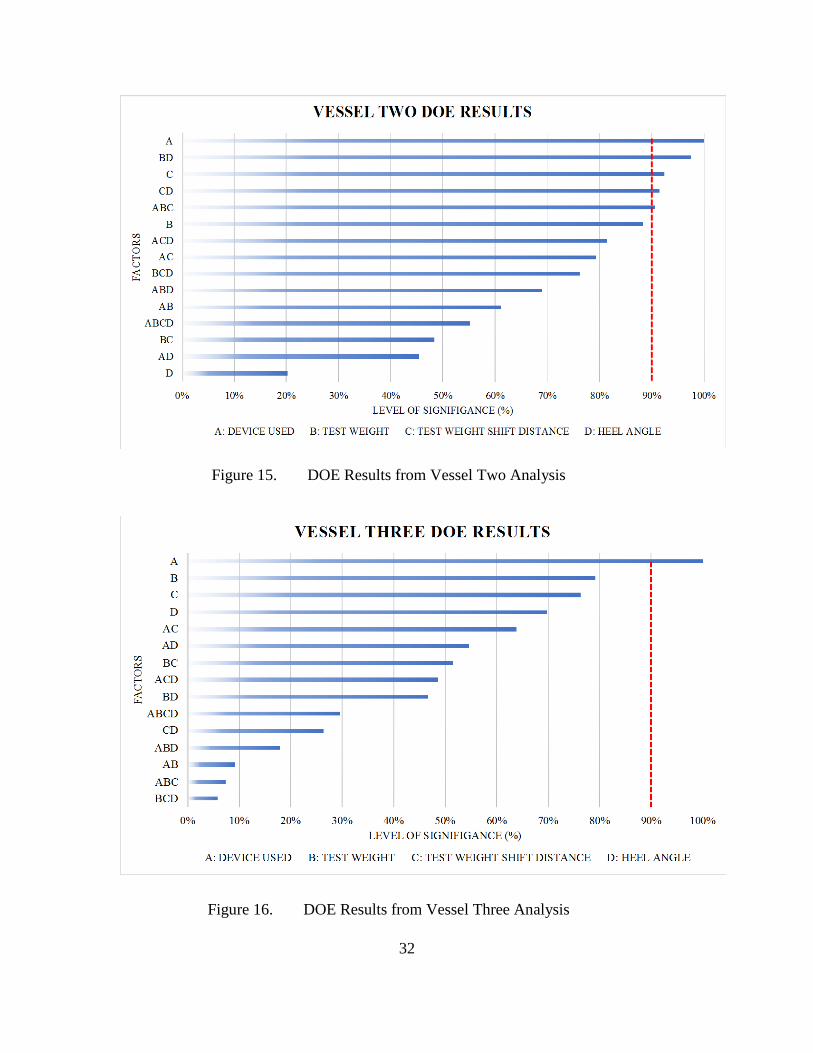
Figure 15. DOE Results from Vessel Two Analysis ...................................................32
Figure 16. DOE Results from Vessel Three Analysis .................................................32
Figure 17. DOE Results from Vessel Four Analysis...................................................33
Figure 18. DOE Results from Vessel 5 Analysis ........................................................33

x
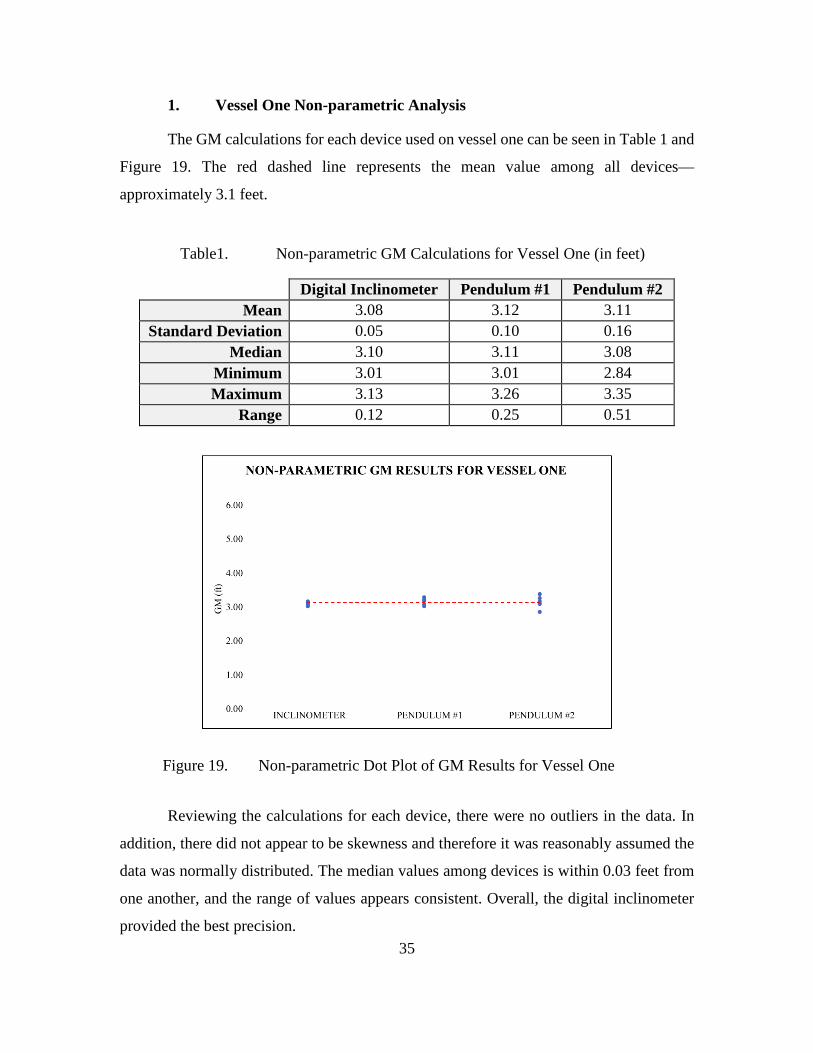
Figure 19. Non-parametric Dot Plot of GM Results for Vessel One ..........................35
Figure 20. Non-parametric Dot Plot of GM Results for Vessel Two ..........................36
Figure 21. Non-parametric GM Results from Vessel Three (in feet) .........................37
Figure 22. Non-parametric GM Results from Vessel Four (in feet) ...........................38
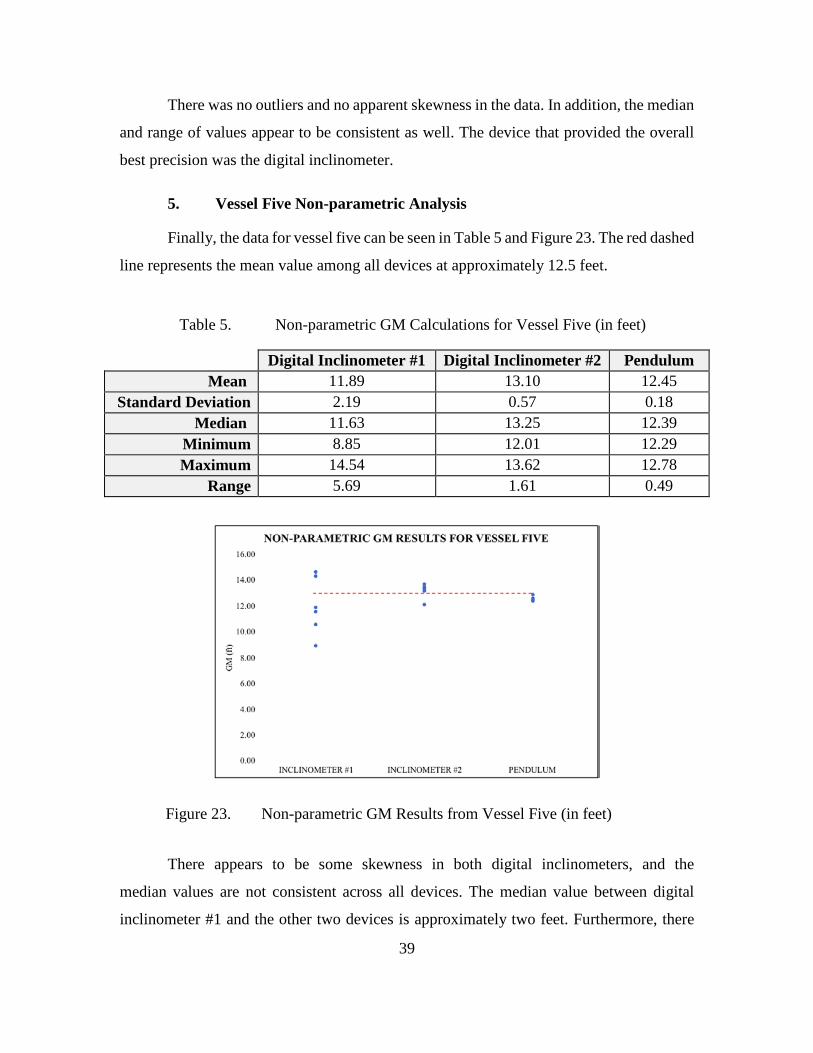
Figure 23. Non-parametric GM Results from Vessel Five (in feet) ............................39
Figure 24. Assembled V-Hull Model to Measure Induced Heel Angles ....................43
Figure 25. Picture of the V-Hull Model with Two Test Weights Shifted to the Starboard Side. ...........................................................................................46
Figure 26. Illustration of the Moment-Tangent Plot from the V-Hull Model. ............47
Figure 27. Non-parametric GM Results from V-Hull Model Experiment ..................48
Figure 28. Picture of the Pontoon Hull Model in the Even Keel Position. .................50
Figure 29. Illustration of the Moment-Tangent Plot from the Pontoon Hull Model. ........................................................................................................51
Figure 30. Non-parametric GM Results from Pontoon Model Experiment ................52
Figure 31. Picture of the Barge Hull Model in the Even Keel Position. .....................54
Figure 32. Illustration of the Moment-Tangent Plot from the Pontoon Hull Model. ........................................................................................................55
Figure 33. Non-parametric GM Results from Pontoon Model Experiment ................56

xi
LIST OF TABLES
Table1. Non-parametric GM Calculations for Vessel One (in feet) .......................35
Table 2. Non-parametric GM Calculations for Vessel Two (in feet) ......................36
Table 3. Non-parametric GM Calculations for Vessel Three (in feet) ....................37
Table 4. Non-parametric GM Calculations for Vessel Four (in feet) ......................38
Table 5. Non-parametric GM Calculations for Vessel Five (in feet) .......................39
Table 6. List of Equipment Used for Inclining Experiment for Physical Models........................................................................................................42
Table 7. Principle Characteristics of the V-Hull Model ..........................................46
Table 8. Non-parametric GM Results from the V-Hull Model Experiment ............48
Table 9. Principle Characteristics of the Pontoon Model ........................................50
Table 10. Non-parametric GM Results from the Pontoon Model Experiment ..........53
Table 11. Principle Characteristics of the Barge Model ............................................54
Table 12. Non-parametric GM Results from the Barge Model Experiment ..............56

xii
THIS PAGE INTENTIONALLY LEFT BLANK

xiii
LIST OF ACRONYMS AND ABBREVIATIONS
ASTM American Society of Testing and Materials
BRSA British Ship Research Association
CFR Code of Federal Regulations
D test weight shift distance
DOE design of experiment
G center of gravity
GM metacentric height
IE inclining experiment
IMO International Maritime Organization
INCOSE International Council of Systems Engineering
ISO International Organization for Standards
ITTC International Towing Tank Conference
KB center of buoyancy
KG vertical center of gravity
KM height of metacenter
M metacenter
SE Systems Engineering
SPV small passenger vessel
UN United Nations
USCG United States Coast Guard
W test weight
WL waterline

xiv
THIS PAGE INTENTIONALLY LEFT BLANK

xv
EXECUTIVE SUMMARY
The United States Coast Guard (USCG) is the primary regulatory authority for U.S.
flagged commercial vessels. The USCG dictates and oversees regulations pertaining to
commercial vessel operations that include but is not limited to stability, machinery,
electrical, lifesaving, and fire protection systems. The regulations that govern these systems
are defined in the Code of Federal Regulations (CFR). The focus of this study is the
stability requirements found in 46 CFR Subchapter S. Currently, vessels that are newly
constructed or have undergone major modifications are required to verify intact stability
with a test known as the incline experiment (IE). This experiment verifies the location of
the vertical center of gravity (KG) which is the basis for determining positive, neutral, or
negative stability. Current regulations stipulate that three measuring devices be used to
measure the incline of the vessel during the experiment. Devices authorized are:
pendulums, manometers, digital inclinometers, and laser pendulums. However, of the three
devices required, one must be a pendulum. Since newer vessel designs make it difficult to
mount pendulums, required to be at least 10 feet in height, owners are requesting to conduct
stability tests without pendulums. A feasibility analysis was conducted to determine
whether performing stability tests without pendulums provides an equivalent level of safety
to other authorized alternate measuring devices.
Two separate experiments were set-up to analyze and draw conclusions regarding
the feasibility of not using pendulums during an IE. The first experiment analyzed raw data
collected from five separate stability tests that were verified and approved by the USCG.
The author developed an Excel-based model to detect factors that had the greatest impact
on the calculation of GM. Of the four factors analyzed, the analysis revealed that the type
of device used was the most significant. However, no conclusive evidence proved that one
measuring device was superior to another. To improve the results of the model, additional
factors influencing the outcome of GM need to be collected. It is recommended that
witnessing live stability tests be carried out to gather additional data not found in submittals
to the USCG. Such data would include prevailing weather conditions during each weight

xvi
shift, identifying additional sources of error during set-up, and measuring the exact
locations of each measuring device relative to the centerline of the vessel.
The second experiment performed was an analysis of three separate stability tests
conducted on three miniature vessel models. An IE was performed on each model to
observe how different factors affect the resultant GM in a controlled environment.
Furthermore, each hull had a different design as an additional factor for analysis. The heel
measuring devices used for each experiment were a pendulum and smartphone. The
experiment found that smartphones consistently provided better precision in the calculation
of GM. However, determining which device provided better accuracy could not be found
since the theoretical GM of each model was unknown. Furthermore, the heel angles
produced by each hull design were notably different according to the corresponding
moment-tangent plots. It is unclear whether this was a result of external factors such as
water fluctuations during the experiment or due to the hull design. It is recommended to
replicate the experiments with longer periods of time between weight shifts to minimize
error due to water disturbances. In addition, adjusting factors on a single model, such as
height of the pendulum, could be carried out to examine its overall effect on GM.
Prior to setting up the experiments, finding relevant research that pertained to IEs
was needed. Two different articles were found that investigated primary factors that
contributed to IE systematic error and the use of smartphone technology to measure heel
angles in lieu of pendulums. The first article, titled “Uncertainty Analysis Procedure for
the Ship Inclining Experiment” (Woodward et al. 2016), found that systematic errors for
IEs were similar to those identified for hydrodynamic testing on ship models. Research
into errors found in ship model testing procedures prescribed by the International Towing
Tank Conference (ITTC) was carried out. The ITTC is the organization that has the
“responsibility for the prediction of the hydrodynamic performance of ships and marine
installations based on the results of physical and numerical experiments” (International
Towing Tank Conference 2018). The article described how the errors found in the ITTC
standards could be applied to actual IE data. After applying errors found in the ITTC
standards, the authors conducted a sensitivity analysis via partial derivatives to calculate
which factors had the greatest impact on KG. The article examined nine separate factors

xvii
affecting KG for five different vessel types. In the end, the article concluded that “no one
parameter can be identified in all cases as problematic from the studies.” (Woodward et al.
2016, 86). Next, the second article researched was “The Application of Smartphone in Ship
Stability Experiment” (Djebli et al. 2015). The article examined existing procedures that
govern the conduct of IEs, identified as the classical method that require pendulums. It
investigated whether a new device could be adopted by the International Maritime
Organization (IMO) during an IE. The IMO is the organization under the United Nations
(UN) that prescribes international shipping standards for all countries signatory to its
conventions. The authors of the article conducted an experiment using a miniature ship
model to conduct an IE using only a pendulum and smartphone to measure heel angles.
The article concluded that “the accuracy of the obtained measurements using this new
method is similar to the classical method based on pendulum measurements and is even
better regarding simplicity, bulk, accuracy, readout, and robustness” (Djebli et al. 2015, 6).
The article concluded that the IMO consider smartphone devices as an authorized
alternative device.
Based on the relevant research, a process was needed for finding feasible solutions
to the problem statement. The author developed a general methodology that followed sound
systems engineering practices to accomplish this. The process included defining the overall
objectives, developing a process or architecture to follow, and finally collecting and
entering data into the architecture to derive results. For the first experiment, the author
contacted the Marine Safety Center (MSC), a division within the USCG, which is tasked
with reviewing and approving all plan review documents pertaining to stability
calculations. By law, the owners of newly constructed vessels are required to submit IE
results to this office for review prior to beginning commercial operations. The MSC sent
the author five IE submissions from small passenger vessels (SPV) that used a variety of
heel measuring devices during their respective experiments. The submissions were studied
and modeled to replicate the results. Factors focused on were: GM, test weights and their
shift distances to create different moments, lightweight displacement, and recorded heel
angles. To predict which factor had the greatest influence on stability, a designed
experiment was developed to measure the change in GM as the remaining four factors were

xviii
adjusted to three different error levels. The factors included in the design of experiment
(DOE) were test weights used, test weight shift distances, heel angle accuracy, and the type
of device used. Lightweight displacement was not included for the analysis due to the wide
subjectivity of estimating weights to add or remove during the lightweight survey. This
DOE was applied to five different IE submissions that each had six weight shifts to
calculate GM. The DOE was set-up with four factors, three error levels that followed a
normal distribution, and was replicated ten times for each weight shift and produced over
24,000 data points for analysis. The error levels that were applied to the DOE were based
on current standards governing IEs and reasonable estimation by the author. The DOE
analysis concluded that the type of device used had the greatest level of significance for all
five vessels. To explore why the type of device used provided the highest level of
significance, the raw, non-parametric, data from the IE submissions was analyzed without
applied error. This identified any outliers or skewness within the data and provided insight
if any device disproportionately shifted the GM which would account for the strong level
of significance in each DOE. Three out of the five vessels each had one device that had a
wide range of GM calculations, but the median values were mostly consistent across all
three vessels. There was no clear indication that one device was superior to the other.
For the second experiment, three separate IEs were conducted on three miniature
hull models constructed by the author. The purpose of the experiment was to provide
insight to the systematic errors during IEs in a controlled environment. The three different
hull types used were V-hull, pontoon, and barge designs and were all constructed of
Styrofoam boards. The models were outfitted with a pendulum, test weights, and a
smartphone as the alternate measuring device. The same procedure found in the CFR and
IMO standards was used during the experiment. The V-hull model produced the best results
during the experiment due to the higher degree of precision between measuring devices.
As the experiment was carried out using the remaining two hull models, the precision
became progressively worst. It was unclear whether this was a product of the hull design
or other external factors that were acting on the models. Although all attempts were made
to minimize water fluctuations during the experiment, further experimentation is needed to
produce better results. In all three models, a two-sample t-test between measuring devices

xix
was used to detect statistical differences. In all three experiments, the level of significance
was 90% indicating strong differences between devices.
References
Djebli, Abdelkader, Benameur Hamoudi, Omar Imine, and Lahouari Adjout. 2015. “The Application of Smartphone in Ship Stability Experiment.” Journal of Marine Science and Application 14, no. 4 (December): 406-12. DOI: 10.1007/s11804-015-1331-9.
International Towing Tank Conference. n.d. “ITTC” Accessed May 4, 2018.
https://ittc.info/. Woodward , Michael D., Martijn van Rijsbergen, Keith W. Hutchinson, and Andrew Scott.
2016. “Uncertainty Analysis Procedure for the Ship Inclining Experiment.” Ocean Engineering 114: 79–86.

xx
THIS PAGE INTENTIONALLY LEFT BLANK

xxi
ACKNOWLEDGMENTS
I would like to thank my beautiful wife for enduring the rough patches of getting
through the SE curriculum. Your unwavering love and support ensured my success at NPS.
I would also like to recognize Professor Fotis Papoulias. Thank you for guiding me
through the thesis process and your time during our weekly meetings. Also, I want to thank
my second reader, Professor Matthew Boensel, for his incredible patience and guidance
during our meetings explaining the more difficult concepts for this thesis. Finally, thank
you, LCDR Andrew Pritchett, for your assistance during my miniature model experiments.

xxii
THIS PAGE INTENTIONALLY LEFT BLANK

1
I. INTRODUCTION
The introduction chapter provides an overview of the purpose and general
guidelines for conducting an inclining experiment (IE). The author examines current
regulations that govern the conduct of IEs and challenges if such regulations can be updated
to incorporate newer technologies. This led to the identity of the problem statement: Do
alternative devices that measure heel angles during the IE offer an equivalent level of safety
to pendulums? Next, a systems engineering (SE) process was developed for finding
solutions to the problem statement. Finally, this section provides an overview of the thesis
organization.
A. BACKGROUND
Conducting an IE is the primary method for verifying intact stability for new and
modified vessels. The test is used in the commercial and military sectors to ensure vessel
designs meet the specifications for positive stability by locating the vertical center of
gravity (KG). The American Society for Testing and Materials (ASTM) defines the
inclining experiment as “moving a series of known weights, normally in the transverse
direction, and then measuring the resulting change in the equilibrium heel angle of the
vessel. By using this information and applying basic naval architecture principles, the
vessel’s KG is determined” (American Society for Testing and Materials [ASTM] 2014,
777). By performing an IE, the stability of the vessel in different loading conditions, sea-
states, or following major repairs can be predicted accurately.
The general theory of how an IE measures KG is based on geometry and some basic
naval architecture principles. The factors influencing the calculation of KG are the center
of buoyancy above the keel (KB) and the height of the metacenter above the keel (KM).
First, the KB of a vessel is the centroid of where all underwater buoyant forces are focused
above the keel. The KB is determined by the shape of the underwater hull. As vessels pitch
and roll, the portion of the underwater hull that is submerged changes resulting in the KB
shifting. When the KB shifts at small angles, namely zero to four degrees, the lines of
2
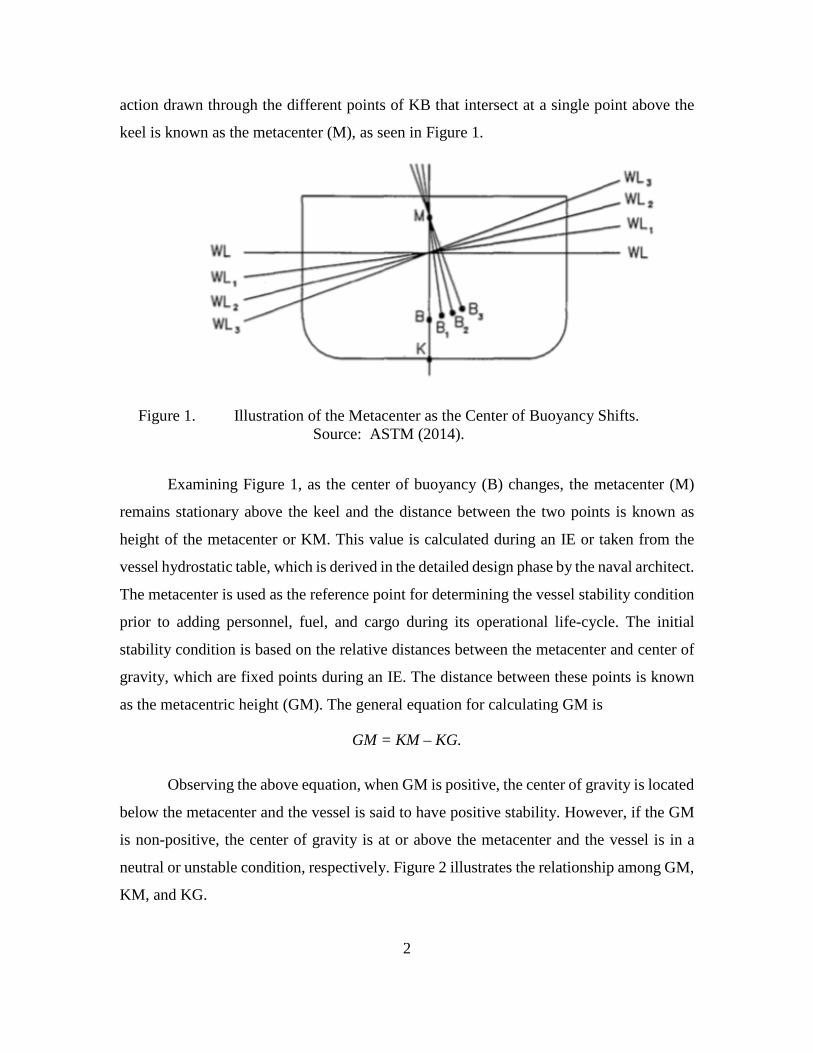
action drawn through the different points of KB that intersect at a single point above the
keel is known as the metacenter (M), as seen in Figure 1.
Figure 1. Illustration of the Metacenter as the Center of Buoyancy Shifts. Source: ASTM (2014).
Examining Figure 1, as the center of buoyancy (B) changes, the metacenter (M)
remains stationary above the keel and the distance between the two points is known as
height of the metacenter or KM. This value is calculated during an IE or taken from the
vessel hydrostatic table, which is derived in the detailed design phase by the naval architect.
The metacenter is used as the reference point for determining the vessel stability condition
prior to adding personnel, fuel, and cargo during its operational life-cycle. The initial
stability condition is based on the relative distances between the metacenter and center of
gravity, which are fixed points during an IE. The distance between these points is known
as the metacentric height (GM). The general equation for calculating GM is
GM = KM – KG.
Observing the above equation, when GM is positive, the center of gravity is located
below the metacenter and the vessel is said to have positive stability. However, if the GM
is non-positive, the center of gravity is at or above the metacenter and the vessel is in a
neutral or unstable condition, respectively. Figure 2 illustrates the relationship among GM,
KM, and KG.

3
Figure 2. Illustration of the Relationship of GM, KM, and KG. Adapted from ASTM (2014).
To evaluate where the center of gravity (G) is focused in relation to the keel, the
vessel is prepared in the lightship condition and surveyed prior to beginning the IE. The
lightship condition means that the “vessel is complete in all respects, but without
consumables, stores, cargo, crew and effects, and without any liquids on board except that
machinery fluids, such as lubricants and hydraulics, are at operating levels” (ASTM 2014,
777). The surveys performed during the IE include taking draft readings, measuring the
salinity of the water in which the vessel is floating, freeboard readings on each side of the
vessel to measure the lightship displacement, and a complete inspection of the vessel to
determine items that should be added or removed to meet the definition of lightship.
When surveys are completed, external weights are added to the vessel to induce a
port or starboard heel. The amount and size of test weights is dependent on the lightship
displacement and the amount of heel required to reach a maximum of four degrees. The
four-degree limit is to ensure the metacenter remains in a fixed position for the duration of
the IE. According to international and domestic regulations, the test weights are required
4
to be certified or validated to limit the error of the calculated moments. In some
circumstances, if the use of test weights is prohibitive due to lack of open deck space, the
moments can be created by filling ballast tanks and exchanging water between the port and
starboard side. However, this method is not preferred since ullage readings are required to
measure the amount of water shifted for each heel angle recorded. Taking manual ullage
readings will generally not be as accurate as certified weights when performing the test.
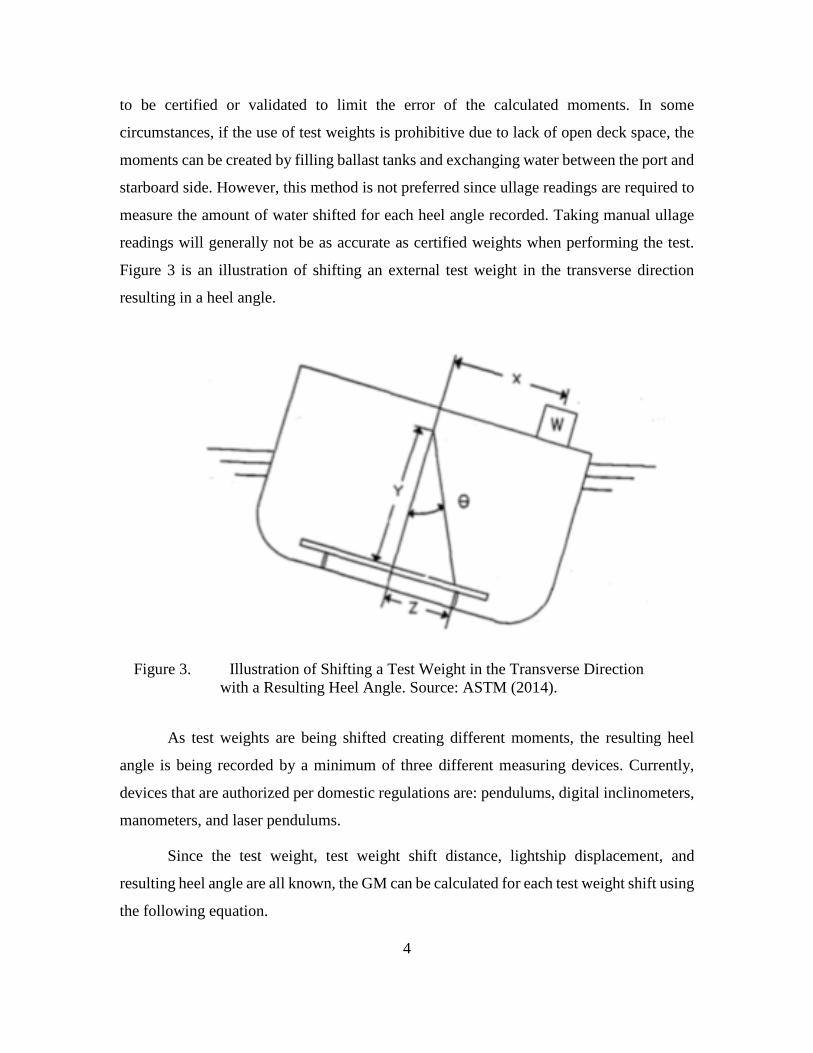
Figure 3 is an illustration of shifting an external test weight in the transverse direction
resulting in a heel angle.
Figure 3. Illustration of Shifting a Test Weight in the Transverse Direction with a Resulting Heel Angle. Source: ASTM (2014).
As test weights are being shifted creating different moments, the resulting heel
angle is being recorded by a minimum of three different measuring devices. Currently,
devices that are authorized per domestic regulations are: pendulums, digital inclinometers,
manometers, and laser pendulums.
Since the test weight, test weight shift distance, lightship displacement, and
resulting heel angle are all known, the GM can be calculated for each test weight shift using
the following equation.
5
𝐺𝐺𝐺𝐺 =𝑡𝑡𝑡𝑡𝑡𝑡𝑡𝑡 𝑤𝑤𝑡𝑡𝑤𝑤𝑔𝑔ℎ𝑡𝑡 (𝑤𝑤) ∗ 𝑡𝑡𝑡𝑡𝑡𝑡𝑡𝑡 𝑤𝑤𝑡𝑡𝑤𝑤𝑔𝑔ℎ𝑡𝑡 𝑡𝑡ℎ𝑤𝑤𝑖𝑖𝑡𝑡 𝑑𝑑𝑤𝑤𝑡𝑡𝑡𝑡𝑑𝑑𝑑𝑑𝑑𝑑𝑡𝑡(𝑑𝑑)
𝑑𝑑𝑤𝑤𝑡𝑡𝑑𝑑𝑑𝑑𝑑𝑑𝑑𝑑𝑡𝑡𝑑𝑑𝑡𝑡𝑑𝑑𝑡𝑡 (∆) ∗ tan (ℎ𝑡𝑡𝑡𝑡𝑑𝑑 𝑑𝑑𝑑𝑑𝑔𝑔𝑑𝑑𝑡𝑡 (𝜃𝜃))
By observing the above equation, “since GM and ∆ remain constant values for the
duration of the IE the ratio between (w)(d) / tan 𝜃𝜃 will be constant” (ASTM 2014, 778)
This equation will be the basis for all modeling results that will be produced in the
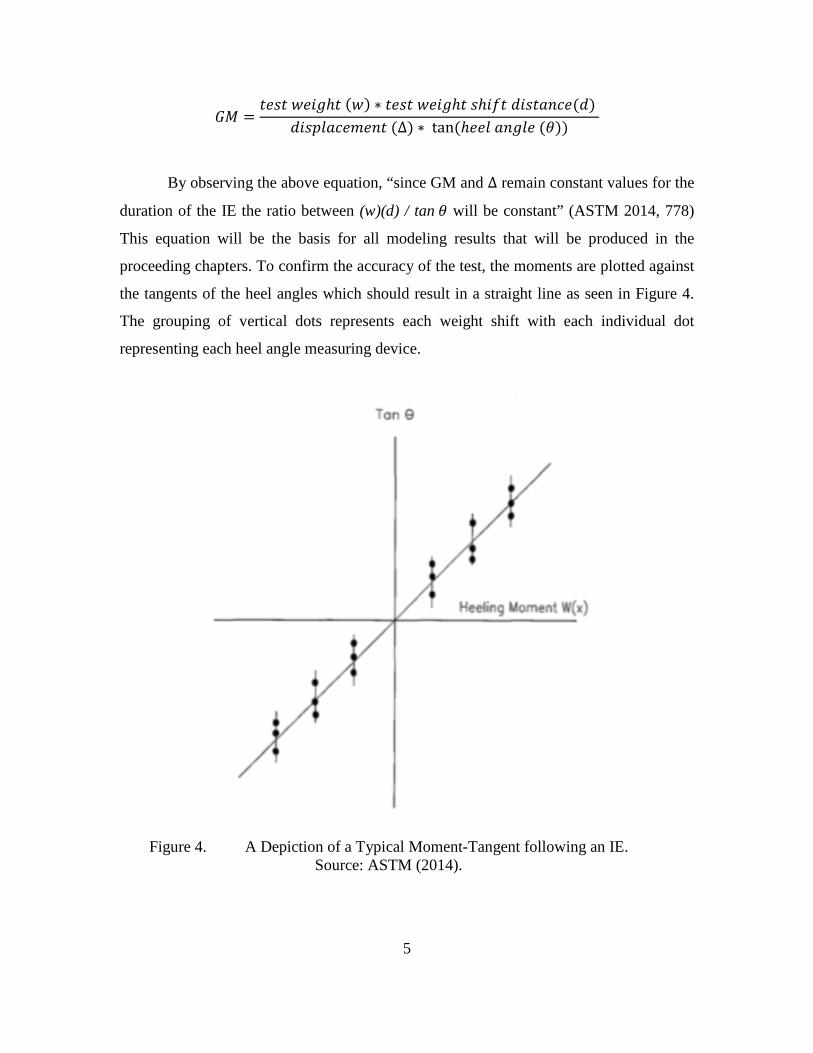
proceeding chapters. To confirm the accuracy of the test, the moments are plotted against
the tangents of the heel angles which should result in a straight line as seen in Figure 4.
The grouping of vertical dots represents each weight shift with each individual dot
representing each heel angle measuring device.
Figure 4. A Depiction of a Typical Moment-Tangent following an IE. Source: ASTM (2014).

6
If the moment-tangent plot does not result in a straight line for all weight shifts, this
could indicate that unwanted moments occurred or error was introduced during the
experiment. If this does occur, an investigation should be conducted to find the root cause
of why the moments and tangents do not plot as a straight line. Depending on the findings,
measurements or the entire experiment may need to be redone.
B. PROBLEM DEFINITION
Current regulations prescribed by the IMO and USCG require three separate heel
measuring devices during the IE, of which, one must be a pendulum. Recently, owners of
commercial small passenger vessels (SPV) have been inquiring on the feasibility of
conducting IEs without pendulums. SPVs are generally no more than 65 feet in length and
carry passengers for hire. Much of the space along the centerline of these vessels is covered
by permanent structures with fixed seating. As newer SPV designs are developed, less
space is being allocated for mounting pendulums, which typically span 10–12 feet, during
the IE. Weather conditions are another factor that may have a large effect on pendulum
use. With the exception of perfect calm conditions, tiny movements of the vessel “make a
typical three-meter (9.8′) pendulum swing 0.80 to 2.40 inches in a haphazard pattern”
(Dalrymple-Smith 2016, 32). A 2.40-inch oscillation would result in a 1.15-degree error,
which is significant. This is approximately equivalent to adding a 150-pound weight
10 feet off the centerline to a vessel with a displacement of 10,000 pounds with a GM of
7.5 feet. To combat oscillations, a large tub may be placed at the bottom of the pendulum,
as seen in Figure 5. The tub would be filled with a heavy viscous liquid, such as motor oil,
to stabilize oscillations and would need to be properly disposed of after the test.

7
Figure 5. An Illustration of a Tub that would Hold Viscous Liquid to Dampen Pendulum Oscillations. Source: Dalrymple-Smith (2016).
Finally, constructing and mounting pendulums is a time-consuming task compared
with using the other authorized measuring devices. This would incur additional time
needed for construction and set-up.
As technology matures and new innovations are developed, alternate devices may
offer the same level of precision and accuracy as pendulums which have been the primary
IE device for hundreds of years. Currently, there is limited research being conducted to
analyze if alternate measuring devices offer an equivalent level of safety to pendulums.
Developing a model that could analyze the factors having the greatest effect on GM would
be useful to study this problem. By studying which factors have the greatest effect, it can
be evaluated whether heel measuring devices have a significant impact on GM results. This
in turn could lead to recommendations to promulgate new policy to allow vessel owners
the option of using pendulums during an IE.
C. SYSTEMS ENGINEERING PROCESS
To evaluate the problem definition, the systems engineering (SE) process was used
to study the feasibility of not using pendulums during an IE. The SE process is “a

8
predefined set of activities selectively used to accomplish Systems Engineering tasks”
(International Council on Systems Engineering [INCOSE] 2004, 12). The SE task for this
thesis was to decompose the problem definition and study its different constituent parts.
By studying the individual parts that make up the IE, the different functions and their
connectivity to the IE as a whole could be examined to understand the problem and how to
model it. To model the problem, a process that was objective, repeatable, and traceable
needed to be developed. This would include defining the objectives, developing
architectures, designing a model, and verifying those elements to form viable solutions to
the problem. The process followed was adopted from the International Council on Systems
Engineering (INCOSE) handbook that is illustrated in Figure 6.
Figure 6: Iterative Model Engineering Approach. Source: INCOSE (2014).
This approach will be used as the basis for two different models used to form
solutions for the defined problem. The objective for each model was to determine the
feasibility of not using pendulums during an IE while still achieving the same level of
accuracy and precision. Furthermore, after formulating the objective, a system architecture
was defined. A system architecture is “a fundamental and unifying structure defined in
terms of elements, information, interfaces, processes, constraints, and behaviors” (Maier
and Rechtin 2002, 287). By organizing the different IE components into a process, the
constraints and connectivity of the different variables that affect metacentric height (GM)

9
could be evaluated. The components specifically examined were the size of the test weights
and their shift distances that formed various moments, heel angles generated as a result of
the moments, and the type of instrument used to measure the heel angle. Two different
architectures were generated using a Microsoft Excel-based data analysis tool developed
by the author and evaluated miniature vessel models. The architectures developed would
serve as the means for meeting the stated objective. Next, the design and synthesis portion
of the process was gathering and producing data from the architectures developed.
Finally, the different models were verified against the original objectives, architecture, and
design to ensure it met the needs of producing feasible solutions to the problem definition.
This process will be the basis for determining the feasibility of not using pendulums during
an IE.
D. THESIS ORGANIZATION
The remaining chapters of this thesis are organized as follows: Chapter II
introduces similar research and current regulations pertaining to the IE. Chapter III covers
the raw data collected for the DOE analysis and performs an initial overview of the data.
Chapter IV details the different sources of random error that were inputted to the DOE
analysis. Chapter V details the analysis for the Microsoft Excel-based DOE model. Chapter
VI provides the set-up, procedure, and analysis of the IEs performed on three different
miniature models constructed by the author. Finally, Chapter VII provides the conclusions,
recommendations, and future work for this study.

10
THIS PAGE INTENTIONALLY LEFT BLANK

11
II. LITERATURE REVIEW AND CURRENT REGULATIONS
This chapter gives a relevant literature review for on-going research for methods of
reducing systematic error in the IE as well as new technologies being considered as
alternate measuring devices. In addition, an overview of domestic and international
regulations pertaining to the IE for commercial vessels will be covered.
A. LITERATURE REVIEW
Limited research exists for investigating IE systematic error or comparing
authorized alternate measuring devices. This section reviews published articles that analyze
error and uncertainty for calculating KG during the IE and examines the feasibility of using
smartphones as an authorized device.
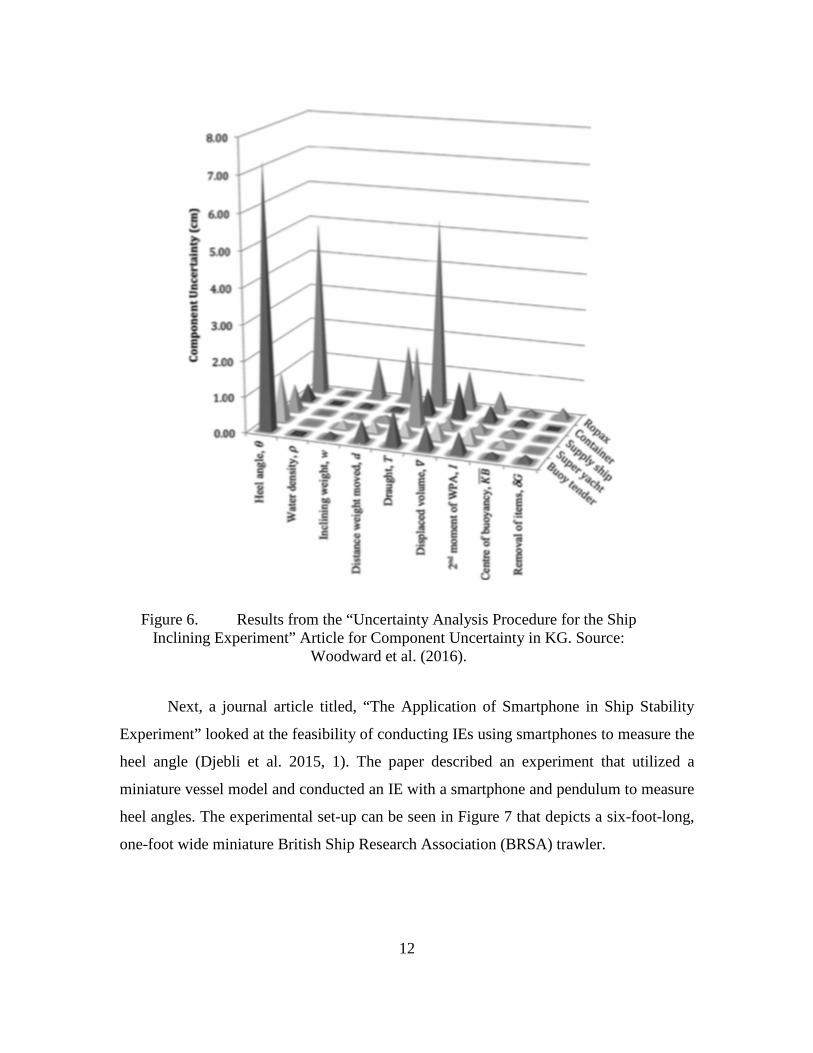
In the article “Uncertainty Analysis Procedure for the Ship Inclining Experiment,”
the authors developed a procedure to identify “experimental uncertainty in the estimate of
KG obtained by the IE” (Woodward et al. 2016, 86). The authors noted that uncertainty
applied to ship model hydrodynamic testing, which is governed by procedures found in
International Towing Tank Conference (ITTC) standards, could also be applied to the IE.
By applying the methodology in the ITTC standards, the paper examined uncertainty for
all independent variables and conducted a sensitivity analysis via partial derivatives. The
paper concluded that none of the variables could be identified as “problematic” but
provided guidelines for estimating the confidence interval for KG and recommendations
on removing uncertainty. Figure 6 provides a graphic of the papers findings for each
independent variable that contributed to KG.
Examining Figure 6, the factors that had the most frequent component uncertainty
were heel angle and draught. A similar analysis will be performed by examining the
metacentric height in lieu of the center of gravity as the response variable for the DOE
analysis and miniature model experiment.
12
Figure 6. Results from the “Uncertainty Analysis Procedure for the Ship Inclining Experiment” Article for Component Uncertainty in KG. Source:
Woodward et al. (2016).
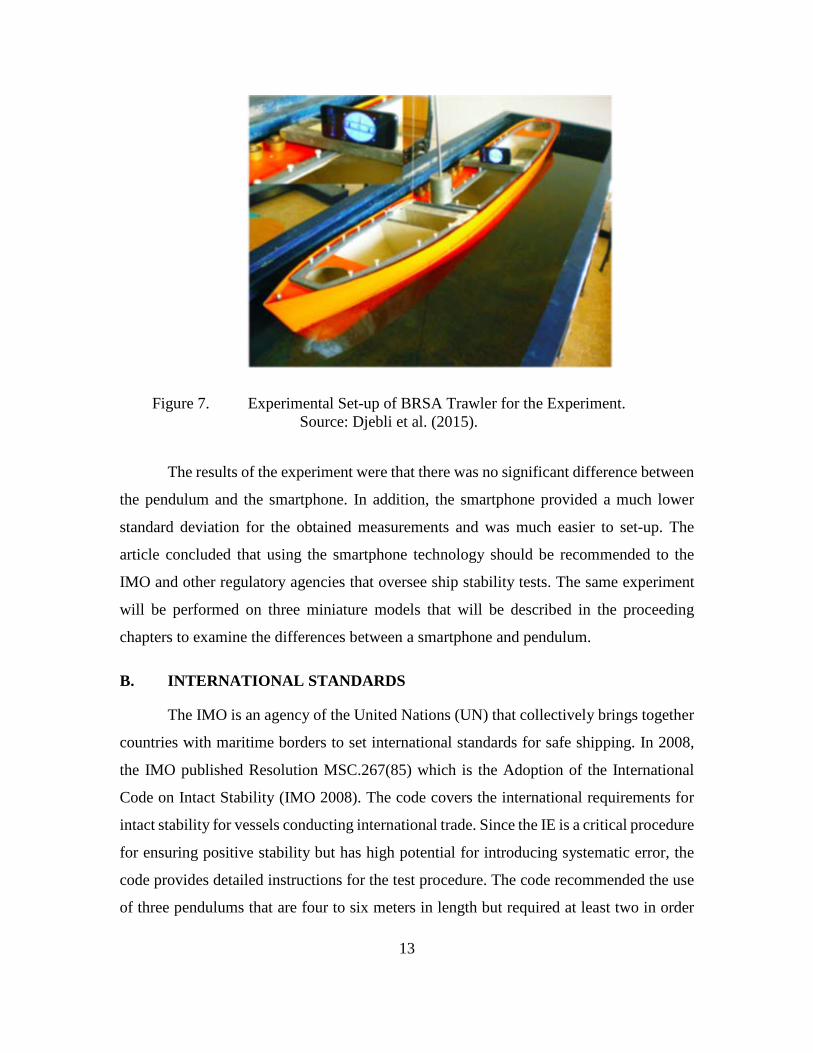
Next, a journal article titled, “The Application of Smartphone in Ship Stability
Experiment” looked at the feasibility of conducting IEs using smartphones to measure the
heel angle (Djebli et al. 2015, 1). The paper described an experiment that utilized a
miniature vessel model and conducted an IE with a smartphone and pendulum to measure
heel angles. The experimental set-up can be seen in Figure 7 that depicts a six-foot-long,
one-foot wide miniature British Ship Research Association (BRSA) trawler.
13
Figure 7. Experimental Set-up of BRSA Trawler for the Experiment. Source: Djebli et al. (2015).
The results of the experiment were that there was no significant difference between
the pendulum and the smartphone. In addition, the smartphone provided a much lower
standard deviation for the obtained measurements and was much easier to set-up. The
article concluded that using the smartphone technology should be recommended to the
IMO and other regulatory agencies that oversee ship stability tests. The same experiment
will be performed on three miniature models that will be described in the proceeding
chapters to examine the differences between a smartphone and pendulum.
B. INTERNATIONAL STANDARDS
The IMO is an agency of the United Nations (UN) that collectively brings together
countries with maritime borders to set international standards for safe shipping. In 2008,
the IMO published Resolution MSC.267(85) which is the Adoption of the International
Code on Intact Stability (IMO 2008). The code covers the international requirements for
intact stability for vessels conducting international trade. Since the IE is a critical procedure
for ensuring positive stability but has high potential for introducing systematic error, the
code provides detailed instructions for the test procedure. The code recommended the use
of three pendulums that are four to six meters in length but required at least two in order

14
“to allow identification of bad readings at any one station” (International Maritime
Organization [IMO] 2008, 71). It further states that alternate devices that have the same
accuracy as pendulums can only be used in conjunction with at least one pendulum.
Alternate devices that the IMO currently authorizes are digital inclinometers and u-tube
manometers. There was no mention of laser pendulums. However, the code does allow for
flag-state administrations, such as the USCG, to waive the pendulum requirement if
mounting pendulums is determined to be impractical due to vessel constraints.
C. DOMESTIC REGULATIONS
The USCG is the regulatory agency that governs commercial vessel regulations for
U.S. flagged vessels. Regulations for vessel stability requirements are generally found in
Title 46 of the Code of Federal Regulations Subchapter S as well as USCG published
guidelines that clarify regulations. Currently, USCG requirements are in sync with IMO
standards and require three measuring devices with at least one pendulum to be used during
the IE. Alternate devices used during the IE need an equivalent level of accuracy to the
pendulum. The only noticeable difference between international standards and the USCG
guidelines is the USCG authorization of laser pendulums if they have the same level of
accuracy as traditional pendulums. In addition, there is no allowance for vessel owners not
to use at least one pendulum during an IE or for the allowance of smartphone technology.

15
III. RAW DATA FOR DESIGN OF EXPERIMENT ANALYSIS
This chapter will discuss the raw data gathered for the Excel-based model that
will be produced for the analysis and results chapter. In addition, moment-tangent plots
will be generated based on the raw data submitted to the USCG in order to draw
expectations of what the DOE analysis may reveal.
A. RAW DATA
To provide an analysis on whether alternate measuring devices offer an equivalent
level of accuracy to pendulums, raw data from IEs that had been conducted on existing
vessels was needed. Per 46 United States Code of Federal Regulations (CFR) Subchapter
S Subpart 170.075(a) states that owners of commercial vessels are required to submit plans
to the USCG Marine Safety Center (MSC) for plan review pertaining to vessel stability.
This is to ensure commercial vessels meet minimum safety standards when carrying crew,
passengers, or cargo. Part of the required submittal package to MSC includes a plan that
shows the location of KG, which is generally done when an IE is performed. Since plans
are reviewed and stored at MSC, the author contacted that office and requested IE
submittals to analyze. Specifically requested were data from vessels that used alternate
devices along with pendulums during IEs. The MSC was able to furnish the author with
five separate IE submittals from commercial SPVs regulated under 46 CFR Subchapter T.
These five vessels were all regulated under the same rules but vastly differed in their size,
shape, and configuration. Due to the different hull shape dimensions, the test weight to
displacement ratios will be noticeably different for each vessel. For vessels with narrower
beams, additional test weights were needed to create the necessary moments for heeling
the vessel to four degrees. For vessels with wider beams, test weights could be extended
further off centerline requiring less overall test weights to be used for the necessary
moments. Furthermore, the details regarding each vessel IE procedure will be discussed in
the sections below; however, identifiable information such as vessel name or its general
characteristics will not be disclosed to protect the privacy of vessel owners who submitted
these plans to the USCG.
16
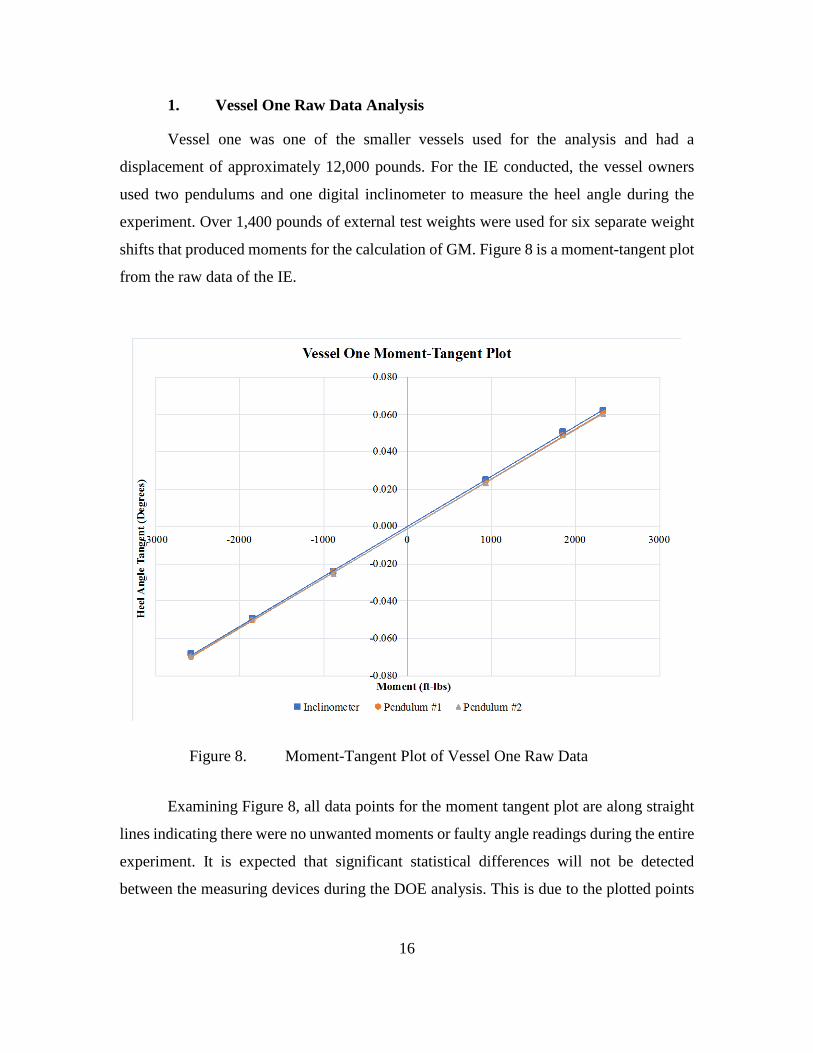
1. Vessel One Raw Data Analysis
Vessel one was one of the smaller vessels used for the analysis and had a
displacement of approximately 12,000 pounds. For the IE conducted, the vessel owners
used two pendulums and one digital inclinometer to measure the heel angle during the
experiment. Over 1,400 pounds of external test weights were used for six separate weight
shifts that produced moments for the calculation of GM. Figure 8 is a moment-tangent plot
from the raw data of the IE.
Figure 8. Moment-Tangent Plot of Vessel One Raw Data
Examining Figure 8, all data points for the moment tangent plot are along straight
lines indicating there were no unwanted moments or faulty angle readings during the entire
experiment. It is expected that significant statistical differences will not be detected
between the measuring devices during the DOE analysis. This is due to the plotted points
17
being nearly stacked on top of one another that indicates strong agreement among all the
devices used.
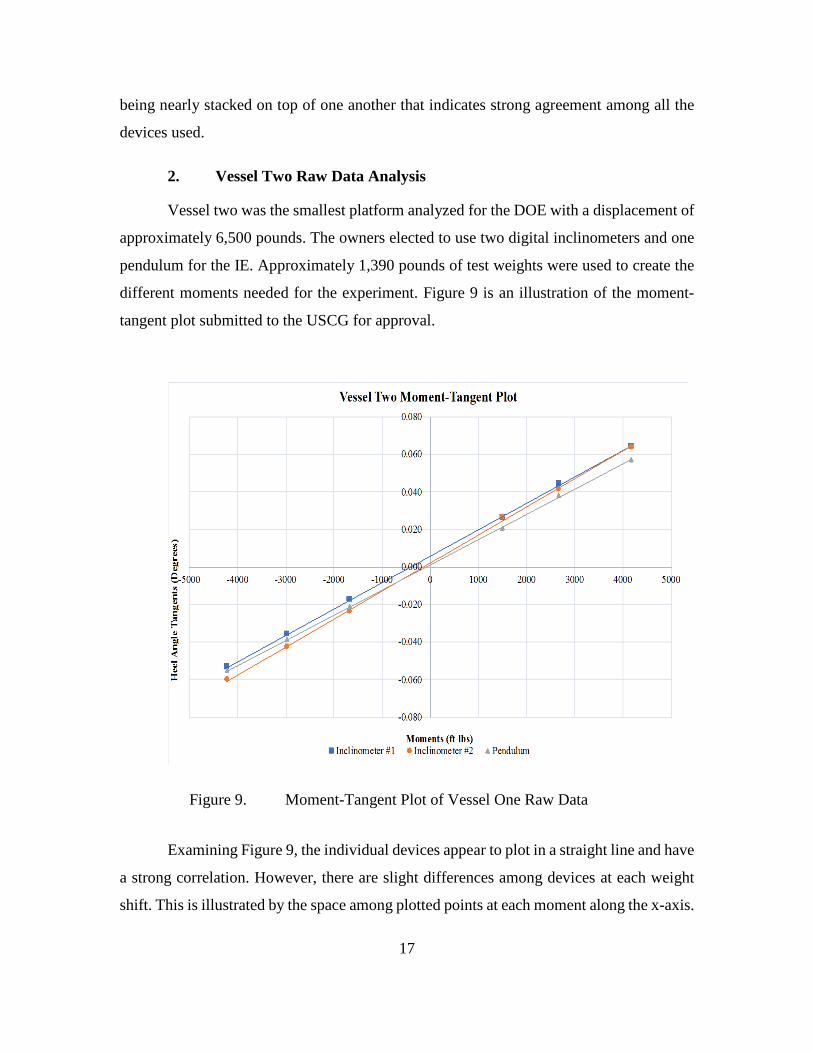
2. Vessel Two Raw Data Analysis
Vessel two was the smallest platform analyzed for the DOE with a displacement of
approximately 6,500 pounds. The owners elected to use two digital inclinometers and one
pendulum for the IE. Approximately 1,390 pounds of test weights were used to create the
different moments needed for the experiment. Figure 9 is an illustration of the moment-
tangent plot submitted to the USCG for approval.
Figure 9. Moment-Tangent Plot of Vessel One Raw Data
Examining Figure 9, the individual devices appear to plot in a straight line and have
a strong correlation. However, there are slight differences among devices at each weight
shift. This is illustrated by the space among plotted points at each moment along the x-axis.
18
It is expected that there may be significant statistical differences among devices since the
plotted points do not consistently overlap with one another. This would mean that there
was not consistent agreement among devices for the duration of the IE.
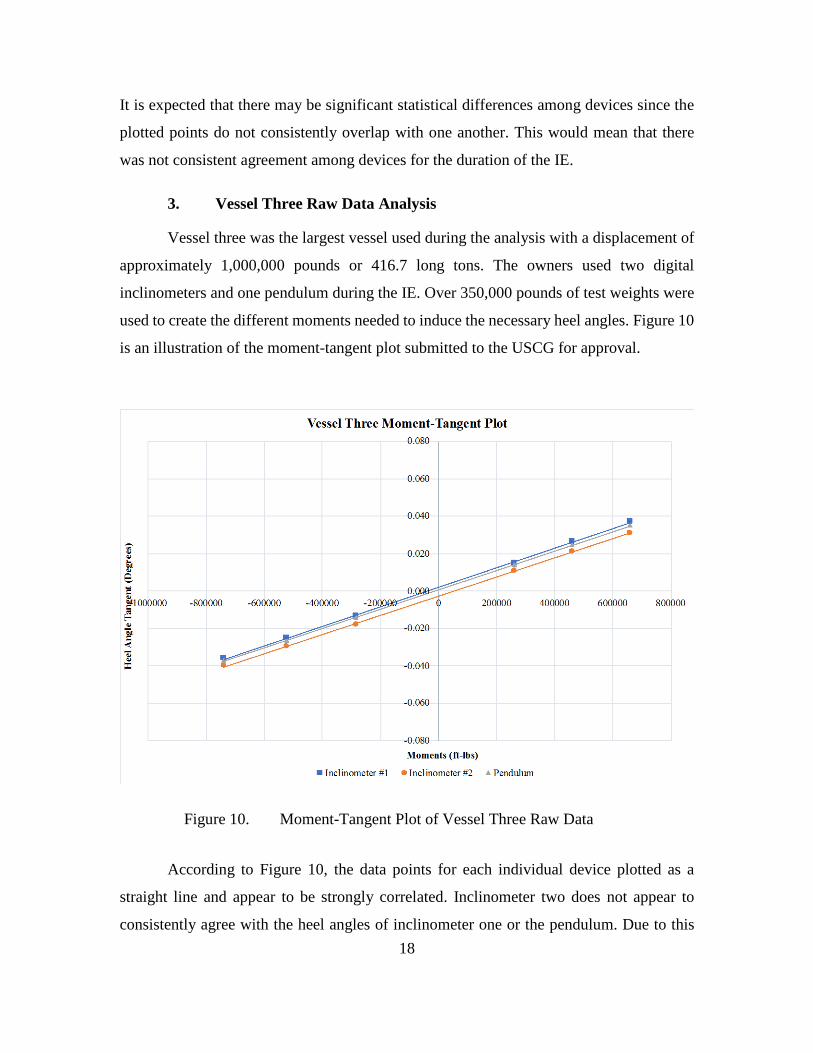
3. Vessel Three Raw Data Analysis
Vessel three was the largest vessel used during the analysis with a displacement of
approximately 1,000,000 pounds or 416.7 long tons. The owners used two digital
inclinometers and one pendulum during the IE. Over 350,000 pounds of test weights were
used to create the different moments needed to induce the necessary heel angles. Figure 10
is an illustration of the moment-tangent plot submitted to the USCG for approval.
Figure 10. Moment-Tangent Plot of Vessel Three Raw Data
According to Figure 10, the data points for each individual device plotted as a
straight line and appear to be strongly correlated. Inclinometer two does not appear to
consistently agree with the heel angles of inclinometer one or the pendulum. Due to this

19
inconsistency, significant statistical differences among devices is expected during the DOE
analysis. This does not mean that inclinometer two produced faulty readings during the IE.
It means that there was a consistent bias that was introduced or that the other two devices
are producing bias readings. The bias could be due to where the device was placed along
the centerline or human error with regards to operating the device. Unfortunately, these
details were not provided in the submittal to perform a more detailed analysis.
4. Vessel Four Raw Data Analysis
Vessel four was the second largest platform used for this analysis and had a
displacement of approximately 29,000 pounds. The owners used two pendulums and one
digital inclinometer during the IE. The vessel used approximately 500 pounds in test
weights to induce the different moments necessary to heel the vessel. Figure 11 is an
illustration of the moment-tangent plot for vessel four.
Figure 11. Moment-Tangent Plot of Vessel Four Raw Data
20
Examining Figure 11, all devices during each weight shift appear to plot as a
straight line and are strongly correlated. There is very little space among the plotted points
at each moment indicating that all devices are in agreement. Based on this graph, it is
expected that there should be no significant differences among devices used.
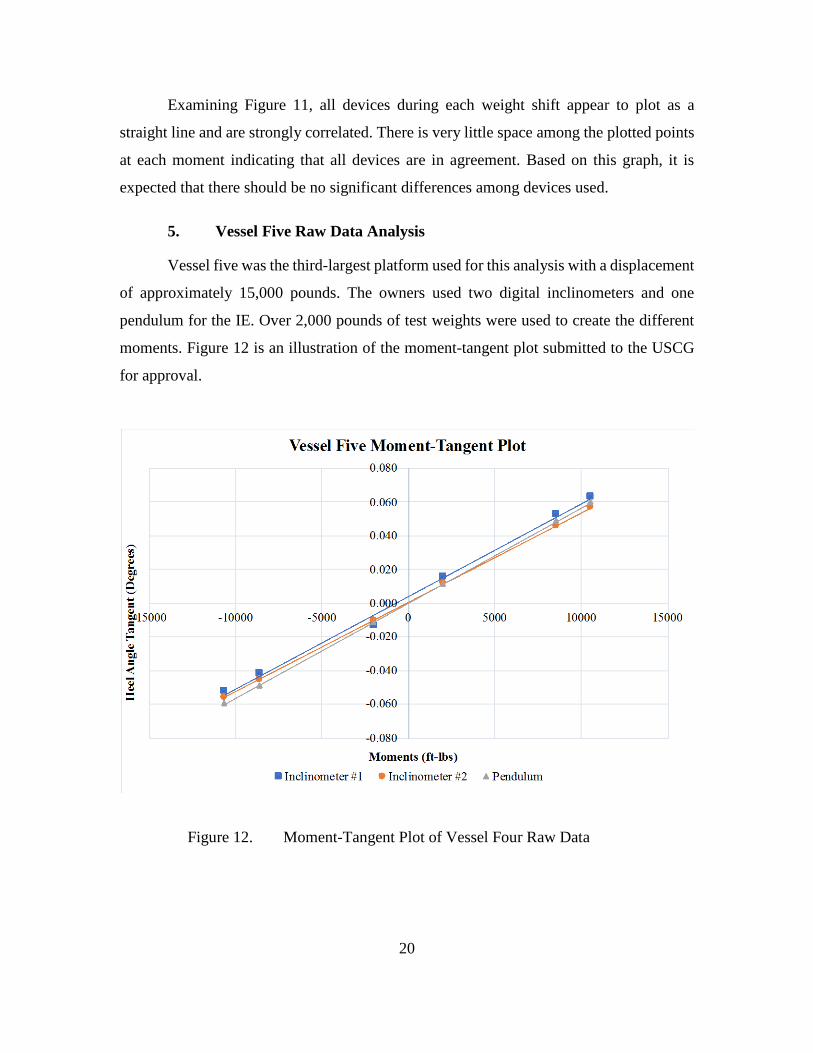
5. Vessel Five Raw Data Analysis
Vessel five was the third-largest platform used for this analysis with a displacement
of approximately 15,000 pounds. The owners used two digital inclinometers and one
pendulum for the IE. Over 2,000 pounds of test weights were used to create the different
moments. Figure 12 is an illustration of the moment-tangent plot submitted to the USCG
for approval.
Figure 12. Moment-Tangent Plot of Vessel Four Raw Data

21
Examining Figure 12, all devices and their respective moment-tangent data points
plotted as a straight line and appear to have a strong correlation. The individual data points
in Figure 12 do not overlap with one another indicating there was no consistent agreement
among devices during the IE. Therefore, it is expected that there will be significant
statistical differences among devices when the DOE analysis is conducted.
B. RAW DATA CONCLUSION
Based on the raw data provided by the USCG, there was no consistent bias that
could be identified that would skew the results. In addition, it could not be concluded that
one measuring device was superior to the others. Examining all the moment-tangent plots
in the previous sections, it is not anticipated that the test weight or test weight shift distance
will be significant factors for the DOE analysis. Most plotted values do not have
statistically significant differences for any given moment value when vertically aligned
with the x-axis which represents the different moments. This means that the test weights
and shift distance measurements were consistent throughout the experiment. The observed
differences among the plotted values were more frequent when horizontally aligned with
the y-axis. This axis plots the tangent of the heel angles produced by each measuring device
during the IE. Due to the numerous vertical gaps observed among the plotted points, it is
expected that the type of device used or the accuracy of the device used will produce the
most significant differences in the results.

22
THIS PAGE INTENTIONALLY LEFT BLANK

23
IV. INCLINING EXPERIMENT UNCERTAINTY
This chapter discusses uncertainty regarding the independent variables used to
calculate the metacentric height, GM. The uncertainty identified will be quantitatively
estimated and used as input for the design of experiment (DOE) analysis in the
proceeding chapter.
A. TEST WEIGHT ERROR
The test weight is the mass that is shifted to create different moments for the heel
angles. Prior to the experiment beginning, test weights are required to be certified or
validated by the person performing the IE (United States Coast Guard [USCG] 2016, 5).
The devices used to verify test weight accuracy (i.e., scale or dynamometer) have error that
is inherent to the device. After analyzing different certificates that accompanied the
certified test weights, there was a wide range of accuracies that were noted based on the
scale used and size of the test weight. The most reasonable error the author could deduce
was to use three different error level settings for the DOE which were 0.50, 2.50, and 5.00
pounds. Unfortunately, applying a consistent percentage error for all test weights was not
feasible. Each IE submitted to MSC used different amounts of test weights to create the
moments necessary to heel the vessel. For instance, vessel three used 20 different test
weights during the IE opposed to vessel two which used six different test weights. Each of
the weights ranged in size and each vessel used different scales which had different error
associated with them. Since modern scales have rated accuracy levels of no more than five
pounds, this was the maximum error level used for the DOE analysis. The five-pound
maximum limit is less than one percent error from the total test weights used in each
submittal analyzed.
B. TEST WEIGHT SHIFT DISTANCE ERROR
After the test weight is placed on board and shifted off the centerline, the naval
architect performing the IE measures the exact distance to accurately calculate the moment.
There are several sources of error with measuring this shift distance that include: accuracy

24
of the measuring device used (i.e., engineering scale or tape measure), using the exact
reference point on the test weight after the shift, or human error of the observer recording
the distance. Since all experiments used different devices and had different personnel
observing the shift distance, error was adjusted to three different levels that included 0.25,
0.50, and 1.00 inches. These values are representative of the probable error for the test
weight shift distance and would account for all sources of error previously mentioned for
shifting test weights.
C. LIGHTWEIGHT DISPLACEMENT ERROR
During the IE, vessels are generally in the lightship condition. The lightship
displacement is calculated prior to the experiment beginning by taking draft and freeboard
readings on each side of the vessel. After recording the salinity of the surrounding water,
the displacement can be calculated by referring back to the hydrostatic tables or it is
manually calculated. After calculating the lightship displacement, a lightship survey is
conducted to add or subtract weight that is not considered part of lightship. During the
survey, if additional items were identified that needed to be added or removed, the naval
architect would either estimate the approximate weight of the item or physically remove or
add it to the vessel. These items, along with other sources of weight (e.g., bilge water, fuel
in tanks), create unnecessary moments which could invalidate the test. The items to be
added or removed are at the discretion of the person-in-charge (PIC) or flag-state or
classification society to make the determination if the vessel is in the lightship condition
(IMO 2008). For these reasons, this factor likely has the greatest source of error.
For the analysis conducted, no sources of error were applied to the lightship
displacement. Each test that was analyzed had a wide range of items that needed to be
added, removed, or estimated prior to the test beginning. If the weight was estimated, the
item would be added or removed after the completion of the test. Since all vessels had
different personnel overseeing the test effort, there was a wide range of subjectivity of how
much error to add for each vessel during the lightship survey which would introduce a large
bias in the data. Therefore, lightship displacement values were kept constant throughout
each analysis.
25
D. HEEL ANGLE ERROR
Each IE examined for this analysis employed only pendulums and digital
inclinometers to measure heel angles. Therefore, laser pendulums and manometers could
not be observed. The different errors associated with pendulums and digital inclinometers
are explained further in the following paragraphs.
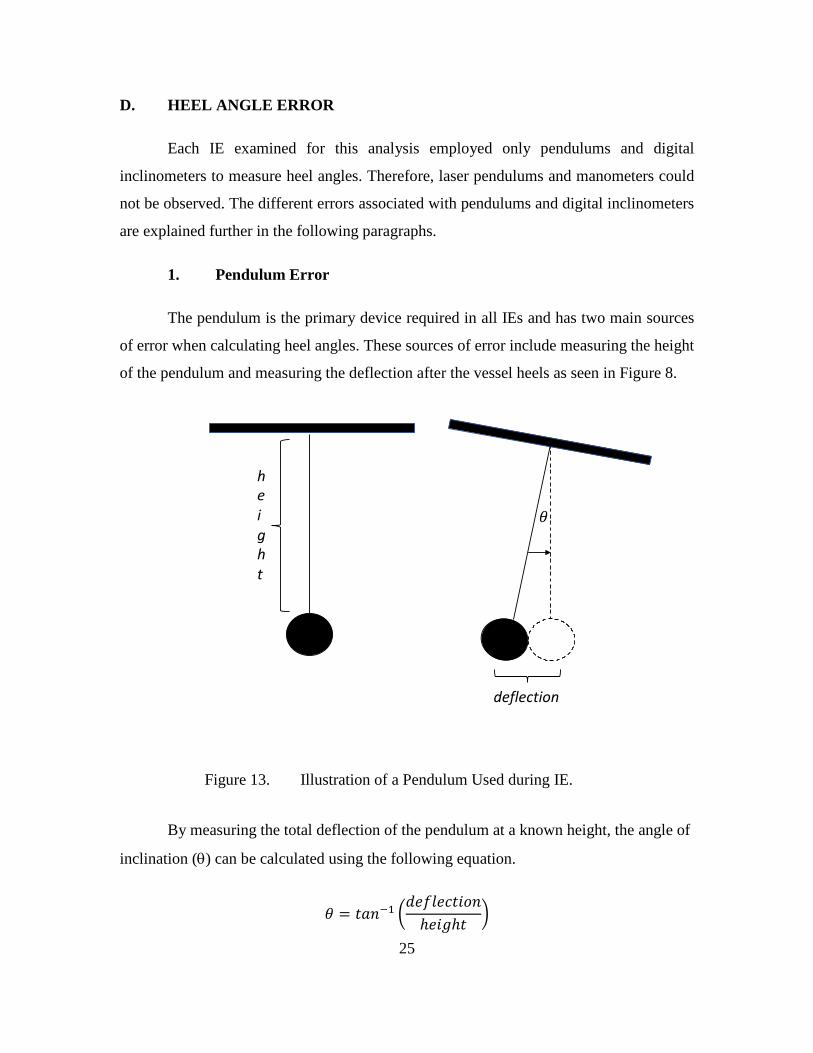
1. Pendulum Error
The pendulum is the primary device required in all IEs and has two main sources
of error when calculating heel angles. These sources of error include measuring the height
of the pendulum and measuring the deflection after the vessel heels as seen in Figure 8.
Figure 13. Illustration of a Pendulum Used during IE.
By measuring the total deflection of the pendulum at a known height, the angle of
inclination (θ) can be calculated using the following equation.
𝜃𝜃 = 𝑡𝑡𝑑𝑑𝑑𝑑−1 �𝑑𝑑𝑡𝑡𝑖𝑖𝑑𝑑𝑡𝑡𝑑𝑑𝑡𝑡𝑤𝑤𝑑𝑑𝑑𝑑ℎ𝑡𝑡𝑤𝑤𝑔𝑔ℎ𝑡𝑡
�

26
For both height and deflection measurements, there is human error involved. For
the set-up of the analysis, error was only applied to the deflection of the pendulum and not
the height. This was done to have an even comparison and produce a balanced DOE since
digital inclinometers only had one source of error applied to them. This is not to say
pendulums and digital inclinometers only have one or two sources of error, but those were
errors that could reasonably be estimated. Other sources of error affecting the pendulum
deflection include: oscillations due to weather, workmanship during construction of the
pendulum, and the distance off centerline the pendulum was placed. To develop error levels
for the DOE, an examination of different commercial engineering scales were researched.
In general, engineering scale tick marks had gaps of 1/32nd, 1/16th, and 1/8th of an inch. If
using a 10-foot pendulum, these markings would correspond to approximately 0.02, 0.03,
and 0.06 degrees of heel, respectively.
2. Digital Inclinometer Error
The digital inclinometer is a mature technology that has been around for many
years. This device is placed along the centerline of the vessel and records the heel angle
via internal components. Depending on the specifications of the device, it can take up to
10 sample readings and return the mean and standard deviation for each weight shift. This
significantly reduces device error relative to pendulums that generally oscillate during the
IE. The USCG has set the specifications that all digital inclinometers shall meet which is
“when employed as a substitute for up to two of the required pendulums, digital
inclinometers must have a precision of at least ± 0.01 degrees with an accuracy of ± 0.05
degree.” (USCG 2016, 6). The inherent accuracy of the digital inclinometer was the only
error applied for this analysis. Other errors for the digital inclinometer that were omitted
were precision of the angular deflections and the transverse position of the device off
centerline. It was assumed that the location error would nearly match the pendulum
location error and, therefore, would have little impact during the analysis. The range of
error levels used were 0.01, 0.03, and 0.05 degrees for the device accuracy. These values
were chosen based on the above USCG specifications with 0.05 degrees being the
maximum permissible error. It should be noted that a 0.05-degree digital inclinometer

27
reading is approximately equal to a 1/10th inch deflection for a 10-foot pendulum. This
means that the error levels applied to both devices are relatively similar and ideal for
comparison.

28
THIS PAGE INTENTIONALLY LEFT BLANK

29
V. DESIGN OF EXPERIMENT ANALYSIS AND RESULTS
This chapter will discuss how the analysis was set-up to examine five separate IEs
that were conducted on U.S. flagged Small Passenger Vessel (SPVs). In addition, the
design of experiment (DOE) results will be analyzed to look at which factors had the
greatest impact on GM. In addition, a non-parametric analysis from the factors with the
greatest level of significance will be evaluated to determine why the DOE produced the
results that it did.
A. ANALYSIS SETUP
The MSC provided the author with five separate IE submittals from commercial
SPVs. The raw data from the submittals was used as the baseline for the analysis. The
information that was extracted from the submittals were: pendulum heights and deflections,
inclinometer heel angles, test weights with shift distances, lightweight displacements, and
final GM calculations. These factors were duplicated in the Microsoft Excel analysis tool
to generate the same results. After verifying the spreadsheet accuracy with the MSC
submittals, the author wanted to explore if there were any statistical differences between
pendulums and the authorized alternate measuring devices used for each vessel. The only
alternate devices that were used from submitted IEs were digital inclinometers. Therefore,
an initial null and alternate hypothesis was formed and used as the objective for the DOE
seen below.
𝐻𝐻𝑂𝑂:𝐺𝐺𝑡𝑡𝑑𝑑𝑡𝑡𝑀𝑀𝑀𝑀𝑡𝑡𝑑𝑑 𝐻𝐻𝑡𝑡𝑡𝑡𝑑𝑑 𝐴𝐴𝑑𝑑𝑔𝑔𝑑𝑑𝑡𝑡𝑡𝑡 𝑖𝑖𝑑𝑑𝑀𝑀 𝑃𝑃𝑡𝑡𝑑𝑑𝑑𝑑𝑀𝑀𝑑𝑑𝑀𝑀𝑑𝑑𝑡𝑡 = 𝐺𝐺𝑡𝑡𝑑𝑑𝑡𝑡𝑀𝑀𝑀𝑀𝑡𝑡𝑑𝑑 𝐻𝐻𝑡𝑡𝑡𝑡𝑑𝑑 𝐴𝐴𝑑𝑑𝑔𝑔𝑑𝑑𝑡𝑡𝑡𝑡 𝑖𝑖𝑑𝑑𝑀𝑀 𝐷𝐷𝑤𝑤𝑔𝑔𝑤𝑤𝑡𝑡𝑑𝑑𝑑𝑑 𝐼𝐼𝑑𝑑𝑑𝑑𝑑𝑑𝑤𝑤𝑑𝑑𝑑𝑑𝑑𝑑𝑡𝑡𝑡𝑡𝑡𝑡𝑀𝑀𝑡𝑡
vs.
𝐻𝐻𝐴𝐴:𝐺𝐺𝑡𝑡𝑑𝑑𝑡𝑡𝑀𝑀𝑀𝑀𝑡𝑡𝑑𝑑 𝐻𝐻𝑡𝑡𝑡𝑡𝑑𝑑 𝐴𝐴𝑑𝑑𝑔𝑔𝑑𝑑𝑡𝑡𝑡𝑡 𝑖𝑖𝑑𝑑𝑀𝑀 𝑃𝑃𝑡𝑡𝑑𝑑𝑑𝑑𝑀𝑀𝑑𝑑𝑀𝑀𝑑𝑑𝑡𝑡 ≠ 𝐺𝐺𝑡𝑡𝑑𝑑𝑡𝑡𝑀𝑀𝑀𝑀𝑡𝑡𝑑𝑑 𝐻𝐻𝑡𝑡𝑡𝑡𝑑𝑑 𝐴𝐴𝑑𝑑𝑔𝑔𝑑𝑑𝑡𝑡𝑡𝑡 𝑖𝑖𝑑𝑑𝑀𝑀 𝐷𝐷𝑤𝑤𝑔𝑔𝑤𝑤𝑡𝑡𝑑𝑑𝑑𝑑 𝐼𝐼𝑑𝑑𝑑𝑑𝑑𝑑𝑤𝑤𝑑𝑑𝑑𝑑𝑑𝑑𝑡𝑡𝑡𝑡𝑡𝑡𝑀𝑀𝑡𝑡
With the spreadsheet model prepared and an objective null hypothesis formed,
random error was applied to the test weight, test weight shift distance, and heel angle. The
random error applied followed a normal distribution since that was what the data most
likely followed and would be verified during the non-parametric analysis of the GM results.

30
A random number generator that followed a normal distribution was used for the model.
To generate the random numbers, the raw data provided in the submittals was inputted as
the mean value and the standard deviation was the three different error levels discussed in
the previous chapter. A GM calculation with the applied error was generated for each
weight shift and compared against the baseline GM calculation.
To analyze whether the random error applied had any meaningful influence on the
model, a DOE was set-up to measure which factors had the highest level of significance.
In addition, the type of device used for the calculation of GM was added as the fourth
factor. All four factors had three levels and were all replicated 10 times. Therefore, there
were 810 data points generated per weight shift, as seen in the below calculation.
𝐷𝐷𝑑𝑑𝑡𝑡𝑑𝑑 𝑃𝑃𝑑𝑑𝑤𝑤𝑑𝑑𝑡𝑡𝑡𝑡 𝑑𝑑𝑡𝑡𝑀𝑀 𝑊𝑊𝑡𝑡𝑤𝑤𝑔𝑔ℎ𝑡𝑡 𝑆𝑆ℎ𝑤𝑤𝑖𝑖𝑡𝑡 = 3 𝐿𝐿𝑡𝑡𝐿𝐿𝑡𝑡𝑑𝑑𝑡𝑡4 𝐹𝐹𝐹𝐹𝐹𝐹𝐹𝐹𝐹𝐹𝐹𝐹𝐹𝐹 ∗ 10 𝑅𝑅𝑡𝑡𝑑𝑑𝑑𝑑𝑤𝑤𝑑𝑑𝑑𝑑𝑡𝑡𝑡𝑡𝑡𝑡
𝐷𝐷𝑑𝑑𝑡𝑡𝑑𝑑 𝑃𝑃𝑑𝑑𝑤𝑤𝑑𝑑𝑡𝑡𝑡𝑡 𝑑𝑑𝑡𝑡𝑀𝑀 𝑊𝑊𝑡𝑡𝑤𝑤𝑔𝑔ℎ𝑡𝑡 𝑆𝑆ℎ𝑤𝑤𝑖𝑖𝑡𝑡 = 810 𝐷𝐷𝑑𝑑𝑡𝑡𝑑𝑑 𝑃𝑃𝑑𝑑𝑤𝑤𝑑𝑑𝑡𝑡𝑡𝑡
The five IEs each had six weight shifts. Therefore, there were 24,300 GM
calculations for the analysis for all vessels. The DOE was set-up in Minitab statistical
software. The software provided five separate balanced full factorial designs with the
previously mentioned factors, levels, and replicates. After generating different full factorial
designs, all were inserted into the spreadsheet model to produce GM calculations based on
the combination of factors and levels. After running all the combinations in the model, the
generated GM calculations were placed back in the Minitab software for analysis. Minitab
generated five separate Analysis of the Variance (ANOVA) tables that provided key
insights to each IE.
B. DOE ANALYSIS
After running Monte Carlo simulations with random errors inputted into each of
the three factors previously mentioned, a GM was calculated for each trial. The resulting
GM was analyzed in Minitab via ANOVA tables. All factors and their contribution to the
overall IE error were plotted as Pareto charts as seen in Figures 14, 15, 16, 17, and 18
where factor “A” represents the device used, factor “B” is the test weight error, factor “C”
is the test weight shift distance error, and factor “D” represents the accuracy of the device
31
being used. The combination of factors, such as “AB,” represent interactions among
factors. The chart is plotted with all factors on the vertical axis and the level of significance
on the horizontal axis. The level of significance is the probability of rejecting the null
hypothesis which, in this scenario, is that there is no difference between pendulums and
digital inclinometers with respect to their measured heel angles. A red dashed line is drawn
at the 90% level of significance value since this is a common threshold for rejecting null
hypotheses.
Figure 14. DOE Results from Vessel One Analysis
32
Figure 15. DOE Results from Vessel Two Analysis
Figure 16. DOE Results from Vessel Three Analysis

33
Figure 17. DOE Results from Vessel Four Analysis
Figure 18. DOE Results from Vessel 5 Analysis

34
In all the results presented in the previous figures, the type of device used for
measuring heel angle was the most significant factor for each vessel. This means that there
is high confidence that if the model were run 100 times, it would be expected that there
would be statistical differences among all devices for all trials. The DOE was set-up with
the null hypothesis that there was no difference among heel measuring devices for
calculating GM. According to the previous figures, the null hypothesis of assuming there
is no difference among measuring devices can be rejected. To explore further why the type
of device used was significant in all five vessels, an analysis of each devices’ raw data as
it contributed to GM will be examined in the next section.
C. NON-PARAMETRIC DEVICE DATA
Since all DOEs concluded that the type of device used during the experiment had
the greatest impact on calculating GM, examining the non-parametric data may explain
why. This section will display and plot the GM calculations from the raw data without
random error applied. It will show the mean, standard deviation, median, minimum,
maximum, and range for all GM calculations. In addition, the GM calculations will be
transformed into dot plots to visualize the data for skewness and outliers.
For the data provided in each dot plot, a standardized method was developed to
evaluate each vessel objectively. First, the data was evaluated for outliers. Outliers are
values that are significantly higher or lower than the mean value of the sample set. These
values can add bias to the data leading to a misinterpretation during the analysis. Next, the
data was evaluated for skewness. Skewness is the degree to which the data set is non-
symmetric about the mean. Skewness or the symmetry of the data set could indicate if the
raw data was normally or nonnormally distributed. This would validate the assumption of
using a normal distribution for the DOE error inputs. Finally, a comparison of the median
values and range of the GM calculations were examined for each vessel indicating accuracy
and precision.
35
1. Vessel One Non-parametric Analysis
The GM calculations for each device used on vessel one can be seen in Table 1 and
Figure 19. The red dashed line represents the mean value among all devices—
approximately 3.1 feet.
Table1. Non-parametric GM Calculations for Vessel One (in feet)
Digital Inclinometer Pendulum #1 Pendulum #2 Mean 3.08 3.12 3.11
Standard Deviation 0.05 0.10 0.16 Median 3.10 3.11 3.08
Minimum 3.01 3.01 2.84 Maximum 3.13 3.26 3.35
Range 0.12 0.25 0.51
Figure 19. Non-parametric Dot Plot of GM Results for Vessel One
Reviewing the calculations for each device, there were no outliers in the data. In
addition, there did not appear to be skewness and therefore it was reasonably assumed the
data was normally distributed. The median values among devices is within 0.03 feet from
one another, and the range of values appears consistent. Overall, the digital inclinometer
provided the best precision.

36
2. Vessel Two Non-parametric Analysis
Next, the non-parametric data from vessel two was examined as seen in Table 2
and Figure 20. The red dashed line represents that mean value among all devices—
approximately 11.1 feet.
Table 2. Non-parametric GM Calculations for Vessel Two (in feet)
Digital Inclinometer #1 Digital Inclinometer #2 Pendulum Mean 11.42 10.31 11.62
Standard Deviation 2.32 0.80 0.44 Median 11.21 10.49 11.67
Minimum 8.91 8.91 10.99 Maximum 14.89 11.03 12.15
Range 5.99 2.13 1.16
Figure 20. Non-parametric Dot Plot of GM Results for Vessel Two
After evaluating the data, it is clear that GM calculations for digital inclinometer
#1 were more variable than the other two devices. There were no outliers for each of the
devices and there does not appear to be skewness. The span of GM calculations for digital
inclinometer #1 had almost a six-foot range between the minimum and maximum values.
Although digital inclinometer #1 had the lowest precision, the median values were

37
approximately one-foot from each other, indicating consistency among devices since
vessel two had an approximate GM of 11 feet. Overall, the pendulum provided the best
precision.
3. Vessel Three Non-parametric Analysis
Furthermore, the non-parametric data from vessel three was examined and can be
seen in Table 3 and Figure 21. The red dashed line represents that mean value among all
devices—approximately 18.6 feet.
Table 3. Non-parametric GM Calculations for Vessel Three (in feet)
Digital Inclinometer #1 Digital Inclinometer #2 Pendulum Mean 18.29 19.08 18.47
Standard Deviation 1.63 3.17 0.43 Median 18.35 18.94 18.48
Minimum 16.67 15.07 17.99 Maximum 19.90 23.77 18.95
Range 3.23 8.70 0.97
Figure 21. Non-parametric GM Results from Vessel Three (in feet)
There were no outliers in the data and no apparent skewness. In addition, the
median values were consistent at less than 0.6 feet. However, the range in data for both

38
digital inclinometers were significantly higher than the pendulum. For digital inclinometer
#2, there was nearly an 8.5-foot range in GM calculations which is a significant fluctuation
between weight shifts. The pendulum had the overall best precision with slightly under
one-foot.
4. Vessel Four Non-parametric Analysis
Next, the data for vessel four was analyzed and can be seen in Table 4 and
Figure 22. The red dashed line represents the mean values among all devices at
approximately 5.4 feet.
Table 4. Non-parametric GM Calculations for Vessel Four (in feet)
Pendulum #1 Pendulum #2 Digital Inclinometer Mean 5.36 5.39 5.50
Standard Deviation 0.18 0.27 0.12 Median 5.35 5.45 5.51
Minimum 5.14 4.99 5.36 Maximum 5.58 5.64 5.64
Range 0.44 0.65 0.28
Figure 22. Non-parametric GM Results from Vessel Four (in feet)
39
There was no outliers and no apparent skewness in the data. In addition, the median
and range of values appear to be consistent as well. The device that provided the overall
best precision was the digital inclinometer.
5. Vessel Five Non-parametric Analysis
Finally, the data for vessel five can be seen in Table 5 and Figure 23. The red dashed
line represents the mean value among all devices at approximately 12.5 feet.
Table 5. Non-parametric GM Calculations for Vessel Five (in feet)
Digital Inclinometer #1 Digital Inclinometer #2 Pendulum Mean 11.89 13.10 12.45
Standard Deviation 2.19 0.57 0.18 Median 11.63 13.25 12.39
Minimum 8.85 12.01 12.29 Maximum 14.54 13.62 12.78
Range 5.69 1.61 0.49
Figure 23. Non-parametric GM Results from Vessel Five (in feet)
There appears to be some skewness in both digital inclinometers, and the
median values are not consistent across all devices. The median value between digital
inclinometer #1 and the other two devices is approximately two feet. Furthermore, there

40
were no outliers recorded for each device that would disproportionately affect the data.
Also, the range in GM calculations were almost seven feet for digital inclinometer #1 with
digital inclinometer #2 having a two-foot range. Overall, the pendulum provided the
best precision.
D. OVERALL NON-PARAMETRIC ANALYSIS
The GM calculations for each vessel had variable results among each device. For
three out of the five vessels, the pendulum provided a higher level of precision compared
to the digital inclinometer. It should be noted that these same three vessels had significantly
higher GM values and all used two digital inclinometers and one pendulum. It is unclear
whether the higher GM values or the combination of devices used were the cause of the
pendulums having more precision. In addition, at least one digital inclinometer for each of
the three vessels had large deviations in comparison to the other two devices used during
the IE. Reasons that may explain the various deviations for each device include the
transverse and longitudinal position of the measuring device along the centerline, human
or inherent device error in the measurements, weather conditions during the IE, or the
design of the vessel. There was no data to support these theories since the submittals did
not provide details on exact device placement relative to the vessel, prevailing weather
conditions for each weight shift, how many personnel were recording measurements, or
the overall design of the vessel and how weather interacts with the hull (i.e., sail area).
Since these variables could not be further explored, a more detailed analysis could not be
conducted.
The key insights that were drawn from this analysis were that all experiments had
at least one device that did not correspond with the other two. There are several factors that
can account for these discrepancies, as was explained in the previous paragraph. The data
could not provide which device had better precision in each analysis since there was no
device that was consistently producing better results over the other devices used. Further
information would need to be gathered from each of these IEs to identify the other external
factors not accounted for in the data. This could lead to a clearer recommendation whether
pendulums could be excluded from IEs.

41
VI. PHYSICAL EXPERIMENTATION
This chapter examines IEs conducted on three separate physical models that were
constructed by the author. The intent of the experiment was to perform IEs on miniature
vessel models with different hull configurations and observe the impact to the GM
calculations. The following paragraphs will cover the initial set-up, materials used, and
configuration of the models. Finally, the analysis results of the experiment will enable
conclusions to be drawn.
A. INITIAL SET-UP AND PROCEDURE
The primary purpose for this experiment was to explore how different hull
configurations affected IE results among different heel measuring devices. By performing
this experiment on a miniature level, the author could control external factors that were
unknown in the MSC submittals. By limiting the external forces to the model, the impact
to GM results could be observed. The systems engineering approach was applied to the
experiment in order to develop, design, and fabricate three separate hull models and
analyze the results of the two-different heel measuring devices used. A smartphone that
measures heel angles via internal accelerometer and a pendulum were used for comparison.
The equipment utilized for this experiment is summarized in Table 6.

42
Table 6. List of Equipment Used for Inclining Experiment for Physical Models
Item Nomenclature Use
Styrofoam Block Three of these rectangular Styrofoam boards that measured 30.4 cm x 15.1 cm x 2.5 cm were procured and used as the foundation for all hull configurations.
Cylindrical Styrofoam Rods
Styrofoam cylinder rods that measured approximately 30.4 cm by 2.5 cm were used as pontoons for one of the hull models. Two pieces were cut in half, lengthwise, and glued to the bottom of the rectangular Styrofoam boards.
Pendulum Mast A 27 cm wooden mast was inserted into the stern portion of all models to suspend the pendulum.
Wooden Spool A wooden spool was attached to the top of the pendulum mast to separate the mast from pendulum string. This enabled the pendulum to swing freely unobstructed.
Paper Clip A paper clip was attached to the end of the spool to minimize the friction between the pendulum string and wooden spool.
Pendulum String A monofilament string was attached to the top of the pendulum that measured approximately 25 cm in length and was attached to each wooden spool via paper clip.
Plumb Bob A small lead plumb bob was attached to the bottom of the pendulum string to ensure it remained straight and not fluctuations due to air movement in the laboratory.
Engineering Scale A small engineering scale that measured 15 cm in length was used to record the pendulum deflections.
Test Weights A series of 20-gram test weights were used to create moments that induced different heel angles needed for the IE.
Rubber Mat
A rubber mat was placed on top of the Styrofoam block to create a friction barrier for the test weights and smartphone. This was to prevent slippage that would create unnecessary moments and to avoid risk of the smartphone dropping in the water.
Smartphone
A smartphone, specifically an iPhone 6 model MG632LL/A, was the other primary device used to measure the heel angle of the model. The specific application used was the Small Craft Motion Program, or SCraMP. SCramP was developed Leigh McCue, a professor within the Aerospace and Ocean Engineering department at Virginia Tech University.

43
Figure 24 is a picture of the complete set-up for one of the three models and
includes all equipment except the cylindrical rods from Table 6.
Figure 24. Assembled V-Hull Model to Measure Induced Heel Angles
To conduct this experiment, the first step was to visually inspect all equipment to
ensure correct set-up and alignment. This included inspecting the pendulum and all of its
components. First, a sufficient air gap between the Styrofoam board and the plumb bob
was examined. The plumb bob needed to be free of obstructions to obtain reliable results.
In addition, verification of the engineering scale used for measuring pendulum deflections
was inspected for vertical alignment with the pendulum mast. The engineering scale and
pendulum needed to be nearly perpendicular to gain accurate readings during the IE. After
the engineering scale was confirmed to be properly set-up, it was glued to the pendulum
mast to lower the risk of it inadvertently moving during the experiment. Finally, the plumb

44
bob was aligned to the assumed zero point on the engineering scale. This was done by first
choosing the zero point to use. After the point was chosen and marked, the paper clip that
the plumb bob hung from was permanently fastened to the wooden spool via glue in order
for the plumb bob to nearly align to that mark when the model was in the even keel position.
Next, the model and all other test equipment used during the experiment (i.e.,
smartphone, test weights) were assumed to be part of each models’ lightship displacement.
To measure the total displacement of the model, a digital scale was used with all equipment
resting on the hull. The digital scale was verified to be calibrated and accurate to 0.1 grams.
Furthermore, a rubber mat was placed on top of the hull to act as a non-skid surface for the
different pieces of equipment as well as to make markings for the exact position for the test
weights to be shifted. Therefore, prior to the experiment beginning, a trial run was
conducted to visualize the approximate distances the test weights would need to be shifted
to achieve the required heel. Since the same rubber mat was used on every model, the red
and yellow markings seen in Figure 26 represent the initial and final test weight positions
for the different hull configurations. It was found during the trial run that as test weights
were shifted, a large amount of human contact with the model was needed. This in turn
created substantial waves in the tub thus causing large oscillations to the pendulum and
large fluctuations to the smartphone readings. To reduce disturbing the water during the
experiment, strings were attached to the different test weights in order to minimize contact
with the hull. Also, during each weight shift, a pen was used to dampen the oscillation by
placing it in the direct path of the plumb bob and slowly backed off until the oscillations
nearly diminished. However, the plumb bob still swung approximately 0.4 cm to either
direction and therefore the mean value was taken from the period it produced.
Prior to beginning the experiment, several measurements were taken that included
the dimensions of the model, height of the pendulum mast, and the distance between marks
for the test weights. In addition, the test weights were weighed on a calibrated scale. These
measurements would be used to calculate various moments, heel angles and ultimately the
GM for each model. Once the equipment was verified to be set-up correctly, the experiment
began by gently placing the first model into the tub with the test weights at their initial
marks. The initial readings from the pendulum and the smartphone were recorded. If the
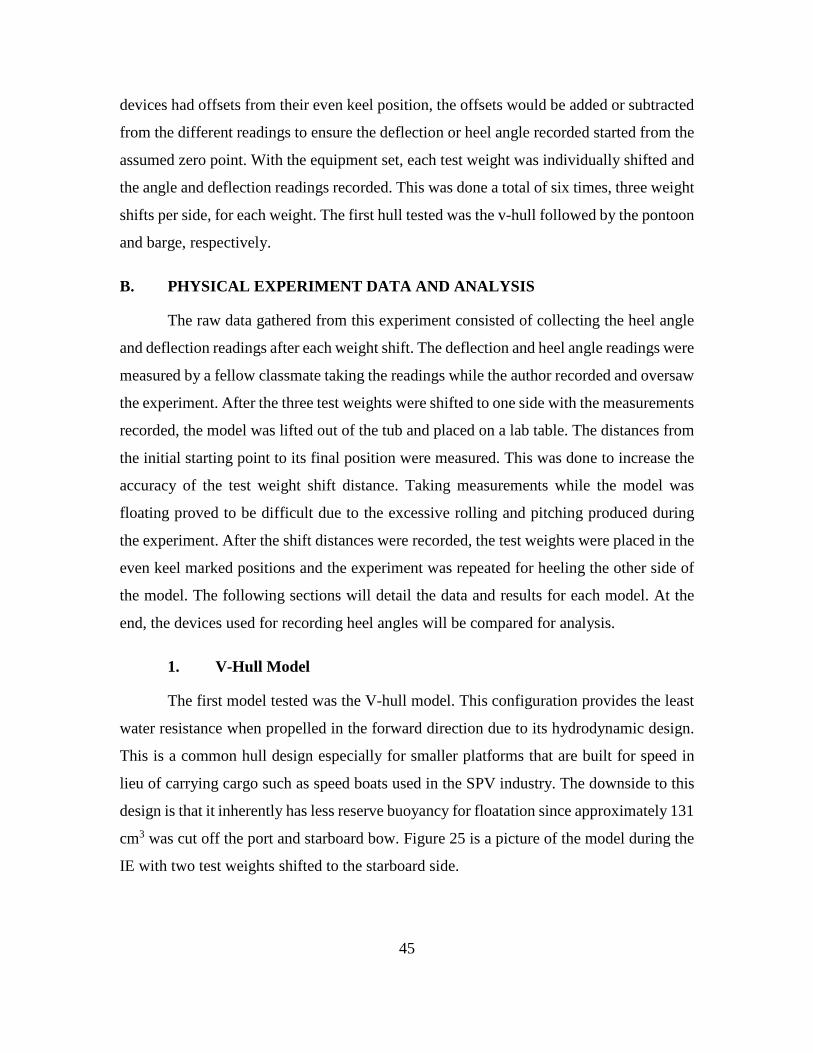
45
devices had offsets from their even keel position, the offsets would be added or subtracted
from the different readings to ensure the deflection or heel angle recorded started from the
assumed zero point. With the equipment set, each test weight was individually shifted and
the angle and deflection readings recorded. This was done a total of six times, three weight
shifts per side, for each weight. The first hull tested was the v-hull followed by the pontoon
and barge, respectively.
B. PHYSICAL EXPERIMENT DATA AND ANALYSIS
The raw data gathered from this experiment consisted of collecting the heel angle
and deflection readings after each weight shift. The deflection and heel angle readings were
measured by a fellow classmate taking the readings while the author recorded and oversaw
the experiment. After the three test weights were shifted to one side with the measurements
recorded, the model was lifted out of the tub and placed on a lab table. The distances from
the initial starting point to its final position were measured. This was done to increase the
accuracy of the test weight shift distance. Taking measurements while the model was
floating proved to be difficult due to the excessive rolling and pitching produced during
the experiment. After the shift distances were recorded, the test weights were placed in the
even keel marked positions and the experiment was repeated for heeling the other side of
the model. The following sections will detail the data and results for each model. At the
end, the devices used for recording heel angles will be compared for analysis.
1. V-Hull Model
The first model tested was the V-hull model. This configuration provides the least
water resistance when propelled in the forward direction due to its hydrodynamic design.
This is a common hull design especially for smaller platforms that are built for speed in
lieu of carrying cargo such as speed boats used in the SPV industry. The downside to this
design is that it inherently has less reserve buoyancy for floatation since approximately 131
cm3 was cut off the port and starboard bow. Figure 25 is a picture of the model during the
IE with two test weights shifted to the starboard side.
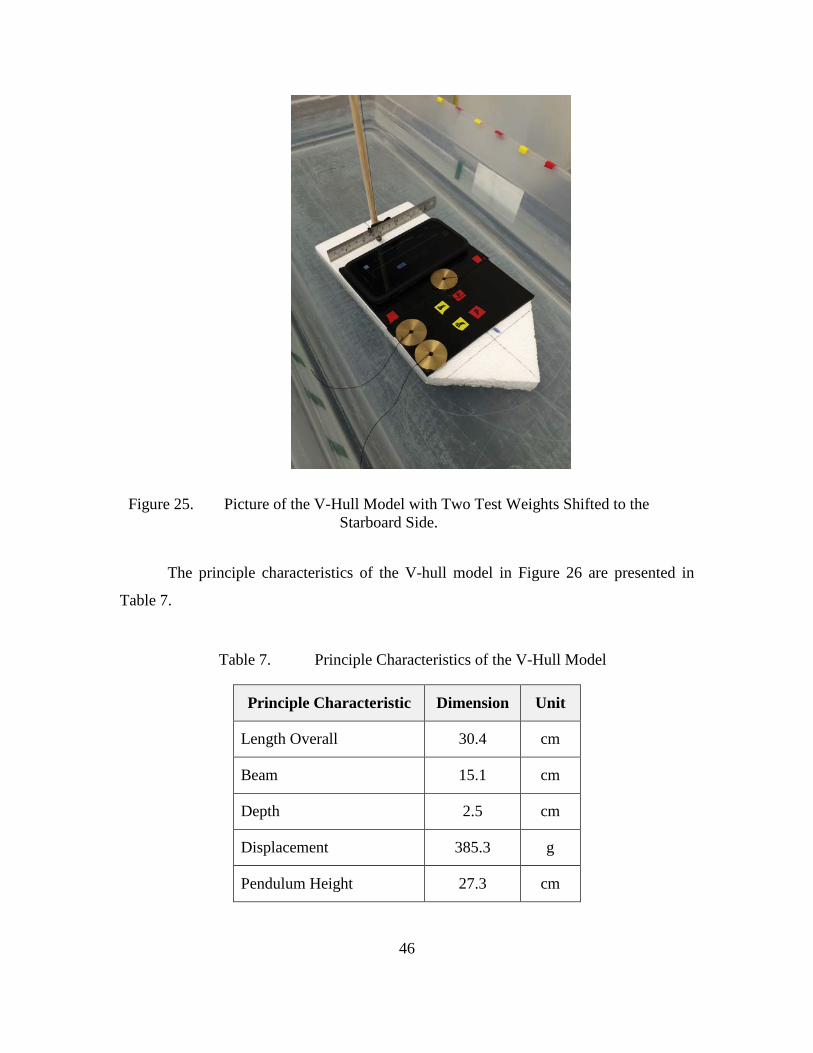
46
Figure 25. Picture of the V-Hull Model with Two Test Weights Shifted to the Starboard Side.
The principle characteristics of the V-hull model in Figure 26 are presented in
Table 7.
Table 7. Principle Characteristics of the V-Hull Model
Principle Characteristic Dimension Unit
Length Overall 30.4 cm
Beam 15.1 cm
Depth 2.5 cm
Displacement 385.3 g
Pendulum Height 27.3 cm
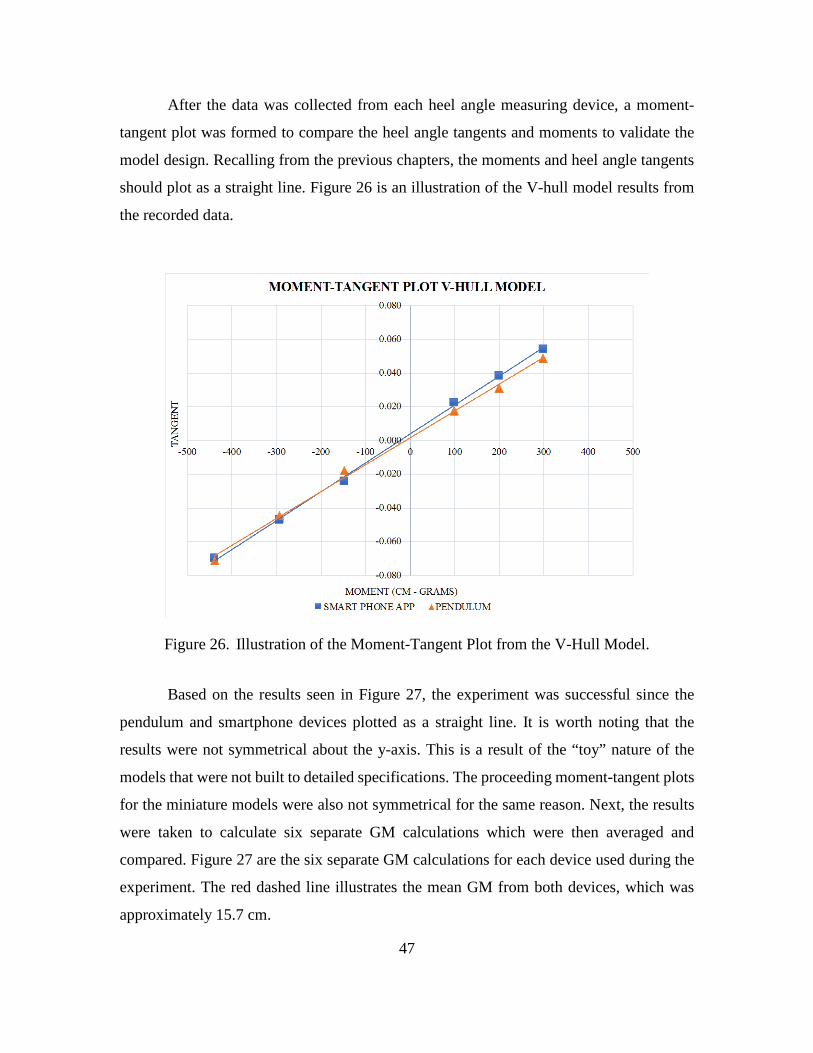
47
After the data was collected from each heel angle measuring device, a moment-
tangent plot was formed to compare the heel angle tangents and moments to validate the
model design. Recalling from the previous chapters, the moments and heel angle tangents
should plot as a straight line. Figure 26 is an illustration of the V-hull model results from
the recorded data.
Figure 26. Illustration of the Moment-Tangent Plot from the V-Hull Model.
Based on the results seen in Figure 27, the experiment was successful since the
pendulum and smartphone devices plotted as a straight line. It is worth noting that the
results were not symmetrical about the y-axis. This is a result of the “toy” nature of the
models that were not built to detailed specifications. The proceeding moment-tangent plots
for the miniature models were also not symmetrical for the same reason. Next, the results
were taken to calculate six separate GM calculations which were then averaged and
compared. Figure 27 are the six separate GM calculations for each device used during the
experiment. The red dashed line illustrates the mean GM from both devices, which was
approximately 15.7 cm.

48
Figure 27. Non-parametric GM Results from V-Hull Model Experiment
Analyzing the results in Figure 27, approximately half of the data points from each
device overlapped indicating there was agreement among the devices. Table 8 is the
numerical breakdown of the GM results and how they compared.
Table 8. Non-parametric GM Results from the V-Hull Model Experiment
Smartphone (cm) Pendulum (cm) Mean 14.53 16.93
Standard Deviation 1.84 2.31 Median 14.94 16.34
Minimum 11.44 14.60 Maximum 16.26 21.31
Range 4.82 6.72
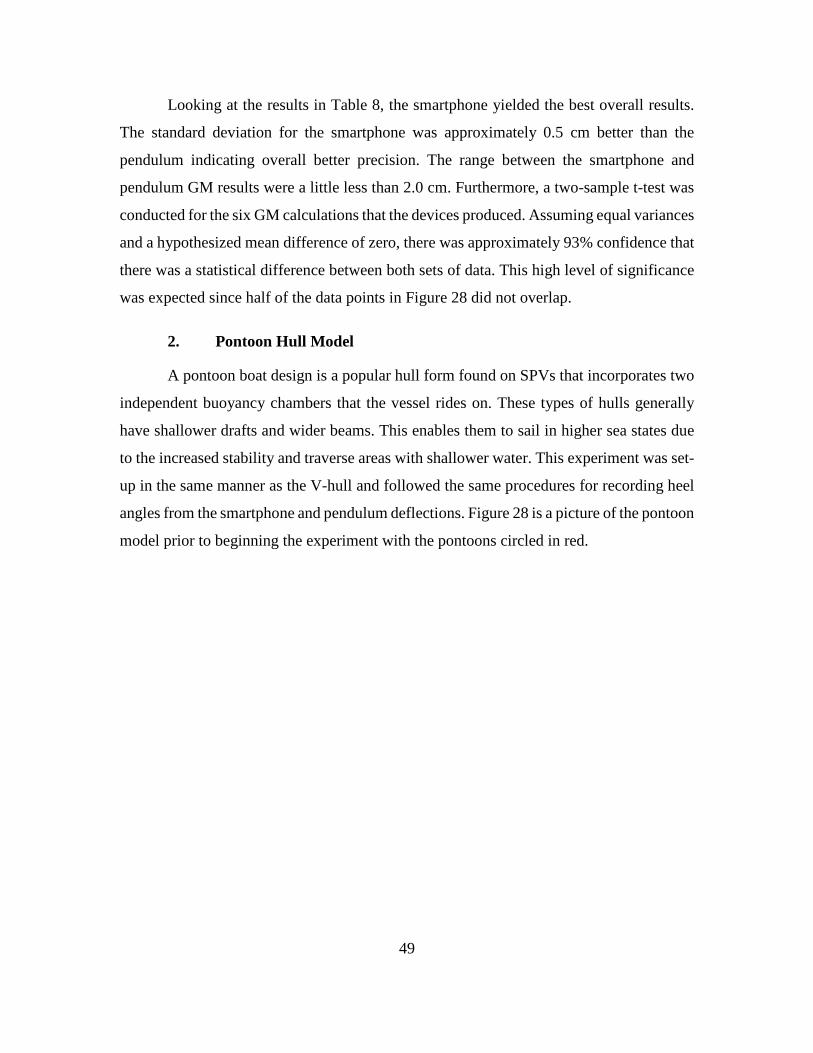
49
Looking at the results in Table 8, the smartphone yielded the best overall results.
The standard deviation for the smartphone was approximately 0.5 cm better than the
pendulum indicating overall better precision. The range between the smartphone and
pendulum GM results were a little less than 2.0 cm. Furthermore, a two-sample t-test was
conducted for the six GM calculations that the devices produced. Assuming equal variances
and a hypothesized mean difference of zero, there was approximately 93% confidence that
there was a statistical difference between both sets of data. This high level of significance
was expected since half of the data points in Figure 28 did not overlap.
2. Pontoon Hull Model
A pontoon boat design is a popular hull form found on SPVs that incorporates two
independent buoyancy chambers that the vessel rides on. These types of hulls generally
have shallower drafts and wider beams. This enables them to sail in higher sea states due
to the increased stability and traverse areas with shallower water. This experiment was set-
up in the same manner as the V-hull and followed the same procedures for recording heel
angles from the smartphone and pendulum deflections. Figure 28 is a picture of the pontoon
model prior to beginning the experiment with the pontoons circled in red.

50
Figure 28. Picture of the Pontoon Hull Model in the Even Keel Position.
The principle characteristics of the pontoon model in Figure 28 are presented in
Table 9.
Table 9. Principle Characteristics of the Pontoon Model
Principle Characteristic Dimension Unit
Length Overall 30.4 cm
Beam 15.0 cm
Depth (including pontoons) 4.0 cm
Displacement 492.2 g
Pendulum Height 27.5 cm
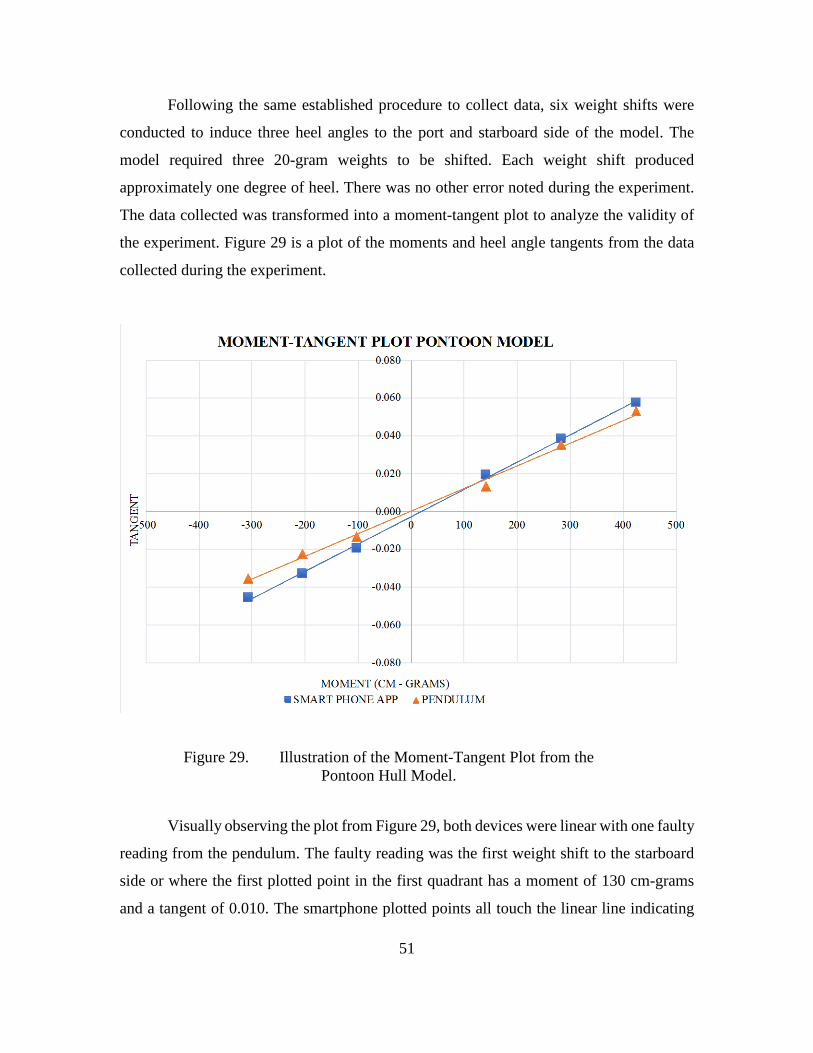
51
Following the same established procedure to collect data, six weight shifts were
conducted to induce three heel angles to the port and starboard side of the model. The
model required three 20-gram weights to be shifted. Each weight shift produced
approximately one degree of heel. There was no other error noted during the experiment.
The data collected was transformed into a moment-tangent plot to analyze the validity of
the experiment. Figure 29 is a plot of the moments and heel angle tangents from the data
collected during the experiment.
Figure 29. Illustration of the Moment-Tangent Plot from the Pontoon Hull Model.
Visually observing the plot from Figure 29, both devices were linear with one faulty
reading from the pendulum. The faulty reading was the first weight shift to the starboard
side or where the first plotted point in the first quadrant has a moment of 130 cm-grams
and a tangent of 0.010. The smartphone plotted points all touch the linear line indicating
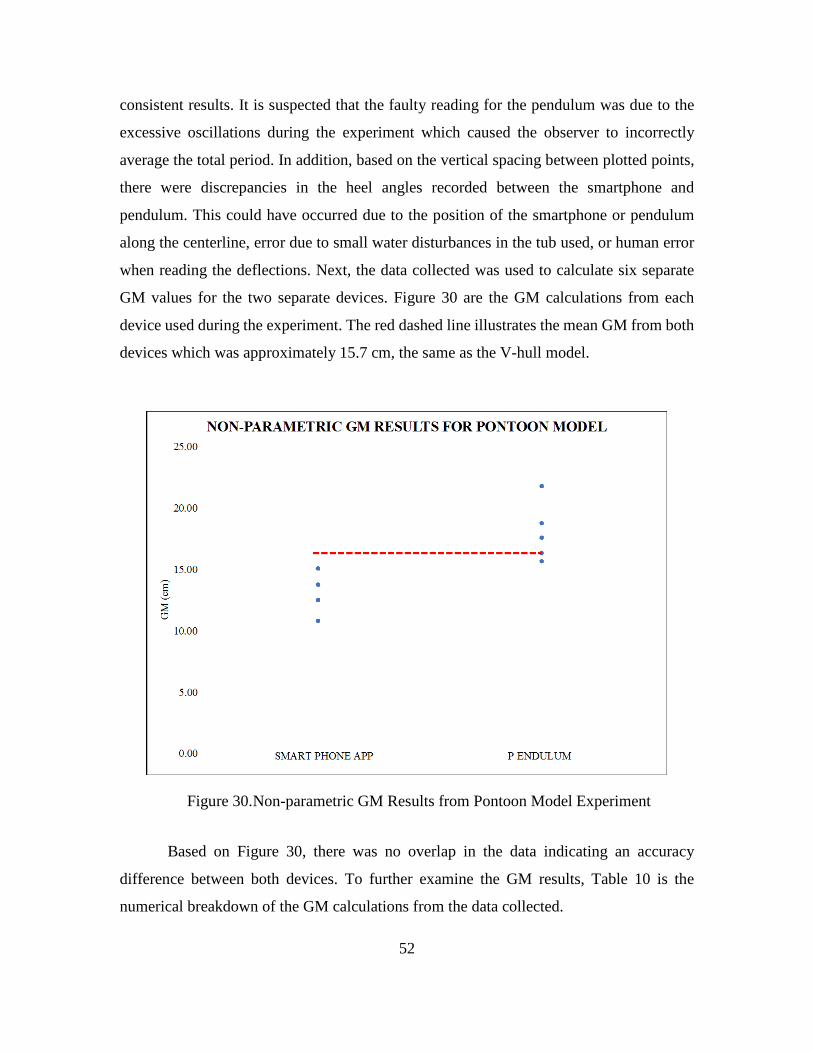
52
consistent results. It is suspected that the faulty reading for the pendulum was due to the
excessive oscillations during the experiment which caused the observer to incorrectly
average the total period. In addition, based on the vertical spacing between plotted points,
there were discrepancies in the heel angles recorded between the smartphone and
pendulum. This could have occurred due to the position of the smartphone or pendulum
along the centerline, error due to small water disturbances in the tub used, or human error
when reading the deflections. Next, the data collected was used to calculate six separate
GM values for the two separate devices. Figure 30 are the GM calculations from each
device used during the experiment. The red dashed line illustrates the mean GM from both
devices which was approximately 15.7 cm, the same as the V-hull model.
Figure 30. Non-parametric GM Results from Pontoon Model Experiment
Based on Figure 30, there was no overlap in the data indicating an accuracy
difference between both devices. To further examine the GM results, Table 10 is the
numerical breakdown of the GM calculations from the data collected.
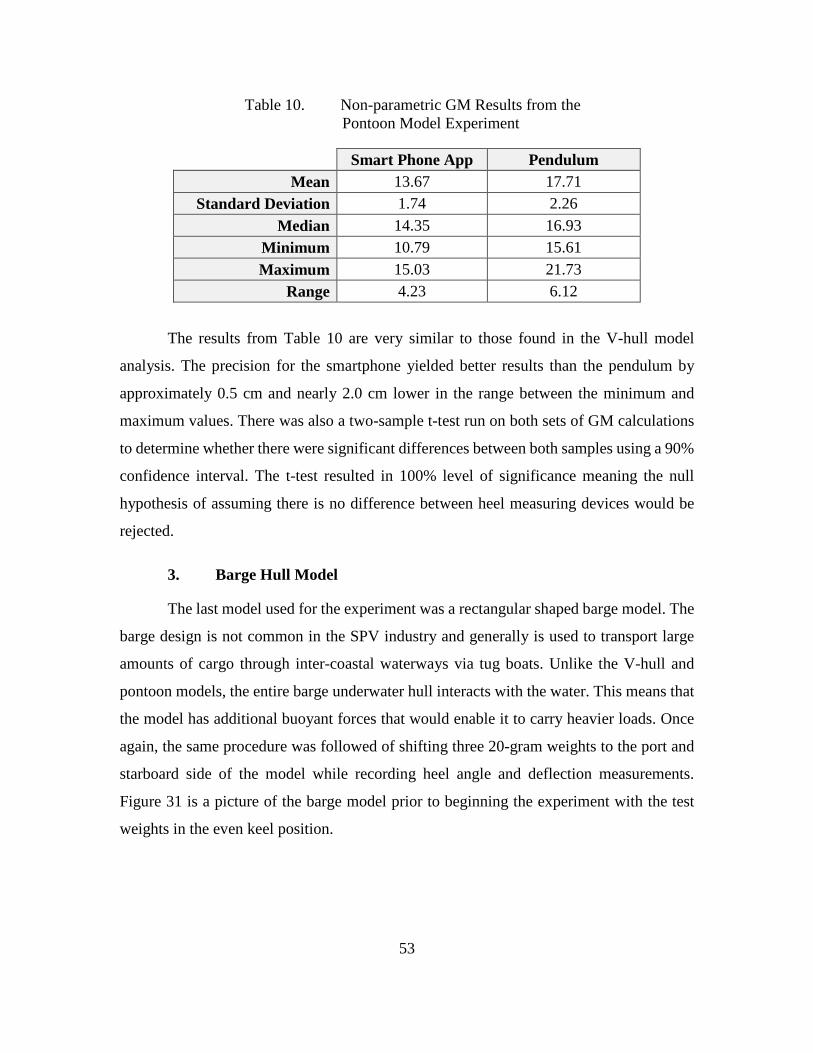
53
Table 10. Non-parametric GM Results from the Pontoon Model Experiment
Smart Phone App Pendulum Mean 13.67 17.71
Standard Deviation 1.74 2.26 Median 14.35 16.93
Minimum 10.79 15.61 Maximum 15.03 21.73
Range 4.23 6.12
The results from Table 10 are very similar to those found in the V-hull model
analysis. The precision for the smartphone yielded better results than the pendulum by
approximately 0.5 cm and nearly 2.0 cm lower in the range between the minimum and
maximum values. There was also a two-sample t-test run on both sets of GM calculations
to determine whether there were significant differences between both samples using a 90%
confidence interval. The t-test resulted in 100% level of significance meaning the null
hypothesis of assuming there is no difference between heel measuring devices would be
rejected.
3. Barge Hull Model
The last model used for the experiment was a rectangular shaped barge model. The
barge design is not common in the SPV industry and generally is used to transport large
amounts of cargo through inter-coastal waterways via tug boats. Unlike the V-hull and
pontoon models, the entire barge underwater hull interacts with the water. This means that
the model has additional buoyant forces that would enable it to carry heavier loads. Once
again, the same procedure was followed of shifting three 20-gram weights to the port and
starboard side of the model while recording heel angle and deflection measurements.
Figure 31 is a picture of the barge model prior to beginning the experiment with the test
weights in the even keel position.

54
Figure 31. Picture of the Barge Hull Model in the Even Keel Position.
The principle characteristics of the pontoon model in Figure 31 are presented in
Table 11.
Table 11. Principle Characteristics of the Barge Model
Principle Characteristic Dimension Unit
Length Overall 30.4 cm
Beam 15.1 cm
Depth 2.5 cm
Displacement 456.5 g
Pendulum Height 27.0 cm

55
Based on the data collected, the moments and heel angle tangents were plotted to
validate the experiment. Figure 32 is an illustration of the moment-tangent plot for the
barge hull model.
Figure 32. Illustration of the Moment-Tangent Plot from the Pontoon Hull Model.
Based on the moment-tangent plot in Figure 32, both devices plotted as straight
lines but the difference in tangents between plotted points at each weight shift was the
greatest out of all three models. The weight shifts that occurred on the port side of the
model produced better results than the weight shifts on the starboard side. This was based
on the plotted points on the right side of the graph not touching the linear line. Figure 33
are the GM calculations from each device used during the experiment. The red dashed line
illustrates the mean GM between both devices which was 14.7 cm, approximately one
centimeter lower than the V-hull and pontoon model.
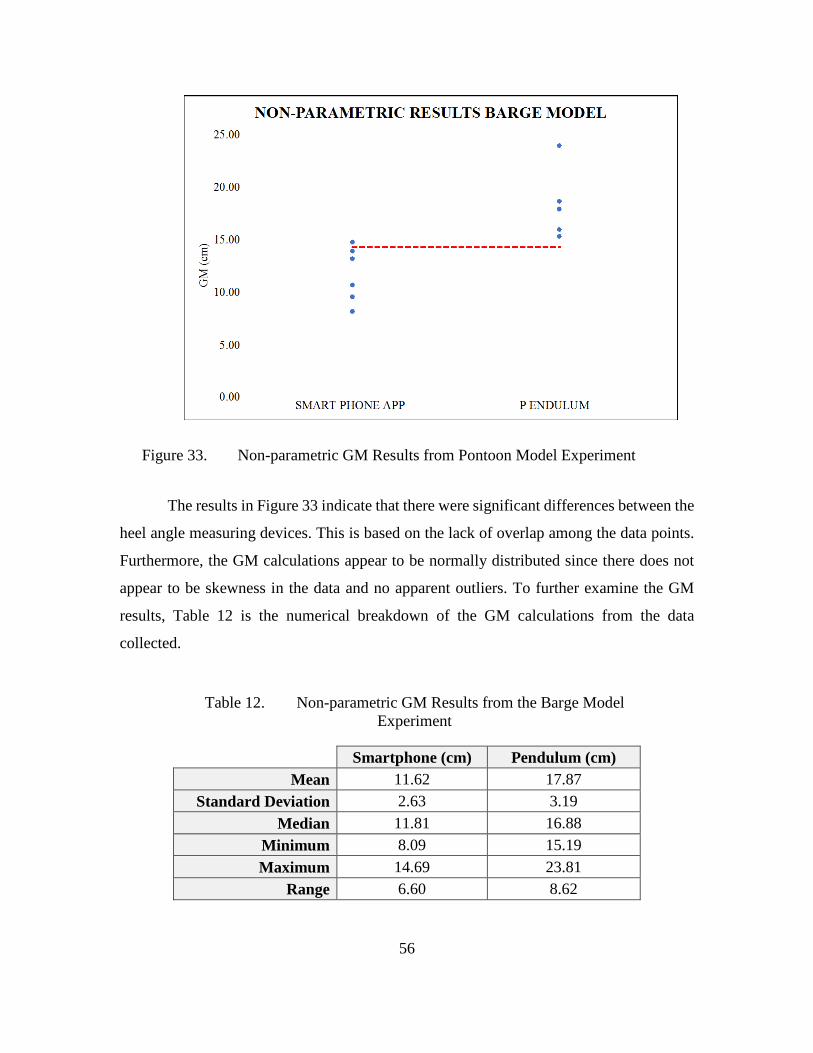
56
Figure 33. Non-parametric GM Results from Pontoon Model Experiment
The results in Figure 33 indicate that there were significant differences between the
heel angle measuring devices. This is based on the lack of overlap among the data points.
Furthermore, the GM calculations appear to be normally distributed since there does not
appear to be skewness in the data and no apparent outliers. To further examine the GM
results, Table 12 is the numerical breakdown of the GM calculations from the data
collected.
Table 12. Non-parametric GM Results from the Barge Model Experiment
Smartphone (cm) Pendulum (cm) Mean 11.62 17.87
Standard Deviation 2.63 3.19 Median 11.81 16.88
Minimum 8.09 15.19 Maximum 14.69 23.81
Range 6.60 8.62

57
The results from Table 12 has similar standard deviations and differences in the
range of minimum and maximum as those found in the V-hull and pontoon models. The
precision for the smartphone yielded the best results by approximately 0.5 cm and nearly
2.0 cm lower in the range between the minimum and maximum values. There was also a
two-sample t-test run on both devices to detect significant differences in the data. The t-
test resulted in 100% level of significance meaning the null hypothesis of assuming there
is no difference between heel measuring devices would be rejected based on a 90%
confidence level assuming no hypothesized mean difference.

58
THIS PAGE INTENTIONALLY LEFT BLANK
59
VII. CONCLUSIONS
This chapter includes conclusions regarding the problem definition, analysis for
determining significant factors during the IEs, and overall results. In addition, it provides
recommendations to the established regulations governing inclining experiments and
future work recommendations.
A. CONCLUSIONS
The purpose of this research was to use the systems engineering process to examine
the feasibility of conducting IEs without using pendulums as the primary device. From the
analysis conducted, the type of device used provided the highest level of significance in all
five vessels regarding GM determination. This meant the null hypothesis of assuming there
was no statistical difference between pendulums and digital inclinometers was rejected.
All other factors and their interactions did not provide the same pattern and their order
appeared to be random. Except in vessel four, accuracy was not a strong predictor affecting
GM calculations.
To further analyze the strong statistical differences among devices, the non-
parametric data for the GM calculations that each device produced was observed. This
identified any outliers or skewness within the data. It provided insight if any device
disproportionately shifted the GM which would account for the strong level of significance
in each DOE. Three out of the five vessels each had one device that had a wide range of
GM results, but the median values were mostly consistent across all three vessels. There
was no clear indication that one device was superior to the other during each IE.
Finally, three separate miniature models were constructed by the author to conduct
IEs in a controlled environment. The three models each had different hull configurations
to control the external factors that were unknown for the DOE analysis. The devices used
for each model were a smartphone and pendulum. After conducting IEs on each model, it
was clear that the smartphone provided overall better precision, but without specific design
calculations, the author was unable to state which device was more accurate in the
calculation of GM.

60
B. RECOMMENDATIONS
Based on the data provided in the MSC submittals and the experiments conducted
with the miniature models, it is recommended that the current regulations remain intact.
This means that at least one pendulum should be used for IEs until further research is
conducted and analyzed. In both sets of analysis, the null hypothesis that there are no
statistical differences among measuring devices was rejected. Until consistent results are
obtained from a larger sample size, it is recommended that the IMO and USCG leave the
regulations unchanged.
C. FUTURE WORK
Future work for personnel researching this topic should include collecting and
analyzing IE data from local shipyards that conduct stability tests on commercial or
military vessels. The submittals to MSC that were used for this thesis do not contain a
myriad of external factor data that may have influenced the overall error for each IE. By
physically witnessing IEs at shipyards, additional data could be recorded such as: weather
conditions, tautness of the lines from the ship to the dock during each weight shift, location
of measuring devices relative to the vessel, approximate distance off centerline, and
number of personnel performing the measurements. In addition, other factors previously
not identified could be observed and analyzed.
Furthermore, constructing more miniature vessel models with different hull
configurations could also be carried out. Prior to conducting the experiment, the height of
metacenter (M) and center of gravity (G) could be calculated using naval architecture
software or manual calculations so that the accuracy of the test results could be further
analyzed. The experiment performed by the author was limited to only examining the
precision between devices. In addition, the miniature vessel model results could be
analyzed via design of experiment (DOE) as was done in the previous chapters.
While the results of this thesis consistently show differences between heel
measuring devices, it is feasible that with more data and using the spreadsheet model
developed by the author could yield better results.
61
LIST OF REFERENCES
American Society of Testing and Materials. 2014. Standard Guide for Conducting a Stability Test (Lightweight Survey and Inclining Experiment). ASTM F1321. West Conshohocken: American Society of Testing and Materials. https://www.astm.org.
Dalrymple-Smith, Butch. 2016. “Best of Inclinations.” Professional Boatbuilder,
August/September 2016. Djebli, Abdelkader, Benameur Hamoudi, Omar Imine, and Lahouari Adjout. 2015. “The
Application of Smartphone in Ship Stability Experiment.” Journal of Marine Science and Application 14, no. 4 (December): 406–12. doi10.1007/s11804-015-1331–9.
International Maritime Organization. 2008. “Resolution MSC.267(85).” December 4,
2008.http://www.imo.org/en/KnowledgeCentre/IndexofIMOResolutions/Maritime-Safety-Committee-%28MSC%29/Documents/MSC.267%2885%29.pdf
International Council on Systems Engineering. 2004. Systems Engineering Handbook,
Version 2a. Seattle, WA: International Council on Systems Engineering. International Towing Tank Conference. 2017. ITTC. Accessed April 15, 2018.
https://ittc.info. Maier, Mark, and Eberhardt Rechtin. 2002. The Art of Systems Architecting. Boca Raton:
CRC Press. United States Coast Guard. 2016. Submission of Stability Test (Deadweight Survey or
Inclining Experiment) Results. GEN-02. Washington, DC: United States Coast Guard.https://www.dco.uscg.mil/Portals/9/MSC/PRG/PRG.GEN-02.2016.04.05.Submission_of_Stability_Test_Results.pdf
Woodward , Michael D., Martijn van Rijsbergen, Keith W. Hutchinson, and Andrew Scott.
2016. “Uncertainty Analysis Procedure for the Ship Inclining Experiment.” Ocean Engineering 114: 79–86.

62
THIS PAGE INTENTIONALLY LEFT BLANK

63
INITIAL DISTRIBUTION LIST
1. Defense Technical Information Center Ft. Belvoir, Virginia 2. Dudley Knox Library Naval Postgraduate School Monterey, California