Testing olfactory models with an artificial experimental platform
6
Abstract—Artificial olfaction systems have been investigated since more than two decades on alleged property of similarities between the receptive field of natural receptors and artificial sensors. Due to the limited number of sensors embedded in these systems the complexity of electronic noses is generally too low to allow the application of olfaction processing models. Actually the literature there are several models attempting to describe some olfaction functionalities, and the availability of an artificial platform to test models could be of great benefit for these studies. Recently, the use of optical image sensors has been demonstrated as a simple method to obtain large sensor arrays. Furthermore, an elegant and simple method to cluster individual sensors in classes allows for the definition of epithelium and glomerular layers. This system enables the application of a complex olfaction model, and these properties are here illustrated applying a glomerular compartmentalization model to the data generated by the exposure of such an artificial system to pure and mixed gases. I. INTRODUCTION he mimicking of natural olfaction is one the most advanced and ambitious objectives in the chemical sensors field [1, 2]. In origin, artificial olfaction was introduced as a model tool to investigate the natural olfaction properties. Rather soon, since odor plays a key role in several practical contexts, the possibility to replace complex analytical procedures with an “electronic nose” shifted almost completely the interests in artificial olfaction from a biologically-oriented tool to a practical instrument for odor identification and recognition [3]. Following the originally proposed parallel between natural and artificial receptors, any ensemble of partially selective chemical sensors, coupled with a suitable pattern recognition algorithm, may be considered as an electronic nose [4], and since almost all chemical sensor technologies fulfill with this definition, electronic nose concept was enriched with many kinds of chemical sensors. Among these technologies optical sensors have at least two interesting properties that can be adequately exploited to reduce the gap between artificial and natural systems. The E. Martinelli , D. Polese, F. Dini, A. D’Amico and C. Di Natale are with the Electrical Engineering Department, University of Rome Tor Vergata, via dl Politecnico 1, 00133 Roma, Italy (corresponding author: E. Martinelli; phone:+390672597259; fax: :+39062020519; e-mail: martinelli@ ing.uniroma2.it). R. Paolesse is with the Department of Chemical Science and Technology, University of Rome Tor Vergata, via della Ricerca Scientifica 1, 00133 Roma, Italy. D. Schild is with the Institute of Physiology, University of Göttingen, and at the Bernstein Forum of Neurotechnology, Göttingen, Germany. D. Filippini and I. Lundstrom are with Division of Applied Physics, University of Linköping, Linköping, Sweden first is the large number of available chemical reporters sensitive to a host of volatile compounds [5]. The second is related to the used image sensors that can enable the simultaneous measurement of the optical properties of a large number of sensitive spots. Rather surprisingly this approach to artificial olfaction has been seldom considered only rarely even though if brilliant examples of artificial olfaction systems were provided by a CCD detection of an array of fluorescent indicators deposited on the tip of individual fibers fiber in a fiber optic bundle [6] and by color measurements with flat-bed digital scanner of a number of dyes indicators [7]. These examples considered either emission (fluorescence) or absorbance properties of sensing molecules. Recently, it was demonstrated that with a simple arrangement based on a computer screen and a web camera it is possible to detect both color and emission changes of a sensitive layer such as metalloporphyrins and similar compounds [8, 9, 10]. This arrangement is known as Computer Screen Photo-assisted Technique (CSPT). As previously mentioned, an image sensor (a digital camera) that captures the image of a sensing layer provides a partition of the whole surface into a number of pixels according to the camera resolution and the optical arrangement. As a consequence, since it is possible to measure the optical properties of each single pixel, the sensing layer portion imaged into one pixel may be considered as an independent sensor. This way, even a low- resolution camera yields an array of tens of thousands of sensors. This feature remains unparalleled if compared to any other sensor technology and makes the sensor array, with respect to this complexity, rather similar, to the sensors in natural olfaction which are endowed with thousands of replicas of few hundreds of different kinds of receptors. An important structure in natural olfaction is the glomerular layer (GLO). This is a zone where the millions of the olfactory Receptor Neurons (ORNs) originating from the olfactory epithelium converge [11, 12]. The convergence is driven by specific receptor properties so that the GLO layer is segmented in different subregions where similar signals from ORNs of the same kind converge and are further processed. Mimicking this convergence can be rather difficult in technological implementations of artificial olfaction. It requires a wiring scheme that has to be precisely followed in order to avoid wrong convergences that are doomed to destroy the olfaction combinatorial selectivity. Convergence strategies inspired by the organization of the first stages in the natural olfaction have been recently proposed in literature [13-15]. They considered the gas Testing Olfactory Models with an Artificial Experimental Platform E. Martinelli, D. Polese, F. Dini, R. Paolesse, D. Filippini, A. D’Amico, D. Schild, I. Lundstrom and C. Di Natale T 978-1-4244-8126-2/10/$26.00 ©2010 IEEE
Transcript of Testing olfactory models with an artificial experimental platform
Abstract—Artificial olfaction systems have been investigated since more than two decades on alleged property of similarities between the receptive field of natural receptors and artificial sensors. Due to the limited number of sensors embedded in these systems the complexity of electronic noses is generally too low to allow the application of olfaction processing models. Actually the literature there are several models attempting to describe some olfaction functionalities, and the availability of an artificial platform to test models could be of great benefit for these studies. Recently, the use of optical image sensors has been demonstrated as a simple method to obtain large sensor arrays. Furthermore, an elegant and simple method to cluster individual sensors in classes allows for the definition of epithelium and glomerular layers. This system enables the application of a complex olfaction model, and these properties are here illustrated applying a glomerular compartmentalization model to the data generated by the exposure of such an artificial system to pure and mixed gases.
I. INTRODUCTION he mimicking of natural olfaction is one the most advanced and ambitious objectives in the chemical sensors field [1, 2]. In origin, artificial olfaction was
introduced as a model tool to investigate the natural olfaction properties. Rather soon, since odor plays a key role in several practical contexts, the possibility to replace complex analytical procedures with an “electronic nose” shifted almost completely the interests in artificial olfaction from a biologically-oriented tool to a practical instrument for odor identification and recognition [3]. Following the originally proposed parallel between natural and artificial receptors, any ensemble of partially selective chemical sensors, coupled with a suitable pattern recognition algorithm, may be considered as an electronic nose [4], and since almost all chemical sensor technologies fulfill with this definition, electronic nose concept was enriched with many kinds of chemical sensors. Among these technologies optical sensors have at least two interesting properties that can be adequately exploited to reduce the gap between artificial and natural systems. The
E. Martinelli , D. Polese, F. Dini, A. D’Amico and C. Di Natale are with
the Electrical Engineering Department, University of Rome Tor Vergata, via dl Politecnico 1, 00133 Roma, Italy (corresponding author: E. Martinelli; phone:+390672597259; fax: :+39062020519; e-mail: martinelli@ ing.uniroma2.it).
R. Paolesse is with the Department of Chemical Science and Technology, University of Rome Tor Vergata, via della Ricerca Scientifica 1, 00133 Roma, Italy.
D. Schild is with the Institute of Physiology, University of Göttingen, and at the Bernstein Forum of Neurotechnology, Göttingen, Germany.
D. Filippini and I. Lundstrom are with Division of Applied Physics, University of Linköping, Linköping, Sweden
first is the large number of available chemical reporters sensitive to a host of volatile compounds [5]. The second is related to the used image sensors that can enable the simultaneous measurement of the optical properties of a large number of sensitive spots. Rather surprisingly this approach to artificial olfaction has been seldom considered only rarely even though if brilliant examples of artificial olfaction systems were provided by a CCD detection of an array of fluorescent indicators deposited on the tip of individual fibers fiber in a fiber optic bundle [6] and by color measurements with flat-bed digital scanner of a number of dyes indicators [7]. These examples considered either emission (fluorescence) or absorbance properties of sensing molecules. Recently, it was demonstrated that with a simple arrangement based on a computer screen and a web camera it is possible to detect both color and emission changes of a sensitive layer such as metalloporphyrins and similar compounds [8, 9, 10]. This arrangement is known as Computer Screen Photo-assisted Technique (CSPT). As previously mentioned, an image sensor (a digital camera) that captures the image of a sensing layer provides a partition of the whole surface into a number of pixels according to the camera resolution and the optical arrangement. As a consequence, since it is possible to measure the optical properties of each single pixel, the sensing layer portion imaged into one pixel may be considered as an independent sensor. This way, even a low-resolution camera yields an array of tens of thousands of sensors. This feature remains unparalleled if compared to any other sensor technology and makes the sensor array, with respect to this complexity, rather similar, to the sensors in natural olfaction which are endowed with thousands of replicas of few hundreds of different kinds of receptors. An important structure in natural olfaction is the glomerular layer (GLO). This is a zone where the millions of the olfactory Receptor Neurons (ORNs) originating from the olfactory epithelium converge [11, 12]. The convergence is driven by specific receptor properties so that the GLO layer is segmented in different subregions where similar signals from ORNs of the same kind converge and are further processed. Mimicking this convergence can be rather difficult in technological implementations of artificial olfaction. It requires a wiring scheme that has to be precisely followed in order to avoid wrong convergences that are doomed to destroy the olfaction combinatorial selectivity. Convergence strategies inspired by the organization of the first stages in the natural olfaction have been recently proposed in literature [13-15]. They considered the gas
Testing Olfactory Models with an Artificial Experimental Platform E. Martinelli, D. Polese, F. Dini, R. Paolesse, D. Filippini, A. D’Amico, D. Schild, I. Lundstrom and
C. Di Natale
T
978-1-4244-8126-2/10/$26.00 ©2010 IEEE

responses of MOX sensor at different temperatures as input of the bio-inspired convergence map. Optical image sensors offer again a singular opportunity to connect each artificial sensor (here a pixel of the image) with its glomerulus. Indeed, since optical properties of each pixel can be “almost independently” measured pixels can be classified according to their optical properties. It has been demonstrated that a collection of indicators such as metalloporphyrins can be conveniently sorted into classes according to their chemical structure. This provides a simple and unsupervised, artificial ORNs-GLO association [16, 17]. Furthermore, the connection between an ORN and its relevant GLO is independent from the geometrical arrangement of the sensing layers. Following this principle an artificial olfactory platform was developed. This system is based on an artificial epithelium formed by a number of chemically sensitive indicators dispersed in a continuous polymer layer. The polymer layer acts as a support for the indicators and as a diffusion media for the volatile molecules playing in practice the role of the supporting mucosa in the olfactory epithelium. The optical properties of the artificial epithelium were measured with a CSPT arrangement, and signals produced by exposing the artificial epithelium to pure gases and mixtures were used as input of a Glomerular Compartmentalization model [18]. Results show the effectiveness of the model in enhancing the samples identification with respect to standard electronic nose data processing.
II. EXPERIMENTAL DETAILS
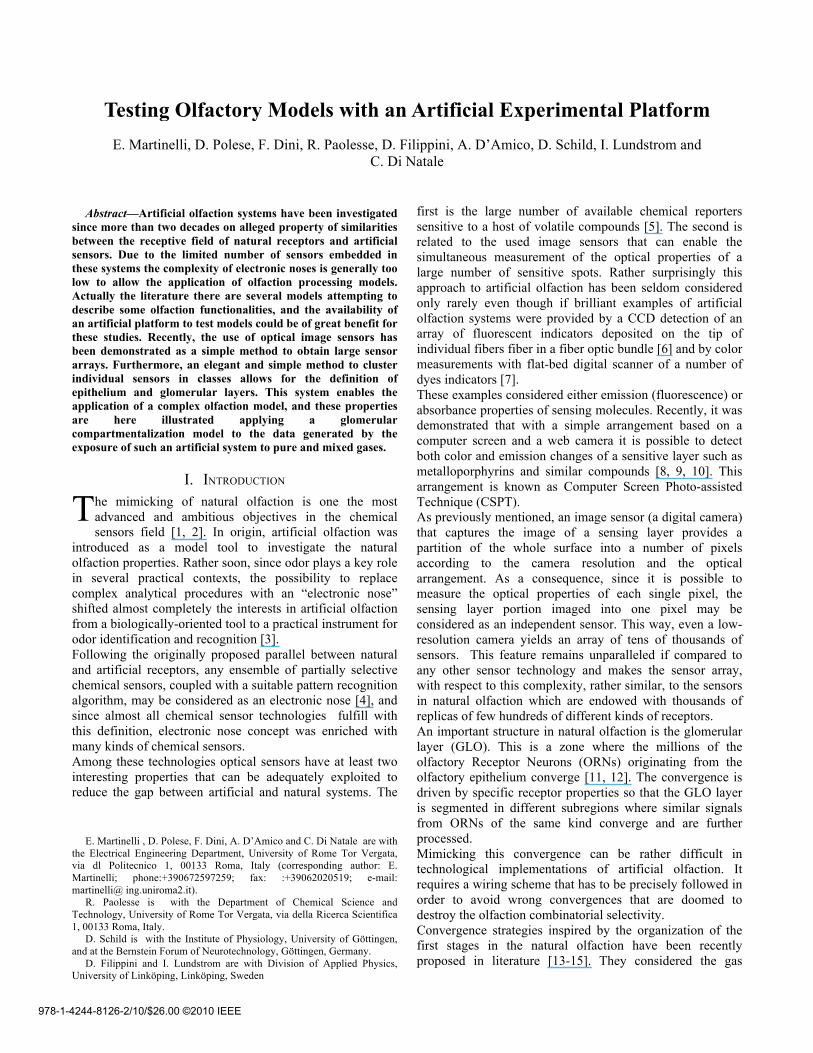
A. Experimental Set-up Color indicators used in these experiments were six metalloporphyrins, a silicon-phthalocyanine and a color indicator known as nile blue. Porphyrins were tetraphenylporphyrin (TPP) complexed with various metals (Pd, Mn, Rh, Fe, Zn, Mo). The relationship between optical properties and chemical interaction of these molecules is well known. In particular metalloporphyrins were used to develop electronic noses for several different applications [19]. Indicators were properly spotted in a PVC continuous membrane uniformly coating a 25 mm diameter plastic substrate. Indicators were randomly spotted in few replicas trying to barely imitate the spatial distribution of receptors in the olfactory epithelium of rodents [20]. The substrate was ideally divided in four zones parallel to the gas flow and two indicators per zone were deposited. The appearance of the substrate can be seen in fig. 1, where the 4 zones are evidenced (dashed lines) and the individual sensing elements are indicated.
Fig. 1. Picture of the artificial epithelium. Chemical indicators are indicated. The correspondence between spots color and indicator suggests that a CSPT fingerprint can adequately classify the indicators. Porphyrin labels are composed by the metal symbol and TPP that indicate the porphyrin structure. The artificial epithelium was placed in a cell with gas-tight optical windows and equipped with tube connectors to the gas delivery system. The epithelium was illuminated through transparent openings with a LCD computer monitor (Philips 1704S) and imaged with a digital camera (Philips SPC900NC). A diagram of the experimental arrangement is shown in fig. 2. A 50 colors sequence gradually changing from red to blue was used for fingerprinting the optical properties of color indicators. Changes during gas exposure were probed by a sequence of the three pure colors: red (255 0 0), green (0 255 0), and blue (0 0 255). Signals were generated exposing the epithelium to controlled amounts of vapors of volatile compounds diluted in pure nitrogen. Tests were made using amines and alcohols, two classes of molecules for which the response of the used indicators is well-known. The following samples were measured, all concentrations are given in parts per millions (ppm): trimethylamine (150 ppm), triethylamine (2800 ppm), butylamine (1700 ppm), ethanol (11000 ppm), butanol (1200 ppm), and mixtures of butanol and ethanol, triethylamine and trimethylamines, and trimethylamine and ethanol. Each measure cycle lasted 1500 seconds, with the exposure limited of 400s and the rest left for baseline recovery. Images were acquired at a sampling rate of 5 s. The camera portions the sensing layer in a number of pixels defined by the image detector resolution and the optical arrangement. The camera was used at a resolution of 320x240 pixels, frames were resized to 160x120 averaging 4 contiguous pixels. With this arrangement the epithelium was composed by 7497 pixels identifying the individual artificial ORNs.

Fig. 2: A sketch of the experimental set-up is shown.
When the sensing layer was exposed to vapors, each pixel underwent a change according to the interactions occurring between the volatile molecules and the chemical indicators. Interactions with odors are detected by illuminating the screen with the three primary colors and reading the corresponding camera output in the three-color bands, in this way six meaningful signals are formed. In order to simplify the data modeling, the six signals were reduced to one summing their absolute values.
B. Data Processing The first step of the processing of the epithelium data is the definition of the connection between the epithelium and GLO. To this end, the glomerular layer was simulated by a Self Organizing Map (SOM) [21]. A 7x7 neurons SOM with hexagonal topology was chosen to classify the 7497 ORNs. SOM neurons identify the sub-glomerular units, and the signals of the pixels converging to the same SOM neuron are processed within this sub-glomerular unit and subsequently they are sent to higher elaboration levels. Various processing strategies within the sub-glomerular units can be considered. In this case the average of the ORNs signals afferent to the same sub glomerular unit was considered. A schematic diagram of the ORNs-Glomerular layer association is shown in fig. 3. The output of a sub glomerular unit is the input to the processing network implementing the multi-compartment model introduced in ref. 18. A schematic of the single element of the network is shown in fig. 4. According to the model, the processed signals are activities. The activity of a sub-GLO for a specific VOC has been defined as the sum of the absolute values of the maximum responses of ORNs converging to the same SOM neuron. A further normalization in unitary range has been applied to the signals of each sub-GLO.
Fig. 3: Schematic view of the ORNs-Glomerular sub-unit association. The unit of the glomerular compartmentalization model is characterized by two entities, sharing the same inputs, that correspond to the mitral and the periglomerular cells found in biological olfaction. An inhibition relationship between the two entities exists: periglomerular units inhibit the operation of mitral unit. The behavior is modeled by the following equations:
€
mij = cijrij 1− f ijk pijk( )k=1
n
∏ ∀i, j (1)
mi = mijj=1
l
∑ ∀i, j (2)
pik = dikrk ∀i,k (3)
where rj is j-th input, mij mi and ci are respectively j-th input of the mitral cell microbranch (MCMB), the output and the j-th synaptic weight of the i-th mitral cell; pik and dik are respectively the potential on the k-th periglomerular microbranch (PGMB) and synaptic weight of the i-th periglomerular cell. The synaptic weights cij, dik vary during simulation according the following learning rule:
€
Δcij = γ amijrj − γ bmij3 ∀i, j (4)
Δdik = δamikrk −δbdik3 ∀i,k (5)
This rule is a “local” version of the Hebbian rule, local because it depends on local microbranch potentials. The coefficients γa, γb, δa, and δb are related to the learning velocity. In the algorithm illustrated here the following values were used:
€
γ a = δa =10−3; γ b = δb =10−4 A network architecture formed by 196 mitral units was here considered. For each run the inhibitory connections between periglomerular and mitral cells (fijk) were randomly generated with a probability equal to 0.5 and their values were comprised in the interval (0, 10-2). The input synaptic weights (cij, dik) were also randomly generated for each calculated network, their values were selected in the range (0,1). The number of inputs to the mitral cell was randomly chosen among the adjacent subglomerular units in the interval (3, 5).

It is also important to note that adjacent network units have neighboring subglomerular units as inputs. Then, sensors converging at neighbors units of the sub-GLO are characterized by similar optical properties. This characteristic of proximity is also preserved by the neural network. In all the simulations, the neural network was trained presenting the generated signals dataset several times.
Figure 4: A sketch of the components and their connections of the unit of the Mitral Cells Network utilized in the simulations. The r1,..rl are the sub-glomerular unit activities in presence of gas exposure of the epithelium.
III. RESULTS A. ORNs – Glomerular layer association
CSPT was used to fingerprint the chemical structure of the indicators. The substrate was illuminated with a sequence of 50 colors, and the images were simultaneously acquired by the webcam. Each image was split into the three color components defined by the red, green and blue camera filters. The optical features of each pixel are then encoded by a fingerprint of 50*3 values. Fig. 5 shows the fingerprints of the 7497 pixels contained in the useful area of the image. In principle only 9 groups of spectra should be expected (8 indicators and the background) but a continuous distribution is found. This is likely due to non homogeneity indicator density and to non uniform background light due to screen imperfections and optical misalignments. Image pixel fingerprints were clustered by the SOM. The SOM is based on competitive unsupervised learning algorithms and offers the interesting feature of maintaining the topology of the input space into the output space. In this case a network formed by 7x7=49 neurons arranged in a hexagonal topology was considered. As a result of the classification, each pixel was attributed to one neuron of the SOM according to the map shown in Fig. 6. This convergence is similar to that occurring in natural olfaction between olfactory receptor neurons and glomeruli.
Figure 5: the optical fingerprint for all the pixel of the olfactory
epithelium. The fingerprint is obtained considering the camera results in the three channels for the 50 color sequences of the LCD source.
Figure 6: the SOM partitioning of the ORNs input space. Each hexagonal tile is a neuron, and the index of each neuron indicate the indicator mapped by the neuron. Indicators are mapped according to the following scheme: 1: RhTPP, 2: ZnTPP; 3: PdTPP; 4: Nile blue; 5: SiPC; 6: MnTPP; 7: FeTPP; 8:MoTPP, and 9: background. Comparing the map with Fig. 1 it is easy to observe that indicators with similar colors are mapped in adjacent SOM regions, as expected by the SOM topology preservation property.
B. Processing of the Glomerular layer signals Figure 7 shows an example of some sub-GLO unit signals
obtained with the Triethylamine applied to the epithelium. It is interesting to observe that the large dynamic range of the sub-GLO responses is due to the different affinity of the chemical receptors to the particular VOC.

Figure 7: Example of the dynamic behavior of the signal of sub-glomerular unit when the sensors are exposed to Triethylamine vapors.
In fig. 8 the Scores Plot of the first two Principal
Components of the Glomerular layer responses are shown. The data have been autoscaled before the Principal Component Analysis (PCA) [22]. It is interesting to note that only the signals related to butylamine are well separated from the others VOCs. The other cases are partially overlapping among each other and even when, a general separation between amines and alcohols is observed no clear distinction about the VOCs is observed.
Figure 8: PCA scores Plot of experimental data considering as measurement descriptors the sub-glomerular activities.
The network implementing the compartmental model was simulated several times changing the network parameters. In all of the runs performed the network converged in few epochs. The network has shown a meaningful improvement of the discrimination capability of the system as it is illustrated in figure 9. The figure shows the first two principal components of the signals obtained by one of the mitral cells network is shown.
Figure 9: PCA scores Plot of experimental data considering as measurement descriptors the mitral cell activities. A clearer definition of the different cases can be observed, and both pure and mixed samples are clearly distinct.
Although a satisfactory discrimination among the different VOCs is obtained in this experiment, it has to be considered that this model does not take into consideration the dynamic evolution of the sensor signals during the gas exposure. For this reason the application of more complex models introducing the sensor signals dynamics and a larger measurement dataset are foreseen. In this way it will be also possible to investigate the role of lateral inhibition among different Mitral Cells in the discrimination task [23]. It has to be remarked that the platform includes also the physico-chemical olfactory mucosa properties that give rise to spatio-temporal signal distribution that are supposed to cooperate in the odor identification process [24].
IV. CONCLUSIONS In this paper we have shown that by taking advantage of
the unique features of image sensors and optically active chemical reporters it is possible to assemble an artificial olfactory system mimicking both the olfactory epithelium and essential parts of the olfactory bulb. This structure can generate, as a consequence of exposure to gases, signals at a
-6
-4
-2
0
2
4
6
8
-8 -6 -4 -2 0 2 4 6 8
TrimethylamineTriethylamineButylamineEthanolButanolTriethylamine-TrimethylamineButanol-EthanolTriethylamine-Ethanol
PC
2 (
20
.41
%)
PC1 (52.07%)
-10
-5
0
5
10
15
20
-15 -10 -5 0 5 10 15 20
TrimethylamineTriethylamineButylamineEthanolButanolTriethylamine-TrimethylamineButanol-EthanolTriethylamine-Ethanol
PC
2 (
30
.05
%)
PC1 (58.09%)

level of a glomerular layer that can be used to train and test physiologically derived olfactory models. An example has been given here using a multi-compartmental model. Results show that such a model enhances the discrimination of pure and mixed odors. Eventually such a platform besides increasing the similarityt between natural and artificial olfactory systems is also proposed as a useful tool for physiologists to test olfactory models.
REFERENCES [1] K. Persaud, G. Dodds, Analysis of discrimination mechanisms in the
mammalian olfactory system using a model nose, Nature 299 (1982) 352–355.
[2] F. Röck, N. Barsan, U.Weimar, Electronic nose: current status and future trends, Chem. Rev. 108 (2008) 705.
[3] T. Pearce, S. Schiffman, H. Nagle, J. Gardner (editors), Handbook of machine olfaction, Wiley-VCH, Weinheim, Germany (2003)
[4] J. Gardner, P. Bartlett, A brief history of electronic noses Sens Actuators B 18 (1994) 211-220
[5] O. Wolfbeis, Sensor paint, Adv. Mater. 20 (2008) 3759-3763. [6] D.Walt, Imaging optical sensor arrays, Curr. Opin. Chem. Biol. 6
(2002) 689–695. [7] Suslick KS, Rakow NA (2000) A colorimetric sensor array for odor
visualization. Nature 406: 710–712. [8] D. Filippini, A. Alimelli, C. Di Natale, R. Paolesse,A. D’Amico, I.
Lundström, Chemical sensing with familiar devices, Angew. Chem. Int. Ed. 45 (2006) 3800–3803.
[9] R. Paolesse, A. Alimelli, A. D’Amico, M. Venanzi, G. Battistini, M. Montalti, D. Filippini, I. Lundström, C. Di Natale, Insights in the chemistry of a,c-biladienes from a CSPT investigation. New J. Chem. 32 (2008) 1162-1166
[10] F. Dini, E. Martinelli, G. Pomarico, R. Paolesse, D. Monti, D. Filippini, A. D’Amico, I. Lundström, C. Di Natale, Chemical sensitivity of self-assembled porphyrin nano-aggregates, Nanotechnology 20 (2009) 055502 (8pp)
[11] S. Korsching, Olfactorymaps and odor images, Curr. Opin. Neurobiol. 12 (2002) 387–392.
[12] G. Galizia, R. Menzel, Odour perception in honeybees: coding information in glomerular patterns, Curr. Opin. Neurobiol. 10 (2000) 504–510.
[13] R. Gutierrez-Osuna, A self-organizing model of chemotopic convergence for olfactory coding Annual International Conference of the IEEE Engineering in Medicine and Biology - Proceedings 1, (2002) pp. 236-237.
[14] A. Perera, T. Yamanaka, A. Gutiérrez-Gálvez, B. Raman, R. Gutiérrez-Osuna, A dimensionality-reduction technique inspired by receptor convergence in the olfactory system, Sensors and Actuators, B: Chemical, 116 (2006), pp. 17-22.
[15] B. Raman, P.A. Sun, A. Gutierrez-Galvez, R. Gutierrez-Osuna, Processing of chemical sensor arrays with a biologically inspired model of olfactory coding, IEEE Transactions on Neural Networks, 17 (2006), pp. 1015-1024.
[16] C. Di Natale, E. Martinelli, R. Paolesse, A. D’Amico, D. Filippini, I. Lundström, An experimental biomimetic platform for artificial olfaction, PLoS ONE 3 (2008) 3139 (11 pages)
[17] C. Di Natale, E. Martinelli, R. Paolesse, A. D’Amico, D. Filippini, I. Lundstrom, An artificial olfaction system based on the optical imaging of a large array of chemical receptors, Sensors and Actuators B 142 (2009) 412-417.
[18] Schild, D., Riedel, H., Significance of glomerular compartmentalization for olfactory coding Biophysical Journal, 61 (1992) pp. 704-715.
[19] C. Di Natale, R. Paolesse, A. D'Amico, Metalloporphyrins based artificial olfactory receptors, Sensors and Actuators, B: Chemical, 121 (2007), pp. 238-246.
[20] K. Mori, H. Nagao, and Y. Yoshihara, “The olfactory bulb: Coding and processing of odor molecule information,” Science, vol. 286, no. 5440, pp. 711–715, 1999.
[21] T. Kohonen, Self Organizing Map, (1997) Springer Verlag (Berlin, Germany).
[22] R. Johnson, D. Wichern, Applied Multivariate Statistical Analysis, Pearson Education Ltd., Upper Saddle River, NY, 2002.
[23] C. Linster and T.A. Cleland, Glomerular microcircuits in the olfactory bulb, Neural Networks, 22 (2009), pp. 1169-1173.
[24] P. Kent, M. Mozell, S. Youngentob, P. Yurco, Mucosal activity patterns as a basis for olfactory discrimination: comparing behavior and optical recordings, Brain Research 981 (2993) 1-11