Testing enhances learning across a range of episodic memory abilities
29
Running head: EPISODIC MEMORY AND THE TESTING EFFECT 1 Testing Enhances Learning Across a Range of Episodic Memory Abilities Steven C. Pan 1 Harold Pashler 1 Zachary E. Potter 1 Timothy C. Rickard 1 1 Department of Psychology, University of California, San Diego 9500 Gilman Drive, La Jolla CA 92093-0109 This manuscript was accepted for publication in the Journal of Memory and Language on April 9, 2015. This document may not exactly replicate the final version published in the Elsevier journal. It is not the copy of record. The final version is available at: http://dx.doi.org/10.1016/j.jml.2015.04.001 © 2015. This manuscript version is made available under the CC-BY-NC-ND 4.0 license http://creativecommons.org/licenses/by-nc-nd/4.0/ Please address correspondence to: Timothy C. Rickard Department of Psychology, #0109 University of California, San Diego 9500 Gilman Drive, La Jolla, CA 92093-0109 Email: [email protected]
Transcript of Testing enhances learning across a range of episodic memory abilities

Running head: EPISODIC MEMORY AND THE TESTING EFFECT 1
Testing Enhances Learning Across a Range of Episodic Memory Abilities
Steven C. Pan1
Harold Pashler1
Zachary E. Potter1
Timothy C. Rickard1
1Department of Psychology,
University of California, San Diego
9500 Gilman Drive, La Jolla CA 92093-0109
This manuscript was accepted for publication in the Journal of Memory and Language on April 9, 2015. This document may not exactly replicate the final version published in the Elsevier journal. It is not the copy of record. The final version is available at: http://dx.doi.org/10.1016/j.jml.2015.04.001
© 2015. This manuscript version is made available under the CC-BY-NC-ND 4.0 license http://creativecommons.org/licenses/by-nc-nd/4.0/
Please address correspondence to:
Timothy C. Rickard
Department of Psychology, #0109
University of California, San Diego
9500 Gilman Drive, La Jolla, CA 92093-0109
Email: [email protected]

EPISODIC MEMORY AND THE TESTING EFFECT 2
Abstract
Brewer and Unsworth (2012) reported that individuals with low episodic memory ability exhibit
a larger testing effect, a finding with potentially important educational implications [Brewer, G.
A., and Unsworth, N. (2012). Individual differences in the effects of retrieval from long-term
memory. Journal of Memory and Language 66, 407-415]. We conducted two replication
attempts of that study. Exp 1 (n = 120) drew from a broad demographic sample and was
conducted online, while Exp 2 (n = 122) was conducted in the lab with undergraduate students.
Both experiments demonstrated a large testing effect across the range of episodic ability in our
sample, and with no trend suggesting a larger testing effect for lower ability subjects. We show
that apparent differences in the distribution of episodic ability levels between our samples and
that of Brewer and Unsworth provide a plausible account of the contrasting correlation results,
and that, more generally, sampling from a restricted ability range can yield positive, negative, or
no correlation even if there is no difference in the effectiveness of testing for low vs. high ability
subjects in the broader population. We discuss methodological and theoretical issues that
complicate interpretation of individual differences effects in this domain, individual difference
predictions of testing effect models, and educational implications.
Keywords: individual differences, testing effect, episodic memory, retrieval practice

EPISODIC MEMORY AND THE TESTING EFFECT 3
Testing Enhances Memory Across a Range of Episodic Memory Abilities
A large body of empirical research has established that retrieval from memory during a
test enhances subsequent memory for that information more than does an equivalent period of
time spent restudying the same materials. This phenomenon has frequently been referred to as
the testing effect or retrieval practice effect. In recent years, the testing effect has been
repeatedly demonstrated using a wide variety of materials ranging from word pairs to lecture
content (for reviews see Carpenter, Pashler, Wixted, & Vul, 2008; McDaniel, Roediger, &
McDermott, 2007; Roediger & Karpicke, 2006). While there has been a great deal of research
into the cognitive mechanisms underlying the testing effect in recent years, the role of individual
differences has only recently begun to receive any attention (Brewer & Unsworth, 2012;
Bouwmeester & Verkoeijen, 2011).
Much of the widespread interest in the testing effect reflects its potential for enhancing
learning in applied contexts. Naturally, a conclusive finding that such enhancements are
confined to a subset of individuals would be of great import. Brewer and Unsworth (2012)
reported evidence suggesting just that. They had subjects complete a battery of assessments
designed to measure working memory, attention control, episodic memory, and general-fluid
intelligence (Unsworth & Spillers, 2010), along with a paired-associate task that served as a
measure of the testing effect (study/test was compared to restudy, in a design roughly modeled
after Carpenter, Pashler, & Vul, 2006). Brewer and Unsworth observed no correlation between
working memory or attention control abilities and the magnitude of the testing effect. However,
both the episodic memory and general-fluid intelligence constructs were negatively correlated
with the testing effect; that is, low episodic memory and general-fluid intelligence scores were

EPISODIC MEMORY AND THE TESTING EFFECT 4
associated with a larger testing effect. Based on their results, Brewer and Unsworth concluded
that test-enhanced learning is most effectively targeted at lower-ability students.
Brewer and Unsworth (2012) were circumspect in proffering explanations for the
correlation between general-fluid intelligence and the testing effect. With regard to episodic
memory, though, they advanced two potential accounts of the negative correlation with the
testing effect. The first was that higher-ability subjects may be better able to use elaborative
encoding in both the study/test and restudy conditions (relating to the elaborative retrieval
hypothesis of Carpenter, 2009), thus reducing the size of the testing effect. The second was that
lower-ability subjects may be forced to use more efficient retrieval strategies during initial
testing.
The work described here focused on determining whether Brewer and Unsworth’s (2012)
episodic memory results can be independently replicated and confirmed. The same
methodologies and materials (provided by the original authors) were used. We completed two
replication attempts, the first online, sampling from a general population of online experimental
subjects, and the second in the laboratory, sampling from university students.
Experiment 1
In Experiment 1, we administered the four episodic memory measures (cued recall,
picture source, gender source, and delayed free recall) used by Brewer and Unsworth (2012),
along with the same paired-associate testing task (detailed in Carpenter et al., 2006), in the same
overall order of presentation, and with the same delay interval between sessions (24 hrs). Aside
from the online data collection (which we did not expect to cause differences in outcome; see
Buhrmester, Kwang, & Gosling, 2011; Crump, McDonnell, & Gureckis, 2013), the primary

EPISODIC MEMORY AND THE TESTING EFFECT 5
difference between this experiment and that of Brewer and Unsworth’s design is that we dropped
their ability measures for working memory, attention control, and general-fluid intelligence.
Method
Subjects. Sample size was selected based on a priori power analyses using G*Power 3.13
(Heinrich Heine University Düsseldorf, Germany). Given α = 0.05 and a desired power of 0.95
to detect a correlation of -0.29 (as observed by Brewer & Unsworth, 2012) or larger (one-tailed
test), the required sample size is 120. One-hundred twenty subjects were thus recruited from the
Amazon Mechanical Turk worker pool using online advertisement (at https://www.mturk.com).
Each subject was compensated $1.50 for their participation. Access to the study was limited to
subjects from the United States that had an approval rate of 80% or greater on prior Mechanical
Turk Human Intelligence Tasks (HITs). Payment was contingent on completion of both sessions
of the experiment and the submission of a valid completion code. The minimum age
requirement for participation was 18 years, and there was no upper age limit. Descriptive
statistics for subject ages were as follows: M = 36.74, SD = 12.64; range = 18 to 65 yrs of age.
Over half of the sample (58%) was female.
Materials. As in the Brewer and Unsworth (2012) study, the paired-associate testing
task involved 40 word pairs. These pairs were originally published in Carpenter et al. (2006).
The four episodic memory measures also used the same word lists, picture stimuli, and audio
clips as in original study and were provided by the original authors.
Design and procedure. The experimental design followed that of Brewer and Unsworth
(2012), with modifications as follows. Due to our specific interest in episodic memory ability,
and the lack of any significant correlations of working memory and attention control abilities
with the testing effect in the original study, we only included the episodic memory measures

EPISODIC MEMORY AND THE TESTING EFFECT 6
from the prior work. Across the two sessions, subjects completed the episodic memory measures
and the paired-associate testing task in the same order as in the original study (session 1
beginning with the cued recall episodic memory measure followed by the study and training
phases of the paired-associate testing task; session 2 featured the image source, gender source,
and delayed free recall episodic memory measures, followed by the final test of the paired-
associate testing task). Sessions 1 and 2 lasted approximately 15 and 25 min, respectively (in
contrast, each session of the original study was two hrs long, which was necessary to
accommodate a total of 13 cognitive ability assessments as well as the paired-associate testing
task).
To enable online participation, the experiment was programmed using Adobe Flash
Professional CS6 (Adobe Systems, San Jose, CA) and subjects were able to access the study
using any Adobe Flash plugin-equipped web browser and with any computer featuring functional
audio output capabilities. Subjects were required to create a username that was used to log-in to
both sessions. At the end of session 1, subjects were reminded to return at the same time the
following day to complete the experiment. They were also given the opportunity to enter an e-
mail address in order to receive an automated reminder of their session 2 appointment. Session 2
became available for log-in at exactly 24 hrs after the server-recorded start time of session 1.
Subjects had a completion window of two hrs to complete session 2 and finish the experiment.
Tasks. The paired-associate testing task and the four episodic memory measures are
described below (following Brewer & Unsworth, 2012).
Paired-associate testing task. Subjects first studied 40 word pairs for 6 s each, followed
by a training phase in which half of the word pairs were again restudied for 6 s each, and the
other half were trained used testing with feedback (5 s to type the target, and 1 s feedback).

EPISODIC MEMORY AND THE TESTING EFFECT 7
These two types of training constituted the restudy and study/test conditions, respectively.
Assignment of word pairs to restudy or testing with feedback (study/test) was counterbalanced
across subjects, and the instructions explicitly forbade subjects from taking notes during the task.
The 40 training trials occurred in one uninterrupted block, with random interleaving of restudy
and test trials. The final test, conducted after a 24 hr delay, entailed testing of all cue-target pairs
without feedback and with 15 s to complete each trial.
Episodic memory measures. The four measures are summarized as follows:
Cued recall. Subjects completed three blocks. Within each block, 10 unique word pairs
were first presented for 2 s each, followed by a cued recall test in which each cue was presented
individually and subjects had 15 s to type their response. Subjects’ scores were the proportion of
word pairs answered correctly.
Picture source. In a single block, subjects were presented with 30 pictures for 1 s each.
Each picture randomly appeared in one of four onscreen quadrants. This was followed by a test
in which the 30 previously viewed pictures and 30 new pictures were shown in random order,
and subjects were asked to recall whether each picture had been seen before (“yes” , Y, or “no”,
N), and if so, in which quadrant the picture had appeared in (1, 2, 3, or 4). There was no time
limit on subject responses to these questions. Subjects’ scores were proportion correct (either
correctly answering “no”, or meeting the two conditions of correctly answering “yes” and
correctly identifying the quadrant that the picture had appeared in).
Gender source. In a single block, subjects heard 30 words spoken in a female or male
voice. This was followed by a test in which the 30 previously-heard words and 30 new words
were shown visually on the screen without any audio and in random order, and subjects asked to
recall whether each word had been heard before (Y or N), and if so, what voice had been used

EPISODIC MEMORY AND THE TESTING EFFECT 8
(“female”, F, or “male”, M). There was no time limit on subject responses to these questions.
Subjects’ scores were proportion correct (either correctly answering “no”, or meeting the two
conditions of correctly answering “yes” and correctly identifying a male or female voice).
Delayed free recall. Subjects completed six blocks. Within each block, 10 unique words
were presented for 1 s each, followed by a 16 s distractor task in which subjects were repeatedly
presented with three digit numbers and asked to transcribe them into a text box, and finally a test
in which subjects had 45 s to type any of the 10 words that they could remember. Subjects’
scores were the proportion of words correctly free recalled.
The tasks described above exactly reproduced those used by Brewer and Unsworth
(2012), except for the following three trial timing changes. Where 5 s was originally allotted for
test trials of the gender source, picture source, and cued recall measures, we imposed no trial
time limit for subject responses on the gender source and picture source measures, and a 15 s
trial time limit for subject responses on the cued recall measure. These changes were motivated
by pilot testing, during which we observed that subjects were frequently cut off while responding
during 5 s trials. Following the changes, we observed no unanswered trials in the gender source
and picture source measures (subjects entered a keypress response on every trial), and no
incomplete trials during the cued recall measure (subjects entered a complete one-word response
per test trial).
Results
Descriptive statistics, KR-20 reliabilities, and correlations are listed in Tables 1 and 2 (for
comparison, see Brewer & Unsworth, 2012, Tables 1 and 2, pp. 411-412).
The testing effect. Subjects recalled 49% of targets for the 20 paired-associate items
presented on the initial test in session 1.

EPISODIC MEMORY AND THE TESTING EFFECT 9
Due to a programming error in session 2, the datum for the last trial of the 40-trial paired-
associate testing task was not recorded. As a result, the testing effect data set for each subject
contained 20 and 19 recorded trials in the restudy and testing condition, respectively, or the
reverse. Because stimulus presentation order was randomly determined for each subject, the
paired-associate item corresponding to the missing data point was not systematic over subjects.
The expected testing effect was observed; mean recall was 29% in the restudy condition versus
46% in the study/test condition, a difference which was highly significant, t(119) = 10.5, p <
0.001, d = 0.96. Both the effect size and the absolute magnitude of the testing effect (0.17) is
similar to that observed in both Experiment 1 (0.14, d = 0.95) and Experiment 2 (0.15, d = 0.80)
of Carpenter et al. (2006). They are both substantially larger than the effects observed by Brewer
and Unsworth (2012; 0.07, d = 0.46).
Correlation with episodic memory ability. Following Brewer and Unsworth (2012), a
composite episodic memory ability measure was calculated by first z-score transforming each of
the four component tasks and then calculating the mean of the four z-scores for each subject. A
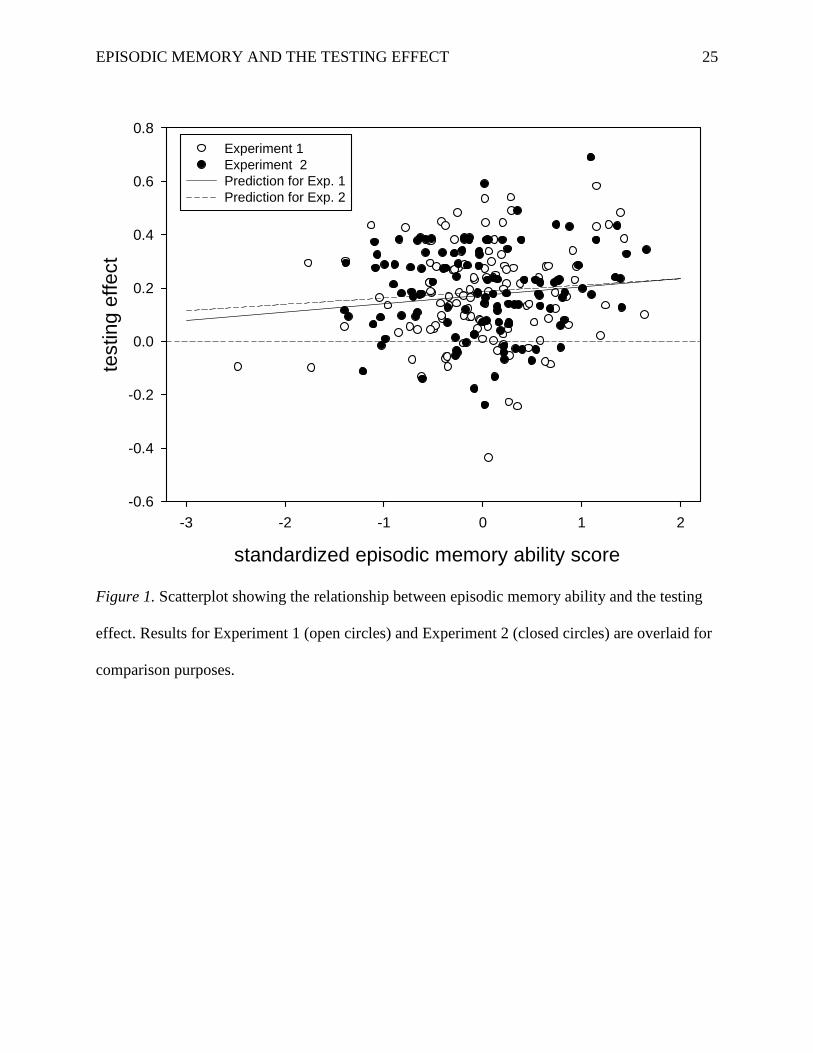
scatterplot of the relation between that composite episodic memory ability measure and the
testing effect is shown in Figure 1, along with the best fitting least squares regression line
(results from Experiment 2 are also shown in Figure 1 as closed circles). In contrast to the
Brewer and Unsworth findings, we observed a non-significant positive correlation, r = 0.15, p =
0.10, rather than a significant negative correlation.
(Figure 1 around here)
Experiment 2
Having found no evidence for a correlation between episodic memory ability and test-
enhanced learning, we next considered the possibility that differences between our Mechanical

EPISODIC MEMORY AND THE TESTING EFFECT 10
Turk sample and the university sample of Brewer and Unsworth (2012) might underlie the
contrasting results. Accordingly, in Experiment 2 we conducted a laboratory experiment with
university students that was identical in nearly all other respects to Experiment 1.
Method
Subjects. One-hundred twenty-two subjects from the University of California, San
Diego subject pool participated for course credit. Descriptive statistics for subject ages were as
follows: M = 20.18, SD = 2.00; range = 18 to 30 yrs of age. Well over half of the sample (77 %)
was female.
Materials, design, and procedure. This experiment was identical to Experiment 1, with
the following exceptions. Subjects completed both sessions at the Cognition and Cognitive
Neuroscience Laboratory at the University of California, San Diego. Like Experiment 1, the
experiment was conducted via internet connections, but using laboratory computers running
Windows 7 or Windows XP (Microsoft, Redmond, WA) and the Mozilla Firefox web browser
(Mozilla Foundation, Mountain View, CA) equipped with the Adobe Flash Player 12 plugin.
Because the experiment did not involve remote internet access, subjects did not have to generate
and remember a username, were not presented with the opportunity to sign up for automated
reminder emails, and did not receive monetary compensation at the end of session 2. All
subjects completed both sessions in the presence of an experimenter, and at appointed times that
were exactly 24 hrs apart. At the start of session 2, subjects were further instructed to wear
headphones; this was used to present the spoken words of the gender source assessment.
Results
Descriptive statistics, KR-20 reliabilities, correlations are listed in Tables 1 and 2.
EPISODIC MEMORY AND THE TESTING EFFECT 11
The testing effect. Subjects recalled 57% of targets during the initial testing phase.
Session 2 performance in the restudy (M = 0.36) and study/test conditions (M = 0.55) was higher
than that for Experiment 1, but the testing effect was of similar magnitude (0.19), t(121) = 12.8,
p < 0.001, d = 1.16.
Correlation with episodic memory ability. A scatterplot of the relation between the
composite episodic memory ability measure and the testing effect is shown in Figure 1 (closed
circles), along with the regression fit. The correlation between the testing effect and the
composite episodic memory measure was again positive but non-significant, r = 0.10, p = 0.29.
Cross-Experiment Analysis
A cross-experiment regression with predictors of episodic memory ability, experiment,
and their interaction yielded only non-significant results: experiment, t(238) = 0.82, p = 0.41;
episodic memory ability, t(238) = 0.95 p = 0.34; interaction, t(238) = -0.35, p = 0.72. Those
results confirm recent work showing that data collected online and in the laboratory yield
substantively the same results (Crump, McDonnell, & Gureckis, 2013; Germine et al., 2012).
Discussion
In the present work we sought to confirm a previously reported negative correlation
between episodic memory ability and the magnitude of the testing effect. The two experiments
closely reproduced the design, procedures, and materials of Brewer and Unsworth (2012),
specifically including the same episodic memory measures and utilizing the same paired-
associate task for gauging the testing effect. We completed the experiments with two distinct
populations, online subjects and university students, testing a combined sample that more than
doubled that of the original study. Using pre-planned analysis methods that followed those of
Brewer and Unsworth, we were unable to confirm their results.

EPISODIC MEMORY AND THE TESTING EFFECT 12
What accounts for the discrepancy between our results and those of Brewer and
Unsworth (2012)? One possibility is that the divergent outcomes merely reflect random error.
However, Fisher’s test for a difference between two correlations for independent groups (Fisher,
1921) was highly significant, z = 3.86, p = 0.0002. It thus appears that some systematic
difference between the two studies underlies the contrasting results.
Another possibility is that differences in experimental design are at play. Although our
experiments were identical in most respects to that of Brewer and Unsworth (2012), there are
two differences that might conceivably explain the contrasting outcomes. First, there were
substantial differences in the number of tasks that subjects performed and in the associated time
demands. In session 1 of the Brewer and Unsworth study, subjects completed three working
memory tasks before the first episodic memory measure (cued recall), followed immediately by
training on the paired-associate testing task and a fluid-intelligence measure. In session 1 of the
current experiments, just the cued recall measure and the paired-associate task were included. In
session 2 of the Brewer and Unsworth study, the picture source and gender source measures were
completed first, then three more fluid-intelligence and attention control measures, the last
episodic memory measure (delayed free recall), one more fluid-intelligence measure, and lastly
the final test of the paired-associate task. In session 2 of the current experiments, only the
picture source and gender source measures, plus the final test of the paired-associate task, were
administered. It is possible that overall subject performance was altered by the additional tasks
in the Brewer and Unsworth study (e.g., greater subject fatigue and worse overall performance),
or that their intervening tasks may have had a more specific effect (e.g., motivational carry-over,
cross-task interference), although such scenarios are speculative. In any case, if their significant
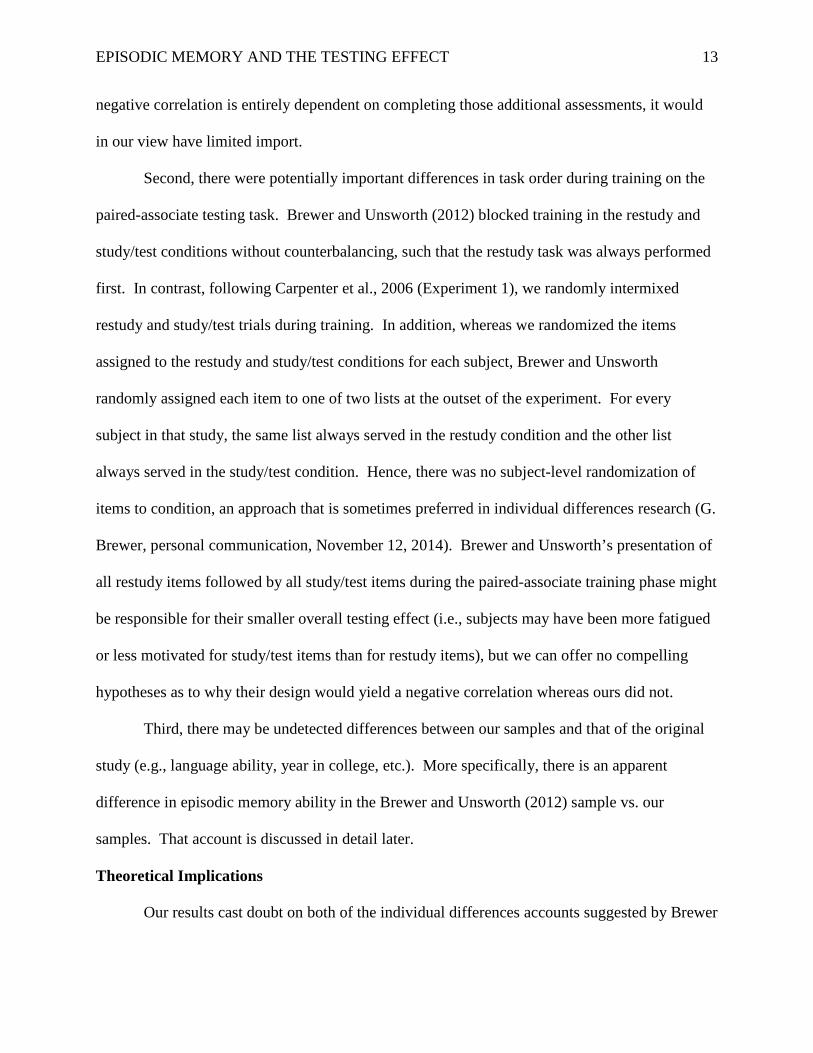
EPISODIC MEMORY AND THE TESTING EFFECT 13
negative correlation is entirely dependent on completing those additional assessments, it would
in our view have limited import.
Second, there were potentially important differences in task order during training on the
paired-associate testing task. Brewer and Unsworth (2012) blocked training in the restudy and
study/test conditions without counterbalancing, such that the restudy task was always performed
first. In contrast, following Carpenter et al., 2006 (Experiment 1), we randomly intermixed
restudy and study/test trials during training. In addition, whereas we randomized the items
assigned to the restudy and study/test conditions for each subject, Brewer and Unsworth
randomly assigned each item to one of two lists at the outset of the experiment. For every
subject in that study, the same list always served in the restudy condition and the other list
always served in the study/test condition. Hence, there was no subject-level randomization of
items to condition, an approach that is sometimes preferred in individual differences research (G.
Brewer, personal communication, November 12, 2014). Brewer and Unsworth’s presentation of
all restudy items followed by all study/test items during the paired-associate training phase might
be responsible for their smaller overall testing effect (i.e., subjects may have been more fatigued
or less motivated for study/test items than for restudy items), but we can offer no compelling
hypotheses as to why their design would yield a negative correlation whereas ours did not.
Third, there may be undetected differences between our samples and that of the original
study (e.g., language ability, year in college, etc.). More specifically, there is an apparent
difference in episodic memory ability in the Brewer and Unsworth (2012) sample vs. our
samples. That account is discussed in detail later.
Theoretical Implications
Our results cast doubt on both of the individual differences accounts suggested by Brewer

EPISODIC MEMORY AND THE TESTING EFFECT 14
and Unsworth (2012). One account was that high episodic ability subjects use elaborative
processing, which can promote learning (Carpenter, 2009), in both the restudy and study/test
conditions. Low episodic ability subjects, on the other hand, may not spontaneously use
elaborative processing in the restudy condition, but may be prompted to do so when tested.
Hence, the testing effect is larger for low ability subjects. By that account, however, we would
expect to have observed the same negative correlation in the current study. Another account
suggested by Brewer and Unsworth was that low ability subjects are forced to use more efficient
retrieval strategies during initial testing. Again, if that factor is robust, we would expect the
same negative correlation in the current experiments. Furthermore, it is unclear under that
account which more efficient retrieval strategies would be used by low ability subjects, nor
whether those strategies would be sufficiently powerful to exceed the effectiveness of strategies
used by high ability subjects.
Here we consider an alternative account of the contrasting outcomes between studies that
is grounded in a simple psychometric model and in data discussed below which suggest that the
Brewer and Unsworth (2012) sample had higher average episodic ability than did our samples.
Beyond providing a candidate account of the contrasting correlation results, this discussion may
have important implications for the design and interpretation of future individual differences
studies.
(Figure 2 around here)
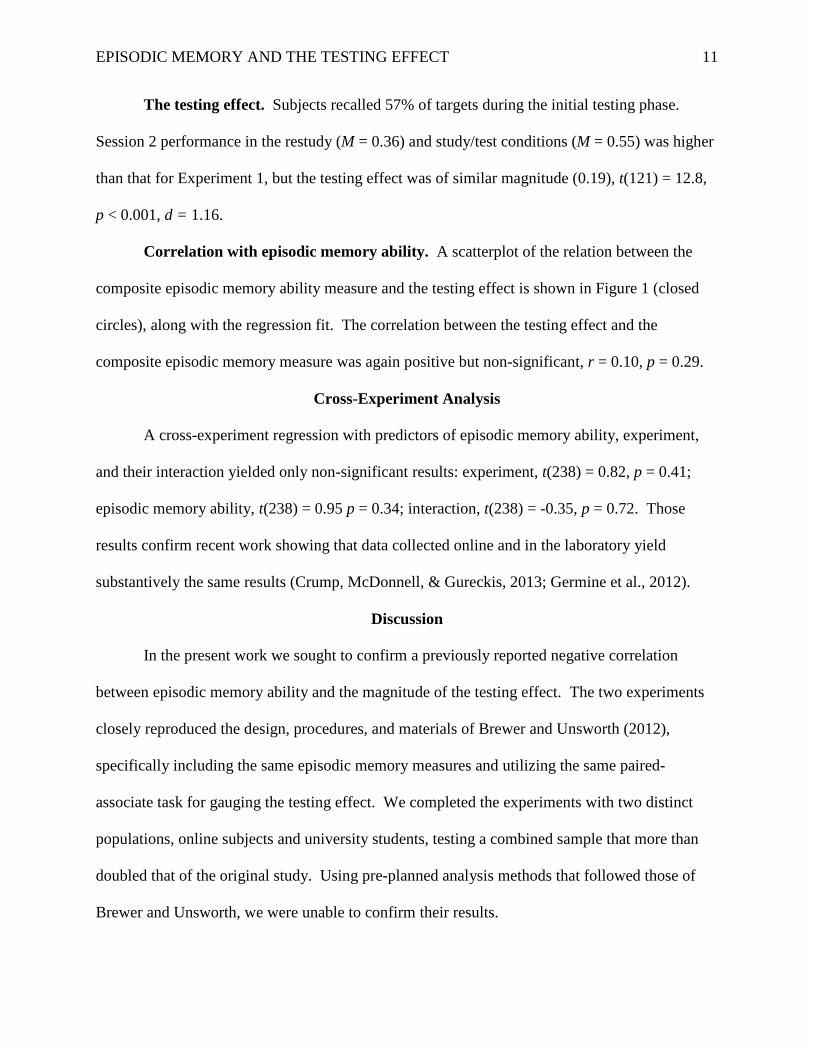
Figure 2a illustrates a model, based on the logistic function, of expected performance in
the restudy and study/test conditions of a given experiment as a function of true episodic
memory ability level in the general population. The model is introduced primarily for illustrative
purposes and not as a fully fleshed-out psychological theory. To represent the null hypothesis of
EPISODIC MEMORY AND THE TESTING EFFECT 15
no intrinsic difference in testing effect magnitude across the episodic ability range, the logistic
function is simply shifted to the left for the study/test condition relative to the restudy condition.
Although the logistic function is assumed in this model, other roughly sigmoidal shaped
functions are plausible. However, given that probability correct is bounded at zero and 1.0, the
functions are very unlikely to be fully linear.
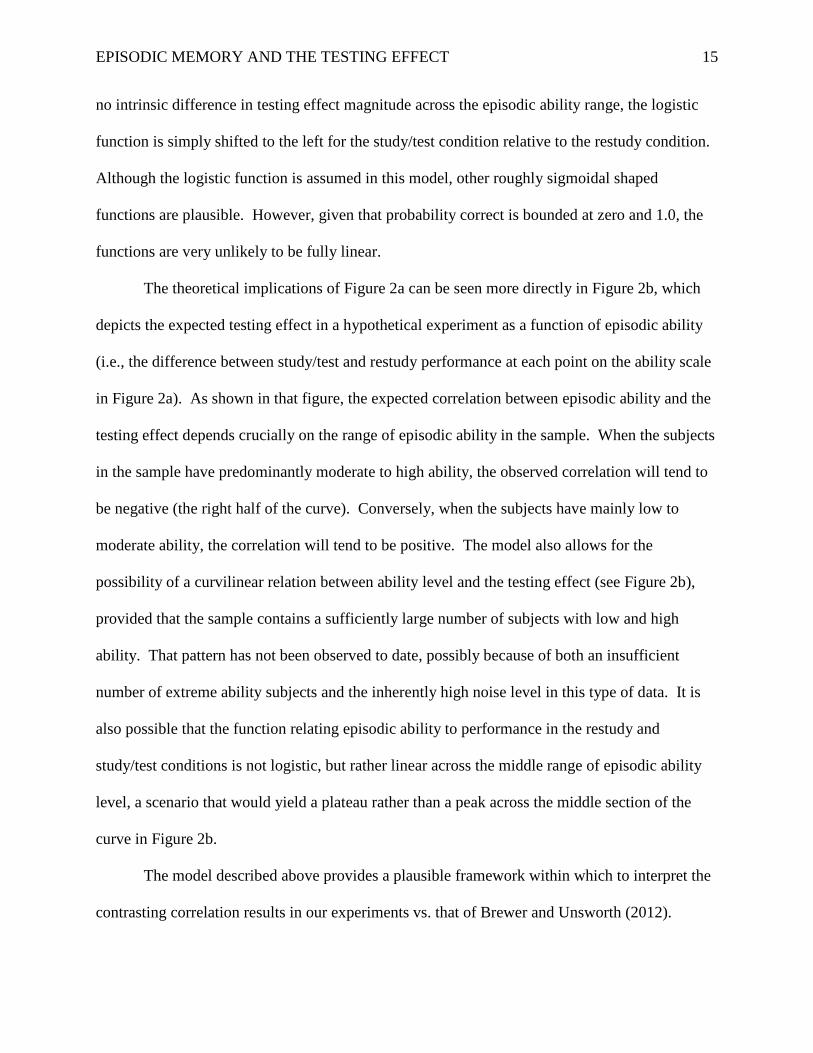
The theoretical implications of Figure 2a can be seen more directly in Figure 2b, which
depicts the expected testing effect in a hypothetical experiment as a function of episodic ability
(i.e., the difference between study/test and restudy performance at each point on the ability scale
in Figure 2a). As shown in that figure, the expected correlation between episodic ability and the
testing effect depends crucially on the range of episodic ability in the sample. When the subjects
in the sample have predominantly moderate to high ability, the observed correlation will tend to
be negative (the right half of the curve). Conversely, when the subjects have mainly low to
moderate ability, the correlation will tend to be positive. The model also allows for the
possibility of a curvilinear relation between ability level and the testing effect (see Figure 2b),
provided that the sample contains a sufficiently large number of subjects with low and high
ability. That pattern has not been observed to date, possibly because of both an insufficient
number of extreme ability subjects and the inherently high noise level in this type of data. It is
also possible that the function relating episodic ability to performance in the restudy and
study/test conditions is not logistic, but rather linear across the middle range of episodic ability
level, a scenario that would yield a plateau rather than a peak across the middle section of the
curve in Figure 2b.
The model described above provides a plausible framework within which to interpret the
contrasting correlation results in our experiments vs. that of Brewer and Unsworth (2012).

EPISODIC MEMORY AND THE TESTING EFFECT 16
Inspection of episodic ability scores for both our samples (Table 1) and the sample of the original
study (Brewer & Unsworth, 2012, Table 1, p. 411) shows that, for three of the four measures
(picture source, cued recall, and delayed free recall), subjects in the Brewer and Unsworth study
had higher mean scores than did subjects in either of the experiments of our study (but nearly
identical standard deviations). The differences between studies for those three measures are
large and highly significant. For cued recall, for example, Brewer and Unsworth’s subjects
scored about 34% higher (proportion correct of 0.49 vs. 0.36) than did our subjects. For delayed
free recall, they scored 50% higher (0.54 vs. 0.36). It thus appears that, for reasons unknown, the
Brewer and Unsworth sample had higher episodic memory ability on average than did either our
Mechanical Turk or university samples (Note: the reliability of the episodic memory measures
was highly comparable between studies). Their subjects may thus have occupied primarily the
right half of the ability range, as approximated in Figure 2b. The result would be a negative
correlation between episodic ability and the testing effect, as observed. In contrast, the apparent
lower ability subjects in our samples would be shifted somewhat to the left of Figure 2b,
potentially resulting in no statistically significant correlation, as was observed. Note that in
Figure 2, the assumed sample ability ranges are intended only to demonstrate general
implications of the model. No attempt was made to optimize that model to fit data.
To facilitate interpretation of the hypothesized sample ability ranges in the context of
Figure 2, it should be noted that the z-score range for episodic ability in the empirical graphs (see
for example, Figure 1) does not map directly onto the theoretical z-score range depicted in Figure
2. In Figure 2, the z-score range is intended to reflect that of the general population. In the
empirical graphs, on the other hand, the z-scores reflect only the standardized relative position of
each subject within each sample. If, as we have suggested, the samples do not cover the full

EPISODIC MEMORY AND THE TESTING EFFECT 17
range of the general population, then the z-scores in Figure 1 do not map directly onto the z-
scores in Figure 2. For example, a z-score of zero in the Brewer and Unsworth (2012) data from
university students is likely to reflect a higher than average ability subject in the general
population, corresponding to an episodic ability z-score in Figure 2 that is larger than zero.
Similarly, the range of z-scores in the empirical graphs does not map directly onto the range in
Figure 2, but rather would be compressed in Figure 2.
Regardless of the accuracy of the particular model that we have described in explaining
expected task performance as a function of episodic ability, the forgoing discussion demonstrates
that the observed correlation may depend critically on the range and central tendency of ability
level in the sample. It is therefore difficult if not impossible to make strong inference that
extrapolates beyond the ability range of the sample. For example, even the lower ability subjects
in the Brewer and Unsworth (2012) study of university students are unlikely to be truly low
ability subjects in the general population. Rather, as argued above, their sample is more likely to
occupy primarily the moderate to high ability range. Similarly, our samples are unlikely to
include many truly low ability subjects. Thus, results of those studies cannot speak compellingly
to the magnitude of the testing effect for low ability subjects relative to high ability subjects in
the general population.
To complicate matters further, the observed correlation is also likely to depend on the
difficulty of the materials used for the testing effect tasks, the difficulty of the tasks themselves
(e.g., number of stimuli, trial timing, etc.), and on aspects of experimental design (e.g., the delay
period between training and test sessions). For example, holding the distribution of episodic
ability constant, use of easy materials (e.g., relatively easy to learn paired-associate items) would
shift the location of both curves to the left in Figure 2a (with corresponding changes in Figure

EPISODIC MEMORY AND THE TESTING EFFECT 18
2b). The resulting correlation between ability and the testing effect could shift in magnitude and
possibly sign. The same point would hold for difficult materials.
We conclude that correlations between ability and the testing effect in sample data should
be interpreted cautiously, and with attention to both the currently unknown function relating true
ability to expected performance on the component tasks, as well as the difficulty level of the
materials and tasks. It appears unlikely, in retrospect, that individual differences in the testing
effect can be fully elucidated using ability measures for which there is no independent normative
data. A more productive approach would be to employ standardized ability measures in which
scores in a sample can be mapped to percentile rankings in the general population. Using that
approach, the ability range in the sample can be located relative to that of the broader population
and inferences can be restricted to that range. That approach would also facilitate interpretation
of divergent results across studies involving different samples. Even in that case, however,
correlation results may be dependent critically on the difficulty of the materials or design. It
appears, then, that conclusive results regarding the relative effectiveness of testing as a function
of ability will require a research paradigm in which (1) the ability range of the sample relative to
the general population is known, and (2) inferences are conditional on material difficulty.
Ideally, the ability range should span that of the general population and item difficulty should
vary from the very easy (yielding high accuracy for both component tasks across the great
majority of the ability range) to the very difficult (yielding low accuracy for both component
tasks across the great majority of the ability range).
Ability differences in encoding through study vs. testing? In addition to the issues
discussed above, it is important to recognize that there may be individual differences in the
relative ability to encode during study vs. testing. That possibility has not been explored in the

EPISODIC MEMORY AND THE TESTING EFFECT 19
literature to date. Rather, all components of the episodic ability measure in the current
experiments and that of Brewer and Unsworth (2012) assessed recall performance following
study only. When that measure is used to predict the testing effect, the resulting correlation may
be driven more by individual differences in encoding through restudy than by individual
differences in encoding through testing; those abilities may or may not be highly correlated. One
approach to addressing that possibility in future work would be to include separate assessments
of ability to encode through study and ability to encode through testing, and to explore how those
different measures correlate with the testing effect.
Theories of the testing effect. In an attempt to connect the empirical individual
differences results with theory, we evaluated predictions of multiple models of the testing effect.
We carefully considered the underlying theoretical claims of the following major theories:
transfer appropriate processing theory (Morris, Bransford, & Franks, 1977), the new theory of
disuse (Bjork & Bjork, 1992), the bifurcation model (Kornell, Bjork, & Garcia, 2011), the
desirable difficulties theory (Bjork, 1994), the complete cue processing theory (Mozer, Howe, &
Pashler, 2004), the mediator effectiveness theory (Pyc & Rawson, 2010), the elaborative retrieval
theory (Carpenter, 2011), and the episodic context theory (Karpicke, Lehman, & Aue, 2014).
By our interpretation, none of those theories make unambiguous predictions about
individual differences, and in particular about whether individual differences in episodic memory
ability moderate the magnitude of the testing effect. Among them, only the desirable difficulties
theory appears to incorporate a specific mechanism that could in principle give rise to individual
differences in the testing effect (because “difficulty” of a given item would presumably depend
on memory ability). Incorporation of learning mechanisms that yield individual differences

EPISODIC MEMORY AND THE TESTING EFFECT 20
predictions, once they are more fully understood, is an important direction for future model
development.
Applied Implications
Given the empirical results and theoretical considerations above, it would be premature to
implement educational interventions based on individual differences in the testing effect, such as
placing a greater emphasis on testing for low ability than for high ability subjects. Indeed,
combining our samples with those of Brewer and Unsworth (2012), the bulk of the episodic
ability range evaluated likely spans from the low-middle to the high. Those data indicate that
testing produces at least as much, and across most of that range substantially more, learning than
does restudy.

EPISODIC MEMORY AND THE TESTING EFFECT 21
Acknowledgments
This work was supported by a collaborative activity award to H. Pashler from the J.S.
McDonnell Foundation, a MURI award from the Office of Naval Research (25684A), and a NSF
Grant (SBE-0542013, G.W. Cottrell, PI). S. Pan is supported by a NSF Graduate Research
Fellowship.
The authors thank Gene Brewer for helpful discussions and assistance with
methodological details, as well as Nash Unsworth for sharing materials. Thanks also to Noriko
Coburn, Jonathan Mejia, and Thomas Chi for assistance with setting up and running the
experiments.

EPISODIC MEMORY AND THE TESTING EFFECT 22
References
Bjork, R.A. (1994). Memory and metamemory considerations in the training of human beings. In
J. Metcalfe and A. Shimamura (Eds.) Metacognition: Knowing about knowing. (pp.185-
205). Cambridge, MA: MIT Press.
Bjork, R. A., & Bjork, E. L. (1992). A new theory of disuse and an old theory of stimulus
fluctuation. In A. Healy, S. Josslyn, & R. Shiffrin (Eds.), Essays in honor of William K.
Estes: from learning processes to cognitive processes. (Vol. 2, pp. 35-67). Hillsdale, NJ:
Lawrence Erlbaum Associates, Inc.
Bouwmeester, S., & Verkoeijen, P. P. J. L. (2011). Why do some children benefit more from
testing than others? Gist trace processing to explain the testing effect. Journal of Memory
and Language, 65(1), 32-41. doi:10.1016/j.jml.2011.02.005
Brewer, G. A., & Unsworth, N. (2012). Individual differences in the effects of retrieval from
long-term memory. Journal of Memory and Language, 66(3), 407–415.
doi:10.1016/j.jml.2011.12.009
Buhrmester, M., Kwang, T., & Gosling, S. D. (2011). Amazon's Mechanical Turk a new source
of inexpensive, yet high-quality, data?. Perspectives on Psychological Science, 6(1), 3-5.
doi:10.1177/1745691610393980
Carpenter, S. K. (2009). Cue strength as a moderator of the testing effect: The benefits of
elaborative retrieval. Journal of Experimental Psychology: Learning, Memory, and
Cognition, 35(6), 1563-1569. doi:10.1037/a0017021
Carpenter, S. K. (2011). Semantic information activated during retrieval contributes to later
retention: Support for the mediator effectiveness hypothesis of the testing effect. Journal of

EPISODIC MEMORY AND THE TESTING EFFECT 23
Experimental Psychology: Learning, Memory, and Cognition, 37(6), 1547-1552. doi:
10.1037/a0024140
Carpenter, S. K., Pashler, H., & Vul, E. (2006). What types of learning are enhanced by a cued
recall test? Psychonomic Bulletin & Review, 13(5), 826-830. doi:10.3758/BF03194004
Carpenter, S. K., Pashler, H., Wixted, J. T., & Vul, E. (2008). The effects of tests on learning and
forgetting. Memory & Cognition, 36(2), 438-448. doi:10.3758/MC.36.2.438
Crump, M. J., McDonnell, J. V., & Gureckis, T. M. (2013). Evaluating Amazon's Mechanical
Turk as a tool for experimental behavioral research. PloS One, 8(3), e57410.
doi:10.1371/journal.pone.0057410
Fisher, R.A. (1921). On the `probable error' of a coefficient of correlation deduced from a small
sample. Metron, 1, 3–32.
Germine, L., Nakayama, K., Duchaine, B. C., Chabris, C. F., Chatterjee, G., & Wilmer, J. B.
(2012). Is the web as good as the lab? Comparable performance from web and lab in
cognitive/perceptual experiments. Psychonomic Bulletin & Review, 19(5), 847-857. doi:
10.3758/s13423-012-0296-9
Karpicke, J. D., Lehman, M., & Aue, W. R. (2014). Retrieval-based learning: An episodic
context account. In B. H. Ross (Ed.), Psychology of Learning and Motivation (Vol. 61)
(pp. 237-284). San Diego, CA: Elsevier Academic Press.
Kornell, N., Bjork, R. A., & Garcia, M. A. (2011). Why tests appear to prevent forgetting: A
distribution-based bifurcation model. Journal of Memory and Language, 65(2), 85-97.
doi:10.1016/j.jml.2011.04.002
Kuder, G. F., & Richardson, M. W. (1937). The theory of the estimation of test reliability.
Psychometrika, 2(3), 151–160.
EPISODIC MEMORY AND THE TESTING EFFECT 24
McDaniel, M. A., Roediger, H. L., & McDermott, K. B. (2007). Generalizing test-enhanced
learning from the laboratory to the classroom. Psychonomic Bulletin & Review, 14(2), 200-
206. doi:10.3758/BF03194052
Morris, C. D., Bransford, J. D., & Franks, J. J. (1977). Levels of processing versus transfer
appropriate processing. Journal of Verbal Learning & Verbal Behavior, 16(5), 519-533.
Mozer, M. C., Howe, M., & Pashler, H. (2004). Using testing to enhance learning: A comparison
of two hypotheses. In Proceedings of the Twenty Sixth Annual Conference of the
Cognitive Science Society. (pp. 975-980). Hillsdale, NJ, Lawrence Erlbaum Associates
Publishers.
Pyc, M. A., & Rawson, K. A. (2010). Why testing improves memory: Mediator effectiveness
hypothesis. Science, 330(6002), 335.
Roediger, H. L., & Karpicke, J. D. (2006). The power of testing memory: Basic research and
implications for educational practice. Perspectives on Psychological Science, 1(3), 181-210.
doi:10.1111/j.1745-6916.2006.00012.x
Unsworth, N., & Spillers, G. J. (2010). Working memory capacity: Attention control, secondary
memory, or both? A direct test of the dual-component model. Journal of Memory and
Language, 62(4), 392-406. doi:10.1016/j.jml.2010.02.001
EPISODIC MEMORY AND THE TESTING EFFECT 25
standardized episodic memory ability score
-3 -2 -1 0 1 2
test
ing
effe
ct
-0.6
-0.4
-0.2
0.0
0.2
0.4
0.6
0.8Experiment 1Experiment 2Prediction for Exp. 1Prediction for Exp. 2
Figure 1. Scatterplot showing the relationship between episodic memory ability and the testing
effect. Results for Experiment 1 (open circles) and Experiment 2 (closed circles) are overlaid for
comparison purposes.

EPISODIC MEMORY AND THE TESTING EFFECT 26
0
0.1
0.2
0.3
0.4
0.5
0.6
0.7
0.8
0.9
1
-3 -2 -1 0 1 2 3 4 5
prop
ortio
n co
rrec
t
episodic memory ability (z)
Restudy Study/Test
0
0.05
0.1
0.15
0.2
-3 -2 -1 0 1 2 3 4 5
test
ing
effe
ct
episodic memory ability (z)
a. b.
Figure 2. Psychometric model of (a) theoretically expected performance in the restudy and study/test conditions as a function of true
episodic memory ability, and (b) the resulting testing effect with dotted ovals representing hypothetical episodic memory ability
ranges in the Brewer and Unsworth (2012) and current studies. The model and the figure are intended primarily to facilitate
discussion. No attempt was made to optimize model parameters to fit the data.
Current study Brewer & Unsworth (2012)

EPISODIC MEMORY AND THE TESTING EFFECT 27
Table 1
Descriptive statistics and reliabilities for all measures in Experiments 1 and 2
Experiment Measure M SD Skew Kurtosis Reliability
1 Testing task
Testing 0.46 0.24 0.05 -0.85 – a
Restudy 0.29 0.19 0.85 0.40 – a
Difference 0.17 0.18 -0.19 0.31 – a
Episodic memory
Gender source 0.69 0.13 -0.31 0.70 0.83
Picture source 0.63 0.12 -0.84 1.98 0.82
Cued recall 0.34 0.20 0.81 0.14 0.85
Delayed free recall 0.36 0.15 0.82 0.78 0.81
2 Testing task
Testing 0.55 0.21 -0.22 -0.79 – a
Restudy 0.36 0.17 0.64 0.39 – a
Difference 0.19 0.16 -0.04 0.04 – a
Episodic memory
Gender source 0.73 0.10 0.022 -0.28 0.75
Picture source 0.67 0.12 -0.11 -0.34 0.81
Cued recall 0.39 0.19 0.29 -0.57 0.80
Delayed free recall 0.36 0.10 0.40 0.18 0.64
Note: The measures are listed in the same order as in Brewer and Unsworth (2012; Table 1, p. 411), not in order of
presentation during the experiments. Reliability calculated using the KR-20 formula (Kuder & Richardson, 1937).

EPISODIC MEMORY AND THE TESTING EFFECT 28
a Reliability for the paired-associate tasks was not computed due to random assignment of items to condition for
each subject.

EPISODIC MEMORY AND THE TESTING EFFECT 29
Table 2
Correlations for all measures in Experiments 1 and 2
Experiment Testing Restudy Difference Gsource Psource Cued recall
Delayed FR
1
Testing 1.00
Restudy 0.66 1.00
Difference 0.61 -0.19 1.00
Gsource 0.28 0.24 0.04 1.00
Psource 0.25 0.12 0.24 0.32 1.00
Cued recall 0.35 0.30 0.14 0.23 0.24 1.00
Delayed FR 0.29 0.42 -0.02 0.27 0.15 0.39 1.00
2
Testing 1.00
Restudy 0.64 1.00
Difference 0.59 -0.23 1.00
Gsource 0.37 0.35 0.10 1.00
Psource 0.07 0.14 -0.06 0.26 1.00
Cued recall 0.42 0.33 0.19 0.24 0.30 1.00
Delayed FR 0.30 0.34 0.03 0.32 0.13 0.43 1.00
Note: Gsource = Gender source, Psource = Picture source, Delayed FR = Delayed free recall. The correlations are
listed in the same order as in Brewer and Unsworth (2012; Table 2, p. 412).