Tese de Doutoramento em Geografia e Planeamento
270
Tese de Doutoramento em Geografia e Planeamento Territorial Especialidade: Território e Desenvolvimento O Cluster das Energias na Região Norte: uma abordagem em Geografia Económica Ana Cristina Horta Corvo Dias Pego maio, 2019
-
Upload
khangminh22 -
Category
Documents
-
view
0 -
download
0
Transcript of Tese de Doutoramento em Geografia e Planeamento

Tese de Doutoramento em Geografia e Planeamento
Territorial
Especialidade: Território e Desenvolvimento
O Cluster das Energias na Região Norte: uma abordagem
em Geografia Económica
Ana Cristina Horta Corvo Dias Pego
maio, 2019

2

3
Tese apresentada para cumprimento dos requisitos necessários à obtenção do grau
de Doutor em Geografia e Planeamento Territorial, especialidade Território e
desenvolvimento, realizada sob a orientação científica da Professora Doutora Maria
Regina Faia Martins Salvador, Professora Catedrática da
Faculdade de Ciências Sociais e Humanas da
Universidade Nova de Lisboa, com a Co-Orientação da Professora Doutora Ana
Monteiro, Professora Catedrática da Faculdade de Letras, Universidade do Porto
Curso de Doutoramento em Geografia e Planeamento Territorial Registado na Direção -Geral do Ensino Superior com o n.o R/B — Cr 178/2009
Diário da República, 2.a serie, Nº 49, 11 de março de 2010

4

Declaro que esta tese é o resultado da minha investigação pessoal e independente. O seu conteúdo é original e todas as fontes consultadas estão devidamente mencionadas no
Declaro que esta tese se encontra em condições
Professora Doutora
Declaro que esta tese se encontra em condições
Pr
DECLARAÇÕES
Declaro que esta tese é o resultado da minha investigação pessoal e independente. O seu conteúdo é original e todas as fontes consultadas estão devidamente mencionadas no
nas notas e na bibliografia.
O Candidato,
____________________
Ana Cristina Pego Lisboa, 26 de novembro de 2018
Declaro que esta tese se encontra em condições de ser apreciada pelo jú
A Orientadora,
___________________________
Professora Doutora Maria Regina Faia Martins SalvadorLisboa, 26 de novembro de 2018
Declaro que esta tese se encontra em condições de ser apreciada pelo jú
A Co- Orientadora,
___________________________ Professora Doutora Ana Monteiro Lisboa, 26 de novembro de 2018
5
Declaro que esta tese é o resultado da minha investigação pessoal e independente. O seu conteúdo é original e todas as fontes consultadas estão devidamente mencionadas no texto,
de ser apreciada pelo júri a designar.
Maria Regina Faia Martins Salvador
de ser apreciada pelo júri a designar.

6
Ao José e ao Gonçalo
7
AGRADECIMENTOS
Ao apoio incondicional do meu companheiro de uma vida, ao meu filho
Gonçalo que muitas vezes soube esperar para lhe explicar algumas matérias do ensino
secundário, aos meus pais por aquilo que sou, à Professora Doutora Regina Salvador
que me acompanhou neste percurso e que me abriu a possibilidade de estudar as
questões do mar, à Professora Doutora Ana Monteiro, à Professora Doutora Rosário
Matos da Universidade Aberta, que me incentivou a estudar além da licenciatura.
A todos que contribuíram para chegar ao fim desta etapa, mais precisamente, e
não menos importantes, os Professores desta Universidade, os meus amigos e aos
meus colegas de curso.

8

9
“Energy is a fundamental ingredient of a modern society and its supply impacts directly
on social and economic development of nations” Gómez - Expósito et al. (2008: 2)

10
O Cluster das Energias na Região Norte: uma abordagem em Geografia
Económica
ANA CRISTINA HORTA CORVO DIAS PEGO
RESUMO
O conceito de cluster está directamente relacionado com o impacte na economia porque promove importantes ligações entre os sectores, nomeadamente na cooperação e colaboração, e indica a contribuição para o investimento e o emprego para um sector específico. Este estudo apresenta o cluster de energia offshore (eólica) em Portugal e suas implicações para a economia nacional. Considera-se que as implicações da energia offshore em Portugal (2017) estão directamente relacionadas com o emprego e o investimento nacional. Para tingir o objetivo de investigação (existe um cluster de energia offshore em Portugal?) foi utilizada a metodologia mista ou seja, a metodologia qualitativa baseada no Modelo de Diamante de Porter e a metodologia quantitativa baseada na matriz de produção Input Output (2013). O confronto entre os resultados permitiu concluir que existe um cluster emergente, e um impacte positivo no emprego e, no investimento direto. Os resultados provaram igualmente que num futuro próximo, o cluster de energia offshore em Portugal será um importante fornecedor de energia e contribuirá para a diminuição da dependência energética, economia verde e uma economia mais sustentável. Além disso, espera-se que projetos de I&D Offshore promovam uma dinâmica empresarial, trabalhadores qualificados, especialização inteligente, em virtude de uma crescente cooperação entre empresas e ao apoio financeiro nacional e europeu. A investigação feita contribuirá para compreender o funcionamento da estratégia de mercado do cluster em termos de colaboração e cooperação entre os players, mas também para definir estratégias no setor em termos de atuação no mercado nacional e europeu.
PALAVRAS - CHAVE: energia offshore, energia do vento, cluster, impacte económico,
localização geográfica

11
The Energy Cluster in the North Region: an approach in Economic
Geography
ANA CRISTINA HORTA CORVO DIAS PEGO
ABSTRACT
The concept of the cluster is directly related with an important impact on the economy because it promotes important linkages between sectors, namely cooperation and collaboration and it indicates the contribution towards investment and employment for a specific sector of the economy. This study presents the offshore energy cluster (wind) in Portugal and its implications for the economy. It is considered that the implications from offshore energy farms in Portugal (2017) are consistent with positive features in national employment and investment. A mixed methodology was used to discuss the results, a qualitative methodology based on Porter’s Diamond Model and a quantitative methodology based on the IO matrix (2013). The confrontation between the results endowed an emergent cluster with weak linkages between sectors but a positive impact on employment and direct investment. The results will also prove that in the near future, the offshore energy cluster in Portugal will be an important renewable energy supply and will contribute activity with less dependence on fuel energy. Additionally, it is expected that R&D projects related to offshore value chains, technology and innovation, business dynamics, skilled workers and smart specialization will have national and European financial support because of their positive impact on the economy. The research will contribute to understanding the offshore renewable energy sector at the national and European level, and will provide support for other cluster studies.
KEYWORDS: offshore energy, wind energy, cluster, economic impact, geographic location

12

13
INDEX
CHAPTER 1- INTRODUCTION ............................................................................ 16
CHAPTER 2– GEOGRAPHICAL SPACE AND CLUSTERS ..................................... 23
2.1. THE CLUSTER ORGANISATION AND COMPETITIVE ADVANTAGE ........... 24
2.1.1. Competitive and Comparative Advantage ....................................... 24
2.1.2 Geographical Location and Competitive Advantage ........................ 25
2.1.3 The Organization Concept.................................................................. 29
2.1.4 Space, Territory and Knowledge ........................................................ 31
2.2 REGIONAL DEVELOPMENT ......................................................................... 33
2.3. CLUSTER: CONCEPT AND THEORY ............................................................ 38
2.3.1 The Role of Geographical Concentration .......................................... 38
2.3.2 The Porter "Diamond Model" ............................................................ 41
2.3.3 The Evolution of the Cluster .............................................................. 47
CHAPTER 3 – MARITIME ECONOMY AND CLUSTERS ................................. 59
3.1 MARITIME ECONOMY ................................................................................. 60
CHAPTER 4 – MARITIME ENERGY..................................................................... 81
4.1 RENEWABLE AND OFFSHORE ENERGIES ................................................... 82
4.2 THE CLEANTECH MODELS ........................................................................... 90
4.2.1 THE Helix model ................................................................................. 96
4.2.2 The Convas Model .............................................................................. 97
CHAPTER 5– MARITIME ENERGY IN THE EU AND IN PORTUGAL ................ 112
5.1 THE RENEWABLE ENERGY IN EUROPE AND PORTUGAL ........................ 113
5.2 THE EUROPEAN ENERGY POLICY ............................................................. 116
5.3 THE OFFSHORE ENERGY INVESTMENTS (WAVE AND WIND) IN PORTUGAL 123
5.3.1 Introduction ..................................................................................... 123
5.3.2 Pico Island ......................................................................................... 129
5.3.3 Aguçadoura ....................................................................................... 130
5.3.4. Planned Offshore Energy Projects .................................................. 132
CHAPTER 6– A GEOGRAPHICAL ANALYSIS OF THE PORTUGUESE OFFSHORE COAST
.......................................................................................................................... 137
6.1 WIND AND WAVE RESOURCES ................................................................ 138
14
6.1.1 Wave resources ................................................................................ 138
6.1.2 Wind resources ................................................................................. 141
6.2 PORTUGUESE OFFSHORE GEOGRAPHY ................................................... 145
6.2.1 The Continental Shelf ....................................................................... 145
6.2.2 Wave conditions in Portugal ............................................................ 149
6.2.3 Offshore wind conditions in Portugal .............................................. 155
CHAPTER 7– THE INPUT-OUTPUT MATRIX .................................................... 160
7.1 The Input-Output Matrix .......................................................................... 161
7.2 The IO model and analytical analysis ...................................................... 166
7.3 The usefulness of the IO model ............................................................... 171
7.5 THE INPUT-OUTPUT MATRIX AND THE ENERGY SECTOR ...................... 183
7.5.1 The IO matrix for renewable energy in Portugal............................. 185
7.5.2 Conclusions ....................................................................................... 189
CHAPTER 8 – THE OFFSHORE ENERGY CLUSTER IN PORTUGAL. AN ECONOMIC AND
GEOGRAPHICAL ANALYSIS.............................................................................. 191
8.1 Introduction ............................................................................................... 192
8.2 QUALITATIVE ANALYSIS ............................................................................ 193
8.2.1 Porter’s Diamond Model and the offshore energy cluster ............. 193
8.2.2 SWOT analysis of the offshore energy sector ................................. 201
8.3 QUANTITATIVE ANALYSIS ......................................................................... 204
CHAPTER 9– CONCLUSIONS AND RECOMMENDATIONS ............................. 211
BIBLIOGRAPHY ................................................................................................ 217
LISt OF TABLES ................................................................................................. 249
LIST OF FIGURES .............................................................................................. 251
ANNEX 1– INTERVIEWEES AND ELECTRONIC QUESTIONNAIRE .................. 254
ANNEX 2– IO MATRIX 2013 ............................................................................ 264
ANNEX 3– LIST OF PUBLICATIONS DURING THE RESEARCH RELATED TO THE OFFSHORE
ENERGY SECTOR .............................................................................................. 268

15

16
CHAPTER 1- INTRODUCTION
"One of the first public experiments in which electrical power was used in a public space in country took place in Coimbra on Wednesday, 8 May 1867. (…) That night there was electric light! The flocks of peregrine birds spread their lazy wings from their mysterious nests and flew into the light, lured and fascinated like night butterflies…they trembled as they burned in the electric light"
Figueira (2018:16)

17
The energy used in human activities provided increasingly better resources and
labour over time. Energy accompanied the activity of man and was a necessary tool for
the performance of his activities.
The evolution of society and the emergence of electric power in the twentieth
century led man to look at energy resources as essential to their activities. Electricity is
associated with essential goods of human activity and prevails as an economic
resource.
This work is framed in the field of economic geography. Several studies
underline the importance of economic analysis in geography (Marshall, 1920;
Krugman,1992; Garafoli, 1994; Bacattini, 2002).
Economic geography studies the occupation space of activities. Marshall (1920)
identified the occupation of territory as "industrial districts" with agglomeration of
activities.
The benefits derived from collaboration among organizations and individuals is
a fundamental instrument for cluster planning (Cooke, 2002), and cannot be seen in
isolation, but has multiple functions (Benneworth and Henry, 2004).
Geographical concentration (Marshall, 1920; Peroux, 1950) is the basis for the
cluster concept. The evolution of industrial districts performed a new concept of
industrial location based on regional innovation and learning regions. More recently,
the economic cluster presented by Porter (2000) involves a network of organizations
that are connected to each other through supplier-buyer relations, knowledge and
cooperation between stakeholders.
The cluster as an engine of economic development (Porter, 1998; Porter, 2000;
Turner, 2001; Ketels and Memedovic, 2008) includes enterprises and other
organizations, such as, universities, public institutions (Maskell and Kebir, 2006).The
importance of cooperation reveals a dynamic character and associated activities,
cooperation in an evaluation of natural, human and technical resources.
The cluster is related to the location sector in a territory (McDonald et al.,
2007;Ianca and Batrinca, 2010;), form of innovation and the development of industrial

18
economic organizations. The creation of specialized products tends to form a cluster
due to resources and skilled labour needs, not available elsewhere (Audretsch and
Feldman, 1996).
However, the cluster location depends on objective factors (geographical
location, transport network connections, supply of skilled labour, availability of land,
energy costs, financial and municipal charges), and subjective (economic environment,
image of the city/region, universities, research institutions and technology, innovative
profile and performance of commercial and industrial associations) (Meyer-Stamer,
2001).
Simões (2013) identifies four typologies types of cluster: mini-cluster, industrial
cluster, regional cluster and mega-cluster.
Some authors have considered electric energy cluster development; Frisillo
(2007) describes electric energy clusters as groups of industries and other institutions,
which favours innovation, entrepreneurship, knowledge transfer, better relations
between partners and more efficient government intervention. The offshore energy
cluster is an economic, social and environmental development model, associated with
better use of synergies. These synergies reflect regional and local development (Simas,
2012) in energy independence, job creation and technological and industrial
development.
Due the lack of studies about offshore wind energy applied to a specific
geographical area, my motivation was to contribute to an enhanced understanding of
the potential offshore energy cluster in Portugal, taking into account my personal
interest in environmental issues.
Additionally, researchers have presented few studies in the renewable energy
sector; therefore, this project will lead to awareness about the use of natural resources
in Portugal and other European countries.
The researcher has a tool to develop his research, the methodology. The
research process is related to epistemology (researcher perspective and the method
how the researcher achieves that perspective), ontology (research phenomenon) and
methodology (researcher knowledge process) (Matos, 2006: 91).

19
As Matos (2006:91) put it: “The methodology is the process of constructing
knowledge from the researcher, as well as the set of procedures and research methods
used to acquire the knowledge”.
The research question of the thesis is the following:
Is there an offshore energy (wave and wind) cluster in Portugal?
In order to answer this research question, the work will follow a mixed
methodology (Crewswell and Clark, 2017: 208). The triangular design defined by
Crewswell and Clark (2017: 210) exposes a set of procedures where the researcher
compares results from qualitative and quantitative data; therefore, the researcher
identifies the variables with which he is confronted and at the same time works
towards solutions for the research questions. The importance of a mixed methodology
is discussed when a researcher tries to link various social sciences. Consequently, its
importance reflects the capacity of analysing social phenomena both quantitatively or
qualitatively.
The regional problems of spatial distribution and equilibrium are related to
location decisions (Bathelt and Glückeen, 2003:117). The location problem is not a
fixed model, but a dynamic model characterized by the relationships within regions;
where it can be studied, taking into account qualitative methodology (economic
agents' behavior) and also a quantitative methodology (the impact of economic agents
in the region).The importance of mixed methodology relays to a conceptual model
where a dynamic analysis can be presented with rationality.
In addition to economic theory, social theories and their conceptualization are
also applied to this approach to explain localized economic phenomena (Bathelt and
Glückeer, 2003:123). This means a relationship between organisations, technologies
and territories (Bathelt and Glückeer, 2003:130).
The proposed methodology presents a relationship between organizations,
innovation and interaction (Bathelt and Glückeer (2003:131).Therefore, the research is

20
a map of objectives and goals which are confirmed in a positive (quantitative) and
interpretative (qualitative) way. Mixing methodologies should be connected with data
analysis (first analysis) and data collection (second phase) (Crewswell and Clark,
2017:208). The interesting issue about mixing methodology is integrating and
embedding data for a better phenomenon, moving understanding towards a better
interpretation of the entire analysis.
Furthermore, mixed methodology allows the researcher to compare two types
of data (quantitative or qualitative) and determine if there are any convergences,
differences or combinations. Moreover, mixed methods are advantageous because
they are familiar to most researchers and can result in well-validated and
substantiated findings. For this purpose, the research will follow two methods (Porter’s
Diamond Model analysis and the Input-Ouput (IO) model). The objective is to compare
data and findings for a better understanding of the research.
To sum up, qualitative and quantitative methodologies were used to describe
the effects resulting from the renewable energy cluster. As the IO model has
considerable merits of its own, the qualitative method based on the Diamond Model
confirms the results from the IO analysis.
The research design also demonstrates the research purposes and its linkages
to the problem that you want to answer (Sekaran, 2003) with information leading
towards a categorized problem (D’Oliveira, 2007).
The research design resides in the benefits from its use as economic, social, and
technical or conversion systems (Kühn, 2001; Henderson et al., 2003; Sclavounos et al.,
2008; Elkinton et al., 2006).
The research design will determine the possibility of an offshore wind energy
cluster in Portugal through a quantitative method (production IO matrix 2013), and a
qualitative method (Porter's Diamond model).
The sample will be based on stakeholders that influence offshore energy
(suppliers, public institutions, companies, organizations, universities, NGOs) and which
can contribute to the offshore cluster in Portugal.
The research question led to the following premises:

21
1. Which factors can contribute most to the offshore energy cluster in Portugal?
2. What are the direct, indirect and induced impacts of the offshore renewable
energy sector on investment and employment?
3. What lessons can be used in Portugal from offshore energy clusters in other
European countries?
In order to answer to these questions the research is divided into nine main
chapters:
The first chapter is introductory and describes the necessity of this research;
the second chapter, named Geographical Space and Clusters focuses on the
geographical space and the clusters; the third chapter, named Maritime Economy
and Clusters, discusses the maritime economy and maritime clusters; the fourth
chapter, named Maritime Energy focuses on maritime energy, comprising the
definition of energy, renewable energy and offshore energy; the chapter five,
named Maritime Energy in the EU and Portugal focus on the maritime energy in
EU and Portugal. The European energy policy as well as the renewable energy
evolution in Europe and Portugal offshore energy investments is discussed; the
chapter six, named A Geographical Analysis of the Portuguese Offshore Coast
analyses why offshore energy production is influenced by the continental shelf,
wind and wave features; the chapter seven, named The Input Output matrix
focuses on a theoretical model where the input-output matrix is presented along
with its importance on this research based on an analytical analysis and the
usefulness of the IO matrix, as well as advantages and limitations; the chapter
eight, named The Offshore Energy Cluster in Portugal. An Economic and
Geographical analysis presents the methodology and the results from the
electronic questionnaire to the potential stakeholders and the IO matrix; the
chapter nine presents the conclusions of the research. The conclusions about the
cluster are presented, and recommendations are given for further research.

22

23
CHAPTER 2– GEOGRAPHICAL SPACE AND CLUSTERS
"The concept of clustering has become a central concept for analyzing the performance of nations, industries and firms"
Langen (2002:209)
The second chapter focuses on the relation between geographical space and clusters. Concepts such as competitive advantages, geographical location are important because they explain the success of a cluster in the territory. On the other hand, organisation, space, territory and Knowlodge are discussed in order to analyse factors which comprise the cluster concept. The importance of geographical concentration in clusters and in the Porter Diamond Model (qualitative analysis in this research) is discussed.

24
2.1. THE CLUSTER ORGANISATION AND COMPETITIVE ADVANTAGE
“A economia redescobre a importância do Espaço e da Geografia que poderão trazer à economia o realismo e a capacidade de intervenção necessária à resolução dos problemas do mundo contemporâneo”
Pontes and Salvador (2002:283)
2.1.1. Competitive and Comparative Advantage
Since the 18th century, economists have been studying the relationship
between organisations and production factors (work and land) as a means to survive in
the market. Awareness about commercial trade is the beginning of comparative
advantages, where goods and services are produced at a lower opportunity cost.
Competitive advantage is the conditions that allow a company or a country to
produce a good or a service at a lower price. These conditions allow productive
capacity to generate more sales or at a higher margin than its competition. The
classical theory of comparative advantage is based on the premise that there is only
one productive factor (work) (Adam Smith, Robert Torrens, David Ricardo and Stuart
Mill) (Salvador, 1993:15).
The main distinguishing feature of international trade singled out by Ricardo
(1817: 134) was the international immobility of factors of production. Factors were
regarded as perfectly mobile within countries and completely immobile between
countries, whereas goods were perfectly mobile within and between countries (at zero
transport costs). Ricardo rather glossed over the question of the interdependence of
industries, treating them as integrated, producing one output and using one primary
input (labour). The latter being internally mobile, the unit cost of each good was
constant, depending only on the amount of labour required to produce it (Chipman, J.
S., 1965:479).
However, it is important to note that this theory does not apply to individuals’
welfare or how benefits are distributed by countries.
25
According to Salvador (1993:42), the classic theory of comparative advantages
presents some limitations but offers a good explication about commercial earnings and
specialized international mechanisms. It was the first theory to demonstrate the
disadvantages of protectionism.
The authors Heckscher (1919) and Ohlin (1933) were the founders of the
Neoclassical Theory. The model set up by the authors considers the production
function equal between countries. The different levels of productivity are because of
different endowments of factors. The Heckscher-Ohlin-Samuelson (HOS) theorem says
that a country will export goods where the production factors are used intensively and
import goods where scarce production factors are used (Salvador, 1993:43).
2.1.2 Geographical Location and Competitive Advantage
“To my mind, however, the most important reason to look again at economic geography is the intellectual and empirical laboratory that is provided”
Krugman, P. (1990: 8)
Geographical location determines the distribution of economic activity
(Fernandes et al., 2016) as in the theories of distribution of agriculture location
(JHVonThünen), industry (A. Weber) and services (W. Christaller and A. Lösch).
Favourable geographical location can promote innovation and economic
development through product specialization (Audretsch and Feldman, 1996; OCDE,
2005).
There are attractive factors for business implementation, such as employment,
capital, technology and human resources in a geographic place. Moreover, Van
Thünen. J. (1826), Weber, A. (1909), Perroux, A. (1950), Lösch, A. (1954) and
Christaller, W. (1966) studied industrial location based on transportation and
production costs.
Later, industrial concentration, transport and production factors were
associated with information, collaboration between companies, human resources
specialization and business cooperation.

26
Krugman (1992) related industrial agglomerations to demand interaction,
increasing marginal incomes and lower transport costs, moving towards a divergent
regional cumulative process, where organizations find externalities. Malmberg and
Markell (2007) consider geographic location as a crucial factor for innovation and
knowledge.
Companies desire to locate near a larger market, and, workers’ desire to have
access to goods and services. For this reason, companies settle where they can achieve
competitiveness and cooperation. For this reason, companies will settle in a particular
geographical location if there is an economic and social environment that favours
cooperation, social benefits and competitiveness.
Therefore, geographical location is a key factor for defining companies
strategies. Geographical location is sustainable if related to the availability of human
capital, regarding the most favourable "place" for their installations.
Santos and Delazari (2011) argue that it is possible to establish a relationship
between the resources available in a particular geographical location and competitive
advantage.
Table 1– Competitive Implications in Geographical Location
The resources are Possessed by the
organization Valuable Rare Hard to
imitate Hard to
substitute Competitive implications
No --- --- --- --- Competitive disadvantages (CD)
Yes No --- --- --- Competitive disadvantages (CD)
Yes Yes No --- --- Temporary competitive parity (TCP)
Yes Yes Yes No --- Temporary competitive advantage (TCA)
Yes Yes Yes Yes No Competitive parity (CP)
Yes Yes Yes Yes Yes Sustainable competitive advantage (SCA)
Source: Santos and Delazari (2011:106)
Geographical location is a determinant factor for a competitive process where
organizations take into account the resources available. Factors such as resources,

27
skills, market and dynamic capabilities determine competitive advantages for a
particular location.
An organization is more competitive if there are resources available for its
activity, but it is also more competitive if there is availability of innovation, knowledge,
and synergy exchanges. Therefore, a competitive advantage is a relationship between
external and internal factors, industry structures and market processes towards a
market strategy, which operates within a region.
Table 2– Explanatory Theories in Competitive Advantage
Competitive advantage can be explained by external factors (markets, industry structure)
Structural Industry Analysis
(Industrial organization: SCP1
model, positioning analysis)
Market Process
(Hayek– Austrian School, Schumpeter)
Competitive advantage is explained by specific factors
internal to the firm
Resource Skills
(Resources Theory) Capabilities and Dynamics
(Dynamic Capabilities Theory)
Static Industry Structure: Balance and Structure
Market Process
Source: Vasconcelos and Cyrino (2000:23)
From the organisations perspective, it is of interest to be in the market with
product differentiation with cost advantages, complemented with size and positive
financial resources in order to move towards industrial attractiveness and competitive
advantage.
Moreover, the market is also related to an organization's capacity to deal with
external agents, like clients and suppliers. The dynamic theory (Harrod, 1939)
addressed competitive advantage based on the relationship between consumers and
others related with internal analysis and market processes within organizations. For
this reason, it is important to cooperate with other organisations in the same market
share. This cooperation results in new products, new production processes, new
markets, high profits, intellectual property and employment.
1SCP model (structure-conduct-performance). Mason, E.(1939) and Bain, J. (1972)argue that
organizations' economic performance is the direct result of their competitive behaviour in terms of pricing and costs and this behaviour depends on the economic structure in which firms are embedded (Vasconcelos and Cyrino, 2000).
28
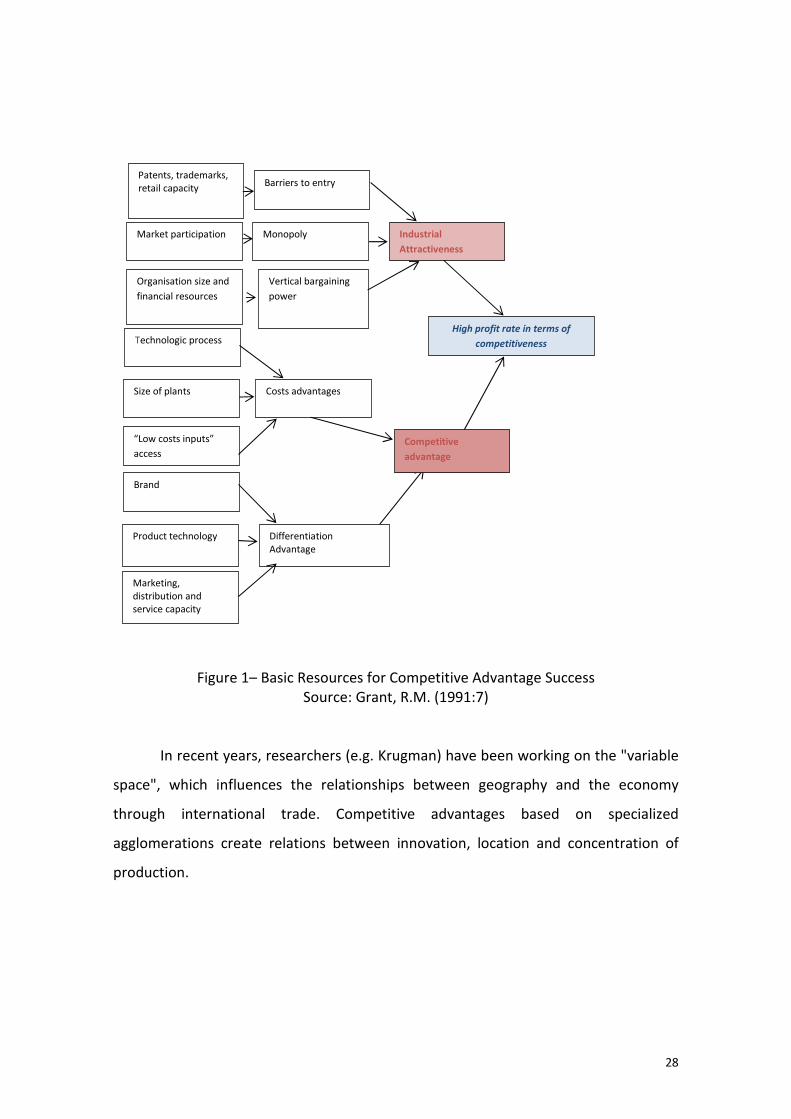
Figure 1– Basic Resources for Competitive Advantage Success Source: Grant, R.M. (1991:7)
In recent years, researchers (e.g. Krugman) have been working on the "variable
space", which influences the relationships between geography and the economy
through international trade. Competitive advantages based on specialized
agglomerations create relations between innovation, location and concentration of
production.
High profit rate in terms of
competitiveness
Product technology
Marketing, distribution and service capacity
Differentiation Advantage
Technologic process
Size of plants
“Low costs inputs”
access
Brand
Costs advantages
Competitive
advantage
Patents, trademarks, retail capacity
Market participation
Organisation size and
financial resources
Barriers to entry
Vertical bargaining
power
Monopoly Industrial
Attractiveness

29
2.1.3 The Organization Concept
Organization and scientific knowledge are linked to practical tasks due to a
specific goal via technology (Galbraith, 1985).Porter (1985) argues that an organization
is a set of activities performed to design, produce, deliver and support its products
through collaboration and cooperation with other organizations in order to keep
competitive. In a more traditional meaning, an organization uses primary factors,
scarce goods and services in order to transform them into other goods and services:
this information is the production.
The organization is an economic operator, which uses production factors
(inputs) to produce an output (Sousa, 1987: 93).An organization produces goods and
services geared to the value added creation which maximizes its usefulness.
Chiavenato (1987) argues that an organisation can use resources efficiently,
yielding the best results. Organizational models can be rational or natural.
A rational model implies that the organization aims to achieve targets and
predefined objectives (theories: Taylor’s scientific management, Taylor’s classical
theory, Weber’s bureaucracy theory).
The model describes the organization as a set of interdependent variable parts
that together form a whole: each part contributes something and gets something from
the whole, which in turn is interdependent on a wider environment. It is an open
system, and presents expected uncertainty and unpredictability (Modern Management
Theory grounded in system theory).

30
Table 3– Organisation Typology
Authors Organization typology
Stanley Udy (1959) Economic production organizations – organizations whose main function is economic andthat can develop other objectives according to the environment in which they operate (production and distribution companies, products and services); political organisations– organisations that aim to allocate forces in society(NGOs); integrative organizations – related to the adjustment of conflicts and thedirection motivation to fulfil certain social expectations (hospitals with the integration of services related to the social need for certain medical care); standard maintenance organisations – organisations whose main function is cultural oreducational(churches and schools).
Blau and Scott (1962) Mutual benefit associations – the main beneficiaries are the organization's members themselves (cooperatives, associations, unions, etc.); Commercial interest organizations – the owners or shareholders are the main beneficiaries(private companies and public limited companies); service organizations –where the customer group is the main beneficiary (hospitals, universities, schools, religious organizations and social agencies); state organizations – where the beneficiary is the public ingeneral (legal institutions);
Etzioni (1967) Coercive organizations –power is imposed by force or by checks based on premiums or punishments; utility organizations– organizations where power is concentrated in central economic incentives; normative organizations–where power is concentrated in the consensus on goals andorganization methods;
Pugh, d. S., Hickson, d.
J., Hinings, c. R., &
Turner, c. (1968)
Total bureaucracy –authority concentration, strong structuring of activities alongside a high degree of dependence, low integration of technology in the workflow, standard procedures for the selection and promotion of staff and formal functions; the “source” of total bureaucracy is the same as above, but to a less marked degree; workflow bureaucracy – highly structured activities, combined with little emphasis on other structural factors; bureaucracy work – flows spring with the same characteristics as the previous one, but to a less marked degree; bureaucracy pre-flow job – little activity structuring; implicitly structured organisation – low-structured activities; bureaucracy staff – little activity structuring and high line control, high concentration of authority.

31
2.1.4 Space, Territory and Knowledge
"A geografia, assim como a economia espacial e a ciência regional, tem na localização das atividades económicas e na articulação entre os diferentes lugares dois dos seus temas principais"
Castillo and Frederico (2010: 461)
The space precedes the territory (Saquet and Sposito, 2009) and the territory is
the object of study of many disciplines and the subject of many policies (Dentinho,
2012).
Knowledge is the binding factor in relationships between individuals and
organisations.
Knowledge and its integration are the basis for local development in a region.
Therefore, knowledge is the basis on which individuals and organizations interact with
economic development and sustainability. It is the key to maximizing the relationship
between performance, people and procedures for decision analysis within
organizations; i.e. the dynamic leads to a research connection between knowledge,
information, and technology in a geographic space.
Haesbaert (2004: 87) defines territory as one of the main concepts that seeks
to answer the problem of society and its relationship with space. An organization
occupies territory in order to maximize its use. In this perspective, space and territory
are involved in individual's utility functions in a particular place. Therefore, indexing
the problem of business location, maximized utility is obtained when there is a low
cost of implementation, through a relationship of three factors: location, territory and
transmission of knowledge.
Utility is also determined when variables like investment, specialized work or
natural resources can relate space and location (Raffestin, 1984; Saquet, 2005; Sack
1983; Saquet and Sposito, 2009: 82).
The relationship that individuals establish in the territory is completed when
territorial governance establishes cooperation between agents (Saquet and Sposito,
2009).

32
In the territory there are physical, political, economic and symbolic dimensions
(Lages et al., 2004:27), and these are related with territory dimension (size) and three
main areas of activity (Lages et. al., 2004: 45):
a) The innovative environments “milieux innovateurs” –a concept developed in
the 1980s, which relates the environment as a set of material (organizations and
infrastructures), immaterial (knowledge) and institutional elements (legislation) that
make up a network of relationships directed towards innovation (Proulx, 1994;
Camagni and Capello, 2002; Moulaert and Sekia, 2003; Amara et al., 2005).
b) The production and innovative system–a concept developed in the 1990s by
Freeman (1982), Lundvall (1990), and Nelson (1993). From this perspective, innovation
is a systemic and an interactive phenomenon involving various factors such as
businesses, which establish links between the production, dissemination and use of
knowledge.
c) The new industrial space – Storper (1997b: 20) assumes that: "an activity is
totally" territorialized "when their economic viability is rooted in assets (including
practices and relationships) that are not available in many other places and that
cannot be easily or quickly created or imitated in places that do not have the same".
These assets range from work and technologies to the capacity for interaction and
relationships. Scott (1988:74) envisions the new industrial space as the “outcome of a
twofold process involving a tendency for modern, flexible production systems to avoid
older centres of accumulation, combined with a location dynamic implosion resulting
from increasing levels of externalization”.
Territorial dynamics are also based on spatial planning, regarding goals, means,
processes, methods, setting and monitoring and strategic evaluation (Ferrão, 2014:41,
42) and the positive impact on regions is measured by the linkages between territory
and organization (Lages et al., 2004:65).
However, activities have greater performance when they are in the same
geographic area, with innovative activities, or technological districts (Cowan el al.,
2001:181).

33
2.2 REGIONAL DEVELOPMENT
"We have become acutely aware in recent years of the existence of a ‘regional’ problem– the problem, that is, of different regions growing at uneven rates; with some regions developing relatively fast and others tending to be left behind”
Kaldor (1970:337)
Local and regional development has become an increasingly important activity
for national as well as local and regional governments across the world since the 1960s
and 1970s (Pikeet al., 2006: 3). Clearly, regional development has also become a
problem for many economies, and one which organizations, people and policy makers
are confronted with.
The economic, social, environmental and political factors relationships within a
region are the main factors for the study of regional development and its positive or
negative effects.
The phenomena which arise from the regional development can be conceptual
or operational. The conceptual applies for the variable space (homogeneity of
variances), regional interdependence (interactions between the socioeconomic system
and the environment) and multidisciplinary approaches (interdependence between
system elements), whereas operational regional development considers a scale of
values adopted by society (Lopes, 1987).
Stimson et al. (2006:241) discussed regional development which influences the
development of industrial clusters. Regional development is a list of new values
(Gaspar, 1996) which identify a region based on the development of sustainable
spaces.
Regionalism deals with economic growth within regions towards creation,
improvement and value capture (Coe et al., 2004: 469,470).
Regional development and the regional innovation system (RIS) are connected.
RIS allows a set of key factors to be identified, which contribute to understanding the
innovation and economic growth considering the innovation system or the cluster
process (Ramos, 2005:49). RIS allows the dynamics between SME and local
environment to be quantified to settle objectively the local determinants of innovation
in these firms (Fernandes, 2004:13).

34
The problems which arise from regional development have to be analysed
through business opportunities, goods and services exportation, labour specialization,
entrepreneurship and small business growth (Lopes, 1987: 22).
Regional planning leads to an economic development area, through regional
development strategies (Pike et al., 2006). Its importance valorizes objectives for each
economic activity and competitiveness advantage through employment and
sustainable growth via business environments and strategies. Strategies in regions can
end up in new development areas with more performance and competitiveness
(Stimson et al., 2006: 256).
The importance of studying regional indicators arises from the fact that they
are a measure that allows us to confirm economic, social or political phenomena. Cobb
and Risford (1998) and Quivy and Campenhoudbt (1997) define the indicator as a
study of a variable related to social, economic, environmental and political issues,
which can be measured or not. From measurability, we can find qualitative and
quantitative indicators, which allow the political objective quantification of
technological process performance, or check if goals are achieved or pursued (Mourão,
2006: 80) (e.g. European Energy Policy 2020).
Mourão (2006:80) and Fernandes et al (2016:253) explain that indicators
analyse relevant information. Mourão (2006: 80) defines the indicator as"um indicador
persegue os propósitos de clarificar e definir objectivos, guiar tendências presentes e
futuras respeitantes a objectivos e valores, avaliar programas específicos, revelar
progressos, medir mudanças em condições específicas ou ao longo do tempo,
determinar o impacto de programas e formular propostas alternativas relacionadas
com o processo de prossecução de objectivos". The indicators explain relevant
information qualitatively or quantitatively with eight criteria: policy applicability,
specificity, validity, relevance, sensitivity, measurability, comprehensiveness and cost
efficiency. The importance of these criteria allows policies to be set up according to the
region. Also, these characteristics (axiom of anonymity, axiom of progressive transfers,

35
bounds, decomposability), will also help us to understand why empirical results could
differ depending on the index applied (Palan, N., 2010: 8).
The use of indicators allows us to present reliable conclusions about the
evolution of certain variables (e.g. employment and investments), solutions regarding
the region and regional policy implementation.
On the other hand, regional indicators can identify historical context problems,
understand the situation in the region, and support decision-making for social and
investment policies.
The qualitative and qualitative variables can be measured according to a small
number of methods.
In this particular work, we point out the benefits of using specialization index
(SI) (A) and location quotients (LQ) (B).
For Salvador (1993), one of the most frequently used indicators to measure the
degree of specialization in the economy is the SI. For Cabral and Sousa (2001:5) the
outcome from SI enables “characterizing the region's economy in terms of greater or
lesser specialization in its production structure compared to the standard".
There are two types of SI:
- Absolute specialization (A.1)( this describes a country’s absolute specialization.
A country would be considered specialized if a small number of industries exhibit high
shares of the overall employment of the country);
- Heterogeneity indices (A.2) (this focuses on the deviation of a country’s
industry structure from the average industry structure of the reference group of
countries) (Palan, N., 2010: 6).
According to the same author,
The absolute specialization indices (A.1) are:
1. The Hirschman- Herfindahl Index (HHI) – much used in industrial economics
to measure market concentration and to investigate the existence of an oligopoly or
cartel. It is also used as a measure of economic diversity and for macroeconomic
specialization analyses; 2. The Shannon Entropy Index (SEI) – used in the research of
income distribution; 3. The Ogive Index (OI) – used to study specialization when there

36
isequal distribution of employment across all sectors as an explicit benchmark for
maximum dispersion; 4. the Diversification Index (DI) – used to study the employment
shares of each industry of country n and then sort them in ascending order according
to their size; itdoes not, however, compare the shares of each industry by pairs, but
only compares the degree of specialization; 5. the Absolute Gini Index (AGI)( a measure
of income equality and heterogeneity of economic structures. It has not yet been
applied as an absolute measure in the field of specialization).
The heterogeneity indices (A.2) are:
1. The Krugman Specialization Index (KSI) –it is the standard index among the
specialization measures. Basically, it is the standard error of industry shares, i.e. it
calculates the share of employment which would have to be relocated to achieve an
industry structure equivalent to the average structure of the reference group; 2. the
Index of Inequality in Productive Structure (IP) –this is the variance of employment
shares; it is similar's to Krugman’s Specialization Index, but by adding up the squared
deviations of employment shares, it gives more weight to large deviations; 3. The
Relative Gini Index (RGI) –this is a common index in many fields of economics, with
many applications also in the context of industry structure and specialization; 4. The
Theil Index (TI) –this has been implemented for analyses of specialization and
concentration.
The benefits of using these methods for estimating specialization are related to
the capacity of product innovations, new forms of organization or new skills which are
arrived at in interactive processes within industrial systems. This means studying new
forms of agglomeration, where there is related economic activity recreated as a result
of an increasing demand for rapid knowledge transfer between firms (Malmberg and
Maskell, 1997:25). From another point of view, the industry measurement from SI,
whether frominter-industry specialization or trade, reflects the conventional forces of
comparative advantage accompanied by intra-industry specialization, which reflects
economies of scale and consumers' taste for a diversity of products (Krugman,
1981:959).

37
B– The location quotient (LQ). The LQ can be defined as a measure of the
relative importance of a certain industry sector or commodity in a region, or more
significantly, the use of location quotients in estimating regional economic impacts
(Isserman, 1977: 33).The measurements which occur in the regions related to
economic impacts are the results of heterogeneity in the regions. Therefore, the
location quotient is the measurement of a variable (e. g. employment, investment)
when compared with the sector in the same region and the total of regions in a
territory (QL= (eij/ei)/ej/E) (Salvador, 1993:106).The benefit of using the LQ for
measuring regional economic impacts is the possibility of comparison variables from
different regions. Therefore, it is possible to draw conclusions about the
concentration, disparities, equilibrium or imbalance in the region when compared with
other regions.

38
2.3. CLUSTER: CONCEPT AND THEORY
“Although the phenomenon of clusters in one form or another has been recognized and explored in a range of literatures, clusters cannot be understood independent of a broader theory of competition and competitive strategy in a global economy”
Porter (2000:16)
2.3.1 The Role of Geographical Concentration
There is no clear definition of a cluster; authors have similar definitions,
connected to a situation of geographic concentration. Brown (2000:4) points out that,
there is no cluster theory per se but rather a broad range of theories and ideas that
constitute the logic of clusters.
The cluster is a major concept in present-day society, and reflects relationships
between organizations in the market outlook.
Barsoumian et al. (2011:90) presented a theoretical foundation about local
industrial concentrations which are linked with the agglomeration economies
(Marshall, 1920), external location economies (Hoover, 1948) and cluster theory
(Porter, 1990).
Alfred Marshall (1890) and Perroux (1950) point out that geographic
concentration is associated with an industrial development sector (Simões, 2013),
where specialization and knowledge are very important transfer (Alfred Marshall,
1890).
The evolution of these geographical concentrations can be presented taking in
account territorial models:
• During the 19th the first territorial model came out – industrial districts
with homogeneity of local institutions. The features are: a) territory of
mainly small and medium enterprises, spatially concentrated and
specialized by sector; b) a strong, relatively homogenous, cultural and
social background, linking the economic agents and creating a common
and widely accepted behavioural code, sometimes explicit but often

39
implicit; c) an intense set of backward, forward, horizontal and labour
linkages, based on market and non-market exchanges of goods,
services, information and people; d) a network of public and private
local institutions supporting the economic agents in the clusters
(Armstrong and Taylor, 2000:293).
• The second territorial model presented by Porter during the 80's
indicates s the factors which comprises the industry rivalry, such as,
bargaining power from the suppliers, threats of new Entrants, threats
of Substitutes and bargaining power of Buyers ( Porter, 1980);
• The third territorial model arose during the 90s (regional innovation and
learning regions). The features are: a) close networking between
different firms and the many other private and public sector
organizations promoting technology; b) free movement within the local
labour market of persons with specialized scientific and management
expertise; c) the spinoff of new SMEs from existing firms, higher
education institutions and governmental research institutions
(Armstrong and Taylor, 2000:298);
• The New Industrial Spaces Theory, considered as the fourth territorial
models; clusters are considered as a “residual” from this third type
because they do not have any affinity with the regional economy (Ferro,
2014:13). This means that there are linkages with other regions in order
to develop business, innovation and knowledge. The regional cluster is
residual because their relationships with others are strongly related to
the agglomeration economies.
Few assumptions are made of industrial districts. Industrial districts are
industrial concentrations where a specialization in tasks and competitive advantages
are identified.
Brown (2000:15) expounds industrial districts as: a highly geographically
concentrated group of companies that ‘either work directly or indirectly, for the same
end market, share values and knowledge so it is important that they define a cultural
environment, and are specifically linked to one another, in a complex mix of

40
competition and cooperation between firms, a result of a close intertwining of
economic, social and community relations’.
Ferreira (2012:61) argues that “industrial districts” are the perfect osmosis
between the local community and organizations. Garafoli (1994) cited by Ferreira
(2012:59) analyses industrial districts according to small organizations’ importance
within an endogenous development.
Industrial districts can pass through a possible development process from
“areas of productive specialization” via “local productive systems” to “systems areas”
as the most advanced forms (Asheim, 1996:383).
The importance of industrial districts as a mature cluster (Keller, 2008:40)
enacts cooperation (vertical or horizontal) between organizations and local economic
agents, which contributes to local production, innovation capacity and sectorial
business association.
The study of industrial districts and their goals toward better performance in a
geographic place is a strategy for alternative models where existing activities are
sustained or transformed.
Table 4– Productive Systems: Relationships between Organization and Exterior
Industrial Districts
(Marshall and
Becatinni);
Local production
systems (Garafoli)
Interpersonal networks, informal circulation of information; direct
knowledge as a confidence factor; through the socio-cultural as
accumulated culture; importance of mechanisms for collective learning;
transfer of human resources; productive specialization a division of
optical sectorial work; productive fabric functionally atomized; significant
horizontal competition; importance of adaptation strategy market
developments (demand response); open in graw material and/or final
product to exterior market;
Loca
lizat
ion
eco
no
my
System-areas
Territorial
Complexes
(Leborgne and
Lipietz);
Innovative Means
(Aydalot)
Strong circulation information;geographical proximity as a favourable
personal factor of contact direct for strategic decisions; intensity of
relations around production (institutions, education, training,
investigation, public administration); intra-sectorial jobs; integration,
functional flexibility (horizontal/vertical): relative stability of customers
and suppliers, subcontracting specialty, use of qualified services and
diverse support; importance of innovative strategies.
Agg
lom
erat
ion
eco
no
my
Source: Fernandes (2004: 56)

41
2.3.2 The Porter "Diamond Model"
The basic cluster model was presented by Porter (1990). Maxoulis et al. (2007),
Zhao et al. (2011), Dögl et al. (2012), and Monteiro et al. (2013) are some of the many
authors that use this model.
Porter’s Diamond Model is used to estimate the relationships within the
internal variables (factor conditions, demand conditions, related support industries,
firms' strategies, structure and rivalry) and external variables (chance, government)
towards industry competitiveness.
Porter (1990: 77) argues that internal factors of competitive advantage are:
1- Factor conditions: the region position in the factors of production, such as
skilled labour or infrastructures, is necessary to compete in a given industry; the
competitiveness in the market is also related to information that generates more data
as a company performs its activities, as organizations collect and capture information
that was lost and necessary (Porter, 1980:152). Therefore, information can be the key
factor for stimulating the relationship within market factors, as described by Porter's
Diamond Model (1990), since the information is the connection between activities in
the market.
2- Demand conditions: demand for industry’s product or service; home-market
or international;
3- Related and supporting industries: the presence in the region of supply
industries and other related activities;
4- Firms strategy, structure and rivalry: the conditions of cooperation and
competition between companies. External factors, such as government policies
(positively or negatively by their intervention in politics, economy, and chance (events
or occurrences that are outside of the control of the firms, industries or even
governments) (Aghdaie et al., 2012:133).

42
Figure 2– Porter Diamond Model Source: Porter (2000:20)
The interest of studying Porter’s model relates to companies. Success is a game
where companies play within the market, and as such "compete" in a dynamic process,
where there are strategies towards competitive advantages.
Therefore, this dynamic process can be analysed using Porter’s Diamond
Model. According to Porter (2000:18), clusters represent a new way of thinking about
local economies and enhance competitiveness. Porter's Diamond Model can show the
linkages between those and present solutions for cooperation and competitiveness in
the long run.
This means more coordination and mutual improvement in areas of common
concern with less risk of distorting competition or limiting the intensity of rivalry
(Porter, 2000:20). Therefore, the Diamond Model demonstrates cooperation and
competitiveness' linkages within market conditions, and promotes the organisation’s
position among others in the market.

43
The objective is to obtain success in the market with a relative gaining position.
Competitive advantage is related to lower cost than rivals, or the ability to
differentiate and command a premium price that exceeds the extra costs of doing so
(Porter, 1991:101).
The organisation performance in the market is divided into opportunities and
values and barriers.
Table 5– Market Barriers
Low High
Low Low returns Worst case
High Best case High returns, but
risky
Source: Porter (1980:37)
The organization challenge is to be part of the market as long as the market
needs. Since 1980, Porter has presented a number of models where the organization's
position in the market is analysed, taking into account external or internal factors. As
such, its importance reveals the capacity of organizations in the market towards a
better performance and utility.
The study presented by Porter (1998) indicates the typology of Portuguese
Regional clusters. According to the author, Portuguese exporting clusters tend to be
more natural resource and labour intensive; this means that the industries’ typologies
are directly linked with the regional products (e.g. wine, horticulture) where intensive
labour constitutes an important factor.
A number of points have to be discussed about Portuguese Regional clusters:
Firstly, the clusters location in the region, which is directly related to natural
conditions and resources;
Secondly, local engagement, which is related to the capacity of the companies,
suppliers, institutions to create the potential for economic value; about this matter the
Exit Barriers
Entry
Barriers
investments made in industries in recent years
stakeholders the capacity to create economic value;
Thirdly, upgrading the clusters, which means upgrad
processes to be more competitive; most Portuguese companies from the cluster have
benefited from new industrial manufacturing process
funds;
Fourthly, working collectively, the Portuguese clusters are not yet fully
organised by associations, although, governmental institutions, such as IEFP
important role in training and research programs in the companies.
Figure
2 The Institute of Employment and Professional Training
n industries in recent years have given the local companies and
stakeholders the capacity to create economic value;
, upgrading the clusters, which means upgrading
to be more competitive; most Portuguese companies from the cluster have
benefited from new industrial manufacturing processes from the use of European
, working collectively, the Portuguese clusters are not yet fully
ions, although, governmental institutions, such as IEFP
important role in training and research programs in the companies.
Figure 3– Mapping Portugal's Clusters Source: Porter (1998:87)
he Institute of Employment and Professional Training
44
the local companies and
new industrial
to be more competitive; most Portuguese companies from the cluster have
from the use of European
, working collectively, the Portuguese clusters are not yet fully
ions, although, governmental institutions, such as IEFP,2 have an

45
The Diamond Model by Porter (1990) applies more technology, human
expertise and the use of natural resources with less direct and indirect costs, moving
towards competitiveness. Porter’s Diamond Model is considered by several authors as
a good model to study competitiveness in the energy sector (Maxoulis, C. N. et al.,
2007; Zhao et al.,2011; Dögl et al., 2012:193).
Table 6–Operationalization of Porter’s Diamond Model for the Renewable Energy Industry
Determinants Contents Causal Variables Proxy Variable
Factor conditions
Solar resource potential, generation costs and on-grid power price, programs and projects, and technology
Natural resources; Scientists, Infrastructure
&innovation
Available potential of renewable energy resources; Quality of math and science Education; Renewable energy infrastructure; Patent applications field under the PCT for renewable technologies;
Demand Condictions
Overall market, installed capacity, and on-grid PV systems
Market size &growth; R&D investments &sophistication
Currently installed capacity in MW Market growth (% p.a.);New investment by region; Education index;
Related and supporting
industries
Industry rules, and industry competitions
Related &supporting firms; R&D investments
Share of medium & high-tech value added in total manufacturing; Gross domestic expenditure on
R&D;
Firm strategy, structure
and rivalry
PV cell manufacturing, and grid construction industry
Competition in home product market; M&A innovative drive
Competition intensity; - Corporate M&A by country of Target Capacity of innovation;
Government and culture
Legislation, policies, financial incentives, and taxation
Government support; Impact of national culture
Financial support systems and environmental regulations; Hofstede: Values for “Masculinity”and “Uncertainty Avoidance”
Change
Industry advantages, and industry challenges
Source: Dögl et al. (2012:197); Zhao et al (2011:4970)
Porter’s model comprises a number of stages in accordance with the regional
development and cluster performance. This means that clusters and their position in
the geographic space and the relationships with others organisations, government
policies and the consumers are the basis for this evaluation. Therefore, the four stages
presented comprise these relationships. The Diamond Model is one of them and

comprises the stages where there are factors which influence the cluster
implementation and development in the region.
Figure
Phase 4 -Value-based competition
(PORTER, M.; TEISBERG, E. Redefining
Creating value-based competition on results.
Business School Press, 2006).
Phase 3- Diamond Model
(PORTER, M. The Competitive Advantage of
York: The Free Press, 1990.)
Phase 2- Value Chain
(PORTER, M. Competitive advantage: Creating and
sustaining superior performance. New York: The Free 1985.)
Phase 1- Competitive advantage by positioning
(PORTER, M. Competitive Strategy: Techniques for
analyzing industries and competitors. New York: The
Free Press, 1980)
where there are factors which influence the cluster
implementation and development in the region.
Figure 4– Porter’s Competitiveness Models
based competition
Redefining health care:
based competition on results. Boston: Harvard
dvantage of Nations. New
Competitive advantage: Creating and
. New York: The Free Press,
Competitive advantage by positioning
echniques for
. New York: The
46
where there are factors which influence the cluster

47
2.3.3 The Evolution of the Cluster
The development of cities, information and regions gave industrial districts a
new concept based on a hub-and-spoke industrial district, revolving around one or
more dominant, externally oriented firms; a satellite platform, an assemblage of
unconnected branch plants embedded in external organization links; and the state-
anchored district, focused on one or more public-sector institutions (Markusen,
2017:177).
Audretsch and Feldaman (1996:257) found that the propensity of innovative
activity to cluster geographically tends to be greater in industries where new economic
knowledge plays a more important role.
However, we should point out that: “Industries which are undergoing rapid
change and innovation and which produce specialty products tend to cluster together
because of the need for specialized resources, particularly skilled labour, not available
elsewhere” (Browne,1980:6, quoted in Audretsch and Feldaman,1996:265). For this
reason, industrial districts tend to evolve towards innovation clusters, where there is
knowledge in product and services.
Figure 5– Industrial Districts vs. Innovation Clusters
Source: Fernandes (2004:59)

48
The cluster concept is the sum of several authors and concepts (Arancegui,
2003:16):
“economic innovation: innovation system; national, sector and technological systems", "economic organization – transaction costs, organization and resources theory", "economic geography– industrial districts" and "leading economy – new trade theory, new growth theory, location theory and regional growth and convergence".
The cluster is an important element in economic development (Menzel and
Fornahl, 2009; Broekel, 2015; Porter, 2000).
In regional industrial clusters there are relationships, leaderships and
infrastructures, networking, marketing intelligence and capacity building, and the use
of endowed resources is maximized.
Therefore, regional economic performance is a sum of identifying industry
clusters, examining changing markets, assessing supplier adequacy and identifying the
foundations for each industry (Stimson et al., 2006:247). The clusters depend on
geographic location, either horizontally or vertically (Ianca and Batrinca, 2010).
Nowadays, the cluster concept is adopted by several organizations (OECD,
2005). Clusters reveal the interaction between sectors; therefore their importance
reflects a territory with the same economic characteristics and complementary
services (technologies, skills, information, marketing, customer needs in organizations
and industries) (Porter, 2000:18).
Porter (1990) argues that the advantages of the cluster approach is based on
location and interaction factors. These factors promote economic advantages and
linkages between companies, associated services in organizations (universities,
organizations or trade associations) towards competitiveness and cooperation (Porter,
2000; OECD, 2005). Porter (1996: 85) stressed the definition of the cluster as a group
of industries connected by specialization buyer-supplier relationships as related by
technology or skills.
The cluster establishes development strategies in a particular activity sector,
associated with increasingly specialized services. Clusters can be recognized by their
geographic concentration, both horizontal and vertical (Ianka and Batrinca, 2010);
clusters can be urban, regional or local (Iammarino and McCann, 2006), considering
geographical location, synergies and collaboration of institutions (Porter, 2000).
49
Clusters are identified with industries’ location in a region (Ianca and Batrinca,
2010; McDonald et al., 2007), dependency factors on natural resources (e.g. wind,
water), tacit knowledge (codified knowledge towards spatial proximity on innovation,
inter-firm collaboration and firm performance (Titze et al, 2011:91)), research and
development.
The attractiveness from various domains constitutes an industry or a group of
business areas (Ketels et al., 2013). These authors identify three pillars for cluster
organization: attractiveness; innovation and R&D; and business development, which
determine its success in terms of technological innovation.
The study of clusters and their location reveals a capacity to connect with other
sectors, essential for creating competitive advantages for development strategies, and
for specialization of quality sectors/services.
Asheim (1996:7) emphasizes that Porter’s cluster is basically an economic
concept, indicating that "industries are usually linked through vertical (buyer/supplier)
or horizontal (common customers, technology, channels, etc.) relationships".
Clusters also are related to smart specialization, 3knowledge and innovation
(European Commission, 2016:13). From the European perspective, the European
Cluster Observatory, European Enterprise Network and Key Technology Infrastructures
(European Commission, 2016:41), tried to bring together European Member States and
regions in designing smart specialization and cluster strategies to assist companies in
developing new, globally competitive advantages in emerging industries (European
Commission, 2015:1). Clusters play an important role as catalysts for structural change,
new industrial value chains and emerging industries, through a favourable
environment facilitating entrepreneurship and cross-sectorial collaboration (market
intelligence, matchmaking, project development, technology transfer and innovation
vouchers) (European Commission, 2014:4,11).
3Smart specialization is based on a set of strategies, such as: supporting investment on key
vertical/regional priorities/challenges and needs for knowledge-based development; building up
strengths, competitive advantages and potential for excellence; supporting innovation and stimulating
private sector investments; the set of stakeholders involved and encouraging all forms of innovation and
experimentation; monitoring and evaluation systems (European Commission, 2016:13).

50
Benito et al. (2003:203) stress: “Research has time and again shown that
dynamic industrial and local clusters are important for the creation of economic value
and, ultimately, for the prosperity of nations and the well-being of their citizens”
“Clustering” means a process where companies collaborate with each other to
identify market failures. The clustering initiatives serve to streamline existing clusters
of horizontal or vertical products.
The concept which arises from the word clustering is associated with marketing
intelligence. This means using several tools to identify future collaboration spaces
(European Commission, 2014: 13). Market intelligence is key to the successful
anticipation of a new business opportunity– both in regard to developing new markets
for already existing products and services and to developing products and services to
be sold in markets that are just emerging due to the new needs of society and industry
(European Commission, 2014: 12).
Figure 6– From Roadmapping to Cluster-to-Cluster Collaboration
Source: European Commission (2014, 13)
According to Fowcs-Williams, I.F.O.R. (2000:9) the clustering process should
present various aspects: people and contact between them; consensus among
participants; cluster actors at various levels; the connection between private and
sustainable content generation in
independet "sub-
networks"
Initiation of cross -network cooperation; promotion of
"open Innovations"; strengthening bondswith
strategic network organisation from other sectors
trend scountig, technology roadmapping, forecast processes; market analysis; multidimensional
strategy development
Consolidation of
diversification measures
Initial activities
Knowledge creation
Intelligent diversification of the
network and its organisation

51
public sector; government acts as the main promoter through neutral participants; and
cluster needs and benefits through “wish-lists”.
The clustering process is dynamic and involves internal and external actors.
However, it depends on particular features present in a region, namely, specialized
human resources, tacit knowledge or transmission of partial knowledge among
multiple cluster members, infrastructures, communication and support services for
information and communication technologies, business activity, and intervention at
the regional level through national or supranational organizations (Cowan et al., 2001).
Menzel and Fornahl (2009) present cluster dynamics according to several
stages, based on the growth strategy in various sectors and competitiveness, job
creation, wealth, economic and social cohesion and efficiency across borders, with the
aim of more equality between regions and industrial reorganization (Faustino, 2013).
The cluster cycle reflects an evolution (Broekel et al., 2015); its development
promotes activities in the region (Ianca and Batrinca, 2010) and R&D organizations not
available elsewhere (Audretsch and Feldman, 1996).
The environment where the cluster is embedded is the key factor for studying
its dynamics and impacts on consumer demand for goods and services and on market
regulations.
It is essential to strengthen the ability to create innovative ideas and creative
capital gains, transforming ideas into concrete and sustainable realities through ideas
exchange networking, providing delivery platforms through an efficient industrial
sector, and finally, creating market needs in a particular geographical location.
The dynamics between the cluster and its environment promotes the
development of various stages of growth and satisfies targeted regional needs related
to local economic growth (OECD, 2005).
According to Ketels ( 2005:2) clusters and competitiveness are conceptual
frameworks used to analyse the differences in economic performance across locations.
Cluster typology is identified with a number of aspects:
• Geographic location: connected organizations and institutions working
in the same industry and with the same branch location. Organizations
establish a causal relationship among themselves on the basis of natural

52
resources, equipment, demand, or other factors that incite a particular sector’s
development (Santos and Varvakis, 1999);
• Horizontal form:when organisations produce the same
products/services with cooperation (Keller, 2008);
• Vertical or lateral form: heterogenic and complementary specialised
organisations which produce in time through a value chain (Piekarske and
Torkomian, 2005);
• By sectors: arrangements (or systems) production (as sets of economic
activities that enable competitiveness) as agglomorates (clusters) of certain
sectors, which present a labour divisionbetween actors and coordination
(horizontally or vertically) (Crocco et al., 2006).
OECD (2005) argues that the methodology used to define cluster typology is not
always considered rational because the industrial concentration of a particular
industry is not always a cluster.
It is considered a failure of geographical identification if the cluster benefits do
not identify the regional actors’ involvement.
For Piekarski and Torkomian (2005), it is possible to relate clusters with their
performance analysis at the macro, medium industrial and micro business level.
Therefore, it is possible to determine the level and actors’ influence in geographical
space.
The key characteristics of clusters that influence the design evaluation include
(European Commission (b), 2016:43):
1. The type of cluster: e.g. industrial cluster, research-driven cluster, launched
through a government policy or without public intervention, mature or emerging
cluster;
2. Geographic scope: e.g. regional, cross-regional (within one country),
transnational (in macro regions), international;
3. Thematic/industrial scope: e.g. narrowly defined cluster, sectoral focus,
cross-sectorial or thematic focus; contribution to societal challenges;

53
4. Type of public intervention: e.g. supporting networking, channelling research
and innovation funding through clusters, conducting training activities, supporting the
internationalisation of SMEs, providing support to infrastructure.
As Rocha and Sternberg (2005: 267) argue: “Both clusters and
entrepreneurship are highly visible among academics and policy makers given that
similar historical conditions explain their resurgence and supposed impact on
employment would justify their economic importance”.
Entrepreneurship is a complex process which stimulates business creation,
while the cluster still involves industry agglomeration factors. The cluster is directly
related with interaction between organizations (public sector, companies, universities,
citizens and NGOs). The relationships that are established inside a cluster can be:
bottom-up planning – the cluster is formed from companies and their networks
towards efficiency in arrangements and organization (Porter, 2000).
Rocha and Sternberg (2005) argue that the relationship between clusters and
entrepreneurship is based on the connection between new organizations and product
or service supply towards economy of scale and an open market.
The planning process is the way by which clusters can be voluntarily
established. Intrinsically, clusters allow complementary relationships between
organizations, beginning with regional entrepreneurship planning. The planning
process is consistent with decision-making from the organisation. This means that in
the short run the organisation takes decisions for the near future, such as: (a) how to
approach the planning problem; (b) what knowledge bears on the problem; (c) what
kinds of actions to try to plan; (d) what specific actions to plan; and (e) how to allocate
cognitive resources during planning (Trochim, 1989:1).
Cluster planning is based on four steps, related to performance in the market,
capacity to deal with other organizations, and planning to go forward for the next step.
This means that the cluster is dynamic with capacity for growth both in specialized
products and the market itself.
Nevertheless, the planning process in the cluster is dynamic and goes through
all stages to improve its capacity to be in the market and cooperate for better
management decisions.

54
Figure 7– The Cluster Life Style Source: Menzel and Fornahl (2009:229).
Clusters make market mechanisms more efficient for entrepreneurship than an
industrial agglomeration because they establish complementary relationships with
other sectors and create externalities from competitive advantages. These benefits are
related to collective efficiency (Schmitz, 1992; Canie and Romijn, 2003): efficiency is
related to production factors within an economy, independently of the development
stage and cultural pattern (Rossetti, 1997:191).

55
Cluster potentiality and its impact on the economy relays on modern cluster
policies that interact with smart specialization strategies across regions within an
international value chain and emerging industries (European Commission (b),
2016:53).
The cluster’s value is smart specialization. There are direct linkages between
smart specialization, cluster development, entrepreneurship ecosystems, new
workspaces and business related facilities, and attraction of investment and
knowledge (Rivas, M., 2016:18). The challenge is to face a new concept of clusters
when there is innovation and knowledge.
This means studying the relationships between organisations based on value
chains, externalities, innovation, collaboration and knowledge, when there is a cluster
policy orientated towards impulsion and local stakeholder coordination and animation.
The interesting thing about the cluster is to observe how it is implemented and
how it will survive based on the cluster's policy. The argument to study cluster policy is
related to the decision-making process taken by companies as to their location and
differences in success across locations (European Commission (b), 2016: 17).
Cluster policy arises from the fact that the cluster will survive if there are no
market failures; this means that the market has offered benefits in terms of
effectiveness. The fact is that the cluster policy can play an important role in changing
a linear economy to a circular economy. Changing attitudes and valuing natural
resources is the biggest step for economies. A circular economy provides a framework
to face challenges and a guide for rethinking and redesigning the future.
Therefore, in the global economy, the challenge is to prove the benefits of
belonging to a circular economy and natural innovation system.
Cluster policy also helps change business models and value chains when there
are positive externalities from industries which constitute the cluster. Therefore, the
European policy programme works towards new design, strategies and instruments for
competitiveness and supporting mature clusters and developing emerging industries.

56
From the business perspective, cluster policy focuses on economic
development based on specialization, innovation and internationalization. The cluster
policy is based on three topics: analysis, strategy and action (European Commission
(b), 2016: 25).
Cluster policy analysis consists of developing new strategies for more
competitiveness, i.e., the choices to be made as to the ambition and value proposition
that the location aspires to pursue. The local economy plays an important role for
cluster policy analysis, when considering the dynamics and that is is subject to
different sets of business environments (European Commission (b), 2016: 27).
Cluster policy supports a cross-sectorial collaboration on marketing intelligence
(identifying opportunities in other industries), matchmaking (finding partners in other
industrial sectors), project development (translating market intelligence and match
marketing into cross-sectorial innovation), technology transfer (spreading capacity and
knowledge), innovation vouchers (channelling funding through a cluster organisation)
(European Commission, 2014:11; European Commission (b), 2016: 35), e.g., the
international cleantech network (ICN) (www.internationalcleantechnetwork. com);
regional meta clusters (www.multicluster.pl); European strategic cluster partnership
(www.clustercollaboration.eu/escps).

57
Table 7– Dos and Don’ts of Modern Cluster Policy
Don’ts Dos
Support individual specialised firms Support new activities, in particular those being
undertaken by groups or networks of related
industries
Create clusters from scratch (i.e. implementing
'wishful thinking' of policy makers)
Facilitate the growth of clusters by building upon
existing strengths (i.e implementing evidence-
based policy by building upon a comparative
analysis of regional strengths and 'entrepreneurial
discovery')
Fund large numbers of widely varied clusters Fund strategic cluster initiatives that focus on
promoting the strengths, linkages and emerging
competences and which are in line with the aims
of national/regional smart specialization
strategies
Follow growth trends without reflection Capitalize upon regional competences to diversity
into new activity areas and to develop emerging
industries
Follow a narrow sectorial approach Follow a systematic cluster approach focusing on
related industries by capturing cross-sectoral
linkages
Develop and implement cluster policy in isolation
from other policy areas
Adopt an inclusive and participatory cluster
approach (i.e. involving business, investors,
academics and policy makers, and making links
related to policy themes such as R&D, innovation,
entrepreneurship, access to finance, SME
internationalization, etc.)
Support cluster initiatives that are only inward
looking
Support cluster initiatives that have an
international perspective on the position of the
cluster in international value chains
Focus exclusively on strengthening regional
partnerships
Build regional partnerships as a basic for joining
European Strategic Cluster Partnership
Source: European Commission (b) (2016: 23)

58

59
CHAPTER 3 – MARITIME ECONOMY AND CLUSTERS
“O Mar - Portugal é um desígnio nacional cujo potencial será concretizado pela valorização económica, social e ambiental do oceano e das zonas costeiras, para benefício de todos os Portugueses”
Governo de Portugal (2013:7)
The third chapter, Maritime Economy and Clusters, discusses the maritime economy
and maritime clusters. The importance of this chapter consists of providing concepts
related to the development of the ocean economy, namely emerging industries, in
which offshore wind and wave are included. The concept of maritime strategy,
including maritime projects and clusters, clusters typology and European ocean
projects are presented. Additionally, the recent analyses of the Portuguese maritime
economy are discussed.

60
3.1 MARITIME ECONOMY
"Ó mar salgado, quanto do teu sal São lágrimas de Portugal!
Por te cruzarmos, quantas mães choraram, Quantos filhos em vão rezaram!
Quantas noivas ficaram por casar Para que fosses nosso, ó mar!
Valeu a pena? Tudo vale a pena Se a alma não é pequena.
Quem quer passar além do Bojador Tem que passar além da dor.
Deus ao mar o perigo e o abismo deu, Mas nele é que espelhou o céu. “
Mar Portuguez, Fernando Pessoa (1888-1935)
OECD (2016:21-23) defines maritime economy as: “all the sectorial and cross-
sectorial economic activities related to the ocean, sea and coast. This includes the
closest direct and indirect supporting activities necessary for the functioning of these
economic sectors, which can be located anywhere, including in landlocked countries”.
The concept of ocean economy presented by Park et al. (2014) cited in OECD
(2016:21) refers to "economic activities that take place in the ocean, receive outputs
from the ocean, and provide goods and services to the ocean".
The marine economy is related both to emerging ocean industries and
established ocean-based industries.
Table 8– Ocean-Based Industries
ESTABLISHED OCEAN-BASED INDUSTRIES EMERGING OCEAN-BASED INDUSTRIES Industrial capture fisheries Industrial seafood processing Shipping Port activities Shipbuilding Offshore oil and gas (shallow water) Marine manufacturing and construction Maritime and coastal tourism Marine business and services Marine R&D and education Dredging
Industrial marine aquaculture Deep and ultra-deep water oil and gas Offshore wind energy Ocean renewable energy Marine and seabed mining Marine safety and surveillance Marine biotechnology High-tech marine products and services Others
Source: Jolly, C. (2016: 8)

61
The concept of maritime economy is also related to investments made in each
maritime sector. The relationship between them is the capacity to be involved in the
market creating flows of services and products. Ocean-based industries need to invest
capital and generate financial flow, while the marine ecosystem has natural capital
assets, and does not operate directly in the market.
Table 9– The Concept of Ocean Economy
Source: Jolly (2016: 7)
As Jolly (2016) describes the ocean economy deals with ocean-based industries
and marine ecosystems.
Stopford (2009:49) considers that the maritime economy includes vessel
operations, shipbuilding, marine resources, marine fisheries and other maritime-
related activities.
European maritime sectors have strong positions in the world (Peeters, 2008:
9).

62
Table 10– European Union Maritime Activities
Source: Salvador et al. (2015: 4)
Figure 8– Ocean Industry value added
Figure 9– Ocean Industry employment
Source: Source: Jolly (2016: 15-16)

63
According to Jolly (2016) and Salvador et al. (2016), it is possible to conclude
that the maritime sector with the greatest impacts on the economy are coastal and
maritime tourism, fisheries, transport and shipbuilding. The tendency for 2030 is to
maintain the same maritime sectors. Additionally, offshore wind energy will have the
most substantial impact on value added in comparison with other maritime sectors.
Employment will follow the same behaviour in maritime sectors.
Jolly (2016) points out the growth of ocean industries, where modest growth is
related to capture fisheries, offshore oil and gas extraction in deep water; high long-
term growth is related to shipping, shipbuilding, offshore wind, marine aquaculture,
tourism, surveillance and safety; long-term potential but not yet on a commercial scale
is associated with ocean renewable energy, marine biotechnology, deep-sea mining,
carbon capture and storage.
At the European level, policy focuses on ensuring a strong competitive position
in the world. In this respect, the European Commission develops measures to improve
competitiveness and innovation under its policies for industry, transport innovation,
shipbuilding and regional development research. National maritime policies are in line
with European trends and policies. National maritime policies in general focus on
stimulation of R&D increasing the intake of personnel and improvement of education,
the promotion of the maritime cluster and the implementation of the State Aid
Guidelines on Maritime Transport (Peeters, 2008: 14).
Maritime sectors comprise activities linked to the sea: the link between
activities and the sea may be explained by the use of marine resources, marine areas
or by the vicinity of these areas. The relationship between the activities and the sea
can be more or less direct and maritime sectors cannot be seen as a single sector
activity within the NACE classification but rather as a set of activities (Salvador et al.,
2015: 3)
Simões (2013:96) identifies the maritime economy with these main sectors:
fisheries and aquaculture, preparation and storage of fish, crustaceans and molluscs,
shipbuilding, ship repair, transport by water, auxiliary transport activities by water

64
(maritime ports) and activities of recreational boating and marinas. The sea economy
tries to study consumption and production of goods and services related to economic
activities, both directly and indirectly from the sea (INE,4 2014:1). According to the
Portuguese Satellite Account for the Sea (SAS, 2016) the Portuguese maritime
economy includes the following sectors:
1- Fisheries, aquaculture, processing, wholesale and retail of its products;
2- Non-living marine resources;
3- Ports, transports and logistics;
4- Recreation, sports, culture and tourism;
5- Shipbuilding, maintenance and repair;
6- Maritime equipment;
7- Infrastructure and maritime works;
8- Maritime services; and
9- New uses and resources of the ocean (unconventional energy resources–
gas hydrates; marine renewable; gas storage).
Concern in grew uses and resources, Statistics Portugal (2015) measured
a classification of these activities (fig. 10).
4Statistics of Portugal

65
Figure 10– New uses and resources of the ocean value chain5 Source: Statistics Portugal (2015:16)
Marine renewable (e.g. energy) are considered a resource where there are
linkages with the ocean value chain. Therefore, ocean energy is considered an
important industry because it supports a connection between upstream and
51–Satellite account for the sea activity (or not); 2– connection activity upstream, activity centered on
value chain; 3– transversal services;4– central activity based on value chain
Energetic function
G7- maritime
infrastructure
G5- floating
platforms
Nonconventionalener
geticresources
G6- maritime
infrastructure(transport
and energy distribution)
G3- Vessels
foroperation
andmaintenance
Gasstorage
Maritime
renewable energies
G6- underwater rubotic (drilling
and underwater
surveys)
Energetic function
G7–maritime
infrastructure (1)
G5–floating
platformsinfrastr
ucture(1)
Non conventional
energetic resources
(4)
G6–maritime infrastructure
(transport and energy
distribution) (1)
G3– Vessels for
operation and
maintenance (1)
Gasstorage (4)
Maritime
renewable energies
(4)
G6–underwater
robotic
(1)(drilling and
underwater
Energetic function
G6– underwater
robotic (1)
G1 –fishing and aquaculture by-
products (1)
Maritime
biotechnology (4)
Health and wellness,
biomaterials,food,
environment function
Transversal service: consulting service and engineer activities; R&D; Education/training – G 8 (3)
Connection
upstream
Central
activities
Connection
downstream

66
downstream services and improves business opportunities. Marine energy can also be
considered an important resource in the Atlantic area.
As Lima (2016:63) puts it "Nunca como hoje a bacia atlântica foi capaz de cruzar
uma variedade tão interessante e tão rica em recursos, tecnologia, transporte,
inovação e economia, catapultando a região para a primeira linha geopolítica da
energia global".
3.2 MARITIME CLUSTERS
“Maritime clusters can derive benefit from knowledge sharing and knowledge transfer from research, encouraging joint innovation exercises (e.g. product development), ensuring availability of know-how (e.g.joint training programs) or innovative organisation methods covering a group of enterprises (e.g.common procurement or distribution)”
Wijnolst (2006: 16)
The Green Book about Maritime Europe published in 2006 is the first step to a
global maritime strategy for the sea (Salvador, 2010).
The maritime activities development and coordination are based on Regulation
(EC) No 1255/2011 from 30th November 2011. The European Integrated Maritime
Policy (IMP) has enabled European economies to rethink maritime clusters as the best
form of organization and promotion of its maritime business activities. Therefore, the
cluster concept can be associated with sea business (Salvador, 2014) and its benefits,
(cooperation and collaboration within the cluster) may be related to the concept of
maritime cluster (Shinohara, 2010).
According to Cluster (2012:382), the maritime industry is a large and globally
interconnected entity, in which it often makes little sense, to analyse national markets
individually, as they are most often interrelated, due to commerce, transport and
exchange of goods, as well as trade in general being a bilateral agreement.

67
Figure 11– Maritime clusters of the world Source: Otsub, S. (2016:3)
The marine cluster project was launched by the Marche Region in October 2004
with the goal of establishing a new, technically specialised yacht and shipbuilding
system in Ancona.
According with OCDE (2010:7) the Marche region is one of the most
industrialized regions in Italy and is considered a region of excellence, not only for its
economic performance, but also for its cultural, natural and social richness. Marche
belongs to what has come to be called the “Third Italy”: a model of development based
on small and medium - sized enterprises (SMEs) located in industrial districts. Its
economy is driven by the performance of a myriad of SMEs, which have been
characterized by a high level of creativity and innovation in the past. Despite sound
economic framework conditions, the Marche's industrial policy makers and
stakeholders recognize the need for an important planning exercise, with the aim of
implementing policies to strengthen the Marche region's entrepreneurship and small
business performance and move towards an economic structure which, on one hand,
recognizes and builds on the strong manufacturing tradition of the region but, on the
other, is able to compete in the modern globalised arena with a renovated, dynamic,
technology - based and green - oriented industrial system.
.

68
The initiative promoted a system of goods and services related to navigation,
namely shipbuilding, pleasure craft, accessories and infrastructures for tourism and
commerce and horizontally connected to the other main regional sectors with the aim
of further integrating the different clusters (Cooke, 2011:31).
By definition, all maritime cluster organizations capture more than one
maritime sector. Maritime cluster organizations represent almost every traditional
maritime sector– although in practice this does not (yet) always seems the case–
except the sectors that only answer a broader definition of maritime sectors, such as
the Navy and coastguard, inland navigation and maritime works. The fisheries and
coastal (and marine) tourism and recreation sectors are sometimes represented by the
national cluster organization, although less frequently than the traditional maritime
sectors (Peeters, 2008: 14).
Benito et al. (2003) argue that studies on maritime cluster or others are mainly
related to the relationships between ports, the shipping industry or services from the
shipbuilding industry.
Salvador et al. (2016:26) argue that Michel Porter´s model can be applied to the
marine sector, as the Norwegian maritime cluster presents the majority of
characteristics that one can find in large industrial groups, including strong inter-
sectorial linkages, economic diversity and competitive rivalry.
Cooke (2011:31) presents maritime clusters as relationships between
competences, entrepreneurship and experiences, both inter- and intra-industries. This
means that the marine cluster is related with organizations and services which
comprise the relationships between the intra- and inter- sectors. In particular, Cooke
(2011) identifies those sectors which have more impact (direct or indirect) on the
marine economy. From Cook’s (2011) point of view, the engines and propulsion
systems, tourism, services and manufacture constitute indirect impacts on the marine
cluster; the other services are the direct impact.

69
Figure 12– Schematic Maritime Cluster in Marche region Source: Cooke (2011:31)
Salvador (2015) argues that European maritime clusters can be national or
regional and top-down (Germany), bottom-up (Norway) or mixed (Netherlands).
There are different approaches to developing maritime cluster organisation.
This initiative can be taken top-down– resulting in government induced organisations –
or induced by leader firms and/or sector associations (bottom-up) (Peeters, C., 2008:
14).
Figure 13– Classification of Maritime Cluster Organisation (top-down vs bottom -up) Source: Peeters, C. (2008: 15)

70
However, according to Viederyte (2013: 624), Europe has an important
maritime industry with a strong position in many sectors, which depends on needs,
stakeholders’ cooperation and coordination.
Figure 14– Dynamic European Maritime Clusters Source: Wijnolst (2006:8)
Wijnolst (2006) identifies the relationship between different levels of clusters
(regions, Member State, European Union, international organisation); these
relationships are based on similar sectors and activities, such as transport, resources,
public sector, other services, research, and leisure and tourism. The dynamic between
them came from the interaction between their activities from different clusters. The
positive aspect is the complementary activity and cooperation of goods and services
between all levels of clusters.
Maritime cluster organisations exist at different geographical levels, focusing
on an international and/or European, national, regional (incl. cross-border) or local
level. Policy (initiatives) and actions are consequently translated to European national
and regional levels, although not in a uniform manner (Peeters, 2008: 15).
Transport
Resources
Public sector
Other services
Research
Leisure and
tourism
Regions
Member
States
European
Union
International
Organisations

71
Figure 15– Differences between similarities of national and regional maritime clusters organisation
Source: Peeters (2008: 16)
Few authors have analysed the maritime cluster through SWOT analysis
(Peeters, 2008; Viederyte, 2013). A SWOT analysis of maritime cluster organisations
distinguishes the strengths, weaknesses, opportunities and threats of top-down and
bottom-up clusters (Peeters, 2008: 17).
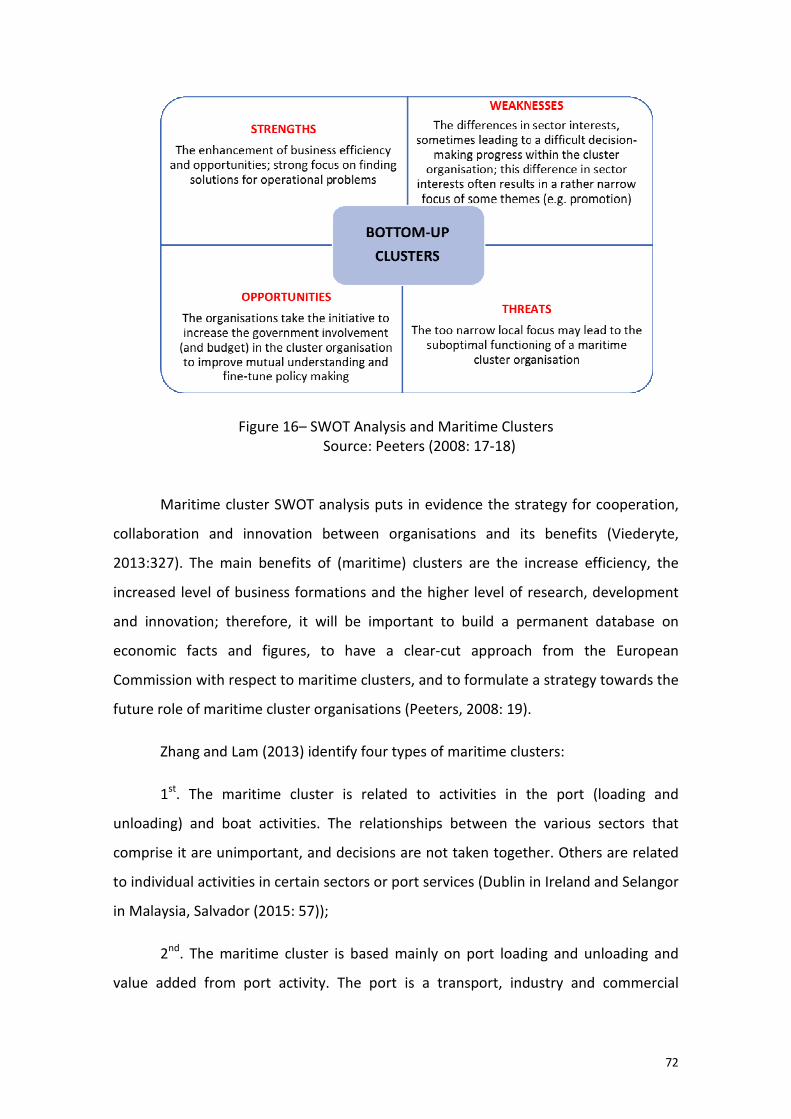
72
Figure 16– SWOT Analysis and Maritime Clusters Source: Peeters (2008: 17-18)
Maritime cluster SWOT analysis puts in evidence the strategy for cooperation,
collaboration and innovation between organisations and its benefits (Viederyte,
2013:327). The main benefits of (maritime) clusters are the increase efficiency, the
increased level of business formations and the higher level of research, development
and innovation; therefore, it will be important to build a permanent database on
economic facts and figures, to have a clear-cut approach from the European
Commission with respect to maritime clusters, and to formulate a strategy towards the
future role of maritime cluster organisations (Peeters, 2008: 19).
Zhang and Lam (2013) identify four types of maritime clusters:
1st. The maritime cluster is related to activities in the port (loading and
unloading) and boat activities. The relationships between the various sectors that
comprise it are unimportant, and decisions are not taken together. Others are related
to individual activities in certain sectors or port services (Dublin in Ireland and Selangor
in Malaysia, Salvador (2015: 57));
2nd. The maritime cluster is based mainly on port loading and unloading and
value added from port activity. The port is a transport, industry and commercial

73
cluster. The direct and indirect cluster activities are related to trade partners and
municipalities (Osaka in Japan and Kaohsiung in Taiwan, Salvador (2015: 57));
3rd. The maritime cluster is related to goods and capital but also to technology
and intangible information. The activity is related to the regional and global scale, and
plays an important role in information distribution, i.e., acting as economic and market
"hub" transactions (Rotterdam in Netherlands, Hong Kong in China, Salvador (2015:
57));
4th. The fourth cluster generation operates on vertical and horizontal terms,
and has a direct relationship to port activities, but also offers services (finance,
insurance, loans) to users who may be geographically distant (London in UK, Salvador
(2015: 57)).
According to Salvador et al. (2015: 8), the most dynamic clusters identified in
the Atlantic area (France, Ireland, Spain, Portugal, UK) are the following:
Table 11– Atlantic Ocean Basin Most Dynamic Clusters
Atlantic Ocean Basin
Cluster Area Activities involved in the cluster area
Status (mature, growing, early development)
Galway/Western Ireland (IRL) Cruise and nautical tourism; renewable; Windfloat areas; aquaculture; deep sea technologies (synergies)
Growing
Scottish West Coast (UK) Offshore wind, marine aquatic resources, fisheries, ocean renewable energy, shipbuilding, blue biotech
Growing
Portuguese Coast (P) Deep and short-sea shipping; coastal, nautical and cruise tourism; offshore gas (south) and oil (north) (oil noted with question mark), marine minerals mining
Growing
Bretagne, Brest (F) Defence, blue biotechnology, shipbuilding fisheries, ocean renewable energy
Mature
Galician Coast (E) Coastal tourism, short-sea shipping, fisheries, offshore renewable energy
Growing
South West England (UK) Marine equipment, yachting, coastal tourism, ocean renewable energy (wave and tidal), fisheries
Growing
Source: Salvador et al. (2015:8)

74
Figure 17– European Maritime Cluster source:http://www.cluster-maritime.fr/en/maritime-economy/10/network-
european-maritime-clusters - consulted on 11/01/2018
Ketels and Protsiv (2014) argue that there are relationships between existing
clusters and emerging industries, like information flux, human resources and
technology, such as Blue Growth Industries.
Ketels (2015) argues that the EU Member States initiatives for increasing
maritime clusters are: shared models between private and public sectors, internal
procedures and cluster external environment performance.
Maritime clusters are related to the connection between external activity
network and internal sustainability conditions through the economy, namely: tourism,
value added services, maritime economy environment and development and cities.
These sectors contribute positively to potential employment, cooperation, networking

75
companies towards competitiveness and collaboration inside maritime cluster (Lópes,
2009:89).
Figure 18– Strategy Sectors Source: Lópes (2009: 72)
Some examples of maritime clusters (Japan, Norway and France) presented are
consistent with the same sectors and the same methodology of production.
Figure 19– Maritime cluster in Japan Source: Otsub (2016:5)
Internal sustainability conditions
External economic activity network

76
Figure 20– Norwegian maritime cluster Source: Skogstad, B.A. (2016: 22)
Figure 21– French maritime cluster Source: http://www.cluster-maritime.fr/en - consulted on 14/01/2018
In Portugal, the modernization process in maritime sectors is long and complex.
The strong dependency on European funds and governmental policy led maritime
sectors to a weak level of competitiveness in comparison to other European countries.
The Portuguese government strategy was to find a key sector, which could compete
with their European partners.
According to Matias (2009:9) the majority of the Portuguese maritime
economic sectors presented negative growing rates in the last three decades. A similar

77
situation occurred in several European countries which however have succeeded in
recovering, mainly through the strengthening of the maritime clusters, as a whole.
The “Cluster do Mar Português/Portuguese Maritime Cluster",6 is promoted
by Fórum Oceano – Associação da Economia do Mar, and was recognised by the
Competitiveness Cluster Strategy by the Ministers of Economy, Maritime, Planning
and Infrastructures, and National Defence. Fórum Oceano is the merger, by
incorporation, of two Portuguese associations Oceano XXI – Association for the
Knowledge and Economy of the Sea (established in 2009) with AFEM – Association
Business Forum of the Sea Economy (established in 2010), which occurred in July 2015.
Its vision is that maritime activities are dynamic and competitive segments of
the economy, enhancing the sea and its resources, generating value, promoting high-
value jobs, and contributing to strengthening Portugal’s position in the global
economy.
Its mission is to strengthen dynamics of strategic cooperation between players;
promote the competitiveness of the main value chains that utilise the sea and marine
resources as the central elements of their activity; contribute, in a sustainable way, to
economic growth and the growth of exports and employment; increase the maritime
economy’s importance to the national economy.
The association has more than 100 members connected to many sectors of the
sea economy, including traditional ones, such as:
- Seafood Conservation, Processing and Commercialization;
- Shipbuilding, repair and maintenance;
- Nautical activities and Marine Tourism;
- Maritime construction;
- Fisheries and Aquaculture;
- Ports, Transport and Logistics;
or complementary areas, such as:
- Maritime Culture; Maritime Defence and Security; Services;
or emerging ones, such as:
6http://www.forumoceano.pt
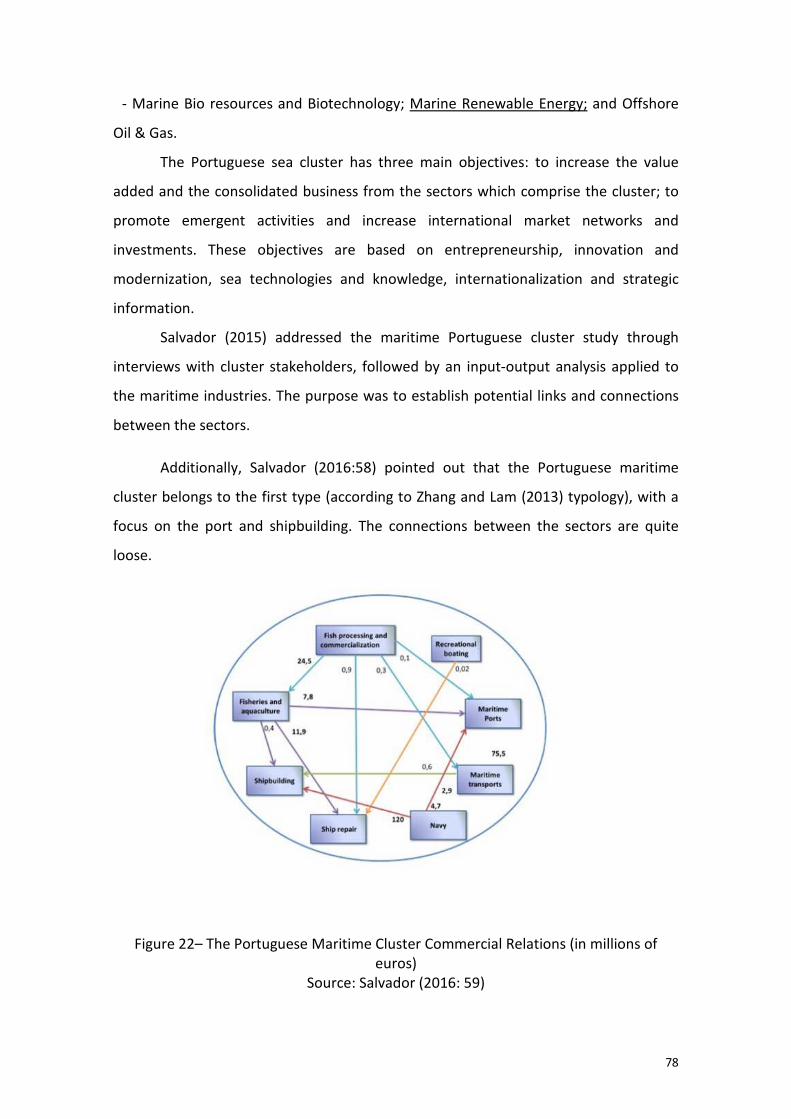
78
- Marine Bio resources and Biotechnology; Marine Renewable Energy; and Offshore
Oil & Gas.
The Portuguese sea cluster has three main objectives: to increase the value
added and the consolidated business from the sectors which comprise the cluster; to
promote emergent activities and increase international market networks and
investments. These objectives are based on entrepreneurship, innovation and
modernization, sea technologies and knowledge, internationalization and strategic
information.
Salvador (2015) addressed the maritime Portuguese cluster study through
interviews with cluster stakeholders, followed by an input-output analysis applied to
the maritime industries. The purpose was to establish potential links and connections
between the sectors.
Additionally, Salvador (2016:58) pointed out that the Portuguese maritime
cluster belongs to the first type (according to Zhang and Lam (2013) typology), with a
focus on the port and shipbuilding. The connections between the sectors are quite
loose.
Figure 22– The Portuguese Maritime Cluster Commercial Relations (in millions of euros)
Source: Salvador (2016: 59)

79
Simões (2013:261) concluded that sectors with strong relationships are:
renewable energy, maritime transport, shipbuilding and repair, maritime tourism,
manufacturing, fishing and aquaculture, ports, maritime teaching and research, fluvial
navigation, marine and maritime research.
The strategy for the Portuguese maritime cluster means developing the
connections between ports, maritime transports and logistics centres.
These are the sectors with more intersectoral connections. Major firms can be
found in them. Logistic infrastructures were already planned or developed during the
last five or six years (Bobadela, Poceirão, Leixões, Sines Pole B, for instance).
Ports, in particular, have a sound financial situation and a good outlook (due to
the growing exports by sea, namely to extra-EU markets). They can also have access to
the Spanish market.
On the other hand, public strategy should also prioritize universities and R&D
centres, as these are also sectors which are largely interconnected with the other
sectors of the cluster, with broad international connections (Salvador, 2016: 58).

80

81
CHAPTER 4 – MARITIME ENERGY
"Nunca como hoje a bacia atlântica foi capaz de cruzar uma variedade tão interessante
e tão rica em recursos, tecnologia, transporte, inovação e economia, catapultando a
região em primeira linha da geopolítica da energia global"
Lima (2016: 63)
The fourth chapter focuses on maritime energy, comprising the definition of energy, renewable energy and offshore energy. The offshore energy cluster and its features are also discussed, according to some authors. Environmental economic impacts are analysed and the European energy policy is presented. The cleantech cluster concept is discussed because of the relationships between renewable energy, maritime clusters and clean cities. In order to prove the dynamic in clusters, the Helix Model, Convas Model and Pentagonal problem is presented. The circular economy is also presented because of its linkages with renewable energy and clusters. As is pointed out, renewable energy is considered in the system as a factor for the minimization of waste and external costs. Furthermore, an offshore energy SWOT analysis is explored.

82
4.1 RENEWABLE AND OFFSHORE ENERGIES
“Of all the forces of nature, I should think the wind contains the greatest amount of power”
Abraham Lincoln
From the Greek “enérgiea”and the Latin“energia” (Grande Dicionário de Língua
Portuguesa, 2004:568) énergie“elleapparraît d’abord en mécanique,où ele signifie
capacité de travail” (Encyclopaedia Universalis, 2002:227) ou, “capacidade de fornecer
trabalho, força física demonstrada” (Dicionário de Língua Portuguesa Contemporânea,
2001:1408).
Castro (2012: 4) identifies “energy” as a set of activities, namely: fuel burning,
charging batteries or running machines. Energy is the technology conversion currency
(Dincer, 2000: 158).
Electric energyis "uma forma de energia facilmente convertível em outras
modalidades de energia (mecânica, luminosa, química) ou, o que resulta da conversão
destas” (Grande Dicionário de Língua Portuguesa, 2004:542), with the purpose of
minimizing costs through primary energy consumption.
To Beels e tal. ( 2007:1) oceans are an enormous source of energy.
Renewable energy means energy from natural resources: “a energia explorada
a partir de fontes naturais como o vento, as marés, o sal e a água e que provém de
fontes inesgotáveis podendo renovar-se” (Grande Dicionário de Língua Portuguesa,
2004:568) e “a força energética obtida de uma fonte cuja matéria-prima não é
eliminada pelo facto de ser transformada” (Dicionário de Língua Portuguesa
Contemporânea, 2001:1408).
Renewable energy comes from non-fossil resources: renewable energy includes
the primary equivalent to hydro (excluding pumped storage) geothermal, solar, wind,
tide and wave. It also includes energy derived from solid biofuels, bio gasoline,
biodiesel, other liquid fuels, biogases and the renewable fraction of municipal waste
(OECD, 2016:106).

83
Renewable energy is a new capacity for energy supply be provided through
technology and specialised human resources.
Renewable energy is fundamental for society and the economy (Kajikawa et al.,
2008:771). Its use became popular from the 70s with the petroleum crises (Castro,
2012 and Pinto, 2013).
Renewable energy usually refers to that energy that does not pollute the
environment and could be recycled in nature (Zhang et al., 2009:440).
The use of renewable energy has several advantages: reduction of fossil fuel
consumption and environmental impacts; greater security of supply and reducing oil
dependence, and disadvantages: production standard control; production and
consumption are not in equal proportion, that is, efficiency losses in the electrical
system, since energy cannot be stored on a large scale (Castro, 2013).
There are a number of types of renewable energy: 1. Eolic (kinetic energy from
moving air masses (wind); 2. Solar (energy from light or sun heating); 3. Aerothermal
(energy stored in the form of heat in the air); 4. Geothermal (energy stored in the form
of heat beneath the solid surface of the Earth); 5) Hydraulic, biomass, landfill gas,
treatment of waste and biogases; 6. Hydrothermal (energy stored in the form of heat
in surface water) and oceanic (Pinto, 2013).
Ocean energy has the potential to play a significant role in the future energy
system, whilst contributing to the reduction of carbon emissions and stimulating
economic growth in coastal and remote areas. Ocean energy has attracted increasing
interest, particularly in the EU, which is currently at the forefront of ocean energy
development (Magagna and Uihlein, 2015:84).
According to Blanco and Rodrigues (2009:2847) the wind energy sector has
grown exponentially since the end of the 1990s, especially within the European Union
(EU), and this has affected the employment levels of the regions involved.
Wind and wave offshore energy are the future of energy supply in Portugal. The
environment policy and the economic impact on Portuguese economy are the main
factors.
The point is to change for a sustainable economy based on renewable energy in
order to decrease the energy dependency towards a green economy. Therefore, the
key challenge of offshore suppliers is to compete with other energy fossil productions.

84
Offshore energy is directly related to expertise employment, technology and direct
investment in electric equipment, dry docks, maritime transport support, engineering
and consultancy studies and expert knowledge.
There are few aspects with which this sector deals in a negative way; the spatial
needs for energy sectors means that the energy and economic infrastructures do not
meet regional needs.
According to the European Commission (2015: 8) exploration, fixed installation,
and decommissioning are the fragile points which countries need to deal with in
environment and use impacts. In order to achieve the targets proposed by the
European Union 2020 programme, every country has to design different strategies to
accomplish the general goal. The development of renewable energy has an
outstanding effect on sustainable economic growth, for the harmonious coexistence of
humans and the environment as well as sustainable development.
Offshore renewable energy faces similar changes in most countries, such as:
location of offshore wind farms, port facilities, underwater cables, operation and
maintenance and decommissioning projects.
On the other hand, environmental impact and spatial competition between
energy and other maritime activities should be analysed. Environmental impacts are
normally related with noise, infrastructure and decommissioning projects, which mean
that the impact on sea species and birds, as well as soil spills should be taken into
account by stakeholders.
Moreover, benefits from the energy sector on the economy (spatial synergies
from wave-tidal-wind; certainty and consistency (certain planning from stakeholders
towards investments in this sector); grid development and grid interconnection within
other sectors; cross-border cooperation in knowledge, skills, development and
experience towards market corridors for regional energy market integration; and data
collection from energy sector) should be analysed.
The objective is to reduce the cost of installation for each type of energy and
guarantee a better performance; in technology, innovation and learning by doing must
be translated into a comprehensive cost-reduction pathway if wave and tidal energy
technologies are to achieve cost competitiveness in commercial markets (Badcock-
Broe, A.,2014:31).
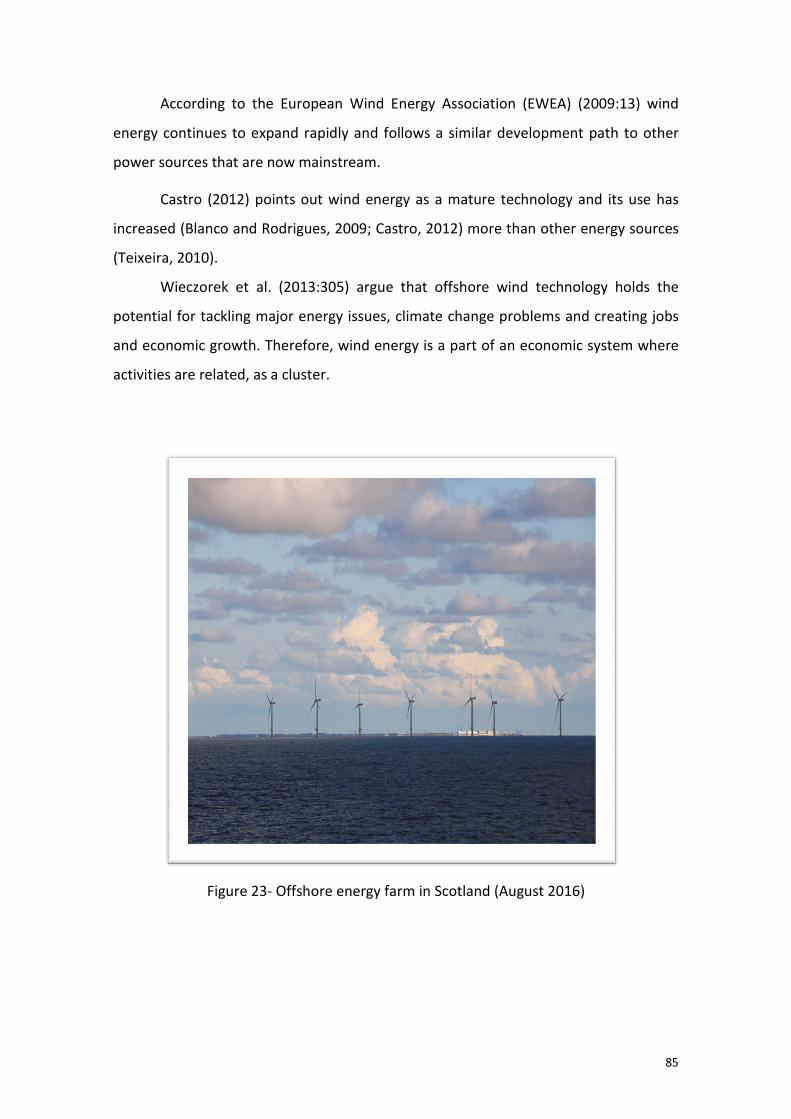
According to the European Wind Energy Association (EWEA) (2009:13)
energy continues to expand rapidly and follows a similar development path to other
power sources that are now mainstream
Castro (2012) points out wind energy as a mature technology and its use has
increased (Blanco and Rodrigues, 2009; Castro, 2012) more than
(Teixeira, 2010).
Wieczorek et al. (2013:305) argue that offshore wind technology holds the
potential for tackling major energy issues, climate change problems and creating jobs
and economic growth. Therefore, wind energy is a part o
activities are related, as a cluster.
Figure 23- Offshore energy farm in Scotland (August 2016)
European Wind Energy Association (EWEA) (2009:13)
continues to expand rapidly and follows a similar development path to other
power sources that are now mainstream.
Castro (2012) points out wind energy as a mature technology and its use has
Rodrigues, 2009; Castro, 2012) more than other energy sources
(2013:305) argue that offshore wind technology holds the
potential for tackling major energy issues, climate change problems and creating jobs
Therefore, wind energy is a part of an economic system where
activities are related, as a cluster.
Offshore energy farm in Scotland (August 2016)
85
European Wind Energy Association (EWEA) (2009:13) wind
continues to expand rapidly and follows a similar development path to other
Castro (2012) points out wind energy as a mature technology and its use has
other energy sources
(2013:305) argue that offshore wind technology holds the
potential for tackling major energy issues, climate change problems and creating jobs
f an economic system where
Offshore energy farm in Scotland (August 2016)

86
Table 12– Offshore Wind Energy Cluster
Authors Sectors
Wieczorek et al.
(2013:300)
Wind motors, ships or other waterborne vessels; equipment for shipping;
separation; dynamo electric machines; machine or engines for liquids; earth or
rock drilling, hydraulic engineering; pipes; joint or fittings for pipes; shaping or
joining of plastics
Sarja (2013: 148)
Mining and quarrying, manufacturing, construction, transportation and
storage, information and communication, real estate activities, professional,
scientific and technical activities, and administrative and support services
activities.
Bolon et al (2007:20)
Collaborative design/R&D facilities; universities, legislators (national, EU,
regional), subcomponent manufacturers, turbine manufactures; supporting
industries (engine, bearing manufactures), wind consultancies; NGOs,
financiers, project developers, wind farm construction& operations
Additionally, positive and negative impacts on environment are considered:
Table 13– Environmental Impacts of Wind Energy Conversion Technologies
Arguments against offshore wind Arguments for offshore wind
Ruins special/historic seascape (Yes)
Kills birds (Yes)
Harms fisheries (No)
Harms marine mammals (No)
Requires subsidies (Yes)
Endangers shipping/navigation (No)
Hurts tourism (No)
Mitigates climate change (Yes)
Decreases water use (Yes)
Improves air quality (Yes)
Reduces foreign fuel dependence (Yes)
Creates jobs (Yes)
Creates electrical price stability (Yes)
Close to population centres (No)
Higher winds offshore (No)
Reduced user conflicts (No)
Source: Snyder and Kaiser (2009: 1569)
To Cruz (2007: 3) Wave energy is reaching a crucial stage, following over three
decades of intensive research and development.
Wave energy belongs to the offshore renewable energy group. Wave energy is
derived from the winds as they blow across the oceans, and this energy transfer
provides a convenient and natural concentration of wind energy in the water near the
free surface. Once created, waves can travel thousands of kilometres with little energy
loss (Clément et al., 2002:407).

Figure
As well as, the offshore wind cluster (
several sectors and belongs to an ec
Inputs to the productivity and costs assessment
Economic assessment
Figure 24- North Sea (August 2017)
offshore wind cluster (previous point), wave energy comprises
several sectors and belongs to an economic system, which forms a cluster.
Table 14– Wave Energy Cluster
Inputs to the productivity and costs assessment Sea characteristics
Vessel characteristics
Device characteristics
Maintenance activity, onshore substations; submarine connectors; onshore cable; submarine cable; assembly; mooring linesequipment; instrumentation and control; hullstructure; bearing line, generic components, motors; dynamic risers;
Source: Teillant et al. (2012:224-225).
87
wave energy comprises
onomic system, which forms a cluster.
onshore substations; submarine connectors; onshore cable; submarine
s; onboard electric equipment; instrumentation and control; hull-structure; bearing line, generic components,

88
There are advantages for using wave energy: it is renewable, it does not
produce any pollution and is less dependent on the coastal conditions.
The disadvantages are: reduced power plants; it requires special geometry of
the coast and with great amplitude waves; it prevents navigation (in most cases); and
the deterioration of materials by exposure to salty sea water.
Additionally, the impacts on the environment are:
Table 15– Environmental Impacts of Wave Energy Conversion Technologies
ENVIRONMENTAL
EFFECTS
SHORELINE NEARSHORE OFFSHORE
Land use/sterilization w
Construction/maintenance sites
w
Recreation w w
Coastal erosion w w-m w-m
Sedimentary flow patterns w w
Navigation hazard w w
Fish & marine biota w w w
Acoustic noise w
Working fluid losses w w
Endangered species w w
Device/mooring damage w-m w-m
source: Clément et al.(2002:409)
w=weak effect; m=medium effect
The environment impacts from wave energy can be divided into three main
areas: shoreline, nearshore, offshore. The shoreline has weak effects overall, while
nearshore and offshore present a similar impact on the environment.
As Yegorov (2014:3) puts it, it is possible to conclude that while renewable
energies represent a remedy, full transition will not be easy. (…) Hence, while
transition to a modest fraction of renewable energies is not a problem, full transition
might be problematic (even technically at present) and practically non-implemented
under a short term horizon when the discussed crises would give clear market signal
for the necessity of such transition.

89
Considering the importance of renewable energies and its impact, maritime
planning and its implication for the economy are considered an important feature for
the future of the maritime sector.
Therefore, maritime spatial planning (MSP) is a transparent and comprehensive
process based on stakeholders’ involvement, the aim of which is to analyse and plan
when human activities take place at sea to support sustainable development and
growth in the maritime sector, applying an ecosystem-based approach (European
Commission, 2015:7).
The importance of MSP is to give an opportunity to all relevant stakeholders to
be involved, whereas marine ecosystems and human activities evolve constantly in
these sectors: environment, fisheries, maritime transport and energy.
Additionally, Member States need to have these requirements: involve
stakeholders, develop cross-border cooperation, apply an ecosystem-based approach,
use the best available data and share information, take into account land-sea
interaction, promote the co-existence of activities and review plans at least every 10
years (European Commission, 2015:7).
MSP allows the benefits derived from Europe's sea to be maximized without
comprising their ability to continue to provide benefits for generations to come
(Badock-Broe, A. et al., 2014:36).
The EU 2030 Framework for Climate and Energy has confirmed its decision to
support marine renewable energy. Clearly, this decision affected the marine
renewable energy plan towards a better use of natural resources, technologies and
human resources. Each renewable energy source requires specific devices, which will
have different spatial features.
Offshore renewable energies comprise spatial needs depending on their
production and location. Therefore, offshore wind energy depends on the location of
offshore wind farms, namely, wind conditions, seabed suitability, the presence of
available infrastructure (e.g. cables) and the instalment of new cables; other factors

90
affecting the location may be the presence of wrecks or other archaeological remains
on the seabed. On the other hand, port facilities are an important part of logistics.
Spatial and infrastructural needs will depend on the vocation of the port.
Moreover, underwater cables are necessary to transfer the energy produced. After the
offshore wind farm is built it is necessary to plan operational and maintenance
activities. The decommissioning phase is critical; the planning process can choose
between two things: re-use the area or replace the turbine (European Commission,
2015:11).
4.2 THE CLEANTECH MODELS
“Further extensive and diachronic analysis of cleantech clusters is however needed to
explore the underlying triggers and drivers for their evolution […] hybridized cleantech
clusters are best seen as heterogeneous assemblies …However, as hybridised
cleantech clustering indicates, more progressive voices and actions that pay attention
to non-market forces, community empowerment, environmental resilience and quality
of life, have not yet been entirely suppressed”
Davies (2013:1293)
According to Pego (2018:321), the word "cleantech" (green) is a new concept of
clean energy, and it is related to transport, recycling &waste, materials, building &
energy efficiency, renewable energy, air, water environment and agriculture & food
sectors. Cleantech is defined as (clean technology) products and services that use
technology to compete for favourable price and performance, while reducing
pollution, waste, and use of natural resources. The main areas involving cleantech are:
renewable energy (Onshore, Offshore Wind, Solar, Geothermal and Bio energy);
clean cities (Green Buildings, Clean Water, Smart Grid, Solid Waste, Clean Road
Transport) and perspectives (Maritime Cleantech, Carbon Storage, Energy Storage).
Additionally, the cleantech capacity involves regions, markets, consumers and
renewable energy as niche activities, which are directly related to regional
development, socio-technical transitions in organizations, coordinated activities, and
institutional involvement. Some institutions have developed cleantech studies (e.g.

91
Cleantech Finland (2014) and Henriksen et. al 2012)) in order to classify methodologies
about renewable energy.
Pego (2018:322) argues that cleantech clusters comprise benefits, such as: the
specialization of regions in activities, higher employment and greater expansion rates,
reducing the cost of production and the cost of exchanging by strengthening trading
relationships, local knowledge spill over, local R&D institutions, business collaboration
and research activities, and strong clusters in the same geographical region.
At the European level, smart grid clusters can be presented which are involved
in the European electricity network towards a sustainable green economy. The
cleantech model based on this premise allows them to: "support the three European
energy policy pillars (security of supply, sustainability and market efficiency) and the
related short term (“20-20-20”) energy policy targets by 2020. These targets translate
into both massive integration of renewable energy sources (RES) into the electricity
system (mainly variable sources such as wind and solar power), and energy efficiency
measures” (EGGI, 2013:3) two types of impacts are expected: "i) optimizing further
capital investment and operational expenditure intensity needed to increase the
network capacity for grid-users; ii) paving the way for a fully decarbonised pan
European electricity system by 2050 (through an extremely large share of renewable
electricity production)" (EEGI, 2013:7).

92
Table 16- Cleantech Industries
Industry Examples
Advanced Materials and Nanotechnology - Non-platinum catalysts for catalytic converters;
- Nano-materials for more efficient and fungible
solar photovoltaic panels;
Agriculture and Nutrition - Innovative plant technologies and modified
crops
designed to reduce reliance on pesticides or
fungicides;
Air Quality - Stationary and mobile emission scrubbers; -
Testing and compliance services;
Consumer Products - Biodegradable plastic ware; - Nontoxic
household cleaners;
Enabling Technologies and Services - Advanced materials research services; - High
throughput screening research equipment;
Energy Generation, Storage, and
Infrastructure
- Solar photovoltaic technology; - Wind power; -
Hydrogen generation; - Batteries and power
management technology;
Environmental Information Technology - Regulatory and policy compliance software; -
Geographic Information Services (GIS);
Manufacturing/Industrial Technologies - Hardware and software to increase
manufacturing productivity and efficiency;
Materials Recovering and Recycling - Chemical recovery and reprocessing in industrial
Manufacturing; - Remanufacturing;
Transportation and Logistics - Fuel cells for cars; - Diesel retrofits equipment; -
Hybrid electric systems for cars, buses, and trucks;
Waste and Water Purification and
Management
- Biological and chemical processes for water and
waste purification; - Fluid flow metering
technology
Source: Burtis et al (2004: 11)
The report presented by Cluster (2012) shows the main sectors which comprise
cleantech and it can be seen that renewable energy either offshore or onshore is one
of these. Renewable energy belongs to the cleantech sector and at same time to the
maritime economy (Chapter 3). The renewable energy cluster is concomitant with
economic and social resource optimization criteria, physical aspects, climate change
and soil features.

93
Figure 25– Cleantech Sectors Source: Cluster (2012:10)
Cleantech capacity involves regions, markets, consumers and renewable energy
as niche activities, which are directly related to regional development, socio-technical
transitions in organizations, coordinated activities, and institutional involvement
(McCauley and Stephens, 2012).
According to Cleantech Finland (2014) cleantech is defined as any product,
service, processes or technology that prevents or decreases the negative impacts on
the environment that the business might cause.
Some institutions have developed cleantech studies (e.g. Cleantech Finland,
2014) and Henriksen et. al 2012)) in order to classify methodologies about renewable
energy. Cleantech clusters comprise benefits, such as: the specialization of regions in
activities, higher employment and greater expansion rates, reducing the cost of
production and the cost of exchanging by strengthening trading relationships, local
knowledge spill over, local R&D institutions, business collaboration and research
activities, as well as strong clusters in the same geographical region (Davies,
2013:1289).

94
Figure 26–Cleantech industry segments
Source: Ragozin (2012:14)
The cleantech industry can be organized through this classification with
thirteen segments where cleantech is used at the moment (Ragozin, 2012:13).
The biggest step towards a world cleantech cluster started in 2009 with the
International Cleantech Network (http://internationalcleantechnetwork.com).
The objective was to perform an exclusive network of cleantech clusters from
the world’s leading cleantech regions with new business opportunities enhancing
competitive advantages and creating value for companies.
The purpose of creating this international collaborative platform between
cleantech clusters is to enhance knowledge between businesses, institutions and local
authorities, and to improve collaboration between the regions in which the cluster is
located to give a competitive edge in the battle for new technologies, talent and
market share (Lämmer et al., 2014:27).

95
Figure 27– Cleantech Barriers
Source: Frankelius et al. (2011:7)
Few institutions developed Cleantech studies (e.g. Cleantech Finland (2014) and
Bisgaard et. al 2012)) in order to classify methodologies about renewable energies.
Cleantech clusters comprise benefits such as: specialization of regions in high
value added activities, higher employment and growth rates, strengthened trading
relationships, local knowledge spill over, local R&D institutions, business collaboration
and research activities, and strong clusters in the same geographical region (Davis,
2013:1289).
The globalization of cleantech industries around the world brings about a new
concept of organizing business methodologies based on cooperation and collaboration
between those intervening (countries). Expertise areas and investment are sectors
with a high impact on the economy; therefore, it is important to set up cleantech
policies to obtain economic and social benefits from their performance.
To summarize, the use of any model in green clusters (green electricity) where
Circular Economy (CE) acts constitute an important issue in the green market, since it
will promote organization competitiveness, maximized consumers utility, and
innovation and collaboration.

96
4.2.1 THE Helix model
The Helix Model (Cleantech Finland, 2014:6) combines five points: customers
needs, enterprise/private sector, coordination of cooperation, education and research
and the public sector.
Figure 28– Business development framework (Helix Model) Source: Cleantech Finland (2014:6)
The model comprises a new methodology to approach five vectors. This
means a new way of implemented a business model where the cooperation and
collaboration between the main actors in the economy act. In the long run, it is
possible to establish a linkage within the sectors towards the intervention of the all
economy. The goal is to develop strategies in order to maximize cooperation between
all sectors in the economy with an innovative business model where market needs,
government, research, and networking are combined. There is a possibility of vertical
interaction between the value chain, a combined of products and services for more
sustainability.

97
4.2.2 The Convas Model
The Convas model is discussed in the chapter about renewable energy clusters
towards business competitiveness.
The Convas Model tries to understand green business models and innovation. It
is based on eleven factors: growth strategy, key partners, key activities, key resources,
value proposition, customer’s relationships, customer segments, cost structures,
revenue streams and comparative strategies (Henriksen et al., 2012, 33).
4.3. THE CIRCULAR ECONOMY AND THE OFFSHORE RENEWABLE ENERGY BUSINESS
MODEL
Innovation constitutes a problem in a modern economy, if related to new
products, such as eco innovation, eco technologies, and new processes for production.
The innovation problem derives from the concept of more sustainability and new
challenges for production (Pego, 2018). The circular economy (CE) refers to the
industrial character of the economy, which becomes self-sustainable through the use
of renewable energy, and there diction of toxic substances and waste (Costea-
Dunarintu, 2016: 150).
The concept of CE (Su et al., 2013; Lieder and Rashid, 2016) is well known for
the transition which allows materials to safely re-enter the biosphere or continue to
circulate as high-quality production resources; the opposite of a linear model where
‘take, make and dispose’ is applied. There are linkages between CE and the business
model. The concept of the business model is based on industrial innovation of future
productivity and competitiveness between organizations. Di Fonzo and Hime (2017:15)
point out some features of business models based on CE, such as decision-making
support for business, measure and value decision-making,regulators, and research
funders.
The CE business model solution can be improved if companies transfer
knowledge from their previous experience based on the relationship with customers,
monetizing idle capacity, having better control of the product life cycle, and creating
stable revenue streams and premiums (MacArthur et al., 2014:47).

98
CE performs four types of resource benefits: improving resource security and
decreasing import dependency; environmental benefits: less environmental impact;
economic benefits: opportunities for economic growth and innovation; and social
benefits: sustainable consumer behaviour and job opportunities (European
Environment Energy (EEA), 2016:13).
The potential gaps to address include: the development of more accurate
metrics i.e. regional rather than global and country level data; improved biodiversity
and soil metrics (through consideration of relevant definitions and ways to report
changes in context); strengthening the linkages between any suggested metrics and
core business processes (Di Fonzo andHime, 2017:23).
On the other hand, the network system and the potential for collaborative
markets constitute the goal for the CE system (MacArthuret al., 2014:39). Further
studies in this field can be based on top-down (legislation and policy, support
infrastructure, social awareness) or bottom-up approaches (collaborative business
models, product design, supply chain and information and communication technology)
(Lieder and Rashid, 2016: 47).
Therefore, the business model based on this methodology is consistent with
sustainable solutions at the product level, and it can be aggregated across businesses
in order to improve their sustainability as well as economic systems.
Moreover, a business strategy based on CE needs to optimize materials and
energy flows inside regions or industrial ecosystems.
This raises a new challenge for resource recovery and tax exemption policy for
companies involved in reverse supply chain activities.
Additionally, the expectation from stakeholders about CE business based on
production, value chain and competitiveness constitute an important vector for social,
environment and resource efficiency in the society.

99
Figure 29– Circular Economy and Green Economy Source: EEA (2016:31)
Action plans and strategic directions are the vectors for the future of CE in
Europe. However, some technical, social, political and economic barriers can be
pointed out: companies are often not aware or do not have the ability or the
knowledge to choose CE solutions; systems, infrastructures, business models and
technology of today can lock the economy into a linear model; investments in
efficiency measures or innovative business models remain insufficient and are
considered risky and complicated; the demand for sustainable products and services
can remain low, especially if they involve changes in behaviour; often, prices reflect
actual costs incurred by the company for the consumption of resources and energy;
the signals of political transition to a circular economy are not strong enough or
consistent (Costea-Dunarintu, 2016:158).
The European Academic Science Advisory Board (EASAB) (2010: 4) points out
some benefits of CE: fostering competitiveness by creating savings and reducing raw
materials and energy dependency; security of supply and control of rising costs;
contributing to EU climate change policy by reducing greenhouse gas emissions;

100
employment opportunities; reducing environmental impact of resource extraction and
waste disposal; opportunities for new businesses by selling goods or offering services.
Consequently, studying offshore energy and its linkages to the CE value chain
and direct or indirect impacts is one of the advantages of studying the relationship
between production and value added on the economy.
A better comparison can be achieved if the values for CE and linear economy or
efficiency, competitiveness, value added and environment impacts are compared.
Energy savings represent an essential component of meeting climate goals, and energy
management is an unparalleled opportunity to enable organizations across all sectors
to achieve ongoing energy consumption reductions.
Accomplishing this goal would enhance economic development at the
organizational, national, and global levels, and would contribute greatly to addressing
urgent global concerns regarding emissions from the use of non-renewable energy
sources and associated climate change impact (Energy Management and Energy
Systems - EMES, 2017:7).
In other words, CE is a concept which involves a set of competencies which are
useful for welfare. This means a network with a number of competencies: system
thinking, goals, strategic and adoption, with external and internal effects, and which
promotes positive externalities in the economy.
Renewable energy is considered in this system as a factor which allows for the
minimization of wastes and external costs. To sum up, the importance of CE in the
business model is related to the capacity of the organization to provide externalities to
the economy. The value-added generated by the symbioses of different sectors in CE
promotes different levels of waste.
In Portugal some organisations are promoting CE in the energy sector. The goal
is to define market strategies to implement the following concepts: refuse, rethink,
reduce, re-use, repair, remanufacture, recycle, recover, repurpose and refurbish. The
goal is to implement a market strategy based on innovation technologies, product
design, revenue models, and institutional change. The strategy implemented by the

101
Portuguese government considered the following ambition for Portugal2050,
mentioned in the Action Plan for the Circular Economy (APCE), and which consists
ofthe following elements: a carbon-neutral economy; knowledge as impulse; inclusive
and resilient economic prosperity; and a flourishing, responsible, dynamic and
inclusive society (Resolução do Conselho de Ministros n.º 190-A/2017). These are
some of the organisations which use CE in Portugal related with energy sector:
COOPERNICO, LIPOR, EDP, BLC3, EDP, VEOLIA, VPS (www.eco.nomia.pt - consulted on
28/07/2018).
4.4 THE IMPACT OF RENEWABLE ENERGY ON ECONOMY
“A “smart grid” is a strategic part of most cleantech activities, and includes construction and real estate developers as well as ICT companies and software providers”
Andersson et. al (2012:30, 31)
Ferreira (2007:V) points out the sustainability and positive impact of renewable
energy through externalities: “Energy decisions play a major role in the achievement of
sustainable development and consequences on the economic, environmental and
social welfare of future generations. Combining energy efficiency with renewable
energy resources constitutes a key strategy for a sustainable future, emphasised in the
European and Portuguese policy guidelines”.

102
Figure 30– The Renewable Sustainability
Source: Ferreira (2007:44)
According to Chien and Hu (2008) the renewable energy impact can be
estimated through an econometric model through GDP (Gross Domestic Product)
increase (GDP= a1I+a2TB+a3C+a4E) + a5RN+E1 where, I=b1RN+b2C+E2; TB=c1EI+c2RN+E3;
EI=d1RN+E4; C=f1EI+f2TB+E5 and C= consumption; I= investment; RN= renewable
energy; EI= energy import; TB= trade balance); government expenditure was not
included due to the multicolinearity problem.
The model presented by Chien and Hu (2008) identified which macroeconomic
variables has major impact in the economy from the renewable energy sector.
According to the authors, there is a direct impact on three main groups, environment,
economic and social towards a GDP increase; the coefficients are the impact which
influences directly the macroeconomic variables. The goal is to estimate and to
control the coefficients towards a positive impact on economy from renewable energy.
External decrease
dependency
Renewable energy
sources
Sustainability
development
dimensions
ENVIRONMENT
ECONOMIC
SOCIAL
Independence from
fossil fuel costs
Economic
competitiveness
Strategic valse; new
business opportunities
Low environment
impact
No resources depletion
Energy production
decentralization

103
Figure 31– The Renewable Energy Influence on GDP7
Source: Chien and Hu (2008:3050)
The model presented by Chien and Hu (2008) studied 116 countries, e.g.
Austria, Belgium, Denmark, Estonia, Finland, France, Greece, Iceland, Ireland, Italy, the
Netherlands, Norway, Portugal, and the United Kingdom. It presents the relationships
between renewables and macroeconomic variables towards GDP sustainability.
Johansson, T. B. (1993) and Diccer (2000) point out some effects of renewable
energy use: economic and social development, air pollution reduction, decrease in
carbon and gas, energy supply diversification, and reduced nuclear weapons.
Renewable energy has essentially three functions in the economy: electricity supply,
transport, heating and refrigeration (Castro (2012:8).
From the Portuguese point of view, the economic impact on employment from
offshore renewable energy was presented by Direção Geral de Recursos Naturais,
Segurança e Serviços Marítimos (DGRM) (2016: 105). The data shows an important
participation in employment in different offshore renewable energy sectors. According
to the same source, the capital yield will be near 30% (€1 will promotes €1.3 of capital)
and the value added will be near €400M in 2020.
7 C- household consumption; TB- trade balance; EI - Energy imports; RN- renewable;
+
+
+
+
+ RN
Value
added
EI
GDP
C
TB
+
+
-

104
Table 17–Activity Provision and Its Impact on Employment (2015-2022)
Source: DGRM (2016: 105)
Table 18– Activity Prevision (2022-2030)
Source: DGRM (2016: 105)
105
4.5. OFFSHORE ENERGY CLUSTERS SWOT ANALYSIS
“SWOT analysis has been praised for its simplicity and practicality. As a framework, it has been widely adopted but, generally, its use has been accepted uncritically. It is timely to reappraise its value as a strategic management tool”
Pickton and Wright (1998: 101).
SWOT analysis is the beginning of a business strategy in any market; therefore,
in order to survive, any organisation needs to assess and evaluat products, to be
competitive. In this perspective it is important to analyse the market position in
comparison with other organisations with the same market segmentation.
Moreover, the SWOT analysis completes how clusters deal with their strengths,
weaknesses, opportunities and threats.
According to Kartakoullis et al. (2002:8) the SWOT analysis allows the
researcher to summarize the relationship between key environmental influences, the
strategic capability of the organization, and the agenda for developing new strategies.
Terrados et al. (2007: 1276) define strategic planning as an extended tool for
regional development and territorial structure. Consequently, SWOT analysis is an
instrument which comprises internal and external factors associated with favourable
and unfavourable factors (Valentin, 2001:54).
In this point of view, there are four main fields in SWOT analysis:
• "Strengths": internal positive characteristics that the organization can
exploit to achieve its goals;
• "Weaknesses": internal characteristics that may inhibit the organization
from achieving its goals;
• "Threats": external environment characteristics that may prevent the
organization from achieving its strategic goals;
• "Opportunities" are described as the characteristics of the external
environment that have the potential to help the organization to achieve
or exceed its strategic goals (Kartakoulliset al., 2002:8).

106
SWOT analysis is a methodology to set up a business plan based on hierarchical
objectives, quantitative objectives, real goals and consistent objectives (Kotler and
Keller, 2007:53). SWOT analysis presents some limitations, such as:inadequate
definition or lack of prioritization of factors; over-subjectivity in the generation of
factors: compiler bias (Pickton and Wright, 1998: 105).
Terrados et al (2005), Markovska et al. (2009), Aydin (2014) and Chen et
al.(2014) point out the importance of using SWOT analysis to face problems in a
renewable energy industry, namely suitable strategies that could overcome such
problems, and also summarize key issues of the business environment, including the
organization capability strategy (Kartakoulliset al., 2002:8).
Not surprisingly, clusters can be related to SWOT analysis. The regional
planning and regional strategy are both concepts which comprise better cluster
performance.
SWOT analysis confirms plans for better utility of resources. The general
balance either internal or external is shortly exposed in the organisation through a
business plan towards problems which emerge in relationship with the environment.
According to Karppi et al. (2001: 17) any process of choice will become a
process of planning (or strategic choice) if the selection of the current actions is made
only after a formulation and comparison of possible solutions over a wider field of
decisions relating to certain anticipated as well as current situations.
Aydin (2014:6) presents the most important points off a SWOT analysis for the
renewable wind energy sector:
1- Strengths– domestic source; new business opportunity; resources are
environmentally friendly; wind energy is renewed on a daily basis; it provides a central
control for each government; the supply of sources depends on the needs; well-
planned transport system can reduce costs on the supply chain; contribution to long-
term energy demand; contribution to energy diversification and energy
competitiveness.
2- Weaknesses – Energy share still small in the world market, although this
share will increase but it will only surpass the fossil fuel by 2030. Governments are

107
required to promote this type of energy otherwise they will fall behind fossil fuel. The
initial investment is high and production does not occur on a stable level;
3- Opportunities - Development of new technologies; market size will increase
effectiveness; more effective SME technologies due to the use of super conductors;
4- Threats – few grants; tax exemptions needed to be provided by governments
(otherwise prices will be higher than fuel energy); as some initial setup costs are high,
there are negative effects on market entry.
The SWOT analysis presented by the European Commission (2013:15) for
central Europe (Austria, Czech Republic, Hungary, Slovakia, Italy, Poland) on energy
and environment presents the following ( it was not mentioned the Opportunities and
weaknesses):
Strengths
• better energy promotion and environment industry; transfer of knowledge andknow-how; cluster internationalization, sharing research and testing facilities,and developing new and better services for clustered firms; ability to innovatecommon projects with real business value; generates market for others products;sharing best practices; regional development policy influence; boosting interestsof potential members due to access to European Union funding.
Threats
• economic crises and lack of financing sources; decrease in clusters members’activity; cultural differences; lack of trust among clusters; differences among themega clusters members (national/regional, priority differences); without amembers string commitment, the mega clusters can became a platform withoutany real content.
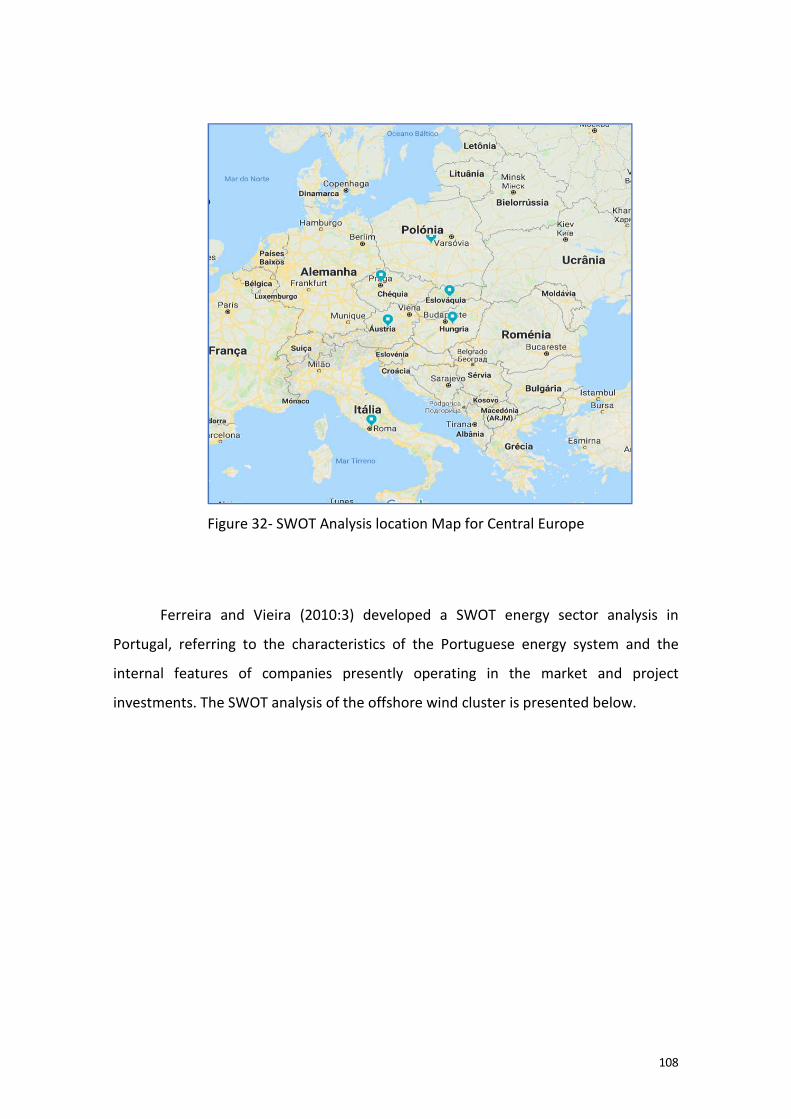
108
Figure 32- SWOT Analysis location Map for Central Europe
Ferreira and Vieira (2010:3) developed a SWOT energy sector analysis in
Portugal, referring to the characteristics of the Portuguese energy system and the
internal features of companies presently operating in the market and project
investments. The SWOT analysis of the offshore wind cluster is presented below.
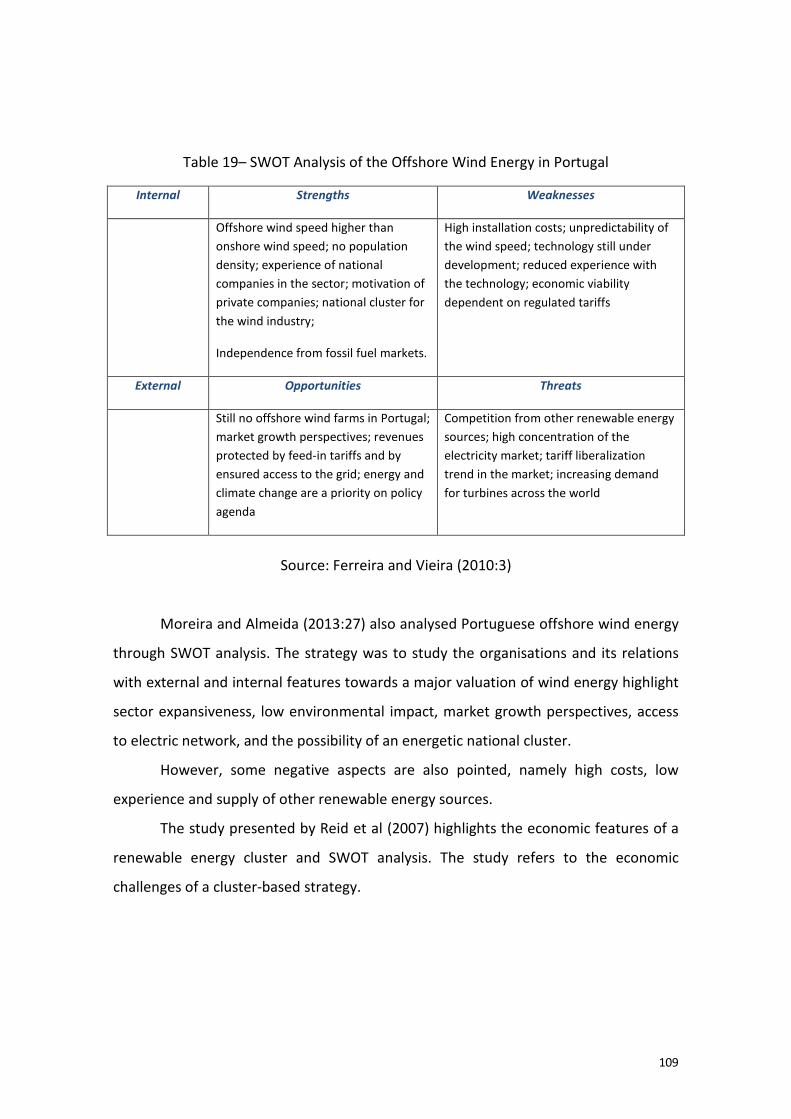
109
Table 19– SWOT Analysis of the Offshore Wind Energy in Portugal
Source: Ferreira and Vieira (2010:3)
Moreira and Almeida (2013:27) also analysed Portuguese offshore wind energy
through SWOT analysis. The strategy was to study the organisations and its relations
with external and internal features towards a major valuation of wind energy highlight
sector expansiveness, low environmental impact, market growth perspectives, access
to electric network, and the possibility of an energetic national cluster.
However, some negative aspects are also pointed, namely high costs, low
experience and supply of other renewable energy sources.
The study presented by Reid et al (2007) highlights the economic features of a
renewable energy cluster and SWOT analysis. The study refers to the economic
challenges of a cluster-based strategy.
Internal Strengths Weaknesses
Offshore wind speed higher than
onshore wind speed; no population
density; experience of national
companies in the sector; motivation of
private companies; national cluster for
the wind industry;
Independence from fossil fuel markets.
High installation costs; unpredictability of
the wind speed; technology still under
development; reduced experience with
the technology; economic viability
dependent on regulated tariffs
External Opportunities Threats
Still no offshore wind farms in Portugal;
market growth perspectives; revenues
protected by feed-in tariffs and by
ensured access to the grid; energy and
climate change are a priority on policy
agenda
Competition from other renewable energy
sources; high concentration of the
electricity market; tariff liberalization
trend in the market; increasing demand
for turbines across the world

Figure 33– Offshore Wind Clusters SWOT Analysis in Several CountriesSource: Michler-Cieluch (2009); Regozin
To sum up, the swot analysis methodology and its applicability to energy sector
is a good instrument to analyse the market and the players. This means, a new way to
improve market strategies and perform a business networking.
important to set up a plan to be competitive with the energy sector in terms of costs,
human resources and prices.
8Japan, South Korea, Finland, Lithuania,
Offshore Wind Clusters SWOT Analysis in Several CountriesCieluch (2009); Regozin (2012:63, 64); Stewart (2013)
(2014: 324,326, 327)
To sum up, the swot analysis methodology and its applicability to energy sector
is a good instrument to analyse the market and the players. This means, a new way to
improve market strategies and perform a business networking. In long run, it is
to set up a plan to be competitive with the energy sector in terms of costs,
human resources and prices.
Japan, South Korea, Finland, Lithuania, Taiwan, Germany, USA
110
Offshore Wind Clusters SWOT Analysis in Several Countries8 Stewart (2013); Chen et al.
To sum up, the swot analysis methodology and its applicability to energy sector
is a good instrument to analyse the market and the players. This means, a new way to
In long run, it is
to set up a plan to be competitive with the energy sector in terms of costs,

111

112
CHAPTER 5– MARITIME ENERGY IN THE EU AND IN PORTUGAL
“It takes more than machines and lines for electricity supply to any country to be
perfect; it takes organisation”
Figueira (2018:66)
The chapter five focus on maritime energy in EU and in Portugal. The European Energy
Policy it is discussed, as well as, the renewable energy evolution in Europe and in
Portugal, offshore energy investments included. To complete the analysis, the
economic impact concept is also discussed. This chapter ends with the presentation of
the planned offshore energy projects in Portugal.

113
5.1 THE RENEWABLE ENERGY IN EUROPE AND PORTUGAL
“el consumo de energía, de materias primas, resultado del desarrrollo económico e industrial a escala mundial (…) Se dessarrolan por tanto nuevas técnicas de propección (por ejemplo de teledetección) y de extracción además de verificar como referimos un esfuerzo creciente de criacón de soluciones alternativas: utilización de los recursos renovables como la energía hidroeléctrica, la energía geotérmica, do los océanos e eólica”
R. Salvador (2005: 632).
Renewable energy has become an important issue in the EU due to the fact it
can make a significant contribution to total electricity production. It is viewed as a
potential industry to stimulate economic development and improve energy
dependence, as well as national competitiveness and re-regulating the economy.
Renewable energy comprises benefits such as reducing the use of fossil fuels,
delivering higher security and reducing energy imports.
The following tables show the importance of renewable energy in energy
production. The data shows an important participation of renewable energy in gross
electrical production, share of energy from renewable sources in consumption (%), and
the contribution of renewable energy to the total primary supply.
Table 20– Member States (and Norway) Renewable Energy Production Growth rate (TWH) in %
Countries Growth
rate
2014/2005
Countries Growth
rate
2014/2005
Austria 25 Finland 13
Sweden 5 Germany 158
Portugal 106 Ireland 239
Denmark 89 Greece 103
Spain 122 UK 329
Italy 167 France 58
Belgium 486 Holand 55
Norway 1
Source: DGEG (2015:18/19)

114
Table 21– EU Renewable Gross Electricity Production (wind and tidal, wave and ocean), 2018, 1990-2013 (GWH)
1990 1995 2000 2005 2011 2012 2013 Growth rate
(1990/2013)
Wind 778 4068 22254 70455 179669 205980 235012 301.1%
Tide, wave and
ocean
503 507 507 481 478 462 420 -16.5%
Source: Eurostat (2015:91)
Table 22– Share of Renewable Sources in Gross Final Consumption of Energy (%)
2011 2012 2013 TARGET 2020
EU-28 12.9 14.3 15.0 20
Portugal 24.7 25.0 25.7 31
Source: Eurostat (2015:91)
Table 23– Renewable Sources as a Percentage of Total Primary Energy Supply
1970 1990 2010 2014
Portugal 21.6% 19.5% 23.2% 24.6%
UE 28 ---- 4.3% 9.8% -----
OECD ----- 5.9% 7.8% 9.2%
Source: OECD (2016: 107)
The European Commission (2016:12) argues that "the energy sector plays a
fundamental role in society and in the Portuguese economy";all agents in the electrical
sector have unanimously recognised that there is a very significant potential for
developing renewable energy in Portugal.
The Directive 2009/28/EC of 23 April established a target of 31% for Portugal as
the share of renewable energy in the nation's gross final energy consumption, to be
achieved by 2020, which implies an increase of 11.3% as compared to the figure
recorded in the base year of 2005, which was 19.8% (European Commission, 2016:23).
Therefore, the potential that exists for developing new projects with regard to RES will
increase the Portuguese capacity for the share of renewable energy consumption for
2020 (31% of the total).
This recognition reflected the importance of renewable energy in various sectors
of activity, such as transport industry and the domestic sector.
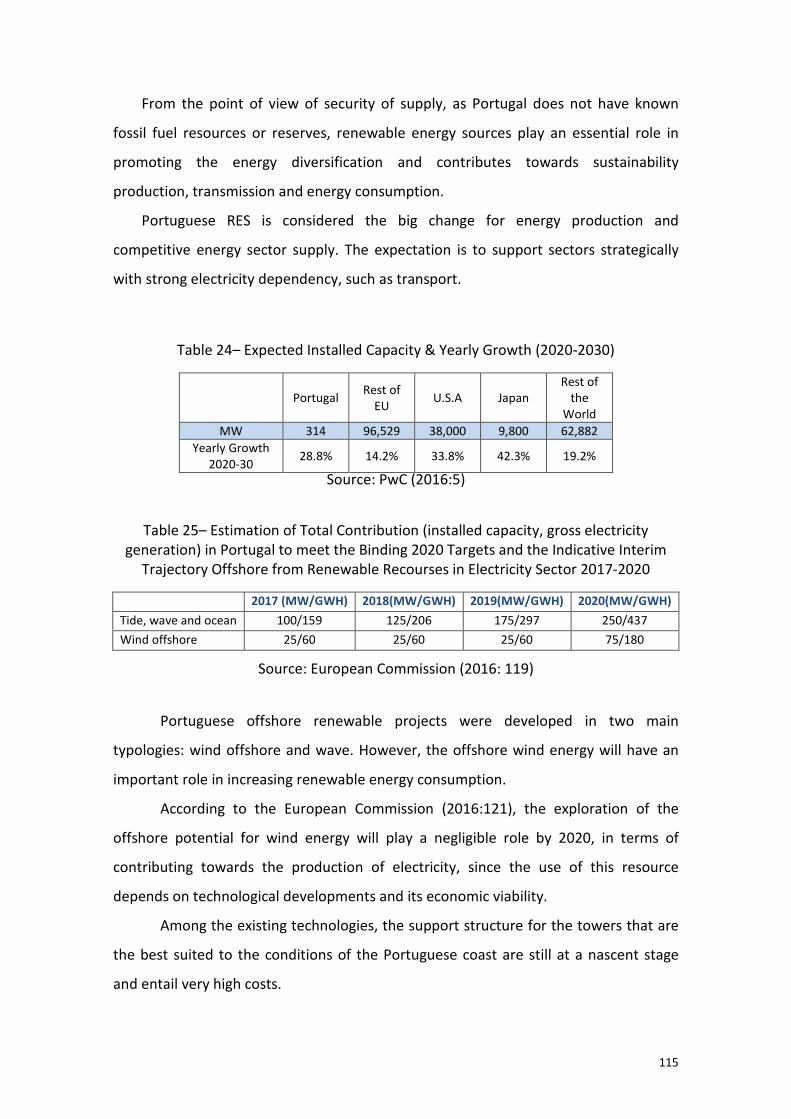
115
From the point of view of security of supply, as Portugal does not have known
fossil fuel resources or reserves, renewable energy sources play an essential role in
promoting the energy diversification and contributes towards sustainability
production, transmission and energy consumption.
Portuguese RES is considered the big change for energy production and
competitive energy sector supply. The expectation is to support sectors strategically
with strong electricity dependency, such as transport.
Table 24– Expected Installed Capacity & Yearly Growth (2020-2030)
Portugal
Rest of EU
U.S.A Japan Rest of
the World
MW 314 96,529 38,000 9,800 62,882
Yearly Growth 2020-30
28.8% 14.2% 33.8% 42.3% 19.2%
Source: PwC (2016:5)
Table 25– Estimation of Total Contribution (installed capacity, gross electricity generation) in Portugal to meet the Binding 2020 Targets and the Indicative Interim
Trajectory Offshore from Renewable Recourses in Electricity Sector 2017-2020
2017 (MW/GWH) 2018(MW/GWH) 2019(MW/GWH) 2020(MW/GWH)
Tide, wave and ocean 100/159 125/206 175/297 250/437
Wind offshore 25/60 25/60 25/60 75/180
Source: European Commission (2016: 119)
Portuguese offshore renewable projects were developed in two main
typologies: wind offshore and wave. However, the offshore wind energy will have an
important role in increasing renewable energy consumption.
According to the European Commission (2016:121), the exploration of the
offshore potential for wind energy will play a negligible role by 2020, in terms of
contributing towards the production of electricity, since the use of this resource
depends on technological developments and its economic viability.
Among the existing technologies, the support structure for the towers that are
the best suited to the conditions of the Portuguese coast are still at a nascent stage
and entail very high costs.

Thus, it is expected that by 2020 the installed capacity for offshore wind energy
will not have exceeded 75MW, which will essential
and technological development.
Figure 34– Evolution of the Estimated Trajectory of Energy Consumption from Renewable Sources in the Heating and Cooling, Electricity and Transport Sectors
Source: European Commission (2016:26)
5.2 THE EUROPEAN ENERGY POLICY
"ENVE9 will contribute to increase the role of local and regional authorities in the EU Energy Policy: especially as regards to the microenergy efficiency, exchange of energy data, energy infrastructure and smart grids, as well as innovative low carbon technology and the position of consumers in the internal market"
Work programme of the ENVE Commission, Committee of the Regions EU, February
9The Commission for the Environment, Climate Change and Energy (ENVE)
of the Regions' work in the following areas:
• Climate change: adaptation and mitigation
• Renewable energy
• Environment Policy
• Trans-European networks in the energy sector
• New energy policie
• Space policy for territorial development (Galileo, GMES/Kopernikus and related issues)
Thus, it is expected that by 2020 the installed capacity for offshore wind energy
exceeded 75MW, which will essentially serve the purposes of research
and technological development.
Evolution of the Estimated Trajectory of Energy Consumption from Renewable Sources in the Heating and Cooling, Electricity and Transport Sectors
Source: European Commission (2016:26)
THE EUROPEAN ENERGY POLICY
will contribute to increase the role of local and regional authorities in the EU Policy: especially as regards to the micro-production of renewable energy,
energy efficiency, exchange of energy data, energy infrastructure and smart grids, as s innovative low carbon technology and the position of consumers in the internal
Work programme of the ENVE Commission, Committee of the Regions EU, February
Commission for the Environment, Climate Change and Energy (ENVE) coordinates the Committee
of the Regions' work in the following areas:
Climate change: adaptation and mitigation
European networks in the energy sector
Space policy for territorial development (Galileo, GMES/Kopernikus and related issues)
116
Thus, it is expected that by 2020 the installed capacity for offshore wind energy
ly serve the purposes of research
Evolution of the Estimated Trajectory of Energy Consumption from Renewable Sources in the Heating and Cooling, Electricity and Transport Sectors
will contribute to increase the role of local and regional authorities in the EU production of renewable energy,
energy efficiency, exchange of energy data, energy infrastructure and smart grids, as s innovative low carbon technology and the position of consumers in the internal
Work programme of the ENVE Commission, Committee of the Regions EU, February 2016
coordinates the Committee
Space policy for territorial development (Galileo, GMES/Kopernikus and related issues)

The European Energy Policy (2014
the environment. On renewable energy
resilient Energy Union 2020
change (Eurostat, 2016) and energy governance up to 2020 and guides development
until 2030.
Figure
In order to meet the climate change dimensions
a National Renewable Action Plan
national targets with regard to the share of energy from renewable sources used in the
transport, electricity and heating and cooling sectors in 2020, as well as the respective
10
Reducing GHG emissions by at least 20% compared with 1990 levels; increasing the share of
renewable energy in final energy consumption to 20%; moving towards a 20% increase in energy
efficiency. (Eurostat, 2016:88)
11
Directive 2009/28/EC of the European Parliament and of the Council, of 23 April 2009 establishes, in
Article 4, that Member States must a
(NREAP) to the European Commission by 30 June 2010.
Energy Action Plan for Portugal was based
a template for national renewable energy action plans in the second paragraph of Article 4(1) of
same European directive.
The European Energy Policy (2014-2020) is synonymous with consistency with
ronment. On renewable energy, the EU's Framework Strategy
resilient Energy Union 2020,10 introduced in 2015, complements the existing climate
and energy governance up to 2020 and guides development
Figure 35– Climate Change Dimensions Source: Eurostat (2016:89)
In order to meet the climate change dimensions, every Member State presents
a National Renewable Action Plan.11 The plan presented by Member State
ith regard to the share of energy from renewable sources used in the
transport, electricity and heating and cooling sectors in 2020, as well as the respective
Reducing GHG emissions by at least 20% compared with 1990 levels; increasing the share of
energy in final energy consumption to 20%; moving towards a 20% increase in energy
Directive 2009/28/EC of the European Parliament and of the Council, of 23 April 2009 establishes, in
Article 4, that Member States must approve and present a National Renewable Energy Action Plan
(NREAP) to the European Commission by 30 June 2010. On renewable energy, the National Renewable
Energy Action Plan for Portugal was based on the Commission Decision of 30 June 2009, which provides
a template for national renewable energy action plans in the second paragraph of Article 4(1) of
117
consistency with
EU's Framework Strategy Goals for a
introduced in 2015, complements the existing climate
and energy governance up to 2020 and guides development
every Member State presents
presented by Member States defines
ith regard to the share of energy from renewable sources used in the
transport, electricity and heating and cooling sectors in 2020, as well as the respective
Reducing GHG emissions by at least 20% compared with 1990 levels; increasing the share of
energy in final energy consumption to 20%; moving towards a 20% increase in energy
Directive 2009/28/EC of the European Parliament and of the Council, of 23 April 2009 establishes, in
pprove and present a National Renewable Energy Action Plan
National Renewable
the Commission Decision of 30 June 2009, which provides
a template for national renewable energy action plans in the second paragraph of Article 4(1) of the

118
trajectories in accordance with the pace of implementing the measures and actions
that have been envisaged for each of these sectors.
The plan must identify and describe these sectorial measures. In addition to
suitable measures to achieve overall national targets, the plan must take into
consideration the effects of other policies pertaining to energy efficiency in the context
of energy use as well as measures to be implemented in order to comply with the
requirements established in articles 12 to 17 of Directive 2009/28/EC.
The plan considered all contributions and synergies, such as cooperation
between local, regional and national authorities, the possibility of using mechanisms to
physically or statistically transfer energy, joint projects with other Member States and
national policies to develop existing endogenous resources and to mobilize new
endogenous resources.
According to the European Commission (2015b:4), energy production
sustainability should be based on competitiveness, security and sustainability, and
The legal basis of the European energy policy legislation is laid down in Article 194 of the European Union Treaty
•1. In the context of the establishment and functioning of the internal market and with regard for the need to preserve and improve the environment, Union policy on energy shall aim, in a spirit of solidarity between Member States, to:
•(a) ensure the functioning of the energy market;
•(b) ensure security of energy supply in the Union;
•(c) promote energy efficiency and energy saving and the development of new and renewable forms of energy; and
•(d) promote the interconnection of energy networks.
•2. Without prejudice to the application of other provisions of the Treaties, the European Parliament and the Council, acting in accordance with the ordinary legislative procedure, shall establish the measures necessary to achieve the objectives in paragraph 1. Such measures shall be adopted after consultation of the Economic and Social Committee and the Committee of the Regions.
•Such measures shall not affect a Member State's right to determine the conditions for exploiting its energy resources, its choice between different energy sources and the general structure of its energy supply, without prejudice to Article 192(2)(c).
•3. By way of derogation from paragraph 2, the Council, acting in accordance with a special legislative procedure, shall unanimously and after consulting the European Parliament, establish the measures referred to therein when they are primarily of a fiscal nature.
•Source:http://www.lisbon-treaty.org/wcm/the-lisbon-treaty/treaty-on-the-functioning-of-the-european-union-and-comments/part-3-union-policies-and-internal-actions/title-xxi-energy/485-article-194.html, consulted in 15/10/2018

119
enhance new energy technologies, with regard to renewable energy sources and
sustainable fossil fuel technologies and public and private funding. Some actions have
been implemented in order to achieve those goals: the White Book (1997): "Integrate
climate and energy policies by 2020" (adopted by the European Council in March
2007); the Green book publication: "A framework for climate and energy policy in
2030" (27th March 2013); the Roadmap for energy 2050: the "Internal energy market
accomplishment"; "External relations in energy field establishment"; the "Energy
supply improvement security and promotion"; and the "European Strategic Plan for
Energy Technologies" (SET plan).
Nevertheless, the European Plan for renewable energy is based on the
e-Highway 2050 program. The program examines the framework conditions
and, using various scenarios, develops approaches for planning the expansion of the
European electricity grid by 2020, 2030, 2040 and 2050 respectively. Stakeholders
from all over Europe are invited to discuss assumptions and intermediate results and
to assess the final results of the different work packages in different consultations and
workshops. The overall objective is to support the planning of the Pan-European
Transmission Network, focusing on 2020 to 2050, to ensure the reliable delivery of
renewable electricity and pan-European market integration.
The project will result in a modular development plan for possible electricity
highways, based on various future power system options such as high Renewable
Energy Sources (RES) penetration, technology breakthroughs in transmission
technologies, innovative active demand-side management, and others.

120
Figure 36– Renewable Energy Sources (RES) development by 2050
Source: https://shop.dena.de/fileadmin/denashop/media/Downloads_Dateien/verkehr/9013_MOB_Brochure_ehighway2050_englisch.pdf (20/07/2018)
Portugal today has a scheme to access the electricity network which prioritizes
RES. Moreover, over the course of recent years Portugal has created a series of
financial and fiscal measures to support investment in renewable energy. These
measures have been boosted with the creation of differentiated tariffs for electricity
produced in renewable plants and feed-in tariffs (FIT), according to the degree of
maturity of the various technologies that are available in the national market.
These measures have helped to successfully achieve the overall objectives of
the national energy policy. Renewable energy has become increasingly important and
visible in national strategies.

121
The latest National Energy Strategy (NES 2020)12 continues to attributing a
pivotal role to renewable energy and its targets that have been delineated for this
sector, with a very significant impact on the Portuguese economy.
NES 2020 incorporates the objectives of the energy policy, and seeks to
maintain Portugal at the forefront of the energy revolution, with regard to the use of
renewable energy. It will be based on unarticulated increase in the installed hydro and
wind energy capacity.
Wave energy will be very important in the future. Specific instruments have
been envisaged to promote it and to develop the necessary technologies. Amongst
these measures, it is especially important to note the implementation of the pilot zone
created by Decree Law No. 5/2008, to test technologies that serve to harness wave
energy.
The main objectives of the National Energy Policy 2020 include:
• Guaranteeing compliance with Portugal’s commitments in the context of
European energy policies and measures to fight climate change, ensuring that
31% of the gross final energy consumption, 60% of the electricity produced and
10% of the energy consumptionin the road transport sector will be derived
from renewable sources in 2020;
• Reducing Portugal’s energy dependence on the importation of fossil fuels, to
around 74% in 2020, by means of increasingthe use of endogenous energy
resources (estimated reduction using a Brent reference of 80USD/bbl);
• Reducing the balance of energy imports by 25% (around €2 billion) with the
energy produced from endogenous sources, making it possible to reduce
imports by an estimated60 million barrels of oil;
• Consolidating the industrial cluster associated with wind energy and to create
new clusters associated with new technologies in the renewable energy sector,
ensuring a Gross Added Value of 3.8 billion euros and creating 100,000 new
jobs in addition to the existing 35,000 jobs associated with the production of
electricity from RES by 2020;
12
Approved by Government Resolution No. 29/2010, of 15 April

122
• Promoting sustainable development, creating the necessary conditions to meet
the commitments that Portugal has made with regard to reducing green house
gases, by means of a greater use of RES and energy efficiency.In addition, the
energy policy for RES, by means of the NES 2020, also established a series of
specific measures in order to comply with these targets;
• Updating the micro-production programme, establishing more ambitious
targets and introducing a mini-production programme aimed at projects with
capacities of up to 150kW or 250 kW, according to the technologies used;
• Promoting the production of forest biomass, so as to ensure theconsumption
needs that have already been installed and will be installed, by means of access
to public support schemes, the promotion of certification for sustainable forest
management, assessing and promoting energy crops, as well as, the residual
biomass resulting from agricultural and agro-industrial activities.
• Creating, by the end of 2010, a permanent planning and monitoring system for
demand and potential supplies of energy, so as to optimise the integrated
management of available resources, improving the security of energy supplies
and promoting more efficient use, along with the integration of different types
of renewable energy.
• Implementing the National Plan for High-Capacity Hydroelectric Dams
(PNBEPH), the new hydropower initiatives that are underway and reinforce the
expected capacities, making it possible to make better use of potential
hydropower and facilitating the growth of wind energy, by introducing a
stabilising element in the form of reversible capacity in the planned
investments.
• Creating the necessary conditions to introduce and popularise the use of
electric vehicles, as a means of promoting the consumption of the renewable
energy produced, with a view to positioning Portugal as a benchmark reference
in terms oftesting, developing and producing solutions for electric mobility.

123
5.3 THE OFFSHORE ENERGY INVESTMENTS (WAVE AND WIND) IN PORTUGAL
5.3.1 Introduction
According to Figueira (2018:188) besides traditional forms of electricity
production - coal fired, fuel or diesel thermal and hydroelectric power stations- which
were used in Portugal from the nineteenth century, new forms of power, particularly
renewable energy sources, such as wind, solar biomass, geothermal and tidal (wave)
power are gaining ground in words and plans alike. Plans for renewable have become
ever-more present since the last decade of the twentieth century and have been the
focus of the energy debate in the country, together with the construction of large
dams.
The same author point out that wind power was the first new power source to
appear due to the technological advancement it achieved up to the 1980s-1990s,
which meant it had reached a greater technical maturity and was able to guarantee
operational and economic results. Although the first plans for the use of wind power to
produce electricity in Portugal date from the early 1980s, only by the end of the
century did it become reality (Figueira, 2018:192).
The latest European agenda for renewable energy 2020 argues for a more
beneficial usage of natural maritime resources.
According to the Blue Growth program, the European Structural Funds provide
good experiences for Members State as they can gain knowledge in research
methodologies and applied science transfer.
Ocean energy is related to integrate maritime surveillance, maritime spatial
planning and maritime knowledge towards sustainability in the economy, environment
and social affairs.
However, negative impacts from Ocean Renewable Energy (ORE) can be
pointed out: construction, operation and maintenance may impact on the
environment; completed projects may result in a loss of access for fishers and
navigation; aesthetic impacts may have a negative non-market impact on local
communities in addition to market impacts on tourism and property values;

124
technologies involve substantial onshore coastal development in the form of cable
landfall, transformer stations, ports and harbours and even power take-off in the case
of devices which pump water ashore (Dalton et al., 2015:863).
The investments made in ORE (Dalton et al., 2015:854) can be divided into two
main groups:
a) Capital expenditure, i.e. total project costs or initial project costs (CAPEX),
which include: devices; cables/pipelines; foundations; installation (e.g. of device,
moorings, cables, or electrical connections);
b) Operating expenditure for ocean energy technologies (OPEX), which includes:
maintenance, insurance, site rent, other rents and annual impact statements.
Portugal has benefited from EU support both in R&D and infrastructures.
Offshore energy projects have benefited mainly from the 7thFramework
Program for Research and Technological Development– FP713 (2009-2013).
Between 2007 and 2012 Portugal received about 12% (€7.6M) of total funding
from FP7 funding (Intelligent Energy Europe). The main R&D offshore energy projects
with EU support (2009-2018) are:
Table 26– R&D Offshore Energy Projects in Portugal
Projects Funding Period Value (€M)
Partners (Beneficiaries)
SURGE FP7 - ENERGY 2009-2013
3.0 AW- Energy
WAVEPORT FP7 - ENERGY 2010-2014
4.6 UK Intelligent Systems Research Institute (ISRI); ISRI (United Kingdom), Wave Energy Centre (Portugal), University of Exeter (United Kingdom), Degima (Spain), Fugro-Oceanor AS (Norway), Ocean Power Technologies Inc., (USA)
DEMOFLOAT FP7 - ENERGY 2011-2015
4.0 EDP Inovação; Principle Power (Europe);Limited, Vestas Wind Systems A/S, Sea Energy Renewables, Damen Shipyards Gorinchem, Laboratório Nacional de Engenharia e Geologia, Instituto de Soldadura e Qualidade, Caixa – Banco de Investimento, Sgurrenergy, National Renewable Energy Laboratory, A. Silva Matos Energia and
13
The FP7program aims to respond to Europe's needs for jobs and competitiveness, and maintain
knowledge leadership in the global economy. National institutions and companies participated in 1,788
FP7 projects, 364 (20.4%) with Portuguese coordination. These projects resulted from a total of 9,449
proposals submitted, which represents a success rate of 18.9%, similar to the EU average, which leads to
a weak investmentin the sector.

125
WavEC.
POLYWEC FP7 - ENERGY 2012-2016
2.1 Scuola Superiore Sant’Anna, PetruPoni Institute, Selmar S.r.l.,University of Edinburgh; WavEC
DTOCEAN FP7 - ENERGY 2013-2016
4.2 University of Edinburgh,IWES, University of Exeter, Marintek, France Energy Marines, Vattenfall, Prysmian, ITP, Join Research Centre, Tecnalia, HMR UCC, Aarborg University, Wavec, Iberdrola, Deme Blue Energy, Tension Technologies International, Sandia National Laboratoires, Oceans Energy Europe
MARINE TT FP7- INFRASTRUCTURES
2011-2015
9.0 AquaTT; EurOcean Partner
TROPOS FP7-TRANSPORT 2012-2015
4.9 Advance Intelligence Development S. L., University of Edinburgh, University of Strathclyde, Norsk Institutt for Vannforskning, Danmarks Tekniske Universitet, Phytolutions GMGH, Universitaet Bremen, Fraunhofer Gesellschaft, Hellenic Center for Marine Research, PMP - TVT, École Centrale de Nantes, Bureau Veritas, DCNS, EnerOcean S.L., Abengoa Seapower SA, Acciona Infrastructure, Universidad Politécnica de Madrid, Wave Energy Centre- Centro da Energia das Ondas
OCEANET FP7-PEOPLE 2013-2017
3.4 WavEC Offshore Renewables(WAVEC), Instituto Superior Técnico (IST), Uppsala Universitet (UU), Fraunhofer – IWES (Fraunhofer-IWES), Maritime Research Institute Netherlands (Marin), Universidad de Cantabria (UC), École Centrale de Nantes (ECN), The University of Exeter (UNEXE), Tecnalia (TECNALIA), University College Cork (UCC-HMRC)
KIC- OTS KIC-INNOENERGY 2011-2014
(not available from the source)
Shareholders(ABB Ab, AGH- University of Science and Technology, AREVA SA, Commissariate à l'Énergie atomique et aux énergies alternatives (CEA), Eindhoven University of Technology, Électricité de France S.A.S, ESADE, Fundació Institut de Recerca de l'energia de Catalunya
HIWAVE KIC-INNOENERGY 2013-2016
2.3 CorPower Ocean, Wavec, Iberdrola
SOWFIA IEE 201-2013
1.4 University of Plymouth, European Ocean energy Association, University College Cork, Wave Energy Centre- Centro de Energia das Ondas, Ente Vasco de la Energia, The University of Exeter, Instalaciones Inabensa Sa, École Centrale de Nates, Usapala University
SIOCEAN IEE 2012-2014
0.8 European Ocean Energy, Wave Energy Centre, The University of Edinburgh, RenewableUK Association Limited, JRC Join Research Centre, DHI, The Carbon Trust
FAME ATLANTIC AREA - INTERREG IV
2010-2013
2.2 Royal Society for the Protection of Birds (RSPB), BirdWatch Ireland (BWI), Ligue pour la Protection des Oiseaux (LPO), Sociedade Portuguesa para o Estudo das Aves (SPEA), Universidade do Minho (UMinho), Wave Energy Centre (WavEC), Sociedade Portuguesa de Vida Selvagem, Agência Francesa de Áreas Marinhas Protegidas, Martifer SGPS, SA
ATLANTICPC ATLANTIC AREA 2012-2014
2.0
ROADMAP FCT (national project)
2010-2013
(not available from the

126
source)
OTEO QREN –COMPETE (national project)
2011-2013
0.2
SDWED DANISH COUNCIL 2010-2014
(n.a.) Det Norske Veritas (England) - DNV, University of Bologna, Federal University of Rio de JanEI-ERO/COPPE, Ocean Structures & Underwater Technology - UFRJ, Rambøll Oil & Gas A/S (Denmark) - RAM, Wave Energy Centre - WavEC, Aalborg University Esbjerg (Denmark) - AAU-E, Edinburgh University, Fraunhofer (Germany) - FRAU
RICORE H2020 2015-2016
1.4 Robert Gordon University from Scotland; Marine Scotland;University College Cork; WavEC; AZTI-Tecnalia;E-Cube Strategy Consultants
WETFEE H2020 2015-2018
3.4 WavEC Offshore Renewables, Johannes Kepler University Linz, Plymouth University, INNOSEA, EDP, Selmar S.r.l., the Faculty of Engineering of Lisbon Technical University, Teamwork Technology, Aurora Ventures Ltd, Trelleborg, Scuola Superiore Sant’Anna (SSSA), University of Edinburgh
WAVEROLLER H2020 2016-2020
10.0 Fortum, Wartsila, Eneólica, Metso, Wavec, Hempel Garrad Hassan, DCNS, Lloyd's Register energy
Source: Wavec (2013-2014)
The first pre-commercial phase was related to R&D. The infrastructures were
partially supported by EU funds, and this will be continued for new projects
(CapitalNER300 fund: wind €30M; wave €9.5M), as well as by the Portuguese
government and private companies.

127
Figure 37– Offshore Infrastructures Source: PwC (2016:6)
The map shows the infrastructures that have been built since the beginning of
the offshore energy projects. The projects were mainly built in the Centre and North
regions, due to the climate features and economic infrastructures (e.g. ports and
related activities). It is expected that the latest offshore energy project located in
Aguçadoura will create a new challenge for the national maritime economy, associated
with jobs, value added and development of local activities.
Portuguese Offshore Energy Projects are divided in two types: wave and wind.
The first investment in offshore energy in Portugal was the wave Pico Island Central
(Falcão, 2000). It was followed by three wave energy investments: two at Aguçadoura
(AWS, 2004 and Pelamis, 2008) and the WaveRoller at Peniche (2007). While Pico
Central is still operational, the two wave farms at Aguçadoura have been shut down,
providing evidence that a technology adjusted to the natural conditions in the north of
the Portuguese offshore is not yet available, which is in fact a general problem as wave
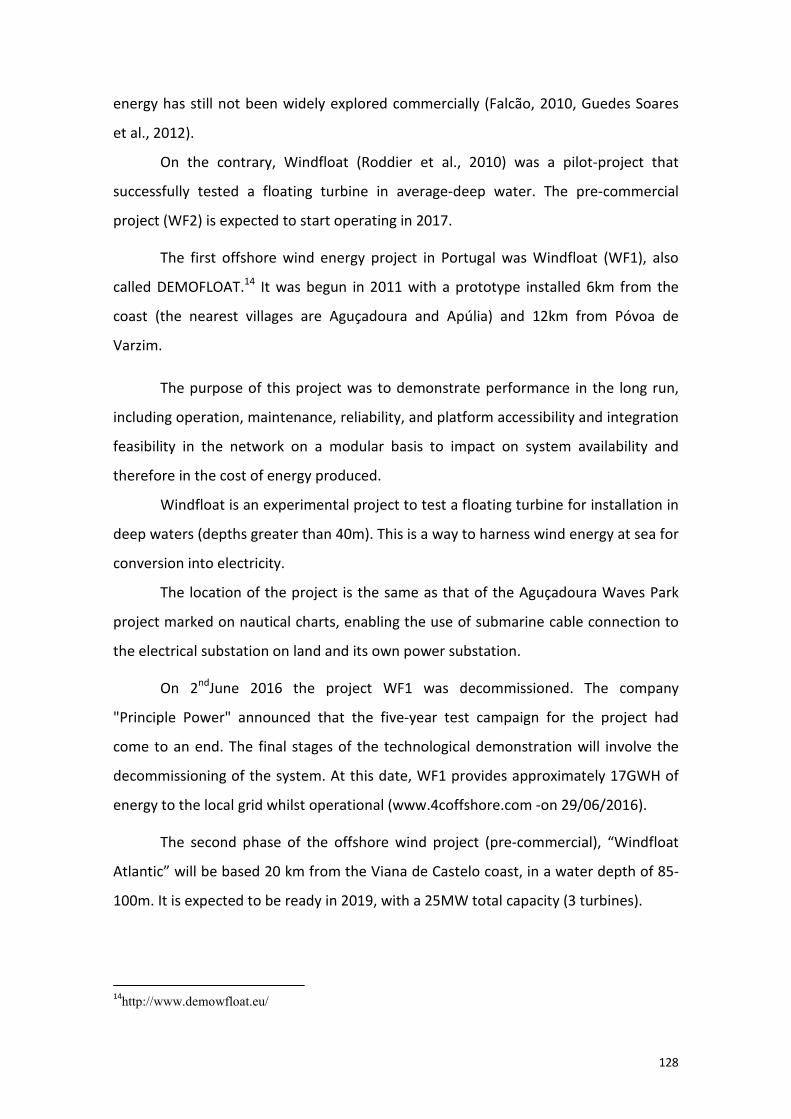
128
energy has still not been widely explored commercially (Falcão, 2010, Guedes Soares
et al., 2012).
On the contrary, Windfloat (Roddier et al., 2010) was a pilot-project that
successfully tested a floating turbine in average-deep water. The pre-commercial
project (WF2) is expected to start operating in 2017.
The first offshore wind energy project in Portugal was Windfloat (WF1), also
called DEMOFLOAT.14 It was begun in 2011 with a prototype installed 6km from the
coast (the nearest villages are Aguçadoura and Apúlia) and 12km from Póvoa de
Varzim.
The purpose of this project was to demonstrate performance in the long run,
including operation, maintenance, reliability, and platform accessibility and integration
feasibility in the network on a modular basis to impact on system availability and
therefore in the cost of energy produced.
Windfloat is an experimental project to test a floating turbine for installation in
deep waters (depths greater than 40m). This is a way to harness wind energy at sea for
conversion into electricity.
The location of the project is the same as that of the Aguçadoura Waves Park
project marked on nautical charts, enabling the use of submarine cable connection to
the electrical substation on land and its own power substation.
On 2ndJune 2016 the project WF1 was decommissioned. The company
"Principle Power" announced that the five-year test campaign for the project had
come to an end. The final stages of the technological demonstration will involve the
decommissioning of the system. At this date, WF1 provides approximately 17GWH of
energy to the local grid whilst operational (www.4coffshore.com -on 29/06/2016).
The second phase of the offshore wind project (pre-commercial), “Windfloat
Atlantic” will be based 20 km from the Viana de Castelo coast, in a water depth of 85-
100m. It is expected to be ready in 2019, with a 25MW total capacity (3 turbines).
14
http://www.demowfloat.eu/

129
Following the trial period of the WF1, WindFloatproject,SA continues to
develop the production of offshore wind energy in Portugal. Windfloat is located in the
union of parishes of Viana do Castelo municipality (Santa Maria Maggiore and
Monserrate and Meadela), 20km from the coast.
In Portugal, wave energy research started in 1978 at the Instituto Superior
Técnico(IST) in Lisbon and it was joined in 1983 by the Instituto Nacional de
Engenhariae Tecnologia Industrial (INETI). Since 1986, Portugal has been successfully
involved in the planning and construction of the shoreline wave energy converter
"Oscillating Water Column" in Pico (Azores), supported by the government, the EU
Programme Joule and companies in the Azores and the mainland (Clément et al.,
2002:412).
5.3.2 Pico Island
The Pico EU Wave Energy Pilot Plant in Pico Island named Pico OWC (Oscillating
Water Column) was built to show the technical viability of wave energy.
The project started in 1992 and was concluded in 1999, partially supported by
the EU Joules Program,15 EDP (Electricity of Portugal - mainland), EDA (Electricity of
Azores- regional) and the Portuguese government.
Several technical problems and a lack of funding to address them after
construction caused interruption of the project for several years. The situation of the
Pico plant has worsened since 2012, when the EU Wavetrain216 project finished.
This project partially financed the Pico plant human resources costs. In 2013
some Pico plant activities were financed by the EU MariNET project.
The year of 2013 was marked by efforts by the Regional Government of the
Azores to obtain funding for the Pico plant.
15
http://cordis.europa.eu/programme/rcn/188_en.html 16
http://cordis.europa.eu/result/rcn/58426_en.html

130
5.3.3 Aguçadoura
"A wave energy pilot zone off the coast was created in January 2008" Palha et al. (2010:62)
1st
phase
The EU-funded Aguçadoura project started in 2003, and is the result of over 20
years of research at Lisbon's Superior Technical Institute.
The global financial crunch of 2008 made the financing of the generators’ re-
installation more difficult. The wave farm has been shut down since then. The project
had an investment of more than 8.8 million euros.
The maritime zone was located on the west coast off São Pedro de Moel, and
was named Pelamis Wave Power. Aguçadoura Wave Farm is the world's first
commercial wave energy project, and was installed at a depth of between 30m and 90
m of water, with an area of 320 sq. km, 5km from the Póvoa de Varzim coast.
The system had an electric tariff of €0.245/KWh, more than 2.5 higher than
wind energy.
Table 27– Aguçadoura Pelamis Suppliers (2003- 2008)
PARTNERS PRODUCTS FROM SUPPLIERS NACE ORGANISATIONS NUTSIII
Babcock&Brown Electricity generation,distribution and
commercialization
3511 Enersis AML
Pelamis wave
power
Electricity generation,distribution and
commercialization
3511 EDP AML
Efacec Electricity generation,distribution and
commercialization
3511 Azores Electricity Azores
Islands
EDP Engineering services 3511 Profabril AML
Civil construction 43290 Marques, SA Azores
Electronic Systems 71120 Efacec AMP
source: www.wavec.org

131
2nd
phase
The second phase of wave energy is related to the second project installed in
2010 on the Peniche Coast, named waveroller technology. The option for this location
is related to geographical features and the national electric network. Peniche
municipality presented positive points, such as local know-how related with maritime
economy, dry assembly and sea activities and the proximity of partners with know-
how. In 2009, a consortium consisting of local authorities, scientific entities and a
company was formed and led by AW-Energy, the WaveRoller developer. The project
called "Simple Underwater Renewable Generation of Energy" or SURGE was financed
by the FP7, an EU funding scheme. The electricity utility company is Enéolica SA. The
wave energy farm consists of three 100kW WaveRoller units (total nominal capacity of
the farm 300kW) and was deployed in 2012.
Table 28– Peniche WaveRoller Project
PARTNERS PRODUCTS FROM SUPPLIERS
NACE ORGANISATIONS NUTSIII
Peniche dry dock
Coordinator 35113 AW- ENERGY OY AMP
WAVEC Electric system draw ---- ABB FINLAND -----
Hydrographical institute
Wing draw ----- Multimart Oy
(Finland)
------
Peniche Municipality
PTO system draw (power
take off)
----- Bosh- Rexroth
(Germany)
------
Technical optimization and
wing manufacturing
30111 Dry Dock
Peniche
Oeste
Final design of the
foundation, laying the
WaveRoller
64202 Lena Group PinhalLitoral
Final design of the
foundation, laying the
WaveRoller
35113 Eneólica PinhalLitoral
Environmental monitoring ---- IMIEU- Germany ------
Local administration 84113 Peniche
Municipality
Oeste

132
Sedimentary studies 72190 Hydrographical
Institute
AML
Technical monitoring
operation of energy
conversion unit and
dissemination of results
35113 WAVEC (Wave
Energy Centre)
AML
source: www.wavec.org
5.3.4. Planned Offshore Energy Projects
The Portuguese Government has approved The Industrial Strategy for Ocean
Renewable Energies (EI-ERO) (DR, 1ª série, nº 227, 24 de novembro de 2017) with the
aim of developing the country’s offshore wind potential.
Based on the more conservative scenario, the government projects that by
2020 the ocean energy sector could generate, EUR 280 million in gross value added
and EUR 119 million in trade, as well as 1,500 new jobs starting from a EUR 254 million
in investment.
According to EI-ERO, ocean renewable energies have the potential to supply
25% of the electricity consumed annually in Portugal and create a new export chain in
these new technologies.
The potential for offshore wind installation in the country is much more
significant for floating turbines (40 GW), than for fixed ones (1.4 to 3.5 GW), according
to EI-ERO, due to the distance to the coast needed for the reduction of the visual
impact of the turbines and due to the slope of the continental shelf.
Looking at export opportunities, Portugal plans to secure a portion of the
offshore wind market expected to be valued at EUR 227 billion by 2030. Portugal sees
its chance in sectors which the country is already active in, such as the production of
foundations and turbine towers, which is expected to be worth EUR 39 billion year by

133
2030. The government projects that potential exports could increase current
employment in the active sectors by ten times, with the greatest potential for exports
seen in the development of floating wind technology.
In terms of active offshore wind projects in Portugal, in November 2016, the
Council of Ministers in Portugal gave the green light to the development of
the WindFloat Atlantic (WFA) project in Viana do Castelo, 20km off the coast
of Northern Portugal, which is scheduled to be operational next year.
When it comes to the developments in the country’s supply chain, ASM
Industries has signed a concession agreement with the Port of Aveiro Administration
(APA), and will start building a new industrial production unit dedicated to offshore
wind in January 2018. The company will also set up ASM Offshore, an autonomous
business unit for manufacturing offshore wind towers and foundation.
One of the main issues is to create an industrial strategy which supports
offshore renewable energy. The Portuguese Government (DR, 1ª série, nº 227, 24 de
novembro de 2017: 6180 ) set up areas with which the industry needs to deal:
1- to stimulate export from value added investments: to be competitive based
on floating technology; to attract investments for wave energy based on
competitiveness of R&D; to diversify and differentiate secondary renewable offshore
energy business models.
2-to reduce risks in industry: to reduce technological risks with the renewable
energy Port Tech clusters; to increase the development cycle; to reduce investment
risks with the cooperation between public and private organisations; to simplify
licences for Pilot-Zones.
Both strategies aim exporting offshore renewable innovative technology,
creating intellectual property and qualified employment.
Therefore, the following value chain for floating renewable offshore energy is
expected:
Planning– preparatory studies;

134
Turbine– design and engineering services; turbine construction; tower
construction; installation, wind turbine blades construction;
Platform– design and engineering services; platform construction; assembly of
platform; anchoring systems; inter-array cable construction;
Installation –anchoring system; cables; tugboat pier and support installations;
Network system connection– installation and network connection;
Services maintenance – turbines and platforms.
Figure 38– The Basic Wind Industry Value Chain Source: MackKinnon (2018:8)
According to the DR, 1ª série, nº 227, 24 de novembro de 2017, it is possible to present
a potential offshore energy cluster in Portugal with the following vectors:
Organisations, Port tech Clusters, Portuguese Government and Financial institutions.

135
Figure 39 - The Potential Offshore Wind Farm Intervenient
It is expected that the Industrial Strategy for Ocean Renewable Energies (EI-
ERO) will promote exportation with high technological intensity, and will develop a
new value chain based on sustainability, employment and value added investment.
On the other hand, EI-ERO will be responsible for network port connections
based on economic and industrial innovation with specialized jobs, growth and
customers.
Moreover, it is expected that a new type of jobs, knowledge and cooperation
will bring a new challenge for this emerging industry.

136

137
CHAPTER 6– A GEOGRAPHICAL ANALYSIS OF THE PORTUGUESE
OFFSHORE COAST
The chapter six is a geographical analysis of the Portuguese offshore coast. This
chapter analyses why offshore energy production is influenced by the continental
shelf, wind and wave features. Therefore, wave and wind potential and factors in the
region where the offshore wind project is implemented are analysed.

138
6.1 WIND AND WAVE RESOURCES
The best way to study a geographic region is to study the natural resources
features. Offshore energy in Portugal is influenced by the continental shelf, wind and
wave features.
However, to make predictions about offshore projects and its success it is
necessary to analyse the physical features. Offshore projects are dependent on the
impacts of climate change and energy technologies. These two factors are the
supporting information to make offshore investment decisions in the future.
The energy production from renewable is completely safe from climate change
point of view (Hassan, 2004:3) and its contribution to emissions of carbon dioxide are
low or nule (Esteban et al., 2011).
Therefore, variables such as: temperature, rain, wind velocity, storms, floating
and dry weather, sea level, and radiation and nebulosity perform the expectations for
offshore projects in the future (Alves, 2013).
For this research the wind and wave resources were considered because they
are the main factors which influence offshore energy production in Portugal.
For offshore wind and wave, the climate change variables are considered:
temperature growth, storms and sea level.
In both cases it is expected that production of wind and wave will decrease
(Alves, 2013); firstly the temperature will decrease the potential output because of low
air density; secondly, storms will conduct the wind system and wave system to low
levels of production, and thirdly, the increase in the sea level will change electric
production.
6.1.1 Wave resources
Wave energy is considered as one of the renewable energy sources with
potential development over the coming years (Mota and Pinto, 2014) due to the
various several technological solutions and intensive research work (Tabuada and
Lemu, 2016).

139
Tabuada and Lemu (2016) present the relationship between wind and waves
towards a useful exploitation of renewable offshore resources. From this point of view,
the best wave resources occur in areas where strong winds have travelled over long
distances.
Figure 40– International Distribution of Wave Power Potential17 Source: Taboada and Lemu (2016:2)
The same study presents the relationship between wave speed and water
depth in the ocean in order to create energy. This means that the energy associated
with the motion of water particles has both kinetic and potential forms due to the
respective orbital and vertical motion of the particles. Studies show that the total
energy, which is proportional to the square of the wave height, is equally divided
between kinetic and potential energy forms (Taboada and Lemu, 2016: 3).
17
the legend refers to the potential wave power in the different regions in kW/m or MW/km,

140
Figure 41– Wave Characteristics and Changes in Orbital Motion of Water Particles in Deep Water (top) and Shallow Water (bottom)
Source: Taboada and Lemu (2016: 3)
To conclude, the typology of waves in ocean is presented according to the
World Meteorological Organization's (WMO) code for sea state, including wave heights
and their descriptive characteristics.
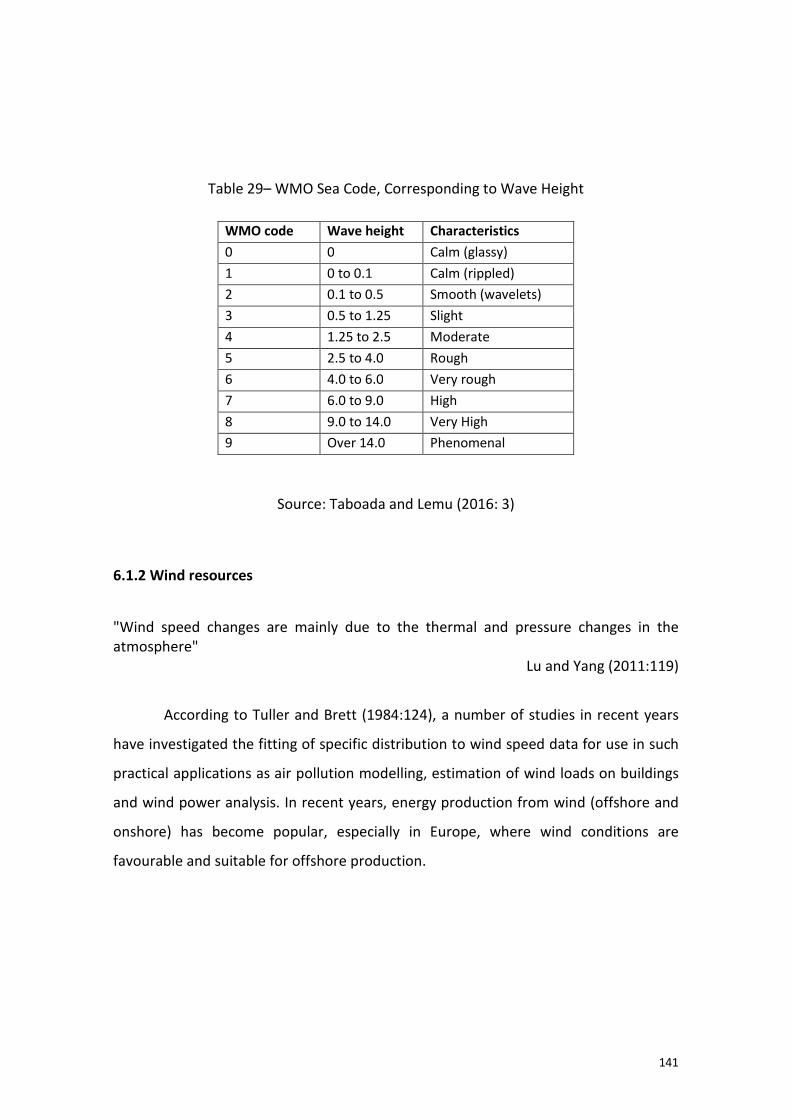
141
Table 29– WMO Sea Code, Corresponding to Wave Height
WMO code Wave height Characteristics
0 0 Calm (glassy)
1 0 to 0.1 Calm (rippled)
2 0.1 to 0.5 Smooth (wavelets)
3 0.5 to 1.25 Slight
4 1.25 to 2.5 Moderate
5 2.5 to 4.0 Rough
6 4.0 to 6.0 Very rough
7 6.0 to 9.0 High
8 9.0 to 14.0 Very High
9 Over 14.0 Phenomenal
Source: Taboada and Lemu (2016: 3)
6.1.2 Wind resources
"Wind speed changes are mainly due to the thermal and pressure changes in the atmosphere"
Lu and Yang (2011:119)
According to Tuller and Brett (1984:124), a number of studies in recent years
have investigated the fitting of specific distribution to wind speed data for use in such
practical applications as air pollution modelling, estimation of wind loads on buildings
and wind power analysis. In recent years, energy production from wind (offshore and
onshore) has become popular, especially in Europe, where wind conditions are
favourable and suitable for offshore production.

142
Table 30– The Relationship between the Beaufort and Douglas Scales
Beaufort (wind) m/s Douglas (Wave) High (m)
0 Calm 0.0-0.2 Calm-glassy 0
1 Light air 0.3-1.5 Calm-Rippled 0.00-0.1
2 Light breeze 1.6-3.3 Smooth 0.2-0.35
3 Gentle breeze 3.4-5.4 Smooth
Slight
0.35-0.5
0.5-1
4 Moderate breeze 5.5-7.9 Slight
Moderate
1-1.25
1.25-1.5
5 Fresh breeze 8.0-10.7 Moderate 1.5-2.5
6 Strong breeze 10.8-13.8 Rough 2.5-4
7 Near gale 13.9-17.1 Very rough 4-5.5
8 Gale 17.2-20.7 Very rough
High
5.5-6
6-7.5
9 Strong gale 20.8-24.4 High
Very high
7.5-9
9-10
10 Storm 24.5-28.4 Very high 10-12
11 Violent Storm 28.5-32.7 Very high
Phenomenal
12-14
14-16
12 Hurricane, Typhoon >=32.7 Phenomenal >16
Source: www.institutohidrografico.pt, in 10/02/2017
The study of wind conditions follows the Beaufort scale and can be linked with
the Douglas scale.
The relationship between these scales is important due to the need for a
precise location for offshore equipment, related with wind, waves and tides.
The next figure shows the wind resource over sea. Offshore energy projects in
Europe are mostly where there are exceptional wind conditions, such as Scotland,
Denmark and Germany.

Figure 42– Values of Sea Winds at Different Heights (European Offshore Wind Atlas)
Wind typology is div
(Mourão, 2010: 5-7).
• The constant are:
of high pressure zones (
Alisios Winds
originated by the rise of the trade winds when they reach low pressure
(equator); West Winds
tosub-polar areas;
temperate zones.
• The continental are:
airflows due to the difference between nearby surfaces;
Values of Sea Winds at Different Heights More than 10 km from Offshore Wind Atlas)
Source: Santos (2012:19)
ind typology is divided into two categories, constant and continental
The constant are: Alisios Winds–winds caused by the mass displacement
igh pressure zones (tropics) follow pressure zones (equator);
Alisios Winds–winds blowing from the equator to the poles
originated by the rise of the trade winds when they reach low pressure
West Winds–winds blowing west from subtropical areas
polar areas; Polar Winds–winds blowing from the poles to
temperate zones.
The continental are: Sea breeze–breeze is the generic name given to
ue to the difference between nearby surfaces;
143
rom the Coast
two categories, constant and continental
inds caused by the mass displacement
ure zones (equator); Contra-
or to the poles at altitude,
originated by the rise of the trade winds when they reach low pressure
inds blowing west from subtropical areas
inds blowing from the poles to
reeze is the generic name given to
ue to the difference between nearby surfaces; Mountain and

144
Valley Breeze– this circulation of breeze occurs due to the topographical
features. At a given level of pressure in the valley, the atmospheric air is
found to get away from the ground; Circulation in the Lakes and Towns
Neighbourhoods–the breeze circulation described above has its origin in
factors that produce horizontal temperature gradients; Thermal
Depressions– this phenomenon has particular relevance because it helps
to understand certain wind regimes that occur in Continental Portugal.

145
6.2 PORTUGUESE OFFSHORE GEOGRAPHY
"O mar português (porção do oceano associada a Portugal) é constituído pró camadas de água que se sobrepõem: - águas profundas (mais de 300 m de profundidade) e frias (3ºC) do Atlântico Norte, provenientes de áreas da Noruega e Gronelândia; - água de origem mediterrânica, quente, que circula entre os 400 e os 1500 m de profundidade; - água central do Atlântico do nordeste, que constitui a camada superficial, com um ramo subtropical e outro subpolar"
Ramalho et. al (2010:180)
Portugal has good natural and weather conditions for offshore wind energy:
average to large depth of waters and fast winds, even if the winter winds are moderate
across the Atlantic façade (Costa&Estanqueiro, 2006).Climate change is already
evident and expected for the twenty-first century and it will have a significant impact
on energy systems in southern Europe, particularly in Portugal (Alves, 2013:IV).
The case study (offshore energy projects) relates two main climate variables,
the wind and the waves on the western coast.
Offshore energy projects started on the NW Portugal coast. Both wind and
wave projects were installed due to the favourable climate conditions. Therefore,
authors such as: Cruz and Sarmento (2004); Santos(2012); Mota and Pinto (2014)
clarify the importance of climate features on waves and wind for these areas and their
relation with the infrastructure implemented.
6.2.1 The Continental Shelf
"The continental shelf of a coastal State comprises the seabed and subsoil of the submarine areas that extend beyond its territorial sea throughout the natural prolongation of its land territory to the outer edge of the continental margin, or to a distance of 200 nautical miles from the baselines from which the breadth of the territorial sea is measured where the outer edge of the continental margin does not extend up to that distance"
Article 76, nº 1, UN Convention on the Law of the Sea

146
The importance of presenting the continental shelf in this study is related to the
implementation of offshore energy projects. Therefore, three main areas are
discussed: 1- territorial sea; 2- contiguous zone and 3- exclusive economic zone (EEZ) (
figure 45).
Figure 43– The Continental Shelf Source: http://www.un.org/Depts/los/clcs_new/marinezones.jpg -on 22/01/2017
The exclusive economic zone (EEZ) is an area beyond and adjacent to the
territorial sea, subject to the specific legal regime established in this Part, under which
the rights and jurisdiction of the coastal State and the rights and freedoms of other
States are governed by the relevant provisions of this Convention (UN Convention on
the Law of the Sea, art 55:43).
The exclusive economic zone is an area beyond and adjacent to the territorial
sea, extending seaward to a distance of no more than 200 nautical miles (370 km) out
from its coastal baseline.
The exception to this rule occurs when exclusive economic zones mayoverlap;
that is, state coastal baselines are less than 400 nautical miles (740 km) apart. The

147
exclusive economic zone stretches much further into sea than the territorial waters,
which end at 12 miles (22 km) from the coastal baseline (if following the rules set out
in the UN Convention on the Law of the Sea).
The EEZ include the contiguous zone. States also have rights to the seabed of
what is called the continental shelf up to 350 nautical miles (648 km) from the coastal
baseline, beyond the exclusive economic zones, but such areas are not part of their
exclusive economic zones.
The legal definition of the continental shelf does not directly correspond to the
geological meaning of the term, as it also includes the continental rise and slope, and
the entire seabed within the exclusive economic zone.
Portugal has the 10th largest EEZ in the world.
Presently, it is divided into three non-contiguous sub-zones: Continental
Portugal 327,667 km2; Azores 953,633 km2; Madeira 446,108 km2; Total:
1,727,408 km2.
Portugal submitted a claim to extend its jurisdiction by an additional 200 miles,
which means over2.15 million square km of the neighbouring continental shelf in May
2009, resulting in an area with a total of more than 3,877,408 km2.

148
Figure 44– The Exclusive Economic Zone of Portugal Source: http://www.emepc.pt/images/pdf/MapaPortugalMar.pdf -consulted in 21/10/2017
The Continental Shelf Extension Project (CSEP) gives Portugal sovereignty over
the soil and subsoil in the area beyond 200 nautical miles. The benefits arising from the
Continental Shelf Extension Project shall be felt to their maximum extent by future
generations. The process to extend CSEP will be finished in 2021.
The exploitation of mineral resources, one of the cornerstones of developing
any society, and this new sovereignty over more territory, will provide new
opportunities for accessing natural resources with high economic potential. Apart from
these, the CSEP was and still is an opportunity to:

149
• Increase the international influence of Portugal – better know-how and greater
visibility with the demonstration of knowledge and scientific and technological
capacity in the broad field of marine sciences;
• Unequivocally strengthen the position of Portugal in matters relating to the sea
and oceans;
• Acquire and develop new equipment and new technologies, increasing
operational capacity for accessing the deep sea;
• Investment in innovative research and development initiatives;
• Contribute to scientific development, particularly in areas such as
hydrographical, geology, geophysics, oceanography, biology, robotics and
international law, supporting research projects and establishing partnerships
with laboratories, institutes and universities at national and international level;
The CSEP will allow Portugal to an increasingly position itself as a major
European maritime nation, and will constitute at the same time a legacy for future
generations, who will be able to enjoy and sustainably exploit this vast maritime
domain, creating more wealth and providing a better quality of life for the Portuguese.
6.2.2 Wave conditions in Portugal
“As wave energy is considered as one of the renewable energy sources with a development potential over the coming years, several technological solutions are under intensive research”
Taboada and Lemu(2016:1).
Wave conditions on the offshore Portuguese coast result from a 15-year (1995
to 2010) wind-wave simulation (Mota and Pinto, 2014:10).
Maritime shaking is directly related with the wave features defined by the wind
speed (IPMA, 2004).
In Portugal there are four main typologies in the western sea:

150
a) Northwestern sea (NW): the sea conditions are a result of NW wind from the
North Atlantic and local winds (N and NW).During the winter time, the waves
are between 2.5m/9s north of Cabo Raso, and 2m/8s south of Cabo
Espichel. During the summer time, the waves are between 1-1.5m/7-8s in
Cascais Barra do Tejo and Cabo Espichel- Barra do Sado.
b) Southwest sea (SW): the sea conditions are related to depressions or front
surfaces in the SW Iberian Peninsula, normally during winter or transition time.
Normally the waves are between 3-4m/9-10s, and sometimes the waves can
reach 7m. The regions Cascais Barra do Tejo and Cabo Espichel- Barra do Sado
have lower waves than the rest of the coast.
c) Western storm: the sea conditions are related to the polar front which gives
rise to west strong waves or very strong waves. The SW wind is strong and the
sea is ruffled. This type of weather conditions is typical in winter time. The
waves are between 8 m (north) and 7 m (south)/16 s.
d) Out sea: the sea conditions are related with weak wind and the waves can
come from long distances. Usually the waves have NW and W directions (winter
time). The waves are between 1-1.5m/14s. The waves’ condition is directly
related to the seabed, and more and deeper waves can be created.
e) Sea bath: the sea conditions are related with weak wind. Normally, this
situation occurs in just 4% in the north region and 10% in the south during the
year. The waves are between 0.5-1 m with NW and WNW direction.
The study presented by Mota and Pinto (2014:11) states that the Portuguese
west coast has essentially two distinct broad regions concerning offshore potential
wave energy; the north and centre west coast corresponding to grid points 1 and 5,
with an average wave power density ranging from 28.11 kW/m to 30.90 kW/m, and

the southwest coast represented by grid points 6 and 7, with an a
density of 21.51 kW/m and 22.96 kW/m, respectively.
The contribution to
figures (figure 45 and 46).
Figure 45– Location of the Offshore Model Grid Points and Nearshore Linear Sectors.
According to the author the figur
nearshore linear sectors considered in this study. The first five offshore sites, covering
the north and center west coast, match computational grid model points while the two
southwest offshore sites are staggered grid mode
segmentation follows the main geometric characteristics of the Portuguese west coast,
identifying local coastline orientation for estimate shoreward wave transformation.
Due to its complexity, the nearshore sector between C
considered in this analysis. However, the shielding effect of the Raso Cape (Cascais)
the southwest coast represented by grid points 6 and 7, with an average wave power
density of 21.51 kW/m and 22.96 kW/m, respectively.
to offshore wave energy by regions is presented in the next
.
Location of the Offshore Model Grid Points and Nearshore Linear Sectors.
Source: Mota and Pinto (2014:10)
According to the author the figure 45 presents the offshore locations and the
nearshore linear sectors considered in this study. The first five offshore sites, covering
the north and center west coast, match computational grid model points while the two
southwest offshore sites are staggered grid model points. The selected shoreline
segmentation follows the main geometric characteristics of the Portuguese west coast,
identifying local coastline orientation for estimate shoreward wave transformation.
Due to its complexity, the nearshore sector between Cascais and Sines was not
considered in this analysis. However, the shielding effect of the Raso Cape (Cascais)
151
verage wave power
offshore wave energy by regions is presented in the next
Location of the Offshore Model Grid Points and Nearshore Linear Sectors.
the offshore locations and the
nearshore linear sectors considered in this study. The first five offshore sites, covering
the north and center west coast, match computational grid model points while the two
l points. The selected shoreline
segmentation follows the main geometric characteristics of the Portuguese west coast,
identifying local coastline orientation for estimate shoreward wave transformation.
ascais and Sines was not
considered in this analysis. However, the shielding effect of the Raso Cape (Cascais)

152
and Espichel Cape prevents direct incidence of the dominant NW waves and, as a
consequence, relatively declining in wave energy resource is expected along this
sector.
Figure 46– Average Annual Offshore Wave Power Density in Each Offshore Site and
Wave Energy Potential in Sections Parallel to the Coastline (Coloured Segment) and
Along the Annual Mean Wave Direction (Coloured Arrow).
Source: Mota and Pinto (2014:14)
The next figure (figure 47) presents the wave features and their implications on
energy production. It is clear that the regions with most impact are in north region, as
was explained due to the climate features.
This means that the north region can be considered the region which is related
positively with the wind and waves and therefore, with good parameters for offshore
energy production.

153
The coastline between Nazaré and Peniche appears to be the most suitable for
wave energy recollection, as it presents very few losses per metre of total annual
energy in all situations. It presents offshore wave power density and 50 m depth
annual wave energy flux in each site, for sections parallel to the coastline and sections
normally oriented to the annual mean wave peak direction.
The relationship between the coastline orientation and the available wave
energy parallel to the coastline is visible in the section between Nazaré and Peniche,
where a suitable coastal orientation clearly benefits the local available wave energy
flux.
On the other hand, the section between Viana do Castelo and Porto,
characterized by a shoreline orientated towards the southwest quadrant, showed a
significant energy flux reduction parallel to the coast (Mota and Pinto, 2014: 14).

Figure 47– Annual Wave Energy Flux Offshore and at 50, 40, 30 and 20 m Depth Considering Self-Orientating WEC, Fixed WEC Deployments Orientated
Annual Wave Energy Flux Offshore and at 50, 40, 30 and 20 m Depth Orientating WEC, Fixed WEC Deployments Orientated
Annual Peak Source: Mota and Pinto (2014:15)
154
Annual Wave Energy Flux Offshore and at 50, 40, 30 and 20 m Depth Orientating WEC, Fixed WEC Deployments Orientated with the Mean

6.2.3 Offshore wind conditions in Portugal
“Marine geotechnical studies are still innovative in Portugal, especially offshore, where marine resources have the greatest potential”
The point stresses the importance of wind conditions in Portugal as a main
factor to explain the project "offshore wind farm
presented by Silva (2011) refers
potential for offshore wind farms in Portugal.
Figure 48– Portuguese Areas
6.2.3 Offshore wind conditions in Portugal
geotechnical studies are still innovative in Portugal, especially offshore, where marine resources have the greatest potential”
Pombo et al. (2015: 399)
The point stresses the importance of wind conditions in Portugal as a main
in the project "offshore wind farm in Portugal- EI-ERO
presented by Silva (2011) refers to the main geographic features
offshore wind farms in Portugal.
Portuguese Areas with Potential for Offshore Wind Farms
Source: Silva (2011:16)
155
geotechnical studies are still innovative in Portugal, especially offshore, where
Pombo et al. (2015: 399)
The point stresses the importance of wind conditions in Portugal as a main
ERO". The study
the main geographic features in areas with
Offshore Wind Farms

156
The main climate features which influence implementation are based on wind
and waves. Therefore, the infrastructure for these projects was based on the following
factors: variation of speed with height; the roughness of the terrain, which is
characterized by vegetation, land use and buildings; the presence of obstacles in the
vicinity; the relief which may cause effect of acceleration or deceleration on the flow
of air (Lopes, 2009:38).
Table 31–Wind speed 100 m high (m/s)
zone IRIE Model Wind Atlas
Zone 1 5.73 7.58
Zone 2 6.43 7.39
Zone 3 6.51 7.53
Table 32- Wave height (m)
zone WaveWarch
III
Ondatlas
Zone 1 1.16 2.01
Zone 2 1.24 2.00
Zone 3 1.35 2.13
Source: Silva (2011:11)

157
Figure 49– Places Most Conducive to the Use of Sea Winds on the Portuguese Coast18 Source: Santos (2012: 28)
Table 33- Electric Production by Portuguese Region
Area Region Production
Estimates (NEP's)
GEWE 1,5 SL
(h/year)
Production
Estimates (NEP'S)
VESTAS V80
(h/year)
Distance from the
coast (km)
A Espinho/Porto 2600-3000 2600-2800 5
B Figueira da Foz 2600-3000 2600-2800 5
C Berlengas/Peniche 3400-3700 2800-3200 10 to 15
D Estuário do Tejo 2400-2600 2000-2400 0.5 to 7
Caparica 2600-3000 2200-2600 5 to 7
Setúbal/ Troia 2600-3000 2000-2600 5
E Bordeira 2600-3400 2800-3000 2 to 3
Portimão/Albufeira 2600-3000 2200-2600 5
F Vila Real de Santo António 2600-3000 2200-2600 10 to 15
Source: Santos (2012: 29)
18
The legend is the same as the figure 50 (energy production/year).

158
As the author points out that the offshore areas reflects a potentiality for all
regions in terms of energy production.
In terms of climate conditions the option for Ei-Ero- project was the Zone 1,
where there are wind conditions for its implementation. The document ( DR, 1ª serie ,
nº 227, 24/11/2017) which supports the EI-Ero project don’t mention directly the
natural impacts from EI- ERO project.

159
160
CHAPTER 7– THE INPUT-OUTPUT MATRIX
"Leontief was extremely critical of most economic theorists, especially of those who
failed to understand economics as an empirical and applied science"
Dietzenbacher and Lahr (2004:9)
The chapter seven focuses on a theoretical model where the input-output matrix is
presented along with its importance on this research based on an analytical analysis
and the usefulness of the IO matrix, as well as, its advantages and limitations. To
complete the analysis, this research is applied to the presentation of economic impact
scenarios based on IO matrix. As such, some indicators are discussed and the total of
type I and type II multiplier is presented. To finish the chapter, the Portuguese IO
matrix for energy sector is presented.

161
7.1 THE INPUT-OUTPUT MATRIX
"One of Leontief's major contributions to economics, of course, was to economic theory"
Dietzenbacher & Lahr" (2004:9)
Economic policies face a dual problem, the empirical and theoretical research
which performs the macroeconomic data; a mixed economic structure composed by
national accounts and input-output (IO) sectors consistent with solving economic
problems based on linkages between them. The economic model which allows the
study of these linkages is the Input-Output matrix.
Wassily Leontief (1905- 1999) was the founding father of IO model economics.
(Dietzenbacher and Lahr, 2004:1).The work presented in 1936 by Wassily Leontief
allowed analysis of the interdependence of industries in the economy and became a
major tool in quantitative economics. Needless, to say, developments in input-output
analysis have been crucial for the evolution of economics as a science. The IO model
developed by Wassily Leontief (1936) helped to create its own set of followers and
revive the classical Ricardian and Marxian theories through the analysis of the linear
production systems used in neo-Walrasian theory (Dietzenbacher and Lahr, 2004:xix).
Miller and Blair (2009:1) and Dietzenbacher and Lahr(2004)described the IO
matrix developed by Wassily Leontief as a system of linear equations, each one of
which describes the distribution of an industry's product throughout the economy.
The basic Leontief IO matrix is generally constructed from observed economic
data for a specific geographic region (nation, state, county, etc.).One is concerned with
the activity of a group of industries (inputs) in the process of producing each industry's
own output. The fundamental information used in IO analysis concerns the flows of
products from each industrial sector, considered as a producer, to each of the sectors,
itself and others, considered as consumers.
This basic information from which an IO model is developed is contained in an
interindustry transaction table. The basis of any input-output system is a transactions
table: a two-way ordering of all interindustry sales and purchases during a given time
period (usually a year). To complete the system a column of sales to ultimate users (or

162
final demand) is added on the right-hand side of the transaction table, and a
corresponding row, called value added (or payment sectors), is included at the bottom
of the table (Dietzenbacher and Lahr, 2004:90).
The rows of such tables describe the distribution of a producer's output
throughout the economy (Miller and Blair, 2009:2). This is the raw material of an input-
output model, from which a number of coefficients are calculated and used for a
variety of analytical purposes (Dietzenbacher and Lahr, 2004:90).
The columns describe the composition of inputs required by a particular
industry to produce its output.
These interindustry exchanges of goods constitute the shaded portion of the
table (Figure 6.1) (Miller and Blair, 2009:2).
The mathematical structure of an IO system consists of a set of a n linear
equations with n unknowns; an IO model is constructed from observed data for a
particular economic area; the necessary data are the flows of products from each of
the sectors (as a producer/seller) to each of the sectors (as a purchase/buyer); these
interindustry flows, or transaction (or intersectoral flows – the terms industry and
sectorare often used interchangeably in IO analysis) are measured for a particular time
period (usually a year) (Miller and Blair, 2009:10). A production matrix is restricted to
information on domestic output of industries by product (Eurostat, 2008:89).
Table 34– Input-Output Transaction Table
Agric. Mining Const. Manuf. Trade Transp. Services others
Personal
Consumption
Expenditures
Gross
Private
Domestic
Investment
Govt.
Purchasases of
Goods &
Services
Net Exports
of Goods &
Services
Agric.
Mining
Const.
Manuf.
Trade
Transp.
Services
others
Employees
Business Owners
and Capital
Government
P
R
O
D
U
C
E
R
S
PRODUCERS AS CONSUMERS FINAL DEMAND
V
A
L
U
E
A
D
D
E
D
Employee compensation
Profit -type and capital consumption allowance
Indirect business taxes
GROSS DOMESTIC PRODUCT
Source: Miller and Blair (2009: 3)

163
Table 35– The IO table
Industries/ Industries Final uses Total
Products Agriculture Industry Services activities
Final consumption
Gross capital formation
Exports
Agricultural products
Intermediate consumption by product final uses by product Total use by product (x'ij)
Industrial products
and by industry (xij) and by category (yij)
Services
Gross Value Added
Value added by component and by industry (zj)
Value added (zn)
Total Total output by industry (Xn) Total final uses by category (yn) X'n
Source: Eurostat (2008:20)
The compilation of supply and use tables has often been associated with the
construction of symmetric input-output tables. This approach has led to a practice in
many countries where supply and use tables (SUT) are calculated after the compilation
of the national accounts has been completed (Eurostat, 2008: 51).Despite the
problems that come with national accounts aggregation, the goal is to provide the
ideal framework guaranteeing the consistency of supply and demand in the system at
current and constant price and the overall quality of national accounts.
According to Eurostat (2008: 51) the recommendation for compiling SUT as an
integral part of production of national accounts can be formulated in general terms as
follows: supply and use tables are the most efficient way to incorporate all basic data –
aggregated or detailed – into the national accounts framework in a systematic way;
supply and use tables effectively ensure the consistency of results at a detailed level
and thereby improve the overall quality of national accounts; the SUT's framework
provides the natural statistical framework to include the components of the
production, income and the expenditure approaches to measuring GDP, thereby
enabling a coherent and balanced estimate of GDP both in current prices and constant
prices to be achieved; the balanced STU's provide consistency and coherency between
the first three accounts for a National Accounts framework: Goods and Services

164
Accounts; Production Accounts by industry and sector; and Generation of Income
Accounts by industry and sector.
Table 36– Classification of Products and Industries in Empirical Tables
Products (P6)
Nº Reference
CPA19 2002
Description Products (short term)
1 A+B Products of agriculture, hunting and forestry, fish +
other fishing products
Products of agriculture
2 C+D+E Products from mining and quarrying,
manufactured products, energy products, gas and
water
Products of industry
3 F Construction work Construction work
4 G+H+I Wholesale and retail trade, repair services, hotel
and restaurant services, transport and
communication services
Trade, hotel, transport
services
5 J+K Financial intermediation services, real estate,
renting and business services
Financial, real estate,
business services
6 L TO P Other services Other services
Source: Eurostat (2008: 59)
The CPA comprises approximately 3150 products. Ideally each product should
be balanced in terms of supply and demand in the system of national accounts. For
each product, the total supply is estimated from total output basic prices, CIP20
19
CPA (Statistical Classification of products by activity in the European Economic Community). The CPA
is the European version of CPC (central product classification). Whilst the CPC is merely a recommended
classification, the CPA is legally binding in the European Community (Eurostat, 2008:553)
20 CIF price ( i.e. cost, insurance and freight price) is the price of a good delivered at the frontier of the
importing country, including any insurance and freight charges incurred to that point, or the price of a
service delivered to a resident, before the payment of any import duties or other taxes on imports or
trade and transport margins within the country; in SNA (System of National Accounts) 1993 this concept
is applied only to detailed imports ( Eurostat, 2008:551)

165
imports and the corresponding trade and transport margins and the net taxes on the
specific product.
The goal is to achieve a better performance from national accounts and
homogeneity within European countries.

166
7.2 THE IO MODEL AND ANALYTICAL ANALYSIS
"Input-Output models when applied correctly can be powerful tools for estimating the economy-wide effects of an initial change in economic activity"
Bess and Ambargis (2011:2)
Assume that the economy can be categorized into n sectors. If we denote asxi
the total output (production) of a sector I and as fi the total demand for sector i's
product, the zij terms represent interindustry sales by sector i (also known as
intermediate sales) to all sectors j (including itself, when j=i), we may write a simple
equation accounting for the way in which sector I distributes its product through sales
to other sectors and to final demand:
xi = zi1+ zi2 +…….+ zij + fi= + fi
Considering the correspondent matrix:
x= , Z= and f=
The interindustry matrix will be:
Table 37– Buying and Selling Sector
1 2 … j … n
1 z11 z12 … z1j … z1n
2 z21 z22 … z2j … z2n
… …. … …. … … ….
i zi1 zi2 zij …. zin
…
n zn1 zn2 znj znn
Buying sector
sell
ing
se
cto
r

167
The primary inputs together are termed the value added in sector j. The
imported goods may be purchased as inputs by sector j. All of these inputs (value
added and imports) are often lumped together as purchases from what is called the
payments sector, whereas the z's on Table 3 serve to record the purchases from the
processing sector, the interindustry inputs (or intermediate inputs). Since the equation
from the table includes the possibility of purchases by a sector of its own output as an
input to production, these interindustry inputs include intraindustry transactions.
The magnitudes of these interindustry flows can be recorded in a table, with
sectors of origin (producers) listed on the left and the same sectors, now destinations
(purchases), listed across the top. From the column point of view, these show each
sector’s inputs; from the row point of view, the figures are each sectors outputs; hence
the name input-output table. These figures are the core of input-output analysis (Miller
and Blair, 2009: 12).
Table 38– Expanded Flow Table for a Two-Sector Economy
PROCESSING SECTORS TOTAL
1 2 OUTPUT (x)
PROCESSING 1 z11 z12 c1 i1 g1 e1 x1
SECTORS 2 z21 z22 c2 i2 g2 e2 x2
PAYMENT
VALUE
ADDED l1 l2 lc lI lG lE L
SECTORS (v') n1 n2 nC nI nG nG N
IMPORTS m1 m2 mC mI mG mE M
x1 x2 C I G E X
FINAL
DEMAND
TOTAL OUTLAYS (x')
Source: Miller and Blair (2009: 14)
The components part of final demand vector for sectors 1 and 2 represents,
respectively, consumer (household) purchases, purchases for (private) investment
purposes, government (federal, state and local) purchases, and sales abroad (exports).
These are often grouped into domestic final demand (C+I+G) and foreign final demand
(exports, E). The fi= c1+i1+g1+e1 and similarly f2= c2+i2+g2+e2.
The components parts of the payment sector are payments by sector 1 and 2
for employee compensation (labour services, l1 and l2) and for all other value-added

168
items, for example, government services (paid for in taxes), capital (interest
payments), land (rental payments), entrepreneurship (profit), and so on. For this
example (two sectors) these other value-added payments are by n1 and n2; then total
value-added payments are v1=l1+n1, and v2=l2+n2. Finally, assume that some (or
perhaps all) sectors use imported goods in producing their outputs. One approach is to
record these import amounts in an import row in the payments sector as m1 and m2.
Total expenditures in the payments sector by sector 1 and 2 are l1+n1+m1=v1+m1 and
l2+n2+m2=v2+m2. However, it is often the case that the exports part of the final
demand column is expressed as net exports so that the sum of all final demands is
equal to traditional definitions of gross domestic product, i.e., net of import. In that
case, a distinction is often made between imports of goods that are also produced
(competitive imports) and those for which there is no domestic source (non
competitive imports), and all the competitive imports in the imports row will have
been netted out of the appropriate elements in a gross exports column.
The elements in the intersection of the value-added rows and the final demand
columns represent payments by final consumers for labour services and for other
value added. The imports row and final demand columns represent imported items
that are re-exported.
To sum up, the total output column, total gross out, throughout the economy, X, is
found as:
X= x1 + x2 + L+ N+M or X=x1+x2+C+I+G+E
The relationship between sectors in terms of input and output for one unit to
be produced is called the technical coefficient: aij= Zij/Xj.
This means that the aij are viewed as measuring fixed relationships between a
sector's output and inputs. Economies of scale in production are ignored; production in
Leontief systems operates under what is known as constant returns of scale.
Production functions relate the amounts of input used by the sector for the
maximum amount of output that could be produced by the sector with those inputs.
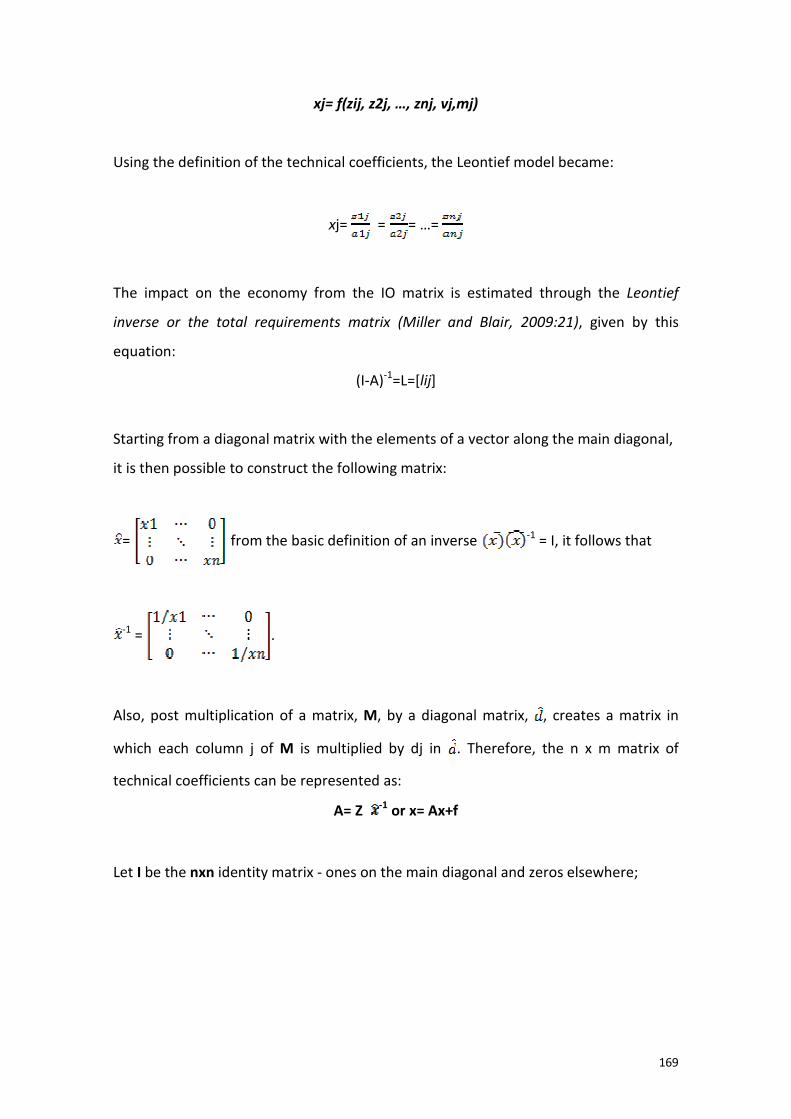
169
xj= f(zij, z2j, …, znj, vj,mj)
Using the definition of the technical coefficients, the Leontief model became:
xj= = = …=
The impact on the economy from the IO matrix is estimated through the Leontief
inverse or the total requirements matrix (Miller and Blair, 2009:21), given by this
equation:
(I-A)-1=L=[lij]
Starting from a diagonal matrix with the elements of a vector along the main diagonal,
it is then possible to construct the following matrix:
= from the basic definition of an inverse -1 = I, it follows that
-1 = .
Also, post multiplication of a matrix, M, by a diagonal matrix, , creates a matrix in
which each column j of M is multiplied by dj in . Therefore, the n x m matrix of
technical coefficients can be represented as:
A= Z -1 or x= Ax+f
Let I be the nxn identity matrix - ones on the main diagonal and zeros elsewhere;

170
I= so then (I- A) =
Then the complete nxn system shown is
(I-A) x=f
For a given set of f's, this is a set of n linear equations in the n unknowns, x1, x2,
xn and hence it may or may not be possible to find a unique solution. In fact, whether
or not there is a unique solution depends on whether or not (I- A) is singular; that is,
whether or not (I-A) -1 exists. The matrix A is known as the technical coefficient
matrix (Miller and Blair, 2009, 21).

171
7.3 THE USEFULNESS OF THE IO MODEL
"Ideally, in constructing a regional input-output model, one would want to carry out a
detailed survey of the regional economy, to establish the strength of the inter-
relationships that exist among sectors"
Flegg and Webber (1996:1)
The IO model is one of the main analytical instruments to study the relationship
between industrial sectors and the impact of those on the economy.
Dorfman (1954:121) briefly describes the first studies made following Leontief's
IO methodology, pointing out four main areas of study: the development of dynamic
models; interregional models; capital production requirements and determinants of
investment in real capital; production functions and determinants of household
consumption.
Over the years many authors have extended the IO model to various issues,
such as energy, the environment, tourism, health, and others related with economic
activity. Flegg and Webber (1996:2) point out that the main issue of an IO matrix is the
transaction matrix, which shows the extent to which each sector depends on itself and
others for its output.
As Flegg et al (1995:1) point out IO analysis has become a routine tool for
impact analysis.
The IO model describes how economy works in a certain geographical area, and
reflects the economic changes between agents and their interdependency (Matias et
al., 2011:72) with some restrictions: each sector has his own product with its own
input structure (homogeneity); the technological conditions are stable; the prices are
constant; the production function is linear (economies of scale), and the input supplies
are elastic (infinite) (Haddad et al., 2011; Henriques, 2008).
The importance of using IO tables in regional performance has gained impact
with geographers and economists when studying regional performance (e.g. Aujac, H.;
Paelinck, J., Kuenne, R., Ozaki,I., Skishido, S.,quoted in Dietzenbacher and Lahr (2004)).

172
Additionally, regional input-output models are powerful and readily available,
but have only recently begun to enjoy widespread use. Though they may initially seem
daunting, they can provide crucial information to help regional economies thrive. In
the end, regional development is all about fostering innovation, staying competitive,
increasing wealth, and raising quality of life. Input-output is just another tool to use for
that goal (Leontief and Strout, 1963).
Isard (1951:328) argues that IO models permit the study of space economy
problems, such as changing regional and interregional structure, based on a set of
restrictive assumptions (constant production coefficients, interregional views and
mean unchanging supply channels).
Bathelt & Glückeen (2003:130) argue that as regional agents are interrelated in
the same value chain through regional IO linkages, knowledge between firms, spill over
effects and learning processes increase. Variables such as GVA, wage, wage growth
and employment growth (Porter, 2003) were important to study economic activities
and their distributions in regions. The model still allows multipliers to be calculated
which show the effects of GVA, employment, investments, etc. It can also estimate the
effects of exports and on the price structure in wage and profit rates exchange
(Dorfman, 1954:131).
From the cluster perspective, the use of IO tables in vertical clusters can be
useful for studying their industry linkages (Bijnen, 1973; Titze et al., 2011:4).
However, it is important to compare the positive aspects and limitations when
using an IO matrix. The option for this research is the IO model’s usefulness to study a
social science phenomenon.

173
Figure 50– Advantages and Limitations of using IO tables Source: Fatemi, A. S. (2002)
However, to study an economic sector, the IO model needed to be
desegregated according the research objective, regional policy or other specific
problem to be studied, based on decision-making and regional planning.
Henriques (2008:35) argues that for a specific sector the IO tables should be
desegregated into n sub-sectors. Each sector is seen as an equal sector in row and
column in the inter-industrial matrix. One of the problems that the IO matrix faces is
the fact of its aggregation by sectors. The level of detail in which to study a specific
problem in the economy needs to be analysed in order to better assess the relevance
of the sector which is considered. According to Miller and Blair (2009:160), the number
of industrial sectors defined in an input-output table is usually decided in the context
of the problem being considered; this means considering a specific industrial sector
aggregated with other or not. The same authors point out some studies made on this
aggregation problem, including: Hatanaka (1952), Balderston and Whitin (1954),

174
McManus (1956), Malinvaud (1956), Theil (1957), Ara (1959),Morimoto (1970)and
more recently Kymn (1990), Cabrer, Contreras et al.(1991) and Olsen (1993). Today's
IO matrix aggregation (number of sectors or regions) is related to multiregional or
interregional models where there is unavailability of data or when it is difficult or
prohibitively expensive to obtain the data.
7.4 THE IO MODEL AND ECONOMIC IMPACT SCENARIOS
The interesting thing about the IO model is deducing the impact on the
economy and therefore creating scenarios for economic development. From this
perspective, the IO model is an instrument with which is possible to estimate the
regional performance in the short run and the economic policy to be carried out.
The next figure is composed by the four steps with which it is possible to settle
the effects on the economy from the IO matrix. The following matrix describes how it
is possible to achieve economic effectsfrom the IO model. This is also important to
estimate the potential sectors with major impact and also the direct, indirect and
induced effects from any sector.
Figure 51– How to use an IO model Source: Leontief and Strout (1963)
Considering the sectors impact on the economy, the Location Quotients (LQs)
are both useful and simple location coefficients and cross-industry quotients (Flegg

175
and Webber, 1996:5). These quotients are used to adjust national coefficients to
produce a regional table, where the rationale or choice for using LQ is examined
(Mayer and Pleeter, 1975). Alternative approaches are evaluated by Round (1983). The
simple type of LQ is defined as the ratio between the regional and national proportions
of output or employment attributable to a particular sector (Flegg et al., 1994: 5).
For most industries, LQs consist of the ratio of an industry’s share of regional
earnings to the industry’s share of national earnings. If the LQ for the industry is one or
greater, then the industry’s national coefficients are used for the region. If the LQ for
an industry is less than one, then the national coefficients are reduced by the ratio to
account for the linkages (Bess and Ambargis, 2011: 9).
Flegg et al. (1994:6) and Bess and Ambargis (2011: 9) point out that the use of
the LQs to adjust national coefficients may, however, produce seriously misleading
results. The use of cross-industry location quotient's (CILQs) goes some way towards
overcoming the shortcomings of LQs. For example, employment based CILQ for sectors
i and j is defined by the formula:
Analytically, sector i is presumed to be supplying inputs to j. The logic behind this
formula is that, where the supplying sector is relatively small regionally compared to
the purchasing sector (so that CILQ is <1), some of the required inputs will have to be
met by imports from outside the region. This means that the national coefficient will
need to be adjusted downwards by multiplying it by the CILQ, with a corresponding
upward adjustment being made to the relevant import coefficient. As in this case of
the simple LQs, no adjustment is made if CILQ is ≥ 1.
Additionally, Flegg et al (1994:8) put forward another indicator, where it is
possible to refine the CILQs coefficients for a better regional adjustment. This means
estimating trading coefficients, which measure the proportion of any given commodity
supplied from within the region. In effect, trading coefficients (tij) measure the degree

176
of self-sufficiency of a region, where0 <tij < 1 will be a function of the following
variables:
1- The relative size of the supplying sector i;
2- The relative size of the purchasing sector j;
3- The relative size of the region;
Location quotients can be estimated mathematically, according to the following:
LQik =(Ei
k/ )/ (EiN / )
Rjk = LQi
k if LQik<1
1 if LQik ≥ 1
Ak= An
Where: LQ= Location quotients E= earnings R= regionalizing Index A= Direct Requirements Matrix K = Region i= Industry N= Nation Source: Bess and Ambargis (2011: 7) According to McGilvray (1977:49) recently, the concept of linkages has
attracted considerable interest, as a means of identifying "key sectors" in a strategy of
industrial development.
Another type of measurable impact of the IO model is the backward and
forward linkages from the production of a particular sector (Chang et al, 2008:338).

177
Linkages are descriptive measures of the economic interdependence of industries
(McGilvray, J., 1977:50).
The concept of linkages drives from the study of multiple market imperfections,
whereas public benefits from a project may be not equal to private benefits. This
conception involves the Hirschmanian concept of "linkages," of which there are two
varieties:
1. The input-provision, derived demand, or backward linkage effects, i.e., every
non-primary economic activity will induce attempts to supply through domestic
production the inputs needed in that activity.
2. The output-utilization or forward linkage effects, i.e., every activity that does
not by its nature cater exclusively to final demands will induce attempts to utilize its
outputs as inputs in some new activities (Jones, 1976:323).
There are two important features underlying Hirschman’s argument:
1- in the rest of developing countries there are imperfections in factor and
product markets; 2- there is a shortage of entrepreneurial talent (McGilvray, 1977:52).
Sonis et al. (1995: 243) put forward the analytical procedures to estimate the
Rasmussen/Hirschman Approach, where the work of Rasmussen (1956) and Hirschman
(1958) led to the development of indices of linkage that have now become part of the
generally accepted procedures for identifying key sectors in the economy.
Hirschman-Rasmussen (HR) indexes allow the study of the linkages of a sector
relative to other buyers or suppliers sectors. Thus, the HR connections rates, also
called “backward” and “forward” coefficients, indicate the strength of chaining across
the various economic sectors. The values of these indicators express how a particular
industry demand inputs or offers outputs to the remaining sectors. “Forward” or
“backward” linkages with higher unit values (above average) represent the key sectors
for economic growth (Salvador et al., 2016: 28).
The “backward” index is interpreted as the total variation (direct and indirect)
in the production of all necessary economic structures to meet a value unitary
variation in final demand of sector j. The “forward” index describes the direct and
indirect impacts on the sector i resulting from a value unitary variation on final
demand in each of the remaining production sectors (Salvador et al., 2016: 29).

178
Impact models can measure the effect which an industry's production has on
other industries in the economy in two ways. If an industry increases its production,
there will be increased demand on the industries that produce intermediate inputs.
Models that measure impacts based on this type of relationship are called backward
linkage models. If an industry increases its production, there will also be increased
supply of output for other industries to use in their production. Models that measure
impacts based on this type of relationship are called forward-linkages models (Bess
and Ambargis, 2011: 7).
One of the criticisms of the above indices is that they do not take into
consideration the different levels of production in each sector of the economy. The
concept and the determination of key sectors in an economy can be presented in
different ways, and the basic need is to explore the insights provided by each kind of
analysis, rather than focusing on the real or apparent advantages any one technique
might offer (Sonis et al, 1995: 243).
The same author points out that the HR indices and the field of influence
approach were used to see how the internal structure of the economy behaved,
without taking into consideration the level of production in each sector. This analysis is
important if the internal structure of the economy is overlooked in defining key
economic sectors. On the other hand, the level of production in each sector is also
important as it helps to determine which sectors will be mainly responsible for changes
in the levels of GNP and other macro level measures of the economy (Sonis et al, 1995:
247). However, the importance of normalized link indexes relies on the fact that they
are independent of measurement units, allowing for inter-sectorial, inter-regional and
inter-time comparisons. As such, the “scattering indexes”, aim to quantify the
dispersion of an economic impact. A relative measure of the variation coefficient
allows the comparison of distributions, as the result is the standard deviation per unit
of average. A low dispersion value means that the impact is disseminated by a large
number of economic sectors; a high dispersion value means that the impact is
concentrated in a reduced number of sectors (Salvador et al., 2016: 29).

179
Mathematically the HR can be calculated considering:
Define bij as a typical element of the Leontief inverse matrix, B; B* as the
average value of all elements of B, and if Bj* and Bi* are the associated typical column
and row sums, then the indices may be developed as follows:
Backward linkage index (power of dispersion):
Uj= B*j/n/B*
Forward linkage index (sensitivity of dispersion):
Ui= B*i/n/B*
The "scattering indexes" are given by the coefficients of variation, resulting from the
ratio between the standard deviation and the average of each sector, both from the
perspective of the buyer and supplier. The “backward” (Vj) and “forward” (Vi)
“scattering indexes” dispersion formulas are the following:
Dispersion index link “forward”
Vi = / 1/n
Dispersion index link “backwards”
Vj = / 1/n
with(i,j= 1,2,…n) being the number of industries.
Source: Salvador et al (2016: 29)

180
The study presented by Salvador et al (2016) describes the seven maritime
sectors with most impact on the Portuguese economy, using the HR and scattering
index.
Figure 52– Links and Scattering Index Source: Salvador et al (2016: 30)
The conclusion about the Portuguese maritime economy was that HR fails to
identify the major impacts that would result from additional investments. It also does

181
not specify which coefficients, when changed, would have greater economic impact. In
order to correct these shortages, different approaches to the calculation of inter-
sectoral linkages were adopted. The calculation of a scattering index allowed the
following features to be concluded: a) the “recreational boating and marinas” sector
has a significant field of influence that confirms its importance in terms of both
supplier and consumer services; b) the “fish processing and preserving” sector has the
least significant value (0.555) in commercial transactions; c) the importance of
“auxiliary services to water transportation”(maritime ports) as a supplier of services to
other sectors –in fact, the most significant field of influence value(9.734)–lies in the
purchases by the “water transport” sector from the former sector; d) it is important to
stimulate the “maritime transport” sector, as a major consumer of goods and services
from other sectors, with a great propagation potential in the economic system.
According to Miller and Blair (2009: 303) the heart of any input-output analysis
is the table of input-output coefficients describing the relationships between inputs
and outputs for a particular economy.
The literature on the calculation of IO multipliers traces back to Leontief (1941),
who developed a set of national-level multipliers that could be used to estimate the
economy-wide effect that an initial change in final demand has on economy. Other
economists have developed research on Keynesian multipliers and their application on
the economy, such as Moore and Peterson (1955), Isard (1951), Richardson (1985),
Coughlin and Mandelboun (1991), Hall (2009) and Bess and Ambargis (2011:4).
There are four measures of change in total economic activity that can be
estimated by Keynesian multipliers, namely gross output, value added, earnings, and
employment. The Keynesian multipliers are divided into Type I and Type II. Type I
multipliers account for the direct and indirect impacts based on how goods and
services are supplied within a region. Type II multipliers not only account for these
direct and indirect impacts, but they also account for induced impacts based on the
purchases made by employees.

182
Table 39– Composition of Total Impact
Type I multiplier Type II multiplier
Final-demand change
+ direct impact
+indirect impact
Final-demand change
+ direct impact
+ indirect impact
+ induced impact
Total impact Total impact
Source: Bess and Ambargis, 2011:7

183
7.5 THE INPUT-OUTPUT MATRIX AND THE ENERGY SECTOR
"The evolution of inter-industry relations has now become, once more, a major
interest for economic analysis"
Sonis et al (2008:153)
The study of energy in IO tables started to be significant when countries
realized that energy consumption was a critical factor of production for many
industries in many regions. As such, researchers and government policy makers began
focusing on the role of energy in the economy.
IO tables were extensively developed during the oil crises in the 70s and early
80s in the wake of the Arab oil embargoes and their effects on the US economy.
There has been resurgence in their use in recent years to analyse the
relationships between energy and climate change (Cumberland, 1966; Strout, 1967;
Ayres and Kneese, 1969; Bullard and Herendeen, 1975b; Griffin, 1976; Blair, 1979 and
1980) (quoted in Miller and Blair, 2009:400).
Recent studies associate energy with energy accounts and environmental
activities (Miller & Blair, 2009: 400).
The use of IO tables in the energy sector determines the total amount of energy
required to deliver a product to final demand, both directly as the energy consumed by
an industry's production process and indirectly as the energy embodied in that
industry´s inputs.
Therefore, the analysis can be made through primary resources; the first round
of energy inputs is the direct energy requirements; subsequent rounds of energy
inputs comprise the indirect energy requirements, with the sum of both being called
total energy requirements.

184
Figure 53– Energy Use Source: adopted from Miller and Blair (2009:402)
From the initial IO table the following is considered for energy IO energy
requirements:
where αkj is the total amount of energy of type k required to produce a dollar’s
worth of sector i ’s output; xj is the total dollar output of sector j; and zij is the euro
value of sector i ’s product consumed by sector j. .
The term gkj is the total of energy output of an energy sector and we define all
elements of the (m×n) matrix G=[gkj] as gk for elements where energy sector k and
industry sector j refer to the same industrial sector and 0 otherwise.
Most elements of G are zero, except for those corresponding to total energy
output for the energy sector designated by the row index (Miller and Blair, 2009:404).
On the other hand, the structural differences between the new technologies
and systems for the use of renewable energy sources and the fossil fuel technologies
seem to call for the definition of their own vector.
The technologies for the use of solar, geothermal and wind energy require new
and different input combinations from different sectors compared to the respective
sectors for the fossil fuel industries in the system (Lehr et al., 2008: 111).

185
From the multiplier perspective, the IO model can measure the impact of the
renewable energy industry on the Gross Value Added (GVA) and employment (direct
effect, indirect effect and induced effect).
Therefore, there are a number of factors which affect the estimate of GVA and
jobs: capital and labour intensity of renewable energy, costs and investment, counting
job losses and treatment of the labour market, job quality and job skills and gross vs
net employment. However, there is some dependence on model assumptions: changes
in demand of the conventional energy sector, energy prices changes, changes in
industries investment and increase in investment in renewable energy (Lambert and
Silvia, 2012).
7.5.1 The IO matrix for renewable energy in Portugal
The first approach to the research about IO matrix renewable energy in
Portugal was presented by Pego et al. (2016). The study considered not the production
itself of the sector but the impact from the energy sector on the economy. These
impacts measure the direct or indirect influence of investments on the GVA and
employment in the economy, through Keynesian multipliers.
In general, authors (Benito et al, 2003; Wijnolst, 2006) agree that a good
indicator of a cluster’s relevance can be assessed by analysing the strength of the
connections (agglomeration economies) between its members, namely by the trade
transaction figures that are at stake.
In general terms, sectors in a successful cluster have a strong dependence on
one another and on the way buyers and suppliers are related. In fact, there is a debate
whether it is more important to have these connections between the same or different
sectors (Titze et al., 2011), or whether the development of clusters is more benefited
by a larger range of activities (Porter, 2000).
The best methodology to estimate inter- and intra-sectoral connections is the
IO model of Leontiev (Salvador & Guedes Soares, 2008 and 2010).

186
Starting from the "Input-Output Matrix of Domestic Production” (431p x 123p –
INE, 2013), at basic prices, one symmetric matrix [A1] (97 x 97) has been derived that
was previously inverted, taking into account that Leontief’s inverse matrix multiplied
by a change in final demand yields a change in total output:
(I-A) -1 ΔY = ΔX
The next step was the creation of the corresponding technical coefficient
matrix [A2], whose elements allow an assessment of the strength of the linkages
between the industries (Simões et al. 2012; Simões & Salvador, 2013; and Simões et
al., 2015) and the impact of past or near future investments.
In fact, IO analysis is especially well suited to assess how changes in one or
more sectors of the economy will impact the total economy (Kweka & Blake, 2003:
338). As the offshore renewable energy industry (“Nomenclature Statistique des
Activités Économiques dans la Communauté Européenne – NACE”, Rev. 2,35113) still
has very poor data due to its being an emerging industry, a working hypothesis has
been adopted that NACE 35113 follows the same pattern has NACE 351, the larger
group which it is part of. Results show that sector 351 (electric power generation,
transmission and distribution) has a strong relationship with itself (€6,400M of intra-
commercial relations).

187
Table 40– Suppliers with Higher Technical Coefficients
This probably is due to the large size of the main company (EDP) and the
concentration of activities (energy production, distribution and commercialisation).
Taking into account all the 97 sectors’ technical coefficients of the Leontief
matrix [aij], it can be concluded that there are just a small number of “average
linkages” (technical coefficient > 0.02) between “Energy Production” and the rest of
the economy.
NACE INDUSTRY TECHNICAL COEFFICIENTS
351 Electr. Prod. 0.45
352 Gas Distr. 0.06
69 + 70+71 Services (Law, Manag, Archit.)
0.03
64 Financial Serv. 0.02
27 Electric Equip. 0.01
33 Mach & Eq Services 0.01
42 Civil Engen. 0.01
82 Other Serv. 0.01

188
Table 41– Electricity Production (351) Main Suppliers and Clients
SUPPLIERS (€M) CLIENTS (€M)
NACE05 Mining 261 NACE 23 Non-metallic products
132
NACE19 Coal & Refined Petroleum
303 NACE 24
Basic Metallic Manufacturing
101
NACE 351
Manufacture of gas; distribution of gaseous fuels through mains
6392 NACE (46+47)
Wholesale & retail trade
448
NACE 352
Gas Production &Distribution
834
NACE (55+56)
Hotels + Restaurants
256
NACE 64
Financial service activities, except insurance and pension funding
242 NACE (84+86)
Public Admin. + Health Service
424
The table presents the main suppliers and clients of sector NACE 351 (electric
power generation, transmission and distribution).
The Type-1 Keynesian multiplier measures the effect over the total output (or
employment) that results from a unitary change in final demand, meaning that it is
given by the change in total output (employment) to the change in that final demand.
Its value adds direct and indirect effects resulting from that unitary increase in demand
and, as such, it is estimated through the following expression:
[(I-A)-1 - I] ∆m
where, A is the technical coefficient matrix (ag); and (I-A)-1 is the Leontief matrix, i.e.,
the matrix whose elements give the “total” impact (direct + indirect) on a sector as a
result of an increase in final demand from another sector (∆m).
The Type-2 Keynesian multiplier measures the sum of direct, indirect and induced
effects that result from a unitary change in the maritime cluster output (employment)

189
and the associated effects in all the other economic sectors. Its expression is the
following:
∆x –v [(I-A) ∆m]
wherev is the GVA line vector per output unit. Taking into account the values from
Table 6, this means that the Windfloat investment (2011), in an amount of about €23M
had €58.2M of direct and indirect effects and €73.1M of total (direct + indirect +
induced) effects. Concerning the effects on employment, a number cannot be added,
as the number of workers at Windfloat is not available.
Table 42– Energy Production (351) Keynesian Multipliers (GVA)
Multiplier Type 1 (Output)
Multiplier Type 2 (Output)
Employment Multiplier
2.53 3.18 2.11
7.5.2 Conclusions
In summary, the study made on IO matrix analysis shows that the IO matrix on
offshore renewable sector is an important economic instrument because it can explain
the economic impact within the sector and outside the sector.
Moreover, it is possible to conclude about the offshore energy cluster. The
same study indicates a relevant conclusion about the pre-commercial farm in Portugal.
It is possible to conclude that there is a possibility of an emergent cluster, due to the
linkages between the production sector (aij <1) and the high impact on economy
(multiplier factors).

190

191
CHAPTER 8 – THE OFFSHORE ENERGY CLUSTER IN PORTUGAL. AN
ECONOMIC AND GEOGRAPHICAL ANALYSIS
“The methodology is the process of constructing knowledge from the researcher, as well as the set of procedures and research methods used to acquire the knowledge”
Matos (2006:91)
The chapter eight presents the methodology and the results from the electronic questionnaire (qualitative analysis) and the IO matrix results (quantitative analysis). The qualitative analysis allowed concluding about the Porter Diamond Model and SWOT analysis to offshore energy cluster. The IO matrix presents the typology Type I and II for the offshore energy cluster EI-ERO project and makes a comparison with the energy sector.

192
8.1 INTRODUCTION
"Sampling is the acquisition of information about relatively small part of a larger group of population, usually with the aim of making inferential generalizations about the larger group. Sampling is necessary because it is often not possible, practicable or desirable to obtain information from an entire population".
Cliford et al. (2016:230)
The offshore wind cluster in Portugal is an emergent cluster. It was considered
the EI-ERO-project21 (see point 5.3.4) and the first study about offshore wind clusters
in Portugal (Pego et al, 2016).
The main subject of EI-ERO- Project is to set up the rules for the construction of
offshore energy export sector in Portugal as an emergent cluster based on natural,
scientific and technological resources.
It is expected that the EI-ERO- project contributes to increase the high
technology exports, valuate the SEA, to create a sustainable value chain and
employments. At the same time the EI- ERO project will promote the Ports in terms of
new investments, employment and new stakeholders. The development of the
methodology was based on the intervention of the EI-ERO Project and others with
relevant action in the emergent cluster. The research also considered SWOT analysis to
confirm results from both methods.
For the qualitative analysis, an electronic questionnaire was used and the
sample was direct suppliers (EI-ERO Project) and others stakeholders which are directly
and indirectly related. For the quantitative analysis Type I and II Keynesian multipliers
were used (IO matrix 2013) for offshore wind farm direct suppliers.
Regarding the confrontation with a qualitative (Porter’s Diamond Model) and
quantitative (IO matrix) methodology, there is a strong possibility for credible results.
The complexity of both analyses confirms that there is an emergent offshore energy
cluster in Portugal.
21
EI-ERO Industrial Strategy for Ocean Renewable Energies- DR, 1ª serie, nº 224, 24 de novembro de
2017
193
8.2 QUALITATIVE ANALYSIS
“There are two things to be considered with regarding any scheme. In the first place, ‘Is it good in itself?’ In the second, ‘Can it be easily put into practice?’” Jean-Jacques Rousseau (quoted in Dunleavy, P., 2003:44)
“Qualitative researches, broadly, is based on the methodological pursuit of understanding the ways that people see, view, approach, and experiences the world and make meaning of their experience as well as specific phenomena within it”
Ravich and Carl (2016: 7)
The qualitative findings were separated into two parts, first Porter’s model and
its applicability to offshore energy sector and then the SWOT analysis.
The qualitative analysis was based on an electronic questionnaire (see
appendix).It tested opinions about the future of the offshore energy cluster in Portugal
and how future organisations are involved in the cluster. The questionnaire was sent
to suppliers, government entities and others which can influence positively the
potential energy cluster in Portugal. The total of inquires was 14 organisations, divided
by private organisations (60%), universities (13%), research centres, public
organisations, the government and NGOs (7%). The list of inquiries is presented in the
Annex 1.
8.2.1 Porter’s Diamond Model and the offshore energy cluster
Regarding the proposed methodology, and as was discussed in Chapter 4,
Porter's Diamond model is a good instrument to check the competitiveness in the
energy sector.
The importance of studying the offshore cluster begins with the awareness of
the relationships between organisations towards competition and cooperation.
Therefore, it is important to discuss business organisation, meaning if they act
alone in the market or if they are aggregated.
194
PARTNERSHIP
The results showed that 36% of the companies were independent or included
in an international group; 21% were included in a national group and just 7% were
considered as "other", such as research centres and universities. In the cases where
organisations are included in a group, the main organisation are in the USA,
Esposende, Braga, Lisbon, Azores University, Oporto, Ponta Delgada, Munich, Spain
and the Baltic Sea region.
Also, this partnership is through training (75%), institutions (67%) and business
organisations (regional/national or European) (67%). The data also showed that the
training is mainly with private organisations and research centres (50%) and the 75% of
the public institutions applied for partnership.
The sample is not representative of the potential cluster, although it was
inquired the main companies which compose the EI-ERO project.
COOPERATION AND SERVICES INDUSTRIES
To evaluate the cooperation and services within the offshore energy sector we
studied the services inside or outside the organisation, main services and goods
supply, cooperation and technological cooperation:
a) The first point, services from the sector, is divided into three points: in
organisation, inside the council and outside the municipality:
1- Innovation (100%), financial services (100%), marketing (67%), market
prospect (75%), legal services (50%), and repair and equipment maintenance (50%) are
inside the organisation;

195
2- The services from outside are from specialised organisations inside the
council, namely, legal services (50%), marketing and publicity (33%) and repair and
maintenance equipment (25%);
3- From specialised organisations outside the council, we can point out market
prospect (25%) and repair and maintenance (25%);
b) The second point, main services and goods supply from the sector, showed
that the interviewees are mainly supplied by EU organisations: components (100%);
raw materials (67%), machinery, accessories and advance services (technical assistant,
drawing, software) (75%).
c) The third point, cooperation with others:
1- The organisations cooperated with other organisations (75%); in this point
organisations pointed out that the necessity to cooperate with others is related to
products that cannot deliver the necessary characteristics or new systems;
technological cooperation with other institutions, and commercial (50%) between
organisations in the same sector and others– consultants (25%);the types of services
which are involved in this cooperation with organisations are mainly R&D activities,
technology transfer, training skills and consultancy. Vertical cooperation is applied, for
example in knowledge transfer.
d) In the fourth point, technological cooperation, the interviewees stated that
with organisations, technological cooperation is in process production and in new
products (50% each), whereas with institutions, technological cooperation is mainly in
the adoption of new products; one interviewed stated that this technological
cooperation is with manufacturers and developers of the components which works
with our new designed products.
PUBLIC POLICIES GOVERNANCE
Legislation, policies, financial incentives and taxation are part of this emergent
cluster, namely Portugal 2020, Interface Program and Blue Fund. Other government

196
areas are Sea (DGPM– Direção Geral da Política do Mar); Economy (DGEG– Direção
Geral de Energia e Geologia; IAPMEI– Instituto de Apoio a Pequenas e Médias
Empresas,and Portugal 2020), Science and Technology plus Economy Ministry (ANI–
Agência Nacional de Inovação) and Facilities and Planning (Portugal 2020).
In terms of investment support for offshore activity, the interviewees
considered that the development of new products, inter-business cooperation and
transnational cooperation, and products improvements are supported by European
programs and National programs, such as, REN21, IEA, World Bank, WWEA (World
Wind Energy Council), reporting Portuguese electricity data, and policy-making.
National programs support the development of new productive processes
(100%), introduction to new commercial techniques (100%), and exportS (100%).
Moreover, financial support is also related to training, knowledge transfer and SME
support.
FACTORS CONDITIONS
The existence of good natural conditions, electricity grid and EI-ERO program
are the main factors to implement the offshore wind energy project.
These conditions are also associated with expert work and R&D activities.
Therefore, these factors confirm the interviewees’ needs about the main factors for
production: expert work, financial support and equipped and accessible spaces.
Testing facilities were also was mentioned, because there is always the need to be
tested outside Portugal.
STRATEGY, STRUCTURE AND RIVALRY ORGANISATION NETWORK ANALYSIS
The interviewees strongly agree that the network can be made through
business networks and financial support with public or private funds. On the other

197
hand, they also considered technical management, knowledge transfer and public
consulting services to be important.
The analysis on cooperation leads to a conclusion about its motives; the
interviewees considered technological costs and development risk the least significant,
and market entrance and scale economies the least important. Cooperation difficulties
are less important when organisations develop strategies, face internal problems or
with other institutions, unrealistic "timings", and low capital resources. However,
cooperation in difficulties is very important for the sector, when they face low human
resources.
The development of the energy sector depends on the role of cooperation in
the market towards more competitiveness. The factors which the interviewees
thought important for its performance are technological planning, selecting possible
stakeholders, support for exchanging knowledge between stakeholders, prototype
support and scale-up, regulation support, and product valuation. The actors thought
the all role cooperation, the infrastructures for pilot test, intellectual property and
financial support for product testing to be the most important.
Therefore, the strategy is to cooperate in new products, new processes,
efficiency and intellectual property. Less important to set up a strategy between the
organisations are new markets, profits, and employment and export quotas.
Due to the fact that the offshore energy sector is an emergent sector, players
need to set up a market strategy to follow the energy sector. The interview considered
a few vectors which comprise this set-up. The important thing is to increase
competitiveness in the value chain first in the national market, and then in the EU
market. Therefore, the market strategy is to follow these premises: energy production
is related to cooperation, capital transfer, specialized human resources and
technology; offshore wind organisations might join others within the same sector and
internationalize it; organisations can cooperate with other actors and promote
initiatives/activities related with R&D in renewable energy. Moreover, it is important
to have a competitive energy cost associated with a system with national and
international networks for price adjustment.

198
The market strategy is also related to an energy value chain and quality of
human resources, associated competitive advantages (lower energy costs and a
differentiated product).
Nevertheless, the firms' strategy faces other specific related strategies,
according to the interviewees, such as:
a) Geographical location and recycling and waste management are considered
very important factors;
b) energy network proximity, climate conditions, good network transport
systems, the proximity of university and research centres, credit facilities, business
networks, competitive business capacity, capital and knowledge transfer, competitive
business capacity, environment quality, cooperation between stakeholders, foreign
capital facility and environment sustainability are considered important factors;
c) Business consulting access is considered a less important factor;
HISTORY
Due to renewable investments in Portugal (Pego, 2016), the new wind offshore
project (2017) will improve technologies adjusted to natural conditions, as well as
private investments based on a renewable energy market strategy (EI-ERO Program).
GEOGRAPHICAL ANALYSIS
“Creations realized at the price of a great deal of work must in spiteof the truth appear easy and effortless... the great rule is to take much trouble to produce things that seem to have cost none”
Michelangelo Buonarotti (quoted in Dunleavy, 2003:89)
From the EI-ERO - Project it was possible to identify the stakeholders
geographic areas. This means that suppliers and other cluster supporters are in a

199
different geographic location, mainly in AMP (Área Metropoliana do Porto), AML (Área
Metropoliana de Lisboa), Aveiro in Portugal, and the Azores Islands.
Figure 54– Offshore Energy Stakeholders Interviewed Geographical Areas
From the questionnaire it was possible to verify the variables which comprise
the Porter’s Diamond Model. The analysis made allowed us to conclude that we are in
a presence of an emergent cluster with high standards in technology, human resources
and capital. It was also possible estimate the strategies which organisations have to
promote linkages to other sectors and regions in order to develop business, innovation
and knowledge. The analysis showed also that the Porter Diamond Model is related
with an innovative cluster and operates in different sectors (vertical value chain).
Additionally, it is also possible to discuss its competitiveness because of its
competitive advantages (costs and differentiation advantages) and industrial
attractiveness (conditioning factors’, related and supporting industries and firms’

200
strategy). The emergent cluster contains few companies; it is heterogeneous and has
low efficiency of networking between stakeholders.
Figure 55– Portuguese Porter's Diamond for offshore energy cluster
FACTOR CONDITIONS: National
electricity grid; Port tech; Windy
geographic area; specialised human
resources and R&D activities; Value
chain relationship between
stakeholders; European and national
funds support; advanced technology
and innovation support; testing
facilities; financial support at national
and European level
RELATED AND SUPPORTING
INDUSTRIES
Value chain support in manufacturing
(tower construction, platform
construction, anchoring system
construction, inter-array cable
construction),
DEMAND CONDITIONS:
Increase in national renewable
energy demand
CONTEXT FOR FIRMS STRATEGY AND
RIVALRY: vertical cooperation within
the value chain; market strategy for
offshore energy competiveness';

201
8.2.2 SWOT analysis of the offshore energy sector
The cluster' SWOT analysis made from the questionnaire enabled conclusions
about strengths, weakness, opportunities and threats that the cluster will face in near
future in Portugal.
The emergent Portuguese offshore energy cluster has now started to make the
first steps towards a competitive European energy offshore cluster. Nevertheless, from
the analysis it is possible to make conclusions about its performance and capacity in
the market and its behaviour in the economy.
The SWOT analysis drives it into an innovation sector, with high R&D activities,
based on expert knowledge and being environment friendly. The strengths will lead
the sector to high competitiveness within the Portuguese energy sector in terms of
innovation and performance.
However, the sector faces weak points related to its strategic planning to set up
linkages between organisations. The inexistence of a road map to deliver a strategy
and regulation within the sector, the lack of communication between the stakeholders,
and the high level of investment are other negative points which the sector will face
when in the market.
The SWOT analysis also refers to the opportunity for new investments and R&D
activities, such as economies of scale and emerging markets (opportunities).
Additionally, the sector faces threats related to its capacity to compete with
other energy sources, and the direct costs related with its production, as well as
funding levels and priorities.
To summarize, the SWOT analysis demonstrates a sector with a high capacity of
employment of expertise, development technologies and R&D activities. However,
because it is an emergent sector in the Portuguese economy, it will need
competitiveness with other energy sources, cooperation between suppliers and high
level of investment. The SWOT analysis also showed that this sector capable of being a
cluster if the stakeholders and others make the compromise to cooperate in the long
run in technology, expertise and knowledge. Moreover, internationalisation of energy

202
production is also expected in this sector, which will lead to a better relationship with
other European partners.
The SWOT analysis allowed us to describe the expectations of the stakeholders
about the potential cluster itself and its relationship within the energy market.
Therefore, the capacity for staying in the market depends on its capacity to promote
renewable energy with lower production costs, and short investment return. Also,
human resources specialization, knowledge transfer and innovation constitute
important decision variables for sector competitiveness.
To conclude, it is to be expected that the emergent offshore energy sector will
constitute a cluster because of its potential in human resources, knowledge transfer
and investments. However, vertical and horizontal decisions need to be consistent
with a competitive sector based on key initiatives such as standardization and
certification, minimizing the environmental impact of offshore wind farms, grid
integration, and offshore development based on collaboration and cooperation.
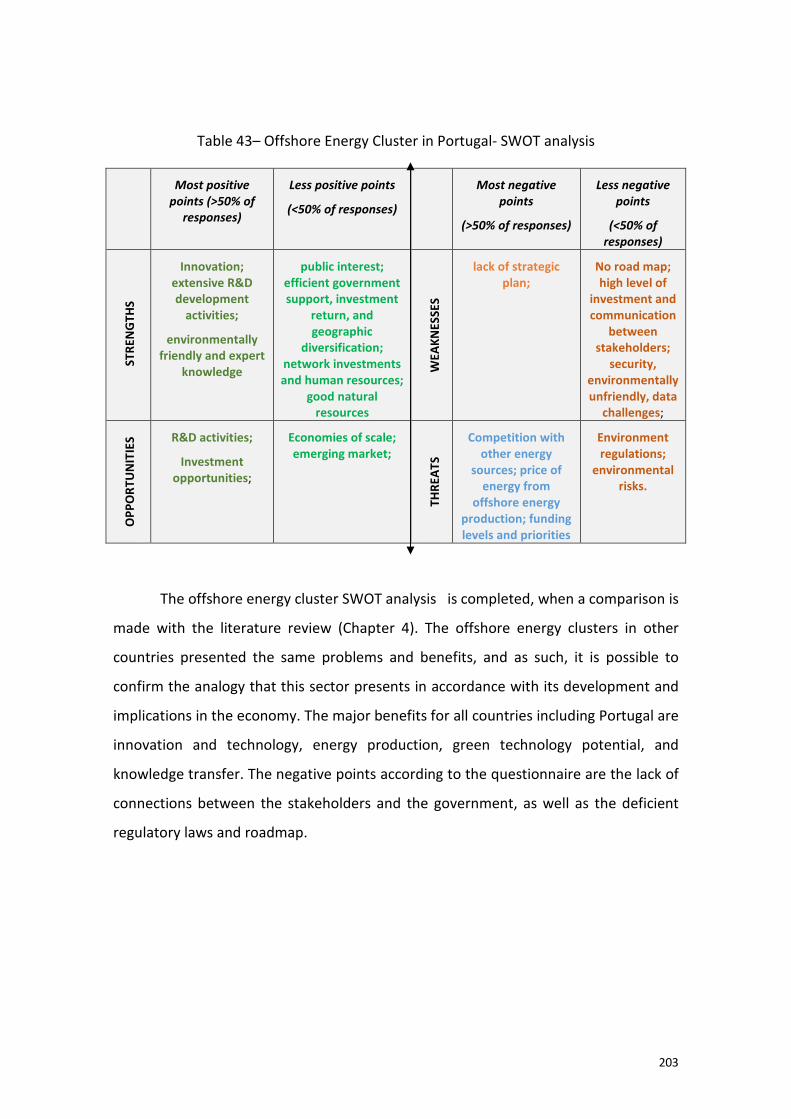
203
Table 43– Offshore Energy Cluster in Portugal- SWOT analysis
Most positive
points (>50% of
responses)
Less positive points
(<50% of responses)
Most negative
points
(>50% of responses)
Less negative
points
(<50% of
responses)
STR
ENG
THS
Innovation; extensive R&D development
activities;
environmentally friendly and expert
knowledge
public interest; efficient government support, investment
return, and geographic
diversification; network investments and human resources;
good natural resources
WEA
KN
ESSE
S
lack of strategic plan;
No road map; high level of
investment and communication
between stakeholders;
security, environmentally unfriendly, data
challenges;
OP
PO
RTU
NIT
IES
R&D activities;
Investment opportunities;
Economies of scale; emerging market;
THR
EATS
Competition with
other energy sources; price of
energy from offshore energy
production; funding levels and priorities
Environment regulations;
environmental risks.
The offshore energy cluster SWOT analysis is completed, when a comparison is
made with the literature review (Chapter 4). The offshore energy clusters in other
countries presented the same problems and benefits, and as such, it is possible to
confirm the analogy that this sector presents in accordance with its development and
implications in the economy. The major benefits for all countries including Portugal are
innovation and technology, energy production, green technology potential, and
knowledge transfer. The negative points according to the questionnaire are the lack of
connections between the stakeholders and the government, as well as the deficient
regulatory laws and roadmap.

204
8.3 QUANTITATIVE ANALYSIS
"Positivism is related to formal mathematic models, laboratory experiments, field experiences and field studies"
Matos (2006:93)
The quantitative analysis was based on the production IO matrix 2013. The
analysis was made taking in account the offshore energy suppliers for platform
construction in 2018 ( EI-ERO- project).
In the chapter 7 the quantitative analysis was presented for the offshore energy
prototype. The results showed that there are weak linkages within the sector and the
economic impact on GVA and employment from this sector is very low. Another
conclusion is that the suppliers are mainly located in "Área Metropolitana do Porto"
and "Área Metropolitana de Lisboa" .
Although, it was a prototype project, the Keynesian multipliers put in evidence
that there are an economic impact in these regions in employment and GVA.

205
Table 44– WF1 – Offshore Wind Project Suppliers prototype (Windfloat Project)
PARTNERS PRODUCTS FROM
SUPPLIERS
NACE ORGANISATIONS NUTSIII
EDP Steel manufactures
structure
25110 ASM AVEIRO
REPSOL Certificated entity 74900 ABS LMA
Portugal
Ventures
Repair and
maintenance of
ships/dry dock
assembly
33150 Lisnave PENÍNSULA
SETÚBAL
AS Matos Tugboats 52220 Rebova PENÍNSULA
SETÚBAL
Others Tugboats 52220 Tinita ALTO MINHO
Speedboats 71120 Multisub PMA
Electric cable 27320 Solidal CÁVADO
Turbine install 5220 Porto Sines ALENT LITORAL
Turbine 28110 Vestas DENMARK
Offshore installer 50200 Bourbon Offshore FRANCE
Geophysical studies 72190 Hydro graphic institute LMA
Know-how/windfloat
environment
35113 Wavec LMA
Source: EDP (2012)

206
Figure 56 - WF1 Suppliers Location
The initial quantitative methodology (7.5.1) was extending to the EI-ERO project. The
following tables analyse the e offshore energy platform suppliers and its impact on the
energy sector. For employment, we considered the total employment for the electric
sector due the fact of a missing value (k=2.11).

207
Table 45– Supporting Suppliers technical coefficients (EI-ERO Project)
NACE PRODUCTS COMPANIES LOCATION
(NUT III)
TECHNICAL
COEFFICIENTS
27110 Turbine and
blade
construction
Enercon ALTO MINHO 0.02
32996 Ria Blades
(Sevion) BAIXO VOUGA
0.0
25110 Tower
construction ASM energia AVEIRO
0.01
25110 Tegopi AMP 0.01
25110 Martifer DÃO- LAFÕES 0.01
46690 Energy systems ALTO MINHO E
AML 0.0
25110 Platform
construction ASM energia AVEIRO
0.01
25110 Tegopi AMP 0.01
25110 Amal- construçoes
metálicas, SA PENÍNSULA DE
SETÚBAL 0.01
25110 Anchoring
system
construction
Lankhorst Euronet AMP 0.01
25931 Oliveira & Sá-
cordoaria de arame AMP
0.01
27320 Inter-array
cable
construction
Solidal CÁVADO 0.02
27320 Cabelte AMP 0.02
wages 0.36
Total 0.14

208
Table 46– Supplier Port Technical Coefficients (EI- ERO Project)
NACE PORT LOCATION
(NUT III)
TECHNICAL
COEFFICIENTS
258359 VIANA DO CASTELO ALTO MINHO 0.01
63220 AVEIRO AVEIRO 0
52220 PENICHE CENTRO - OESTE 0.01
63220 SETÚBAL PENÍNSULA DE
SETÚBAL 0
52220 SINES ALENTEJO LITORAL
0.01
TOTAL 0.03
Figure 57 - Supporting Suppliers Location and Ports

209
Few aspects should be pointed out:
1- The EI-ERO project has contributed to include others stakeholders different
from the prototype project (WF1);
2- The analysis made through the IO matrix is characterized by a low impact
between the sectors (suppliers and port tech), all presented aij<1;
3- The economic structure from IO matrix (2013) is the same, therefore the EI-
Ero project has the same multiplier as WF1, where multiplier type I=2.53 and multiplier
type II= 3.18, this means that the Ei-ERO investment, in an amount of about 254 M. €
had 642.6 M.€ of direct and indirect effects and 807.72 M. € of total (direct + indirect +
induced) effects. On what concerns the effects on Employment, one cannot add a
number, as the number of workers at Ei-ERO is not available ( the wind farm will be
finished in 2020).
4- It is not possible to confirm that there is an offshore energy cluster in
Portugal, but an emergent sector;
5- The IO matrix 2013 is not disaggregated for offshore energy sector; thus the
impact from the multiplier reflects the total of the energy sector;
6- In terms of employment, it was considered the same multiplier as the
electric sector because the lack of data, thus for k=2.11, 1500 jobs are expected in this
sector, which will make an impact of 3165 jobs in the offshore energy sector.

210

211
CHAPTER 9– CONCLUSIONS AND RECOMMENDATIONS
"The best way to inform your reader is to tell them what they are likely to want to know– no more and no less”
Robert J. Sternberg (quoted in Dunleavy, 2003:84)
“All good things which exist are the fruits of originality”
John Stuart Mills (quoted in Dunleavy, 2003:26)
"I am not afraid of failure... if you are learning anything new; you have got to get
through humiliation"
Eddie Izzard (quoted in Dunleavy (2003:34))

212
The analysis made along this research work and its conclusion allowed dressing
a few aspects about the initial research question: Is there an offshore energy cluster
(wave and wind) in Portugal?
The results presented in this thesis are related with the offshore wind project
(EI-ERO), because, the wave project was decommissioning in 2012 (5.3.2) and offshore
wind farm comprise a recent cluster for maritime energy in Portugal.
The recent offshore energy farm in Portugal is considered one of the greatest
investments in terms of innovation, knowledge and technology. The offshore energy
sector holds the potential to generate externalities, creating jobs and economic
growth. This industry is also related to innovation, production processes and policy
attention.
In order to analyse the cluster, an electronic questionnaire was sent to all
suppliers, public organisations and research centres which are related with EI-ERO
project. To conclude the study, phone calls were made where the reason for the study
was explained. Some of the suppliers were not available to answer and others
organisations said it was not possible to answer because it was "private".
However, of those organisations which answered, some want conclusion of the
offshore energy cluster; they stated that it is highly important to their organisation
because it is their strategy to be in the electricity market.
From the qualitative analysis and the qualitative results, it was possible to
confirm the emergent offshore energy cluster in Portugal.
The emergent offshore energy cluster and its features allow us to conclude
about the economic impact from the sector, management performance and direct and
indirect investments.
Therefore, a number of points must be addressed to understand the offshore
energy cluster and its impact on the Portuguese economy. The analysis made through
the mixed methodology has contributed to the following aspects:
1. The IO matrix showed that the impact on GVA and employment and the
supplier's contribution to the economy are high;
2- The linkages between sectors are weak;

213
3- The sector needs a high investment and skilled human resources;
4- There is no road map for this sector;
5- The strategy to stay in the market according to the stakeholders is not yet
defined;
6- There are threats (competition with non renewable energy prices) and
weaknesses (a plan to stakeholders to be in the market) which are considered negative
points to cluster implementation and development;
7- The sector has a high impact on R&D activities and expert activities;
8- The government has set up new strategies for the offshore sector (EI-ERO
program) in order to bring about more innovation, production processes, knowledge
development and transfer, and legitimacy.
9- It is expected that all sectors in the value chain will contribute positively to
the sector’s development;
10- The offshore energy sector is considered an innovative sector and therefore
will contribute to smart grid projects (INOVGRID EDP);
11- The geographical location is heterogonous and the suppliers are mainly in
AMP and AML;
12- The offshore energy sector is considered a top down and downscaling
sector;
The conclusions about the offshore energy cluster follow the initial research
questions:
1- Which factors can contribute most to the offshore energy cluster in
Portugal?
The analysis revealed the following factors for cluster development: capacity of
a potential cooperation between the organisations; government support to new
investments; expert human resources; windy geographic areas; R&D activities', and a
smart electricity grid. From the port perspective, Viana do Castelo, Aveiro, Peniche,

214
Setúbal and Sines, constitute an important hub for the offshore energy cluster
development because its services support; the ports constitute also an important
geographic point to develop a business strategy for the sector.
From the financial perspective, the Portugal 2020, the Fund Azul and the EEA
Grants assume the principal instruments for its implementation.
2- What are the direct, indirect and induced impacts of the offshore energy
sector on investment and employment?
From the IO matrix it was possible to estimate the investments impact (€254M)
in GVA and in employment in the sector.
3- What lessons can be used in Portugal from the offshore energy clusters in
other European countries?
The offshore energy cluster in Europe is consistent with a number of premises:
less energy dependence from the EU; European countries with strong potential for
renewable energy production can contribute to a global European offshore cluster (the
most important factor);the European offshore cluster promotes innovation, human
resources specialization and technology transfer due the fact of cooperation between
organisations (where Portugal can contribute positively), as well as contributing to
environmental solutions and the circular economy. Other less important factors, also
considered by the interviewees: maximization of public and private utility; the role of
public institutions; business conditions, distribution and logistics centres; vertical
cooperation; the adjustment of Energy Policy 2020 to consumer's needs and
satisfaction; the European countries can contribute to relevant cooperation between
stakeholders.
The research carried out in this field is the first in Portugal, therefore, it can be
a good instrument to implement a market strategy for the sector and also create
analogies with onshore energy clusters, or other sectors with the same features.

215
The research can promote a political debate about the future of an ocean
energy cluster and its linkages to other sectors. In geographic terms, it is possible to
make comparisons with other sectors and to draw conclusions about the cluster’s
proximity needs. Moreover, the emergent cluster and the emergent market about
clean energy, smart grids, green economy and ecosystem is good for debate to
understand climate change, consumers’ needs and adjustments to the economy for
welfare.
Additionally, this study will contribute to bring closer the debate about
European clusters and their capacity to maximize the consumers’ and organizations
needs associated with European goals for energy.
Despite the fact of being an emergent cluster, the Portuguese offshore energy
is a competitive sector, a business model based on innovation, investment
opportunities and skilled workers, and related to the Portuguese ecosystem. On
other hand, the cluster promotes large scale demonstrations as proof of concepts for
the above scientific, technical, market/regulation and social issues (EEGI, 2013: 102).
In summary, although it appears that the offshore energy cluster brings
benefits to the national economy and it will be a potential industry in the near future
for energy supply in Europe and in the world, it is clear that there are many
unanswered questions. Future suggestions lie in the debate: how can the government
promote positive externalities in the economy, and which networks should be
established? How can prices be determined in the market to be competitive? Can it be
developed for suppliers? And how can offshore energy be stored for consumers’
needs?
The answer to these questions can contribute comprehensively to the
understanding of the offshore energy cluster' new challenges.

216
217
BIBLIOGRAPHY
- AGHDAIE, S. F. A., SEIDI, M., & RIASI, A. (2012). Identifying the barriers to Iran's
saffron export by using Porter's diamond model. International Journal of Marketing
Studies, 4(5), 129.
- ALVES, M.A.P (2013).Impacto de cenários de alterações climáticas nos recursos
energéticos renováveis. Sistema eléctrico português até 2070. Master Thesis.
Faculdade de Ciências e Tecnologia - Lisboa: Universidade Nova de Lisboa
- AMARA, N., LANDRY, R., &OUIMET, M. (2005).Milieuxinnovateurs: Determinants
and policy implications. European Planning Studies, 13 (6), 939-965.
- ARA, K. (1959). The aggregation problem in input-output analysis. Econometrica:
Journal of the Econometric Society, 257-262.
- ARMSTRONG, H., TAYLOR, J., & TAYLOR, J. (2000).Regional economics and
policy.Oxford: Blackwell Publishers.
- ANDERSSON, M., TAMANINI, J., ASPLUND, C., FRANSSON, M., SPORRE, M.,
&PARLIDEN, J. (2012).Strategic global marketing of Nordic Cleantech clusters and
competencies.
-ARANCEGUI, M. N. (2003). Análisis y políticas de clusters: teoría y realidad.
Ekonomiaz: Revista Vasca de Economía, (53), 14-49.
-ASHEIM, B. R. T. (1996). Industrial districts as ‘learning regions’: a condition for
prosperity. European Planning Studies, 4(4), 379-400.
-AUDRETSCH, D. B., & FELDMAN, M. P. (1996). R&D spillovers and the geography of
innovation and production. The American Economic Review, 86(3), 630-640.

218
- AYDIN, B. (2014, MARCH). SWOT analysis of renewable energy. In Green Energy for
Sustainable Development (ICUE), 2014 International Conference and Utility Exhibition
on (1-7).IEEE.
- BADCOCK-BROE, A., FLYNN, R., GEORGE, S., GRUET, R. MEDIC, N. (2014).Wave and
tidal energy market deployment strategy for Europe (1st
edition).http://www.oceanenergy-
europe.eu/images/projects/SI_Ocean_Market_Deployment_Strategy_-
_Web_version.pdf (Accessed 3rd August 2016).
-BALDERSTON, J. B., & WHITIN, T. M. (1954). Aggregation in the input-output model.
Economic Activity Analysis, 79-128.
- BARSOUMIAN, S., SEVERIN, A., & VAN DER SPEK, T. (2011). Eco-innovation and
national cluster policies in Europe. A Qualitative Review. Europe INNOVA, European Cluster
Observatory.
- BOLON, E., COMMONS, M., ROSIERS, F., GUZMAN, P., & KUKRIKA, N. (2007). The
Spanish wind power cluster. Harvard Business School.
- BATHELT, H. & GLÜCKEN, J. (2003). Towards a related economic geography. Journal
of Economic Geography, 3, 117-144
- BECATTINI, G. (2002). From Marshall’s to the Italian “Industrial districts”.A brief
critical reconstruction. In Complexity and Industrial Clusters (83-106). Physica-Verlag
HD.
- BEELS, C., HENRIQUES, J. C. C., DE ROUCK, J., PONTES, M. T., DE BACKER, G., &
VERHAEGHE, H. (2007). Wave energy resource in the North Sea. In EWTEC 2007-7th
European Wave and Tidal Energy Conference.

219
- BENITO, G. R., BERGER, E., DE LA FOREST, M., & SHUM, J. (2003). A cluster analysis
of the maritime sector in Norway. International Journal of Transport Management,
1(4), 203-215.
- BENNEWORTH, P., & HENRY, N. (2004). Where is the value added in the cluster
approach? Hermeneutic theorising, economic geography and clusters as a
multiperspectival approach. Urban Studies, 41 (5-6), 1011-1023.
- BESS, R., & AMBARGIS, Z. O. (2011, MARCH). Input-output models for impact
analysis: Suggestions for practitioners using RIMS II multipliers. In 50th Southern
Regional Science Association Conference (pp. 23-27). Morgantown, WV: Southern
Regional Science Association.
- BIJNEN, E. J. (1973). Cluster Analysis: Survey and Evaluation of Techniques. Tilburg
studies on sociology, (1).
- BISGAARD, T., HENRIKSEN, K., &BJERRE, M. (2012).Green Business Model
Innovation-Conceptualisation, Next Practice and Policy.Nordic Innovation Report, 12,
2012.
-BLANCO, M. I., & RODRIGUES, G. (2009). Direct employment in the wind energy
sector: An EU study. Energy Policy, 37(8), 2847-2857.
- BLAU, P. M., & SCOTT, W. R. (1962).Formal organizations: A comparative approach.
USA: Stanford University Press.
- BOYER, W., GADOW, B., MILLS, N., & ROBERTS, C. (2008).The North Dakota wind
energy cluster: an economic analysis. PA8081 (7) Community and Economic
Development Capstone, Hubert Humphrey Institute of Public Affairs, University of
Minnesota, 148.

220
- BRENNER, T. (2000, JUNE). Industrial districts: a typology from an evolutionary
perspective. In DRUID Conference (pp. 15-17).
-BROEKEL, T., FORNAHL, D., & MORRISON, A. (2015). Another cluster premium:
Innovation subsidies and R&D collaboration networks. Research Policy, 44(8), 1431-
1444.
- BROWN, R. (2000).Cluster dynamics in theory and practice with application to
Scotland. University of Strathclyde, European Policies Research Centre.
- BURTIS, P. R., EPSTEIN, B., & HWANG, R. J. (2004).Creating the California cleantech
cluster: How innovation and investment can promote job growth and a healthy
environment.Natural Resources Defense Council.
- CABRER, B., CONTRERAS, D., & MIRAVETE, E. (1991). Aggregation in input–output
tables: how to select the best cluster linkage. Economic Systems Research, 3(2), 99-
110.
- CAMAGNI, R., &CAPELLO, R. (2002). Milieuxinnovateurs and collective learning: from
concepts of measurement. In The emergence of the Knowledge Economy (15-45).
Berlin: Springer Berlin Heidelberg.
- CANIËLS, M. C., & ROMIJN, H. A. (2003). Dynamic clusters in developing countries:
Collective efficiency and beyond. Oxford Development Studies, 31(3), 275-292.
- CASTILLO, R., & FREDERICO, S. (2010). Espaço geográfico, produção e movimento:
uma reflexão sobre o conceito de circuito espacial produtivo. Sociedade & Natureza,
22(3).
- CASTRO, R. (2012).Uma introdução às energias renováveis: Eólica, Fotovoltaica e
Mini-Hidrica. Coleção Ensino da Ciência e Tecnologia. 2º Edição. Lisboa: Instituto
Superior Técnico.

221
- CHANG, Y. T., PAUL, T. W., CHEN, T., SHIN, S. H., YU-CHANG, L. I. N., & CHIA-LING, L.
I. U. (2008, March). A Comparative Study on Economic Effects of the Water
Transportation Sector in Korea and Taiwan Using Input-Output Analysis. In 2008
International Conference on Shipping, Port & Logistics Management (pp. 429-443).
- CHEN, W. M., KIM, H., & YAMAGUCHI, H. (2014). Renewable energy in eastern Asia:
Renewable energy policy review and comparative SWOT analysis for promoting
renewable energy in Japan, South Korea, and Taiwan. Energy Policy, 74, 319-329.
- CHIEN, T., & HU, J. L. (2008). Renewable energy: An efficient mechanism to improve
GDP. Energy Policy, 36 (8), 3045-3052.
-CHIPMAN, J. S. (1965). A survey of the theory of international trade: Part 1, The
classical theory. Econometrica: Journal of the Econometric Society, 477-519.
- CHORINCAS, J., MARQUES, I., & RIBEI-ERO, J. F. (2001). Clusters e políticas de
inovação—conceitos, experiências europeias e perspectivas de aplicação a Portugal.
Prospectiva e Planeamento, 7, 43-104.
- CHRISTALLER, W. (1966).Central places in southern Germany. Prentice-Hall.
- CLÉMENT, A., MCCULLEN, P., FALCÃO, A., FIORENTINO, A., GARDNER, F.,
HAMMARLUND, K., PONTES, M. T. (2002). Wave energy in Europe: current status and
perspectives. Renewable and Sustainable Energy Reviews, 6(5), 405-431.
- CLIFFORD, N., COPE, M., FRENCH, S., & GILLESPIE, T. (EDS.). (2016).Key methods in
geography(2nd edition). London: Sage Editions.
- CLUSTER, C. C. (2012). The global cleantech report 2012. Copenhagen Cleantech
Cluster,
Copenhagen.http://s3.amazonaws.com/academia.edu.documents/32009944/Global_C
lean_Tech_Report_2012.pdf?AWSAccessKeyId=AKIAJ56TQJRTWSMTNPEA&Expires=14

222
70308466&Signature=PbkcwHZbKibnueeGm4kJgtd4Sq8%3D&response-content-
disposition=inline%3B%20filename%3DGlobal_Clean_Tech_Report_2012.pdf
(Accessed 4th August 2016).
- COBB, C. W., & RIXFORD, C. (1998).Lessons learned from the history of social
indicators (Vol. 1). San Francisco: Redefining Progress.
- COE, N. M., HESS, M., YEUNG, H. W. C., DICKEN, P., & HENDERSON, J. (2004).
‘Globalizing’regional development: a global production network perspective.
Transactions of the Institute of British Geographers, 29 (4), 468-484.
- COOKE, P. (2002).Knowledge economies: Clusters, learning and cooperative
advantage. Routledge.
- COOKE, P. (2011).Resilience and Potential in Maritime Clusters (No. 2011-9).CIEO-
Research Centre for Spatial and Organizational Dynamics, University of Algarve.
- COSTA, P., MIRANDA, P., & ESTANQUEI-ERO, A. (2006). Development and validation
of the Portuguese wind atlas. In EWEC'2006-European Wind Energy Conference (pp. 1-
9).
- COSTEA-DUNARINTU, A. (2016). The Circular Economy in the European
Union.Knowledge Horizons. Economics, 8 (1), 148–150.
- COWAN, R., WINTJES, R. J. M., ANTONELLI, C., &FERRÃO, J. (2001). Criação da
mudança tecnológica localizada: exemplos de intervenção pública. Comunicação
Conhecimento Colectivo e Inovação: As Vantagens da Aglomeração Geográfica, 317-
351.
- CRESWELL, J. W.& CLARK, V. L. P. (2017).Research design qualitative,
quantitative,and mixed methods approaches. 3rd edition. University of Nebraska-
Llncoln. SAGE. USA: Los Angeles.

223
- CROCCO, M. A., GALINARI, R., SANTOS, F., LEMOS, M. B., & SIMÕES, R. (2006).
Metodologia de identificação de aglomerações produtivas locais. Nova Economia,
16(2), 211-241.
- CRUZ, J. (2007).Ocean wave energy: current status and future prespectives. Springer
Science & Business Media.
- DALTON, G., ALLAN, G., BEAUMONT, N., GEORGAKAKI, A., HACKING, N., HOOPER,
T., SHENG, W. (2015). Economic and socio-economic assessment methods for ocean
renewable energy: Public and private perspectives. Renewable and Sustainable Energy
Reviews, 45, 850-878.
- DAVIES, A. R. (2013). Cleantech clusters: transformational assemblages for a just,
green economy or just business as usual?. Global Environmental Change, 23(5), 1285-
1295.
- DENTINHO, T. P. (2012).New challenges for sustainable growth.Chapters.
- DE PORTUGAL, G. (2013). Estratégia Nacional para o Mar 2013-2020.Lisboa: Governo
de Portugal.
- DI FONZO, M. &HIME, S., (2017). How businesses measure their impacts on nature:
A gap analysis’, University of Cambridge Institute for Sustainability Leadership (CISL),
Working Paper 01/2017.
- DIETZENBACHER, E. & LAHR, L.M. (2004).Wassily Leontief and Input-output
economics. UK: Cambridge University Press.
- DINCER, I. (2000). Renewable energy and sustainable development: a crucial review.
Renewable and Sustainable Energy Reviews, 4 (2), 157-175.

224
- DIREÇÃO GERAL DE RECURSOS NATURAIS, SEGURANÇA E SERVIÇOS MARITIMOS
(DGRM)(2016)-Relatório Energia No Mar - Estratégia Industrial Renováveis Oceânicas
novembro 2016.
- DÖGL, C., HOLTBRÜGGE, D., & SCHUSTER, T. (2012). Competitive advantage of
German renewable energy firms in India and China: An empirical study based on
Porter's diamond. International Journal of Emerging Markets, 7(2), 191-214.
- DORFMAN, R. (1954). The nature and significance of input-output.TheReviewof
Economics and Statistics, 121-133.
- DUNLEAVY, P. (2003).Authoring a PhD: How to plan, draft, write and finish a doctoral
thesis or dissertation. Macmillan International Higher Education.
- EDP (2012). Projeto windfloat- XIX Congresso da ordem dos engenhEI-EROs.
http://www.ordemengenhEI-
EROs.pt/fotos/dossier_artigo/20121020_windfloat_v1_edit_172377366150d0ac66609
04.pdf (Accessed 25th March 2016).
-EEGI (EUROPEAN ELECTRICITY GRID INITIATIVE) (2013).Research and Innovative
roadmap (2013-2020).
- ELKINTON, C. N., MANWELL, J. F., & MCGOWAN, J. G. (2006). Offshore wind farm
layout optimization (OWFLO) project: Preliminary results. University of Massachusetts.
- ENERGY MANAGEMENT AND ENERGY SAVINGS (EMES) (2017). Draft Business Plan
ISO TC 301. http://isotc.iso.org/livelink/livelink/open/tc301. Accessed 6th June 2017.
- ESTEBAN, M. D., DIEZ, J. J., LÓPEZ, J. S., & NEGRO, V. (2011). Why offshore wind
energy?. Renewable Energy, 36(2), 444-450.

225
- ETZIONI, A. (1967). Mixed-scanning: A"third" approach to decision-making. Public
Administration Review, 385-392.
- EUROPEAN ACADEMIC SCIENCE ADVISORY BOARD (EASAB)(2015).Circular economy:
a commentary from the perspectives of the natural and social sciences.
http://vatt.fi/documents/2956369/3244616/European+Academies+Science+Advisory+
Council+Circular+economy+a+commentary+from+the+perspectives+of+the+natural+an
d+social+sciences/82982e56-56f6-466d-8fe6-dc2b8079cb7b. Accessed 31 May 2017
- EUROPEAN COMMISSION (1997). The energy in the future: sources of renewable
energy. White Book for a Communitarian Strategy. European Commission Report.
- EUROPEAN COMMISSION
(2013)http://www.central2013.eu/fileadmin/user_upload/Downloads/outputlib/CLUS
TERS_CORD_Energy_Environment_strategic_plan.pdf (Accessed 20th May 2018).
- EUROPEAN COMMISSION (2014). Cluster collaboration and business support tools to
facilitate entrepreneurship, cross-sectorial collaboration and growth. September 2014.
- EUROPEAN COMMISSION (2015a).European Union Energy in figures. Statistic pocket
book.
- EUROPEAN COMMISSION (2015b).Energy Sectors and the implementation of the
Maritime Spatial Planning Directive. Luxemburg: Publications Office of the European
Union.
- EUROPEAN COMMISSION (2015c).European Cluster Observatory Report- European
Cluster Trends. March 2015.
- EUROPEAN COMMISSION,
http://www.europarl.europa.eu/ftu/pdf/pt/FTU_5.7.1.pdf, at
http://europa.eu/pol/ener/index_pt.htm;
http://issuu.com/eng2solutions/docs/res_report (Accessed 4th January 2016).

226
- EUROPEAN COMMISSION (2016).Renewable energy national plan for Portugal.
(Accessed 22th December 2016). https://ec.europa.eu/energy/en/topics/renewable-
energy/national-action-plans.
- EUROPEAN COMMISSION (2016b).Smart Guide to Cluster Policy. Guide Book series-
How to Support SME Policy from structural Funds.
-EUROPEAN ENVIRONMENT AGENCY (EEA) (2016).Circular economy in
Europe.Developing the knowledge base.EEA Report, No. 2/2016.
- EUROPEAN WIND ENERGY ASSOCIATION. (2009).The economics of wind energy.
EWEA.
- EUROSTAT (2008).Eurostat Manual of Supply, Use and Input-output tables. 2008
edition. European Commission.
- EUROSTAT (2015).Energy, transport and environment indicators. Statistical Book.
European Commission.
- EUROSTAT (2016).Smarter, greener more inclusive? Indicators to support the Europe
2020 Strategy. Statistical Book. European Commission.
- EXPÓSITO, A. G., CONEJO, A. J., & CANIZARES, C. (2016).Electric energy systems:
analysis and operation. CRC press.
- FATEMI, A. S. (2002). Input-output economics. Labour (men years), 182, 170.
-FAUSTINO, P. (2013).Indústrias criativas, media e clusters: políticas, desenvolvimento,
mercado regiões, produções, estratégias. Lisboa: Editora Media XXI.

227
- FCT Project PTDC/ENR/105403/2008. Roadmap para as energias renováveis offshore
em Portugal 2020 - 2030 – 2050.
- FERNANDES, A. (2013).Clusters Industriais Eólicos-Sustentabilidade dos
Investimentos. EEFOR-Energia Elétrica de Fontes Renováveis.
- FERNANDES, S. B. (2004).Inovação tecnológica nas PME e dinâmica regional em
Portugal. PHD Thesis. Faro: Universidade do Algarve.
- FERNANDES, J., TRIGAL, L., & SPOSITO, E. (2016).Dicionário de Geografia Aplicada,
terminologia da análise, do planeamento e da gestão do território (1ª
edição).Porto:Porto Editora.
- FERRÃO, J. (2014).O ordenamento do território como política pública (2ª edição).
Lisboa: Fundação Caloust Gulbenkian.
- FERREIRA, P.F.V. (dezembro 2007).Electricity power planning in Portugal: the role of
wind energy. PHD Thesis. Braga: Universidade do Minho.
- FERREIRA, P. V., & VIEIRA, F. D. (2010, NOVEMBER). Evaluation of an offshore wind
power project: economic, strategic and environmental value. In International
Conference on Environmental Systems Engineering and Technology (WASET).
- FERREIRA, A. M. C. (2012). A sustentabilidade territorial de um cluster do mar em
Portugal. PHD Thesis. Lisboa: Universidade Nova de Lisboa.
- FERRO, L. S. (2014).Sistemas regionais de inovação: o caso das regiões Portuguesas.
MASTER Thesis. Porto: Faculdade de Economia da Universidade do Porto.
- FFOWCS-WILLIAMS, I. F. O. R. (2000, JUNE). Policy for inter-firm networking and
clustering: a practitioner’s perspective.In paper for OECD/Italian Ministry of Industry
Bologna Conference for Ministers.
228
- FIGUEIRA, J. (2018). A history of electricity in Portugal. Clube colecionador dos
correios. Lisboa: Correios de Portugal.
- FINLAND, C. (2014). Cleantech industry in Finland 2014.Presentation available on
http://www. slideshare. net/cleantechfinland(Accessed5th May 2017).
- FLEGG, A.T., WEBBER, C.D., ELLIOT, M.V. (1995). A new approach to the use of
laction quotients in building a regional input-output model using national data.
Working papers, No. 12. Faculty of Economics and Social Science. UK: University of the
West England.
- FLEGG, A.T., WEBBER, C.D. (1996). The FLQ formula for generating regional input-
output tables: an application and reformulation. Working papers, 17. Faculty of
Economics and Social Science. UK: University of the West England.
- FRANKELIUS, P., HULTMAN, C. M., LINTON, G., JOHANZON, C., & GUNNARSSON, C.
(2011). The cleantech mystery: new theoretical model for understanding export
capabilities in small and medium sized innovative cleantech companies. In The R&D
Management Conference 2011: R&D, Sustainability & Innovation, the need for new
ideas, initiatives and alliances, Norrköping, Sweden 28-30 June (14).
- FREEMAN, C. (1982).The economics of industrial innovation.
- FRISILLO, D. (2007). An analysis of a potential cluster in an energy sector of Albany,
NY. Journal of Business & Industrial Marketing, 22 (7), 508-516.
- GALBRAITH, J. K. (1985). O novo Estado industrial. Lisboa: Publicações Europa
America.
- GAROFOLI, G. (1994). New firm formation and regional development: the Italian
case. Regional studies, 28(4), 381-393.

229
- GASPAR, J. (1996). “O novo ordenamento do território, geografia e valores” in AA.VV
dinamismos Sócio -Económicos e (Re)organização Territorial: Processos de
Urbanização e Reestruturação Produtiva, Coimbra: Instituto de Estudos Geográficos,
Faculdade de Letras da Universidade de Coimbra, pp 707-718 (disponível em
http://www.ub.edu/geocrit/sv-39.htm); - (2007), “Notas em torno do Processo de
Elaboração do PNPOT”. Sociedade e Território, 40, 74-86.
- GRANT, R.M. (1991). The resource -based theory of competitive advantage:
implications for strategy formulation. Knowlodge and Strategy, 33(3), 3-23.
- HADDAD, E. A., RAMOS, P.N. & CASTRO, E. A. (2011).Modelos operacionais de
Economia Regional. Lisboa: Editora Principia.
- HAESBAERT, R. (2004). Des-caminhos e perspectivas do território. Território e
desenvolvimento: diferentes abordagens. Francisco Beltrão: UNIOESTE, 171, 87-120.
-HARROD, R. F. (1939). An essay in dynamic theory. The Economic Journal, 49(193), 14-
33.
- HATANAKA, M. (1952). Note on consolidation within a Leontief system.
Econometrica: Journal of the Econometric Society, 301-303.
- HASSAN, G. (2004).Sea Wind
Europe.http://www.greenpeace.org/international_en/multimedia/download/1/42358
4/0/SEaWindEurope.pdf (Accessed 23th January 2017).
-HECKSCHER, E. F. (1919). Utrikeshandelns verkan på inkomstfördelningen. Några
teoretiska grundlinjer. Ekonomisk tidskrift, 1-32.

230
- HENDERSON, A. R., MORGAN, C., SMITH, B., SØRENSEN, H. C., BARTHELMIE, R. J.,
&BOESMANS, B. (2003). Offshore wind energy in Europe-A review of the state-of-the-
art. Wind Energy, 6(1), 35-52.
- HENRIQUES, C.M.S.O (2008).Modelos Input-Output multiobjetivo com coeficientes
intervalares para o estudo das interações economia- energia-ambiente. PHD Thesis
Faculdade de Ciência e Tecnologia. Coimbra: Universidade de Coimbra.
- HENRIKSEN, K., BJERRE, M., MARIA ALMASI, A., & DAMGAARD-GRANN, E.
(2012).Green Business Model Innovation-Conceptualization Report.
- HIRSCHMAN, A. O. (1958).The strategy of economic development(No. 04; HD82, H5).
- HOOVER, E. M. (1948).The location of economic activity. Mcgraw-Hill Book Company,
Inc; London.
- IAMMARINO, S., & MCCANN, P. (2006). The structure and evolution of industrial
clusters: Transactions, technology and knowledge spillovers. Research Policy, 35(7),
1018-1036.
- IANCA, C. R. I. S. T. I. A. N., & BATRINCA, G. H. I. O. R. G. H. E. (2010). Towards a
Romanian maritime cluster. In Proceedings of the 3rd International Conference on
Maritime and Naval Science and Engineering (pp. 94-99).
- INE (2014).Conta Satélite do Mar. Definição conceptual da economia do mar.
http://www.dgpm.mam.gov.pt/Documents/CSM_Defini%C3%A7%C3%A3o%20Econo
mia%20do%20Mar_draft%2012maio2014-site.pdf(Accessed 20thJuly 2016).
- ISSERMAN, A. M. (1977). The location quotient approach to estimating regional
economic impacts. Journal of the American Institute of Planners, 43(1), 33-41.

231
- ISARD, W. (1951). Interregional and regional input-output analysis: a model of a
space-economy. The Review of Economics and Statistics, 318-328.
- INSTITUTO PORTUGUÊS DO MAR E ATMOSFERA - IPMA (2004).Relatório das
condições climáticas da costa portuguesa, https://www.ipma.pt (Accessed 23th
January 2017).
- IWA (2016).Water utility pathways in a circular economy. International Water
Association.
- JOHANSSON, T. B. (1993).Renewable energy: sources for fuels and electricity. Island
press.
- JOLLY, C. (2016).The ocean energy in 2030. workshop on Maritime Clusters and Global
Challenges. OCDE.
-JONES, L. P. (1976). The measurement of Hirschmanian linkages. The Quarterly
Journal of Economics, 90(2), 323-333.
- KAJIKAWA, Y., & TAKEDA, Y. (2008). Structure of research on biomass and bio-fuels:
A citation-based approach. Technological Forecasting and Social Change, 75 (9), 1349-
1359.
- KALDOR (1970). The Case for Regional Policies. Scottish journal of political economy,
17 (3), 337-348.
- KARTAKOULLIS, N. L., &KARLIS, G. (2002). Developing Cyprus as a sport tourism
destination: the results of a SWOT analysis.Journal of Sport Tourism, 7(4), 3-17.
- KARPPI, I., KOKKONEN, M., &LÄHTEENMÄKI-SMITH, K. (2001).SWOT-analysis as a
basis for regional strategies. Nordregio WP, 4, 80.

232
- KELLER, P. F. (2008). Clusters, distritos industriais e cooperação interfirmas: uma
revisão da literatura. Revista Economia &Gestão, 8 (16), 30-47.
- KETELS, C. H., & MEMEDOVIC, O. (2008). From clusters to cluster-based economic
development. International Journal of Technological Learning, Innovation and
Development, 1(3), 375-392.
- KETELS, C. H., PECK, F., LINDQVIST, G., LUBICKA, B., NAUWELAERS, C., & HARPER, J.
C. (2013). The role of clusters in smart specialisation strategies. Publications Office of
the European Union.
- KETELS, C., & PROTSIV, S. (2014). European cluster panorama 2014. Center for
Strategy and Competitiveness, Stockholm School of Economics, October.
- KETELS, C. (2015).Competitiveness and clusters: implications for a new European
growth strategy (No. 84). WWW.forEuropeWorking Paper.
- KITSON, M., MARTIN, R., & TYLER, P. (2004). Regional competitiveness: an elusive
yet key concept? Regional Studies, 38 (9), 991-999.
- KOTLER, P. AND KELLER, K.L. (2007). Administração de Marketing (12 editions). São
Paulo: Pearson Prentice Hall.
- KRUGMAN, P. R. (1981). Intraindustry specialization and the gains from trade.
Journal of Political Economy, 89(5), 959-973.
- KRUGMAN, P. (1990).Increasing returns and economic geography.The Journal of
Political Economy, 19 (3), 483-499.
- KRUGMAN, P. R. (1992).Geography and trade.MIT Press.

233
- KÜHN, M. J. (2001).Dynamics and design optimisation of offshore wind energy
conversion systems. TU Delft, Delft University of Technology.
- KWEKA, J., MORRISSEY, O., & BLAKE, A. (2003). The economic potential of tourism in
Tanzania. Journal of International Development, 15(3), 335-351.
- KYMN, K. O. (1990). Aggregation in input–output models: a comprehensive review,
1946–71. Economic Systems Research, 2(1), 65-93.
- LAGES,V.N., BRAGA,C., &MORELLI,G. (2004). Territórios em movimento: cultura e
identidade como estratégia de inserção competitiva. Brasilia: SEBRAE Editora.
- LAM, H. L., VARBANOV, P. S., &KLEMEŠ, J. J. (2011). Regional renewable energy and
resource planning. Applied Energy, 88 (2), 545-550.
- LAMBERT, R. J., & SILVA, P. P. (2012). The challenges of determining the employment
effects of renewable energy. Renewable and Sustainable Energy Reviews, 16(7), 4667-
4674.
- LÄMMER- GAMP, T., KÖCKER,G.M.,NERGER, M. (2014). Cluster collaboration and
business support tools to facilitate entrepreneurship, cross- sectoral and growth.
European Cluster Observatory Report. European Commission.
- LANGEN, P. D. (2002). Clustering and performance: the case of maritime clustering in
The Netherlands. Maritime Policy & Management, 29 (3), 209-221.
- LEHR, U., NITSCH, J., KRATZAT, M., LUTZ, C., & EDLER, D. (2008). Renewable energy
and employment in Germany. Energy Policy, 36(1), 108-117.
-LEONTIEF, W., & STROUT, A. (1963). Multiregional input-output analysis. In Structural
interdependence and economic development (119-150). Palgrave Macmillan, London.

234
- LIEDER, M., & RASHID, A. (2016). Towards circular economy implementation: a
comprehensive review in the context of manufacturing industry. Journal of Cleaner
production, 115, 36-51.
- LIMA, B. P. (2016).Portugal e o Atlântico. Lisboa: Fundação Francisco Manuel dos
Santos.
- LOPES, A.S. (1987).Desenvolvimento regional - problemática, teoria e modelos (3ª
edição). Lisboa: Fundação Calouste Gulbenkian
- LOPES, E. (2009). O Hypercluster da economia do mar. SaeR/ACL: Lisboa.
- LU, L., YANG, H. (2011). Wind data analysis and a case study of wind power
generation in Hong Kong. Wind Engineering, 25 (2), pp 115-123.
- LUNDVALL, B. Å. (1990).Explaining Inter-Firm Cooperation and Innovation-Limits of
the Transaction Cost Approach.
- MACARTHUR ELLEN, MACKINSEY&COMPANY (2014).World Economic Forum
http://www3.weforum.org/docs/WEF_ENV_TowardsCircularEconomy_Report_2014.p
df. (Accessed 28th May 2017).
- MACKINNON, D., DAWLEY, S., STEEN, M., MENZEL, M. P., KARLSEN, A., SOMMER,
P., ... & NORMANN, H. E. (2018). Path creation, global production networks and
regional development: a comparative international analysis of the offshore wind
sector. Progress in Planning.
- MARKUSEN, A. (2017). Sticky places in slippery space: a typology of industrial
districts. In Economy (177-197). Routledge.
- MCGILVRAY, J. (1977). Linkages, key sectors and development strategy. Structure,
System and Economic Policy, 49-56.

235
- MCMANUS, M. (1956). General consistent aggregation in Leontief models. Bulletin of
Economic Research, 8(1), 28-48.
- MAGAGNA, D., UIHLEIN,A. (2015). Ocean energy development in Europe: Current
status and future perspectives. International Journal of Marine Energy, 11, 84-104.
- MALINVAUD, E. (1956). L'agrégation dans les modèles économiques. Cahiers du
séminaire d'économétrie, 69-146.
- MARKOVSKA, N., TASESKA, V., & POP-JORDANOV, J. (2009). SWOT analyses of the
national energy sector for sustainable energy development. Energy, 34(6), 752-756.
- MARSHALL, A. (1890).Principles of political economy.New York: Maxmillan Edition.
- MARSHALL, A. (1920).Industry and trade: a study of industrial technique and business
organization; and of their influences on the conditions of various classes and nations.
New York: Maxmillan Edition.
- MASKELL, P., & KEBIR, L. (2006). What qualifies as a cluster theory. Clusters and
regional development: Critical reflections and explorations, 30-49.
- MASKELL, P., & MALMBERG, A. (2007). Myopia, knowledge development and cluster
evolution. Journal of Economic Geography, 7(5), 603-618.
- MATIAS, N. V. (2009). A "clusterização" da economia marítima. Nação e Defesa,
122(4), 9-23.
- MATOS, R. (2006).Os agentes de software e o processo de tomada de decisão. Estudo
empirico do impacto de um shopot. Instituto Superior de Economia e Gestão. PHD
thesis. Lisboa: Universidade Técnica de Lisboa.

236
-MATTI, C., DE VICENTE LÓPEZ, J., SARGEANTSON, E., BURN, C., & DAHL, P. L. S.
(2016, JUNE). Practice-based knowledge on system innovation and climate change.A
learning approach for practitioners through active-blended
format.https://www.ris.uu.nl/ws/files/22582552/WEB040716_POSTER_EDUCATION_A
1.pdfv. (Accessed 10th June 2017).
-MAYER, W., & PLEETER, S. (1975). A theoretical justification for the use of location
quotients. Regional Science and Urban Economics, 5(3), 343-355.
- MAXOULIS, C. N., CHARALAMPOUS, H. P., &KALOGIROU, S. A. (2007).Cyprus solar
water heating cluster: A missed opportunity?. Energy Policy, 35 (6), 3302-3315.
- MCCAULEY, S. M., & STEPHENS, J. C. (2012). Green energy clusters and socio-
technical transitions: analysis of a sustainable energy cluster for regional economic
development in Central Massachusetts, USA. Sustainability Science, 7(2), 213-225.
- MCDONALD, F., HUANG, Q., TSAGDIS, D., & JOSEF TÜSELMANN, H. (2007). Is there
evidence to support Porter-type cluster policies?. Regional Studies, 41(1), 39-49.
- MCELROY, M. B., LU, X., NIELSEN, C. P., & WANG, Y. (2009). Potential for wind-
generated electricity in China.Science, 325 (5946), 1378-1380.
-MENZEL, M. P., & FORNAHL, D. (2009). Cluster life cycles—dimensions and rationales
of cluster evolution. Industrial and corporate change, 19(1), 205-238.
- MEYER-STAMER, J. (2001). Estratégias de desenvolvimento local e regional: clusters,
polıtica de localização e competitividade sistêmica. Friedrich-Ebert-Stiftung.
- MICHLER-CIELUCH, T., KRAUSE, G., & BUCK, B. H. (2009).Reflections on integrating
operation and maintenance activities of offshore wind farms and
mariculture.Ocean&CoastalManagement, 52(1), 57-68.
237
- MILLER, R. E., & BLAIR, P. D. (2009).Input-output analysis: foundations and
extensions. UK: Cambridge University Press.
- MONTEI-ERO, P., DE NORONHA, T., & NETO, P. (2013). A differentiation framework
for maritime clusters: Comparisons across Europe. Sustainability, 5 (9), 4076-4105.
- MOREIRA, S. E. C., & ALMEIDA, T. A. D. S. (2013). Potencial de produção de energia
eólica em parques offshore. http://recipp.ipp.pt/handle/10400.22/3584.
- MORIMOTO, Y. (1970). On aggregation problems in input-output analysis. The
Review of Economic Studies, 37(1), 119-126.
- MOTA, P., & PINTO, J. P. (2014). Wave energy potential along the western
Portuguese coast. Renewable Energy, 71, 8-17.
- MOULAERT, F., &SEKIA, F. (2003). Territorial innovation models: a critical survey.
Regional Studies, 37 (3), 289-302.
- MOURÃO, F. (2010).Análise da variabilidade inter-anual do vento em Portugal
Continental. Contribuição para o estabelecimento de um índice de vento. Master
Thesis. Porto: Faculdade de Engenharia da Universidade do Porto.
- NELSON, R. R. (ED.)(1993).National innovation systems: a comparative analysis. UK:
Oxford University Press on Demand.
- OLSEN, J. A. (1993). Aggregation in input–output models: prices and quantities.
Economic Systems Research, 5(3), 253-275.
Chapter 3, "Enterprise Development" in OECD (2010), “SMEs, Entrepreneurship and
Local Development in the Marche Region, Italy”, OECD Local Economic and Employment
Development (LEED) Working Papers, CFE. | Request PDF. Available from:
https://www.researchgate.net/publication/282704753_Chapter_3_Enterprise_Development_i
n_OECD_2010_SMEs_Entrepreneurship_and_Local_Development_in_the_Marche_Region_Ital

238
y_OECD_Local_Economic_and_Employment_Development_LEED_Working_Papers_CFE
[accessed Oct 14 2018].
- ORGANISATION FOR ECONOMIC CO-OPERATION AND DEVELOPMENT STAFF.
(2005). OECD factbook 2005: economic, environmental and social statistics. Paris:
OECD Publishing.
- ORGANISATION FOR ECONOMIC CO-OPERATION AND DEVELOPMENT STAFF.
(2010). Chapter 3, "Enterprise Development" in OECD (2010), “SMEs, Entrepreneurship
and Local Development in the Marche Region, Italy”, OECD Local Economic and
Employment Development (LEED) Working Papers, CFE. | Request PDF. Available from:
https://www.researchgate.net/publication/282704753_Chapter_3_Enterprise_Develo
pment_in_OECD_2010_SMEs_Entrepreneurship_and_Local_Development_in_the_Ma
rche_Region_Italy_OECD_Local_Economic_and_Employment_Development_LEED_Wo
rking_Papers_CFE [accessed Oct 14 2018].
- ORGANISATION FOR ECONOMIC CO-OPERATION AND DEVELOPMENT STAFF
(2016).OECD factbooks 2015-2016: economic, environmental and social statistics.
Paris: OECD Publishing.
-OHLIN, B. (1933). International and interregional trade. Harvard Economic Studies,
Cambridge, MA.
-OTSUB, S. (2016). Maritime clusters in Japan. Workshop on Maritime Clusters and
Global Challenges. Paris: OCDE Publishing.
- PALAN, N. (2010).Measurement of Specialization – The Choice of Indices (No. 62). FIW
working paper.

239
- PALHA, A., MENDES, L., FORTES, C. J., BRITO-MELO, A., & SARMENTO, A. (2010). The
impact of wave energy farms in the shoreline wave climate: Portuguese pilot zone case
study using Pelamis energy wave devices. Renewable Energy, 35(1), 62-77.
- PARK, D., SEO, K., KILDOW, D., & JUDITH, T. (2014). Rebuilding the classification
system of the ocean economy. Journal of Ocean and Coastal Economics, 2014(1), 4.
- PEETERS, C. (2008). The role of maritime clusters to enhance the strength and
development of maritime sectors. European Commission, DG Fisheries & Maritime
Affaire, 2008.
- PEGO, A., MARQUES, M., SALVADOR, R., SOARES G., MONTEI-ERO, A. (2016). The
potential offshore energy cluster in Portugal. Progress in renewable energy offshore.
Guedes Soares (Ed). London: Taylor & Francis., pp 867- 873.
- PEGO, A. (2018).The pentagonal problem and the offshore energy sector in Portugal.
Why does it matter? Entrepreneurship along the Industry Life Cycle: The changing role
of Entrepreneurial Activities and Knowledge Competencies. edited by S. Cubico, G.
Favretto, J. Leitão, and U. Cantner. Springer Book, 313-327.
- PEROUX, F. (1950). Economic space theory and application. Quarterly Journal of
Economics, 64(1), 89-104.
- PIEKARSKI, A. E. T., & TORKOMIAN, A. L. V. (2005). Identificação de clusters
industriais: uma análise de métodos quantitativos. Revista GEPROS, (1), Pag-40.
-PIKE, A., TOMANEY, J., & RODRIGUEZ-POSE, A. (2006).Local and regional
development. London: Routledge.
- PICKTON, D. W., & WRIGHT, S. (1998). What's swot in strategic analysis?
Strategicchange, 7(2), 101-109.

240
- PINTO, M. O. (2013).Fundamentos da energia eólica. Rio de JanEI-ERO: Editora LTC.
- POMBO, J., RODRIGUES, A., & DA SILVA, A. P. F. (2015). Seabed Properties for
Anchoring Floating Structures in the Portuguese Offshore. In Engineering Geology for
Society and Territory-Volume 6 (pp. 399-403). Springer International Publishing.
- PONTES, J. P., & SALVADOR, R. (2002).A nova geografia econômica. Compêndio de
Economia Regional, volume 1: teoria, temáticas e políticas. Lisboa: Editora Principia.
- PORTER, M. E. (1980). Industry structure and competitive strategy: keys to
profitability. Financial Analysts Journal, 36 (4), 30-40.
- PORTER, M. E. (1985).Competitive advantage.
- PORTER, M. E. (1990). New global strategies for competitive advantage. Planning
Review, 18(3), 4-14.
- PORTER, M. E. (1991). Towards a dynamic theory of strategy. Strategic Management
Journal, 12(S2), 95-117.
- PORTER, M. E. (1998).Clusters and the new economics of competition, 76(6), 77-90.
Boston: Harvard Business Review.
- PORTER, M. E. (2000). Location, competition, and economic development: Local
clusters in a global economy. Economic Development Quarterly, 14(1), 15-34.
- PORTER, M. (2003). The economic performance of regions. Regional Studies, 37(6-7),
549-578.
- PRICEWATERHOUSECOOPERS (PWC) (2016). The Potential Economic Impact of the
Offshore. Renewable Energy Industries (Executive Summary). Lisboa [in Portuguese].

241
-PROULX, M. U. (1994). Milieuxinnovateurs: concept et application. Revue
internationale PME: Économie et gestion de la petite et moyenneentreprise, 7(1), 63-
84.
- PUGH, D. S., HICKSON, D. J., HININGS, C. R., & TURNER, C. (1968). Dimensions of
organization structure. Administrative Science Quarterly, 65-105.
- QUIVY, R., & VAN CAMPENHOUDT, L. (1998).Manual de investigação em ciências
sociais. Lisboa: Editora Gradiva.
-RAFFESTIN, C. (1984). Territoriality: A reflection of the discrepancies between the
organization of space and individual liberty. International Political Science Review, 5(2),
139-146.
- RAGOZIN, P. (2012).Co-operation between Finland and Lithuania in the development
of clean technologies. Master Thesis. Lithuania: Central Ostrobothnia University of
Applied Sciences.
- RAMALHO, M.H., LOPES, A.,CARVALHO, M., VELHAS, E. (2010). Rostos de Portugal.
Lisboa: Porto Editora.
- RAMOS, G. (2005). Sistemas regionais de inovação e clusters: instrumentos de
desenvolvimento em regiões periféricas. Revista Internacional de Estudios Económicos
y Empresariales, 47-76.
- RAVITCH, S. M., & CARL, N. M. (2015).Qualitative research: Bridging the conceptual,
theoretical, and methodological. London: Sage Publications.
- RASMUSSEN, P. N. (1956).Studies in inter-sectoral relations, 15. E. Harck.
- REID, N., CARROLL, M. C., & SMITH, B. W. (2007). Critical steps in the cluster building
process. Economic Development Journal, 6(4), 44.

242
- REIS MOURÃO, P. (2006). Contributo para o estudo económico dos indicadores
regionais. Revista Portuguesa de Estudos Regionais, 12, 77-92.
- RICARDO, D. (1817).The works and correspondence of David Ricardo Vol. 1: On the
principles of political economy and taxation.
- RIVAS, M. (2016).Cluster- based local economic development in the context of RIS3.
URBACT - Infocus thematic paper.
- ROCHA, H. O., & STERNBERG, R. (2005). Entrepreneurship: The role of clusters
theoretical perspectives and empirical evidence from Germany. Small Business
Economics, 24(3), 267-292.
- ROSSETTI, J.P. (1997). Introdução à economia. São Paulo: Editora Atlas (17 edição).
- ROUND, J. I. (1983). Nonsurvey techniques: a critical review of the theory and the
evidence. International Regional Science review, 8(3), 189-212.
-SACK, R. D. (1983). Human territoriality: a theory. Annals of the Association of
American geographers, 73(1), 55-74.
-SALVADOR, R. (1993).Vantagens comparativas reveladas: o caso da industria
algarvia. Phd Thesis. Lisboa: Universidade Nova de Lisboa.
- SALVADOR, R. (2005). Los factores del medio físico en el desarrollo de los territorios.
Estudios geográficos, 66 (259), 615-636.
- SALVADOR, R., & GUEDES SOARES, C. (2008). Metodologias para Estimação de Níveis
de Competitividade e Ligações Inter-Sectoriais num Cluster do Mar. Inovação e
Desenvolvimento nas Actividades Marítimas, Salamandra, Lisboa, 85-102.

243
-SALVADOR,R.(2010).Os clusters marítimos.
http://revistademarinha.com/index.php?option=com_content&view=article&id=1497:
clusters-maritimos&catid=106:marinha-mercante&Itemid=390
- SALVADOR, R. (2015). Maritime clusters evolution. The (not so) strange case of the
Portuguese maritime cluster. Journal of Maritime Research, 11(1), 53-59.
- SALVADOR, R., SIMÕES, A., SOARES, R.G. (2015).Features of the European Maritime
Clusters. ERSA- European Regional Science Association.
- SALVADOR, R., SIMÕES, A., & SOARES, C. G. (2016). The economic features, internal
structure and strategy of the emerging Portuguese maritime cluster.Ocean & Coastal
Management, 129, 25-35.
- SANTOS, D. M. P. D. (2012).Caracterização simplista das potencialidades energéticas
da costa ocidental portuguesa. MASTER Thesis. Porto: Faculdade de Engenharia da
University do Porto.
- SANTOS, L. C., & VARVAKIS, G. (1999).Redes de Pequenas e Médias Empresas:
organizações virtuais vs. clusters.Foz do Iguaçu: ENANPAD.
- SANTOS CARNASCIALI, A. M. D., & STAMATO DELAZARI, L. (2011). A localização
geográfica como recurso organizacional: utilização de sistemas especialistas para
subsidiar a tomada de decisão locacional do setor bancário. RAC-Revista de
Administração Contemporânea, 15(1).
- SARJA, J. M. (2013). The actors of a wind power cluster: a case of a wind power
capital. Journal of Urban and Environmental Engineering (JUEE), 7(1).
-SAQUET, M. A. (2005).Entender a produção do espaço geográfico para compreender
o território. Produção do espaço e redefinições regionais: a construção de uma
temática. Presidente Prudente: UNESP/FCT/GAsPERR, 35-51.

244
-SAQUET, M. A., & SPOSITO, E. S. (2009).Territórios e territorialidades: teorias,
processos e conflitos. Expressão Popular.
-SCHMITZ, H. (1992). On the clustering of small firms. IDS bulletin, 23(3), 64-69.
- SCLAVOUNOS, P., TRACY, C., & LEE, S. (2008, January). Floating offshore wind
turbines: Responses in a seastate Pareto optimal designs and economic assessment. In
ASME 2008 27th International Conference on Offshore Mechanics and Arctic
Engineering (pp. 31-41). American Society of Mechanical Engineers.
- SCOTT, A. J. (1988). Flexible production systems and regional development: the rise
of new industrial spaces in North America and Western Europe. International Journal
of Urban and Regional Research, 12 (2), 171-186.
- SILVA, N.A.R. (2011).Impacto das condições meteorológicas nas janelas de
oportunidades para a operação de parques eólicos offshore em Portugal. MASTER
Thesis. Departamento de Engenharia Geográfica, Geofísica e Energia. Lisboa:
Universidade de Lisboa.
- SIMAS, M. S. (2012).Energia eólica e desenvolvimento sustentável no Brasil:
estimativa da geração de empregos por meio de uma matriz insumo-produto
ampliada. PHD Thesis. São Paulo: Universidade de São Paulo.
- SIMÕES, A. D. S. (2013).O e-planning como instrumento na construção do cluster do
mar em Portugal - quantificação, participação e envolvimento dos setores
socioeconómicos nacionais. PHD thesis. Lisboa: Universidade Nova de Lisboa.
- SHINOHARA, M. (2010). Maritime cluster of Japan: implications for the cluster
formation policies. Maritime Policy & Management, 37(4), 377-399.

245
-SKOGSTAD, B.A. (2016). Development and bnefits of maritime clusters Norwegian
policy. Workshop on Maritime Clusters and Global Challenges. Paris: OCDE publishing.
- SNYDER, B., & KAISER, M. J. (2009). Ecological and economic cost-benefit analysis of
offshore wind energy. Renewable Energy, 34(6), 1567-1578.
- SONIS, M., HEWINGS, G. J., & GUO, D. (2008). Industrial clusters in the input—
output economic system. Handbook of Research on Cluster Theory, 1, 153.
- SOUSA, A. (1987).Análise económica. Faculdade de Economia. Universidade Nova de
Lisboa.
- STIMSON, R. J., STOUGH, R. R., & ROBERTS, B. H. (2006).Regional economic
development: analysis and planning strategy. Springer Science & Business Media.
- STOPFORD, M. (2009).Maritime Economics 3e (3rd edition).London:Routledge.
- STORPER, M. (1997b). Territories, flows, and hierarchies in the global economy.
Spaces of globalization: Reasserting the power of the local, 19-44.
- STEWART, C. A. (2013).Wind Development in the United States: A Comprehensive
Policy Framework for Effective Wind Development as Framed by PJM Stakeholders.
Wilmington University (Delaware).
- TABOADA, J. V., & LEMU, H. G. (2016, JUNE). Analysis of Wave Energy Sources in the
North Atlantic Waters in View of Design Challenges. In ASME 2016 35th International
Conference on Ocean, Offshore and Arctic Engineering (pp. V006T09A011-
V006T09A011). American Society of Mechanical Engineers.
- TEILLANT, B., COSTELLO, R., WEBER, J., & RINGWOOD, J. (2012). Productivity and
economic assessment of wave energy projects through operational simulations.
Renewable Energy, 48, 220-230.

246
- TEIXEIRA, A. R. P. D. A. (2010). Micro-turbinas instaladas em ambiente urbano, para
aplicações de microgeração: desenvolvimento de uma metodologia para identificação
e caracterização do potencial eólico. PHD Thesis. Lisboa: Universidade de Lisboa.
- TERRADOS, J., ALMONACID, G., & HONTORIA, L. (2007). Regional energy planning
through SWOT analysis and strategic planning tools.: Impact on renewables
development. Renewable and Sustainable Energy Reviews, 11(6), 1275-1287.
- TITZE, M., BRACHERT, M., KUBIS, A. (2011).The identification of regional industrial
clusters using qualitative input-output analysis (13). Halle Institute for Economic
Research.
- THEIL, H. (1957). Linear aggregation in input-output analysis.Econometrica: Journal of
the Econometric Society, 111-122.
-THÜNEN, J. V. (1826). Der isolierte Staat. Beziehung auf Landwirtschaft und
Nationalökonomie.
- TURNER, R. C. (2001).A framework for cluster-based economic development policies.
Nelson A. Rockefeller Institute of Government.
- VALENTIN, E. K. (2001). SWOT analysis from a resource-based view. Journal of
Marketing Theory and Practice, 9(2), 54-69.
- VASCONCELOS, F. C., & CYRINO, Á. B. (2000). Vantagem competitiva: os modelos
teóricos atuais ea convergência entre estratégia e teoria organizacional. Revista de
Administração de Empresas, 40(4), 20-37.
- VIEDERYTE, R. (2013). Maritime cluster organizations: enhancing role of maritime
industry development. Procedia-Social and Behavioral Sciences, 81, 624-631.

247
-UDY JR, S. H. (1959). " Bureaucracy" and" Rationality" in Weber's Organization
Theory: An Empirical Study. American Sociological Review, 791-795.
-WAVEC OFFSHORE RENEWABLES (2013-2014).Relatório de sustentabilidade 2013-
2014.
-WEBER, A. (1909). Ueber den standort der industrien, 2. Рипол Классик.
-WIECZOREK, A. J., NEGRO, S. O., HARMSEN, R., HEIMERIKS, G. J., LUO, L., &HEKKERT,
M. P. (2013). A review of the European offshore wind innovation system.Renewable
and Sustainable Energy Reviews, 26, 294-306.
- WIJNOLST, N. (2006).Dynamic European maritime clusters, 30.IOS Press.
- YEGOROV, Y. (2014).Uncertainty of timing for Global Challenges and Problems with
Transition to Renewable energies. ERSA- European Regional Science Association.
- ZHANG, W., & LAM, J. S. L. (2013). Maritime cluster evolution based on symbiosis
theory and Lotka–Volterra model. Maritime Policy & Management, 40(2), 161-176.
- ZHAO, Z. Y., ZHANG, S. Y., & ZUO, J. (2011). A critical analysis of the photovoltaic
power industry in China–From diamond model to gear model. Renewable and
Sustainable Energy Reviews, 15(9), 4963-4971.

248

249
LIST OF TABLES
Table 1– Competitive Implications in Geographical Location ..................................................... 26
Table 2– Explanatory Theories in Competitive Advantage ......................................................... 27
Table 3– Organisation Typology .................................................................................................. 30
Table 4– Productive Systems: Relationships between Organization and Exterior ..................... 40
Table 5– Market Barriers ............................................................................................................. 43
Table 6–Operationalization of Porter’s Diamond Model for the Renewable Energy Industry ... 45
Table 7– Dos and Don’ts of Modern Cluster Policy ..................................................................... 57
Table 8– Ocean-Based Industries ................................................................................................ 60
Table 9– The Concept of Ocean Economy .................................................................................. 61
Table 10– European Union Maritime Activities .......................................................................... 62
Table 11– Atlantic Ocean Basin Most Dynamic Clusters ............................................................. 73
Table 12– Offshore Wind Energy Cluster .................................................................................... 86
Table 13– Environmental Impacts of Wind Energy Conversion Technologies ............................ 86
Table 14– Wave Energy Cluster .................................................................................................. 87
Table 15– Environmental Impacts of Wave Energy Conversion Technologies ........................... 88
Table 16- Cleantech Industries .................................................................................................... 92
Table 17–Activity Provision and Its Impact on Employment (2015-2022) ................................ 104
Table 18– Activity Prevision (2022-2030).................................................................................. 104
Table 19– SWOT Analysis of the Offshore Wind Energy in Portugal ........................................ 109
Table 20– Member States (and Norway) Renewable Energy Production Growth rate (TWH) in %
................................................................................................................................................... 113
Table 21– EU Renewable Gross Electricity Production (wind and tidal, wave and ocean), 2018,
1990-2013 (GWH) ..................................................................................................................... 114
Table 22– Share of Renewable Sources in Gross Final Consumption of Energy (%) ................. 114
Table 23– Renewable Sources as a Percentage of Total Primary Energy Supply ...................... 114
Table 24– Expected Installed Capacity & Yearly Growth (2020-2030) ..................................... 115
Table 25– Estimation of Total Contribution (installed capacity, gross electricity generation) in
Portugal to meet the Binding 2020 Targets and the Indicative Interim Trajectory Offshore from
Renewable Recourses in Electricity Sector 2017-2020 ............................................................. 115
Table 26– R&D Offshore Energy Projects in Portugal ............................................................... 124
Table 27– Aguçadoura Pelamis Suppliers (2003- 2008) ............................................................ 130
Table 28– Peniche WaveRoller Project ..................................................................................... 131
Table 29– WMO Sea Code, Corresponding to Wave Height ..................................................... 141
Table 30– The Relationship between the Beaufort and Douglas Scales ................................... 142
Table 31–Wind speed 100 m high (m/s) ................................................................................... 156
Table 32- Wave height (m) ........................................................................................................ 156
Table 33- Electric Production by Portuguese Region ................................................................ 157
Table 34– Input-Output Transaction Table ............................................................................... 162
Table 35– The IO table .............................................................................................................. 163
Table 36– Classification of Products and Industries in Empirical Tables .................................. 164
Table 37– Buying and Selling Sector ......................................................................................... 166

250
Table 38– Expanded Flow Table for a Two-Sector Economy .................................................... 167
Table 39– Composition of Total Impact .................................................................................... 182
Table 40– Suppliers with Higher Technical Coefficients ........................................................... 187
Table 41– Electricity Production (351) Main Suppliers and Clients .......................................... 188
Table 42– Energy Production (351) Keynesian Multipliers (GVA) ............................................. 189
Table 43– Offshore Energy Cluster in Portugal- SWOT analysis ............................................... 203
Table 44– WF1 – Offshore Wind Project Suppliers prototype (Windfloat Project) .................. 205
Table 45– Supporting Suppliers technical coefficients (EI-ERO Project) ................................... 207
Table 46– Supplier Port Technical Coefficients (EI- ERO Project) ............................................. 208

251
LIST OF FIGURES
Figure 1– Basic Resources for Competitive Advantage Success ................................................. 28
Figure 2– Porter Diamond Model ............................................................................................... 42
Figure 3– Mapping Portugal's Clusters........................................................................................ 44
Figure 4– Porter’s Competitiveness Models ............................................................................... 46
Figure 5– Industrial Districts vs. Innovation Clusters .................................................................. 47
Figure 6– From Roadmapping to Cluster-to-Cluster Collaboration ............................................ 50
Figure 7– The Cluster Life Style ................................................................................................... 54
Figure 8– Ocean Industry value added ........................................................................................ 62
Figure 9– Ocean Industry employment ....................................................................................... 62
Figure 10– New uses and resources of the ocean value chain ................................................... 65
Figure 11– Maritime clusters of the world.................................................................................. 67
Figure 12– Schematic Maritime Cluster in Marche region ......................................................... 69
Figure 13– Classification of Maritime Cluster Organisation (top-down vs bottom -up) ............. 69
Figure 14– Dynamic European Maritime Clusters ...................................................................... 70
Figure 15– Differences between similarities of national and regional maritime clusters
organisation ................................................................................................................................ 71
Figure 16– SWOT Analysis and Maritime Clusters ...................................................................... 72
Figure 17– European Maritime Cluster ....................................................................................... 74
Figure 18– Strategy Sectors......................................................................................................... 75
Figure 19– Maritime cluster in Japan .......................................................................................... 75
Figure 20– Norwegian maritime cluster...................................................................................... 76
Figure 21– French maritime cluster ............................................................................................ 76
Figure 22– The Portuguese Maritime Cluster Commercial Relations (in millions of euros) ....... 78
Figure 23- Offshore energy farm in Scotland (August 2016) ...................................................... 85
Figure 24- North Sea (August 2017) ............................................................................................ 87
Figure 25– Cleantech Sectors ...................................................................................................... 93
Figure 26–Cleantech industry segments ..................................................................................... 94
Figure 27– Cleantech Barriers ..................................................................................................... 95
Figure 28– Business development framework (Helix Model) ..................................................... 96
Figure 29– Circular Economy and Green Economy ..................................................................... 99
Figure 30– The Renewable Sustainability ................................................................................. 102
Figure 31– The Renewable Energy Influence on GDP ............................................................... 103
Figure 33- SWOT Analysis location Map for Central Europe ..................................................... 108
Figure 33– Offshore Wind Clusters SWOT Analysis in Several Countries ................................. 110
Figure 34– Evolution of the Estimated Trajectory of Energy Consumption from Renewable
Sources in the Heating and Cooling, Electricity and Transport Sectors .................................... 116
Figure 35– Climate Change Dimensions .................................................................................... 117
Figure 36– Renewable Energy Sources (RES) development by 2050 ........................................ 120
Figure 37– Offshore Infrastructures .......................................................................................... 127
Figure 38– The Basic Wind Industry Value Chain ...................................................................... 134
Figure 39 - The Potential Offshore Wind Farm Intervenient .................................................... 135

252
Figure 40– International Distribution of Wave Power Potential .............................................. 139
Figure 41– Wave Characteristics and Changes in Orbital Motion of Water Particles in Deep
Water (top) and Shallow Water (bottom) ................................................................................. 140
Figure 42– Values of Sea Winds at Different Heights More than 10 km from the Coast
(European Offshore Wind Atlas) ............................................................................................... 143
Figure 43– The Continental Shelf .............................................................................................. 146
Figure 44– The Exclusive Economic Zone of Portugal ............................................................... 148
Figure 45– Location of the Offshore Model Grid Points and Nearshore Linear Sectors. .......... 151
Figure 46– Average Annual Offshore Wave Power Density in Each Offshore Site and Wave
Energy Potential in Sections Parallel to the Coastline (Coloured Segment) and Along the Annual
Mean Wave Direction (Coloured Arrow). 152
Figure 47– Annual Wave Energy Flux Offshore and at 50, 40, 30 and 20 m Depth Considering
Self-Orientating WEC, Fixed WEC Deployments Orientated with the Mean Annual Peak ....... 154
Figure 48– Portuguese Areas with Potential for Offshore Wind Farms .................................... 155
Figure 49– Places Most Conducive to the Use of Sea Winds on the Portuguese Coast ........... 157
Figure 50– Advantages and Limitations of using IO tables ....................................................... 173
Figure 51– How to use an IO model .......................................................................................... 174
Figure 52– Links and Scattering Index ....................................................................................... 180
Figure 53– Energy Use ............................................................................................................... 184
Figure 54– Offshore Energy Stakeholders Interviewed Geographical Areas ............................ 199
Figure 55– Portuguese Porter's Diamond for offshore energy cluster ..................................... 200
Figure 56 - WF1 Suppliers Location ........................................................................................... 206
Figure 57 - Supporting Suppliers Location and Ports ................................................................ 208

253

254
ANNEX 1– INTERVIEWEES AND ELECTRONIC QUESTIONNAIRE

255
LETTER SENT TO THE INTERVIEWEES
Dear Sir/ Madam
You are invited to participate in a research study titled "The offshore energy cluster in
Portugal. A cluster perspective".
In this study, you will be asked to complete an electronic survey. Your participation in
this study is voluntary and you are free to withdraw your participation from this study
at any time.
The survey should only take 10 minutes to complete. There are no risks associated
with participating in this study. The survey collects no identifying information of any
respondent. All of the responses in the survey will be recorded anonymously.
If you have any questions regarding the survey or this research project in general,
please contact Ana Pego (doctoral candidate) at [email protected].
By completing and submitting this survey, you are indicating your consent to
participate in the study. Your participation is appreciated.
Yours faithfully,
Ana Pego, doctoral candidate, CICS Nova, FCSH, UNL
Professor Regina Salvador, CICS Nova, FCSH, UNL, Jean Monet Chair
Please click on the survey link below and provide us with your feedback no later than
30/04/2018
https://kwiksurveys.com/s/ZAi9wfqJ
The survey content and findings are the sole responsibility of the individual conducting
the survey.

256
LIST OF INTERVIEWEES WHO AGREED TO PARTICIPATE IN THIS SURVEY
a= Suppliers; b= Ports; c= Research Centre/University; d= Public Institutions; others public institutions
as municipalities council didn’t agree in participated
Name Activity Code CAE
Person who answered
Email NUTS II typology
APCER- Serviços de Certificação, Educação e Formação, Auditoria e Inspeção, Energia, AgroFood.
71200 Carlos Vila [email protected] AMP d
APREN - Associação Portuguesa de Energias Renováveis
João Graça Gomes
joã[email protected] AML d
A Silva Matos Metalomecânica, SA
25110
A Silva Matos Metalomecânica, SA
[email protected] Sever do Vouga
a
Cabelte - Cabos Eléctricos e Telefónicos, S.A:
27320 Mario Pais de Sousa
[email protected] AMP a
IEP- Instituto Elétrico Português
94995 Modesto de Morais
[email protected] AMP d
IST- Instituto Superior Técnico
85420 Henrique Matos [email protected] AML c
Lankhorst Euronete Portugal, S. A.
13942 Alberto Leão [email protected] AMP a
MARE - Centro de Ciências do Mar e do Ambiente
85420 José Lino Costa José[email protected] AML c
MARE - Centro de Ciências do Mar e do Ambiente (AZores)
85420 Paula Lourinho [email protected] Azores c
Polish Maritime Cluster
12345 Marek Grzybowski
[email protected] Pomerania (Baltic Sea Region)
d
Porto Peniche 52220 Serrano Augusto [email protected] Centro b
SENVION 42220 Rui Carvalho [email protected] AMP a
SIEMENS 27110 Filipe Rodrigues [email protected] AML a
TEGOPI 25110 Diana Vasconcelos
[email protected] AMP a

257
ELECTRONIC QUESTIONNAIRE
1- Identification
Name
City
Country
Person who answered
2- Economic activity - 5 dig ______
3- Type of organisation:
Public organization; Government; Private Organization; Research Centre; University; Municipality Council; Other;
4- NUTS II location :
Norte; Centro; Lisboa e Vale do Tejo; Alentejo; Algarve; Açores; Madeira; Other;
5- Identify NUT III ____
6- Relationship with other organization:
Independent; Integrated in a National Group; Integrated in an International Group; Other;
7- If the organization is integrated in a group the main organization is located in
Portugal; Portuguese District; Other Country;
8- Number of employees
Total; Senior Management; Number of Skilled Workers; Number of No Skilled Workers;
9- Partnerships
Option Scale of values
Training (go to question 10); Institutions ( go to question
11); Business Organisation (
regional/national/European) ( got to question 12);
Yes/No;

258
10- Training
Option
Universities; Training Institutions; Private Organisations; Research Centers; Other;
11- Institutions
Option
Apply; not apply; Other;
12- From the following services indicate which services are inside or outside the organization
Option Scale of values
Innovation Process; Marketing and Publicity; Financial
Services; Legal Services; Market Prospect; Repair and
Maintenance Equipments; Others;
In organisation; From Specialized Organizations Inside
the Council; From Specialized Organizations Outside
the Council; Foreign Organizations';
13- Principal services and good suppliers
Option Scale of values
Components; Raw Materials; Machinery; Accessories;
Advance Services (technical assistant, drawing,
software); Other;
Local; Regional; National; EU; Other Countries;
14- Cooperation
Option
Between Organization in the Same Sector; Between Organization in the Same Value Chain; With Public Agents;
Technological With Other Organization; Technological With Other Institution; Commercial; Other;
15- Technological cooperation
Option Scale of values
With other Organization; With Other Institution; Other; In Process Production; In New Products; In New
Commercial Techniques; Adoption to new Products;
adoption to Existent Products;

259
16- Financial support and incentives
Option Scale of values
Developing New Products; Developing New Productive
Process; Introduction to New Commercial Techniques;
Products Improvement; Export; Training; Inter-
Business Cooperation; Transnational Cooperation;
Regional Programs; National Programs; European
Programs;
17- Cooperation with stakeholders
Option Scale of values
Stakeholders; Type of Relationship; Regional Level; National Level; European Level;
International Level;
18- Production factors availability and technical conditions
Option Scale of values
Expertise Work; Financial Support; Equipped and
Accessible Spaces; Transport Infrastructures; Other
Infrastructures;
Positive; Negative; Needed; Problems;
19- Cooperation with organizations
Option
Training skills; Consultancy; Investment Support; Infrastructures; Technological Transfer; Human Resources; R&D
Activities; Other
20- Cooperation with organization
Option
Vertical; horizontal;
21- Vertical cooperation
22- Horizontal cooperation
23- Intuitional expertise areas

260
Option
Environment; Quality; Human Resources; Sustainability; Other;
24- Investment support to organizations
Option Scale of values
EU Funds; National Funds; Regional Funds; Other; No important at all; Unimportant; Neutral; Important;
Very Important;
25- Production factors availability and technical conditions
Option Scale of values
Expertise work; Financial Support; Equipped and
Accessible Spaces; Transport and Infrastructures; Other
infrastructures;
Positive; Negative; Needed; Strongly Agree;
26- Network with private or other organization in renewable energy can be made with:
Option Scale of values
Business Network; Technical Management; Financial
Support with Public or Private Funds; Knowlodge
Transfer; Public Consulting Services;
Strongly Disagree; Disagree; Neutral; Agree; Strongly
Agree;
27- Organization Typology
Option
Technology Centre; R&D Laboratory; University; Research Organization;
28- Cooperation motives
Option Scale of values
Less Technological Costs; Less Market Entrance Costs;
Less Technological Development Risks; Less Market
Entrance Risks; Scale Economies; Reduce the time on
new Products; Promote the Knowledge and Learning;
Very Insignificant; Insignificant; Neutral; Significant;
Very Significant;
29- Cooperation difficulties
Option Scale of values

261
Strategies/Goals; Problems with Organization;
Asymmetric Relationship With Organization; Unreal
"timings"; Low Human Resources; Low Capital
Resources; Other;
Very Unimportant; Unimportant; Neutral; Important;
Very Important
30- Organization role
Option Scale of values
Technological Planning; Select the Possible
Stakeholders; Change Knowlodge Support Between
Stakeholders; Infrastructure for Pilot Test; Prototypes
Support and Scale-UP; Regulamentation Support;
Intellectual Property; Financial Support for product
Testing; Evaluated Product; Other;
Very Unimportant; Unimportant; Neutral; Important;
Very Important
31- Cooperation Results
Option Scale of values
New Products; New Process; New Markets; Profits;
Employment; Export Quota; Efficiency; Intellectual
Property; Other
Very Ineffective; Ineffective; Neutral; Effective; Very
Effective
32 -
Option Scale of values
The Renewable Energy Costs are Competitive; Energy
Production is Related With Cooperation, Capital
Transfer, Specialized Human Resources and
Technology; There are a Possibility of the Organization
Join Other from the Same Sector; The Organization
Cooperates with Public Institutions, Universities and
Other Organizations Towards Better Services; The
Organization Develop Research Activities and
Innovation; The organization intend to be Internalized;
The Use of Information and Technology Systems are
important for Competiveness; A system With National
and International Networks Constitute an Important
factor for energy prices; The Energy Value Chain is
Fundamental for the Organization Performance; The
Quality of Human Resources and Technology Constitute
an Important Vector for Competiveness; Organization
Work Together for Market Needs;
Strongly Disagree; Disagree; Neutral; Agree; Strongly
Agree;
33- Specify other Market Strategy if Necessary

262
34
Option Scale of values
Geographical Location; Energy Network Proximity;
Climatic Conditions; Good Network Transport System;
Universities and Research Centers Proximity; Credit
Facilities; Network Business; Competitive Business
Capacity; Capital and Knowlodge Transfer between
Organizations; Business Consulting Access;
Environmental Quality; Cooperation Between
Stakeholders; Foreign Capital Facility; Environmental
Sustainability; Recycling and Waste Management;
Very Unimportant; Unimportant; Neutral; Important;
Very Important
35 - Other development factor not listed
36- Which factors comprise the offshore energy cluster in Europe?
Option
The energy policy 2020 on renewable (offshore energy) is adequate to EU needs and promotes consumer
satisfaction;
The strategies followed by the renewable energy intend to maximize private and public consumers utility;
The renewable energy promotes less energy dependency;
The offshore cluster will promote innovation, human resources and technology transfer, because cooperation it will
established between organizations;
European countries with strong potential for renewable energy production can contribute for a global European
offshore cluster;
European countries with high offshore energy production can contribute for relevant cooperation between
stakeholders among European countries;
Portugal can cooperate with other offshore European clusters;
Accessibility, employment, social affairs, economic and social development, natural resources and energy efficiency
are important factors;
Public Institutions, business conditions, distribution and logistics centers have an important role on offshore energy
cluster;
Vertical cooperation among offshore energy cluster is more suitable than horizontal because the government should
have an important role;
Offshore energy cluster will comprise environment solutions and contribute positively for circular economy;

263
37- Portuguese Offshore energy cluster strengths
Option
Environmental Friendly; Innovation; Public Interest; Efficient Government Support; Expertise Knowlodge;
Investment Return; Extensive R&D Development Activities; Geographical Diversification; Other;
38- Portuguese offshore energy cluster weakness
Option
Security; Data Challenges; High Level of Investment; No Road Map; Communication Between Stakeholders;
Technology Training/Orientation; Lack of Strategic Plan; Other
39- Portuguese offshore energy cluster opportunities
Option
Economies of Scale; Integration of Information System; Network Investments and Human Resources; Infrastructure
Management; Investment Opportunities; Employment Expertise; R&D activities; Emerging Market, Other;
40- Portuguese offshore energy threats
Option
Environmental Regulation; Funding Levels and Priorities; Competition With Other Energy Source; Price of Energy
from Offshore Energy Production; Value Chain; other

264
ANNEX 2– IO MATRIX 2013

265
27 28 29 30 31 32 33 351 352 353 36 37+38+39 41 42 43 45 46 47 49 50 51 52 53 55
Equip.
eléctrico
Máq. e
equip., n.e.
Veíc.
Autom.,
reboques e
semi-
reboques
Outro mat.
Transp.
Mobiliário Prod. div.
indúst.
transform.
Serv. rep e
instal. máq
e equip Produção,
transporte,
distribuição e
comércio de
electricidade
gaz natural
distribuido
Produção e
distribuição de
vapor, água
quente e fria e ar
frio por conduta;
produção de gelo
Captação,
tratam. e
distrib.
água
Serv.
Saneam.,
descontami
n. e valoriz.
de
materiais
Constr.
edifícios
Trabalhos
engenharia
civil
Trabalhos
de
construção
especializ.
Vendas p/
gros. e ret.
e serv. rep.
Autom. e
motocic.
Vendas p/
grosso, exc.
veíc. Auto.
e
motociclos
Vendas a
retalho,
exc veíc.
Autom. e
motoc.
Serv.
Transp.
terrestre e
por cond.
(pipelines)
Serviços de
transporte
por água
Serviços de
transporte
aéreo
Serv.
armaz. e
auxil. dos
transp.
Serviços
postais e
de courrier
Serv.
Alojam.
0,0 0,7 9,3 0,0 0,0 0,1 0,1 0,00 0,0 0,0 0,0 0,0 0,0 0,0 0,3 0,0 47,8 17,1 0,0 9,3 0,0 0,0 0,0 40,30,0 0,0 0,0 0,0 1,7 1,5 0,1 0,00 0,0 0,0 0,0 0,0 0,0 0,0 0,9 0,0 2,7 3,1 0,0 0,0 0,0 0,0 0,0 0,0
0,0 0,0 0,0 0,0 0,0 0,0 0,0 0,00 0,0 0,0 0,0 0,0 0,0 0,0 0,0 0,0 0,8 0,0 0,0 0,0 0,0 0,0 0,0 5,50,0 0,0 0,0 0,0 0,0 0,0 0,0 260,46 0,0 0,0 0,0 0,1 0,0 0,0 0,0 0,0 0,0 0,0 0,0 0,0 0,0 0,0 0,0 0,0
0,0 0,0 0,0 0,0 0,0 0,0 0,0 0,00 0,0 0,0 0,0 0,0 0,0 0,0 0,0 0,0 0,0 0,0 0,0 0,0 0,0 0,0 0,0 0,00,0 0,0 0,0 0,0 0,0 0,0 0,0 0,00 1358,4 0,0 0,0 0,0 0,0 0,0 0,0 0,0 0,0 0,0 0,0 0,0 0,0 0,0 0,0 0,00,7 0,7 0,0 0,0 0,0 0,5 0,1 0,00 0,4 0,0 5,0 1,3 58,2 40,0 40,4 0,1 5,2 0,4 0,7 0,0 0,0 3,3 0,0 0,2
0,1 0,0 0,0 0,0 0,0 2,8 0,0 1,16 0,0 0,0 0,1 0,2 0,6 0,5 0,2 0,4 76,0 147,2 0,8 0,0 0,0 0,9 0,1 223,82,0 2,5 2,9 0,3 1,6 1,1 2,6 1,18 0,1 0,0 0,5 4,6 14,0 3,7 6,5 8,3 70,2 22,5 6,7 1,7 0,3 3,5 0,4 91,6
0,0 0,0 0,0 0,0 0,0 0,0 0,0 0,00 0,0 0,0 0,0 0,0 0,0 0,0 0,0 0,0 0,0 0,0 0,0 0,0 0,0 0,0 0,0 0,00,4 0,2 139,9 1,5 103,2 13,8 1,3 0,00 0,0 0,0 0,0 0,0 9,8 2,4 3,5 1,1 19,7 3,7 0,3 125,7 1,5 0,1 0,0 16,40,2 0,2 1,2 0,1 0,1 2,9 0,4 0,28 0,0 0,0 0,3 0,9 1,0 0,3 1,0 0,7 3,5 11,9 1,0 0,8 0,1 1,3 0,0 1,2
0,0 0,0 53,5 1,8 40,1 1,5 0,2 0,00 0,0 0,0 0,0 0,0 0,0 0,0 0,0 0,0 2,9 2,2 0,0 53,5 1,8 0,8 0,0 0,0
14,2 3,2 3,7 1,5 266,7 22,7 1,1 0,00 0,0 0,0 1,3 1,5 211,3 70,7 148,0 0,1 21,3 29,2 2,2 1,5 1,5 3,6 0,0 4,1
8,5 6,9 13,7 1,6 14,0 6,8 3,6 3,30 0,0 0,0 0,7 2,1 3,2 2,7 3,9 4,1 43,6 23,2 6,6 13,1 1,6 4,6 1,2 7,30,9 1,5 1,2 0,7 1,9 2,4 0,7 26,17 0,2 0,0 1,0 1,8 2,1 0,9 1,1 8,4 73,5 51,8 7,3 0,3 0,7 4,7 1,8 5,3
14,3 14,8 8,2 1,5 16,9 13,4 23,9 302,28 0,9 7,0 12,7 59,8 131,4 136,3 182,7 65,2 371,5 161,8 1442,5 6,1 1,5 37,6 11,7 21,4182,3 50,6 177,9 15,1 62,3 38,1 21,4 17,44 0,0 0,0 39,4 12,4 127,3 46,8 72,3 30,9 102,1 59,5 18,5 171,5 15,1 1,9 0,4 64,3
0,1 0,1 0,1 0,0 0,0 0,0 0,1 1,97 0,0 0,0 0,3 0,6 1,3 1,1 0,2 0,2 67,5 3,5 1,0 0,1 0,0 3,1 0,2 0,8
84,2 67,0 192,0 14,7 30,7 118,3 19,4 3,49 0,0 0,4 6,8 2,4 125,6 79,2 114,8 382,5 49,6 80,9 36,4 144,1 14,7 2,4 0,1 0,720,9 11,4 43,5 0,9 13,0 10,6 4,0 0,03 0,0 0,0 9,0 1,6 672,7 357,3 363,4 24,9 30,2 16,4 12,0 15,2 0,9 4,8 0,0 16,0
612,7 414,2 326,5 32,9 44,5 42,5 28,7 4,07 0,1 0,0 3,9 0,0 103,2 109,6 87,8 10,9 11,2 3,3 2,3 277,2 32,9 2,5 0,0 0,8
85,0 163,8 149,4 44,3 46,6 12,1 91,3 18,16 0,0 0,0 1,6 15,6 394,6 73,7 272,5 25,9 140,1 75,4 28,2 115,0 44,3 9,0 0,7 22,256,6 8,6 186,6 2,0 0,2 9,6 56,9 18,47 0,1 0,0 4,0 0,0 4,9 2,5 9,9 30,7 238,5 11,6 6,3 162,1 2,0 1,3 0,0 0,0
377,0 61,9 164,0 3,3 1,0 13,9 93,0 94,31 0,0 0,0 0,0 0,0 152,2 34,6 143,6 56,9 32,0 27,3 22,1 145,1 3,3 0,1 0,0 25,373,9 445,1 80,6 8,0 2,3 4,1 54,0 15,13 0,0 0,0 17,6 1,0 72,7 90,5 88,4 45,9 13,8 8,3 12,1 61,7 8,0 0,3 0,0 10,7
2,4 3,5 3120,1 1,4 0,0 3,4 0,7 0,00 0,0 0,0 0,0 0,7 0,0 0,0 0,2 496,8 2,5 3,9 14,6 1279,1 1,4 0,0 0,0 0,0
0,0 0,1 1,9 125,1 0,0 5,1 27,5 0,00 0,0 0,0 0,0 0,0 0,0 0,3 0,6 7,5 8,7 6,4 0,5 1,9 125,1 0,0 0,0 0,00,1 1,4 0,7 0,1 54,7 3,2 0,0 0,00 0,0 0,0 0,0 0,0 24,2 0,0 18,4 0,4 9,5 1,1 0,6 0,3 0,1 0,2 0,0 17,81,2 1,1 2,0 0,1 1,0 26,2 1,1 0,60 0,0 0,0 0,5 91,4 2,0 1,3 2,5 2,2 8,5 55,5 3,1 1,3 0,1 2,4 0,6 7,7
13,5 13,1 17,3 2,6 11,1 6,6 196,2 71,89 3,9 0,9 5,6 13,1 8,5 6,9 10,8 18,3 14,1 10,3 142,7 13,1 2,6 13,9 7,1 32,820,6 18,6 33,9 4,2 28,5 7,7 11,6 6394,11 0,3 1,7 31,2 70,4 13,3 9,3 9,5 32,5 132,4 315,1 75,5 24,8 4,2 64,7 6,0 110,0
3,3 4,5 9,4 0,6 1,4 0,7 0,7 833,87 104,9 0,1 0,5 3,6 6,3 4,1 2,9 3,3 8,3 3,4 11,5 5,4 0,6 3,5 0,1 33,60,0 0,0 0,0 0,0 0,0 0,0 0,0 0,00 0,0 0,3 0,0 0,0 0,0 0,0 0,0 0,0 0,0 0,0 0,0 0,0 0,0 0,0 0,0 14,20,5 0,4 0,6 0,1 0,3 0,2 1,7 1,01 0,0 0,8 169,3 36,1 3,3 0,8 0,6 3,0 5,6 10,9 7,5 0,4 0,1 3,7 0,2 17,7
0,6 32,3 0,6 0,7 0,9 0,3 0,7 1,14 0,0 0,1 145,9 892,9 3,3 2,1 0,7 8,9 12,2 13,5 6,3 0,5 0,7 3,6 0,2 17,810,3 8,8 17,4 4,0 5,9 3,1 18,6 0,00 0,0 0,0 3,6 26,7 565,7 392,6 0,0 18,8 132,2 96,7 8,8 15,5 4,0 2,2 18,2 42,8
0,0 0,0 0,0 0,0 0,0 0,0 0,0 114,61 7,6 0,3 9,5 16,1 344,6 1451,7 0,0 0,0 0,0 0,0 180,8 0,0 0,0 106,4 0,0 0,0
0,0 0,0 0,0 0,0 0,0 0,0 0,0 0,00 0,0 0,0 0,0 0,0 942,8 428,5 751,8 0,0 0,0 0,0 0,0 0,0 0,0 0,0 0,0 0,05,3 3,5 7,5 0,9 2,3 1,2 8,1 23,26 0,9 0,2 7,9 10,5 6,9 6,4 7,9 20,8 46,5 76,9 80,4 6,1 0,9 10,1 3,0 17,0
15,3 5,2 6,0 0,8 7,6 2,1 2,4 0,76 0,6 0,1 1,0 0,9 1,6 1,3 1,9 8,8 647,9 71,3 10,0 5,9 0,8 5,7 0,1 1,60,0 0,0 0,0 0,0 0,0 0,0 0,0 0,00 0,0 0,0 0,0 0,0 0,0 0,0 0,0 0,0 0,0 0,0 0,0 0,0 0,0 0,0 0,0 0,0
27,4 30,2 55,8 7,8 18,0 12,1 11,6 5,58 115,0 0,1 1,0 19,1 15,3 27,6 21,1 70,4 527,8 218,6 1033,6 43,3 7,8 58,9 18,7 3,9
1,3 0,7 1,9 0,3 0,6 0,4 0,2 0,10 0,3 0,0 0,0 0,7 0,5 0,6 0,6 1,5 3,4 2,9 1,0 1,5 0,3 1,9 1,3 0,12,5 3,0 2,5 0,4 1,8 1,0 3,9 1,41 0,1 0,0 0,3 1,4 7,7 8,4 8,1 5,9 27,5 13,8 18,7 1,8 0,4 13,9 0,5 8,4
31,4 21,7 18,8 5,5 11,4 10,9 4,7 27,96 66,1 0,0 10,5 6,9 22,4 11,1 6,6 42,1 372,2 229,9 176,7 18,4 5,5 1144,9 8,2 11,31,1 1,4 1,2 0,2 1,5 0,8 1,4 6,20 0,3 0,0 2,6 3,2 3,0 2,0 3,2 8,3 44,6 38,5 8,9 0,9 0,2 3,5 228,9 5,92,4 2,9 2,3 0,4 1,7 1,0 3,7 1,35 0,1 0,0 0,2 1,4 7,5 8,1 10,2 6,1 43,7 17,3 19,3 1,7 0,4 3,6 0,4 181,0
1,8 1,4 3,9 0,6 2,5 1,5 4,4 3,75 0,2 0,0 4,5 9,4 4,3 4,1 1,4 4,8 33,8 31,8 8,9 3,2 0,6 6,5 5,8 10,70,8 1,4 2,1 0,1 0,8 0,4 1,9 1,26 0,1 0,0 0,5 0,9 3,0 1,0 0,9 8,8 23,7 25,7 5,9 1,5 0,1 4,0 0,4 4,90,0 0,0 0,0 0,0 0,0 0,0 0,0 0,00 0,0 0,0 0,0 0,0 0,0 0,0 0,0 0,0 0,3 0,0 0,1 0,0 0,0 0,1 0,0 0,0
0,0 0,0 0,0 0,0 0,0 0,0 0,0 0,00 0,0 0,0 0,0 0,0 0,0 0,0 0,0 0,0 0,0 0,0 0,0 0,0 0,0 0,0 0,0 0,05,8 8,6 7,6 1,1 8,7 4,1 9,3 27,02 1,7 0,1 18,6 15,8 18,1 11,4 19,8 49,4 175,9 112,2 46,1 6,1 1,1 29,3 7,9 56,5
5,9 4,0 8,9 1,1 2,3 1,7 10,2 52,25 8,1 0,1 10,7 6,2 14,1 12,0 6,2 18,1 62,3 49,7 20,7 7,5 1,1 34,6 4,4 16,71,4 0,9 3,7 0,2 0,5 0,5 2,6 8,35 1,6 0,0 1,2 0,8 0,9 0,7 0,3 4,9 12,8 12,4 3,7 3,2 0,2 6,7 1,1 6,8
25,5 23,5 24,1 4,2 19,8 7,4 17,8 241,79 6,6 0,1 67,0 66,7 365,2 228,7 54,9 85,2 448,1 261,9 187,2 13,8 4,2 421,2 17,4 177,0
3,9 3,0 4,1 0,9 5,0 1,8 3,2 8,36 1,7 0,1 2,9 6,1 8,5 19,5 10,5 6,4 31,5 19,0 30,2 3,2 0,9 10,5 3,5 7,72,5 4,0 2,0 0,4 1,2 1,9 2,4 4,51 0,4 0,0 0,1 0,4 1,0 1,5 0,9 1,8 12,6 23,5 1,3 1,3 0,4 0,6 0,0 2,09,6 11,5 15,9 3,4 12,5 5,9 36,7 16,05 1,3 0,2 7,5 14,9 90,9 10,3 3,6 74,2 332,2 532,6 8,9 14,5 3,4 85,4 22,6 93,8
0,0 0,0 0,0 0,0 0,0 0,0 0,0 0,00 0,0 0,0 0,0 0,0 0,0 0,0 0,0 0,0 0,0 0,0 0,0 0,0 0,0 0,0 0,0 0,013,6 8,9 15,8 5,3 6,6 3,4 21,4 103,53 9,0 0,6 6,6 11,2 30,4 47,5 20,4 31,6 59,7 75,5 53,0 13,9 5,3 68,1 7,3 39,3
14,4 10,1 22,2 3,5 6,0 4,0 53,3 104,23 8,3 0,6 9,4 8,6 43,4 56,3 25,7 37,2 256,5 239,6 34,9 19,5 3,5 93,4 11,4 49,414,3 8,9 19,4 3,2 5,5 3,3 24,0 116,82 8,0 0,2 11,7 11,9 41,4 54,5 23,2 38,9 122,2 58,5 39,7 15,8 3,2 88,7 8,6 31,3
0,0 0,0 0,0 0,0 0,0 0,0 0,1 0,00 0,0 0,0 0,0 0,5 0,0 0,0 0,0 0,0 0,0 0,0 0,0 0,0 0,0 0,0 0,0 0,0
9,8 5,0 6,2 1,2 8,1 7,2 3,2 15,74 2,5 0,1 2,4 8,7 10,6 3,7 5,1 110,1 695,0 313,2 14,4 4,8 1,2 7,3 4,2 44,51,5 0,8 1,9 0,1 0,6 0,4 3,0 14,92 0,6 0,0 3,9 9,3 14,5 5,8 4,8 2,6 9,4 3,9 11,7 1,7 0,1 16,9 2,8 3,40,0 0,0 0,0 0,0 0,0 0,0 0,0 0,00 0,0 0,0 0,0 0,0 0,0 0,0 0,0 0,0 0,0 0,0 0,0 0,0 0,0 0,0 0,0 0,0
16,1 13,5 32,2 2,6 7,4 23,0 12,1 20,41 0,9 0,0 2,9 7,7 20,8 39,2 24,3 30,3 256,3 330,7 87,5 31,6 2,6 53,1 13,2 77,718,4 7,5 141,7 0,5 0,1 0,4 4,6 1,68 0,0 0,0 1,5 5,2 0,9 4,0 7,8 6,8 58,6 20,7 20,5 141,5 0,5 8,9 6,8 11,4
1,0 0,6 0,4 0,1 0,6 0,3 1,1 0,18 0,0 0,0 0,1 0,4 0,4 0,6 0,6 1,5 6,4 3,2 4,9 0,3 0,1 1,1 0,1 1,38,4 1,8 5,7 0,8 1,1 0,8 3,6 9,96 0,8 0,0 2,8 14,2 6,6 4,9 4,0 9,3 22,2 77,2 18,9 4,6 0,8 43,3 2,8 10,62,2 1,3 3,9 0,3 0,8 0,8 3,0 8,94 0,1 0,0 3,0 16,1 11,9 22,3 1,8 8,0 22,6 35,8 17,6 2,7 0,3 42,7 3,0 29,0
26,4 21,9 29,2 4,8 7,1 4,3 23,0 145,10 9,3 0,5 6,8 51,3 66,5 71,8 37,7 89,6 377,3 188,2 126,0 21,6 4,8 141,0 24,2 31,30,0 0,0 0,0 0,0 0,0 0,0 0,0 0,00 0,0 0,0 0,1 4,0 0,5 0,9 0,8 0,0 0,0 0,0 0,7 0,0 0,0 1,0 0,0 0,01,2 0,8 2,3 0,2 0,4 0,3 1,5 0,19 0,1 0,0 0,6 0,5 1,8 1,9 2,4 4,7 10,6 7,2 1,9 1,4 0,2 8,4 0,1 1,2
0,8 0,8 1,3 0,2 0,6 0,5 1,0 0,70 0,4 0,0 0,4 0,7 6,4 1,6 5,4 3,3 20,5 11,2 3,7 1,1 0,2 1,9 0,5 4,60,0 0,0 0,0 0,0 0,0 0,0 0,0 0,00 0,0 0,0 0,0 0,0 0,0 0,0 0,0 0,0 0,0 0,0 0,0 0,0 0,0 0,0 0,0 0,0
0,0 0,0 0,0 0,0 0,0 0,0 0,0 0,00 0,0 0,0 0,0 0,0 0,0 0,0 0,0 0,0 0,0 0,0 0,0 0,0 0,0 0,0 0,0 0,00,3 0,3 0,3 0,0 0,2 0,1 0,0 0,14 0,1 0,0 0,0 0,1 0,0 0,0 0,0 0,8 1,5 3,2 0,7 0,1 0,0 0,7 0,8 0,60,0 0,0 0,0 0,0 0,0 0,0 0,0 0,00 0,0 0,0 0,0 0,0 0,0 0,0 0,0 0,0 0,0 0,0 0,0 0,0 0,0 0,0 0,0 0,0
0,0 0,0 0,0 0,0 0,0 0,0 0,0 0,00 0,0 0,0 0,0 0,0 0,0 0,0 0,0 0,0 0,0 0,0 0,0 0,0 0,0 0,0 0,0 0,00,0 0,0 0,0 0,0 0,0 0,0 0,0 0,00 0,0 0,0 0,0 0,0 0,2 0,0 0,0 0,0 0,0 0,1 0,3 0,0 0,0 0,6 0,0 17,61,3 0,8 0,6 0,2 0,5 0,3 0,5 2,80 0,1 0,0 0,2 0,6 4,9 2,8 2,7 3,8 22,5 8,4 8,1 0,5 0,2 2,8 1,1 5,5
1,6 1,0 2,9 0,2 1,0 0,6 2,8 8,48 0,3 0,0 1,3 5,5 5,4 4,8 3,3 2,4 15,7 10,6 17,3 1,8 0,2 9,4 1,3 3,50,0 0,0 0,0 0,0 0,0 0,0 0,0 0,00 0,0 0,0 0,0 0,0 0,0 0,0 0,0 0,0 0,0 0,0 0,0 0,0 0,0 0,0 0,0 2,60,0 0,0 0,0 0,0 0,0 0,0 0,0 0,00 0,0 0,0 0,0 0,0 0,0 0,0 0,0 0,0 0,0 0,0 0,0 0,0 0,0 0,0 0,0 0,0
1861,6 1548,2 5212,3 320,5 895,4 479,7 944,2 9168,90 1722,9 14,8 660,4 1578,6 4837,6 4027,7 2667,6 2087,3 6561,6 4402,4 4182,3 3042,9 320,5 2716,6 461,5 1822,52440,9 2285,9 6372,5 453,2 1489,2 808,3 1604,4 14293,65 3687,4 4027,2 1440,8 2561,2 7367,0 6170,4 4746,6 4023,7 17989,1 12969,6 7022,7 3807,9 453,2 5520,2 918,9 4464,7
579,4 737,7 1160,2 132,7 593,7 328,6 660,3 3387,07 1289,3 1773,4 780,4 982,6 2529,4 2142,7 2079,0 1936,4 11427,5 8567,2 2840,4 765,0 132,7 2803,6 457,4 2642,2372,5 394,0 697,3 110,4 344,7 186,3 460,6 445,15 304,5 760,5 272,7 485,5 1675,5 1052,7 1432,5 1261,5 4241,9 4513,0 1749,9 501,6 110,4 1029,0 343,3 918,0
01020305
061062
07+08+09 1011
121314
15
161718192021222324252627282930313233
35135235336
37+38+3941424345464749505152535556585960616263646566
6801+68026803
6970717273747577787980818284858687889091929394959697
totalProdução do ramoVABremuneraçoes

266
01020305
061062
07+08+09 1011
121314
15
161718192021222324252627282930313233
35135235336
37+38+3941424345464749505152535556585960616263646566
6801+68026803
6970717273747577787980818284858687889091929394959697
totalProdução do ramoVABremuneraçoes
56 58 59 60 61 62 63 64 65 66 6801+6802 6803 69 70 71 72 73 74 75 77
Serv.
restauraçã
o e
similares
Serviços de
edição
Serv prod
filmes,
vídeos e
prog TV,
grav som e
ed mús.
Serviços de
program. e
radiodif.
Serviços de
telecomuni
cações
Consult. e
prog
informát. e
serv. relac.
Serv. de
informação
Serv.
financ.,
exc.
seguros e
fund.
pensões
Serv
seguros,
resseg e f.
pensões,
exc. Seg
soc. Obrig.
Serv. Auxil.
de serv.
Financ. e
de seguros
Serviços
imobil.
excl.
rendas
imput. em
habit.
próp.
Rendas
imput. em
habit.
Próp.
Serviços
jurídicos e
contabil.
Serv. sedes
soc.; serv.
Consult. de
gestão
Serv arquit.
e de eng.;
serv. de
ensaios e
de anál.
Técn.
Serviços de
investig. e
desenv.
Científ.
Serv.
publicidade
e estudos
de
mercado
Out serv
consult.,
científ.,
técn. e
simil.
Serv.
Veterin.
Serviços de
aluguer
233,0 0,0 0,2 2,7 0,0 0,1 0,1 0,0 0,0 0,0 0,8 0,0 0,1 0,5 2,0 0,0 1,8 2,8 0,4 0,10,0 0,0 0,0 0,0 0,0 0,0 0,0 0,0 0,0 0,0 0,0 0,0 0,0 0,0 0,0 0,0 0,0 0,0 0,0 0,0
81,4 0,0 0,0 0,0 0,0 0,0 0,0 0,0 0,0 0,0 0,0 0,0 0,0 0,0 0,0 0,0 0,0 0,0 0,0 0,00,0 0,0 0,0 0,0 0,0 0,0 0,0 0,0 0,0 0,0 0,0 0,0 0,0 0,0 0,0 0,0 0,0 0,0 0,0 0,00,0 0,0 0,0 0,0 0,0 0,0 0,0 0,0 0,0 0,0 0,0 0,0 0,0 0,0 0,0 0,0 0,0 0,0 0,0 0,00,0 0,0 0,0 0,0 0,0 0,0 0,0 0,0 0,0 0,0 0,0 0,0 0,0 0,0 0,0 0,0 0,0 0,0 0,0 0,00,0 0,0 0,0 0,0 0,0 0,0 0,0 0,0 0,0 0,0 0,9 0,0 0,0 0,0 1,0 0,3 0,1 0,0 0,0 0,0
1646,0 0,0 0,6 0,1 0,1 0,1 0,0 0,0 0,0 0,0 1,6 0,0 0,0 0,2 0,1 0,4 0,2 0,7 0,6 0,2970,8 1,4 0,7 8,0 1,4 3,2 0,4 1,0 0,0 1,5 16,2 0,0 3,5 7,5 8,4 0,5 5,7 1,1 0,2 1,3
0,0 0,0 0,0 0,0 0,0 0,0 0,0 0,0 0,0 0,0 0,0 0,0 0,0 0,0 0,0 0,0 0,0 0,0 0,0 0,08,9 0,1 0,1 0,2 0,0 0,0 0,0 0,0 0,0 0,0 2,5 3,4 0,0 0,0 0,0 0,2 0,1 0,2 0,0 0,02,1 0,0 0,6 0,1 0,0 0,1 0,0 0,0 0,0 0,0 0,3 0,0 0,2 0,4 0,2 0,0 0,0 0,0 0,0 0,1
0,0 0,1 0,1 0,9 0,0 0,2 0,0 0,0 0,0 0,0 0,0 0,0 0,0 0,6 0,0 0,0 3,8 0,1 0,0 0,0
4,2 0,0 0,0 0,1 0,0 0,0 0,0 0,0 0,0 0,0 12,3 0,0 0,0 0,0 1,8 0,2 0,7 0,6 0,0 3,94,0 61,1 1,2 5,6 0,4 8,0 0,8 23,7 11,2 6,0 12,0 0,0 10,3 10,2 20,1 1,0 5,8 3,5 0,5 1,53,9 107,6 2,6 2,2 8,9 13,5 0,9 0,1 5,7 6,9 47,5 0,0 0,9 28,8 1,9 0,6 22,1 3,3 0,0 5,7
31,6 3,9 3,0 1,8 10,1 10,9 1,0 47,3 8,4 12,8 10,2 0,0 16,0 18,4 25,8 4,6 7,0 6,3 1,7 30,119,5 13,4 2,8 5,2 0,2 14,2 0,7 0,0 1,2 0,3 2,4 51,1 2,2 5,5 12,3 5,0 2,7 2,2 1,3 0,8
0,2 0,0 0,1 0,0 0,2 0,2 0,0 0,1 0,0 0,2 1,3 0,0 0,1 0,6 0,1 1,2 0,1 0,0 11,5 0,321,5 0,9 3,9 6,1 0,0 8,0 0,4 0,0 0,0 0,0 6,0 12,1 0,0 1,8 35,1 0,3 6,8 10,7 0,0 0,928,1 0,3 0,1 0,6 0,1 0,3 0,0 0,0 0,0 0,1 4,4 47,0 0,2 1,0 3,4 2,0 1,7 0,3 0,0 0,5
2,2 0,2 0,4 0,0 0,0 0,0 0,0 0,0 0,0 0,0 0,0 1,9 0,0 0,0 3,9 0,8 0,5 0,1 0,0 0,025,9 1,7 4,4 2,2 0,9 9,1 1,3 0,2 0,0 1,7 6,4 0,0 2,5 4,5 39,3 0,6 12,4 2,9 0,8 17,5
0,1 3,6 2,2 4,9 413,4 64,3 2,9 0,0 0,0 0,4 2,0 0,0 0,1 4,3 5,2 0,5 0,4 1,2 0,0 4,312,1 0,1 3,8 1,5 108,3 23,8 0,1 0,0 0,0 0,0 0,9 7,3 0,1 3,3 9,8 0,2 1,4 1,1 0,0 1,6
4,9 0,1 0,2 0,2 0,1 1,8 0,0 0,0 0,0 0,0 4,4 28,3 0,1 0,3 6,0 0,4 0,2 0,3 0,1 0,90,0 0,0 0,0 0,0 0,0 0,0 0,0 0,0 0,0 0,0 0,0 0,0 0,0 0,0 0,0 0,1 0,0 0,0 0,0 0,70,0 0,0 0,0 0,0 0,0 0,0 0,0 0,0 0,0 0,0 0,0 0,0 0,0 0,0 0,0 0,0 0,0 0,0 0,0 0,08,1 0,0 0,4 0,0 0,0 0,0 0,0 0,0 0,0 1,1 7,5 40,1 0,0 2,1 0,3 0,4 0,1 0,1 0,1 0,24,9 0,7 0,8 1,6 0,4 1,8 0,3 0,0 0,0 0,0 1,7 0,0 1,5 2,0 1,9 0,9 1,5 1,1 10,5 0,86,9 3,1 2,9 1,2 55,1 31,4 3,6 7,0 2,9 1,0 15,4 0,0 15,1 12,2 9,1 0,3 2,3 2,9 0,8 27,7
148,6 2,7 4,6 5,0 48,8 8,8 1,7 31,9 14,4 3,6 21,2 40,4 9,6 15,6 7,3 3,1 2,7 2,3 1,1 2,365,9 0,0 0,1 0,2 0,1 0,1 0,1 0,0 0,0 0,0 2,8 0,0 0,3 0,8 0,6 1,8 0,1 0,1 0,1 0,8
9,7 0,0 0,0 0,0 0,0 0,0 0,0 0,0 0,0 0,0 0,0 0,0 0,0 0,0 0,0 0,0 0,0 0,0 0,0 0,018,5 0,1 0,2 0,5 0,4 0,3 0,0 2,4 0,7 0,4 2,5 3,9 0,8 0,9 0,7 1,2 0,1 0,2 0,1 0,318,0 0,3 0,2 0,1 0,4 0,4 0,0 1,1 0,6 0,2 4,8 0,1 0,9 1,0 0,7 0,2 0,2 0,2 0,1 0,314,4 2,4 1,9 2,3 0,0 26,9 3,2 48,2 19,7 4,2 130,2 209,2 16,5 10,2 15,7 1,5 2,9 2,3 0,6 24,1
0,0 0,0 0,0 0,0 77,1 0,0 0,0 0,0 0,0 0,0 0,0 0,0 0,0 0,6 0,0 0,5 0,0 0,0 0,0 0,00,0 0,0 0,0 0,0 0,0 0,0 0,0 0,0 0,0 0,0 0,0 0,0 0,0 0,0 0,0 0,0 0,0 0,0 0,0 0,06,3 1,2 0,8 1,5 6,3 8,6 1,4 0,0 0,0 0,0 6,5 0,0 3,4 4,8 7,7 0,3 1,3 1,7 0,5 10,40,6 3,3 0,9 0,2 22,2 5,0 0,2 0,0 0,0 0,0 2,0 0,0 0,7 4,9 1,5 0,2 1,6 1,3 0,1 10,80,0 0,0 0,0 0,0 0,0 0,0 0,0 0,0 0,0 0,0 0,0 0,0 0,0 0,0 0,0 0,0 0,0 0,0 0,0 0,05,3 8,0 3,4 0,8 7,5 11,5 1,0 10,6 4,7 5,9 2,9 0,0 6,1 39,3 11,5 1,9 3,8 5,1 0,2 27,00,2 0,3 0,1 0,0 0,3 0,3 0,0 0,0 0,0 0,1 0,1 0,0 0,1 0,9 0,3 0,2 0,1 0,2 0,0 0,63,6 2,7 2,5 0,9 2,3 13,9 0,8 15,1 7,1 5,9 3,4 0,0 10,9 17,2 9,8 1,6 2,8 4,2 0,2 1,36,0 1,4 1,6 1,0 7,1 12,1 1,6 9,0 0,0 11,2 7,7 0,0 3,4 8,8 4,5 4,9 1,8 3,1 0,2 14,76,9 8,3 1,6 1,9 8,2 9,0 2,3 18,5 7,2 1,7 4,4 0,0 10,7 15,5 6,2 1,9 2,8 2,3 0,4 2,23,4 2,5 2,3 0,7 2,1 13,3 0,7 11,4 4,7 4,5 3,5 0,0 9,3 15,0 9,3 1,1 2,7 4,0 0,2 1,3
11,5 9,4 3,9 4,9 1,7 7,0 1,8 43,1 14,9 26,2 5,3 0,0 2,7 3,7 1,9 5,1 1,8 4,9 0,3 3,03,8 42,2 1,0 0,6 21,1 1,7 0,8 2,3 0,0 1,4 0,8 0,0 5,2 1,9 3,9 12,1 140,8 0,9 0,2 0,80,0 0,4 141,1 229,3 0,1 1,2 0,0 0,1 0,0 0,0 0,1 0,0 0,5 0,0 0,0 0,0 13,9 0,0 0,0 0,00,0 0,0 0,0 9,7 138,5 0,0 0,0 0,0 0,0 0,0 0,0 0,0 0,0 0,0 0,0 0,0 428,6 0,0 0,0 0,0
35,4 17,4 4,7 7,1 1115,4 47,9 11,9 144,8 69,9 15,5 21,4 1,3 97,6 70,6 27,9 3,9 10,3 20,1 2,4 7,215,4 9,9 8,6 4,3 70,2 400,6 9,6 383,2 0,0 27,2 15,1 0,0 42,0 45,3 29,4 16,8 8,5 8,5 0,8 7,1
3,9 8,4 3,2 3,9 20,4 50,4 49,8 19,1 0,0 0,2 4,4 0,0 14,1 7,2 1,4 1,0 5,4 3,6 0,3 2,170,0 15,4 5,7 8,1 46,7 32,8 4,7 2021,9 113,6 164,7 335,9 -528,2 31,7 732,0 43,0 3,4 15,5 13,6 1,2 46,3
4,8 2,0 1,7 0,9 5,6 6,0 1,3 17,8 493,7 131,8 8,4 14,2 7,1 7,0 8,4 0,3 1,4 2,4 0,5 13,10,5 0,5 0,6 0,6 3,5 0,6 0,1 286,4 834,2 15,9 0,6 0,0 1,9 2,6 0,9 0,1 0,3 0,3 0,0 1,7
24,0 16,1 28,1 10,8 58,3 51,3 6,1 253,5 92,3 21,6 159,7 24,0 54,5 14,8 8,8 5,7 4,4 12,5 2,8 7,30,0 0,0 0,0 0,0 0,0 0,0 0,0 0,0 0,0 0,0 0,0 0,0 0,0 0,0 0,0 0,0 0,0 0,0 0,0 0,0
10,2 18,4 12,4 2,4 137,1 89,2 9,7 212,8 0,0 6,1 48,1 4,6 127,9 95,8 52,1 1,4 8,3 36,2 1,9 14,99,9 22,1 15,0 5,0 186,5 142,9 15,6 212,2 24,1 27,3 58,0 0,0 94,9 528,1 91,3 2,1 15,3 40,4 2,2 32,5
14,0 18,5 12,5 8,7 147,9 66,1 10,0 34,8 0,0 8,7 43,5 0,0 62,5 88,6 411,8 9,1 8,7 13,4 1,4 10,60,0 0,0 0,0 0,0 0,0 0,0 0,0 13,3 0,0 1,3 0,0 0,0 0,0 0,1 0,0 55,5 0,0 0,0 0,0 0,0
25,4 53,9 8,9 2,2 148,8 26,3 2,5 312,8 45,6 6,4 26,8 0,0 24,7 34,1 24,5 1,1 223,4 19,7 0,4 41,02,9 1,4 1,5 1,2 8,5 6,9 1,0 78,3 0,0 17,0 5,3 0,0 3,9 6,3 3,6 1,1 1,4 6,7 0,1 3,90,0 0,0 0,0 0,0 0,0 0,0 0,0 0,0 0,0 0,0 0,0 0,0 0,0 0,0 0,0 0,0 0,0 0,0 0,8 0,0
108,9 37,7 25,5 19,6 72,1 134,7 3,0 64,8 6,7 7,8 30,3 0,0 19,4 48,3 62,7 3,4 15,0 7,0 0,8 190,349,1 2,1 0,4 0,6 293,1 5,4 0,1 0,0 0,0 0,0 4,9 0,0 7,7 9,1 3,5 12,6 4,4 1,0 0,1 1,8
0,2 1,0 0,5 0,4 0,7 2,4 0,4 0,0 0,0 0,0 0,8 0,0 2,4 2,7 0,9 0,6 1,0 1,0 0,0 0,510,2 1,1 1,1 2,1 11,2 3,3 0,8 52,3 0,0 0,4 17,1 16,0 2,1 7,1 2,3 11,8 0,8 0,4 0,1 1,133,2 1,0 1,8 2,9 3,6 3,0 0,6 29,0 0,0 3,1 9,3 17,3 3,6 4,4 3,3 9,5 1,0 0,7 0,3 2,3
8,0 28,5 3,6 4,5 69,9 37,9 29,0 136,3 29,6 22,5 45,0 0,0 23,3 141,9 79,9 7,2 5,8 71,8 0,5 70,70,0 0,0 0,0 0,0 94,4 0,0 0,0 0,0 0,0 0,0 0,0 0,0 0,0 0,0 0,0 0,0 0,0 0,0 0,0 0,00,8 0,7 0,1 0,8 3,7 5,6 0,1 12,4 0,0 0,9 1,0 0,0 3,1 6,7 1,8 0,5 0,2 0,4 0,1 0,35,2 3,3 5,7 1,2 4,1 7,8 1,1 39,4 0,0 2,6 5,7 0,0 31,0 11,0 9,7 0,6 2,8 4,1 0,5 0,90,0 0,0 0,0 0,0 0,0 0,0 0,0 0,0 0,0 0,0 0,0 0,0 0,0 0,0 0,0 0,0 0,0 0,0 0,0 0,00,0 0,0 0,0 0,0 0,0 0,0 0,0 0,0 0,0 0,0 0,0 0,0 0,0 0,0 0,0 0,0 0,0 0,0 0,0 0,00,2 42,5 10,1 15,6 0,1 0,0 0,0 0,0 0,0 0,0 0,0 0,0 0,0 0,1 0,7 0,0 0,6 0,0 0,0 0,00,0 0,0 0,0 0,0 0,0 0,0 0,0 0,0 0,0 0,0 0,0 0,0 0,0 0,1 0,0 0,2 0,0 0,0 0,0 0,00,0 0,0 0,0 0,0 0,0 0,0 0,0 0,0 0,0 0,0 0,0 0,0 0,0 0,0 0,0 0,0 0,0 0,0 0,0 0,08,2 0,0 5,6 33,4 0,0 0,0 0,0 0,4 0,0 0,0 0,3 0,0 0,0 0,2 0,0 0,1 33,8 0,0 0,0 0,02,1 1,2 0,6 0,4 1,9 2,2 0,2 0,0 0,0 0,0 5,3 0,0 6,8 6,0 2,2 0,3 0,8 0,7 0,1 0,54,5 0,4 0,3 0,4 9,9 3,5 0,6 86,7 0,3 7,0 4,4 0,0 1,3 1,7 1,5 0,5 0,5 0,4 0,1 2,61,2 0,0 0,4 0,6 0,0 0,0 0,0 0,0 0,0 0,0 0,0 0,0 0,0 0,0 0,0 0,2 0,0 0,0 0,0 0,00,0 0,0 0,0 0,0 0,0 0,0 0,0 0,0 0,0 0,0 0,0 0,0 0,0 0,0 0,0 0,0 0,0 0,0 0,0 0,0
3891,3 587,1 356,1 442,4 3457,5 1437,9 186,5 4685,7 1813,5 585,6 1206,5 -6,0 797,5 2116,9 1141,1 207,0 1055,0 339,1 50,3 658,18810,0 948,6 542,3 782,6 6036,7 3019,6 354,6 10242,2 3719,7 1378,0 6961,4 12812,3 2362,2 3465,0 2164,1 720,0 1515,0 640,2 109,9 1478,24918,7 361,5 186,2 340,2 2579,2 1581,7 168,1 5556,5 1906,2 792,4 5755,0 12818,3 1564,7 1348,1 1023,0 513,0 460,0 301,1 59,6 820,22632,6 298,6 87,3 176,8 660,9 1245,0 134,8 3329,7 493,3 279,0 418,2 0,0 707,7 1412,2 685,0 221,2 267,1 194,0 37,3 174,0
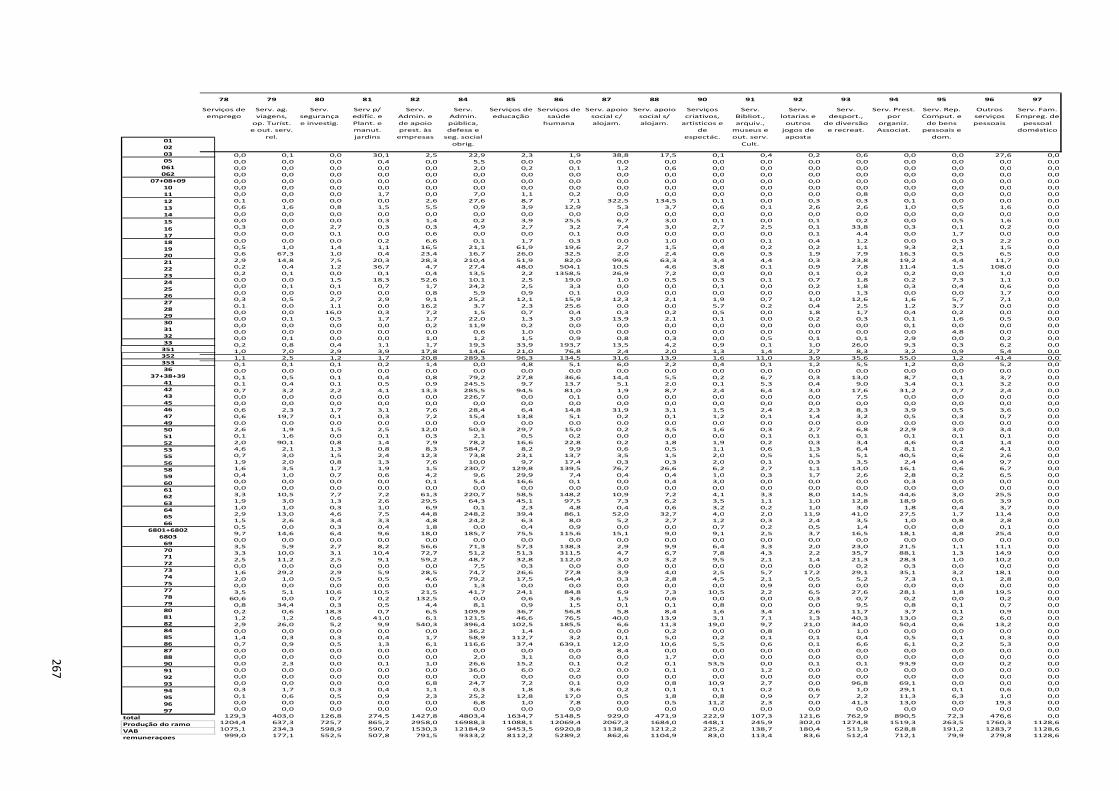
267
01020305
061062
07+08+09 1011
121314
15
161718192021222324252627282930313233
35135235336
37+38+3941424345464749505152535556585960616263646566
6801+68026803
6970717273747577787980818284858687889091929394959697
totalProdução do ramoVABremuneraçoes
78 79 80 81 82 84 85 86 87 88 90 91 92 93 94 95 96 97
Serviços de
emprego
Serv. ag.
viagens,
op. Turíst.
e out. serv.
rel.
Serv.
segurança
e investig.
Serv p/
edifíc. e
Plant. e
manut.
jardins
Serv.
Admin. e
de apoio
prest. às
empresas
Serv.
Admin.
pública,
defesa e
seg. social
obrig.
Serviços de
educação
Serviços de
saúde
humana
Serv. apoio
social c/
alojam.
Serv. apoio
social s/
alojam.
Serviços
criativos,
artísticos e
de
espectác.
Serv.
Bibliot.,
arquiv.,
museus e
out. serv.
Cult.
Serv.
lotarias e
outros
jogos de
aposta
Serv.
desport.,
de diversão
e recreat.
Serv. Prest.
por
organiz.
Associat.
Serv. Rep.
Comput. e
de bens
pessoais e
dom.
Outros
serviços
pessoais
Serv. Fam.
Empreg. de
pessoal
doméstico
0,0 0,1 0,0 30,1 2,5 22,9 2,3 1,9 38,8 17,5 0,1 0,4 0,2 0,6 0,0 0,0 27,6 0,0
0,0 0,0 0,0 0,4 0,0 5,5 0,0 0,0 0,0 0,0 0,0 0,0 0,0 0,0 0,0 0,0 0,0 0,00,0 0,0 0,0 0,0 0,0 2,0 0,2 0,1 1,2 0,6 0,0 0,0 0,0 0,0 0,0 0,0 0,0 0,00,0 0,0 0,0 0,0 0,0 0,0 0,0 0,0 0,0 0,0 0,0 0,0 0,0 0,0 0,0 0,0 0,0 0,0
0,0 0,0 0,0 0,0 0,0 0,0 0,0 0,0 0,0 0,0 0,0 0,0 0,0 0,0 0,0 0,0 0,0 0,00,0 0,0 0,0 0,0 0,0 0,0 0,0 0,0 0,0 0,0 0,0 0,0 0,0 0,0 0,0 0,0 0,0 0,00,0 0,0 0,0 1,7 0,0 7,0 1,1 0,2 0,0 0,0 0,0 0,0 0,0 0,8 0,0 0,0 0,0 0,0
0,1 0,0 0,0 0,0 2,6 27,6 8,7 7,1 322,5 134,5 0,1 0,0 0,3 0,3 0,1 0,0 0,0 0,00,6 1,6 0,8 1,5 5,5 0,9 3,9 12,9 5,3 3,7 0,6 0,1 2,6 2,6 1,0 0,5 1,6 0,0
0,0 0,0 0,0 0,0 0,0 0,0 0,0 0,0 0,0 0,0 0,0 0,0 0,0 0,0 0,0 0,0 0,0 0,00,0 0,0 0,0 0,3 1,4 0,2 3,9 25,5 6,7 3,0 0,1 0,0 0,1 0,2 0,0 0,5 1,6 0,00,3 0,0 2,7 0,3 0,3 4,9 2,7 3,2 7,4 3,0 2,7 2,5 0,1 33,8 0,3 0,1 0,2 0,0
0,0 0,0 0,1 0,0 0,6 0,0 0,0 0,1 0,0 0,0 0,0 0,0 0,1 4,4 0,0 1,7 0,0 0,0
0,0 0,0 0,0 0,2 6,6 0,1 1,7 0,3 0,0 1,0 0,0 0,1 0,4 1,2 0,0 0,3 2,2 0,00,5 1,0 1,4 1,1 16,5 21,1 61,9 19,6 2,7 1,5 0,4 0,2 0,2 1,1 9,3 2,1 1,5 0,00,6 67,3 1,0 0,4 23,4 16,7 26,0 32,5 2,0 2,4 0,6 0,3 1,9 7,9 16,3 0,5 6,5 0,0
2,9 14,8 7,5 20,3 28,3 210,4 51,9 82,0 99,6 63,3 3,4 4,4 0,3 23,8 19,2 4,4 11,7 0,00,2 0,4 1,2 36,7 4,7 27,4 48,0 504,1 10,5 4,6 3,8 0,1 0,9 7,8 11,4 1,5 108,0 0,0
0,2 0,1 0,0 0,1 0,4 13,5 2,2 1358,5 26,9 7,2 0,0 0,0 0,1 0,2 0,2 0,0 1,0 0,00,0 0,0 1,5 18,3 52,6 10,1 2,5 19,0 1,0 0,5 0,3 0,1 0,7 1,8 0,2 7,3 1,1 0,00,0 0,1 0,1 0,7 1,7 24,2 2,5 3,3 0,0 0,0 0,1 0,0 0,2 1,8 0,3 0,4 0,6 0,0
0,0 0,0 0,0 0,0 0,8 5,9 0,9 0,1 0,0 0,0 0,0 0,0 0,0 1,3 0,0 0,0 1,7 0,00,3 0,5 2,7 2,9 9,1 25,2 12,1 15,9 12,3 2,1 1,9 0,7 1,0 12,6 1,6 5,7 7,1 0,0
0,1 0,0 1,1 0,0 16,2 3,7 2,3 25,6 0,0 0,0 5,7 0,2 0,4 2,5 1,2 3,7 0,0 0,00,0 0,0 16,0 0,3 7,2 1,5 0,7 0,4 0,3 0,2 0,5 0,0 1,8 1,7 0,4 0,2 0,0 0,00,0 0,1 0,5 1,7 1,7 22,0 1,3 3,0 13,9 2,1 0,1 0,0 0,2 0,3 0,1 1,6 0,5 0,0
0,0 0,0 0,0 0,0 0,2 11,9 0,2 0,0 0,0 0,0 0,0 0,0 0,0 0,0 0,1 0,0 0,0 0,00,0 0,0 0,0 0,0 0,0 0,6 1,0 0,0 0,0 0,0 0,0 0,0 0,0 0,0 0,0 4,8 0,0 0,00,0 0,1 0,0 0,0 1,0 1,2 1,5 0,9 0,8 0,3 0,0 0,5 0,1 0,1 2,9 0,0 0,2 0,0
0,2 0,8 0,4 1,1 1,7 19,3 33,9 193,7 13,5 4,2 0,9 0,1 1,0 26,0 9,3 0,3 6,2 0,01,0 7,0 2,9 3,9 17,8 14,6 21,0 76,8 2,4 2,0 1,3 1,4 2,7 8,3 3,2 0,9 5,4 0,0
1,1 2,5 1,2 1,7 20,8 289,3 96,3 134,5 31,6 13,9 1,6 11,0 3,9 35,6 55,0 1,2 41,4 0,00,1 0,1 0,1 0,2 1,4 0,0 4,8 5,1 6,0 2,2 0,4 0,1 1,2 5,5 1,2 0,0 5,2 0,00,0 0,0 0,0 0,0 0,0 0,0 0,0 0,0 0,0 0,0 0,0 0,0 0,0 0,0 0,0 0,0 0,0 0,0
0,1 0,5 0,1 0,4 0,8 79,2 27,8 36,6 14,4 5,5 0,2 6,7 0,3 13,0 8,7 0,1 3,7 0,00,1 0,4 0,1 0,5 0,9 245,5 9,7 13,7 5,1 2,0 0,1 5,3 0,4 9,0 3,4 0,1 3,2 0,0
0,7 3,2 2,2 4,1 13,3 285,5 94,5 81,0 1,9 8,7 2,4 6,4 3,0 17,6 31,2 0,7 2,4 0,00,0 0,0 0,0 0,0 0,0 226,7 0,0 0,1 0,0 0,0 0,0 0,0 0,0 7,5 0,0 0,0 0,0 0,00,0 0,0 0,0 0,0 0,0 0,0 0,0 0,0 0,0 0,0 0,0 0,0 0,0 0,0 0,0 0,0 0,0 0,0
0,6 2,3 1,7 3,1 7,6 28,4 6,4 14,8 31,9 3,1 1,5 2,4 2,3 8,3 3,9 0,5 3,6 0,00,6 19,7 0,1 0,3 7,2 15,4 13,8 5,1 0,2 0,1 1,2 0,1 1,4 3,2 0,5 0,3 0,7 0,0
0,0 0,0 0,0 0,0 0,0 0,0 0,0 0,0 0,0 0,0 0,0 0,0 0,0 0,0 0,0 0,0 0,0 0,02,6 1,9 1,5 2,5 12,0 50,3 29,7 15,0 0,2 3,5 1,6 0,3 2,7 6,8 22,9 3,0 3,4 0,00,1 1,6 0,0 0,1 0,3 2,1 0,5 0,2 0,0 0,0 0,0 0,1 0,1 0,1 0,1 0,1 0,1 0,0
2,0 90,1 0,8 1,4 7,9 78,2 16,6 22,8 0,2 1,8 1,9 0,2 0,3 3,4 4,6 0,4 1,4 0,04,6 2,1 1,3 0,8 8,3 584,7 8,2 9,9 0,6 0,5 1,1 0,6 1,3 6,4 8,1 0,2 4,1 0,00,7 3,0 1,5 2,4 12,3 73,8 23,1 13,7 3,5 1,5 2,0 0,5 1,5 5,1 40,5 0,6 2,6 0,0
1,9 2,0 0,8 1,3 7,6 10,0 9,7 17,4 0,3 0,3 2,0 0,1 0,3 3,5 2,4 0,4 9,7 0,01,6 3,5 1,7 1,9 1,5 230,7 129,8 139,5 76,7 26,6 6,2 2,7 1,1 14,0 16,1 0,6 6,7 0,0
0,4 1,0 0,7 0,6 4,2 9,6 29,9 7,4 0,4 0,4 1,0 0,3 1,7 2,6 2,8 0,2 6,5 0,00,0 0,0 0,0 0,0 0,1 5,4 16,6 0,1 0,0 0,4 3,0 0,0 0,0 0,0 0,3 0,0 0,0 0,00,0 0,0 0,0 0,0 0,0 0,0 0,0 0,0 0,0 0,0 0,0 0,0 0,0 0,0 0,0 0,0 0,0 0,0
3,3 10,5 7,7 7,2 61,3 220,7 58,5 148,2 10,9 7,2 4,1 3,3 8,0 14,5 44,6 3,0 25,5 0,01,9 3,0 1,3 2,6 29,5 64,3 45,1 97,5 7,3 6,2 3,5 1,1 1,0 12,8 18,9 0,6 3,9 0,0
1,0 1,0 0,3 1,0 6,9 0,1 2,3 4,8 0,4 0,6 3,2 0,2 1,0 3,0 1,8 0,4 3,7 0,02,9 13,0 4,6 7,5 44,8 248,2 39,4 86,1 52,0 32,7 4,0 2,0 11,9 41,0 27,5 1,7 11,4 0,01,5 2,6 3,4 3,3 4,8 24,2 6,3 8,0 5,2 2,7 1,2 0,3 2,4 3,5 1,0 0,8 2,8 0,0
0,5 0,0 0,3 0,4 1,8 0,0 0,4 0,9 0,0 0,0 0,7 0,2 0,5 1,4 0,0 0,0 0,1 0,09,7 14,6 6,4 9,6 18,0 185,7 75,5 115,6 15,1 9,0 9,1 2,5 3,7 16,5 18,1 4,8 25,4 0,00,0 0,0 0,0 0,0 0,0 0,0 0,0 0,0 0,0 0,0 0,0 0,0 0,0 0,0 0,0 0,0 0,0 0,0
3,5 5,9 2,7 8,2 56,6 71,3 57,3 138,3 2,9 9,9 6,4 3,3 2,0 23,0 21,5 1,1 11,1 0,03,3 10,0 3,1 10,4 72,7 51,2 51,3 311,5 4,7 6,7 7,8 4,3 2,2 35,7 88,1 1,3 14,9 0,0
2,5 11,2 2,5 9,1 59,2 48,7 32,8 112,0 3,0 3,2 9,5 2,1 1,4 21,3 28,3 1,0 10,2 0,00,0 0,0 0,0 0,0 0,0 7,5 0,3 0,0 0,0 0,0 0,0 0,0 0,0 0,2 0,3 0,0 0,0 0,01,6 29,2 2,9 5,9 28,5 74,7 26,6 77,8 3,9 4,0 2,5 5,7 17,2 29,1 35,1 3,2 18,1 0,0
2,0 1,0 0,5 0,5 4,6 79,2 17,5 64,4 0,3 2,8 4,5 2,1 0,5 5,2 7,3 0,1 2,8 0,00,0 0,0 0,0 0,0 0,0 1,3 0,0 0,0 0,0 0,0 0,0 0,9 0,0 0,0 0,0 0,0 0,0 0,0
3,5 5,1 10,6 10,5 21,5 41,7 24,1 84,8 6,9 7,3 10,5 2,2 6,5 27,6 28,1 1,8 19,5 0,060,6 0,0 0,7 0,2 132,5 0,0 0,6 3,6 1,5 0,6 0,0 0,0 0,3 0,7 0,2 0,0 0,2 0,0
0,8 34,4 0,3 0,5 4,4 8,1 0,9 1,5 0,1 0,1 0,8 0,0 0,0 9,5 0,8 0,1 0,7 0,0
0,2 0,6 18,3 0,7 6,5 109,9 36,7 56,8 5,8 8,4 1,6 3,4 2,6 11,7 3,7 0,1 0,9 0,01,2 1,2 0,6 41,0 6,1 121,5 46,6 76,5 40,0 13,9 3,1 7,1 1,3 40,3 13,0 0,2 6,0 0,02,9 26,0 5,2 9,9 540,3 396,4 102,5 185,5 6,6 11,3 19,0 9,7 21,0 34,0 50,4 0,6 13,2 0,0
0,0 0,0 0,0 0,0 0,0 36,2 1,4 0,0 0,0 0,2 0,0 0,8 0,0 1,0 0,0 0,0 0,0 0,01,4 0,3 0,3 0,4 1,7 58,9 112,7 3,2 0,1 5,0 0,2 0,1 0,1 0,4 0,5 0,1 0,3 0,0
0,7 0,9 0,5 1,3 6,1 116,6 37,4 639,1 12,0 10,6 5,5 0,6 0,1 6,6 6,1 0,2 5,3 0,00,0 0,0 0,0 0,0 0,0 0,0 0,0 0,0 8,4 0,0 0,0 0,0 0,0 0,0 0,0 0,0 0,0 0,00,0 0,0 0,0 0,0 0,0 2,0 3,1 0,0 0,0 1,7 0,0 0,0 0,0 0,0 0,0 0,0 0,0 0,0
0,0 2,3 0,0 0,1 1,0 26,6 15,2 0,1 0,2 0,1 53,5 0,0 0,1 0,1 93,9 0,0 0,2 0,00,0 0,0 0,0 0,0 0,0 36,0 6,0 0,2 0,0 0,1 0,0 1,2 0,0 0,0 0,0 0,0 0,0 0,0
0,0 0,0 0,0 0,0 0,0 0,0 0,0 0,0 0,0 0,0 0,0 0,0 0,0 0,0 0,0 0,0 0,0 0,00,0 0,0 0,0 0,0 6,8 24,7 7,2 0,1 0,0 0,8 10,9 2,7 0,0 96,8 69,1 0,0 0,0 0,00,3 1,7 0,3 0,4 1,1 0,3 1,8 3,6 0,2 0,1 0,1 0,2 0,6 1,0 29,1 0,1 0,6 0,0
0,1 0,6 0,5 0,9 2,3 25,2 12,8 17,0 0,5 1,8 0,8 0,9 0,7 2,2 11,3 6,3 1,0 0,00,0 0,0 0,0 0,0 0,0 6,8 1,0 7,8 0,0 0,5 11,2 2,3 0,0 41,3 13,0 0,0 19,3 0,00,0 0,0 0,0 0,0 0,0 0,0 0,0 0,0 0,0 0,0 0,0 0,0 0,0 0,0 0,0 0,0 0,0 0,0
129,3 403,0 126,8 274,5 1427,8 4803,4 1634,7 5148,5 929,0 471,9 222,9 107,3 121,6 762,9 890,5 72,3 476,6 0,01204,4 637,3 725,7 865,2 2958,0 16988,3 11088,1 12069,4 2067,3 1684,0 448,1 245,9 302,0 1274,8 1519,3 263,5 1760,3 1128,6
1075,1 234,3 598,9 590,7 1530,3 12184,9 9453,5 6920,8 1138,2 1212,2 225,2 138,7 180,4 511,9 628,8 191,2 1283,7 1128,6999,0 177,1 552,5 507,8 791,5 9333,2 8112,2 5289,2 862,6 1104,9 83,0 113,4 83,6 512,4 712,1 79,9 279,8 1128,6

268
ANNEX 3– LIST OF PUBLICATIONS DURING THE RESEARCH RELATED TO
THE OFFSHORE ENERGY SECTOR

269
Pego, A. (2015). Clusters, análise e fundamentos. Uma abordagem teórica. X
CONGRESSO DA GEOGRAFIA PORTUGUESA. Valores da Geografia. Lisboa: Universidade
Nova de Lisboa
Pego, A. (2016). The importance of Mix Methodology for Studying Offshore Energy
sector.International Journal of Humanities and Social Science Invention, 5 (11), pp. 06-
08ISSN (Online): 2319 - 7722, ISSN (Print): 2319 - 7714
PEGO, A., MARQUES, M., SALVADOR, R., SOARES G., MONTEIRO, A. (2016).The
potential offshore energy cluster in Portugal. Progress in renewable energy offshore.
Guedes Soares (Ed). London: Taylor & Francis., pp 867- 873. ISBN 0 978-1-1-138-03000-
8
PEGO, A. (2016). Os sistemas e tecnologias de informação e os clusters. Uma
abordagem ao cluster de energia offshore em Portugal. Ibero American Conference,
Lisbon, 10-11 December, pp. 310-314.. ISBN: 978-989-8533-59-3.
PEGO, A. (2018).The pentagonal problem and the offshore energy sector in Portugal.
Why does it matter? Entrepreneurship along the Industry Life Cycle: The changing role
of Entrepreneurial Activities and Knowledge Competencies. Edited by S. Cubico, G.
Favretto, J. Leitão, and U. Cantner. Springer Book, 313-327.
PEGO, A., & BERNARDO, M. D. R. M. (2019). The Role of Urban Living Labs in
Entrepreneurship, Energy, and Governance of Smart Cities. In L. Carvalho, & P. Isaías
(Eds.), Handbook of Research on Entrepreneurship and Marketing for Global Reach in
the Digital Economy (pp. 203-221). Hershey, PA: IGI Global.