Micro end-milling of channels using ultrafine-grained low-carbon steel
Materials and Design 57 (2014) 211–217
Contents lists available at ScienceDirect
Materials and Design
journal homepage: www.elsevier .com/locate /matdes
Technical Report
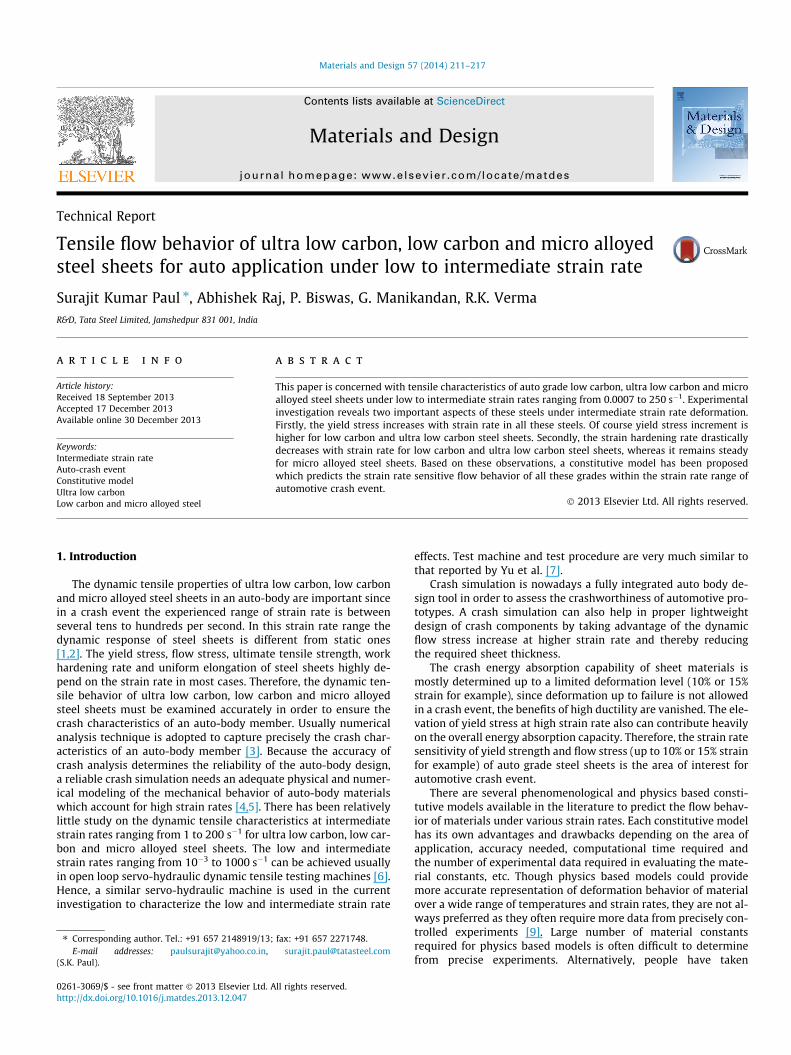
Tensile flow behavior of ultra low carbon, low carbon and micro alloyedsteel sheets for auto application under low to intermediate strain rate
0261-3069/$ - see front matter � 2013 Elsevier Ltd. All rights reserved.http://dx.doi.org/10.1016/j.matdes.2013.12.047
⇑ Corresponding author. Tel.: +91 657 2148919/13; fax: +91 657 2271748.E-mail addresses: [email protected], [email protected]
(S.K. Paul).
Surajit Kumar Paul ⇑, Abhishek Raj, P. Biswas, G. Manikandan, R.K. VermaR&D, Tata Steel Limited, Jamshedpur 831 001, India
a r t i c l e i n f o
Article history:Received 18 September 2013Accepted 17 December 2013Available online 30 December 2013
Keywords:Intermediate strain rateAuto-crash eventConstitutive modelUltra low carbonLow carbon and micro alloyed steel
a b s t r a c t
This paper is concerned with tensile characteristics of auto grade low carbon, ultra low carbon and microalloyed steel sheets under low to intermediate strain rates ranging from 0.0007 to 250 s�1. Experimentalinvestigation reveals two important aspects of these steels under intermediate strain rate deformation.Firstly, the yield stress increases with strain rate in all these steels. Of course yield stress increment ishigher for low carbon and ultra low carbon steel sheets. Secondly, the strain hardening rate drasticallydecreases with strain rate for low carbon and ultra low carbon steel sheets, whereas it remains steadyfor micro alloyed steel sheets. Based on these observations, a constitutive model has been proposedwhich predicts the strain rate sensitive flow behavior of all these grades within the strain rate range ofautomotive crash event.
� 2013 Elsevier Ltd. All rights reserved.
1. Introduction
The dynamic tensile properties of ultra low carbon, low carbonand micro alloyed steel sheets in an auto-body are important sincein a crash event the experienced range of strain rate is betweenseveral tens to hundreds per second. In this strain rate range thedynamic response of steel sheets is different from static ones[1,2]. The yield stress, flow stress, ultimate tensile strength, workhardening rate and uniform elongation of steel sheets highly de-pend on the strain rate in most cases. Therefore, the dynamic ten-sile behavior of ultra low carbon, low carbon and micro alloyedsteel sheets must be examined accurately in order to ensure thecrash characteristics of an auto-body member. Usually numericalanalysis technique is adopted to capture precisely the crash char-acteristics of an auto-body member [3]. Because the accuracy ofcrash analysis determines the reliability of the auto-body design,a reliable crash simulation needs an adequate physical and numer-ical modeling of the mechanical behavior of auto-body materialswhich account for high strain rates [4,5]. There has been relativelylittle study on the dynamic tensile characteristics at intermediatestrain rates ranging from 1 to 200 s�1 for ultra low carbon, low car-bon and micro alloyed steel sheets. The low and intermediatestrain rates ranging from 10�3 to 1000 s�1 can be achieved usuallyin open loop servo-hydraulic dynamic tensile testing machines [6].Hence, a similar servo-hydraulic machine is used in the currentinvestigation to characterize the low and intermediate strain rate
effects. Test machine and test procedure are very much similar tothat reported by Yu et al. [7].
Crash simulation is nowadays a fully integrated auto body de-sign tool in order to assess the crashworthiness of automotive pro-totypes. A crash simulation can also help in proper lightweightdesign of crash components by taking advantage of the dynamicflow stress increase at higher strain rate and thereby reducingthe required sheet thickness.
The crash energy absorption capability of sheet materials ismostly determined up to a limited deformation level (10% or 15%strain for example), since deformation up to failure is not allowedin a crash event, the benefits of high ductility are vanished. The ele-vation of yield stress at high strain rate also can contribute heavilyon the overall energy absorption capacity. Therefore, the strain ratesensitivity of yield strength and flow stress (up to 10% or 15% strainfor example) of auto grade steel sheets is the area of interest forautomotive crash event.
There are several phenomenological and physics based consti-tutive models available in the literature to predict the flow behav-ior of materials under various strain rates. Each constitutive modelhas its own advantages and drawbacks depending on the area ofapplication, accuracy needed, computational time required andthe number of experimental data required in evaluating the mate-rial constants, etc. Though physics based models could providemore accurate representation of deformation behavior of materialover a wide range of temperatures and strain rates, they are not al-ways preferred as they often require more data from precisely con-trolled experiments [9]. Large number of material constantsrequired for physics based models is often difficult to determinefrom precise experiments. Alternatively, people have taken
300
350
400
450
500
550
-1tress
, MPa
(a)
212 S.K. Paul et al. / Materials and Design 57 (2014) 211–217
optimization technique to evaluate these material constants [10].On the other hand, the phenomenological models are quite usefulfor practical applications such as numerical simulations of struc-tures subjected to dynamic loading. In the current work, a phe-nomenological model is used to describe the flow behavior ofultra low carbon, low carbon and micro alloyed steel sheets at var-ious low and intermediate strain rates.
0 5 10 15 20 25 30 35 40 45 50 550
50
100
150
200
250
Low carbon Steel
Strain rate (S ) 239 117 10 0.7 0.07 0.007 0.0007
Engi
neer
ing
S
Engineering Strain, %
500
550
600(b)
2. Experimental procedure
Cold rolled low carbon, ultra low carbon and micro alloyed steelsheets are investigated in this study. The sheet thicknesses are1.0 mm for low carbon and ultra low carbon steel, and 1.2 mmfor micro alloyed steel. The microstructure of low carbon and ultralow carbon steel consist of completely ferrite phase whereas microalloyed steel consist of ferrite-perlite. Alloying elements of thethree steels considered for current investigation are tabulated inTable 1. Both quasi-static and intermediate strain rate experimen-tations are preformed in an open loop servo hydraulic machine(similar to Yu et al. [7]).
0 5 10 15 20 25 30 35 40 45 50 550
50
100
150
200
250
300
350
400
450
Ultra low carbon steel
Strain rate (S-1) 223 113 9 0.7 0.07 0.007 0.0007
Engi
neer
ing
Stre
ss, M
Pa
Engineering Strain, %
0 5 10 15 20 25 30 35 40 450
50100150200250300350400450500550600650700750
Micro alloyed steel
Strain rate 200 67 10 0.7 0.07 0.007 0.0007
Engi
neer
ing
Stre
ss, M
Pa
Engineering Strain, %
(c)
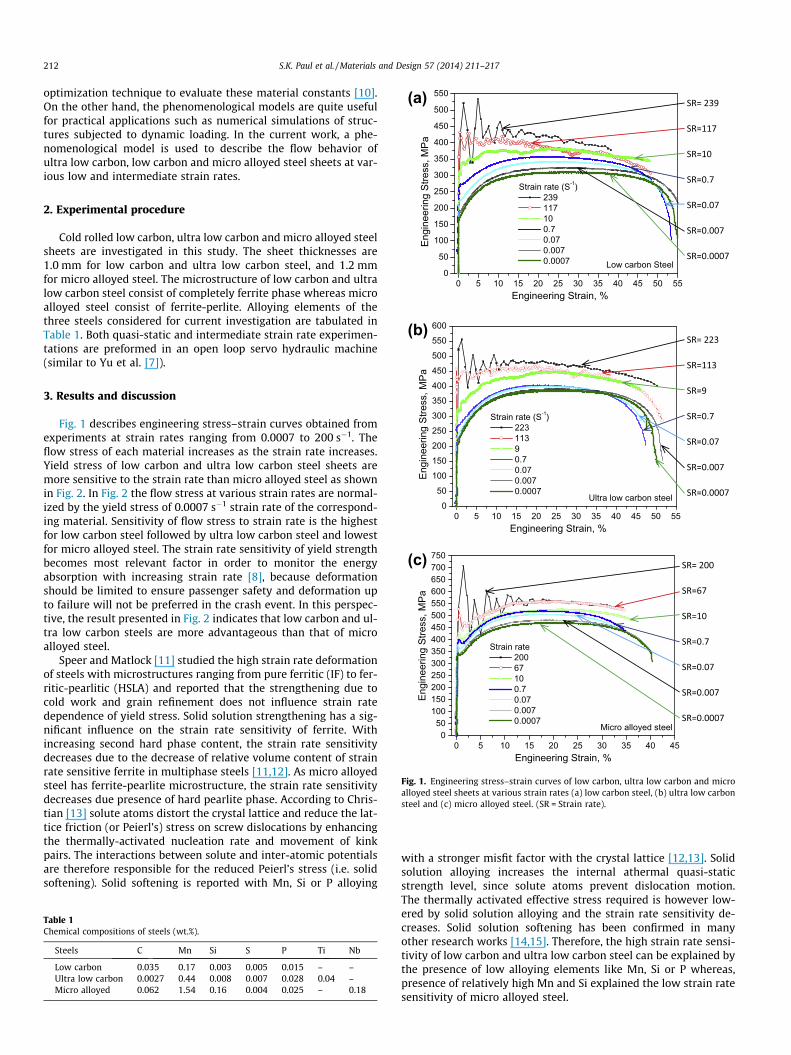
Fig. 1. Engineering stress–strain curves of low carbon, ultra low carbon and microalloyed steel sheets at various strain rates (a) low carbon steel, (b) ultra low carbonsteel and (c) micro alloyed steel. (SR = Strain rate).
3. Results and discussion
Fig. 1 describes engineering stress–strain curves obtained fromexperiments at strain rates ranging from 0.0007 to 200 s�1. Theflow stress of each material increases as the strain rate increases.Yield stress of low carbon and ultra low carbon steel sheets aremore sensitive to the strain rate than micro alloyed steel as shownin Fig. 2. In Fig. 2 the flow stress at various strain rates are normal-ized by the yield stress of 0.0007 s�1 strain rate of the correspond-ing material. Sensitivity of flow stress to strain rate is the highestfor low carbon steel followed by ultra low carbon steel and lowestfor micro alloyed steel. The strain rate sensitivity of yield strengthbecomes most relevant factor in order to monitor the energyabsorption with increasing strain rate [8], because deformationshould be limited to ensure passenger safety and deformation upto failure will not be preferred in the crash event. In this perspec-tive, the result presented in Fig. 2 indicates that low carbon and ul-tra low carbon steels are more advantageous than that of microalloyed steel.
Speer and Matlock [11] studied the high strain rate deformationof steels with microstructures ranging from pure ferritic (IF) to fer-ritic-pearlitic (HSLA) and reported that the strengthening due tocold work and grain refinement does not influence strain ratedependence of yield stress. Solid solution strengthening has a sig-nificant influence on the strain rate sensitivity of ferrite. Withincreasing second hard phase content, the strain rate sensitivitydecreases due to the decrease of relative volume content of strainrate sensitive ferrite in multiphase steels [11,12]. As micro alloyedsteel has ferrite-pearlite microstructure, the strain rate sensitivitydecreases due presence of hard pearlite phase. According to Chris-tian [13] solute atoms distort the crystal lattice and reduce the lat-tice friction (or Peierl’s) stress on screw dislocations by enhancingthe thermally-activated nucleation rate and movement of kinkpairs. The interactions between solute and inter-atomic potentialsare therefore responsible for the reduced Peierl’s stress (i.e. solidsoftening). Solid softening is reported with Mn, Si or P alloying
Table 1Chemical compositions of steels (wt.%).
Steels C Mn Si S P Ti Nb
Low carbon 0.035 0.17 0.003 0.005 0.015 – –Ultra low carbon 0.0027 0.44 0.008 0.007 0.028 0.04 –Micro alloyed 0.062 1.54 0.16 0.004 0.025 – 0.18
with a stronger misfit factor with the crystal lattice [12,13]. Solidsolution alloying increases the internal athermal quasi-staticstrength level, since solute atoms prevent dislocation motion.The thermally activated effective stress required is however low-ered by solid solution alloying and the strain rate sensitivity de-creases. Solid solution softening has been confirmed in manyother research works [14,15]. Therefore, the high strain rate sensi-tivity of low carbon and ultra low carbon steel can be explained bythe presence of low alloying elements like Mn, Si or P whereas,presence of relatively high Mn and Si explained the low strain ratesensitivity of micro alloyed steel.

1E-4 1E-3 0.01 0.1 1 10 100 10000.8
1.0
1.2
1.4
1.6
1.8
2.0
2.2
2.4
2.6
2.8
Strain rate
Nor
mal
ized
yie
ld s
tress
Low carbon steel Ultra low carbon steel Micro alloyed steel
Fig. 2. Normalized yield stress (yield stress at various strain rates divided by yieldstress at strain rate of 0.0007 s�1) of low carbon, ultra low carbon and micro alloyedsteel sheets at various strain rates.
0.00 0.05 0.10 0.15 0.20 0.25 0.300
500
1000
1500
2000
2500
3000
3500
4000Strain rate
0.0007 0.7 10 117
Low carbon steel
Stra
in h
arde
ning
rate
(MPa
)
True strain
0.00 0.05 0.10 0.15 0.20 0.25 0.300
500
1000
1500
2000
2500
3000
3500
4000Strain rate
0.0007 0.7 9 113
Ultra low carbon steelSt
rain
har
deni
ng ra
te (M
Pa)
True strain
0.00 0.05 0.10 0.15 0.20 0.25 0.300
500
1000
1500
2000
2500
3000
3500
4000Strain rate
0.0007 0.7 10 67
Micro alloyed steel
Stra
in h
arde
ning
rate
(MPa
)
True strain
(a)
(b)
(c)
Fig. 3. Strain hardening rates at various strain rates (a) low carbon steel, (b) ultralow carbon steel and (c) micro alloyed steel.
S.K. Paul et al. / Materials and Design 57 (2014) 211–217 213
The work hardening rate, dr/de, of each steel grades are deter-mined by fitting of third order polynomial in the plastic region ofthe flow curves and then differentiating it with respect to truestrain. The work hardening rate for different material is presentedin Fig. 3. The results show that slopes of the true stress–true straincurves of ultra low carbon and micro alloyed steels after the onsetof yielding are larger than those of low carbon steel, as shown inFig. 3. The work hardening rate, dr/de, of each steels decreasegradually with the increase of the true strain. The work hardeningrate rapidly decreases with strain rate in the low carbon and ultralow carbon steels whereas for micro alloyed steel, work hardeningrate is insensitive to strain rate. Though rapid increase of yieldstress occurs with strain rate for low carbon and ultra low carbonsteel, fast decrease in work hardening rate with strain rate candiminish the advantages of these steels in an auto crash event.Whereas, a moderate increase in yield stress with strain rate andalmost an invariant work hardening rate in all strain rates indicatesthat micro alloyed steel can be advantageous in higher strain rateapplications. Fig. 4 shows the strain energy density (area undertensile true stress–strain curve) up to true strain of 0.1 versusstrain rate plot for three different steel sheets. Micro alloyed steelshows highest energy absorption at higher strain rates, and whichindicates that the use of micro alloyed steel in higher strain rateapplications can be beneficial over low carbon and ultra low car-bon steels.
Fig. 5 shows the strain rate sensitivities of three steels selectedfor current investigation at various engineering strains. For lowcarbon and ultra low carbon steels, the gap between yield stressand flow stress at any strain (for example 10% engineering strain,e = 0.1) decreases with increase in strain rate, it means work hard-ening decreases with strain rate. The similar trend can also be in-ferred from the behavior of the work hardening rate shown inFig. 3. On the other hand, for micro alloyed steel, the gap betweenyield stress and flow stress at any strain remains constant for strainrate up to 10 s�1 (Fig. 5) which corroborates with the work harden-ing rate presented in Fig. 3.
4. Strain rate sensitive models
Depending upon the metals/alloys and their strengtheningmechanisms, the yield stress and flow stress at given plastic straindepend upon the strain rate. Fig. 6 describes the four categories ofgeneral stress–strain behavior of metals and alloys.
Type 1 (Fig. 6a): In this case material exhibits nearly strain-rate-independent yielding behavior, whereas the post-yieldstrain hardening is strongly rate dependent, High-purity FCCmetals such as Cu, Ni, Al, and Ag in fully annealed condition,exhibit this behavior. The strong dependency of strain harden-ing in FCC metals with decreasing temperature and/or increas-ing strain rate is due to the suppression of dynamic recoveryprocesses [16].Type 2 (Fig. 6b): The strain-hardening response of BCC metals(Fe, Ta, W, Mo and Nb) (6) and HCP metals (Zn and Ti) and alloys[17,18] is represented by this category. The yield strengths dis-play a strong temperature and strain-rate dependency due totheir high lattice resistance [19]. In this class of metals,

1E-4 1E-3 0.01 0.1 1 10 100 100020
25
30
35
40
45
50
55
60
Low carbon steel Ultra low carbon steel Micro alloyed steel
Total true strain 0.1Stra
in e
nerg
y de
nsity
(MJ/
m3 )
Strain rate (S-1)
Fig. 4. Strain energy density (area under tensile true stress–strain curve) up to truestrain of 0.1 versus strain rate plot for low carbon, ultra low carbon and microalloyed steel sheets.
1E-4 1E-3 0.01 0.1 1 10 100 1000150175200225250275300325350375400425450475500525550575
Strain, ε ε = yield ε = 0.05 ε = 0.1 ε = 0.15 ε = 0.2
Strain rate
Engi
neer
ing
stre
ss, M
Pa
Low carbon steel
1E-4 1E-3 0.01 0.1 1 10 100 1000150175200225250275300325350375400425450475500525550575
Strain, ε ε = yield ε = 0.05 ε = 0.1 ε = 0.15 ε = 0.2
Strain rate
Engi
neer
ing
stre
ss, M
Pa
Ultra low carbon steel
1E-4 1E-3 0.01 0.1 1 10 100 1000150175200225250275300325350375400425450475500525550575
Strain, ε ε = yield ε = 0.05 ε = 0.1 ε = 0.15 ε = 0.2 Micro alloyed steel
Engi
neer
ing
stre
ss, M
Pa
Strain rate
(a)
(b)
(c)
Fig. 5. Strain rate sensitivity curves at various strains (a) low carbon steel, (b) ultralow carbon steel and (c) micro alloyed steel.
214 S.K. Paul et al. / Materials and Design 57 (2014) 211–217
strain-hardening response after yielding is nearly invariant tostrain rate; i.e., the stress–strain curves are all parallel withan offset in their initial yields.Type 3 (Fig. 6c): Flow behavior of some alloys like 304 and 316stainless steels [20] is represented by this type. In this case,both yield stress and strain hardening increases with strain rate.Temperature has an inverse effect when compared with strainrate.Type 4 (Fig. 6d): Low carbon and mild steel [21] stress–straincurve is represented by this category. Yield stress increasesand strain hardening decreases with the strain rate in this case.
To describe the four types of flow behavior of metals, the consti-tutive models are discussed in this section. The flow stress r at anyplastic strain ep is the summation of yield stress r0 and plastic partof the stress a (a = r � r0). The quasi-static stress–strain curve canbe represented as follows:
r ¼ r0 þ aðepÞ: ð1Þ
Let us consider, Mð _eÞ and Nð _eÞ are the two separate strain ratedependent functions. Type 1 flow curve as discussed in this sectioncan be represented by Eq. (2). Zerilli–Armstrong for FCC [22] is anexample of this category of model.
r ¼ r0 þ aðep; _eÞ ¼ r0 þ aðepÞMð _eÞ ð2Þ
Eq. (3) can describe the type 2 flow curve. Zerilli–Armstrong forBCC [22], Corus model [23], El-Magd–Swift [24], Yu et al. [25] arethe example of this kind of model.
r ¼ r0ð _eÞ þ aðepÞ ¼ r0Mð _eÞ þ aðepÞ ð3Þ
Type 3 flow curves can also be represented by both Eqs. (4) and(5) given below. Whereas, type 4 flow curve can be only repre-sented by Eq. (5).
r ¼ r0ð _eÞ þ aðep; _eÞ ¼ ðr0 þ aðepÞÞMð _eÞ ð4Þ
r ¼ r0ð _eÞ þ aðep; _eÞ ¼ r0Mð _eÞ þ aðepÞNð _eÞ ð5Þ
Eq. (4) is the special category of Eq. (5) and can be arrived at byconsidering the strain rate dependency of yield stress and flowstress at any plastic strain is same. Cowper–Symonds [26], John-son–Cook [27], Lin–Wagoner [28] models are of the form givenby Eq. (4). Whereas, BMW [29], Zhao [10], Khan–Liang [2], Rusi-nek–Klepaczko [21], Tanimura–Hockett/Sherby [30], Paul [31]models are represented by Eq. (5). Some other forms of coupledtemperature-strain rate equations [32–36] are also available inthe literature to describe hot deformation. Lin and Chen [37]
comprehensively described these models in their review article.As in auto crash event, room temperature strain rate sensitivemodels are fundamentally important; therefore, our discussion isrestricted only in strain rate sensitive models. As shown in Fig. 1the flow curves of ultra low carbon, low carbon and micro alloyedsteel sheets at different strain rates are of type 4 curve (Fig. 6d)which can be described only by Eq. (5). The yield stress and flowstress at any fixed plastic strain do not change in the same propor-tion with strain rate for this type of behavior. Therefore, two strainrate dependent functions Mð _eÞ and Nð _eÞ (Eq. (5)) are required to ad-dress the yield stress and variation of flow stress at any plasticstrain corresponding to different strain rates. Eqs. (2)–(4) are thespecial conditions of Eq. (5). Hence, Eq. (5) can describe all the four
(a) (b)
(c) (d)
Type 2
Type 4Type 3
Type 1
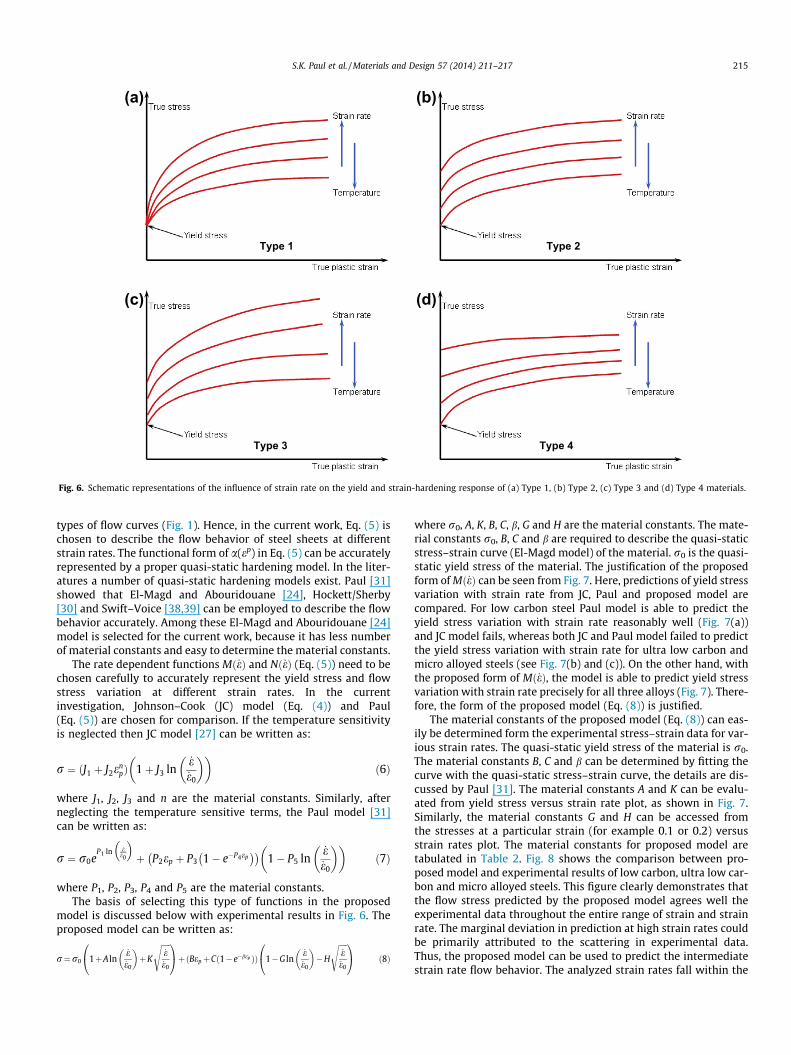
Fig. 6. Schematic representations of the influence of strain rate on the yield and strain-hardening response of (a) Type 1, (b) Type 2, (c) Type 3 and (d) Type 4 materials.
S.K. Paul et al. / Materials and Design 57 (2014) 211–217 215
types of flow curves (Fig. 1). Hence, in the current work, Eq. (5) ischosen to describe the flow behavior of steel sheets at differentstrain rates. The functional form of a(ep) in Eq. (5) can be accuratelyrepresented by a proper quasi-static hardening model. In the liter-atures a number of quasi-static hardening models exist. Paul [31]showed that El-Magd and Abouridouane [24], Hockett/Sherby[30] and Swift–Voice [38,39] can be employed to describe the flowbehavior accurately. Among these El-Magd and Abouridouane [24]model is selected for the current work, because it has less numberof material constants and easy to determine the material constants.
The rate dependent functions Mð _eÞ and Nð _eÞ (Eq. (5)) need to bechosen carefully to accurately represent the yield stress and flowstress variation at different strain rates. In the currentinvestigation, Johnson–Cook (JC) model (Eq. (4)) and Paul(Eq. (5)) are chosen for comparison. If the temperature sensitivityis neglected then JC model [27] can be written as:
r ¼ ðJ1 þ J2enpÞ 1þ J3 ln
_e_e0
� �� �ð6Þ
where J1, J2, J3 and n are the material constants. Similarly, afterneglecting the temperature sensitive terms, the Paul model [31]can be written as:
r ¼ r0eP1 ln _e
_e0
� �þ P2ep þ P3 1� e�P4ep
� �� �1� P5 ln
_e_e0
� �� �ð7Þ
where P1, P2, P3, P4 and P5 are the material constants.The basis of selecting this type of functions in the proposed
model is discussed below with experimental results in Fig. 6. Theproposed model can be written as:
r¼r0 1þA ln_e_e0
� �þK
ffiffiffiffiffi_e_e0
s0@
1AþðBepþCð1�e�bep ÞÞ 1�G ln
_e_e0
� ��H
ffiffiffiffiffi_e_e0
s0@
1A ð8Þ
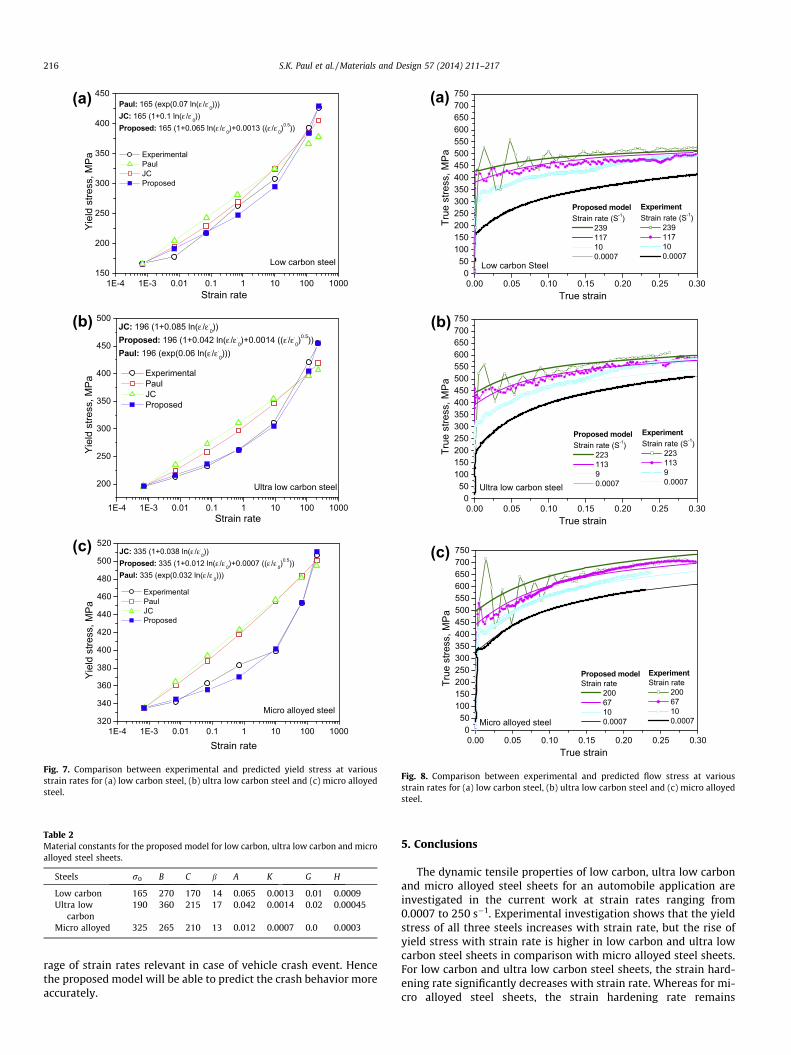
where r0, A, K, B, C, b, G and H are the material constants. The mate-rial constants r0, B, C and b are required to describe the quasi-staticstress–strain curve (El-Magd model) of the material. r0 is the quasi-static yield stress of the material. The justification of the proposedform of Mð _eÞ can be seen from Fig. 7. Here, predictions of yield stressvariation with strain rate from JC, Paul and proposed model arecompared. For low carbon steel Paul model is able to predict theyield stress variation with strain rate reasonably well (Fig. 7(a))and JC model fails, whereas both JC and Paul model failed to predictthe yield stress variation with strain rate for ultra low carbon andmicro alloyed steels (see Fig. 7(b) and (c)). On the other hand, withthe proposed form of Mð _eÞ, the model is able to predict yield stressvariation with strain rate precisely for all three alloys (Fig. 7). There-fore, the form of the proposed model (Eq. (8)) is justified.
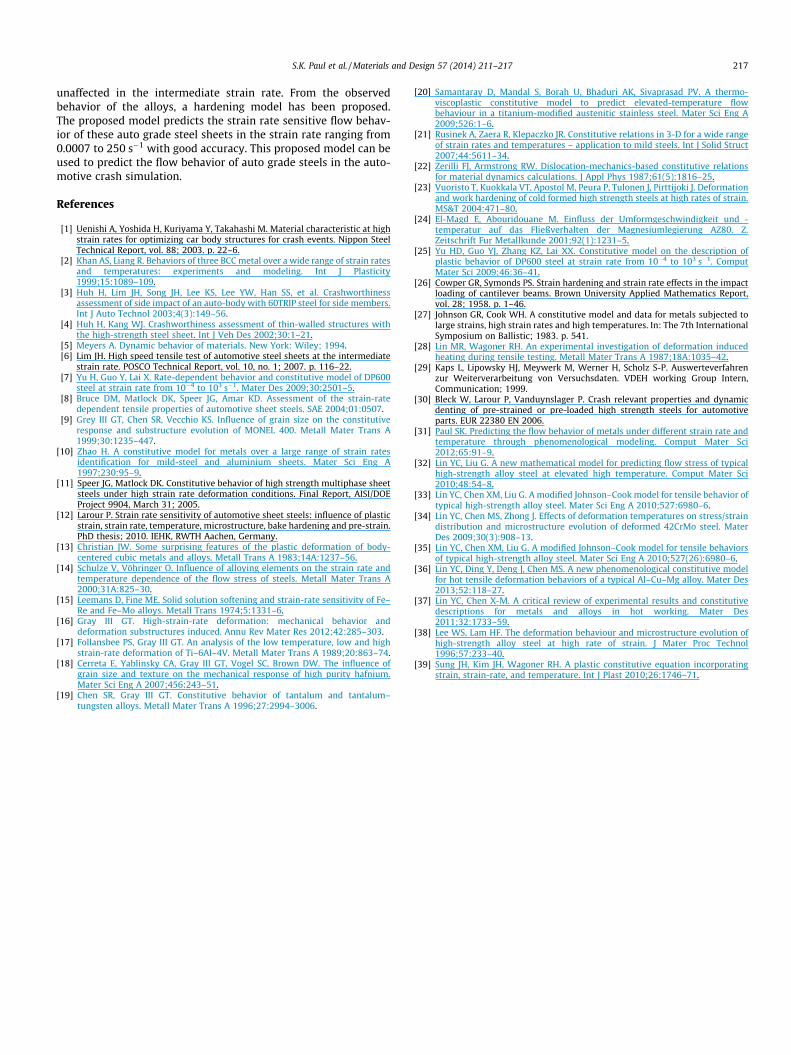
The material constants of the proposed model (Eq. (8)) can eas-ily be determined form the experimental stress–strain data for var-ious strain rates. The quasi-static yield stress of the material is r0.The material constants B, C and b can be determined by fitting thecurve with the quasi-static stress–strain curve, the details are dis-cussed by Paul [31]. The material constants A and K can be evalu-ated from yield stress versus strain rate plot, as shown in Fig. 7.Similarly, the material constants G and H can be accessed fromthe stresses at a particular strain (for example 0.1 or 0.2) versusstrain rates plot. The material constants for proposed model aretabulated in Table 2. Fig. 8 shows the comparison between pro-posed model and experimental results of low carbon, ultra low car-bon and micro alloyed steels. This figure clearly demonstrates thatthe flow stress predicted by the proposed model agrees well theexperimental data throughout the entire range of strain and strainrate. The marginal deviation in prediction at high strain rates couldbe primarily attributed to the scattering in experimental data.Thus, the proposed model can be used to predict the intermediatestrain rate flow behavior. The analyzed strain rates fall within the
1E-4 1E-3 0.01 0.1 1 10 100 1000
200
250
300
350
400
450
500JC: 196 (1+0.085 ln(ε./ε.
0))Proposed: 196 (1+0.042 ln(ε./ε.
0)+0.0014 ((ε./ε.0)
0.5))Paul: 196 (exp(0.06 ln(ε./ε.
0)))
Experimental Paul JC Proposed
Ultra low carbon steel
Strain rate
Yiel
d st
ress
, MPa
1E-4 1E-3 0.01 0.1 1 10 100 1000150
200
250
300
350
400
450Paul: 165 (exp(0.07 ln(ε./ε.
0)))JC: 165 (1+0.1 ln(ε./ε.
0))Proposed: 165 (1+0.065 ln(ε./ε.
0)+0.0013 ((ε./ε.0)
0.5))
Experimental Paul JC Proposed
Low carbon steel
Yiel
d st
ress
, MPa
Strain rate
1E-4 1E-3 0.01 0.1 1 10 100 1000320
340
360
380
400
420
440
460
480
500
520JC: 335 (1+0.038 ln(ε./ε.
0))Proposed: 335 (1+0.012 ln(ε./ε.
0)+0.0007 ((ε./ε.0)
0.5))Paul: 335 (exp(0.032 ln(ε./ε.
0)))
Experimental Paul JC Proposed
Micro alloyed steel
Strain rate
Yiel
d st
ress
, MPa
(a)
(b)
(c)
Fig. 7. Comparison between experimental and predicted yield stress at variousstrain rates for (a) low carbon steel, (b) ultra low carbon steel and (c) micro alloyedsteel.
Table 2Material constants for the proposed model for low carbon, ultra low carbon and microalloyed steel sheets.
Steels r0 B C b A K G H
Low carbon 165 270 170 14 0.065 0.0013 0.01 0.0009Ultra low
carbon190 360 215 17 0.042 0.0014 0.02 0.00045
Micro alloyed 325 265 210 13 0.012 0.0007 0.0 0.0003
0.00 0.05 0.10 0.15 0.20 0.25 0.300
50100150200250300350400450500550600650700750
Proposed modelStrain rate (S-1)
239 117 10 0.0007
Low carbon Steel
ExperimentStrain rate (S-1)
239 117 10 0.0007
True
stre
ss, M
Pa
True strain
0.00 0.05 0.10 0.15 0.20 0.25 0.300
50100150200250300350400450500550600650700750
Proposed model Strain rate (S-1)
223 113 9 0.0007Ultra low carbon steel
ExperimentStrain rate (S-1)
223 113 9 0.0007
True
stre
ss, M
Pa
True strain
0.00 0.05 0.10 0.15 0.20 0.25 0.300
50100150200250300350400450500550600650700750
Proposed modelStrain rate
200 67 10 0.0007Micro alloyed steel
ExperimentStrain rate
200 67 10 0.0007
True
stre
ss, M
Pa
True strain
(a)
(b)
(c)
Fig. 8. Comparison between experimental and predicted flow stress at variousstrain rates for (a) low carbon steel, (b) ultra low carbon steel and (c) micro alloyedsteel.
216 S.K. Paul et al. / Materials and Design 57 (2014) 211–217
rage of strain rates relevant in case of vehicle crash event. Hencethe proposed model will be able to predict the crash behavior moreaccurately.
5. Conclusions
The dynamic tensile properties of low carbon, ultra low carbonand micro alloyed steel sheets for an automobile application areinvestigated in the current work at strain rates ranging from0.0007 to 250 s�1. Experimental investigation shows that the yieldstress of all three steels increases with strain rate, but the rise ofyield stress with strain rate is higher in low carbon and ultra lowcarbon steel sheets in comparison with micro alloyed steel sheets.For low carbon and ultra low carbon steel sheets, the strain hard-ening rate significantly decreases with strain rate. Whereas for mi-cro alloyed steel sheets, the strain hardening rate remains
S.K. Paul et al. / Materials and Design 57 (2014) 211–217 217
unaffected in the intermediate strain rate. From the observedbehavior of the alloys, a hardening model has been proposed.The proposed model predicts the strain rate sensitive flow behav-ior of these auto grade steel sheets in the strain rate ranging from0.0007 to 250 s�1 with good accuracy. This proposed model can beused to predict the flow behavior of auto grade steels in the auto-motive crash simulation.
References
[1] Uenishi A, Yoshida H, Kuriyama Y, Takahashi M. Material characteristic at highstrain rates for optimizing car body structures for crash events. Nippon SteelTechnical Report, vol. 88; 2003. p. 22–6.
[2] Khan AS, Liang R. Behaviors of three BCC metal over a wide range of strain ratesand temperatures: experiments and modeling. Int J Plasticity1999;15:1089–109.
[3] Huh H, Lim JH, Song JH, Lee KS, Lee YW, Han SS, et al. Crashworthinessassessment of side impact of an auto-body with 60TRIP steel for side members.Int J Auto Technol 2003;4(3):149–56.
[4] Huh H, Kang WJ. Crashworthiness assessment of thin-walled structures withthe high-strength steel sheet. Int J Veh Des 2002;30:1–21.
[5] Meyers A. Dynamic behavior of materials. New York: Wiley; 1994.[6] Lim JH. High speed tensile test of automotive steel sheets at the intermediate
strain rate. POSCO Technical Report, vol. 10, no. 1; 2007. p. 116–22.[7] Yu H, Guo Y, Lai X. Rate-dependent behavior and constitutive model of DP600
steel at strain rate from 10�4 to 103 s�1. Mater Des 2009;30:2501–5.[8] Bruce DM, Matlock DK, Speer JG, Amar KD. Assessment of the strain-rate
dependent tensile properties of automotive sheet steels. SAE 2004;01:0507.[9] Grey III GT, Chen SR, Vecchio KS. Influence of grain size on the constitutive
response and substructure evolution of MONEL 400. Metall Mater Trans A1999;30:1235–447.
[10] Zhao H. A constitutive model for metals over a large range of strain ratesidentification for mild-steel and aluminium sheets. Mater Sci Eng A1997;230:95–9.
[11] Speer JG, Matlock DK. Constitutive behavior of high strength multiphase sheetsteels under high strain rate deformation conditions. Final Report, AISI/DOEProject 9904, March 31; 2005.
[12] Larour P. Strain rate sensitivity of automotive sheet steels: influence of plasticstrain, strain rate, temperature, microstructure, bake hardening and pre-strain.PhD thesis; 2010. IEHK, RWTH Aachen, Germany.
[13] Christian JW. Some surprising features of the plastic deformation of body-centered cubic metals and alloys. Metall Trans A 1983;14A:1237–56.
[14] Schulze V, Vöhringer O. Influence of alloying elements on the strain rate andtemperature dependence of the flow stress of steels. Metall Mater Trans A2000;31A:825–30.
[15] Leemans D, Fine ME. Solid solution softening and strain-rate sensitivity of Fe–Re and Fe–Mo alloys. Metall Trans 1974;5:1331–6.
[16] Gray III GT. High-strain-rate deformation: mechanical behavior anddeformation substructures induced. Annu Rev Mater Res 2012;42:285–303.
[17] Follansbee PS, Gray III GT. An analysis of the low temperature, low and highstrain-rate deformation of Ti–6Al–4V. Metall Mater Trans A 1989;20:863–74.
[18] Cerreta E, Yablinsky CA, Gray III GT, Vogel SC, Brown DW. The influence ofgrain size and texture on the mechanical response of high purity hafnium.Mater Sci Eng A 2007;456:243–51.
[19] Chen SR, Gray III GT. Constitutive behavior of tantalum and tantalum–tungsten alloys. Metall Mater Trans A 1996;27:2994–3006.
[20] Samantaray D, Mandal S, Borah U, Bhaduri AK, Sivaprasad PV. A thermo-viscoplastic constitutive model to predict elevated-temperature flowbehaviour in a titanium-modified austenitic stainless steel. Mater Sci Eng A2009;526:1–6.
[21] Rusinek A, Zaera R, Klepaczko JR. Constitutive relations in 3-D for a wide rangeof strain rates and temperatures – application to mild steels. Int J Solid Struct2007;44:5611–34.
[22] Zerilli FJ, Armstrong RW. Dislocation-mechanics-based constitutive relationsfor material dynamics calculations. J Appl Phys 1987;61(5):1816–25.
[23] Vuoristo T, Kuokkala VT, Apostol M, Peura P, Tulonen J, Pirttijoki J. Deformationand work hardening of cold formed high strength steels at high rates of strain.MS&T 2004:471–80.
[24] El-Magd E, Abouridouane M. Einfluss der Umformgeschwindigkeit und -temperatur auf das Fließverhalten der Magnesiumlegierung AZ80. Z.Zeitschrift Fur Metallkunde 2001;92(1):1231–5.
[25] Yu HD, Guo YJ, Zhang KZ, Lai XX. Constitutive model on the description ofplastic behavior of DP600 steel at strain rate from 10�4 to 103 s�1. ComputMater Sci 2009;46:36–41.
[26] Cowper GR, Symonds PS. Strain hardening and strain rate effects in the impactloading of cantilever beams. Brown University Applied Mathematics Report,vol. 28; 1958. p. 1–46.
[27] Johnson GR, Cook WH. A constitutive model and data for metals subjected tolarge strains, high strain rates and high temperatures. In: The 7th InternationalSymposium on Ballistic; 1983. p. 541.
[28] Lin MR, Wagoner RH. An experimental investigation of deformation inducedheating during tensile testing. Metall Mater Trans A 1987;18A:1035–42.
[29] Kaps L, Lipowsky HJ, Meywerk M, Werner H, Scholz S-P. Auswerteverfahrenzur Weiterverarbeitung von Versuchsdaten. VDEH working Group Intern,Communication; 1999.
[30] Bleck W, Larour P, Vanduynslager P. Crash relevant properties and dynamicdenting of pre-strained or pre-loaded high strength steels for automotiveparts. EUR 22380 EN 2006.
[31] Paul SK. Predicting the flow behavior of metals under different strain rate andtemperature through phenomenological modeling. Comput Mater Sci2012;65:91–9.
[32] Lin YC, Liu G. A new mathematical model for predicting flow stress of typicalhigh-strength alloy steel at elevated high temperature. Comput Mater Sci2010;48:54–8.
[33] Lin YC, Chen XM, Liu G. A modified Johnson–Cook model for tensile behavior oftypical high-strength alloy steel. Mater Sci Eng A 2010;527:6980–6.
[34] Lin YC, Chen MS, Zhong J. Effects of deformation temperatures on stress/straindistribution and microstructure evolution of deformed 42CrMo steel. MaterDes 2009;30(3):908–13.
[35] Lin YC, Chen XM, Liu G. A modified Johnson–Cook model for tensile behaviorsof typical high-strength alloy steel. Mater Sci Eng A 2010;527(26):6980–6.
[36] Lin YC, Ding Y, Deng J, Chen MS. A new phenomenological constitutive modelfor hot tensile deformation behaviors of a typical Al–Cu–Mg alloy. Mater Des2013;52:118–27.
[37] Lin YC, Chen X-M. A critical review of experimental results and constitutivedescriptions for metals and alloys in hot working. Mater Des2011;32:1733–59.
[38] Lee WS, Lam HF. The deformation behaviour and microstructure evolution ofhigh-strength alloy steel at high rate of strain. J Mater Proc Technol1996;57:233–40.
[39] Sung JH, Kim JH, Wagoner RH. A plastic constitutive equation incorporatingstrain, strain-rate, and temperature. Int J Plast 2010;26:1746–71.
Copyright © 2022 FDOKUMEN