
Transition to a low-carbon city: lessons learned from Suzhou in China
14
RESEARCH ARTICLE Transition to a low-carbon city: lessons learned from Suzhou in China Wenling LIU 1,2 , Can WANG (✉) 1 , Xi XIE 3 , Arthur P. J. MOL 2 , Jining CHEN 1 1 School of Environment, Tsinghua University, Beijing 100084, China 2 Environmental Policy Group, Wageningen University, Wageningen 6706 KN, the Netherlands 3 The Administrative Centre for China’s Agenda 21, Beijing 100038, China © Higher Education Press and Springer-Verlag Berlin Heidelberg 2011 Abstract Climate change has become one of the most serious challenges facing humanity; developing a low- carbon economy provides new opportunities for addres- sing this issue. Building a low-carbon city has been pursued by people with a high degree of enthusiasm in China. Different from actions at the national level and distinct from practices of developed countries, low-carbon development in Chinese cities should be placed on diverse concerns. Taking Suzhou of Jiangsu Province of China as a case city, this paper adopts a scenario analysis approach to explore strategic focal points in the transition to a low- carbon city. Within this transition, we mainly focus on the different contributions from two factors–economic restruc- turing and technological upgrading. Scenario analysis results show that 1) in the case of no breakthrough technologies, it is difficult to achieve absolute emission reductions; 2) technologies involved in optimizing energy structure and improving energy efficiency of basic service sectors should be highly emphasized in local planning; 3) in comparison with technological upgrading, economic structural adjustment could be a stronger contributor to mitigation, which is one of the main differences from developed countries. However, the key issue of economic restructuring is to promote the growth of emerging low- carbon industries, which requires not only a strategic choice of new industries but also an introduction of advanced low-carbon technologies. It is also found that establishing a local carbon emissions accounting system is a prerequisite and the first priority for realizing a low-carbon transition and government capacity buildings should be strengthened accordingly. Keywords low-carbon city, economic restructuring, tech- nology upgrading 1 Introduction As nowadays the largest greenhouse gas emitter in the world, climate change mitigation has posed significant challenges for China. However, tackling climate change is not only an environmental issue but also a development issue. Developing a low carbon economy has become a major challenge for the world economy in the context of addressing climate change. Cities are regarded as the main sources of pollution. Their energy consumption and CO 2 emissions have been significantly increasing especially in developing countries, since rapidly expanding populations enjoy higher living standards and material affluence [1,2]. In China cities are responsible for more than 60 percent of the national energy consumption [3]. And this percentage keeps growing along with China’s high-speed urbanization [4]. Previous literature has paid especially attention to China’s carbon emissions at the national level, while cities, which are important and basic units to perform national strategies, have usually been neglected [5]. In recent years, however, we see a different trend. Researchers and policy makers are placing greater importance and emphasis on urban green- house gases (GHGs) [6,7]; similarly, developing long-term urban emission scenarios and identifying potential low- carbon pathways require more scientific and practical inputs [8]. In this respect, previous studies and practices of developed countries provide referable experiences for China. 1) Previous studies on low-carbon cities Socio-economic structure, energy structure and technol- ogy are regarded as key elements in a city’s economic low- carbon transition. Some studies tested the roles of these factors and mainly developed cities were taken as research objectives. Among these, Shimada et al. [9] formulated long-term scenarios toward a local low-carbon economy taking Shiga prefecture in Japan as a case and proving the Received June 3, 2010; accepted March 30, 2011 E-mail: [email protected] Front. Environ. Sci. Eng. 2012, 6(3): 373–386 DOI 10.1007/s11783-011-0338-y
Transcript of Transition to a low-carbon city: lessons learned from Suzhou in China
RESEARCH ARTICLE
Transition to a low-carbon city: lessons learned from Suzhouin China
Wenling LIU1,2, Can WANG (✉)1, Xi XIE3, Arthur P. J. MOL2, Jining CHEN1
1 School of Environment, Tsinghua University, Beijing 100084, China2 Environmental Policy Group, Wageningen University, Wageningen 6706 KN, the Netherlands
3 The Administrative Centre for China’s Agenda 21, Beijing 100038, China
© Higher Education Press and Springer-Verlag Berlin Heidelberg 2011
Abstract Climate change has become one of the mostserious challenges facing humanity; developing a low-carbon economy provides new opportunities for addres-sing this issue. Building a low-carbon city has beenpursued by people with a high degree of enthusiasm inChina. Different from actions at the national level anddistinct from practices of developed countries, low-carbondevelopment in Chinese cities should be placed on diverseconcerns. Taking Suzhou of Jiangsu Province of China as acase city, this paper adopts a scenario analysis approach toexplore strategic focal points in the transition to a low-carbon city. Within this transition, we mainly focus on thedifferent contributions from two factors–economic restruc-turing and technological upgrading. Scenario analysisresults show that 1) in the case of no breakthroughtechnologies, it is difficult to achieve absolute emissionreductions; 2) technologies involved in optimizing energystructure and improving energy efficiency of basic servicesectors should be highly emphasized in local planning; 3)in comparison with technological upgrading, economicstructural adjustment could be a stronger contributor tomitigation, which is one of the main differences fromdeveloped countries. However, the key issue of economicrestructuring is to promote the growth of emerging low-carbon industries, which requires not only a strategicchoice of new industries but also an introduction ofadvanced low-carbon technologies.It is also found that establishing a local carbon emissions
accounting system is a prerequisite and the first priority forrealizing a low-carbon transition and government capacitybuildings should be strengthened accordingly.
Keywords low-carbon city, economic restructuring, tech-nology upgrading
1 Introduction
As nowadays the largest greenhouse gas emitter in theworld, climate change mitigation has posed significantchallenges for China. However, tackling climate change isnot only an environmental issue but also a developmentissue. Developing a low carbon economy has become amajor challenge for the world economy in the context ofaddressing climate change.Cities are regarded as the main sources of pollution.
Their energy consumption and CO2 emissions have beensignificantly increasing especially in developing countries,since rapidly expanding populations enjoy higher livingstandards and material affluence [1,2]. In China cities areresponsible for more than 60 percent of the national energyconsumption [3]. And this percentage keeps growing alongwith China’s high-speed urbanization [4]. Previousliterature has paid especially attention to China’s carbonemissions at the national level, while cities, which areimportant and basic units to perform national strategies,have usually been neglected [5]. In recent years, however,we see a different trend. Researchers and policy makers areplacing greater importance and emphasis on urban green-house gases (GHGs) [6,7]; similarly, developing long-termurban emission scenarios and identifying potential low-carbon pathways require more scientific and practicalinputs [8]. In this respect, previous studies and practices ofdeveloped countries provide referable experiences forChina.1) Previous studies on low-carbon citiesSocio-economic structure, energy structure and technol-
ogy are regarded as key elements in a city’s economic low-carbon transition. Some studies tested the roles of thesefactors and mainly developed cities were taken as researchobjectives. Among these, Shimada et al. [9] formulatedlong-term scenarios toward a local low-carbon economytaking Shiga prefecture in Japan as a case and proving the
Received June 3, 2010; accepted March 30, 2011
E-mail: [email protected]
Front. Environ. Sci. Eng. 2012, 6(3): 373–386DOI 10.1007/s11783-011-0338-y
essential roles of both economic structural changes andtechnological measures. Similarly, a low-carbon scenariocreation method for a local-scale economy and the idea ofback-casting were applied to Kyoto city by Gomi et al.[10,11]. With regard to the openness of the local-scaleeconomy, they emphasized the reduction potential ofenergy efficiency improvements. The Ministry of theEnvironment of Japan simulated a low-carbon societyscenario till 2050 by a back-casting approach. The resultsshowed that Japan has the technological potential to reduceits CO2 emissions by 70 percent below the 1990 level [12].Similar attention was paid to Bangkok [13], where anenergy alternative planning system (LEAP) model wasused to simulate a range of policy interventions for a low-carbon city. The same method was applied to Xiamen cityin China [14] as well. In Xiamen’s case, policy scenarioswere designed to evaluate the effectiveness of urbanenergy conservation and other mitigation measures.Besides scenario analysis, methods such as city systematicmodels [2], evaluation indicators and urban planning werealso developed for building a low-carbon city.2) Practical experiences from developed countriesThere have been many successful experiences with
respect to low-carbon city construction, as shown inTable 1. To summarize, most cities set up exact emissionreduction targets at first; second, mainly technologicalmeasurements were adopted so as to achieve the target,including techniques for deployment of renewable energyand to improve energy efficiency; third, they particularlyemphasized the role of lifestyle, for instance, to promoteenergy saving and build low carbon communities.However, it is common that the cities paid less attentionto economic structure, which can partly be explained by arelatively steady industrial structure in these cities,combined with sound market mechanisms with littlegovernmental interventions.
In conclusion, related studies either applied a back-casting approach, exploring effective countermeasuressurrounding a given target, or predicted potential emissionscenarios evaluating effectiveness of a range of bottom-uppolicy interventions. It is worth noting both the studies andthe city practices emphasized the particular importance oftechnology.Nevertheless, can experiences of developed countries be
copied to China? Comparatively speaking, Chinese lowcarbon city construction differs from that in developedcountries. On the one hand, in the process of industrializa-tion and urbanization, China needs to give certain priorityto development, and meanwhile perhaps faces somedifferent and difficult problems, for instance, to balancecarbon reduction of some important manufacturing sectorsand their contributions to economy. On the other hand, theimportance of technology is emphasized in previousstudies and by several local practices. The transfer of lowcarbon technologies to developing countries has often beendiscussed [15–17]. This issue is also an important topic ofdebate in international negotiations [18]. However, localgovernments in China are usually confronted with financiallimitations, e.g. the lack of budget for investment on lowcarbon technologies1). Therefore it is difficult to transittoward a low-carbon city entirely relying on technologicalbreakthrough. Hence, the specific focus in China regardingthe transition process will most likely have to be different,moving beyond technology. Different from post-industrialcountries, both upgrading industrial structure and improv-ing energy efficiency may be equally important compo-nents in low carbon urban development [19].In view of the above, Suzhou city is chosen as a case
study to identify strategic focal points in the transition to alow-carbon city in China. Suzhou is a typical manufactur-ing-oriented industrialized city, with some energy intensivesectors such as ferrous metals and textiles as leading
Table 1 Examples of low-carbon city practices in developed countries
cities target specific measures
London to reduce emissions by 60 percent in 2025 comparedto 1990 level
building green houses, focusing on commercial sector, energy efficiencyand transportation
Tokyo to reduce emissions by 25 percent in 2020 comparedto 2000 level
focusing on enterprise GHGs reduction, governmental and residentialenergy saving, reducing residential waste and transportation emissions
etc
New York to reduce emissions by 30 percent in 2030 comparedto 2005 level
increasing clean energy supply, improving building energy efficiency,emphasizing energy saving policies on government, commercial sector
and households, reducing transportation emissions
Copenhagen to reduce emissions by 20 percent in 2015 comparedto 2005 level; to come to zero emission in 2025
promoting wind and biomass power generation, implementing combinedheat and power production, promoting energy-efficient buildings,
developing urban green transportation, encouraging separate garbagecollection, developing new energy technologies, etc
Barcelona – increasing utilization of renewable energy (especially solar energy)
Malmo – building carbon neutral communities
1) Gotelind Alber. Local Authorities and Climate Protection. www.unfccc.int/files/meetings/workshops/other_meetings/.../vnd.../alber.pps
374 Front. Environ. Sci. Eng. 2012, 6(3): 373–386
industries [20]. In overall competitiveness it ranked eighthout of 200 cities in 2008 [21], but its economiccontribution was achieved at the price of huge energyconsumption; thus there is an urgency to transform towarda low-carbon city. In the past few years, Suzhou carried outenergy efficiency audits on energy intensive enterprises,which provided useful information for the judgment ontheir local technological level, combining existing statis-tical basis. These audits to a large extent facilitated thisresearch.This paper simulates short, medium and long-term
scenarios of a low-carbon city, aimed to identify essentialfactors within economic low-carbon transformation. In thisstudy, we didn’t perform a simulation with changes ofenergy structure, because for the Suzhou case the energyconsumption structure is highly dependent on city’sindustrial composition, given the scarcity of renewableenergy sources and a high reliance on imported energy(this will also be elaborated in section 3.1). Hence, wemainly examine the roles of economic restructuring and
technology upgrading. The reminder of this paper isorganized as follows: section 2 introduces methodologiesfor scenario setting and data sources; section 3 summarizescurrent energy and CO2 emissions in Suzhou as well asvarious policies; section 4 presents the scenario results.Finally, a conclusion and discussion is presented insection 5.
2 Methodology and data sources
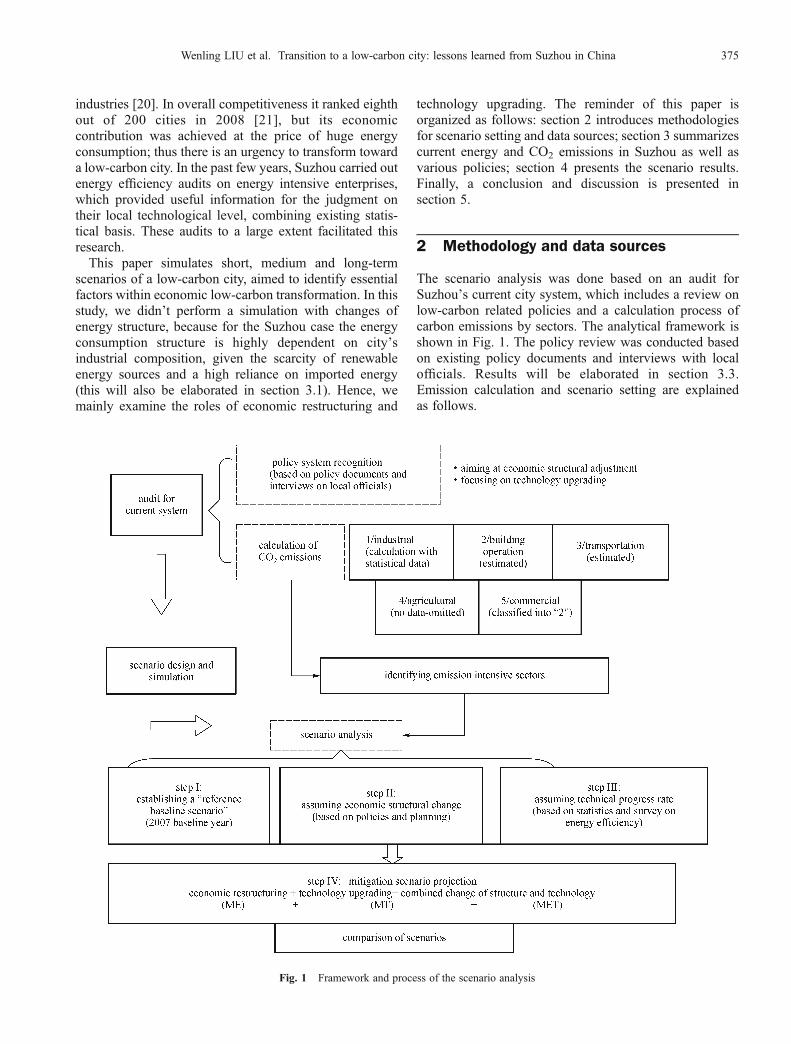
The scenario analysis was done based on an audit forSuzhou’s current city system, which includes a review onlow-carbon related policies and a calculation process ofcarbon emissions by sectors. The analytical framework isshown in Fig. 1. The policy review was conducted basedon existing policy documents and interviews with localofficials. Results will be elaborated in section 3.3.Emission calculation and scenario setting are explainedas follows.
Fig. 1 Framework and process of the scenario analysis
Wenling LIU et al. Transition to a low-carbon city: lessons learned from Suzhou in China 375
2.1 CO2 emission calculation for different sectors and datasources
The CO2 emissions of Suzhou city were calculated bysector, with only energy related carbon emissions takeninto account. According to the classification of sectors inthe statistical yearbook, different approaches were appliedto different sectors. Because there was no statistical data onagricultural energy consumption, and because this sectorformed only a tiny part in the gross economy of Suzhou(less than 2% contribution to Gross Domestic Product(GDP) in 2008), and its direct (end-use) energy consump-tion would thus only generate quite slight effects on city’scarbon emissions, the agricultural sector was not includedin this paper. Building operation and transportation areacknowledged dominant sources of carbon emissions;however, there was no statistical data on their direct energyconsumption, so estimation methods were used. Limitedby the methodology and data availability, especially for airand rail transportation, the attribution of their emissions isalways controversial, thus only the largest emitter in thetransportation sector [22]— road transportation—wasevaluated. As to the building operation sector, its energyconsumption is closely related to building types. Bothresidential and commercial buildings are considered in thisarticle, and hence it also covers energy consumption of thecommercial and services sector. As a result, emissionsources of Suzhou city include industrial sectors, roadtransportation and residential and commercial energyconsumption, which nearly covers all the main sourcesof energy related CO2 emissions. Different calculationmethods for each sector are illustrated as follows:1) Emissions from industrial sectorsBased on the end-use energy consumption of each
sector, CO2 emissions from 34 industrial sectors werecalculated. This was obtained by multiplying energyconsumption for each fuel type by its corresponding CO2
emission factor, and then aggregating emission by sourcefor each sector, as shown in Eq. (1).The main data source, Suzhou Statistical Yearbook
(2007–2009) [23], describes the energy consumption ofeach sector per annum, categorized into seven types ofprimary energy. The CO2 emission factor of each type ofprimary energy was obtained by multiplying the calorificvalue [24] by carbon content [25] with an assumption ofthe oxidation rate of 100 percent (as shown in Eq. (2)).
Eiο ¼X7
j¼1
EFj � Ciοj, (1)
EFj ¼ CEfj � NCVj � ORj � 44=12, (2)
where: Eio: CO2 emissions of sector i in baseline year 2007(t); EFj: CO2 emission factor for fuel j(t CO2 per fuel unit);Cioj: Consumption of fuel j by sector i in year 2007 (fuelunit); CEfj: Carbon content of the fuel j (t C$TJ–1); NCVj:Net calorific value of fuel j (TJ per fuel unit); ORj:Oxidation rate of fuel j (percent).The CO2 emission coefficients of seven types of primary
energy (raw coal, clean coal, coke, gasoline, diesel fuel,fuel oil, and LPG) were calculated according to theIntergovernmental Panel on Climate Change (IPCC)greenhouse gas emission guidelines [25].2) Emissions from building operations (including
residential and commercial buildings)Since there was no direct statistical data on building
operation energy consumption, estimation methods wereadopted. Considering that mainly electricity was consumedwithin building operations, first we calculated CO2
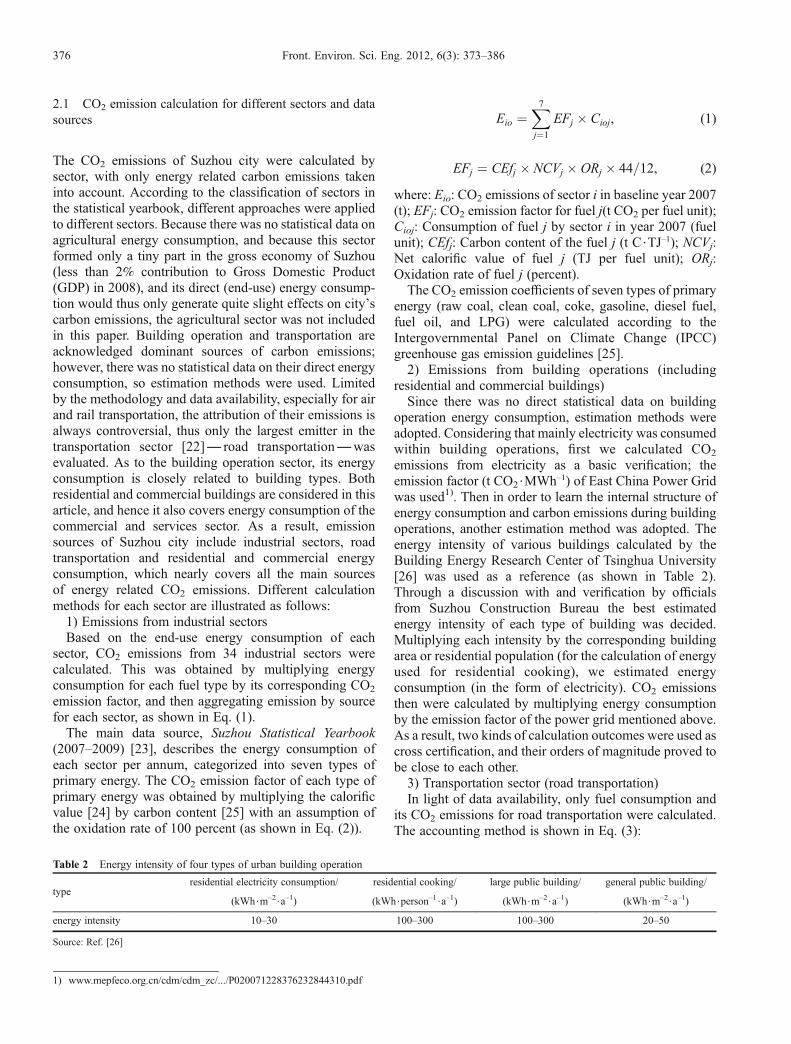
emissions from electricity as a basic verification; theemission factor (t CO2$MWh–1) of East China Power Gridwas used1). Then in order to learn the internal structure ofenergy consumption and carbon emissions during buildingoperations, another estimation method was adopted. Theenergy intensity of various buildings calculated by theBuilding Energy Research Center of Tsinghua University[26] was used as a reference (as shown in Table 2).Through a discussion with and verification by officialsfrom Suzhou Construction Bureau the best estimatedenergy intensity of each type of building was decided.Multiplying each intensity by the corresponding buildingarea or residential population (for the calculation of energyused for residential cooking), we estimated energyconsumption (in the form of electricity). CO2 emissionsthen were calculated by multiplying energy consumptionby the emission factor of the power grid mentioned above.As a result, two kinds of calculation outcomes were used ascross certification, and their orders of magnitude proved tobe close to each other.3) Transportation sector (road transportation)In light of data availability, only fuel consumption and
its CO2 emissions for road transportation were calculated.The accounting method is shown in Eq. (3):
1) www.mepfeco.org.cn/cdm/cdm_zc/.../P020071228376232844310.pdf
Table 2 Energy intensity of four types of urban building operation
typeresidential electricity consumption/ residential cooking/ large public building/ general public building/
(kWh$m–2$a–1) (kWh$person–1$a–1) (kWh$m–2$a–1) (kWh$m–2$a–1)
energy intensity 10–30 100–300 100–300 20–50
Source: Ref. [26]
376 Front. Environ. Sci. Eng. 2012, 6(3): 373–386
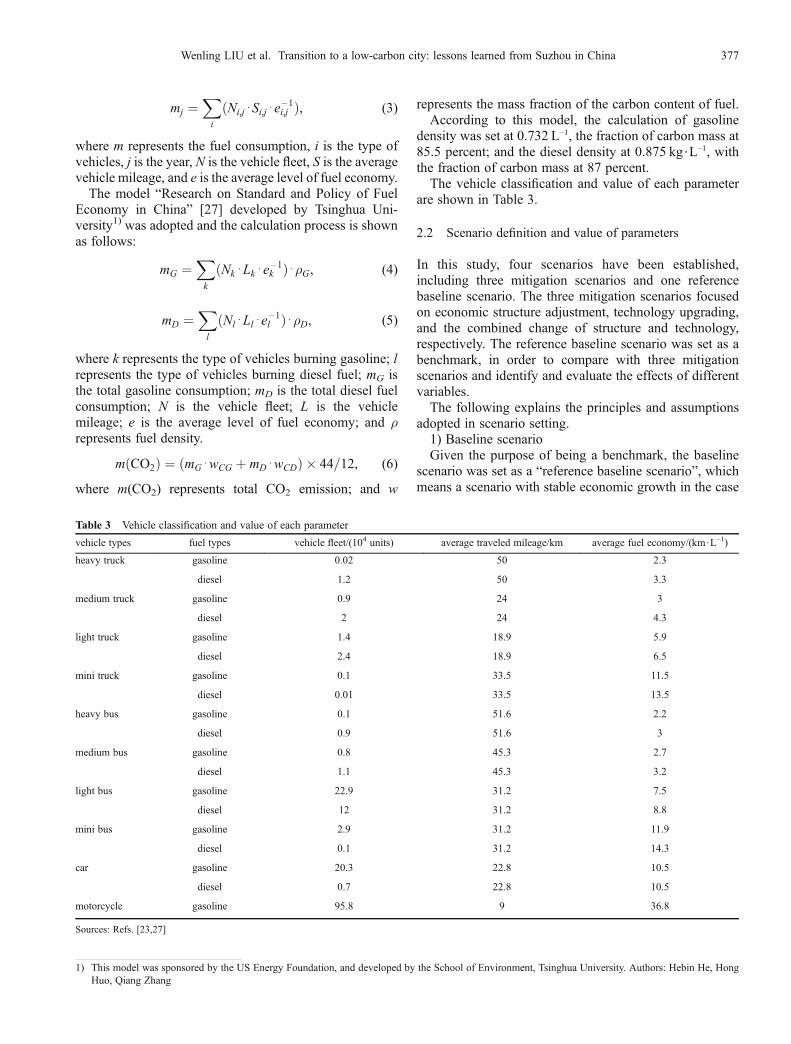
mj ¼X
i
ðNi,j⋅Si,j⋅e– 1i,j Þ, (3)
where m represents the fuel consumption, i is the type ofvehicles, j is the year, N is the vehicle fleet, S is the averagevehicle mileage, and e is the average level of fuel economy.The model “Research on Standard and Policy of Fuel
Economy in China” [27] developed by Tsinghua Uni-versity1) was adopted and the calculation process is shownas follows:
mG ¼X
k
ðNk⋅Lk⋅e– 1k Þ⋅�G, (4)
mD ¼X
l
ðNl⋅Ll⋅e– 1l Þ⋅�D, (5)
where k represents the type of vehicles burning gasoline; lrepresents the type of vehicles burning diesel fuel; mG isthe total gasoline consumption; mD is the total diesel fuelconsumption; N is the vehicle fleet; L is the vehiclemileage; e is the average level of fuel economy; and �represents fuel density.
mðCO2Þ ¼ ðmG⋅wCG þ mD⋅wCDÞ � 44=12, (6)
where m(CO2) represents total CO2 emission; and w
represents the mass fraction of the carbon content of fuel.According to this model, the calculation of gasoline
density was set at 0.732 L–1, the fraction of carbon mass at85.5 percent; and the diesel density at 0.875 kg$L–1, withthe fraction of carbon mass at 87 percent.The vehicle classification and value of each parameter
are shown in Table 3.
2.2 Scenario definition and value of parameters
In this study, four scenarios have been established,including three mitigation scenarios and one referencebaseline scenario. The three mitigation scenarios focusedon economic structure adjustment, technology upgrading,and the combined change of structure and technology,respectively. The reference baseline scenario was set as abenchmark, in order to compare with three mitigationscenarios and identify and evaluate the effects of differentvariables.The following explains the principles and assumptions
adopted in scenario setting.1) Baseline scenarioGiven the purpose of being a benchmark, the baseline
scenario was set as a “reference baseline scenario”, whichmeans a scenario with stable economic growth in the case
1) This model was sponsored by the US Energy Foundation, and developed by the School of Environment, Tsinghua University. Authors: Hebin He, HongHuo, Qiang Zhang
Table 3 Vehicle classification and value of each parameter
vehicle types fuel types vehicle fleet/(104 units) average traveled mileage/km average fuel economy/(km$L–1)
heavy truck gasoline 0.02 50 2.3
diesel 1.2 50 3.3
medium truck gasoline 0.9 24 3
diesel 2 24 4.3
light truck gasoline 1.4 18.9 5.9
diesel 2.4 18.9 6.5
mini truck gasoline 0.1 33.5 11.5
diesel 0.01 33.5 13.5
heavy bus gasoline 0.1 51.6 2.2
diesel 0.9 51.6 3
medium bus gasoline 0.8 45.3 2.7
diesel 1.1 45.3 3.2
light bus gasoline 22.9 31.2 7.5
diesel 12 31.2 8.8
mini bus gasoline 2.9 31.2 11.9
diesel 0.1 31.2 14.3
car gasoline 20.3 22.8 10.5
diesel 0.7 22.8 10.5
motorcycle gasoline 95.8 9 36.8
Sources: Refs. [23,27]
Wenling LIU et al. Transition to a low-carbon city: lessons learned from Suzhou in China 377
of maintaining existing status. Taking 2007 as the baselineyear, it was assumed that the urban economy would growat an annual growth rate of 12 percent between 2007 and2010, 10 percent between 2010 and 2015, and 8 percentbetween 2015 and 2020, but without any change ineconomic structure, energy structure or level of techno-logy. The zero-change assumption was adopted so that theimpacts of change in adjusted variables can be evaluated.A similar setting can also be found in other literature[28,29].As to the residential sector and road transportation, it is
hard to define their growth in economic terms; distinc-tively, we assumed the total emissions (or scale) of thesetwo sectors would grow at the same rate as the cityeconomy, and equally without any change of innerstructure and level of technology.2) Mitigation scenario through economic restructuring
— MEAssuming the total economy will keep growing as set in
the baseline scenario, in this scenario the economiccontribution of each sector is adjusted according to currentpolicies and planning. Generally, in principle high-technology sectors were assumed to develop further,while energy-intensive sectors or sectors that need toeliminate backward production techniques were controlledor reduced, and some basic industries stay a constantposition.It should be noted that, residential and road transporta-
tion sectors (of which the main function is to meet the basicservice demand) are supposed to show the same economicgrowth as described in the baseline scenario setting above,while they consolidate their position in the city economy.To observe the sensitivity of emissions on economicstructural change, both low and high scenarios weredesigned; they follow all the assumptions set above andonly differ in the changes of each sector’s economiccontribution. The rate of change in the high scenario wasslightly steeper than that in the low scenario. For detailsplease see Table 4.3) Mitigation scenario through improvements in tech-
nology — MTIn this scenario, it was assumed that nearly each sector
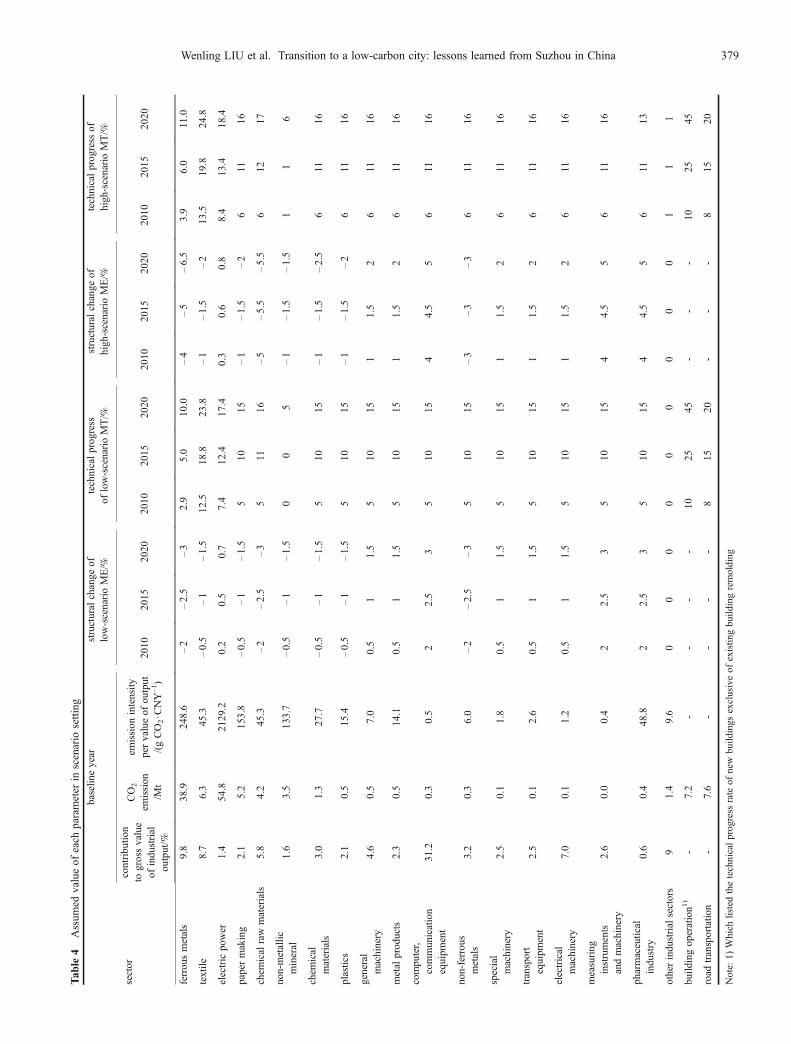
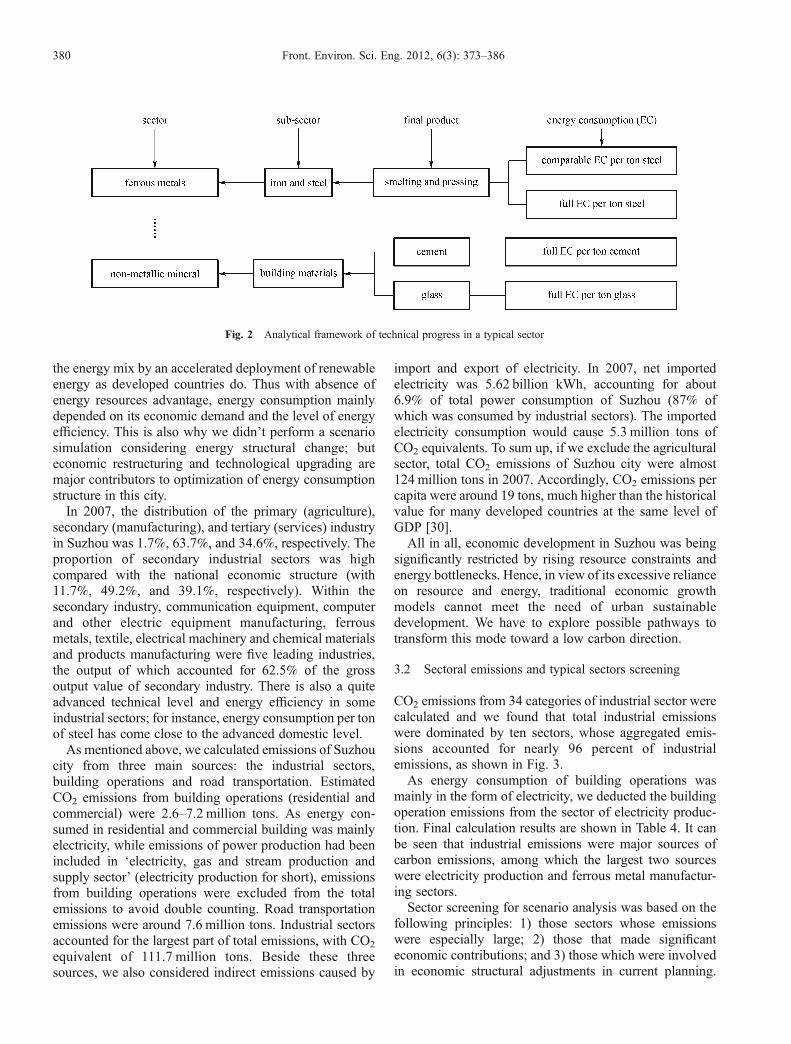
would make technical progress. Referring to technicalprogress rate, a bottom-up method was applied, withtechnical level of typical products in each sector (energyconsumption per unit) as a basic indicator. The specificanalytical framework is shown in Fig. 2.The assumption on the rate of technological progress
was based on the assessment of the technological level ofSuzhou and on one existing policy document – NationalMedium and Long-term Scientific and TechnologicalDevelopment Plan (2006–2020)1). In this document atarget was set that the indicator of energy consumption perunit of major industrial product would reach world
advanced level in 2020. According to our field surveyand statistical data, we found that current energy efficiencyof Suzhou was not low, especially in certain sectors such asferrous metals manufacturing where the technology was atan advanced level. Thus more ambitious assumptions weremade compared to the national target, which proposed thatit is possible for Suzhou to catch up with current nationaladvanced levels in 2010, and to reach world advancedlevel in 2015. Technologies in 2020 would be moreadvanced than this 2015 level.Similar to scenario ME, in order to observe the
sensitivity of emissions on technology upgrading, bothlow and high scenarios were designed. In the highscenario, the technical progress rate was slightly higherthan that in the low scenario, as shown in Table 4.4) Mitigation scenario through combined change of
structure and technology — METThis scenario was designed by combining different
economic restructuring and technical progress scenarios.As mentioned above, there were both high and lowscenarios in scenario ME and scenario MT, so we deducedfour scenarios via different ways of combination: a lowscenario, two medium scenarios and one high scenario.Table 4 lists selected sectors in the scenario analysis and
presents the value of each parameter, and of assumptionson changing rates of economic structure and technology.Since scenario MET was obtained by combining scenarioME and MT in four different ways, relative parameterswere not listed.
3 Current carbon emissions of Suzhou andrelative policies
3.1 Energy constraints and carbon emissions
As mentioned in the beginning, Suzhou ranked eighth inoverall competitiveness out of 200 cities in 2008, but itshuge economic contribution was based on massive energyconsumption. Its energy consumption per unit of GDP in2008 was 12.8 percent higher than the average level inJiangsu province. Along with its high-speed economicgrowth some contradictions and problems graduallyappeared: 1) industrialization and a heavy industry-oriented structure resulted in excessive dependence onenergy resources; 2) rapid growth of energy consumptionhas made resource constraints more and more striking.Suzhou was suffering from the scarcity of naturalresources; the supply of required raw coal, crude oil andother primary energy sources relied entirely on otherplaces, which led to an energy structure highly dependentupon electricity-based secondary energy consumption andproduction. In addition, renewable energy sources inSuzhou were quite limited; it proved not easy to optimize
1) http://www.gov.cn/jrzg/2006-02/09/content_183787.htm
378 Front. Environ. Sci. Eng. 2012, 6(3): 373–386
Tab
le4
Assum
edvalueof
each
parameter
inscenario
setting
sector
baselin
eyear
structural
change
oflow-scenarioME/%
technicalprog
ress
oflow-scenarioMT/%
structural
change
ofhigh
-scenarioME/%
technicalprogress
ofhigh-scenarioMT/%
contribu
tion
togrossvalue
ofindustrial
output/%
CO2
emission
/Mt
emission
intensity
pervalueof
output
/(gCO2$C
NY–1)
2010
2015
2020
2010
2015
2020
2010
2015
2020
2010
2015
2020
ferrousmetals
9.8
38.9
248.6
–2
–2.5
–3
2.9
5.0
10.0
–4
–5
–6.5
3.9
6.0
11.0
textile
8.7
6.3
45.3
–0.5
–1
–1.5
12.5
18.8
23.8
–1
–1.5
–2
13.5
19.8
24.8
electric
power
1.4
54.8
2129.2
0.2
0.5
0.7
7.4
12.4
17.4
0.3
0.6
0.8
8.4
13.4
18.4
papermaking
2.1
5.2
153.8
–0.5
–1
–1.5
510
15–1
–1.5
–2
611
16
chem
ical
raw
materials
5.8
4.2
45.3
–2
–2.5
–3
511
16–5
–5.5
–5.5
612
17
non-metallic
mineral
1.6
3.5
133.7
–0.5
–1
–1.5
00
5–1
–1.5
–1.5
11
6
chem
ical
materials
3.0
1.3
27.7
–0.5
–1
–1.5
510
15–1
–1.5
–2.5
611
16
plastics
2.1
0.5
15.4
–0.5
–1
–1.5
510
15–1
–1.5
–2
611
16
general
machinery
4.6
0.5
7.0
0.5
11.5
510
151
1.5
26
1116
metal
prod
ucts
2.3
0.5
14.1
0.5
11.5
510
151
1.5
26
1116
compu
ter,
communication
equipm
ent
31.2
0.3
0.5
22.5
35
1015
44.5
56
1116
non-ferrou
smetals
3.2
0.3
6.0
–2
–2.5
–3
510
15–3
–3
–3
611
16
special
machinery
2.5
0.1
1.8
0.5
11.5
510
151
1.5
26
1116
transport
equipm
ent
2.5
0.1
2.6
0.5
11.5
510
151
1.5
26
1116
electrical
machinery
7.0
0.1
1.2
0.5
11.5
510
151
1.5
26
1116
measuring
instruments
andmachinery
2.6
0.0
0.4
22.5
35
1015
44.5
56
1116
pharmaceutical
indu
stry
0.6
0.4
48.8
22.5
35
1015
44.5
56
1113
otherindu
strial
sectors
91.4
9.6
00
00
00
00
01
11
build
ingop
eration1
)-
7.2
--
--
1025
45-
--
1025
45
road
transportatio
n-
7.6
--
--
815
20-
--
815
20
Note:
1)Which
listedthetechnicalprogress
rate
ofnew
build
ings
exclusiveof
existin
gbuild
ingremolding
Wenling LIU et al. Transition to a low-carbon city: lessons learned from Suzhou in China 379
the energy mix by an accelerated deployment of renewableenergy as developed countries do. Thus with absence ofenergy resources advantage, energy consumption mainlydepended on its economic demand and the level of energyefficiency. This is also why we didn’t perform a scenariosimulation considering energy structural change; buteconomic restructuring and technological upgrading aremajor contributors to optimization of energy consumptionstructure in this city.In 2007, the distribution of the primary (agriculture),
secondary (manufacturing), and tertiary (services) industryin Suzhou was 1.7%, 63.7%, and 34.6%, respectively. Theproportion of secondary industrial sectors was highcompared with the national economic structure (with11.7%, 49.2%, and 39.1%, respectively). Within thesecondary industry, communication equipment, computerand other electric equipment manufacturing, ferrousmetals, textile, electrical machinery and chemical materialsand products manufacturing were five leading industries,the output of which accounted for 62.5% of the grossoutput value of secondary industry. There is also a quiteadvanced technical level and energy efficiency in someindustrial sectors; for instance, energy consumption per tonof steel has come close to the advanced domestic level.As mentioned above, we calculated emissions of Suzhou
city from three main sources: the industrial sectors,building operations and road transportation. EstimatedCO2 emissions from building operations (residential andcommercial) were 2.6–7.2 million tons. As energy con-sumed in residential and commercial building was mainlyelectricity, while emissions of power production had beenincluded in ‘electricity, gas and stream production andsupply sector’ (electricity production for short), emissionsfrom building operations were excluded from the totalemissions to avoid double counting. Road transportationemissions were around 7.6 million tons. Industrial sectorsaccounted for the largest part of total emissions, with CO2
equivalent of 111.7 million tons. Beside these threesources, we also considered indirect emissions caused by
import and export of electricity. In 2007, net importedelectricity was 5.62 billion kWh, accounting for about6.9% of total power consumption of Suzhou (87% ofwhich was consumed by industrial sectors). The importedelectricity consumption would cause 5.3 million tons ofCO2 equivalents. To sum up, if we exclude the agriculturalsector, total CO2 emissions of Suzhou city were almost124 million tons in 2007. Accordingly, CO2 emissions percapita were around 19 tons, much higher than the historicalvalue for many developed countries at the same level ofGDP [30].All in all, economic development in Suzhou was being
significantly restricted by rising resource constraints andenergy bottlenecks. Hence, in view of its excessive relianceon resource and energy, traditional economic growthmodels cannot meet the need of urban sustainabledevelopment. We have to explore possible pathways totransform this mode toward a low carbon direction.
3.2 Sectoral emissions and typical sectors screening
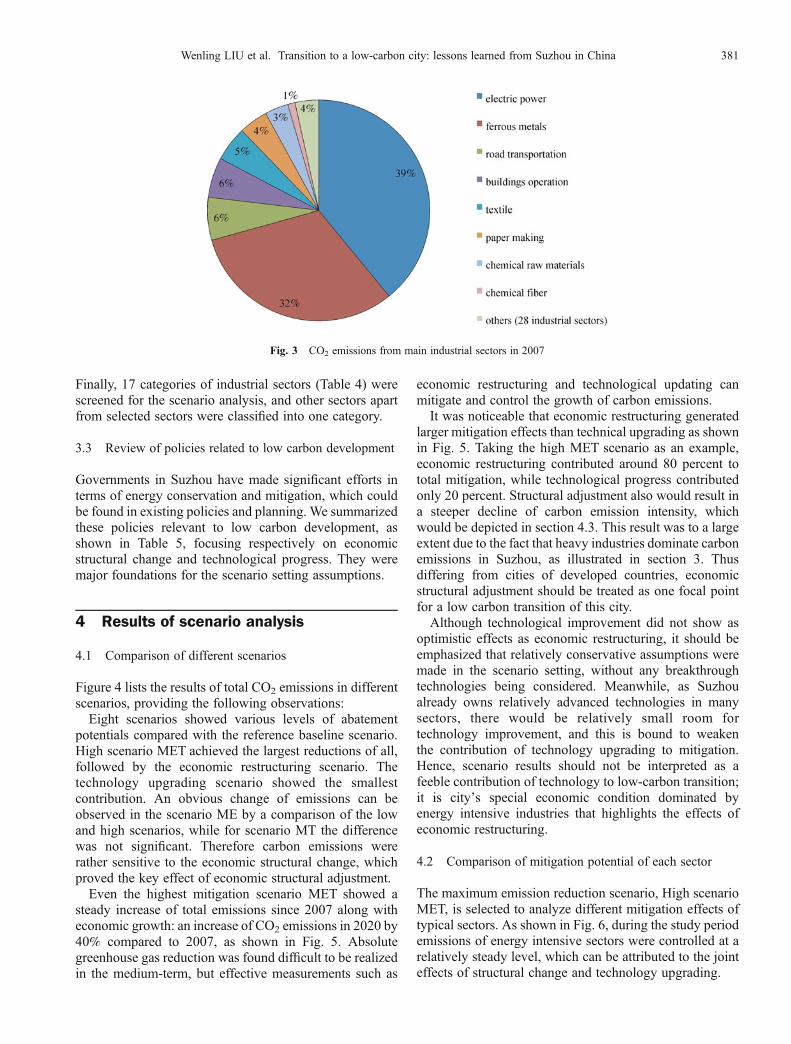
CO2 emissions from 34 categories of industrial sector werecalculated and we found that total industrial emissionswere dominated by ten sectors, whose aggregated emis-sions accounted for nearly 96 percent of industrialemissions, as shown in Fig. 3.As energy consumption of building operations was
mainly in the form of electricity, we deducted the buildingoperation emissions from the sector of electricity produc-tion. Final calculation results are shown in Table 4. It canbe seen that industrial emissions were major sources ofcarbon emissions, among which the largest two sourceswere electricity production and ferrous metal manufactur-ing sectors.Sector screening for scenario analysis was based on the
following principles: 1) those sectors whose emissionswere especially large; 2) those that made significanteconomic contributions; and 3) those which were involvedin economic structural adjustments in current planning.
Fig. 2 Analytical framework of technical progress in a typical sector
380 Front. Environ. Sci. Eng. 2012, 6(3): 373–386
Finally, 17 categories of industrial sectors (Table 4) werescreened for the scenario analysis, and other sectors apartfrom selected sectors were classified into one category.
3.3 Review of policies related to low carbon development
Governments in Suzhou have made significant efforts interms of energy conservation and mitigation, which couldbe found in existing policies and planning. We summarizedthese policies relevant to low carbon development, asshown in Table 5, focusing respectively on economicstructural change and technological progress. They weremajor foundations for the scenario setting assumptions.
4 Results of scenario analysis
4.1 Comparison of different scenarios
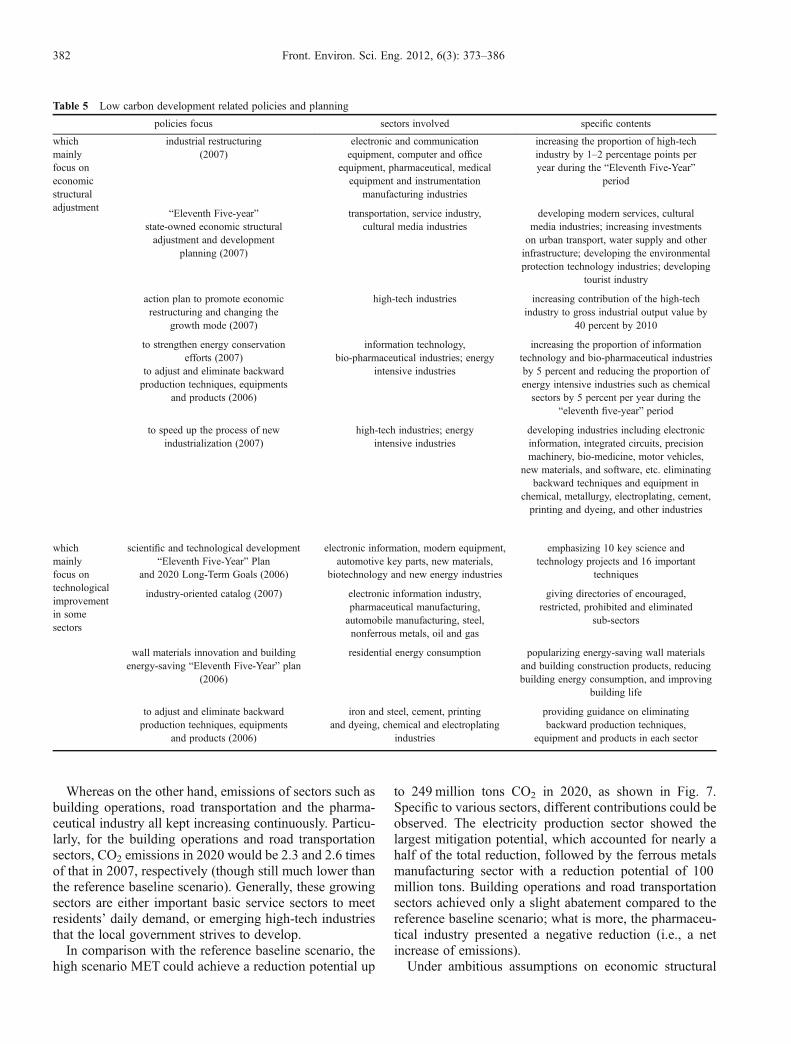
Figure 4 lists the results of total CO2 emissions in differentscenarios, providing the following observations:Eight scenarios showed various levels of abatement
potentials compared with the reference baseline scenario.High scenario MET achieved the largest reductions of all,followed by the economic restructuring scenario. Thetechnology upgrading scenario showed the smallestcontribution. An obvious change of emissions can beobserved in the scenario ME by a comparison of the lowand high scenarios, while for scenario MT the differencewas not significant. Therefore carbon emissions wererather sensitive to the economic structural change, whichproved the key effect of economic structural adjustment.Even the highest mitigation scenario MET showed a
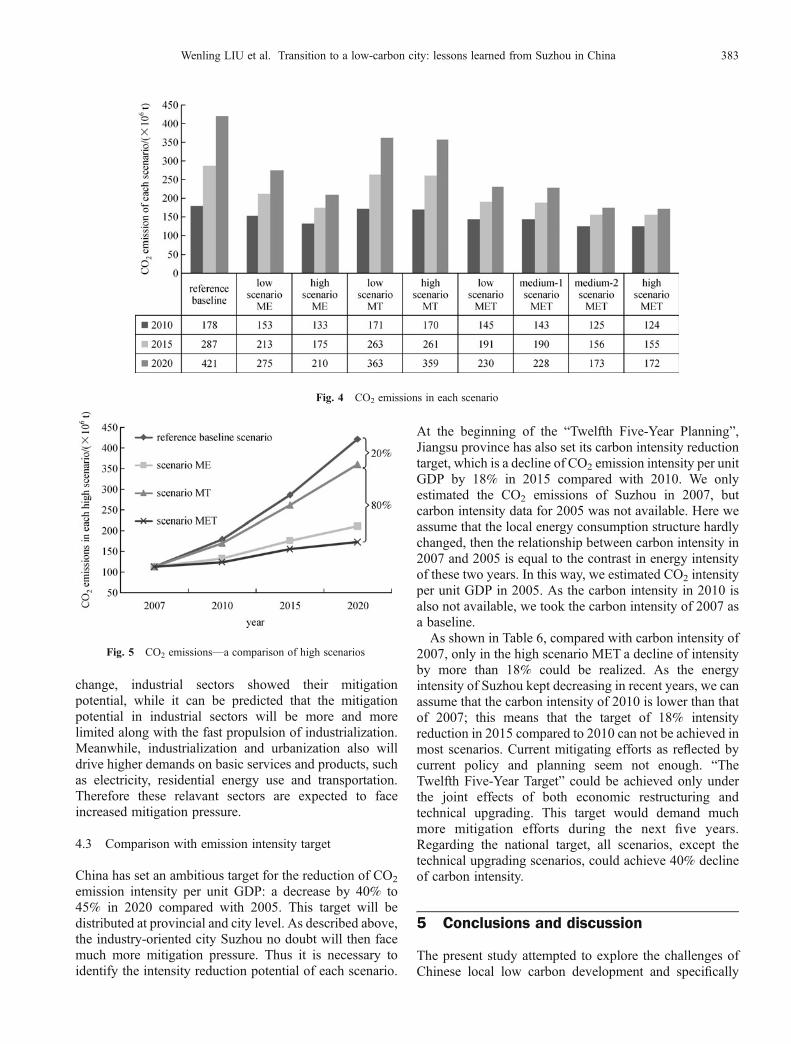
steady increase of total emissions since 2007 along witheconomic growth: an increase of CO2 emissions in 2020 by40% compared to 2007, as shown in Fig. 5. Absolutegreenhouse gas reduction was found difficult to be realizedin the medium-term, but effective measurements such as
economic restructuring and technological updating canmitigate and control the growth of carbon emissions.It was noticeable that economic restructuring generated
larger mitigation effects than technical upgrading as shownin Fig. 5. Taking the high MET scenario as an example,economic restructuring contributed around 80 percent tototal mitigation, while technological progress contributedonly 20 percent. Structural adjustment also would result ina steeper decline of carbon emission intensity, whichwould be depicted in section 4.3. This result was to a largeextent due to the fact that heavy industries dominate carbonemissions in Suzhou, as illustrated in section 3. Thusdiffering from cities of developed countries, economicstructural adjustment should be treated as one focal pointfor a low carbon transition of this city.Although technological improvement did not show as
optimistic effects as economic restructuring, it should beemphasized that relatively conservative assumptions weremade in the scenario setting, without any breakthroughtechnologies being considered. Meanwhile, as Suzhoualready owns relatively advanced technologies in manysectors, there would be relatively small room fortechnology improvement, and this is bound to weakenthe contribution of technology upgrading to mitigation.Hence, scenario results should not be interpreted as afeeble contribution of technology to low-carbon transition;it is city’s special economic condition dominated byenergy intensive industries that highlights the effects ofeconomic restructuring.
4.2 Comparison of mitigation potential of each sector
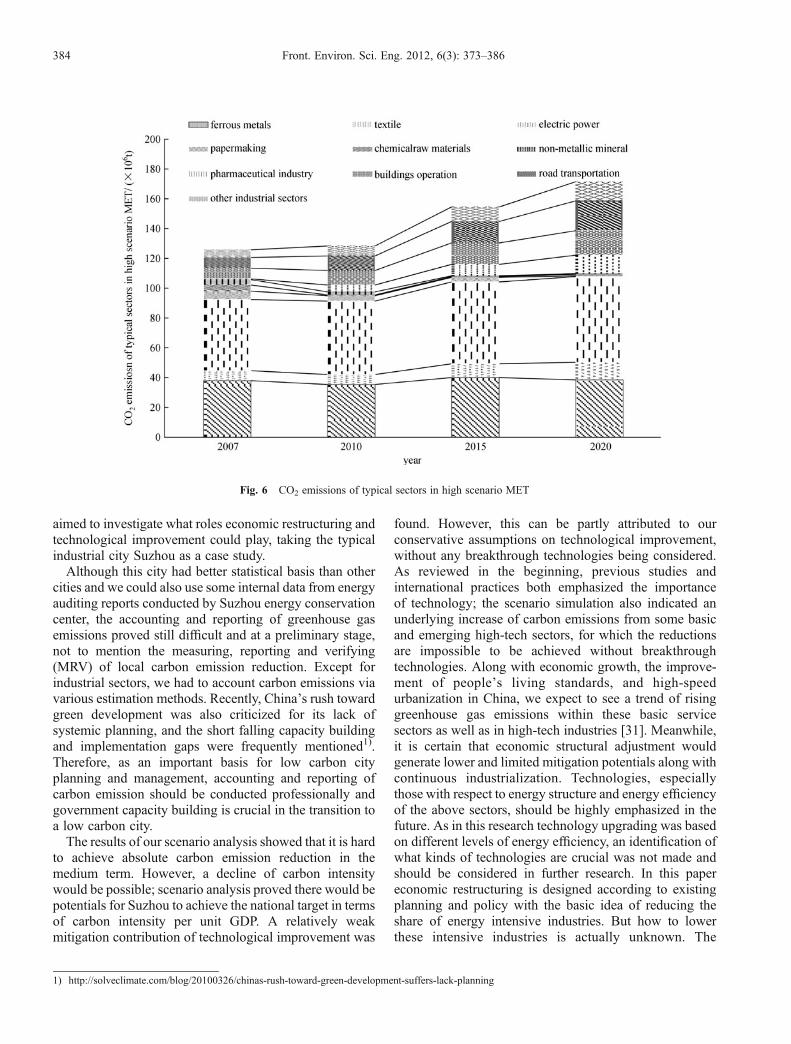
The maximum emission reduction scenario, High scenarioMET, is selected to analyze different mitigation effects oftypical sectors. As shown in Fig. 6, during the study periodemissions of energy intensive sectors were controlled at arelatively steady level, which can be attributed to the jointeffects of structural change and technology upgrading.
Fig. 3 CO2 emissions from main industrial sectors in 2007
Wenling LIU et al. Transition to a low-carbon city: lessons learned from Suzhou in China 381
Whereas on the other hand, emissions of sectors such asbuilding operations, road transportation and the pharma-ceutical industry all kept increasing continuously. Particu-larly, for the building operations and road transportationsectors, CO2 emissions in 2020 would be 2.3 and 2.6 timesof that in 2007, respectively (though still much lower thanthe reference baseline scenario). Generally, these growingsectors are either important basic service sectors to meetresidents’ daily demand, or emerging high-tech industriesthat the local government strives to develop.In comparison with the reference baseline scenario, the
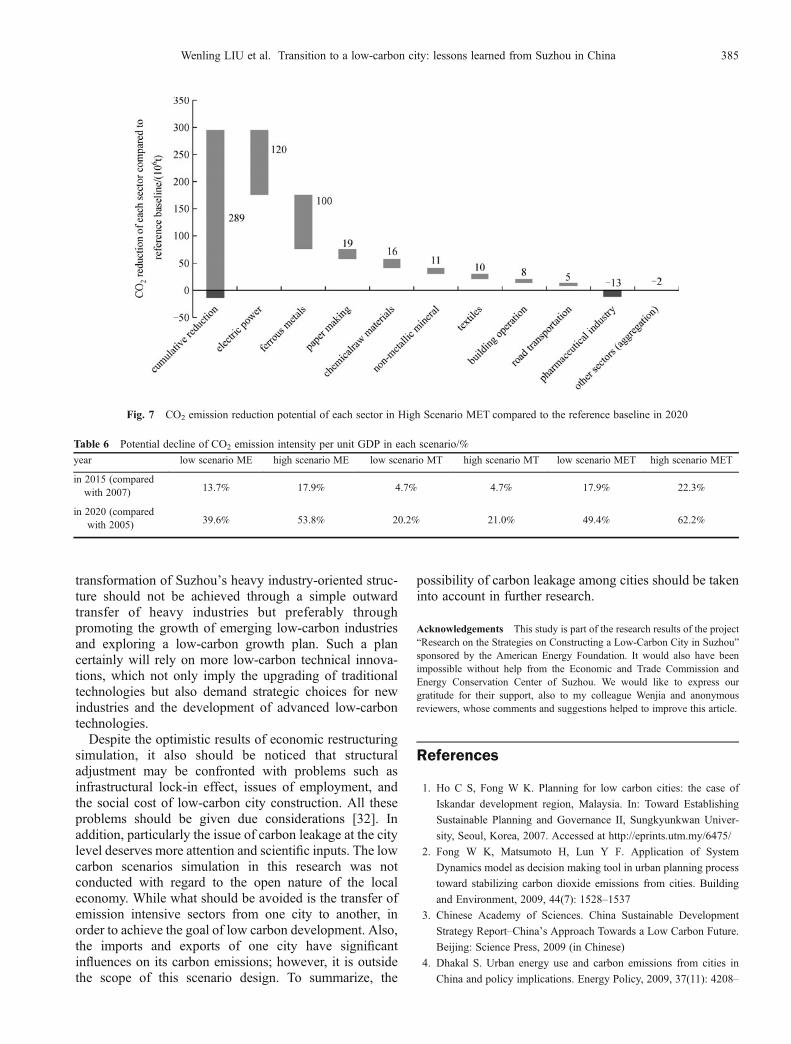
high scenario MET could achieve a reduction potential up
to 249 million tons CO2 in 2020, as shown in Fig. 7.Specific to various sectors, different contributions could beobserved. The electricity production sector showed thelargest mitigation potential, which accounted for nearly ahalf of the total reduction, followed by the ferrous metalsmanufacturing sector with a reduction potential of 100million tons. Building operations and road transportationsectors achieved only a slight abatement compared to thereference baseline scenario; what is more, the pharmaceu-tical industry presented a negative reduction (i.e., a netincrease of emissions).Under ambitious assumptions on economic structural
Table 5 Low carbon development related policies and planning
policies focus sectors involved specific contents
whichmainlyfocus oneconomicstructuraladjustment
industrial restructuring(2007)
electronic and communicationequipment, computer and office
equipment, pharmaceutical, medicalequipment and instrumentation
manufacturing industries
increasing the proportion of high-techindustry by 1–2 percentage points peryear during the “Eleventh Five-Year”
period
“Eleventh Five-year”state-owned economic structuraladjustment and development
planning (2007)
transportation, service industry,cultural media industries
developing modern services, culturalmedia industries; increasing investmentson urban transport, water supply and otherinfrastructure; developing the environmentalprotection technology industries; developing
tourist industry
action plan to promote economicrestructuring and changing the
growth mode (2007)
high-tech industries increasing contribution of the high-techindustry to gross industrial output value by
40 percent by 2010
to strengthen energy conservationefforts (2007)
to adjust and eliminate backwardproduction techniques, equipments
and products (2006)
information technology,bio-pharmaceutical industries; energy
intensive industries
increasing the proportion of informationtechnology and bio-pharmaceutical industriesby 5 percent and reducing the proportion ofenergy intensive industries such as chemicalsectors by 5 percent per year during the
“eleventh five-year” period
to speed up the process of newindustrialization (2007)
high-tech industries; energyintensive industries
developing industries including electronicinformation, integrated circuits, precisionmachinery, bio-medicine, motor vehicles,
new materials, and software, etc. eliminatingbackward techniques and equipment in
chemical, metallurgy, electroplating, cement,printing and dyeing, and other industries
whichmainlyfocus ontechnologicalimprovementin somesectors
scientific and technological development“Eleventh Five-Year” Plan
and 2020 Long-Term Goals (2006)
electronic information, modern equipment,automotive key parts, new materials,
biotechnology and new energy industries
emphasizing 10 key science andtechnology projects and 16 important
techniques
industry-oriented catalog (2007) electronic information industry,pharmaceutical manufacturing,automobile manufacturing, steel,nonferrous metals, oil and gas
giving directories of encouraged,restricted, prohibited and eliminated
sub-sectors
wall materials innovation and buildingenergy-saving “Eleventh Five-Year” plan
(2006)
residential energy consumption popularizing energy-saving wall materialsand building construction products, reducingbuilding energy consumption, and improving
building life
to adjust and eliminate backwardproduction techniques, equipments
and products (2006)
iron and steel, cement, printingand dyeing, chemical and electroplating
industries
providing guidance on eliminatingbackward production techniques,
equipment and products in each sector
382 Front. Environ. Sci. Eng. 2012, 6(3): 373–386
change, industrial sectors showed their mitigationpotential, while it can be predicted that the mitigationpotential in industrial sectors will be more and morelimited along with the fast propulsion of industrialization.Meanwhile, industrialization and urbanization also willdrive higher demands on basic services and products, suchas electricity, residential energy use and transportation.Therefore these relavant sectors are expected to faceincreased mitigation pressure.
4.3 Comparison with emission intensity target
China has set an ambitious target for the reduction of CO2
emission intensity per unit GDP: a decrease by 40% to45% in 2020 compared with 2005. This target will bedistributed at provincial and city level. As described above,the industry-oriented city Suzhou no doubt will then facemuch more mitigation pressure. Thus it is necessary toidentify the intensity reduction potential of each scenario.
At the beginning of the “Twelfth Five-Year Planning”,Jiangsu province has also set its carbon intensity reductiontarget, which is a decline of CO2 emission intensity per unitGDP by 18% in 2015 compared with 2010. We onlyestimated the CO2 emissions of Suzhou in 2007, butcarbon intensity data for 2005 was not available. Here weassume that the local energy consumption structure hardlychanged, then the relationship between carbon intensity in2007 and 2005 is equal to the contrast in energy intensityof these two years. In this way, we estimated CO2 intensityper unit GDP in 2005. As the carbon intensity in 2010 isalso not available, we took the carbon intensity of 2007 asa baseline.As shown in Table 6, compared with carbon intensity of
2007, only in the high scenario MET a decline of intensityby more than 18% could be realized. As the energyintensity of Suzhou kept decreasing in recent years, we canassume that the carbon intensity of 2010 is lower than thatof 2007; this means that the target of 18% intensityreduction in 2015 compared to 2010 can not be achieved inmost scenarios. Current mitigating efforts as reflected bycurrent policy and planning seem not enough. “TheTwelfth Five-Year Target” could be achieved only underthe joint effects of both economic restructuring andtechnical upgrading. This target would demand muchmore mitigation efforts during the next five years.Regarding the national target, all scenarios, except thetechnical upgrading scenarios, could achieve 40% declineof carbon intensity.
5 Conclusions and discussion
The present study attempted to explore the challenges ofChinese local low carbon development and specifically
Fig. 4 CO2 emissions in each scenario
Fig. 5 CO2 emissions—a comparison of high scenarios
Wenling LIU et al. Transition to a low-carbon city: lessons learned from Suzhou in China 383
aimed to investigate what roles economic restructuring andtechnological improvement could play, taking the typicalindustrial city Suzhou as a case study.Although this city had better statistical basis than other
cities and we could also use some internal data from energyauditing reports conducted by Suzhou energy conservationcenter, the accounting and reporting of greenhouse gasemissions proved still difficult and at a preliminary stage,not to mention the measuring, reporting and verifying(MRV) of local carbon emission reduction. Except forindustrial sectors, we had to account carbon emissions viavarious estimation methods. Recently, China’s rush towardgreen development was also criticized for its lack ofsystemic planning, and the short falling capacity buildingand implementation gaps were frequently mentioned1).Therefore, as an important basis for low carbon cityplanning and management, accounting and reporting ofcarbon emission should be conducted professionally andgovernment capacity building is crucial in the transition toa low carbon city.The results of our scenario analysis showed that it is hard
to achieve absolute carbon emission reduction in themedium term. However, a decline of carbon intensitywould be possible; scenario analysis proved there would bepotentials for Suzhou to achieve the national target in termsof carbon intensity per unit GDP. A relatively weakmitigation contribution of technological improvement was
found. However, this can be partly attributed to ourconservative assumptions on technological improvement,without any breakthrough technologies being considered.As reviewed in the beginning, previous studies andinternational practices both emphasized the importanceof technology; the scenario simulation also indicated anunderlying increase of carbon emissions from some basicand emerging high-tech sectors, for which the reductionsare impossible to be achieved without breakthroughtechnologies. Along with economic growth, the improve-ment of people’s living standards, and high-speedurbanization in China, we expect to see a trend of risinggreenhouse gas emissions within these basic servicesectors as well as in high-tech industries [31]. Meanwhile,it is certain that economic structural adjustment wouldgenerate lower and limited mitigation potentials along withcontinuous industrialization. Technologies, especiallythose with respect to energy structure and energy efficiencyof the above sectors, should be highly emphasized in thefuture. As in this research technology upgrading was basedon different levels of energy efficiency, an identification ofwhat kinds of technologies are crucial was not made andshould be considered in further research. In this papereconomic restructuring is designed according to existingplanning and policy with the basic idea of reducing theshare of energy intensive industries. But how to lowerthese intensive industries is actually unknown. The
1) http://solveclimate.com/blog/20100326/chinas-rush-toward-green-development-suffers-lack-planning
Fig. 6 CO2 emissions of typical sectors in high scenario MET
384 Front. Environ. Sci. Eng. 2012, 6(3): 373–386
transformation of Suzhou’s heavy industry-oriented struc-ture should not be achieved through a simple outwardtransfer of heavy industries but preferably throughpromoting the growth of emerging low-carbon industriesand exploring a low-carbon growth plan. Such a plancertainly will rely on more low-carbon technical innova-tions, which not only imply the upgrading of traditionaltechnologies but also demand strategic choices for newindustries and the development of advanced low-carbontechnologies.Despite the optimistic results of economic restructuring
simulation, it also should be noticed that structuraladjustment may be confronted with problems such asinfrastructural lock-in effect, issues of employment, andthe social cost of low-carbon city construction. All theseproblems should be given due considerations [32]. Inaddition, particularly the issue of carbon leakage at the citylevel deserves more attention and scientific inputs. The lowcarbon scenarios simulation in this research was notconducted with regard to the open nature of the localeconomy. While what should be avoided is the transfer ofemission intensive sectors from one city to another, inorder to achieve the goal of low carbon development. Also,the imports and exports of one city have significantinfluences on its carbon emissions; however, it is outsidethe scope of this scenario design. To summarize, the
possibility of carbon leakage among cities should be takeninto account in further research.
Acknowledgements This study is part of the research results of the project“Research on the Strategies on Constructing a Low-Carbon City in Suzhou”sponsored by the American Energy Foundation. It would also have beenimpossible without help from the Economic and Trade Commission andEnergy Conservation Center of Suzhou. We would like to express ourgratitude for their support, also to my colleague Wenjia and anonymousreviewers, whose comments and suggestions helped to improve this article.
References
1. Ho C S, Fong W K. Planning for low carbon cities: the case of
Iskandar development region, Malaysia. In: Toward Establishing
Sustainable Planning and Governance II, Sungkyunkwan Univer-
sity, Seoul, Korea, 2007. Accessed at http://eprints.utm.my/6475/
2. Fong W K, Matsumoto H, Lun Y F. Application of System
Dynamics model as decision making tool in urban planning process
toward stabilizing carbon dioxide emissions from cities. Building
and Environment, 2009, 44(7): 1528–1537
3. Chinese Academy of Sciences. China Sustainable Development
Strategy Report–China’s Approach Towards a Low Carbon Future.
Beijing: Science Press, 2009 (in Chinese)
4. Dhakal S. Urban energy use and carbon emissions from cities in
China and policy implications. Energy Policy, 2009, 37(11): 4208–
Fig. 7 CO2 emission reduction potential of each sector in High Scenario MET compared to the reference baseline in 2020
Table 6 Potential decline of CO2 emission intensity per unit GDP in each scenario/%
year low scenario ME high scenario ME low scenario MT high scenario MT low scenario MET high scenario MET
in 2015 (comparedwith 2007) 13.7% 17.9% 4.7% 4.7% 17.9% 22.3%
in 2020 (comparedwith 2005) 39.6% 53.8% 20.2% 21.0% 49.4% 62.2%
Wenling LIU et al. Transition to a low-carbon city: lessons learned from Suzhou in China 385
4219
5. Guo R, Cao X J, Yang X Y, Li Y K, Jiang D H, Li F T. The strategy
of energy-related carbon emission reduction in Shanghai. Energy
Policy, 2010, 38(1): 633–638
6. Glaeser E L, Kahn M E. The greenness of cities: carbon dioxide
emissions and urban development. Journal of Urban Economics,
2010, 67(3): 404–418
7. Liu J Y, Deng X Z. Impacts and mitigation of climate change on
Chinese cities. Current Opinion in Environmental Sustainability,
2011, 3(3): 188–192
8. Dhakal S. GHG emissions from urbanization and opportunities for
urban carbon mitigation. Current Opinion in Environmental
Sustainability, 2010, 2(4): 277–283
9. Shimada K, Tanaka Y, Gomi K, Matsuoka Y. Developing a long-
term local society design methodology towards a low-carbon
economy: an application to Shiga Prefecture in Japan. Energy
Policy, 2007, 35(9): 4688–4703
10. Gomi K, Shimada K, Matsuoka Y. A low-carbon scenario creation
method for a local-scale economy and its application in Kyoto.
Energy Policy, 2010, 38(9): 4783–4796
11. Gomi K, Ochi Y, Matsuoka Y. A systematic quantitative back-
casting on low-carbon society policy in case of Kyoto city.
Technological Forecasting and Social Change, 2011, 78(5): 852–
871
12. Ministry of the Environment, Government of Japan. Japan’s Low
Carbon Society Scenarios toward 2050. Accessed at http://2050.
nies.go.jp/, 2009
13. Phdungsilp A. Integrated energy and carbon modeling with a
decision support system: policy scenarios for low-carbon city
development in Bangkok. Energy Policy, 2010, 38(9): 4808–
4817
14. Lin J Y, Cao B, Cui S H, Wang W, Bai X M. Evaluating the
effectiveness of urban energy conservation and GHG mitigation
measures: the case of Xiamen city, China. Energy Policy, 2010, 38
(9): 5123–5132
15. Linares P, Pérez-Arriaga I. Promoting investment in low-carbon
energy technologies. European Review of Energy Markets, 2009, 3
(2): 1–23
16. Ockwell D G, Watson J, Mackerron G, Pal P, Yamin F. Key policy
considerations for facilitating low carbon technology transfer to
developing countries. Energy Policy, 2008, 36(11): 4104–4115
17. Gaast W V D, Begg K, Flamos A. Promoting sustainable energy
technology transfers to developing countries through the CDM.
Applied Energy, 2009, 86(2): 230–236
18. UNFCCC. Technology Transfer Clearing House. Accessed at http://
unfccc.int/ttclear/jsp/index.jsp, 2010.19. Liu Z L, Dai Y X, Dong C G, Qi Y. Low carbon city: concepts,
international practice and implications for China. Urban Studies,
2009, 16(6): 1–7 (in Chinese)20. Suzhou Statistics Bureau. Suzhou Economic and Social Develop-
ment Statistical Communique 2008. Accessed at http://www.sztjj.
gov.cn/, 2009 (in Chinese)21. Chinese Academy of Social Science. Annual Report on Urban
Competitiveness 2008. Beijing: Society Science Document Publish-
ing House, 2008 (in Chinese).
22. He K B, Huo H, Zhang Q, He D Q, An F, Wang M, Walsh M P. Oil
consumption and CO2 emissions in China’s road transport: current
status, future trends, and policy implications. Energy Policy, 2005,
33(12): 1499–1507
23. Suzhou Statistics Bureau. Suzhou Statistical Yearbook 2006–2008.
Beijing: China Statistics Press, 2007–2009 (in Chinese)
24. National Statistical Bureau. China Energy Statistical Yearbook
2008. Beijing: China Statistics Press, 2009 (in Chinese)
25. The Intergovernmental Panel on Climate Change (IPCC). 2006
IPCC Guidelines for National Greenhouse Gas Inventories.
Hayama: The Institute for Global Environmental Strategies
(IGES), on behalf of the IPCC, 2006
26. Yang X, Wei Q P, Jiang Y. Statistical methods of building energy
consumption. China Energy, 2006, 28(10): 12–16 (in Chinese)
27. Huo H. Study on China’s Energy Consumption of Road Transport,
and Technologies and Policies of Vehicular Fuel Economy.
Dissertation for the Master Degree. Beijing: Tsinghua University,
2002 (in Chinese).
28. Wang C, Cai W J, Lu X D, Chen J N. CO2 mitigation scenarios in
China’s road transport sector. Energy Conversion and Management,
2007, 48(7): 2110–2118
29. Hu X L, Jiang K J. Evaluation of technology and countermeasure for
greenhouse gas mitigation in China. Beijing: China Environmental
Science Press, 2001 (in Chinese)
30. Pan J H, Zheng Y. Responsibility and individual equity for carbon
emissions right. World Economy and Politics, 2009(10): 1–12 (in
Chinese)
31. Jung T Y, Rovere E L L, Gaj H, Shukla P R, Zhou D D. Structural
changes in developing countries and their implication for energy-
related CO2 emissions. Technological Forecasting and Social
Change, 2000, 63(2–3): 111–136
32. Ye Z D. The social cost of construction of low-carbon cities. Modern
Urban Research, 2010(8): 15–21 (in Chinese)
386 Front. Environ. Sci. Eng. 2012, 6(3): 373–386