Part One: IPOs – The backbone of SME eco-structure - Liquidnet
Upload
khangminh22Category
view
0download
0
Tendring District Council TENDRING INFRASTRUCTURE STUDY – PART ONE
Final Report
September 2009

P1931
ROGER TYM & PARTNERS Fairfax House
15 Fulwood Place
London
WC1V 6HU
t (020) 7831 2711
f (020) 7831 7653
w www.tymconsult.com
This document is formatted for double-sided printing.
CONTENTS
1 INTRODUCTION .......................................................................................................... 1
2 POLICY CONTEXT ...................................................................................................... 3 The evidence base that LDF Core Strategies need on infrastructure ............................. 3
3 OPTIONS FOR GROWTH ............................................................................................ 7
4 HEALTH ..................................................................................................................... 11
5 EMERGENCY SERVICES .......................................................................................... 23 Police ............................................................................................................................ 23 Fire Service .................................................................................................................. 25 Ambulance ................................................................................................................... 26
6 EDUCATION .............................................................................................................. 31
7 TRANSPORT ............................................................................................................. 41
8 UTILITIES ................................................................................................................... 59 Electricity ...................................................................................................................... 59 Gas ............................................................................................................................... 60 Telecommunications..................................................................................................... 62 Water – Potable Supply ................................................................................................. 64 Water – Wastewater ...................................................................................................... 65
9 WASTE ...................................................................................................................... 69
10 CEMETERIES ............................................................................................................ 73
11 DEVELOPER CONTRIBUTION FUNDING ................................................................. 75 Introduction ................................................................................................................... 75 Our remit ...................................................................................................................... 75 Background .................................................................................................................. 75 Past contribution levels ................................................................................................. 76 Factors affecting future contribution levels ................................................................... 76
12 SUMMARY OF KEY FINDINGS .................................................................................. 89
13 OPTIONS ................................................................................................................... 93 Harwich ........................................................................................................................ 93 Clacton-on-Sea/Walton-on-the-Naze ........................................................................... 95 Other Locations ............................................................................................................ 96
14 CONCLUSIONS ......................................................................................................... 99 Consideration of Part One outputs ............................................................................... 99 Mechanisms for delivery ............................................................................................. 101

APPENDICES
Appendix 1 – List of Consultees
Appendix 2 – Further education information (from ECC)
Appendix 3 – Transport modelling outputs
Appendix 4 – Funding for transport infrastructure schemes
Appendix 5 – Previous developer contribution levels
Appendix 6 – Developer contribution analysis assumptions

Tendring Infrastructure Study – Part One Final Report
Roger Tym & Partners with Peter Brett Associates September 2009 1
1 INTRODUCTION
1.1 This report is Part One of the Tendring Infrastructure Study. The report was written by
Roger Tym & Partners with specialist transport input from Peter Brett Associates.
1.2 The Consultants’ brief was to prepare an Infrastructure Delivery Plan which will ensure
that the delivery of any development required is not compromised by unrealistic
expectations about the availability of infrastructure. The study will directly inform the
Council and other service providers to identify and prioritise infrastructure provision as
part of an integrated approach to planning and infrastructure development.
1.3 Essentially, the study will underpin the spatial development strategy of the Core Strategy
in the face of testing. It seeks to show that the chosen development strategy is robust and
‘sound’ in planning terms.
1.4 Part One seeks to understand, in terms of infrastructure requirements, which of the
possible development options that are being considered through the emerging Core
Strategy have the greatest chance of being delivered. This considers existing
infrastructure surpluses or deficits and the potential to secure mainstream public funding
for particular types of development. This is coupled with an assessment of the issues
affecting potential developer contribution funding for infrastructure.
1.5 The study brief requires only the following infrastructure items to be considered:
Education – pre-school, primary and secondary
Further Education
Health
Transport
Emergency Services – police, fire, ambulance
Utilities – electricity, gas, telecommunications
Water – potable water and wastewater
Cemeteries
1.6 A list of the consultees in the Part One study is given in Appendix 1.
1.7 Part Two of the study will consider in more depth the infrastructure needs of the Core
Strategy Preferred Option.


Tendring Infrastructure Study – Part One Final Report
Roger Tym & Partners with Peter Brett Associates September 2009 3
2 POLICY CONTEXT
The evidence base that LDF Core Strategies need on infrastructure
2.1 There has been a growing recognition of the link between spatial plans and infrastructure
provision in achieving timely and sustainable delivery of spatial growth. This has taken on
a greater importance in recent years through planning documents.
Local government is required to play an infrastructure co-ordinating role
2.2 The Local Government White Paper on Strong and Prosperous Communities published in
October 2006 referred to local authorities playing a positive co-ordinating role in the
delivery of infrastructure to ensure that the right infrastructure is provided at the right time.
An increased emphasis on ‘place shaping’ was also made.
The Planning White Paper, CSR 07 and PPS12 emphasise the need for an infrastructure planning evidence base
2.3 The Planning White Paper 2007 states that ‘local authorities should demonstrate how and
when infrastructure that is required to facilitate development will be delivered’. This has
also been a major theme in the H M Treasury’s CSR07 Policy Review on Supporting
Housing Growth.
2.4 Planning Policy Statement 12 (PPS12) highlights the importance of ensuring that the core
strategy of Local Development Frameworks is supported by a robust evidence base on
infrastructure planning.1 PPS 12 states that:
“The core strategy should be supported by evidence of what physical and social infrastructure is needed to enable the amount of development proposed for the area, taking account of its type and distribution. This evidence should cover who will provide the infrastructure and when it will be provided. The core strategy should draw on and in parallel influence any strategies and investment plans of the local authority and other organisations.”
2.5 The document also notes that:
'Good infrastructure planning considers the infrastructure required to support development, costs, sources of funding, timescales for delivery and gaps in funding. This allows for the identified infrastructure to be prioritised in discussions with key local partners.'
2.6 It states what should be considered as part of the infrastructure evidence base and
emphasises the need for the alignment of investment plans of a range of key
infrastructure providers. In particularly, PPS12 states that the planning process
infrastructure evidence base should take account of:
The scale, type and distribution of development proposed for the area;
1 PPS12 June 2008, paragraphs 4.8 to 4.12

Tendring Infrastructure Study – Part One Final Report
Roger Tym & Partners with Peter Brett Associates September 2009 4
The physical, social and green infrastructure needed to enable the development
proposed;
The phasing of development;
The cost, sources of funding and gaps in funding (recognising that the budgeting
processes of different agencies could mean that less information may be available
when the core strategy is being prepared than would be ideal);
The uncertainty of investment plans and undue reliance on critical elements of
infrastructure whose funding is uncertain;
The prioritisation of infrastructure requirements in discussion with key partners;
The responsibility for the delivery of infrastructure.
2.7 Key infrastructure providers are to be encouraged to reflect the core strategy within their
own future planning documents and seek alignment between their infrastructure planning
and the planning process.
There is no detailed guidance on what an infrastructure planning evidence base should consist of
2.8 Unlike some areas of the core strategy where the evidence base requirement is
accompanied with a guidance manual on how to prepare the evidence (for instance in the
case of retail, strategic housing land availability and employment), there is no such
provision for undertaking the evidence base for infrastructure assessment.
2.9 Given the shortage of guidance, the key point to emphasise is that we are mindful of the
need to create a realistic infrastructure assessment that will aid spatial growth delivery.
But the content of the evidence base is not defined and is likely to vary depending on local
circumstances.
We are relying on our understanding of best practice in order to comply with inspectors’ likely requirements for an evidence base
2.10 Given this lack of guidance, we have relied more on our own work and expertise in this
field. This has been cited by the Planning Advisory Service as good practice2. We have
also reviewed Inspector’s Reports on core strategies to improve our understanding of the
expectation from Infrastructure Plans.
2.11 From our review work and experience, it appears that the key is to ensure that we capture
the infrastructure needed and identify the range of providers including the developers and
others who will be responsible for funding the infrastructure. Further:
The infrastructure assessment will be of no use if it is an unrealistic ‘wish list’ that has
no likelihood of getting delivered and will hinder the overall delivery of the planned
growth;
The infrastructure assessment is a way of ensuring that aspirational growth proposals
in spatial plans are clearly grounded in terms of the likelihood of their delivery through
a rigorous process that considers infrastructure ‘showstoppers’, funding, phasing, joint
2 Planning Advisory Service (2008) Local Development Framework seminars: Infrastructure planning and delivery – Participant’s resource book, Key references and links, p.74

Tendring Infrastructure Study – Part One Final Report
Roger Tym & Partners with Peter Brett Associates September 2009 5
collaboration and delivery mechanisms and builds these considerations into the core
strategy and monitoring framework;
At this stage in the development of the infrastructure assessment, where all the
detailed modelling and master planning is not yet available, it is important to note a
point by the Inspector in his response to the Joint North Northamptonshire Core
Strategy. The Inspector stated that ’I do not believe that for soundness, the specific solutions need to be identified in the Core Strategy, only that appropriate solutions
would need to be found.’;
The Inspector will want to see there is a realistic prospect of delivery and if gaps in
funding are identified then a mechanism should be in place to demonstrate how these
are to be addressed in the future; and
The need for infrastructure to support housing growth and the associated need for an
infrastructure delivery planning process has been highlighted in the Government’s
Housing Green Paper. We consider this as an essential element of Infrastructure
Planning and is considered later under the Delivery Process of the final report.

Tendring Infrastructure Study – Part One Final Report
Roger Tym & Partners with Peter Brett Associates September 2009 7
3 OPTIONS FOR GROWTH
3.1 The Tendring Core Strategy Issues and Options was published in March 2009. This
provided four possible spatial strategy options to inform consultation. These options are:
Option 1: Priority Areas for Regeneration. This option focuses new growth in jobs and
housing on Clacton and Harwich, both being Priority Areas for Regeneration in the
Haven Gateway.
Option 2: Incremental Growth. This option seeks to distribute growth between urban
settlements broadly on a pro-rata basis relative to the size of the existing built up area
and its population, recent development rates, the associated demand for new housing
and the identified need for affordable housing. As with Option 1, Clacton would be the
main focus for growth but there would be more scope for development in and around
other settlements, including some of the key rural villages where local needs justify.
Option 3: Economic Potential. This option involves distributing housing growth on a
pro-rata basis in line with the potential for job creation taking into account the
proposed port expansion at Bathside Bay, Harwich and the strength of Colchester as
an economic centre and a growth point in its own right. Harwich would see the biggest
amount of growth but there would also be major developments in Clacton and
eastward expansion of Colchester in the vicinity of the Crown Interchange where the
A120 meets the A12.
Option 4: Hybrid Approach. This option is a hybrid between options 2 and 3. It
distributes new housing growth on a pro-rata basis driven by the housing-led factors in
option 2 but includes an element of employment growth on the fringe of Colchester to
take advantage of its economic strength.
3.2 It would be reasonable to expect that one or a combination of these options will be taken
forward as the Preferred Option, but this will depend on the outcome of the consultation
process and emerging technical evidence, including the findings of this study.
3.3 This study was commenced through a workshop with the service providers. The purpose
of the workshop was to introduce service providers to the study and the new approaches
to understanding infrastructure needs. It also enabled service providers to identify
particular issues with their respective services.
3.4 In order to provide the most appropriate representation of these development options (or
any combination thereof), a broad mapping approach was adopted using the sites put
forward under the Call for Sites process. However, it is important to be clear that Part
One of this infrastructure study is not an assessment of individual sites. Rather, it is an
assessment of the theoretical levels of growth in broad locations across the district. It will
be the role of the Part Two study to understand the specific needs of the individual
development sites and therefore come to a view as to which are the best options in terms
of the ability to deliver development sites along with the necessary accompanying
infrastructure.
3.5 These maps were shared with service providers who then provided a broad response by
location in terms of:

Tendring Infrastructure Study – Part One Final Report
Roger Tym & Partners with Peter Brett Associates September 2009 8
Existing infrastructure surpluses or deficits;
Possible future issues for providing additional services; and
Mainstream funding that may be available to fund development.
3.6 An example of the type of map used is shown in Figure 3.1.

Tendring Infrastructure Study – Part One Final Report
Roger Tym & Partners with Peter Brett Associates September 2009 9
Figure 3.1 Possible development locations for testing


Tendring Infrastructure Study – Part One Final Report
Roger Tym & Partners with Peter Brett Associates September 2009 11
4 HEALTH
Introduction
4.1 Primary health care services in Tendring are delivered by the North East Essex Primary
Care Trust (NEEPCT). NEEPCT was set up in October 2006 through a merger of the
former Tendring and Colchester PCTs, as part of national plans to reconfigure primary
care trusts in England.
4.2 In total, there are 318,000 residents that have registered with commissioned GP
practices. This represents, in effect, the population served by the PCT. Although the
proportion of those aged 0-14 years is largely similar between the two PCTs, the
proportion of older people is markedly different between Colchester (14.5%) and Tendring
(26.2%). Colchester (3.8%) has a slightly more diverse ethnic population than Tendring
(1.3%). The PCT is also responsible for any itinerant or unregistered patients within its
geographical patch, but this is estimated as a relatively low number within North East
Essex.
Our remit
4.3 The following areas are outside our study.
Acute health care. We do not cover acute (generally hospital) care in this report. Our
reasoning here is that whilst PCTs operate as the purchasers and thus the funders of
hospital services, acute service providers are responsible for ensuring the provision of
the infrastructure required to deliver their contracted activity and therefore have
funding which adjusts for capitation .
Pharmacies and Optometrists. PCTs do not financially support the initial provision or
ongoing costs of pharmaceutical and optometric premises. This is a private sector
function. However, the PCT does have a role in advising on the optimal location of
pharmacy and optometric services to ensure access and patient choice is determined
by the national regulations. Applications for the location of pharmacies are managed
on a case by case basis, in line with national regulations.
Dental Premises. PCTs issue a contract to dentists but there are no ongoing capital or
revenue issues. Dentists are contracted to provide an agreed level of units of dental
activity. For this they receive an income. All running costs are charged against this
income.
Infrastructure needs
4.4 Our assessment needs to try to separate out a number of complex and overlapping
issues. The provision of premises is broadly determined by:
Changes in demand – population changes and growth, and expanded patient choice
and public expectations;
Changes in services – new models of care, and new clinical pathways. There is
currently a strong focus from the Government to improve the quality of GPs surgeries.
(For example, the provision of GPs surgeries from converted private housing stock is
no longer seen as adequate); and
Statutory requirements – including the DDA, and Health and Safety.

Tendring Infrastructure Study – Part One Final Report
Roger Tym & Partners with Peter Brett Associates September 2009 12
4.5 Clearly all of these dimensions are important, but it is changes in demand, specifically
regarding population, which fundamentally concerns this report. In particular, it is
important to clearly distinguish between the current reconfiguration of health service
delivery (in larger, more fit-for-purpose health centres) and the expansion in demand
which results from new housing development.
4.6 However, it is the case that the health services can use all of the above drivers to help
them reconfigure the way that services are delivered in order to respond to changing
population sizes, distributions and profiles.
4.7 For example, the PCTs’ mainstream funding has been recently used to improve the
quality of GP surgeries (converted houses being used as surgeries are no longer seen as
adequate), and this process of modernisation that would occur anyway can be intelligently
applied to the changing circumstances of growth. Examples of good practice include the
use by both PCTs of the Department of Health’s Equitable Access Programme, used to
provide money for new facilities. Importantly, future growth requirements over a five year
period were reviewed before spending decisions were made.
Primary health needs are driven by population, not housing growth
4.8 PCTs undertake detailed demographic work, and make planning assumptions about a
growing population. A rough rule of thumb used by PCTs across the country is that there
should be 1 GP for every 2,000 people.
4.9 However, it is the case that some GPs’ lists serve significantly more people than the
rough average of 2,000 while some serve significantly fewer. In practice, there is a good
degree of flexibility in list lengths and no longer, as might be imagined, any statutory
maximum list size. Practices are contracted to provide a range of primary care services
to a registered population and increasingly this means engaging a much richer skill mix of
appropriately trained staff (such as nurse practitioners or health advisory staff) than in
previous years. It is therefore often difficult to identify a “slice” of new provision
specifically targeted at new growth.
The provision of new surgeries
4.10 The size of an average GP’s list means that, even if existing GPs were working at the
maximum sustainable rate, 2,000 new people (or approximately 800 new homes based on
a household size of 2.5 people) would be needed before a new GP practice would
become sustainable. As a result, there is very often no requirement to provide a new GP
surgery for each new development. However, PCTs need to ensure there is sufficient
capacity for patients to register with a local GP, with a degree of choice where possible.
Where there is a small growth in population this may mean extending an existing practice
rather than creation of a new practice and/or building a new practice premise.

Tendring Infrastructure Study – Part One Final Report
Roger Tym & Partners with Peter Brett Associates September 2009 13
4.11 The solution sometimes proposed, that of opening branch surgeries to treat a smaller,
more local population, is not always optimal. Branch surgeries often find it difficult to offer
the wide range of services demanded due to their size although this may be feasible
where premises or facilities can be shared with other agencies, such as local authorities
and social care providers.
4.12 Conversely:
Larger surgeries can be more economically efficient, with shared ancillary and support
facilities;
Larger surgeries often offer wider range of co-located primary services, therefore
providing a wider choice and better access for patients – the national drivers for
change are to provide a wider range of services in a primary care setting;and
Surgeries with a number of GPs are often able to provide additional capacity and can
(at times) absorb some new housing growth. This can be a combination of physical
extension of premises, or more intensive use of existing premises.
4.13 As GP practices accept patients from within an agreed practice boundary, the location of
the proposed developments will impact on some practices more than others, particularly
in more rural areas where the increased demand may fall on only one or two practices.
4.14 NEEPCT suggests a Health Impact Assessment (HIA) should be required for
developments of more than 50 dwellings.
There is a need to make best use of existing capacity
4.15 Overall, though, PCTs believe that there is a need to make use of existing capacity in
order to use resources efficiently.
4.16 NEEPCT’s Estates Strategy 2008-2011 is an implementation strategy, setting out ways to
identify and close gaps in the infrastructure which may affect the capacity and/or
capability of the organisation to deliver the objectives set out in the Five Year Strategic
Plan.
4.17 The Estates Strategy contains a Capital Plan, which outlines designated capital expenses
for the financial years 2008/2009 to 2013/2014. For this period, the plan contains mainly
maintenance activities and works on existing buildings. It also contains the Strategic
Service Development Plan 2007/2008. This is a plan setting out the improvements to the
primary and community health and social care infrastructure for North East Essex.
4.18 A summary of existing capacity is set out in Table 4.1 below.
Capital needs resulting from new growth in Tendring
4.19 The RSS target of 8,500 dwellings would equate to approximately 21,250 new people
(based on a household size of 2.5 people3), and therefore approximately 12 new GPs
would be required in Tendring to 2021. The configuration of this new provision will
3 From ONS mid-year population projections

Tendring Infrastructure Study – Part One Final Report
Roger Tym & Partners with Peter Brett Associates September 2009 14
depend upon a number of factors which will be specific to each growth area, some of
which are set out below:
Location and capacity of existing practices – whether there is capacity for them to
absorb some/all of the growth;
Distance to services for patients – whether the geographic locations of existing
practices are suitable for the new patients;
Workforce availability – recruitment and retention of GPs and supporting staff can
fluctuate;
Relationship to wider strategies and the movement of services, from acute to
community settings for example; and
Cost, including the viability of establishing a small practice and the balance of funding
other priorities at the time of the decision.
4.20 In broad terms, commissioning new practices below around 5,000 patients is unlikely to
be financially viable and the quantum of growth for a new facility would need to exceed
this in order to justify the required infrastructure investment. NEEPCT has a preference
for absorbing growth below this level into existing primary care practices where possible.
4.21 This may mean that the existing premises are no longer viable and a new facility will need
to be considered for the expanding practices. This will have to be judged practice by
practice as capacity needs to be assessed at this individual level.
Current Strategy
4.22 NEEPCT is currently developing its spatial planning for extending or developing new
primary care facilities. At present this is carried out by a combination of direct
commissioning (e.g. through LIFT which is discussed in paragraph 4.29 below) and
applications from GPs.
4.23 NEEPCT has carried out a number of reports, assessments and strategy documents
which are summarised below. However, it does not currently have a detailed 5-year
financial plan, or a longer term assessment of the implications of growth in Tendring.
This is being constructed, alongside revised service delivery strategies, in line with the
East of England Strategic Health Authority World Class Commissioning (WCC)
developments.
Making Healthy Choices – Vision and 5-year Health Strategy 2008-2013 – North East Essex NHS
4.24 The North East Essex NHS’s vision and 5-year health strategy document (2008-13),
entitled Making Healthy Choices, was published in May 2008. It contains nine
commitments for the development of healthcare services. Commitment 6 relates to
improving premises and making them suitable for modern healthcare. The document
explains that a survey of all 44 DP practices and the PCT’s premises has been
undertaken, to inform the PCT’s estates strategy. This document will be superseded by
the new 5 year strategy which the PCT is required to produce as part of the WCC
development but many aspects will remain the same.

Tendring Infrastructure Study – Part One Final Report
Roger Tym & Partners with Peter Brett Associates September 2009 15
4.25 Making Healthy Choices states that the estates strategy will be shaping priorities for the
improvement of healthcare premises which are sub-standard, inadequate in size, or
where local needs can be met in better ways. Making Healthy Choices then states that
consultation with GPs and other healthcare professionals was under way at the time of
the publication of the document. This consultation was particularly concerned with
improving premises in the following locations:
Frinton Road Medical Centre, Holland-on-Sea;
Epping Close Surgery, Great Clacton;
North Road, Great Clacton;
Parsons Heath, Colchester4;
Wivenhoe; and
West Mersea.
4.26 The document states that the Estates Strategy will provide an investment plan to maintain
existing premises and prioritise premises developments for funding decisions. It also states that the design brief for these premises is being developed. It states that the PCT is
also investigating areas where there are insufficient primary care premises, and that the
next tranche of development priorities for future investment will be considered.
Annual Public Health Report and Needs Assessment - North Essex PCT (March 2008)
4.27 NEEPCT’s Annual Public Health Report and Needs Assessment for North Essex contains
an annual assessment of the local health-related needs. The latest available assessment
from March 2008 explains that a number of organisations work in a partnership to set new
targets for improving the health and well-being of the community, as well as health and
social care services. These organisations include The Strategic Health Authority for the
East of England, Essex County Council, and local Councils.
4.28 The document describes a number of health and lifestyle trends in the region, but does
not currently identify specific requirements.
Commissioners' Investment and Asset Management Strategy (CIAMS)
4.29 Arguably the most relevant strategy document to this study is the Commissioners'
Investment and Asset Management Strategy (CIAMS). The CIAMS is a Department of
Health requirement for PCTs to be completed by April 2010. It involves a stock take of
existing premises and then overlaying this information with current need and service
delivery.
4.30 The CIAMS is intended to be future looking to ensure that service reconfiguration and
population needs drive the evidence base for estates rationalisation and configuration for
the future.
4.31 We understand NEEPCT hope to complete the first part of the CIAMS, the estates audit,
by October 2009.
4 We understand Parsons Heath is no longer proceeding and as a result of a public consultation Epping Close will remain autonomous and has been removed from the LIFT programme

Tendring Infrastructure Study – Part One Final Report
Roger Tym & Partners with Peter Brett Associates September 2009 16
Colchester and Tendring LIFT
4.32 The Local Improvement Finance Trust (LIFT) company for Tendring and Colchester is
called Realise Health Ltd. It builds, maintains, operates and owns primary care buildings.
The company is 60% privately owned, with 20% owned by Community Health
Partnerships Ltd (a private company formed by Government to deliver LIFT) and 20%
owned by NEEPCT. The partnership spans 25 years to enable long term benefits to be
gained from the partnership arrangement, both in terms of the transfer of skills and
knowledge, and maintenance of the premises. The Colchester & Tendring 25 year
NEEPCT LIFT agreement began in 2004.
4.33 The LIFT Strategic Service Development Plan 2008/09 – 2013/14 sets out proposed
projects, which are identified below. The first LIFT project was Fryatt Hospital & Mayflower
medical centre in Harwich. The second completed LIFT project was Colchester PCC
completed in 2006.
Colchester Primary Care Centre
4.34 The most recent development by Realise Health Ltd is the new North Colchester Primary
Healthcare Centre on Turner Road in Colchester, which is due to open on 1st June 2009
and can accommodate up to 6,000 patients. This follows the Darzi report which outlined
reforms to improve patients' access to GPs through the creation of 150 extra health
centres in easily-accessible places across the country, open seven days a week from 8am
to 8pm.
Other LIFT developments
4.35 There are currently plans for the following LIFT developments in Tendring:
North Road, Gt Clacton; and
Frinton Road, Holland-on-Sea (currently in negotiation with the Council to purchase
the site in Brighton Road)
4.36 The following LIFT developments in the Colchester catchment may also affect Tendring:
West Mersea (negotiations underway for purchase of land); and
Wivenhoe (negotiations underway for purchase of land)
GP led expansions & relocations
4.37 There are a number of other non-LIFT, GP led potential expansions and relocations in
Tendring. The capital or lease costs of these are still borne by the PCT however, and
proposals must meet the overarching strategic objectives of the PCT.
The largest, in Frinton, near Walton-on-the-Naze, is a proposal for a 8,500 patient health
centre which was recently subject to public consultation; funding for the scheme will be
subject to assessment by the PCT in the summer of 2009. Other applications in Tendring
have been made, but are currently confidential.
Capacity of existing infrastructure
4.38 Based on discussions with NEEPCT, we have summarised the current capacity of the key
areas of Tendring below. It should be noted this is only an approximate “snapshot” in time

Tendring Infrastructure Study – Part One Final Report
Roger Tym & Partners with Peter Brett Associates September 2009 17
and will need to be reviewed on a regular basis. It is also prior to more detailed capacity
consideration which we understand NEEPCT will be carrying out for Part 2 of the study
and will be subject to the findings of NEEPCT’s Commissioners' Investment and Asset
Management Strategy (CIAMS), which will assess current capacity and is due to be
completed next year (see 4.29 above).
Table 4.1 Summary of primary health care capacity in Tendring
Area Capacity Comments
Clacton Reasonable Current capacity is reasonable, but plans
need to be reviewed in light of potential
housing and population growth.
Consequently, this capacity may be
insufficient to accommodate growth.
Harwich Reasonable Primary care centre in Harwich hospital.
Capacity for some growth may be absorbed
into existing primary care practices, but
further provision may be required if
subsequent growth exceeds estimated
population growth.
Walton-on-the-
Naze
Limited Existing capacity is very limited, but new
capacity is subject to approval of the funding
for a new premise at Frinton (see above).
Other options would be developed and
explored with the practice should the
scheme not proceed.
Manningtree Limited Current capacity is limited. Potential
extension of existing practice under
consideration; options would need to be
developed/explored with the practice if the
application for the extension is not
successful
Brightlingsea At capacity Existing modern facility, but no additional
capacity available to accommodate growth
Source: RTP & NEEPCT
Funding
Some mainstream capital funding is available
4.39 Funding for health services is provided to PCTs on a capitation basis, i.e. an amount per
patient. The Trusts are expected to manage their requirements within this. They have a

Tendring Infrastructure Study – Part One Final Report
Roger Tym & Partners with Peter Brett Associates September 2009 18
degree of flexibility in this respect including use of their own capital, realisation of surplus
assets and through various flavours of the PFI.
4.40 The DoH states that part of the Comprehensive Spending Review settlement was a
capital funding increase of 10 per cent in 2008/09, which will support continued growth in
capital investment programmes. Nationally in 2008/09, £400 million is being made
available to fund PCT local capital schemes, with an additional £250 million to fund
national initiatives, such as the community hospitals programme.5 However, there are
expected to be significant constraints on public service funding after 2011 as the country
deals with the ongoing impact of the global recession. This is now being considered
urgently by all public sector bodies, including the NHS, in terms of how it will impact on
current and future investments.
4.41 As explained in paragraph 4.32, there is also a LIFT company in place in Tendring and
Colchester, which can provide capital for some new projects. However, whilst the LIFT
scheme can secure capital funding through the private sector to develop new premises,
the cost of these is borne by the NHS through annual lease payments and hence the
consequences of this revenue must be taken into account as PCTs judge investment
proposals.
4.42 There has always been significant private sector involvement in the creation and capital
funding of new health centres which are then leased to GP practices, with the rent met
from the PCT’s revenue funding within the PCTs budgetary restraints (e.g. development
companies such as Primary Health Properties and Carecapital, together with a number of
specialist investment funds).
4.43 The LIFT company is therefore a procurement option for accommodating future growth
requirements in Tendring, rather than a source of mainstream funding for it. Indeed, using
LIFT may become more difficult for some PCTs in the future as LIFT developments will
have to go on balance sheets next year and will require capital cover. We understand the
Department of Health has only agreed to cover existing assets until 2011. Those PCTs
which have a number of such assets may be the most constrained, although we
understand the LIFT company in Tendring and Colchester is not as stretched as other
PCTs.
Mainstream funding should pay for new capital requirements
4.44 In theory, capitation funding should follow population growth and provide PCTs with the
necessary funds to pay for the new facilities needed. In practice, this is not
straightforward. Firstly, facilities will need to be built in advance of the full realisation of
the population increase, and secondly there will be a subsequent time lag before Health
Service revenue funding catches up with the population growth.
4.45 Changes to the funding allocation mechanism should go some way to address this but will
probably not eradicate it. Neither is it entirely clear that capitation funding responds fully to
the needs of the growth. This was tacitly recognised by Government with a specific
5 DoH (2007) The Operating Framework for the NHS in England 2008/09 (chapter 4)
Tendring Infrastructure Study – Part One Final Report
Roger Tym & Partners with Peter Brett Associates September 2009 19
budget for additional strategic capital investment in the Growth Areas but none for Growth
Points such as Haven Gateway. In any event, the funding made available to the Growth
Areas only amounted to £20 million during the period 2005-6. The result is that NHS
budgets are under pressure in all areas experiencing growth.
PCTs do receive payments for premises, but do not receive specific budget for premises development
4.46 PCTs get funding for GP premises from PCT budget allocations. Funding arrangements
in place at 1st April 2004 (at the time of the new General Medical Services contract)
cannot be rescinded, but PCTs can now negotiate more flexibility in the extent and
duration of new funding commitments. There is no ringfenced funding within PCT
budgets, and all premises costs (existing and new) must come from central PCT
allocations.
4.47 PCTs do not receive a specific budget for new premises developments. Funding for
expansion to the current provision would be at the expense of other competing priorities
and ultimately may not be possible.
4.48 The revenue consequences will be critical to NEEPCT; capital costs are embedded in the
revenue costs attached to new development. Therefore other sources of funding for new
facilities have to be explored. As part of this it is the PCT’s policy is to seek S106
contributions towards healthcare for housing developments.
PCTs have provision in place for small scale premises improvement and extension
4.49 NEEPCT will consider funding small scale improvements and expansion to extend the
range of services they provide where this meets with the overarching strategic objectives
of the PCT.
The approach to capital funding for growth will need to be different in individual cases
4.50 As discussed above, in the case of GP practices only, the PCT pays rent (recurrent
revenue) to the GPs for the use of existing premises and, where funding permits, the PCT
can provide capital and/or recurrent revenue funding for new and expanded premises for
new developments.
4.51 In some instances a form of private finance arrangement exists, where independent
contractor GPs enter into agreements with third party developer companies that specialise
in building Primary Care developments to lease back to the GPs. However, the GPs will
expect this rent to be funded by the PCT and will seek reimbursement assurances prior to
the development proceeding.
Developer funding (Sec.106 agreements)
4.52 NEEPCT does not currently have a developer contribution policy for primary care
premises. We understand it is currently considering the most appropriate way to secure
developer funding for health needs, and is seeking to continue discussions with the
Council and other service providers as part of wider service planning and delivery.

Tendring Infrastructure Study – Part One Final Report
Roger Tym & Partners with Peter Brett Associates September 2009 20
Priorities
4.53 The PCT has identified three key priorities which underpin its healthcare strategy:
Addressing health inequalities;
Mental health; and
Children’s services.
4.54 These priorities do not preclude investment in other services, but are intended to steer
attention into these particularly pressing areas of need. The PCT’s 5 year health strategy
is currently being revised and is due for completion in Autumn 2009, but indications are
that these three key items will remain a high area of priority in future strategy iterations.
4.55 The Tendring area itself has already been identified through the PCT’s health needs
assessment and six facet premises survey as the priority development area. These
assessments were undertaken in 2008 and found that 22% of the PCT’s population is
registered in an area of greatest health need, with the worst premises. This is likely to
effect where NEEPCT funding is directed to meet these needs, and could benefit
Tendring’s ability to accommodate new growth.
4.56 In terms of specific localities, it is likely that the housing development and population
growth in the West Clacton area will be a priority development, as capacity in the vicinity
of that area is unlikely to be able to absorb the additional people requiring primary care
services.
Timing of provision
4.57 As set out above, West Clacton is a key priority in terms of need, and if allocations are
made there and development plans are taken forward, this is likely to need to be delivered
early on.
4.58 The PCT is therefore already in discussions with the Council and the developer of the first
phase to address this issue. The wider Clacton area capacity needs will follow, to ensure
that any proposals for new services fit into a wider ranging plan. Two LIFT schemes are
already underway in Great Clacton and Holland-on-Sea, and these will be factored in to
the locality planning process.
Key issues & conclusions
4.59 The key issues and conclusions for primary health care requirements and funding to
respond to housing growth in Tendring are:
Funding for larger facilities in areas of potential high growth – both Clacton and
Harwich have potential for significant development. As set out above, it may not be
viable to commission a new facility where the increased population from housing
growth is less than 5,000 people (without additional government or developer
contribution funding). Consequently, the actual level of growth in these respective
areas could be a key determinant as to whether NEEPCT can provide the necessary
new facilities that will almost certainly be needed. Where it is found that the
additional primary care capacity cannot be found within local existing practices, then
additional facilities or a new practice may need to be considered even where this is

Tendring Infrastructure Study – Part One Final Report
Roger Tym & Partners with Peter Brett Associates September 2009 21
below the expected lower list size – the PCT is duty bound to commission sufficient
capacity for its population so all options must be explored;
Ability of GPs to absorb capacity where limited development could be located to
accommodate new patients – this won’t be known until the capacity of individual
surgeries is assessed. Assessment will focus on physical capacity, as well as
workforce and recruitment issues;
Capacity created by current applications for extended/new facilities– although Table
4.1 shows there is reasonable capacity in primary care facilities in Tendring, much of
this is dependent on the success of applications by GPs to extend or relocate existing
premises. All new investments are expected to demonstrate a match to the strategic
plans of the PCT and expected population changes – where this is the case, then
these provider led schemes may be considered for funding. Priority will be given to
schemes which address the priority development areas above;
Patient choice –Where possible, patients will be offered a choice of GP practice.
However, in rural areas or areas of low density population this is not always possible.
GP practices in such areas are encouraged to provide as much service choice to
patients as possible, such as gender of the GP, locally based services, etc but there
are sometimes constraints which limit the possible choices available. The PCT works
closely with patient groups and GP practices to address these issues as far as it is
practical to do so;
Movement of services from acute hospital settings to the community. The PCT is
committed to providing services closer to where patients live whenever it is practical to
do so. There will be limitations on this, such as workforce availability, cost of some
specialist equipment, and maintaining the skill level of staff providing highly specialist
treatments. The PCT strategy will set out some of the services which will move to
community settings, including some diagnostic and surgical services, and the
infrastructure requirements will be recognised within any premises development
plans;
Changes to the location and/or delivery of services. Services are increasingly being
delivered at times to suit patients’ changing lifestyles, including early or late sessions
and weekends. All new facilities will have lock down areas to enable the premises to
be open out of normal hours without the need for full staffing. One or two members of
staff will be able to work safely (in line with the PCT’s lone worker policy) and have
access to the facilities they need without needing to leave secure staff areas.
Security and IT systems are similarly geared towards these new ways of working,
which will become increasingly common in the coming years; and
Shared facilities. The PCT is keen to work with partners, through the auspices of the
Strategic Partnering Board, to explore the possibility of shared facilities. Evidence
shows that these are best developed on the basis of service, rather than premises,
needs. Work will continue to explore this potential.


Tendring Infrastructure Study – Part One Final Report
Roger Tym & Partners with Peter Brett Associates September 2009 23
5 EMERGENCY SERVICES
Police
5.1 The Essex Police Authority is an independent organisation whose purpose is to support
and oversee the work of Essex Police. The Police Authority currently comprises nine
councillors, three magistrates and five independent members, but from 1st October 2008
this will become nine councillors and eight independent members, though at least one
independent member must be a magistrate. The functions of the Authority are to:
Ensure Essex has an efficient and effective Police Force;
Obtain the views of the general public as to the kind of Police Service it wishes to see;
Approve the annual budget;
Appoint Chief Police Officers;
Ensure the provision of a continuously improving service by Essex Police;
Act as a responsible authority on Crime & Disorder Reduction Partnerships (CDRPs);
Maintain a statutory scheme for independent custody visiting;
Ensure Essex Police cooperates with other forces where such cooperation would
be efficient or effective to do so; and
Promote equality and diversity within Essex Police.
Key Policy Documents
Essex Police Authority and Essex Police – Strategy 2008-2011 and Plan 2008-2009
5.2 This document aims to set a clear direction for the policing of Essex, and provides a
framework for the annual plan. In terms of capital investment, it makes the following three
points:
The annual capital grant for 2008/2009 and subsequent financial years will be £3.2 m;
Capital requirements for the next three years have been identified, totalling £42.4 m.
These payments will be phased over three years to 2010/2011; and
In addition to Government Capital Grant, further capital resources will be found from
existing reserves and the sale of existing assets.
5.3 The Strategy also includes some planned budget reductions, as part of the Operation
Austin programme being run by the Police. As part of this programme, full year savings of
£4.4m have been identified towards the 2008/2009 budget, as of 31st December 2007.
The 2008/2009 budget contains total savings of £5.2m, states the strategy. In addition,
the strategy states that the Austin Programme has a target of £6.0m by 31st of March
2009, in line with the published police year plan.
Essex Police Authority Business Plan 2008-2011
5.4 This Plan contains a budget for financial years 2008/2009 to 2010/2011. For 2008/2009,
the overall revenue budget for the Police Authority is £251m, with a capital programme of
£18m.

Tendring Infrastructure Study – Part One Final Report
Roger Tym & Partners with Peter Brett Associates September 2009 24
Capacity of Existing Infrastructure
5.5 The existing facilities are sufficient to serve the needs of the Police force at present in
Tendring.
Needs
5.6 No new build facilities are required, but additional officers and police vehicles are needed.
In terms of officers, there is a need in all areas for sergeants, constables and Police
Community Support Officers (PCSOs) in all areas. The overall assessed impact of
providing for each of the LDF options being tested is as follows:
Clacton – low resourcing impact;
Tendring – medium resourcing impact;
Harwich – medium/high resourcing impact; and
Manningtree/Mistley – high resourcing impact
5.7 The consideration of what constitutes a ‘low’, ‘medium’ or ‘high’ resourcing impact is a
judgement made by the Essex Police Authority.
5.8 In addition, a need for one additional police vehicle for each area has been identified.
Costs
5.9 ACPO in the Eastern Region has undertaken an assessment of the one-off capital cost of
providing an additional officer - £8,136. The table below shows the assessed overall cost
of providing the numbers of additional officers that would be required to police the
additional growth in each location. So, for Clacton for example, the total additional cost of
£81,360 is to provide 10 additional officers (1 sergeant, 6 constables and 3 PCSOs).
Table 5.1 Cost of providing additional officers by location
Area Sergeants Constables PCSOs Total
Cost per officer (£8,136)
Clacton £8,136 £48,816 £24,408 £81,360
Tendring Rural (St Osyth, Elmstead Market, Frinton/Walton. Includes Little Clacton, Bentley, Thorpe-le-Soken; Alresford and Brightlingsea)
£8,136 £32,544 £32,544 £73,224
Harwich £8,136 £56,952 £16,272 £81,360
Manningtree &Mistley (includes Ardleigh)
£8,136 £24,408 £16,272 £48,816
Total £284,760
Source: ACPO Eastern Region (2006) Policing Contributions from Development Schemes
Tendring Infrastructure Study – Part One Final Report
Roger Tym & Partners with Peter Brett Associates September 2009 25
5.10 This shows that, for all of the options in aggregate, there would be a total cost of provision
of £285,000. By option, this varies from £48,800 for Manningtree/Mistley to £81,400 for
Clacton or Harwich.
5.11 The cost of a fully equipped new police vehicle has been estimated at £50,000. Therefore,
there would be an additional £50,000 cost per growth option.
Funding
5.12 Essex Police is revenue funded by a mixture of Central Government and local
government funding, with the former only intended to cover national projects. It is
assumed that the Police will effectively fund its capital requirements out of its revenue
budget either by saving, borrowing or renting.
5.13 At a national level, a formula is currently being put together to justify a charge on
development. This has been commissioned by the Association of Chief Police Officers
and the Association of Police Authorities and the intention is to roll this out nationally. It is
likely to be adopted nationally later in 2009. The formula is based on needs being
population, not housing, driven. It reflects the fact that not all occupants of new housing
are new to an area so it discounts the population in new housing to reflect the fact that
many occupants will be in-migrants.
5.14 This formula is, as yet, still in draft and there are several issues that would need to be
reviewed to ensure that it is consistent with the information used by other service
providers. However, the recommendation is that planning contributions are assumed to
have to meet the full cost of growth needs. This is because the capital needs of the Police
are comparatively small and also because the pressure on local authority capital budgets
is likely to become increasingly severe.
Priorities
5.15 No particular priorities have been identified.
Timing of provision
5.16 It is critical that new or enhanced police facilities are provided early on as local police
need to be able to build relationships with expanded or new communities from the outset,
and to react to the need for police services, demand for which will typically commence as
soon as growth starts.
Issues
5.17 No particular issues have been identified. However, it will be important to understand
further the Police’s new contributions policy, and in particular, the demographic
assumptions that underpin it.
Fire Service
5.18 The Essex Fire Authority was formed on April 1st 1998 by virtue of the Local Government
Act 1992. Essex County Fire and Rescue Service (ECFRS), which serves Tendring
district, is directly responsible to the Essex Fire Authority.

Tendring Infrastructure Study – Part One Final Report
Roger Tym & Partners with Peter Brett Associates September 2009 26
Key Policy Documents
Essex Fire Service Budget 2008/2009
5.19 This document states that the budget for capital payments for 2008/2009 has been set at
£10.870m.The greatest part of this budget are the capital financing costs associated with
the development of a new headquarters and a new fire station at Rayleigh Weir. The
provisional figures for the 2009/10 and 2010/11 programmes are £16.681m and
£15.441m.
Capacity of Existing Infrastructure
5.20 There is no current spare capacity within the existing service covering Tendring district.
However, neither was it reported that the service is over-capacity.
Needs
5.21 Under almost all growth scenarios, there would be no foreseen change to current
resource deployment. Only the options in Harwich/Dovercourt would possible require a
change in the current staffing model at Dovercourt Fire Station, as part of ECFRS’s
Integrated Risk Management Plan (IRMP). However, this is unlikely to require any new
capital expenditure.
Costs
5.22 No specific costs have been identified that would arise from growth.
Funding
5.23 ECFRS mainstream funding comes from a combination of grants from Central
Government and precept from Essex County Council via council tax. These are
constrained by Government Comprehensive Spending Review (three-year plan) and
Government capping on local authorities. In addition to normal capital funding
arrangements, ECFRS will, if necessary, continue to explore opportunities through
partnership working and PFI.
5.24 However, in light of the zero cost figure identified, funding is not an issue.
Priorities
5.25 There are no priorities identified.
Timing of Provision
5.26 There are no issues related to the ECFRS in respect of the timing of growth.
Issues
5.27 There are no particular issues.
Ambulance
5.28 The East of England Ambulance Service NHS Trust (EEAST) provides emergency and
unscheduled care and patient transport services in Tendring. The EEAST was formed on
1 July 2006 by the amalgamation of the former Bedfordshire and Hertfordshire Ambulance
and Paramedic Service NHS Trust, the East Anglian Ambulance NHS Trust and the

Tendring Infrastructure Study – Part One Final Report
Roger Tym & Partners with Peter Brett Associates September 2009 27
Essex Ambulance NHS Trust. The new Trust is, geographically, the second largest in
England, employing about 4,000 people (as at July 2007) with more than 2,000 volunteers
working in community response schemes and as non-emergency drivers.
5.29 The East of England Ambulance Service NHS Trust is required to reach 75% of all life
threatening emergencies within 8 minutes. This target is now measured from the time the
Trust receives the call to arrival on scene.
5.30 The Trust’s main objectives are to:
meet these mandatory standards in service delivery;
deliver current priorities such as Call Connect and the new digital radio and despatch
systems;
begin work on projects to deliver the vision, particularly the technical preparation for
building a knowledge management system and reshaping HEOCs to move to the
emergency and urgent care assessment centre concept; and
prepare the organisation to apply for Foundation Trust status.
5.31 EEAST has service level agreements with the PCTs, specifically in respect of Accident
and Emergency.
Key Policy Documents
Strategic Direction (2007-12)
5.32 The future issues and direction for EEAST is set out in its “Strategic Direction” (2007-12)
document.
5.33 The Trust anticipates that the five-year period covered by this Strategic Direction
document will see “a major shift in the pattern of demand for services”.
5.34 The shift will be driven by “radical changes in the way that different types of emergency
and urgent calls are classified, how they are commissioned, the need to place the patient
at the centre of determining how services are delivered, and a focus on clinical evidence
of patient outcomes, as opposed to target response times, as the key measure of
performance”.
5.35 The ambulance service is therefore demand driven, as opposed to purely population
driven. EEAST is already experiencing a 6% a year increase in calls, which has doubled
since 1992/93; partly driven by changing public attitudes to using the 999 service, an
ageing population profile and increased resources being allocated to emergency
capability.
5.36 These challenges are resulting in consideration of major changes to the delivery of the
ambulance service, which could result in a more flexible “hub and spoke” approach, with
operational staff not assigned to a single centre and only going there as required (e.g. for
training). This could reduce the number of command centres and therefore its property
portfolio.

Tendring Infrastructure Study – Part One Final Report
Roger Tym & Partners with Peter Brett Associates September 2009 28
5.37 In terms of specific requirements relating to housing and jobs growth, we understand no
studies or strategies have been completed to date. Indeed, some more detailed physical
planning relating to new development has been frozen due to the abrupt slow down in
housing development.
Capacity of Existing Infrastructure
5.38 EEAST is currently undertaking a regional review of facilities. While this is intended as an
internal document, we understand EEAST could circulate this to external stakeholders,
such as local authorities and the PCTs.
5.39 EEAST has the following stations in Tendring:
Harwich
Frinton
Clacton
Weeley
5.40 We understand that EEAST generally has difficulty in achieving mandatory national
response time requirements in Tendring because of:
Relatively old stations not now located in optimal locations
Lack of resources at stations
Constraints of the road network
Limited “dynamic deployment” facilities (see 5.45 below)
Pressure on services from Clacton and Frinton stations
5.41 We further understand that Clacton and Frinton are the stations currently under most
pressure, with Weeley also under a significant amount of pressure. All areas served by
these stations therefore have no additional capacity to accommodate any increased
demand for services as a result of new development.
5.42 In particular, there is no station in Brightlingsea; the closest are in Greenstead (east of
Colchester) and then Clacton. Consequently, EEAST struggles to meet response times to
this area and therefore any additional growth would need to be carefully considered on
the basis of current capacity. There is a similar situation in Manningtree/Lawford/Mistley
although the problem is not quite as significant as in Brightlingsea.
Some potential capacity at Harwich station
5.43 We understand the ambulance station in Harwich is likely to be able to cope with
additional growth up to the potential level identified through the call for sites. Additional
resources (including staff and potentially vehicles) would be required in this instance.
Needs
Dynamic Deployment to be introduced more widely
5.44 EEAST is hoping to deliver more of a “hub and spoke” service arrangement in Tendring
over the next 5-10 years to meet demand from the existing population.
5.45 This is part of a “dynamic deployment” approach to improve patient care and response
times through the placement of resources in areas of predicted high demand. Dynamic

Tendring Infrastructure Study – Part One Final Report
Roger Tym & Partners with Peter Brett Associates September 2009 29
deployment is the pre-positioning of resources rather than the activation or mobilisation of
resources to calls. In simple terms, it is about where staff work from during the course of
their shifts.
5.46 The identified locations in this respect are currently identified as:
Traditional ambulance stations (the “hubs”);
Response posts – smaller 24/7 buildings for staff (a “spoke”);
Dynamic activation (or stand by) points – limited or no facilities, but can be a better
location to meet predicted demand (a “spoke”); and
Temporary holding areas
5.47 Demand profiles are analysed by geographical areas and resources matched wherever
possible to the predicted demand. This demand fluctuates depending on time of day, day
of the week and seasonal variations within the year.
Expansion of some facilities, consolidation of others
5.48 As stated above, Tendring does not currently have any response posts or dynamic
activation posts. Consequently, some of these are likely to be introduced in the future.
5.49 However, EEAST is currently considering the consolidation or relocation of some of the
existing ambulance stations. In particular, EEAST would like to co-locate the Weeley and
Clacton stations.
5.50 If there were significant growth in West Clacton, this could be an appropriate location for
such a facility, with a response post or DAP located in Clacton town centre. This would
also potentially improve EEAST’s service to Brightlingsea.
Funding
5.51 EEAST is funded largely by the PCTs, with some additional charitable donations. This
funding is tied to the service level agreements, and is driven more by demand than
housing numbers. For more information on the funding of PCT’s, please refer to the
health section.
5.52 There is, however, often a funding “time lag” where mainstream funding is not provided in
advance or at the same time as step changes in demand, such as through significant new
development. We often reflect this as a need for other funding sources, the annualised
equivalent of the capital costs of the required facilities for three years.
5.53 Where facilities are co-located or relocated, the sale of the existing asset(s) can be used
to fund new facilities. We understand this has not been considered in detail at this stage,
although this may be carried out as a more detailed exercise following the completion of
the regional review of facilities (see above).
5.54 EEAST may seek to secure contributions from development to help fund any shortfall in
new facilities where significant additional demand is created that cannot be adequately
met by current facilities, particularly in Clacton and Frinton.

Tendring Infrastructure Study – Part One Final Report
Roger Tym & Partners with Peter Brett Associates September 2009 30
Priorities
5.55 As stated above, EEASTs priorities are to introduce more dynamic deployment
capabilities in Tendring, and consolidate and/or relocate existing stations that are dated or
not in an optimal location and therefore under pressure to deliver a quality service.
Timing of Provision
5.56 Any significant growth in the Clacton and Frinton areas may require the early provision of
a new station, or introduction of other dynamic deployment facilities.
Issues
5.57 There are no further issues in addition to those identified above.

Tendring Infrastructure Study – Part One Final Report
Roger Tym & Partners with Peter Brett Associates September 2009 31
6 EDUCATION
Introduction
6.1 Education services in Tendring are largely delivered by Essex County Council (ECC).
This section seeks to simplify what is a very complicated subject, based on information
provided by the County Council and our own research.
Our remit
6.2 We have included the following education services within our assessment:
Early Years;
Primary Education;
Secondary Education; and
Post-16 Education / Further Education (FE).
6.3 Only further education is principally provided by the private sector.
Infrastructure Need
Infrastructure requirements are guided by demographic change and shifting demand/supply
6.4 Overall demand for education will be affected by both the quantum and location of new
school aged pupils associated with housing growth, but also changes in the quantum and
location of the current population.
6.5 How this translates into actual infrastructure requirements for education will also be
affected by the quantum and location of existing school capacity. Understanding this
demand and supply equation spatially is critical to assessing education requirements.
Education is now part of a wider approach to children’s services
6.6 It is also important to consider education as part of a wider Children’s Service offer. The
Every Child Matters White Paper and the Children Act 2004 focused on providing a joined
up approach to Children’s services. There are a large number of changes affecting the
delivery of children’s education service delivery, including greater parental choice, the
move to transfer post 16 education funding from Learning and Skills Councils to local
authorities in March 2010, the creation of Children’s Centres, Sure Start programmes,
Extended School provision, the creation of Academies, Voluntary Aided Schools, and
delivery and roll out of programmes such as Building Schools for the Future to help
rebuild or refurbish existing schools.
‘Strategies for Change’ will have a major impact on the future provision of education infrastructure
6.7 There is a process in place aimed at taking a longer term, joined-up look at primary,
secondary and in some instances FE provision, based on forecast population growth,
needs of the community and business in order to provide the best service to the
community. This is being channelled through the preparation of Strategies for Change.

Tendring Infrastructure Study – Part One Final Report
Roger Tym & Partners with Peter Brett Associates September 2009 32
This will involve the merging of various funding programmes to create a holistic delivery
programme for a modernised school infrastructure.
6.8 ECC has completed Parts I and II of its “Strategies for Change”.
There is a need to make best use of existing capacity
6.9 ECC recognises that there is a need to make use of existing capacity in schools in order
to use resources efficiently.
6.10 ECC produces the Essex Schools Organisation Plan (the Organisation Plan) each year.
This is not a statutory requirement following the need for a Children & Young Persons
Plan (C & YP Plan). However, ECC still view the Organisation Plan as a key document,
but that it is not appropriate to include this in the higher level C & YP Plan.
6.11 The Organisation Plan sets out the requirement for places in maintained primary and
secondary schools over a five year period, and identifies the areas where providers will
need to match supply more closely with demand. It provides the context for the future
organisation of school places in Essex and sets out the principles that need to be given
serious consideration when planning school places.
6.12 In doing so, the Organisation Plan reflects the Local Authority’s changing role as it moves
from being a provider to a strategic commissioner of school places. The last published
plan was for the period 2007-12, although the 2008-13 plan is set to be published shortly.
Constantly evolving and changing requirements
6.13 Any education plans or infrastructure requirements could be subject to considerable
alteration over the next few years as the investment and provision in education is
expected to undergo major changes. Therefore it will be essential to keep this information
under constant review and updated regularly.
Current Strategy
6.14 The Organisation Plan is the key education document relevant to this study. Not only
does it consider key county wide objectives such as the appropriate size of schools,
remedies for a surplus or shortage of spaces and admission arrangements, it also looks at
the demand/supply of spaces up to 2012 in each individual area.
Planning for housing growth not yet undertaken
6.15 At present the plan is unable to consider the impact of housing growth but in the event of
the Tendring Local Development Framework making provision for additional housing in
the area, a further review of places is recognised as necessary. ECC prefers to undertake
full scenario testing to influence the spatial strategy adopted and provide a firm footing for
its long term service planning.

Tendring Infrastructure Study – Part One Final Report
Roger Tym & Partners with Peter Brett Associates September 2009 33
Childcare
6.16 The Childcare Sufficiency Assessment 2008 (Essex County Council Directorate of
Schools, Children and Families) sets out the assessment of sufficiency regarding the
supply of childcare and parental demand for childcare within Essex. This identifies
perceived unmet need and barriers to take-up identified through parental surveys.
6.17 Its aim is to identify gaps and establish plans to ensure the provision of high quality,
accessible and affordable childcare. The report provides a detailed picture of each district,
enabling the planning of services to take place, together with relevant partners and
childcare providers. In terms of Tendring, this report provides a picture of current services
that are available, and use levels.
6.18 The 2008 assessment for Tendring District identifies gaps in childcare provisions by
geographical area. In Mistley a gap in the provision of flexible childcare options has been
identified. The assessment proposes that a pre-school be developed in the area, together
with a local childminding network.
6.19 Another area where a ‘physical’ gap has been identified is Walton and Frinton. There is a
lack of out-of-school provision, which is proposed to be dealt with through working with
potential providers of out-of-school provision, and the establishment of an all year round
services in the area.
Building schools for the future
6.20 The government’s Building Schools for the Future (BSF) programme seeks to rebuild and
renew secondary schools and the Primary Capital Programme seeks to provide
substantial new investment in primary schools.
6.21 Local authorities are being encouraged to consider from first principles what secondary
school buildings are needed, where they should be located and what facilities they should
have, including their potential development as extended schools. BSF is likely to have a
major impact on the pattern of secondary provision across the county, but it is a long-term
initiative, extending from 2005/6 to at least 2020, subject to continuing political support
beyond the next Comprehensive Spending Review (see para 6.42).
6.22 The indicative programme allocated to Essex anticipates a start in the south of the county
during the period 2008 to 2011, for the west 2011 to 2014 and for central and north Essex
2017 to 2020. An announcement on the start date for the south of the county was made in
December 2006 and Essex formally joined the BSF programme in February 2007.
6.23 The latest Essex Schools Organisation Plan (2007-12) anticipates that the procurement of
a private sector partner to form the Local Education Partnership (LEP) will commence
early in 2008 and this should take around 18-20 month, with building works should
commence on schools in the south of the county in the spring of 2010.
6.24 The 2008 summary progress of the Essex Children and Young People’s Plan (CYPSP)
2006 states that the current Building Schools for the Future programme brings a funding
package of approximately £350 million to cover the construction of 22 secondary schools,
6 special schools and 2 Pupil Referral Units.

Tendring Infrastructure Study – Part One Final Report
Roger Tym & Partners with Peter Brett Associates September 2009 34
6.25 The outline business case for Wave 4 was approved in November 2008, which includes
the Shorefields Special School in Clacton.
Capacity of existing infrastructure
6.26 As set out in 6.10, the Essex Schools Organisation Plan assesses the demand and supply
for education in the County, and by district. The 2007 projections (up to 2012) for primary
and secondary schools are set out below:
Table 6.1 Tendring District Primary Schools (2007-2012)
Table 6.2 Tendring District Secondary Schools (2007-2012)
Primary & secondary schools currently have capacity
6.27 Overall, there is anticipated to be an increased surplus in primary and secondary school
places in Tendring up to 2012, even with additional housing.
Rural areas have surplus but pressure in Harwich
6.28 The Organisation Plan comments that some primary schools in rural areas are identified
as having a number of surplus places. It also states that whilst the removal of permanent
accommodation from rural primary schools remains difficult, the situation will be closely
monitored with a view to removing more surplus accommodation in the future.
6.29 The latest plan has not assumed growth in primary school pupil numbers in Clacton due
to inward migration, which had been a previous theme. However, it comments that large
housing developments have taken place in the Harwich area, which has led to pressure
on school places but where appropriate additional accommodation has been put in place.
ECC preliminary assessment of potential education capacity & requirements in Tendring
6.30 ECC has provided an assessment of education capacity and requirements for each of the
potential development sites from the Council’s call for sites.
6.31 Capacity can either be in the form of existing school places or an ability to expand or
improve an existing school. A summary of this is set out in Table 6.2 below.
Actual
2007 2012 2007 20122012 with
housing2007 2012
2012 with
housing
10,800 10,678 9,836 8,603 9,002 964 2,075 1,676
Source: Essex County Council
Forecast
Number on rollCapacity of Schools Surplus/Deficit
Actual
2007 2012 2007 20122012 with
housing2007 2012
2012 with
housing
9,571 9,717 8,928 8,254 8,577 643 1,463 1,140
Source: Essex County Council
Capacity of SchoolsNumber on roll
Surplus/DeficitForecast

Tendring Infrastructure Study – Part One Final Report
Roger Tym & Partners with Peter Brett Associates September 2009 35
6.32 A key school with potential existing physical capacity is the new Clacton Coastal
Academy. This is effectively a merger of the existing Bishops Park College and Colbayns
High School, and opened in September 2009. We understand Bishops Park College was
built using PFI in anticipation of housing growth in the area. As this growth has been
limited, there is significant existing physical capacity. However, some of the school
buildings are likely to be decommissioned in the short term as it is unlikely this capacity
will be needed. We therefore understand the new Academy would have fewer places
than the two existing schools but would retain a degree of flexibility to expand and
accommodate demand from new development in the future. This could provide critical
capacity for development in and around Clacton, if decommissioned buildings can be cost
effectively brought back into use, thereby potentially negating the need for new schools or
school buildings.
6.33 Our analysis has assumed this is provided before development, although we understand
a decision from the government is expected in August. We therefore suggest the
assessment of education capacity and need in the Clacton areas is reviewed when this
decision is made, and the design for the school is monitored closely.
6.34 Two other existing secondary schools that will be critical to accommodate growth are
Tendring Technology College and Colne Community School. Both would only require
limited expansion based on the numbers tested. Bussing pupils to these schools from the
more remote locations considered, and the impacts of additional traffic from parents
driving longer distances, would be opposed by ECC.
Funding
Schools Capital Allocations Funding
6.35 Funding for education is a complex picture, with numerous mainstream sources available
to the service provider (in this case Essex County Council). The bulk of schools’ capital
funding is allocated by formula to education authorities by central Government in line with
the national spending review. Thus the published information for this study relates to the
period from 2008 to 2011. This funding is provided in the form of a grant or as supported
borrowing.
6.36 The main sources of capital funding for the purpose of this study are made up of Basic
Needs Funding, Modernisation Funding and Building Schools for the Future Funding.
Basic Needs Funding
6.37 Basic Needs Funding (BNF) is a capital allocation for building investment based on
forecast population growth using a national formula (adjusted for area differentials). It
therefore responds to a situation in which there is a need for additional school places
aggregated over the entire area covered by an education authority. This aggregation
means that any funding anticipated in growth areas is reduced if numbers on roll are
falling elsewhere. The County has been allocated £51,422,101 for the period 2008/9 to
2010/11.

Tendring Infrastructure Study – Part One Final Report
Roger Tym & Partners with Peter Brett Associates September 2009 36
Modernisation Funding
6.38 This capital funding is available to support building programmes for new or refurbishment
of existing provision and is not intended to meet the growth agenda. The current 2008 –
2011 Capital Allocation is £43,764,695.The County Council Capital Programmes team are
currently completing a new ‘suitability assessment’ that will set priorities for this funding.
We understand it is unlikely any funding will be available for helping to fund new or
expanded schools to accommodate housing growth.
Local Authority Coordinated Voluntary Aided Programme (LCVAP)
6.39 LCVAP is a formulaic programme where the local authority and its partners (usually the
associated dioceses) allocate DCSF funding in line with local needs and priorities for
Voluntary Aided (VA) schools. A project can be phased over several years. Governing
bodies must contribute 10 per cent of the LCVAP project costs.
Building Schools for the Future / Secondary School Funding
6.40 As discussed above, Building Schools for the Future (BSF) is aimed at providing a new
approach to capital investment. It is bringing together significant investment (circa £45bn
nationally) in buildings and in Information and Communications Technology (ICT) over the
coming years to support educational reform. It will be used for replacing and renewing the
existing school stock and funded through the PFI mechanism.
6.41 Generally speaking the sums available have been adequate for these purposes, although
many education authorities claim that the need to demonstrate value for money in PFI
bids makes it difficult to meet the highest standards of provision. Some local authorities
also object to the alleged use by DCSF of BSF to promote Academy schools.
6.42 This focus has restricted the possible application of the BSF to finance the growth
agenda. However the last Comprehensive Spending Review (2007) stated that DCSF
would be looking at the ways in which their capital programmes responded to the growth
agenda and that this review would include Building Schools for the Future Wave 7. In the
future, the rules governing new investment in schools might be more supportive of the
growth agenda than hitherto. Conversely, there is no Government commitment to fund
the BSF programme beyond the duration of the current spending review.
6.43 There is also no indication of when each of the remaining areas in the county will receive
funding. The process by which areas have been identified as areas which will receive
funding has recently changed and there could be further future changes. The level of
funding provided through BSF does not cover the full costs of new provision for marginal
additional pupils. On the PfS funding formula, additional pupils generate 75% of the costs
of new additional provision.
Primary Capital Programme
6.44 The Primary Capital Programme (often inaccurately referred to as BSF for primary
schools) is part of the strategic programme by the government to put more focus on
primary education. Because this is a relatively new focus of attention there is a more
explicit focus on new and universal provision.

Tendring Infrastructure Study – Part One Final Report
Roger Tym & Partners with Peter Brett Associates September 2009 37
6.45 The County has been allocated £30,164,384 for the period 2008/9 to 2010/11. As this is a
relatively new funding stream, it is difficult to evaluate its effectiveness in the context of
existing and emerging needs.
Developer Contributions
6.46 Developer contributions are relied upon to fund new schools and provide the land for the
development. Developer contributions will remain a major source of funding but will be
competing in a climate for limited resources to fund other social and community provision.
6.47 We are aware Essex County Council has a policy on developer contributions, which is set
out in its Developer Contributions Guide.
Conclusions on Education funding
6.48 Although there are numerous mainstream funding sources for education provision, in
reality there is no specific funding (other than discretionary sources such as growth area
funding) for requirements related to housing growth.
6.49 The main funding source, Basic Needs Funding, makes no allowance for a situation in
which there is a need for spaces in one part of an education authority area offset by a
reduction in the number of spaces required in another part. Usually, the proceeds of
selling a surplus school only make a small contribution to the cost of constructing a new
one elsewhere. In any event, these receipts will diminish if planning contributions
increase.
6.50 Consequently, dealing with demographic shifts in the existing population from mainstream
funding sources and existing assets is already a major challenge for education authorities.
6.51 It is therefore likely that developer contribution funding will be required to fund a
significant proportion of any new education requirements resulting from new housing
development in Tendring.
Issues
6.52 Based on our experience elsewhere, education is likely to be, after transport, the second
highest infrastructure cost as a result of housing growth in Tendring.
6.53 Given the complex nature of spatial demand and supply for school places, in addition to
education funding, understanding the key issues is critical to helping shape a spatial
strategy for housing growth in Tendring.
6.54 Based on our conversations with ECC, the above information and our general experience
of education infrastructure, we have summarised the general education issues in
Tendring below:
The importance of existing capacity – there is existing school place capacity in some
areas of Tendring, but not necessarily in the right places or sufficient to accommodate
all the new potential housing growth in an area;
Constraints on using existing capacity - the County Council is required to provide
school transport to any child that would need to walk in excess of two miles up to the
age of eight or three miles for older children, using a safe route. Unless balanced by
better utilisation of existing school places, developments that do not meet these

Tendring Infrastructure Study – Part One Final Report
Roger Tym & Partners with Peter Brett Associates September 2009 38
criteria should be avoided. ‘Tolerable’ walking distances may of course be lower than
these thresholds and opposed on sustainability grounds. The quality of walking and
cycling routes to schools and potential improvements to them must be considered;
Achieving critical mass from development – justifying new schools requires sufficient
demand for new school places. Developments of 200 – 600 dwellings in an area are
often difficult to provide for, being too small to justify a new primary school but too
large to integrate into existing provision;
Risk of underestimating impacts from urban “infill” development – although this
development may be more difficult to identify, provision in an area should not just rely
on the implications of the large greenfield sites. Urban infill sites can change an
education strategy, so should be accounted for as far as possible at the start; and
Availability of developer contributions to cover new requirements – there is likely to be
limited, if any, mainstream funding for new or extended education facilities.
Consequently, securing sufficient developer contributions to be spent in the right
areas will be critical to ensuring the delivery of the necessary future education
requirements resulting from new housing growth in Tendring.
Key risk areas
6.55 In some areas there is currently either no solution or a potentially undesirable solution
(such as provision of a new school where there would be insufficient critical mass of new
pupils) to the levels of potential growth. Other education ‘show-stoppers’ are likely to
emerge once infill development and combinations of site are considered. At this stage,
most of the significant issues appear to relate to primary school provision, except for
secondary school provision in Parkeston/Bathside. Early Years and childcare needs have
not been included below as facilities are generally smaller and, as a result, easier to
establish:
Frinton (impact of 100 additional dwellings) - Frinton Primary would not have sufficient
capacity to take the number of additional pupils without displacing children living in
areas that currently have a reasonable expectation of entry to the school. In order to
maintain single age teaching groups it would be undesirable to expand the school.
Rolls are falling in the area and places may be found at Kirby Primary, although
development in Kirby may require these places;
Kirby Cross (500 dwellings) – the only solution would be to either secure some
adjoining land for Kirby Primary School or move the school to a larger site on the new
development;
Elmstead Market (200 dwellings) - Elmstead Primary is full and does not have site
area to expand. There are no alternative schools within safe walking distance. The
town relies upon school transport to secondary provision;
Great Bentley (200 dwellings) - Great Bentley Primary is full and does not have site
area to expand. There are no alternative schools within safe walking distance. The
village relies upon school transport to secondary provision;
Thorpe-le-Soken (200 dwellings) - Rolph CE Primary could, with an additional
permanent classbase, accommodate around half this level of development. There are
no alternative suitable schools within walking distance to accommodate the balance;

Tendring Infrastructure Study – Part One Final Report
Roger Tym & Partners with Peter Brett Associates September 2009 39
Mistley (600 dwellings) - The precise location of these homes would be key to finding
a solution to the lack of primary capacity in the area, as a single development of 600
dwellings would not quite sustain a new school. Limited surplus capacity at Highfields
and Lawford CE Primaries could be utilised and Mistley Norman could potentially be
expanded. The ‘wrong’ number of homes in the priority admissions area of any one of
the three schools could prove very disruptive to current admission patterns;
Harwich (600 dwellings) - This on its own is not sufficient to justify a new primary
school, yet potentially too large to easily accommodate through expansion of existing
schools. A new primary school in this case may only be justifiable if further urban infill
development creates additional demand. If a new primary school is needed as a
result of development, this creates potential opportunity for urban infill development to
use school without putting pressure on existing schools;
Parkeston/Bathside (3,150 dwellings) - In the absence of other development within its
priority admissions area, a little less than half of this number of homes could be
accommodated within existing capacity at The Harwich (Secondary) School.
Expansion to 1,800 places may be possible given the school’s site area, but this
would be tight and may still not quite accommodate the number of pupils that would
require a place.
Summary of capacity and requirements
6.56 We have identified where existing capacity in school places is available, capacity to
expand or improve an existing school or where new provision is required to accommodate
the potential growth in different areas of Tendring below.
6.57 The following should be noted:
This information has largely been provided by ECC; it has been prepared on the basis
that this stage of the study is ‘a filtering exercise’, with full impacts being considered
as sites (and feasible combinations of sites) are clarified;
ECC was therefore instructed to consider each site in isolation and without accounting
for infill sites that may have or gain planning permission;
ECC point out that once details of site allocations to deliver growth are known and
tested a significantly different picture from the one below may emerge;
If the level of housing growth in an area is lowered, this may affect the proposed
solution for accommodating these additional pupils;
Where capacity for expansion/improvement has been identified, full feasibility studies
will be required to confirm this is possible and acceptable (approximately six month
process); and
Finally, the table should be read in conjunction with Appendix 2 for additional
information and the key risk areas set out in 6.55 above.
6.58 Where there is existing capacity of school places, this would represent a potentially zero
cost solution to accommodating housing growth. Although new provision represents a
higher cost than expansion/improvement, this is not necessarily a higher cost solution on
the basis of costs per pupil (or new house).
6.59 For example, half the new requirement for school places in West Clacton (based on 3,400
dwellings) could be accommodated utilising, and where appropriate expanding existing

Tendring Infrastructure Study – Part One Final Report
Roger Tym & Partners with Peter Brett Associates September 2009 40
primary schools. Consequently, the new requirement would only be for a single two-form
entry school on this basis.
Table 6.2 Summary of potential education solutions to accommodating tested housing growth6
6 These solutions are dependent on the dwelling numbers tested (see Appendix 2). Areas where no potential solution has been identified are not shown.
Potential Use of Existing for
Growth Needs
Potential Expansion of
Existing for Growth Needs
Potential New for Growth
Needs(subject to needs of existing population) (subject to feasibility studies) (subject to suitable land)
Clacton Town Centre Frinton West & Little Clacton
Brightlingsea urban area Great Clacton & Holland-on-Sea
Elmstead Market Harwich*
Alresford Dovercourt*
Thorpe-le-Soken Parkeston/ Bathside
Colchester Fringe
Walton*
Kirby Cross
Brightlingsea Waterside Area*
Mistley
Great Bentley*
St Osyth
Clacton Town (assuming no additional urban infill)
Great Clacton, Little Clacton & Holland-on-Sea
West Clacton
Dovercourt Walton Harwich*
St.Osyth Brightlingsea Waterside & Urban Areas
Parkeston/ Bathside
Mistley Colchester Fringe
Alresford
Dovercourt Clacton areas, Holland-on-Sea & St.Osyth**
Colchester Fringe * (if linked with Colchester North Growth Area)
Brightlingsea urban area Parkeston/ Bathside (key risk area and therefore potentially not possible/ desirable - see 6.54 above)
Harwich Walton
Elmstead Market** Frinton
Alresford** Kirby Cross
Great Bentley** Brightlingsea Waterside Area
Mistley
Colchester Fringe ** (if not linked with Colchester North Growth Area)Thorpe-le-Soken
Source: RTP & ECC
* expansion of existing verses new provision would require careful consideration at the appropriate time
** subject to safe transport routes and costs being met
Early Years & Childcare
Primary
Sec ondary

Tendring Infrastructure Study – Part One Final Report
Roger Tym & Partners with Peter Brett Associates September 2009 41
7 TRANSPORT
Introduction
7.1 Responsibility for transportation policy within Tendring District Council is shared by Essex
County Council, as the Highways Authority, Tendring District Council and the Highways
Agency.
Background
7.2 The principal strategic roads within the district are the A120 and the A133. The A120,
running from Colchester to Harwich, is the only trunk road to pass through the district and
is managed by the Highways Agency. From Harwich to Hare Green the road is single
carriageway, and from Hare Green to Crown Interchange the road is dual carriageway.
Figure 7.1 shows the strategic highway network.
Figure 7.1 The strategic highway network serving Tendring District
7.3 With up to 30,000 vehicles per day on the dual carriageway sections and up to 12,000
vehicles per day on the single carriageway sections, the A120 provides the main transport
link for the movement of freight and passenger traffic travelling between the port of
Harwich and the national road network. As such the proportion of HGV traffic on the road
is relatively high (between 10 and 14%) compared to other roads within Tendring and
Essex.

Tendring Infrastructure Study – Part One Final Report
Roger Tym & Partners with Peter Brett Associates September 2009 42
7.4 The A133 runs from Colchester to Clacton-on-Sea linking into the A120 at Hare Green.
The road is single carriageway apart from the final section from Crabtree roundabout
leading into the A120.
7.5 Aside from the A137 running from Colchester to Manningtree, all other roads within the
district are rural B-roads, providing local access to the coastal towns of Brightlingsea,
Walton-on-the-Naze and Manningtree.
7.6 The district has 14 railway stations, with 6 along the Manningtree to Harwich branch line
and 8 on the Colchester to Clacton and Walton-on-the-Naze lines. Services are operated
by National Express East Anglia. All the stations provide services to London Liverpool
Street; however, these differ in their frequency and journey time. Manningtree provides
the quickest and most frequent service to London with four services an hour in the peak
and a journey time of approximately an hour. Services to Clacton-on-Sea and Harwich run
at a frequency of one an hour in the peak periods and take 1 hour 30 minutes
approximately. To access Walton-on-the-Naze requires changing trains at Thorpe-Le-
Soken.
7.7 The Great Eastern Mainline carries around 60,000 passengers a day into London during
the morning peak, of which approximately 14,000 are from outer suburban areas including
Ipswich, Colchester, Clacton and Chelmsford (Great Anglia Route Utilisation Strategy,
2007).
7.8 First Group operates the bus network which covers the majority of the district. Due to the
rural nature of the district, service frequencies are generally low, apart from in the town
centres of Clacton-on-Sea and Harwich. The majority of services are local, however there
are some more strategic routes.
7.9 Within the district there is also the major international port of Harwich as well as the
smaller coastal ports of Mistley Quay and Brightlingsea.
Key Policy Documents
7.10 A number of key documents provide the policy background for transport provision within
Tendring. These are summarised as follows:
Regional Transport Strategy
7.11 The key objectives of the Regional Transport Strategy for the East of England (May 2008)
are:
to manage travel behaviour and the demand for transport to reduce the rate of road
traffic growth and ensure the transport sector makes an appropriate contribution to
reducing greenhouse gas emissions;
to encourage efficient use of existing transport infrastructure;
to enable the provision of the infrastructure and transport services necessary to
support existing communities and development proposed in the spatial strategy; and
to improve access to jobs, services and leisure facilities.
7.12 The Haven Gateway (a sub region based around the three ports of Harwich, Felixstowe
and Ipswich) is identified as an area likely to come under increasing transport pressure as
a result of underlying traffic growth and the development strategy of the Regional Spatial

Tendring Infrastructure Study – Part One Final Report
Roger Tym & Partners with Peter Brett Associates September 2009 43
Strategy. Changing travel behaviour and managing traffic demand as well as improving
public transport provision will be key to alleviating this transport pressure.
Essex Local Transport Plan 2006-2011
7.13 Essex’s Second Local Transport Plan (LTP2) (2006-2011) is a long term plan which sets
out Essex County Council's plans and policies for the future of transport in Essex. The
Plan sets out five key objectives:
Tackling Congestion: To reduce the rate and incidence of congestion and its effect on
residents and businesses in Essex;
Delivering Accessibility: To enhance accessibility to key services (Education,
Employment, Healthcare and Retail);
Creating Safer Roads: To improve safety on the transport network and to enhance
and promote a safe travelling environment;
Promoting Better Air Quality: To manage the impact of road and air transport on air
pollution; and
Enhancing Maintenance: To maintain highways and public rights of way to a standard
appropriate to their use.
7.14 Within the LTP2, the Haven Gateway forms one of the five Area Transport Delivery
Strategies that have been identified. It is recognised within the plan that the level of
growth expected in the Haven Gateway, specifically Colchester (17,000 dwellings to be
located in and around Colchester town, and 8,500 to be built in Tendring District), will
bring a number of transport opportunities and challenges.
Tendring District Local Plan
7.15 The overriding aim of the Tendring Local Plan is to, “reduce the need to travel and
promote an integrated transportation system, which meets the needs of the whole
community, encourages economic growth and minimises environmental damage.” As part
of this, new development needs to integrate with all forms of transport provision and
ensure that transport needs generated by new development are met.
Capacity of existing infrastructure
Highways
7.16 Current levels of congestion on the strategic highway network are shown in Figure 7.2
(sourced from the Essex Local Transport Plan 2006 -2011). This shows the Congestion
Reference Flow (CRF) which is a measure of the ability of a particular highway link to
accommodate the traffic imposed on it. The CRF is determined by a combination of
factors including traffic composition (e.g. HGV content), traffic flow variation and type of
link. When actual daily traffic levels reach the CRF value (1.0) it is expected that
congestion will occur in the peak periods on a regular basis. When the CRF value
exceeds 1.0, congestion will be experienced during peak and off-peak periods.

Tendring Infrastructure Study – Part One Final Report
Roger Tym & Partners with Peter Brett Associates September 2009 44
Figure 7.2 Highway network congestion – present day
7.17 Currently the majority of the strategic highway network is operating within capacity.
Discussion held with Essex County Council’s Environment, Sustainability and Highways
department supported this view. However, pinch points can be identified on the A133
between Crabtree roundabout and Green Lane roundabout, where CRF values are
between 0.8 and 0.99. It is likely that this section of the highway network will become a
constraint in the future. The A120 is currently operating within capacity.
7.18 The CRF flow focuses on link capacity. However the significant limiting factor on the links
will be the key junctions. With regard to the A133 the key junctions are the Crabtree
roundabout and Green Lane roundabout.
7.19 Investigating the A133 pinch point further, localised junction modelling was undertaken of
the existing situation at Crabtree roundabout and Green Lane roundabout. Essex County
Council provided turning count surveys of the junctions undertaken in July 2008, and this
base data was used within the ARCADY model.
7.20 The results show significant queuing on the A133 northbound from Clacton-on-Sea in the
AM peak (0800-0900), and on the A133 southbound in the PM peak (1700-1800). Green
Lane roundabout showed less queuing. Full modelling outputs are contained within
Appendix 3. Maximum queues seen are 84 vehicles in the AM peak and 30 vehicles in the
PM peak on the A133.

Tendring Infrastructure Study – Part One Final Report
Roger Tym & Partners with Peter Brett Associates September 2009 45
7.21 In discussion with Essex County Council it was also noted that access roads leading to
the coast get congested on sunny days. In particular, the B1029 approach to Brightlingsea
experiences queuing on occasions as it is the sole access into the town.
7.22 Figure 7.3 shows fatal accident locations over the last three years within Tendring District,
as obtained from Essex County Council. It can be seen that there are not a significant
number of fatal accidents in the district giving rise to concerns or the need for mitigation.
Figure 7.3 Fatal accidents in Tendring District, 2005-2008
Public Transport
7.23 A public transport accessibility model, Accession, has been used to show how accessible
the District is with regard to public transport services. This accession work highlights the
current areas of under provision and can be used to develop a strategy for serving areas
and highlighting the best areas for the location of sustainable developments.
7.24 Figure 2 shows the peak rail capacity utilisation across the district, as obtained from the
Great Anglia Route Utilisation Strategy (December 2007). This shows the Capacity
Utilisation Index (CUI). The CUI, developed by Network Rail, is a measure of how much of
the available capacity on a section of line is used by the train service taking account of
route characteristics, timetable, the order of trains in the timetable and the headways.
7.25 Figure 7.4 indicates that there are no significant capacity issues on any of the lines within
Tendring district. The maximum capacity utilisation seen is up to 30-70%, on the
Colchester to Manningtree and Colchester to Clacton and Walton-on-the-Naze lines. The
Manningtree to Harwich line sees a particularly low capacity utilisation currently with less

Tendring Infrastructure Study – Part One Final Report
Roger Tym & Partners with Peter Brett Associates September 2009 46
than 30%. Utilisation greatly increases when reaching Colchester and in particular onward
travel to London.
Figure 7.4 Rail capacity utilisation
7.26 It is understood, from discussions with First Group that the bus network currently operates
within capacity. Although services cover the majority of the district, service frequencies
are generally low apart from in town centres such as Clacton-on-Sea, Harwich and
Walton-on-the-Naze. This is shown in Figure 7.5.

Tendring Infrastructure Study – Part One Final Report
Roger Tym & Partners with Peter Brett Associates September 2009 47
Figure 7.5 Bus frequency
Committed Development
7.27 The most significant committed development within the district that is likely to affect future
transport infrastructure needs is Bathside Bay, a £300 million container terminal
development that will make Harwich International Port the second largest container port in
the UK. Planning permission was granted in March 2006 and permissions will run out in
2016.
7.28 Road and rail infrastructure is already in place, servicing the present Harwich International
Port; however, upgrades to the A120 have been recommended by the London to Ipswich
Multi-Modal Study (LOIS) which has been carried out on behalf of the Government.
7.29 In particular LOIS recommended dualling of the A120 between Hare Green and the
Ramsey roundabout to give improved access to the Harwich ports, significant accident
benefits and support for rural regeneration policies. This was identified within the
Inspectors Report for Bathside Bay, where it was stated that the A120 Hare Green to
Harwich dualling was identified as a longer term proposal (post 2016). It was also stated
that in July 2003, the Secretary of State - in referring to the dualling of the A120 between
Hare Green and Harwich – indicated that the scheme is for the longer term and that he
was not asking the Highways Agency to prioritise work on it at that stage as it would
require further detailed examination. In the shorter term, it was suggested that the
Highways Agency address safety issues within its Route Management Strategies.
7.30 As stated within the Inspector’s Report:

Tendring Infrastructure Study – Part One Final Report
Roger Tym & Partners with Peter Brett Associates September 2009 48
“In the base case Traffic Impact Assessment, Bathside Bay Container Terminal (BBCT) would - when fully developed - introduce 3,000 extra 2-way HGV movements/day onto the A120. The volume of traffic on those sections of the A120 between Hare Green and the A120/Little Bentley/Bentley Road junction, and between the Horsley Cross and Ramsey Bridge roundabouts, would exceed the Congestion Reference Flow (CRF) by about 2010/11. These sections of the A120 would need to be improved to at least wide single 2 lane carriageway (WS2) standard if they were to accommodate this level of traffic.”
7.31 Improvements in the short term would however also be needed for the A12/A120/A1232
Ardleigh Crown interchange, the A120/Harwich Road, Wix junction, the A120/Church
Hill/Main Road Ramsey Bridge roundabout and the Parkeston roundabout.
7.32 Development of Bathside Bay will not go ahead until a Preferred Route Announcement
has been made for the A120, together with associated works. Hutchinson Ports UK
Limited (HPUK) would fund any road improvements necessary. If the development does
go ahead, there would be a period of several years from the opening of Phase one of the
development during which an HGV capping measure would operate until the necessary
highway works have been completed.
7.33 In addition to Bathside Bay, Pond Hall Farm, a 27ha site located to the south of the
Dovercourt bypass on land north of the main residential areas of Dovercourt, is allocated
for the development of a new business park for storage and distribution along with general
and light industrial uses. As part of this new development a new access will be needed
directly onto the A120.
7.34 Assuming the Pond Hall Farm site remains an employment-only land use, an at-grade
roundabout access onto to A120 would be appropriate, as advised by the Highways
Agency. The construction cost of this would be in the region of £750,000. The full cost of
the works, including earthworks, telecoms diversions, drainage works and other
infrastructure is likely to come to approximately £1.5 million. The timescales for delivering
an access onto the A120 is likely to be up to three years from application to completion.
7.35 Aside from the access onto the A120, there is also a possibility that if Pond Hall Farm
goes ahead in conjunction with Bathside Bay, the road will need to be dualled from
Ramsey roundabout eastwards to Parkeston roundabout, or there will be a need to
provide suitable demand management measures to ensure the trunk road continues to
operate within capacity. The cost of this, at least in part, may have to be borne by the
Pond Hall Farm developers.
7.36 If the A120 is required to be dualled on this section, the likely cost would be in the order of
£20 million. Such a scheme represents a long term aspiration for the District Council and
is expected to be addressed in the first review of the LDF.

Tendring Infrastructure Study – Part One Final Report
Roger Tym & Partners with Peter Brett Associates September 2009 49
Needs
7.37 The housing requirements for the district, as provided by the East of England Plan, will
need to be supported by appropriate transport infrastructure. It has been assumed that the
dwellings will be allocated across the district, but with the majority being located in the
major coastal towns of Clacton-on-Sea and Harwich.
Highways
7.38 Figure 7.6 (sourced from the Essex Local Transport Plan 2006 -2011) shows that by
2021, under a ‘do nothing’ scenario, congestion on the strategic highway is expected to
rise with the additional housing proposed within the East of England Plan (i.e. 8,500
dwellings for Tendring).
Figure 7.6 Highway network congestion, 2021 Do Nothing scenario
7.39 Clacton-on-Sea/Walton-on-the-Naze: In particular the A133 between Crabtree roundabout
and Green Lane roundabout will become increasingly congested in both the peak and off-
peak periods, and links to Walton-on-the-Naze and Clacton-on-Sea will also see
increased congestion in the peak periods.
7.40 It can be seen therefore that the allocation of significant levels of new development within
the Clacton-on-Sea or Walton-on-the-Naze areas will potentially require improvements or
upgrading of certain sections of the A133, or a robust sustainable transport strategy.
7.41 It is difficult to be exact on what level of development would represent the ‘tipping point’,
such that the A133 improvements are then required. However, it is considered likely that a

Tendring Infrastructure Study – Part One Final Report
Roger Tym & Partners with Peter Brett Associates September 2009 50
figure of approximately 50% of the total development levels assessed (3,000 dwellings
across Clacton and Walton) would potentially create unacceptable levels of congestion.
Essex County Council are currently undertaking a modelling exercise to understand fully
the impact this development might have on the A133.
7.42 What is clear is that currently, congestion is experienced in the peak periods on the pinch
point on the A133. Therefore, further development will put further pressure on this pinch
point and improvements are likely to be needed for relatively small additional levels of
development.
7.43 Harwich: The A120 is shown to have no capacity constraints by 2021 with the addition of
the East of England housing allocations. Therefore, with the housing allocation only, it can
be assumed that upgrades to the A120 will not be necessary.
7.44 This plan however does not take into account the Bathside Bay development, which is
estimated to add up to 3,000 extra 2-way HGV movements per day onto the A1207. If the
Bathside Bay development was to come forward by 2016, Hutchinson Ports UK Limited
(HPUK) will need to upgrade the A120, including dualling of particular sections as well as
other minor improvements. If the development does go ahead, there would be a period of
several years from the opening of Phase One of the development, during which an HGV
capping measure would operate until the necessary highway works have been completed.
HPUK would fund the necessary highways works. This is the situation at present but it is
understood that the Section 106 agreement to which these requirements are tied has yet
to be signed.
7.45 Other areas of development: In addition to Harwich, Clacton-on-Sea and Walton-on-the-
Naze, a lower allocation of additional housing is proposed in Lawford/Manningtree/Mistley
and Brightlingsea. Although these areas of development will have a smaller impact there
may be local access issues arising, particularly where access to a town is by one road
only, e.g. Brightlingsea.
7.46 Sustainable Transport Strategy: The highway impacts stated above all presume that a
sustainable transport strategy would not be implemented with any new development
within the district, and that current mode shares will remain the same. However
sustainable transport and reducing the need to travel are key aims within the adopted
Tendring Local Plan, and therefore it is likely that car usage within the new housing
developments will be discouraged and more sustainable modes of transport encouraged.
This will create mode shifts towards public transport, walking and cycling. Whilst this will
lessen the impact of development on the strategic highway network, investment will be
required to improve the public transport system within Tendring.
Rail
7.47 Currently there are no capacity issues on the rail lines within Tendring District. With the
addition of the allocated housing development within the district, it is not envisaged that
there will be significant problems. Currently the main constraint on rail travel is the low
7 source: Inspectors Report on the Bathside Bay Inquiry

Tendring Infrastructure Study – Part One Final Report
Roger Tym & Partners with Peter Brett Associates September 2009 51
service frequency and journey times to key destinations such as London. In the future
demand for services may increase if the main coastal towns such as Clacton-on-Sea grow
significantly, and as such there may be a need to upgrade lines or increase services. New
rail services would be provided by the franchisee, currently National Express East Anglia.
Bus
7.48 Currently there are no significant capacity issues with the bus network in Tendring,
however, this, like rail, may be associated with the lack of demand for services. With the
new housing allocation within the district, demand for services, particularly local, may
increase which will require planning and delivering new services. One such area that this
might apply is West Clacton, where a significant amount of housing is planned. New
services would be provided by First Group, who would either pay for this directly or look
for an appropriate contribution. There will be a need to place greater emphasis on local
services to link the major housing developments at Clacton and Harwich with town
centres and local jobs - even if existing services are not very well used.
Accessibility
7.49 Accessibility analysis has been undertaken using the public transport modelling software,
Accession. This shows how accessible the potential development areas will be in terms of
public transport (rail and bus) times. The promotion of a sustainable transport strategy will
require good public transport accessibility. Figures 7.7 to 7.12 show the results of the
accessibility modelling.
7.50 Development sites located within town centres (Clacton-on-Sea, Harwich and Walton-on-
the-Naze) are closer to public transport nodes and therefore have the ability to access
more places within 60 minutes. From Clacton-on-Sea for example, Colchester and
Walton-on-the-Naze can be accessed within 31-40 minutes. From Harwich, Manningtree
can be accessed in 21-30 minutes.
7.51 By contrast, developments in more ‘greenfield’ locations have less accessibility. From the
edge of Clacton-on-Sea, Colchester can no longer be accessed within a 60-minute public
transport ride. Similarly, access from Brightlingsea to Clacton has a journey time of 60
minutes despite being relatively close in distance terms. Lack of accessibility to key
destinations by public transport will constrain development. Therefore as stated earlier,
there will be a need to place greater emphasis on local bus provision.
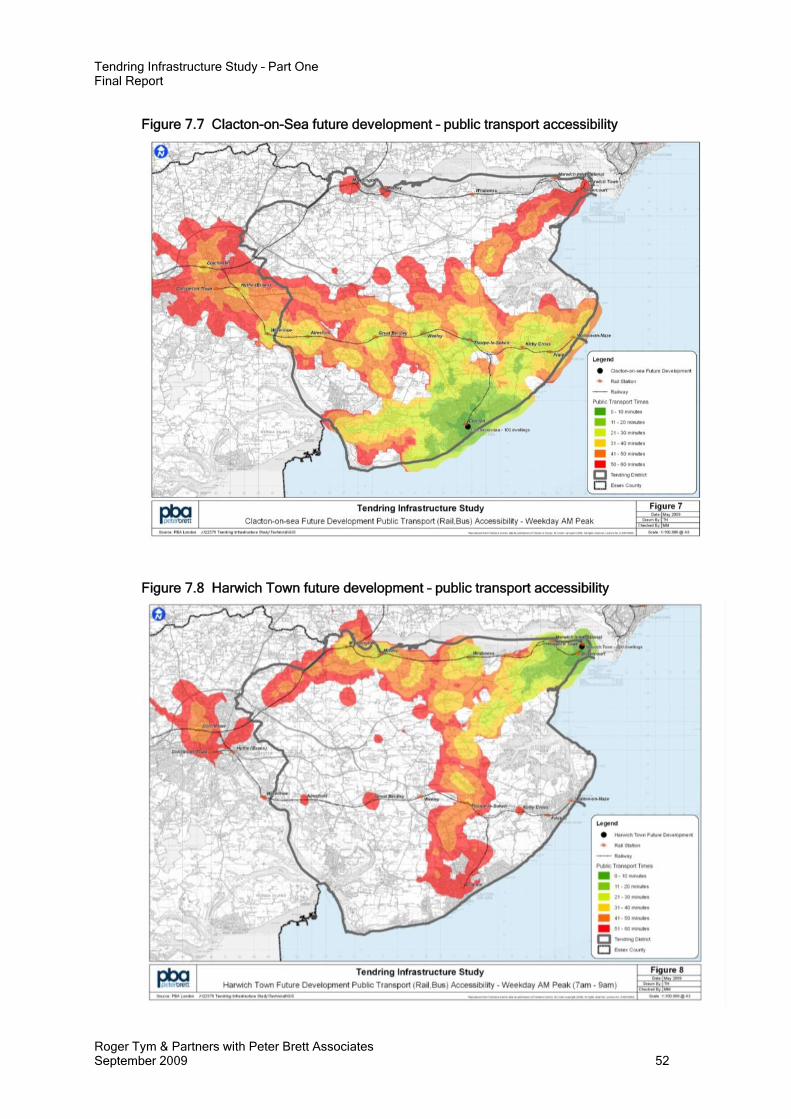
Tendring Infrastructure Study – Part One Final Report
Roger Tym & Partners with Peter Brett Associates September 2009 52
Figure 7.7 Clacton-on-Sea future development – public transport accessibility
Figure 7.8 Harwich Town future development – public transport accessibility

Tendring Infrastructure Study – Part One Final Report
Roger Tym & Partners with Peter Brett Associates September 2009 53
Figure 7.9 Walton-on-the-Naze future development – public transport accessibility
Figure 7.10 Brightlingsea future development – public transport accessibility

Tendring Infrastructure Study – Part One Final Report
Roger Tym & Partners with Peter Brett Associates September 2009 54
Figure 7.11 Lawford/Manningtree/Mistley future development – public transport accessibility
Figure 7.12 West Clacton future development – public transport accessibility

Tendring Infrastructure Study – Part One Final Report
Roger Tym & Partners with Peter Brett Associates September 2009 55
Costs
7.52 It is estimated that the cost of construction of the dualling of the A120 from Hare Green to
Ramsey will be in the order of £45 million. Dualling will need to come forward when the
Bathside Bay development is progressing, however, it is envisaged dualling will be a
longer term scheme, and in the interim shorter term improvements of the A120 will be
implemented in order to enable the early phases of the Bathside Bay development to be
operational.
7.53 The cost of providing access to the A120 for the Pond Hall Farm employment allocation is
likely to be in the order of £1.5 million (including construction costs, earthworks and
drainage works etc). This is assuming Pond Hall Farm remains an employment site only.
If further dualling of the A120 is required between Ramsey Roundabout and Parkeston
Roundabout the approximate cost would be likely to be in the region of £20 million. This
further dualling of the A120 would likely follow the dualling from Hare Green to Ramsey,
therefore would be covered by the first review of the Local Development Framework.
7.54 For the improvements to the A133 between the Crabtree and Green Lane roundabouts,
including upgrades of the roundabouts, the cost is likely to be approximately £12 million.
Funding
7.55 The main sources of funding available for transport infrastructure can be summarised as
follows:
Local Transport Plan (LTP) funding – LTP2 funding is now closed. There may be
potential for LTP3 funding which will run between 2012 and 2016;
Regional Funding Allocation (RFA) funding – This applies for schemes over £5m. As
part of this funding a Major Schemes Business Case needs to be prepared;
Growth Area Funding (GAF);
Growth Point Funding (GPF) – Haven Gateway now has Growth Point Status and can
therefore apply for this funding;
Community Infrastructure Fund (CIF) funding – this closes on May 22nd 2009. Future
funding for CIF currently unknown; and
Regional Infrastructure Funding (RIF) – This is a newer source of funding coming
forward and its applicability is currently unknown.
7.56 More information about these funds and the process for bidding for them is included in
Appendix 4.
7.57 In addition, developer contributions can be secured to help pay for infrastructure access
by all travel modes and to ‘pump prime’ new bus services. Typically, a developer may
need to provide a new bus service as part of a S106 agreement, or provide contributions.
Currently, the District Council are in pre-application discussions with Bloor Homes on a
400-dwelling proposal at West Clacton, where this will be discussed. If a developer has to
provide the service directly, they will go to bus companies and form an agreement. The
key point is that this process is negotiable. Only where a route is profitable will a bus
company provide it in any event.

Tendring Infrastructure Study – Part One Final Report
Roger Tym & Partners with Peter Brett Associates September 2009 56
7.58 Out of these sources of funding, the most significant will be LTP and RFA funding. In
financial years 2006/07 to 2010/11 Essex County was allocated £68.3 million from LTP
(integrated transport) funding. For the Colchester and Haven Gateway sub area, a
number of major schemes are highlighted within the delivery programme for 2006-2011.
These include £5m for the regeneration of Jaywick, £7.1m for countywide schemes,
£516,000 for urban traffic management schemes (potentially to resolve localised
congestion problems including in the Clacton-on-Sea area) and £150,000 for Community
Rail Partnership Station Enhancements (for promotion and support of the enhancement of
the Clacton branch rail line). The £12 million for the A133 upgrades could be sought from
LTP3 but it is unlikely that the full amount could be secured.
7.59 Previous funding from GAF has allocated £55,200,000 in 2008/09 – 2010/11 to support
schemes in Chelmsford, Braintree, Haven Gateway and Harlow.
7.60 It should be noted that the proposals for investment on the A120 from Stanway to
Braintree have been cancelled. This was a Highways Agency scheme and therefore does
not have any implications for money that might otherwise become available to spend in
Tendring because it was not under the discretion of Essex County Council.
7.61 The potential from these funding pots, by timescale, is shown in Table 7.1.

Tendring Infrastructure Study – Part One Final Report
Roger Tym & Partners with Peter Brett Associates September 2009 57
Table 7.1 Summary of funding allocations
£m
Comments 2006/07-
2010/11
2011/12 –
2015/16
2016/17 –
2020/21
2021/22-
2025/26
LTP - Essex Wide
LTP (integrated
transport)
£68.345 £68.345 £68.345 £68.345 This is the Essex wide figure. The first period is projected through to
2025/26.
LTP - Colchester and Haven Gateway Sub Area
Jaywick Regeneration £5 Funding will be made available for this through 2nd and 3rd LTPs (majority
3rd).
Countywide schemes £7.130 This is funding from the countywide programme (£68m) for Colchester and
the Haven Gateway.
Urban traffic
Management
£0.516 Delivery of a traffic management strategy to resolve localised congestion
problems including in Clacton-on-Sea.
Community Rail
Partnership Station
enhancements
£0.150 Promotion and support the enhancement of the Clacton branch rail line.
Total funding for Tendring related
schemes
12.796 12.796 12.796 This is the figure currently allocated for projects applicable to
Tendring District within the Delivery programme as outlined in the
Essex LTP 2006-2011.The first period is projected through to 2021/22
– 2025/26.
Growth Area Funding
GAF £55.200 * £92 £92 £92 * This figure is the allocation for 2008/09 -2010/11. Future projections
have been growthed up to 5 years. This is a provisional total allocated by
government to support schemes in Chelmsford, Braintree, Haven
Gateway and Harlow.
Growth Point Funding
GPF £12 £12 £12 £12 Identified for Haven Gateway as a Growth Point.


Tendring Infrastructure Study – Part One Final Report
Roger Tym & Partners with Peter Brett Associates September 2009 59
8 UTILITIES
Electricity
8.1 Electricity is generated from power stations and transmitted through a national network of
electricity lines operating at 275 and 400kv before connecting to local networks owned by
distribution companies. EDF Energy is the appointed distribution company for Tendring
district.
8.2 Electricity in Tendring is supplied from the National Grid transmission system to EDF
Energy at 132kV. Their Grid and Primary sub-stations supply the towns and villages at
33kV and within the catchments via smaller sub-stations and a network of underground
cables at 11kV.
8.3 The area is served by two 132/33kV (Grid) substations, one at Lawford supplying the area
to the north including Manningtree, Harwich and Dovercourt, the other at Clacton
supplying Walton, Frinton, Clacton and areas to the south. Each Grid substation supplies
several 33/11kV substations that finally provide the 11kV distribution network to meet the
local requirements.
Capacity of Existing Infrastructure
8.4 Generally across Tendring district there are no existing capacity issues. The Clacton
132/33kV substation is nearing capacity and is expected to require reinforcement in the
fullness of time. Lawford was reinforced a few years ago and so, at present, has a greater
level of available transformer capacity.
Needs
8.5 As stated above, the Clacton 132/33kV substation will need reinforcement at some stage
in the near future. This is expected to be achieved on the existing site with new larger
capacity transformers and 33kV switchgear.
8.6 Network capacity in the area to the west of Clacton is limited at present. Some
reinforcement has been taking place to maintain the network for generic growth. If an
additional 3,400 dwellings were developed there, it would exceed the existing headroom
available. This may prompt the establishment of a new 33/11kV primary substation in the
area. Land would be required to facilitate this - a new substation would require a plot of
approximately 30m x 40m - and should ideally not be located adjacent to housing. Initial
supplies to new housing would be available from existing 11kV circuits, with the new
primary being delivered when required. In addition, locating a further primary sub-station
to the west of Clacton could also support further development in the area if it was
required.
8.7 All other growth options would be capable of being accommodated by the existing
network of primary sub-stations. In all cases, there may be a requirement to install some
new 11kV network in order to provide new supplies. Development of this network in the
Kirby Cross area may require new crossings of Network Rail lines. However, none of this
is considered to be significant in terms of preventing development.
Tendring Infrastructure Study – Part One Final Report
Roger Tym & Partners with Peter Brett Associates September 2009 60
Costs
8.8 As a guide the current cost of a new sub-station – as may be required to serve high levels
of growth in West Clacton - would be in the region of £2m and the off-site network cable
works are likely to be between £1-3m, dependent on the extent to which operational and
upgrading works are needed to serve the developments.
Funding
8.9 The existing charging methodology is for developers to support the capital investment
needed to extend or reinforce the electricity network to their developments. The charges
made to existing connected customers does not support network extension; it supports
maintenance, repairs and generic reinforcement. Where a development prompts
infrastructure reinforcement they may be required to contribute towards the reinforcement
on a total or a proportional basis.
8.10 EDF may be prepared to fund some strategic infrastructure if that has the benefit of
reinforcing supply to the existing networks. However, the developer will be recharged a
proportion of these costs.
Priorities
8.11 If there is spare capacity within the system this will be allocated on a first come first
served basis. Developments located closer to the point of connection will generally
require a lower capital investment then developments located a distance from the major
infrastructure. EDF will look to invest in the existing infrastructure where customers are
experiencing problems with supply and will look to carry out the necessary reinforcement
works as a priority.
Timing of Provision
8.12 The installation of network and sub-stations to supply a new development could take in
the region of two to three years and this would be phased with the planned growth.
Issues
8.13 The assessment is based on existing network loading. The available headroom capacity
may change as a result of other new connections or increases in demand. This may affect
the assessment of need currently identified. A diverse approach to the increase in
provision of new dwellings across the district reduces the overall impact to the electricity
infrastructure, making large scale projects unlikely.
Gas
8.14 Gas is delivered through seven reception points into the United Kingdom and distributed
through a National Transmission System (NTS). National Grid is responsible for the NTS
which covers the whole of Great Britain.
8.15 A series of off-take points in the NTS supplies gas to twelve Local Distribution Zones. In
the Tendring area, National Grid Gas is the licensed gas transporter.

Tendring Infrastructure Study – Part One Final Report
Roger Tym & Partners with Peter Brett Associates September 2009 61
Capacity of Existing Infrastructure
8.16 Across Tendring district there are no existing capacity issues.
Needs
8.17 All of the possible growth locations, based on the indicative dwelling numbers, currently
have sufficient good quality infrastructure gas mains to support development. The exact
needs will depend on the specific requirements of the particular development (i.e. exact
locations and whether the existing network is providing low pressure/medium pressure,
etc).
8.18 The only growth options that would cause a potential requirement for reinforcement would
be those at St. Osyth (200 dwellings), Brightlingsea (600 dwellings), and Walton-on-the-
Naze (1,000 dwellings). The reason for this is that these locations are at the extremity of
the infrastructure network.
Costs
8.19 The costs of upgrading the existing network – as opposed to providing new infrastructure –
are comparatively small.
Funding
8.20 The expectation by National Grid is that the cost of the network infrastructure both on-site
(i.e. direct services to dwellings) and off-site (i.e. new connections to provide gas from the
National Grid) will be borne solely by developers. The gas company may wish to install
strategic pipelines at an early stage of the developments and will recharge a proportion of
the costs to each developer.
Priorities
8.21 If there is spare capacity within the system this will be allocated on a first come first
served basis. Developments located closer to the point of connection will generally
require a lower capital investment then developments located a distance from the major
infrastructure.
Timing of Provision
8.22 Given that only upgrading of the network is needed, National Grid Gas would be able to
supply these new loads, or reinforce them on a reasonably short timescale, i.e. within six
months. Therefore, the need would follow the planned provision of development.
8.23 Only if a large number of loads are added to the network in a short period of time could
the upstream systems be overloaded. These reinforcements could cause delays in "gas
on dates" but these delays are not considered to be significant within the context of the
likely programme of housing delivery.
Issues
8.24 It will be important to fully engage with National Grid Gas once specific site information is
available, specifying what size loads are likely to be connected and a proposed time
scale. Within NGG’s Network Planning, infrastructure budgets are heavily regulated and
constrained by OFGEM (the gas regulator). This means that reinforcement projects are

Tendring Infrastructure Study – Part One Final Report
Roger Tym & Partners with Peter Brett Associates September 2009 62
planned on a very reactive basis as and when new loads connect to the network. The
connections analysis process and regulatory rules force a reactive, rather than proactive,
approach and any reinforcement requirements are subject to an economic test to
apportion costs. As a wider issue – outside the confines of the study – it will be important
for the infrastructure planning system to work with NGG in order to determine whether a
more proactive approach can be taken.
Telecommunications
Introduction
8.25 This section considers telecommunications infrastructure in Tendring. We review this
subject briefly because landline and broadband provision is dealt with between
developers and providers.
Capacity of existing infrastructure
8.26 We understand there are some current broadband capacity issues in Tendring. ADSL
Max (8Mbps) enabled broadband presence in Essex is 98.4%, although it is 100% in
many other areas of the country8. There are currently the following exchanges in
Tendring:
Harwich
Clacton-on-Sea
Frinton-on-Sea
Holland-on-Sea
Brightlingsea
St Osyth
Little Clacton
Weeley
Great Bentley
Wivenhoe
Ardleigh
Manningtree
Wix
Ramsey Source: – www.samknowsbest.com
Needs
8.27 There are no infrastructure requirements on the public sector for providing either fixed-line
or mobile telecom services. BT has an obligation to provide a landline to every household
in the UK, and developers will want to facilitate this otherwise their developments will be
unsellable. The market is functioning well in this regard and there is no need for public
involvement. Mobile phone provision is also a matter for private sector provision. The
8 www.samknowsbest.com

Tendring Infrastructure Study – Part One Final Report
Roger Tym & Partners with Peter Brett Associates September 2009 63
main requirement is for sites for masts. This is dealt with through the development
system.
8.28 Broadband access is also almost universally available through the market, so this places
no infrastructure demands on the public sector either. Business users can purchase
additional bandwidth to speed up their internet access if they wish to. Those requiring
speeds higher than ADSL (up to 8 mbps) can obtain increased bandwidth through the
market.
8.29 It is noted that many users across the district have complained of slow or intermittent
broadband access.
Costs
8.30 As the infrastructure provision is private investment, we have not felt it necessary to
identify the costs.
Funding
8.31 In the case of both fixed-line and mobile, telecoms, new infrastructure will be funded from
the capital programmes of BT and also cable companies, where the latter operate.
8.32 The Digital Britain review mentions a universal access to 2mbps broadband by 2012, but
is unclear on exactly how this will be funded (although it appears to be an extension of
BT’s Public Service Obligation on phone provision across the broadband industry). By
the summer, the review will decide whether the government needs to invest in next-
generation broadband - a superfast network which would further revolutionise
communications and, so the theory runs, stimulate the economy.9
Priorities
8.33 Telecom services should be rolled out as the new housing and commercial development
is built so the issue of priorities does not arise.
8.34 If issues of prioritisation arise with regard to high-speed internet access, BT and other
providers should be encouraged to give priority to employment areas, although they will
probably wish to do so on commercial grounds in any event. But it is important to note
that many existing residents are currently experiencing poor levels of broadband
connectivity and performance. This needs to be addressed.
8.35 We have shown above that these infrastructure costs are generally picked up by the
private sector. They do not represent a priority for public sector investment.
Timing of provision
8.36 Our assessment concentrates on infrastructure provided by the public sector. Telecoms
connections are dealt with privately by the developer. We have therefore not made any
timing assumptions.
9 http://www.culture.gov.uk/what_we_do/broadcasting/5631.aspx

Tendring Infrastructure Study – Part One Final Report
Roger Tym & Partners with Peter Brett Associates September 2009 64
Key issues and conclusions
8.37 We do not consider that the provision of telecoms infrastructure gives rise to any
significant issues. It will not be a showstopper. However, there is a need to improve the
levels of broadband quality serving existing residents and, by extension, all future
residential developments.
Water – Potable Supply
8.38 The provider of potable (drinking) water supply to Tendring district is Tendring Hundred
Water Services Limited.
Capacity of Existing Infrastructure
8.39 Existing infrastructure is sufficient to deliver current demand.
Needs
8.40 Nearly all of the major locations – Clacton, Frinton/Walton, Manningtree/Mistley/Lawford
and Brightlingsea - either definitely or almost certainly have sufficient capacity to supply
all the possible growth options. There are various issues that may impact on the need for
particular additional potable water infrastructure but will not be sufficiently significant to
potentially hinder development. These are:
Clacton Town Centre – the water mains in the town centre are generally small
diameter and therefore local mains reinforcements may be required. Special
consideration would need to be given for any high rise development as the maximum
mains pressure is potentially too low to support this;
Frinton - special consideration would need to be given for any high rise development
as the maximum mains pressure is potentially too low to support this; and
Dovercourt, Lawford/Manningtree/Mistley and Brightlingsea – some local offsite
reinforcement may be required depending upon the location of the development.
8.41 There is only one location that cannot come forward until new infrastructure is put in. This
is at Parkeston/Bathside which is dependent on a new service water reservoir being
provided on the outskirts of Dovercourt. This development is already planned. It is
important to be clear that this only relates to new greenfield development around
Parkeston/Bathside. The levels of development assessed within the existing Harwich
urban area will not, on their own, require additional infrastructure.
8.42 The other locations, although within the Company’s area of supply, have limited mains
capacity to serve them. This is principally because these are more rural locations that
have not seen significant development in the past, so little network capacity has been
needed or planned to support their needs.
Costs
8.43 Cost information has not been provided. This is partly because it is dependent on the type
and location of development. Also, it reflects the nature of the funding of water services,
which is explained below.

Tendring Infrastructure Study – Part One Final Report
Roger Tym & Partners with Peter Brett Associates September 2009 65
Funding
8.44 Any new development would be funded by the developer in accordance with the
requirements of the Water Industry Act. In reality, the actual payments made by the
developer for any on-site water main would be significantly less than the cost of the asset.
Any new service connection would be charged in accordance with standard rates and
standard infrastructure charges would also apply. Given the fact that revenue will fill the
shortfall, there are no funding issues with providing potable water supply.
Priorities
8.45 No priorities have been identified.
Timing of Provision
8.46 There are no particular priorities for timing identified.
Issues
8.47 No particular issues have been identified.
Water – Wastewater
8.48 The provider of wastewater services to Tendring district is Anglian Water.
Capacity of Existing Infrastructure
8.49 Across the East of England region as a whole, the sewage treatment works (STWs) and
sewer networks are largely at or near to capacity. This is true of Tendring district where
very little growth can be accommodated without the need for additional capacity to be
provided. The exception is Harwich, where a STW was completed approximately 13
years ago to cope with anticipated growth at that time. As this growth largely did not
materialise, there is sufficient capacity to accommodate potential levels of growth
identified for this area, subject to more detailed feasibility assessment.
8.50 Anglian Water would therefore support growth in Harwich to enable the treatment works to
operate efficiently.
Needs
8.51 Growth in most locations will require some form of expansion of the network. This will
either be in the form of an extension to an existing STW or additional tunnel networks.
8.52 In the major growth locations at Clacton, there would need to be an extension to the
respective existing STW. For development in West Clacton, there could be an issue with
the ability to expand the Jaywick STW (into which flows would discharge) if the full scale
of development was delivered. Therefore, the solution would either be to develop a new
STW in the nearest appropriate location or to move the existing STW to a new location
capable of supporting a larger facility. Development in other parts of Clacton would
require upgrading of Clacton STW and new sewers. In all cases the level of additional
infrastructure required is directly related to the scale of development.
8.53 For all development at Harwich the existing STW is located to the north of the town and
discharges into the River Stour. Therefore, brownfield development in and around
Tendring Infrastructure Study – Part One Final Report
Roger Tym & Partners with Peter Brett Associates September 2009 66
Harwich Town/Dovercourt should be capable of being supported, as long as the tunnel
sewer can be accessed. Development at Parkeston/Bathside would be on the other side
of town to the STW, so would need significant additional sewer networks to be able to
access it. The greater the level of development, the more significant the infrastructure
requirement. Subject to maximising use of the tunnel sewer, there is sufficient treatment
works capacity (subject to more detailed feasibility assessments) to accommodate the
levels of potential growth in the Harwich area.
8.54 Development in Frinton/Walton is likely to be capable of being accommodated in terms of
the capacity of the existing STW, but there is likely to be a need for upgrading to existing
sewers or new sewers.
8.55 Development on the Colchester fringe would discharge into the Colchester STW. This has
capacity to accommodate such levels of growth but the sewer network would need to be
expanded.
8.56 Development at Lawford/Manningtree/Mistley would require expansion of the existing
Manningtree STW. The same applies to any development at Brightlingsea.
8.57 Elmstead Market and Alresford are served by the Thorrington STW. This is a bio bubble
STW and is comparatively new. When taken together, development at these locations
should enable a small expansion of the capacity that this STW can accommodate, such
that development could be supported. However, it is likely that new sewers will be
needed.
8.58 Development at Great Bentley and St Osyth could not be supported by the existing STWs,
so both would need expansion.
8.59 Development at Thorpe-le-Soken would flow into the Clacton STW which has sufficient
capacity to support this development.
Costs
8.60 At this point, it is not possible to determine the cost of extensions to existing STWs or the
cost of providing additional sewer networks. This will need to be determined when
particular schemes are assessed. However, the nature of funding of waste water services
means that costs are not likely to create issues for the delivery of infrastructure needs
(see below).
Funding
8.61 Capital spending on waste water services is funded by the revenue collected from existing
customers. Anglian Water produces a 5-year Asset Management Programme that is
approved by OFWAT. The current 5-year plan is expected to be determined shortly. This
identifies all needs over the next five years.
8.62 On large developments, Anglian Water would expect to see developer contributions being
used to support early delivery of waste water facilities.
8.63 Anglian Water only pays for waste water services related to residential development. The
costs for serving employment and retail development are expected to be met in full by the
developer.

Tendring Infrastructure Study – Part One Final Report
Roger Tym & Partners with Peter Brett Associates September 2009 67
Priorities
8.64 Anglian Water does not consider that there are any particular priorities for growth. The key
issue is timing of provision (see below).
Timing of Provision
8.65 The lead-in times for providing new facilities are considerable. Depending on the size of
the additional facilities (which in turn are directly related to the scale of additional housing
growth) and their location, the expansion of an existing STW would take between 2½ and
5 years. A new STW would take up to 8 years to provide.
8.66 Therefore, any major growth that would require expansion of an existing STW would have
a significant lead-in time.
Issues
8.67 At present it is assumed that there is the land available to extend existing STWs.
However, if there is not (and there is doubt over the ability to expand the Jaywick STW)
then the additional land would have to be acquired which would create additional costs.
This would need to be determined when considering specific schemes.
8.68 It will be the role of the Part Two study to look at the need for and potential to expand
existing STWs.


Tendring Infrastructure Study – Part One Final Report
Roger Tym & Partners with Peter Brett Associates September 2009 69
9 WASTE
9.1 Essex County Council is responsible for the treatment and disposal of municipal waste.
Tendring District Council is responsible for the collection of household waste. The brief for
the study makes it clear that only the management (i.e. treatment and disposal) of waste
should be considered. Therefore, it is only the County function that is relevant.
Key Documents
Essex Waste Strategy 2007 - 2032
9.2 In order to meet the requirements of the EU Landfill Directive, the Government has set the
following targets for recycling and composting of household waste: at least 40% by 2010,
45% by 2015 and 50% by 2020. There are also specific targets for reducing the amount of
biodegradable municipal waste going to landfill to:
75% of 1995 levels by 2010;
50% of 1995 levels by 2013; and
35% of 1995 levels by 2020.
9.3 In practice, this would mean having to dispose of 225kg of residual waste per person by
2020.
9.4 The Essex Waste Strategy states that municipal waste in Essex is currently increasing by
less than 0.5% per annum. This is based on a 7-year historical trend of waste generation
in Essex, which has been 1% per annum. The Strategy estimates that in the future, that
rate will be 0.5% per annum. This projected growth takes into account an increasing
population and an increase in household numbers, as well as behavioural changes from
the public, such as reuse and recycling, reduced packaging, etc.
9.5 In terms of costs, the Strategy states that the average gross cost of municipal waste
management of the Essex CC (as reported under Best Value Performance Indicator 87)
has increased from £35.66 per tonne in 2001/02 to £60.64 per tonne in 2006/07. Whilst
this increase is partly due to service improvements, the increases are mainly as a result of
the Landfill Tax price escalator and other landfill related factors such as diminishing
landfill void space, tougher legislation governing landfill engineering and cost inflation.
Total landfill costs for Essex County Council amounted to £23.3 million in 2006/07. Costs
of waste collection per household in Tendring were £33.60 in 2006/2007.
Capacity of Existing Infrastructure
9.6 There are currently five Recycling Centres for Household Waste in Tendring, located at:
Clacton;
Dovercourt;
Kirby-le-Soken;
Lawford; and
St Osyth.
9.7 The Waste Strategy states that Essex as a whole has been successful in achieving
continued reductions in the total amount of municipal waste going to landfill each year and
Tendring Infrastructure Study – Part One Final Report
Roger Tym & Partners with Peter Brett Associates September 2009 70
increasing recycling rates for household waste year on year. At present there are no
known shortfalls in provision for existing waste transfer and treatment facilities or for
recycling services.
9.8 Equally, there is no known clear surplus in existing facilities. However, with the change in
the type of provision – related to the targets for increased recycling and waste processing –
some of the existing facilities will become obsolete over the long term.
Needs
9.9 The Waste Strategy does not identify a physical infrastructure need as such. However, in
order to deliver the targets in the Strategy for recycling and treatment of waste, it will be
necessary to overhaul the service. To do this, new facilities are required.
9.10 As part of understanding future needs, Essex County Council has undertaken an options
appraisal. In the outset, this looked at the potential for one or two waste processing plants
serving the whole of Essex, or a series of much smaller facilities dotted about the County.
It was determined that the preferred approach was to have either one or two facilities, and
further analysis settled on a two-site approach.
9.11 Although the locations of these two sites have not been finalised – this will only be done
once a bid for Private Finance Initiative funding has been approved – it has been
confirmed that neither will be in Tendring, therefore there are no needs relating to the
district.
Costs
9.12 New households potentially give rise to the following requirements:
Civic Amenity Sites or Recycling Centres for Household Waste (RCHW) – These may
need to be extended, redeveloped or relocated to accommodate the increased waste
throughput. The costs of extending an existing site may be very small if the extension
is modest, but a new site may cost up to £2.5 million;
Waste Transfer Stations – Depending on the location of new development, it may be
more economical to transfer waste from collection vehicles for onward transport to
treatment/disposal facilities. The cost of a waste transfer station is of the order of £1.5
million; and
Waste Treatment Facilities – These typically have a lifespan of at least 25 years and
need to be designed to accommodate housing and waste growth over this period. It is
generally not feasible to extend or upgrade waste treatment facilities and the capital
costs for providing one large enough to deal with growth over its life must be borne at
the beginning of the project. Costs depend on scale and technology adopted.
9.13 However, given that there are no needs associated with future waste provision in
Tendring, there are zero costs as well.
Funding
9.14 In order to deliver the objectives of the Waste Strategy and to meet environmental and
legislative targets, Essex County Council estimates that an investment of £300m of capital
funding is needed in Essex and Southend (on the basis of a joint working approach) over
the next five years or so to provide the new facilities required.
Tendring Infrastructure Study – Part One Final Report
Roger Tym & Partners with Peter Brett Associates September 2009 71
9.15 Essex County Council has put together an Outline Business Case for new strategic waste
facilities. The purpose is to seek funding for these needs through the Private Finance
Initiative (PFI).
9.16 The bid – and the identified need for two facilities – is based on several assumptions.
These include the forecasts of population growth from the Office for National Statistics
and the forecast change in the number of households that informed the East of England
Regional Spatial Strategy.
9.17 It is understood that only 50% of the funding for capital need will come from PFI. Of the
remaining £150m, Essex County Council considers that it will be able to cover the full
outstanding amount through private finance funding sources with the public sector
meeting the service costs that are recharged.
Priorities
9.18 It is clear that the construction of these two waste facilities represents a priority for the
county as a whole, including Tendring.
Timing of Provision
9.19 It is understood that these facilities are to be provided within the first five years of the LDF
period (2011-2016).
Issues
9.20 There are no issues associated with this assessment.

Tendring Infrastructure Study – Part One Final Report
Roger Tym & Partners with Peter Brett Associates September 2009 73
10 CEMETERIES
Capacity of Existing Infrastructure
10.1 There are presently four cemeteries within the district:
Clacton
Dovercourt
Kirby-le-Soken
Walton-on-the-Naze
10.2 The cemetery at Walton is closed to new burials (i.e. it will accept burial of family
members of those already buried there) but the other three still have available burial
space. The cemetery at Kirby is sufficiently close by and with sufficient space to
accommodate the needs of Frinton, Walton and Kirby for the duration of the plan period.
10.3 The Clacton facility has an adjacent plot which was to be used for further burials. Whilst it
has some difficult land conditions, it is considered that there is sufficient burial space for at
least the next 20 years.
10.4 The Dovercourt facility currently has plenty of space, sufficient to cover at least the
duration of the plan period.
Needs
10.5 Subject to mitigation against the ground conditions on the land at Clacton cemetery, there
is no need for any further burial space in Tendring.
Costs
10.6 There are no costs to be addressed.
Funding
10.7 No additional funding is required for any capital growth.
Priorities
10.8 There are no priorities.
Timing of Provision
10.9 The additional space required at Clacton must come forward when required.
Issues
10.10 There are no issues.

Tendring Infrastructure Study – Part One Final Report
Roger Tym & Partners with Peter Brett Associates September 2009 75
11 DEVELOPER CONTRIBUTION FUNDING
Introduction
11.1 In the previous sections we have considered the existing capacity of different types of
infrastructure in Tendring, and an indication of what the future needs and costs issues are
likely to be in response to growth. We also considered what mainstream funding issues
there will be in meeting these potential needs and costs.
11.2 There has generally been insufficient mainstream funding to meet all infrastructure needs
and costs resulting from growth in the past. Developer contributions have been (and are
likely to continue to be) critical to helping to fund new infrastructure requirements.
Our remit
11.3 It is therefore necessary to consider potential developer contribution funding as part of an
infrastructure delivery plan. In this section we have assessed:
Past levels of developer contribution funding;
Factors affecting developer contribution funding; and
Indicative potential developer contribution levels for different types of development in
Tendring.
Background
Each development site is unique
11.4 Development is not a homogenous product; all the development sites identified to
potentially accommodate the identified growth are different. At a fundamental level, the
location of each site is unique. However, there are also likely to be potentially large
differences in the value a site will generate from development, the cost of such
development (including site acquisition costs) and the timing of when the development will
be delivered.
The potential development contribution “pot”
11.5 To understand what level of developer contribution a site could potentially provide
towards funding infrastructure, it is important to understand how value is created by
development to afford this.
11.6 As Figure 11.1 shows below, a theoretical surplus available for developer contributions
can be created where development value exceeds total costs (which includes developer
profit).

Tendring Infrastructure Study – Part One Final Report
Roger Tym & Partners with Peter Brett Associates September 2009 76
Figure 11.1 Estimation of developer contribution approach
Total Development Value
Minus
Land Acquisition Costs
Minus
Total Development Costs
Minus
Developers Profit
= Theoretical Surplus Available to Fund Developer Contributions
11.7 This theoretical surplus or contribution “pot” (where it exists) is a finite amount, and can be
used by a developer to pay for required contributions. These contributions can include
on-site infrastructure such as schools and/or financial contributions such as for strategic
transport infrastructure and open space.
Past contribution levels
11.8 We have been provided with information from the Council on contribution levels for 20
developments in Tendring (see Appendix 5). This information indicates financial
developer contributions ranged from £0 to £8,000 per unit and affordable housing of 0 –
100%. Unsurprisingly, the higher financial contributions levels (for infrastructure such as
open space, education and transport) were achieved where low (or no) affordable housing
was required.
Factors affecting future contribution levels
11.9 The following key variables will affect the general level of developer contribution that
could be available from growth, and how much variation there will be between sites:
The level of land values needed to maintain an adequate flow of land onto the market
(or the site acquisition cost where it has already been acquired by a developer);
The types of sites earmarked for development in the context of their existing use value
and preparation costs;
Whether there are different markets in terms of demand, supply and general sales
values the earmarked sites are located in;
General economic issues such as the affect of the credit crunch on sales values and
demand;
Policy issues such as layout and design rules, and sustainability requirements (such
as Code for Sustainable Homes code levels); and
Potential availability of Housing and Communities Agency grant for affordable housing
contributions.
11.10 Some of the key variables outlined above are discussed below.
House prices and the property market
11.11 House prices are one of the main determinants of the level of potential theoretical value
that a development creates which could be captured by a local planning authority as
Tendring Infrastructure Study – Part One Final Report
Roger Tym & Partners with Peter Brett Associates September 2009 77
developer contributions. As house prices can vary significantly across a district, so
therefore can the potential developer contributions that could be secured to help fund
infrastructure.
11.12 The Fordham Research Affordable Housing Site Viability Study (2006) identified four
broad categories of development in Tendring:
High value locations such as Frinton and Mistley;
Medium-high value rural inland locations such as Ardleigh;
Medium value locations such as Little Clacton; and
Low value sites in less attractive locations such as Dovercourt, Jaywick and some
parts of Clacton.
11.13 When the study was carried out the property market was close to its “peak” in terms of
house prices. The Fordham report suggested prices at this time varied between less than
£2,000 per sq m in lower value areas to in excess of £2,500 per sq m in high value areas.
House prices are falling
11.14 We are currently in an unstable housing market, with house prices having fallen
significantly since 2007/8.
11.15 The Royal Institution of Chartered Surveyors (RICS) 2009 Housing Forecast reports the
consensus view is that residential prices (based on the mortgage approval indices
compiled by HBOS and the Nationwide Building Society) are likely to decline by 10% -
15% over the course of 2009, with the peak to trough drop of somewhere between 25%
and 30%.
Predicated timescales for recovery
11.16 There is, however, no consensus view on when values will recover fully to their 2007/8
peak. The RICS Housing Market Survey in June 2009 showed a reported decline in the
rate of price falls nationally. As noted by the Nationwide though, this is based on
abnormally low supply levels. It predicts additional supply is likely to come from
homeowners who see their financial position impacted by higher unemployment and lower
incomes. Increased demand is therefore one potential obstacle to continuing to build
towards a recovery.
11.17 In November 2008 Savills Research predicted that growth would return to the mainstream
by early 2011, with a full recovery to 2007 values in the South East by 2012, and the
South West, East Midlands, East of England, London and Scotland by 201310. Its latest
research in May 2009 predicts growth will not return to the mainstream now until late 2011
or early 201211. Knight Frank reported last year that “prices will take some time to recover
to their 2007 peak, a process which, on average, will be complete by 2015, led by central
London (2012) and concluded by Northern Ireland (2019)”.
10 Savills Research – UK Residential Forecast: Boom and Bust – The Inevitable Cycle? (November 2008) 11 Savills Research – Residential Property Focus: Housing market recovery, the four stages (May 2009)
Tendring Infrastructure Study – Part One Final Report
Roger Tym & Partners with Peter Brett Associates September 2009 78
11.18 Price Waterhouse Coopers UK Economic Outlook (July 2009) includes a more pessimistic
analysis of potential housing market recovery scenarios. Analysis of different economic
conditions shows that even in 2020, after five years of relatively strong growth, real house
prices are projected in a median scenario to be only around 8% above 2008 levels in real
inflation-adjusted terms. Furthermore, their analysis shows there is a 30% chance that
real house prices in 2020 could still be below 2008 levels.
Assumed recovery scenario
11.19 With no consensus on the recovery of the housing market, a possible scenario for the
future level of residential sales values in Tendring is set out below:
Bottom of the market (sales values 25% lower than “peak” levels): 2009-11
Partial recovery (sales values 10% lower than “peak” levels): 2012-14
Full recovery (sales values return to “peak” levels): 2015 +
Local authorities are currently under pressure to renegotiate Section 106 agreements
11.20 As house prices and demand have fallen significantly recently, developers who acquired
land at peak land values, and secured planning permissions before the credit crunch, are
now reassessing the viability of their schemes. In many cases, developers are arguing
their schemes are now unviable on the basis of the Section 106 requirements previously
agreed and are seeking to reduce these requirements. This may be due to genuine
viability issues (such as high abnormal costs and existing use values which are discussed
in more detail below) or because they paid too much for the land.
11.21 This suggests that developer contribution funding for infrastructure is likely be
compromised to some degree until the property and land markets recover.
The differences between brownfield and greenfield development
11.22 One of the key differences that will affect developer contribution levels is the land type.
The most recognised distinction is between “greenfield” and “brownfield” land.
11.23 Although brownfield land can usually support a higher density of development, particularly
where it is in an existing urban area, it still often less profitable to develop than greenfield
land due to the following:
Brownfield existing use values (EUVs) are often higher – The Fordham study in 2006
suggested agricultural land values (i.e. greenfield sites) were £4,000 per ha, but were
£450,000 per ha for industrial land. An agricultural landowner would expect a much
higher price for its land where a residential planning permission can be secured, and
the Fordhams study suggests a greenfield landowner would be prepared to sell at
£150,000 per ha. However, brownfield residential development sites often have
existing buildings on the site rather than been clear. For example, if the existing use
is industrial, the EUV of a site could be in the order of £2m per ha (depending on
factors such as the capital value of the existing buildings, site density etc) with
buildings, rather than £450,000 per ha without buildings; and
Brownfield development costs can be higher. - Brownfield land often has site specific
or “abnormal” development costs associated with it, such as remediation, demolition
and relocation of existing businesses that are not associated with greenfield

Tendring Infrastructure Study – Part One Final Report
Roger Tym & Partners with Peter Brett Associates September 2009 79
development. These costs often have a major impact on viability, and can render
sites unviable for development without public subsidy.
The importance of land costs
11.24 Land costs can form a significant proportion of development costs. As a consequence,
the land cost will have a major impact on the level of developer contributions that could be
secured.
11.25 As set out above, brownfield land with existing value for employment uses often costs
significantly more than greenfield land. As greenfield land forms a potential proportion of
the sites under consideration in this study, we have considered this in more detail.
11.26 The uplift in value of greenfield land on the grant of planning permission for residential
development is significant. However, much of this value goes to the landowner rather
than the developer in the form of eventual development profit. Capturing this landowner
value for developer contributions is critical to funding infrastructure.
11.27 In addition, due to its low existing use value, the land cost of greenfield land is usually
based on the “residual” land value i.e. the residual value after taking into account
projected development value, costs, profit and developer contribution requirements,
including affordable housing that can be paid for land. Consequently, if a developer has
assumed unrealistic values or much lower contributions than a local authority’s
contribution policy, then development may be either unviable or the LA will not receive its
required contributions (see para. 11.20 above).
11.28 Whether the land has already been acquired is therefore an important factor as to the
level of developer contribution that can be secured, particularly in the current market if the
land was acquired before the credit crunch at “peak” land prices.
Developer “options”
11.29 Most medium to large “greenfield” development sites that have been (or could be)
allocated for housing by the LPA are “optioned” by developers rather than purchased
outright. One key reason is due to the risks involved in trying to calculate a set price for a
development on a residual basis (where many costs and other variables such as
development density are unknown).
11.30 A developer will usually pay the landowner (such as a farmer) a non-returnable, but
relatively small, option fee (e.g. £100,000) to secure the legal right to acquire the land in
agreed circumstances. Within the option agreement, there will be a mechanism for
calculating what price will be paid by the developer for the land. This usually includes a
minimum (or “base”) land price (e.g. £250,000 per ha) the landowner will receive if the
developer exercises the option, and a mechanism for calculating a share of any further
value created by the development (usually a percentage of open market value). This
additional value (e.g. a further £250,000 per ha) will take into account development costs,
such as infrastructure costs required to service the site for residential development.
11.31 However, developers usually closely guard details of their option agreements, and
consequently obtaining this information is difficult (unlike, say, house prices which are
publicly available through the Land Registry).

Tendring Infrastructure Study – Part One Final Report
Roger Tym & Partners with Peter Brett Associates September 2009 80
11.32 Even where land was optioned in a strong market with more optimistic assumptions on
house prices, it is possible to secure reasonable developer contributions should the
market weaken (such as now) if the base land price is not breached. In this situation, the
lower development value will be passed on to the landowner through a lower land price
rather than reducing a developer’s profit resulting in unviable development or a need for a
renegotiated Section 106 agreement.
11.33 Indeed, even if a base option price is breached, to ensure reasonable contributions are
secured a developer can seek to renegotiate the terms of the option rather than
renegotiate the Section 106 agreement.
The impact of other planning policies
11.34 As set out above, the potential contribution “pot” from a development is limited. Other
planning policies, such as affordable housing, layout and sustainability requirements, will
need to be borne from this pot. Consequently, planning policies are not mutually
independent; for example, the greater the affordable housing requirements, the less
contribution will be available towards infrastructure and visa versa.
11.35 Affordable housing policy requirements often take a substantial amount out of this pot
(and in some instances render a development unviable). We understand there is a
regional expectation in the RSS that 35% of all new housing should be affordable. We
understand the current affordable housing policy of 40% is currently being reviewed, but
that significant change is not anticipated.
11.36 The Fordhams Study tested the viability of a number of sites in Tendring at varying
affordable housing requirement levels. Based on assumed developer contributions of
£1,650 - £11,600 per unit, it found that 40% affordable housing is only viable in higher
value areas, greenfield sites in other areas (assuming a low land value is required by the
landowner) or brownfield sites with few abnormal development costs.
Housing grant
11.37 The viability assessments in the Fordhams study were required to assume zero housing
grant for affordable housing. This is consistent with the Housing Corporation’s (HC)
previous national policy on grant funding to support procurement through Section 106
Agreements was that none would be available, unless the need for public subsidy could
be demonstrated. Importantly, the HC wished to ensure it did not subsidise land values
i.e. help maintain high land prices to the benefit of land owners.
11.38 In reality, we understand grant funding has been available for developments in Tendring
in the past. We understand from the Council that for the right scheme delivering a
balance of accommodation types with guaranteed delivery, grant rates in excess of
£60,000 per unit were being achieved for socially rented units.
11.39 We also understand the Homes and Communities Agency have recently released their
outturn figures for the East of England for 2008/09. These show an average grant per unit
of £47,545 for social rent (£12,873 per person) and £22,354 per unit for low cost home
ownership (£6,077 per person). This reflects payment of higher grant rates in order to

Tendring Infrastructure Study – Part One Final Report
Roger Tym & Partners with Peter Brett Associates September 2009 81
stimulate the housing industry at a time of recession. Previously the average grant rate for
socially rented units was approximately £35,000 per unit.
11.40 However, it cannot be assumed such levels of grant funding will continue to be available
in the future.
Initial assessment of potential developer contribution funding levels
11.41 For the purposes of this stage of the study, we have undertaken an initial high level
assessment of potential indicative levels of developer contribution funding based on
“generic” development sites to help identify issues effecting infrastructure planning and
selection of growth options in infrastructure terms.
11.42 It should be noted that this will be refined in Part 2 of the study and there are some
important caveats, which are set out below. It should also be noted the Council would
need robust planning policy in place to justify future contributions levels, particularly
where they are significantly higher than previous contribution levels.
Our approach
11.43 As set out above, there are likely to be significant differences in key variables that will
affect potential future developer contribution levels in Tendring.
11.44 To understand the range of potential developer contributions from different developments,
we have undertaken high level assessments of a notional urban extension and a notional
town centre development site at varying house price levels (low, medium and high).
11.45 We have set out below the assumptions used in this analysis. We have varied some of
the key assumptions, e.g. affordable housing, to understand the impact they might have
on developer contribution levels.
Important caveats
Our assessment only draws out strategic issues
11.46 At this stage, we are seeking to understand broad developer contribution issues that will
effect strategic infrastructure planning and the potential growth options on this basis. Our
initial assessment of developer contribution levels does not accurately reflect the wide
range of development sites within the potential growth options.
Calculations used here are not based on, and do not constitute, “Red Book” valuations
11.47 It is very important to note that our assessment of indicative developer contribution
estimates are produced at a high level with a number of assumptions made. The figures
that will be reported from this exercise need to be treated as indicative figures on the
basis of the inputs and assumptions made. They are calculations of the residual worth of
land for development and not the price which it might fetch in the market which can be
very different. They are not based on, and do not constitute, “Red Book” valuations (RICS
Valuation Standards 6th Edition) and do not provide any kind of reliable guide to the
market value of any particular site. It is not our intention in this work to attempt to provide
a substitute for a detailed site viability assessment.

Tendring Infrastructure Study – Part One Final Report
Roger Tym & Partners with Peter Brett Associates September 2009 82
Our analysis is only at a high level. This work should not be used to calculate developer contributions from specific sites
11.48 Our analysis is not on an individual site basis; we have assessed two notional types of
development sites (see below) to understand the potential developer contribution issues
at this stage.
11.49 Consequently, this information should not be used for any purpose other than the
infrastructure assessment, and should not be used in developer contribution negotiations
or to support any developer contribution policy.
11.50 We have not used standard development appraisal software (such as Circle Developer).
This is for a number of reasons. Firstly, they are not tailored to assessing long term
residential development schemes which could form a large part of the expected growth in
Tendring. Most, in our experience, work on the assumption that money will be borrowed
by a developer to pay for a scheme in which they key financial aim is to achieve a
satisfactory margin (profit) on cost whereas volume housebuilders manage equity funding
and aim to achieve a target return on the capital they employ. We understand the
emerging DCLG guidance on appraising Eco-towns recommends using a NPV (return on
capital employed) approach.
11.51 Secondly, appraisal packages are standardised and are therefore not designed to be
integrated with infrastructure spreadsheet models. In our experience, they are also not as
user friendly to allow predetermined key variables to be changed (e.g. affordable housing
percentages).
11.52 We have therefore undertaken our analysis in Excel as this can be refined and directly
linked into a spreadsheet infrastructure funding model at a later stage as required.
We have not undertaken any site specific research
11.53 Given the high level nature of this part of the study, we have not undertaken any research
to understand individual site issues. Consequently, key variables such as site
specific/abnormal costs and land costs are based on our general market knowledge and
do not necessarily accurately reflect actual potential future development sites in Tendring.
Estimated developer contributions are highly sensitive to the assumptions
11.54 Any estimate of developer contributions potentially available to contribute to infrastructure
requirements are extremely sensitive to the assumptions made.
Further refinement will be necessary in the future to understand potential developer contribution levels more accurately
11.55 On the basis of the above, further work and refinement will be necessary in the future to
achieve a more accurate picture of potential developer contribution levels from
development in Tendring to help fund infrastructure. We recommend this is carried out in
Part Two of the study.
Assumptions used for the initial analysis
11.56 In addition to the important caveats above, there are a number of important assumptions
we have used. More detailed assumptions for the purposes of our high level assessment

Tendring Infrastructure Study – Part One Final Report
Roger Tym & Partners with Peter Brett Associates September 2009 83
of developer contribution issues (such as house price levels, densities, affordable housing
etc) are set out after.
No specific developer contribution mechanism is assumed
11.57 Development contributions are currently secured through the Section 106 system
(governed by Circular 05/2005). Although the Community Infrastructure Levy (CIL) is
proposed to work alongside and partially replace the Section 106 system, the maximum
level of contribution that development could afford (without becoming unviable) under
each system is largely the same, although timing and certainty of required contribution will
affect this level.
11.58 The purpose of this assessment is not to determine a CIL charge and implementation
mechanism. However, we still need to include developer contributions that could
realistically be secured to help fund the infrastructure requirements identified in the
assessment. We therefore propose to calculate this based on the level of financial
contribution that could be reasonably secured from development, regardless of the
particular mechanism (whether Section 106 or CIL).
11.59 We have assumed the timing of contribution payments is spread out over the life of the
development. This is envisaged in the latest CIL guidance and contributions in the
majority of large residential and mixed use developments are either spread or back
ended. Our specific assumptions on timing are set out in more detail below.
We have used a notional large urban extension and a notional small, high density, town centre development
11.60 As set out above, we have used a notional urban extension and notional town centre development in our assessment. We have assumed a large “greenfield” urban extension of 25 ha (equating to 525 units) with some site abnormal cost issues, and a cleared 1 ha town centre development (equating to 70 units) with alternative use value for industrial development and some site abnormal cost issues.
Summary of key development assumptions
11.61 As set out above, at this stage we are seeking to understand developer contribution
funding issues as opposed to assessing potential developer contribution funding. We
have therefore based our high level assessment on assumptions made in the Fordhams
report, such as sales values, build costs etc, although these will need to be refined
through the next stage of the infrastructure study. More detailed information on our
assumptions is provided in Appendix 6.
11.62 Our assumptions on affordable housing and sustainability requirements were agreed with
the Council. Finally, we have used our own general market knowledge where necessary.
11.63 We have set our key base assumptions out below. It should be noted that sales values
(i.e. house prices) are based on previous “peak” values rather than current values; this is
discussed in more detail later on.

Tendring Infrastructure Study – Part One Final Report
Roger Tym & Partners with Peter Brett Associates September 2009 84
Table 11.1 Summary of key development assumptions
Variable Urban Extension Category Town Centre Category
Site size (gross) 25 1
Development Density 35dph 100dph
Net/Gross Site Ratio 60% 70%
Development Mix 90% houses/10% flats 10% houses/90% flats
Sales Value £1,884 - £2,422psm (houses) £2,072 - £2,664psm
(houses)
Affordable Housing 40% of residential units
(78% socially rented / 22%
intermediate)
40% of residential units
(78% socially rented / 22%
intermediate)
Affordable Housing
Grant Funding
£0 per unit £0 per unit
Land Acquisition Cost £0.5m per ha £1.0m per ha
Build Costs Apartments: £1,184psm
Houses: £766psm
Apartments: £1,342psm
Houses: £766psm
Sustainability Costs
(Code for Sustainable
Homes)
Code Level 3 assumed
(+ 5% build costs)
Code Level 3 assumed
(+ 5% build costs)
Site Specific / Abnormal
Costs
£0.5m per ha £0.5m per ha
Secondary
Infrastructure Costs
£0.25m per ha £0.25m per ha
External Works 13% of build costs 13% of build costs
Fees & Other Costs 10% of build costs 10% of build costs
Sales Rates 100 units pa 50 units pa
Average Unit Sizes
(Private)
Apartments: 65 sq m
Houses: 85 sq m
Apartments: 65 sq m
Houses: 85 sq m
Average Unit Sizes
(Affordable)
Apartments: 70 sq m
Houses: 90 sq m
Apartments: 70 sq m
Houses: 90 sq m
Developer’s Required
Rate of Return
17%pa 17%pa
Key findings from the initial analysis
New development may struggle to provide contributions on basis of assumptions
11.64 To provide a potential contribution to infrastructure funding, it is necessary for sites to
produce a surplus after allowing for other planning requirements (e.g. affordable housing
and sustainability standards).
11.65 Our initial analysis shows both the notional urban extension and town centre sites
produce a negative theoretical surplus available for developer contributions on the basis
of the above assumptions. This indicates not only that actual allocated development sites
might not provide any contributions to infrastructure funding, they may also be financially

Tendring Infrastructure Study – Part One Final Report
Roger Tym & Partners with Peter Brett Associates September 2009 85
unviable i.e. a developer would not undertake the development as little or no profit is
generated and therefore undeliverable.
Urban extension sites appear more viable than town centre sites on basis of assumptions
11.66 Our initial analysis indicates the notional urban extension site is more viable than the town
centre site on the basis of the above assumptions. Whereas the notional urban extension
in a high value area is on the margins of viability (without producing any theoretical
surplus for developer contributions for potential infrastructure funding), the notional town
centre site in all the assumed value areas is significantly unviable.
Sensitivity testing of key assumptions
Reducing affordable housing requirements significantly improves viability
11.67 If affordable housing is reduced to 20%, with grant funding of approximately £20,000 per
unit, a limited amount of theoretical surplus is created in the assumed high value areas. It
should be noted this is based on previous “peak” house prices, and therefore it cannot be
assumed that such indicative contribution levels could be achieved in the current market.
Urban extension sites with limited or no abnormal cost issues could potentially provide significant contributions to infrastructure funding
11.68 We have assumed abnormal costs on the notional urban extension site of £500,000 per
ha as an average to cover some of the types of abnormal issues that are encountered on
development sites. For example, one site may require off site infrastructure works, such
as a stretch of access road or additional utilities, a second remediation/decontamination
and a third acquisition of existing buildings or land (with associated demolition costs).
11.69 We have used an average as we have not assessed individual development sites, and
such information may not be available or accurate in any event. However, some
“greenfield” development sites in Tendring may have limited abnormal costs for residential
development.
11.70 If abnormal costs of only £100,000 per ha are assumed, our analysis indicates an
indicative theoretical surplus available for developer contributions from the notional urban
extension site of over £10,000 per unit in the assumed high value area, based on 40%
affordable housing. If affordable housing is reduced to 20% this increases to over
£25,000 per unit in assumed high value areas and over £5,000 per unit in medium value
areas. The notional urban extension in an assumed low value area still struggles to
produce a theoretical surplus to help fund infrastructure in our notional example though.
11.71 It should be noted that the Fordham Research Affordable Housing Site Viability Study
assumed contributions on sites tested of £1,650 - £11,600 per unit. On this basis, its
viability analysis indicated that 40% social rented affordable housing on sites such as the
St Johns Rd urban extension site in Clacton (assuming £6,900 per unit contributions) was
deliverable, although this assumed much lower land costs.

Tendring Infrastructure Study – Part One Final Report
Roger Tym & Partners with Peter Brett Associates September 2009 86
Lowering greenfield land costs, particularly in lower value areas, could be critical to securing developer contributions
11.72 We have assumed £500,000 per ha land costs for both the notional urban extension and
notional town centre site. Although existing use values for agricultural land, which we
understand will form part of the urban extensions in Tendring, are only approximately
£10,000 per ha from Valuation Office Agency (VOA) information, greenfield landowners
have historically been paid much higher levels where residential permission has been, or
is likely to be, granted.
11.73 If it is assumed land costs for the notional urban extension site are reduced to £250,000
per ha in the future (but house prices have recovered to their 2007 peak levels), the
indicative theoretical surplus available for developer contributions is approximately £5,000
per unit in the assumed high value area at 40% affordable housing. However, medium
and low value areas struggle to produce theoretical surplus available for developer
contributions at 40% affordable housing.
11.74 It should be noted that even if much higher planning contributions than have previously
been secured are required (i.e. in excess of £3,000 per unit), and this is reflected by
developers in the amount they are prepared to pay such landowners, there is a risk land
will not come to the market as landowners may choose to wait for land values to increase
again to past levels.
Some town centre sites may have significantly higher land costs which will effect viability
11.75 While the urban extension land cost assumption is based on high previous levels and in
reality could be lower in Tendring in the future, especially in low value areas, land costs
for town centre and other brownfield land sites could be significantly higher on some sites.
11.76 Fordhams assumed an alternative use value for industrial development of £500,000 per
ha. This is based on VOA information, which we understand assumes cleared sites for
development. As set out in paragraph 11.23, where there are existing buildings on a site
this can push up the value of a site considerably to in the region of £2m per ha. We
therefore used an indicative land cost of £1,000,000 per ha which is likely to be between a
cleared industrial site and one still in use for our notional town centre development site.
11.77 Where land costs are in the region of £2m per ha, this has a significant impact on viability
and would make it extremely difficult for such sites to provide affordable housing, higher
sustainability standards and contributions to infrastructure; one or more of these potential
planning requirements is likely need to be significantly reduced to produce financially
viable development.

Tendring Infrastructure Study – Part One Final Report
Roger Tym & Partners with Peter Brett Associates September 2009 87
Summary of initial developer contribution analysis
11.78 Set out below is a summary table of our findings and sensitivity testing:
Table 11.2 Summary of initial developer contributions analysis
Summary of key issues and findings
11.79 A summary of the key issues and findings from our initial assessment of developer
contribution funding for infrastructure is set out below:
Development only has a limited developer contribution “pot” - This pot can vary
significantly between sites due to differences in variables such as house prices and
development costs (particularly land and abnormal costs). In addition, other
requirements such as affordable housing can significantly reduce the “pot”. The
relationship between different types of contributions needs to be understood as not all
these are likely to be secured without compromising viability and deliverability;
Past developer contribution levels in Tendring have been relatively low - Infrastructure
costs from growth can vary significantly; our experience indicates this range could be
in the order of £10,000 to £40,000 per unit. However, we understand on average only
approximately £3,000 per unit has been secured from development in Tendring in the
last five years, some of which required limited or no affordable housing. This
suggests that developer contribution levels may need to increase if sufficient funding
is to be secured for infrastructure requirements;
The current affordable housing requirements have a significant impact on viability and
potential levels of developer contribution - We have assumed a 40% affordable
housing requirement and no grant is provided by HCA. Our initial analysis, based on
notional urban extension and town centre development sites, suggests such a
requirement may risk sites in low and medium value areas being unviable (i.e. even if
no developer contributions were required, sites may not be financially viable) and may
severely restrict developer contributions from high value areas or those with low land
and abnormal costs;
T he o re tica l Surp lus Ava ila b le to Fund De ve lo p e r Co ntrib utio ns
Base
Assumptions
Lower Affordable
Housing
(20%)
Lower Abnormal
Costs
(£100k per ha)
Lower Affordable
Housing & Abnormal
Costs
Notional Urban
Extension Site
Negative for all value areas
Marginal viability in higher value
area
Over £10,000 per unit in high value
area
Over £5,000 per unit in medium value area &
over £25,000 per unit in high value area
Notional Town Centre
Site
Negative for all value areas
Marginal viability in higher value
area
Negative for all value areas
Over £5,000 per unit in high value area

Tendring Infrastructure Study – Part One Final Report
Roger Tym & Partners with Peter Brett Associates September 2009 88
Viability and developer contributions will be adversely affected until the housing
market recovers - Our analysis has been on the basis of previous “peak” residential
sales values. However, current residential values are significantly lower which will
have a negative impact on the viability of all sites. Some sites may still be deliverable
based on some affordable housing and developer contribution requirements in current
market conditions e.g. where “options” for large greenfield site can be renegotiated to
reflect the short term impact on land values, but it is likely planning requirements
would need to be significantly reduced from those assumed in our initial analysis to
deliver development at the moment;
Prioritisation of planning requirements is required - Our analysis has shown the
impact of other potential planning requirements, in particular affordable housing. It is
unlikely that sufficient developer contributions to infrastructure costs resulting from
growth can be secured if other planning requirements are onerous and there is
significant development in low value areas and brownfield sites with high existing use
and/or abnormal costs. Prioritisation of policy objectives may be essential to ensure
both development and infrastructure are deliverable; and
Allocation of sites and robust developer contribution planning policy will be critical to
securing funding for infrastructure - Our analysis has highlighted the large differences
in potential levels of developer contributions that could theoretically be secured
between different types of site (e.g. straightforward greenfield urban extensions and
brownfield town centre sites with a high existing use value) and the different value
areas of Tendring. If relatively high affordable housing levels are still sought after
prioritisation of planning requirements, then a careful allocation of development sites
will be required to secure sufficient developer contributions to demonstrate the
deliverability of key infrastructure required to support growth. This will need to be
coupled with a robust developer contribution policy to secure the necessary
infrastructure funding from development.

Tendring Infrastructure Study – Part One Final Report
Roger Tym & Partners with Peter Brett Associates September 2009 89
12 SUMMARY OF KEY FINDINGS
12.1 Below is a short summary of the big issues arising from the Part One study.
Major issues
12.2 There are fundamentally no infrastructure issues that will absolutely prevent development in
any of the potential locations being considered in the study. However, there are some items
that will have a significant bearing on the preferred locations and, in particular, on the
possible scale of development that could occur. These are:
Transport (A120): If Bathside Bay goes ahead, then significant improvements will need to
be made to the A120, including dualling of certain sections. Without Bathside Bay, then
housing development could occur without the need for these major improvements;
Transport (Pond Hall Farm): if this goes ahead solely for employment uses, then it will
require an at-grade roundabout, costing £1.5 million and taking at least three years to
deliver. If it goes ahead in conjunction with Bathside Bay, then additional dualling of the
A120 could be needed at a cost of £20 million;
Transport (A133): If significant development occurs in Clacton-on-Sea and Walton-on-
the-Naze, then there will need to be upgrading of the A133. This is thought to be in the
region of 50% of the theoretical maximum level of development, i.e. 3,000 dwellings;
Waste water: Any significant development in the district will require extensions to existing
sewage treatment works and major expansions to the capacity of the sewer network; and
Education: potentially, even with the highest levels of growth proposed, there may be
insufficient need in Harwich to justify a new secondary school.
Costs and Funding
12.3 A large proportion of the costs of providing the major infrastructure in Tendring will be met by
the providers themselves. This particularly relates to the utilities, for whom this is a standard
practice and part of their licence agreement with Central Government. Also for waste
management, a large proportion of the costs will be met by the PFI that has been secured.
12.4 Most other infrastructure needs are part-funded by mainstream funding and part-funded by
developer contributions. In this Part One study, it is not possible to be precise about the costs
that would be incurred. This is because exact costs can only be provided when specific
schemes and levels of development are looked at. This will be undertaken in Part Two.
12.5 Clearly it is the major items that will have a significant impact on the overall costs. In
particular, this relates to the major transport schemes on the A120 and A133. Inevitably an
increasing proportion of these costs will have to be met by the developer in the form of
contributions. However, what developers can afford is limited by the viability of the
development, which is discussed below.
12.6 A summary of the costs and funding of the major transportation schemes is shown in Table
12.1.
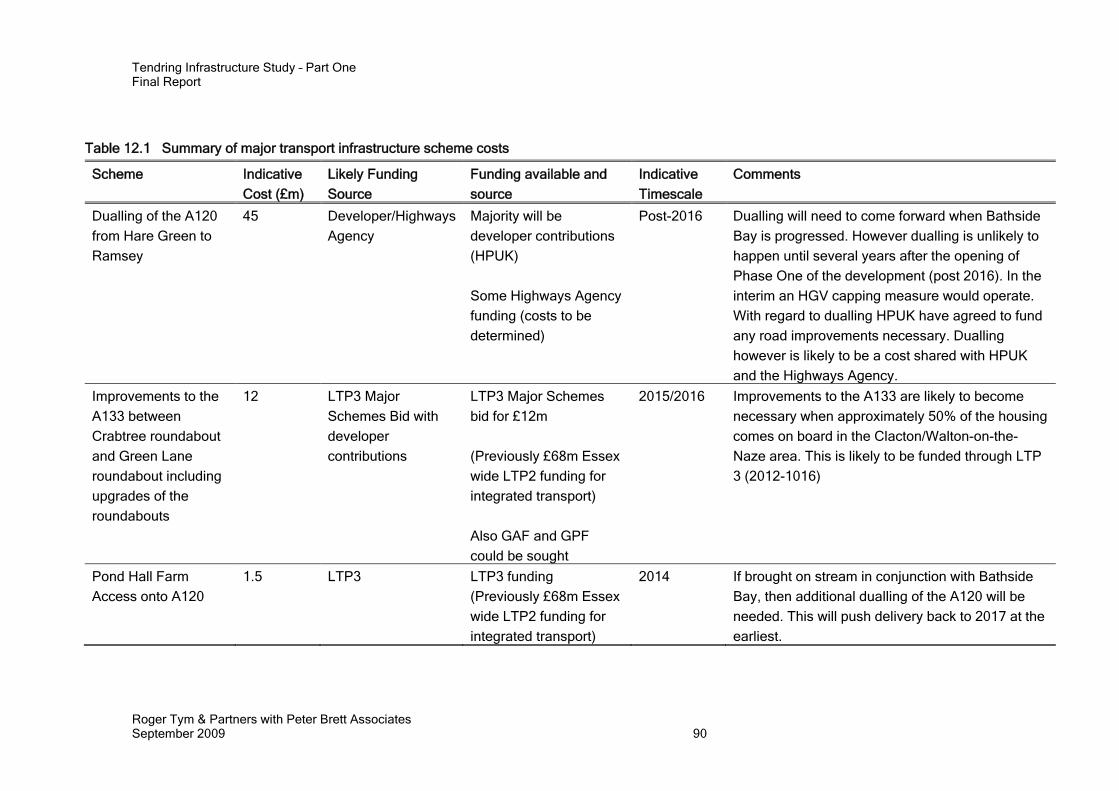
Tendring Infrastructure Study – Part One Final Report
Roger Tym & Partners with Peter Brett Associates September 2009 90
Table 12.1 Summary of major transport infrastructure scheme costs
Scheme Indicative
Cost (£m)
Likely Funding
Source
Funding available and
source
Indicative
Timescale
Comments
Dualling of the A120
from Hare Green to
Ramsey
45 Developer/Highways
Agency
Majority will be
developer contributions
(HPUK)
Some Highways Agency
funding (costs to be
determined)
Post-2016 Dualling will need to come forward when Bathside
Bay is progressed. However dualling is unlikely to
happen until several years after the opening of
Phase One of the development (post 2016). In the
interim an HGV capping measure would operate.
With regard to dualling HPUK have agreed to fund
any road improvements necessary. Dualling
however is likely to be a cost shared with HPUK
and the Highways Agency.
Improvements to the
A133 between
Crabtree roundabout
and Green Lane
roundabout including
upgrades of the
roundabouts
12 LTP3 Major
Schemes Bid with
developer
contributions
LTP3 Major Schemes
bid for £12m
(Previously £68m Essex
wide LTP2 funding for
integrated transport)
Also GAF and GPF
could be sought
2015/2016 Improvements to the A133 are likely to become
necessary when approximately 50% of the housing
comes on board in the Clacton/Walton-on-the-
Naze area. This is likely to be funded through LTP
3 (2012-1016)
Pond Hall Farm
Access onto A120
1.5 LTP3 LTP3 funding
(Previously £68m Essex
wide LTP2 funding for
integrated transport)
2014 If brought on stream in conjunction with Bathside
Bay, then additional dualling of the A120 will be
needed. This will push delivery back to 2017 at the
earliest.

Tendring Infrastructure Study – Part One Final Report
Roger Tym & Partners with Peter Brett Associates September 2009 91
Developer contribution funding
12.7 Securing the maximum reasonable contributions possible from development will be an
important way of funding, and therefore delivering, the infrastructure required to support
growth in Tendring.
12.8 At the moment, relatively low levels of developer contribution have been secured from
development (up to approximately £8,000 per residential unit). On the basis of other
infrastructure studies and the capacity analysis in this study, it is likely this level of
contributions will be insufficient to provide the necessary funding to meet infrastructure
requirements (even after accounting for mainstream funding available for infrastructure).
12.9 There are likely to be significant differences in the developer contribution funding that
could potentially be secured between areas and types of sites. Our initial analysis has
suggested that both brownfield development and greenfield development in lower value
areas may struggle to provide sufficient contributions based on current affordable housing
requirements and the other assumptions set out in Section 11.
12.10 However, it is likely that a significant amount of the growth in Tendring will be delivered on
these sites. Consequently, relatively large greenfield sites that do not offer reasonable
contributions may need to limited, or those that are relatively straightforward to develop
chosen.
12.11 In addition, securing relatively high contributions from smaller developments in medium to
high value areas that will still have a cumulative impact on infrastructure requirements is
likely to be needed.
12.12 To achieve the above the Council will need to have a robust developer contribution policy
in place to justify higher contribution requirements than previously secured. Ensuring
developers and landowners are aware of the expectations for contributions towards
infrastructure may be important so this is reflected in future land values or results in
renegotiated option agreements where necessary.
12.13 Public sector intervention, for example through the strategic use of HCA grant funding and
Cascade Agreements, may also be required to ensure as much of the future development
as possible provides reasonable contribution levels towards infrastructure.
12.14 We would recommend the Council undertakes further work to understand site specific
issues (e.g. landownership and likely levels of site specific costs) to refine the findings of
the viability analysis in this study.
12.15 In the next chapter we go on to consider the potential of each of the various development
options by location.
.


Tendring Infrastructure Study – Part One Final Report
Roger Tym & Partners with Peter Brett Associates September 2009 93
13 OPTIONS
13.1 In respect of infrastructure considerations there are five key factors that will, to a greater
or lesser degree, impact on which locations will be best to develop. All of these issues will
require decisions to be made by Tendring District Council, informed by the other studies
that make up the evidence base to the Core Strategy. This report outlines what these
issues are and the potential impacts each could have.
13.2 The five key factors are:
The scale of growth that would be delivered (in terms of dwellings and also
commercial space);
The prioritisation of key items needed to support growth;
The ability to fund the principal infrastructure items through public sources, and the
associated impact that this would have on delivery timescales. ‘Principal’
infrastructure means the items without which development simply could not occur;
The mechanisms for securing developer funding, i.e. section 106 or a tariff
approach;and
The differing levels of what development can afford, by location.
13.3 In addition to this, there is the associated impact of other major development to consider.
In the case of Tendring, this fundamentally relates to the development of Bathside Bay. At
present, this has planning permission, subject to the signing of a section 106 agreement.
It is the Consultants’ understanding that one of the major issues currently outstanding
relates to contributions for increases in capacity on the A120. Clearly this will also impact
on delivery of housing at Harwich and also the ability to fund the related infrastructure.
13.4 The assessment of the various options will be shaped around these considerations.
Harwich
13.5 The principal issue dictating the scale of growth that could be achieved in Harwich is the
need for improvements to the A120. Directly related to this is when the Bathside Bay
development will go ahead and how much of the associated improvements to the A120
will be paid for by the developer, Hutchinson Ports UK Limited (HPUK). Without the
Bathside Bay development it would likely be possible to deliver the highest levels of
development (approximately 3,900 dwellings when taking into account all the
development areas tested in Harwich) without the need for the improvements. Equally
however, this may create other pressures on the transport network as the absence of the
new container port would mean fewer local job opportunities for the new residents which
would lead to higher levels of out-commuting. Indeed, the consideration of significant
levels of housing in Harwich is underpinned by the large numbers of jobs that will be
created by the Bathside Bay development.
13.6 However, it is assumed that Bathside Bay will go ahead and currently it is expected that
the first phases of the development will be operational within the first half of the plan
period (by 2018/19). For significant levels of housing development to come forward in the
same first half of the plan period, then it is likely that dualling will be required earlier than

Tendring Infrastructure Study – Part One Final Report
Roger Tym & Partners with Peter Brett Associates September 2009 94
currently envisaged. Given that the proposed timetable for any dualling to go ahead is
over the longer term, then it is unlikely that more than a small proportion of the total
proposed number of dwellings could come forward before this dualling was undertaken.
Nevertheless, following dualling of the A120, the full 3,900 dwellings could be delivered
without unnecessarily detrimental impacts to the road network being experienced.
13.7 There is also the issue of the strategic site at Pond Hall Farm. This will require direct
access to be provided onto the A120 and given the importance it will have in serving
Bathside Bay’s associated employment land needs, this will need to come forward shortly
after Bathside Bay is operational (or earlier). The extent to which this can be paid for by
developer contributions depends on detailed viability analysis and on the possible
mechanisms for charging for development. It is understood that the Pond Hall Farm site
has not come forward to date because of the significant costs associated with providing
the required access (estimated at £1.5m). Moreover, if it was developed along with
Bathside Bay, then additional dualling of the A120 would be needed, pushing the costs up
to £20 million, and delaying delivery until 2017.
13.8 However, if contributions from housing development were to be pooled in some way
(possible through a Community Infrastructure Levy charge - if this is taken forward by
Central Government – or equivalent), then there would be a greater potential for these
costs to be met. Therefore, the higher the levels of housing development, the greater the
chance of bringing forward the Pond Hall Farm site as a major strategic employment
location, which would also provide local jobs for the new residents.
13.9 In terms of other infrastructure needs, it is likely that even at the highest levels of
development, there will be insufficient numbers to justify a new secondary school. Equally
therefore, the larger the number of houses developed, the greater the pressure on the
existing secondary schools serving the area. It will be necessary to undertake further
testing of more detailed options with the education authority (Essex County Council) in
order to understand the optimum level of development from the point of view of secondary
education.
13.10 Waste water is a significant issue for accommodating major development at Harwich, as it
would require expansion of the existing sewerage treatment works and further capacity
added to the sewer network. It will therefore be important to undertake testing of detailed
options with Anglian Water at the earliest stage. Given the longer timescale for significant
growth at Harwich coming forward, the need for expanded sewerage capacity is unlikely
to provide a delay to this.
Recommendation
13.11 It is considered that, subject to further testing of options with the education authority in
respect of secondary education provision and Anglian Water in respect of waste water,
Harwich could reasonably accommodate levels of development up to the maximum level
of 3,900 dwellings. This would occur whether Bathside Bay was delivered or not, although
it is assumed that it will be delivered. If it was not, then there would be other effects
related to the loss of potential job opportunities for new residents that would have been
created.

Tendring Infrastructure Study – Part One Final Report
Roger Tym & Partners with Peter Brett Associates September 2009 95
13.12 Only a small proportion of this growth level (unlikely to be more than 20-25%) could come
forward in the first half of the plan period, as the major improvements to the A120 will not
come forward before then. These improvements are needed to increase the capacity for
development.
13.13 An added consideration is that the development of Bathside Bay will provide a lot of the
funding necessary to make improvements to the highway network, so it is likely that the
development will need to come forward and to do so on its existing planned timescale if it
is not to push major development at Harwich back further, and possibly beyond the 2026
end date of the plan period.
13.14 As Harwich is a lower value area of Tendring, the potential level of development
contribution funding that could be secured from development, particularly on brownfield
sites, could be lower than other areas. However, as there is the potential for significant
greenfield urban extension development, we would recommend further work is
undertaken to establish landownership in this area (i.e. has land been acquired by
developers, and at what price) and the potential level of site specific/abnormal costs.
Clacton-on-Sea/Walton-on-the-Naze
13.15 Like at Harwich, one of the principal issues dictating the scale and timing of growth at
Clacton-on-Sea and also Walton-on-the-Naze is the need for improvements to the A133.
A high level assessment has determined that, if approximately 3,000 of the 6,500
dwellings assessed in the development areas (including existing allocations) were
delivered, then a tipping point would be reached whereby the improvements would be
needed. The majority of the cost of these improvements are likely to be funded through
LTP 3 (2012-1016), so could come forward in the first part of the plan period. However,
they would need to be supported by developer contributions to cover the full cost.
13.16 Moreover, even if possible growth locations at Clacton and/or Walton were developed
prior to the A133 improvements being made, they would not exert unacceptable levels of
congestion on the network. Part of the reason is that, as Clacton grows and moves
towards the District Council’s intentional goal of it becoming a higher order service centre,
increasing numbers of residents will be able to access jobs locally, rather than having to
commute out to other locations, principally Colchester. Therefore, the comparative
additional impact on the A133 will be small. It is only when the higher levels of
development arise that the overall traffic levels on the network will require the
improvements to be made.
13.17 Significant levels of housing development could bring with it significant developer
contributions. In respect of improvements to the A133, these will be needed to support the
LTP3 funding in covering the full costs of the required upgrade. Therefore it will be
imperative that development at Clacton and Walton contributes towards meeting these
costs. A possible risk is that, if planning contributions are sought through a Section 106
agreement, then it may be argued that development cannot directly be related to the need
for the improvements. This is because Clacton and Walton are not adjacent to the location
of the required upgrade, so such strategic needs should be funded by other means.
Therefore, it may be appropriate to explore a mechanism of pooling contributions, either

Tendring Infrastructure Study – Part One Final Report
Roger Tym & Partners with Peter Brett Associates September 2009 96
district-wide or for development in the Clacton/Walton area, recognising its impact on key
locations such as the A133. A clear case would need to be made for doing so, focussing
on making the case that these developments would clearly create unacceptable levels of
congestion on the A133.
13.18 Like at Harwich, waste water treatment will need significant additional infrastructure. This
would be for an extension to the existing sewage treatment works and also significant
additions to the sewer network. This would be the case whether development was in
either west or east Clacton. Again, further work in respect of more specific options would
need to be addressed at an early stage with Anglian Water. If significant levels of
development are to be brought forward early in the plan period, then this is particularly
important given the significant lead-in times generally for providing expanded sewerage
capacity.
Recommendation
13.19 It is recommended that higher levels of development are explored at Clacton and Walton,
at least up to 5,000 dwellings. Certainly, a minimum level of development of 3,000
dwellings should be considered. But development beyond this could be considered
because it is likely that the necessary improvements to the A133 will be delivered, as they
are programmed in LTP3 (whilst recognising the need for developer contributions to meet
some of the costs).
13.20 There is no particular issue that would prevent the focus of development being on either
west or east Clacton, subject to further testing of waste water needs by Anglian Water.
13.21 There is no particular issue either with timescales, so a significant proportion of
development could potentially occur in the first five years of the plan period.
13.22 Clacton, like Harwich, is another relatively low value area of Tendring and therefore the
potential level of development contribution funding that could be secured from
development, particularly on brownfield sites, could also be lower than other areas.
Other Locations
13.23 Most other locations in the district are small and could only accommodate small levels of
development. Certainly those locations such as Brightlingsea that can only reasonably be
accessed by a single road are restricted in their capacity to accommodate the growth
levels proposed.
13.24 In respect of the utilities, and particularly waste water, such locations are operating at or
close to their capacity. To provide additional capacity would be possible but would provide
little additional value on the investment when considering the comparatively low levels of
development that the new infrastructure would be expected to support. Therefore, it may
be difficult to justify such development in a 5-year asset management plan.
13.25 In terms of education, development in any of these locations would certainly be
insufficient to enable the provision of a new secondary school. However, in such a rural
district, if these locations are permitted to grow, then they place significant additional
pressures on the education system as children have to be bussed to the nearest

Tendring Infrastructure Study – Part One Final Report
Roger Tym & Partners with Peter Brett Associates September 2009 97
secondary schools, which can be some distance away. It is for the District Council to
decide where education sits in its list of priorities; on the assumption that it is a high
priority, then significant growth of the smaller towns and villages is not recommended.
13.26 Again, specific infrastructure requirements can more appropriately be assessed by
service providers when they are given more specific growth options to respond to.
Recommendation
13.27 In principle, none of the individual growth locations outside of Clacton/Walton and
Harwich have any fundamental infrastructure problems that mean they could not
accommodate at least some growth. The larger locations such as Brightlingsea and
Lawford/Manningtree/Mistley have potential to accommodate the largest proportion of
development of these areas.
13.28 However, it is a policy decision for the District Council as to the degree it wishes to grow
its existing small towns and villages. Also, whilst service providers have suggested that
there are no fundamental problems in providing additional infrastructure in these
locations, it is clearly more cost efficient to provide for development in areas where there
is already a significant base of infrastructure on which to build.
13.29 Many of the other potential development locations are medium to high value areas of
Tendring. Consequently, relatively straightforward greenfield development sites in these
locations could yield much higher developer contributions than areas such as Clacton and
Harwich/Dovercourt.


Tendring Infrastructure Study – Part One Final Report
Roger Tym & Partners with Peter Brett Associates September 2009 99
14 CONCLUSIONS
Consideration of Part One outputs
14.1 Below is a matrix summarising the significance of the issues for each of the LDF options,
by infrastructure item:

Tendring Infrastructure Study – Part One Final Report
Roger Tym & Partners with Peter Brett Associates September 2009 100
Option Option 1 Option 2 Option 3 Option 4
Cemeteries/crematoria
Secondary education Harwich – need for new secondary school but numbers possibly insufficient to justfiy
Harwich – need for new secondary school but numbers possibly insufficient to justfiy
Harwich – need for new secondary school but numbers possibly insufficient to justfiy
Primary education Harwich Town – would put significant pressure on existing
primary schools but insufficient to justify new
school
Harwich Town – would put pressure on existing primary
schools
Harwich Town – would put significant pressure on existing
primary schools but insufficient to justify new
school
Harwich Town – would put pressure on existing primary
schools
Emergency services – fire
Emergency services – police
Emergency services – ambulance
Health All areas ‐ Additional capacity needed but levels of growth insufficient to justify new
facilities
All areas ‐ Additional capacity needed but levels of growth insufficient to justify new
facilities
All areas ‐ Additional capacity needed but levels of growth insufficient to justify new
facilities
All areas ‐ Additional capacity needed but levels of growth insufficient to justify new
facilities
Utilities – telecommunications
Utilities – electricity Clacton ‐ New substation needed to serve growth at
West Clacton
Clacton ‐ New substation needed to serve growth at
West Clacton
Clacton ‐ New substation needed to serve growth at
West Clacton
Clacton ‐ New substation needed to serve growth at
West Clacton
Utilities – gas
Utilities – potable water supply
Utilities – waste water Clacton – potential issue over ability to expand capacity of
Jaywick STW. Harwich – significant
additional capacity for sewer network required
Clacton – potential issue over ability to expand capacity of
Jaywick STW. Harwich – significant
additional capacity for sewer network required
Clacton – potential issue over ability to expand capacity of
Jaywick STW. Harwich – significant
additional capacity for sewer network required
Clacton – potential issue over ability to expand capacity of
Jaywick STW. Harwich – significant
additional capacity for sewer network required
Transport
Waste management
No significant needs Some needs, each of which, in isolation, can be delivered without issue Significant needs which may be difficult to deliver or may serve to push back the timescale of development. Further work needed.

Tendring Infrastructure Study – Part One Final Report
Roger Tym & Partners with Peter Brett Associates September 2009 101
14.2 This represents Part One of a two-part study of the infrastructure needs in Tendring
district to support potential growth. The Part One study largely provides a baseline
assessment of current infrastructure, any potential major issues that would significantly
impact on development and possible requirements associated with growth levels in
certain locations. It supports this with a broad understanding, where possible, of costs and
available funding.
14.3 Inevitably the Part One study can only provide a broad understanding of potential and
needs. It will be for the Part Two study to assess more specific options and understand
process needs. Certainly, from the point of view of the service providers it is far easier to
provide a coherent response to specific growth levels in precise locations. It is therefore
important to stress that the study findings from Part One will in no way prejudice the future
views of the service providers when it comes to the Part Two work or any subsequent
negotiations with developers on particular planning applications.
14.4 The Part One assessment has determined that the main potential locations for
development – Clacton and Harwich – can both accommodate significant levels of growth.
In the case of Clacton, a significant proportion of this could come forward in the first half of
the plan period, given what is known about funding streams for required development. In
Harwich, it is likely that significant development may have to come in the second half of
the plan period, as funding for major improvements to the A120 is not programmed until
this period and this will be necessary to support major growth.
14.5 The other locations can potentially support growth but it is doubtful if it will be possible to
accommodate all of the levels of growth being tested. Certainly for many of the service
providers, it is inefficient to be providing additional infrastructure to service these areas
because the absolute numbers of additional dwellings are relatively small.
Mechanisms for delivery
14.6 As has been briefly considered earlier in the report, it is important to consider not only the
infrastructure needs associated with growth and what development can afford, but also
what mechanisms should be used to secure the developer funding associated with that
growth. At present, this is done through the use of Section 106 agreements which provide
flexibility in the way they can be applied (within the restrictions of Circular 05/2005), but
also lack the certainty of knowing how much developer funding will be secured.
Furthermore, Circular 05/2005 ties the contributions firmly to the direct impact that the
development has. This results in much of the strategic infrastructure (particularly roads,
which development clearly places additional pressure upon) not being provided with
developer funding in order to undertake the necessary upgrading.
14.7 The Government has recognised this and is currently considering a Community
Infrastructure Levy (CIL). This will be a broadly flat charge across all development in an
area, which can then be pooled and contribute to providing for all the infrastructure
needed across that area. A CIL charge would provide a solution to the possible issue that
may arise with development in Clacton and Walton in respect of the improvements
needed to the A133. Under Circular 05/2005, developers may argue that these
developments are not directly related to the congestion on the A133, so should not

Tendring Infrastructure Study – Part One Final Report
Roger Tym & Partners with Peter Brett Associates September 2009 102
contribute to the needs. However, under a CIL, it would be possible to collect a charge per
dwelling from across the district and use it to fund these upgrade works.
14.8 There is still much uncertainty as to whether CIL will be put in place. The recent pre-
Budget report stated that it will not come forward until April 2010 at the earliest. In any
event, districts are not obliged to use a CIL charge. But the draft guidance on CIL,
published by the Department of Communities and Local Government (CLG) in August
2008, suggests that the Government is certainly looking at generally changing the existing
system. It states at paragraph 20 that:
“The Government is considering whether restrictions on the use of planning obligations should be made once CIL is introduced. There would be a transitional period before any restriction would take effect.”
14.9 Para 5.10 of the document also states that:
“Other options include reducing the scope of planning obligations through a narrower set of criteria than those set out in Circular 05/05, or preventing planning obligations from being used to secure developer contributions through the use of standard charges.”
14.10 If this were to occur then a standard charge approach would not be possible. At present
however, some form of standard charge could possibly alleviate the issues raised for
development at Clacton and Walton. It could also be applied in respect of the
development of Pond Hall Farm at Harwich, whereby a charge on housing development
could contribute to the necessary highway access improvements onto the A120 of a major
strategic employment site, which would provide significant employment opportunities for
the new residents.
14.11 Figure 14.1 illustrates the differences between the alternative types of mechanism that
could be used for collecting developer contributions. If greater certainty of contribution is
wanted, then a tariff or CIL is most appropriate because for each new dwelling there will
be a guaranteed contribution that will not have to be negotiated. If greater flexibility is
required, then it is preferable to continue with the Section 106 approach of negotiating on
a site by site basis.

Tendring Infrastructure Study – Part One Final Report
Roger Tym & Partners with Peter Brett Associates September 2009 103
Figure 14.1 Choices for collecting developer contributions
14.12 It is also important to consider the area over which a charging mechanism should apply.
The draft CIL guidance is clear that a charge doesn’t necessarily have to be applied at just
the district level. It could be applied across a county or sub-region. Potentially, a Haven
Gateway-wide charge should be explored to see if this would provide the required
developer contributions to address the significant needs of the sub-region.
14.13 The more detailed assessment that will be undertaken in the Part Two study will make it
clearer what the preferred options for charging development should be for Tendring
District.
Section 106 Standard Contribution Tariff / CIL
Need for Flexibility to Maximise Contributions
Need for Certainty of Contributions


APPENDIX 1
List of Consultees


Infrastructure category Contact Organisation Education Blaise Gammie Essex County Council Health Tonia Parsons North East Essex Primary Care Trust
Penny Lansdown North East Essex Primary Care Trust Ambulance East of England Ambulance Service Waste water Rob Morris Anglian Water Water Neil Walkington-Mayo Tendring Hundred Water Services Cemeteries David Hall Tendring DC Gas Paul Cudby National Grid Electricity Howard Green EDF Energy Police Jason Gwillim Essex Police
Suzanne Allen Essex Police Strategic Waste Alex Creecy Essex County Council Fire Andy Butcher Essex Fire and Rescue Service Further Education Carol Snape Essex University Telecommunications N/a N/a Transport Martin Mason Essex County Council
Alan Lindsay Essex County Council Peter Chappell Essex County Council Julian Elliot First Group


APPENDIX 2 Further Education Information (from ECC)


Site Type ECC Comments Summary of potential type of provision required
West Clacton (Bockings Elm) – 3,400 dwellings
Early Years & Childcare
A development of this scale would require a range of settings to be established, creating i.r.o. 270 additional places. The majority of the provision would need to be on site, including nurseries integrated into any new primary schools that are established. A full Childrens’ Centre may be needed to serve a community of this size if existing ‘reach areas’ cannot be suitably adjusted.
New facility
Primary
Approximately half of the pupils generated by a development of this size could be accommodated by utilising and, where appropriate, expanding existing primary schools in West Clacton. Careful consideration regarding the suitability of each school for expansion and the availability of safe routes to them would be required. Assuming such expansion is feasible, a single new 2f.e. school would need to be established. It is likely that this would be on site and form part of the development’s community hub. Approximately two hectares of land would be needed.
New facility and expansion of existing
Secondary
A development of this size can be expected to generate up to 680 secondary age pupils. Plans for a new Academy in Clacton to replace Bishops Park College and Colbayns High School are under consideration. The new Academy would have fewer places than the two existing schools but would retain a degree of flexibility to expand and accommodate demand from new development. Recommissioning accommodation for secondary school use would incur a relatively small cost.
Expansion of proposed new Clacton academy
Great Clacton & Holland‐on‐Sea ‐ 1,100 dwellings
Early Years & Childcare
A development of this size would leave an estimated deficit of 84 places in the relevant wards. On site provision is likely to be required.
New facility
Primary
Homes in and around Great Clacton could be accommodated utilising existing provision. Safe routes to Burrsville Infant and Gt Clacton Junior would however need to be established (not included in cost below). Capacity to serve Holland‐on‐Sea is limited but a programme of replacing temporary classbases with permanent build would provide the additional long term capacity required.
Expansion of existing
Secondary
As noted above, the proposal for a new Academy to serve Clacton has been made cognisant of the need to retain some flexibility to accommodate housing growth.
Expansion of proposed new Clacton academy
Clacton Early Years This level of growth throughout the town could be None required
Summary of potential education solutions to accommodating tested housing growth1
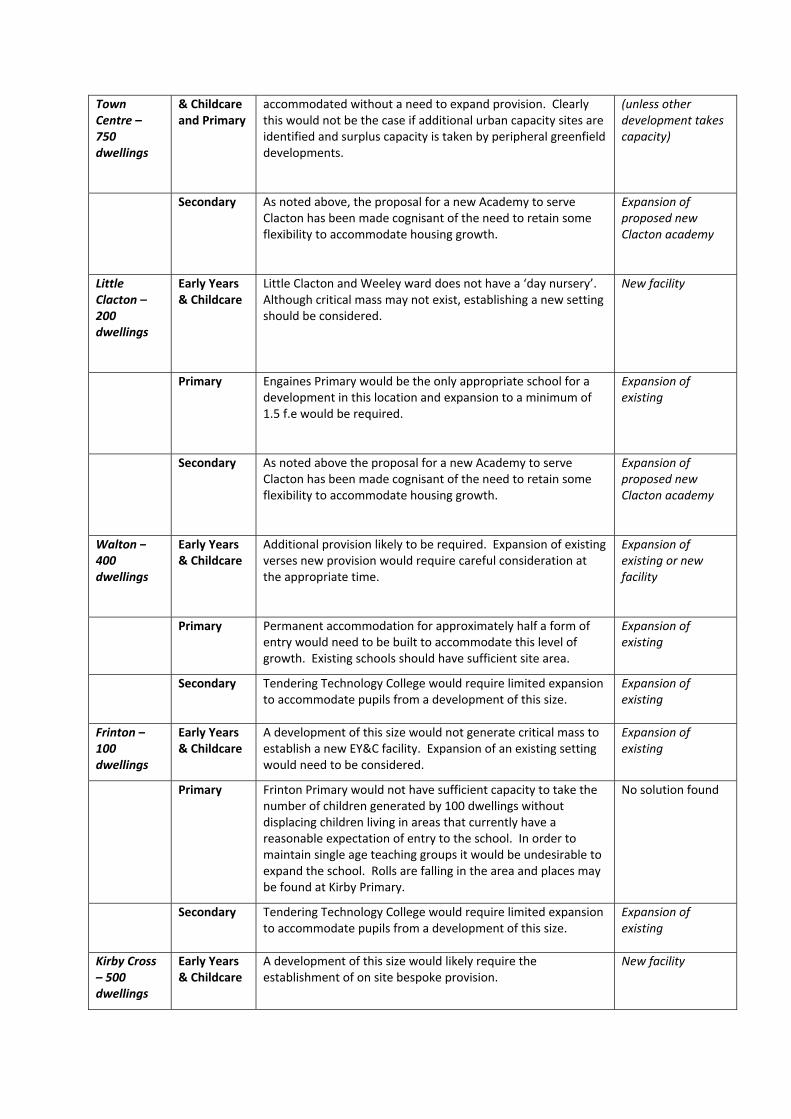
Town Centre – 750 dwellings
& Childcare and Primary
accommodated without a need to expand provision. Clearly this would not be the case if additional urban capacity sites are identified and surplus capacity is taken by peripheral greenfield developments.
(unless other development takes capacity)
Secondary
As noted above, the proposal for a new Academy to serve Clacton has been made cognisant of the need to retain some flexibility to accommodate housing growth.
Expansion of proposed new Clacton academy
Little Clacton – 200 dwellings
Early Years & Childcare
Little Clacton and Weeley ward does not have a ‘day nursery’. Although critical mass may not exist, establishing a new setting should be considered.
New facility
Primary
Engaines Primary would be the only appropriate school for a development in this location and expansion to a minimum of 1.5 f.e would be required.
Expansion of existing
Secondary
As noted above the proposal for a new Academy to serve Clacton has been made cognisant of the need to retain some flexibility to accommodate housing growth.
Expansion of proposed new Clacton academy
Walton – 400 dwellings
Early Years & Childcare
Additional provision likely to be required. Expansion of existing verses new provision would require careful consideration at the appropriate time.
Expansion of existing or new facility
Primary
Permanent accommodation for approximately half a form of entry would need to be built to accommodate this level of growth. Existing schools should have sufficient site area.
Expansion of existing
Secondary
Tendering Technology College would require limited expansion to accommodate pupils from a development of this size.
Expansion of existing
Frinton – 100 dwellings
Early Years & Childcare
A development of this size would not generate critical mass to establish a new EY&C facility. Expansion of an existing setting would need to be considered.
Expansion of existing
Primary
Frinton Primary would not have sufficient capacity to take the number of children generated by 100 dwellings without displacing children living in areas that currently have a reasonable expectation of entry to the school. In order to maintain single age teaching groups it would be undesirable to expand the school. Rolls are falling in the area and places may be found at Kirby Primary.
No solution found
Secondary
Tendering Technology College would require limited expansion to accommodate pupils from a development of this size.
Expansion of existing
Kirby Cross – 500 dwellings
Early Years & Childcare
A development of this size would likely require the establishment of on site bespoke provision.
New facility

Primary Kirby Primary could accommodate under half the proposed development and does not have the site area to expand sufficiently to serve 500 additional dwellings. A development of this size would not justify a new school and therefore the only solution would be to either secure some adjoining land (recreation ground?) or move the school to a larger site on the new development.
Potential expansion on or off‐site
Secondary Tendering Technology College would require limited expansion to accommodate pupils from a development of this size.
Expansion of existing
Harwich – 600 dwellings
Early Years & Childcare
Additional provision would be required. Expansion of existing verses new provision would require careful consideration at the appropriate time.
Expansion of existing or new facility
Primary
A development of this size would not be quite large enough to justify a new primary school although coupled with demand from urban infill this may be the only practical option. Expansion of existing provision would require careful consideration and the completion of a feasibility study.
Expansion of existing
Secondary
There is sufficient capacity at The Harwich School to accommodate the number of secondary age pupils that can be anticipated from a development of this size.
None required
Dovercourt – 250 dwellings
Early Years & Childcare
Harwich West Central ward does not have a ‘day nursery’. Although critical mass may not exist, establishing a new setting should be considered.
New facility
Primary
There should be sufficient capacity at Spring Meadow Primary to accommodate a development of this size.
None required
Secondary
There is sufficient capacity at The Harwich School to accommodate the number of secondary age pupils that can be anticipated from a development of this size.
None required
Parkeston / Bathside – 3,150 dwellings
Early Years & Childcare
A development of this scale would require a range of settings to be established, creating i.r.o. 284 additional places. The majority of the provision would need to be on site, including nurseries integrated into any new primary schools that are established. A full Childrens’ Centre may be needed to serve a community of this size if existing ‘reach areas’ cannot be suitably adjusted.
New facility
Primary
A development of this size would require up to 4.5fe to serve it. Some local capacity exists that could be utilised but two new 2fe primary schools may eventually need to be established each on a two hectare site within the development.
New facilities
Secondary
In the absence of other development within its priority admissions area, a little less than half of this number of homes could be accommodated within existing capacity at The Harwich School. Expansion to 1,800 places may be possible given the school’s site area, but this would be tight and may still not quite accommodate the number of pupils that would require a place.
Expansion of existing or new facility
Mistley – 600 dwellings
Early Years & Childcare
There is limited provision in this area and a development of this size would likely require bespoke on site provision.
New facility

Primary
The precise location of these homes would be key to finding a solution to the lack of primary capacity in the area, as a single development of 600 would not quite sustain a new school. Limited surplus capacity at Highfields and Lawford CE Primaries could be utilised and Mistley Norman could potentially be expanded. The ‘wrong’ number of homes in the priority admissions area of any one of the three schools could prove very disruptive to current admission patterns.
Expansion of existing or new facility
Secondary Manningtree High could accommodate approximately half the likely pupil product from 600 dwellings. The school appears to have sufficient site area to expand to accommodate the balance of pupils generated. An important consideration would be ensuring all new homes are accessible to the school by safe direct walking and cycling routes of no more than three miles.
Expansion of existing
Brightlingsea Waterside Area – 400 dwellings
Early Years & Childcare
Current provision is close to fully subscribed. Expansion of existing verses new provision would require careful consideration at the appropriate time.
Expansion of existing or new facility
Primary
This level of development could be accommodated by Brightlingsea Infant and Junior Schools but temporary accommodation would need to be replaced with permanent buildings.
Expansion of existing
Secondary
Colne Community School could accommodate approximately half the likely pupil product from 400 dwellings. Minor expansion would be necessary.
Expansion of existing
Brightlingsea urban area – 200 dwellings
Early Years & Childcare
A development of this size would be unlikely to generate critical mass to establish a new EY&C facility. Expansion of an existing setting would need to be considered.
Expansion of existing
Primary
This level of development could be accommodated by Brightlingsea Infant and Junior Schools but at least one temporary classbase at the Infant School would need to be replaced with permanent buildings.
Expansion of existing
Secondary
Colne Community School could accommodate pupils from this level of development. An important consideration should be ensuring all new homes are accessible to the school by safe direct walking and cycling routes of no more than three miles.
None required
Colchester Fringe‐ 1,000 dwellings
Early Years & Childcare
A development of this size would likely require the establishment of on‐site bespoke provision.
New facility
Primary
The level of growth anticipated for north Colchester dictates that surplus places in this area cannot be ‘assigned’ to a development in Tendering. A development of this size would generate up to 300 pupils requiring a 1.5fe school on a 1.6 hectare site.
New facility
Secondary
Colchester secondary provision is currently under review with the likely outcome that surplus places in the south of the town are reduced. There is only one secondary school north of the
Expansion of existing or new

London to Ipswich railway line and any surplus, or expansion potential, will be required to accommodate know development plans. Colchester BC’s core strategy alludes to a potential new secondary school to serve their north west greenfield allocation. If this were progressed the necessary redistribution of priority admission areas and planned works could accommodate this development. In the absence of a new school a development in this location would be unsustainable will an estimated 200 pupils requiring transport to the existing priority admission area school, Manningtree High. The school would also need significant expansion, which would require further work to ascertain feasibility.
facility
Elmstead Market – 200 dwellings
Early Years & Childcare
There are a few unfilled places in the area and a development of this size would not generate critical mass to establish a new EY&C facility. Expansion of an existing setting would need to be considered.
Expansion of existing
Primary
Elmstead Primary is full and does not have site area to expand. There are no alternative schools within safe walking distance.
No solution
Secondary
There are no secondary schools within safe walking distance. Pupils from this level of development could be accommodated at Cone Community but school transport costs would need to be met.
None required*
Alresford – 200 dwellings
Early Years & Childcare
There are unfilled places in the area but some additional places would be required.
Expansion of existing or new facility
Primary
Alresford Primary has some surplus capacity and can be expanded to serve this level of development in its priority admissions area.
Expansion of existing
Secondary
There are no secondary schools within safe walking distance. Pupils from this level of development could be accommodated at Cone Community but school transport costs would need to be met.
None required*
Great Bentley – 200 dwellings
Early Years & Childcare
There is limited provision in the ward with only one surplus place identified. Although critical mass may not exist, establishing a new setting should be considered.
Expansion of existing or new facility
Primary
Great Bentley Primary is full and does not have site area to expand. There are no alternative schools within safe walking distance.
No solution
Secondary
There are no secondary schools within safe walking distance. Pupils from this level of development could be accommodated at Cone Community but school transport costs would need to be met.
None required*
St. Osyth – 200 dwellings
Early Years & Childcare
Data on St. Osyth and Point Clear Ward was not available. In common with other rural wards, provision may be patchy and new provision is likely to be necessary.
Expansion of existing or new facility
Primary St. Osyth CE Primary is forecast to have sufficient surplus None required

Source: ECC & RTP
1 These solutions are dependent on the dwelling numbers tested and each site has been considered in isolation
* subject to school transport costs being met. The County Council is required to provide school transport to any child that would need to walk in excess of two miles up to the age of eight or three miles for older children, using a safe route. Unless balanced by better utilisation of existing school places, developments that do not meet these criteria should be avoided. ‘Tolerable’ walking distances may be lower than these thresholds and opposed on sustainability grounds.
places to accommodate this level of development.
Secondary
As noted above, the proposal for a new Academy to serve Clacton has been made cognisant of the need to retain some flexibility to accommodate housing growth. An important consideration should be ensuring all new homes are accessible by safe direct walking and cycling routes of no more than three miles. Failure to provide these would incur long term school transport costs, making the site unsustainable in these terms.
Expansion of proposed new Clacton academy
Thorpe‐le‐Soken – 200 dwellings
Early Years & Childcare
Beaumont and Thorpe ward has a range of provision but not quite sufficient to accommodate this level of housing growth. Minor expansion of existing provision would be required.
Expansion of existing
Primary
Rolph CE Primary could, with an additional permanent classbase, accommodate around half this level of development. There are no alternative suitable schools within walking distance to accommodate the balance.
Partial solution to use existing capacity
Secondary
Tendering Technology College would require limited expansion to accommodate pupils from a development of this size.
Expansion of existing

APPENDIX 3 Transport Modelling Output

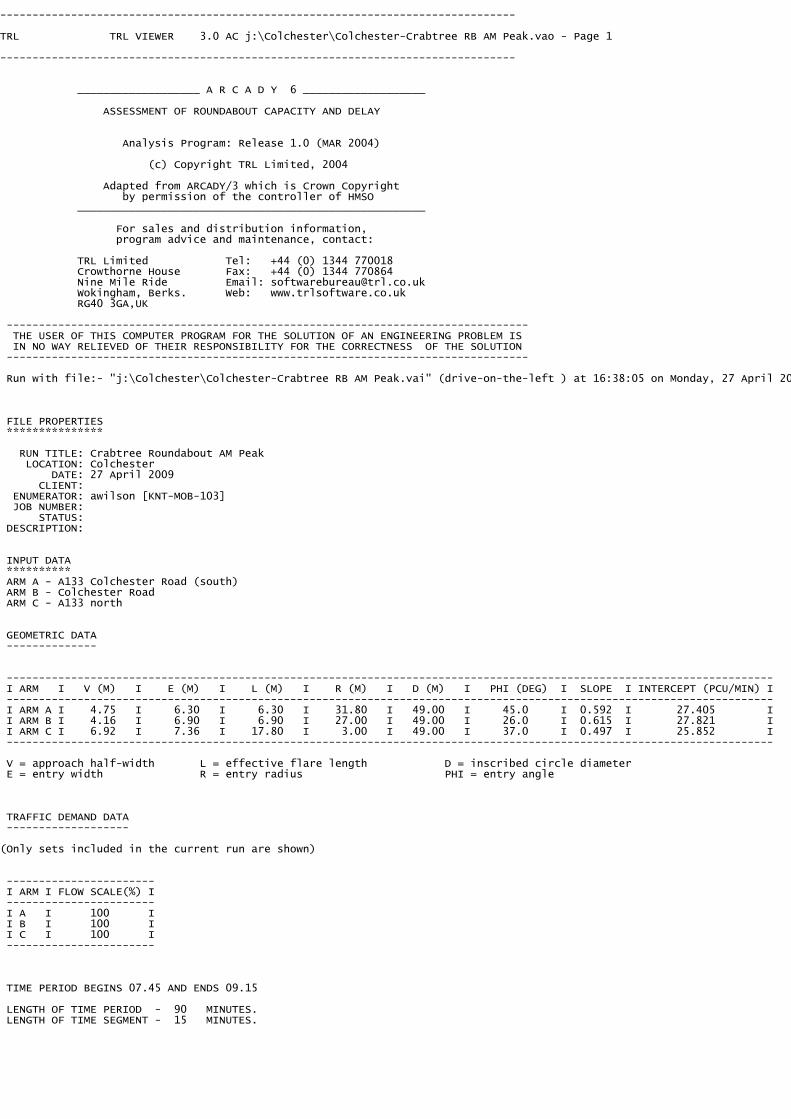
-------------------------------------------------------------------------------- TRL TRL VIEWER 3.0 AC j:\Colchester\Colchester-Crabtree RB AM Peak.vao - Page 1 -------------------------------------------------------------------------------- ___________________ A R C A D Y 6 ___________________ ASSESSMENT OF ROUNDABOUT CAPACITY AND DELAY Analysis Program: Release 1.0 (MAR 2004) (c) Copyright TRL Limited, 2004 Adapted from ARCADY/3 which is Crown Copyright by permission of the controller of HMSO ______________________________________________________ For sales and distribution information, program advice and maintenance, contact: TRL Limited Tel: +44 (0) 1344 770018 Crowthorne House Fax: +44 (0) 1344 770864 Nine Mile Ride Email: [email protected] Wokingham, Berks. Web: www.trlsoftware.co.uk RG40 3GA,UK --------------------------------------------------------------------------------- THE USER OF THIS COMPUTER PROGRAM FOR THE SOLUTION OF AN ENGINEERING PROBLEM IS IN NO WAY RELIEVED OF THEIR RESPONSIBILITY FOR THE CORRECTNESS OF THE SOLUTION --------------------------------------------------------------------------------- Run with file:- "j:\Colchester\Colchester-Crabtree RB AM Peak.vai" (drive-on-the-left ) at 16:38:05 on Monday, 27 April 2009
FILE PROPERTIES *************** RUN TITLE: Crabtree Roundabout AM Peak LOCATION: Colchester DATE: 27 April 2009 CLIENT: ENUMERATOR: awilson [KNT-MOB-103] JOB NUMBER: STATUS: DESCRIPTION:
INPUT DATA ********** ARM A - A133 Colchester Road (south) ARM B - Colchester Road ARM C - A133 north
GEOMETRIC DATA -------------- ----------------------------------------------------------------------------------------------------------------------- I ARM I V (M) I E (M) I L (M) I R (M) I D (M) I PHI (DEG) I SLOPE I INTERCEPT (PCU/MIN) I ----------------------------------------------------------------------------------------------------------------------- I ARM A I 4.75 I 6.30 I 6.30 I 31.80 I 49.00 I 45.0 I 0.592 I 27.405 I I ARM B I 4.16 I 6.90 I 6.90 I 27.00 I 49.00 I 26.0 I 0.615 I 27.821 I I ARM C I 6.92 I 7.36 I 17.80 I 3.00 I 49.00 I 37.0 I 0.497 I 25.852 I ----------------------------------------------------------------------------------------------------------------------- V = approach half-width L = effective flare length D = inscribed circle diameter E = entry width R = entry radius PHI = entry angle
TRAFFIC DEMAND DATA ------------------- (Only sets included in the current run are shown)
----------------------- I ARM I FLOW SCALE(%) I ----------------------- I A I 100 I I B I 100 I I C I 100 I -----------------------
TIME PERIOD BEGINS 07.45 AND ENDS 09.15
LENGTH OF TIME PERIOD - 90 MINUTES. LENGTH OF TIME SEGMENT - 15 MINUTES.

-------------------------------------------------------------------------------- TRL TRL VIEWER 3.0 AC j:\Colchester\Colchester-Crabtree RB AM Peak.vao - Page 2 -------------------------------------------------------------------------------- DEMAND FLOW PROFILES ARE SYNTHESISED FROM TURNING COUNT DATA DEMAND SET TITLE: Crabtree Roundabout AM Peak ----------------------------------------------------------------------------- I I NUMBER OF MINUTES FROM START WHEN I RATE OF FLOW (VEH/MIN) I I ARM I FLOW STARTS I TOP OF PEAK I FLOW STOPS I BEFORE I AT TOP I AFTER I I I TO RISE I IS REACHED IFALLING I PEAK I OF PEAK I PEAK I ----------------------------------------------------------------------------- I ARM A I 15.00 I 45.00 I 75.00 I 19.25 I 28.88 I 19.25 I I ARM B I 15.00 I 45.00 I 75.00 I 9.11 I 13.67 I 9.11 I I ARM C I 15.00 I 45.00 I 75.00 I 11.84 I 17.76 I 11.84 I ----------------------------------------------------------------------------- DEMAND SET TITLE: Crabtree Roundabout AM Peak
----------------------------------------------------------- I I TURNING PROPORTIONS I I I TURNING COUNTS (VEH/HR) I I I (PERCENTAGE OF H.V.S) I I -------------------------------------- I TIME I FROM/TO I ARM A I ARM B I ARM C I ----------------------------------------------------------- I 07.45 - 09.15 I I I I I I I ARM A I 0.000 I 0.270 I 0.730 I I I I 0.0 I 416.0 I 1124.0 I I I I ( 0.0)I ( 0.0)I ( 0.0)I I I I I I I I I ARM B I 0.568 I 0.000 I 0.432 I I I I 414.0 I 0.0 I 315.0 I I I I ( 0.0)I ( 0.0)I ( 0.0)I I I I I I I I I ARM C I 0.837 I 0.163 I 0.000 I I I I 793.0 I 154.0 I 0.0 I I I I ( 0.0)I ( 0.0)I ( 0.0)I I I I I I I -----------------------------------------------------------
QUEUE AND DELAY INFORMATION FOR EACH 15 MIN TIME SEGMENT --------------------------------------------------------
------------------------------------------------------------------------------------------------------------------ I TIME DEMAND CAPACITY DEMAND/ PEDESTRIAN START END DELAY GEOMETRIC DELAY AVERAGE DELAY I I (VEH/MIN) (VEH/MIN) CAPACITY FLOW QUEUE QUEUE (VEH.MIN/ (VEH.MIN/ PER ARRIVING I I (RFC) (PEDS/MIN) (VEHS) (VEHS) TIME SEGMENT) TIME SEGMENT) VEHICLE (MIN) I I 07.45-08.00 I I ARM A 19.25 26.27 0.733 0.0 2.6 36.7 0.14 I I ARM B 9.11 19.27 0.473 0.0 0.9 12.8 0.10 I I ARM C 11.84 23.29 0.508 0.0 1.0 14.7 0.09 I I I ------------------------------------------------------------------------------------------------------------------
------------------------------------------------------------------------------------------------------------------ I TIME DEMAND CAPACITY DEMAND/ PEDESTRIAN START END DELAY GEOMETRIC DELAY AVERAGE DELAY I I (VEH/MIN) (VEH/MIN) CAPACITY FLOW QUEUE QUEUE (VEH.MIN/ (VEH.MIN/ PER ARRIVING I I (RFC) (PEDS/MIN) (VEHS) (VEHS) TIME SEGMENT) TIME SEGMENT) VEHICLE (MIN) I I 08.00-08.15 I I ARM A 22.99 26.05 0.882 2.6 6.5 83.7 0.28 I I ARM B 10.88 17.63 0.617 0.9 1.6 22.4 0.15 I I ARM C 14.14 22.79 0.620 1.0 1.6 23.0 0.11 I I I ------------------------------------------------------------------------------------------------------------------
------------------------------------------------------------------------------------------------------------------ I TIME DEMAND CAPACITY DEMAND/ PEDESTRIAN START END DELAY GEOMETRIC DELAY AVERAGE DELAY I I (VEH/MIN) (VEH/MIN) CAPACITY FLOW QUEUE QUEUE (VEH.MIN/ (VEH.MIN/ PER ARRIVING I I (RFC) (PEDS/MIN) (VEHS) (VEHS) TIME SEGMENT) TIME SEGMENT) VEHICLE (MIN) I I 08.15-08.30 I I ARM A 28.15 25.75 1.093 6.5 47.3 418.7 1.23 I I ARM B 13.33 16.41 0.812 1.6 3.9 51.7 0.30 I I ARM C 17.31 22.13 0.782 1.6 3.4 46.4 0.20 I I I ------------------------------------------------------------------------------------------------------------------
------------------------------------------------------------------------------------------------------------------ I TIME DEMAND CAPACITY DEMAND/ PEDESTRIAN START END DELAY GEOMETRIC DELAY AVERAGE DELAY I I (VEH/MIN) (VEH/MIN) CAPACITY FLOW QUEUE QUEUE (VEH.MIN/ (VEH.MIN/ PER ARRIVING I I (RFC) (PEDS/MIN) (VEHS) (VEHS) TIME SEGMENT) TIME SEGMENT) VEHICLE (MIN) I I 08.30-08.45 I I ARM A 28.15 25.74 1.094 47.3 84.3 988.3 2.69 I I ARM B 13.33 16.30 0.818 3.9 4.2 61.4 0.33 I I ARM C 17.31 22.09 0.784 3.4 3.5 51.9 0.21 I I I ------------------------------------------------------------------------------------------------------------------

-------------------------------------------------------------------------------- TRL TRL VIEWER 3.0 AC j:\Colchester\Colchester-Crabtree RB AM Peak.vao - Page 3 -------------------------------------------------------------------------------- ------------------------------------------------------------------------------------------------------------------ I TIME DEMAND CAPACITY DEMAND/ PEDESTRIAN START END DELAY GEOMETRIC DELAY AVERAGE DELAY I I (VEH/MIN) (VEH/MIN) CAPACITY FLOW QUEUE QUEUE (VEH.MIN/ (VEH.MIN/ PER ARRIVING I I (RFC) (PEDS/MIN) (VEHS) (VEHS) TIME SEGMENT) TIME SEGMENT) VEHICLE (MIN) I I 08.45-09.00 I I ARM A 22.99 26.03 0.883 84.3 43.2 956.7 2.51 I I ARM B 10.88 16.28 0.668 4.2 2.1 33.8 0.19 I I ARM C 14.14 22.74 0.622 3.5 1.7 26.6 0.12 I I I ------------------------------------------------------------------------------------------------------------------
------------------------------------------------------------------------------------------------------------------ I TIME DEMAND CAPACITY DEMAND/ PEDESTRIAN START END DELAY GEOMETRIC DELAY AVERAGE DELAY I I (VEH/MIN) (VEH/MIN) CAPACITY FLOW QUEUE QUEUE (VEH.MIN/ (VEH.MIN/ PER ARRIVING I I (RFC) (PEDS/MIN) (VEHS) (VEHS) TIME SEGMENT) TIME SEGMENT) VEHICLE (MIN) I I 09.00-09.15 I I ARM A 19.25 26.26 0.733 43.2 2.9 172.0 0.40 I I ARM B 9.11 17.98 0.507 2.1 1.0 16.4 0.11 I I ARM C 11.84 23.26 0.509 1.7 1.0 16.3 0.09 I I I ------------------------------------------------------------------------------------------------------------------
QUEUE AT ARM A -------------- TIME SEGMENT NO. OF ENDING VEHICLES IN QUEUE 08.00 2.6 *** 08.15 6.5 ****** 08.30 47.3 *********************************************** 08.45 84.3 ************************************************************************************ 09.00 43.2 ******************************************* 09.15 2.9 ***
QUEUE AT ARM B -------------- TIME SEGMENT NO. OF ENDING VEHICLES IN QUEUE 08.00 0.9 * 08.15 1.6 ** 08.30 3.9 **** 08.45 4.2 **** 09.00 2.1 ** 09.15 1.0 *
QUEUE AT ARM C -------------- TIME SEGMENT NO. OF ENDING VEHICLES IN QUEUE 08.00 1.0 * 08.15 1.6 ** 08.30 3.4 *** 08.45 3.5 **** 09.00 1.7 ** 09.15 1.0 *
QUEUEING DELAY INFORMATION OVER WHOLE PERIOD -------------------------------------------- ---------------------------------------------------------------------------- I ARM I TOTAL DEMAND I * QUEUEING * I * INCLUSIVE QUEUEING * I I I I * DELAY * I * DELAY * I I I------------------------------------------------------------------I I I (VEH) (VEH/H) I (MIN) (MIN/VEH) I (MIN) (MIN/VEH) I ---------------------------------------------------------------------------- I A I 2111.7 I 1407.8 I 2656.1 I 1.26 I 2656.2 I 1.26 I I B I 999.6 I 666.4 I 198.4 I 0.20 I 198.5 I 0.20 I I C I 1298.5 I 865.7 I 178.9 I 0.14 I 178.9 I 0.14 I ---------------------------------------------------------------------------- I ALL I 4409.8 I 2939.9 I 3033.4 I 0.69 I 3033.6 I 0.69 I ---------------------------------------------------------------------------- * DELAY IS THAT OCCURRING ONLY WITHIN THE TIME PERIOD. * INCLUSIVE DELAY INCLUDES DELAY SUFFERED BY VEHICLES WHICH ARE STILL QUEUEING AFTER THE END OF THE TIME PERIOD. * THESE WILL ONLY BE SIGNIFICANTLY DIFFERENT IF THERE IS A LARGE QUEUE REMAINING AT THE END OF THE TIME PERIOD. END OF JOB ============================================= end of file ===============================================

[Printed at 16:38:12 on 27/04/2009]

-------------------------------------------------------------------------------- TRL TRL VIEWER 3.0 AC j:\Colchester\Colchester-Crabtree RB PM Peak.vao - Page 1 -------------------------------------------------------------------------------- ___________________ A R C A D Y 6 ___________________ ASSESSMENT OF ROUNDABOUT CAPACITY AND DELAY Analysis Program: Release 1.0 (MAR 2004) (c) Copyright TRL Limited, 2004 Adapted from ARCADY/3 which is Crown Copyright by permission of the controller of HMSO ______________________________________________________ For sales and distribution information, program advice and maintenance, contact: TRL Limited Tel: +44 (0) 1344 770018 Crowthorne House Fax: +44 (0) 1344 770864 Nine Mile Ride Email: [email protected] Wokingham, Berks. Web: www.trlsoftware.co.uk RG40 3GA,UK --------------------------------------------------------------------------------- THE USER OF THIS COMPUTER PROGRAM FOR THE SOLUTION OF AN ENGINEERING PROBLEM IS IN NO WAY RELIEVED OF THEIR RESPONSIBILITY FOR THE CORRECTNESS OF THE SOLUTION --------------------------------------------------------------------------------- Run with file:- "j:\Colchester\Colchester-Crabtree RB PM Peak.vai" (drive-on-the-left ) at 16:39:29 on Monday, 27 April 2009
FILE PROPERTIES *************** RUN TITLE: Crabtree Roundabout PM Peak LOCATION: Colchester DATE: 27 April 2009 CLIENT: ENUMERATOR: awilson [KNT-MOB-103] JOB NUMBER: STATUS: DESCRIPTION:
INPUT DATA ********** ARM A - A133 Colchester Road (south) ARM B - Colchester Road ARM C - A133 north
GEOMETRIC DATA -------------- ----------------------------------------------------------------------------------------------------------------------- I ARM I V (M) I E (M) I L (M) I R (M) I D (M) I PHI (DEG) I SLOPE I INTERCEPT (PCU/MIN) I ----------------------------------------------------------------------------------------------------------------------- I ARM A I 4.75 I 6.30 I 6.30 I 31.80 I 49.00 I 45.0 I 0.592 I 27.405 I I ARM B I 4.16 I 6.90 I 6.90 I 27.00 I 49.00 I 26.0 I 0.615 I 27.821 I I ARM C I 6.92 I 7.36 I 17.80 I 3.00 I 49.00 I 37.0 I 0.497 I 25.852 I ----------------------------------------------------------------------------------------------------------------------- V = approach half-width L = effective flare length D = inscribed circle diameter E = entry width R = entry radius PHI = entry angle
TRAFFIC DEMAND DATA ------------------- (Only sets included in the current run are shown)
----------------------- I ARM I FLOW SCALE(%) I ----------------------- I A I 100 I I B I 100 I I C I 100 I -----------------------
TIME PERIOD BEGINS 16.45 AND ENDS 18.15
LENGTH OF TIME PERIOD - 90 MINUTES. LENGTH OF TIME SEGMENT - 15 MINUTES.

-------------------------------------------------------------------------------- TRL TRL VIEWER 3.0 AC j:\Colchester\Colchester-Crabtree RB PM Peak.vao - Page 2 -------------------------------------------------------------------------------- DEMAND FLOW PROFILES ARE SYNTHESISED FROM TURNING COUNT DATA DEMAND SET TITLE: Crabtree Roundabout PM Peak ----------------------------------------------------------------------------- I I NUMBER OF MINUTES FROM START WHEN I RATE OF FLOW (VEH/MIN) I I ARM I FLOW STARTS I TOP OF PEAK I FLOW STOPS I BEFORE I AT TOP I AFTER I I I TO RISE I IS REACHED IFALLING I PEAK I OF PEAK I PEAK I ----------------------------------------------------------------------------- I ARM A I 15.00 I 45.00 I 75.00 I 12.02 I 18.04 I 12.02 I I ARM B I 15.00 I 45.00 I 75.00 I 7.10 I 10.65 I 7.10 I I ARM C I 15.00 I 45.00 I 75.00 I 15.40 I 23.10 I 15.40 I ----------------------------------------------------------------------------- DEMAND SET TITLE: Crabtree Roundabout PM Peak
----------------------------------------------------------- I I TURNING PROPORTIONS I I I TURNING COUNTS (VEH/HR) I I I (PERCENTAGE OF H.V.S) I I -------------------------------------- I TIME I FROM/TO I ARM A I ARM B I ARM C I ----------------------------------------------------------- I 16.45 - 18.15 I I I I I I I ARM A I 0.000 I 0.319 I 0.681 I I I I 0.0 I 307.0 I 655.0 I I I I ( 0.0)I ( 0.0)I ( 0.0)I I I I I I I I I ARM B I 0.697 I 0.000 I 0.303 I I I I 396.0 I 0.0 I 172.0 I I I I ( 0.0)I ( 0.0)I ( 0.0)I I I I I I I I I ARM C I 0.998 I 0.002 I 0.000 I I I I 1230.0 I 2.0 I 0.0 I I I I ( 0.0)I ( 0.0)I ( 0.0)I I I I I I I -----------------------------------------------------------
QUEUE AND DELAY INFORMATION FOR EACH 15 MIN TIME SEGMENT --------------------------------------------------------
------------------------------------------------------------------------------------------------------------------ I TIME DEMAND CAPACITY DEMAND/ PEDESTRIAN START END DELAY GEOMETRIC DELAY AVERAGE DELAY I I (VEH/MIN) (VEH/MIN) CAPACITY FLOW QUEUE QUEUE (VEH.MIN/ (VEH.MIN/ PER ARRIVING I I (RFC) (PEDS/MIN) (VEHS) (VEHS) TIME SEGMENT) TIME SEGMENT) VEHICLE (MIN) I I 16.45-17.00 I I ARM A 12.02 27.39 0.439 0.0 0.8 11.3 0.06 I I ARM B 7.10 22.81 0.311 0.0 0.4 6.6 0.06 I I ARM C 15.40 23.40 0.658 0.0 1.9 26.5 0.12 I I I ------------------------------------------------------------------------------------------------------------------
------------------------------------------------------------------------------------------------------------------ I TIME DEMAND CAPACITY DEMAND/ PEDESTRIAN START END DELAY GEOMETRIC DELAY AVERAGE DELAY I I (VEH/MIN) (VEH/MIN) CAPACITY FLOW QUEUE QUEUE (VEH.MIN/ (VEH.MIN/ PER ARRIVING I I (RFC) (PEDS/MIN) (VEHS) (VEHS) TIME SEGMENT) TIME SEGMENT) VEHICLE (MIN) I I 17.00-17.15 I I ARM A 14.36 27.39 0.524 0.8 1.1 15.9 0.08 I I ARM B 8.48 21.82 0.389 0.4 0.6 9.3 0.07 I I ARM C 18.39 22.92 0.802 1.9 3.8 51.8 0.21 I I I ------------------------------------------------------------------------------------------------------------------
------------------------------------------------------------------------------------------------------------------ I TIME DEMAND CAPACITY DEMAND/ PEDESTRIAN START END DELAY GEOMETRIC DELAY AVERAGE DELAY I I (VEH/MIN) (VEH/MIN) CAPACITY FLOW QUEUE QUEUE (VEH.MIN/ (VEH.MIN/ PER ARRIVING I I (RFC) (PEDS/MIN) (VEHS) (VEHS) TIME SEGMENT) TIME SEGMENT) VEHICLE (MIN) I I 17.15-17.30 I I ARM A 17.59 27.38 0.642 1.1 1.8 25.4 0.10 I I ARM B 10.38 20.48 0.507 0.6 1.0 14.7 0.10 I I ARM C 22.52 22.26 1.012 3.8 20.5 205.1 0.75 I I I ------------------------------------------------------------------------------------------------------------------
------------------------------------------------------------------------------------------------------------------ I TIME DEMAND CAPACITY DEMAND/ PEDESTRIAN START END DELAY GEOMETRIC DELAY AVERAGE DELAY I I (VEH/MIN) (VEH/MIN) CAPACITY FLOW QUEUE QUEUE (VEH.MIN/ (VEH.MIN/ PER ARRIVING I I (RFC) (PEDS/MIN) (VEHS) (VEHS) TIME SEGMENT) TIME SEGMENT) VEHICLE (MIN) I I 17.30-17.45 I I ARM A 17.59 27.38 0.642 1.8 1.8 26.6 0.10 I I ARM B 10.38 20.46 0.507 1.0 1.0 15.3 0.10 I I ARM C 22.52 22.25 1.012 20.5 30.2 383.0 1.31 I I I ------------------------------------------------------------------------------------------------------------------

-------------------------------------------------------------------------------- TRL TRL VIEWER 3.0 AC j:\Colchester\Colchester-Crabtree RB PM Peak.vao - Page 3 -------------------------------------------------------------------------------- ------------------------------------------------------------------------------------------------------------------ I TIME DEMAND CAPACITY DEMAND/ PEDESTRIAN START END DELAY GEOMETRIC DELAY AVERAGE DELAY I I (VEH/MIN) (VEH/MIN) CAPACITY FLOW QUEUE QUEUE (VEH.MIN/ (VEH.MIN/ PER ARRIVING I I (RFC) (PEDS/MIN) (VEHS) (VEHS) TIME SEGMENT) TIME SEGMENT) VEHICLE (MIN) I I 17.45-18.00 I I ARM A 14.36 27.39 0.524 1.8 1.1 17.2 0.08 I I ARM B 8.48 21.79 0.389 1.0 0.6 9.9 0.08 I I ARM C 18.39 22.90 0.803 30.2 4.5 157.8 0.52 I I I ------------------------------------------------------------------------------------------------------------------
------------------------------------------------------------------------------------------------------------------ I TIME DEMAND CAPACITY DEMAND/ PEDESTRIAN START END DELAY GEOMETRIC DELAY AVERAGE DELAY I I (VEH/MIN) (VEH/MIN) CAPACITY FLOW QUEUE QUEUE (VEH.MIN/ (VEH.MIN/ PER ARRIVING I I (RFC) (PEDS/MIN) (VEHS) (VEHS) TIME SEGMENT) TIME SEGMENT) VEHICLE (MIN) I I 18.00-18.15 I I ARM A 12.02 27.39 0.439 1.1 0.8 12.1 0.07 I I ARM B 7.10 22.78 0.312 0.6 0.5 7.0 0.06 I I ARM C 15.40 23.39 0.659 4.5 2.0 31.7 0.13 I I I ------------------------------------------------------------------------------------------------------------------
QUEUE AT ARM A -------------- TIME SEGMENT NO. OF ENDING VEHICLES IN QUEUE 17.00 0.8 * 17.15 1.1 * 17.30 1.8 ** 17.45 1.8 ** 18.00 1.1 * 18.15 0.8 *
QUEUE AT ARM B -------------- TIME SEGMENT NO. OF ENDING VEHICLES IN QUEUE 17.00 0.4 17.15 0.6 * 17.30 1.0 * 17.45 1.0 * 18.00 0.6 * 18.15 0.5
QUEUE AT ARM C -------------- TIME SEGMENT NO. OF ENDING VEHICLES IN QUEUE 17.00 1.9 ** 17.15 3.8 **** 17.30 20.5 ******************** 17.45 30.2 ****************************** 18.00 4.5 **** 18.15 2.0 **
QUEUEING DELAY INFORMATION OVER WHOLE PERIOD -------------------------------------------- ---------------------------------------------------------------------------- I ARM I TOTAL DEMAND I * QUEUEING * I * INCLUSIVE QUEUEING * I I I I * DELAY * I * DELAY * I I I------------------------------------------------------------------I I I (VEH) (VEH/H) I (MIN) (MIN/VEH) I (MIN) (MIN/VEH) I ---------------------------------------------------------------------------- I A I 1319.1 I 879.4 I 108.5 I 0.08 I 108.6 I 0.08 I I B I 778.8 I 519.2 I 62.7 I 0.08 I 62.7 I 0.08 I I C I 1689.3 I 1126.2 I 855.8 I 0.51 I 855.9 I 0.51 I ---------------------------------------------------------------------------- I ALL I 3787.3 I 2524.9 I 1027.1 I 0.27 I 1027.2 I 0.27 I ---------------------------------------------------------------------------- * DELAY IS THAT OCCURRING ONLY WITHIN THE TIME PERIOD. * INCLUSIVE DELAY INCLUDES DELAY SUFFERED BY VEHICLES WHICH ARE STILL QUEUEING AFTER THE END OF THE TIME PERIOD. * THESE WILL ONLY BE SIGNIFICANTLY DIFFERENT IF THERE IS A LARGE QUEUE REMAINING AT THE END OF THE TIME PERIOD. END OF JOB ============================================= end of file ===============================================

[Printed at 16:39:34 on 27/04/2009]

-------------------------------------------------------------------------------- TRL TRL VIEWER 3.0 AC j:\Colchester\Green Lane Roundabour AM Peak.vao - Page 1 -------------------------------------------------------------------------------- ___________________ A R C A D Y 6 ___________________ ASSESSMENT OF ROUNDABOUT CAPACITY AND DELAY Analysis Program: Release 1.0 (MAR 2004) (c) Copyright TRL Limited, 2004 Adapted from ARCADY/3 which is Crown Copyright by permission of the controller of HMSO ______________________________________________________ For sales and distribution information, program advice and maintenance, contact: TRL Limited Tel: +44 (0) 1344 770018 Crowthorne House Fax: +44 (0) 1344 770864 Nine Mile Ride Email: [email protected] Wokingham, Berks. Web: www.trlsoftware.co.uk RG40 3GA,UK --------------------------------------------------------------------------------- THE USER OF THIS COMPUTER PROGRAM FOR THE SOLUTION OF AN ENGINEERING PROBLEM IS IN NO WAY RELIEVED OF THEIR RESPONSIBILITY FOR THE CORRECTNESS OF THE SOLUTION --------------------------------------------------------------------------------- Run with file:- "j:\Colchester\Green Lane Roundabour AM Peak.vai" (drive-on-the-left ) at 16:40:44 on Monday, 27 April 2009
FILE PROPERTIES *************** RUN TITLE: Green lane Roundabout AM Peak LOCATION: Colchester DATE: 27 April 2009 CLIENT: ENUMERATOR: awilson [KNT-MOB-103] JOB NUMBER: 22376 STATUS: DESCRIPTION:
INPUT DATA ********** ARM A - A133 Colchester Road north ARM B - B1033 ARM C - Services ARM D - A133
GEOMETRIC DATA -------------- ----------------------------------------------------------------------------------------------------------------------- I ARM I V (M) I E (M) I L (M) I R (M) I D (M) I PHI (DEG) I SLOPE I INTERCEPT (PCU/MIN) I ----------------------------------------------------------------------------------------------------------------------- I ARM A I 6.82 I 9.27 I 9.80 I 41.60 I 79.90 I 43.0 I 0.575 I 40.500 I I ARM B I 4.10 I 8.91 I 3.90 I 18.80 I 79.90 I 40.0 I 0.432 I 24.647 I I ARM C I 3.86 I 6.75 I 5.20 I 17.30 I 79.90 I 33.0 I 0.433 I 24.299 I I ARM D I 3.00 I 8.88 I 18.00 I 21.30 I 79.90 I 29.0 I 0.487 I 29.859 I ----------------------------------------------------------------------------------------------------------------------- V = approach half-width L = effective flare length D = inscribed circle diameter E = entry width R = entry radius PHI = entry angle
TRAFFIC DEMAND DATA ------------------- (Only sets included in the current run are shown)
----------------------- I ARM I FLOW SCALE(%) I ----------------------- I A I 100 I I B I 100 I I C I 100 I I D I 100 I -----------------------
TIME PERIOD BEGINS 07.45 AND ENDS 09.15
LENGTH OF TIME PERIOD - 90 MINUTES. LENGTH OF TIME SEGMENT - 15 MINUTES.

-------------------------------------------------------------------------------- TRL TRL VIEWER 3.0 AC j:\Colchester\Green Lane Roundabour AM Peak.vao - Page 2 -------------------------------------------------------------------------------- DEMAND FLOW PROFILES ARE SYNTHESISED FROM TURNING COUNT DATA DEMAND SET TITLE: Green lane Roundabout AM Peak ----------------------------------------------------------------------------- I I NUMBER OF MINUTES FROM START WHEN I RATE OF FLOW (VEH/MIN) I I ARM I FLOW STARTS I TOP OF PEAK I FLOW STOPS I BEFORE I AT TOP I AFTER I I I TO RISE I IS REACHED IFALLING I PEAK I OF PEAK I PEAK I ----------------------------------------------------------------------------- I ARM A I 15.00 I 45.00 I 75.00 I 14.66 I 21.99 I 14.66 I I ARM B I 15.00 I 45.00 I 75.00 I 9.68 I 14.51 I 9.68 I I ARM C I 15.00 I 45.00 I 75.00 I 3.28 I 4.91 I 3.28 I I ARM D I 15.00 I 45.00 I 75.00 I 12.93 I 19.39 I 12.93 I ----------------------------------------------------------------------------- DEMAND SET TITLE: Green lane Roundabout AM Peak
-------------------------------------------------------------------- I I TURNING PROPORTIONS I I I TURNING COUNTS (VEH/HR) I I I (PERCENTAGE OF H.V.S) I I ----------------------------------------------- I TIME I FROM/TO I ARM A I ARM B I ARM C I ARM D I -------------------------------------------------------------------- I 07.45 - 09.15 I I I I I I I I ARM A I 0.000 I 0.280 I 0.107 I 0.613 I I I I 0.0 I 329.0 I 125.0 I 719.0 I I I I ( 0.0)I ( 0.0)I ( 0.0)I ( 0.0)I I I I I I I I I I ARM B I 0.795 I 0.000 I 0.079 I 0.127 I I I I 615.0 I 0.0 I 61.0 I 98.0 I I I I ( 0.0)I ( 0.0)I ( 0.0)I ( 0.0)I I I I I I I I I I ARM C I 0.397 I 0.439 I 0.000 I 0.164 I I I I 104.0 I 115.0 I 0.0 I 43.0 I I I I ( 0.0)I ( 0.0)I ( 0.0)I ( 0.0)I I I I I I I I I I ARM D I 0.817 I 0.078 I 0.104 I 0.000 I I I I 845.0 I 81.0 I 108.0 I 0.0 I I I I ( 0.0)I ( 0.0)I ( 0.0)I ( 0.0)I I I I I I I I --------------------------------------------------------------------
QUEUE AND DELAY INFORMATION FOR EACH 15 MIN TIME SEGMENT --------------------------------------------------------
------------------------------------------------------------------------------------------------------------------ I TIME DEMAND CAPACITY DEMAND/ PEDESTRIAN START END DELAY GEOMETRIC DELAY AVERAGE DELAY I I (VEH/MIN) (VEH/MIN) CAPACITY FLOW QUEUE QUEUE (VEH.MIN/ (VEH.MIN/ PER ARRIVING I I (RFC) (PEDS/MIN) (VEHS) (VEHS) TIME SEGMENT) TIME SEGMENT) VEHICLE (MIN) I I 07.45-08.00 I I ARM A 14.66 38.33 0.383 0.0 0.6 9.1 0.04 I I ARM B 9.68 19.53 0.495 0.0 1.0 13.9 0.10 I I ARM C 3.28 16.59 0.197 0.0 0.2 3.6 0.07 I I ARM D 12.93 24.81 0.521 0.0 1.1 15.5 0.08 I I I ------------------------------------------------------------------------------------------------------------------
------------------------------------------------------------------------------------------------------------------ I TIME DEMAND CAPACITY DEMAND/ PEDESTRIAN START END DELAY GEOMETRIC DELAY AVERAGE DELAY I I (VEH/MIN) (VEH/MIN) CAPACITY FLOW QUEUE QUEUE (VEH.MIN/ (VEH.MIN/ PER ARRIVING I I (RFC) (PEDS/MIN) (VEHS) (VEHS) TIME SEGMENT) TIME SEGMENT) VEHICLE (MIN) I I 08.00-08.15 I I ARM A 17.51 37.90 0.462 0.6 0.9 12.6 0.05 I I ARM B 11.55 18.52 0.624 1.0 1.6 23.1 0.14 I I ARM C 3.91 15.07 0.260 0.2 0.3 5.1 0.09 I I ARM D 15.43 23.81 0.648 1.1 1.8 25.8 0.12 I I I ------------------------------------------------------------------------------------------------------------------
------------------------------------------------------------------------------------------------------------------ I TIME DEMAND CAPACITY DEMAND/ PEDESTRIAN START END DELAY GEOMETRIC DELAY AVERAGE DELAY I I (VEH/MIN) (VEH/MIN) CAPACITY FLOW QUEUE QUEUE (VEH.MIN/ (VEH.MIN/ PER ARRIVING I I (RFC) (PEDS/MIN) (VEHS) (VEHS) TIME SEGMENT) TIME SEGMENT) VEHICLE (MIN) I I 08.15-08.30 I I ARM A 21.44 37.33 0.574 0.9 1.3 19.5 0.06 I I ARM B 14.15 17.16 0.825 1.6 4.2 55.4 0.30 I I ARM C 4.79 13.05 0.367 0.3 0.6 8.3 0.12 I I ARM D 18.90 22.50 0.840 1.8 4.8 62.6 0.25 I I I ------------------------------------------------------------------------------------------------------------------
------------------------------------------------------------------------------------------------------------------ I TIME DEMAND CAPACITY DEMAND/ PEDESTRIAN START END DELAY GEOMETRIC DELAY AVERAGE DELAY I I (VEH/MIN) (VEH/MIN) CAPACITY FLOW QUEUE QUEUE (VEH.MIN/ (VEH.MIN/ PER ARRIVING I I (RFC) (PEDS/MIN) (VEHS) (VEHS) TIME SEGMENT) TIME SEGMENT) VEHICLE (MIN) I I 08.30-08.45 I I ARM A 21.44 37.31 0.575 1.3 1.3 20.1 0.06 I I ARM B 14.15 17.14 0.826 4.2 4.5 65.5 0.33 I I ARM C 4.79 12.98 0.369 0.6 0.6 8.7 0.12 I I ARM D 18.90 22.44 0.842 4.8 5.0 73.9 0.28 I I I ------------------------------------------------------------------------------------------------------------------

-------------------------------------------------------------------------------- TRL TRL VIEWER 3.0 AC j:\Colchester\Green Lane Roundabour AM Peak.vao - Page 3 -------------------------------------------------------------------------------- ------------------------------------------------------------------------------------------------------------------ I TIME DEMAND CAPACITY DEMAND/ PEDESTRIAN START END DELAY GEOMETRIC DELAY AVERAGE DELAY I I (VEH/MIN) (VEH/MIN) CAPACITY FLOW QUEUE QUEUE (VEH.MIN/ (VEH.MIN/ PER ARRIVING I I (RFC) (PEDS/MIN) (VEHS) (VEHS) TIME SEGMENT) TIME SEGMENT) VEHICLE (MIN) I I 08.45-09.00 I I ARM A 17.51 37.86 0.462 1.3 0.9 13.3 0.05 I I ARM B 11.55 18.50 0.625 4.5 1.7 27.8 0.15 I I ARM C 3.91 14.97 0.261 0.6 0.4 5.5 0.09 I I ARM D 15.43 23.72 0.651 5.0 1.9 30.9 0.13 I I I ------------------------------------------------------------------------------------------------------------------
------------------------------------------------------------------------------------------------------------------ I TIME DEMAND CAPACITY DEMAND/ PEDESTRIAN START END DELAY GEOMETRIC DELAY AVERAGE DELAY I I (VEH/MIN) (VEH/MIN) CAPACITY FLOW QUEUE QUEUE (VEH.MIN/ (VEH.MIN/ PER ARRIVING I I (RFC) (PEDS/MIN) (VEHS) (VEHS) TIME SEGMENT) TIME SEGMENT) VEHICLE (MIN) I I 09.00-09.15 I I ARM A 14.66 38.31 0.383 0.9 0.6 9.5 0.04 I I ARM B 9.68 19.50 0.496 1.7 1.0 15.5 0.10 I I ARM C 3.28 16.53 0.198 0.4 0.2 3.8 0.08 I I ARM D 12.93 24.76 0.522 1.9 1.1 17.2 0.09 I I I ------------------------------------------------------------------------------------------------------------------
QUEUE AT ARM A -------------- TIME SEGMENT NO. OF ENDING VEHICLES IN QUEUE 08.00 0.6 * 08.15 0.9 * 08.30 1.3 * 08.45 1.3 * 09.00 0.9 * 09.15 0.6 *
QUEUE AT ARM B -------------- TIME SEGMENT NO. OF ENDING VEHICLES IN QUEUE 08.00 1.0 * 08.15 1.6 ** 08.30 4.2 **** 08.45 4.5 **** 09.00 1.7 ** 09.15 1.0 *
QUEUE AT ARM C -------------- TIME SEGMENT NO. OF ENDING VEHICLES IN QUEUE 08.00 0.2 08.15 0.3 08.30 0.6 * 08.45 0.6 * 09.00 0.4 09.15 0.2
QUEUE AT ARM D -------------- TIME SEGMENT NO. OF ENDING VEHICLES IN QUEUE 08.00 1.1 * 08.15 1.8 ** 08.30 4.8 ***** 08.45 5.0 ***** 09.00 1.9 ** 09.15 1.1 *

-------------------------------------------------------------------------------- TRL TRL VIEWER 3.0 AC j:\Colchester\Green Lane Roundabour AM Peak.vao - Page 4 -------------------------------------------------------------------------------- QUEUEING DELAY INFORMATION OVER WHOLE PERIOD -------------------------------------------- ---------------------------------------------------------------------------- I ARM I TOTAL DEMAND I * QUEUEING * I * INCLUSIVE QUEUEING * I I I I * DELAY * I * DELAY * I I I------------------------------------------------------------------I I I (VEH) (VEH/H) I (MIN) (MIN/VEH) I (MIN) (MIN/VEH) I ---------------------------------------------------------------------------- I A I 1608.4 I 1072.3 I 84.1 I 0.05 I 84.1 I 0.05 I I B I 1061.3 I 707.5 I 201.3 I 0.19 I 201.4 I 0.19 I I C I 359.3 I 239.5 I 35.0 I 0.10 I 35.0 I 0.10 I I D I 1417.8 I 945.2 I 226.0 I 0.16 I 226.0 I 0.16 I ---------------------------------------------------------------------------- I ALL I 4446.8 I 2964.6 I 546.3 I 0.12 I 546.4 I 0.12 I ---------------------------------------------------------------------------- * DELAY IS THAT OCCURRING ONLY WITHIN THE TIME PERIOD. * INCLUSIVE DELAY INCLUDES DELAY SUFFERED BY VEHICLES WHICH ARE STILL QUEUEING AFTER THE END OF THE TIME PERIOD. * THESE WILL ONLY BE SIGNIFICANTLY DIFFERENT IF THERE IS A LARGE QUEUE REMAINING AT THE END OF THE TIME PERIOD. END OF JOB ============================================= end of file ===============================================
[Printed at 16:40:50 on 27/04/2009]

-------------------------------------------------------------------------------- TRL TRL VIEWER 3.0 AC j:\Colchester\Green Lane Roundabour PM Peak.vao - Page 1 -------------------------------------------------------------------------------- ___________________ A R C A D Y 6 ___________________ ASSESSMENT OF ROUNDABOUT CAPACITY AND DELAY Analysis Program: Release 1.0 (MAR 2004) (c) Copyright TRL Limited, 2004 Adapted from ARCADY/3 which is Crown Copyright by permission of the controller of HMSO ______________________________________________________ For sales and distribution information, program advice and maintenance, contact: TRL Limited Tel: +44 (0) 1344 770018 Crowthorne House Fax: +44 (0) 1344 770864 Nine Mile Ride Email: [email protected] Wokingham, Berks. Web: www.trlsoftware.co.uk RG40 3GA,UK --------------------------------------------------------------------------------- THE USER OF THIS COMPUTER PROGRAM FOR THE SOLUTION OF AN ENGINEERING PROBLEM IS IN NO WAY RELIEVED OF THEIR RESPONSIBILITY FOR THE CORRECTNESS OF THE SOLUTION --------------------------------------------------------------------------------- Run with file:- "j:\Colchester\Green Lane Roundabour PM Peak.vai" (drive-on-the-left ) at 16:41:49 on Monday, 27 April 2009
FILE PROPERTIES *************** RUN TITLE: Green lane Roundabout AM Peak LOCATION: Colchester DATE: 27 April 2009 CLIENT: ENUMERATOR: awilson [KNT-MOB-103] JOB NUMBER: 22376 STATUS: DESCRIPTION:
INPUT DATA ********** ARM A - A133 Colchester Road north ARM B - B1033 ARM C - Services ARM D - A133
GEOMETRIC DATA -------------- ----------------------------------------------------------------------------------------------------------------------- I ARM I V (M) I E (M) I L (M) I R (M) I D (M) I PHI (DEG) I SLOPE I INTERCEPT (PCU/MIN) I ----------------------------------------------------------------------------------------------------------------------- I ARM A I 6.82 I 9.27 I 9.80 I 41.60 I 79.90 I 43.0 I 0.575 I 40.500 I I ARM B I 4.10 I 8.91 I 3.90 I 18.80 I 79.90 I 40.0 I 0.432 I 24.647 I I ARM C I 3.86 I 6.75 I 5.20 I 17.30 I 79.90 I 33.0 I 0.433 I 24.299 I I ARM D I 3.00 I 8.88 I 18.00 I 21.30 I 79.90 I 29.0 I 0.487 I 29.859 I ----------------------------------------------------------------------------------------------------------------------- V = approach half-width L = effective flare length D = inscribed circle diameter E = entry width R = entry radius PHI = entry angle
TRAFFIC DEMAND DATA ------------------- (Only sets included in the current run are shown)
----------------------- I ARM I FLOW SCALE(%) I ----------------------- I A I 100 I I B I 100 I I C I 100 I I D I 100 I -----------------------
TIME PERIOD BEGINS 16.45 AND ENDS 18.15
LENGTH OF TIME PERIOD - 90 MINUTES. LENGTH OF TIME SEGMENT - 15 MINUTES.
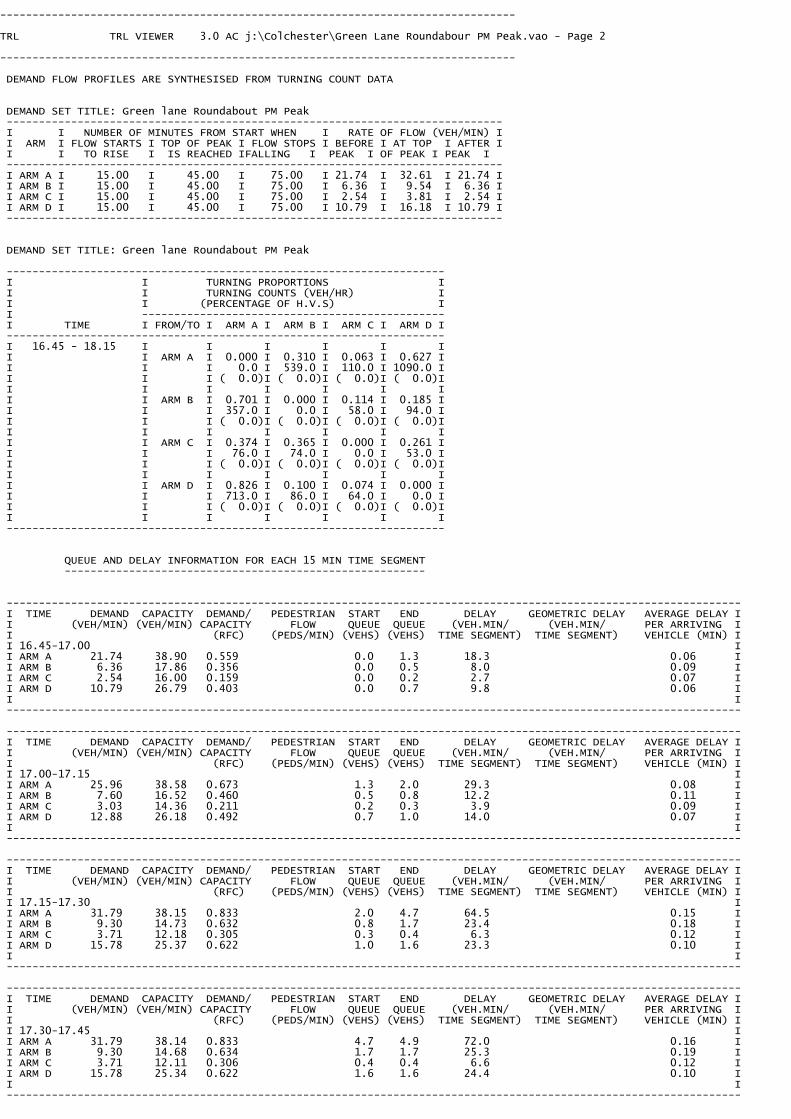
-------------------------------------------------------------------------------- TRL TRL VIEWER 3.0 AC j:\Colchester\Green Lane Roundabour PM Peak.vao - Page 2 -------------------------------------------------------------------------------- DEMAND FLOW PROFILES ARE SYNTHESISED FROM TURNING COUNT DATA DEMAND SET TITLE: Green lane Roundabout PM Peak ----------------------------------------------------------------------------- I I NUMBER OF MINUTES FROM START WHEN I RATE OF FLOW (VEH/MIN) I I ARM I FLOW STARTS I TOP OF PEAK I FLOW STOPS I BEFORE I AT TOP I AFTER I I I TO RISE I IS REACHED IFALLING I PEAK I OF PEAK I PEAK I ----------------------------------------------------------------------------- I ARM A I 15.00 I 45.00 I 75.00 I 21.74 I 32.61 I 21.74 I I ARM B I 15.00 I 45.00 I 75.00 I 6.36 I 9.54 I 6.36 I I ARM C I 15.00 I 45.00 I 75.00 I 2.54 I 3.81 I 2.54 I I ARM D I 15.00 I 45.00 I 75.00 I 10.79 I 16.18 I 10.79 I ----------------------------------------------------------------------------- DEMAND SET TITLE: Green lane Roundabout PM Peak
-------------------------------------------------------------------- I I TURNING PROPORTIONS I I I TURNING COUNTS (VEH/HR) I I I (PERCENTAGE OF H.V.S) I I ----------------------------------------------- I TIME I FROM/TO I ARM A I ARM B I ARM C I ARM D I -------------------------------------------------------------------- I 16.45 - 18.15 I I I I I I I I ARM A I 0.000 I 0.310 I 0.063 I 0.627 I I I I 0.0 I 539.0 I 110.0 I 1090.0 I I I I ( 0.0)I ( 0.0)I ( 0.0)I ( 0.0)I I I I I I I I I I ARM B I 0.701 I 0.000 I 0.114 I 0.185 I I I I 357.0 I 0.0 I 58.0 I 94.0 I I I I ( 0.0)I ( 0.0)I ( 0.0)I ( 0.0)I I I I I I I I I I ARM C I 0.374 I 0.365 I 0.000 I 0.261 I I I I 76.0 I 74.0 I 0.0 I 53.0 I I I I ( 0.0)I ( 0.0)I ( 0.0)I ( 0.0)I I I I I I I I I I ARM D I 0.826 I 0.100 I 0.074 I 0.000 I I I I 713.0 I 86.0 I 64.0 I 0.0 I I I I ( 0.0)I ( 0.0)I ( 0.0)I ( 0.0)I I I I I I I I --------------------------------------------------------------------
QUEUE AND DELAY INFORMATION FOR EACH 15 MIN TIME SEGMENT --------------------------------------------------------
------------------------------------------------------------------------------------------------------------------ I TIME DEMAND CAPACITY DEMAND/ PEDESTRIAN START END DELAY GEOMETRIC DELAY AVERAGE DELAY I I (VEH/MIN) (VEH/MIN) CAPACITY FLOW QUEUE QUEUE (VEH.MIN/ (VEH.MIN/ PER ARRIVING I I (RFC) (PEDS/MIN) (VEHS) (VEHS) TIME SEGMENT) TIME SEGMENT) VEHICLE (MIN) I I 16.45-17.00 I I ARM A 21.74 38.90 0.559 0.0 1.3 18.3 0.06 I I ARM B 6.36 17.86 0.356 0.0 0.5 8.0 0.09 I I ARM C 2.54 16.00 0.159 0.0 0.2 2.7 0.07 I I ARM D 10.79 26.79 0.403 0.0 0.7 9.8 0.06 I I I ------------------------------------------------------------------------------------------------------------------
------------------------------------------------------------------------------------------------------------------ I TIME DEMAND CAPACITY DEMAND/ PEDESTRIAN START END DELAY GEOMETRIC DELAY AVERAGE DELAY I I (VEH/MIN) (VEH/MIN) CAPACITY FLOW QUEUE QUEUE (VEH.MIN/ (VEH.MIN/ PER ARRIVING I I (RFC) (PEDS/MIN) (VEHS) (VEHS) TIME SEGMENT) TIME SEGMENT) VEHICLE (MIN) I I 17.00-17.15 I I ARM A 25.96 38.58 0.673 1.3 2.0 29.3 0.08 I I ARM B 7.60 16.52 0.460 0.5 0.8 12.2 0.11 I I ARM C 3.03 14.36 0.211 0.2 0.3 3.9 0.09 I I ARM D 12.88 26.18 0.492 0.7 1.0 14.0 0.07 I I I ------------------------------------------------------------------------------------------------------------------
------------------------------------------------------------------------------------------------------------------ I TIME DEMAND CAPACITY DEMAND/ PEDESTRIAN START END DELAY GEOMETRIC DELAY AVERAGE DELAY I I (VEH/MIN) (VEH/MIN) CAPACITY FLOW QUEUE QUEUE (VEH.MIN/ (VEH.MIN/ PER ARRIVING I I (RFC) (PEDS/MIN) (VEHS) (VEHS) TIME SEGMENT) TIME SEGMENT) VEHICLE (MIN) I I 17.15-17.30 I I ARM A 31.79 38.15 0.833 2.0 4.7 64.5 0.15 I I ARM B 9.30 14.73 0.632 0.8 1.7 23.4 0.18 I I ARM C 3.71 12.18 0.305 0.3 0.4 6.3 0.12 I I ARM D 15.78 25.37 0.622 1.0 1.6 23.3 0.10 I I I ------------------------------------------------------------------------------------------------------------------
------------------------------------------------------------------------------------------------------------------ I TIME DEMAND CAPACITY DEMAND/ PEDESTRIAN START END DELAY GEOMETRIC DELAY AVERAGE DELAY I I (VEH/MIN) (VEH/MIN) CAPACITY FLOW QUEUE QUEUE (VEH.MIN/ (VEH.MIN/ PER ARRIVING I I (RFC) (PEDS/MIN) (VEHS) (VEHS) TIME SEGMENT) TIME SEGMENT) VEHICLE (MIN) I I 17.30-17.45 I I ARM A 31.79 38.14 0.833 4.7 4.9 72.0 0.16 I I ARM B 9.30 14.68 0.634 1.7 1.7 25.3 0.19 I I ARM C 3.71 12.11 0.306 0.4 0.4 6.6 0.12 I I ARM D 15.78 25.34 0.622 1.6 1.6 24.4 0.10 I I I ------------------------------------------------------------------------------------------------------------------

-------------------------------------------------------------------------------- TRL TRL VIEWER 3.0 AC j:\Colchester\Green Lane Roundabour PM Peak.vao - Page 3 -------------------------------------------------------------------------------- ------------------------------------------------------------------------------------------------------------------ I TIME DEMAND CAPACITY DEMAND/ PEDESTRIAN START END DELAY GEOMETRIC DELAY AVERAGE DELAY I I (VEH/MIN) (VEH/MIN) CAPACITY FLOW QUEUE QUEUE (VEH.MIN/ (VEH.MIN/ PER ARRIVING I I (RFC) (PEDS/MIN) (VEHS) (VEHS) TIME SEGMENT) TIME SEGMENT) VEHICLE (MIN) I I 17.45-18.00 I I ARM A 25.96 38.57 0.673 4.9 2.1 33.1 0.08 I I ARM B 7.60 16.45 0.462 1.7 0.9 13.6 0.11 I I ARM C 3.03 14.27 0.212 0.4 0.3 4.2 0.09 I I ARM D 12.88 26.15 0.493 1.6 1.0 15.2 0.08 I I I ------------------------------------------------------------------------------------------------------------------
------------------------------------------------------------------------------------------------------------------ I TIME DEMAND CAPACITY DEMAND/ PEDESTRIAN START END DELAY GEOMETRIC DELAY AVERAGE DELAY I I (VEH/MIN) (VEH/MIN) CAPACITY FLOW QUEUE QUEUE (VEH.MIN/ (VEH.MIN/ PER ARRIVING I I (RFC) (PEDS/MIN) (VEHS) (VEHS) TIME SEGMENT) TIME SEGMENT) VEHICLE (MIN) I I 18.00-18.15 I I ARM A 21.74 38.89 0.559 2.1 1.3 19.7 0.06 I I ARM B 6.36 17.81 0.357 0.9 0.6 8.6 0.09 I I ARM C 2.54 15.94 0.159 0.3 0.2 2.9 0.07 I I ARM D 10.79 26.76 0.403 1.0 0.7 10.4 0.06 I I I ------------------------------------------------------------------------------------------------------------------
QUEUE AT ARM A -------------- TIME SEGMENT NO. OF ENDING VEHICLES IN QUEUE 17.00 1.3 * 17.15 2.0 ** 17.30 4.7 ***** 17.45 4.9 ***** 18.00 2.1 ** 18.15 1.3 *
QUEUE AT ARM B -------------- TIME SEGMENT NO. OF ENDING VEHICLES IN QUEUE 17.00 0.5 * 17.15 0.8 * 17.30 1.7 ** 17.45 1.7 ** 18.00 0.9 * 18.15 0.6 *
QUEUE AT ARM C -------------- TIME SEGMENT NO. OF ENDING VEHICLES IN QUEUE 17.00 0.2 17.15 0.3 17.30 0.4 17.45 0.4 18.00 0.3 18.15 0.2
QUEUE AT ARM D -------------- TIME SEGMENT NO. OF ENDING VEHICLES IN QUEUE 17.00 0.7 * 17.15 1.0 * 17.30 1.6 ** 17.45 1.6 ** 18.00 1.0 * 18.15 0.7 *

-------------------------------------------------------------------------------- TRL TRL VIEWER 3.0 AC j:\Colchester\Green Lane Roundabour PM Peak.vao - Page 4 -------------------------------------------------------------------------------- QUEUEING DELAY INFORMATION OVER WHOLE PERIOD -------------------------------------------- ---------------------------------------------------------------------------- I ARM I TOTAL DEMAND I * QUEUEING * I * INCLUSIVE QUEUEING * I I I I * DELAY * I * DELAY * I I I------------------------------------------------------------------I I I (VEH) (VEH/H) I (MIN) (MIN/VEH) I (MIN) (MIN/VEH) I ---------------------------------------------------------------------------- I A I 2384.5 I 1589.7 I 236.8 I 0.10 I 236.8 I 0.10 I I B I 697.9 I 465.3 I 91.1 I 0.13 I 91.1 I 0.13 I I C I 278.4 I 185.6 I 26.6 I 0.10 I 26.6 I 0.10 I I D I 1183.4 I 788.9 I 97.1 I 0.08 I 97.1 I 0.08 I ---------------------------------------------------------------------------- I ALL I 4544.2 I 3029.5 I 451.5 I 0.10 I 451.6 I 0.10 I ---------------------------------------------------------------------------- * DELAY IS THAT OCCURRING ONLY WITHIN THE TIME PERIOD. * INCLUSIVE DELAY INCLUDES DELAY SUFFERED BY VEHICLES WHICH ARE STILL QUEUEING AFTER THE END OF THE TIME PERIOD. * THESE WILL ONLY BE SIGNIFICANTLY DIFFERENT IF THERE IS A LARGE QUEUE REMAINING AT THE END OF THE TIME PERIOD. END OF JOB ============================================= end of file ===============================================
[Printed at 16:41:54 on 27/04/2009]

APPENDIX 4 Funding for transport infrastructure schemes


Funding for transport infrastructure schemes The sources of funding for transport infrastructure schemes are:
- Regional Funding Allocation - Transport Innovation Fund - Growth Fund - Community Infrastructure Fund - European funds - Road safety grant to local authorities - Local councils, financed through borrowing - PFI schemes - Highways Agency routes of strategic national importance - Highways Agency small schemes under £5m - Network Rail investment, including small schemes under £5m - DfT rail through the High Level Output Specification - Investment by private transport providers eg bus companies, train operating
companies - Developer contributions ( section 106/278) - Community Infrastructure Levy
LTP and Regional Funding Allocation (RFA) Who Leads the Bid? For LTP funding the local Council writes the bid document and DfT decide the money. For RFA funding Dft decide the amount for region and the Regional Transport Board decide on its allocation, but DfT have to give final approval for funding. Explanation/Process RFA is the main source of grant funding for transport infrastructure schemes. There three ways in which the RFA is used to finance the capital cost of schemes which appear in an area’s Local Transport Plan. These are:
- Major scheme allocation for an individual transport schemes over £5million - Integrated Transport Allocation which funds all non-maintenance capital
transport schemes costing less than £5m eg small road projects, bus priority schemes, walking and cycling schemes and transport information projects
- Maintenance Allocation which is used to fund all structural local road maintenance such as re-surfacing.
The Regional Transport Board decides on the priority within its region of schemes to receive monies from the regions allocation of money from the DfT in its RFA. The RFA will fund 90% of the capital cost of prioritised schemes and part of the preparation costs. The boards are now prioritising schemes for delivery upto 2018/19. The final decision on whether a scheme represents value for money and should receive funding rests with the DfT For Essex the Integrated Transport Allocation is around £15.3 million in 2011/12 rising to £17.5 million in 2018/19. The Maintenance Allocation is £21.5 million in 2011.12 rising to £24.7 million in 2018/19.

For Thurrock the Integrated Transport Allocation is around £1.6 million in 2011/12 rising to £1.9 million in 2018/19. The Maintenance Allocation is £1.9 million in 2011.12 rising to £2.2 million in 2018/19. For major schemes, Essex and Thurrock are competing for limited funds against schemes throughout the East of England area. Transport Innovation Fund (TIF) is for the capital funding of schemes which are part of a package of measures which includes a congestion charge. Only a few local authorities are still developing bids from this fund. Regional Infrastructure Funding (RIF) Who Leads the Bid? The Regional Transport Board. This funding is essentially just forward funding mechanism for schemes that will get RFA Explanation/Process This is a newer source of funding coming forward and its applicability is currently unknown. Growth Fund (GAF and GPF) Who Leads the Bid? The funding is decided by Communities and Local Government (CLG) but Home and Communities Agency (HCA) will be involved. Explanation/Process This fund was administered by the Department of Communities and Local Government to support the delivery of infrastructure in the three newer Growth Areas and the Growth Points ( see map attached). It is part of the money that the CLG is spending on the Growth Areas, Thames Gateway, Growth Points and eco-towns. The funding runs until 2011 and is now fully allocated (see spreadsheet for allocation of funds to areas). The money is an unringfenced grant, although it is divided into a capital and revenue element. This means that the local authorities and local partnerships receiving the grant decide how it is spent. It will not all be available for transport projects. Community Infrastructure Fund. Who Leads the Bid? CIF actually doesn’t exist anymore. No plans for further CIF funding. Explanation/Process This was a fund for specific transport projects which helped to deliver housing. All the money has now been allocated to schemes. Like the Growth Fund, these monies were available under the current Comprehensive Spending Review (CSR07). The next CSR will take place after the next election. It may provide additional funds for the growth and community infrastructure fund, or may provide funds for new schemes, consolidate all funding under the RFA process or do something entirely different. European Funds. In the past it has been possible to obtain European Union Funds for schemes such as new roads and public transport in the most deprived areas of Europe. Other funds appear from time to time, for example European money was used to help finance Fastrack in Kent Thameside.

Road safety grant to local authorities. There is only a small sum available annually for local road safety schemes.from the Road Safety Partnership grant administered by the DfT. Local Councils may decide to borrow money or raise Council Tax ( as in the case of Manchester) in order to finance transport schemes. PFI schemes. For these schemes a private company is set up to deliver a scheme and associated maintenance and operation for a fixed period of time. Central government allocates the necessary funds each year needed to meet the payments due to the private company. These are known as PFI credits. To date PFI has been mainly used by the Highways Agency and Transport for London. DfT PFI credits are usually given to highway maintenance and street lighting schemes. Highways Agency has funds for schemes of national importance and a small discretionary fund for schemes under £5m. Many road schemes are funded through the Regional Funding Allocation. Rail schemes. The DfT decides what rail schemes it wishes to fund under the High Level Output Specification. Network Rail also sets out its plans in the Route Utilisation Strategy for each area. Network Rail also has a small discretionary fund fro schemes under £5m. Developer contributions. These are subject to the ability of local planers to negotiate settlements. There are competing demands from other sectors such as health and education. The current economic climate means that these sums are likely to be lower than expected in the immediate future. They are extremely valuable as a source of the 10% local contribution to schemes required by RFA grants. Community Infrastructure Levy. After April 2010 local authorities can choose to exercise the power to make a standard charge on new development ( akin to a tariff) calculated by multiplying the amount of development by the standard local rate for each land use type. The monies raised will be used towards the cost of infrastructure in the area.


APPENDIX 5 Previous Developer Contribution Levels


SITE NO OF UNITSAFFORDABLE HOUSING
‐ UNITS
AFFORDABLE HOUSING
‐ CONTRIBUTIONOPEN SPACE ‐ LAND
OPEN SPACE/PLAY
EQUIPMENT PUBLIC REALM
HARWICH
MASTERPLAN
LOSS OF
EMPLOYMENT HIGHWAYS EDUCATION
TOTAL
CONTRIBUTION
TOTAL
CONTRIBUTION
(per unit)
AFFORDABLE
HOUSING (%)
Thorpe Road Clacton 5 £40,000 £40,000 £8,000 0%
Thorpe Road Kirby
Cross49 10 £20,000 £248,303 £268,303 £5,476 20%
Lees School Clacton 39 £80,000 £80,000 £2,051 0%
Highlands Clacton 120 £774,500 £774,500 £6,454 0%
Low Road Dovercourt 162 5 4 parcels of land on site £18,564 £18,564 £115 3%
Capital House,
Dovercourt93 28
Small play area
equipped£228,000 £115,000 £343,000 £3,688 30%
Sydney St. Brightlingsea
(Outline)Up to 37 units £0 £0 0%
Byng Crescent Thorpe 12 12 £0 £0 100%
Royal Hotel Clacton 46 £360,000 £360,000 £7,826 0%
Windsor School Clacton 24 0.81 hectare £100,000 £100,000 £4,167 0%
Former Factory
Harwich34 £61,694 £129,200 £190,894 £5,615 0%
Woolner Road Clacton 30 £82,269 £82,269 £2,742 0%
St Marys Gt Bentley 12 12 £0 £0 100%
Jackson House Clacton 32 12 £44,219 £10,025 £54,244 £1,695 38%
Pallister Road Clacton 10 £18,026 £18,026 £1,803 0%
Harwich Primary 39 £62,530 £62,530 £1,603 0%
High St Dovercourt 10 £13,520 £13,520 £1,352 0%
Waterside Brightlingsea 99 £720,000 £34,400 £78,486 £840,159 £8,486 0%
Lighthouse Clacton 14 £18,590 £20,000 £38,590 £2,756 0%
Plot 3 Stanton Euro,
Dovercourt81 30 £138,000 £60,000 £198,000 £2,444 37%
948 109 £1,854,500 ‐ £843,143 £20,000 £129,200 £10,025 £209,400 £409,058 £3,482,599 £3,674 11%


APPENDIX 6 Developer Contribution Analysis Assumptions

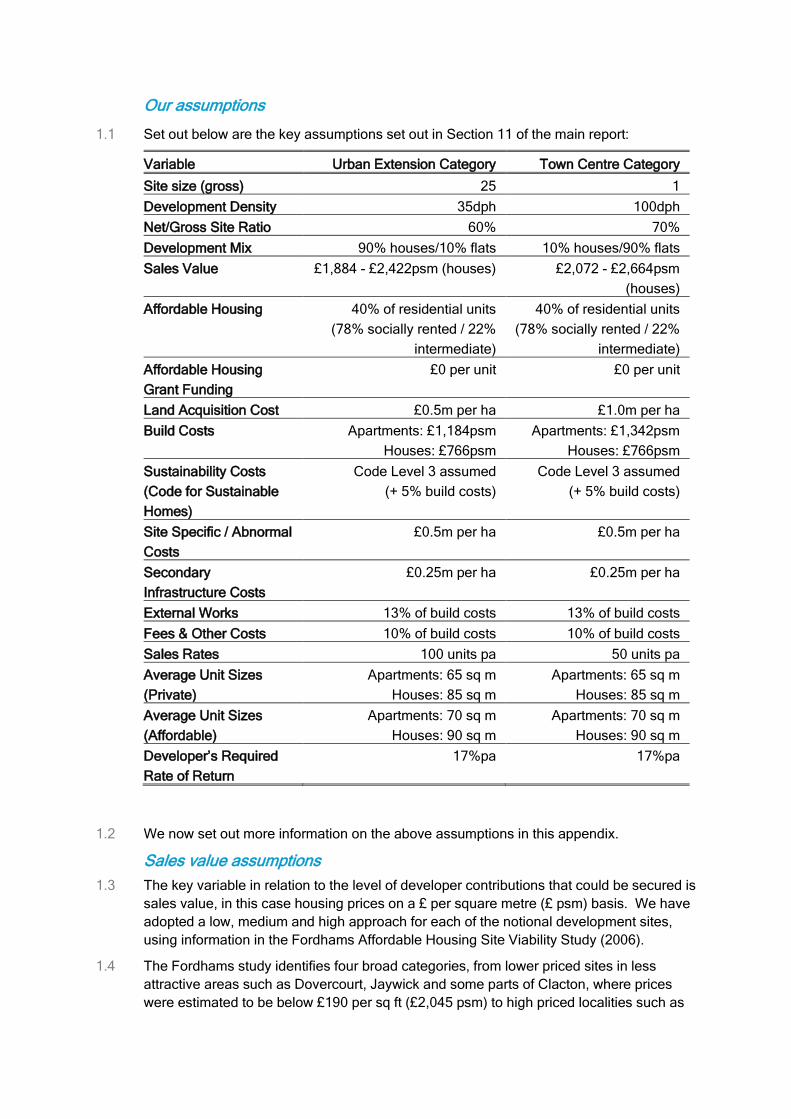
Our assumptions
1.1 Set out below are the key assumptions set out in Section 11 of the main report:
Variable Urban Extension Category Town Centre Category
Site size (gross) 25 1
Development Density 35dph 100dph
Net/Gross Site Ratio 60% 70%
Development Mix 90% houses/10% flats 10% houses/90% flats
Sales Value £1,884 - £2,422psm (houses) £2,072 - £2,664psm
(houses)
Affordable Housing 40% of residential units
(78% socially rented / 22%
intermediate)
40% of residential units
(78% socially rented / 22%
intermediate)
Affordable Housing
Grant Funding
£0 per unit £0 per unit
Land Acquisition Cost £0.5m per ha £1.0m per ha
Build Costs Apartments: £1,184psm
Houses: £766psm
Apartments: £1,342psm
Houses: £766psm
Sustainability Costs
(Code for Sustainable
Homes)
Code Level 3 assumed
(+ 5% build costs)
Code Level 3 assumed
(+ 5% build costs)
Site Specific / Abnormal
Costs
£0.5m per ha £0.5m per ha
Secondary
Infrastructure Costs
£0.25m per ha £0.25m per ha
External Works 13% of build costs 13% of build costs
Fees & Other Costs 10% of build costs 10% of build costs
Sales Rates 100 units pa 50 units pa
Average Unit Sizes
(Private)
Apartments: 65 sq m
Houses: 85 sq m
Apartments: 65 sq m
Houses: 85 sq m
Average Unit Sizes
(Affordable)
Apartments: 70 sq m
Houses: 90 sq m
Apartments: 70 sq m
Houses: 90 sq m
Developer’s Required
Rate of Return
17%pa 17%pa
1.2 We now set out more information on the above assumptions in this appendix.
Sales value assumptions
1.3 The key variable in relation to the level of developer contributions that could be secured is sales value, in this case housing prices on a £ per square metre (£ psm) basis. We have adopted a low, medium and high approach for each of the notional development sites, using information in the Fordhams Affordable Housing Site Viability Study (2006).
1.4 The Fordhams study identifies four broad categories, from lower priced sites in less attractive areas such as Dovercourt, Jaywick and some parts of Clacton, where prices were estimated to be below £190 per sq ft (£2,045 psm) to high priced localities such as

Frinton and Mistley, where prices were estimated to be £240 per sq ft (£2,583 psm) and upwards.
1.5 We assumed apartments will sell for approximately 10% more on a per sq m basis than houses, and we assumed values in town centre locations would be 10% higher than in urban extensions. On this basis, we used the following indicative value categories:
Assumed “peak” sales values by category (per sq m) houses / apartments
Source: RTP; Fordhams
Our approach to affordable housing
1.6 The two main approaches to using new development to provide affordable housing is either through requiring a developer to provide a set percentage of units as affordable to a Registered Social Landlord (RSL), or provide a set percentage of its land for an RSL.
1.7 We understand from stakeholders that most LPAs usually take the first approach – that is, to apply percentage affordable housing targets to the overall proposed dwelling numbers on the site.
1.8 Following discussions with the Council, we have adopted a requirement for 40% affordable housing. We have used a 78:22 split between socially rented and intermediate affordable housing units.
Factors affecting affordable housing values
1.9 An RSL will pay the developer less for the affordable housing in a development than private buyers pay for private units. This is taken into account in our model.
1.10 Assuming an RSL acquires the units rather than the land for affordable housing, the value a developer will receive from the RSL will largely depend on the following three key factors:
The tenure type (i.e. whether the units are for socially rented or intermediate affordable housing)
“Open market” values (i.e. what “private” units are sold for)
The level of grant funding available
1.11 Our approach to these variables is as follows.
Accounting for tenure type: more value is achieved from intermediate affordable housing
NOTIONAL URBAN EXTENSION NOTIONAL TOWN CENTRE SITELOW
VALUEMEDIUM
VALUEHIGH
VALUELOW
VALUEMEDIUM
VALUEHIGH
VALUE
Apartments £2,072 £2,368 £2,664 £2,280 £2,605 £2,931
Houses £1,884 £2,153 £2,422 £2,072 £2,368 £2,664

1.12 A developer will receive more for intermediate affordable housing units from an RSL than for socially rented units. This reflects the respective value of such affordable housing to the RSL.
1.13 Often a developer will receive less than half the “open market” (or private) value for socially rented units where no grant funding is available. In contrast, where there is grant funding available, a developer can receive almost full market value from an RSL for intermediate affordable units.
Accounting for open market values: we have assessed the value of affordable housing as a percentage of market value
1.14 Higher “open market” (or private) residential values usually correspond to a developer receiving more from an RSL for the affordable housing units.
1.15 We have made assumptions on “open market” residential values for the different development categories (see above). Our approach is therefore to apply a percentage of these “open market” values to the affordable housing element in our notional developments.
Accounting for grant levels: affordable housing grant is changing
1.16 A developer will receive more from an RSL where grant funding is made available by the Homes and Communities Agency (previously the Housing Corporation).
1.17 The Housing Corporation’s (HC) previous national policy on grant funding was none would be available, unless the need for public subsidy could be demonstrated. Importantly, the HC wished to ensure it did not subsidise land values i.e. help maintain high land prices to the benefit of land owners. We understand from meetings with its successor, the Homes and Communities Agency (HCA), that it is still following the principle that developer contributions in the first instance should bring forward affordable housing in accordance with the overall percentages, mix of tenure and house type as set out in the local authorities SPD for affordable housing.
We have assumed nil grant funding
1.18 The need for grant funding needs to be justified on an individual site or need basis. It is therefore difficult to apply assumptions of likely grant funding to particular “categories” of development (such as urban extension or urban sites).
1.19 We have therefore adopted a nil based grant position for National Affordable Housing Programme (NAHP) grant as our base assumption, although this has been varied within the sensitivity analysis.
We have combined the above factors to make some affordable housing value assumptions
1.20 We have set out below the assumptions in our analysis model regarding how much the RSL pays the developer for the affordable housing units to allow sensitivity analysis to this variable. It should be noted we have assumed that the grant level per unit will not be applied equally to the socially rented and intermediate affordable housing; the latter will normally be allocated less due to its higher value to an RSL. We have based this high level assessment on our general experience elsewhere.
1.21 These assumptions can be changed or tested in the analysis model in the second stage of the study. We recommend they are reviewed in due course through consultation with local RSLs.

Affordable housing value assumptions (% of market value)
Grant Level
Social Rented Assumed Value
(% of market value)
Intermediate Assumed Value
(% of market value)
No Grant 45% 75%
£10,000 per unit 50% 80%
£20,000 per unit 55% 85%
£30,000 per unit 60% 90%
Source: RTP
1.22 As the above table shows, we have assumed that the developer receives a higher percentage of market value for intermediate affordable units. Indeed, close to full market value (i.e. 100%) is achieved on intermediate housing with a £30,000 per unit HCA grant funding. In contrast, on socially rented affordable units where no HCA grant funding is assumed, the amount received by the developer is assumed to be less than half of that achieved on private units.
Build cost assumptions
Build cost increases are levelling off
1.23 Average build costs have risen by around 25% since the end of 2003 although the rate of increase is now levelling off. DCLG’s Cost Analysis of The Code for Sustainable Homes (July 2008) assumes build costs (i.e. excluding site preparation, external works etc which are separately set out below) of £766 per sq m and £1,342 per sq m for houses and apartments respectively. This is broadly consistent with our own knowledge of build costs. We have used £766 per sq m and £1,184 per sq m on the notional urban extension site, and the higher apartment cost of £1,342 per sq m on the notional town centre site to reflect the higher density and potentially higher quality required.
Code for Sustainable Homes standards will drive build costs up in future
1.24 The introduction of the Code for Sustainable Homes (CSH) Standards will significantly add to costs when they are introduced (DCLG have not announced any plan to delay this). Unfortunately, there are relatively few houses built to these standards to use as comparables to assess the increased costs above “base” build costs.
1.25 We have used an average of the estimated percentage build cost increases for varying CSH standards in our analysis model from DCLG’s Cost Analysis of The Code for Sustainable Homes. These are as follows:
Code Level 3 – cost increase of 5%
Code Level 4 – cost increase of 11%
Code Level 5 – cost increase of 21%
Code Level 6 – cost increase of 37%

1.26 Unfortunately, there are still relatively few houses built to these standards, so we would recommend these figures are reviewed in the future.
Pre-development and secondary infrastructure cost assumptions
1.27 We have assumed £250,000 per gross ha for pre-development and secondary
infrastructure costs (site preparation including drainage, distributor roads and utilities).
Although this is at the lower end of such costs, we have made a general allowance for
site specific or abnormal costs (see below). We have also allowed 13% of build costs for
external works (such as landscaping and public open space) using published case
studies and our experience of costs elsewhere, and 10% of build costs for professional
fees and other minor costs.
1.28 As with many of the variables, it is not possible to be site specific as each development will have unique costs in this respect, but these general levels are based on experience elsewhere.
Site specific, or “abnormal” development cost assumptions
1.29 There are likely to be additional development costs specific to individual developments
which reflect their individual characteristics. These are usually described as “abnormal”
costs. For example, one site may require off site infrastructure works such as a stretch of
access road or additional utilities, a second remediation/decontamination and a third
acquisition of existing buildings or land (with associated demolition costs). For example,
a report for English Partnerships in 2005 suggested that a typical budget for cleaning up
an industrial site in an area with a low water risk was around £75k - £175k per ha1
1.30 It is not possible to assess all these site specific (or additional) development costs for each site. Indeed, they may not be known at this stage. We have therefore assumed costs of £500,000 per ha for both the notional urban extension and town centre sites. However, if there are town centre sites that have particularly difficult issues such as acute contamination, flood protection and ground conditions, abnormal costs could be higher than those assumed.
,
although it is relatively common for greater sums to be expended on additional
groundworks and substructure on sites that are sloping, wet or unstable.
Sales rate assumptions
Sales rates are key to the cashflow of a development
1.31 Cashflow is critical to a developer. The quicker residential units are sold, the quicker a developer can pay off loans, or achieve a higher rate of return on its own capital employed and reinvest these funds elsewhere. Conversely, a slow sale of residential units means costs already incurred, including land acquisition costs and site preparation costs, will continue to accumulate finance costs until sales income can pay off outstanding balances, or reduce the return on capital employed.
There has been a big slow-down in build and sales rates
1.32 DDCLG data suggests that market housing starts in June 2008 were 27 per cent lower than the June 2007.2
1 English Partnerships Best Practice Note 27 'Contaminated Land Remediation Costs' July 2005
In contrast housing starts by Registered Social Landlords were at their highest quarterly level in eleven years. In September the NHBC estimated a
2http://www.communities.gov.uk/housing/housingresearch/housingstatistics/housingstatisticsby/housingmarket/

quarterly fall of 50% compared with the previous year. Perusal of the interim reports from housebuilders which are mostly released in July and August shows comparably steep falls in completions during the half year. Some of these will be on committed schemes which points to the possibility of further decline, a conclusion backed by anecdotal evidence suggesting that the rate of new private sector starts will be markedly lower still during the coming year.
We have made sales rates assumptions
1.33 A developer is only likely to construct units at a rate it is able to sell units within a reasonable period. In other words, it will not build all private units at one time if this will “flood” the market and mean many are left unsold for a significant length of time.
1.34 We have therefore assumed a sales rate of 25 private (as opposed to affordable) residential units per quarter on the notional urban extension and 7.5 units per quarter on the assumed smaller notional town centre, based on our general market knowledge and information in the Fordhams study where some of the smaller sites are only assumed to have a ceiling level of completions of 4-10 units per quarter.
1.35 Exact sales rates will depend on the strength of the market, demand for the particular development and its size (e.g. a large development site may have more than one developer constructing residential units at one time, which offers a greater diversity of product and is likely to increase sales rates). In our analysis model, for the “urban extension” category at 40% affordable housing, equates to a total of 315 private units in the generic site of 25ha. At a sales rate of 25 units per quarter, the development takes approximately13 quarters (or just over 4 years) for all the units to be sold.
1.36 As with sales values, these reflect closer to rates experienced at the “peak” of the market rather than now; although we have reflected slower build rates in the overall phasing of development, we have utilised this base case for the purposes of analysing theoretical development surpluses.
Developer’s profit
1.37 We have developed a hybrid residual / discounted cash flow analysis to estimate theoretical development surplus arising from residential development to help fund new infrastructure requirements resulting from growth. This can be regarded as a type of “development appraisal” model.
1.38 We have assumed a developer profit based on a discount rate of 17%pa in this analysis model. Although this may be lower than current market profit rates, we are assuming a reasonable profit under normal market conditions for the purposes of this study.
Development mix assumptions
1.39 Through discussions with the Council, and our general development knowledge from other areas, we have assumed the following development mix at this stage:
Assumed “urban extension” development sites: 90% houses / 10% apartments
Assumed “town centre” development sites: 10% houses / 90% apartments
Average unit size assumptions
1.40 We have used the following average unit sizes based on our general development knowledge:

Table 0.1 Average unit size assumptions
Apartment House
Private Residential Units
65 sq m 85 sq m
Affordable Units 70 sq m 90 sq m
Source: RTP
Developer contribution payment timing assumptions
1.41 Finally, we have assumed developer contributions are spread over the life of the development.
1.42 In terms of Sec.106 payments/contributions, the timing of these will be specific to the individual development. For larger developments, these aren’t usually “front loaded” (i.e. are not at the start of the development as this adversely effects a developers cashflow as it may already have other significant site preparation/infrastructure costs in this respect), and are therefore phased or “back ended”.
1.43 Where tariffs are used, these are usually based on a set payment structure that ensures some monies are paid upfront. For example, the Milton Keynes tariff is structured as follows:
10% upon implementable consent
15% before start on site
75% on a quarterly basis after the first completion is sold or rented. The payment size relating to the proportion of dwellings sold or rented.
1.44 The latest CIL guidance envisages the levy is paid by “instalments”, but that these will not be individually negotiated as a Sec.106 is. As the client group has not committed to a CIL or a tariff at this stage, we have therefore adopted a simple timing structure that follows the sale of units i.e. developer contributions are spread over the sales period.
Copyright © 2022 FDOKUMEN