Ten-year blood pressure trajectories, cardiovascular mortality, and life years lost in 2 extinction...
11
Ten-Year Blood Pressure Trajectories, Cardiovascular Mortality, and Life Years Lost in 2 Extinction Cohorts: the Minnesota Business and Professional Men Study and the Zutphen Study Susanne M. A. J. Tielemans, MSc; Johanna M. Geleijnse, PhD; Alessandro Menotti, MD, PhD; Hendriek C. Boshuizen, PhD; Sabita S. Soedamah-Muthu, PhD; David R. Jacobs Jr, PhD; Henry Blackburn, MD; Daan Kromhout, PhD, MPH Background-—Blood pressure (BP) trajectories derived from measurements repeated over years have low measurement error and may improve cardiovascular disease prediction compared to single, average, and usual BP (single BP adjusted for regression dilution). We characterized 10-year BP trajectories and examined their association with cardiovascular mortality, all-cause mortality, and life years lost. Methods and Results- —Data from 2 prospective and nearly extinct cohorts of middle-aged men—the Minnesota Business and Professional Men Study (n=261) and the Zutphen Study (n=632)—were used. BP was measured annually during 1947–1957 in Minnesota and 1960–1970 in Zutphen. BP trajectories were identified by latent mixture modeling. Cox proportional hazards and linear regression models examined BP trajectories with cardiovascular mortality, all-cause mortality, and life years lost. Associations were adjusted for age, serum cholesterol, smoking, and diabetes mellitus. Mean initial age was about 50 years in both cohorts. After 10 years of BP measurements, men were followed until death on average 20 years later. All Minnesota men and 98% of Zutphen men died. Four BP trajectories were identified, in which mean systolic BP increased by 5 to 49 mm Hg in Minnesota and 5 to 20 mm Hg in Zutphen between age 50 and 60. The third systolic BP trajectories were associated with 2 to 4 times higher cardiovascular mortality risk, 2 times higher all-cause mortality risk, and 4 to 8 life years lost, compared to the first trajectory. Conclusions-—Ten-year BP trajectories were the strongest predictors, among different BP measures, of cardiovascular mortality, all-cause mortality, and life years lost in Minnesota. However, average BP was the strongest predictor in Zutphen. ( J Am Heart Assoc. 2015;4:e001378 doi: 10.1161/JAHA.114.001378) Key Words: blood pressure • cardiovascular disease • epidemiology • prospective cohort study T he relation between arterial blood pressure (BP) and cardiovascular disease (CVD) has been investigated in many cohorts. The Prospective Studies Collaboration reported a 1.5 to 2 times higher coronary heart disease mortality risk per 20 mm Hg difference in systolic BP level. 1 A previous report from the Seven Countries Study indicated a 1.7 times higher coronary heart disease mortality risk per 20 mm Hg difference in systolic BP level. 2 In both studies, BP was based on resting BP obtained on a single occasion in midlife and relative risks were adjusted for regression dilution. 3 Compared to single BP assessment adjusted for regression dilution, patterns of BP over time (ie, BP trajectories) may have greater power in predicting CVD. 4 In the Minnesota Business and Professional Men Study and the Zutphen Study, BP was recorded annually over a 10-year period. 5,6 The Minnesota Study started in 1947 and the Zutphen Study in 1960, a time in which only exceptionally high levels of BP were treated. 7,8 In 2002, the last Minnesota man died and by 2010, 98% of the Zutphen cohort had died. These “extinction” cohorts provide a unique opportunity to study not only the predictive value of BP trajectories in relation to CVD mortality and all-cause mortality, but also in relation to life years lost. The aim of the present study was to characterize trajectories of systolic and diastolic BP based on annual resting BP measurements over a 10-year period and to investigate the association of these BP trajectories with CVD mortality, all- cause mortality, and life years lost in 2 cohorts of middle-aged From the Division of Human Nutrition, Wageningen University, Wageningen, The Netherlands (S.M.A.J.T., J.M.G., H.C.B., S.S.S.-M., D.K.); Association for Cardiac Research, Rome, Italy (A.M.); Division of Epidemiology and Community Health, School of Public Health, University of Minnesota, Minneapolis, MN (D.R.J., H.B., D.K.). Correspondence to: Johanna M. Geleijnse, PhD, Division of Human Nutrition, Wageningen University, P.O. Box 8129, 6700 EV, Wageningen, The Netherlands. E-mail: [email protected] Received August 25, 2014; accepted February 5, 2015. ª 2015 The Authors. Published on behalf of the American Heart Association, Inc., by Wiley Blackwell. This is an open access article under the terms of the Creative Commons Attribution-NonCommercial License, which permits use, distribution and reproduction in any medium, provided the original work is properly cited and is not used for commercial purposes. DOI: 10.1161/JAHA.114.001378 Journal of the American Heart Association 1 ORIGINAL RESEARCH
-
Upload
independent -
Category
Documents
-
view
1 -
download
0
Transcript of Ten-year blood pressure trajectories, cardiovascular mortality, and life years lost in 2 extinction...

Ten-Year Blood Pressure Trajectories, Cardiovascular Mortality, andLife Years Lost in 2 Extinction Cohorts: the Minnesota Business andProfessional Men Study and the Zutphen StudySusanne M. A. J. Tielemans, MSc; Johanna M. Geleijnse, PhD; Alessandro Menotti, MD, PhD; Hendriek C. Boshuizen, PhD;Sabita S. Soedamah-Muthu, PhD; David R. Jacobs Jr, PhD; Henry Blackburn, MD; Daan Kromhout, PhD, MPH
Background-—Blood pressure (BP) trajectories derived from measurements repeated over years have low measurement error andmay improve cardiovascular disease prediction compared to single, average, and usual BP (single BP adjusted for regressiondilution). We characterized 10-year BP trajectories and examined their association with cardiovascular mortality, all-causemortality, and life years lost.
Methods and Results-—Data from 2 prospective and nearly extinct cohorts of middle-aged men—the Minnesota Business andProfessional Men Study (n=261) and the Zutphen Study (n=632)—were used. BP was measured annually during 1947–1957 inMinnesota and 1960–1970 in Zutphen. BP trajectories were identified by latent mixture modeling. Cox proportional hazards andlinear regression models examined BP trajectories with cardiovascular mortality, all-cause mortality, and life years lost.Associations were adjusted for age, serum cholesterol, smoking, and diabetes mellitus. Mean initial age was about 50 years inboth cohorts. After 10 years of BP measurements, men were followed until death on average 20 years later. All Minnesota menand 98% of Zutphen men died. Four BP trajectories were identified, in which mean systolic BP increased by 5 to 49 mm Hg inMinnesota and 5 to 20 mm Hg in Zutphen between age 50 and 60. The third systolic BP trajectories were associated with 2 to 4times higher cardiovascular mortality risk, 2 times higher all-cause mortality risk, and 4 to 8 life years lost, compared to the firsttrajectory.
Conclusions-—Ten-year BP trajectories were the strongest predictors, among different BP measures, of cardiovascular mortality,all-cause mortality, and life years lost in Minnesota. However, average BP was the strongest predictor in Zutphen. ( J Am HeartAssoc. 2015;4:e001378 doi: 10.1161/JAHA.114.001378)
Key Words: blood pressure • cardiovascular disease • epidemiology • prospective cohort study
T he relation between arterial blood pressure (BP) andcardiovascular disease (CVD) has been investigated in
many cohorts. The Prospective Studies Collaboration reporteda 1.5 to 2 times higher coronary heart disease mortality riskper 20 mm Hg difference in systolic BP level.1 A previousreport from the Seven Countries Study indicated a 1.7 timeshigher coronary heart disease mortality risk per 20 mm Hg
difference in systolic BP level.2 In both studies, BP was basedon resting BP obtained on a single occasion in midlife andrelative risks were adjusted for regression dilution.3
Compared to single BP assessment adjusted for regressiondilution, patterns of BP over time (ie, BP trajectories) mayhave greater power in predicting CVD.4 In the MinnesotaBusiness and Professional Men Study and the Zutphen Study,BP was recorded annually over a 10-year period.5,6 TheMinnesota Study started in 1947 and the Zutphen Study in1960, a time in which only exceptionally high levels of BPwere treated.7,8 In 2002, the last Minnesota man died and by2010, 98% of the Zutphen cohort had died. These “extinction”cohorts provide a unique opportunity to study not only thepredictive value of BP trajectories in relation to CVD mortalityand all-cause mortality, but also in relation to life years lost.
The aim of the present study was to characterize trajectoriesof systolic and diastolic BP based on annual resting BPmeasurements over a 10-year period and to investigate theassociation of these BP trajectories with CVD mortality, all-cause mortality, and life years lost in 2 cohorts of middle-aged
From the Division of Human Nutrition, Wageningen University, Wageningen, TheNetherlands (S.M.A.J.T., J.M.G., H.C.B., S.S.S.-M., D.K.); Association for CardiacResearch, Rome, Italy (A.M.); Division of Epidemiology and Community Health,School of Public Health, University of Minnesota, Minneapolis, MN (D.R.J., H.B.,D.K.).
Correspondence to: Johanna M. Geleijnse, PhD, Division of HumanNutrition, Wageningen University, P.O. Box 8129, 6700 EV, Wageningen,The Netherlands. E-mail: [email protected]
Received August 25, 2014; accepted February 5, 2015.
ª 2015 The Authors. Published on behalf of the American Heart Association,Inc., by Wiley Blackwell. This is an open access article under the terms of theCreative Commons Attribution-NonCommercial License, which permits use,distribution and reproduction in any medium, provided the original work isproperly cited and is not used for commercial purposes.
DOI: 10.1161/JAHA.114.001378 Journal of the American Heart Association 1
ORIGINAL RESEARCH
men followed to “extinction.” Moreover, we compared theseassociations with those of single BP (defined as BPmeasured atbaseline), average BP (defined as the average of all available BPlevels during the 10-year period), and usual BP (defined as singleBP adjusted for regression dilution) with CVD mortality, all-cause mortality, and life years lost.
Methods
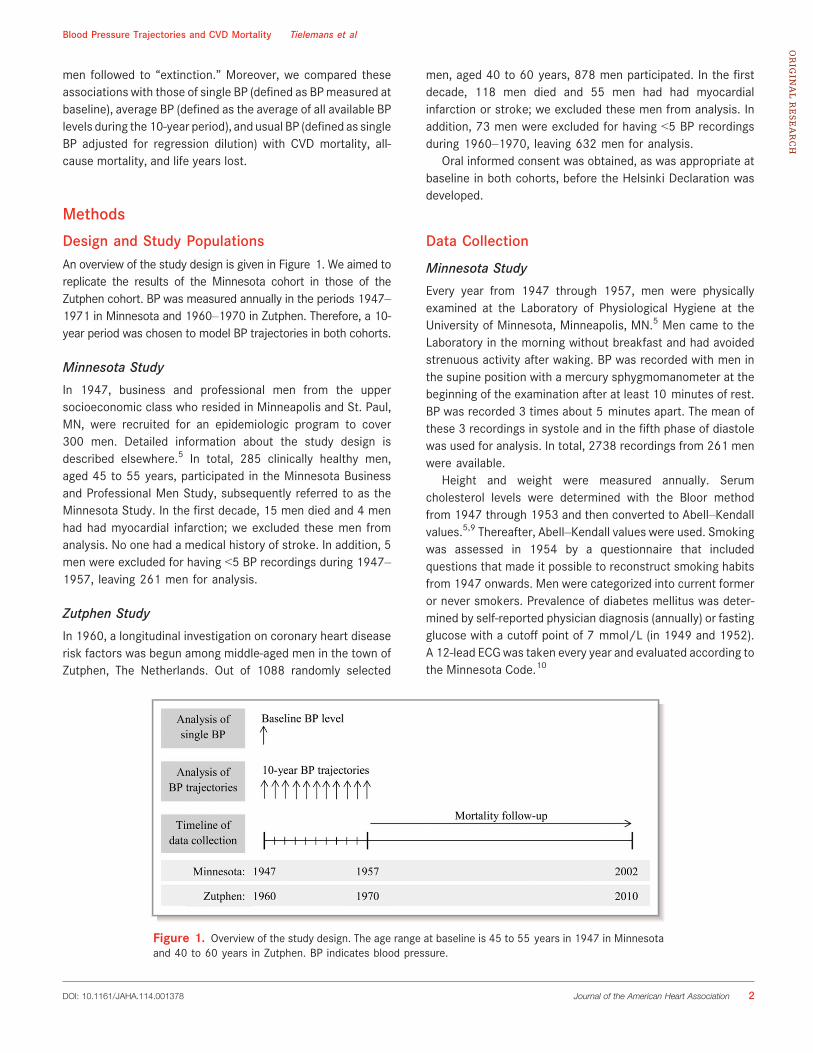
Design and Study PopulationsAn overview of the study design is given in Figure 1. We aimed toreplicate the results of the Minnesota cohort in those of theZutphen cohort. BP was measured annually in the periods 1947–1971 in Minnesota and 1960–1970 in Zutphen. Therefore, a 10-year period was chosen to model BP trajectories in both cohorts.
Minnesota Study
In 1947, business and professional men from the uppersocioeconomic class who resided in Minneapolis and St. Paul,MN, were recruited for an epidemiologic program to cover300 men. Detailed information about the study design isdescribed elsewhere.5 In total, 285 clinically healthy men,aged 45 to 55 years, participated in the Minnesota Businessand Professional Men Study, subsequently referred to as theMinnesota Study. In the first decade, 15 men died and 4 menhad had myocardial infarction; we excluded these men fromanalysis. No one had a medical history of stroke. In addition, 5men were excluded for having <5 BP recordings during 1947–1957, leaving 261 men for analysis.
Zutphen Study
In 1960, a longitudinal investigation on coronary heart diseaserisk factors was begun among middle-aged men in the town ofZutphen, The Netherlands. Out of 1088 randomly selected
men, aged 40 to 60 years, 878 men participated. In the firstdecade, 118 men died and 55 men had had myocardialinfarction or stroke; we excluded these men from analysis. Inaddition, 73 men were excluded for having <5 BP recordingsduring 1960–1970, leaving 632 men for analysis.
Oral informed consent was obtained, as was appropriate atbaseline in both cohorts, before the Helsinki Declaration wasdeveloped.
Data Collection
Minnesota Study
Every year from 1947 through 1957, men were physicallyexamined at the Laboratory of Physiological Hygiene at theUniversity of Minnesota, Minneapolis, MN.5 Men came to theLaboratory in the morning without breakfast and had avoidedstrenuous activity after waking. BP was recorded with men inthe supine position with a mercury sphygmomanometer at thebeginning of the examination after at least 10 minutes of rest.BP was recorded 3 times about 5 minutes apart. The mean ofthese 3 recordings in systole and in the fifth phase of diastolewas used for analysis. In total, 2738 recordings from 261 menwere available.
Height and weight were measured annually. Serumcholesterol levels were determined with the Bloor methodfrom 1947 through 1953 and then converted to Abell–Kendallvalues.5,9 Thereafter, Abell–Kendall values were used. Smokingwas assessed in 1954 by a questionnaire that includedquestions that made it possible to reconstruct smoking habitsfrom 1947 onwards. Men were categorized into current formeror never smokers. Prevalence of diabetes mellitus was deter-mined by self-reported physician diagnosis (annually) or fastingglucose with a cutoff point of 7 mmol/L (in 1949 and 1952).A 12-lead ECGwas taken every year and evaluated according tothe Minnesota Code.10
Figure 1. Overview of the study design. The age range at baseline is 45 to 55 years in 1947 in Minnesotaand 40 to 60 years in Zutphen. BP indicates blood pressure.
DOI: 10.1161/JAHA.114.001378 Journal of the American Heart Association 2
Blood Pressure Trajectories and CVD Mortality Tielemans et alORIG
INALRESEARCH

Zutphen Study
Every year from 1960 through 1970, men were physicallyexamined according to the protocol of the Seven CountriesStudy.11 With men in the supine position, BP was recordedwith a mercury sphygmomanometer at the end of theexamination after at least 5 minutes of rest. Two successiveBP recordings were made. The mean of these 2 recordings insystole and in the fifth phase of diastole was used. In total,6616 recordings from 632 men were available.
Height and weight were measured annually. In 1960 and1965, serum cholesterol levels were determined with theAbell–Kendall method and in 1970 with the Zlatkis method12
that were converted to Abell–Kendall values.13 Smoking wasassessed by the Seven Countries Study questionnaire.11 Menwere categorized into current former or nonsmokers. Preva-lence of diabetes mellitus was determined by self-reportedphysician diagnosis in 1960, 1965, and 1970. A 12-lead ECGwas taken every year and evaluated according to theMinnesota Code.10
Outcome AscertainmentIn both cohorts, men were followed to “extinction.” InMinnesota, mortality follow-up continued until the last mandied in 2002. Mortality information was obtained from deathcertificates, hospital records, the Minnesota Department ofHealth, and the National Death Index. In Zutphen, mortalityfollow-up continued until July 1, 2010, when 12 men aged 90to 95 years were still alive. Mortality information wasobtained from the municipal population registry, hospitaldisease registry, general practitioners, and Statistics Nether-lands.
Causes of death were adjudicated by an expert incardiovascular epidemiology (A.M.), according to theInternational Classification of Diseases (ICD). In Minnesota,CVD mortality included ICD-9 codes 401-459 and 798. InZutphen, CVD mortality included ICD-8 codes 400-458 and795. In the present analysis, mortality follow-up started10 years after baseline in both cohorts (Figure 1).
Statistical AnalysisAnalyses were done separately for each cohort. Over a 10-year period, systolic and diastolic BP trajectories wereidentified by using latent mixture modeling within the PROCTRAJ procedure in SAS.14 This procedure identifies groups ofindividuals with similar trajectories. We started with a1-trajectory model and then fitted those up to the optimalnumber of trajectories by comparing the Bayesian InformationCriterion for each number of trajectories14 and by comparingthe number of men per trajectory. Each man was assigned toa trajectory based on the likelihood of correctly classifying
men in trajectories (range of mean likelihood acrosstrajectories: 91% to 95%). Linear and quadratic terms wereconsidered and evaluated based on their significance level,starting with the highest polynomial. Age was used astimescale for the trajectories. Because a small fraction ofmen (<5% in both cohorts) was assigned to the fourthsystolic BP trajectories (SBP4), the present study focused onthe comparison of the third trajectories (SBP3) with the firsttrajectories (SBP1).
Cox proportional hazards analysis was used to investigatethe association of BP trajectories with risk of CVD and all-cause mortality. Systolic or diastolic BP trajectories wereincluded as dummy variables in the model using the first BPtrajectories (SBP1 and DBP1) as reference.
For all men who had died during follow-up, age at deathwas calculated. Linear regression analysis was used toinvestigate the association between BP trajectories and ageat death (which was normally distributed), resulting in theestimated number of life years lost per trajectory compared tomean age at death of the reference trajectory. BP trajectorieswere included as dummy variables in the model using the firstBP trajectories as reference. For the 12 men who were stillalive in Zutphen on July 1, 2010, their age in 2010 was usedas age at death. Using age plus 3 years (the life expectancyfor an average 90-to-95-year-old man in 2011) instead did notchange the results.
In addition to BP trajectories, Cox proportional hazardsanalysis was used to investigate the association of single BP(BP measured at baseline), average BP (average of all availableBP levels during the 10-year period), and usual BP (single BPadjusted for regression dilution) with risk of CVD and all-causemortality. Linear regression analysis was used to investigatethe association of single, average, and usual BP with thenumber of life years lost. Estimates were obtained for eachunit difference of 10, 25, and 50 mm Hg systolic BP and 10,15, and 30 mm Hg diastolic BP. These units were selectedbecause they are similar to the differences in BP levelbetween the reference trajectory and other BP trajectories atage 50 (the mean age at baseline). Average BP level wasdefined as the mean of all available BP levels during the10-year period. We calculated the regression dilution ratio3
from 11 annual BP measurements over the 10-year period toapproximate the underestimate of the strength of theassociation between usual BP and risk of CVD mortality,all-cause mortality, and number of life years lost. The AkaikeInformation Criterion of proportional hazards models (singleBP, average BP, and BP trajectories) were compared toinvestigate the best model fit.
Prediction of CVD mortality, all-cause mortality, and thenumber of life years lost by BP trajectories was comparedbetween the 2 cohorts by calculating Z-scores andcorresponding P values. All associations were adjusted for
DOI: 10.1161/JAHA.114.001378 Journal of the American Heart Association 3
Blood Pressure Trajectories and CVD Mortality Tielemans et alORIG
INALRESEARCH

age, serum cholesterol, smoking status, and diabetes mellitusat baseline. Analyses were performed for both cohorts usingSAS version 9.2 (SAS Institute, Inc). A 2-sided P value of<0.05 was considered statistically significant.
ResultsInitial mean age was 49.4 years in both cohorts (Table 1).Mean BP level at baseline was 17/16 mm Hg lower inMinnesota than in Zutphen. During 10 years, mean BP levelincreased by 11/9 mm Hg in Minnesota and 5/0 mm Hg inZutphen. Mean body mass index was about 25 kg/m2 in bothcohorts at baseline and 10 years later. At baseline, meanserum cholesterol level was 23 mg/dL higher in Zutphen,compared to Minnesota, but levels were similar after10 years. In Minnesota, fewer men were smokers than inZutphen. In both cohorts, few men were diabetic (<2%).
Four trajectories of systolic BP (SBP1 to SBP4) anddiastolic BP (DBP1 to DBP4) were identified in both cohorts(Figure 2). Trajectories consisted of increasing BP levelsfanning out with age, that is, BP increased more rapidly inmen with higher initial BP levels. Mean systolic BP of the 4trajectories increased by 5 to 49 mm Hg in Minnesota and 5to 20 in Zutphen from age 50 to 60. For diastolic BP, these10-year increases were 6 to 26 mm Hg in Minnesota and 2 to12 mm Hg in Zutphen.
During a mean (�SD) follow-up of 20.9�10.0 years, allMinnesota men had died, of whom 137 (52.5%) died fromCVD. During a mean follow-up of 18.8�9.6 years, 623Zutphen men had died (98.1%), of whom 282 (44.6%) died
from CVD. In both cohorts, CVD mortality rate was �25 per1000 person-years and all-cause mortality rate was �50 per1000 person-years. Mean age at death was 79.7�9.5 yearsin Minnesota and 78.3�8.8 years in Zutphen.
Systolic BP was directly associated with CVD mortality(Tables 2 and 3). This association was more pronounced inMinnesota than in Zutphen. After adjustment, the thirdsystolic BP trajectory, SBP3, was associated with a CVDmortality risk ratio of 3.8 (95% CI: 2.2 to 6.6) in Minnesotaand 2.1 (95% CI: 1.5 to 2.9) in Zutphen, compared to the firsttrajectory (Table 2). For SBP3, hazard ratios were significantlyhigher in Minnesota than in Zutphen (P=0.03) (Table 4). Eachunit difference of 25 mm Hg systolic BP was associated witha CVD mortality risk ranging from 1.5 for single BP to 1.6 forusual BP in Minnesota and from 1.3 for single BP to 1.7 foraverage BP in Zutphen (Table 3). Similar patterns were foundfor diastolic BP. In addition to CVD mortality, systolic BP wasdirectly associated with all-cause mortality (Tables 5 and 6).BP trajectories were the strongest predictors of CVD and all-cause mortality in Minnesota, whereas in Zutphen, average BPwas the strongest predictor (Table 7).
Systolic BP was directly associated with life years lost(Tables 8 and 9). This association was more pronounced inMinnesota than in Zutphen. After adjustment, the number oflife years lost associated with SBP3 was 8.1 (95% CI: 4.4 to11.8) years in Minnesota and 3.7 (95% CI: 1.8 to 5.6) years inZutphen (Table 8). For SBP3, the number of life years lostwere significantly higher in Minnesota than in Zutphen(P=0.01) (Table 3). The number of life years lost associatedwith each 25 mm Hg difference in systolic BP ranged from
Table 1. Characteristics of Men Participating in the Minnesota Study and the Zutphen Study at the First and Last Year of the BPTrajectory
Minnesota Study Zutphen Study
1947 1957 1960 1970
N 261 231 632 568
Age, y 49.4 (2.8) 59.4 (2.8) 49.4 (5.4) 59.5 (5.4)
Height, cm 176.0 (6.2) 175.8 (6.3) 173.7 (6.6) 173.8 (6.6)
Weight, kg 76.3 (12.1) 78.1 (11.5)* 72.6 (9.5) 76.0 (9.5)†
BMI, kg/m2 24.6 (3.6) 25.3 (3.4)* 24.0 (2.7) 25.1 (2.7)†
Systolic BP, mm Hg 124.1 (15.4)‡ 134.8 (22.2) 141.4 (18.5)§ 146.1 (20.2)‖
Diastolic BP, mm Hg 73.0 (10.9)‡ 81.6 (11.6) 89.0 (11.8)¶ 88.9 (11.5)‖
Serum cholesterol, mg/dL 209.4 (33.6)‡ 234.4 (38.5)* 232.7 (43.6)** 237.6 (42.4)
Current smoking, N (%) 147 (56.3%)‡‡ 103 (44.6%)‡‡ 499 (74.3%) 304 (54.3%)††
Diabetes mellitus, N (%) 0 (0.0%) 4 (1.7%) 6 (0.9%) 10 (1.8%)
Values are means (SD) unless stated otherwise. BMI indicates body mass index; BP, blood pressure.Data are available for *229 men, †565 men, ‡259 men, §629 men, ‖567 men, ¶628 men, **599 men, and ††560 men.‡‡Smoking was assessed in 1954 by an extensive questionnaire that included questions about smoking history that made it possible to reconstruct the smoking habits in 1947. Smokinghabits in 1954 were used as a proxy for those in 1957.
DOI: 10.1161/JAHA.114.001378 Journal of the American Heart Association 4
Blood Pressure Trajectories and CVD Mortality Tielemans et alORIG
INALRESEARCH

2.9 for single BP to 3.9 for average BP in Minnesota and from1.7 for single BP to 2.9 for average BP in Zutphen (Table 9).Similar patterns were found for diastolic BP.
DiscussionIn 1 extinct cohort of American middle-aged men and 1nearly extinct cohort of Dutch middle-aged men, 10-year BPtrajectories were identified that were strong predictors ofCVD mortality, all-cause mortality, and life years. Comparedto other BP measures, 10-year BP trajectories were thestrongest predictors of mortality in Minnesota. In Zutphen,however, average BP was the strongest predictor ofmortality. The third systolic BP trajectory was associatedwith 4 times greater CVD mortality risk in Minnesota and2 times greater risk in Zutphen, compared to the firsttrajectory. In both cohorts, these trajectories were associ-ated with a 2 times greater risk of all-cause mortality. Thenumber of life years lost between these trajectories was8 years in Minnesota and 4 years in Zutphen.
In this study, mean initial BP level in Minnesota was lowerthan in Zutphen. This finding was confirmed by a study inwhich BP levels in the Minnesota Study were compared to
those in other American cohorts.15 An explanation for theselower BP levels may be that measured BP in Minnesotawas closer to basal BP levels because 3 consecutivemeasurements of BP separated by 5 minutes each weretaken after a long period of rest. Moreover, the MinnesotaStudy involved highly educated men who were selected forhealth, whereas the Zutphen Study involved a randompopulation sample of Zutphen inhabitants.
Although BP levels were lower in Minnesota than inZutphen, we observed relatively similar BP trajectories inboth cohorts. In all 4 trajectories, BP levels increased morerapidly in men with higher initial levels. In Minnesota, theseincreases were more rapid than in Zutphen. For example,from age 50 through 60, mean systolic BP of the4 trajectories increased by 5 to 49 mm Hg in Minnesotaand 5 to 20 mm Hg in Zutphen. In the Framingham HeartStudy, 4 trajectories were identified in 890 men aged 30 to84 years with a maximum of 15 BP measurements perperson. Systolic BP rose linearly by 5 to 23 mm Hg per10 years within all 4 trajectories.16 These findings weresimilar to those observed in Zutphen, but the associationsbetween trajectories and cardiovascular outcomes were notinvestigated.
A B
C D
Figure 2. Trajectories of systolic (A, B) and diastolic (C, D) BP in 261 American men participating in theMinnesota Study and 632 Dutch men participating in the Zutphen Study. DBP indicates diastolic bloodpressure; SBP, systolic blood pressure.
DOI: 10.1161/JAHA.114.001378 Journal of the American Heart Association 5
Blood Pressure Trajectories and CVD Mortality Tielemans et alORIG
INALRESEARCH

The CARDIA study recently demonstrated that higher BPtrajectories from young adulthood through middle age wereassociated with an increased risk of coronary artery calcifi-
cation, a marker of subclinical atherosclerosis.4 In our study,higher BP trajectories from middle age through old age wereassociated with a higher risk of CVD mortality. Since the
Table 2. Hazard Ratios (95% CI) for Risk of CVD Mortality Per Trajectory of Systolic and Diastolic BP in the Minnesota Study andthe Zutphen Study
Minnesota Study (n=261) Zutphen Study (n=632)
N Unadjusted Age-adjusted*Fullyadjusted†‡ N Unadjusted Age-adjusted* Fully adjusted†‡
N cases CVDmortality (%)
137 (52.5%) 282 (44.6%)
Sum ofperson-years
5448 11912
N cases/1000person-years
25.1 23.7
Systolic BP trajectories
SBP1 119 Reference Reference Reference 195 Reference Reference Reference
SBP2 109 1.68 (1.16 to 2.43) 1.87 (1.28 to 2.72) 1.82 (1.25 to 2.66) 265 1.15 (0.86 to 1.54) 1.38 (1.03 to 1.86) 1.34 (1.00 to 1.81)
SBP3 29 3.11 (1.82 to 5.30) 3.91 (2.26 to 6.74) 3.80 (2.18 to 6.64) 142 1.56 (1.13 to 2.15) 2.13 (1.53 to 2.97) 2.05 (1.47 to 2.87)
SBP4 4 4.35 (1.35 to 14.04) 2.99 (0.92 to 9.75) 3.95 (1.17 to 13.38) 30 1.97 (1.15 to 3.39) 3.06 (1.76 to 5.33) 3.05 (1.74 to 5.33)
Diastolic BP trajectories
DBP1 113 Reference Reference Reference 240 Reference Reference Reference
DBP2 101 1.13 (0.78 to 1.65) 1.33 (0.90 to 1.95) 1.34 (0.90 to 1.98) 271 1.19 (0.91 to 1.56) 1.39 (1.06 to 1.82) 1.35 (1.02 to 1.78)
DBP3 42 1.63 (1.01 to 2.64) 2.09 (1.27 to 3.43) 2.10 (1.26 to 3.49) 92 1.16 (0.80 to 1.66) 1.69 (1.16 to 2.46) 1.66 (1.14 to 2.43)
DBP4 5 3.67 (1.32 to 10.17) 3.10 (1.11 to 8.65) 4.07 (1.42 to 11.63) 29 2.17 (1.31 to 3.61) 3.61 (2.13 to 6.10) 3.68 (2.16 to 6.26)
CVD indicates cardiovascular disease; DBP, diastolic blood pressure; SBP, systolic blood pressure.*Adjusted for age.†Adjusted for age, serum cholesterol, smoking status, and diabetes mellitus.‡Missing values for serum cholesterol at baseline were replaced by serum cholesterol levels measured at the consecutive year.
Table 3. Hazard Ratios* (95% CI) for CVD Mortality Risk Per Single BP Unit Difference† in the Minnesota Study and Zutphen Study
Minnesota Study (n=261) Zutphen Study (n=632)
Single BP‡ Average BP§ Usual BP‖ Single BP‡ Average BP§ Usual BP‖
Baseline systolic BP
Per 10 mm Hg 1.17 (1.06 to 1.28) 1.17 (1.08 to 1.27) 1.22 1.12 (1.06 to 1.19) 1.24 (1.15 to 1.34) 1.17
Per 25 mm Hg 1.47 (1.16 to 1.86) 1.49 (1.22 to 1.82) 1.62 1.34 (1.16 to 1.54) 1.72 (1.43 to 2.08) 1.50
Per 50 mm Hg 2.16 (1.35 to 3.45) 2.22 (1.49 to 3.33) 2.64 1.78 (1.34 to 2.38) 2.96 (2.03 to 4.32) 2.23
Baseline diastolic BP
Per 10 mm Hg 1.18 (1.02 to 1.37) 1.29 (1.10 to 1.50) 1.28 1.14 (1.03 to 1.26) 1.40 (1.20 to 1.62) 1.24
Per 15 mm Hg 1.28 (1.03 to 1.60) 1.46 (1.16 to 1.83) 1.44 1.21 (1.04 to 1.41) 1.65 (1.32 to 2.07) 1.37
Per 30 mm Hg 1.64 (1.06 to 2.55) 2.12 (2.12 to 3.37) 2.08 1.47 (1.08 to 1.99) 2.73 (1.74 to 4.27) 1.89
BP indicates blood pressure; CVD, cardiovascular disease.*Adjusted for age, serum cholesterol, smoking status, and diabetes mellitus. Missing values for serum cholesterol at baseline were replaced by serum cholesterol levels measured at theconsecutive year.†Differences in single BP level are similar to the differences in BP level between the reference trajectory (SBP1) and other BP trajectories at age 50, which is the mean age at baseline.‡Defined as BP level measured at baseline.§Defined as the average of all available BP levels during the 10-year period.‖Defined as single BP adjusted for regression dilution. Adjustment factors were 1.26 for systolic and 1.48 for diastolic BP in the Minnesota Study and 1.39 for systolic and 1.65 for diastolicBP in the Zutphen Study.
DOI: 10.1161/JAHA.114.001378 Journal of the American Heart Association 6
Blood Pressure Trajectories and CVD Mortality Tielemans et alORIG
INALRESEARCH

present study focuses on middle through old age, thesefindings complement those of the younger CARDIA population.Moreover, the association of BP trajectories with a mortalityend point, rather than a marker of CVD, was investigated in thepresent study.
Our findings regarding life years lost are in line with thoseof the Framingham Heart Study. In that study, normotensivemen were expected to live 1.7 years longer than prehyper-tensive men and 5.1 years longer than hypertensive men.17
The second trajectory in our study, which is comparable to
Table 4. Comparison of Associations of Systolic BP Trajectories With CVD Mortality, All-Cause Mortality, and Life Years LostBetween Minnesota and Zutphen
Minnesota Study Zutphen Study Z Score P Value
CVD mortality, HR (95% CI)
SBP2 1.82 (1.25 to 2.66) 1.34 (1.00 to 1.81) �1.27 0.10
SBP3 3.80 (2.18 to 6.64) 2.05 (1.47 to 2.87) �1.87 0.03
SBP4 3.95 (1.17 to 13.38) 3.05 (1.74 to 5.33) �0.40 0.34
All-cause mortality, HR (95% CI)
SBP2 1.44 (1.10 to 1.88) 1.12 (0.93 to 1.36) �1.47 0.07
SBP3 2.48 (1.62 to 3.79) 1.54 (1.23 to 1.93) �1.93 0.03
SBP4 2.45 (0.88 to 6.86) 2.44 (1.64 to 3.62) �0.01 0.50
Number of life years lost, years (95% CI)
SBP2 3.06 (0.68 to 5.43) 1.07 (�0.53 to 2.67) �1.62 0.05
SBP3 8.10 (4.39 to 11.82) 3.68 (1.80 to 5.56) �2.32 0.01
SBP4 12.75 (3.74 to 21.77) 6.42 (3.11 to 9.74) �1.38 0.08
CVD indicates cardiovascular disease; HR, hazard ratio; SBP, systolic blood pressure.
Table 5. Hazard Ratios (95% CI) for Risk of All-Cause Mortality Per Trajectory of Systolic and Diastolic BP in the Minnesota Studyand the Zutphen Study
Minnesota Study (n=261) Zutphen Study (n=632)
N Unadjusted Age-adjusted* Fully adjusted†‡ N Unadjusted Age-adjusted* Fully adjusted†‡
N cases all-causemortality (%)
261 (100%) 620 (98.1%)
Sum ofperson-years
5448 11912
N cases/1000person-years
47.9 52.0
Systolic BP trajectories
SBP1 119 Reference Reference Reference 195 Reference Reference Reference
SBP2 109 1.34 (1.03 to 1.74) 1.48 (1.14 to 1.93) 1.44 (1.10 to 1.88) 265 0.93 (0.77 to 1.12) 1.12 (0.93 to 1.36) 1.12 (0.93 to 1.36)
SBP3 29 2.14 (1.42 to 3.23) 3.91 (1.73 to 4.01) 2.48 (1.62 to 3.79) 142 1.15 (0.92 to 1.43) 1.57 (1.25 to 1.96) 1.54 (1.23 to 1.93)
SBP4 4 2.71 (1.00 to 7.36) 1.91 (0.70 to 5.24) 2.45 (0.88 to 6.86) 30 1.47 (1.00 to 2.17) 2.32 (1.56 to 3.43) 2.44 (1.64 to 3.62)
Diastolic BP trajectories
DBP1 113 Reference Reference Reference 240 Reference Reference Reference
DBP2 101 1.08 (0.83 to 1.42) 1.26 (0.96 to 1.66) 1.24 (0.94 to 1.64) 271 0.91 (0.77 to 1.09) 1.05 (0.88 to 1.26) 1.04 (0.87 to 1.25)
DBP3 42 1.44 (1.01 to 2.06) 1.83 (1.27 to 2.64) 1.75 (1.21 to 2.55) 92 0.85 (0.67 to 1.09) 1.24 (0.96 to 1.60) 1.22 (0.95 to 1.58)
DBP4 5 2.42 (0.99 to 5.95) 2.05 (0.83 to 5.05) 2.55 (1.02 to 6.38) 29 1.36 (0.93 to 2.01) 2.24 (1.51 to 3.33) 2.38 (1.59 to 3.54)
DBP indicates diastolic blood pressure; SBP, systolic blood pressure.*Adjusted for age.†Adjusted for age, serum cholesterol, smoking status, and diabetes mellitus.‡Missing values for serum cholesterol at baseline were replaced by serum cholesterol levels measured at the consecutive year.
DOI: 10.1161/JAHA.114.001378 Journal of the American Heart Association 7
Blood Pressure Trajectories and CVD Mortality Tielemans et alORIG
INALRESEARCH

the prehypertensive group in the Framingham Heart Study,was associated with 1.1 (Zutphen) to 3.1 (Minnesota) lifeyears lost compared with the first trajectories. The thirdtrajectory, which is comparable to the hypertensive group,was associated with 3.7 (Zutphen) to 8.1 (Minnesota) lifeyears lost. Although similar results were observed, it shouldbe noted that life expectancy was the outcome of theFramingham Heart Study, whereas life years lost that arebased on the actual age at death was the outcome of thepresent study.
Due to random-within person variation in BP, the strengthof the association between BP obtained on a single occasionand mortality will be underestimated. By taking the averageBP or adjusting for regression dilution (usual BP), associationswith CVD mortality, all-cause mortality and life years lostbecame stronger compared to single BP. Associationsregarding BP trajectories were about twice as strong ascompared to single BP. The number of life years lostaccording to BP trajectories was twice as high in Minnesotathan in Zutphen. Moreover, we observed that BP trajectorieswere stronger predictors of mortality than single, average, andusual BP in Minnesota. In Zutphen, however, average BP wasthe strongest predictor of mortality. BP was based on 3recordings with longer time intervals in Minnesota and on 2recordings with shorter time intervals in Zutphen. Therefore,BP may be measured less accurately in Zutphen than inMinnesota, which has led to less valid BP trajectories inZutphen. Another explanation could be that BP trajectories inZutphen are quite linear, which is also captured by averageBP. Therefore, the model with a long-term continuous BPvariable (average BP) was superior to the model withcategorical BP variables (BP trajectories) in terms of modelfit. These findings indicate that measuring BP accurately iscrucial for estimating the association between BP andmortality.
Cumulative BP levels over time (eg, patterns of BP) are nottaken into account in recommendations for management ofhypertension. In individuals younger than 60 years, thecurrent recommendation is to start pharmacologic treatment
Table 6. Hazard Ratios* (95% CI) for All-Cause Mortality Risk Per Single BP Unit Difference† in the Minnesota Study and ZutphenStudy
Minnesota Study (n=261) Zutphen Study (n=632)
Single BP‡ Average BP§ Usual BP‖ Single BP‡ Average BP§ Usual BP‖
Baseline systolic BP
Per 10 mm Hg 1.10 (1.02 to 1.18) 1.13 (1.06 to 1.20) 1.13 1.08 (1.04 to 1.13) 1.16 (1.10 to 1.23) 1.11
Per 25 mm Hg 1.26 (1.05 to 1.52) 1.34 (1.14 to 1.58) 1.34 1.21 (1.09 to 1.35) 1.46 (1.27 to 1.68) 1.30
Per 50 mm Hg 1.60 (1.11 to 2.30) 1.80 (1.31 to 2.48) 1.81 1.47 (1.19 to 1.82) 1.71 (1.24 to 2.37) 1.71
Baseline diastolic BP
Per 10 mm Hg 1.14 (1.02 to 1.27) 1.23 (1.09 to 1.38) 1.21 1.08 (1.01 to 1.16) 1.20 (1.08 to 1.33) 1.14
Per 15 mm Hg 1.21 (1.03 to 1.42) 1.36 (1.14 to 1.62) 1.33 1.12 (1.01 to 1.24) 1.31 (1.11 to 1.54) 1.21
Per 30 mm Hg 1.47 (1.06 to 2.03) 1.86 (1.31 to 2.64) 1.77 1.25 (1.01 to 1.55) 1.71 (1.24 to 2.37) 1.45
BP indicates blood pressure; CI, confidence interval; CVD, cardiovascular disease; SBP, systolic blood pressure.*Adjusted for age, serum cholesterol, smoking status, and diabetes mellitus. Missing values for serum cholesterol at baseline were replaced by serum cholesterol levels measured at theconsecutive year.†Differences in single BP level are similar to the differences in BP level between the reference trajectory (SBP1) and other BP trajectories at age 50, which is the mean age at baseline.‡Defined as BP level measured at baseline.§Defined as the average of all available BP levels during the 10-year period.‖Defined as single BP adjusted for regression dilution. Adjustment factors were 1.26 for systolic and 1.48 for diastolic BP in the Minnesota Study and 1.39 for systolic and 1.65 for diastolicBP in the Zutphen Study.
Table 7. Comparison of the Akaike Information Criterion*,a Measure of the Model Fit, for Each Proportional HazardsModel of Systolic BP†
Minnesota Study Zutphen Study
CVD mortality
Single systolic BP 1251 3126
Average systolic BP 1248 3111
Systolic BP trajectories 1239 3119
All-cause mortality
Single systolic BP 2379 6761
Average systolic BP 2374 6747
Systolic BP trajectories 2370 6750
*The lower the Akaike Information Criterion (AIC), the better the model fit.†The AIC was not obtained for usual blood pressure (BP), because for usual BP single BPwas adjusted for regression dilution.
DOI: 10.1161/JAHA.114.001378 Journal of the American Heart Association 8
Blood Pressure Trajectories and CVD Mortality Tielemans et alORIG
INALRESEARCH

at BP levels of ≥140 mm Hg systolic or ≥90 mm Hgdiastolic.18 An individual’s BP pattern before reaching thisBP cut-off level is not included in these recommendations. Ourfindings emphasize the importance of taking BP increasesduring time into account. Increases in BP seem especially
important in the group that does not yet reach the treatmentcut-off level of 140/90 mm Hg. We observed that the firsttrajectories, in which systolic BP increased from 114 to121 mm Hg in Minnesota and 125 to 130 mm Hg in Zutphenfrom age 50 through 60, were the most favorable in terms of
Table 8. Life Years Lost (Years)* (95% CI) per Trajectory of Systolic and Diastolic BP in the Minnesota Study and the Zutphen Study
Minnesota Study (n=261) Zutphen Study (n=632)
N Unadjusted Age-adjusted† Fully adjusted‡§ N Unadjusted Age-adjusted† Fully adjusted‡§
Age at death, y 79.6�9.6 78.3�8.8
Systolic BP trajectories
SBP1 119 Reference Reference Reference 195 Reference Reference Reference
SBP2 109 3.29 (0.89 to 5.69) 3.35 (0.92 to 5.77) 3.06 (0.68 to 5.43) 265 1.32 (�0.27 to 2.91) 0.97 (�0.63 to 2.57) 1.07 (�0.53 to 2.67)
SBP3 29 8.54 (4.79 to 12.29) 8.61 (4.84 to 12.39) 8.10 (4.39 to 11.82) 142 4.15 (2.29 to 6.01) 3.69 (1.82 to 5.56) 3.68 (1.80 to 5.56)
SBP4 4 11.88 (2.67 to 21.08) 11.96 (2.72 to 21.19) 12.75 (3.74 to 21.77) 30 6.69 (3.39 to 10.00) 6.07 (2.75 to 9.38) 6.42 (3.11 to 9.74)
Diastolic BP trajectories
DBP1 113 Reference Reference Reference 240 Reference Reference Reference
DBP2 101 2.28 (�0.24 to 4.79) 2.45 (�0.11 to 5.02) 2.28 (�0.25 to 4.82) 271 0.84 (�0.67 to 2.35) 0.48 (�1.04 to 2.00) 0.55 (�0.97 to 2.07)
DBP3 42 6.01 (2.69 to 9.34) 6.25 (2.86 to 9.65) 5.80 (2.46 to 9.14) 92 2.37 (�0.28 to 4.45) 1.67 (�0.45 to 3.79) 1.77 (�0.35 to 3.89)
DBP4 5 11.08 (2.68 to 19.49) 11.40 (2.94 to 19.86) 11.61 (3.36 to 19.86) 29 6.68 (3.33 to 10.02) 5.84 (2.48 to 9.21) 6.37 (3.00 to 9.75)
DBP indicates diastolic blood pressure; SBP, systolic blood pressure.*The number of life years lost is based on the age at death.†Adjusted for age.‡Adjusted for age, serum cholesterol, smoking status, and diabetes mellitus.§Missing values for serum cholesterol at baseline were replaced by serum cholesterol levels measured at the consecutive year.
Table 9. Life Years Lost (Years)*† (95% CI) Per Single BP Unit Difference‡ in the Minnesota Study and Zutphen Study
Cohort
Minnesota Study (n=261) Zutphen Study (n=632)
Single BP§ Average BP‖ Usual BP¶ Single BP§ Average BP‖ Usual BP¶
Age at death, y 79.7�9.5 78.3�8.8
Baseline systolic BP
Per 10 mm Hg 1.16 (0.42 to 1.89) 1.54 (0.84 to 2.25) 1.46 0.66 (0.29 to 1.03) 1.16 (0.71 to 1.62) 0.92
Per 25 mm Hg 2.89 (1.05 to 4.73) 3.86 (2.10 to 5.62) 3.64 1.65 (0.73 to 2.57) 2.91 (1.78 to 4.04) 2.29
Per 50 mm Hg 5.79 (2.11 to 9.47) 7.71 (4.19 to 11.23) 7.30 3.30 (1.47 to 5.13) 5.82 (3.56 to 8.08) 4.59
Baseline diastolic BP
Per 10 mm Hg 1.58 (0.54 to 2.62) 2.64 (1.39 to 3.88) 2.34 0.68 (0.10 to 1.27) 1.51 (0.67 to 2.35) 1.12
Per 15 mm Hg 2.37 (0.80 to 3.93) 3.95 (2.09 to 5.82) 3.51 1.03 (0.15 to 1.90) 2.26 (1.01 to 3.52) 1.70
Per 30 mm Hg 4.73 (1.61 to 7.86) 7.91 (4.18 to 11.63) 7.00 2.05 (0.30 to 3.80) 4.53 (2.02 to 7.04) 3.38
BP indicates blood pressure; SBP, systolic blood pressure.*The number of life years lost are based on the age at death.†Adjusted for age, serum cholesterol, smoking status, and diabetes mellitus. Missing values for serum cholesterol at baseline were replaced by serum cholesterol levels measured at theconsecutive year.‡Differences in single BP level are similar to the differences in BP level between the reference trajectory (SBP1) and other BP trajectories at age 50, which is the mean age at baseline.§Defined as BP level measured at baseline.‖Defined as the average of all available BP levels during the 10-year period.¶Defined as single BP adjusted for regression dilution. Adjustment factors were 1.26 for systolic and 1.48 for diastolic BP in the Minnesota Study and 1.39 for systolic and 1.65 for diastolicBP in the Zutphen Study.
DOI: 10.1161/JAHA.114.001378 Journal of the American Heart Association 9
Blood Pressure Trajectories and CVD Mortality Tielemans et alORIG
INALRESEARCH

life years lost and risk of CVD and all-cause mortality.Trajectories starting at a systolic BP level of 127 mm Hg inMinnesota and 137 mm Hg in Zutphen at age 50 andincreasing with 10 mm Hg until age 60 were associated witha 30% to 80% greater risk of CVD mortality, a 10% to 40%greater risk of all-cause mortality and 1.1 to 3.1 life years lost,compared with the first trajectories. These findings suggestthat regularly monitoring BP of middle-aged men who have aBP level between 130 to 140 mm Hg is important, as thesemen are usually not treated but already have an increased riskof CVD mortality. Monitoring BP in this group provides theopportunity to detect hypertension and prevent CVDearlier in life. Moreover, our findings show that average BPis superior to single BP in terms of mortality prediction. Forclinical settings, this implies that a BP level based onmultiple annual BP recordings is a stronger predictor than aBP level based on a few recordings at a single moment intime.
A major strength of the present study is that detailed dataon BP during a long follow-up period were collected in bothcohorts. Almost everyone had died at the end of follow-up,which enabled us to investigate the association of BPtrajectories with life years lost. A mean of 10 (out of 11) BPmeasurements per person was included to characterize10-year BP trajectories, which indicates that the majority ofmen had complete BP data. Because cohorts were initiated ina time when only very high levels of BP were treated, it isunlikely that the observed associations are confounded byantihypertensive medication. A drawback of the present studyis that the characterization of BP trajectories is complex. It istoo time-consuming to use BP trajectories as a predictive toolin clinical settings. However, our findings on average BP andmortality emphasize the importance of repeated BPmeasurements from middle into old age, which is relevantfor clinicians. Another drawback is the small number ofparticipants. Few men were assigned to the fourth BPtrajectories, which warrants cautious interpretation for thesespecific findings. It should be noted that the Minnesota menwere all from the upper socioeconomic class in the metro-politan area of Minneapolis, St. Paul, which could limit thegeneralizability of these findings. However, we observedsimilar findings in the population-based Zutphen Study, whichincluded more men with large differences in socioeconomicclass.
PerspectivesIn 2 cohorts of American and Dutch middle-aged men, 4 10-year BP trajectories were characterized. BP trajectories werestronger predictors of CVD mortality, all-cause mortality, andlife years lost than single, average, and usual BP inMinnesota, but not in Zutphen. In general, we observed
similar associations within these cohorts, emphasizing thereplication of the results of 1 cohort in the other. To ourknowledge, this is the first study that investigated theassociation of BP trajectories with CVD mortality, all-causemortality, and life years lost. The novel approach of using datafrom cohorts in which participants were physically examinedand followed to “extinction” provided a unique opportunity tostudy the association of risk factors in relation to cardiovas-cular health and life years lost.
Sources of FundingThe contribution to this work of Susanne M. A. J. Tielemans,Sabita S. Soedamah-Muthu, and Daan Kromhout was fundedby the Royal Netherlands Academy of Arts and Sciences.
DisclosuresNone.
References1. Lewington S, Clarke R, Qizilbash N, Peto R, Collins R; Prospective Studies
Collaboration. Age-specific relevance of usual blood pressure to vascularmortality: a meta-analysis of individual data for one million adults in 61prospective studies. Lancet. 2002;360:1903–1913.
2. van den Hoogen PC, Feskens EJ, Nagelkerke NJ, Menotti A, Nissinen A,Kromhout D. The relation between blood pressure and mortality due tocoronary heart disease among men in different parts of the world. Sevencountries study research group. N Engl J Med. 2000;342:1–8.
3. Clarke R, Shipley M, Lewington S, Youngman L, Collins R, Marmot M, Peto R.Underestimation of risk associations due to regression dilution in long-termfollow-up of prospective studies. Am J Epidemiol. 1999;150:341–353.
4. Allen NB, Siddique J, Wilkins JT, Shay C, Lewis CE, Goff DC, Jacobs DR Jr, Liu K,Lloyd-Jones D. Blood pressure trajectories in early adulthood and subclinicalatherosclerosis in middle age. JAMA. 2014;311:490–497.
5. Keys A, Taylor HL, Blackburn H, Brozek J, Anderson JT, Simonson E. Coronaryheart disease among Minnesota business and professional men followedfifteen years. Circulation. 1963;28:381–395.
6. Keli S, Bloemberg B, Kromhout D. Predictive value of repeated systolic bloodpressure measurements for stroke risk: The Zutphen study. Stroke.1992;23:347–351.
7. Law MR, Watt HC, Wald NJ. The underlying risk of death after myocardialinfarction in the absence of treatment. Arch Intern Med. 2002;162:2405–2410.
8. Mahmood SS, Levy D, Vasan RS, Wang TJ. The Framingham Heart Study andthe epidemiology of cardiovascular disease: a historical perspective. Lancet.2014;383:999–1008.
9. Abel LL, Levy BB, Brodie BB, Kendall FE. A simplified method for the estimationof total cholesterol in serum and demonstration of its specificity. J Biol Chem.1952;195:357–366.
10. Rose GA, Blackburn H. Classification of the electrocardiogram for populationstudies. In: Cardiovascular Survey Methods. Geneva, Switzerland: WorldHealth Organization; 1968:137–154.
11. Keys A, Aravanis C, Blackburn HW, Van Buchem FS, Buzina R, Djordjevic BD,Dontas AS, Fidanza F, Karvonen MJ, Kimura N, Lekos D, Monti M, Puddu V,Taylor HL. Epidemiological studies related to coronary heart disease:characteristics of men aged 40-59 in seven countries. Acta Med Scand.1966;460(suppl):1–392.
12. Zlatkis A, Zak B, Boyle AJ. A new method for the direct determination of serumcholesterol. J Lab Clin Med. 1953;41:486–492.
13. Kromhout D. Body weight, diet, and serum cholesterol in 871 middle-agedmen during 10 years of follow-up (the Zutphen study). Am J Clin Nutr.1983;38:591–598.
DOI: 10.1161/JAHA.114.001378 Journal of the American Heart Association 10
Blood Pressure Trajectories and CVD Mortality Tielemans et alORIG
INALRESEARCH

14. Jones BL, Nagin DS, Roeder K. A SAS procedure based on mixture models forestimating developmental trajectories. Soc Methods Res. 2001;29:374–393.
15. The Pooling Project Research Group. Relationship of blood pressure, serumcholesterol, smoking habit, relative weight and ECG abnormalities to incidenceof major coronary events: final report of the pooling project. J Chronic Dis.1978;31:201–306.
16. Franklin SS, Gustin WT, Wong ND, Larson MG, Weber MA, Kannel WB, Levy D.Hemodynamic patterns of age-related changes in blood pressure. TheFramingham Heart Study. Circulation. 1997;96:308–315.
17. Franco OH, Peeters A, Bonneux L, de Laet C. Blood pressure in adulthood andlife expectancy with cardiovascular disease in men and women: life courseanalysis. Hypertension. 2005;46:280–286.
18. James PA, Oparil S, Carter BL, Cushman WC, Dennison-Himmelfarb C, HandlerJ, Lackland DT, LeFevre ML, MacKenzie TD, Ogedegbe O, Smith SC Jr, SvetkeyLP, Taler SJ, Townsend RR, Wright JT Jr, Narva AS, Ortiz E. 2014 evidence-based guideline for the management of high blood pressure in adults: reportfrom the panel members appointed to the eighth joint national committee (JNC8). JAMA. 2014;311:507–520.
DOI: 10.1161/JAHA.114.001378 Journal of the American Heart Association 11
Blood Pressure Trajectories and CVD Mortality Tielemans et alORIG
INALRESEARCH