Temporomandibular joint disorders in patients with skeletal ...
430
i TEMPOROMANDIBULAR JOINT DISORDERS IN PATIENTS WITH SKELETAL DISCREPANCIES SALMA AL-RIYAMI B.D.S (University of Bristol) M.Sc (University of London) Submitted for The Degree of Doctor in Philosophy in Clinical Dentistry (Orthodontics) UCL Eastman Dental Institute for Oral Health Sciences 2010
-
Upload
khangminh22 -
Category
Documents
-
view
1 -
download
0
Transcript of Temporomandibular joint disorders in patients with skeletal ...

i
TEMPOROMA ND IBU L AR J O I NT DISORDER S I N PAT I ENT S WIT H
SKEL ETAL DISC RE P ANC I ES
SALMA AL-RIYAMI
B.D.S (University of Bristol)
M.Sc (University of London)
Submitted for The Degree of Doctor in Philosophy in Clinical Dentistry
(Orthodontics)
UCL Eastman Dental Institute for Oral Health Sciences
2010

ii
―I, Salma Al-Riyami confirm that the work presented in this
thesis is my own. Where information has been derived from
other sources, I confirm that this has been indicated in the
thesis‖
London, 19th
November 2010
Salma Al-Riyami

iii
Abstract
Chapter I Literature review on the Temporomandibular joint (TMJ) and
Temporomandibular disorders (TMD)
Chapter II Systematic review of TMD in orthognathic patients
This review was conducted to investigate the prevalence of temporomandibular joint
dysfunction (TMD) in orthognathic patients and to determine the effect of the surgical
intervention on the status of the temporomandibular joint (TMJ). A methodological
process was applied for study selection, data management and quality assessment and
meta-analyses were conducted where appropriate. This review identified 53 papers for
inclusion and there was heterogeneity in the diagnosis and classification of TMD
between the studies. Patients undergoing orthognathic treatment for the correction of
dentofacial deformity and suffering from TMD appeared more likely to see an
improvement in their signs and symptoms than deterioration, particularly with respect to
pain related symptoms. This information should be given to prospective patients during
the consent process, but it should be stressed that no guarantees can be made.
Chapter III TMD in orthognathic patients and a control group with no skeletal
discrepancies
Sixty eight orthognathic patients and 72 control subjects (with no anterior-posterior,
vertical or transverse discrepancies) were recruited for this section of the PhD. Self-
reported symptoms and clinical signs of TMD were recorded and compared between the
two groups. A significant difference in TMD prevalence was observed between the
controls (27.8%) and patients (44.1%), with the patients being more susceptible to
TMD. However, although orthognathic patients appear more likely to suffer from TMD,
whether treatment improves their TMJ condition is highly questionable. This issue
should be highlighted in any informed consent process.

iv
Chapter IV A longitudinal study of TMD in orthognathic patients
Twenty orthognathic patients were followed longitudinally throughout treatment to
establish whether TMD signs and symptoms altered during the course of treatment.
Although no significant differences were found when comparing the pre-treatment (T1)
findings with those prior to surgery (T2), sufficient individual changes in TMD signs
and symptoms were observed to question the suitability of the ―prior to surgery‖ time
point as a baseline for comparisons in future studies. When comparing pre (T1) and
post-treatment (T3) TMD changes, no significant differences were observed. This study
supports the theory that TMD is a dynamic condition and signs and symptoms are likely
to fluctuate throughout treatment. However, the small sample size in this study was
clearly a limiting factor.
Chapter V TMJ information course: Comparison of the instructional efficacy of
an internet-based TMJ tutorial with a traditional face-to-face seminar
A TMJ tutorial was developed on a virtual learning environment (VLE) to enable
students to enhance their examination and diagnostic skills and a randomised cross-over
trial was then conducted. Thirty postgraduate students were recruited as participants and
the success of this mode of teaching was compared with a conventional face-to-face
seminar. This study found that both modes of teaching were equally effective in
delivering information to students but teaching the topic twice enhanced the retention of
knowledge. In addition the students reported positive perceptions of VLE learning and
the feedback for this mode of teaching was comparable with traditional methods of
teaching.

v
Publications Resulting from this Research
1. Al-Riyami S, Moles DR, Cunningham SJC (2009)
Orthognathic treatment and temporomandibular disorders: A systematic review.
Part 1. A new quality-assessment technique and analysis of study characteristics
and classifications.
Am J Orthod Dentofacial Orthop. 136:624.e1-624.e.15.
(Appendix II)
2. Al-Riyami S, Cunningham SJC, Moles DR (2009)
Orthognathic treatment and temporomandibular disorders: A systematic review.
Part 2. Signs and symptoms and meta-analyses.
Am J Orthod Dentofacial Orthop. 136:626.e1-624.e.16.
(Appendix II)
3. Al-Riyami S, Moles DR, Cunningham SJC
Comparison of the instructional efficacy of an internet-based
temporomandibular joint (TMJ) tutorial with a traditional seminar.
Accepted for publication by the British Dental Journal, April 2010. Manuscript
reference: MSS-2009-721R
(Appendix II)

vi
Acknowledgments
It is with my sincerest gratitude that I take this opportunity to thank those, without
whom, this PhD thesis would not have been possible. I am truly and deeply indebted
to so many people that there is no way to acknowledge them all or even any of them
properly. I sincerely hope that everyone who knows that they have contributed
towards achieving my goals feels the satisfaction that they have helped, and that
they do not feel remorse that I have not ungratefully omitted them from explicit
mention.
Firstly, I thank my primary supervisor Dr. Susan Cunningham whose
encouragement, supervision and guidance from the preliminary to the concluding
level of this thesis has been endless. Her continuous support throughout this PhD
has enabled me to complete the task ahead. She so selflessly gave up so much of her
time reading and reviewing the many drafts and chapters, and for that I am forever
grateful. Dr. Cunningham has been so much more than just the perfect supervisor;
she has been a mentor, teacher and friend.
Special thanks goes to my secondary supervisor, Professor David Moles, for helping
me complete the writing of this dissertation as well as the challenging research that
lies behind it. He has always been at hand to listen and to give advice and has
showed me different ways to approach a research problem and the need to be
persistent to accomplish any goal. I am truly fortunate to have been able to enjoy
and benefit from such a relationship.
Professor Nigel Hunt, for his support throughout my study at the Eastman Dental
Institute. It has been a great privilege to have the opportunity to study at the
Eastman and work with him.
I have to thank Dr. Rachel Leeson for sharing her wisdom on the subject, and for so
graciously giving up so much of her time to help develop the educational
components of this research. Her dedication went above and beyond the call of duty.

vii
I am deeply indebted to Dr Derren Ready, for his support and kindness, and I am
very thankful to the Eastman Dental Institute, Microbiology department, for being
the best volunteers any one could have asked for.
A special note of gratitude is reserved for my orthodontic graduate colleagues,
whom I have worked with over the course of this research study. Their support has
been invaluable, and I am eternally grateful to them all for giving up their time at
various points throughout this study.
I would also like to thank Dr. Stephen Davies for his very fine introduction to the
topic, and for hosting me at the Manchester University Dental School.
My thanks go to the many people at UCL who helped and encouraged me during
my time here, including but not limited to Patrick Robinson, Desmond and the rest
of the UCL multimedia department for their fine work and skill in creating an
incredible presentation. Additionally, the UCL LTSS department for developing my
Moodle skills.
I have been extremely fortunate to share an office with some of the best people. I
have to thank all my officemates not only for benefiting from their intelligence, wit,
humanity, and companionship, but also for all their patience and generosity.
Let me also say ‗thank you‘ to all the consultants, clinical lecturers, nurses,
laboratory staff and others in the Orthodontic Department of the Eastman Dental
Hospital, they have put up with me for the duration of my course, and without their
support, my time at the Eastman would have been miserable. I would also like to
say a special thank you to Annette Robinson, who never failed to keep me updated
about the comings and goings of patients. None of this would have also been
possible without the help and support of the library and support staff of the Eastman
Dental Institute; Andy, Marianne Dang, the Information Technology department and
the countless others.
I offer my regards and blessings to all of those who helped me in any respect during
the completion of this research, and would like to thank all my great friends that

viii
have been a backbone of support. Without your encouragement and sometimes
distractions, this thesis would never have been completed.
Last, but not least, I thank my family especially my father (may his soul rest in
peace) and my mother Asma, for educating me, for her unconditional support and
encouragement to pursue my interests and for believing in me. My sister Aisha, for
listening to my complaints and frustrations and being such wonderful company
throughout my time in London. My brother Sultan for his wisdom and remarkable
sense of humour. Without the love and support of my husband Amin, I would be
nowhere. Thank you all for being a part of my life.

1
Table of Contents
Title...............................................................................................................i
Signed Declaration Statement..................................................................ii
Abstract......................................................................................................iii
Publications resulting from this research.................................................v
Acknowledgments......................................................................................vi
Table of Contents ..................................................................................... i
List of Figures .......................................................................................... 6
List of Tables ........................................................................................... 8
Chapter I: Literature review on the Temporomandibular Joint and
Temporomandibular disorders............................................................. 12
1.1 Introduction ......................................................................................................... 12
1.2 Temporomandibular Joint Anatomy ..................................................................... 15
1.3 Conditions affecting the Temporomandibular Joint .............................................. 25
1.4 Aetiology of TMD .............................................................................................. 36
1.5 TMD Epidemiology ............................................................................................. 44
1.6 Measuring TMD and Classification ...................................................................... 47
1.7 TMD and Occlusion ............................................................................................. 52
1.8 TMD and Malocclusion........................................................................................ 57
1.9 TMD and Orthodontics ........................................................................................ 59
Summary of the research ...................................................................... 66
Chapter II: Systematic review of TMD in orthognathic patients ....... 68
2.1 Review of the Literature ....................................................................................... 68
2.1.1 Introduction ............................................................................................... 68

2
2.1.2 Orthognathic treatment and TMD .............................................................. 69
2.1.3 Systematic reviews .................................................................................... 70
2.2 Methodology ....................................................................................................... 78
2.2.1 Aims of this Systematic Review ................................................................ 78
2.2.2 Conducting a systematic review of the literature ........................................ 78
2.2.3 Analysis of the results of the systematic review ......................................... 95
2.2.4 Methodology for the Meta-analysis............................................................ 96
2.3 Results .............................................................................................................. 101
2.3.1 Evidence Tables ...................................................................................... 163
2.3.2 Meta-analyses .......................................................................................... 173
2.4 Discussion ......................................................................................................... 181
2.4.1 Heterogeneity .......................................................................................... 181
2.4.2 Narrative Findings ................................................................................... 183
2.4.3 Meta-analysis findings ............................................................................. 186
2.5 Conclusions ...................................................................................................... 189
Chapter III: TMD in orthognathic patients and a control group with
no skeletal discrepancies ..................................................................... 191
3.1 Introduction ....................................................................................................... 192
3.2 Materials and Methods ....................................................................................... 196
3.2.1 Pilot Study and Ethical Approval ............................................................. 196
3.2.2 Calibration ............................................................................................... 196
3.2.3 Recruitment of participants ................................................................... 197
3.2.4 Data collection for the study .................................................................... 199
3.2.5 Statistical Analyses .................................................................................. 205
3.3 Results .............................................................................................................. 207
3.3.1 RDC/TMD: Calibration of TMD diagnosis .............................................. 207
3.3.2 Demographics of subjects in the main study ............................................ 207
3.3.3 Orthognathic patients: Skeletal classification ........................................... 208
3.3.4 Questionnaire findings ............................................................................. 209
3.3.5 Clinical Findings ..................................................................................... 214
3.3.6 TMD Diagnosis and Classification .......................................................... 218

3
3.3.7 TMD in relation to aetiological factors .................................................... 219
3.3.8 Kinesiograph Findings ............................................................................. 223
3.4 Discussion .......................................................................................................... 224
3.4.1 Demographics (Tables 3.3 to 3.7) ............................................................ 224
3.4.2 Questionnaire findings: Patient self reported symptoms (Table 3.8) ......... 225
3.4.3 Quality of Life (QoL) (Tables 3.9 to 3.12) ............................................... 226
3.4.4 Clinical findings ...................................................................................... 227
3.4.5 TMD diagnosis and classification (Tables 3.18 and 3.19) ........................ 230
3.4.6 TMD in relation to aetiological factors .................................................... 231
3.4.7 Kinesiography Findings (Table 3.25) ....................................................... 233
3.5 Conclusions ....................................................................................................... 234
Chapter IV: A longitudinal study of TMD in orthognathic patients
.............................................................................................................. 236
4.1 Introduction ...................................................................................................... 236
4.2 Materials and Methods ...................................................................................... 239
4.2.1 Recruitment of orthognathic patients ....................................................... 239
4.2.2 Ethical approval ....................................................................................... 239
4.2.3 Control group comprising subjects with skeletal discrepancies ................ 239
4.2.4 Data collection and measurements ........................................................... 240
4.2.5 Statistical Analyses .................................................................................. 241
4.3 Results .............................................................................................................. 242
4.3.1 Orthognathic patient recruitment ............................................................. 242
4.3.2 Comparison between T1 and T2 .............................................................. 243
4.3.3 Comparison at T1 and T2: Patient reported symptoms ............................. 244
4.3.4 Comparison at T1 and T2: Clinical findings ............................................. 246
4.3.5 Comparison at T1 and T3 ........................................................................ 248
4.3.6 Comparison at T1 and T3: Patient reported symptoms ............................. 250
4.3.7 Comparison at T1 and T3: Clinical findings ............................................. 251
4.3.8 Longitudinal follow up of the 20 patients who completed treatment ......... 253
4.4 Discussion ......................................................................................................... 256
4.4.1 Orthognathic patient recruitment ............................................................. 256

4
4.4.2 Skeletal Control group ............................................................................. 256
4.4.3 Comparison between T1 and T2 (N=46) .................................................. 257
4.4.4 Comparison between T1 and T3 (N=20) .................................................. 260
4.4.5 TMD at T1 and T3 and the influence of skeletal pattern (Table 4.20) ....... 262
4.5 Conclusions ...................................................................................................... 263
Chapter V: TMJ information course: Comparison of the instructional
efficacy of an internet-based TMJ tutorial with a traditional face-to-
face seminar. ........................................................................................ 264
5.1 Literature review ................................................................................................ 264
5.1.1 History of VLE ........................................................................................ 264
5.1.2 Features of VLEs ..................................................................................... 266
5.1.3 Research into VLEs ................................................................................. 269
5.1.4 VLEs in Medicine and Dentistry .............................................................. 271
5.1.5 Summary ................................................................................................. 276
5.2 Materials and Methods ...................................................................................... 279
5.2.1 Methods for developing the TMJ course .................................................. 279
5.2.2 Cross-over Trial....................................................................................... 281
5.3 Results .............................................................................................................. 293
5.3.1 Individual Assessment results .................................................................. 293
5.3.2 Assessment Results after grouping the procedures ................................... 303
5.3.3 Feedback questionnaire findings .............................................................. 307
5.4 Discussion:......................................................................................................... 315
5.4.1 Developing the Moodle tutorial ............................................................... 315
5.4.2 Cross-over trial ........................................................................................ 316
5.4.3 Feedback ................................................................................................. 319
5.5 Conclusion ......................................................................................................... 323
Appendix I ........................................................................................... 324
Appendix 1- Data abstraction forms ......................................................................... 325
Appendix 2- Quality Assessment Form .................................................................... 331
Appendix 3- Ethical Approval.................................................................................. 334

5
Appendix 4- Amendment to Ethical Approval 1 ....................................................... 336
Appendix 5- Orthognathic patients‘ information leaflet ............................................ 337
Appendix 6- Orthognathic patients consent form ...................................................... 338
Appendix 7- Control group information leaflet and control consent form ................. 339
Appendix 8- TMD Questionnaire and OHIP-14 ....................................................... 341
Appendix 9- TMJ Clinical examination video .............................................. Back Cover
Appendix 10- TMJ examination form ...................................................................... 344
Appendix 11- RDC/TMD Classification .................................................................. 347
Appendix 12- Amendment to Ethical Approval 2 ..................................................... 348
Appendix 13- TMD assessment checklist ................................................................. 350
Appendix 14- TMD feedback questionnaire ............................................................. 351
Appendix II- Publications resulting from this research .............................. 355
References ............................................................................................ 370

6
List of Figures
Figure 1.1 The articulatory system 15
Figure 1.2 The Mandible 16
Figure 1.3 The Temporomandibular fossa 17
Figure 1.4 The Articular Disc of the TMJ 18
Figure 1.5 The Joint capsule of the TMJ 19
Figure 1.6 The Sphenomandibular ligament (indicated by the arrows) 20
Figure 1.7 The Stylomandibular ligament (indicated by the arrows) 21
Figure 1.8 The muscles of mastication 21
Figure 1.9 Dissection of the masseter and pterygoid muscles 23
Figure 1.10 Path of lasting deviations 32
Figure 1.11 Path of transient deviations 32
Figure 2.1 Hierarchy of Evidence (Reproduced from Clarkson et al., 2003) 73
Figure 2.2 Flow chart for assigning bias for the selection criteria of the
included studies 89
Figure 2.3 Flow chart for assigning bias for the performance/methodology
of the included studies 90
Figure 2.4 Flow chart for assigning bias for the outcome measurement
of the included studies 91
Figure 2.5 Flow chart for assigning attrition bias for the included studies 92
Figure 2.6 Forest plot of the overall proportion of patients with TMD
pre-surgery (using the Helkimo Index) 175
Figure 2.7a Forest Plot showing the proportion of pre-surgery skeletal II
patients diagnosed as having TMD-BSSO advancement surgery 178
Figure 2.7b Forest Plot showing the proportion of post-surgery skeletal II
patients diagnosed as having TMD-BSSO advancement surgery 178
Figure 2.7c Forest Plot showing the change in proportion of skeletal II
patients affected by TMD when comparing pre- and post-surgery 179
Figure 2.8 Forest plot of the proportion of VME patients undergoing
Le Fort 1 maxillary impaction affected by TMD
(post-surgery data) 180
Figure 3.1 Kinesiograph K6-I evaluation system and head frame 203

7
Figure 3.2 Kinesiograph. Head frame secured on subjects head 204
Figure 3.3 Graphs obtained from the kinesiograph for scan 2 205
Figure 4.1 Progress of orthognathic patients through this study 242
Figure 5.1 Components of a Managed Learning Environment 268
Figure 5.2 Cross over trial study design 284
Figure 5.3 Bar chart comparing whether the course is easy to use or follow 307
Figure 5.4 Bar chart comparing whether the course was interesting 308
Figure 5.5 Bar chart comparing whether the course was motivating 308
Figure 5.6 Bar chart comparing skills development from the course 309
Figure 5.7 Bar chart comparing the course information 310
Figure 5.8 Bar chart comparing the academic expectations from the course 310
Figure 5.9 Bar chart comparing the quality of the course 311
Figure 5.10 Bar chart comparing course recommendations 311
Figure 5.11 Bar chart comparing whether the course stimulated the
postgraduates interest for further learning 312
Figure 5.12 Bar chart comparing the rating of both courses 313

8
List of Tables
Table 1.1 Origin and insertion of the muscles of mastication 22
Table 1.2 Actions of the muscles of mastication on the mandible 24
Table 2.1 Electronic search strategy for identification of studies 81
Table 2.2 Interpretation of Kappa Values (Landis and Koch, 1977) 82
Table 2.3 Kappa scores for first stage 83
Table 2.4 Kappa scores for second stage of agreement 83
Table 2.5a Agreement and Kappa scores for Selection (1st stage of testing) 86
Table 2.5b Agreement and Kappa scores for Performance (1st stage of testing) 87
Table 2.5c Agreement and Kappa scores for Measurement/Outcome (1st stage
of testing) 87
Table 2.5d Agreement and Kappa scores for Attrition (1st stage of testing) 87
Table 2.6a Agreement for Selection (2nd
stage of testing) 93
Table 2.6b Agreement and Kappa scores for Performance (2nd
stage of testing) 93
Table 2.6c Agreement and Kappa scores for Measurement/Outcome (2nd
stage
of testing) 93
Table 2.6d Agreement and Kappa scores for Attrition 93
Table 2.7a Agreement and Kappa scores for Selection (Final stage of testing) 94
Table 2.7b Agreement and Kappa scores for Performance (Final stage of
testing) 94
Table 2.7c Agreement and Kappa scores for Measurement/outcome (Final
stage of testing) 94
Table 2.7d Agreement and Kappa scores for Attrition (Final stage of testing) 95
Table 2.8 Study characteristics 102
Table 2.9 Study Participants 112
Table 2.10 Orthognathic Intervention 120
Table 2.11 Classification of TMD 125
Table 2.12 Self Reported TMD Symptoms 130
Table 2.13 TMD Signs Clinical Findings 134
Table 2.14 Percentages of patients presenting with confirmed TMD at
various time intervals 142
Table 2.15 Change in TMJ signs and symptoms 145

9
Table 2.16 TMD findings in studies using the Helkimo Index 153
Table 2.17 Findings in studies using the Craniomandibular Index (CMI) 157
Table 2.18 Quality Assessment 158
Table 2.19 Heterogeneity test and Meta-analysis for the overall proportion
of patients with TMD prior to surgery (using the Helkimo Index) 175
Table 2.20a Heterogeneity test and Meta-analysis for the proportion of skeletal
II patients with TMD prior to surgery (using the Helkimo Index) 176
Table 2.20b Heterogeneity test and Meta-analysis for proportion of skeletal II
patients with TMD following surgery (using the Helkimo Index) 176
Table 2.20c Heterogeneity test and Meta-analysis of the change in proportion
of TMD pre and post surgically in skeletal II patients undergoing
BSSO advancement surgery 177
Table 2.21 Heterogeneity test and Meta-analysis for VME patients
undergoing Le Fort 1 impaction (post-surgery data) 180
Table 3.1 RDC/TMD Axis 1 diagnoses 202
Table 3.2 Agreement between the researcher (SA) and expert (SD) for
calibration of TMD diagnosis 207
Table 3.3 Gender distribution of control and orthognathic subjects 207
Table 3.4 Ethnicity of control and orthognathic subjects 208
Table 3.5 Age of control and orthognathic subjects 208
Table 3.6 Antero-posterior relationship of the orthognathic cohort 208
Table 3.7 Vertical relationship of the orthognathic cohort 209
Table 3.8 Frequency of self reported symptoms for orthognathic and
control subject 210
Table 3.9 Two way ANOVA for the OHIP score as the dependent variable 211
Table 3.10 Overall OHIP Score for the control and orthognathic subjects 211
Table 3.11 OHIP scores according to TMD status 212
Table 3.12 Descriptive results for the seven OHIP domains for both control
and orthognathic groups 213
Table 3.13 TMJ signs in the control and orthognathic subjects 214
Table 3.14 Observations relating to TMJ clicks for both control and
orthognathic patient 214
Table 3.15 The percentage of control and orthognathic subjects suffering
from tenderness of the muscles of mastication 216

10
Table 3.16 The percentage of controls and orthognathic patients with
deviation of the mandible on opening 217
Table 3.17 Mean opening and lateral excursion values of both control and
orthognathic subjects 217
Table 3.18 Presence of TMD in controls and orthognathic patients from the
RDC/TMD diagnosis 218
Table 3.19 Distribution of TMD according to the RDC/TMD classification 219
Table 3.20 TMD in orthognathic patients according to A-P skeletal pattern 220
Table 3.21 Presence or absence of TMD according to vertical skeletal pattern 220
Table 3.22 Presence or absence of TMD in relation to lateral excursions in
control and orthognathic subjects 221
Table 3.23 Presence or absence of TMD in relation to centric
occlusion/centric relation in control and orthognathic subjects 221
Table 3.24 Univariate logistic regression of presence or absence of TMD
and the association with Gender, Group and Age 222
Table 3.25 Kinesiograph findings for control (Crl) and orthognathic (OG)
groups 223
Table 4.1 Summary of the demographic details for the 46 patients at T2 243
Table 4.2 TMD diagnosis at T1 and T2 244
Table 4.3 Comparison of headaches at T1 and T2 244
Table 4.4 Comparison of jaw pain on opening/closing at T1 and T2 245
Table 4.5 Comparison of muscle pain around the jaw at T1 and T2 245
Table 4.6 Comparison of pain over the lateral poles of the TMJ at T1 and T2 246
Table 4.7 Comparison of clicking of the TMJ at T1 and T2 follow up points 247
Table 4.8 Comparison of the number of muscles sites tender to palpation at
T1 and T2 247
Table 4.9 Comparison of maximum opening at T1 and T2 248
Table 4.10 Summary of the demographic details for the 20 patients who had
completed orthognathic treatment (T1, T2 and T3 data available) 248
Table 4.11 TMD diagnosis of at T1 and T3 249
Table 4.12 Comparison of headaches at T1 and T3 250
Table 4.13 Comparison of jaw pain on opening/closing at T1 and T3 250
Table 4.14 Comparison of muscles pain around the jaw at T1 and T3 251
Table 4.15 Comparison of pain over the lateral poles of the TMJ at T1 and T3 251

11
Table 4.16 Comparison of clicking of the TMJ at T1 and T3 252
Table 4.17 Comparison of the number of muscles sites tender to palpation
at T1 and T3 252
Table 4.18 Comparison of maximum opening at T1 and T3 253
Table 4.19 Summary of patients who had either an improvement or
deterioration in their TMJ Status between T1 and T3 254
Table 4.20 Longitudinal follow up of 20 patients who completed treatment 255
Table 5.1 Randomisation of 30 postgraduates for first episode of teaching 287
Table 5.2 Randomisation of 30 postgraduates for the second episode of
teaching following cross-over 288
Table 5.3 Criteria for assessment of TMD 290
Table 5.4 Assessment results after first teaching episode 294
Table 5.5 Assessment results after cross over and second teaching episode 297
Table 5.6 Group 1 assessments comparing the first and second episodes of
teaching 300
Table 5.7 Group 2 assessments comparing the first and second episodes of
teaching 302
Table 5.8 Results for the assessment after first teaching episode 303
Table 5.9 Results for the assessment after the cross-over and second
teaching episode 304
Table 5.10 Group 1 results comparing first and second assessments 305
Table 5.11 Group 2 results comparing first and second assessments 306
Table 5.12 Comparison of the total scores between the first and second
assessments 307
Table 5.13 Comments provided by postgraduates regarding the Moodle
and Face-to-face seminar 314

12
Chapter I: Literature Review on the Temporomandibular
Joint and Temporomandibular disorders
1.1 Introduction
Temporomandibular joint disorders (TMD), and their relevance to dentistry, has been a
highly debated topic in recent years. The temporomandibular joint (TMJ) syndrome was
first described by Costen in 1934. Although Costen was not the first to ascribe ear pain,
tinnitus, impaired hearing, and dizziness to TMJ dysfunction, he developed an
integrated and systematic approach ascribing the symptoms to dental malocclusion. A
few years after his original article, the term Costen‘s Syndrome came into general use.
The American Dental Association President's Conference on Temporomandibular
Disorders (American Dental Association, 1983) (Laskin et al., 1983) defined TMD as
―a group of orofacial disorders characterised by pain in the preauricular area, TMJ, or
muscles of mastication, limitations and deviations in mandibular range of motion, TMJ
sounds during jaw function‖. Luther (1998a) used the term TMD to signify the variety
of symptoms, signs and combinations thereof that have been assigned to the TMJ and
its related structures. Thus it becomes apparent that clinicians cannot agree upon a
precise definition for TMD. Dibbets and Van der Weele (1991) commented that ―...
many different definitions of TMJ dysfunction have come into existence and
consequently, even in a single individual the diagnosis of TMJ dysfunction depends on
the definition used‖. Some of the synonyms for conditions causing pain and dysfunction
in the TMJ include: temporomandibular dysfunction syndrome, pain dysfunction
syndrome, facial arthromylagia, TMJ dysfunction syndrome, myofacial pain
dysfunction syndrome, craniomandibular dysfunction and myofacial pain dysfunction
(Al-Ani et al., 2004).
Temporomandibular disorders: are the commonly used all encompassing and
comprehensive terms for conditions affecting the TMJ. This includes conditions such as
pain in the TMJ or associated muscles, limitation of joint movement, disc displacement,
disc dislocation, deviation of the mandible, osteoarthritis and arthralgias etc. It is also

13
the term favoured by current literature and TMD is used as an abbreviation throughout
this study for this described condition.
Temporomandibular dysfunction: is a more traditional term (also abbreviated to
TMD) which refers mainly to painful and dysfunction symptoms of the TMJ (e.g. disc
derangements, limitation in movement and dislocations), this term has lost favour in
recent years.
What can be agreed, however, is that patients suffering from disorders of the TMJ
frequently experience the following combinations of symptoms:
Painful Symptoms: Headaches, facial pain, dental pain, pain in the jaw joints or
on jaw movement, ear pain, tinnitus, ear pressure, neck, back, shoulder and chest
pain.
Dysfunctional Symptoms: Limited jaw movement, deviated, slow or irregular
jaw movement, limited range of motion, joint sounds such as clicking or crepitus
and locked or dislocated jaw.
Dental Destruction: Traumatic occlusion, clenching, grinding (bruxism);
excessive wear and abrasion of the dentition.
To this end, conflict arises in the dental community when views are expressed about
topics such as occlusion, condylar position, orthodontics and TMD. If the relevance of
TMD to orthognathic treatment is questioned, the diverse viewpoints expressed include
that orthognathic treatment may either resolve or induce TMD, or may have little or no
effect on TMJ pain and dysfunction.
There have traditionally been two schools of thought regarding TMD, malocclusion and
orthodontics. Protagonists of the first felt strongly about the cause and effect
relationship of orthodontics and TMD and it was suggested that orthodontics might play
a role in initiating TMD (Ricketts, 1966). On the other hand, proponents of the second
school claimed that orthodontics might actually be effective in alleviating signs and
symptoms of TMD (Luther, 1998a; Proffit, 2000). Many of the findings used to support
these arguments, were based on clinical experience, uncontrolled observations and
contrived logic.

14
This conflict really came to light when the results of the Michigan orthodontic/ TMJ
law suit were announced. The case of Brimm vs. Malloy in 1987 (Luecke and Johnston,
1992) centred on whether a patients orthodontic treatment caused TMD. The case went
against the orthodontist with the six-member jury finding in favour of the patient. As a
result the American Association of Orthodontists (AAO) began a programme to support
research on orthodontic treatment as it relates to TMD.
In the last two decades, a more comprehensive understanding of the TMJ and its
associated structures has done little to diminish the controversy surrounding this issue.
The main problem stems from the conflicting information in the literature. In actuality
this ―heated‖ conflict probably lies somewhere in the middle ground but the need for
objective data and well conducted research is now stronger than ever.

15
1.2 Temporomandibular Joint Anatomy
The articulatory system comprises of a hinge (the TMJ), motors (the masticatory and
accessory muscles) and the contacts between the teeth (occlusion).
Figure 1.1 The Articulatory system
Reproduced with permission from Nucleus Images
The TMJ is the articulation between the condyle of the mandible and the squamous
portion of the temporal bone. The condyle is elliptically shaped with its long axis
oriented mediolaterally, whilst the articular surface of the temporal bone is composed of
the concave articular fossa and the convex articular eminence (Johnson and Moore,
1997).
The TMJ is a bilateral synovial joint that functions in speech, mastication, and
deglutition and allows movement of the mandible in three planes of space. It is atypical
in that the articular surfaces are covered by white fibrocartilage (mostly collagen with
only a few cartilage cells), rather than the more usual hyaline cartilage. Beneath the
articular covering of the head of the condyle is a layer of hyaline cartilage (Johnson and
Moore, 1997).

16
The TMJ consists of:
1. Mandibular condyle
2. Temporomandibular fossa
3. Articular disc
4. Joint capsule (lined by synovial membrane)
5. Ligaments
6. Muscles of mastication
7. Blood and nerve supply
Mandibular condyle
The mandible consists of a curved body and two vertical rami which project upwards.
At the superior border of the ramus are the coronoid and condylar processes, separated
by the mandibular incisure. The coronoid process is a triangular plate of bone which
projects upwards (Johnson and Moore, 1997).
Figure 1.2 The Mandible
Adapted from Encyclopaedia Britannica 2007
The condyle is approximately cylindrical in shape, being expanded from side to side but
narrowing from front to back (Johnson and Moore, 1997) and it measures between 13
and 25 mm mediolaterally (Bernard, 2001). The long axis is not quite in the transverse
plane but is directed posteriorly and superiorly as well as medially. The constricted part
of the condylar process below the head is termed the neck of the mandible. Part of the
lateral pterygoid muscle is inserted into the anterior aspect of the condyle.

17
Temporomandibular fossa (glenoid fossa)
The temporomandibular fossa forms the superior articular surface of the TMJ and is
located on the squamous part of the temporal bone. It is bounded anteriorly by the
articular tubercle and posteriorly by the tympanic part of the bone; which separates it
from the external acoustic meatus. The temporomandibular fossa is divided into two
parts by a narrow fissure, which is termed the petrotympanic fissure (Johnson and
Moore, 1997).
Figure 1.3 The Temporomandibular fossa
Reproduced with permission from Nucleus Images
Articular Disc (meniscus)
The meniscus is a fibrous, saddle shaped structure that separates the condyle and the
temporal bone and it is separated into bands which vary in thickness (Bernard, 2001):
1. The thinner, central intermediate zone,
2. Thicker portions, called the anterior band, lying below the posterior edge of the
articular eminence and
3. A thick posterior band that lays on top of the condyle.

18
Figure 1.4 The Articular Disc of the TMJ
Reproduced with permission from Clinical Anatomy of Masticatory Apparatus
and Pharyngeal Spaces by Joannes Lang: Rudman (1995): Thieme Medical
Publishers, NY
Anteriorly, the disc is attached to the articular eminence above and to the articular
margin of the condyle below. It also has an anterior attachment to the superior head of
the lateral pterygoid muscle. Posteriorly, it is attached to the posterior wall of the
glenoid fossa above and to the distal aspect of neck of the condyle below. This area is
called the posterior bilaminar zone and was first described by Rees in 1954. The
bilaminar zone is formed of a vascular, innervated tissue that plays an important role in
allowing the condyle to move forward.
The meniscus and its attachments divide the joint into superior and inferior joint spaces.
The superior joint space is bounded above by the articular fossa and the articular
eminence and this allows translatory movement. The inferior joint space is bounded
below by the condylar head, which allows a hinge or rotatory movement (Bernard,
2001). Both joint spaces have small capacities, generally in the region of 1cc or less.
The TMJ is thus not considered a stationary hinge, as it allows both gliding and hinge
actions, but is described as a synovial sliding joint (Bell, 1982).
Joint capsule
The articular capsule is a thin, loose envelope which is attached above to the
circumference of the mandibular fossa, to the articular tubercle immediately in front

19
and, below, to the neck of the condyle of the mandible. The capsule encloses the joint
and acts as a stabiliser which allows complex function.
Figure 1.5 The Joint capsule of the TMJ
Reproduced with permission from Nucleus Images
The synovial membranes line the inner aspect of the joint capsule (Bell, 1982) and are
located above and below the articular disc. The upper, which is the larger and looser of
the two, is continued from the margin of the cartilage covering the mandibular fossa and
articular tubercle onto the upper surface of the disc. The lower one passes from the
under surface of the disc to the neck of the condyle. The synovial membrane consists of
two layers, a cellular layer and a vascular layer. The cellular layer contains type A cells,
which are phagocytic, and type B cells, which synthesise hyalorunate found in synovial
fluid. The vascular layer consists of blood vessels and lymphatics within a loose
connective tissue matrix. The synovial membrane secretes synovial fluid for lubrication
and nourishment of the articular surfaces and the lining of both compartments.
Ligaments
There are three ligaments associated with the TMJ, one major and two minor. The
temporomandibular ligament is a lateral thickening of the joint capsule which consists
of two short, narrow fasciculi, one in front of the other. It is attached, above, to the
lateral surface of the zygomatic arch and to the tubercle on its lower border and, below,
to the lateral surface and posterior border of the neck of the mandible. It is broader
above than below and its fibres are directed obliquely downward and backward. It is
covered by the parotid gland and by the integument (Standring, 2004).

20
Two minor ligaments are classed among the ligaments of the TMJ, but can only be
considered as accessory to it:
1. The sphenomandibular ligament is a flat, thin band which is attached above to
the spina angularis of the sphenoid bone and becomes broader as it descends to
the lingula of the mandibular foramen. Its lateral surface is in relation, above,
with the lateral pterygoid whilst, below, it is separated from the neck of the
condyle by the internal maxillary vessels. Below this, the inferior alveolar
vessels and nerve and a lobule of the parotid gland lie between it and the ramus
of the mandible. Its medial surface is in close relation with the medial pterygoid.
Figure 1.6 The Sphenomandibular ligament (indicated by the arrows)
Reproduced with permission from Colour Atlas of Dental Medicine: Bumann
and Lotzmann (2002): Thieme Medical Publishers, NY
2. The stylomandibular ligament is a specialised band of the cervical fascia, which
extends from near the apex of the styloid process of the temporal bone to the
angle and posterior border of the ramus of the mandible, between the masseter
and medial pterygoid. This ligament separates the parotid from the submaxillary
gland and some fibres of the styloglossus take origin from its deep surfaces
(Standring, 2004).

21
Figure 1.7 The Stylomandibular ligament (indicated by the arrows)
Reproduced with permission from Colour Atlas of Dental Medicine:
Bumann and Lotzmann (2002): Thieme Medical Publishers, NY
Muscles of Mastication
Although many muscles are involved in mastication, the primary muscles of mastication
are the temporalis, masseter, medial pterygoid and lateral pterygoid (other muscle of
mastication include the suprahyoid, infrahyoid, digastric and geniohyoid muscles).
These muscles attach to the mandible at various points and move the mandible in all
directions. A summary of the origins and insertion are described in Table 1.1.
Figure 1.8 The muscles of mastication
Reproduced with permission from Nucleus Images

22
Muscles Origin Insertion
Masseter Superficial head: Anterior two
thirds of lower border of
zygomatic arch
Deep head: Posterior one third
and medial surface of zygomatic
arch
Superficial head: Angle of mandible
Deep head: Ramus of mandible
Temporalis Temporal fossa
Coronoid process of mandible
Lateral
pterygoid
Superior head: Greater wing of
sphenoid bone
Inferior head: Lateral plate of
sphenoid bone
Both heads: Pterygoid fovea of
mandible
Medial
pterygoid
Pterygoid fossa of sphenoid bone Angle of mandible
Table 1.1 Origin and insertion of the muscles of mastication
The masseter is a thick, quadrilateral muscle, consisting of two portions, superficial and
deep. The superficial portion is the larger and arises as a thick, tendinous aponeurosis
from the zygomatic process of the maxilla and from the anterior two-thirds of the lower
border of the zygomatic arch; its fibres pass downward and backward, to be inserted
into the angle and lower half of the lateral surface of the ramus of the mandible. The
deep portion is much smaller and denser in texture and it arises from the posterior third
of the lower border and from the whole of the medial surface of the zygomatic arch; its
fibres pass downward and forward, to be inserted into the upper half of the ramus and
the lateral surface of the coronoid process of the mandible. The deep portion of the
muscle is partly concealed by the superficial portion and, behind, it is covered by the
parotid gland (Standring, 2004). The masseter elevates the jaw and allows clenching of
the teeth.
The temporalis muscle arises from the temporal fossa and the deep part of temporal
fascia. It inserts onto the coronoid process of the mandible and is covered by the

23
temporal fascia, also known as the temporal aponeurosis (Standring, 2004). The muscle
can be felt by palpating the temple region while the subject clenches and unclenches
their teeth.
The lateral pterygoid (or external pterygoid) is a muscle of mastication with two
heads. The upper head originates from the infratemporal surface of the sphenoid bone
and the lower head from the lateral surface of the lateral pterygoid plate. Both heads
insert onto the pterygoid fovea under the condylar process of the mandible. The lateral
pterygoid acts to lower the mandible, open the jaw, and help the medial pterygoid in
moving the jaw from side to side during mastication (Standring, 2004).
The medial pterygoid (or internal pterygoid muscle), is a thick, quadrilateral muscle. It
arises from the medial surface of the lateral pterygoid plate and the grooved surface of
the pyramidal process of the palatine bone but also has a second slip of origin from the
lateral surfaces of the pyramidal process of the palatine and the tuberosity of the
maxilla. Its fibres pass downward, laterally, and posteriorly and are inserted by a strong
tendinous lamina, into the lower and posterior part of the medial surface of the ramus
and angle of the mandible, as high as the mandibular foramen (Standring, 2004).
Figure 1.9 Dissection of the masseter and pterygoid muscles
Reproduced with permission from Clinical Anatomy of Masticatory Apparatus and
Pharyngeal Spaces by Joannes Lang: Rudman (1995): Thieme Medical Publishers, NY

24
The medial pterygoid, masseter and temporalis muscles exert vertical forces in closing
the jaw, whilst the lateral pterygoid muscle protracts the mandible and stabilises the
joint (Bernard, 2001). Table 1.2 describes the actions of the muscles of mastication on
the mandible.
Muscles Mandibular Movements
Masseter Elevation of mandible (during jaw closing)
Temporalis Elevation of mandible (during jaw closing) Retraction of mandible
(lower jaw backward)
Lateral
pterygoid
Inferior heads: slight depression of mandible (during jaw opening)
Unilateral action: lateral deviation of mandible (shift lower jaw to
opposite side)
Bilateral action: protrusion of mandible (lower jaw forward)
Medial
pterygoid
Elevation of mandible (during jaw closing)
Table 1.2 Actions of the muscles of mastication on the mandible.
Thus the muscles of mastication are important in co-ordinating mandibular movements
in all three dimensions; transverse, vertical and sagittal. A fourth dimension, time, also
plays a part and is considered in the Bennett movement. The angle formed by the
downward movement of the mandible is the condylar angle, whilst that formed by the
medial movement is known as the Bennett angle (Davies and Gray, 2001). During the
Bennett movement, the mandible shifts towards the working side and this shift is
classified based on the time at which it occurs in relation to the lateral movements.
Blood and nerve supply
The joint is supplied with sensory fibres by branches of the auriculotemporal nerve and
the masseteric nerve, both of which are branches of the mandibular division of the
trigeminal nerve which also supplies the muscles acting on the joint.

25
Proprioception in the TMJ involves four receptors (Bell, 1982):
1. Ruffini endings function as static mechanoreceptors which deal with the
posture of the mandible.
2. Pacinian corpuscles are dynamic mechanoreceptors which accelerate
movement during reflexes.
3. Golgi tendon organs function as static mechanoreceptors for protection of
ligaments around the TMJ.
4. Free nerve endings are the pain receptors for protection of the TMJ itself.
In order to facilitate functioning, there is neither innervation nor vascularisation within
the central portion of the articular disc. Presence of nerve fibres or blood vessels would
result in bleeding every time the jaw was moved and this would be extremely painful.
The blood supply for the TMJ is through the maxillary and superficial temporal branch
of the external carotid artery.
1.3 Conditions affecting the Temporomandibular Joint
Some of the conditions that may affect the TMJ include:
1. Pain in the TMJ or associated muscles
2. Limitation of joint movement
3. Disc displacement
4. Condylar dislocation
5. Deviation
6. Systemic autoimmune diseases, connective tissue disorders, and arthritic
conditions
7. Osteoarthritis
8. Neoplasm

26
1. Pain in the TMJ or associated muscles
Pain or tenderness can affect the TMJ and any of the associated muscles of mastication.
Pain may come from the TMJ itself, the muscles or often a combination of the two.
Symptoms are diverse and the pain can range from a mild ache to a chronic debilitating
pain. It may present in many ways including jaw pain in the muscles near the mouth or
as a headache at the temples (temporal headache) due to inflammation in the temporalis
muscle (Bumann and Lotzmann, 2002).
Pain in the joint itself is usually due to inflammation within the structure but sometimes
the symptoms are referred and are perceived to be in other facial structures; such as dull
ear pain, toothache, or neck pain. TMJ pain disorders may occur because of unbalanced
activity, spasm, or overuse of the jaw muscles. Symptoms tend to be chronic and
treatment is aimed at eliminating the precipitating factors (Bumann and Lotzmann,
2002).
2. Limitation of joint movement
This term is used to describe either a reduction in maximum mouth opening or limited
lateral excursions. The average range of jaw movements varies between individuals, but
the incisal opening (measured from the upper incisal tip to the lower incisal tip) usually
measures approximately 35mm for females and 40mm for males. However, this can
range between 35 and 50mm (Harris et al., 1993; Gray et al., 1994b). Mouth opening
reduces with age and is generally wider in individuals under 50 years of age (Gallagher
et al., 2004; Placko et al., 2005). Lateral excursions are the ability to move the mandible
laterally with the teeth in contact, with the average range of movement being
approximately 8 mm in either direction (Gray et al., 1994b). Lateral excursion is said to
be reduced if the lateral movement which can be achieved in either direction is less than
a lower incisor width (Harris et al., 1993).
A reduction in vertical range of movement or the inability to fully open the mouth is
also known as trismus. This may be due either to pain preventing the patient from fully
opening or a physical obstruction. Pain may indicate a muscular problem whereas
physical obstruction usually involves disc displacement. If trismus is persistent and
permanent it may be called ankylosis; this can occur after condylar fracture and the
aetiology is categorised into extra-auricular and intra-auricular causes (van der Waal,
1991).
27
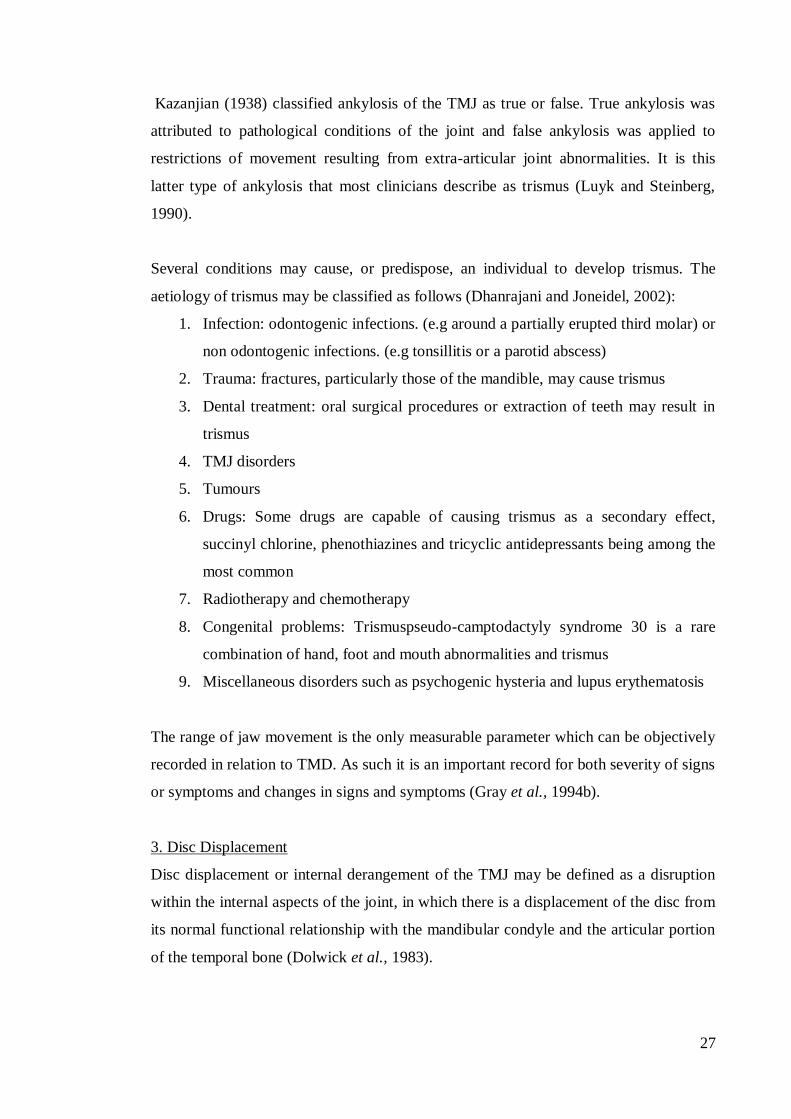
Kazanjian (1938) classified ankylosis of the TMJ as true or false. True ankylosis was
attributed to pathological conditions of the joint and false ankylosis was applied to
restrictions of movement resulting from extra-articular joint abnormalities. It is this
latter type of ankylosis that most clinicians describe as trismus (Luyk and Steinberg,
1990).
Several conditions may cause, or predispose, an individual to develop trismus. The
aetiology of trismus may be classified as follows (Dhanrajani and Joneidel, 2002):
1. Infection: odontogenic infections. (e.g around a partially erupted third molar) or
non odontogenic infections. (e.g tonsillitis or a parotid abscess)
2. Trauma: fractures, particularly those of the mandible, may cause trismus
3. Dental treatment: oral surgical procedures or extraction of teeth may result in
trismus
4. TMJ disorders
5. Tumours
6. Drugs: Some drugs are capable of causing trismus as a secondary effect,
succinyl chlorine, phenothiazines and tricyclic antidepressants being among the
most common
7. Radiotherapy and chemotherapy
8. Congenital problems: Trismuspseudo-camptodactyly syndrome 30 is a rare
combination of hand, foot and mouth abnormalities and trismus
9. Miscellaneous disorders such as psychogenic hysteria and lupus erythematosis
The range of jaw movement is the only measurable parameter which can be objectively
recorded in relation to TMD. As such it is an important record for both severity of signs
or symptoms and changes in signs and symptoms (Gray et al., 1994b).
3. Disc Displacement
Disc displacement or internal derangement of the TMJ may be defined as a disruption
within the internal aspects of the joint, in which there is a displacement of the disc from
its normal functional relationship with the mandibular condyle and the articular portion
of the temporal bone (Dolwick et al., 1983).

28
Internal derangement of the TMJ is present when the posterior band of the meniscus is
anteriorly displaced in front of the condyle. As the meniscus translates anteriorly, the
posterior band remains in front of the condyle and the bilaminar zone becomes
abnormally stretched and attenuated. Often the displaced posterior band will return to its
normal position when the condyle reaches a certain point and this is termed anterior
displacement with reduction.
When the meniscus reduces, the patient often feels a ―pop‖ or click in the joint. In some
patients, the meniscus remains anteriorly displaced at full mouth opening and this is
termed anterior displacement without reduction. These patients often experience
restricted mouth opening. It has been estimated that up to 25% of the entire population
could be affected by TMJ internal derangements (Farrar, 1981). Traditionally, internal
derangement of the TMJ has been described as a progressive disorder with a natural
history that may be classified into four consecutive clinical stages (Kaplan, 1991):
1. Stage one has been described as disc displacement with reduction. It is
characterised clinically by reciprocal clicking as a result of anterior disc
displacement with reduction. Although it has been stated that the later (in the
cycle of mandibular opening the opening) click occurs, the more advanced
the disc displacement, diagnosis based on joint sounds has come under
debate (Stohler, 1992). Anterior disc displacement with reduction can also
exist without joint noises, i.e. false negatives (Rohlin et al., 1985). The
clinical sign of disc displacement with reduction is limited mouth opening,
usually accompanied by deviation of the mandible to the involved side, until
a ―pop‖ or click (reduction) occurs. The patient is then able to open the
mouth fully along the facial midline (thus a transient deviation).
Arthrograms show anterior disc displacement in centric occlusion, but the
disc is normally located in the open-mouth position (Kaplan, 1991).
2. Stage two is disc displacement with reduction and intermittent locking. It
features all of the above characteristics, plus additional episodes of limited
mouth opening which can last for various lengths of time. Patients may
describe it as ―hitting an obstruction‖ when opening is attempted. The
―obstruction‖ may disappear spontaneously or the patient may be able to

29
manipulate the mandible beyond the interference. Arthrographically, stage
two is similar to stage one (Kaplan, 1991).
3. Stage three has been described as disc displacement without reduction
(closed lock). Closed lock occurs when clicking noises disappear but limited
opening persists. The patient complains of joint pain and chronic limited
opening, with the opening usually less than 30 mm. Examination reveals
preauricular tenderness and deviation of the mandible to the affected side
during mouth opening and protrusive movements. Arthrocentesis and
arthroscopic surgery have documented consistently high success rates in
relieving this particular pattern of internal derangement (Sanders, 1986).
Arthrographic examination and magnetic resonance imaging (MRI) show
anterior disc displacement in both centric occlusion and maximal mouth
open positions. Limited condylar translation may also be evident (Kaplan,
1991). In chronic closed lock episodes, if the condition progresses the
condyle may steadily push the disc forward to achieve almost normal ranges
of mouth opening, in spite of the presence of a non-reducing disc.
4. Stage four is described as disc displacement without reduction and with
perforation of the disc or posterior attachment tissue (degenerative joint
disease). With continued mandibular function, the stretched posterior
attachment slowly loses its elasticity and the patient begins to regain some of
the lost range of motion. As retro-discal tissue continues to be stretched and
loaded, it becomes subject to thinning and perforation (Kaplan, 1991).
Anatomical studies have shown that this tissue may remodel before it
succumbs, ill-adapted to the functional load, and perforates (Heffez et al.,
1990). Arthrograms have shown joint crepitus to be suggestive of, but not
exclusive to, disc perforation.
The progressive nature of this disorder necessitates a thorough clinical history and it is
especially important to ascertain whether a patient has had previous history of joint
sounds, as this could assist in determining the current diagnosis. Absence of joint
sounds should not necessarily be taken as absence of disease, or an improvement in
TMD in patients with prior history of clicks. Rather there is a possibility that the
disorder has progressed to stage three or stage four of internal derangements as
discussed above.

30
Often classified as characteristic of a separate final stage, hard tissue remodelling may
occur throughout all of these stages. Clinically, osteoarthrosis may be diagnosed
because the remodelling often occurs unilaterally. The symptoms frequently worsen
throughout the course of a day, crepitation as distinct from clicking is often present and
radiographic evidence (flattening, sclerosis, osteophytes and erosion) may be seen (Zarb
et al., 1994).
Although in many patients internal derangement undergoes the progressive changes
described, it is still not clear whether this progression happens in all cases and
longitudinal epidemiological studies do not seem to support the idea of progression.
Magnusson et al. (1986) studied 293 subjects with clicking over a 10 year period. At the
five-year follow-up, clicking had not changed to locking in any of the subjects and at
the 10-year follow-up, only one of the 293 subjects reported intermittent locking
(Magnusson et al., 1993). Additionally, the authors reported that half of the patients
who exhibited clicking at 15 years of age no longer did so at 20 years, and about half of
those who did not exhibit clicking at age 15 went on to develop clicking. Thus, the
probability that TMJ clicking would disappear in a symptomatic individual was equal to
the probability of it appearing in an asymptomatic individual. This lack of progression
of internal derangement from a reducing disc to a non-reducing disc condition has also
been shown in other studies (Greene and Laskin, 1988; Laskin, 1994).
Sato et al. (1998) studied the natural course of anterior disc displacement without
reduction in 44 subjects who agreed to observation without treatment. The incidence of
successful resolution of the condition was 68% at 18 months. This finding suggests that
the signs and symptoms of anterior disc displacement without reduction tend to be
alleviated during the natural course of the condition. The authors failed to mention what
happened to the anteriorly displaced disc. They noted, however, that the maximal mouth
opening increased from 29.7 mm to 38 mm and concluded that it was unlikely that the
disc became self-reducing; it was felt to be more plausible that there was some
stretching and remodelling of the retro-discal tissues, enabling the disc to be displaced
more anteriorly by the translating condyle.
Thus, although clinical evidence suggests progressive worsening of the internal
derangement in some patients, important clinical questions still remain. It is unclear
what the progression rate is, nor is it clear which patients have the greatest risk of

31
progressing to the more advanced stages. As such, it is suggested that clinicians who
justify aggressive treatment of asymptomatic TMJ clicking based on their belief in a
high progression rate to a non-reducing state should instead exercise patience and
clinical vigilance in their management of this condition (Barkin and Weinberg, 2000).
4. Condylar dislocation
Condylar dislocation occurs when the jaw locks in an open position and the mouth
cannot be closed. The condition can cause significant discomfort until the joint returns
to the correct position. Dislocation occurs when the ligaments that normally keeps the
condyle in place are ―loose‖, allowing the condyle to move beyond the articular
eminence. The surrounding muscles often go into spasm and hold the condyle in the
dislocated position. Subluxation, which is the partial dislocation of the jaws, is self
reducing and requires no treatment. Alternatively recurrent joint dislocation may be
managed by surgical intervention.
In the absence of an anatomical defect in the TMJ, dislocation is uncommon. It is
usually associated with trauma, occurring when the patient is hit with the mouth open
(Gray et al., 1994a), although it can occur as a result of opening the mouth wide on
yawning or eating when there is laxity of the capsule and ligaments (Perrini et al.,
1997). Intubation during surgical procedures and general anaesthetic has been known to
cause jaw joint disorders and dislocation because the patient's mouth must be opened
quickly, and widely, to insert the respiration tube and the jaw may remain fixed in
position for a prolonged period of time (Ting, 2006).
Hypermobile TMJs and a high incidence of TMJ dislocation are also seen in patients
with Ehler-Danlos and Marfan‘s syndrome due to the extra elasticity of the ligaments
resulting from the collagen and connective tissue abnormality (De Coster et al., 2005).
5. Deviation
Deviation in movement may occur in either an opening or closing cycle and is due to a
variety of causes (Gray et al., 1994b). Deviations can be either lasting or transient.
1. A lasting deviation (Figure 1.10) is a gradual deviation along a straight line
axis, which may be caused by adhesions within the joint. Alternatively it
may present as a predominantly vertical opening with a marked lateral

32
movement when maximum opening is achieved. This is usually caused by
anterior disc displacement without reduction.
2. A transient deviation (Figure 1.11) can be described as a vertical opening
with a lateral shift in the middle of the opening cycle which then returns to
normal in the vertical plane. This may be associated with disc displacement
with reduction.
Figure 1.10 Path of lasting deviations Figure 1.11 Path of transient deviations
Deviations may or may not be accompanied by painless joint sounds and,
radiographically, mild structural bony changes may be detected. In a study by Uy-Co et
al. (2000) the relationship between condylar bony change and mandibular deviation in
orthodontic patients was assessed. Seventy-one patients were examined with helical
computed tomography and magnetic resonance imaging to assess the condylar bony
changes and/or disc displacement prior to acceptance for orthodontic treatment. Patients
were classified into those with no condylar bony changes and those with unilateral
condylar bony changes. They concluded that patients who presented with unilateral
condylar bony changes were more likely to present with mandibular deviations and this
could affect the cant of the maxillary basal bone, mandibular plane angle and lower
dentition.

33
6. Systemic autoimmune diseases, connective tissue disorders, and arthritic conditions
Systemic autoimmune diseases are a group of disorders in which the body‘s immune
system attacks a number of organs, tissues and cells. Examples of these conditions
include:
Systemic Lupus Erythematosis
Rheumatoid Arthritis (RA)
Scleroderma
Sjőgrens syndrome
Connective tissue diseases are disorders of the body in which the primary target of
pathology is the connective tissue. These disorders can be hereditary or auto immune
and examples of hereditary connective tissue disorders include:
Marfans syndrome
Ehlers-Danlos syndrome.
Sticklers syndrome
There is an overlap between autoimmune connective tissue disorders and autoimmune
diseases, as many of the autoimmune diseases also affect the connective tissues. As
such diseases such as Sjőgrens syndrome, systemic lupus erythematosis, scleroderma
and rheumatoid arthritis can also be classified as connective tissue disorders.
Polyarthritis is any arthritic condition which involves five or more joints and is most
frequently a consequence of an autoimmune disorder. Chronic inflammation of the
joints, pain and limited movement are often observed. An inflammation of two, three or
four joints is an oligoarthritis. Juvenile idiopathic arthritis (JIA) is the most common
rheumatic disease presenting in childhood and is of unknown aetiology (Müller et al.,
2009). JIA which is present for longer than 6 weeks and occurs before the age of 16
years, can be classified into systemic arthritis, rheumatoid factor negative, positive poly
arthritis, oligoarthritis, enthesis-related arthritis and psoriatic arthritis (Pirttiniemi et al.,
2009).
TMD is highly prevalent in individuals with autoimmune and connective tissue
disorders (De Coster et al., 2005; Ardic et al., 2006). The TMJ has even been reported

34
to be the first joint involved in some individuals affected by rheumatoid diseases
(Uotila, 1964). Reported frequencies of TMJ involvement in RA vary between 2% and
86% (Kopp and Rockler, 1979; Larheim et al., 1990). Pain, crepitus and decreased
movement of the TMJ are frequent clinical findings in patients with rheumatic disease
and erosions and cysts of the mandibular condyle are typical radiological findings. In
addition synovial proliferation and joint effusion can be observed by magnetic
resonance imaging of the TMJ (Suenaga et al., 2000; Melchiorre et al., 2003). In JIA
the reported frequency of TMJ involvement ranges from 17 to 87%, additionally it may
be the initial presentation of the disease, if not the only joint involved (Müller et al.,
2009).
Larheim et al. (1990) studied 28 symptomatic patients with rheumatic diseases (21 with
RA, four with psoriatic arthropathies, two with ankylosing spondylitis and one with
Reiter's disease). MRI showed bony abnormalities in 27 of the 36 joints studied and the
reported abnormalities included joint effusion, disc abnormalities and condylar
degeneration.
A study by Helenius et al. (2006) investigated TMJ in patients with different rheumatic
diseases and reported correlations between the clinical, radiographic and MRI findings.
Sixty seven recruited patients were divided into four groups: 16 with rheumatoid
arthritis (RA), 15 with mixed connective tissue disease (MCTD), 18 with ankylosing
spondylitis (AS) and 18 with spondyloarthropathy (SPA). MRI showed a reduction in
the articular cartilage in 25% of RA, 0% of MCTD, 17% of AS and 17% of SPA
patients. Condylar changes observed included erosion, osteophytes and abnormal shape,
while disc alterations included perforation, abnormal anterior position and decreased
movement. These abnormalities were most common amongst RA patients and least
frequently seen in MCTD and SPA patients. A correlation was observed between
crepitus and reduced maximum opening of the mouth and abnormalities of the disc and
articular cartilage as shown by MRI. In addition severe condylar erosion in panoramic
tomograms significantly correlated with MRI findings of condylar erosion, diminished
thickness of the condylar cartilage, abnormal condylar shape, and abnormal shape of the
temporal surface of the TMJ. The presence of crepitus, limited mandibular movement
and/or pain on movement of the jaw often indicated structural damage to the TMJ.

35
Müller et al. (2009) examined 30 consecutive patients with JIA. They found that 63% of
patients had signs of TMJ involvement on the MRI, and this was also associated with
condylar deformity in 47% of the patients. They recommended frequent measuring of
the maximum mouth opening in patients with JIA, as restricted opening is a sign of
TMJ involvement even in the absence of pain, tenderness or mandibular deviations.
7. Osteoarthritis
Osteoarthritis (OA) is defined as a degenerative condition of the joint characterised by
deterioration and abrasion of the articular tissue and concomitant remodelling of the
underlying subchondral bone (flattening of the articular surfaces). Osteoarthritis may
cause the breakdown and eventual loss of the cartilage of one or more joints. It is
especially prevalent among older people and is sometimes called degenerative joint
disease or ―wear and tear‖ disease of the elderly.
It may also cause damage to the disc of the TMJ, leading to erosion, reduction in disc
space, and perforation of disc tissue (Castelli et al., 1985; de Bont et al., 1985). The
occurrence of OA may be related to the adaptive capacity of the articular cartilage with
regard to joint loading throughout life (Stegenga et al., 1991). The loading of a joint
beyond its capacity may lead to tissue breakdown in the cartilage and eventually result
in OA (Stegenga et al., 1991; de Bont et al., 1993). The cause of OA, however, is not
fully understood and it is thought that both local and general factors may play a role in
the development and progress of the condition.
Osteoarthritis which affects the TMJ may cause changes in dental and skeletal
structures and studies have suggested that, in children, it may potentially alter
mandibular growth leading to mandibular retrusion and/or mandibular deviation. If TMJ
OA appears during orthodontic treatment, the mandible usually rotates posteriorly
resulting in an unsatisfactory profile, especially in patients with pre-existing mandibular
retrusion (Yamada et al., 2004).
8. Neoplasm
Tumours and tumour like conditions of the TMJ region are exceedingly rare (Benson
and Ottis, 1994) and most of those which are presented in the literature are isolated case
reports (Mock, 1999). Symptoms associated with neoplasia of the TMJ may include
clicking, preauricular swelling, limited mandibular mobility/trismus, pain, jaw deviation

36
(Mock, 1999), progressive mandibular asymmetry, and malocclusion (Benson and Ottis,
1994). Unfortunately, these symptoms are often also associated with the more common
pathologies affecting the joint, such as internal derangements, myofascial pain
dysfunction syndromes, arthralgias, arthritidies and, traumatic injuries. Thus the
possibility of other unusual causes needs to be carefully considered and imaging may be
indicated. The most common tumour of the condyle is osteochondroma, although it
occurs very rarely (Kerscher et al., 1993). Tumours from the prostate, thyroid and breast
may also occasional metastasise to the condylar head (De Boom et al., 1985).
Although not strictly neoplastic in nature, condylar hyperplasia is the most common
abherent growth condition affecting the mandible. In condylar hyperplasia, there is a
pathological overgrowth of the condylar process leading to facial asymmetry. This has
been differentiated into hemimandibular hyperplasia (HH) and hemimandibular
elongation (HE) (Deleurant et al., 2008). HH is distinguished by the asymmetrical
enlargement of one side of the mandible (condyle, condylar neck, ramus and corpus)
without a deviation of the mandibular midline. In HE there is elongation of one side of
the mandible, the condylar neck, ramus and corpus may be affected but the condylar
head does not appear to be involved. In addition, the lower dental midline is often
shifted away from the affected side, while a crossbite is commonly observed on the
unaffected side (Deleurant et al., 2008).
1.4 Aetiology of TMD
Although the evidence suggests that TMD has an uncertain aetiology, most experts
agree that there are multiple potential causes. However, with the exception of trauma
and disease (e.g systemic arthritic conditions and connective tissue disorders), there is
still much controversy regarding the extent to which possible causes may influence
outcomes. It is unclear which of the proposed causes are actual causes, which are risk
factors, and which are coincidental. The more factors involved, the more difficult it is to
make this distinction. Consequently, many studies that attempt to identify aetiology are
inconclusive and/or unscientific. A number of contrasting theories have evolved, some

37
of which appear to be tailored to fit the treatment administered rather than the evidence
(Mew, 1997). Some of these potential theories include:
1. Trauma
Some clinicians have suggested that an injury either directly to the joint or to the head
and neck area can trigger a TMJ problem (McCarty, 1980). For example, a heavy blow
to the side of the face may cause fracture of the condyle or the disc may be displaced. A
whiplash injury sustained during a car accident can stretch or tear tissues and ligaments,
displace the disc, and even cause bleeding which leads to the formation of scar tissue,
thereby decreasing mobility and causing pain (Salé and Isberg, 2007). Wilkes (1989)
even suggested that trauma was the single most frequent cause of TMD. Some
professionals believe, however, that even though specific traumatic events may seem to
precipitate clinical symptoms, they may not always have initiated the disorder (Ryan,
1993).
2. Disease
The TMJ is susceptible to the same diseases as other joints in the body, such as
osteoarthritis (progressive degeneration of the joint with bony changes, destruction of
the disc, and muscle pain), rheumatoid arthritis, gout and neoplasia. Although relatively
uncommon, they may affect the TMJ, causing pain and compromising function.
3. Genetic/Congenital
Some researchers have suggested that a relationship exists between the serotonin
receptors or transporter genes and TMD. Mutlu et al. (2004) investigated the
relationship between T102C polymorphism of the 5-HT2A receptor gene and TMD.
Sixty-three patients with TMD and 54 healthy volunteer controls were included in the
study. Molecular analysis of the T102C polymorphism of the 5-HT2A receptor gene
was performed using the PCR technique. They found that the C/C genotype was over
represented in the patient group, whereas the T/T genotype was over represented in the
controls. Hence they concluded that T102C polymorphism may be involved in the
aetiology of TMD. The over-representation of the C/C variant of the 5-HT2A receptor
gene in TMD suggests a possible role of the serotonergic system in this disease,

38
particularly at the receptor level. However, the genotype distribution of the patients who
had TMD was not different from those who did not have TMD.
Little research has been conducted in these areas and the results of other studies have
been inconclusive (Herken et al., 2001). There is no scientific evidence to suggest that
TMD can be inherited. There is also great variation in craniofacial structures and a wide
range of "normal" TMJs. As such, a consensus has not been reached on an "ideal"
condyle/fossa structure or position and it is unknown if a certain condylar position or
anatomical form is more likely to cause TMD.
4. Habits and posture
Some clinicians believe that habits such as tongue thrusting, mouth breathing, excessive
mouth opening, and nail, lip, or cheek biting can precipitate a TMJ problem. Their
argument is that putting the jaw in an abnormal position may weaken the structures of
the joint, eventually leading to damage as a result of continuous stress.
Changes in head posture have been associated with changes in the stomatognathic
system, thus head posture is presumed to have an influence on the biomechanical
behaviour of the TMJ and its associated structures (Olivo et al., 2006). There is some
evidence to suggest closed mouth postures are beneficial, and that forward growth
patterns which are less likely to present as open bites are associated with reduced signs
of TMD (Dibbets and van der Weele, 1996). Some studies have reported that the
position of the head affects the resting position of the mandible (Solow and Tallgren,
1976; Goldstein et al.,1984; Gonzalez and Manns, 1996), thus increasing muscular
activity (Funakoshi et al.,1976) and altering the internal arrangement of the TMJ
(Visscher et al., 2000).
There are many everyday tasks and activities that may lead to pain and muscle spasm,
either in the muscles of the jaw or those of the head, neck or shoulders. These include
cradling a telephone between the ear and shoulder, talking excessively, carrying a heavy
shoulder bag, playing a violin or woodwind instrument, singing, or activities that
promote a forward head position such as hunching forward to read. The majority of
people seeking treatment for TMD experience myofascial pain dysfunction (resulting
from the later causes) rather than a problem within the joint itself. As such a TMD

39
patient usually experiences varying degrees of pain involving the muscles of the head,
neck and upper back. Several studies have found a significant overlap between TMD
and pain conditions in other parts of the body including back pain (Allebring and
Hagerstam, 1993; Hagberg et al., 1994; Turp et al., 1998). In addition, high rates of co
morbidity between myogenous facial pain and fibromyalgia have been noted in several
studies (Marbach, 1995; Plesh et al., 1996; Hedenberg-Magnusson et al., 1999).
It has been proposed that the most physiological position of the condyle within the
temporomandibular fossa is in the so-called Gelb 4/7 position, in which the condyle is
located in the most anteriorly recommended position (Gelb, 1977). It has been
suggested that in cases of disc displacement the condyle is positioned too far posteriorly
and anterior repositioning of the condyles to the Gelb 4/7 position will allow for
recapturing of the disc to a normal position (Gelb, 1977). In recent years this concept
has come under scrutiny, and it is believed that condylar position is not a specific point,
but like other biological systems there is a bioadaptive range of normal function
(Okeson, 1996).
Although there is a difference of opinion concerning the extent to which habits and
posture affect the development of TMD, it makes sense to avoid anything that
aggravates a pre-existing condition. Olivo et al. (2006) carried out a systematic review
to assess the evidence concerning the association between head and cervical posture and
temporomandibular disorders. They concluded that most of the studies included in the
review were of poor methodological quality and the findings of the studies should be
interpreted with caution. The association between intra-articular and muscular TMD and
head and cervical posture therefore remains unclear, and better controlled studies with
comprehensive TMD diagnoses, larger sample sizes, and objective posture evaluation
are necessary.
5. Diet consistency/Hard Foods
Although Helkimo (1974) stated that a hard diet was not an aetiological factor, this is a
poorly researched area and it seems possible that food consistency or content may
influence TMD. Many clinicians advise patients who have a TMJ disorder to avoid
biting into anything that forces the mouth wide open or anything that is hard, crunchy,
or chewy. Raphael et al. (2000) found that patients with severe myofascial pain were
40
likely to reduce their intake of dietary fibre, thus masticatory activity, to avoid
exacerbating facial pain. Irving et al. (1999) conducted a study on 35 patients attending
an oral and maxillofacial surgery department due to facial pain. They found that thirty-
one subjects reported that eating was a problem, 15 prepared food differently and 24
considered that their choice of food was limited. The five foods most often reported to
be difficult to eat were meat, apples, bread, toast and toffees. However, it must be borne
in mind that these dietary changes are just as likely to be a consequence of TMD as a
causative factor.
6. Bruxism, Stress and Psychosocial factors
1. Bruxism: Bruxism is a diurnal or nocturnal tooth contact parafunctional activity,
incorporating clenching and grinding (Mohl et al., 1988). Sleep bruxism has
been defined by the American Sleep Disorders Association (ASDA) in its
International Classification as a "stereotyped movement disorder characterised
by grinding or clenching of the teeth during sleep" (Thorpy, 1990). The
prevalence of bruxism in the general population ranges from 8 to 21 % when
assessed by a questionnaire and from 48 to 58 % when clinical oral examination
is employed (Seligman et al., 1988). The aetiology of bruxism is unclear and it
has been suggested to be a multifactorial psychosomatic phenomenon
(Olkinuora, 1972). Bruxers are suggested to have increased levels of stress and
tension, disturbed sleep, and depression (Dao et al., 1994). At present, bruxism
is considered a phenomenon of centrally mediated neurologic activity related to
sleep disorders (Lobbezoo and Lavigne, 1997).
Patients are often told they have TMD because they grind their teeth and that
they grind their teeth because they are stressed. It has yet to be proven whether
stress is the cause of bruxism and the resulting pain or merely the result of
dealing with a chronic pain condition. There are studies, however, which have
found that bruxism and other parafunctional habits are associated with head and
facial pain (Dao et al., 1994; Molina et al., 1997; Glaros et al., 1998).
Up to 20% of the population with or without TMD grind their teeth at night,
however, not all people with TMD grind their teeth, and not all habitual tooth-

41
grinders have TMD. Van der Muelen et al. (2006) examined the relationship
between different types of self reported oral parafunction and the intensity of the
TMD pain complaints taking into account factors such as age and gender. They
found no significant relationship between bruxism and TMD and concluded that
if a causal relation between TMD pain intensity and bruxism exists, it is
probably minor.
2. Psychosocial factors: Some authors believe that psychosocial factors play an
important role in the development of TMD, in adaptation to pain and eventual
recovery. TMD patients exhibit a variety of behavioural characteristics including
increased somatisation, stress, anxiety and depression (Pankhurst, 1997). The
perception of pain is highly dependent upon psychological state (Price, 1988).
The importance of psychological factors has also been emphasised in TMD
(Kight et al., 1999; Rollman and Gillespie, 2000). Psychological factors are
thought to have a role in the cause or maintenance of TMD (Rugh, 1992) and
may predispose the condition to chronicity (Gatchel et al., 1996). Categorisation
of the patients into diagnostic subgroups of TMD suggests that myogenous
patients may have more psychological difficulties than patients with
arthrogenous TMD (McCreary et al., 1991; Jaspers et al. 1993; Scholte et al.,
1993; Lobbezoo-Scholte et al., 1995). On the other hand, it has been stated that
psychological disturbances may be a direct consequence of pain-related life
events in TMD patients (Rugh, 1992; Murray et al., 1996).
Pallegama et al. (2005) tested the hypothesis that muscle related TMD patients,
with cervical muscle pain exhibited a greater degree of psychological distress
compared with patients without cervical muscle pain and controls. Thirty-eight
muscle related TMD patients (including 10 patients with cervical muscle pain)
and 41 healthy controls participated in their study. State and trait anxiety levels
and personality traits (extroversion, neuroticism, psychoticism and social
desirability) were assessed. The TMD patients, in general, exhibited
significantly higher degrees of neuroticism and trait anxiety. Those patients with
cervical muscle pain demonstrated a significantly higher level of psychoticism
compared with the patients without cervical muscle pain and the controls and a
significantly higher state anxiety level than the controls. They also demonstrated

42
higher pain intensities in the masseter and temporalis muscles compared with
patients without cervical muscle pain, however as there were only 10 patients
with cervical muscle pain, these results should be treated with some caution.
Their main conclusions were that subjects with psychological distress are prone
to temporomandibular disorders, or psychological distress is a manifestation of
existing chronic pain conditions.
3. Somatisation: Somatisation is defined as ―a tendency to experience and
communicate somatic distress in response to psychosocial stress and to seek
medical help for it‖ (Lipowski, 1988). Somatoform disorders are conditions in
which the patient reports somatic complaints, yet no physical evidence of
organic disease is present (American Psychiatric Association, 1994).
Somatisation has been correlated with frequent use of health services
(Jyväsjärvi, 2001) and about 20 % of frequent attendees have been classified as
chronically somatising patients (Karlsson et al., 1997). Somatising patients have
a negative perception of their health (Katon et al., 1991) and often have
psychosocial difficulties (Mechanic, 1992), substantial distress (Noyes et al.,
1995), and show enhanced sensitivity to normal physical sensations (Blackwell
and DeMorgan, 1996). In addition, they are characterised by abnormal illness
behaviour (Noyes et al., 1995). TMD patients have been found to have
increased somatisation scores (Wilson et al., 1991; McGregor et al., 1996). It
has been suggested that patients with masticatory muscle pain may be more
prone to report symptoms as compared with normal controls (Wilson et al.,
1991) and are likely to be more sensitive to painful stimuli (Reid et al., 1994),
although these findings were disputed by Carlson et al. (1998).
4. Depression: Depression is a disorder that can be defined as a collection of
symptoms such as depressed mood, loss of interest or pleasure, weight loss or
gain, insomnia or hypersomnia, feelings of worthlessness, and a diminished
ability to concentrate (American Psychiatric Association, 1994).
Epidemiological studies have shown that depression is the most common mental
disorder, with the prevalence of a clinically significant depressive disorder
around 4% among males and 8% among females. It affects at least 20% of
women and 10% of men during their lifetimes (Kessler et al., 1994). There is

43
evidence of a greater prevalence of depressive symptoms in subjects with
chronic pain than in controls (VonKorff et al., 1988; Dworkin et al., 1990).
Numerous studies have also shown a high rate of depression in patients with
facial pain and TMD (Gallagher et al., 1991; Korszun et al., 1996; Carlson et
al., 1998; Madland et al., 2000), whilst a number of population-based studies
have implied a connection between depression and TMD (VonKorff et al.,
1988; Dworkin et al., 1990; Vimpari et al., 1995). In contrast, McGregor et al.
(1996) found no difference in depression between orofacial pain patients and
normal controls.
7. Malocclusion and Muscle parafunction
Another aetiological theory which has been proposed for the development of TMD is
malocclusion. This is an extremely controversial theory and despite its popularity, the
causal relationship between malocclusion and TMJ disorders has not been scientifically
proven. The role of malocclusions in TMD and the evidence for and against this theory
will be discussed in greater detail later in this literature review.
8. Dental Treatment
It has been suggested that certain clinical procedures may cause TMD symptoms and it
is not uncommon for patients to experience trismus after oral surgical procedures or
extractions (Dhanrajani and Joneidel, 2002). To avoid causing or exacerbating an
existing problem, dentists should not apply too much pressure on the jaw, push the
mandible posteriorly, or leave restorations ―high‖. Lengthy dental work requiring the
patient's mouth to be open for extended periods of time can aggravate a TMD problem.
Some patients experience their first symptoms after root canal treatment, whilst other
patients may suffer muscle spasms after extraction of third molars.
General Summary:
The lack of real explanation for temporomandibular joint disorders has set the stage for
current aetiological theories. Many professionals utilise treatments which are based on
what they perceive to be the cause, as well as their belief in certain treatments. Thus a

44
proportion of patients present with iatrogenic disturbance because of inappropriate
surgery, unnecessary occlusal equilibration, unwarranted restorations, orthodontics and
incorrect splint therapy (Perry, 1991). It is imperative that aetiological studies from the
molecular, biomechanical, neuro-endocrine, physiological, and clinical perspectives be
carried out. Discovering the causes of TMJ disorders will aid in the development of safe
and effective treatments. Furthermore, if the causes of TMD are understood and risk
factors can be identified perhaps TMD can be prevented in some patients.
1.5 TMD Epidemiology
1. Prevalence
The reported prevalence of TMD differs between studies, probably because of
variations in methodology and definitions. Proffit (2000) suggested that the true
incidence of TMD ranged between 5 and 35% depending on the signs and symptoms
recorded. In a group of 7337 Japanese children, Motegi et al. (1992) reported that
12.2% of six to eighteen year olds experienced TMD. This increased with age and was
slightly higher in girls (13%) than in boys (11.1%), but this difference was not
statistically significant. Joint sound as the only symptom was more common in younger
subjects. TMD symptoms seemed more complicated with age, when pain and abnormal
jaw movement were often combined with joint sounds. Joint sounds were the most
common symptom (89.3 %), followed by a combination of sounds and pain (2.2%).
Nilsson et al. (2005) studied the prevalence of TMJ pain and subsequent dental
treatment in Swedish adolescents. The participants included all patients between the
ages of twelve and nineteen who attended public dental clinics during 2000. They found
that, of the 28,899 youths who participated, 4.2% reported TMD pain. The prevalence
increased with age and a significant difference was seen between boys (2.7 %) and girls
(6.0%). As such they concluded that the prevalence of self-reported TMD pain was
relatively low, increased with age, and was higher among girls than boys. In contrast,
Williamson (1977) concluded that 35 % of six to sixteen year olds in a sample of 304
adolescents experienced TMD.

45
Gray et al. (1994a) made a distinction between signs and symptoms when researching
TMD. They defined a sign as a clinical finding recorded by the examiner of which the
patient may have been unaware and a symptom was classed as a finding of which the
patient was aware, e.g. pain. They reported that 50-70% of populations surveyed have
signs of TMD at some stage. An estimated 20-25% of the population have symptoms of
TMD, with approximately 3-4% of the population (approximately one fifth of those
with symptoms) seeking treatment.
LeResche (1997a) carried out a review of the literature on the epidemiology of TMD.
She found that, despite methodological and population differences, many consistencies
were apparent in the epidemiologic literature. Pain in the TMJ region appears to be
relatively common, occurring in approximately 10% of the population over the age of
eighteen. It is also primarily a condition of young and middle-aged adults, rather than of
children or the elderly, and is approximately twice as common in females as in males.
Most signs and symptoms (e.g. joint sounds and pain in the joint) also appeared to be
more prevalent in females than in males, although age patterns for these signs and
symptoms were not as clear as for TMJ pain.
Gender
Both males and females suffer from TMJ diseases and disorders. Although earlier
population studies found the prevalence of symptoms and signs of TMD to be similar in
males and females (Helkimo, 1974; 1976), later studies have reported a higher
prevalence among females (Dworkin et al., 1990; Magnusson et al., 1993; Magnusson
et al., 2000). Several studies with representative general population cohorts indicate that
females experience more TMD-related pain than males, usually at a ratio in the region
of two to one (Dworkin et al., 1990; Lipton et al., 1993; LeResche 1997a).
The predominance of females with TMD is even higher in surveys of people seeking
treatment for TMD with a ratio in the region of 4:1 to 5:1 (Dworkin et al., 1990; Bush
et al. 1993; Dworkin and LeResche 1993; McNeill, 1997). Furthermore, it has been
shown that females seek treatment for their TMD problems two to three times more
frequently than males (Agerberg and Inkapööl 1990; Kuttila et al., 1998).

46
Although figures from patient studies have reported the female to male ratio as ranging
between 4:1 and 5:1, epidemiological studies show that clinical signs and symptoms are
present in both genders in equal proportions. As such the commonly held belief that
females suffer from TMD more than males may be a fallacy. It does however appear
that females outnumber males in seeking treatment and there is wide speculation as to
why this is so. Some studies have said that women utilise the health care system more
than men, others state that women have a lower tolerance to pain or are more willing to
admit to pain than men (Gray et al., 1994a).
Recent research has focused attention on the relationship between sex hormones and
pain. A study conducted by LeResche et al. (1997b) demonstrated that the odds of
suffering from TMD were approximately 30% higher among those receiving oestrogens
compared with those not exposed to these hormones and women on hormone
replacement therapy were 77 % more likely to seek treatment for jaw pain than those
not undergoing such treatment. Also, women on oral contraceptive therapy were 20%
more likely to seek treatment. Oestrogen administration may increase the incidence of
chronic pain (Dao and LeResche, 2000) and this can be explained by actions brought
about at a central and peripheral level. For example oestrogen has be shown to increase
nerve growth factor, activate MAP-kinase and excite neurons in the cerebral cortex
(McEwen and Alves, 1999; Toran-Allerand et al., 1999; Lanlua et al., 2001) all of
which can increase nociception and pain.
In addition it has been found that the pain perception in women varies across the
menstrual cycle, with temporomandibular pain at its highest in the pre-menstrual period
and during menses (LeResche et al., 2003). Evidence is emerging in support of a
biological explanation for why there may be more women than men suffering from
TMD pain but this is still in the relatively early stages of research.
Age
Gray et al. (1994b) reported the age range for those suffering from TMD as 15 to 30
year olds for dysfunctional syndromes and forty years and upwards for degenerative
joint diseases, with any age potentially suffering from internal derangement.

47
Magnusson et al. (1985) undertook a longitudinal study of clinical signs and subjective
symptoms of mandibular dysfunction in 119 children (initially either 7 or 11 years at the
first assessment) with a 4 year interval between the first and second assessments. At the
second assessment the results showed that 66% of subjects in both age groups had
clinical signs, while 62 % of the 11 year olds and 66 % of the 15 year olds reported
subjective symptoms. In most cases the signs were mild, but 11% of the 11 year olds
and 17% of the 15 year olds had moderate or, in a few cases severe, signs of
dysfunction. Most of the children with subjective symptoms had occasional symptoms
but 3% in the younger and 11% in the older age group had frequent symptoms. When
comparisons were made with the findings four years earlier at the first assessment, it
was noted that the subjective symptoms were greater in frequency in the younger
children and the clinical signs had increased in both groups.
Salonen et al. (1990) studied the prevalence of signs and symptoms of dysfunction in
the masticatory system as a part of an epidemiological survey on oral health. Nine
hundred and twenty Swedish subjects were examined and the questions and clinical
examination parameters were in accordance with those suggested by Helkimo in 1974.
They found that reported symptoms decreased with age, whilst clinical signs increased.
Many other studies have shown that the highest prevalence of TMD occurs amongst
adults under 45 years of age, with lower levels at earlier ages (Locker and Slade, 1988;
Dworkin, 1990; Agerberg and Inkapööl, 1990; LeResche, 1997a). Therefore, the adult
population is of special interest as far as TMD is concerned and studies regarding the
prevalence of TMD and related factors should perhaps be directed at this group.
1.6 Measuring TMD and Classification
Research and epidemiological studies need to be defined on the basis of clinical signs,
or on the basis of a combination of clinical signs and symptoms. Over the years, many
classification schemes for TMD have been proposed (Okeson, 1996).

48
Helkimo Indices
Helkimo Indices were first developed for epidemiological purposes in the diagnosis of
TMD (Helkimo 1974). They have been widely used in studies measuring TMD and are
still frequently used today (Carlsson & LeResche, 1995).
Helkimo Anamnestic Index (Ai) comprises three classifications which are: symptomless
(Ai0), mild symptoms (AiI), and severe symptoms (AiII).
The Clinical Dysfunction Index (Di) is based on the evaluation of five clinical signs:
impaired range of movement, impaired function of the TMJ, muscle pain, TMJ pain,
and pain on movement of the mandible. The Di index comprises four classifications
which are: no signs (Di0), mild dysfunction (DiI), moderate dysfunction (DiII), and
severe dysfunction (DiIII).
Thus, these indices are used by looking at the presenting signs and symptoms of
patients suffering from TMD and allocating a severity grade if a certain set of clinical
signs and symptoms are present.
Helkimo Indices are not without flaws (Clark et al., 1993). The Indices do not contain
several key operational definitions, such as muscle and joint palpation pressures, nor
does it endorse a method for scoring joint sound severity. Other problems associated
with the Indices relate to the validity and reproducibility (van der Weele and Dibbets,
1987). However, Helkimo Indices were developed specifically for epidemiological
surveys and were never intended to be used by clinicians as a TMD classification
system for individual patient diagnosis and treatment and this was clearly stated in his
original work (Clark et al., 1993).
Craniomandibular Index (CMI) (Fricton and Schiffman, 1986)
In recognition of the shortcomings of the Helkimo Indices, the Craniomandibular Index
(CMI) was developed for use in epidemiological and clinical outcome studies to provide
a standardised measure of severity of limitations of mandibular movement, TMJ
sounds, and muscle and joint tenderness. The instrument was designed to have clearly
defined objective criteria, simple clinical methods, and ease in scoring. It is divided into
the Dysfunction Index and the Palpation Index and the reliability of both indices was
evaluated in the original study (Fricton and Schiffman, 1986). The CMI requires a

49
score to be calculated by adding the score of the Dysfunction Index (DI), which
examines TMJ functional problems, to the score of the Palpation Index (PI), which
looks at tenderness on palpation of the TMJ capsule and surrounding muscles. This
resulting score does not ―intuitively‖ describe the patient however (Clark et al., 1993).
Fricton and Schiffman (1987) evaluated the validity of the CMI and found that it
appeared to be valid for use in clinical studies, but that users need to be aware of the
methodological guidelines to ensure accuracy and reproducibility of results. The
subjective nature of some items demands that the same rater, who is unaware of the
management status of the patient, perform both evaluations. If multiple raters are used,
it is recommended that the raters discuss all items and compare scoring of
―demonstration subjects‖ before the study and use a pressure algometer for muscle
palpation. These strict standardisation procedures are cumbersome in nature, hence the
CMI has not proved to be popular in clinical patient care (Clark et al., 1993).
American Academy of Orofacial Pain (AAOP) Classification
In 1990, the American Academy of Orofacial Pain (AAOP) established the first well-
defined diagnostic classification for TMD, and this was subsequently revised in 1993
(McNeill, 1993). The AAOP classification divides TMD broadly into 2 categories:
1. Muscle-related TMD (myogenous TMD): This is sometimes called TMD secondary
to myofacial pain and dysfunction (MPD). In its pure form, it lacks apparent destructive
changes of the TMJ on radiographic examination and can be caused by multiple
aetiological factors such as bruxism and jaw clenching in a stressed and anxious person.
The myogenous classification is often further subdivided into muscular hyperarousal
due to stress and muscular abnormality associated with parafunctional oral habits (e.g.
bruxism).
2. Joint-related (arthrogenous) TMD: This is TMD secondary to true articular disease.
Arthrogenous TMD can be further specified as disc displacement disorder, chronic
recurrent dislocations, degenerative joint disorders, systemic arthritic conditions,
ankylosis, infections, and neoplasia. The arthrogenous category is subdivided on the
basis of specific structural abnormalities (e.g. internal derangement of the TMJ or
degenerative disease).
50
The two types of TMD can be present at the same time, making diagnosis and treatment
more challenging. In addition these classifications are not always clear, and there can be
a considerable overlap or progression from one category to the other (Kuttila et al.,
1998).
The Research Diagnostic Criteria (RDC) (Dworkin and LeResche, 1992).
Problems regarding classification and measurement of TMD were demonstrated by
Dworkin et al. (1990). Four experienced dental hygienists, who were field examiners
for a large epidemiological study of TMD, and three experienced clinical TMD
specialists, who were co-investigators in the same study, followed carefully detailed
specifications and criteria for examination of TMD patients and pain-free controls.
Excellent reliability was found for the vertical range of motion measures and for
summary indices measuring the overall presence of a clinical sign that could arise from
several sources (for example, summary indices of muscle palpation pain). However,
many clinical signs which are important in the differential diagnosis of subtypes of
TMD were not measured with high reliability. In particular, assessment of pain in
response to muscle palpation and identification of specific TMJ sounds only had
modest, sometimes marginal, reliability. These modest reliabilities could arise from
examiner error because clinical signs themselves are unreliable and change
spontaneously over time, thus making it difficult to find the same sign on successive
examinations. They also found that, without calibration, experienced clinicians showed
low reliability with other clinicians. This emphasised the importance of establishing
reliable clinical standards for the examination and diagnostic classification of TMD.
In an attempt to address the shortcomings of previous indices, the Research Diagnostic
Criteria for Temporomandibular Disorders (RDC/TMD) were developed and made
available to researchers and clinicians for scientific evaluation (Dworkin and LeResche,
1992). The RDC/TMD was developed by a team of international clinical researchers
who met to develop, an empirically-based and operationalised system for diagnosing
and classifying TMD, based on the best available scientific evidence.
With the RDC/TMD approach subjects are assigned specific TMD diagnoses that
recognise not only the physical conditions (Axis I), including muscle disorders, disc
displacements and other types of joint conditions, but also the psychosocial issues (Axis

51
II) that contribute to the suffering, pain behaviour, and disability associated with the
patient‘s pain experience. The RDC/TMD uses a dual axis system:
Axis I - a physical diagnosis based on pathophysiology; combined with
Axis II - an assessment of TMD-pain and related parafunctional behaviours,
psychological distress and psychosocial dysfunction
The RDC/TMD uses clinical examination and history-gathering methods, with
scientifically demonstrated reliability, for gathering clinical signs of TMD. It also
includes assessment of behavioural, psychological and psychosocial factors. The
scheme is non hierarchical, so subjects can receive more than one diagnosis. The
RDC/TMD also provides standardised examination criteria of known reliability, so that
findings from different studies using the RDC/TMD can be compared directly.
This dual-axis classification approach has recently been incorporated in a diagnostic
scheme not only for TMD but for all orofacial pain disorders (Okeson, 1996). The RDC
have been shown to be reliable for diagnosing TMD in U.S. and Swedish populations
(Wahlund et al., 1998). The classification was approved by the European Academy of
Craniomandibular Disorders (EACD) in 2002 and it is now widely used in both
research and clinical studies.
In a recent study, however, the RDC was shown to provide insufficient reliability for
the determination of arthrogenous TMD such as the presence of TMJ internal
derangement and osteoarthrosis (Emshoff and Rudisch, 2001). Emshoff and Rudisch
(2001) looked at the validity of the RDC/TMD when comparing clinical versus MRI
diagnosis of TMJ internal derangement and osteoarthrosis. One clinician used the
RDC/TMD to classify 163 consecutive patients with TMD on physical diagnosis and
the radiologist then performed MRIs. The diagnostic agreement was determined for the
absence of internal derangement, disc displacement with reduction, disc displacement
without reduction, and osteoarthrosis. Use of the Kappa statistic test indicated a poor
diagnostic agreement between the clinician and the radiologist. This suggests that in
patients who present with signs of TMJ derangement, MRI imaging should also be
carried out if at all possible for a comprehensive diagnosis as this is the ideal imaging
technique for identifying disc derangements.

52
1.7 TMD and Occlusion
Orthodontic treatment aims to create an ideal occlusion (Andrews, 1972). This is based
mainly on the description of arch form, tooth position and tooth contacts in the
intercuspal position. As such, considerable emphasis is placed on this static occlusal
relationship (Clark and Evans, 1998). It has been assumed that an ideal static occlusion
is synonymous with an ideal functional occlusion (Andrews, 1976; Roth, 1976),
however this may not necessarily be the case. Thus it is important to evaluate the
features that are thought to be harmonious with an ideal functional occlusion and those
which may be detrimental.
Centric Relation-Centric Occlusion (CR-CO)
Centric relation (CR) is the occlusal position when the first tooth contact occurs on the
mandibular path of closure, with the condyles in the retruded axis position. Centric
occlusion (CO) is the occlusal position with the teeth in maximum intercuspation (Clark
and Evans, 2001). It is generally accepted that in most individuals there is a short slide
between CR and CO, in an antero-posterior direction. Studies have reported this
discrepancy to be between 0.5 and 1.5mm (Agergberg and Sandstrom, 1988; Utt et al.,
1995).
Numerous authors have suggested that for an ideal treatment goal to be achieved, CR
should be coincident with CO (Williams, 1971; Roth, 1981; Williamson, 1981) and
some cross sectional studies have reported a relationship between CR-CO discrepancies
and TMD (Solberg et al., 1979; Ingervall et al., 1980; Pullinger et al., 1988).
In contrast, Clark and Evans (2001) reported that the evidence for this was inconclusive,
few of the mentioned studies used control groups, and the signs and symptoms used to
asses TMD were inconsistent and diverse. If epidemiological studies fail to find this
occlusal relationship in the natural dentition, the question arises why should this be the
goal following orthodontic treatment?
A sensible interpretation of the current evidence would suggest that a CO that does not
exactly coincide with the CR, but is within approximately 1mm, can be considered
normal. Hence, evidence suggesting that there is a direct correlation between occlusal

53
studies with TMD is weak. Whilst every effort should be made to achieve this goal,
treatment need not be unduly lengthened in order to do so.
Posterior relationships during lateral excursions
Posterior lateral excursions can be either group function or canine guided. Group
function occurs when the buccal cusps of the posterior teeth on the working side are in
contact during the entire lateral movement and there is no tooth contact on the non-
working side. Canine guidance is said to occur during lateral excursion, when contact
occurs between the upper and lower canine and the first premolar on the working side
only. The theory of this canine protected occlusion is attributed to Nagao (1919). It is
based on the concept that the canine is the most suitable tooth to guide mandibular
excursions for the following reasons:
1. The canine has a good crown: root ratio, capable of tolerating high occlusal
load.
2. The canine root has a greater surface area than adjacent teeth, providing greater
proprioception.
3. The shape of the palatal surface of the canine is concave and is suitable for
guiding lateral movements (Clark and Evans, 2001).
Various epidemiological studies have assessed the types of lateral excursions occurring
in the untreated natural dentition. Weinberg (1964) found that 81 % of his sample had
group function, whilst 5 % had canine guidance. Scaife and Holt (1969) examined 1200
individuals and found that the majority had either unilateral or bilateral canine guidance.
As no single type of occlusal pattern has been shown to occur in natural dentitions,
studies have attempted to clarify which occlusal scheme is preferable.
Roth (1981) advocated canine guidance, referring to this as the mutually protected
occlusion. Williamson and Lundquist (1983) examined electromyographic activity of
the temporalis and masseter muscles during lateral excursion in individuals with canine
guidance and group function and found that considerably less muscle activity was
observed in those individuals with canine guidance. Belser and Hannam (1985)
conducted a similar study and concluded that canine protected occlusions did not

54
significantly alter muscle activity during mastication, but significantly reduced muscle
activity during clenching.
Taskaya-Yilmaz et al. (2004) investigated the relationship between condyle and disc
positions and occlusal contacts on lateral excursions of the mandible in patients with
TMD. A total of 122 TMJs in 61 patients with TMD were evaluated using MRI and
clinical occlusal analyses. The researchers found that the non-working side contacts
occurred significantly more often in patients who had anterior disc displacement
affecting their TMJ. However, no significant correlation was found between the severity
of the disc displacement and the non-working side contacts in either canine guidance or
group function. As such it was concluded that non-working-side contacts had some
effect on disc position in TMD, but the presence of these contacts in both canine
guidance and group function did not correlate statistically with anterior disc
displacement.
A more recent case-control study by Selaimen et al. (2007) examined occlusal factors in
the aetiology of TMD. The study controlled for socio-demographic factors
(employment, age, cigarette and alcohol consumption) and the results confirmed that
some occlusal factors (overbite, overjet, number of anterior and posterior teeth and
protrusive movements) including the absence of canine guidance, may be considered
risk factors for TMD.
It is generally agreed that both canine guidance and group function occlusion are
acceptable (McAdam 1976; Belser and Hannam, 1985). The evidence of one occlusal
scheme being preferable to the other is scarce; however it is of note that a canine guided
occlusion is less likely to be associated with non-working side occlusal interferences
(Clark and Evans, 2001).
Occlusal Interferences
Occlusal interferences are defined as ―occlusal contact relationships that interfere in a
meaningful way with function or parafunction‖ (Ash and Ramfjord, 1998). Some of
these features are thought to give rise to TMD signs and symptoms. These include:
1. Occlusal contacts on the non-working side (Mohlin and Thilander, 1984)

55
2. Unilateral contacts in the CR (Seligman and Pullinger, 1991)
3. Slides from CR to CO which are greater than 1mm (Pullinger et al., 1988)
4. Asymmetric slide between CR and CO (Pullinger et al.,1988)
Roth (1973) examined 9 patients with symptoms of TMD aged 15 to 24 years. The
patients were seen between 6 months and 7 years after they had completed orthodontic
treatment. Results showed that 7 of the patients experienced variable TMD symptoms as
well as balancing interferences and two of the patients did not have any symptoms.
Patients who had symptoms underwent occlusal equilibrium using splints and this
relieved the symptoms due to the occlusal changes that were introduced. It was
concluded that patients should be treated to a mutually protected occlusion, devoid of
interferences as there appeared to be a close correlation between occlusal disharmony
and symptoms of TMD. This study however had a small sample size and weak study
design, so the conclusions should be treated with some caution.
A double blind study was carried out by Magnusson and Enbom (1984) where non-
working side interferences were artificially induced in patients. A group that had no
intervention acted as a control group and both groups of participants were re-examined
after 2 weeks. Ten of the twelve individuals in the experimental group reported one or
more subjective symptoms during the 2 weeks, whereas seven exhibited clinical signs of
dysfunction. The most common symptom was headache and the most common clinical
sign was muscle tenderness on palpation. In the control group, three out of the twelve
individuals reported subjective symptoms and three had clinical signs of dysfunction.
Thus the researchers found the signs and symptoms of TMD were twice as high in the
patient group as in the controls. One week after elimination of the interferences, signs
and symptoms had disappeared in all but two of the experimental group. In these two
subjects it took 6 weeks for pre-experimental conditions to be restored. The authors
concluded that there is no simple relationship between interferences and signs and
symptoms of dysfunction and how the individual reacts to local factors is variable. In
some individuals, addition of balancing-side interferences is sufficient to create
dysfunction. The findings thus underline the importance of local factors in the aetiology
of TMD but also show that a relationship is not obligatory.
Liu and Tsai (1998) investigated the role of the functional occlusion on
temporomandibular joint disorders in untreated orthodontic patients. A total of 508

56
orthodontic patients were enrolled and the functional occlusion scheme and clinical
signs of TMD were assessed before treatment. TMD were assessed existed in 44.2% of
patients with retruded position interferences and in 38.1 % of those without such
interferences. The frequency of TMD in patients with protrusive interferences was
greater than those without (32.2 % vs 18.4 %) and patients with balancing interferences
also had a significantly higher frequency of TMD than those without (49.2 % vs 23.9
%). Thus it was concluded that patients with balancing or protrusive interferences have
an increased risk for developing TMD.
More recently Barker (2004) examined a randomly selected group of 60 orthodontic
patients with occlusal interferences for signs and symptoms of TMD. They used a
mandibular orthotic to balance the occlusions at centric relation. When the occlusions of
symptomatic patients were balanced in centric relation, there was a significant reduction
or elimination of the TMD complaints, suggesting a relationship between balancing the
occlusion in centric relation and optimum management of TMD.
TMD pain resulting from occlusal interferences may also be influenced by changes in
oestrogen levels. Oestrogen administration can increase the incidence of chronic pain
conditions and, as such, may precipitate or exaggerate any pain if occlusal interferences
exist (Dao and LeResche, 2000). Thus an individual‘s oestrogen levels could also
explain the variability in the findings.
There are however many limitations to these studies. There is a lack of control groups in
some and a clear definition of TMD is often not stated, in addition the features that
comprise TMD are often subject to disagreement. There are also inconsistencies in
diagnosing occlusal interferences (Clark and Evans, 2001). Occlusal interferences are
widespread in the population and there are more people with non ideal functional
occlusions than those with signs or symptom of TMD (Agerberg and Sandstrom, 1988).
In addition non-working side contacts are common, occurring in 91% of patients
(Sadowsky and BeGole, 1980). In fact Rinchuse and Sassouni (1983) found that
patients with Andrews‘ 6 Keys (considered by many to be the ideal static occlusion) had
the highest prevalence of non working side contacts during function.
The current evidence suggests that although occlusal interferences may play a role in
TMD, the aetiology is multifactorial in nature. McNamara et al. (1995) estimated that

57
the contribution of occlusal factors to TMD is approximately 10-20%. This should be
taken in an association context and does not imply a cause and effect relationship. Thus,
although a stable occlusion is a reasonable orthodontic treatment goal, not achieving
this does not necessarily result in the development of TMD signs and symptoms.
1.8 TMD and Malocclusion
Malocclusion is also a potential aetiological factor for TMD. Proponents of this theory
believe that malocclusion may prevent ―normal‖ functioning of the masticatory system
and put extra stress on the muscles, causing them to go into spasm, which subsequently
causes pain and more spasm. Electromyographic studies show that TMD patients often
have abnormal patterns of muscle activity (Moss, 1975), although this may be the result
of patients attempting to avoid premature contacts. Others believe that although
malocclusion may not cause TMD, it can exacerbate an existing problem. There is
conflicting evidence in the literature with regards to this topic.
Williamson (1977) undertook a survey of 304 adolescent patients who were being
screened for orthodontic treatment at the Ohio State University Orthodontic
Department. It was found that 107 of the subjects (35.2%) had TMJ clicking and pain
affecting the pterygoid muscles. In addition, he found that 72% of the symptomatic
patients either had a deep bite or an open bite. He recommended that orthodontists
should attempt to identify patients with risk factors for TMD before embarking on any
orthodontic treatment as it may contribute to the dysfunctional problem. These findings
were echoed by Mohlin and Thilander (1984) who found a link between certain occlusal
features and TMD. They undertook a study comparing 58 patients with
temporomandibular joint dysfunction with 661 non-symptomatic individuals (389 males
and 272 females). Their results showed that there was a positive correlation between
Class III malocclusion, cross-bites and temporomandibular joint dysfunction.
A study by Mohlin et al. (1980) investigated at a group of 389 Swedish males between
the ages of 21 and 54 years. The relationship between the type of malocclusion, occlusal
interferences and temporomandibular joint symptoms was studied. They found that
certain malocclusions, particularly Class III and anterior open bites, were strongly

58
linked to symptoms of temporomandibular joint dysfunction. There was no correlation
between crossbites and TMD however and, despite these findings, it was emphasised
that malocclusion plays only a small part in the multifactorial aetiology of TMD.
Egermark et al. (2003) noted that, over a long period of time, subjects with
malocclusion tended to report more TMD symptoms and to show a higher dysfunction
index, compared with subjects with no malocclusion. They included 402 subjects in
their study, of which 85% were subsequently traced 20 years later. There were no
statistically significant differences in the prevalence of TMD signs and symptoms
between subjects with or without previous experience of orthodontic treatment. This 20-
year follow-up also supported the opinion that no single occlusal factor is of major
importance in the development of TMD, but a lateral forced bite (the mandible is forced
laterally into a non-optimal intercuspal position due to premature contacts) between
retruded contact position and intercuspal position, as well as unilateral crossbite, may be
potential risk factors.
Thilander et al. (2002) also found a relationship between malocclusion and TMD. They
examined a sample of 4724 children between the ages of 5 and 17 years. The children
were classified by chronological age and also by stage of dental development
(deciduous, early mixed, late mixed and permanent dentition). The parameters studied
included functional occlusion, anterior and lateral sliding occlusal interferences, dental
wear, mandibular mobility, maximal opening, deflection, and TMJ and muscular pain
recorded by palpation. Headache was the only symptom of TMD reported by the
children. They found the prevalence of TMD increased during the developmental stages
and girls were affected more frequently than boys. The significant associations found
between TMD and the occlusal features included posterior crossbite, anterior open bite,
a Class III malocclusion, and an increased overjet.
In contrast to the previous studies, other large cross sectional studies have found a weak
correlation between malocclusion and TMD, when assessing anterior open bites, deep
bites and both decreased and increased overjets (Riolo et al., 1987; Motegi et al., 1992).
Gesch (2004) also found few associations between malocclusion, functional occlusion
and TMD, and these associations were not uniform. No particular morphological or
functional occlusal factors became apparent.

59
A survey by Pullinger and Seligman (1991) studied occlusal factors, including overbite
and overjet, to examine if there was a correlation between these features and TMD.
Patients with myalgia and osteoarthritis were compared with a control group and results
showed that patients with osteoarthritis exhibited features including reduced overbite
and open bite when compared with the control group. This was however attributed to
the joint itself. They concluded that a deep overbite or increased overjet was not in itself
diagnostic of an underlying TMD condition and no strong relationship existed between
TMD and these occlusal features.
1.9 TMD and Orthodontics
Does orthodontic treatment cause TMD?
There has been much controversy over the relationship between orthodontic treatment
and TMJ disorders and orthodontists remain divided over the concept. Evidence
supporting the claim that orthodontics causes TMD, particularly the earlier studies, were
usually based on anecdotal evidence, weak study designs and small sample sizes. Others
have claimed that subjects with a history of orthodontic treatment do not run a higher
risk of developing TMD later in life, compared with subjects with no such experience
(Egermark, 2003).
Ricketts (1966) was one of the first researchers to publicly state that orthodontic
treatment could be a cause of TMD. As the occlusion is changed during orthodontic
treatment, symptoms of joint derangement may be noticed and he attributed this to the
various forces applied during therapy that may predispose patients to TMJ problems.
His suggestions, however, do not appear to be based on scientific evidence.
In contrast, Larsson and Ronnerman (1981) looked at TMD symptoms in
orthodontically treated patients ten years after the completion of treatment. They
followed 23 patients and assessed them for signs and symptoms of TMD using the
Helkimo Indices and found that there was no relationship between orthodontic treatment
and TMD. The results of this study however must be interpreted with some caution due
to the small sample size.

60
Many other studies with larger sample sizes have failed to find a relationship between
TMD and orthodontic treatment. Hirata et al. (1992) compared 102 orthodontically
treated patients with 41 subjects from a non-orthodontically treated control group. They
evaluated the effects of orthodontic treatment on signs and symptoms of TMD, as well
as the prevalence and incidence of TMD. Subjects answered a questionnaire covering
medical health, history of trauma and their personal experience of TMD. In addition, a
clinical examination was undertaken by a trained examiner to determine missing teeth,
range of mandibular motion, overjet and overbite, and joint sounds. Data was collected
at baseline (pre-treatment) and at 12 to 24 month intervals for the treatment group and
twice at the same time intervals for the control group. The results indicated no
significant differences between the two groups, suggesting that patients undergoing
orthodontic treatment were at no greater risk of developing TMD.
Mohlin et al. (2004) examined a total of 1018 subjects at the age of 11 years. Of these,
791 were re-examined at 15 years, 456 at 19 years, and 337 at 30 years. Anamnestic and
clinical recordings of TMD were made. Other information recorded included Peer
Assessment Rating (PAR) scores, previous history of orthodontic treatment and
muscular endurance (muscular endurance was calculated using bite force, and was
defined as the time taken by the individual to bite with 50% of the maximal bite force
until pain or obvious discomfort arose). The subjects also completed four psychological
measures: The Life Events Inventory, General Health Questionnaire (GHQ-30),
Eysenck Personality Inventory-Neuroticism (EPIN) and Rosenberg Self-Esteem (RSE)
Scale. The malocclusion prevalence, occlusal contacts, psychological factors, and
muscular endurance in subjects with no recorded signs and symptoms of TMD were
compared with those with the most severe dysfunction at 19 years of age. Future
development of TMD up to 30 years of age was also recorded. PAR scores were
significantly higher in the subjects with the most severe dysfunction. With the exception
of crowding of teeth, no other significant differences were found between the groups
with regard to malocclusion tooth contact pattern, orthodontic treatment, or extractions.
A greater proportion of subjects with low muscle endurance were found in the TMD
group. Significant associations were also found between TMD and general health and
psychological well-being, as well as the personality dimension of neuroticism and self-
esteem. During the period from 19 to 30 years, the prevalence of muscular signs and
symptoms reduced, whereas clicking showed a slight increase. Locking of the joint

61
showed a decrease from 19 to 30 years and a quarter of the TMD subjects showed
complete recovery. Thus, it appears that orthodontic treatment is neither a major
preventive factor, nor a significant cause, of TMD.
A recent study by Egermark et al. (2005) also supported the opinion that orthodontic
treatment in childhood does not result in an increased risk of developing signs or
symptoms of TMD in later life. This was based on a prospective long term study of
TMD signs and symptoms in patients who received orthodontic treatment in childhood.
The original sample consisted of 50 orthodontic patients (27 girls and 23 boys) different
malocclusions. The prevalence of signs and symptoms of TMD was low both before
and after the active phase of orthodontic treatment, as well as at long-term follow-up
after 15 to 18 years. The authors found that patients developed severe TMD (requiring
treatment) at an incidence of 1% per year and this low figure suggests that there is no
elevated risk for developing TMD after orthodontic treatment.
Other studies have investigated the effects of orthodontic treatment on the condylar
position and TMD. Roth (1981) favoured the rearmost, midmost and upper most
position for condyles to avoid occlusal interferences but this recommendation appears to
be based on his own personal opinions rather than any scientific evidence. This
condylar position favoured by Roth and functional orthodontists could not be verified in
a study undertaken by Lueck and Johnston, (1992).
Ártun et al. (1992) studied the relationship between orthodontic treatment, condylar
position and internal derangement in the TMJ. The study included 29 female patients
with Class II division I malocclusions who were treated with extractions of maxillary
premolars and 34 patients with Class I malocclusions treated on a non-extraction basis.
The condylar position was measured using tomography and a clinical examination was
also undertaken. The results showed that there were no signs of degenerative changes in
the TMJ. The condylar position was more posterior in patients who had undergone
extractions and in the non extraction group there appeared to be an anterior
displacement. Patients who had clicking sounds, however, had significant posterior
displacement. The study concluded that there was no correlation between TMJ pain and
condylar position.

62
A longitudinal study by Sadowsky et al. (1991) investigated orthodontic treatment and
TMJ sounds in order to examine changes in the occurrence and resolution of these
sounds in patients before and after orthodontic treatment with full upper and lower fixed
appliances. One hundred and sixty patients were examined before and after orthodontic
treatment. When joint sounds were reported or detected clinically, these patients
underwent an audiovisual examination to more precisely and objectively record the
occurrence and timing of the sound during mandibular opening and closing. Results
showed no statistically significant differences in the occurrence of joint sounds between
patients treated with extraction and non-extraction strategies. Overall, fewer patients
had joint sounds at the end of the active stage of orthodontic treatment than before and
fewer patients demonstrated reciprocal clicking after treatment than before. Therefore it
appeared that orthodontic treatment did not pose an increased risk for developing TMJ
sounds, irrespective of whether extraction or non-extraction treatment strategies were
used. A progression of signs or symptoms to more serious problems was not apparent
over the time period studied.
Henrikson and Nilner (2003) carried out a prospective, longitudinal study of signs and
symptoms of TMD and occlusal changes in girls with Class II malocclusions receiving
fixed appliance treatment. The subjects were compared with untreated Class II and
Class I (normal occlusion) subjects. Sixty five girls with Class II malocclusions
received orthodontic treatment, 58 girls with Class II malocclusions received no
treatment, and 60 Class I (normal occlusion) subjects acted as a control group. The girls
were examined for signs and symptoms of TMD and then re-examined 2 years later.
Additional records were taken in the orthodontic group during active treatment and 1
year after treatment. It was found that all three groups included subjects with TMD and
there was individual fluctuation during the study. In the orthodontic group, the
prevalence of muscular pain associated with TMD was significantly less post-treatment.
In contrast, TMJ clicking increased in all three groups over the 2 years, but was less
common in the control group. The control group also had a lower overall prevalence of
TMD than the treated and untreated Class II groups at both assessments. Functional
occlusal interferences decreased in the orthodontic group, but remained the same in the
other groups over the 2 years. Thus they concluded from this study that:
1. Orthodontic treatment, either with or without extractions, did not increase
the prevalence or worsen pre-treatment signs and symptoms of TMD.

63
2. Individually, TMD fluctuated over time with no predictable pattern.
However, on a group basis, the type of occlusion may play a role as a
contributing factor for the development of TMD.
3. The large fluctuations in signs and symptoms of TMD over time lead the
authors to suggest a conservative treatment approach when stomatognathic
treatment in children and adolescents is considered.
There is a further consideration in this field of study and that is the evidence that the
incidence of TMD increases with age and on-going orthodontic treatment may coincide
with this increase (Pilley et al., 1997). This is why it is important to include a control
group in studies of this kind.
Does Orthodontic treatment improve TMD?
A number of authors have suggested that TMD can be improved as a result of
orthodontic treatment. Egermark and Ronnermann (1995) looked at TMD in patients
undergoing active orthodontic treatment. Subjective symptoms and clinical signs of
TMD as well as the presence of headaches, bruxism and occlusal interferences, were
examined in 50 patients (mean age 12.9 years) before, during and immediately after
orthodontic treatment. In general, signs and symptoms of TMD, and the presence of
headache reduced during treatment, although joint sounds increased. The major factor
for the decrease in the Dysfunction Indices during treatment was tenderness to palpation
of the masticatory muscles. Although there was a high prevalence of occlusal
interferences during treatment, they seemed to have little impact on the development of
TMD. One explanation may be that teeth which are being moved orthodontically are
sensitive to contact resulting in a decrease of oral parafunction. A decrease in clenching
and grinding was also reported by the patient group, which support this theory.
A randomised controlled trial of Class II children receiving early functional appliance
treatment was carried out by Keeling et al. (1995). Seventy one patients received
treatment with headgear and a bite plane; sixty received treatment with a bionator
appliance and sixty patients acted as a control group. TMJ sounds, joint pain on
palpation, and muscle pain on palpation were scored as binary responses (present/absent
prior to treatment). Determinations were made by blinded, calibrated examiners initially
and after a Class I molar correction was achieved or 2 years had elapsed. They found

64
that subjects with TMJ sounds, joint pain, and/or muscle pain at follow-up tended to
have these signs at baseline and that early treatment with a bionators and headgear/bite
planes did not place healthy children without signs at risk. It was, concluded that
treatment with the bionator or headgear neither improved nor worsened TMJ function. It
was, however, noted that patients treated using the bionator appliance showed some
improvement in TMJ pain.
Proffit (2000) suggested that orthodontic treatment may relieve TMD symptoms due to
the sensitivity of teeth resulting in a reduction in grinding habits. However, he stated
that orthodontic treatment should not be undertaken on the grounds of treating TMD
symptoms and that TMD prevention should not be a major motivating factor for
orthodontic treatment (Mohlin et al., 2002). Luther (1998a) reviewed the TMD
literature and proposed that, there is a tendency in longitudinal studies for
orthodontically treated patients to have fewer signs of TMD. Of the four longitudinal
studies identified, one found no relationship between the onset or change in TMD and
the course of orthodontic treatment (Rendell et al., 1992). The other three studies all
reported an improvement in TMD after orthodontic treatment (Kremenak et al., 1992a;
Kremenak et al., 1992b; Olsson and Lindqvist, 1995) and one study suggested that
orthodontics may even prevent TMD from occurring (Olsson and Lindqvist, 1995).
McNamara (1997) carried out a review of the literature and his findings can be
summarised as follows:
1. Signs and symptoms of TMD may occur in healthy persons.
2. Signs and symptoms of TMD increase with age and therefore TMD which originates
during orthodontic treatment may not be related to the treatment.
3. In general, orthodontic treatment performed during adolescence does not increase or
decrease the chances of developing TMD later in life.
4. The extraction of teeth as part of an orthodontic treatment plan does not appear to
increase the risk of TMD.
5. There is no increased risk of TMD associated with any particular type of orthodontic
mechanics.

65
6. Although a stable occlusion is a reasonable orthodontic treatment goal, not achieving
an ideal gnathologic occlusion does not necessarily result in signs and symptoms of
TMD.
7. Thus far, there is little evidence that orthodontic treatment prevents or improves
TMD, although the role of unilateral posterior crossbite correction in children may
warrant further investigation.
1.10 Summary
Much confusion and controversy still exists regarding TMD and its relevance to the
dental profession as a whole and this stems partially from the conflicting definitions and
classifications that are used in the literature. Many theories have been suggested as to
what causes TMD, however the precise aetiology remains unknown and is probably
multi-factorial in origin, with no single aetiological factor playing a role. Correlation
between features of malocclusion and TMD does not imply causality, nor does the
current research concerning TMD and orthodontics, thus these assumptions should be
avoided in future literature.
More information on the aetiology, diagnosis and assessment of TMD is needed. In
addition improved on study designs are required to reduce bias, as is standardisation of
research methodology will provide the best available evidence in this field.

66
Summary of the Research
Chapter II Systematic review of TMD in orthognathic patients
In order to fully comprehend the research currently published in the field of TMD and
orthognathic treatment, a systematic review of the literature was conducted to
investigate the percentages of orthognathic patients affected by TMD, how it affects
their quality of life and to establish clinical signs and/or symptoms. In addition the
studies which followed patients longitudinally throughout treatment were examined in
order to determine whether interventions to correct jaw discrepancy affected TMD
symptoms.
Chapter III TMD in orthognathic patients and a control group with no skeletal
discrepancies
Chapters III and IV in this PhD report on the recruitment of orthognathic patients with
severe skeletal discrepancies. Chapter III involved the recruitment of control subjects
with no anterior-posterior, vertical or transverse skeletal discrepancies in order to
compare TMD signs and symptoms with the patient group. The TMD signs and
symptoms (if any) and range of jaw movements in these individuals were investigated
and the percentage of subjects with TMD in the control group was compared with that
in the orthognathic group. The signs and symptoms were also compared between the
two cohorts.
Chapter IV A longitudinal study of TMD in orthognathic patients
Chapter IV was a longitudinal study which followed orthognathic patients through the
course of treatment, to establish whether TMD signs and symptoms altered during the
course of the orthognathic treatment. The percentage of pre-treatment orthognathic
patients affected by TMD was determined and changes in TMD signs and symptoms
during the course of treatment were recorded. The TMD signs and symptoms at the
different time points were compared with those recorded prior to treatment.

67
Chapter V TMJ information course: Comparison of the instructional efficacy of
an internet-based TMJ tutorial with the more traditional seminar
A TMJ tutorial was developed on a virtual learning environment (VLE) to enable
students to enhance their examination and diagnostic skills. A randomised cross-over
trial was conducted and the success of this mode of teaching was compared with
conventional face-to-face teaching. The students' perception of VLE learning when
compared with traditional methods of teaching was also determined.

68
Chapter II: Systematic review of TMD in orthognathic
patients
2.1 Review of the Literature
2.1.1 Introduction
Temporomandibular joint disorders (TMD) can be defined as multifactorial
disturbances of the masticatory system (Riolo et al., 1987), with occlusion appearing to
play only a minimal part. Little is known about the precise aetiology and mechanisms of
action of the condition and, as disagreement is still evident regarding the diagnosis and
classification of the various subtypes of TMD, this inevitably impacts on research in
this field.
It should therefore come as no surprise that TMD, and its relevance to dentistry, has
been a highly debated topic in recent years (Rinchuse et al., 2005). To this end, conflict
arises in the dental community when views are expressed about topics such as condyle
position, malocclusion, orthodontic treatment and temporomandibular disorders.
The evidence in the literature as to whether malocclusion can cause TMD is conflicting.
Proffit (2000) stated ―The prevalence of TMD in the population is between 5% and
30%, which is less than the 50% of the population exhibiting a moderate degree of
malocclusion. As such some argue that it is unlikely malocclusion is a major cause of
TMD‖. It is of note, however, that some studies have found that certain malocclusions
(for example, Class III, deep bites and anterior open bites) are significantly associated
with symptoms of TMD (Williamson, 1977; Mohlin et al., 1980; Mohlin and Thilander,
1984). In contrast, other large cross sectional studies have found only weak associations
between malocclusion and TMD (Riolo et al., 1987; Motegi et al., 1992). Pullinger and
Seligman (1991) studied occlusal features, including overbite and overjet and their
association with TMD. Symptomatic patients were compared with a control group of
symptom free individuals and the results showed that a greater proportion of
symptomatic patients exhibited a reduced overbite or open bite when compared with the
control group (P<0.02). This was, however, attributed to changes within the joint itself

69
and they concluded that a deep overbite or increased overjet were not in themselves
diagnostic of underlying TMD. As such no strong relationship was found to exist
between TMD and these occlusal features.
As discussed in the review of the literature there is also much controversy over the
relationship between orthodontic treatment and temporomandibular joint disorders and
orthodontists remain divided over this concept. Evidence supporting orthodontic
treatment as a causative factor for TMD, particularly the earlier research, tends to be
based on anecdotal evidence, weak study designs and small sample sizes.
Ricketts (1966) was a major proponent of the theory that orthodontic treatment could be
a cause of TMD. However, his suggestions do not appear to be based on empirical
evidence and longitudinal studies have suggested that patients undergoing orthodontic
treatment are at no greater risk of developing TMD than those who remain untreated
(Sadowsky et al., 1991; Hirata et al., 1992; Mohlin et al., 2004; Egermark et al., 2005).
These studies have all concluded that orthodontic treatment seems to be neither a major
preventive nor a significant cause of TMD.
2.1.2 Orthognathic treatment and TMD
Orthognathic treatment is undertaken to correct skeletal discrepancies and involves a
combination of orthodontics and maxillofacial surgery. There is little high quality
research published on the association between major skeletal disharmonies and their
effects on TMD. If the relevance of TMD to orthognathic treatment is considered, the
viewpoints expressed are diverse and include that orthognathic intervention may resolve
or induce TMD, or may have little or no effect. The following studies are examples of
the differing viewpoints expressed.
Wolford et al. (2003) undertook a retrospective study on 25 patients with pre-existing
TMD who had undergone orthognathic surgery. This study concluded that orthognathic
patients may experience worsening of their condition post-operatively. In contrast, a
study by White and Dolwick (1992) found that the majority of patients undergoing
orthognathic treatment showed an improvement in symptoms. The study assessed 75

70
patients of whom 49% had pre-operative TMD symptoms. Of those with symptoms,
89.1% showed an improvement, whilst 10.8% either had increased symptoms post-
surgery or remained the same.
In a longitudinal study of 52 orthognathic patients by Egermark et al. (2000), 51% of
the patients reported improvement in TMD post-surgery, while 37% reported no
change. Therefore the results of this study supported the theory that orthognathic
treatment could have some beneficial effects on TMD.
As the influence of orthognathic surgery on TMD is unclear, there is a definite need for
further investigations evaluating TMD in patients undergoing orthognathic intervention.
Luther (1998b) stated ―We are still awaiting the perfect study to assess the relationship
between malocclusion and TMD. More steps should be taken when carrying out studies
to eliminate bias‖. Thus current research in the field of TMD should be as objective as
possible and utilise reliable clinical standards for the examination and diagnostic
classification of TMD.
2.1.3 Systematic reviews
Definition
A systematic review is a review of a clearly formulated question that uses systematic
and explicit methods to identify, select and critically appraise relevant research, and to
collect and analyse data from the studies that are included in the review (Chalmers and
Altman, 1996). The procedures involved are explicit and transparent, so that others may
replicate the review, and they are defined in advance of the review.
Systematic reviews provide the most reliable evidence for decision making in health
care. As such an understanding of systematic reviews and how to implement them in
practice is mandatory for all professionals involved in the delivery of health care (Egger
et al., 2001).

71
Importance of Systematic Reviews
Over 3 million articles are published in biomedical journals annually and a practitioner
needs to consider a large volume of material in order to keep up to date (Egger et al.,
2001). Review articles can assist in addressing the above issue, but unfortunately
narrative reviews are often of poor quality and expert reviewers can make conflicting
recommendations, hence conventional reviews can be an unreliable source of
information (Egger et al., 2001).
A systematic review therefore aims to be:
1. Systematic in its identification of literature
2. Explicit in its statement of objectives, materials and methods
3. Reproducible in its methodology and conclusions
Systematic reviews are needed to efficiently integrate valid information and provide a
basis for rational decision making. The use of these explicit systematic methods limits
bias and reduces chance effects, thus providing more reliable results upon which to
draw conclusions and make decisions (Higgins and Green, 2009). The stages of a
systematic review project are:
1. Planning the review: identifying the need for a review and documenting
the methodology
2. Conducting the review: finding, selecting, appraising, extracting and
synthesising primary research studies
3. Reporting and dissemination: writing up and disseminating the results of
the review
At the initial stage, reviewers begin by formulating the problem to be addressed which
involves determining the focused questions for the review that is to be conducted. A
poorly formulated focused question leads to uncertainty in the research which is
included in the subsequent summaries, as such the most important decision in
conducting a review is to determine the focus of the review. The principal components
of the focused question are often referred to as PICO (Participants, Interventions,
Comparison and Outcome). Thus a clearly defined question should specify the types

72
of participants, interventions or exposures and the outcomes that are of interest to the
review. Additionally, where it is applicable, the types of comparisons that are to be
made should also be clearly described.
In subsequent stages of a systematic review a comprehensive search of the literature is
performed. Studies are then selected according to the original inclusion criteria and an
assessment of the quality of these selected studies is carried out. Data are extracted from
the included studies and synthesised in an appropriate manner, either quantitatively (in
the form of a meta-analysis), or qualitatively (in tables). This allows conclusions to be
formed both for practice and for future research (Higgins and Green, 2009).
Systematic reviews are an integral part of evidence based medicine (EBM). Evidence
based medicine is ―An approach to decision making in which the clinician uses the best
available evidence, in consultation with the patient, to decide upon the option which
suits that patient best‖ (Greenhalgh, 1997). One aspect of EBM is to categorise different
types of clinical evidence and rank them according to their strength (the extent to which
they are protected against the various biases often associated with medical research).
The Oxford Centre for Evidence-based Medicine suggests the following levels of
evidence (LOE) according to the study designs and critical appraisal of prevention,
diagnosis, prognosis, therapy, and harm studies:
1. Level A: consistent randomised controlled trials, cohort studies, all or none,
clinical decision rule validated in different populations.
2. Level B: consistent retrospective cohort, exploratory cohort, ecological study,
outcomes research, case-control study; or extrapolations from level A studies.
3. Level C: case-series study or extrapolations from level B studies
4. Level D: expert opinion without explicit critical appraisal, or based on
physiology, bench research or first principles
Bickley and Harrison (2003) considered systematic reviews as the foundation stone in
the pyramidal hierarchy of evidence (Figure 2.1).

73
Anecdotal case report
Cross-sectional survey
Case series without a control
Case-control observational study
Cohort study with a literature control
Analysis using computer databases
Cohort study with a historical control group
Unconfirmed randomised controlled clinical trial
Confirmed definitive randomised controlled clinical trials
Systematic review of randomised controlled clinical trials
Figure 2.1 Hierarchy of Evidence (Reproduced from Clarkson et al., 2003)
History of Systematic Reviews
Reviews play an important role in synthesising and disseminating the results of research
and the recognition of this prompted researchers to consider their validity. In the 1970s
and early 1980s, psychologists and social scientists drew attention to the systematic
steps needed to minimise bias and random errors in reviews of research (Glass, 1976).
Around the same time Professor Archie Cochrane (a medical researcher who
contributed greatly to the development of epidemiology as a science) wrote "It is surely
a great criticism of our profession that we have not organised a critical summary, by
specialty or subspecialty, adapted periodically, of all relevant randomised controlled
trials" (Cochrane, 1979). Thus two fundamental shortcomings of research were
highlighted:
1. The validity and bias associated with research and study design needed to be
identified when considering evidence.
2. Critical summaries or reviews of evidence and trials were very much needed.
People wanting to make informed healthcare decisions did not have access to
reliable reviews of available evidence at that stage (Cochrane, 1979).

74
By the mid 1980s, healthcare professionals had begun to recognise that it was
impossible to interpret the results of any one study in isolation and that critical
summaries were needed to put results into context. Unfortunately because a systematic
approach to assessing research on the effects of healthcare interventions was not being
utilised, patients were not always being offered the best possible care and some may
have been suffering unnecessarily. This was evident in a comparison of the conflicting
advice from textbooks in relation to the results of published clinical trials. Relevant and
sound information could have been available in many areas of medicine had a
scientifically defensible approach been used to cumulate evidence as it emerged
(Antman et al., 1992).
These shortcomings led to advancements in the field of perinatal medicine. In the mid
1980s, work began on developing registers of controlled trials of interventions during
pregnancy, labour and early infancy (Grant and Chalmers, 1981; Chalmers et al., 1986).
This was based at the National Perinatal Epidemiology Unit in Oxford, with the aim of
coordinating systematic reviews in pregnancy and childbirth.
During this time, advances in computer technology were making it possible to consider
more ambitious projects. In a letter to The Lancet regarding the publication of a trial,
Chalmers (1986) recognised that space is limited in printed journals and consequently
the amount of detail that could be included was limited. Electronically however, there
are no restrictions, thus allowing people to consider new approaches to presenting and
summarising research evidence, an example of which was The Oxford Database of
Perinatal Trials (ODPT). The ODPT was said to be ―a milestone in the history of
randomised controlled trials and evaluation of care‖ (Cochrane, 1987 cited in Chalmers
et al., 1989). ODPT was funded by Oxford University Press and provided a
computerised register of randomised controlled trials in perinatal medicine. The
systematic reviews in ODPT known as ―overviews‖ were highly structured and were all
presented in the same format (Starr and Chalmers, 2003). It was the first electronic
publication to present regularly updated systematic reviews of research on the effects of
healthcare interventions.
By 1992, many policy makers, practitioners, and consumers had come to recognise the
importance of systematic reviews for making decisions about healthcare. Although the

75
ODPT had proved popular, Oxford University Press found the electronic publication
costly to maintain and concluded that it was not economically viable. In 1992, Oxford
University Press decided to discontinue ODPT as a commercial product (Starr and
Chalmers, 2003).
The Research and Development Programme of the UK National Health Service
recognised the value of the work being done at the National Perinatal Epidemiology
Unit and provided funds for a new centre. This centre was subsequently named the UK
Cochrane Centre and was aimed at promoting an extension of the process to other areas
of healthcare. The UK Cochrane Centre opened in October 1992 and was followed by
The Cochrane Collaboration which was inaugurated in October 1993 (Chalmers, 1993).
Six further Cochrane Centres were established internationally by the end of 1994 and, in
addition, ten groups were founded to prepare reviews within the different areas of
healthcare and assess methodological factors (Egger et al., 2001).
It was clear from the start of the Cochrane Collaboration in 1993 that it would be many
years before the majority of research studies assessing the effects of healthcare
interventions could be placed in the context of a systematic review. A marked increase
in activities surrounding the Cochrane Collaboration followed, and the efforts of the
collaboration focused on producing an output medium for maintaining up-to-date
systematic reviews which would be widely available. In April 1996, the first issue of the
Cochrane Library was presented. This incorporated:
The Cochrane Database of Systematic Reviews (CDRS). CDRS consists of
regularly-updated systematic reviews and protocols for reviews. This is the
primary product of the Cochrane Collaboration
The Database of Abstracts of Reviews of Effectiveness (DARE). This aims to
include structured abstracts and quality appraisals of all non-Cochrane
systematic reviews of the effects of healthcare interventions and diagnostic test
accuracy published in journals and elsewhere. The UK National Health Service
Centre for Reviews and Dissemination (CRD) at the University of York
critically appraises the reviews.
The Cochrane Controlled Trials Register (CCTR). CCTR is a bibliography of
controlled trials, assembled by the Update Software Company from registers

76
submitted by Cochrane Centres and Cochrane review groups, together with
entries downloaded from MEDLINE and Embase.
The Cochrane Review Methodology Database (CRMD). This is a register and
bibliography of articles and books on the science of reviewing evidence,
research synthesis and evaluations on the effects of healthcare
Information about the Cochrane Collaboration. This is a compilation of
descriptions of each entity within the collaboration maintained by the respective
entities.
Other sources of information. This includes lists of internet sites relevant to
evidence based practise, complied by the School of Heath and Related Research
(ScHARR) at the University of Sheffield (Egger et al., 2001).
Many aspects of the Cochrane Library can be viewed as part of the hierarchy of
evidence, ranging from regularly updated reviews to high-quality reviews published
elsewhere, and to reports of individual controlled trials (Starr and Chalmers, 2003).
In 1998 the Cochrane Library was made available on the World Wide Web
(http://www.cochrane.org, www.thecochranelibrary.com) and, by 2003; Cochrane
Reviews were available from most major information providers. The Cochrane Library,
to date, comprises over 4,000 completed reviews and 2,000 protocols (Cochrane
Collaboration, 2010).
Many healthcare journals now publish systematic reviews, but the best known source
remains The Cochrane Collaboration. The Cochrane Collaboration has tended to limit
its remit to reviews of the effects of healthcare interventions and thus focuses on the
synthesis of evidence drawn predominantly from clinical trials. The Cochrane
Collaboration also undertakes methodological developments including work to develop
the methodology for synthesising evidence of effectiveness of diagnostic/screening tests
and procedures. There are other organisations, however, that also conduct systematic
reviews, some of which have a wider focus than The Cochrane Collaboration.
The Centre for Reviews and Dissemination (CRD) at the University of York was
established in January 1994 and is now the largest group in the world engaged
exclusively in evidence synthesis in the health field. The centre undertakes high quality
systematic reviews that evaluate the effects of health and social care interventions and

77
the delivery and organisation of health care. The centre has played a leading role in the
development and promotion of evidence informed decision- making in health policy and
practice. The findings of CRD reviews are widely disseminated and have impacted on
the quality of healthcare delivered.
The Campbell Collaboration (C2) was created with support from a large number of
social and behavioural scientists and some social practitioners following an idea which
was initially discussed at a meeting in London in July 1999. With partnerships
developing in a number of countries, Campbell began its tradition of annual Colloquia
in Philadelphia, USA in February 2000. The Campbell Collaboration was founded on
the principle that systematic reviews looking out the effects of interventions will inform
and improve policy and services. Through its reviews and annual colloquia, the
Collaboration strives to make the best social science research available and accessible.
The Campbell collaboration is a sibling organisation to the Cochrane Collaboration.
Despite the existence of a number of different organisations publishing the results of
systematic reviews, they are all united in implementing strict criteria and methodology
for conducting reviews to ensure reliability and quality of the published results.
78
2.2 Methodology
2.2.1 Aims of this Systematic Review
In order to fully comprehend the research currently published in the field of TMD and
orthognathic treatment, a systematic review of the literature was conducted with the
following aims:
1. To investigate the percentage of orthognathic patients affected by TMD, how it
affects their quality of life and to establish the most common signs and/or
symptoms.
2. To examine those studies which follow patients longitudinally throughout
treatment in order to determine whether intervention to correct their skeletal
discrepancy affects TMD signs and symptoms.
2.2.2 Conducting a systematic review of the literature
In view of the fact that it was anticipated that there would be few randomised controlled
trials in this area, it was not considered appropriate to register the title with the
Cochrane Oral Health Group. However, a similar methodological process was followed.
Objectives of this systematic review
The focused questions and null hypotheses for this review were as follows:
Focused Questions
1. In individuals undergoing orthognathic treatment to correct dento-facial
deformities, what is the percentage of patients who present with pre-treatment
TMD?
2. What proportion of orthognathic patients who do not have signs or symptoms
of TMD pre-operatively, develop TMD signs or symptoms post-surgery?
3. In patients who presented with signs or symptoms of TMD pre-operatively
how do these signs or symptoms change post- treatment?

79
4. In individuals undergoing orthognathic treatment and presenting with signs and
symptoms of TMD, how does this affect their quality of life when compared
with orthognathic patients with no signs or symptoms of TMD?
First Null Hypothesis
In patients who are affected by TMD there is no difference in pre and post-treatment
signs and symptoms (i.e. there is no change in their signs or symptoms).
Second Null Hypothesis
There is no difference in asymptomatic patients pre-treatment when compared with
post-treatment (i.e. patients who do not suffer from TMD pre-treatment are unlikely to
develop TMD after treatment).
Third Null Hypothesis
There is no difference in the quality of life of orthognathic patients in those affected by
TMD and those who are not affected by TMD.
Criteria for considering studies
Types of studies:
1. Randomised controlled trials (RCT)
Due to logistical and ethical considerations it was anticipated that few, if any,
randomised control trials (RCT) would be available in this area.
2. Cohort Studies and Case-Control Studies
These were included if there were at least 10 patients included in the study. This
criterion was applied in order to attempt to distinguish between genuine cohorts
as opposed to case series.
Types of participants:
Male or female patients (14 years or over) of any ethnicity who have undergone
orthognathic surgery. Although orthognathic treatment is not ordinarily carried out prior
to the age of 17 years in the UK, 14 years was chosen as it is not uncommon for
surgeries to be performed on younger patients in the North America. This would then
allow inclusion of the relevant American based studies in this review.

80
Exclusion criteria were:
1. Craniofacial syndromes
2. Cleft lip and/or palate
3. Individuals with a history of facial fractures due to trauma
4. Individuals undergoing orthognathic surgery purely to correct TMD
5. Subjects who had orthognathic treatment and concomitant temporomandibular
joint surgery
6. Animal studies
Types of interventions:
Orthognathic treatment to correct severe jaw discrepancies, including:
1. Maxillary advancement
2. Superior repositioning (impaction) of the maxilla
3. Inferior repositioning of the maxilla
4. Surgical maxillary expansion (SARPE)
5. Mandibular advancement
6. Mandibular set-back
7. Segmental procedures
8. Distraction osteogenesis
9. Any combination of these reported in the literature.
Outcome measures:
1. The percentage of patients with TMD signs and symptoms. This was examined
at all intervals reported, pre and post-treatment (up to 5 years post-treatment).
2. Changes in TMD status. Did the signs and symptoms improve, worsen or remain
the same?
3. Patient satisfaction and quality of life.
Search strategy for identification of studies
Attempts were made to identify relevant studies irrespective of language.
1. Electronic searching. Detailed search strategies (Table 2.1) were developed
for MEDLINE.
2. References. The bibliographies and reference lists of identified publications
and reviews were checked for references to any other relevant studies.

81
3. Personal communication with experts and specialists in the field, in order to
obtain further information about unpublished and ongoing studies.
Search Strategy for MEDLINE via OVID
1 (Jaw adj1 joint adj1 (pain or click or lock$ or nois$ or sound))
2 (Jaw adj1 (pain or click or lock$ or nois$ or sound))
3 pterygoid hypersensitivity dysfunction
4 (intra?auricular adj1 (Pain or ache or tender))
5 (jaw or oral or mouth)
6 ((limited or reduced or restricted or decreased) adj1 (opening or lateral excursion$ or excursion$
or interincisal or vertical$))
7 5 and 6
8 ((pterygoid or masseter or temporalis) adj1 (Pain or ache or spasm or tender$))
9 (muscle adj1 (Pain or ache or spasm or tender$)). 10 5 and 9
11 exp Temporomandibular Joint Dysfunction Syndrome
12 exp Temporomandibular Joint Disorders
13 TMD
14 exp Trismus
15 exp Facial Pain
16 myofacial pain
17 lateral pole
18 crepitus
19 exp Jaw Fractures
20 ((jaw$ adj2 fracture$) or (condyl$ adj2 fracture$))
21 exp Osteotomy, Le Fort 22 exp Mandibular Advancement
23 (maxilla$ adj1 advancement)
24 (orthognathic adj1 surg$)
25 (orthognathic adj1 treatment)
26 (jaw$ adj1 surg$)
27 (mand$ adj2 surg$)
28 (maxill$3 adj2 surg$)
29 BSSO
30 (sagittal adj2 split adj2 osteotom$)
31 (retrognathi$ and (surgery or surgical$))
32 (prognathi$ and (surgery or surgical$)) 33 superior maxillary repositioning
34 maxillary impaction
35 inferior repositioning of maxilla
36 mandibular setback
37 BVSS
38 (vertical adj2 subsigmoid adj1 osteotomy)
39 (distraction adj1 osteogen$)
40 1 or 2 or 7 or 8 or 10 or 11 or 12 or 13 or 14 or 15 or 16 or 17 or 18
41 19 or 20 or 21 or 22 or 23 or 24 or 25 or 26 or 27 or 28 or 29 or 30 or 31 or 32 or 33 or 34 or 35
or 36 or 37 or 38 or 39
42 40 and 41
Table 2.1. Electronic search strategy for identification of studies

82
Methods of review
Selection of studies
The results of the search, as determined by the search strategy were compiled. The
reviewers assessed titles and abstracts to determine whether each article might meet
predetermined eligibility criteria for inclusion in this study. Two reviewers took part
(SA, SJC) as this reduced the possibility that relevant reports were discarded.
At the first stage, if an article definitely failed to meet the inclusion criteria, it was
rejected. If the title or abstract raised doubt, the article could not be rejected and the full
text of the article was obtained. At the second stage, the full articles were read to
establish the eligibility definitively. Reading the full text led the reviewers to exclude
some studies that did not meet the inclusion criteria. Agreement was assessed using the
Kappa statistic (Table 2.2). Any disagreement between the reviewers was resolved by
discussion.
κ
Interpretation
< 0 Poor agreement
0.0 — 0.20 Slight agreement
0.21 — 0.40 Fair agreement
0.41 — 0.60 Moderate agreement
0.61 — 0.80 Substantial agreement
0.81 — 1.00 Almost perfect agreement
Table 2.2. Interpretation of Kappa Values (Landis and Koch, 1977)
A total of 480 studies and abstracts were identified for possible inclusion in the study as
determined by the search strategy. This was not dissimilar to a review by Abrahamsson
et al. (2007) looking at TMD before and after orthognathic surgery in which 467 articles
were identified. At the first stage, 350 articles/abstracts were excluded as they did not
fulfil the inclusion criteria. The examiner agreement was assessed using Kappa scores
and this was found to be substantial (Kappa=0.723 Table 2.3). After discussion it was
agreed to include 130 articles for full text evaluation at the second stage.

83
Kappa = 0.723 (95% CI 0.651 to 0.795)
Table 2.3. Kappa scores for the first stage of study selection
After obtaining the articles, 29 of the 130 articles were in foreign languages (the
majority of which were in Chinese). Logistically, it was not possible to make a decision
regarding inclusion/exclusion and, as obtaining translations proved impossible, it was
decided to exclude them at this stage. The remaining 101 articles were then assessed for
eligibility for inclusion. The kappa scores for this second stage also indicated substantial
agreement (Table 2.4). After discussion, it was agreed to include 60 English language
articles for the final review stage.
Kappa = 0.762 (95% CI 0.630 to 0.895)
Table 2.4. Kappa scores for the second stage of study selection
Data extraction and Management
The next stage in the process was to design a form for data extraction (Appendix 1).
This also incorporated information on patient characteristics such as the number of
patients in the study, the gender of the patients, age range, as well as information on the
malocclusion types and interventions. The form also permitted the TMD classification
methods to be recorded, as well as the observational time points. Primary outcome
Include Exclude
Include 98 39
Exclude 12 331
Include Exclude
Include 60 9
Exclude 2 30
Examiner
1 (SA)
Examiner 2 (SJC)
Examiner
1 (SA)
Examiner 2 (SJC)

84
measures and the results were recorded in table format, and a distinction was made
between patient reported findings (symptoms) and clinical findings (signs). The table
listed common signs and symptoms that would be reported in TMD studies, but also
allowed further items to be added as appropriate. Where possible a tick box format was
included for ease of use. Additional findings such as radiographic and imaging findings
and quality of life assessments could also be recorded.
The inclusion criteria were pilot tested on a sample of articles (seven papers), including
some that were thought to be definitely eligible, definitely not eligible and questionable.
The pilot was used to refine the data extraction form and clarify the inclusion criteria,
whilst training the reviewers and ensuring that the criteria could be applied consistently.
Data extraction was then performed on all 60 eligible full text articles. This process was
independently carried out by both reviewers (SA and SJC). At this stage a further 7
articles were found not to meet the inclusion criteria and were therefore excluded. The
data extraction forms completed by both investigators were compared; any
discrepancies between the forms were identified and discussed until agreement was
reached. A total of 53 articles were finally summarised for inclusion in this review. This
was in contrast to Abrahamsson et al. (2007) where only 3 articles were included and
this may be explained by the different aims stated in the two studies.
Assessment of methodological quality of included studies
Quality assessment of individual studies included in systematic reviews is necessary to
limit bias, gain insight into potential comparisons, and guide interpretation of findings.
From the results of the search it became apparent that, the majority of the articles
obtained were case control and cohort studies. As such it was initially decided to use the
Newcastle-Ottawa Scale (NOS) (http://www.ohri.ca/programs/clinical_
epidemiology/oxford.htm) which was developed to assess the quality of non-
randomised studies. However, on piloting of this scale it became evident that there were
many restrictions associated with its use for the type of studies that had been included.
This scale could not be applied accurately and consistently to studies involving TMD
research and was better suited for epidemiological studies. This presented a challenging
situation, and it was decided that a quality assessment scale would be developed
specifically for this study, which would be better suited for the research in question.

85
The principles for developing the quality assessment form were based on identifying the
main forms of bias (Sackett, 1979):
1. Selection bias (allocation bias). This is the systematic differences between
comparison groups in prognosis or responsiveness to treatment. Randomisation
of large numbers of patients with concealment of their allocation to different
groups reduces this bias. Whether inclusion/exclusion criteria were reported and
appropriate and how the subjects were recruited into the study (e.g. volunteers or
consecutive patients) all helped to determine the level of bias in this review.
2. Performance bias. This includes systematic differences in care provided, apart
from the intervention being evaluated. Standardisation of the care protocol and
blinding (masking) of clinicians and participants minimises this bias. The
number of operators involved in the studies and grouping of the interventions
were some of the criteria examined to evaluate this bias.
3. Measurement bias (detection bias, ascertainment bias). This is the systematic
difference between comparison groups in how the outcomes are ascertained.
Blinding of study participants and outcome assessors reduces this bias. For the
purpose of this research the use of standard measures (e.g. the Helkimo Index)
was considered important to reduce bias.
4. Attrition bias (exclusion bias). This is the systematic difference between
comparison groups in terms of withdrawal or exclusion of participants (e.g.
because of side effects from the intervention). Inclusion of such participants in
the analysis (in combination with a sensitivity analysis) reduces this bias. In this
study, a follow up period of greater than 6 months was selected to reduce bias.
In addition it was decided that the number of patients lost to follow up should
not exceed 20%.
Once the main types of bias were identified they were included as subsections of a
quality assessment form (Selection, Performance, Measurement/Outcome and
Attrition). This was refined by incorporating principles of other quality assessment
tools; for example, studies that were planned in advance and followed prospectively
should show less bias than studies undertaken retrospectively. Checklists which were
available from epidemiological studies were also modified for inclusion in the
assessment form (Fleiss and Gross, 1991; Levine et al., 1994). For example:

86
Were the groups assembled at a similar point in their disease progression?
Was the intervention/treatment reliably ascertained?
Was the group comparable on all important confounding factors?
Was there adequate adjustment for the effects of these confounding
variables?
Was outcome assessment blind to exposure status?
Was follow-up long enough for the outcomes to occur/be assessed?
Was the case definition explicit?
Was the disease state of the cases reliably assessed and validated?
Were the criteria for inclusion explicit?
Was the outcome assessed using objective criteria or was blinding used?
After several iterations of testing, a quality assessment form was ultimately developed
which was relatively easy to use and reproducible (Appendix 2).
First Stage testing of quality assessment forms
The quality assessment form was used on all 53 eligible articles, with both reviewers
(SA and SJC) independently carrying out this process. The results from both reviewers
were summarised into tables and the agreement calculated using the Kappa statistic
(Table 2.5a-d).
Kappa = 0.398 (95% CI 0.127 to 0.668)
Table 2.5a Agreement and Kappa scores for Selection (1st stage of testing)
Low bias High Bias Total
Low bias 10 10 29
High bias 5 29 34
Total 15 38 53
Examiner
1 (SA)
Examiner 2 (SJC)

87
Kappa = 0.316 (95% CI 0.048 to 0.584)
Table 2.5b Agreement and Kappa scores for Performance (1st stage of testing)
Kappa = 0.364 (95% CI 0.030 to 0.699)
Table 2.5c Agreement and Kappa scores for Measurement/Outcome (1st stage of
testing)
Kappa = 0.579 (95% CI 0.358 to 0.801)
Table 2.5d Agreement and Kappa scores for Attrition (1st stage of testing)
The Kappa score results were not acceptable (moderate agreement only for all four
sections) and this indicated that there was variability between the two reviewers in
interpreting the quality assessment forms and identifying bias. Hence, it was essential to
improve the definitions of the criteria on which to assign levels of bias for the quality
Low bias High Bias Total
Low bias 8 16 24
High bias 1 28 29
Total 9 44 53
Low bias High Bias Total
Low bias 5 9 14
High bias 2 37 39
Total 7 46 53
Low bias High Bias Total
Low bias 17 3 20
High bias 8 25 33
Total 25 28 53
Examiner 2 (SJC)
Examiner 2 (SJC)
Examiner 2 (SJC)
Examiner
1 (SA)
Examiner
1 (SA)
Examiner
1 (SA)

88
assessment forms. By setting criteria, it was hoped both investigators would carry out
the process of quality assessment consistently and reproducibly.
Second stage testing of quality assessment forms
A set of criteria were developed for all four sections, in the form of flow charts (Figures
2.2 to 2.5) and both investigators met to discuss the flow charts and calibrate
themselves. The flow chart system was then pilot tested on 9 randomly selected articles.
Agreement was assessed by percentage agreement (and the Kappa statistic where
possible) and the scores were considerably improved, with substantial agreement (Table
2.6a to d). On discussion of the discrepancies it was found that with regard to Attrition
(Table 2.6d) the disagreement was minor and was the result of one investigator
rounding up a value, whilst the other reported the value to a decimal point. An
agreement of 100% would otherwise have been achieved in this case.

89
Selection
Figure 2.2 Flow chart for assigning bias for the selection criteria of the included
studies
Study
Retrospective Prospective
High Bias Ethical
Approval
Inclusion/ Exclusion
criteria
specified
0 +
High Bias
Inclusion /
Exclusion
criteria appropriate
High Bias
+
yes no
yes
no
yes no
Subjects recruited
volunteers, not
reported , other High Bias
yes
Subjects recruited are random sample,
consecutive patients
no
+
Subjects assembled
at similar time
+ -
yes
no /
unclear
Subjects comparable on Confounding
Factors ?
Skeletal Form
Age
(reasonable range)
Gender
TMD at starting pt (Only long.studies)
+
+
+
+
-
-
-
-
yes
yes
yes
yes
no
no
no
no
Adjustment for confounding
factors +
yes
-
no
If automatic high bias has not been
assigned then compare the number of
positives to the number of negatives
scores assigned.
If (+ ) > ( - ) Then “Low Bias” can be
assigned
If (+ ) < ( - ) Then “High Bias” can
be assigned

90
Performance
If automatic high bias has not been assigned then compare the number of positives to the number of negatives scores assigned.
If (+ ) > ( - ) Then “Low Bias” can be assigned
If (+ ) < ( - ) Then “High Bias” can be assigned
* This implies that there has been some mention of all subjects having orthodontic treatment pre-operatively for care protocol to be clearly
defined. If some patients have not had ortho whilst other have, then care protocol was not standardized. In addition if some form of TMD
relief therapy has been used, such as physio, or splints, then all subjects are to have been included or enrolled in this procedure for
standardization.
Figure 2.3 Flow chart for assigning bias for the performance of the included
studies
Is the Intervention controlled
for?
Where subjects with
different interventions
grouped?
+
yes No
+ High Bias
no yes Was care protocol prior to
intervention clearly defined
/ standardized?*
yes
+
no/
not
reported
- 0
N/A
Was the intervention clearly
defined?
+ 0 -
yes N/A
no/
not
reported
No. of operators?
+ + - -
Unclear Multiple Multiple
trained
together
Single

91
Measurement/ Outcome
Figure 2.4 Flow chart for assigning bias for the measurement/outcome of the
included studies
Is Outcome of interest clearly
defined? (statement of the aim of study looking for
either 1ºor 2ºoutcomes)
+ High Bias
yes
Has the disease state been
reliably ascertained or
validated? (RDC/TMD,
Helkimo/modified, CMI)
+ High Bias
Examiners calibrated ?
Outcome Assessment
High Bias +
Not reported
Unclear
-
Clinical exam Self report
+ +
Masked
Unmasked
Not reported
+
0
0
No/ unclear yes
yes No/ unclear
No/ unclear

92
Attrition
Figure 2.5 Flow chart for assigning attrition bias for the included studies
Follow up long enough for
outcome to occur?
no/
not reported
High Bias 6mnth -1 yr
1 yr - 2 yrs + +
+
yes
Complete Follow
up?
Low Bias Subjects lost to
follow up
Likely to introduce
bias > 20%
Unclear
Unlikely to introduce
bias > 20%
+ - --
Losses to follow up
similar for all
groups?
yes no
- - +
0
yes no N/A not
reported

93
Agreement on 8/9 articles = 89%
Kappa score could not be calculated as only one investigator (SJC) entered a low bias
value
Table 2.6a Agreement for Selection (2nd
stage of testing)
Kappa = 0.727 (95% CI 0.223 to 1)
Table 2.6b Agreement and Kappa scores for Performance (2nd
stage of testing)
Kappa could not be calculated, but agreement was 100%
Table 2.6c Agreement and Kappa scores for Measurement/Outcome (2nd
stage of
testing)
Agreement on 8/9 articles = 89%Kappa score could not be calculated as only one
investigator (SJC) entered a high bias value
Table 2.6d Agreement and Kappa scores for Attrition
Low bias High Bias Total
Low bias 0 0 0
High bias 1 8 9
Total 1 8 9
Low bias High Bias Total
Low bias 2 1 3
High bias 0 6 6
Total 2 7 9
Low bias High Bias Total
Low bias 0 0 0
High bias 0 9 9
Total 0 9 9
Low bias High Bias Total
Low bias 8 1 9
High bias 0 0 0
Total 8 1 9
Examiner
1 (SA)
Examiner 2 (SJC)
Examiner
1 (SA)
Examiner
1 (SA)
Examiner
1 (SA)
Examiner 2 (SJC)
Examiner 2 (SJC)
Examiner 2 (SJC)

94
Final stage of quality assessment
The flow chart method was finally used for quality assessment of all 53 eligible articles
and Kappa scores were calculated. As anticipated, the Kappa scores had improved
greatly, and agreement was good between the two reviewers (Table 2.7a-d).
Kappa = 0.312 (95% CI 0 to 0.960)*
* NB Percentage agreement is 90.6% (see later comment)
Table 2.7a Agreement and Kappa scores for Selection (Final stage of testing)
Kappa = 0.827 (95% CI 0.664 to 0.990)
Table 2.7b Agreement and Kappa scores for Performance (Final stage of testing)
Kappa = 0.737 (95% CI 0.448 to 1.000)
Table 2.7c Agreement and Kappa scores for Measurement/Outcome (Final stage of
testing)
Low bias High Bias Total
Low bias 1 0 1
High bias 4 48 52
Total 5 48 53
Low bias High Bias Total
Low bias 15 2 17
High bias 2 34 36
Total 17 36 53
Low bias High Bias Total
Low bias 5 1 6
High bias 2 45 47
Total 7 46 53
Examiner
1 (SA)
Examiner 2 (SJC)
Examiner
1 (SA)
Examiner 2 (SJC)
Examiner
1 (SA)
Examiner 2 (SJC)
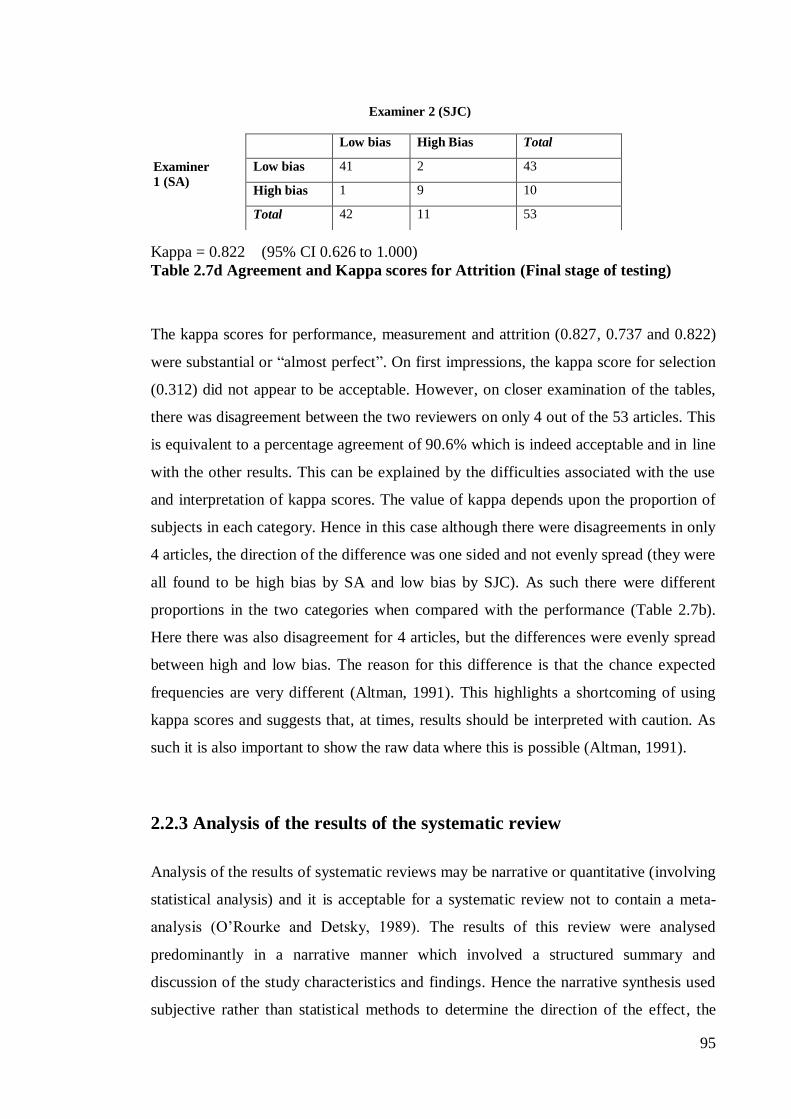
95
Kappa = 0.822 (95% CI 0.626 to 1.000)
Table 2.7d Agreement and Kappa scores for Attrition (Final stage of testing)
The kappa scores for performance, measurement and attrition (0.827, 0.737 and 0.822)
were substantial or ―almost perfect‖. On first impressions, the kappa score for selection
(0.312) did not appear to be acceptable. However, on closer examination of the tables,
there was disagreement between the two reviewers on only 4 out of the 53 articles. This
is equivalent to a percentage agreement of 90.6% which is indeed acceptable and in line
with the other results. This can be explained by the difficulties associated with the use
and interpretation of kappa scores. The value of kappa depends upon the proportion of
subjects in each category. Hence in this case although there were disagreements in only
4 articles, the direction of the difference was one sided and not evenly spread (they were
all found to be high bias by SA and low bias by SJC). As such there were different
proportions in the two categories when compared with the performance (Table 2.7b).
Here there was also disagreement for 4 articles, but the differences were evenly spread
between high and low bias. The reason for this difference is that the chance expected
frequencies are very different (Altman, 1991). This highlights a shortcoming of using
kappa scores and suggests that, at times, results should be interpreted with caution. As
such it is also important to show the raw data where this is possible (Altman, 1991).
2.2.3 Analysis of the results of the systematic review
Analysis of the results of systematic reviews may be narrative or quantitative (involving
statistical analysis) and it is acceptable for a systematic review not to contain a meta-
analysis (O‘Rourke and Detsky, 1989). The results of this review were analysed
predominantly in a narrative manner which involved a structured summary and
discussion of the study characteristics and findings. Hence the narrative synthesis used
subjective rather than statistical methods to determine the direction of the effect, the
Low bias High Bias Total
Low bias 41 2 43
High bias 1 9 10
Total 42 11 53
Examiner
1 (SA)
Examiner 2 (SJC)

96
size of the effect, whether the effect was consistent across studies, and the strength of
evidence for the effect. This was because, for the majority of studies included, a meta-
analysis was neither feasible nor appropriate.
Meta-analysis is a statistical analysis of the results from independent studies, which
generally aims to produce a single estimate of effect (Huque, 1988). Meta-analysis
should only be carried out after assessing the methodological quality of studies and only
if there is sufficient homogeneity to warrant pooling the estimates from the studies.
Studies should ideally be free from clinical and methodological diversity, for example
studies using different classification systems for TMD provide a biased comparison for
establishing the effects of an intervention. Only a small number of subgroups in this
review were sufficiently homogenous to enable a meta-analysis to be undertaken. The
majority of the studies did not use a validated scale to measure TMD and as such it was
not possible to include them for meta-analysis.
2.2.4 Methodology for the Meta-analysis
Meta-analysis is a two-stage process involving the calculation of an appropriate
summary statistic for each of a set of studies followed by the combination of these
statistics into weighted averages. The selection of a meta-analysis method should take
into account the data type, choice of summary statistic, observed heterogeneity and the
known limitations of the computational methods (Egger et al., 2001). Based on this
statement, the basic principles of conducting a meta-analysis as described by the
Cochrane Handbook are as follows (Higgins and Green, 2009):
1. A summary statistic is calculated for each study which describes the treatment
effects, or the effect size, observed in each individual study.
2. A pooled treatment effect estimate/effect size estimate is calculated as a
weighted average of the treatment effect/effect size estimated in the individual
studies.
3. The combination of treatment effect estimates across studies may incorporate an
assumption that the studies are not all estimating the same treatment effect, but
estimate treatment effects that follow a distribution across studies. This is the

97
basis of a random effects meta-analysis. Alternatively, it may be assumed that
each study is estimating exactly the same quantity, and a fixed effect meta-
analysis is performed.
4. The standard error of the pooled treatment effect/effect size can be used to
calculate a confidence interval which communicates the precision of the pooled
estimate
Summary statistics
In order to carry out a meta-analysis two pieces of information are required for each
included study: 1) the estimated effect size and 2) a measure of the precision of the
effect size.
Only the studies that used standardised methods for diagnosing and classifying TMD (in
this instance, classification according to the Helkimo Index) were eligible for inclusion
in the meta-analyses. The proportion of patients with TMD, and the change in
proportion of patients with TMD were the basis for data analysis. For the purpose of
this review only dichotomous data were used (TMD or no TMD). The effect size for
each included study at each time point was calculated as:
Number of patients with TMD
Total number of patients
It was also necessary to calculate the standard error as a measure of the precision of the
estimate for each study to be included in the meta-analysis. The standard error of the
proportion [SE (p) ]was calculated for each study as:
SE(p)=√p(1-p)
n
Where p is the proportion of patients with TMD, and n is the total number of patients.
Assessing Homogeneity
Assessing homogeneity between the studies is a very important aspect of carrying out a
meta-analysis and may impact on the decision whether to use a fixed or random effects
model. Thus it was important to consider to what extent the results of the studies were

98
consistent (homogenous). A heterogeneity test was undertaken prior to each meta-
analysis; the heterogeneity statistic was given by:
Q= ∑ wi (θ i – θ IV)2
For the purpose of these calculations the summary statistic, which in this case is the
proportion (p) with the characteristic in each study, is denoted by θi where i is the study
index. Thus SE (p) will be denoted by SE (θi). The weights for each study (wi) are a
reciprocal of the squared standard error thus calculated as wi = 1/ SE (θi)2
. The pooled
proportion is denoted by θIV and this is calculated by:
θIV = ∑ wi θ i / ∑ wi
N.B. this is also referred to as the Generic Inverse Variance method for calculating a
pooled treatment effect or proportion (see later discussion).
This test assessed whether observed differences in results are compatible with chance
alone. A low P-value provides evidence of heterogeneity of treatment effects/ effect size
(variation in effect estimates beyond chance). Care must be taken in the interpretation of
the test, a statistically significant result may indicate a problem with heterogeneity, but a
non-significant result must not be taken as evidence of no heterogeneity. Some argue
that, since clinical and methodological diversity continually occur in a meta-analysis,
statistical heterogeneity is unavoidable and therefore that the test for heterogeneity is
irrelevant to the choice of analysis and heterogeneity will always exist whether or not
we detect it using a statistical test. Methods have been developed for quantifying
inconsistency across studies that move the focus away from testing whether
heterogeneity is present and rather on assessing its impact on the meta-analysis (Higgins
et al., 2003).
Fixed effect and random effects models
Once homogeneity was established, a decision was made on the type of meta-analysis
model to be followed. A fixed effect meta-analysis provides a result that may be viewed
as a typical treatment effect from the studies included in the analysis. In order to

99
calculate a confidence interval for a fixed effect meta-analysis the assumption is made
that the true effect of treatment (in both magnitude and direction) is the same in every
study (i.e. fixed across studies). This assumption implies that the observed differences
among study results are due solely to chance, i.e. that there is no statistical
heterogeneity (Egger et al., 2001, Deeks et al., 2008).
When there is heterogeneity that cannot readily be explained, a random effects approach
is used. This involves an assumption that the effects being estimated in the different
studies are not identical, but follow a distribution. The centre of this symmetrical
distribution describes the average of the effects and its width describes the degree of
heterogeneity. The conventional choice of distribution is a normal distribution. It is
difficult to establish the validity of any distributional assumption, and this is a common
criticism of the random effects meta-analysis (Deeks et al., 2008). By using the random
effects model it should not be assumed that heterogeneity is no longer an issue and the
possible causes of heterogeneity should be explored where feasible (Deeks et al., 2008).
Heterogeneity was found in all of the results for this review and as such random effect
models were used.
Generic inverse variance method
The analyses for the dichotomous variables were conducted using the generic inverse
variance method where the weight given to each study was the inverse of the variance
of the effect estimate (i.e. 1/ SE2) (Deeks et al., 2008). Thus, larger more precise
studies, which have smaller standard errors are given more weight than smaller less
precise studies, which have larger standard errors. This choice of weight minimises the
imprecision (uncertainty) of the pooled effect estimate. The inverse variance method is
widely applicable and can be used to combine any estimates that have standard errors
available (Egger et al., 2001).
For a fixed effect meta-analysis using the inverse variance method the weighted average
is, as previously stated, calculated by:
Generic inverse variance weighted average (θIV ) = ∑ wi θ i / ∑ wi

100
However, more applicable to this review, the random effects, sometimes known as the
DerSimonian and Laird model was used to present the results. This is a variation of the
generic inverse variance method. Here the standard errors of the study-specific
estimates SE(θi) were adjusted to incorporate a measure of the extent of variation, or
heterogeneity, among the treatment effects observed in different studies. The size of this
adjustment can be estimated from the treatment effects and standard errors of the studies
included in the meta-analysis (Deeks et al., 2008). The formula for this calculation is
not included as it beyond the scope of this review.
All calculations stated above were carried out using StataTM
. This is a general purpose,
command-line driven, programmable statistical package. Several meta-analytic methods
can be carried out using Stata commands and outputs are then produced (Egger et al.,
2001).

101
2.3 Results
The results of the systematic review were summarised into evidence tables. These are
listed below:
1. Study characteristics (Table 2.8)
2. Study participants (Table 2.9)
3. Orthognathic Intervention (Table 2.10)
4. Classification of TMD (Table 2.11)
5. Self reported TMD symptoms (Table 2.12)
6. Clinical TMJ signs (Table 2.13)
7. Percentage of patients presenting with confirmed TMD at the various
time points (Table 2.14)
8. Change in TMJ signs and symptoms (Table 2.15)
9. TMD findings in studies using the Helkimo index (Table 2.16)
10. TMD findings in studies using the CMI index (Table 2.17)
11. Quality Assessment (Table 2.18)

102
Tab
le 2
.8
Stu
dy
ch
ara
cte
ris
tics
Au
thor,
Yea
r
Stu
dy D
esig
n
Pro
spec
tive/
Ret
rosp
ecti
ve
*
Des
cri
pti
on
S
ite†
Ag
habeig
i et
al.
,
2001
Co
ho
rt
Ret
rosp
ecti
ve
83 p
atie
nts
surv
eyed
. R
eco
rds
exam
ined
and s
urv
ey s
ent
to p
atie
nts
Eas
tman D
enta
l In
stit
ute
,
Lo
ndo
n,
UK
Ao
yam
a et
al.
,
2005
Co
ho
rt
Ret
rosp
ecti
ve
37 c
onse
cuti
ve
pat
ients
co
mpar
ed
befo
re a
nd a
fter
BS
SO
To
kyo
Med
ical and D
enta
l
Univ
ersi
ty,
To
kyo
, Ja
pan
Ath
anasi
ou a
nd
Mels
en,
1992
Co
ho
rt
(Pro
spec
tive)
36 a
du
lt p
atie
nts
fo
llo
wed
long
itud
inall
y p
re-s
urg
ery a
nd a
gain
6
mo
nth
s la
ter
Ro
yal D
enta
l C
oll
ege,
Aar
hus,
Denm
ark
Ath
anasi
ou a
nd
Yüce
l-E
roğlu
,
1994
Co
ho
rt
(Pro
spec
tive)
82 c
onse
cuti
vely
tre
ated
adult
s w
ith
var
ious
dento
facia
l defo
rmit
ies
rece
ived
co
mbin
ed o
rtho
do
nti
c-
surg
ical
manag
em
ent
Ro
yal D
enta
l C
oll
ege,
Aar
hus,
Denm
ark
Ath
anasi
ou e
t al.
,
1996
Co
ho
rt
(Pro
spec
tive)
43 p
atie
nts
stu
die
d t
o a
sses
s fu
nct
ional
alt
erat
ion i
n s
tom
ato
gnat
hic
syst
em
follo
win
g o
rtho
do
nti
c-su
rgic
al
manag
em
ent
Ro
yal D
enta
l C
oll
ege,
Aar
hus,
Denm
ark
Azu
mi
et a
l.,
2004
Co
ho
rt
(Ret
rosp
ecti
ve)
13 p
atie
nts
evalu
ated
to
ass
ess
sho
rt
term
eff
ects
of
mand
ibu
lar
dis
trac
tio
n
ost
eogen
esis
To
ho
ku U
niv
ersi
ty,
Sen
dai,
Jap
an

103
Au
thor,
Yea
r
Stu
dy D
esig
n
Pro
spec
tive/
Ret
rosp
ecti
ve
*
Des
cri
pti
on
S
ite†
Bail
ey e
t al.
,
2001
Co
ho
rt
Ret
rosp
ecti
ve
2074
pat
ients
rec
ord
s ex
am
ined
to
evalu
ate
tren
d i
n r
efe
rral pat
tern
s fo
r
ort
ho
gnat
hic
surg
ery a
nd a
ccep
tance
of
trea
tment
Univ
ersi
ty o
f N
ort
h
Car
oli
na,
Chap
el H
ill,
No
rth C
aro
lina,
US
A
Bo
rstl
ap e
t al.
,
2004
a
Co
ho
rt
Pro
spec
tive
222 p
atie
nts
under
go
ing B
SS
O
evalu
ated
pre
and p
ost
-oper
ativ
ely
fo
r
cli
nic
al
par
am
eter
s
Mu
lti ce
ntr
e st
udy.
UM
C S
t. R
adbo
und
,
Nij
meg
en,
The
Net
her
land
s
Bo
rstl
ap e
t al.
,
2004b
Co
ho
rt
Pro
spec
tive
222 p
atie
nts
analy
sed f
or
radio
log
ical
chang
es i
n t
he
TM
J aft
er B
SS
O
Mu
lti ce
ntr
e st
udy.
UM
C S
t. R
adbo
und,
Nij
meg
en,
The
Net
her
land
s
Cutb
irth
et
al.
,
1998
Co
ho
rt
(Ret
rosp
ecti
ve)
100 m
and
ibu
lar
defi
cie
ncy p
atie
nts
who
under
went
BS
SO
- r
ecord
s
evalu
ated
Univ
ersi
ty o
f T
exas
, S
an
Anto
nio
, U
SA
Dah
lber
g e
t al.
,
1995
Co
ho
rt
Pro
spec
tive
53 c
onse
cuti
ve
pat
ients
exam
ined
cli
nic
all
y a
nd w
ith b
ilat
eral
arth
rogra
phy
Univ
ersi
ty H
osp
ital o
f
Lu
nd,
Lund,
Sw
eden
De
Bo
ever
et
al.
,
1996
Co
ho
rt
(Pro
spec
tive)
102 p
atie
nts
ass
esse
d f
or
the
rela
tio
nsh
ip b
etw
een T
MD
and
malo
cclu
sio
n
Mu
lti
centr
e st
udy.
Univ
ersi
ty o
f T
exas
Hea
lth S
cie
nce
Cente
r,
San
Anto
nio
, T
exas
, U
SA

104
Au
thor,
Yea
r
Stu
dy D
esig
n
Pro
spec
tive/
Ret
rosp
ecti
ve
*
Des
cri
pti
on
S
ite†
De
Cle
rcq e
t al.
,
1995
Co
ho
rt
Ret
rosp
ecti
ve
317 c
onse
cuti
ve
pat
ients
who
under
went
ort
ho
gnat
hic
surg
ery -
reco
rds
evalu
ated
pre
and p
ost
-op
Gen
eral
Ho
spit
al S
t-Jo
hn,
Bru
ges
, B
elg
ium
De
Cle
rcq e
t al.
,
1998
Co
ho
rt
Ret
rosp
ecti
ve
296 p
atie
nts
qu
esti
oned
po
st-
oper
ativ
ely
Gen
eral
Ho
spit
al S
t-Jo
hn,
Bru
ges
, B
elg
ium
Der
vis
and
Tunce
r,
2002
Cas
e co
ntr
ol
(Pro
spec
tive)
50 o
rtho
gnat
hic
pat
ients
inves
tigat
ed
for
alt
erat
ions
in s
igns
and s
ym
pto
ms
of
TM
D c
om
par
ed w
ith h
ealt
hy
contr
ols
Univ
ersi
ty o
f Is
tanbu
l,
Ista
nbu
l, T
urk
ey
Eger
mar
k e
t al.
,
2000
Co
ho
rt
Ret
rosp
ecti
ve
52 p
atie
nts
exam
ined
fo
r si
gns
and
sym
pto
ms
of
TM
D 5
year
s aft
er
surg
ery
Dep
artm
ent
of
Ora
l and
Maxil
lofa
cia
l S
urg
ery,
Halm
stad
, S
wed
en
Fein
erm
an a
nd
Pie
cuch,
1995
Co
ho
rt
Ret
rosp
ecti
ve
66 p
atie
nts
exam
ined
aft
er B
SS
O
Univ
ersi
ty o
f C
onnec
ticu
t,
Far
min
gto
n,
US
A
Fly
nn e
t al.
,
199
0
Co
ho
rt
N/R
40 p
atie
nts
who
had
rec
eiv
ed
mand
ibu
lar
adv
ance
ment
surg
ery
evalu
ated
fo
r T
MD
Ind
iana
Univ
ersi
ty,
Mesa
,
Ari
zona,
US
A
Fo
rsse
ll e
t al.
,
1998
Co
ho
rt
Pro
spec
tive
100 c
onse
cuti
ve
pat
ients
inte
rvie
wed
conce
rnin
g r
egar
din
g t
heir
su
rger
y
Turk
u U
niv
ersi
ty,
Turk
u ,
Fin
land

105
Au
thor,
Yea
r
Stu
dy D
esig
n
Pro
spec
tive/
Ret
rosp
ecti
ve
*
Des
cri
pti
on
S
ite†
Gag
gl
et a
l.,
1999
Co
ho
rt
Pro
spec
tive
25 p
atie
nts
exam
ined
befo
re a
nd a
fter
ort
ho
gnat
hic
surg
ery
Univ
ersi
ty H
osp
ital, G
raz,
Au
stri
a
Hac
kney e
t al.
,
1989
Co
ho
rt
(Pro
spec
tive)
18 p
atie
nts
stu
die
d f
or
changes
in
inte
rco
nd
yla
r w
idth
and a
ng
le a
nd
corr
ela
ted w
ith T
MJ
sym
pto
ms
aft
er
BS
SO
Univ
ersi
ty o
f T
exas
Hea
lth S
cie
nce
Centr
e,
San
Anto
nio
, T
exas
, U
SA
Her
bo
sa e
t al.
,
1990
Co
ho
rt
(Pro
spec
tive)
29 p
atie
nts
tre
ated
wit
h L
e F
ort
1
ost
eoto
my o
r se
gm
enta
l pro
cedure
s
and c
hanges
in c
ond
yla
r po
siti
on
com
par
ed
St
Mar
y’s
Hea
lth C
ente
r,
St
Lo
uis
, M
O,
US
A
Ho
ppen
reij
s et
al.
,
1998
Co
ho
rt
Ret
rosp
ecti
ve
259 p
atie
nts
wit
h V
ME
and A
OB
analy
sed r
egar
din
g T
MJ
sounds,
cond
yla
r re
mo
deli
ng,
and r
eso
rpti
on
Mu
lti ce
ntr
e st
udy.
Rij
nst
ate
Ho
spit
al
Arn
hem
, T
he
Net
her
land
s
Hu e
t al.
,
2000
Co
ho
rt/C
ase
Co
ntr
ol ?
(Pro
spec
tive)
50 p
atie
nts
inves
tigat
ed f
or
chan
ges
in
TM
J fu
nct
ion a
nd c
ond
yla
r po
siti
on
aft
er m
and
ibu
lar
setb
ack
West
Chin
a U
niv
ersi
ty o
f
Med
ical S
cie
nce
s,
Chengdu,
Chin
a
Hw
ang e
t al.
,
2000
Co
ho
rt
(Ret
rosp
ecti
ve)
11 p
atie
nts
evalu
ated
fo
r co
nd
yla
r
reso
rpti
on p
ost
-ort
ho
gnat
hic
surg
ery
Dep
artm
ent
of
Cra
nio
-
Maxil
lofa
cia
l S
urg
ery,
Univ
ersi
ty H
osp
ital,
Zuri
ch

106
Au
thor,
Yea
r
Stu
dy D
esig
n
Pro
spec
tive/
Ret
rosp
ecti
ve
*
Des
cri
pti
on
S
ite†
Hw
ang e
t al.
,
200
4
Cas
e co
ntr
ol
(Ret
rosp
ecti
ve)
34 p
atie
nts
stu
die
d t
o identi
fy n
on-
surg
ical
risk
fac
tors
fo
r co
nd
yla
r
reso
rpti
on a
fter
ort
ho
gnat
hic
surg
ery
Seo
ul N
atio
nal U
niv
ersi
ty
Den
tal H
osp
ital,
Seo
ul,
So
uth
Ko
rea
Kall
ela
et
al.
,
2005
Co
ho
rt
Ret
rosp
ecti
ve
40 c
onse
cuti
ve
pat
ients
who
under
went
BS
SO
ad
van
cem
ent
mo
nit
ore
d 2
.2
yea
rs p
ost
-oper
ativ
ely
Dep
artm
ent
of
Ora
l and
Maxil
lofa
cia
l S
urg
ery,
Hels
ink
i U
niv
ersi
ty,
Fin
land
Kar
abo
uta
and
Mar
tis,
1985
Co
ho
rt
N/R
280 p
atie
nts
evalu
ated
fo
r T
MD
befo
re
and a
fter
BS
SO
Dep
artm
ent
of
Ora
l and
Maxil
lofa
cia
l S
urg
ery,
Univ
ersi
ty o
f
Thes
salo
nik
a,
Thes
salo
nik
a, G
reec
e
Ker
sten
s et
al.
,
1989
Co
ho
rt
N/R
480 p
atie
nts
obse
rved
fo
r pre
and p
ost
-
oper
ativ
e T
MJ
sym
pto
ms.
Pat
ients
had
var
ious
dento
facia
l defo
rmit
ies
and
oper
ated
fo
r dysg
nat
hia
Dep
artm
ent
of
Ora
l and
Maxil
lofa
cia
l S
urg
ery,
Fre
e U
niv
ersi
ty o
f
Am
ster
dam
, A
mst
erdam
,
The
Net
her
land
s
Lai
et a
l.,
2002
Co
ho
rt
(Pro
spec
tive)
23 p
atie
nts
oper
ated
by B
SS
O
analy
sed f
or
skele
tal st
abil
ity a
nd T
MJ
sig
ns
and s
ym
pto
ms
Nii
gat
a U
niv
ersi
ty
Gra
duat
e S
choo
l o
f
Med
ical and D
enta
l
Scie
nce
s, N
iigat
a, J
apan

107
Au
thor,
Yea
r
Stu
dy D
esig
n
Pro
spec
tive/
Ret
rosp
ecti
ve
*
Des
cri
pti
on
S
ite†
Land
es,
2004
Cas
e C
ontr
ol
(Pro
spec
tive)
30 p
atie
nts
evalu
ated
- d
ynam
ic
pro
xim
al se
gm
ent
po
siti
onin
g b
y
intr
aoper
ativ
e so
no
gra
phy v
ersu
s sp
lint
and p
late
tec
hn
iqu
e. C
lin
ical
dysf
unct
ion a
nd d
isc
dis
loca
tio
n a
lso
com
par
ed p
re a
nd p
ost
-oper
ativ
ely
Go
ethe
Univ
ersi
ty
Med
ical
Centr
e, F
rank
furt
,
Ger
many
Lin
k a
nd N
icker
son,
1992
Co
ho
rt
(Pro
spec
tive)
39 p
atie
nt
under
go
ing o
rtho
gnat
hic
inte
rventi
on e
valu
ated
fo
r T
MJ
inte
rnal
der
angem
ent
pre
and p
ost
-surg
ery
Van
der
bil
t U
niv
ersi
ty
Sch
oo
l o
f M
edic
ine,
Nas
hvil
le,
Ten
ness
ee,
US
A
Lit
tle
et a
l.,
1986
Co
ho
rt
Ret
rosp
ecti
ve
17 p
atie
nts
ret
rosp
ecti
vely
evalu
ated
for
the
effe
cts
of
surg
ical o
rtho
do
nti
c
corr
ecti
on o
n t
he
TM
J an
d r
ela
ted
stru
cture
s
Univ
ersi
ty o
f L
ou
isvil
le
Sch
oo
l o
f D
enti
stry
,
Lo
uis
vil
le,
Kentu
cky,
US
A
Milo
sevic
and
Sam
uels
,
2000
Cas
e C
ontr
ol
(Pro
spec
tive)
42 p
atie
nts
evalu
ated
- t
he
po
st
ort
ho
do
nti
c pre
vale
nce
of
TM
D a
nd
funct
ional o
cclu
sio
n c
onta
cts
asse
ssed
in s
urg
ical and n
on s
urg
ical ca
ses
Mu
lti ce
ntr
e st
udy.
Dep
artm
ent
of
Cli
nic
al
Den
tal S
cie
nce
s
Univ
ersi
ty o
f L
iver
po
ol,
Liv
erpoo
l, U
.K
Mota
med
i,
1996
Cas
e S
tudy
Ret
rosp
ecti
ve
13 p
atie
nts
evalu
ated
and c
om
par
ed f
or
the
long
-ter
m o
utc
om
e o
f bil
ater
al an
d
unil
ater
al o
steo
tom
ies
of
the
mand
ible
Baq
iyat
all
ah M
edic
al
Centr
e T
ehra
n,
Iran

108
Au
thor,
Yea
r
Stu
dy D
esig
n
Pro
spec
tive/
Ret
rosp
ecti
ve
*
Des
cri
pti
on
S
ite†
Nem
eth e
t al.
,
2000
RC
T
Pro
spec
tive
127 p
atie
nts
evalu
ated
befo
re a
nd 2
yea
rs a
fter
surg
ery f
or
sig
ns
and
sym
pto
ms
of
TM
D
Mu
lti ce
ntr
e st
udy.
Pri
vat
e C
lin
ic,
Au
stin
,
Tex
as,
US
A
Univ
ersi
ty o
f T
exas
Hea
lth S
cie
nce
Cente
r,
San
Anto
nio
, T
exas
, U
SA
Nurm
inen e
t al.
,
1999
Co
ho
rt
Ret
rosp
ecti
ve
28 o
rtho
gnat
hic
pat
ients
ques
tio
ned
regar
din
g m
oti
vat
ion f
or
star
ting
trea
tment.
Sat
isfa
ctio
n w
ith r
esu
lts
evalu
ated
on t
he
basi
s o
f re
pli
es
to a
ques
tio
nnair
e and c
lin
ical exam
Inst
itute
of
Denti
stry
Turk
u U
niv
ersi
ty,
Turk
u,
Fin
land
Oniz
awa
et a
l.,
1995
Cas
e C
ontr
ol
(Pro
spec
tive)
30 p
atie
nts
inves
tigat
ed f
or
alte
rati
ons
in T
MJ
funct
ion a
fter
ort
ho
gnat
hic
surg
ery.
The
stu
dy a
lso
co
mpar
ed t
he
find
ing
s w
ith t
ho
se o
f hea
lthy
vo
lunte
ers
Dep
artm
ent
of
Ora
l and
Maxil
lofa
cia
l S
urg
ery,
Med
izin
ische
Ho
chsc
hu
le,
Han
no
ver
, G
erm
any
Pah
kala
and
Hein
o,
2004
Co
ho
rt
(Pro
spec
tive)
72 p
atie
nts
obse
rved
befo
re a
nd 2
yea
rs a
fter
surg
ical-
ort
ho
do
nti
c
trea
tment
for
pre
-oper
ativ
e an
d p
ost
-
oper
ativ
e T
MD
Kuo
pio
Univ
ersi
ty
Ho
spit
al, K
uo
pio
, F
inla
nd

109
Au
thor,
Yea
r
Stu
dy D
esig
n
Pro
spec
tive/
Ret
rosp
ecti
ve
*
Des
cri
pti
on
S
ite†
Pan
ula
et
al.
,
2000
Cas
e C
ontr
ol
Pro
spec
tive
60 p
atie
nts
inves
tigat
ed i
n a
co
ntr
oll
ed
pro
spec
tive
4 y
ear
follo
w-u
p s
tud
y t
o
exam
ine
the
infl
uence
of
ort
ho
gnat
hic
trea
tment
on s
igns
and s
ym
pto
ms
of
TM
J d
ysf
unct
ion
Mu
lti ce
nte
r st
udy.
Vaa
sa C
entr
al
Ho
spit
al,
Sein
ajo
ki, F
inla
nd
Centr
al H
osp
ital,
Univ
ersi
ty o
f O
ulu
,
Fin
land
Raveh e
t al.
,
1988
Co
ho
rt/C
ase
Co
ntr
ol ?
N/R
103 p
atie
nts
under
went
sag
itta
l sp
lit
ost
eoto
my a
nd f
ind
ings
inclu
din
g
dysf
unct
ion r
epo
rted
. N
ew t
echniq
ues
for
repro
duct
ion o
f co
nd
yle
rela
tio
n
als
o e
valu
ated
.
Univ
ersi
ty o
f B
erne,
Ber
ne,
Sw
itze
rland
Ro
dri
guez
-Gar
cia
et
al.
, 19
98
RC
T
Pro
spec
tive
124 p
atie
nts
wit
h C
l II
malo
cclu
sio
n
exam
ined
, and t
he
rela
tio
nsh
ip
bet
wee
n m
alo
cclu
sio
n a
nd T
MD
befo
re a
nd a
fter
BS
SO
evalu
ated
.
Mu
lti ce
nte
r st
udy
Univ
ersi
ty o
f T
exas
Hea
lth S
cie
nce
Cente
r,
San
Anto
nio
, T
exas
, U
SA
Sch
earl
inck
et
al.
,
1994
Co
ho
rt
Pro
spec
tive
103 p
atie
nts
evalu
ated
fo
r sk
ele
tal
stab
ilit
y,
TM
J fu
nct
ion,
and i
nfe
rio
r
alv
eola
r ner
ve
funct
ion.
The
pat
ients
pre
sente
d w
ith m
and
ibu
lar
hypo
pla
sia
and t
reat
ed w
ith B
SS
O
Dep
artm
ent
of
Ora
l and
Maxil
lofa
cia
l S
urg
ery,
Rij
nst
ate
Ho
spit
al,
Arn
hem
, T
he
Net
her
land
s

110
Au
thor,
Yea
r
Stu
dy D
esig
n
Pro
spec
tive/
Ret
rosp
ecti
ve
*
Des
cri
pti
on
S
ite†
Sco
tt e
t al.
,
1997
RC
T
Pro
spec
tive
58 p
atie
nts
stu
die
d t
o d
ocu
ment
the
agre
em
ent
bet
wee
n p
rosp
ecti
ve
cli
nic
al
exam
inat
ions
and r
etro
spec
tive
char
t re
vie
w i
n i
denti
fyin
g s
igns
and
sym
pto
ms
of
TM
D
Mu
lti ce
nte
r st
udy
Univ
ersi
ty o
f T
exas
Hea
lth S
cie
nce
Cente
r,
San
Anto
nio
, T
exas
, U
SA
Sm
ith e
t al.
,
1992
Co
ho
rt
Pro
spec
tive
22 p
atie
nts
exam
ined
fo
r si
gns
and
sym
pto
ms
of
TM
D p
ost
-ort
ho
gnat
hic
surg
ery
Univ
ersi
ty o
f D
etro
it,
Sch
oo
l o
f D
enti
stry
, U
SA
Tim
mis
et
al.
,
1986
Co
ho
rt
Pro
spec
tive
28 B
SS
O p
atie
nts
evalu
ated
- s
igns
and
sym
pto
ms
of
TM
D a
nd m
asti
cato
ry
dysf
unct
ion i
nves
tigat
ed
Univ
ersi
ty o
f T
exas
Hea
lth S
cie
nce
Cente
r,
San
Anto
nio
, T
exas
, U
SA
Uek
i et
al.
,
2001
Co
ho
rt
(Pro
spec
tive)
42 p
atie
nts
inves
tigat
ed f
or
the
rela
tio
n
bet
wee
n c
hang
es i
n c
ond
yla
r lo
ng a
xis
and T
MJ
funct
ion a
fter
BS
SO
Dep
artm
ent
of
Ora
l a
nd
Maxil
lofa
cia
l S
urg
ery,
Kanaza
wa
Univ
ersi
ty,
Kanaza
wa,
Jap
an
Uek
i et
al.
,
2002
Co
ho
rt
(Pro
spec
tive)
42 p
atie
nts
stu
die
d t
o c
om
par
e changes
in T
MJ
mo
rpho
log
y a
nd c
lin
ical
sym
pto
ms
aft
er B
SS
O
Dep
artm
ent
of
Ora
l and
Maxil
lofa
cia
l S
urg
ery,
Kanaza
wa
Univ
ersi
ty,
Kanaza
wa,
Jap
an
Upto
n e
t al.
,
1984
Co
ho
rt
Ret
rosp
ecti
ve
102 p
atie
nts
res
po
nded
to
a
ques
tio
nnair
e exp
lori
ng t
he
rela
tio
nsh
ip o
f su
rgic
al
corr
ecti
on o
f
skele
tal d
ishar
mo
ny w
ith T
MJ
pain
dysf
unct
ion
Univ
ersi
ty o
f M
ichig
an,
Ann A
rbo
r, M
ichig
an,
US
A

111
Au
thor,
Yea
r
Stu
dy D
esig
n
Pro
spec
tive/
Ret
rosp
ecti
ve
*
Des
cri
pti
on
S
ite†
West
erm
ark
et
al.
,
2001
Co
ho
rt
Ret
rosp
ecti
ve
1,5
15 p
atie
nts
- p
aper
rep
ort
s T
MD
befo
re a
nd a
fter
ort
ho
gnat
hic
surg
ery
base
d o
n p
atie
nts
ow
n r
epo
rts
Kar
oli
nsk
a H
osp
ital,
Sto
ckho
lm,
Sw
eden
Whit
e and D
olw
ick,
1992
Co
ho
rt
Ret
rosp
ecti
ve
75 p
atie
nts
stu
die
d r
etro
spec
tively
to
asse
ss t
he
pre
vale
nce
and v
aria
nce
of
TM
D i
n a
n o
rtho
gnat
hic
po
pu
lati
on
Dep
artm
ent
of
Ora
l and
Maxil
lofa
cia
l S
urg
ery,
Univ
ersi
ty o
f F
lori
da
Co
lleg
e o
f D
enti
stry
,
Gain
esv
ille
, F
lori
da,
US
A
Wo
lfo
rd e
t al.
,
2003
Co
ho
rt
Ret
rosp
ecti
ve
25 b
imaxil
lary
surg
ery p
atie
nts
trea
tment
reco
rds
evalu
ated
fo
r T
MD
sig
ns
and s
ym
pto
ms
Pri
vat
e pra
ctic
e
Baylo
r C
oll
ege
of
Den
tist
ry,
Dall
as,
Tex
as,
US
A
Zho
u e
t al.
,
2001
Co
ho
rt
Ret
rosp
ecti
ve
94 p
atie
nts
evalu
ated
fo
r th
e o
bje
ctiv
e
rela
tio
nsh
ip b
etw
een p
re-o
per
ativ
e
psy
cho
logic
al
stat
us
and a
ttit
ude
and
po
st-s
urg
ical
exper
ience
of
trea
tment
Univ
ersi
ty o
f H
ong K
ong,
Ho
ng K
ong,
Chin
a
* I
tem
s p
lace
d i
n b
rack
ets
are
assu
med
to b
e ei
ther
pro
spec
tiv
e or
retr
osp
ecti
ve
bas
ed o
n s
tud
y in
form
atio
n. N
/R r
epre
sen
ts n
ot
report
ed a
nd u
nab
le t
o a
ssum
e fr
om
th
e st
udy
info
rmat
ion
. † I
f th
e si
te i
s n
ot
report
ed, th
e co
untr
y of
firs
t au
thor
was
sta
ted
.

112
Tab
le 2
.9 S
tud
y P
arti
cip
an
ts
Au
thor,
Yea
r
Sam
ple
size
No.
F
No.
M
Age
Ran
ge
Mea
n
Ag
e
Eth
nic
ity
Inclu
sion
/E
xclu
sion
crit
eria
$
Sk
eleta
l D
efo
rm
ity /
Malo
cclu
sion
Sk
I
Sk
II
Sk
III
Deep
‡
AO
B§
Asy
mm
U
ncle
ar
N/R
**
Ag
hab
eig
i
et a
l.,
20
01
83
Appro
x 2
:1
rati
o
15-6
0
25
.8
N/R
A
ll p
atie
nts
wh
o
resp
on
ded
to s
urv
ey
Ao
yam
a et
al.
, 2
00
5
37
21
16
19-3
5
24
N
/R
N/R
Ath
anas
iou
and
Mel
sen
,
19
92
36
25
11
17-2
3
N/R
N
/R
CL
, S
y, C
f, E
den
t, H
x
of
T
Ath
anas
iou
and
Yü
cel-
Ero
ğlu
,
19
94
82
N/R
N
/R
17-3
9
N/R
N
/R
CL
, S
y, C
f, E
den
t, H
x
of
T
Ath
anas
iou
et a
l.,
19
96
43
N/R
N
/R
17-3
9
N/R
N
/R
CL
, S
y, C
f, E
den
t, H
x
of
T
Azu
mi
et
al.
,
20
04
13
11
2
16-4
6
26
††
30
.7
35
.7
N/R
N
/R
Bai
ley e
t a
l.,
20
01
2074
65%
35
%
15 t
o>
35
N/R
N
/R
All
pat
ien
ts r
ecord
s
bet
wee
n 1
98
4-1
99
6
Pat
ien
ts n
ot
off
ered
surg
ery
Bors
tlap
et
al.
, 2
00
4a
222
169
53
14-5
3
25
.2
N/R
P
re a
nd
post
-op
ort
ho
Ps,
Op
en b
ite,
an
d
Inco
mp
lete
arc
hes

113
Au
thor,
Yea
r
Sam
ple
size
No.
F
No.
M
Age
Ran
ge
Mea
n
Ag
e
Eth
nic
ity
Inclu
sion
/E
xclu
sion
crit
eria
$
Sk
eleta
l D
efo
rm
ity /
Malo
cclu
sion
Sk
I
Sk
II
Sk
III
Deep
‡
AO
B§
Asy
mm
U
ncle
ar
N/R
**
Bors
tlap
et
al.
, 2
00
4b
222
169
53
14-5
3
25
.2
N/R
N
/R
Cu
tbir
th e
t
al.
, 1
99
8
100
70
30
N
/R
N/R
N
/R
BS
SO
cas
es
Max
illa
ry s
urg
ery
Dah
lber
g e
t a
l.,
19
95
53
33
20
17-5
3
28
N
/R
N/R
De
Boev
er
et a
l.,1
99
6
102
75
27
15-4
8
29
N
/R
BS
SO
cas
es,
>1
4yr
s,
Ps,
CA
, E
den
t, M
ed,
Pre
gn
ant
De
Cle
rcq e
t
al.
, 1
99
5
196
150
46
14-2
4
35
N
/R
Pat
ien
ts w
ith
norm
al/l
ow
an
gle
(≤
32
º) a
nd m
and
def
icie
ncy
tx
by
adv,
Hig
h a
ngle
(>
32
º)
man
dib
ula
r re
trogn
ath
ia
Pts
tx w
ith
bim
ax
surg
ery
CL
, la
tero
gn
ath
ia a
nd
gen
iop
last
y on
ly
De
Cle
rcq e
t
al.
, 1
99
8
238
149
89
14-4
2
19
.81
N/R
A
ll p
atie
nts
Rx
bet
wee
n
Jan
199
3-
Au
g 1
99
4
CL
, C
A, E
den
t,
Lat
erogn
ath
ia a
nd
Gen
iop
last
y on
ly

114
Au
thor,
Yea
r
Sam
ple
size
No.
F
No.
M
Age
Ran
ge
Mea
n
Ag
e
Eth
nic
ity
Inclu
sion
/E
xclu
sion
crit
eria
$
Sk
eleta
l D
efo
rm
ity /
Malo
cclu
sion
Sk
I
Sk
II
Sk
III
Deep
‡
AO
B§
Asy
mm
U
ncle
ar
N/R
**
Der
vis
an
d
Tun
cer,
20
02
50
29
21
19-4
2
29
.3
N/R
P
s, L
e F
ort
II
& I
II
TM
J su
rger
y,
Def
orm
ity
of
con
dyl
e,
Rig
id f
ixat
ion
Eg
erm
ark
et
al.
, 2
00
0
52
34
18
15-6
5
27
N
/R
All
ort
hogn
ath
ic
pat
ien
ts b
etw
een
19
88-
19
95
Fei
ner
man
and
Pie
cuch
,
19
95
66
42
24
N
/R
36
.5§
30
.4
N/R
P
re-o
p T
MJ
exam
in
char
ts, A
vai
labil
ity
for
foll
ow
up
Fly
nn
et
al.
,
19
90
40
28
12
18-4
5
27
.5
Cau
casi
an
Ag
e 1
8-4
5 y
rs,
Man
d
retr
ogn
ath
ia, O
rth
o
app
lian
ce r
emoved
by
last
eval
uat
ion
Ed
ent,
Ps,
Fors
sell
et
al.
, 1
99
8
100
71
29
17-5
5
31
N
/R
N/R
Gag
gl
et a
l.,
19
99
25
20
5
19-3
2
23
N
/R
N/R
Hac
kn
ey e
t
al.
,19
89
15
N/R
N
/R
N/R
N
/R
N/R
N
/R

115
Au
thor,
Yea
r
Sam
ple
size
No.
F
No.
M
Age
Ran
ge
Mea
n
Ag
e
Eth
nic
ity
Inclu
sion
/E
xclu
sion
crit
eria
$
Sk
eleta
l D
efo
rm
ity /
Malo
cclu
sion
Sk
I
Sk
II
Sk
III
Deep
‡
AO
B§
Asy
mm
U
ncle
ar
N/R
**
Her
bosa
et
al.
,19
90
29
19
10
16-3
3
20
.2
N/R
N
/R
Hop
pen
reij
s
et a
l.,1
99
8
259
203
56
14-4
6
23
.6
N/R
M
and
ret
rogn
ath
ia a
nd
AO
B,
Le
Fort
I,
Com
ple
te c
lin
ical
reco
rds
CL
, C
A, T
,
amel
og
enei
s im
per
fect
a
Hu
et
al.
,
20
00
50
32
18
18-3
5
N/R
C
hin
ese
N/R
Hw
ang
et
al.
,
20
00
11
11
0
16-2
8
19
N
/R
Post
-op
red
uce
d
con
dyl
ar h
eigh
t,
red
uce
d O
B,
incr
ease
d
OJ
CA
, T
, F
acia
l
asym
met
ry,
Con
dyl
ar
reso
rpti
on
du
e to
Med
Hw
ang
et
al.
,
20
04
39
36
3
15-4
3
N/R
N
/R
Post
-op
red
uce
d
con
dyl
ar h
eigh
t,
red
uce
d O
B,
incr
ease
d
OJ
CA
, T
, F
acia
l
asym
met
ry,
Con
dyl
ar
reso
rpti
on
du
e to
Med
Kal
lela
et
al.
,
20
05
40
29
11
17-5
4
29
N
/R
Fir
st 4
0 p
atie
nts
un
der
goin
g B
SS
O
advan
cem
ent

116
Au
thor,
Yea
r
Sam
ple
size
No.
F
No.
M
Age
Ran
ge
Mea
n
Ag
e
Eth
nic
ity
Inclu
sion
/E
xclu
sion
crit
eria
$
Sk
eleta
l D
efo
rm
ity /
Malo
cclu
sion
Sk
I
Sk
II
Sk
III
Deep
‡
AO
B§
Asy
mm
U
ncle
ar
N/R
**
Kar
abou
ta
and
Mar
tis,
19
85
280
N/R
N
/R
N/R
N
/R
N/R
N
/R
Ker
sten
s et
al.
, 1
98
9
480
N/R
N
/R
N/R
N
/R
N/R
N
/R
Lai
et
al.
,
20
02
23
15
8
17-3
2
20
.9
N/R
C
L,
CA
Lan
des
,
20
04
30
17
13
16-4
4
25
N
/R
N/R
Lin
k a
nd
Nic
ker
son
,
19
92
39
33
6
17-4
7
29
C
auca
sian
A
ll p
atie
nts
ref
ered
to
on
e su
rgeo
n b
etw
een
19
86-1
98
7
Cla
ss I
II m
alocc
lusi
on
s
excl
ud
ed
Lit
tle
et a
l.,
19
86
17
14
3
16-3
7
25
.6
N/R
H
x o
f m
ax i
mp
acti
on
and
avai
labil
ity
to
atte
nd
Mil
ose
vic
and
Sam
uel
s,
20
00
42
N/R
N
/R
N/R
2
2.6
N
/R
Rec
eived
fix
ed
app
lian
ce, R
x t
o C
lass
I
CL
Mota
med
i,
19
96
13
1
12
19-3
7
25
.8
N/R
N
/R

117
Au
thor,
Yea
r
Sam
ple
size
No.
F
No.
M
Age
Ran
ge
Mea
n
Ag
e
Eth
nic
ity
Inclu
sion
/E
xclu
sion
crit
eria
$
Sk
eleta
l D
efo
rm
ity /
Malo
cclu
sion
Sk
I
Sk
II
Sk
III
Deep
‡
AO
B§
Asy
mm
U
ncle
ar
N/R
**
Nem
eth
et
al.
,
20
00
127
95
32
N
/R
28
.5§
30
.4
N/R
C
lass
II
mal
occ
ocl
usi
on
s,
BS
SO
, >
14
yrs
, st
able
resi
den
ce
Med
, E
den
t, P
erio
, B
imax
cas
es,
CA
, P
s,
Pre
gn
ancy
Nu
rmin
en e
t
al.
, 1
99
9
28
19
9
18-4
6
31
F
inn
ish
N
/R
On
izaw
a et
al.
, 1
99
5
30
20
10
17-3
4
24
N
/R
Def
orm
ity
of
con
dyl
e,
TM
J su
rger
y, L
e F
ort
II
and
III
Pah
kal
a an
d
Hei
no, 2
00
4
72
49
23
16-5
3
32
N
/R
Sle
ep a
pn
oea
, P
atie
nts
wh
o m
ov
ed a
way
Pan
ula
et
al.
, 2
00
0
60
49
11
16-5
6
33
.2
N/R
N
/R
Rav
eh e
t a
l.,
19
88
103
N/R
N
/R
N/R
N
/R
N/R
N
/R
Rod
rig
ues
-
Gar
cia
et
al.
, 1
99
8
124
92
32
15-5
7
30
.2
N/R
C
lass
II
mal
occ
lusi
on
,
BS
SO
, >
14
yrs
Med
, E
den
t, P
erio
,
Sch
earl
inck
et a
l.,
19
94
103
71
32
14-4
3§
15-4
5
25
.8§
23
.7
N/R
M
axil
lary
su
rger
y,
Gen
iop
last
y

118
Au
thor,
Yea
r
Sam
ple
size
No.
F
No.
M
Age
Ran
ge
Mea
n
Ag
e
Eth
nic
ity
Inclu
sion
/E
xclu
sion
crit
eria
$
Sk
eleta
l D
efo
rm
ity /
Malo
cclu
sion
Sk
I
Sk
II
Sk
III
Deep
‡
AO
B§
Asy
mm
U
ncle
ar
N/R
**
Sco
tt e
t a
l.,
19
97
58
44
14
14-5
7
30
N
/R
Cla
ss I
I m
alocc
lusi
on
,
BS
SO
, >
14
yrs
Ed
ent,
Per
io,
CA
, P
s,
Bim
ax s
urg
ery
Sm
ith
et
al.
, 1
99
2
22
14
8
15-5
3
26
.3
Can
adia
n
N/R
Tim
mis
et
al.
,
19
86
28
19
9
N
/R
28
.6§
27
.1
N/R
N
/R
Uek
i et
al.
,
20
01
42
N/R
N
/R
N/R
N
/R
N/R
N
/R
Uek
i et
al.
,
20
02
42
N/R
N
/R
15-3
7
23
Ja
pan
ese
N/R
Up
ton
et
al.
,
19
84
102
70
32
N
/R
N/R
N
/R
All
ort
hogn
ath
ic
pat
ien
ts b
etw
een
19
78-
19
81
Wes
term
ark
et a
l.,
20
01
1516
958
558
N/R
2
6
N/R
N
/R
Wh
ite
and
Dolw
ick
,
19
92
75
55
20
N
/R
24
.6
N/R
N
/R
Wolf
ord
et
al.
, 2
00
3
25
23
2
14-4
9
N/R
N
/R
Sel
ecte
d p
atie
nts
wit
h
con
firm
ed T
MJ
dis
c
der
ang
emen
t on
ly,
Min
12
mon
th p
ost
-op
r/v

119
Au
thor,
Yea
r
Sam
ple
size
No.
F
No.
M
Age
Ran
ge
Mea
n
Ag
e
Eth
nic
ity
Inclu
sion
/E
xclu
sion
crit
eria
$
Sk
eleta
l D
efo
rm
ity /
Malo
cclu
sion
Sk
I
Sk
II
Sk
III
Deep
‡
AO
B§
Asy
mm
U
ncle
ar
N/R
**
Zh
ou
et
al.
,
20
01
94
54
40
N
/R
N/R
C
hin
ese
CL
, C
A
$ K
ey f
or
incl
usi
on e
xcl
usi
on c
rite
ria:
CA
= C
ran
iofa
cial
an
omal
ies
, C
L =
Cle
fts,
E
den
t= e
den
tulo
us
pat
ien
ts, M
ed=
Med
ical
/m
enta
l co
ndit
ion
s , P
erio
= P
erio
don
tal
con
dit
ion
, P
s= P
revio
us
ort
hogn
ath
ic s
urg
ery,
Sy
= S
yndro
mes
, T
= tra
um
a
‡ D
eep
bit
e
= i
ncl
udes
low
an
gle
§ A
OB
= i
ncl
udes
hig
h a
ngle
** N
/R
=
Not
report
ed
†† V
aria
ble
mea
n a
ges
/ ag
e ra
nge
dep
endin
g o
n t
he
surg
ical
gro
up
or
gen
der

112
Tab
le 2
.10 O
rth
og
na
thic
In
terven
tion
Au
thor,
Yea
r O
rth
og
nath
ic I
nte
rven
tio
ns
M
axil
lary
(so
lely
)
Man
dib
ula
r (s
ole
ly)
Bim
ax
Com
bin
ati
on
of
proced
ures
list
ed
Oth
er
Pro
ced
ure
s
Com
men
ts
Le Fort 1
Advancement
Le Fort 1
Inferior
Reposition
Le Fort 1
Impaction
Le Fort 1
Unspecified
Surgical
Expansion
BSSO
Advancement
BSSO
Setback
VRO
Advancement
VRO
Setback
Unspecified
Ag
hab
eig
i et
al.
,
20
01
S
egm
enta
l
pro
cedure
s
Ao
yam
a et
al.
,
20
05
Ath
anas
iou a
nd
Mel
sen
,
19
92
Ath
anas
iou a
nd
Yü
cel-
Ero
ğlu
,
19
94
Ath
anas
iou
et
al.
,
19
96
Azu
mi
et a
l.,
20
04
D
istr
acti
on
ost
eogen
esis
Bai
ley e
t al.
,
20
01
Inte
rven
tion n
ot
report
ed
Bors
tlap
et
al.
,
20
04
a

113
Au
thor,
Yea
r O
rth
og
nath
ic I
nte
rven
tio
ns
M
axil
lary
(so
lely
)
Man
dib
ula
r (s
ole
ly)
Bim
ax
Com
bin
ati
on
of
proced
ures
list
ed
Oth
er
Pro
ced
ure
s
Com
men
ts
Le Fort 1
Advancement
Le Fort 1
Inferior
Reposition
Le Fort 1
Impaction
Le Fort 1
Unspecified
Surgical
Expansion
BSSO
Advancement
BSSO
Setback
VRO
Advancement
VRO
Setback
Unspecified
Bors
tlap
et
al.
,
20
04
b
Cu
tbir
th e
t al.
,
19
98
Dah
lber
g e
t al.
, 1
99
5
Oth
er p
roce
dure
s n
ot
report
ed
De
Boev
er e
t al.
,
19
96
De
Cle
rcq e
t al.
,
19
95
De
Cle
rcq e
t al.
,
19
98
Der
vis
an
d T
un
cer,
20
02
Inte
rven
tion n
ot
report
ed
Eg
erm
ark
et
al.
,
20
00
Fei
ner
man
an
d
Pie
cuch
, 1995
Fly
nn
et
al.
,
19
90
Fors
sell
et
al.
,
19
98
Gen
iopla
sty
Gag
gl
et a
l.,
19
99

114
Au
thor,
Yea
r O
rth
og
nath
ic I
nte
rven
tio
ns
M
axil
lary
(so
lely
)
Man
dib
ula
r (s
ole
ly)
Bim
ax
Com
bin
ati
on
of
proced
ures
list
ed
Oth
er
Pro
ced
ure
s
Com
men
ts
Le Fort 1
Advancement
Le Fort 1
Inferior
Reposition
Le Fort 1
Impaction
Le Fort 1
Unspecified
Surgical
Expansion
BSSO
Advancement
BSSO
Setback
VRO
Advancement
VRO
Setback
Unspecified
Hac
kn
ey e
t al.
,
19
89
Her
bosa
et
al.
,
19
90
Hop
pen
reij
s et
a
l.,1
99
8
G
enio
pla
sty
Hu e
t al.
,
20
00
Hw
ang
et
al.
,
20
00
Hw
ang
et
al.
,
20
04
Kal
lela
et
al.
,
20
05
Kar
abou
ta a
nd
Mar
tis,
1985
Ker
sten
s et
al.
,
19
89
Lai
et
al.
, 2002
Lan
des
, 2
004

115
Au
thor,
Yea
r O
rth
og
nath
ic I
nte
rven
tio
ns
M
axil
lary
(so
lely
)
Man
dib
ula
r (s
ole
ly)
Bim
ax
Com
bin
ati
on
of
proced
ures
list
ed
Oth
er
Pro
ced
ure
s
Com
men
ts
Le Fort 1
Advancement
Le Fort 1
Inferior
Reposition
Le Fort 1
Impaction
Le Fort 1
Unspecified
Surgical
Expansion
BSSO
Advancement
BSSO
Setback
VRO
Advancement
VRO
Setback
Unspecified
Lin
k a
nd
Nic
ker
son,
19
92
Lit
tle
et a
l.,
19
86
Mil
ose
vic
an
d
Sam
uel
s, 2
000
In
terv
enti
on n
ot
report
ed
Mota
med
i, 1
996
Nem
eth
et
al.
,
20
00
Nu
rmin
en e
t al.
,
19
99
On
izaw
a et
al.
,
19
95
Pah
kal
a an
d H
ein
o,
20
04
Pan
ula
et
al.
,
20
00
Gen
iopla
sty
Rav
eh e
t a
l.,
19
88
Seg
men
tal
pro
cedure
Rod
rig
ues
-Gar
cia
et
al.
, 1
99
8

116
Au
thor,
Yea
r O
rth
og
nath
ic I
nte
rven
tio
ns
M
axil
lary
(so
lely
)
Man
dib
ula
r (s
ole
ly)
Bim
ax
Com
bin
ati
on
of
proced
ures
list
ed
Oth
er
Pro
ced
ure
s
Com
men
ts
Le Fort 1
Advancement
Le Fort 1
Inferior
Reposition
Le Fort 1
Impaction
Le Fort 1
Unspecified
Surgical
Expansion
BSSO
Advancement
BSSO
Setback
VRO
Advancement
VRO
Setback
Unspecified
Sch
earl
inck
et
al.
,
19
94
Sco
tt e
t a
l.,
19
97
G
enio
pla
sty
Sm
ith
et
al.
, 1
99
2
Tim
mis
et
al.
,
19
86
Uek
i et
al.
,
20
01
Uek
i et
al.
,
20
02
Up
ton
et
al.
, 1984
Inte
rven
tion n
ot
report
ed
Wes
term
ark e
t al.
,
20
01
Inte
rven
tion n
ot
report
ed
Wh
ite
and
Dolw
ick,
19
92
Inte
rven
tion n
ot
report
ed
Wolf
ord
et
al.
,
20
03
Inte
rven
tion n
ot
report
ed
Zh
ou
et
al.
,
20
01
G
enio
pla
sty

117
Tab
le 2
.11 C
lass
ific
ati
on
of
TM
D
Au
thor,
Year
How
ou
tcom
e w
as
mea
sured
/ass
ess
ed
Cla
ssif
icati
on
Self
rep
ort
Cli
nic
al
exam
inati
on
Ra
dio
gra
ph
ic
Oth
er
Hel
kim
o/
Mod
ifie
d
Hel
kim
o
EA
CD
C
MI
No f
orm
al
TM
D c
lass
ific
ati
on
prese
nte
d
Ag
hab
eig
i
et
al.
, 2
00
1
A
oya
ma
et
al.
, 2
00
5
Ath
anas
iou
and
Mel
sen
,
19
92
Ath
anas
iou
and
Yü
cel-
Ero
ğlu
,
19
94
Ath
anas
iou
et a
l.,
19
96
A
zum
i
et a
l.,
20
04
B
aile
y e
t a
l.,
20
01
Un
clea
r
Bors
tlap
et
al.
, 2
00
4a
Bors
tlap
et
al.
, 2
00
4b
‡‡
Cu
tbir
th
et
al.
, 1
99
8
Dah
lber
g
et
al.
, 1
99
5
Art
hro
gra
ph
y
D
e B
oev
er
et
al.
,19
96

118
Au
thor,
Year
How
ou
tcom
e w
as
mea
sured
/ass
ess
ed
Cla
ssif
icati
on
Self
rep
ort
Cli
nic
al
exam
inati
on
Ra
dio
gra
ph
ic
Oth
er
Hel
kim
o/
Mod
ifie
d
Hel
kim
o
EA
CD
C
MI
No f
orm
al
TM
D c
lass
ific
ati
on
prese
nte
d
De
Cle
rcq
et a
l.,
19
95
De
Cle
rcq
et a
l.,
19
98
Der
vis
an
d
Tun
cer,
20
02
E
ger
mar
k
et a
l.,
20
00
F
ein
erm
an
and
Pie
cuch
,
19
95
Fly
nn
et
al.
,
19
90
F
ors
sell
et
al.
,
19
98
§§
Gag
gl
et a
l.,
19
99
H
ack
ney
et
al,
19
89
H
erbosa
et
al.
, 19
90
*
Hop
pen
reij
s
et a
l.,
19
98
Hu
et
al.
,
20
00
H
wan
g e
t a
l.,
20
00
Hw
ang
et
al.
,
20
04

119
Au
thor,
Year
How
ou
tcom
e w
as
mea
sured
/ass
ess
ed
Cla
ssif
icati
on
Self
rep
ort
Cli
nic
al
exam
inati
on
Ra
dio
gra
ph
ic
Oth
er
Hel
kim
o/
Mod
ifie
d
Hel
kim
o
EA
CD
C
MI
No f
orm
al
TM
D c
lass
ific
ati
on
prese
nte
d
Kal
lela
et
al.
,
20
05
K
arab
ou
ta
and
Mar
tis,
19
85
Ker
sten
s
et a
l.,
19
89
L
ai e
t a
l.,
20
02
Lan
des
, 2
004
Lin
k a
nd
Nic
ker
son
,
19
92
Lit
tle
et a
l.,
19
86
M
ilose
vic
&
Sam
uel
s,
20
00
Mota
med
i,
19
96
Nem
eth
et
al.
, 2
00
0
N
urm
inen
et a
l.,
19
99
O
niz
awa
et a
l.,
19
95
P
ahk
ala
and
Hei
no, 2
00
4

120
Au
thor,
Year
How
ou
tcom
e w
as
mea
sured
/ass
ess
ed
Cla
ssif
icati
on
Self
rep
ort
Cli
nic
al
exam
inati
on
Ra
dio
gra
ph
ic
Oth
er
Hel
kim
o/
Mod
ifie
d
Hel
kim
o
EA
CD
C
MI
No f
orm
al
TM
D c
lass
ific
ati
on
prese
nte
d
Pan
ula
et
al.
,
20
00
Rav
eh e
t a
l.,
19
88
Rod
rig
ues
-G
arci
a et
al.
,
19
98
Sch
earl
inck
et a
l.,
19
94
Sco
tt e
t a
l.,
19
97
Sm
ith
et
al.
,
19
92
T
imm
is e
t a
l.,
19
86
Uek
i et
al.
,
20
01
†
U
eki
et a
l.,
20
02
U
pto
n e
t al.
,
19
84
Wes
term
ark
et a
l.,
20
01
Wh
ite
and
Dolw
ick
, 1
99
2
Wolf
ord
et a
l.,
20
03
†

121
Au
thor,
Year
How
ou
tcom
e w
as
mea
sured
/ass
ess
ed
Cla
ssif
icati
on
Self
rep
ort
Cli
nic
al
exam
inati
on
Ra
dio
gra
ph
ic
Oth
er
Hel
kim
o/
Mod
ifie
d
Hel
kim
o
EA
CD
C
MI
No f
orm
al
TM
D c
lass
ific
ati
on
prese
nte
d
Zh
ou
et
al.
,
20
01
‡‡
Con
dyl
ar M
orp
holo
gy
Sca
le (
CM
S),
Pull
ing
er I
nd
ex u
sed
§§
Incl
ud
ed u
se o
f V
AS
/Lik
ert
scal
es

130
Tab
le 2
.12
Self
-Rep
orte
d T
MD
Sym
pto
ms*
**
Stu
dy
, Y
ear
Tim
e
inte
rval
Join
t S
ou
nd
s
Pa
in
Jaw
Movem
en
t O
ther
Sym
pto
ms
Click
Pop
Crepitus
TMJ
Jaw
Face
Muscles
Movement
Ear
Unspecified
Fatigue
Limited
opening
Jaw Locking
Jaw
deviation
Headache
Chewing Diff.
Parafunction
Ag
hab
eig
i et
al.
, 2
00
1
Pre
-Rx
38
4
5
3
Post
-op
43
3
8
14
De
Cle
rcq e
t
al.
, 1
99
8
Pre
-op
30
23
4.3
±2.1
††
†
19
18
N
/R
N/R
1-2
.5yr
s
Post
-op
30
17
3.4
±2.2
†
21
18
57
13
Der
vis
an
d
Tun
cer,
20
02
Pre
-op
20
16
2yr
s P
ost
-op
16
12
Eg
erm
ark
et
al.
, 2
00
0
2-9
.5yr
s
Post
-op
50
1
8
25
83
69
Fly
nn
et
al.
,
19
90
1-5
yrs
Post
-op
33
5
2
0
4
0
8
18
23
Fors
sell
et
al.
,
19
98
1 m
nth
Pre
-op
3.5
± 1
.9†
3.6
±2.1
†
1 y
r
Post
-op
1.9
± 1
.1†
1.7
±1.3
†

131
Stu
dy
, Y
ear
Tim
e
inte
rval
Join
t S
ou
nd
s
Pa
in
Jaw
Movem
en
t O
ther
Sym
pto
ms
Click
Pop
Crepitus
TMJ
Jaw
Face
Muscles
Movement
Ear
Unspecified
Fatigue
Limited
opening
Jaw Locking
Jaw
deviation
Headache
Chewing Diff.
Parafunction
Hac
kn
ey e
t
al.
,19
89
Pre
-op
1
7
6-1
2m
nth
Post
-op
1
1
Kal
lela
et
al.
,
20
05
Pre
-op
28
3
28
15
2
0
3
1 y
r
Post
-op
8
8
8
8
8
0
Lon
ges
t fo
llow
up
3
3
13
5
5
0
Nu
rmin
en e
t
al.
, 1
99
9
Pre
-op
32
32
68
Pah
kal
a an
d
Hei
no, 2
00
4
Pre
-Rx
6
46
Mea
n
1.9
yr
Post
-op
1
13
Pan
ula
et
al.
,
20
00
Pre
-Rx
61
1 y
r
Post
-op
18
Lon
ges
t
foll
ow
up
20

132
Stu
dy
, Y
ear
Tim
e
inte
rval
Join
t S
ou
nd
s
Pa
in
Jaw
Movem
en
t O
ther
Sym
pto
ms
Click
Pop
Crepitus
TMJ
Jaw
Face
Muscles
Movement
Ear
Unspecified
Fatigue
Limited
opening
Jaw Locking
Jaw
deviation
Headache
Chewing Diff.
Parafunction
Rod
rig
ues
-
Gar
cia
et a
l.,
19
98
Pre
-op
46
2.0
6 ±
1.6
0‡
‡‡
2 y
r
Post
-op
3
2
1.6
1 ±
1.2
1‡
Tim
mis
et
al.
,
19
86
Pre
-op
3
9
0
4
7
6-3
6m
nth
Post
-op
2
9
4
0
0
Up
ton
et
al.
,
19
84
Pre
-op
27
22
19
2
6
27
Wes
term
ark
et a
l.,
20
01
Pre
-op
24
1
1
9
10
9
5
2 y
r
Post
-op
20
6
4
3
4
2
Wh
ite
and
Dolw
ick
,
19
92
Pre
-op
§§
§
34
4
8
20
21
13
12
Wolf
ord
et
al.
, 2
00
3
Pre
-op
3.7
†
4.5
†
Lon
ges
t
foll
ow
up
6.8
†
4.8
†

133
Stu
dy
, Y
ear
Tim
e
inte
rval
Join
t S
ou
nd
s
Pa
in
Jaw
Movem
en
t O
ther
Sym
pto
ms
Click
Pop
Crepitus
TMJ
Jaw
Face
Muscles
Movement
Ear
Unspecified
Fatigue
Limited
opening
Jaw Locking
Jaw
deviation
Headache
Chewing Diff.
Parafunction
Zh
ou
et
al.
,
20
01
Post
-op
83
71
*** P
erce
nta
ges
hav
e b
een r
ou
nd
ed u
p
††
† V
isu
al A
nal
oge
Sca
le (
VA
S)
rati
ng
‡‡
‡ O
ral
Hea
lth
Sta
tus
Ques
tionnai
re 1
=M
ild,
7=
Extr
eme
§§§ U
ncl
ear
wh
eth
er f
indin
g r
eport
ed a
re f
rom
cli
nic
al e
xam
inat
ion
or
pat
ien
t q
ues
tion
nai
re

134
Tab
le 2
.13 T
MD
Sig
ns-
Cli
nic
al
Fin
din
gs*
***
Au
thor,
Yea
r Tim
e
Inte
rval
(m=
Mon
th
Y =
yea
r)
Join
t S
ou
nd
s
Pain
R
an
ge
of
jaw
movem
ent
Jaw Locking
Deviation
Cli
ck
(%)
Pop
(%)
Cre
pit
us
(%)
TM
J
(%)
Mu
scle
(%)
Jaw
(%)
Face
(%)
Movem
ent
(%)
Ear
(%)
MIO
††
††
(mm
)
Late
ral
excu
rsio
ns
(mm
)
Lim
ited
op
enin
g
(%)
R
t L
t N
/S#
Ao
yam
a et
al.
, 2
00
5
Pre
-op
14
3
14
3
1y
Post
-op
11
11
19
8
Ath
anas
iou
and
Mel
sen
,
19
92
Pre
-op
36
¥
8
11
46.5
7.1
9
53
36
¥
6m
Post
-op
11
¥
0
11
41.1
7.8
8.1
64
11
¥
Ath
anas
iou
and
Yü
cel-
Ero
ğlu
, 1
99
4
Pre
-op
32
¥
10
16
32
¥
6m
Post
-op
17
¥
2
7
17
¥
Ath
anas
iou
et a
l.,
19
96
Pre
-op
M
n‡
‡‡
‡
46.2
M
x
45.5
Mn
‡
8.2
M
x
9.1
Mn
‡
8.3
M
x
9.1
6m
Post
-op
Mn
‡
40.7
M
x
43.6
Mn
‡
7.6
M
x
8.2
Mn
‡
7.4
M
x
8.1
Azu
mi
et
al.
, 2
00
4§§§§
Pre
-op
27
4
Post
dis
trac
tion
0
8
Aft
er
dis
trac
tion
rem
oval
12
19

135
Au
thor,
Yea
r Tim
e
Inte
rval
(m=
Mon
th
Y =
yea
r)
Join
t S
ou
nd
s
Pain
R
an
ge
of
jaw
movem
ent
Jaw Locking
Deviation
Cli
ck
(%)
Pop
(%)
Cre
pit
us
(%)
TM
J
(%)
Mu
scle
(%)
Jaw
(%)
Face
(%)
Movem
ent
(%)
Ear
(%)
MIO
††
††
(mm
)
Late
ral
excu
rsio
ns
(mm
)
Lim
ited
op
enin
g
(%)
R
t L
t N
/S#
Bors
tlap
et
al.
, 2
00
4a
Pre
-op
33
16
46.4
10.1
3m
Post
-op
22
17
37.6
6.6
6m
Post
-op
25
14
41.8
7.5
24m
P
ost
-op
28
10
45.6
8.3
Bors
tlap
et
al.
, 2
00
4b
3m
Post
-op
25
24
6m
Post
-op
12
30
24m
P
ost
-op
17
26
Cu
tbir
th e
t a
l.,
19
98
Pre
-op
39
13
Post
-op
18
5
Dah
lber
g e
t
al.
, 1
99
5
Pre
-op
30
4
53
De
Boev
er
et a
l.,
19
96
Pre
-op
36
8
Der
vis
an
d
Tun
cer,
20
02
Pre
-op
38
24
20
70
49.5
10
28
2y
Post
-op
28
30
14
40
48.3
10
14

136
Au
thor,
Yea
r Tim
e
Inte
rval
(m=
Mon
th
Y =
yea
r)
Join
t S
ou
nd
s
Pain
R
an
ge
of
jaw
movem
ent
Jaw Locking
Deviation
Cli
ck
(%)
Pop
(%)
Cre
pit
us
(%)
TM
J
(%)
Mu
scle
(%)
Jaw
(%)
Face
(%)
Movem
ent
(%)
Ear
(%)
MIO
††
††
(mm
)
Late
ral
excu
rsio
ns
(mm
)
Lim
ited
op
enin
g
(%)
R
t L
t N
/S#
Eg
erm
ark
et
al.
, 2
00
0
5y
Post
-op
25
23
52
8.4
17
Fei
ner
man
and
Pie
cuch
,
19
95
Pre
-op
52
20
33
IMF
48.6
**
**
*
RF
49.7
Auth
ors
rep
ort
th
at r
esult
s ar
e in
com
ple
te
2-9
y
Post
-op
49
14
29
IMF
**
48.6
R
F
47.6
IMF
**
8.2
R
F
9.7
IMF
**
8.6
R
F
9.3
Fly
nn
et
al.
,
19
90
1-5
y
Post
-op
30
10
13
28
43.5
8
Gag
gl
et a
l.,
19
99
Pre
-op
88
36
28
47.5
88
3m
Post
-op
52
16
12
35.5
96
Hac
kn
ey e
t
al.
, 1
98
9
Pre
-op
22
17
>
40
0
6-1
2m
P
ost
-op
17
11
>
40
0
Her
bosa
et
al.
, 1
99
0
Pre
-op
28
4
4
28
10.2
to
10.3
6-1
8m
P
ost
-op
17
0
4
7
9.4
to
9.8

137
Au
thor,
Yea
r Tim
e
Inte
rval
(m=
Mon
th
Y =
yea
r)
Join
t S
ou
nd
s
Pain
R
an
ge
of
jaw
movem
ent
Jaw Locking
Deviation
Cli
ck
(%)
Pop
(%)
Cre
pit
us
(%)
TM
J
(%)
Mu
scle
(%)
Jaw
(%)
Face
(%)
Movem
ent
(%)
Ear
(%)
MIO
††
††
(mm
)
Late
ral
excu
rsio
ns
(mm
)
Lim
ited
op
enin
g
(%)
R
t L
t N
/S#
Hop
pen
reij
s
et a
l.,
19
98
Pre
-Rx
RH
S 3
8
LH
S 4
0
N/A
Lat
est
Foll
ow
up
RH
S 3
1
LH
S 3
2
45
Hu
et
al.
,
20
00
Pre
-op
46.2
‡
45.9
6m
Post
-op
42.1
‡
44.5
Kal
lela
et
al.
, 2
00
5
Pre
-op
25
23
13
13
44.7
1y
Post
-op
13
3
8
3
44.7
Lat
est
Foll
ow
up
8
5
13
0
45.9
Kar
abou
ta
and
Mar
tis,
19
85
Pre
-op
41
29
4
30
6m
Post
-op
6
4
3
5
Lan
des
, 2
00
4
3m
Post
-op
47%
†††††
66
%
6m
Post
-op
76%
††
96
%
1y
Post
-op
90%
††
10
9
%
Lin
k a
nd
Nic
ker
son
, 1
99
2
Pre
-op
50
Post
-op
44

138
Au
thor,
Yea
r Tim
e
Inte
rval
(m=
Mon
th
Y =
yea
r)
Join
t S
ou
nd
s
Pain
R
an
ge
of
jaw
movem
ent
Jaw Locking
Deviation
Cli
ck
(%)
Pop
(%)
Cre
pit
us
(%)
TM
J
(%)
Mu
scle
(%)
Jaw
(%)
Face
(%)
Movem
ent
(%)
Ear
(%)
MIO
††
††
(mm
)
Late
ral
excu
rsio
ns
(mm
)
Lim
ited
op
enin
g
(%)
R
t L
t N
/S#
Lit
tle
et a
l.,
19
86
Post
-op
30
6
18
Mil
ose
vic
&
Sam
uel
s,
20
00
Post
-op
42.0
4.8
4.6
Nem
eth
et
al.
, 2
00
0
Pre
-op
47
4
1y
Post
-op
29
11
On
izaw
a et
al.
, 1
99
5
Pre
-op
50
30
50.1
8.0
7.4
40
3m
‡‡
‡‡
‡
II
35
.4
III
37
.3
II 5
.4
III
6.5
II
5.2
III
5.8
6m
‡‡
II
40
.6
III
41
.3
II 6
.7
III
6.9
II
6.5
III
6.5
Pah
kal
a an
d
Hei
no, 2
00
4
Pre
-Rx
35
8
21
32
28
~2y
P
ost
-op
13
12
10
22
26
Pan
ula
et
al.
, 2
00
0
Pre
-Rx
42
22
45
50
0
1y
Post
-op
42
20
12
20
13
Lat
est
Foll
ow
up
48
10
18
18
10

139
Au
thor,
Yea
r Tim
e
Inte
rval
(m=
Mon
th
Y =
yea
r)
Join
t S
ou
nd
s
Pain
R
an
ge
of
jaw
movem
ent
Jaw Locking
Deviation
Cli
ck
(%)
Pop
(%)
Cre
pit
us
(%)
TM
J
(%)
Mu
scle
(%)
Jaw
(%)
Face
(%)
Movem
ent
(%)
Ear
(%)
MIO
††
††
(mm
)
Late
ral
excu
rsio
ns
(mm
)
Lim
ited
op
enin
g
(%)
R
t L
t N
/S#
Rav
eh e
t a
l.,
19
88
Pre
-op
6
3
6
1-4
y
Post
-op
4
2
1
Rod
rig
ues
-
Gar
cia
et a
l.,
19
98
Pre
-op
49
14
5
2 y
Post
-op
24
8
15
Sch
earl
inck
et a
l.,
19
94
Pre
-op
46.8
1 y
Post
-op
6
13
45.8
2
Sco
tt e
t a
l.,
19
97
§§
§§
§
8 w
eeks
Post
-op
R 3
CE
17
R
0
CE
2
R 9
CE
48
R
N/R
CE
90
6m
Post
-op
R 3
C
E 4
3
R
0
CE
3
R 2
C
E
48
R
N/R
C
E 4
5
1y
Post
-op
R 3
C
E 3
3
R
0
CE
12
R 2
C
E
45
R
0
CE
33
2y
Post
-op
R 7
C
E 5
0
R
2
CE
10
R 3
C
E
29
R
3
CE
21
Sm
ith
et
al.
,
19
92
Pre
-op
50
9
49.7
9.9
8.9
6-7
m
Post
-op
64
9
44.8
8.6
8.5

140
Au
thor,
Yea
r Tim
e
Inte
rval
(m=
Mon
th
Y =
yea
r)
Join
t S
ou
nd
s
Pain
R
an
ge
of
jaw
movem
ent
Jaw Locking
Deviation
Cli
ck
(%)
Pop
(%)
Cre
pit
us
(%)
TM
J
(%)
Mu
scle
(%)
Jaw
(%)
Face
(%)
Movem
ent
(%)
Ear
(%)
MIO
††
††
(mm
)
Late
ral
excu
rsio
ns
(mm
)
Lim
ited
op
enin
g
(%)
R
t L
t N
/S#
Tim
mis
et
al.
, 1
98
6
Pre
-op
54
4
18
25
6-3
6m
P
ost
-op
36
4
14
18
Uek
i et
al.
,
20
01
Pre
-op
62
7
SP
******
44.4
B
P
49.6
1y
Post
-op
19
7
SP
**
*
40.7
B
P
45.8
Wes
term
ark
et a
l.,
20
01
Pre
-op
24
N/R
2y
Post
-op
N
/R
10
Wh
ite
and
Dolw
ick
,
19
92
Pre
-op
35
4
8
20
21
13
Wolf
ord
et
al.
, 2
00
3
Pre
-op
64
16
48.6
8.3
Longes
t F
oll
ow
up
16
24
40.7
6.7
**** A
ll p
erce
nta
ges
hav
e bee
n r
ounded
up
¥ T
he
resu
lts
are
for
both
cli
cks
and d
evia
tion
s co
mbin
ed

141
††
†† M
IO=
max
imal
in
cisa
l open
ing.
All
fig
ure
s q
uote
d a
re m
ean
s un
less
a r
ang
e is
sp
ecif
ied
#
Not
Sp
ecif
ied
‡
‡‡
‡ R
esu
lts
are
subdiv
ided
acc
ord
ing t
o s
urg
ical
gro
up
s e.
g. (m
andib
ula
r ost
eoto
my
and
max
illa
ry o
steo
tom
y)
§§§§ S
tud
y lo
ok
ed a
t n
um
ber
of
join
ts a
ffec
ted n
ot
pat
ien
ts
***** R
esu
lts
are
subdiv
ided
acc
ord
ing t
o I
nte
r m
axil
lary
fix
atio
n s
urg
ical
gro
up
an
d r
igid
fix
atio
n g
rou
p
††
††
† R
ang
e of
moti
on
on
mouth
open
ing w
as r
edu
ced
to t
he
foll
ow
ing
per
cen
tag
es
‡‡
‡‡
‡ R
esu
lts
are
subdiv
ided
acc
ord
ing t
o s
kel
etal
gro
up
§§§§§ T
his
stu
dy
eval
uat
ed r
etro
spec
tive
(rec
ord
s =
R)
and p
rosp
ecti
ve
(cli
nic
al e
xam
=C
E)
eval
uat
ion
of
TM
D a
fter
ort
hogn
ath
ic s
urg
ery
****** R
esu
lts
are
subdiv
ided
acc
ord
ing t
o f
ixat
ion
met
hod
SP
=st
raig
ht
pla
te B
P=
ben
t p
late

142
Ta
ble
2.1
4
Percen
tage o
f p
ati
en
ts p
rese
nti
ng w
ith
con
firm
ed
TM
D a
t th
e v
ario
us
tim
e p
oin
ts††††††
A
uth
or,
Yea
r
Pre
Ort
ho
%
Pre
Su
rgery
%
< 6
mn
ths
Post
-op
%
≥ 6
mn
ths
Post
-
op
%
≥ 1
yr
Post
-op
%
≥ 2
yrs
Post
-op
%
Aghab
eigi
et a
l.,
2001
40
45
Aoya
ma
et a
l.,
2005
3
0
38
Ath
anas
iou a
nd M
else
n
1992
6
7
6
7
Ath
anas
iou a
nd Y
üce
l-
Ero
ğlu
, 1994
6
6
6
2
Ath
anas
iou e
t
al.
,1996
‡‡‡‡‡‡
M
n 6
2
Mx
88
M
n 7
7
Mx
71
Bors
tlap
et
al.
, 2004a
3
9
3
1
31
Cutb
irth
et
al.
, 1998
7
Dah
lber
g e
t al.
, 1995
5
3
De
Boev
er e
t al.
, 1996
5
8
De
Cle
rcq e
t al.
, 1995
2
6
1
8
Der
vis
an
d T
un
cer,
2002
6
0
38
Her
bosa
et
al.
, 1990
38
21

143
Au
thor,
Yea
r
Pre
Ort
ho
%
Pre
Su
rgery
%
< 6
mn
ths
Post
-op
%
≥ 6
mn
ths
Post
-
op
%
≥ 1
yr
Post
-op
%
≥ 2
yrs
Post
-op
%
Hu
et
al.
, 2000
4
4
Kal
lela
et
al.
, 2005
7
3
48
Kar
abouta
an
d M
arti
s,
1985
4
1
11
Ker
sten
s et
al.
, 1989
1
6
Lai
et
al.
, 2002
2
6
4
Lan
des
, 2004
§§
§§
§§
II
64
III
21
II 7
III
0
Lit
tle
et a
l.,
1986
4
7
59
Mil
ose
vic
an
d
Sam
uel
s, 2
000
4
3
Mota
med
i, 1
996
6
9
Nurm
inen
et
al.
, 1999
32
Oniz
awa e
t al.
, 1995
6
7
Pah
kal
a an
d H
ein
o,
2004
78
Pan
ula
et
al.
, 2000
73
60
Rav
eh e
t al.
, 1988
2
8

144
Au
thor,
Yea
r
Pre
Ort
ho
%
Pre
Su
rgery
%
< 6
mn
ths
Post
-op
%
≥ 6
mn
ths
Post
-
op
%
≥ 1
yr
Post
-op
%
≥ 2
yrs
Post
-op
%
Rodri
gues
-Gar
cia
et
al.
, 1998
4
6
74
Sch
earl
inck
et
al.
,
1994
4
6
Sm
ith
et
al.
,
1992
*******
A
73
C 8
2
Uek
i et
al.
, 2001
4
3
Uek
i et
al.
, 2002
7
4
Upto
n e
t al.
, 1984
5
3
Wes
term
ark e
t al.
,
2001
4
3
28
Wh
ite
and D
olw
ick,
1992
4
9
Wolf
ord
et
al.
,
2003
3
6
84
††
††
†† P
erce
nta
ges
hav
e bee
n r
oun
ded
up
‡‡
‡‡
‡‡ T
he
resu
lts
hav
e bee
n d
ivid
ed i
nto
tw
o g
rou
ps
dep
endin
g o
n s
urg
ery
typ
e M
n=
Man
dib
ula
r ost
eoto
my
gro
up a
nd M
x =
Max
illa
ry o
steo
tom
y gro
up
§§§§§§ T
he
resu
lts
hav
e bee
n p
rese
nte
d a
ccord
ing
to s
kel
etal
cla
ssif
icat
ion
II
= S
kel
etal
II, II
I= S
kel
etal
III
******* A
= T
MD
dia
gn
osi
s bas
ed o
n A
nam
nes
tic
eval
uat
ion
C=
TM
D d
iagn
osi
s bas
ed o
n C
lin
ical
eval
uat
ion

145
Tab
le 2
.15
Ch
an
ge i
n T
MJ
sig
ns
an
d s
ym
pto
ms
Au
thor,
Yea
r
Sig
n/
sym
pto
m
Init
ial
Tim
e P
oin
t
Foll
ow
Up
Tim
e P
oin
t †††††††
Init
ial
Tim
e
inte
rval
% A
ffecte
d
Foll
ow
up
Tim
e
inte
rva
l
% A
ffecte
d
% S
am
e %
Bett
er
% W
orse
%
New
sym
pto
ms/
sign
s
Ag
habeig
i et
al.
, 2001
Pain
Pre
-Rx
40
1 y
r
Po
st-o
p
45
30
N/R
8
N/R
Dysf
unct
ion
N/R
‡‡‡‡‡‡‡
43
32
N/R
11
N/R
Ao
yam
a et
al.
, 2005
TM
D
Dia
gno
sis
Pre
-op
29
1 y
r
Po
st-o
p
38
60
16
24
Ath
anasi
ou
and M
els
en,
1992
Musc
ula
r
pain
Pre
-op
11
6 m
nth
Po
st-o
p
11
Mand
ibu
lar
mo
bil
ity
53
67
TM
J
funct
ion
39
11
TM
J pain
8
0
Ath
anasi
ou
and Y
üce
l-
Ero
ğlu
, 1994
TM
D
Dia
gno
sis
Pre
-op
66
6 m
nth
Po
st-o
p
62
n =
1
n =
11
n =
8

146
Au
thor,
Yea
r
Sig
n/
sym
pto
m
Init
ial
Tim
e P
oin
t
Foll
ow
Up
Tim
e P
oin
t †††††††
Init
ial
Tim
e
inte
rval
% A
ffecte
d
Foll
ow
up
Tim
e
inte
rva
l
% A
ffecte
d
% S
am
e %
Bett
er
% W
orse
%
New
sym
pto
ms/
sign
s
Ath
anasi
ou e
t
al.
, 1996
TM
D i
n
mand
ibu
lar
ost
eoto
my
gro
up
Pre
-op
62
6 m
nth
Po
st-o
p
77
15
TM
D i
n
maxil
lary
ost
eoto
my
gro
up
Pre
-op
88
6 m
nth
Po
st-o
p
71
18
Azu
mi
et a
l.,
2004
TM
J
sym
pto
ms
Pre
-op
n=
6
N=
13
Po
st-o
p
n=
7
n=
1
n=
6
n=
7
Bo
rstl
ap e
t
al.
, 2004a
TM
D
Dia
gno
sis
Pre
-op
39
24 m
nth
Po
st-o
p
30
44
22
Cutb
irth
et
al.
, 1998
Cli
ck
Pre
-op
39
Po
st-o
p
21
10
Pain
13
8
10
De
Cle
rcq e
t
al.
, 1995
TM
D
Dia
gno
sis
Pre
-op
27
6 m
nth
Po
st-o
p
18
n=
34
n=
17

147
Au
thor,
Yea
r
Sig
n/
sym
pto
m
Init
ial
Tim
e P
oin
t
Foll
ow
Up
Tim
e P
oin
t †††††††
Init
ial
Tim
e
inte
rval
% A
ffecte
d
Foll
ow
up
Tim
e
inte
rva
l
% A
ffecte
d
% S
am
e %
Bett
er
% W
orse
%
New
sym
pto
ms/
sign
s
De
Cle
rcq e
t
al.
, 1998
1 t
o 2
.5 y
rs
Po
st-o
p
49
40
11
Der
vis
and
Tunce
r, 2
002
TM
D
Dia
gno
sis
Pre
-op
60
2 y
r
Po
st-o
p
38
10
Eger
mar
k e
t
al.
, 2000
TM
D
Dia
gno
sis
2.2
to 9
.5
yrs
Po
st-o
p
37
51
12
Hea
dac
he
33
67
-
Chew
ing
abil
ity
17
81
-
Fein
erm
an
and P
iecu
ch,
1995
Cli
ck
Pre
-op
52
2.5
to 9
yrs
Po
st-o
p
49
n=
7
n=
23
n=
4
TM
J pain
20
14
n=
2
n=
10
n=
1
Musc
le p
ain
33
29
n=
5
n=
16
n=
1
Hac
kney e
t
al.
, 1989
Cli
ck
Pre
-op
22
6 t
o 1
2
mnth
Po
st-
op
17
6
17
11
TM
J pain
17
11
6

148
Au
thor,
Yea
r
Sig
n/
sym
pto
m
Init
ial
Tim
e P
oin
t
Foll
ow
Up
Tim
e P
oin
t †††††††
Init
ial
Tim
e
inte
rval
% A
ffecte
d
Foll
ow
up
Tim
e
inte
rva
l
% A
ffecte
d
% S
am
e %
Bett
er
% W
orse
%
New
sym
pto
ms/
sign
s
Hu e
t al.
,
2000
TM
D
Dia
gno
sis
Pre
-op
22
6 m
nth
Po
st-o
p
41
55
10
Hw
ang e
t al.
,
2004
TM
J so
unds
Pre
-op
59
2 y
rs
Po
st-o
p
46
26
26
TM
J pain
21
28
Kall
ela
et
al.
,
2005
1 o
r m
ore
sig
ns
or
sym
pto
ms
of
TM
D
Pre
-op
73
Lat
est
Fo
llo
w u
p
1 t
o 5
yrs
Po
st-o
p
48
41
18
Kar
abo
uta
and M
arti
s,
1985
1 o
r m
ore
sig
ns
or
sym
pto
ms
of
TM
D
Pre
-op
41
n=
114
N=
280
Po
st-o
p
11.1
n=
12
N=
114
4
n=
6
N=
166
Ker
sten
s et
al.
, 1989
TM
J pain
&
dysf
unct
ion
Pre
-op
16
1.4
to
4.7
yrs
Po
st-o
p
66
12
Lai
et a
l.,
2002
Cli
ckin
g ±
Pain
Pre
-op
26
n=
6
N=
23
≥ 6
mnth
Po
st-o
p
4
n=
0
n=
6
n=
1

149
Au
thor,
Yea
r
Sig
n/
sym
pto
m
Init
ial
Tim
e P
oin
t
Foll
ow
Up
Tim
e P
oin
t †††††††
Init
ial
Tim
e
inte
rval
% A
ffecte
d
Foll
ow
up
Tim
e
inte
rva
l
% A
ffecte
d
% S
am
e %
Bett
er
% W
orse
%
New
sym
pto
ms/
sign
s
Lit
tle
et a
l.,
1986
TM
D
Dia
gno
sis
Pre
-op
47
n=
8
N=
17
1.4
to 4
.7
yrs
Po
st-o
p
59
n=
10
N=
17
6
n=
1
35
n=
6
41
n=
7
35
n=
6
Oniz
awa
et
al.
, 1995
1 o
r m
ore
subje
ctiv
e
find
ing
s
Pre
-op
67
6 m
nth
Po
st-o
p
33
30
17
Pah
kala
and
Hein
o,
200
4
TM
D
Dia
gno
sis
Pre
-Rx
78
n=
56
N=
72
1.9
yrs
Po
st-o
p
67
n=
48
N=
72
51
n=
37
N=
72
14
n=
10
N=
72
TM
J pain
n=
4
n=
11
n=
3
Cli
ckin
g
n=
5
n=
20
n=
4
Cre
pit
atio
n
n=
5
n=
1
n=
4
Lo
ckin
g
n=
0
n=
4
n=
1
Musc
le p
ain
n=
10
n=
13
n=
6
Dev
iati
on
n=
5
n=
15
n=
14
Hea
dac
he
n=
6
n=
27
n=
3

150
Au
thor,
Yea
r
Sig
n/
sym
pto
m
Init
ial
Tim
e P
oin
t
Foll
ow
Up
Tim
e P
oin
t †††††††
Init
ial
Tim
e
inte
rval
% A
ffecte
d
Foll
ow
up
Tim
e
inte
rva
l
% A
ffecte
d
% S
am
e %
Bett
er
% W
orse
%
New
sym
pto
ms/
sign
s
Pan
ula
et
al.
,
2000
1 o
r m
ore
sig
ns
or
sym
pto
ms
of
TM
D
Pre
-Rx
73
29 m
nth
Po
st-o
p
60
7
Raveh e
t al.
,
1988
TM
D e
.g.
pain
,
sublu
xat
ion
and c
lick
ing
Pre
-op
28
1 t
o 4
yrs
Po
st-o
p
26
64
7
Ro
dri
guez
-
Gar
cia
et
al.
,
1998
Pain
P
re-o
p
46
2yrs
Po
st-o
p
31
19
27
13
Sch
earl
inck
et a
l.,
1994
TM
D
Dia
gno
sis
Pre
-op
46
n=
47
N=
103
Po
st-o
p
20
68
12
11
n=
11
N=
103
Sco
tt e
t al.
,
1997
N/R

151
Au
thor,
Yea
r
Sig
n/
sym
pto
m
Init
ial
Tim
e P
oin
t
Foll
ow
Up
Tim
e P
oin
t †††††††
Init
ial
Tim
e
inte
rval
% A
ffecte
d
Foll
ow
up
Tim
e
inte
rva
l
% A
ffecte
d
% S
am
e %
Bett
er
% W
orse
%
New
sym
pto
ms/
sign
s
Sm
ith e
t al.
,
1992
TM
D
Anam
nest
ic
evalu
atio
n
Pre
-op
73
6 t
o 7
mnth
s
Po
st-o
p
50
32
18
TM
D
Cli
nic
al
evalu
atio
n
82
64
18
18
Cli
cks
67
13
20
Uek
i et
al.
,
2001
TM
D
Dia
gno
sis
Pre
-op
67
n=
28
N=
42
1 y
r
Po
st-o
p
64
n=
18
N=
28
Uek
i et
al.
,
2002
TM
D-
base
d o
n
rad
iogra
phic
exam
inat
ion
Pre
-op
74
n=
32
N=
43
6 m
nth
Po
st-o
p
n=
21
Upto
n e
t al.
,
1984
TM
J pain
&
dysf
unct
ion
sym
pto
ms
Pre
-op
53
Po
st-o
p
16
78
5
8.5

152
Au
thor,
Yea
r
Sig
n/
sym
pto
m
Init
ial
Tim
e P
oin
t
Foll
ow
Up
Tim
e P
oin
t †††††††
Init
ial
Tim
e
inte
rval
% A
ffecte
d
Foll
ow
up
Tim
e
inte
rva
l
% A
ffecte
d
% S
am
e %
Bett
er
% W
orse
%
New
sym
pto
ms/
sign
s
West
erm
ark
,
2001
1 o
r m
ore
sig
ns
or
sym
pto
ms
of
TM
D
Pre
-op
43
2 y
rs
Po
st-o
p
28
21
Whit
e and
Do
lwic
k,
1992
TM
D
Dia
gno
sis
Pre
-op
49
Po
st-o
p
3
89
8
8
Zho
u e
t al.
,
2001
Pain
Pre
-op
54
Po
st-o
p
51
Cli
ckin
g
55
67
††
††
††
† W
her
e p
oss
ible
per
centa
ges
are
rep
ort
ed,
oth
erw
ise
n=
den
ote
s th
e n
um
ber
of
pat
ien
ts a
ffec
ted
an
d N
= t
ota
l n
um
ber
of
pat
ien
ts i
n t
he
gro
up
‡‡
‡‡
‡‡
‡ N
/R =
Not
report
ed

153
Tab
le 2
.16
T
MD
fin
din
gs
in s
tud
ies
usi
ng t
he H
elk
imo I
nd
ex
Stu
dy, Y
ear
D
ysf
un
ctio
n
Sev
erit
y
Init
ial
Tim
e In
terv
al
Foll
ow
Up
Tim
e In
terv
al
Init
ial
tim
e
inte
rva
l %
Aff
ecte
d
Foll
ow
up
tim
e i
nte
rva
l %
Aff
ecte
d
% S
am
e %
Bett
er
% W
orse
Ath
anas
iou
an
d M
else
n,
19
92
P
re-o
p
6 m
on
ths
post
-op
Di0
§§§§§§§
33
33
Di1
5
8
58
D2
8
8
Ath
anas
iou
an
d Y
üce
l-
Ero
ğlu
, 1
99
4
P
re-o
p
6 m
on
ths
post
-op
Di0
3
4
38
Di1
4
9
51
Di2
1
7
11
Ath
anas
iou
et
al.
, 1996
P
re-o
p
6 m
on
ths
post
-op
Di0
2
8
26
Di1
+D
i2
72
74
Der
vis
an
d T
un
cer,
2002
N
o b
reak
dow
n r
eport
ed
Eg
erm
ark
et
al.
, 2000
P
re-o
p
2.2
to 9
.5 y
ea
rs
post
-op
D
i0
N/R
3
5
Di1
N
/R
50
D
i2
N/R
1
3
Di3
N/R
2

154
Stu
dy, Y
ear
D
ysf
un
ctio
n
Sev
erit
y
Init
ial
Tim
e In
terv
al
Foll
ow
Up
Tim
e In
terv
al
Init
ial
tim
e
inte
rva
l %
Aff
ecte
d
Foll
ow
up
tim
e i
nte
rva
l %
Aff
ecte
d
% S
am
e %
Bett
er
% W
orse
Kal
lela
et
al.
, 2005
P
re-o
p
1 t
o 5
years
post
-op
Ai0
5
0
80
Ai1
1
8
10
Ai2
3
2
10
Di0
4
3
58
Di1
5
0
38
Di2
7
5
Di3
0
0
Lan
des
, 2
004
No b
reak
dow
n r
eport
ed
Lit
tle
et a
l.,
19
86
P
re-o
p
1 t
o 4
.7 y
ears
post
-op
Ai0
********
53
41
Ai1
2
4
47
Ai2
2
4
13
Di0
N
/R
35
Di1
N
/R
53
Di2
N
/R
12
Di3
N
/R
0

155
Stu
dy, Y
ear
D
ysf
un
ctio
n
Sev
erit
y
Init
ial
Tim
e In
terv
al
Foll
ow
Up
Tim
e In
terv
al
Init
ial
tim
e
inte
rva
l %
Aff
ecte
d
Foll
ow
up
tim
e i
nte
rva
l %
Aff
ecte
d
% S
am
e %
Bett
er
% W
orse
Mil
ose
vic
an
d S
amuel
s,
20
00
P
re-o
p
At
lea
st 6
mon
ths
po
st-d
eb
on
d
D
i0
N/R
5
7
D
i1
N/R
4
3
D
i2
N/R
0
Mi0
††
††
††
††
N/R
1
0
M
i1
N/R
5
0
M
i2
N/R
4
0
Pah
kal
a an
d H
ein
o,
20
04
P
re-o
p
Mea
n o
f 1
.9 y
ears
post
-op
Di0
2
2
33
Di1
3
6
58
Di2
3
1
8
D
i3
11
0
P
anu
la e
t a
l.,
2000
‡‡
‡‡
‡‡
‡‡
P
re-o
p
Mea
n o
f 2
.5 y
ears
post
-op
Ai0
~
12
~5
0
A
i1
~6
8
~4
8
A
i2
~2
0
~2
D
i0
~4
~8
D
i1
~1
3
~3
8
D
i2
~7
5
~5
4
D
i3
~8
~0

156
Stu
dy, Y
ear
D
ysf
un
ctio
n
Sev
erit
y
Init
ial
Tim
e In
terv
al
Foll
ow
Up
Tim
e In
terv
al
Init
ial
tim
e
inte
rva
l %
Aff
ecte
d
Foll
ow
up
tim
e i
nte
rva
l %
Aff
ecte
d
% S
am
e %
Bett
er
% W
orse
Sm
ith
et
al.
, 1
992
P
re-o
p
6-7
mon
ths
po
st-o
p
A
i0
27
23
50
32
18
Ai1
4
6
73
Ai2
2
7
4
Di0
1
8
9
64
18
18
Di1
4
6
68
Di2
3
6
23
Di3
0
0
§§§§§§§
Hel
kim
o’s
Dys
fun
ctio
n I
ndex
D
i0 =
No d
ysfu
nct
ion
D
i1=
Mil
d d
ysfu
nct
ion
D
i2=
Moder
ate
dys
fun
ctio
n
D
i3=
Sev
ere
dys
fun
ctio
n
******** H
elk
imo’s
Anam
nes
tic
Index
A
i0=
Sym
pto
m f
ree
A
i1=
Mil
d s
ympto
ms
A
i2=
Sev
ere
sym
pto
ms
††
††
††
†† H
elk
imo’s
Man
dib
ula
r M
obil
ity
Index
M
i0=
N
orm
al m
obil
ity
M
i1=
Mil
d i
mpai
rmen
t
Mi2
= S
ever
ely
impai
red
‡
‡‡
‡‡
‡‡
‡ P
erce
nta
ges
rep
ort
ed i
n t
his
stu
dy
are
appro
xim
ate
on
ly a
nd h
ave
bee
n t
aken
fro
m t
he
gra
ph
in
th
e p
ubli
shed
art
icle
.

157
Tab
le 2
.17
F
ind
ing
s in
stu
die
s u
sin
g t
he C
ra
nio
Ma
nd
ibu
lar
Ind
ex (
CM
I)§§§§§§§§
S
tud
y, Y
ear
In
itia
l T
ime P
oin
t F
oll
ow
Up
Tim
e P
oin
t
Init
ial
tim
e
Inte
rv
al
CM
I M
i D
i F
oll
ow
up
tim
e I
nte
rva
l
CM
I M
i D
i
De
Bo
ever
et
al.
,
1996
Pre
-ort
ho
0.1
8
0.1
8
0.1
7
Pre
-op
0.1
7
0.2
0
0.1
5
Nem
eth e
t al.
, *********
2000
Pre
-op
N/R
N
/R
N/R
2
y P
ost
-op
WF
0.0
5†††††††††
RF
0.0
4‡
WF
0.0
8‡
RF
0.0
8‡
WF
0.0
2‡
RF
0.0
1‡
Ro
dri
gues-
Gar
cia
et
al.
,
1998
Pre
-op
0.1
4
0.1
5
0.1
3
2y P
ost
-op
0.1
0
0.0
8
0.1
2
Sco
tt e
t al.
,
1997
Valu
es
no
t re
port
ed
§§§§§§§§ T
he
CM
I co
nsi
sts
of
two s
ub-i
ndic
es:
Th
e D
ysf
un
ctio
n I
nd
ex (
Di)
an
d t
he
Mu
scle
In
dex
(M
i). A
ll t
hre
e in
dic
es r
ange
from
0 t
o 1
, w
ith
1 i
ndic
atin
g t
he
hig
hes
t le
vel
of
clin
ical
dys
fun
ctio
n
********* R
esu
lts
for
this
stu
dy
wer
e div
ided
acc
ord
ing t
o p
atie
nt
gro
up
. W
F=
wir
e fi
xat
ion
, R
F=
rig
id f
ixat
ion
††
††
††
††
† T
he
val
ues
in
dic
ate
the
chan
ge
bet
wee
n p
re-o
p a
nd p
ost
-op
sco
res
(not
actu
al C
MI,
Mi
and D
i sc
ore
s)

158
Tab
le 2
.18
Qu
ali
ty A
ssess
men
t‡‡
‡‡
‡‡
‡‡
‡
Au
thor,
Yea
r
Sel
ecti
on
SA
Sel
ecti
on
SJC
Perf
orm
an
ce
SA
Perf
orm
an
ce
SJC
Mea
sure
men
t
SA
Mea
sure
men
t
SJC
Att
riti
on
SA
Att
riti
on
SJC
Over
all
Bia
s
Ag
habeig
i et
al.
, 2001
Hig
h
Hig
h
Lo
w
Lo
w
Hig
h
Hig
h
Lo
w
Lo
w
Hig
h
Ao
yam
a et
al.
, 2005
Hig
h
Hig
h
Hig
h
Hig
h
Hig
h
Hig
h
Lo
w
Lo
w
Hig
h
Ath
anasi
ou
and M
els
en,
1992
Hig
h
Hig
h
Hig
h
Hig
h
Hig
h
Hig
h
Lo
w
Lo
w
Hig
h
Ath
anasi
ou
and Y
üce
l-
Ero
ğlu
,1994
Lo
w
Lo
w
Lo
w
Lo
w
Hig
h
Hig
h
Lo
w
Lo
w
Hig
h
Ath
anasi
ou
et a
l.,
1996
Hig
h
Hig
h
Hig
h
Hig
h
Hig
h
Hig
h
Hig
h
Hig
h
Hig
h
Azu
mi
et a
l.,
2004
H
igh
H
igh
L
ow
L
ow
H
igh
H
igh
L
ow
L
ow
H
igh
Bail
ey e
t al.
,
2001
H
igh
H
igh
H
igh
H
igh
H
igh
H
igh
L
ow
L
ow
H
igh
Bo
rstl
ap e
t
al.
, 2004a
Hig
h
Hig
h
Lo
w
Lo
w
Hig
h
Hig
h
Lo
w
Lo
w
Hig
h
Bo
rstl
ap e
t
al.
, 2004b
Hig
h
Hig
h
Lo
w
Lo
w
Lo
w
Hig
h
Lo
w
Lo
w
Hig
h
Cutb
irth
et
al.
, 1998
Hig
h
Hig
h
Hig
h
Hig
h
Hig
h
Hig
h
Lo
w
Lo
w
Hig
h
Dah
lber
g e
t
al.
, 1995
Hig
h
Hig
h
Hig
h
Hig
h
Hig
h
Hig
h
Lo
w
Lo
w
Hig
h
De
Bo
ever
et
al.
, 1996
Hig
h
Hig
h
Lo
w
Lo
w
Lo
w
Lo
w
Lo
w
Lo
w
Hig
h

159
Au
thor,
Yea
r
Sel
ecti
on
SA
Sel
ecti
on
SJC
Perf
orm
an
ce
SA
Perf
orm
an
ce
SJC
Mea
sure
men
t
SA
Mea
sure
men
t
SJC
Att
riti
on
SA
Att
riti
on
SJC
Over
all
Bia
s
De
Cle
rcq e
t
al.
, 1995
Hig
h
Hig
h
Hig
h
Hig
h
Hig
h
Hig
h
Lo
w
Hig
h
Hig
h
De
Cle
rcq e
t
al.
, 1998
Hig
h
Hig
h
Hig
h
Hig
h
Hig
h
Hig
h
Lo
w
Lo
w
Hig
h
Der
vis
and
Tunce
r, 2
002
H
igh
H
igh
H
igh
H
igh
H
igh
H
igh
L
ow
L
ow
H
igh
Eger
mar
k e
t
al.
, 2000
Hig
h
Hig
h
Lo
w
Lo
w
Hig
h
Hig
h
Lo
w
Lo
w
Hig
h
Fein
erm
an
and P
iecu
ch,
1995
Hig
h
Lo
w
Hig
h
Hig
h
Hig
h
Hig
h
Lo
w
Lo
w
Hig
h
Fly
nn e
t al.
,
1990
H
igh
H
igh
H
igh
H
igh
H
igh
H
igh
L
ow
L
ow
H
igh
Fo
rsse
ll e
t
al.
, 1998
Hig
h
Hig
h
Hig
h
Hig
h
Hig
h
Hig
h
Lo
w
Lo
w
Hig
h
Gag
gl
et
al.
,1999
Hig
h
Hig
h
Hig
h
Hig
h
Hig
h
Hig
h
Hig
h
Hig
h
Hig
h
Hac
kney e
t
al.
, 1989
Hig
h
Hig
h
Hig
h
Hig
h
Hig
h
Hig
h
Hig
h
Hig
h
Hig
h
Her
bo
sa e
t
al.
, 1990
Hig
h
Hig
h
Hig
h
Hig
h
Hig
h
Hig
h
Lo
w
Lo
w
Hig
h
Ho
ppen
reij
s
et a
l.,
1998
Hig
h
Hig
h
Hig
h
Hig
h
Hig
h
Hig
h
Lo
w
Lo
w
Hig
h
Hu e
t al.
,
2000
H
igh
H
igh
L
ow
L
ow
H
igh
H
igh
L
ow
L
ow
H
igh
Hw
ang e
t al.
,
2000
Hig
h
Hig
h
Hig
h
Lo
w
Hig
h
Hig
h
Lo
w
Lo
w
Hig
h

160
Au
thor,
Yea
r
Sel
ecti
on
SA
Sel
ecti
on
SJC
Perf
orm
an
ce
SA
Perf
orm
an
ce
SJC
Mea
sure
men
t
SA
Mea
sure
men
t
SJC
Att
riti
on
SA
Att
riti
on
SJC
Over
all
Bia
s
Hw
ang e
t al.
,
2004
H
igh
H
igh
H
igh
H
igh
H
igh
H
igh
L
ow
L
ow
H
igh
Kall
ela
et
al.
,
2005
H
igh
H
igh
H
igh
H
igh
H
igh
H
igh
L
ow
L
ow
H
igh
Kar
abo
uta
and M
arti
s,
1985
Hig
h
Hig
h
Lo
w
Lo
w
Hig
h
Lo
w
Hig
h
Lo
w
Hig
h
Ker
sten
s et
al.
, 1989
Hig
h
Hig
h
Hig
h
Hig
h
Hig
h
Hig
h
Lo
w
Lo
w
Hig
h
Lai
et a
l.,
2002
H
igh
H
igh
L
ow
H
igh
H
igh
H
igh
L
ow
L
ow
H
igh
Landes
, 2004
Hig
h
Hig
h
Hig
h
Hig
h
Hig
h
Hig
h
Hig
h
Hig
h
Hig
h
Lin
k a
nd
Nic
ker
son,
1992
Hig
h
Hig
h
Lo
w
Hig
h
Hig
h
Lo
w
Hig
h
Hig
h
Hig
h
Lit
tle
et a
l.,
1986
H
igh
L
ow
L
ow
L
ow
H
igh
H
igh
H
igh
H
igh
H
igh
Milo
sevic
and S
am
uels
,
2000
Hig
h
Hig
h
Hig
h
Hig
h
Hig
h
Hig
h
Lo
w
Lo
w
Hig
h
Mota
med
i,
1996
H
igh
H
igh
H
igh
H
igh
L
ow
L
ow
H
igh
H
igh
H
igh
Nem
eth e
t
al.
, 2000
Hig
h
Hig
h
Hig
h
Hig
h
Hig
h
Hig
h
Lo
w
Lo
w
Hig
h
Nurm
inen e
t
al.
, 1999
Hig
h
Hig
h
Lo
w
Lo
w
Lo
w
Lo
w
Lo
w
Lo
w
Hig
h
Oniz
awa
et
al.
, 1995
Hig
h
Hig
h
Hig
h
Hig
h
Hig
h
Hig
h
Lo
w
Lo
w
Hig
h

161
Au
thor,
Yea
r
Sel
ecti
on
SA
Sel
ecti
on
SJC
Perf
orm
an
ce
SA
Perf
orm
an
ce
SJC
Mea
sure
men
t
SA
Mea
sure
men
t
SJC
Att
riti
on
SA
Att
riti
on
SJC
Over
all
Bia
s
Pah
kala
and
Hein
o,
2004
Hig
h
Hig
h
Hig
h
Hig
h
Hig
h
Hig
h
Lo
w
Lo
w
Hig
h
Pan
ula
et
al.
,
2000
H
igh
L
ow
H
igh
H
igh
H
igh
H
igh
L
ow
L
ow
H
igh
Raveh e
t al.
,
1988
H
igh
H
igh
H
igh
H
igh
H
igh
H
igh
L
ow
L
ow
H
igh
Ro
dri
guez
-
Gar
cia
et
al.
,
1998
Hig
h
Hig
h
Lo
w
Lo
w
Lo
w
Lo
w
Lo
w
Lo
w
Hig
h
Sch
earl
inck
et a
l.,
1994
Hig
h
Hig
h
Hig
h
Lo
w
Lo
w
Lo
w
Hig
h
Hig
h
Hig
h
Sco
tt e
t al.
,
1997
H
igh
L
ow
L
ow
L
ow
H
igh
H
igh
L
ow
L
ow
H
igh
Sm
ith e
t al.
,
1992
H
igh
H
igh
L
ow
L
ow
H
igh
H
igh
L
ow
L
ow
H
igh
Tim
mis
et
al.
, 1986
Hig
h
Hig
h
Hig
h
Hig
h
Hig
h
Hig
h
Lo
w
Lo
w
Hig
h
Uek
i et
al.
,
2001
H
igh
H
igh
H
igh
H
igh
H
igh
H
igh
H
igh
H
igh
H
igh
Uek
i et
al.
,
2002
H
igh
H
igh
L
ow
L
ow
H
igh
H
igh
L
ow
L
ow
H
igh
Upto
n e
t al.
,
1984
H
igh
H
igh
H
igh
H
igh
H
igh
H
igh
L
ow
L
ow
H
igh
West
erm
ark
et a
l.,
2001
Hig
h
Hig
h
Hig
h
Hig
h
Hig
h
Hig
h
Lo
w
Lo
w
Hig
h
Whit
e and
Do
lwic
k,
1992
Hig
h
Hig
h
Hig
h
Hig
h
Hig
h
Hig
h
Lo
w
Lo
w
Hig
h

162
Au
thor,
Yea
r
Sel
ecti
on
SA
Sel
ecti
on
SJC
Perf
orm
an
ce
SA
Perf
orm
an
ce
SJC
Mea
sure
men
t
SA
Mea
sure
men
t
SJC
Att
riti
on
SA
Att
riti
on
SJC
Over
all
Bia
s
Wo
lfo
rd e
t
al.
, 2003
Hig
h
Hig
h
Hig
h
Hig
h
Hig
h
Hig
h
Lo
w
Lo
w
Hig
h
Zho
u e
t al.
,
2001
H
igh
H
igh
H
igh
H
igh
H
igh
H
igh
L
ow
H
igh
H
igh
‡‡
‡‡
‡‡
‡‡
‡ T
his
tab
le i
ndic
ates
th
e le
vel
of
bia
s as
sign
ed t
o e
ach
of
the
sect
ion
s (s
elec
tion
, p
erfo
rman
ce, m
easu
rem
ent
and a
ttri
tion
) o
f th
e qual
ity
asse
ssm
ent
form
s
by
both
rev
iew
ers
(SA
an
d S
JC)
as w
ell
as t
he
over
all
bia
s as
sign
ed t
o e
ach
stu
dy.
If
a st
ud
y sc
ore
d h
igh
bia
s in
an
y se
ctio
n i
t w
as a
uto
mat
ical
ly g
iven
an o
ver
all
hig
h b
ias.

163
2.3.1 Evidence Tables
Study characteristics (Table 2.8)
A total of 53 articles were analysed for the review. The majority of studies (n=41) were
of a cohort design, 8 were case-control studies, whilst 3 were part of larger randomised
controlled trials. Almost half of the studies (n=20) were not explicit about whether the
study was retrospective or prospective, although with the majority of these it could be
assumed based on the details provided in the study. Based on these assumptions there
were 21 retrospective and 28 prospective studies (Table 2.8); the remaining 4 articles
(Karabouta and Martis, 1985; Raveh et al., 1988; Kerstens et al., 1989; Flynn et al.,
1990) were not sufficiently clear to determine whether they were prospective or
retrospective.
Forty-one studies followed patients longitudinally, with patients clinically examined
before and after surgery. Signs and symptoms of TMD prior to surgery were compared
with those post-surgery, although the post-surgical time interval varied from 6 months
to 4 years. In seven studies, records of the patients were examined and surveys or
questionnaires were sent to patients thus providing self-reported assessments of TMD.
In eight studies radiological changes or other imaging modalities (such as MRI or
arthrography) were used as diagnostic tests for TMD.
The papers which made up this systematic review spanned from the North America to
Europe and Asia. The sites ranged from private practices to university hospitals and
multi centre trials were also included.
Study participants (Table 2.9)
The sample size for the studies ranged from 11 to over 2000 patients. In the majority of
these, the ratio of females to males was over 2:1. The mean age of the participants
ranged from 19 to 36.5 years. Whilst not all studies reported a mean age, the majority
(n=39) provided an age range.
A small number of studies specified the ethnicity of patients, in fact only seven studies
reported this information (Link and Nickerson, 1992; Smith et al., 1992; Flynn et al.,

164
1990; Nurminen et al., 1999; Hu et al., 2000; Zhou et al., 2001; Ueki et al., 2002). Not
all studies reported their inclusion/ exclusion criteria; having this information is
essential for determination of the extent of bias when assessing the study.
The types of skeletal deformities investigated in the studies were extensive. Thirty-three
articles looked at patients with skeletal II deformities, either in isolation (15 articles) or
in combination with other deformities such as anterior open bites (18 articles). Twenty-
two studies looked at patients with skeletal III deformities, whilst 16 assessed patients
with anterior open bites. Ten studies did not specify the malocclusion type or skeletal
deformity of their subjects.
Orthognathic Interventions (Table 2.10)
As skeletal II deformities were the most common amongst the study participants,
mandibular advancement was the most common orthognathic intervention (n=28
studies). The majority of the advancements were sagittal split osteotomies (BSSO)
(n=27), although in two of the studies vertical ramus osteotomies (VRO) were carried
out for mandibular advancement (Athanasiou and Melsen, 1992; Link and Nickerson,
1992). Thirteen studies favoured BSSO setback as the intervention of choice for
correction of skeletal III deformities, whilst VRO setback was performed in six studies.
Le Fort I osteotomies were the most common maxillary interventions. However, in the
majority of studies the direction of movement of the maxillary surgery was not
specified. Six of the articles clearly stated that they had looked at Le Fort I impaction,
whilst three looked at advancement osteotomies. This was in contrast with the
mandibular surgeries, where only three studies failed to report on the type of
mandibular intervention.
In eighteen of the studies, bimaxillary surgery was reported, with the surgery being a
combination of the various mandibular and maxillary procedures. Forty studies had a
subset of participants who had undergone only mandibular surgery, whilst twenty had a
subset who had solely undergone maxillary Le Fort I procedures.
Other surgical interventions also reported, but with less frequency, included segmental
procedures, distraction osteogenesis and genioplasty. Of the 53 studies included, only

165
seven failed to include any information on the types of orthognathic surgical
interventions performed.
Classification of TMD (Table 2.11)
Signs and symptoms of TMD were evaluated by patient self report, clinical examination
and/or radiographic findings. In the majority of the studies (n=44), clinical
examinations were conducted, whilst patients‘ self report was utilised in twenty-six
studies. Clinical examination and self report were combined in twenty studies. In only
four of the studies did the patients‘ self report solely provide information regarding TMJ
status. Radiographic findings contributed to the diagnosis of TMD or TMJ findings in
eight studies.
The majority of the studies did not report a formal classification for the TMD diagnosis.
Of the 53 studies included in this systematic review, 37 studies did not appear to
classify TMD according to any published criteria. This implies that there is potential for
great variability in the diagnosis of TMD. Only sixteen studies diagnosed TMD using a
validated scale; twelve of these studies used the Helkimo/Modified Helkimo Index
(Helkimo, 1974), whilst four studies used the Cranio Mandibular Index (Fricton and
Schiffman, 1986). None of the studies classified TMD according to the RDC/TMD
criteria which is the classification system now recommended in research (Wahlund et
al., 1998). It is, however, important to note that the RDC/TMD was first described in
1992 and only forty of the included studies were published after this time and could
potentially have used the RDC/TMD criteria.
Self reported TMD symptoms (Table 2.12)
Of the 53 included studies, only 18 presented information regarding the symptoms
reported by patients (some studies stated that they looked at this but did not report on
the findings).
Joint sounds
With regards to joint sounds reported by the subjects, the pre-surgical prevalence ranged
from 27 % to 38 % and post-surgical prevalence ranged from 3% to 50%. In the studies
that followed subjects longitudinally, the percentage of subjects experiencing joint
sounds decreased post-surgically in two studies: clicking reduced from 28% to 3%

166
(Kallela et al., 2005) and joint sounds from 24% to 20% (Westermark et al., 2001). The
prevalence of joint sounds remained the same in one study at 30% (De Clercq et al.,
1998) and clicking increased in one study from 38% to 43% (Aghabeigi et al., 2001).
The most commonly reported joint sounds were clicks (6 studies), whilst crepitus was
reported in 3 studies (Flynn et al., 1990; White and Dolwick, 1992; Kallela et al.,
2005).
Pain
Painful symptoms reported by patients included TMJ pain, jaw, face and muscle pain,
pain on movement and ear pain. The percentage of patients reporting TMJ pain ranged
from 11 % to 28 % prior to surgery and from 6% to 19% after surgery. In all studies that
reported both pre-surgical and post-surgical results, the percentage of patients affected
by TMJ pain decreased post-surgically (Hackney et al., 1989; Westermark et al., 2001;
Kallela et al., 2005). A similar trend was seen with jaw pain, where decreases from 45%
to 38% (Aghabeigi et al., 2001) and from 23% to 17% (De Clercq et al., 1998) were
observed. Facial pain, muscle pain and pain on movement were also found to have a
similar tendency to decrease post-surgery. A small number of studies (n=3) used a
Visual Analogue Scale (VAS) to determine changes in patients‘ perceptions to pain;
with the exception of one study (Wolford et al., 2003), the results showed a reduction in
VAS scores post-operatively.
Movement
With regards to jaw movements, the percentage of patients affected by a limitation in
mouth opening increased post-surgically from: 19% to 21% and from 3% to 14% (De
Clercq et al., 1998; Aghabeigi et al., 2001). This was also seen in a study using a VAS
scale where the average overall score increased from 4.5 to 4.8 (Wolford et al., 2003).
The percentage of patients affected by jaw locking either remained the same (De Clercq
et al., 1998) or decreased following surgery (Timmis et al., 1986; Pahkala and Heino,
2004; Kallela et al., 2005).
Other
The percentage of patients experiencing headaches reduced post-surgery in all studies
that provided this information (n=6). This reduction also applied to chewing difficulties

167
and parafunction, although fewer studies recorded these parameters especially with
regards to pre and post-surgical results (n=1 and n=3 respectively).
Clinical TMD signs (Table 2.13)
A range of TMD signs were reported. For the purpose of this review, these were
categorised according to:
Joint sounds
Pain
Range of jaw movement
Jaw locking
Deviation
Joint sounds
Clicking was the most commonly reported joint sound and the percentage of patients
affected prior to surgery ranged from 6% (Raveh et al., 1988) to 88% (Gaggl et al.,
1999). Post-surgically the percentage of patients affected by clicking ranged from 4%
(Raveh et al., 1988) to 64% (Smith et al., 1992). The percentage of crepitus reported
was between 3% (Raveh et al., 1988) and 36% (Gaggl et al., 1999) pre-surgically and
between 2% (Raveh et al., 1988) and 30% (Dervis and Tuncer, 2002) post-surgically. In
the majority of studies that presented both pre-surgical and post-surgical data, there was
a tendency for the percentage of patients affected by joint clicking to decrease post-
surgically (22 studies out of 24). Only two studies (Scott et al., 1997; Panula et al.,
2000) found that clicking increased following surgery.
With regards to crepitus, the findings were varied. Some studies reported a decrease in
crepitus post-surgery (Gaggl et al., 1999; Panula et al., 2000; Dervis and Tuncer, 2002;
Kallela et al., 2005), whilst others reported that it either remained the same (Herbosa et
al., 1990; Smith et al., 1992; Ueki et al., 200) or increased (Rodrigues-Garcia et al.,
1998; Nemeth at al., 2000; Pahkala and Heino, 2004).
Pain
Pre-surgical TMJ pain varied from 3% (Aoyama et al., 2005) to 45% (Panula et al.,
2000) and post surgically, it ranged from 0 (Athanasiou and Melsen, 1992) to 29%

168
(Scott et al., 1997). In the majority of studies, the proportion of patients affected by
TMJ pain decreased post-surgically (14 studies out of 18). It was, however, seen to
increase in three studies (Azumi et al., 2004; Borstlap et al., 2004b; Aoyama et al.,
2005) and remained the same in one (Timmis et al., 1996).
Muscle pain was also a commonly reported TMD sign and the proportion of
symptomatic individuals ranged from 8% (De Boever et al., 1996) to 70% (Dervis and
Tuncer, 2002) prior to surgery. Following surgery, the percentage of affected patients
ranged from 0% (Kallela et al., 2005) to 40% (Dervis and Tuncer, 2002). When
comparing the pre and post-surgical findings, the majority of studies (9 out of 11)
showed a decrease in the percentage of patients affected by muscle pain post-surgery.
Only one study (Aoyama et al., 2005) reported an increase in symptoms, whilst one
study found that it remained the same (Athanasiou and Melsen, 1992).
Movement
The range of jaw movements involved observation of the results for maximal incisal
opening, right and left lateral excursions and the percentage of patients affected by
limited mouth opening. The values recorded for maximal incisal opening (MIO) ranged
from 44.4mm to 50.1mm prior to surgery and between 40.7mm and 52mm following
surgery. MIO decreased post-surgery in the majority of the studies, however the longer
the follow-up period reported the greater the tendency for this to improve. Gaggl et al.
(1999) reported a MIO value of 47.5mm prior to surgery and 35.5mm three months
post-surgery, but studies that had a longer follow-up such as Borstlap et al. (2004a)
showed a reduction from 46.4mm prior to surgery to 45.6mm two years post-surgically
(which at 1mm is unlikely to be clinically relevant).
The values recorded for lateral excursions were within the expected range, at
approximately 7mm to 10.3mm prior to surgery and slightly reduced at 6.5mm to
9.8mm following surgery.
A small number of studies (n=9) reported the percentage of patients affected by limited
mouth opening. Of these, the percentages ranged from 0 (Panula et al., 2000) to 53%
(Athanasiou and Melsen, 1992) prior to surgery and 3% (Karabouta and Martis, 1985)
to 64% (Athanasiou and Melsen, 1992) post-surgery. In most cases there was an

169
increase in the percentage of patients affected by limited opening post-surgery (3
studies out of 5).
Jaw locking and deviations
Jaw locking and deviations on jaw opening were rarely reported in the clinical findings.
Only one study (Schearlinck et al., 1994) reported the incidence of jaw locking and this
was seen in 2% of post-surgery subjects. There were no pre-surgical results available
for this study. With regards to deviations, the prevalence ranged between 25% (Timmis
et al., 1996) and 88% (Gaggl et al., 1999) pre-surgically and between 5% (Karabouta
and Martis, 1985) and 96% (Gaggl et al., 1999) post-surgery. It was not possible to
identify any trends in these results as there were too few studies which provided this
information.
Percentages of patients presenting with confirmed TMD at the various time parts
(Table 2.14)
For the majority (n=31) of the studies that reported the overall prevalence of TMD
amongst their participants, the initial time point was prior to surgery. Very few studies
(Nurminen et al., 1999; Panula et al., 2000; Aghabiegi et al., 2001; Pakhala and Heino,
2004) looked at patients at the start of treatment before any pre-surgical orthodontics.
Eighteen studies also reported post-surgery follow-up, this ranged from 6 months post-
surgery to studies that followed the patients more than 2 years post-surgery. Thus there
was great variation in the follow-up periods.
TMD was reported to affect between 7% (Cutbirth et al., 1998) and 78% (Pahkala and
Heino, 2004) of the participants prior to surgery. In the eighteen longitudinal studies
with follow up data, the post-operative prevalence of TMD varied. The percentage of
patients affected by TMD was found to decrease in the majority (n=10, N=18) of the
studies. This decrease in TMD was marked in some studies from 43% to 28% and from
73% to 48% (Westermark et al., 2001; Kallela et al., 2005) and less in others e.g. 66%
to 62% (Athanasiou and Yücel-Eroğlu, 1994). TMD prevalence remained the same in
one study (Athanasiou and Melsen, 1992) and actually increased in five studies (Little
et al., 1986; Rodrigues-Garcia et al., 1998; Aghabiegi et al., 2001; Wolford et al., 2003;
Aoyama et al., 2005). This increase was marked in the Wolford et al. (2003) study,

170
where the percentage of participants affected by TMD increased from 36% to 84%
following surgery.
Athanasiou et al. (1996) reported TMD in patients who had either mandibular or
maxillary osteotomies. The results indicated that the percentage of patients affected by
TMD increased in the mandibular osteotomy group and decreased in the maxillary
group. Whilst Landes (2004) reported the prevalence of TMD in Skeletal II and Skeletal
III groups pre and post-orthognathic surgery and found that the percentage of patients
affected by TMD decreased in both skeletal groups.
Change in TMJ signs and symptoms (Table 2.15)
Thirty five studies reported changes in TMD / TMJ signs and symptoms and these
included:
Pain (general)
Muscle pain
TMJ pain
Dysfunction
Mandibular mobility
TMJ function
Click
Headache
Chewing ability
TMJ sounds
Crepitation
Locking
Deviation
One or more subjective signs or symptoms
There was great variability in the signs and symptoms investigated amongst the studies.
The initial time point for most studies was prior to surgery, although in two studies
(Panula et al., 2000; Zhou et al., 2001) the initial time point was prior to any pre-
surgical orthodontic treatment. Subsequent follow-up time intervals ranged from 6
months to 9 years (Egermark et al., 2000).

171
There was little consistency in the results for changes in TMJ signs and symptoms
during follow-up. Only thirteen studies reported whether patients who were
asymptomatic prior to surgery developed new signs and symptoms post-surgery and this
ranged from 4% (Karabouta and Martis, 1985) to 35% (Little et al., 1986).
When considering whether signs or symptoms improved, the percentage ranged from
6% improvement in TMJ pain (Hackney et al., 1989) to 89% improvement in TMD
diagnosis (White and Dolwick, 1992). Between 5% (Upton et al., 1984) and 41% (Little
et al., 1986) showed worsening of TMJ signs and/or symptoms. In the majority of
studies which reported whether symptoms got better, worse or remained the same, the
percentage of patients whose symptoms improved (18 studies out of 23), outweighed
those whose symptoms worsened (4 studies out of 23).
In patients who had TMJ signs and symptoms at the initial time point, the proportion
whose symptoms remained the same ranged from 3% (White and Dolwick, 1992) to
67% (Smith et al., 1992), depending on which sign or symptom was being studied.
TMD findings in studies using the Helkimo Index (Table 2.16)
Twelve studies classified TMD according to the Helkimo, or modified Helkimo, Index.
Of these, two studies (Dervis and Tuncer, 2002; Landes, 2004) did not report a
breakdown of the results into the Dysfunction and Anamnestic Indices. In the remainder
of the studies, the results were reported according to either the Dysfunction Index
(where Di0 indicates no dysfunction, Di1 mild dysfunction, Di2 moderate dysfunction
and Di3 severe dysfunction) and/or the Anamnestic Index (Ai0 indicates symptom free,
Ai1 mild symptoms, Ai2 moderate symptoms and Ai3 severe symptoms).
Three studies (Little et al., 1986; Egermark et al., 2000; Milosevic and Samuels, 2000)
had incomplete results for the initial time point. In the remaining studies, both the pre
and post-surgical percentage of patients with TMD was reported. The percentage of
patients with no dysfunction (Di0) pre-operatively ranged from 4% (Panula et al., 2000)
to 43% (Kallela et al., 2005). Post-surgery this changed to between 8% (Panula et al.,
2000) and 58% (Kallela et al., 2005). In four of the studies where a comparison was
possible, the proportion of Di0 patients increased post-surgery, it remained the same in

172
one study (Athanasiou and Melsen, 1992) and decreased in two studies (Smith et al.,
1992; Athanasiou et al., 1996).
When mild dysfunction is considered (Di1), the proportion of patients affected ranged
from 13% (Panula et al., 2000) to 58% (Athanasiou and Melsen, 1992) prior to surgery,
and between 38% (Panula et al., 2000; Kallela et al., 2005) and 68% post-surgery
(Smith et al., 1992). The proportion of moderate dysfunction (Di2) ranged from 7%
(Kallela et al., 2005) to 75% (Panula et al., 2000) prior to surgery and between 5%
(Kallela et al., 2005) and 54% (Panula et al., 2000) post-surgery. Very few studies
reported patients with severe dysfunction (Di3) (n=3). In four of the studies the
proportion of Di1 patients increased post-surgery, whilst the proportion of Di2 and Di3
patients showed a tendency to decrease post-surgery (n=5).
Only four studies also recorded the Anamnestic Index (Little et al., 1986; Smith et al.,
1992; Panula et al., 2000; Kallela et al., 2005) and the results varied between studies.
In two studies the proportion of patients who were symptom free (Ai0) increased post-
surgery (Panula et al., 2000; Kallela et al., 2005). In the remaining two studies the
proportion of Ai0 patients decreased post-surgery (Little et al., 1986, Smith et al.,
1992). Similar results were also seen with mild symptoms (Ai1). However the
percentage of patients with severe symptoms (Ai2) decreased following surgery in all
cases (Little et al., 1986; Smith et al., 1992; Panula et al., 2000; Kallela et al., 2005).
One study (Milosevic and Samuels, 2000) reported results for the mandibular mobility
index, however only post-surgical results were given and, as such, pre/post- surgery
comparisons were not possible.
TMD findings in studies using the CMI index (Table 2.17)
Of the 53 eligible articles, only four studies used the Cranio Mandibular Index (CMI)
for the classification of TMD (De Boever et al., 1996; Scott et al., 1997; Rodrigues-
Garcia et al., 1998; Nemeth et al., 2000). Of these four studies, Scott et al. (1997) did
not report any values, whilst Nemeth et al. (2000) reported the change between pre and
post-surgery scores for wire fixation and rigid fixation groups (Table 2.17).

173
Prior to surgery the CMI values were between 0.14 (Rodrigues-Garcia et al., 1998) and
0.18 (De Boever et al., 1996). When comparing the Dysfunction Index scores,
Rodrigues-Garcia et al. (1998) reported a value of 0.13, whilst De Boever et al. (1996)
reported a value of 0.17. The Muscle Index scores on the other hand were 0.18 (De
Boever et al., 1996) and 0.15 (Rodrigues-Garcia et al., 1998) respectively.
Quality Assessment (Table 2.18)
The results of the quality assessment are presented in Table 2.18. Both investigators
(SA and SJC) scored the articles independently, according to the four quality
assessment categories (selection, performance, measurement and attrition). If one, or
more, of the categories was recorded as a high risk of bias, then this classification
applied to the article as a whole. This assessment meant that all 53 eligible articles were
judged to be at high risk of bias.
Quality of Life
There were no studies identified which matched the inclusion criteria for this review
and which looked at how TMD affected quality of life in orthognathic patients. As such
no conclusions could be drawn with regards to this outcome measure.
2.3.2 Meta-analyses
Twelve studies used the Helkimo Index (Helkimo, 1974) to classify TMD in pre and/or
post-surgery patients (Table 2.16). Although the patients represented in these studies
had differing combinations of skeletal deformities, malocclusions, and had undergone a
range of orthognathic interventions, there was sufficient homogeneity to carry out a
meta-analysis on the proportion of patients affected by TMD prior to surgery. However
it was not appropriate to carry out a meta-analysis on the post-surgical proportions as
the patients in these studies had undergone different interventions and this was
considered to be a source of marked clinical heterogeneity. A meta-analysis was carried
out based on data from the five studies that had complete pre-operative results (Smith et
al., 1992; Athanasiou and Yücel-Eroğlu, 1994; Panula et al., 2000; Pahkala and Heino,
2004; Kallela et al., 2005). Although 12 studies were identified for potential inclusion,

174
7 were eliminated on the basis of incomplete or duplicated results; this will be discussed
in further detail at a later stage.
Two further subgroups were identified in this review which were sufficiently
homogenous to enable meta-analyses to be carried out regarding the effect of surgery on
TMD prevalence.
1. Patients with Skeletal II deformity undergoing BSSO advancement procedures
2. Patients with vertical maxillary excess undergoing Le Fort 1 maxillary
impaction procedures.
In both of these subgroups only those studies where TMD was classified according to
Helkimo‘s Index were included, as this reduces potential measurement bias. In addition
as the patients within each subgroup had undergone the same intervention, differences
in performance bias were less likely to be a major source of heterogeneity. It should be
noted, however, that the vertical relationships of the patients in these subgroups were
not specified.
A further factor which was taken into account prior to conducting the meta-analyses
was whether there was the potential for the patients to have been included in more than
one study. There was a high chance of this occurring in the Athanasiou longitudinal
studies between 1992 and 1996. Personal communication with Professor Athanasiou
revealed that the data reported from the three longitudinal studies (Athanasiou and
Melsen, 1992; Athanasiou and Yücel-Eroğlu, 1994; Athanasiou et al., 1996) were
derived from the same pool of patients. As such it was necessary to eliminate two of
these studies from the meta-analysis to avoid the risk of duplication of data.
Proportion of orthognathic patients with TMD prior to surgery
Statistical tests of heterogeneity were carried out on the five studies eligible for meta-
analysis (Table 2.19), to assess whether the individual study results were likely to
reflect a single underlying effect, as opposed to a distribution of effects. The P value of
<0.001 signified that the null hypothesis of homogeneity should be rejected, which
indicates variations between the studies which are in excess of sampling variation,
therefore a random effects model was chosen.

175
Study/ Method Study Estimate /
Pooled Estimate
95% Confidence Interval
Lower Upper
Athanasiou and Yucel-Eroglu
(1994)
0.66 0.56 0.76
Kallela et al., ( 2005) 0.57 0.42 0.73
Smith et al., (1992)
0.82 0.66 0.98
Pahkala and Heino, (2004) 0.67 0.57 0.77
Panula et al., (2000) 0.97 0.92 1.01
Pooled (Fixed) 0.86 0.82 0.89
Pooled (Random) 0.74 0.57 0.92
Test for heterogeneity: Q= 65.384 on 4 degrees of freedom (P<0.001)
Table 2.19 Heterogeneity test and Meta-analysis for the overall proportion of
patients with TMD prior to surgery (using the Helkimo Index)
The random effects pooled estimate of TMD prevalence prior to surgery for all studies
was 74% (CI 57% to 92%) (Table 2.19, Figure 2.6). There was significant between-
study variation (Figure 2.6) and the individual study estimates (66%, 57%, 82%, 67%
and 97%) varied greatly (Table 2.19).
Figure 2.6 Forest plot of the overall proportion of patients with TMD pre-
operatively (using the Helkimo Index)

176
Patients with Skeletal II deformity undergoing BSSO advancement procedures
Statistical tests of heterogeneity were carried out and Tables 2.20a to 2.20c report the
findings of these tests. P-values of P=0.005, P<0.001 and P=0.0041 all indicate
significant heterogeneity between the results of the included studies (rejection of the
null hypothesis of homogeneity), and variations between the studies in excess of
sampling variation. As discussed previously a random effects model was therefore
utilised. The meta-analysis of the studies using fixed and random models is shown in
Tables 2.20a to 2.20c
Study/ Method Study Estimate /
Pooled Estimate
95% Confidence Interval
Lower Upper
Athanasiou and Yucel-Eroglu
(1994)
0.33 0.07 0.60
Kallela et al. (2005)
0.57 0.42 0.73
Smith et al., (1992)
0.82 0.66 0.98
Pooled (Fixed) 0.64 0.54 0.74
Pooled (Random) 0.59 0.35 0.84
Test for heterogeneity: Q= 10.500 on 2 degrees of freedom (P= 0.005)
Table 2.20a Heterogeneity test and Meta-analysis for the proportion of skeletal II
patients with TMD prior to surgery (using the Helkimo Index)
Study/ Method Study Estimate /
Pooled Estimate
95% Confidence Interval
Lower Upper
Athanasiou and Yucel-Eroglu
(1994)
0.83 0.62 1.04
Kallela et al. (2005)
0.43 0.27 0.58
Smith et al. (1992)
0.91 0.79 1.03
Pooled (Fixed) 0.74 0.66 0.83
Pooled (Random) 0.72 0.40 1.04
Test for heterogeneity: Q= 24.721 on 2 degrees of freedom (P<0.001)
Table 2.20b Heterogeneity test and Meta-analysis for proportion of skeletal II
patients with TMD following surgery (assessed using the Helkimo Index)

177
Study/ Method Study
Estimate /
Pooled
Estimate
95% Confidence
Interval
P value
Lower Upper
Athanasiou and Yucel-Eroglu
(1994)
0.50 0.16 0.84 N/A
Kallela et al.(2005)
-0.01 -0.23 0.20 N/A
Smith et al. (1992)
0.09 -0.11 0.29 N/A
Pooled (Fixed) 0.12 -0.02 0.25 0.10
Pooled (Random) 0.16 -0.09 0.41 0.22
Test for heterogeneity: Q= 6.378 on 2 degrees of freedom (P= 0.041)
NB: a negative sign indicates that the proportion of patients with TMD decreased
Table 2.20c Heterogeneity test and Meta-analysis of the change in proportion of
TMD pre and post-surgery in skeletal II patients undergoing BSSO advancement
surgery (assessed using the Helkimo Index)
There was significant between-study variation in the proportion of patients affected by
TMD pre-operatively (Smith et al., 1992; Athanasiou & Yucel-Eroglu, 1994; Kallela et
al., 2005). This significant between-study variation was also found for the proportion of
TMD post-surgery and the overall change following surgery.
Due to these variations, random models were used to present the results graphically.
The Forest plots of the proportion of patients with TMD pre and post-surgery are shown
in Figures 2.7a and 2.7b and the change in the proportion of patients affected by TMD
following surgery is shown in Figure 2.7c.

178
Figure 2.7a Forest Plot showing the proportion of pre-surgery skeletal II patients
who were diagnosed as having TMD (BSSO advancement surgery).
Figure 2.7b Forest Plot showing the proportion of post-surgery skeletal II patients
who were diagnosed as having TMD (BSSO advancement surgery).
Figure 2.7a shows that the pooled meta-analysis effect of pre-operative patients
suffering from TMD was 59% (95% CI 35% to 84%) but the individual study estimates
varied greatly (33%, 57% and 82%). The pooled post-surgery percentage of patients
suffering from TMD was 72% (95% CI 40% to 100%), whilst the individual study
estimates were 83%, 43% and 91%, respectively (Figure 2.7b).

179
N.B: A positive change indicates a worsening in the proportion of people affected.
Figure 2.7c Forest Plot showing the change in proportion of skeletal II patients
affected by TMD when comparing pre- and post-surgery
Figure 2.7c shows a pooled change in the percentage of patients affected by TMD of
16% (95% CI -9% to 41%), which suggests an increase in patients affected by TMD
following surgery to correct a Class II malocclusion. However, the confidence interval
crosses zero and the P-value of 0.22 indicates no evidence of a significant overall
change. As with the previous results, the individual study estimates varied greatly (50 %
increase in TMD, 1 % decrease and 9 % increase respectively).
Patients with VME undergoing Le Fort 1 maxillary impaction procedures (post-
surgery data)
It was not possible to carry out a meta-analysis on the pre-operative data, or to obtain an
estimate of the change following treatment as the pre-operative results for Little et al.
(1986) were not reported. Only two studies were identified for inclusion in this meta-
analysis. The test for heterogeneity indicated no evidence of between study
heterogeneity (P=0.713) (Table 2.21). The meta-analysis for the post-surgical data is

180
shown in Table 2.21 and the pooled estimate for the studies was 68% (95% CI 52% to
84%) for both the fixed and random effects models.
Study/ Method Study Estimate /
Pooled Estimate
95% Confidence Interval
Lower Upper
Athanasiou et al.(1996)
0.71 0.49 0.92
Little et al.(1986)
0.65 0.42 0.87
Pooled (Fixed) 0.68 0.52 0.84
Pooled (Random) 0.68 0.52 0.84
Test for heterogeneity: Q= 0.135 on 1 degrees of freedom (P= 0.713)
Table 2.21 Heterogeneity test and Meta-analysis for VME patients undergoing Le
Fort I impaction (post-surgery data)
The Forest plot (Figure 2.8) shows that the study estimates of both studies (71% and
65%) do not vary greatly from the pooled meta-analysis estimate of 68% (95% CI 52%
to 84%). It must however be noted that only two studies have contributed to these
results.
Figure 2.8 Forest plot of the proportion of VME patients undergoing Le Fort 1
maxillary impaction affected by TMD (post-operative data)

181
2.4 Discussion
2.4.1 Heterogeneity
From the results of this review, it is clear that there is great variation in studies where
TMD and orthognathic treatment are investigated. This variability encompasses how
TMD is classified, the signs and symptoms recorded, and the time intervals reported,
amongst other factors.
Patients
When looking at the patients represented in these studies it immediately becomes
apparent that there is great heterogeneity with respect to the included participants. The
age range and mean ages of the participants varied from study to study, although they
were within the range set by the inclusion criteria. The relevance that age may have on
the proportion of orthognathic patients affected by TMD is unclear but Rutkiewcz et al.
(2006) reported a higher prevalence of TMD signs in older patients. In addition age may
be a contributory factor in diminishing the normal functional remodelling capacity of
the condyle, thus resulting in idiopathic condylar resorption (Arnett et al., 1996).
Ethnicity of the participants was also a possible source of heterogeneity amongst the
studies, with many authors not specifying this information. The studies which did report
this information had patients who were Caucasian, Japanese, Chinese, Canadian and
Finnish and it is unclear whether certain ethnic groups may have a higher predisposition
to TMD than others.
Perhaps most importantly, however, was the great variation in the skeletal groups
included in the studies. Whilst some studies included patients with one specific skeletal
discrepancy, others included a range of skeletal deformities, and as such comparisons
were not always possible, and when carried out could be a source of heterogeneity.
Most of the studies that reported positive effects on TMD after orthognathic surgery
reported this association in skeletal Class II patients. A decrease in signs and symptoms
of TMD by more than 50% post-surgery compared with the pre-surgery state was
reported in some studies (Karabouta and Martis, 1985; Kerstens et al., 1989; White and
Dolwick 1992), while subjects with skeletal Class III patterns or patients with a high

182
mandibular plane angle (> 32°) seemed to benefit considerably less from surgery
(Kerstens et al., 1989; White & Dolwick, 1992; De Clercq et al., 1995). As such the
participants‘ skeletal deformity may have a direct impact on TMD, especially following
surgery.
Intervention
Due to the variety of skeletal groups represented in the studies, it is inevitable that a
variety of interventions or surgical procedures were carried out. Whether a particular
type of surgery has a greater predisposition to causing (or curing) TMD is not known.
As stated previously, patients with certain skeletal deformities (e.g. high angle patients)
did not appear to benefit as much from their surgeries. This may be a direct effect of the
skeletal deformity itself, the type of surgery carried out or may be a reflection on how
the data was collected.
Outcome
Perhaps, the greatest source of heterogeneity in this review was the different outcome
measures used to report TMD. In addition, many studies did not classify TMD
according to a validated scale. Although the shortcomings of the lack of a universal
scale or outcome measure in reporting TMD has not previously been explored in
relation to orthognathic populations, it has been identified in other epidemiological
studies (Luther, 1998a).
Epidemiological research has found that signs and symptoms of TMD are not
uncommon in the general population. In US studies, clicking sounds have been reported
in 8% to 41% of adults (Fricton and Schiffman, 1995), whilst the prevalence of TMD
related pain was reported at 12% (Dworkin et al., 1990). In Scandinavia, estimates
ranged from 16% to 59% for reported symptoms, and from 33% to 86% for clinical
signs (Carlsson, 1984). However, this discrepancy between US and European studies
may not reflect true differences between these populations, but instead may be due to
the fact that the set of diagnostic criteria used differed between the studies. Some
studies may rely on self-reports of pain and dysfunction, whereas others may include
diverse clinical assessment procedures (Carlsson and LeResche, 1995).

183
2.4.2 Narrative Findings
Study Characteristics (Table 2.8)
The study characteristics of the included articles were standard, the majority were
cohort studies, which in terms of the hierarchy of evidence is approximately halfway up
the pyramid (Figure 2.1). The areas of potential bias in these studies include: i) selection
bias arising from the way that patients were included and ii) measurement bias arising
from the unmasked (unblinded) assessment of subjective outcomes. Although a RCT
would provide greater protection from bias, this type of study design would not have
been feasible for patients undergoing orthognathic interventions in the majority of
cases. Ethical considerations would be breached if patients were randomised into groups
having surgery and groups not having surgery, for example.
Study Participants (Table 2.9)
The majority of the included studies had a reasonable number of study participants as
case series were not included in this review. With regards to gender, more women than
men were recruited, and this may be related to the greater proportion of women seeking
orthognathic treatment in general (Samman et al., 1996; Yu et al., 2000). A Class II
malocclusion is one of the most common malocclusions (Proffit et al., 1998) and this
may explain why the majority of the deformities reported in the studies were skeletal II
deformities. This may also explain why procedures to correct skeletal II deformities (i.e.
mandibular advancements) were the most commonly reported interventions amongst the
studies. Many other surgical interventions were also reported and this, in addition to the
various skeletal deformities, was a source of great heterogeneity for this review.
Classification of TMD (Table 2.11)
It was encouraging to note that the majority of studies identified TMD by clinical
examination and a number of the studies supplemented this with either patients‘ self
report or, less frequently, radiographic imaging. However, despite a clinical
examination being conducted, the majority of these studies did not classify TMD
according to any validated scale. These studies appear to have used their own methods
of classifying TMD, according to non-standardised criteria which made it virtually
impossible for comparisons to be made between the studies. The exceptions to this were
the twelve studies that used the Helkimo Index.

184
Patients‘ self reported symptoms (Table 2.12)
I. Joint sounds and Pain
There was great variability in the proportion of joint sounds post-surgery. However, the
patients‘ perception was that pain tended to improve after surgery. For almost all types
of pain reported (TMJ, jaw, muscles, face) there was a tendency for the percentage of
patients with reported pain to decrease following surgery. It is unclear whether this was
a genuine effect due to changes within the joint caused by surgery, or a placebo effect
due to the patients altered outlook. Although placebo effects in patients undergoing
orthognathic intervention have not been explored, they have been researched widely in
medicine. Turner et al. (1994) reviewed the literature to estimate the importance and
implications of placebo effects in pain treatment. They found that placebo response
rates varied greatly and were frequently much higher than the often-cited ―one third‖
and, as with medication, surgery can produce substantial placebo effects. They
concluded that placebo effects influence patient outcomes after any treatment, including
surgery, which the clinician and patient believe is effective.
II. Movement
Limitations in mouth opening increased post-surgery in almost all studies, but this is
likely to be due to inflammation and scar tissue formed as a direct result of the surgery
itself. It is not uncommon for patients to have a reduction in mouth opening
immediately after surgery, and in many cases the limitation of opening continues to
improve up to 24 months post-surgery (Zimmer et al., 1991).
Clinical signs (Table 2.13)
I. Pain
The clinical findings were similar to the patients‘ self reported findings. All types of
pain showed a tendency to decrease following surgery, and a reduction in mouth
opening was observed in the majority of cases.
II. Joint sounds
With regards to joint sounds, however, the clinical findings seemed to show a reduction
in clicking post-surgery, the results for crepitus on the other hand were more varied,
with some studies reporting an increase and others, a decrease post-surgery. In the

185
majority of studies that reported post-surgery TMD results, the overall proportion of
TMD decreased post-surgically, this was however subjectively observed as a trend in
the data.
III. Movement
A shortcoming of a large number of the studies was the failure to record maximum
inter-incisal opening and the lateral excursions. These are very simple recordings to take
and are essential to establish the range of jaw movements.
Quality assessment (Table 2.18)
Quality assessment of individual studies is an essential feature of systematic reviews
(Moher et al., 1999) and is necessary to account for bias, gain insight into potential
comparisons, and guide interpretation of the findings. In the past decade, research has
focused on two main issues: (i) which components of the quality assessment are
predictive of valid results and (ii) which tools (scales or checklists) produce the best
quality assessments (Moja et al., 2005). Egger et al. (2003) found that the quality of
allocation concealment and evidence of double blinding were strongly related to the
reported treatment effect sizes. Whilst a number of quality scales and checklists have
been proposed over the years (Moher et al., 1995; Jüni et al., 1999), the answer to
question (ii) remains unclear, and many doubt that a generic quality assessment tool
which would prove valid for all research can ever be found (Moja et al., 2005).
For the current review, a quality assessment tool was developed which was more
appropriate for the research in question than previously devised generic tools proved to
be. The development of this tool, along with establishing the criteria for assigning the
risk of bias presented major challenges for the review. The quality assessment forms
and flowcharts that were developed proved to be reliable and reproducible, and can be
recommended for assessing the quality of non-randomised TMD studies in the future.

186
2.4.3 Meta-analysis findings
Percentage of Orthognathic patients with TMD
Attempts to determine the exact percentage of patients with TMD in an orthognathic
population was difficult. There was great variability amongst the studies with regards to
the percentages reported (7% to 78%). This variability could be explained by the
different criteria used for assessing and classifying TMD and it may also be dependent
on the characteristics of the study participants themselves (i.e. skeletal deformity, age
etc.).
As previously stated, it was appropriate to conduct a meta-analysis for only a few
specifically chosen studies. The meta-analysis pooled estimate for the percentage of
pre-operative orthognathic patients with TMD was 74% (95% CI 57% to 92%). The
wide confidence intervals (95% CI 57% to 92%) highlight the lack of precision of this
estimate. This estimate was towards the higher end of the range reported in all of the
studies and was influenced by the large weight given to the Panula et al. (2000) study
(Figure 2.6). Panula et al. (2000) discussed the high prevalence reported and reiterated
that other studies have also found a high prevalence of TMD in orthognathic patients
(Schneider and Witt, 1991; Link and Nickerson, 1992). They attributed the high
prevalence reported in their study, when compared with other studies, to:
The criteria used for the self-reported symptoms
The patient sample itself and
Varying patterns of referrals
The first two points have been discussed previously but not the third issue. Patterns of
referrals may vary in different countries and cultures and this could impact on the
prevalence of TMD in orthognathic populations. Thus studies which have found that the
majority of orthognathic patients have normal TMJ function (Laskin et al.,1986) may be
associated with cosmetic motives for seeking treatment. In contrast, certain countries or
cultures may only advocate orthognathic surgery for patients who have impairment in
function and, as such, these studies are likely to report a greater proportion of patients
affected by TMD.

187
On the whole, given the clinical and statistical heterogeneity associated with TMD in
orthognathic populations, one must question whether obtaining a single estimate for the
proportion of TMD is appropriate. It may be that there are several different estimates
based on the differing patient characteristics (such as skeletal relationship) or differing
interventions (such as the type of surgery).
Class II patients
Prior to surgery the percentage of skeletal II patients with TMD was estimated at 59%
(95% CI 35% to 84%), whilst the post-surgery estimate was 72% (95% CI 40% to
100%). The wide confidence intervals associated with the values again indicate lack of
precision. The change in percentage of patients with TMD when comparing pre and
post-surgery data suggests a 16% increase in TMD following surgery (95% CI -9% to
41%). The P-value of 0.216 indicates no evidence of a statistically significant change in
the percentage of patients affected and the wide confidence intervals show lack of
precision. Thus in the pre-treatment informed consent process, this information may be
used when discussing potential TMD changes with patients. Patients should be advised
that some studies have shown a reduction in TMD, whilst others have shown an
increased prevalence, although overall there does not appear to be a significant change.
Patients must also be advised of the great individual variation.
Patients presenting with VME
The final meta-analysis looked at the percentage of vertical maxillary excess patients
affected by TMD post-surgery (Table 2.21). Unfortunately the lack of pre-surgery data
prevented an estimation of the pre-surgical prevalence and consequently also prevented
an estimation of the pre to post-surgery change. The pooled estimate of TMD post-
surgery was 68% (95% CI 52% to 84%), which is clearly a high percentage. It is
difficult to draw conclusions from this analysis without any pre-treatment data,
however, this is an important area to consider in future research. The limitations of only
including two studies in a meta-analysis should not be overlooked and any conclusions
have to be treated with caution.
The findings from all of the meta-analyses in this review were subject to considerable
variation amongst the results. As such it was not possible to draw strong inferences
relating to the percentage of orthognathic patients with TMD with any degree of

188
certainty. It is important to explain sources of heterogeneity in these results and, in most
cases, the study design (cohort studies) was likely to be a source of selection bias.
Additionally one can hypothesise when carrying out studies involving TMD that if a
larger number of patients are identified with TMD, this may be because clinicians are
specifically attempting to identify this group of individuals and this is a potential source
of measurement bias. Other sources of heterogeneity involving patient characteristics,
intervention and outcomes have been discussed previously.
Summary
Although determining a precise percentage of orthognathic patients affected by TMD
was not possible narratively or with a meta-analysis, the appropriateness and the clinical
relevance of attempting to do this is debatable given the clinical diversity of patients
and their interventions. This became clear during the systematic review as the study
data were analysed in detail.
Whilst remaining mindful of the heterogeneity, certain trends in the signs and
symptoms of TMD were tentatively observed in this study. Pain tended to decrease
following surgery and this was true both clinically and for self reported symptoms.
Limitation in jaw movements was also often experienced. With respect to joint sounds,
the post-surgery results were more varied. The percentage of patients with clicking
tended to decrease post-surgically, but any improvements in crepitus were questionable.
A large number of patients experienced an improvement in TMD symptoms after
orthognathic surgery but conversely, some subjects who were asymptomatic prior to
surgery developed TMD following surgery. There are, however, limitations to most of
the studies; few had non-treatment control groups for comparison, the sample sizes were
small in some studies, follow-ups were often short and many studies were retrospective.
For the majority of parameters, the heterogeneity of the studies prevented the results
from being analysed statistically. This heterogeneity might originate, in part, from lack
of a universal diagnostic system and the variability of TMD; as such definitive
conclusions could often not be drawn. In a recent review by Abrahamsson el al. (2007),
investigating the changes in TMD before and after orthognathic surgery, no clear
conclusions could be drawn. This study was limited by the number of articles included

189
in the review (three) and the authors also cited heterogeneity in study design and
ambiguous results as explanatory factors.
2.5 Conclusions
The conclusions which can be drawn from this systematic review have clinical
implications which may be useful for orthodontic practitioners and surgeons when
advising their patients and obtaining informed consent.
Although orthognathic surgery should not be advocated solely for treating TMD,
according to this systematic review patients who are undergoing orthognathic treatment
for the correction of dentofacial deformity and who are also suffering from TMD appear
to be more likely to see an improvement in their signs and symptoms than a
deterioration. The majority of the studies included in the review showed that the various
signs and symptoms of TMD tended to improve post-surgery, and fewer studies showed
signs and symptoms which became worse. This trend can form part of the information
given to prospective patients, but it should be stressed that absolutely no guarantees can
be made.
With specific regards to pain; TMJ pain, muscle pain and headaches experienced by
patients pre-surgically appeared more likely to improve than to worsen post-surgery.
This trend was observed in those studies which undertook post-surgical examinations.
Clicking sounds also appeared more likely to improve post-surgery than to deteriorate,
but the results were less consistent than those observed for pain. In contrast, crepitus did
not appear to be affected by surgery and, as such, is unlikely to either improve or
deteriorate. However, fewer studies reported on crepitus so these findings should be
treated with some caution. Crepitus is closely associated with pathology/ resorption of
the condylar head as a result of advanced TMJ damage and degenerative changes. It is
usually due to a tear in the disc or the posterior attachment which then produces bone to
bone contact, wear and flattening of the condylar head. Thus the exact influence that
surgery may have on this remains unclear.

190
The majority of patients experienced restriction in mouth opening and lateral excursions
post-surgery. This, however, continued to improve and the majority of patients appeared
to regain the full mandibular range of motion two years after surgery.
Recommendations
The major limitation in conducting this review was the great source of heterogeneity
associated with this topic. Many researchers have noted this shortcoming and as such
the following recommendations can be made:
1. Standardised criteria should be used for diagnosing and classifying TMD. These
should be valid and reproducible, as well as simple to carry out.
2. Future research in TMD should adhere to an internationally recognised set of
criteria and a universal scale.
3. There is a need for more prospective longitudinal studies which implement strict
quality assurance protocols to minimise bias, thus increasing their standing in
the evidence based hierarchy.
4. Research should focus on categorising participants homogenously to reduce the
effects of confounding factors and enable adequate comparisons to be made
between studies.
By following the above recommendations it should be possible to conduct good quality
studies that are adequately homogenous and allow comparisons to be made, enabling
statistical analyses to be carried out and further strengthen conclusions in the area of
TMD and orthognathic surgery.

191
Chapter III: Temporomandibular Joint Disorders in
Orthognathic Patients and a Control group with no Skeletal
Discrepancies
Introduction, Aims and Objectives
The following two chapters in this PhD report on the recruitment of orthognathic
patients with skeletal discrepancies. These individuals were examined to establish the
percentage of patients affected by TMD, as well as the range of signs and symptoms
present. In addition the orthognathic patients were followed longitudinally throughout
treatment to establish whether TMD signs and symptoms alter during the course of
orthognathic intervention. The results of this part of the investigation are discussed in
Chapter IV.
This chapter reports the findings for pre-treatment orthognathic patients compared with
control subjects who presented with no antero-posterior, vertical or transverse skeletal
discrepancies. Control subjects are an essential part of most research designs, allowing
researchers to reduce confounding variables and bias and to attribute observed changes
to the effect of an intervention rather than to other factors. Normal biological variation,
researcher bias and environmental variations are all factors that can affect outcomes,
thus control groups act as a standard for comparison purposes. The main objectives of
this study were:
1. To determine the percentage of orthognathic patients with TMD.
2. To determine the percentage of control subjects with TMD.
3. To compare the percentage of subjects with TMD in the two cohorts.
4. To investigate the signs and symptoms and the range of jaw movements in those
individuals affected by TMD.
5. To investigate how the presence of TMD affects quality of life.
6. To investigate whether TMD signs and symptoms in those subjects with no
skeletal discrepancy differ from those in orthognathic patients.

192
3.1 Introduction
TMD has an uncertain aetiology, although some studies have found that certain
malocclusions (Class III, deep bites and anterior open bites) may be linked with
symptoms of TMD (Mohlin et al., 1980; Mohlin and Thilander, 1984). Thus an
important consideration is whether skeletal discrepancies have an impact on the
development of TMD. As with the general population, it is difficult to determine the
true prevalence of TMD among orthognathic patients. The systematic review in Chapter
II showed great variability between studies with regards to the percentage of patients
affected, with figures from 7% to 78% reported (Pahkala and Heino, 2004; Cutbirth et
al., 1998). This may be explained by the different criteria used when assessing and
classifying TMD. Thus it is unclear whether patients who have skeletal discrepancies
have a higher prevalence of TMD than subjects with no skeletal discrepancies, or
whether skeletal discrepancies are indeed an aetiological factor for TMD.
A number of studies have investigated and compared the signs and symptoms of TMD
in orthognathic and control subjects. Dervis and Tuncer (2002) used Helkimo‘s
Anamnestic and Dysfunction Indices to evaluate the signs and symptoms of TMD in
orthognathic patients immediately before surgery, 1 week after removal of
intermaxillary fixation, and 1 and 2 years after surgery. Fifty patients and fifty subjects
without skeletal discrepancies were recruited into the study and a statistically significant
reduction in the prevalence of TMD signs and symptoms was noted 2 years after
surgery compared with before surgery. At initial examination, orthognathic patients did
not report significantly more TMD signs and symptoms than the healthy subjects,
however, at the final examination, greater improvements in TMD symptoms were noted
in the orthognathic patients when compared with the healthy controls. The results of the
study suggested that the functional status of the temporomandibular joint may be
improved following orthognathic surgery, but no clear association could be shown
between TMD symptoms and the type of dentofacial deformity. The small sample sizes
involved when grouping patients according to their skeletal deformity could result in a
lack of study power and the inability to show any clear association between TMD and
the type of skeletal deformity.

193
A study by Onizawa et al. (1995) investigated TMD symptoms in 30 pre-operative
patients compared with those of 30 volunteers with no skeletal discrepancy and changes
in symptoms were evaluated at 3 and 6 months post-surgery. They found no significant
difference in the prevalence of joint sounds, deviation on opening, or tenderness of the
TMJ and masticatory muscles between the patients and the healthy volunteers. Patients
did not report signs and symptoms of TMD significantly more than the volunteers with
no skeletal discrepancies. However, this study had a relatively small sample size and
assessing patients 3 and 6 months post-surgery is may not allow sufficient time for
healing or for inflammation to subside post-surgery, thus results from this study should
be interpreted with some caution.
Panula et al. (2000) undertook a prospective follow-up study to examine the influence
of orthognathic treatment on signs and symptoms of TMD. Sixty consecutive patients
were diagnosed and classified according to the Helkimo Index and 20 patients with
similar skeletal discrepancies who declined treatment served as controls. They found
that the majority (73.3%) of patients had TMD at the initial assessment but at the final
assessment this prevalence had significantly reduced to 60%. In the control group, the
results were almost identical, with 75% having some signs or symptoms of TMD at the
first assessment, but in contrast with the patient group this increased to 85% at follow-
up. The results from this study could not be directly compared with the previous studies
due to the differing types of controls recruited; the control subjects had skeletal
discrepancies thus they were included to determine whether surgery had an effect on
their TMD status, but also taking time into account and removing it as a potential
confounding factor.
A more recent study by Abrahamsson et al. (2009) investigated 121 consecutively
referred orthognathic patients. These patients were interviewed and examined for signs
and symptoms of TMD and headaches. A group recruited for comparison included 56
individuals with no skeletal discrepancies matched for gender and average age with the
patients. The advantage of this study was that all TMD diagnoses were carried out
according to the RDC/TMD criteria by one of two calibrated examiners. As
demonstrated by the systematic review in Chapter II, previous research in this field has
been difficult to synthesise due to the heterogeneity of the study designs and diagnostic
criteria used. The use of the RDC/TMD criteria in the study by Abrahamsson et al.

194
(2009) ensured standardisation of the results obtained and gave a high reliability to the
TMD diagnosis (John et al., 2005). In contrast with previous findings (Onizawa et al.
1995; Dervis and Tuncer, 2002), Abrahamsson et al. (2009) found a significant
difference in the prevalence of TMD between patients and subjects with no skeletal
discrepancies, with the patient group suffering more signs and symptoms. Forty two
percent of the patients were diagnosed with at least one form of TMD in comparison
with 32% of the non-patients, and this difference was statistically significant.
It has been reported that the most common motivating factors for a patient to seek
orthognathic treatment are the desire for enhanced aesthetics and the relief of functional
problems (Cunningham et al., 1995). Nurminen et al. (1999) found that, of the 28
orthognathic patients examined in their study, the most common reason for seeking
professional help was to alleviate problems with biting and chewing (68%). A number
of patients also complained of temporomandibular joint symptoms (32%) and headache
(32%). Similar trends were noted by Espeland et al. (2008), where the most frequent
motives for treatment were to improve dental appearance and also chewing ability (83
and 81% of patients, respectively). With increasing numbers of patients seeking
orthognathic treatment, it appears more patients are resorting to surgical intervention for
functional problems. In a cohort of pre-surgery patients, Forrsell et al. (1998) found that
problems relating to function were most frequently reported, followed by aesthetic
concerns and, to a lesser extent, social interaction problems. In addition, the patients‘
motives for seeking treatment were primarily related to functional issues (Forrsell et al.,
1998). The fact that functional issues were of greater concern than aesthetics differs
from findings in previous studies. This could be explained partly by sociocultural
differences, alternatively patients may think they are more likely to get treatment if they
report functional rather than aesthetic problems, or this may truly reflect a change in
motivation for seeking orthognathic treatment.
As the demand for orthognathic treatment is rising, it is important to understand the
motivational factors behind a patient seeking treatment, and whether functional
considerations such as TMD genuinely play a role. If TMD is equally prevalent
amongst individuals with skeletal deformities and the general population and the signs
and symptoms experienced in these two groups are the same, then providing

195
orthognathic treatment solely on the basis of these functional issues is clearly not
justified.
By investigating the prevalence of TMD in an orthognathic cohort using reliable
diagnostic tools and comparing the findings with those from subjects with no skeletal
discrepancies, the impact of the condition can be fully understood and patients‘
motivations to seek treatment may be corroborated.
196
3.2 Materials and Methods
3.2.1 Pilot Study and Ethical Approval
The pilot study was conducted by Miss RA Muwahid (2006) as part of her MSc thesis
and this established the most appropriate methodology to be used in this study. The
success and the findings of this pilot study also encouraged the continuation of the study
on a longitudinal basis.
Ethical approval for the initial pilot study was obtained from the University College
London Hospitals Ethics Committee in February 2005 (Appendix 3). A notice of major
amendment detailing the change in the investigator and requesting that this study be
extended was approved in March 2006. A second notice of substantial amendment was
submitted to include a comparison group of subjects with no skeletal discrepancies into
this study and approval for this was obtained in April 2006 (Appendix 4).
3.2.2 Calibration
The importance of a valid and reproducible examination is essential to reduce
misclassification errors in research. In order to achieve this it was important to be
calibrated in undertaking a thorough TMJ examination and diagnosis according to the
RDC/TMD criteria. Manchester University Dental Hospital runs a clinic which
specialises in temporomandibular disorders and this is one of the few TMD specialist
clinics in the country. Mr Stephen Davies (SD) is the lead clinician in the
Temporomandibular Disorder Clinic and has published numerous articles in this field;
he is regarded by many as a leading UK expert in diagnosing and managing TMD.
SD was contacted to arrange attendance at the clinic in order to calibrate the researcher
(SA) against an expert in TMJ examinations. This request was granted and four full day
sessions at the University of Manchester were attended in February and March of 2006.

197
During the first session a two hour tutorial was given on TMJ anatomy, disorders
affecting the TMJ and diagnosing and classifying TMD. The RDC/TMD classification
was adopted by Manchester University Dental Hospital in 2005 and this classification
was followed for the remainder of the sessions. The second half of the first day involved
clinical examination of new patients attending the TMD clinic and diagnosing them
according to the RDC/TMD classification. Initially SD undertook the supervision of the
clinical examination, to ensure this was done correctly and the first three clinical
examinations on new patients were supervised.
In subsequent sessions, when each patient had been examined, a diagnosis was
submitted by the researcher (SA) and SD then also examined the patient and submitted
his diagnosis independently. The results were compared to determine agreement.
Over the four sessions, forty-four new patients were examined and by the final session
there was excellent agreement in the diagnosis and classification of TMD between the
two examiners. The results of the agreement are shown in Table 3.2.
3.2.3 Recruitment of participants
Recruitment of orthognathic patients
All patients for this study were recruited from the Joint Orthodontic/Orthognathic clinic
at the Eastman Dental Hospital, UCLH Foundation Trust from April 2006 to January
2009. New patients attending the clinic were invited to participate, an information
leaflet was given to each patient and the research procedures were explained in detail.
The patients were allowed to read the information leaflet (Appendix 5) and consider
their decision for as long as required. If there were any questions the researcher was
available to offer assistance. If a patient agreed to take part in the study, they were
asked to sign a consent form (Appendix 6) and a copy of this was given to the patient,
another was placed in the hospital records and a final copy kept in the study file.
Inclusion criteria for the patients were:
1. Over 16 years of age

198
2. Awaiting orthodontic and orthognathic surgical treatment at the Eastman Dental
Hospital
3. Seen prior to starting any orthodontic treatment
Exclusion criteria for patients were:
1. A history of previous orthognathic surgery
2. If they had already commenced pre-surgical orthodontics
3. No requirement for pre-surgical orthodontic treatment
4. Cleft lip and/or palate or other craniofacial syndromes
5. Previous history of facial trauma
A sample size calculation was conducted based on patient reported signs and symptoms
in a study of 22 patients by Smith et al. (1992). A discordant proportion of 32% was
obtained; as such it was estimated that a sample size of 57 subjects would be required to
have an 80% power to detect a difference in proportions of 0.20.
Recruitment of control subjects with no skeletal discrepancies.
This cohort consisted of non-clinical members of staff at the Eastman Dental Institute
and Hospital who volunteered to take part. E-mails and flyers were generated inviting
subjects to be involved in this study and those who were interested were requested to
contact the researcher. A suitable appointment was arranged and the volunteer attended
for a short examination to establish their skeletal pattern. Provided the subjects had no
skeletal discrepancy, they were included in the study and asked to read the information
leaflet and complete a consent form (Appendix 7). The subjects recruited were gender
matched to patients in the orthognathic group as previous research has suggested that
gender may influence the prevalence of TMD.
Although age matching would have also been ideal, the difficulties in recruiting to the
study meant this was not possible. However it was ensured that all of the subjects with
no skeletal discrepancies were within the 16 to 40 years age range, to coincide with that
of patients presenting for orthognathic treatment.
To ensure accuracy in skeletal pattern determination, the researcher (SA) initially
assessed patients who were attending the Orthodontic Department for routine

199
orthodontic care and the classification of both antero-posterior (I, II or III) and vertical
(normal, reduced or increased) skeletal relationships was compared with the
cephalometric findings. The researcher examined 20 patients in total with 100%
accuracy in determining the skeletal patterns.
3.2.4 Data collection for the study
One researcher (SA) carried out all of the data collection for this study, including the
clinical examinations for both groups.
There were three main components to the assessments:
1. Questionnaire to determine self-reported symptoms and quality of life
2. Clinical examination to determine the clinical signs present and therefore the
presence or absence of TMD
3. Kinesiography to investigate the range of jaw movements
Questionnaire assessing patient self reported TMD symptoms and QoL (Appendix
8)
Each subject completed a questionnaire which was divided into three sections and took
approximately 10 minutes to complete.
1. The first section comprised demographic details (e.g. age, gender, ethnicity and
occupation).
2. The second section included 12 questions relating to the frequency of TMJ
symptoms experienced by the patient in the previous three months, including
headaches, facial pain, jaw clicking, and limited mouth opening. These
questions were collated from questionnaires used in previous TMD studies and
were based on the most common TMD symptoms.
3. The third section was the 14 questions which form the Oral Health Impact
Profile (OHIP-14), a validated questionnaire widely used in dentistry (Slade,
1997). The OHIP-14 is an instrument which measures the subject‘s perception
of the social impact of oral disorders on their well being and quality of life. If
any symptoms were present, the frequency was indicated. As such it was aimed
to determine how often facial and dental problems affected the subject‘s day to
day life.

200
Clinical examination (RDC/TMD) (Further details of this examination procedure can
be watched on the DVD included as Appendix 9)
This was a non invasive examination, following which each subject was classified
according to the RDC/TMD classification. The researcher completed a TMJ
examination form (Appendix 10) for each subject. There were three main components
to the examination.
1. TMJ examination
This included palpation of the TMJ (both intra-auricular and at the lateral
poles) for any pain or tenderness. The patient was asked to open and
close their mouth several times to enable the researcher to listen for joint
sounds. A double barrelled stethoscope was used to amplify any sounds
heard and these were then recorded as necessary.
The range of jaw movements was recorded, including the maximal and
comfortable opening, as well as the right and left lateral excursions. All
measurements were taken with the patient in an upright and comfortable
position and a millimetre ruler was used to record the measurements.
Finally, any deviations in the mandibular path of opening were recorded.
2. Muscle examination
The muscles of mastication were palpated bilaterally for any signs of tenderness/
discomfort.
The masseter was palpated bimanually at the origin and insertion by
placing one finger intra-orally and the other on the cheek.
The temporalis was examined at both the origin and insertion by asking
the patient to clench the teeth together whilst palpating extra-orally.
The lateral pterygoids were examined by recording the response to
resisted movements. The operator‘s hand was placed under the chin and
the patient was asked to open against resistance. In addition, intra-oral
palpation behind each maxillary tuberosity was carried out to ascertain
pain in the lateral pterygoid region.

201
Pain or tenderness from the medial pterygoid muscles was recorded with
caution in this study as the muscle is not accessible to comfortable
palpation and the results of medial pterygoid palpation are unreliable.
This was however recorded as a best estimate for completeness.
It is recommended that the pressure generated for palpation with the middle and
index fingers should be 900grams for the extra-oral muscles and 450grams for
the joints and intra-oral muscles (Dworkin and LeResche, 1992). A domestic
weighing scale was used to calibrate the examiner in generating these forces.
Consistency in applying the correct force was checked at 6 monthly intervals
throughout the duration of the study. The domestic scale was placed in such a
way that the dial was not visible to the examiner and finger pressure was applied
to the scale. A colleague recorded the forces generated, ensuring the examiner
applied forces in the range of both 400-500grams and 850-950grams
respectively. This process was repeated if recalibration was required.
3. Occlusion
The skeletal base and type of malocclusion, including the British
Standard Institution Incisor Classification (British Standard Institution
1983) were recorded.
The dentition was also studied in centric occlusion and lateral excursions
for premature contacts and non-working side interferences. Any signs of
excessive tooth wear were noted.
RDC/TMD Classification:
This was originally published by Dworkin and LeResche (1992) and was approved by
the European Academy of Craniomandibular Disorders (EACD) in 2002. The
classification is divided into:
Axis 1 - a physical diagnosis based on pathophysiology
Axis 2 - an assessment of TMD pain and related parafunctional behaviours in
relation to psychological distress and psychosocial dysfunction

202
As part of the joint orthodontic/orthognathic surgical team, a liaison psychiatrist is
present to assess the patients' behaviour and expectations. If a patient was perceived to
be psychologically distressed as a result of their condition, further assessment of
behavioural, psychological and psychosocial factors was available to establish Axis 2
diagnoses. The subdivisions of Axis 1 are as follows (Further details and the
classification table are available in Appendix 11):
Axis 1 Group Subdivision
Group 1 Muscle disorders
(1a) Myofacial pain
(1b) Myofacial pain with limited
opening
Group 2 Disc displacements
(2a) Disc displacement with reduction
(2b) Disc displacement without
reduction and limited opening (lock)
(2c) Disc displacement without
reduction, without limited opening.
Group 3 Arthralgia, arthritis and
arthrosis
(3a) Arthralgia
(3b) Arthritis
(3c) Arthrosis
Table 3.1 RDC/TMD Axis 1 diagnoses
Radiographic Assessments
Radiographic assessments were required to determine the patient‘s skeletal pattern and
this was also confirmed by clinical examination. As part of the routine procedure for
patients attending orthognathic consultations at the Eastman Dental Hospital, lateral
cephalograms are taken to assess the severity of skeletal discrepancies and for treatment
planning purposes, thus all orthognathic patients recruited in this study had radiographs
available. All pre-treatment lateral cephalograms were scanned and saved using Dolphin
Imaging™ software, and the researcher digitised each cephalogram to obtain the ANB

203
and MMPA angles. The patients were then categorised into Class I, II, or III skeletal
patterns based on the ANB value and into average, high or low angle according to their
MMP angle. The classifications were based on known mean values and standard
deviations for the patient‘s ethnic group.
Due to ethical considerations, it was not possible to obtain lateral cephalograms for the
control subjects and the absence of any significant skeletal discrepancies was therefore
determined solely on the basis of the clinical assessment as previously indicated.
Kinesiography
The kinesiograph K6-I evaluation system (Myotornics-Noromed Inc., Seattle, USA) is
an integrated computerised machine that consists of a head frame connected to a
computer system. The machine tracks mandibular movement in three dimensions:
anterior/posterior, vertical and lateral (Figure 3.1).
Figure 3.1 Kinesiograph K6-I evaluation system and head frame
The head frame was secured on the subject‘s head such that the horizontal bars on the
head frame were parallel to the subject's interpupillary line and the left and right sensory
arrays were equidistant from the subject's mandible (Figure 3.2). A magnet was attached

204
to the patient‘s labial vestibule in the lower midline, just below the mandibular incisors
using Stomahesive® adhesive tape (Convatec, E.R. Squibb and Sons, L.L.C., New
Jersey, USA) to secure the magnet in place. Mandibular movements were then tracked
from the incisor point by a sensory array in the head frame that is sensitive to alterations
in the magnetic field.
Figure 3.2 Kinesiograph: head frame secured on subject’s head
Two scans (described below) were undertaken for each subject and each was repeated at
least three times. The data were obtained by registering the range of jaw movements as
a scan on screen, in addition to numerical values. The results were then saved as a series
of graphs (Figure 3.3).
Scan 1: The subject was asked to open and close their mouth comfortably and
simultaneous sagittal and frontal tracings were recorded. This scan illustrates normal
opening and whether opening/closing of the mandible can be achieved without
deviation.
Scan 2: The subject was asked to open his/her mouth to their maximum opening without
straining the muscles, then slide the mandible as far to the left as possible and then to

205
the right as far as possible. Finally the subject was asked to protrude the mandible as far
forward as possible and return to the centric occlusion. Hence the range of motion was
recorded, including maximum vertical opening, maximum lateral excursions and
maximum protrusive movements.
Figure 3.3 Graphs obtained from the kinesiograph for scan 2
3.2.5 Statistical Analyses
Statistical tests were undertaken using SPSS version 14 (SPSS UK Ltd, Guildford
Surrey, UK).
Demographics
Descriptive statistics were used to provide summaries of the data; these consisted of
percentages, means, medians and standard deviations.
Questionnaire findings
The Mann Whitney U test was used to compare the orthognathic and control subjects
for the various self-reported symptoms. The Mann-Whitney U test is a non-parametric
test that can be used to test for differences in medians for independent variables (Petrie
and Watson, 2006). A two-way ANOVA was carried out to test the effect of
presence/absence of TMD and the subject group on the OHIP-14 scores and assess
whether any interaction existed between these variables.

206
Clinical findings and TMD diagnosis
Two-by-two contingency tables were constructed for all binary variables and Chi
squared analyses were undertaken to test for statistical significance between groups. In
instances, when expected frequencies were less than or equal to 5, a Fishers Exact Test
was used (Petrie and Watson, 2006).
For continuous variables (e.g. opening and lateral excursions) the data set was assessed
for normality using histograms and box and whisker plots and, as the data were found to
follow normal distributions, independent sample t-tests were used to test for differences
in means between the two groups (Petrie and Watson, 2006).
TMD in relation to aetiological factors
Three-by-two contingency tables were constructed for some of the analyses (TMD and
skeletal base, TMD and MMPA) and Chi squared analyses were undertaken to test for
significance (Petrie and Watson, 2006). Additionally logistic regression analyses were
used to investigate possible associations between TMD (as the outcome variable) and
gender, group and age.

207
3.3 Results
3.3.1 RDC/TMD: Calibration of TMD diagnosis
Number of patients
examined by both
clinicians
Agreement
Week 1 10 6 (60.0%)
Week 2 12 10 (83.3%)
Week 3 11 11 (100%)
Week 4 11 11 (100%)
Total no of
Patients
44 38 (86.4%)
Table 3.2 Agreement between the researcher (SA) and expert (SD) for calibration
of TMD diagnosis
Reasonable agreement was observed between the two clinicians in the first week, but by
the third and fourth week agreement was perfect (100%).
3.3.2 Demographics of subjects in the main study
Gender distribution
Male Female Total N
Control
36 (50.0%) 36 (50.0%) 72 (100%)
Orthognathic
34 (50.0%) 34 (50.0%) 68 (100%)
Table 3.3 Gender distribution of control and orthognathic subjects.
A total of 72 control group subjects and 68 orthognathic patients were recruited. This
was in keeping with the estimated sample size required for 80% power. There was an
equal distribution of males and females in the control and orthognathic groups.

208
Ethnicity
White South
Asian
Oriental African/Afro
Caribbean
Other Total
Control
28
(38.9%)
20
(27.8%)
4
(5.6%)
4
(5.6%)
16
(22.3%)
72
(100%)
Orthognathic
31
(45.6%)
9
(13.2%)
5
(7.4%)
10
(14.5%)
13
(19.1%)
68
(100%)
Table 3.4 Ethnicity of control and orthognathic subjects
The majority of subjects recruited into this study were white (38.9% of controls and
45.6% of orthognathic patients). The next most prevalent ethnicity in both groups was
South Asians, who represented 27.8% and 13.2% of the control and orthognathic
subjects respectively.
Age
Mean (years) Standard Deviation
(years)
Median (years)
Control
30.13 6.48 29.00
Orthognathic
24.26 7.71 21.50
Table 3.5 Age of control and orthognathic subjects
The mean age of the control group subjects was 30.13 years, whilst that of the
orthognathic group was 24.26 years.
3.3.3 Orthognathic patients: Skeletal classification
Antero-posterior relationship
Antero-posterior Skeletal Base
Total
Class I Class II Class III
10 (14.5%) 29 (42.6%) 29 (42.6%) 68 (100%)
Table 3.6 Antero-posterior skeletal relationships for the orthognathic cohort

209
An equal proportion of the orthognathic patients had Class II and Class III skeletal
patterns (42.6%), whilst only 14.5% of the patients had a Class I pattern and these were
patients with anterior open bites, facial asymmetries or both.
Vertical relationship
Vertical skeletal pattern (MMPA)
Total
Average Low High
26 (38.2%) 10 (14.7%) 32 (47.1%) 68 (100%)
Table 3.7 Vertical relationships for the orthognathic cohort
With respect to the vertical relationship of the orthognathic patients, the majority
presented with a high MMPA (47.1%), followed by an average angle (38.2%) and fewer
patients presented with a low MMPA (14.7%).
3.3.4 Questionnaire findings
Self reported symptoms
Table 3.8 presents the self reported symptoms of both the orthognathic and control
subjects based on the questionnaire findings. The following symptoms were asked about
and the frequency of the symptoms recorded: headaches, earaches, general facial pain,
and painful neck, jaw pain on opening/closing, jaw pain on biting/chewing, sore
muscles around the jaw, clicking, jaw locking, limited mouth opening, clenching and
grinding.
The Mann-Whitney U test showed a statistically significant difference between the two
groups for a number of the symptoms, with the orthognathic patients suffering greater
symptoms than the control group. These were earaches, general facial pain, jaw pain on
opening and closing, jaw pain on biting or chewing, sore muscles around the jaw,
clicking, jaw locks and limited mouth opening. With regards to headaches and painful
neck symptoms however, no statistically significant differences were found between the
two groups.

210
When considering parafunctional habits, no statistically significant difference was
found between the two groups for grinding, however the control subjects group were
found to exhibit significantly more clenching than the patient group (P=0.031).
Table 3.8 Frequency of self reported symptoms for orthognathic and control subjects
Condition Group Frequency
Total
N
P
Value No Occasionally Frequently All the
time
Headaches
Control 41
(56.9%)
26
(36.1%)
5
(6.9%)
0
(0%)
72
(100%) 0.593
Orthognathic 36 (52.9%)
26 (38.2%)
5 (7.4%)
1 (1.5%)
68 (100%)
Earaches
Control 70 (97.2%)
2 (2.8%)
0 (0%)
0 (0%)
72 (100%)
0.003 Orthognathic 56
(82.4%)
7
(10.3%)
5
(7.4%)
0 68
(100%)
General Facial
Pain
Control 68 (94.4%)
4 (5.6%)
0 (0%)
0 (0%)
72 (100%)
0.001 Orthognathic 51
(75.0%) 12 (17.6%)
4 (5.9%)
1 (1.5%)
68 (100%)
Painful Neck
Control 52 (72.2%)
13 (18.1%)
6 (8.3%)
1 (1.4%)
72 (100%)
0.532 Orthognathic 52
(76.5%) 12 (17.6%)
2 (2.9%)
2 (2.9%)
68 (100%)
Jaw pain on
opening/closing
Control 67 (93.1%)
3 (4.2%)
1 (1.4%)
1 (1.4%)
72 (100%)
≤0.001 Orthognathic 44
(64.7%) 15 (22.1%)
7 (10.3%)
2 (2.9%)
68 (100%)
Jaw pain on
biting/ chewing
Control 65 (90.3%)
6 (8.3%)
1 (1.4%)
0 (0%)
72 (100%)
≤0.001 Orthognathic 41
(60.3%) 20 (29.4%)
7 (10.3%)
0 (0%)
68 (100%)
Sore muscles
around the jaw
Control 62 (86.1%)
9 (12.5%)
0 (0%)
1 (1.4%)
72 (100%)
0.048 Orthognathic 50
(73.5%) 11 (16.2%)
6 (8.8%)
1 (1.5%)
68 (100%)
Clicking
Control 56 (77.8%)
12 (16.7%)
3 (4.2%)
1 (1.4%)
72 (100%)
0.001 Orthognathic 37
(54.4%) 13 (19.1%)
10 (14.7%)
8 (11.8%)
68 (100%)
Jaw Locks
Control 71 (98.6%)
1 (1.4%)
0 (0%)
0 (0%)
72 (100%)
≤0.001 Orthognathic 54
(79.4%) 10 (14.7%)
1 (1.5%)
3 (4.4%)
68 (100%)
Limited mouth
opening
Control 71 (98.6%)
1 (1.4%)
0 (0%)
0 (0%)
72 (100%)
0.002 Orthognathic 57
(83.8%) 5 (7.4%)
4 (5.9%)
2 (2.9%)
68 (100%)
Clenching
Control 42 (58.3%)
21 (29.2%)
7 (9.7%)
2 (2.8%)
72 (100%)
0.031 Orthognathic 52
(76.5%) 10 (14.7%)
5 (7.4%)
1 (1.5%)
68 (100%)
Grinding
Control 51 (70.8%)
17 (23.6%)
3 (4.2%)
1 (1.4%)
72 (100%)
0.196 Orthognathic 55
(80.9%) 9 (13.2%)
4 (5.9%)
0 (0%)
68 (100%)

211
Oral Health Impact Profile: OHIP-14
A two way ANOVA was carried out to determine whether a subject's TMD status and the
group they belonged to (orthognathic or control) had an effect on the OHIP score. In
addition whether any interaction existed between the OHIP-14 score, a subject‘s TMD
status and the group they belonged to.
Source
Type III Sum
of Squares df
Mean
Square F Sig.
Corrected Model 6340.396a 3 2113.465 40.881 <0.001
Intercept 10530.708 1 10530.708 203.694 <0.001
Group 5134.730 1 5134.730 99.321 <0.001
TMD status 390.389 1 390.389 7.551 0.007
Group * TMD status 137.431 1 137.431 2.658 0.105
Error 7031.004 136 51.699
Total 23968.000 140
Corrected Total 13371.400 139
Table 3.9 Two way ANOVA for the OHIP score as the dependent variable
The main effects (TMD status and group) were both statistically significant predictors of
mean OHIP-14 score; however there was no interaction between the two variables and the
OHIP-14 score.
Mean Median Minimum Maximum
Control 2.46 0 0 17
Orthognathic 15.31 14 0 39
Table 3.10 Overall OHIP Score for the control and orthognathic subjects

212
Group had a significant effect on the OHIP-14 score (P<0.001), with the orthognathic
patients experiencing poorer quality of life on average (Table 3.10).
Mean Median Minimum Maximum
No TMD 6.60 3 0 39
TMD 12.48 13.0 0 35
Table 3.11 OHIP scores according to TMD status
The TMD status of the subjects also had an effect on the mean OHIP-14 score, with a
statistically significant difference between the presence/absence of TMD and the relevant
score (Table 3.11). Subjects with TMD had a statistically significantly higher OHIP-14
score, and therefore a significantly poorer quality of life on average, than those who were
not affected.
No interaction existed between the TMD status and group with respect to the OHIP score
(P=0.105), hence there was no evidence that the combined effect of TMD status and group
is significantly different to their additive independent effects. Thus the presence of TMD, in
combination with being an orthognathic patient, does not significantly alter the OHIP-14
score beyond what would be found from a combination of both factors independently.
OHIP Domain Scores
The OHIP-14 questions can be subdivided into seven domains and the descriptive results
for the two groups according to these domains are shown in Table 3.12. The individual
domains were not analysed statistically to avoid issues relating to multiple testing and ―data
dredging‖.
For all seven domains, the orthognathic group had higher mean OHIP-14 scores when
compared with the control subjects group in this sample.

213
Domains Group Median Mean Minimum Maximum
1. Functional
Limitation
Control
0 0.10 0 2
Orthognathic
1 1.18 0 8
2. Physical pain Control
0 0.71 0 4
Orthognathic
3 2.44 0 6
3.Physiological
Discomfort
Control
0 0.69 0 5
Orthognathic
5 4.35 0 8
4. Physical
disability
Control
0 0.25 0 4
Orthognathic
0 0.74 0 4
5. Psychological
disability
Control
0 0.36 0 4
Orthognathic
3 3.25 0 8
6. Social
disability
Control
0 0.14 0 3
Orthognathic
1 1.59 0 8
7. Handicap Control
0 0.21 0 3
Orthognathic
2 1.76 0 6
Table 3.12 Descriptive results for the seven OHIP domains for both control and
orthognathic groups.

214
3.3.5 Clinical Findings
Temporomandibular Joint Clinical Findings
Both the orthognathic and control subjects were assessed for pain and tenderness associated
with the lateral poles of the TMJ and intra-auricularly. In addition, any joint sounds were
recorded. The results of the TMJ examinations are reported in Table 3.13 and show that
8.3% of the controls and 11.8% of the orthognathic patients had pain affecting either one or
both TMJs, whilst 4.2% of the control group and 7.4% of the orthognathic patients had pain
intra-auricularly. The Chi-squared test (or Fisher's exact test where necessary) for both
variables were non-significant (P=0.499, P=0.485).
Similar results were observed for joint sounds, none of the controls and only 2 orthognathic
patients suffered from crepitus and this difference in prevalence was not statistically
significant (P=0.498), but the small number of observations must be borne in mind. The
percentage of controls and orthognathic patients with clicks were 22.2% and 27.9%
respectively and the difference between the groups was not statistically significant.
Sign/ Observation Controls
(N= 72)
Orthognathic
Patient (N=68)
P Values
TMJ pain (lateral
poles)
6
(8.3%)
8
(11.8%)
0.499
Intra-auricular pain
3
(4.2%)
5
(7.4%)
0.485 #
Clicks
16
(22.2%)
19
(27.9%)
0.435
Crepitus
0 2
(2.9%)
0.234 #
The table indicates the number of patients with signs not the number of sides
# Fishers Exact test where cells have expected frequency of less than 5
Table 3.13 TMJ signs in the control and orthognathic subjects

215
Observations Relating to Clicks
The following table relates to the symptomatic joints only and classifies the type of clicks
experienced by both groups.
Control
Orthognathic
Right Joints
N= 12
Left Joints
N=8
Right Joints
N=11
Left Joints
N=12
Consistent 10
(83.3%)
6
(75.0%)
7
(63.6%)
9
(75.0%)
Intermittent 2
(16.7%)
2
(25.0%)
4
(36.4%)
3
(25.0%)
Opening
9
(75.0%)
6
(75.0%)
8
(72.7%)
11
(91.7%)
Closing
2
(16.7%)
2
(25.0%)
1
(9.1%)
1
(8.3%)
Both (opening +
closing)
1
(11.1%)
0
(0%)
2
(20.0%)
0
(0%)
Painful
0
(0%)
0
(0%)
1
(9.1%)
0
(0%)
Single 12
(100%)
8
(100%)
11
(100%)
11
(91.7%)
Multiple 0
(0%)
0
(0%)
0
(0%)
1
(8.3%)
Table 3.14 Observations relating to TMJ clicks for both control and orthognathic
subjects
The majority of the clicks heard in both groups were consistent and in the opening cycle.
Only one of the clicks recorded was painful and only one multiple click was observed; both
of these findings occurred in the orthognathic group but were experienced by different
patients.

216
Muscle Pain
The muscles of mastication were assessed for pain or tenderness on palpation and those
muscles that elicited a positive response were recorded. Although each of the muscle
groups was assessed separately as per the RDC/TMD guidelines, the results of both the
right and left muscle groups were combined (reflecting the number of subjects affected by
the condition) for ease of comparison.
NB: This table show the number of patients suffering from pain or tenderness of the muscles NOT the number
of sides affected
Table 3.15 The percentage of control and orthognathic subjects suffering from
tenderness of the muscles of mastication
The orthognathic patients had a higher susceptibility to masseteric and lateral pterygoid
pain (P=0.014 and P<0.001 respectively) although no statistically significant differences
were found for temporalis pain or tenderness.
Muscle group Control
N= 72
Orthognathic
N=68
P Values
Masseter 4
(5.6%)
13
(19.1%)
0.014
Temporalis 4
(5.6%)
8
(11.8%)
0.190
Lateral Pterygoid 6
(8.3%)
23
(33.8%)
<0.001
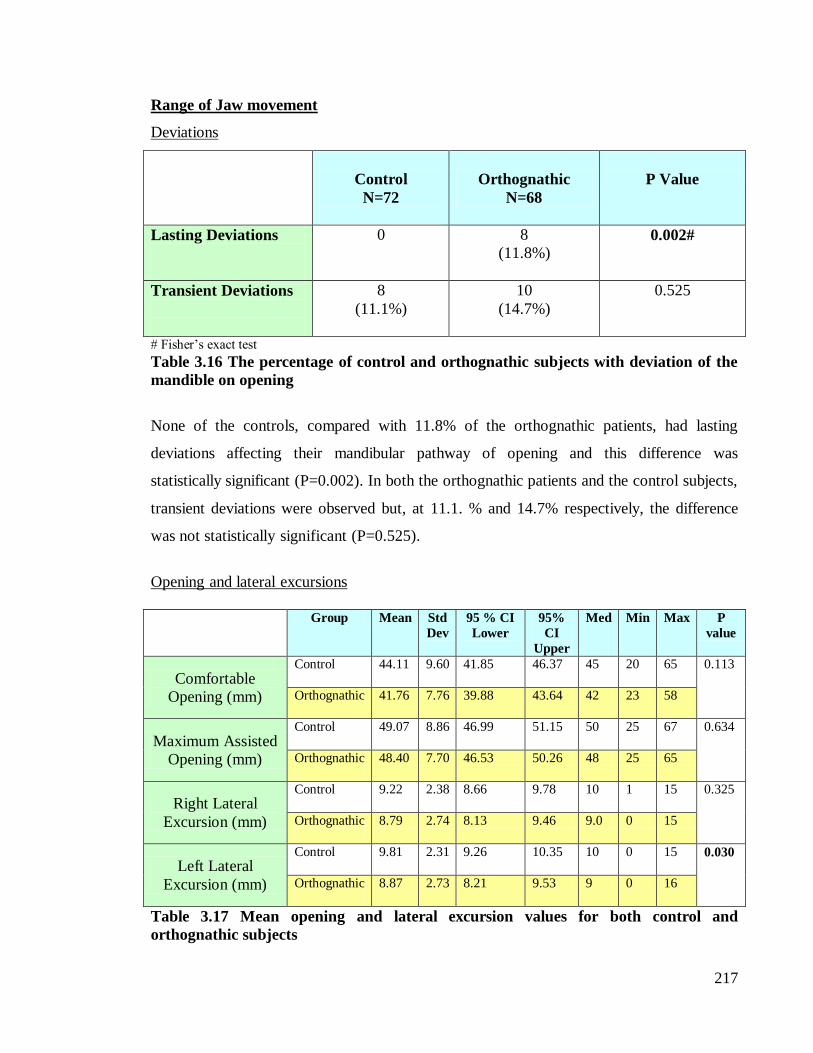
217
Range of Jaw movement
Deviations
Control
N=72
Orthognathic
N=68
P Value
Lasting Deviations
0 8
(11.8%) 0.002#
Transient Deviations
8
(11.1%)
10
(14.7%)
0.525
# Fisher‘s exact test
Table 3.16 The percentage of control and orthognathic subjects with deviation of the
mandible on opening
None of the controls, compared with 11.8% of the orthognathic patients, had lasting
deviations affecting their mandibular pathway of opening and this difference was
statistically significant (P=0.002). In both the orthognathic patients and the control subjects,
transient deviations were observed but, at 11.1. % and 14.7% respectively, the difference
was not statistically significant (P=0.525).
Opening and lateral excursions
Group Mean Std
Dev
95 % CI
Lower
95%
CI
Upper
Med Min Max P
value
Comfortable
Opening (mm)
Control
44.11 9.60 41.85 46.37 45 20 65 0.113
Orthognathic 41.76 7.76 39.88 43.64 42 23 58
Maximum Assisted
Opening (mm)
Control
49.07 8.86 46.99 51.15 50 25 67 0.634
Orthognathic
48.40 7.70 46.53 50.26 48 25 65
Right Lateral
Excursion (mm)
Control
9.22 2.38 8.66 9.78 10 1 15 0.325
Orthognathic
8.79 2.74 8.13 9.46 9.0 0 15
Left Lateral
Excursion (mm)
Control
9.81 2.31 9.26 10.35 10 0 15 0.030
Orthognathic
8.87 2.73 8.21 9.53 9 0 16
Table 3.17 Mean opening and lateral excursion values for both control and
orthognathic subjects

218
The results for comfortable opening, maximum assisted opening and right and left lateral
excursions all followed a normal distribution and as such it was appropriate to use
parametric statistical tests. No significant differences were found for mean comfortable
opening, maximum assisted opening and right lateral excursions, however, a statistically
significant difference was found for left lateral excursions (P=0.030) with the orthognathic
group having a reduced mean value compared with the control group.
3.3.6 TMD Diagnosis and Classification
Diagnosis Total
N
P Value
No TMD TMD
Control
52
(72.2%)
20
(27.8%)
72
0.044
Orthognathic
38
(55.9%)
30
(44.1%)
68
Table 3.18 Presence of TMD in controls and orthognathic subjects from the
RDC/TMD diagnosis
When comparing the prevalence of TMD in the control and orthognathic groups, 27.8% of
the controls were classified as having TMD compared with 44.1% of the orthognathic
patients. This difference was statistically significant (P=0.044).

219
The following table shows the distribution of TMD according to the RDC/TMD
classification.
Diagnosis
Group
Control
Orthognathic
(1a) Myofacial pain
N 5 11
(1b ) Myofacial pain
with limited opening
N
0
3
(2a) Disc Displacement
with reduction
N
15
16
(2b) Disc Displacement
without reduction and
with limited opening
N
2
4
(3c) Arthrosis
N 0 2
Total 22
36
NB: Subjects may have more than one diagnosis
Table 3.19 Distribution of TMD according to the RDC/TMD classification
Orthognathic patients most commonly suffered from disc displacement with reduction (2a),
followed by myofacial pain (1a). However there were patients who also suffered from
myofacial pain with limited opening (1b), disc displacement without reduction (2b) and
arthrosis (3c). A similar pattern was seen for the controls who also suffered mainly from
disc displacement with reduction (2a), followed by myofacial pain (1a). None of the
controls were classified as suffering from myofacial pain with limited opening (1b) or
arthrosis (3c)
3.3.7 TMD in relation to aetiological factors
This section explores the relationship between TMD and potential aetiological factors such
as age, gender, skeletal pattern and occlusal features. Ethnicity was not included due to the
small numbers in some of the groups.
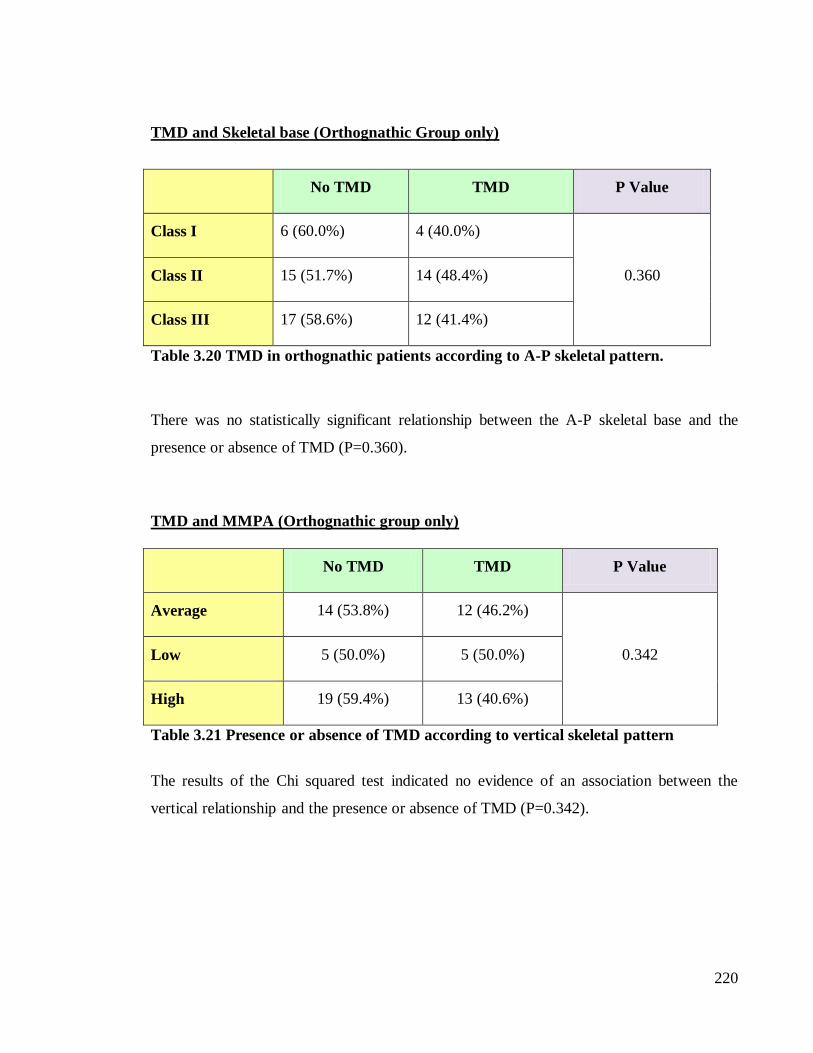
220
TMD and Skeletal base (Orthognathic Group only)
No TMD TMD P Value
Class I 6 (60.0%) 4 (40.0%)
0.360 Class II 15 (51.7%) 14 (48.4%)
Class III 17 (58.6%) 12 (41.4%)
Table 3.20 TMD in orthognathic patients according to A-P skeletal pattern.
There was no statistically significant relationship between the A-P skeletal base and the
presence or absence of TMD (P=0.360).
TMD and MMPA (Orthognathic group only)
No TMD TMD P Value
Average 14 (53.8%) 12 (46.2%)
0.342 Low 5 (50.0%) 5 (50.0%)
High 19 (59.4%) 13 (40.6%)
Table 3.21 Presence or absence of TMD according to vertical skeletal pattern
The results of the Chi squared test indicated no evidence of an association between the
vertical relationship and the presence or absence of TMD (P=0.342).

221
TMD and Occlusal features (Control and Orthognathic Groups)
Canine Guidance or Group function
P Value
CG GF Mixed
(CG and GF)
No TMD 31 (64.6%) 47 (61.8%) 10 (83.3%)
0.351
TMD 17 (35.4%) 29 (38.2) 2 (16.7%)
N.B It was not possible to record the excursions in 4 subjects due to open bite or extracted canine
Table 3.22 Presence or absence of TMD in relation to lateral excursions in control and
orthognathic subjects
Centric Occlusion/Centric relation
P Value
Centric occlusion=
Centric relation
Centric occlusion ≠
Centric Relation
No TMD 70 (77.8%) 35 (70.0%)
0.309
TMD 20 (22.2%) 15 (30.0%)
Table 3.23 Presence or absence of TMD in relation to centric occlusion/ centric
relation in control and orthognathic subjects
No statistically significant association was found between the type of lateral excursion
(canine guidance, group function or a combination of the two) and the presence or absence
of TMD. In addition there was no statistically significant association observed for the
presence of TMD and those who had centric occlusion coincident with centric relation and
those who did not.

222
Presence or absence of TMD and relationship with gender, group and age
Logistic regression analyses were applied to the outcome of interest (the presence or
absence of TMD) to investigate any associations with gender, group and age. The results of
the univariate logistic regressions are shown in Table 3.24.
Factor Odds Ratio 95% CI P value
Gender Male
Female
1
1.455 (0.726, 2.915) 0.291
Group Control
Orthognathic
1
2.053 (1.016, 4.148) 0.045
Age (per year)
0.996 (0.952, 1.043) 0.877
Table 3.24: Univariate logistic regression investigating presence or absence of TMD,
and association with gender, group and age
Females were 1.455 times more likely to have TMD than males, this was not however
found to be statistically significant (P=0.291). When comparing the groups, orthognathic
patients were twice (2.053) as likely to have TMD as the control subjects and this was
significant (P=0.045). With regards to age, for every one unit of change (i.e. for every
additional year) the odds of having TMD were reduced by 0.04% but this finding was not
statistically significant.
Due to the fact that only one factor (group) was statistically significantly associated with
the odds of having TMD and the remaining factors had no significant difference, it was not
appropriate to undertake a multivariable analysis.

223
3.3.8 Kinesiograph Findings
The range of jaw movement was also established using the kinesiograph and the following
parameters were recorded: comfortable opening, maximum opening, right and left lateral
excursions, along with the maximum anterior jaw movement.
Table 3.25 Kinesiograph findings for control (Crl) and orthognathic (OG) subjects
The orthognathic patients were found to have a statistically significantly reduced average
comfortable opening compared with the control group (P<0.001), the findings were similar
for average maximum opening, with the orthognathic group having a statistically
Grp Mean N Std
Dev
Lower
95%
CI
Upper
95%
CI
Median Min Max P Value
Comfortable
Opening (mm)
Crl
33.8 60 11.4 30.85 36.74 37.35 5.2 50.5
<0.001 OG
25.84 56 9.8 23.23 28.46 26.05 5.0 44.3
Maximum
Opening (mm)
Crl
37.5 60 7.3 35.61 39.40 38.40 20.3 50.8
0.006 OG
34.3 56 6.5 32.52 36.03 34.60 19.7 46.3
Right Lateral
Excursion
(mm)
Crl
7.03 60 2.6 6.36 7.70 6.80 0.9 13.2
0.420 OG
6.6 56 2.0 6.10 7.17 6.60 3.1 11.9
Left Lateral
Excursion
(mm)
Crl
7.1 60 2.6 6.44 7.79 7.25 1.7 12.7
0.305 OG
7.4 56 2.7 6.65 8.11 7.20 1.4 14.4
Maximum
Anterior
Movement
(mm)
Crl
6.4 60 3.5 5.53 7.34 6.65 0.7 13.1
0.059 OG
5.35 56 2.6 4.65 6.04 5.5 1.0 12.8

224
significantly reduced maximum opening (P=0.006) when compared with the control group.
For the remainder of the kinesiograph results (i.e. lateral excursions and protrusions) no
statistically significant differences were found between the groups.
3.4 Discussion
3.4.1 Demographics (Tables 3.3 to 3.7)
Previous authors have reported a higher proportion of females seeking orthognathic
treatment with ratios of 3:2 (Mayo et al., 1991) and approximately 2:1 quoted (Bailey et al.,
2001; Cunningham and Moles, 2009). This was not found to be the case for this study, as is
reflected by the equal numbers of male and female orthognathic patients recruited during
the study period. In view of the fact that it has previously been suggested that there may be
a gender predilection for TMD, a similar distribution of control subjects was recruited.
The most common ethnic group in this study was white, which is not surprising given the
results of the Government Census in 2001 when white individuals were noted to form the
largest ethnic group in Britain (92.1%) (Office for National Statistics, 2008). With specific
regard to the orthognathic patients, the findings of this study are similar to those reported
by Bailey et al. (2001). They carried out a review to determine who seeks orthognathic
treatment in the US and concluded that the vast majority of patients were white, although
other ethnic minorities such as Hispanics were increasingly seeking treatment.
The mean age of the subjects in the control group was 30.13 years, which is in keeping with
the inclusion criteria of 16-40 years of age. A mean age of 24.26 years was observed in the
orthognathic group and this was similar to that reported in previous studies of UK
orthognathic patients (Smith and Cunningham, 2004; Cunningham and Moles, 2009).

225
With regards to the skeletal pattern of the orthognathic patients, the majority of those
recruited had a Class II or III antero-posterior skeletal pattern (42.6% in both instances) and
there were fewer Class I cases (14.5%). When the vertical pattern was considered, a high
angle was the most prevalent discrepancy (47.1%). Espeland et al. (2008) found that Class
III patients constituted 55% of their sample, followed by 30% and 15% for skeletal Class II
and I respectively. Although Class II malocclusions are the most prevalent in the Caucasian
population (Proffit et al., 1998), it appears that Class III and long-face individuals are more
likely to seek orthognathic treatment than those with Class II problems. However, of those
individuals offered orthognathic treatment, relatively more of the Class II groups were
found to accept it (Bailey et al., 2001).
3.4.2 Questionnaire findings: Patient self reported symptoms (Table 3.8)
Eight of the twelve parameters recorded from the self completion questionnaire were
statistically significantly more problematic for the orthognathic patients than the control
subjects. Headaches, neck pain and grinding showed equal prevalence in the two groups,
but the patient group suffered from significantly more earaches, general facial pain, and jaw
pain on opening/closing, jaw pain on biting/chewing, sore muscles around the jaw;
clicking, jaw locking and limited mouth opening. In contrast, clenching was significantly
more frequent amongst the controls.
Some of the findings in this current study are in agreement with previous findings and
others conflict. Dervis and Tuncer (2002) found no significant difference for headaches or
grinding between orthognathic patients and a control group who did not have skeletal
discrepancies. However, in contrast with the current study, they found no statistically
significant differences for any of the other subjective TMD symptoms reported by the
control and patient groups. These conflicting results could be explained by the different
time points used for conducting the examination in the two studies. Dervis and Tuncer
(2002) examined orthognathic patients immediately prior to surgery, whilst in the current
study patients were examined before any orthodontic treatment and this may have

226
influenced the results. In addition, fewer subjects were recruited in their study than in the
current study which may have also affected the findings.
In a more recent study by Abrahamsson et al. (2009), orthognathic patients were also
examined pre-treatment and compared with a group of subjects with no skeletal
discrepancies. There were no reported differences between the groups with regards to the
prevalence of headaches and grinding (P=0.373 and 0.080 respectively). However they did
find that the patient group reported significantly more subjective TMD discomfort than the
control group, and pain affecting the TMJ and masticatory muscles, jaw tiredness and
clicking were also reported significantly more often in the orthognathic group.
3.4.3 Quality of Life (QoL) (Tables 3.9 to 3.12)
As the motivation to seek orthognathic treatment appears to be related to the desire to
improve both function and aesthetics, one may expect orthognathic patients to have a
poorer QoL. The OHIP-14 scores reflected this, with orthognathic patients having
significantly higher overall average OHIP-14 scores, and therefore poorer QoL, compared
with the controls (P<0.001). Similar findings were reported in other studies (Lee et al.,
2008).
A statistically significant difference was also found in the OHIP-14 scores between those
subjects suffering from TMD and those who did not (P=0.007), with individuals suffering
from TMD having a poorer QoL. A recent study assessing the impact of orofacial pain on
the quality of life of patients with temporomandibular disorder also found a significant
correlation between impact on quality of life and severity of TMD (Barros et al., 2009).
When looking at the 7 domains separately (Functional limitation, Physical pain,
Physiological discomfort, Physical disability, Psychological disability, Social disability and
Handicap), the scores for the control group were relatively constant across all 7 domains,
with mean scores ranging from 0.10 to 0.71. In the orthognathic group the mean scores
ranged from 1.18 to 4.35, suggesting that the patients had a poorer quality of life in the

227
individual domains. These findings were not assessed statistically as the overall OHIP-14
was more relevant and showed a highly significant result. In addition as 7 domains would
have been analysed there was a greater probability of obtaining a spurious significant result
due to multiple testing and chance. However, the trends in the data would suggest that
patients with skeletal discrepancies do have a poorer quality of life. The reasons behind this
finding are clearly complex but were not the main focus of the current study.
3.4.4 Clinical findings
Joint related symptoms (Tables 3.13 to 3.14)
Some authors have reported equal proportions of orthognathic patients and controls
suffering from TMJ pain on palpation (Dervis and Tuncer, 2002). When looking at pain on
palpation of the TMJ (lateral poles) and intra-auricular pain in the current study, more
subjects suffered from these symptoms in the orthognathic group than in the control group
(11.8% vs 7.4% and 8.3% vs 4.2%). However, these differences were not statistically
significant. Abrahamsson et al. (2009) found that orthognathic patients were four times
more likely to have pain on TMJ lateral palpation than control subjects and this difference
was statistically significant. The number of orthognathic patients recruited by Abrahamsson
et al. (2009) was 121 compared with 68 in the present study, thus it is possible that the
present study was underpowered and this may have affected the findings.
When comparing joint sounds between the two groups, no statistically significant
differences were found for the prevalence of clicks or crepitus. These findings mirror those
reported by Dervis and Tuncer (2002), but are in contrast with Abrahamsson et al. (2009)
who found that orthognathic patients were twice as likely to have clicking on
opening/closing than control subjects.
The majority of clicks observed in both the control and orthognathic groups were
consistent, painless, and occurred on opening. It is not easy to draw conclusions regarding
the clinical implications of these findings and this should be looked at in future studies. An
opening click often reflects the condyle moving beneath the posterior band of the disc until

228
it returns to its normal relationship on the concave under surface of the disc. The opening
click can occur at various points on the opening cycle: early, middle or late. Early clicks are
often indicative of damage to the articular surfaces, whilst middle clicks are often caused
by separation of the joint surfaces or by the snapping of the temporomandibular ligament
over the lateral pole of the condyle. Clicks that occur late in the opening cycle may be the
result of the condyle translating onto the anterior band of the meniscus and the closing click
reflects reversal of this process (reciprocal clicking). The condyle moves under the
posterior band of the disc until it snaps off the disc and onto the posterior attachment.
Closing clicks usually occur in the final third of the cycle but must not be confused with the
sounds generated by the premature contact of the teeth (Watt, 1980). The protrusive and
retrusive condylar paths do not coincide because on mouth opening the disc is displaced
and the distance between the osseous components is impaired, compared with when the
disc is in a normal position between the bony joint components during mouth closure
(Isberg, 2001).
Muscle Pain (Table 3.15)
A statistically significant difference was found when comparing prevalence of
tenderness/pain on palpation of the masseter and lateral pterygoid muscles between the
control and orthognathic groups, with the orthognathic group suffering from muscle
tenderness more often. However, there were no statistically significant differences, between
the two groups when considering pain on palpation of the temporalis. Again, previous
studies have shown conflicting results. Dervis and Tuncer (2002) looked at overall muscle
tenderness on palpation and found no significant differences between orthognathic patients
and controls, although other researchers have found a statistically significant difference in
prevalence (Abrahamsson et al., 2009).
Range of Jaw movement (Tables 3.16 and 3.17)
Orthognathic patients had a greater prevalence of lasting deviations on opening when
compared with controls, 11.8% of the orthognathic group and none of the controls had
lasting deviations and this difference was statistically significant (P=0.002). The
orthognathic group also had a higher percentage of transient deviations than the control

229
group (14.7% and 11.1% respectively), although this difference was not statistically
significant. A significant difference was also reported by Abrahamsson et al. (2009) who
found that orthognathic patients were more likely to have deviations on opening or closing
of the mandible, although the types of deviation observed were not specified.
The aetiological factors associated with lasting deviations include condylar hyperplasia,
coronoid hyperplasia, unilateral fibrous ankylosis, condyle osteoarthritis, unilateral disc
displacement without reduction, adhesions within the joint (anchored disc phenomenon),
unilateral mandibular dislocation, and occasionally primary or metastatic tumours of the
condyle (Lima et al., 2009). Disc displacement without reduction is caused by laxity of the
lateral disc attachment which allows migration of the disc to an anterior and medial
position, resulting in a mechanical barrier to the movement of the condyle. The anchored
disc phenomenon occurs when the disc is pressed against the fossa in the absence of
sufficient lubrication (Lima et al., 2009). As lasting deviations are frequently caused by
adhesions within the joint or disc displacement without reduction (Campos et al., 2008;
Lima et al., 2009), this would imply that the orthognathic patients may be more likely to
experience these conditions. Two individuals in the control group were classified as being
RDC/TMD 2b (disc displacement without reduction and with limited opening) compared
with 4 orthognathic patients (Table 3.19), although these numbers are too small to draw
conclusions regarding the predilection of orthognathic patients to these conditions. Further
comprehensive investigations with MRI imaging techniques would be required to confirm
this with certainty.
There was no statistically significant difference for average comfortable and maximum
assisted opening between the patients and controls, nor was there a difference with respect
to right lateral excursions. A significant difference (P=0.030) was observed with respect to
left lateral excursions, with the orthognathic group having a reduced mean value.
Limitations in lateral excursions are sometimes also an indication of disc displacement
without reduction (if this is less than 7mm) or adhesions within the joint (Lima et al.,
2009), this may therefore indicate that orthognathic patients have a greater susceptibility to
these conditions. However, this finding could also be incidental due to multiple testing,

230
which would be supported by the fact that there was no significant difference for right
lateral excursions. In addition, the magnitude of the differences found is unlikely to be
clinically relevant (9.81mm compared with 8.87mm).
The findings contrast with those of Abrahamsson et al. (2009), who found a significant
difference between the mean maximum opening and lateral excursion values for their
orthognathic and control groups. It is also interesting that the mean maximum opening and
lateral excursion values were higher for both groups in the Abrahamsson et al. (2009) study
than were recorded in this study, thus the differing findings may be explained by the
difference in sample frames (Sweden vs. UK). It is possible that anthropological differences
exist between the two populations particularly with regards to jaw and muscular structure.
It may also be possible that the culture for seeking treatment is different between the two
populations, with the Scandinavian patients being referred or seeking treatment more
commonly because of functional (rather than aesthetic) problems. As such, they may
present with a greater degree of dysfunction, thus explaining the significant differences
observed when comparing them with the control group.
3.4.5 TMD diagnosis and classification (Tables 3.18 and 3.19)
In this study, the presence or absence of TMD was diagnosed according to the RDC/TMD
criteria (Dworkin and LeResche, 1992). The RDC/TMD demonstrates high reliability for
the most common TMD diagnoses, thus supporting its use in clinical research (John et al.,
2005). Based on this classification 27.8% of the controls were diagnosed as having TMD
compared with 44.1% of the orthognathic patients and this difference was statistically
significant (P=0.044). This suggests that orthognathic patients are more likely to suffer
from TMD than their skeletal Class I counterparts and clinicians should consider this when
dealing with orthognathic patients. Abrahamsson et al. (2009) also used the RDC/TMD and
their findings were in agreement with this study, 42.1% of the orthognathic group and
32.1% of the controls were diagnosed with TMD and this difference in prevalence was also
statistically significant (P<0.001). Dervis and Tuncer (2002) found no statistically
significant difference between orthognathic patients and control subjects, however they

231
used the Helkimo Index to diagnose TMD and this may explain the different results
obtained.
The most commonly presenting classification based on the RDC/TMD was disc
displacement with reduction (2a), which accounted for approximately half of the diagnoses
observed in both the orthognathic and control groups. The next most prevalent diagnosis
was myofacial pain (1a). These diagnoses were also amongst the most commonly observed
in the Abrahamsson et al. (2009) study.
The higher prevalence of TMD reiterates the need for a thorough TMD examination prior
to undertaking orthognathic intervention in order to obtain accurate baseline records and to
allow a full discussion of the fact that it is not possible to guarantee any improvement in the
signs and symptoms of TMD post-surgery. The findings may also have implications when
managing adolescents with skeletal discrepancies and this should be looked at in future
research.
3.4.6 TMD in relation to aetiological factors
A-P skeletal pattern (Table 3.20)
There was no evidence to suggest that the prevalence of TMD differed amongst the
different A-P skeletal groups in this study, although the relatively small number of subjects
in each of the sub-groups must be borne in mind and further studies with larger sample
sizes are recommended. Other researchers have also reported a lack of association between
TMD signs/symptoms and the skeletal classification (Laskin et al., 1986; Onizawa et al.,
1995; Panula et al., 2000; Dervis and Tuncer, 2002; Farella et al., 2007). In contrast, White
and Dolwick (1992) reported that TMD was more common amongst Class II patients and
this finding was consistent with that of other studies (Upton et al., 1984; Sonnesen et al.,
1998).
Forty percent of the patients with Class I skeletal pattern discrepancies had TMD,
compared with 48.4% of Class II patients and 41.4% of Class III which suggests a trend

232
towards Class II patients having an increased TMD prevalence, although this was not
statistically significant (P=0.360).
Vertical Pattern (Table 3.21)
There was no evidence of an association between the MMPA and the presence or absence
of TMD. Forty six percent of the average angle patients had TMD compared with 50% of
those low angle and 40.6% of those with high angles. Again, the actual numbers involved
were small and although the findings were not statistically significant, the trend was for
average and low angle patients to have a greater prevalence of TMD than the high angle
patients. This finding was consistent with other studies (Kerstens et al., 1989; White and
Dolwick, 1992). Again the small sample size in the subgroups may have been a limiting
factor.
Occlusal features (Tables 3.22 and 3.23)
The association between TMD and occlusal features has been explored in the orthodontic
literature (Solberg et al., 1979; Ingervall et al., 1980; Pullinger et al., 1988; Clark and
Evans, 2001). Some studies found an association between occlusal discrepancies in the CR-
CO and temporomandibular disorders (Solberg et al., 1979; Ingervall et al., 1980; Pullinger
et al., 1988). The findings from the current study are in agreement with more recent studies
reporting no significant association between occlusal relationships and TMD (Clark and
Evans, 2001). In their review articles, Reynders (1990) and Seligman and Pullinger (1991)
concluded that no scientific evidence existed for a causal relationship between occlusion
and TMD. Hence, orthognathic treatment cannot be recommended purely on occlusal
grounds (such as occlusal slides).
Presence or absence of TMD and the influence of gender, group and age (Table 3.24)
Although both males and females suffer from TMD, studies have reported a higher
prevalence among women, usually in the ratio of 2:1 (Dworkin et al., 1990; Lipton et al.,
1993; LeResche 1997). When comparing results from previous studies, it is therefore
important to consider the potential effect of the gender distribution of subjects in the patient
and control groups. In this study the gender distribution in both the orthognathic and

233
control groups was 1:1, but in studies where a greater proportion of females are recruited
this could have an effect on the overall prevalence of TMD within that group.
The results found in the current study were not significant for gender, however, the odds
ratio of approximately 1.5 indicates that women are 1.5 times more likely to experience
TMD than males and therefore seems to reiterate the trend reported in previous research. It
must be borne in mind that the studies mentioned above are representative of the general
population, whereas the results for the current study apply to a combined orthognathic
patient/ control group population. Dervis and Tuncer (2002) did not find any significant
difference between the females and males in their study of orthognathic patients, although
they attributed this to the small sample size (21 males and 29 females).
Although the association between TMD and age has been explored in the general
population, it is rarely reported in orthognathic cohorts. This study found no significant
association between TMD and age. This suggests that there is no need to preclude older
patients from having surgery because of concerns regarding development of TMD or
worsening of existing signs/symptoms. However, it must be acknowledged that the age
range of those recruited in the study was specific (16 to 40 years) and it would be unwise to
attempt to extrapolate the results to patients outside this age range.
3.4.7 Kinesiography Findings (Table 3.25)
A significant difference was observed for comfortable opening and maximum opening
between the control and orthognathic groups. In both cases the orthognathic group had a
reduced mean opening (mean difference of 8mm for comfortable opening and 3mm for
maximum opening). A difference of 8mm would be considered clinically relevant,
however, a 3mm difference for the maximum opening is less likely to be of clinical
importance. Of more importance is that both groups would be considered to have an
adequate comfortable and maximum opening. No significant difference was observed for
the remaining kinesiography findings (lateral excursions and protrusion).

234
The findings for comfortable and maximum recorded opening contradicted the findings
observed from the clinical examination where there were no significant differences between
the two groups with regards to opening. While some authors have indicated that moderate
agreement can be expected between the measurements obtained from kinesiograph readings
and conventional measurement methods (Rivera-Morales et al., 1996), others have reported
that jaw tracking devices have a low additional diagnostic value because of the biological
variation in the function of the stomatognathic system, fluctuations over time and because
of the inherent mechanical factors involved in the clinical use of such instruments.
Although more recent tracking devices have higher reliability, the clinical usefulness is
sometimes doubtful (De Boever et al., 2008). Assembling the kinesiograph and attuning it
to the patient is time consuming and although it may be useful for tracking jaw movements
diagrammatically, it does not substitute for clinical measurements and, as such, the
conclusions of this study would be that the kinesiography adds little diagnostic value to
TMD studies. Similar trends in the data were observed when comparing the results with the
clinical measurements however.
3.5 Conclusions
The prevalence of TMD reported in this orthognathic population was 44.1% which is lower
than that reported by some authors (Schneider et al., 1991; Link and Nickerson, 1992;
Panula et al., 2000). It is, however, similar to that reported by Abrahamsson et al. (2009)
and this may be explained by the use of the RDC/TMD criteria in both studies. This ability
to compare findings highlights the benefits of standardising TMJ examination protocols and
this is a recommendation for future research.
This study found a significant difference in TMD prevalence between the controls (27.8%)
and patients (44.1%), with the patient cohort being more susceptible to TMD. However,
although orthognathic patients appear more likely to suffer from TMD, whether treatment

235
will improve their TMD is highly questionable. This is an important issue to be highlighted
in any informed consent process.
Orthognathic patients reported more TMD symptoms (such as general facial pain, jaw pain
on opening/closing, clicking and limited mouth opening) than their control group
counterparts. When comparing the clinical findings of the two groups, there was a greater
prevalence of orthognathic patients presenting with signs such as pain on palpation of the
TMJ and clicking, but these results were not significant. There was a significantly higher
prevalence of orthognathic patients presenting with pain on palpation of the masseter and
the lateral pterygoid than in the control group.
This chapter examined and discussed relevant variables concerning TMD and the
presenting signs and symptoms in orthognathic patients, when compared with subjects with
no skeletal discrepancies. The overall findings from this study support other researchers
who have found that orthognathic patients are more likely to suffer from TMD
(Abrahamsson et al., 2009). However, no relationship could be established with regards to
TMD and the various skeletal patterns due to the relatively small subgroups. Future studies
involving larger sample sizes and classification according to the RDC/TMD criteria will
hopefully address this issue.

236
Chapter IV: A Longitudinal Study of Temporomandibular Joint
Disorders in Orthognathic patients
Introduction, Aims and Objectives
This chapter reports on a longitudinal study of orthognathic patients with skeletal
discrepancies undertaking orthognathic intervention. The study followed this cohort of
patients longitudinally throughout treatment with the aim of establishing whether any TMD
symptoms altered during the course of treatment.
The objectives were as follows:
1. To determine patient reported symptoms and clinical signs during the course of
treatment.
2. To investigate whether there were any changes in TMD signs and symptoms during
the course of treatment.
3. To assess TMD signs and symptoms at the pre-surgery time point (which has often
been used at the ―baseline‖ measure in previous studies) and determine how this
compares with the pre-treatment status.
4.1 Introduction
Viewpoints expressed regarding TMD and the impact of orthognathic treatment is often
conflicting. There is little high quality research on the association between major skeletal
disharmonies and the effects on TMD and few longitudinal, controlled long-term follow-up
studies investigating TMD and function post-surgically. There appears to be wide variation
in the prevalence of signs and symptoms of TMD in the orthognathic population prior to
treatment, but several studies report significant proportions of orthognathic patients with
TMD who experienced improvements in their symptoms after surgery (White and Dolwick,

237
1992; De Clercq et al., 1995; Gaggl et al., 1999). In contrast, other subjects who were
asymptomatic pre-operatively developed TMD post-operatively (Scheerlinck et al., 1994;
Wolford et al., 2003).
A longitudinal follow-up of 52 orthognathic patients undertaken by Egermark et al. (2000)
showed that fifty-one percent reported improvement in their TMD signs and symptoms
post-surgery, while 37% reported no change. Therefore, the results of this study supported
the theory that orthognathic treatment may have a beneficial effect on TMJ status.
However, other studies report minimal or no change in TMD after orthognathic surgery.
Sostmann et al. (1991) evaluated 86 orthognathic patients using Helkimo´s Anamnestic and
Dysfunction Indices and found no relationship between TMD and the type of malocclusion
or the surgical approach, but concluded that possible beneficial effects were achieved for
certain symptoms, such as TMJ pain and sounds. A modification of Helkimo´s Index was
also used in a prospective study of 22 Class II patients who underwent BSSO procedures
(Smith et al., 1992). Subjectively, there was a reduction in muscular pain, headache, joint
sounds and parafunctional habits, but clinical signs remained largely unchanged.
Although a number of prospective longitudinal studies have investigated the signs and
symptoms of TMD in orthognathic patients (for further details see the systematic review of
the literature in Chapter II), very few of these studies (n=3) examined patients pre-
treatment rather than pre-surgery as the initial time point (Rodrigues-Garcia et al., 1998;
Panula et al., 2000; Pahkala and Heino, 2004) and none diagnosed patients according to the
RDC/TMD criteria which is currently recommended for research in this area.
The prospective multicentre study undertaken by Rodrigues-Garcia et al. (1998) explored
the relationship between Class II malocclusions and TMD pre-treatment and 2 years after
BSSO using the Craniomandibular Index (CMI). The results showed significant
improvements in CMI scores and muscle pain, reduction in subjective pain and discomfort
and a reduction in clicking upon opening. However, crepitus in the TMJ increased. The
magnitude of the change in muscular pain did not appear to be related to the severity of the

238
pre-treatment malocclusion and the authors concluded that the results did not support the
theory that TMD is related to the presence of a severe Class II malocclusion.
Pahkala and Heino (2004) investigated the effect of the sagittal split ramus osteotomy on
TMD in 72 (49 females and 29 males) patients before, and 2 years after, orthognathic
treatment using the modified Helkimo Index. The patients were classified into subgroups:
myogenous, arthrogenous, or both components of TMD. They found that clicking and
headaches decreased significantly following treatment, whilst crepitus increased. In
general, the severity of the dysfunction was reduced and multiple regression analysis
showed that patients with the largest overjets and previous occlusal splint therapy benefited
most from orthognathic treatment. In addition, patients with signs of mainly myogenous
origin experienced greater improvement than patients with mainly arthrogenous
components of TMD. The results suggested that, in patients with severe maxillomandibular
discrepancies, orthognathic treatment may reduce myogenous TMD pain and discomfort.
There are, however, weaknesses in many of these studies as there are no non-treatment
control groups; patient samples are often small; follow-up duration is short and many of the
studies are retrospective.

239
4.2 Materials and Methods
4.2.1 Recruitment of orthognathic patients
All patients for this section of the study were recruited from the Joint Orthodontic/
Orthognathic clinic at the Eastman Dental Hospital, UCLH Foundation Trust during the
period April 2006 to January 2009, and this cohort of patients is already described in
Chapter III. Not all patients recruited for Chapter III had completed treatment and could be
included in this chapter.
4.2.2 Ethical approval
A notice of substantial amendment was submitted to University College London Hospitals
Ethics Committee to allow inclusion of a skeletal control group into this study and approval
for this was obtained (Appendix 12).
4.2.3 Control group comprising subjects with skeletal discrepancies
It was initially intended to use a control group of patients with skeletal discrepancies in this
study. A cohort of orthognathic patients were identified, who had severe skeletal
discrepancies and were seen on the Orthognathic clinic but subsequently decided not to
proceed with treatment. These patients were consented to be examined twice: at the time
they were seen on the Orthognathic clinic and a second time at least 1 year later. The
intention was that these individuals could act as a control group to allow for TMD changes
which may occur over time in the absence of orthognathic treatment. Eighteen patients
were initially recruited and, at the second time point, all of these individuals were sent a
letter inviting them to return for a second examination and an incentive (a gift voucher) was
offered. Unfortunately only 2 individuals responded to arrange appointments despite
several reminders being sent out. It was therefore decided that it was not feasible to include
this group within the study, thus only the orthognathic patients undergoing treatment were
followed longitudinally.

240
4.2.4 Data collection and measurements
One researcher (S.A.) carried out all of the data collection for this part of the study and this
included:
1. Questionnaire: self reported TMD symptoms and Quality of Life (OHIP-14)
2. Clinical examination using the RDC/TMD classification
3. Kinesiography examination
Details of all of the above procedures have previously been described in Chapter III.
Time points for observations
All of the required observations were undertaken at three time points during the course of
treatment.
1. Prior to any treatment (T1)
2. Approximately 9-12 months into pre-surgical orthodontics (―prior to surgery‖) (T2)
3. Approximately six weeks following removal of orthodontic appliances (T3)
The above time points were chosen for the following reasons:
T1: To act as a true baseline for comparisons before any treatment had been started.
T2: This time point has been used as a baseline in many previous studies. This allowed
comparison between T1 and T2 to determine whether there were any changes in signs and
symptoms. This would then allow a conclusion to be drawn as to whether T2 can
legitimately be used as a ―proxy‖ baseline.
T3: By choosing debond as the end of treatment outcome, the final follow-up was at
least 6 months post surgery for all patients, this allowed swelling and inflammation to
subside and the presence of the fixed appliances could not affect the outcomes.
Data collection began in April 2006 (following TMJ examination calibration in March
2006). The final data collection date was the beginning of November 2009 and this

241
coincided with the end of SA‘s research time, as set by University College London
enrolment. No patient follow-ups were possible beyond November 2009.
4.2.5 Statistical Analyses
Statistical analysis was carried out using SPSS version 14, (SPSS UK Ltd, Guildford
Surrey, UK).
McNemar test
The McNemar test is undertaken on 2x2 contingency tables for dichotomous data to test the
difference between paired proportions e.g. in studies in which patients serve as their own
control or in studies with a "before and after" design (Petrie and Watson, 2006). Thus it
was suitable when comparing presence or absence of TMD or other signs and symptoms, at
the various time points.
Wilcoxon signed rank test
The Wilcoxon signed rank test, also known as the Wilcoxon matched pairs test, is a non-
parametric test used to test the difference in median values for paired data. This test is the
non-parametric equivalent of the paired t-test and was used in this study to compare the
number of muscle sites that were tender to palpation at the time points assessed (Petrie and
Watson, 2006).
Paired t-test
The paired t-test is a statistical technique used to compare the difference between two
means when the two samples are related i.e. in ‗before and after‘ studies. The first
assumption in the paired sample t-test is that only matched pairs can be used and secondly,
a normal distribution is assumed and the variance of the two samples must be the same
(Petrie and Watson, 2006). A paired sample t-test was used for comparison of the
continuous variables in this study (i.e. maximum opening) at the different time points.

242
4.3 Results
4.3.1 Orthognathic patient recruitment
Figure 4.1 Progress of orthognathic patients through this study
T1 Pre-orthodontic treatment
N=68
T2 Pre-surgery
N=46
T3 Post-surgery
N=20
No follow
up data, < 9
months of
Tx
N=22
Still in
active
orthodontic
Tx
N=24
Dropped
out/
Transferred
N=2

243
At the first time point (T1) 68 orthognathic patients were recruited and examined (as
described in Chapter III). Twenty two of this cohort provided pre-treatment data but were
less than 9 months into pre-surgical orthodontics and could not provide T2 data within the
time constraints of the study.
Forty-six patients were assessed at T2. Two patients were lost to follow up after T2; one of
these patients transferred to another unit and the second patient could not be contacted.
Of the 68 patients recruited at T1, 20 patients had completed their course of orthognathic
treatment and had appliances removed during the time frame of this study and were
assessed at the third time point (T3). A further 24 patients were still in active post-surgical
orthodontics at the cut-off date and could not be included for their final assessments.
4.3.2 Comparison between T1 and T2
Demographics:
Gender Skeletal Base MMPA
Male Female Class I Class
II
Class
III
Average High Low
N
%
27
59
19
41
5
11
19
41
22
48
20
43
22
48
4
9
Total
N
46 46 46
Table 4.1 Summary of the demographic details for the 46 patients at T2
Twenty seven males and 19 females were examined at T2. Forty eight percent of the
patients were being treated for the correction of a skeletal Class III discrepancy, 41% for
the correction of a skeletal Class II and only 11% involved skeletal Class I patients. In
addition, 43% of patients had an average MMP angle; 48% had a high angle and 9% had a
low MMP angle.
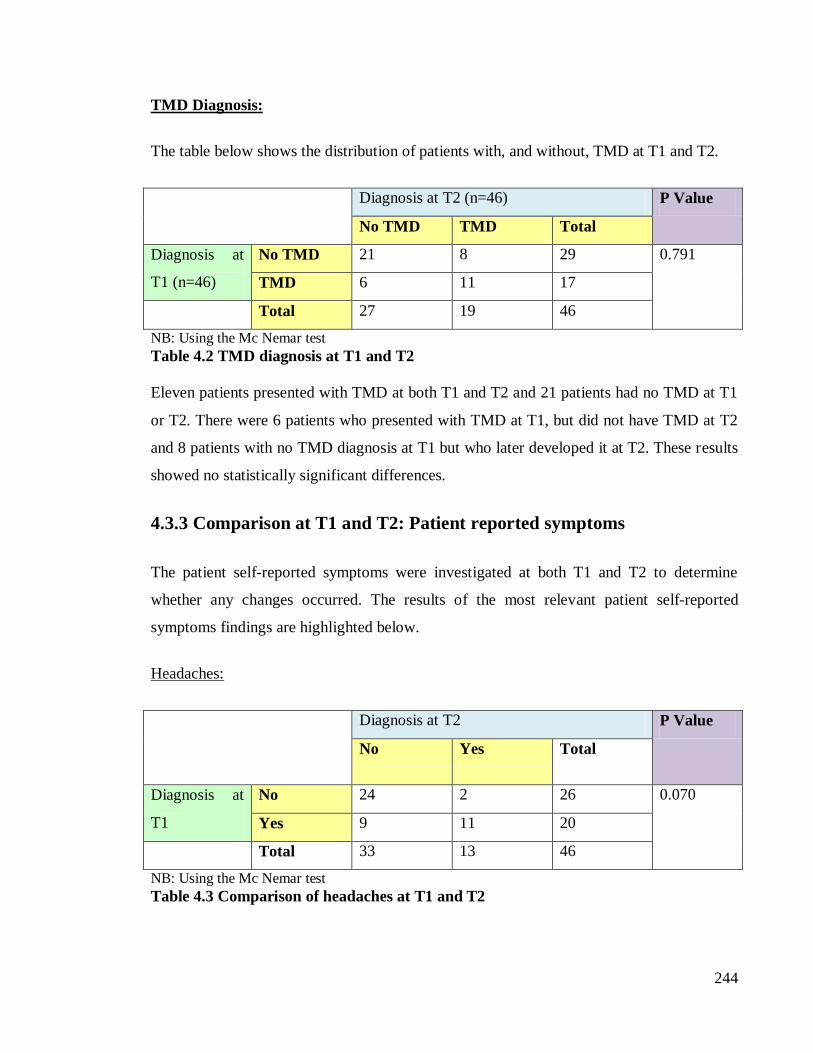
244
TMD Diagnosis:
The table below shows the distribution of patients with, and without, TMD at T1 and T2.
Diagnosis at T2 (n=46) P Value
No TMD TMD Total
Diagnosis at
T1 (n=46)
No TMD 21 8 29 0.791
TMD 6 11 17
Total 27 19 46
NB: Using the Mc Nemar test
Table 4.2 TMD diagnosis at T1 and T2
Eleven patients presented with TMD at both T1 and T2 and 21 patients had no TMD at T1
or T2. There were 6 patients who presented with TMD at T1, but did not have TMD at T2
and 8 patients with no TMD diagnosis at T1 but who later developed it at T2. These results
showed no statistically significant differences.
4.3.3 Comparison at T1 and T2: Patient reported symptoms
The patient self-reported symptoms were investigated at both T1 and T2 to determine
whether any changes occurred. The results of the most relevant patient self-reported
symptoms findings are highlighted below.
Headaches:
Diagnosis at T2 P Value
No Yes Total
Diagnosis at
T1
No 24 2 26 0.070
Yes 9 11 20
Total 33 13 46
NB: Using the Mc Nemar test
Table 4.3 Comparison of headaches at T1 and T2

245
Twenty four patients did not report headaches at either time point, whilst 11 reported
headaches at both. Nine patients suffered from headaches at T1 but did not report them at
T2, whilst 2 patients who did not report headaches at T1 reported them at T2. None of these
differences were statistically significant.
Jaw pain on opening and closing:
Diagnosis at T2 P Value
No Yes Total
Diagnosis at
T1
No 22 9 31 0.803
Yes 7 8 15
Total 29 17 46
NB: Using the Mc Nemar test
Table 4.4 Comparison of jaw pain on opening/closing at T1 and T2
Of the 46 patients, 22 did not report any pain on opening or closing at T1 or T2, whilst 8
patients reported this at both time points. However, 7 patients who had jaw pain on opening
and closing improved by T2 and 9 patients with no pain at T1 complained of this at T2. The
differences were not statistically significant.
Muscle pain around the jaw
Diagnosis at T2 P Value
No Yes Total
Diagnosis at
T1
No 28 6 34 0.752
Yes 4 8 12
Total 32 14 46
NB: Using the Mc Nemar test
Table 4.5 Comparison of muscle pain around the jaw at T1 and T2

246
No statistically significant differences were found for muscle pain; twenty eight patients
had no muscle pain at either time point, whilst 8 patients complained of pain at both T1 and
T2. Four of the patients who had muscle pain at T1 did not report symptoms at T2, whilst 6
patients who had no symptoms at T1 had developed them at T2.
4.3.4 Comparison at T1 and T2: Clinical findings
Although all of the clinical signs were investigated, only the most relevant signs are
reported here due to the relatively small sample size.
Pain over the lateral poles of TMJ:
Diagnosis at T2 P Value
No Yes Total
Diagnosis at
T1
No 39 5 44 0.219
Yes 1 1 2
Total 40 6 46
NB: Using the Mc Nemar test
Table 4.6 Comparison of pain over the lateral poles of the TMJ at T1 and T2
Only 1 patient had pain on palpation of the lateral poles of the TMJ at both T1 and T2, the
majority of the patients (n=39) did not experience pain on palpation at either time point.
There were, however, 5 patients who developed new symptoms of pain at T2 and 1 patient
whose pain improved at T2. These findings were not statistically significant.

247
Clicking of the TMJ:
Diagnosis at T2 P Value
No Yes Total
Diagnosis at
T1
No 28 6 34 0.508
Yes 3 9 12
Total 31 15 46
NB: Using the Mc Nemar test
Table 4.7 Comparison of clicking of the TMJ at T1 and T2
No statistically significant difference was found between T1 and T2 for clicking of the
TMJ. The majority of patients had no TMJ clicking (n=28), whilst 9 patients had clicking at
both T1 and T2. Six patients who were symptom free at T1 developed clicking during pre-
surgical orthodontics and 3 patients who initially presented with clicking had no clicking at
T2.
Muscle pain on palpation:
Diagnosis at T2 P Value
Diagnosis at T1
Number of muscles
sites tender to
palpation
0 1 2 ≥3 Total
0.773 0 27 3 2 0 23
1 4 0 0 1 4
2 1 0 1 1 3
≥3 0 1 3 1 5
Total 32 4 6 4 46
NB: Using the Wilcoxon signed rank test
Table 4.8 Comparison of the number of muscles sites which were tender to palpation
at T1 and T2
The majority of the patients did not experience any pain on muscle palpation at either T1 or
T2 (n=27). Five patients had pain on palpation of 3 or more muscle sites at T1, compared

248
with 4 patients at T2. These differences were not statistically significant, however, the
small number of subjects in each of the cells should be noted.
Maximum opening:
Mean (mm)
Std.
Deviation
(mm)
P Value
Maximum opening at T1 48.70 8.151 P<0.001
Maximum opening at T2 51.85 7.794
NB: Using the t-test
Table 4.9 Comparison of maximum opening at T1 and T2
A highly significant difference was observed for maximum opening (P<0.001), with the
patients having an increased maximum opening at T2 compared with T1.
4.3.5 Comparison at T1 and T3
This section presents the findings at the start of treatment and following debond (T1 and
T3).
Demographics:
Gender Skeletal Base MMPA
Male Female Class I Class
II
Class
III
Average High Low
n
%
12
60
8
40
1
5
7
35
12
60
11
55
7
35
2
10
Total
N
20 20 20
Table 4.10 Summary of the demographic details for the 20 patients who had
completed orthognathic treatment (i.e had T1, T2 and T3 data available)

249
Twelve males and 8 females completed treatment in the time frame of this study. Twelve of
the 20 cases were for the correction of a skeletal Class III discrepancy, 7 were for the
correction of a skeletal Class II and only 1 patient had a skeletal Class I base. In addition,
11 patients had an average MMP angle; seven had a high angle and 2 had a low MMP
angle. Further details of these patients can be found in Table 4.20.
TMD Diagnosis:
Diagnosis at T3 P Value
No TMD TMD Total
Diagnosis at
T1
No TMD 6 5 11 0.727
TMD 3 6 9
Total 9 11 20
NB: Using the Mc Nemar test
Table 4.11 TMD diagnosis at T1 and T3
When considering the presence or absence of TMD amongst the 20 patients who were
examined at the initial time point and end of treatment, 6 patients suffered from TMD at
both T1 and T3, whilst a further 6 patients had no TMD at either time points. Three patients
who had TMD at T1 did not have TMD at the end of treatment, whilst 5 patients who were
initially asymptomatic, had TMD at the end of treatment. These differences were not
statistically significant.

250
4.3.6 Comparison at T1 and T3: Patient reported symptoms
Headaches:
Diagnosis at T3 P Value
No Yes Total
Diagnosis at
T1
No 12 1 13 0.371
Yes 4 3 7
Total 16 4 4
NB: Using the Mc Nemar test
Table 4.12 Comparison of headaches at T1 and T3
Headaches were reported by 3 patients at both T1 and T3, whilst 12 patients did not suffer
from headaches at either time point. Four of the patients who initially suffered from
headaches did not report this at T3 and only one patient developed new symptoms at T3. As
with the previous results, no statistically significant difference in the prevalence was
observed between the two time points.
Jaw pain on opening and closing:
Diagnosis at T3 P Value
No Yes Total
Diagnosis at
T1
No 14 2 16 0.617
Yes 2 2 4
Total 16 4 20
NB: Using the Mc Nemar test
Table 4.13 Comparison of jaw pain on opening/closing at T1 and T3

251
The majority of patients (n=14) did not report jaw pain on opening and closing at either
time point. Two patients who were previously asymptomatic developed new symptoms at
T3 and 2 patients experienced an improvement in their condition at T3. These differences
in prevalence were not statistically significant.
Muscles pain around the jaw
Diagnosis at T3 P Value
No Yes Total
Diagnosis at
T1
No 11 4 15 0.724
Yes 4 1 5
Total 15 5 20
NB: Using the Mc Nemar test
Table 4.14 Comparison of muscles pain around the jaw at T1 and T3
With regards to muscle pain around the jaw, the results were in line with other self-reported
symptoms and no significant difference in the prevalence of muscle pain existed between
T1 and T3. Eleven of the 20 patients had no soreness at T1 or T3 and only 1 patient
reported pain at both time points. Four patients experienced a worsening of their symptoms
at T3 and a further 4 patients experienced an improvement.
4.3.7 Comparison at T1 and T3: Clinical findings
Pain over the lateral poles of the TMJ:
Diagnosis at T3 P Value
No Yes Total
Diagnosis at
T1
No 16 3 19 0.625
Yes 1 0 1
Total 17 3 20
NB: Using the Mc Nemar test
Table 4.15 Comparison of pain over the lateral poles of the TMJ at T1 and T3

252
Clinical examination revealed that 16 patients had no pain on palpation of the lateral poles
of the TMJ at T1 or T3. Three previously asymptomatic patients had developed pain on
palpation at T3 and one symptomatic patient improved. No statistically significance
difference was found.
Clicking of the TMJ:
Diagnosis at T3 P Value
No Yes Total
Diagnosis at
T1
No 11 4 15 0.375
Yes 1 4 5
Total 12 8 20
NB: Using the Mc Nemar test
Table 4.16 Comparison of clicking of the TMJ at T1 and T3
Eleven patients had no signs of clicking at either T1 or T3, whilst 4 patients had signs at
both time points. Four patients who were initially asymptomatic developed new clicks and
one patient who initially had a click did not have this at T3. There were no statistically
significant differences in the prevalence of the clicks between the two time points.
Muscle pain on palpation:
Diagnosis at T3 P Value
Diagnosis at T1
Number of
muscles sites
tender to
palpation
0 1 2 ≥3 Total
0.903 0 11 1 1 1 14
1 3 0 0 0 3
2 1 0 0 1 2
≥3 0 0 0 1 1
Total 15 1 1 3 20
NB: Using the Wilcoxon sign rank test
Table 4.17 Comparison of the number of muscles sites tender to palpation at T1 and
T3

253
Eleven patients did not have tenderness to palpation of their muscles of mastication at T1 or
T3. One patient experienced pain on palpation of 3 or more muscle sites at T1 compared
with three patients at T3, but this difference in prevalence was not statistically significant.
Maximum opening:
Mean (mm) Std. Deviation
(mm)
P Value
Maximum opening at T1 47.65 8.689 0.552
Maximum opening at T3 49.50 8.294
NB: Using the t-test
Table 4.18 Comparison of maximum opening at T1 and T3
The mean maximum opening improved from 47.65mm to 49.50mm at T3. However, this
difference in means was not statistically significant.
4.3.8 Longitudinal follow up of the 20 patients who completed treatment
A summary of the findings for the 20 patients who completed orthognathic treatment is
shown in Table 4.20
Twelve patients had no change in their TMD status between T1 and T3; five had a
worsening of their condition and three patients showed an improvement. Of the cases
where worsening of the TMD condition was observed (Table 4.19):
• OG4 - a average angle Class III patient developed new signs of clicking and pain on
palpation of more than three muscles
• OG5 - a average angle Class III patient developed new signs of clicking
• OG12 - a high angle Class II patient developed new signs of clicking
• OG24 - a high angle Class III patient developed pain on palpation of the lateral
poles and restricted opening
• OG27 - a low angle Class III patient developed new signs of clicking

254
No definite trend could be observed regarding TMD and antero-posterior/ vertical skeletal
patterns, but in the majority of the cases where the condition worsened (n=4 of 5), the
change in TMD diagnosis was due to the development of a new click.
The two patients who experienced an improvement in their TMD were of differing skeletal
patterns (Table 4.19):
• OG14 - a high angle skeletal Class I patient had reduced muscular and TMJ lateral
pole pain post-surgery
• OG16 - a high angle skeletal Class II patient had an improvement in clicking post-
surgery
Due to the small numbers involved no trend could be shown for the two patients.
Deterioration in TMD Improvement in TMD
Pt ID Malocclusion Change in TMD Pt ID Malocclusion Change in TMD
OG4 Class III
Average angle
Clicking and Pain OG14 Class I
High angle
Pain on palpation
of TMJ and
muscular pain
OG5 Class III
Average angle
Clicking OG16 Class II
High angle
Clicking
OG12 Class II
High angle
Clicking
OG24 Class III
High angle
Pain on palpation
of TMJ and
restricted opening
OG27 Class III
Low angle
Clicking
Table 4.19 Summary of patients who had either an improvement or deterioration in
their TMJ status between T1 and T3.

255
Pt Gender Skeletal
base
MMPA Max opening TMJ-lateral
pole pain
Click Muscle pain in >
3 muscles
TMD
T1 T2 T3 T1 T2 T3 T1 T2 T3 T1 T2 T3 T1 T2 T3
OG3 M 3 Average 52 N N N N N N N N N N N N
OG4 F 3 Average 50 N Y N N Y Y N Y Y N Y Y
OG5 M 3 Average 50 N N N N Y Y N N N N Y Y
OG6 M 2 Average 25 N N N N N N N N N Y Y N
OG7 F 3 Average 50 N N N N N N N N N N N N
OG11 M 2 Average 44 N N N N N N N N Y N N N
OG12 M 2 High 48 N N N N N Y N N N N N Y
OG14 M 1 High 40 Y N N N N N N N N Y N N
OG15 M Low N N N N N N N N N N N N
OG16 F High N N N Y N N N N N Y N N
OG17 F High N N N Y Y Y N Y N Y Y Y
OG24 M High N N Y N N N N N N N N Y
OG27 M Low N N N N Y Y N N N N Y Y
OG35 F Average N N Y N N N N N Y Y N Y
OG41 F High N N N N N N N N N N N N
OG47 M Average N N N Y Y Y N N N Y Y Y
OG48 F Average N N N N Y N N N N N Y N
OG5 F Average N Y Y Y Y Y Y Y Y Y Y Y
OG52 M Average N N N N N N N N N Y Y Y1
OG53 M High N N N Y N Y N N N Y N Y
Table 4.20 Longitudinal follow up of the 20 patients who completed treatment
1 TMD diagnosis due to crepitus

256
4.4 Discussion
4.4.1 Orthognathic patient recruitment
Sixty eight orthognathic patients were initially recruited into this study and this sample
size was comparable with, and in some case greater than, other research conducted in
this field (Panula et al., 2000; Pahkala and Heino, 2004). Although Rodrigues-Garcia et
al. (1998) prospectively recruited 124 patients, this was a three site multicentre study
with multiple examiners. Whilst every effort was made to recruit a larger number of
patients, there were certain limitations to this which included:
• The number of patients attending for orthognathic treatment
• The number of patients consenting to take part in the study: 16 patients (19%)
declined to take part and some patients had already consented to other research
studies within the department hence could not take part in this study from an
ethical view point.
Of the 68 patients who were recruited, only 20 completed their treatment and were
debonded by November 2009. The average length of orthognathic treatment is 2.5 to 3
years and often longer when postgraduates undertake treatment, which clearly placed
restrictions on the number of patients followed through to completion of treatment.
Thus, as anticipated, only the patients recruited within the first year of this PhD had
completed their treatment.
4.4.2 Skeletal Control group
A Class I control group provided a suitable comparison with the orthognathic cohort in
Chapter III. It was intended that patients with skeletal discrepancies who had decided
not to undergo orthognathic treatment would be beneficial controls for this chapter, in
order to account for the potential changes in TMD over time. TMD signs and symptoms
show fluctuations with time (Kuttila, 1998; Magnusson et al., 2000) and this is part of
normal variation. Thus an investigation with a non-treatment control group with skeletal
discrepancies would have allowed determination of whether surgery had an effect on
TMD status by taking time into account and reducing its effect as a potential
confounding variable. Unfortunately this did not prove feasible, due to the number of

257
responses obtained (n=2) and this is clearly a limitation in this research. In addition,
even if a sufficient sample size had been obtained, there would remain the issue of
potential selection bias.
4.4.3 Comparison between T1 and T2 (N=46)
The comparison of TMD and the various signs and symptoms between T1 and T2
served two purposes:
1. To determine whether pre-surgical orthodontic treatment had any effect on the
TMJ and thus on the signs and symptoms of TMD in orthognathic patients.
2. The majority of the studies that have investigated the effect of orthognathic
surgery on TMD have used during pre-surgical orthodontics or pre-surgery at
the baseline. It was hoped this comparison would therefore determine whether or
not this time point can be used as a ―proxy‖ baseline.
TMD Diagnosis (Table 4.2):
In 6 patients, the TMD diagnosis improved between T1 and T2, however TMD
developed in 8 previously asymptomatic individuals. No changes were observed in the
remaining 32 patients. No statistically significant differences in the prevalence of TMD
were found between T1 and T2.
Although no significant differences were found in the proportion of patients with TMD
at T1 and T2, fourteen of the 46 patients (30%) had a change in their TMD status. This
would suggest that T2 is not an ideal baseline as individual changes and fluctuations in
TMD do occur during pre-surgical orthodontics. This time point may be acceptable as a
baseline if overall group changes are being studied but if paired data are investigated in
the same way as in this study, this is clearly not the case.
Unfortunately comparison of the above results could not be made with other studies.
Few of the prospective studies which investigated TMD longitudinally in orthognathic
patients used pre-treatment examinations as the baseline. Of the few studies which did,
patients were examined at the start of treatment but not then examined prior to surgery
(Panula et al., 2000; Pahkala and Heino, 2004). One study did examine patients both

258
pre-treatment and pre-surgery (Rodrigues-Garcia et al., 1998) but did not report the pre-
treatment results.
Patient reported symptoms (Tables 4.3 to 4.5):
No significant differences were observed between T1 and T2 for any of the patient
reported symptoms (headaches, jaw pain on opening and closing and sore muscles
around the jaw).
With regards to headaches, 35 patients experienced no change in their symptoms,
compared with 9 who reported an improvement and 2 who complained of a
deterioration. Patients complaining of headaches may experience an improvement in
their condition at T2, but whether this improvement is perceived (placebo effect) as a
result of the orthodontic intervention needs to be investigated in future studies.
Thirty patients experienced no changes in jaw pain on opening or closing, whilst a
similar number of patients reported either worsening of their symptoms (n=9) or an
improvement (n=7). The results for general muscle soreness were in line with previous
findings and the majority of patients reported no change in their symptoms (n=36),
compared with 4 patients who noted an improvement and 6 whose symptoms worsened.
This would suggest that in the majority of cases there are no changes in self-reported
pain symptoms during pre-surgical orthodontics.
Despite no significant differences being observed for patient self-reported symptoms
between T1 and T2, 24% of the patients (n=11 of the 46) reported a change in headache
related symptoms; 9 patients (20%) experienced an improvement compared with 2
patients who reported new headaches. In addition 35% of patients (n=14) experienced
changes in jaw pain on opening/closing between T1 and T2 and 22% reported changes
in muscle soreness. Thus, although these changes were not significant, they do appear to
be sufficient to question the use of T2 as an acceptable baseline for TMD studies.
Clinical findings (Tables 4.6 to 4.9):
There were no significant changes for pain on palpation of the lateral poles of the TMJ
between T1 and T2. Five patients did, however, experience worsening of pain,
compared with one individual who improved. Similar findings were observed for

259
clicking of the TMJ where no changes were observed in 37 patients, an improvement
was seen in 3 and new clicks developed in 6 patients.
The sample size in this component of the research was too small to discuss trends in the
data confidently, but it would be interesting to further investigate these clinical
parameters in future studies. As with patient self-reported symptoms, although no
significant difference was observed between T1 and T2, changes in clinical signs were
observed. Twenty percent of patients experienced changes in clicks and 13% changes in
jaw pain. This would reiterate the concern as to whether T2 is appropriate to use as a
baseline, and ideally, a T1 baseline examination should be used. Individual changes in
TMD signs and symptoms do occur during pre-surgical orthodontic treatment in a
reasonable percentage of patients.
The RDC/TMD criteria stipulate that a patient must experience pain on palpation of 3 or
more muscle sites for a group 1 muscle disorder diagnosis. Only five patients in this
study experienced pain in 3 or more muscles at T1 compared with 4 patients at T2 and
this difference was not statistically significant (Table 4.8). As previously mentioned, the
small sample size in this study does not allow for any trends to be reported, and further
investigations are warranted.
A significant mean difference was observed for the mean maximum opening at T1
compared with T2, with an improvement in opening at T2 (P<0.001). This may be
explained by the adaptation of the jaws and the improved ―gape‖ as a result of frequent
stretching and opening required at routine orthodontic visits over the previous months
of treatment. However, it is debatable whether a 3mm change in opening (from
48.70mm to 51.85mm) is of clinical relevance.
The results from this study indicate that although pre-surgical orthodontics does not
have a significant overall group effect on TMD and its signs and symptoms, on an
individual basis changes between T1 and T2 do occur. Thus to answer the question
―Does it matter when the baseline assessment is?‖, using the pre-surgical time point
(T2) as a baseline is questionable. Another team of researchers who analysed a patient
group pre-treatment and 2 weeks prior to surgery reported no significant change in
TMD symptoms between the two time points, and identified the pre-surgical time point

260
as an appropriate baseline measurement (De Boever et al., 1996). Enough doubt,
however, has been raised with the findings of this study to question that conclusion.
4.4.4 Comparison between T1 and T3 (N=20)
This part of the analysis compared the results between T1 and T3, thus explored the
effect that orthognathic treatment had on TMD, albeit accepting that time itself may
have some effect on outcomes.
TMD Diagnosis (Table 4.11):
Of the 20 patients who were followed through to completion of treatment, 12 (60%) had
no change in their TMD diagnosis, 3 (15%) patients experienced an improvement and a
further 5 (25%) previously asymptomatic patients developed TMD. These findings were
not statistically significant. Other studies that have investigated the effect of
orthognathic surgery on TMD, diagnosed patients according to the CMI or Helkimo
Indices (Panula et al., 2000; Pahkala and Heino, 2004) and, as such, their results could
not be directly compared with this study. Panula et al. (2000) reported that the
prevalence of TMD at the pre-treatment time point was 73.3% and this reduced to 60%
after a 4 year follow up, this difference represented a significant reduction (P=0.013).
Pahkala and Heino (2004) also found that the severity of the dysfunction was reduced
post-surgery and that surgical interventions were particularly beneficial for patients with
myogenous symptoms rather than arthrogenous components of TMD.
In the current study, there was a slight increase in the prevalence of TMD post-surgery
(from 45% to 55%), however, this finding should be interpreted with caution due to the
small sample sizes involved. Further investigations with larger sample sizes but still
using standardised classification techniques (such as RDC/TMD) should be undertaken
to resolve this conflict.
Patient reported symptoms (Tables 4.12 to 4.14):
Fifteen patients reported no changes in headaches after treatment; however 4 patients
reported that headaches improved and 1 patient reported development of headaches.
These differences were not statistically significant. Other studies that have looked at the
prevalence of headaches pre and post-treatment found improvements (Panula et al.,

261
2000; Pahkala and Heino, 2004). Panula et al. (2000) reported that 63% of patients
suffered headaches at their first assessment compared with 25% at the final examination
and this difference was significant. The difference between the two studies could be
explained by the small sample size in this study but it must also be noted that only 35%
in the current study suffered from headaches compared with 63% in the Panula et al.
(2000) study, hence the baseline figures differed considerably.
Jaw pain on opening/closing and muscle pain around the jaw also showed no significant
change in the prevalence of the symptoms between T1 and T3. This was again in
contrast with the results reported by Rodrigues-Garcia et al. (1998), who found that
there was a significant reduction in the prevalence of subjective facial pain and
discomfort on opening following surgery. Again the small sample size in this study and
different questionnaires being used could be a source of disparity between the results.
Clinical findings (Tables 4.15 to 4.18):
No significant differences were found for any of the clinical signs investigated in this
study. When pain on palpation of the lateral poles of the TMJ was considered, 16
patients showed no change in their symptoms, 1 patient improved and 3 patients
developed new symptoms. Similar results were observed with clicking, where 15
patients showed no change, 1 patient improved and 4 patients developed new clicks.
Rodrigues-Garcia et al. (1998) reported that the percentage of patients with clicking on
opening decreased significantly from 26.6% to 10.5% following surgery. Other authors
have also reported a reduction in clicks post-surgery (Pahkala and Heino, 2004). The
findings of this study may contradict these previous findings, although the small sample
size must again be considered. With regards to pain on palpation of the muscles of
mastication, one patient experienced pain in 3 or more muscles at T1 and a further two
patients had this level of pain at T3. This is in contrast with other studies that have
reported a reduction in muscle related symptoms post-surgery (Rodrigues-Garcia et al.,
1998; Pahkala and Heino, 2004), although as with previous results the small sample size
in this study dictates that the findings are treated with caution.
In addition to the sample size which may lead to sampling variation, the different
classification criteria used in these studies could clearly explain some of the differences
found. For example, the Helkimo Index classifies someone as having myogenous

262
dysfunction if at least 1 muscle is positive to pain, which is in contrast with the
RDC/TMD criteria where at least 3 muscle sites have to elicit a painful response for a
positive diagnosis.
The Helkimo Index requires that each item evaluated on the clinical examination is
scored and the sum of scores is used to define the dysfunction group and severity, thus a
cut-off score must be decided on in order to formulate a case definition. The score
produced from the Helkimo Index provides little information about the actual clinical
presentation and a patient with a condylar fracture or with severe myofacial pain could
have exactly the same score (Fonseca, 2000). With the RDC/TMD, subjects are
assigned specific TMD diagnoses (e.g. myofacial pain, arthralgia) if particular
combinations of signs and symptoms are present, this is both easier and quicker to use
and gives a more accurate clinical picture. In addition, findings from different studies
using the RDC/TMD can be compared more readily as calibration is less problematic
with the RDC/TMD than the Helkimo Index.
The general quality of a prevalence study is influenced by the diagnostic method used
and studies which use standardised criteria, such as the RDC/TMD, tend to be of higher
quality than others which use non standardised diagnostic criteria (Giannakopoulos et
al., 2007). As such this TMD classification system is highly recommended for use in
future studies.
4.4.5 TMD at T1 and T3 and the influence of skeletal pattern (Table
4.20)
The majority of studies that have reported positive effects on TMD after orthognathic
surgery report an association between skeletal Class II deformities and improved
signs/symptoms. Some studies have reported a decrease in signs and symptoms by more
than 50% compared with the pre-operative state (Karabouta and Martis, 1985; Kerstens
et al., 1989; Magnusson et al., 1990; De Clercq et al., 1995). Subjects with skeletal
Class III bases or a high mandibular plane angle (> 32°) seem to benefit considerably
less (Kerstens et al., 1989; White & Dolwick 1992; De Clercq et al., 1995) or have
signs and symptoms which are unpredictable (Farella et al., 2007). However, TMD
improvement in Class III patients has also been reported following orthognathic surgery
(Magnusson et al., 1990; Le Bell et al., 1993).

263
There were very small numbers of patients within each group in this study when
patients were subdivided according to their skeletal base and MMP angle, and it was not
possible to comment on any trends or correlations between specific skeletal features and
TMD.
4.5 Conclusions
Although no significant differences were found between the prevalence of TMD pre-
treatment (T1) when compared with prior to surgery (T2), sufficient individual changes
in TMD signs and symptoms were observed to question the suitability of the ―prior to
surgery‖ time point as a baseline in future studies.
When comparing pre (T1) and post-treatment (T3) TMD changes, no significant
differences were observed. It was noted that there was a tendency for worsening of
clicks and pain in this study and these observations contradict previous studies. In
contrast, headaches appeared to improve with treatment and this was in agreement with
other studies. However, any findings in this study should be interpreted with caution
due to the small sample size.
Thus this study would support the theory that TMD is a dynamic condition and signs
and symptoms are likely to fluctuate throughout treatment. It is difficult to predict with
any certainty the impact surgery may have on the TMJ and thus whether it causes TMD,
worsens the condition or results in an improvement.
As TMD signs and symptoms do change throughout the course of treatment, clinicians
must warn patients of this possibility during the informed consent process, regardless of
whether they present with TMD at that time or not. Consent should make clear the
dynamic nature of TMD and the unpredictability of what may happen during the
orthognathic treatment process.
264
Chapter V: Temporomandibular Joint Information Course:
Comparison of the instructional efficacy of an internet-based
TMJ tutorial with a traditional face-to-face seminar.
Introduction, Aims and Objectives
Carrying out a thorough TMJ examination should be part of the routine assessment of
patients undergoing orthodontic or orthognathic treatment, yet anecdotal evidence
suggests this is rarely undertaken in practice. Perhaps part of the reason why TMJ
examination is under utilised in graduate orthodontic programmes is a gap in the
knowledge base. Many graduate orthodontic students may not have been exposed to, or
taught how to undertake, a thorough TMJ examination as undergraduates. As such there
is clearly a need to provide this teaching. Virtual learning environments (VLEs) are an
innovative method of delivering information and there is a growing interest in their use
by schools, colleges and universities. VLEs make it possible for a course designer to
present the components required for a course of education or training through a single
consistent and intuitive interface. By incorporating a TMJ information course (including
teaching of a thorough TMJ examination) on a VLE platform it is hoped this will enable
graduate students to enhance their TMJ examination and diagnostic skills.
5.1 Literature review
5.1.1 History of VLE
A virtual learning environment (VLE) is a set of teaching and learning tools designed to
enhance a student's learning experience by including computers and the internet in the
learning process. As such VLEs are vessels that facilitate computerised learning or e-
learning. Many synonyms exist for these e-learning systems, and they are sometimes
referred to as a Learning Management System (LMS), Course Management System
(CMS), Learning Support System (LSS), Online Learning Centre (OLC), Learning
Platform (LP) or Online Education. The concept of computerised learning has been in

265
existence since the 1960s, however for the history of virtual learning environments, the
1990s was a time of growth, primarily due to the increased popularity of the internet.
In 1960, the Plato system was developed at the University of Illinois and featured
multiple roles. Students could study assigned lessons and communicate with teachers
through online notes, instructors could examine the students‘ progress and in addition,
communicate and take lessons. Authors could also do all of the above and create new
lessons (Davis, 1980). In 1969 the internet was founded, adding an important milestone
to education and technology. The Havering Computer Managed Learning System was
developed in London in the 1970s and by 1980 was used by over 10,000 students and
100 teachers in various science technology, career guidance, and industrial training
applications (Broderick et al., 1980). These early VLEs were ‗purpose-built‘ or
‗bespoke‘ systems mainly based on shared communication tools and course content, and
were used by enthusiasts rather than whole departments or organisations.
With the 1990s came growing interest in technology and investments in commercial and
off-the-shelf VLEs (Milligan, 1999). Early examples of these included the Lotus
Learning Management System and Lotus Virtual Classroom developed in 1994 (owned
by IBM) and WOLF (Wolverhampton Online Learning Framework) in 1995. WOLF
was developed to deliver training materials to both small and medium enterprises. By
1999, WOLF was both adopted as Wolverhampton University's VLE and sold for
commercial distribution to Granada Learning, who rebranded the product as Learnwise.
WOLF is still in use at the University of Wolverhampton today and undergoing
continual development to meet the ever-changing needs of education.
Off-the-shelf VLEs may be bought from, or sold to organisations, and may also be built
upon by adding various components and software. Educational institutions tend to use
commercial VLEs, such as Blackboard and WebCT, rather than purpose-built VLEs and
many versions of these VLEs exist as they are continually updated.
Some of the more popular and commercially available off-the shelf VLEs in use today
include WebCT, Blackboard and Moodle. Initially developed at the University of
British Columbia, Vancouver in 1995, WebCT has become the world's most widely
used VLEs, used by millions of students in 80 countries
(http://www.manningawards.ca/awards/winners/mgoldberg-media.shtml).

266
Blackboard was founded in 1997 and by 1998 had released its first software product.
Early trials of Moodle began in 1999, and it was finally released in 2002). In 2006
WebCT was acquired by Blackboard with the aim of providing a powerful platform for
innovative technology infrastructure. As part of the acquisition terms the WebCT name
is currently being phased out in favour of the Blackboard brand (Helfer, 2005). This
has seen a number of colleges and universities shift to open source systems such as
Moodle (http://www.insidehighered.com/news/2009/05/07/bb).
Moodle has become very popular among educators around the world as a tool for
creating online dynamic web sites for their students (http://moodle.org). It is a user-
friendly Course Management System (CMS) which allows students more interaction
between each other and educators. Moodle is an open source system that is not owned
by anyone and according to the Moodle Web site, ―It is a free web application to
download, that educators can use to create effective online learning sites‖ (Collison,
2009). Approximately four thousand institutions are currently using Moodle, with some
institutions projecting substantial monetary saving associated with the shift from
Blackboard to Moodle as it is not as resource intensive as Blackboard (Ewald, 2009).
Moodle currently has over 29 million users across 200 countries with over 2.5 million
courses registered on the site (http://moodle.org).
5.1.2 Features of VLEs
There is continual expansion in the use of Virtual Learning Environments by schools,
colleges and universities. An example of this can be seen with Coventry University
which provided a campus-wide online learning environment in 2000 and students at the
university now have access to all of their modules online (Deepwell, 2001). In 2002
Bristol University conducted a four-month feasibility study into the use of Blackboard
as part of the VIOLET (Virtual Integrated Online Environment for Teaching) project,
the decision was then made to extend the use of Blackboard to cover more departments
(Becta, 2008). This popularity is a likely consequence of the widespread use of
computer-based educational activities, improvements in web technology, the escalating
pressures to improve the quantity and quality of the educational experience, a shortage
of teachers and an increasing pressure from the government to provide flexible training
(Shah and Cunningham, 2009). A survey carried out by the Joint Information Systems

267
Committee (JISC) in 2005 indicated a high use of VLEs in all types of institutions, with
86% of further education colleges, 97% of pre−1992 universities and 90% of post−1992
universities reporting the use of at least one type of VLE. However, the use across
various subject areas was inconsistent, ranging from 16% in medicine, dentistry and
veterinary medicine to 82% in business management, accountancy, economics and law
(Joint Information Systems Committee, 2008).
Although there is some debate about what constitutes VLEs, they are generally accepted
to have a combination of some, or all, of the following features (Becta, 2008):
Communication resources such as e-mail, bulletin boards and chat rooms.
Collaborations such as online forums, intranets, electronic diaries and
calendars.
Tools to create online content and courses.
Features to carry out online assessment and marking.
Integration with the educational body‘s management information systems.
Controlled access to curriculum resources.
Student access to content and communications off site.
VLEs are essential components of a managed learning environment (MLE) (Fig 5.1),
and there is a high level of interaction between the VLE and the surrounding MLE. This
interaction consists of:
Controlled access to the curriculum, which has been mapped to elements that
can be separately assessed and recorded.
Tracking of student activity and achievement against these elements, using
simple processes for tutors to define and set up a course with accompanying
materials and activities to direct, guide and monitor learner progress.
Support of online learning, including access to learning resources, assessment
and guidance; the learning resources might be self-developed or professionally
authored and purchased, and can be imported and made available for use by
learners.
Communications between the learner, the tutor and other learning support
specialists to provide direct support and feedback for learners, as well as peer

268
group communications that build a sense of group identity and a community of
interest.
Links to other administrative systems, both in house and externally.
Figure 5.1 Components of a MLE (Taken from Becta ICT research report, 2001).
In addition to these features, it is generally regarded that:
There is a level of security built into the system, including password protection.
VLEs normally provide two views of the system, one for the tutor and one for
the student.
Tutors have access to a wide range of tools and privileges in a VLE that allow
them to add materials, create tools and track student progress.
MLEs and VLEs are browser based and use web technologies, but do not require
knowledge of HTML in order to use or contribute content to the system.

269
The use of web technology for VLEs means that the system can be accessed
anywhere, including at school and home; with portable technologies, the
―anytime, anywhere‖ learning model will be possible.
The elements that go together to make up the system should interrelate and be
interoperable, allow for the sharing of data, and provide a consistent interface
for students and staff.
5.1.3 Research into VLEs
There has been a great deal of research into the benefits and uses of VLEs in education
Delivery
Potential benefits of VLE delivery include the ability to offer 'anytime, anywhere'
access, a protected environment, the ability to link to resources on an intranet or
internet, user-friendly interfaces and ease of web page and course content development
(Becta, 2008). Musgrove (2001) examined the ability of a VLE (specifically WebCT) to
enable distance learning, and found it invaluable in assisting universities in their
delivery of web-based learning, through such features as an improved designer
interface, a rich variety of communication tools and the capability to customise course
delivery to suit individual preferences.
A study of WebCT use in course delivery was undertaken by the University of British
Columbia, in order to investigate student acceptance of the system, and the academic
effectiveness of various modes of course delivery (Goldberg, 1997). They found that
approximately 30% of the access to online resources came from outside the university,
indicating considerable use by students offsite. In addition students considered that
online resources had improved their understanding of the course materials.
Curriculum mapping
A VLE improves communication between faculties and enables, for example, the
electronic distribution of conventional reading lists and improved collaboration between
academics and library staff (Stubley, 2002). Both academics and library staff have seen

270
the potential for providing added-value services through this link, and the 'reading list' is
now known as the 'resource list'.
Assessment
VLEs have an important role in administering assessments and monitoring of students'
marks. WebCT was used to construct, administer and mark a mid-term examination
made up of randomly selected items from a question bank, as part of an undergraduate
course in computer science at the University of Calgary. Jacobson and Kremer (2000)
reported that students identified the following benefits:
The flexibility of 'anytime, anywhere' access.
Being able to sit the examination at a time most convenient to them.
Being able to set up their work space for the examination.
However, students also perceived certain disadvantages:
The potential for unethical conduct among their fellow students in an
unsupervised examination.
Difficulty in contacting an instructor during the examination, despite contact
information for the instructor being made available.
Confusion over time elapsing during the examination and uncertainty about how
to set-up the workstation.
Problems with home internet access.
Weaknesses of multiple-choice questions, for example, it is not possible to
demonstrate the thought processes that lie behind an answer, and there is no
opportunity for partial marks.
Communication
The potential to share ideas and information and to join in online conferencing may help
improve the quality of students' work and enable them to participate in virtual
discussion forums. Some products have been linked to developing higher levels of
learning and key skills by enabling students to engage in online discussions and
nurturing self-study. Focusing on the use of VLEs to support student discussion and
debate on a computing course, Wilson and Whitelock (1997) found that common uses
included:
Help with problem solving (49 %).

271
Keeping in touch with fellow students (29 %).
Contacting tutors (20 %).
Selinger (1997) evaluated the use of a VLE for an Open University postgraduate teacher
education course and found that extensive use of the system encouraged collaboration
among students. There was recognition that it enhanced good practice, leading to the
development of an electronic community of teachers capable of encouraging long-term
professional development.
FirstClass is a client/server groupware, online conferencing, and bulletin-board system,
its primary markets are the higher-education and education sectors. A study of
FirstClass involving PGCE students at the Open University by Kyriakidou (1999)
concluded that:
Electronic conferencing is available as a tool in enhancing student teachers'
learning and teaching.
Electronic conferencing enables students to gain some technological skills.
The medium enhanced student teachers' professional development by promoting
reflective discussion on educational issues.
Problems in the use of the medium exist and further research should propose
alternative solutions.
The success of a conference depends on certain criteria, including the nature of
the interaction and level of collaboration among participants; the moderator's
input is crucial for the success of the activity, and further research is required on
conference moderation.
5.1.4 VLEs in Medicine and Dentistry
Medical and dental training has followed traditional methods of delivery over many
years; it has been predominantly based in the work place with students required to
supplement this with textbook learning. This apprenticeship model however is
disappearing in most parts of the world (Larvin, 2009) and the use of communication
and information technologies to support and augment medical and dental educational
practice is gradually emerging (Ellaway et al., 2003). Early efforts by universities in e-

272
learning provision consisted mainly of loading lecture notes and slides onto a website.
This would now be considered as resource distribution rather than e-learning as it failed
to involve active learning. An article in the Lancet in 2001 stated that "within less than
two student generations, communication and information technology has been
repositioned as an integral component of the environment" (Ward et al., 2001).
There are many reasons for this shift towards information and communication
technology in the medical and dental fields. Dental education exerts high demands on
universities and teaching hospitals (Ireland et al., 2005). There are also ever increasing
needs and demands by dentists and all other members of the dental team for continuing
education and these are straining the resources of existing providers at a time of
dynamic growth in the demand for postgraduate and continuing education (Eaton and
Reynolds, 2008).
Alongside these issues is a reduction in institutional funding and major institutional
changes, with a drop of 37% in funding per (UK higher education) full time student
since 1989. Moreover, there has been a shift towards increasing financial dependence
on research rather than teaching and rising burdens of audit and accountability required
of educational practice (Ellaway et al., 2003).
In addition, the number of academics and teaching staff is diminishing and the
European Working Time Directive (EWTD) has reduced the contact time with both
trainers and peers which may lead to the content in some educational programmes being
compromised. Reduced training years at postgraduate level have also diminished
experiential exposure and this has made formal skills training courses and simulation
more important than ever (Larvin, 2009).
At the same time there are ever increasing developments and opportunities to expand
online delivery and services for education. The options are varied and range from online
web seminars to online courses and teaching modules. The USA currently leads in e-
learning activity and by 2006 nearly 3.5 million students were participating in online
learning at US higher education institutions, whilst almost 20% were taking at least one
online course module (Allen, 2007). Thus, in more recent years, e-learning and VLEs

273
have become so common place in undergraduate medical courses in both the US and the
UK that current trainees are already experienced users (Larvin, 2009).
Most teaching in the medical and dental fields falls into the hybrid category and uses a
mixture of printed materials, electronic resources and face-to-face teaching (Eaton and
Reynolds, 2008). This can also be termed a blended learning programme; that
incorporates a variety of e-learning resources and combines it with conventional
resources (Larvin, 2009). Many courses that are run by UK universities or the Royal
College of Surgeons (e.g. the Faculty of General Dental Practice, UK) offer Certificate
Diploma and Masters certificate programmes based on blended learning. This may
involve participants in a series of short, face-to-face attendance courses, typically
between one and five days duration, which are linked with practice based clinical work,
home based written assignments and the production of a dissertation. All these activities
are supported by communication information technology such as e-mailing
assignments, attending lectures by video conferencing or as web casts, gathering
information via the internet or joining online discussion forums and debates (Eaton and
Reynolds, 2008).
In 2001 the Royal College of Surgeons of England reconfigured their Surgical
Education and Training Programme (STEP) to incorporate e-STEP, an e-learning
component (Larvin, 2009), and this was further updated in 2008 as STEP core. Early
feedback confirmed that effective e-learning required new material to be created for
comfortable on screen viewing and interaction, and should include texts supplemented
by animations, audio and video, and online discussion to provide a real-life learning
context. Detailed evaluations of e-Step were carried out after a pilot period of 12
months and repeated 36 months later (Larvin and Masih, 2002; Larvin et al., 2006).
Feedback gathered from surgical trainees across the UK indicated dissatisfaction with
the traditional learning models, in particular reduced experiential learning opportunities,
and loss of contact time with trainers and other trainees. Surgical trainees were almost
all capable of using the e-learning resources and appreciated their added value.
Preparation for skills can be achieved through e-learning, aided by online discussion
with peers and trainers. Surgical outcomes also depend on clinical leadership and
communication skills and e-learning provides trainees who have learned to use evidence

274
based material and guidelines the ability to foster cost effective use of health resources
and this may potentially compensate for lack of experience (Larvin, 2009).
Guidelines have emerged over the last 7 years of experience of e-learning for surgical
trainees:
e-content must add value to existing resources, rather than simply duplicating
them.
e-learning should link into other e-resources as well as conventional materials to
accommodate various learning styles and behaviours.
e-learning can be a solitary activity, but teacher input and peer contact can be
achieved through community discussion. It cannot however replace face-to- face
contact.
Formative online assessment is highly valued and represents a safe means of self
assessment.
Personalisation helps steer learners towards agreed objectives in a timely fashion
and peer assessment data can provide strong motivation.
e-learning should be enjoyable, leaving participants with a sense of
achievement.
The University of Edinburgh re-designed and re-launched its undergraduate medical
curriculum in 1998. The introduction of an electronic information system for the course
was made practical by the development in technologies at that time. The first version of
the Edinburgh Electronic Medical Curriculum (EEMeC) was launched in 1999 and it
has proved to be an invaluable resource which helps to address the problems arising
from introducing a new course and modern medical education in general (Ellaway et al.,
2003). For example:
It provides clear representation to staff and students of the integrated nature of
the course: for example, body systems are introduced at the start of the course
and revisited in subsequent years, also themes such as ethics and pharmacology
are woven throughout as full courses or embedded as concepts and practices.
This differs from previous courses where academic departments held full
autonomy for teaching their individual subjects with very little integration.

275
It facilitates course management with tools allowing room bookings, electronic
timetabling and notice boards (where messages are targeted to specific
individuals or year groups thus avoiding bulk e-mails).
It promotes and facilitates a greater degree of student-centred-learning. Students
are expected to manage their learning and take a more holistic approach to their
development as health professionals.
It supports staff and students at distant locations, thus providing the "anytime,
anywhere" level of access to all course documentation and tools over the
internet.
It has provision for online evaluation and feedback, replacing existing paper
questionnaires.
There are however some negative aspects to this and these include:
Loss of complexity: the complex form of communications required from a
course cannot be entirely built into computer algorithms, thus EEMeC exists in a
blended relationship with other elements of the course.
Managing information flow: this is complex and requires coordination from
many locations and in many ways. Individuals are required to ensure the
relevant information is passed on to ensure the system is kept up to date.
Access: although internet access is becoming ubiquitous in modern times, there
are problems if individuals do not have this, or if connections are slow or non-
functioning
Hidden costs: Particularly for staff development and network maintenance.
On the whole, the evaluation of the EEMeC found that VLEs can provide medical
education with a robust and adaptable central support and reference system. Traditional
methods should still be used where they are effective, such as one-to-one or small group
clinical teaching, thus VLEs are very much about supporting educational and course
processes than about technology (Ellaway et al., 2003).
In dental education, computer assisted learning (CAL) and other electronic learning
resources have been shown to be as effective as other methods of traditional teaching
(Ireland et al., 2005). In fact, in some situations, examination results improved when

276
CAL was used. A study by Irvine and Moore found that students who undertook a CAL
programme for mixed dentition analysis had better results than those who had
traditional didactic teaching. Whilst more recently an instructional multimedia
programme for teaching undergraduate orthodontics was found to be as effective as a
traditional lecture (Aly et al., 2004).
Questions sometimes arise regarding the effectiveness of e-learning for teaching clinical
procedures where decision making skills are required. A study by Kay et al. (2001)
found that the use of a CAL programme did not improve the sensitivity and specificity
of dentists' restorative treatment decisions and as such had no effect on their decision
making behaviour. Thus education delivered via CAL may have little benefit for
complex topics.
In 2004 Bristol University Dental School developed a modular teaching resource
housed within the Blackboard™ VLE which aimed to facilitate the academic
orthodontic training for specialist registrars. It consisted of 40 online modules which
provided comprehensive, up to date, peer reviewed and referenced summaries of
orthodontic topics. The VLE also contained video lectures and short videos of clinical
procedures, as well as communication tools such as a discussion board and video
conferencing facilities (Mulgrew et al., 2009). The resource had positive effects on
postgraduate orthodontic teaching and learning with improvements in flexibility and
efficiency of learning. Despite this, trainees welcomed the opportunity to have face-to-
face interactions with their teachers and peers. Thus the most appropriate use for a VLE
in orthodontic training appears to be a blended model.
5.1.5 Summary
The advent of e-learning has brought greater flexibility to the delivery of all levels of
dental education and to the learning process. It provides teaching material and support
anytime from anywhere in the workplace or home. E-learning also provides an
advantage over traditional learning and teaching activities by permitting a wider spread
of appropriate pedagogies. One of the benefits of e-learning is the ability to treat
teaching materials as reusable teaching objects. Self-contained units are catalogued,

277
tagged with key words and saved. Thus the delivery of academic material through a
VLE may improve the efficiency and effectiveness of dental education and yet it has the
added advantage of flexibility for students. As such it has the potential to become a way
to share resources amongst dental schools (Ireland et al., 2005).

278
Aims and Objectives:
A web based TMJ tutorial was developed to compare how two groups of postgraduate
students (VLE tutorial group followed by a face-to-face seminar group or vice versa)
respond to these two different methods of teaching. Specifically assessing the skills
gained by the postgraduates in examination and diagnosis of the TMJ and its conditions
and learning experiences obtained from both courses. The aims were:
1) To determine whether there are any differences in the skills obtained by students
after undertaking the VLE tutorial or the face-to face seminar.
2) To determine whether the order in which teaching is received makes a difference
to the student‘s performance in the assessments.
3) To determine whether providing teaching twice makes a difference to the
knowledge acquired by students.
4) To investigate the students' perceptions of either mode of teaching and their
learning experiences.

279
5.2 Materials and Methods
5.2.1 Methods for developing the TMJ course
5.2.1.1 VLE Tutorial
Acquiring technical skills
In order to create a course for the virtual learning environment, it was important to learn
the technical skills required to develop such a module. After consultation with the
Learning Technology and Support Service (LTSS) at University College London
(UCL), it was decided that the Moodle environment was most suited for the
requirements of this study. Moodle is currently UCL‘s main VLE. Moodle is a
password protected environment and can be accessed by all UCL staff and students who
have registered user names and passwords. As it is the primary system used by UCL,
there are training courses and support facilities for users and those wishing to develop
content on this platform.
In the first instance it was necessary to enrol in an introductory course for the use of
Moodle. This allowed the researcher (SA) to familiarise herself with this virtual
learning environment and to understand the features and functionalities available
through this platform. The initial ―Getting started with Moodle‖ course was completed
at the LTSS Department in November 2007.
Developing content of the VLE tutorial
The next stage of developing the course was deciding on the content that was to be
hosted on the Moodle platform. Close liaison was established with a lecturer in the Oral
and Maxillofacial Surgery Department/Facial Pain Unit with extensive knowledge of
TMJ assessment and TMD diagnosis. This allowed development of the content to be
included on the Moodle tutorial, as well as the list of appropriate assessment criteria for
a later stage of the study.

280
The TMJ course content included:
Table of contents
Introduction and course information
Anatomy of the TMJ
Disorders of the TMJ tutorial (including diagnosis of TMD)
Conducting a TMJ examination (multimedia file/ video demonstration)
TMD forums/ Discussion boards
Additional resources and supplementary reading.
Anatomy Tutorial: This was a basic anatomy tutorial which provided students with
information on the anatomy of the TMJ and associated muscles of mastication.
Disorders of the TMJ: This tutorial guided the users through the conditions which may
affect the TMJ. It also gave an overview of temporomandibular disorders (TMD) and
how the classification of TMD has evolved.
Conducting a thorough TMJ examination: This section included a multimedia
presentation (video) which demonstrated how to conduct a thorough TMJ examination
and highlighted the important signs that need to be recorded. In addition, the supporting
documentation (TMJ chart to be filled in by the clinician and TMD questionnaire that is
given to patients) were made available to users to aid them with the process of
diagnosing and classifying TMD in an efficient way.
The RDC/TMD classification criteria were also presented in a user friendly format, and
could be printed out and kept in the clinical area for reference.
TMD Forums/Discussion board: The forum section gave users the opportunity to post
their questions which would be answered within a 48 hour period. Additionally it
provided the opportunity to debate the topic or share information.
Additional resources: These were links to external websites and resources. Whilst they
were not compulsory, it was hoped that users would find these useful.
Content delivery and implementation
After the content had been developed, the course was uploaded on to the system and it
was necessary for the researcher/course designer to enrol in an advanced Moodle course

281
to achieve this objective. This was undertaken in February 2008 and provided advanced
techniques in managing Moodle, as well as a better understanding of its functionality
and features. The LTSS teams were invaluable in this process of implementation and
provided the necessary support.
Once the course had been successfully added to the Moodle platform, it was piloted and
tested. Senior members of the Orthodontic Department at the Eastman Dental Institute
were given access to the course and asked for feedback and suggestions. These
suggestions were then incorporated and changes carried out accordingly. The
postgraduate student users were enrolled and assigned usernames and passwords and
could then begin to use the system when instructed.
5.2.1.2 Face-to-face seminar
A PowerPoint© presentation and practical demonstration was also prepared for a face-
to-face seminar in a class room setting with similar information and content and
following exactly the same format as the Moodle tutorial. One tutor (S.A.) prepared the
content and delivered the seminar to all of the students, thus this ensured consistency in
delivering the teaching. The seminar was of 50 minutes duration, of which the practical
demonstration lasted 20 minutes and postgraduates had the opportunity to ask questions
throughout. The students were given handouts of the RDC/TMD diagnostic criteria.
5.2.2 Cross-over Trial
In a cross-over trial the participants are randomly allocated to study arms where each
arm consists of a sequence of two or more effects given consecutively. The simplest
model is the AB/BA study.
This study followed the AB/BA study design. Participants allocated to the AB study
arm received teaching method A first, followed by teaching method B, and vice versa in
the BA arm. Thus it allowed the teaching received from A to be contrasted with the
teaching received from B. Reducing the participant variation in this way makes cross-
over trials more efficient than similar sized, parallel group trials in which each
subject is
exposed to only one method of teaching. In theory the effects of the teaching can be
estimated with greater precision given the same number of participants (Senn, 1993).

282
The principal drawback of the cross-over trial is that the effects of one teaching method
may "carry over" and alter the response to the subsequent teaching method. The usual
approach to preventing this is to introduce a washout period (in this study an adequate
break from teaching) which is long enough to allow the effects of the latter teaching to
dominate.
Study details
Postgraduates were initially assigned by stratified random sampling to one of two
groups:
i. Group 1: Moodle tutorial followed by the face-to-face seminar
ii. Group 2: Face-to-face seminar followed by Moodle tutorial.
There were 23 female and 7 male students in the study, with an age range of 26 to 36
years. Eighteen of the students were from the UK/EU and 12 were from countries
outside the UK/EU; initial questioning of the students revealed none of them had
undergone any formal teaching in TMJ examination beyond a basic undergraduate
level. None of them had significant experience of the use of VLEs.
There were fifteen postgraduates per group and Group 1 were required to undertake the
Moodle tutorial first. They were allowed to carry this out at their leisure but were given
a two week deadline and the Moodle software tracked users who had logged-on and
which elements they had completed. Group 2 were required to attend a face-to-face
seminar on TMJ assessment and diagnosis which included information on carrying out
an accurate and thorough TMJ examination and diagnosis according to the RDC/TMD
classification.
Both groups had access to the same information but the content was conveyed using
different methods. At the end of this process both groups were assessed in order to
ascertain their knowledge in the skills of TMJ examination and diagnosis. These
assessments were carried out within 3 weeks of the teaching episodes and were
dependent on the student‘s schedule and availability. Postgraduates from both groups
were required to examine a patient and diagnose their TMJ condition as appropriate.
The researcher was present and observed all students during the examinations. The

283
postgraduates were then scored according to a checklist with pre-defined criteria as
shown in Table 5.3.
A total of 29 procedures were recorded on the checklist (Appendix 13) for the
assessments. The researcher independently scored each postgraduate and had previously
examined all patients to determine their condition and set a gold standard for the
examination. As discussed previously in Chapter 3 the assessor had previously
undergone a 4-day calibration in TMJ examination procedures. In addition, the checklist
and its criteria were developed in conjunction with an expert from the Oral and
Maxillofacial Surgery Department/Facial Pain Unit who provided advice on how to
consistently and accurately assess the postgraduates.

284
Fig 5.2 Cross over trial study design
At the end of each postgraduate's assessment, the assessment sheets were collected,
compared with the gold standard and marked accordingly. The results of the assessment
Group 1 Face-to-Face
seminar n=15
Group 2 Moodle tutorial
n=15
Assessment
Compare results
Cross over
Assessment
Compare results
Group 1 Moodle tutorial
n=15
Group 2 Face-to-Face
seminar n=15
Assessed for
eligibility N=31
Randomised N=30
Excluded n=1
unable to participate

285
were compared for each group based on their performance. The two groups then crossed
over (Figure 5.2) and the other method of teaching was provided. There was a washout
period of two months between the first and second episodes of teaching. Although one
must appreciate that introducing this washout period was unlikely to negate what the
postgraduates had learned during the first phase of teaching, it does help in minimising
short term memory or surface learning. During the cross-over the postgraduates were
unaware they would undertake the second mode of teaching and assessments, to avoid
them revising during that period.
The groups were assessed again after the cross-over and within 3 weeks of the second
mode of teaching, the students in Group 1 who had initially completed the Moodle
tutorial had access to the VLE withdrawn, thus were unable to log-on and reinforce their
knowledge. As previously described, the results of the two groups were then recorded
for the second time. The postgraduates were asked to complete an anonymous
questionnaire based on their learning experiences and how they rated both methods of
teaching (Appendix 14).
Participants
First, second and third year postgraduate orthodontic students were recruited for the
study and the two groups were assigned by stratified random sampling. None of the
postgraduates had undergone formal teaching in TMJ examination. A total of 30
postgraduates were recruited for this study and the identifiers S1 to S30 used. Initially
the year groups were independently allocated to either Group 1 or 2, ensuring an equal
number of each year in both groups and the student identifications were then randomly
assigned.
Patients
After each episode of teaching, postgraduates were required to undertake an assessment
in TMJ examination and diagnosis. Subjects who presented with, and without, TMD
signs and symptoms volunteered for this assessment. These subjects were 12 auxiliary
staff and non-clinical student volunteers. All volunteers were given gift vouchers as a
thank you for their time. The unique identifiers X1 to X12 represented the twelve
subjects recruited to assist with the trial.

286
Subjects were not examined by more than 3 postgraduates in any one day as
repeated examinations on the same subjects were likely to fatigue the subject
and may have elicited false positive results.
Each postgraduate examined a different subject at the two assessments. This was
to ensure the postgraduates were accurately diagnosing the subjects based on
their examination and not from memory of their previous encounter.
Subjects who were examined by 3 postgraduates after the first episode of
teaching, were only examined by 2 postgraduates after the cross-over. This
decision had no scientific basis but was introduced to ensure fairness to all
subjects recruited.
As previously stated the twelve subjects had a range of conditions, some having no
TMD signs and symptoms and others having definite signs and symptoms. As this was
an exercise in carrying out an examination as well as diagnosing TMD conditions, it
was intended that by randomising the patients, bias would be minimised (i.e. some
postgraduates may have had harder patients to assess than others).
Participant and Patient distribution
Tables 5.1 and 5.2 demonstrate how the postgraduates were divided into the two groups
and in addition to their assessment cohorts for the cross-over trial. It was necessary to
have assessment cohorts (A to F for stage one and G to L for stage 2) as it was not
feasible to assess all of the postgraduates at the same time or on the same day. Each
assessment cohort consisted of 5 postgraduates. The assessments for the five
postgraduates within each cohort were carried out on the same day and were completely
independent. Postgraduates were not present for assessments undertaken by their
colleagues.

287
Group 2: Face-to-face seminar (first
episode of teaching)
Group 1: Moodle tutorial (first episode
of teaching)
Assessment
Group
Student ID Patient ID Assessment
Group
Student ID Patient ID
A
S1
X1
D
S16
X3 S2 S17
S3 S18
S4 X2
S19 X4
S5 S20
B
S6
X5
E
S21
X7 S7 S22
S8 S23
S9 X6
S24 X8
S10 S25
C
S11
X9
F
S26
X11 S12 S27
S13 S28
S14 X10
S29 X12
S15 S30
Table 5.1 Randomisation of the 30 postgraduates for first episode of teaching

288
Group 2: Moodle tutorial
(second episode of teaching)
Group 1: Face-to-face seminar
(second episode of teaching)
Assessment
Group
Student ID Patient ID Assessment
Group
Student ID Patient ID
G
S1
X4
J
S16
X2 S2 S17
S3 S18
S4 X3
S19 X1
S5 S20
H
S6
X8
K
S21
X6 S7 S22
S8 S23
S9 X7
S24 X5
S10 S25
I
S11
X12
L
S26
X10 S12 S27
S13 S28
S14 X11
S29 X9
S15 S30
Table 5.2 Randomisation of the 30 postgraduates for the second episode of
teaching following cross-over

289
Criteria for assessment:
The criteria on which the postgraduates were assessed are described in Table 5.3 below.
Procedure Criteria
1. Correct application of force A domestic scale is used to ensure the
student is generating 850-950g of force
for the extra-oral muscles examination
and 400-500g for the intra-oral muscles
and joint examination.
2. Lateral palpation Correct identification and palpation of
lateral poles and report on any pain if
present.
3. Inter-auricular palpation The postgraduate is required to palpate
in the external meatus by placing the
right and left little fingers and applying
pressure. The postgraduate is required
to recognise pain if present.
4. Click Present:
Yes No
Has the postgraduate recognised the
presence or absence of a click?
5. Classification of Click If present, can the postgraduate identify
the nature of the click, i.e. whether it is
in the opening cycle or closing cycle,
painful or painless, consistent or
intermittent?
6. Crepitus Present:
Yes No
Has the postgraduate identified the
presence or absence of crepitus
correctly?
7. Measurement of comfortable
opening
Compare the values obtained by the
postgraduate to that of the gold
standard. Is it within reasonable
deviation of the gold standard ( within
+/– 5mm for opening measurements and
+/– 2mm for lateral excursions)?
8. Measurement of maximal opening
9. Measurement of right lateral excursion
10. Measurement of left lateral excursion
11. Recognition of path of opening Has the postgraduate correctly
identified the path of opening and
recognised any deviations if present?
12. Lateral pterygoid palpation
For this section of the assessment the
postgraduate has to be able to:
1. Correctly identify the muscle groups
and their anatomical positions
2. Recognise the presence or absence of
pain on palpation of these muscles
13. Recognition of lateral pterygoid
tenderness
14. Mesial pterygoid palpation
15. Recognition of mesial pterygoid
tenderness
16. Temporalis palpation
17. Recognition of temporalis tenderness

290
18. Masseter palpation
19. Recognition of masseter tenderness
20. Skeletal base assessment Correct identification of the patient’s
skeletal base by palpation with the index
and middle finger with the patient in
natural head position.
21. Angle classification assessment Correct identification of the patient’s
Angle classification
22. CO-CR identified The postgraduate should place the
patient in centric occlusion, then
identify the patients centric relation
23. Direction of the slide If there are any premature contacts, the
postgraduate should identify the
direction of the slide from CO to CR
24. Assessment of canine guidance/
group function
The postgraduate should correctly
identify the patient’s lateral excursion
25. Assessment of tooth wear Requires the postgraduate to assess the
dentition and report on any findings of
tooth wear if applicable
26. Assessment of cheek ridging The postgraduate should examine the
buccal mucosa for any signs of cheek
ridging and accurately report the
findings
27. Assessment of tongue scalloping The postgraduate should examine the
tongue and identify any tongue
scalloping if present
28. Followed correct sequence Has the postgraduate carried out all the
required elements of this examination,
and followed the recommended
sequence of steps?
29. Correct diagnosis of the condition Has the postgraduate correctly
identified and diagnosed the patients
TMD condition (if any) according to the
RDC/TMD criteria?
Table 5.3 Criteria for assessment of TMD
The 29 procedures included as assessment criteria were chosen after careful discussion
with an expert in facial pain from the Facial Pain Unit, Department of Oral and
Maxillofacial surgery, Eastman Dental Hospital (RL). It was important that these
outcome measures were valid and reproducible and, as such, only procedures that could
confidently be determined by the assessor were included. If a procedure on the check
list did not apply to the patient (such as presence of a click) then the postgraduates were
assessed on their ability to recognise the absence of a click and record this as such on
the examination performa. Once the criteria were established, the researcher (SA) was
calibrated by RL to ensure consistency in assessment.
291
Volunteers were recruited and examined by both RL and SA. Five restorative
postgraduates were then asked to examine the volunteer and RL and SA independently
assessed them carrying out a TMJ examination. The results of the assessments were
compared between RL and the examiner and any discrepancies were discussed. This
process was repeated on a further five Restorative postgraduates until it was confidently
established that consistency in marking the assessments was reached.
Statistical Analyses
Statistical analysis was undertaken to establish whether any significant differences
existed between the two groups. The objectives of the statistical analysis were to answer
the following:
1. Is Moodle a better, or worse, method of teaching TMJ assessment when
compared with face-to-face seminars?
2. If both methods of teaching are provided, does the order in which the teaching is
received make a difference? (i.e. is Moodle followed by face-to-face better than
face-to-face teaching followed by Moodle?)
3. Does teaching twice make a difference? If the student had a face-to-face seminar
in the first instance does having further teaching with Moodle improve how well
postgraduates do, and vice versa?
Statistical analyses were carried out using SPSS version 14, SPSS UK Ltd, Surrey, UK.
Two-by-two contingency tables were constructed using the statistical package and Chi
squared analyses undertaken on all of the 29 procedures. In view of the fact that there
were many procedures that were being considered, the significance level was set at
P≤0.01. It was felt that this would reduce the likelihood of finding a significant result
purely by chance.
For comparison of paired variables a McNemar's test method was applied to 2 × 2
contingency tables. This was carried out for comparison of Group 1 initial and post
cross-over assessments and Group 2 initial and post cross-over assessments (i.e. within
group comparisons). The significance level was again set at P≤0.01.

292
The numerical results (obtained by grouping/ summing the 29 individual assessment
procedures into four themes) were assessed for normality using histograms and box and
whisker plots. The data did not follow a normal distribution therefore the Mann-Whiney
U test was applied to the independent variables, whilst the Wilcoxon Signed Ranks test
was applied to the paired variables. The significance level was set at P≤0.05 as fewer
tests were conducted and the potential for obtaining spurious results through multiple
testing was reduced.

293
5.3 Results
For ease of comparison, the 29 procedures on the checklist were categorised into four
main themes:
1. Joint symptoms
2. Jaw movement
3. Muscle symptoms
4. Occlusal features
5.3.1 Individual Assessment results
5.3.1.1 Assessment Results after first teaching episode
Group 1 carried out the Moodle tutorial first whilst Group 2 attended a face-to-face
seminar and practical demonstration. A summary of these findings are shown in Table
5.4
Procedure
undertaken
Correctly
undertaken
Total P
Value##
Group 1
(Moodle)
N=15
Group 2
(FtoF)
N=15
Join
t Sym
pto
ms
Correct application of force
2
13.3%
3
20.0%
5 1.000#
Lateral Palpation
7
46.7%
3
20.0%
10 0.245
Inter auricular palpation 9
60.0%
9
60.0%
18 1.000
Identified presence/absence of
click
7
46.7%
14
93.3%
21 0.014#
Classification of click 9
60.0%
11
73.3%
20 0.439
Identified presence/absence of
crepitus
9
60.0%
13
86.7%
22 0.215#
Jaw
Movem
ents
Measurement of comfortable
opening
12
80.0%
14
93.3%
26 0.598#
Measurement of maximum
opening
11
73.3%
9
60.0%
20 0.439
Measurement of right lateral
excursion
10
67.7%
6
40.0%
16 0.143
Measurement of left lateral
excursion
10
66.7%
7
46.7%
17 0.269
Recognition of pathway of
opening
7
46.7%
10
66.7%
17 0.269

294
Mu
scle Sym
pto
ms
Recognition and correct palpation
of lateral pterygoid muscle
7
46.7%
9
60.0%
16 0.464
Recognition of lateral pterygoid
tenderness
12
80.0%
14
93.3%
26 0.598#
Recognition and correct palpation
of mesial pterygoid muscle
5
33.3%
0
0%
5 0.042#
Recognition of mesial pterygoid
tenderness
9
60.6%
8
53.3%
17 0.713
Recognition and correct palpation
of temporalis muscle
5
33.3%
4
26.7%
9 1.000#
Recognition of temporalis
tenderness
11
73.3%
15
100%
9 0.100#
Recognition and correct palpation
of masseter muscle
4
26.7%
5
33.3%
9 1.000#
Recognition of masseter
tenderness
12
80.0%
14
93.3%
26 0.598#
Occlu
sal F
eatu
res
Skeletal base assessment 12
80.0%
15
100%
27 0.224#
Angle classification 12
80.0%
14
93.3%
26 0.598#
CO-CR identified 12
80.0%
14
93.3%
26 0.598#
Direction of slide (if any)
identified
12
80.0%
14
93.3%
26 0.598#
Assessment of canine
guidance/group function
10
67.7%
13
86.7%
23 0.390#
Assessment of tooth wear 10
67.7%
14
93.3%
24 0.169#
Assessment of cheek ridging 11
73.3%
12
80.0%
23 1.000#
Assessment of tongue scalloping 9
60.6%
8
53.3%
17 0.713
Followed correct sequence of
steps
8
53.3%
6
40.0%
14 0.464
Diagnosis of patient's condition 9
60.6%
11
73.3%
20 0.439
# Where the expected frequency of the 2 x 2 table is less than 5, Fisher's exact test was used
rather than chi-squared. # #
Significance indicated by P< 0.01
Table 5.4 Assessment results after first teaching episode
In ―Joint Symptoms‖, there was a borderline significant difference in the ability of the
two groups to identify the presence or absence of a click (p=0.014), with Group 2 (face-
to-face seminar group) achieving better results. However when the remainder of the
Joint Symptoms were considered, there were no significant differences for any of the
other procedures. Both groups performed poorly in recognising the correct application

295
of force; only 13.3% of Group 1 and 20% of Group 2 were able to apply the correct
force for examination of the joints and muscles. In Group 1, 46.7% palpated the lateral
poles of the TMJ correctly, but only 20% of Group 2, however, there was no significant
difference between the two groups.
There were no significant differences between Group 1 and Group 2 for the Jaw
Movements theme. The majority of postgraduates (80.0% of Group 1 and 93.3% of
Group 2) measured the comfortable opening of the mandible to within +/– 5mm from
the gold standard, however fewer postgraduates were able to accurately record
maximum mandibular opening examination to within +/– 5mm (73.3% of Group 1 and
60.0% of Group 2). When comparing lateral excursions, a similar number of
postgraduates accurately diagnosed left and right lateral excursions to within +/– 2mm
of the gold standard (n=17 and 16 for Groups 1 and 2 respectively).
When considering Muscle Symptoms, the majority of the postgraduates were able to
correctly identify muscle tenderness, although fewer postgraduates carried out the
muscle palpations in the correct manner. For example, 80% of Group 1 and 93.4% of
Group 2 accurately identified the lateral pterygoid muscular state (i.e presence or
absence of tenderness), but only 46.7% and 60.0% carried out the palpation correctly.
Similar trends were seen with the remainder of the muscle groups. The results for
medial pterygoid palpation were particularly poor, with only 33.3% of Group 1 and
none of the postgraduates in Group 2 carrying out the palpations correctly. It must be
acknowledged that is debatable whether the medial pterygoid muscle can actually be
palpated with accuracy.
The results of the Occlusal Features category were in line with the previous findings for
Joint Symptoms, Jaw Movements and Muscle Symptoms. No significant differences
were apparent for any of the individual procedures and both groups performed well in
these assessments. Eighty percent of Group 1 and 100% of Group 2 accurately recorded
the skeletal classification. The results of the remainder of the procedures in this theme
were similar, e.g. 80.0% of Group 1 and 93.3% of Group 2 correctly recorded the
Angle's classification, Centric occlusion-Centric relation (Co-Cr) and direction of slide.
However, all of these procedures are commonly occurring principles in orthodontic
practice and postgraduates had ample experience in recording these parameters.

296
Finally, both groups were equally able to diagnose the patient's TMJ condition
according to the RDC/TMD classification. Sixty percent of Group 1 and 73.3% of
Group 2 were able to correctly classify the patient‘s TMJ status.
5.3.1.2 Assessment results after cross-over and second teaching episode
The following table summarises the results of the two groups after the cross-over. The
second episode of teaching involved Group 1 attending the face-to-face seminar and
Group 2 undertaking the Moodle tutorial.
Procedure
undertaken
Correctly
undertaken
Total P
Value##
Group 1
(F2F)
N=15
Group 2
(Moodle)
N=15
Join
t Sym
pto
ms
Correct application of
force
7
46.7%
7
46.7%
14 1.00
Lateral Palpation
7
46.7%
5
33.3%
12 0.456
Inter auricular palpation 12
80.0%
12
80.0%
24 0.674#
Identified
presence/absence of click
14
93.3%
15
100.0%
29 1.000#
Classification of click
7
46.7%
14
93.3%
21 0.014#
Identified
presence/absence of
crepitus
12
80.0%
15
100.0%
27 0.224#
Jaw
Movem
ents
Measurement of
comfortable opening
15
100.0%
14
93.3%
29 1.000#
Measurement of maximum
opening
10
66.7%
14
93.3%
24 0.169#
Measurement of right
lateral excursion
14
93.3%
8
53.3%
22 0.035#
Measurement of left lateral
excursion
14
93.3%
8
53.3%
22 0.035#
Recognition of pathway of
opening
13
86.7%
14
93.3%
27 1.000#

297
Mu
scle Sym
pto
ms
Recognition and correct
palpation of lateral
pterygoid muscle
10
66.7%
4
26.7%
14 0.028
Recognition of lateral
pterygoid tenderness
15
100.0%
12
80.0%
27 0.224#
Recognition and correct
palpation of mesial
pterygoid muscle
7
46.7%
6
40.0%
13 0.713
Recognition of mesial
pterygoid tenderness
12
80.0%
12
80.0%
24
1.000#
Recognition and correct
palpation of temporalis
muscle
10
66.7%
5
33.3%
15 0.068
Recognition of temporalis
tenderness
14
93.3%
15
100.0%
29 1.000#
Recognition and correct
palpation of masseter
muscle
10
66.7%
8
53.3%
18 0.456
Recognition of masseter
tenderness
15
100.0%
15
100.0%
30 -
Occlu
sal F
eatu
res
Skeletal base assessment
15
100.0%
15
100.0%
30 -
Angle classification
15
100.0%
15
100.0%
30 -
CO-CR identified
15
100.0%
14
93.3%
29 1.000#
Direction of slide (if any)
identified
15
100.0%
14
93.3%
29 1.000#
Assessment of canine
guidance/group function
13
86.7%
14
93.3%
27 1.000#
Assessment of tooth wear 13
86.7%
15
100.0%
28 0.483#
Assessment of cheek
ridging
12
80.0%
13
86.7%
25 1.000#
Assessment of tongue
scalloping
14
93.3%
11
73.7%
25 0.330#
Followed correct sequence
of steps
11
73.7%
11
73.7%
22 1.000#
Diagnosis of patient's
condition
12
80.0%
12
80.0%
24 1.000#
# Where the expected frequency of the 2 x 2 table is less than 5, Fishers exact test was used
rather than chi-squared. - Where no P value is given, a calculation was not possible as discordant pairs were not present # #
Significance indicated by P< 0.01
Table 5.5 Assessment results after cross over and second teaching episode

298
The results after cross-over mirrored the initial assessment, and there were no
significant differences between Group 1 and Group 2 for any of the procedures. When
considering Joint Symptoms, both groups had identical results for the correct
application of force (46.7%) and intra-auricular palpation (80.0%). There were no
significant differences between the two groups for any of the procedures. The presence
or absence of a click was correctly identified by 93.3 % of Group 1 and 100.0% of
Group 2. Lateral pole palpation was performed poorly with only 46.7% of Group 1 and
33.3% of Group 2 carrying this out correctly. There was, however, borderline
significance for the classification of clicks (P=0.014) with only 46.7% of Group 1
classifying them correctly compared with 93.3% of Group 2.
No significant differences were detected between the groups for any of the procedures
relating to Jaw Movements. One hundred percent of Group 1 accurately measured the
comfortable opening to within +/– 5mm of the gold standard compared with 93.3% of
Group 2. More subjects in Group 2 (93.3%) recorded the maximal assisted opening
correctly compared with Group 1 (66.7%), but there was a tendency for Group 1 to
outperform Group 2 in recording both right and left lateral excursions (93.3% and
53.3% respectively for left and right excursions) and although this was not statistically
significant, it may be clinically relevant.
With regards to Muscle Symptoms, the majority of postgraduates were able to
accurately recognise the presence or absence of muscular tenderness, this was
particularly so with the recognition of temporalis tenderness which all postgraduates
recorded correctly. However, postgraduates were not as consistent in their ability to
locate/ accurately palpate the muscles: 66.7% of Group 1 accurately palpated the lateral
pterygoid muscle but only 26.7% of Group 2. A similar trend was seen with temporalis
palpation, with 66.7% of Group 1 and 33.3% of Group 2 undertaking the procedure
correctly, none of these differences were statistically significant though.
The results for the Occlusal Features theme were in line with previous results and no
significant differences were observed between the two groups for any of the procedures
and postgraduates in both groups performed well in this section.

299
Seventy three percent of postgraduates in Group 1 and Group 2 followed the correct
sequence of steps, and in addition 80% of the postgraduates in both groups were able to
give a correct diagnosis according to the RDC/TMD criteria.
5.3.1.3 Group 1 (Moodle followed by face-to-face teaching)
This table compares how the postgraduates in Group 1 performed after the first and
second assessments having undertaken the Moodle tutorial in the first instance then
attending a face-to-face seminar.
Procedure
undertaken
Correctly
undertaken
Total P Value##
First time
( Moodle)
Second
time (FtoF)
Join
t Sym
pto
ms
Correct application of force 2
13.3%
7
46.7%
9 0.180
Lateral Palpation
7
46.7%
7
46.7%
14 1.000
Inter auricular palpation 9
40.0%
12
80.0%
21 0.375
Identified presence/absence of
click
7
46.7%
14
93.3%
21 0.016
Classification of click
9
40.0%
7
46.7%
16 0.625
Identified presence/absence of
crepitus
9
40.0%
12
80.0%
21 0.375
Jaw
Movem
ents
Measurement of comfortable
opening
12
80.0%
15
100.0%
27 -
Measurement of maximum
opening
11
73.3%
10
66.7%
21 1.000
Measurement of right lateral
excursion
10
66.7%
14
93.3%
24 0.125
Measurement of left lateral
excursion
10
66.7%
14
93.3%
24 0.125
Recognition of pathway of
opening
7
46.7%
13
86.7%
20 0.031

300
Mu
scle Sym
pto
ms
Recognition and correct
palpation of lateral pterygoid
muscle
7
46.7%
10
66.7%
17 0.375
Recognition of lateral pterygoid
tenderness
12
80.0%
15
100.0%
27 -
Recognition and correct
palpation of mesial pterygoid
muscle
5
33.3%
7
46.7%
13 0.625
Recognition of mesial pterygoid
tenderness
9
40.0%
12
80.0%
21 0.375
Recognition and correct
palpation of temporalis muscle
5
33.3%
10
66.7%
15 0.063
Recognition of temporalis
tenderness
11
73.3%
14
93.3%
25 0.375
Recognition and correct
palpation of masseter muscle
4
26.7%
10
66.7%
14 0.031
Recognition of masseter
tenderness
12
80.0%
15
100.0%
27 -
Occlu
sal F
eatu
res
Skeletal base assessment
12
80.0%
15
100.0%
27 -
Angle classification
12
80.0%
15
100.0%
27 -
CO-CR identified
12
80.0%
15
100.0%
27 -
Direction of slide (if any)
identified
12
80.0%
15
100.0%
27 -
Assessment of canine
guidance/group function
10
66.7%
13
86.7%
23 0.375
Assessment of tooth wear 10
66.7%
13
86.7%
23 0.375
Assessment of cheek ridging
11
73.3%
12
80.0%
23 1.000
Assessment of tongue
scalloping
9
40.0%
14
93.3%
23 0.063
Followed correct sequence of
steps
8
53.3%
11
73.3%
19 0.375
Diagnosis of patient's condition 9
40.0%
12
80.0%
21 0.375
- Where no P value is given, a calculation was not possible as discordant pairs were not present # #
Significance indicated by P< 0.01
Table 5.6 Group 1 assessments comparing the first and second episodes of teaching
Although there was a definite trend for results to improve after the second assessment,
no significant differences were found for any of the 29 procedures on the checklist. The
identification of presence/absence of a click (P=0.016) was of borderline significance,
with 46.7% of Group 1 postgraduates identifying this correctly at the first assessment

301
and 93.3% at the second assessment. For 26 of the 29 procedures, the percentage of
postgraduates who undertook procedures correctly at the second assessment increased.
It remained the same for 1 procedure (lateral palpation) and decreased for two
procedures (classification of a click and measurement of maximum opening). It must,
however, be appreciated that the sample sizes in this study are small and increasing the
sample size in future studies would be beneficial.
5.3.1.4 Group 2 (face-to-face teaching followed by Moodle)
This table summarises the results of the Group 2 postgraduates who had undertaken
face-to-face teaching first and then the Moodle tutorial.
Procedure
undertaken
% Correctly
undertaken
Total P Value##
First time (FtoF)
Second
time
(Moodle)
Join
t Sym
pto
ms
Correct application of force 3
20.0%
7
46.7%
10 0.289
Lateral Palpation
3
20.0%
5
33.3%
8 0.688
Inter auricular palpation 9
40.0%
12
80.0%
27 0.508
Identified presence/absence of
click
14
93.3%
15
100.0%
29 -
Classification of click
11
73.3%
14
93.3%
25 0.375
Identified presence/absence of
crepitus
13
86.7%
15
100.0%
28 -
Jaw
Movem
ents
Measurement of comfortable
opening
14
93.3%
14
93.3%
28 1.000
Measurement of maximum
opening
9
40.0%
14
93.3%
23 0.063
Measurement of right lateral
excursion
6
40.0%
8
53.3%
14 0.688
Measurement of left lateral
excursion
7
46.7%
8
53.3%
15 1.000
Recognition of pathway of
opening
10
66.7%
14
93.3%
24 0.219

302
Mu
scle Sym
pto
ms
Recognition and correct
palpation of lateral pterygoid
muscle
9
40.0%
4
26.7%
13 0.180
Recognition of lateral pterygoid
tenderness
14
93.3%
12
80.0%
26 0.625
Recognition and correct
palpation of mesial pterygoid
muscle
6
40.0%
15
100.0%
21 -
Recognition of mesial pterygoid
tenderness
8
53.3%
12
80.0%
20 0.219
Recognition and correct
palpation of temporalis muscle
4
26.7%
5
33.3%
9 1.000
Recognition of temporalis
tenderness
15
100.0%
15
100.0%
30 -
Recognition and correct
palpation of masseter muscle
5
33.3%
8
53.3%
13 0.453
Recognition of masseter
tenderness
14
93.3%
15
100.0%
29 -
Occlu
sal F
eatu
res
Skeletal base assessment
15
100.0%
15
100.0%
30 -
Angle classification
14
93.3%
15
100.0%
29 -
CO-CR identified
14
93.3%
14
93.3%
28 1.000
Direction of slide (if any)
identified
14
93.3%
14
93.3%
28 1.000
Assessment of canine
guidance/group function
13
86.7%
14
93.3%
27 1.000
Assessment of tooth wear 14
93.3%
15
100.0%
29 -
Assessment of cheek ridging 12
80.0%
13
86.7%
25 1.000
Assessment of tongue
scalloping
8
53.3%
11
73.3%
19 0.453
Followed correct sequence of
steps
6
40.0%
11
73.3%
17 0.063
Diagnosis of patient's condition 11
73.3%
12
80.0%
23 1.000
- Where no P value is given, a calculation was not possible as discordant pairs were not present # #
Significance indicated by P< 0.01
Table 5.7 Group 2 assessments comparing the first and second episodes of teaching
The findings were similar to those for Group 1, and no significant differences were
found between the first and the second assessments. The trend was for an improvement
in assessment results (22 of the 29 procedures). For five procedures, the percentage of
postgraduates who undertook the procedure correctly remained the same (measurement
of comfortable opening, recognition of temporalis tenderness, skeletal base assessment

303
CO-CR identified and direction of slide identified). It must be borne in mind, however,
that the skeletal base assessment results were already 100% at the initial assessment and
there was therefore no room for further improvement due to the "ceiling effect". The
percentage of postgraduates who undertook the procedure correctly decreased for 2
procedures (recognition/correct palpation of lateral pterygoid muscle and recognition of
lateral pterygoid tenderness).
5.3.2 Assessment Results after grouping the procedures
Due to the complexity of analysing 29 individual procedures and the small sample sizes
obtained it was also decided to analyse the results according to the summary scores for
the four themes rather than individual procedures within the themes. As previously
mentioned the four themes were as follows:
1. Joint symptoms
2. Jaw movements
3. Muscle symptoms
4. Occlusal features
5.3.2.1 Assessment after the first teaching episode
Theme Group
Results of the assessment P
Value##
Mean
Lower
95%
CI
Upper
95%
CI
Std
Dev
Median Min Max
Joint
Symptoms
1 2.87 1.89 3.85 1.77 3 0 5 0.319
2 3.59 2.84 4.22 1.25 4 1 5
Jaw
Movement
1 3.33 2.38 4.28 1.72 4 0 5 0.553
2 3.07 2.19 3.94 1.58 3 0 5
Muscle
Symptoms
1 4.33 2.80 5.87 2.77 4 0 8 0.441
2 4.60 4.14 5.00 0.83 5 3 6
Occlusal
Features
1 3.33 2.38 4.28 1.72 4 0 5 0.553
2 3.07 2.19 3.94 1.58 3 0 5
Total 1 13.87 10.37 17.36 6.31 11 4 23 0.787
2 14.27 12.18 16.35 3.77 15 9 19
# # Significance indicated by P< 0.05
Table 5.8 Results for the assessment after first teaching episode

304
There were no significant differences observed between the assessment marks of the
Group 1 and Group 2 postgraduates for the first assessment. These results mirror the
individual results presented in the previous section. The findings for all 29 procedures
summed (Total row) also indicated that there were no significant differences observed
between Groups 1 and 2.
5.3.2.2 Assessment after the cross-over and second teaching episode
Theme Group
Results of the assessment P
Value##
Mean Lower
95%
CI
Upper
95%
CI
Std
Dev
Median Min Max
Joint
Symptoms
1 3.93 3.14 4.73 1.44 4 1 6 0.153
2 4.53 3.99 5.08 0.99 5 2 6
Jaw
Movement
1 4.40 3.78 5.02 1.12 5 1 5 0.267
2 3.87 3.06 4.67 1.46 5 0 5
Muscle
Symptoms
1 6.20 5.17 7.23 1.86 6 4 8 0.081
2 5.13 4.18 6.09 1.73 5 3 8
Occlusal
Features
1 7.47 7.00 7.93 0.83 8 5 8 0.583
2 7.40 6.65 8.15 1.35 8 3 8
Total 1 22.00 19.79 24.21 3.98 23 16 27 0.416
2 20.93 19.12 22.75 3.28 22 14 25
# # Significance indicated by P< 0.05
Table 5.9 Results for the assessment after the cross-over and second teaching
episode
No significant differences were observed for the second assessment between Groups 1
and 2 for any of the four themes. In addition there was no significant difference for the
29 procedures combined (P=0.416).

305
5.3.2.3 Group 1: Moodle followed by face-to-face
Theme
Results of the assessment P
Value##
Time Mean Lower
95%
CI
Upper
95%
CI
Std
Dev
Median Min Max
Joint
Symptoms
1st 2.87 1.89 3.85 1.77 3 0 5 0.060
2nd 3.93 3.14 4.73 1.44 4 1 6
Jaw
Movement
1st 3.33 2.38 4.28 1.72 4 0 5 0.012
2nd 4.40 3.78 5.02 1.12 5 1 5
Muscle
Symptoms
1st 4.33 2.80 5.87 2.77 4 0 8 0.018
2nd 6.20 5.17 7.23 1.86 6 4 8
Occlusal
Features
1st 3.33 2.38 4.28 1.72 4 0 5 0.001
2nd 7.47 7.00 7.93 0.83 8 5 8
Total 1st 13.87 10.37 17.36 6.31 11 4 23 0.001
2nd 22.00 19.79 24.21 3.98 23 16 27
# # Significance indicated by P< 0.05
Table 5.10 Group 1 results comparing first and second assessments
When comparing the scores for Group 1 postgraduates before and after the cross-over, a
significant difference was observed for three of the themes (Jaw Movements, Muscle
Symptoms and Occlusal Symptoms: P= 0.012, 0.018 and 0.001), whilst a borderline
significant difference was observed for Joint Symptoms. There was an improvement in
the scores for the second assessment in all cases. This is in contrast with the non-
significant findings observed when the procedures were looked at independently,
however it is in line with the trend that was observed in the individual procedure
analysis. In addition the difference between the total scores was also found to be highly
significant (P=0.001), with postgraduates achieving better results at the second
assessment than the first (mean of 22.00 compared with 13.87).

306
5.3.2.4 Group 2: Face-to-face followed by Moodle
Theme
Results of the assessment P
Value##
Time Mean Lower
95% CI
Upper
95%CI
Std
Dev
Median Min Max
Joint
Symptoms
1st 3.59 2.84 4.22 1.25 4 1 5 0.053
2nd 4.53 3.99 5.08 0.99 5 2 6
Jaw
Movement
1st 3.07 2.19 3.94 1.58 3 0 5 0.190
2nd 3.87 3.06 4.67 1.46 5 0 5
Muscle
Symptoms
1st 4.60 4.14 5.00 0.83 5 3 6 0.332
2nd 5.13 4.18 6.09 1.73 5 3 8
Occlusal
Features
1st 3.07 2.19 3.94 1.58 3 0 5 0.001
2nd 7.40 6.65 8.15 1.35 8 3 8
Total 1st 14.27 12.18 16.35 3.77 15 9 19 0.001
2nd 20.93 19.12 22.75 3.28 22 14 25
# # Significance indicated by P< 0.05
Table 5.11 Group 2 results comparing first and second assessments
A significant difference (P=0.001) was observed for Occlusal Features between the first
and second assessments. With regards to Joint Symptoms, the difference in marks
between the first and second assessment was of borderline significance. In contrast no
significant difference was observed between the two assessments for the Muscle
Symptoms or Jaw Movements themes, although there was a trend for the marks to
improve in both themes. For the total marks achieved, there was a highly significant
improvement between the first and second assessment .
5.3.2.5 Sum of all procedures
Thus in summary, when looking at the total scores obtained by all of the postgraduates,
(regardless of which group they belonged in) there was a highly significant
improvement between the first and second assessments (Table 5.12).

307
Assessment Mean Std Dev Lower
95% CI
Upper
95%CI
Median Min Max P Value##
1st 14.07 5.11 12.16 15.98 14 4 23 < 0.001
2nd 21.47 3.63 20.11 22.82 22.5 14 27
# # Significance indicated by P< 0.05
Table 5.12 Comparison of the total scores between the first and second assessments
5.3.3 Feedback questionnaire findings
Due to the relatively small sample size in the study, it was decided to present the results
of the questionnaire (Appendix 14) graphically rather than statistically analysing the
data. The procedures are presented for Moodle and face-to-face in the same bar chart to
aid comparisons.
Figure 5.3 Bar chart comparing whether the course is easy to use or follow
Questions 1 and 2 - Is the course easy to use/ follow?
The postgraduates felt that both courses were easy to follow and the majority either
"Agreed" or "Strongly agreed" with the statement. Only 3 of the 30 postgraduates were
unsure about the ease of following either of the courses.
0
2
4
6
8
10
12
14
16
Number of
postgraduates
Strongly
Disagree
Disagree Unsure Agree Strongly
Agree
Is the course is easy to use/ follow ?
Moodle easy to use
Face-to-Face easy to follow

308
Figure 5.4 Bar chart comparing whether the course was interesting
Questions 3 and 4 - Was the course interesting?
Most of the postgraduates "Agreed" or "Strongly agreed" that the courses were
interesting. A total of 7 postgraduates however, were unsure about the level of interest
the courses generated and 6 of these postgraduates felt unsure about the Moodle tutorial
compared with 1 postgraduate for the face-to-face seminar.
Figure 5.5: Bar chart comparing whether the course was motivating
Questions 5 and 6 - Was the course motivating?
0
2
4
6
8
10
12
14
16
18
Number of
postgraduates
Strongly
Disagree
Disagree Unsure Agree Strongly
Agree
Was the course interesting ?
Moodle course was interesting
Face-to-Face tutorial was interesting
0
2
4
6
8
10
12
14
16
18
Number of
postgraduates
Strongly
Disagree
Disagree Unsure Agree Strongly
Agree
Was the course motivating ?
Moodle course was motivating
Face-to-Face tutorial was motivating

309
The majority of the postgraduates either ―Agreed" or "Strongly agreed" that the face-to-
face tutorial was more motivating (n=26). On the other hand 14 postgraduates either
―Disagreed‖ or were ―Unsure‖ about whether the Moodle course was motivating.
Figure 5.6 Bar chart comparing skills development from the course
Questions 7 and 8 - Did the course help to develop my skills?
The responses to these questions were similar for both modes of teaching, and
postgraduates recognised the ability of both courses to develop their TMJ examination
skills. Only 1 student disagreed with this statement and 8 postgraduates were unsure.
0
2
4
6
8
10
12
14
16
Number of
postgraduates
Strongly
Disagree
Disagree Unsure Agree Strongly
Agree
Did the course help to develop my skills?
Moodle helped to develop my skills
Face-to-Face tutorial helped to
develop my skills

310
Figure 5.7 Bar chart comparing the course information
Questions 9 and 10 - Did the course give adequate information?
Most of the postgraduates believed that the course provided adequate information and
content. Only 3 "Disagreed" with the level of information provided, while a further 3
postgraduates were "Unsure".
Figure 5.8 Bar chart comparing the academic expectations from the course
Questions 11 and 12 - How were the academic expectations?
0
2
4
6
8
10
12
14
16
18
Number of
postgraduates
Strongly
Disagree
Disagree Unsure Agree Strongly
Agree
Did the course give adequate information ?
Moodle course gave adequate
information
Face-to-Face tutorial gave adequate
information
0
5
10
15
20
25
30
Number of
postgraduates
Far too high Too high Appropriate Too low Far too Low
How were the academic expectations?
The academic expectations
of the Moodle course
The academic expectations
of the Face-to-Face tutorial

311
Almost all of the postgraduates found the academic expectations of the courses to be
"Appropriate".
Figure 5.9 Bar chart comparing the quality of the course
Questions 13 and 14 - What was the quality of the course?
On the whole the quality of both courses was regarded as "Good" or "Very good" and
none of postgraduates considered the level to be either "Poor" or "Very poor".
Figure 5.10 Bar chart comparing course recommendations
Questions 15 and 16 - Which course would you recommend?
0
2
4
6
8
10
12
14
16
Number of
postgraduates
Very good Good OK Poor Very poor
What was the quality of the course?
Quality of the Moodle course
Quality of the Face-to-Face tutorial
course
0
2
4
6
8
10
12
14
16
18
Number of
postgraduates
Strongly
Disagree
Disagree Undecided Agree Strongly
Agree
Which course would you recommend ?
I would recommend the Moodle course
I would recommend the Face-to-Face
tutorial

312
When asked which course they would recommend 16 postgraduates said they would
recommend the Moodle tutorial compared with the 14 for the face-to-face seminar.
There were however a few negative responses and 9 postgraduates "Strongly disagreed,
disagreed or were ―Undecided" on which course they would recommend the course to
others.
Figure 5.11 Bar chart comparing whether the course stimulated the postgraduates
interest for further learning
Questions 17 and 18 - Did the course stimulate interest for further learning?
This statement elicited mixed responses from the postgraduates. Although the majority
"Agreed" that the courses stimulated their enthusiasm for further learning, 16
postgraduates were unsure about this, and 6 postgraduates either "Disagreed" or
"Strongly disagreed".
0
2
4
6
8
10
12
14
16
18
Number of
postgraduates
Strongly
Disagree
Disagree Unsure Agree Strongly
Agree
Did the course stimulate enthusiasm for further learning?
Moodle course has stimulated my
enthusiasm for further learning
Face-to-Face tutorial has stimulated my
enthusiasm for further learning

313
Figure 5.12 Bar chart comparing the rating of both courses on a scale of 1 to 10
Question 19- How would you rate the Moodle tutorial/Face-to-face seminar on a scale
of 1-10?
The rating values for both the two courses given by the postgraduates were varied.
Although none of the postgraduates gave the courses very low ratings (1 and 2), a few
considered the course less than favourably, with 7 postgraduates giving the Moodle
tutorial and 4 postgraduates giving the face-to-face seminar a rating ≤ 5. In contrast, 18
postgraduates rated the Moodle tutorial very highly giving scores of ≥ 8, and 15
postgraduates gave the face-to-face seminar similar scores. The mean rating score for
both the two courses was 7.4.
0
1
2
3
4
5
6
7
8
9
10
Number of
postgraduates
1 2 3 4 5 6 7 8 9 10
How would you rate the course on a scale of 1 to 10?
Moodle on a Scale of 1 to 10
Face-to-Face tutorial on a scale of
1 to 10

314
Table 5.13 Comments provided by postgraduates regarding the Moodle and Face-
to-face seminar
Question 20 - What aspect of the course was most valuable/enjoyable?
Moodle
Comments
With the Moodle tutorial you can replay the examination, and repeat things that are
not clear…..
You can stop and rewind to take notes
More convenient and accessible
I liked Moodle because you can go back to it again and again,
I can take my time and do the course at my own convenience, also can go backwards
and forwards over parts
You can replay parts you miss
Moodle was easier to understand and remember because it felt like doing something fun… like watching a movie.
I could go back and reread and take notes
Information is present to revise and re-watch at anytime
You can watch it over and over again
You can go through the teaching at anytime
Face- to
- Face
Comments
Found it difficult to concentrate during the Moodle tutorial
Face-to-face teaching is more interesting and more engaging
Real life is easier to understand
Easier to follow and easier to understand
Easier to understand
Ability to ask questions and probably easier to retain information with person to person interaction
Having a real patient in the face to face
Moodle tutorial was too impersonal
I enjoyed the ability to ask questions
Can ask direct questions at the time to clarify things
More motivating as you can ask questions
Question 21- If you could choose one course to enrol on which would it be?
Sixteen postgraduates choose the Moodle tutorial, compared with the fourteen
postgraduates who choose the face-to-face seminar.

315
5.4 Discussion:
5.4.1 Developing the Moodle tutorial
Although the TMJ Information Course was developed in the Orthodontic Department of
UCL Eastman Dental Institute, the topic is relevant to many disciplines including
Prosthodontics, Oral Surgery and Facial Pain. As such it is a useful learning tool for
many graduates and undergraduates. As the responsibility for providing this teaching is
shared amongst the various departments, it can sometimes be overlooked. Creating this
course module provides a central point for students to access the information.
There are undoubtedly many benefits associated with providing teaching modules on a
VLE platform, however, the development stage of this study highlighted certain
difficulties and drawbacks. Some postgraduates wanting to access the course from their
home had log-in difficulties associated with the universities networking capabilities. In
addition some experienced web-browser incompatibilities especially with respect to
watching the TMJ examination video. Individual‘s internet band-width also affected
their ability to efficiently complete the course and should a student experience any
number of the above problems they are less likely to persevere and log-on again.
For the Moodle tutorial, it was possible to track user activity and identify the elements a
student had completed, however it was not possible to determine the length of time each
student spent on the content. Thus if a student skimmed through a tutorial or read it in-
depth the projected usage would be the same. Nonetheless, traditional teaching methods
do not overcome this obstacle, and even in a lecture, it is highly likely that some of
those present may be preoccupied elsewhere.
The Moodle course incorporated a discussion board and forum for users to discuss the
topic with each other and to provide interactivity between the students and the tutor.
Unfortunately, however, this feature of Moodle was underutilised in this study.

316
5.4.2 Cross-over trial
By carrying out the cross-over trial it was hoped to determine how the two groups of
postgraduates responded to the different methods of teaching, specifically with regards
to the skills gained and the accuracy of their examination procedure and diagnosis. Thus
establishing whether placing lectures and videos on a VLE could be as effective as
training students for clinical procedures with face-to-face teaching, and whether this
could be used to replace practical demonstrations when necessary.
Ideally baseline assessment results would have been obtained for the postgraduates prior
to their enrolment onto either modes of teaching. In depth discussions went into the
methodology of this trial and it was decided that in this cross-over trial it would not be
feasible. The practicality of recruitment of the postgraduates for three phases of
assessments was not possible due to the academic commitments of the postgraduates,
time constraints and ―fatigue‖ of the postgraduates and volunteers. In addition obtaining
baseline assessments may influence future results, as the postgraduates would know
what to expect in subsequent assessments. As such it was decided not to undertake
baseline assessments.
Assessment results after first teaching episode (Tables 5.4 and 5.8)
The assessment results showed no significant difference in how well the postgraduates
performed for each of the 29 procedures (Table 5.4). For ease of comparison the results
of the individual procedures were also summed into the four main themes but, again, no
significant differences were found between the performance of the Group 1 and 2
postgraduates. This indicated that both are equally effective educational tools (Table
5.8). Finally when the sum of all the themes was compared for Groups 1 and 2 (Table
5.8), no significant difference was observed, thus reinforcing previous findings.
Both modes of teaching was equally effective at delivering the information to the
postgraduates and it appeared that both groups of postgraduates acquired similar skill
sets in conducting a TMJ examination. With respect to diagnosis, 60.6% of the
postgraduates in Group 1 and 73.3% in Group 2 accurately diagnosed the patient's
condition, but this difference was not found to be statistically significant (P=0.439). As
such the type of teaching the postgraduates received did not appear to influence their

317
ability to diagnose temporomandibular joint disorders. Others looking at the
effectiveness of web based learning have come to the same conclusion. A study by
Fordis et al. (2005) examined whether an internet based continuing medical education
(CME) module could produce comparable changes (with respect to physicians'
knowledge and behaviours that have an impact on patient care) as a "live", small group,
interactive CME workshop. They found that online CME produced objectively
measured changes in the behaviour of the physicians, as well as sustained gains in their
knowledge that were comparable with those realised from the " live" CME group.
Second Assessment - after the cross over and second teaching episode (Tables 5.5
and 5.9)
After the cross-over and second episode of teaching, the postgraduates were assessed
again and the results of each procedure were independently analysed as reported
previously. There was no significant difference between the two groups and the findings
were replicated when the procedures were grouped into four themes. Based on these
results, it can be deduced that even after the cross-over both teaching modalities were
equally effective and there were no significant differences in the marks postgraduates
gained, and thus in the skills acquired. In addition, both groups of postgraduates
performed equally well in the diagnosis of TMD (80% diagnosed the TMJ condition
accurately in both groups).
It does not appear that the order in which the postgraduates had received the teaching
made a difference, whether a student had Moodle followed by a face-to-face seminar or
a face-to-face seminar followed by Moodle, the postgraduates performed similarly. It is
clear that the ability of e-learning to promote educational objectives can be
considerable, it has to be borne in mind however that quality e-learning is not only
about exploiting computer power. The e-learning must include educational expertise
and an awareness of the strength and limitations of this method of teaching (Eaton and
Reynolds, 2008). Thus provided it is well designed and executed, online or web based
courses can be equally effective in conveying information, and influencing changes to
practice (Fordis et al., 2005).
318
Group 1- comparison of first and second assessments (Moodle followed by face-to-
face) (Table 5.6 and 5.10)
The results of the Group 1 postgraduates were compared before and after the cross-over.
When the analyses were conducted on the individual procedures, no significant
differences were seen between the two assessments, although there was a definite trend
for the marks to improve at the second assessment. When the procedures were grouped
into 4 themes and the analyses repeated, a significant difference was found for three of
the themes (Jaw Movements, Muscle Symptoms and Occlusal Features) with the
postgraduates' performance improving at the second assessment (Table 5.10). The
fourth theme (Joint Symptoms) showed a borderline significant improvement at the
second assessment. When all 29 procedures were combined and compared between
assessments, postgraduates were found to have higher marks at the second assessment
and this was highly significant for three of the themes (Jaw Movements, Muscle
Symptoms and Occlusal Symptoms). As such although Moodle or face-to-face teaching
may be equally effective, having the teaching twice reinforces knowledge and there was
a significant improvement in performance at the second assessment.
Group 2- comparison of first and second assessments (face-to-face followed by
Moodle) (Tables 5.7 and 5.11)
As for the Group 1 findings, no significant difference were observed between the two
assessments when the 29 procedures were looked at independently, although again there
was a trend for the postgraduates to improve at the second assessment. When the results
were grouped into four themes, a significant difference was seen for two of the themes
(Joint Symptoms and Occlusal Features), whilst no significant differences were found in
the remaining two themes (Jaw Movements and Muscle Symptoms). However, there
was an obvious improvement at the second assessment even though it did not reach
statistical significance. This finding may be due to the relatively small sample sizes in
this trial and warrants further investigation.
When all 29 procedures were compared, a highly significant improvement was found at
the second assessment (Table 5.11). Thus receiving the teaching twice improved the
results and the performance of the postgraduates on the basis of their assessments
Moodle and face-to-face teaching combined therefore appears to be better than either on
its own and the order of teaching does not appear to make a difference.

319
Overall findings
To confirm the effectiveness of further teaching on the performance of the
postgraduates, the total results of all the postgraduates were compared between the first
and second assessments (Table 5.12). A highly significant difference was found in the
results, with postgraduates attaining higher marks at the second. This is in line with
what may be expected educationally.
There is always the possibility that postgraduates performed better the second time
because they knew what to expect. Assessments are used by many instructors and
organisations to improve the learning process and diagnostic assessments can direct
students to suitable learning practices, stimulating attention and retrieval processes
(Shepard and Godwin, 2004).
Repetition is a common pedagogy technique which helps to stimulate the memory.
Repeating an encounter motivates awareness and the learning process is one of slow
engagement, gradually building to the acquisition of an idea. Repetition can hasten and
deepen the engagement process, thus for quality learning one should consciously design
repetitive engagement into courses and daily teaching (Bruner, 2001).
Repeated teaching of the same topic is more effective than teaching a topic once and it
is not uncommon in educational environments to provide revision lectures and tutorials.
Having a lecture or other form of teaching on a VLE can be considered an invaluable
educational tool, as it provides the resources for revision, and refreshing of knowledge
without the need to schedule a live lecture, thus more efficient use of academics time.
5.4.3 Feedback
The questionnaire provided valuable feedback on different aspects of the courses, along
with a gauge to assess the postgraduates' receptiveness to online learning. A number of
dimensions were explored including:
1. Ease of use
2. Interest

320
3. Motivation
4. Skills gained
5. Adequate information
6. Academic expectation
7. Quality
8. Stimulated interest for further learning
In addition the postgraduates' preference was determined by asking three questions:
1. Would they recommend the course?
2. How would they rate the course on a scale of 1- 10?
3. If given one option which would they prefer?
An important place to begin discussing the findings is looking at which of the two
methods of teaching the postgraduates preferred. Sixteen postgraduates preferred the
Moodle tutorial, whilst 14 postgraduates preferred the face-to-face seminar, thus similar
opinions were observed (Question 21). When asked whether they would recommend the
course, the distribution of postgraduates who would recommend the Moodle tutorial
was similar to those who would recommend the face-to-face seminar and the responses
were positive, with the majority answering "Agree" or" Strongly agree" (Figure 5.10).
Finally when asked how the postgraduates would rate the course, 18 postgraduates gave
the Moodle tutorial a ranking of 8 and above, whilst 15 postgraduates gave the face-to-
face seminar a ranking of 8 and above (Figure 5.12). This reflects previous studies,
which reported that VLEs received positive feedback from students (Kings College
London, 2002; Thornton et al., 2004)
With regards to the other questions, the results indicated an even spread of responses to
the questions, with the majority being of the positive nature "Agree" or "Strongly
agree", "Good" or "Very Good" (Figures 5.3 to 5.9). These findings collectively
indicate that both courses were well received by the postgraduates and there is certainly
a place for both in dental education. Twenty two postgraduates were either unsure or
disagreed that the Moodle course and face-to-face tutorial stimulated their enthusiasm
for further learning (Figure 5.11). This however, may be due to the topic being
perceived as a ―dry subject‖.

321
Postgraduates could theoretically be given the option of which course they enrol on and
some may find online learning beneficial due to travel constraints and clinical
restrictions. However, it should be noted that a study looking at VLE use in dentistry
found that some peripheral trainees placed a high value on face-to-face teaching and
were prepared to travel in order to attend this form of teaching to allow peer group and
peer teacher interaction (Mulgrew et al., 2009). Indeed students have frequently cited
fear of isolation and lack of a community environment as a shortcoming of VLEs (Shah
and Cunningham, 2009).
Many constructive comments were made by the postgraduates and some had recurring
themes. For example "With the Moodle tutorial you can replay the examination, and
repeat things that are not clear..." was often cited as reason postgraduates preferred
Moodle. On the other hand "I enjoyed the ability to ask questions..." was a comment
often made by the proponents of the face-to-face seminar. Based on the interpretation of
the comments the following advantages were derived for both courses.
With the Moodle tutorial advantages included:
1. Postgraduates could replay sections of the video and could go back to the
course at any time.
2. Convenient and accessible at anytime and anywhere.
3. It was fun approach to learning because it was novel.
Advantages of face-to face teaching included:
1. It was more interesting and more engaging.
2. Real life tutorials were seen as easier to follow.
3. There was the ability to ask direct questions.
The findings from the cross-over trial and the feedback indicated that a strong case
could be made for introducing clinical lectures on a VLE platform and this form of e-
learning is, in general, well perceived by the new generation of graduate students. At the
same time VLEs should not completely replace traditional lectures and tutorials as these
are also very well regarded by students. The solution to this conundrum is the concept
of blended learning. Blended courses combine online components of study with face-to-
face classroom based interaction. Ruiz et al. (2006) recommended the integration of e-
learning into curricula using a blended learning format rather than moving entirely to

322
computer-based programmes. To maximise the outcomes of an educational process
VLEs should be aligned with the process of the course and not the other was around. As
such VLEs should be adaptable to meet a course's needs and traditional methods are still
used where they are most effective, such as in some one-to-one clinical teaching
scenarios (Biggs, 1999).
A recent study by Carbonaro et al. (2008) looked at the effects and benefits of a newly
developed blended learning course for health science students and compared this with
the existing face-to-face format. As with this study, the students were assigned into
either of the two groups, and completed a post-course Objective Structured Clinical
Examination (OSCE). The results were similar to this study and no differences were
found between the two groups in achieving team process skills. Both the blended
learning group and the face-to-face groups demonstrated similar post class results.
Interestingly, Carbonaro et al. (2008) found significant differences between the groups
on the perceived positive achievement of the course learning objectives and the blended
learning group were more convinced that their course provided them this. The novelty
of using technology in the classroom may have played a role in the positive responses
(Neimiec and Walberg, 1987), and could explain the encouraging feedback received by
some students in this study.
VLE based information may also prove useful and relevant to GDPs or specialists to be
run alongside Continued Professional Development (CPD) courses. CPD courses
provide face-to-face teaching, but participants do not usually have the opportunity for
revision lectures, thus VLEs can be used as a revision tool.

323
5.5 Conclusion
1) There were no differences in skills gained between students who were enrolled
in the seminar and those who learned through a VLE tutorial, with regards to
accuracy in TMJ examination and diagnosis.
2) Students had positive perceptions of VLE learning, and the feedback regarding
this mode of teaching was comparable with the more traditional method of
teaching (seminar).
3) VLEs are suitable for delivering clinical/practical demonstration concepts. They
may also be particularly useful as a follow-up or revision tool, for example
alongside CPD courses in order to reinforce the information at a later stage.
Blended learning and the incorporation of on-line learning into medical and dental
education certainly appears to be the way forward. This is highlighted by the numerous
institutions that have adopted this approach over the last decade (Ellaway et al., 2003;
Mulgrew et al., 2009). The uptake of information and the skills that are attained by
students are comparable to those expected from traditional teaching methods. There are
the added benefits of easy access "anytime, anywhere" and the conservation of
academic resources in what is already an overwhelmed profession. Provided courses are
appropriately designed they can be instrumental in encouraging effective learning.

324
Appendix I

325
Appendix 1- Data abstraction forms

326

327

328

329

330

331
Appendix 2- Quality Assessment Form
Title/Authors: ______________________________________
Selection
Study type:
□ Prospective □ Retrospective
Ethical approval reported:
□ Yes □ No
Were inclusion criteria specified?
□Yes □ No
If specified, were the inclusion criteria appropriate?
□Yes □ No
How were the subjects recruited?
□ Random sample □ Consecutive patients □ Volunteers
□ Not reported □Other__________
Were the subjects assembled at a similar point/ are groups similar at the baseline (e.g. all subjects examined pre-ortho, did all subjects enter the survey at a similar point in their disease
progression)?
□Yes □ No □ Unclear
Were the groups in the study comparable on all the important confounding factors?
List of important confounding factors:
Yes No Not Reported
Skeletal Form
Age
Gender
TMD at starting point
Para functional habits
Psychogenic state
Others_
If not balanced on confounders, was there adequate adjustment for these confounding variables
in the analysis? □ Yes □No □ Not reported

332
Performance
Was the care protocol clearly defined and standardised for all subjects (i.e. all patients were
subjected to the same sets of procedures prior to the intervention)?
□ Yes □No □ Not reported □ N/A (No intervention)
Was the exposure/intervention clearly defined (e.g. surgery type)? □ Yes □Not reported □Unclear □ N/A (No intervention)
Comparability of Intervention:
Is the intervention controlled for (e.g. same surgical procedures)?
□ Yes □No □Unclear □ N/A (No intervention)
If no:
Were the subjects with different interventions grouped (e.g. Group 1 max advance, Group 2
mand advance, Group 3 max advance and mand setback?) □ Yes □No □Unclear □ N/A (No intervention)
Number of operators:
□ Single □Multiple □Unclear
Measurement/outcome
Has the disease state/outcome been reliably ascertained or validated?
□ Yes □No □Unclear
Were examiners calibrated / trained in taking measurements?
□ Yes □No □Unclear
Number of examiners:
□ Single □Multiple □Unclear
Was the outcome of interest clearly defined?
□ Yes □No □Unclear( defined but not in sufficient detail)
Outcome assessment: □ Clinical exam □Self report □ Both □Not reported
If Clinical Exam: □ Masked
□ Unmasked
□ Unspecified

333
Is self reported symptoms were used, was the information provided by the patient validated
against existing records? □ Yes □No □Unclear
Attrition
Was follow up long enough for outcomes to occur:
□ Yes □No □ Not reported
Was there a complete follow up (All subjects accounted for)
□ Yes □No □ Not reported
If no:
Were losses to follow up similar for all groups?
□ Yes □No □ Not reported
Were reasons for losses to follow up reported?
□ Yes □No □ Unclear □ N/A
If yes, (tick one):
□ Subjects lost to follow up unlikely to introduce bias. □ Subjects lost to follow up likely to introduce bias.
□ No description of those lost
_____________________________________________________________________
Likelihood of Bias:
Selection Performance Measurement/outcome Attrition
High
Low

334
Appendix 3- Ethical Approval

335

336
Appendix 4- Amendment to Ethical Approval 1

337
Appendix 5- Orthognathic patients’ information leaflet

338
Appendix 6- Orthognathic patients consent form

339
Appendix 7- Control group information leaflet and control
consent form

340

341
Appendix 8- TMD Questionnaire and OHIP-14

342

343

344
Appendix 10- TMJ examination form
Patient identification number: Date: 1. TMJ EXAMINATION (Yes = √)
A. Tenderness on palpation
R L
(i) Lateral
(ii) Intra-auricular
B. Joint sounds
R L
Click
Soft / Loud
Consistent/Intermittent
Opening/Closing/Both
Early/ Mid / Late
Painful/ Painless
Single/Multiple
Crepitus
Painful / Painless
C. Range of motion (mm):
Comfortable opening mm
Maximum opening mm
R L

345
Lateral mm mm
Overbite mm
D. Pathway of opening: (tick as appropriate)
Straight
Lasting Deviation
To LHS
To RHS
Transient Deviation To LHS
To RHS
2. MUSCLE EXAMINATION (Tenderness = √)
R L
Medial pterygoid
Lateral pterygoid
Origin of masseter
Insertion of masseter
Origin of temporalis
Temporalis tendon

346
3. OCCLUSION
Skeletal base (tick)
I II III
Angle’s classification
Are CO and CR coincident (tick)
Yes No
If no, where is the first contact
If no, what is the direction of the slide (tick)
Forward Left Right
Canine guidance or group function
R
CG GF
L
CG GF
Evidence of excessive wear
Yes No
Cheek ridging Yes No
Tongue Scalloping
Yes No

347
Appendix 11- RDC/TMD Classification
Adapted from Manchester University Dental School (Davies et al., 2005)
RDC/TMD Classification of Temporomandibular Disorders1992 Original Paper: Research Diagnostic Criteria (LeResche and Dworkin)
2002 Approved by European Academy of Craniomandibular Disorders
•Axis 1: A set of operationalised
research diagnostic criteria for use in
evaluating and investigating masticatory
muscle pain, disc displacements and
degenerative diseases of the TMJ.
•Axis 2: A set of operational research
diagnostic criteria to assess chronic pain,
dysfunction, depression, non-specific
physical symptoms, and orofacial
disability.
Axis 1: Clinical TMD
Conditions
Group 1: Muscle Disorders
1a Myofascial Pain
1. Report of pain or ache in the jaw,
temples, face,preauricular area, or inside
the ear at rest or during function; plus
2. Pain on palpation of three or more of
the following muscle sites (right and left
count as separate sites)
posterior, middle, or anterior temporalis,
tendon of temporalis.
•origin, body, or insertion of masseter
posterior mandibular region,
submandibular region.
•lateral pterygoid area (using resisted
movement test).
•At least one of the sites must be on the
same side as the complaint of pain.
1b Myofascial Pain with
Limited Opening1. Myofascial pain as defined in 1a; plus
2. Comfortable (pain free) unassisted
mandibular opening of less than 40mm
inter-incisal; plus
3. Maximum assisted opening (passive
stretch) of 5 or more mm greater than
pain free unassisted opening (2)
Group 2: Disc Displacements
2a Disc Displacement with
Reduction
•The articular disc is displaced from its
position between the condyle and the
eminence, to an anterior and medial or
lateral position, but reduces on full
opening, usually resulting in a noise
(click).
Either: (a) Reciprocal clicking in TMJ
reproducible on two of three consecutive
trials; or (b) Click in TMJ on opening or
closing, reproducible on two of three
consecutive trials, and click during lateral
excursion or protrusion, reproducible on
two of three consecutive trials.
2b Disc Displacement Without
Reduction, With Limited
Opening (Lock)
•A condition in which the articular disc is
displaced from its normal position between
the condyle and the fossa to an anterior and
medial or lateral position, associated with
limited mandibular opening.
1.History of significant limitation in
opening; plus
2.Maximum unassisted opening less than
35mm; plus
3.Passive stretch increases opening by
4mm or less over maximum unassisted
opening.
4.Contralateral excursion less than 7mm
and/or uncorrected deviation to the
ipsilateral side on opening; plus
5.Either: (a) absence of joint sounds, or (b)
presence of joint sounds not meeting
criteria for disc displacement with
reduction.
2c Disc Displacement
Without Reduction,
Without Limited Opening
•A condition in which the articular disc is
displaced from its normal position between
the condyle and the fossa to an anterior and
medial or lateral position, not associated
with limited mandibular opening.
1.History of significant limited opening
plus
2. Maximum unassisted opening more than
35mm; plus
3. Passive stretch increases opening by
5mm or more over maximum unassisted
opening.
4. Contralateral excursion more than 7mm;
plus
5. Presence of joint sounds not meeting
criteria for disc displacement with
reduction
6. Imaging – Arthrogram or MRI
reveals anterior displacement
without reduction.
Group 3: Arthralgia,
Arthritis, Arthrosis
3a Arthralgia: Pain and
tenderness in the joint capsule
and/or the synovial lining of the
TMJ.
•Pain in one or both joint sites
(lateral pole and/or posterior
attachment) during palpation; plus
one or more of the following self-
reports of pain: pain in the region of
the joint, pain in the joint during
maximum unassisted opening, pain
in the joint during assisted opening,
pain in the joint during lateral
excursion. For a diagnosis of simple
arthralgia, coarse crepitation must
be absent.
3b Arthritis: Inflammatory
condition within the joint that
results from a degenerative
condition of the joint structures
1. Arthralgia; plus
2. Either a or b (or both)
a. Coarse crepitus in the joint
b. Imaging – Tomograms show one
or more of the following: erosion of
normal cortical delineation, sclerosis
of parts or all of the condyle and
articular eminence, flattening of
joint surfaces, osteophyte formation.
3c Arthrosis: Degenerative
disorder of the joint in which joint
form and structure are abnormal.
1. Absence of all signs of arthralgia,
plus
2.Either a or b (or both)
a.Coarse crepitus in the joint.
b.Imaging – Tomograms show one
or more of the following: erosion of
normal cortical delineation, sclerosis
of parts or all of the condyle and
articular eminence, flattening of
joint surfaces, osteophyte formation.

348
Appendix 12- Amendment to Ethical Approval 2
The National Hospital for Neurology and Neurosurgery & Institute of Neurology Joint REC
Dr Susan Cunningham Senior Lecturer in Orthodontics Department of Orthodontics, Eastman Dental Institute 256 Gray's Inn Road, London WC1X 8LD Our Ref: 09L 007
Research & Development 1st Floor,
30 Guilford Street London
WC1N 1EH Tel: 020 7905 2703 Fax: 020 7905 2701
Email: [email protected]
Website: www.uclh.nhs.uk
22 January 2009 Dear Dr Cunningham Study title: Factors affecting temporomandibular joint dysfunction
(jaw joint problems) in patients with severe skeletal problems who are undergoing orthognathic intervention.
REC reference: 04/Q0512/100 Amendment number: Amendment date: 18 December 2008
The above amendment was reviewed at the meeting of the Sub-Committee of the REC held on 22 January 2009. Ethical opinion
The members of the Committee present gave a favourable ethical opinion of the amendment on the basis described in the notice of amendment form and supporting documentation. Approved documents
The documents reviewed and approved at the meeting were:
Document Version Date
Protocol 2 11 April 2006
Follow up invitation 1 14 December 2008
Notice of Substantial Amendment (non-CTIMPs) 2 18 December 2008
Covering Letter 1 18 December 2008
Membership of the Committee
The members of the Committee who were present at the meeting are listed on the attached sheet. R&D approval

349
All investigators and research collaborators in the NHS should notify the R&D office for the relevant NHS care organisation of this amendment and check whether it affects R&D approval of the research.
Statement of compliance The Committee is constituted in accordance with the Governance Arrangements for Research Ethics Committees (July 2001) and complies fully with the Standard Operating Procedures for Research Ethics Committees in the UK.
04/Q0512/100: Please quote this number on all correspondence
Yours sincerely Miss Sasha Vandayar Committee Co-ordinator
E-mail: [email protected] Enclosures List of names and professions of members who were present at the
meeting. Copy to: UCLH NHS Trust
The National Hospital for Neurology and Neurosurgery & Institute of Neurology Joint REC
Attendance at Sub-Committee of the REC meeting on 22 January 2009
Dr Yogi Amin Chair Dr Lorraine Ludman Vice Chair

350
Appendix 13- TMD assessment checklist
Assessment Checklist: TMD Examination
Operator: Date:
Assessor:
Item N/A Done
Correctly
Incorrect Unclear
1. Correct application of force
2. Lateral Palpation
3. Inter-auricular palpation
4. Click Present:
Yes No
5. Classification of Click
6. Crepitus Present:
Yes No
7. Measurement of comfortable
opening
8. Measurement of maximal opening
9. Measurement of right lateral excursion
10. Measurement of left lateral excursion
11. Recognition of path of opening
12. Lateral pterygoid palpation
13. Recognition of Lateral Pterygoid
tenderness
14. Mesial pterygoid palpation
15. Recognition of Mesial Pterygoid
tenderness
16. Temporalis Palpation
17. Recognition of Temporalis
tenderness
18. Masseter palpation
19. Recognition of Masseter tenderness
20. Skeletal base assessment
21. Angle classification assessment
22. CO-CR identified
23. Direction of the slide
24. Assessment of canine guidance/
group function
25. Assessment of tooth wear
26. Assessment of cheek ridging
27. Assessment of tongue scalloping
28. Followed correct sequence
29. Diagnosis

351
Appendix 14- TMD feedback questionnaire

352

353

354

355
Appendix II
Publications resulting from this research

356

357

358

359

360

361

362

363

364

365

366

367

368

369

370
References
Abrahamsson C, Ekberg E, Henrikson T, Bondemark L (2007)
Alterations of temporomandibular disorders before and after orthognathic surgery: a
systematic review.
Angle Orthod. 77(4):729-34.
Abrahamsson C, Ekberg E, Henrikson T, Nilner M, Sunzel B, Bondemark L
(2009)
TMD in consecutive patients referred for orthognathic surgery.
The Angle Orthod. 79(4):621-7.
Agerberg G, Inkapööl I (1990)
Craniomandibular disorders in an urban Swedish population.
J Craniomandib Disord. 4(3):154-64.
Agerberg G, Sandström R (1988)
Frequency of occlusal interferences: a clinical study in teenagers and young adults.
J Prosthet Dent. 59(2):212-7.
Aghabeigi B, Hiranaka D, Keith DA, Kelly JP, Crean SJ (2001)
Effect of orthognathic surgery on the temporomandibular joint in patients with anterior
open bite.
Int J Adult Orthodon Orthognath Surg. 16(2):153-60.
Al-Ani MZ, Davies SJ, Gray RJ, Sloan P, Glenny AM (2004)
Stabilisation splint therapy for temporomandibular pain dysfunction syndrome.
Evid Based Dent. 5(3):65-6.
Allen JC (2007)
Temporal arteritis: don't let this disease fool you.
Gen Dent. 55(1):52-3.

371
Allerbring M, Haegerstam G (1993)
Characteristics of patients with chronic idiopathic orofacial pain. A retrospective study.
Acta Odontol Scand. 51(1):53-8.
Altman DG (1991)
Practical Statistics for Medical Research.
London: Chapman & Hall.
Aly M, Willems G, Elen J (2004)
Instructional multimedia programmes versus standard lecture: a comparison of two
methods for teaching the undergraduate orthodontic curriculum.
Eur J Dent Educ. 8:43-46
American Psychiatric Association (1994)
American Psychiatric Association: Diagnostic and Statistical Manual of Mental
Disorders IV edition
American Psychiatric Association, Washington, DC.
Andrews LF (1972)
The six keys to normal occlusion.
Am J Orthod. 62(3):296-309.
Andrews LF (1976)
The straight-wire appliance, origin, controversy, commentary.
J Clin Orthod. 10(2):99-114.
Antman EM, Lau J, Kupelnick B, Mosteller F, Chalmers TC (1992)
A comparison of results of meta-analyses of randomized control trials and
recommendations of clinical experts. Treatments for myocardial infarction
J Am Med Assoc 268(2):240-48.

372
Aoyama S, Kino K, Kobayashi J, Yoshimasu H, Amagasa T (2005)
Clinical evaluation of the temporomandibular joint following orthognathic surgery-
multiple logistic regression analysis.
J Med Dent Sci. 52(2):109-14.
Ardic F, Gokharman D, Atsu S, Guner S, Yilmaz M, Yorgancioglu R (2006)
The comprehensive evaluation of temporomandibular disorders seen in rheumatoid
arthritis.
Aust Dent J. 51(1):23-8.
Arnett GW, Milam SB, Gottesman L (1996)
Progressive mandibular retrusion--idiopathic condylar resorption. Part I.
Am J Orthod Dentofacial Orthop. 110(1):8-15.
Ártun J, Hollender LG, Truelove EL (1992)
Relationship between orthodontic treatment, condylar position, and internal
derangement in the temporomandibular joint.
Am J Orthod Dentofacial Orthop. 101(1):48-53.
Ash MM Jr, Ramfjord SP (1998)
Reflections on the Michigan splint and other intraocclusal devices.
J Mich Dent Assoc. 80(8):32-5, 41-6.
Athanasiou AE, Yücel-Eroğlu E (1994)
Short-term consequences of orthognathic surgery on stomatognathic function.
Eur J Orthod. 16(6):491-9.
Athanasiou AE, Melsen B (1992)
Craniomandibular dysfunction following surgical correction of mandibular
prognathism.
The Angle Orthod. 62(1):9-14.

373
Athanasiou AE, Elefteriadis J, Dre E (1996)
Short-term functional alterations in the stomatognathic system after orthodontic-surgical
management of skeletal vertical excess problems.
Int J Adult Orthodon Orthognath Surg. 11(4):339-46.
Azumi Y, Sugawara J, Takahashi I, Mitani H, Nagasaka H, Kawamura H (2004)
Positional and morphologic changes of the mandibular condyle after mandibular
distraction osteogenesis in skeletal class II patients.
World J Orthod. 5(1):32-9.
Bailey LJ, Collie FM, White RP Jr (2001)
Long-term soft tissue changes after orthognathic surgery.
Int J Adult Orthodon Orthognath Surg. 11(1):7-18.
Barker DK (2004)
Occlusal interferences and temporomandibular dysfunction.
Gen Dent. 52(1):56-61.
Barkin S, Weinberg S (2000)
Internal derangements of the temporomandibular joint: the role of arthroscopic surgery
and arthrocentesis.
J Can Dent Assoc. 66(4):199-203.
Barros Vde M, Seraidrian PI, Cortes MI, de Paula LV (2009)
The impact of orofacial pain on the quality of life of patients with temporomandibular
disorders.
J Orofac Pain 23(1):28-37
Becta ICT research (2001)
A review of the research literature on the use of managed learning environments and
virtual learning environments in education, and a consideration of the implications for
schools in the United Kingdom.
Accessed from: http://partners.becta.org.uk/uploaddir/downloads/page_documents/
research/VLE_report.pdf.

374
Becta (2008)
http://www.becta.org.uk/
Accessed on 17/5/2008.
Bell WE (1982)
Clinical management of temporomandibular disorders.
Chicago: Year Book Medical Publishers.
Belser UC, Hannam AG (1985)
The influence of altered working-side occlusal guidance on masticatory muscles and
related jaw movement.
J Pros Dent 53(3):406–413.
Benson BW, Otis LL (1994)
Disorders of the temporomandibular joint
Dent Clin North Am. 38(1):167-85.
Bernard L (2001)
The Anatomical Basis of Dentistry, 3rd
Edition.
St. Louis: Mosby.
Blackwell B, De Morgan NP (1996)
The primary care of patients who have bodily concerns.
Arch Fam Med. 5(8):457-63.
Bickley SR, Harrison JE (2003)
How to.... find the evidence.
J Orthod. 30(1):72-8.
Biggs J (1999)
What the student does: Teaching for enhanced learning.
Higher Education Research & Development 18(1): 57-75.

375
Borstlap W, Stoelinga P, Hoppenreijs T , van't Hof M (2004a)
Stabilisation of sagittal split advancement osteotomies with miniplates: a prospective,
multicentre study with two-year follow-up. Part I- Clinical parameters.
Int J Oral Maxillofac Surg. 33(5):433-41.
Borstlap W, Stoelinga P, Hoppenreijs T, van't Hof M (2004b)
Stabilisation of sagittal split advancement osteotomies with miniplates: a prospective,
multicentre study with two-year follow-up. Part III- Condylar remodelling and
resorption.
Int J Oral Maxillofac Surg. 33(7):649-55.
British Standard Institution (1983)
British Standard Incisor Classification. Glossary of Dental Terms BS 4492.
London: British Standard Institution.
Broderick W, Brahan J, Shevel R (1980)
An instructional management system for NATAL-74.
In Swail, E. and Neal, G. (Eds.) Proceedings of the Third Canadian Symposium on
Instructional Technology.
Vancouver, February 27, Ottawa: National Research Council Canada.
Bruner RF (2001)
Repetition is the First Principle of All Learning.
August 17: Available at SSRN: http://ssrn.com/abstract=224340.
Bumann A , Lotzmann U (2002)
Colour Atlas of Dental Medicine-TMJ Disorders and Orofacial Pain: The Role of
Dentistry in a Multidisciplinary Diagnostic Approach
New York: Thieme Medical Publishers.
Bush FM, Harkins SW, Harrington WG, Price DD (1993)
Analysis of gender effects on pain perception and symptom presentation in
temporomandibular pain.
Pain 53(1):73-80.

376
Campos P, Macedo Sobrinho J, Crusoe-Rebello I, Pena N, Dantas J, Mariz A,
Oliveira C (2008)
Temporomandibular joint disc adhesion without mouth-opening limitation.
J Oral Maxillofac Surg. 66:551-552.
Carbonaro M, King S, Taylor E, Satzinger F, Snart F, Drummond J (2008)
Integration of e-learning technologies in an inter professional health science course.
Med Teach. 30(1):25-33.
Carlson CR, Reid KI, Curran SL, Studts J, Okeson JP, Falace D, Nitz A, Bertrand
PM (1998)
Psychological and physiological parameters of masticatory muscle pain.
Pain 76(3):297-307.
Carlsson GE (1984)
Epidemiological studies of signs and symptoms of temporomandibular joint-pain
dysfunction. A literature review.
Aust Prosthodont Soc Bull. 14:7-12.
Carlsson GE, LeResche L (1995)
Epidemiology of temporomandibular disorders.
In: Sessle BJ, Bryant PS, Dionne RA (eds ) Temporomandibular disorders and related
pain conditions. Progress in pain research and management. Vol.4.
Copenhagen, Denmark: Munksgaard, p221-226.
Castelli WA, Nasjleti CE, Diaz-Perez R, Caffesse RG (1985)
Histopathologic findings in temporomandibular joints of aged individuals.
J Prosthet Dent. 53(3):415-9
Chalmers I (1986)
Electronic publications for updating controlled trial reviews.
Lancet 2(8501):287.
377
Chalmers I, Hetherington J , Newdick M, Mutch L, Grant A, Enkin M, Eleanor
Enkin E, K Dickersin K (1986)
The Oxford database of perinatal trials: Developing a register of published reports of
controlled trials
Oxford, UK: Elsevier Science.
Chalmers I, Enkin M, Keirse M, eds. (1989)
Foreword. In: Effective care in pregnancy and childbirth.
Oxford: Oxford University Press.
Chalmers I (1993)
The Cochrane Collaboration: Preparing, Maintaining, and Disseminating Systematic
Reviews of the Effects of Health Care.
Ann NY Acad Sci. 703: 156 - 63.
Chalmers I, Altman DG (1996)
Systematic reviews.
London: BMJ Publishing Group.
Clark JR, Evans RD (1998)
Functional occlusal relationships in a group of post-orthodontic patients: preliminary
findings.
Eur J Orthod. 20(2):103-10.
Clark JR, Evans RD (2001)
Functional occlusion: I. A review.
J Orthod. 28(1):76-81.
Clark GT, Delcanho RE, Goulet JP (1993)
The utility and validity of current diagnostic procedures for defining
temporomandibular disorder patients.
Adv Dent Res. 7(2):97-112.

378
Clarkson J, Harrison JE, Ismail AI, Needleman I, Worthington H (2003)
Evidence Based Dentistry for Effective Practice.
New York: Martin Dunitz.
Cochrane Collaboration (2010)
http://www.thecochranelibrary.com/view/0/index.html
Accessed on 28/3/2010
Cochrane AL (1979)
1931-1971: A critical review, with particular reference to the medical profession.
In: Medicines for the year 2000.
London: Office of Health Economics, p1-11.
Collison D (2009)
Moodle is ‗WebCT meets Facebook‘
Daily Sundial: September 22, 2009
http://sundial.csun.edu/2009/09/moodl-is-webct-meets-facebook.
Costen JB (1934)
A syndrome of ear and sinus symptoms dependent upon disturbed function of the
temporomandibular joint.
Ann Otol Rhinol Laryngol. 4: 1-15
Cunningham SJ, Moles DR (2009)
A national review of mandibular orthognathic surgery activity in the National Health
Service in England over a nine year period: Part 2--patient factors.
Br J Oral Maxillofac Surg. 47(4):274-8.
Cunningham SJ, Hunt NP, Feinmann C (1995)
Psychological aspects of orthognathic surgery: a review of the literature
Int J Adult Orthodon Orthognath Surg. 10(3):159-72.

379
Cutbirth M, Van Sickels JE, Thrash WJ (1998)
Condylar resorption after bicortical screw fixation of mandibular advancement.
J Oral Maxillofac Surg. 56(2):178-82.
Dahlberg G, Petersson A, Westesson PL, Eriksson L (1995)
Disk displacement and temporomandibular joint symptoms in orthognathic surgery
patients.
Oral Surg Oral Med Oral Pathol Oral Radiol Endod. 79(3):273-7.
Dao TT, LeResche L (2000)
Gender differences in pain.
J Orofac Pain. 14: 169-184.
Dao TT, Lund JP, Lavigne GJ (1994)
Comparison of pain and quality of life in bruxers and patients with myofascial pain of
the masticatory muscles.
J Orofacial Pain 8: 350-353.
Davis CR (1980)
Fundamentals of PLATO programming
Urbana, III:CERL, University of Illinois.
Davies S , Gray R (2001)
Occlusion: The examination and recording of the occlusion: why and how
BDJ 191(6):291-302
De Boever AL, Keeling SD, Hilsenbeck S, Van Sickels JE, Bays RA, Rugh JD
(1996)
Signs of temporomandibular disorders in patients with horizontal mandibular
deficiency.
J Orofac Pain. 10(1):21-7.

380
De Boever JA, Nilner M, Orthlieb JD, Steenks MH (2008)
Recommendations by the EACD for examination, diagnosis, and management of
patients with temporomandibular disorders and orofacial pain by the general dental
practitioner. Educational Committee, Council of the European Academy of
Craniomandibular Disorders.
J Orofac Pain. 22(3):268-78.
De Bont LG, van der Kuijl B, Stegenga B, Vencken LM, Boering G (1993)
Computed tomography in differential diagnosis of temporomandibular joint disorders.
Int J Oral Maxillofac Surg. 22(4):200-9.
De Boom GW, Jensen JL, Siegel W, Bloom C (1985)
Metastatic tumours of the mandibular condyle. Review of the literature and report of a
case.
Oral Surg Oral Med Oral Pathol. 60:512-516
De Clercq C, Abeloos J, Mommaerts M, Neyt L (1995)
Temporomandibular joint symptoms in an orthognathic surgery population
J Craniomaxillofac Surg. 23:195-9.
De Clercq CA, Neyt LF, Mommaerts MY, Abeloos JS (1998)
Orthognathic surgery: patients' subjective findings with focus on the
temporomandibular joint.
J Craniomaxillofac Surg. 26(1):29-34.
De Coster PJ, Van den Berghe LI, Martens LC (2005)
Generalized joint hypermobility and temporomandibular disorders: inherited connective
tissue disease as a model with maximum expression.
J Orofac Pain 19(1):47-57.

381
Deeks J, Higgins JPT, Altman D (2008)
Chapter 9: Analysing data and undertaking meta-analyses.
In: Higgins JPT, Green S (editors). Cochrane Handbook for Systematic Reviews of
Interventions Version 5.0.0 (updated February 2008).
The Cochrane Collaboration: Available from www.cochrane-handbook.org.
Deepwell F (2001)
Learning Technology in their Hands, Interactions, 5, 1
(http://www.warwick.ac.uk/ETS/interactions/vol5no1/index.html)
Deleurant Y, Zimmermann A, Peltomäki T (2008)
Hemimandibular elongation: treatment and long-term follow-up.
Orthod Craniofac Res. 11(3):172-9.
Dervis E, Tuncer E (2002)
Long-term evaluations of temporomandibular disorders in patients undergoing
orthognathic surgery compared with a control group.
Oral Surg Oral Med Oral Pathol Oral Radiol Endod. 94(5):554-60.
Dhanrajani PJ, Jonaidel O (2002)
Trismus: aetiology, differential diagnosis and treatment.
Dent Update. 29(2):88-92.
Dibbets JM, van der Weele LT (1991)
Extraction, orthodontic treatment, and craniomandibular dysfunction.
Am J Orthod Dentofacial Orthop. 99(3):210-9.
Dibbets JM, van der Weele LT (1996)
Signs and symptoms of temporomandibular disorder (TMD) and craniofacial form.
Am J Orthod Dentofacial Orthop. 110(1):73-8.
Dolwick MF, Katzberg RW, Helms CA (1983)
Internal derangements of the temporomandibular joint: fact or fiction?
J Prosthet Dent. 49(3):415-8.

382
Dworkin SF, LeResche L (1992)
Research diagnostic criteria for temporomandibular disorders: review, criteria,
examinations and specifications, critique.
J Craniomandib Disord. 6(4):301-55.
Dworkin SF, LeResche L, DeRouen T, Von Korff M (1990)
Assessing clinical signs of temporomandibular disorders: reliability of clinical
examiners.
J Prosthet Dent. 63(5):574-9.
European Academy of Craniomandibular disorders (EACD)
http://www.eacmd.org
Accessed on 24/10/2009
Eaton KA, Reynolds PA (2008)
Continuing professional development and ICT: target practice.
Br Dent J. 205(2):89-93.
Egermark I, Ronnermann A (1995)
Temporomandibular disorders in the active phase of orthodontic treatment.
J Oral Rehabil. 22(8):613-8.
Egermark I, Blomqvist JE, Cromvik U, Isaksson S (2000)
Temporomandibular dysfunction in patients treated with orthodontics in combination
with orthognathic surgery.
Eur J Orthod. 22(5):537-44.
Egermark I, Magnusson T, Carlsson GE (2003)
A 20-year follow-up of signs and symptoms of temporomandibular disorders and
malocclusions in subjects with and without orthodontic treatment in childhood.
The Angle Orthod. 73(2):109-15.

383
Egermark I, Carlsson GE, Magnusson T (2005)
A prospective long-term study of signs and symptoms of temporomandibular disorders
in patients who received orthodontic treatment in childhood.
The Angle Orthod. 75(4):645-50.
Egger, M., Davey Smith, G., Altman, D G (eds) (2001)
Systematic Reviews in Health Care: meta-analysis in context, 2nd Edition,
London: BMJ.
Egger M, Juni P, Bartlett C, Holenstein F, Sterne J (2003)
How important are comprehensive literature searches and the assessment of trial quality
in systematic reviews? Empirical study.
Health Technol Assess.7: 1-76.
Ellaway R, Dewhurst D, Cumming A (2003)
Managing and supporting medical education with a virtual learning environment: the
Edinburgh Electronic Medical Curriculum.
Med Teach. 25(4):372-80.
Emshoff R, Rudisch A (2001)
Validity of clinical diagnostic criteria for temporomandibular disorders: clinical versus
magnetic resonance imaging diagnosis of temporomandibular joint internal
derangement and osteoarthrosis.
Oral Surg Oral Med Oral Pathol Oral Radiol Endod. 91(1):50-5.
Espeland L, Dowling PA, Mobarak KA, Stenvik A (2008)
Three-year stability of open-bite correction by 1-piece maxillary osteotomy.
Am J Orthod Dentofacial Orthop. 134(1):60-6.
Ewald S (2009)
Moodle moves in
Published: Wednesday, July 29, 2009
http://www.technicianonline.com/features/moodle-moves-in-1.1788039.

384
Farella M, Michelotti A, Bocchino T, Cimino R, Laino A, Steenks MH (2007)
Effects of orthognathic surgery for class III malocclusion on signs and symptoms of
temporomandibular disorders and on pressure pain thresholds of the jaw muscles.
Int J Oral Maxillofac Surg. 36(7):583-7.
Farrar WB (1981)
Myofascial pain dysfunction syndrome.
J Am Dent Assoc. 102:10-1.
Fleiss JL, Gross AJ (1991)
Meta-analysis in epidemio with special reference to studies of the association between
exposure to environmental tobacco smoke and lung cancer: a critique.
J Clin Epidemiol. 44(2):127-39.
Flynn B, Brown D, Lapp T, Bussard D, Roberts W (1990)
Acomparative study of temporomandibular symptoms following mandibular
advancement by bilateral; sagittal split osteotomies: rigid versus non rigid fixation.
Oral Surg Oral Med Oral Pathol. 70(3):372-80.
Fonseca R (2000)
Oral & Maxillofacial Surgery; Temporomandibular Disorders, vol. 4, 1st edition.
Philadelphia: W.B. Saunders Company
Fordis M, King JE, Ballantyne CM, Jones PH, Schneider KH, Spann SJ,
Greenberg SB, Greisinger AJ (2005)
Comparison of the instructional efficacy of Internet-based CME with live interactive
CME workshops: a randomized controlled trial.
J Am Med Assoc. 294(9):1043-51.
Forssell H, Finne K, Forssell K, Panula K, Blinnikka LM (1998)
Expectations and perceptions regarding treatment: a prospective study of patients
undergoing orthognathic surgery.
Int J Adult Orthodon Orthognath Surg. 13(2):107-13.

385
Fricton JR, Schiffman EL(1986)
Reliability of a craniomandibular index.
J Dent Res. 65(11):1359-64.
Fricton JR , Schiffman EL (1987)
The craniomandibular index: validity.
J Prosthet Dent 58:222-228.
Friction JR, Schiffman EL (1995)
Epidemiology of temporomandibular disorders. In: Friction JR, Dubner R, eds.
Orofacial pain and temporomandibular disorders.
New York: Raven Press, p1–14.
Funakoshi M, Fujita N, Takehana S (1976)
Relations between occlusal interference and jaw muscle activities in response to
changes in head position.
J Dent Res. 55(4):684-90.
Gaggl A, Schultes G, Santler G, Kärcher H, Simbrunner J (1999)
Clinical and magnetic resonance findings in the temporomandibular joints of patients
before and after orthognathic surgery.
Br J Oral Maxillofac Surg. 37(1):41-5.
Gallagher C, Gallagher V, Whelton H, Cronin M (2004)
The normal range of mouth opening in an Irish population
J Oral Rehabil. 31(2):110-116
Gallagher RM, Marbach JJ, Raphael KG, Dohrenwend BP, Cloitre M (1991)
Is major depression comorbid with temporomandibular pain and dysfunction syndrome?
A pilot study.
Clin J Pain. 7(3):219-25.

386
Gatchel RJ, Garofalo JP, Ellis E, Holt C (1996)
Major psychological disorders in acute and chronic TMD: an initial examination.
J Am Dent Assoc. 127(9):1365-70, 1372, 1374.
Gesch D, Bernhardt O, Kirbschus A (2004)
Association of malocclusion and functional occlusion with temporomandibular
disorders (TMD) in adults: a systematic review of population-based studies.
Quintessence Int. 35(3):211-21.
Giannakopoulos N, Rammelsberg P, Schmitter M (2007)
0262 Quality-Assessment of TMD prevalence studies of the last 60 years
11:30 am-1:30 pm, Friday, September 28, 2007 Ioannis Vellidis Congress Centre Hall "
http://iadr.confex.com/iadr/israel07/techprogram/abstract_96129.htm
Glaros AG, Glass EG, Williams KB (1998)
Clinical examination findings of temporomandibular disorder patients: a factor analytic
study.
J Orofac Pain. 12(3):193-202.
Glass GV (1976)
Primary, secondary and meta-analysis of research
Educ Res. 5(9):3-8.
Gelb H (1977)
Effective Management and Treatment of the Craniomandibular Syndrome. In H. Gelb
(Ed.) Clinical Management of Head, Neck, and TMJ Dysfumction.
Philadelphia: W.B Saunders Co.
Goldberg MW (1997)
―CALOS: First Results from an Experiment in Computer-Aided Learning for Operating
Systems,‖
SIGCSE Bulletin 29(1):48-52.

387
Goldstein DF, Kraus SL, Williams WB, Glasheen-Wray M (1984)
Influence of cervical posture on mandibular movement.
J Prosthet Dent. 52(3):421-6.
Gonzalez HE, Manns A (1996)
Forward head posture: its structural and functional influence on the stomatognathic
system, a conceptual study.
Cranio. 14(1):71-80.
Grant A, Chalmers I (1981)
Register of randomised controlled trials in perinatal medicine.
Lancet 1(8211):100.
Gray RJ, Davies SJ, Quayle AA (1994a)
A clinical approach to temporomandibular disorders. 1. Classification and functional
anatomy.
Br Dent J. 176:429-435.
Gray RJ, Davies SJ, Quayle AA (1994b)
A clinical approach to temporomandibular disorders.. 2. Examination of the articulatory
system: the temporomandibular joints.
Br Dent J. 176:473-477.
Greenhalgh T (1997)
How to read a paper: Papers that summarise other papers (systematic reviews and meta-
analyses)
Br Med J. 315:672-675
Greene CS, Laskin DM (1988)
Long-term status of TMJ clicking in patients with myofascial pain and dysfunction.
J Am Dent Assoc. 117(5):461-5.

388
Hackney FL, Van Sickels JE, Nummikoski PV (1989)
Condylar displacement and temporomandibular joint dysfunction following bilateral
sagittal split osteotomy and rigid fixation.
J Oral Maxillofac Surg. 47(3):223-7.
Hagberg C, Hagberg M, Kopp S (1994)
Musculoskeletal symptoms and psychosocial factors among patients with
craniomandibular disorders.
Acta Odontol Scand. 52(3):170-7.
Harris M, Feinmann C, Wise M, Treasure F (1993)
Temporomandibular joint and orofacial pain: clinical and medicolegal management
problems.
Br Dent J. 174(4):129-36.
Hedenberg-Magnusson B, Ernberg M, Kopp S (1999)
Presence of orofacial pain and temporomandibular disorder in fibromyalgia. A study by
questionnaire.
Swed Dent J. 23(5-6):185-92.
Heffez L, Blaustein D, Eds (1990)
Pathologic anatomy of internal derangements.
In: Heffez L, Blaustein D, Arthroscopic atlas of the temporomandibular joint.
Philadelphia: Lea & Febiger.
Helenius LM, Tervahartiala P, Helenius I, Al-Sukhun J, Kivisaari L, Suuronen R,
Kautiainen H, Hallikainen D, Lindqvist C, Leirisalo-Repo M (2006)
Clinical, radiographic and MRI findings of the temporomandibular joint in patients with
different rheumatic diseases. Oral complications in patients with rheumatoid arthritis
Int J Oral Maxillofac Surg. 35(11):983-9.

389
Helfer DS (2005)
E-Learning Service Leaders Blackboard and WebCT Merge.
Information Today Inc. http://www.informationtoday.com.
Accessed 26/9/2009: http://www.infotoday.com /newsbreaks/nb051017-2.shtml.
Helkimo M (1974)
Studies on function and dysfunction of the masticatory system. II. Index for anamnestic
and clinical dysfunction and occlusal state.
Acta Odontol Scand. 32(4):255-67.
Helkimo M (1976)
Epidemiological surveys of dysfunction of the masticatory system.
Oral Sci Rev. 7:54-69.
Henrikson T, Nilner M (2003)
Temporomandibular disorders, occlusion and orthodontic treatment.
J Orthod. 30(2):129-37.
Herbosa EG, Rotskoff KS, Ramos BF, Ambrookian HS (1990)
Condylar position in superior maxillary repositioning and its effect on the
temporomandibular joint.
J Oral Maxillofac Surg. 48(7):690-6.
Herken H, Erdal E, Mutlu N, Barlas O, Cataloluk O, Oz F, Güray E (2001)
Possible association of temporomandibular joint pain and dysfunction with a
polymorphism in the serotonin transporter gene.
Am J Orthod Dentofacial Orthop. 120(3):308-13.
Higgins JPT and Green S (2009)
Cochrane Handbook for Systematic Reviews of Interventions Version 5.0.0
The Cochrane Collaboration, 2009. Available from www.cochrane-handbook.org.
Accessed on 28/10/2009.

390
Higgins JP, Thompson SG, Deeks JJ, Altman DG (2003)
Measuring inconsistency in meta-analyses
Br Med J. 327:557-560.
Hirata RH, Heft MW, Hernandez B, King GJ (1992)
Longitudinal study of signs of temporomandibular disorders (TMD) in orthodontically
treated and nontreated groups.
Am J Orthod Dentofacial Orthop. 101(1):35-40.
Hoppenreijs TJ, Freihofer HP, Stoelinga PJ, Tuinzing DB, van't Hof MA (1998)
Condylar remodelling and resorption after Le Fort I and bimaxillary osteotomies in
patients with anterior open bite. A clinical and radiological study.
Int J Oral Maxillofac Surg. 27(2):81-91.
Hu J, Wang D, Zou S (2000)Effects of mandibular setback on the temporomandibular
joint: a comparison of oblique and sagittal split ramus osteotomy.
J Oral Maxillofac Surg. 58(4):375-80.
Huque MF (1988)
Experiences with meta-analysis in NDA submissions.
Proceedings of the Biopharmaceutical Section of the American Statistical Association
2: 28-33.
Hwang S, Haers P, Sailer H (2000)
The role of a posteriorly inclined condylar neck in condylar resorption after orthognatic
surgery.
J Craniomaxillofac Surg. 28:85-90.
Hwang S, Haers P, Seifert B, Sailer H (2004)
Non-surgical risk factors for condylar resorption after orthognathic surgery.
J Craniomaxillofac Surg. 32(2):103-11.

391
Ingervall B, Mohlin B, Thilander B (1980)
Prevalence of symptoms of functional disturbances of the masticatory system in
Swedish men.
J Oral Rehabil.7(3):185-97.
Ireland A, Smith A, Alder DM, Sandy JR, Chadwick SM (2005)
Current Products and Practice: Building a learning community on-line: the first step
towards a national virtual learning environment in orthodontics
J Orthod. 32(3): 214-219.
Irving J, Wood GD, Hackett AF (1999)
Does temporomandibular disorder pain dysfunction syndrome affect dietary intake?
Dent Update. 26(9):405-7.
Isberg A (2001)
Temporomandibular joint dysfunction: a practitioner's guide 1 edition.
London:Martin Dunitz Publishers
Jacobson D, Kremer R (2000)
Online Testing and Grading Using WebCT in Computer Science.
Proceedings of the WebNet World Conference on the WWW and Internet (Webnet
2000). Association for the Advancement of Computing in Education, San Antonio,
Texas, October 20 - November 4, 2000.
Jaspers JP, Heuvel F, Stegenga B, de Bont LG (1993)
Strategies for coping with pain and psychological distress associated with
temporomandibular joint osteoarthrosis and internal derangement.
Clin J Pain. 9(2):94-103.
Joint Information System Committee (JISC) (2008)
Accessed 12/12/2008:http://www.jiscinfonet.ac.uk/InfoKits/effective-use-of-
VLEs/intro-to-VLEs/introtovleintro.

392
John MT, Dworkin SF, Mancl LA (2005)
Reliability of clinical temporomandibular disorder diagnoses.
Pain 118(1-2):61-9.
Johnson DR, Moore WJ (1997)
Anatomy for Dental Students Third Edition.
Oxford, New York, Toronto: Oxford University Press.
Jüni P, Witschi A, Bloch R, Egger M (1999)
The hazards of scoring the quality of clinical trials for meta-analysis.
J Am Med Assoc. 282:1054-60.
Jyväsjärvi S, Joukamaa M, Väisänen E, Larivaara P, Kivelä S, Keinänen-
Kiukaanniemi S. (2001)
Somatizing frequent attenders in primary health care.
J Psychosom Res. 50(4):185-92.
Kaplan A (1991)
Natural history of internal derangement of the temporomandibular joint.
In: Thomas M, Bronstein S, editors. Arthroscopy of the temporomandibular joint.
Philadelphia: WB Saunders, p. 70-4.
Kallela I, Laine P, Suuronen R, Lindqvist C, Iizuka T (2005)
Assessment of material- and technique-related complications following sagittal split
osteotomies stabilized by biodegradable polylactide screws.
Oral Surg Oral Med Oral Pathol Oral Radiol Endod. 99(1):4-10.
Karabouta I, Martis C (1985)
The TMJ dysfunction syndrome before and after sagittal split osteotomy of the rami.
J Maxillofac Surg. 13(4):185-8.

393
Karlsson H, Joukamaa M, Lahti I, Lehtinen V, Kokki-Saarinen T (1997)
Frequent attender profiles: Different clinical subgroups among frequent attender
patients in primary care
J Psychosom Res. 42(2):157-166.
Katon W, Lin E, Von Korff M, Russo J, Lipscomb P, Bush T (1991)
Somatization: a spectrum of severity.
Am J Psychiatry. 148(1):34-40.
Kazanjian VH (1938)
Ankylosis of the temporomandibular joint.
Am J Orthod. 24:1181.
Keeling SD, Garvan CW, King GJ, Wheeler TT, McGorray S (1995)
Temporomandibular disorders after early Class II treatment with bionators and
headgears: results from a randomized controlled trial.
Semin Orthod. 1(3):149-64.
Kay EJ, Silkstone B, Worthington HV (2001)
Evaluation of computer aided learning in developing clinical decision-making skills.
Br Dent J. 190(10):554-7.
Kerscher A, Piette E, Tideman H, Wu PC (1993)
Osteochondroma of the coronoid process of the mandible - Report of a case and review
of literature.
Oral Surg Oral Med Oral Pathol. 75: 559-564.
Kerstens HC, Tuinzing DB, van der Kwast WA (1989)
Temporomandibular joint symptoms in orthognathic surgery.
J Craniomaxillofac Surg. 17(5):215-8.
Kessler A, Potsic WP, Marsh RR (1994)
Type 1 tympanoplasty in children.
Arch Otolaryngol Head Neck Surg. 120(5):487-90.

394
Kight M, Gatchel RJ, Wesley L (1999)
Temporomandibular disorders: evidence for significant overlap with psychopathology.
Health Psychol.18(2):177-82.
Kings College London (2002)
Observatory on Borderless Higher Education.
Review of information and communication technology for learning and teaching at
King's College, London. Online Learning.
Institutional Review. London: King's College London.
Kopp S, Rockler, B (1979)
Relationship between clinical and radiographic findings in patients with mandibular
pain or dysfunction.
Acta Radiol Diagn (Stockh). 20(3):465-77.
Korszun A, Hinderstein B, Wong M (1996)
Comorbidity of depression with chronic facial pain and temporomandibular disorders.
Oral Surg Oral Med Oral Pathol Oral Radiol Endod. Nov; 82(5):496-500.
Kremenak CR, Kinser DD, Harman HA, Menard CC, Jakobsen JR (1992a )
Orthodontic risk factors for temporomandibular disorders TMD. I: Premolar extractions.
Am J Orthod Dentofacial Orthop. 101(1):13-20.
Kremenak CR, Kinser DD, Melcher TJ, Wright GR, Harrison SD, Ziaja RR,
Harman HA, Ordahl JN, Demro JG, Menard CC (1992b)
Orthodontics as a risk factor for temporomandibular disorders (TMD). II.
Am J Orthod Dentofacial Orthop. 101(1):21-7.
Kuttila M, Niemi PM, Kuttila S, Alanen P, Le Bell Y (1998)
TMD treatment need in relation to age, gender, stress, and diagnostic subgroup.
Fluctuation of treatment need for temporomandibular disorders and age, gender, stress,
and diagnostic subgroup.
J Orofac Pain. 12(1):67-74.

395
Kyriakidou M (1999)
Electronic-conferencing: Promoting a collaborative community with learning
opportunities for developing teachers.
In British Educational Research Association Annual Conference
University of Sussex at Brighton.
Lai W, Yamada K, Hanada K, Ali IM, Takagi R, Kobayashi T, Hayashi T (2002)
Postoperative mandibular stability after orthognathic surgery in patients with
mandibular protrusion and mandibular deviation.
Int J Adult Orthodon Orthognath Surg. 17(1):13-22.
Landes CA (2004)
Proximal segment positioning in bilateral sagittal split osteotomy: intraoperative
dynamic positioning and monitoring by sonography.
J Oral Maxillofac Surg. 62(1):22-8.
Landis JR, Koch GG (1977)
The measurement of observer agreement for categorical data.
Biometrics 33:159-174.
Lanlua P, Decorti F, Gangula PR, Chung K, Taglialatela G, Yallampalli C (2001)
Female steroid hormones modulate receptors for nerve growth factor in rat dorsal root
ganglia.
Biol. Reprod. 64: 331-338.
Larheim TA, Smith HJ, Aspestrand F (1990)
Rheumatic disease of the temporomandibular joint: MR imaging and tomographic
manifestations.
Radiology 175(2):527-31.
Larsson E, Ronnerman A (1981)
Mandibular dysfunction symptoms in orthodontically treated patients ten years after the
completion of treatment.
Eur J Orthod. 3(2):89-94

396
Larvin M (2009)
E-learning in surgical education and training.
Aust NZ J Surg. 79(3):133-7.
Larvin M, Haine L, Kamal T (2006)
What trainees want from a distance learning programme
Bulletin of The Royal College of Surgeons of England 88(7):230-231.
Larvin M, Masih J (2002)
STEP: what we have learnt about BSTs as online learners.
Ann. R. Coll. Surg. Engl. 84 (Suppl.): 318–21.
Laskin D, Greenfield W, Gale E (1983)
The president's conference on the examination, diagnosis and management of
temporomandibular disorders.
Chicago, American Dental Association.
Laskin DM (1994)
Etiology and pathogenesis of internal derangements of the temporomandibular joint.
Oral Maxillofac Surg Clin North Am. 6:217-22.
Le Bell Y, Lehtinen R, Peltomäki T, Peltola J (1993)
Function of masticatory system after surgical-orthodontic correction of
maxillomandibular discrepancies.
Proc Finn Dent Soc. 89(3-4):101-7
Lee S, McGrath C, Samman N (2008)
Impact of orthognathic surgery on quality of life.
J Oral Maxillofac Surg. 66(6):1194-9
LeResche L (1997a)
Epidemiology of temporomandibular disorders: implications for the investigation for
etiologic factors.
Crit Rev Oral Biol Med 8: 291-305.

397
LeResche L, Saunders K, Von Korff MR, Barlow W & Dworkin SF (1997b)
Use of exogenous hormones and risk of temporomandibular disorder pain.
Pain 69: 153-60.
LeResche L, Mancl L, Sherman JJ, Gandara B, Dworkin SF (2003)
Changes in temporomandibular pain and other symptoms across the menstrual cycle.
Pain, 106:253-261.
Levine M, Walter S, Lee H, Haines T, Holbrook A, Moyer V (1994)
Users' guides to the medical literature. IV. How to use an article about harm. Evidence-
Based Medicine Working Group.
J Am Med Assoc. 271(20):1615-9.
Link JJ, Nickerson JW (1992)
Temporomandibular joint internal derangements in an orthognathic surgery population.
Int J Adult Orthodon Orthognath Surg. 7(3):161-9.
Lima S , Júnior S, Maliska M, Dimitroulis G, Modolo F ,Nazareno D, Gil J (2009)
Painful deviation of the mandible.
Oral Surg Oral Med Oral Pathol Oral Radiol Endol. 107(6):749-53
Lipowski ZJ (1988)
Somatization: the concept and its clinical application.
Am J Psychiatry 145: 1358-1368.
Little SQ, Showfety KJ, Moshiri F, Jackson R, Moshiri F (1986)
Posttreatment evaluation of temporomandibular joint dysfunction after orthodontics and
maxillary surgical impaction.
Int J Adult Orthodon Orthognath Surg. 1(3):225-30.
Lipton JA, Ship JA, Larach-Robinson D (1993)
Estimated prevalence and distribution of reported orofacial pain in the United States.
J Am Dent Assoc. 124(10):115-21.
398
Liu Jk, Tsai MY (1998)
Association of functional malocclusion with temporomandibular disorders in
orthodontic patients prior to treatment.
Funct Orthod. 15(3):17-20.
Lobbezoo-Scholte AM, Lobbezoo F, Steenks MH, De Leeuw JR, Bosman F (1995)
Diagnostic subgroups of craniomandibular disorders. Part II: Symptom profiles.
J Orofac Pain. 9(1):37-43.
Lobbezoo F, Lavigne GJ (1997)
Do bruxism and temporomandibular disorders have a cause-and-effect relationship?
J Orofac Pain. 11(1):15-23.
Locker D, Slade G (1988)
Prevalence of symptoms associated with temporomandibular disorders in a Canadian
population.
Community Dent Oral Epidemiol. 16(5):310-3.
Luecke PE, Johnston LE (1992)
The effect of maxillary first premolar extraction and incisor retraction on mandibular
positions: testing the central dogma of ‗functional orthodontics‘.
Am J Orthod Dentofac Orthop. 101: 4-12.
Luther F (1998a)
Orthodontics and the temporomandibular joint: where are we now? Part I. Orthodontic
treatment and temporomandibular disorders.
The Angle Orthod. 68(4):295-304.
Luther F (1998b)
Orthodontics and the temporomandibular joint: where are we now? Part 2. Functional
occlusion, malocclusion, and TMD.
The Angle Orthod. 68(4):305-18.

399
Luyk NH, Steinberg B (1990)
Aetiology and diagnosis of clinically evident jaw trismus.
Aust Dent J. 35:523-9.
Mackie A, Lyons K (2008)
The role of occlusion in temporomandibular disorders- a review of the literature.
N Z Dent J. 104(2):54-9
Madland G, Feinmann C, Newman S (2000)
Factors associated with anxiety and depression in facial arthromyalgia
Pain 84(2-3):225-32.
Magnusson T, Enbom L (1984)
Signs and symptoms of mandibular dysfunction after introduction of experimental
balancing-side interferences.
Acta Odontol Scand. 42(3):129-35.
Magnusson T, Egermark-Eriksson I, Carlsson GE (1985)
Four-year longitudinal study of mandibular dysfunction in children.
Community Dent Oral Epidemiol. 13(2):117-20.
Magnusson T, Ahlborg G, Finne K, Nethander G, Svartz K (1986)
Changes in temporomandibular joint pain-dysfunction after surgical correction of
dentofacial anomalies.
Int J Oral Maxillofac Surg. 15(6):707-14.
Magnusson T, Ahlborg G, Svartz K (1990)
Function of the masticatory system in 20 patients with mandibular hypo- or hyperplasia
after correction by a sagittal split osteotomy.
Int J Oral Maxillofac Surg. 19(5):289-93.

400
Magnusson T, Carlsson GE, Egermark I (1993)
Changes in subjective symptoms of craniomandibular disorders in children and
adolescents during a 10-year period.
J Orofac Pain 7(1):76-82.
Magnusson T, Egermark I, Carlsson GE (2000)
A longitudinal epidemiologic study of signs and symptoms of temporomandibular
disorders from 15 to 35 years of age.
J Orofac Pain 14(4):310-9.
Marbach JJ (1995)
Is there a myofascial, temporomandibular disorder personality?
J Mass Dent Soc. 44(1):12-5, 36-7.
Mayo KH, Vig KD, Vig PS, Kowalski CJ (1991)
Attitude variables of dentofacial deformity patients: demographic characteristics and
associations.
J Oral Maxillofac Surg. 49(6):594-602.
McAdam D B (1976)
Tooth loading and cuspal guidance in canine and group-function occlusions.
J Pros Dent. 35: 283-90.
McCarty DJ (1980)
American rheumatology--the future of our guild. Antidisestablishmentarianism.
Arthritis Rheum. 23(9):969-76.
McCreary CP, Clark GT, Merril RL, Flack V, Oakley ME (1991)
Psychological distress and diagnostic subgroups of temporomandibular disorder
patients.
Pain 44(1):29-34.

401
McEwen BS, Alves SE (1999)
Estrogen actions in the central nervous system.
Endocr. Rev. 20: 279-307
McGregor NR, Butt HL, Zerbes M, Klineberg IJ, Dunstan RH, Roberts TK (1996)
Assessment of pain (distribution and onset), Symptoms, SCL-90-R Inventory responses,
and the association with infectious events in patients with chronic orofacial pain.
Orofac Pain. 10(4):339-50.
McNamara JA Jr (1997)
Orthodontic treatment and temporomandibular disorders.
Oral Surg Oral Med Oral Pathol Oral Radiol Endod. 83(1):107-17.
McNamara JA Jr, Seligman DA, Okeson JP (1995)
Occlusion, Orthodontic treatment, and temporomandibular disorders: a review.
J Orofac Pain. 9(1):73-90.
McNeill C (1993)
Temporomandibular disorders. Guidelines for classification, assessment, and
management.
Chicago: Quintessence Publishing Co.
McNeill C (1997)
Management of temporomandibular disorders: concept and controversies.
J Prosth Dent. 77: 510-522.
Mechanic D (1992)
Managed care for the seriously mentally ill.
Am J Public Health. 82(6):788-9.

402
Melchiorre D, Calderazzi A, Maddali Bongi S, Cristofani R, Bazzichi L, Eligi C,
Maresca M, Ciompi M (2003)
A comparison of ultrasonography and magnetic resonance imaging in the evaluation of
temporomandibular joint involvement in rheumatoid arthritis and psoriatic arthritis.
Rheumatol. 42(5):673-6.
Mew JR (1997)
The aetiology of temporomandibular disorders: a philosophical overview.
Eur J Orthod. 19(3):249-58.
Milligan C (1999)
Virtual learning environments in the online delivery of staff development. Report 2:
Delivering staff and professional development using Virtual Learning Environments.
JISC Technology Application Programme.
Accessed on 13/7/2008: http://www.jisc.ac.uk/uploaded_documents/jtap-044.doc.
Milosevic A, Samuels RH (2000)
The post-orthodontic prevalence of temporomandibular disorder and functional
occlusion contacts in surgical and non-surgical cases.
J Oral Rehabil. 27(2):142-9.
Mock D (1999)
The differential diagnosis of temporomandibular disorders.
J Orofac Pain. 13(4):246-50.
Moher D, Cook D, Jadad A, Tugwell P, Moher M, Jones A, Pham B, Klassen T
(1999)
Assessing the quality of reports of randomised trials: implications for the conduct of
meta-analyses.
Health Technol Assess. 3(12):1-98.

403
Moher D, Jadad AR, Nichol G, Penman M, Tugwell P, Walsh S (1995)
Assessing the quality of randomized controlled trials: an annotated bibliography of
scales and checklists.
Control Clin Trials. 16(1):62-73.
Moja L, Telaro E, D'Amico R, Moschetti I, Coe L, Liberati A (2005)
Assessment of methodological quality of primary studies by systematic reviews: results
of the metaquality cross sectional study.
Br Med J. 330(7499):1053.
Mohl ND, Zarb GA, Carlsson GE, Rugh JD (1988)
Textbook of occlusion.
Chicago: Quintessence Publishing Co, p 249-261.
Mohlin B, Thilander B (1984)
The importance of the relationship between malocclusion and mandibular dysfunction
and some clinical applications in adults.
Eur J Orthod. 6(3):192-204.
Mohlin B, al-Saadi E, Andrup L, Ekblom K (2002)
Orthodontics in 12-year old children. Demand, treatment motivating factors and
treatment decisions.
Swed Dent J. 26(2):89-98.
Mohlin B, Ingervall B, Thilander B (1980)
Relation between malocclusion and mandibular dysfunction in Swedish men.
Eur J Orthod. 2(4):229-38.
Mohlin B, Thilander B (1984)
The importance of the relationship between malocclusion and mandibular dysfunction
and some clinical applications in adults.
Eur J Orthod. 6(3):192-204.

404
Mohlin BO, Derweduwen K, Pilley R, Kingdon A, Shaw WC, Kenealy P (2004)
Malocclusion and temporomandibular disorder: a comparison of adolescents with
moderate to severe dysfunction with those without signs and symptoms of
temporomandibular disorder and their further development to 30 years of age
The Angle Orthod. 74(3):319-27.
Molina OF, dos Santos J Jr, Nelson SJ, Grossman E (1997)
Prevalence of modalities of headaches and bruxism among patients with
craniomandibular disorder.
Cranio. 15(4):314-25.
Motamedi MH (1996)
Treatment of condylar hyperplasia of the mandible using unilateral ramus osteotomies.
J Oral Maxillofac Surg. 54(10):1161-9.
Motegi E, Miyazaki H, Ogura I, Konishi H, Sebata M (1992)
An orthodontic study of temporomandibular joint disorders. Part 1: Epidemiological
research in Japanese 6-18 year olds.
The Angle Orthod. 62(4):249-56.
Moss ML (1975)
A functional cranial analysis of centric relation.
Dent Clin North Am. 19(3):431-42
Mulgrew B, Drage K, Gardiner P, Ireland T, Sandy JR (2009)
An evaluation of the effects of a web-based modular teaching programme, housed
within a virtual learning environment on orthodontic training for specialist registrars.
J Orthod. 36(3):167-76.

405
Müller L, Kellenberger CJ, Cannizzaro E, Ettlin D, Schraner T, Bolt IB,
Peltomäki T, Saurenmann RK (2009)
Early diagnosis of temporomandibular joint involvement in juvenile idiopathic arthritis:
a pilot study comparing clinical examination and ultrasound to magnetic resonance
imaging.
Rheumatol. 48(6):680-5
Murray H, Locker D, Mock D, Tenenbaum HC (1996)
Pain and the quality of life in patients referred to a craniofacial pain unit.
J Orofac Pain. 10(4):316-23.
Musgrove P (2001)
Evaluating the performance of the health systems
Rev Assoc Med Bras. 47(3):193-4.
Mutlu N, Erdal ME, Herken H, Oz G, Bayazit YA (2004)
T102C polymorphism of the 5-HT2A receptor gene may be associated with
temporomandibular dysfunction.
Oral Dis.10(6):349-52.
Muwahid R A (2006)
Temporomandibular joint dysfunction in orthognathic surgery patients.
M.Sc. University College London
Nagao M (1919)
Comparative studies on the curve of Spee in mammals, with a discussion of its relation
to the form of the fossa mandibularis.
J Dent Res. 1:159-202.
Niemiec RP, Walberg HJ (1987)
Comparative effects of computer-assisted instruction: A synthesis of reviews.
J Educ Computing Res. 3:19-37.

406
Nemeth D, Rodrigues-Garcia R, Sakai S, Hatch J, Van Sickels J, Bays R, Clark G,
Rugh J (2000)
Bilateral sagittal split osteotomy and temporomandibular disorders: rigid fixation versus
wire fixation.
Oral Surg Oral Med Oral Pathol Oral Radiol Endod. 89(1):29-34.
Nilsson IM, List T, Drangsholt M (2005)
Prevalence of temporomandibular pain and subsequent dental treatment in Swedish
adolescents.
J Orofac Pain. 19(2):144-50.
Noyes R, Jr., Holt CS & Kathol RG (1995)
Somatization. Diagnosis and management.
Arch Fam Med 4(9):790-795.
Nurminen L, Pietilla T, Vinkka-Puhakka H (1999)
Motivation for and satisfaction with orthodontic surgical treatment, a retrospective
study of 28 patients.
Eur J Orthod. 21(1):79-87.
Office for National Statistics (2008)
Source: Annual Local Area Labour Force Survey, Office for National Statistics.
Accessed on 15/4/2008: http://www.statistics.gov.uk/CCI/nugget.asp?ID=764&
Pos=&ColRank=2&Rank=896.
Okeson JP (1996)
Orofacial pain: guidelines for assessment, diagnosis and management.
Chigaco: Quintessence Publishing Co.
Olivo SA, Bravo J, Magee DJ, Thie NM, Major PW, Flores-Mir C (2006)
The association between head and cervical posture and temporomandibular disorders: a
systematic review.
J Orofac Pain. 20(1):9-23.

407
Olkinuora M (1972)
A psychosomatic study of bruxism with emphasis on mental strain and familiar
predisposition factors.
Proc Finn Dent Soc. 68(3):110-23.
Olsson M, Lindqvist B (1995)
Mandibular function before and after orthodontic treatment.
Eur J Orthod. 17(3):205-14.
Onizawa K, Schmelzeisen R, Vogt S (1995)
Alteration of temporomandibular joint symptoms after orthognathic surgery:
comparison with healthy volunteers.
J Oral Maxillofac Surg. 53(2):117-21.
O’Rourke K, Detsky AS (1989)
Meta-analysis in medical research: strong encouragement for higher quality in
individual research efforts.
J Clin Epidemiol. 42(10):1021-4.
Pahkala R, Heino J (2004)
Effects of sagittal split ramus osteotomy on temporomandibular disorders in seventy-
two patients.
Acta Odontol Scand. 62(4):238-44.
Pallegama RW, Ranasinghe AW, Weerasinghe VS, Sitheeque MA (2005)
Anxiety and personality traits in patients with muscle related temporomandibular
disorders.
J Oral Rehabil. 32(10):701-7.
Panula K, Somppi M, Finne K, Oikarinen K (2000)
Effects of orthognathic surgery on temporomandibular joint dysfunction. A controlled
prospective 4-year follow-up study.
Int J Oral Maxillofac Surg. 29(3):183-7.

408
Pirttiniemi P, Peltomäki T, Müller L, Luder HU (2009)
Abnormal mandibular growth and the condylar cartilage.
Eur J Orthod. 31(1):1-11.
Petrie A, Watson P (2006)
Statistics for Veterinary and Animal Science, 2nd Edition.
Cambridge: Blackwell Publishing
Pankhurst CL (1997)
Controversies in the aetiology of temporomandibular disorders. Part 1.
Temporomandibular disorders: all in the mind?
Prim Dent Care. 4(1):25-30.
Perrini F, Tallents RH, Katzberg RW, Ribeiro RF, Kyrkanides S, Moss ME (1997)
Generalized joint laxity and temporomandibular disorders.
J Orofac Pain. 11(3):215-21.
Perry H (1991)
Above All Else, Do No Harm.
J Craniomandib Disord. 5(2):8.
Pilley JR, Mohlin B, Shaw WC, Kingdon A (1997)
A survey of craniomandibular disorders in 500 19-year-olds.
Eur J Orthod. 19(1):57-70.
Placko G, Bellot-Samson V, Brunet S, Guyot L, Richard O, Cheynet F, Chossegros
C, Ouaknine M (2005)
Normal mouth opening in the adult French population (translated on-line)
Rev Stomatol Chir Maxillofac. 106(5):267-71.
409
Plesh O, Wolfe F, Lane N (1996)
The relationship between fibromyalgia and temporomandibular disorders: prevalence
and symptom severity.
J Rheumatol. 23(11):1948-52.
Price DD (1988)
Psychological and Neural Mechanisms of Pain.
New York: Raven Press.
Proffit (2000)
Contemporary Orthodontics, Third Edition
St Louis: Mosby, p16.
Proffit WR, Fields HW Jr, Moray LJ (1998)
Prevalence of malocclusion and orthodontic treatment need in the United States:
Estimates from the NHANES III survey.
Int J Adult Orthod Orthognath Surg. 13(2): 97–106.
Pullinger AG, Seligman DA (1991)
Overbite and overjet characteristics of refined diagnostic groups of temporomandibular
disorder patients.
Am J Orthod Dentofacial Orthop. 100(5):401-15.
Pullinger AG, Seligman DA, Solberg WK (1988)
Temporomandibular disorders. Part II: Occlusal factors associated with
temporomandibular joint tenderness and dysfunction.
J Prosthet Dent. 59(3):363-7.
Raphael KG, Marbach JJ, Klausner J (2000)
Myofascial face pain. Clinical characteristics of those with regional vs. widespread
pain.
J Am Dent Assoc. 131: 161-171.

410
Raveh J, Vuillemin T, Lädrach K, Sutter F (1988)
New techniques for reproduction of the condyle relation and reduction of complications
after sagittal ramus split osteotomy of the mandible.
J Oral Maxillofac Surg. 46(9):751-7.
Reid KI, Gracely RH, Dubner RA (1994)
The influence of time, facial side, and location on pain-pressure thresholds in chronic
myogenous temporomandibular disorder.
J Orofac Pain. 8(3):258-65.
Rendell JK, Norton LA, Gay T (1992)
Orthodontic treatment and temporomandibular joint disorders.
Am J Orthod Dentofacial Orthop. 101(1):84-7.
Reynders RM (1990)
Orthodontics and temporomandibular disorders: a review of the literature (1966-1988)
Am J Orthod Dentofacial Orthop. 97(6):463-71.
Ricketts RM (1966)
Clinical implications of the temporomandibular joint.
Am J Orthod. 52(6):416-39.
Rinchuse DJ, Rinchuse DJ, Kandasamy S (2005)
Evidence-based versus experience-based views on occlusion and TMD.
Am J Orthod Dentofacial Orthop. 127(2):249-54.
Rinchuse DJ, Sassouni V (1983)
An evaluation of eccentric occlusal contacts in orthodontically treated subjects.
Am J Orthod. 82(3):251-6.
Riolo ML, Brandt D, TenHave TR (1987).
Associations between occlusal characteristics and signs and symptoms of TMJ
dysfunction in children and young adults.
Am J Orthod Dentofacial Orthop. 92(6):467-77.

411
Rohlin M, Westesson PL, Eriksson L (1985)
The corrolation of temporomandibular joint sounds with joint morphology in fifty-five
autopsy specimens.
J Oral Maxillofac Surg. 43(3):194-200.
Rivera-Morales WC, Goldman BM, Jackson RS (1996)
Simplified technique to measure mandibular range of motion.
J Prosthet Dent. 75(1):56-9.
Rodrigues-Garcia RC, Sakai S, Rugh JD, Hatch JP, Tiner BD, van Sickels JE,
Clark GM, Nemeth DZ, Bays RA (1998)
Effects of major Class II occlusal corrections on temporomandibular signs and
symptoms.
J Orofac Pain. 12(3):185-92.
Rollman GB, Gillespie JM (2000)
The role of psychosocial factors in temporomandibular disorders.
Curr Rev Pain. 4(1):71-81.
Roth RH (1973)
Temporomandibular pain-dysfunction and occlusal relationships.
The Angle Orthod. 43(2):136-53.
Roth RH (1976)
The maintenance system and occlusal dynamics.
Dent Clin North Am. 20(4):761-88
Roth RH (1981)
Functional occlusion for the orthodontist.
J Clin Orthod. 15(1):32-40, 44-51.
Rudman R (1995)
Clinical Anatomy of Masticatory Apparatus and Pharyngeal Spaces By Joannes Lang
New York: Thieme Medical Publishers.

412
Rugh JD (1992)
Psychological factors in TMD.
In: McNeill C (ed) Current controversies in temporomandibular disorders.
Chicago: Quintessence Publishing, p 62-65.
Ruiz JG, Mintzer MJ, Leipzig RM (2006)
The impact of E-learning in medical education.
Acad Med. 81(3):207-12.
Rutkiewicz T, Könönen M, Suominen-Taipale L, Nordblad A, Alanen P (2006)
Occurrence of clinical signs of temporomandibular disorders in adult Finns.
J Orofac Pain. 20(3):208-17.
Ryan, DE (1993)
Temporomandibular Disorders.
Curr Opin Rheumatol. 5:209-218.
Sackett DL (1979)
Bias in analytic research.
J Chronic Dis. 32(1-2):51-63.
Sadowsky C, Begole EA (1980)
Long-term status of temporomandibular joint function and functional occlusion after
orthodontic treatment.
Am J Orthod. 78(2):201-12.
Sadowsky C, Theisen TA, Sakols EI (1991)
Orthodontic treatment and temporomandibular joint sounds--a longitudinal study.
Am J Orthod Dentofacial Orthop. 99(5):441-7.
Samman N, Cheung LK, Tideman H (1996)
Functional reconstruction of the jaws: new concepts.
Ann R Australas Coll Dent Surg. 13:184-92.

413
Salé H and Isberg A (2007)
Delayed temporomandibular joint pain and dysfunction induced by whiplash trauma: a
controlled prospective study.
J Am Dent Assoc. 138(8):1084-91.
Salonen L, Helldén L, Carlsson GE (1990)
Prevalence of signs and symptoms of dysfunction in the masticatory system: an
epidemiologic study in an adult Swedish population.
J Craniomandib Disord. 4(4):241-50.
Sanders B (1986)
Arthroscopic surgery of the temporomandibular joint: treatment of internal derangement
with persistent closed lock.
Oral Surg Oral Med Oral Pathol. 62(4):361-72.
Sato S, Takahashi K, Kawamura H, Motegi K (1998)
The natural course of nonreducing disc displacement of the temporomandibular joint:
changes in condylar mobility and radiographic alterations at one-year follow-up.
Int J Oral Maxillofac Surg. 27(3):173-7.
Scaife R, Holt J (1969)
Natural occurrence of cuspid guidance.
J Prosthet Dent. 22(2):225-9.
Scheerlinck JP, Stoelinga PJ, Blijdorp PA, Brouns JJ, Nijs ML (1994)
Sagittal split advancement osteotomies stabilized with miniplates. A 2-5-year follow-
up.
Int J Oral Maxillofac Surg. 23(3):127-31.
Schneider S, Witt E (1991)
The functional findings before and after a combined orthodontic and oral surgical
treatment of Angle class-III patients
Fortschr Kieferorthop. 52(1):51-9.

414
Scholte AM, Steenks MH, Bosman F (1993)
Characteristics and treatment outcome of diagnostic subgroups of CMD patients:
retrospective study.
Community Dent Oral Epidemiol. 21(4):215-20.
Scott BA, Clark GM, Hatch JP, van Sickels J, Rugh JD (1997)
Comparing prospective and retrospective evaluations of temporomandibular disorders
after orthognathicsurgery.
J Am Dent Assoc. 128(7):999-100.
Selaimen C, Jeronymo JC, Brilhante DP, Lima EM, Grossi PK, Grossi ML (2007)
Occlusal risk factors for temporomandibular disorders
The Angle Orthod. 77(3):471-7
Seligman DA, Pullinger AG, Solberg WK (1988)
The prevalence of dental attrition and its association with factors of age, gender,
occlusion, and TMJ symptomatology.
J Dent Res. 67(10):1323-33.
Seligman DA, Pullinger AG (1991)
The role of functional occlusal relationships in temporomandibular disorders: a review.
J Craniomandib Disord. 5(4):265-79.
Selinger M (1997)
Open learning, electronic communications and beginning teachers.
Eur J Teacher Educ. 20(1):71–84.
Senn SJ (1993)
Crossover Trials in Clinical Research.
Chichester and New York: Wiley.

415
Shah R, Cunningham SJ (2009)
Implementation of the virtual learning environment into a UK orthodontic training
programme: the postgraduate and lecturer perspective.
Eur J Dent Educ. 13(4):223-32.
Shepherd E, Godwin J (2004)
Assessments through the Learning Process.
Questionmark Whitepaper. Norwalk, CT: Questionmark.
www.questionmark.com
Slade GD (1997)
Derivation and validation of a short-form oral health impact profile.
Community Dent Oral Epidemiol. 25(4):284-90.
Smith ASA, Cunningham SJ (2004)
Which factors influence willingness-to-pay for orthognathic treatment?
Eur J Orthod. 26(5):499-506
Smith V, Williams B, Stapleford R (1992)
Rigid internal fixation and the effects on the temporomandibular joint and masticatory
system: a prospective study.
Am J Orthod Dentofacial Orthop. 102(6):491-500.
Solberg WK, Woo MW, Houston JB (1979)
Prevalence of mandibular dysfunction in young adults.
J Am Dent Assoc. 98(1):25-34.
Solow B, Tallgren A (1976)
Head posture and craniofacial morphology.
Am J Phys Anthropol. 44(3):417-35.

416
Sonnesen L, Bakke M, Solow B (1998)
Malocclusion traits and symptoms and signs of temporomandibular disorders in
children with severe malocclusion.
Eur J Orthod. 20(5):543-59
Sostmann M, Meyer J, Berten JL (1991)
TMJ-function following orthognathic surgery
Dtsch Stomatol. 41(12):487-9.
Standring S (ed) (2004)
Gray's Anatomy, 39th ed. The Anatomical Basis of Clinical Practice
Edinburgh, London: Churchill Livingstone.
Starr M, Chalmers I (2003)
The Evolution of the Cochrane Library, 1988–2003. Oxford:Update Software.
Available at: www.update-software.com/history/clibhist.htm
Accessed on 23/1/2008.
Stegenga B, de Bont LG, Boering G, van Willigen JD (1991)
Tissue responses to degenerative changes in the temporomandibular joint: a review.
J Oral Maxillofac Surg. 49(10):1079-88.
Stohler C (1992)
Disk-interference disorders.
In: Zarb G, Carlsson G, Sessle B, Mohl N, editors. Temporomandibular joint and
masticatory muscle disorders.
Copenhagen: Munksgaard, p 271-276.
Stubley P (2002)
Going beyond resource discovery.
Library and Information Update 1(6):52–54.

417
Suenaga S, Ogura T, Matsuda T, Noikura T (2000)
Severity of synovium and bone marrow abnormalities of the temporomandibular joint in
early rheumatoid arthritis: role of gadolinium-enhanced fat-suppressed T1-weighted
spin echo MRI.
J Comput Assist Tomogr. 24(3):461-5.
Taşkaya-Yilmaz N, Oğütcen-Toller M, Saraç YS (2004)
Relationship between the TMJ disc and condyle position on MRI and occlusal contacts
on lateral excursions in TMD patients.
J Oral Rehabil. 31(8):754-8.
Thilander B, Rubio G, Pena L, de Mayorga C (2002)
Prevalence of temporomandibular dysfunction and its association with malocclusion in
children and adolescents: an epidemiologic study related to specified stages of dental
development.
The Angle Orthod. 72(2):146-54.
Thorpy MJ (1990)
Parasomnias.
In: Thorpy MJ (ed) International classification of sleep disorders. Diagnostic and coding
manual.
Americal Sleep Disorders Association, Rochester: Allen Press, p 142-185.
Timmis DP, Aragon SB, Van Sickels JE (1986)
Masticatory dysfunction with rigid and nonrigid osteosynthesis of sagittal split
osteotomies.
Oral Surg Oral Med Oral Pathol. 62(2):119-23.
Ting J (2006)
Temporomandibular joint dislocation after use of a laryngeal mask airway.
Anaesthesia. 61(2):201.

418
Thornton M, Jefferies A, Jones I, Alltree J, Leinonen E (2004)
Changing pedagogy: does the introduction of networked learning have an impact on
teaching?
Paper presented at the Networked Learning Conference, Lancaster University 2004.
Toran-Allerand CD, Singh M, Setalo G Jr (1999)
Novel mechanisms of estrogen action in the brain: new players in an old story.
Front. Neuroendocrinol. 20: 97-121.
Türp JC, Kowalski CJ, O’Leary N, Stohler CS (1998)
Pain maps from facial pain patients indicate a broad pain geography.
J Dent Res. 77(6):1465-72.
Turner J, Deyo R, Loeser J, Von Korff M, Fordyce WE (1994)
The importance of placebo effects in pain treatment and research.
J Am Med Assoc. 271(20):1609-14.
Ueki K, Marukawa K, Nakagawa K, Yamamoto E (2002)
Condylar and temporomandibular joint disc positions after mandibular osteotomy for
prognathism.
J Oral Maxillofac Surg. 60(12):1424-32.
Uotila E (1964)
The temporomandibular joint in adult rheumatoid arthritis. A clinical and
roentgenologic study.
Acta Odontol Scand. 22:Suppl 39:1-91.
Upton LG, Scott RF, Hayward JR (1984)
Major maxillomandibular malrelations and temporomandibular joint pain-dysfunction.
J Prosthet Dent. 51(5):686-90.

419
Utt TW, Meyers CE Jr, Wierzba TF, Hondrum SO (1995)
A three-dimensional comparison of condylar position changes between centric relation
and centric occlusion using the mandibular position indicator.
Am J Orthod Dentofacial Orthop. 107(3):298-308.
Uy-Co ET, Yamada K, Hanada K, Hayashi T, Ito J (2000)
Condylar bony change and mandibular deviation in orthodontic patients - using helical
CT and MRI.
Clin Orthod Res. 3(3):132-143.
Van der Meulen MJ, Lobbezoo F, Aartman IH, Naeije M (2006)
Self-reported oral parafunctions and pain intensity in temporomandibular disorder
patients.
J Orofac Pain. 20(1):31-5.
Van der Waal I (1991)
Non-plaque related periodontal lesions. An overview of some common and uncommon
lesions.
J Clin Periodontol. 18(6):436-40.
Van der Weele LT, Dibbets JM (1987)
Helkimo's index: a scale or just a set of symptoms?
J Oral Rehabil. 14(3):229-37.
Vimpari SS, Knuuttila ML, Sakki TK, Kivelä SL (1995)
Depressive symptoms associated with symptoms of the temporomandibular joint pain
and dysfunction syndrome.
Psychosom Med. 57(5):439-44.
Visscher CM, Huddleston Slater JJ, Lobbezoo F, Naeije M (2000)
Kinematics of the human mandible for different head postures.
J Oral Rehabil. 27(4):299-305.

420
VonKorff M, Dworkin SF, Le Resche L, Kruger A (1988)
An epidemiologic comparison of pain complaints.
Pain 32(2):173-83.
Wahlund K, List T, Dworkin SF (1998)
Temporomandibular disorders in children and adolescents: reliability of a questionnaire,
clinical examination, and diagnosis.
J Orofac Pain 12(1):42-51.
Ward JPT, Gordon J, Field MJ, Lehman HP (2001)
Communication and information technology in medical education.
Lancet 357(9258):792–796.
Watt DM (1980)
Temporomandibular joint sounds.
J Dent. 8(2):119-27.
Weinberg, LA (1964)
A cinematic study of centric and eccentric occlusions,
J Prosthet Dent. 14:290-293.
Westermark A, Shayeghi F, Thor A (2001)
Temporomandibular dysfunction in 1,516 patients before and after orthognathic
surgery.
Int J Adult Orthodon Orthognath Surg. 16(2):145-51.
White CS, Dolwick MF (1992)
Prevalence and variance of temporomandibular dysfunction in orthognathic surgery
patients.
Int J Adult Orthodon Orthognath Surg. 7(1):7-14.
Wilkes CH (1989)
Internal derangements of the temporomandibular joint. Pathological variations.
Arch Otolaryngol Head Neck Surg. 115(4):469-77.

421
Williams RL ( 1971)
Occlusal treatment for the postorthodontic patient.
Am J Orthod. 59(5):431-42.
Williamson EH (1977)
Temporomandibular dysfunction in pretreatment adolescent patients.
Am J Orthod. 72(4):429-33.
Williamson EH, Lundquist DO (1983)
Anterior guidance: its effect on electromyographic activity of the temporal and masseter
muscles.
J Prosthet Dent. 49(6):816-23.
Williamson, E H (1981)
Occlusion and TMJ dysfunction. Part I,
J Clin Orthod 15:333-350.
Wilson L, Dworkin SF, LeResche L, Whitney CW & Dicker BG (1991)
Somatization and diffuseness of clinical pain symptoms.
J Behav Med 12: 17-18.
Wilson T, Whitelock D (1997)
Opening up horizons: providing online course material in cyber space.
Displays Journal on Multimedia 17:3-4
Wolford LM, Reiche-Fischel O, Mehra P (2003)
Changes in temporomandibular joint dysfunction after orthognathic surgery.
J Oral Maxillofac Surg. 61(6):655-60.
Yamada K, Saito I, Hanada K, Hayashi T (2004)
Observation of three cases of temporomandibular joint osteoarthritis and mandibular
morphology during adolescence using helical CT.
J Oral Rehabil. 31(4):298-305.

422
Yu CN, Chow TK, Kwan AS, Wong SL, Fung SC (2000)
Intra-operative blood loss and operating time in orthognathic surgery using induced
hypotensive general anaesthesia: prospective study.
Hong Kong Med J. 6(3):307-11.
Zarb GA, Carlsson GE, Sessle BJ, Mohl ND (1994)
Osteoarthrosis/Osteoarthritis.
In: Temporomandibular joint and masticatory muscle disorder.
Copenhagen: Munksgaard p298–314.
Zimmer B, Engelke D, Radlanski RJ, Kubein-Meesenburg D (1991)
Changes in opening mobility due to surgical advancement of the mandible.
Fortschr Kieferorthop. 52(2):78-83.
Zhou Y, Hägg U, Rabie A (2001)
Patient satisfaction following orthognathic surgical correction of skeletal Class III
malocclusion.
Int J Adult Orthodon Orthognath Surg. 16(2):99-107.
Website references
(http:// www.cochrane.org)
(www.thecochranelibrary.com)
(http://www.manningawards.ca/awards/winners/mgoldberg-media.shtml).
(http:// www.insidehighered.com/news/2009/05/07bb)
(http:moodle.org)
(http:// www.ohri.ca/programs/clinical_epedimology/oxford.htm)