
Temporal Patterns of Fruit Fly (Drosophila) Evolution Revealed by Mutation Clocks
31
1 Molecular Biology & Evolution Revised (July 31, 2003) Temporal Patterns of Fruit Fly (Drosophila) Evolution Revealed by Mutation Clocks Koichiro Tamura* , Sankar Subramanian * & Sudhir Kumar * * Center for Evolutionary Functional Genomics, Arizona Biodesign Institute, and School of Life Sciences, Arizona State University, Tempe, AZ 85287-4501. Department of Biological Sciences, Tokyo Metropolitan University, Tokyo 192-0397, Japan. Keywords: mutation rate, Drosophila, speciation, molecular evolution, molecular clock, evolutionary distance estimation Correspondence and other requests should be addressed to S. K. ([email protected] ) Address for correspondence: Dr. Sudhir Kumar School of Life Sciences Life Sciences Building A-351 Arizona State University Tempe, AZ 85287-4501, USA Tel: (480) 727 6949 Fax: (480) 965 2519 E-mail: [email protected] Copyright (c) 2003 Society for Molecular Biology and Evolution MBE Advance Access published August 29, 2003 by guest on November 21, 2013 http://mbe.oxfordjournals.org/ Downloaded from
-
Upload
independent -
Category
Documents
-
view
4 -
download
0
Transcript of Temporal Patterns of Fruit Fly (Drosophila) Evolution Revealed by Mutation Clocks
1
Molecular Biology & Evolution Revised (July 31, 2003)
Temporal Patterns of Fruit Fly (Drosophila) Evolution Revealed by Mutation Clocks
Koichiro Tamura*�, Sankar Subramanian* & Sudhir Kumar*
*Center for Evolutionary Functional Genomics, Arizona Biodesign Institute, and School of
Life Sciences, Arizona State University, Tempe, AZ 85287-4501. �Department of Biological
Sciences, Tokyo Metropolitan University, Tokyo 192-0397, Japan.
Keywords: mutation rate, Drosophila, speciation, molecular evolution, molecular clock,
evolutionary distance estimation
Correspondence and other requests should be addressed to S. K. ([email protected])
Address for correspondence: Dr. Sudhir Kumar School of Life Sciences Life Sciences Building A-351 Arizona State University Tempe, AZ 85287-4501, USA
Tel: (480) 727 6949 Fax: (480) 965 2519
E-mail: [email protected]
Copyright (c) 2003 Society for Molecular Biology and Evolution
MBE Advance Access published August 29, 2003 by guest on N
ovember 21, 2013
http://mbe.oxfordjournals.org/
Dow
nloaded from
2
Drosophila melanogaster has been a canonical model organism to study genetics,
development, behaviour, physiology, evolution and population genetics for nearly a century.
Despite this emphasis and the completion of its nuclear genome sequence, the timing of
major speciation events leading to the origin of this fruit fly remain elusive due to paucity
of extensive fossil records and biogeographic data. Use of molecular clocks as an
alternative has been fraught with non-clocklike accumulation of nucleotide and amino-acid
substitutions. Here we present a novel methodology in which genomic mutation distances
are used to overcome these limitations and to make use of all available gene sequence data
for constructing a fruit fly molecular timescale. Our analysis of 2977 pair-wise sequence
comparisons from 176 nuclear genes reveals a long-term fruit fly mutation clock ticking at
a rate of 11.1 mutations per kilobasepairs per million years. Genomic mutation clock based
timings of the landmark speciation events leading to the evolution of D. melanogaster show
that it shared most recent common ancestor 5.4 million years ago (mya) with D. simulans,
12.6 mya with D. erecta-D. orena, 12.8 mya with D. yakuba-D. teisseri, 35.6 mya with the
takahashii subgroup, 41.3 mya with the montium subgroup, 44.2 mya with the ananassae
subgroup, 54.9 mya with the obscura group, 62.2 mya with the willistoni group, and 62.9
mya with the subgenus Drosophila. These and other estimates are compatible with those
known from limited biogeographic and fossil records. The inferred temporal pattern of
fruit fly evolution shows correspondence with the cooling patterns of paleoclimate changes
and habitat fragmentation in the Cenozoic.
by guest on Novem
ber 21, 2013http://m
be.oxfordjournals.org/D
ownloaded from
3
INTRODUCTION
Inference of species divergence times in the fruit fly phylogeny that lead to the evolution of
Drosophila melanogaster has been hindered by the absence of extensive, reliable fossil
records and biogeographic data. Molecular clocks are routinely used as an alternative tool
to infer temporal speciation patterns in such cases (Easteal and Oakeshott 1985; Powell
1997; Hedges and Kumar 2003). In fruit fly evolutionary studies, however, it has been
difficult to establish reliable molecular clock calibrations and obtain unbiased time
estimation because of the unequal substitution rates among species even for synonymous
substitutions (Eanes et al. 1996; Rodriguez-Trelles, Tarrio and Ayala 1999; Tatarenkov et
al. 1999; Rodriguez-Trelles, Tarrio and Ayala 2000). Highly expressed genes show
extreme preference for certain codons, which often leads to lower estimates of the number
of synonymous substitution per site due to the effects of natural selection and estimation
biases (Shields et al. 1988; Sharp and Li 1989; Dunn, Bielawski and Yang 2001).
Furthermore, codon usage biases are known to vary significantly among lineages
(Rodriguez-Trelles et al. 1999), which will lead to synonymous substitution rate variation
among lineages. This poses severe problems while inferring molecular timescales of fruit
fly evolution. For instance, the Hawaiian Drosophila species, for which the divergence
time is considered to be the best point for calibrating molecular clocks, show much lower
codon usage biases compared to D. melanogaster (Rodriguez-Trelles et al. 2000); the D.
melanogaster Adh gene sequence shows a 36% higher codon adaptation index (CAI, Sharp
and Li 1987) than the Hawaiian D. picticornis Adh gene sequence. This is also true even
when we compute codon usage statistics independent of the knowledge of the optimal
codons, such as the effective number of codons (Wright 1990); D. picticornis has a much
higher effective number of codons (47.1) as compared to D. melanogaster (36.1). This
by guest on Novem
ber 21, 2013http://m
be.oxfordjournals.org/D
ownloaded from
4
difference in codon usage biases is also reflected in the rejection of the homogeneity of the
substitution patterns in the third codon positions at a 1% level when the disparity index test
(Kumar and Gadagkar 2001) is used.
Because evolutionary divergences currently used for building fruit fly molecular
clocks directly use the actual amount of synonymous or nonsynonymous change that has
been permitted in sequence evolution, the intrinsic non-clock like behaviour of substitution
accumulation has repeatedly impeded those efforts (Thomas and Hunt 1993; Russo,
Takezaki and Nei 1995; Rodriguez-Trelles, Tarrio and Ayala 2001a, b). Therefore, in order
to build molecular timescales, we need to estimate distances that are independent of the
effects of codon usage bias and selection. Here we present a method for estimating
mutation distance based on analysis of multiple genes (we refer to this as genomic mutation
distance) and use it for inferring timing of major fruit fly speciation events.
METHODS
SEQUENCE DATA ACQUISITION
cDNA and protein sequences for D. melanogaster were obtained from
http://www.fruitfly.org/sequence/dlMfasta.shtml. All available sequences belonging to the
genus Drosophila were downloaded from NCBI (GenBank). Redundant sequences were
identified based on the annotated gene name and the sequence similarity, and were
excluded. A BLASTP (Altschul et al. 1997) search was conducted using each D.
melanogaster protein sequence as a query and the database of all other fruit fly sequences
as the target set. For each set of BLAST-hits produced, we constructed an orthologous
sequence data set by taking the best hit from each distinct species available. Sequences in
each putative orthologous set were then checked for gene name to ensure the use of the
by guest on Novem
ber 21, 2013http://m
be.oxfordjournals.org/D
ownloaded from
5
same gene; GenBank protein identification numbers (protein_id) were matched in case of
gene name ambiguities. When multiple sequences were available for the same gene from a
species, the longest sequence was chosen. The data for known genes from Bergman et al.
(2002) was then added to this collection. Each protein sequence pair (obtained by
translating the cDNA sequence) was aligned using ClustalW (Thompson, Higgins and
Gibson 1994) and the corresponding cDNA alignments were generated using the protein
sequence alignments as guides. All the analyses were conducted by using these pairs of
aligned sequences.
DISTANCE ESTIMATION
Synonymous distances. We used the number of nucleotide substitutions per fourfold-
degenerate site as the measure of synonymous distance to avoid estimation biases due to
approximations needed to separate synonymous and nonsynonymous sites (Dunn et al.
2001; Kumar and Subramanian 2002). A third codon position was considered fourfold
degenerate only if it was fourfold degenerate in both sequences compared. To reduce
estimation errors, only sequence pairs with 50 or more fourfold-degenerate sites were
included. This produced 6085 sequence pairs from 176 genes. Of these only 2977 pairs
involved in major divergence events that occurred in the lineage leading to D. melanogaster
were used. The Tamura-Nei (1993) method was used to correct for multiple hits in order to
account for transition/transversion rate and base-composition biases. The Disparity index
test (Kumar and Gadagkar 2001) revealed significant base composition differences among
lineages as the stationarity of substitution pattern was rejected in 35% pairwise
comparisons at a 5% level, confirming significant differences in codon usage among
lineages. Therefore, we used the modified Tamura-Nei method (Tamura and Kumar 2002)
by guest on Novem
ber 21, 2013http://m
be.oxfordjournals.org/D
ownloaded from
6
to account for substitution pattern heterogeneity in four-fold degenerate sites among
lineages.
Genomic mutation distances. For computing genomic mutation distances, we express the
relationship between synonymous distance (dSi) and the mutation distance (dµi) for a given
gene i by
dSi = (1 - fi)dµi, (1)
where fi refers to the fraction of mutations underestimated due to selection against the
unpreferred codons and estimation biases. This equation is parallel in concept to that well
known for the neutral theory (Kimura 1983), showing that the rate of synonymous
substitution becomes equal to the rate of point mutation under the strict neutrality. The
synonymous distance for the genes with the smallest (or no) codon usage bias is one of the
best candidates of the mutation distance, as there is the least selection or evolutionary
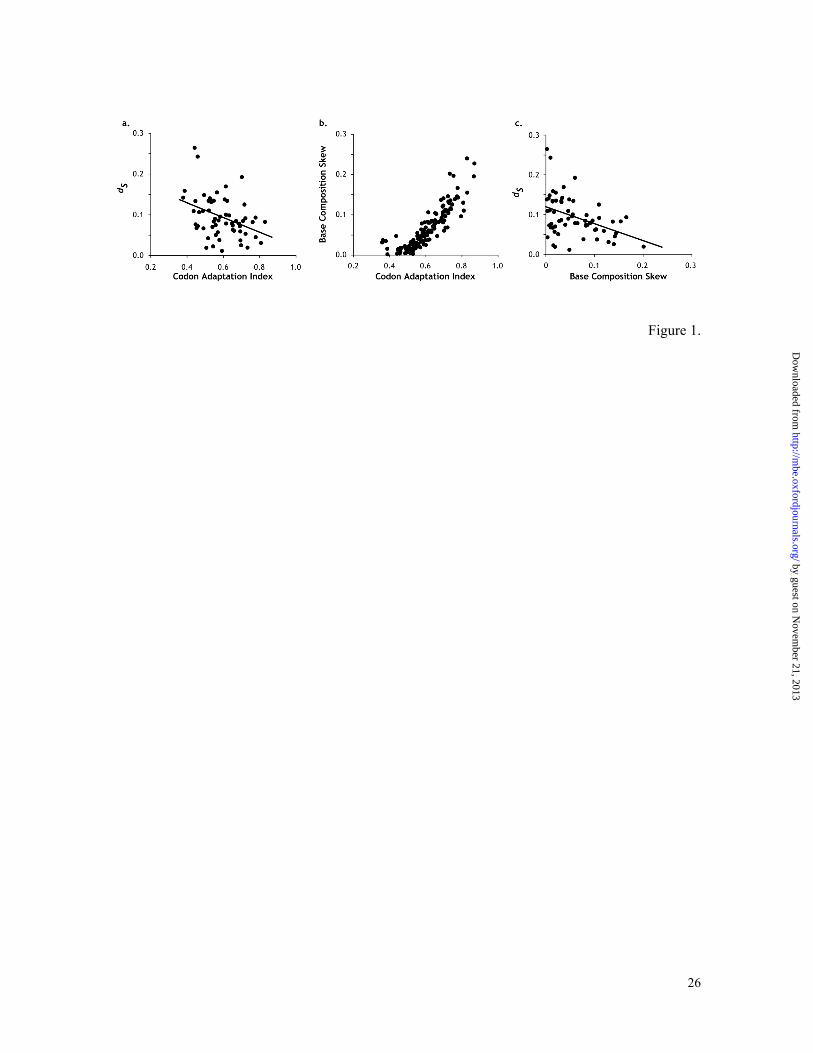
distance estimation bias (e.g., Dunn et al. 2001). For instance, Figure 1a shows the well-
known negative relationship between CAI and synonymous distance (Sharp and Li 1987;
Shields et al. 1988) for the comparison of D. melanogaster and D. simulans, where the
actual mutation distance is close to synonymous distances observed for genes with the
smallest CAI. However, estimates of codon usage bias (e.g., CAI) have large variances (as
they involve many parameters) and it is unclear what constitutes the minimum codon usage
bias. Instead, we find that the base composition skew, BCS (Tamura and Kumar 2002), at
synonymous sites, is directly related with CAI (Figure 1b). It shows a better linear
relationship with synonymous distance than CAI (Figure 1c); R2 = 0.148 and 0.176 for CAI
and BCS, respectively. BCS is also better because it can be computed with less sampling
error (as it requires fewer parameters). Furthermore, in our preliminary analysis, BCS gave
a smaller variance and higher correlation with dS than the G+C content of silent sites (R2 =
by guest on Novem
ber 21, 2013http://m
be.oxfordjournals.org/D
ownloaded from
7
0.159), which is thought to be an alternative indirect measure of codon usage bias (Shields
et al. 1988). These results also hold fine for species comparisons with much higher
divergences: melanogaster-yakuba, melanogaster-pseudoobscura, and melanogaster-
virilis (results not shown). Since genes with the lowest codon usage bias showed a BCS ≈
0, the y-intercept in Figure 1c could be used as a bias-corrected estimate of the mutation
distance.
Based on the observed linear relationship in Figure 1c, we can express fi in equation
(1) as a product of Ci and η (fi = ηCi), where Ci is the BCS for gene i and η is the fraction of
mutations eliminated per unit BCS for the genome pair compared. We can now rewrite
equation (1) to convert the observed synonymous distance (dSi) for a given gene into the
estimate of number of mutations per site (dµi) using the observed base composition skew
for that gene (Ci).
dµi = dSi/(1 - ηCi). (2)
The value of η necessary for using equation (2) is estimated by using all genes for the given
species pair. It is obtained by dividing the absolute value of the slope of the linear
regression of BCS on dS by the y-intercept of the regression line. For the melanogaster-
simulans pair, η = 3.3. We found that the estimates of η for other species pairs with many
genes (e.g., melanogaster-yakuba, melanogaster-pseudoobscura, and melanogaster- virilis)
were quite similar to that one for melanogaster-simulans and statistically not significantly
different at the 5% level (P = 0.74, 0.76, and 0.48 for melanogaster-yakuba, melanogaster-
pseudoobscura, and melanogaster- virilis, respectively). Since the melanogaster-simulans
comparison has the largest number of genes, η is estimated with the smallest error and is
therefore used as a global value for estimating dµi in all further analyses.
by guest on Novem
ber 21, 2013http://m
be.oxfordjournals.org/D
ownloaded from
8
RESULTS
GENOMIC MUTATION CLOCKS
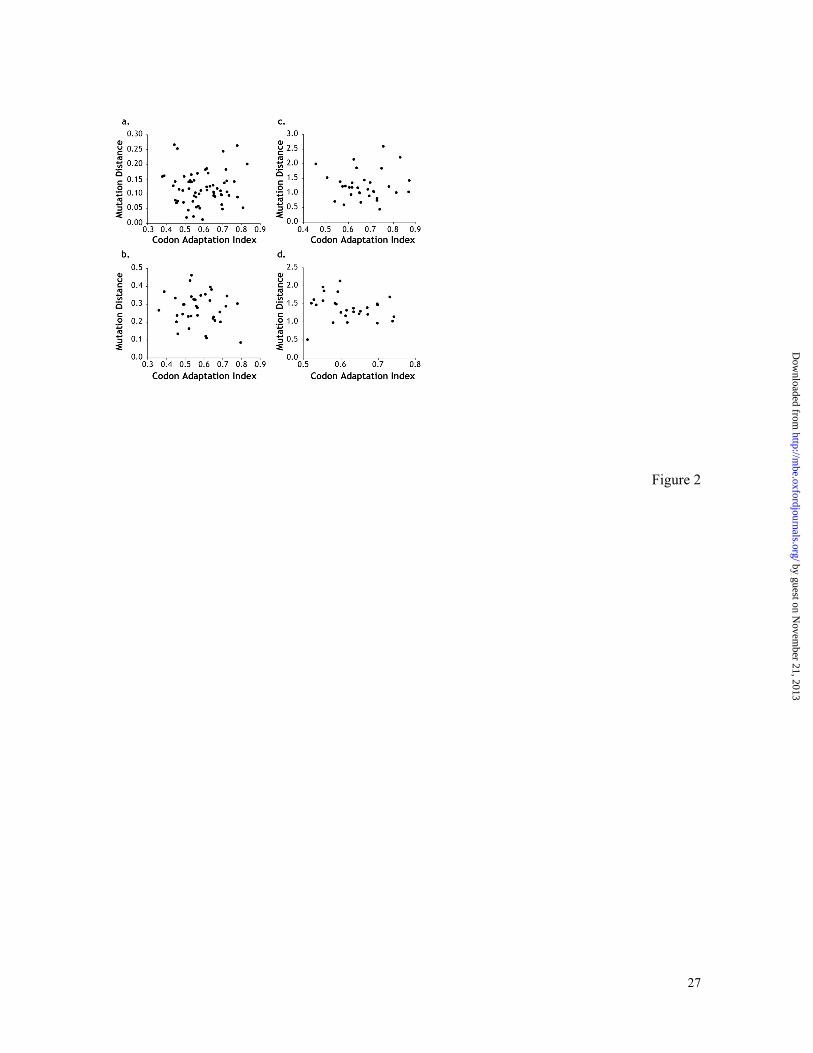
Relationship of mutation distance and codon adaptation. Figure 2a-d show that the
estimated dµi does not depend the extent of codon adaptation in the analysis of closely as
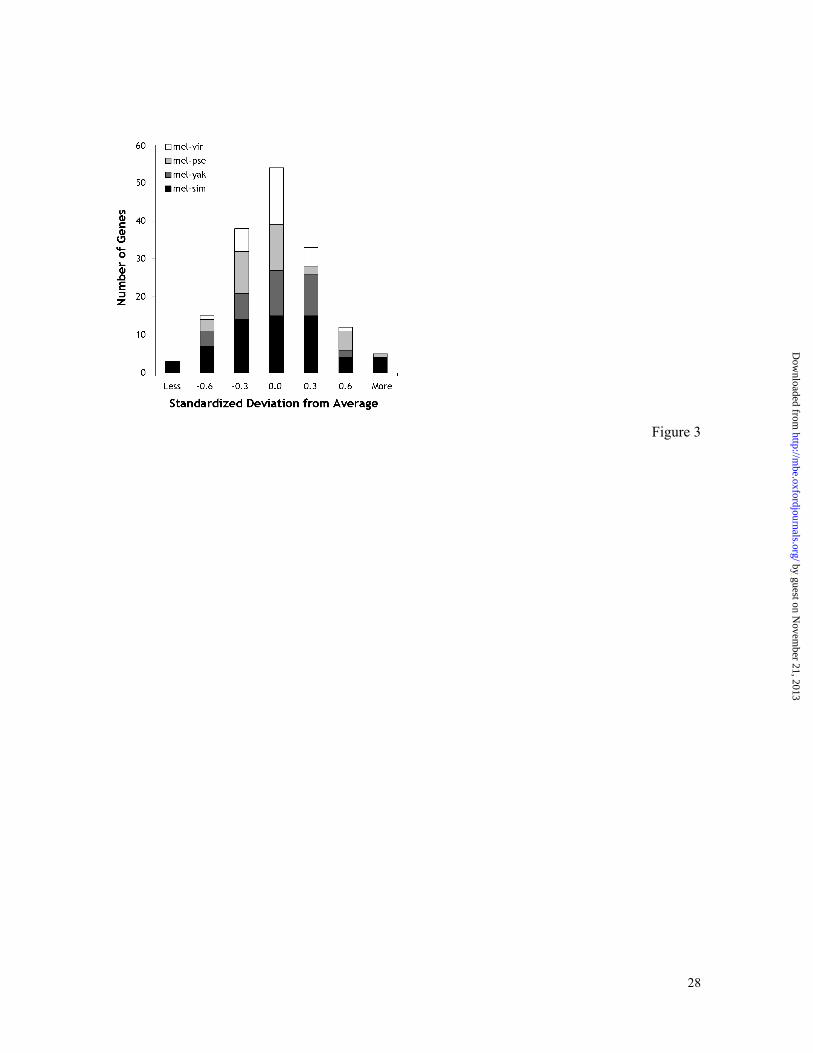
well as distantly related species. The multigene distributions of dµi are symmetrical in
nature and have a clear-cut central tendency (Figure 3); means of these distributions
provide estimates of genomic mutation distances, dµ. This method for estimating genomic
mutation distance is useful when building molecular timescales, as it allows for the
combining of data from many different genes for different pairs of species because
databases are gene rich for some species but poor for most others.
Relative rate tests and mutation clocks. With the ability to compute genomic mutation
distances between species, we are in a position to estimate mutation rate and species
divergence times as long as mutations accumulate in a clock like fashion. Therefore, we
conducted the relative rate tests (Beverley and Wilson 1984; Wu and Li 1985; Nei and
Kumar 2000) of the mutational clock at different levels of evolutionary relatedness.
Results from the relative rate tests for five pairs of species are shown in Table 1. None of
the tests show significant departure from the null hypothesis of mutation rate equality
between lineages. Therefore, mutations appear to accumulate at similar rates among diverse
Drosophila species, at least up to the melanogaster-pseudoobscura divergence.
Divergence time estimation. An accurate calibration point is required to anchor the
molecular clock to estimate divergence times. This is provided by a well-established
divergence time of 5.1 million years ago (Mya) between D. picticornis and other species
belonging to the planitibia subgroup based on the time of formation of Kauai in Hawaii
by guest on Novem
ber 21, 2013http://m
be.oxfordjournals.org/D
ownloaded from
9
(Carson and Clauge 1995). This estimate is considered to be the most robust/reliable
estimate and has been used in numerous studies (e.g., Rowan and Hunt 1991; Takezaki,
Rzhetsky and Nei 1995). With this estimate, the rate of point mutation was computed to be
µ = 0.113/ (2×5.1×106) = 1.1 (±0.2) ×10-8 mutations per site per year per lineage, because
the genomic mutation distance between D. picticornis and other species belonging to the
planitibia subgroup was 0.113 ± 0.0218. We used this rate to convert the genomic
mutation distance to time for all other species comparisons. The variance of divergence
time (Vt) was estimated by Vt = dµ2/µ2(Vd/ dµ
2 + Vµ/µ2), where Vd and Vµ represent the
variances of dµ and µ, respectively.
In the estimation of divergence times of the ananassae subgroup from the
melanogaster subgroup, we found that the average of uncorrected synonymous distances
was much higher than that for the obscura-melanogaster comparison. This is unexpected
because the species in the ananassae subgroup are considered to be more closely related to
D. melanogaster than those in the obscura group. In fact, in the ananassae- melanogaster
sequence comparisons, the observed heterogeneity of substitution pattern was higher than
that expected in >99% Monte-Carlo replicates of the disparity index test (Kumar and
Gadagkar 2001) for 7 out of 10 genes. For the other 3 genes, this percentage was >80%.
This extreme substitution pattern heterogeneity in the ananassae lineage might be a reason
for the high synonymous distance estimates. However, there were three genes that were
shared by species belonging to the ananassae subgroup, melanogaster subgroup, and
obscura group. In these genes, the mutation distance for the ananassae- melanogaster
comparison was always lower than that for the obscura-melanogaster comparison. This
allowed us to use these genes to estimate ananassae-melanogaster divergence time by
using the obscura group is an outgroup. For each gene, we divided the mutation distance
for the ananassae-melanogaster divergence by the mutation distance for the obscura-
by guest on Novem
ber 21, 2013http://m
be.oxfordjournals.org/D
ownloaded from
10
melanogaster divergence and multiplied it by the obscura-melanogaster divergence time to
obtain the ananassae-melanogaster divergence time. Finally, the average divergence time
was obtained from 3 gene specific estimates to reduce the effect of gene sampling errors.
This estimate will need to be refined in the future as more sequences become available.
DIVERGENCE TIMES IN FRUIT FLY EVOLUTION
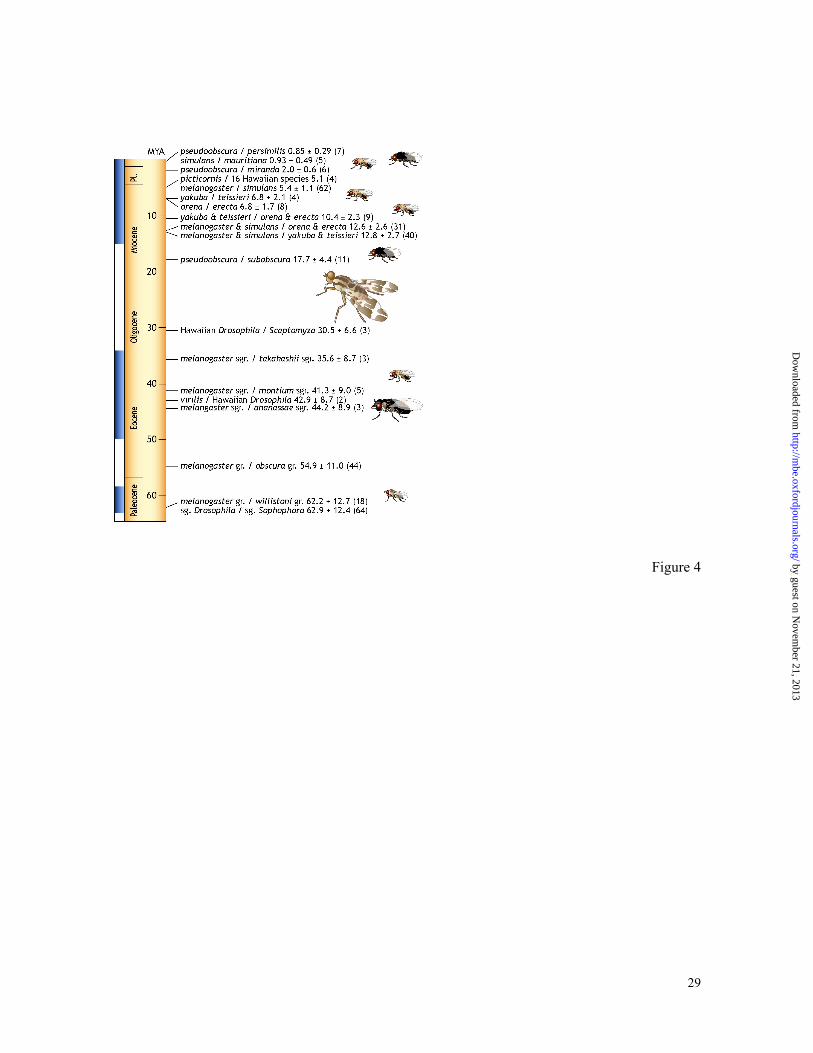
Figure 4 shows the species divergence times for taxon-pairs with multiple genes (3-64
genes). 2977 pairwise sequence comparisons from 176 genes were used in this analysis.
The estimated molecular time scales for major divergence events are in good accordance
with the inferences from biogeography and fossil records. The divergence of
melanogaster+simulans from orena+erecta and from yakuba+teissieri (12.6�12.8 mya) is
in agreement with previous inferences based on biogeography (Lachaise et al. 1988). A
fossil of a Scaptomyza species was found in Dominican amber with a minimal age of 23
Myr (Grimaldi 1987). Since Scaptomyza originated in Hawaii from a common ancestor of
the Hawaiian Drosophila (Tamura et al. 1995; Tatarenkov, Zurovcova and Ayala 2001),
their divergence time should be at least 23 Mya. A molecular estimate of 30.5 (± 6.6) Mya
is consistent with this requirement. In a similar way, the oldest time estimate of 62.9 ± 12.4
Mya is consistent with the maximum possible divergence time of 80 Mya between
subgenera Drosophila and Sophophora as inferred from biogeographic considerations
(Beverley and Wilson 1984). These agreements support potential appropriateness of the
calibration of the genomic mutation clock.
However, our genomic mutation clock based estimates are significantly older for
some speciation events that have been previously dated by molecular clock methods. In
particular, the melanogaster-simulans divergence based on 62 genes is twice as old as
thought before (Thomas and Hunt 1993; Russo et al. 1995); this result is statistically
by guest on Novem
ber 21, 2013http://m
be.oxfordjournals.org/D
ownloaded from
11
significant (P < 0.02; using a Z-test to compare our estimate with the currently accepted
value of 2.5 Mya). Previous studies mainly used Adh gene data whose sequences are
available from the largest number of Drosophila species. Although we have used the same
calibration point (Hawaiian species divergence) as did the other studies, they did not
account for codon usage bias differences between the Hawaiian and other species. Effect
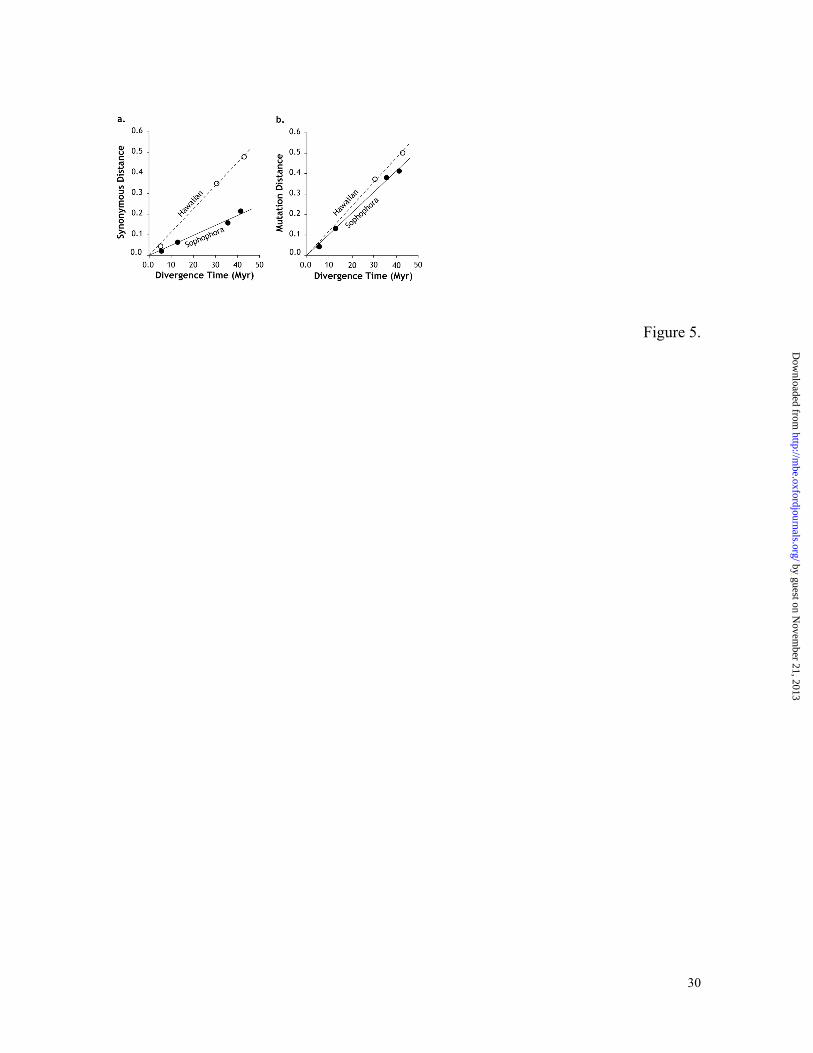
of this factor is clearly evident in Figure 5a for the Adh gene data; the rate of uncorrected
synonymous substitution for the Sophophora lineage leading to D. melanogaster is almost
half of that for the subgenus Drosophila lineage leading to the Hawaiian species. This
correlates with the difference in codon usage bias between D. melanogaster and Hawaiian
D. picticornis, which produces much higher reduction in synonymous distances for the
Sophophora lineage than those for the Hawaiian species and leads to considerable
underestimate of the divergence times. After correcting for the effect of the codon usage
bias difference on synonymous substitutions using equation (2), the mutation rate
difference observed in Adh genes between the two subgenera disappears (Figure 5b).
Consequently, our mutation distance for the Adh gene alone dated the melanogaster-
simulans and melanogaster-yakuba divergence times to be 4.0 ± 1.7 and 13.7 ± 3.7 Mya,
respectively, whereas the uncorrected synonymous distances for four-fold degenerate sites
suggested that they were 2.1 ± 0.9 and 6.8 ± 1.9 Mya. It is interesting to note that the older
time estimates based on corrected synonymous distances are in a good agreement with
those reported in Beverly and Wilson (1984). Therefore, it is important to use corrected
synonymous distance (mutation distance) in building reliable fruit fly evolutionary
timescales.
In Figure 4, we have also presented three divergence times between very closely
related species pairs, i.e., pseudoobscura-persimilis, simulans-mauritiana, and
pseudoobscura-miranda. These estimates do not exclude the affect of ancestral population
by guest on Novem
ber 21, 2013http://m
be.oxfordjournals.org/D
ownloaded from
12
polymorphism, as population polymorphism data do not currently exist for many genes.
Therefore, they may be considered as maximum estimates and will need to be revised in the
future.
SINGLE GENE MOLECULAR CLOCKS
The linear fit of species divergence times for the mutation distances observed for each
individual gene with divergence times estimated by using all the genes is shown in Table 2.
For almost all genes shown, R2 values in linear regressions are very high for mutation
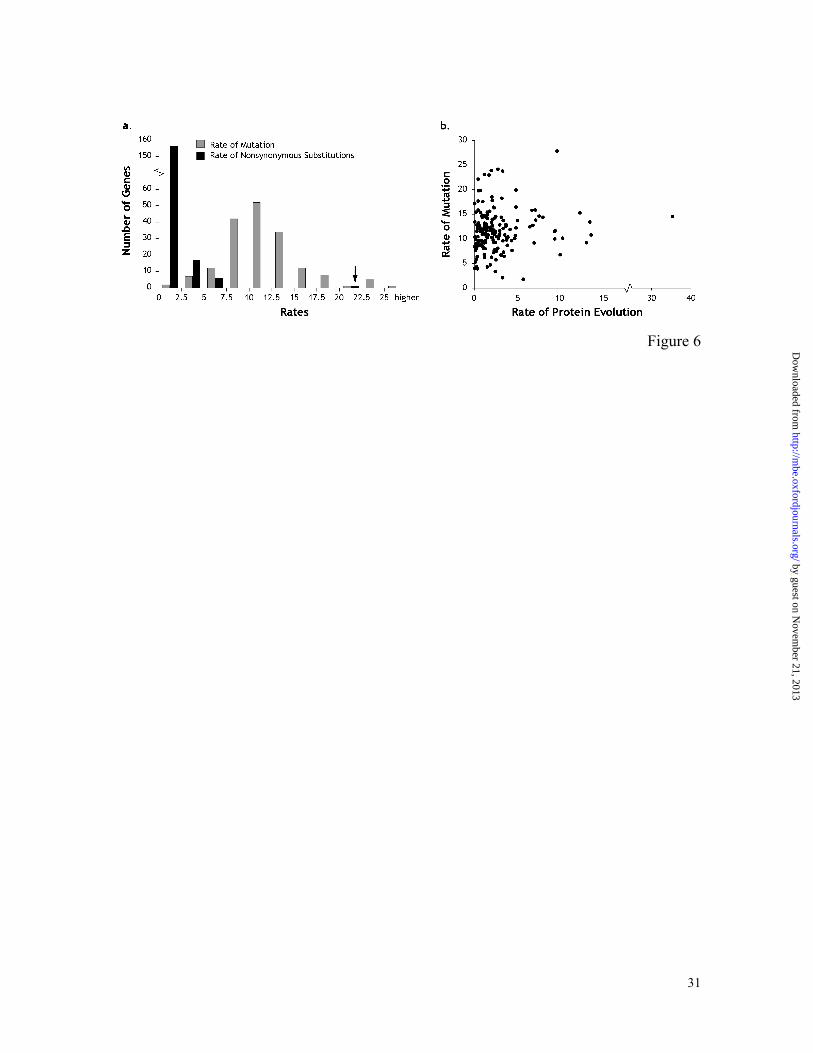
distances and the average rates of mutation are rather similar. The multigene histogram of
these mutation rates is shown in Figure 6a. This distribution has the average rate (± 1SE)
of 0.0114 ± 0.0003. These mutation rates are contrasted with the nonsynonymous
substitution rates for the same set of genes in Figure 6a. The L-shaped distribution of the
nonsynonymous substitution rates shows that Drosophila genes are under strong purifying
selection, with only one gene showing the nonsynonymous substitution rate significantly
higher than the average genomic mutation rate. This is Acp26Aa gene, which is well
known to be under strong positive selection (Tsaur and Wu 1997). Some of the other genes
showing high nonsynonymous substitution rates were Acp29AB, mei-218, and rux; they
have already been recognized as rapidly evolving at the protein sequence level (Aguade
1999; Avedisov et al. 2001; Manheim et al. 2002). However, the nonsynonymous rates
were much lower than the average genomic mutation rate in all of these cases.
The protein distances for individual genes show much poorer linearity with species
divergence times, as compared to that for mutation distances (Table 2). Many genes for
which amino acid substitutions are known not to follow a clock like accumulation are
clearly exposed. Both Adh and Gpdh show extremely poor fit with species divergence
by guest on Novem
ber 21, 2013http://m
be.oxfordjournals.org/D
ownloaded from
13
times (Rodriguez-Trelles et al. 2001a), suggesting that their protein evolution is not
clocklike. On the other hand, some genes such as amd, yellow, and rux appear to
accumulate amino-acid substitutions in a more clock-like fashion. It is notable that
mutation and protein evolutionary rates do not show a significant correlation (Figure 6b),
clearly establishing the independence of the estimated mutation and protein evolutionary
rates.
DISCUSSION
We have presented a method to correct the bias introduced by the codon adaptation
when estimating evolutionary divergence at synonymous sites for inferring mutation
distances. Our method works by utilizing the relationship of the codon usage bias with the
synonymous divergence observed in the Drosophila genomes and produces a measure of
the average genomic mutation distance. However, the codon usage bias is caused not only
by selection, but also by mutational bias in the strictly neutral sites. For example, the G+C
contents of introns and noncoding regions are about 40% in a variety of Drosophila species,
as the direction of mutation is biased toward nucleotides A and T (Moriyama and Hartl
1993; Bergman and Kreitman 2001). This suggests that the expected codon usage in the
absence of codon selection is already biased and that BCS = 0 (used in our formulation)
may not correspond to the case of zero codon adaptation. The violation of the assumption
may lead to biased estimation of the mutation distance. However, it is well known from
studies of mammalian genomes (e.g., Hughes and Yeager 1997) that the third codon
position G+C content is about 10% higher than that observed in introns and intergenic
regions. If this is true for Drosophila genomes as well, then we expect about 50% G+C
content to be the baseline G+C content for the fourfold-degenerate sites in the Drosophila
genomes. This is indeed the case because >97% genes show fourfold degenerate site G+C
by guest on Novem
ber 21, 2013http://m
be.oxfordjournals.org/D
ownloaded from
14
content equal to or higher than 50% in our study. At any rate, it is virtually impossible to
estimate the exact base composition at the strictly neutral synonymous sites. Therefore, the
average genomic mutation rate reported here should be considered an approximate.
Comparative sequence analysis inherently generate average genomic rates among
species, therefore our estimates are average estimates among species. However, the
similarity of base compositions of introns and noncoding regions over widely divergent
Drosophila species (Moriyama and Hartl 1993; Bergman and Kreitman 2001) suggests that
the mutation bias have not changed so much during the fruit fly evolution and that our
estimates may be close approximations for species specific mutation rates. (See, however,
a small departure for D. willistoni (Bergman et al. 2002).) This permitted us to use
genomic mutation distances from different gene sets from different species pairs to
maximally utilize the available data in our analyses.
Relative rate tests conducted using the mutation distances at different levels of
taxonomic divergence show that the null hypothesis of mutation clock in diverse fruitfly
species is not rejected. This allows for assuming a mutation clock and inferring a temporal
pattern of species divergences during the fruit fly evolution leading to D. melanogaster. In
fact, the order of divergences for all the species groups (obscura and willistoni) and
subgroups (takahashii, montium and ananassae) belonging to the subgenus Sophophora
from D. melanogaster (Fig. 4) is consistent with previous studies for molecular phylogeny
of Sophophora using multiple genes (Goto and Kimura 2001; O'Grady and Kidwell 2002).
On the basis of the divergence times estimated, it is interesting to speculate about the
temporal pattern of speciation events in the evolutionary history leading to D.
melanogaster. Figure 4 suggest that the speciation events have not occurred regularly in
time, as several events are clustered. Three independent pairs of sibling species
by guest on Novem
ber 21, 2013http://m
be.oxfordjournals.org/D
ownloaded from
15
(melanogaster-simulans, yakuba-teissieri and orena-erecta) diverged within a short time
range (5.4-6.8 Mya). Evolutionary divergences among these three pairs also occurred in a
short span of time 10.4-12.8 Mya. The melanogaster subgroup (containing these six
species) diverged from the cluster of the three major subgroups in the melanogaster group
(containing ananassae, montium and takahashii subgroups) during the Late to Middle
Eocene (35-45 Mya). The Hawaiian Drosophila also diverged from the lineage leading to
D. virilis during this time period. Finally, both the obscura and willistoni groups diverged
from the melanogaster group about 55 to 62 Mya after the divergence of the subgenera
Drosophila and Sophophora close to the K-T boundary, 63 Mya. These clustered timings
of divergences are compatible with �radiations� proposed by Throckmorton (1975) to
explain coincidental distribution patterns of species from independent species groups.
Many of the clustered divergence times either coincide or fall close to the periods of
major climate changes during the Cenozoic. Marine sediment records suggest that
important cooling steps occurred during the latest Miocene (5.0-6.5 Mya) and the middle
Miocene (12-15 Mya) (Kennett 1995; Zachos et al. 2001), which coincide with a number of
divergence time estimates (Figure 4). By contrast, there is a paucity of speciation events
during Oligocene to the early Miocene, which were periods with relatively uniform climatic
temperatures or warming. An event mapped to this period is the Hawaiian Drosophila-
Scaptomyza split which occurred in Hawaii, where the local volcanic activities are thought
to be responsible for speciation (Carson 1992). There are also clear correspondences of
older species divergence events with the climatic cooling. While we have many species
from most of the major species groups and subgroups related to D. melanogaster in our
analysis, speciation patterns for independent species groups and subgroups need to be
examined with a number of genes to generalize these inferences. Nevertheless, if the
observed correspondence between the time of species divergences and paleoclimate
by guest on Novem
ber 21, 2013http://m
be.oxfordjournals.org/D
ownloaded from
16
changes is true, it supports Wallace�s hypothesis for a rapid species change due to climatic
change (Wallace 1870a, b). In the present case, the factor is postulated to be climatic
cooling in the Cenozoic. A major consequence of this cooling was an extensive increase in
aridification in the middle to low latitude regions, which lead to expansions of savannas
and grasslands as well as the fragmentation of forests (Kennett 1995) that were primary
habitats of ancestral fruit fly species and populations (Throckmorton 1975). The adaptation
to the newly arisen dry environment and the allopatry caused by the forest fragmentation
are potential causes for stimulating fruit fly speciation. The former is supported by the
distribution patterns of D. teissieri and D. yakuba, which are adapted to forests and
savannas, respectively (Lachaise et al. 1988). The allopatric speciation is also plausible
from the overlapping distribution patterns for independent species pairs, say, D.
melanogaster-simulans and D. teissieri-yakuba (Lachaise et al. 1988).
Therefore the mutation clock proposed here provides opportunities to get an
important glimpse of speciation processes and mechanisms when they are examined in the
context of the contemporary earth history and environmental changes. Although the
current view is still mostly speculative, the correlation between speciation events and
Cenozoic climatic cooling will become better understood with accumulation of gene
sequence data for other fruit fly species. The inferred temporal pattern of speciation from
these efforts will be also useful in selecting genomes for sequencing and annotation,
calibrating the tempo of DNA loss, building temporal contexts of origin and horizontal
transfer events of the transposable elements, and understanding timing of gene duplications,
chromosomal changes, and evolution of genome anatomies in general (Petrov and Hartl
1998; Silva and Kidwell 2000; Bergman et al. 2002; Kaminker et al. 2002).
by guest on Novem
ber 21, 2013http://m
be.oxfordjournals.org/D
ownloaded from
17
Acknowledgements
We would like to thank Drs. Adriana Briscoe, Thomas Dowling, Michael
Rosenberg, Martin Wojciechowski, Margaret Kidwell, and Alan Filipski for their
comments on an earlier draft of this manuscript. We thank Balaji Ramanujum for
providing invaluable technical assistance. This work was supported by research grant from
Ministry of Education, Culture, Sports, Science and Technology, Japan, to K. T. and from
National Science Foundation, National Institutes of Health, and Burroughs Wellcome Fund,
USA, to S.K.
by guest on Novem
ber 21, 2013http://m
be.oxfordjournals.org/D
ownloaded from
18
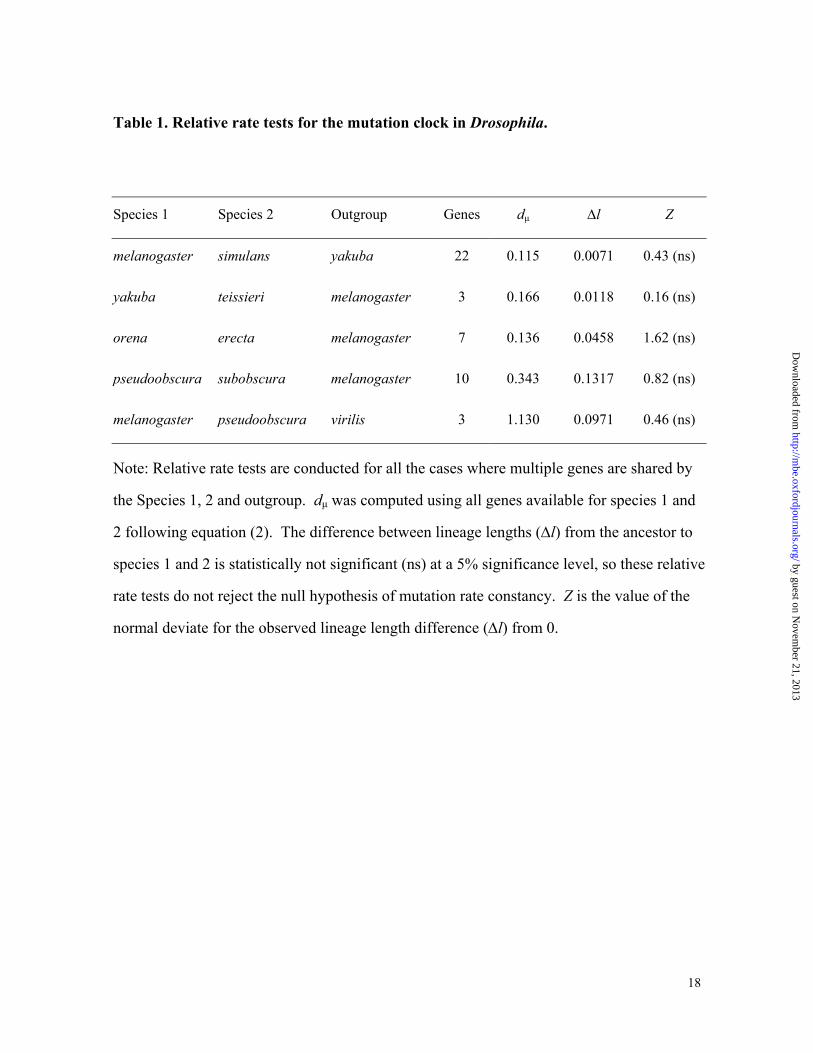
Table 1. Relative rate tests for the mutation clock in Drosophila.
Species 1 Species 2 Outgroup Genes dµ ∆l Z
melanogaster simulans yakuba 22 0.115 0.0071 0.43 (ns)
yakuba teissieri melanogaster 3 0.166 0.0118 0.16 (ns)
orena erecta melanogaster 7 0.136 0.0458 1.62 (ns)
pseudoobscura subobscura melanogaster 10 0.343 0.1317 0.82 (ns)
melanogaster pseudoobscura virilis 3 1.130 0.0971 0.46 (ns)
Note: Relative rate tests are conducted for all the cases where multiple genes are shared by
the Species 1, 2 and outgroup. dµ was computed using all genes available for species 1 and
2 following equation (2). The difference between lineage lengths (∆l) from the ancestor to
species 1 and 2 is statistically not significant (ns) at a 5% significance level, so these relative
rate tests do not reject the null hypothesis of mutation rate constancy. Z is the value of the
normal deviate for the observed lineage length difference (∆l) from 0.
by guest on Novem
ber 21, 2013http://m
be.oxfordjournals.org/D
ownloaded from
19
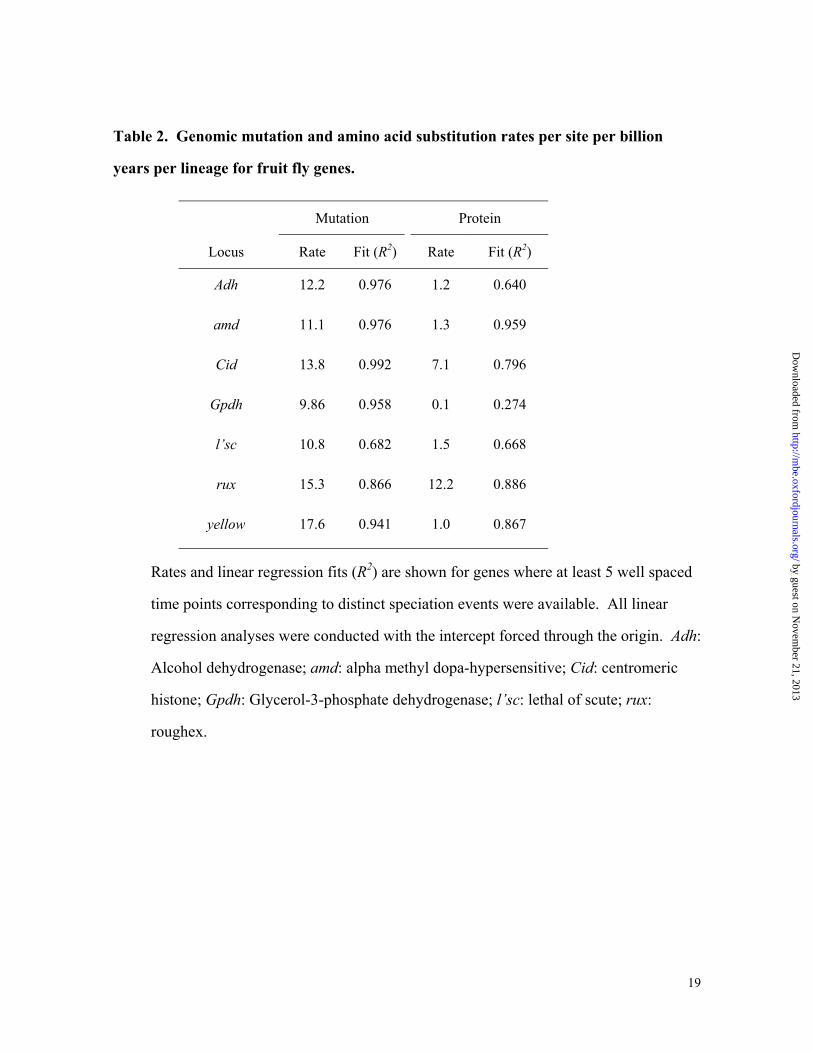
Table 2. Genomic mutation and amino acid substitution rates per site per billion
years per lineage for fruit fly genes.
Mutation Protein
Locus Rate Fit (R2) Rate Fit (R2)
Adh 12.2 0.976 1.2 0.640
amd 11.1 0.976 1.3 0.959
Cid 13.8 0.992 7.1 0.796
Gpdh 9.86 0.958 0.1 0.274
l�sc 10.8 0.682 1.5 0.668
rux 15.3 0.866 12.2 0.886
yellow 17.6 0.941 1.0 0.867
Rates and linear regression fits (R2) are shown for genes where at least 5 well spaced
time points corresponding to distinct speciation events were available. All linear
regression analyses were conducted with the intercept forced through the origin. Adh:
Alcohol dehydrogenase; amd: alpha methyl dopa-hypersensitive; Cid: centromeric
histone; Gpdh: Glycerol-3-phosphate dehydrogenase; l�sc: lethal of scute; rux:
roughex.
by guest on Novem
ber 21, 2013http://m
be.oxfordjournals.org/D
ownloaded from
20
Figure 1. (a) Relationship of codon adaptation index (CAI) and the number of
substitutions per fourfold-degenerate site (dS) between D. melanogaster and D. simulans
(62 genes; R2 = 0.148). (b) Relationship between CAI and the base composition skew
(BCS) in D. melanogaster genes (146 genes). (c) Relationships between BCS and dS
between D. melanogaster and D. simulans (62 genes; R2 = 0.176). Fit of the linear
regression line is shown in panels a and c. In panel c, higher order regression fit was
statistically not significantly better than the linear regression fit shown.
Figure 2. Relationship of estimated mutation distances (dµ) and codon adaptation index
(CAI) for the comparison of D. melanogaster with (a) D. simulans, (b) D. yakuba, (c) D.
psuedoobscura, and (d) D. virilis. The correlation between dµ and CAI is not significant in
any of the cases (P > 0.7, 0.80, 0.3, and 0.4, respectively).
Figure 3. Multigene mutation distance histogram for comparisons between D.
melanogaster and simulans (mel-sim), yakuba (mel-yak), pseudoobscura (mel-pse), and
virilis (mel-vir). For direct comparison, each multigene distribution was standardized by
using the average genomic distance for the corresponding species pair.
Figure 4. A Drosophila evolutionary timescale based on genomic mutation distances. The
number of genes (in parentheses) and standard errors are shown along with representative
taxa. Paleoclimatic cooling periods are shown in light blue on the left of the geologic
timescale (Kennett 1995; Zachos et al. 2001). sg. subgenus; gr. species group; sgr. species
subgroup.
Figure 5. The relationship of synonymous substitutions (a) and mutational distances (b)
with time for the Adh gene in the subgenus Sophophora lineage leading to D. melanogaster
(filled circle) and in the subgenus Drosophila leading to the Hawaiian D. picticornis (open
by guest on Novem
ber 21, 2013http://m
be.oxfordjournals.org/D
ownloaded from
21
circle). Regression analysis shows slopes of 0.011 and 0.005 for subgenus Sophophora and
Drosophila, respectively, in panel a. These values are 0.012 and 0.010 in panel b.
Figure 6. (a) Histograms showing distributions of mutation rates and nonsynonymous
substitution rates (nucleotide substitution rate at non-degenerate sites) in 176 genes. The
arrow points to the nonsynonymous substitution rate of the Acp26Aa gene, which is higher
than the average rate of the mutation distances. See text for details. (b) Relationship
between genomic mutation and protein sequence evolution rates based on Poisson corrected
distances. All rates are in the units of per site per billion years per lineage.
by guest on Novem
ber 21, 2013http://m
be.oxfordjournals.org/D
ownloaded from
22
Literature cited
Aguade, M., 1999 Positive selection drives the evolution of the Acp29AB accessory gland protein
in Drosophila. Genetics 152: 543-551.
Altschul, S. F., T. L. Madden, A. A. Schaffer, J. Zhang, Z. Zhang et al., 1997 Gapped BLAST and
PSI-BLAST: a new generation of protein database search programs. Nucleic Acids Res 25:
3389-3402.
Avedisov, S. N., I. B. Rogozin, E. V. Koonin and B. J. Thomas, 2001 Rapid Evolution of a Cyclin
A Inhibitor Gene, roughex, in Drosophila. Mol. Biol. Evol. 18: 2110-2118.
Bergman, C. M., and M. Kreitman, 2001 Analysis of conserved noncoding DNA in Drosophila
reveals similar constraints in intergenic and intronic sequences. Genome Res 11: 1335-
1345.
Bergman, C. M., B. D. Pfeiffer, D. E. Rincon-Limas, R. A. Hoskins, A. Gnirke et al., 2002
Assessing the impact of comparative genomic sequence data on the functional annotation of
the Drosophila genome. Genome Biol 3: RESEARCH0086-0086.
Beverley, S. M., and A. C. Wilson, 1984 Molecular evolution in Drosophila and the higher Diptera
II. A time scale for fly evolution. J Mol Evol 21: 1-13.
Carson, H. L., 1992 Inversions in Hawaiian Drosophila, pp. 407-439 in Drosophila Inversion
Polymorphism, edited by C. B. Krimbas and J. R. Powell. CRC Press, Boca Raton, Florida.
Carson, H. L., and D. A. Clauge, 1995 Geology and biogeography of Hawaii, pp. 14-29 in
Hawaiian biogeography : evolution on a hot spot archipelago, edited by W. L. Wagner and
V. A. Funk. Smithsonian Institution Press, Washington DC.
Dunn, K. A., J. P. Bielawski and Z. Yang, 2001 Substitution rates in Drosophila nuclear genes:
implications for translational selection. Genetics 157: 295-305.
Eanes, W. F., M. Kirchner, J. Yoon, C. H. Biermann, I. N. Wang et al., 1996 Historical selection,
amino acid polymorphism and lineage-specific divergence at the G6pd locus in Drosophila
melanogaster and D. simulans. Genetics 144: 1027-1041.
Easteal, S., and J. G. Oakeshott, 1985 Estimating Divergence Times of Drosophila Species from
DNA-Sequence Comparisons. Mol. Biol. Evol. 2: 87-91.
Goto, S. G., and M. T. Kimura, 2001 Phylogenetic utility of mitochondrial COI and nuclear Gpdh
genes in Drosophila. Mol Phylogenet Evol 18: 404-422.
Grimaldi, D. A., 1987 Amber Fossil Drosophilidae (Diptera), with Particular Reference to the
Hispaniolan Taxa. Am. Mus. Novitates 2880: 1-23.
by guest on Novem
ber 21, 2013http://m
be.oxfordjournals.org/D
ownloaded from
23
Hedges, S. B., and S. Kumar, 2003 Genomic Clocks and Evolutionary Timescales. Trends in
Genetics 19: 200-206.
Hughes, A. L., and M. Yeager, 1997 Comparative evolutionary rates of introns and exons in murine
rodents. J Mol Evol 45: 125-130.
Kaminker, J. S., C. M. Bergman, B. Kronmiller, J. Carlson, R. Svirskas et al., 2002 The
transposable elements of the Drosophila melanogaster euchromatin: a genomics
perspective. Genome Biol 3: RESEARCH0084-0084.
Kennett, J. P., 1995 A Review of Polar Climatic Evolution during the Neogene, Based on the
Marine Sediment Record, pp. 49-64 in Paleoclimate and Evolution, with emphasis on
human origins, edited by E. S. Vrba, G. H. Denton, T. C. Partridge and L. H. Burckle. Yale
University Press, New Heaven, Connecticut.
Kimura, M., 1983 The neutral theory of molecular evolution. Cambridge University Press,
Cambridge.
Kumar, S., and S. R. Gadagkar, 2001 Disparity index: a simple statistic to measure and test the
homogeneity of substitution patterns between molecular sequences. Genetics 158: 1321-
1327.
Kumar, S., and S. Subramanian, 2002 Mutation rates in mammalian genomes. Proc. Natl. Acad. Sci.
U. S. A. 99: 803-808.
Lachaise, D., M. L. Cariou, J. R. David, F. Lemeunier, L. Tsacas et al., 1988 Historical
Biogeography of the Drosophila-Melanogaster Species Subgroup. Evol Biol 22: 159-225.
Manheim, E. A., J. K. Jang, D. Dominic and K. S. Mckim, 2002 Cytoplasmic localization and
evolutionary conservation of MEI-218, a protein required for meiotic crossing-over in
Drosophila. Mol Biol Cell 13: 84-95.
Moriyama, E. N., and D. L. Hartl, 1993 Codon usage bias and base composition of nuclear genes in
Drosophila. Genetics 134: 847-858.
Nei, M., and S. Kumar, 2000 Molecular evolution and phylogenetics. Oxford University Press,
Oxford ; New York.
O'grady, P. M., and M. G. Kidwell, 2002 Phylogeny of the subgenus sophophora (Diptera:
drosophilidae) based on combined analysis of nuclear and mitochondrial sequences. Mol
Phylogenet Evol 22: 442-453.
Petrov, D. A., and D. L. Hartl, 1998 High rate of DNA loss in the Drosophila melanogaster and
Drosophila virilis species groups. Mol Biol Evol 15: 293-302.
by guest on Novem
ber 21, 2013http://m
be.oxfordjournals.org/D
ownloaded from
24
Powell, J. R., 1997 Progress and prospects in evolutionary biology : the Drosophila model. Oxford
University Press, New York.
Rodriguez-Trelles, F., R. Tarrio and F. J. Ayala, 1999 Switch in codon bias and increased rates of
amino acid substitution in the Drosophila saltans species group. Genetics 153: 339-350.
Rodriguez-Trelles, F., R. Tarrio and F. J. Ayala, 2000 Fluctuating mutation bias and the evolution
of base composition in Drosophila. J Mol Evol 50: 1-10.
Rodriguez-Trelles, F., R. Tarrio and F. J. Ayala, 2001a Erratic overdispersion of three molecular
clocks: GPDH, SOD, and XDH. Proc Natl Acad Sci U S A 98: 11405-11410.
Rodriguez-Trelles, F., R. Tarrio and F. J. Ayala, 2001b Xanthine dehydrogenase (XDH): episodic
evolution of a "neutral" protein. J Mol Evol 53: 485-495.
Rowan, R. G., and J. A. Hunt, 1991 Rates of DNA change and phylogeny from the DNA sequences
of the alcohol dehydrogenase gene for five closely related species of Hawaiian Drosophila.
Mol Biol Evol 8: 49-70.
Russo, C. A. M., N. Takezaki and M. Nei, 1995 Molecular Phylogeny and Divergence Times of
Drosophilid Species. Mol. Biol. Evol. 12: 391-404.
Sharp, P. M., and W. H. Li, 1987 The Codon Adaptation Index - a Measure of Directional
Synonymous Codon Usage Bias, and Its Potential Applications. Nucleic Acids Res. 15:
1281-1295.
Sharp, P. M., and W. H. Li, 1989 On the rate of DNA sequence evolution in Drosophila. J Mol Evol
28: 398-402.
Shields, D. C., P. M. Sharp, D. G. Higgins and F. Wright, 1988 Silent Sites in Drosophila Genes
Are Not Neutral - Evidence of Selection among Synonymous Codons. Mol. Biol. Evol. 5:
704-716.
Silva, J. C., and M. G. Kidwell, 2000 Horizontal transfer and selection in the evolution of P
elements. Mol Biol Evol 17: 1542-1557.
Takezaki, N., A. Rzhetsky and M. Nei, 1995 Phylogenetic test of the molecular clock and linearized
trees. Mol Biol Evol 12: 823-833.
Tamura, K., and S. Kumar, 2002 Evolutionary Distance Estimation Under Heterogeneous
Substitution Pattern Among Lineages. Mol. Biol. Evol. 19: 1727-1736.
Tamura, K., and M. Nei, 1993 Estimation of the Number of Nucleotide Substitutions in the Control
Region of Mitochondrial-DNA in Humans and Chimpanzees. Mol. Biol. Evol. 10: 512-526.
Tamura, K., G. Toba, J. Park and T. Aotsuka, 1995 Origin of Hawaiian drosophilids inferred from
alcohol dehydrogenase gene sequences, pp. 9-18 in Current Topics on Molecular
by guest on Novem
ber 21, 2013http://m
be.oxfordjournals.org/D
ownloaded from
25
Evolution: Proceedings of the US-Japan Workshop, edited by M. Nei and N. Takahata. The
Pennsylvania State University, USA, Graduate School for Advanced Studies, Hayama,
Japan.
Tatarenkov, A., J. Kwiatowski, D. Skarecky, E. Barrio and F. J. Ayala, 1999 On the evolution of
Dopa decarboxylase (Ddc) and Drosophila systematics. J Mol Evol 48: 445-462.
Tatarenkov, A., M. Zurovcova and F. J. Ayala, 2001 Ddc and amd sequences resolve phylogenetic
relationships of Drosophila. Mol Phylogenet Evol 20: 321-325.
Thomas, R. H., and J. A. Hunt, 1993 Phylogenetic relationships in Drosophila: a conflict between
molecular and morphological data. Mol Biol Evol 10: 362-374.
Thompson, J. D., D. G. Higgins and T. J. Gibson, 1994 Clustal-W - Improving the Sensitivity of
Progressive Multiple Sequence Alignment through Sequence Weighting, Position-Specific
Gap Penalties and Weight Matrix Choice. Nucleic Acids Res. 22: 4673-4680.
Throckmorton, L. H., 1975 The phylogeny, ecology, and geography of Drosophila., pp. 421-469 in
Handbook of Genetics, edited by R. C. King. Plenum Press, New York.
Tsaur, S. C., and C. I. Wu, 1997 Positive selection and the molecular evolution of a gene of male
reproduction, Acp26Aa of Drosophila. Mol Biol Evol 14: 544-549.
Wallace, A. R., 1870a The measurement of geological time I. Nature 1: 399-401.
Wallace, A. R., 1870b The measurement of geological time II. Nature 1: 425-455.
Wright, F., 1990 The 'effective number of codons' used in a gene. Gene 87: 23-29.
Wu, C. I., and W. H. Li, 1985 Evidence for higher rates of nucleotide substitution in rodents than in
man. Proc Natl Acad Sci U S A 82: 1741-1745.
Zachos, J., M. Pagani, L. Sloan, E. Thomas and K. Billups, 2001 Trends, rhythms, and aberrations
in global climate 65 Ma to present. Science 292: 686-693.
by guest on Novem
ber 21, 2013http://m
be.oxfordjournals.org/D
ownloaded from
26
Figure 1.
by guest on Novem
ber 21, 2013http://m
be.oxfordjournals.org/D
ownloaded from
27
Figure 2
by guest on Novem
ber 21, 2013http://m
be.oxfordjournals.org/D
ownloaded from
28
Figure 3
by guest on Novem
ber 21, 2013http://m
be.oxfordjournals.org/D
ownloaded from
29
Figure 4
by guest on Novem
ber 21, 2013http://m
be.oxfordjournals.org/D
ownloaded from
30
Figure 5.
by guest on Novem
ber 21, 2013http://m
be.oxfordjournals.org/D
ownloaded from
31
Figure 6
by guest on Novem
ber 21, 2013http://m
be.oxfordjournals.org/D
ownloaded from


![[flY] Alph.a](https://static.fdokumen.com/doc/165x107/63370c276fd2e64f8d0dd91b/fly-alpha.jpg)


