Propranolol-induced inhibition of unconditioned stimulus ...
Upload
independentCategory
view
4download
0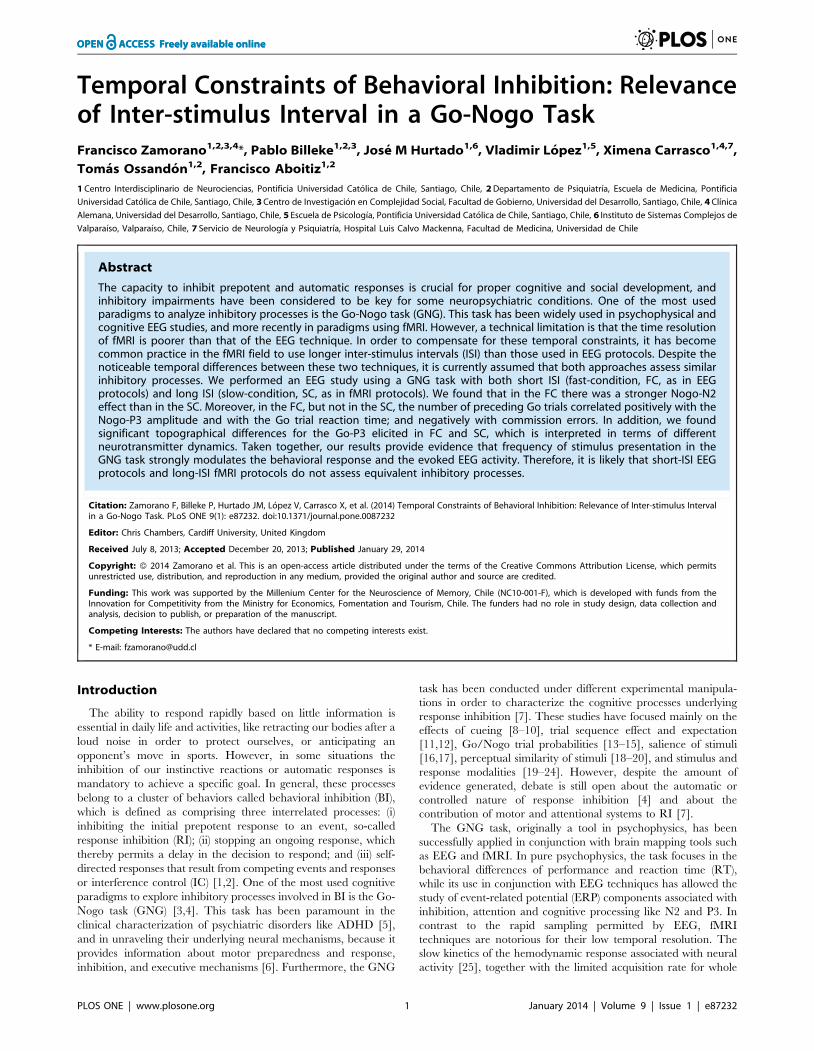
Temporal Constraints of Behavioral Inhibition: Relevanceof Inter-stimulus Interval in a Go-Nogo TaskFrancisco Zamorano1,2,3,4*, Pablo Billeke1,2,3, Jose M Hurtado1,6, Vladimir Lopez1,5, Ximena Carrasco1,4,7,
Tomas Ossandon1,2, Francisco Aboitiz1,2
1 Centro Interdisciplinario de Neurociencias, Pontificia Universidad Catolica de Chile, Santiago, Chile, 2 Departamento de Psiquiatrıa, Escuela de Medicina, Pontificia
Universidad Catolica de Chile, Santiago, Chile, 3 Centro de Investigacion en Complejidad Social, Facultad de Gobierno, Universidad del Desarrollo, Santiago, Chile, 4 Clınica
Alemana, Universidad del Desarrollo, Santiago, Chile, 5 Escuela de Psicologıa, Pontificia Universidad Catolica de Chile, Santiago, Chile, 6 Instituto de Sistemas Complejos de
Valparaıso, Valparaıso, Chile, 7 Servicio de Neurologıa y Psiquiatrıa, Hospital Luis Calvo Mackenna, Facultad de Medicina, Universidad de Chile
Abstract
The capacity to inhibit prepotent and automatic responses is crucial for proper cognitive and social development, andinhibitory impairments have been considered to be key for some neuropsychiatric conditions. One of the most usedparadigms to analyze inhibitory processes is the Go-Nogo task (GNG). This task has been widely used in psychophysical andcognitive EEG studies, and more recently in paradigms using fMRI. However, a technical limitation is that the time resolutionof fMRI is poorer than that of the EEG technique. In order to compensate for these temporal constraints, it has becomecommon practice in the fMRI field to use longer inter-stimulus intervals (ISI) than those used in EEG protocols. Despite thenoticeable temporal differences between these two techniques, it is currently assumed that both approaches assess similarinhibitory processes. We performed an EEG study using a GNG task with both short ISI (fast-condition, FC, as in EEGprotocols) and long ISI (slow-condition, SC, as in fMRI protocols). We found that in the FC there was a stronger Nogo-N2effect than in the SC. Moreover, in the FC, but not in the SC, the number of preceding Go trials correlated positively with theNogo-P3 amplitude and with the Go trial reaction time; and negatively with commission errors. In addition, we foundsignificant topographical differences for the Go-P3 elicited in FC and SC, which is interpreted in terms of differentneurotransmitter dynamics. Taken together, our results provide evidence that frequency of stimulus presentation in theGNG task strongly modulates the behavioral response and the evoked EEG activity. Therefore, it is likely that short-ISI EEGprotocols and long-ISI fMRI protocols do not assess equivalent inhibitory processes.
Citation: Zamorano F, Billeke P, Hurtado JM, Lopez V, Carrasco X, et al. (2014) Temporal Constraints of Behavioral Inhibition: Relevance of Inter-stimulus Intervalin a Go-Nogo Task. PLoS ONE 9(1): e87232. doi:10.1371/journal.pone.0087232
Editor: Chris Chambers, Cardiff University, United Kingdom
Received July 8, 2013; Accepted December 20, 2013; Published January 29, 2014
Copyright: � 2014 Zamorano et al. This is an open-access article distributed under the terms of the Creative Commons Attribution License, which permitsunrestricted use, distribution, and reproduction in any medium, provided the original author and source are credited.
Funding: This work was supported by the Millenium Center for the Neuroscience of Memory, Chile (NC10-001-F), which is developed with funds from theInnovation for Competitivity from the Ministry for Economics, Fomentation and Tourism, Chile. The funders had no role in study design, data collection andanalysis, decision to publish, or preparation of the manuscript.
Competing Interests: The authors have declared that no competing interests exist.
* E-mail: [email protected]
Introduction
The ability to respond rapidly based on little information is
essential in daily life and activities, like retracting our bodies after a
loud noise in order to protect ourselves, or anticipating an
opponent’s move in sports. However, in some situations the
inhibition of our instinctive reactions or automatic responses is
mandatory to achieve a specific goal. In general, these processes
belong to a cluster of behaviors called behavioral inhibition (BI),
which is defined as comprising three interrelated processes: (i)
inhibiting the initial prepotent response to an event, so-called
response inhibition (RI); (ii) stopping an ongoing response, which
thereby permits a delay in the decision to respond; and (iii) self-
directed responses that result from competing events and responses
or interference control (IC) [1,2]. One of the most used cognitive
paradigms to explore inhibitory processes involved in BI is the Go-
Nogo task (GNG) [3,4]. This task has been paramount in the
clinical characterization of psychiatric disorders like ADHD [5],
and in unraveling their underlying neural mechanisms, because it
provides information about motor preparedness and response,
inhibition, and executive mechanisms [6]. Furthermore, the GNG
task has been conducted under different experimental manipula-
tions in order to characterize the cognitive processes underlying
response inhibition [7]. These studies have focused mainly on the
effects of cueing [8–10], trial sequence effect and expectation
[11,12], Go/Nogo trial probabilities [13–15], salience of stimuli
[16,17], perceptual similarity of stimuli [18–20], and stimulus and
response modalities [19–24]. However, despite the amount of
evidence generated, debate is still open about the automatic or
controlled nature of response inhibition [4] and about the
contribution of motor and attentional systems to RI [7].
The GNG task, originally a tool in psychophysics, has been
successfully applied in conjunction with brain mapping tools such
as EEG and fMRI. In pure psychophysics, the task focuses in the
behavioral differences of performance and reaction time (RT),
while its use in conjunction with EEG techniques has allowed the
study of event-related potential (ERP) components associated with
inhibition, attention and cognitive processing like N2 and P3. In
contrast to the rapid sampling permitted by EEG, fMRI
techniques are notorious for their low temporal resolution. The
slow kinetics of the hemodynamic response associated with neural
activity [25], together with the limited acquisition rate for whole
PLOS ONE | www.plosone.org 1 January 2014 | Volume 9 | Issue 1 | e87232

brain scans require a lower rate of stimuli presentation in order to
detect effects using fMRI. This temporal constraint in fMRI has
led to important modifications in the interstimuli-timing schedule
for GNG experiments from that used in classical behavioral/EEG
paradigms. Whereas the classical paradigm uses ISIs of hundreds
of milliseconds [21,26], most of the fMRI studies increase the ISI
to several seconds [3,11,27–29].
The dramatic differences in the ISIs used in fMRI and EEG
approaches of the GNG task raise the question of whether there
are qualitative or quantitative differences in the cognitive
mechanisms underlying behavioral inhibition when using either
technique. In one scenario both techniques may be probing the
same cognitive mechanism only with different degrees of temporal
stress. In an alternative scenario, different mechanisms are
engaged as a function of temporal delay. The aim of this study
is to scrutinize how variation in the temporal parameters (e.g. ISI)
used in EEG and fMRI studies modulates the nature of the
inhibitory process measured.
Materials and Methods
ParticipantsTwenty normal adult subjects, all right-handed Spanish
speakers, 6 female, 14 male, ages 18–31 years (mean 24.6),
participated in the study. All participants had normal or corrected-
to-normal vision, no color-vision deficiency, no history of
neurological diseases, and no current psychiatric diagnosis or
psychotropic prescriptions.
Ethics StatementWritten consent was signed after detailed explanation of the
scope of the study, in accordance with guidelines and procedures
approved by the Ethics Committee of the Pontificia Universidad
Catolica de Chile. All experiments were performed at the
Laboratorio de Neurociencia Cognitiva of the Department of
Psychiatry of the University.
ParadigmParticipants performed two versions of the Go-Nogo task, a Fast
Condition (FC) and a Slow Condition (SC) that differed only in
their inter-stimuli interval (ISI). ISIs were drawn from uniform
distributions, 500–800 ms interval for the FC and 3000–3700 ms
interval for the SC (Figure 1A). Stimulus duration was 300 ms
indistinctly for Go and Nogo trials in both FC and SC. Each
participant performed four randomly alternated blocks of 300
trials, two FC and two SC, each one.
Our experimental paradigm consisted of a serial presentation of
screen centered green or red colored circles (3.5u of visual arc) for
Go and Nogo stimuli, respectively. Nogo trials were preceded by
sequences of 1, 3, 5 Go trials as indicated in Durston and
colleagues [11]; in addition we used a fourth condition with 7 Go
trials (Figure 1B).
Stimuli were presented in a 210 CRT monitor positioned 57 cm
in front of the subject. The subjects were instructed to press a
button as fast as possible after a Go stimulus (green circle) and to
restrain after a Nogo stimulus (red circle). The same instruction
was provided in both FC and SC. Two consecutive Nogo stimuli
were never presented. The tasks were programmed in Presentation
13.0 (Neurobehavioral Systems, Inc.).
Electrophysiological RecordingsContinuous EEG recordings were obtained with a 40-electrode
NuAmps EEG System (Compumedics Neuroscan). All impedances
were kept below 5 kV. Electrode impedance was retested during
pauses to ensure stable values throughout the experiment. All
electrodes were referenced to averaged mastoids during acquisi-
tion and the signal was digitized at 1 kHz. Electro-oculograms
(EOG) were obtained from four electrodes arranged in two bipolar
derivations, HEOG and VEOG [30]. All recordings were
obtained using Scan 4.3 (Compumedics Neuroscan) and stored
for off-line treatment. Later, EEG signals were preprocessed using
a 0.1–100 Hz band-pass filter. Eye blinks were identified by a
threshold criterion of 6 100 mV, and their contribution was
removed from each dataset using principal components analysis by
singular value decomposition and spatial filter transform. Other
remaining artifacts (e.g., muscular artifacts) were detected by visual
inspection of the signal and the trials that contained them were
removed. Thus, we obtained 220620 artifact-free trials per subject
for FC and SC.
Behavioral Statistical AnalysisAll behavioral statistical analyses were performed in R software
(http://www.R-project.org). For a better characterization of the
Go trial RTs measured in FC and SC, we perform an ex-Gaussian
analysis as follows. First, a smoothed RT density distribution was
obtained by convolving the raw RT distribution per subject and
condition with a Gaussian kernel (standard deviation of 10 ms) in
steps of 1 ms from 100 to 600 ms. Then, we computed a Wilcoxon
signed rank test between conditions across subjects for each
temporal bin, and corrected the resulting p-values using the
Bonferroni multiple comparison criterion. Additionally, we fitted
an ex-Gaussian distribution per subject and condition. This
distribution is the sum of a normal and an exponential
distribution, and is defined by three parameters: Mu, Sigma
(mean and standard deviation of the normal part of the
distribution, respectively) and Nu (decay constant of the
exponential part of the distribution) [31,32]. We finally compared
these parameters between conditions using a Wilcoxon signed rank
test.
For behavioral data analysis, Go trial RT and Nogo trial
commission errors (CE) were grouped according to the number of
Go trials that preceded the Nogo trial in each sequence. For RT
analysis we used only Go trials that preceded Nogo trials (i.e. the
last Go trial of the sequence) in order to obtain a similar number of
trials per condition. We used both (i) the mean value per subject,
comparing them by the Friedman rank sum test, and (ii) the single
Figure 1. Schematic representation of the task A. Representa-tion of ISI differences between FC and SC. B.- Diagram ofsequences used for stimulus presentation.doi:10.1371/journal.pone.0087232.g001
Temporal Constraints of Behavioral Inhibition
PLOS ONE | www.plosone.org 2 January 2014 | Volume 9 | Issue 1 | e87232

trial values computing a Spearman correlation per subject and
condition. Finally, to compare the Rho values obtained we
performed a Wilcoxon signed rank test. All tests were two-tailed.
In bar plot of Rho values (Figures 2C, E), we show the 95%
confidences intervals of the means obtained by bootstrapping
distribution.
EEG Data AnalysisAll algorithms were implemented in MATLAB 7.0. (MATLAB,
version 7.0 (r14) ed. Natick, Massachusetts: The Mathworks Inc.,
2004), by in-house scripts used in our previous work [33] (available
online http://lantoolbox.wikispaces.com/). Evoked activity was
computed as the mean of the electrical brain activity for each
electrode and each participant over trials.
Figure 2. Behavioral results. A. Density distribution for reaction times to Go trials in FC (blue), and SC (orange). The bar below represents regionswhere the distributions are significantly different (blue, FC . SC; orange, SC .FC; p,0.05, Bonferroni corrected). B. Go trial reaction times classifiedby the number of consecutive Go trials that preceded a Nogo trial (1,3,5 and 7) for FC (blue) and SC (orange). C. Correlation coefficients (Rho)between Go trials that preceded a Nogo trial and the respective Go trial reaction time, calculated per each subject and condition. D. Nogo trial errorsclassified by the number of consecutive Go trials that preceded a Nogo trial (1,3,5 and 7) for FC (blue) and SC (orange). E. Correlation coefficients(Rho) between Nogo trial errors and number of Go trials that preceded a Nogo trial, calculated per each subject and condition. B, D. Boxes representthe interquartile range and the whiskers the most extreme data points. C, E. Error bar represent the 95% confidence interval by bootstrappingdistributions.doi:10.1371/journal.pone.0087232.g002
Temporal Constraints of Behavioral Inhibition
PLOS ONE | www.plosone.org 3 January 2014 | Volume 9 | Issue 1 | e87232

To determinate differences between the ERPs elicited by Go
and Nogo trials in FC and SC, we conducted paired comparisons
(Wilcoxon signed-rank tests, two-tailed) across the mean per
condition per subject at each temporal bin. Then, we corrected for
multiple comparisons using a cluster based permutation test [34].
In this method, the data was transformed to a three-dimensional
space (two-dimensional plane of electrode positions and time) and
clusters of continuous significant areas were defined by pooling
neighboring bins showing the same effect (p,0.05). The cluster-
level statistics was the sum of the individual statistics of all bins
within the corresponding cluster. We controlled for the false alarm
rate of the complete spatio-temporal cluster (set of electrodes and
time bins) by evaluating the cluster-level significance under the
permutation distribution of the cluster that had the largest cluster-
level statistics. The permutation distribution was obtained by
randomly permuting all trials of the two conditions for each
subject thereby eliminating any systematic difference between the
conditions. After each permutation, a Wilcoxon signed-rank test
was computed across the mean per permuted-conditions per
subject. After 1000 permutations, the cluster-level significance was
estimated as the proportion of elements of the permutation
distribution greater than the observed cluster-level significance.
The N2 amplitude was calculated using the major negativity of
the FCz electrode between 200 and 300 ms after stimulus
presentation. In the same way the P3 amplitude was calculated
using the major positivity of the FCz electrode between 300 and
400 ms after stimulus presentation, for every subject and
condition. In the analysis of Nogo-P3 amplitude classified by the
number of preceding Go trials we used the Friedman rank sum
test, and the Spearman correlation test per subject and condition
(using the number of preceding Go trials as ordinal variable).
Finally, we used the Wilcoxon signed rank test for Rho values
comparison. To study the relationship between Go-N2, Go-P3,
Nogo-N2, Nogo-P3 amplitudes, number of preceding Go trials,
Go trial RT and the Nogo trial CE, we used the Spearman partial
correlation test among all variables for both FC and SC. To
compare the partial correlation obtained from FC and SC, we
used a permutation test as follows. First, we calculated the strength
of all links in both conditions by taking the sum of the squared Rho
values of every correlation. Second, we contrasted the observed
absolute difference between conditions with a distribution
obtained by randomly permuting the two conditions (FC and
SC) by subject. Finally, we calculated the p-values as the
proportion of the absolute differences in the permutation
distribution greater than or equal to the observed difference
between conditions. Thus, we were able to control that the
observed differences in the link strength between conditions were
not due to chance.
Results
Behavioral studyTo assess whether the change of ISI impacts the behavior of
subjects, we first studied the accuracy (rate of successful trials)
across subjects for different conditions. We did not find differences
between FC and SC in Go trials (p = 0.25, Wilcoxon signed rank
test); however, in Nogo trials we observed a significant decrease in
accuracy in the FC compared with the SC (p = 1.37e-2). We also
found that reaction times were significantly shorter in FC Go trials
than in SC Go trials. To examine this difference in detail we
performed an ex-Gaussian analysis of reaction times in the FC and
SC (Figure 2A). This analysis showed significant differences in Mu
(p = 3e26) and Sigma (p = 2e23) parameters, which represent the
mean and standard deviation of the Gaussian part of the
distribution respectively. The Nu parameter, that represents the
time decay of the exponential part of the distribution, showed no
significant difference, indicating that both conditions exhibit a
similar tendency to obtain long reaction times.
In the FC, the number of Go trials before a Nogo stimulus
modulated both the Go trial RT and the Nogo trial CE. Thus, in
FC sequences, the first responses were significantly faster
(p = 3.3e29, Friedman rank test) but more inaccurate than the
latter (p = 7.4e26). None of these effects were observed in the SC
(p = 0.11 for RT and p = 0.25 for CE) (Figure 2B, 2D). To assess
the strength of the effects, we computed the Spearman rank
correlation coefficient (Rho) between the number of preceding Go
trials and both Go trial RTs and Nogo trial CEs, for each subject
and each condition. In accordance with the previous results, only
in the FC, the Rho values of the correlation between the number
of preceding Go trials and their RT differed significantly from zero
(p = 1e25), yielding a significant difference between these Rho
values for FC and SC (p = 9.0e26) (Figure 2C). In the same way,
for CE in Nogo trials, only in the FC the Rho values were
significantly different from zero (p = 6e25), and the Rho values for
FC and SC were significantly different (p = 4e25, Figure 2E).
Finally, we evaluated the correlation between Go trial RT and
Nogo trial CE. In this analysis, the Rho coefficients were
significantly different between conditions (mean Rho for FC =
20.23; mean Rho for SC = 20.09; p = 0.01, Wilcoxon signed
rank test).
Summarizing these results, (i) in the FC, there were shorter
overall reaction times to Go trials and more commission errors to
Nogo trials than in the SC; (ii) only in the FC, Go trials RT and
Nogo CE were significantly correlated with the number of
preceding Go trials.
Electroencephalographic studyThe ERPs for Go and Nogo stimuli in both FC and SC are
illustrated in Figure 3A. Figure 3B displays the scalp topographies
of N2 and P3 for all conditions. In line with previous studies,
overall higher amplitudes were evidenced for Nogo than for Go
ERP late components (N2, P3)[21].
Additionally, when comparing FC and SC in both Go and
Nogo conditions, early components (P1, N1) showed statistical
differences. Whereas, both Go and Nogo stimuli elicited a P1 ERP
component whose amplitude was significantly greater in FC than
in SC, the amplitude of N1 ERP component was significantly
greater in SC than in FC (Figure S1).
On the other hand, when comparing late inhibition-related
components elicited by both Go and Nogo stimuli, only Nogo-N2
was significantly greater in FC (see Figure 3A). Neither N2 nor P3
evidenced statistical differences between FC and SC in the Go
condition.
In order to characterize the inhibitory processes involved in the
Go-Nogo task for FC and SC, we studied the Nogo-effect, which
contrasts Nogo and Go activities. In this way the inhibitory activity
reflected in N2 and P3 components emerges clearly for both FC
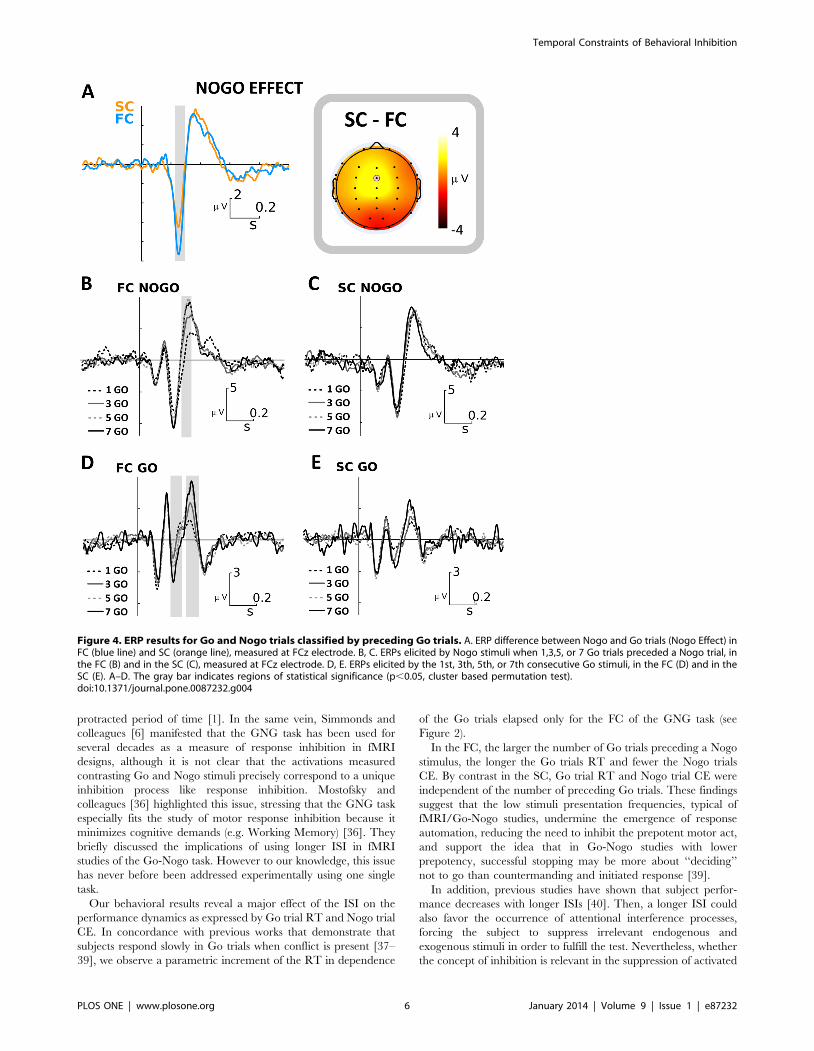
and SC conditions (Figure 4A). We found that the Nogo-N2 was
significantly larger in FC than in SC (p,0.01 cluster based
permutation test for multiple comparisons correction). The
difference for the Nogo effect between FC and SC is depicted in
the right panel of Figure 4A. No statistically significant differences
were observed for the Nogo-P3 component in a preliminary
analysis that included all Nogo trials for FC and SC. Considering
this, we additionally performed a specific analysis taking into
account the possible increased expectative after each Go trial and
the increased effort to inhibit interferences.
Temporal Constraints of Behavioral Inhibition
PLOS ONE | www.plosone.org 4 January 2014 | Volume 9 | Issue 1 | e87232

Thus, we studied the Nogo-P3 amplitude when preceded by 1,
3, 5, and 7 Go stimuli for both FC and SC, and observed a
parametric increase of the Nogo-P3 amplitude only in the FC
(Figure 4B). This amplitude modulation effect did not occur in the
SC (Figure 4C). In a similar way, we studied the ERPs elicited by
Go trials, with the difference that in this case we studied the ERPs
generated by the first, third, fifth and seventh consecutive Go
stimuli of each sequence. As in the previous case, the Go-P3
amplitude was modulated by the length of Go-trial sequences only
in the FC. Remarkably, we also found a parametric increase of the
Go-N2 amplitudes in the same condition (Figure 4D, E).
Finally, in order to obtain a better characterization of the
relation among independent (number of preceding Go trials) and
dependent variables (Go-N2, Go-P3, Nogo-N2, Nogo-P3 ampli-
tude, Go trial RT and Nogo CE) in both FC and SC, we
performed a Spearman partial correlation analysis (Figure 5). On
one hand, in the FC we found that the number of preceding Go
trials correlated significantly and positively with Go-P3 (p = 2e22;
r = 0.25) and Nogo-P3 amplitude (p = 4e22; r = 0.23) and RT
(p = 6e26; r = 0.49), and negatively with Go-N200 (p = 2e23;
r = 20.34) with the CE (p = 3e22; r = 20.24). The amplitude of
the Nogo-N2 component showed a significant correlation only
with the previous Go-RT (p = 1e24; r = 0.43) and Go-N2
amplitude (p = 1e25; r = 0.48). Additionally, the CE also shows
a negative and significant correlation with the amplitude of the
Nogo-P3 component (p = 4e23; r = 20.32). On the other hand,
most of the significant correlations obtained in the FC were not
replicated in SC. Nonetheless, the Go-RT were inversely
correlated the Nogo-N2 amplitude (p = 2e23; r = 20.34) and
the Go-N2 amplitudes were also modulated by the number of
preceding Go trials (p = 3e23; r = 0.34); additionally RT was
significantly and negatively correlated with CE (p = 2e22; r =
20.25), and the amplitudes of Go-P3 and Nogo-P3 were
significantly correlated (p = 3e22; r = 0.24). To verify that the
differences in the partial correlation analysis between FC and SC
were not due to chance, we performed a permutation test (see
methods). This analysis indicated that the differences between the
strength of overall links in FC and SC partial correlations were
significant (p = 3e22). In other words, the variables were more
strongly correlated among them in FC than in SC.
Summarizing these findings, (i) there was a larger N2 response
to Nogo trials in the FC than in the SC, but no amplitude
modulation by the number of preceding Go trials was observed in
any of the two conditions; (ii) amplitude modulation was observed
for Go-N2 in both FC and SC, and for Go-P3 and Nogo-P3
amplitudes in FC but not in SC; (iii) only in the FC, all dependent
variables measured (Go-N2, Go-P3, Nogo-P3, Go trial RT and
Nogo CE), with the exception of the Nogo-N2 amplitude,
correlated significantly with the number of preceding Go trials
(Figure 5).
Discussion
The main objective of this article has been to examine whether
variations of the inter-stimulus interval modify the nature of the
inhibitory process that operates during the Go–Nogo task.
Originally, the Go–Nogo task was purported to measure response
inhibition, which is only one component of behavioral inhibition
[35]. It was not intended to assess other components, such as
inhibiting interferences or the ability to inhibit a response over a
Figure 3. ERP results for all Go and Nogo trials. A. ERP for Nogo and Go trials in FC (blue line) and SC (orange line), measured at FCz electrode.B. Topographic distributions of Nogo-N2, Nogo-P3, Go-N2 and Go-P3 for FC (first raw) and SC (second raw). Statistical differences between FC and SCtopographies are depicted in the third row.doi:10.1371/journal.pone.0087232.g003
Temporal Constraints of Behavioral Inhibition
PLOS ONE | www.plosone.org 5 January 2014 | Volume 9 | Issue 1 | e87232
protracted period of time [1]. In the same vein, Simmonds and
colleagues [6] manifested that the GNG task has been used for
several decades as a measure of response inhibition in fMRI
designs, although it is not clear that the activations measured
contrasting Go and Nogo stimuli precisely correspond to a unique
inhibition process like response inhibition. Mostofsky and
colleagues [36] highlighted this issue, stressing that the GNG task
especially fits the study of motor response inhibition because it
minimizes cognitive demands (e.g. Working Memory) [36]. They
briefly discussed the implications of using longer ISI in fMRI
studies of the Go-Nogo task. However to our knowledge, this issue
has never before been addressed experimentally using one single
task.
Our behavioral results reveal a major effect of the ISI on the
performance dynamics as expressed by Go trial RT and Nogo trial
CE. In concordance with previous works that demonstrate that
subjects respond slowly in Go trials when conflict is present [37–
39], we observe a parametric increment of the RT in dependence
of the Go trials elapsed only for the FC of the GNG task (see
Figure 2).
In the FC, the larger the number of Go trials preceding a Nogo
stimulus, the longer the Go trials RT and fewer the Nogo trials
CE. By contrast in the SC, Go trial RT and Nogo trial CE were
independent of the number of preceding Go trials. These findings
suggest that the low stimuli presentation frequencies, typical of
fMRI/Go-Nogo studies, undermine the emergence of response
automation, reducing the need to inhibit the prepotent motor act,
and support the idea that in Go-Nogo studies with lower
prepotency, successful stopping may be more about ‘‘deciding’’
not to go than countermanding and initiated response [39].
In addition, previous studies have shown that subject perfor-
mance decreases with longer ISIs [40]. Then, a longer ISI could
also favor the occurrence of attentional interference processes,
forcing the subject to suppress irrelevant endogenous and
exogenous stimuli in order to fulfill the test. Nevertheless, whether
the concept of inhibition is relevant in the suppression of activated
Figure 4. ERP results for Go and Nogo trials classified by preceding Go trials. A. ERP difference between Nogo and Go trials (Nogo Effect) inFC (blue line) and SC (orange line), measured at FCz electrode. B, C. ERPs elicited by Nogo stimuli when 1,3,5, or 7 Go trials preceded a Nogo trial, inthe FC (B) and in the SC (C), measured at FCz electrode. D, E. ERPs elicited by the 1st, 3th, 5th, or 7th consecutive Go stimuli, in the FC (D) and in theSC (E). A–D. The gray bar indicates regions of statistical significance (p,0.05, cluster based permutation test).doi:10.1371/journal.pone.0087232.g004
Temporal Constraints of Behavioral Inhibition
PLOS ONE | www.plosone.org 6 January 2014 | Volume 9 | Issue 1 | e87232

cognitive contents or in the control of interfering information is
still being disputed [7]. In line with this interpretation is the
evidence from the cognitive-energetic model for ADHD [41],
which posits that event rate alters the energetic state of the subject
promoting fast-inaccurate responding at high rates, and slow-
inaccurate responding at low rate event presentation.
Previous ERP studies indicated that behavioral inhibition is
associated to the N2 component, whose amplitude increases in
Nogo trials according to the response inhibition requirements
[26,42–44], as compared to Go trials where no RI activity is
needed [15].
In particular, the Nogo-N2 has been interpreted to represent
motor inhibition [45–47], detection of response conflict
[15,45,48], processing a mismatch between a stimulus an a
mental template [49] or cognitive resources allocation [50]. On
the other hand, Go-N2 may represent the strength of motor
preparation processes, which seems to vary as a positive function
of the probability of the Go stimulus [9]. For a comprehensive
review about existent literature on response inhibition tasks and
EEG studies see Huster and colleagues [7].
In the current study the amplitude of the N2 Nogo-effect was
significantly different when comparing FC and SC (Figure 4A).
The larger N2 effect in FC could be explained by the greater effort
required to withhold the Go response [51]. Additionally, when we
studied in detail the Nogo-N2 amplitude elicited by 1, 3, 5, and 7
preceding Go stimuli, we observed significant modulations only in
the FC (Figure 4B, 4C), and this was confirmed by the partial
correlation analysis (Figure 5).
Our results are in line with those reported in previous works
[52] suggesting that N2 may represent attentional rather than
cognitive control processing [49]. We observed an absence of
Nogo-N2 amplitude modulation by the number of preceding Go
trials for both FC and SC, but there was an overall higher
amplitude in FC. This effect could also be interpreted as resulting
from a higher level of arousal in the latter condition, revealing the
susceptibility of this component to the attentional state but not
necessarily to the cognitive interference control processing. A
similar amplitude modulation was found in the earlier P1 and N1
components (Figure S1). That said, it is noticeable that a negative
and significant correlation was found in both the FC and SC
between Go-N2 amplitude (but not for Nogo-N2) and the number
of preceding Go trials. These might be reflecting local changes in
the expectancy or probability of occurrence of a Nogo trial, and
the resulting modification of attentional resources allocation [7].
The Stimulus-driven N2 amplitude modulation has been inter-
preted as part of adjustments related to what is called the
‘‘Stimulus Set’’ and differs from those related with the ‘‘Response
Set’’. This interpretation concurs with earlier discussions on the
significance of N2 and P3 and the differential modulation of these
two components [53]. While perceptual load and conflict
monitoring might broadly modulate N2, the P3 seems more
dependent on the cognitive load and response preparation [7,53].
Furthermore, increased frontal-midline N2 has been observed
whenever an event is unexpected, irrespective for whether it is a
Go or Nogo stimulus. In contrast, in these designs, the P3 effect
does not seem to be affected in the same way [12]. Other authors
have suggested that the amplitude of the Nogo-N2 and Nogo-P3
vary as a negative function of Nogo stimulus probability [15],
while the Go P3 varies as a negative function of Go stimulus
probability [9].
One of the first phenomenological descriptions proposed that
P3 amplitude represented cognitive load and cognitive effort [54],
and since then it has been traditionally associated with updating
working memory [55,56], attentional processes [44,57,58], and
inhibitory processes [7,10,45,59–63]. Based on current evidence
two things can be said, with relative certainty, about P3: (i) P3 does
not represent a single cognitive process and, (ii) its interpretation
will vary depending on experimental and task settings.
Since withholding responses after a Nogo stimulus presentation
is a common task requirement, it is not surprising that a Nogo-P3a
component was elicited in both FC and SC. Furthermore, the
amplitude difference observed between FC and SC can be
explained in terms of the strength of response inhibition [14], and
as a reflect of the amount of allocated cognitive resources [50]. In
contrast to the Nogo stimuli, we found a strong divergence
between FC and SC Go-P3 topography. Our results showed that
the maximum amplitude of the Go-P3 component in FC was
found over the mid-frontocentral region of the scalp, whereas that
Go-P3 in SC showed a mid-centroparietal distribution (Figure 3B).
These two P3 scalp topographies have been extensively described
before as P3 subcomponents named P3a and P3b respectively.
While P3a may reflect a stimulus-driven disruption of frontal
attention engagement mediated by dopaminergic activity, P3b
should reflect both attentional and memory processing, related to
the norepinephrinergic system (for a review see Polich 2007).
In our view, the ‘‘posteriorization’’ of Go-P3 observed in SC
(Figure 3) is a reflex of a different processing mechanisms than in
FC. This topographic shift could be given by an increase of top-
down processing related to overriding interfering information, or
alternatively, it could reflect an increase in the expectation of the
Nogo stimulus appearance in the next presentation.
Normally during experiments subjects might think about things
apart from the task they are performing, especially when the task
has low incentive value [64,65]. In FC the short ISI forces the
attentional focus to keep engaged in the task for both Go and
Nogo stimuli, while in SC, a long ISI could facilitate the
appearance of task-unrelated thoughts which are associated to
high tonic NE activity [65]. Thus, the neural processing associated
to Go and Nogo stimuli under two different ISI may differ.
We hypothesize that in both FC and SC, Nogo stimulus
presentation captures attentional resources guided by perceptual
differences or novelty, triggering phasic dopamine (evidenced by
the P3a) and norepinephrine signaling. In this regard, Aston-Jones
Figure 5. Spearman partial correlation analysis for FC and SC.Solid color lines indicate significant correlation coefficientsbetween variables (blue for FC and orange for SC).doi:10.1371/journal.pone.0087232.g005
Temporal Constraints of Behavioral Inhibition
PLOS ONE | www.plosone.org 7 January 2014 | Volume 9 | Issue 1 | e87232

and Cohen (2005) postulated that the LC phasic response plays a
role in facilitating task-relevant behavioral responses [66] (i.e.
Nogo stimuli detection). Nonetheless in the FC, given the short
ISI, an overactivated state could be naturally triggered as the result
of the synergic participation of phasic DA and NE responses.
These may be behaviorally associated with a higher level of
arousal, shorter RTs and, by a tendency to false alarms when
Nogo stimuli are less probable. Then, to prevent errors in the short
ISI condition, the overactive response state (in FC but not in SC)
should be dampened through effort control [40,67], herein
referred as cognitive control.
Similarly, processing of Go-P3 stimulus in FC and SC could
imply two different neurotransmitter dynamics. In a first instance,
incoming stimuli invoke top-down attention switching, and
bottom-up memory-driven operations that might guide response
organization and production [63] in both FC and SC. Neverthe-
less, in a second instance because of the longer ISI of SC, fast
transient bursts of NE necessary to maintain focused attention
could derivate into increased levels of tonic NE, which has been
related to the posteriorization of the P3 component [63,68] and
with decreased arousal and task performance [66]. Thus, both the
posteriorization effect observed in Go-P3 (Figure 3B), and the
significant increase of RT and its variability (Figure 2A) in the SC
condition, may be interpreted as reflecting the involvement of
tonic NE activity.
Processes that demand cognitive control are often distinguished
from automatic ones, as they require the suppression of interfering
or distracting stimuli that are not usually present in automatic tasks
[69,70]. Our results show that variations of the inter-stimulus
interval in the Go-Nogo tasks, result in shifting from automatic
processes in short ISI to interference control in long ISI conditions.
Short ISI conditions require mainly automatic/attentional process-
es, which allow responding quickly but inaccurately. On the other
hand, long ISI conditions activate different levels of cognitive
control, as there is access to contextual information due to fewer
temporal constraints. In addition in SC there is less need of motor
inhibition (characteristic of FC) and decision-making processes
could emerge naturally at the expenses of slower reaction times,
improving accuracy. Thus, in contrast to the SC, the temporal
constraints of the FC force to a fine-tune regulation between these
two opposite processes in order to achieve an optimal performance.
Therefore, RI could be functionally understood as a conflict of two
opposite brain strategies oriented to solve problems in a different
way. In this context, the rhythm of the task (e.g. the frequency of the
stimulus presentation) is relevant to the processes involved in RI.
Thereby, our data indicates that a significant and relevant part
of the response inhibition process may not be appropriately
captured using long ISI as in fMRI Go-Nogo task designs.
Therefore, both experimental design and results interpretation
should consider the timing of the different cognitive processes, and
how the technical constraints can allow us to measure faster or
slower responses. A well-documented example about this issue,
also using Go-Nogo tasks, corresponds to the simultaneous
recording of skin conductance responses (SCR) and EEG studies
[71,72]. In this case, even when SCR and EEG can be assessed
with high temporal resolution, the differences in the specific time
courses and recovery times are considered an impediment for co-
registration of slow autonomic emotional responses at skin level
and faster cognitive activity related to response inhibition.
Conclusion
The present work emphasizes the relevance of ISI in the nature
of the inhibition processes measured with the Go-Nogo task, which
has been only tangentially considered before [6,73]. Our data
indicates that due to the nature of the original design of the Go-
Nogo task and the temporal constraints of the hemodynamic
response, the long ISI (fMRI-like) GNG task puts a stronger load
on cognitive inhibition processes, while short ISI (EEG-like) GNG
tasks probe more directly response inhibition. These results
highlight the need of further studies oriented to understand how
fading between automatic and cognitive control processing
operates in order to optimize behavior under different environ-
mental demands.
Supporting Information
Figure S1 Visual ERP components. A. ERP elicited by Go
trials in FC (blue line) and SC (orange line). B. ERP elicited by
Nogo trials in FC (blue line) and SC (orange line). A, B. ROI is
depicted in the superior right corner of each figure. The gray bar
indicates regions of statistical significance (p,0.05, cluster based
permutation test). The lower panel shows the P1 and N1
topographical representations for both FC and SC, and its
statistical differences.
(TIF)
Acknowledgments
We want to thank Felipe Crocco and Maximiliano Macuer for his technical
assistance.
Author Contributions
Conceived and designed the experiments: FZ PB JH VL. Performed the
experiments: FZ PB. Analyzed the data: FZ PB TO. Contributed reagents/
materials/analysis tools: PB JH FA. Wrote the paper: FZ PB JH VL TO
XC FA. Interpretation of results and discussion: FZ PB JH VL TO XC FA.
References
1. Barkley RA (1997) Behavioral inhibition, sustained attention, and executive
functions: constructing a unifying theory of ADHD. Psychol Bull 121: 65–94.
2. Oosterlaan J, Logan GD, Sergeant JA (1998) Response inhibition in AD/HD,
CD, comorbid AD/HD + CD, anxious, and control children: a meta-analysis of
studies with the stop task. J Child Psychol Psychiatry 39: 411–425.
3. Konishi S, Nakajima K, Uchida I, Kikyo H, Kameyama M, et al. (1999)
Common inhibitory mechanism in human inferior prefrontal cortex revealed by
event-related functional MRI. Brain 122 (Pt 5): 981–991.
4. Verbruggen F, Logan GD (2008) Automatic and controlled response inhibition:
associative learning in the go/no-go and stop-signal paradigms. J Exp Psychol
Gen 137: 649–672.
5. Henriquez M, Villarroel L, Henriquez H, Zamorano F, Rothhammer F, et al.
(2012) Intratask Variability As a Correlate for DRD4 and SLC6A3 Variants: A
Pilot Study in ADHD. J Atten Disord.
6. Simmonds DJ, Pekar JJ, Mostofsky SH (2008) Meta-analysis of Go/No-go tasks
demonstrating that fMRI activation associated with response inhibition is task-
dependent. Neuropsychologia 46: 224–232.
7. Huster RJ, Enriquez-Geppert S, Lavallee CF, Falkenstein M, Herrmann CS
(2013) Electroencephalography of response inhibition tasks: functional networks
and cognitive contributions. Int J Psychophysiol 87: 217–233.
8. Kopp B, Mattler U, Goertz R, Rist F (1996) N2, P3 and the lateralized readiness
potential in a nogo task involving selective response priming. Electroencephalogr
Clin Neurophysiol 99: 19–27.
9. Bruin KJ, Wijers AA (2002) Inhibition, response mode, and stimulus probability:
a comparative event-related potential study. Clin Neurophysiol 113: 1172–1182.
10. Smith JL, Johnstone SJ, Barry RJ (2007) Response priming in the Go/NoGo
task: the N2 reflects neither inhibition nor conflict. Clin Neurophysiol 118: 343–
355.
11. Durston S, Thomas KM, Worden MS, Yang Y, Casey BJ (2002) The effect of
preceding context on inhibition: an event-related fMRI study. Neuroimage 16:
449–453.
12. Smith JL, Smith EA, Provost AL, Heathcote A (2010) Sequence effects support
the conflict theory of N2 and P3 in the Go/NoGo task. Int J Psychophysiol 75:
217–226.
Temporal Constraints of Behavioral Inhibition
PLOS ONE | www.plosone.org 8 January 2014 | Volume 9 | Issue 1 | e87232

13. Bruin KJ, Wijers AA, van Staveren AS (2001) Response priming in a go/nogo
task: do we have to explain the go/nogo N2 effect in terms of response activationinstead of inhibition? Clin Neurophysiol 112: 1660–1671.
14. Enriquez-Geppert S, Konrad C, Pantev C, Huster RJ (2010) Conflict and
inhibition differentially affect the N200/P300 complex in a combined go/nogoand stop-signal task. Neuroimage 51: 877–887.
15. Nieuwenhuis S, Yeung N, van den Wildenberg W, Ridderinkhof KR (2003)Electrophysiological correlates of anterior cingulate function in a go/no-go task:
effects of response conflict and trial type frequency. Cogn Affect Behav Neurosci
3: 17–26.16. Schulz KP, Clerkin SM, Halperin JM, Newcorn JH, Tang CY, et al. (2009)
Dissociable neural effects of stimulus valence and preceding context during theinhibition of responses to emotional faces. Hum Brain Mapp 30: 2821–2833.
17. Elliott R, Rubinsztein JS, Sahakian BJ, Dolan RJ (2000) Selective attention toemotional stimuli in a verbal go/no-go task: an fMRI study. NeuroReport 11:
1739–1744.
18. Kiefer M, Marzinzik F, Weisbrod M, Scherg M, Spitzer M (1998) The timecourse of brain activations during response inhibition: evidence from event-
related potentials in a go/no go task. NeuroReport 9: 765–770.19. Nieuwenhuis S, Yeung N, Cohen JD (2004) Stimulus modality, perceptual
overlap, and the go/no-go N2. Psychophysiology 41: 157–160.
20. Smith JL, Douglas KM (2011) On the use of event-related potentials to auditorystimuli in the Go/NoGo task. Psychiatry Res 193: 177–181.
21. Bokura H, Yamaguchi S, Kobayashi S (2001) Electrophysiological correlates forresponse inhibition in a Go/NoGo task. Clin Neurophysiol 112: 2224–2232.
22. Salisbury DF, Griggs CB, Shenton ME, McCarley RW (2004) The NoGo P300‘anteriorization’ effect and response inhibition. Clin Neurophysiol 115: 1550–
1558.
23. Logan GD, Cowan WB, Davis KA (1984) On the ability to inhibit simple andchoice reaction time responses: a model and a method. J Exp Psychol Hum
Percept Perform 10: 276–291.24. Ramautar JR, Slagter HA, Kok A, Ridderinkhof KR (2006) Probability effects in
the stop-signal paradigm: the insula and the significance of failed inhibition.
Brain Res 1105: 143–154.25. Detre JA, Wang J (2002) Technical aspects and utility of fMRI using BOLD and
ASL. Clin Neurophysiol 113: 621–634.26. Eimer M (1993) Effects of attention and stimulus probability on ERPs in a Go/
Nogo task. Biol Psychol 35: 123–138.27. Garavan H, Ross TJ, Stein EA (1999) Right hemispheric dominance of
inhibitory control: an event-related functional MRI study. Proc Natl Acad
Sci U S A 96: 8301–8306.28. Menon V, Adleman NE, White CD, Glover GH, Reiss AL (2001) Error-related
brain activation during a Go/NoGo response inhibition task. Hum Brain Mapp12: 131–143.
29. Ford JM, Gray M, Whitfield SL, Turken AU, Glover G, et al. (2004) Acquiring
and inhibiting prepotent responses in schizophrenia: event-related brainpotentials and functional magnetic resonance imaging. Arch Gen Psychiatry
61: 119–129.30. Jervis BW, Ifeachor EC, Allen EM (1988) The removal of ocular artefacts from
the electroencephalogram: a review. Med Biol Eng Comput 26: 2–12.31. Dawson MRW (1988) Fitting the Ex-Gaussian Equation to Reaction-Time
Distributions. Behav Res Meth Instrum Comput 20: 54–57.
32. Castellanos FX, Sonuga-Barke EJ, Milham MP, Tannock R (2006) Character-izing cognition in ADHD: beyond executive dysfunction. Trends Cogn Sci 10:
117–123.33. Billeke P, Zamorano F, Cosmelli D, Aboitiz F (2013) Oscillatory brain activity
correlates with risk perception and predicts social decisions. Cereb Cortex 23:
2872–2883.34. Maris E, Oostenveld R (2007) Nonparametric statistical testing of EEG- and
MEG-data. J Neurosci Methods 164: 177–190.35. Nigg JT (2000) On inhibition/disinhibition in developmental psychopathology:
views from cognitive and personality psychology and a working inhibition
taxonomy. Psychol Bull 126: 220–246.36. Mostofsky SH, Schafer JG, Abrams MT, Goldberg MC, Flower AA, et al. (2003)
fMRI evidence that the neural basis of response inhibition is task-dependent.Brain Res Cogn Brain Res 17: 419–430.
37. Aron AR, Behrens TE, Smith S, Frank MJ, Poldrack RA (2007) Triangulating acognitive control network using diffusion-weighted magnetic resonance imaging
(MRI) and functional MRI. J Neurosci 27: 3743–3752.
38. Jahfari S, Stinear CM, Claffey M, Verbruggen F, Aron AR (2010) Respondingwith restraint: what are the neurocognitive mechanisms? J Cogn Neurosci 22:
1479–1492.39. Aron AR (2011) From reactive to proactive and selective control: developing a
richer model for stopping inappropriate responses. Biol Psychiatry 69: e55–68.
40. van der Meere JJ, Shalev RS, Borger N, Wiersema JR (2009) Methylphenidate,interstimulus interval, and reaction time performance of children with attention
deficit/hyperactivity disorder: a pilot study. Child Neuropsychol 15: 554–566.41. Sergeant J (2000) The cognitive-energetic model: an empirical approach to
attention-deficit hyperactivity disorder. Neurosci Biobehav Rev 24: 7–12.42. Falkenstein M, Koshlykova NA, Kiroj VN, Hoormann J, Hohnsbein J (1995)
Late ERP components in visual and auditory Go/Nogo tasks. Electroencepha-
logr Clin Neurophysiol 96: 36–43.
43. Fallgatter AJ, Ehlis AC, Seifert J, Strik WK, Scheuerpflug P, et al. (2004) Alteredresponse control and anterior cingulate function in attention-deficit/hyperac-
tivity disorder boys. Clin Neurophysiol 115: 973–981.
44. Pliszka SR, Glahn DC, Semrud-Clikeman M, Franklin C, Perez R, 3rd, et al.(2006) Neuroimaging of inhibitory control areas in children with attention deficit
hyperactivity disorder who were treatment naive or in long-term treatment.
Am J Psychiatry 163: 1052–1060.
45. Smith JL, Johnstone SJ, Barry RJ (2008) Movement-related potentials in theGo/NoGo task: the P3 reflects both cognitive and motor inhibition. Clin
Neurophysiol 119: 704–714.
46. Kok A (1986) Effects of degradation of visual stimuli on components of the
event-related potential (ERP) in go/nogo reaction tasks. Biol Psychol 23: 21–38.
47. van Boxtel GJ, van der Molen MW, Jennings JR, Brunia CH (2001) A
psychophysiological analysis of inhibitory motor control in the stop-signalparadigm. Biol Psychol 58: 229–262.
48. Donkers FC, van Boxtel GJ (2004) The N2 in go/no-go tasks reflects conflict
monitoring not response inhibition. Brain Cogn 56: 165–176.
49. Folstein JR, Van Petten C (2008) Influence of cognitive control and mismatch on
the N2 component of the ERP: a review. Psychophysiology 45: 152–170.
50. Botvinick MM, Cohen JD, Carter CS (2004) Conflict monitoring and anteriorcingulate cortex: an update. Trends Cogn Sci 8: 539–546.
51. Jodo E, Kayama Y (1992) Relation of a negative ERP component to responseinhibition in a Go/No-go task. Electroencephalogr Clin Neurophysiol 82: 477–
482.
52. Senkowski D, Herrmann CS (2002) Effects of task difficulty on evoked gamma
activity and ERPs in a visual discrimination task. Clin Neurophysiol 113: 1742–1753.
53. Kok A (2001) On the utility of P3 amplitude as a measure of processing capacity.
Psychophysiology 38: 557–577.
54. Donchin E, Kubovy M, Kutas M, Johnson R, Tterning RI (1973) Graded
changes in evoked response (P300) amplitude as a function of cognitive activity.Percept Psychophys 14: 319–324.
55. Donchin E, Coles MGH (1998) Context updating and the P300. Behav Brain
Sci 21: 152–154.
56. Gaspar PA, Ruiz S, Zamorano F, Altayo M, Perez C, et al. (2011) P300
amplitude is insensitive to working memory load in schizophrenia. BmcPsychiatry 11: 29.
57. Duncan-Johnson CC, Donchin E (1977) On quantifying surprise: the variationof event-related potentials with subjective probability. Psychophysiology 14:
456–467.
58. Hillyard SA, Hink RF, Schwent VL, Picton TW (1973) Electrical signs of
selective attention in the human brain. Science 182: 177–180.
59. Kok A, Ramautar JR, De Ruiter MB, Band GP, Ridderinkhof KR (2004) ERPcomponents associated with successful and unsuccessful stopping in a stop-signal
task. Psychophysiology 41: 9–20.
60. Bekker EM, Kenemans JL, Verbaten MN (2005) Source analysis of the N2 in a
cued Go/NoGo task. Brain Res Cogn Brain Res 22: 221–231.
61. Dimoska A, Johnstone SJ, Barry RJ (2006) The auditory-evoked N2 and P3components in the stop-signal task: indices of inhibition, response-conflict or
error-detection? Brain Cogn 62: 98–112.
62. Smith JL, Johnstone SJ, Barry RJ (2006) Effects of pre-stimulus processing on
subsequent events in a warned Go/NoGo paradigm: response preparation,execution and inhibition. Int J Psychophysiol 61: 121–133.
63. Polich J (2007) Updating P300: an integrative theory of P3a and P3b. ClinNeurophysiol 118: 2128–2148.
64. Baars BJ, Ramsoy TZ, Laureys S (2003) Brain, conscious experience and the
observing self. Trends Neurosci 26: 671–675.
65. Smallwood J, Brown KS, Baird B, Mrazek MD, Franklin MS, et al. (2012)
Insulation for daydreams: a role for tonic norepinephrine in the facilitation ofinternally guided thought. PLoS ONE 7: e33706.
66. Aston-Jones G, Cohen JD (2005) An integrative theory of locus coeruleus-
norepinephrine function: adaptive gain and optimal performance. Annu Rev
Neurosci 28: 403–450.
67. Sanders AF (1983) Towards a model of stress and human performance. ActaPsychol (Amst) 53: 61–97.
68. Polich J, Criado JR (2006) Neuropsychology and neuropharmacology of P3aand P3b. Int J Psychophysiol 60: 172–185.
69. Shenhav A, Botvinick MM, Cohen JD (2013) The expected value of control: an
integrative theory of anterior cingulate cortex function. Neuron 79: 217–240.
70. Norman DA, Shallice T (1986) Attention to Action: Willed and Automatic
Control of Behavior. In: Davidson RJ, Schwartz GE, Shapiro D, editors.Consciousness and self-regulation: Advances in research, Vol IV: Plenum
Press.pp. 1–18.
71. Schacht A, Dimigen O, Sommer W (2010) Emotions in cognitive conflicts are
not aversive but are task specific. Cogn Affect Behav Neurosci 10: 349–356.
72. Recio G, Schacht A, Sommer W (2009) Effects of inter-stimulus interval on skinconductance responses and event-related potentials in a Go/NoGo task. Biol
Psychol 80: 246–250.
73. Nakata H, Inui K, Wasaka T, Tamura Y, Kida T, et al. (2005) Effects of ISI and
stimulus probability on event-related go/nogo potentials after somatosensorystimulation. Exp Brain Res 162: 293–299.
Temporal Constraints of Behavioral Inhibition
PLOS ONE | www.plosone.org 9 January 2014 | Volume 9 | Issue 1 | e87232
Copyright © 2022 FDOKUMEN