Temporal and spatial variations of energy consumption in rural China
10
Temporal and spatial variations of energy consumption in rural China L.X. Zhang a , Z.F. Yang a, * , B. Chen a , G.Q. Chen a,b , Y.Q. Zhang c a State Key Joint Laboratory of Environmental Simulation and Pollution Control, School of Environment, Beijing Normal University, Beijing 100875, China b National Laboratory for Complex Systems and Turbulence, Department of Mechanics, Peking University, Beijing 100871, China c School of Forestry and Wildlife Sciences, Auburn University, AL 36849-5418, USA article info Article history: Received 12 November 2007 Received in revised form 18 March 2008 Accepted 4 April 2008 Available online 21 May 2008 PACS: 89.30.g Keywords: Rural energy Consumption pattern Biomass abstract Presented in this paper is an overview of energy consumption in rural China in view of temporal and spatial variations. Characterized by steadily decreased proportion of biomass use and increased percentage of coal and electricity use, coal and biomass are still the major energy sources in rural areas, accounting for nearly 80% of the total rural energy con- sumption. Moreover, the energy consumption varies significantly across provinces both in total sum and by fuel types due to diversities of geographic features, economic develop- ment levels and local energy source availability. Three statistical groups are clustered asso- ciated with quantitative change and structural change, exhibiting evident transition from noncommercial energy pattern to commercial energy pattern. Much more work need to be done to cope with the forthcoming dramatic changes associated with booming rural economy and newly released policy from the points of both energy security and environ- mental pressure in China. Ó 2008 Elsevier B.V. All rights reserved. 1. Introduction China’s rural economy has undergone an incredible high-speed development since 1978, accompanied by a substantial and profound change of rural energy pattern, which deserves more attention from several viewpoints, due to its relations with energy demand and supply, land degradation, air pollution, and social behavior and lifestyle changes in rural areas [1]. For a long time, however, the energy issues in rural areas of China have not been fully considered, in comparison with those in urban areas, due to its subsidiary position in Chinese overall development strategy. This, in turn, resulted in a neg- ative influence on commercial energy supply and use in rural areas. At the same time, the shortage and inefficient energy utilization as well as excessive fuelwood collection and pollution in rural areas have troubled China for decades [2,3]. Highly relevant to national energy security and rural environment, an escalating interest has been emerging for the extensive analysis of rural energy issues in China. In the recent researches on systematic resource accountings and sectoral energy efficiency of China, rural energy issues have been incorporated and emphasized [4–17]. The major characteristics and affecting factors of rural household energy consumption in China have been revealed through case studies as well [3,18–23]. The development potential of biomass and other renewable resources has also been emphasized [24–29]. Nevertheless, it is necessary to give an overall picture and a well-grounded prospect of rural energy consumption in China. This paper intends to present a better understanding of the observed variations and current situation through a historic evolution of the rural energy consumption. 1007-5704/$ - see front matter Ó 2008 Elsevier B.V. All rights reserved. doi:10.1016/j.cnsns.2008.04.019 * Corresponding author. Tel.: +86 10 58807951; fax: +86 10 58800397. E-mail address: [email protected] (Z.F. Yang). Commun Nonlinear Sci Numer Simulat 14 (2009) 4022–4031 Contents lists available at ScienceDirect Commun Nonlinear Sci Numer Simulat journal homepage: www.elsevier.com/locate/cnsns
Transcript of Temporal and spatial variations of energy consumption in rural China

Commun Nonlinear Sci Numer Simulat 14 (2009) 4022–4031
Contents lists available at ScienceDirect
Commun Nonlinear Sci Numer Simulat
journal homepage: www.elsevier .com/locate /cnsns
Temporal and spatial variations of energy consumption in rural China
L.X. Zhang a, Z.F. Yang a,*, B. Chen a, G.Q. Chen a,b, Y.Q. Zhang c
a State Key Joint Laboratory of Environmental Simulation and Pollution Control, School of Environment, Beijing Normal University, Beijing 100875, Chinab National Laboratory for Complex Systems and Turbulence, Department of Mechanics, Peking University, Beijing 100871, Chinac School of Forestry and Wildlife Sciences, Auburn University, AL 36849-5418, USA
a r t i c l e i n f o
Article history:Received 12 November 2007Received in revised form 18 March 2008Accepted 4 April 2008Available online 21 May 2008
PACS:89.30.g
Keywords:Rural energyConsumption patternBiomass
1007-5704/$ - see front matter � 2008 Elsevier B.Vdoi:10.1016/j.cnsns.2008.04.019
* Corresponding author. Tel.: +86 10 58807951; fE-mail address: [email protected] (Z.F. Yang).
a b s t r a c t
Presented in this paper is an overview of energy consumption in rural China in view oftemporal and spatial variations. Characterized by steadily decreased proportion of biomassuse and increased percentage of coal and electricity use, coal and biomass are still themajor energy sources in rural areas, accounting for nearly 80% of the total rural energy con-sumption. Moreover, the energy consumption varies significantly across provinces both intotal sum and by fuel types due to diversities of geographic features, economic develop-ment levels and local energy source availability. Three statistical groups are clustered asso-ciated with quantitative change and structural change, exhibiting evident transition fromnoncommercial energy pattern to commercial energy pattern. Much more work need tobe done to cope with the forthcoming dramatic changes associated with booming ruraleconomy and newly released policy from the points of both energy security and environ-mental pressure in China.
� 2008 Elsevier B.V. All rights reserved.
1. Introduction
China’s rural economy has undergone an incredible high-speed development since 1978, accompanied by a substantialand profound change of rural energy pattern, which deserves more attention from several viewpoints, due to its relationswith energy demand and supply, land degradation, air pollution, and social behavior and lifestyle changes in rural areas[1]. For a long time, however, the energy issues in rural areas of China have not been fully considered, in comparison withthose in urban areas, due to its subsidiary position in Chinese overall development strategy. This, in turn, resulted in a neg-ative influence on commercial energy supply and use in rural areas. At the same time, the shortage and inefficient energyutilization as well as excessive fuelwood collection and pollution in rural areas have troubled China for decades [2,3].
Highly relevant to national energy security and rural environment, an escalating interest has been emerging for theextensive analysis of rural energy issues in China. In the recent researches on systematic resource accountings and sectoralenergy efficiency of China, rural energy issues have been incorporated and emphasized [4–17]. The major characteristics andaffecting factors of rural household energy consumption in China have been revealed through case studies as well [3,18–23].The development potential of biomass and other renewable resources has also been emphasized [24–29]. Nevertheless, it isnecessary to give an overall picture and a well-grounded prospect of rural energy consumption in China. This paper intendsto present a better understanding of the observed variations and current situation through a historic evolution of the ruralenergy consumption.
. All rights reserved.
ax: +86 10 58800397.

L.X. Zhang et al. / Commun Nonlinear Sci Numer Simulat 14 (2009) 4022–4031 4023
2. Rural energy data
The data on rural energy in China are mainly associated with the state statistics bureau (SSB, representing governmentalstatistics) and ministry of agriculture (MOA, belonging to sectoral statistics). These two departments catch different aspectsof information through different channels. MOA mainly possesses data of renewable energy such as straws, biogas, and smallhydropower, through its hierarchical energy offices in provinces, counties and even in towns, while SSB gathers residentialdata through rural household survey conducted annually by its branch – China rural socio-economic division (CRSED) anddata reported by sectoral sources.
We try to collect as much available data as possible to give a holistic picture and a preliminary assessment from theseavailable data sources. Most of the data are from the Science, Technology and Education Division of MOA (from 1991 to2005), who is responsible for rural energy statistics and various reports (particularly before 1991). All the data are comparedand rectified through various sources [30–34].
Official statistics are not necessarily always accurate, of course. The biomass may especially be underestimated [35], butthey are an irreplaceable starting point for analyzing a national energy system and do reflect a tendency to some extent. Noalternative information is available to improve the past energy statistics. In addition, it will also take significant resourcesand time to achieve better data collection [36]. Since the government has started to pay attention to the rural energy statis-tics, it is expected the future data will be improved.
3. Overall trends of China’s rural energy consumption
3.1. General trends
Our analysis is initiated by briefly reviewing the overall trends in rural energy use based on the available discontinuoustime series data. Total rural energy consumption has increased substantially from 307.19 Mtce in 1979 to 869.21 Mtce in2005, nearly tripling with an annual growth of 4.08%. Correspondingly, the per capita energy consumption has increasedat a steady rate of 4.31% from 388.78 kgce in 1979 to 1166.03 kgce in 2005. As shown in Fig. 1, the total energy consumptionin rural China illustrates a trend of steady increase throughout the years of study, of which three different phases can beidentified. The first phase is characterized by steady increase of total energy consumption from 1979 to 1995, reachingthe first peak at 649.52 Mtce in 1995. During the second phase, the total energy consumption remained relatively stable untilthe end of the last century, but has resumed another fast growth in recent years, i.e., from 2000 onwards (the third phase).The energy decline against increased economy in the late 1990s is considered to be greatly attributed to improved efficiencyrather than structural change [37,38].
As to the energy users in rural areas, the proportion of energy for livelihood has declined from 83.13% in 1979 to 55.95% in2005, but still takes over 50% of the total energy consumption. In fact, the absolute amount of energy consumed by
Fig. 1. Total and per capita energy consumption in rural China from 1979 to 2005.
4024 L.X. Zhang et al. / Commun Nonlinear Sci Numer Simulat 14 (2009) 4022–4031
household use has increased from 255.38 Mtce to 486.35 Mtce during the concerned period, indicating a relatively low levelof agricultural mechanization and industrial activities.
3.2. Structural changes
A close examination of the main components shows that the source variance of rural energy consumption is considerablefrom 1979 to 2005, as presented in Fig. 2, incarnating characteristics of some transition from traditional energy use mode toa more commercial and industrialized energy use mode. In 1979, of the energy consumption in rural areas, coal accountedfor 18.30%, oil 4.65%, electricity 5.40%, straw 37.01%, firewood 33.78% and biogas 0.24%, but the structure changed to coal42.17%, oil 9.25%, electricity 11.05%, straw 18.36%, firewood 15.64% and biogas 0.57% in 2005. The most obvious trend isthe decreased proportion of biomass use and increased percentage of oil and electricity use, whereas coal and biological mat-ters are the major parts of energy consumed in rural areas, accounting for nearly 80% of the total rural energy consumptioneven in 2005.
Coal, oil and electricity constitute the major parts of commercial energy in rural areas of China [39]. Due to inaccessibilityand high price, LPG remains very small proportion in rural energy consumption pattern, despite being a clean energy formwith high quality. The commercial energy is mainly used for production, rural residential consumption accounts for compar-atively less, though the ratio increased from 17% in 1979 to 44% in 2005. To what extent commercial energy is used generallydepends upon to what extent the accessibility to and rural economic capability of buying commercial energy.
In the mix of commercial energy, coal has been the dominant source of primary energy with its amount increasing from58.15 Mtce in 1979 to 366.54 Mtce in 2005, six times higher than 26 years earlier, since China is a country rich in coal re-sources. Another factor that contributes to the high proportion of coal use in rural areas is the relevance to the particularrural energy policy.
The increase of oil consumption in rural area, at rate of 7.08%, is associated more with agricultural modernization anddevelopment of rural enterprises, while in household consumption, oil account for little proportion (only 18.18% in 2005)during the considered time course, mainly adopted for lighting due to lacking grid-based electricity service in remote areasand used for transportation energy such as for motorcycle in relatively developed regions.
Electricity consumption is an essential index usually adopted to reflect the economic development and energy structurein rural areas. Since the 1980s, with the development of rural electrification by promotion of building electrical network andsmall hydroplants (less than 50 MW), the electricity consumption has increased rapidly both for production and for house-hold use. The total amount reached 2.50 � 1011 kwh, of which 0.84 � 1011 kwh was for residential use in 2005. Apart fromsmall hydropower, in remote areas away from grid-based electricity service, there are still about 1.06 � 105 aerogeneratorswith installing capacity of 1.24 � 104 kW and annual output of 3.93 � 107 kWh in 2005 [40], see Table 1. However, theamount of aerogenerators decreased dramatically during the tenth 5-year plan (2001–2005) period, possibly due to unstable
Fig. 2. Variation of energy consumption structure in rural China from 1979 to 2005.

Table 1Wind power generation in rural China from 2000 to 2005
Year Total generator (�104 Units) Installing capacity (�104 kW) Annual output (�104 kWh)
2000 12.05 1.72 20172001 12.13 2.29 27412002 12.13 3.35 34032003 9.84 3.14 37212004 9.91 1.17 37882005 10.56 1.24 3925
L.X. Zhang et al. / Commun Nonlinear Sci Numer Simulat 14 (2009) 4022–4031 4025
utilization and high maintenance cost. More reliable electricity supply in recent yeas makes it possible for many rural fam-ilies to purchase home appliances, such as color TV, washing machine, etc., even refrigerators and air conditioners with high-er energy consumption can be found among some wealthier families [19].
Most biomass fuels are used mainly for home cooking and heating by direct combustion and are not tied to majorportions of economic activity [36]. In the production sector, fuel wood is mainly used but does not account for a largeproportion for local traditional production, such as tea and food processing and ceramic firing. Examining the three maincomponents of biomass fuels shows that, in contradiction to other energy consumption, the use of agricultural residuesand firewood has experienced fluctuation but not changed very much over the whole period, as shown in Fig. 3, whilethe proportion of energy from biomass has decreased constantly, from 70.79% to 34%. Being accused of low efficiency asfuel for direct combustion, in domestic cooking stoves, for example, the conversion efficiency is only 10–20%, bio-mass energy is and will remain as a significant source of energy for much of China’s rural population, especially in poorareas.
In addition, anaerobic digestion or biogas technology is bioconversion technology widely used in China, of which 90% ishydraulic biogas digester, especially in rural areas. Fig. 4 shows the development of household biogas digesters in rural Chinafrom 1978 to 2005, from which we can find that there is a boost in quantity of digester in recent years especially after2000.There had been about 18.07 million family-sized biogas digesters with the total output of 4.93 Mtce by the end of2005, still accounting for less than 2% of biomass energy despite the various advantages and the great efforts of Chinese gov-ernments to popularize this technology in rural areas.
Another important renewable energy is solar energy, exploited mainly for heating and power generation at present.Although utilized by multifarious forms, it accounts for a very minor part in total rural energy system in China. The solarwater heater is the most commonly used in rural areas and therefore experienced high rate of increase, e.g., 23.70% duringthe tenth 5-year plan period, followed by solar cooker with an annual growth of 15.60% [40]. Listed in Table 2 is detailedinformation associated with solar energy use during 2000–2005 in rural China.
Fig. 3. Biomass consumption and its proportion in rural China from 1979 to 2005.

Fig. 4. Development of household biogas digesters in rural China.
Table 2Solar utilization in rural China from 2000 to 2005
Year Solar water heater (�104 m2) Greenhouse (�104 m2) Solar cooker (�104 Units) Solar photovoltaic power (�104 Wp)
2000 1108 978 33.24 80.742001 1319 1095 38.86 82.912002 1622 1194 47.84 91.852003 2465 1251 52.62 94.982004 2846 1360 57.76 92.962005 3206 1514 68.56 95.59
4026 L.X. Zhang et al. / Commun Nonlinear Sci Numer Simulat 14 (2009) 4022–4031
4. Regional characteristics of China’s rural energy consumption
4.1. Quantitative differences
China is a country with vast territory, various terrain, diverse climates and multifarious lifestyles. With regard to admin-istrative division, Mainland China consists of 31 regions, including 27 provinces and 4 municipalities, Beijing, Shanghai, Tian-jin and Chongqing, directly under central government. The data of Tibet and Shanghai is unavailable, due to extremeconditions for data collection and very low proportion of rural population, respectively.
Regarding the quantum of regional energy consumption, per capita rather than total data are used in consideration of thedisparities of population and administrative areas. Just like the whole rural China, per capita energy consumption of all re-gions except Jiangxi exhibits the overall increasing trend that experiences annual fluctuations (Fig. 5). The steady decrease ofper capita rural energy consumption in Jiangxi is mainly due to the reduction of productive energy from 1.53 Mtce in 1991 to0.59 Mtce in 2005. According to local official reports, it was believed that industrial structure adjustment and energy savingfrom the associated pottery and porcelain industry contributed to this decline.
From the perspective of spatial distribution, there exist great differences in rural energy consumption among regions. Inthe year 2005, for instance, the per capita energy consumptions vary from 0.56 kgce to 3.34 kgce among the provinces. Rel-atively low per capita energy consumptions are found in Hainan, Qinghai and Fujian, and high values in Beijing, Neimengguand Chongqing. As a whole, the per capita energy use is significantly higher in the north than in the south, and in the eastthan in the west.
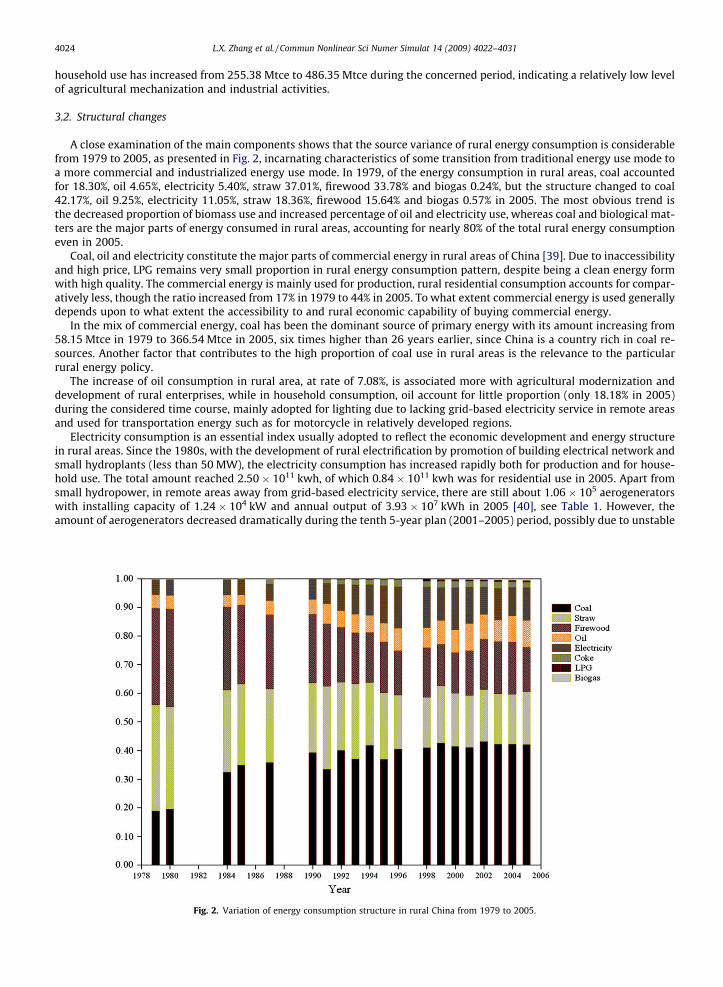
As the dominant energy source in rural areas, biomass was prone to being insufficient for large demand and caused eco-logical degradation. Fig. 6 shows the per capita biomass energy consumption between 1991 and 2005, with provinces ar-ranged counter-clockwise in an ascending order of value of 2005. In the absolute terms, Guizhou, Heilongjiang andSichuan consumed more biomass energy than other provinces while Zhejiang consumed the least in 2005. Jiangxi, Zhejiangand Fujian have dramatic decline in per capita biomass energy consumption, while Guangdong, Ningxia, Guizhou and Sichuanhave greatly increased. The dramatic decline of biomass consumption in Jiangxi, Zhejiang and Fujian is largely associated withthe technique improvements in traditional rural industries, such as tea making in Zhejiang and Fujian, pottery and porcelain
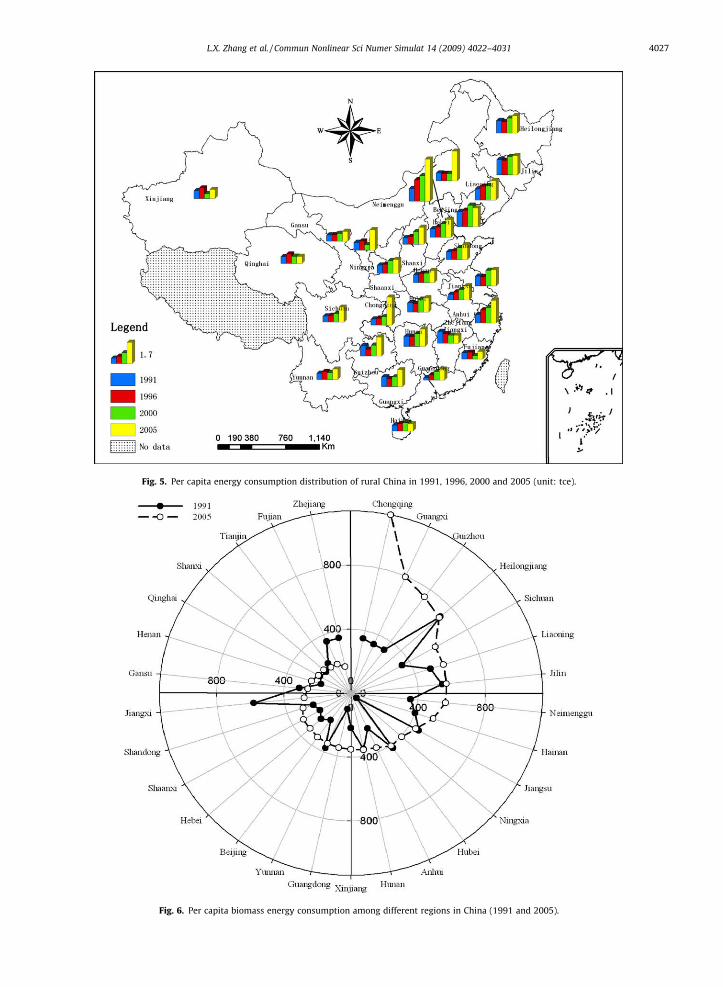
Fig. 5. Per capita energy consumption distribution of rural China in 1991, 1996, 2000 and 2005 (unit: tce).
Fig. 6. Per capita biomass energy consumption among different regions in China (1991 and 2005).
L.X. Zhang et al. / Commun Nonlinear Sci Numer Simulat 14 (2009) 4022–4031 4027

4028 L.X. Zhang et al. / Commun Nonlinear Sci Numer Simulat 14 (2009) 4022–4031
industry in Jiangxi. However, the increase of biomass consumption in above mentioned provinces may result from variousreasons. Take Ningxia for example, the vegetation restoration and migration may distinguish it from the other provinces.
Fig. 7. Province-level energy consumption structure in rural China, 1991(a) and 2005(b).
L.X. Zhang et al. / Commun Nonlinear Sci Numer Simulat 14 (2009) 4022–4031 4029
Various studies have demonstrated the impetus of economic development to rural energy consumption [19,41], which isgreatly associated with increased living standards and development of rural enterprises. In addition, weather conditions arealso likely to play a role, which explains the high per capita energy consumption in Neimenggu, Heilongjiang and Jilin.Households in the north spend much more energy for heating in the winter, implying that large quantities of ‘‘noncommer-cial” energy are consumed in the rural areas of those regions with relatively poor economic conditions.
4.2. Structural variance
Regional disparities in the structure of rural energy consumption are tremendous. Fig. 7a and b shows the province-levelrural energy consumption structures in the year 1991 and 2005, respectively.
At first sight of the figures, it seems that there are no discernable distribution rules by geographic region with regardto energy structure. However, resources availability is found to be a critical factor affecting the types of energy consumedin each province. Provinces rich in coal resources, e.g., Shanxi, Shaanxi, Hebei, Guizhou, Henan, Xinjiang, and Ningxia,have a large proportion of coal use. Though not rich in coal resources, Beijing and Tianjin also have a large ratio of coalconsumption due to easy access to short-distance coal-producing areas such as Shanxi and Hebei and relatively powerfulpurchasing capability. Furthermore, households in the northeast, south or southwest are more likely to use biomass thanthose in the north, southeast or northwest, which is essentially in accordance with China’s distribution of vegetationresources.
By further comparison of Fig. 7a with Fig. 7b, i.e., the rural energy structures of 1991 and 2005, the most evident change isalso found to be the declining proportion of biomass use and increase of commercial energy proportion in most regions ex-
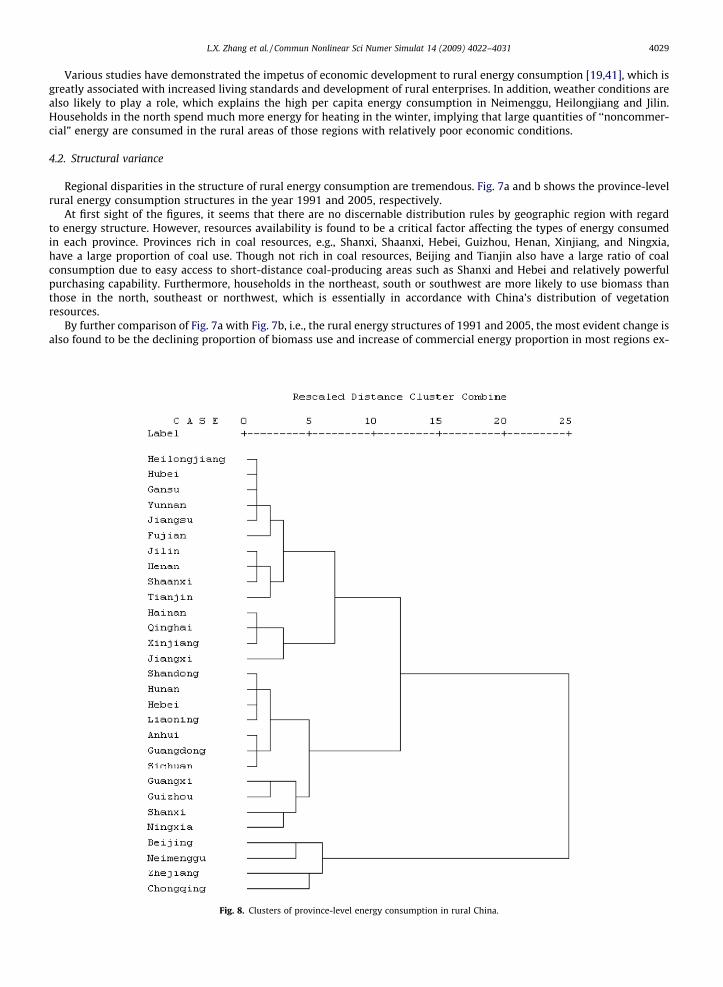
Fig. 8. Clusters of province-level energy consumption in rural China.
4030 L.X. Zhang et al. / Commun Nonlinear Sci Numer Simulat 14 (2009) 4022–4031
cept Guangxi, Hainan, Guizhou, Qinghai, Ningxia and Xinjiang provinces. The possible reasons behind the unusual change ofthe six provinces are that: these regions are relative rich in coal resources and can easily get coal for fuel in the past; how-ever, with the closing of small coal mines and price increase of fuels, as well as lagging rural economy, the proportion of com-mercial energy use decreased rather than increased. It is worth noting that the provinces of Hainan, Guangxi, Heilongjiang,Chongqing, and Guizhou still have high proportion over 50% of biomass energy consumption, and Hainan, the only provincelocated in subtropical zone in China, even reached 92% in 2005.
In 2005, the highest proportion of per capita electricity use was in Zhejiang followed by Jiangsu, two developed provinceswith advanced rural enterprise systems and high rural economic development in China. However, Xinjiang, Neimenggu andYunnan take the last three places, consuming significantly less electricity. Apart from the relatively low economic develop-ment level, high cost of grid extension makes the progress in expanding electricity service to unserved rural areas slowerthan population growth in those provinces [42].
4.3. Cluster analysis
To further investigate the regional pattern variances of energy consumption changes in rural China, cluster analysiswas employed with a view to group the similar changes during the concerned period from 1991 to 2005. Hierarchicalagglomerative cluster analysis (CA) was performed on the normalized data set by means of the Ward’s method, usingEuclidean distances as a measure of similarity. Data sets were processed using routines taken from SPSS-13.0 statisticalsoftware.
The different values of straw, firewood, coal, coke, electricity, oil, biogas and LPG between 2005 and 1991 by per capitaunits, together with three parameters of D per capita energy consumption, D proportion for production use and D proportionof commercial energy, were chosen as variables. The dendrogram indicates the status of quantitative change as well as struc-ture variance, which are categorized into different groups.
Fig. 8 shows the yielded dendrogram, grouping all 29 regions into two or three statistically significant clusters under cer-tain distance requirement. In two group divisions, one group with Beijing, Neimenggu, Zhejiang and Chongqing is character-ized by quantitative changes, i.e., rapid energy consumption increase, while the other group involving other provincescorresponds to structure variances. In the second group, they can be further divided into two clusters. Cluster 1 (from Hei-longjiang to Jiangxi in Fig. 8) represents the items with relatively low increase rate and proportion of commercial energy,while Cluster 2 (from Shandong to Ningxia in Fig. 8) is the opposite, i.e., with relatively rapid increase and high proportionof commercial energy.
5. Conclusions
Based on the analysis of available discrete statistical data from 1979 to 2005, the consumption patterns in rural China areexplored from the perspective of temporal and spatial variations. The total rural energy consumption has increased substan-tially from 307.19 Mtce (388.78 kgce) per cap in 1979 to 869.21 Mtce (1166.03 kgce) per cap in 2005, with annual growths of4.08% and 4.31%, respectively. The most obvious trend is the steady decreased proportion of biomass use, from 70.79% to34%, during the concerned period, and increased percentage of coal and electricity use, whereas coal and biological mattersare still the major sources of energy in rural areas, accounting for nearly 80% of total rural energy consumption even in 2005.Nevertheless, the rural energy consumption structure exhibits some evident transition from noncommercial energy to com-mercial energy. Moreover, the energy consumption pattern varies significantly among the regions within China due to diver-sities and complex distribution of geography and social economy, and more importantly, access to different energy sources.CA was used to reveal the similarity of variance of energy consumption patter among the rural regions, with three statisticalgroups clustered associated with quantitative and structural changes.
Social economic development is the active factor largely determining temporal evolution and the spatial distribution ofrural energy consumption, e.g., coastal areas, especially in the south, experienced more rapid economic progress than theinland regions, which directly affected the rural energy consumption pattern in China. It is important to note that in China’sEleventh Five Year Plan building a new socialist countryside as well as the target of reducing energy intensity by 20% hasbeen proposed, indicating more investment in rural infrastructure and agricultural technology, continued reductions inthe tax burden on the countryside, and improving rural public services one the one hand, and more systematic managementof rural energy consumption especially of the rural enterprises on the other hand. All these regulations would have profoundinfluence on rural energy consumption besides rural economy in the near future. Even though this analysis potentially servesas a reference for recognizing the temporal and spatial characteristics of rural energy consumption in China, further researchis still needed to provide feasible solutions and operable policy for the rural energy shortage and environmental pressureaccompanied by booming rural economy of China.
Acknowledgement
This work has been supported by the National Basic Research Program of China (973 Programs, Grant Nos.2006CB403304, 2006CB403303 and 2005CB724204).
L.X. Zhang et al. / Commun Nonlinear Sci Numer Simulat 14 (2009) 4022–4031 4031
References
[1] Tonooka Y, Liu JP, Kondou Y, Ning YD, Fukasawa O. A survey on energy consumption in rural households in the fringes of Xian city. Energy Build2006;38:1335–42.
[2] Catania P. China’s rural energy system and management. Appl Energy 1999;64:229–40.[3] Wang XH, Feng ZM. Study on affecting factors and standard of rural household energy consumption in China. Renew Sust Energy Rev 2005;9:101–10.[4] Chen B, Chen GQ. Exergy analysis for resource conversion of the Chinese society 1993 under the material product system. Energy 2006; 31:1115–50.[5] Chen B, Chen GQ. Ecological footprint accounting based on emergy – A case study of the Chinese society. Ecol Model 2006;198(1–2):101–14.[6] Chen GQ, Chen B. Resource analysis of the Chinese society 1980–2002 based on exergy – Part 1: Fossil fuels and energy minerals. Energ Policy
2007;35:2038–50.[7] Chen B, Chen GQ. Resource analysis of the Chinese society 1980–2002 based on exergy – Part 2: Renewable energy sources and forest. Energy Policy
2007;35:2051–64.[8] Chen B, Chen GQ. Resource analysis of the Chinese society 1980–2002 based on exergy – Part 3: Agricultural products. Energy Policy 2007;35:2065–78.[9] Chen B, Chen GQ. Resource analysis of the Chinese society 1980–2002 based on exergy – Part 4: Fishery and rangeland, Energy Policy 2007;35:2079–
86.[10] Chen GQ, Chen B. Resource analysis of the Chinese society 1980–2002 based on exergy – Part 5: Resource structure and intensity. Energy Policy
2007;35:2087–95.[11] Chen B, Chen GQ. Modified ecological footprint accounting and analysis based on embodied exergy – a case study of the Chinese society 1981–2001.
Ecol Econ 2007;61:355–76.[12] Chen B, Chen GQ, Yang ZF. Exergy-based resource accounting for China. Ecol Model 2006;196:313–28.[13] Chen B, Chen GQ, Yang ZF, Jiang MM. Ecological footprint accounting for energy and resource in China. Energy Policy 2007;35:1599–609.[14] Chen GQ, Qi ZH. System account of societal exergy utilization: China 2004. Ecol Model 2007;208:102–18.[15] Jiang MM, Chen B, Zhou JB, Tao FR, Li Z, Yang ZF, et al. Emergy account for biomass resource exploitation by agriculture in China. Energy Policy
2007;35:4704–19.[16] Jiang MM, Zhou JB, Chen B, Chen GQ. Emergy-based ecological account for the Chinese economy in 2004. Commun Nonlinear Sci Numer Simul, in press,
doi:10.1016/j.cnsns.2007.04.025.[17] Zhang LX, Yang ZF, Chen GQ. Emergy analysis of cropping–grazing system in Neimenggu Autonomous Region, China. Energy Policy 2007;35:3843–55.[18] Wang XH, Feng ZM. A survey of rural energy in the developed region of China. Energy 1997;22:511–4.[19] Wang XH, Feng ZM. Rural household energy consumption with the economic development in China: stages and characteristic indices. Energy Policy
2001;29:1391–7.[20] Wang XH, Feng ZM. Common factors and major characteristics of household energy consumption in comparatively well-off rural China. Renew Sust
Energy Rev 2003;7:545–52.[21] Wang XH, Feng ZM, Gao XF, Jiang K. On household energy consumption for rural development: a study on Yangzhong County of China. Energy
1999;24:493–500.[22] Wang XH, Dai XQ, Zhou YD. Domestic energy consumption in rural China: A study on Sheyang County of Jiangsu Province. Biomass Bioenerg
2002;22:251–6.[23] Wang XH, Dai XQ, Zhou YD. Rural energy in Jiangsu Province of China: survey of renewable energy source and energy consumption. Int J Glob Energy
Issues 2002;18(2:/3.4):302–14.[24] Byrne J, Shen B, Wallace W. The economics of sustainable energy for rural development: A study of renewable energy in rural China. Energy Policy
1998;26:45–54.[25] Byrne J, Zhou AM, Shen B, Hughes K. Evaluating the potential of small-scale renewable energy options to meet rural livelihoods needs: A GIS- and
lifecycle cost-based assessment of Western China’s options. Energy Policy 2007;35:4391–401.[26] Li JJ, Zhuang X, DeLaquil P, Larson ED. Biomass energy in China and its potential. Energy Sust Dev 2001;4:66–80.[27] Li JF, Hu RQ, Song YQ, Shi JL, Bhattacharya SC, Salam AP. Assessment of sustainable energy potential of non-plantation biomass resources in China.
Biomass Bioenerg 2005;29:167–77.[28] Yang Q, Chen B, Ji X, He YF, Chen GQ. Exergetic evaluation of corn–ethanol production in China. Commun Nonlinear Sci Numer Simul, in press,
doi:10.1016/j.cnsns.2007.08.011.[29] Zeng XY, Ma YT, Ma LR. Utilization of straw in biomass energy in China. Renew Sust Energy Rev 2007;11:976–87.[30] CREY. China’s rural energy yearbook 1997. Beijing: China Agricultural Press; 1998.[31] CREY. China’s rural energy yearbook 1998–1999. Beijing: China Agricultural Press; 2000.[32] TEDSPC. Energy saving in China. Beijing: China Electricity Press; 1997.[33] Wang QY. Energy in China. Beijing: Metallurgical Industry Press; 1988.[34] Zhou FQ, Wang QY. Fifty years of China’s energy. Beijing: China Electricity Press; 2002.[35] Sun JW. Real rural residential energy consumption in China 1990. Energy Policy 1996;24:827–39.[36] Sinton JE, Fridley DG. Comments on recent energy statistics from China 2003. Available from <http://china.lbl.gov/publications/sinton-
fridley_sinosphere-oct03.pdf>.[37] Wei YM, Fan Y, Han ZY, Wu G. China energy report, 2006: Strategy and policy research. Beijing: Science Press; 2006.[38] Wu LB, Kaneko S, Matsuoka S. Driving forces behind the stagnancy of China’s energy-related CO2 emissions from 1996 to 1999: the relative importance
of structural change, intensity change and scale change. Energy Policy 2005;33:319–35.[39] Pan JH. Rural energy patterns in China: A preliminary assessment from available data sources. a meeting convened jointly by the Energy and Resources
Institute and PESD 2002. Available from <http://pesd.stanford.edu/events/rural_energy_transitions/>.[40] Li ZH, Yue YZ, Chen KQ. Statistical analysis on renewable energy during tenth five-year plan period in rural China. China Constr (Solar Renew Energy
Sources) 2006;8:60–4.[41] Jiang L, O’Neill BC. The energy transition in rural China. Int J Glob Energy Issues 2004;21(1/2):2–26.[42] Lenssen N. Providing energy in developing countries in World Watch Institute, state of the World, 1993. New York: W.W. Norton and Company, Inc.;
1993. p. 101–19.