TEMPORAL AND SPATIAL VARIABILITY OF ANNUAL PRECIPITATION IN COSTA RICA AND THE SOUTHERN OSCILLATION
21
INTERNATIONAL JOURNAL OF CLIMATOLOGY, VOL. 16, 173-1 93 (1 996) TEMPORAL AND SPATIAL VARIABILITY OF ANNUAL PRECIPITATION IN COSTA RICA AND THE SOUTHERN OSCILLATION PETER R. WAYLEN Department of Geography, University of Florida, Gainesville, Florih. 3261 1-7315, USA MARVIN E. QUESADA Apdo 390, Grecia, Alajuela, Costa Rica AND CkSAR N. CAVIEDES Department of Geogmphy, University of Florida, Gainesville, Florida. 32611-7315, USA Received 14 February 1995 Accepted I0 July 1995 ABSTRACT Annual precipitation totals from over 100 stations in Costa Rica are analysed to provide estimates of the nature of their response to El Niiio-Southern Oscillation (ENSO) events. Responses are found to be varied in terms of their signs (droughts or excessive precipitation), magnitudes, and durations. The results of simple interstation correlations and lag cross-correlations with the Southern Oscillation Index suggest a marked difference in response in those areas draining towards the Pacific and those towards the Caribbean, as well as latitudinal variations, particularly along the Pacific coast. The marked regional differences in statistical properties over so small an area are related to complex physical processes of precipitation generation, the differing provenances of the humidity laden winds, and the fluctuations of local atmosphere-ocean interactions in response to ENSO. KEY WORDS: Costa Rica; annual precipitation; variability; El Niiio-Southern Oscillation; lag cross-correlation INTRODUCTION Interannual variability of precipitation has considerable implications in a variety of water resources applications including, flood and drought prevention, agriculture, silviculture, soil erosion, and the design and operation of hydraulic structures. The impact of such variability at a location is a fimction of the size of the deviation, although, regionally, effects may be exacerbated or ameliorated by the spatial extent and temporal phasing of any perturbation. Despite its small size Costa Rica is an excellent locale to search for spatial and temporal patterns of precipitation variability. Proximity to the tropical Pacific places Costa Rica near the origin of the largest known single cause of current climatic variability, the El NiiicF-Southern Oscillation (ENSO) (Intergovernmental Panel on Climate Change, 1990). Moreover Costa Rica’s position astride the Central American isthmus at almost its narrowest point, segmented meridionally by high cordilleras, permits oceanic and climatological influences from both the Pacific and Caribbean. San Jose’s excellent meterological record has been used frequently in regional and global studies of the effect of ENSO (e.g. Ropelewski and Halpert, 1987; Rogers, 1988; Hastenrath, 1988). It has been considered representative of Costa Rica and much of Central American, partially because of paucity of suitable records in neighbouring countries and to the limited areal extent of the region. This paper uses records from reliable stations in Costa Rica in combination with some simple numerical techniques to obtain information about the spatial and temporal variability of annual precipitation over the counhy. Interstation correlations of annual totals are utilized to determine regional patterns of precipitation through cluster analysis. Lag cross-correlations establish potential teleconnections between annual precipitation and the Southern Oscillation Index (SOI), and are used to delimit regions of similar response to ENSO. Lastly, the regional variations CCC 0899-8418/96/020 173-2 1 0 1996 by the Royal Meteorological Society
Transcript of TEMPORAL AND SPATIAL VARIABILITY OF ANNUAL PRECIPITATION IN COSTA RICA AND THE SOUTHERN OSCILLATION

INTERNATIONAL JOURNAL OF CLIMATOLOGY, VOL. 16, 173-1 93 (1 996)
TEMPORAL AND SPATIAL VARIABILITY OF ANNUAL PRECIPITATION IN COSTA RICA AND THE SOUTHERN OSCILLATION
PETER R. WAYLEN Department of Geography, University of Florida, Gainesville, Florih. 3261 1-7315, USA
MARVIN E. QUESADA Apdo 390, Grecia, Alajuela, Costa Rica
AND
CkSAR N. CAVIEDES Department of Geogmphy, University of Florida, Gainesville, Florida. 32611-7315, USA
Received 14 February 1995 Accepted I0 July 1995
ABSTRACT
Annual precipitation totals from over 100 stations in Costa Rica are analysed to provide estimates of the nature of their response to El Niiio-Southern Oscillation (ENSO) events. Responses are found to be varied in terms of their signs (droughts or excessive precipitation), magnitudes, and durations. The results of simple interstation correlations and lag cross-correlations with the Southern Oscillation Index suggest a marked difference in response in those areas draining towards the Pacific and those towards the Caribbean, as well as latitudinal variations, particularly along the Pacific coast. The marked regional differences in statistical properties over so small an area are related to complex physical processes of precipitation generation, the differing provenances of the humidity laden winds, and the fluctuations of local atmosphere-ocean interactions in response to ENSO.
KEY WORDS: Costa Rica; annual precipitation; variability; El Niiio-Southern Oscillation; lag cross-correlation
INTRODUCTION
Interannual variability of precipitation has considerable implications in a variety of water resources applications including, flood and drought prevention, agriculture, silviculture, soil erosion, and the design and operation of hydraulic structures. The impact of such variability at a location is a fimction of the size of the deviation, although, regionally, effects may be exacerbated or ameliorated by the spatial extent and temporal phasing of any perturbation.
Despite its small size Costa Rica is an excellent locale to search for spatial and temporal patterns of precipitation variability. Proximity to the tropical Pacific places Costa Rica near the origin of the largest known single cause of current climatic variability, the El NiiicF-Southern Oscillation (ENSO) (Intergovernmental Panel on Climate Change, 1990). Moreover Costa Rica’s position astride the Central American isthmus at almost its narrowest point, segmented meridionally by high cordilleras, permits oceanic and climatological influences from both the Pacific and Caribbean. San Jose’s excellent meterological record has been used frequently in regional and global studies of the effect of ENSO (e.g. Ropelewski and Halpert, 1987; Rogers, 1988; Hastenrath, 1988). It has been considered representative of Costa Rica and much of Central American, partially because of paucity of suitable records in neighbouring countries and to the limited areal extent of the region.
This paper uses records from reliable stations in Costa Rica in combination with some simple numerical techniques to obtain information about the spatial and temporal variability of annual precipitation over the counhy. Interstation correlations of annual totals are utilized to determine regional patterns of precipitation through cluster analysis. Lag cross-correlations establish potential teleconnections between annual precipitation and the Southern Oscillation Index (SOI), and are used to delimit regions of similar response to ENSO. Lastly, the regional variations
CCC 0899-841 8/96/020 173-2 1 0 1996 by the Royal Meteorological Society

174 P. R. WAYLEN, M. E. QUESADA AND C. N. CAVIEDES
in years of a warmer (El Niiio) and cooler (La Niiia) Pacific are assessed in a fashion similar to Waylen et al. (1 994) as revealed by the descriptive statistics and probabilities of annual precipitation totals. These procedural steps are conducted to explore the relevance of extant theories of atmospheric circulation in the area and the role of ENS0 as the main factor causing variability.
STLJDY AREA AND DATA
Costa Rica occupies over 50700 km2 of the southern Central American isthmus (Figure 1). It is divided from north-west to south-east by four cordilleras, Guanacaste, Tilarim, Central, and Talamanca, each of which rise above 3000 m, displaying increased widths and elevations towards the south-east. The alignments of the Cordillera Central and Cordillera de Talamanca delineate an area of lower relief known as the Central Valley. Coastlines and cordilleras do not run parallel to one another, thus the widths of coastal lowlands vary considerably.
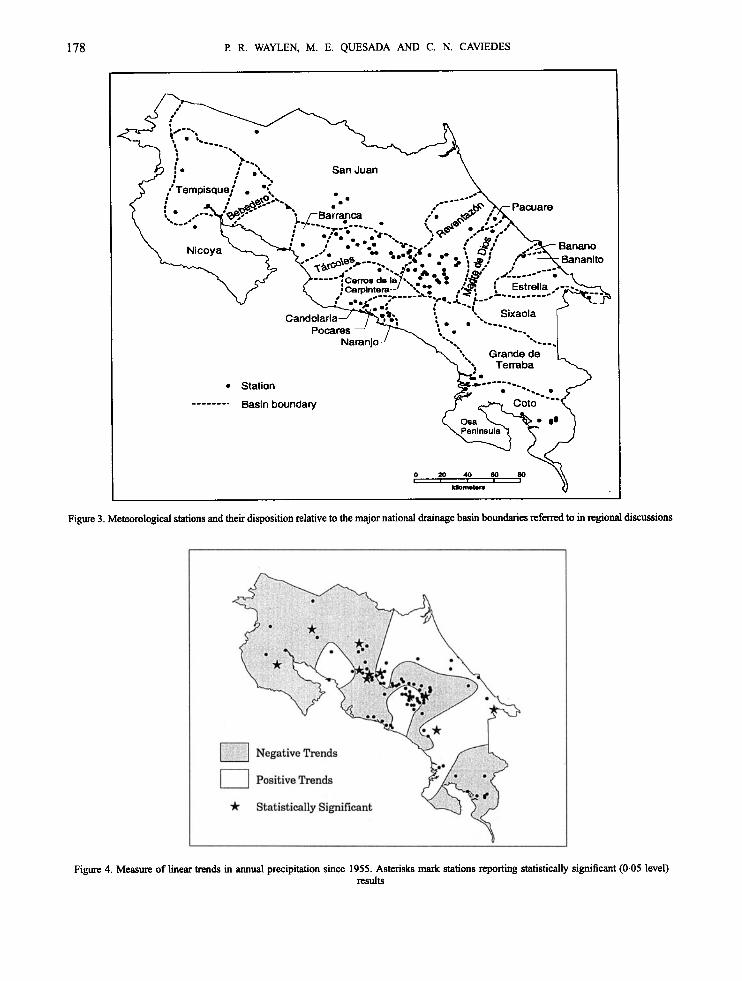
The Instituto Meteorol6gico of Costa Rica (Ministerio de Recursos Naturales, Energia y Minas, 1988) runs 105 stations, which, up to 1987, possessed at least 20 years of complete records (Figure 2 and Table I). Annual totals are summed over a calendar year. Much of the country experiences a pronounced summer maximum of precipitation (June-September) and a winter minimum. In some areas that experience a second peak in autumn (November-December), this usually declines by January. Coding each station by major drainage basins provides a convenient means of regional identification for preliminary discussion (Figure 3 and Table I). Precipitation stations are concentrated in the populated Central Valley, which is h n e d towards the Pacific by the Rio Grande de Thrcoles and towards the Caribbean by the Reventazbn. The remainder of the country is well represented with the exception of the thinly populated extreme north-east and south-central regions.
Vargas and Trejos (1 994) report that over 75 per cent of Costa Rica experienced diminishing precipitation in the period 1960-1990. Application of simple linear regression (significance 0.05) to sites in this study, possessing at least 20 years of record since 1955, reveals that 11 stations (approximately 10 per cent) report significant linear
Figure 1 . Generalized physiography of Costa Rica and its regional setting (inset)

COSTA RICAN RAINFALL 175
Figure 2. Locations of meteorological stations and their identification numbers used in the study, corresponding to the fbll tabulation provided in table I
trends (Table I). A partial explanation for this discrepancy may be that the former estimate is based on land areas extrapolated from point data. Areas shown as experiencing trends includes the San Juan basis (north-east), Cordillera Talamanca (south-central) and Osa Peninsula (south-west), which are unrepresented by stations with sufficient record in this research (Figures 2 and 3). The spatial pattern of correlation (Figure 4) is similar to that shown by Vargas and Trejos (1 994), with a grouping of stations reporting significant trends along the western Cordillera Central. The lack of major discontinuities or trends is M e r supported by application of the Wald- Wolfowitz test of runs (significance 0.05), which only returns Cordoncillal (station 13 in Figure 2) as possessing a significantly large number of runs abovehelow the median. The presence of trends will have a bearing only upon the assumption of statistical stationarity in the proposed frequency analyses.
Hastenrath (1 967) discusses the major factors governing the pattern of mean annual precipitation (Figure 5). At the latitudes of Costa Rica (9-1 1"N) surface winds are dominated by the north-east trades, which blow fairly consistently from the Caribbean (Hastenrath and Lamb, 1977) producing precipitation along the east coast and a rain shadow in the west. Along the Pacific this pattern is disrupted by the northward migration of the Inter Tropical Convergence Zone (ITCZ) in summer and its persistence into the autumn. Deflection of southerly winds crossing the Equator causes onshore equatorial westerlies, the duration of which diminishes towards the north, as do annual precipitation totals. Vargas and Trejos (1 994) propose that 70 per cent of annual precipitation along the Pacific coast of Central America is 'generated' by tropical cyclones in the Caribbean. As no more than three Atlantic

176 I? R. WAYLEN, M. E. QUESADA AND C. N. CAVIEDES
Table I. Station information and numbering scheme used on maps
Map Station name number
National Elevation Years Mean Significant Significant code' (m) of annual linear association
data precipitation trends with Caribbean (mm) tropical cyclone
count
1 2 3 4 5 6 7 8 9
10 11 12 13 14 15 16 17 18 19 20 21 22 23 24 25 26 27 28 29 30 31 32 33 34 35 36 37 38 39 40 41 42 43 44 45 46 47 48 49 50 51 52 53 54
Aeropuerto Juan Santamaria Asunci6n Atenas, Sabena Larga Avance de Tres Bios Bartolo Bel6n Berma Caiias, San Luis Cedral Chase Commandancia Cartago Cordoncillal Coronado Cot0 41 coto 43 coto 44 coto 47 Cuidad Quesada Desamparados El Alto de Ochomongo El Cairo, Siquirres El Caii6n El Destierro El Gat0 El Humo El Llano Finca 10 Finca 13 Finca 3 Finca Angeles Finca Cemtos Finca Palo Seco Finca Puntarenas Finca Tigre, Quepos Freeman Golfito Hacienda Concepcion, Tres Rios Hacienda Dominica Hacienda La Laguna, Cunidabat Hacienda Ojo de Agua Kilbmetro 18 La Argentina, Grecia La Cangreja La Central, E.F.B. La Lola La Marina La Maruja, Orosi La Suiza Liberia, Llano Grande Lim6n Linda Vista, El Guarco Llorona Los Andes de Orotina Los Diamates, Gdpiles
8402 1 83003 84004 84005 9200 1 73034 73040 76005 98010 87001 73003 73030 84007
10005 1 100057 100058 100035 69510 84022 84040 73009 73027 73037 73036 73028 73029 98077
100013 98070 88003 90005 88004
10002 1 88002 750 13
100034 84006 73006 84019 84024
100038 84003 73041 84023 77002 69530 73015 73044 74020 81003 73018 92002 84017 73013
932 130 696
1870 10
2010 2480
95 1450
40 1440 1240 1382
17 13 7 8
650 1162 1546
60 2460 2020 1600 680
1572 8 6
10 5 5
15 18 12 5
15 1320 707
1240 850
6 760
1830 840 40
380 1100 620 85
5 1400
10 224 249
31 30 32 36 41 22 23 48 20 28 43 25 23 25 23 27 40 41 26 20 22 23 24 22 30 26 23 21 35 43 25 43 28 22 72 44 23 25 30 23 34 42 21 24 33 38 31 31 53 6
29 42 20 32
1947.7 3952.0 1801.3 2674.0 3778.9 3217.9 3758.8 1693.4 4066.9 2662.7 1329.2 5372.4 2236.8 5046.2 4560.8 4048.0 3801.8 4574.1 1820.7 1834.5 3863.1 2 106.9 6408.3 6885.7 3236.0 2934.1 3574.7 3829.5 3572.4 3117.0 3834.2 3033.7 4686.3 2789.5 3592.8 4817.7 23499 1 2353.3 2187.1 1755.6 3 176.8 21 14.5 1712.4 1949.9 3562.9 4069.6 2261.3 2464.4 1652.7 353 1.4 1455.6 353 1.7 2444.5 4465.8
+ +
+ + +
+
+
+
+
+
+
+
+ + +

COSTA RICAN RAINFALL 177
Table I. (CON.)
55 56 57 58 59 60 61 62 63 64 65 66 67 68 69 70 71 72 73 74 75 76 77 78 79 80 81 82 83 84 85 86 87 88 89 90 91 92 93 94 95 96 97 98 99
100 101 102 103 1 04 105
Los Ensayos, Buena Vista Margarita Monte Verde Muiieco Nagatac Naranjo, Beneficio Pilas Nicoya Nievecita Ojo de Agua Pacay as Palmar Sur Palmares Pandora Paraiso de Cartago Pocares Puerto Humo Puntarenas Puriscal Quebrada Azul Quebrada Bonita Quebrada Grande Quepos Rancho Redondo Repunta Rosemont, Juan Viiias San Ignacio de Acosta San Isidro de El General San Joaquin de Flores San Jos6 San Miguel de Barranca San Vito de Java Sanatorio L h i n Santa Ana santa cruz Santo Domingo del Roble Subestacibn San Rambn T-Seis Thbano Tacacori, Alajuela Tapanti Taus Tierras Morenas Til& Tres de Junio Tucunique Tunialba, 1.I.C.A. Tunucares Upala Vara Blanca Villa Mills Zarcero
6951 1 87002 78002 73042 80005 840 16 72101 87004 73038 73022 98002 84014 85001 73024 9000 1 74005 78003 88001 695 15 90004 74004 90003 84018 98009 730 19 88005 98004 84015 84001 80002 98007 7301 1 8401 1 74003 84043 84027 73036 73057 84026 73026 73045 76006 76002 73039 73047 73010 840 12 69538 69505 73033 69512
1090 12
1460 1410 450
1042 120 20
2960 1735
16 1017
17 1380
6 10 3
1102 83 4
366 5
1780 580
1165 1095 703
1050 1172 140 890
2337 909 54
1320 1061 2000 1360 1050 1203 900 695 562
2200 770 602 639 50
1804 3000 1736
42 20 25 24 25 27 29 20 23 29 43 34 21 21 36 21 6
22 23 37 20 41 30 25 60 27 39 35
117 42 24 36 42 38 28 39 21 22 23 32 21 22 30 23 22 43 34 20 20 30 28
3086.8 2339.7 2466.8 1908.2 3383.7 241 0.7 2232.3 -
2415.2 2648.0 2284.6 3706.8 1891.8 2467.1 1757.5 2982.6 1988.6 1598.1 2541.2 3374.8 - 3467.4 1849.1 385 1 .O 2497.6 2598.1 4111.1 2 192.4 2934.5 2115.2 1882.5 2066.7 3803.7 1515.9 1665.9 1881.8 3220.4 1923.5 - 7555.8 6685.7 31 17.0 + 2704.9 4598,l 237 1.2 - 21 19.8 2978.6 2204.6 2604.9 1891.8 2558.3 3543.5 2812.0 1920.8
+ +
+
+
+
+ +
+ + +
+
+
+
a First two or three digits identify the drainage basin within which station lies, as follows: 69 San Juan 72 Nicoya 73 Reventazdn 74 Tempisque 75 Pacuare 76 Bebedero 77 Madre de Dios 80 B m c a 81 Banano 83 Bananito 84 Thcoles 85 Estrella 87 Sixaola 88 Candelaria 90 Pocares 92 Naranjo 98 Grande de Tkrraba
78 Rivers between Bebedero and Barranca
100 Cot0 and neighbouring rivers
S3a3IAV3 'N '3 CINV VaVSEUlb '3 'N 'NBUVM X 'd 8LI

COSTA RICAN RAINFALL 179
Figure 5 . Mean annual precipitation (mm) based upon the station records used in the paper
tropical storms or hurricanes passed over Costa Rica in the period 1871-1986 (Neumann et al., 1988), such storms must be effective through the disruption of the north-easterlies and the promotion of westerlies. Embedded occasionally in this westerly equatorial flow are large-scale disturbances or temporales (Portig, 1965; Hastenrath, 1988), which may produce copious precipitation and induce considerable interannual variability.
During the boreal winter the ITCZ migrates southward in the eastern Pacific to about 3"N (Alpert, 1945), thereby generating almost consistent westerlies in south-western Costa Rica (Hastenrath, 1967, 1990), and a slight rain shadow on the opposing Caribbean side. There is a region of higher precipitation in the extreme north-east extending into Nicaragua, which results from winter outbursts of cooler northerly winds, or nortes, proceeding from North America across the Gulf of Mexico and Caribbean (Garcia et al., 1978; Cavazos and Hastenrath, 1990). The orientation of the coastline and pressure gradients produce stress-differential-induced convergence and locally heavy coastal precipitation following the passage of cold fronts (Bryson and Kuhn, 1961). Elevation and the orientation of the major cordilleras are important modifiers of local precipitation patterns (Chac6n and Fernhdez, 1985), although their exact role in enhancing or reducing precipitation in the tropics is a question open to debate because it may relate to the dominant mode of precipitation generation (Hastenrath, 1988).
An association between precipitation totals in the Caribbean and Central America and atmosphere-ocean circulation in the South Pacific is well established (Hastenrath, 1984, 1988; Ropelewski and Halpert, 1987; Rogers, 1988; Cavazos and Hastenrath, 1990). In several of these works Costa Rica has been lumped with Central America and the Caribbean as experiencing droughts during the boreal summer preceding the onset of El Niiio. This is the weakest regional association reported by Ropelewski and Halpert (1987). Hastenrath (1976, 1984, 1988) uses 48 stations to produce a single composite time series of precipitation for the Caribbean and Central American region. Only four of these stations lie in Costa Rica (Hastenrath, 1976). One is San JosC (83), and the others could be Lim6n (50), Villa Mills (104) and San Isidro de El General (81), all of which were selected for extensive study previously (Hastenrath, 1967).
180 I! R. WAYLEN, M. E. QUESADA AND C. N. CAVIEDES
, , , I I I I I I
l&’ I& ’ 1ebO ’ 1910 ‘ l&O 1930 1940 1950 1960 1970 1980 y i R Year
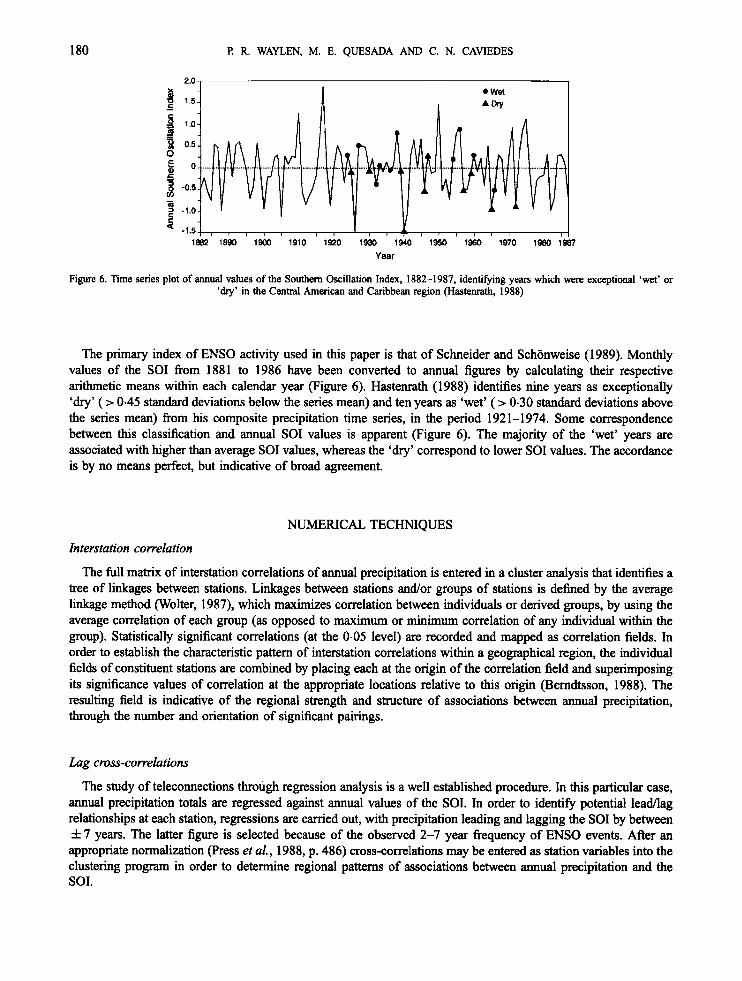
Figure 6. Time series plot of annual values of the Southern Oscillation Index, 1882-1987, identifjmg years which were exceptional ‘wet’ or ‘dry‘ in the Central American and Caribbean region (Hastenrath, 1988)
The primary index of ENS0 activity used in this paper is that of Schneider and Schonweise (1989). Monthly values of the SO1 from 1881 to 1986 have been converted to annual figures by calculating their respective arithmetic means within each calendar year (Figure 6). Hastenrath (1988) identifies nine years as exceptionally ‘dry’ ( > 0.45 standard deviations below the series mean) and ten years as ‘wet’ ( > 0.30 standard deviations above the series mean) from his composite precipitation time series, in the period 1921-1974. Some correspondence between this classification and annual SO1 values is apparent (Figure 6). The majority of the ‘wet’ years are associated with higher than average SO1 values, whereas the ‘dry’ correspond to lower SO1 values. The accordance is by no means perfect, but indicative of broad agreement.
NUMERICAL TECHNIQUES
Interstation correlation
The full matrix of interstation correlations of annual precipitation is entered in a cluster -pis that identifies a tree of linkages between stations. Linkages between stations and/or groups of stations is defined by the average linkage method (Wolter, 1987), which maximizes correlation between individuals or derived groups, by using the average correlation of each group (as opposed to maximum or minimum correlation of any individual within the group). Statistically significant correlations (at the 0-05 level) are recorded and mapped as correlation fields. In order to establish the characteristic pattern of interstation correlations within a geographical region, the individual fields of constituent stations are combined by placing each at the origin of the correlation field and superimposing its significance values of correlation at the appropriate locations relative to this origin (Berndtsson, 1988). The resulting field is indicative of the regional strength and structure of associations between annual precipitation, through the number and orientation of significant pairings.
Lug cross-correlations
The study of teleconnections through regression analysis is a well established procedure. In this particular case, annual precipitation totals are regressed against annual values of the ,501. In order to identify potential lead/lag relationships at each station, regressions are carried out, with precipitation leading and lagging the SO1 by between f 7 years. The latter figure is selected because of the observed 2-7 year fiequency of ENS0 events. After an appropriate normalization (Press et al., 1988, p. 486) cross-correlations may be entered as station variables into the clustering program in order to determine regional patterns of associations between annual precipitation and the SOI.

COSTA RICAN RAINFALL 181
Frequency analysis
Each annual record at a station is allocated to one of three subsamples; ‘warm’, relating to a low phase of the SO1 and a warmer than average western Pacific, ‘cold’, associated with high phase SO1 and a colder eastern Pacific, and the remaining ‘normal’ years, according to the classification provided in Waylen et al. (1994). Descriptive statistics of each subsample are derived using L-moments (Hosking, 1986; Guttman, et al., 1993). Two tailed F- tests (significance 0.05) are used to compare the variances in each subsample, and two tailed t-tests (significance 0.05) to compare means. The exact nature of the computed t-statistic varies depending upon the outcome of the comparison of variances. The goodness-of-fit of normal distributions estimated for each subsample is tested using a modified Kolmogorov-Smimov test (Crutcher, 1975) at a significance level of 0.20 to diminish the chance of committing type I1 errors. The computation of L-moments requires a minimum sample size of four in any one of the three subsamples, thereby reducing the number of suitable stations to 90 in this procedure.
RESULTS
Interstation correlation
Figure 7 depicts the allocation of stations by the clustering to one of four major groups, which can be classified broadly as, North-west, Mid-Pacific, South-west and Caribbean. The limits to each may be described in terms of the major watersheds (Figure 3).
Group I-the North-west. Consists primarily of stations in the Nicoya, Tempisque, Bebedero, and Tkcoles basins, and intervening areas. Of the 34 stations within these basins, only four are classified differently. Puerto
,?I *\
* CsribbennGmup
Northwestern Group
A Mid-Pacific Croup
Southwestern Croup
Figure 7. Allocation of each station to one of four groups based upon the similarities of interstation correlations of annual precipitation, defined by clustet analysis

182 P R. WAYLEN, M. E. QUESADA AND C. N. CAVIEDES
Hum0 (70) and San Miguel de Barranca (84), both on the Golfo de Nicoya, display correlation fields more akin to those of stations in Group I11 (South-west). Cordoncillal (13) and Desamparados (19), close to the low drainage divide of the Cerros de la Carpintera (< 2000 m) in the eastern headwaters of the Thcoles basin, are classified with the nearby Caribbean stations (Group IV). In addition, six stations beyond the basin limits are assigned to the North-west group. They share common characteristics of elevation, orientation, and exposure: El Caiion (22), Villa Mills (104), San Isidro de El General (81), and Repunta (78) are located at fairly high elevations on the leeside of mountain divides separating them from the Pacific (Figures 1 and 2); at lower elevation, the same is true of Finca Puntarenas (33), leaving only Linda Vista, El Guarco (51) in the eastern Reventazon as anomalous.
Group ZZ-Mid-Pacijic. Includes 11 stations drawn almost exclusively from the small basins of the Candelaria, Pocares, and Naranjo. Topographic similarities and the density of stations along the coast makes the allocation of Finca Tigre, Quepos (34) to Group 111 (south-west) unusual. La Cangreja (43) and San Vito de Java (85 ) lie outside the basin boundaries: the former is located just over the divide in the Reventazon, whereas the latter is in the extreme south-west of the El General basin on the leeside of a more sizeable divide.
Group IZZ-South-west. This is the least geographically contiguous group, comprising low-lying stations in the Cot0 and El General basins and stations at intermediate elevations in the southern Reventazon. Chase (lo), at the northernmost border with Panama, appears anomalous. The Caribbean influence on this station is greatly lessened despite the sea’s proximity. Margarita (56) and Nievecita (62) lie m e r downstream and are exposed to the Caribbean influences, whereas Chase is located inland of a large bend in a river. To the north and east the station is ringed by uplands, and to the south-west, by high lands in Panama. The local topographic setting, then, orientates the station in the direction of equatorial westerlies and on the leeside with respect to winds from the Caribbean.
Group ZV-Caribbean. Aside from the few noted exceptions, this region encompasses stations located in the Sixaola, Estrella, Bananito, Blanca, Madre de Dios, Pacuare, and San Juan basins. Northern portions of the Reventazbn are also included. Exposure to the Caribbean influences is a primary consideration for membership in this group (Figure 1). A northward projecting ridge of the Cordillera de Talamanca blocks portions of the southern Reventazon basin from Caribbean airflows and the eight stations therein are assigned to Group I11 (south-west.)
Regional correlation jields
Only statistically significant correlations are mapped and used in the construction of the regional composite correlation fields (Figures 8-1 1). The distribution of dots provides a rough guide to the dimensions of Costa Rica. Beyond these the correlation fields are purely artifices of the mapping package. All correlation fields reveal strong north-west-south-east trends, paralleling the dominant physiographic and coastline orientations.
The North-west group (Figure 8) displays high positive correlations ( > 0.6) along an east-west axis located about 75 km either side of the origin, and limited to about 25 km in a north-south direction. These dimensions correspond to those of the Thcoles basin, whose stations constitute the majority of the group. A second area of high correlation lies between 100 and 250 km to the south-west, corresponding to stations of the South-west group. Intervening correlations are lower, which is consistent with the identification of the Mid-Pacific stations as a distinct group. A marked feature of this correlation field is the decline of correlation to the east and east-south-east from 0.4 at 150 km, to -0.3 at 250 km, corresponding to distances from most north-westerly stations to those along the Caribbean coast.
This inverse behaviour of Pacific and Caribbean coastal stations is also clearly displayed in the correlation field of the mid-Pacific group (Figure 9). The steepest gradient occurs at about 100 km in a quadrant from the north-east to the south-south-east, which approximates distances and directions to the Caribbean drainage &vide from most Mid-Pacific stations. Several negative correlations are observed at distances (1 75-200 km) equivalent to the intracoastal dimensions. Correlations are highly positive in the 75 km encompassing the group, but diminish to the north-west and south-east, identifying groups I and I11 as being similar, but not identical.

COSTA RICAN RAINFALL
I I 1
I
183
c 200 lWI 0
-1 00 c -200 -
100 200
I I I
100 200
Figure 8. Correlation fields and isocorrelation line of significant interstation correlations of annual precipitation between stations in the North- west group (see stars in inset) and all other stations. All numbers on axes represent distances in kilometres from the point of origin. Negative
numbers on the vertical and horizontal axes represent distances south and west of the origin
30
20
19
-10
-20
-30
Figure 9. As in Figure 8, except for stations in the Mid-Pacific group of stations

184 R R. WAYLEN, M. E. QUESADA AND C. N. CAVIEDES
t 1 I ' - - 1 - 3 0 0 -32L ' -200 -100 0 100 200 300
Figure 10. As in Figure 8, except for stations in the South-west group of stations
The dispersed nature of the South-west group is revealed in Figure 10. High positive correlations ( > 0.7) appear north and south of the origin at about 75 km, equivalent to the distances between the two aggregations of constituent stations in the south-west and southern portions of the Reventazon basin respectively. Northwards, beyond this limit, some decline in correlation is noted with stations in the Caribbean watershed.
Group N (Figure 11) displays strong similarity (correlation > 0.6) over distances (250 km) along the topographic axis, which are equivalent to the length of the entire Caribbean seaboard. To the west, correlations decrease rapidly at about 100 km and became negative, illustrating the Pacific-Caribbean contrast.
Correlation of annual precipitation and SO1
Use of lag cross-correlation to detect teleconnections may induce spurious periodic behaviour if the variables are correlated serially (Katz, 1988; Chu and Katz, 1989). First-order autocorrelation of the annual SO1 is low (0.078) and not significantly different from zero. Only 20 meteorological series showed sigmilcant lag-one serial correlation (all positive), and their disposition revealed no clearly defined spatial pattern. In light of these findings, the search for teleconnections proceeded without further statistical filtering.
Most significant cross-correlations occur at lag zero, decreasing with increased positive lags (precipitation in years preceding the year of SOI) and negative lags (precipitation in years following the SOI), to about 4 years (Table II). Using the simple assumption of independence between precipitation stations, a minimum number of 10 stations reporting statistically significant correlations is required to imply statistical significance (level 0.05) of each field at each lag (Livezey and Chen, 1983). Even under this generous assumption correlation fields at many lags can be discarded as not being significant. The locations of stations reporting significant associations (Figure 12) reveals a discernible pattern of correlations during the period of lags + 1 to -2. In the year preceding the SO1 observation (+ l), precipitation in all areas but the Caribbean lowlands shows positive associations with the SO1 that is to follow. Notable areas of association occur in the Cot0 and El General basins of the south-west, some of the mid-Pacific stations and the Thrcoles basin. Of the stations in the Reventazh basin, only Villa Mills (1 04) and Tabano (92) reveal significant associations. All significant correlations are positive at lag 0, and are restricted mainly to the Pacific watershed. Additional correlations occur at those group IV stations located in the headwaters

COSTA RICAN RAINFALL 185
-200 -100 0 100
I I t I I I I I I -300 -300 -200 -100 0 100 200 303
Figure 1 1 . As in Figure 8, except for stations in the Caribbean group of stations
Table 11. Number of stations reporting significant cross-correlations between annual precipitation and the Southern Oscillation Index over various lag time periods in years
7 6 5 4 3 2 1 0 - 1 -2 -3 -4 -5 -6 -7
Stations 11 7 ~ 28 0 ~ 7 7 14- 40 11 13 8 8 3 12 3
of the Reventazon and Chase (10). Within the Tholes basin itself, more numerous significant results are found in the west. Stations located along the north and mid-Caribbean coast return low or slightly negative (not significant) correlations, and those within the San Juan basin show a greater influence from the Pacific. The latter finding should be interpreted cautiously owing to the noted absence of stations in the extreme north-east. Precipitation in the following year (lag - 1) presents a completely opposite isocorrelation map, with the divide between negative (Pacific) and positive (Caribbean) correlations again coinciding with the major topographic divide but becoming blurred in the western San Juan basin. Significant correlations are restricted to the North-west and Mid-Pacific groups, whereas Lim6n (50) is positively correlated, emphasizing the strong east-west contrast found at this latitude. This pattern persists until lag -2, but the region of significant correlations shifts markedly southward to the Cot0 basin and nearby portions of the El General valley.
Regionalization of correlations with SOI
Two major groups of stations, separated by the topographic divide, emerge from clustering performed on cross- correlations for the periods (lags + 1 to -2) related most closely to the SO1 observation (Figure 13). A possible Caribbean ‘core’ with radially diminishing influence is revealed when the tree of group linkages is viewed in reverse. This procedure plots the disposition of groups of stations in which lag cross-correlation characteristics become progressively less dissimilar from the bulk of unclassified stations (Figure 13(b)). The first group to be identified, i.e. those most unlike the rest, consists of the Caribbean ‘core’, runs from L i m h (50) and Freeman (35)

186 P. R. WAYLEN, M. E. QUESADA AND C. N. CAVIEDES
* SiMcanr n.gathre
Figure 12. Spatial disposition of stations reporting significant correlations between annual precipitation and the annual Southern Oscillation Index at selected time periods. SO1 0 represents synchronous years of the two variables, negative numbers give the numbers of years after the
Southern Oscillation observation in which precipitation is recorded and the positive numbers are years before
inland through to Vara Blanca (1 03) in the south-west San Juan basis, and includes Rosemont (79) and Tucurrique (99) in the Reventazbn basin. This is followed by a group of stations ringing the Caribbean core from Asuncibn (2) to Ciudad Quesada (1 8) and Los Ensayos (55) in the San Juan basin. The group includes portions of the Tholes- Reventazbn interlluve, and most of the middle Reventazh basin. A group of southern Caribbean stations, from the Sixaola basin to the eastern Tholes, is next identified, with an outlier at Los Andes de Orotina (53) in the westem Tikcales basin. The subsequent group corresponds to the north-westem Pacific region.
The remaining unclassified stations (dots in Figure 13(b)) represent varying aspects of the Pacific influence and are grouped separately in Figure 13(c), whereas Caribbean stations are left undifferentiated. The north-west Pacific grouping is plotted on both figures 13@) and 13(c) in order to stress the continuity of the process. The group with the next greatest degree of internal similarity comprises mainly south-westem stations, followed by a midPacific clustering, and finally, those that are intermediate to both Pacific and Caribbean coastal influences. There is subjectivity in the interpretation of these objectively defined groupings, many of which possess considerable geographic overlap. This overlap may be a statistical artefact of using cross-correlation coefficients of which only 31.7 per cent are statistically different from zero, or it may reflect the importance of local topography in contributing to the patchwork of groupings especially near regional boundaries. However, the process stresses the Caribbean-Pacific contrast in responses to ENS0 and yields groupings that are broadly compatible with those derived from the preceding analysis of interstation correlations.
Probability distributions of rainfall in years of a warm and cold Pacific
The intrinsic variability of precipitation at a site is often represented through appropriate probability distributions. The preceding analyses inhcate that the characteristics of annual precipitation and its responses to ENS0 vary regionally over Costa Rica. This section identifies differences in the probabilistic description of likely annual precipitation across the study area during unusually w m and cold phases of the South Pacific, by fitting the normal distribution and comparing its parameters, means and variances, under each set of conditions.

COSTA RICAN RAINFALL 187
Figure 13. Groupings of stations on the basis of lag cross-correlation characteristics of precipitation and SO1 using only lags from + 1 to - 2 years. (a) Tivo major gropings, @) groupings emphasizing differentiation on the Caribbean slope and, (c) groupings emphasizing the structure of
groups on the Pacific slope
188 I? R. WAKEN, M. E. QUESADA AND C. N. CAVIEDES *
‘E) a

5'
I
68 I

190 P. R. WAYLEN, M. E. QUESADA AND C. N. CAVIEDES
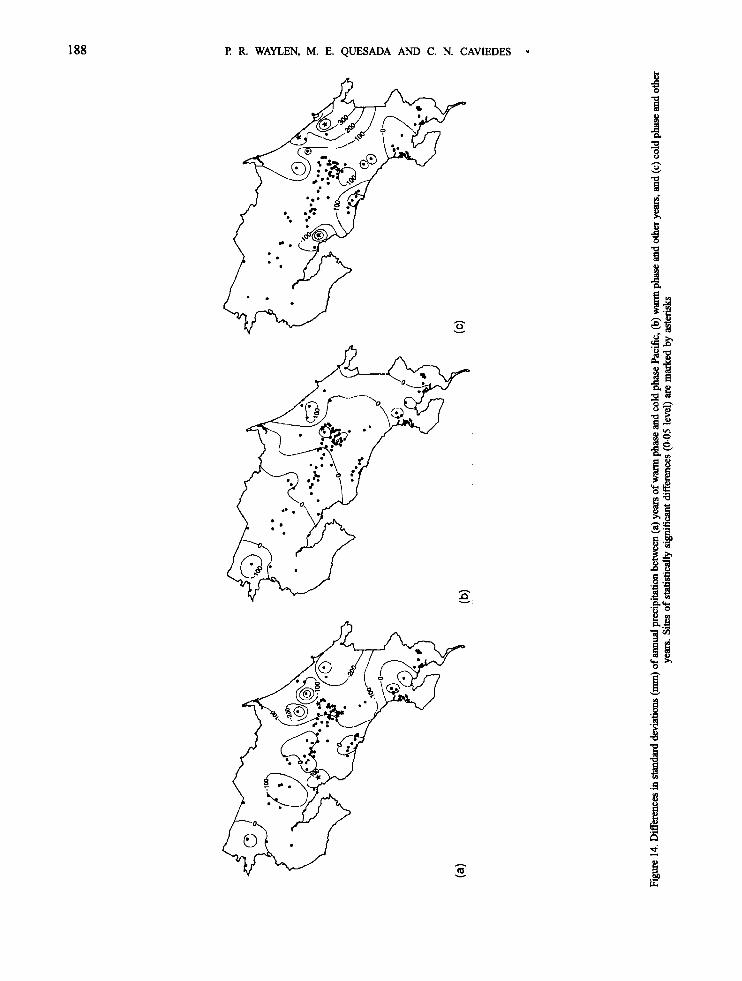
The normal distribution provides an adequate description of the frequency of annual precipitation in each subsample at every site. Very few stations report significant differences in variances between any of the subsamples. For ease of interpretation these data are plotted as differences in standard deviations in Figure 14(a-c). It can be seen that differences in the standard deviation are generally restricted to less than 100 mm, and that the largest changes are often found along the Caribbean slope and in the headwaters of the Reventazdn. Generally, standard deviations are lowest in warm years and highest in cold years.
More significant differences are observed in subsample means, particularly along the Pacific slope (Figure 15(a- c)). Reductions in mean annual precipitation between warm and cold years of greater than 400 mm are common over much of the country (Figure 15(a)), and exceed 800 mm in the south-west. Such differences constitute up to 40 per cent of mean annual precipitation (Figure 5). Warm years are plainly coupled with droughts along the Pacific, however, the Caribbean slope shows increased rainfall, reasserting the unique attributes of the region. The anticipated increase of mean precipitation in cold years (Figure 15(c)) along the Pacific is also unexpectedly present along the southern Caribbean slope. In sum, the parameters of the normal distribution vary with the specific condition of the South Pacific, but the changes along the Caribbean coast are more complex than a simple leeward- windward contrast. A study of Panamanian precipitation during the 1975-1976 El Niiio (Estoque et al., 1985) bears out the regional persistence of this unexpected result.
DISCUSSION AND CONCLUSIONS
Generalized regional statements made by Hastenrath (1976, 1988), Ropelewski and Halpert (1987), and Rogers (1 988) concerning the response of annual precipitation in Costa Rica to ENS0 phases have been broadly correct. The finer geographical scale used in this study reveals a more complex and varied range of responses, which occasionally contradict previous findings. The complexity arises from differences in dominant precipitation- generating mechanisms, geographical location with respect to topography and oceans, and the leadlag period considered. Because such factors have been identified previously as controlling precipitation in other areas of Central America (Hastemath, 1967; Chacdn and Fernhdez, 1985; Cavazos and Hastenrath, 1990; Vargas and Trejos, 1994), these findings may have a broader regional significance.
Interstation correlations indicate that marked contrasts between Caribbean and Pacific coastal stations may persist, to a lesser degree, up to the drainage divide. North-east trades and nortes generate precipitation along the Caribbean and a rain-shadow effect on the Pacific. Precipitation on the latter is controlled by the seasonal migration of the eastern Pacific ITCZ and equatorial westerlies. Both are fairly continuous, both inter- and intra-annually, in the south-west, but become shorter in duration and more variable to the north (Hastenrath, 1967, 1976). The mid- Pacific stations lie at the northernmost average position of the ITCZ and are therefore most sensitive to interannual variability of the ITCZ and associated precipitation. Locally, topography may modify this established pattern. Stations that appear to be misclassified geographically often share a common windward or leeward orientation with other stations in the group. The differing orientations of the Central and Talamanca cordilleras produce rain- shadow effects and permit ‘leakage’ of Pacific influences over the locally lower Caribbean-Pacific divide. Their detection is facilitated by the higher density of recording stations in the Central Valley.
The regional findings are, partially, a function of the clustering algorithm used and the interpretation of the subsequent output. The four groupings derived from the interstation correlation represent only a selected point along the tree of clusterings. Subsequent stages combine the South-west and North-west groups, followed by the mid-Pacific stations, retaining the Pacificxaribbean differentiation to the last step. Further disaggregation of the groups reduces the spatial cohesion found in the fourfold classification.
Annual precipitation totals are associated most strongly with the SO1 during the period extending from the year preceding the SO1 observation to two years after it, which is in keeping with the previous analysis of ‘wet’ and ‘dry’ years in the regional precipitation time series (Hastenrath, 1976 and 1988). On the basis of the zero-lag cross- correlations, ‘dry’ years correspond to low SO1 values (‘warm phases’ or ‘El Niiios’), and ‘wet’ to high values (‘cold phases’ or ‘La Niiias’), at the Costa Rican stations that might have been included in the aggregate series, with the exception of Limon on the Caribbean coast.
Hastenrath and Lamb (1977) indicate that the ‘dry’ years are characterized by higher than normal pressures in the North Atlantic anticyclone and lower pressures in the eastern equatorial Pacific, leading to increased resultant

COSTA RlCAN RAINFALL 191
velocities of the north-east trade winds, particularly in July-August, and a reduction of the equatorial westerlies. The trades blow onshore to the Caribbean coast enhancing the rain-shadow effect on the Pacific (Fernhndez and Ramirez, 199 1 ; Vargas and Trejos, 1994). There is evidence that winds blowing westward through the breaks in the cordilleras induce cold water upwellings on the Pacific side. Such a gap occurs along the Costa Rica-Nicaragua border, inducing an upwelling centre off the country’s north-west coast called the Costa Rica dome (Clarke, 1988; Legeckis, 1988; McCreary et al., 1989), the dimensions of which fluctuate, possibly in association with the Southern Oscillation Index (Barberb et al., 1981; Umatani and Yamagata, 1991). Expansion of the dome lowers sea-surface temperatures and restricts northward migration of the ITCZ. The resulting reduction in westerlies and sea breezes may enhance the droughts observed on the Pacific slopes during periods of low SOI.
Pacific stations, particularly those in the south-west, show positive correlations at lags of+ 1 and zero, and negative correlations in the following 2 years. If years of low SO1 are equated with El Niiio events, then this fact is in keeping with the ‘canonical El Niiio’ of Rasmusson and Carpenter (1 983). Warm eastward advecting water from the western equatorial Pacific arrives at the coast of South America in DecemberIJanuary and expands north and south, thereby increasing sea-surface temperatures in the Pacific off Costa Rica and permitting the northward extension of the ITCZ in the following year. Most negative correlations at this time (lag - 1) are found in the North-west and Mid-Pacific groups, whereas Lim6n (50) reports a positive correlation, implying a reduction of precipitation along the Caribbean. The pattern persists, to a lesser degree, into the following year (lag 2), with most significant correlations being restricted to the South-west. This suggests that the westerlies and precipitation associated with the ITCZ are displaced to the northernmost extent in the year following the Southern Oscillation low-phase events but take an additional year, when their displacement is less extensive, to return to ‘normal’.
Vargas and Trejos (1 994) report that considerable interannual variability in precipitation along the Pacific coast results from tropical cyclone activity in the Caribbean. Correlation of annual precipitation and the number of tropical cyclones in the Caribbean region defined by Vargas and Trejos (1 994), yields significant associations at 23 sites in this study (Figure 16 and Table 1). With the exception of T-Seis (91), all the significant correlations were positive and found on the Pacific coast or in the Central Valley. The number of tropical storms in the North Atlantic has been shown to diminish in the boreal summer of a warming Pacific and increase in cold phases (Gray, 1984),
Figure 16. Measure of linear association between annual precipitation totals and the annual number of tropical cyclones in the Caribbean region. Statistically significant results (0.05 level) shown by asterisks

192 P. R. WAYLEN, M. E. QUESADA AND C. N. CAVIEDES
which is consistent with the enhancement of the trade winds over the Caribbean (Hastenrath, 1976) and droughts observed along the Pacific coast during warm phase periods. Again, precipitation along the Caribbean slope appears to behave in the opposite fashion to the Pacific, although not significantly so.
Regional variations in response along the Pacific coast may then be related to the position of the ITCZ, dimensions of the Costa Rica dome and, possibly, tropical cyclone activity in the Caribbean. Such seasonality may be better understood by an analysis of monthly precipitation totals. Similarly, the lack of a single clear response to the SO1 among the core stations along the Caribbean, despite the evidence of increased resultant velocities of the north-east trade winds, requires further investigation. The precipitation brought by the trade winds constitutes the first of two maxima on this coast. The later peak, in late autumn and early winter, results from the convergence of coastal winds during nortes, the development of which is favoured by high meridional pressure gradients between continental North America and the Caribbean. Because ‘wet’ years tend to follow ‘dry’ years (Hastenrath, 1988; Waylen et al., 1994), Hastenrath’s ‘wet’ Janwy/February conditions may follow a ‘dry’ July/August. Should this be so, then sea-level pressures off the Caribbean coast are higher than normal, and those in the Gulf of Mexico lower, in the January-February period of a norte season following a low-phase Southern Oscillation event (Hastenrath, 1976). The meridonial pressure gradient, probabilities of nortes, and ‘winter’ precipitation along the Caribbean should all decrease. This may compensate for the increased ‘summer’ precipitation caused by the north- east trades, thereby producing little or no change in the annual precipitation total at lag-zero. The balance between two different contributing generating processes, displaying opposing tendencies, could explain the absence of any strong, consistent, regional signal along the Caribbean coast. It follows that the interannual variability of precipitation in Costa Rica, and by extension, in other areas of the Central American landbridge, exhibit characteristics that are not only attributable to fluctuations of the Southern Oscillation, but also to circulation conditions over the Caribbean-Gulf of Mexico and the North Atlantic. As a consequence, responses of the whole region to ENS0 events are far from being as unitary and consistent as proposed previously and their peculiarities could be better understood with the analysis of monthly precipitation values.
ACKNOWLEDGEMENTS
This research was carried out while the first author was a Hartley Visiting Fellow at the Department of Geography, University of Southamption, England. The fiiancial and logistic support of the University’s Committee for Advanced Studies and Geography Department is gratefully acknowledged, particularly the contributions of Drs D. Maddy and J. Milne. Data were acquired by Marvin Quesada with the fiiancial support of a Tinker Fellowship from the Center for Latin American Studies, University of Florida. Data entry was completed with the assistance of Lee Swanson and Karl Merrem. Dr D. LeBoutillier M s h e d the program for the computation of L-moments.
REFERENCES
Alpert, L. 1945. ‘The Inter-tropical Convergence Zone of the Eastern Pacific Region, 1’, Bull. Am. Metered. SOC., 26, 426432. Barbertin, J., Gallegos, A. and Padilla, A. R. 1984. ‘The Costa Rica Dome during the onset of the 1982-83 El Niiio’, Trop. Atmos. Ocean
Berndtsson, R. 1988. ‘Temporal variability in spatial correlation of daily rainfall,’ Water Resou,: Res., 24, 1511-1518. Bryson, R. A. and Kuhn, F! M. 1961. ‘Stress-differential induced divergence with application to littoral precipitation’, Erkunde, 15, p. 287-294. Cavazos, T. and Hastemath, S. L. 1990. ‘Convection and rainfall over Mexico and their modulation by the Southem Oscillation’, Int. 1
Chacbn, R. E. and Fernhdez, 1985. ‘Temporal and spatial rainfall variability in the mountainous region of the Reventazon River basin, Costa
Chu, P -S. and Katz, R. W. 1989. ‘Spectral estimation from time series models with relevance to the Southern Oscillation’, 1 Climate, 2, 8690. Clarke, A. J. 1988. ‘Inertial wind path and sea surface temperature patterns near the Gulf of Tehuantepec and Gulf of Papagayo’, 1 Geophys.
Crutcher, H. L. 1975. ‘A note on the possible misuse of the Kolmogorov-Smimov test’, 1 Appl. Meteoml., 14, 1600-1603. Estoque, M. A., Luque, J., Chandek-Monteza, M. and Garcia, J. 1985. ‘Effects of El Niiio on Panama rainfall’, Geofis. I n t , 24, 355-381. Fernhdez, W. and Ramirez, P 1991. ‘El Niiio, La Oscilacion del Sur sus effectos en Costa Rica: Una revision’. Tecnol. Murchu, 11, 3-1 1. Garcia, O., Bosart, L. and DiMego, G. 1978. ‘On the nature of winter season rainfall in the Dominican Republic’, Mon. Weu. Rev., 106, 961-
Gray, W. M. 1984. ‘Atlantic seasonal hurricane frequency: Part 1: El Niiio and 30 mb quasi-biennial oscillation influences’, Mon. Wea. Rev., 112,
NousI., 24, 13-14.
Climatol., 10, 377-386.
Rica’, 1 Climatol., 5, 175-188.
Rm., 93, 15491-15501.
982.
1649-1683.

COSTA RICAN RAINFALL 193
Guttman, N. B., Hosking, J. R. M. and Wallis, J. R. 1993. ‘Regional precipitation quantile values for the continental United States computed
Hastenrath, S. L. 1967. ‘Rainfall distribution and regime in Central America’, Arch. Meteoml. Geophys. Bioklimatol., Sene B, Band 15, Heft 3,
Hastenrath, S. L. 1976. ‘Variations in low latitude circulation and extreme climatic events in the tropical Americas’, 1 Atmos. Sci., 33,202-215. Hastenrath, S. 1984. ‘Interannual variability and annual cycle: mechanisms of circulation and climate in the tropical Atlantic sector’, Mon. Wea.
Hastenrath, S. L. 1988. Climate and Cimrlation in the Tropics, Reidel, Dordrecht. Hastenrath, S. L. 1990. ‘Diagnostics and prediction of anomalous river discharge in northern South America’, 1 Climate, 3, 1080-1096. Hastenrath, S. L. and Lamb, I? J. 1977. Climatic Atlas of the %pica/ Atlantic and Eastern Pacijic Oceans, The University of Wisconsin Press,
Hosking, J. R. M. 1986. The Theory of Probability Weighted Moments, Research Report RC 12210, IBM Research, Yorktown Heights, New
Intergovernmental Panel on Climate Change 1990. Climate Change. World Meteorological Organization, United Nations Environment Program.
Katz, R. W. 1988. ‘Use of cross correlations in the search for teleconnections’, 1 Climatol., 8, 241-253. Legeckis, R. 1988. ‘Upwelling off the Gulf of Panama and Papagayo in the Tropical Pacific, during March 1985’, 1 Geophys. Res., 93, 15485-
Livezey, R. E. and Chen, W. Y. 1983. ‘Statistical field significance and its determination by Monte Carlo techniques’, Mom Wea. Rev., 111,46-
McCreary, J. P., Lee, H. S. and Enfield, D. B. 1989. ‘The response of the coastal ocean to strong offshore winds: with application to circulations
Ministerio de Recursos Naturales, Energia y Minas 1988. Instituto Meteoroldgico Nacional Alio del Centenario 1888-1988: Catash0 de las
Neumann, C. J., Jarvinen, B. R., Pike, A. C. and Elms, J. D. (eds) 1988. %pica/ Cyclones of the North Atlantic Ocean. Historical Climatology
Portig, W. 1965. ‘Central American rainfall’, G e m Rev., 55, 68-90. Press, W. H., Flannery, B. I?, Teukolsky, S. A. and Vetterling, W. T., 1988. Numerical Recipes: the Art of Scientzzc Computing, Cambridge
Rasmusson, E. M. and Carpenter, T. H. 1983. ‘The relationship between eastern equatorial Pacific sea surface temperatures and rainfall over
Rogers, J. C. 1988. ‘Precipitation variability over the Caribbean and tropical Americas associated with the Southern Oscillation’, 1 Climate, 1,
Ropelewski, C. F. and Halpert, M. S. 1987. ‘Global and regional scale precipitation patterns associated with the El Niiio/Southern Oscillation’,
Schneider, U. and Schonwiese, C.-D. 1989. ‘Statistical characteristics of El Niiio/Southern Oscillation and North Atlantic Oscillation indices’,
Umatani, S. and Yamagata, T. 1991. ‘Response of the eastern tropical Pacific to meridional migration of the ITCZ: the generation of the Costa
Vargas, A. B. and Trejos, V F. S. 1994. ‘Changes in the general circulation and its influences on precipitation trends in Central America: Costa
Waylen, P. R., Quesada, M. E. and Caviedes, C. N. 1994. ‘The effects of El Nitio on precipitation in San Jost, Costa Rica’, Int. 1 Climatol., 14,
Wolter, K. 1987. ‘The Southern Oscillation in surface circulation and climate over the tropical Atlantic, eastern Pacific, and Indian Oceans as
using L-moments’, 1 Climate, 6, 2326-2340.
20 1-241,
Rev., 112, 1097-1 107.
Madison, WI.
York (reissued with corrections 1989).
Cambridge University Press, Cambridge.
15489.
59.
in the Gulfs of Tehuantepec and Papagayo’, 1 Ma,: Res., 47, 81-109.
Series de Precipitaciones Medidas en Costa Rica, San Jo&, Costa Rica, 361 pp.
Series, 6 2 , National Climate Data Center, National Oceanic and Atmospheric Administration, Asheville, NC, 186 p.
University Press, Cambridge.
India and Sri Lanka’, Mon. Wea. Rev., 11 1, 5 17-28.
172-82.
Mon. Wea. Rev., 115, 16061626.
Atmosfem, 22, 34-47.
Rica Dome’, 1 Phys. Oceanogr., 21, 346363.
Rica’, Ambio, 23, 87-90.
559-568.
captured by cluster analysis’, 1 Clim. Appl. Meteoml., 26, 540-558.