Temperature Changes in Central Asia from 1979 to 2011 ...
43
University of Nebraska - Lincoln DigitalCommons@University of Nebraska - Lincoln Papers in the Earth and Atmospheric Sciences Earth and Atmospheric Sciences, Department of 2-1-2014 Temperature Changes in Central Asia from 1979 to 2011 Based on Multiple Datasets ZENGYUN HU Xinjiang University CHI ZHANG Xinjiang Institute of Ecology and Geography, [email protected] Q. Steven Hu University of Nebraska-Lincoln, [email protected] HANQIN TIAN Auburn University Follow this and additional works at: hp://digitalcommons.unl.edu/geosciencefacpub is Article is brought to you for free and open access by the Earth and Atmospheric Sciences, Department of at DigitalCommons@University of Nebraska - Lincoln. It has been accepted for inclusion in Papers in the Earth and Atmospheric Sciences by an authorized administrator of DigitalCommons@University of Nebraska - Lincoln. HU, ZENGYUN; ZHANG, CHI; Hu, Q. Steven; and TIAN, HANQIN, "Temperature Changes in Central Asia from 1979 to 2011 Based on Multiple Datasets" (2014). Papers in the Earth and Atmospheric Sciences. 400. hp://digitalcommons.unl.edu/geosciencefacpub/400
-
Upload
khangminh22 -
Category
Documents
-
view
1 -
download
0
Transcript of Temperature Changes in Central Asia from 1979 to 2011 ...

University of Nebraska - LincolnDigitalCommons@University of Nebraska - Lincoln
Papers in the Earth and Atmospheric Sciences Earth and Atmospheric Sciences, Department of
2-1-2014
Temperature Changes in Central Asia from 1979 to2011 Based on Multiple DatasetsZENGYUN HUXinjiang University
CHI ZHANGXinjiang Institute of Ecology and Geography, [email protected]
Q. Steven HuUniversity of Nebraska-Lincoln, [email protected]
HANQIN TIANAuburn University
Follow this and additional works at: http://digitalcommons.unl.edu/geosciencefacpub
This Article is brought to you for free and open access by the Earth and Atmospheric Sciences, Department of at DigitalCommons@University ofNebraska - Lincoln. It has been accepted for inclusion in Papers in the Earth and Atmospheric Sciences by an authorized administrator ofDigitalCommons@University of Nebraska - Lincoln.
HU, ZENGYUN; ZHANG, CHI; Hu, Q. Steven; and TIAN, HANQIN, "Temperature Changes in Central Asia from 1979 to 2011Based on Multiple Datasets" (2014). Papers in the Earth and Atmospheric Sciences. 400.http://digitalcommons.unl.edu/geosciencefacpub/400

Temperature Changes in Central Asia from 1979 to 2011 Based on Multiple Datasets*
ZENGYUN HU
State Key Laboratory of Desert and Oasis Ecology, Xinjiang Institute of Ecology and Geography, Chinese Academy
of Sciences, and College of Mathematics and System Sciences, Xinjiang University, Urumqi, China
CHI ZHANG
School of Resources Environment Science and Engineering, Hubei University of Science and Technology, Hubei,
and State Key Laboratory of Desert and Oasis Ecology, Xinjiang Institute of Ecology and Geography,
Chinese Academy of Sciences, Urumqi, China
QI HU
School of Natural Resources and Department of Earth and Atmospheric Sciences, University
of Nebraska–Lincoln, Lincoln, Nebraska
HANQIN TIAN
International Center for Climate and Global Change Research, and School of Forestry and Wildlife Sciences,
Auburn University, Auburn, Alabama
(Manuscript received 28 January 2013, in final form 27 September 2013)
ABSTRACT
The arid and semiarid region in central Asia is sensitive and vulnerable to climate variations. However, the
sparse and highly unevenly distributed meteorological stations in the region provide limited data for un-
derstanding of the region’s climate variations. In this study, the near-surface air temperature change in central
Asia from 1979 to 2011 was examined using observations from 81 meteorological stations, three local ob-
servation validated reanalysis datasets of relatively high spatial resolutions, and the Climate Research Unit
(CRU) dataset. Major results suggested that the three reanalysis datasets match well with most of the local
climate records, especially in the low-lying plain areas. The consensus of the multiple datasets showed sig-
nificant regional surface air temperature increases of 0.368–0.428Cdecade21 in the past 33 years. No significant
contributions from declining irrigation and urbanization to temperature change were found. The rate is larger
in recent years than in the early years in the study period. Additionally, unlike in many regions in the world,
the temperature in winter showed no increase in central Asia in the last three decades, a noticeable departure
from the global trend in the twentieth century. The largest increase in surface temperature was occurring in
the spring season. Analyses further showed a warming center in the middle of the central Asian states and
weakened temperature variability along the northwest–southeast temperature gradient from the northern
Kazakhstan to southern Xinjiang. The reanalysis datasets also showed significant negative correlations be-
tween temperature increase rate and elevation in this complex terrain region.
1. Introduction
The arid and semiarid region in central Asia covers
53 106km2, includingKazakhstan, Kyrgyzstan, Tajikistan,
Turkmenistan, Uzbekistan, and Xinjiang province in
northwest China. The region is especially sensitive and
vulnerable to climate change (UNDP 2005; Parry et al.
2007). Rising air temperatures increase the surface
evapotranspiration, stimulate substantial glacial retreats,
* Supplemental information related to this paper is available at
the Journals Online website: http://dx.doi.org/10.1175/JCLI-D-13-
00064.s1.
Corresponding author address: Dr. Chi Zhang, School of Re-
sources Environment Science and Engineering, Hubei University
of Science and Technology, Xianning, Hubei, China.
E-mail: [email protected]
1 FEBRUARY 2014 HU ET AL . 1143
DOI: 10.1175/JCLI-D-13-00064.1
� 2014 American Meteorological Society

and exacerbate water shortage in the region (UNDP 2005;
Siegfried et al. 2012; Sorg et al. 2012). Because of the
critical dependence on climate of the water resources,
ecosystems, and societies in this massive inland region, it is
crucial to understand its climate variation and change in
order to support sustainable development policies. Our
review has found few studies that examined climate var-
iation in central Asia (e.g., Houghton et al. 2001;
Lioubimtseva et al. 2005; Lioubimtseva and Cole 2006;
Lioubimtseva and Henebry 2009), especially its temper-
ature variation. The Intergovernmental Panel on Climate
Change (IPCC; Houghton et al. 2001) reported that the
region’s averaged near-surface air temperature rose by
18–28C during the twentieth century. However, the report
provided no specific information about its temporal (e.g.,
the time of abrupt temperature changes) or spatial (e.g.,
areas of substantial temperature rise or fall) variations.
Meanwhile, large uncertainties have been noticed existing
in these previous studies, arising from either using obser-
vational records from a few meteorological stations (e.g.,
Kharlamova and Revyakin 2006; Mamtimin et al. 2011) or
using a single spatially interpolated dataset of the Climate
Research Unit (CRU) time series from New et al. (1999,
2000) and Mitchell and Jones (2005) in the region. As
pointed out by Lioubimtseva and Cole (2006), the spatial
interpolation or extrapolation was particularly prone to
errors in this region of very complex terrains with rather
sparse and highly skewed spatially distributed meteoro-
logical stations. In comparison with other regions, the
limited weather stations in central Asia are clustered in
and around the oases. Moreover, long-term climatic ob-
servations are rare (Lioubimtseva and Cole 2006). Most
stations outside China stopped functioning in the 1990s
after the dissolution of the former Soviet Union (Chub
2000), losing continuation of data for analysis of regional
climate variations in the recent decades (Schiemann et al.
2008). These problems in data pose severe challenges for
the study of climate in central Asia and limit our un-
derstanding of the spatial and temporal variations in
temperatures in the region.
The National Centers for Environmental Prediction
(NCEP)–National Center for Atmospheric Research
(NCAR) reanalysis dataset (Kalnay et al. 1996) pro-
vided an alternative data source and helped overcome
some of the data issues. While the reanalysis data have
been widely used in regional climate studies (e.g.,
Marshall 2002; Blender and Fraedrich 2003; Bromwich
and Fogt 2004; Bordi et al. 2006; Bromwich et al. 2007;
Song and Zhang 2007; Grotjahn 2008; Dessler andDavis
2010; Bao and Zhang 2012), the data have rarely been
used in climate studies for central Asia except for a few
studies on the region’s precipitation (e.g., Schiemann
et al. 2008), partially because the spatial resolution of
the dataset (2.58 3 2.58 of latitude and longitude) was
considered too coarse to describe important details in
regional climate in central Asia.
In the last few years, a new generation of reanalysis
datasets has been developed with improved accuracy
and spatial resolution [#(0.758 3 0.758) of latitude and
longitude]. These new datasets include the NCEP Cli-
mate Forecast System Reanalysis (CFSR; Saha et al.
2010), European Centre for Medium-Range Weather
Forecasts (ECMWF) InterimRe-Analysis (ERA-Interim;
Dee et al. 2011), and Modern-Era Retrospective Analysis
forResearch andApplications (MERRA;Rienecker et al.
2011). These data could be suitable for regional climate
studies in central Asia. However, as cautioned by the
data producers, few evaluations have been made so far
and the suitability and accuracy of these global datasets
for regional studies are not yet fully understood (https://
climatedataguide.ucar.edu/reanalysis/climate-forecast-
system-reanalysis-cfsr). Because of the differences in
the models and methods used in these reanalysis pro-
jects these datasets may, for example, describe near-
surface air temperatures (Pitman and Perkins 2009).
Thus, before using them their suitability or accuracy
to describe the regional climate features needs to be
evaluated against available field observations (Ma
et al. 2008).
In this study, we first examine the accuracy of the
three relatively high spatial resolution datasets, CFSR,
ERA-Interim, and MERRA, in describing the regional
temperature variations in central Asia by comparing the
reanalysis data with observations from stations in the
region. After the evaluation these datasets are used to
examine temperature variations in central Asia for the
period from 1979 to 2011.
There are three major questions to be addressed in
this study. Was there a warming trend in central Asian
climate in recent decades? If there was, how does it
compare to the temperature changes in the mid- and
early-twentieth century, and how does it compare with
temperature changes in other regions in the Eurasian
continent? Were there changes in seasonal temperature
variation in central Asia and which season experienced
the strongest temperature change? Were there signifi-
cant differences in temperature change among different
subregions of central Asia and how does the tempera-
ture change rate vary with elevation?
2. Study area, data, and methodologies
a. Study area
Our study area consists of Xinjiang Uygur Autonomous
Region, China (Xinjiang), and five central Asian states
(CAS):Kazakhstan,Kyrgyzstan, Tajikistan, Turkmenistan,
1144 JOURNAL OF CL IMATE VOLUME 27

FIG. 1. The study area and distribution of meteorological stations. (a) The location, elevation, country boundary, subregions, and
major water and orographic features in central Asia. The dashed-line rectangle delineates the Tian Shan region (408–44.58N, 698–908E). Climate stations are represented by circles filled with different colors, indicating different data quality. The country boundary
and major rivers were drawn with the Environmental Systems Research Institute, Inc. (ESRI) Basemap Services (http://www.esri.
com/software/arcgis/arcgis-online-map-and-geoservices/map-services). (b) Distribution of the meteorological stations and their
temperature change from 1979 to 2011. The identification (ID) numbers of the stations are labeled (station descriptions are found in
Table S1 in the supplementary material). The size of each circle is in proportion to the rate of change. An open circle indicates no
significant change at the station. A filled circle indicates significant temperature change, and the color of the filling indicates the
turning point (in a time span of 5 yr) of temperature change in 1979–2011 according to the M-K test.
1 FEBRUARY 2014 HU ET AL . 1145
and Uzbekistan (Fig. 1a). We will refer this region as
central Asia. There have been discrepancies and dis-
cussions about the usage of the term ‘‘central Asia.’’ In
some publications, central Asia refers to western China
and Mongolia (Le Houerou 2005); in others, it refers to
the five CAS in the former Soviet Union (e.g., Mayhew
et al. 2004). Our definition agrees with Goudie (2002)’s
description, in which central Asia consists of two parts
separated by high mountains, including the Pamirs, the
Tian Shan Mountains, Kunlun Mountains, and Altai
Mountains (Fig. 1a): ‘‘To the west lie the deserts of the
former Soviet Union and to the east are the deserts of
China’’ (Goudie 2002).
According to the topography and climate character-
istics, the CAS are usually divided into three climatic
subregions: the northern Kazakhstan region in the
north, the Turanian plain in the central and southeast,
and the mountainous region in the southwest [defini-
tions of these climatic subregions also can be found in
Schiemann et al. (2008) and Small et al. (1999)]. In ad-
dition, Xinjiang consists of two climatic subregions: the
northern Xinjiang and the southern Xinjiang. The for-
mer consists of the Junggar basin and the Altai Moun-
tains to its north and the northern slope of the Tian Shan
Mountains to its south and west. The latter consists of
the Tarim basin and the southern slope of the Tian Shan
Mountains to its north and the Kunlun Mountains and
Pamir Plateau to its south and west (Fig. 1a). To in-
vestigate the relationship between elevation and tem-
perature change, we further outline the Tian Shan
region (408–44.58N, 698–908E) (Fig. 1a) according to
Chen (2012).
b. Data
Daily observational records of near-surface (2m
above the ground) air temperatures from 365 meteoro-
logical stations in the study region were collected in this
study. Among them, 295 stations are in the five central
Asian states, and their temperature records were ob-
tained from the National Climatic Data Center (NCDC)
of the U.S. National Oceanic and Atmospheric Ad-
ministration (NOAA). The remaining 70 stations are in
Xinjiang, China, and their records were obtained from
the National Meteorological Center of China Meteo-
rological Administration and from Xinjiang Meteoro-
logical Agency. The data history of these stations is
shown in Table 1. These data are referred to as OBS in
the following sections.
Among the reanalysis data, we used themonthly CRU
time series 3.1 (TS3.1) dataset (New et al. 1999; Mitchell
and Jones 2005) from 1901 to 2009. We also used the
NCEP CFSR, ERA-Interim, and MERRA datasets.
Some details of these reanalysis datasets are provided in
Table 1. These datasets were first examined by com-
parisons with observations from the ground stations for
their accuracy in describing the near-surface air tem-
perature, and then to aid the analysis of spatial varia-
tions in the near-surface temperature. For the analyses
that require elevation information (see below), the
30-arc-s resolution digital elevation data (GTOPO30;
downloaded from http://eros.usgs.gov) were resampled
to match the spatial resolution of each reanalysis dataset.
The elevation at each reanalysis data grid was calculated
as the mean of the digital elevation data within that grid.
To assess the potential impacts of climate change on the
dryland ecosystems and water resources in central Asia,
we further evaluated changes in temperature in vege-
tated and glacial areas in central Asia. The glacial and
vegetated areas were determined with the 300-m resolu-
tion European Space Agency global land cover dataset
(GlobCover 2009; Arino et al. 2010), which has been
evaluated and used for environmental studies in the study
region (Chen et al. 2013). The ‘‘glacier area’’ in the
GlobCover 2009 includes permanent snow and glacier.
Boundaries of northern Kazakhstan and the Turanian
plain in the CAS region were digitized based on the maps
provided by Small et al. (1999) and Schiemann et al.
(2008).
c. Methodologies
Quality control of the OBS involves three steps.
1) Stations whose climate records did not cover the
analysis period were excluded. 2) Stations with missing
observations for more than 5 consecutive days or with
20% observation missing in any 30-day period were
excluded. Otherwise, the missing values in the climate
records were filled with 30-day running means. 3) Sta-
tions that failed to pass the standard normal homoge-
neity test were excluded (Alexandersson 1986). This
homogenization test aims to preserve the climatic signal
and eliminate or reduce the effects on nonclimatic fac-
tors from such changes in instrumentations, observing
practices, and station locations (Aguilar et al. 2003; Li
et al. 2004; DeGaetano 2006). For example, among the
365 meteorological stations under study, only 191 cover
the period between 1979 and 2011, among which 59 have
too many missing values to pass the quality control (step
2). Of the remaining 132 stations, only 81 stations passed
the homogeneity test and were used in climate change
analysis for the period of 1979–2011 (Fig. 1a). The longer
the study period, the fewer number of stations passed
quality control. Compared to the period of 1979–2011,
only 62 stations are qualified for climate change analyses
for the period of 1960–2011 (Table 1).
The three reanalysis data products are evaluated by
comparing their temperatures against the OBS at or
1146 JOURNAL OF CL IMATE VOLUME 27
near the reanalysis grid points for the 1980s, 1990s, and
2000s1 (2000–11). For each meteorological station, its
closest grid in a reanalysis dataset is identified. Then, the
temperature of the reanalysis data at that grid is ad-
justed according to the lapse rate and the elevation
difference between the grid and the station. This ele-
vation difference was calculated using the GTOPO30
developed by the U.S. Geological Survey (USGS; http://
eros.usgs.gov). Annual and seasonal temperature lapse
rates [8C (100m)21] in central Asia were calculated
based on the 1979–2011 mean temperature in the Tian
Shan region (408–44.58N, 698–908E) (Fig. 1a) (see Table
S2 in the supplementary material). The seasonal mean
lapse rates were then linearly interpolated to derive the
daily lapse rate, which was used for the temperature
adjustment.
Following Ma et al. (2008) and You et al. (2010), the
absolute errors (AE) or bias, two-tailed Pearson corre-
lation coefficients (CC), mean absolute errors (MAE),
and root-mean-square error (RMSE) were calculated
to measure various aspects of the differences between
the observed air temperatures and those from the three
reanalysis datasets. The reanalysis products were eval-
uated separately for mountainous and plain areas.
The definition of mountainous area by the United Na-
tions Environment Programme (UNEP) was used; that
is, a mountainous area should have elevation .2500m,
or between 1500 and 2500m and with a slope .28, orbetween 1000 and 1500m and with a slope.58 or localelevation range .300m (Blyth et al. 2002). Infor-
mation of topography was derived from the USGS
GTOPO30 elevation dataset. For each grid in the
USGS GTOPO30 dataset, the local elevation range
was derived from a 5 3 5 km2 buffer around the grid.
Areas outside of the mountainous area were treated as
plain areas.
Temporal variations of the temperature were com-
pared between the OBS and the CRU, and between the
OBS and each of the three reanalysis datasets. In these
comparisons, eachmeteorological station or each grid in
the spatial datasets was treated as a sample point, and
the mean values for the study region were analyzed and
compared. Trends of temperature variation were eval-
uated using linear trend fit and the nonparametric
Mann–Kendall method (or M-K test) (Mann 1945;
Kendall 1948). A trend was considered statistically sig-
nificant when it is at the 95% confidence level. The M-K
test also was used to detect the time of significant or
abrupt climate changes. Temperature changes in the
four seasons, spring [March–May (MAM)], summer
[June–August (JJA)], fall [September–November (SON)],
and winter [December–February (DJF)], as well as the
annual (ANN) change were examined. Furthermore, we
analyzed the OBS and the CRU data to examine the
temperature variation and trend for the past five de-
cades (1961–2011) and also from 1901 to 2009. These
long-term variations in temperature were compared to
the variation from 1979 to 2011 to put the recent changes
in context. The method used to study temperature
change at the turn of the twenty-first century was by
comparing and contrasting the differences (DIF) of the
change from the 1980s to the 1990s and the change from
the 1990s to 2000s1 (i.e., 2000–11):
DIF1990s-1980s5T1990s2T1980s
DIF2000s1-1990s5T2000s1 2T1990s . (1)
In the above, T (8C) is a decadal mean temperature.
To compare the spatial pattern of surface temperature
change derived from the CRU, CFSR, ERA-Interim,
and MERRA datasets, we applied empirical orthogonal
function (EOF) analyses (Lorenz 1956) to their annual
temperature anomalies (from the average of 1979–2011).
EOF analysis finds a set of orthogonal variables to de-
scribe the observed variance in the data, whereby large-
scale variability will be shown in the low-order EOFs
while the higher-order EOFs contain low-amplitude
spatially incoherent noise. The EOF method can iden-
tify the dominant spatial pattern of the variation in
temperature and also produces its index time series,
the principal component (PC), which explains the mag-
nitude of the variation of each EOF mode of the tem-
perature. Following North et al. (1982), a significance test
is applied to distinguish the physical signal from the noise
in the EOF.
Dependence of the change in near-surface temperature
on elevation is examined for the Tian Shan mountain-
ous region, which is the major mountain area in central
Asia (Fig. 1a). Although the Pamirs in Tajikistan are
as important for the Amu Darya as the Tian Shan
Mountains are for the Syr Darya and other rivers, they
are not investigated because no valid stations in the
Pamirs are available for this analysis (Fig. 1b). Pepin
and Lundquist (2008) suggested that a reliable analysis
of the relationship between temperature change and
elevation should be based on observations from mete-
orological stations in the mountain summit or freely
draining slopes. To identify such meteorological sta-
tions, we overlay the location map of the stations on
the topographic maps (relief map and slope map)
derived from the USGS GTOPO30 dataset and the
high-resolution (about 1–10m) remote sensing maps
retrieved from http://www.google.com/earth (last vis-
ited by the authors on 4 July 2013). A visual check
showed only three stations meeting the criteria of Pepin
1 FEBRUARY 2014 HU ET AL . 1147

TABLE1.Near-surface
(2m)airtemperature
datasetsusedin
thisstudy.
Dataset
Abbreviation
Resolution
Datasetdescriptionanddata
sources
Reference
Observationsfrom
metrological
stations
OBS
Daily
Climate
recordsfrom
295stationsin
thefive
centralA
sian
stateswere
obtainedfrom
the
NCDC(ftp://ftp.ncdc.noaa.gov/pub/data/
gsod/).Climate
recordsfrom
70stationsin
Xinjiang,China,w
ere
obtainedfrom
China
Meteorological
Administration(http://
www.cma.gov.cn/2011qxfw
/2011qsjgx/)
andXinjiangMeteorologicalAgency
(http://www.xjqx.cn/ggtz/ggtz.aspx).
Amongthe295central
Asianstations,
44
are
locatedin
northernKazakhstan,149in
theTuranianplain,and102in
the
mountainousareas.T
here
are
77stationsin
theTianShanregion(Fig.1a).Ofthe365
clim
ate
stations,
107,112,114,81,and62
covertheperiodsof1979–89,the1990s,
2000–11,
1979–2011,and1960–2011,
respectively.Otherstationswere
notused
inthetemperature
changeanalyses
because
oftheirlowdata
quality
(toomany
missingdata
orfailingthehomogeneity
test).
Climate
ResearchUnittimeseries3.1
CRU
Monthly,0.583
0.58
Angu
lardistance–weighted(A
DW
)
interpolationbasedonrecordsfrom
275
meteorological
stations,withtheinfluence
ofelevationignored(N
ewetal.1999,
2000).Thedatasetcoversthe109years
from
1901to
2009.
MitchellandJones(2005)
NationalCenters
forEnvironmen
talPrediction
(NCEP)ClimateForecastSystem
Reanalysis
CFSR
Dailyaggregatedfrom
hourly
prediction,0.3183
0.318
Airtemperature
at2m.W
iththree-
dim
ensionalvariational
data
assim
ilation
(3DVAR)ofsatelliteradiancesbythe
gridpointstatisticalinterpolationschem
e
overtheentire
period.TheCFSR
atm
osphericmodelcontainsobserved
variationsin
CO
2overthe1979–2009
periods,togetherwithchanges
inaerosols
andothertrace
gasesandsolarvariations.
The2011clim
atologieswasproduced
by
NCEP’sClimate
ForecastSystem
version2
(CFSv2)withunchan
gedmodelbut
ahigherspatialresolution(0.28)(http://cfs.
ncep.noaa.gov/)
Sahaetal.(2010)
1148 JOURNAL OF CL IMATE VOLUME 27

andLundquist (2008): Turgart (station ID269), Balgantai
(station ID 343), and Akqi (station ID 298). Station
information is found in Table S1 of the supplementary
material. Because of the lack of qualified stations, in
this study only the three reanalysis datasets are used
in analyzing the elevation effect on temperature
change.
Since these reanalysis datasets have different spatial
resolutions, we also resampled the CFSR and MERRA
datasets to match the coarser resolution (0.758 3 0.758 inlatitude and longitude) in the ERA-Interim dataset to
examine, by comparing the results to the original data-
sets, whether the analysis results could be influenced by
scaling or spatial resolution.
3. Results and analyses
a. Evaluating the reanalysis datasets with climaterecords
We used the observational data to evaluate the
reanalysis datasets for their accuracy in describing the
near-surface temperature in central Asia. In this
evaluation, we first collected data from 365 meteoro-
logical stations in our study region. Of the 365 stations,
there are 107, 112, and 114 with continuous surface
temperature records in the 1980s, 1990s, and 2000s1,
respectively. The increasing number of stations in
those decades is attributable to new stations added to
the network. Although new stations were added, the
addition could not compensate for the damages done
by stopping observations at some historical stations in
the early 1990s after the former Soviet Union dis-
integrated. There are only 81 and 62 stations that have
continuous climate observations in the periods of
1979–2011 and 1960–2011, respectively. The spatial
distribution of the stations is shown in Fig. 1a. It should
be noted that the long-term stations (covering the
1979–2011 period), from which the climate trend is
derived, were not evenly distributed in central Asia
(Fig. 1b). Many areas, such as the Pamirs, the deserts in
the middle of the Tarim and Junggar basins, and the
northern part of the Turanian plain have very low
station density. Such poor station coverage makes it
difficult to use the station data to investigate climate
change in those areas. The gaps in station observations
can, however, be filled with information provided by
spatially explicit reanalysis products that utilize model
simulation outputs. To assure that the model simula-
tions are reasonable in describing the climate in the
regions it is necessary to first evaluate the reanalysis
datasets using the quality-controlled station records
(i.e., OBS).
TABLE1.(C
ontinued
)
EuropeanCentreforMedium-R
ange
Weather
ForecastsInterim
Reanalysis
ERA-Interim
Dailyaggregatedfrom
hourly
prediction,0.758
30.758
ERA-Interim
wasdevelopedbasedonthe
40-yrECMW
FRe-A
nalysis(E
RA-40)
withseveralim
provements(e.g.,the12-h
4DVAR
assim
ilation)asintroducedin
the
ECMW
Fwebsite
(http://www.ecm
wf.int/
research/era/do/get/era-interim)
Deeetal.(2011)
Modern-E
raRetrospectiveAnalysisfor
ResearchandApplications
MERRA
Dailyaggregatedfrom
hourly
prediction,0.58(lat)3
0.678
(lon)
Airtemperature
at2m.A
3DVAR
assim
ilationwasim
plementedwith
incrementalanalysisupdates(IAU)to
slowly
adjustthemodelstatestoward
the
observedstate,avoidingunrealistic
spindown.Alsowithanim
provedsetof
landsurface
hydrological
fields.
Rieneckeretal.(2011)
1 FEBRUARY 2014 HU ET AL . 1149

Comparisons between the observed and reanalysis
results of variations in near-surface air temperature
show rather encouraging results: no significant differ-
ences in the annual and seasonal temperatures between
the OBS and each of the three reanalysis datasets. As
shown in Table 2, the surface temperatures in CFSR,
ERA-Interim, and MERRA are significantly correlated
with the OBS, with high correlation coefficients of 0.82–
0.87. Compared to the OBS the average absolute error
ranges from 20.598C for ERA-Interim to 1.68C for
MERRA. As also expected, all three reanalysis datasets
show closer match with the OBS in the plains region
(with CC of 0.90–0.92) than in mountainous areas (with
CC of 0.63–0.79) (Table 2). The CC between the OBS
and the three reanalysis datasets decreases slightly from
0.87 in the 1980s and 1990s to 0.81 in the 2000s1. These
statistics indicate that the three reanalysis datasets can
faithfully describe the temperatures and their variations
in central Asia. In particular, the CSFR had the lowest
AE, MAE, and RSME and highest CC among the three
reanalysis datasets. Noticeably, CSFR also has the
highest spatial resolution among all the three datasets
(Table 1).
b. Temporal variation in surface temperature basedon multiple datasets
The OBS, the CRU, and the three reanalysis datasets
all show that central Asia has experienced a significant
rise in surface temperatures from 1979–2011. Most areas
in our study region, about 75%–90% according to linear
least squares fitting and 60%–85% according to the M-K
test, have experienced a significant (at the 95% confidence
level) increase in annual mean temperatures in the period
from 1980 to 2011 (Figs. 2a and 2b). Areas experiencing
TABLE 2. Evaluating three reanalysis products using annual mean temperature recorded by meteorological stations in central Asia.
Period Region Reanalysis product
Statistics
AE (8C) CC MAE (8C) RMSE (8C)
1980s Plain area (74 stations) CFSR 0.4 0.93 1.27 1.73
ERA-Interim 0.25 0.92 1.19 1.9
MERRA 1.79 0.92 2.08 2.71
Mountain area (33 stations) CFSR 21.19 0.83 2.54 3.44
ERA-Interim 22.12 0.68 3.47 4.62
MERRA 1.59 0.85 3.22 4.03
All areas (107 stations) CFSR 20.09 0.89 1.66 2.37
ERA-Interim 20.48 0.84 1.9 2.99
MERRA 1.73 0.89 2.43 3.16
1990s Plain area (80 stations) CFSR 0.37 0.95 1.18 1.65
ERA-Interim 0.11 0.93 1.2 1.89
MERRA 1.72 0.92 2.07 2.68
Mountain area (32 stations) CFSR 21.63 0.78 2.85 3.84
ERA-Interim 22.43 0.61 3.62 4.80
MERRA 1.35 0.79 3.23 4.02
All areas (112 stations) CFSR 20.21 0.89 1.66 2.46
ERA-Interim 20.61 0.85 1.89 3.00
MERRA 1.62 0.89 2.4 3.11
2000s Plain area (81 stations) CFSR 0.66 0.88 1.78 2.42
ERA-Interim 0.16 0.85 1.99 2.75
MERRA 1.97 0.85 2.69 3.47
Mountain area (33 stations) CFSR 22.05 0.75 3.17 4.15
ERA-Interim 22.72 0.6 3.82 5.1
MERRA 0.18 0.69 3.43 4.46
All areas (114 stations) CFSR 20.13 0.84 2.18 3.0
ERA-Interim 20.67 0.78 2.52 3.57
MERRA 1.45 0.81 2.91 3.76
1979–2011 average Plain area CFSR 0.48 0.92 1.41 1.93
ERA-Interim 0.17 0.90 1.46 2.18
MERRA 1.83 0.90 2.28 2.95
Mountain area CFSR 21.62 0.79 2.85 3.81
ERA-Interim 22.42 0.63 3.64 4.84
MERRA 1.04 0.78 3.29 4.17
All areas CFSR 20.14 0.87 1.83 2.61
ERA-Interim 20.59 0.82 2.10 3.19
MERRA 1.60 0.86 2.58 3.34
1150 JOURNAL OF CL IMATE VOLUME 27

cooling are rare. Results from linear fitting analysis
show that the region’s annual mean temperatures have
increased at an average rate of 0.398C decade21 (ranging
from 0.368–0.428Cdecade21) from 1979 to 2011 (Figs. 3
and 4a). This rate is higher than the average warming rates
of 0.308 and 0.158Cdecade21 in the last 5 decades (1960–
2011) and 11 decades (1901–2009), respectively, based
on the OBS and CRU datasets (Figs. 3b,c and 4a), as
FIG. 2. Percentage of stations and study area (according to the CRU, CFSR, ERA-Interim, and MERRA datasets) showing no change
(white) or significant (at the 95% confidence level) warming (stippled) or cooling (gray) in surface temperature during 1979–2011. Results
in are derived based on (a) linear trend fit and (b) the M-K test. Along the abscissa, ANN indicates annual, MAM spring, JJA summer,
SON fall, and DJF winter.
1 FEBRUARY 2014 HU ET AL . 1151

FIG. 3. Trends of temperature change: (a) from 1979 to 2011 based on observational records from 81meteorological stations; (b) for 1979–
2011 and 1960–2011 revealed by records from 62meteorological stations; (c) for 1901–2009, 1960–2009, and 1979–2009 revealed by theCRU
dataset; (d) for 1979–2011 revealed by the CFSR reanalysis dataset; (e) for 1979–2011 revealed by the ERA-Interim reanalysis dataset; and
(f) for 1979–2011 revealed by the MERRA reanalysis dataset. In each panel, annual mean temperatures are shown by the dots along with
a linear fit to the data to show the trend in temperature variation. The yellow curve is a smoothed depiction using 5-yr moving average to
capture the variations in the data. The 95% confidence interval envelope is shown by cyan color (annual values exceed those limits).
1152 JOURNAL OF CL IMATE VOLUME 27

probably anticipated. Moreover, the decadal temper-
ature difference for seasonal and annual mean surface
temperatures between the 2000s1 and 1990s is 35%–
200% higher than the difference between the 1990s
and 1980s, indicating the warming continuing into the
twenty-first century (Fig. 4b). The M-K tests indicate
that an overwhelming temperature increase took place
in the late 1990s and early 2000s, a result again sug-
gesting strong warming near the turn of this century
(Fig. 5a).
Figure 4a also shows that the changes in seasonal
temperatures are similar among the results from the
OBS, the CRU, and the three reanalysis datasets.
Warming is most prominent in the spring, at rates
ranging 0.648–0.818Cdecade21 from 1979–2011 among
the datasets. Figure 4b further shows that the difference
of temperatures between the 2000s1 and the 1990s [Eq.
(1)] accounts for 75%–83% of the spring warming in the
last three decades, a result again indicating strong
warming near the turn of this century. Except for winter,
the other seasons also show significant warming from
1979 to 2011 (also see Fig. 2). Results fromanalysis of the
OBS and MERRA data show that 3%–4% of the study
region has experienced decrease in winter temperatures
FIG. 4. Annual and seasonal changes in near-surface air temperature (a) for 1979–2011, 1960–
2009, and 1901–2009, calculated using linear fitting and (b) from 1980 to 2011 as revealed by
decadal differences [i.e., (1990s2 1980s) vs (2000s21990s); Eq. (1)]. Note that the two periods,
1990s2 1980s and 2000s2 1990s, are stacked in (b). Error bars show 1 standard error in both
(a) and (b).
1 FEBRUARY 2014 HU ET AL . 1153

during the last three decades. A linear fitting result of the
MERRA data (Fig. 4a) suggests a cooling rate of
0.278Cdecade21 in mean winter temperature from 1979
to 2011. Results from decadal difference analyses [Eq.
(1)] of the OBS, ERA-Interim, and MERRA show that
the average winter temperature of the 2000–11 is about
0.118–0.398C lower than that of the 1990s in central Asia,
indicatingmild winter cooling near the turn of the century
(Fig. 4b). The other two datasets, CFSR and CRU, show
a slight increase in winter temperatures (magnitude
smaller than one standard error).
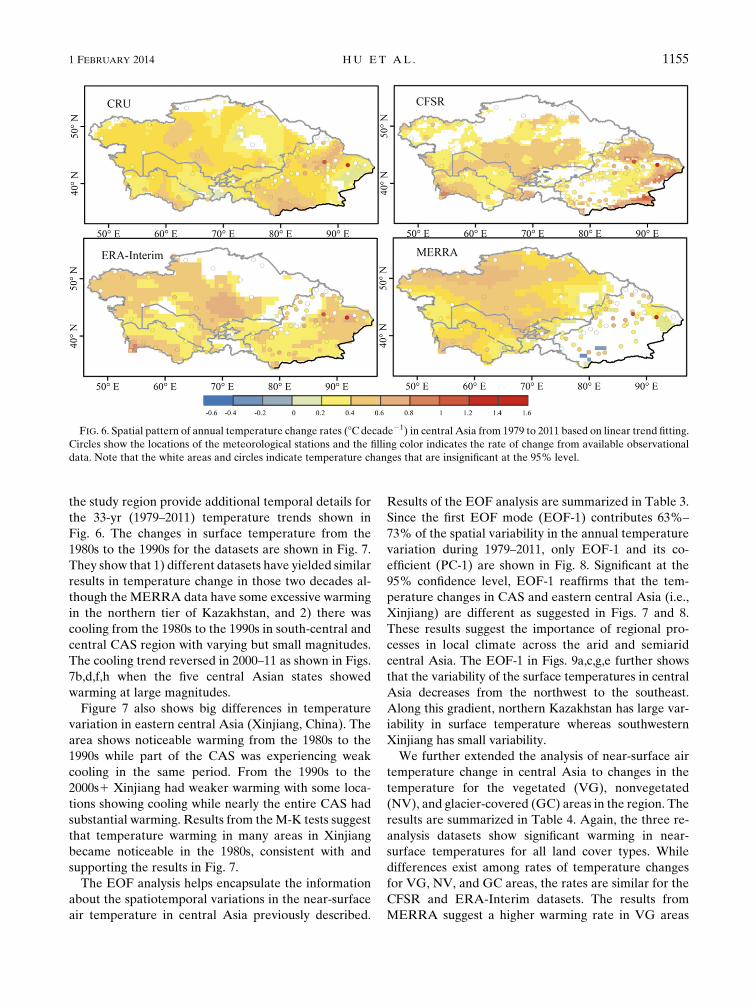
c. Spatial variation in temperature changes
Although the analysis of average temperatures in the
study region shows similar variations between the OBS
and the CRU and the three reanalysis datasets, there are
dissimilarities in their spatial patterns. Figures 6b and 6c
show that theCFSR andERA-Interim have similar spatial
pattern of temperature change with relatively strong in-
crease in the northern and southwestern Turanian plain
and in eastern Xinjiang. This pattern is largely similar to
that shown in Fig. 1b from the OBS and Fig. 6a from the
CRU data, but different from the result derived from the
MERRA dataset (Fig. 6d). The major differences are in
Xinjiang, where the MERRA result shows little change in
temperature, and in northern and eastern Kazakhstan
where there is widespread increase in temperature in the
MERRA result.
We further examined and compared the evolution of
the decadal temperature change pattern from the 1980s
to 2000s1 derived from all the datasets. The differences
of the decadal averaged near-surface air temperatures in
FIG. 5. Turning point (in a span of 5 yr) in temperature trend from 1979 to 2011: (a) temperature
increase and (b) temperature decrease.
1154 JOURNAL OF CL IMATE VOLUME 27
the study region provide additional temporal details for
the 33-yr (1979–2011) temperature trends shown in
Fig. 6. The changes in surface temperature from the
1980s to the 1990s for the datasets are shown in Fig. 7.
They show that 1) different datasets have yielded similar
results in temperature change in those two decades al-
though the MERRA data have some excessive warming
in the northern tier of Kazakhstan, and 2) there was
cooling from the 1980s to the 1990s in south-central and
central CAS region with varying but small magnitudes.
The cooling trend reversed in 2000–11 as shown in Figs.
7b,d,f,h when the five central Asian states showed
warming at large magnitudes.
Figure 7 also shows big differences in temperature
variation in eastern central Asia (Xinjiang, China). The
area shows noticeable warming from the 1980s to the
1990s while part of the CAS was experiencing weak
cooling in the same period. From the 1990s to the
2000s1 Xinjiang had weaker warming with some loca-
tions showing cooling while nearly the entire CAS had
substantial warming. Results from theM-K tests suggest
that temperature warming in many areas in Xinjiang
became noticeable in the 1980s, consistent with and
supporting the results in Fig. 7.
The EOF analysis helps encapsulate the information
about the spatiotemporal variations in the near-surface
air temperature in central Asia previously described.
Results of the EOF analysis are summarized in Table 3.
Since the first EOF mode (EOF-1) contributes 63%–
73% of the spatial variability in the annual temperature
variation during 1979–2011, only EOF-1 and its co-
efficient (PC-1) are shown in Fig. 8. Significant at the
95% confidence level, EOF-1 reaffirms that the tem-
perature changes in CAS and eastern central Asia (i.e.,
Xinjiang) are different as suggested in Figs. 7 and 8.
These results suggest the importance of regional pro-
cesses in local climate across the arid and semiarid
central Asia. The EOF-1 in Figs. 9a,c,g,e further shows
that the variability of the surface temperatures in central
Asia decreases from the northwest to the southeast.
Along this gradient, northern Kazakhstan has large var-
iability in surface temperature whereas southwestern
Xinjiang has small variability.
We further extended the analysis of near-surface air
temperature change in central Asia to changes in the
temperature for the vegetated (VG), nonvegetated
(NV), and glacier-covered (GC) areas in the region. The
results are summarized in Table 4. Again, the three re-
analysis datasets show significant warming in near-
surface temperatures for all land cover types. While
differences exist among rates of temperature changes
for VG, NV, and GC areas, the rates are similar for the
CFSR and ERA-Interim datasets. The results from
MERRA suggest a higher warming rate in VG areas
FIG. 6. Spatial pattern of annual temperature change rates (8Cdecade21) in central Asia from 1979 to 2011 based on linear trend fitting.
Circles show the locations of the meteorological stations and the filling color indicates the rate of change from available observational
data. Note that the white areas and circles indicate temperature changes that are insignificant at the 95% level.
1 FEBRUARY 2014 HU ET AL . 1155

than the other two datasets. Additionally, results from
MERRA show that the warming rate of 0.418Cdecade21
in theVGarea is (statistically) significantly higher than the
warming rate of 0.248Cdecade21 in the glacier-covered
areas.
The change in the temperature trend as function of
elevation is also examined using the datasets. Figure 9
shows such elevation dependence of the annual and
seasonal near-surface air temperature in the Tian Shan
mountainous area. In general, the effect of elevation
FIG. 7. Spatial pattern of differences in decadal mean temperature (8C) for different datasets: (left) the difference between the 1990s and 1980s
and (right) the difference between the 2000s1 (2000–11) and 1990s: datasets (top)–(bottom) CRU, CFSR, ERA-Interim, and MERRA.
1156 JOURNAL OF CL IMATE VOLUME 27

damps the warming in the surface temperature. The
results from the CFSR dataset show stronger altitude
effects (with correlation coefficients as high as 0.41) than
the results from MERRA and ERA-Interim. Our fur-
ther analysis shows that this difference is not due to the
high resolution of CFSR, because even when the CFSR
and MERRA were rescaled to match the coarse reso-
lution of ERA-Interim (0.758 3 0.758) the general pat-
tern is unchanged (see Table S3 in the supplementary
material). CFSR always has stronger altitude effects
than the other two reanalysis datasets. Also shown in the
results of the CFSR data is that the effect of elevation is
most prominent in spring, when the decadal mean
warming rate is damped by 0.228C with every 1-km in-
crease in elevation.
4. Discussion
a. Comparison of this study with prior studies
Our results show a strong increase in the near-surface
air temperature at 0.398Cdecade21 averaged in central
Asia during the period from 1979 to 2011. This rate of
change is larger than the rate averaged for global land
areas (i.e., 0.278–0.318Cdecade21 from 1979 to 2005)
(Table 5; Brohan et al. 2006; Smith and Reynolds 2005)
and is about twice as large as the warming rate in Europe
(Simmons et al. 2004). This rate is comparable to the
observed warming trend in China [0.258–0.348Cdecade21
according to Ren et al. (2005) and Li et al. (2011, 2012)]
and also is in line with the central Asian averaged warm-
ing rate in the 50 years from1960 to 2009, 0.308Cdecade21.
It is worth of noting that this rate is much smaller than the
rate averaged over China, 0.528Cdecade21, reported in
Wang and Gong (2000). This difference results from dif-
ferent years used in these two studies. Wang and Gong
(2000) used data from 1979 to 1998. Because 1998 was an
extraordinarily warm year in China, ending the analysis
period in that year could have yielded a larger rate of
temperature change.
Our extension of the analysis indicates that centralAsian
temperature has increased at a rate of 0.158Cdecade21
from 1901 to 2011, which is comparable to the
0.178Cdecade21 temperature increase inRussia (Kattsov
et al. 2008) but twice as large as the global mean rate of
0.078–0.088Cdecade21 over the same period (Brohan
et al. 2006; Smith and Reynolds 2005). Additional com-
parisons of the results from our study to some relevant
previous studies are summarized in Table 5.
A breakdown of the decadal temperature change in
the recent 30 years further suggests an accelerated
warming in the past three decades (Table 4; Figs. 3b,c
and 7). This strong warming trend agrees with the pre-
dictions from global climate model (GCM) simulations,
which suggested that central Asia will have a warming
rate well above the global mean in the twenty-first
century (Trenberth et al. 2007). For example, model
simulations with eight GCMs (Pollner et al. 2008) and
four coupled atmosphere–ocean GCMs (AOGCMs;
Lioubimtseva and Henebry 2009) projected the tem-
perature in central Asia to increase with a rate of 0.298–0.488Cdecade21 in the twenty-first century, comparable
to the recent warming rate (0.398Cdecade21) found in
this study (Table 5).
b. A shift in seasonal temperature change patternin recent decades and its impacts
It has been reported that temperature increase in
many regions around the world and in central Asian
countries has occurred most prominently in the winter
months. Winter warming contributed strongly to the
annual temperature increase (Zoi Environment Net-
work 2009; Huang et al. 2005; Li et al. 2011; Ren et al.
2005; Trenberth et al. 2007). Climate model projected
temperature change in the twenty-first century also
suggested that the largest temperature increase would
occur in winter in the central Asian states (e.g., Kattsov
et al. 2008; Lioubimtseva andHenebry 2009). Our study,
however, has revealed a dramatic shift of the largest
temperature increase in central Asia from its winter to
spring season. During most of the twentieth century,
surface air temperature on average has been increasing
at larger rate in winter than in other seasons. This situ-
ation has changed in the recent 33 years. From 1990s to
2000s1 the largest increase in seasonal temperatures has
been found in spring months (Fig. 4b) whereas the
winter temperature increase has been leveling off.
Our results further show that large rate of spring
temperature increase up to 1.28–2.28Cdecade21 has
TABLE 3. The eigenvalues l and variance contributions R (%) of the EOF analyses. The numeric subscripts indicate the EOF modes 1–4.
Datasets l1 R1 l2 R2 l3 R3 l4 R4
CRU 1186.55 72.50 145.25 8.88 132.28 8.08 39.34 2.40
CFSR 3490.33 62.99 577.43 10.42 355.58 6.06 280.59 5.06
ERA-Interim 521.21 69.05 77.59 10.28 64.68 8.57 17.82 2.36
MERRA 917.21 70.43 132.36 10.16 82.68 6.35 37.32 2.87
1 FEBRUARY 2014 HU ET AL . 1157

concentrated in the central part of the central Asian
states (Fig. 10). This shift of the largest warming rate of
the seasonal temperature from winter to spring may
have started affecting the ecosystems in central Asia.
Strong spring warming could stimulate early leaf onset,
as observed in Europe during the last three decades
(Menzel and Fabian 1999; Menzel 2000; Menzel et al.
2006). Propastin et al. (2008) have detected a significant
FIG. 8. (left) EOF-1 of the annual temperature anomalies (8C) and (right) the corresponding time series from the four datasets:
(a),(b) CRU, (c),(d) CFSR, (e),(f) ERA-Interim, and (g),(h) MERRA.
1158 JOURNAL OF CL IMATE VOLUME 27

FIG. 9. (top)–(bottom) Annual and seasonal temperature trends from 1979 to 2011 (ordinate, 8Cdecade21) as function of elevation
(abscissa, mMSL) in the Tian Shanmountainous area (see Fig. 1a for the geographical location of this area) based on (left)–(right) CFSR,
ERA-Interim, and MERRA datasets. ANN indicates annual, MAM spring, JJA summer, SON fall, and DJF winter.
1 FEBRUARY 2014 HU ET AL . 1159

increase (13.58%) in vegetation growth in terms of the
normalized difference vegetation index (NDVI) in
central Asian states from 1982 to 2003, which they at-
tributed largely to the increase in spring temperatures.
Furthermore, the strong spring warming in the central
Asian states was reported to have increased risks of
natural hazards such as flooding and formation and
outburst of ice dams in major rivers (Michael 2011;
Siegfried et al. 2012).
c. Elevation dependence of the near-surface airtemperature change in central Asia
A recent review by Rangwala and Miller (2012) sug-
gests that elevation dependence in temperature change
varies under spatial and temporal conditions. Some prior
studies using observational data have shown positive
correlations of the elevation with the warming rate in
the European Alps (Beniston and Rebetez 1996), Nepal
Himalayas (Shrestha et al. 1999), Yunnan Plateau in
China (Fan et al. 2011), and the Tibet Plateau (Liu and
Chen 2000). The warming is more pronounced at higher
elevations in those areas. This positive correlation of the
warming rate and elevation is also found in most model
simulation results (Giorgi et al. 1997; Chen et al. 2003).
However, our analysis shows significant negative corre-
lations (up to R2 5 0.41) between elevation and the
warming rate in the Tian Shan mountainous area of
central Asia during 1979–2011 (Fig. 9). A similar nega-
tive correlation also was found in the tropical Andes in
Vuille and Bradley (2000) and Vuille et al. (2003).
According to Liu and Chen (2000), a decrease in
spring snow cover at higher elevations could lower the
surface albedo and initiate a positive feedback on the
surface and near-surface air temperatures, leading to
more pronounced warming at high altitudes. This
mechanism has been confirmed by model simulations
(Chen et al. 2003) and was used to explain the observed
positive correlation between the warming rate and ele-
vation in the Tibetan Plateau (Liu and Chen 2000).
However, it is difficult to explain why in Tian Shan,
a region not far from the Tibetan Plateau, we found a
completely opposite pattern with warming rate decreas-
ing with elevation. Some possible factors attributing to
these differences could include the effectiveness of the
feedback as the elevation increase (into the permafrost
elevation or higher) and regional atmospheric circula-
tion. A conclusive understanding of this relationship
will require a more comprehensive network of climate
monitoring in mountainous regions and detailed mod-
eling (Rangwala and Miller 2012).
d. Effects of land-use changes
Although the temperature change in central Asia well
matched the recent warming in the North Hemisphere,
it could also be influenced by land-use changes such as
irrigation and urbanization at local scales (Lioubimtseva
et al. 2005). It has been widely observed that the oases in
our study region have lowered temperature comparing
to the surrounding desert (i.e., oasis cooling effect),
mainly due to the evaporative cooling caused by plant
transpiration and irrigation (Kai et al. 1997; Han 1999).
According to the statistics in Dukhovny et al. (2009),
both the intensity and total water of irrigation in the five
central Asian states decreased from 1994 to 2008
(Fig. 11a), possibly due to deintensification of agricul-
ture following the collapse of the former Soviet Union
(Lioubimtseva and Henebry 2009). Therefore, the ob-
served temperature rise could be partially caused by
local climate effect from declining irrigation intensity in
the CAS. To investigate this possibility, we first identi-
fied all the meteorological stations located in or within
5 km of the irrigated land in CAS based on the United
Nations Food and Agriculture Organization (FAO)
global map of irrigated land (Siebert et al. 2007). We
then paired them to the closest stations in nonirrigated
land (Fig. 11b). Although the advective effect of oases
on local climate fades rapidly with distance (Taha et al.
1991), there has been evidence that the effects could still
be considerable within 1–10 km from the vegetated
areas (DeVries 1959; Zhang and Zhao 1999), and the
typical width of the oasis–desert ecotone in the tem-
perate desert of central Asia is about 4 km (Han 1999).
Therefore, we used a 5-km buffer around the irrigated
land to identify the meteorological stations where local
conditions or observations may have been influenced by
changes in irrigation intensity since the early 1990s.
Comparisons between the temperature change rates of
those ‘‘oasis stations’’ and the control sites (i.e., the se-
lected stations outside the irrigated land) are shown in
Table 6. Although the mean warming rate of the oasis
stations was slightly higher than the mean rate of the
control sites (0.388 versus 0.348Cdecade21), the differ-
ence was not significant (p value . 0.05; N 5 14) ac-
cording to a paired t test. There was also no significant
difference between the mean warming rates of the oasis
stations and all other stations in central Asia according
TABLE 4. Rates of temperature change (8Cdecade21) from 1979
to 2011 in central Asia (CA), and in vegetated (VG), nonvegetated
(NV), and glacier-covered (GC) areas in central Asia.
Dataset CA VG NV GC
CRU 0.42 0.42 0.42 0.42
CFSR 0.36 0.37 0.34 0.33
ERA-Interim 0.36 0.36 0.37 0.33
MERRA 0.36 0.41 0.29 0.24
1160 JOURNAL OF CL IMATE VOLUME 27

TABLE5.C
omparisonofdecadal
temperature
changerate
(8Cdecade2
1)in
centralAsiafrom
1979to
2011derivedfrom
thisstudyto
ratesreported
inotherstudies.CAS:centralAsian
states;OBS:observations;CRU:Climate
ResearchUnit(http://www.cru.uea.ac.uk/cru/data/temperature);NCDC:NationalClimaticData
Center.
Studies
Studyarea
Studyperiod
Data
andmethods
Annual
Spring
Summer
Fall
Winter
Aizenetal.(1997)
TianShanmountain
1940–91
Observationsfrom
110stations
0.10
Lietal.(2011)
Xinjiang
1961–2005
Observationsfrom
65stations
0.28
0.12
0.45
Lietal.(2012)
NorthwestChina
1960–2010
Observationsfrom
74stations
0.34
Pollneretal.(2008)
CAS
from
1980–99to
2030–50
Modelsimulationswith8GCMs
0.38
0.48
0.32
Lioubim
tsevaand
Henebry
2009
CAS
from
1961–90to
2080
Modelsimulationswith4AOGCMs
0.29–0.48
Renetal.(2005)
China
1951–2004
Observationsfrom
740stations
0.25
0.15
0.39
Jonesetal.(1997);W
ang
andGong(2000)
China
1979–98
Areaweightedobservationsin
10
clim
aticsubregionsin
China
0.52
Sim
monsetal.(2004)
Europe
1958–2001
CRU
0.17
Kattsovetal.(2008)
Russia
1980–2006
Observationsfrom
meteorological
stationsin
Russia
0.43
1907–2006
0.13
Easterlingetal.(1997)
Globe
1950–93
Observationsfrom
4100stations
0.05–0.11
0.11–0.25
Solomonetal.(2007)
Globe
1901–2005
Multiple
globallandtemperature
reconstructionsbasedonmultiple
historicalclim
ate
recordsfrom
CRU,NCDC,andGoddard
Institute
forSpace
Studies(G
ISS)
(Lugina2006)
0.07–0.08
1979–2005
0.19–0.32
Thisstudy
CASandXinjiang
1979–2011
Observationsfrom
81stations
0.41
0.64
0.38
0.52
20.01
CRU
0.42
0.81
0.25
0.46
0.16
CFSR
0.36
0.74
0.22
0.42
0.02
ERA-Interim
0.36
0.69
0.24
0.49
0.05
MERRA
0.36
0.75
0.36
0.47
20.28
1960–2009
CRU
0.33
0.34
0.23
0.32
0.47
1960–2011
Observationsfrom
62stations
0.27
0.23
0.19
0.31
0.33
1901–2009
CRU
0.15
0.19
0.09
0.12
0.19
1 FEBRUARY 2014 HU ET AL . 1161

to unpaired t tests. Finally, when comparing the mean
temperatures between the early 1990s (1990–95) and
late 1990s (1995–2000), we found that the warming in
the oasis stations was actually smaller than that in the
other stations (0.668 versus 0.848C). Our analysis,
therefore, detected no significant positive effect from
de-intensification of agriculture following the collapse
of the former Soviet Union in the early 1990s on the
observed temperature increase in central Asia.
We used a similar approach to investigate whether
urbanization in the study region may have affected the
observed temperature change. First, all urban stations in
central Asia were identified with the 500-m-resolution
global urban land map developed by Schneider et al.
(2009). Then, these urban stations were paired to the
closest rural stations in central Asia (Fig. 12a; Table 7).
In Fig. 12, the crosses mark the 22 meteorological sta-
tions located in urban areas. Although the population
increased by about 45.7% in those cities in 1980–2000
(Fig. 12b), paired t test showed no significant differences
in temperature change rates between the urban and
rural stations (p value . 0.05; N 5 22). Unpaired t test
values also indicated no significant difference in tem-
perature change rates between the urban stations and all
the other stations in the study region. These test results
thus suggest no significant effect from urbanization on
the observed temperature change in central Asia.
5. Conclusions
Temperature observations at meteorological stations,
the CRU dataset, and three recently developed high-
resolution reanalysis datasets, CSRF, MERRA, and
ERA-Interim, were used in this study to evaluate the
near-surface air temperature change in central Asia
from 1979 to 2011. The reanalysis datasets of CSRF,
MERRA, andERA-Interimwere first examined for their
accuracy in describing the temperature variations in the
study region. Comparisons of these datasets with quality-
controlled in situ observations showed that the datasets
are fairly accurate by several statistical measures, al-
though minor differences exist among these datasets and
the observations. While these test results are important
for validation of the datasets they justify the use of these
datasets in our analysis of the temperature variation in
central Asia. Their high-resolution spatial coverage
overcomes the difficulty of the ground observations
from sparse stations in the region and allows us to examine
and understand central Asian temperature variations
(Lioubimtseva et al. 2005; Lioubimtseva and Cole 2006).
FIG. 10. Spatial pattern of spring warming rate (8Cdecade21) from 1979 to 2011 in central Asia according to the four reanalysis datasets:
(a) CRU, (b) CFSR, (c) ERA-Interim, and (d) MERRA.
1162 JOURNAL OF CL IMATE VOLUME 27

FIG. 11. (a) Changes in total water for irrigation and irrigation intensity in the five central Asian states from 1994 to 2008 (Dukhovny
et al. 2009) indicating a declining irrigation in the region. (b) Pairing ofmeteorological stations located in the irrigated landwith the closest
stations outside the irrigated land.
1 FEBRUARY 2014 HU ET AL . 1163

The consensus of these datasets and available in situ
observations indicates accelerated warming at the av-
erage rate of 0.398Cdecade21 in central Asia from 1979
to 2011, which is stronger than the mean rate of tem-
perature change for global land areas (e.g., Brohan et al.
2006; Smith and Reynolds 2005) and other regions
(Simmons et al. 2004; Ren et al. 2005; Li et al. 2011,
2012). Moreover, the warming rate in central Asia in the
first 12 years of the twenty-first century is larger than
that of the previous decades. This increase rate in central
Asia in the early twenty-first century is comparable to
that averaged for Russia and for China (Brohan et al.
2006; Smith and Reynolds 2005) and is larger than that
averaged for Europe (Simmons et al. 2004). In addition
to showing the spatial pattern of the temperature change
we further identified that the maximum rate of tem-
perature increase in central Asia occurred in the central
areas of the central Asian states.
We also found that the seasonal pattern of the rise in
near-surface air temperature has changed in central
Asia in the recent decades. While winter warming was
most prominent among all the seasons during the most
part of the twentieth century (Zoi Environment Net-
work 2009; Huang et al. 2005; Li et al. 2011; Ren et al.
2005; Trenberth et al. 2007), the winter warming has
weakened and even reversed in some areas over time.
Mean winter temperature in the early twenty-first cen-
tury is cooler than in the 1990s. Meanwhile, the spring
temperature has been steadily increasing from 1979 to
2011, with a larger increase rate in the early twenty-first
century. The spring warming has replaced the winter
warming as the major contributor to the annual tem-
perature rise. This shift of the strong warming from the
dormant winter season to the germination spring season
could result in changes in phenology of plants in the
region and also raise the risk of spring flooding (Michael
2011; Siegfried et al. 2012).
The magnitude of temperature increase is found
shrinking significantly with elevation, a result different
from the results of some previous studies in regions
surrounding central Asia (Beniston and Rebetez 1996;
TABLE 6. Comparison of the observed temperature change rates
from 1979 to 2011 between stations in irrigated land and the se-
lected stations out of irrigated land in the five central Asian states.
Stations in irrigated
land
Selected stations outside of irrigated
land
ID
Warming rate
(8Cdecade21) ID
Warming rate
(8Cdecade21)
12 0.33 23 0.31
7 0.24 19 0.10
176 0.11 151 0.28
261 0.16 106 0.20
138 0.50 109 0.41
193 0.30 106 0.20
223 0.52 241 0.37
236 0.68 224 0.34
299 0.27 260 0.39
305 0.46 273 0.42
334 0.52 350 0.57
346 0.41 260 0.39
338 0.44 260 0.39
356 0.41 224 0.34
FIG. 12. Pairs of meteorological stations located in the urban areas and the closest rural stations.
1164 JOURNAL OF CL IMATE VOLUME 27

Shrestha et al. 1999; Fan et al. 2011; Liu and Chen 2000)
and from most model simulations (Giorgi et al. 1997;
Chen et al. 2003). This different result and further un-
derstanding of underlying mechanisms for the observed
temperature change and its spatial heterogeneity in
central Asia will continue to elude us in the absence of
comprehensive networks of climate monitoring in this
vast arid and semiarid region (Rangwala and Miller
2012).
It has been suggested that the de-intensification of ag-
riculture following the collapse of the Soviet Union in
early 1990s and urbanization may be influencing the ob-
served temperature change in irrigated or urban areas
(Zhou et al. 2004; Ren et al. 2008; Lioubimtseva and
Henebry 2009). Our analysis, however, did not find sig-
nificant contributions from urbanization or declined irri-
gation to temperature change in the study region. This
finding assures the relevance of our results in describing
the surface temperature variations in central Asia.
Acknowledgments. This study was supported by
grants from Chinese National Basic Research Program
(2014CB954204), and the International Science & Tech-
nologyCooperationProgramofChina (2010DFA92720-10)
and the National Basic Research Programs of China
(2009CB825105). We thank Dr. Qingxiang Li from the
National Meteorological Information center, China
Meteorological Administration, and Mr. Gang Yin and
Ms. Yan Yan from the Xinjiang Institute of Ecology
andGeography, Chinese Academy of Sciences for their
assistance during this study. We also thank the editor
and reviewers for their valuable comments on this
manuscript. The authors are grateful to Earth System
Science Data Sharing Platform, Xinjiang and Central
Asian scientific data sharing platform. Q. Hu was sup-
ported by USDA Research Project NEB-38-088.
REFERENCES
Aguilar, E., I. Auer,M. Brunet, T. C. Peterson, and J.Wieringa, 2003:
Guidance on metadata and homogenization. WMO Tech. Doc.
TD 1186 (WCDMP 53), 51 pp. [Available online at http://www.
wmo.int/pages/prog/wcp/wcdmp/wcdmp_series/.]
Aizen, V. B, and Coauthors, 1997: Climatic and hydrologic
changes in the Tien Shan, central Asia. J. Climate, 10, 1393–
1404.
Alexandersson, H. A., 1986: Homogeneity test applied to pre-
cipitation data. J. Climatol., 6, 661–675.
Arino, O., J. Ramos, V. Kalogirou, P. Defourny, and F. Achard,
2010: GlobCover 2009. Proc. ESA Living Planet Symp.,
Bergen, Norway, ESA, SP-686.
Bao, X., and F. Zhang, 2012: Evaluation of NCEP–CFSR, NCEP–
NCAR, ERA-Interim, and ERA-40 reanalysis datasets against
independent sounding observations over the Tibetan Plateau.
J. Climate, 26, 206–214.Beniston, M., and M. Rebetez, 1996: Regional behavior of mini-
mum temperatures in Switzerland for the period 1979–1993.
Theor. Appl. Climatol., 53, 231–243.
Blender, R., and K. Fraedrich, 2003: Long time memory in global
warming simulation. Geophys. Res. Lett., 30, 1769, doi:10.1029/
2003GL017666.
Blyth, S., B. Groombridge, I. Lysenko, L. Miles, and A. Newton,
cited 2009: Mountain watch. UNEP World Conservation
Monitoring Centre, 80 pp. [Available online at http://www.
unep-wcmc.org/biodiversity-series-12_113.html.]
Bordi, I., K. Fraedrich, M. Petitta, and A. Sutera, 2006: Large-
scale assessment of drought variability based on NCEP/
NCAR and ERA-40 Re-Analyses. Water Resour. Manage.,
20, 899–915.
Brohan, P., J. J. Kennedy, I. Harris, S. F. Tett, and P. D. Jones,
2006: Uncertainty estimates in regional and global observed
temperature changes: A new data set from 1850. J. Geophys.
Res., 111, D12106, doi:10.1029/2005JD006548.
Bromwich, D. H., and R. L. Fogt, 2004: Strong trends in the skill of
the ERA-40 and NCEP–NCAR reanalyses in the high and
midlatitudes of the Southern Hemisphere, 1958–2001. J. Cli-
mate, 17, 4603–4619.——, ——, K. I. Hodges, and J. E. Walsh, 2007: A tropospheric
assessment of the ERA-40, NCEP, and JRA-25 global re-
analyses in the polar regions. J. Geophys. Res., 122, D10111,
doi:10.1029/2006JD007859.
Chen, B., W. C. Chao, and X. Liu, 2003: Enhanced climatic
warming in the Tibetan Plateau due to doubling CO2: A
model study. Climate Dyn., 20, 401–413.Chen, X., 2012: Retrieval and Analysis of Evapotranspiration in
Central Areas of Asia (in Chinese). China Meteorological
Press, 214 pp.
TABLE 7. Comparison of the observed temperature change rates
from 1979 to 2011 between urban station and the closest rural
station in central Asia.
Urban station Rural station
ID
Warming rate
(8Cdecade21) ID
Warming rate
(8Cdecade21)
273 0.42 350 0.57
334 0.52 305 0.46
346 0.41 338 0.44
299 0.27 260 0.39
138 0.50 109 0.41
356 0.41 338 0.44
236 0.68 224 0.34
193 0.30 224 0.34
261 0.16 258 0.27
54 0.03 106 0.20
287 0.55 279 0.36
19 0.10 7 0.24
176 0.11 151 0.28
319 0.32 345 0.49
357 0.64 360 0.40
159 0.45 179 0.41
131 0.30 144 0.45
225 20.11 219 0.29
125 0.20 120 0.55
220 0.39 212 0.37
162 1.01 150 0.43
196 0.21 167 0.95
1 FEBRUARY 2014 HU ET AL . 1165

——, J. Bai, X. Li, G. Luo, J. Li, and B. L. Li, 2013: Changes in land
use/land cover and ecosystem services in Central Asia during
1990–2009. Curr. Opin. Environ. Sustainability, 5, 116–127.
Chub, V. E., 2000: Climate Change and its Impact on the Natural
Resources Potential of the Republic of Uzbekistan (in Russian).
Gimet, 253 pp.
Dee, D. P., and Coauthors, 2011: The ERA-Interim reanalysis:
Configuration and performance of the data assimilation sys-
tem. Quart. J. Roy. Meteor. Soc., 137, 553–597.
DeGaetano, A. T., 2006: Attributes of several methods for de-
tecting discontinuities in mean temperature series. J. Climate,
19, 838–853.Dessler, A. E., and S. M. Davis, 2010: Trends in tropospheric hu-
midity from reanalysis systems. J. Geophys. Res., 115,D19127,
doi:10.1029/2010JD014192.
DeVries, D. A., 1959: The influence of irrigation on the energy bal-
ance and the climate near the ground. J. Meteor., 16, 256–270.
Dukhovny, V., V. Sokolov, and H. Manthrithilake, 2009: In-
tegrated water resources management: Putting good theory
into real practice. Central Asian Experience. SIC ICWCRep.,
384 pp. [Available online at http://www.gwp.org/Global/
GWP-CACENA_Files/en/pdf/iwrm_monograph_e.pdf.]
Easterling, D. R., and Coauthors, 1997: Maximum and minimum
temperature trends for the globe. Science, 277, 364–367.
Fan, Z.-X., A. Brauning, A. Thomas, J. B. Li, and K. F. Cao, 2011:
Spatial and temporal temperature trends on the Yunnan
Plateau (southwest China) during 1961–2004. Int. J. Climatol.,
31, 2078–2090.
Giorgi, F., J. W. Hurrell, M. R. Marinucci, and M. Beniston, 1997:
Elevation dependency of the surface climate change signal:
A model study. J. Climate, 10, 288–296.
Goudie, A. S., 2002: Great Warm Deserts of the World. Oxford
University Press, 444 pp.
Grotjahn, R., 2008: Different data, different general circulations?
A comparison of selected fields in NCEP/DOE AMIP-II and
ERA-40 reanalyses. Dyn. Atmos. Oceans, 44, 108–142.
Han, D. L., 1999: The progress of research on oasis in China (in
Chinese). Sci. Geogr. Sin., 19, 313–319.
Houghton, J. T., Y. Ding, D. J. Griggs, M. Noguer, P. J. van der
Linden, X. Dai, K. Maskell, and C. A. Johnson, Eds., 2001:
Climate Change 2001: The Scientific Basis. Cambridge Uni-
versity Press, 881 pp.
Huang, M., G. Peng, L. M. Leslie, X. Shao, and W. Sha, 2005:
Seasonal and regional temperature changes in China over
the 50 year period 1951–2000. Meteor. Atmos. Phys., 89,105–115.
Jones, P. D., T. J. Osborn, and K. R. Briffa, 1997: Estimating
sampling errors in large-scale temperature averages. J. Cli-
mate, 10, 2548–2568.Kai, K.,M.Matsuda, andR. Sato, 1997:Oasis effect observed at the
Zhangye Oasis in Hexi Corridor, China. J. Meteor. Soc. Japan,
75, 1171–1178.Kalnay, E., and Coauthors, 1996: The NCEP/NCAR 40-Year Re-
analysis Project. Bull. Amer. Meteor. Soc., 77, 437–471.
Kattsov, V., V. Govorkova, V.Meleshko, T. Pavlova, and I. Shkolnik,
2008: Climate change projections and impacts in Russian Fed-
eration and central Asia states. North Eurasia Climate Centre,
Saint Petersburg, Russia. [Available online at http://neacc.
meteoinfo.ru/research/20-research.]
Kendall, M. G., 1948: Rank Correlation Methods. Hafner, 160 pp.
Kharlamova, N. F., and V. S. Revyakin, 2006: Regional climate
and environmental change in Central Asia. Environmental
Security and Sustainable Land Use with Special Reference to
Central Asia,H. Vogtmann and N. Dobretsov, Eds., Springer,
19–26.
Le Houerou, H. N., 2005: Book review: Botanical Geography of
Kazakhstan andMiddleAsia (Desert Region).Arid LandRes.
Manage., 19, 89–90.
Li, B., Y. Chen, and X. Shi, 2012: Why does the temperature rise
faster in the arid region of northwest China? J. Geophys. Res.,
117, D16115, doi:10.1029/2012JD017953.
Li, Q. H., Y. Chen, Y. Shen, X. Li, and J. Xu, 2011: Spatial and
temporal trends of climate change in Xinjiang, China. J. Geogr.
Sci., 21, 1007–1018.
Li, Q. X., X. Liu, H. Zhang, C. Thomas, and R. David, 2004: De-
tecting and adjusting temporal inhomogeneity in Chinesemean
surface air temperature data. Adv. Atmos. Sci., 21, 260–268.
Lioubimtseva, E., and R. Cole, 2006: Uncertainties of climate
change in arid environments of central Asia.Rev. Fish. Sci., 14,
29–49.
——, andG.M.Henebry, 2009: Climate and environmental change
in arid central Asia: Impacts, vulnerability, and adaptations.
J. Arid Environ., 73, 963–977.
——, R. Cole, J. M. Adams, and G. Kapustin, 2005: Impacts of
climate and land-cover changes in arid lands of central Asia.
J. Arid Environ., 62, 285–308.Liu, X. D., and B. D. Chen, 2000: Climatic warming in the Tibetan
Plateau during recent decades. Int. J. Climatol., 20, 1729–1742.
Lorenz, E. N., 1956: Empirical orthogonal functions and statistical
weather prediction. Statistical Forecast Project Rep. 1, MIT
Department of Meteorology, 49 pp.
Lugina, K.M., P. Ya. Groisman, K. Ya. Vinnikov, V. V. Koknaeva,
andN.A. Speranskaya, 2006:Monthly surface air temperature
time series area-averaged over the 30-degree latitudinal belts
of the globe, 1881-2005. A compendium of data on global
change, Carbon Dioxide Information Analysis Center Rep.,
doi:10.3334/CDIAC/cli.003.
Ma, L., T. Zhang, Q. Li, W. Frauenfeld, and D. Qin, 2008: Evalu-
ation of ERA-40, NCEP-1, and NCEP-2 reanalysis air
temperatures with ground-based measurements in China.
J. Geophys. Res., 113, D15115, doi:10.1029/2007JD009549.
Mamtimin, B., A. M. M. Et-Tantawi, D. Schaefer, F. X. Meixner,
and M. Domroes, 2011: Recent trends of temperature change
under hot and cold desert climates: Comparing the Sahara
(Libya) and central Asia (Xinjiang, China). J. Arid Environ.,
75, 1105–1113.
Mann, H. B., 1945: Nonparametric tests against trend. Econo-
metrica, 13, 245–259.Marshall, G. J., 2002: Trends in Antarctic geopotential height and
temperature: A comparison between radiosonde and NCEP–
NCAR reanalysis data. J. Climate, 15, 659–674.
Mayhew, B., P. Clammer, and M. Kohn, 2004: Lonely Planet
Central Asia. Lonely Planet, 512 pp.
Menzel, A., 2000: Plant phenological anomalies in Germany and
their relation to air temperature and NAO. Climatic Change,
57, 243–263.
——, and P. Fabian, 1999: Growing season extended in Europe.
Nature, 397, 659, doi:10.1038/17709.
——, and Coauthors, 2006: European phenological response to
climate change matches the warming pattern. Global Change
Biol., 12, 1969–1976.
Michael, T., 2011: Natural disaster risks in central Asia: A syn-
thesis. UN Development Programme Rep., 47 pp. [Available
online at http://europeandcis.undp.org/uploads/public1/
files/vulnerability/Senior%20Economist%20Web%20site/
CA_Disaster_Risks_-_MT_-_D5_11_04.pdf.]
1166 JOURNAL OF CL IMATE VOLUME 27

Mitchell, T. D., and P. D. Jones, 2005: An improved method of
constructing a database of monthly climate observations and
associated high-resolution grids. Int. J. Climatol., 25, 693–712.
New, M., M. Hulme, and P. Jones, 1999: Representing twentieth-
century space–time climate variability. Part I: Development of
a 1961–90meanmonthly terrestrial climatology. J. Climate, 12,
829–856.
——,——, and——, 2000: Representing twentieth-century space–
time climate variability. Part II: Development of 1901–96
monthly grids of terrestrial surface climate. J. Climate, 13,
2217–2238.
North, G. R., T. L. Bell, R. F. Cahalan, and F. J. Moeng, 1982:
Sampling errors in the estimation of empirical orthogonal
functions. Mon. Wea. Rev., 110, 699–706.
Parry,M. L., O. F. Canziani, J. P. Palutikof, P. J. van der Linden, and
C. E. Hanson, Eds., 2007: Climate Change 2007: Impacts, Ad-
aptation andVulnerability.CambridgeUniversity Press, 976 pp.
Pepin, N. C., and J. D. Lundquist, 2008: Temperature trends at high
elevations: Patterns across the globe. Geophys. Res. Lett., 35,L14701, doi:10.1029/2008GL034026.
Pitman, A. J., and S. E. Perkins, 2009: Global and regional compar-
ison of daily 2-m and 1000-hPa maximum and minimum tem-
peratures in three global reanalyses. J. Climate, 22, 4667–4681.Pollner, J., J. Kryspin-Watson, and S. Nieuwejaar, 2008: Disaster
risk management and climate change adaptation in Europe
and central Asia. TheWorld Bank, 54 pp. [Available online at
http://sistemaprotezionecivile.it/allegati/1188_DRM-Climate_
Change_Europe.pdf.]
Propastin, P. A., M. Kappas, and N. R. Muratova, 2008: Inter-
annual changes in vegetation activities and their relationship
to temperature and precipitation in central Asia from 1982 to
2003. J. Environ. Inf., 12, 75–87.
Rangwala, I., and J. Miller, 2012: Climate change in mountains:
A review of elevation-dependent warming and its possible
causes. Climatic Change, 114, 527–547.
Ren, G., and Coauthors, 2005: Changes of surface air temperature
in China during 1951–2004 (in Chinese with English abstract).
Climate Environ. Res., 10, 717–727.
——,Y. Zhou, Z. Chu, J. Zhou, A. Zhang, J. Guo, andX. Liu, 2008:
Urbanization effects on observed surface air temperature
trends in North China. J. Climate, 21, 1333–1348.Rienecker, M. M., and Coauthors, 2011: MERRA: NASA’s
Modern-Era Retrospective Analysis for Research and Ap-
plications. J. Climate, 24, 3624–3648.
Saha, S., andCoauthors, 2010: TheNCEPClimate Forecast System
Reanalysis. Bull. Amer. Meteor. Soc., 91, 1015–1057.
Schiemann, R., D. L€uthi, P. L. Vidale, and C. Sch€ar, 2008: The
precipitation climate of central Asia—Intercomparison of
observational and numerical data sources in a remote semiarid
region. Int. J. Climatol., 28, 295–314.
Schneider, A., M. A. Friedl, and D. Potere, 2009: A new map of
global urban extent from MODIS data. Environ. Res. Lett., 4,044003, doi:10.1088/1748-9326/4/4/044003.
Shrestha, A., C. Wake, R. Mayewski, and J. Dibb, 1999: Maximum
temperature trends in the Himalaya and its vicinity: An
analysis based on temperature records from Nepal for the
period 1971–94. J. Climate, 12, 2775–2786.
Siebert, S., P. D€oll, S. Feick, J. Hoogeveen, and K. Frenken, 2007:
Globalmap of irrigation areas, version 4.0.1. JohannWolfgang
Goethe University, Frankfurt am Main, Germany, and Food
and Agriculture Organization of the United Nations, Rome,
Italy. [Available online at http://www2.uni-frankfurt.de/
45218039/Global_Irrigation_Map.]
Siegfried, T., T. Bernauer, R. Guiennet, S. Sellars, A. W.
Robertson, J. Mankin, P. Bauer-Gottwein, and A. Yakovlev,
2012: Will climate change exacerbate water stress in central
Asia? Climatic Change, 112, 881–899.
Simmons, A. J., and Coauthors, 2004: Comparison of trends and
low-frequency variability in CRU, ERA-40, and NCEP/
NCAR analyses of surface air temperature. J. Geophys. Res.,
109, D24115, doi:10.1029/2004JD005306.
Small, E. E., F. Giorgi, and L. C. Sloan, 1999: Regional climate
model simulation of precipitation in central Asia: Mean and
interannual variability. J. Geophys. Res., 104 (D6), 6563–6582.
Smith, T. M., and R. W. Reynolds, 2005: A global merged land and
sea surface temperature reconstruction based on historical
observations (1880–1997). J. Climate, 18, 2021–2036.
Solomon, S., D. Qin,M.Manning, Z. Chen,M.Marquis, K. Averyt,
M. M. B. Tignor, and H. L. Miller Jr., 2007: Climate Change
2007: The Physical Science Basis.CambridgeUniversity Press,
996 pp.
Song, H., and M. H. Zhang, 2007: Changes of the boreal winter
Hadley circulation in the NCEP–NCAR and ECMWF re-
analyses: A comparative study. J. Climate, 15, 5191–5200.
Sorg, A., T. Bolch, M. Stoffel, O. Solomina, andM. Beniston, 2012:
Climate change impacts on glaciers and runoff in Tian Shan
(central Asia). Nat. Climate Change, 2, 725–731.
Taha, H., H. Akbari, and A. Rosenfeld, 1991: Heat island and oasis
effects of vegetative canopies: Micro-meteorological field-
measurements. Theor. Appl. Climatol., 44, 123–138.Trenberth, K. E., and Coauthors, 2007: Observations: Surface and
atmospheric climate change. Climate Change 2007: The
Physical Science Basis, S. Solomon et al., Eds., Cambridge
University Press, 235–336.
UNDP, 2005: Central Asia human development report. UN De-
velopment Programme, 246 pp.
Vuille, M., and R. S. Bradley, 2000: Mean annual tempera-
ture trends and their vertical structure in the tropical Andes.
Geophys. Res. Lett., 27, 3885–3888.
——, ——, M. Werner, and F. Keimig, 2003: 20th century climate
change in the tropical Andes: Observations and model results.
Climatic Change, 59, 75–99.
Wang, S. W., and D. Y. Gong, 2000: Enhancement of the warming
trend in China. Geophys. Res. Lett., 27, 2581–2584.
You, Q. L., S. C. Kang, N. Pepin, W. A. Flugel, Y. P. Yan,
H. Behrawan, and J. Huang, 2010: Relationship between
temperature trend magnitude, elevation and mean tempera-
ture in the Tibetan Plateau from homogenized surface stations
and reanalysis data. Global Planet. Change, 71, 124–133.Zhang, Q., and M. Zhao, 1999: Field experiment and numerical
simulation of inverse over humidity of atmosphere over desert
oasis (in Chinese). Acta Meteor. Sin., 57, 729–740.Zhou, L., R. E. Dickinson, Y. Tian, J. Fang, Q. Li, R. Kaufmann,
C. Tucker, and R. B. Myneni, 2004: Evidence for a significant
urbanization effect on climate in China. Proc. Natl. Acad. Sci.
USA, 101, 9540–9544.Zoi Environment Network, 2009: Climate change in central Asia:
A visual synthesis. Zoı̈ environment publication, 79 pp.
[Available online at http://www.preventionweb.net/english/
professional/publications/v.php?id512033.]
1 FEBRUARY 2014 HU ET AL . 1167

Supplementary Material
Table S1. Information for climate stations used in this study
ID Station Name Country&
Latitude
(degree)
Longitude
(degree)
Elevation
(m)
Time in function
(YYYMMDD) Quality
control#
Start End
1 URDA KZ 48.767 47.433 4 19590101 19981009 0
2 NOVYJ USHTOGAN KZ 47.900 48.800 -10 19590101 20111231 3
3 GANJUSHKINO KZ 46.600 49.267 -23 19590101 20111231 2
4 ZHALPAKTAL KZ 49.667 49.483 10 19590101 20111231 1
5 KULALY ISLAND KZ 45.017 50.033 -22 19590101 20020319 0
6 FORT SHEVCHENKO KZ 44.550 50.250 -25 19320201 20111231 1
7 DZHANGALA KZ 49.217 50.300 7 19881001 20040731 0
8 SEVCENKO KZ 43.583 51.083 -15 19601201 20110125 1
9 CHAPAEVO KZ 50.200 51.167 17 19590101 20111231 1
10 URALSK KZ 51.250 51.283 37 19320102 20111231 3
11 ATYRAU KZ 47.117 51.817 -22 20040706 20111231 0
12 TAIPAK KZ 49.050 51.867 2 19361231 20111231 1
13 ATYRAU KZ 47.117 51.917 -22 19320101 20111231 2
14 TUSCIKUDUK KZ 44.733 51.967 56 19590101 20110125 1
15 KARABOGAZKEL TX 41.050 52.917 -22 19590101 20090414 0
16 DZHAMBEJTY KZ 50.250 52.567 32 19480101 20111231 3
17 OGRYDA TX 39.100 53.100 -26 19590101 20070306 0
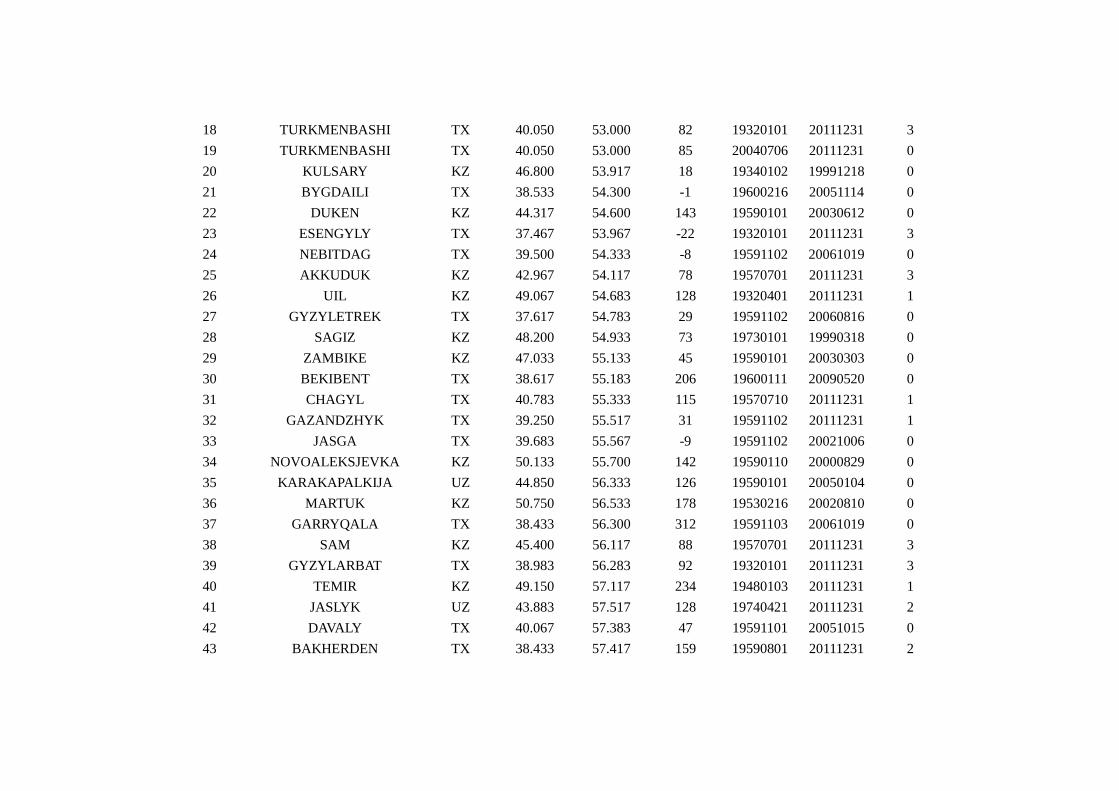
18 TURKMENBASHI TX 40.050 53.000 82 19320101 20111231 3
19 TURKMENBASHI TX 40.050 53.000 85 20040706 20111231 0
20 KULSARY KZ 46.800 53.917 18 19340102 19991218 0
21 BYGDAILI TX 38.533 54.300 -1 19600216 20051114 0
22 DUKEN KZ 44.317 54.600 143 19590101 20030612 0
23 ESENGYLY TX 37.467 53.967 -22 19320101 20111231 3
24 NEBITDAG TX 39.500 54.333 -8 19591102 20061019 0
25 AKKUDUK KZ 42.967 54.117 78 19570701 20111231 3
26 UIL KZ 49.067 54.683 128 19320401 20111231 1
27 GYZYLETREK TX 37.617 54.783 29 19591102 20060816 0
28 SAGIZ KZ 48.200 54.933 73 19730101 19990318 0
29 ZAMBIKE KZ 47.033 55.133 45 19590101 20030303 0
30 BEKIBENT TX 38.617 55.183 206 19600111 20090520 0
31 CHAGYL TX 40.783 55.333 115 19570710 20111231 1
32 GAZANDZHYK TX 39.250 55.517 31 19591102 20111231 1
33 JASGA TX 39.683 55.567 -9 19591102 20021006 0
34 NOVOALEKSJEVKA KZ 50.133 55.700 142 19590110 20000829 0
35 KARAKAPALKIJA UZ 44.850 56.333 126 19590101 20050104 0
36 MARTUK KZ 50.750 56.533 178 19530216 20020810 0
37 GARRYQALA TX 38.433 56.300 312 19591103 20061019 0
38 SAM KZ 45.400 56.117 88 19570701 20111231 3
39 GYZYLARBAT TX 38.983 56.283 92 19320101 20111231 3
40 TEMIR KZ 49.150 57.117 234 19480103 20111231 1
41 JASLYK UZ 43.883 57.517 128 19740421 20111231 2
42 DAVALY TX 40.067 57.383 47 19591101 20051015 0
43 BAKHERDEN TX 38.433 57.417 159 19590801 20111231 2

44 AKTOBE KZ 50.283 57.150 219 19320101 20111231 3
45 BOKYRDAK TX 38.750 58.467 84 19591101 20001027 0
46 KOS-ISTEK KZ 50.733 57.900 340 19590628 20090621 0
47 MUGODZARSKAJA KZ 48.633 58.500 398 19570701 20111231 1
48 EKEZHE TX 41.033 57.767 62 19590101 20111231 3
49 DEVERZE TX 40.183 58.483 84 19550703 20101219 0
50 ASHGABAT KESHI TX 37.987 58.361 211 19320101 20111231 3
51 ERBENT TX 39.317 58.600 87 19590109 20111231 1
52 SHASENEM TX 41.583 58.717 62 19600207 20090414 0
53 MUJNAK UZ 43.750 58.733 55 20021124 20021124 0
54 KUNGRAD UZ 43.083 58.933 64 19480101 20111231 2
55 KENEURGENCH TX 42.300 59.133 71 19591101 20090414 0
56 AYAK-KUM KZ 46.717 59.167 114 19570710 20020319 0
57 TALDYK KZ 49.250 59.550 260 19590101 19941202 0
58 CELKAR KZ 47.850 59.617 176 19361231 20020319 0
59 NUKUS UZ 42.450 59.617 77 19591101 20111231 2
60 NUKUS/KARAKALPAKS UZ 42.483 59.633 77 20040713 20111231 0
61 KAKA TX 37.350 59.633 308 19590810 20101008 0
62 TEDZHEN TX 37.383 60.517 186 19480101 20111231 1
63 DASHKHOVUZ TX 41.750 59.817 82 19480101 20111231 3
64 DASHOGUZ TX 41.750 59.833 83 20050724 20111231 0
65 BARSAKELMES ISLAND KZ 45.683 59.917 80 19600101 19970318 0
66 AKMOLLA TX 39.583 59.950 108 19730102 20051114 0
67 CHIMBAJ UZ 42.950 59.817 66 19320602 20111231 2
68 URGENCH UZ 41.567 60.567 101 19480101 20111231 1
69 URGENCH UZ 41.583 60.633 98 20040713 20111231 0

70 CHESHME TX 38.683 61.200 147 19570703 19980225 0
71 SARAGT TX 36.533 61.217 275 19460403 20111231 1
72 IRGIZ KZ 48.617 61.267 114 19320401 20041003 0
73 ZABELOVKA KZ 52.300 61.317 279 19600101 20000105 0
74 TAMABULAK KZ 49.983 61.483 221 19600109 20030218 0
75 KAZALINSK KZ 45.767 62.117 68 19340201 20111231 2
76 MARY TX 37.617 61.900 222 20050722 20111231 0
77 CABANKAZGAN KZ 43.600 61.933 64 19600101 20021101 0
78 TAUP KZ 48.250 62.000 74 19590101 19951113 0
79 ARALSKOE MORE KZ 46.783 61.650 62 19480101 20111231 3
80 BUZAUBAJ UZ 41.750 62.467 98 19600101 20111231 1
81 TOBOL KZ 52.683 62.600 208 19530216 20020319 0
82 GYSHGY TX 35.283 62.350 625 19320101 20111231 1
83 ELOTEN TX 37.300 62.417 259 19590818 20050127 0
84 BAJRAMALY TX 37.600 62.183 240 19370731 20111231 3
85 DARGANATA TX 40.467 62.283 142 19480101 20111231 3
86 ARALKOL' KZ 51.083 62.700 230 19630302 19981009 0
87 APPROXIMATE LOCALE KZ 50.450 62.800 183 19820102 19820428 0
88 UCHADZHY TX 38.083 62.800 185 19530216 20111231 2
89 CIRIK-RABAT KZ 44.067 62.900 88 19480101 20060923 0
90 TAGTABAZAR TX 35.950 62.917 349 19570710 20090910 0
91 FYODOROV SOVKHOZ KZ 53.750 63.167 184 19590101 19631218 0
92 REPATEK TX 38.567 63.183 185 19320101 20081101 0
93 DJACHEV TX 39.317 63.200 182 20081101 20081101 0
94 KUL-KUDUK UZ 42.533 63.283 333 19591120 19940430 0
95 DZANGELDY UZ 40.850 63.333 208 19590901 20070306 0

96 TORGAI KZ 49.633 63.500 136 19320101 20111231 1
97 DZHUSALY KZ 45.500 64.083 103 19480102 20111231 1
98 SHUMEKTY KZ 50.267 64.217 76 19600317 20020830 0
99 LEKKER TX 36.267 63.700 787 19600101 20011007 0
100 KARAKUL UZ 39.500 63.850 196 19591101 20020814 0
101 CHARDZHEV TX 39.083 63.600 190 19480101 20111231 3
102 KUSTANAI KZ 53.217 63.617 156 19351231 20111231 3
103 ZARAFSHAN UZ 41.617 64.233 425 20061110 20061110 0
104 AK-BAJTAL UZ 43.150 64.333 234 19570201 20111231 2
105 BYRDALYK TX 38.467 64.367 212 19591102 20111231 1
106 BUKHARA UZ 39.767 64.467 229 20040706 20111231 0
107 AYAKAGITMA UZ 40.683 64.483 219 19590801 20040215 0
108 BISARY KZ 48.817 64.617 122 19630302 20050824 0
109 CARSANGA TX 37.517 66.017 265 19590801 20111231 1
110 BUHARA UZ 39.717 64.617 226 19361231 20111231 1
111 KUSMURUN KZ 52.467 64.667 110 19590101 20000807 0
112 KARA-KUM KZ 46.883 64.667 79 19570711 20020726 0
113 TAMDY UZ 41.733 64.617 237 19591110 20111231 3
114 AMANGELDY KZ 50.133 65.233 142 19530216 20090612 0
115 MASHIKUDUK UZ 41.050 65.283 200 19590930 20050804 0
116 NAVOI UZ 40.133 65.349 341 19600101 20111231 1
117 KERKI TX 37.833 65.200 240 19320101 20111231 3
118 KYZYLORDA KZ 44.850 65.500 130 19320101 20111231 3
119 URICKY KZ 53.317 65.550 210 19530216 20111231 1
120 NURATA UZ 40.550 65.683 485 19480106 20111231 2
121 KARSHI UZ 38.800 65.717 376 19590804 20111231 2

122 KARSHI KHANABAD UZ 38.833 65.917 416 20070101 20111231 0
123 KARASUL KZ 52.667 65.500 209 19590101 19741025 0
124 SENBER KZ 49.750 66.150 229 19600401 20020319 0
125 GUZAR UZ 38.617 66.267 524 19480101 20090612 0
126 ESIL KZ 51.883 66.333 221 19530216 20111231 1
127 TORUK KZ 41.800 66.717 202 19590101 20021212 0
128 KARSAKPAJ KZ 47.833 66.750 508 19351231 20020920 0
129 CIILI KZ 44.167 66.750 153 19480101 20111231 2
130 SHAHRISABZ UZ 39.033 66.783 599 20080724 20111231 0
131 ARKALYK KZ 50.217 66.833 343 19690102 20060114 0
132 AKRABAT UZ 38.250 66.833 1601 19600817 20040319 0
133 MINCHUKUR UZ 38.650 66.933 2121 19600101 20030429 0
134 SAMARKAND UZ 39.567 66.950 724 19480101 20111231 1
135 BLACOVESCHENKA KZ 54.367 66.967 153 19480101 20111231 1
136 RUZAEVKA KZ 52.817 66.967 227 19531101 20111231 2
137 SHIRABAD UZ 37.667 67.017 410 19590811 20050713 0
138 ZLIKHA KZ 45.250 67.067 138 19530216 20111231 1
139 CARDARA KZ 41.367 68.000 275 19730101 20111231 2
140 KIJMA KZ 51.600 67.567 272 19850702 19971128 0
141 PENDZHIKENT TI 39.500 67.600 1015 19600117 20031130 0
142 ZHEZKAZGAN KZ 47.800 67.717 346 19480102 20111231 1
143 DZIZAK UZ 40.117 67.833 345 19480101 20111231 1
144 DENAU UZ 38.267 67.900 520 19590811 20020829 0
145 TERMEZ UZ 37.233 67.267 310 19480101 20111231 3
146 ALGABAS KZ 48.883 68.083 506 19810101 19970209 0
147 VOLODARSKOE KZ 53.317 68.100 319 19590101 20020319 0

148 SHAARTUZ TI 37.317 68.133 380 19600602 20040611 0
149 TURKESTAN KZ 43.267 68.217 207 19320104 20111231 1
150 ISAMBAJ TI 38.050 68.350 563 19600102 20111231 1
151 DUSHANBE TI 38.550 68.783 800 19320101 20111231 1
152 ISKANDERKUL TI 39.100 68.383 2204 19751101 20050115 0
153 GANDZHINA TI 37.950 68.567 752 20101214 20111231 0
154 SHAHRISTANSKIJ PEREV TI 39.567 68.583 3143 19610107 20080131 0
155 JETI-KONUR KZ 46.583 68.617 276 19570710 20020730 0
156 SONGISTON (MTN STN) TI 39.383 68.617 1507 19610119 20050126 0
157 SYR-DARJA UZ 40.817 68.683 264 19600101 20111231 1
158 BALKASINO KZ 52.533 68.750 399 19590101 20111231 2
159 ATBASAR KZ 51.817 68.367 304 19480101 20111231 3
160 KURGAN-TYUBE TI 37.817 68.783 429 19600101 20111231 1
161 JANGIER UZ 40.217 68.833 317 19530216 20050402 0
162 ANZOBSKIJ PEREVAL TI 39.083 68.867 3373 19610201 20080602 0
163 ACHISAJ KZ 43.550 68.900 822 19611203 20111231 1
164 URA-TYUBE TI 39.900 68.983 1005 19600102 20070303 0
165 PYANDJ TI 37.233 69.083 363 19480101 20040408 0
166 TASTY KZ 44.800 69.117 190 19530216 20030121 0
167 PETROPAVLOVSK KZ 54.833 69.150 136 19320101 20111231 1
168 SANGLOK TI 38.250 69.233 2239 19730101 20111231 1
169 KYZYLZHAR KZ 48.300 69.650 361 19550301 20111231 1
170 DANGARA TI 38.100 69.317 660 19591102 20111231 1
171 NUREK TI 38.417 69.350 549 19830701 19970106 0
172 KOKSHETAY KZ 53.283 69.383 229 19320101 20111231 1
173 PARKHAR TI 37.483 69.383 448 19591030 20111231 1

174 TASHKENT VOSTOCNY UZ 41.317 69.400 466 20050411 20111231 0
175 BERLIK KZ 49.883 69.517 349 19530216 20080328 0
176 BARSHINO KZ 49.683 69.517 349 20090203 20111231 0
177 KOKSHETAU AIRPORT KZ 53.317 69.600 263 20050724 20111231 0
178 TASHKENT UZ 41.267 69.267 466 19320101 20111231 3
179 MADRUSHKAT TI 39.433 69.667 2234 19591029 20111231 1
180 KHUDZHAND TI 40.217 69.683 442 20040706 20111231 0
181 SHYMKENT KZ 42.317 69.700 604 19480101 20111231 1
182 KHUDJAND TI 40.217 69.733 427 19360101 20111231 1
183 KULYAB TI 37.917 69.783 659 19600101 19950405 0
184 ZHALTYR KZ 51.617 69.800 305 19590101 20111231 1
185 KAJRAKKUMSKOE TI 40.267 69.817 347 20101214 20111231 0
186 HOVALING TI 38.367 69.983 1468 20090929 20111231 0
187 KURGALJINO KZ 50.583 70.000 330 19600223 20020804 0
188 BETPAK-DALA STEPPE KZ 46.000 70.000 325 19570706 20020607 0
189 DEHAVZ TI 39.450 70.200 2561 19751101 20111231 1
190 SUCINSK KZ 52.950 70.217 384 19530216 20111231 2
191 AUL TURARA
RYSKULOV
KZ 42.483 70.300 808 19590101 20111231 2
192 RASHT TI 39.000 70.300 1316 19591124 20020507 0
193 PSKEM UZ 41.900 70.367 1258 19600208 20111231 2
194 ISFARA TI 40.133 70.600 873 19480101 19970510 0
195 TERS KG 41.667 70.717 1759 19591222 19960416 0
196 OLGAING UZ 42.167 70.883 2151 19630610 19981009 0
197 DARVAZ TI 38.467 70.883 1288 19590901 20100605 0
198 KOKTAS KZ 47.517 70.900 471 19590101 20090220 0

199 VOZVISHEN SOVKHOZ KZ 54.433 70.917 127 19590102 20080905 0
200 UJUK KZ 43.783 70.933 366 19590101 20090612 0
201 AKKOL KZ 52.000 70.950 384 19590101 20111231 1
202 KOKAND UZ 40.550 70.950 499 19590913 20101029 0
203 ULANBEL' KZ 44.800 71.067 266 19590101 20040104 0
204 APPROXIMATE LOCALE KZ 50.833 72.183 411 19810101 19860605 0
205 HUMRAGI TI 38.283 71.333 1737 19730101 20080229 0
206 CATKAL RIVER KG 41.900 71.350 1937 19591101 20020411 0
207 ASTANA KZ 51.133 71.367 350 19320101 20111231 2
208 TARAZ KZ 42.850 71.383 655 19480101 20111231 3
209 KHOROG TI 37.500 71.500 2077 19571011 20111231 1
210 NAMANGAN UZ 40.983 71.583 474 19480101 20111231 1
211 KAZGORODOK KZ 49.950 71.583 422 19630601 20030216 0
212 NAMANGAN UZ 40.983 71.583 474 20040706 20051110 0
213 ISHKASHIM TI 36.717 71.600 2523 19591108 20080131 0
214 ATASU KZ 48.700 71.633 488 19590102 20101130 0
215 OSH KG 40.533 72.800 875 19591102 20031003 0
216 LAHSH TI 39.283 71.867 1198 19730312 20111231 1
217 KZYL-TAU KZ 47.850 72.083 810 19570710 20050704 0
218 FEDCENKO GLACIER TI 38.917 72.167 4169 19370104 20050827 0
219 TARAZ KZ 42.850 71.300 666 20070827 20111231 0
220 TALAS KG 42.517 72.217 1218 19480101 20111231 1
221 ANDIZAN UZ 40.733 72.333 477 19591205 19840218 0
222 KZIL-TUS SOVKHOZ KZ 53.633 72.367 138 19630602 20030223 0
223 ANAR KZ 50.617 72.433 437 19530216 19800322 0
224 IRHT TI 38.167 72.633 3276 19590101 20020608 0
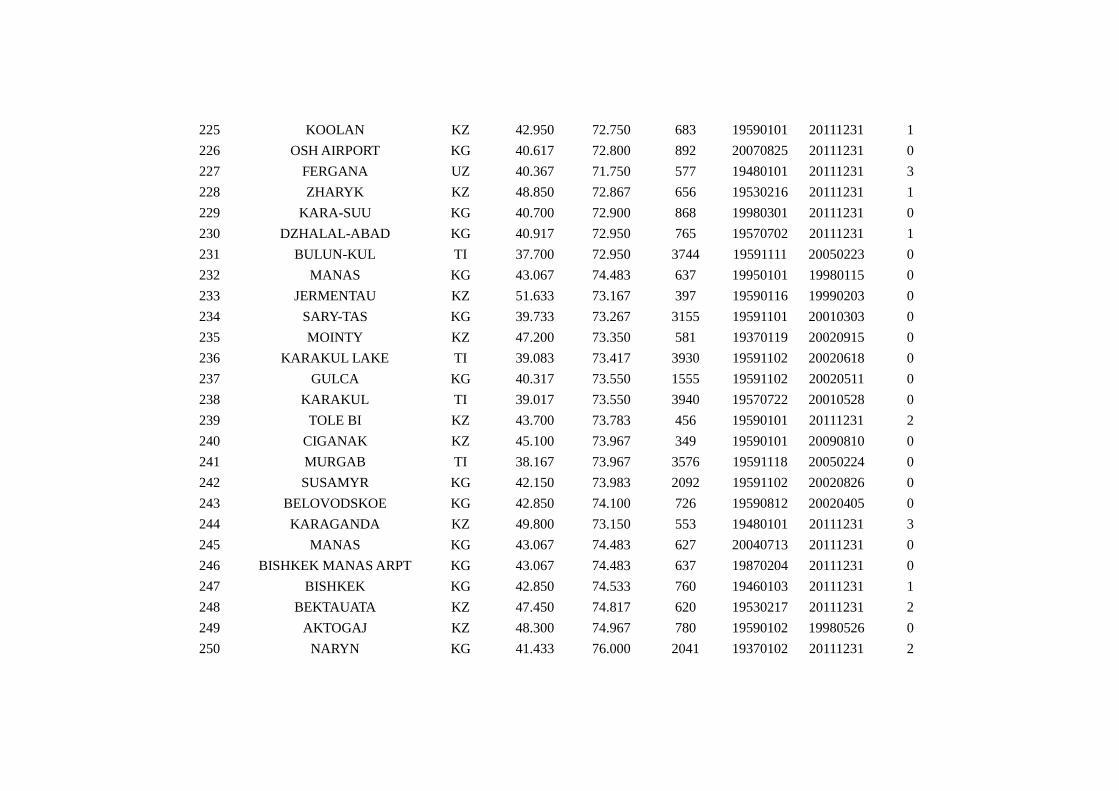
225 KOOLAN KZ 42.950 72.750 683 19590101 20111231 1
226 OSH AIRPORT KG 40.617 72.800 892 20070825 20111231 0
227 FERGANA UZ 40.367 71.750 577 19480101 20111231 3
228 ZHARYK KZ 48.850 72.867 656 19530216 20111231 1
229 KARA-SUU KG 40.700 72.900 868 19980301 20111231 0
230 DZHALAL-ABAD KG 40.917 72.950 765 19570702 20111231 1
231 BULUN-KUL TI 37.700 72.950 3744 19591111 20050223 0
232 MANAS KG 43.067 74.483 637 19950101 19980115 0
233 JERMENTAU KZ 51.633 73.167 397 19590116 19990203 0
234 SARY-TAS KG 39.733 73.267 3155 19591101 20010303 0
235 MOINTY KZ 47.200 73.350 581 19370119 20020915 0
236 KARAKUL LAKE TI 39.083 73.417 3930 19591102 20020618 0
237 GULCA KG 40.317 73.550 1555 19591102 20020511 0
238 KARAKUL TI 39.017 73.550 3940 19570722 20010528 0
239 TOLE BI KZ 43.700 73.783 456 19590101 20111231 2
240 CIGANAK KZ 45.100 73.967 349 19590101 20090810 0
241 MURGAB TI 38.167 73.967 3576 19591118 20050224 0
242 SUSAMYR KG 42.150 73.983 2092 19591102 20020826 0
243 BELOVODSKOE KG 42.850 74.100 726 19590812 20020405 0
244 KARAGANDA KZ 49.800 73.150 553 19480101 20111231 3
245 MANAS KG 43.067 74.483 627 20040713 20111231 0
246 BISHKEK MANAS ARPT KG 43.067 74.483 637 19870204 20111231 0
247 BISHKEK KG 42.850 74.533 760 19460103 20111231 1
248 BEKTAUATA KZ 47.450 74.817 620 19530217 20111231 2
249 AKTOGAJ KZ 48.300 74.967 780 19590102 19980526 0
250 NARYN KG 41.433 76.000 2041 19370102 20111231 2

251 AUL KZ 45.633 75.117 353 19570701 20020319 0
252 BAKANAS KZ 44.833 76.267 396 19590114 20111231 2
253 ALGAZY OSTROV KZ 46.550 76.867 349 19630502 20111231 2
254 WUQIA XJ(CN) 39.717 75.250 2176 19550101 20111231 3
255 TOKMAK KG 42.833 75.283 817 19590630 20111231 1
256 EKIBASTUZ KZ 51.700 75.367 234 19590102 20010928 0
257 COLPON-ATA KG 42.650 77.100 1645 19730104 20080618 0
258 AK-SYJRAK KG 41.817 78.733 3540 19591101 19981008 0
259 KARKARALINSK KZ 49.383 75.517 812 19320106 19940725 0
260 BAJANAUL KZ 50.800 75.700 504 19570710 20090612 0
261 DARHAN KG 42.317 77.900 1700 19600102 20000107 0
262 BALHASH KZ 46.800 75.083 350 19480101 20111231 3
263 PRUDKY KZ 43.167 76.050 992 19630302 20010629 0
264 TAXKORGAN XJ(CN) 37.767 75.233 3090 19570101 20111231 3
265 MIKHAILOVKA KZ 53.817 76.533 114 19590102 20111231 2
266 OTAR KZ 43.533 75.250 743 19530216 20111231 1
267 ZHANGIZTOBE KZ 49.217 81.217 455 19480101 20111231 2
268 BARSHATAS KZ 48.167 78.417 643 19590101 20090612 0
269 TURGART XJ(CN) 40.517 75.400 3504 19580101 20111231 3
270 ERTIS KZ 53.350 75.450 94 19480101 20111231 3
271 OGIZTAU KZ 48.267 77.317 699 19590101 19970622 0
272 KAJNAR KZ 49.200 77.367 842 19570706 20100514 0
273 KARAKOLKA KG 41.483 77.400 3080 19600102 19981226 0
274 KASHI XJ(CN) 39.467 75.983 1289 19510101 20111231 3
275 BOLSAJA KZYL KG 42.200 78.200 1719 19591124 19970529 0
276 TIAN-SHAN KG 41.883 78.233 3639 19590101 20111231 1

277 AKSU XJ(CN) 41.167 80.233 1104 19530101 20111231 3
278 MULALY KZ 45.450 78.333 564 19890513 20020820 0
279 SEMIJARKA KZ 50.867 78.350 149 19480101 20111231 2
280 KYZYL-SUU KG 42.350 78.350 1769 20071001 20071001 0
281 TALDY-KURGAN KZ 45.000 78.383 602 19590101 20040731 0
282 ALMATY KZ 43.233 76.933 851 19320101 20111231 3
283 PAVLODAR KZ 52.300 76.933 122 19320102 20111231 3
284 YUMIN XJ(CN) 46.200 82.933 716 19600101 20111231 2
285 SHACHE XJ(CN) 38.433 77.267 1231 19530101 20111231 3
286 URDZHAR KZ 47.117 81.617 491 19530216 20111231 2
287 KARAUL KZ 49.000 79.333 618 19610313 20060830 0
288 KATON-KARAGAJ KZ 49.183 85.617 1081 19570701 20060531 0
289 SEMONAIHA KZ 50.633 81.917 320 19530216 20051013 0
290 LUOPU XJ(CN) 37.083 80.167 1348 19710101 20111231 2
291 UZYNBULAK KZ 45.850 82.183 362 19731109 20030213 0
292 PISHAN XJ(CN) 37.617 78.283 1375 19590101 20111231 3
293 SEMIPALATINSK KZ 50.417 80.300 196 19320101 20111231 2
294 AJAGUZ KZ 47.967 80.450 655 19570701 20020105 0
295 UC-ARAL KZ 46.167 80.933 397 19530216 20090612 0
296 UST-KAMENOGORSK KZ 49.967 82.633 292 19570710 20010504 0
297 ULKEN NARY KZ 49.200 84.517 401 19530216 20111231 2
298 AKQI XJ(CN) 40.933 78.450 1985 19570101 20111231 3
299 BA CHU XJ(CN) 39.800 78.567 1117 19530101 20111231 3
300 SHANSHAN XJ(CN) 42.850 90.233 399 19550901 20111231 2
301 KE PING XJ(CN) 40.500 79.050 1162 19590101 20111231 3
302 RIDDER KZ 50.333 83.550 811 19590102 20111231 2

303 WADA XJ(CN) 37.133 79.933 1375 19530101 20111231 3
304 ZHARKENT KZ 44.167 80.067 645 19460114 20111231 3
305 WENSU XJ(CN) 41.267 80.233 1133 19660201 20111231 2
306 KOKPEKTY KZ 48.750 82.367 512 19480101 20111231 2
307 UST KAMENOGORSK KZ 50.033 82.500 286 20070827 20111231 0
308 MOSUOWAN XJ(CN) 45.017 86.100 348 19580110 20111231 2
309 WEN QUAN XJ(CN) 44.967 81.017 1358 19570101 20111231 3
310 ZHAO SU XJ(CN) 43.150 81.133 1851 19540101 20111231 3
311 FUKANG XJ(CN) 44.167 87.917 547 19710101 20111231 2
312 ALAR XJ(CN) 40.550 81.267 1012 19580101 20111231 3
313 YINING XJ(CN) 43.950 81.333 663 19510101 20111231 3
314 PAOTAI XJ(CN) 44.850 85.250 338 19540101 20111231 2
315 YU TIAN XJ(CN) 36.850 81.650 1422 19550101 20111231 3
316 BAICHENG XJ(CN) 41.783 81.900 1229 19580101 20111231 3
317 EMIN XJ(CN) 46.550 83.650 524 19590901 20111231 2
318 ANDEHE XJ(CN) 37.933 83.650 1263 19600101 19981231 0
319 TA ZHONG XJ(CN) 39.000 83.667 1099 19990101 20111231 0
320 KURCUM KZ 48.550 83.683 427 19590121 19981009 0
321 ALASHANKOU XJ(CN) 45.183 82.567 336 19560101 20111231 3
322 MUQIZHAN XJ(CN) 43.320 87.380 1929 19780101 20111231 2
323 MINFENG XJ(CN) 37.067 82.717 1410 19560101 20111231 3
324 JINGHE XJ(CN) 44.617 82.900 320 19530101 20111231 3
325 KUQA XJ(CN) 41.717 82.967 1082 19510101 20111231 3
326 TACHENG XJ(CN) 46.733 83.000 535 19560101 20111231 3
327 KATUN KZ 49.733 86.550 1800 19600427 19941231 0
328 TUOLI XJ(CN) 45.933 83.600 1078 19561001 20111231 3

329 HUTUBI XJ(CN) 44.133 86.817 523 19601001 20111231 2
330 JIMUNAI XJ(CN) 47.433 85.867 984 19600801 20111231 2
331 SHIHEZI XJ(CN) 44.317 86.050 443 19520101 20111231 2
332 BAYINBULUKE XJ(CN) 43.033 84.150 2458 19570101 20111231 3
333 LUNTAI XJ(CN) 41.783 84.250 976 19580101 20111231 3
334 MANASI XJ(CN) 44.317 86.200 473 19610101 20111231 2
335 WUSU XJ(CN) 44.433 84.667 479 19530101 20111231 3
336 KARAMAY XJ(CN) 45.617 84.850 450 19561201 20111231 3
337 QIEMO XJ(CN) 38.150 85.550 1247 19530101 20111231 3
338 TIEGANLIKE XJ(CN) 40.633 87.700 846 19570101 20111231 3
339 HOBOKSAR XJ(CN) 46.783 85.717 1292 19560101 20111231 3
340 BUERJING XJ(CN) 47.700 86.867 474 19600101 20111231 2
341 CHANGJI XJ(CN) 44.010 87.100 577 19530301 20111231 2
342 KORLA XJ(CN) 41.750 86.133 932 19580101 20111231 3
343 BALGANTAI XJ(CN) 42.733 86.300 1739 19570101 20111231 3
344 HABAHE XJ(CN) 48.050 86.400 533 19570101 20111231 3
345 RUOQIANG XJ(CN) 39.033 88.167 888 19530101 20111231 3
346 YANQI XJ(CN) 42.083 86.567 1055 19510101 20111231 3
346 KUMUX XJ(CN) 42.233 88.217 922 19580101 20111231 3
347 FU HAI XJ(CN) 47.117 87.467 501 19600101 20111231 3
348 CAIJIAHU XJ(CN) 44.200 87.533 441 19580101 20111231 3
349 URUMQI XJ(CN) 43.783 87.650 935 19510101 20111231 3
349 JIMUSAER XJ(CN) 44.017 89.167 736 19610101 20111231 2
350 TURPAN XJ(CN) 42.933 89.200 35 19510101 20111231 3
351 ALTAY XJ(CN) 47.733 88.083 735 19600101 20111231 3
353 QITAI XJ(CN) 44.017 89.567 794 19510101 20111231 3
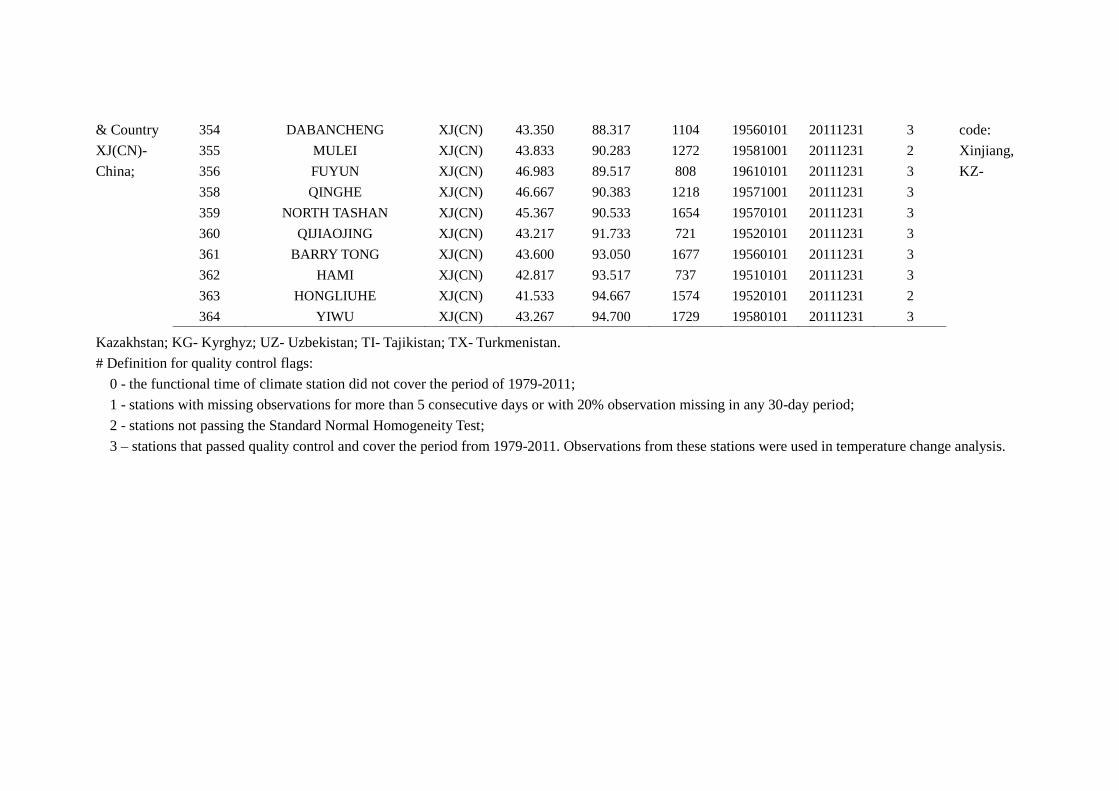
& Country code:
XJ(CN)- Xinjiang,
China; KZ-
Kazakhstan; KG- Kyrghyz; UZ- Uzbekistan; TI- Tajikistan; TX- Turkmenistan.
# Definition for quality control flags:
0 - the functional time of climate station did not cover the period of 1979-2011;
1 - stations with missing observations for more than 5 consecutive days or with 20% observation missing in any 30-day period;
2 - stations not passing the Standard Normal Homogeneity Test;
3 – stations that passed quality control and cover the period from 1979-2011. Observations from these stations were used in temperature change analysis.
354 DABANCHENG XJ(CN) 43.350 88.317 1104 19560101 20111231 3
355 MULEI XJ(CN) 43.833 90.283 1272 19581001 20111231 2
356 FUYUN XJ(CN) 46.983 89.517 808 19610101 20111231 3
358 QINGHE XJ(CN) 46.667 90.383 1218 19571001 20111231 3
359 NORTH TASHAN XJ(CN) 45.367 90.533 1654 19570101 20111231 3
360 QIJIAOJING XJ(CN) 43.217 91.733 721 19520101 20111231 3
361 BARRY TONG XJ(CN) 43.600 93.050 1677 19560101 20111231 3
362 HAMI XJ(CN) 42.817 93.517 737 19510101 20111231 3
363 HONGLIUHE XJ(CN) 41.533 94.667 1574 19520101 20111231 2
364 YIWU XJ(CN) 43.267 94.700 1729 19580101 20111231 3

Table S2. Annual and seasonal temperature lapse rates (℃100m-1
) in Central Asia based on the long-term (1979-2011) mean temperature in the
Tianshan region (40º-44.5ºN, 69º-90 ºE) (Fig 1a). The correlations (R2) are significant (p-value<0.05) for all reanalysis datasets.
Datasets Statistics Annual Spring Summer Fall Winter
CFSR Laps rate -0.38 -0.38 -0.50 -0.37 -0.26
R2 0.54 0.49 0.70 0.56 0.29
ERA-Interim Laps rate -0.30 -0.30 -0.45 -0.30 -0.17
R2 0.40 0.36 0.66 0.43 0.12
MERRA Laps rate -0.32 -0.34 -0.49 -0.30 -0.16
R2 0.40 0.41 0.67 0.40 0.10

Table S3. Annual and seasonal temperature trend (ºC decade-1
) from 1979-2011 as function of elevation in Tien Shan Mountain area for CFSR,
MERRA, ERA-Interim and OBS. Statistics for the correlation (p-value and R2) are showed. Because the spatial resolution of CFSR and MERRA
are finer than that of the ERA-Interim, to assess the scaling effects on the analysis, we also resampled the CFSR and MERRA datasets to match
the resolution of ERA-Interim (0.75º×0.75º), and compared the results side by side with that from the original resolution.
Dataset Season#
Original resolution CFSR and MERRA resampled to 0.75º×0.75º
Temperature trend Sig. R2 Temperature trend Sig. R
2
CFSR
ANN -1.37×10⁻⁴
p<0.05 0.41 -1.09×10⁻⁴
p<0.05 0.27
MAM -2.18×10⁻⁴
p<0.05 0.35 -1.67×10⁻⁴
p<0.05 0.19
JJA -5.47×10⁻⁶
p=0.32 0.001 1.34×10⁻⁵
p=0.32 0.0058
SON -1.47×10⁻⁴
p<0.05 0.46 -1.10×10⁻⁴
p<0.05 0.27
DJF -1.82×10⁻⁴
p<0.05 0.34 -1.60×10⁻⁴
p<0.05 0.27
MERRA
ANN -7.10×10⁻⁶
p<0.05 0.15 -3.33×10⁻⁵
p<0.05 0.026
MAM -8.40×10⁻⁵
p<0.05 0.13 -4.39×10⁻⁵
p=0.14 0.013
JJA -7.10×10⁻⁵
p<0.05 0.06 -3.83×10⁻⁵
p<0.05 0.041
SON -1.30×10⁻⁴
p<0.05 0.28 -5.11×10⁻⁵
p<0.05 0.092
DJF -3.80×10⁻⁶
p<0.05 0.0004 1.19×10⁻⁵
p=0.39 0.0043
ERA-Interim
ANN -4.2×10⁻⁵
p<0.05 0.045
MAM -7.6×10⁻⁵
p<0.05 0.04
JJA -3.9×10⁻⁵
p<0.05 0.042
SON -6.4×10⁻⁵
p<0.05 0.18
DJF 2.6×10⁻⁵
p<0.05 0.023
OBS
ANN 3.49×10⁻⁵
p=0.64 0.0084
MAM 1.08×10⁻⁵
p=0.84 0.0015
JJA -5.78×10⁻⁵
p=0.49 0.0189
SON -3.87×10⁻⁵
p=0.64 0.0085
DJF 2.40×10⁻⁴
p=0.10 0.1005