Tectono-magmatic evolution of the Mesoproterozoic Singhora basin, central India: Evidence for...
19
Precambrian Research 227 (2013) 276–294 Contents lists available at SciVerse ScienceDirect Precambrian Research journal homepage: www.elsevier.com/locate/precamres Tectono-magmatic evolution of the Mesoproterozoic Singhora basin, central India: Evidence for compressional tectonics from structural data, AMS study and geochemistry of basic rocks Subhojit Saha a , Kaushik Das b,1 , Partha Pratim Chakraborty a,∗ , Priyabrata Das b , Subrata Karmakar c , Manish A. Mamtani d a Department of Geology, University of Delhi, Delhi 110007, India b Department of Earth Sciences, Bengal Engineering and Science University, Howrah 711103, India c Department of Geological Sciences, Jadavpur University, Kolkata 700032, India d Department of Geology & Geophysics, Indian Institute of Technology, Kharagpur 721302, India article info Article history: Received 14 November 2011 Received in revised form 4 March 2012 Accepted 9 March 2012 Available online 24 March 2012 Keywords: Singhora basin Chhattisgarh Supergroup India Mesoproterozoic compressional tectonics abstract Studies in Proterozoic sedimentary basins are generally fraught with continuous and conformable hypothesis. Unlike many such undeformed and unmetamorphosed Proterozoic sedimentary basins around the Globe, the Mesoproterozoic Singhora basin, a so called “proto-basin” for the Chhattisgarh basin of central India, registers signatures of pervasive deformation documented in both field and anisotropic magnetic susceptibility (AMS) based study. While three constituent Formations of the Singhora Group viz. Saraipali, Bhalukona and Chuipali record outcrop-scale deformation in presence of folds having plane non-cylindrical to non-plane cylindrical geometry, the signatures of deformation within the coarse gran- ular sandstones and conglomerates of the basal Rehtikhol Formation are shown principally from angular relation between the magnetic foliation and bedding plane under AMS study. Systematic formation-wise structural analysis reveals that the basin, as a whole, is deformed in the form of a regional-scale non-plane non-cylindrical fold; whereas non-planarity can be visualized in the regional scale, non-cylindricity is more prominent in the outcrop-scale. Penetrative fabric is only observed in the south-eastern corner of the basin. Compression in two directions is inferred, one being broadly N−S and the other E−W, with resultant overall compressional direction of NW−SE. Additionally, a narrow high strain zone is devel- oped at the southern boundary of the basin in contact with gneissic basement, evident from the sheared metabasite band. Basic rocks (sheared and massive), metamorphosed at greenschist facies, present at the basin margin, and unaltered basaltic intrusives within the basin allowed us to constrain the broad time frame of defor- mation. Despite variation in mineralogy and major element geochemistry between the metamorphosed and unaltered variety, the intrusives are identified as cogenetic from the similarity in REE pattern and trace element character. Considering the ∼1420 Ma emplacement age of the intrusive into the Saraipali Formation, the deformation age is constrained as <1420 Ma. Signatures of compressional deformation traced within all formations of the Singhora Group suggest that the Group is pervasively deformed and thereby indicates an unconformable relationship with its overlying undeformed Chandarpur Group of sediments. The present study warrants necessity of further work in the area to establish causal relationship, if any, between the operative tectonics within the frontal thrust belt in the immediate eastern proximity of the basin and the compressional deformation event/s recorded within the basin. © 2012 Elsevier B.V. All rights reserved. ∗ Corresponding author. Fax: +91 011 27666295. E-mail address: [email protected] (P.P. Chakraborty). 1 Present address: Department of Earth and Planetary Systems Science, Hiroshima University, Higashi-hiroshima 739-8526, Japan. 1. Introduction Sedimentary basins are considered to be the products of long- lived isostatic compensation due to (i) tectono-thermal processes operating at the lithosphere scale and (ii) water- and sediment- load effective at the basinal scale (Allen and Allen, 1990; Eriksson 0301-9268/$ – see front matter © 2012 Elsevier B.V. All rights reserved. doi:10.1016/j.precamres.2012.03.004
-
Upload
independent -
Category
Documents
-
view
4 -
download
0
Transcript of Tectono-magmatic evolution of the Mesoproterozoic Singhora basin, central India: Evidence for...
TcA
SSa
b
c
d
a
ARRAA
KSCIM
U
0d
Precambrian Research 227 (2013) 276–294
Contents lists available at SciVerse ScienceDirect
Precambrian Research
journa l homepage: www.e lsev ier .com/ locate /precamres
ectono-magmatic evolution of the Mesoproterozoic Singhora basin,entral India: Evidence for compressional tectonics from structural data,MS study and geochemistry of basic rocks
ubhojit Sahaa, Kaushik Dasb,1, Partha Pratim Chakrabortya,∗, Priyabrata Dasb,ubrata Karmakarc, Manish A. Mamtanid
Department of Geology, University of Delhi, Delhi 110007, IndiaDepartment of Earth Sciences, Bengal Engineering and Science University, Howrah 711103, IndiaDepartment of Geological Sciences, Jadavpur University, Kolkata 700032, IndiaDepartment of Geology & Geophysics, Indian Institute of Technology, Kharagpur 721302, India
r t i c l e i n f o
rticle history:eceived 14 November 2011eceived in revised form 4 March 2012ccepted 9 March 2012vailable online 24 March 2012
eywords:inghora basinhhattisgarh Supergroup
ndiaesoproterozoic compressional tectonics
a b s t r a c t
Studies in Proterozoic sedimentary basins are generally fraught with continuous and conformablehypothesis. Unlike many such undeformed and unmetamorphosed Proterozoic sedimentary basinsaround the Globe, the Mesoproterozoic Singhora basin, a so called “proto-basin” for the Chhattisgarh basinof central India, registers signatures of pervasive deformation documented in both field and anisotropicmagnetic susceptibility (AMS) based study. While three constituent Formations of the Singhora Groupviz. Saraipali, Bhalukona and Chuipali record outcrop-scale deformation in presence of folds having planenon-cylindrical to non-plane cylindrical geometry, the signatures of deformation within the coarse gran-ular sandstones and conglomerates of the basal Rehtikhol Formation are shown principally from angularrelation between the magnetic foliation and bedding plane under AMS study. Systematic formation-wisestructural analysis reveals that the basin, as a whole, is deformed in the form of a regional-scale non-planenon-cylindrical fold; whereas non-planarity can be visualized in the regional scale, non-cylindricity ismore prominent in the outcrop-scale. Penetrative fabric is only observed in the south-eastern corner ofthe basin. Compression in two directions is inferred, one being broadly N−S and the other E−W, withresultant overall compressional direction of NW−SE. Additionally, a narrow high strain zone is devel-oped at the southern boundary of the basin in contact with gneissic basement, evident from the shearedmetabasite band.
Basic rocks (sheared and massive), metamorphosed at greenschist facies, present at the basin margin,and unaltered basaltic intrusives within the basin allowed us to constrain the broad time frame of defor-mation. Despite variation in mineralogy and major element geochemistry between the metamorphosedand unaltered variety, the intrusives are identified as cogenetic from the similarity in REE pattern andtrace element character. Considering the ∼1420 Ma emplacement age of the intrusive into the SaraipaliFormation, the deformation age is constrained as <1420 Ma.
Signatures of compressional deformation traced within all formations of the Singhora Group suggestthat the Group is pervasively deformed and thereby indicates an unconformable relationship with itsoverlying undeformed Chandarpur Group of sediments. The present study warrants necessity of furtherwork in the area to establish causal relationship, if any, between the operative tectonics within the frontalthrust belt in the immediate eastern proximity of the basin and the compressional deformation event/srecorded within the basin.
© 2012 Elsevier B.V. All rights reserved.
∗ Corresponding author. Fax: +91 011 27666295.E-mail address: [email protected] (P.P. Chakraborty).
1 Present address: Department of Earth and Planetary Systems Science, Hiroshimaniversity, Higashi-hiroshima 739-8526, Japan.
301-9268/$ – see front matter © 2012 Elsevier B.V. All rights reserved.oi:10.1016/j.precamres.2012.03.004
1. Introduction
Sedimentary basins are considered to be the products of long-lived isostatic compensation due to (i) tectono-thermal processesoperating at the lithosphere scale and (ii) water- and sediment-load effective at the basinal scale (Allen and Allen, 1990; Eriksson
n Rese
edtspcoppP(sbtwbs(catnW2mhtstmdrfisssCE
crobaScpt(hS(pabcpcpswi((ra
S. Saha et al. / Precambria
t al., 2001; Slingerland et al., 1994), the understanding of whichepends on evaluation of roles of four causative factors viz. tec-onics, magmatism, eustacy and paleoclimate. For Precambrianedimentary basins such understanding is fraught with severalroblems that include precise age bracketing, reconstruction ofhanges in relative sea-level, role of climate on rate and naturef mass wasting processes, and above all, the tectono-magmaticrocesses operative at shallow to deep crustal levels that under-in the initiation and evolution of the basins. In the backdrop ofrecambrian supercontinent assembly viz. Ur (3.0 Ga), Kenorland2.7−2.5 Ga), Columbia (1.9−1.8 Ga), Rodinia (1.1 Ga) the under-tanding of tectono-magmatic processes that govern sedimentaryasin evolution has become more important. It is believed thathe large-scale flow of material and energy through mantle down-elling and upwelling in course of ‘Supercontinent’ assembly and
reakup affect the Earth’s dynamo, leading to the large-scale sub-idence of the crust and the sedimentary basins hosted within itSantosh and Zhao, 2009; Yakubchuk, 2010; Santosh, 2010). In thisontext although consensus is yet to be formed on the time of initi-tion (Miall, 1990), a strong school believes in operation of plateectonic processes and consequent development of Superconti-ents since the late Archean-early Proterozoic time (Brandl and Deit, 1997; Martins-Neto et al., 2001; Mueller and Corcoran, 1998,
001; Windley, 1995). However, the comprehension of develop-ent of sedimentary basins at the plate margins in the Proterozoic
as indeed remained a challenge. It is more so in case of cra-onic marginal basins where the same crustal boundaries mayubsequently be remobilized thereby obliterating the history ofhe interacting crustal domains in the course of basin develop-
ent. The deformation processes may also obliterate the primaryepositional structures of the pre-existing sedimentary formationsendering the process-response reconstruction of the basin-fill dif-cult. Notwithstanding, the paleoenvironmental reconstructions,tratigraphic exercises including lithostratigraphy and sequencetratigraphy also need to be judiciously inferred from such unfos-iliferous, structurally deformed basin-fills (Aspler et al., 2001;atuneanu and Biddulph, 2001; Eriksson et al., 1998; Walker andyles, 1988).
The Singhora basin at the southeast of the Chhattisgarh basin,entral India represents one such Mesoproterozoic basin whichemains a subject of debate in recent times particularly in termsf its time frame and stratigraphic status (Bickford et al., 2011a,; Chakraborty et al., 2011, 2012; Das et al., 2009; Patranabis-Debnd Chaudhuri, 2007, 2008). The lithopackage that represents theinghora succession is designated as the ‘Singhora Group’ (alsoalled “proto-basin”; Das et al., 1992) and considered as the archivereserving the signatures of early Chhattisgarh depositional his-ory. However, implications drawn from some recent publicationsBickford et al., 2011a, b; Patranabis-Deb and Chaudhuri, 2008)ave casted doubt on (a) the early depositional status for theinghora lithopackage in Chhattisgarh sedimentation history andb) deformation character of the Singhora basin-fill. Indeed, theroper appraisal of tectono-magmatic history using mesoscopicnd megascopic structural study is needed for the Chhattisgarhasin, in general, and the Singhora basin, in particular, as this hasrucial bearing on the stratigraphic correlation between differentarts of the basin-fill, and formulation of a tectonic model thatan embrace tectonic grains preserved within the basin-fill. Theresent study is aimed to fill the gap with outcrop-based structuraltudy (supported by anisotropic magnetic susceptibility analyses)ithin the Singhora Group of rocks which, in general, is character-
zed by (i) unmetamorphosed but deformed stratal character and
ii) occurrence of lithodemic units at different stratigraphic levelsboth concordant and discordant). Further, the study also aims cor-elation of obtained signatures with crustal scale events at regionalnd global context.arch 227 (2013) 276–294 277
2. Regional geology: the current understanding andongoing debates
Here, we present a brief review on the present knowledgeand ongoing debates toward understanding the early history ofthe Chhattisgarh basin and, thereby, highlight the need for basin-scale structural study within the Singhora basin. The Chhattisgarhbasin, present at the margin of the east Indian craton, is thesecond largest Proterooic basin in India and offers an oppor-tunity to carry out process-based sedimentological studies tounderstand uniqueness of surface processes in pre-vegetative Pro-terozoic Earth (Chakraborty and Paul, 2008; Chaudhuri et al.,2002; Chakraborty et al., 2009). In the present-day configurationthe basin is delimited by two regional-scale crustal discontinu-ities (viz. Pranhita–Godavari (P–G) Rift on south–southwest andMahanadi Rift on north–northeast), and one Proterozoic mobilebelt (the NNE–SSW trending Eastern Ghats Mobile Belt; EGMB) onits east–southeast (Fig. 1a). With the EGMB the basin boundary isdemarcated by the presence of a narrow but regional terrain bound-ary shear zone (Biswal et al., 2000; Bhadra et al., 2004; Gupta et al.,2000). Although major exposures of the Chhattisgarh basin can betraced westward away from the margin of the craton, availabledepositional models envisage opening of the basin at the south-eastern part of the exposure area close to the cratonic fringe zone.On the basis of basin-scale geological mapping Das et al. (1992)collated the local-scale stratigraphy proposed by earlier workersover the last four decades (Dutt, 1964; Moitra, 1990; Murti, 1987)since the time of Schnitzer (1969) and suggested a three-tier clas-sification for the Chhattisgarh Supergroup viz. Singhora Group,Chandarpur Group and Raipur Group, in order of superposition(Fig. 1b, c), exposed in two sub-basins i.e., Hirri and Baradwar. TheSinghora Group that records the early basin history is representedby a ∼400 m thick arenite–argillite–carbonate sequence compris-ing of four Formations, namely Rehtikhol, Saraipali, Bhalukonaand Chuipali. Rocks of this Group are punctuated by magmaticinputs at different stratigraphic levels either as concordant (vol-caniclastics, acid crystal tuff or porcellanite) or discordant (dyke)bodies (Chakraborti, 1997; Das et al., 2011). A string of publica-tions in recent time (Bickford et al., 2011a,b,c; Das et al., 2009; Daset al., 2011; Partanabis-Deb et al., 2007) have convincingly estab-lished the Mesoproterozoic time frame for the basin i.e. between∼1500 Ma and 1000 Ma.
Besides age bracketing, two other putative issues are (i) stratig-raphy of the basin, in particular whether the Singhora Group holdsthe oldest and independent status in the Chhattisgarh geology inits three-tier classification or if it is one and the same with theChandarpur Group and hence, does not deserve any independentstratigraphic status (Bickford et al., 2011a,b; Chakraborty et al.,2009, 2011; Patranabis-Deb and Chaudhuri, 2008) and (ii) the tec-tonic framework for the basin (rift or foreland) (Bickford et al.,2011a; Chakraborty and Paul, 2008; Chaudhuri et al., 2002; Paul,2005).
Patranabis-Deb and Chaudhuri (2008) (their fig. 1), working onthe eastern half of the basin, subdivided the Chhattisgarh suc-cession into two sequences viz. Sequence I and II. Without anyreference to the Singhora Group, these authors described theSequence I as unconformably overlying the granitic/gneissic base-ment of the Bastar craton and internally constituted of siliciclasticformations belonging to the Chandarpur Group and carbonate-shale formations of the Raipur Group and identified the newlyintroduced Kharsiya Group as Sequence II that overlies the rocks ofthe Raipur Group with unconformable relationship (Fig. 1b). This
idea was subsequently adopted by Bickford et al. (2011a) (theirfig. 3) while putting forward an age bracket for Chhattisgarh depo-sition on the basis of U–Pb SHRIMP geochronology. This two-tierclassification for Chhattisgarh succession, without any reference
278 S. Saha et al. / Precambrian Research 227 (2013) 276–294
Fig. 1. Geological map of Singhora basin. (a) The locations of Singhora basin, Chhattisgarh Main basin, Mahanadi and Godavari Rift systems and Eastern Ghats granulite beltare shown at the eastern cratonic fringe of Indian craton. (b) The two contrasting stratigraphic columns as available in published literature (i) modified after Das et al. (1992)and (ii) Patranabis-Deb and Chaudhuri (2008), followed by Bickford et al. (2011a,b,c). Note the later has no independent status for Singhora Group of rocks.
n Rese
tefnCdortocracdtprtaitlKdiaapttht(tcrm
Mtsottsrt22Gtt(opeofpdt
3
t
S. Saha et al. / Precambria
o the basal Singhora Group, is argued strongly by Chakrabortyt al. (2009, 2011) by advocating the presence of an angular uncon-ormity between the deformed Singhora Group and its overlyingear horizontal strata of the Chandarpur Group. The claim ofhakraborty et al. (2011) that Singhora Group rocks are thoroughlyeformed with regional- and outcrop-scale folds bearing signaturesf at least two major directions of compressional deformation isefuted by Bickford et al. (2011b) with the arguments that, (1) onlyhe relatively incompetent beds are folded, (2) the oldest formationf the Singhora Group i.e., the Rehtikhol Formation dominated byonglomerate and coarse-grained, granular sandstones, does noteveal any deformation, and (3) angular unconformity (discord-nce of dips) is not encountered in any outcrop. It can be wellonstrued that in fossil-less Proterozoic systems having patchy,iscontinuous outcrops, clinching evidence in favor of either ofhese claims can only be obtained by systematic structural map-ing. The necessity of such mapping is greater in situations whereecognition of angular unconformity is difficult on outcrop owingo its occurrence between a thick, argillaceous formation that lacksrenaceous interbeds and its overlying arenacous formation. Son the present case where the claim of unconformity is betweenhe argillaceous Chuipali Formation of the Singhora Group, whichacks arenaceous interbed in its uppermost part and its overlyingansapathar Formation of the Chandarpur Group. This prompted aetailed structural appraisal for the Singhora Group to resolve the
ssues viz. (i) whether rocks of the Singhora Group are deformednd deformations are pervasive within the rocks of the Groupnd (ii) if deformed, the detailed characterization of deformationattern and (iii) the reasons behind non-uniform deformation pat-erns between different formations, and (iv) spatial variation inhe deformation pattern within a formation. These issues will alsoave far-fetched implications in terms of subsidence rate and tec-onic model for the basin. The exclusion of the Singhora Group∼400 m compacted thickness; Das et al., 1992, their table 2) fromhe ∼2000 m thick Chhattisgarh succession (i.e. ∼20% of total suc-ession) will imply significant condensation and decrease in theate of subsidence for the basin, which will need a suitable tectonicodel for validation.Proximity to crustal-scale geotectonic features viz. rift (P–G,
ahanadi), orogenic fold-thrust belt (EGMB) etc. biased the tec-onic modeling of the Chhattisgarh basin. Features such as (i) ahrinking, bowl-shape for the basin with a somewhat concentricutcrop pattern, and (ii) evaporites alternating with and overlyinghe carbonate successions to mark the cessation of basin deposi-ion (Das et al., 1992), point toward a probable ‘desiccated-basinetting’ in an intracratonic sag depositional mode. Yet, the twoecently discussed tectonic models for the basin are inclined eitheroward rift (Chaudhuri et al., 2002; Dhang and Patranabis-Deb,011; Patranabis-Deb, 2001, 2004; Patranabis-Deb and Chaudhuri,007) or a foreland (Biswal et al., 2002; Chakraborty and Paul, 2008;upta, 2011; Paul, 2005) depositional setting. The proponents of
he rift model heavily relied on the presence of NNW–SSE and N–Srending fault systems both in the Singhora and Barapahar areasDas et al., 2003), which often do not get support from the field datar basement structure revealed from aeromagnetic anomaly mapatterns (Ram et al., 2007). The proponents of the foreland hypoth-sis also could not justify their claim by systematic documentationf different morphometric parts of the foreland (i.e. wedge-top,oredeep, forebulge and back-bulge; Decelles and Giles, 1996),rocess-product relationship between spatio-temporal structuralevelopment of the hinterland mobile belt and consequent evolu-ion of the foreland basin.
. Methodology
The mainstay of the present work is field mapping. In addi-ion to the formation-based regional-scale structural mapping of
arch 227 (2013) 276–294 279
the Singhora basin on 1:50,000 scale, this study also involvedoutcrop-scale thematic mapping in 1:100–1:500 scale at differentlocations, namely those that expose the best deformation charac-ters for different formations. While doing this, it has been noticedthat unlike all overlying formations the Rehtikhol Formation at itsbasal part, constituted of conglomerate and very coarse-grainedarkosic sandstone, does not show mesoscopic or megascopic defor-mation features in the northern part of the basin,. However, innature, at several instances it is observed that the evidence of defor-mation fabric is not preserved on the mesoscopic scale, but thesame can be identified from anisotropy of magnetic susceptibility(AMS) analysis (e.g., Mamtani et al., 1999; Stacey, 1960; Tarling andHrouda, 1993). Keeping this in mind the authors have carried outAMS measurements on rocks of the study area.
AMS analysis involves induction of magnetism in an orientedsample in different directions and measurement of the inducedmagnetization in each direction. The analysis yields magnitudesand directions of the three principal axes of the magnetic suscep-tibility ellipsoid K1, K2 and K3 (K1 ≥ K2 ≥ K3). The plane containingmean K1 and K2 defines the magnetic foliation plane for a particularsample; K3 is the pole to the magnetic foliation plane. Magnitudes ofK1, K2 and K3 are used to calculate various parameters viz. the meansusceptibility, [Km = (K1 + K2 + K3)/3], the strength of the magneticfoliation, [F = (K2 − K3)/Km] and strength of the magnetic lineation,[L = (K1 − K2)/Km]. Moreover, following Jelinek (1981), the degree ofmagnetic anisotropy P′ or Pj and shape parameter (T) are calculatedas follows:
P′ = exp
√{2[(�1 − �m)2 + (�2 − �m)2 + (�3 − �m)2]},
T = (2�2 − �1 − �3)/(�1 − �3).
Here, �1 = ln K1, �2 = ln K2, �3 = ln K3 and �m = (�1�2�3)1/3. WhilstPj is a measure of the eccentricity of the AMS ellipsoid, T defines theshape of the AMS ellipsoid. The latter varies from −1 to +1. Prolateshape yields a negative T value; while oblate shape gives a positivevalue (Tarling and Hrouda, 1993).
In the present study, AMS was measured using the KLY-4S Kap-pabridge (AGICO, Czech Republic) in the Department of Geology& Geophysics, Indian Institute of Technology, Kharagpur (India).The instrument has an operating frequency of 875 Hz and the mea-surements were made in the spinner mode in a field intensity of300 Am−1. In this spinner mode, the AMS of a spinning specimenfixed in the rotator is measured. The specimen rotates with a speedof one revolution per 2 s inside the coil of the Kappabridge andthe susceptibility is measured 64 times during one revolution. Themeasurements are made along three perpendicular axes and theabove mentioned AMS parameters are calculated using the pro-gram SUFAR that runs the measurements. The sensitivity of AMSmeasurement in the spinner mode is 2 × 10⁻⁸ (SI units). Here, AMSanalysis of 13 oriented rock specimens from the Rehtikhol Forma-tion located in different parts of the basin was performed. Multiplecores (at least five) were investigated from each oriented fieldsample. A total of 74 standard cylindrical cores (25.4 mm diame-ter × 22 mm height) from the 13 samples were analyzed. Data fromall cores from a particular sample were used to calculate the meanvalues of the various AMS parameters (Jelinek statistics; Jelinek,1981). The program Anisoft (version 4.2; AGICO, Czech Republic)was used for this calculation. Since the attitudes of bedding wererecorded in the field for each site, lower hemisphere equal areaprojections of the field as well as magnetic data were prepared for
comparison and interpretation regarding origin of the magneticfabric. It is well established from previous studies that the shapeof the magnetic fabric may be related to (a) strain in the case ofdeformed metamorphosed rocks (tectonic origin), (b) paleocurrent
2 n Rese
dialvrAattiMhaet
errPGodstXcewHMs
4
4
edovpdwsSsl
dvlRhmofiti(gob
80 S. Saha et al. / Precambria
irection in the case of sedimentary rocks and (c) flow directionn igneous rocks such as flowing lavas (e.g., Hrouda, 1982; Tarlingnd Hrouda, 1993). In the case of sedimentary rocks, it is well estab-ished that the initial diagenesis is predominantly associated withertical shortening due to loading of rocks by overlying strata whichesults in a magnetic foliation that is parallel to the bedding plane.s a consequence, the angle between the pole to the bedding planend pole to the magnetic foliation (K3) is negligible. However, withhe superimposition of tectonic deformation and related fabric overhe sedimentary fabric, the angle between the above two polesncreases (e.g., Hrouda and Kahan, 1991; Hrouda and Jezek, 1999;
amtani and Sengupta, 2010; Mukherji et al., 2004). This aspectelps in recognizing the effect of tectonic deformation in rocks thatre devoid of mesoscopic secondary planar and linear structurallements. The rocks of the Rehtikhol Formation (sandstones) areherefore ideal for AMS investigation.
The intrusive units are studied for their petrography, min-ral chemistry, bulk rock geochemistry including major, trace andare-earth elements. Chemical compositions of minerals from rep-esentative samples were analyzed using a Cameca SX 100 Electronrobe Micro Analyzer (EPMA) at the Wadia Institute of Himalayaneology (WIHG) Dehradun, India. The EPMA was operated at 15 kVf acceleration voltage using 15 nA of specimen current. Probeiameter of 1–2 �m for the spot size was used for point analy-es. Natural standards were used and raw data were corrected byhe PAP program. Bulk chemistry for the samples was analyzed byRF (major and trace elements) using fused beads in a Panalyti-al MagixPro machine at Hokkaido University, Japan. Rare-earthlements (REE) were measured by ICP-MS (PerkinElmer) at WIHG,ith 0.04 g of the sample subjected to standard acid digestion withF-HNO3. The detailed method is discussed in Das et al. (2011).ineral composition calculations are carried out by using PYROX
oftware (Yavuz, 2001).
. Formation-wise regional structural studies
.1. Rehtikhol Formation
Except for the Kurlubahal Section at the southeastern part of thexposure area, this formation does not reveal any outcrop-scaleeformation features. However, the strike of the bedding planesf this conglomeratic and coarse, granular sandstone formationaries between N−S in the northern part and E−W in the southernart of the studied basin (Fig. 2a). The spatial distribution of bed-ing plane orientations from north to south shows a broad regionalarping. In rare occasions sandstones of Rehtikhol Formation also
how outcrop-scale fold at the contact with shale/tuff dominatedaraipalli Formation (Fig. 2b) and the orientation of such folds areimilar to that of the folds observed in the overlying bedded tuffayers.
Unlike other formations the general lack of outcrop-scaleeformation features in this formation is possibly because of itsery coarse-grained lithology (microphotograph of Fig. 2c). It isikely that the conglomeratic and coarse granular sandstones ofehtikhol Formation accommodated the deformation by moreomogeneous strain compared to its finer-grained overlying for-ations. Only at the Kurlubahal area, at the south-eastern corner
f the basin where the Formation is represented by medium-tone-grained sandstones (microphotograph of Fig. 2d) and rela-ively thinner (decimeter to meter-thick) sandstone beds withnterbedded tuffaceous shale, outcrop-scale deformation is noticed
discussed later). To verify the signature of deformation in coarser-rained varieties of the Formation AMS study was carried outn samples collected from locations spread across the entireasin.arch 227 (2013) 276–294
4.1.1. Mesoscopic deformation features of Rehtikhol Formation atthe Kurlubahal section
The decimeter-thick bedded sandstones of Rehtikhol Formationat this section show presence of outcrop-scale folds with presenceof a prominent northeast–southwest trending (60–240◦) subverti-cal penetrative fabric (Fig. 2e, f, h). Moreover, a fracture set is foundat a high angle (170–350◦) to this fabric. The beds, in general, strikeNE–SW and have moderate dip (average dip of 40◦) toward the SE.Only a few beds dip toward the NW.
The outcrop study reveals two orientations of folds forming aplane non-cylindrical interference pattern i.e. type-1 fold of Ramsayand Huber (1987) (Fig. 2g). It is noteworthy that the dome andbasin structures on this fold interference are slightly elongated withlong axis (∼40 cm) trending toward 60◦ and the short axis (∼30 cm)trending toward 170◦. Stereo-plotting of the axial traces of the foldsshows them coinciding with the orientation of the penetrative fab-ric (Fig. 2f). This implies the presence of a large-scale fold in thearea with NE–SW trending axial plane. Lower order outcrop-scalefolds are discernible with axial planar penetrative subvertical fab-ric (Fig. 2h). However, no such fabric is recorded in axial planarorientation to the cross-folding at high angle (except a fracture setoriented in 170–350◦), to produce the dome and basin fold inter-ference in the area. Under microscope also the fabric developmentis noticeable (Fig. 2i). Magnetic foliation poles as revealed from theAMS data of oriented samples of sandstone taken from this locationare also shown in the stereonet (Fig. 2f).
4.1.2. Anisotropic magnetic susceptibility (AMS) study of theRehtikhol Formation
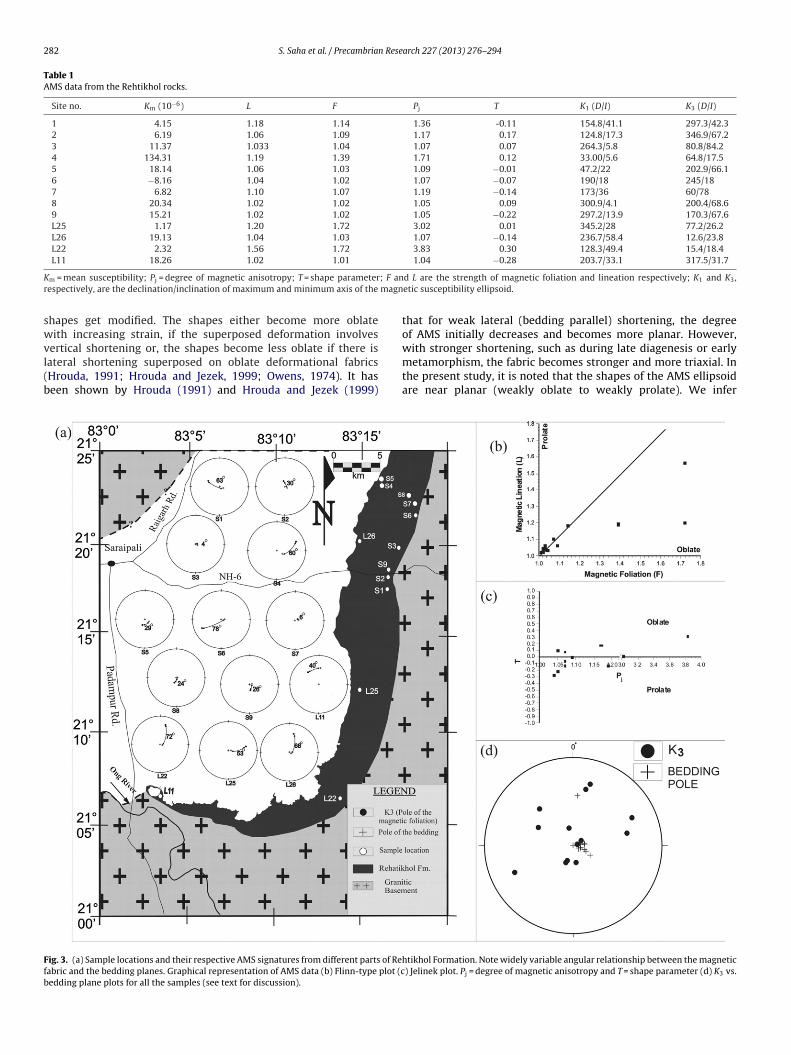
Table 1 illustrates the obtained mean susceptibility (Km),strength of magnetic lineation (L), and foliation (F), shape parame-ter (T) and corrected anisotropy degree (Pj) of the oriented samplesof Rehtikhol Formation, mostly from northern side of the basin.The mean magnetic susceptibility (Km) is generally low, with val-ues ranging between 8 × 10⁻⁶ and 134 × 10−6 SI units, indicatingdominance of diamagnetic and paramagnetic minerals over fer-romagnetic minerals. Lower hemisphere equal area projection ofpoles to magnetic foliation (K3) plotted along with poles of cor-responding bedding planes for samples collected from differentparts of the exposure area reveal a wide scatter in the angularrelationship between the two; the amount of angular separationvaries between 4◦ and 72◦ (Fig. 3a, d). The degree of magneticanisotropy (Pj) varies widely in space, ranging between a very lowvalue of 1.0486 and values as high as 3.837; values between 1.0503and 1.7182 are recorded in the north, 1.0486 in the south and3.0268−3.8375 in the southeast, respectively (Table 1).
A Flinn-type plot (Fig. 3b) is obtained by plotting the magneticfoliation (F) vs. magnetic lineation (L). It is noted that the intensityof F and L are similar in several samples. Therefore, the points ploton or close to the 45◦ line passing through the origin (1,1). This issimilar to the plane strain line (k = 1) of a Flinn diagram that is con-ventionally used to graphically represent shape of a strain ellipsoid(Hobbs et al., 1976). In the Jelinek plot (Fig. 3c) where the degreeof magnetic anisotropy (Pj) is plotted against the shape parameter(T), it is noted that most of the samples have a shape parameter (Tvalue) close to 0. This is true for samples with highly eccentric AMSellipsoid (for example sample L25 has Pj = 3.02) and also for sam-ples with low eccentricity AMS ellipsoid (e.g., sample 8; Pj = 1.05).Thus, the Jelinek plot supports the inferences from the Flinn-typeplot regarding the shape of the AMS ellipsoid.
It is known that initial depositional fabrics generally giverise to oblate shapes of the ellipsoid (grain shape fabrics as
well as magnetic fabrics). This is because vertical shorteningduring deposition and burial plays an important role in sedi-mentary fabric development. However, on superimposition ofdeformation over initial deposition fabrics, the initial oblate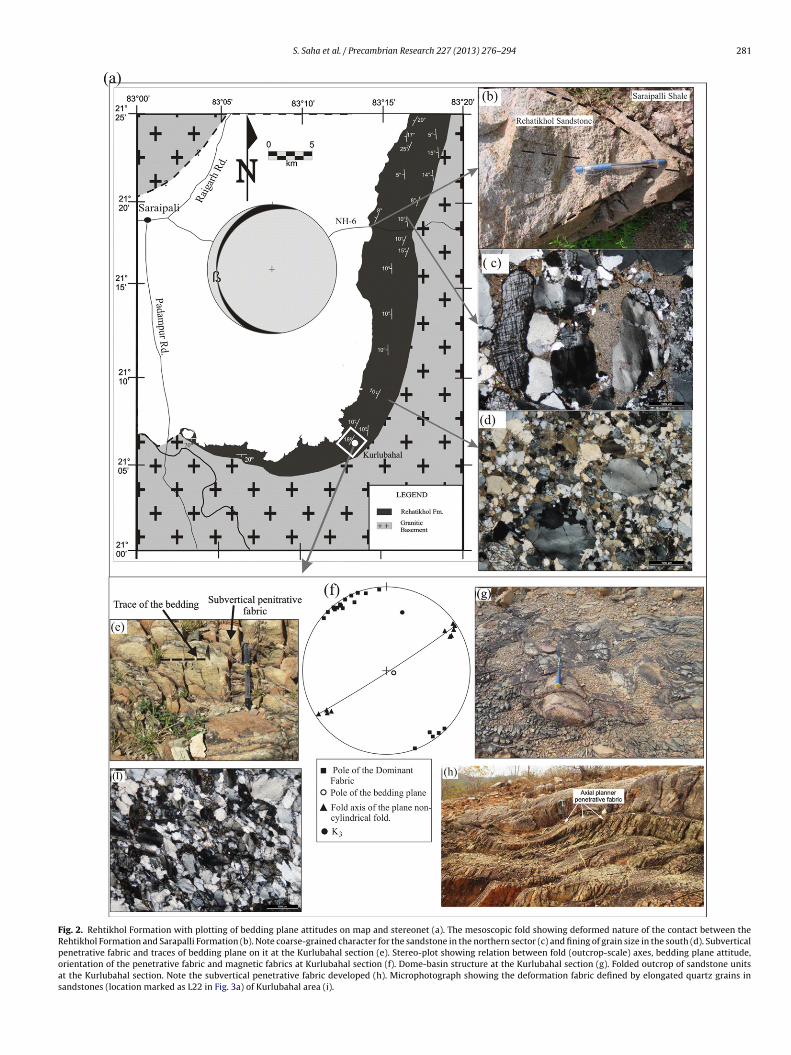
S. Saha et al. / Precambrian Research 227 (2013) 276–294 281
Fig. 2. Rehtikhol Formation with plotting of bedding plane attitudes on map and stereonet (a). The mesoscopic fold showing deformed nature of the contact between theRehtikhol Formation and Sarapalli Formation (b). Note coarse-grained character for the sandstone in the northern sector (c) and fining of grain size in the south (d). Subverticalpenetrative fabric and traces of bedding plane on it at the Kurlubahal section (e). Stereo-plot showing relation between fold (outcrop-scale) axes, bedding plane attitude,orientation of the penetrative fabric and magnetic fabrics at Kurlubahal section (f). Dome-basin structure at the Kurlubahal section (g). Folded outcrop of sandstone unitsat the Kurlubahal section. Note the subvertical penetrative fabric developed (h). Microphotograph showing the deformation fabric defined by elongated quartz grains insandstones (location marked as L22 in Fig. 3a) of Kurlubahal area (i).
282 S. Saha et al. / Precambrian Research 227 (2013) 276–294
Table 1AMS data from the Rehtikhol rocks.
Site no. Km (10−6) L F Pj T K1 (D/I) K3 (D/I)
1 4.15 1.18 1.14 1.36 -0.11 154.8/41.1 297.3/42.32 6.19 1.06 1.09 1.17 0.17 124.8/17.3 346.9/67.23 11.37 1.033 1.04 1.07 0.07 264.3/5.8 80.8/84.24 134.31 1.19 1.39 1.71 0.12 33.00/5.6 64.8/17.55 18.14 1.06 1.03 1.09 −0.01 47.2/22 202.9/66.16 −8.16 1.04 1.02 1.07 −0.07 190/18 245/187 6.82 1.10 1.07 1.19 −0.14 173/36 60/788 20.34 1.02 1.02 1.05 0.09 300.9/4.1 200.4/68.69 15.21 1.02 1.02 1.05 −0.22 297.2/13.9 170.3/67.6L25 1.17 1.20 1.72 3.02 0.01 345.2/28 77.2/26.2L26 19.13 1.04 1.03 1.07 −0.14 236.7/58.4 12.6/23.8L22 2.32 1.56 1.72 3.83 0.30 128.3/49.4 15.4/18.4L11 18.26 1.02 1.01 1.04 −0.28 203.7/33.1 317.5/31.7
K ; F anr magn
swvl(b
Ffb
m = mean susceptibility; Pj = degree of magnetic anisotropy; T = shape parameterespectively, are the declination/inclination of maximum and minimum axis of the
hapes get modified. The shapes either become more oblateith increasing strain, if the superposed deformation involves
ertical shortening or, the shapes become less oblate if there isateral shortening superposed on oblate deformational fabricsHrouda, 1991; Hrouda and Jezek, 1999; Owens, 1974). It haseen shown by Hrouda (1991) and Hrouda and Jezek (1999)
ig. 3. (a) Sample locations and their respective AMS signatures from different parts of Reabric and the bedding planes. Graphical representation of AMS data (b) Flinn-type plot (cedding plane plots for all the samples (see text for discussion).
d L are the strength of magnetic foliation and lineation respectively; K1 and K3,etic susceptibility ellipsoid.
that for weak lateral (bedding parallel) shortening, the degreeof AMS initially decreases and becomes more planar. However,
with stronger shortening, such as during late diagenesis or earlymetamorphism, the fabric becomes stronger and more triaxial. Inthe present study, it is noted that the shapes of the AMS ellipsoidare near planar (weakly oblate to weakly prolate). We inferhtikhol Formation. Note widely variable angular relationship between the magnetic) Jelinek plot. Pj = degree of magnetic anisotropy and T = shape parameter (d) K3 vs.
S. Saha et al. / Precambrian Research 227 (2013) 276–294 283
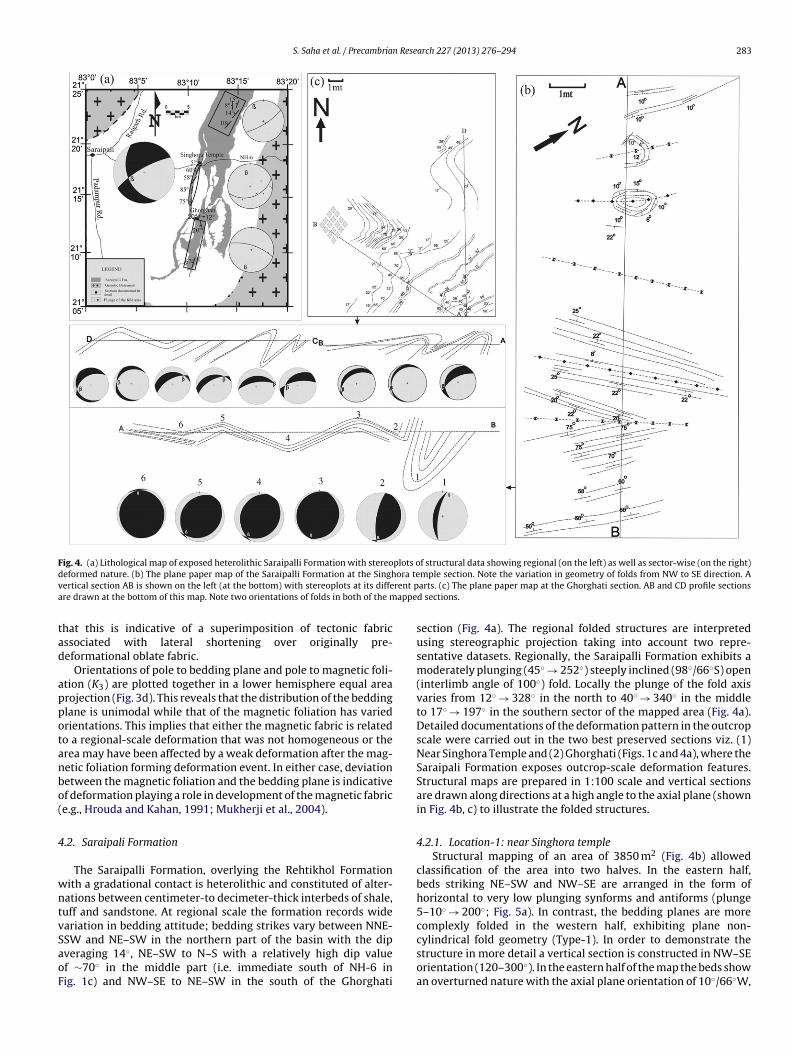
Fig. 4. (a) Lithological map of exposed heterolithic Saraipalli Formation with stereoplots of structural data showing regional (on the left) as well as sector-wise (on the right)d ora tev rent pa appe
tad
appotanbo(
4
wntvSaoF
eformed nature. (b) The plane paper map of the Saraipalli Formation at the Singhertical section AB is shown on the left (at the bottom) with stereoplots at its differe drawn at the bottom of this map. Note two orientations of folds in both of the m
hat this is indicative of a superimposition of tectonic fabricssociated with lateral shortening over originally pre-eformational oblate fabric.
Orientations of pole to bedding plane and pole to magnetic foli-tion (K3) are plotted together in a lower hemisphere equal arearojection (Fig. 3d). This reveals that the distribution of the beddinglane is unimodal while that of the magnetic foliation has variedrientations. This implies that either the magnetic fabric is relatedo a regional-scale deformation that was not homogeneous or therea may have been affected by a weak deformation after the mag-etic foliation forming deformation event. In either case, deviationetween the magnetic foliation and the bedding plane is indicativef deformation playing a role in development of the magnetic fabrice.g., Hrouda and Kahan, 1991; Mukherji et al., 2004).
.2. Saraipali Formation
The Saraipalli Formation, overlying the Rehtikhol Formationith a gradational contact is heterolithic and constituted of alter-ations between centimeter-to decimeter-thick interbeds of shale,uff and sandstone. At regional scale the formation records wideariation in bedding attitude; bedding strikes vary between NNE-
SW and NE–SW in the northern part of the basin with the dipveraging 14◦, NE–SW to N–S with a relatively high dip valuef ∼70◦ in the middle part (i.e. immediate south of NH-6 inig. 1c) and NW–SE to NE–SW in the south of the Ghorghatimple section. Note the variation in geometry of folds from NW to SE direction. Aarts. (c) The plane paper map at the Ghorghati section. AB and CD profile sectionsd sections.
section (Fig. 4a). The regional folded structures are interpretedusing stereographic projection taking into account two repre-sentative datasets. Regionally, the Saraipalli Formation exhibits amoderately plunging (45◦ → 252◦) steeply inclined (98◦/66◦S) open(interlimb angle of 100◦) fold. Locally the plunge of the fold axisvaries from 12◦ → 328◦ in the north to 40◦ → 340◦ in the middleto 17◦ → 197◦ in the southern sector of the mapped area (Fig. 4a).Detailed documentations of the deformation pattern in the outcropscale were carried out in the two best preserved sections viz. (1)Near Singhora Temple and (2) Ghorghati (Figs. 1c and 4a), where theSaraipali Formation exposes outcrop-scale deformation features.Structural maps are prepared in 1:100 scale and vertical sectionsare drawn along directions at a high angle to the axial plane (shownin Fig. 4b, c) to illustrate the folded structures.
4.2.1. Location-1: near Singhora templeStructural mapping of an area of 3850 m2 (Fig. 4b) allowed
classification of the area into two halves. In the eastern half,beds striking NE–SW and NW–SE are arranged in the form ofhorizontal to very low plunging synforms and antiforms (plunge5–10◦ → 200◦; Fig. 5a). In contrast, the bedding planes are morecomplexly folded in the western half, exhibiting plane non-
cylindrical fold geometry (Type-1). In order to demonstrate thestructure in more detail a vertical section is constructed in NW–SEorientation (120–300◦). In the eastern half of the map the beds showan overturned nature with the axial plane orientation of 10◦/66◦W,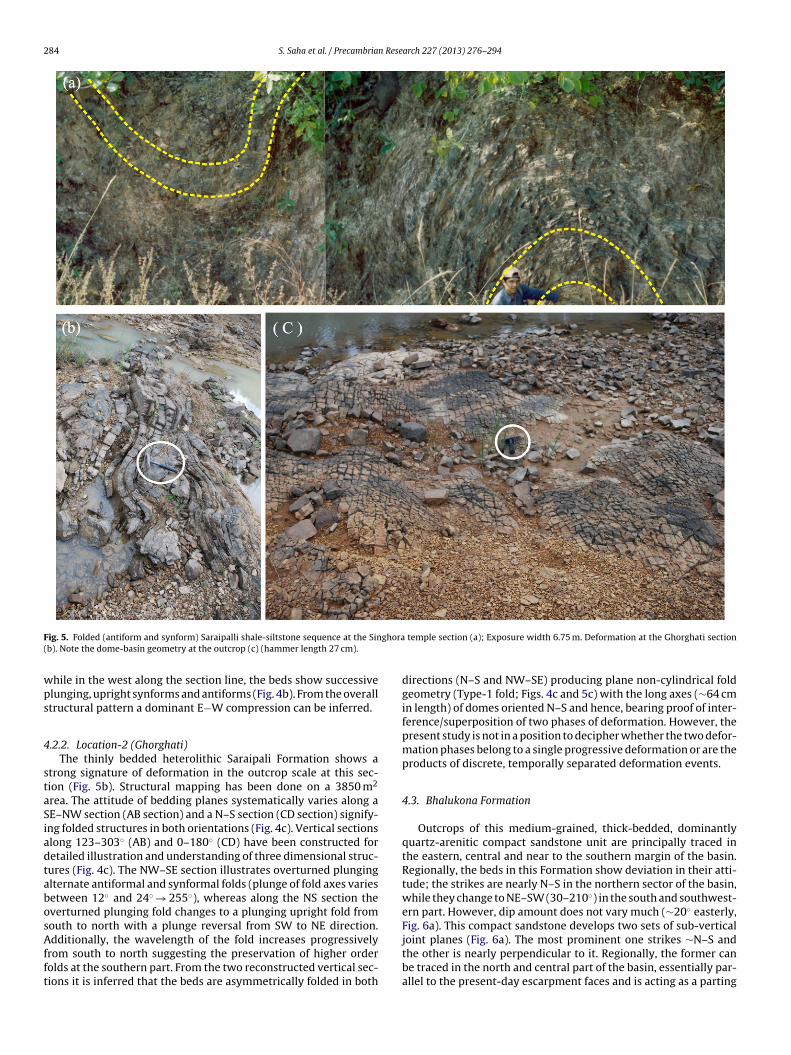
284 S. Saha et al. / Precambrian Research 227 (2013) 276–294
F ghora(
wps
4
staSiadtabosAfft
ig. 5. Folded (antiform and synform) Saraipalli shale-siltstone sequence at the Sinb). Note the dome-basin geometry at the outcrop (c) (hammer length 27 cm).
hile in the west along the section line, the beds show successivelunging, upright synforms and antiforms (Fig. 4b). From the overalltructural pattern a dominant E−W compression can be inferred.
.2.2. Location-2 (Ghorghati)The thinly bedded heterolithic Saraipali Formation shows a
trong signature of deformation in the outcrop scale at this sec-ion (Fig. 5b). Structural mapping has been done on a 3850 m2
rea. The attitude of bedding planes systematically varies along aE–NW section (AB section) and a N–S section (CD section) signify-ng folded structures in both orientations (Fig. 4c). Vertical sectionslong 123–303◦ (AB) and 0–180◦ (CD) have been constructed foretailed illustration and understanding of three dimensional struc-ures (Fig. 4c). The NW–SE section illustrates overturned plunginglternate antiformal and synformal folds (plunge of fold axes variesetween 12◦ and 24◦ → 255◦), whereas along the NS section theverturned plunging fold changes to a plunging upright fold fromouth to north with a plunge reversal from SW to NE direction.
dditionally, the wavelength of the fold increases progressivelyrom south to north suggesting the preservation of higher orderolds at the southern part. From the two reconstructed vertical sec-ions it is inferred that the beds are asymmetrically folded in both
temple section (a); Exposure width 6.75 m. Deformation at the Ghorghati section
directions (N–S and NW–SE) producing plane non-cylindrical foldgeometry (Type-1 fold; Figs. 4c and 5c) with the long axes (∼64 cmin length) of domes oriented N–S and hence, bearing proof of inter-ference/superposition of two phases of deformation. However, thepresent study is not in a position to decipher whether the two defor-mation phases belong to a single progressive deformation or are theproducts of discrete, temporally separated deformation events.
4.3. Bhalukona Formation
Outcrops of this medium-grained, thick-bedded, dominantlyquartz-arenitic compact sandstone unit are principally traced inthe eastern, central and near to the southern margin of the basin.Regionally, the beds in this Formation show deviation in their atti-tude; the strikes are nearly N–S in the northern sector of the basin,while they change to NE–SW (30–210◦) in the south and southwest-ern part. However, dip amount does not vary much (∼20◦ easterly,Fig. 6a). This compact sandstone develops two sets of sub-vertical
joint planes (Fig. 6a). The most prominent one strikes ∼N–S andthe other is nearly perpendicular to it. Regionally, the former canbe traced in the north and central part of the basin, essentially par-allel to the present-day escarpment faces and is acting as a parting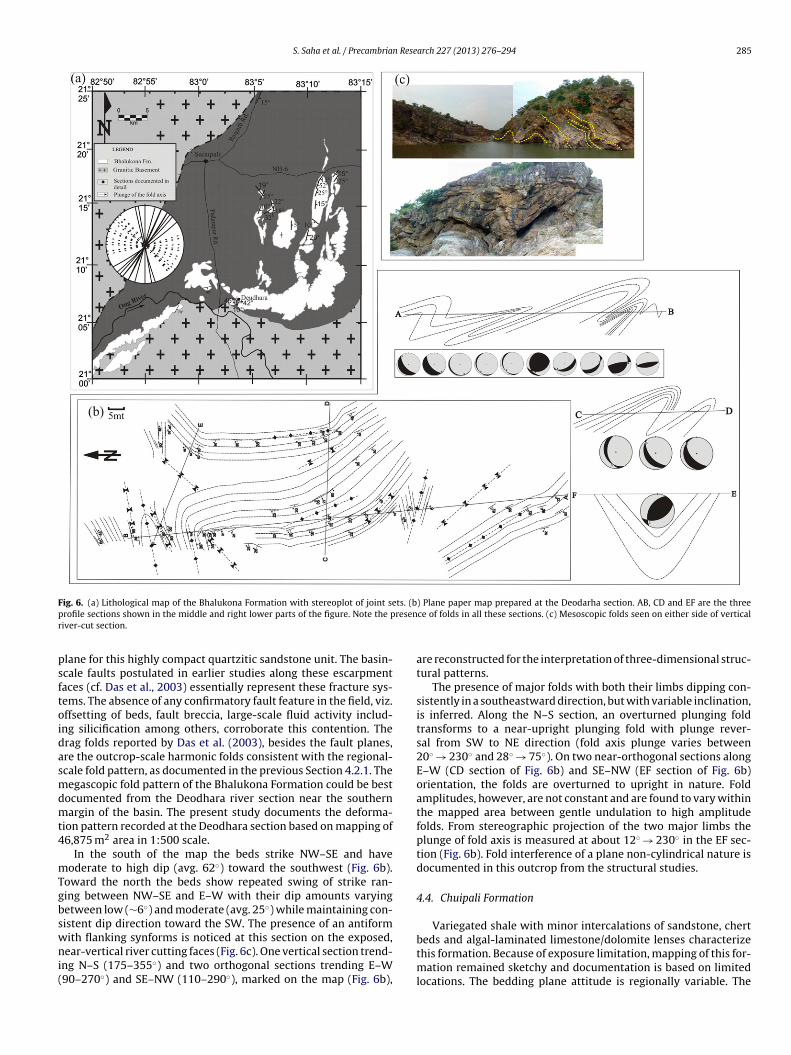
S. Saha et al. / Precambrian Research 227 (2013) 276–294 285
F ts. (bp resenr
psftoidasmdmt4
mTgbswni(
ig. 6. (a) Lithological map of the Bhalukona Formation with stereoplot of joint serofile sections shown in the middle and right lower parts of the figure. Note the piver-cut section.
lane for this highly compact quartzitic sandstone unit. The basin-cale faults postulated in earlier studies along these escarpmentaces (cf. Das et al., 2003) essentially represent these fracture sys-ems. The absence of any confirmatory fault feature in the field, viz.ffsetting of beds, fault breccia, large-scale fluid activity includ-ng silicification among others, corroborate this contention. Therag folds reported by Das et al. (2003), besides the fault planes,re the outcrop-scale harmonic folds consistent with the regional-cale fold pattern, as documented in the previous Section 4.2.1. Theegascopic fold pattern of the Bhalukona Formation could be best
ocumented from the Deodhara river section near the southernargin of the basin. The present study documents the deforma-
ion pattern recorded at the Deodhara section based on mapping of6,875 m2 area in 1:500 scale.
In the south of the map the beds strike NW–SE and haveoderate to high dip (avg. 62◦) toward the southwest (Fig. 6b).
oward the north the beds show repeated swing of strike ran-ing between NW–SE and E–W with their dip amounts varyingetween low (∼6◦) and moderate (avg. 25◦) while maintaining con-istent dip direction toward the SW. The presence of an antiform
ith flanking synforms is noticed at this section on the exposed,ear-vertical river cutting faces (Fig. 6c). One vertical section trend-ng N–S (175–355◦) and two orthogonal sections trending E–W90–270◦) and SE–NW (110–290◦), marked on the map (Fig. 6b),
) Plane paper map prepared at the Deodarha section. AB, CD and EF are the threece of folds in all these sections. (c) Mesoscopic folds seen on either side of vertical
are reconstructed for the interpretation of three-dimensional struc-tural patterns.
The presence of major folds with both their limbs dipping con-sistently in a southeastward direction, but with variable inclination,is inferred. Along the N–S section, an overturned plunging foldtransforms to a near-upright plunging fold with plunge rever-sal from SW to NE direction (fold axis plunge varies between20◦ → 230◦ and 28◦ → 75◦). On two near-orthogonal sections alongE–W (CD section of Fig. 6b) and SE–NW (EF section of Fig. 6b)orientation, the folds are overturned to upright in nature. Foldamplitudes, however, are not constant and are found to vary withinthe mapped area between gentle undulation to high amplitudefolds. From stereographic projection of the two major limbs theplunge of fold axis is measured at about 12◦ → 230◦ in the EF sec-tion (Fig. 6b). Fold interference of a plane non-cylindrical nature isdocumented in this outcrop from the structural studies.
4.4. Chuipali Formation
Variegated shale with minor intercalations of sandstone, chert
beds and algal-laminated limestone/dolomite lenses characterizethis formation. Because of exposure limitation, mapping of this for-mation remained sketchy and documentation is based on limitedlocations. The bedding plane attitude is regionally variable. The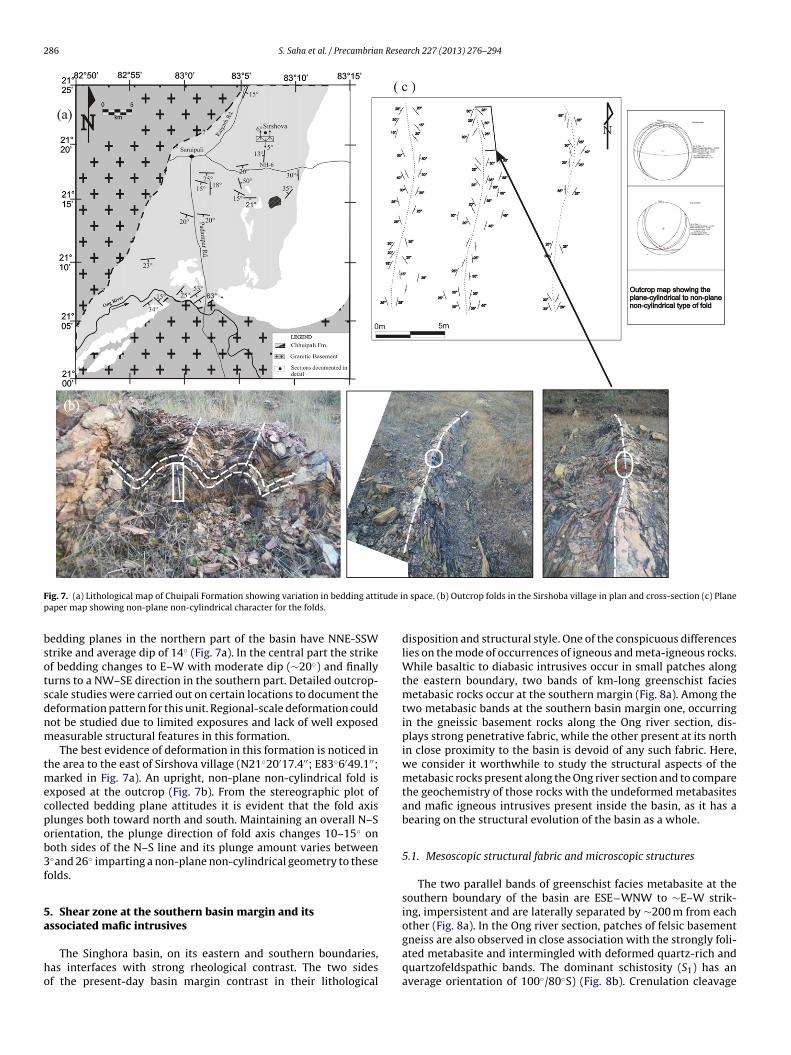
286 S. Saha et al. / Precambrian Research 227 (2013) 276–294
F tude ip
bsotsdnm
tmecpob3f
5a
ho
ig. 7. (a) Lithological map of Chuipali Formation showing variation in bedding attiaper map showing non-plane non-cylindrical character for the folds.
edding planes in the northern part of the basin have NNE-SSWtrike and average dip of 14◦ (Fig. 7a). In the central part the strikef bedding changes to E–W with moderate dip (∼20◦) and finallyurns to a NW–SE direction in the southern part. Detailed outcrop-cale studies were carried out on certain locations to document theeformation pattern for this unit. Regional-scale deformation couldot be studied due to limited exposures and lack of well exposedeasurable structural features in this formation.The best evidence of deformation in this formation is noticed in
he area to the east of Sirshova village (N21◦20′17.4′′; E83◦6′49.1′′;arked in Fig. 7a). An upright, non-plane non-cylindrical fold is
xposed at the outcrop (Fig. 7b). From the stereographic plot ofollected bedding plane attitudes it is evident that the fold axislunges both toward north and south. Maintaining an overall N–Srientation, the plunge direction of fold axis changes 10–15◦ onoth sides of the N–S line and its plunge amount varies between◦and 26◦ imparting a non-plane non-cylindrical geometry to theseolds.
. Shear zone at the southern basin margin and itsssociated mafic intrusives
The Singhora basin, on its eastern and southern boundaries,as interfaces with strong rheological contrast. The two sidesf the present-day basin margin contrast in their lithological
n space. (b) Outcrop folds in the Sirshoba village in plan and cross-section (c) Plane
disposition and structural style. One of the conspicuous differenceslies on the mode of occurrences of igneous and meta-igneous rocks.While basaltic to diabasic intrusives occur in small patches alongthe eastern boundary, two bands of km-long greenschist faciesmetabasic rocks occur at the southern margin (Fig. 8a). Among thetwo metabasic bands at the southern basin margin one, occurringin the gneissic basement rocks along the Ong river section, dis-plays strong penetrative fabric, while the other present at its northin close proximity to the basin is devoid of any such fabric. Here,we consider it worthwhile to study the structural aspects of themetabasic rocks present along the Ong river section and to comparethe geochemistry of those rocks with the undeformed metabasitesand mafic igneous intrusives present inside the basin, as it has abearing on the structural evolution of the basin as a whole.
5.1. Mesoscopic structural fabric and microscopic structures
The two parallel bands of greenschist facies metabasite at thesouthern boundary of the basin are ESE−WNW to ∼E–W strik-ing, impersistent and are laterally separated by ∼200 m from eachother (Fig. 8a). In the Ong river section, patches of felsic basement
gneiss are also observed in close association with the strongly foli-ated metabasite and intermingled with deformed quartz-rich andquartzofeldspathic bands. The dominant schistosity (S1) has anaverage orientation of 100◦/80◦S) (Fig. 8b). Crenulation cleavage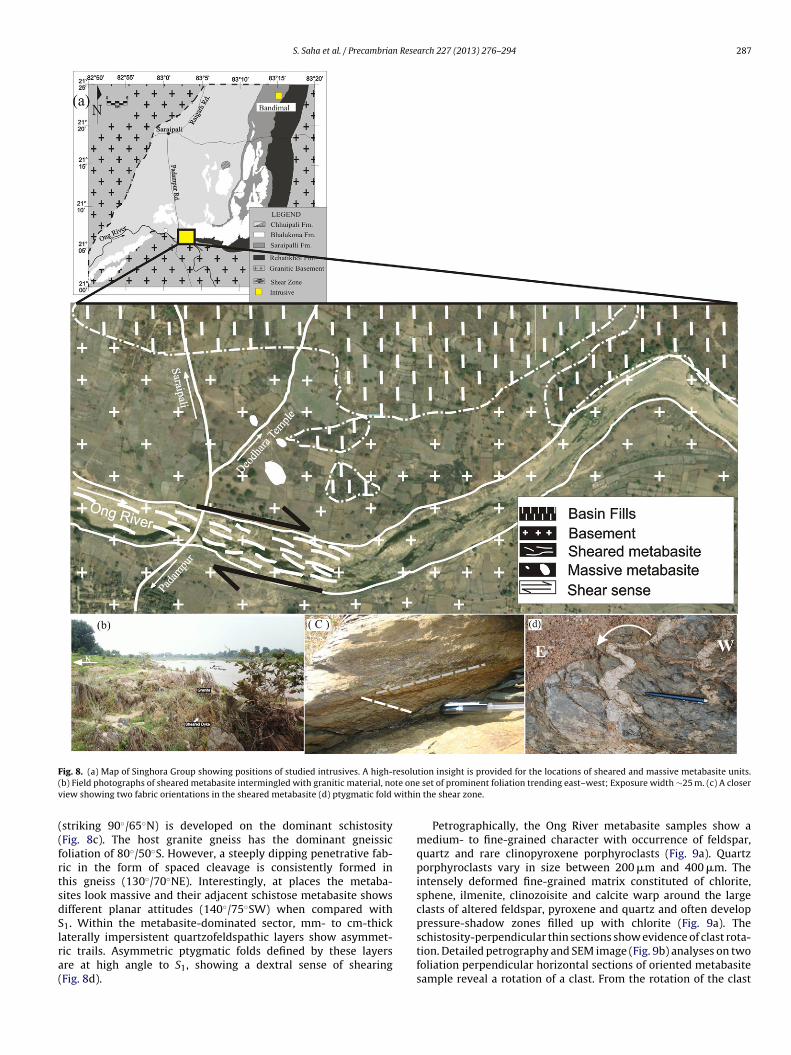
S. Saha et al. / Precambrian Research 227 (2013) 276–294 287
F resolu( te onev within
((frtsdSlra(
ig. 8. (a) Map of Singhora Group showing positions of studied intrusives. A high-b) Field photographs of sheared metabasite intermingled with granitic material, noiew showing two fabric orientations in the sheared metabasite (d) ptygmatic fold
striking 90◦/65◦N) is developed on the dominant schistosityFig. 8c). The host granite gneiss has the dominant gneissicoliation of 80◦/50◦S. However, a steeply dipping penetrative fab-ic in the form of spaced cleavage is consistently formed inhis gneiss (130◦/70◦NE). Interestingly, at places the metaba-ites look massive and their adjacent schistose metabasite showsifferent planar attitudes (140◦/75◦SW) when compared with1. Within the metabasite-dominated sector, mm- to cm-thick
aterally impersistent quartzofeldspathic layers show asymmet-ic trails. Asymmetric ptygmatic folds defined by these layersre at high angle to S1, showing a dextral sense of shearingFig. 8d).tion insight is provided for the locations of sheared and massive metabasite units.set of prominent foliation trending east–west; Exposure width ∼25 m. (c) A closerthe shear zone.
Petrographically, the Ong River metabasite samples show amedium- to fine-grained character with occurrence of feldspar,quartz and rare clinopyroxene porphyroclasts (Fig. 9a). Quartzporphyroclasts vary in size between 200 �m and 400 �m. Theintensely deformed fine-grained matrix constituted of chlorite,sphene, ilmenite, clinozoisite and calcite warp around the largeclasts of altered feldspar, pyroxene and quartz and often developpressure-shadow zones filled up with chlorite (Fig. 9a). The
schistosity-perpendicular thin sections show evidence of clast rota-tion. Detailed petrography and SEM image (Fig. 9b) analyses on twofoliation perpendicular horizontal sections of oriented metabasitesample reveal a rotation of a clast. From the rotation of the clast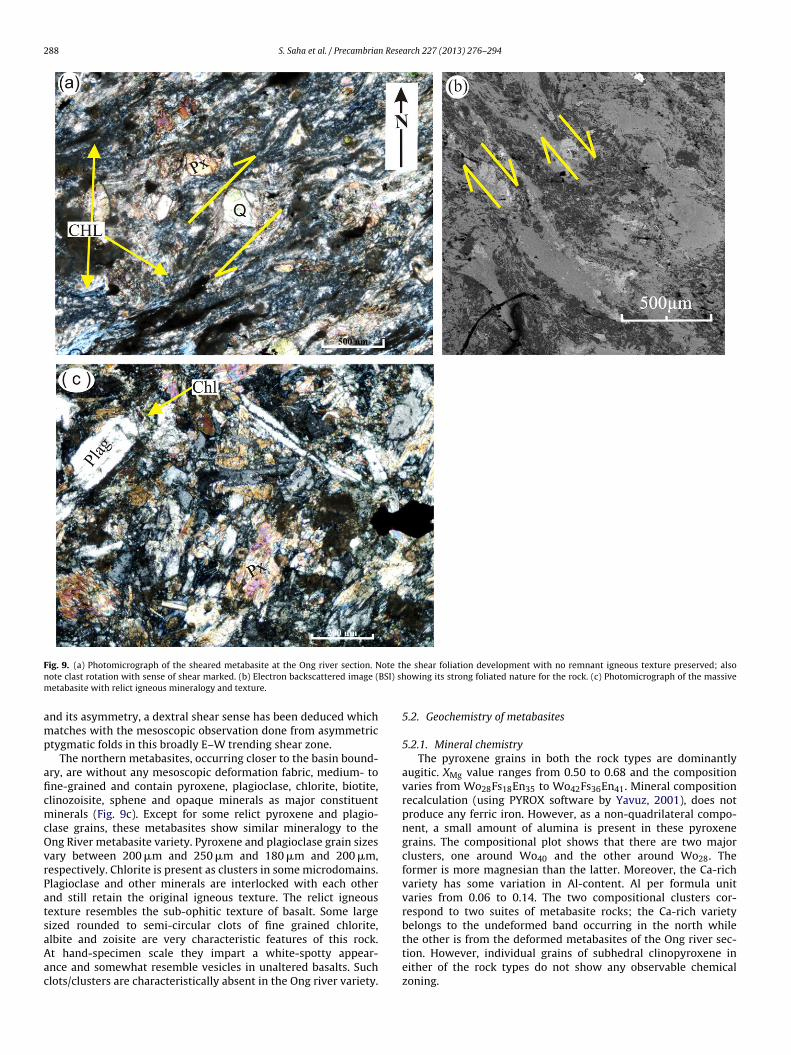
288 S. Saha et al. / Precambrian Research 227 (2013) 276–294
F ote thn BSI) shm
amp
aficmcOvrPatsaAac
ig. 9. (a) Photomicrograph of the sheared metabasite at the Ong river section. Note clast rotation with sense of shear marked. (b) Electron backscattered image (etabasite with relict igneous mineralogy and texture.
nd its asymmetry, a dextral shear sense has been deduced whichatches with the mesoscopic observation done from asymmetric
tygmatic folds in this broadly E–W trending shear zone.The northern metabasites, occurring closer to the basin bound-
ry, are without any mesoscopic deformation fabric, medium- tone-grained and contain pyroxene, plagioclase, chlorite, biotite,linozoisite, sphene and opaque minerals as major constituentinerals (Fig. 9c). Except for some relict pyroxene and plagio-
lase grains, these metabasites show similar mineralogy to theng River metabasite variety. Pyroxene and plagioclase grain sizesary between 200 �m and 250 �m and 180 �m and 200 �m,espectively. Chlorite is present as clusters in some microdomains.lagioclase and other minerals are interlocked with each othernd still retain the original igneous texture. The relict igneousexture resembles the sub-ophitic texture of basalt. Some largeized rounded to semi-circular clots of fine grained chlorite,
lbite and zoisite are very characteristic features of this rock.t hand-specimen scale they impart a white-spotty appear-nce and somewhat resemble vesicles in unaltered basalts. Suchlots/clusters are characteristically absent in the Ong river variety.e shear foliation development with no remnant igneous texture preserved; alsoowing its strong foliated nature for the rock. (c) Photomicrograph of the massive
5.2. Geochemistry of metabasites
5.2.1. Mineral chemistryThe pyroxene grains in both the rock types are dominantly
augitic. XMg value ranges from 0.50 to 0.68 and the compositionvaries from Wo28Fs18En35 to Wo42Fs36En41. Mineral compositionrecalculation (using PYROX software by Yavuz, 2001), does notproduce any ferric iron. However, as a non-quadrilateral compo-nent, a small amount of alumina is present in these pyroxenegrains. The compositional plot shows that there are two majorclusters, one around Wo40 and the other around Wo28. Theformer is more magnesian than the latter. Moreover, the Ca-richvariety has some variation in Al-content. Al per formula unitvaries from 0.06 to 0.14. The two compositional clusters cor-respond to two suites of metabasite rocks; the Ca-rich varietybelongs to the undeformed band occurring in the north while
the other is from the deformed metabasites of the Ong river sec-tion. However, individual grains of subhedral clinopyroxene ineither of the rock types do not show any observable chemicalzoning.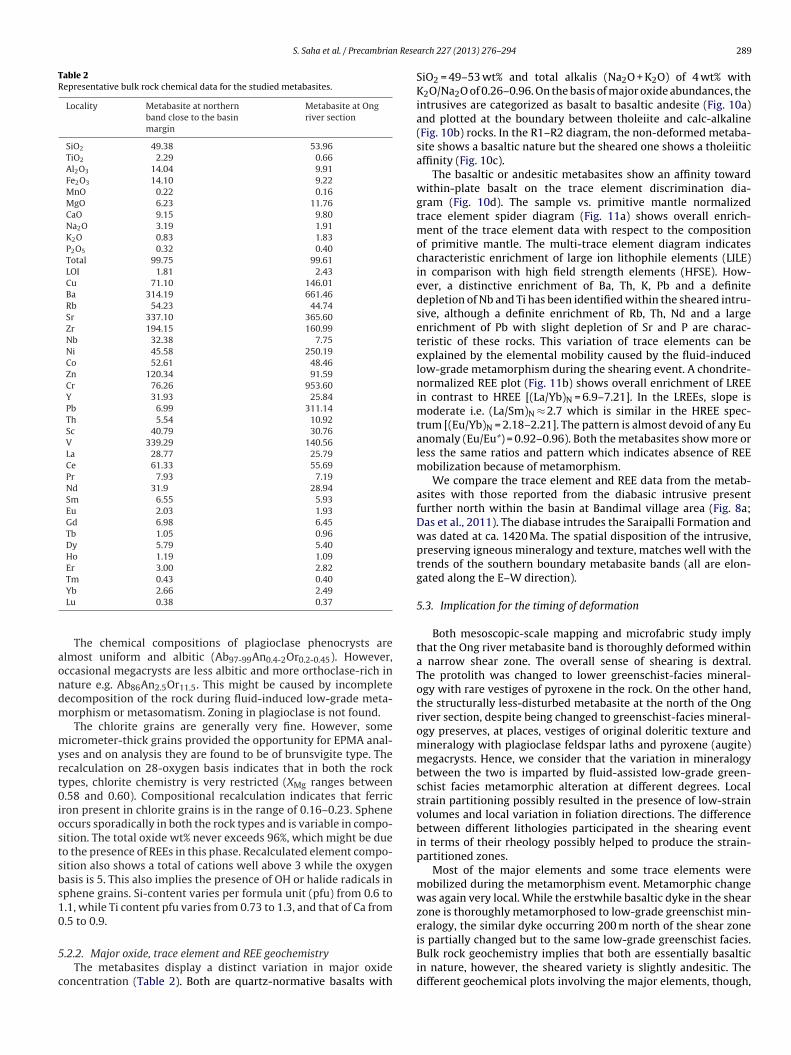
S. Saha et al. / Precambrian Rese
Table 2Representative bulk rock chemical data for the studied metabasites.
Locality Metabasite at northernband close to the basinmargin
Metabasite at Ongriver section
SiO2 49.38 53.96TiO2 2.29 0.66Al2O3 14.04 9.91Fe2O3 14.10 9.22MnO 0.22 0.16MgO 6.23 11.76CaO 9.15 9.80Na2O 3.19 1.91K2O 0.83 1.83P2O5 0.32 0.40Total 99.75 99.61LOI 1.81 2.43Cu 71.10 146.01Ba 314.19 661.46Rb 54.23 44.74Sr 337.10 365.60Zr 194.15 160.99Nb 32.38 7.75Ni 45.58 250.19Co 52.61 48.46Zn 120.34 91.59Cr 76.26 953.60Y 31.93 25.84Pb 6.99 311.14Th 5.54 10.92Sc 40.79 30.76V 339.29 140.56La 28.77 25.79Ce 61.33 55.69Pr 7.93 7.19Nd 31.9 28.94Sm 6.55 5.93Eu 2.03 1.93Gd 6.98 6.45Tb 1.05 0.96Dy 5.79 5.40Ho 1.19 1.09Er 3.00 2.82Tm 0.43 0.40
aondm
myrt0iostsbs10
5
c
Yb 2.66 2.49Lu 0.38 0.37
The chemical compositions of plagioclase phenocrysts arelmost uniform and albitic (Ab97-99An0.4-2Or0.2-0.45). However,ccasional megacrysts are less albitic and more orthoclase-rich inature e.g. Ab86An2.5Or11.5. This might be caused by incompleteecomposition of the rock during fluid-induced low-grade meta-orphism or metasomatism. Zoning in plagioclase is not found.The chlorite grains are generally very fine. However, some
icrometer-thick grains provided the opportunity for EPMA anal-ses and on analysis they are found to be of brunsvigite type. Theecalculation on 28-oxygen basis indicates that in both the rockypes, chlorite chemistry is very restricted (XMg ranges between.58 and 0.60). Compositional recalculation indicates that ferric
ron present in chlorite grains is in the range of 0.16–0.23. Spheneccurs sporadically in both the rock types and is variable in compo-ition. The total oxide wt% never exceeds 96%, which might be dueo the presence of REEs in this phase. Recalculated element compo-ition also shows a total of cations well above 3 while the oxygenasis is 5. This also implies the presence of OH or halide radicals inphene grains. Si-content varies per formula unit (pfu) from 0.6 to.1, while Ti content pfu varies from 0.73 to 1.3, and that of Ca from.5 to 0.9.
.2.2. Major oxide, trace element and REE geochemistryThe metabasites display a distinct variation in major oxide
oncentration (Table 2). Both are quartz-normative basalts with
arch 227 (2013) 276–294 289
SiO2 = 49–53 wt% and total alkalis (Na2O + K2O) of 4 wt% withK2O/Na2O of 0.26–0.96. On the basis of major oxide abundances, theintrusives are categorized as basalt to basaltic andesite (Fig. 10a)and plotted at the boundary between tholeiite and calc-alkaline(Fig. 10b) rocks. In the R1–R2 diagram, the non-deformed metaba-site shows a basaltic nature but the sheared one shows a tholeiiticaffinity (Fig. 10c).
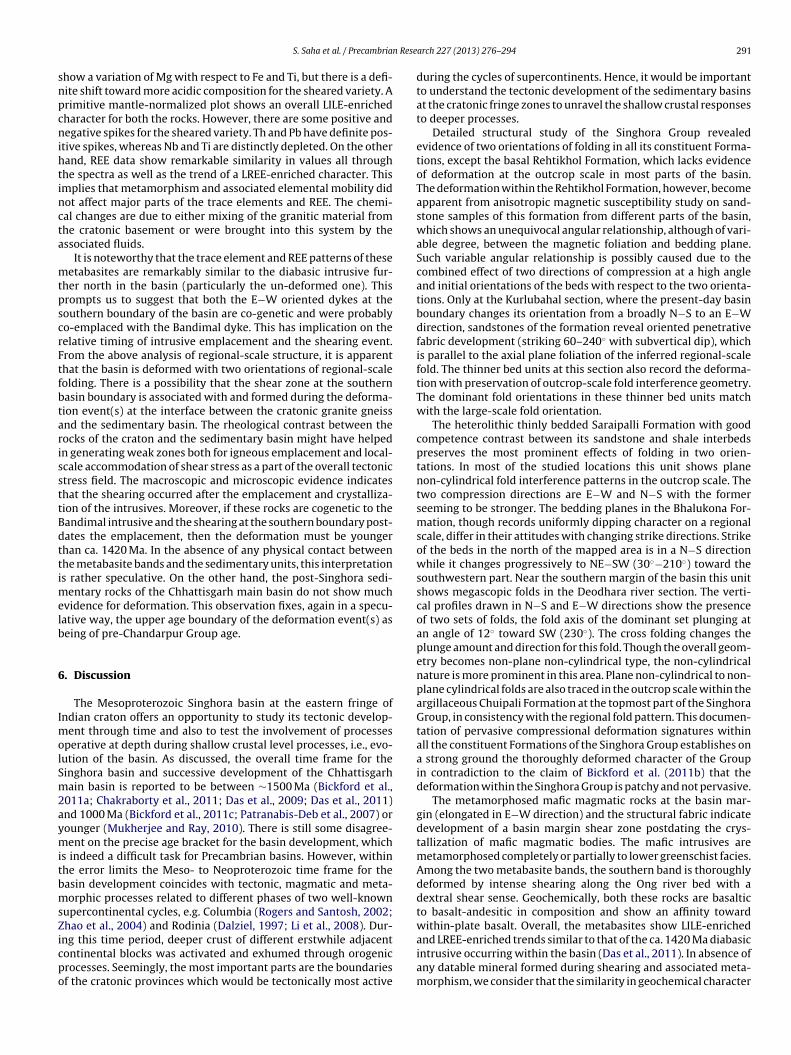
The basaltic or andesitic metabasites show an affinity towardwithin-plate basalt on the trace element discrimination dia-gram (Fig. 10d). The sample vs. primitive mantle normalizedtrace element spider diagram (Fig. 11a) shows overall enrich-ment of the trace element data with respect to the compositionof primitive mantle. The multi-trace element diagram indicatescharacteristic enrichment of large ion lithophile elements (LILE)in comparison with high field strength elements (HFSE). How-ever, a distinctive enrichment of Ba, Th, K, Pb and a definitedepletion of Nb and Ti has been identified within the sheared intru-sive, although a definite enrichment of Rb, Th, Nd and a largeenrichment of Pb with slight depletion of Sr and P are charac-teristic of these rocks. This variation of trace elements can beexplained by the elemental mobility caused by the fluid-inducedlow-grade metamorphism during the shearing event. A chondrite-normalized REE plot (Fig. 11b) shows overall enrichment of LREEin contrast to HREE [(La/Yb)N = 6.9–7.21]. In the LREEs, slope ismoderate i.e. (La/Sm)N ≈ 2.7 which is similar in the HREE spec-trum [(Eu/Yb)N = 2.18–2.21]. The pattern is almost devoid of any Euanomaly (Eu/Eu*) = 0.92–0.96). Both the metabasites show more orless the same ratios and pattern which indicates absence of REEmobilization because of metamorphism.
We compare the trace element and REE data from the metab-asites with those reported from the diabasic intrusive presentfurther north within the basin at Bandimal village area (Fig. 8a;Das et al., 2011). The diabase intrudes the Saraipalli Formation andwas dated at ca. 1420 Ma. The spatial disposition of the intrusive,preserving igneous mineralogy and texture, matches well with thetrends of the southern boundary metabasite bands (all are elon-gated along the E–W direction).
5.3. Implication for the timing of deformation
Both mesoscopic-scale mapping and microfabric study implythat the Ong river metabasite band is thoroughly deformed withina narrow shear zone. The overall sense of shearing is dextral.The protolith was changed to lower greenschist-facies mineral-ogy with rare vestiges of pyroxene in the rock. On the other hand,the structurally less-disturbed metabasite at the north of the Ongriver section, despite being changed to greenschist-facies mineral-ogy preserves, at places, vestiges of original doleritic texture andmineralogy with plagioclase feldspar laths and pyroxene (augite)megacrysts. Hence, we consider that the variation in mineralogybetween the two is imparted by fluid-assisted low-grade green-schist facies metamorphic alteration at different degrees. Localstrain partitioning possibly resulted in the presence of low-strainvolumes and local variation in foliation directions. The differencebetween different lithologies participated in the shearing eventin terms of their rheology possibly helped to produce the strain-partitioned zones.
Most of the major elements and some trace elements weremobilized during the metamorphism event. Metamorphic changewas again very local. While the erstwhile basaltic dyke in the shearzone is thoroughly metamorphosed to low-grade greenschist min-eralogy, the similar dyke occurring 200 m north of the shear zone
is partially changed but to the same low-grade greenschist facies.Bulk rock geochemistry implies that both are essentially basalticin nature, however, the sheared variety is slightly andesitic. Thedifferent geochemical plots involving the major elements, though,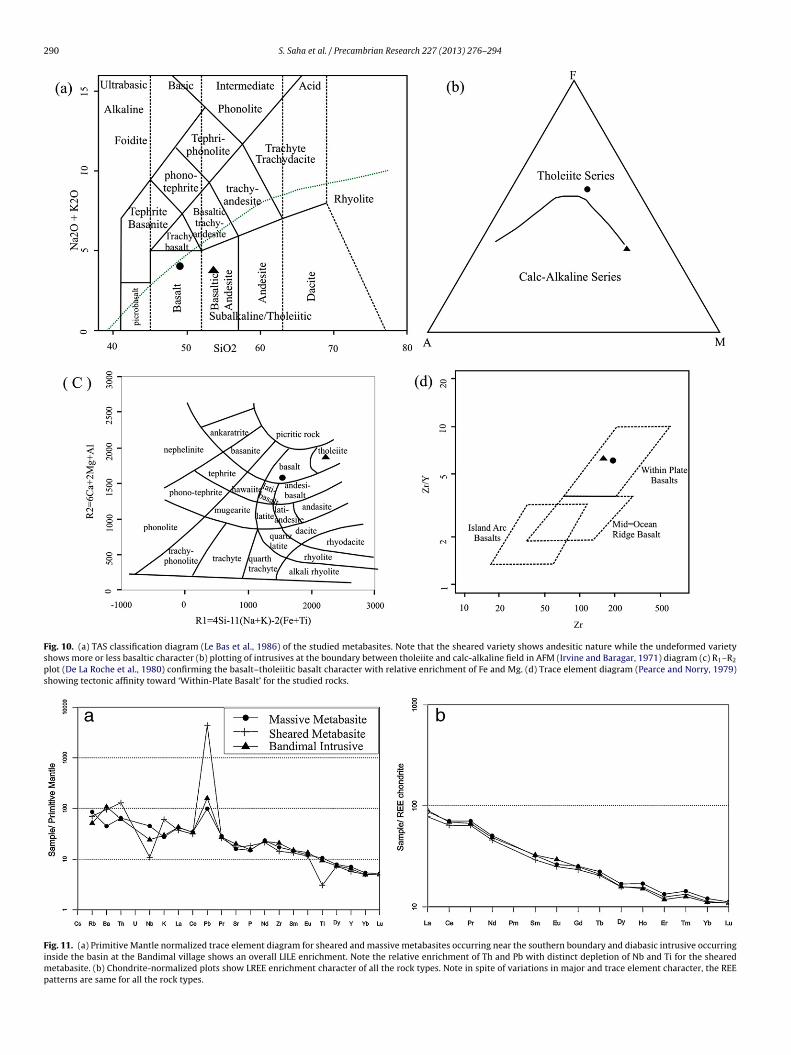
290 S. Saha et al. / Precambrian Research 227 (2013) 276–294
Fig. 10. (a) TAS classification diagram (Le Bas et al., 1986) of the studied metabasites. Note that the sheared variety shows andesitic nature while the undeformed varietyshows more or less basaltic character (b) plotting of intrusives at the boundary between tholeiite and calc-alkaline field in AFM (Irvine and Baragar, 1971) diagram (c) R1–R2
plot (De La Roche et al., 1980) confirming the basalt–tholeiitic basalt character with relative enrichment of Fe and Mg. (d) Trace element diagram (Pearce and Norry, 1979)showing tectonic affinity toward ‘Within-Plate Basalt’ for the studied rocks.
Fig. 11. (a) Primitive Mantle normalized trace element diagram for sheared and massive metabasites occurring near the southern boundary and diabasic intrusive occurringinside the basin at the Bandimal village shows an overall LILE enrichment. Note the relative enrichment of Th and Pb with distinct depletion of Nb and Ti for the shearedmetabasite. (b) Chondrite-normalized plots show LREE enrichment character of all the rock types. Note in spite of variations in major and trace element character, the REEpatterns are same for all the rock types.
n Rese
snpcnihtincta
mtpscrFtfbtarissttBdttimelb
6
ImolSm2aymitbmsZicpo
S. Saha et al. / Precambria
how a variation of Mg with respect to Fe and Ti, but there is a defi-ite shift toward more acidic composition for the sheared variety. Arimitive mantle-normalized plot shows an overall LILE-enrichedharacter for both the rocks. However, there are some positive andegative spikes for the sheared variety. Th and Pb have definite pos-
tive spikes, whereas Nb and Ti are distinctly depleted. On the otherand, REE data show remarkable similarity in values all throughhe spectra as well as the trend of a LREE-enriched character. Thismplies that metamorphism and associated elemental mobility didot affect major parts of the trace elements and REE. The chemi-al changes are due to either mixing of the granitic material fromhe cratonic basement or were brought into this system by thessociated fluids.
It is noteworthy that the trace element and REE patterns of theseetabasites are remarkably similar to the diabasic intrusive fur-
her north in the basin (particularly the un-deformed one). Thisrompts us to suggest that both the E−W oriented dykes at theouthern boundary of the basin are co-genetic and were probablyo-emplaced with the Bandimal dyke. This has implication on theelative timing of intrusive emplacement and the shearing event.rom the above analysis of regional-scale structure, it is apparenthat the basin is deformed with two orientations of regional-scaleolding. There is a possibility that the shear zone at the southernasin boundary is associated with and formed during the deforma-ion event(s) at the interface between the cratonic granite gneissnd the sedimentary basin. The rheological contrast between theocks of the craton and the sedimentary basin might have helpedn generating weak zones both for igneous emplacement and local-cale accommodation of shear stress as a part of the overall tectonictress field. The macroscopic and microscopic evidence indicateshat the shearing occurred after the emplacement and crystalliza-ion of the intrusives. Moreover, if these rocks are cogenetic to theandimal intrusive and the shearing at the southern boundary post-ates the emplacement, then the deformation must be youngerhan ca. 1420 Ma. In the absence of any physical contact betweenhe metabasite bands and the sedimentary units, this interpretations rather speculative. On the other hand, the post-Singhora sedi-
entary rocks of the Chhattisgarh main basin do not show muchvidence for deformation. This observation fixes, again in a specu-ative way, the upper age boundary of the deformation event(s) aseing of pre-Chandarpur Group age.
. Discussion
The Mesoproterozoic Singhora basin at the eastern fringe ofndian craton offers an opportunity to study its tectonic develop-
ent through time and also to test the involvement of processesperative at depth during shallow crustal level processes, i.e., evo-ution of the basin. As discussed, the overall time frame for theinghora basin and successive development of the Chhattisgarhain basin is reported to be between ∼1500 Ma (Bickford et al.,
011a; Chakraborty et al., 2011; Das et al., 2009; Das et al., 2011)nd 1000 Ma (Bickford et al., 2011c; Patranabis-Deb et al., 2007) orounger (Mukherjee and Ray, 2010). There is still some disagree-ent on the precise age bracket for the basin development, which
s indeed a difficult task for Precambrian basins. However, withinhe error limits the Meso- to Neoproterozoic time frame for theasin development coincides with tectonic, magmatic and meta-orphic processes related to different phases of two well-known
upercontinental cycles, e.g. Columbia (Rogers and Santosh, 2002;hao et al., 2004) and Rodinia (Dalziel, 1997; Li et al., 2008). Dur-
ng this time period, deeper crust of different erstwhile adjacentontinental blocks was activated and exhumed through orogenicrocesses. Seemingly, the most important parts are the boundariesf the cratonic provinces which would be tectonically most activearch 227 (2013) 276–294 291
during the cycles of supercontinents. Hence, it would be importantto understand the tectonic development of the sedimentary basinsat the cratonic fringe zones to unravel the shallow crustal responsesto deeper processes.
Detailed structural study of the Singhora Group revealedevidence of two orientations of folding in all its constituent Forma-tions, except the basal Rehtikhol Formation, which lacks evidenceof deformation at the outcrop scale in most parts of the basin.The deformation within the Rehtikhol Formation, however, becomeapparent from anisotropic magnetic susceptibility study on sand-stone samples of this formation from different parts of the basin,which shows an unequivocal angular relationship, although of vari-able degree, between the magnetic foliation and bedding plane.Such variable angular relationship is possibly caused due to thecombined effect of two directions of compression at a high angleand initial orientations of the beds with respect to the two orienta-tions. Only at the Kurlubahal section, where the present-day basinboundary changes its orientation from a broadly N−S to an E−Wdirection, sandstones of the formation reveal oriented penetrativefabric development (striking 60–240◦ with subvertical dip), whichis parallel to the axial plane foliation of the inferred regional-scalefold. The thinner bed units at this section also record the deforma-tion with preservation of outcrop-scale fold interference geometry.The dominant fold orientations in these thinner bed units matchwith the large-scale fold orientation.
The heterolithic thinly bedded Saraipalli Formation with goodcompetence contrast between its sandstone and shale interbedspreserves the most prominent effects of folding in two orien-tations. In most of the studied locations this unit shows planenon-cylindrical fold interference patterns in the outcrop scale. Thetwo compression directions are E−W and N−S with the formerseeming to be stronger. The bedding planes in the Bhalukona For-mation, though records uniformly dipping character on a regionalscale, differ in their attitudes with changing strike directions. Strikeof the beds in the north of the mapped area is in a N−S directionwhile it changes progressively to NE−SW (30◦−210◦) toward thesouthwestern part. Near the southern margin of the basin this unitshows megascopic folds in the Deodhara river section. The verti-cal profiles drawn in N−S and E−W directions show the presenceof two sets of folds, the fold axis of the dominant set plunging atan angle of 12◦ toward SW (230◦). The cross folding changes theplunge amount and direction for this fold. Though the overall geom-etry becomes non-plane non-cylindrical type, the non-cylindricalnature is more prominent in this area. Plane non-cylindrical to non-plane cylindrical folds are also traced in the outcrop scale within theargillaceous Chuipali Formation at the topmost part of the SinghoraGroup, in consistency with the regional fold pattern. This documen-tation of pervasive compressional deformation signatures withinall the constituent Formations of the Singhora Group establishes ona strong ground the thoroughly deformed character of the Groupin contradiction to the claim of Bickford et al. (2011b) that thedeformation within the Singhora Group is patchy and not pervasive.
The metamorphosed mafic magmatic rocks at the basin mar-gin (elongated in E−W direction) and the structural fabric indicatedevelopment of a basin margin shear zone postdating the crys-tallization of mafic magmatic bodies. The mafic intrusives aremetamorphosed completely or partially to lower greenschist facies.Among the two metabasite bands, the southern band is thoroughlydeformed by intense shearing along the Ong river bed with adextral shear sense. Geochemically, both these rocks are basalticto basalt-andesitic in composition and show an affinity towardwithin-plate basalt. Overall, the metabasites show LILE-enriched
and LREE-enriched trends similar to that of the ca. 1420 Ma diabasicintrusive occurring within the basin (Das et al., 2011). In absence ofany datable mineral formed during shearing and associated meta-morphism, we consider that the similarity in geochemical character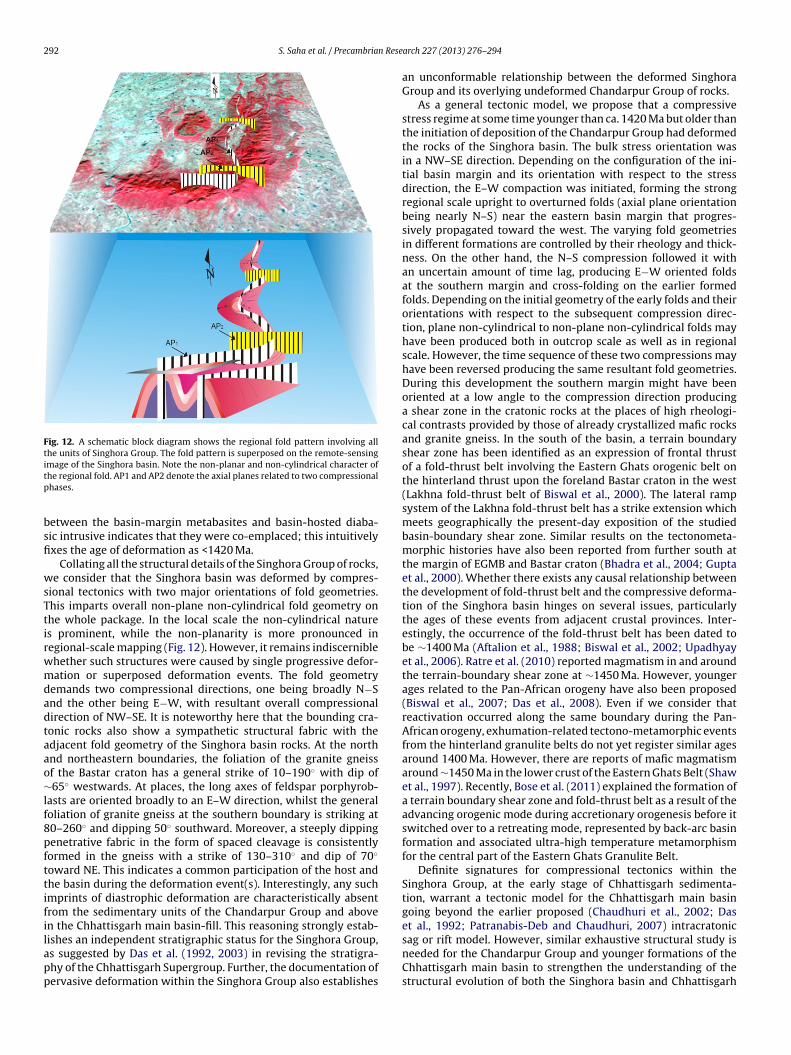
292 S. Saha et al. / Precambrian Rese
Fig. 12. A schematic block diagram shows the regional fold pattern involving allthe units of Singhora Group. The fold pattern is superposed on the remote-sensingitp
bsfi
wsTtirwmdadtaao∼lf8pfttifilapp
mage of the Singhora basin. Note the non-planar and non-cylindrical character ofhe regional fold. AP1 and AP2 denote the axial planes related to two compressionalhases.
etween the basin-margin metabasites and basin-hosted diaba-ic intrusive indicates that they were co-emplaced; this intuitivelyxes the age of deformation as <1420 Ma.
Collating all the structural details of the Singhora Group of rocks,e consider that the Singhora basin was deformed by compres-
ional tectonics with two major orientations of fold geometries.his imparts overall non-plane non-cylindrical fold geometry onhe whole package. In the local scale the non-cylindrical natures prominent, while the non-planarity is more pronounced inegional-scale mapping (Fig. 12). However, it remains indiscerniblehether such structures were caused by single progressive defor-ation or superposed deformation events. The fold geometry
emands two compressional directions, one being broadly N−Snd the other being E−W, with resultant overall compressionalirection of NW–SE. It is noteworthy here that the bounding cra-onic rocks also show a sympathetic structural fabric with thedjacent fold geometry of the Singhora basin rocks. At the northnd northeastern boundaries, the foliation of the granite gneissf the Bastar craton has a general strike of 10–190◦ with dip of65◦ westwards. At places, the long axes of feldspar porphyrob-
asts are oriented broadly to an E–W direction, whilst the generaloliation of granite gneiss at the southern boundary is striking at0–260◦ and dipping 50◦ southward. Moreover, a steeply dippingenetrative fabric in the form of spaced cleavage is consistentlyormed in the gneiss with a strike of 130–310◦ and dip of 70◦
oward NE. This indicates a common participation of the host andhe basin during the deformation event(s). Interestingly, any suchmprints of diastrophic deformation are characteristically absentrom the sedimentary units of the Chandarpur Group and aboven the Chhattisgarh main basin-fill. This reasoning strongly estab-
ishes an independent stratigraphic status for the Singhora Group,s suggested by Das et al. (1992, 2003) in revising the stratigra-hy of the Chhattisgarh Supergroup. Further, the documentation ofervasive deformation within the Singhora Group also establishesarch 227 (2013) 276–294
an unconformable relationship between the deformed SinghoraGroup and its overlying undeformed Chandarpur Group of rocks.
As a general tectonic model, we propose that a compressivestress regime at some time younger than ca. 1420 Ma but older thanthe initiation of deposition of the Chandarpur Group had deformedthe rocks of the Singhora basin. The bulk stress orientation wasin a NW–SE direction. Depending on the configuration of the ini-tial basin margin and its orientation with respect to the stressdirection, the E–W compaction was initiated, forming the strongregional scale upright to overturned folds (axial plane orientationbeing nearly N–S) near the eastern basin margin that progres-sively propagated toward the west. The varying fold geometriesin different formations are controlled by their rheology and thick-ness. On the other hand, the N–S compression followed it withan uncertain amount of time lag, producing E−W oriented foldsat the southern margin and cross-folding on the earlier formedfolds. Depending on the initial geometry of the early folds and theirorientations with respect to the subsequent compression direc-tion, plane non-cylindrical to non-plane non-cylindrical folds mayhave been produced both in outcrop scale as well as in regionalscale. However, the time sequence of these two compressions mayhave been reversed producing the same resultant fold geometries.During this development the southern margin might have beenoriented at a low angle to the compression direction producinga shear zone in the cratonic rocks at the places of high rheologi-cal contrasts provided by those of already crystallized mafic rocksand granite gneiss. In the south of the basin, a terrain boundaryshear zone has been identified as an expression of frontal thrustof a fold-thrust belt involving the Eastern Ghats orogenic belt onthe hinterland thrust upon the foreland Bastar craton in the west(Lakhna fold-thrust belt of Biswal et al., 2000). The lateral rampsystem of the Lakhna fold-thrust belt has a strike extension whichmeets geographically the present-day exposition of the studiedbasin-boundary shear zone. Similar results on the tectonometa-morphic histories have also been reported from further south atthe margin of EGMB and Bastar craton (Bhadra et al., 2004; Guptaet al., 2000). Whether there exists any causal relationship betweenthe development of fold-thrust belt and the compressive deforma-tion of the Singhora basin hinges on several issues, particularlythe ages of these events from adjacent crustal provinces. Inter-estingly, the occurrence of the fold-thrust belt has been dated tobe ∼1400 Ma (Aftalion et al., 1988; Biswal et al., 2002; Upadhyayet al., 2006). Ratre et al. (2010) reported magmatism in and aroundthe terrain-boundary shear zone at ∼1450 Ma. However, youngerages related to the Pan-African orogeny have also been proposed(Biswal et al., 2007; Das et al., 2008). Even if we consider thatreactivation occurred along the same boundary during the Pan-African orogeny, exhumation-related tectono-metamorphic eventsfrom the hinterland granulite belts do not yet register similar agesaround 1400 Ma. However, there are reports of mafic magmatismaround ∼1450 Ma in the lower crust of the Eastern Ghats Belt (Shawet al., 1997). Recently, Bose et al. (2011) explained the formation ofa terrain boundary shear zone and fold-thrust belt as a result of theadvancing orogenic mode during accretionary orogenesis before itswitched over to a retreating mode, represented by back-arc basinformation and associated ultra-high temperature metamorphismfor the central part of the Eastern Ghats Granulite Belt.
Definite signatures for compressional tectonics within theSinghora Group, at the early stage of Chhattisgarh sedimenta-tion, warrant a tectonic model for the Chhattisgarh main basingoing beyond the earlier proposed (Chaudhuri et al., 2002; Daset al., 1992; Patranabis-Deb and Chaudhuri, 2007) intracratonic
sag or rift model. However, similar exhaustive structural study isneeded for the Chandarpur Group and younger formations of theChhattisgarh main basin to strengthen the understanding of thestructural evolution of both the Singhora basin and Chhattisgarh
n Rese
bocaac
7
(
(
A
tPfMSrtorm
R
A
A
A
B
S. Saha et al. / Precambria
asin as a whole. Geophysical data delineating the subsurface geol-gy, age data and data related to tectonic processes for all therustal provinces including the Bastar craton, sedimentary basinsnd adjacent deep crustal provinces are needed to finally proposecrustal-scale model in the backdrop of a Mesoproterozoic ‘Super-ontinent’.
. Conclusions
(a) The Mesoproterozoic Singhora basin at the east of the Chhattis-garh main basin occurring at the fringe zone of the Indian cratonoffers an opportunity to understand the early history of thetectono-magmatic evolution of the basin and its surroundingcrustal provinces.
b) The detailed structural mapping of all the four reported forma-tions of the Singhora basin and AMS analysis of the lowermostRehtikhol Formation were carried out. These data indicatethe presence of two orientations of basin-scale compressioninvolving all the rock units. The outcrop-scale fold geometry isplane non-cylindrical to weakly non-plane non-cylindrical. Weenvisage a large-scale non-plane non-cylindrical fold formedin response to an overall NW–SE compressional stress field.The two components of this stress field, namely N–S and E–Wcaused initiation of folding from the eastern and southern basinmargin, which progressively propagated toward the west andthe north. The interaction of these two, with or without timelag in between, may have produced regional to outcrop-scalefolds.
(c) The formation of a narrow shear zone in the craton near thesouthern boundary was caused due to low-angle interactionbetween the basin margin and the stress field post-dating thebasaltic dyke emplaced in and around the basin at ca. 1420 Ma.This marks the upper age limit of the deformation event.
d) The rocks of the Chandarpur Group and its overlying units of theChhattisgarh main basin do reportedly not show any evidenceof deformation. Hence, this deformation event should be pre-Chandarpur in age. We propose that the Singhora Group shouldhave its own independent status in the Chattisgarh stratigra-phy and that the Chandarpur Group overlies it with an angularunconformity.
cknowledgments
We are thankful to Prof. M. Jayananda for inviting us to presenthis paper. SS is funded by INSPIRE fellowship of DST, India. KD andPC acknowledge the research grants of DST, India. PD is thank-ul to CSIR for carrying out part of this work. Several students of
.Sc. course of KD and PPC helped to map different parts of theinghora basin. We are thankful to them. KD acknowledges theesearch grant of Visiting Professorship at ISEI, Misasa when most ofhe manuscript was prepared. SK acknowledges CAS, Departmentf Geological Sciences, Jadavpur University. Thorough and incisiveeviews of Drs. P.G. Eriksson and S. Gupta helped us to improve thisanuscript to a great extent.
eferences
ftalion, M., Bowes, D.R., Dash, B., Dempster, T.J., 1988. Late Proterozoic Charnockitesof Orissa, India: a U–Pb and Rb–Sr isotopic study. Journal of Geology 96, 663–676.
llen, P.A., Allen, J.R., 1990. Basin Analysis: Principles and Applications. BlackwellScientific Publications, Cambridge, 451 pp.
spler, L.B., Wisotzek, I.E., Chiarenzelli, J.R., Losonczy, M.F., Cousens, B.L., McNi-coll, V.J., Davis, W.J., 2001. Paleoproterozoic intracratonic basin processes, from
breakup of Kenorland to assembly of Laurentia: Hurwitz basin, Nunavut, Canada.Sedimentary Geology 141–142, 287–318.hadra, S., Gupta, S., Banerjee, M., 2004. Structural evolution across the EasternGhats Mobile Belt—Bastar craton boundary: hot over cold thrusting in an ancientcollision zone. Journal of Structural Geology 26, 233–245.
arch 227 (2013) 276–294 293
Bickford, M.E., Basu, A., Patranabis-Deb, S., Dhang, P.C., Schieber, J., 2011a. Depo-sitional history of the Chhattisgarh basin, central India: constraints from newSHRIMP zircon ages. The Journal of Geology 119, 33–50.
Bickford, M.E., Basu, A., Patranabis-Deb, S., Dhang, P.C., Schieber, J., 2011b. Depo-sitional history of the Chhattisgarh basin, central India: constraints from newshrimp zircon ages: a reply. The Journal of Geology 119, 553–556.
Bickford, M.E., Basu, A., Mukherjee, A., Hietpas, J., Juergen, S., Patranabis-Deb, S., Ray,R.K., Guhey, R., Bhattacharya, P., Dhang, P.C., 2011c. New U–Pb SHRIMP zirconages of the Dhamda Tuff in the mesoproterozoic Chhattisgarh Basin, PeninsularIndia: stratigraphic implications and significance of a 1-Ga thermal-magmaticevent. Journal of Geology 119, 535–548.
Biswal, T.K., Jena, S.K., Datta, S., Das, R., Khan, K., 2000. Deformation of the TerraneBoundary Shear Zone (Lakhna shear zone) between the Eastern Ghats MobileBelt and the Bastar Craton, in Balangir and Kalahandi districts of Orissa. Journalof Geological Society of India 55, 367–380.
Biswal, T.K., Biswal, B., Mitra, S., Moulik, M.R., 2002. Deformation pattern of the NWTerrane boundary of the Eastern Ghats mobile belt India: a tectonic model andcorrelation with Antarctica. Gondwana Research 5, 45–52.
Biswal, T.K., Waele, B.D., Ahuja, H., 2007. Timing and dynamics of the juxtapositionof the Eastern Ghats Mobile Belt against the Bhandara Craton, India: a structuraland zircon U–Pb SHRIMP study of the fold-thrust belt and associated nephelinesyenite plutons. Tectonics 6, TC4006.
Bose, S., Dunkley, D.J., Dasgupta, S., Das, K., Arima, M., 2011. India-Antarctica-Australia-Laurentia connection in the Paleoproterozoic–Mesoproterozoic revis-ited: evidence from new zircon U–Pb and monazite chemical age data fromthe Eastern Ghats Belt, India. Geological Society of America Bulletin 123,2031–2049.
Brandl, G., De Wit, M.J., 1997. The Kaapvaal Craton. In: de Wit, M.J., Ashwal, L.D.(Eds.), Greenstone Belts. Oxford University Press, Oxford, U.K., pp. 581–607.
Catuneanu, O., Biddulph, M.N., 2001. Sequence stratigraphy of the Vaal Reef faciesassociations in the Witwatersrand foredeep, South Africa. Sedimentary Geology141–142, 113–130.
Chakraborti, S., 1997. Elucidation of the sedimentary history of the Singhora Groupof rocks, Chattisgarh Supergroup, M.P. Records of Geological Survey of India 130(6), 184–187.
Chakraborty, P.P., Paul, S., 2008. Depositional pattern across forced regressive-transgressive sea-level history on a Neoproterozoic siliciclastic shelf: Chan-darpur Group, central India. Precambrian Research 162, 227–247.
Chakraborty, P.P., Das, K., Sarkar, A., Das, P., 2009. Fan-delta and storm-dominatedshelf sedimentation in the Proterozoic Singhora Group, Chattisgarh Supergroup,central India. Precambrian Research 70, 88–106.
Chakraborty, P.P., Das, K., Tsutsumi, Y., Horie, K., 2011. Depositional history of theChhattisgarh Basin, Central India: constraints from New SHRIMP zircon ages: adiscussion. Journal of Geology 119, 549–552.
Chakraborty, P.P., Das, P., Das, K., Saha, S., Balakrishnan, S., 2012. Regressivedepositional architecture on a mesoproterozoic siliciclastic ramp: sequencestratigraphic and Nd isotopic evidences from Bhalukona Formation, SinghoraGroup, Chhattisgarh Supergroup, central India. Precambrian Research 200–203,129–148.
Chaudhuri, A.K., Saha, D., Deb, G.K., Patranabis-Deb, S., Mukherjee, M.K., Ghosh,G., 2002. The purana basins of southern cratonic province of India—a case formesoproterozoic fossil rifts. Gondwana Research 5, 23–33.
Dalziel, I.W.D., 1997. Neoproterozoic-Paleozoic geography and tectonics: review,hypothesis, environmental speculation. Geological Society of America Bulletin109 (1), 16–42.
Das, D.P., Kundu, A., Das, N., Dutta, D.R., Kumaran, K., Ramamurthy, S., Thangavelu,C., Rajaiya, V., 1992. Lithostratigraphy and sedimentation of Chattisgarh basin.Indian Minerals 46, 271–288.
Das, D.P., Dutta, N.K., Dutta, D.R., Thanavelu, C., Baburao, K., 2003. SinghoraGroup—the oldest proterozoic lithopackage of eastern Baster Craton and itssignificance. Indian Minerals 57, 127–138.
Das, S., Nasipuri, P., Bhattacharya, A., Swaminathan, S., 2008. The thrust-contactbetween the Eastern Ghats Belt and the adjoining Bastar craton (Eastern India):evidence from mafic granulites and tectonic implications. Precambrian Research162, 70–85.
Das, K., Yokoyama, K., Chakraborty, P.P., Sarkar, A., 2009. Basal tuffs and con-temporaneity of the Chattisgarh and Khariar Basins based on new dates andgeochemistry. Journal of Geology 117, 88–102.
Das, P., Das, K., Chakraborty, P.P., Balakrishnan, S., 2011. 1420 Ma diabasic intrusivesfrom the mesoproterozoic Singhora Group, Chhattisgarh Supergroup, India:implications towards non-plume intrusive activity. Journal of Earth System Sci-ence 120, 1–14.
Dhang, P.C., Patranabis-Deb, S., 2011. Lithostratigraphy of the basal part of the Chat-tisgarh Supergroup around Singhora-Saraipali area and its tectonic implication.In: Tiwari, R.P. (Ed.), Cenozoic Tectonics, Seismology and Paleobiology of theEastern Himalayas and Indo-Myanmar Range. Geological Society of India Mem-oir, Bangalore, p. 77.
Decelles, P.G., Giles, K.A., 1996. Foreland basin systems. Basin Research 8, 105–123.De La Roche, H., Leterrier, J., Grandclaude, P., Marchal, M., 1980. A classification of vol-
canic and plutonic rocks using R1–R2-diagram and major element analyses—itsrelationships with current nomenclature. Chemical Geology 29, 183–210.
Dutt, N.V.B.S., 1964. A suggested succession of the Purana Formations of the southernpart of Chattisgarh, M.P. Rec. Geol. Surv. India 93, 143–148.
Eriksson, P.G., Condie, K.C., Tirsgaard, H., Mueller, W.U., Altermann, W., Miall, A.D.,Aspler, L.B., Catuneanu, O., Chiarenzelli, J.R., 1998. Precambrian clastic sedimen-tation systems. Sedimentary Geology 120, 5–53.
2 n Rese
E
G
G
H
H
H
H
H
I
J
L
L
M
M
M
M
M
M
M
M
M
M
94 S. Saha et al. / Precambria
riksson, P.G., Matrins-Neto, M.A., Nelson, D.R., Aspler, L.B., Chiarenzelli, J.R.,Catuneanu, O., Sarkar, S., Altermann, W., Rautenbach, C.J. de W., 2001. An intro-duction to Precambrian basins: their characteristics and genesis. SedimentaryGeology 141–142, 1–35.
upta, S., 2011. Strain localization, granulite formation and geodynamic setting of‘hot orogens: a case study from the Eastern Ghats Province, India. GeologicalJournal, doi:10.1002/gj.1328.
upta, S., Bhattacharya, A., Raith, M., Nanda, J.K., 2000. Contrasting pressure-temperature-deformation history across a vestigial craton-mobile belt bound-ary: the western margin of the Eastern Ghats Belt at Deobhog, India. Journal ofMetamorphic Geology 18, 683–697.
obbs, B.E., Means, W.D., Williams, P.F., 1976. An Outline of Structural Geology. JohnWiley and Sons, Australia.
rouda, F., 1982. Magnetic anisotropy of rocks and its application in geology andgeophysics. Geophysics Survey 5, 37–82.
rouda, F., 1991. Models of magnetic anisotropy variations in sedimentary thrustsheets. Tectonophysics 185, 203–210.
rouda, F., Kahan, S., 1991. The magnetic fabric relationship between sedimentaryand basement nappes in the High Tatra Mts. (N Slovakia). Journal of StructuralGeology 13, 431–442.
rouda, F., Jezek, J., 1999. Magnetic anisotropy indications of deformations asso-ciated with diagenesis. In: Tarling, D.H., Turner, P. (Eds.), Paleomagnetism andDiagenesis in Sediments, vol. 151. Geological Society of London Special Publica-tions, pp. 127–137.
rvine, T.N., Baragar, W.R.A., 1971. A guide to the chemical classification of the com-mon rocks. Canadian Journal of Earth Sciences 8, 523–548.
elinek, V., 1981. Characterization of the magnetic fabrics of rocks. Tectonophysics79, T63–T67.
e Bas, M.J., Le Maitre, R.W., Streckkisen, A., Zanettin, B., 1986. A Chemical Classi-fication of Volcanic Rocks Based on the Total Alkali-Silica Diagram. Journal ofPetrology 27, 745–750.
i, Z.X., Bogdanova, S.V., Collins, A.S., Davidson, A., De Waele, B., Ernst, R.E., Fitzsi-mons, I.C.W., Fuck, R.A., Gladkochub, D.P., Jacobs, J., Karlstrom, K.E., Lul, S.,Natapov, L.M., Pease, V., Pisarevsky, S.A., Thrane, K., Vernikovsky, V., 2008.Assembly, configuration, and break-up history of Rodinia: a synthesis. Precam-brian Research 160, 179–210.
amtani, M.A., Sengupta, P., 2010. Significance of AMS analysis in evaluating super-posed folds in quartzites. Geological Magazine 147, 910–918.
amtani, M.A., Greiling, R.O., Karanth, R.V., Merh, S.S., 1999. Orogenic deforma-tion and its relation with AMS fabric—an example from the southern Aravallimountain belt, India. In: Radhakrishna, T., Piper, J.D. (Eds.), The Indian subconti-nent and Gondwana: a palaeomagnetic and rock magnetic perspective, vol. 44.Geological Society of India Memoir, Bangalore, pp. 9–24.
artins-Neto, M.A., Pedrosa-Soares, A.C., Lima, S.A.A., 2001. Tectono-sedimentaryevolution of sedimentary basins from Late Paleoproterozoic to Late Neopro-terozoic in the São Francisco craton and Aracuaıı fold belt, eastern Brazil.Sedimentary Geology 141–142, 343–370.
iall, A.D., 1990. Principles of Sedimentary Basin Analysis, second ed. Springer-Verlag, New York, N.Y.
oitra, A.K., 1990. Chronologic implications of the stromatolites, microbiota andtracefossils of the Chattisgarh Basin, M.P. Geological Survey of India specialPublication 28, 384–399.
ueller, W.U., Corcoran, P.L., 1998. Late-orogenic basins in the Archean SuperiorProvince, Canada: characteristics and interferences. Sedimentary Geology 120,177–203.
ueller, W.U., Corcoran, P.L., 2001. Volcano-sedimentary processes operating on amarginal continental arc: the Archean Raquette Lake Formation, Slave Province,Canada. Sedimentary Geology 141/142, 169–204.
ukherjee, A., Ray, R.K., 2010. An alternate view on the stratigraphic position of the1 Ga Sukhda Tuff vis-à-vis chronostratigraphy of the Precambrians of the CentralIndian Craton. Journal of Geology 118, 325–332.
ukherji, M.A., Chaudhuri, A.K., Mamtani, M.A., 2004. Regional scale strain vari-
ations in Banded Iron Formations of eastern India: results from anisotropy ofmagnetic susceptibility studies. Journal of Structural Geology 26, 2175–2189.urti, K.S., 1987. Sedimentation in Chattisgarh basin. In: Purana Basins of Peninsu-lar India. Memoir of the Geological Society of India, Memoir of the GeologicalSociety of India, pp. 139–260.
arch 227 (2013) 276–294
Owens, W.H., 1974. Mathematical studies on factors affecting the magneticanisotropy of deformed rock. Tectonophysics 24, 115–131.
Patranabis-Deb, S., 2001. Purana (Proterozoic) stratigraphy and sedimentation inthe eastern part of the Chattisgarh Basin: a fan delta motif. Ph.D. Dissertation,Jadavpur University, Calcutta, 169 pp.
Patranabis-Deb, S., 2004. Lithostratigraphy of the Neoproterozoic ChattisgarhSequence, its bearing on the tectonics and palaeogeography. GondwanaResearch 7, 323–337.
Patranabis-Deb, S., Chaudhuri, A.K., 2007. A retreating fan delta system in the Neo-proterozoic Chattisgarh rift basin, central India: major controls on its evolution.AAPG Bulletin 91, 785–808.
Patranabis-Deb, S., Chaudhuri, A.K., 2008. Sequence evolution in the easternChhattisgarh basin: constraints on correlation and stratigraphic analysis. Pale-obotanist 57, 15–32.
Patranabis-Deb, S., Bickford, M.E.H., Chaudhuri, A.K., Basu, A., 2007. SHRIMP Agesof Zircon in the Uppermost Tuff in Chattisgarh Basin in Central India Require∼500-Ma adjustment in Indian Proterozoic Stratigraphy. Journal of Geology 115,407–415.
Paul, S., 2005. Facies, paleogeographiy and depositional sequence analysis in partsof Meso-to neoproterozoic rocks of Chattisgarh Supergroup, India. UnpublishedPh.D. Thesis, Indian School of Mines, 153 pp.
Pearce, J.A., Norry, M.J., 1979. Petrogenetic Implications of Ti, Zr, Y, and Nb Variationsin Volcanic Rocks. Contributions to Mineralogy and Petrology 69, 33–47.
Ram, B., Singh, N.P., Murty, A.S.K., 2007. A note on the qualitative appraisal of aero-magnetic image of Chhattisgarh basin. Journal of Indian Geophysical Union 11,129–133.
Ramsay, J.G., Huber, M.I., 1987. The Techniques of Modern Structural Geology: Foldsand Fractures., vol. 2. Academic Press, London.
Ratre, K., Waele, B.D., Biswal, T.K., Sinha, S., 2010. SHRIMP geochronology for the1450 Ma Lakhna dyke swarm: Its implication for the presence of Eoarchaeancrust in the Bastar Craton and 1450–517 Ma depositional age for Purana basin(Khariar), Eastern Indian Peninsula. Journal of Asian Earth Sciences 39, 565–577.
Rogers, J.J.W., Santosh, M., 2002. Configuration of Columbia, a Mesoproterozoicsupercontinent. Gondwana Research 5, 5–22.
Santosh, M., 2010. A synopsis of recent conceptual models on supercontinent tec-tonics in relation to mantle dynamics, life evolution and surface environment.Journal of Geodynamics 50, 116–133.
Santosh, M., Zhao, G., 2009. Supercontinent dynamics. Gondwana Research 15,225–227.
Shaw, R.K., Arima, M., Kagami, H., Fanning, C.M., Shiraishi, K., Motoyoshi, Y.,1997. Proterozoic events in the Eastern Ghats Granulite Belt, India: evidencefrom Rb–Sr, Sm–Nd systematics, and SHRIMP dating. Journal of Geology 105,645–656.
Schnitzer, W.A., 1969. Zur Stratigraphy und Lithologic des Nordichen ChattisgarhBeckens (Zentral Indian) Unter Besounderer Beruckcichtigurg von AlgenriffKomplexenx dt. Geol. Ges. 118, 290–295.
Slingerland, R., Harbaugh, J.W., Furlong, K., 1994. Simulating Clastic SedimentaryBasins: Physical Fundamentals and Computer Program for Creating DynamicSystems. PTR Printice Hall, Englewood Cliff, New Jersey, 219 pp.
Stacey, F.D., 1960. Magnetic anisotropy of igneous rock. Journal of GeophysicalResearch 65, 2429–2442.
Tarling, D.H., Hrouda, F., 1993. The Magnetic Anisotropy of Rocks. Chapman and Hall,London.
Upadhyay, D., Raith, M.M., Mezger, K., Hammerschmidt, K., 2006. Mesoproterozoicrift related alkaline magmatism at Elchuru, Prakasam Alkaline Province, SE India.Lithos 89, 447–477.
Walker, R.G., Eyles, C.H., 1988. Geometry and facies of stacked shallow marinesandier upward sequences dissected by an erosion surface, Cardium Formation,Willesden Green, Alberta. AAPG Bulletin 72, 1469–1494.
Windley, B., 1995. The Evolving Continents. Wiley, New York, 526 pp.Yakubchuk, A., 2010. Restoring the supercontinent Columbia and tracing its frag-
ments after its breakup: a new configuration and a Super-Horde hypothesis.
Journal of Geodynamics 50, 166–175.Yavuz, F., 2001. PYROX: a computer program for the IMA pyroxene classification andcalculation scheme. Computer Geoscience 27, 97–107.
Zhao, G., Sun, M., Wilde, S.A., Li, S.Z., 2004. A Paleo-Mesoproterozoic supercontinent:assembly, growth and breakup. Earth-Science Reviews 67, 91–123.