Chapter 2 Instruction Set The MIPS Instruction Set Arithmetic ...
Upload
khangminh22Category
view
5download
0
Claremont CollegesScholarship @ Claremont
CGU Theses & Dissertations CGU Student Scholarship
2012
Technology Use in Higher Education InstructionSammy ElzarkaClaremont Graduate University
This Open Access Dissertation is brought to you for free and open access by the CGU Student Scholarship at Scholarship @ Claremont. It has beenaccepted for inclusion in CGU Theses & Dissertations by an authorized administrator of Scholarship @ Claremont. For more information, pleasecontact [email protected].
Recommended CitationElzarka, Sammy, "Technology Use in Higher Education Instruction" (2012). CGU Theses & Dissertations. Paper 39.http://scholarship.claremont.edu/cgu_etd/39
DOI: 10.5642/cguetd/39
CORE Metadata, citation and similar papers at core.ac.uk
Provided by Scholarship@Claremont
Technology Use in Higher Education Instruction
By
Sammy Elzarka
Claremont Graduate University
2012
© Copyright Sammy Elzarka, 2012 All rights reserved.

APPROVAL OF THE REVIEW COMMITTEE
This dissertation has been duly read, reviewed, and critiqued by the Committee listed below, which hereby approves the manuscript of Sammy Elzarka as fulfilling the scope and quality requirements for meriting the degree of PhD.
Dr. David Drew, Chair Claremont Graduate University
Professor
Dr. Mary Poplin Claremont Graduate University
Professor
Dr. Carl Cohn Claremont Graduate University
Professor
Abstract
Technology Use in Higher Education Instruction
by
Sammy Elzarka
Claremont Graduate University: 2012
The significance of integrating technology use in higher education instruction is undeniable. The
benefits include those related to access to instruction by underserved populations, adequately
preparing students for future careers, capitalizing on best instructional practices, developing
higher order thinking activities, and engaging students whose relationships with technology are
increasingly native, among others. The significance of the current study is based on the fact that
few prior studies focused on the factors that support, or inhibit, the use of educational technology
by faculty in schools of education. The data collection instrument was a survey designed by the
principal investigator based on review of the literature and professional experience. Five
constructs were addressed by the survey: institutional policies, belief in the learning benefits,
efficacy with integrating technology with content, barriers to technology use, and personal uses
of technology. The survey was administered online and targeted 379 full and part time faculty in
schools of education throughout the U.S. A total of 203 faculty members responded which was a
response rate of 53%. Several path analyses were conducted to determine the variables that most
related with the dependent variable, rate of technology adoption for professional instructional
purposes. The variable that had the strongest relationship with the adoption rate for professional
use was the adoption rate for personal use. This held true for all subgroups except part-time and
older faculty. Suggestions for future research include the use of additional data sources to
measure the variables described here. Study of the role of institutional policies in technology
adoption should consider administrator perspectives in addition to those of faculty. Study of
learning benefits should consider students' views in addition to those of faculty. Finally, efficacy
variables should consider perspectives of college leaders and administrators.
v
Acknowledgement
I would like to acknowledge my dissertation committee for the great contributions each member
has made in my professional and educational growth. Dr. Drew, as my committee chair, provided
me with patient guidance and wisdom throughout the research and data collection and analysis
portions of the dissertation effort. His witty sense of humor provided much color to an otherwise
stress-ridden experience. Dr. Poplin provided much needed insights into the operations of teacher
education programs and school management. Her personable demeanor made her a joy to work
with. Dr. Cohn provided lessons that only a seasoned leader could, both during class discussions
and one to one advisement. I can only hope to aspire to the greatness exemplified by these
education leaders.
vi
Table of Contents
Chapter 1 Introduction 1 Statement of Problem 2 Statement of Significance 5 Glossary 11
Chapter 2 Literature Review 14
Introduction 14 Origins of the Diffusion of Innovation Framework 14 History of Technology Use in Education Practices 18 Training Requirements and Implications 20 Adopter Qualities 23 Learning Benefits and Teaching Styles 28 Implementation Environments and Strategies 32 Literature Review Summary 39
Chapter 3 Methodology 43
Introduction 43 Research Questions 43 Instrument 44 Sampling 50 Conceptual Model 51 Analysis 52 Chapter 4 Results 55
Descriptive Statistics 55 Path Analysis 64 Correlations 65 Subgroup Analyses 72 Heuristic Analyses 85 Alternative Path Model 89 Open-ended Survey Responses 92 Chapter 5 Discussion/Conclusion 94 Introduction 94 Barriers 96 Learning Impacts 97 Institutional Policies 102 Personal Use of Technology 105 Self-Efficacy 109 Limitations of Study 111 Suggestions for Future Research 112 References 113 Appendix 119
vii
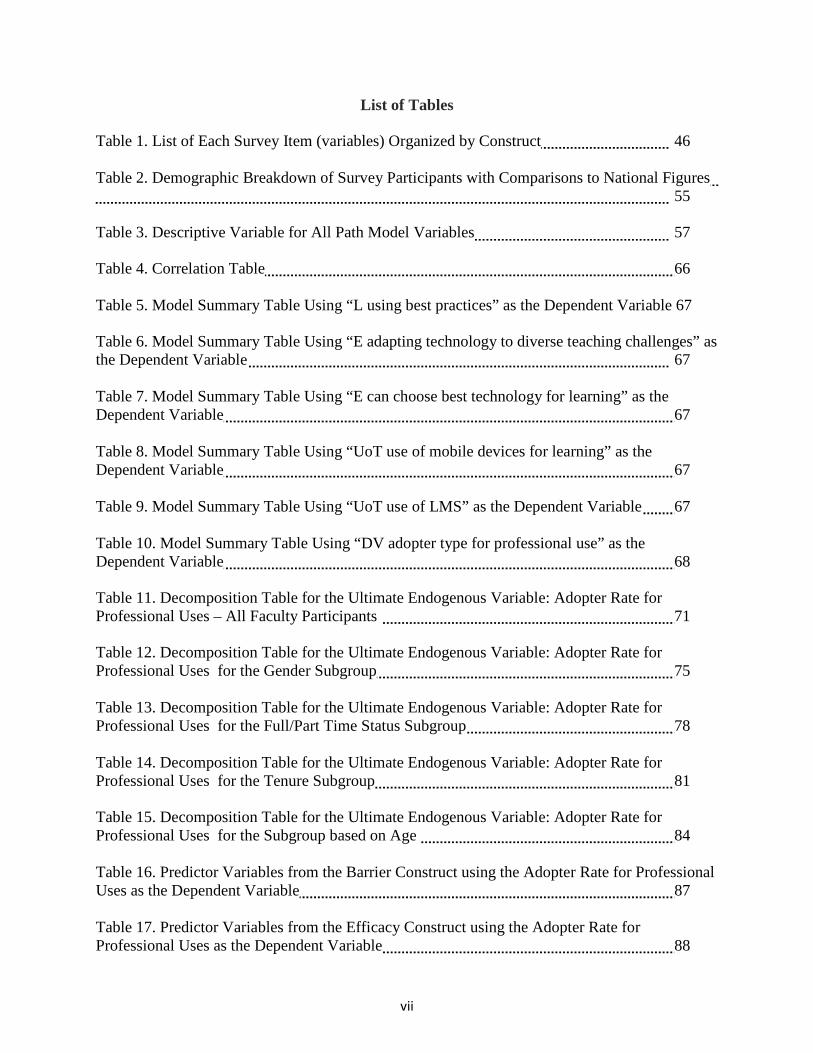
List of Tables
Table 1. List of Each Survey Item (variables) Organized by Construct 46 Table 2. Demographic Breakdown of Survey Participants with Comparisons to National Figures 55
Table 3. Descriptive Variable for All Path Model Variables 57
Table 4. Correlation Table 66 Table 5. Model Summary Table Using “L using best practices” as the Dependent Variable 67
Table 6. Model Summary Table Using “E adapting technology to diverse teaching challenges” as the Dependent Variable 67 Table 7. Model Summary Table Using “E can choose best technology for learning” as the Dependent Variable 67 Table 8. Model Summary Table Using “UoT use of mobile devices for learning” as the Dependent Variable 67 Table 9. Model Summary Table Using “UoT use of LMS” as the Dependent Variable 67 Table 10. Model Summary Table Using “DV adopter type for professional use” as the Dependent Variable 68
Table 11. Decomposition Table for the Ultimate Endogenous Variable: Adopter Rate for Professional Uses – All Faculty Participants 71
Table 12. Decomposition Table for the Ultimate Endogenous Variable: Adopter Rate for Professional Uses for the Gender Subgroup 75 Table 13. Decomposition Table for the Ultimate Endogenous Variable: Adopter Rate for Professional Uses for the Full/Part Time Status Subgroup 78 Table 14. Decomposition Table for the Ultimate Endogenous Variable: Adopter Rate for Professional Uses for the Tenure Subgroup 81
Table 15. Decomposition Table for the Ultimate Endogenous Variable: Adopter Rate for Professional Uses for the Subgroup based on Age 84 Table 16. Predictor Variables from the Barrier Construct using the Adopter Rate for Professional Uses as the Dependent Variable 87 Table 17. Predictor Variables from the Efficacy Construct using the Adopter Rate for Professional Uses as the Dependent Variable 88
viii
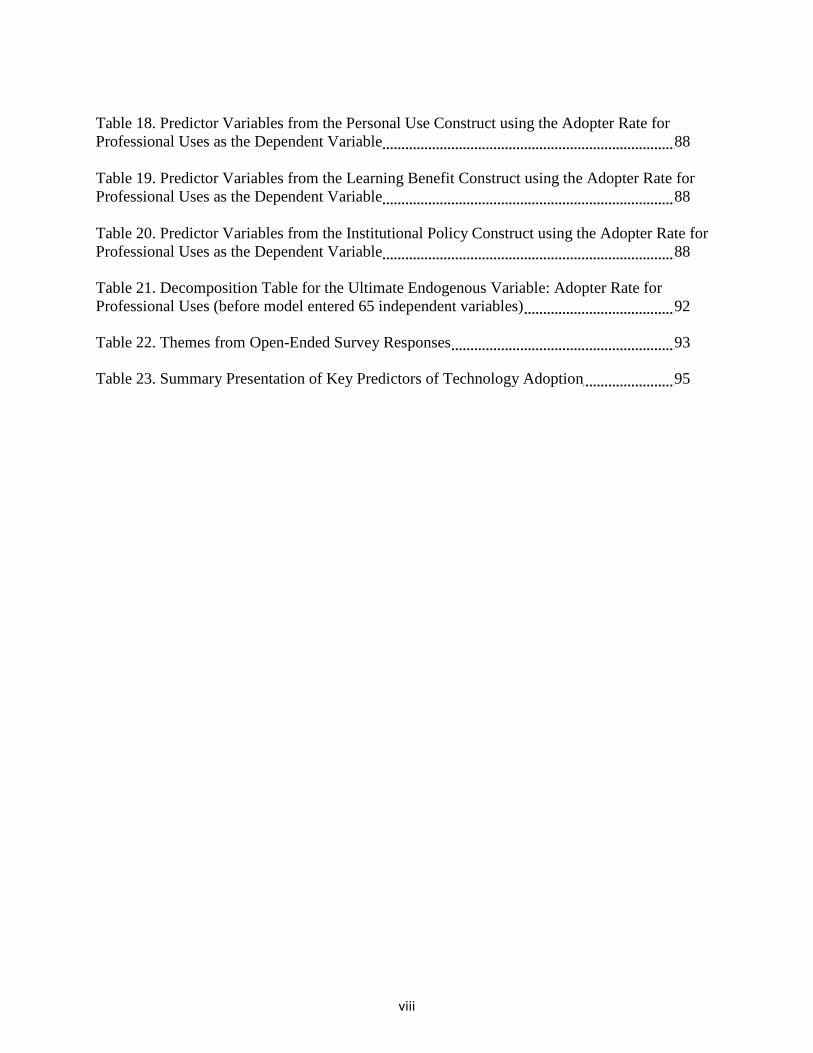
Table 18. Predictor Variables from the Personal Use Construct using the Adopter Rate for Professional Uses as the Dependent Variable 88 Table 19. Predictor Variables from the Learning Benefit Construct using the Adopter Rate for Professional Uses as the Dependent Variable 88 Table 20. Predictor Variables from the Institutional Policy Construct using the Adopter Rate for Professional Uses as the Dependent Variable 88
Table 21. Decomposition Table for the Ultimate Endogenous Variable: Adopter Rate for Professional Uses (before model entered 65 independent variables) 92
Table 22. Themes from Open-Ended Survey Responses 93
Table 23. Summary Presentation of Key Predictors of Technology Adoption 95
ix
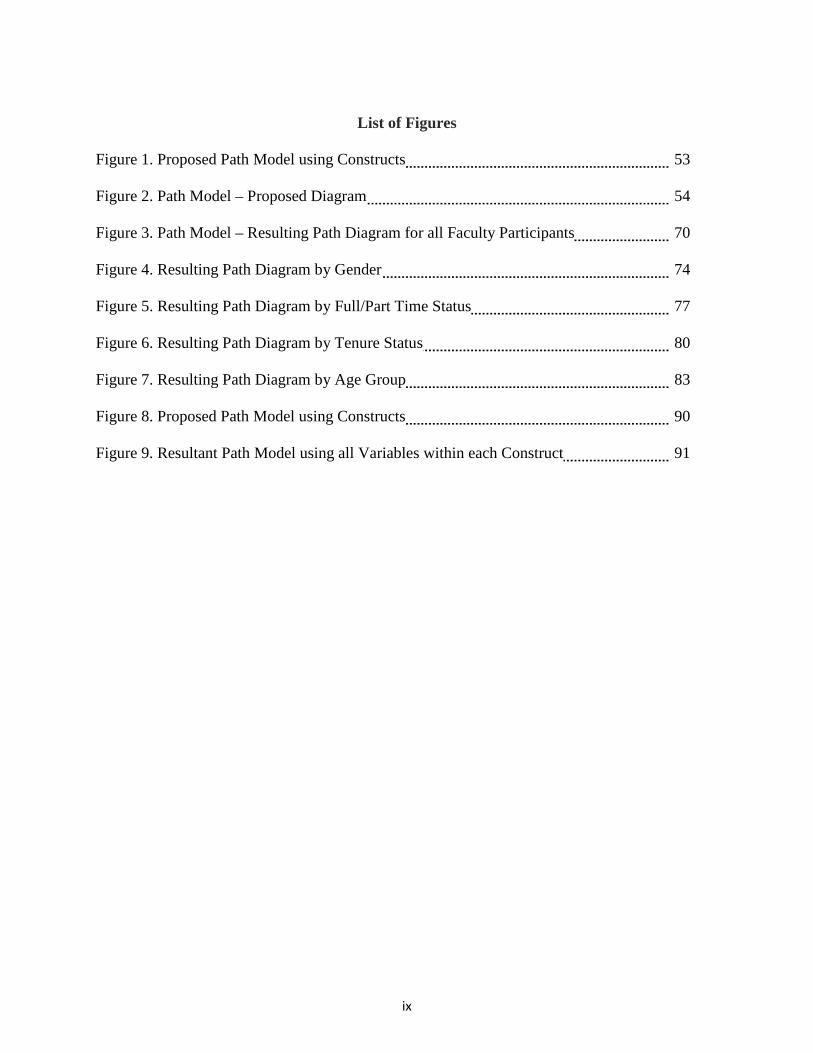
List of Figures Figure 1. Proposed Path Model using Constructs 53 Figure 2. Path Model – Proposed Diagram 54 Figure 3. Path Model – Resulting Path Diagram for all Faculty Participants 70 Figure 4. Resulting Path Diagram by Gender 74 Figure 5. Resulting Path Diagram by Full/Part Time Status 77 Figure 6. Resulting Path Diagram by Tenure Status 80 Figure 7. Resulting Path Diagram by Age Group 83 Figure 8. Proposed Path Model using Constructs 90 Figure 9. Resultant Path Model using all Variables within each Construct 91
1
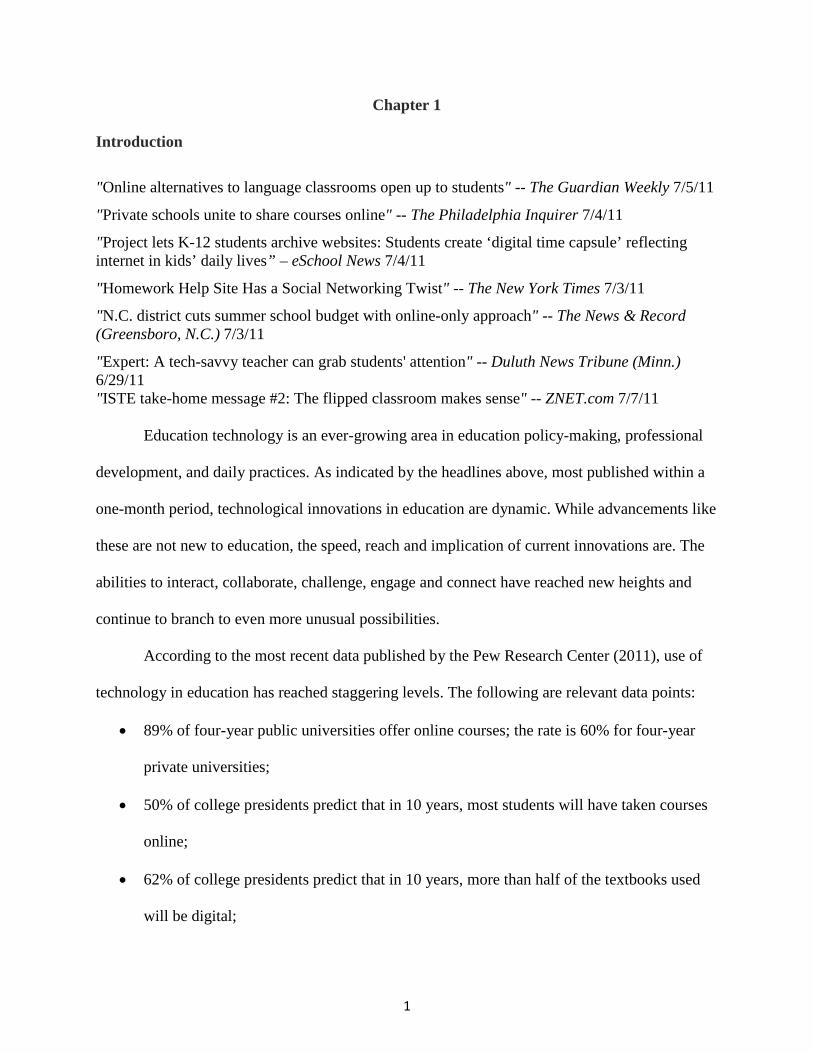
Chapter 1
Introduction
"Online alternatives to language classrooms open up to students" -- The Guardian Weekly 7/5/11
"Private schools unite to share courses online" -- The Philadelphia Inquirer 7/4/11
"Project lets K-12 students archive websites: Students create ‘digital time capsule’ reflecting internet in kids’ daily lives” – eSchool News 7/4/11
"Homework Help Site Has a Social Networking Twist" -- The New York Times 7/3/11
"N.C. district cuts summer school budget with online-only approach" -- The News & Record (Greensboro, N.C.) 7/3/11
"Expert: A tech-savvy teacher can grab students' attention" -- Duluth News Tribune (Minn.) 6/29/11 "ISTE take-home message #2: The flipped classroom makes sense" -- ZNET.com 7/7/11
Education technology is an ever-growing area in education policy-making, professional
development, and daily practices. As indicated by the headlines above, most published within a
one-month period, technological innovations in education are dynamic. While advancements like
these are not new to education, the speed, reach and implication of current innovations are. The
abilities to interact, collaborate, challenge, engage and connect have reached new heights and
continue to branch to even more unusual possibilities.
According to the most recent data published by the Pew Research Center (2011), use of
technology in education has reached staggering levels. The following are relevant data points:
• 89% of four-year public universities offer online courses; the rate is 60% for four-year
private universities;
• 50% of college presidents predict that in 10 years, most students will have taken courses
online;
• 62% of college presidents predict that in 10 years, more than half of the textbooks used
will be digital;
2
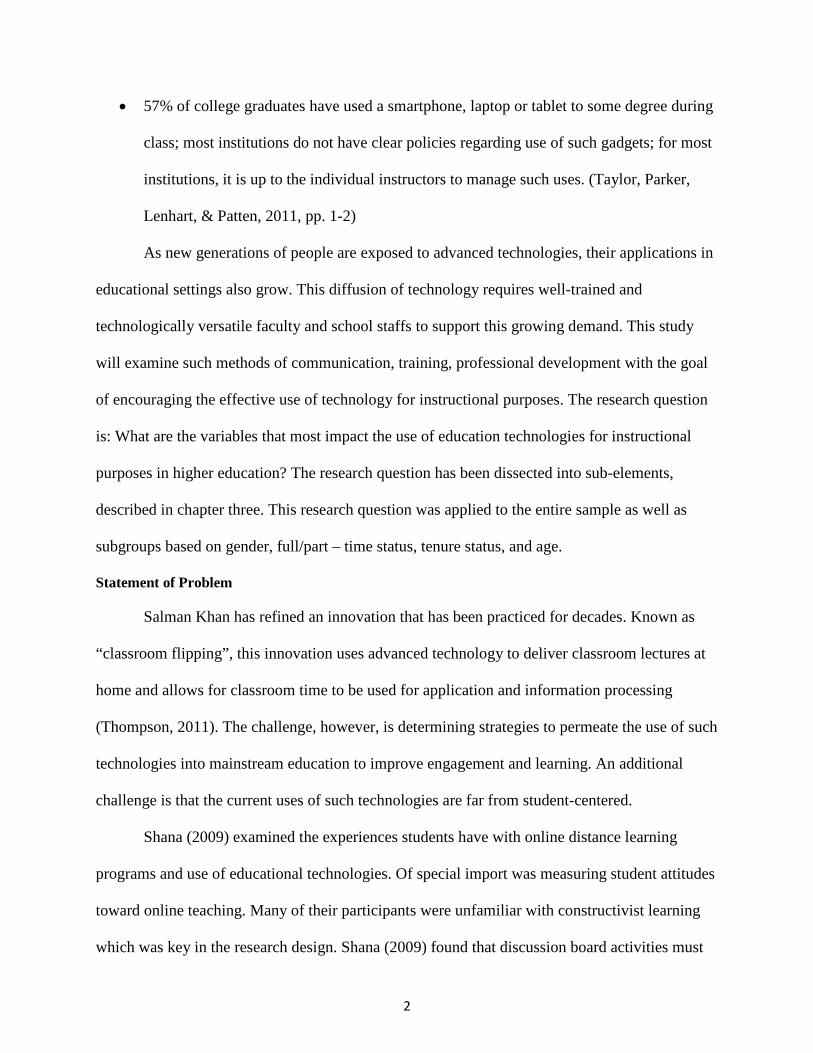
• 57% of college graduates have used a smartphone, laptop or tablet to some degree during
class; most institutions do not have clear policies regarding use of such gadgets; for most
institutions, it is up to the individual instructors to manage such uses. (Taylor, Parker,
Lenhart, & Patten, 2011, pp. 1-2)
As new generations of people are exposed to advanced technologies, their applications in
educational settings also grow. This diffusion of technology requires well-trained and
technologically versatile faculty and school staffs to support this growing demand. This study
will examine such methods of communication, training, professional development with the goal
of encouraging the effective use of technology for instructional purposes. The research question
is: What are the variables that most impact the use of education technologies for instructional
purposes in higher education? The research question has been dissected into sub-elements,
described in chapter three. This research question was applied to the entire sample as well as
subgroups based on gender, full/part – time status, tenure status, and age.
Statement of Problem
Salman Khan has refined an innovation that has been practiced for decades. Known as
“classroom flipping”, this innovation uses advanced technology to deliver classroom lectures at
home and allows for classroom time to be used for application and information processing
(Thompson, 2011). The challenge, however, is determining strategies to permeate the use of such
technologies into mainstream education to improve engagement and learning. An additional
challenge is that the current uses of such technologies are far from student-centered.
Shana (2009) examined the experiences students have with online distance learning
programs and use of educational technologies. Of special import was measuring student attitudes
toward online teaching. Many of their participants were unfamiliar with constructivist learning
which was key in the research design. Shana (2009) found that discussion board activities must

3
be learner-centered and linear type learning must be carefully designed and implemented for
high engagement. Additionally, Shana (2009) observed the need for complete resource offerings
online. For example, course syllabi, study guides, activity expectations, among others, should be
well-organized and accessible to the digital native students. Similarly, Razzeq and Heffernan
(2009) examined the differences in learning using educational technology compared with
traditional methods. The emphasis here, however, was on treatment of homework assignments.
Using a counterbalance experimental design, Razzeq and Heffernan (2009) found that the online
homework group showed higher gains in learning than the paper-pencil homework group.
Additionally, engagement was also higher with the online group. Since the online program used
in this study was designed to be tutor-based and aligned with learning theories, it would be
instructive to explore these tutor designs further.
Chuang and Chen (2009) also studied the use of computer technology for instructional
purposes. Using an experimental design, they examined the merits of computer-assisted
instruction (CAI) as compared with computer-based video games designed to promote learning.
They found that the video game activities produced better results than the CAI activities in the
areas of recall, strategic skills, problem-solving and higher level cognitive processes. No
significant difference was found with judgment-related tasks such as identifying similarities and
differences. Similar to the study by Razzeq and Heffernan (2009), deeper exploration of the
designs of online instruction programs and the merits of their individual characteristics would be
instructive.
An emphatic case for using and teaching educational technologies has been made by both
Aworuwa, Worrell, and Smaldino (2005) and Smith and Robinson (2003). While varying
reasons were described, both studies identified the need for teacher preparatory programs to
4
work harder to meet minimum technology standards. Several technology-based strategies were
found to be effective as an alternative to field experience placements as well as in tapping into
students' strengths and learning styles (Aworuwa et al., 2005). Smith and Robinson (2003)
discussed the risks assumed by teacher preparatory program of not deeply integrating technology
uses. Technology competent and eager teachers and teacher candidates who do not find support
and encouragement may leave teaching altogether for more technology─supportive fields. For
other teacher candidates, it was found that they became frustrated with their lack of technology
skills and the faculty’s. Successful integration of technology requires collaboration, rapport
building and development of self-efficacy (Smith & Robinson, 2003). Additionally, partnerships
among teacher preparatory programs and K-12 schools should be cognizant of these
characteristics (Aworuwa et al., 2005).
Bybee and Starkweather (2006) argue for the imperative need to address future workforce
needs. Similar to Manning and Carpenter (2008), they identify global competitiveness as a major
impetus for improving technology use and training for grade school students. Similar arguments
can be made about those in higher education. Teacher preparatory programs have an integral role
in facilitating such innovation application. Bybee and Starkweather (2006) indicate that quality
teaching will rely more heavily on advancements of technology proficiency. Additionally,
Manning and Carpenter (2008) describe the need for teacher preparatory programs to integrate
technology use and instruction deeply throughout, rather than isolate them in one or two courses.
Higher education accreditation also holds high standards in technology instruction (National
Council for Accreditation of Teacher Education, 2001). Competencies such as problem-solving,
ability to reason, and critical evaluation are especially important for technology use and
instruction (Bybee & Starkweather, 2006).
5
Statement of Significance
The study of educational technology is significant for several reasons. It has been well-
established, as described in the next chapter, that use of current technologies for instructional
purposes has great impact on the following: student engagement, learning styles, student-faculty
interactions, faculty satisfaction, demands for technology use as well as learning outcomes.
These themes as well as the conceptual framework are discussed below.
The significance of Diffusion of Innovation (DOI) in higher education instruction has
been established by many studies examining a variety of dependent variables. These variables
include academic performance, cost, satisfaction, among others. Two such studies are described
here and both used the meta-analysis methodology. The first, by Means, Toyama, Murphy, Bakia
and Jones (2009), was published by the U.S. Department of Education. The purpose of this study
was to determine the extent to which online or technology-based methods were used to deliver
classroom instruction. While the intent of this meta-analysis was to focus on K-12 instruction,
too few studies met the criteria for inclusion. Therefore, several studies examining higher
education instruction were included. The findings of this study clearly indicate the importance of
this type of research. Instruction that combined online with face-to-face methods produced better
academic performance than that which was purely online or purely face-to-face. While this was
the most important finding in this study, other findings added value. For example, Means et al.
(2009) also found that the specific tools used as part of online instruction did not produce
variations in outcomes. While the inclusion criteria included studies that examined web-based
tools, the specific characteristics or manufacturers of these tools had little impact. Means et al.
(2009) described the need to improve our understanding of education technologies and how to
promote their use.

6
Projections for demand of technology-competent instructors at all levels are staggering.
The authors suggest that web-based forms of instruction will grow at rates far beyond all other
technology advancements of the past (televisions, audio recording, among others). Birch,
Greenfield, Janke, Schaeffer, and Woods (2008) describe the importance of technology-based
information literacy with reference to national accreditation standards. Among the six National
Council on Accreditation of Teacher Education standards, four delineate technology
competencies (NCATE, 2002). These include locating, evaluating and using technology─derived
information, the integration in planning and delivery of meaningful technology in instruction,
and use of technology-based professional development. Birch et al. (2008) identified the
requisite technology instruction in teacher preparation programs to elicit such meaningful
technology in K-12 classrooms. Additionally, when shifting to a technology-intense preparation
program, teacher candidates' skills evolved from retrieve and read to sophisticated uses of
technology and information literacy (Birch et al., 2008).
Shoffner (2009) describes the imperative for teacher preparation programs to provide
training in uses of education technologies. This must be achieved at multiple levels, including
academic, personal and pedogagic levels of technology use. The benefits include opportunities
for reflective thinking and expression, as well as engagement with peers (Shoffner, 2009).
The academic challenges of using education technologies include assessment and
advising. The strengths are training, support, instructional designs, student satisfaction, student
completion, and student retention. Regarding training, 53% of higher education institutions
(HEI's) mandate technology training. The average duration of such trainings is 27 hours (Green,
2009). Recent growth in uses of educational technology indicates a 37% to 65% rise in recent
years (Means et al., 2009). Zhao, Alexander, Perreault, Waldman, and Truell (2009) have
7
indicated that 52% of public universities and colleges use two-way audio and video technologies
as part of their instructional programs. In their study, it was clear that students found such
technologies as productivity enhancers.
Archambault and Crippen (2009) have profiled the differences between those who teach
through online means and traditional means. Among the many benefits identified by online
teachers, student honesty was primary. These teachers described the lack of face-to-face
interaction as lending to more openeness by students. Similar to Razzeq and Heffernan (2009),
Archambault and Crippen (2009) also observed that teachers who had strong grasps of their
instructional content made an easier transition to use of online technologies for teaching.
Projections of demand for online teaching are staggering. By 2019, it is expected that
50% of all high school courses will be offered online (Archambault & Crippen, 2009).
Additionally, Means et al. (2009) have found that particular types of knowledge are better
learned through online delivery methods. For example, declarative knowledge outcomes were
better with online learning methods. Also, the authors described asynchronous discourse as more
conducive to self-reflection and deeper thinking.
Over 60% of HEI’s have reorganized, or plan to reorganize, IT units within two years.
While the demand for innovative, instruction-focused technologies continues to rise, the demand
for computer labs is declining. Use of e-portfolios has increased from 22% in 2004 to 43% in
2009 of higher education institutions. Additionally, 70% of HEI’s believe e-textbooks will be an
important part of technology planning within five years. Use of learning management systems is
approaching 60% of HEI's. The availability of wireless classrooms approaches 80% (Green,
2009). Lee and Rha (2009) describe the educational technology movement as an important
paradigm shift.

8
Often, use of educational technology tools involves distance between instructor and
learner. This spatial separation is a difficult concept for those trained to use traditional pedagogy.
Lee and Rha (2009) advance the concept that a well-structured and cohesive online program can
compensate for this spatial distance. This is especially true with skills based on understanding,
memorization, and recall of ideas without analysis. With critical thinking challenges, however,
such compensation has not been observed (Lee & Rha, 2009). They suggest deeper research on
the nature of the interaction structure as related to achievement.
An additional study examining the significance of DOI was conducted by Shacher and
Neumann (2010). This was a meta analysis of studies published between 1991 and 2009. The
focus was on distance education (DE) in higher education. The authors attempted to measure
students' attitudes toward DE, student-instructor interactions, student learning outcomes, and
faculty satisfaction. Their findings were based on comparisons between DE students and those in
face-to-face settings. DE students were found to outperform those in face-to-face classrooms on
learning outcome measures. The authors predict this gap in performance will widen over time.
The basis for this prediction is the evaluation of the innovations currently available. DE
strategies of the past were more limiting, pedagogically, than those based on the interactive and
collaborative capabilities of current technology advancements. Shacher and Neumann (2010)
suggest that future research focus on the various delivery models (synchronous vs.
asynchronous) and whether differences exist among particular disciplines.
The top two most important issues in IT are network upgrades and financing. The next
three issues include distance education instructional integration and user support. Distance
education is a priority because of rising enrollments and the new role of IT in the infrastructure
of online instructional programs (Green, 2009). Paechter, Maier, and Macher (2009) explored the

9
views of students toward e-learning with instruments measuring attitudes and achievement.
While achievement was self-reported, they did find a correlation of r=0.6 between self perceived
achievement and actual achievement. Success factors regarding e-learning were more
pedagogy─related than technology driven. Also important were the needs for autonomy, mastery
and purpose of e-learning activities. Paechter et al. (2009) suggest that highly structured
technology training for instructors will allow the benefits to manifest.
The trend toward globalization of all industries, including higher education, warrants
thought and planning in the area of technology-driven, distance education. Competition among
higher education institutions, revenue sources, and relevance for digital natives are all factors
that demand education technologies. Cultural characteristics, at the macro, societal level, as well
as the micro, institution level also place demand on faculty to adapt to current methods for
communication and relating with others. Among the micro adaptations is the need to match the
advancements in the administrative services with curriculum delivery at an institution (Sadykova
& Dautermann, 2006). While Martinez, Liu, Watson and Bichelmeyer (2006) agree with
Sadykova and Dautermann (2006) regarding the significant factors of use of education
technologies, they make one addition. The reputation of the institution was identified as
important and defined as providing innovative research and development opportunities for both
faculty and students.
The availability of computers in classrooms has increased four-fold within the past
decade. Classroom technologies have been focused on easing teacher workload such as through
use of online assessments and record-keeping. To capitalize on the positive impact such
technologies can have on student achievement, they must be authentically integrated into daily
instruction (Kopcha, 2010). In 2005, nearly all large higher education institutions offered some

10
online course delivery. Enrollment in online courses has been on a sharp incline since. It is
suspected that institution size is an important factor in the effective use of education technology
(Chen, 2005). While Saeed, Yang, and Sinnappan (2009) examined the role of learning styles in
achievement, they found technology preferences as having a much greater impact. They suggest
that current students are far more flexible with learning styles than those of the past. Since the
focus of their study was students in IT fields, they suggest examining similar variables in non-
science-based disciplines.
Foulger and Williams (2007) have been critical of teacher preparation programs for
addressing technology standards in a single, stand-alone course. Rather, they advocate a more
integrated design where technology has an integral role in delivering core content. They also
identified the importance of collaboration in maintaining effective use of new technology
practices. Similarly, Nicholas and Ng (2009) examined engagement, collaboration and learning
within online environments. They used a mixed methods design and found that the relationship
with the instructor was pivotal in successful online learning experiences. As facilitators,
instructors can create a spotlight venue for students which increases motivation and engagement.
This involves the expectation that student artifacts will be made, at least partially, public.
Nichols and Ng (2009) suggest that students be given opportunities to explore education
technology tools to make transitions in learning methods more successful. Santilli and Beck
(2005) have found that faculty who have embraced use of education technologies laud their
abilities to create student communities and opportunities to provide meaningful feedback. They
suggest examining similar variables within all sub-disciplines of education. Peluchette and Rust
(2005) indicate the need to further study the technology preferences of faculty and how those
lead to more effective adoption.
11
It is clear through these studies that DOI is a critical component of education reform and
the future trends of education culture in the U.S. This research endeavor will attempt to
contribute to the DOI body of knowledge by examining strategies that are most successful in
recruiting faculty participation in innovative instructional models. This will provide clear
strategies for training, compliance, and professional growth in DOI. A faculty engaged in DOI
will enhance students' engagement, thus better preparing them for future professional demands.
The research question for the current study is: What are the variables that most impact the use of
education technologies for instructional purposes in higher education?
To assist in understanding the terminology and reference to the conceptual models, a list
of definitions has been provide:
Glossary
The current study examined the use of terminology specific to the conceptual framework as well as to technology tools used for educational purposes. To enhance clarity, below are definitions of key terms referenced throughout this study:
personal use of technology – use of any technology tools for personal reasons; such tools might include personal uses of email, social media, sharing of photos and videos with friends and family, etc.
learning benefits – the benefits of using education technology tools regarding student learning; measurement of these variables are based on faculty’s self-reported beliefs
efficacy – the self-reported competency of faculty members regarding teaching of discipline content and the use of technology for instructional purposes
institutional policy – policies of institutions related to the use of education technologies; examples include training, professional development, rewards, workload management, among others
barriers – factors that inhibit the use of education technologies
education technology – the instructional uses of technology tools; these can include software, hardware, web-based resources; examples are podcasts, laptops, netbooks, smartphones, tablet computers, course management systems, learning management systems, among others
12
exogenous variable – in path analysis, these variables have impacts on other variables but are not impacts by any; these variables send arrows while not receiving any
endogenous variable – in path analysis, these variables are impacted by other variables in the path model; these variables receive arrows;
intermediate endogenous variable – these variables help measure indirect relationships in path analysis; they are both impacted by some variables in the model while impacting others in the model; these variables receive and send arrows
mobile technology – any technology tool that is portable; examples are laptops, tablets, smartphones, among others
LMS – learning management system
CMS – course management system
adopter rate – the rate at which a user adopts newly released technologies;
DOI – diffusion of innovation; this is the theoretical framework in the current study
blog – a website on which an individual or group of users record opinions, information, etc. on a regular basis wiki – a website developed collaboratively by a community of users, allowing any user to add and edit content
Chapter two will examine in more depth the body of knowledge on this topic.
Specifically, research studies addressing the following factors will be analyzed: origins of the
DOI framework, history of education technology use and development, training factors,
technology adopter qualities, learning and teaching elements, and technology implementation
strategies. Chapter three will describe the methodology used for the current study, including an
overview of the conceptual model. Chapter four provides the results of the data collection and
analysis efforts. Included are descriptive and inferential statistical analyses. The conceptual
model described in chapter three is applied to the entire sample of the study as well as to various
subgroups. Chapter five describes the implications of the findings from chapter four in

13
accordance with the constructs of the study. The appendix includes the data collection
instrument.
14
Chapter 2
Literature Review
Introduction
A review of prior studies and literature was conducted to help identify the emergent
themes regarding the integration of technology use in higher education. The areas covered
include the origins of the DOI framework, the history of technology use in education, training
requirements and implicatrions, adopter qualities, learning benefits and teaching style, and
implementation environments and strategies.
Origins of the Diffusion of Innovation Framework
Technological advancements in education have been vast, innovative and customer-
oriented. While most education professionals would agree with this statement, virtually none
would agree that the field has seen unanimous adoption of an innovation upon its release. This
DOI has many elements and requirements. This paper will explore this DOI theoretical
framework as well as its uses and advancement in many education contexts.
Everett Rogers founded the DOI concept five decades ago. While he founded this concept
in an agricultural setting, the theory has been infused into many fields, including medicine,
political science and education. There are four elements to the diffusion of Innovation (DOI)
theoretical framework. These are the innovation, communication channels, time passage and the
social system. The term innovation has been defined as an idea, practice or object that is
perceived as new to a member or members of a social system. This term is often used
synonymously with technology which is described as the design for an instrumental action that
clarifies the relationship between cause and effect regarding a desired goal. Technology often has
15
two components, hardware and software, and can often consist of clusters where multiple
components are seen as closely related (Rogers, 2003).
Living on a midwestern farm, Rogers was interested in agricultural studies. He earned his
bachelor's, master's, and PhD degrees from Iowa State University where there was an emphasis
on rural sociology. Because there had been diffusion studies conducted by leaders there, Rogers
was able to explore this framework with expert guidance. A primary research question examined
the reasons that some farmers adopted innovations while others lagged, even if the advantages
were indisputable. Studying this resistance was the crux of his graduate work (Baker & Singhal,
2005).
As Rogers' diffusion interests broadened, he delved into the dynamics of adoption in
fields other than agriculture. Medical practices and education were included in this interest list.
His work culminated in the 1962 version of the book Diffusion of Innovation. This text helped
promote action research and broad improvements in many disciplines. It was immediately
popular on the international stage. It is currently the second most cited text in social science
(Baker & Singhal, 2005). This research work was accepted as authoritative in technology
adoption studies. The current version of the text includes the massive impact by the internet on
communication (Rogers, 2003).
Rogers held faculty positions in six large universities, earning several coveted awards for
his pioneering research (Baker & Singhal, 2005).
Innovations have been described by Rogers (2003) as having five key characteristics.
These are:
• Relative advantage – the degree to which an innovation is perceived as being superior to
one that it replaced;
16
• Compatibility – the degree to which an innovation is perceived as being consistent with
the existing values, experiences and needs of potential users;
• Complexity – the degree to which an innovation is perceived as being difficult to
understand or use;
• Trialability – the degree to which an innovation may be experimented with; and
• Observability – the degree to which the results of an innovation are visible to others.
Understanding the factors that influence the rate of innovation adoption is critical to the DOI.
Relative advantage and compatibility are viewed as being the most important of the
characteristics to the rate of innovation adoption (Rogers, 2003).
Communication channels are used for the transmission of information about an
innovation’s value and use. Early adopters tend to be more explorative with innovations and
therefore rely more on objective, scientific information about them. Late adopters however rely
more on others and their subjective evaluations who have adopted an innovation. Potential
adopters are more likely to trust such evaluations from those they see as similar to themselves,
known as homophilous groups. However, in a social system, heterophily is required since those
who are alike tend to have the same level of exposure and relationships with innovations
(Rogers, 2003).
Time passage is required for DOI. The innovation-decision process is the process through
which an individual passes from knowledge to the decision of whether to adopt or reject an
innovation. The steps involved with this innovation-decision process are knowledge, persuasion,
decision, implementation and confirmation. The process is driven by information-seeking and
processing. These steps must happen in the sequence described for an adoption to remain
17
(Rogers, 2003). Without sufficient time passage, this process will be disrupted and is not
sustainable. The ideal duration of time depends on a variety of factors.
The social system is the context within which innovation-decisions are made. Change
agents are critical in this process since they promote such innovations and use many techniques
to achieve DOI. There are three type of decisions that can be made:
• Optional innovation-decisions – innovation adoption choices made by an individual
independent of others in the social system;
• Collective innovation decision – innovation adoption choices made by consensus where
all in the social system conform; and
• Authority innovation-decisions – innovation adoption choices made by a few who have
power or technical prowess to enforce and others in the social system cannot do much to
change such a decision.
A fourth type of decision is called contingent and is an amalgam of two or three of the other
types. As far as rate of adoption, authority-based decisions produce the fastest (Rogers, 2003).
The social system is also concerned with the consequences of innovation decisions. The
following three type of consequences have been identified:
• Desirable-undesirable – dependent on functionality of innovation; • Direct-indirect – dependent on whether the innovation’s effect is first order or beyond;
and • Anticipated-unanticipated – dependent on whether the innovation’s effect is intended.
These DOI elements have been studied and the theory advanced as a whole through research in a
diversity of settings.

18
History of Technology Use in Education Practices
While some revolutions can be abrupt and pivotal, others are gradual and evolutionary.
Technological advances in the field of education have roots thousands of years in history.
Communication was primarily oral 2,500 years ago, wherein memorization was the only way to
pass along knowledge and skills. The advent of written records caused concerns, even then,
among scholars. A troubling question was whether the written record would diminish the need
for human memory (Fahmy, 2004).
A second revolution within the education discipline was the formation of campus life
where students and scholars share space and resources. This new education community led to
campus infrastructure which supports scholarship in a variety of ways (Fahmy, 2004). This
support has likely led to adoption of practices from other disciplines. For example, the use of
hypertext technology in 1940 military training helped the advent of presentation technologies
used in the 1950’s. Through the 1970's and 1980's, telecourses have gained popularity as part of
the distance learning movement. The new demands for higher education training and the
diversification of the student population have been primary factors in this movement.
Telecourses added television to the print media materials already used in correspondence
courses. The populations served with this technological advancement include adult learners who
cannot commit to campus life as well as those seeking enrichment as opposed to comprehensive
degree programs.
While popular, these advancements had critics. Those who believe in the traditional
classroom environment insisted that learning and scholarship would be compromised. Those
espousing such critiques were overwhelmed by the students and other market demands for
alternatives to the traditional learning system. An important challenge to higher education
19
service providers posed as a question was (this question remains relevant today), "Will we use
and control it, or will we ignore and lose it to other providers?" (Voegel, 1986, p.59). Also in the
1970’s, computer-based instruction had started its journey. Again, with roots in military
innovation, those computer-driven devices were used for instructional diagnoses and engagement
(Educational Technology, 2011). Additional benefits of computer-driven instruction include test
preparation, computer-adaptive testing for accurate diagnosis, and providing immediate learning
feedback to students (Rounds, Kanter, & Blumin, 1987). Further, computer technology
advancements have also allowed virtual conferencing where much collaboration work can be
accomplished among people in different parts of the world (Southworth, Knezek & Flanigan,
2003). By the 1990’s, the World Wide Web (WWW) had allowed for yet further advancements
in technology use in education practices. In addition to computer-driven instruction, the WWW
has allowed for computer-mediated instruction, as well. This allows the relationship between
instructors and learners to remain direct while making use of the latest technologies to augment
the learning experience (Educational Technology, 2011).
Additionally, the open-source information movement has been an integral aspect of DOI
in education practices. This movement began in the 1970’s when Richard Stallman, a researcher
with MIT, requested the programming code to a printer from Xerox to fix a persistent paper jam
problem. When Xerox firmly refused, Stallman became infuriated and began a free-open-source
movement with his GNU Project, an open operating system. Mimicking the cultures of the
scientific and higher education communities, he insisted on creating a transparent and
collaborative environment in information technology. David Wiley built on the work of Stallman
in the late 1990’s by creating a system of learning objects. This allowed the integration of open-
source capabilities into education scholarship (Wiley & Gurrell, 2009).

20
With such deep history, education technology is ever-evolving. It is difficult to identify a
starting point of this innovation and it is clear we remain in the midst of further growth and
possibilities. The next challenges in the use of education technologies include the need to
maintain communities among people separated by large distances, minimizing cultural and
generational gaps in knowledge and resources as well as ensuring scholarship quality and
accountability.
Training Requirements and Implications
Samarawickerma and Stacey (2007) examined the adoption of learning management
systems in a multi-campus university in Australia. Several elements of the diffusion of
innovation (DOI) theoretical framework were explored. Also referenced was the actor-network
theory. Six campuses were included with 22 participants chosen based on use of web-based
approaches for on and off campus learners. While some participants had used web-based
teaching tools prior to the study, the innovation was the tool used at this institution following a
university-designed training protocol. Data sources included in-person interviews with
participants, examination of teaching artifacts and field notes describing participants and their
teaching materials. Of particular interest were university technology policies and the
maintenance and support of technology resources.
The findings produced a profile of the impact of the university environment on faculty
behavior. This profile included management of faculty time and workload, funding for the
additional technology-related tasks and the propensity for learning new things. Within this
framework, the authors concluded that university policies regarding technology use impacted
faculty action. To facilitate technology adoption, such policies need to be adaptive, must address
on-going needs for professional development, training and mentoring and must be driven by
21
clear visions and expectations. Santilli and Beck (2005) set out to help identify creative reward
systems to encourage the adoption of technology by graduate level faculty. Their participants
were doctoral study faculty members using a common learning management system. A survey
including both quantitative and qualitative items was used with all participants. They found that
much of online course faculty's time was spent on question and answer sessions as well as on
mediating online discussions among students. Among the benefits of online instruction identified
by these faculty were student-to student interactions and the venue for providing feedback to
students. The discussions boards built learning communities comprised and led by students.
Santilli and Beck (2005) determined that the use of learning management system technologies
help to focus on individual student needs. They suggest that future studies on this topic devote
energy on matters of student work authenticity, learning assessment as well as examining faculty
with more diverse backgrounds. Successful implementation of technology must be holistic,
addressing issues regarding pedagogy, copyright, formative evaluation and learning approaches.
Peer pressure was found to be important. Robust training increases user confidence which
increases technology adoption (Samarawickerma and Stacey, 2007).
Bennett and Bennett (2003) explored characteristics of educational technology that
impact faculty adoption. This was done through the design and deployment of a faculty training
program aimed at encouraging use of the course management software (CMS). With this focus
on improving DOI, the authors used surveys to collect data on several constructs. The findings
suggest that the training program enhanced each of the constructs of interest including faculty’s
sense of technology efficacy, positive attitudes towards computers and plans to use computers to
facilitate student learning.
22
As with Santilli and Beck (2005), Jones and Laffey (2000) identified the importance of
training support and a rewards system to encourage the use of education technology. Their study
included 16 MBA students and data were collected through observation and a series of surveys.
The foci of this study were on the impact of collaborative technologies on student learning and
factors promoting DOI. The authors suggest that collaborative technologies may help counter the
individualistic environments that permeate higher education. Such tools might enhance
organizational power as opposed to the abundant individual power. The authors also identify key
requirements for DOI based on collaboration goals. These include a cooperative organizational
culture, clear value and benefit of the new system, adequate training, system must be user-
centered, support from users and top management, time for experimentation and adaptation as
well as a reward system (Jones and Laffey, 2000).
Jones and Laffey (2000) produced a formulaic approach to measuring DOI, considering all
key variables. These variables centered around Rogers' five characteristics of innovation. The
authors also suggest that future researchers examine DOI differences among colleges within
institution, majors and regions of the US. Also, future focus should delve more deeply into the
impact of technology use on student learning.
Russell, Kleiman, Carey, and Douglas (2009) researched the impact of various support levels
on the use and engagement by users. The focus of the content was on professional development
of teachers in the area of math instruction. The participants were 231 middle school teachers of
math. There were four groups; one was supported with a math instructor, online facilitator and
peer interactions; a second group with only an online facilitator and peer interactions; a third
with a math instructor and online facilitator and the fourth with no support. Data were collected
through several surveys (background, pedagogy, and student), a math assessment, and teacher
23
log and course evaluation. The core research question focused on whether the various supported
levels affected teachers' mathematical understanding, pedagogical beliefs and instructional
practices.
The findings were revealing. Pedagogical beliefs were significantly different in multiple
areas between the pre and post conditions for all four groups. There were no differences among
the four groups. The same was true for student survey responses and teacher logs. Zhoa,
Alexander, Perreault, Waldman and Truell (2009) described the importance of technology
adoption for distance learning programs. Their research goals were to provide guidance to
administrators and instructors of distance learning programs on cost and effectiveness measures.
They found that most faculty in the business department believe that use of the internet, online
discussions, and voicemail services helped increased faculty productivity. The results from the
student were largely in alignment with those of Russell et al. (2009), except for use of voicemail.
Zhao et al. (2009) describe the need to treat current and emerging technologies differently from
those of the past. The capabilities now possible are unprecedented and should be examined fully
for effectiveness and efficiency measures. Russell et al. (2009) suggest that the participant
recruitment strategy explains some of these results. Recruitment was based on volunteerism and
the authors posit that only the highly motivated and skilled teachers stepped forward.
Suggestions for future research include employing various recruitment strategies to account for
this. Also suggested was the examination of online and in-person comparisons (Russell et al.,
2009).
Adopter Qualities
Tabata and Johnsrud (2008) examined faculty attitudes toward distance education and the
technology that supports it. DOI was used as the theoretical framework. Full and part-time
24
(N=4,534) faculty members were included representing 10 college campuses. These institutions
included research universities, baccalaureate and community colleges. Surveys were the source
of data and they included the following constructs: technology use, attitude toward technology,
attitude toward distance education, and the adoption of innovation. Factor analysis was the
primary analysis technique. Also used was regression analysis with participation in distance
education used as a dependent variable. Demographic variables examined included race, gender,
tenure, age and title. The survey response rate was 46%.
The findings of this study advance the cause of technology adoption. Barriers to such
adoption include learning time, technology support, and impact of workload, which are
congruent with Rogers’ (2003) time passage element. An important outcome was the emphatic
need to reward innovators and incorporate DOI matters into the tenure and promotion process.
Cited was a 1998 NCES finding that email users spent 10% more time working than non-users of
email. With the advances and plethora of technology tools since then, this added workload is
sure to be much greater. Suggestions for future research might examine this item as well as
researching how early technology adopters acquire their interest and skills (Tabata and Johnsrud,
2008).
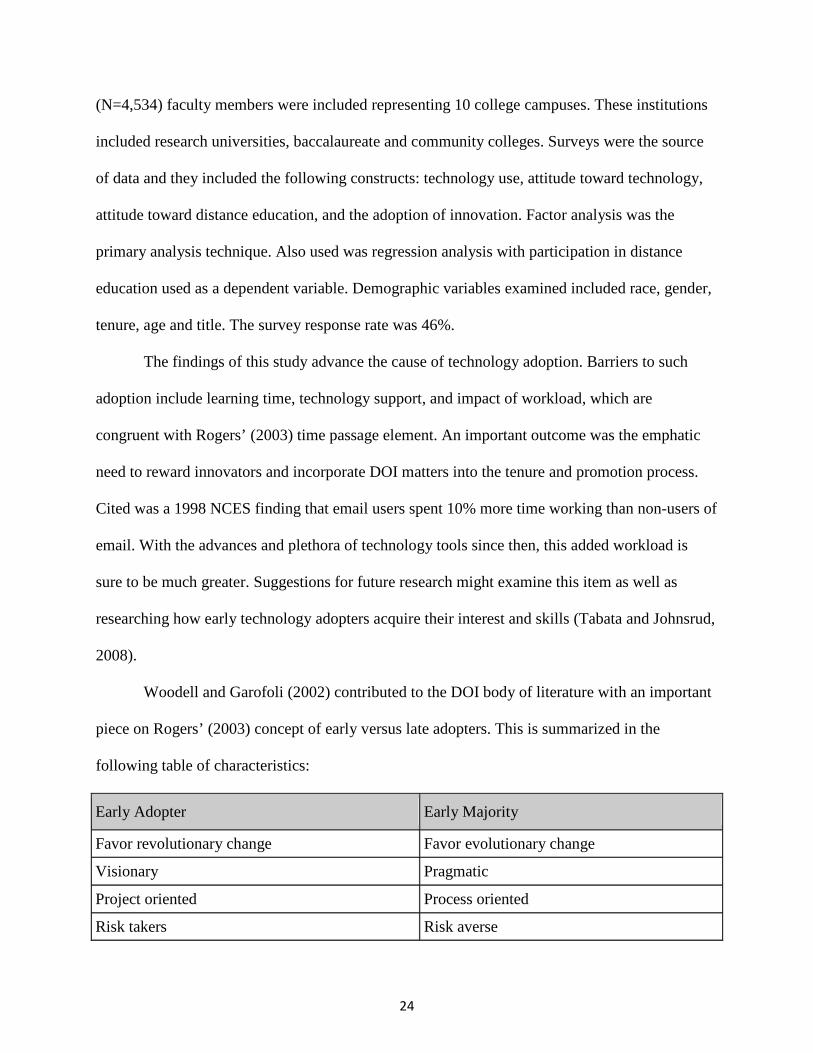
Woodell and Garofoli (2002) contributed to the DOI body of literature with an important
piece on Rogers’ (2003) concept of early versus late adopters. This is summarized in the
following table of characteristics:
Early Adopter Early Majority
Favor revolutionary change Favor evolutionary change
Visionary Pragmatic
Project oriented Process oriented
Risk takers Risk averse

25
Willing to experiment Want proven applications
Generally self-sufficient May need significant support
Horizontally connected Vertically connected
Additionally, the authors make an important distinction between early adopters and early
majority adopters. Since each of these groups has different reasons for adopting an innovation,
the implementation (“marketing”) techniques must cater to the respective needs. This alternative
approach might include a transition space, allowing the various adopters to integrate and
collaborate. This would allow adopters to enter the adoption cycle at any point during the
collaborative practice. This supports Rogers’ (2003) time passage requirement. A suggestion for
future research is to clarify the basis for adopting an innovation to better understand, and serve,
user motives (Woodell and Garofoli, 2002).
Hansen and Salter (2001) studied adoption of web technology into mainstream teaching.
This was a descriptive study focused on the need to use adopter-centric approaches to technology
rather than the developer-centric approaches. The authors suggest this “bottom-up” approach
produces more successful technology adoption practices, although the upfront time and effort
required is greater. The user-centered method of adoption entails five steps:
1. Identify the potential adopter;
2. Measure the relevant potential adopter perceptions;
3. Design and develop a user-friendly product;
4. Inform the potential adopter (of the user-friendliness); and
5. Provide post-adoption support.
26
This user-centric approach is presented as one of two prongs required for successful adoption by
teaching staffs. The second is related to the innovation-decision-making process. There are four
such decisions as presented by the authors and as congruent with Rogers’ (2003) decision types:
1. Optional innovation decisions – the choices made by individuals are independent of
others;
2. Collective innovation decisions – the choices are decided by consensus and then adopted
by all in that consensus;
3. Authority innovation decisions – choices made by a few with power and are then adopted
by the whole; and
4. Contingent innovation decisions – choices made by one or more of the above, but only
after a prior innovation decision.
These organizational level decision-making processes must be integrated with the user-centric
characteristics described earlier to produce effective adoption and reduce discontinuance (or
rejection) soon after adoption (Hansen and Salter, 2001).
Hug and Reese (2006) explored the adoption aspect of the DOI theory with a case study. A
maverick teacher was the participant since she was assertive in her research and use of a drawing
software program. The research goal was to illuminate how to best encourage the adoption of
innovation by teachers. The authors identified the need for this research given the lack of
literature on the underlying characteristics of Rogers' (2003) various adopters. The early versus
late adopters have been described but not explained. Since this is a case study design, only the
matter of innovation adoptions can be explored as opposed to innovation diffusion. Data were
collected through analysis of communication between the participant and various audiences. The

27
framework for this analysis was Rogers' (2003) innovation-decision process. Hug and Reese
(2006) described this framework as follows:
• Knowledge - In this stage the individual is first exposed to an innovation but lacks
information about the innovation. During this stage of the process the individual has not
been inspired to find more information about the innovation;
• Persuasion - In this stage the individual is interested in the innovation and actively seeks
information/detail about the innovation;
• Decision - In this stage the individual takes the concept of the innovation and weighs the
advantages/disadvantages of using the innovation and decides whether to adopt or reject
the innovation. Due to the individualistic nature of this stage Rogers notes that it is the
most difficult stage to acquire empirical evidence;
• Implementation - In this stage the individual employs the innovation to a varying degree
depending on the situation. During this stage the individual determines the usefulness of
the innovation and may search for further information about it; and
• Confirmation - Although the name of this stage may be misleading, in this stage the
individual finalizes their decision to continue using the innovation and may use the
innovation to its fullest potential.
The authors found that the early adopter experienced stages of the above model in a compressed
fashion. The participant in this study found relevant uses for the tool quickly and, therefore, did
not hesitate to explore and eventually adopt it. A reason for this successful adoption experience
is the participant's willingness to invest time into learning and using the new tool. The authors
suggest that future research should focus on the methods for encouraging such engagement into
new technologies.
28
Learning Benefits and Teaching Styles
Liao (2005) explored the impact of technology use on student learning and
communication using the DOI model. The learning management system (LMS) program Angel
was used and the data were collected through surveys. Survey items were clustered to address
each of Rogers’ (2003) five characteristics of innovation (relative advantage, compatibility,
complexity, trialability and observability). The study participants were 196 graduate and
undergraduate students majoring in communication in Western New York. Factor analysis was
used to determine the most impactful of the innovation characteristics. Path analysis was used to
determine important technology variables in the use of the LMS and technology-based
interactions.
Liao (2005) found that student motivation was more related to LMS usage than learning
styles. Similarly, Saeed et al. (2009) conducted an action research study to determine students'
preferences for technology tools as well as learning styles. They hypothesized that learning style
impacts preferred technology tools which then impacts achievement. The research problem they
helped address with their study is the scant studies relating learning preferences and
achievement. Since they explored a variety of technology tools, they were able to determine that
there was little correlation between emerging technologies such as blog's, wikis, and podcasts
and conventional technologies such as email and learning management systems. While many of
the findings by Saeed et al. (2009) support those of Butler (2006), Saeed et al. (2009) found that
students preferred both synchronous and asynchronous communication whereas Butler (2006)
found preference for asynchronous only. Saeed et al. (2009) used students enrolled in a web
programming course, therefore, they suggest the use of students in non-science-based courses or
majors to further the knowledge of technology preferences. Of the five innovation
29
characteristics, Liao (2005) found that simplicity (complexity) predicted usage best. When
examining demographic variables, the author found years in school to be a better predictor of
LMS use than age or technology competence. When treating student learning as the dependent
variable, the author found that compatibility to be the strongest predictor. It was also found that
learning was facilitated by interactions between students and content as well as instructors which
the LMS promulgated (Liao, 2005).
Kilmon and Fagan (2007) examined the consequences that result from a decision to adopt
an innovation. The design was a case study based on the DOI framework. This was appropriate
given that the research questions were “why” in nature. The focus was on the use of course
management software and this study used only adopters. Data were collected through semi-
structured interviews with the adopting faculty members. These faculty members primarily used
the hybrid teaching model, integrating in-person with online instruction. The findings suggest
diverse reasoning for adoption. Most did so for practical and/or logistical reasons, citing the need
to teach to students off-site or extend additional instructional support. Also, while the initial
investment of time and effort was difficult, the pay-off was great. Three themes emerged through
these interviews: 1) the course management system facilitates course organization, 2) the course
management system improves communication when used as a supplement to classroom
instruction and 3) the course management system is easy to use with minimal training and
minimal need for technical support. While most adopters did not have to change their teaching
styles, all had to be organized, including attention to detail and good written communication.
Many adopters cited, as a benefit, the ability to engage students online in a way less possible in
class. Passive learning is much easier in a classroom setting.
30
Since one of the goals of this study was to further the understanding of desirable and
undesirable effects of innovation adoption, the authors focused on this with suggestions for
future research. These are one of the consequence types included in Rogers’ (2003) DOI model.
The other types of consequences include direct vs. indirect, and anticipated vs. unanticipated. A
follow-up suggestion was to examine the consequence of adoption in environments less
favorable than that of this study (Kilmon and Fagan, 2007). For example, use of non-adopting
faculty or a technology tool that is more complex might provide an important contrast to these
findings.
Freeman, Bell, Comerton-Forde, Pickering, and Blayney (2007) looked at DOI using
electronic response systems (ERS’s). This was a case study examining the use of ERS’s after a
series of pilots on the devices. Data were collected through a combination of written exercises
and interviews. Rogers’ (2003) five characteristics of innovation were the basis of the data
organization and participants were divided into academic and non-academic (administrative) user
groups. Academic users reported increased job satisfaction when using the ERS’s for the
following reasons: more student engagement, better formative capabilities, and use of aggregated
data to inform improvement of future courses. The authors also found that cultural compatability,
complexity and relative advantage to be most important in the adoption decision. Additionally,
teaching style must be considered to improve adoption rate. The example cited in this study was
the comparison of a constructivist teacher versus the “sage on the stage”, authoritative, style
teacher. Each would have differing motives for and needs of instructional technology. The
authors have deemed this to be such an important variable that it is the basis for the suggestion
for future study.

31
Kebritchi (2008) conducted a case study on the factors that affect teachers' use of
computer games. The author is addressing a research problem given the dearth of published
studies on the use of computer games in the classroom setting. The sample used was purposeful
including three math teachers with seven or more years of experience. Data were collected
through interviews and the questions were based on Rogers' (2003) five characteristics of
innovation.
The findings point to two critical elements required for successful adoption of computer
game technology for instructional purposes. These are fun and alignment with the teachers'
instructional methodologies. Fun is important for student engagement while integration is crucial
for smooth transitions into and out of computer game activities. These critical elements will help
users overcome the following cited problems with such educational technology: curriculum
issues, time and purpose of game implementation, outcome issues, and technical issues.
Foulger and Williams (2007) identified a lack of deep integration of technology into
teacher preparation programs. Rather than embedded throughout all instructional portions of
such programs, they rely on a single course to teach the requisite knowledge and skills. To help
address this gap, Foulger and Williams (2007) strove to pair instructors of technology with those
teaching content areas. They describe the significance of organizational support in the adoption
and integration of technology. For example, organization members can provide support,
encouragement, challenges, and growth unavailable when working individually. The study by
Foulger and Williams (2007) required collaboration between the paired instructors. Gaps in
technology curriculum were identified and filled, jointly. A seven stage redevelopment process
was used along with corresponding surveys for all participants. A repeated measure analysis
system was used with these pre-post survey data. They found that collaboration was key in the
32
effective integration of technology. In alignment with Roger's (2002) concepts of communication
channels, Foulger and Williams (2007) found that the more open the communications among
faculty, the higher the likelihood of effective integration. Since the primary focus of the adoption
study by Kebritchi (2008) was on the teaching personnel, a suggestion for future research is to
examine these matters with the administrative and support staffs (Kebritchi, 2008).
Matthew, Felvegi and Callaway (2009) studied the use of wikis as a collaborative tool with
students of teacher education. Their research questions were relevant to previously described
DOI challenges and interests. These included the study of student perceptions regarding the use
of wikis, the relationship between wikis and learning and technology related concerns. The
method was a case study to examine these items as well as other benefits and challenges. There
were 37 pre-service teachers and their tasks were to contribute to the wikis at regular intervals.
There was no instructor participation in these wiki discussions. Data were collected through
interviews and analysis of the online content produced by students using the constant
comparative method. The results indicated that the wiki discussion process led to exposure to
learning material because posting comments required that students become familiar with the
posting of classmates. There was peer pressure to take initiative and contribute in a meaningful
way. This also led to students reaching beyond the confines of their class assignments to make
important learning connections. While the amount of learning was self-reported, many students
reported that this was an important source of information and collaboration. The authors suggest
that future research examine the role of contributors in ensuring quality content.
Implementation Environments and Strategies
Murray (2009) examined ways to facilitate diffusion on innovations. While the focus of
this study was on the gap between research and practices in counseling, the DOI principles

33
presented are instructive. Several postulates were described, all based on Rogers’ (2003) DOI
framework. The first addresses the five characteristics of innovation that impact its adoption.
Since most of these characteristics are perception-driven, the author suggests that researchers
should reach out to clinicians to address perception-related conflict regarding adoption. Chen
(2009) examined the factors that contribute to the adoption of distance learning services by
higher education institutions. Primary foci were program costs and faculty participation. Berge
(2002) has indicated that barriers to adoption can include technical expertise, faculty
compensation, as well as time and attitudes toward technology (as cited by Chen, 2009). Chen
(2009) found that institution type was an important factor. The highest likelihood of adoption
was with public four-year institutions and private institutions had the lowest likelihood of
adoption. Additionally, faculty workload was found to be an important factor. For each unit
increase of concerns about workload, adoption likelihood increased over three units (Chen,
2009). Chen (2009) recommends replicating this study using data more current than the 2001-
2002 set used here. A second, and related, postulate by Murray (2009) refers to the homophilous-
heterophilous difference. Potential adopters are more likely to be persuaded to adopt an
innovation by someone they see as similar to them. The last postulate presented is the adopter
categories based on the rate of adoption. In this context, the author suggests that researchers must
deeply understand the practitioners’ motives and concerns regarding the adoption rate. The
author concludes with a six-step procedure to improve DOI:
1. Innovations should be relevant to potential adopters;
2. Innovators should use the appropriate communication channels to convey their solutions
effectively;
3. Innovators should carefully consider the consequences of their solutions;
34
4. Innovators should allow for implementation flexibility so adopters can make the solution
their own;
5. Innovators must deeply understand the decision-making process used by their target
audiences; and
6. Innovators should seek input from potential adopters.
Nichols (2008) has published a descriptive study on the challenges faced by institutions
when implementing e-learning solutions. He has identified the importance of such solutions by
citing prior studies indicating improved student retention and learning effectiveness when using
such tools. Data in this study were collected through interviews with e-learning managers from
14 institutions. The design assumed the benefits of instructional technology and focused on the
methods of successful diffusion. Some of the important findings that contribute to sustainable
diffusion include large-scale centralization of instructional technology matters and incremental,
staff-based change. These ingredients must include a clear vision and open communication,
similar to the social context and communication ideas by Rogers (2003). Additionally, sufficient
resources, detailed professional development and an institutional approach (strategic planning
rather than mere policy compliance) are essential for this effort. Peluchette and Rust (2005)
examined technology preferences of faculty in a management program. Surveys were used as the
primary method of data collection. Among the technology tools included were PowerPoint
presentations, computer simulations, email and web pages, online chat rooms, as well as lower
technology tools such as transparencies and video recordings. While Peluchette and Rust (2005)
found that class size did not impact preferred tools, they indicated a possible problem with
selection bias. They also found that the tools most preferred were of the low tech variety:
transparencies, chalkboards, and PowerPoint presentations. The authors attribute this to the fact

35
that the content required more experiential learning and student demonstrations. While most
faculty members indicated issues with limited time with regard to technology adoption, this was
more pronounced among female faculty. The authors conclude that release time and smaller class
sizes should be part of a successful technology adoption plan. Of interest for further research
should be the role of learning styles and use of faculty from other disciplines (Peluchette & Rust,
2005). Nichols (2008) suggests that future research focus on factors that hinder innovations and
their sustainability.
Keller (2005) has published a descriptive examination of three implementation
perspectives regarding virtual learning environments (VLE's). The author contends that student
perceptions are not deeply impacted by demographic variables; therefore, the research problem
here is the lack of attention on implementation styles. Implementation is treated as having many
phases, depending on the user. These include initiation, development, adoption, adaptation,
acceptance, freezing, unfreezing, among others. These indirectly influence the implementation
perspectives which include implementation as technology acceptance, implementation as
diffusion of innovation and implementation as a learning process (Keller, 2005).
The technology acceptance model (TAM) postulates that user perceptions are paramount.
These include perceived usefulness and ease of use. Also included is subjective norm which is
the perception of what is expected from close members of society (Keller, 2005) supporting
Rogers’ (2003) homophilous concept.
Implementation as DOI includes the decision-making process which consists of the
knowledge, persuasion, decision, implementation and confirmation phases. Within the
persuasion phase are Rogers' (2003) five characteristics of innovation: relative advantage,
comparability, complexity, trialability and observability. These qualities have deep meaning for
36
organizations since they are animated when there are gaps between performance and
expectations. When innovations experience initiation and implementation, careful calculations of
this gap are made to ensure implementation effectiveness (Keller, 2005).
Implementation as a process of learning requires an understanding of interactions
between communities of practice (people) and technology (boundary objects). Communities of
practice must identify the extent to which change is supported and with whom knowledge is
willingly shared. Clarity with these items will promote the advancement of innovations which
then may produce one of several effects. These include creating new communities, strengthening
or threatening existing communities, and changing knowledge distribution. While there are
clearly distinct qualities to each of these theoretical approaches to technology use, there remains
overlap among all three which can advance effective implementation of technology (Keller,
2005).
Morin (1975) has expanded on Rogers' five characteristics of innovation as well as
requirement for an effective change agent. The author presents facilitators and prohibitors to
each of Rogers' (2003) five innovation characteristics. Since most of the prohibitors reflect the
opposite of a facilitator, only facilitators are presented per characteristic:
• Relative advantage - availability of money, needs of people, health, welfare, and appeal
to a better life;
• Compatibility - values of people, needs of people, lack of habits in people involved;
• Complexity - availability of technology, supporting material and institutions, lack of
habits of people;
• Divisability - information, consultants, cost in divided units; and
37
• Communicability - leadership, openness, needs of people, political pressure, spirit of the
time (for example, change for change sake) (Morin, 1975).
Careful application of Rogers' (2003) theory will result in effective and efficient uses of
innovations.
The effective change agent must:
• Enjoy high professional esteem;
• Be a stimulator, an inspiring person;
• Be open to changing point of view, prudent and well aware of social implications;
• Be capable of working with others; and
• Have leadership qualities (Rogers, 2003).
Weiner (2003) has examined the use of technology in library settings. The "life" problem
addressed here is the discontinuous adoption of technologies by libraries given the pace of
innovation. Three relevant theories are reviewed: structuration, DOI and contingency.
Structuration suggests that the organizational structure of a unit has a significant impact on
its operation. It is the process by which systems are produced and reproduced through its
members' use of rules and resources. Variations in resource allocation create hierarchies which
impact unit operations. In the library setting, history, staffing, the surrounding environment and
budget matters directly relate to such matters as technology adoption. Structuration involves
tension management which is always present between people involved, between people and rules
as well as between people and established norms. Structuration suggests the need to break
routines in process and procedures to allow for change agents to infuse innovation as needed.
DOI, conversely, requires an alternate viewpoint. With a focus on the users, DOI examines
the rate of adoption and the requirements to support change in technology use and acceptance.
38
The author highlights the differences between innovators and users. The former tend to be
visionary, looking at possibilities for the future, while the latter tend to take direction from the
former and use the past as a point of reference. The author also highlights the difference between
methodical and tool-based innovation. Hardware-driven changes require much less change
investment and are less abstract than those that are procedure-oriented. This points to the need
for ample training and communication (Weiner, 2003). Kopcha (2008) identified predispositions
that prevent faculty from adopting education technology tools. These include time, beliefs,
access, professional development and culture. He set out to examine system-based model of
technology intrgration. This included communication and mentoring strategies. Their
implementation matrix included four stages and accounted for mechanics of technology use,
system for training and support, culture adaptations, and curricular adjustments. His finding was
that such a teacher-centered approach was effective with encouraging adoption, providing just-
in-time support to maintain momentum and addressing the other barriers to adoption. Kopcha
(2008) suggests examining a similar model for faculty in a variety of disciplines as well as with
students. DOI requires a client-centered focus rather than one that is change-centered. There are
several reasons users have to resist technology-based change including fear of job termination,
loss of status and deeply ingrained habits. However, the author also suggests that once a first
innovation is adopted, there seems to be a seal that is broken allowing for subsequent adoptions
to occur with more ease (Weiner, 2003).
Contingency theory is concerned with organizational decentralization while also creating
much integration. Seemingly paradoxical, this balance is achieved through healthy and
cooperative tensions between groups in an organization. The author suggests that libraries that
are organized in this way should be responsive to environmental needs for technology adoption.
39
This is greatly impacted by the type of transactional leadership and directs this growth. Low
transactional leadership is focused on rewards and compliance while high level transactional
leadership is focused on vision and growth. Libraries with this type of structure should be nimble
and priority-focused (Weiner, 2003).
Weiner (2003) provides a summarized list of requirements for the adoption of innovation:
• Provide clear, detailed vision of the change;
• Be a model for expecting and incorporating change;
• Involve all stakeholders;
• Give people time to adjust;
• Divide a big change into manageable, familiar steps;
• Make standards and requirement clear;
• Offer positive reinforcement;
• Allow expressions of nostalgia for the past, then create excitement for the future;
• Maintain a sense of humor; and
• Continuously access change and effect quality improvement.
Literature Review Summary
Several themes have emerged among the studies and perspectives presented here. With
DOI as a goal and point of interest, these researchers addressed the successful uses of
educational technologies by students, faculty, the larger system as well as the managers and
deliverers of such tools. The themes include:
• Effective training;
• Role of institutional policies;
• Self efficacy;
40
• Implications for learning;
• Resource availability (financial incentives and on-going technical support);
• User-centric approaches to DOI;
• Peer pressure (on students and faculty);
• Alignment with teaching styles;
• Best predictors of innovation adoption;
• Need for ample time passage;
• Clear vision;
• Enjoyment; and
• Interactions between students and instructional content.
The resounding need for supportive and user-centric training is borne from the many past
experiences users have with failed technology uses. The empty vessel fallacy occurs when
trainers, or change agents, treat potential adopters as though they are without preconceived ideas
and attitudes about technology. Change agents must also be sensitive to the previous methods
and procedures and resist the urge to dismiss them for the superior replacement technology. This
innovation negativism can also be countered by financial incentives (Rogers, 2003). Bennett and
Bennett (2003), like Samarawickerma and Stacey (2007), suggest that comprehensive training
programs enhance faculty’s sense of efficacy, positive attitudes toward computers and plans to
use computers to facilitate student learning. With regard to the decision process, mass media
channels are primarily knowledge creators whereas interpersonal networks are important for
persuasion (Rogers, 2003). Training facilitates this at the user level.
As far as predictors of DOI, Liao (2005) identified complexity as the best of the five
characteristics of innovation. When treating student learning as the dependent variable,
41
compatibility was found to be the best. Freeman et al. (2007) identified compatibility,
complexity, and relative advantage as the most important for this prediction. Innovation-
decisions are experienced more rapidly with an individual compared with an organization
(Rogers, 2003), which impacts the role of the five characteristics in the prediction of adoption.
This is, in part, due to the fact that threshold is required at the individual level whereas critical
mass is required at the system level for adoption to take hold. Strategies for moving towards
critical mass include:
1. Respected change agent;
2. Enhancing perception of innovation;
3. Target groups more likely to adopt if early adopters help spread the adoption; and
4. Incentives.
The researchers’ suggestions for future research are based on their findings and persistent
gaps between technology availability and use. These include identifying the sources of
motivation for early adopters, assessing the impact of teaching style and pedagogical beliefs in
use of education technology, as well as obstacles to DOI. Since innovation adoption requires
behavioral change, not merely cognitive or attitudinal change, a suggestion for future research is
to examine the network influences on individual (and organizational) innovation (Rogers, 2003).
Additionally, these researchers are not in agreement about the best predictor of innovation
adoption. Since each of their studies was comprised of varying populations, technology
instruments, and fields, future work should disaggregate and analyze data on each of these
variables.
Using these prior studies as a basis, the current study will examine the factors most related
with the adoption of technology in higher education instruction. The five constructs used will be
42
personal uses of technology, institutional policies, efficacy with the instructional content and
technology use, belief in the learning benefits of technology use, and general barriers to
technology use.
43
Chapter 3 Methodology
Introduction
Statistical techniques must be appropriate for the research design and data limitations.
Much of the research in education is deemed non-experimental, meaning there's an absence of
control groups, and of randomized assignment of participants and treatment..
Statistical techniques must address this. Path analysis is one such technique. This
technique requires the justification of use of variables and how a researcher connects them with
one another. Often, this justification is based on the findings of prior studies and experiences of
the researchers. Additionally, this technique has the advantage of not only measuring direct
relationships between variables, but also indirect relationships. The path coefficients produced
by this technique represent the variability of one variable given variability in another (Keith,
1988).
Research Question The research question in this study was as follows: What are the variables that most
impact the use of education technologies for instructional purposes in higher education? Use of
education technologies has been defined by the variable adopter rate for professional uses of
technologies.
The list of question elements below is intended to provide specificity to address some of
the possible factors.
Elements of the Research Question:
1. What are the personal use of technology factors leading to professional adoption?
2. What learning benefits (as believed by faculty) predict technology adoption?
44
3. What are the self perceptions of performance quality as an instructor (efficacy) and their
impacts on technology use?
4. What are the impacts of institution policies regarding reward and workload reduction on
technology use?
5. What is the relationship between technology use and barriers such as training provider
and technical problem-solving?
Hypotheses:
1. Faculty uses of technology-based solutions in their professional arenas are aligned with
their personal uses.
2. Faculty who perceive learning benefits of use of technology will be more likely to adopt
technology use for instruction.
3. Faculty who have high self-efficacies are more likely to learn and integrate technology-
based solutions into their craft.
4. University policies regarding reward and workload management have a clear and direct
impact on faculty uses of technology for the purposes of instruction.
5. Barriers such as training needs and technical challenges greatly impact the adoption of
technology use for instruction.
Instrument
The primary method for collecting data in the present study was through the use of an
online survey. The target population was higher education faculty members working in education
colleges or departments. The survey was devised by the principal investigator based on the
emergent themes identified from a review of prior studies. Items were created based on the
technology adoption factors described in prior studies, the experiences of the principal
45
investigator, and on the elements of the DOI theoretical framework. An initial draft of the survey
was distributed to four reviewers for clarity of survey items and directions. Once these
modifications were made to the survey, it was distributed to a group of 43 faculty members. This
distribution was based on convenience sampling, including those working at a local university.
Additional feedback on survey item and direction clarity was received and used to further refine
the survey. The survey addressed the following constructs:
• Current professional technology use (P)
• Barrier to use of education tech (B)
• Institutional policies – rewards and workload management (I)
• Faculty teaching efficacy (E)
• Learning benefits of technology use (L)
Single letter prefixes were used for each survey item as listed above to identify the construct to
which it belongs. Table 1 lists each survey item categorized by the constructs. These constructs
emerged through reviews of prior studies.
Samarawickerma and Stacey (2007) referenced the institutional policy construct by
describing the importance of workload management for faculty regarding courses taught and
administrative duties. This profile included management of faculty time and workload, funding
for the additional technology-related tasks and the propensity for learning new things. Within
this framework, the authors concluded that university policies regarding technology use impacted
faculty action. To facilitate technology adoption, such policies need to be adaptive, must address
on-going needs for professional development, training and mentoring, and must be driven by
clear visions and expectations.
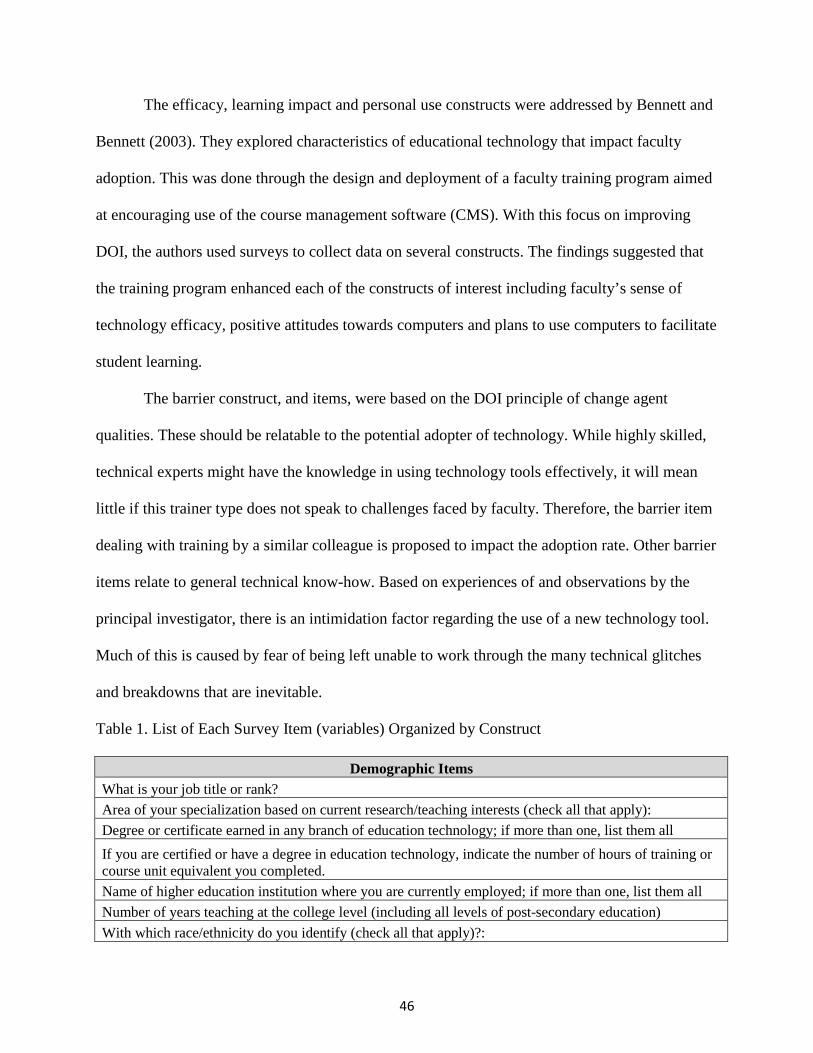
46
The efficacy, learning impact and personal use constructs were addressed by Bennett and
Bennett (2003). They explored characteristics of educational technology that impact faculty
adoption. This was done through the design and deployment of a faculty training program aimed
at encouraging use of the course management software (CMS). With this focus on improving
DOI, the authors used surveys to collect data on several constructs. The findings suggested that
the training program enhanced each of the constructs of interest including faculty’s sense of
technology efficacy, positive attitudes towards computers and plans to use computers to facilitate
student learning.
The barrier construct, and items, were based on the DOI principle of change agent
qualities. These should be relatable to the potential adopter of technology. While highly skilled,
technical experts might have the knowledge in using technology tools effectively, it will mean
little if this trainer type does not speak to challenges faced by faculty. Therefore, the barrier item
dealing with training by a similar colleague is proposed to impact the adoption rate. Other barrier
items relate to general technical know-how. Based on experiences of and observations by the
principal investigator, there is an intimidation factor regarding the use of a new technology tool.
Much of this is caused by fear of being left unable to work through the many technical glitches
and breakdowns that are inevitable.
Table 1. List of Each Survey Item (variables) Organized by Construct
Demographic Items What is your job title or rank?
Area of your specialization based on current research/teaching interests (check all that apply):
Degree or certificate earned in any branch of education technology; if more than one, list them all
If you are certified or have a degree in education technology, indicate the number of hours of training or course unit equivalent you completed.
Name of higher education institution where you are currently employed; if more than one, list them all
Number of years teaching at the college level (including all levels of post-secondary education)
With which race/ethnicity do you identify (check all that apply)?:
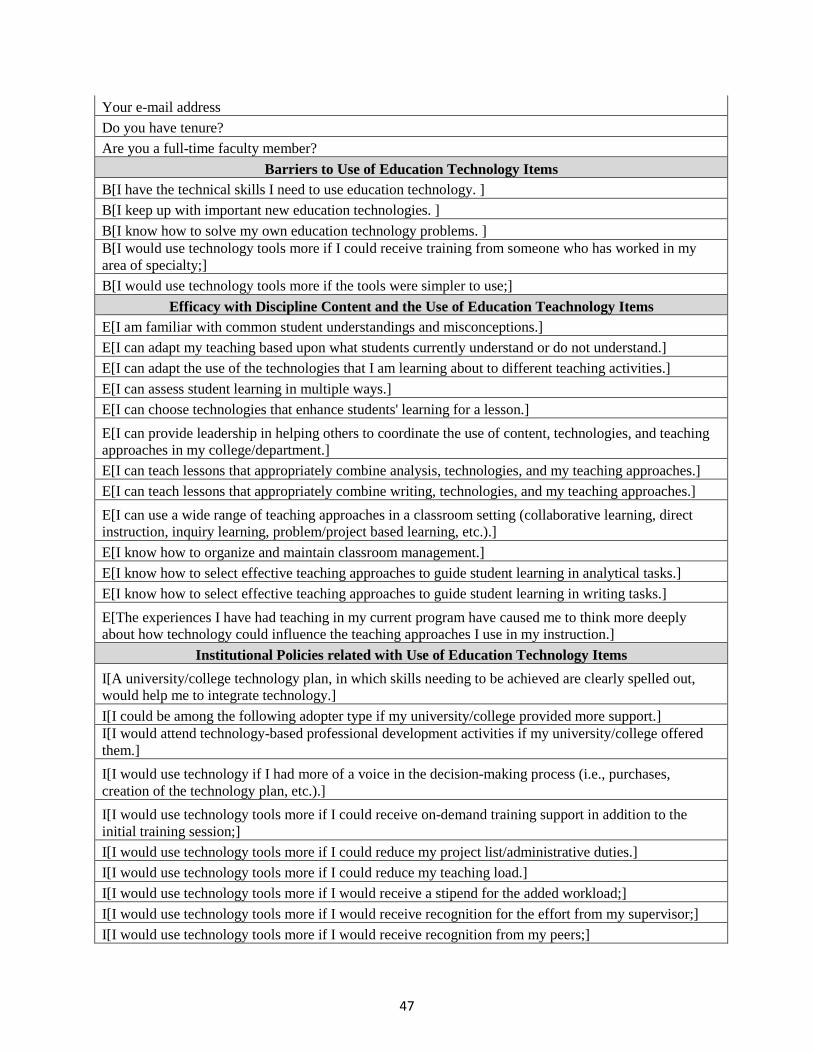
47
Your e-mail address
Do you have tenure?
Are you a full-time faculty member?
Barriers to Use of Education Technology Items B[I have the technical skills I need to use education technology. ]
B[I keep up with important new education technologies. ]
B[I know how to solve my own education technology problems. ] B[I would use technology tools more if I could receive training from someone who has worked in my area of specialty;]
B[I would use technology tools more if the tools were simpler to use;]
Efficacy with Discipline Content and the Use of Education Teachnology Items E[I am familiar with common student understandings and misconceptions.]
E[I can adapt my teaching based upon what students currently understand or do not understand.]
E[I can adapt the use of the technologies that I am learning about to different teaching activities.]
E[I can assess student learning in multiple ways.]
E[I can choose technologies that enhance students' learning for a lesson.]
E[I can provide leadership in helping others to coordinate the use of content, technologies, and teaching approaches in my college/department.]
E[I can teach lessons that appropriately combine analysis, technologies, and my teaching approaches.]
E[I can teach lessons that appropriately combine writing, technologies, and my teaching approaches.]
E[I can use a wide range of teaching approaches in a classroom setting (collaborative learning, direct instruction, inquiry learning, problem/project based learning, etc.).]
E[I know how to organize and maintain classroom management.]
E[I know how to select effective teaching approaches to guide student learning in analytical tasks.]
E[I know how to select effective teaching approaches to guide student learning in writing tasks.]
E[The experiences I have had teaching in my current program have caused me to think more deeply about how technology could influence the teaching approaches I use in my instruction.]
Institutional Policies related with Use of Education Technology Items
I[A university/college technology plan, in which skills needing to be achieved are clearly spelled out, would help me to integrate technology.]
I[I could be among the following adopter type if my university/college provided more support.] I[I would attend technology-based professional development activities if my university/college offered them.]
I[I would use technology if I had more of a voice in the decision-making process (i.e., purchases, creation of the technology plan, etc.).]
I[I would use technology tools more if I could receive on-demand training support in addition to the initial training session;]
I[I would use technology tools more if I could reduce my project list/administrative duties.]
I[I would use technology tools more if I could reduce my teaching load.]
I[I would use technology tools more if I would receive a stipend for the added workload;]
I[I would use technology tools more if I would receive recognition for the effort from my supervisor;]
I[I would use technology tools more if I would receive recognition from my peers;]
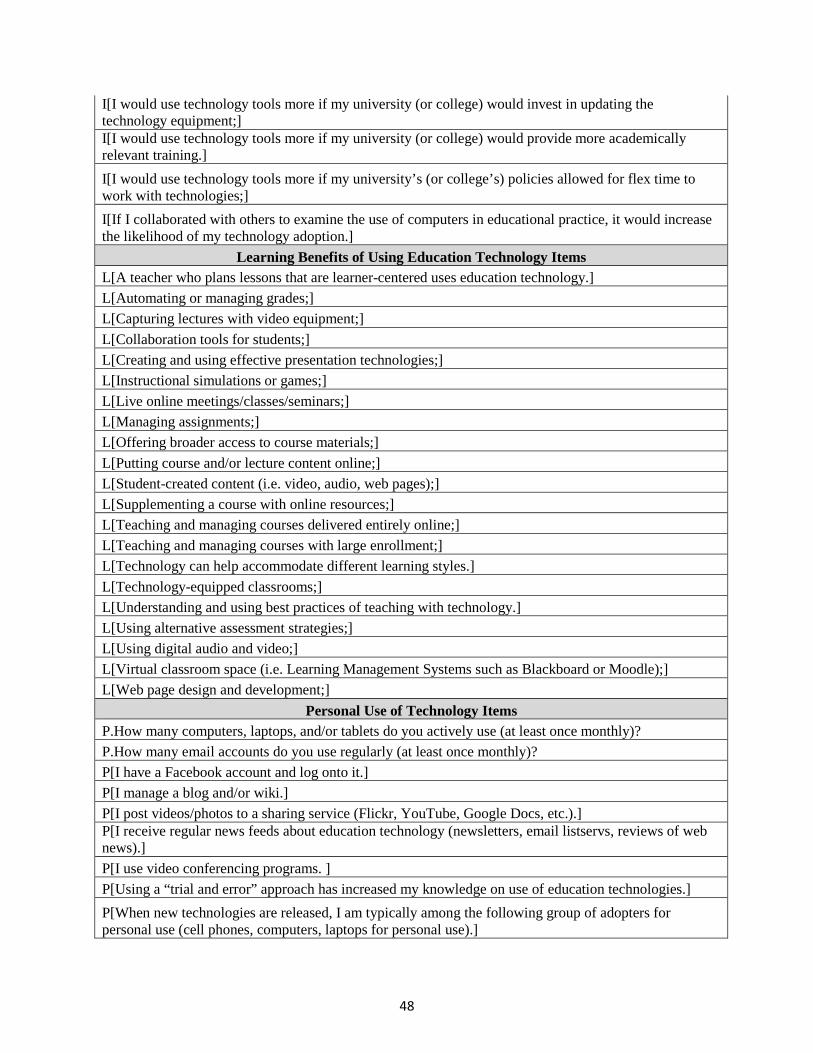
48
I[I would use technology tools more if my university (or college) would invest in updating the technology equipment;] I[I would use technology tools more if my university (or college) would provide more academically relevant training.]
I[I would use technology tools more if my university’s (or college’s) policies allowed for flex time to work with technologies;]
I[If I collaborated with others to examine the use of computers in educational practice, it would increase the likelihood of my technology adoption.]
Learning Benefits of Using Education Technology Items L[A teacher who plans lessons that are learner-centered uses education technology.]
L[Automating or managing grades;]
L[Capturing lectures with video equipment;]
L[Collaboration tools for students;]
L[Creating and using effective presentation technologies;]
L[Instructional simulations or games;]
L[Live online meetings/classes/seminars;]
L[Managing assignments;]
L[Offering broader access to course materials;]
L[Putting course and/or lecture content online;]
L[Student-created content (i.e. video, audio, web pages);]
L[Supplementing a course with online resources;]
L[Teaching and managing courses delivered entirely online;]
L[Teaching and managing courses with large enrollment;]
L[Technology can help accommodate different learning styles.]
L[Technology-equipped classrooms;]
L[Understanding and using best practices of teaching with technology.]
L[Using alternative assessment strategies;]
L[Using digital audio and video;]
L[Virtual classroom space (i.e. Learning Management Systems such as Blackboard or Moodle);]
L[Web page design and development;]
Personal Use of Technology Items P.How many computers, laptops, and/or tablets do you actively use (at least once monthly)?
P.How many email accounts do you use regularly (at least once monthly)?
P[I have a Facebook account and log onto it.]
P[I manage a blog and/or wiki.]
P[I post videos/photos to a sharing service (Flickr, YouTube, Google Docs, etc.).] P[I receive regular news feeds about education technology (newsletters, email listservs, reviews of web news).]
P[I use video conferencing programs. ]
P[Using a “trial and error” approach has increased my knowledge on use of education technologies.]
P[When new technologies are released, I am typically among the following group of adopters for personal use (cell phones, computers, laptops for personal use).]
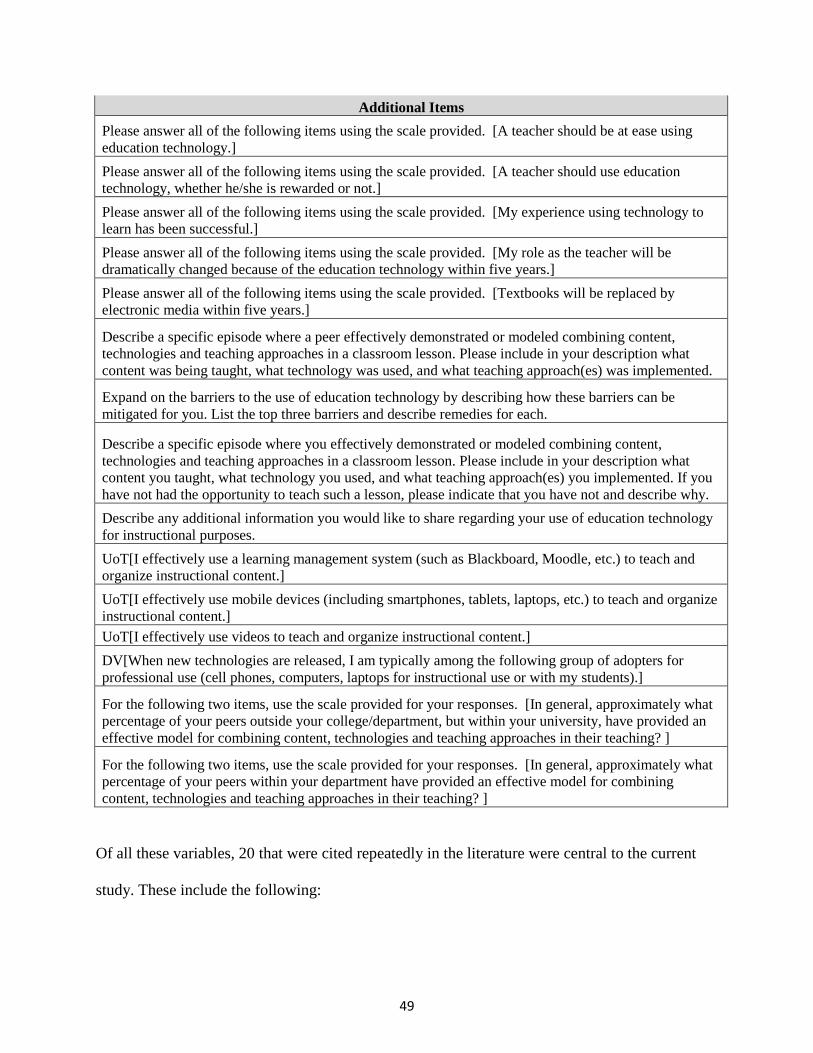
49
Additional Items
Please answer all of the following items using the scale provided. [A teacher should be at ease using education technology.]
Please answer all of the following items using the scale provided. [A teacher should use education technology, whether he/she is rewarded or not.]
Please answer all of the following items using the scale provided. [My experience using technology to learn has been successful.]
Please answer all of the following items using the scale provided. [My role as the teacher will be dramatically changed because of the education technology within five years.]
Please answer all of the following items using the scale provided. [Textbooks will be replaced by electronic media within five years.]
Describe a specific episode where a peer effectively demonstrated or modeled combining content, technologies and teaching approaches in a classroom lesson. Please include in your description what content was being taught, what technology was used, and what teaching approach(es) was implemented.
Expand on the barriers to the use of education technology by describing how these barriers can be mitigated for you. List the top three barriers and describe remedies for each.
Describe a specific episode where you effectively demonstrated or modeled combining content, technologies and teaching approaches in a classroom lesson. Please include in your description what content you taught, what technology you used, and what teaching approach(es) you implemented. If you have not had the opportunity to teach such a lesson, please indicate that you have not and describe why.
Describe any additional information you would like to share regarding your use of education technology for instructional purposes.
UoT[I effectively use a learning management system (such as Blackboard, Moodle, etc.) to teach and organize instructional content.]
UoT[I effectively use mobile devices (including smartphones, tablets, laptops, etc.) to teach and organize instructional content.]
UoT[I effectively use videos to teach and organize instructional content.]
DV[When new technologies are released, I am typically among the following group of adopters for professional use (cell phones, computers, laptops for instructional use or with my students).]
For the following two items, use the scale provided for your responses. [In general, approximately what percentage of your peers outside your college/department, but within your university, have provided an effective model for combining content, technologies and teaching approaches in their teaching? ]
For the following two items, use the scale provided for your responses. [In general, approximately what percentage of your peers within your department have provided an effective model for combining content, technologies and teaching approaches in their teaching? ]
Of all these variables, 20 that were cited repeatedly in the literature were central to the current
study. These include the following:
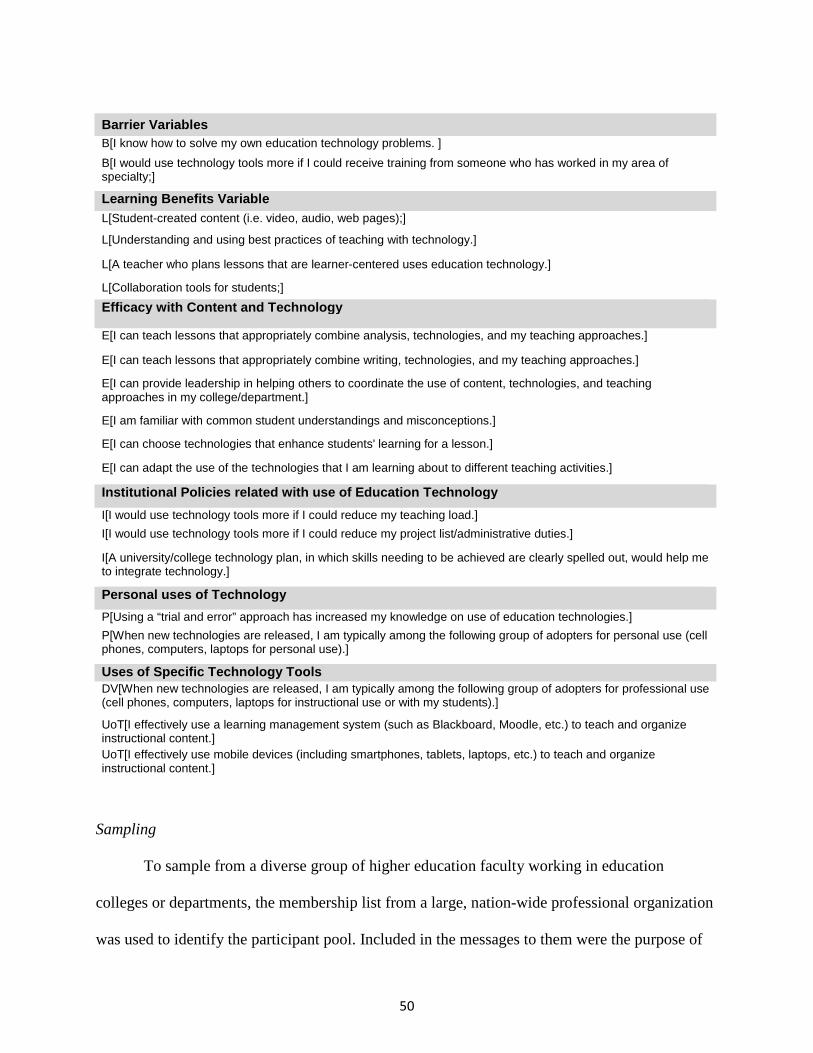
50
Barrier Variables B[I know how to solve my own education technology problems. ]
B[I would use technology tools more if I could receive training from someone who has worked in my area of specialty;]
Learning Benefits Variable L[Student-created content (i.e. video, audio, web pages);]
L[Understanding and using best practices of teaching with technology.]
L[A teacher who plans lessons that are learner-centered uses education technology.]
L[Collaboration tools for students;]
Efficacy with Content and Technology
E[I can teach lessons that appropriately combine analysis, technologies, and my teaching approaches.]
E[I can teach lessons that appropriately combine writing, technologies, and my teaching approaches.]
E[I can provide leadership in helping others to coordinate the use of content, technologies, and teaching approaches in my college/department.]
E[I am familiar with common student understandings and misconceptions.]
E[I can choose technologies that enhance students' learning for a lesson.]
E[I can adapt the use of the technologies that I am learning about to different teaching activities.]
Institutional Policies related with use of Educatio n Technology
I[I would use technology tools more if I could reduce my teaching load.]
I[I would use technology tools more if I could reduce my project list/administrative duties.]
I[A university/college technology plan, in which skills needing to be achieved are clearly spelled out, would help me to integrate technology.]
Personal uses of Technology
P[Using a “trial and error” approach has increased my knowledge on use of education technologies.]
P[When new technologies are released, I am typically among the following group of adopters for personal use (cell phones, computers, laptops for personal use).]
Uses of Specific Technology Tools DV[When new technologies are released, I am typically among the following group of adopters for professional use (cell phones, computers, laptops for instructional use or with my students).]
UoT[I effectively use a learning management system (such as Blackboard, Moodle, etc.) to teach and organize instructional content.] UoT[I effectively use mobile devices (including smartphones, tablets, laptops, etc.) to teach and organize instructional content.]
Sampling
To sample from a diverse group of higher education faculty working in education
colleges or departments, the membership list from a large, nation-wide professional organization
was used to identify the participant pool. Included in the messages to them were the purpose of
51
this study, directions on how to take the survey, contact information for any IRB or other
methodological concerns, and the link to the online survey. The desired number of participants
was a minimum of 200.
The number of members in this organization was determined to be 22,540. Using an
online random number generator, www.random.org, 379 numbers were pulled from the range
between one and 22,540. The member names that corresponded to each of the 379 numbers
based on alphabetical ranking were sent the request for participation in this study. A limit of two
faculty was set per institution. After two reminder messages, a total of 203 members completed
the survey in the fall of 2011.
Conceptual Model Based on Constructs
Using prior research, the Diffusion of Innovation theoretical framework, survey
participant responses to the open-ended survey items, and the principal investigator's
observations, the constructs in the model below were chosen (Figure 1). Each of the five
constructs introduced in this chapter are represented. The list of constructs included and their
proposed relationships to the adoption of technology follow:
• Personal uses of technology - the greater the personal use of technologies, the greater the
professional uses of them;
• Learning impact - the more faculty believe in the learning benefits for student of technology
use, the more likely they are to adopt its use;
• Efficacy - the more comfortable faculty are with teaching their content, the more likely they
are to adopt technology uses;
• Institutional policies - the more institution policies support reduced course and project loads,
the more likely faculty are to adopt technology use;
52
• Barriers - the more faculty are trained by peers, the more likely they are to respond with
greater adoption; the more self-sufficient faculty are regarding technical problems, the more
likely they are to adopt.
Figure 1 displays the direct and indirect relationships among all constructs and the ultimate
endogendous variable. In addition to the five constructs and one ultimate endogendous variable,
a sixth category was included. This is called use of specific technology tools and serves to
identify the role those tools play. Given that the goal of the current study is to identify the factors
that foster technology adoption, it is proposed that the use of these specific tools (mobile devices
and learning management systems) might yield predictor variables. The survey item regarding
mobile devices asked the degree to which the participant used them for their own learning.
Conversely, the LMS item references the use of this tool for classroom instruction. Figure 2
displays the independent variables and their proposed relationships with the ultimate endogenous
variable. These proposed relationships are compatible with the conceptual model in Figure 1.
Analysis
Data were analyzed using descriptive and inferential statistical techniques. Regression
coefficients were used in path analysis to identify variables that impact adoption most.
Descriptive statistics from the current study were compared with national norms. Additionally,
means and standard deviations of each of the 20 path variables were computed for all faculty
participants as well as the subgroups based on age, gender, full/part-time status, and tenure
status. Resulting path diagrams were produced for all faculty participants as well as for
subgroups based on age, tenure, full/part-time status and gender.
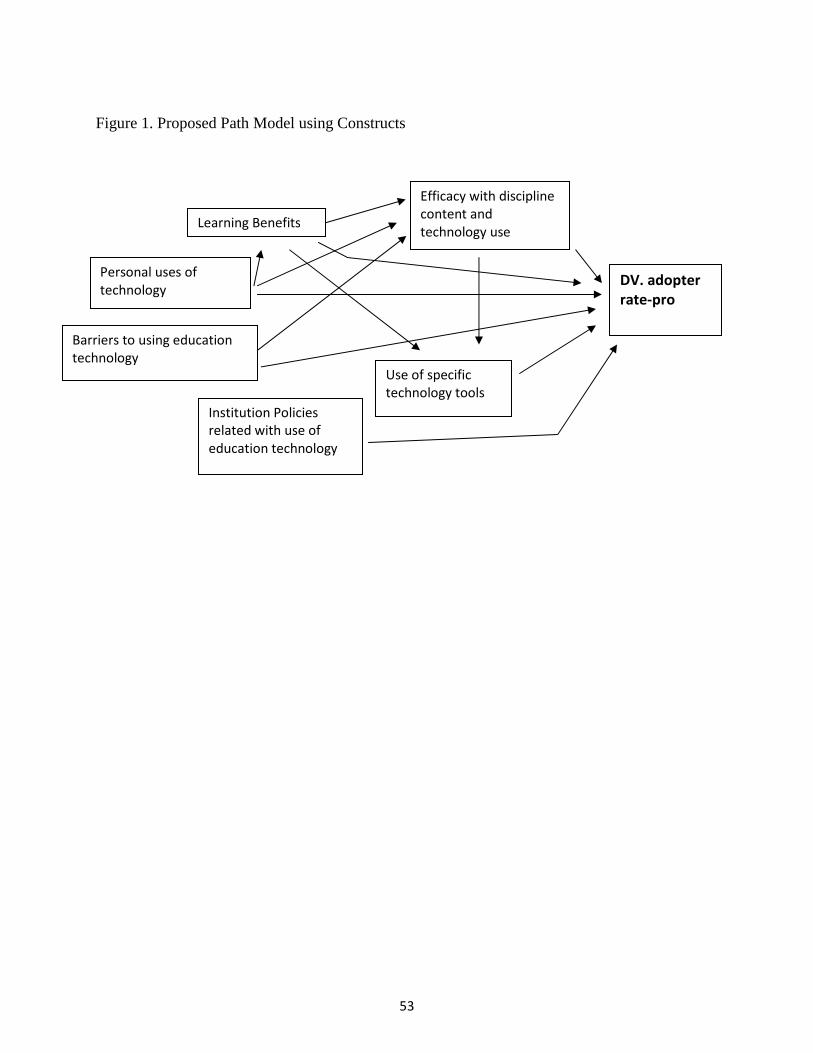
53
Figure 1. Proposed Path Model using Constructs
Learning Benefits
Personal uses of
technology
Barriers to using education
technology
Efficacy with discipline
content and
technology use
Institution Policies
related with use of
education technology
Use of specific
technology tools
DV. adopter
rate-pro
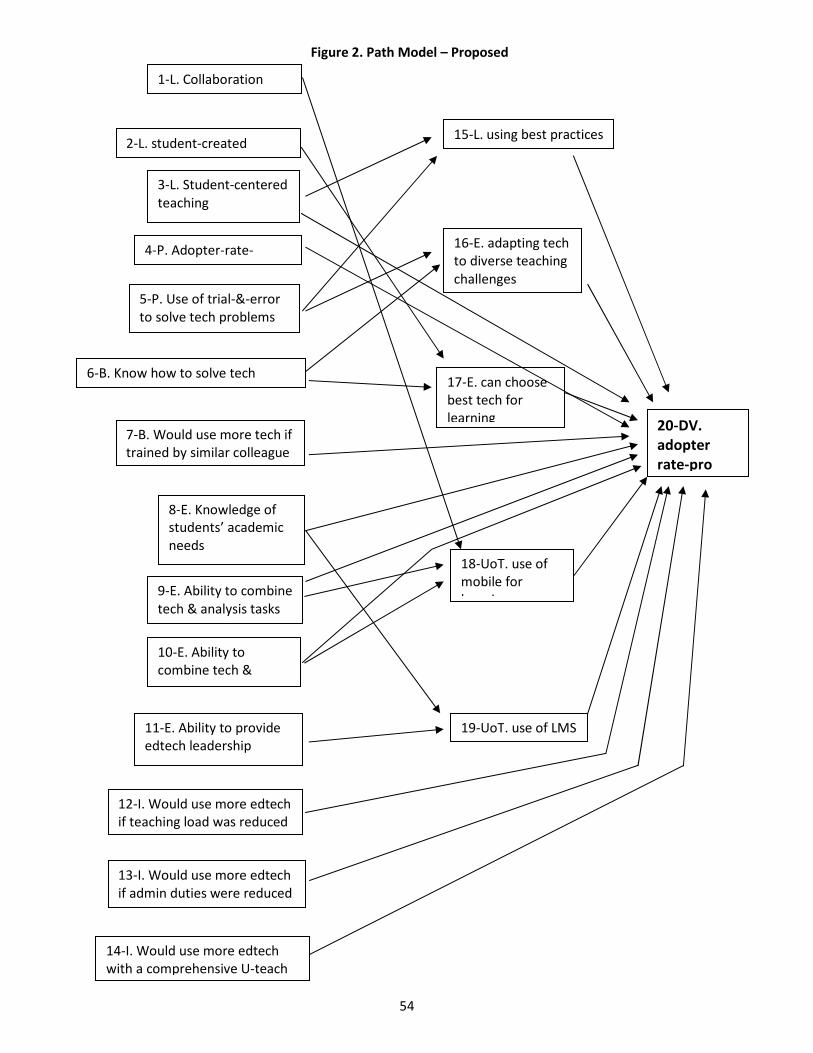
54
Figure 2. Path Model – Proposed
1-L. Collaboration
tools
2-L. student-created
content
3-L. Student-centered
teaching
4-P. Adopter-rate-
personal
5-P. Use of trial-&-error
to solve tech problems
6-B. Know how to solve tech
problems
16-E. adapting tech
to diverse teaching
challenges
8-E. Knowledge of
students’ academic
needs
9-E. Ability to combine
tech & analysis tasks
11-E. Ability to provide
edtech leadership
12-I. Would use more edtech
if teaching load was reduced
17-E. can choose
best tech for
learning
18-UoT. use of
mobile for
learning
15-L. using best practices
7-B. Would use more tech if
trained by similar colleague
10-E. Ability to
combine tech &
writing tasks
13-I. Would use more edtech
if admin duties were reduced
14-I. Would use more edtech
with a comprehensive U-teach
19-UoT. use of LMS
20-DV.
adopter
rate-pro
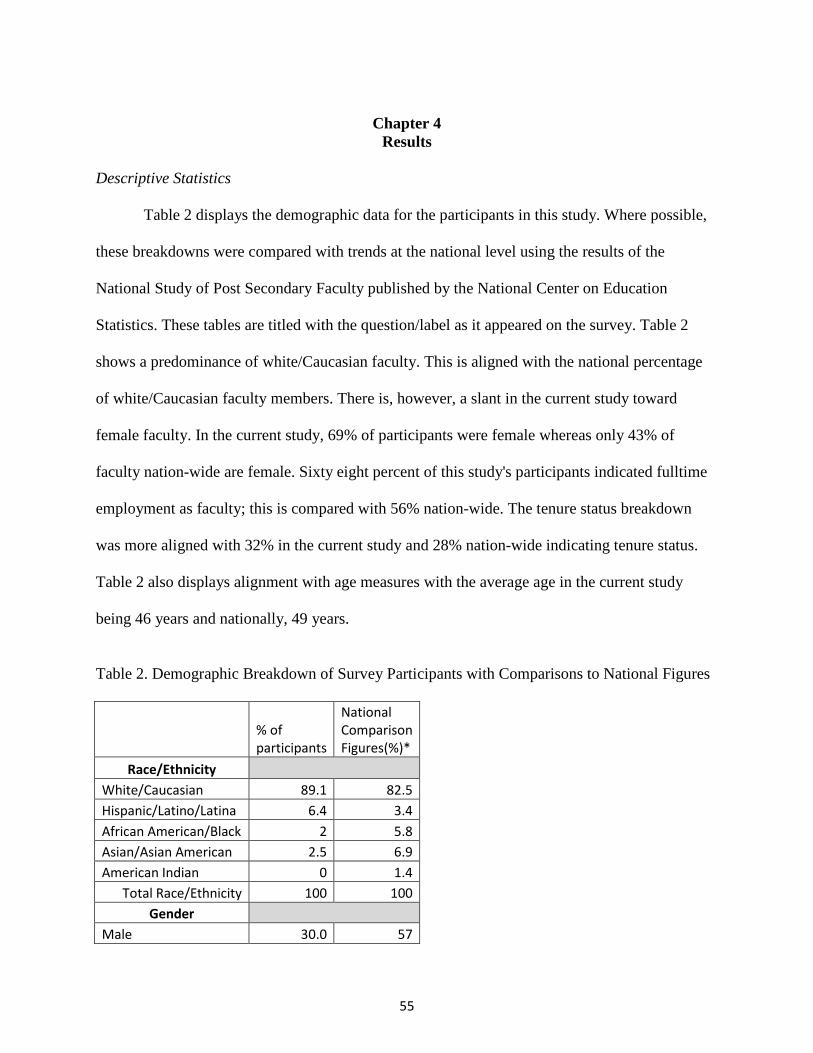
55
Chapter 4
Results Descriptive Statistics
Table 2 displays the demographic data for the participants in this study. Where possible,
these breakdowns were compared with trends at the national level using the results of the
National Study of Post Secondary Faculty published by the National Center on Education
Statistics. These tables are titled with the question/label as it appeared on the survey. Table 2
shows a predominance of white/Caucasian faculty. This is aligned with the national percentage
of white/Caucasian faculty members. There is, however, a slant in the current study toward
female faculty. In the current study, 69% of participants were female whereas only 43% of
faculty nation-wide are female. Sixty eight percent of this study's participants indicated fulltime
employment as faculty; this is compared with 56% nation-wide. The tenure status breakdown
was more aligned with 32% in the current study and 28% nation-wide indicating tenure status.
Table 2 also displays alignment with age measures with the average age in the current study
being 46 years and nationally, 49 years.
Table 2. Demographic Breakdown of Survey Participants with Comparisons to National Figures
% of
participants
National
Comparison
Figures(%)*
Race/Ethnicity
White/Caucasian 89.1 82.5
Hispanic/Latino/Latina 6.4 3.4
African American/Black 2 5.8
Asian/Asian American 2.5 6.9
American Indian 0 1.4
Total Race/Ethnicity 100 100
Gender
Male 30.0 57

56
Female 69.9 43
Total Gender 100 100
Full vs Part Time
Status
Fulltime 69.8 56
Part-time 30.2 44
Total F/P Status 100 100
Tenure
Yes 32.2 28
No 67.8 72
Total Tenure 100 100
Age
Mean 46.6 49.4
Standard Deviation 11.4 11.1
Range 25-82=57 19-89=70
*based on the National Study of Post Secondary Faculty published by the National Center on Educational Statistics
The means and standard deviations for each of the path model variables are listed for all faculty
participants as well as for each subgroup including gender, tenure, full/part time, and age factors
(Table 3). The item that consistently scored the lowest average was an efficacy variable: faculty
know students' common misunderstanding and misconceptions. The item that scored consistently
high was the adopter rate for personal use of technology.

57
Table 3: Descriptive Measures for All Path Model Variables
Descriptive Statistics on Key Variables Gender Subgroups
All Faculty Participants Males Females
N Min Max Mean
Std. Dev. N Mean
Std. Dev. N Mean
Std. Dev.
Barrier Variables 1.000 4.000 2.032 0.817 2.000 0.785 2.045 0.809
B[I know how to solve my own education technology problems. ]
203 1 4 1.93 .735 60 1.65 .709 143 2.05 .715
B[I would use technology tools more if I could receive training from someone who has worked in my area of specialty;]
203 1 4 2.13 .899 60 2.35 .860 143 2.04 .903
Learning Benefits Variable 1.000 4.000 1.818 0.787 2.004 0.831 1.740 0.756
L[Student-created content (i.e. video, audio, web pages);]
203 1 4 1.84 .787 60 2.07 .821 143 1.75 .755
L[Understanding and using best practices of teaching with technology.]
203 1 4 1.56 .717 60 1.77 .810 143 1.48 .659
L[A teacher who plans lessons that are learner-centered uses education technology.]
203 1 4 2.25 .907 60 2.42 .926 143 2.18 .893
L[Collaboration tools for students;] 203 1 4 1.62 .738 60 1.77 .767 143 1.55 .719
Efficacy with Content and Technology
1.000 4.000 1.755 0.696 1.794 0.707 1.739 0.692
E[I can teach lessons that appropriately combine analysis, technologies, and my teaching approaches.]
203 1 4 1.79 .694 60 1.82 .701 143 1.78 .693
E[I can teach lessons that appropriately combine writing, technologies, and my teaching approaches.]
203 1 4 1.83 .719 60 1.87 .747 143 1.82 .708
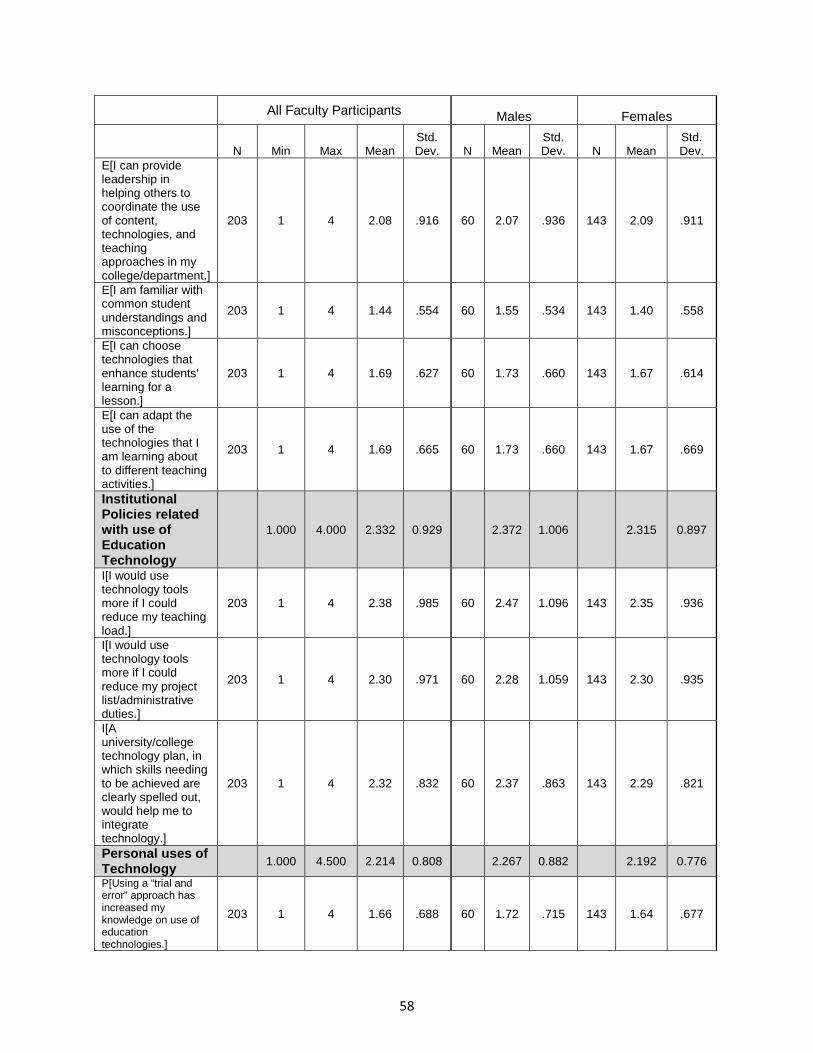
58
All Faculty Participants Males Females
N Min Max Mean
Std. Dev. N Mean
Std. Dev. N Mean
Std. Dev.
E[I can provide leadership in helping others to coordinate the use of content, technologies, and teaching approaches in my college/department.]
203 1 4 2.08 .916 60 2.07 .936 143 2.09 .911
E[I am familiar with common student understandings and misconceptions.]
203 1 4 1.44 .554 60 1.55 .534 143 1.40 .558
E[I can choose technologies that enhance students' learning for a lesson.]
203 1 4 1.69 .627 60 1.73 .660 143 1.67 .614
E[I can adapt the use of the technologies that I am learning about to different teaching activities.]
203 1 4 1.69 .665 60 1.73 .660 143 1.67 .669
Institutional Policies related with use of Education Technology
1.000 4.000 2.332 0.929 2.372 1.006 2.315 0.897
I[I would use technology tools more if I could reduce my teaching load.]
203 1 4 2.38 .985 60 2.47 1.096 143 2.35 .936
I[I would use technology tools more if I could reduce my project list/administrative duties.]
203 1 4 2.30 .971 60 2.28 1.059 143 2.30 .935
I[A university/college technology plan, in which skills needing to be achieved are clearly spelled out, would help me to integrate technology.]
203 1 4 2.32 .832 60 2.37 .863 143 2.29 .821
Personal uses of Technology 1.000 4.500 2.214 0.808 2.267 0.882 2.192 0.776
P[Using a “trial and error” approach has increased my knowledge on use of education technologies.]
203 1 4 1.66 .688 60 1.72 .715 143 1.64 .677

59
All Faculty Participants Males Females
N Min Max Mean
Std. Dev. N Mean
Std. Dev. N Mean
Std. Dev.
P[When new technologies are released, I am typically among the following group of adopters for personal use (cell phones, computers, laptops for personal use).]
203 1 5 2.77 .928 60 2.82 1.049 143 2.75 .876
Uses of Specific Technology Tools
1.000 4.333 2.230 0.850 2.444 0.950 2.140 0.786
UoT[When new technologies are released, I am typically among the following group of adopters for professional use (cell phones, computers, laptops for instructional use or with my students).]
203 1 5 2.62 .896 60 2.70 1.046 143 2.58 .826
UoT[I effectively use a learning management system (such as Blackboard, Moodle, etc.) to teach and organize instructional content.]
203 1 4 1.59 .741 60 1.82 .873 143 1.50 .659
UoT[I effectively use mobile devices (including smartphones, tablets, laptops, etc.) to teach and organize instructional content.]
203 1 4 2.48 .914 60 2.82 .930 143 2.34 .873
Means 203 1.000 4.113 2.013 0.799 60 2.106 0.846 143 1.974 0.772
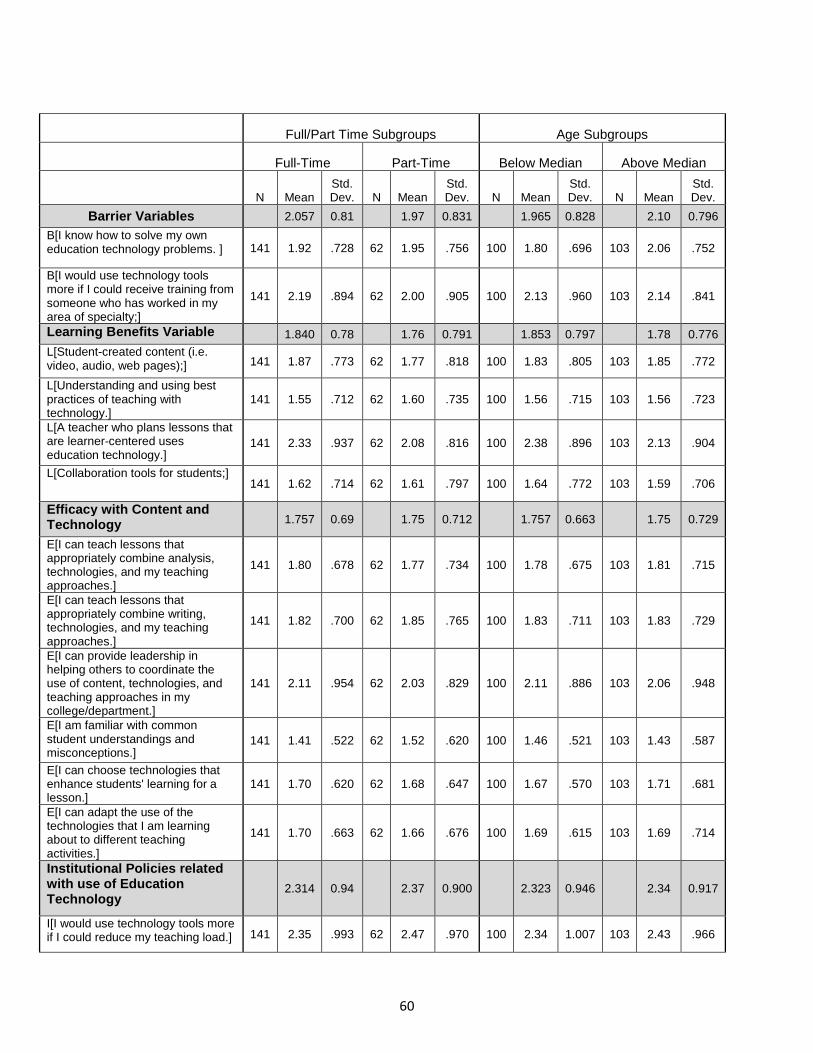
60
Full/Part Time Subgroups Age Subgroups
Full-Time Part-Time Below Median Above Median
N Mean Std. Dev. N Mean
Std. Dev. N Mean
Std. Dev. N Mean
Std. Dev.
Barrier Variables 2.057 0.81 1.97 0.831 1.965 0.828 2.10 0.796
B[I know how to solve my own education technology problems. ] 141 1.92 .728 62 1.95 .756 100 1.80 .696 103 2.06 .752
B[I would use technology tools more if I could receive training from someone who has worked in my area of specialty;]
141 2.19 .894 62 2.00 .905 100 2.13 .960 103 2.14 .841
Learning Benefits Variable 1.840 0.78 1.76 0.791 1.853 0.797 1.78 0.776
L[Student-created content (i.e. video, audio, web pages);] 141 1.87 .773 62 1.77 .818 100 1.83 .805 103 1.85 .772
L[Understanding and using best practices of teaching with technology.]
141 1.55 .712 62 1.60 .735 100 1.56 .715 103 1.56 .723
L[A teacher who plans lessons that are learner-centered uses education technology.]
141 2.33 .937 62 2.08 .816 100 2.38 .896 103 2.13 .904
L[Collaboration tools for students;] 141 1.62 .714 62 1.61 .797 100 1.64 .772 103 1.59 .706
Efficacy with Content and Technology 1.757 0.69 1.75 0.712 1.757 0.663 1.75 0.729
E[I can teach lessons that appropriately combine analysis, technologies, and my teaching approaches.]
141 1.80 .678 62 1.77 .734 100 1.78 .675 103 1.81 .715
E[I can teach lessons that appropriately combine writing, technologies, and my teaching approaches.]
141 1.82 .700 62 1.85 .765 100 1.83 .711 103 1.83 .729
E[I can provide leadership in helping others to coordinate the use of content, technologies, and teaching approaches in my college/department.]
141 2.11 .954 62 2.03 .829 100 2.11 .886 103 2.06 .948
E[I am familiar with common student understandings and misconceptions.]
141 1.41 .522 62 1.52 .620 100 1.46 .521 103 1.43 .587
E[I can choose technologies that enhance students' learning for a lesson.]
141 1.70 .620 62 1.68 .647 100 1.67 .570 103 1.71 .681
E[I can adapt the use of the technologies that I am learning about to different teaching activities.]
141 1.70 .663 62 1.66 .676 100 1.69 .615 103 1.69 .714
Institutional Policies related with use of Education Technology
2.314 0.94 2.37 0.900 2.323 0.946 2.34 0.917
I[I would use technology tools more if I could reduce my teaching load.] 141 2.35 .993 62 2.47 .970 100 2.34 1.007 103 2.43 .966

61
Full/Part Time Subgroups Age Subgroups
Full-Time Part-Time Below Median Above Median
I[I would use technology tools more if I could reduce my project list/administrative duties.]
141 2.30 .971 62 2.27 .978 100 2.30 1.000 103 2.29 .946
I[A university/college technology plan, in which skills needing to be achieved are clearly spelled out, would help me to integrate technology.]
141 2.29 .866 62 2.37 .752 100 2.33 .829 103 2.30 .838
Personal uses of Technology 2.216 0.81 2.21 0.807 2.270 0.806 2.16 0.793
N Mean Std. Dev. N Mean
Std. Dev. N Mean
Std. Dev. N Mean
Std. Dev.
P[Using a “trial and error” approach has increased my knowledge on use of education technologies.]
141 1.67 .681 62 1.63 .707 100 1.60 .739 103 1.72 .633
P[When new technologies are released, I am typically among the following group of adopters for personal use (cell phones, computers, laptops for personal use).]
141 2.76 .940 62 2.79 .908 100 2.94 .874 103 2.60 .953
Uses of Specific Technology Tools 2.215 0.85 2.26 0.847 2.230 0.833 2.23 0.868
UoT[When new technologies are released, I am typically among the following group of adopters for professional use (cell phones, computers, laptops for instructional use or with my students).]
141 2.60 .926 62 2.66 .829 100 2.66 .890 103 2.57 .903
UoT[I effectively use a learning management system (such as Blackboard, Moodle, etc.) to teach and organize instructional content.]
141 1.54 .712 62 1.71 .797 100 1.55 .672 103 1.63 .804
UoT[I effectively use mobile devices (including smartphones, tablets, laptops, etc.) to teach and organize instructional content.]
141 2.51 .915 62 2.42 .915 100 2.48 .937 103 2.49 .895
Means 141 2.015 0.799 62 2.009 0.800 100 2.021 0.793 103 2.006 0.804
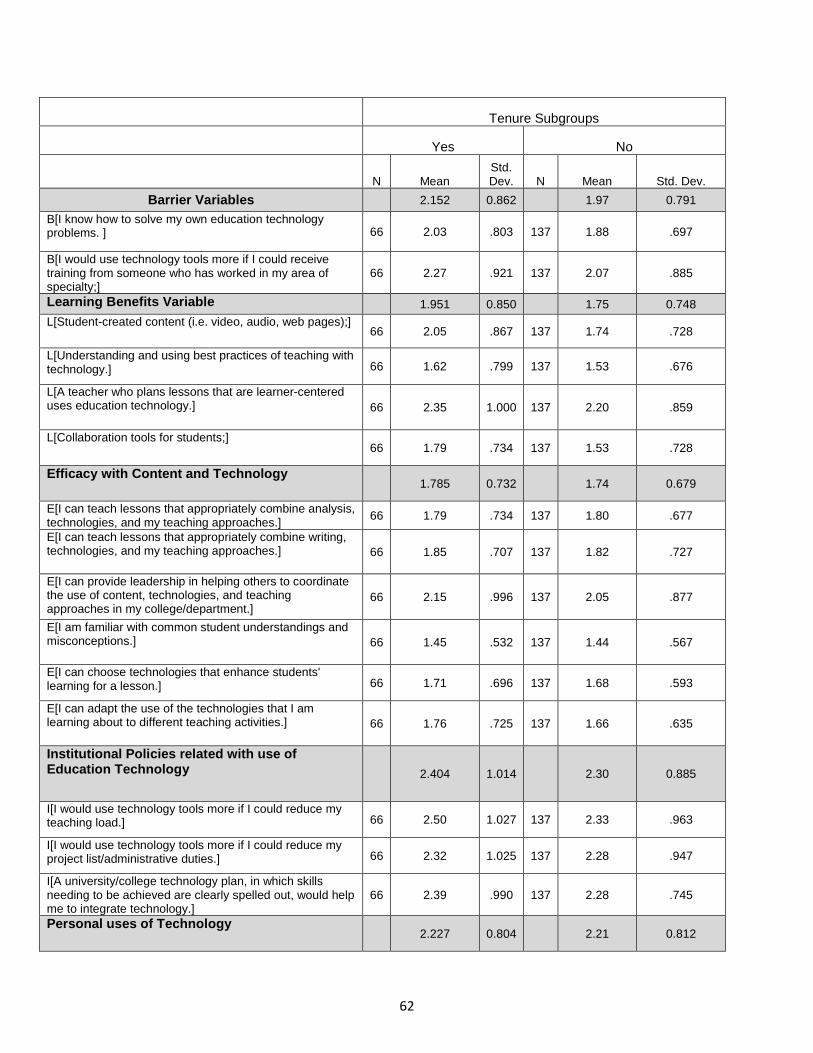
62
Tenure Subgroups
Yes No
N Mean Std. Dev. N Mean Std. Dev.
Barrier Variables 2.152 0.862 1.97 0.791
B[I know how to solve my own education technology problems. ] 66 2.03 .803 137 1.88 .697
B[I would use technology tools more if I could receive training from someone who has worked in my area of specialty;]
66 2.27 .921 137 2.07 .885
Learning Benefits Variable 1.951 0.850 1.75 0.748
L[Student-created content (i.e. video, audio, web pages);] 66 2.05 .867 137 1.74 .728
L[Understanding and using best practices of teaching with technology.] 66 1.62 .799 137 1.53 .676
L[A teacher who plans lessons that are learner-centered uses education technology.] 66 2.35 1.000 137 2.20 .859
L[Collaboration tools for students;] 66 1.79 .734 137 1.53 .728
Efficacy with Content and Technology 1.785 0.732 1.74 0.679
E[I can teach lessons that appropriately combine analysis, technologies, and my teaching approaches.] 66 1.79 .734 137 1.80 .677
E[I can teach lessons that appropriately combine writing, technologies, and my teaching approaches.] 66 1.85 .707 137 1.82 .727
E[I can provide leadership in helping others to coordinate the use of content, technologies, and teaching approaches in my college/department.]
66 2.15 .996 137 2.05 .877
E[I am familiar with common student understandings and misconceptions.] 66 1.45 .532 137 1.44 .567
E[I can choose technologies that enhance students' learning for a lesson.] 66 1.71 .696 137 1.68 .593
E[I can adapt the use of the technologies that I am learning about to different teaching activities.] 66 1.76 .725 137 1.66 .635
Institutional Policies related with use of Education Technology 2.404 1.014 2.30 0.885
I[I would use technology tools more if I could reduce my teaching load.] 66 2.50 1.027 137 2.33 .963
I[I would use technology tools more if I could reduce my project list/administrative duties.] 66 2.32 1.025 137 2.28 .947
I[A university/college technology plan, in which skills needing to be achieved are clearly spelled out, would help me to integrate technology.]
66 2.39 .990 137 2.28 .745
Personal uses of Technology 2.227 0.804 2.21 0.812
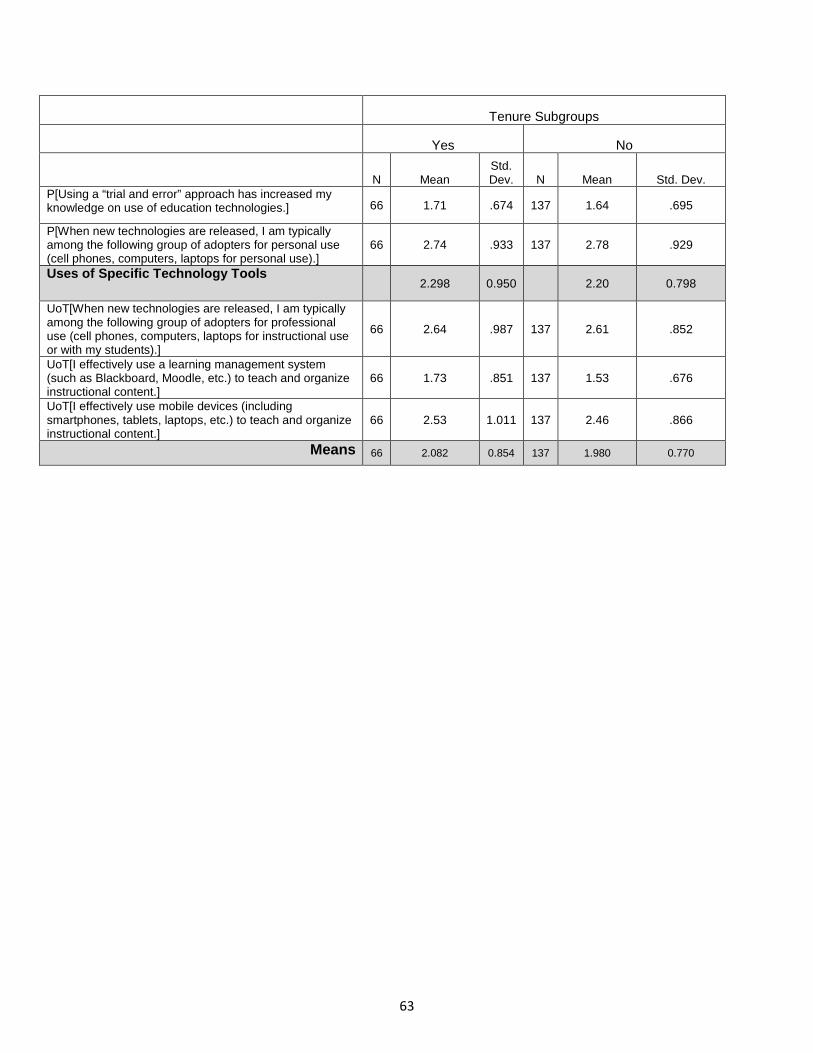
63
Tenure Subgroups
Yes No
N Mean Std. Dev. N Mean Std. Dev.
P[Using a “trial and error” approach has increased my knowledge on use of education technologies.] 66 1.71 .674 137 1.64 .695
P[When new technologies are released, I am typically among the following group of adopters for personal use (cell phones, computers, laptops for personal use).]
66 2.74 .933 137 2.78 .929
Uses of Specific Technology Tools 2.298 0.950 2.20 0.798
UoT[When new technologies are released, I am typically among the following group of adopters for professional use (cell phones, computers, laptops for instructional use or with my students).]
66 2.64 .987 137 2.61 .852
UoT[I effectively use a learning management system (such as Blackboard, Moodle, etc.) to teach and organize instructional content.]
66 1.73 .851 137 1.53 .676
UoT[I effectively use mobile devices (including smartphones, tablets, laptops, etc.) to teach and organize instructional content.]
66 2.53 1.011 137 2.46 .866
Means 66 2.082 0.854 137 1.980 0.770
64
Path Analysis
The path model began with 14 exogenous variables, five intermediate endogenous
variables, and one ultimate endogenous variable (Figure 2 below). Using the model summary
and coefficient tables (Table 4-9), the resulting “after” diagram was created for all faculty
participants (Figure 3 below). Of the five constructs represented in the proposed diagram (Figure
1), four remained in the resulting diagram. The construct that was excluded through the stepwise
regression analysis was institutional policy. That is, institutional policies as, defined in the
current study, were not deemed to impact the adoption of technology for instructional purposes
using the current analysis. The four constructs that remained in the model were each represented
by two variables. These were:
Learning impact –
Faculty believes that using technology helps to make the instruction student-centered
Faculty believes that using technology helps to identify best instructional practices
Personal use of technology –
Adopter type for personal uses of technology
Faculty uses trial and error approaches to solving technology-related problems
Barriers to technology use –
Faculty knows how to solve technical problems/glitches
Faculty would adopt more technology if he/she was trained by a colleague in the same discipline
Efficacy with use of technology in content area –
Faculty has the ability to combine technology use with writing tasks
Faculty knows how to adapt technology use to diverse teaching challenges
65
Correlations Table 4 displays the correlation matrix for all 20 variables included in the proposed path
model. The variables are numbered as they appear in the path model and are labeled according to
the appropriate construct. One additional category was added along with the five constructs. This
is called use of tools and is valuable to in determining the adoption of specific technology tools
as related with the ultimate endogenous variable. The majority of the coefficients were
significant at the p<0.05 or p<0.01 level.
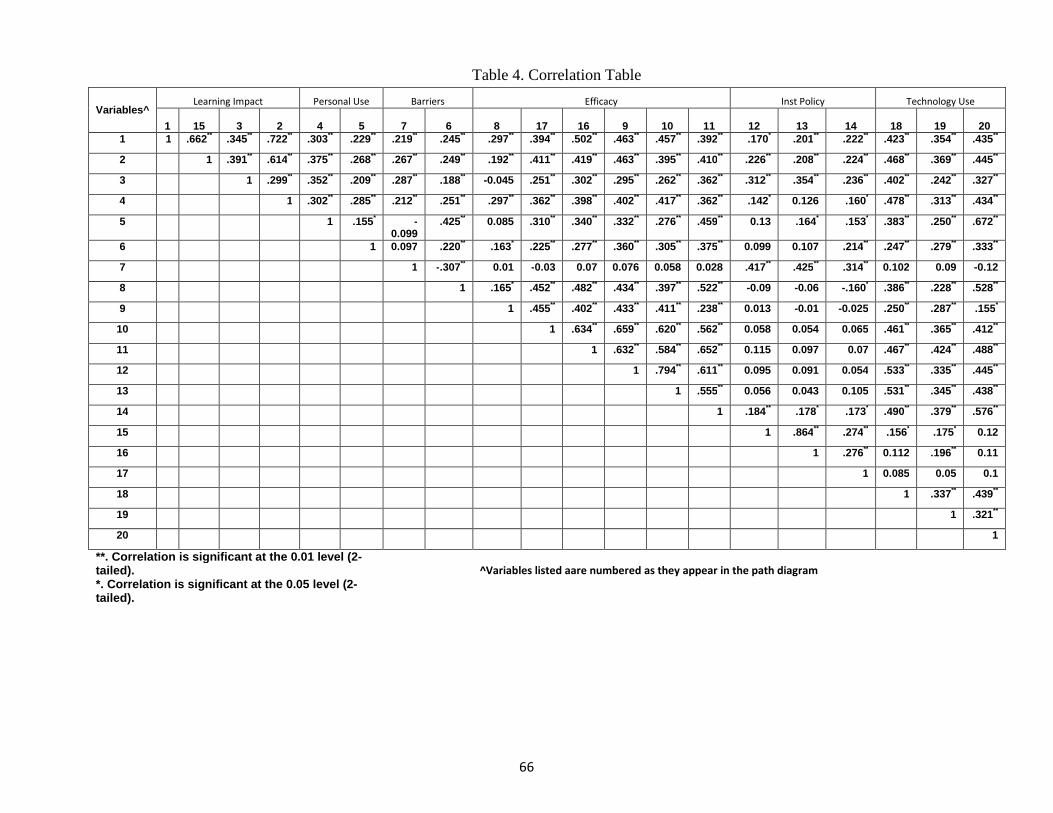
66
Variables^ Learning Impact Personal Use Barriers Efficacy Inst Policy Technology Use
1 15 3 2 4 5 7 6 8 17 16 9 10 11 12 13 14 18 19 20 1 1 .662** .345** .722** .303** .229** .219** .245** .297** .394** .502** .463** .457** .392** .170* .201** .222** .423** .354** .435**
2 1 .391** .614** .375** .268** .267** .249** .192** .411** .419** .463** .395** .410** .226** .208** .224** .468** .369** .445**
3 1 .299** .352** .209** .287** .188** -0.045 .251** .302** .295** .262** .362** .312** .354** .236** .402** .242** .327**
4 1 .302** .285** .212** .251** .297** .362** .398** .402** .417** .362** .142* 0.126 .160* .478** .313** .434**
5 1 .155* -0.099
.425** 0.085 .310** .340** .332** .276** .459** 0.13 .164* .153* .383** .250** .672**
6 1 0.097 .220** .163* .225** .277** .360** .305** .375** 0.099 0.107 .214** .247** .279** .333**
7 1 -.307** 0.01 -0.03 0.07 0.076 0.058 0.028 .417** .425** .314** 0.102 0.09 -0.12
8 1 .165* .452** .482** .434** .397** .522** -0.09 -0.06 -.160* .386** .228** .528**
9 1 .455** .402** .433** .411** .238** 0.013 -0.01 -0.025 .250** .287** .155*
10 1 .634** .659** .620** .562** 0.058 0.054 0.065 .461** .365** .412**
11 1 .632** .584** .652** 0.115 0.097 0.07 .467** .424** .488**
12 1 .794** .611** 0.095 0.091 0.054 .533** .335** .445**
13 1 .555** 0.056 0.043 0.105 .531** .345** .438**
14 1 .184** .178* .173* .490** .379** .576**
15 1 .864** .274** .156* .175* 0.12
16 1 .276** 0.112 .196** 0.11
17 1 0.085 0.05 0.1
18 1 .337** .439**
19 1 .321**
20 1
**. Correlation is significant at the 0.01 level (2 -tailed).
^Variables listed aare numbered as they appear in the path diagram
*. Correlation is significant at the 0.05 level (2 -tailed).
Table 4. Correlation Table
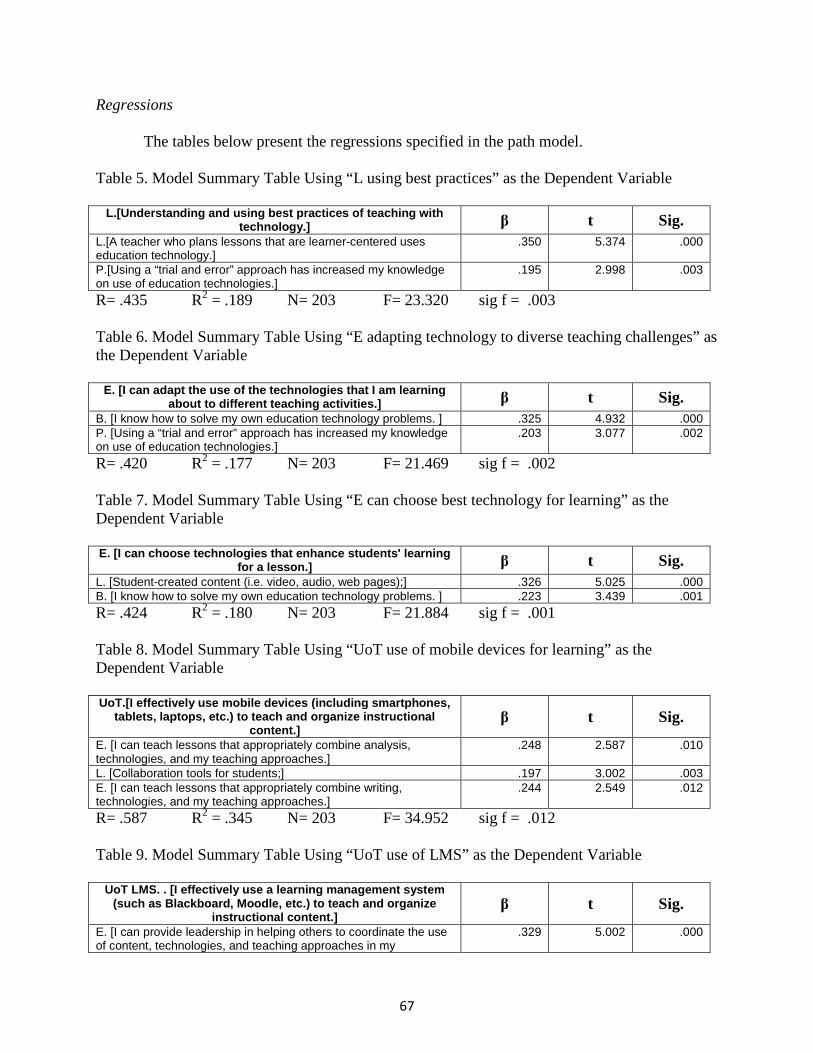
67
Regressions The tables below present the regressions specified in the path model. Table 5. Model Summary Table Using “L using best practices” as the Dependent Variable
L.[Understanding and using best practices of teachi ng with technology.] β t Sig.
L.[A teacher who plans lessons that are learner-centered uses education technology.]
.350 5.374 .000
P.[Using a “trial and error” approach has increased my knowledge on use of education technologies.]
.195 2.998 .003
R= .435 R2 = .189 N= 203 F= 23.320 sig f = .003 Table 6. Model Summary Table Using “E adapting technology to diverse teaching challenges” as the Dependent Variable
E. [I can adapt the use of the technologies that I am learning about to different teaching activities.] β t Sig.
B. [I know how to solve my own education technology problems. ] .325 4.932 .000 P. [Using a “trial and error” approach has increased my knowledge on use of education technologies.]
.203 3.077 .002
R= .420 R2 = .177 N= 203 F= 21.469 sig f = .002 Table 7. Model Summary Table Using “E can choose best technology for learning” as the Dependent Variable E. [I can choose technologies that enhance students ' learning
for a lesson.] β t Sig. L. [Student-created content (i.e. video, audio, web pages);] .326 5.025 .000 B. [I know how to solve my own education technology problems. ] .223 3.439 .001
R= .424 R2 = .180 N= 203 F= 21.884 sig f = .001 Table 8. Model Summary Table Using “UoT use of mobile devices for learning” as the Dependent Variable UoT.[I effectively use mobile devices (including smartphones,
tablets, laptops, etc.) to teach and organize instr uctional content.]
β t Sig.
E. [I can teach lessons that appropriately combine analysis, technologies, and my teaching approaches.]
.248 2.587 .010
L. [Collaboration tools for students;] .197 3.002 .003 E. [I can teach lessons that appropriately combine writing, technologies, and my teaching approaches.]
.244 2.549 .012
R= .587 R2 = .345 N= 203 F= 34.952 sig f = .012 Table 9. Model Summary Table Using “UoT use of LMS” as the Dependent Variable
UoT LMS. . [I effectively use a learning management system (such as Blackboard, Moodle, etc.) to teach and org anize
instructional content.] β t Sig.
E. [I can provide leadership in helping others to coordinate the use of content, technologies, and teaching approaches in my
.329 5.002 .000
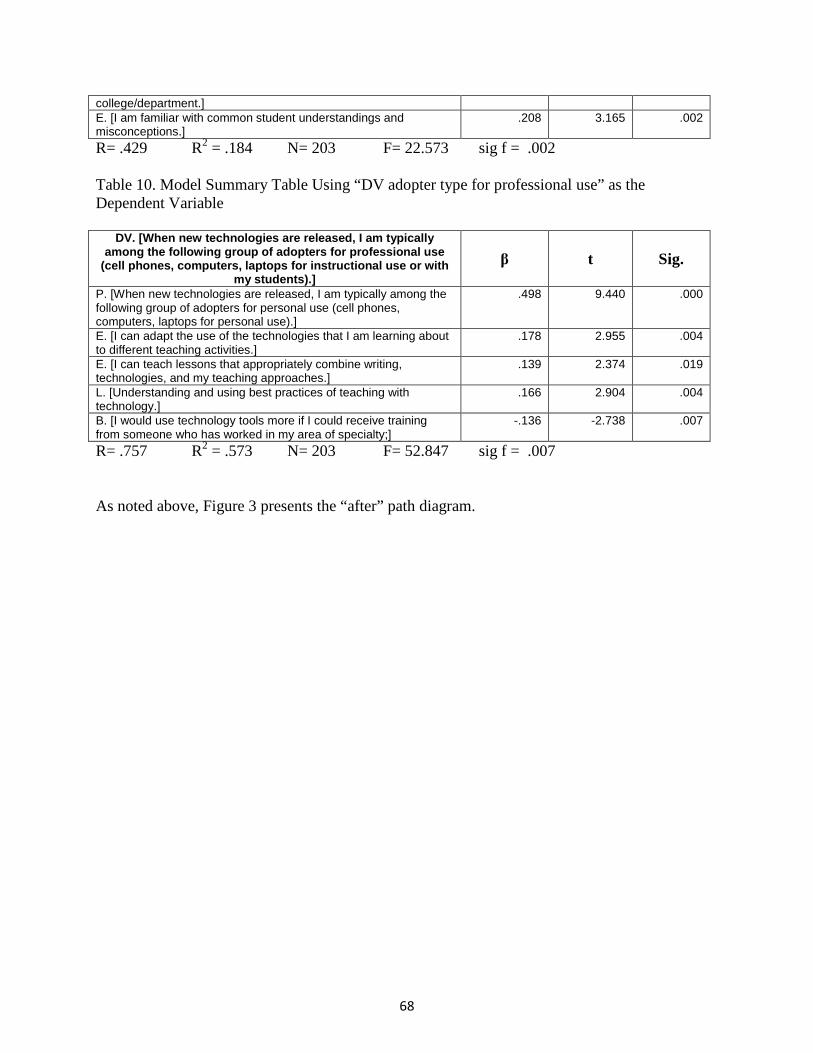
68
college/department.] E. [I am familiar with common student understandings and misconceptions.]
.208 3.165 .002
R= .429 R2 = .184 N= 203 F= 22.573 sig f = .002 Table 10. Model Summary Table Using “DV adopter type for professional use” as the Dependent Variable
DV. [When new technologies are released, I am typic ally among the following group of adopters for professio nal use
(cell phones, computers, laptops for instructional use or with my students).]
β t Sig.
P. [When new technologies are released, I am typically among the following group of adopters for personal use (cell phones, computers, laptops for personal use).]
.498 9.440 .000
E. [I can adapt the use of the technologies that I am learning about to different teaching activities.]
.178 2.955 .004
E. [I can teach lessons that appropriately combine writing, technologies, and my teaching approaches.]
.139 2.374 .019
L. [Understanding and using best practices of teaching with technology.]
.166 2.904 .004
B. [I would use technology tools more if I could receive training from someone who has worked in my area of specialty;]
-.136 -2.738 .007
R= .757 R2 = .573 N= 203 F= 52.847 sig f = .007 As noted above, Figure 3 presents the “after” path diagram.
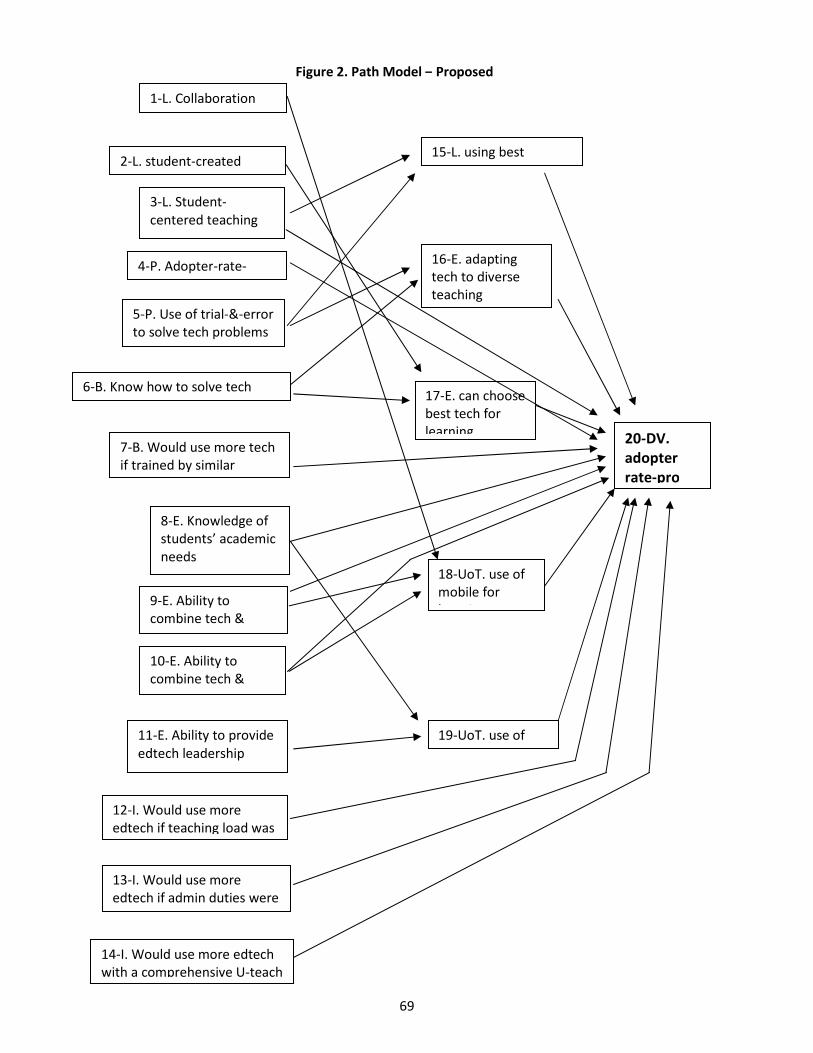
69
Figure 2. Path Model – Proposed
1-L. Collaboration
2-L. student-created
3-L. Student-
centered teaching
4-P. Adopter-rate-
5-P. Use of trial-&-error
to solve tech problems
6-B. Know how to solve tech
problems
16-E. adapting
tech to diverse
teaching
8-E. Knowledge of
students’ academic
needs
9-E. Ability to
combine tech &
analysis tasks
11-E. Ability to provide
edtech leadership
12-I. Would use more
edtech if teaching load was
17-E. can choose
best tech for
learning
18-UoT. use of
mobile for
learning
15-L. using best
practices
7-B. Would use more tech
if trained by similar
10-E. Ability to
combine tech &
writing tasks
13-I. Would use more
edtech if admin duties were
14-I. Would use more edtech
with a comprehensive U-teach
19-UoT. use of
20-DV.
adopter
rate-pro
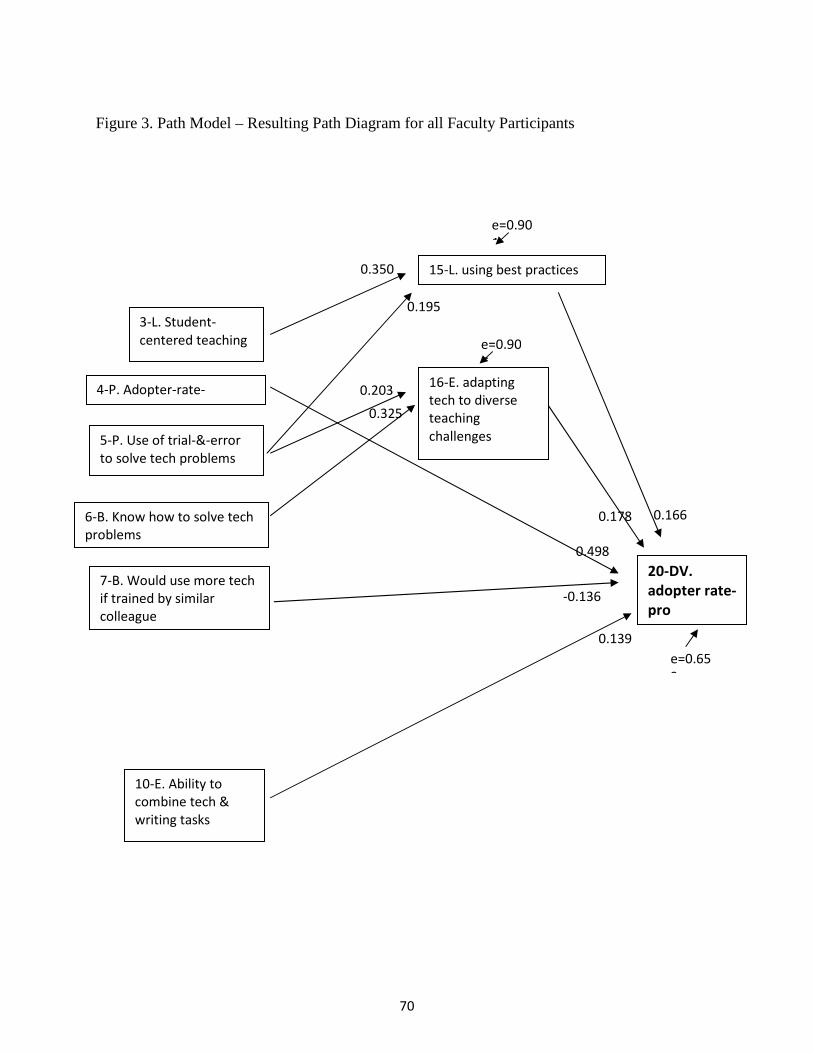
70
Figure 3. Path Model – Resulting Path Diagram for all Faculty Participants
3-L. Student-
centered teaching
4-P. Adopter-rate-
personal
5-P. Use of trial-&-error
to solve tech problems
6-B. Know how to solve tech
problems
16-E. adapting
tech to diverse
teaching
challenges
15-L. using best practices
7-B. Would use more tech
if trained by similar
colleague
10-E. Ability to
combine tech &
writing tasks
20-DV.
adopter rate-
pro
0.498
0.178
0.139
0.166
-0.136
0.350
0.195
0.203
0.325
e=0.90
1
e=0.90
7
e=0.65
3
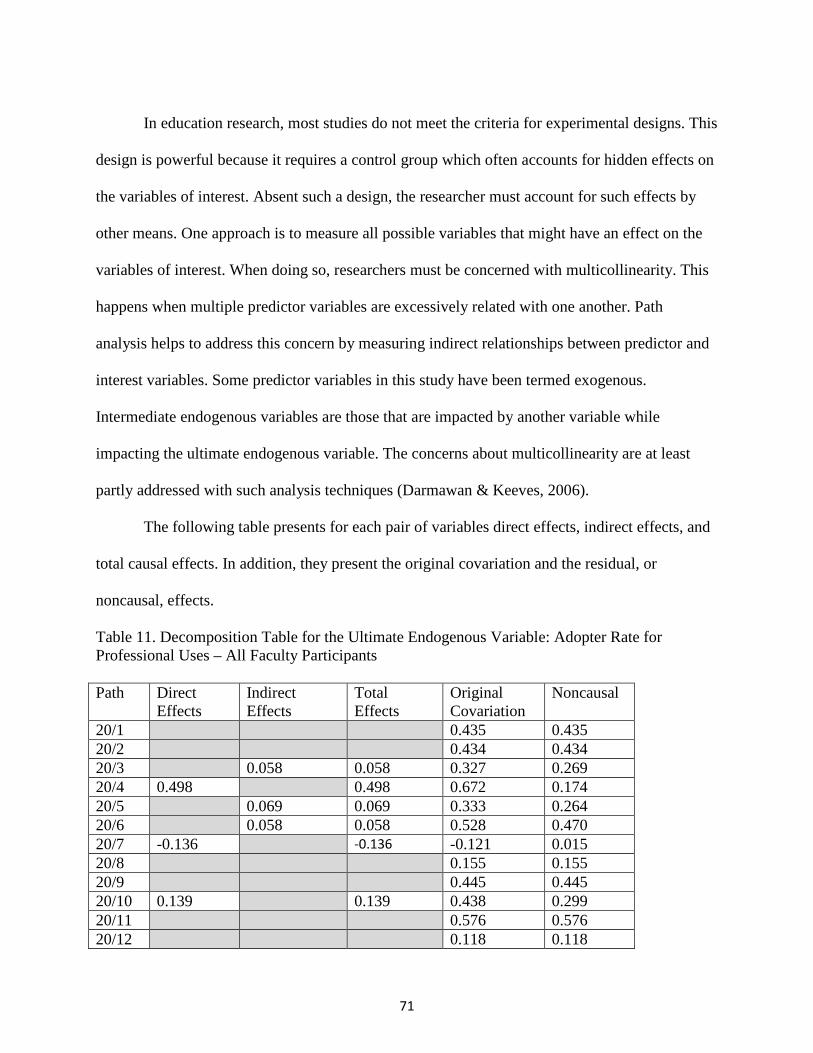
71
In education research, most studies do not meet the criteria for experimental designs. This
design is powerful because it requires a control group which often accounts for hidden effects on
the variables of interest. Absent such a design, the researcher must account for such effects by
other means. One approach is to measure all possible variables that might have an effect on the
variables of interest. When doing so, researchers must be concerned with multicollinearity. This
happens when multiple predictor variables are excessively related with one another. Path
analysis helps to address this concern by measuring indirect relationships between predictor and
interest variables. Some predictor variables in this study have been termed exogenous.
Intermediate endogenous variables are those that are impacted by another variable while
impacting the ultimate endogenous variable. The concerns about multicollinearity are at least
partly addressed with such analysis techniques (Darmawan & Keeves, 2006).
The following table presents for each pair of variables direct effects, indirect effects, and
total causal effects. In addition, they present the original covariation and the residual, or
noncausal, effects.
Table 11. Decomposition Table for the Ultimate Endogenous Variable: Adopter Rate for Professional Uses – All Faculty Participants Path Direct
Effects Indirect Effects
Total Effects
Original Covariation
Noncausal
20/1 0.435 0.435 20/2 0.434 0.434 20/3 0.058 0.058 0.327 0.269 20/4 0.498 0.498 0.672 0.174 20/5 0.069 0.069 0.333 0.264 20/6 0.058 0.058 0.528 0.470 20/7 -0.136 -0.136 -0.121 0.015 20/8 0.155 0.155 20/9 0.445 0.445 20/10 0.139 0.139 0.438 0.299 20/11 0.576 0.576 20/12 0.118 0.118
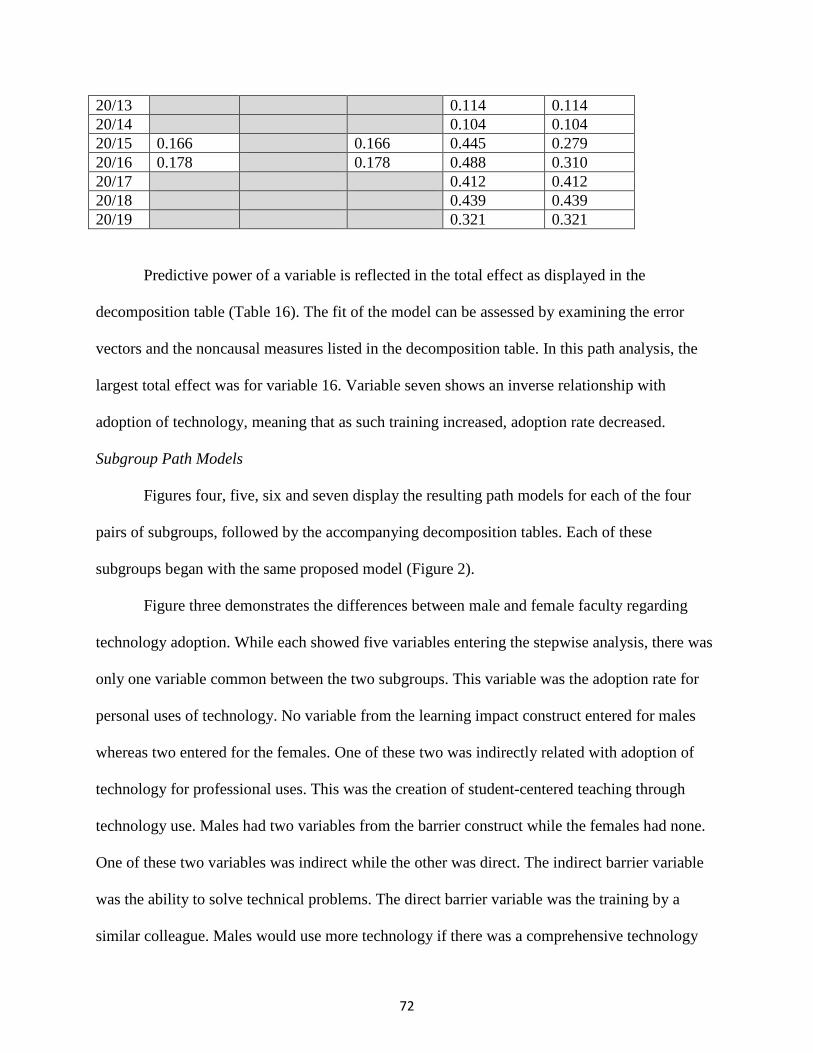
72
20/13 0.114 0.114 20/14 0.104 0.104 20/15 0.166 0.166 0.445 0.279 20/16 0.178 0.178 0.488 0.310 20/17 0.412 0.412 20/18 0.439 0.439 20/19 0.321 0.321
Predictive power of a variable is reflected in the total effect as displayed in the
decomposition table (Table 16). The fit of the model can be assessed by examining the error
vectors and the noncausal measures listed in the decomposition table. In this path analysis, the
largest total effect was for variable 16. Variable seven shows an inverse relationship with
adoption of technology, meaning that as such training increased, adoption rate decreased.
Subgroup Path Models
Figures four, five, six and seven display the resulting path models for each of the four
pairs of subgroups, followed by the accompanying decomposition tables. Each of these
subgroups began with the same proposed model (Figure 2).
Figure three demonstrates the differences between male and female faculty regarding
technology adoption. While each showed five variables entering the stepwise analysis, there was
only one variable common between the two subgroups. This variable was the adoption rate for
personal uses of technology. No variable from the learning impact construct entered for males
whereas two entered for the females. One of these two was indirectly related with adoption of
technology for professional uses. This was the creation of student-centered teaching through
technology use. Males had two variables from the barrier construct while the females had none.
One of these two variables was indirect while the other was direct. The indirect barrier variable
was the ability to solve technical problems. The direct barrier variable was the training by a
similar colleague. Males would use more technology if there was a comprehensive technology

73
plan at the institution. This variable did not enter for the females. Males who were able to adapt
technology to diverse teaching challenges were more likely to adopt technology use. This
variable did not enter for females. Females who believed that technology use helped determine
best instructional practices were more likely to adopt technology use whereas this variable did
not enter for males.

74
Figure 4. Resulting Path Diagram by Gender
4-P. Adopter-rate-personal
6-B. Know how to solve tech problems
16-E. adapting tech
to diverse teaching
challenges
7-B. Would use more tech if
trained by similar colleague
14-I. Would use more edtech with a
comprehensive U-teach plan 20-DV.
adopter rate-
pro
0.192
-0.322
0.523
0.330
0.485
e=0.875
e=0.534
Male Faculty N=60
3-L. Student-
centered teaching
4-P. Adopter-rate-personal
5-P. Use of trial-&-error
to solve tech problems
15-L. using best practices
10-E. Ability to combine
tech & writing tasks
20-DV.
adopter rate-
pro
0.170
0.521
0.246
e=0.708 0.241
0.218
e=0.935 Female Faculty N=142

75
Table 17. Decomposition Table for the Ultimate Endogenous Variable: Adopter Rate for Professional Uses for the Gender Subgroup Male Faculty Path Direct Effects Indirect Effects Total Effects Original
Covaraition Noncausal
20/1 0.435 0.435 20/2 0.434 0.434 20/3 0.327 0.327 20/4 0.523 0.523 0.672 0.149 20/5 0.333 0.333 20/6 0.160 0.160 0.528 0.368 20/7 -0.322 -0.322 -0.121 0.201 20/8 0.155 0.155 20/9 0.445 0.445 20/10 0.438 0.438 20/11 0.576 0.576 20/12 0.118 0.118 20/13 0.114 0.114 20/14 0.192 0.192 0.104 -.088 20/15 0.445 0.445 20/16 0.330 0.330 0.488 0.158 20/17 0.412 0.412 20/18 0.439 0.439 20/19 0.321 0.321 Female Faculty Path Direct Effects Indirect Effects Total Effects Original
Covaraition Noncausal
20/1 0.435 0.435 20/2 0.434 0.434 20/3 0.327 0.327 20/4 0.521 0.521 0.672 0.151 20/5 0.037 0.037 0.333 0.296 20/6 0.528 0.528 20/7 -0.121 -0.121 20/8 0.155 0.155 20/9 0.445 0.445 20/10 0.246 0.246 0.438 0.192 20/11 0.576 0.576 20/12 0.118 0.118 20/13 0.114 0.114 20/14 0.104 0.104 20/15 0.170 0.170 0.445 0.275 20/16 0.488 0.488 20/17 0.412 0.412 20/18 0.439 0.439 20/19 0.321 0.321
76
The full-time and part-time subgroups showed three variables in common (Figure 5).
These were adopter rate for personal technology uses, use of trial-and-error to solve technology
problems, and the belief that technology use helps identify best instructional practices. For full-
time faculty, the use of trial-and-error variable was mediated by the ability to adapt technology to
diverse teaching challenges, whereas, the same variable for the part-time faculty was mediated
by the belief that technology use helps identify best practices. Full-time faculty were more likely
to adopt technology use if they believed it helps create student-centered teaching, if they know
how to solve technical problems, and knew how to adapt technology to diverse teaching
challenges. None of these variables entered for the part-time faculty. Part-time faculty were more
likely to adopt technology use if they believed in the collaborative benefits, had the ability to
combine technology use with analysis-based tasks, and used mobile devices for learning. None
of these three variables entered for full-time faculty.
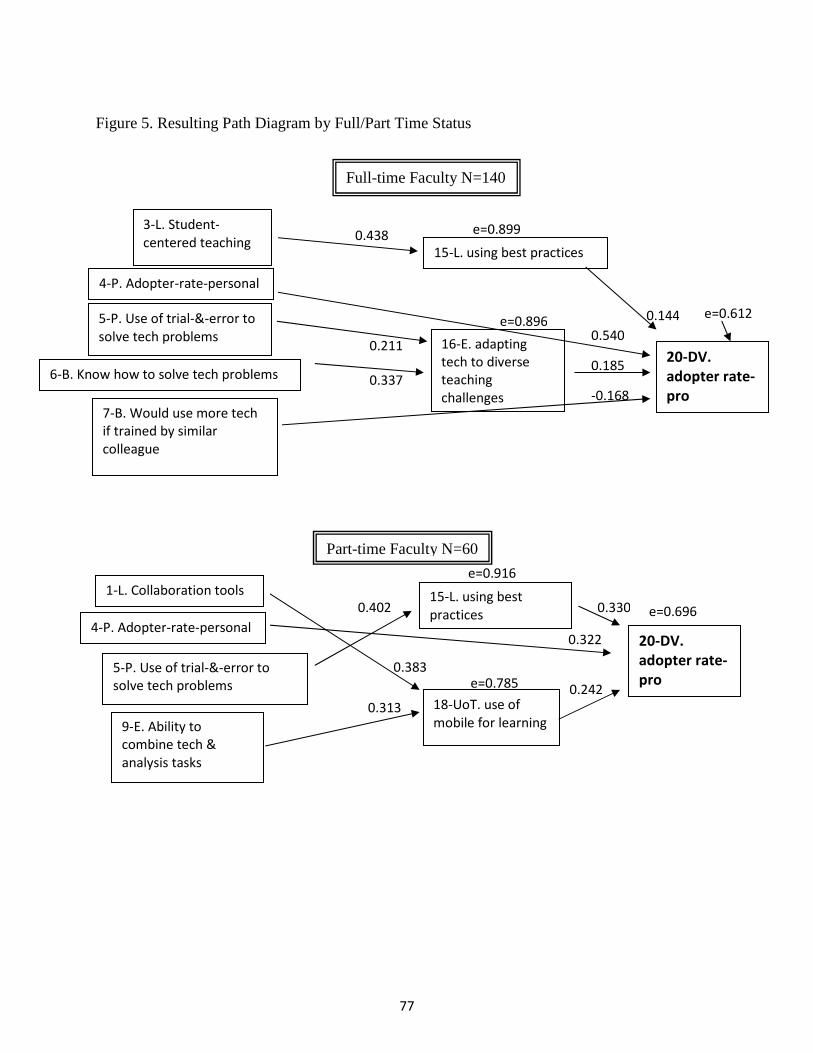
77
Figure 5. Resulting Path Diagram by Full/Part Time Status
3-L. Student-
centered teaching
4-P. Adopter-rate-personal
5-P. Use of trial-&-error to
solve tech problems
6-B. Know how to solve tech problems
16-E. adapting
tech to diverse
teaching
challenges
15-L. using best practices
7-B. Would use more tech
if trained by similar
colleague
20-DV.
adopter rate-
pro
0.144
0.540
0.185
-0.168
e=0.612
e=0.899
e=0.896
0.438
0.211
0.337
Full-time Faculty N=140
1-L. Collaboration tools
4-P. Adopter-rate-personal
5-P. Use of trial-&-error to
solve tech problems
9-E. Ability to
combine tech &
analysis tasks
18-UoT. use of
mobile for learning
15-L. using best
practices
20-DV.
adopter rate-
pro
0.402 0.330
0.322
0.242
0.383
0.313
e=0.916
e=0.696
e=0.785
Part-time Faculty N=60
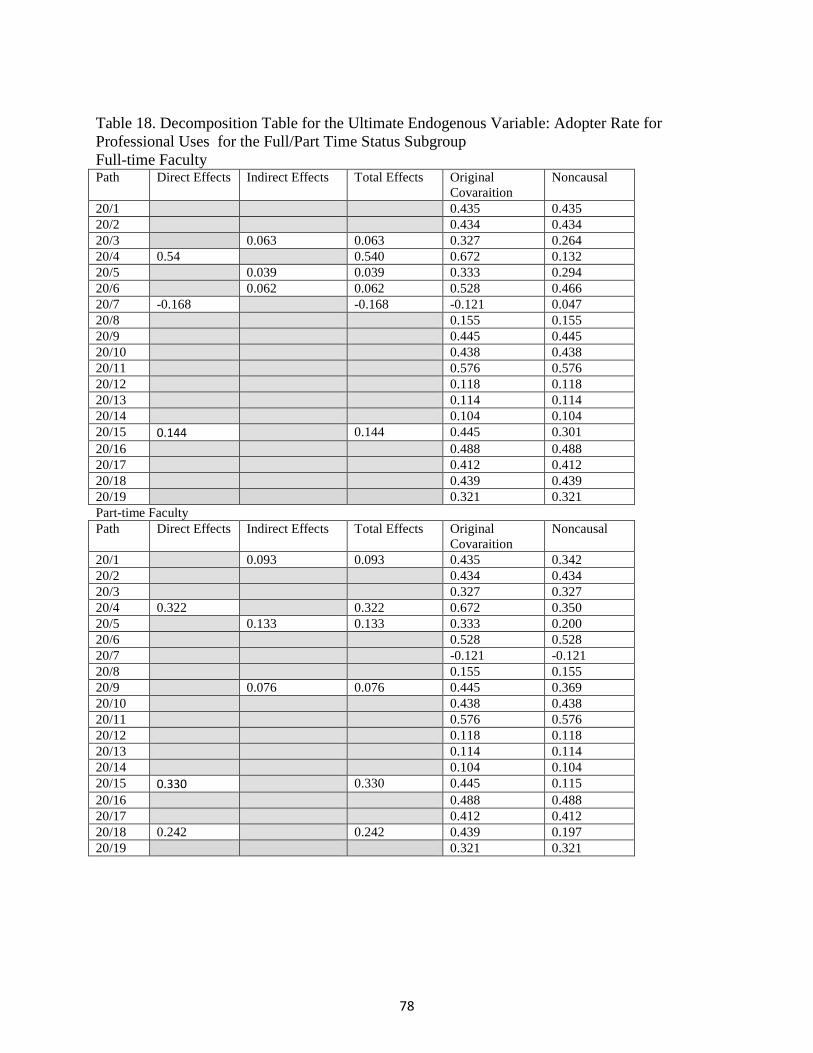
78
Table 18. Decomposition Table for the Ultimate Endogenous Variable: Adopter Rate for Professional Uses for the Full/Part Time Status Subgroup Full-time Faculty Path Direct Effects Indirect Effects Total Effects Original
Covaraition Noncausal
20/1 0.435 0.435 20/2 0.434 0.434 20/3 0.063 0.063 0.327 0.264 20/4 0.54 0.540 0.672 0.132 20/5 0.039 0.039 0.333 0.294 20/6 0.062 0.062 0.528 0.466 20/7 -0.168 -0.168 -0.121 0.047 20/8 0.155 0.155 20/9 0.445 0.445 20/10 0.438 0.438 20/11 0.576 0.576 20/12 0.118 0.118 20/13 0.114 0.114 20/14 0.104 0.104 20/15 0.144 0.144 0.445 0.301 20/16 0.488 0.488 20/17 0.412 0.412 20/18 0.439 0.439 20/19 0.321 0.321 Part-time Faculty Path Direct Effects Indirect Effects Total Effects Original
Covaraition Noncausal
20/1 0.093 0.093 0.435 0.342 20/2 0.434 0.434 20/3 0.327 0.327 20/4 0.322 0.322 0.672 0.350 20/5 0.133 0.133 0.333 0.200 20/6 0.528 0.528 20/7 -0.121 -0.121 20/8 0.155 0.155 20/9 0.076 0.076 0.445 0.369 20/10 0.438 0.438 20/11 0.576 0.576 20/12 0.118 0.118 20/13 0.114 0.114 20/14 0.104 0.104 20/15 0.330 0.330 0.445 0.115 20/16 0.488 0.488 20/17 0.412 0.412 20/18 0.242 0.242 0.439 0.197 20/19 0.321 0.321
79
The differences between tenured and non-tenured faculty are displayed in Figure 6. There
were two common variables between them, adopter rate for personal technology use and ability
to combine technology use with analysis-based tasks. Tenured faculty were more likely to adopt
technology use if they had knowledge of students' academic needs. Non-tenured faculty,
however, were more likely to adopt if they believed in the collaborative benefits of technology
use, they knew how to solve their own technology problems, had the ability to adapt technology
use to diverse teaching challenges, and they used mobile devices for learning.
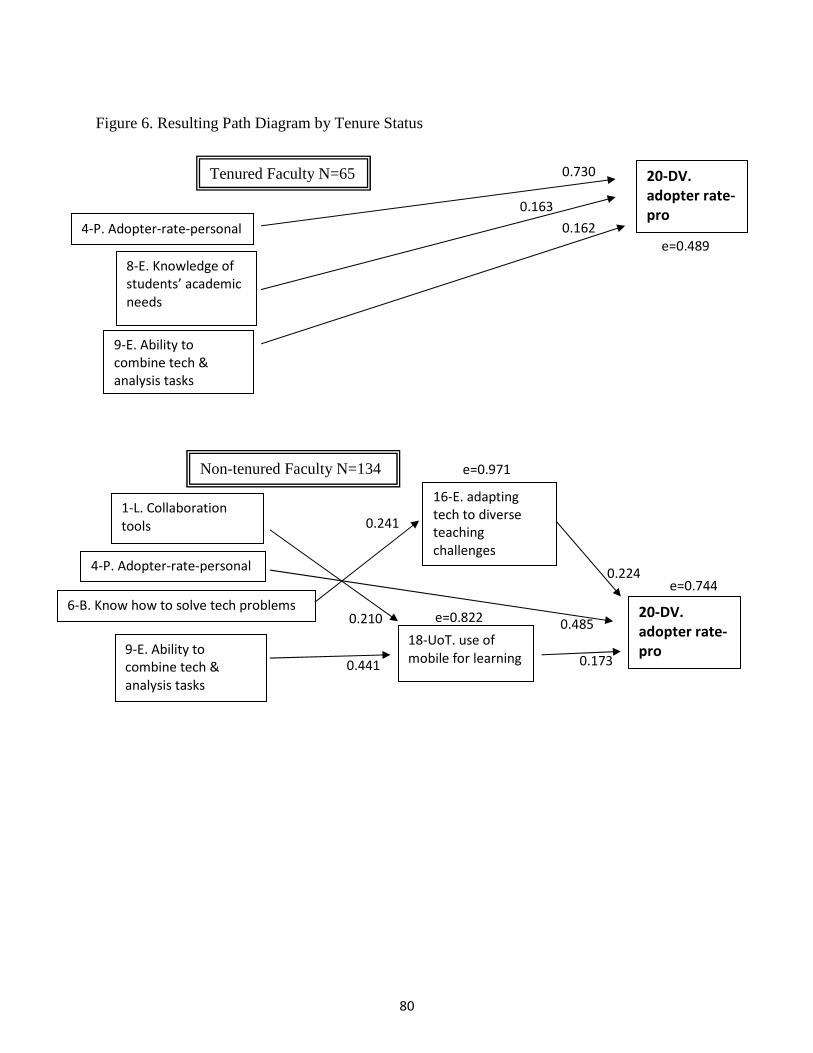
80
Figure 6. Resulting Path Diagram by Tenure Status
4-P. Adopter-rate-personal
8-E. Knowledge of
students’ academic
needs
9-E. Ability to
combine tech &
analysis tasks
20-DV.
adopter rate-
pro
0.730
0.163
0.162
Tenured Faculty N=65
e=0.489
1-L. Collaboration
tools
4-P. Adopter-rate-personal
6-B. Know how to solve tech problems
16-E. adapting
tech to diverse
teaching
challenges
9-E. Ability to
combine tech &
analysis tasks
18-UoT. use of
mobile for learning
20-DV.
adopter rate-
pro
0.224
0.485
0.173
e=0.744
e=0.971
e=0.822
0.241
0.210
0.441
Non-tenured Faculty N=134

81
Table 19. Decomposition Table for the Ultimate Endogenous Variable: Adopter Rate for Professional Uses for the Tenure Subgroup Tenured Faculty Path Direct Effects Indirect Effects Total Effects Original
Covaraition Noncausal
20/1 0.435 0.435 20/2 0.434 0.434 20/3 0.327 0.327 20/4 0.730 0.730 0.672 -0.058 20/5 0.333 0.333 20/6 0.528 0.528 20/7 -0.121 -0.121 20/8 0.163 0.163 0.155 -0.008 20/9 0.162 0.162 0.445 0.283 20/10 0.438 0.438 20/11 0.576 0.576 20/12 0.118 0.118 20/13 0.114 0.114 20/14 0.104 0.104 20/15 0.445 0.445 20/16 0.488 0.488 20/17 0.412 0.412 20/18 0.439 0.439 20/19 0.321 0.321 Non-tenured Faculty Path Direct Effects Indirect Effects Total Effects Original
Covaraition Noncausal
20/1 0.036 0.036 0.435 0.399 20/2 0.434 0.434 20/3 0.327 0.327 20/4 0.485 0.485 0.672 0.187 20/5 0.333 0.333 20/6 0.054 0.054 0.528 0.474 20/7 -0.121 -0.121 20/8 0.155 0.155 20/9 0.076 0.076 0.445 0.369 20/10 0.438 0.438 20/11 0.576 0.576 20/12 0.118 0.118 20/13 0.114 0.114 20/14 0.104 0.104 20/15 0.445 0.445 20/16 0.224 0.224 0.488 0.264 20/17 0.412 0.412 20/18 0.173 0.173 0.439 0.266 20/19 0.321 0.321

82
The resultant path models for the age subgroup are revealing (Figure 7). The median age of 46
years was used as the threshold to separate the sample in two groups. The below median age
group showed just two predictor variables, both of which were directly related with the ultimate
endogenous variable. These were adopter rate for personal uses of technology and the ability to
combine technology and writing tasks during instruction. For the above median age group, there
were three variables directly related with the ultimate endogenous variable. These were the
identification of best practices, adopter rate for personal technology use, and the ability to adapt
technology to diverse teaching challenges. The variables indirectly related with the ultimate
endogenous variable are the benefits of student-centered teaching, use of trial-and-error to solve
technology problems, and the knowledge to solve technology problems.
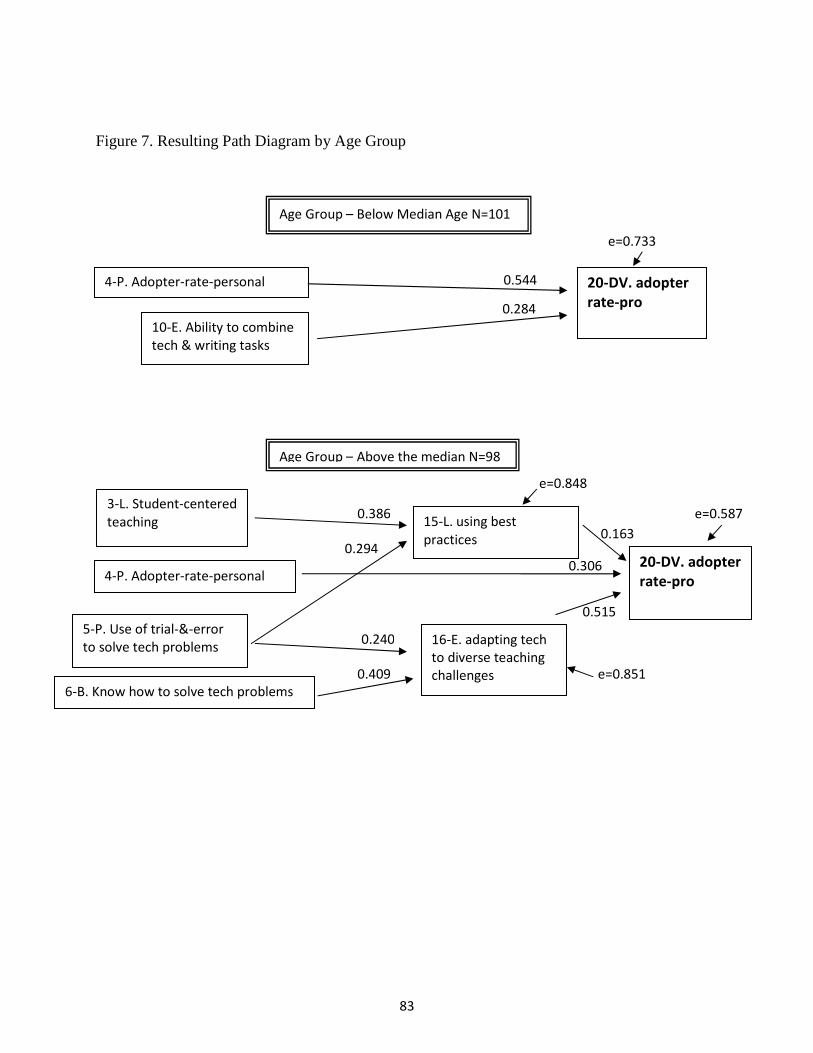
83
Figure 7. Resulting Path Diagram by Age Group
4-P. Adopter-rate-personal
10-E. Ability to combine
tech & writing tasks
20-DV. adopter
rate-pro
Age Group – Below Median Age N=101
0.544
0.284
e=0.733
3-L. Student-centered
teaching
4-P. Adopter-rate-personal
5-P. Use of trial-&-error
to solve tech problems
6-B. Know how to solve tech problems
16-E. adapting tech
to diverse teaching
challenges
15-L. using best
practices
20-DV. adopter
rate-pro
0.386
0.294
0.240
0.409
0.163
0.306
0.515
Age Group – Above the median N=98
e=0.848
e=0.587
e=0.851
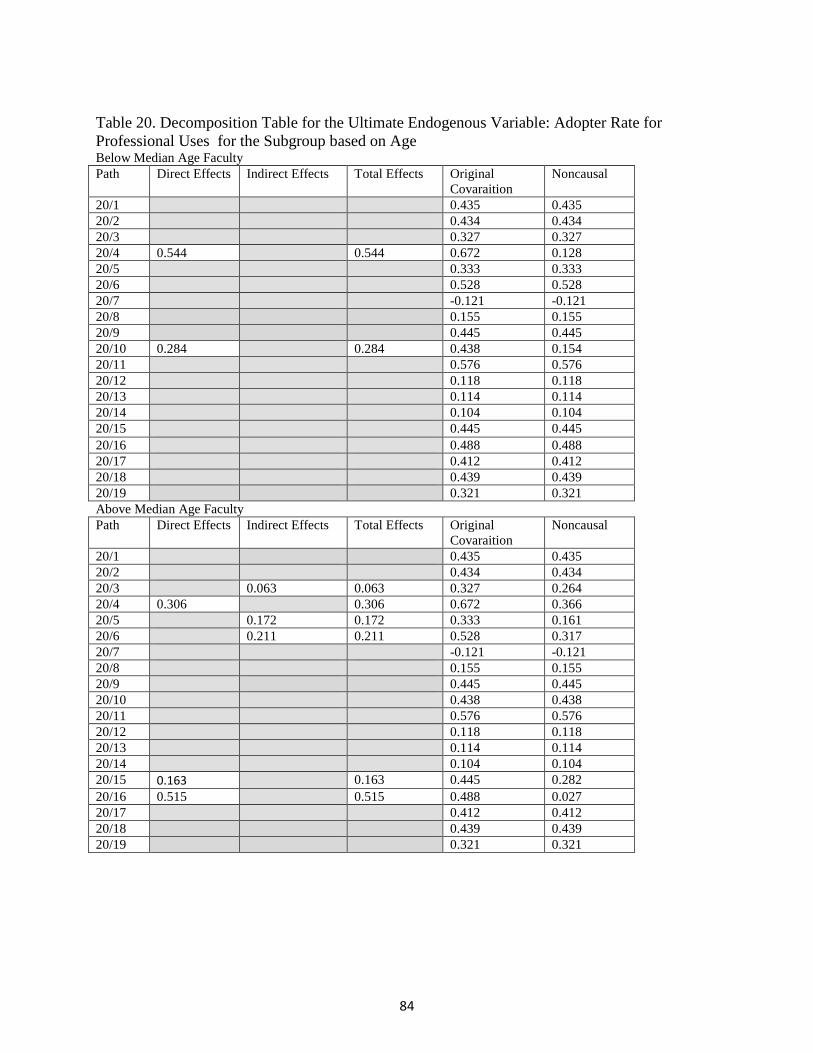
84
Table 20. Decomposition Table for the Ultimate Endogenous Variable: Adopter Rate for Professional Uses for the Subgroup based on Age Below Median Age Faculty Path Direct Effects Indirect Effects Total Effects Original
Covaraition Noncausal
20/1 0.435 0.435 20/2 0.434 0.434 20/3 0.327 0.327 20/4 0.544 0.544 0.672 0.128 20/5 0.333 0.333 20/6 0.528 0.528 20/7 -0.121 -0.121 20/8 0.155 0.155 20/9 0.445 0.445 20/10 0.284 0.284 0.438 0.154 20/11 0.576 0.576 20/12 0.118 0.118 20/13 0.114 0.114 20/14 0.104 0.104 20/15 0.445 0.445 20/16 0.488 0.488 20/17 0.412 0.412 20/18 0.439 0.439 20/19 0.321 0.321 Above Median Age Faculty Path Direct Effects Indirect Effects Total Effects Original
Covaraition Noncausal
20/1 0.435 0.435 20/2 0.434 0.434 20/3 0.063 0.063 0.327 0.264 20/4 0.306 0.306 0.672 0.366 20/5 0.172 0.172 0.333 0.161 20/6 0.211 0.211 0.528 0.317 20/7 -0.121 -0.121 20/8 0.155 0.155 20/9 0.445 0.445 20/10 0.438 0.438 20/11 0.576 0.576 20/12 0.118 0.118 20/13 0.114 0.114 20/14 0.104 0.104 20/15 0.163 0.163 0.445 0.282 20/16 0.515 0.515 0.488 0.027 20/17 0.412 0.412 20/18 0.439 0.439 20/19 0.321 0.321
85
Heuristic Analyses: Regressions of the Ultimate Endogenous Variable onto the Variables within Each Construct
In this section, regressions were run to determine the relationships with the ultimate
variable. While many variables were included in the data collection instrument, the 19
exogenous and intermediate endogenous variables in Figure 2 were selected for the primary
conceptual model based on strong support from prior studies.
Linear regressions were run with the variable of interest, adoption rate for professional
uses of technology, as the dependent, or ultimate endogenous, variable. To identify key relations
between construct variables and adoption rate, each set of variables within a given construct was
entered using the stepwise method separately. The variables entered for each construct were
listed earlier in Table 1. For example, of all the barrier variables included in the analysis, only
two entered using the stepwise method. These were keeping abreast of technology news and
having the technical skills needed to use technology (Tables 10-14). These variables were
responsible for 37.5% (R squared value of 0.375) of the variation in adoption rate. The second of
these variables had been included in the path model while the first was not. The primary reason
is that technology news updates did not appear with any degree of prominence in the review of
prior studies nor was it evident as important in the commentary by the current study's
participants. The additional barrier variable that indeed was added to the model was training by a
similar peer or colleague. This inclusion was based on the change agent qualities described by
Rogers (2003).
The efficacy construct similarly showed two variables entering the analysis. These were
the ability to provide leadership in education technology matters and the ability to adapt
technology to diverse teaching challenges. The Rsquared value for these two was 0.348. Both of
86
these variables had been included in the model. Additional efficacy variables were added to the
model. These were the ability to combine technology use with analysis tasks, ability to combine
technology with writing tasks, the knowledge of students’ common misunderstandings of the
subject matter, and the ability to choose the best technology for instruction. Prior studies have
indicated the importance of efficacy with the subject matter being taught in technology adoption.
These three additional efficacy variables specifically reference this aspect of instruction.
The personal use of technology construct produced five variables in the regression
output. These were adopter rate for personal uses of technology, use of trial-and-error to solve
technology problems, receiving regular newsfeeds on technology matters, sharing media such as
videos and photos, and having a Facebook account. Only the first two variables listed here had
been included in the path model. The others were excluded given their absence as key factors in
the body of literature. The combination of these five variables produced an R squared value of
0.539.
The analysis of the learning benefits construct produced four significant variables. These
were using best practices, helping with differentiated learning styles, student-created content, and
managing courses online. The R squared for these variables was 0.318. Of these, using best
practices and student-created content had been included in the path model. While some prior
studies supported the benefits for different learning styles, several found no impact. Therefore,
this variable was excluded. The management of courses online was scantily supported by prior
studies. For this construct, two additional variables were added to the model. These were the use
of collaborative tools and student-centered teaching. These additions were based on prior
research supporting their inclusion. For example, Ma, Williams, Prejean, Lai, and Ford (2008)
indicated the important role technology can play in creating student-centered teaching. Their
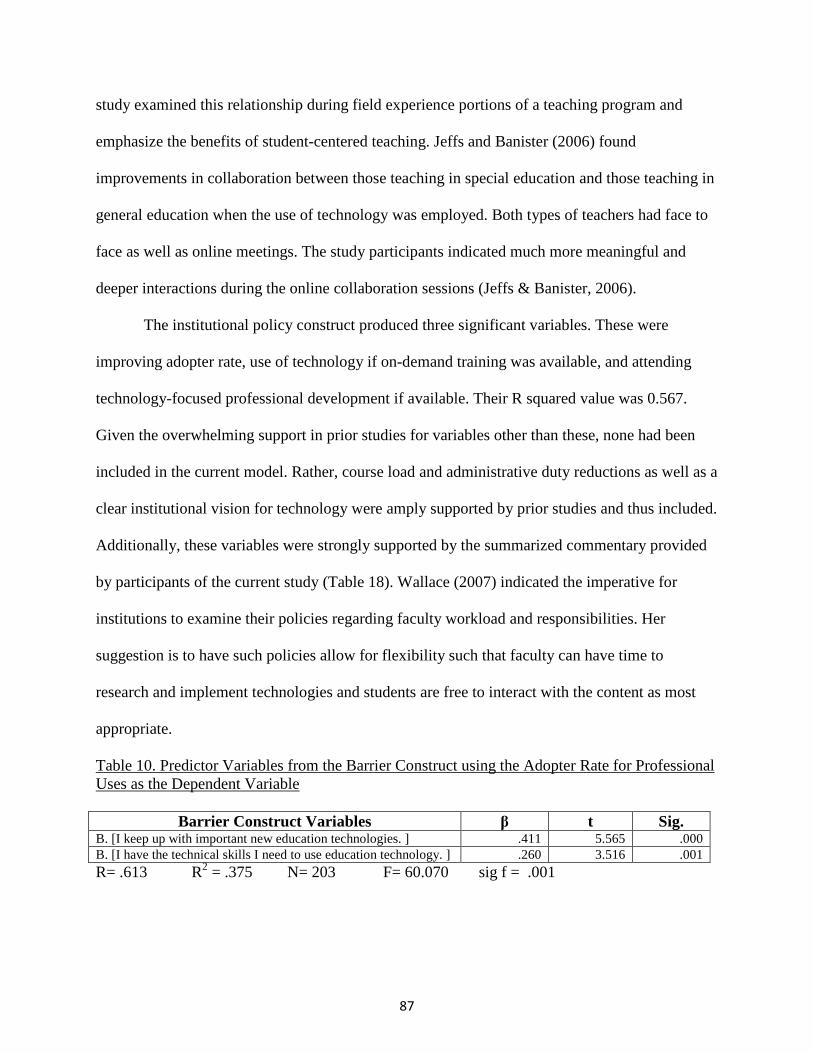
87
study examined this relationship during field experience portions of a teaching program and
emphasize the benefits of student-centered teaching. Jeffs and Banister (2006) found
improvements in collaboration between those teaching in special education and those teaching in
general education when the use of technology was employed. Both types of teachers had face to
face as well as online meetings. The study participants indicated much more meaningful and
deeper interactions during the online collaboration sessions (Jeffs & Banister, 2006).
The institutional policy construct produced three significant variables. These were
improving adopter rate, use of technology if on-demand training was available, and attending
technology-focused professional development if available. Their R squared value was 0.567.
Given the overwhelming support in prior studies for variables other than these, none had been
included in the current model. Rather, course load and administrative duty reductions as well as a
clear institutional vision for technology were amply supported by prior studies and thus included.
Additionally, these variables were strongly supported by the summarized commentary provided
by participants of the current study (Table 18). Wallace (2007) indicated the imperative for
institutions to examine their policies regarding faculty workload and responsibilities. Her
suggestion is to have such policies allow for flexibility such that faculty can have time to
research and implement technologies and students are free to interact with the content as most
appropriate.
Table 10. Predictor Variables from the Barrier Construct using the Adopter Rate for Professional Uses as the Dependent Variable
Barrier Construct Variables β t Sig. B. [I keep up with important new education technologies. ] .411 5.565 .000 B. [I have the technical skills I need to use education technology. ] .260 3.516 .001 R= .613 R2 = .375 N= 203 F= 60.070 sig f = .001

88
Table 11. Predictor Variables from the Efficacy Construct using the Adopter Rate for Professional Uses as the Dependent Variable
Efficacy Construct Variables β t Sig. E. [I can provide leadership in helping others to coordinate the use of content, technologies, and teaching approaches in my college/department.]
.449 5.987 .000
E. [I can adapt the use of the technologies that I am learning about to different teaching activities.]
.196 2.616 .010
R= .595 R2 = .354 N= 203 F= 54.857 sig f = .010 Table 12. Predictor Variables from the Personal Use Construct using the Adopter Rate for Professional Uses as the Dependent Variable
Personal Use Construct Variables β t Sig. P. [When new technologies are released, I am typically among the following group of adopters for personal use (cell phones, computers, laptops for personal use).]
.573 10.795 .000
P. [Using a “trial and error” approach has increased my knowledge on use of education technologies.]
.219 4.484 .000
P. [I receive regular news feeds about education technology (newsletters, email listservs, reviews of web news).]
.155 3.098 .002
P. [I post videos/photos to a sharing service (Flickr, YouTube, Google Docs, etc.).]
.159 2.794 .006
P. [I have a Facebook account and log onto it.] -.122 -2.214 .028 R= .742 R2 = .550 N= 203 F= 48.229 sig f = .028 Table 13. Predictor Variables from the Learning Benefit Construct using the Adopter Rate for Professional Uses as the Dependent Variable
Learning Benefit Construct Variables β t Sig. L. [Understanding and using best practices of teaching with technology.]
.198 2.582 .011
L. [Technology can help accommodate different learning styles.] .242 3.888 .000 L. [Student-created content (i.e. video, audio, web pages);] .190 2.502 .013 L. [Teaching and managing courses delivered entirely online;] .153 2.366 .019 R= .564 R2 = .318 N= 203 F= 23.115 sig f = .019 Table 14. Predictor Variables from the Institutional Policy Construct using the Adopter Rate for Professional Uses as the Dependent Variable
Institutional Policy Construct Variables β t Sig. I. [I could be among the following adopter type if my university/college provided more support.]
.692 14.154 .000
I. [I would use technology tools more if I could receive on-demand training support in addition to the initial training session;]
-.206 -4.075 .000
I. [I would attend technology-based professional development activities if my university/college offered them.]
.143 2.719 .007
R= .753 R2 = .567 N= 203 F= 86.733 sig f = .007
89
Alternative Path Analysis
The survey instrument included several items that were not included in the path models
above. These items were included on the survey based on the body of literature on the topic
and/or personal experiences of the principal researcher of the current study. A path analysis was
conducted using all 65 variables included in the survey (Figures 8 and 9). Each endogenous
variable was regressed against all the variables within the constructs that are directly related to it.
The ultimate endogenous variable adoption rate for professional uses was regressed against all
65 variables. Of all the “efficacy” variables, three entered the stepwise analysis. Each of these
three efficacy variables was treated as a dependent variable and regressed against all “learning
benefits”, “personal uses”, and “barriers” variables (based on the model presented in Figure 8).
The resultant model is presented in Figure 9.

90
Figure 8. Proposed Path Model using Constructs
Learning Benefits
Personal uses of
technology
Barriers to using education
technology
Efficacy with discipline
content and
technology use
Institution Policies
related with use of
education technology
Use of specific
technology tools
DV. adopter
rate-pro
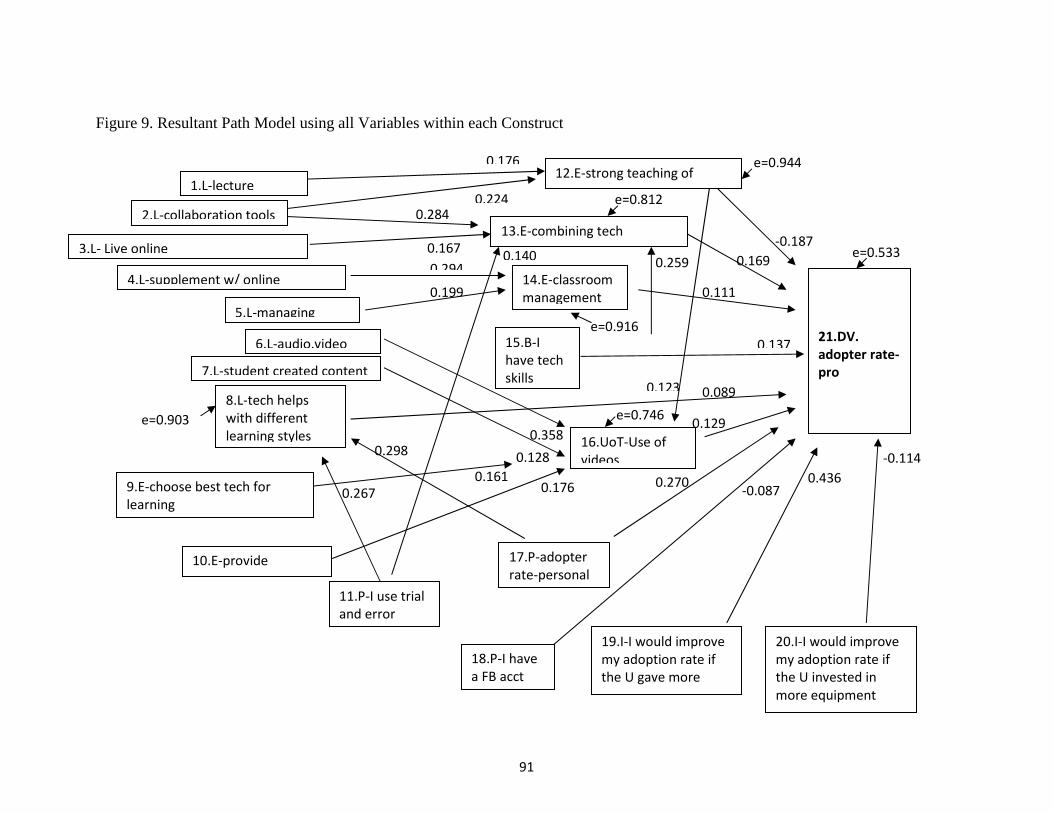
91
Figure 9. Resultant Path Model using all Variables within each Construct
4.L-supplement w/ online
15.B-I
have tech
skills
12.E-strong teaching of
writing
19.I-I would improve
my adoption rate if
the U gave more
support
16.UoT-Use of
videos
21.DV.
adopter rate-
pro
13.E-combining tech
&writing
14.E-classroom
management
1.L-lecture
2.L-collaboration tools
3.L- Live online
5.L-managing
8.L-tech helps
with different
learning styles
18.P-I have
a FB acct
11.P-I use trial
and error
17.P-adopter
rate-personal
6.L-audio.video
7.L-student created content
20.I-I would improve
my adoption rate if
the U invested in
more equipment
e=0.533
e=0.944
e=0.812
e=0.916
e=0.746 e=0.903
-0.114
0.436 -0.087
0.270
0.129
0.089
0.137
0.111
0.169
-0.187
0.176
0.224 0.284
0.167
0.294
0.199
0.358
0.128 0.298
0.267
0.140 0.259
0.123
9.E-choose best tech for
learning
10.E-provide
leadership
0.176 0.161
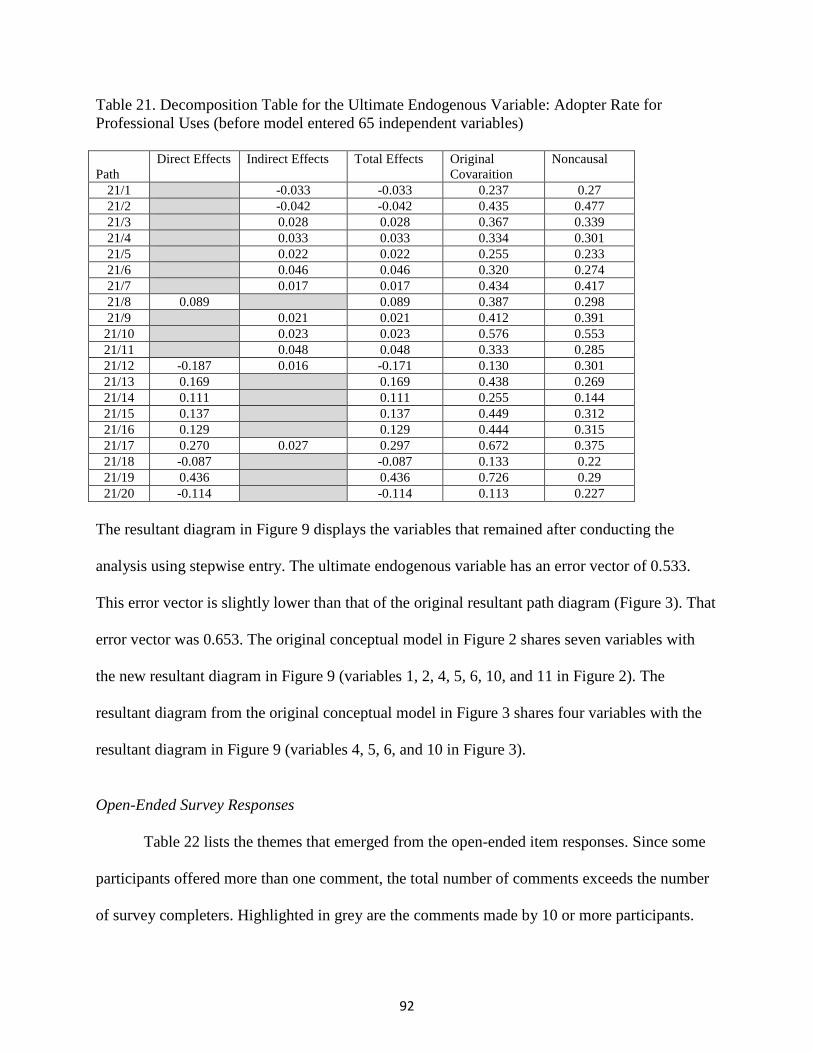
92
Table 21. Decomposition Table for the Ultimate Endogenous Variable: Adopter Rate for Professional Uses (before model entered 65 independent variables) Path
Direct Effects Indirect Effects Total Effects Original Covaraition
Noncausal
21/1 -0.033 -0.033 0.237 0.27 21/2 -0.042 -0.042 0.435 0.477 21/3 0.028 0.028 0.367 0.339 21/4 0.033 0.033 0.334 0.301 21/5 0.022 0.022 0.255 0.233 21/6 0.046 0.046 0.320 0.274 21/7 0.017 0.017 0.434 0.417 21/8 0.089 0.089 0.387 0.298 21/9 0.021 0.021 0.412 0.391 21/10 0.023 0.023 0.576 0.553 21/11 0.048 0.048 0.333 0.285 21/12 -0.187 0.016 -0.171 0.130 0.301 21/13 0.169 0.169 0.438 0.269 21/14 0.111 0.111 0.255 0.144 21/15 0.137 0.137 0.449 0.312 21/16 0.129 0.129 0.444 0.315 21/17 0.270 0.027 0.297 0.672 0.375 21/18 -0.087 -0.087 0.133 0.22 21/19 0.436 0.436 0.726 0.29 21/20 -0.114 -0.114 0.113 0.227
The resultant diagram in Figure 9 displays the variables that remained after conducting the
analysis using stepwise entry. The ultimate endogenous variable has an error vector of 0.533.
This error vector is slightly lower than that of the original resultant path diagram (Figure 3). That
error vector was 0.653. The original conceptual model in Figure 2 shares seven variables with
the new resultant diagram in Figure 9 (variables 1, 2, 4, 5, 6, 10, and 11 in Figure 2). The
resultant diagram from the original conceptual model in Figure 3 shares four variables with the
resultant diagram in Figure 9 (variables 4, 5, 6, and 10 in Figure 3).
Open-Ended Survey Responses
Table 22 lists the themes that emerged from the open-ended item responses. Since some
participants offered more than one comment, the total number of comments exceeds the number
of survey completers. Highlighted in grey are the comments made by 10 or more participants.
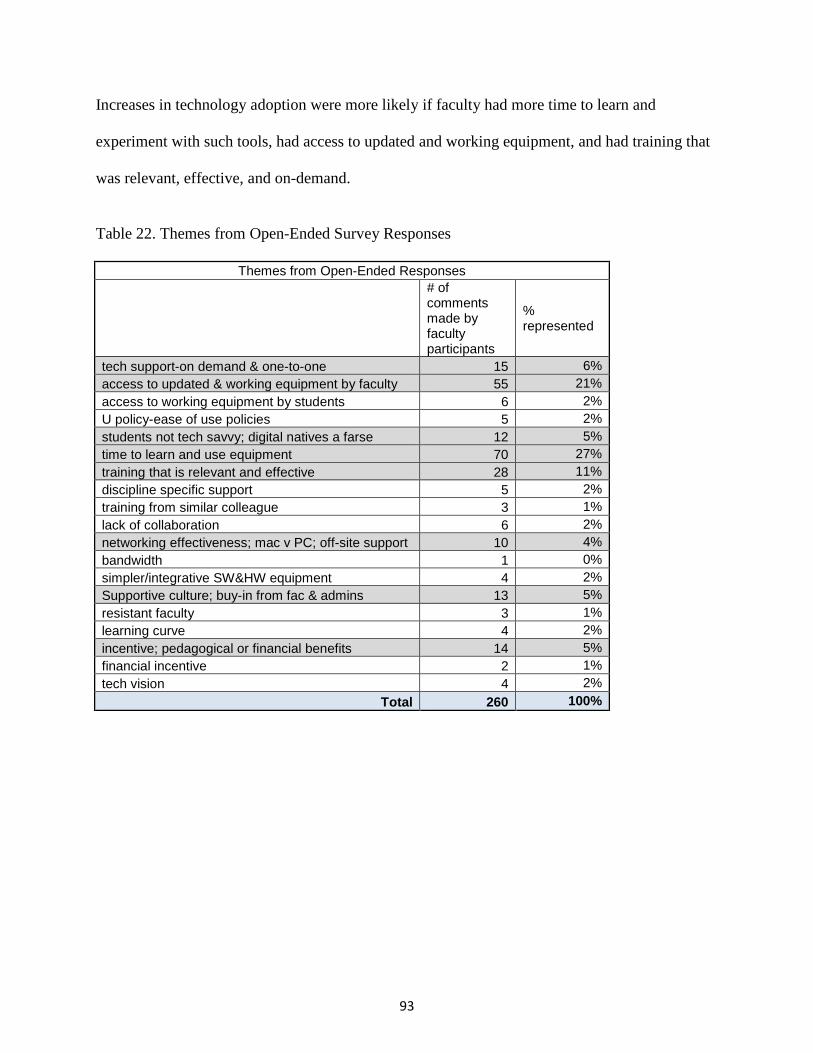
93
Increases in technology adoption were more likely if faculty had more time to learn and
experiment with such tools, had access to updated and working equipment, and had training that
was relevant, effective, and on-demand.
Table 22. Themes from Open-Ended Survey Responses
Themes from Open-Ended Responses
# of comments made by faculty participants
% represented
tech support-on demand & one-to-one 15 6% access to updated & working equipment by faculty 55 21% access to working equipment by students 6 2% U policy-ease of use policies 5 2% students not tech savvy; digital natives a farse 12 5% time to learn and use equipment 70 27% training that is relevant and effective 28 11% discipline specific support 5 2% training from similar colleague 3 1% lack of collaboration 6 2% networking effectiveness; mac v PC; off-site support 10 4% bandwidth 1 0% simpler/integrative SW&HW equipment 4 2% Supportive culture; buy-in from fac & admins 13 5% resistant faculty 3 1% learning curve 4 2% incentive; pedagogical or financial benefits 14 5% financial incentive 2 1% tech vision 4 2%
Total 260 100%
94
Chapter 5 Discussion/Conclusions
Introduction
The findings of the current study and their relationships to prior studies are presented
below. Four of the five hypotheses have been supported. Each hypothesis predicted a significant
relationship between a construct and the adoption rate. The one construct that did not persist as a
predictor was the institutional policy. Table 23 displays the strongest predictors of technology
adoption for all faculty participants as well as for each subgroup. Using the total causal effect for
each group, the top three variables are indicated with an 'X'. Adoption rate for personal uses was
most persistent among all these groups. This is followed by the variables belief that it is
important to identify and use best instructional practices incorporating technology and the ability
to adapt technology to diverse teaching challenges. The least persistent variables in Table 23
include technical ability to resolve glitches (appeared for the above median age group only),
knowledge of students' academic needs (appeared for tenured group only), and the ability to
combine technology with writing tasks (appeared for tenured group only).
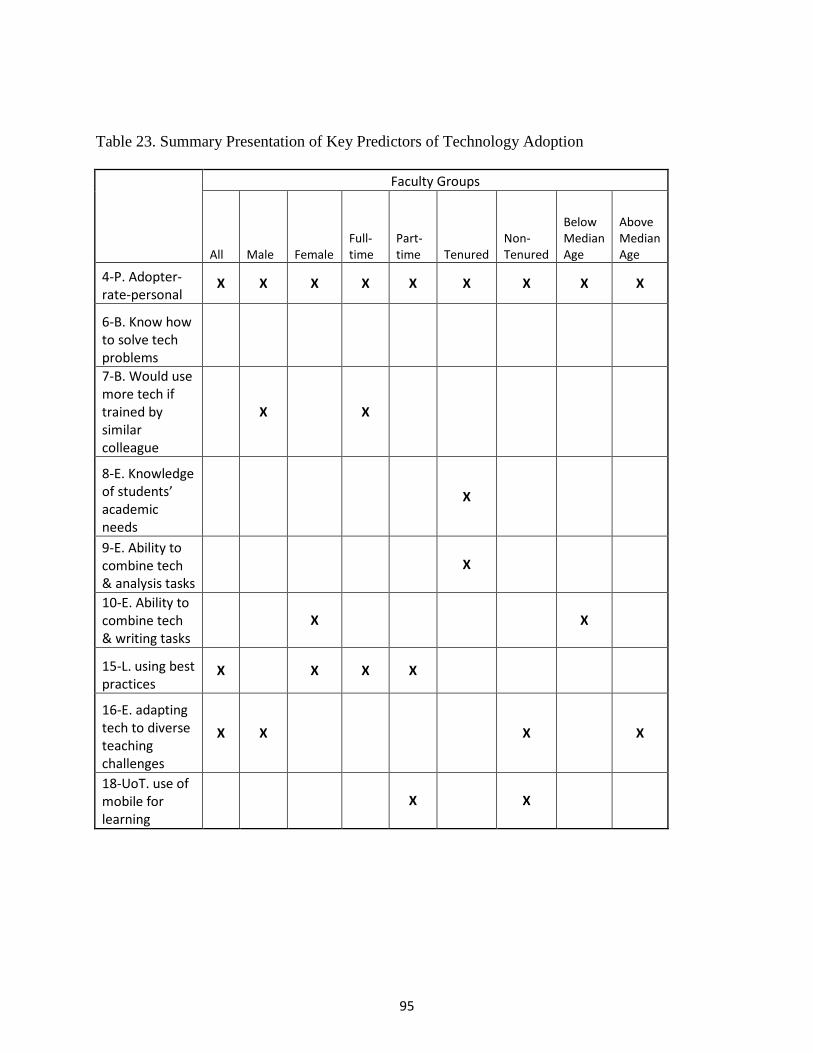
95
Table 23. Summary Presentation of Key Predictors of Technology Adoption
Faculty Groups
All Male Female
Full-
time
Part-
time Tenured
Non-
Tenured
Below
Median
Age
Above
Median
Age
4-P. Adopter-
rate-personal X X X X X X X X X
6-B. Know how
to solve tech
problems
7-B. Would use
more tech if
trained by
similar
colleague
X X
8-E. Knowledge
of students’
academic
needs
X
9-E. Ability to
combine tech
& analysis tasks
X
10-E. Ability to
combine tech
& writing tasks
X X
15-L. using best
practices X X X X
16-E. adapting
tech to diverse
teaching
challenges
X X X X
18-UoT. use of
mobile for
learning
X X

96
Barriers
Using the importance of achievement, fulfillment, administrative support, growth, and
compensation as bases for the theoretical framework, Gautreau (2010) examined the factors most
important in motivating the use of technology in higher education instruction. She found that
non-tenured faculty were more likely to adopt technology for teaching. She also found that
personal uses of technology transferred to professional uses among this study sample. The top
three motivating factors identified in this study were compensation, responsibility, and
achievement. Additionally, she confirmed the importance of sufficient training and development
in effective adoption. Suggestions for further work include increasing awareness of motivational
factors among subgroups, examining of prohibitive factors, faculty development, and enhancing
technology skills (Gautreau, 2011).
These findings are aligned with the current study. The two barrier variables in the
proposed model were the ability to solve technology problems and receiving training from a
similar colleague. The first variable was chosen to address an intimidation factor regarding
technology use. The second variable was chosen based on the Rogers’ (2003) change agent
principle. This states that adoption is more successful if the trainee deems the trainer as similar in
rank, status, or position. For all faculty, the barrier related with technical skill was indirectly
related with the likelihood to adopt technology. The intermediate endogenous variable in the
indirect relationship was the ability to adapt to diverse teaching challenges.. Additionally, access
to training by a peer trainer was related directly with the ultimate endogenous variable and
produced a path coefficient of -0.136. Given the negative coefficient, the relationship between
this training barrier and adoption of technology is inverse (Figure 2).
97
When examining this construct in the males versus females model, the training by a
similar colleague was inversely related with adoption for males. Neither of the barrier variables
entered for females. This means that intimidation was not a factor in the adoption of technology.
Neither barrier variable was related to adoption of technology when comparing full-time versus
part-time faculty. For full-time faculty, the ability to solve technical problems was indirectly
related to adoption through the mediating variable ability to adapt technology to diverse teaching
challenges. Neither barrier variable was directly related to adoption when assessing tenured
versus non-tenured faculty. However, the ability to solve technology problems was indirectly
related to adoption for non-tenured faculty. This was mediated by the variable ability to adapt
technology to diverse teaching challenges.
It is instructive to know that these barrier variables had no prominent role in the adoption
of technology. Since the training variable was not key, training program at institutions need no
major reorganization based on peer training models. The ability to solve technology problems
was, however, more important. Change agents should address this gap with effective support on
key technology problems and their solutions.
Learning impact
Education technologies allow for student-centered instruction in ways not possible
otherwise. Students are better positioned to take more responsibility over their learning. This is
often done by equalizing the access to the "microphone" during online discussions and
interactions (Sadykova & Dautermann, 2006). For all faculty in the current study, beliefs in the
benefits of student-centered teaching related indirectly with the adoption of technology. This
variable was mediated by the belief that using technology for instruction would help identify best
98
practices. The total causal effect for these relationships was 0.058. The error vector, 0.901,
suggests moderate predictive power (Figure 2).
Oner and Adadan (2011) identified the following as learning benefits when using
technology-based platforms for instruction: easy access to content, supported organizational
challenges, timely collaboration with peers, and ease of assignment submission. In their study,
students lauded specific characteristics of technology-driven instruction. Online discussions
encouraged students to present well-researched information. They also suggested that online and
transparent feedback from peers placed positive pressure to be well-informed. This was done by
more reflection and draft-writing on the part of students (Oner & Adadan, 2011). While the
current study included peer collaboration and student-created content, neither variable entered
using the stepwise procedures for all faculty participants. However, for both part-time faculty
and non-tenured faculty, the variable benefits of collaboration was indirectly related with
technology adoption. In each case, this learning impact variable was mediated by the use of
mobile devices for learning variable. It might be argued that there is much overlap between the
part-time faculty and non-tenured faculty subgroups. Some non-tenured faculty might be full-
time and simply on a non-tenure track position, while others might be adjuncts.
Sherman, Crum, and Beaty (2010) found that students in education leadership programs
identified several benefits to using education technologies in higher education. These included
creation of more independent learners, connections between theory and application, as well as
display of knowledge and skills related to program standards. However, whether the delivery of
content via technology was superior to face to face modalities was equivocal. The suggestions
for future researchers on this topic were to allow the measure of technology efficiencies to be
based on guidance of peers, importance of networks, and role of technology-based communities
99
(Sherman, Crum, & Beaty, 2010). Some faculty indicated the importance of the application of
theory using technology-enhance instruction in the open-ended responses of the current study.
In a study by Brown (2011), student feedback on the role of education technology on
learning was investigated. While students thought there was an increase in workload with the use
of education technology, they believed learning improved. The increased workload was related
to the required adjustment to use of the technology tools. A concern expressed by faculty was
about questionable authenticity of student work. Some have suggested requiring hard copy
versions of artifacts until technology-based solutions to verify authenticity are devised (Brown,
2001). In the current study, student work authenticity was not a concern, however, the added
workload was. During some open-ended survey responses, faculty indicated the need to teach
and for students to learn about the use of particular technology tools. This often subtracted from
time and effort toward learning the content of the course.
Kay and Lauricella (2011) were interested in the technology behaviors of undergraduate
students with special focus on the driving forces. They identified the advantages and
disadvantages of technology use in higher education instruction. A salient finding was that the
list of advantages overwhelmed the list of disadvantages. The advantages included note-taking,
communication for collaboration, academic research, among others. Disadvantages were about
distractions. These included instant messaging for personal reasons, engaging in games, movie-
watching and internet surfing, as well as technical problems, maintaining focus on academics,
and self-discipline (Kay & Lauricella, 2011). The current study reinforced the benefits of
technology use by highlighting that it helps faculty create student-centered teaching and the
identification of best instructional practices. These variables were important in the resulting path
100
model for all subgroups except tenured and male faculty. That is, female, full-time, part-time,
and non-tenured faculty used technology for these two learning benefits.
Jefferies and Hyde (2010) revealed the high expectations students have of professors
regarding technology use. This was to the extent that students invested their own money on
updated equipment and subscriptions for technology use for their learning. These uses were
creative and innovative. However, they rendered the modeling by professors inadequate. These
self-guided students showed increased competence and confidence with technology use for
learning benefits during their course of study. Use of an LMS was seen as critical to a positive
learning experience. While busier students were shown to use technology for learning purposes
more than others, most students favored blended learning environments rather than those that
were strictly technology-based or classroom-based (Jefferies & Hyde, 2010). This is contrary to
the responses by faculty to the open-ended survey items in the current study. Many were
concerned that students lacked the technical knowledge and inquiry to use technology
effectively. Several indicated the need to spend much instructional time teaching the technology
prior to the content of the courses.
Littlejohn, Margaryan and Vojt (2010) examined the learning benefits of technology use
in teaching. These benefits were reported by students and were strongly connected to technology
use. The learning impact varied by students' technology skills. Those with higher skills believed
in the learning benefits more than those with low skills. This was true even though most students
did not expect to see a difference in learning benefits at the onset. Additionally, the correlation
between students' self-efficacy with the content and their technology use was low. One possible
explanation for this was that institutional practices favored traditional, tutor-based instruction.
This explanation is also offered to clarify the reason why students use technology more
101
prolifically outside the classroom than in. Examples include employment, social and personal
uses of technology (Littlejohn, Margaryan & Vojt, 2010). Several faculty in the current study
identified the gap between personal uses of technical (such as texting, facebook participation and
email use) and the willingness to invest with similar interest in classroom-based technology
tools.
With a focus on serving student needs through assessment, Pellegrino and Quellmalz
(2010) discuss the emerging synergy among uses of technology, instruction, theory and practice.
Current technologies offer deeper insights into what students learn, how they learn it and ways to
improve learning. With such an emphasis on cognitive development, Pellegrino and Quellmalz
(2010) laud the potential and untapped benefits of technology-driven student assessment.
Measurements of learning can be more accurate, timely and efficient. This would be true even
when the amount of instructional data is multiplied. Formative and diagnostic uses of
technology-based assessments are certain to improve student learning (Pellegrino & Quellmalz,
2010). In the current study, faculty who adopted technology more readily believed in its ability
to help identify best instructional practices. This was true for the all-faculty model, the model
based on full-time/part-time faculty, and for the female faculty. The male, tenured, and non-
tenured subgroups showed no connection between best practices and technology adoption.
Bell (2011) argues for the improvement and spreading of technology-driven learning. The
alternative theory offered, called Connectivism, touts the learning benefits of technology-driven
instruction. Described are five requirements for such benefits to be realized. The first is the
teacher's use of advanced technology tools in the classroom, otherwise, known as Web 2.0.
Blogs and wikis provide insight into students' thinking and learning development. Deep
integration of these tools allows instructors to capitalize on the instructional benefits of
102
technology use. Secondly, institutions should welcome the open resource communities. Building
on the actor-network framework, connectivism encourages the accumulation of freely accessible
resources and content for the benefit of all. Information literacy is the third requirement. With
the student experience as the focus, information literacy is most successful when training efforts
are measured as a return on investment. The fourth requirement is the study of informal and
educational uses of technology by students. The personal versus educational divide regarding the
use of technology is of interest here. While low achieving with school content, some students
demonstrate deep investment in self-directed learning using Web 2.0. The final requirement is
community-based. There should be assurance that low-resource communities have access to Web
2.0 tools to foster community learning (Bell, 2011). The current study demonstrated faculty’s
belief in the learning benefits of technology use. These benefits varied among the various
subgroups, however, the consensus is that technology use should indeed be encouraged and
supported for the sake of student learning.
Institutional Policy
The relationship between institutional policies and education technology adoption was
described by Cao and Sakchutchawan (2011). Such policies that supported access to content
delivery by distant faculty and students enhanced the use of such tools. To enhance an
institution's cultural relevance, realize maximum learning benefits, and attract creative faculty,
Sadykova and Dautermann (2006) recommend the following: supporting the gap between
students' and faculty's technology prowess with clear postings and articulation of expectations,
precise advisement to students about such expectations, and robust and ongoing training support
for faculty. The current study offered lessons in the importance of aligning the technical know-
how between faculty and students.

103
The Parisot (1997) study examined the importance of institutional policies in faculty
adoption of technology. Recognizing the centrality of the faculty experience, this study focused
on ways to recruit faculty participation in education technology initiatives. Because the identified
barriers included faculty concerns about learning benefits, the changing role of the instructor,
and perceiving the technology movement as threatening, suggestions were offered to overcome
these. Modeling, encouragement, and training were some of these proposed solutions. It was also
found that adoption rates varied by college departments so a unit-wide rate wasn't seen as
representative. One of the reasons for this is the varying degrees of support and modeling
available to faculty which are not uniform across the college unit. The best results occurred when
faculty were able to pilot the technology tools and observe others using them. These are two key
principles in Rogers' (2003) framework. The findings of this study resulted in a theoretical model
which builds on Rogers' (2003). The focus of this model is on faculty agreement regarding the
benefits and uses of education technologies. The four-part model includes acknowledgement,
awareness, acculturation and affirmation. Acknowledgement is the first step to unit-wide
adoption; requiring faculty ownership of technology use being central. Awareness is the stage
when faculty agreement is built. There must be clarity on the benefits of and roles education
technologies should have in the instructional programs. This clarity will help mitigate what is
referred to as cyberphobia. Technology use should be driven by outcome benefits, not merely the
need to use the most current tools. Acculturation is when decisions are made to adopt. This
requires faculty to take on facilitator roles for the purpose of modeling and garnering buy-in.
This also demands that technology initiatives be student-centered which will assist in the faculty
adoption. Affirmation is when the decisions made during the acculturation stage are reinforced.
This stage is a critical one and is supported by institutional policies. For example, release time,
104
monetary incentives, and professional development support are all policies that will help sustain
the unit adoption of education technologies (Parisot, 1997).
In addition to the learning benefits of technology use, Junco and Chickering (2010)
examined the social and communication impacts. They describe the significance of clearly and
widely-publicized institutional policies on use of technology. Guidelines should include rules for
engaging via technology-driven interactions, appropriate roles for students, faculty, and staff, as
well as the role for opinion leaders, referred here as technology ambassadors. They describe the
need for civil interactions regarding online communication which starts with institutional policy
declarations. Additionally, policy statements can foster responsible and effective uses of
technology for learning and general communication. Such statements should also sanction the
role and value of opinion leaders to achieve the requisite faculty engagement as well as support
faculty modeling regarding effective uses of technology (Junco & Chickering, 2010).
Diem (2002) touts the learning benefits of technology use for instruction in high school.
This, however, requires appropriate technology training and support during pre-service
instruction. Such curriculum-based training should be supported by institutional policies.
Otherwise, the digital divide between newly trained teachers and the students they serve will
create conflict regarding effective technology use. Such deficiencies in teacher training prevent
authentic integration of technology in instruction. While institutional policies can have a
progressive impact on such trends, it remains true that student demand for technology use
outpaces policy-driven practices (Diem, 2002).
While institutional policy variables did not enter the stepwise analysis in the current
study, there were several references by faculty to the importance of creating and maintaining
supportive culture. Elements of this included the need for buy-in from faculty and administrators
105
as well as the need for effective and on-demand training. Such a culture can be supported by
institutional policies that foster and celebrate the effective use of education technology.
The three institutional policy variables used in the current study did not enter the
analysis. These variables included reduction in course load for use of technology, reduction in
administrative duties for use of technology, and an institution-driven technology plan. This is
countered by the comments made in the open-ended item survey responses. Among the
prominent themes was the need for more time to learn and use new technologies. The lesson
learned regarding this construct is that change agents should support faculty adoption of
technology by identifying efficient ways to provide time allowances to learn and experiment
with such tools.
Personal use
Shoffner (2009) identified a connection between personal uses of computers and use for
instructional purposes. Those who spent more time on a computer for personal reasons also used
blogs and discussion boards that were course content-based. Faculty who engage with education
technologies are typically self directed, early adopters. They are more apt to learn these new
tools and transfer their personal to professional uses (Sadykova & Dautermann, 2006). The two
personal use variables in the current study that were part of the proposed path model entered the
stepwise analysis. The adopter rate for personal use was directly related with the adopter rate for
professional use for all faculty. This path coefficient was 0.498, the strongest of all paths to the
endogenous variable. The other personal use variable, use of trial-and-error, was indirectly
related with the ultimate endogenous variable. The first indirect relationship was through the
learning impact variable identifying best practices. This total causal effect coefficient was 0.032.
The second indirect relationship was through the efficacy variable adapting technology to diverse

106
teaching challenges. This aggregated path coefficient was 0.036. The use of trial-and-error was
evidently important for both identifying best practices for learning and for adapting to teaching
challenges.
Kumar and Vigil (2011) also highlight the importance of modeling effective and creative
uses of technology-driven instruction. Even with clear standards for technology use, teacher
preparation programs lack appropriate support for optimal modeling. Such standards include
those from the International Society for Technology Education (ISTE), the National Education
Technology Standards for Students (NETS-S), and the National Council on Accreditation of
Teacher Education (NCATE). Among students, personal uses of technology don't seem to
transfer to classroom uses in an automated way. Additionally, of seven technology platforms
(online forums, social bookmarking, Google Docs, blogs, wikis, podcasts and online videos),
only one showed more use for education than in private lives. This platform was online forum
and the explanation was that such forums have been in use for many years and consequently are
embedded in higher education culture (Kumar & Vigil, 2011).
With an emphasis on constructivist teaching, Rakes, Fields, and Cox (2006) examined the
impact of personal technology use on teaching. They found low uses of instructional
technologies were caused by lack of time with the tools. Even when personal uses of
technologies were deemed high, instructional uses were still low. When treating the instructional
use variable as the dependent and personal use variable as independent variables in a multiple
regression technique, they found personal use as a strong predictor of instructional use of
technology. Additionally, technology adoption was found to be a strong predictor of
constructivist teaching. These findings are especially significant since they cite the benefits of
107
technology adoption on higher cognitive skill and development of complex thinking (Rakes,
Fields, & Cox, 2006).
Panda and Mishra (2007) explored barriers, institutional policies and personal interests as
related to technology adoption. Faculty attitudes toward technology were measured at the onset
of the study and were found to be moderately positive. While these faculty predisposition were
initially encouraging, it was found that attitudes did not improve with increased support and
training. The requisite professional development should focus on the top barriers to embracing
technology use. The top general barriers include concerns about student access, training, strength
of institution networks, institutional policies and on-going support. With specific focus on
incentives, focus should be placed on personal interest and usage and intellectual challenge. A
necessity to help encourage adoption, especially for the positively predisposed, is the removal of
key barriers. Supporting faculty personal interest should include ongoing development of the
integration of technology use and pedagogy, a supportive institutional policy facilitating the
design, implementation and reflective stages of adoption, access to network resources, hardware
and software (Panda & Mishra, 2007).
Lowther, Inan, Strahl, and Ross (2008) examined the impact of removing barriers to
technology use on the integration of it in instruction. The identified barriers include access to
computer equipment, access to relevant curricula, beliefs of instructors, technology competence
of instructors, and support. When these barriers were mitigated, technology usage improved. For
example, the treatment group saw statistically significant differences in the following:
technology use as a resources, project-based and technology-driven learning, inquiry-based
research activities, collaborative learning using technology tools, and computer use for a variety
of instructional delivery methods. The treatment group also demonstrated more student-centered
108
instruction and more committed beliefs in the learning benefits of technology use. While those in
the treatment group also saw more student learning, technology skills greater than self-perceived,
and more meaningful integration of technology during instruction, deficiencies were still present.
The assortment of tools used was limited as was the level of creative uses. This suggests the
imperative need for initial and ongoing support for professional development. While this study
was revealing, suggestions for future study were offered. Of importance for such work should be
use of technology relative to content standards and assessment, the sustainability of technology
use initiatives, and effective support mechanisms (Lowther, Inan, Strahl, & Ross, 2008).
Karasavvidis (2010) studied the use of wikis for instructional purposes. While he found
that wikis helped improve learning, their use was not as universal as one might expect. There
were two primary reasons for this. These include the style of learning and student perceptions of
the tool. Student perceptions hindered use of wikis based on low value placed on collaboration
with peers. Even when wikis were used, it became evident that artifacts were produced
individually, not collaboratively. Learning styles also inhibited collaboration through wikis. For
example, critique of student work by peers was often seen as excessively critical, not
constructive. Students must be acculturated to the benefits such learning styles.
Rather than viewing these challenges as technology-based, Karasavvidis (2010) suggest
that the challenge is more fundamental. The core issue is the instructional practices and the need
to adapt them for effective use of current technology tools. One key example is the students'
hesitance to modify work created by peers. This collaborative technique requires direct guidance
and establishing of rules for effective use. Key issues to address in this effort are the need for
instructional scaffolding and mitigating the tendency of students to lean on others during group
activities (Karasavvidis, 2010).
109
The current study showed that faculty’s self-reported adopter rate for personal and
professional uses were strongly related. This might suggest the need for change agents to identify
committed users of technologies for personal reasons.. This seems to increase the likelihood of
technology adoption for instructional purposes. Additionally, personal uses of technology should
be allowed to transfer to instructional uses. This might be accomplished by providing appropriate
resources to support use of blogs, wikis, and social networking media. Providing training support
to foster trial-and-error approaches to problem-solving would also encourage technology
adoption.
Self-efficacy
A challenge for the use of education technologies cited by faculty includes the difficulty
in providing feedback to students. This was especially cited as a challenge by those who were
reticent to adopt education technologies (Martinez et al., 2006).
Using Rogers' (2003) social systems postulate, Talab (1993) examined the needs of
instructors relative to technology use and adoption. Such needs were organized in alignment with
Maslow's hierarchy of needs. The most primary of the needs was access to the technology tools.
Then, and in order of need, there was dependability of the tools, ownership over the tools (sense
of responsibility), impact on design of use, and technology integration. Talab (1993) found
significant relationships between self-efficacy and performance as instructors. Self-efficacy was
measured using a three-fold system including commitment to technology use, responsiveness to
innovative technology, and effectiveness of role.
Benson and Mekolichick (2007) examined the use of digital technologies for learning in
higher education. While they describe the ubiquity of technology use in higher education, they
also note wide variations in usage by faculty. This study attempted to reveal the student-faculty
110
interaction as related to technology use. The stakes are high since academic performance by
students and professional reputations of faculty are greatly impacted by effective use of
education technology. They refer to the "person-technology nexus", especially when examining
self efficacy variables (p. 49). The theoretical framework used was the symbolic interaction
theory and describes the importance of matching role identity and behavior. Applied in this
study, the theory suggested that compatibility between role identity and technology use would
result in higher technology use, higher self-efficacy regarding technology use, greater comfort
with technology use, and the greater the desire to use technologies. The findings suggest positive
correlations in each of these paired relationships. Results for students and faculty were similar.
The implications of these findings are important. Students who had low use of education
technologies hesitate to reach out to and collaborate with faculty seen as high technology users.
Additionally, males were predisposed to high education technology use. Finally, low faculty use
of technology was related with low academic commitment given the deep integration of
education technologies into higher education life (Benson & Mekolichick, 2007). Of the four
exogenous efficacy variables in the current study, one entered the stepwise analysis. This was the
ability to combine technology and writing tasks. This was a direct relationship with the ultimate
endogenous variable producing a path coefficient of 0.139. Of the two intermediate endogenous
efficacy variables, one entered the stepwise analysis. This was the ability to adapt technology to
diverse teaching challenges. This relationship produced a path coefficient of 0.178. Each of the
six subgroups analyzed showed at least one efficacy variable in the resulting path models. The
ability to combine technology with writing tasks predicted technology adoption for female
faculty only. No other subgroup showed this relationship. The ability to adapt technology to

111
diverse teaching challenges predicted technology adoption for male, full-time, and non-tenured
faculty.
Efficacy factors are critical in the effort to encourage adoption of technology for
instructional purposes. The results of the current study can guide change agents in the training
and support of faculty to enhance efficacy with discipline content as well as integrating
technology use.
Limitations of Study
The limitations of the current study include sampling selection, identification of teaching
level, use of faculty from education schools only and identification of private versus public
institutions. The gender breakdown of the participants in this study was slanted more toward the
females than males. External validity might have been diminished as a result. While comparisons
between the current study’s demographic data were made with the national trends, caution
should be exercised. The population pool used for the current study was the membership in the
large professional organization rather than the total faculty population nation-wide.
The faculty chosen for the study were based on their position as instructors at the higher
education level. While some faculty teach undergraduate students, others teach at the doctoral
and post-doctoral level. The current study did not distinguish among these various levels. Since
some survey items asked about learning benefits of technology use for students, this might also
impact external validity. Addtionally, only faculty teaching in education schools were considered
in this study, impacting generalizability. Finally, the current study did not distinguish between
those teaching in private versus public institutions. Resource availability such as updated and
working equipment as well as relevant and effective training were prominent themes in the
112
responses to open-ended survey items. Such resource factors could be impacted by the private
versus public status of the institutions.
Suggestions for Future Research
Future research in uses of education technology should delve more deeply in the
variables measured in the current study. First, rather than measuring faculty beliefs in the
learning impact of technology use, learning by students should be measured and related with
technology use. Secondly, in addition to using self-reported efficacy variables, supervisor and
peer evaluations should also be used to measure efficacy with teaching discipline content.
Finally, institutional policies should be assessed through faculty input as well as input from
administrators and those managing the information systems departments.
113
References
Archambault, L.M. & Crippen, K.J. (2009). K-12 distance educators at work: Who’s teaching
online across the United States. Journal of Research on Technology in Education, 41(4), 363-391.Lee and Rha (2009)
Aworuwa, B., Worrell, P., & Smaldino, S. (2005). Working with Partners: A reflection on
partners and projects. Tech Trends, 50(3), 38-43. Backer, T. & Singhal, A. (2005). Forum: The life and work of Everett Rogers - Some personal
reflections. Journal of Health Communication, 10, 285-288. Bell, F. (2011). Connectivism: Its Place in Theory-informed Research and Innovation in
Technology-enabled Learning. International Review of Research in Open and Distance Learning, 12(3), 98-118.
Bennett, J. & Bennett, L. (2003). A Review of Factors that Influence the Diffusion of Innovation
When Structuring a Faculty Training Program. Internet and Higher Education. 6, 53-63. Benson, D. & Mekolichick, J. (2007). Conceptions of Self and the Use of Digital Technologies
in a Learning Environment. Education, 127(4), 498-510. Birch, T., Greenfield, L., Janke, K., Schaeffer, D., & Woods, A. (2008). Partnering with
Librarians to Meet NCATE Standards in Teacher Education. Education, 128(3), 369-379. Brown, J. (2011). Dwell in Possibility: PLAR and e-Portfolios in the Age of Information and
Communication Technologies. International Review of Research in Open and Distance Learning, 12(1), 1-23.
Butler, T & Pinto-Zipp, G. (2006). Students’ Learning Styles and Their Preferences for Online
Instructional Methods. Journal of Educational Technology Systems. 34(2), 199-221. BybeeR. & Starkweather K. (2006). The Twenty-First Century Workforce: A contemporary
challenge for technology education. The Technology Teacher, May/June, 27-32. Cao, Y. & Sakchutchawan, S. (2011). Online vs. Traditional MBA Courses: An Empirical Study
of Students' Characteristics, Course Satisfaction, and Overall Success. Journal of Human Resources and Adult Learning, 2.
Cataldi, E., Fahimi, M, Bradburn, E., & Zimbler, L. (2004) National Study of Postsecondary
Faculty (NSOPF:04) Report on Faculty and Instructional Staff in Fall 2003. E.D. TAB. NCES 2005-172.
114
Chen, B. (2009). Barriers to Adoption of Technology-mediated Distance Education in Higher Education Institutions. The Quarterly Review of Distance Education. 10(4), 333-338.
Chuang, T. & Chen, W. (2009). Effect of Computer-Based Video Games on Children: An
experimental study. Educational Technology & Society, 12(2), 1-10. Darmawan, I. & Keeves, J. (2006). Suppressor Variables and Multilevel Mixture Modeling.
International Education Journal, 7(2), 160-173. Diem, R. (2002). An Examination of the Effects of Technology Instruction in Social Studies
Methods Classes. Presentation at the Annual Meeting of the American Educational Research Association, New Orleans, LA, April 1-5, 2002.
Educational Technology. (n.d.). In Wikipedia. Retrieved April 22, 2011 from
http://en.wikipedia.org/wiki/Education_technology Fahmy, M. (2004). Thinking About Technology Effects on Higher Education. The Journal of
Technology Studies, 55-58. Foulger, T. & Williams, M. (2007). Filling the Gap with Technology Innovations: Standards,
Curriculum, Collaboration, Success. Journal of Computing in Teacher Education, 23(3), 107-114.
Freeman, M. Bell, A. Comerton-Forde, C. Pickering, J. & Blayney, P. (2007). Factors Affecting
Educational Innovation with in Class Electronic Response Systems. Australasian Journal of Educational Technology. 23(2), 149-170.
Gautreau, C. (2011). Motivational Factors Affecting the Integration of a Learning Management
System by Faculty. The Journal of Educators Online, 8(1), 1-25. Green, K. (2009). Campus Computing Project. Educause Conference, November 2009, Denver,
CO. Hansen, S. & Salter, G. (2001). The Adoption and Diffusion of Web Technologies into
Mainstream Teaching. Journal of Interactive Learning Research. 12(2/3), 281-299. Hug, B. & Reese, G. (2006). How Technology Integration in Mathematics and Science Teaching
Can Occur: The Role of the Maverick Teacher. Teaching Education. 17(2), 167-179. Jefferies, A & Hyde, R. (2010). Building the Future Students' Blended Learning Experiences
from Current Research Findings. Electronic Journal of e-Learning, 8(2), 133-140. Jeffs, T. & Banister, S. (2006). Enhancing Collaboration and Skill Acquisition Through the Use
of Technology. Journal of Technology and Teacher Education, 14(2), 407-433.

115
Jones, N. & Laffey, J. (2000). The Diffusion of Collaborative Technologies into a College Classroom. Performance Improvement Quarterly. 13(4), 29-46.
Junco, R. & Chickering, A. (2010). Civil Discourse in the Age of Social Media. American
College Personnel Association and Wiley Periodicals, Inc. Wiley Online Library, 12-18. Karasavvidis, I. (2010). Wiki Uses in Higher Education: Exploring Barriers to Successful
Implementation. Interactive Learning Environments, 18(9), 219-231. Kay, R & Lauricella, S. (2011). Exploring the Benefits and Challenges of Using Laptop
Computers in Higher Education Classrooms: A Formative Analysis. Canadian Journal of Learning and Technology, 37(1), 1-18.
Kebritchi, M. (2008). Factors Affecting Teachers’ Adoption of Educational Computer Games: A
Case Study. British Journal of Educational Technology. 41(2), 256-270. Keller, C. (2005). Virtual Learning Environments: Three Implementation Perspectives. Learning
Media and Technologies. 30(3), 299-311. Keith, T. (1988). Path Analysis: An Introduction for School Psychologists. School Psychology
Review, 17(2), 343-362. Kilmon, C. & Fagan, M. (2007). Course Management Software Adoption: A Diffusion of
Innovation Perspective. Emerald Insight. 24(2). Kopcha, T. (2010). A System-based Approach to Technology Integration Using Mentoring and
Communities of Practice. Education Technology Research Development. 58, 175-190. Kumar, S. & Vigil, K. (2011). The Net Generation as Preservice Teachers: Transferring
Familiarity with New Technologies to Educational Environments. Journal of Digital Learning in Teacher Education, 27(4), 144-152.
Liao, H. (2005). Communication Technology, Student Learning, and Diffusion of Innovation.
College Quarterly. 8(2). Littlejohn, A., Margaryan, A. & Vojt, G. (2010). Exploring Students' Use of ICT and
Expectations of Learning Methods. Electronic Journal of e-Learning, 8(1), 13-22. Lowther, D., Inan, F., Strahl, D., & Ross, M. (2008). Does Technology Integration "Work"
When Barriers are Removed. Educational Media International, 45(3), 195-213. Ma, Y., Williams, D., Prejean, L., Lai, G., & Ford, M. (2008). A Model for Facilitating Field
Experience in a Technology-Enhanced Model Pedagogical Laboratory. Journal of Computing in Teacher Education, 24(3).
116
Manning, J. & Carpenter, L. (2008). Assistive Technology WebQuest: Improving Learning for Preservice Teachers. Tech Trends, 52(6), 47-52.
Martinez, R., Liu, S., Watson, W. & Bichelmeyer, B. (2006). Evaluation of a Web-based
Master's Degree Program: Lessons Learned from an Online Instructional Design and Technology Program. The Quarterly Review of Distance Education, 7(3), 267-283.
Matthew, K., Felvegi E., & Callaway R. (2009). Wiki as a Collaborative Learning Tool in a
Language Arts Methods Class. Journal of Research on Technology in Education. 42(1), 51-72.
Means, B., Toyama, Y., Murphy, R., Bakia, M., & Jones, K.(2009). Evaluation of Evidence-
Based Practices in Online Learning: A meta-analysis and review of online learning studies. U.S. Department of Education: Office of Planning, Evaluation, and Policy Development.
Morin, A. (1975). An Innovator’s Odyssey: How to Become a Thoughtful Change Agent.
Educational Technology. 15(11), 42-44. Murray, C. (2009). Diffusion of Innovation Theory: A Bridge for the Research-Practice Gap in
Counseling. Journal of Counseling & Development. 87. National Council for Accreditation of Teacher Education (2008). Professional Standards for the
Accreditation of Teacher Preparation Institutions. Washington D.C. Nicholas, H. & Ng, W. (2009) Fostering online social construction of science knowledge with
primary pre-service teachers working in virtual teams. Asia-Pacific Journal of Teacher Education, 37(4), 379 – 398.
Nichols, M. (2008). Institutional Perspectives: The Challenges of e-Learning Diffusion. British
Journal of Educational Technology. 39(4). Paechter, M., Maier, B., & Macher, D. (2009). Student expectation of and experiences in e-
learning: Their relation to learning achievement and course satisfaction. Journal of Computers and Education 54, 222-229.
Pellegrino, J. & Quellmalz, E. (2010). Perspectives on the Integration of Technology and
Assessment. Journal of Research on Technology in Education, 43(2), 119-134. Oner, D. & Adadan, E. (2011). Use of Web-based Portfolios as Tools for Reflection in
Preservice Teacher Education. Journal of Teacher Education, 62(5), 477-492. Panda, S. & Mishra, S. (2007). E-Learning in a Mega Open University: Faculty attitude, barriers
and motivates. Educational Media International, 44(4), 323-338.
117
Parisot, A. (1997). Distance Education as a Catalyst for Changing Teaching in the Community College: Implications for Institutional Policy. New Direction for Community Colleges, 99, 5-13.
Peluchette, J. & Rust, K. (2005). Technology Use in the Classroom: Preferences of Management
Faculty Members. Journal of Education for Business, Heldref Publications. Rakes, G., Fields, V. & Cox, K. (2006). The Influence of Teachers' Technology Use on
Instructional Practices. Journal of Research on Technology in Education, 38(4), 409-424. Razzaq, L. & Heffernan, N. (2009). To Tutor or Not to Tutor: That is the Question. In Dimitrova,
Mizoguchi, du Boulay & Graesser (Eds.) Proceedings of the 2009 Artificial Intelligence in Education Conference. pp. 457-464.
Rogers, E. (2003). Diffusion of Innovations, Fifth Edition. New York. Free Press. Rounds, J., Kanter, M., & Blumin, M. (1987). Technology and Testing: What is Around the
Corner? In Bray, D., Belcher, M., Issues in Student Assessment. New Direction for Community Colleges (pp. 83-93). San Francisco, CA: Jossey-Bass Inc. Publishers.
Russell, M., Kleiman, G., Carey, R., & Douglas, J. (2009). Comparing Self-Paced and Cohort-
Based Online Courses for Teachers. Journal of Research on Technology in Education. 41(4), 443-466.
Sadykova, G. & Dautermann, J. (2006). Crossing Cultures and Borders in International Online
Distance Higher Education. Journal of Asynchronous Learning Networks, 13(2), 89-114. Saeed, N., Yang, Y., & Sinnappan, S. (2009). Emerging Web Technologies in Higher Education:
A Case of Incorporating Blog's, Podcasts, and Social Bookmarks in a Web Programming Course based on Students' Learning Styles and Technology Preferences. Educational Technology & Society, 12(4), 98-109.
Samarawickerma, G. & Stacey, E. (2007). Adopting Web-Based Learning and Teaching: A Case
Study in Higher Education. Distance Education. 28(3), 313-333. Santilli, S. & Beck, V. (2005). Graduate Faculty Perceptions of Online Teaching. The Quarterly
Review of Online Teaching, 6(2), 155-160. Shacher, M. & Neumann, Y. (2010). Twenty Years of Research on the Academic Performance
Differences Between Traditional and Distance Learning: Summative meta-analysis and trend examination. MERLOT Journal of Online Learning and Teaching. 6(2).
Shoffner, M. (2009). Personal Attitudes and Technology: Implications for Preservice Teacher
Reflective Practice. Teacher Education Quarterly, 143-161.
118
Shana, Z. (2009). Learning with Technology: Using discussion forums to augment traditional-style class. Educational Technology & Society, 12(3), 214-228.
Sherman, W, Crum, K. & Beaty, D. (2010). Perspectives on Distance Technology in Leadership
Education: Transfer, Meaning, and Change. Journal of Research on Leadership Education, 5(13), 589-610.
Smith, S. & Robinson, S. (2003). Technology Integration Through Collaborative Cohorts:
Preparing future teachers to use technology. Remedial and Special Education, 24(3), 254-160.
Southworth, J., Knezek, G., & Flanigan, J. (2003). Three Decades of Distance Learning:
Enrishment at the University of Hawaii. Educational Perspectives, 3-8. Tabata, L. & Johnsrud, L. (2008). The Impact of Faculty Attitudes Toward Technology, Distance
Education, and Innovation. Research in Higher Education. 49, 625-646. Talab, R. (1993). Self Efficacy, Performance Variables and Distance Learning Facilitator
Technology Adoption: Support for the Teacher Needs Hierarchy. Proceedings of Selected Research and Development Presentations at the Convention of the Association for Educational Communications and Technology Sponsored by the Research and Theory Division, January 13-17, New Orleans, LA.
Taylor, P, Parker, K., Lenhart, A., & Patten, E. (2011). The Digital Revolution and Higher
Education, Pew Research Center. Thomspon, C. (2011). The New Way to be a Fifth Grader. Wired, 19(08), 127-152. Voegel, G. (1986). Advances in Instructional Technology. San Francisco, CA: Jossey-Bass Inc.
Publishers. Wallace, L. (2007). Online Teaching and University Policy: Investigating the Disconnect.
Journal of Distance Education, 22(1), 87-100. Weiner, S. (2003). Resistance to Change in Libraries: Application of Communication Theories.
Project Muse. 3(1), 69-78. Wiley, D. & Gurrell, S. (2009). Context and Catalyst: A decade of development… Open
Learning, 24, 11-21. Woodell, J. & Garofoli, E. (2002). Faculty Development and the Diffusion of Innovations.
Campus Technology. 16(6). Zhao, J., Alexander, M., Perreault, H., Waldman, L., & Truell, A. (2009). Faculty and Student
Use of Technologies, User Productivity, and User Preference in Distance Education. Journal of Education for Business, Heldref Publications.

119
Appendix
120
Education Technology Survey -- Sammy Elzarka, Claremont Graduate University Thank you for taking time to complete this survey. Please answer each item to the best of your knowledge. Your thoughtfulness and candid responses are greatly appreciated. Your responses will be kept completely confidential. Technology is a broad concept that can mean a lot of different things. For the purpose of this survey, education technology is referring to digital technologies used for education purposes. Examples are digital tools such as computers, laptops, handheld devices, interactive whiteboards, software programs, and the like. If an item does not apply, enter N/A in the text box. * Required Informed Consent Form for The Education Technology Research Project *You are being asked to participate in a research project conducted by Sammy Elzarka as part of the dissertation in the School of Educational Studies at the Claremont Graduate University (CGU). You have been selected because you are a faculty member (part-time or full-time) in higher education. PURPOSE: The purpose of this study is to identify the barriers to the use of education technology in higher education. PARTICIPATION: You will be asked to complete a survey regarding use of education technology tools in your teaching. We expect your participation to take about 20 minutes. Email addresses are requested merely for follow up communication. RISKS & BENEFITS: The potential risk associated with this study includes the time required to complete the survey. In addition, we expect this research to benefit science and higher education instruction by providing information about how to recruit faculty members’ uses of educational technology tools to further the learning process. COMPENSATION: You will receive no compensation. VOLUNTARY PARTICIPATION: Please understand that participation is completely voluntary. Your decision whether or not to participate will in no way affect your current or future relationship with CGU or its faculty, students, or staff. You have the right to withdraw from the research at any time without penalty. You also have the right to refuse to answer any question(s) for any reason, without penalty. CONFIDENTIALITY: Your individual privacy will be maintained in all publications or presentations resulting form this study. All survey data will be collect using the Google Docs forms product and all responses will be accessible only to the primary investigator. In order to preserve the confidentiality of your responses, we have ensured that the online forms are secured and password-protected. Please note that, while all data will be kept tightly confidential, they are not anonymous. Only aggregated summaries will be reported as part of the study’s findings. No individual responses will be identifiable with respondents. If you have any questions or would like additional information about this research, please contact Sammy Elzarka at 626-869-8190 or [email protected]. You can also contact the research advisor, Dr. David Drew, at 909-621-8000. The CGU Institutional Review Board, which is administered through the Office of Research and Sponsored Programs (ORSP), has approved this project. You may also contact ORSP at (909) 607-9406 with any questions. I understand the above information and have had all of my questions about participation in this research project answered. By checking this box, I voluntarily consent to participate in this research study.
• I accept these terms and agree to voluntarily complete this survey. Gender *
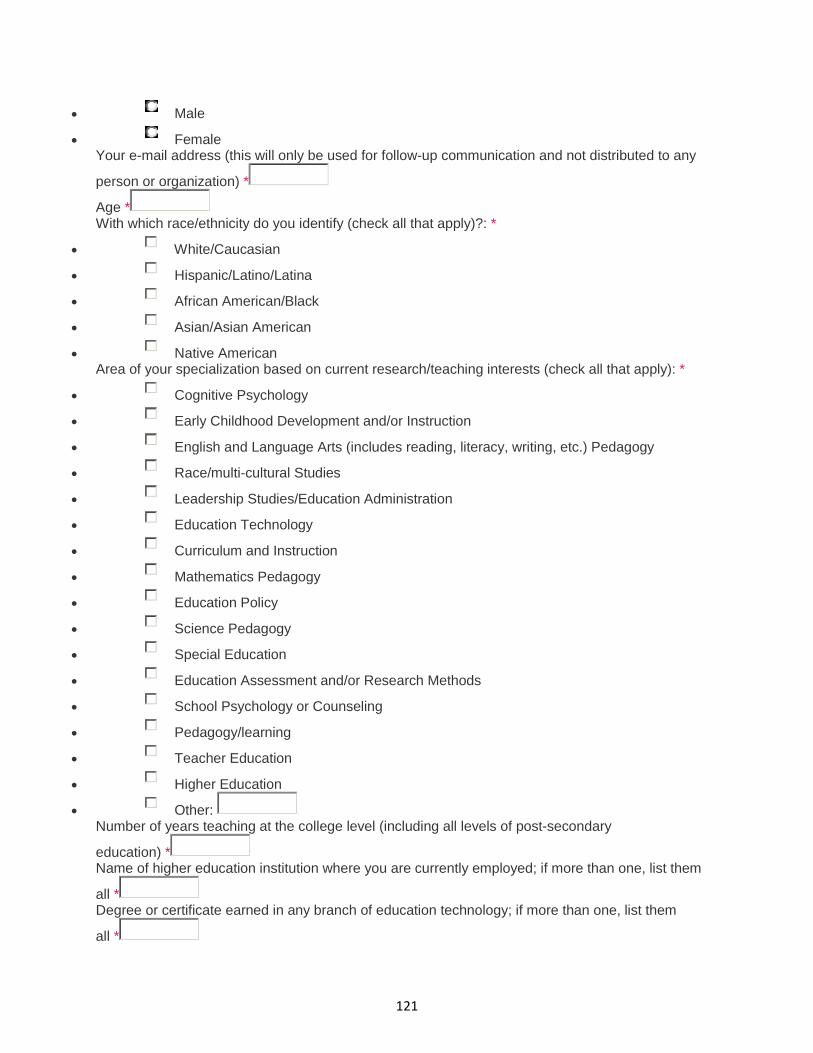
121
• Male
• Female Your e-mail address (this will only be used for follow-up communication and not distributed to any
person or organization) *
Age * With which race/ethnicity do you identify (check all that apply)?: *
• White/Caucasian
• Hispanic/Latino/Latina
• African American/Black
• Asian/Asian American
• Native American Area of your specialization based on current research/teaching interests (check all that apply): *
• Cognitive Psychology
• Early Childhood Development and/or Instruction
• English and Language Arts (includes reading, literacy, writing, etc.) Pedagogy
• Race/multi-cultural Studies
• Leadership Studies/Education Administration
• Education Technology
• Curriculum and Instruction
• Mathematics Pedagogy
• Education Policy
• Science Pedagogy
• Special Education
• Education Assessment and/or Research Methods
• School Psychology or Counseling
• Pedagogy/learning
• Teacher Education
• Higher Education
• Other: Number of years teaching at the college level (including all levels of post-secondary
education) * Name of higher education institution where you are currently employed; if more than one, list them
all * Degree or certificate earned in any branch of education technology; if more than one, list them
all *
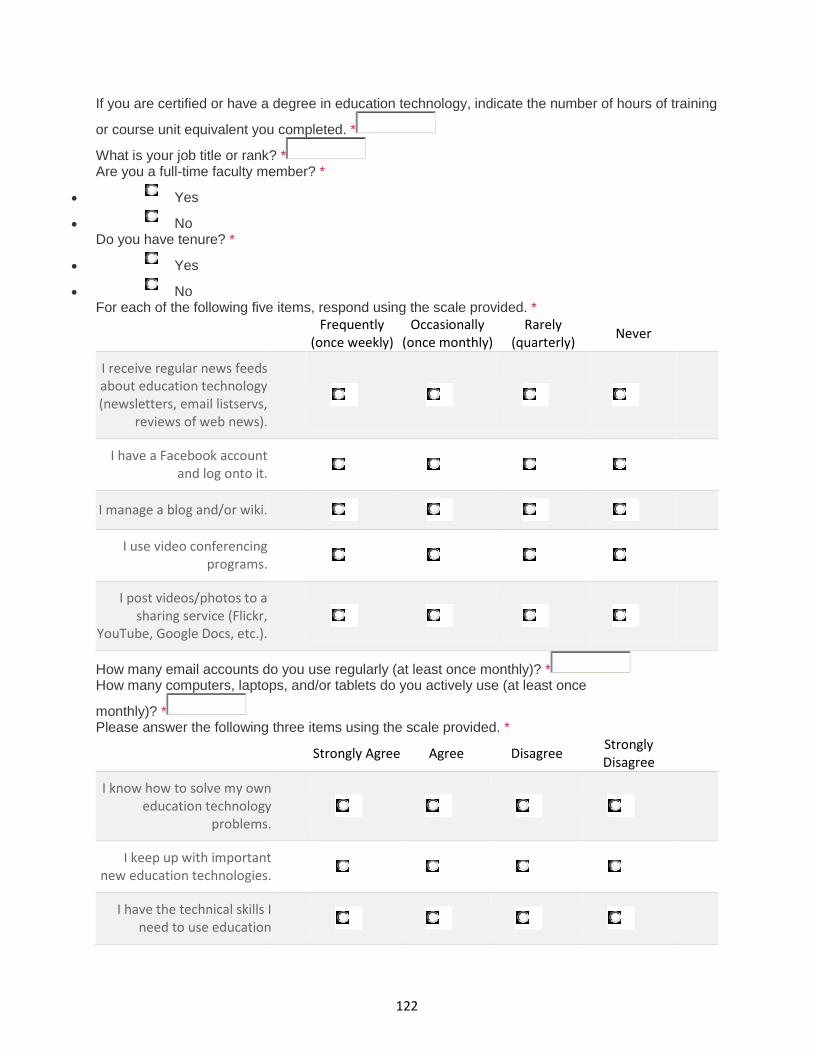
122
If you are certified or have a degree in education technology, indicate the number of hours of training
or course unit equivalent you completed. *
What is your job title or rank? * Are you a full-time faculty member? *
• Yes
• No Do you have tenure? *
• Yes
• No For each of the following five items, respond using the scale provided. *
Frequently
(once weekly)
Occasionally
(once monthly)
Rarely
(quarterly) Never
I receive regular news feeds
about education technology
(newsletters, email listservs,
reviews of web news).
I have a Facebook account
and log onto it.
I manage a blog and/or wiki.
I use video conferencing
programs.
I post videos/photos to a
sharing service (Flickr,
YouTube, Google Docs, etc.).
How many email accounts do you use regularly (at least once monthly)? * How many computers, laptops, and/or tablets do you actively use (at least once
monthly)? * Please answer the following three items using the scale provided. *
Strongly Agree Agree Disagree Strongly
Disagree
I know how to solve my own
education technology
problems.
I keep up with important
new education technologies.
I have the technical skills I
need to use education

123
Strongly Agree Agree Disagree Strongly
Disagree
technology.
Please answer all of the following items using the scale provided. *Each of the following is important for my students’ learning:
Strongly
Agree Agree Disagree
Strongly
Disagree
Supplementing a course with
online resources;
Putting course and/or lecture
content online;
Capturing lectures with video
equipment;
Teaching and managing courses
delivered entirely online;
Web page design and
development;
Teaching and managing courses
with large enrollment;
Managing assignments;
Automating or managing grades;
Offering broader access to
course materials;
Using digital audio and video;
Creating and using effective
presentation technologies;
Live online
meetings/classes/seminars;
Technology-equipped
classrooms;
Virtual classroom space (i.e.
Learning Management Systems
such as Blackboard or Moodle);
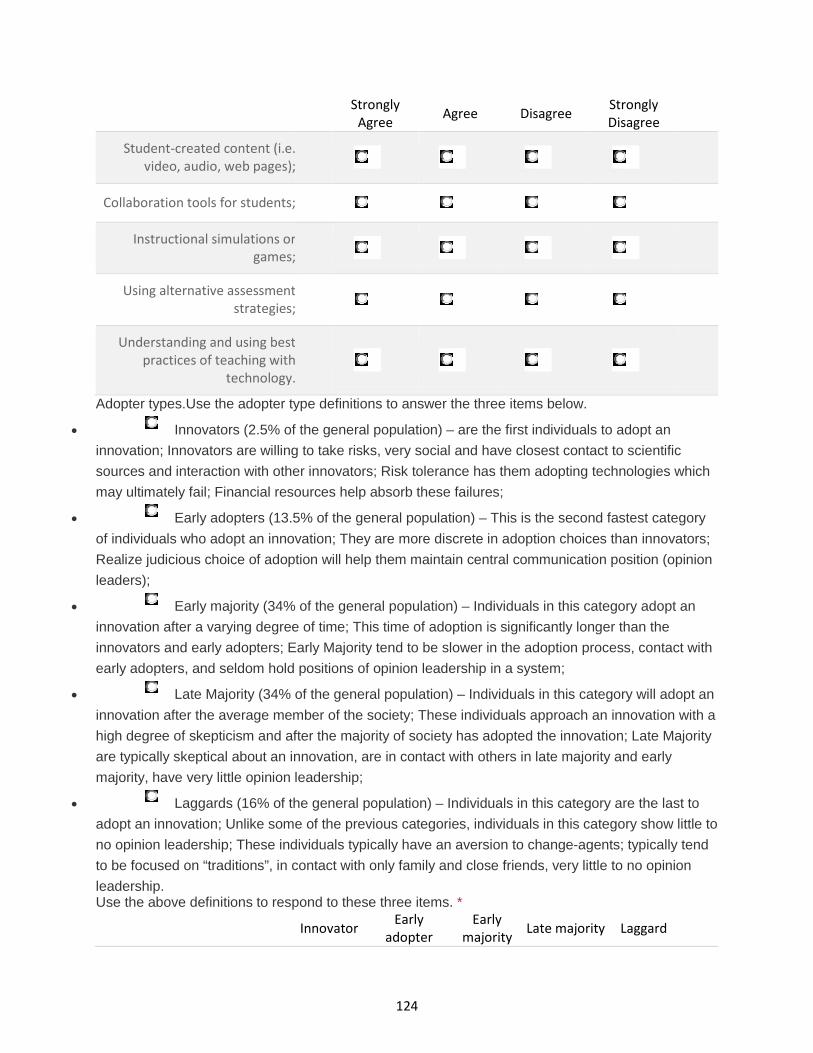
124
Strongly
Agree Agree Disagree
Strongly
Disagree
Student-created content (i.e.
video, audio, web pages);
Collaboration tools for students;
Instructional simulations or
games;
Using alternative assessment
strategies;
Understanding and using best
practices of teaching with
technology.
Adopter types.Use the adopter type definitions to answer the three items below.
• Innovators (2.5% of the general population) – are the first individuals to adopt an
innovation; Innovators are willing to take risks, very social and have closest contact to scientific
sources and interaction with other innovators; Risk tolerance has them adopting technologies which
may ultimately fail; Financial resources help absorb these failures;
• Early adopters (13.5% of the general population) – This is the second fastest category
of individuals who adopt an innovation; They are more discrete in adoption choices than innovators;
Realize judicious choice of adoption will help them maintain central communication position (opinion
leaders);
• Early majority (34% of the general population) – Individuals in this category adopt an
innovation after a varying degree of time; This time of adoption is significantly longer than the
innovators and early adopters; Early Majority tend to be slower in the adoption process, contact with
early adopters, and seldom hold positions of opinion leadership in a system;
• Late Majority (34% of the general population) – Individuals in this category will adopt an
innovation after the average member of the society; These individuals approach an innovation with a
high degree of skepticism and after the majority of society has adopted the innovation; Late Majority
are typically skeptical about an innovation, are in contact with others in late majority and early
majority, have very little opinion leadership;
• Laggards (16% of the general population) – Individuals in this category are the last to
adopt an innovation; Unlike some of the previous categories, individuals in this category show little to
no opinion leadership; These individuals typically have an aversion to change-agents; typically tend
to be focused on “traditions”, in contact with only family and close friends, very little to no opinion
leadership. Use the above definitions to respond to these three items. *
Innovator Early
adopter
Early
majority Late majority Laggard
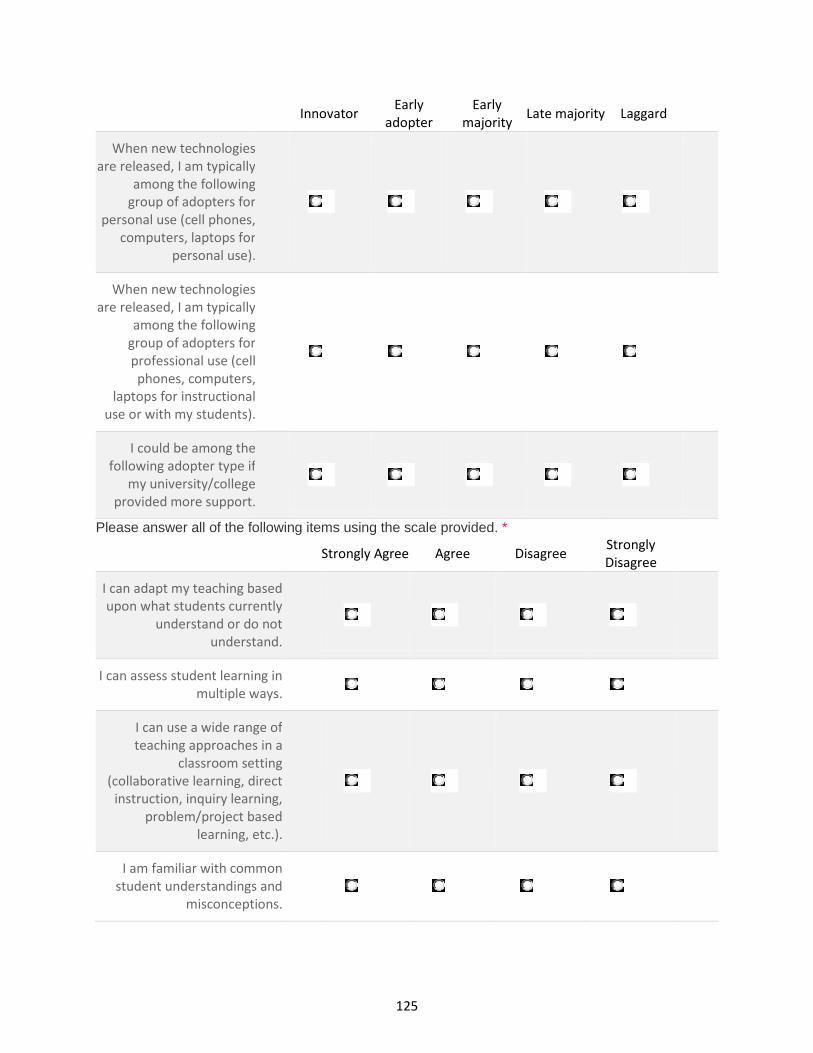
125
Innovator Early
adopter
Early
majority Late majority Laggard
When new technologies
are released, I am typically
among the following
group of adopters for
personal use (cell phones,
computers, laptops for
personal use).
When new technologies
are released, I am typically
among the following
group of adopters for
professional use (cell
phones, computers,
laptops for instructional
use or with my students).
I could be among the
following adopter type if
my university/college
provided more support.
Please answer all of the following items using the scale provided. *
Strongly Agree Agree Disagree Strongly
Disagree
I can adapt my teaching based
upon what students currently
understand or do not
understand.
I can assess student learning in
multiple ways.
I can use a wide range of
teaching approaches in a
classroom setting
(collaborative learning, direct
instruction, inquiry learning,
problem/project based
learning, etc.).
I am familiar with common
student understandings and
misconceptions.
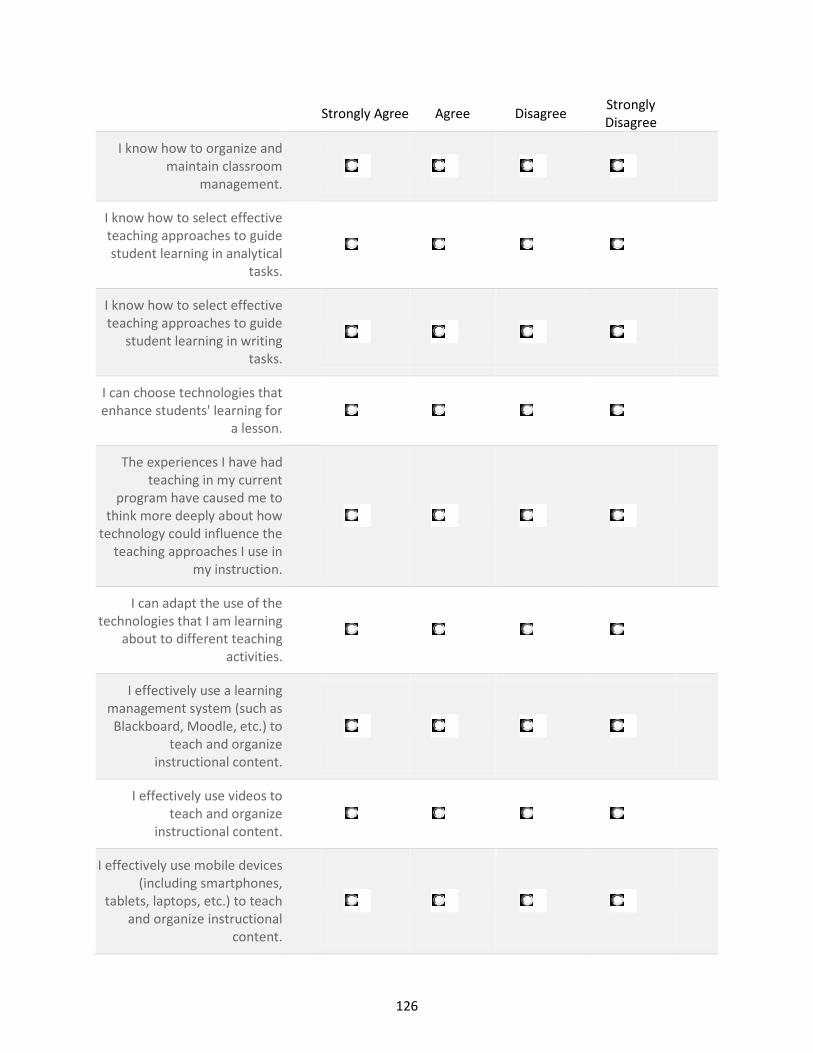
126
Strongly Agree Agree Disagree Strongly
Disagree
I know how to organize and
maintain classroom
management.
I know how to select effective
teaching approaches to guide
student learning in analytical
tasks.
I know how to select effective
teaching approaches to guide
student learning in writing
tasks.
I can choose technologies that
enhance students' learning for
a lesson.
The experiences I have had
teaching in my current
program have caused me to
think more deeply about how
technology could influence the
teaching approaches I use in
my instruction.
I can adapt the use of the
technologies that I am learning
about to different teaching
activities.
I effectively use a learning
management system (such as
Blackboard, Moodle, etc.) to
teach and organize
instructional content.
I effectively use videos to
teach and organize
instructional content.
I effectively use mobile devices
(including smartphones,
tablets, laptops, etc.) to teach
and organize instructional
content.
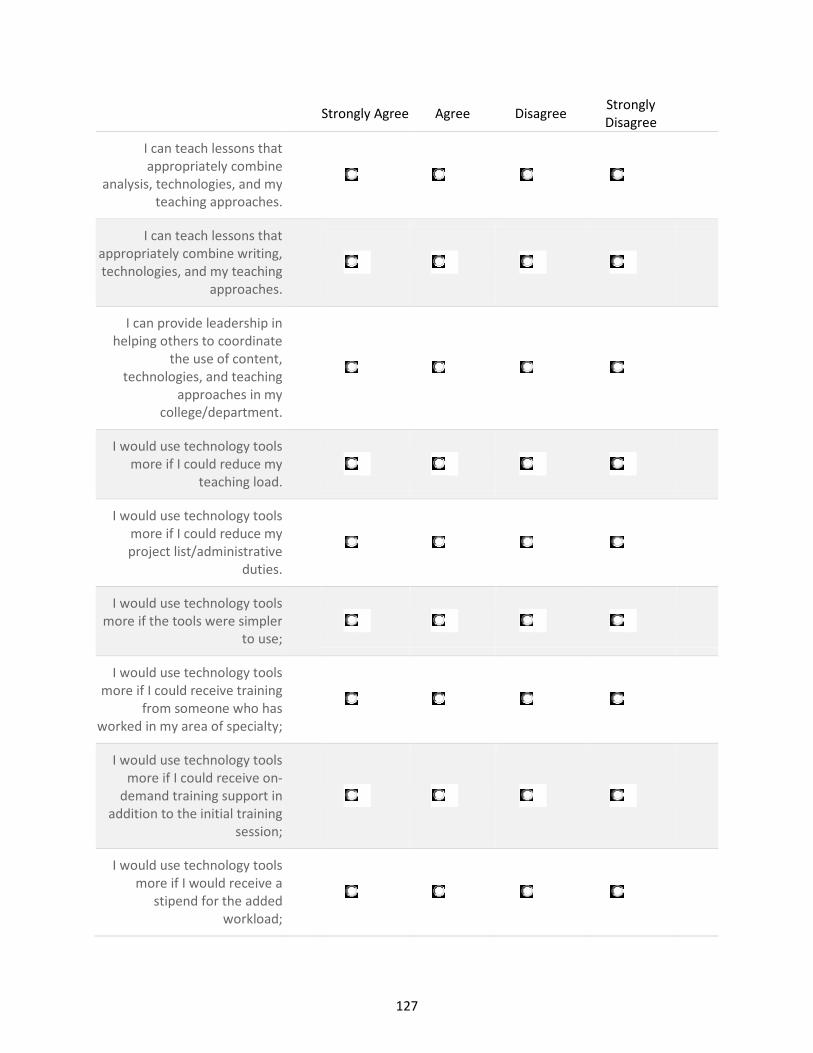
127
Strongly Agree Agree Disagree Strongly
Disagree
I can teach lessons that
appropriately combine
analysis, technologies, and my
teaching approaches.
I can teach lessons that
appropriately combine writing,
technologies, and my teaching
approaches.
I can provide leadership in
helping others to coordinate
the use of content,
technologies, and teaching
approaches in my
college/department.
I would use technology tools
more if I could reduce my
teaching load.
I would use technology tools
more if I could reduce my
project list/administrative
duties.
I would use technology tools
more if the tools were simpler
to use;
I would use technology tools
more if I could receive training
from someone who has
worked in my area of specialty;
I would use technology tools
more if I could receive on-
demand training support in
addition to the initial training
session;
I would use technology tools
more if I would receive a
stipend for the added
workload;

128
Strongly Agree Agree Disagree Strongly
Disagree
I would use technology tools
more if I would receive
recognition for the effort from
my supervisor;
I would use technology tools
more if I would receive
recognition from my peers;
I would use technology tools
more if my university’s (or
college’s) policies allowed for
flex time to work with
technologies;
I would use technology tools
more if my university (or
college) would invest in
updating the technology
equipment;
I would use technology tools
more if my university (or
college) would provide more
academically relevant training.
For the following two items, use the scale provided for your responses. * 25% or less 26% - 50% 51% - 75% 76% - 100%
In general, approximately what
percentage of your peers
within your department have
provided an effective model for
combining content,
technologies and teaching
approaches in their teaching?
In general, approximately what
percentage of your peers
outside your
college/department, but within
your university, have provided
an effective model for
combining content,
technologies and teaching
approaches in their teaching?
Please answer all of the following items using the scale provided. *
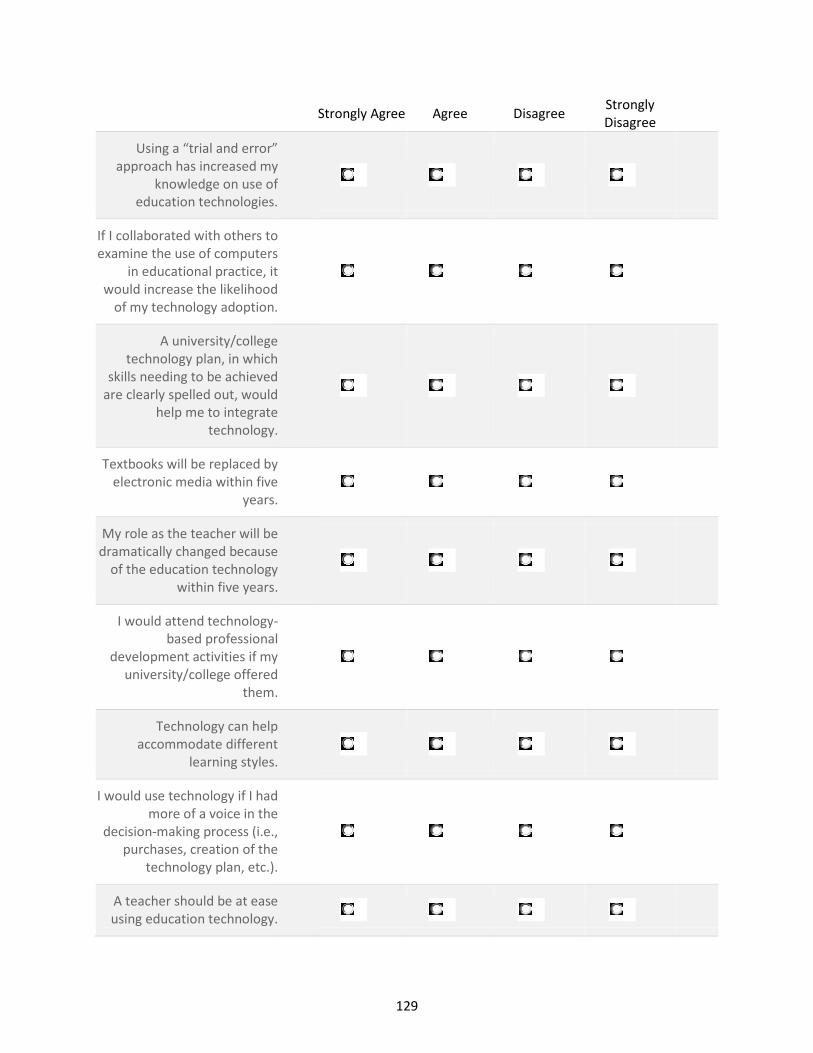
129
Strongly Agree Agree Disagree Strongly
Disagree
Using a “trial and error”
approach has increased my
knowledge on use of
education technologies.
If I collaborated with others to
examine the use of computers
in educational practice, it
would increase the likelihood
of my technology adoption.
A university/college
technology plan, in which
skills needing to be achieved
are clearly spelled out, would
help me to integrate
technology.
Textbooks will be replaced by
electronic media within five
years.
My role as the teacher will be
dramatically changed because
of the education technology
within five years.
I would attend technology-
based professional
development activities if my
university/college offered
them.
Technology can help
accommodate different
learning styles.
I would use technology if I had
more of a voice in the
decision-making process (i.e.,
purchases, creation of the
technology plan, etc.).
A teacher should be at ease
using education technology.

130
Strongly Agree Agree Disagree Strongly
Disagree
A teacher should use
education technology,
whether he/she is rewarded
or not.
A teacher who plans lessons
that are learner-centered uses
education technology.
My experience using
technology to learn has been
successful.
Please complete this section by typing your responses in the space provided. *Describe a specific episode where a peer effectively demonstrated or modeled combining content, technologies and teaching approaches in a classroom lesson. Please include in your description what content was being taught, what technology was used, and what teaching approach(es) was
implemented. Please complete this section by typing your responses in the space provided. *Expand on the barriers to the use of education technology by describing how these barriers can be mitigated for you. List the top three barriers and describe remedies for
each. Please complete this section by typing your responses in the space provided. *Describe a specific episode where you effectively demonstrated or modeled combining content, technologies and teaching approaches in a classroom lesson. Please include in your description what content you taught, what technology you used, and what teaching approach(es) you implemented. If you have
131
not had the opportunity to teach such a lesson, please indicate that you have not and describe
why. Please complete this section by typing your responses in the space provided. *Describe any additional information you would like to share regarding your use of education technology for
instructional purposes.
Submit
Powered by Google DocsReport Abuse - Terms of Service - Additional Terms
Copyright © 2022 FDOKUMEN