
Technology-driven industry evolution in the telecom sector
116
Technology-driven industry evolution in the telecom sector: The comparative case of Ecuador MSc Degree Programme in Strategy Master's thesis Jose Valarezo Garcia 2014 Department of Management Studies Aalto University School of Business Powered by TCPDF (www.tcpdf.org)
-
Upload
khangminh22 -
Category
Documents
-
view
0 -
download
0
Transcript of Technology-driven industry evolution in the telecom sector
Technology-driven industry evolution in the telecomsector: The comparative case of Ecuador
MSc Degree Programme in Strategy
Master's thesis
Jose Valarezo Garcia
2014
Department of Management StudiesAalto UniversitySchool of Business
Powered by TCPDF (www.tcpdf.org)
Aalto University School of Business ABSTRACT
Master’s Thesis José Valarezo
Technology-driven industry evolution in the telecom sector:
The comparative case of Ecuador
PURPOSE OF THE STUDY
The purpose of this case study is to analyze the current situation of the telecom industry
in Ecuador and its tendencies as part of the Telecom, Media and Technology TMT
industry. The analysis is mainly linked with the effects at the industry and business
levels of the widespread of mainstream products and services in the TMT market in the
case of Ecuador, benchmarking it with the global context. The case study elaborates on
this objective before by addressing the following question: How the widespread of
mainstream products and services in the TMT market are and might continue shaping
the development of the telecom industry in Ecuador in the next decade and how does it
compare to the global environment?
STRUCTURE OF THE STUDY
A brief review of the telecom industry evolution and its present and future challenges
are provided in the first chapter, as well as the specificities of the development in
Ecuador are introduced in the same chapter. In the second chapter, the predominant
approaches about organization development and change are discussed openly with the
aim to gain a concise but global perspective in this matter, setting the theoretical
framework. Before developing the study case, a compressed review of the telecom
ecosystem as part of the TMT industry is provided in chapter three in order to identify
the forces driving the industry. Chapter four presents the methodology used in this study
and then the case study is developed in chapter five, in which I attempt to depict the
current situation of the telecom industry in Ecuador and its tendencies as part of the
TMT industry, while reflecting on the theoretical framework presented in the literature
review section. Finally a general discussion of the findings and conclusion are provided.
CONCLUSIONS
In this thesis it has been evidenced that the development of the telecom industry in
Ecuador has been boosted by the widespread of mainstream products and services in the
TMT market including broadband fixed and mobile internet, smartphones, social

networks, HDTV, e-commerce and OTT content. The deployment of next generation
networks represents a technological discontinuity that cannot be overlooked by firms,
and become determinant for the future performance of firms.
KEY WORDS
Industry evolution, telecom ecosystem, telecom, media and technology industry,
information and communication technologies, information society, knowledge economy,
disruptive innovations, broadband, next-generation networks, triple play service.

ACKNOWLEDGEMENTS
I want to thank god because he has gave me everything and the opportunity of witting
this thesis and of course to my family Vinicio, Gretty, Andrea and Natazha that is my
source of motivation and that have supported me throughout my life. I would also like
to thank to my good friends Cruzkaya, Mika, Matias, Manuel and Anis that
accompanied my studies during my fruitful stay in Finland. Finally I would like to thank
to all the staff of Aalto University that shared their knowledge and time with me.
TABLE OF CONTENTS
1. INTRODUCTION…………………………………………………………………..1
1.1 Background…………………………………………………………………..1
1.1.1 Challenges of next-generation telecommunications ...…………………..3
1.1.2 Contextualizing development in Ecuador…………………………….….5
1.2 Approach and purpose of the study……………………………………….…8
1.3 Limitations…………………………………………………………………...9
1.4 Definitions…………………………………………………………………...9
1.5 Structure of the study……………………………………………………....10
2. ORGANIZATIONAL DEVELOPMENT AND CHANGE……………………....12
2.1 Industry life cycle…………………………………………………………..14
2.1.1 Is the industry evolution captured by the product life cycle?..................19
2.1.2 Investments over the industry life cycle………………………………..22
2.1.3 Life cycle as a contingency variable for strategic management………..23
2.2 Innovation and technology………………………………………………....26
2.2.1 Dominant designs……………………………………………………....30
2.2.2 Disruptive innovations………………………………………………....36
2.2.3 Appropriability regimes and complementary assets…………………...37
2.2.4 Exploiting and exploring…………………………………………….....39
3. TELECOM ECOSYSTEM………………………………………………………..42
3.1 Operators and industry sectors……………………………………………..42
3.2 Customers………………………………………………………………......50
3.2.1 Enterprise customers……………………………………………………50
3.2.2 Consumer customers……………………………………………………55
4. RESEARCH METHODS………………...………………….……………………59
4.1 Comparative case study approach....……………………………………….59
4.2 Case selection……………………………………………………………....59
4.3 Data collection and analysis……………………………………………......59
4.3.1 Sources and timeframe……………………………………………..…..61
4.3.2 Limitations of the data………………………………………………....63
5. A COMPARATIVE STUDY OF THE TELECOM SECTOR IN ECUADOR….65
5.1 Value drivers and development factors of the TMT industry………………....66
5.2 TMT industry development in Ecuador and Worldwide..………………….…77
5.2.1 TMT Market forces……………………………………………….......81
5.2.2 Firms’ population……………………………………………………..84
5.3 Telecom industry development in Ecuador…………………………………....85
6. CONCLUSIONS…………………………………………………………………..93
REFERENCES ……………………………………………………...............................95
LIST OF FIGURES AND TABLES
Figure 1: Process Theories of Organizational Development and Change……………...12
Figure 2: Number of automobiles produced USA in census years, 1899-1937………..17
Figure 3: Entry, exit and number of automobile producers……………………………18
Figure 4: Innovation and stage of development………………………………..............29
Figure 5: The technology cycle…………………………………………………..….....32
Figure 6: Roles and Relationships in the Telecom Operator Ecosystem…………........43
Figure 7: Change in Ecosystem Structure……………………………………………...47
Figure 8: Number of mobile and fixed data/internet access subscriptions in Ecuador,
2001-2013………………………………………………………………………………67
Figure 9: Number of subscribers of mobile voice service in Ecuador, 2009-2014…….68
Figure 10: Internet users by type of technology access in Ecuador, 2006-2010……….69
Figure 11: Flat fees of different data rate plans of the telecom operator CNT EP, 2006-
2012…………………………………………………………………………………….70
Figure 12: Smartphones market penetration in Ecuador, 2011-2013…………….…….71
Figure 13: Usage of social networks in Ecuador, 2011-2013…………………………..73
Figure 14: Tariffs evolution of fixed to mobile voice service in Ecuador, 2006-2014
(privately owned operators)…………………………………………………………….74
Figure 15: Tariffs evolution of fixed to mobile voice service in Ecuador, 2006-2014
(state-owned operators)………………………………………………………………...74
Figure 16: Tariffs evolution of mobile voice service in Ecuador, 2006-2013………….75
Figure 17: Tariffs evolution of fixed telephony (average) in Ecuador, 1998-2014…….76
Figure 18: Overall Telecom, Media and Technology TMT revenue growth in Ecuador,
2010-2013………………………………………………………………………………80
Figure 19: Overall Telecom, Media and Technology TMT revenue growth Worldwide.
2009-2013………………………………………………………………………………81
Figure 20: Operating margin of the TMT industry sectors in Ecuador, 2010-2013……82
Figure 21: Market concentration of the four largest firms in the different TMT industry
sectors in Ecuador, 2010-2013…………………………………………………………83
Figure 22: Firms’ population for the different TMT industry sectors in Ecuador, 2000-
2012…………………………………………………………………………………….84
Figure 23: Evolution of Internet Service Providers population in Ecuador, 1998-
2013…………………………………………………………………………………….85
Figure 24: Revenue of different telecom services in the telecom market in Ecuador,
2010-2013………………………………………………………………………………87
Figure 25: Number of active mobile data subscribers in Ecuador, 2009-2013………...88
Figure 26: Market concentration in the pay TV segment in Ecuador, 2010-2013……..89
Figure 27: Market concentration in the fixed Internet access segment in Ecuador, 2010-
2013…………………………………………………………………………………….90
Figure 28: CAPEX investments of the major telecom operators in Ecuador, 2010-
2013…………………………………………………………………………………….91
Table 1: Firms with meaningful market share in each TMT industry sector in Ecuador
and Worldwide…………………………………………………………………………46
Table 2: Development benchmark in the TMT industry in Ecuador with respect to the
World…………………………………………………………………………………..66
Table 3: CAGR and absolute revenue growth in Ecuador and Worldwide, 2010-
2013……………………………………………………………………………………78
Table 4: Growth rate and absolute growth in the telecom industry in Ecuador, 2010-
2013……………………………………………………………………………………87
1
1. INTRODUCTION
1.1 Background
Despite the history of telecommunications can date back since the use of smoke signals
and drums, we can assume that the first engineered telecommunications system was the
semaphore system. Certainly these systems before were not scalable for their limited
use and cost, thus we can consider the invention of the electric telegraph in Europe
during the first decade of nineteenth century as the beginning of a series of
technological advancements that have transformed people’s lives (Huurdeman, 2003, pp.
14-24).
It was not until the mid of the nineteenth century that the use of the electric telegraph,
improved to print the transmitted message, spanned over North America. In the late
1870s the new invention for voice telecommunications, the telephone, patented by
Alexander Graham Bell, was rapidly deployed in both sides of the Atlantic with
telephone exchanges deployed in every major city in the United States during the first
decade since its invention (Huurdeman, 2003, pp. 48-195).
Other important technological advancements constitute the transmission of audio and
video over the wireless medium by means of electromagnetic waves which happened
during the first and third decade of the twentieth century respectively. These
technological advancements gave rise to the radio and television broadcast systems.
With the widespread and popular telephone systems, and the introduction of radio and
television broadcast systems, the next technological improvements were focused to cope
with service coverage during the next decades until around the mid-twentieth century.
Microwave links for instance allowed extending the coverage of these systems for long
distances and remote areas. Moreover, differentiated services such as paid television
service provisioned over coaxial cable, offering a wide variety of specialized channels
including sports, movies, music, children, etc., became a strong market practice.
Nonetheless, with all these advancements in place, transatlantic telecommunications
constituted the big challenge. Transatlantic commercial telephone service was only
possible around 1930s using radio transmission systems which had a limited capacity
2
until the first transatlantic cable was completed by 1956, which trebled the capacity of
transatlantic communications (The Telecommunications History Group, 2014). The next
important technological advancement for long-distance telecommunications was the
launch of satellites to the earth orbit around 1960s, which in principle improved the
reach and coverage of terrestrial antennas. Taking advantage of these characteristics
before, satellites served as relay links for long-distance intercontinental telephone
service. After some adaptations satellites also served to provide television, Internet
access and mobile telephone services.
Now that the Internet and mobile communications have been mentioned, it can be
certainly acknowledged that these inventions transformed people’s lives. On one hand,
mobile communications were developed in 1980s as a solution for mobility over wide
areas and internationally. Mobile communications represented a new paradigm that
consisted in communications from anywhere at any time. Mobile communications
started as a means of voice communication but today can provide all types of
telecommunications services over the radio cellular system including telephone,
television and Internet (Huurdeman, 2003, pp. 519-540).
On the other hand, around 1970s in the United States the Internet started as a computer
network project named ARPANET that allowed digital computer-based terminals to
connect remotely and transfer data using the Internet Protocol IP, and today has become
the most powerful medium of communication and information. Before the start of the
Internet, the commercial telecommunication systems were primarily analog, used
dedicated circuit-switched channels to establish connections and offered primarily one-
way communications and limited data-based services. Since about 1990s, several data-
based services available worldwide are provided with the Internet, including file transfer,
email service, and all web-based applications. Taking advantage of the digitalization of
communication devices, thanks to the wide development of transistor-based electronics,
the Internet employed a totally new logic of switching technology known as packet-
switching, which allows using and sharing network resources more efficiently than
circuit-switching technologies.
3
1.1.1 Challenges of next-generation telecommunications
The evolution of the telecommunications industry have provoked certain situations,
including a vast data-intensive services and applications available on the Internet, the
demand of high-definition television and multimedia services, the existence of various
telecommunication systems and technologies and so on, which have required to upgrade
the legacy telecommunications networks to the next-generation networks.
Acknowledging these issues before, next-generation networks are primarily meant to
provide solutions for technology convergence and quality of services (Hacklin et al.,
2009). With respect to convergence of technologies the natural evolution clearly seems
to be the convergence of telecommunication technologies to All-IP technology, that is,
the convergence of all types of telecommunication networks to the Internet Protocol
(Talukder et al., 2014). With respect to the quality of services, the main challenge of the
telecommunication industry is to cope with the industry technical bottleneck such as the
limited user-to-network access speed (Flournoy, 2004).
The access speed has been the industry bottleneck since the beginning of the Internet
and mobile communications. In the beginning, the access to the Internet was provided
over the twisted pair telephone line, a narrowband technology known as Integrated
Services Digital Network ISDN, which resulted enough to provide added value services
to the conventional telephone service, such as PBX-like services, but slow to access to
the Internet. Soon the so called broadband technologies like Digital Subscriber Line
DSL technologies substituted the ISDN technology for accessing to the Internet, which
reached much higher access speeds over the same twisted pair telephone line that are
still used nowadays. Internet access over coaxial cable networks has been very popular
as well thanks to its good access speeds comparable or higher than DSL technologies.
However, DSL and cable modem technologies are lagging behind the ever increasing
access speeds required by fixed line subscribers, and the spread of Fiber-To-The-Home
FTTH technologies has started in the last years. FTTH technologies constitute the main
part of fixed-line next-generation networks and are not based on transmission of
electrical signals but on conveying information through optical signals propagating over
a fiber made of glass that can reach unprecedented access speeds (Corning, 2005).
4
With respect to mobile communications, the second generation 2G mobile networks
were not anymore analog as the first generation 1G mobile networks and therefore
achieved better Internet access speed thanks to the higher resolution of digital
transmissions against environmental interference and noise. The third generation 3G
mobile networks offer an improved access speed thanks to the use of a more efficient
access technique and an extended wireless spectrum band. However, the data rates
achieved by the third generation 3G mobile networks are not enough to cope with the
quality demands of data-intensive and time-sensitive network services and applications
like peer-to-peer file sharing, cloud computing, teleworking, high-definition TV, video
on demand, multiplayer gaming, and some others. In this sense, next-generation mobile
networks, that is, the fourth generation 4G mobile networks, have been developed to
support these services and applications before while supporting mobility (Rummey,
2008).
One of the most important characteristics of next-generation networks is that they have
the potential to cope with the technical bottleneck of the telecom industry, such as the
limited access speed, at a lower total cost of ownership than previous network
technologies. Next-generation networks enable the convergence of various transport
network technologies into one packet-based high-speed network technology with
differentiated quality of service to support high-quality triple play service and to offer
unrestricted access by users to different online service providers. This before has
important implications at different levels including telecom operators, network users,
the information society and the knowledge economy.
Telecom operators can attain higher value of existing customers and increase the rate of
growth of network users by offering appealing products and high-quality services at
reasonable prices. Next-generation networks enable the convergence of triple play
service including telephony, high-definition television and broadband Internet into a
single pipe, that is, a single unified competitive telecom network ready to deliver high-
quality triple play service at a lower total cost of ownership than previous network
technologies. In the same way, network users are technically-wise unlimitedly
empowered to become the main source of innovation, creating their own entertainment,
enhancing the community interaction, using multimedia communications, getting
informed and sharing files, learning and carrying out person-to person commerce and of
5
course enjoy conventional network services delivered with high quality and improved
user experience.
On the other hand, the information society and the knowledge economy can experience
fast development as a result of an increment of the network users that become part of
them. Next-generation networks technology become strategic for policy makers and
society planners in order to pursue their policies and plans effectively and to achieve the
desirable environment for the society. Next-generation technologies are shaping the
global economy and society, they give rise to new forms of education and bring new
opportunities of interaction that can improve lives’ standards; however, a clear
understanding of how next-generations networks might shape the global environment in
the next decade is fundamental for governments to articulate policies and plans with
desirable outcomes (Manyika et al., 2013).
1.1.2 Contextualizing development in Ecuador
Ecuador is located in South America and is crossed by the Equator, belonging in this
way to the Latin American and Caribbean economic sector. Ecuador is categorized
under the upper middle income countries according to the World Bank with Gross
Domestic Product GDP of 90,02 USD billions in the year 2013 and a population of
15,74 millions of people living in Ecuador by 2013 (World Bank - Ecuador Home,
2014). However, Ecuador is currently below the region’s average and the upper middle
income countries’ average in terms of Gross National Income GNI per capita.
Based on the data available in the web portal of the World Bank (World Bank - Ecuador
Home, 2014), Ecuador has grown 0,78 points faster than the region’s average from year
2000 until year 2009 with positive average compound annual growth of 3,8%; and it has
grown on average about 1,44 points faster than the region year after year since 2011
until 2013 with positive average annual growth of 5,22%, except in the year 2010 in
which it grew 0,34 points below the region’s average but with positive annual growth of
3,5%. Furthermore, according to the World Bank, it has been forecasted that Ecuador
will grow 1,08 points faster than the region’s average from year 2014 until year 2016
with a positive average annual growth of 4,53%.

6
It should be mentioned that the global financial crisis that affected the region in the year
2009 did not contract the Ecuadorian economy but it decelerated abruptly the economic
growth almost to cero. However, the Ecuadorian economy performed better in light if
the global crisis than the other developing countries in the region, which could not avoid
the contraction of their economies on average (World Bank - Ecuador Home, 2014).
Despite this before, Ecuador had a slower recovery from the crisis than the other
developing countries of the region which caused that the year 2010 was the only one in
which Ecuador grew below the region’s average as mentioned before.
Additionally, as it can be noticed, the average annual growth from the year 2014 until
the year 2016 of the Ecuadorian economy is expected to decelerate with respect to the
years from 2010 to 2013, since the financing of emblematic ongoing hydroelectric and
energy projects, that will make Ecuador self-sustaining in terms of electricity, are
causing a significant deficit in the State budget (El Telegrafo, 2014). At the moment the
only option seems to be contracting more loans to tackle this situation until these
emblematic projects start to supply energy in 2016 as planned (El Telegrafo, 2014),
which will in turn save important monetary resources to refinance the State budget.
In this sense, the public budget is particularly important for the Ecuadorian economy
since the major source of growth in the last years has been the increase of the public
expense and investment that has raised from 21% of the GDP in the year 2006 to 44%
in the year 2013 (World Bank - Ecuador Home, 2014). This before has been primarily
possible thanks to the more efficient tax collection, the renegotiation of the oil contracts
with more favorable conditions for Ecuador, and the repurchase of State debt at low
price. However, despite these adjustments to the fiscal policy have given good
economic results for Ecuador, reducing poverty, measured by income, from 37,6% in
2006 to 24,5% by June 2014 (World Bank - Ecuador Home, 2014), the main objective
of the actual government, such as to continue both the stable growth and inequality
reduction, is threaten by the volatility of international oil prices and the short
amortization of loans.
In order to tackle these treats before, the government urges to capitalize the benefits of
the public investments in energy, infrastructure and competitiveness in general. For this
aim the government is promoting the change of the production matrix to evolve from an
7
extractive economy to an industrialized and value added economy. However, to realize
this before, apart from better infrastructure and more competitive production factors, the
country requires trained human capital and the commitment of the private sector which
seems to be the main obstacles for this intent. In light of this, the Ecuadorian economy
will depend longer from the oil extraction of new reserves and also the extraction of
minerals until the change of the productive matrix becomes true.
On the other hand, with respect to the ICT developments in Ecuador, the World
Economic Forum WEF in its “Global Information Technology Report 2014” (Bilbao-
Osorio et al., 2014) shows that Ecuador is among the ten countries that is bridging the
digital divide much faster than others, but its current ICT development and impact is
below the average yet. However, Ecuador scaled 9 positions in the Network Readiness
Ranking from the 2013 year report to the 2014, with a net score increment of 0,27
points, which means that Ecuador will be in the next year about the average in terms of
ICT development and impact if the tendency continues. With respect to the Latin
American and Caribbean region, Ecuador and Peru seem to have started the journey to
achieve the development stage of the LATAM countries at the forefront of ICT
development in the region such as Chile, Panama and Costa Rica.
For this aim before Ecuador requires to tackle main problems in the current
environment that are not letting the sector to unleash its full potential. In this sense,
according to the “Global Information Technology Report 2014” one of the main issues
in the Ecuadorian environment is the complexity and slowness to start a business and to
enforce a contract, as well as the lack of independence and efficiency of the judicial and
legal systems. Other important aspects to improve are the mobile coverage, the
affordability of telecom services, the usage by individuals and the economic impact of
ICT. On the other hand, Ecuador should continue emphasizing in aspects where it is at
the forefront in the region such as the government procurement of advanced technology,
the availability of venture capital, the international Internet bandwidth, the business
innovation capacity, the government ICT usage in general and the social impacts.
In addition to this before, Ecuador should continue improving the efficiency and quality
of its education system to achieve higher level of literacy and more solid knowledge in
8
math and sciences, which will prepare the ground to fully integrate the Ecuadorians to
the international knowledge-based society.
1.2 Approach and purpose of the study
The purpose of this case study is to analyze the implications at the telecom industry and
business levels of the widespread of mainstream products and services in the TMT
market in the case of Ecuador, and benchmark it with the global context. In the
literature there are various studies in the context of Information and Communications
Technology (ICT) convergence and next-generation networks technologies in which the
authors have addressed the subject from both the technological point of view (e.g.
Hacklin et al., 2009; IPv6.com, 2008; IMS NGN Forum, 2008) and the business point of
view (e.g. Kowalke, 2014; Yovanof & Hazapis, 2008). In an effort to provide a
complementary point of view of these previous studies, in this thesis I present a revision
of the telecom ecosystem, as part of the TMT industry, in a developing country such as
Ecuador, assessing the impulse injected by the widespread of mainstream products and
services in the market. The research question that will be addressed in the study is the
following:
How the widespread of mainstream products and services in the TMT market are
and might continue shaping the development of the telecom industry in Ecuador
in the next decade and how does it compare to the global environment?
In order to address this question before, in this thesis I first present the theories about
organizational development and change in the industry in order to acquire a wide
perspective of the forces that can be driving the industry development in the case of the
telecom sector. Furthermore I provide an explanation of the roles and relationships in
the telecom ecosystem as part of the TMT industry as well as the customer and product
portfolio specifies of telecom operators in order to better understand the development
forces arising from the customer side. Finally I present the findings of the quantitative
study of the TMT industry in Ecuador and put it in perspective with the global context
by analyzing how the widespread of mainstream products and services in the TMT
market are and might continue shaping the telecom industry in Ecuador.
9
1.3 Limitations
In this study I do not analyze the technical issues and enablers of the underlying
technologies, instead I focus on analyzing and evaluating the development of the
telecom ecosystem as part of the TMT industry. On the other hand, this study is
centered in the telecom industry in Ecuador, which requires focusing our view on the
business, economic and social specificities of developing countries such as Ecuador:
however, I compare the findings with the global environment based on other third party
studies and data available in reports and summits.
One additional limitation of this study is given by its research approach that is, it basis
its analysis on quantitative data available from official and specialized sources, but the
final discussion and conclusion with respect to the future of the telecom industry in
Ecuador is limited to my own synthesis of the findings and not qualitatively contrasted
with the opinion of local experts or managers that could improve the overall perception.
1.4 Definitions
Industry evolution relates to the changes, modifications, adjustments and advancements
that have shaped the industry for the production of goods and services since about the
industrial revolution.
Telecom ecosystem relates to the actors, roles and their relationships that shape and
sustain the telecommunications industry.
Telecom, Media and Technology TMT industry comprises all the industry sectors
involved in the service and satisfaction of telecommunications, information, media and
entertainment needs by using technological resources based on electronics.
Information and Communication Technologies ICT constitute computer-based
technologies that enable the generation, processing, storage, and access to information
together with the technologies that enable conveying multimedia information and all
types of information formats over telecommunications networks.
Information society refers to a society that carries out economic, educational, social and
cultural activities in great proportion by means of ICT, and uses information as the main
object for interaction.
10
Knowledge economy refers to an economy where the know-how is the fundamental
resource for generating value and attaining competitive advantage, and uses in great
proportion ICT to create, spread and apply the knowledge.
Disruptive technologies constitute technological innovations that shake the industry,
impact in the market significantly and may also influence people’s lives.
Broadband relates to the technologies that enable accessing to the telecommunications
networks with speeds that satisfy the quality demands of the data-intensive and/or time-
sensitive services and applications in the network.
“Next-generation network is a packet-based network able to provide services including
Telecommunication Services and able to make use of multiple broadband, QoS-enabled
transport technologies and in which service-related functions are independent from
underlying transport-related technologies. It offers unrestricted access by users to
different service providers.” (International Telecommunication Union, 2004).
Triple play service is a marketing term employed to promote the provision of voice,
data and video services by one provider.
1.5 Structure of the study
The present study is structured in six chapters. The first chapter sets the ground for this
thesis, the second and third chapters provide the theoretical framework based on the
literature review and my own understanding of the topic, whereas in the last three
chapters I present the methodology, develop the case study, and provide the discussion
and conclusion respectively. In chapter one I briefly revise the history of the telecom
industry and provide insights on the present and future challenges of next-generation
telecommunications, as well as I describe the current development scenario in Ecuador.
The literature review is then carried out in the following two chapters. In chapter two I
discuss the four predominant approaches that explain organizational development and
change such as organizational ecology, industry life cycle, strategic management, and
innovation and technology. This analysis contributes to understand how research has
been focused about this topic, which in turn will provide a more systematic insight
about the rationales that govern the industrial development and change. In chapter three

11
I will describe and explain the roles and relationships in the telecom ecosystem as part
of the TMT industry, including the business models and the customer profiles in order
to gain a clear view of the main factors that can drive the evolution of the telecom
industry.
In chapters four and five I present the methodology and develop the case study
respectively. In chapter four, I described the research methods employed in this thesis
and provide additional information about the case selection, data collection and its
analysis. In chapter five I start to develop the case study by analyzing the findings while
reflecting and connecting them with the theoretical framework presented in the
literature review and the global context. Finally, in chapter six I conclude and provide a
general vision of the tendencies of the telecom industry in Ecuador.
12
2. ORGANIZATIONAL DEVELOPMENT AND CHANGE
Organizations are social entities that interplay with other organizations and social actors,
and therefore are subject to the underlying forces of social change that operate at both
the individual and collective levels, where the events causing the changes trace a
sequence or cycle of development stages. In this sense, there is no unique theory about
the rationales and sequence or cycle of development stages that explain organizational
development and change; instead, the theories spectrum addressing this matter is
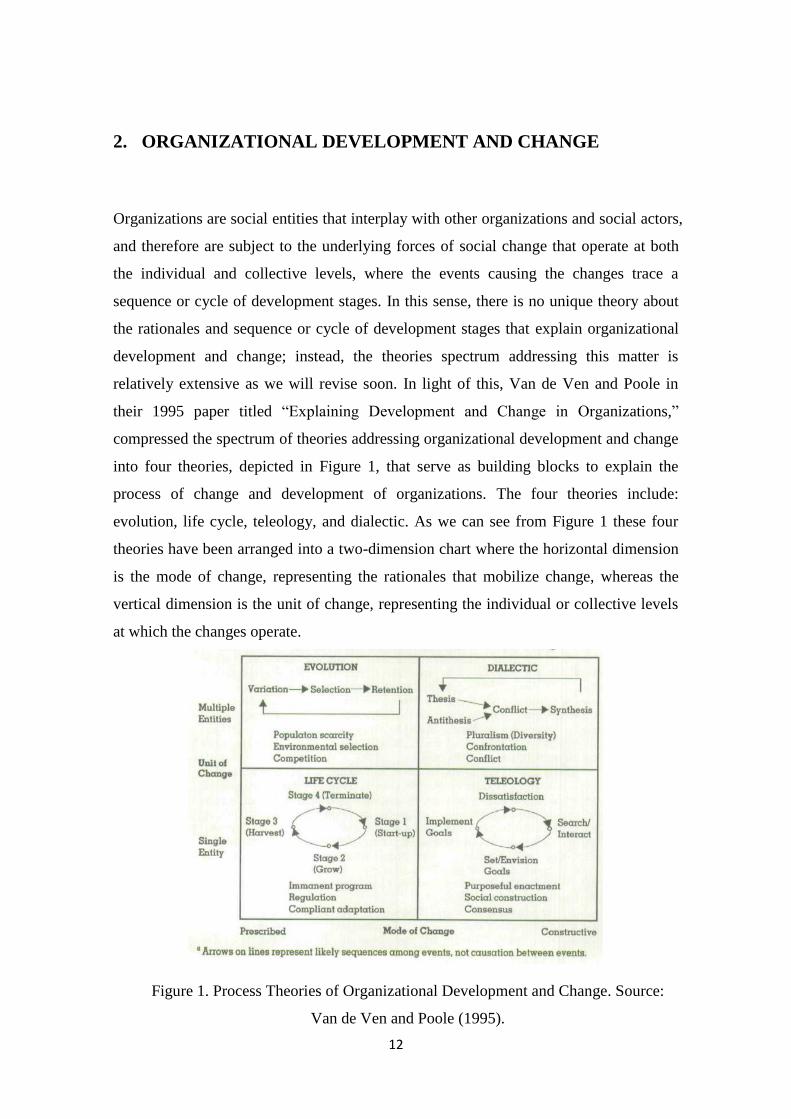
relatively extensive as we will revise soon. In light of this, Van de Ven and Poole in
their 1995 paper titled “Explaining Development and Change in Organizations,”
compressed the spectrum of theories addressing organizational development and change
into four theories, depicted in Figure 1, that serve as building blocks to explain the
process of change and development of organizations. The four theories include:
evolution, life cycle, teleology, and dialectic. As we can see from Figure 1 these four
theories have been arranged into a two-dimension chart where the horizontal dimension
is the mode of change, representing the rationales that mobilize change, whereas the
vertical dimension is the unit of change, representing the individual or collective levels
at which the changes operate.
Figure 1. Process Theories of Organizational Development and Change. Source:
Van de Ven and Poole (1995).
13
This first approach shown in Figure 1, the evolutionary approach, explains
organizational development and change from an environmental perspective where
changes operate at the collective level and are driven by competition pressures, and the
organizational development process follows a repetitive cycle of variation, selection and
retention that seems to be naturally prescribed. In this sense, the organizational ecology
approach is the most prominent field of study in this area (Hall, 1982; McKelvey &
Aldrich, 1983; Hannan & Freeman, 1989). The organizational ecology approach relies
on the fundamentals of ecological research to link the organizational theories with the
practice, allowing in this way higher stringency in terms of basic research criteria such
as classifiability, generalizability, and predictability, which are hardly achieved under
non-ecological organizational research approaches (McKelvey & Aldrich, 1983).
The second approach shown in Figure 1, the life cycle approach, seems to follow a
prescribed mode of change not controlled by firms, similar to the case of the
evolutionary approach. The life cycle approach considers certain imminent sequential
stages of development, where firms and/or industries first grow and finally decay
(Anderson & Zeithaml, 1984; Jovanovic & MacDonald, 1994; Klepper, 1997). It should
be noted that the life cycle approach helps to explain the organizational development
and change at both the industry and firm level, and it is not necessary linked to the
individual level as Figure 1 suggests. In this sense, the life cycle approach is especially
applied for the analysis of the industry from a collective perspective.
Under the third approach depicted in Figure 1, the teleological theory, it is sustained that
the intentions, strategies and plans of the firms to compete and grow govern the
organizational development process. In this sense, the changes are driven by the firms’
constructive mindset and purposes about the present and future and not necessary by
prescribed patterns, therefore, the teleological approach assumes that the organizational
changes are strongly driven by the decisions made at the firm level. Under this view, the
strategic management approach is the most prominent field of study in this area, which
today seeks to study the fundamentals for sustaining competitive advantage in a market-
based economy. Nonetheless, it should be noted that the notions about business strategy
started since around 1950s and 1960s with important exponents who contributed with
the grounds for what we understand as strategic management today (Drucker, 1954;
Selznick, 1957; Levitt, 1960; Ansoff, 1965; Henderson, 1968; Andrews, 1971; Chandler,
14
1977), and its predominant popularity has continue shaping today’s practice with the
contributions of other more contemporary exponents (Hofer, 1975; Hambrick et al.,
1982; Hambrick & Lei, 1985; Anderson & Zeithaml, 1984; Anderson & Tushman, 1990;
Porter, 1985, 1996, 2008; Hill, 1988; Kaplan & Norton, 1996; Kim & Mauborgne,
2004).
Under the fourth approach depicted in Figure 1, the dialectic theory, the organizational
development process is governed by the confrontation of ideas, originated in the
diversity of thoughts. Under this view, the innovation and technology approach is the
most predominant field of study in this area, where firms compete in order to gain the
market preference in the products designs, leading to a dialectical confrontation of
varied firms’ propositions synthetized in the emergence of a dominant design until a
new proposition confronts and breaks the existing technological path (Utterback &
Abernathy, 1975; Katz & Shapiro, 1985, 1986; Farrell & Saloner, 1985; Anderson &
Tushman, 1990; Utterback & Suárez, 1995; Christensen et al., 1998; Koski &
Kretschmer, 2006). Therefore, under the innovation and technology view, the
organizational changes occur at the industry-wide collective level and are driven by the
constructive purpose of innovation and technological progress.
Considering that in this thesis I attempt to explain the development of the telecom sector
in Ecuador as an effect of the technological evolution, relying on market analysis more
than both an ecological analysis and an analysis of the firm strategies, in the next
sections I do not study the fields of organizational ecology and strategic management,
instead, I concentrate on the study of the other two areas such as the life cycle approach
and the innovation and technology approach, in order to connect the theoretical
framework with the analysis of the changes in the telecom sector in Ecuador from a
technological evolution and market perspective.
2.1 Industry life cycle
Based on the observations of sales’ volumes of industries, many scholars (Anderson &
Zeithaml, 1984; Jovanovic & MacDonald, 1994; Klepper, 1997) have acknowledged the
fact that the product life cycle PLC, widely used for product marketing purposes,
provides an appropriate perspective to describe the evolution of the majority of
industries. In this sense, life cycles not only help to determine the natural progress since
15
its birth until its death of something that is biologically alive, like humans and organism
in general, but they also help to describe the evolution of existing things created by
humans, like products and their industries. In light of this powerful information that the
industry life cycle provides, many firms employ it as a contingency variable to consider
the expected industry wide performance when developing their strategic plans.
The change of sales volume throughout the evolution of an industry commonly depicts
four distinctive stages known as the introduction, the growth, the maturity, and the
decline stages. Through these stages, the sales volume is low in the beginning but grows
rapidly until it stabilizes and suddenly declines. Nonetheless, some firms and even
industries renew or extend the product life by finding new uses for it, until a new
technology or product substitutes it and a new life cycle commences. Similarly to the
sales curve, the profits tend to grow throughout the life cycle, even though the prices
tend to decrease and then stabilize, thanks to sales growth and the reduction of unit costs
through experience curves (Henderson, 1968) and outsourcing of activities. However, in
the beginning of the industry life cycle, the high expectations of the many entrants and
the low sales generate zero profits or even temporary losses.
In the Introduction stage there are few or even a single firm offering a new product that
provides an innovative unique set of attributes like for instance use, technology,
application, design, performance, and others. The introduction stage can be analogically
seen as the embryonic and infancy phases of a human, in which the firms first explore
the market to build a trial version of the new product and then continue progressively
tuning it based on the market feedback. According to Hofer (1975), during this stage
firms strategies are primarily meant to satisfy the buyer experience of the product and to
create an awareness and demand of the product through marketing, especially through
advertisement. Some firms use a focused marketing strategy to first attract a sort of
niche market that are people who like trying out innovations, which are known as “early
adopters.”
In the introduction stage, the production is commonly done in job workshops at low
scale, with a low degree of mechanization of processes, experimenting the production
processes and methods. However, in this stage is where first movers start to build
competitive advantages by developing strategic relationships with its supply chain. In

16
this sense, it has been evidenced by Menzel and Fornahl (2009) and by Audretsch and
Feldman (1996) that firms tend to locate within geographical clusters to be in close
proximity of other firms that provide knowledge and technological support during the
emergence of a new industry, this is especially the case of technology-based industries
such as those domiciled in Silicon Valley in North America and also the ones located in
Europe within the Great Yellow Banana and the Small Nordic Potato described by
Koski et al. (2002).
As the name suggests, in the Growth stage the output rises at a good pace as the result
of the attraction of a mainstream of new consumers to the industry accompanied by a
decrease in sales prices. The product design undergoes a phase of stabilization with less
product innovations, and the firms start to compete for the market share instead, looking
to pursue strategies to position in the market, with some degree of market segmentation,
focusing further on the satisfaction of the customer expectations. The production
processes are scaled through the use of specialized machinery to cope with the
increasing demand, and the supply chains become crucial for the growth of the industry.
In the Maturity stage the output growth slows and then stabilizes. In this stage firms
tend to reinforce their strategies to position in the market sustainably, refining their
management, increasing productivity in labor, improving efficiency in product
marketing and distribution, and focusing in processes innovation with the main goal of
reducing the overall unit cost and maintaining profit margins. In this stage the market
share settles down and the dominant firms compete strongly in further differentiation of
their products and support to consumers, seeking for the best cost-value relationship of
the product for consumers.
As the name suggests, in the Decline stage the industry output decreases as well as
profits, however, firms tend to find new uses for the products to extend their life,
attaining further profits from them. This decline can be attributed to the reason that
buyers find substitutes or better products with architectural innovations that make
obsolete the actual one. In this stage the overall profit of the industry is widely reduced
and the absorption of competing firms through mergers and acquisitions becomes an
options for firms looking to extend the life cycle of a product. However, the decay stage
17
may also represent a stage of commoditization of the industry, where firms find difficult
to differentiate their products, offering them at a low or minimum profit margin.
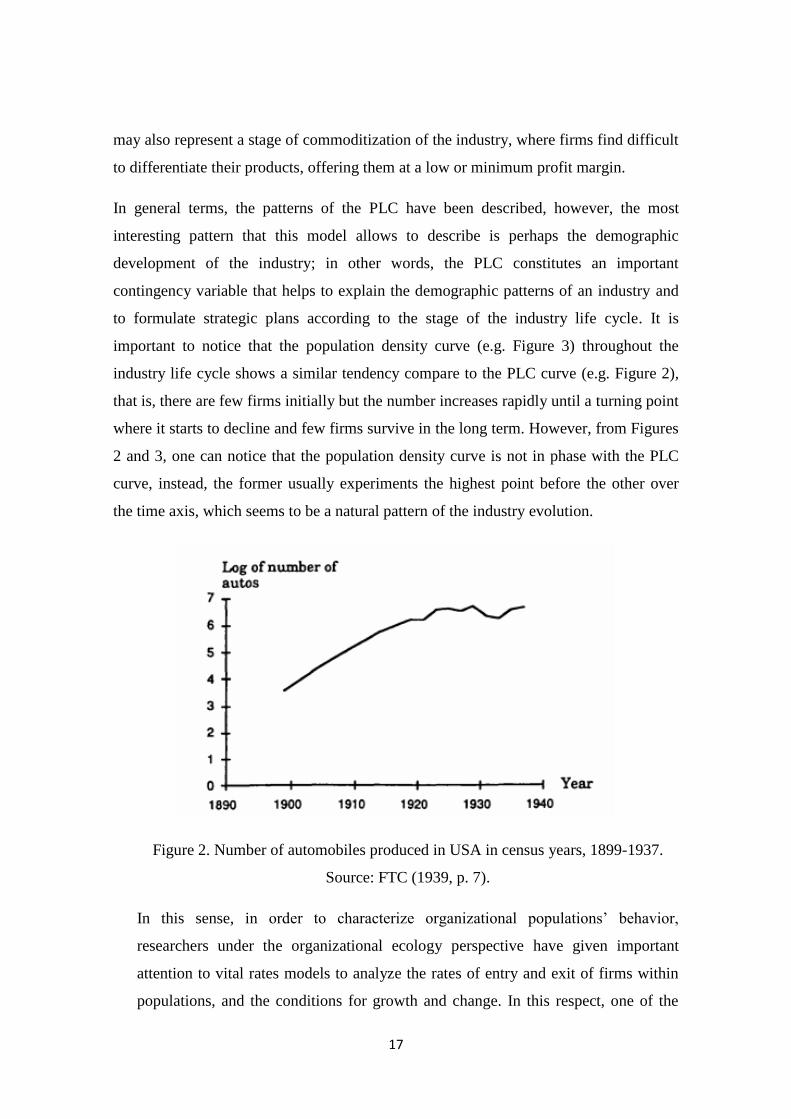
In general terms, the patterns of the PLC have been described, however, the most
interesting pattern that this model allows to describe is perhaps the demographic
development of the industry; in other words, the PLC constitutes an important
contingency variable that helps to explain the demographic patterns of an industry and
to formulate strategic plans according to the stage of the industry life cycle. It is
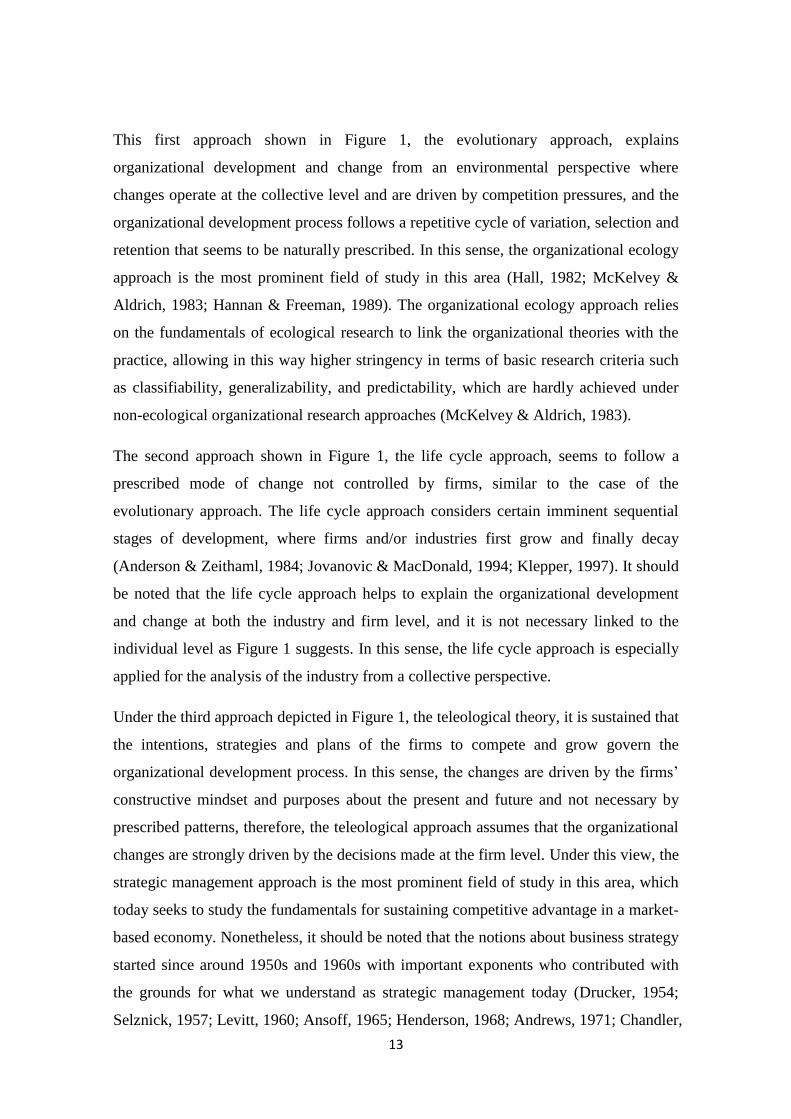
important to notice that the population density curve (e.g. Figure 3) throughout the
industry life cycle shows a similar tendency compare to the PLC curve (e.g. Figure 2),
that is, there are few firms initially but the number increases rapidly until a turning point
where it starts to decline and few firms survive in the long term. However, from Figures
2 and 3, one can notice that the population density curve is not in phase with the PLC
curve, instead, the former usually experiments the highest point before the other over
the time axis, which seems to be a natural pattern of the industry evolution.
Figure 2. Number of automobiles produced in USA in census years, 1899-1937.
Source: FTC (1939, p. 7).
In this sense, in order to characterize organizational populations’ behavior,
researchers under the organizational ecology perspective have given important
attention to vital rates models to analyze the rates of entry and exit of firms within
populations, and the conditions for growth and change. In this respect, one of the
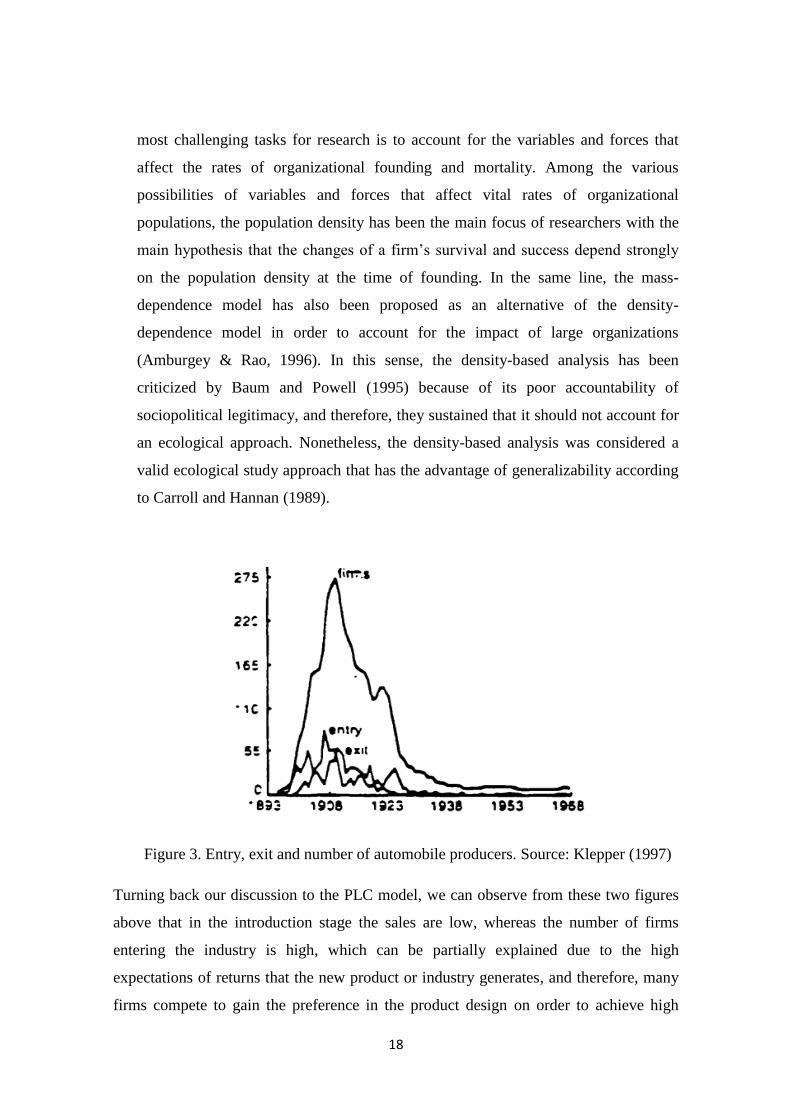
18
most challenging tasks for research is to account for the variables and forces that
affect the rates of organizational founding and mortality. Among the various
possibilities of variables and forces that affect vital rates of organizational
populations, the population density has been the main focus of researchers with the
main hypothesis that the changes of a firm’s survival and success depend strongly
on the population density at the time of founding. In the same line, the mass-
dependence model has also been proposed as an alternative of the density-
dependence model in order to account for the impact of large organizations
(Amburgey & Rao, 1996). In this sense, the density-based analysis has been
criticized by Baum and Powell (1995) because of its poor accountability of
sociopolitical legitimacy, and therefore, they sustained that it should not account for
an ecological approach. Nonetheless, the density-based analysis was considered a
valid ecological study approach that has the advantage of generalizability according
to Carroll and Hannan (1989).
Figure 3. Entry, exit and number of automobile producers. Source: Klepper (1997)
Turning back our discussion to the PLC model, we can observe from these two figures
above that in the introduction stage the sales are low, whereas the number of firms
entering the industry is high, which can be partially explained due to the high
expectations of returns that the new product or industry generates, and therefore, many
firms compete to gain the preference in the product design on order to achieve high
19
sales and returns in the future. One can think that the actual challenges that the industry
will face and the capacity required to cope with them are not well dimensioned in the
beginning of an industry life cycle, and therefore many firms take the challenge at that
point. Another important reason for the rapid growth of the industry population is that
product innovations tend to be on a trial-and-error basis, and thus, large firms with R&D
departments do not have a clear advantage.
In this sense, despite that the R&D capacity does not represent a clear advantage
initially, during the growth stage it certainly does since the product innovations reach a
high level of technique, especially in technology-based industries, requiring specialized
R&D to cope with the fast pace of development and clear know-how to cope with the
scaling production. These facts before together with the raising competition that firms
face from an overpopulated industry raises the entry barriers and provokes that many
firms incapable to cope with the challenges exit the industry, especially during the
slowdown of the overall industry profits, leading to the so called shakeout, that is, the
number of firms declines below 70% of the peak number and it does not recovered to
over 90% of the peak according to Klepper and Miller (1995).
During the maturity stage, after the shakeout, the market tends to settle down and the
number of firms stabilizes. The competition for retaining customers is high and usually
focuses on price. In this situation newcomers find it very difficult to take a stake of the
non-growing and profit-compressing market; however, few firms take the challenge,
especially when the knowledge gets codified since the R&D barriers are lowered.
Klepper (1997) noted that there is evidence that suggests that the firms that entered
earliest to the industry tend to be the ones that capture the greatest market share and
earn the greatest returns on investments.
2.1.1 Is the industry evolution captured by the product life cycle?
I think this question does not have a straight answer but instead it allows developing on
the hypothesis about the life cycle(s) that can capture the evolution of different types of
industries. This question is particularly important for business leaders in order to
understand today’s fast changing business environments, which makes it very important
in order to sustain a market position.
20
Klepper (1997) finds that some industries evolution show life cycles that are mostly
explained by the PLC, especially through their formative eras in which sales are low
initially and many firms enter the industry focusing their strategies in product
innovation and market creation, then the output grows rapidly and the entry barriers
become higher leading to a shakeout of producers which turns competition from product
innovation to process innovation, stabilizing the market. However, despite this model
actually describes the evolution of many industries during their formation and
development, after the number of firms stabilizes and the market share settles down,
some industries experience certain behaviors that are not described by the PLC.
Despite the PLC describes appropriately the evolution of many industries, it does not
seem to account for the impact of external environmental forces, such as the entrance of
foreign competitors, the international trade, the widespread of the know-how and
innovation worldwide, and the network economies. These forces can be observed in
some industries, especially through the prolonged maturity stage, as a sort of
turbulences with respect to the PLC causing a new impulse of innovations at the product
and process levels, the entrance and exit of firms, and the redistribution of the market
share.
For instance, in the case of the automobile industry in USA, in which the PLC has been
very popular for determining and describing appropriately the formative and
development patterns of the industry, the PLC does not capture the turbulences in the
industry that occurred after 1960s since the entry of foreign competitors to the market in
USA. Klepper (1997) notes that these turbulences were also observed for other products,
where similar to automobiles, market shares tended to stabilize in the long term, and
first movers took leadership of the markets until challenged by foreign firms.
These patterns not described by the PLC can be partially attributed to the fact that
incumbent firms are often victims of inertial pressures after surviving to shakeouts and
positioning in the market, since they tend to rely on their de facto standards, dominant
designs, and operational efficiencies in order to secure their market share and future
profits. However, this is not the case in fast changing business environments which
require continual product and process innovation in order to sustain competitive
advantage, even when the market seems stable. In light of this, some industries tend to
21
reach high degrees of specialization to cope with continual innovation and efficiency,
and therefore, as shown by Greer et. al. (1999), as an industry grows over time firms
find it profitable and strategic to outsource more activities to specialists.
In this sense, Klepper (1997) found that there are various industries with similar patterns
that depart from the PLC. He exemplifies some industries like the disposable diapers,
petrochemicals, zippers, ATMs, lasers, jets and others that even though their output
growth is similar to the PLC, they show evolution patterns very different with respect to
the PLC such as continual entry of new firms, adverted or reversed shakeouts, high
survival rates of late entrants, non-pronounced first-movers advantage, and eventual loss
of market share by leaders to domestic challengers.
According to Klepper (1997), these different behaviors that depart from the PLC take
place in industries that reach high degrees of specialization that can be grouped at three
industry wide levels such as the innovation of production methods, processes and
equipment, the innovation of products, and the submarket segments. The first two
groups of firms’ specialization are focused on innovation, which in turn has been
achieved thanks to the division of labor, letting technical specialists to carry out the
innovations of production and products while leaving the marketing/manufacturing
firms to take care of creating and supplying the demand. The third group of firms’
specialization is focused at the market level, which is achieved by exploiting the needs
of niche markets.
It can be observed that the specialization of firms within an industry provides alternative
paths for firms in order to become part of it, maybe by providing innovation-driven
services to the producers and traders of the final product or maybe by serving a market
segment with very specific needs. This can in turn create an industry with more
participation and opportunities for continual entry and aversion or reversion of
shakeouts, but without clear advantages to first movers and leaders since the industry
resources and key factors, like for instance innovation patents, are accessible to
challengers. It is clear then that there are some industries for which the PLC seems
irrelevant, but from my perspective, it seems that the natural PLC-like evolution of such
industries had been interfered by the strategic management of challengers that seek for
new modes of participation within an industry.
22
2.1.2 Investments over the industry life cycle
When we think on a business as an entity with the objective to supply goods and
services at a profit and increase the business value for the owners, we need to
acknowledge that this task requires efficient and prudent manage of the business
resources by managers. When it comes to managing financial resources certainly one of
the most challenging tasks for managers is to invest on new products or technologies
due to the high risk involved. In this sense, we have discussed before that the R&D
demands is one of the main facts that make firms to exit an industry and this can be
attributed to the high investments costs that it represents.
According to Kato (2009), the size of the firms affects the impact of R&D investments
in different ways. He sustains that large and resourceful firms reduce investment costs
and run innovation projects more efficiently thanks to the intangible assets they possess,
like the gained experience, know-how, reputation, market information and others. He
further develops a model that draws on the probabilities of firms’ survival in light of
capital investments for competence enhancing technologies, and finds that the major
proportion of firms exiting an industry are relatively small firms. However, for
investments on new technologies that can be competence destroying, the large firms
may be in disadvantage due to inertial pressures, and therefore, may totter and even exit
the industry. This suggests that small firms have a better opportunity to succeed in new
industries that do not enhance the competences of large ones, while large firms that
invest on innovations that enhance their competences are likely to succeed.
If we look at the PLC, we can identify a turning point in the level of investments such as
the emergence of the dominant design and the transition towards processes innovation.
According to Klepper (1997), when the innovations turns from product to processes, the
producers become more confident that investments in the production process will give
long term returns and will not become obsolete due to major product innovations. This
fact is determinant for producers that undergo on investments in capital intensive
methods of production that help to reduce the unit cost and to cope with the market
demand. On the other hand, investing in marketing is a constant in the PLC in order to
both get more customers and retain old ones. In the beginning, marketing is required to
create awareness and to communicate the benefits of the new product, and later on it is
23
important to attract the main stream of customers and retain them in the long term,
which makes marketing investments to be considerable throughout the PLC.
2.1.3 Life cycle as a contingency variable for strategic management
The contingency approach deserves special attention due to the contributions to the
strategic management field that it provides (Hambrick & Lei, 1985; Hofer, 1975;
Hambrick et al., 1982). The contingency approach obeys to the logic that the success
and suitability of different business strategies depend on certain dynamics of
competition, and such dynamics can be analyzed with certain degree of generalization.
In other words, this approach provides a trade-off between the extreme views such as
universal business strategies and situation-specific business strategies (Hambrick & Lei,
1985). The authors cited right before in their 1985 paper “Toward an Empirical
Prioritization of Contingency Variables for Business Strategy” noted that the
contingency approach requires hypothesizing on the significance of certain promising
and prominent contingency variables in the literature out of a wide range of possibilities
if we do not want to end in the situation-specific case. In this sense, one hypothesis of
Hambrick and Lei (1985) is that the most significant contingency variable is the stage of
the product life cycle, and another important hypothesis is that there are two classes of
the contingency variables, the primary ones that have the highest significance which
include the stage of the product life cycle, consumer versus industrial sector, product
differentiability, and technological change, and the secondary ones which include the
concentration rate of the industry, purchase frequency, industry imports, share
instability, demand instability and dollar importance to customer.
Hambrick and Lei (1985) analyzed the significance of individual contingency variables
in terms of their relationship between business performance and strategic attributes as a
simple measure of return on investment. The strategic attributes analyzed included
aspects of asset mix and utilization, cost efficiency, differentiation, and business scale
and scope. In this sense, they noted that the study does not provide a conclusion about
the relative significance of individual contingency variables on the field of strategy, but
some consideration can be drawn out of it like for instance that the three most
significant contingency variables are consumer versus industrial sector, purchase
frequency, and stage of the product life cycle, and the results showed that the purchase

24
frequency variable has apparently higher significance than the stage of the product life
cycle. They also suggested that researchers should not mix studies of consumer and
industrial sectors, and that strategists should consider the substantial chasm between
these two sectors. Technological change, dollar importance to customers, and product
differentiation seem to have medium significance, and the rest of variables including
demand instability and industry imports have low significance. Moreover, filtering
samples for strategic studies based on concentration rates of industries did not seem
relevant, and similarly, market share instability of the industry does not seem to be a
primary contingency variable when pursuing business strategies. However, they
indicated that all these appreciations should be confirmed with further research.
In the contingency approach, there is some degree of classification of contingency
variables in two groups such as environmental and non-environmental. Hambrick and
Lei (1985) noted that their study was limited to environmental variables considered as
the ones that the firms have low control and require to manage. On the other hand, non-
environmental variables have also deserved important attention in the contingency
approach like for instance market share, product quality, vertical integration, and brand
image; out of those market share appears as the most prominent one, which one, from
my own perspective, represents an environmental variable since the firms cannot
maintain control of it. Profit margins and return on investment have showed to have a
positive correlation with market share, and this later has showed to keep a net strong
influence in the business performance even with the consideration of other factors
related to profitability like for instance market growth, vertical integration, capital
intensity, and others (Buzzell & Wiersema, 1981).
A different perspective is that market share does not have an intrinsic value and should
not represent a business goal per se, instead, it works on average as a predictor of
business performance gained thanks to the success of the products, management, and
exogenous events (Rumelt & Wensley, 1981). In this respect, the paper (Hamermesh et
al., 1978) suggests that the market share alone does not represent a rule of thumb for
predicting business performance since many low share firms in different industries have
showed to outperform much larger competitors thanks to their appropriate business
strategies with clear products portfolio, price policy, customers management,
distribution channels, financing sources and so on. However, to understand better the
25
implications of the market share as a contingency variable, it should be analyzed
considering at least another significant contingency variable like for instance the stage
of the product life cycle. This work was performed by Hambrick et al. (1982) who
concluded that the business performance and strategic attributes showed by firms have
relationship with two predominant contingency variables such as the stage of the
product life cycle and the market share, which form a four cells matrix to classify firms
that differ from each other.
In practice, out the universe of contingency variables that managers could rely on to
assess their strategies, perhaps the stage of the product life cycle is the most popular.
Hofer (1975) developed a comprehensive theoretical profile of the implications of the
PLC in business strategy. As noted by Anderson and Zeithaml (1984), two important
Hofer’s propositions should be remarked:
1. "The most fundamental variable in determining an appropriate business strategy is the
stage of the product life cycle" (Hofer, 1975, p. 798).
2. "Major changes in business strategy are usually required during three stages of the
life cycle: introduction, maturity, and decline" (Hofer, 1975, p. 799).
Hofer’s thesis is supported by Anderson and Zeithaml, who provided a thorough
analysis of the strategic variables and performance drivers for firms at different stages
of the PLC in their 1984 paper “Stage of the Product Life Cycle, Business Strategy, and
Business Performance,” and as well as Hofer, suggested the use of this contingency
approach for strategy formulation and implementation. They suggested that there is no
unique set of strategies that can provide the winning formula, but the product life cycle
framework provides a contingency approach to formulate strategies according to the
evolution of the product and the industry. They found that the strategic attributes that
drive and determine business performance during each stage of the PLC vary, and that
those strategic attributes can be categorized in groups such as industry, product
competition, R&D, production and investment, efficiency, vertical integration, and
marketing.
The significance of different strategic attributes throughout the PLC can be evidenced
by analyzing few of them like for instance marketing and product competition. During
26
the introduction and growth stages marketing becomes crucial and requires important
investments for creating awareness of the product and demand, but during the maturity
stage it becomes more constant with respect to the revenues in order to retain customers.
Therefore, marketing investments represent a high cost in the introduction and growth
stages that can deteriorate the financial balance in this stage, but it can determine future
sales and performance. As another example we can take the case of innovation, where
firms tend to compete strongly on the characteristics and attributes of the products
during the growth stage, trying to gain the market preference by dominating the product
design. In this sense, the emergence of a dominant design may lead to an industry
shakeout that becomes determinant for the survival of firms. After the shakeout, the
surviving firms turn their innovation focus to process innovations looking mainly at
improving operational efficiency during the maturity and decline stages in order to
achieve good financial performance.
2.2 Innovation and technology
The expected value of a new product technology certainly plays an important role in
attracting users to such technology, as mentioned by Kurkinen (2008). The expected
value of a new product technology can even determine a firm's leadership position,
especially in markets with significant level of network effects since the adoption of a
firm’s product design would leave little market share for other technologies, if any. The
expected value of a new product technology can be broadly decomposed in two
elements: the stand-alone expected value of the technology and its externalities, a view
also supported by Katz and Shapiro (1985, 1986) and Farrell and Saloner (1985). The
stand-alone expected value of the technology refers to the expected utility of it in terms
of features, services and performance that it offers to the users; whereas its externalities
refer to the negative or positive effects that the production and consumption of the
technology has in the market. An example of externality is the classical network effect,
popularized by Robert Metcalfe for the telecommunications networks case, which
constitutes a positive consumption-driven externality that in principle sustains that the
value of a network-based service is higher as more people uses it, like in the classic
example of the telephone, and nowadays in the case of social networks like Twitter and
Facebook that show a more pronounced network effect. It is worth to mention that
externalities represent a very important field of study since they can be a source of value,
27
education, efficiency and other positive effects, but they can also represent a source of
inefficiency, damage and other negative effects, like for instance the pollution that the
production or consumption of certain product can cause to the environment.
Managing the expectations of a new product technology is crucial, especially in light of
a potential network effect. Network effects typically lead to indirect network effects,
like for instance increased availability of complementary products and technologies, in
which case, an appropriate expectations management can achieve higher availability of
compatible complementary products. This before in turn would further increase the
expected value of a new product technology. In this sense, major firms clearly run with
advantage at creating expected value since they will perceive higher expectations from
potential users thanks to the firm’s reputation. However, even though more than one
strategy in order to create big expectations can be used, they are just expectations that
require to be capitalized into superior market shares and profit margins. Therefore, an
important question in this point is how can firms capture the market attention and
capitalize innovations and potential network effects for dominance?
Certainly there is no unique approach to address this question before, instead, there are
several considerations that should be taken into account for the aim of capturing the
market attention and capitalizing innovations and potential network effects for
dominance. In order to structure our considerations in this subject we can begin
analyzing the innovation model provided by Utterback and Abernathy in their 1975
paper “A Dynamic Model of Process and Product Innovation.” The main hypothesis
that they proposed in their study is that the characteristics of the firm’s innovative
process and its innovation attempts will correspond with the stage of development of the
firm’s production processes and its strategy for competition and growth. This before
suggests that there exist mutual relationships between the capacity of a firm to innovate
with its competitive strategy and the development of its production processes. Utterback
and Abernathy (1975) sustained that these relationships before are evidenced in
statistical information in the literature.
According to the authors mentioned right before, the relationship between the
characteristics of the firm’s innovative process and its innovation attempts with the
firm’s strategy for competition and growth is due to the forces that drive the business
28
environment and market behavior. In this sense, firms are subject to the environmental
forces and the most appropriate thing that they can do is to strategically manage the
business to compete and grow, which in turn requires the firm’s innovative process and
its innovation attempts to be correspondent with the business environment. Whereas, the
cause of the relationship between the characteristics of the firm’s innovative process and
its innovations attempts with the stage of development of the firm’s production
processes is not clearly identified by Utterback and Abernathy (1975); nonetheless,
inferring from the process and product innovation models described by them, the cause
of the relationship between the characteristics of the innovative process and the stage of
development of the production processes can be attributed to the emergence of a
dominant design in the industry.
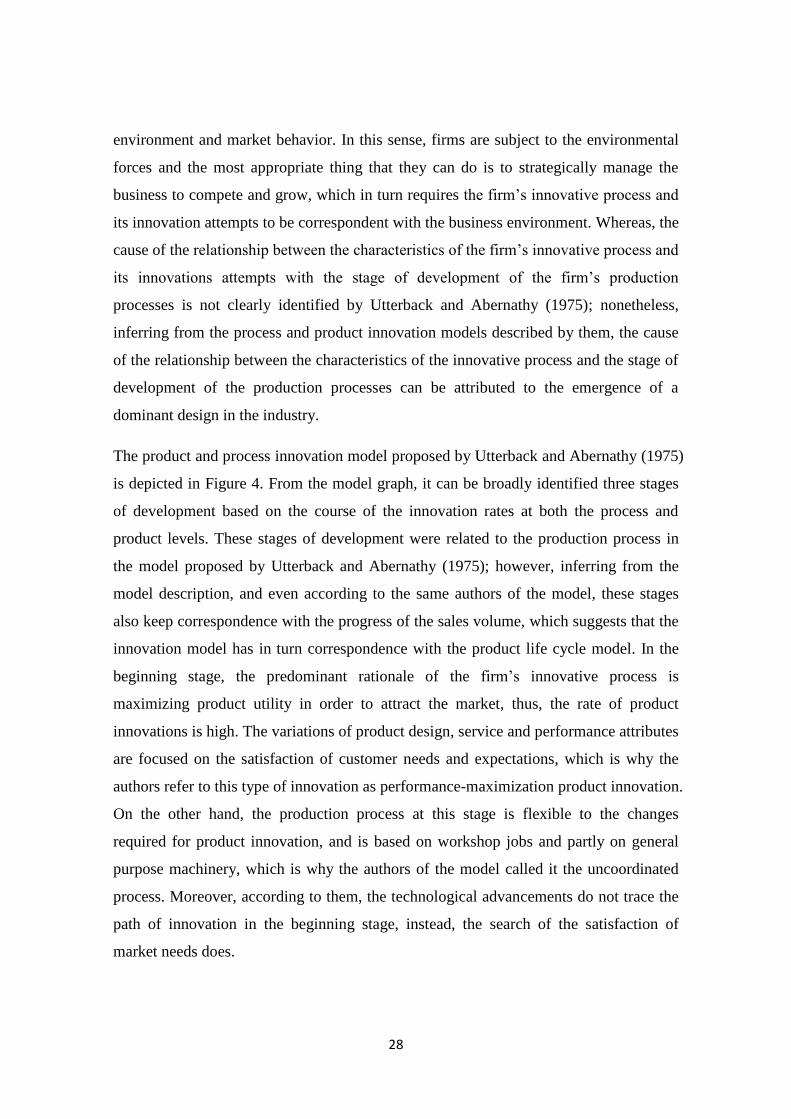
The product and process innovation model proposed by Utterback and Abernathy (1975)
is depicted in Figure 4. From the model graph, it can be broadly identified three stages
of development based on the course of the innovation rates at both the process and
product levels. These stages of development were related to the production process in
the model proposed by Utterback and Abernathy (1975); however, inferring from the
model description, and even according to the same authors of the model, these stages
also keep correspondence with the progress of the sales volume, which suggests that the
innovation model has in turn correspondence with the product life cycle model. In the
beginning stage, the predominant rationale of the firm’s innovative process is
maximizing product utility in order to attract the market, thus, the rate of product
innovations is high. The variations of product design, service and performance attributes
are focused on the satisfaction of customer needs and expectations, which is why the
authors refer to this type of innovation as performance-maximization product innovation.
On the other hand, the production process at this stage is flexible to the changes
required for product innovation, and is based on workshop jobs and partly on general
purpose machinery, which is why the authors of the model called it the uncoordinated
process. Moreover, according to them, the technological advancements do not trace the
path of innovation in the beginning stage, instead, the search of the satisfaction of
market needs does.
29
Figure 4. Innovation and stage of development. Source: Utterback and Abernathy (1975)
With the progress of the innovative process, firms’ get higher visibility of mainstream
buyers and the market needs become less uncertain, which together with the greater
diffusion of the new product usage and its utility gives rise to a new stage of
development characterized by a transition of the innovative process course. The lower
market needs uncertainty allows firms to focus on providing advanced and/or more
optimal technological solutions to the emergent dominant design, and at the same time,
to standardize the general attributes of the product, reducing in this way the innovations
at the product. On the other hand, the success of the firms’ growth strategies, targeting
the potential mainstream of buyers, depend strongly on the firms’ capacity to upgrade
the production process in order to meet the technological requirements of the emerging
dominant design and also to scale production to cope with the increasing market
demand. As a result of this before, the production process becomes greatly mechanic
and automated, and the majority of the innovation attempts gradually center in the
improvement of the production processes technologies.
Based on the analysis of the production process, the last stage of development that is
identified by Utterback and Abernathy (1975) in their innovation model corresponds to
the systemic production stage. In this stage, important capital investments are required
in order to attain high returns out of the established dominant design being already
adopted by the mainstream of buyers, as well as to cope with strong price competitions
30
by reducing the production factors cost through economies of scale and scope. At the
same time, the production processes reach a high level of integration, seeking to reduce
production costs through the improvement of efficiencies in the production processes.
This high integration of the production processes makes it very costly to introduce
technological innovations to them since the change in a single process may require the
upgrade of several ones. This before, together with the necessity of amortizing the
capital investments and attaining high returns of the innovation, changes the rationale of
the firm’s innovative process course from technology-driven towards costs-
minimization.
It is important to notice in this point that according to Utterback and Abernathy (1975),
the firm’s innovative process faces two important barriers. The first barrier obeys to the
natural uncertainty of the innovative product success in attracting the market and
creating demand, which happens during the beginning stage of development. On the
other hand, the second barrier obeys to the fact that a successful new product may
eventually substitute an existing one or simply change certain consumer habits that
affect the consumption of other different products, which occurs during the two later
stages of development. In addition to these two barriers mentioned by Utterback and
Abernathy (1975), an additional important aspect of product innovation such as
compatibility should be noted as it is addressed by Katz & Shapiro (1985).
Compatibility requirements may impede the flourish of a potential breakthrough
innovation since users cannot reap the benefits of a new technology if there is a lack of
compatible products. Acknowledging this before, managers strategically manage market
expectations and attempt to coordinate the innovation path and compatibility
requirements with other firms in a way that the return potentials of an innovation are
actually capitalized by firms.
2.2.1 Dominant designs
The study of dominant designs and de-facto standards is particularly important in terms
of industry evolution as it provides better understanding of the influence of technology
evolution as a main force in a competitive environment affecting the firms’ survival and
success (Utterback & Suárez, 1995). Generally speaking, a dominant design represents a
technological option that has achieved significantly higher preference in the
31
marketplace than others, and which technological features become de-facto standards.
In this sense, the origins of the concept of dominant design may be attributed to
Utterback and Abernathy, who provided the fundaments of the dominant design concept
through their innovation model proposed in their 1975 paper “A Dynamic Model of
Process and Product Innovation,” which one was analyzed previously. At this point,
perhaps the most important question to address is how dominant designs emerge?
Various studies in the field of dominant designs and technology evolution (Anderson &
Tushman, 1990; Utterback & Suarez, 1993, 1995; Christensen et al., 1998; Koski &
Kretschmer, 2006) shed lights about how dominant designs emerge, suggesting in
various ways that it does not merely depend on the success of the technological
development; in practice, it also depends on other aspects like the buyers’ value
dimensions, governments’ interventions, possession of collateral assets, industry
externalities, and firms’ strategic maneuvers.
About technology evolution, Anderson and Tushman (1990) noted that at that time there
was few work done about the nature and dynamics of technological change, and, with
the aim of tackling this theoretical and empirical scarcity, they proposed a model to
explain the rationales of technological change, which is depicted in Figure 5. According
to them, technological change follows a cyclical model in which two eras can be
distinguished: ferment and incremental. The ferment era is characterized by the
technological variation that originates from a technological breakthrough or
discontinuity. In this era, the technological variability is intense in the beginning but
starts to decrease gradually with the emergence of a dominant design that appears as a
result of a selection process. When a certain technological option is significantly
preferred in the marketplace over others, that is, a dominant design has emerged; the
next era of the cyclical innovation model starts to take place, which is characterized by
incremental technological innovations.
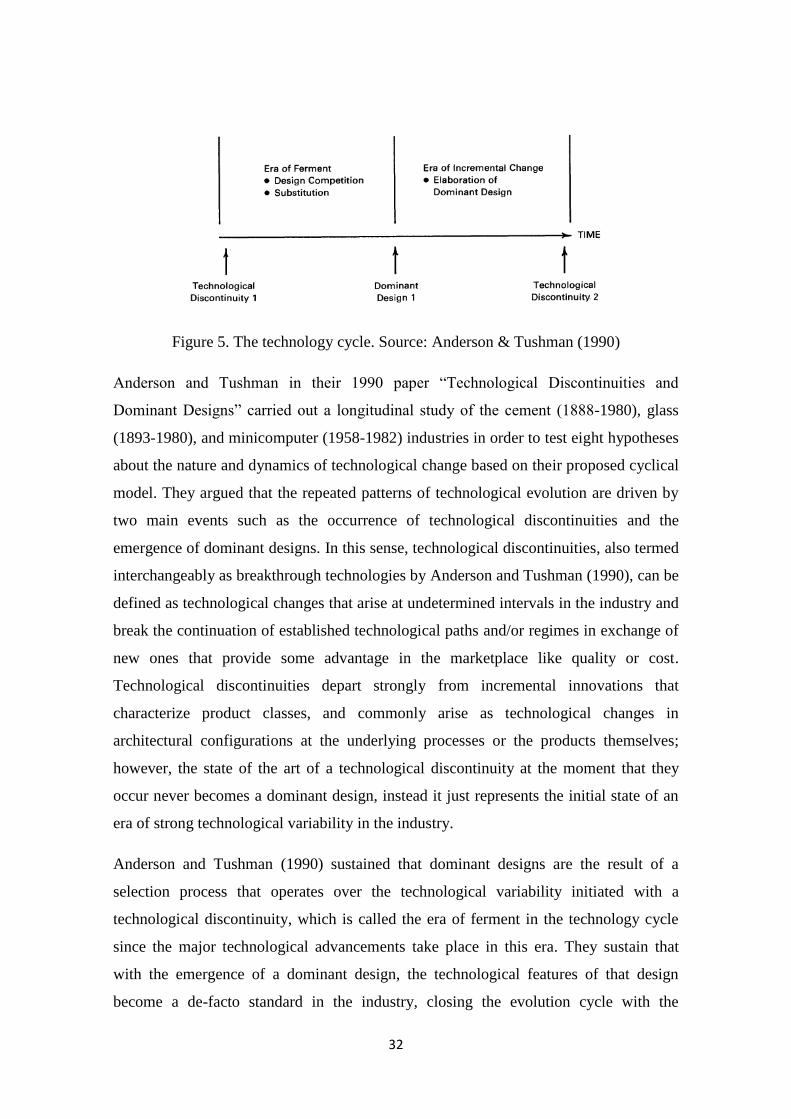
32
Figure 5. The technology cycle. Source: Anderson & Tushman (1990)
Anderson and Tushman in their 1990 paper “Technological Discontinuities and
Dominant Designs” carried out a longitudinal study of the cement (1888-1980), glass
(1893-1980), and minicomputer (1958-1982) industries in order to test eight hypotheses
about the nature and dynamics of technological change based on their proposed cyclical
model. They argued that the repeated patterns of technological evolution are driven by
two main events such as the occurrence of technological discontinuities and the
emergence of dominant designs. In this sense, technological discontinuities, also termed
interchangeably as breakthrough technologies by Anderson and Tushman (1990), can be
defined as technological changes that arise at undetermined intervals in the industry and
break the continuation of established technological paths and/or regimes in exchange of
new ones that provide some advantage in the marketplace like quality or cost.
Technological discontinuities depart strongly from incremental innovations that
characterize product classes, and commonly arise as technological changes in
architectural configurations at the underlying processes or the products themselves;
however, the state of the art of a technological discontinuity at the moment that they
occur never becomes a dominant design, instead it just represents the initial state of an
era of strong technological variability in the industry.
Anderson and Tushman (1990) sustained that dominant designs are the result of a
selection process that operates over the technological variability initiated with a
technological discontinuity, which is called the era of ferment in the technology cycle
since the major technological advancements take place in this era. They sustain that
with the emergence of a dominant design, the technological features of that design
become a de-facto standard in the industry, closing the evolution cycle with the
33
retention process after the periods of variability and selection. They also sustained that
dominant designs always lag behind the technical frontier at the time they emerge, but
with its emergence, expected minor incremental innovations trace the technological
progress until a subsequent discontinuity takes place, which constitutes the era of
incremental change. They also indicated that the adoption of a single standard with the
emergence of a single dominant design, after a technological discontinuity, always
peaks sales. Sales are further stimulated by lowering prices through intense capital
investments in mass and efficient production thanks to the lower technological and
market needs uncertainty. However, the emergence of a dominant design can be
impeded in environments with strong intellectual property rights protection, in which
situations its emergence is a matter of strategic choice for the protected innovating firm.
Moreover, Anderson and Tushman (1990) noted that technological discontinuities can
be either competence-enhancing or competence-destroying, acknowledging the fact that
the expertise and assets to manage technologies that preceded a discontinuity either
contribute to manage the new technological order or just become obsolete. Therefore,
incumbent firms attempt to establish dominant designs that enhance their competences,
providing them an advantage over new entrants that are less competent than them in the
current technological order; whereas new entrants attempt to establish dominant designs
that leave obsolete the competences of incumbent firms to manage previous
technologies. They also noted that the era of ferment following a competence-
destroying discontinuity is longer than the era of ferment following a competence-
enhancing discontinuity, which may be attributed to the time that it takes to learn to
manage a new technological order when the previous knowledge and skills become
obsolete.
Despite this model before provides a fundamental model of technological change that is
based on the emergence of a dominant design after a technological discontinuity, the
situations in which a dominant design will not emerge after a technological
discontinuity are not openly addressed by Anderson and Tushman (1990). For instance,
it would be interesting to analyze in which situations competition that arises from
positioned firms, in order to extend the life of the preceding technological order in light
of a competence-destroying discontinuity, may impede the emergence of a dominant
design. The authors before mentioned that the life of a technological order preceding a

34
technological discontinuity may be extended through the intensification of incremental
innovations. However, one can think on other situations that may impede the emergence
of a dominant design after a technological discontinuity, like for instance the
establishment of price wars between the substituting technologies, the resistance to
change from the preceding supply network, and the possession of collateral assets.
On the other hand, Koski and Kretschmer (2006) addressed the dynamics and nature
about the type of innovations that become part of a dominant design and the competing
factors that stimulate their emergence for the case of the mobile phone industry during
the years from the early 1980s onwards. In this sense, they distinguished two broad
types of innovations, vertical and horizontal innovations; where innovations of the core
technology or existing features of the product that arise based on technological
improvements are considered as vertical innovations, whereas the addition of new
features to the product are considered as horizontal innovations. According to them,
firms may temporarily differentiate vertically and horizontally, but if the innovations are
successful in the marketplace, imitators will follow them and make them part of the
dominant design. This before suggests that the main force that drives innovators is to
differentiate in the marketplace. Koski and Kretschmer (2006) found that after a new
core-system appeared in the mobile industry, such as 2G and 3G handsets, firms
compete on vertical innovations focused on quality improvements of the system
technology, which creates higher demand until the technology becomes mature enough
and the high level of standardization of the dominant design leaves small room for
differentiation in the market, leading to unprofitable price competition. Before being
trap in risky price competitions when the technologies starts to reach high levels of
maturity, the firms will start to innovate horizontally in order to differentiate in the
market.
From the study done by Koski and Kretschmer (2006), one can identify a transition
phase from vertical to horizontal innovation-based competition with the emergence of a
dominant design. As mentioned before, firms compete on vertical innovations after a
technological discontinuity, but as long as a dominant design emerges, the vertical
innovations start to decrease gradually and competition focuses on horizontal
innovations. This logic suggests a dominant design is mainly shaped by vertical
innovations occurring after a technological discontinuity that compete for the market
35
preference and horizontal innovations that occur during the transition phase that provide
some initial degree of differentiability after the standardization of the dominant design.
They sustained that after the emergence of a dominant design, firms still continue to
innovate vertically, especially with the purpose of keeping almost cero the learning
costs associated with the use of the next product version and thus retain their customers,
which is known as lock-in strategy. However, horizontal innovations are more frequent
and seem to be more important after the emergence of a dominant design in order to
keep the firm’s market position and attract new customers.
On the other hand, another important matter to consider about dominant designs are the
strategic choice that firms face in light of a de-facto standardization process. In his 2004
paper, Marcus Ehrhardt acknowledges the importance of assessing the opportunities and
threats when adopting a de-facto standard in order to succeed, especially in markets
driven by network effects. He sustained that situational factors to be analyzed when
adopting a de-facto technology include: the internal resources of the firm, the
technology/product related criteria, and the external/market related factors. The
constellation formed by situational factors determine different competitive positions,
which require different positioning strategies with respect to the adoption of a certain
de-facto technology. For instance, establishing a de-facto industry standard on a stand-
alone basis requires a firm to possess the sufficient resources and competences and a
strong reputation so that the expectations that the technology will be an industry-
standard is big. In this situation before, developing or adopting industry standards are
the two options depending on the existence or not of internal firm resources.
In addition to the firm’s internal resources, product-related and external-related factors
to consider include the attractiveness of the product compare to competing ones, the
regime of appropriability, and the importance and strength of network effects, which
could determine whether a proprietary standard or open standard should be supported.
In light of this complexity, the existence or not of previous standardization trajectories
of similar product family would ease the decision of choosing a strategy in a de-facto
standardization process. On the other hand, even when considering these situational
factors mentioned before, it is not clear when the needs of mainstream customers that
sustain the firm’s business come to the scene and how they affect the strategic choices
of a firm on a de-facto standardization process, if it does. In this sense, one may think
36
that a firm should not only consider situational factors to take strategic choices in light
of a de-facto standardization process, but it should also align its strategic choices in this
matter according to its competitive market strategy that has attracted its current
mainstream customers. However, this perception before is not as simple as it sounds
since it requires to consider the effects of potentially disruptive innovations that are not
seen by the current mainstream customers.
2.2.2 Disruptive innovations
Disruptive innovation is a matter that deserves special attention when it comes to
attaining a leadership position in an industry, especially in technology-driven industries.
Disruptive innovations represent new value configurations that create new markets or
boosts currently irrelevant ones, and ultimately disrupts existing markets, based on
successful business models that are normally enabled thanks to the technological
advancements. Disruptive innovations are fundamentally different from the concept of
technological breakthroughs or discontinuities, incremental innovations, and vertical
and horizontal innovations discussed with respect to the technology cycle and dominant
design in the previous section. These type of innovations before can be classified as
sustaining innovations since they do not create new markets neither boost currently
irrelevant ones, they just sustain existing ones even though they have the potential to
change, revolutionize, or impulse the performance trajectories and business models of
established products in the industries. Therefore, disruptive innovations are
fundamentally different to sustaining innovations since these first create new markets or
boost currently irrelevant ones, and ultimately disrupt existing markets.
According to Bower and Christensen (1995), protecting the emergence of a potentially
disruptive innovation requires creating a separate different organization, to manage the
emerging business, from the one managing the mainstream customers of the existing
businesses. In this sense, in their 1995 paper they wrote that “every company that has
tried to manage mainstream and disruptive businesses within a single organization
failed”. This is because mainstream customers of existing markets are not willing to try
out disruptive innovations since they generally do not meet their overall needs when
they just appear. Managing both mainstream and disruptive businesses is not an easy
task given that “well-managed” firms normally are stuck in costly and rigid structures
37
focusing on the needs of their mainstream customers of their existing businesses and do
everything in order to sustain those existing business units. However, they do not know
how to explore and capitalize the potential of emerging markets while exploiting the
existing ones, which may require to let some existing business units to die and see new
ones to flourish. In this sense, new entrants, especially small start-ups, seem to achieve
better results when it comes to explore new markets according to Bower and
Christensen (1995).
On the other hand, something that would be interesting to know is whether the common
believe that disruptive innovations are needed when the physical boundaries become
constraints for further performance improvements, under which situation new
technologies that enable these improvements would be a true success, actually drives
the majority of disruptive innovations. However, with the appearance of disruptive
innovations, something that is usually evidenced is that companies that did not identify
and move to future technologies on time fall behind the ones that went with the wave.
But if the movement towards the adoption of new technologies is hasty and the market
is hard to wake up, imitators will have time to react and pioneers will lose their
competitive advantage.
2.2.3 Appropriability regimes and complementary assets
The ability to capture rents out of innovation strongly depends on the ability to limit the
chances of rivals to benefit out of them. Innovators must look after management
strategies to secure the biggest part of the pie if they do not want to see imitators or
players in the supply chain of the innovation to do so; however, not all innovations are
viable as the costs and risks for trying to secure their returns may not be worth it. In this
sense, it is certainly important to consider the nature and the actual stage of the
innovation in order for the innovator to adequately build value and capture the returns
from the innovation. Furthermore, an innovation can be easy or hard to protect from
imitators or followers depending on its nature, thus, managers may draw upon
intellectual property rights and strategic maneuvers to protect it from imitators. Even
though in certain cases legal resources may not suffice to impede imitators to follow a
successful innovation, in tight appropriability regimes they can give time to the firm to
mature a dominant design and acquire complementary assets in order to capture the
38
greatest returns from the innovation. However, in loose appropriability regimes the risk
to lose revenues taken by imitators is big since they will overtake the innovation to their
favor if the innovator does not assert the dominant design of the product (Teece, 1987).
Based on Teece (1987), once a dominant design emerges, competition turns to
economies of scale and specialized complementary assets become significantly critical
in the supply chain. This before suggests that the possession of complementary assets
may provide competitive advantage over rivals that are not capable to access them or to
integrate them. Ceccagnoli and Rothaermel in their 2008 book chapter “Appropriating
the returns from innovation”, remarked the importance of owning complementary assets
in order to profit out of innovations. According to them, complementary assets can be
divided into generic and specialized. Generic assets refers to the assets that do not need
to be adjusted to the innovation and can be contracted in the market such as general
purpose machinery; whereas, specialized assets are those with dependencies to the
innovation such as customized services. In this respect, manufacturing skills satisfying
the market demands is a crucial complementary asset to profit out innovations, and the
lack of necessary manufacturing skills conduce to poor company performance as
evidenced by Ceccagnoli and Rothaermel (2008). Moreover, they sustain that large-
scale manufacturing skills conduce to economies of scale and production experience,
which in turn influences dominant-design markets.
In this point, it can be noticed that the ability to capture the returns from innovation
seems to depend mainly on the underlying appropriabilty regime and the ownership of
complementary assets. In the existence of tight appropriability regimes, when the
required complementary assets are generic, innovators capture most of the value;
whereas, when specialized complementary assets are required, the value is shared
between the innovator and the owners of specialized complementary assets. This before
suggests that an innovator lacking of necessary specialized complementary assets may
find itself obligated to cede significant fraction of the innovation rents to the owners of
the specialized assets if it wants to profit ultimately. In such situations, establishing
strategic alliances and/or joint ventures may be a better way to go for the innovator
when it is not self-capable. Moreover, licensing the innovation to other firms and letting
them to produce and commercialize the innovation in exchange for royalties may be a
good option, especially if the innovation requires specialized complementary assets.
39
On the other hand, depending on the innovator’s capabilities and the nature of its
complementary assets, developing and commercializing the innovation may be done by
the innovator itself by integrating the value chain vertically, which would in turn enable
the innovator to capture most of the innovation rents. However, in the existence of loose
appropriability regimes, major returns from innovations may leak away from innovators
if they are easy to imitate and manufacture. In such situations, customers capture most
of the value from innovations that are easy to imitate and manufacture since the market
becomes highly competitive, even when the innovator manages to vertically integrate its
value chain.
2.2.4 Exploiting and exploring
In the paper “Exploration and Exploitation in Organizational Learning” written by
James March (1991), the author addresses very important points concerning the inability
of major firms in established markets to come up with innovations that enable them to
lead future markets. In this sense, the article suggests that the inabilities of incumbent
firms to lead future markets have their roots in their cost structures as they allocate most
of the resources to incremental innovations that sustain the present demands of the
mainstream customers and very scarce resources to disruptive innovations that create
future demand. Commonly managers focus at reducing costs and refining existing assets
utilization, achieving economies of scale and scope in order to improve profits but face
big challenges when it comes to creating sustainable growth. In this sense, investing in
assets with stable rents is logical, attractive, and safe for managers on-board; however,
this strategy before entails to an imbalance in the innovation portfolio. A balanced
innovation strategy should seek for a trade-off between innovations that sustain the
present demand with the ones that create future demand. The question is how to
effectively manage to achieve a balanced innovation strategy? O’Reilly III and
Tushman in their 2004 paper “The Ambidextrous Organization” provide us some
guidance to address this question before, basing their thesis on the idea that a
sustainable business depends on its ability to exploit the opportunities of the exiting
business and to explore new ones.
According to them, the Ambidextrous Organization seems to successfully achieve both
profitability and growth by employing two separate business units, one for the existing
40
business and one for the emerging business, each one with its own structures,
procedures and cultures, but integrated at the senior managerial level. The authors argue
that this type of organizations are good at sharing experience between the business units
without overwhelming entrepreneurial minds with rigid and efficient methods of
operational units. They note that there is evidence of organizations that are successful in
exploiting the present and exploring the future, which ones share important
characteristics aligned with the ambidextrous organization model. In this respect,
successful implementations of ambidextrous organizations require managers capable to
objectively meet the needs of very different kind of business units as well as
management teams conveying clear and unbreakable vision. They argue that successful
implementations of ambidextrous organizations significantly depend on the ability of
the senior management team to adopt this model. However, more work should be done
with respect to the type of collaboration that should exist or not between other
hierarchical levels in the ambidextrous organization like for instance the horizontal
collaboration between the junior managerial levels of the separate business units.
On the other hand, a successful exploitation and exploration strategy also depends on
the ability of the management team to be tuned with the Research & Development
department. The diversification of development projects will definitely affect the firm's
performance projection, and therefore it requires careful decision making of the mix of
different types of development projects. Once the real potentials and risks of a set of
development projects are assessed, capital constraints ultimately constraints the decision
making of the “right balance” of different types of development projects in order to
sustain the short-term business and enable long-term growth. However, the firm's
management skillset can be easily overlooked when deciding the R&D portfolio
investments. The best R&D portfolio balance and return, based on real options analysis
and R&D portfolio mapping approaches (McGrath and MacMillan, 2000, 2002), should
be contrasted with the managerial complexity caused by the portfolio mix. Usually
firm's core competences and assets heavily influence the attractiveness of R&D projects
that require similar competences and resources as it allows leveraging economies of
scope. However, R&D projects requiring similar management routines and skillset to
the existing ones in the firm may lead to higher firm performance than those requiring
similar core competences and resources (Gino et al., 2006). Therefore, achieving a

41
balanced innovation strategy requires looking at various aspects including, the firm’s
resources, complementary assets, appropriability regime, and managerial skillsets along
with the forces prevailing the paradigm of the dominant design.
42
3 TELECOM ECOSYSTEM
In very dynamic business ecosystems such as the telecom ecosystem it is common that
some players may take predominant positions within the business ecosystem and others
may become mere business enablers and supporters. In the telecom industry, players
must be aware of the opportunities and threats that the digital convergence unleashes by
looking at their role in the medium term. In this sense, the digital convergence has its
two major axis of development in one hand on the convergence of telecom networks
into a single one controlled by a large company, and, on the other hand, in the battle for
the operating system dominance (Hämmäinen et al., 2013).
3.1 Operators and industry sectors
Operator is a general term that defines a firm running certain operations required to
provide a service or to support the provisioning of it. In the telecom market, telecom
operators are fundamental for sustaining the industry and keeping it running, and their
main mission is to provide connectivity for local, regional and international
communication, supporting in this way the provisioning of legacy telecom services such
as telephone, television and radio, but also of online services based on the Internet. In
this sense, telecom operators take care of fundamental functions in the telecom industry
including connectivity, quality, mobility, security, convergence, charging, which
functions are supported and enabled by network equipment sellers. However, in this
study we analyze the telecom industry as part of a wider ecosystem such as the
Telecommunications, Media and Technology TMT industry that not only focuses on the
satisfaction of telecommunication needs, but also on the satisfaction of information,
media and entertainment needs using technological resources based on electronics. In
this sense, other players that enable the generation, management and consumption of
TMT services, including sellers of computers and devices, producers and aggregators of
content, Internet intermediaries and IT service and software providers, are part of the
ecosystem (Péladeau et al., 2011, 2013).
From this wider perspective before, the TMT industry functions can be disaggregated
into more specific roles that relate to each other in other to enable the generation,
delivery and consumption of the services as shown in Figure 6 (ECOSYS, 2004;
Hämmäinen et al., 2013). The figure below provides a reference model that depicts the
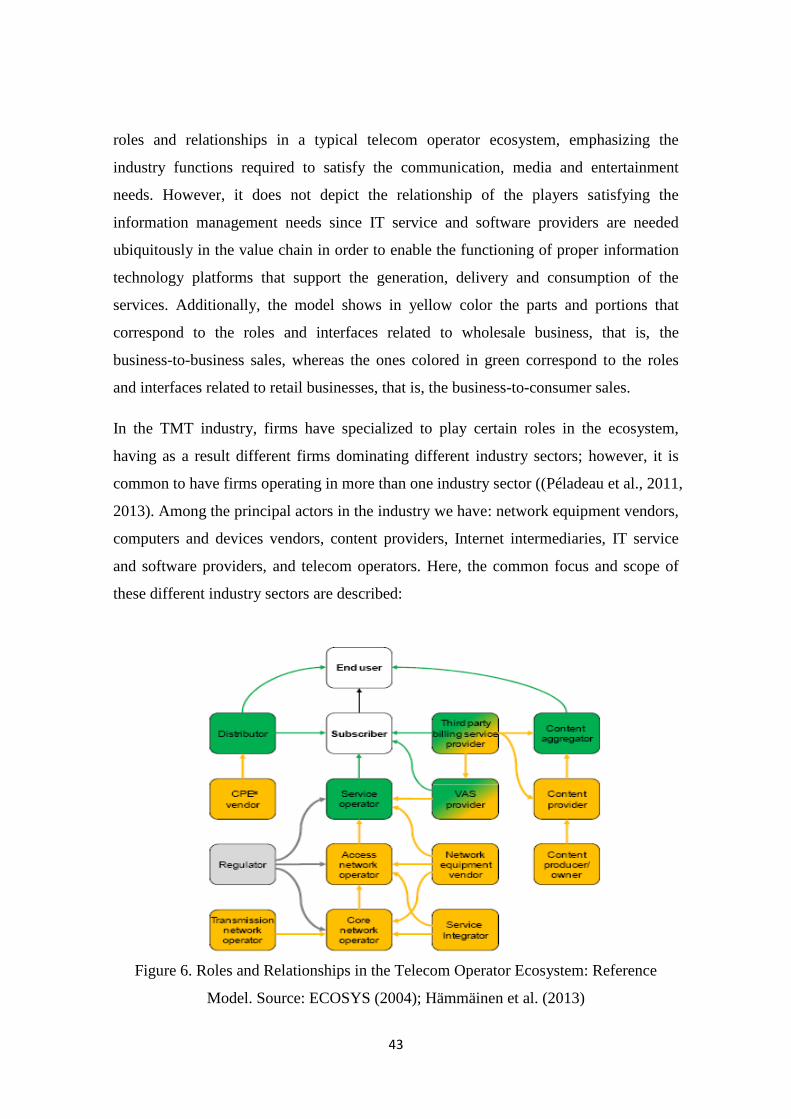
43
roles and relationships in a typical telecom operator ecosystem, emphasizing the
industry functions required to satisfy the communication, media and entertainment
needs. However, it does not depict the relationship of the players satisfying the
information management needs since IT service and software providers are needed
ubiquitously in the value chain in order to enable the functioning of proper information
technology platforms that support the generation, delivery and consumption of the
services. Additionally, the model shows in yellow color the parts and portions that
correspond to the roles and interfaces related to wholesale business, that is, the
business-to-business sales, whereas the ones colored in green correspond to the roles
and interfaces related to retail businesses, that is, the business-to-consumer sales.
In the TMT industry, firms have specialized to play certain roles in the ecosystem,
having as a result different firms dominating different industry sectors; however, it is
common to have firms operating in more than one industry sector ((Péladeau et al., 2011,
2013). Among the principal actors in the industry we have: network equipment vendors,
computers and devices vendors, content providers, Internet intermediaries, IT service
and software providers, and telecom operators. Here, the common focus and scope of
these different industry sectors are described:
Figure 6. Roles and Relationships in the Telecom Operator Ecosystem: Reference
Model. Source: ECOSYS (2004); Hämmäinen et al. (2013)
44
Network and service operators: In this industry sector we find the firms generating
revenues by providing voice, data and video services through fixed and mobile
networks, including the satellite and cable broadcast networks providing paid services
such as television (Péladeau et al., 2011, 2013). In this sense, the infrastructure
providing end-to-end connectivity is commonly integrated by three parts such as the
access network, the core network, and the transmission network as depicted in Figure 6.
The operation of these three types of networks, together with the integration of the end-
to-end network service, constitute the core competence of telecom operators. Of course,
the operation of these three different networks is commonly split among different firms.
For example, ISPs focus on the operation of the access networks, taking care of the
service provisioning to the end user, whereas other telecom carriers provide the
upstream connection to the Internet, taking care of the core and transmission networks.
Additionally, as part of the telecom operators’ competences, we find the retail sales and
service management that include the management of the offerings portfolio, service
quality, charging and billing, customer care, value added services, and in some cases the
sales of users’ devices as part of the portfolio offerings. In this sense, telecom operators
share an important stake of the TMT market, taking care and supporting very important
technological functions such as connectivity, quality, mobility, security, convergence;
but also taking care of the customer relationship management at the end user level.
Network equipment suppliers: In this sector we find the firms developing, fabricating
and selling network equipment for telecom operators and firms with high-scale
networking needs. The core competence of network equipment vendors is to provide
network infrastructure solutions to telecom operators, occupying in this way a very
specific place in the vertical wholesale telecom market. For this reason before, network
equipment vendors face strong bargaining forces from telecom operators that have the
market power arising from the end-users demand side, which has driven this industry
segment to the fire competition of cost leadership players (Gyllerup & Björnsjö, 2012).
However, network equipment vendors are crucial for the technological evolution of the
telecom industry since they carry out the development of next-generation network
technologies to tackle two important industry challenges such as the access speed and
the networks convergence to one All-IP solution (International Telecommunication
Union, 2004), which developments constitute main enablers for the continuous industry
45
growth. Considering this before, as well as the accumulated know-how of network
equipment vendors and their property rights over their networks and systems solutions,
network equipment vendors have an important position in the telecom industry, assuring
their space in the vertical market.
Media and content providers: This industry sector includes the firms generating
revenues from the content production, aggregation, and/or transmission (Péladeau et al.,
2011, 2013). Among the various types of contents we can find movies, TV shows and
series, music, news, books, and games. Apart from the firms in the gaming industry,
firms in this industry sector have big opportunity to increase revenues with the ongoing
growth of On-Demand content consumption on smart TVs, laptops, tablets,
smartphones, normally enabled by the Internet.
Internet companies: In this industry sector we find the firms generating revenues by
facilitating electronic transactions, providing over-the-top OTT content, and
intermediating in general between people and merchants through search engines, social
networking, e-commerce and web portals which may support chatting apps, email
service, telematics or a combination of them. As this list before evidences, Internet
companies have shown to be a major source of innovation, offering a wide range of
creative solutions and applications to the end users, where the clear dominants are
Google and Facebook (Bloomberg Visual Data, 2014). It should be noted that firms
positioned in the software industry, owning and developing operating systems for users,
have started the expansion to the intermediation industry by enabling the convergence
of online services into their online platforms, especially in the case of mobile devices.
Computers and devices vendors: In this industry sector we find the firms generating
revenues from the development, fabrication, and sale of personal computers and devices
such as handsets, computers, tablets, televisions, game consoles and their peripherals
and gadgets including smart watches, glasses and others. This industry sector is strongly
influenced by the operating systems battle driving the evolution of the user interfaces;
therefore, the firms owning and developing operating systems are main part of the
evolution of the consumer device market (IDC, 2014). Furthermore, in this industry
sector we can also include the firms developing, fabricating, and selling specialized
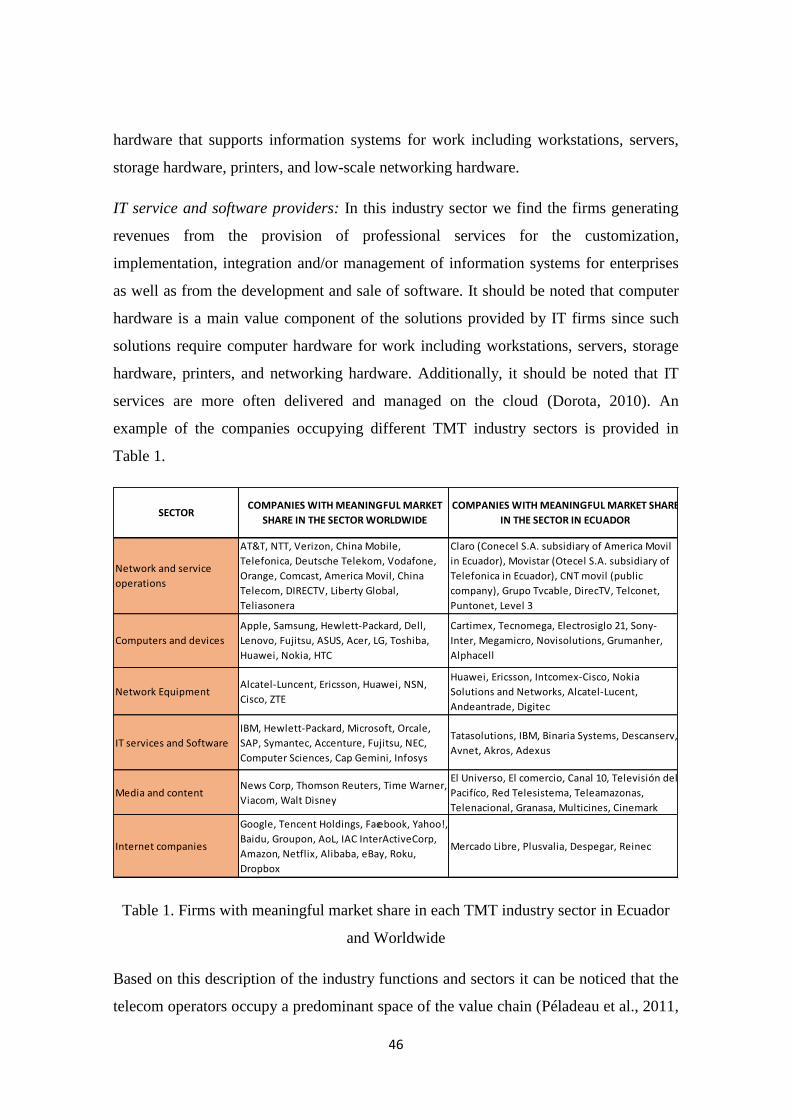
46
hardware that supports information systems for work including workstations, servers,
storage hardware, printers, and low-scale networking hardware.
IT service and software providers: In this industry sector we find the firms generating
revenues from the provision of professional services for the customization,
implementation, integration and/or management of information systems for enterprises
as well as from the development and sale of software. It should be noted that computer
hardware is a main value component of the solutions provided by IT firms since such
solutions require computer hardware for work including workstations, servers, storage
hardware, printers, and networking hardware. Additionally, it should be noted that IT
services are more often delivered and managed on the cloud (Dorota, 2010). An
example of the companies occupying different TMT industry sectors is provided in
Table 1.
Table 1. Firms with meaningful market share in each TMT industry sector in Ecuador
and Worldwide
Based on this description of the industry functions and sectors it can be noticed that the
telecom operators occupy a predominant space of the value chain (Péladeau et al., 2011,
Network EquipmentAlcatel-Luncent, Ericsson, Huawei, NSN,
Cisco, ZTE
Huawei, Ericsson, Intcomex-Cisco, Nokia
Solutions and Networks, Alcatel-Lucent,
Andeantrade, Digitec
IT services and Software
IBM, Hewlett-Packard, Microsoft, Orcale,
SAP, Symantec, Accenture, Fujitsu, NEC,
Computer Sciences, Cap Gemini, Infosys
Tatasolutions, IBM, Binaria Systems, Descanserv,
Avnet, Akros, Adexus
Media and contentNews Corp, Thomson Reuters, Time Warner,
Viacom, Walt Disney
El Universo, El comercio, Canal 10, Televisión del
Pacifíco, Red Telesistema, Teleamazonas,
Telenacional, Granasa, Multicines, Cinemark
Internet companies
Google, Tencent Holdings, Facebook, Yahoo!,
Baidu, Groupon, AoL, IAC InterActiveCorp,
Amazon, Netflix, Alibaba, eBay, Roku,
Dropbox
Mercado Libre, Plusvalia, Despegar, Reinec
Claro (Conecel S.A. subsidiary of America Movil
in Ecuador), Movistar (Otecel S.A. subsidiary of
Telefonica in Ecuador), CNT movil (public
company), Grupo Tvcable, DirecTV, Telconet,
Puntonet, Level 3
Cartimex, Tecnomega, Electrosiglo 21, Sony-
Inter, Megamicro, Novisolutions, Grumanher,
Alphacell
COMPANIES WITH MEANINGFUL MARKET SHARE
IN THE SECTOR IN ECUADOR
Computers and devices
Apple, Samsung, Hewlett-Packard, Dell,
Lenovo, Fujitsu, ASUS, Acer, LG, Toshiba,
Huawei, Nokia, HTC
SECTORCOMPANIES WITH MEANINGFUL MARKET
SHARE IN THE SECTOR WORLDWIDE
Network and service
operations
AT&T, NTT, Verizon, China Mobile,
Telefonica, Deutsche Telekom, Vodafone,
Orange, Comcast, America Movil, China
Telecom, DIRECTV, Liberty Global,
Teliasonera
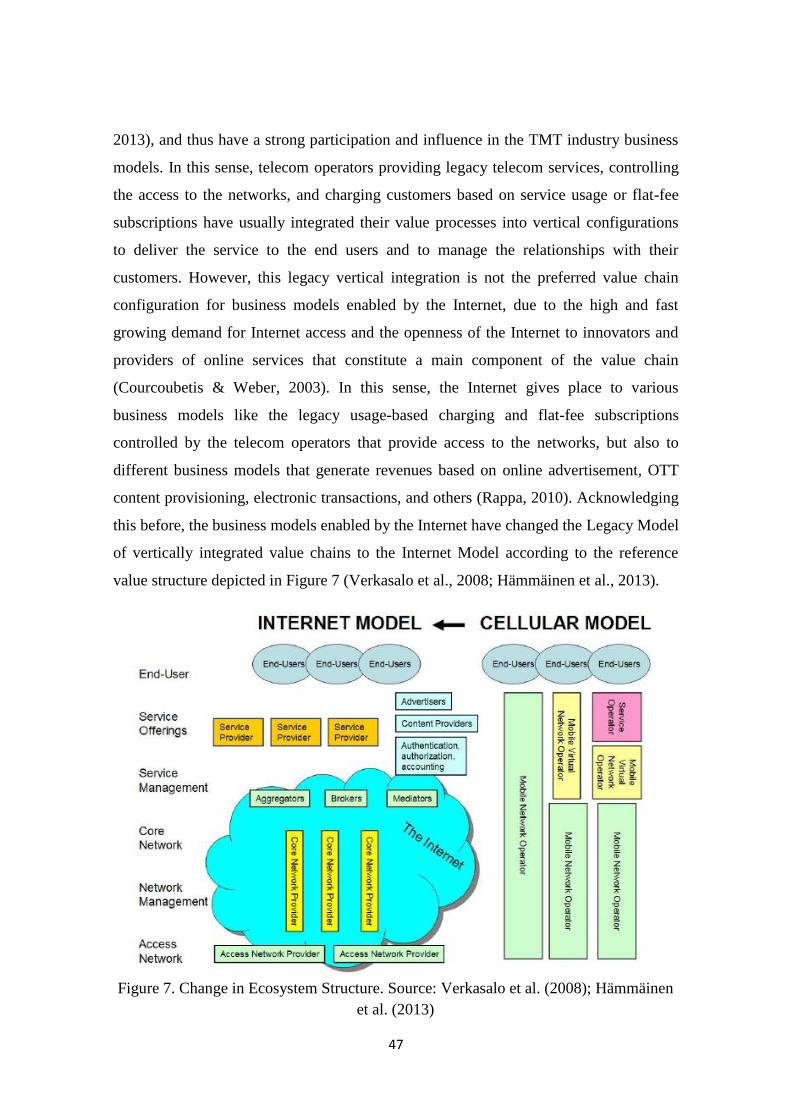
47
2013), and thus have a strong participation and influence in the TMT industry business
models. In this sense, telecom operators providing legacy telecom services, controlling
the access to the networks, and charging customers based on service usage or flat-fee
subscriptions have usually integrated their value processes into vertical configurations
to deliver the service to the end users and to manage the relationships with their
customers. However, this legacy vertical integration is not the preferred value chain
configuration for business models enabled by the Internet, due to the high and fast
growing demand for Internet access and the openness of the Internet to innovators and
providers of online services that constitute a main component of the value chain
(Courcoubetis & Weber, 2003). In this sense, the Internet gives place to various
business models like the legacy usage-based charging and flat-fee subscriptions
controlled by the telecom operators that provide access to the networks, but also to
different business models that generate revenues based on online advertisement, OTT
content provisioning, electronic transactions, and others (Rappa, 2010). Acknowledging
this before, the business models enabled by the Internet have changed the Legacy Model
of vertically integrated value chains to the Internet Model according to the reference
value structure depicted in Figure 7 (Verkasalo et al., 2008; Hämmäinen et al., 2013).
Figure 7. Change in Ecosystem Structure. Source: Verkasalo et al. (2008); Hämmäinen
et al. (2013)
48
On the other hand, in addition to the changing value configuration of the Internet model,
the mobile industry have used a fragmented value chains in some geographical markets
since about two decades, as shown in Figure 7. Under this fragmented value-chain
model, a firm not owning the mobile access network infrastructure, known as Mobile
Virtual Network Operators MVNO, takes care of the operations related with the end-
user retail business including the customer care, service offerings and network services
management; whereas the incumbent mobile operators owning the mobile access
networks, also known as real operators, generate additional revenues, apart from their
end-user retail business, by using their exceeding network capacity to provide wholesale
wireless access to MVONs. This model before mainly responds to the government
actions to reduce the market power of strong oligopolies, where customers have few
alternatives and just take the prices set by incumbent mobile operators. By pushing
incumbent mobile operators to let their exceeding capacity for rent, social planners look
that other firms use the leased capacity to offer telecom services to end users, procuring
in this way more alternatives in terms of services and prices for the end users.
Nonetheless, this approach may be initiated from the side of the incumbent mobile
operators in very specific cases, especially when the revenues arising from the rents of
MVNOs offset the marginal utility arising from their own end-user customers.
Moreover, the value chain can be further fragmented when roles taken by the MVNOs
are divided among two or three firms where one of them typically assumes the roles of
managing the service offerings and customer care and the other handles the network
services management (Kiiski, A., 2007).
Moderating the market power of oligopolies is an important task of social planners
considering that the telecom markets have consolidated into strong oligopolies in almost
every segment including telecom operators, equipment vendors, device vendors and
content providers. In the case of telecom operators, the market concentration may be a
consequence of the changes in the business environment originated with the
privatization of the telecom operators in several countries, which triggered the potential
of the global telecom market thanks to higher investments to improve the capacity,
coverage and quality of the networks. On the other hand, the privatization gave birth to
telecom operators that expanded globally, exploiting the economies of scale and scope,
brand and other assets. Looking to achieve economies of scope, telecom operators have
49
also expanded their offerings portfolio from providing a single type of service to full
services.
Due to their strong market dominance and the high entry barriers to the telecom
operator business, large telecom operators have capitalized their opportunities to
maximize profits into important empires very well valued in the stock markets.
However, the changes in the telecom ecosystem structure shown in Figure 7, driven by
the business models enabled by the Internet, have gradually played in favor of the
consumers who have benefited from a wider range of online services, increasing the
consumers surplus and the competition in the telecom industry in general. Furthermore,
the increasing data-intensive online services based on the Internet, like for instance
streaming traffic, have increased the traffic volume in the networks in an increasing
manner following an exponential curve, whereas the revenues have increased in a
decreasing manner following a logarithmic curve (Hämmäinen et al., 2013). This fact
before represents a big challenge for mobile operators that have required more
bandwidth in the electromagnetic spectrum to cope with the increasing traffic and have
increased the prices for Internet traffic in order to moderate the usage. Despite the
challenge of the increasing mobile Internet traffic, telecom operators seem to be
comfortable with the ratio tendency between revenue and traffic volume for other
services like mobile voice and Short Messaging Service SMS. Of course it is important
to notice that the ratios between revenue and traffic volume of different type of telecom
services do not follow any clear relationship (Hämmäinen et al., 2013).
Another important challenge that telecom operators face in consolidated markets is to
retain customers. Churn forces are stronger in oligopolies with subscriber-based
business models since customers are more aware of the offerings of the other service
providers. Given these particular competition settings of concentrated markets, firms
typically support their strategic decisions based on game theory analysis in order to
assess the potential net benefit of such moves (Brandenburger & Nalebuff, 1995). In
this sense, the main parameters for the game theory analysis are the ones driving the
profit such as the subscribers base, the Average Return Per User ARPU, the OPerational
EXpenditure OPEX, and the Capital Expenditure CAPEX that relate to the profit
according to the following formula:
50
Profit = Subscriber * ARPU – OPEX – CAPEX
Generally speaking, the main driver of profit maximization has been the increment of
the subscriber base since the profit margins have lowered with the time, but it is
important to notice as well that the ARPU is related with the service usage per user,
which has also significantly increased with the time, contributing in this way to generate
higher revenues. However, the cost components are also important parameters for profit
maximization, where the OPEX is usually higher than the CAPEX. It is important to
consider that in the OPEX we should include the customer acquisition, marketing and
handset subsidies costs, whereas in the CAPEX we should include the spectrum license
cost. This tendency between the OPEX and CAPEX predominates in the widespread
Internet Service Provider ISP business, and is more pronounced for the case of ISP not
located in the United States since the upstream ISP cost is very high. However, has
changed gradually with the constructions of new international links and data centers that
bypass the US-located Tiers.
3.2 Customers
The customers’ portfolio of telecom operators can be broadly classified into two main
groups such as enterprises and consumers. Enterprises, more generally speaking
organizations, may require a set of ICT services and equipment with some degree of
customization whereas consumers, more generally speaking individuals, commonly
require standard telecom services with possible bundling of services and personal
devices. In this sense, telecom operators require different management strategies and
systems for enterprise and consumer customers in order to take care of various value
drivers such as offerings portfolio and marketing, customer relationship, cost and billing,
and network and service quality.
3.2.1 Enterprise customers
Enterprises strongly depend on ICT services and equipment to operate and manage their
business processes. In the market there are various alternatives to solve ICT needs of
enterprises; however, it may become a complex task to determine suitable solutions and
implement them considering several decision criteria including technological
performance, compatibility, integrability, upgradability, total cost of ownership, but
51
specially the level of market uncertainty. In light of this before, firms may opt to rely on
consulting and advisory services to determine suitable solutions and implement them in
the firm. In this sense, ICT solutions designs have to take into account the umbrella of
services, systems, and equipment available in the market that include telecom services,
intranet solutions, information solutions, infrastructure and application software,
specialized hardware for work, mobile phones and devices, computers and others that
have been classified in the previous section. For instance, the firm Microsoft serves the
infrastructure and applications software industry segments but is not in the intranet
equipment segment, whereas the firm Cisco provides intranet equipment solutions but
does not provide infrastructure and application software solutions. The fact that there
exist various vertical segments in the ICT industry, where not all the same vendors
compete and serve in all the segments, makes the decision-making task to determine
suitable solutions subject to the prevailing market uncertainty that arises from
competition for design and standards dominance and its side effects such as products
compatibility and complementarity (Hämmäinen et al., 2013).
From the telecom operators’ side, the ICT needs of enterprises are served at four broad
levels of offerings such as: access services, managed services, carrier services, and
colocation services. Access services mainly include standard fixed and mobile
subscriptions for voice, data and video services provisioning, with the standard roaming
service for mobile subscriptions. Access services are commonly complemented with the
provisioning of enhanced information and communication security features like for
instance anti-virus and firewalls. Targeting to satisfy the information and
communication needs of enterprises, telecom operators also provide managed services
which may include, on one hand, Internet-based managed services like for instance web
and email hosting, Virtual Private Network VPN support, Voice over IP VoIP,
videoconference, video surveillance, unified communications, GPS-based and
telematics services, and, on the other hand, non-Internet-based services like for instance
the Centrex System that provides PBX-like services to offices hosted and managed
centrally by the telecom operator. In this sense, the scope of application services seems
to be unlimited with the development of the Internet of Things and may reach a high
level of customization to assist in task automation and control to enterprises and
organizations in general, improving productivity and effectiveness.
52
On the other hand, carrier services may be divided in two groups such as network-layer
and transmission-layer services (Hämmäinen et al., 2013). Network-layer services are
typically meant for Internet Service Providers ISP in order to satisfy the interconnection
and transit demands with other ISP, commonly transnational Tier 2 and Tier 1 ISP
(Winther, 2006). Network-layer services are also employed to satisfy the demand of
enterprises for two-way communications over the Internet to remote private networks or
terminals. On the other hand, transmission-layer services are typically meant to satisfy
the high data rate demands of enterprises to connect their offices at fixed locations, as
well as to satisfy the demand of other telecom operators to connect their switching
centers.
The last type of services in the telecom operators’ portfolio are the colocation services
meant for firms that highly depend on ICT services to operate like for instance
ecommerce businesses, social network websites, banks, media streaming websites and
others including the same telecom operators that may find more efficient to use
collocation services to cover certain geographical markets than running their own sites
in order to provide the service to their clients. The typical functions provided with
collocation services consist in lockable space in data centers with electricity,
connectivity, cooling, backup, redundancy and physical security facilities to host ICT
equipment that stay under the constant monitoring of data center engineers in order to
guarantee the uninterrupted operation of these functions outsourced. Therefore,
colocation services consist on providing housing, hosting and management of ICT
hardware and systems of enterprises with high demands of communication and
information services. In this sense, cloud services should be included in this segment
considering that it would mainly represent a collocation service managed through the
web (Dorota, 2010).
Based on these four broad levels of service offerings of telecom operators, the different
ICT needs of enterprises can be served. In this sense, not all firms require the same set
of services and therefore telecom operators typically segment the market to manage the
customer relationships accordingly. A logical segmentation can be done based on the
number of employees in the enterprise, the location of the enterprise, and the ownership
of the enterprise (Hämmäinen, 2013). With this classification, the telecom operator can
manage its customer relationships with more effectiveness. For instance, firms with a
53
large number of employees will be logically offered lower prices than the ones in the
price list that the telecom operator maintains for small firms, and for this end a request-
for-proposal RFP usually takes place. Additionally, when firms are located in multiple
sites, the telecom operator maybe required to support VPN services, and maybe also
multi-operator VPN services when the sites are in different countries or continents.
Finally, private customers request the service based on demand and have flexible
purchase processes, whereas governmental entities usually request the service based on
the budget availability and have regulated purchase processes (Hämmäinen, 2013).
A more refined segmentation can be done based on the nature of the business, that is,
whether its ICT needs are continuous, eventual or occasional; and whether the business
critically depends on network infrastructure to operate. In this sense we can find that
some organizations require continuous network-based services, like for instance
universities, which become important customers for the business sustainability; whereas
other customers that require eventual and occasional network-based services, like for
instance promoters of concerts, may be important for the business for marketing
purposes (Hämmäinen, 2013). Additionally, some firms not only require continuous
ICT services, but they actually require permanent and uninterrupted services to support
critical business processes and therefore be able to operate, like for instance ecommerce
businesses, social network websites, banks, media streaming websites and others.
Acknowledging all this before, the first three levels of offerings including access,
application and network-layer services are usually meant to satisfy the ICT needs of
small firms, whereas all the five levels of offerings are normally used to serve large
firms including the same telecom operators.
Something that should be noted is the fact that, on average, the highest rate of network-
based services usage occurs internally in the firm for the communications among
employees, where the most popular services include email, voice and messaging. The
usage of connectivity services to access to external resources or to communicate with
people outside the firm represent the next level in terms of service usage rate. Finally
the direct interaction between employees and the ICT systems of the firms shows the
lowest frequency in terms of service usage profile. In this sense, an important parameter
for firms to consider in order to decide for a certain ICT solution is the total cost of
ownership per employee of the different technological options that satisfy needs and
54
align with the firm strategy. The total cost of ownership is composed by the direct and
indirect costs. The direct cost is composed by the capital expenditure in the hardware,
software and their upgrades and supplies that integrate the system, the labor cost to
manage the systems and to support their operation and necessary developments, and
finally by the fees arising from the telecom operators for the provisioning of
connectivity and network-based services and other possible fees arising from outsourced
services, cloud services, contracts for support and maintenance and others. The indirect
cost arises from the training and learning efforts required to get the staff to effectively
use the ICT resources, the effects of the satisfaction or dissatisfaction of employees with
such resources, and finally the unproductivity arising from planned or unplanned
downtime of the systems (Hämmäinen, 2013).
In light of all these facts like the vertical segmentation of the ICT industry, the telecom
operators’ offerings, and the total cost of ownership of solutions, making a decision of
the right approach to meet the technological needs of the firm is not a simple task when
the functions required are critical to support the business operations. Given that most of
the ICT functions are integrated into networks, the main issue in this sense is how to
manage network-based services, for which telecom operators become strategic partners.
In this sense, the major concern to determine suitable solutions is the level of market
uncertainty, which will determine the levels of centralization and distribution of the
management architecture. For instance outsourcing email and web hosting services may
be a suitable solution that benefits from the economies of scale achieved by the service
providers thanks to the low market uncertainty. Under this approach the service is
managed centrally with high stability. However, when the market uncertainty is high,
firms may take a proactive approach by experimenting on distributed architectures that
provide higher flexibility.
In terms of efficiency, the ICT industry is perhaps facing a paradigm shift with respect
to network-based services, where firms are opting to use configurable and usage-based
priced cloud services that go beyond isolated SaaS solutions rather than operating their
own ICT infrastructure and even outsourcing non-traditional network-based services
that in many cases result in costly Service Level Agreements SLAs. One of the main
advantages of cloud services is that they reduce the capital and operational expenditure
for ICT functions since firms pay according to the service usage instead of buying fixed
55
assets, usually underused during their lifetime, and maintaining and operating legacy
infrastructure that do not deliver new capabilities (Dorota, 2010).
3.2.2 Consumer customers
Consumer customers in general are subject to various value drivers that build their
experiences towards a product and a firm; where these value drivers can influence the
customer behavior and thus become crucial to fuel growth and sustain the business in
the long term (Gentile et al., 2007; Duncan et al., 2013; Yan et al., 2004). Knowing the
consumer behavior is the main task of the people managing customers in the firm such
as marketing, sales and customer care staff. A satisfactory customer experience, that is
when the customer expectations are met or exceed, can become the most important asset
for the firm sustainability and growth. In other words, a happy customer will purchase
again and again from the same firm and will recommend other people to buy the
product. Therefore, the questions are what value drivers matter for building the
customer experience and how do we get a happy customer?
Answering these questions is not easy because customers value more than product
utility, they also create sensations, emotions and feelings about a product and firm when
they get to know about the product, select, purchase, use and get after-sales support.
Firms usually target these processes before as the key elements of customer experience
and therefore develop strategies to build that experience. In this sense, a popular
practice among the marketing and sales strategies has been to manage touchpoints as a
means to build satisfactory customer experience under the belief that showing care is
good enough to keep the customer happy. Despite touchpoints are important to manage
transactions they may create a misleading impression of a satisfied customer as noted by
Duncan et al. in their 2013 article titled “The Truth About Customer Experience.”
Creating a comfortable and careful relationship with customers is important but does not
usually solve the client pain points.
In this sense, a good starting point to address this problem above is to understand the
cyclic process of value creation. The value creation process begins with the
identification of the market needs which are then translated into firms’ offerings that
constitute value propositions based on their customer behavior knowledge. On the other
side, customers select a product based on their perceived utilitarian and hedonic value of
56
the product; however, they usually show further value expectations of the product that
should be realized by the firms in order to continue with the value creation process
cycle with a new value proposition. In other words, firms should go along with
customers throughout their whole experience journey of the product, as noted by
Duncan et al. (2013), and in this way they will identify the client pain points, or
expectations, and satisfy them in a new cycle of value creation.
Nonetheless, these cyclical processes of value creation would work better in perfect
markets, but the telecom operator market is usually governed by mature oligopolies
with very large firms competing to retain their customers through strong lock-in
strategies, overlooking the customer expectations many times. In this sense, the value
creation process for the consumer customers in the telecom market may become a one
way process where telecom operators make their value propositions and the customers
select among the locking and confusing telecom operators offerings based mostly on
hedonic perceptions than well-informed utility perceptions. Perhaps this logic before
obeys to the high information asymmetry that there exist between the service provider
and the consumer customer in the telecom market as explained by Stiglitz (1989). This
information asymmetry gives telecom operators space to maneuver with lock-in
strategies, especially to mobile operators, that typically offer bundles contracts of
services and equipment for minimum terms with high switching costs.
The fact that there exist high information asymmetry in the telecom market not only
allows operators to develop lock-in strategies while attaining high profits, but also to
maximize the producer surplus in many cases, especially in developing markets where
the digital gap is still broad. Producer try to maximize the overall profit by analyzing the
cross elasticities of services, that is, how much a change in price of a certain service
may affect the demand of another service. On the other side, the consumer customers try
to maximize their net benefit, and therefore their consumer surplus, by selecting the
offering that gives them the best trade-off between utility and price, of course according
to their needs. However, this is not a straight forward task since the price list of products
bundles and traditional stand-alone services are not linear, especially in the case of
mobile operators. Consumer customers may face some confusion when they subscribe
for telecom services provision since they do not only have to choose from the nonlinear
offerings of the a single telecom operator, but from multiple firms’ offerings, usually
57
three or four, that may increase the confusion, but at the same time gives the chance to
them to attain higher surplus thanks to competition, of course if switching costs do not
limit the selection process.
In this point it is important to notice that in the telecom market there are strong network
effects that intervene in the utility equation. Telecom access services that are not subject
to person-to-person communications like the television, are not subject to direct network
effects; however, telecom access services that require person-to-person communications
like the fixed or mobile telephone, face strong network effects, especially due to
interconnection costs. This means that the perceived value of consumer customers
increases when the number of users of the same network increases, which usually
becomes a crucial aspect when selecting telecom access services, especially if the
majority of people that are communicating frequently with are subscribers of the same
network. Network effects are determinant for the consumer market consolidation (Katz
& Shapiro, 1985). As a telecom operator`s subscribers base starts to grow, the firm may
experience two important points of equilibrium of the offer and demand driven by the
network effect. One point occurs in an early growth phase, which constitutes an
unstable equilibrium since any negative feedback, usually induced by the one or a
combination of the Porter’s five forces effects, may bring a firm or the market to failure,
but if not, the positive network effect will induce an stable growth of the subscribers
base until it reaches a second point of equilibrium that is stable and is normally not
subject to risks of firm or market failure (Courcoubetis & Weber, 2003).
On the other hand, internet access service per se is generally not subject to network
effects since users do not perceive any additional value in the number of users
subscribing with the same firm because they pay a flat price for unlimited usage and not
according to usage or interconnection. However, internet-based network effects are
mainly exploited by content providers such as social network firms like Facebook,
Twitter and WhatsApp. Actually, social networks have triggered unprecedented
network effects, surpassing access-based network effects for voice service, given the
enormous worldwide popularity and group forming features, which today enjoy the
highest preference in terms of medium of communication among people. In this sense,
according to Metcalfe’s Law, the value of a network enabling two-way communication,
like the telephone and data networks, increases with the square of the number of users in
58
the network N; whereas, according to Reed’s Law, the value of a network enabling
group forming communication grows exponentially with the number of users in the
network and is equal to 2N when the number of users is large. Therefore, traditional
telecom operators perceiving the majority of their revenues and profit out of access
services subscriptions cannot overlook the risks of churn considering this dominating
preference of communications through social networks, and therefore, they require to
suitably manage the customer relationships through their whole journey, including four
important processes for customer retention such as customer care, offerings portfolio,
purchase process, and network and service quality.
59
4 RESEARCH METHODS
4.1 Comparative case study approach
The case study approach has certainly be a widely used method that helps to
operationalize concepts, theories and models to real world cases, which in turn allows
us to determine the applicability of such frameworks, finding out whether we
understand the reality, and to look forward to possible scenarios (Yin, 2014). In addition,
the purpose of carrying out a comparative case study of Ecuador is to exemplify how
the widespread of mainstream products and services in the TMT market are and might
continue shaping the telecom industry in Ecuador, considering the specificities of a
developing country such as Ecuador and comparing it objectively with the global
environment.
4.2 Case selection
In this thesis I have chosen as a target of study my home country Ecuador considering
that this is the place where I live and that I strongly believe that developing countries
such as Ecuador must emphasize and take advantage of the opportunities of ICT to
shorten the development gap. The development of the telecom industry is therefore a
main factor for getting integrated into the international information society, and in turn,
gaining competitive advantage by fostering the knowledge economy.
4.3 Data collection and analysis
The main purpose of the selected research methodology is to enable to quantitatively
and objectively depict the current situation of the TMT industry in Ecuador and its
tendencies, to then compare the findings with the global context and reflect about them
based on the theoretical framework. This comparison and reflection before will provide
us a benchmarked and supported view about how the widespread of mainstream
services and products in the TMT market are and might continue shaping the telecom
industry in the next decade in Ecuador.
60
In this sense, looking to answer the research question I have employed a quantitative
research approach that includes data from two hundred fifty five (255) firms according
to the following steps:
a) I gathered ICT statistical information of Ecuador in order to identify the
main drivers of development of the telecom industry in Ecuador as part of
TMT industry. This information helped to evidence the widespread of
mainstream services and products in Ecuador including mobile broadband
Internet, fixed broadband Internet, smartphones and tablets, social networks,
High Definition HD Television, e-commerce and OTT content.
b) I gathered financial and population information of firms domiciled in
Ecuador participating in the local TMT industry in order to determine
important parameters for the analysis including revenue, operational margin,
CAPEX investment, market share, prices and firms’ population that help to
describe the development of the telecom industry in Ecuador and its
tendencies according to the main parameters of the models presented in the
theoretical framework.
c) I revised the financial reports of the companies in order to filter, classify and
tabulate the data acquired according to the different sectors of the TMT
industry, so that the information in the case of firms that operate in more
than one industry sector or segment gets classified and tabulated with the
least error possible. I also analyzed the website of the firms to assess the
main products and services that they offer, and in some cases I also called
the companies to confirm in which sector(s) the firm operates.
d) I analyzed the findings by comparing them to the global context. For this
intent I used as reference model the article “The 2013 Value Shift Index:
Slower growth, subtle shifts” (Péladeau et al., 2013), which provides a
quantitative analysis of the size of the global TMT industry, its growth
tendencies and an insight about the value shifts among the different industry
sectors. Based on this article before, I benchmarked my findings about the
TMT industry in Ecuador with the global context. It is important to mention
that the results in the article of reference are based on a sample that accounts
61
for the 60% of the universe according to the authors; whereas, in this Thesis
the used sample accounts for about 93% of the universe.
e) Apart from presenting the information about the TMT industry according to
the article of reference “The 2013 Value Shift Index: Slower growth, subtle
shifts,” I disaggregated the revenue of the Network and Service Operations
industry sector into the different types of telecom services offered in this
sector including access, managed, carrier, and colocation services, which
were described in the previous chapter. This separation helped to evidence
the tendencies of each segment of the Network and Service Operations
industry sector, and to realize the leading segment of the whole TMT
industry as we will see later on.
f) Additionally, to provide a complementary comparison in terms of per capita
development I used the information available in web portal of The World
Bank as well as the annual ranking of The Networked Readiness Index
provided in the “Global Information Technology Report 2014” of the WEF
(Bilbao-Osorio et al., 2014) to put in context the per capita findings.
4.3.1 Sources and Timeframe
Financial Information: The main source of the financial information of companies in
Ecuador depicted in the figures and tables in the next chapter was the web portal of the
Superintendence of Companies and Securities of Ecuador (SUPERCIAS, 2014), which
maintains the most complete data base of Annual Reports of Companies, including
detailed Financial Statements and Notes of mercantile associations in Ecuador. Another
main source of financial information was the web portal of the magazine EKOS (Ekos,
2014), an Ecuadorian magazine specialized in research on the economy and markets in
Ecuador. EKOS provides financial rankings considering revenue, profit, and taxes as
well as a classification by industry sector of companies in Ecuador, which served as a
starting point for the classification of companies in this Thesis. However, in order to
accurately classify the companies into each industry sector I further confirmed the
products and services that each company offers by analyzing the notes of the financial
statements, looking at the company website, and calling the company to ask about its
portfolio of products when it was necessary.
62
Moreover, I used the web portal of the official Tax Office of Ecuador (Servicio de
Rentas Internas SRI, 2014) in the few cases where the information of EKOS did not
match the information of the Superintendence of Companies in order to confirm which
one was correct. It should be mentioned that the only financial information available
from the official web portal of the Tax Office of Ecuador is actually the tax calculated
for each company for each year; however this information served to confirm whether
the information from the Superintendence of Companies is correct or the information
from EKOS when there was a difference between them, since the Tax Office is the first
entity where a change of financial information of a company gets registered.
For the analysis of the financial information of the Companies in Ecuador I covered the
years from 2010 to year 2013 given that the beginning of this decade marks an
important point in the TMT industry in Ecuador with the widespread of mainstream
products and services including mobile broadband Internet, fixed broadband Internet,
smartphones and tablets, social networks, High Definition HD Television, e-commerce
and OTT content. It should be noted that all the figures and tables showing financial
information of the telecom industry in Ecuador, like revenue, profit, market
concentration and CAPEX investments, represent the original work done in this Thesis.
However, with the aim to clearly distinguish which figures/tables represent original
work and findings and which ones are just supporting information I have clarified this in
every figure in the next chapter.
ICT Statistics in Ecuador: The main source of the ICT statistics in Ecuador shown in
the figures and tables in the next chapter was the web portal of the National Secretary of
Telecommunications of Ecuador (SENATEL, 2014), which maintains the most
complete data base of the statistics of the evolution of the different telecom services in
Ecuador in terms of number of subscribers, market penetration, installed infrastructure,
and prices which are disaggregated in some cases by provinces, by technologies and/or
by service providers. This data provided insight about the main drivers of development
in the telecom sector as we will see in the next chapter.
Another important source of ICT statistics in Ecuador in terms of usage and market
penetration of telecom and information services and products is the National Institute of
Statistics and Censuses of Ecuador (INEC, 2014). This source before provided
63
important data about the market penetration of mobile phones and smartphones as well
as the usage of social networks in Ecuador as main drivers of development of the TMT
industry.
It should be noted that for the case of the figures of ICT statistics in Ecuador presented
in the next chapter the timeframe of the data includes the years since the beginning of
the 21st century until the year 2014, depending on the figure, in the same timeframe that
they are presented by their corresponding original sources such as National Secretary of
Telecommunications of Ecuador (SENATEL, 2014) and National Institute of Statistics
and Censuses of Ecuador (INEC, 2014). The fact that these figures of ICT statistics in
Ecuador include information before the year 2010 gives us a wider perspective of the
evolution of the telecom industry in Ecuador where the main drivers of development
can be pinpointed. In addition to this before, in the introduction part of this Thesis I
briefly went through the history of the telecommunications since the industrial evolution
with the aim that we get an overall perspective of the past and present situation of the
telecom industry and its tendencies.
Population Information: The main source of the population information of companies
in Ecuador depicted in the figures in the next chapter was the web portal of the
Superintendence of Companies and Securities of Ecuador (SUPERCIAS, 2014), which
maintains the most complete data base of the legal status of companies including the
foundation and dissolution of companies, the current number of active companies
corresponding to each economic sectors based on their core business activities.
Furthermore, the National Secretary of Telecommunications of Ecuador (SENATEL,
2014) also provided the population evolution of Internet Service Providers ISP in
Ecuador which represents the segment of the telecom industry in Ecuador with the
highest activity in the last decade.
4.3.2 Limitations of the data
One of the possible limitations of the data is that some companies that operate in more
than one TMT industry sector do not disaggregate the revenue by sector, in which cases
a fair estimation is required. In the case of the Network and Service Operations industry
sector, the data was not disaggregated according to the different service segments
analyzed like fixed telephony, mobile services, carrier services, and fixed Internet
64
access in the case of the public enterprises such as CNT EP and ETAPA EP; therefore,
fair estimations of these disaggregation was done, keeping coherence with the data
found in the budget statements of the aforementioned public enterprises.
Furthermore, it should be noticed that the data of the 255 firms included in this study
account for about 93% of the total TMT industry revenue, and the remaining 7%, that
account in its majority to Small and Medium Enterprises SME, was fairly estimated
independently for each industry sector based on the information about the sector-
specific firms’ population for micro, small, and medium enterprises and their
corresponding revenue range available in the web portal of the Superintendence of
Companies and Securities of Ecuador (SUPERCIAS, 2014). It should be noted as well
that the summations of values in the tables and figures in the next section may not
coincide with the totals due to rounding errors.
65
5 A COMPARATIVE STUDY OF THE TELECOM SECTOR IN
ECUADOR
The TMT industry in Ecuador is on average developing faster than worldwide, but its
current development is yet behind the average according to the findings of this study,
which seem to be consistent with the ranking of The Networked Readiness Index
provided in the Global Information Technology Report of the World Economic Forum
WEF (Bilbao-Osorio et al., 2014). According to Table 2, the TMT industry grew 10,03%
from year 2010 to year 2013 in the case of Ecuador, and of 6,26% worldwide taking as
reference the year 2010. A similar thing occurs if we compare the Gross Domestic
Product GDP of the Ecuadorian economy with the global GDP, inferring in this sense
that on average both the Ecuadorian economy and TMT industry are growing
significantly faster than worldwide. In this sense, it can be observed as well that the
global TMT industry is growing slightly faster than the global GDP, whereas, the
Ecuadorian TMT industry is growing about the same pace than its GDP, taking as
reference the year 2010. It should be noted that the GDP and TMT revenue are
considered at purchaser’s prices, that is, they are not calculated with reference prices of
any given year; therefore, the inflation may introduce some variation in terms of real
growth, however, the comparisons between Ecuador and the global context are rather
fair considering the similarity of the evolution of the inflation rate in Ecuador compared
to the World (World Bank – Inflation Data, 2014).
Another important finding from Table 2 is that on average a person in Ecuador spends
more percentage of his or her income in TMT products and services than a person in the
world, especially in telecom services as it will be seen further on. If we analyze this fact
before together with the 2013 ranking of Ecuador in The Networked Readiness Index, it
may suggest that the access and consumption to TMT products and services among the
Ecuadorian population is a fair measure of the income distribution inequality. However,
we could also say that we are in an ongoing journey to reduce the digital gap worldwide
considering that both the Ecuadorian and global economies and TMT industries are
growing much faster than the global population.
With respect to the data of the global TMT industry, it should be remarked that it has
been taken from the reference article “The 2013 Value Shift Index: Slower growth,
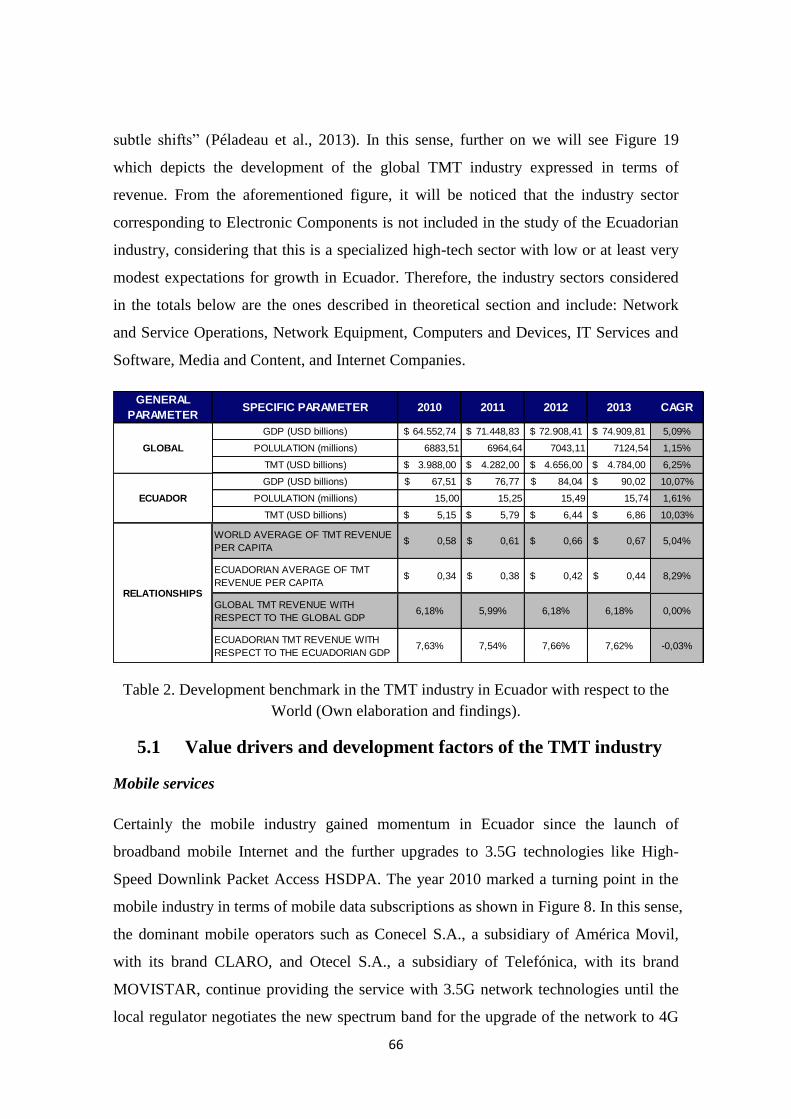
66
subtle shifts” (Péladeau et al., 2013). In this sense, further on we will see Figure 19
which depicts the development of the global TMT industry expressed in terms of
revenue. From the aforementioned figure, it will be noticed that the industry sector
corresponding to Electronic Components is not included in the study of the Ecuadorian
industry, considering that this is a specialized high-tech sector with low or at least very
modest expectations for growth in Ecuador. Therefore, the industry sectors considered
in the totals below are the ones described in theoretical section and include: Network
and Service Operations, Network Equipment, Computers and Devices, IT Services and
Software, Media and Content, and Internet Companies.
Table 2. Development benchmark in the TMT industry in Ecuador with respect to the
World (Own elaboration and findings).
5.1 Value drivers and development factors of the TMT industry
Mobile services
Certainly the mobile industry gained momentum in Ecuador since the launch of
broadband mobile Internet and the further upgrades to 3.5G technologies like High-
Speed Downlink Packet Access HSDPA. The year 2010 marked a turning point in the
mobile industry in terms of mobile data subscriptions as shown in Figure 8. In this sense,
the dominant mobile operators such as Conecel S.A., a subsidiary of América Movil,
with its brand CLARO, and Otecel S.A., a subsidiary of Telefónica, with its brand
MOVISTAR, continue providing the service with 3.5G network technologies until the
local regulator negotiates the new spectrum band for the upgrade of the network to 4G
GENERAL
PARAMETERSPECIFIC PARAMETER 2010 2011 2012 2013 CAGR
GDP (USD billions) 64.552,74$ 71.448,83$ 72.908,41$ 74.909,81$ 5,09%
POLULATION (millions) 6883,51 6964,64 7043,11 7124,54 1,15%
TMT (USD billions) 3.988,00$ 4.282,00$ 4.656,00$ 4.784,00$ 6,25%
GDP (USD billions) 67,51$ 76,77$ 84,04$ 90,02$ 10,07%
POLULATION (millions) 15,00 15,25 15,49 15,74 1,61%
TMT (USD billions) 5,15$ 5,79$ 6,44$ 6,86$ 10,03%
WORLD AVERAGE OF TMT REVENUE
PER CAPITA0,58$ 0,61$ 0,66$ 0,67$ 5,04%
ECUADORIAN AVERAGE OF TMT
REVENUE PER CAPITA0,34$ 0,38$ 0,42$ 0,44$ 8,29%
GLOBAL TMT REVENUE WITH
RESPECT TO THE GLOBAL GDP6,18% 5,99% 6,18% 6,18% 0,00%
ECUADORIAN TMT REVENUE WITH
RESPECT TO THE ECUADORIAN GDP7,63% 7,54% 7,66% 7,62% -0,03%
GLOBAL
ECUADOR
RELATIONSHIPS
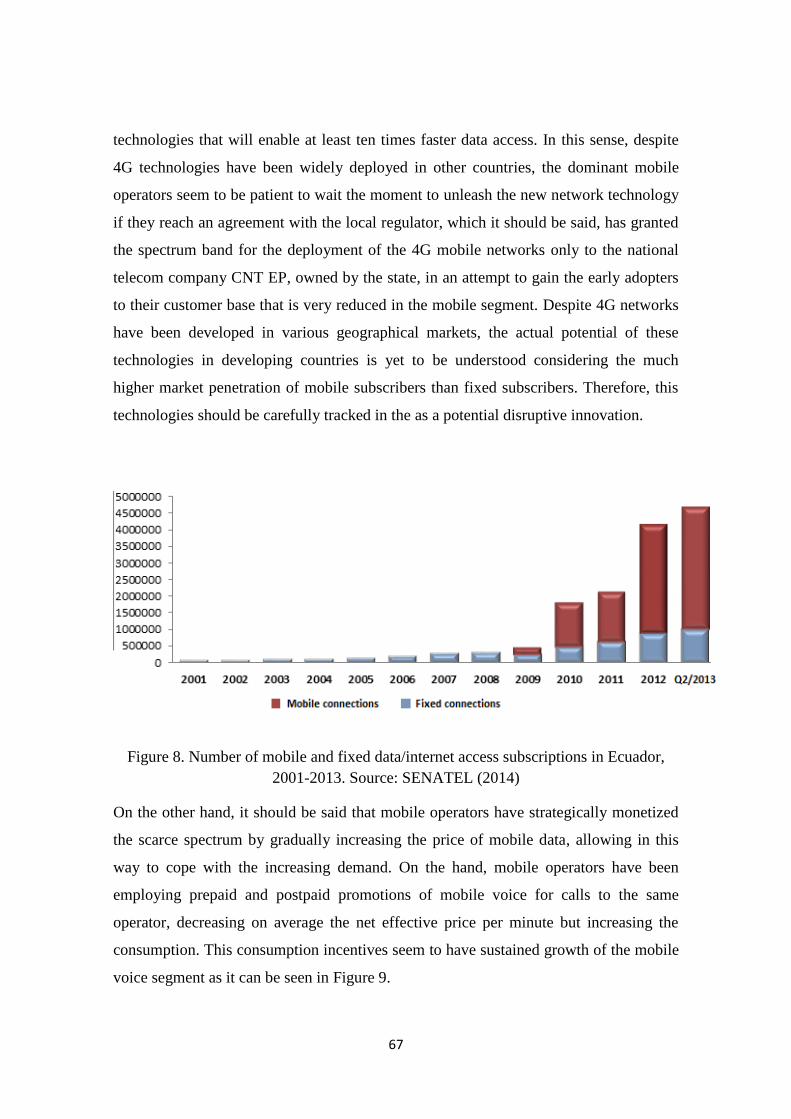
67
technologies that will enable at least ten times faster data access. In this sense, despite
4G technologies have been widely deployed in other countries, the dominant mobile
operators seem to be patient to wait the moment to unleash the new network technology
if they reach an agreement with the local regulator, which it should be said, has granted
the spectrum band for the deployment of the 4G mobile networks only to the national
telecom company CNT EP, owned by the state, in an attempt to gain the early adopters
to their customer base that is very reduced in the mobile segment. Despite 4G networks
have been developed in various geographical markets, the actual potential of these
technologies in developing countries is yet to be understood considering the much
higher market penetration of mobile subscribers than fixed subscribers. Therefore, this
technologies should be carefully tracked in the as a potential disruptive innovation.
Figure 8. Number of mobile and fixed data/internet access subscriptions in Ecuador,
2001-2013. Source: SENATEL (2014)
On the other hand, it should be said that mobile operators have strategically monetized
the scarce spectrum by gradually increasing the price of mobile data, allowing in this
way to cope with the increasing demand. On the hand, mobile operators have been
employing prepaid and postpaid promotions of mobile voice for calls to the same
operator, decreasing on average the net effective price per minute but increasing the
consumption. This consumption incentives seem to have sustained growth of the mobile
voice segment as it can be seen in Figure 9.
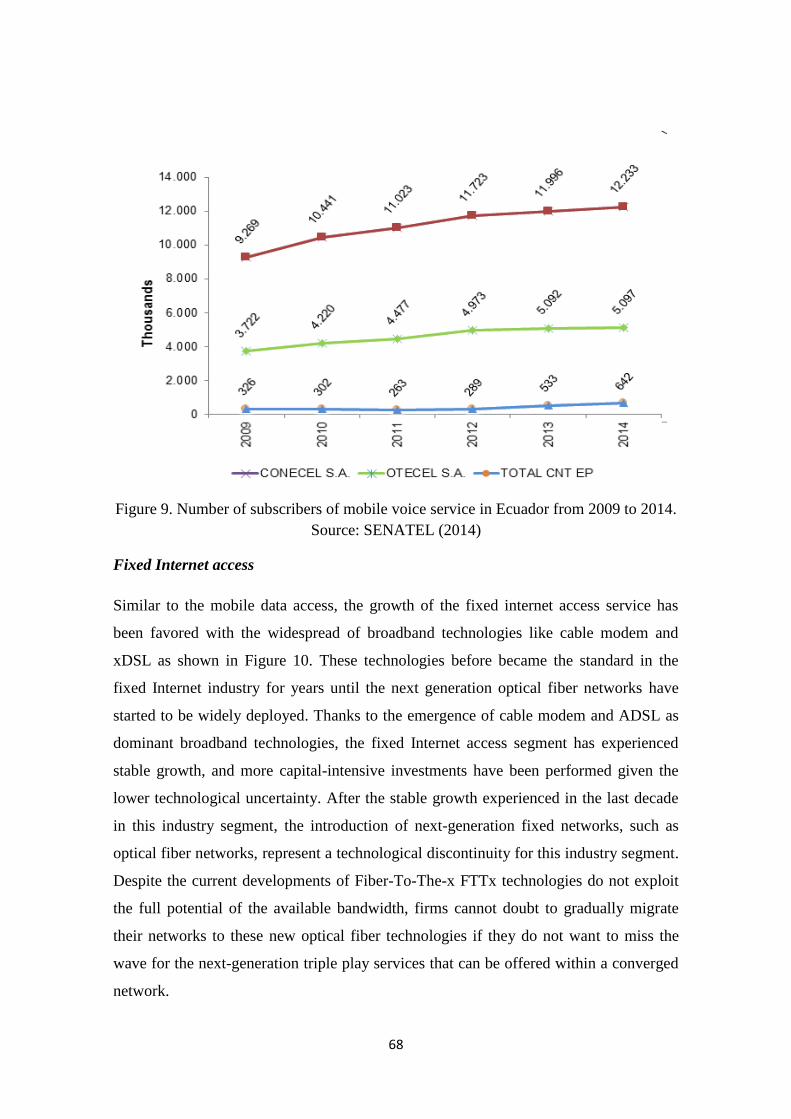
68
Figure 9. Number of subscribers of mobile voice service in Ecuador from 2009 to 2014.
Source: SENATEL (2014)
Fixed Internet access
Similar to the mobile data access, the growth of the fixed internet access service has
been favored with the widespread of broadband technologies like cable modem and
xDSL as shown in Figure 10. These technologies before became the standard in the
fixed Internet industry for years until the next generation optical fiber networks have
started to be widely deployed. Thanks to the emergence of cable modem and ADSL as
dominant broadband technologies, the fixed Internet access segment has experienced
stable growth, and more capital-intensive investments have been performed given the
lower technological uncertainty. After the stable growth experienced in the last decade
in this industry segment, the introduction of next-generation fixed networks, such as
optical fiber networks, represent a technological discontinuity for this industry segment.
Despite the current developments of Fiber-To-The-x FTTx technologies do not exploit
the full potential of the available bandwidth, firms cannot doubt to gradually migrate
their networks to these new optical fiber technologies if they do not want to miss the
wave for the next-generation triple play services that can be offered within a converged
network.
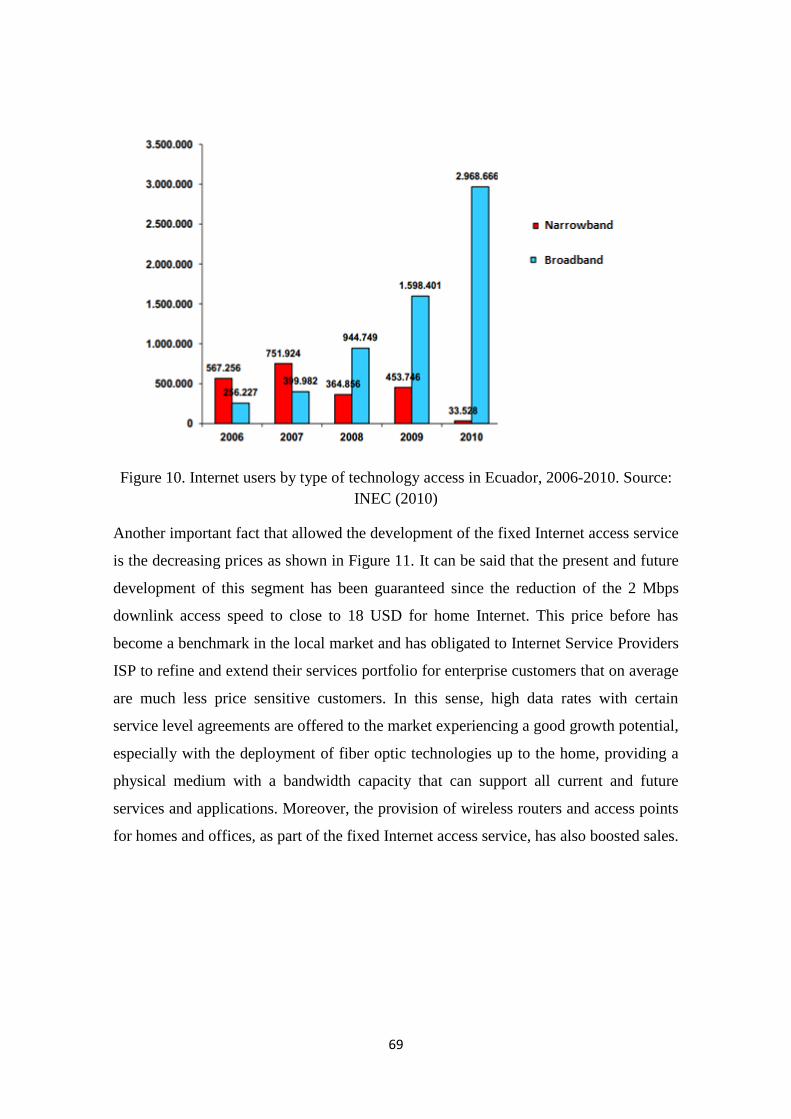
69
Figure 10. Internet users by type of technology access in Ecuador, 2006-2010. Source:
INEC (2010)
Another important fact that allowed the development of the fixed Internet access service
is the decreasing prices as shown in Figure 11. It can be said that the present and future
development of this segment has been guaranteed since the reduction of the 2 Mbps
downlink access speed to close to 18 USD for home Internet. This price before has
become a benchmark in the local market and has obligated to Internet Service Providers
ISP to refine and extend their services portfolio for enterprise customers that on average
are much less price sensitive customers. In this sense, high data rates with certain
service level agreements are offered to the market experiencing a good growth potential,
especially with the deployment of fiber optic technologies up to the home, providing a
physical medium with a bandwidth capacity that can support all current and future
services and applications. Moreover, the provision of wireless routers and access points
for homes and offices, as part of the fixed Internet access service, has also boosted sales.
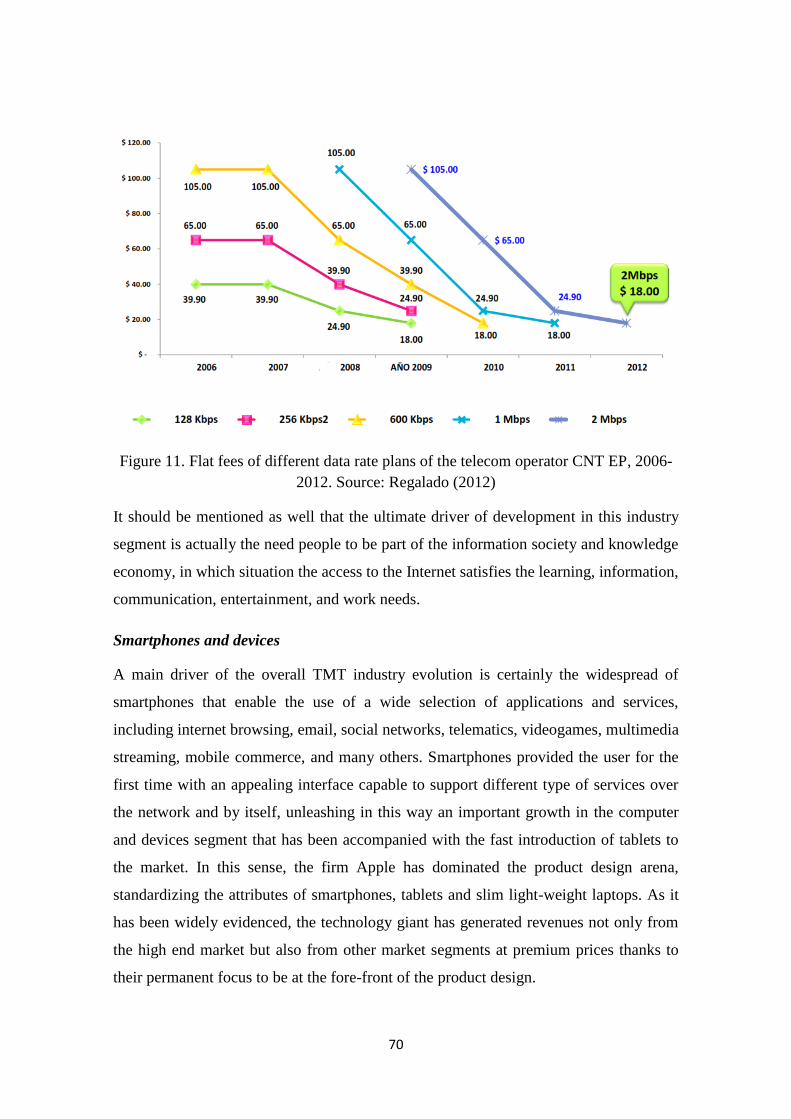
70
Figure 11. Flat fees of different data rate plans of the telecom operator CNT EP, 2006-
2012. Source: Regalado (2012)
It should be mentioned as well that the ultimate driver of development in this industry
segment is actually the need people to be part of the information society and knowledge
economy, in which situation the access to the Internet satisfies the learning, information,
communication, entertainment, and work needs.
Smartphones and devices
A main driver of the overall TMT industry evolution is certainly the widespread of
smartphones that enable the use of a wide selection of applications and services,
including internet browsing, email, social networks, telematics, videogames, multimedia
streaming, mobile commerce, and many others. Smartphones provided the user for the
first time with an appealing interface capable to support different type of services over
the network and by itself, unleashing in this way an important growth in the computer
and devices segment that has been accompanied with the fast introduction of tablets to
the market. In this sense, the firm Apple has dominated the product design arena,
standardizing the attributes of smartphones, tablets and slim light-weight laptops. As it
has been widely evidenced, the technology giant has generated revenues not only from
the high end market but also from other market segments at premium prices thanks to
their permanent focus to be at the fore-front of the product design.
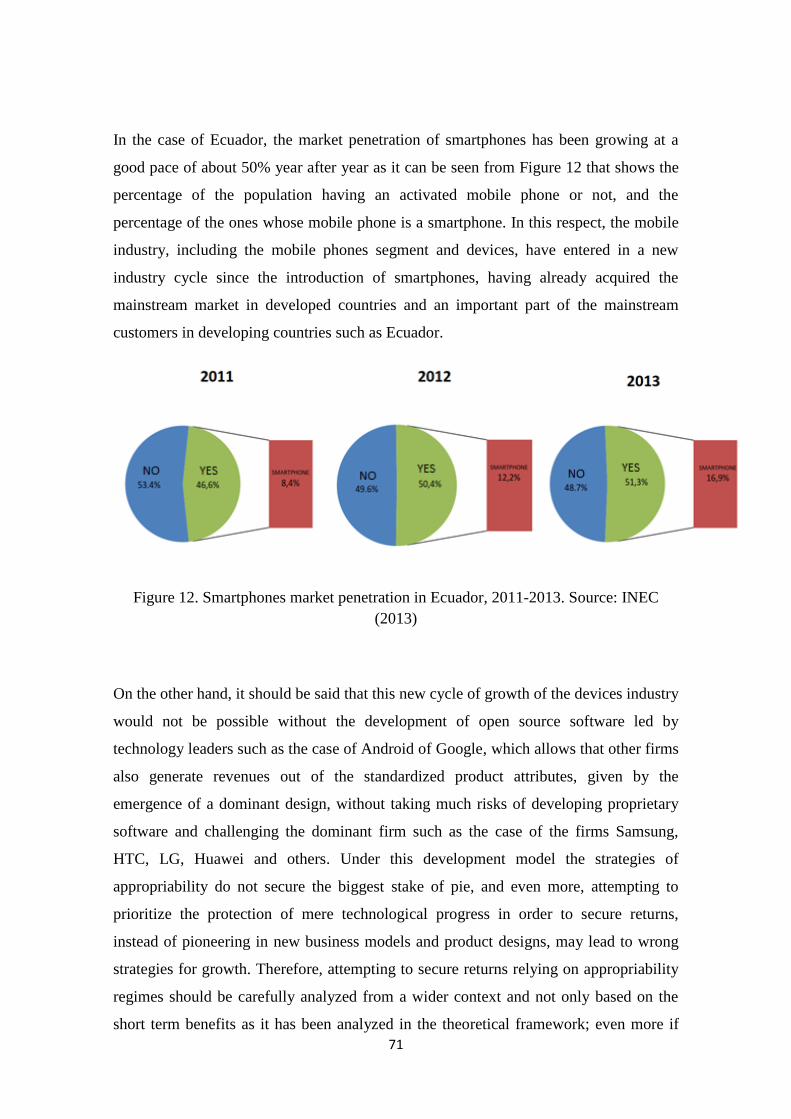
71
In the case of Ecuador, the market penetration of smartphones has been growing at a
good pace of about 50% year after year as it can be seen from Figure 12 that shows the
percentage of the population having an activated mobile phone or not, and the
percentage of the ones whose mobile phone is a smartphone. In this respect, the mobile
industry, including the mobile phones segment and devices, have entered in a new
industry cycle since the introduction of smartphones, having already acquired the
mainstream market in developed countries and an important part of the mainstream
customers in developing countries such as Ecuador.
Figure 12. Smartphones market penetration in Ecuador, 2011-2013. Source: INEC
(2013)
On the other hand, it should be said that this new cycle of growth of the devices industry
would not be possible without the development of open source software led by
technology leaders such as the case of Android of Google, which allows that other firms
also generate revenues out of the standardized product attributes, given by the
emergence of a dominant design, without taking much risks of developing proprietary
software and challenging the dominant firm such as the case of the firms Samsung,
HTC, LG, Huawei and others. Under this development model the strategies of
appropriability do not secure the biggest stake of pie, and even more, attempting to
prioritize the protection of mere technological progress in order to secure returns,
instead of pioneering in new business models and product designs, may lead to wrong
strategies for growth. Therefore, attempting to secure returns relying on appropriability
regimes should be carefully analyzed from a wider context and not only based on the
short term benefits as it has been analyzed in the theoretical framework; even more if
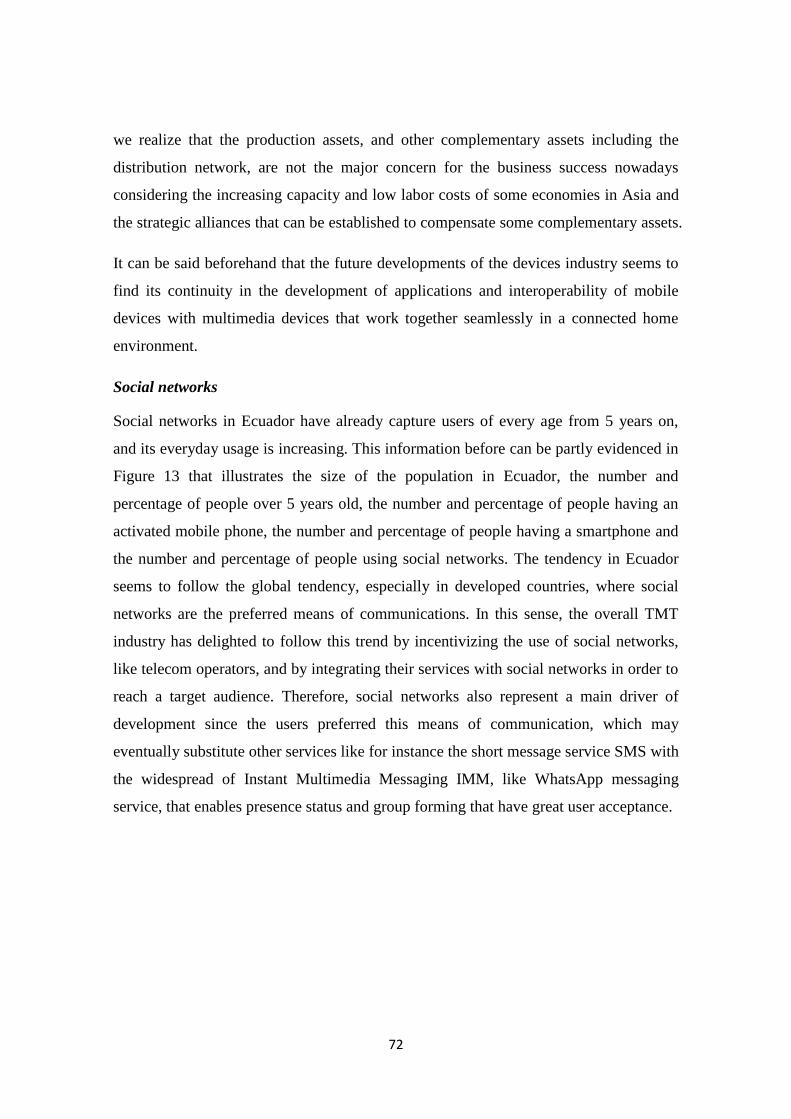
72
we realize that the production assets, and other complementary assets including the
distribution network, are not the major concern for the business success nowadays
considering the increasing capacity and low labor costs of some economies in Asia and
the strategic alliances that can be established to compensate some complementary assets.
It can be said beforehand that the future developments of the devices industry seems to
find its continuity in the development of applications and interoperability of mobile
devices with multimedia devices that work together seamlessly in a connected home
environment.
Social networks
Social networks in Ecuador have already capture users of every age from 5 years on,
and its everyday usage is increasing. This information before can be partly evidenced in
Figure 13 that illustrates the size of the population in Ecuador, the number and
percentage of people over 5 years old, the number and percentage of people having an
activated mobile phone, the number and percentage of people having a smartphone and
the number and percentage of people using social networks. The tendency in Ecuador
seems to follow the global tendency, especially in developed countries, where social
networks are the preferred means of communications. In this sense, the overall TMT
industry has delighted to follow this trend by incentivizing the use of social networks,
like telecom operators, and by integrating their services with social networks in order to
reach a target audience. Therefore, social networks also represent a main driver of
development since the users preferred this means of communication, which may
eventually substitute other services like for instance the short message service SMS with
the widespread of Instant Multimedia Messaging IMM, like WhatsApp messaging
service, that enables presence status and group forming that have great user acceptance.
73
Figure 13. Usage of social networks in Ecuador, 2011-2013. Source: INEC (2011, 2012,
2013)
Fixed telephony
With respect With respect to prices, Figures 10, 11 and 12 illustrate the evolution of the
tariffs for mobile voice service per minute. From Figure 14 and 15 we can see that the
prices for voice service from fixed to mobile networks have reduced on average to about
half of their initial price, with only one operator having the minute price higher than 14
USD cents. It can also be evidenced that the lowest tariff for fixed to mobile voice
service is offered by the state-owned telecom operator CNT EP, which attains more than
80% of the fixed telephony market share, thanks to the lower interconnections fees.
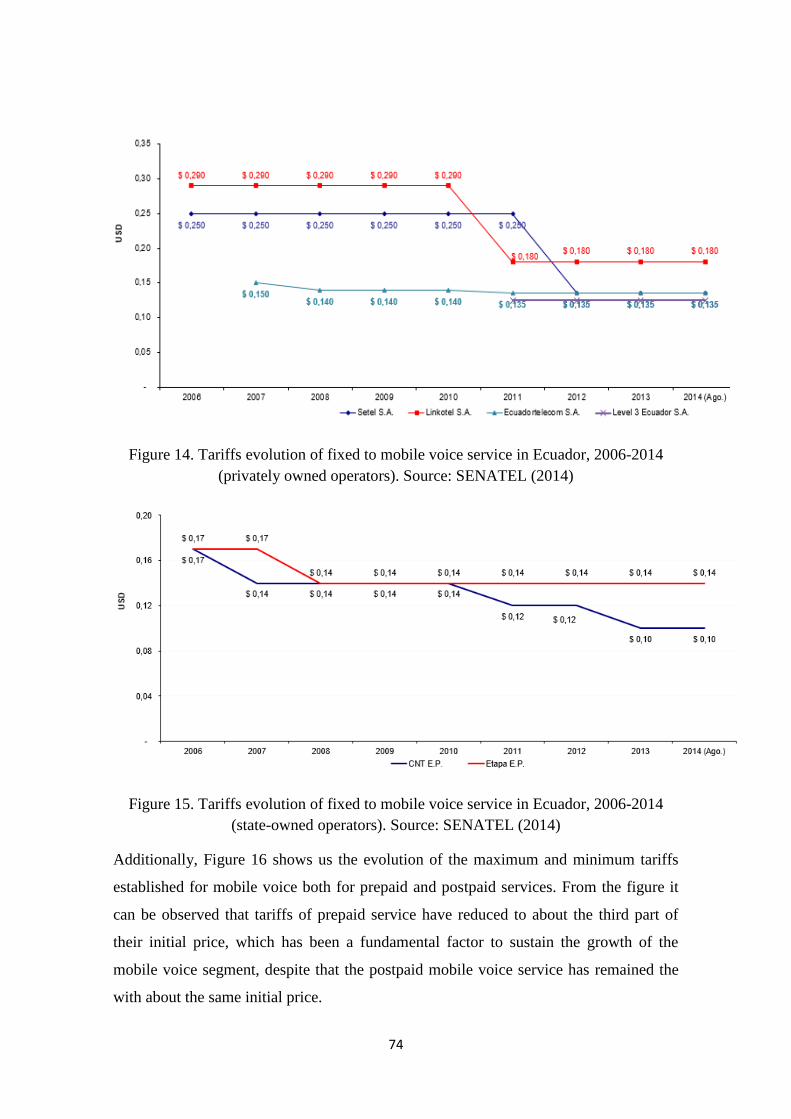
74
Figure 14. Tariffs evolution of fixed to mobile voice service in Ecuador, 2006-2014
(privately owned operators). Source: SENATEL (2014)
Figure 15. Tariffs evolution of fixed to mobile voice service in Ecuador, 2006-2014
(state-owned operators). Source: SENATEL (2014)
Additionally, Figure 16 shows us the evolution of the maximum and minimum tariffs
established for mobile voice both for prepaid and postpaid services. From the figure it
can be observed that tariffs of prepaid service have reduced to about the third part of
their initial price, which has been a fundamental factor to sustain the growth of the
mobile voice segment, despite that the postpaid mobile voice service has remained the
with about the same initial price.
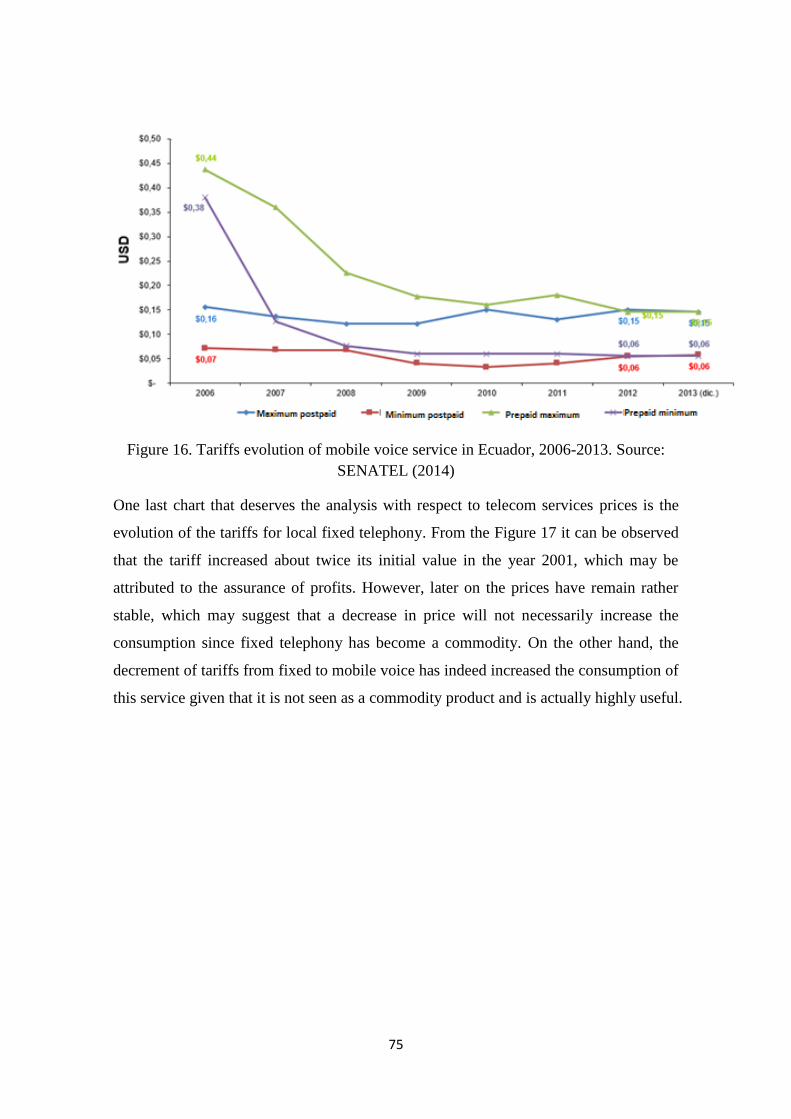
75
Figure 16. Tariffs evolution of mobile voice service in Ecuador, 2006-2013. Source:
SENATEL (2014)
One last chart that deserves the analysis with respect to telecom services prices is the
evolution of the tariffs for local fixed telephony. From the Figure 17 it can be observed
that the tariff increased about twice its initial value in the year 2001, which may be
attributed to the assurance of profits. However, later on the prices have remain rather
stable, which may suggest that a decrease in price will not necessarily increase the
consumption since fixed telephony has become a commodity. On the other hand, the
decrement of tariffs from fixed to mobile voice has indeed increased the consumption of
this service given that it is not seen as a commodity product and is actually highly useful.
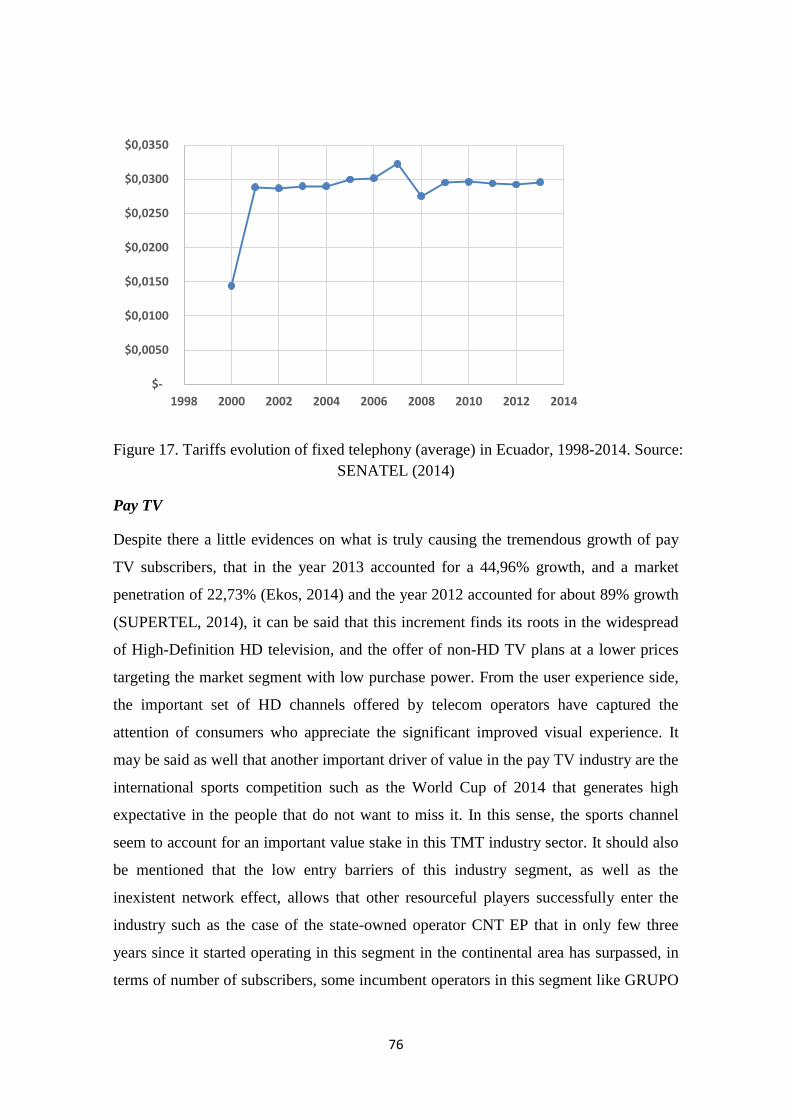
76
Figure 17. Tariffs evolution of fixed telephony (average) in Ecuador, 1998-2014. Source:
SENATEL (2014)
Pay TV
Despite there a little evidences on what is truly causing the tremendous growth of pay
TV subscribers, that in the year 2013 accounted for a 44,96% growth, and a market
penetration of 22,73% (Ekos, 2014) and the year 2012 accounted for about 89% growth
(SUPERTEL, 2014), it can be said that this increment finds its roots in the widespread
of High-Definition HD television, and the offer of non-HD TV plans at a lower prices
targeting the market segment with low purchase power. From the user experience side,
the important set of HD channels offered by telecom operators have captured the
attention of consumers who appreciate the significant improved visual experience. It
may be said as well that another important driver of value in the pay TV industry are the
international sports competition such as the World Cup of 2014 that generates high
expectative in the people that do not want to miss it. In this sense, the sports channel
seem to account for an important value stake in this TMT industry sector. It should also
be mentioned that the low entry barriers of this industry segment, as well as the
inexistent network effect, allows that other resourceful players successfully enter the
industry such as the case of the state-owned operator CNT EP that in only few three
years since it started operating in this segment in the continental area has surpassed, in
terms of number of subscribers, some incumbent operators in this segment like GRUPO
$-
$0,0050
$0,0100
$0,0150
$0,0200
$0,0250
$0,0300
$0,0350
1998 2000 2002 2004 2006 2008 2010 2012 2014
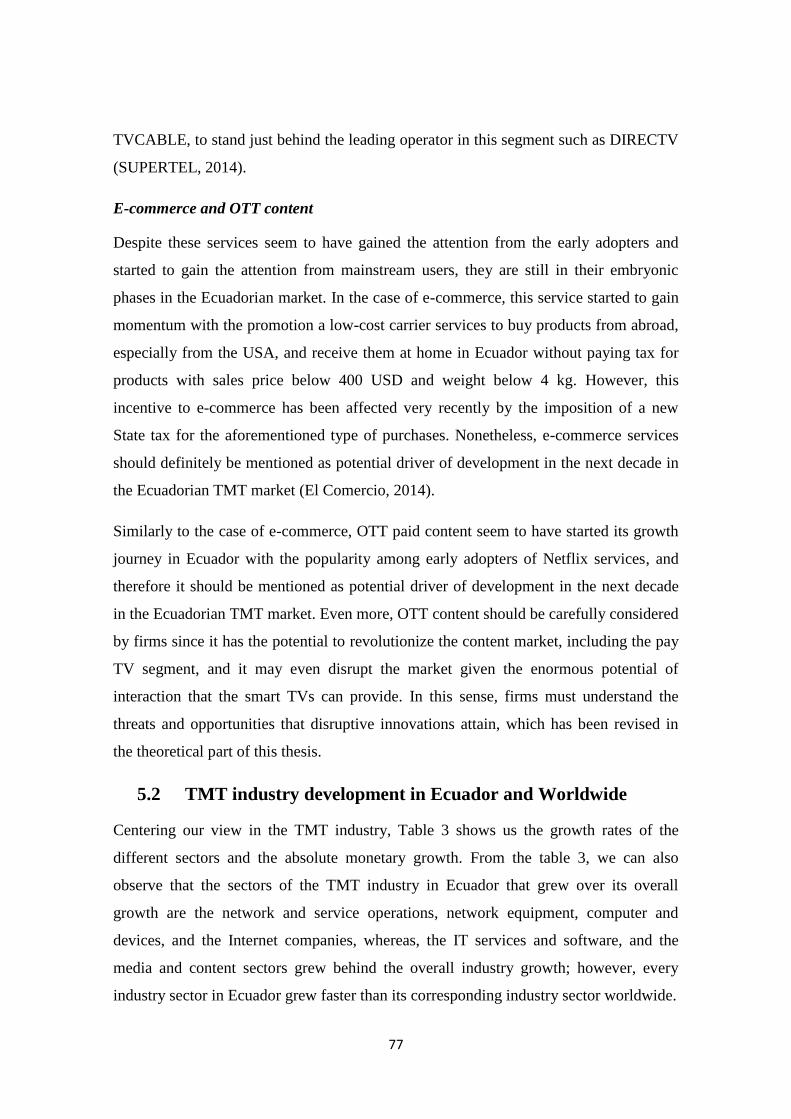
77
TVCABLE, to stand just behind the leading operator in this segment such as DIRECTV
(SUPERTEL, 2014).
E-commerce and OTT content
Despite these services seem to have gained the attention from the early adopters and
started to gain the attention from mainstream users, they are still in their embryonic
phases in the Ecuadorian market. In the case of e-commerce, this service started to gain
momentum with the promotion a low-cost carrier services to buy products from abroad,
especially from the USA, and receive them at home in Ecuador without paying tax for
products with sales price below 400 USD and weight below 4 kg. However, this
incentive to e-commerce has been affected very recently by the imposition of a new
State tax for the aforementioned type of purchases. Nonetheless, e-commerce services
should definitely be mentioned as potential driver of development in the next decade in
the Ecuadorian TMT market (El Comercio, 2014).
Similarly to the case of e-commerce, OTT paid content seem to have started its growth
journey in Ecuador with the popularity among early adopters of Netflix services, and
therefore it should be mentioned as potential driver of development in the next decade
in the Ecuadorian TMT market. Even more, OTT content should be carefully considered
by firms since it has the potential to revolutionize the content market, including the pay
TV segment, and it may even disrupt the market given the enormous potential of
interaction that the smart TVs can provide. In this sense, firms must understand the
threats and opportunities that disruptive innovations attain, which has been revised in
the theoretical part of this thesis.
5.2 TMT industry development in Ecuador and Worldwide
Centering our view in the TMT industry, Table 3 shows us the growth rates of the
different sectors and the absolute monetary growth. From the table 3, we can also
observe that the sectors of the TMT industry in Ecuador that grew over its overall
growth are the network and service operations, network equipment, computer and
devices, and the Internet companies, whereas, the IT services and software, and the
media and content sectors grew behind the overall industry growth; however, every
industry sector in Ecuador grew faster than its corresponding industry sector worldwide.
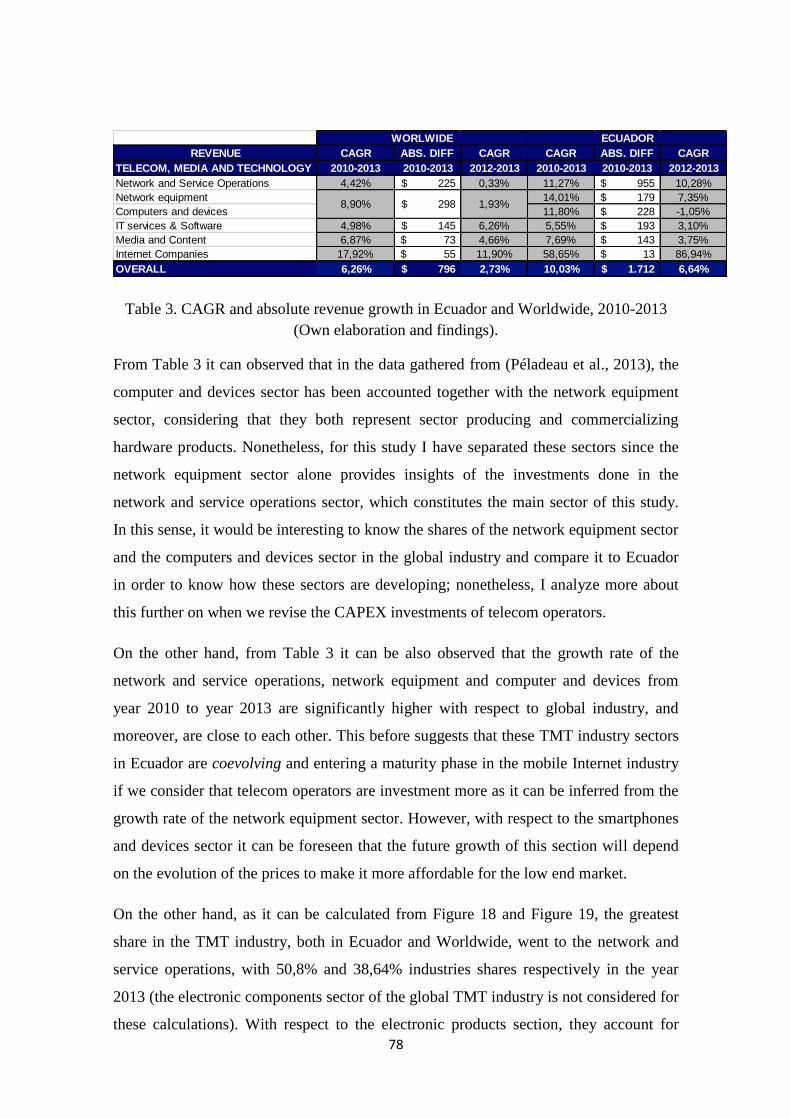
78
Table 3. CAGR and absolute revenue growth in Ecuador and Worldwide, 2010-2013
(Own elaboration and findings).
From Table 3 it can observed that in the data gathered from (Péladeau et al., 2013), the
computer and devices sector has been accounted together with the network equipment
sector, considering that they both represent sector producing and commercializing
hardware products. Nonetheless, for this study I have separated these sectors since the
network equipment sector alone provides insights of the investments done in the
network and service operations sector, which constitutes the main sector of this study.
In this sense, it would be interesting to know the shares of the network equipment sector
and the computers and devices sector in the global industry and compare it to Ecuador
in order to know how these sectors are developing; nonetheless, I analyze more about
this further on when we revise the CAPEX investments of telecom operators.
On the other hand, from Table 3 it can be also observed that the growth rate of the
network and service operations, network equipment and computer and devices from
year 2010 to year 2013 are significantly higher with respect to global industry, and
moreover, are close to each other. This before suggests that these TMT industry sectors
in Ecuador are coevolving and entering a maturity phase in the mobile Internet industry
if we consider that telecom operators are investment more as it can be inferred from the
growth rate of the network equipment sector. However, with respect to the smartphones
and devices sector it can be foreseen that the future growth of this section will depend
on the evolution of the prices to make it more affordable for the low end market.
On the other hand, as it can be calculated from Figure 18 and Figure 19, the greatest
share in the TMT industry, both in Ecuador and Worldwide, went to the network and
service operations, with 50,8% and 38,64% industries shares respectively in the year
2013 (the electronic components sector of the global TMT industry is not considered for
these calculations). With respect to the electronic products section, they account for
CAGR ABS. DIFF CAGR CAGR ABS. DIFF CAGR
TELECOM, MEDIA AND TECHNOLOGY 2010-2013 2010-2013 2012-2013 2010-2013 2010-2013 2012-2013
Network and Service Operations 4,42% 225$ 0,33% 11,27% 955$ 10,28%
Network equipment 14,01% 179$ 7,35%
Computers and devices 11,80% 228$ -1,05%
IT services & Software 4,98% 145$ 6,26% 5,55% 193$ 3,10%
Media and Content 6,87% 73$ 4,66% 7,69% 143$ 3,75%
Internet Companies 17,92% 55$ 11,90% 58,65% 13$ 86,94%
OVERALL 6,26% 796$ 2,73% 10,03% 1.712$ 6,64%
8,90% 298$ 1,93%
WORLWIDE ECUADOR
REVENUE
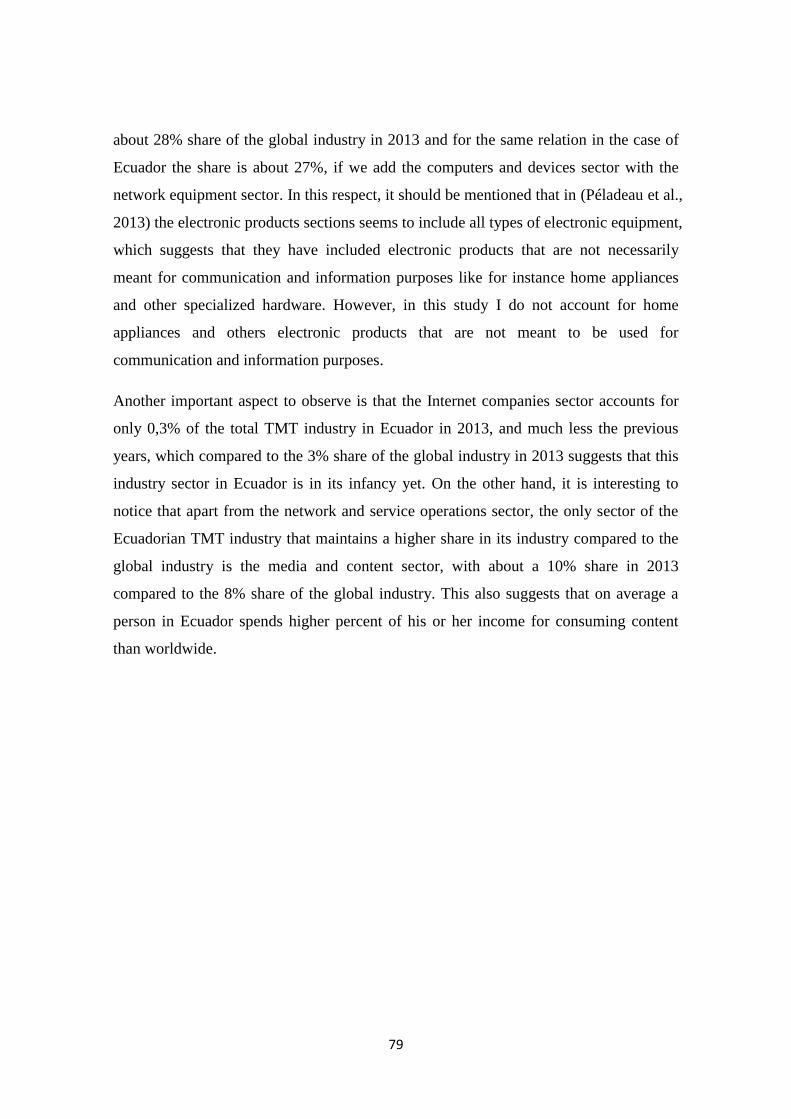
79
about 28% share of the global industry in 2013 and for the same relation in the case of
Ecuador the share is about 27%, if we add the computers and devices sector with the
network equipment sector. In this respect, it should be mentioned that in (Péladeau et al.,
2013) the electronic products sections seems to include all types of electronic equipment,
which suggests that they have included electronic products that are not necessarily
meant for communication and information purposes like for instance home appliances
and other specialized hardware. However, in this study I do not account for home
appliances and others electronic products that are not meant to be used for
communication and information purposes.
Another important aspect to observe is that the Internet companies sector accounts for
only 0,3% of the total TMT industry in Ecuador in 2013, and much less the previous
years, which compared to the 3% share of the global industry in 2013 suggests that this
industry sector in Ecuador is in its infancy yet. On the other hand, it is interesting to
notice that apart from the network and service operations sector, the only sector of the
Ecuadorian TMT industry that maintains a higher share in its industry compared to the
global industry is the media and content sector, with about a 10% share in 2013
compared to the 8% share of the global industry. This also suggests that on average a
person in Ecuador spends higher percent of his or her income for consuming content
than worldwide.
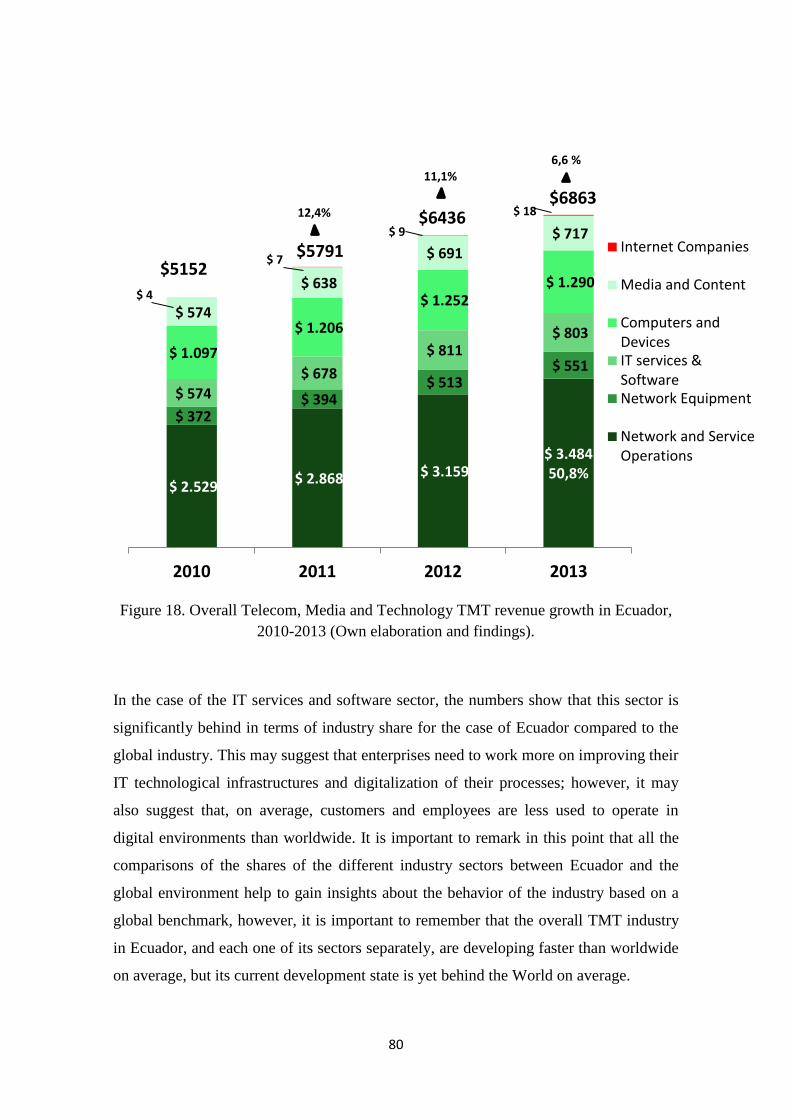
80
Figure 18. Overall Telecom, Media and Technology TMT revenue growth in Ecuador,
2010-2013 (Own elaboration and findings).
In the case of the IT services and software sector, the numbers show that this sector is
significantly behind in terms of industry share for the case of Ecuador compared to the
global industry. This may suggest that enterprises need to work more on improving their
IT technological infrastructures and digitalization of their processes; however, it may
also suggest that, on average, customers and employees are less used to operate in
digital environments than worldwide. It is important to remark in this point that all the
comparisons of the shares of the different industry sectors between Ecuador and the
global environment help to gain insights about the behavior of the industry based on a
global benchmark, however, it is important to remember that the overall TMT industry
in Ecuador, and each one of its sectors separately, are developing faster than worldwide
on average, but its current development state is yet behind the World on average.
$ 2.529 $ 2.868 $ 3.159
$ 3.484 50,8%
$ 372 $ 394
$ 513 $ 551
$ 574
$ 678
$ 811 $ 803
$ 1.097
$ 1.206
$ 1.252 $ 1.290
$ 574
$ 638
$ 691 $ 717
$ 4
$ 7
$ 9
$ 18
2010 2011 2012 2013
Internet Companies
Media and Content
Computers andDevicesIT services &SoftwareNetwork Equipment
Network and ServiceOperations
$5152
$6863 $6436
$5791
12,4%
11,1% 6,6 %
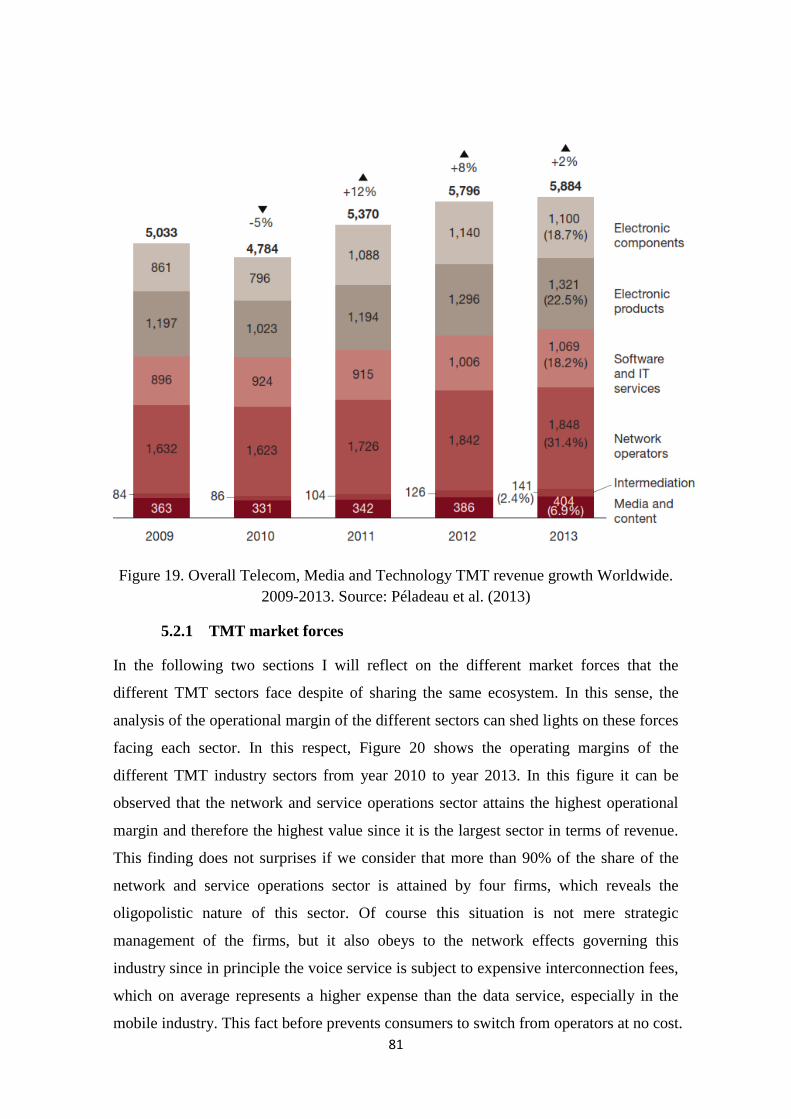
81
Figure 19. Overall Telecom, Media and Technology TMT revenue growth Worldwide.
2009-2013. Source: Péladeau et al. (2013)
5.2.1 TMT market forces
In the following two sections I will reflect on the different market forces that the
different TMT sectors face despite of sharing the same ecosystem. In this sense, the
analysis of the operational margin of the different sectors can shed lights on these forces
facing each sector. In this respect, Figure 20 shows the operating margins of the
different TMT industry sectors from year 2010 to year 2013. In this figure it can be
observed that the network and service operations sector attains the highest operational
margin and therefore the highest value since it is the largest sector in terms of revenue.
This finding does not surprises if we consider that more than 90% of the share of the
network and service operations sector is attained by four firms, which reveals the
oligopolistic nature of this sector. Of course this situation is not mere strategic
management of the firms, but it also obeys to the network effects governing this
industry since in principle the voice service is subject to expensive interconnection fees,
which on average represents a higher expense than the data service, especially in the
mobile industry. This fact before prevents consumers to switch from operators at no cost.
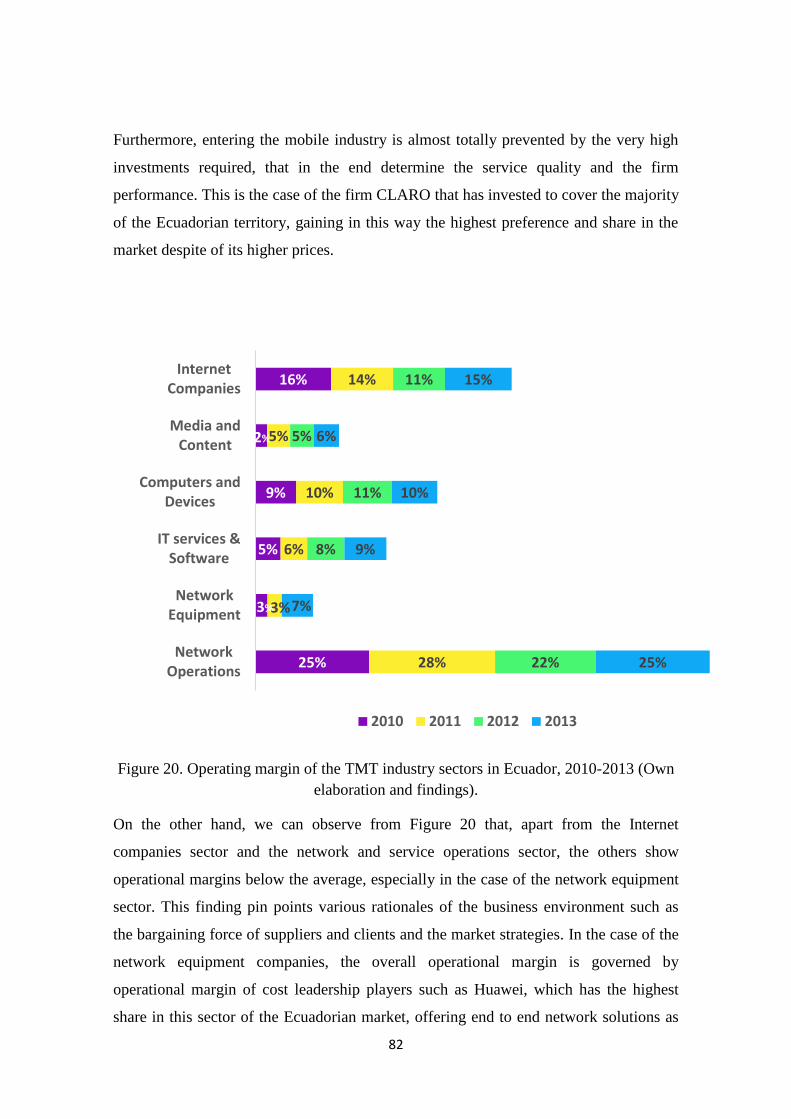
82
Furthermore, entering the mobile industry is almost totally prevented by the very high
investments required, that in the end determine the service quality and the firm
performance. This is the case of the firm CLARO that has invested to cover the majority
of the Ecuadorian territory, gaining in this way the highest preference and share in the
market despite of its higher prices.
Figure 20. Operating margin of the TMT industry sectors in Ecuador, 2010-2013 (Own
elaboration and findings).
On the other hand, we can observe from Figure 20 that, apart from the Internet
companies sector and the network and service operations sector, the others show
operational margins below the average, especially in the case of the network equipment
sector. This finding pin points various rationales of the business environment such as
the bargaining force of suppliers and clients and the market strategies. In the case of the
network equipment companies, the overall operational margin is governed by
operational margin of cost leadership players such as Huawei, which has the highest
share in this sector of the Ecuadorian market, offering end to end network solutions as
25%
3%
5%
9%
2%
16%
28%
3%
6%
10%
5%
14%
22%
8%
11%
5%
11%
25%
7%
9%
10%
6%
15%
NetworkOperations
NetworkEquipment
IT services &Software
Computers andDevices
Media andContent
InternetCompanies
2010 2011 2012 2013
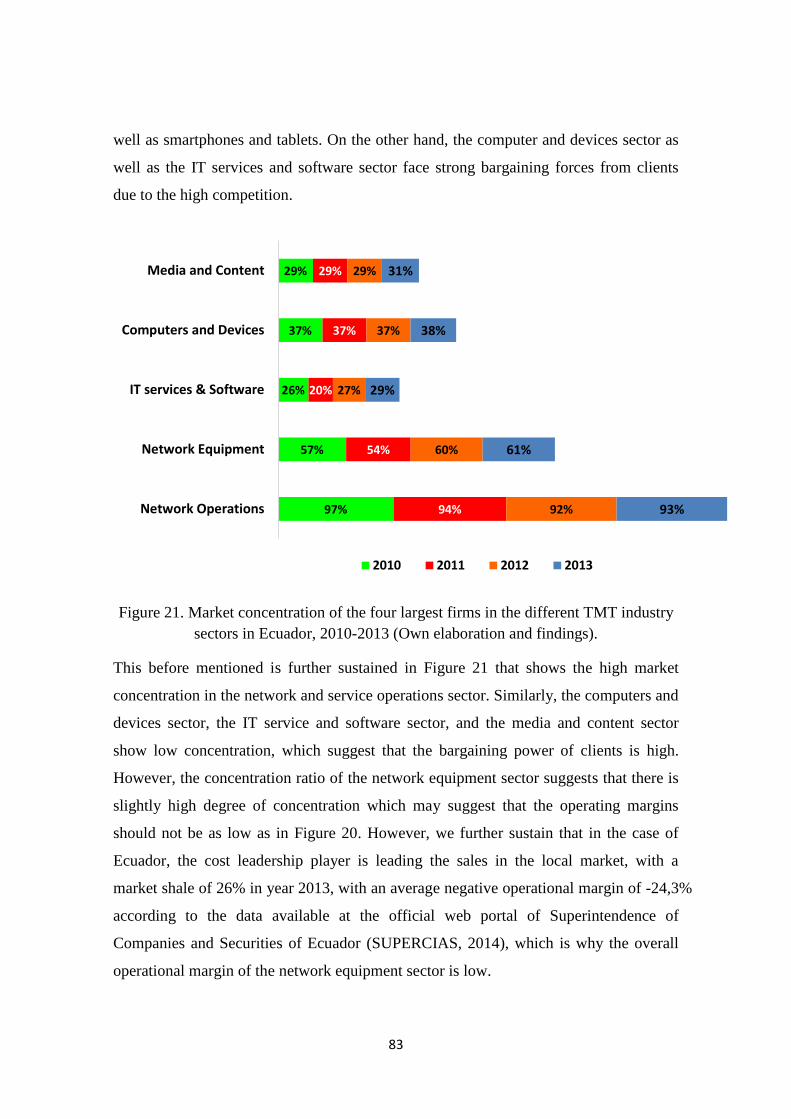
83
well as smartphones and tablets. On the other hand, the computer and devices sector as
well as the IT services and software sector face strong bargaining forces from clients
due to the high competition.
Figure 21. Market concentration of the four largest firms in the different TMT industry
sectors in Ecuador, 2010-2013 (Own elaboration and findings).
This before mentioned is further sustained in Figure 21 that shows the high market
concentration in the network and service operations sector. Similarly, the computers and
devices sector, the IT service and software sector, and the media and content sector
show low concentration, which suggest that the bargaining power of clients is high.
However, the concentration ratio of the network equipment sector suggests that there is
slightly high degree of concentration which may suggest that the operating margins
should not be as low as in Figure 20. However, we further sustain that in the case of
Ecuador, the cost leadership player is leading the sales in the local market, with a
market shale of 26% in year 2013, with an average negative operational margin of -24,3%
according to the data available at the official web portal of Superintendence of
Companies and Securities of Ecuador (SUPERCIAS, 2014), which is why the overall
operational margin of the network equipment sector is low.
97%
57%
26%
37%
29%
94%
54%
20%
37%
29%
92%
60%
27%
37%
29%
93%
61%
29%
38%
31%
Network Operations
Network Equipment
IT services & Software
Computers and Devices
Media and Content
2010 2011 2012 2013
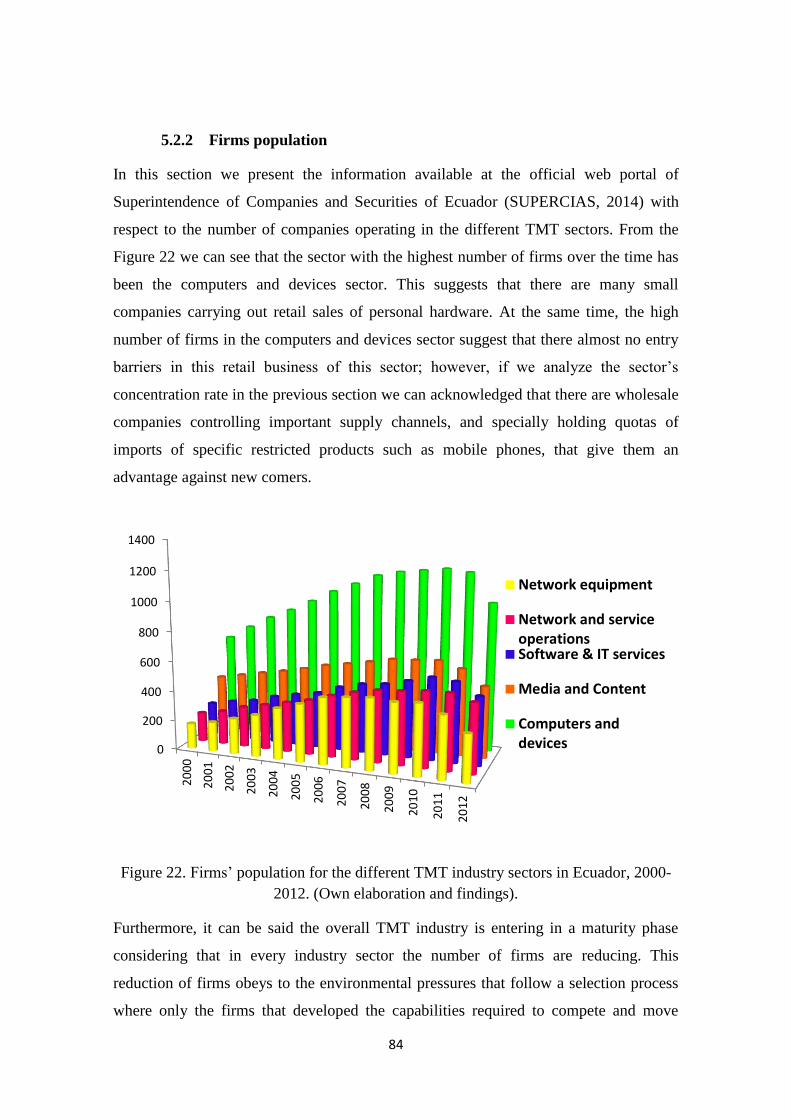
84
5.2.2 Firms population
In this section we present the information available at the official web portal of
Superintendence of Companies and Securities of Ecuador (SUPERCIAS, 2014) with
respect to the number of companies operating in the different TMT sectors. From the
Figure 22 we can see that the sector with the highest number of firms over the time has
been the computers and devices sector. This suggests that there are many small
companies carrying out retail sales of personal hardware. At the same time, the high
number of firms in the computers and devices sector suggest that there almost no entry
barriers in this retail business of this sector; however, if we analyze the sector’s
concentration rate in the previous section we can acknowledged that there are wholesale
companies controlling important supply channels, and specially holding quotas of
imports of specific restricted products such as mobile phones, that give them an
advantage against new comers.
Figure 22. Firms’ population for the different TMT industry sectors in Ecuador, 2000-
2012. (Own elaboration and findings).
Furthermore, it can be said the overall TMT industry is entering in a maturity phase
considering that in every industry sector the number of firms are reducing. This
reduction of firms obeys to the environmental pressures that follow a selection process
where only the firms that developed the capabilities required to compete and move
0
200
400
600
800
1000
1200
1400
20
00
20
01
20
02
20
03
20
04
20
05
20
06
20
07
20
08
20
09
20
10
20
11
20
12
Network equipment
Network and serviceoperationsSoftware & IT services
Media and Content
Computers anddevices
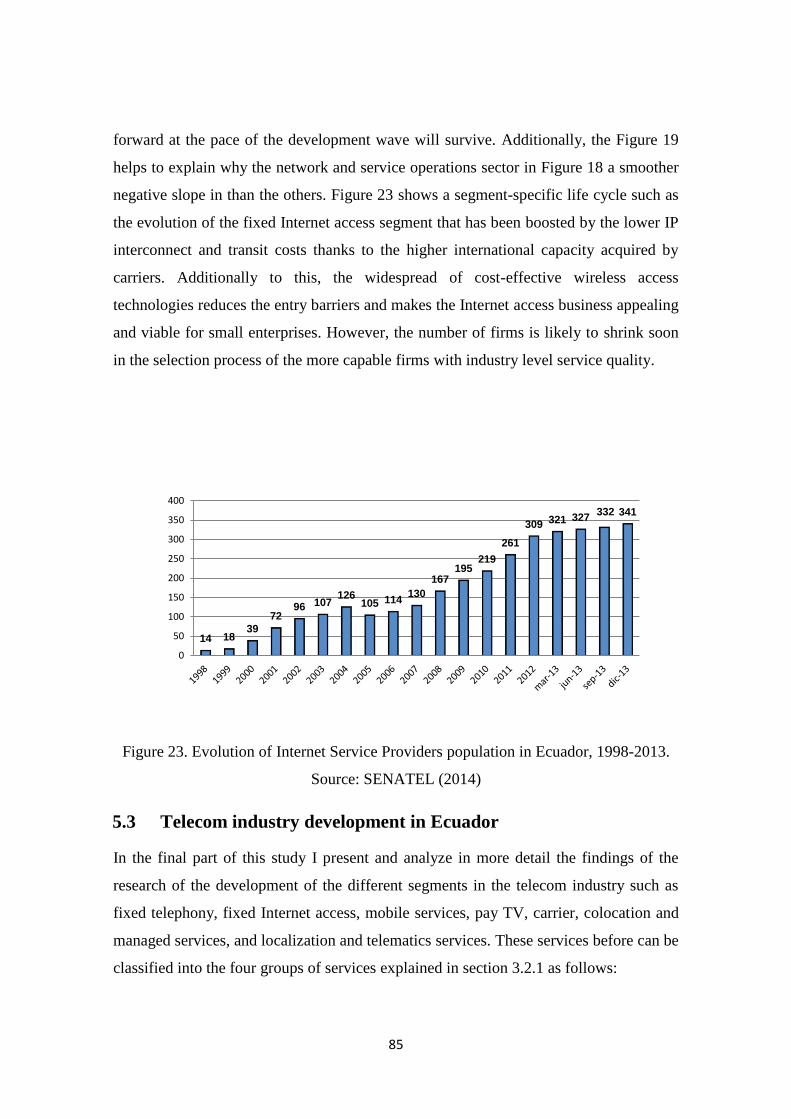
85
forward at the pace of the development wave will survive. Additionally, the Figure 19
helps to explain why the network and service operations sector in Figure 18 a smoother
negative slope in than the others. Figure 23 shows a segment-specific life cycle such as
the evolution of the fixed Internet access segment that has been boosted by the lower IP
interconnect and transit costs thanks to the higher international capacity acquired by
carriers. Additionally to this, the widespread of cost-effective wireless access
technologies reduces the entry barriers and makes the Internet access business appealing
and viable for small enterprises. However, the number of firms is likely to shrink soon
in the selection process of the more capable firms with industry level service quality.
Figure 23. Evolution of Internet Service Providers population in Ecuador, 1998-2013.
Source: SENATEL (2014)
5.3 Telecom industry development in Ecuador
In the final part of this study I present and analyze in more detail the findings of the
research of the development of the different segments in the telecom industry such as
fixed telephony, fixed Internet access, mobile services, pay TV, carrier, colocation and
managed services, and localization and telematics services. These services before can be
classified into the four groups of services explained in section 3.2.1 as follows:
14 18 39
72 96 107
126 105 114
130
167 195
219
261
309 321 327 332 341
0
50
100
150
200
250
300
350
400
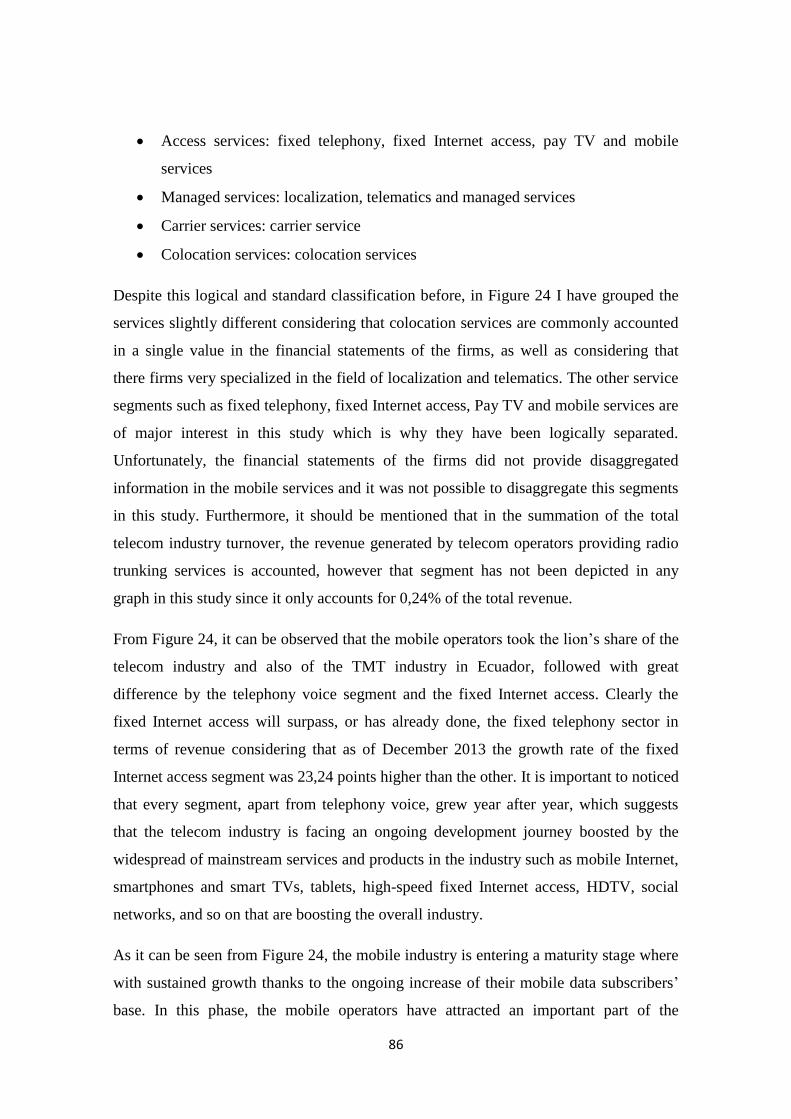
86
Access services: fixed telephony, fixed Internet access, pay TV and mobile
services
Managed services: localization, telematics and managed services
Carrier services: carrier service
Colocation services: colocation services
Despite this logical and standard classification before, in Figure 24 I have grouped the
services slightly different considering that colocation services are commonly accounted
in a single value in the financial statements of the firms, as well as considering that
there firms very specialized in the field of localization and telematics. The other service
segments such as fixed telephony, fixed Internet access, Pay TV and mobile services are
of major interest in this study which is why they have been logically separated.
Unfortunately, the financial statements of the firms did not provide disaggregated
information in the mobile services and it was not possible to disaggregate this segments
in this study. Furthermore, it should be mentioned that in the summation of the total
telecom industry turnover, the revenue generated by telecom operators providing radio
trunking services is accounted, however that segment has not been depicted in any
graph in this study since it only accounts for 0,24% of the total revenue.
From Figure 24, it can be observed that the mobile operators took the lion’s share of the
telecom industry and also of the TMT industry in Ecuador, followed with great
difference by the telephony voice segment and the fixed Internet access. Clearly the
fixed Internet access will surpass, or has already done, the fixed telephony sector in
terms of revenue considering that as of December 2013 the growth rate of the fixed
Internet access segment was 23,24 points higher than the other. It is important to noticed
that every segment, apart from telephony voice, grew year after year, which suggests
that the telecom industry is facing an ongoing development journey boosted by the
widespread of mainstream services and products in the industry such as mobile Internet,
smartphones and smart TVs, tablets, high-speed fixed Internet access, HDTV, social
networks, and so on that are boosting the overall industry.
As it can be seen from Figure 24, the mobile industry is entering a maturity stage where
with sustained growth thanks to the ongoing increase of their mobile data subscribers’
base. In this phase, the mobile operators have attracted an important part of the
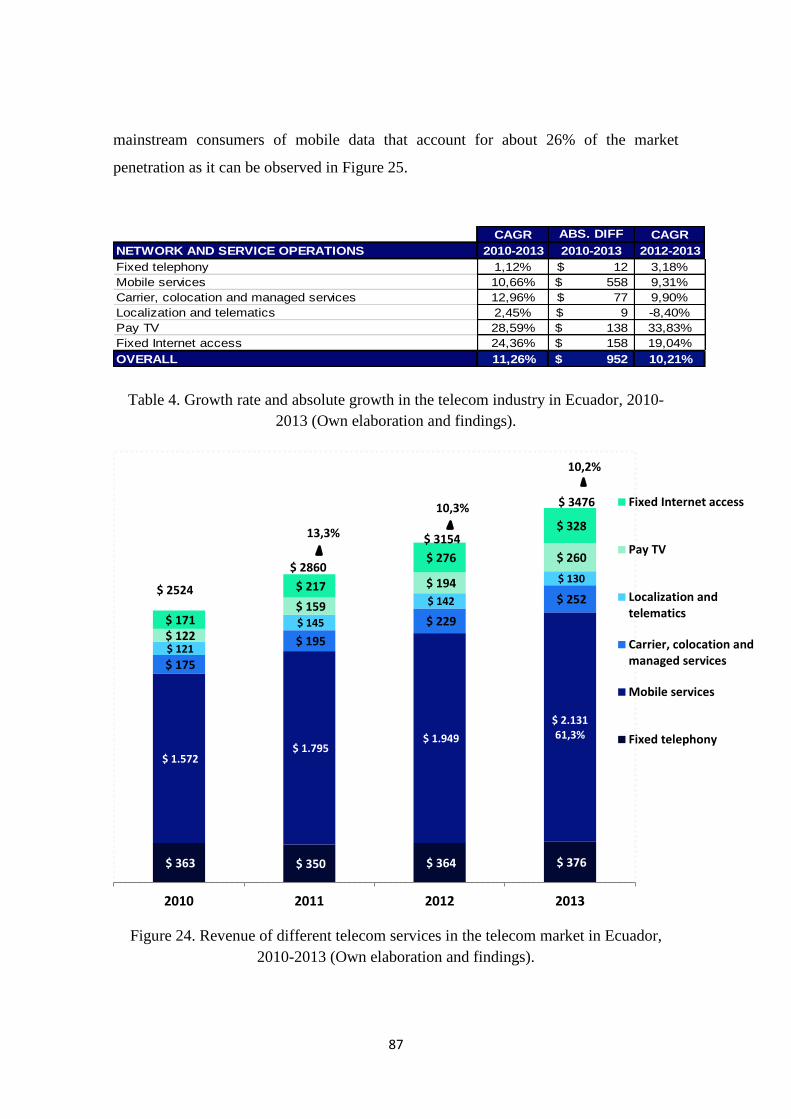
87
mainstream consumers of mobile data that account for about 26% of the market
penetration as it can be observed in Figure 25.
Table 4. Growth rate and absolute growth in the telecom industry in Ecuador, 2010-
2013 (Own elaboration and findings).
Figure 24. Revenue of different telecom services in the telecom market in Ecuador,
2010-2013 (Own elaboration and findings).
CAGR ABS. DIFF CAGR
NETWORK AND SERVICE OPERATIONS 2010-2013 2010-2013 2012-2013
Fixed telephony 1,12% 12$ 3,18%
Mobile services 10,66% 558$ 9,31%
Carrier, colocation and managed services 12,96% 77$ 9,90%
Localization and telematics 2,45% 9$ -8,40%
Pay TV 28,59% 138$ 33,83%
Fixed Internet access 24,36% 158$ 19,04%
OVERALL 11,26% 952$ 10,21%
$ 363 $ 350 $ 364 $ 376
$ 1.572 $ 1.795
$ 1.949
$ 2.131 61,3%
$ 175
$ 195
$ 229
$ 252
$ 121
$ 145
$ 142
$ 130
$ 122
$ 159
$ 194
$ 260
$ 171
$ 217
$ 276
$ 328
2010 2011 2012 2013
Fixed Internet access
Pay TV
Localization andtelematics
Carrier, colocation andmanaged services
Mobile services
Fixed telephony
$ 2524
$ 2860
$ 3154
$ 3476
13,3%
10,3%
10,2%
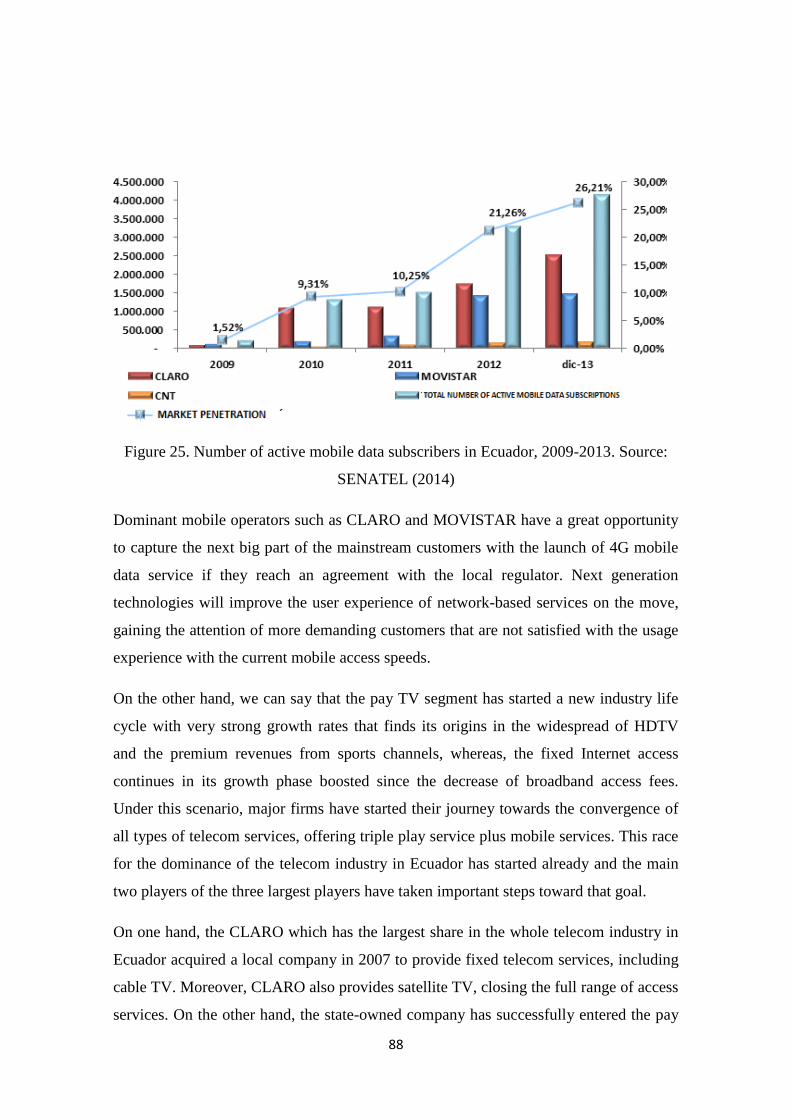
88
Figure 25. Number of active mobile data subscribers in Ecuador, 2009-2013. Source:
SENATEL (2014)
Dominant mobile operators such as CLARO and MOVISTAR have a great opportunity
to capture the next big part of the mainstream customers with the launch of 4G mobile
data service if they reach an agreement with the local regulator. Next generation
technologies will improve the user experience of network-based services on the move,
gaining the attention of more demanding customers that are not satisfied with the usage
experience with the current mobile access speeds.
On the other hand, we can say that the pay TV segment has started a new industry life
cycle with very strong growth rates that finds its origins in the widespread of HDTV
and the premium revenues from sports channels, whereas, the fixed Internet access
continues in its growth phase boosted since the decrease of broadband access fees.
Under this scenario, major firms have started their journey towards the convergence of
all types of telecom services, offering triple play service plus mobile services. This race
for the dominance of the telecom industry in Ecuador has started already and the main
two players of the three largest players have taken important steps toward that goal.
On one hand, the CLARO which has the largest share in the whole telecom industry in
Ecuador acquired a local company in 2007 to provide fixed telecom services, including
cable TV. Moreover, CLARO also provides satellite TV, closing the full range of access
services. On the other hand, the state-owned company has successfully entered the pay
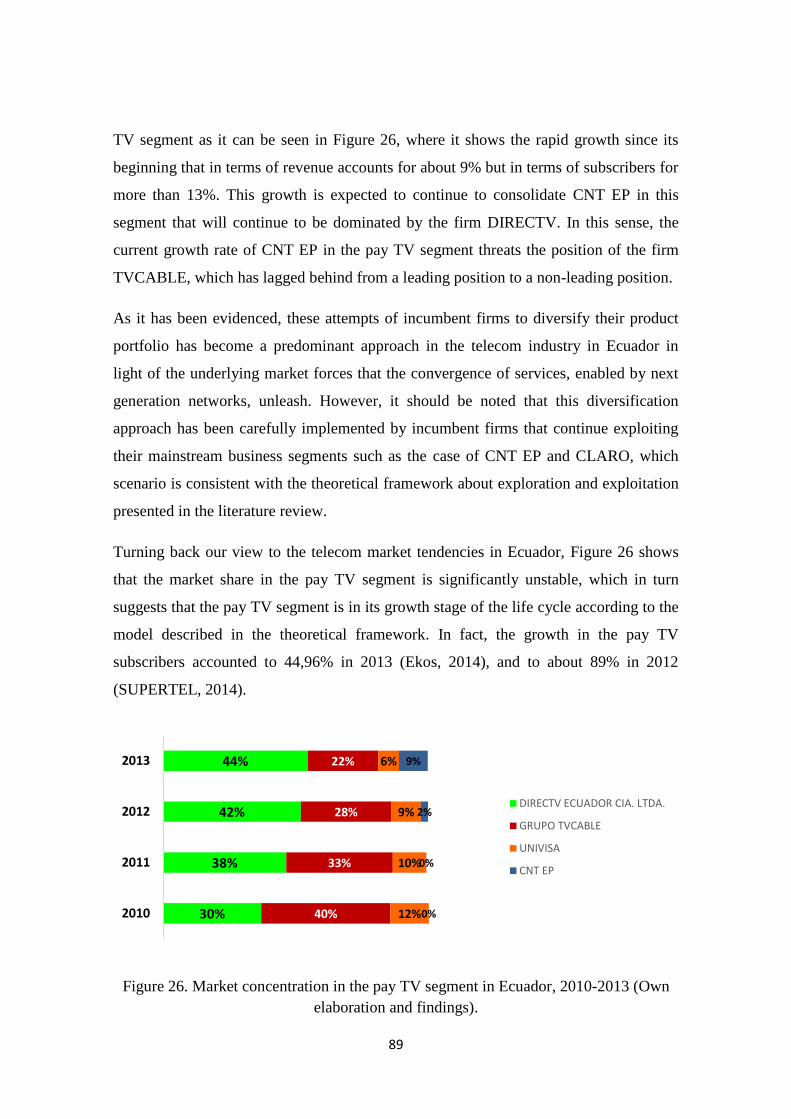
89
TV segment as it can be seen in Figure 26, where it shows the rapid growth since its
beginning that in terms of revenue accounts for about 9% but in terms of subscribers for
more than 13%. This growth is expected to continue to consolidate CNT EP in this
segment that will continue to be dominated by the firm DIRECTV. In this sense, the
current growth rate of CNT EP in the pay TV segment threats the position of the firm
TVCABLE, which has lagged behind from a leading position to a non-leading position.
As it has been evidenced, these attempts of incumbent firms to diversify their product
portfolio has become a predominant approach in the telecom industry in Ecuador in
light of the underlying market forces that the convergence of services, enabled by next
generation networks, unleash. However, it should be noted that this diversification
approach has been carefully implemented by incumbent firms that continue exploiting
their mainstream business segments such as the case of CNT EP and CLARO, which
scenario is consistent with the theoretical framework about exploration and exploitation
presented in the literature review.
Turning back our view to the telecom market tendencies in Ecuador, Figure 26 shows
that the market share in the pay TV segment is significantly unstable, which in turn
suggests that the pay TV segment is in its growth stage of the life cycle according to the
model described in the theoretical framework. In fact, the growth in the pay TV
subscribers accounted to 44,96% in 2013 (Ekos, 2014), and to about 89% in 2012
(SUPERTEL, 2014).
Figure 26. Market concentration in the pay TV segment in Ecuador, 2010-2013 (Own
elaboration and findings).
30%
38%
42%
44%
40%
33%
28%
22%
12%
10%
9%
6%
0%
0%
2%
9%
2010
2011
2012
2013
DIRECTV ECUADOR CIA. LTDA.
GRUPO TVCABLE
UNIVISA
CNT EP
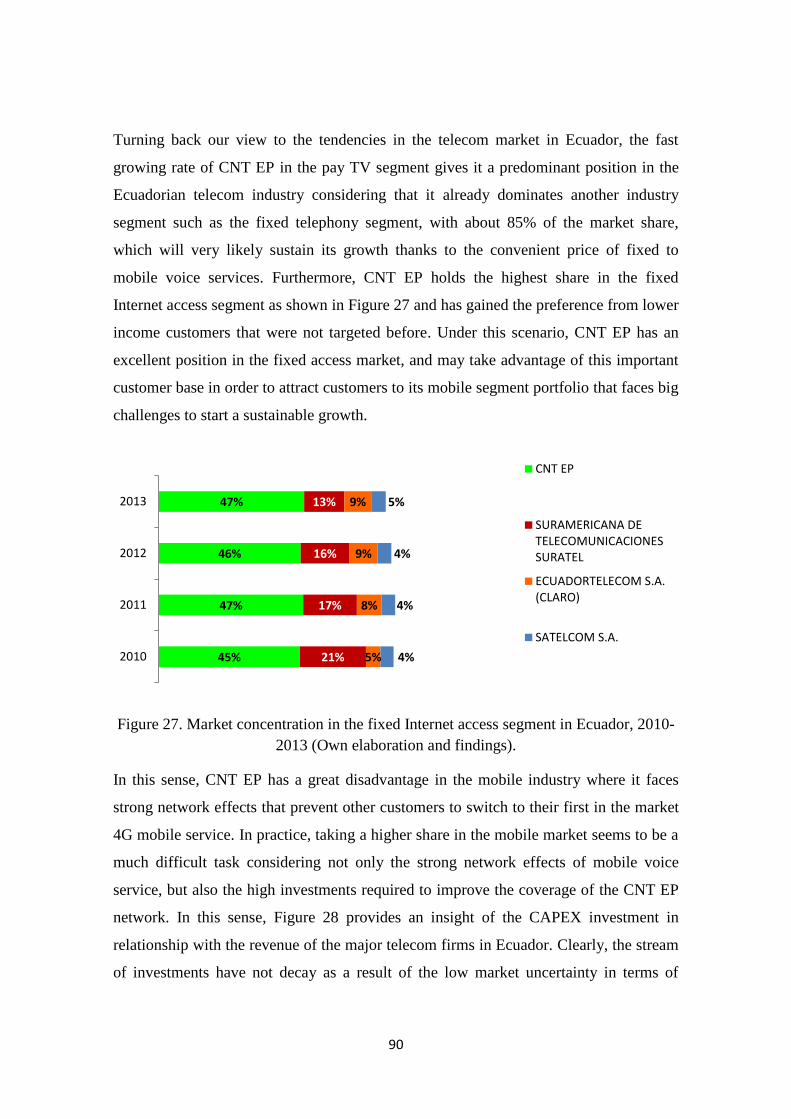
90
Turning back our view to the tendencies in the telecom market in Ecuador, the fast
growing rate of CNT EP in the pay TV segment gives it a predominant position in the
Ecuadorian telecom industry considering that it already dominates another industry
segment such as the fixed telephony segment, with about 85% of the market share,
which will very likely sustain its growth thanks to the convenient price of fixed to
mobile voice services. Furthermore, CNT EP holds the highest share in the fixed
Internet access segment as shown in Figure 27 and has gained the preference from lower
income customers that were not targeted before. Under this scenario, CNT EP has an
excellent position in the fixed access market, and may take advantage of this important
customer base in order to attract customers to its mobile segment portfolio that faces big
challenges to start a sustainable growth.
Figure 27. Market concentration in the fixed Internet access segment in Ecuador, 2010-
2013 (Own elaboration and findings).
In this sense, CNT EP has a great disadvantage in the mobile industry where it faces
strong network effects that prevent other customers to switch to their first in the market
4G mobile service. In practice, taking a higher share in the mobile market seems to be a
much difficult task considering not only the strong network effects of mobile voice
service, but also the high investments required to improve the coverage of the CNT EP
network. In this sense, Figure 28 provides an insight of the CAPEX investment in
relationship with the revenue of the major telecom firms in Ecuador. Clearly, the stream
of investments have not decay as a result of the low market uncertainty in terms of
45%
47%
46%
47%
21%
17%
16%
13%
5%
8%
9%
9%
4%
4%
4%
5%
2010
2011
2012
2013
CNT EP
SURAMERICANA DETELECOMUNICACIONESSURATEL
ECUADORTELECOM S.A.(CLARO)
SATELCOM S.A.
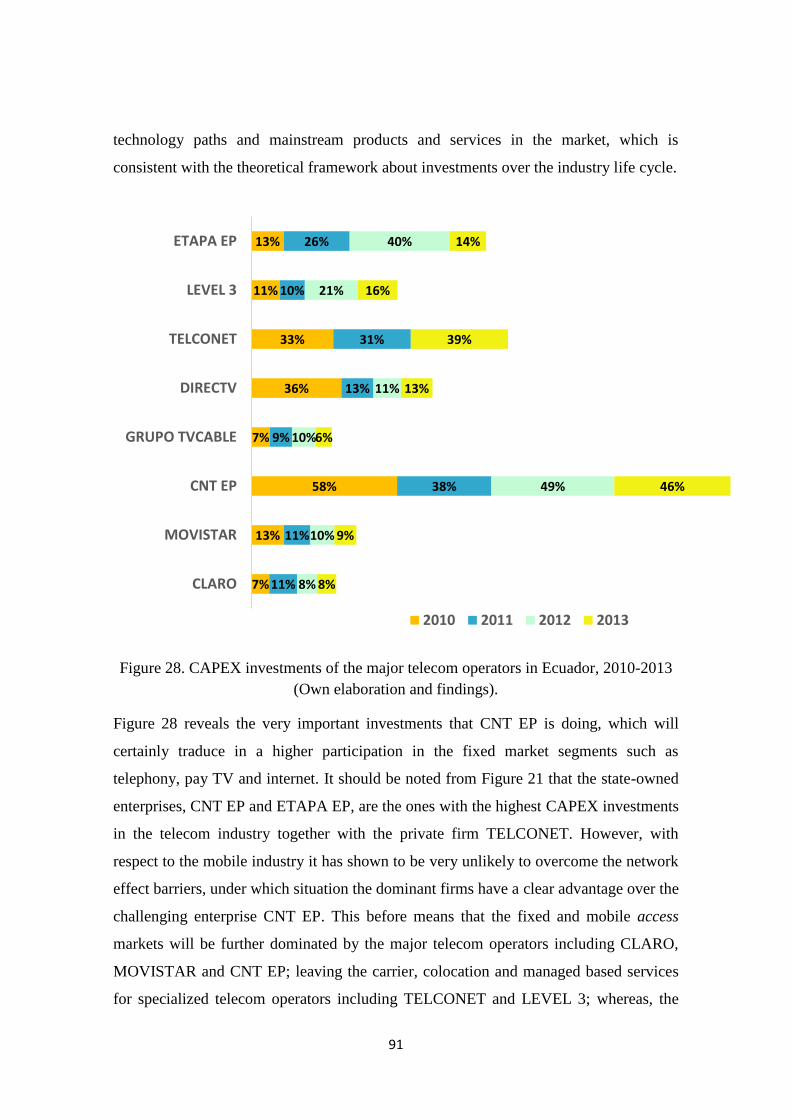
91
technology paths and mainstream products and services in the market, which is
consistent with the theoretical framework about investments over the industry life cycle.
Figure 28. CAPEX investments of the major telecom operators in Ecuador, 2010-2013
(Own elaboration and findings).
Figure 28 reveals the very important investments that CNT EP is doing, which will
certainly traduce in a higher participation in the fixed market segments such as
telephony, pay TV and internet. It should be noted from Figure 21 that the state-owned
enterprises, CNT EP and ETAPA EP, are the ones with the highest CAPEX investments
in the telecom industry together with the private firm TELCONET. However, with
respect to the mobile industry it has shown to be very unlikely to overcome the network
effect barriers, under which situation the dominant firms have a clear advantage over the
challenging enterprise CNT EP. This before means that the fixed and mobile access
markets will be further dominated by the major telecom operators including CLARO,
MOVISTAR and CNT EP; leaving the carrier, colocation and managed based services
for specialized telecom operators including TELCONET and LEVEL 3; whereas, the
7%
13%
58%
7%
36%
33%
11%
13%
11%
11%
38%
9%
13%
31%
10%
26%
8%
10%
49%
10%
11%
21%
40%
8%
9%
46%
6%
13%
39%
16%
14%
CLARO
MOVISTAR
CNT EP
GRUPO TVCABLE
DIRECTV
TELCONET
LEVEL 3
ETAPA EP
2010 2011 2012 2013

92
localization and telematics services will remain dominated by specialized firms that
already attain very high market concentration.
93
6 CONCLUSIONS
In this thesis it has been evidenced that the development of the telecom industry in
Ecuador has been boosted by the widespread of mainstream products and services in the
TMT market including broadband fixed and mobile internet, smartphones, social
networks, HDTV, e-commerce and OTT content. The deployment of next generation
networks represents a technological discontinuity that cannot be overlooked by firms,
and become determinant for the future performance of firms. In the case of the mobile
industry, the deployment of 4G mobile networks represents a big opportunity for mobile
operators and its potential is not well foreseen considering the much higher market
penetration of mobile subscribers than fixed subscribers. At the moment, the value
drivers of mobile Internet have, in great proportion, relied on the usage of social
networks and instant messaging services.
On the other hand, the smartphones and HDTV segments in Ecuador are expected to
continue its stable growth considering their actual market penetrations, unless other
external factors prevent sales. However, in the case of the smartphones segment,
sustaining growth will depend on the evolution of prices in order to make these products
more affordable for the low end. On the other hand, in the case of e-commerce and OTT
content, the actual potential of this services are not well foreseen as well, especially
considering the habits and culture of people; nonetheless, the first steps have been taken
in this respect showing a promising development of these services that have the
potential to disrupt the commerce and content sectors.
On the other hand, the diversification of the product portfolio of incumbent firms to
offer the wide range of access services, that is, triple play service plus mobile service, is
giving its first results, with the consolidation of the state-owned enterprise CNT EP in
the fixed segment on one hand, and the consolidation of the brand CLARO, subsidiary
of American Movil in Ecuador, in the mobile segment on the other hand. In this
scenarios, the carrier, colocation and managed based services will be naturally
dominated by specialized telecom operators including TELCONET and LEVEL 3,
having as well as a relatively new player in this arena the incumbent mobile operator
with the brand MOVISTAR, subsidiary of Telefonica in Ecuador, in the managed

94
service segment; whereas, the telematics services will remain dominated by specialized
firms that already attain very high market concentration.
95
REFERENCES:
Aldrich, H. E. & Fiol, C. M. (1994). Fools Rush in? The Institutional Context of
Industry Creation. Academy of Management Review, 19(4): 645-670.
Aldrich, H. E. (1979). Organizations and environments. Englewood CliHs, NJ: Prentice
Hall.
Ancona, D. et al. (2007). In Praise of the Incomplete Leader. Harvard Business Review.
Anderson, C. R. & Zeithaml, C. P. (1984). Stage of the Product Life Cycle, Business
Strategy, and Business Performance. Academy of Management Journal, 27(1): 5-24.
Anderson, P. & Tushman, M. (1990). Technological Discontinuities and Dominant
Designs: A Cyclical Model of technological Change. Administrative Science Quarterly,
35: 604-633.
Andrews, K. (1971). The concept of corporate strategy. Richard D. Irwin, Homewood.
Ansoff, Igor Corporate Strategy McGraw Hill, New York, 1965.
Amburgey, T. L. & Rao H. (1996). Organizational Ecology: Past, Present and Future
Directions. Academy of Management Journal, 39(5):1265-1286.
Audretsch D. B. & Feldman, M. P. (1996). Innovative Clusters and the Industry Life
Cycle. Review of Industrial Organization, 11: 253-273.
Baum, J. A. C, & Powell, W. A. (1995). Cultivating an institutional ecology of
organizations: Comment on Hannan, Carroll, Dundon, and Torres. American
Sociological Review, 60: 529-538.
Bilbao-Osorio, B., Dutta, S. and Lanvin, B. (2014). The Global Information Technology
Report 2014. World Economic Forum.
Bower, J. & Christensen, C. (1995). Disruptive Technologies: Catching the Wave.
Harvard Business Review.
Brandenburger, A. M. & Nalebuff, B. J. (1995). The Right Game: Use game theory to
shape strategy. Harvard Business Review, 73(4): 57-71.
Buzzell, R. D. & Wiersema, F. D. (1981). Successful Share-Building Strategies.
Harvard Business Review.
Carroll, G. R. (1988). Ecological models of organizations. Cambridge, MA: Ballinger.
Carroll, G. R. & Hannan, M. T. (1989). On using institutional theory in studying
organizational populations: Reply to Zucker. American Sociological Review, 54: 545-
548.
96
Ceccagnoli, M. & Rothaermel, F. T. (2008). Chapter 1 Appropriating the returns from
innovation, Technological Innovation: Generating Economic Results (Advances in the
Study of Entrepreneurship, Innovation & Economic Growth). Emerald Group
Publishing Limited, 18: 11-34.
Chandler, A. D. (1977). The Visible Hand: The Managerial Revolution in American
Business. Harvard University Press.
Chermack, T. J. & Bernadette, K. K. (2007). The Use of and Misuse of SWOT analysis
and implications for HRD professionals. Human Resource Development
International, 10 (4): 383-399.
Christensen, C. M., Suárez F. F., and Utterback, J. M. (1998). Strategies for Survival in
Fast-Changing Industries. Management Science, 44(12): 207-220.
Courcoubetis, C. A., & Weber, R. R. (2003). Pricing Communication Networks:
Economics, Technology and Modeling. Wiley.
Dorota, K. (2010). Beyond the Cloud: Tieto approach to enterprise cloud services.
Telecom Forum, Aalto University.
Drucker, P. (1954). The Practice of Management. Harper & Row.
ECOSYS (2004). Techno-ECOnomics of integrated communication SYStems and
services: Business models in telecommunications. Deliverable 3. The CELTIC Initiative.
Ehrhardt, M. (2004). Network effects, standardization and competitive strategy: How
companies influence the emergence of dominant designs. International Journal of
Technology Management, 27: 272-294.
97
Farrell, J. & Saloner, G. (1985). Standardization, compatibility, and innovation. The
Rand Journal of Economics, Mount Morris, 16(1): 70.
Federal Trade Commission (1939). Report on the Motor Vehicle Industry. Government
Printing Office: Washington DC.
Flournoy, D. (2004). The Broadband Millennium: Communication Technologies and
Markets. International Engineering Consortium Publication, United States of America.
Garud, R., Jain, S., and Kumaraswamy, A. (2002). Institutional entrepreneurship in the
sponsorship of common technological standards: The case of Sun Microsystems and
Java. Academy of Management Journal, 45(1): 196-214.
Gentile, C., Spiller, N., and Noci, G. (2007). How to Sustain the Customer Experience:
An Overview of Experience Components that Co-create Value With the Customer.
European Management Journal, 25(5): 395-410.
Gino, F., Pisano, G., Sorell, M. R., and Szigety, M. (2006). R&D Portfolio Strategy,
Diversification and Performance: An Information Perspective. Harvard Business
Review.
Gyllerup, M. & Björnsjö, A. (2012). Network Equipment Providers – Restoring
Investor Trust. Accenture.
Greer, C. R. et. al. (1999). Human resource management outsourcing: The make or buy
decision. Academy of Management Perspective, 13(3): 85-96.
Hacklin, F., Marxt, C., and Fahrni, F. (2009). Coevolutionary cycles of convergence:
An extrapolation from the ICT industry, Technological Forecasting & Social Change,
76: 723–736.
Hämmäinen et al. (2013). Service and Network Operators. Operator Business course
lectures. Comnet, Aalto University.
Hämmäinen et al. (2013). Operators’ Enterprise Customers. Operator Business course
lectures. Comnet, Aalto University.
Hannan, M. T. & Freeman, J. (1977). The Population Ecology of Organizations.
American Journal of Sociology, 82(5): 929-964.
Hannan, M. T. & Freeman, J. (1989). Organizational Ecology. President and Fellows of
Harvard College. First Harvard University Press paperback edition, 1993, United States
of America.
98
Hambrick, D., MacMillan, I., & Day, D. (1982). Strategic attributes and performance in
the BCG matrix—A PIMS-based analysis of industrial-product businesses. Academy of
Management Journal, 25: 510-531.
Hambrick, D. C. & Lei, D. (1985). Toward an Empirical Prioritization of Contingency
Variables for Business Strategy. Academy of Management Journal, 28(4): 763-788.
Hamermesh, R. G., Anderson, m. J., and Harris, J. E. (1978). Strategies for Low
Market Share Businesses. Harvard Business Review.
Hill, C. W. (1988). Differentiation Versus Low Cost or Differentiation and Low Cost: A
Contingency Framework. Academy of Management Review, 13(3): 401-412.
Hofer, C. W. (1975). Toward a contingency theory of business strategy. Academy of
Management Journal, 18: 784-810.
Huurdeman, A. (2003). The Worldwide History of Telecommunications. Wiley-
Interscience publication, United States of America.
INEC (2010). Information and Communication Technologies ICT 2013. National
Institute of Statistics and Censuses of Ecuador.
INEC (2011). Information and Communication Technologies ICT 2013. National
Institute of Statistics and Censuses of Ecuador.
INEC (2012). Information and Communication Technologies ICT 2013. National
Institute of Statistics and Censuses of Ecuador.
INEC (2013). Information and Communication Technologies ICT 2013. National
Institute of Statistics and Censuses of Ecuador.
Jovanovic, B. & MacDonald, G.M. (1994). The Life Cycle of a Competitive Industry.
Journal of Political Economy, 102(2): 322-347.
Kaplan, R. S. & Norton, D. P. (1996). The Balanced Scorecard: Translating Strategy
Into Action. Harvard Business School Press, Boston, MA.
Kato, M. (2009). The role of investment efficiency in the industry life cycle. Industrial
and Corporate Change, 19(1):273-294.
Katz, M. L. & Shapiro, C. (1985). Network externalities, competition, and compatibility.
The American Economic Review, 75(3): 424-440.
Katz, M. L. & Shapiro, C. (1986). Technology adoption in the presence of network
externalities. Journal of Political Economy, 94: 822-841.
Kim, W. C. & Mauborgne, R. (2004). Blue Ocean Strategy. Harvard Business Review.
99
Kiiski, A. (2007). Impacts of virtual operators on mobile market. Licentiate thesis,
Helsinki University of Technology, Finland.
Koski, H., Rouvinen, P., and Ylä-Antilla, P. (2002). ICT Clusters in Europe: The Great
Central Banana and the Small Nordic Potato. Elsevier, Information Economics and
Policy, 14(2): 145-165.
Koski, H. & Kretschmer, T. (2006). Innovation and dominant design in mobile
telephony. ETLA Discussion Papers, The Research Institute of the Finnish Economy
(ETLA), No. 1012.
Klepper, S. & Miller, J.H. (1995). Entry, Exit, and Shakeouts in the United States in
New Manufactured Products. International Journal of Industrial Organization, 13:
567-591.
Klepper, S. (1997). Industry Life Cycles. Industrial and Corporate Change, 6(1): 145-
182.
Kurkinen, L. (2008). Externalities and Effects in High-tech Industries: Supporting the
Evolution of a Technology. Bachelor Thesis, Helsinki University of Technology.
Levitt, L. (1960). Marketing Myopia. Harvard Business Review.
Manyika, J., et al. (2013). Disruptive technologies: Advances that will transform life,
business, and the global economy. McKinsey Global Institute, McKinsey & Company.
March, J. G. (1991). Exploration and Exploitation in Organizational Learning.
Organization Science, 2(1): 71-87.
McKelvey, B. & Aldrich, H. (1983). Populations, Natural Selection, and Applied
Organizational Science. Administrative Science Quarterly, 28 (1): 101-128.
McGrath, R. G. & MacMillan, I. C. (2000). ¿Assessing technology projects using real
options reasoning? Research Technology Management, 43(4): 35-50.
McGrath, R. G. & MacMillan, I. C. (2002). Crafting R&D Project Portfolios. Research
Technology Management, 45(5): 48-59.
Menzel, M. P. & Fornahl, D. (2009). Cluster life cycles – dimensions and rationales of
cluster evolution. Industrial and Corporate Change, 19(1): 205-238.
Mintzberg, H. & Waters, J. (1985). Of Strategies, Deliberate and Emergent. Strategic
Management Journal, 6(3): 257-272.
Nelson, R. R. & Winter, S. G. (1982). An evolutionary theory of economic change.
Harvard University Press, Cambridge, Massachusetts
O’Reilly III, C. A. & Tushman, M. L. (2004). The Ambidextrous Organization.
Harvard Business Review.
100
Péladeau, P., Benzin, T., and Sarrat, F. (2013). The 2013 Value Shift Index: Slower
growth, subtle shifts. PricewaterhouseCoopers.
Pfeffer, J. M. (1993). Barriers to the advance of organizational science: Paradigm
development as a dependent variable. Academy of Management Review, 18: 599-620.
Phillips, A. (1971). Technology and Market Structure. Lexington Books: Lexington,
MA.
Péladeau, P., Friedrich, R., Benzin, T., and Sarrat, F. (2011). Value Shifts in the
Telecom, Media, and Technology Industries. Booz & Company.
Porter, M. E. (1985). Competitive Advantage. Free Press.
Porter, M. E. (1996). What Is Strategy?. Harvard Business Review.
Porter, M. E. (2008). The Five Competitive Forces that Shape Strategy. Harvard
Business Review.
Rawson, A., Duncan, E., Jones, C. (2013). The Truth About Customer Experience.
Harvard Business Review.
Regalado, C. (2012). Management Results. Corporacion Nacional de
Telecomunicaciones.
Rumelt, R. P. & Wensley, R. (1981). In Search of the Market Share Effect. Proceedings
of the Academy of Management.
Rummey, M. (2008). IMT-Advanced: 4G Wireless Takes Shape in an Olympic Year.
Agilent Measurement Journal, 6: 51-60.
Selznick, P. (1957). Leadership in Administration: a Sociological Interpretation.
Evanston, IL: Row, Peterson.
Smith, A. (1776). An Inquiry into the Nature and Causes of the Wealth of Nations. W.
Strahan and T. Cadell, London.
Stiglitz, J. E. (1989). Chapter 13 Imperfect information in the product market.
Handbook of Industrial Organization, 1: 769-847.
Talukder, A., Garcia, N., and Jayateertha, G. (2014). Convergence Through All-IP
Networks. Pan Stanford Publishing, United States of America.
Teece, D. J. (1987). Chapter: Capturing Value From Technological Innovation:
Integration, Strategic Partnering, and Licensing Decisions. Technology and Global
Industry: Companies and Nations in the World Economy. National Academy Press,
Washington D.C.
101
Utterback, J. M. & Abernathy W. J. (1975). A Dynamic Model of Process and Product
Innovation. Elsevier, Omega 3(6): 639-656.
Utterback J. M. & Suárez, F. F. (1993). Innovation, competition, and industry structure.
Research Policy, 22(1): 1-21.
Utterback J. M. & Suárez, F. F. (1995). Dominant Designs and the Survival of Firms.
Strategic Management Journal, 16: 415-430.
Witt, U. (2006). Evolutionary concepts in economics and biology. Journal of
Evolutionary Economics, 16: 473-476.
Yan, L., Wolniewicz, R. H., and Dodier, R. (2004). Predicting customer behavior in
telecommunications. Intelligent Systems IEEE, 19(2): 50-58.
Yin, R. K. (2014). Case Study Research: Design and Methods, fifth edition, Sage
Publications, United Sates of America.
Yovanof, G. & Hazapis, G. (2008). Disruptive Technologies, Services, or Business
Models?. Wireless Press Commun, 45: 569-583.
Van de Ven, A. H. & Poole, M. S. (1995). Explaining Development and Change in
Organizations. Academy of Management Review, 20(3): 510-540.
Verkasalo, H., Lindqvist, K., and Hämmäinen, H. (2008). Scenario Analysis of Mobile
Voice Services Market. Proceedings of IEEE Services Computing Conference.
Zollo, M. & Winter, S. G. (2002). Deliberate Learning and the Evolution of Dynamic
Capabilities. Journal of Organizational Science, 13(3): 339-351.
ELECTRONIC REFERENCES:
Bloomberg Visual Data (2014). Industry Market Leaders: Internet Media. Accessed on
10/2014 from:
http://www.bloomberg.com/visual-data/industries/detail/internet-media
Corning. (2005). Broadband Technology Overview. White Paper. Accessed 7/2014
from:
http://www.corning.com/docs/opticalfiber/wp6321.pdf
Corporacion Nacional de Telecomunicaciones CNT EP (2014). Financial Results 2013.
Accessed 5/2014 from:
http://www.micnt.com.ec/images/Pdfs/lotaip/G2.pdf
102
Corporacion Nacional de Telecomunicaciones CNT EP (2013). Financial Results 2012.
Accessed 5/2014 from:
http://soy.cnt.com.ec/pdfs/lotaip/G2.pdf
Corporacion Nacional de Telecomunicaciones CNT EP (2013). Financial Results 2011.
Accessed 5/2014 from:
http://soy.cnt.com.ec/pdfs/lotaip/G1.pdf
Ekos (2014). The Business Portal. Accessed 10/2014 from:
http://www.ekosnegocios.com/negocios/
Ekos (2014). Clients of paid TV increase. Accessed 11/2014 from:
http://www.ekosnegocios.com/negocios/verArticuloContenido.aspx?idart=3095
El Comercio (2014). E-commerce centers in Quito, Guayaquil and Cuenca. Accessed
10/2014 from:
http://www.elcomercio.com.ec/tendencias/comercio-electronico-ecommerce-
emprendimiento-internet.html
El Telegrafo (2014). Investment in Megaprojects will be reflected in 2016. Accessed
10/2014 from:
http://www.telegrafo.com.ec/economia/item/inversion-en-megaproyectos-se-vera-
reflejada-en-2016.html
Henderson, B. (1968). The Experience Curve. Boston Consulting Group. Accessed
8/2014 from:
https://www.bcgperspectives.com/content/Classics/strategy_the_experience_curve/
IDC (2014). Smartphone OS market share. Accessed 10/2014 from:
http://www.idc.com/prodserv/smartphone-os-market-share.jsp
International Telecommunication Union (2004). Definition of Next Generation Network.
Accessed 5/2014 from:
http://www.itu.int/ITU-T/studygroups/com13/ngn2004/working_definition.html
IPv6.com (2008). Next Generation Networking. Accessed 5/2014 from:
http://ipv6.com/articles/general/Next-Generation-Networking.htm
IMS NGN Forum (2008). IMS NGN Report Card. Accessed 5/2014 from:
http://www.imsforum.org/files/IMS-Report-Card-Nov08.pdf
Kowalke, M. (2014). Local Government Leverages Value of Next Generation
Broadband. Alcatel-Lucent. Accessed 5/2014 from:
103
http://next-generation-communications.tmcnet.com/topics/service-
provider/articles/377944-local-government-leverages-value-next-generation-
broadband.htm
INEC (2014). Web portal of the National Institute of Statistics and Censuses of Ecuador:
ICT. Accessed 10/2014 from:
http://www.inec.gob.ec/sitio_tics/
Rappa, M. (2010). Business Models on the Web. Managing the Digital Enterprise.
Accessed 10/2014 from:
http://digitalenterprise.org/models/models.html
SENATEL (2014). Web portal of the National Secretary of Telecommunications of
Ecuador: Statistics. Accessed 10/2014 from:
http://www.regulaciontelecomunicaciones.gob.ec/biblioteca/
Servicio de Rentas Internas SRI (2014). Web portal. Accessed 10/2014 from:
SUPERCIAS (2014). Web Portal of the Superintendence of Companies and Securities
of Ecuador. Accessed 10/2014 from:
http://www.supercias.gob.ec/portal/
SUPERTEL (2014). Web Portal of the Superintendence of Telecommunications of
Ecuador: News. Accessed 10/2014 from:
The Telecommunications History Group (2014). Virtual Museum. Accessed 5/2014
from:
http://www.telcomhistory.org/vm/scienceLongDistance.shtml
Winther, M. (2006). Tier 1 ISPs: What They Are and Why They Are Important. IDC,
White Paper. Accessed 10/2014 from:
https://www.us.ntt.net/downloads/papers/IDC_Tier1_ISPs.pdf
World Bank (2014). Ecuador Home. Accessed 10/2014 from:
http://www.worldbank.org/en/country/ecuador
World Bank (2014). Inflation data. Accessed 10/2014 from:
http://data.worldbank.org/indicator/FP.CPI.TOTL.ZG
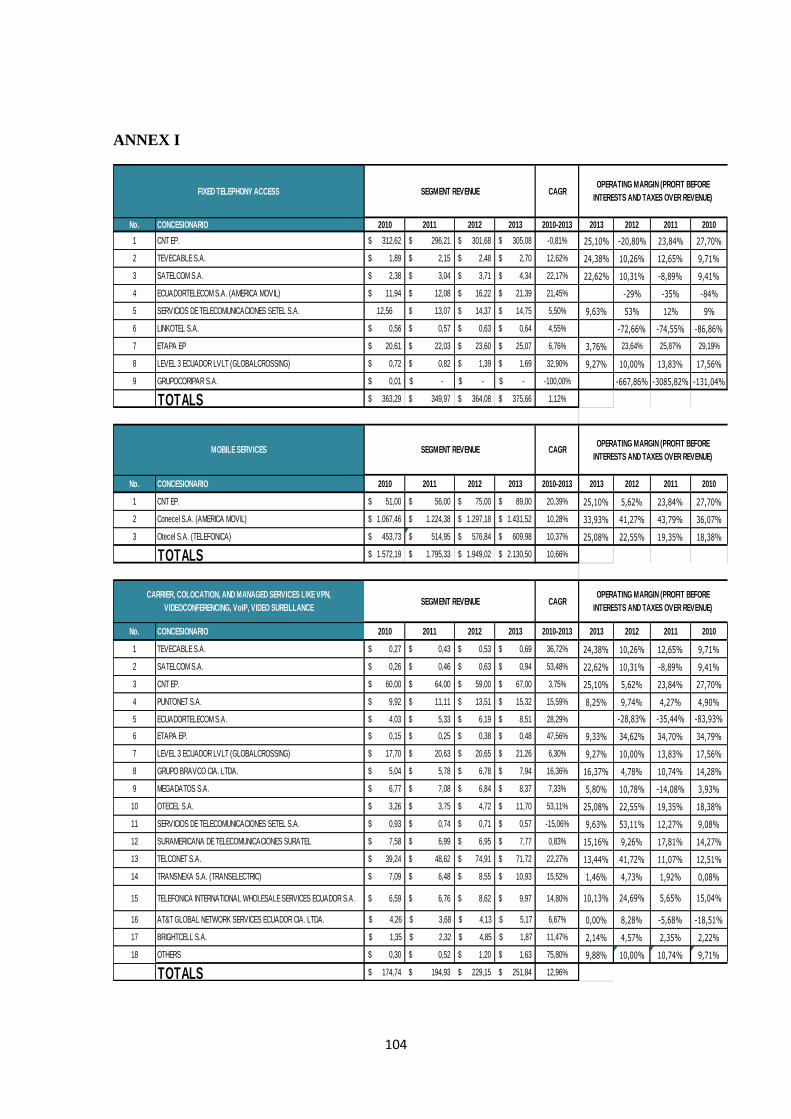
104
ANNEX I
No. CONCESIONARIO 2010 2011 2012 2013 2010-2013 2013 2012 2011 2010
1 CNT EP. 312,62$ 296,21$ 301,68$ 305,08$ -0,81% 25,10% -20,80% 23,84% 27,70%
2 TEVECABLE S.A. 1,89$ 2,15$ 2,48$ 2,70$ 12,62% 24,38% 10,26% 12,65% 9,71%
3 SATELCOM S.A. 2,38$ 3,04$ 3,71$ 4,34$ 22,17% 22,62% 10,31% -8,89% 9,41%
4 ECUADORTELECOM S.A. (AMERICA MOVIL) 11,94$ 12,08$ 16,22$ 21,39$ 21,45% -29% -35% -84%
5 SERVICIOS DE TELECOMUNICACIONES SETEL S.A. 12,56 13,07$ 14,37$ 14,75$ 5,50% 9,63% 53% 12% 9%
6 LINKOTEL S.A. 0,56$ 0,57$ 0,63$ 0,64$ 4,55% -72,66% -74,55% -86,86%
7 ETAPA EP 20,61$ 22,03$ 23,60$ 25,07$ 6,76% 3,76% 23,64% 25,87% 29,19%
8 LEVEL 3 ECUADOR LVLT (GLOBALCROSSING) 0,72$ 0,82$ 1,39$ 1,69$ 32,90% 9,27% 10,00% 13,83% 17,56%
9 GRUPOCORIPAR S.A. 0,01$ -$ -$ -$ -100,00% -667,86% -3085,82% -131,04%
TOTALS 363,29$ 349,97$ 364,08$ 375,66$ 1,12%
No. CONCESIONARIO 2010 2011 2012 2013 2010-2013 2013 2012 2011 2010
1 CNT EP. 51,00$ 56,00$ 75,00$ 89,00$ 20,39% 25,10% 5,62% 23,84% 27,70%
2 Conecel S.A. (AMERICA MOVIL) 1.067,46$ 1.224,38$ 1.297,18$ 1.431,52$ 10,28% 33,93% 41,27% 43,79% 36,07%
3 Otecel S.A. (TELEFONICA) 453,73$ 514,95$ 576,84$ 609,98$ 10,37% 25,08% 22,55% 19,35% 18,38%
TOTALS 1.572,19$ 1.795,33$ 1.949,02$ 2.130,50$ 10,66%
No. CONCESIONARIO 2010 2011 2012 2013 2010-2013 2013 2012 2011 2010
1 TEVECABLE S.A. 0,27$ 0,43$ 0,53$ 0,69$ 36,72% 24,38% 10,26% 12,65% 9,71%
2 SATELCOM S.A. 0,26$ 0,46$ 0,63$ 0,94$ 53,48% 22,62% 10,31% -8,89% 9,41%
3 CNT EP. 60,00$ 64,00$ 59,00$ 67,00$ 3,75% 25,10% 5,62% 23,84% 27,70%
4 PUNTONET S.A. 9,92$ 11,11$ 13,51$ 15,32$ 15,59% 8,25% 9,74% 4,27% 4,90%
5 ECUADORTELECOM S.A. 4,03$ 5,33$ 6,19$ 8,51$ 28,29% -28,83% -35,44% -83,93%
6 ETAPA EP. 0,15$ 0,25$ 0,38$ 0,48$ 47,56% 9,33% 34,62% 34,70% 34,79%
7 LEVEL 3 ECUADOR LVLT (GLOBALCROSSING) 17,70$ 20,63$ 20,65$ 21,26$ 6,30% 9,27% 10,00% 13,83% 17,56%
8 GRUPO BRAVCO CIA. LTDA. 5,04$ 5,78$ 6,78$ 7,94$ 16,36% 16,37% 4,78% 10,74% 14,28%
9 MEGADATOS S.A. 6,77$ 7,08$ 6,84$ 8,37$ 7,33% 5,80% 10,78% -14,08% 3,93%
10 OTECEL S.A. 3,26$ 3,75$ 4,72$ 11,70$ 53,11% 25,08% 22,55% 19,35% 18,38%
11 SERVICIOS DE TELECOMUNICACIONES SETEL S.A. 0,93$ 0,74$ 0,71$ 0,57$ -15,06% 9,63% 53,11% 12,27% 9,08%
12 SURAMERICANA DE TELECOMUNICACIONES SURATEL 7,58$ 6,99$ 6,95$ 7,77$ 0,83% 15,16% 9,26% 17,81% 14,27%
13 TELCONET S.A. 39,24$ 48,62$ 74,91$ 71,72$ 22,27% 13,44% 41,72% 11,07% 12,51%
14 TRANSNEXA S.A. (TRANSELECTRIC) 7,09$ 6,48$ 8,55$ 10,93$ 15,52% 1,46% 4,73% 1,92% 0,08%
15 TELEFONICA INTERNATIONAL WHOLESALE SERVICES ECUADOR S.A. 6,59$ 6,76$ 8,62$ 9,97$ 14,80% 10,13% 24,69% 5,65% 15,04%
16 AT&T GLOBAL NETWORK SERVICES ECUADOR CIA. LTDA. $ 4,26 $ 3,68 $ 4,13 $ 5,17 6,67% 0,00% 8,28% -5,68% -18,51%
17 BRIGHTCELL S.A. $ 1,35 $ 2,32 $ 4,85 $ 1,87 11,47% 2,14% 4,57% 2,35% 2,22%
18 OTHERS 0,30$ 0,52$ 1,20$ 1,63$ 75,80% 9,88% 10,00% 10,74% 9,71%
TOTALS 174,74$ 194,93$ 229,15$ 251,84$ 12,96%
CARRIER, COLOCATION, AND MANAGED SERVICES LIKE VPN,
VIDEOCONFERENCING, VoIP, VIDEO SUREILLANCE
FIXED TELEPHONY ACCESS
MOBILE SERVICES
SEGMENT REVENUE
SEGMENT REVENUE
CAGR
CAGR
SEGMENT REVENUE CAGR
OPERATING MARGIN (PROFIT BEFORE
INTERESTS AND TAXES OVER REVENUE)
OPERATING MARGIN (PROFIT BEFORE
INTERESTS AND TAXES OVER REVENUE)
OPERATING MARGIN (PROFIT BEFORE
INTERESTS AND TAXES OVER REVENUE)
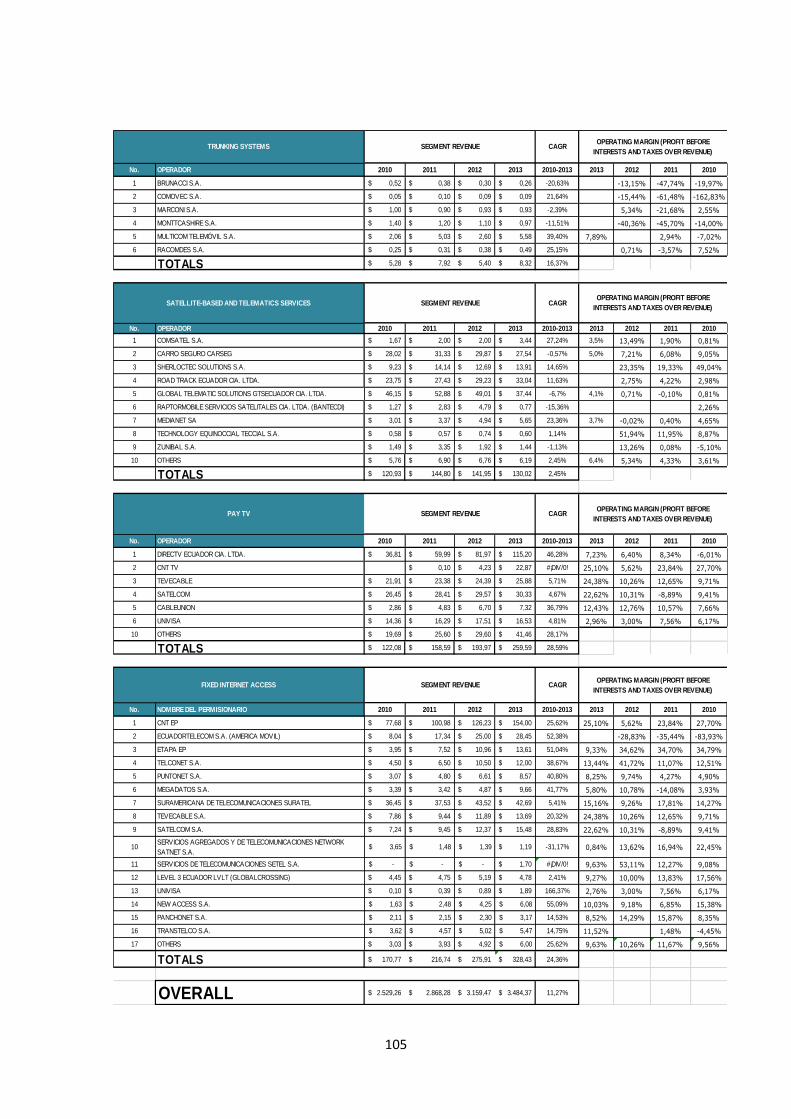
105
No. OPERADOR 2010 2011 2012 2013 2010-2013 2013 2012 2011 2010
1 BRUNACCI S.A. 0,52$ 0,38$ 0,30$ 0,26$ -20,63% -13,15% -47,74% -19,97%
2 COMOVEC S.A. 0,05$ 0,10$ 0,09$ 0,09$ 21,64% -15,44% -61,48% -162,83%
3 MARCONI S.A. 1,00$ 0,90$ 0,93$ 0,93$ -2,39% 5,34% -21,68% 2,55%
4 MONTTCASHIRE S.A. 1,40$ 1,20$ 1,10$ 0,97$ -11,51% -40,36% -45,70% -14,00%
5 MULTICOM TELEMÓVIL S.A. 2,06$ 5,03$ 2,60$ 5,58$ 39,40% 7,89% 2,94% -7,02%
6 RACOMDES S.A. 0,25$ 0,31$ 0,38$ 0,49$ 25,15% 0,71% -3,57% 7,52%
TOTALS 5,28$ 7,92$ 5,40$ 8,32$ 16,37%
No. OPERADOR 2010 2011 2012 2013 2010-2013 2013 2012 2011 2010
1 COMSATEL S.A. 1,67$ 2,00$ 2,00$ 3,44$ 27,24% 3,5% 13,49% 1,90% 0,81%
2 CARRO SEGURO CARSEG 28,02$ 31,33$ 29,87$ 27,54$ -0,57% 5,0% 7,21% 6,08% 9,05%
3 SHERLOCTEC SOLUTIONS S.A. 9,23$ 14,14$ 12,69$ 13,91$ 14,65% 23,35% 19,33% 49,04%
4 ROAD TRACK ECUADOR CIA. LTDA. 23,75$ 27,43$ 29,23$ 33,04$ 11,63% 2,75% 4,22% 2,98%
5 GLOBAL TELEMATIC SOLUTIONS GTSECUADOR CIA. LTDA. 46,15$ 52,88$ 49,01$ 37,44$ -6,7% 4,1% 0,71% -0,10% 0,81%
6 RAPTORMOBILE SERVICIOS SATELITALES CIA. LTDA. (BANTECDI) 1,27$ 2,83$ 4,79$ 0,77$ -15,36% 2,26%
7 MEDIANET SA 3,01$ 3,37$ 4,94$ 5,65$ 23,36% 3,7% -0,02% 0,40% 4,65%
8 TECHNOLOGY EQUINOCCIAL TECCIAL S.A. 0,58$ 0,57$ 0,74$ 0,60$ 1,14% 51,94% 11,95% 8,87%
9 ZUNIBAL S.A. 1,49$ 3,35$ 1,92$ 1,44$ -1,13% 13,26% 0,08% -5,10%
10 OTHERS 5,76$ 6,90$ 6,76$ 6,19$ 2,45% 6,4% 5,34% 4,33% 3,61%
TOTALS 120,93$ 144,80$ 141,95$ 130,02$ 2,45%
No. OPERADOR 2010 2011 2012 2013 2010-2013 2013 2012 2011 2010
1 DIRECTV ECUADOR CIA. LTDA. 36,81$ 59,99$ 81,97$ 115,20$ 46,28% 7,23% 6,40% 8,34% -6,01%
2 CNT TV 0,10$ 4,23$ 22,87$ #¡DIV/0! 25,10% 5,62% 23,84% 27,70%
3 TEVECABLE 21,91$ 23,38$ 24,39$ 25,88$ 5,71% 24,38% 10,26% 12,65% 9,71%
4 SATELCOM 26,45$ 28,41$ 29,57$ 30,33$ 4,67% 22,62% 10,31% -8,89% 9,41%
5 CABLEUNION 2,86$ 4,83$ 6,70$ 7,32$ 36,79% 12,43% 12,76% 10,57% 7,66%
6 UNIVISA 14,36$ 16,29$ 17,51$ 16,53$ 4,81% 2,96% 3,00% 7,56% 6,17%
10 OTHERS 19,69$ 25,60$ 29,60$ 41,46$ 28,17%
TOTALS 122,08$ 158,59$ 193,97$ 259,59$ 28,59%
No. NOMBRE DEL PERMISIONARIO 2010 2011 2012 2013 2010-2013 2013 2012 2011 2010
1 CNT EP 77,68$ 100,98$ 126,23$ 154,00$ 25,62% 25,10% 5,62% 23,84% 27,70%
2 ECUADORTELECOM S.A. (AMERICA MOVIL) 8,04$ 17,34$ 25,00$ 28,45$ 52,38% -28,83% -35,44% -83,93%
3 ETAPA EP 3,95$ 7,52$ 10,96$ 13,61$ 51,04% 9,33% 34,62% 34,70% 34,79%
4 TELCONET S.A. 4,50$ 6,50$ 10,50$ 12,00$ 38,67% 13,44% 41,72% 11,07% 12,51%
5 PUNTONET S.A. 3,07$ 4,80$ 6,61$ 8,57$ 40,80% 8,25% 9,74% 4,27% 4,90%
6 MEGADATOS S.A. 3,39$ 3,42$ 4,87$ 9,66$ 41,77% 5,80% 10,78% -14,08% 3,93%
7 SURAMERICANA DE TELECOMUNICACIONES SURATEL 36,45$ 37,53$ 43,52$ 42,69$ 5,41% 15,16% 9,26% 17,81% 14,27%
8 TEVECABLE S.A. 7,86$ 9,44$ 11,89$ 13,69$ 20,32% 24,38% 10,26% 12,65% 9,71%
9 SATELCOM S.A. 7,24$ 9,45$ 12,37$ 15,48$ 28,83% 22,62% 10,31% -8,89% 9,41%
10SERVICIOS AGREGADOS Y DE TELECOMUNICACIONES NETWORK
SATNET S.A. $ 3,65 $ 1,48 $ 1,39 1,19$ -31,17% 0,84% 13,62% 16,94% 22,45%
11 SERVICIOS DE TELECOMUNICACIONES SETEL S.A. -$ -$ -$ 1,70$ #¡DIV/0! 9,63% 53,11% 12,27% 9,08%
12 LEVEL 3 ECUADOR LVLT (GLOBALCROSSING) 4,45$ 4,75$ 5,19$ 4,78$ 2,41% 9,27% 10,00% 13,83% 17,56%
13 UNIVISA 0,10$ 0,39$ 0,89$ 1,89$ 166,37% 2,76% 3,00% 7,56% 6,17%
14 NEW ACCESS S.A. $ 1,63 $ 2,48 $ 4,25 $ 6,08 55,09% 10,03% 9,18% 6,85% 15,38%
15 PANCHONET S.A. $ 2,11 $ 2,15 $ 2,30 $ 3,17 14,53% 8,52% 14,29% 15,87% 8,35%
16 TRANSTELCO S.A. $ 3,62 $ 4,57 $ 5,02 $ 5,47 14,75% 11,52% 1,48% -4,45%
17 OTHERS 3,03$ 3,93$ 4,92$ $ 6,00 25,62% 9,63% 10,26% 11,67% 9,56%
TOTALS 170,77$ 216,74$ 275,91$ 328,43$ 24,36%
OVERALL 2.529,26$ 2.868,28$ 3.159,47$ 3.484,37$ 11,27%
FIXED INTERNET ACCESS SEGMENT REVENUE
SEGMENT REVENUE
CAGR
CAGR
SATELLITE-BASED AND TELEMATICS SERVICES
PAY TV
SEGMENT REVENUE
TRUNKING SYSTEMS SEGMENT REVENUE CAGROPERATING MARGIN (PROFIT BEFORE
INTERESTS AND TAXES OVER REVENUE)
OPERATING MARGIN (PROFIT BEFORE
INTERESTS AND TAXES OVER REVENUE)
OPERATING MARGIN (PROFIT BEFORE
INTERESTS AND TAXES OVER REVENUE)
OPERATING MARGIN (PROFIT BEFORE
INTERESTS AND TAXES OVER REVENUE)CAGR
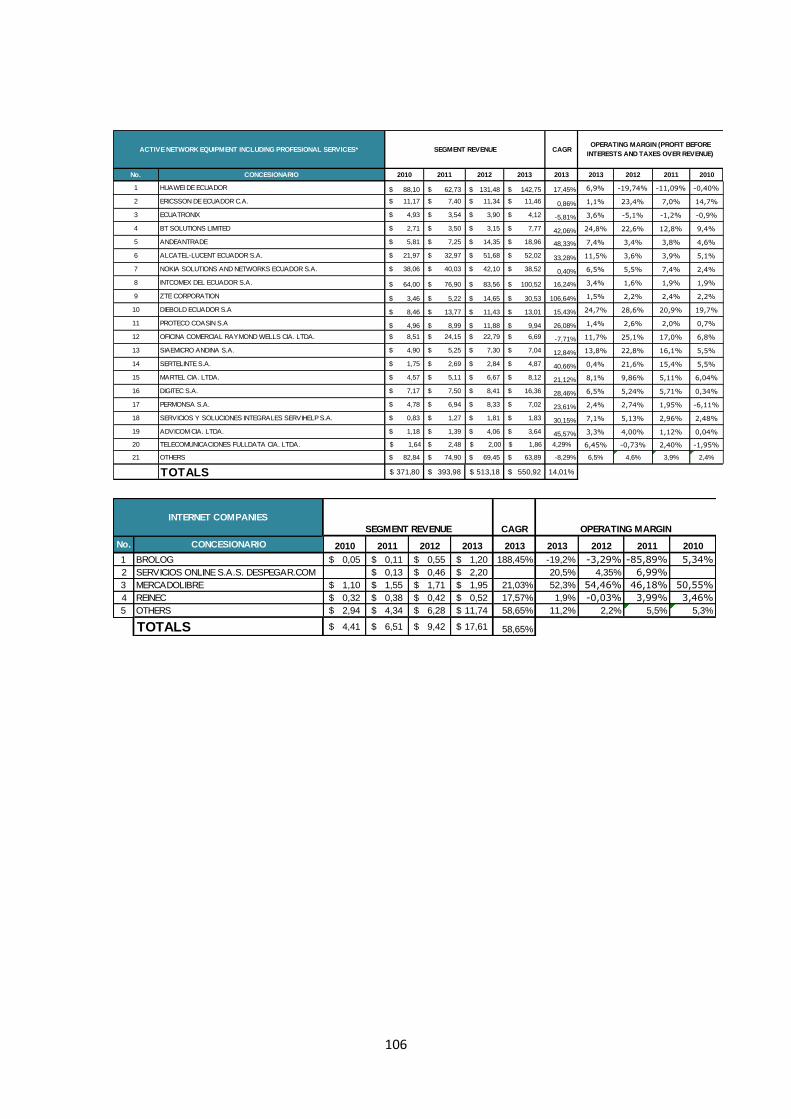
106
CAGR
No. CONCESIONARIO 2010 2011 2012 2013 2013 2013 2012 2011 2010
1 HUAWEI DE ECUADOR 88,10$ 62,73$ 131,48$ 142,75$ 17,45% 6,9% -19,74% -11,09% -0,40%
2 ERICSSON DE ECUADOR C.A. 11,17$ 7,40$ 11,34$ 11,46$ 0,86% 1,1% 23,4% 7,0% 14,7%
3 ECUATRONIX 4,93$ 3,54$ 3,90$ 4,12$ -5,81% 3,6% -5,1% -1,2% -0,9%
4 BT SOLUTIONS LIMITED 2,71$ 3,50$ 3,15$ 7,77$ 42,06% 24,8% 22,6% 12,8% 9,4%
5 ANDEANTRADE 5,81$ 7,25$ 14,35$ 18,96$ 48,33% 7,4% 3,4% 3,8% 4,6%
6 ALCATEL-LUCENT ECUADOR S.A. 21,97$ 32,97$ 51,68$ 52,02$ 33,28% 11,5% 3,6% 3,9% 5,1%
7 NOKIA SOLUTIONS AND NETWORKS ECUADOR S.A. 38,06$ 40,03$ 42,10$ 38,52$ 0,40% 6,5% 5,5% 7,4% 2,4%
8 INTCOMEX DEL ECUADOR S.A. 64,00$ 76,90$ 83,56$ 100,52$ 16,24% 3,4% 1,6% 1,9% 1,9%
9 ZTE CORPORATION 3,46$ 5,22$ 14,65$ 30,53$ 106,64% 1,5% 2,2% 2,4% 2,2%
10 DIEBOLD ECUADOR S.A 8,46$ 13,77$ 11,43$ 13,01$ 15,43% 24,7% 28,6% 20,9% 19,7%
11 PROTECO COASIN S.A 4,96$ 8,99$ 11,88$ 9,94$ 26,08% 1,4% 2,6% 2,0% 0,7%
12 OFICINA COMERCIAL RAYMOND WELLS CIA. LTDA. 8,51$ 24,15$ 22,79$ 6,69$ -7,71% 11,7% 25,1% 17,0% 6,8%
13 SIAEMICRO ANDINA S.A. 4,90$ 5,25$ 7,30$ 7,04$ 12,84% 13,8% 22,8% 16,1% 5,5%
14 SERTELINTE S.A. 1,75$ 2,69$ 2,84$ 4,87$ 40,66% 0,4% 21,6% 15,4% 5,5%
15 MARTEL CIA. LTDA. 4,57$ 5,11$ 6,67$ 8,12$ 21,12% 8,1% 9,86% 5,11% 6,04%
16 DIGITEC S.A. 7,17$ 7,50$ 8,41$ 16,36$ 28,46% 6,5% 5,24% 5,71% 0,34%
17 PERMONSA S.A. 4,78$ 6,94$ 8,33$ 7,02$ 23,61% 2,4% 2,74% 1,95% -6,11%
18 SERVICIOS Y SOLUCIONES INTEGRALES SERVIHELP S.A. 0,83$ 1,27$ 1,81$ 1,83$ 30,15% 7,1% 5,13% 2,96% 2,48%
19 ADVICOM CIA. LTDA. 1,18$ 1,39$ 4,06$ 3,64$ 45,57% 3,3% 4,00% 1,12% 0,04%
20 TELECOMUNICACIONES FULLDATA CIA. LTDA. $ 1,64 2,48$ $ 2,00 $ 1,86 4,29% 6,45% -0,73% 2,40% -1,95%
21 OTHERS 82,84$ 74,90$ 69,45$ 63,89$ -8,29% 6,5% 4,6% 3,9% 2,4%
TOTALS 371,80$ 393,98$ 513,18$ 550,92$ 14,01%
OPERATING MARGIN (PROFIT BEFORE
INTERESTS AND TAXES OVER REVENUE)ACTIVE NETWORK EQUIPMENT INCLUDING PROFESIONAL SERVICES* SEGMENT REVENUE
CAGR
No. CONCESIONARIO 2010 2011 2012 2013 2013 2013 2012 2011 2010
1 BROLOG 0,05$ 0,11$ 0,55$ 1,20$ 188,45% -19,2% -3,29% -85,89% 5,34%
2 SERVICIOS ONLINE S.A.S. DESPEGAR.COM 0,13$ 0,46$ 2,20$ 20,5% 4,35% 6,99%
3 MERCADOLIBRE 1,10$ 1,55$ 1,71$ 1,95$ 21,03% 52,3% 54,46% 46,18% 50,55%
4 REINEC 0,32$ 0,38$ 0,42$ 0,52$ 17,57% 1,9% -0,03% 3,99% 3,46%
5 OTHERS 2,94$ 4,34$ 6,28$ 11,74$ 58,65% 11,2% 2,2% 5,5% 5,3%
TOTALS 4,41$ 6,51$ 9,42$ 17,61$ 58,65%
INTERNET COMPANIES
SEGMENT REVENUE OPERATING MARGIN
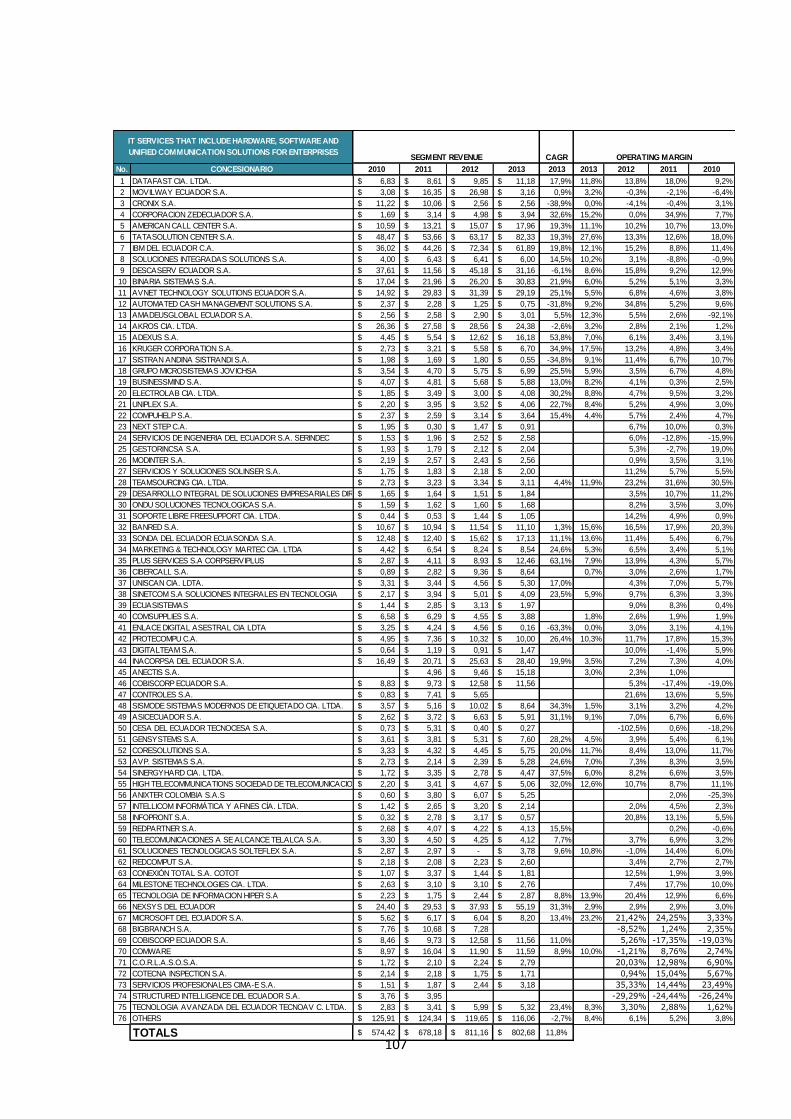
107
CAGR
No. CONCESIONARIO 2010 2011 2012 2013 2013 2013 2012 2011 2010
1 DATAFAST CIA. LTDA. 6,83$ 8,61$ 9,85$ 11,18$ 17,9% 11,8% 13,8% 18,0% 9,2%
2 MOVILWAY ECUADOR S.A. 3,08$ 16,35$ 26,98$ 3,16$ 0,9% 3,2% -0,3% -2,1% -6,4%
3 CRONIX S.A. 11,22$ 10,06$ 2,56$ 2,56$ -38,9% 0,0% -4,1% -0,4% 3,1%
4 CORPORACION ZEDECUADOR S.A. 1,69$ 3,14$ 4,98$ 3,94$ 32,6% 15,2% 0,0% 34,9% 7,7%
5 AMERICAN CALL CENTER S.A. 10,59$ 13,21$ 15,07$ 17,96$ 19,3% 11,1% 10,2% 10,7% 13,0%
6 TATASOLUTION CENTER S.A. 48,47$ 53,66$ 63,17$ 82,33$ 19,3% 27,6% 13,3% 12,6% 18,0%
7 IBM DEL ECUADOR C.A. 36,02$ 44,26$ 72,34$ 61,89$ 19,8% 12,1% 15,2% 8,8% 11,4%
8 SOLUCIONES INTEGRADAS SOLUTIONS S.A. 4,00$ 6,43$ 6,41$ 6,00$ 14,5% 10,2% 3,1% -8,8% -0,9%
9 DESCASERV ECUADOR S.A. 37,61$ 11,56$ 45,18$ 31,16$ -6,1% 8,6% 15,8% 9,2% 12,9%
10 BINARIA SISTEMAS S.A. 17,04$ 21,96$ 26,20$ 30,83$ 21,9% 6,0% 5,2% 5,1% 3,3%
11 AVNET TECHNOLOGY SOLUTIONS ECUADOR S.A. 14,92$ 29,83$ 31,39$ 29,19$ 25,1% 5,5% 6,8% 4,6% 3,8%
12 AUTOMATED CASH MANAGEMENT SOLUTIONS S.A. 2,37$ 2,28$ 1,25$ 0,75$ -31,8% 9,2% 34,8% 5,2% 9,6%
13 AMADEUSGLOBAL ECUADOR S.A. 2,56$ 2,58$ 2,90$ 3,01$ 5,5% 12,3% 5,5% 2,6% -92,1%
14 AKROS CIA. LTDA. 26,36$ 27,58$ 28,56$ 24,38$ -2,6% 3,2% 2,8% 2,1% 1,2%
15 ADEXUS S.A. 4,45$ 5,54$ 12,62$ 16,18$ 53,8% 7,0% 6,1% 3,4% 3,1%
16 KRUGER CORPORATION S.A. 2,73$ 3,21$ 5,58$ 6,70$ 34,9% 17,5% 13,2% 4,8% 3,4%
17 SISTRAN ANDINA SISTRANDI S.A. 1,98$ 1,69$ 1,80$ 0,55$ -34,8% 9,1% 11,4% 6,7% 10,7%
18 GRUPO MICROSISTEMAS JOVICHSA 3,54$ 4,70$ 5,75$ 6,99$ 25,5% 5,9% 3,5% 6,7% 4,8%
19 BUSINESSMIND S.A. 4,07$ 4,81$ 5,68$ 5,88$ 13,0% 8,2% 4,1% 0,3% 2,5%
20 ELECTROLAB CIA. LTDA. 1,85$ 3,49$ 3,00$ 4,08$ 30,2% 8,8% 4,7% 9,5% 3,2%
21 UNIPLEX S.A. 2,20$ 3,95$ 3,52$ 4,06$ 22,7% 8,4% 5,2% 4,9% 3,0%
22 COMPUHELP S.A. 2,37$ 2,59$ 3,14$ 3,64$ 15,4% 4,4% 5,7% 2,4% 4,7%
23 NEXT STEP C.A. 1,95$ 0,30$ 1,47$ 0,91$ 6,7% 10,0% 0,3%
24 SERVICIOS DE INGENIERIA DEL ECUADOR S.A. SERINDEC 1,53$ 1,96$ 2,52$ 2,58$ 6,0% -12,8% -15,9%
25 GESTORINCSA S.A. 1,93$ 1,79$ 2,12$ 2,04$ 5,3% -2,7% 19,0%
26 MODINTER S.A. 2,19$ 2,57$ 2,43$ 2,56$ 0,9% 3,5% 3,1%
27 SERVICIOS Y SOLUCIONES SOLINSER S.A. 1,75$ 1,83$ 2,18$ 2,00$ 11,2% 5,7% 5,5%
28 TEAMSOURCING CIA. LTDA. 2,73$ 3,23$ 3,34$ 3,11$ 4,4% 11,9% 23,2% 31,6% 30,5%
29 DESARROLLO INTEGRAL DE SOLUCIONES EMPRESARIALES DIRES S.A. 1,65$ 1,64$ 1,51$ 1,84$ 3,5% 10,7% 11,2%
30 ONDU SOLUCIONES TECNOLOGICAS S.A. 1,59$ 1,62$ 1,60$ 1,68$ 8,2% 3,5% 3,0%
31 SOPORTE LIBRE FREESUPPORT CIA. LTDA. 0,44$ 0,53$ 1,44$ 1,05$ 14,2% 4,9% 0,9%
32 BANRED S.A. 10,67$ 10,94$ 11,54$ 11,10$ 1,3% 15,6% 16,5% 17,9% 20,3%
33 SONDA DEL ECUADOR ECUASONDA S.A. 12,48$ 12,40$ 15,62$ 17,13$ 11,1% 13,6% 11,4% 5,4% 6,7%
34 MARKETING & TECHNOLOGY MARTEC CIA. LTDA 4,42$ 6,54$ 8,24$ 8,54$ 24,6% 5,3% 6,5% 3,4% 5,1%
35 PLUS SERVICES S.A CORPSERVIPLUS 2,87$ 4,11$ 8,93$ 12,46$ 63,1% 7,9% 13,9% 4,3% 5,7%
36 CIBERCALL S.A. 0,89$ 2,82$ 9,36$ 8,64$ 0,7% 3,0% 2,6% 1,7%
37 UNISCAN CIA. LDTA. 3,31$ 3,44$ 4,56$ 5,30$ 17,0% 4,3% 7,0% 5,7%
38 SINETCOM S.A SOLUCIONES INTEGRALES EN TECNOLOGIA 2,17$ 3,94$ 5,01$ 4,09$ 23,5% 5,9% 9,7% 6,3% 3,3%
39 ECUASISTEMAS 1,44$ 2,85$ 3,13$ 1,97$ 9,0% 8,3% 0,4%
40 COMSUPPLIES S.A. 6,58$ 6,29$ 4,55$ 3,88$ 1,8% 2,6% 1,9% 1,9%
41 ENLACE DIGITAL ASESTRAL CIA LDTA 3,25$ 4,24$ 4,56$ 0,16$ -63,3% 0,0% 3,0% 3,1% 4,1%
42 PROTECOMPU C.A. 4,95$ 7,36$ 10,32$ 10,00$ 26,4% 10,3% 11,7% 17,8% 15,3%
43 DIGITALTEAM S.A. 0,64$ 1,19$ 0,91$ 1,47$ 10,0% -1,4% 5,9%
44 INACORPSA DEL ECUADOR S.A. 16,49$ 20,71$ 25,63$ 28,40$ 19,9% 3,5% 7,2% 7,3% 4,0%
45 ANECTIS S.A. 4,96$ 9,46$ 15,18$ 3,0% 2,3% 1,0%
46 COBISCORP ECUADOR S.A. 8,83$ 9,73$ 12,58$ 11,56$ 5,3% -17,4% -19,0%
47 CONTROLES S.A. 0,83$ 7,41$ 5,65$ 21,6% 13,6% 5,5%
48 SISMODE SISTEMAS MODERNOS DE ETIQUETADO CIA. LTDA. 3,57$ 5,16$ 10,02$ 8,64$ 34,3% 1,5% 3,1% 3,2% 4,2%
49 ASICECUADOR S.A. 2,62$ 3,72$ 6,63$ 5,91$ 31,1% 9,1% 7,0% 6,7% 6,6%
50 CESA DEL ECUADOR TECNOCESA S.A. 0,73$ 5,31$ 0,40$ 0,27$ -102,5% 0,6% -18,2%
51 GENSYSTEMS S.A. 3,61$ 3,81$ 5,31$ 7,60$ 28,2% 4,5% 3,9% 5,4% 6,1%
52 CORESOLUTIONS S.A. 3,33$ 4,32$ 4,45$ 5,75$ 20,0% 11,7% 8,4% 13,0% 11,7%
53 AVP. SISTEMAS S.A. 2,73$ 2,14$ 2,39$ 5,28$ 24,6% 7,0% 7,3% 8,3% 3,5%
54 SINERGYHARD CIA. LTDA. 1,72$ 3,35$ 2,78$ 4,47$ 37,5% 6,0% 8,2% 6,6% 3,5%
55 HIGH TELECOMMUNICATIONS SOCIEDAD DE TELECOMUNICACIONES CIA. LTDA.2,20$ 3,41$ 4,67$ 5,06$ 32,0% 12,6% 10,7% 8,7% 11,1%
56 ANIXTER COLOMBIA S.A.S 0,60$ 3,80$ 6,07$ 5,25$ 2,0% -25,3%
57 INTELLICOM INFORMÁTICA Y AFINES CÍA. LTDA. 1,42$ 2,65$ 3,20$ 2,14$ 2,0% 4,5% 2,3%
58 INFOPRONT S.A. 0,32$ 2,78$ 3,17$ 0,57$ 20,8% 13,1% 5,5%
59 REDPARTNER S.A. 2,68$ 4,07$ 4,22$ 4,13$ 15,5% 0,2% -0,6%
60 TELECOMUNICACIONES A SE ALCANCE TELALCA S.A. 3,30$ 4,50$ 4,25$ 4,12$ 7,7% 3,7% 6,9% 3,2%
61 SOLUCIONES TECNOLOGICAS SOLTEFLEX S.A. 2,87$ 2,97$ -$ 3,78$ 9,6% 10,8% -1,0% 14,4% 6,0%
62 REDCOMPUT S.A. 2,18$ 2,08$ 2,23$ 2,60$ 3,4% 2,7% 2,7%
63 CONEXIÓN TOTAL S.A. COTOT 1,07$ 3,37$ 1,44$ 1,81$ 12,5% 1,9% 3,9%
64 MILESTONE TECHNOLOGIES CIA. LTDA. 2,63$ 3,10$ 3,10$ 2,76$ 7,4% 17,7% 10,0%
65 TECNOLOGIA DE INFORMACION HIPER S.A 2,23$ 1,75$ 2,44$ 2,87$ 8,8% 13,9% 20,4% 12,9% 6,6%
66 NEXSYS DEL ECUADOR 24,40$ 29,53$ 37,93$ 55,19$ 31,3% 2,9% 2,9% 2,9% 3,0%
67 MICROSOFT DEL ECUADOR S.A. 5,62$ 6,17$ 6,04$ 8,20$ 13,4% 23,2% 21,42% 24,25% 3,33%
68 BIGBRANCH S.A. 7,76$ 10,68$ 7,28$ -8,52% 1,24% 2,35%
69 COBISCORP ECUADOR S.A. 8,46$ 9,73$ 12,58$ 11,56$ 11,0% 5,26% -17,35% -19,03%
70 COMWARE 8,97$ 16,04$ 11,90$ 11,59$ 8,9% 10,0% -1,21% 8,76% 2,74%
71 C.O.R.L.A.S.O.S.A. 1,72$ 2,10$ 2,24$ 2,79$ 20,03% 12,98% 6,90%
72 COTECNA INSPECTION S.A. 2,14$ 2,18$ 1,75$ 1,71$ 0,94% 15,04% 5,67%
73 SERVICIOS PROFESIONALES CIMA-E S.A. 1,51$ 1,87$ 2,44$ 3,18$ 35,33% 14,44% 23,49%
74 STRUCTURED INTELLIGENCE DEL ECUADOR S.A. 3,76$ 3,95$ -29,29% -24,44% -26,24%
75 TECNOLOGIA AVANZADA DEL ECUADOR TECNOAV C. LTDA. 2,83$ 3,41$ 5,99$ 5,32$ 23,4% 8,3% 3,30% 2,88% 1,62%
76 OTHERS 125,91$ 124,34$ 119,65$ 116,06$ -2,7% 8,4% 6,1% 5,2% 3,8%
TOTALS 574,42$ 678,18$ 811,16$ 802,68$ 11,8%
SEGMENT REVENUE
IT SERVICES THAT INCLUDE HARDWARE, SOFTWARE AND
UNIFIED COMMUNICATION SOLUTIONS FOR ENTERPRISESOPERATING MARGIN
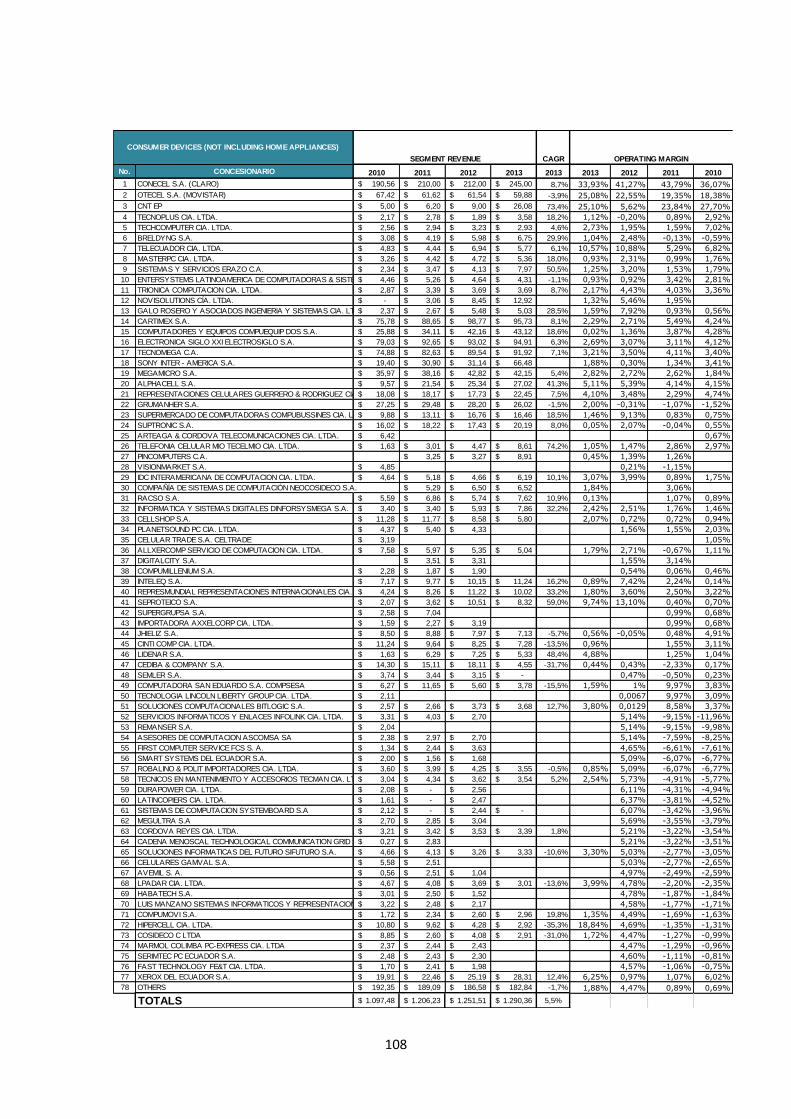
108
CAGR
No. CONCESIONARIO 2010 2011 2012 2013 2013 2013 2012 2011 2010
1 CONECEL S.A. (CLARO) 190,56$ 210,00$ 212,00$ 245,00$ 8,7% 33,93% 41,27% 43,79% 36,07%
2 OTECEL S.A. (MOVISTAR) 67,42$ 61,62$ 61,54$ 59,88$ -3,9% 25,08% 22,55% 19,35% 18,38%
3 CNT EP 5,00$ 6,20$ 9,00$ 26,08$ 73,4% 25,10% 5,62% 23,84% 27,70%
4 TECNOPLUS CIA. LTDA. 2,17$ 2,78$ 1,89$ 3,58$ 18,2% 1,12% -0,20% 0,89% 2,92%
5 TECHCOMPUTER CIA. LTDA. 2,56$ 2,94$ 3,23$ 2,93$ 4,6% 2,73% 1,95% 1,59% 7,02%
6 BRELDYNG S.A. 3,08$ 4,19$ 5,98$ 6,75$ 29,9% 1,04% 2,48% -0,13% -0,59%
7 TELECUADOR CIA. LTDA. 4,83$ 4,44$ 6,94$ 5,77$ 6,1% 10,57% 10,88% 5,29% 6,82%
8 MASTERPC CIA. LTDA. 3,26$ 4,42$ 4,72$ 5,36$ 18,0% 0,93% 2,31% 0,99% 1,76%
9 SISTEMAS Y SERVICIOS ERAZO C.A. 2,34$ 3,47$ 4,13$ 7,97$ 50,5% 1,25% 3,20% 1,53% 1,79%
10 ENTERSYSTEMS LATINOAMERICA DE COMPUTADORAS & SISTEMAS CIA. LTDA.4,46$ 5,26$ 4,64$ 4,31$ -1,1% 0,93% 0,92% 3,42% 2,81%
11 TRIONICA COMPUTACION CIA. LTDA. 2,87$ 3,39$ 3,69$ 3,69$ 8,7% 2,17% 4,43% 4,03% 3,36%
12 NOVISOLUTIONS CÍA. LTDA. -$ 3,06$ 8,45$ 12,92$ 1,32% 5,46% 1,95%
13 GALO ROSERO Y ASOCIADOS INGENIERIA Y SISTEMAS CIA. LTDA. 2,37$ 2,67$ 5,48$ 5,03$ 28,5% 1,59% 7,92% 0,93% 0,56%
14 CARTIMEX S.A. 75,78$ 88,65$ 98,77$ 95,73$ 8,1% 2,29% 2,71% 5,49% 4,24%
15 COMPUTADORES Y EQUIPOS COMPUEQUIP DOS S.A. 25,88$ 34,11$ 42,16$ 43,12$ 18,6% 0,02% 1,36% 3,87% 4,28%
16 ELECTRONICA SIGLO XXI ELECTROSIGLO S.A. 79,03$ 92,65$ 93,02$ 94,91$ 6,3% 2,69% 3,07% 3,11% 4,12%
17 TECNOMEGA C.A. 74,88$ 82,63$ 89,54$ 91,92$ 7,1% 3,21% 3,50% 4,11% 3,40%
18 SONY INTER - AMERICA S.A. 19,40$ 30,90$ 31,14$ 66,48$ 1,88% 0,30% 1,34% 3,41%
19 MEGAMICRO S.A. 35,97$ 38,16$ 42,82$ 42,15$ 5,4% 2,82% 2,72% 2,62% 1,84%
20 ALPHACELL S.A. 9,57$ 21,54$ 25,34$ 27,02$ 41,3% 5,11% 5,39% 4,14% 4,15%
21 REPRESENTACIONES CELULARES GUERRERO & RODRIGUEZ CIA. LTDA.18,08$ 18,17$ 17,73$ 22,45$ 7,5% 4,10% 3,48% 2,29% 4,74%
22 GRUMANHER S.A. 27,25$ 29,48$ 28,20$ 26,02$ -1,5% 2,00% -0,31% -1,07% -1,52%
23 SUPERMERCADO DE COMPUTADORAS COMPUBUSSINES CIA. LTDA. 9,88$ 13,11$ 16,76$ 16,46$ 18,5% 1,46% 9,13% 0,83% 0,75%
24 SUPTRONIC S.A. 16,02$ 18,22$ 17,43$ 20,19$ 8,0% 0,05% 2,07% -0,04% 0,55%
25 ARTEAGA & CORDOVA TELECOMUNICACIONES CIA. LTDA. 6,42$ 0,67%
26 TELEFONIA CELULAR MIO TECELMIO CIA. LTDA. 1,63$ 3,01$ 4,47$ 8,61$ 74,2% 1,05% 1,47% 2,86% 2,97%
27 PINCOMPUTERS C.A. 3,25$ 3,27$ 8,91$ 0,45% 1,39% 1,26%
28 VISIONMARKET S.A. 4,85$ 0,21% -1,15%
29 IDC INTERAMERICANA DE COMPUTACION CIA. LTDA. 4,64$ 5,18$ 4,66$ 6,19$ 10,1% 3,07% 3,99% 0,89% 1,75%
30 COMPAÑÍA DE SISTEMAS DE COMPUTACIÓN NEOCOSIDECO S.A. 5,29$ 6,50$ 6,52$ 1,84% 3,06%
31 RACSO S.A. 5,59$ 6,86$ 5,74$ 7,62$ 10,9% 0,13% 1,07% 0,89%
32 INFORMATICA Y SISTEMAS DIGITALES DINFORSYSMEGA S.A. 3,40$ 3,40$ 5,93$ 7,86$ 32,2% 2,42% 2,51% 1,76% 1,46%
33 CELLSHOP S.A. 11,28$ 11,77$ 8,58$ 5,80$ 2,07% 0,72% 0,72% 0,94%
34 PLANETSOUND PC CIA. LTDA. 4,37$ 5,40$ 4,33$ 1,56% 1,55% 2,03%
35 CELULAR TRADE S.A. CELTRADE 3,19$ 1,05%
36 ALLXERCOMP SERVICIO DE COMPUTACION CIA. LTDA. 7,58$ 5,97$ 5,35$ 5,04$ 1,79% 2,71% -0,67% 1,11%
37 DIGITALCITY S.A. 3,51$ 3,31$ 1,55% 3,14%
38 COMPUMILLENIUM S.A. 2,28$ 1,87$ 1,90$ 0,54% 0,06% 0,46%
39 INTELEQ S.A. 7,17$ 9,77$ 10,15$ 11,24$ 16,2% 0,89% 7,42% 2,24% 0,14%
40 REPRESMUNDIAL REPRESENTACIONES INTERNACIONALES CIA. LTDA. 4,24$ 8,26$ 11,22$ 10,02$ 33,2% 1,80% 3,60% 2,50% 3,22%
41 SEPROTEICO S.A. 2,07$ 3,62$ 10,51$ 8,32$ 59,0% 9,74% 13,10% 0,40% 0,70%
42 SUPERGRUPSA S.A. 2,58$ 7,04$ 0,99% 0,68%
43 IMPORTADORA AXXELCORP CIA. LTDA. 1,59$ 2,27$ 3,19$ 0,99% 0,68%
44 JHIELIZ S.A. 8,50$ 8,88$ 7,97$ 7,13$ -5,7% 0,56% -0,05% 0,48% 4,91%
45 CINTI COMP CIA. LTDA. 11,24$ 9,64$ 8,25$ 7,28$ -13,5% 0,96% 1,55% 3,11%
46 LIDENAR S.A. 1,63$ 6,29$ 7,25$ 5,33$ 48,4% 4,88% 1,25% 1,04%
47 CEDIBA & COMPANY S.A. 14,30$ 15,11$ 18,11$ 4,55$ -31,7% 0,44% 0,43% -2,33% 0,17%
48 SEMLER S.A. 3,74$ 3,44$ 3,15$ -$ 0,47% -0,50% 0,23%
49 COMPUTADORA SAN EDUARDO S.A. COMPSESA 6,27$ 11,65$ 5,60$ 3,78$ -15,5% 1,59% 1% 9,97% 3,83%
50 TECNOLOGIA LINCOLN LIBERTY GROUP CIA. LTDA. 2,11$ 0,0067 9,97% 3,09%
51 SOLUCIONES COMPUTACIONALES BITLOGIC S.A. 2,57$ 2,66$ 3,73$ 3,68$ 12,7% 3,80% 0,0129 8,58% 3,37%
52 SERVICIOS INFORMATICOS Y ENLACES INFOLINK CIA. LTDA. 3,31$ 4,03$ 2,70$ 5,14% -9,15% -11,96%
53 REMANSER S.A. 2,04$ 5,14% -9,15% -9,98%
54 ASESORES DE COMPUTACION ASCOMSA SA 2,38$ 2,97$ 2,70$ 5,14% -7,59% -8,25%
55 FIRST COMPUTER SERVICE FCS S. A. 1,34$ 2,44$ 3,63$ 4,65% -6,61% -7,61%
56 SMART SYSTEMS DEL ECUADOR S.A. 2,00$ 1,56$ 1,68$ 5,09% -6,07% -6,77%
57 ROBALINO & POLIT IMPORTADORES CIA. LTDA. 3,60$ 3,99$ 4,25$ 3,55$ -0,5% 0,85% 5,09% -6,07% -6,77%
58 TECNICOS EN MANTENIMIENTO Y ACCESORIOS TECMAN CIA. LTDA. 3,04$ 4,34$ 3,62$ 3,54$ 5,2% 2,54% 5,73% -4,91% -5,77%
59 DURAPOWER CIA. LTDA. 2,08$ -$ 2,56$ 6,11% -4,31% -4,94%
60 LATINCOPIERS CIA. LTDA. 1,61$ -$ 2,47$ 6,37% -3,81% -4,52%
61 SISTEMAS DE COMPUTACION SYSTEMBOARD S.A 2,12$ -$ 2,44$ -$ 6,07% -3,42% -3,96%
62 MEGULTRA S.A 2,70$ 2,85$ 3,04$ 5,69% -3,55% -3,79%
63 CORDOVA REYES CIA. LTDA. 3,21$ 3,42$ 3,53$ 3,39$ 1,8% 5,21% -3,22% -3,54%
64 CADENA MENOSCAL TECHNOLOGICAL COMMUNICATION GRID S. A 0,27$ 2,83$ 5,21% -3,22% -3,51%
65 SOLUCIONES INFORMATICAS DEL FUTURO SIFUTURO S.A. 4,66$ 4,13$ 3,26$ 3,33$ -10,6% 3,30% 5,03% -2,77% -3,05%
66 CELULARES GAMVAL S.A. 5,58$ 2,51$ 5,03% -2,77% -2,65%
67 AVEMIL S. A. 0,56$ 2,51$ 1,04$ 4,97% -2,49% -2,59%
68 LPADAR CIA. LTDA. 4,67$ 4,08$ 3,69$ 3,01$ -13,6% 3,99% 4,78% -2,20% -2,35%
69 HABATECH S.A. 3,01$ 2,50$ 1,52$ 4,78% -1,87% -1,84%
70 LUIS MANZANO SISTEMAS INFORMATICOS Y REPRESENTACIONES LMS CIA. LTDA.3,22$ 2,48$ 2,17$ 4,58% -1,77% -1,71%
71 COMPUMOVI S.A. 1,72$ 2,34$ 2,60$ 2,96$ 19,8% 1,35% 4,49% -1,69% -1,63%
72 HIPERCELL CIA. LTDA. 10,80$ 9,62$ 4,28$ 2,92$ -35,3% 18,84% 4,69% -1,35% -1,31%
73 COSIDECO C LTDA 8,85$ 2,60$ 4,08$ 2,91$ -31,0% 1,72% 4,47% -1,27% -0,99%
74 MARMOL COLIMBA PC-EXPRESS CIA. LTDA 2,37$ 2,44$ 2,43$ 4,47% -1,29% -0,96%
75 SERIMTEC PC ECUADOR S.A. 2,48$ 2,43$ 2,30$ 4,60% -1,11% -0,81%
76 FAST TECHNOLOGY FE&T CIA. LTDA. 1,70$ 2,41$ 1,98$ 4,57% -1,06% -0,75%
77 XEROX DEL ECUADOR S.A. 19,91$ 22,46$ 25,19$ 28,31$ 12,4% 6,25% 0,97% 1,07% 6,02%
78 OTHERS 192,35$ 189,09$ 186,58$ 182,84$ -1,7% 1,88% 4,47% 0,89% 0,69%
TOTALS 1.097,48$ 1.206,23$ 1.251,51$ 1.290,36$ 5,5%
CONSUMER DEVICES (NOT INCLUDING HOME APPLIANCES)
SEGMENT REVENUE OPERATING MARGIN
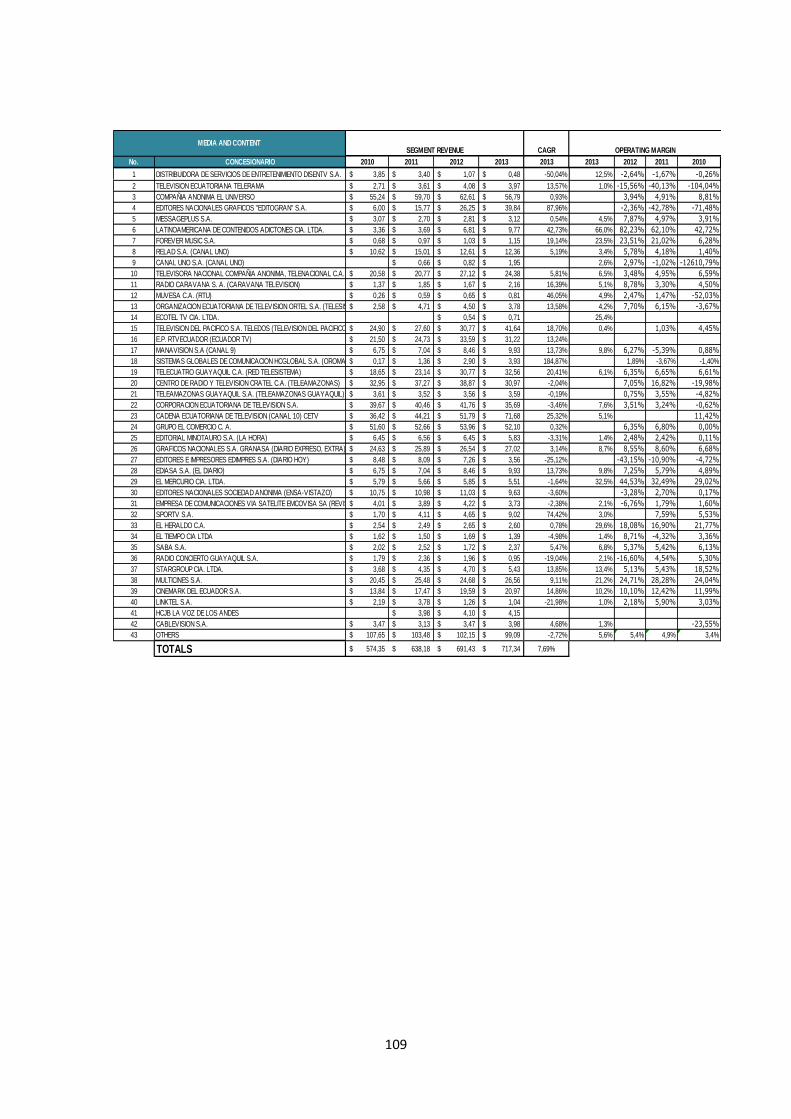
109
CAGR
No. CONCESIONARIO 2010 2011 2012 2013 2013 2013 2012 2011 2010
1 DISTRIBUIDORA DE SERVICIOS DE ENTRETENIMIENTO DISENTV S.A. 3,85$ 3,40$ 1,07$ 0,48$ -50,04% 12,5% -2,64% -1,67% -0,26%
2 TELEVISION ECUATORIANA TELERAMA 2,71$ 3,61$ 4,08$ 3,97$ 13,57% 1,0% -15,56% -40,13% -104,04%
3 COMPAÑIA ANONIMA EL UNIVERSO 55,24$ 59,70$ 62,61$ 56,79$ 0,93% 3,94% 4,91% 8,81%
4 EDITORES NACIONALES GRAFICOS "EDITOGRAN" S.A. 6,00$ 15,77$ 26,25$ 39,84$ 87,96% -2,36% -42,78% -71,48%
5 MESSAGEPLUS S.A. 3,07$ 2,70$ 2,81$ 3,12$ 0,54% 4,5% 7,87% 4,97% 3,91%
6 LATINOAMERICANA DE CONTENIDOS ADICTONES CIA. LTDA. 3,36$ 3,69$ 6,81$ 9,77$ 42,73% 66,0% 82,23% 62,10% 42,72%
7 FOREVER MUSIC S.A. 0,68$ 0,97$ 1,03$ 1,15$ 19,14% 23,5% 23,51% 21,02% 6,28%
8 RELAD S.A. (CANAL UNO) 10,62$ 15,01$ 12,61$ 12,36$ 5,19% 3,4% 5,78% 4,18% 1,40%
9 CANAL UNO S.A. (CANAL UNO) 0,66$ 0,82$ 1,95$ 2,6% 2,97% -1,02% -12610,79%
10 TELEVISORA NACIONAL COMPAÑIA ANONIMA, TELENACIONAL C.A. 20,58$ 20,77$ 27,12$ 24,38$ 5,81% 6,5% 3,48% 4,95% 6,59%
11 RADIO CARAVANA S. A. (CARAVANA TELEVISION) 1,37$ 1,85$ 1,67$ 2,16$ 16,39% 5,1% 8,78% 3,30% 4,50%
12 MUVESA C.A. (RTU) 0,26$ 0,59$ 0,65$ 0,81$ 46,05% 4,9% 2,47% 1,47% -52,03%
13 ORGANIZACION ECUATORIANA DE TELEVISION ORTEL S.A. (TELESISTEMA) 2,58$ 4,71$ 4,50$ 3,78$ 13,58% 4,2% 7,70% 6,15% -3,67%
14 ECOTEL TV CIA. LTDA. 0,54$ 0,71$ 25,4%
15 TELEVISION DEL PACIFICO S.A. TELEDOS (TELEVISION DEL PACIFICO) 24,90$ 27,60$ 30,77$ 41,64$ 18,70% 0,4% 1,03% 4,45%
16 E.P. RTVECUADOR (ECUADOR TV) 21,50$ 24,73$ 33,59$ 31,22$ 13,24%
17 MANAVISION S.A (CANAL 9) 6,75$ 7,04$ 8,46$ 9,93$ 13,73% 9,8% 6,27% -5,39% 0,88%
18 SISTEMAS GLOBALES DE COMUNICACION HCGLOBAL S.A. (OROMAR) 0,17$ 1,36$ 2,90$ 3,93$ 184,87% 1,89% -3,67% -1,40%
19 TELECUATRO GUAYAQUIL C.A. (RED TELESISTEMA) 18,65$ 23,14$ 30,77$ 32,56$ 20,41% 6,1% 6,35% 6,65% 6,61%
20 CENTRO DE RADIO Y TELEVISION CRATEL C.A. (TELEAMAZONAS) 32,95$ 37,27$ 38,87$ 30,97$ -2,04% 7,05% 16,82% -19,98%
21 TELEAMAZONAS GUAYAQUIL S.A. (TELEAMAZONAS GUAYAQUIL) 3,61$ 3,52$ 3,56$ 3,59$ -0,19% 0,75% 3,55% -4,82%
22 CORPORACION ECUATORIANA DE TELEVISION S.A. 39,67$ 40,46$ 41,76$ 35,69$ -3,46% 7,6% 3,51% 3,24% -0,62%
23 CADENA ECUATORIANA DE TELEVISION (CANAL 10) CETV 36,42$ 44,21$ 51,79$ 71,68$ 25,32% 5,1% 11,42%
24 GRUPO EL COMERCIO C. A. 51,60$ 52,66$ 53,96$ 52,10$ 0,32% 6,35% 6,80% 0,00%
25 EDITORIAL MINOTAURO S.A. (LA HORA) 6,45$ 6,56$ 6,45$ 5,83$ -3,31% 1,4% 2,48% 2,42% 0,11%
26 GRAFICOS NACIONALES S.A. GRANASA (DIARIO EXPRESO, EXTRA) 24,63$ 25,89$ 26,54$ 27,02$ 3,14% 8,7% 8,55% 8,60% 6,68%
27 EDITORES E IMPRESORES EDIMPRES S.A. (DIARIO HOY) 8,48$ 8,09$ 7,26$ 3,56$ -25,12% -43,15% -10,90% -4,72%
28 EDIASA S.A. (EL DIARIO) 6,75$ 7,04$ 8,46$ 9,93$ 13,73% 9,8% 7,25% 5,79% 4,89%
29 EL MERCURIO CIA. LTDA. 5,79$ 5,66$ 5,85$ 5,51$ -1,64% 32,5% 44,53% 32,49% 29,02%
30 EDITORES NACIONALES SOCIEDAD ANONIMA (ENSA-VISTAZO) 10,75$ 10,98$ 11,03$ 9,63$ -3,60% -3,28% 2,70% 0,17%
31 EMPRESA DE COMUNICACIONES VIA SATELITE EMCOVISA SA (REVISTA COSAS)4,01$ 3,89$ 4,22$ 3,73$ -2,38% 2,1% -6,76% 1,79% 1,60%
32 SPORTV S.A. 1,70$ 4,11$ 4,65$ 9,02$ 74,42% 3,0% 7,59% 5,53%
33 EL HERALDO C.A. 2,54$ 2,49$ 2,65$ 2,60$ 0,78% 29,6% 18,08% 16,90% 21,77%
34 EL TIEMPO CIA LTDA 1,62$ 1,50$ 1,69$ 1,39$ -4,98% 1,4% 8,71% -4,32% 3,36%
35 SABA S.A. 2,02$ 2,52$ 1,72$ 2,37$ 5,47% 6,8% 5,37% 5,42% 6,13%
36 RADIO CONCIERTO GUAYAQUIL S.A. 1,79$ 2,36$ 1,96$ 0,95$ -19,04% 2,1% -16,60% 4,54% 5,30%
37 STARGROUP CIA. LTDA. 3,68$ 4,35$ 4,70$ 5,43$ 13,85% 13,4% 5,13% 5,43% 18,52%
38 MULTICINES S.A. 20,45$ 25,48$ 24,68$ 26,56$ 9,11% 21,2% 24,71% 28,28% 24,04%
39 CINEMARK DEL ECUADOR S.A. 13,84$ 17,47$ 19,59$ 20,97$ 14,86% 10,2% 10,10% 12,42% 11,99%
40 LINKTEL S.A. 2,19$ 3,78$ 1,26$ 1,04$ -21,98% 1,0% 2,18% 5,90% 3,03%
41 HCJB LA VOZ DE LOS ANDES 3,98$ 4,10$ 4,15$
42 CABLEVISION S.A. 3,47$ 3,13$ 3,47$ 3,98$ 4,68% 1,3% -23,55%
43 OTHERS 107,65$ 103,48$ 102,15$ 99,09$ -2,72% 5,6% 5,4% 4,9% 3,4%
TOTALS 574,35$ 638,18$ 691,43$ 717,34$ 7,69%
MEDIA AND CONTENTSEGMENT REVENUE OPERATING MARGIN