
Techno-Economic Feasibility of Off-Grid Renewable Energy ...
32
Citation: Amupolo, A.; Nambundunga, S.; Chowdhury, D.S.P.; Grün, G. Techno-Economic Feasibility of Off-Grid Renewable Energy Electrification Schemes: A Case Study of an Informal Settlement in Namibia. Energies 2022, 15, 4235. https://doi.org/10.3390/en15124235 Academic Editors: Zhengmao Li, Tianyang Zhao, Ke Peng, Jinyu Wang, Zao Tang and Sumedha Sharma Received: 14 April 2022 Accepted: 16 May 2022 Published: 9 June 2022 Publisher’s Note: MDPI stays neutral with regard to jurisdictional claims in published maps and institutional affil- iations. Copyright: © 2022 by the authors. Licensee MDPI, Basel, Switzerland. This article is an open access article distributed under the terms and conditions of the Creative Commons Attribution (CC BY) license (https:// creativecommons.org/licenses/by/ 4.0/). energies Article Techno-Economic Feasibility of Off-Grid Renewable Energy Electrification Schemes: A Case Study of an Informal Settlement in Namibia Aili Amupolo 1,2, *, Sofia Nambundunga 1 , Daniel S. P. Chowdhury 3 and Gunnar Grün 2 1 Department of Electrical and Computer Engineering, Namibia University of Science and Technology, Windhoek 13388, Namibia; [email protected] 2 Institute of Acoustics and Building Physics, University of Stuttgart, 70569 Stuttgart, Germany; [email protected] 3 Department of Electrical Engineering, Nelson Mandela University, Port Elizabeth 6031, South Africa; [email protected] * Correspondence: [email protected] Abstract: This paper examines different off-grid renewable energy-based electrification schemes for an informal settlement in Windhoek, Namibia. It presents a techno-economic comparison between the deployment of solar home systems to each residence and the supplying power from either a centralized roof-mounted or ground-mounted hybrid microgrid. The objective is to find a feasible energy system that satisfies technical and user constraints at a minimum levelized cost of energy (LCOE) and net present cost (NPC). Sensitivity analyses are performed on the ground-mounted microgrid to evaluate the impact of varying diesel fuel price, load demand, and solar photovoltaic module cost on system costs. HOMER Pro software is used for system sizing and optimization. The results show that a hybrid system comprising a solar photovoltaic, a diesel generator, and batteries offers the lowest NPC and LCOE for both electrification schemes. The LCOE for the smallest residential load of 1.7 kWh/day and the largest microgrid load of 5.5 MWh/day is USD 0.443/kWh and USD 0.380/kWh, respectively. Respective NPCs are USD 4738 and USD 90.8 million. A sensitivity analysis reveals that variation in the fuel price and load demand changes linearly with system costs and capacities. However, reducing the PV module price in an energy system that includes wind and diesel power sources does not offer significant benefits. Furthermore, deploying an energy system that relies on fossil fuels to each residence in an informal settlement is not environmentally responsible. Unintended negative environmental impacts may result from the mass and simultaneous use of diesel generators. Therefore, a microgrid is recommended for its ability to control the dispatch of diesel generation, and its scalability, reliability of supply, and property security. A roof-mounted microgrid can be considered for piloting due to its lower initial investment. The electricity tariff also needs to be subsidized to make it affordable to end-users. Equally, government and community involvement should be prioritized to achieve long-term economic sustainability of the microgrid. Keywords: hybrid energy system; techno-economic; off-grid; electrification; microgrid; informal settlement; HOMER; levelized cost of energy; net present cost; case study 1. Introduction Access to electricity is an essential stimulant to improved productivity, enhanced living standards, and promotion of various types of social–economic welfare [1–3]. Whilst the proportion of those without electricity in sub-Saharan Africa has steadily declined [4], about 45% of the people in Namibia still lack access to electricity [5], especially those living in rural areas and informal settlements. The country’s electricity access for rural and urban areas is 34.9% and 74.6%, respectively [6]. The disparity has motivated many people to migrate from rural to urban settings in pursuit of better opportunities [7]. They often Energies 2022, 15, 4235. https://doi.org/10.3390/en15124235 https://www.mdpi.com/journal/energies
-
Upload
khangminh22 -
Category
Documents
-
view
0 -
download
0
Transcript of Techno-Economic Feasibility of Off-Grid Renewable Energy ...

Citation: Amupolo, A.;
Nambundunga, S.; Chowdhury,
D.S.P.; Grün, G. Techno-Economic
Feasibility of Off-Grid Renewable
Energy Electrification Schemes: A
Case Study of an Informal Settlement
in Namibia. Energies 2022, 15, 4235.
https://doi.org/10.3390/en15124235
Academic Editors: Zhengmao Li,
Tianyang Zhao, Ke Peng, Jinyu Wang,
Zao Tang and Sumedha Sharma
Received: 14 April 2022
Accepted: 16 May 2022
Published: 9 June 2022
Publisher’s Note: MDPI stays neutral
with regard to jurisdictional claims in
published maps and institutional affil-
iations.
Copyright: © 2022 by the authors.
Licensee MDPI, Basel, Switzerland.
This article is an open access article
distributed under the terms and
conditions of the Creative Commons
Attribution (CC BY) license (https://
creativecommons.org/licenses/by/
4.0/).
energies
Article
Techno-Economic Feasibility of Off-Grid Renewable EnergyElectrification Schemes: A Case Study of an InformalSettlement in NamibiaAili Amupolo 1,2,*, Sofia Nambundunga 1, Daniel S. P. Chowdhury 3 and Gunnar Grün 2
1 Department of Electrical and Computer Engineering, Namibia University of Science and Technology,Windhoek 13388, Namibia; [email protected]
2 Institute of Acoustics and Building Physics, University of Stuttgart, 70569 Stuttgart, Germany;[email protected]
3 Department of Electrical Engineering, Nelson Mandela University, Port Elizabeth 6031, South Africa;[email protected]
* Correspondence: [email protected]
Abstract: This paper examines different off-grid renewable energy-based electrification schemes foran informal settlement in Windhoek, Namibia. It presents a techno-economic comparison betweenthe deployment of solar home systems to each residence and the supplying power from either acentralized roof-mounted or ground-mounted hybrid microgrid. The objective is to find a feasibleenergy system that satisfies technical and user constraints at a minimum levelized cost of energy(LCOE) and net present cost (NPC). Sensitivity analyses are performed on the ground-mountedmicrogrid to evaluate the impact of varying diesel fuel price, load demand, and solar photovoltaicmodule cost on system costs. HOMER Pro software is used for system sizing and optimization.The results show that a hybrid system comprising a solar photovoltaic, a diesel generator, andbatteries offers the lowest NPC and LCOE for both electrification schemes. The LCOE for the smallestresidential load of 1.7 kWh/day and the largest microgrid load of 5.5 MWh/day is USD 0.443/kWhand USD 0.380/kWh, respectively. Respective NPCs are USD 4738 and USD 90.8 million. A sensitivityanalysis reveals that variation in the fuel price and load demand changes linearly with system costsand capacities. However, reducing the PV module price in an energy system that includes windand diesel power sources does not offer significant benefits. Furthermore, deploying an energysystem that relies on fossil fuels to each residence in an informal settlement is not environmentallyresponsible. Unintended negative environmental impacts may result from the mass and simultaneoususe of diesel generators. Therefore, a microgrid is recommended for its ability to control the dispatchof diesel generation, and its scalability, reliability of supply, and property security. A roof-mountedmicrogrid can be considered for piloting due to its lower initial investment. The electricity tariffalso needs to be subsidized to make it affordable to end-users. Equally, government and communityinvolvement should be prioritized to achieve long-term economic sustainability of the microgrid.
Keywords: hybrid energy system; techno-economic; off-grid; electrification; microgrid; informalsettlement; HOMER; levelized cost of energy; net present cost; case study
1. Introduction
Access to electricity is an essential stimulant to improved productivity, enhancedliving standards, and promotion of various types of social–economic welfare [1–3]. Whilstthe proportion of those without electricity in sub-Saharan Africa has steadily declined [4],about 45% of the people in Namibia still lack access to electricity [5], especially those livingin rural areas and informal settlements. The country’s electricity access for rural and urbanareas is 34.9% and 74.6%, respectively [6]. The disparity has motivated many people tomigrate from rural to urban settings in pursuit of better opportunities [7]. They often
Energies 2022, 15, 4235. https://doi.org/10.3390/en15124235 https://www.mdpi.com/journal/energies

Energies 2022, 15, 4235 2 of 32
settle in informal settlements due to unemployment, low incomes, and other economicchallenges. Due to a lack of affordable housing and declining economic opportunitiesowing to the impacts of the COVID-19 pandemic, informal settlements have also becomehome to middle-class citizens who otherwise could reside in better suburbs [8,9].
Informal settlements are typically semi- or un-serviced peri-urban areas on the out-skirts of municipal boundaries. Weber et al. [10] classify informal settlements as either:(i) structured settlements, (ii) unstructured settlements with high density, or (iii) uncon-trolled urban expansions where residents set up illegal and informal housing structures,often made of low-cost corrugated iron. Where informal settlements are recognized bylocal authorities, road layouts are structured, and basic essential services such as water,sanitation, and electricity are provided. Thus, their “informality” is due to them not beingformally proclaimed and also because residents do not have registered land tenure [11].However, most informal settlements in Namibia are without electricity and other essentialservices that could improve residents’ living conditions and social status [12]. Studieshave shown that access to electricity can influence the aspirations of people living in ruraland informal settlements towards a productive life [13–15], better education [16,17], andincreased health [18–20]. Thus, providing electricity to informal settlements is expected toreduce poverty and indirectly contribute to the country’s socio-economic development.
Although the Namibian government has made efforts to electrify rural and informalsettlements through traditional grid extension, various challenges have deterred the efforts.Firstly, a large investment is needed to extend the national grid for a country as wideand low-densely populated as Namibia [21–23]. Secondly, development has not kept pacewith the rapid growth of informal settlements. Thirdly, domestic generation is not enoughto meet the country’s existing demand, let alone the additional load expected from gridexpansions. Currently, about 60% of national demand [24] is met by electricity importsfrom neighboring countries such as South Africa, through the Southern African Power Pool(SAPP) [25]. With increasing regional demand [26], SAPP energy deficits could soon affectNamibia’s energy security and further slow down economic growth. It is thus prudent thatNamibia considers renewable energy supplies to mitigate the existing power shortage andextend electricity services to rural and informal settlements.
Worldwide deployment of renewable energy systems has drastically increased in thepast decade, owing to reduced components cost [27,28], technological advancements [29],global environmental concerns [30], market growth [31], and policy support [32]. Forinstance, the global average cost of crystalline silicon photovoltaic modules has drasticallyfallen by 85% between 2010 and 2020 [33]. Subsequently, the installed cost of utility-scale,commercial-rooftop, and residential photovoltaic systems has reduced by 82%, 69%, and64%, respectively [34]. Installed cost includes the cost of equipment, site preparation, andinstallation of equipment. In general, total installed costs vary for different countries andregions but largely depend on project size, location, maturity of the market, and financingscheme [35].
In the next sub-sections, this paper provides a brief assessment of renewable energy po-tential in Namibia, the country’s current power generation capacity, problem identificationand objectives, and contributions of this study.
1.1. Potential Renewable Resources in Namibia
Namibia is geographically located in the south-west of Africa, bordering Angola(north), South Africa (south), the Atlantic Ocean (west), and Botswana (east). It has aland area of 825,615 km2, a population of about 2.5 million [36], and a diverse terrainwith a mostly semi-arid climate characterized by irregular rainfall and large temperaturedifferences in day and night times [37,38]. The country has extensive and untappedrenewable energy resources for electricity production, which include hydro, solar, wind,biomass, and natural gas [39], as outlined below:

Energies 2022, 15, 4235 3 of 32
• The hydro resource is currently the largest renewable source contributing to domesti-cally generated electricity. In 2021, the only hydropower plant in the country (Ruacana)contributed 80% of domestic capacity [5,24].
• Namibia receives abundant solar radiation, with daily global horizontal irradiationbetween 4.4 kWh/m2 along the coastal areas and roughly 7.8 kWh/m2 in arid areas.A pre-feasibility study established that more than 33,000 km2 of potential sites forconcentrated solar power exist in the country and produce up to 250 GWe [40,41].
• Average wind speed in the country ranges from 4 to 15 m/s, with higher speedexpected along the coastline. A wind-power density of class 7 can be expected on theLuderitz coastline and class 3 in most parts of the country [42].
• Encroacher bush and solid waste are key biomass resources in Namibia for electricitygeneration. There are approximately 260 billion m2 of bush-encroached land in thecountry and it is expected to grow by 3.2% annually [43].
• A natural gas field with the potential for an 800 MW (nominal) power plant wasdiscovered in offshore Namibia, but its implementation remains elusive [44].
1.2. Overview of the Namibian Power Sector
Namibia’s average peak demand is about 688 MW, and is largely met by a local/importratio of about 40/60. The 40% local generation is comprised of hydro (≈80%), coal(≈2.5%), and solar/wind/biomass (≈17.5%) [5,25]. Though local installed capacity isabout 639.5 MW, as shown in Table 1, the hydro generation is a run of the river plantwhose throughput depends on rainfall patterns. Therefore, energy shortage could be upto 60% and is often met by electricity imports from the region [25,45]. To reduce importsdependency, the government, (i) implemented a modified single buyer market frameworkthat promotes participation from independent power producers [46], (ii) increased therenewable share [46,47], and (iii) improved governing policies that attract more energyinvestments [48,49]. Consequently, Namibia’s solar photovoltaic market has grown [50,51],and deployment of more than 278 MW of renewable capacity is expected within the next5 years [24]. However, more effort is still needed to harness abundant renewable sources toensure self-sufficiency and achieve universal electricity access, including electrification ofinformal settlements.
Table 1. Existing power production plants in Namibia [25].
Power Plant Type Built Capacity (MW) Operating Modus
Ruacana Hydro 1978 347 Flexible/BaseloadVan Eck Coal 1973 90 Stand-byAnixas Diesel 2011 22.5 Stand-byIPPs 1 Solar vary 174.5 Flexible
IPPs 1—Ombepo Wind 2019 5 FlexibleIPPs 1—N-BiG Biomass 2010 0.5 Flexible
Total Capacity (MW) 639.51 IPP—Independent Power Producers.
1.3. Problem Identification and Study Objectives
Existing and planned renewable generation in Namibia is primarily via large-scalepower plants feeding into the national grid and located far from loads. This necessi-tates large capital investments, and lengthy procurement and construction processes. Theupgrading of network infrastructure is also inevitable to integrate large and varying re-newable energy, and also mitigate possible grid instability. Meantime, the country’s energydemand increases [39] and unelectrified informal settlements grow rapidly [10], thus posingirrepressible socio-economic challenges [52].
In the wake of the declining cost of renewable energy components and vast researchon renewable grid integrations, the energy sector is now favoring solar home systems(SHS) and microgrids as a means to reduce capital costs [53], provide rapid electrifica-

Energies 2022, 15, 4235 4 of 32
tion [54,55], and increase network reliability and resiliency [56,57]. Generally, both SHSand microgrids are relatively “small grids” that integrate distributed energy resourcessuch as solar photovoltaics, distributed energy storage devices such as batteries, and localloads. They, however, differ in generation capacity, control strategies, and ability to operateautonomously or in parallel with the grid for better reliability and resiliency [58]. Micro-grids tend to have better features and are commonly sized between 50 kW and multiplemegawatts [59].
In view of the above, this study examines the technical and economic conditionsunder which the deployment of solar home systems and microgrids becomes cost effectiveand viable for a peri-urban area in a developing country. The study is limited to off-gridconfigurations for an informal settlement in Namibia and assesses whether electrificationfrom a centralized microgrid or stand-alone solar home systems for each resident would becheaper, sustainable, and environmentally friendly. A sensitivity analysis is also conductedto assess the impact of changes in the diesel fuel price, load demand, and solar PV modulecosts on optimal energy systems.
The study employs HOMER (Hybrid Optimization of Multiple Energy Resources)software to find optimal energy systems that can cost-effectively satisfy load demand byminimizing the net present cost (NPC) and levelized cost of energy (LCOE). NPC refers tothe difference between the present value of all costs of installing and operating a renewableenergy system and savings or revenues earned over the project’s lifetime. LCOE is acost-per-unit measure (USD/kWh) that compares the competitiveness of generating energyfrom different systems. Furthermore, HOMER is a widely used micro-power simulationsoftware that employs an iterative optimization algorithm to find a feasible off-grid oron-grid energy solution [60].
1.4. Study Contributions
This study contributes the following:
• It examines different off-grid energy configurations that can supply the load profileexpected in a typical informal settlement or peri-urban community.
• It presents a comparative analysis of the deployment of individual solar home systemsto each resident versus supplying electricity from a centralized microgrid.
• It implements a “framework for rural energy system design” proposed by Ali et al. [61]and assesses its performance for an informal settlement.
• It provides a holistic feasibility study that considers both technical, economic, social,and governance aspects in determining the optimal and practical energy solution forthe selected community.
• It provides insight on whether an off-grid renewable energy system designed for aninformal settlement will have techno-economic characteristics similar to a rural area,an urban area, or otherwise.
• It can inform power system planners, policy makers, energy investors, and otherresearchers on the technical and economic conditions to electrify a peri-urban areausing renewable energy sources.
This paper is structured into five main sections. Section 1 provides an introduction, therenewable energy potential and power sector overview in Namibia, and the study objectivesand contributions. Section 2 discusses recent related techno-economic studies. Section 3detailed the steps to optimal sizing and techno-economic assessment of a renewable energysystem. Section 4 discusses simulation results, while Section 5 concludes the study andprovides recommendations.
2. Related Techno-Economic Studies on Hybrid Renewable Energy Systems
Techno-economic optimization of off-grid and on-grid hybrid renewable energy sys-tems (HRES) has drawn immense attention from researchers in recent years. Most studiesexamined different HRES configurations to determine optimal options for specific loadssuch as residential, rural villages, industrial, islands, and medical facilities. An optimal

Energies 2022, 15, 4235 5 of 32
solution is the one that can sufficiently meet the load at the lowest cost. Common criteriaused in evaluating the economic performance of HRES include net present cost (NPC),levelized cost of energy (LCOE), discounted payback period, and carbon dioxide emissionrates [62,63].
Generally, optimal HRES integrates various renewable sources, such as solar pho-tovoltaic and wind, conventional generation such as a diesel generator, and/or energystorage devices, and local loads into a single power system, as depicted in Figure 1. Suchconfigurations can exploit the difference in seasonal and daily profiles of renewable powersources, such that their complimentary behaviors can results in improved reliability of sup-ply while reducing system energy cost [60,64]. Integrating energy storage such as batteriesand fuel cells is also found to improve system reliability and stability by countering theeffect of fluctuating, and unpredictability of, output power from renewable sources [65].
Energies 2022, 15, x FOR PEER REVIEW 5 of 32
examined different HRES configurations to determine optimal options for specific loads such as residential, rural villages, industrial, islands, and medical facilities. An optimal solution is the one that can sufficiently meet the load at the lowest cost. Common criteria used in evaluating the economic performance of HRES include net present cost (NPC), levelized cost of energy (LCOE), discounted payback period, and carbon dioxide emission rates [62,63].
Generally, optimal HRES integrates various renewable sources, such as solar photo-voltaic and wind, conventional generation such as a diesel generator, and/or energy stor-age devices, and local loads into a single power system, as depicted in Figure 1. Such con-figurations can exploit the difference in seasonal and daily profiles of renewable power sources, such that their complimentary behaviors can results in improved reliability of supply while reducing system energy cost [60,64]. Integrating energy storage such as bat-teries and fuel cells is also found to improve system reliability and stability by countering the effect of fluctuating, and unpredictability of, output power from renewable sources [65].
Figure 1. An example of an off-grid hybrid renewable energy system (HRES).
Table 2 provides a summary of some recent studies on the techno-economic viability of off-grid hybrid renewable energy systems (HRES) for different load profiles. It outlines each study’s main objective, load type, optimization tool employed, and key findings of the research. Generally, most studies found HRES to be the optimal choice as it effectively improves the energy usage factor [66], enhances supply reliability [67], reduces energy storage requirements [64], and lowers carbon emission [68]. A review of selected research is expanded in the next paragraphs.
Ali et al. [61] developed a design framework that can be used to structure a techno-economic feasibility study for a rural energy system. The framework was implemented to design potential off-grid and on-grid HRES for a village in Dera Ismail Khan, Pakistan, and examined its potential for benchmarking in other developing countries. Real-time electrical load data were used, and HOMER software was employed to carry out system optimization and techno-economic feasibility. The system’s robustness and commercial viability were tested via a sensitivity analysis that considered the impacts of solar photo-voltaic modules’ derating factor and various macro-economic variables. The study found a grid-integrated HRES to offer lower costs than an off-grid configuration, at a levelized cost of energy between USD 0.072/kWh and USD 0.078/kWh, which was also lower than the existing utility tariff. The best solution included a solar photovoltaic source, battery storage, a diesel generator, and restricted grid-connection time that reliably caters for fre-quent power outages.
Figure 1. An example of an off-grid hybrid renewable energy system (HRES).
Table 2 provides a summary of some recent studies on the techno-economic viabilityof off-grid hybrid renewable energy systems (HRES) for different load profiles. It outlineseach study’s main objective, load type, optimization tool employed, and key findings ofthe research. Generally, most studies found HRES to be the optimal choice as it effectivelyimproves the energy usage factor [66], enhances supply reliability [67], reduces energystorage requirements [64], and lowers carbon emission [68]. A review of selected researchis expanded in the next paragraphs.
Ali et al. [61] developed a design framework that can be used to structure a techno-economic feasibility study for a rural energy system. The framework was implementedto design potential off-grid and on-grid HRES for a village in Dera Ismail Khan, Pakistan,and examined its potential for benchmarking in other developing countries. Real-timeelectrical load data were used, and HOMER software was employed to carry out systemoptimization and techno-economic feasibility. The system’s robustness and commercialviability were tested via a sensitivity analysis that considered the impacts of solar photo-voltaic modules’ derating factor and various macro-economic variables. The study found agrid-integrated HRES to offer lower costs than an off-grid configuration, at a levelized costof energy between USD 0.072/kWh and USD 0.078/kWh, which was also lower than theexisting utility tariff. The best solution included a solar photovoltaic source, battery storage,a diesel generator, and restricted grid-connection time that reliably caters for frequentpower outages.
Uddin et al. [69] investigated the technical, economic, and environmental feasibilityof a 1.4 MW microgrid that employed recently innovated floating solar photovoltaic mod-

Energies 2022, 15, 4235 6 of 32
ules to serve a remote coastal region in Bangladesh. The load included 2500 households,120 electric-vehicle scooters, and a 25,000 L water treatment facility. Techno-economic sim-ulation and analysis of system electrical characteristics such as bus voltage were conductedusing HOMER and MATLAB/Simulink software, respectively. A configuration of floatingsolar photovoltaic and battery storage system was found to reliably serve the load at USD0.183/kWh, which was consistent with the region’s grid tariff. The microgrid could alsoresult in an annual saving of up to 694.56 metric tons of carbon dioxide emissions (CO2).
In [70], three potential off-grid HRES were compared to determine the configurationthat would reliably and cost-effectively supply a commercial load for a remote transportfacility in Makkah Province, Saudi Arabia. A techno-economic assessment was performedusing HOMER software, and the best solution was a combination of wind as a powersource, batteries and fuel cells for storage, and a diesel generator for backup supply. Itslevelized cost of energy was USD 0.271/kWh.
Mehta and Chowdhury [71], investigated the technical and economic feasibility ofan optimal HRES for medical facilities in Tanzania. Analysis was carried out using therenowned HOMER software. It was observed that an optimal HRES at both locationsincluded a solar photovoltaic, a diesel generator, and battery storage, presenting lowerNPC and LCOE. The total system cost was USD 63,136.93 and USD 51,544.75 for an averagedaily load of 20.26 kWh/day and 16.22 kWh/day for hospitals in the districts of Upangaand Ngamiani, respectively. The fuel cost was between 12.3% and 13.3% of the overallsystem cost, implying cleaner energy production.
In a study by Zebra et al. [72], a review was conducted to identify key opportunitiesand barriers to HRES implementation in developing countries. The study consideredpolitical/policy, economic, social, technological, environmental, and legal (PESTEL) issuesthat could influence the integration of HRES in different countries. Information wasobtained from scientific literature, development reports, and semi-structured qualitativeinterviews with experts. The study revealed that on-grid utility-scaled solar photovoltaicmicrogrids offer lowest the LCOE, ranging between USD 0.54/kWh and USD 0.77/kWh. Itwas further shown that community and government support were key to the successfulimplementation of HRES solutions.
A techno-economic study for a rural community in Fouay, Benin, found an off-gridhybrid solar photovoltaic, diesel generator, and battery system to offer the lowest LCOE ofUSD 0.207/kWh. Analysis was performed using HOMER software and established thatintegrating a diesel generator increased supply reliability and reduced battery requirementsby 70% compared to a solar photovoltaic and battery configuration [73].
Krishan and Suhag [74] compared the techno-economic performance of three hybridrenewable energy systems for residential and agricultural loads in the Yamunanagar com-munity in the State of Haryana, India. HOMER and MATLAB/Simulink software wereused for techno-economic evaluation and analysis of electrical systems, respectively. Theresult showed that an energy system that combines solar, wind, and battery was cost-effective for the selected site, with an LCOE of USD 0.288/kWh. The MATLAB simulationdemonstrated that an active power balance was maintained amidst solar irradiance, load,and wind speed variations. Similarly, Javed et al. [75], developed a genetic optimizationalgorithm to evaluate the technical and economic viability of a hybrid solar, wind, andbattery system for a remote island. The algorithm was compared to HOMER optimizationand offered better performance, in terms of supply reliability and cost. The selected en-ergy configuration could sufficiently supply load, but with high initial capital costs. Thestudy also observed that the size of a wind turbine had little impact on the system costand reliability.
It is evident from past research that the subject of assessing the viability of renewableenergy systems continues to evolve. Literature shows that there is no single solution. Anoptimal solution is influenced by factors such as accuracy of load profiles [70], types ofrenewable energy resources at the site [61], component costs [28], and an optimizationmethod used [68]. Government and community support are also key to the implementation

Energies 2022, 15, 4235 7 of 32
and economic sustainability of these projects [76,77]. Therefore, each case study is expectedto present unique constraints and outcomes.
Table 2. Selected research on off-grid hybrid renewable energy systems (HRES), published between2018 and 2022 *.
No Year Case Study Load Type Objective andOptimization Tool(s) Key Findings
1 2022 Bangladesh [69]Remote
western coastalregion
- Investigated the technical,economic, and environmentalfeasibility of a 1.4 MW solarmini-grid to serve 2500households, 120 electricalscooters, and a 25,000 L watertreatment facility.
- Used MATLAB and HOMERsoftware
- A floating PV|BAT systemcould optimally serve the loadat an LCOE of USD0.183/kWh, which is found tobe in line with the region’sgrid tariff.
- Annual carbon dioxideemissions (CO2) of 466.56 and228 metric tons could also besaved from EV scooters andhouseholds, respectively.
2 2022 Makkah Province,Saudi Arabia [70]
Remotecommercial
facility
- Evaluated thetechno-economic feasibility ofthree possible off-grid HRESsystems for a commercial loadof a remotely locatedtransport company.
- HOMER software.
- A WT|DG|FC|BAT systemwas the most optimal andeco-friendly option at NPC ofUSD 7.045 million and LCOEof USD 0.271/kWh.
3 2021 Dera Ismail Khan,Pakistan [61]
Semi-electrified
village
- Developed and implementeda design framework for arural electrification system.Techno-economic viability oftwo off-grid and two on-gridconfigurations was performedusing HOMER software
- A grid-connected hybrid solarPV, batteries, and dieselgenerator was theeconomically feasible solution.Excess energy is traded withthe grid.
- LCOE for on-grid systemswere USD 0.072/kWh andUSD 0.078/kWh, and USD0.145/kWh and USD0.167/kWh for the off-gridoptions.
4 2021Upanga andNgamiani,
Tanzania [71]
Medicalfacilities
- Investigated the technical,economic, and environmentalfeasibility of an optimal HRESfor medical facilities inTanzania.
- HOMER software was used.
- The PV|DG/BAT option wasthe most optimal HRESoption, presenting lower NPC,LCOE, and excess electricity.

Energies 2022, 15, 4235 8 of 32
Table 2. Cont.
No Year Case Study Load Type Objective andOptimization Tool(s) Key Findings
5 2021Various
DevelopingCountries [72]
Ruralcommunities
- Compared thetechno-economic performanceof a range of off-grid HRESsystems to electrify ruralcommunities in variousdeveloping countries.
- Used PESTEL analyticalframework
- A PV|DG system was themost optimal solution formost locations.
- LCOE for this option rangedbetween (USD 0.54/kWh andUSD 0.77/kWh.
- It was further established thatcommunity and governmentsupports were key to thesuccessful implementation ofoff-grid HRES solutions.
6 2020 Benin, Africa [73] Remote village
- Evaluated the technical, andeconomic feasibility of ahybrid off-grid option for aremote village in Benin.
- Used HOMER software.
- A PV|DG|BAT was the leastcost option at an LCOE ofUSD 0.207/kWh and reducedbattery storage requirementsby 70%.
7 2019Chungbuk
Innovation City,South Korea [78]
Town
- Assessed the environmentaleconomic impact of an HRESfor a town in South Korea,which included electrical andthermal load.
- Used HOMER software.
- When compared toconventional systems, asystem with a higher solarfraction could result in CO2reduction of up to 61%,energy savings of up to 73%, acost/benefit ratio of 1.7, and alower LCOE.
8 2019Jiuduansha,
Near Shanghai,China [75]
Remote island
- Evaluated the technical andeconomic viability of a hybridsolar-wind-battery system.
- Used a genetic algorithm andHOMER
- Hybrid PV|WT/BAT systemscould sufficiently electrify anisland without violating anyconstraints but with highinitial capital requirements.
- The size of a wind turbinehad little impact on thesystem cost and reliability.
9 2019 Maluku Province,Indonesia [79]
Remotevillages
- Compared the viability ofdifferent HRES systems for 3villages in Maluku province,Indonesia.
- HOMER, PVsyst, and PVsolwere used.
- The PV|DG option was themost optimal solution forKlistau village, while thePV|WT/DG was found to beoptimal for Wairatan andLeiting villages.
10 2019 Yamunanagar,India [74]
Ruralcommunity
- Investigate thetechno-economic viability ofan HRES system forresidential and agricultureload. Impact of renewablesource variability on HRESelectrical characteristics wasalso assessed.
- Used HOMER andMATLAB/Simulink software
- The hybrid PV|WT|BAT wasthe most cost-effective optionfor the site.
- Active power balance andvoltage buses weremaintained in spite of solarirradiance, wind speed, andload variations.
Energies 2022, 15, 4235 9 of 32
Table 2. Cont.
No Year Case Study Load Type Objective andOptimization Tool(s) Key Findings
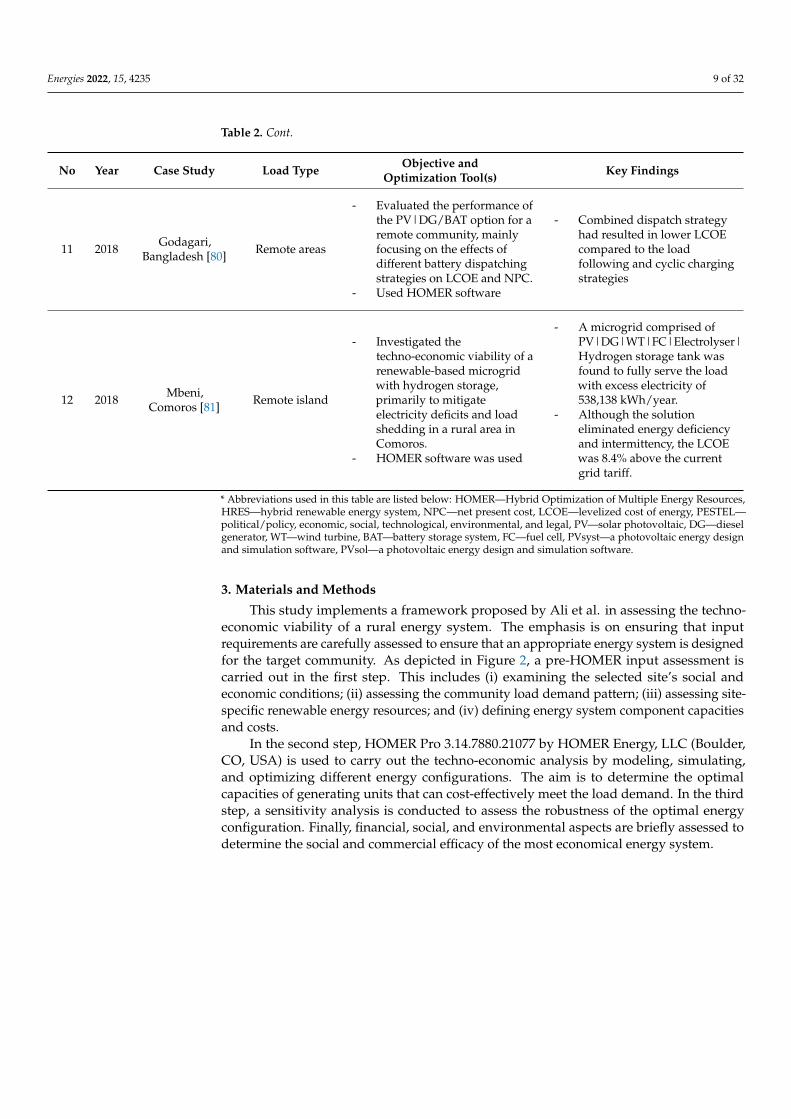
11 2018 Godagari,Bangladesh [80] Remote areas
- Evaluated the performance ofthe PV|DG/BAT option for aremote community, mainlyfocusing on the effects ofdifferent battery dispatchingstrategies on LCOE and NPC.
- Used HOMER software
- Combined dispatch strategyhad resulted in lower LCOEcompared to the loadfollowing and cyclic chargingstrategies
12 2018 Mbeni,Comoros [81] Remote island
- Investigated thetechno-economic viability of arenewable-based microgridwith hydrogen storage,primarily to mitigateelectricity deficits and loadshedding in a rural area inComoros.
- HOMER software was used
- A microgrid comprised ofPV|DG|WT|FC|Electrolyser|Hydrogen storage tank wasfound to fully serve the loadwith excess electricity of538,138 kWh/year.
- Although the solutioneliminated energy deficiencyand intermittency, the LCOEwas 8.4% above the currentgrid tariff.
* Abbreviations used in this table are listed below: HOMER—Hybrid Optimization of Multiple Energy Resources,HRES—hybrid renewable energy system, NPC—net present cost, LCOE—levelized cost of energy, PESTEL—political/policy, economic, social, technological, environmental, and legal, PV—solar photovoltaic, DG—dieselgenerator, WT—wind turbine, BAT—battery storage system, FC—fuel cell, PVsyst—a photovoltaic energy designand simulation software, PVsol—a photovoltaic energy design and simulation software.
3. Materials and Methods
This study implements a framework proposed by Ali et al. in assessing the techno-economic viability of a rural energy system. The emphasis is on ensuring that inputrequirements are carefully assessed to ensure that an appropriate energy system is designedfor the target community. As depicted in Figure 2, a pre-HOMER input assessment iscarried out in the first step. This includes (i) examining the selected site’s social andeconomic conditions; (ii) assessing the community load demand pattern; (iii) assessing site-specific renewable energy resources; and (iv) defining energy system component capacitiesand costs.
In the second step, HOMER Pro 3.14.7880.21077 by HOMER Energy, LLC (Boulder,CO, USA) is used to carry out the techno-economic analysis by modeling, simulating,and optimizing different energy configurations. The aim is to determine the optimalcapacities of generating units that can cost-effectively meet the load demand. In the thirdstep, a sensitivity analysis is conducted to assess the robustness of the optimal energyconfiguration. Finally, financial, social, and environmental aspects are briefly assessed todetermine the social and commercial efficacy of the most economical energy system.

Energies 2022, 15, 4235 10 of 32
Energies 2022, 15, x FOR PEER REVIEW 9 of 32
12 2018 Mbeni, Comoros [81]
Remote island
- Investigated the techno-economic viability of a renewable-based mi-crogrid with hydrogen storage, primarily to mitigate electricity deficits and load shedding in a ru-ral area in Comoros.
- HOMER software was used
- A microgrid comprised of PV|DG|WT|FC|Electro-lyser|Hydrogen storage tank was found to fully serve the load with excess electricity of 538,138 kWh/year.
- Although the solution elim-inated energy deficiency and intermittency, the LCOE was 8.4% above the current grid tariff.
* Abbreviations used in this table are listed below: HOMER—Hybrid Optimization of Multiple En-ergy Resources, HRES—hybrid renewable energy system, NPC—net present cost, LCOE—levelized cost of energy, PESTEL—political/policy, economic, social, technological, environmental, and legal, PV—solar photovoltaic, DG—diesel generator, WT—wind turbine, BAT—battery storage system, FC—fuel cell, PVsyst—a photovoltaic energy design and simulation software, PVsol—a photovol-taic energy design and simulation software.
3. Materials and Methods This study implements a framework proposed by Ali et al. in assessing the techno-
economic viability of a rural energy system. The emphasis is on ensuring that input re-quirements are carefully assessed to ensure that an appropriate energy system is designed for the target community. As depicted in Figure 2, a pre-HOMER input assessment is car-ried out in the first step. This includes (i) examining the selected site’s social and economic conditions; (ii) assessing the community load demand pattern; (iii) assessing site-specific renewable energy resources; and (iv) defining energy system component capacities and costs.
Figure 2. The techno-economic analysis process using HOMER.
In the second step, HOMER Pro 3.14.7880.21077 by HOMER Energy, LLC (Boulder, CO, USA) is used to carry out the techno-economic analysis by modeling, simulating, and optimizing different energy configurations. The aim is to determine the optimal capacities of generating units that can cost-effectively meet the load demand. In the third step, a sen-sitivity analysis is conducted to assess the robustness of the optimal energy configuration.
Figure 2. The techno-economic analysis process using HOMER.
3.1. Site Socio-Economic Assessment
The case study is a semi-electrified Havana informal settlement located on the outskirtsof Katutura, a suburb in the northern part of Windhoek, the Namibian capital city (shownin Figure 3). The site is geographically located at 22◦29′ S, 17◦01′ E, at 1558 m in elevation.It is in a semi-arid climatic region with hot summers and cold to mild winters [38]. Havanais the most populous and one of the oldest informal settlements in Windhoek, spanninga total area of approximately 3.1 km2 and a dwelling density of around three dwellingsper 100 m2. The settlement is mainly for rural migrants, but it has also become a residencefor anyone seeking low-cost living in the city [82]. This is because authorities are slowin delivering proper, sufficient, and affordable housing at a rate that keeps pace with theinflux and increasing living costs.
Energies 2022, 15, x FOR PEER REVIEW 10 of 32
Finally, financial, social, and environmental aspects are briefly assessed to determine the social and commercial efficacy of the most economical energy system.
3.1. Site Socio-Economic Assessment The case study is a semi-electrified Havana informal settlement located on the out-
skirts of Katutura, a suburb in the northern part of Windhoek, the Namibian capital city (shown in Figure 3). The site is geographically located at 22°29′ S, 17°01′ E, at 1558 m in elevation. It is in a semi-arid climatic region with hot summers and cold to mild winters [38]. Havana is the most populous and one of the oldest informal settlements in Wind-hoek, spanning a total area of approximately 3.1 km2 and a dwelling density of around three dwellings per 100 m2. The settlement is mainly for rural migrants, but it has also become a residence for anyone seeking low-cost living in the city [82]. This is because authorities are slow in delivering proper, sufficient, and affordable housing at a rate that keeps pace with the influx and increasing living costs.
Figure 3. Havana informal settlement terrain and characteristics.
Although many residents have the means to construct decent housing, houses in the informal settlements are mainly constructed of cheap and uninsulated corrugated iron that can easily be erected or removed [10]. This is because most of the informal settlers lack formal property rights and are therefore at risk of losing their investments in event of eviction from the land. However, the Havana settlement has been proclaimed a city structure and basic services are gradually being rolled out. This includes electrification of Havana Ext 1–3 in 2020/2021 through the “Windhoek Peri-Urban Electrification Project” [83–85]. Since service delivery has not kept pace with rapid growth of informal settle-ments, illegal electricity connections have been on the rise as the un-electrified residents try to connect from those legally supplied [86–88].
Available data from 2004 estimated that 29% of the Windhoek population lived in informal settlements [89]. Since the Windhoek population has grown annually by 4.2% between 1991 and 2011 [10], all things equal, it can be inferred that informal settlers con-stituted roughly 48% of Windhoek population by 2021, of which roughly 40% reside in the Havana settlement and other populous settlements such as Babylon, Ombili, Okahandja Park, and Goreagab. The population in Havana is largely a working group of 20–40-year-olds, comprised of unskilled workers, job seekers, and self-employed individ-uals operating informal businesses [9,10,82]. Thus, electricity consumption is expected to
Figure 3. Havana informal settlement terrain and characteristics.

Energies 2022, 15, 4235 11 of 32
Although many residents have the means to construct decent housing, houses in theinformal settlements are mainly constructed of cheap and uninsulated corrugated iron thatcan easily be erected or removed [10]. This is because most of the informal settlers lackformal property rights and are therefore at risk of losing their investments in event of evic-tion from the land. However, the Havana settlement has been proclaimed a city structureand basic services are gradually being rolled out. This includes electrification of HavanaExt 1–3 in 2020/2021 through the “Windhoek Peri-Urban Electrification Project” [83–85].Since service delivery has not kept pace with rapid growth of informal settlements, illegalelectricity connections have been on the rise as the un-electrified residents try to connectfrom those legally supplied [86–88].
Available data from 2004 estimated that 29% of the Windhoek population lived in infor-mal settlements [89]. Since the Windhoek population has grown annually by 4.2% between1991 and 2011 [10], all things equal, it can be inferred that informal settlers constitutedroughly 48% of Windhoek population by 2021, of which roughly 40% reside in the Havanasettlement and other populous settlements such as Babylon, Ombili, Okahandja Park, andGoreagab. The population in Havana is largely a working group of 20–40-year-olds, com-prised of unskilled workers, job seekers, and self-employed individuals operating informalbusinesses [9,10,82]. Thus, electricity consumption is expected to be dominated by domesticconsumers and small businesses. The energy needed for cooking and lighting is currentlymet by firewood and kerosene, respectively. There are also some users operating dieselgenerators, gas cookers, rechargeable portable lamps, and small solar home systems [9].The characteristics of the site are summed up in Table 3.
Table 3. Site parameters for Havana informal settlement.
Parameter Value
Location name and city: Havana settlement, Windhoek, NamibiaType of location: Informal settlement (peri-urban area)Longitude: 22◦29′ SLatitude: 17◦01′ EPopulation: ≈96,000 [10]Estimated number of dwellings: ≈12,773Main type of dwellings: Shacks made of corrugated iron [10]
Main source of energy: Electricity (for the electrified area), kerosene, andfirewood (for un-electrified area)
Dominant population: 20–40 years (male and female) [9]
Main source of income: Small informal businesses, general labor, andconstruction labor [10]
Monthly income: USD 30–2500 [10]
An aerial and closer view of the Havana settlement is shown in Figure 4. The areaconstitutes about 80% residential, 10% small-scale commercial (comprised of small groceryshops, hair salons, and small liquor shops mainly operated from residential properties),and the remaining 10% is made up by a few public facilities such as schools, clinics, andmunicipal areas. Two sizes of corrugated iron residences are dominant: the 10–12 m2 singleroom occupying 1–2 persons and the 15–24 m2 usually partitioned to occupy a family of2–4 persons, typically a couple with young children. There are also a few brick houses,mainly 4 rooms structures in the size range of 30–40 m2. These dwellings will henceforthbe referred to as Shack-12sqm, Shack-24sqm, and Brick-House, respectively.
Energies 2022, 15, 4235 12 of 32
Energies 2022, 15, x FOR PEER REVIEW 11 of 32
be dominated by domestic consumers and small businesses. The energy needed for cook-ing and lighting is currently met by firewood and kerosene, respectively. There are also some users operating diesel generators, gas cookers, rechargeable portable lamps, and small solar home systems [9]. The characteristics of the site are summed up in Table 3.
Table 3. Site parameters for Havana informal settlement.
Parameter Value Location name and city: Havana settlement, Windhoek, Namibia Type of location: Informal settlement (peri-urban area) Longitude: 22°29′ S Latitude: 17°01′ E Population: ≈96,000 [10] Estimated number of dwellings:
≈12,773
Main type of dwellings: Shacks made of corrugated iron [10]
Main source of energy: Electricity (for the electrified area), kerosene, and firewood (for un-electrified area)
Dominant population: 20–40 years (male and female) [9]
Main source of income: Small informal businesses, general labor, and construction la-bor [10]
Monthly income: USD 30–2500 [10]
An aerial and closer view of the Havana settlement is shown in Figure 4. The area constitutes about 80% residential, 10% small-scale commercial (comprised of small gro-cery shops, hair salons, and small liquor shops mainly operated from residential proper-ties), and the remaining 10% is made up by a few public facilities such as schools, clinics, and municipal areas. Two sizes of corrugated iron residences are dominant: the 10–12 m2 single room occupying 1–2 persons and the 15–24 m2 usually partitioned to occupy a fam-ily of 2–4 persons, typically a couple with young children. There are also a few brick houses, mainly 4 rooms structures in the size range of 30–40 m2. These dwellings will henceforth be referred to as Shack-12sqm, Shack-24sqm, and Brick-House, respectively.
(a) (b)
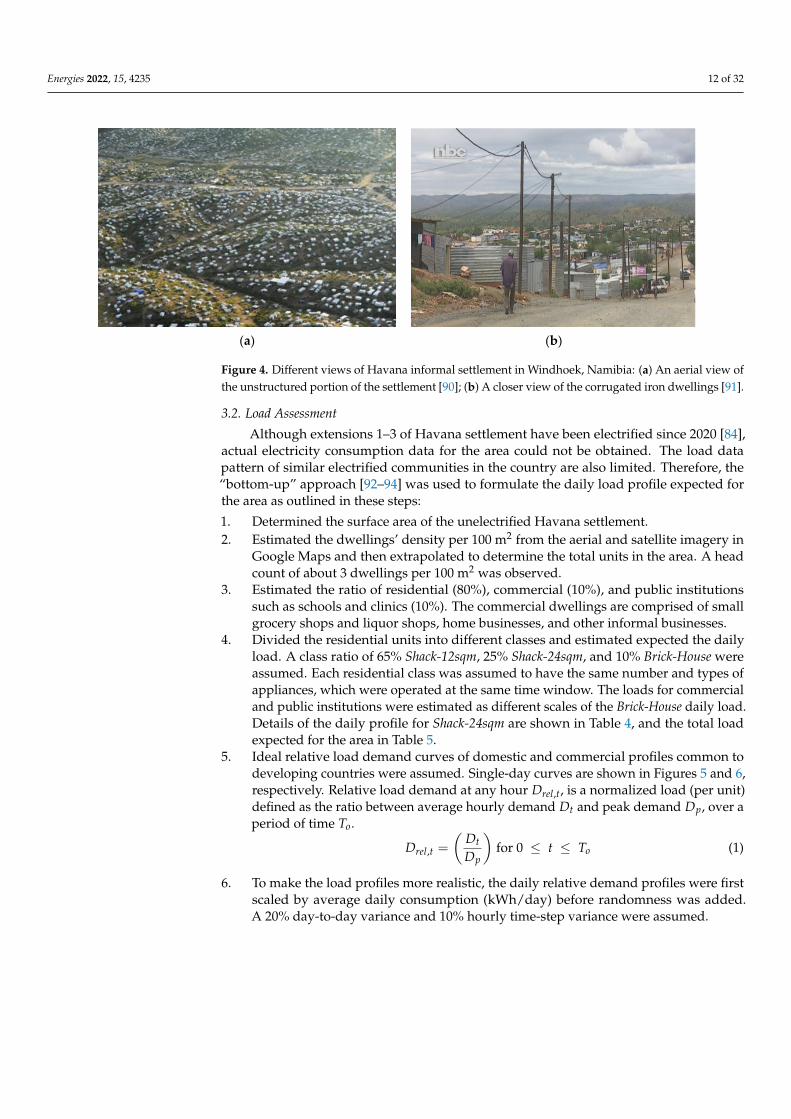
Figure 4. Different views of Havana informal settlement in Windhoek, Namibia: (a) An aerial view of the unstructured portion of the settlement [90]; (b) A closer view of the corrugated iron dwellings [91].
Figure 4. Different views of Havana informal settlement in Windhoek, Namibia: (a) An aerial view ofthe unstructured portion of the settlement [90]; (b) A closer view of the corrugated iron dwellings [91].
3.2. Load Assessment
Although extensions 1–3 of Havana settlement have been electrified since 2020 [84],actual electricity consumption data for the area could not be obtained. The load datapattern of similar electrified communities in the country are also limited. Therefore, the“bottom-up” approach [92–94] was used to formulate the daily load profile expected forthe area as outlined in these steps:
1. Determined the surface area of the unelectrified Havana settlement.2. Estimated the dwellings’ density per 100 m2 from the aerial and satellite imagery in
Google Maps and then extrapolated to determine the total units in the area. A headcount of about 3 dwellings per 100 m2 was observed.
3. Estimated the ratio of residential (80%), commercial (10%), and public institutionssuch as schools and clinics (10%). The commercial dwellings are comprised of smallgrocery shops and liquor shops, home businesses, and other informal businesses.
4. Divided the residential units into different classes and estimated expected the dailyload. A class ratio of 65% Shack-12sqm, 25% Shack-24sqm, and 10% Brick-House wereassumed. Each residential class was assumed to have the same number and types ofappliances, which were operated at the same time window. The loads for commercialand public institutions were estimated as different scales of the Brick-House daily load.Details of the daily profile for Shack-24sqm are shown in Table 4, and the total loadexpected for the area in Table 5.
5. Ideal relative load demand curves of domestic and commercial profiles common todeveloping countries were assumed. Single-day curves are shown in Figures 5 and 6,respectively. Relative load demand at any hour Drel,t, is a normalized load (per unit)defined as the ratio between average hourly demand Dt and peak demand Dp, over aperiod of time To.
Drel,t =
(Dt
Dp
)for 0 ≤ t ≤ To (1)
6. To make the load profiles more realistic, the daily relative demand profiles were firstscaled by average daily consumption (kWh/day) before randomness was added.A 20% day-to-day variance and 10% hourly time-step variance were assumed.

Energies 2022, 15, 4235 13 of 32
Table 4. Shack-24sqm daily load profile (a 24 sqm unit segmented into 2 rooms housing a family of 4).
Load Type Power (W) Qty Total Power(W)
Total DailyUse (Hours)
DailyDemand
(kWh/Day)
Living room light 15 1 15 2 0.030Bedrooms lights 15 2 30 2 0.060Security light 15 1 15 10 0.150Single plate cooker 1275 1 1275 0.7 0.893Fridge (150 lt = 5.3 Cu Ft) 105 1 105 6 0.630Cell phone charging 9 2 18 1 0.018Radio 12 1 12 2 0.024Television (21” LCD) 150 1 150 6 0.900
Average energy demand (kWh/day) 2.705Average power demand (kW/day) 0.113
Peak demand (kW/day) 0.436
Table 5. Estimated daily load profile for the Havana settlement.
Facility Total Units Unit Demand(kWh/Day)
Total DailyDemand
(kWh/Day)
% DailyDemand
Shack-12 sqm 8303 1.76 14,595.88 38.12%Shack-24 sqm 3193 2.70 8636.25 22.55%Brick-House 1277 7.54 9628.40 25.14%Liquor shops * 102 15.08 1540.54 4.02%Mini grocery shops 102 16.58 1694.60 4.43%Small-scale industries 102 20.73 2118.25 5.53%Public services (e.g.,schools, clinics, libraries) 3 26.38 79.15 0.21%
Total average energy demand (kWh/day) 38,293.07Average residential load (kWh/day) 32,860.53Average community load (kWh/day) 5432.54Total peak demand (kW/day) 1595.54
* Locally known as shebeens or pubs.
Energies 2022, 15, x FOR PEER REVIEW 13 of 32
Table 5. Estimated daily load profile for the Havana settlement.
Facility Total Units Unit Demand (kWh/Day)
Total Daily Demand (kWh/Day)
% Daily Demand
Shack-12 sqm 8303 1.76 14,595.88 38.12% Shack-24 sqm 3193 2.70 8636.25 22.55% Brick-House 1277 7.54 9628.40 25.14% Liquor shops * 102 15.08 1540.54 4.02% Mini grocery shops 102 16.58 1694.60 4.43% Small-scale indus-tries 102 20.73 2118.25 5.53%
Public services (e.g., schools, clinics, li-braries)
3 26.38 79.15 0.21%
Total average energy demand (kWh/day) 38,293.07 Average residential load (kWh/day) 32,860.53 Average community load (kWh/day) 5432.54
Total peak demand (kW/day) 1595.54 * Locally known as shebeens or pubs.
Figure 5. Hourly average relative demand for domestic load. Source [60].
Figure 6. Hourly average relative demand for commercial load. Source [60].
Figure 5. Hourly average relative demand for domestic load. Source [60].

Energies 2022, 15, 4235 14 of 32
Energies 2022, 15, x FOR PEER REVIEW 13 of 32
Table 5. Estimated daily load profile for the Havana settlement.
Facility Total Units Unit Demand (kWh/Day)
Total Daily Demand (kWh/Day)
% Daily Demand
Shack-12 sqm 8303 1.76 14,595.88 38.12% Shack-24 sqm 3193 2.70 8636.25 22.55% Brick-House 1277 7.54 9628.40 25.14% Liquor shops * 102 15.08 1540.54 4.02% Mini grocery shops 102 16.58 1694.60 4.43% Small-scale indus-tries 102 20.73 2118.25 5.53%
Public services (e.g., schools, clinics, li-braries)
3 26.38 79.15 0.21%
Total average energy demand (kWh/day) 38,293.07 Average residential load (kWh/day) 32,860.53 Average community load (kWh/day) 5432.54
Total peak demand (kW/day) 1595.54 * Locally known as shebeens or pubs.
Figure 5. Hourly average relative demand for domestic load. Source [60].
Figure 6. Hourly average relative demand for commercial load. Source [60]. Figure 6. Hourly average relative demand for commercial load. Source [60].
In Figure 5, domestic demand is dominated by morning and evening peaks, whereascommercial demand in Figure 6 is uniformly distributed during the day with a singleevening peak. Commercial loads would be dominated by liquor shops, hair salons, andother small businesses; while residential needs would mainly be for lighting, television,radios, phone charging, and refrigeration.
3.3. Renewable Resource Assessment
The study only considers solar and wind resources for the selected site. Both solar andwind data are obtained from NASA’s (National Aeronautics and Space Administration)database via HOMER software. The data set is comprised of long-term monthly averagesof global horizontal irradiance recorded over a 22-year period. In Figure 7, the site hasdaily average solar radiation of 4.82 kWh/m2 in winter, 7.44 kWh/m2 in summer, and anannual average of 6.17 kWh/m2. The clearance index is between 0.58 and 0.78 in winter.Thus, 4 to 7 h of full sunlight is available at the site throughout the year and has potentialto generate adequate electricity from solar photovoltaic (PV) modules.
Energies 2022, 15, x FOR PEER REVIEW 14 of 32
In Figure 5, domestic demand is dominated by morning and evening peaks, whereas commercial demand in Figure 6 is uniformly distributed during the day with a single evening peak. Commercial loads would be dominated by liquor shops, hair salons, and other small businesses; while residential needs would mainly be for lighting, television, radios, phone charging, and refrigeration.
3.3. Renewable Resource Assessment The study only considers solar and wind resources for the selected site. Both solar
and wind data are obtained from NASA’s (National Aeronautics and Space Administra-tion) database via HOMER software. The data set is comprised of long-term monthly av-erages of global horizontal irradiance recorded over a 22-year period. In Figure 7, the site has daily average solar radiation of 4.82 kWh/m2 in winter, 7.44 kWh/m2 in summer, and an annual average of 6.17 kWh/m2. The clearance index is between 0.58 and 0.78 in winter. Thus, 4 to 7 h of full sunlight is available at the site throughout the year and has potential to generate adequate electricity from solar photovoltaic (PV) modules.
Figure 7. Annual solar radiation and clearness index profile for Windhoek. Source [60].
Due to wide temperature range of the site (Figure 8), the effect of temperature on solar PV modules is considered. Temperature coefficient of −0.41%/°C of power, module efficiency of 14.91%, and PV derating factor of 80% are assumed. PV modules are modeled as fixed and tilted north at a 45° angle and assumed to use maximum power point tracking (MPPT).
Figure 8. Climate pattern for Windhoek. Source [95].
Figure 7. Annual solar radiation and clearness index profile for Windhoek. Source [60].
Due to wide temperature range of the site (Figure 8), the effect of temperature onsolar PV modules is considered. Temperature coefficient of −0.41%/◦C of power, moduleefficiency of 14.91%, and PV derating factor of 80% are assumed. PV modules are mod-eled as fixed and tilted north at a 45◦ angle and assumed to use maximum power pointtracking (MPPT).

Energies 2022, 15, 4235 15 of 32
Energies 2022, 15, x FOR PEER REVIEW 14 of 32
In Figure 5, domestic demand is dominated by morning and evening peaks, whereas commercial demand in Figure 6 is uniformly distributed during the day with a single evening peak. Commercial loads would be dominated by liquor shops, hair salons, and other small businesses; while residential needs would mainly be for lighting, television, radios, phone charging, and refrigeration.
3.3. Renewable Resource Assessment The study only considers solar and wind resources for the selected site. Both solar
and wind data are obtained from NASA’s (National Aeronautics and Space Administra-tion) database via HOMER software. The data set is comprised of long-term monthly av-erages of global horizontal irradiance recorded over a 22-year period. In Figure 7, the site has daily average solar radiation of 4.82 kWh/m2 in winter, 7.44 kWh/m2 in summer, and an annual average of 6.17 kWh/m2. The clearance index is between 0.58 and 0.78 in winter. Thus, 4 to 7 h of full sunlight is available at the site throughout the year and has potential to generate adequate electricity from solar photovoltaic (PV) modules.
Figure 7. Annual solar radiation and clearness index profile for Windhoek. Source [60].
Due to wide temperature range of the site (Figure 8), the effect of temperature on solar PV modules is considered. Temperature coefficient of −0.41%/°C of power, module efficiency of 14.91%, and PV derating factor of 80% are assumed. PV modules are modeled as fixed and tilted north at a 45° angle and assumed to use maximum power point tracking (MPPT).
Figure 8. Climate pattern for Windhoek. Source [95]. Figure 8. Climate pattern for Windhoek. Source [95].
The average wind speed for the site ranged from 4.34 to 6.50 m/s (Figure 9), with anannual average of 6.31 m/s. This translates between wind power classes 2 and 3, whichcan generate marginal to fair wind output.
Energies 2022, 15, x FOR PEER REVIEW 15 of 32
The average wind speed for the site ranged from 4.34 to 6.50 m/s (Figure 9), with an annual average of 6.31 m/s. This translates between wind power classes 2 and 3, which can generate marginal to fair wind output.
Figure 9. Monthly average wind speed for Windhoek.
3.4. System Component Capacities and Costs 3.4.1. Solar Photovoltaic Capacity
The solar photovoltaic output power capacity is a function of the site’s solar radia-tion, tilt angle, photovoltaic module rating, and temperature. HOMER calculates solar photovoltaic array power output as follows [60]:
( )[ ],
,
1T
PV PV PV P c c STC
T STC
GP Y f T T
Gα= + −
,
(2)
where 𝑃 is the solar photovoltaic output power, 𝑌 is the rated photovoltaic module capacity (kW), 𝑓 is the photovoltaic module derating factor (%), 𝐺 is the photovoltaic array incident solar radiation at a given time (kW/m2), 𝐺 , is the global incident solar radiation (1 kW/m2) under standard test conditions, 𝛼 is the power temperature coeffi-cient (%/°C), 𝑇 is the temperature of a photovoltaic cell at a given time (°C), and 𝑇 , is the temperature of a photovoltaic cell under standard test conditions (25 °C).
3.4.2. Wind Capacity HOMER computes the wind turbine output power as a 4-steps process [60].
1. Generate statistically reasonable hourly time series wind data from monthly average wind speeds. This step is only performed when time-series data are not available, as with the case in this study.
2. Calculates the wind speed for the selected wind turbine’s hub height. A generic wind turbine of 3 kW rating and 50 m hub height is selected for the study.
3. Uses the wind turbine power curve to predict the amount of output power that can be produced at the wind speed computed in step 2, and at standard air density.
4. Adjusts the output power in step 3 for the actual air density as follows [60]. 𝑃 = · 𝑃 , , (3)
where 𝑃 is the wind turbine output power in kW, 𝐴 is the actual air density in kg/m3, 𝐴 is the air density at standard conditions (1.225 kg/m3), and 𝑃 , is the wind turbine output power in kW at standard.
3.4.3. Diesel Generator, Battery Storage, and Capacity Generic HOMER components are used to model the diesel generator, lead acid bat-
teries, and converter. Where applicable, a diesel generator and a battery system are used
Figure 9. Monthly average wind speed for Windhoek.
3.4. System Component Capacities and Costs3.4.1. Solar Photovoltaic Capacity
The solar photovoltaic output power capacity is a function of the site’s solar radia-tion, tilt angle, photovoltaic module rating, and temperature. HOMER calculates solarphotovoltaic array power output as follows [60]:
PPV = YPV fPV
(GT
GT,STC
)[1 + αP(Tc − Tc,STC)], (2)
where PPV is the solar photovoltaic output power, YPV is the rated photovoltaic modulecapacity (kW), fPV is the photovoltaic module derating factor (%), GT is the photovoltaicarray incident solar radiation at a given time (kW/m2), GT,STC is the global incident solarradiation (1 kW/m2) under standard test conditions, αP is the power temperature coefficient(%/◦C), Tc is the temperature of a photovoltaic cell at a given time (◦C), and Tc,STC is thetemperature of a photovoltaic cell under standard test conditions (25 ◦C).
3.4.2. Wind Capacity
HOMER computes the wind turbine output power as a 4-steps process [60].

Energies 2022, 15, 4235 16 of 32
1. Generate statistically reasonable hourly time series wind data from monthly averagewind speeds. This step is only performed when time-series data are not available, aswith the case in this study.
2. Calculates the wind speed for the selected wind turbine’s hub height. A generic windturbine of 3 kW rating and 50 m hub height is selected for the study.
3. Uses the wind turbine power curve to predict the amount of output power that canbe produced at the wind speed computed in step 2, and at standard air density.
4. Adjusts the output power in step 3 for the actual air density as follows [60].
PWT =
(AiAo
)·PWT,std, (3)
where PWT is the wind turbine output power in kW, Ai is the actual air density inkg/m3, Ao is the air density at standard conditions (1.225 kg/m3), and PWT,std is thewind turbine output power in kW at standard.
3.4.3. Diesel Generator, Battery Storage, and Capacity
Generic HOMER components are used to model the diesel generator, lead acid bat-teries, and converter. Where applicable, a diesel generator and a battery system are usedfor backup supply and energy storage, respectively. Output from the diesel generator andbattery system is computed as outlined by Ali et al. [10] and the HOMER manual [60].
3.4.4. Component Costs
In Table 6, a summary of the ratings and costs of system components used in thisstudy is given.
Table 6. Ratings and costs for various system components used in the study.
Component ProductSpecification
Rating(kW)
Unit Cost($/Wp)
Capital Cost(USD) 1
ReplacementCost (USD) 1
O&M Cost 2
(USD)Lifetime(Years)
PV module Generic flat plate 1 0.6 600 540 10 25Wind turbine Generic 3 3.0 9000 9000 180 20Converter Generic 1 0.25 250 225 5 15Deep cycle battery Generic lead Acid 1 kWh 0.49 490 430 10 5Diesel generator Auto-size Genset N/A 500 N/A 500/kW 0.03/h 15,000 h
1 Component costs are based on quotations sourced from various Namibian suppliers to install a 5 kW solar homesystem (SHS). Microgrid components are assumed to be of better quality than an SHS; hence, they are costedat 20% higher than SHS. Replacement costs for solar PV, batteries, and converters are assumed at 10% less thancapital costs [96–98]. 2 O&M cost for a diesel generator is based on 2021 average fuel price in Namibia [99]. OtherO&M costs are obtained from an IRENA report on African solar PV market [100].
3.5. Techno-Economic Analysis
Energy systems need to be sized properly to ensure accurate matching of supplyand demand and to avoid under- or oversizing of the system that could lead to reducedreliability or increased costs, respectively. The intermittency behavior of power fromrenewable sources and load uncertainties makes it difficult to obtain optimal sizes ofgenerating units that can cost-effectively meet the load demand. Therefore, use of HOMERsoftware eases this process by minimizing the difference between generated power anddemanded power over a period of time.
∆P = ∑Toi=0 Pg,i − Pd,i, (4)
where ∆P is the minimal power,(
Pg,i)
is the supplied power, (Pd,i) is the demanded power,and (To) is the simulation time step, usually 60 min.

Energies 2022, 15, 4235 17 of 32
The main economic metrics used in this study to evaluate the economic sustainabilityof feasible renewable energy systems are net present costs (NPC), levelized cost of energy(LCOE), and discounted payback period.
3.5.1. Net Present Cost
The net present cost (NPC) is the present value of all systems costs to be incurredduring its lifetime. It includes costs of capital, component replacements, operation andmaintenance, fuel costs, and salvage. The NPC is calculated by aggregating total andannual discounted cash flows over the project lifetime. HOMER computes the NPC asfollows [60]:
Cnpc =Cann,tot
CRF(i, N), where CRF =
i(1 + i)N
(1 + i)N − 1, (5)
where Cnpc is the system net present costs, Cann,total is total costs incurred annually, N is theinterest period (project lifetime), i is the discounted rate, and CRF is the capital recoveryfactor, which divides an investment into a stream of equal annual payments over an interestperiod N.
3.5.2. Levelized Cost of Energy
Due to opposing cost characteristics between renewable and fossil-fuel-based genera-tion systems, levelized cost of energy (LCOE) is used to assess the cost-competitivenessof energy systems. It combines all cost factors into a cost-per-unit measure (USD/kWh).Thus, LCOE represents the minimum unsubsidized price of energy. HOMER calculatesLCOE as follows [60]:
Ccoe =Cann,tot
Eprim + Ede f + Egrid,sales, (6)
where Ccoe is the levelized cost of energy, Cann,tot is the total annualized system costs, Eprimis the total amount of annual energy used to serve primary load, Ede f is the total amount ofannual energy used to serve deferrable load, Egrid,sales is the total amount of annual energysold to the grid per year (if any). Egrid,sales = 0 for off-grid systems.
3.5.3. Discounted Payback Period
Discounted payback period refers to how long it will take (years) to recover the cost ofan initial investment, factoring in the time value of money. Since there is no actual revenueexpected from an off-grid energy system, the cash flow from an investment is definedas annual savings from not having to pay for the investment or generating power froman alternative source. For instance, revenue for a renewable solar home system (PV andbattery) can be defined as annual savings from using a diesel-only alternative (base case).By default, HOMER uses a fossil fuel-based off-grid configuration as the base case andcomputes the discounted payback period as follows [60]:
Tdp =Cost o f investment
Discounted annual savings= ∑N
n=0
(In
CFn(1 + r)−n
), (7)
where Tdp is the discounted payback period, In is the initial investment in the nth period,CFn(1 + r)−n is the net discounted cash flow (i.e., discounted annual savings), r is thediscount rate, n is the current year, and N is the project lifetime.
3.5.4. Other Economic Inputs
Apart from the system component costs, this study assumes other economic inputslisted in Table 7.

Energies 2022, 15, 4235 18 of 32
Table 7. Project economic input assumptions.
Parameter Value
Project lifetime 25 yearsAnnual discount rate 1 8%Inflation rate 1 4.5%Diesel fuel cost 2 USD 1.08/L
1 Discount and inflation rates obtained from [101], 2 Fuel cost obtained from [99].
3.5.5. Potential Energy Configurations
The Potential for solar home systems (SHS) is explored using three off-grid energyconfigurations, for each type of dwelling. Scenarios considered are: (i) solar photovoltaic(PV) and batteries (BAT); (ii) solar photovoltaic and diesel generator (DG); and (iii) solarphotovoltaic, diesel generator, and batteries. Henceforth, the three configurations areabbreviated as PV|BAT, PV|DG, and PV|DG|BAT.
In addition, the study considers two microgrid scenarios: a rooftop and a ground-based option. In the first case, solar PV arrays are assumed to be installed on a rooftopof one of the local schools. This option is valid when a dedicated land for a microgridcannot be secured. The four energy configurations considered for SHS are simulated fora rooftop microgrid. Furthermore, a local school with a total shade-free rooftop area of2200 m2 (275 m2/building) and a PV module efficiency of 14.9% is simulated. The solar PVpower output is computed as follows [60]:
PPV = APV ·GT,STC·(ηPV), (8)
where PPV is the PV array power output (kW), APV is the rooftop surface area (m2), GT,STCis the global incident solar radiation (1 kW/m2), and ηPV is the PV module efficiency (%).
The second case considers a ground-based microgrid. In addition to the three off-gridenergy configurations discussed above, a solar photovoltaic (PV), wind turbine (WT), dieselgenerator (DG), and batteries (BAT) setup (henceforth, PV|WT|DG|BAT) is simulated.The HOMER schematic diagrams used to model the SHS for Shack-24sqm load, and a roof-top microgrid are shown in Figure 10. A load ratio of 75% residential and 25% commercialload is assumed for a roof-top microgrid to cater to a limited solar PV area.
Energies 2022, 15, x FOR PEER REVIEW 18 of 32
m2/building) and a PV module efficiency of 14.9% is simulated. The solar PV power output is computed as follows [60]: 𝑃 = 𝐴 · 𝐺 , · (𝜂 ), (8)
where 𝑃 is the PV array power output (kW), 𝐴 is the rooftop surface area (m2), 𝐺 , is the global incident solar radiation (1 kW/m2), and 𝜂 is the PV module effi-ciency (%).
The second case considers a ground-based microgrid. In addition to the three off-grid energy configurations discussed above, a solar photovoltaic (PV), wind turbine (WT), die-sel generator (DG), and batteries (BAT) setup (henceforth, PV|WT|DG|BAT) is simu-lated. The HOMER schematic diagrams used to model the SHS for Shack-24sqm load, and a roof-top microgrid are shown in Figure 10. A load ratio of 75% residential and 25% com-mercial load is assumed for a roof-top microgrid to cater to a limited solar PV area.
(a) (b)
Figure 10. A HOMER model for: (a) Shack-24sqm load; (b) Solar rooftop microgrid.
3.5.6. Energy Dispatching HOMER uses two energy dispatching strategies to regulate operations of a diesel
generator (DG) and charging/discharging of a battery (BAT) storage system to ensure eco-nomic energy balance between supply and load demand is at each time step. The first method, called load following (LF), allows the DG to be operated at its minimum rated capacity to serve the net load whenever the output from RES sources is not sufficient. In this case, the DG is not used to charge the battery storage, regardless of its state of charge, but solely serves the net load [102]. However, when the minimum DG output power is more than the net load, the excess DG power is directed to the baseload and RES excess power is reserved to charge the BAT. The second technique is the cycle-charging (CC), which allows the DG to always be operating at its maximum capacity to serve the net load and to use any excess power to charge the battery [102]. Irrespective of the dispatching strategy, however, whenever DG and BAT are simultaneously operated, HOMER always chooses the most economically available way to serve the load at each time step [103–105], as depicted in Figure 11. It can be observed that priority was given to BAT supply in hour 1–9 to serve the load instead of operating the DG, because BAT seemed economical during that time duration. At hour 18–22, and hour 22–24, energy was dispatched from DG and BAT, respectively. Although DG and BAT were both available, HOMER had to choose the cheapest available energy source at different times.
Figure 10. A HOMER model for: (a) Shack-24sqm load; (b) Solar rooftop microgrid.
3.5.6. Energy Dispatching
HOMER uses two energy dispatching strategies to regulate operations of a dieselgenerator (DG) and charging/discharging of a battery (BAT) storage system to ensureeconomic energy balance between supply and load demand is at each time step. The firstmethod, called load following (LF), allows the DG to be operated at its minimum ratedcapacity to serve the net load whenever the output from RES sources is not sufficient. In

Energies 2022, 15, 4235 19 of 32
this case, the DG is not used to charge the battery storage, regardless of its state of charge,but solely serves the net load [102]. However, when the minimum DG output power ismore than the net load, the excess DG power is directed to the baseload and RES excesspower is reserved to charge the BAT. The second technique is the cycle-charging (CC),which allows the DG to always be operating at its maximum capacity to serve the net loadand to use any excess power to charge the battery [102]. Irrespective of the dispatchingstrategy, however, whenever DG and BAT are simultaneously operated, HOMER alwayschooses the most economically available way to serve the load at each time step [103–105],as depicted in Figure 11. It can be observed that priority was given to BAT supply inhour 1–9 to serve the load instead of operating the DG, because BAT seemed economicalduring that time duration. At hour 18–22, and hour 22–24, energy was dispatched from DGand BAT, respectively. Although DG and BAT were both available, HOMER had to choosethe cheapest available energy source at different times.
Energies 2022, 15, x FOR PEER REVIEW 19 of 32
Figure 11. An illustration of how HOMER dispatch energy in a hybrid renewable energy system.
4. Results and Discussion This study explores two potential off-grid electrification methods to supply electric-
ity to the Havana informal settlement in Windhoek, with the aim of finding an optimal solution that can cost-effectively meet the load requirements. This section presents and discusses simulation results.
4.1. Electrification through Solar Home Systems (SHS) Figure 12 compares the net present costs (NPC) of the three potential energy designs
for each residential type. Expected daily load demand of 1.76 kWh, 2.71 kWh, and 7.54 kWh are considered for Shack-12sqm, Shack-24sqm, and BrickHouse-42sqm, respectively. It is observed that, for each energy configuration, NPC increases linearly with load demand. Costs of fuel and operation and maintenance (O&M) make up the largest share of NPC for designs that integrate diesel generators, while capital and replacement costs are the highest for a complete renewable option. For instance, in a solar photovoltaic and diesel generator (PV|DG) option, fuel and O&M costs together account for between 74% and 76% of the total cost. In a hybrid solar photovoltaic and batteries (PV|BAT), capital and replacement costs respectively account for 82% to 90% of NPC. Thus, a large initial invest-ment is required to acquire a complete renewable solar home system.
Figure 11. An illustration of how HOMER dispatch energy in a hybrid renewable energy system.
4. Results and Discussion
This study explores two potential off-grid electrification methods to supply electricityto the Havana informal settlement in Windhoek, with the aim of finding an optimal solutionthat can cost-effectively meet the load requirements. This section presents and discussessimulation results.
4.1. Electrification through Solar Home Systems (SHS)
Figure 12 compares the net present costs (NPC) of the three potential energy designs foreach residential type. Expected daily load demand of 1.76 kWh, 2.71 kWh, and 7.54 kWh areconsidered for Shack-12sqm, Shack-24sqm, and BrickHouse-42sqm, respectively. It is observedthat, for each energy configuration, NPC increases linearly with load demand. Costs offuel and operation and maintenance (O&M) make up the largest share of NPC for designsthat integrate diesel generators, while capital and replacement costs are the highest fora complete renewable option. For instance, in a solar photovoltaic and diesel generator(PV|DG) option, fuel and O&M costs together account for between 74% and 76% of the totalcost. In a hybrid solar photovoltaic and batteries (PV|BAT), capital and replacement costsrespectively account for 82% to 90% of NPC. Thus, a large initial investment is required toacquire a complete renewable solar home system.

Energies 2022, 15, 4235 20 of 32Energies 2022, 15, x FOR PEER REVIEW 20 of 32
Figure 12. Comparing costs of different SHS system configurations.
In Figure 13, levelized cost of energy (LCOE) for different solar home systems is com-pared and ranges between USD 0.440/kWh and USD 0.724/kWh for different residential loads and energy configurations. The lowest LCOE is from a hybrid solar photovoltaic, diesel generator, and batteries (PV|DG|BAT). A lower LCOE is mainly influenced by the use of complementary energy sources and system efficiencies. Therefore, a hybrid PV|DG|BAT option offers the best economic metrics across all three residential load types. Its NPC range of USD 4738 to USD 20,404 is comprised of fuel costs (≈35%), opera-tion and maintenance costs (≈17%), replacement costs (≈33%), and initial capital (≈16%).
Although the PV|DG|BAT configuration offers a minimum LCOE of USD 0.440/kWh, it is almost three times the current grid electricity tariff of USD 0.13/kWh [56] and, therefore, not competitive. In addition, it will have unintended consequences such as noise and air pollution, stemming from the mass and simultaneous use of diesel genera-tors by residents. Furthermore, the need to constantly buy fuel and maintain diesel gen-erators over the system’s lifetime would also deter investment from residents, even when the cost of initial investment is subsidized. Therefore, deploying the PV|DG|BAT option to each household in this community would not be environmentally responsive.
Shack-12sqm
Shack-24sqm
BrickHouse
Shack-12sqm
Shack-24sqm
BrickHouse
Shack-12sqm
Shack-24sqm
BrickHouse
PV|DG|BAT PV|DG PV|BAT
Fuel Cost ($) 1609 2344 6630 4475 7081 20,113 0 0 0
O&M Cost ($) 586 919 2510 1207 1828 5202 823 1156 3290
Replacement Cost ($) 1420 2534 6754 1067 1651 4721 3351 5488 13,225
Initial Capital ($) 1136 1881 4984 991 1262 3525 2494 3566 10,066
Daily Load Demand (kWh) 1.76 2.71 7.54 1.76 2.71 7.54 1.76 2.71 7.54
-202468
10121416182022242628303234
Net
Prs
ent C
osts
(U
SD)
Thou
sand
s
NPC of Different Solar Home System (SHS) Configurations
Figure 12. Comparing costs of different SHS system configurations.
In Figure 13, levelized cost of energy (LCOE) for different solar home systems is com-pared and ranges between USD 0.440/kWh and USD 0.724/kWh for different residentialloads and energy configurations. The lowest LCOE is from a hybrid solar photovoltaic,diesel generator, and batteries (PV|DG|BAT). A lower LCOE is mainly influenced bythe use of complementary energy sources and system efficiencies. Therefore, a hybridPV|DG|BAT option offers the best economic metrics across all three residential load types.Its NPC range of USD 4738 to USD 20,404 is comprised of fuel costs (≈35%), operation andmaintenance costs (≈17%), replacement costs (≈33%), and initial capital (≈16%).
Although the PV|DG|BAT configuration offers a minimum LCOE of USD 0.440/kWh,it is almost three times the current grid electricity tariff of USD 0.13/kWh [56] and, therefore,not competitive. In addition, it will have unintended consequences such as noise and airpollution, stemming from the mass and simultaneous use of diesel generators by residents.Furthermore, the need to constantly buy fuel and maintain diesel generators over thesystem’s lifetime would also deter investment from residents, even when the cost of initialinvestment is subsidized. Therefore, deploying the PV|DG|BAT option to each householdin this community would not be environmentally responsive.

Energies 2022, 15, 4235 21 of 32Energies 2022, 15, x FOR PEER REVIEW 21 of 32
Figure 13. Comparing LCOE of different solar home systems.
4.2. Electrification through Microgrids The study compares two microgrid settings: the roof-mounted and ground-mounted.
A roof-mounted microgrid with a solar PV capacity of 300 kW is designed to supply about 170 dwellings, comprised of a daily residential load of 2636 kWh and a commercial load of 879 kWh. A hybrid solar photovoltaic, diesel generator, and batteries (PV|DG|BAT) is the optimal option. The expected NPC, LCOE, and the payback period are USD 8.3 mil-lion, USD 0.386/kWh, and 3.14 years, respectively. To ensure the reliability of supply, fuel and Q&M costs will account for 38% and 15% of NPC, respectively.
Furthermore, a ground-mounted microgrid is designed to serve the entire un-electri-fied Havanna settlement, with an estimated residential and commercial average daily load of about 5435 kWh and 32,860 kWh, respectively. As shown in Figure 14, the hybrid solar photovoltaic, wind turbine, diesel generator, and batteries (PV|WT|DG|BAT) op-tion offers the lowest NPC and LCOE. However, when compared to the next lowest option of hybrid PV|DG|BAT, its NPC and LCOE are only 3% lower, while its initial capital is 30% higher due to the costs of a wind turbine (WT). Since energy production and energy excess between the two models are similar, as noted in Table 8, the PV|DG|BAT option would be recommended for the selected site. It offers low capital investment, competitive NPC and LCOE, and ease of implementation. The expected NPC, LCOE, and payback period from the hybrid PV|DG|BAT are USD 90.8 million, USD 0.388/kWh, and 3.05 years, respectively.
PV|BAT PV|DG PV|DG|BAT
Shack-12sqm 0.576 0.713 0.440
Shack-24sqm 0.560 0.709 0.440
Brick-House 0.564 0.724 0.443
0.3000.3200.3400.3600.3800.4000.4200.4400.4600.4800.5000.5200.5400.5600.5800.6000.6200.6400.6600.6800.7000.7200.740
LCO
E (U
SD/k
Wh)
L C O E o f D i f f e r e n t S o l a r H o m e S y s t e m s ( S H S )
Figure 13. Comparing LCOE of different solar home systems.
4.2. Electrification through Microgrids
The study compares two microgrid settings: the roof-mounted and ground-mounted.A roof-mounted microgrid with a solar PV capacity of 300 kW is designed to supply about170 dwellings, comprised of a daily residential load of 2636 kWh and a commercial load of879 kWh. A hybrid solar photovoltaic, diesel generator, and batteries (PV|DG|BAT) is theoptimal option. The expected NPC, LCOE, and the payback period are USD 8.3 million,USD 0.386/kWh, and 3.14 years, respectively. To ensure the reliability of supply, fuel andQ&M costs will account for 38% and 15% of NPC, respectively.
Furthermore, a ground-mounted microgrid is designed to serve the entire un-electrifiedHavanna settlement, with an estimated residential and commercial average daily load ofabout 5435 kWh and 32,860 kWh, respectively. As shown in Figure 14, the hybrid solar pho-tovoltaic, wind turbine, diesel generator, and batteries (PV|WT|DG|BAT) option offersthe lowest NPC and LCOE. However, when compared to the next lowest option of hybridPV|DG|BAT, its NPC and LCOE are only 3% lower, while its initial capital is 30% higherdue to the costs of a wind turbine (WT). Since energy production and energy excess betweenthe two models are similar, as noted in Table 8, the PV|DG|BAT option would be recom-mended for the selected site. It offers low capital investment, competitive NPC and LCOE,and ease of implementation. The expected NPC, LCOE, and payback period from thehybrid PV|DG|BAT are USD 90.8 million, USD 0.388/kWh, and 3.05 years, respectively.

Energies 2022, 15, 4235 22 of 32Energies 2022, 15, x FOR PEER REVIEW 22 of 32
Figure 14. Comparing costs of different microgrid system configurations.
Table 8. Techno-economic comparison of different energy system configurations *.
Load Configuration Capacity 1 DS 2 EP 3
MWh/Year REP 4
% EE 5
%
NPC 6
USD Thsd 13
CAP 7
USD Thsd 13
LCOE 8
US$/kWh DPP 9 Years
Shac
k-24
sqm
PV|BAT 1.68 kW|5 kWh|0.437
kW CC 10 3.25 12 100.0 63.6 9.27 3.57 0.560 -
PV|DG 1.63 kW|0.49 kW|0.168
kW CC 4.08 12 77.2 75.4 11.76 1.26 0.709 5.20
PV|DG|BAT 0.98 kW|0.49 kW|2
kWh|0.27 kW LF 11 2.26 12 84.0 52.2 7.29 1.88 0.440 2.85
Mic
rogr
id-R
oof
PV|BAT 2.41 MW|5.74 MWh|0.56
MW CC 4.68 100.0 67.4 13,587 5295 0.633 -
PV|DG 1.87 MW|0.59 MW|0.21
MW CC 4.79 75.7 72.8 12,110 1703 0.563 7.09
PV|DG|BAT 1.06 kW|0.59 MW|1.25
MWh|0.32 MW LF 2.66 76.9 49.2 8297 1889 0.386 3.14
Mic
rogr
id-G
roun
d
PV|BAT 26.61 MW|63,424
kWh|6508 kW CC 51.63 100.0 67.7 150,825 58,532 0.644 -
PV|DG 19.55 MW|6.60 MW|2.24
MW CC 50.94 74.5 72.2 131,984 18,045 0.564 6.74
PV|DG|BAT 11.52 MW|6.60
MW|12.18 MWh|3.53 MW
LF 29.37 76.1 49.9 90,834 19,840 0.388 3.05
PV|WT|BAT 17.77 MW|1.40
MW|61.64 MWh|6.06 MW
CC 42.49 100.0 62.6 135,440 63,577 0.579 5.17
PV|WT|DG 19.42 MW|—|6.60
MW|2.19 MW CC 50.71 74.3 72.0 131,933 17,940 0.563 6.69
PV|BAT PV|DGPV|DG|BAT
PV|BAT PV|DGPV|DG|BAT
PV|WT|BAT
PV|WT|DG
PV|WT|DG|B
AT
Roof-mounted Microgrid Ground-mounted Microgrid
Salvage ($) −942,072 −38,332 −371,237 −9,978,032 −421,407 −2,759,154 −14,420,57 −407,510 −3,543,987
Fuel Cost ($) − 6,179,600 3,131,580 − 66,897,27 34,787,47 − 66,946,42 27,611,07
O&M Cost ($) 1,413,812 2,246,583 1,207,990 15,629,87 24,899,18 13,445,73 18,033,57 24,890,74 14,067,63
Replacement Cost ($) 7,820,189 2,018,867 2,439,873 86,641,40 22,564,45 25,520,23 68,250,63 22,563,22 24,236,28
Initial Capital ($) 5,294,983 1,702,839 1,889,008 58,531,84 18,044,64 19,839,82 63,576,86 17,939,90 25,850,81
−20 −
20 40 60 80
100 120 140 160 180
Net
Pre
stnt
Cos
t (U
SD)
Mill
ions
Comparing NPC of Different Microgrid Configurations
Figure 14. Comparing costs of different microgrid system configurations.
4.3. Comparing Electrical Productions
A comparison of the LCOE of various feasible configurations is shown in Figure 15.The lowest LCOE of USD 0.377/kWh, is from a hybrid PV|WT|DG|BAT ground-mountedmicrogrid. Apart from system component costs, the use of complementary power sourcesand the energy dispatching technique can result in a lower LCOE. For instance, combiningsolar PV with wind, and dispatchable power sources, such as DG and/or BAT, can offsetthe limitations of each power source by minimizing initial capital and fuel costs.
Moreover, excess electricity observed in Table 8 is mainly due to non-dispatchablerenewable sources, which do not always produce power at the time of need. There-fore, it needs to be controlled to maintain system frequency and bus voltages. Use ofdump/resistive load in the form of a water heater or air cooler, and demand response, arecommon control techniques for off-grid solutions. In the case of the Havana settlement, aseparate battery charging station can be considered as a dump load, which allows residentsto charge their rechargeable equipment at a fee to offset this investment. With demandresponse, consumers are encouraged to operate certain loads at specific times for less tariff,thus reducing the need to operate a diesel generator to serve at peak load.
4.4. Sensitivity Analysis
A sensitivity analysis is performed on the PV|WT|DG|BAT ground-based microgridto assess the impact of change in fuel price, load growth, and solar PV installed cost onNPC, LCOE, initial capital, and system capacity.

Energies 2022, 15, 4235 23 of 32
Table 8. Techno-economic comparison of different energy system configurations *.
Load Configuration Capacity 1 DS 2 EP 3
MWh/YearREP 4
%EE 5
%
NPC 6
USDThsd 13
CAP 7
USDThsd 13
LCOE 8
US$/kWhDPP 9
Years
Shac
k-24
sqm
PV|BAT 1.68 kW|5 kWh|0.437 kW CC 10 3.25 12 100.0 63.6 9.27 3.57 0.560 -
PV|DG 1.63 kW|0.49 kW|0.168 kW CC 4.08 12 77.2 75.4 11.76 1.26 0.709 5.20
PV|DG|BAT 0.98 kW|0.49 kW|2 kWh|0.27 kW LF 11 2.26 12 84.0 52.2 7.29 1.88 0.440 2.85
Mic
rogr
id-R
oof PV|BAT 2.41 MW|
5.74 MWh|0.56 MW CC 4.68 100.0 67.4 13,587 5295 0.633 -
PV|DG 1.87 MW|0.59 MW|0.21 MW CC 4.79 75.7 72.8 12,110 1703 0.563 7.09
PV|DG|BAT 1.06 kW|0.59 MW|1.25 MWh|0.32 MW LF 2.66 76.9 49.2 8297 1889 0.386 3.14
Mic
rogr
id-G
roun
d
PV|BAT 26.61 MW|63,424 kWh| 6508 kW CC 51.63 100.0 67.7 150,825 58,532 0.644 -
PV|DG 19.55 MW|6.60 MW|2.24 MW CC 50.94 74.5 72.2 131,984 18,045 0.564 6.74
PV|DG|BAT 11.52 MW|6.60 MW|12.18 MWh|3.53 MW LF 29.37 76.1 49.9 90,834 19,840 0.388 3.05
PV|WT|BAT 17.77 MW|1.40 MW|61.64 MWh|6.06 MW CC 42.49 100.0 62.6 135,440 63,577 0.579 5.17
PV|WT|DG 19.42 MW|—|6.60 MW|2.19 MW CC 50.71 74.3 72.0 131,933 17,940 0.563 6.69
PV|WT|DG|BAT8.87 MW|0.87 MW|
6.60 MW|12.55 MWh|3.19 MW
LF 27.69 80.0 47.4 88,222 25,851 0.377 3.65
* Abbreviations used in this table are listed below: 1 Capacities for Solar PV|Wind|Diesel|Battery|Converter(whichever is applicable). 2 DS—Dispatching Strategy, 3 EP—Energy Production (kWh/yr), 4 REP—RenewableEnergy Production, 5 EE—Excess Energy, 6 NPC—Net Present Cost, 7 CAP—Initial Capital Cost, 8 LCOE—Levelized Cost of Energy, 9 DPP—Discounted Payback Period, 10 CC—Cycle Charging, 11 LF—Load Following,12 These values are kilowatts (KW), 13 Thsd—Amount in thousand US dollars.
4.4.1. Fuel Price Variations
From February 2018 to February 2022, the highest fuel price increase recorded inWindhoek was 7.64% and the lowest price decrease was 2.2% [99]. Therefore, the dieselfuel price is varied between the two limits. A base diesel price of USD 1.08/L, recordedin February 2022, is used. Figure 16 shows that an increase in the diesel price by 7.64%increases all system costs, except capital costs, owing to reduced diesel generator capacity(as a means to save costs). A fuel price reduction of 2.2% decreases system costs, except foroperating costs. This is due to the frequent use of the diesel generator to serve the net load.In each case, however, solar PV and wind capacity are reduced to maintain lower marginalcosts. This implies that the diesel generator has to run longer to make up for the reducedrenewable supply.
4.4.2. Load Variations
A load increase of 30% and 100% is simulated. The choice of 30% growth aligns withthe expected annual growth of informal settlements in Namibia [10]. From Figure 17, systemcosts and component capacities increased to cater for load growth, with few exceptions.For instance, LCOE decreases with load growth because generated energy is efficientlyput to use. Renewable energy systems tend to be oversized to increase reliability, thusresulting in large excess energy, which is mostly wasted in an off-grid system. When theload increases, existing excess energy is consumed, and generation capacity only needs

Energies 2022, 15, 4235 24 of 32
to increase marginally to cater for load growth. With less unused energy, the cost ofenergy reduces.
Energies 2022, 15, x FOR PEER REVIEW 23 of 32
PV|WT|DG|BAT8.87 MW|0.87 MW|6.60 MW|12.55 MWh|3.19
MW LF 27.69 80.0 47.4 88,222 25,851 0.377 3.65
* Abbreviations used in this table are listed below: 1 Capacities for Solar PV|Wind|Diesel|Bat-tery|Converter (whichever is applicable). 2 DS—Dispatching Strategy, 3 EP—Energy Production (kWh/yr), 4 REP—Renewable Energy Production, 5 EE—Excess Energy, 6 NPC—Net Present Cost, 7 CAP—Initial Capital Cost, 8 LCOE—Levelized Cost of Energy, 9 DPP—Discounted Payback Period, 10 CC—Cycle Charging, 11 LF—Load Following, 12 These values are kilowatts (KW), 13 Thsd—Amount in thousand US dollars.
4.3. Comparing Electrical Productions A comparison of the LCOE of various feasible configurations is shown in Figure 15.
The lowest LCOE of USD 0.377/kWh, is from a hybrid PV|WT|DG|BAT ground-mounted microgrid. Apart from system component costs, the use of complementary power sources and the energy dispatching technique can result in a lower LCOE. For instance, combining solar PV with wind, and dispatchable power sources, such as DG and/or BAT, can offset the limitations of each power source by minimizing initial capital and fuel costs.
Figure 15. Comparing LCOE of different electrification schemes.
Moreover, excess electricity observed in Table 8 is mainly due to non-dispatchable renewable sources, which do not always produce power at the time of need. Therefore, it needs to be controlled to maintain system frequency and bus voltages. Use of dump/re-sistive load in the form of a water heater or air cooler, and demand response, are common control techniques for off-grid solutions. In the case of the Havana settlement, a separate battery charging station can be considered as a dump load, which allows residents to charge their rechargeable equipment at a fee to offset this investment. With demand re-sponse, consumers are encouraged to operate certain loads at specific times for less tariff, thus reducing the need to operate a diesel generator to serve at peak load.
PV|BAT PV|DGPV|DG|
BATPV|WT|
BATPV|WT|
DGPV|WT|DG|BAT
Shack-12sqm 0.576 0.713 0.440
Shack-24sqm 0.560 0.709 0.440
BrickHouse 0.564 0.724 0.443
Roof Microgrid 0.633 0.563 0.386
Ground Microgrid 0.644 0.564 0.388 0.579 0.563 0.377
0.300
0.350
0.400
0.450
0.500
0.550
0.600
0.650
0.700
0.750
0.800
LCO
E (U
SD/k
Wh)
LCOE of Different System Configurat ions
Figure 15. Comparing LCOE of different electrification schemes.
Energies 2022, 15, x FOR PEER REVIEW 24 of 32
4.4. Sensitivity Analysis A sensitivity analysis is performed on the PV|WT|DG|BAT ground-based microgrid
to assess the impact of change in fuel price, load growth, and solar PV installed cost on NPC, LCOE, initial capital, and system capacity.
4.4.1. Fuel Price Variations From February 2018 to February 2022, the highest fuel price increase recorded in
Windhoek was 7.64% and the lowest price decrease was 2.2% [99]. Therefore, the diesel fuel price is varied between the two limits. A base diesel price of USD 1.08/L, recorded in February 2022, is used. Figure 16 shows that an increase in the diesel price by 7.64% in-creases all system costs, except capital costs, owing to reduced diesel generator capacity (as a means to save costs). A fuel price reduction of 2.2% decreases system costs, except for operating costs. This is due to the frequent use of the diesel generator to serve the net load. In each case, however, solar PV and wind capacity are reduced to maintain lower marginal costs. This implies that the diesel generator has to run longer to make up for the reduced renewable supply.
Figure 16. Impact of fuel price change on system costs.
4.4.2. Load Variations A load increase of 30% and 100% is simulated. The choice of 30% growth aligns with
the expected annual growth of informal settlements in Namibia [10]. From Figure 17, sys-tem costs and component capacities increased to cater for load growth, with few excep-tions. For instance, LCOE decreases with load growth because generated energy is effi-ciently put to use. Renewable energy systems tend to be oversized to increase reliability, thus resulting in large excess energy, which is mostly wasted in an off-grid system. When the load increases, existing excess energy is consumed, and generation capacity only needs to increase marginally to cater for load growth. With less unused energy, the cost of energy reduces.
Figure 17. Impact of load growth on system costs.
Figure 16. Impact of fuel price change on system costs.
Energies 2022, 15, x FOR PEER REVIEW 24 of 32
4.4. Sensitivity Analysis A sensitivity analysis is performed on the PV|WT|DG|BAT ground-based microgrid
to assess the impact of change in fuel price, load growth, and solar PV installed cost on NPC, LCOE, initial capital, and system capacity.
4.4.1. Fuel Price Variations From February 2018 to February 2022, the highest fuel price increase recorded in
Windhoek was 7.64% and the lowest price decrease was 2.2% [99]. Therefore, the diesel fuel price is varied between the two limits. A base diesel price of USD 1.08/L, recorded in February 2022, is used. Figure 16 shows that an increase in the diesel price by 7.64% in-creases all system costs, except capital costs, owing to reduced diesel generator capacity (as a means to save costs). A fuel price reduction of 2.2% decreases system costs, except for operating costs. This is due to the frequent use of the diesel generator to serve the net load. In each case, however, solar PV and wind capacity are reduced to maintain lower marginal costs. This implies that the diesel generator has to run longer to make up for the reduced renewable supply.
Figure 16. Impact of fuel price change on system costs.
4.4.2. Load Variations A load increase of 30% and 100% is simulated. The choice of 30% growth aligns with
the expected annual growth of informal settlements in Namibia [10]. From Figure 17, sys-tem costs and component capacities increased to cater for load growth, with few excep-tions. For instance, LCOE decreases with load growth because generated energy is effi-ciently put to use. Renewable energy systems tend to be oversized to increase reliability, thus resulting in large excess energy, which is mostly wasted in an off-grid system. When the load increases, existing excess energy is consumed, and generation capacity only needs to increase marginally to cater for load growth. With less unused energy, the cost of energy reduces.
Figure 17. Impact of load growth on system costs. Figure 17. Impact of load growth on system costs.
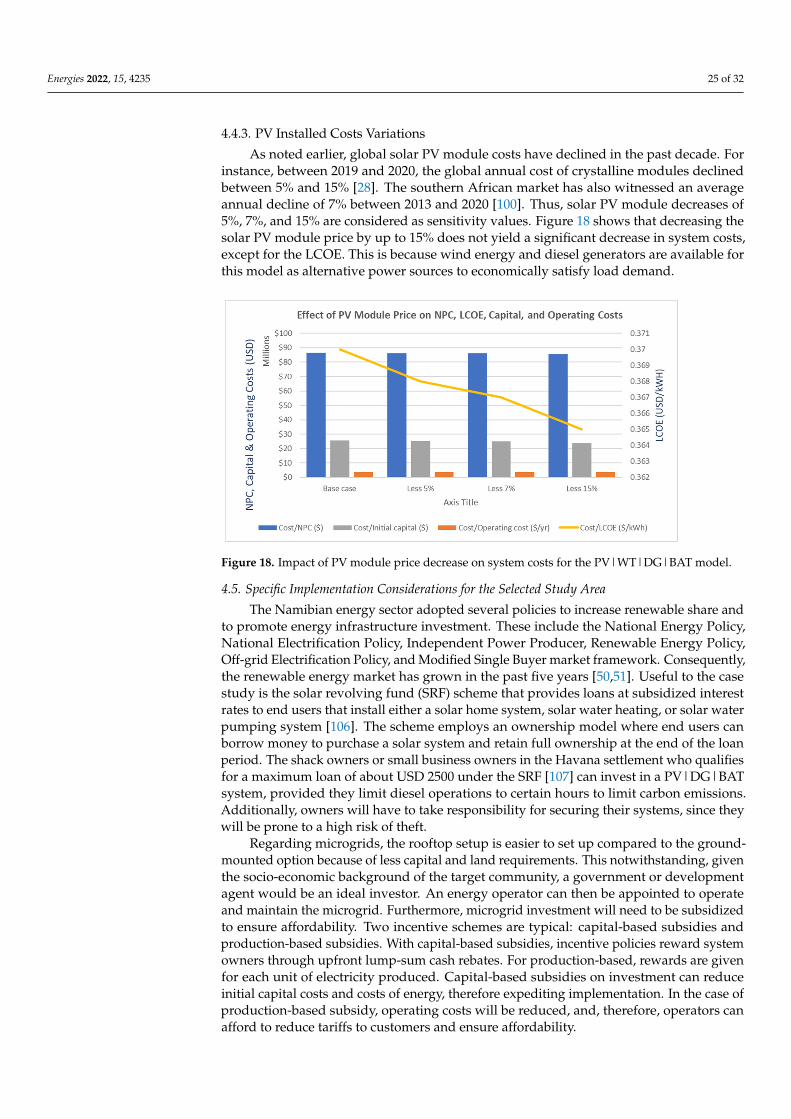
Energies 2022, 15, 4235 25 of 32
4.4.3. PV Installed Costs Variations
As noted earlier, global solar PV module costs have declined in the past decade. Forinstance, between 2019 and 2020, the global annual cost of crystalline modules declinedbetween 5% and 15% [28]. The southern African market has also witnessed an averageannual decline of 7% between 2013 and 2020 [100]. Thus, solar PV module decreases of5%, 7%, and 15% are considered as sensitivity values. Figure 18 shows that decreasing thesolar PV module price by up to 15% does not yield a significant decrease in system costs,except for the LCOE. This is because wind energy and diesel generators are available forthis model as alternative power sources to economically satisfy load demand.
Energies 2022, 15, x FOR PEER REVIEW 25 of 32
4.4.3. PV Installed Costs Variations As noted earlier, global solar PV module costs have declined in the past decade. For
instance, between 2019 and 2020, the global annual cost of crystalline modules declined between 5% and 15% [28]. The southern African market has also witnessed an average annual decline of 7% between 2013 and 2020 [100]. Thus, solar PV module decreases of 5%, 7%, and 15% are considered as sensitivity values. Figure 18 shows that decreasing the solar PV module price by up to 15% does not yield a significant decrease in system costs, except for the LCOE. This is because wind energy and diesel generators are available for this model as alternative power sources to economically satisfy load demand.
Figure 18. Impact of PV module price decrease on system costs for the PV|WT|DG|BAT model.
4.5. Specific Implementation Considerations for the Selected Study Area The Namibian energy sector adopted several policies to increase renewable share and
to promote energy infrastructure investment. These include the National Energy Policy, National Electrification Policy, Independent Power Producer, Renewable Energy Policy, Off-grid Electrification Policy, and Modified Single Buyer market framework. Conse-quently, the renewable energy market has grown in the past five years [50,51]. Useful to the case study is the solar revolving fund (SRF) scheme that provides loans at subsidized interest rates to end users that install either a solar home system, solar water heating, or solar water pumping system [106]. The scheme employs an ownership model where end users can borrow money to purchase a solar system and retain full ownership at the end of the loan period. The shack owners or small business owners in the Havana settlement who qualifies for a maximum loan of about USD 2500 under the SRF [107] can invest in a PV|DG|BAT system, provided they limit diesel operations to certain hours to limit carbon emissions. Additionally, owners will have to take responsibility for securing their sys-tems, since they will be prone to a high risk of theft.
Regarding microgrids, the rooftop setup is easier to set up compared to the ground-mounted option because of less capital and land requirements. This notwithstanding, given the socio-economic background of the target community, a government or devel-opment agent would be an ideal investor. An energy operator can then be appointed to operate and maintain the microgrid. Furthermore, microgrid investment will need to be subsidized to ensure affordability. Two incentive schemes are typical: capital-based sub-sidies and production-based subsidies. With capital-based subsidies, incentive policies re-ward system owners through upfront lump-sum cash rebates. For production-based, re-wards are given for each unit of electricity produced. Capital-based subsidies on invest-ment can reduce initial capital costs and costs of energy, therefore expediting implemen-tation. In the case of production-based subsidy, operating costs will be reduced, and, therefore, operators can afford to reduce tariffs to customers and ensure affordability.
Figure 18. Impact of PV module price decrease on system costs for the PV|WT|DG|BAT model.
4.5. Specific Implementation Considerations for the Selected Study Area
The Namibian energy sector adopted several policies to increase renewable share andto promote energy infrastructure investment. These include the National Energy Policy,National Electrification Policy, Independent Power Producer, Renewable Energy Policy,Off-grid Electrification Policy, and Modified Single Buyer market framework. Consequently,the renewable energy market has grown in the past five years [50,51]. Useful to the casestudy is the solar revolving fund (SRF) scheme that provides loans at subsidized interestrates to end users that install either a solar home system, solar water heating, or solar waterpumping system [106]. The scheme employs an ownership model where end users canborrow money to purchase a solar system and retain full ownership at the end of the loanperiod. The shack owners or small business owners in the Havana settlement who qualifiesfor a maximum loan of about USD 2500 under the SRF [107] can invest in a PV|DG|BATsystem, provided they limit diesel operations to certain hours to limit carbon emissions.Additionally, owners will have to take responsibility for securing their systems, since theywill be prone to a high risk of theft.
Regarding microgrids, the rooftop setup is easier to set up compared to the ground-mounted option because of less capital and land requirements. This notwithstanding, giventhe socio-economic background of the target community, a government or developmentagent would be an ideal investor. An energy operator can then be appointed to operateand maintain the microgrid. Furthermore, microgrid investment will need to be subsidizedto ensure affordability. Two incentive schemes are typical: capital-based subsidies andproduction-based subsidies. With capital-based subsidies, incentive policies reward systemowners through upfront lump-sum cash rebates. For production-based, rewards are givenfor each unit of electricity produced. Capital-based subsidies on investment can reduceinitial capital costs and costs of energy, therefore expediting implementation. In the case ofproduction-based subsidy, operating costs will be reduced, and, therefore, operators canafford to reduce tariffs to customers and ensure affordability.

Energies 2022, 15, 4235 26 of 32
5. Conclusions and Recommendations
This paper explores the technical and economic viability of supplying electricity to theHavana informal settlement on the outskirts of Windhoek, Namibia. The study is limited toa hypothetical load profile and off-grid hybrid renewable energy systems employing solarphotovoltaic and wind resources. Electrification schemes compared are: the deploymentof individual solar home systems to each residence, and supplying power from either aroof-mounted or ground-mounted hybrid microgrid. HOMER software is used to model,simulate, and optimize potential energy systems to an optimal configuration that cansatisfy the load at the lowest net present cost (NPC) and levelized cost of energy (LCOE). Asensitivity analysis is also carried out on the ground-mounted microgrid to understand theimpact of varying diesel fuel prices, load demand, and solar PV module costs. The studyconcludes as follows:
Firstly, although the hybrid solar photovoltaic, diesel generator, and battery (PV|DG|BAT)offers better economic benefits for the solar home system scheme, it is not environmentallyresponsible. Deploying an energy system that relies on fossil fuels to each residencecould result in high noise and air pollution when residents operate their diesel generatorssimultaneously, and is therefore not recommended for the entire community.
Secondly, both roof-mounted and ground-mounted microgrids are feasible for the se-lected community because they offer competitive NPC and LCOE that are in line with mostliterature. The hybrid PV|DG|BAT and PV|WT|DG|BAT are the optimal configurationsfor the roof-mounted and ground-mounted microgrid, at LCOE of USD 0.386/kWh andUSD 0.388/kWh, respectively. Integrating a wind turbine (WT) in the ground-mountedoption, however, does not offer significant benefits. The model’s initial capital is 30%higher and its savings in NPC and LCOE is around 3% compared to the next lowest energyoption, the hybrid PV|DG|BAT. Therefore, the PV|DG|BAT configuration is preferred formicrogrids rollout. Electricity tariffs, however, need to be subsidized to make it affordableto target consumers and ensure long-term economic sustainability of the microgrid. Interms of implementation, the roof-mounted option is recommended for a pilot projectsince its initial investment and land requirements are lower compared to the ground-mounted microgrid. If land can be secured within a reasonable timeframe, a scalableground-mounted microgrid can be deployed to lower investment costs and implementa-tion time. An appropriate business model is also needed to ensure commercial viabilityand timely revenue collection.
Thirdly, the sensitivity analysis on a hybrid PV|WT|DG|BAT microgrid reveals thatan increase/decrease in diesel fuel price and load demand increases/decreases systemcomponent capacities and costs, but with few exceptions. For instance, operating costsincrease when fuel prices reduce by 2.2%, because of the frequent use of a diesel generatorto serve the load. Increasing load demand by 30% and 100% reduces LCOE, mainly becauseexcess energy is economically put to use. Furthermore, reducing the PV module pricein an energy system that includes wind and diesel power sources results in less than a1% decrease in system costs, which is not a significant benefit. This is mainly becausethere was no need to increase PV capacity if energy can be economically dispatched fromother sources.
The findings of this study agree with research on rural electrifications, in terms ofoptimal energy configurations. However, actual NPC and LCOE values mainly depend onthe load profile accuracy and renewable energy resources available at the site. Commercialviability and practical implementation are also influenced by existing electricity tariffs,socio-economic conditions of the target community, and supporting energy policies. Forinstance, policy support that encourages private energy investors, tax incentives, and lowerdiscount rates are crucial to commercial feasibility. Furthermore, a hybrid PV|DG|BATstandalone solar home system will be ideal for the selected community, because it offerslower costs, faster rollout time, and no additional cost for a reticulation network will beincurred. However, given the socio-economic status of the community, the system will notbe affordable to many people and can have unintended environmental consequences.
Energies 2022, 15, 4235 27 of 32
Generally, the study confirms that off-grid electrification schemes can serve an informalsettlement or any peri-urban area, because of socio-economic characteristics similar to ruralareas. However, for a community that is close to an existing electrical grid, it will berecommended to assess its techno-economic viability of a grid-connected microgrid andgrid extension. Since excess electricity of simulated off-grid options results in 47.4% to75.4%, this could be sold to the grid to reduce costs and increase commercial viability.Therefore, future research work can consider the above, in addition to assessing reticulationnetwork costs.
Author Contributions: Conceptualization, A.A.; methodology, A.A., S.N. and D.S.P.C.; software,A.A. and S.N.; validation, D.S.P.C. and G.G.; formal analysis, A.A.; investigation, A.A. and S.N.;resources, S.N., D.S.P.C. and G.G.; data curation, S.N.; writing—original draft preparation, A.A.;writing—review and editing, A.A., S.N., D.S.P.C. and G.G.; visualization, A.A.; supervision, D.S.P.C.,and G.G.; project administration, D.S.P.C. and G.G.; funding acquisition, A.A. and G.G. All authorshave read and agreed to the published version of the manuscript.
Funding: This research was partially funded by Deutscher Akademischer Austauschdienst (DAAD),grant number: 2021/22 (57552340).
Institutional Review Board Statement: Not applicable.
Informed Consent Statement: Not applicable.
Data Availability Statement: The data presented in this study are available on request from thecorresponding author.
Acknowledgments: The authors would like to acknowledge initial input from Hashem Nehrir ofthe Montana State University, Bozeman, USA, and for administrative and facility supports from theNamibian University of Science and Technology, Department of Electrical Engineering, Windhoek,Namibia; the Institute of Acoustics and Building Physics, University of Stuttgart, Stuttgart, Ger-many; and the Nelson Mandela University, Port Elizabeth, South Africa; in conducting the researchand writing of this paper. All individuals and institutional representatives have consented to theacknowledgements.
Conflicts of Interest: The authors declare no conflict of interest.
Abbreviations
BAT BatteryCC Cycle ChargingCCGT Combined Cycle Gas TurbineDG Diesel GeneratorEV Electric VehicleFC Fuel CellGHI Global Horizontal IrradianceGWe Giga Watt electricHOMER Hybrid Optimization of Multiple Energy ResourcesHRES Hybrid Renewable Energy SystemsIPP Independent Power ProducerkW KilowattkWh kilowatt-hourL LiterLCD Liquid Crystal DisplayLCOE Levelized Cost of EnergyLF Load FollowingMATLAB Matrix Laboratory (software)MPPT Maximum Power Point TrackingMSB Modified Single Buyer
Energies 2022, 15, 4235 28 of 32
MW MegawattMWh Megawatt hourNASA National Aeronautics and Space AdministrationNPC Net Present CostO&M Operation and MaintenancePESTEL Political/Policy, Economic, Social, Technological, Environmental, and LegalPV PhotovoltaicSAPP Southern African Power PoolSHS Solar Home SystemSRF Solar Revolving FundSSA Sub-Saharan AfricaWT Wind Turbine
References1. William, R. Goal 7. Ensure Access to Affordable, Reliable, Sustainable, and Modern Energy for All, in A New Era in Global Health-Nursing
and the United Nations 2030 Agenda for Sustainable Development; Springer: Berlin/Heidelberg, Germany, 2018. [CrossRef]2. Bos, K.; Chaplin, D.; Mamun, A. Benefits and challenges of expanding grid electricity in Africa: A review of rigorous evidence on
household impacts in developing countries. Energy Sustain. Dev. 2018, 44, 64–77. [CrossRef]3. IEA; IRENA; The World Bank; World Health Organization. Tracking SDG 7: The Energy Progress Report 2020; IEA: Paris,
France, 2020.4. Brew-Hammond, A. Energy access in Africa: Challenges ahead. Energy Policy 2010, 38, 2291–2301. [CrossRef]5. IRENA. Energy Profile—Namibia. 2021. Available online: https://www.irena.org/IRENADocuments/Statistical_Profiles/
Africa/Namibia_Africa_RE_SP.pdf (accessed on 27 February 2022).6. The World Bank. Access to Electricity (% of Population)—Namibia. 2022. Available online: https://data.worldbank.org/
indicator/EG.ELC.ACCS.ZS?locations=NA (accessed on 27 February 2022).7. Tenenbaum, B.; Greacen, C.; Siyambalapitiya, T.; Knucles, J. From the Bottom Up: How Small Power Producers and Mini-Grids Can
Deliver Electrification and Renewable Energy in Africa; World Ban Publications: Washington, DC, USA, 2014; pp. 1–30.8. Lennon, J. How Namibia’s Housing Shortage Became a Humanitarian Crisis. 2018. Available online: https://jade-lennon.
medium.com/how-namibias-housing-shortage-became-a-humanitarian-crisis-eef05ba14b9b (accessed on 27 February 2022).9. Endjala, T.; Botes, L. Surviving like a Bird: Livelihood Coping Strategies in an Informal Settlement of Windhoek, Namibia. Afr.
Sociol. 2020, 24, 151–173.10. Weber, B.; Mendelsohn, J. Informal Settlements in Namibia: Their Nature and Growth; Development Workshop Namibia: Windhoek,
Namibia, 2017. Available online: https://www.raison.com.na/sites/default/files/Informal-Settlements-in-Namibia-Book-Web.pdf (accessed on 2 March 2022).
11. Republic of South Africa. Informal Settlements Policy Guidelines for Integrated National Electrification Programme (INEP); Departmentof Energy: Pretoria, South Africa, 2018. Available online: http://www.energy.gov.za/files/policies/electrification/Informal-Settlements-Policy-Guidelines-for-INEP.pdf (accessed on 2 March 2022).
12. Republic of Namibia. Response to the Questionnaire of Informal Settlements in Namibia and Human Rights; Ministry of Jus-tice: Windhoek, Namibia, 2017. Available online: https://www.ohchr.org/sites/default/files/Documents/Issues/Housing/InformalSettlements/Namibia.pdf (accessed on 2 March 2022).
13. Singh, M.; Balachandra, P. Microhybrid Electricity System for Energy Access, Livelihoods, and Empowerment. Proc. IEEE 2019,107, 1995–2007. [CrossRef]
14. Opiyo, N.N. How solar home systems temporally stimulate increasing power demands in rural households of Sub-SaharanAfrica. Energy Trans. 2020, 4, 141–153. [CrossRef]
15. Pelz, S.; Pachauri, S.; Groh, S. A critical review of modern approaches for multidimensional energy poverty measurement. WileyInterdiscip. Rev. Energy Environ. 2018, 7, e304. [CrossRef]
16. IRENA. Fostering Livelihoods with Decentralised Renewable Energy: An Ecosystem Approach. 2022. Available on-line: https://www.irena.org/-/media/Files/IRENA/Agency/Publication/2022/Jan/IRENA_Livelihood_Decentralised_Renewables_2022.pdf (accessed on 2 March 2022).
17. Hussein, M.A. Analysis of energy as a precondition for improvement of living conditions and poverty reduction in sub-SaharanAfrica. Sci. Res. Essays 2012, 7, 2656–2666. [CrossRef]
18. Markandya, A.; Wilkinson, P. Electricity generation and health. Lancet 2007, 370, 979–990. [CrossRef]19. Sverdlik, A. Ill-health and poverty: A literature review on health in informal settlements. Environ. Urban. 2011, 23, 979–990.
[CrossRef]20. Ortega, N.; Curto, A.; Dimitrova, A.; Nunes, J.; Rasella, D.; Sacoor, C.; Tonne, C. Health and environmental impacts of replacing
kerosene-based lighting with renewable electricity in East Africa. Energy Sustain. Dev. 2021, 63, 16–23. [CrossRef]21. Republic of Namibia. National Electrification Policy; Ministry of Mines and Energy: Windhoek, Namibia, 2020. Available
online: https://www.ecb.org.na/images/docs/Economic_Regulation/1st%20DRAFT%20-%20National%20Electrification%20Policy%20-%20Rev%202%20-%2020200916.pdf (accessed on 2 March 2022).

Energies 2022, 15, 4235 29 of 32
22. Jain, P.K.; Jain, P.; Dhafana, P. Addressing Barriers to Off-Grid Rural Electrification in Africa: The Botswana and NamibiaExperience. 2014. Available online: https://www.researchgate.net/publication/281612732 (accessed on 2 March 2022).
23. Hoeck, I.; Steurer, E.; Dolunay, Ö.; Ileka, H. Challenges for off-grid electrification in rural areas. Assessment of the situation inNamibia using the examples of Gam and Tsumkwe. Energy Ecol. Environ. 2021. [CrossRef]
24. Namibia Power Corporation. Nampower Annual Report 2021; Nampower: Windhoek, Namibia, 2021. Available online: https://www.nampower.com.na/public/docs/annual-reports/NamPower/Annual/Report/202021.pdf (accessed on 6 May 2022).
25. von Oertzen, D. State of the Namibian Electricity Sector, Windhoek; Konrad-Adenauer-Stiftung: Bonn, Germany, 2019.26. Akpeji, K.O.; Olasoji, A.O.; Gaunt, C.; Oyedokun, D.T.O.; Awodele, K.O.; Folly, K.A. Economic impact of electricity supply
interruptions in south Africa. SAIEE Afr. Res. J. 2020, 111, 73–87. [CrossRef]27. NREL. Documenting a Decade of Cost Declines for PV Systems. 2021. Available online: https://www.nrel.gov/news/program/
2021/documenting-a-decade-of-cost-declines-for-pv-systems.html (accessed on 27 February 2022).28. Hansen, K. Decision-making based on energy costs: Comparing levelized cost of energy and energy system costs. Energy Strategy
Rev. 2019, 24, 68–82. [CrossRef]29. IRENA. World Energy Transitions Outlook 2022: 1.5 ◦C Pathway. 2022. Available online: https://www.irena.org/-/media/Files/
IRENA/Agency/Publication/2022/Mar/IRENA_World_Energy_Transitions_Outlook_2022.pdf (accessed on 10 May 2022).30. Lou, X.; Li, L.M.W.; Xia, W.; Zhu, Q. A meta-analysis of temporal shifts in environmental concern between 1994 and 2017: An
examination of the new environmental paradigm. Anthropocene 2022, 38, 100335. [CrossRef]31. Solar Plaza, Top 5 Fastest-Growing Solar Markets in Africa. 2019. Available online: https://www.qualenergia.it/wp-content/
uploads/2019/09/White-Paper-The-Big-5-Africa-fastest-growing-solar-energy-markets.pdf (accessed on 27 February 2022).32. IRENA. Global Renewables Outlook: Energy Transformation 2050. 2020. Available online: https://www.irena.org/publications/
2020/Apr/Global-Renewables-Outlook-2020 (accessed on 10 May 2022).33. IRENA. Renewable Power Generation Costs 2020. 2020. Available online: https://www.irena.org/-/media/Files/IRENA/
Agency/Publication/2021/Jun/IRENA_Power_Generation_Costs_2020.pdf (accessed on 2 March 2022).34. Feldman, D.; Ramasamy, V.; Fu, R.; Ramdas, A.; Desai, J.; Margolis, R.U.S. Solar Photovoltaic System and Energy Storage Cost
Benchmark: Q1 2020. 2020. Available online: https://www.nrel.gov/docs/fy21osti/77324.pdf (accessed on 2 March 2022).35. Fu, R.; James, T.L.; Chung, D.; Gagne, D.; Lopez, A.; Dobos, A. Economic competitiveness of U.S. utility-scale photovoltaics
systems in 2015: Regional cost modeling of installed cost ($/W) and LCOE ($/kWh). In Proceedings of the 2015 IEEE 42ndPhotovoltaic Specialist Conference (PVSC 2015), New Orleans, LA, USA, 14–19 June 2015. [CrossRef]
36. Namibia Statistic Agency. Namibia 2011 Census Atlas. 2013. Available online: https://nsa.org.na/page/publications/ (accessedon 10 May 2022).
37. Info-Namibia, Climate and Weather of Namibia. 2022. Available online: https://www.info-namibia.com/info/namibia-weather(accessed on 2 March 2022).
38. The World Bank. Namibia Climatology Climate Change Knowledge Portal. 2022. Available online: https://climateknowledgeportal.worldbank.org/country/namibia/climate-data-historical (accessed on 2 March 2022).
39. Energypedia. Namibia Energy Situation. 2022. Available online: https://energypedia.info/wiki/Namibia_Energy_Situation#Renewable_Energy (accessed on 11 May 2022).
40. Solargis. Solar Resource Maps and GIS Data for 200+ Countries|Solargis. 2022. Available online: https://solargis.com/maps-and-gis-data/download/namibia (accessed on 2 March 2022).
41. Global Solar Atlas. Global Solar Atlas. Available online: https://globalsolaratlas.info/download/namibia (accessed on27 February 2022).
42. Ministry of Mines and Energy. Wind Energy. 2022. Available online: https://mme.gov.na/energy/ene_wind.php (accessed on2 March 2022).
43. Beck, J.; Markstein, M. State and Trends of the Namibian Bush Biomass Sector. 2019. Available online: https://www.dasnamibia.org/?wpfb_dl=129 (accessed on 2 March 2022).
44. National Petroleum Corporation of Namibia. Kudu gas-NAMCOR. 2022. Available online: https://www.namcor.com.na/kudu-gas/ (accessed on 10 May 2022).
45. Electricity Control Board. Annual Report 2021; ECB: Windhoek, Namibia, 2021. Available online: https://ecb.org.na/images/docs/Annual%20Reports/ECB%20Annual%20Report%202021.pdf (accessed on 2 March 2022).
46. Republic of Namibia. Electricity Supply Industry Detailed Market Design; Ministry of Mines and Energy: Windhoek, Namibia,2019. Available online: https://www.ecb.org.na/images/docs/Rules_and_Regulations/MSB/MSB_Detailed_Design_Report.pdf(accessed on 27 February 2022).
47. Republic of Namibia. National Energy Policy; Ministry of Mines and Energy: Windhoek, Namibia, 2017. Available on-line: https://www.mme.gov.na/files/publications/fd8_National%20Energy%20Policy%20-%20July%202017.pdf (accessed on27 February 2022).
48. Republic of Namibia. National Renewable Energy Policy for Namibia; Ministry of Mines and Energy: Windhoek, Namibia, 2017.Available online: https://www.mme.gov.na/files/publications/03f_National%20Renewable%20Energy%20Policy%20-%20July%202017.pdf (accessed on 27 February 2022).

Energies 2022, 15, 4235 30 of 32
49. World Economic Forum. How Namibia Is Moving towards a Green and Blue Economy. 2021. Available online: https://www.weforum.org/agenda/2021/10/namibia-is-positioned-to-become-the-renewable-energy-hub-of-africa/ (accessed on10 May 2022).
50. Saure Energy. Top 5 Fastest-Growing Solar Markets in Africa. 2022. Available online: https://www.saurenergy.com/solar-energy-news/top-5-fastest-growing-solar-markets-in-africa (accessed on 2 March 2022).
51. Rödl & Partner. Namibia—A small but Attractive Market. 2022. Available online: https://www.roedl.com/insights/renewable-energy/2017-02/namibia-small-attractive-market (accessed on 11 May 2022).
52. United Nations Namibia. Namibia Socio-Economic Recovery Plan. 2021. Available online: https://namibia.un.org/sites/default/files/2021-06/UN%20SERP%20Report.pdf (accessed on 11 May 2022).
53. Perez-DeLaMora, D.A.; Quiroz-Ibarra, J.E.; Fernandez-Anaya, G.; Hernandez-Martinez, E.G. Roadmap on community-basedmicrogrids deployment: An extensive review. Energy Rep. 2021, 7, 2883–2898. [CrossRef]
54. Yon, K.; Alvarez-Herault, M.C.; Raison, B.; Khon, K.; Vai, V.; Bun, L. Microgrids planning for rural elec-trification. In Proceedingsof the 2021 IEEE Madrid PowerTech, PowerTech 2021-Conference Proceedings, Madrid, Spain, 28 June–2 July 2021. [CrossRef]
55. Meyer, E.L.; Overen, O.K. Towards a sustainable rural electrification scheme in South Africa: Analysis of the Status quo. EnergyRep. 2021, 7, 4273–4287. [CrossRef]
56. Mishra, M.; Patnaik, B.; Biswal, M.; Hasan, S.; Bansal, R.C. A systematic review on DC-microgrid protection and groundingtechniques: Issues, challenges and future perspective. Appl. Energy 2022, 313, 118810. [CrossRef]
57. Yang, W.; Sparrow, S.N.; Ashtine, M.; Wallom, D.C.H.; Morstyn, T. Resilient by design: Preventing wildfires and blackouts withmicrogrids. Appl. Energy 2022, 313, 118793. [CrossRef]
58. Boche, A.; Foucher, C.; Villa, L.F.L. Understanding Microgrid Sustainability: A Systemic and Compre-hensive Review. Energies2022, 15, 2906. [CrossRef]
59. SolarTown. Rural Electrification with Solar Energy: Microgrids vs. Solar Home Systems. 2022. Available online: https://solartown.com/learning/solar-panels/rural-electrification-with-solar-energy-microgrids-vs-solar-home-systems/ (accessedon 11 May 2022).
60. HOMER Pro. Optimize Your Renewable Hybrid Power System. HOMER® Energy. 2022. Available online: Moz-extension://3f77186b-2803-443f-8635-06142985ec0d/enhanced-reader.html?openApp&pdf=https%3A%2F%2Fwww.homerenergy.com%2Fpdf%2FHomer-Product-Overview.pdf (accessed on 1 March 2022).
61. Ali, F.; Ahmar, M.; Jiang, Y.; AlAhmad, M. A techno-economic assessment of hybrid energy systems in rural Pakistan. Energy2021, 215, 119103. [CrossRef]
62. Yavor, K.M.; Bach, V.; Finkbeiner, M. Resource assessment of renewable energy systems—A review. Sustainability 2021, 13, 6107.[CrossRef]
63. Hamatwi, E.; Nyirenda, C.N.; Davidson, I.E. Cost Optimization and Design of a Hybrid Distributed Generation System for a DCMicrogrid. In Proceedings of the 2018 IEEE PES/IAS PowerAfrica, Cape Town, South Africa, 28–29 June 2018. [CrossRef]
64. Alkafaji, A.S.; Al-Samawi, A.A.; Trabelsi, H. Hybrid Energy Storage Review for Renewable Energy System Technologies andApplications. In Proceedings of the 2021 18th International Multi-Conference on Systems, Signals & Devices (SSD), Monastir,Tunisia, 22–25 March 2021. [CrossRef]
65. Tobajas, J.; Garcia-Torres, F.; Roncero-Sánchez, P.; Vázquez, J.; Bellatreche, L.; Nieto, E. Resilience-oriented schedule of microgridswith hybrid energy storage system using model predictive control. Appl. Energy 2022, 306, 118092. [CrossRef]
66. Bhandari, B.; Lee, K.T.; Lee, G.Y.; Cho, Y.M.; Ahn, S.H. Optimization of hybrid renewable energy power systems: A review. Int. J.Precis. Eng. Manuf. Technol. 2015, 2, 99–112. [CrossRef]
67. Gan, J.; Li, J.; Qi, W.; Kurban, A.; He, Y.; Guo, S. A Review on Capacity Optimization of Hybrid Renewable Power System withEnergy Storage. In E3S Web of Conferences; EDP Sciences: Les Ulis, France, 2019; p. 118. [CrossRef]
68. Parhizi, S.; Lotfi, H.; Khodaei, A.; Bahramirad, S. State of the art in research on microgrids: A review. IEEE Access 2015, 3, 890–925.[CrossRef]
69. Uddin, M.N.; Biswas, M.M.; Nuruddin, S. Techno-economic impacts of floating PV power generation for remote coastal regions.Sustain. Energy Technol. Assess. 2022, 51, 101930. [CrossRef]
70. Seedahmed, M.M.A.; Ramli, M.A.M.; Bouchekara, H.R.E.H.; Shahriar, M.S.; Milyani, A.H.; Rawa, M. A techno-economic analysisof a hybrid energy system for the electrification of a remote cluster in western Saudi Arabia. Alex. Eng. J. 2021, 61, 5183–5202.[CrossRef]
71. Mehta, R.; Chowdhury, S. Design of an optimal stand-alone hybrid renewable energy system with storage for supplying medicalfacilities in Tanzania. In Proceedings of the 2021 IEEE PES/IAS PowerAfrica, Nairobi, Kenya, 23–27 August 2021. [CrossRef]
72. Zebra, E.I.C.; van der Windt, H.J.; Nhumaio, G.; Faaij, A.P.C. A review of hybrid renewable energy systems in mini-grids foroff-grid electrification in developing countries. Renew. Sustain. Energy Rev. 2021, 144, 111036. [CrossRef]
73. Odou, O.D.T.; Bhandari, R.; Adamou, R. Hybrid off-grid renewable power system for sustainable rural electrification in Benin.Renew. Energy 2020, 145, 1266–1279. [CrossRef]
74. Krishan, O.; Suhag, S. Techno-economic analysis of a hybrid renewable energy system for an energy poor rural community.J. Energy Storage 2019, 23, 305–319. [CrossRef]
75. Javed, M.S.; Song, A.; Ma, T. Techno-economic assessment of a stand-alone hybrid solar-wind-battery system for a remote islandusing genetic algorithm. Energy 2019, 176, 704–717. [CrossRef]
Energies 2022, 15, 4235 31 of 32
76. Hussain, S.; Xuetong, W.; Maqbool, R.; Hussain, M.; Shahnawaz, M. The influence of government support, organizationalinnovativeness and community participation in renewable energy project success: A case of Pakistan. Energy 2022, 239, 122172.[CrossRef]
77. Qazi, A.; Hussain, F.; Rahim, N.A.; Hardaker, G.; Alghazzawi, D.; Shaban, K.; Haruna, K. Towards Sustainable Energy:A Systematic Review of Renewable Energy Sources, Technologies, and Public Opinions. IEEE Access 2019, 7, 63837–63851.[CrossRef]
78. Kim, M.H.; Kim, D.; Heo, J.; Lee, D.W. Techno-economic analysis of hybrid renewable energy system with solar district heatingfor net zero energy community. Energy 2019, 187, 115916. [CrossRef]
79. Faridah, L.; Purwadi, A.; Ibrahim, M.H.; Rizqiawan, A. Study and design of hybrid off-grid power system for communaland administrative load at 3 regions in Maluku, Indonesia. In Proceedings of the 2018 Conference on Power Engineering andRenewable Energy (ICPERE), Solo, Indonesia, 29–31 October 2018. [CrossRef]
80. Das, B.K.; Zaman, F. Performance analysis of a PV/Diesel hybrid system for a remote area in Bangladesh: Effects of dispatchstrategies, batteries, and generator selection. Energy 2019, 169, 263–276. [CrossRef]
81. Manama, S.M.; Scipioni, A.; Davat, B.; el Ganaoui, M. The idea of feeding a rural area in Comoros zith a micro-grid system withrenewable energy source with hydrogen storages. In Proceedings of the 2018 6th International Renewable and Sustainable EnergyConference, IRSEC 2018, Rabat, Morocco, 5–8 December 2018. [CrossRef]
82. van Greunen, S. The city assemblage: A case of Windhoek, Namibia. Cities 2021, 119, 103374. [CrossRef]83. Namibia Economist. City of Windhoek Launches Spatial Development Framework|Namibia Economist. 2021. Available
online: https://economist.com.na/60693/extra/city-of-windhoek-launches-spatial-development-framework/ (accessed on27 February 2022).
84. Namibia Economist. Power utility to ‘Light Up’ Windhoek’s Informal Settlements—NamPower, City of Windhoek ink AgreementWorth N$15.5 Million for Electrification Project. 2020. Available online: https://economist.com.na/53233/general-news/power-utility-to-light-up-windhoeks-informal-settlements-nampower-injects-n15-5-million-to-electrification-project/ (accessed on27 February 2022).
85. Namibia Economist. Government Moves to Formalise Shacks—Land Tenure System Pilot Project Kicks Off. 2019. Avail-able online: https://economist.com.na/44768/community-and-culture/government-moves-to-formalise-shacks-land-tenure-system-pilot-project-phase-kicks-off/ (accessed on 27 February 2022).
86. Dave, R.; Smyser, C.; Koehrer, F. Where and How Slum Electrification Succeeds: A Proposal for Replication; World Bank: Washington,DC, USA, 2019. [CrossRef]
87. New Era. City to Crack down on Electricity Theft-Truth, for Its Own Sake. 2021. Available online: https://neweralive.na/posts/city-to-crack-down-on-electricity-theft (accessed on 6 March 2022).
88. Informante. City Warns Residents against Electricity Theft-Informanté. 2021. Available online: https://informante.web.na/?p=308395 (accessed on 6 March 2022).
89. Karuaihe, S.T.; Wandschneider, P.R. Limited access to services for the urban poor in Windhoek, Namibia. Dev. S. Afr. 2018, 35,466–479. [CrossRef]
90. Namibian Sun. Informal Settlements Still in Crisis-Infrastructure-Windhoek Express. 2020. Available online: https://www.we.com.na/news/informal-settlements-still-in-crisis-2020-10-09 (accessed on 6 March 2022).
91. Namibia Broadcasting News. 1200 Windhoek Informal Settlement Households Will Soon Have Electricity. 2020. Available online:https://nbcnews.na/havana (accessed on 11 May 2022).
92. Mandelli, S.; Merlo, M.; Colombo, E. Novel procedure to formulate load profiles for off-grid rural areas. Energy Sustain. Dev. 2016,31, 130–142. [CrossRef]
93. Mandelli, S.; Brivio, C.; Moncecchi, M.; Riva, F.; Bonamini, G.; Merlo, M. Novel LoadProGen procedure for micro-grid design inemerging country scenarios: Application to energy storage sizing. Energy Proc. 2017, 135, 367–378. [CrossRef]
94. Tshabeni, T.; Freece, P. Comparison of informal settlement electrification: A case study at seaview, eastern cape, South Africa. InProceedings of the 2017 IEEE AFRICON, Cape Town, South Africa, 18–20 September 2017.
95. ClimaTemps. Windhoek Climate & Temperatures. 2017. Available online: http://www.windhoek.climatemps.com/ (accessed on7 March 2022).
96. Pupkewitz Megatech, Pupkewitz Megatech Renewable Energy. 2022. Available online: https://megatechsolar.com.na/ (accessedon 7 March 2022).
97. NEC Namibia. Specialists in Green Energy-NEC Power & Pumps Pty (Ltd.). 2022. Available online: https://nec-namibia.com/(accessed on 7 March 2022).
98. Light Systems Namibia. Light Systems Namibia—LSN—A Renewable Energy Company Focused on Solar Technology. 2022.Available online: https://lsn.com.na/ (accessed on 7 March 2022).
99. National Petroleum Corporation of Namibia. Fuel Prices. 2022. Available online: https://www.namcor.com.na/fuel-prices/(accessed on 7 March 2022).
100. IRENA. Solar Pv in Africa: Costs and Market; IRENA: Abu Dhabi, United Arab Emirates, 2016.101. Bank of Namibia, Today’s Rates. 2022. Available online: https://www.bon.com.na/ (accessed on 7 March 2022).102. Aziz, A.S.; Tajuddin, M.F.N.; Adzman, M.R.; Ramli, M.A.M.; Mekhilef, S. Energy management and optimization of a
PV/diesel/battery hybrid energy system using a combined dispatch strategy. Sustainability 2019, 11, 683. [CrossRef]

Energies 2022, 15, 4235 32 of 32
103. Das, C.K.; Bass, O.; Kothapalli, G.; Mahmoud, T.S.; Habibi, D. Overview of energy storage systems in distribution networks:Placement, sizing, operation, and power quality. Renew. Sustain. Energy Rev. 2018, 91, 1205–1230. [CrossRef]
104. Ekren, O.; Canbaz, C.H.; Güvel, Ç.B. Sizing of a solar-wind hybrid electric vehicle charging station by using HOMER software.J. Clean. Prod. 2021, 279, 123615. [CrossRef]
105. Das, B.K.; Hasan, M. Optimal sizing of a stand-alone hybrid system for electric and thermal loads using excess energy and wasteheat. Energy 2021, 214, 119036. [CrossRef]
106. Ministry of Mines and Energy. Solar Revolving Fund. 2022. Available online: https://mme.gov.na/directorates/efund/srf/(accessed on 7 March 2022).
107. Energypedia. Solar Revolving Fund: A Financing Strategy for Solar Energy Technologies in Namibia. 2022. Available online: https://energypedia.info/wiki/Solar_Revolving_Fund:_A_Financing_Strategy_for_Solar_Energy_Technologies_in_Namibia (accessedon 7 March 2022).