TECHNNICAL REPORT O BR ON MINER RITISH CO RAL RES ...
291
TECHN NICAL RE EPORT O BR E ON MINER RITISH CO QUAL Scot Keith Greg Robert Ronald Effective da Report da RAL RES OLUMBIA IFIED PERS tt Jones, P. Merriam, P Yelland, P. Rotzinger, G. Simpson te: Septemb ate: Octobe ERVES A A, CANAD SONS: Eng. P.Eng. .Eng. P.Eng. n, P.Geo ber 15, 2014 er 30, 2014 AT THE A DA 4 ALEY PRO OJECT
-
Upload
khangminh22 -
Category
Documents
-
view
1 -
download
0
Transcript of TECHNNICAL REPORT O BR ON MINER RITISH CO RAL RES ...
TECHN
NICAL REEPORT O
BR
E
ON MINER
RITISH CO
QUALScot
Keith Greg
RobertRonald
Effective daReport da
RAL RES
OLUMBIA
IFIED PERStt Jones, P.Merriam, P Yelland, P.Rotzinger, G. Simpson
te: Septembate: Octobe
ERVES A
A, CANAD
SONS: Eng.
P.Eng. .Eng. P.Eng.
n, P.Geo
ber 15, 2014er 30, 2014
AT THE A
DA
4
ALEY PROOJECT
Aley Project Technical Report October 2014
DATE AND SIGNATURE PAGE
The effective date of this Technical report, entitled “Technical Report on the Mineral Reserves at the Aley Project, British Columbia, Canada” is September 15, 2014.
“Signed and Sealed” _________________________________
Scott Jones, P.Eng.

Aley Project Technical Report October 2014
Table of Contents
Section 1.0 Summary
Section 2.0 Introduction
Section 3.0 Reliance on Other Experts
Section 4.0 Property Description and Location
Section 5.0 Accessibility, Climate, Local Resources, Infrastructure and Physiography
Section 6.0 History
Section 7.0 Geological Setting and Mineralization
Section 8.0 Deposit Types
Section 9.0 Exploration
Section 10.0 Drilling
Section 11.0 Sample Preparation, Analyses and Security
Section 12.0 Data Verification
Section 13.0 Mineral Processing and Metallurgical Testing
Section 14.0 Mineral Resources Estimates
Section 15.0 Mineral Reserve Estimates
Section 16.0 Mining Methods
Section 17.0 Recovery Methods
Section 18.0 Project Infrastructure
Section 19.0 Market Studies and Contracts
Section 20.0 Environmental Studies, Permitting and Social or Community Impact
Section 21.0 Capital and Operating Costs
Section 22.0 Economic Analysis
Section 23.0 Adjacent Properties
Section 24.0 Other Relevant Data and Information
Section 25.0 Interpretation and Conclusions
Section 26.0 Recommendations
Section 27.0 References

Aley Project Technical Report October 2014
SECTION 1: SUMMARY
Aley Project Technical Report October 2014
Table of Contents
1.0 Summary ..................................................................................................................................1
1.1 Introduction ...........................................................................................................................1
1.2 Ownership and Location ........................................................................................................1
1.3 Accessibility, Climate, Local Resources and Physiography .................................................1
1.4 Project History .......................................................................................................................2
1.5 Geology and Mineralization ..................................................................................................3
1.6 Drill Hole and Assay Database ..............................................................................................3
1.7 Metallurgical Testing .............................................................................................................3
1.8 Resource Estimate .................................................................................................................4
1.9 Reserve Estimate ...................................................................................................................6
1.10 Mining Method ....................................................................................................................6
1.11 Recovery Method ................................................................................................................7
1.12 Project Infrastructure ...........................................................................................................7
1.13 Market Studies .....................................................................................................................7
1.14 Environmental Considerations ............................................................................................8
1.15 Capital and Operating Costs ................................................................................................9
1.16 Economic Analysis ............................................................................................................10
1.17 Conclusions and Recommendations ..................................................................................10
List of Tables
Table 1.1: Measured and Indicated Mineral Resources .................................................................. 5
Table 1.2: Inferred Mineral Resources ........................................................................................... 5
Table 1.3: Mineral Reserves at Aley ............................................................................................... 6
Table 1.4: Summary of Capital Costs (x $1,000) ........................................................................... 9
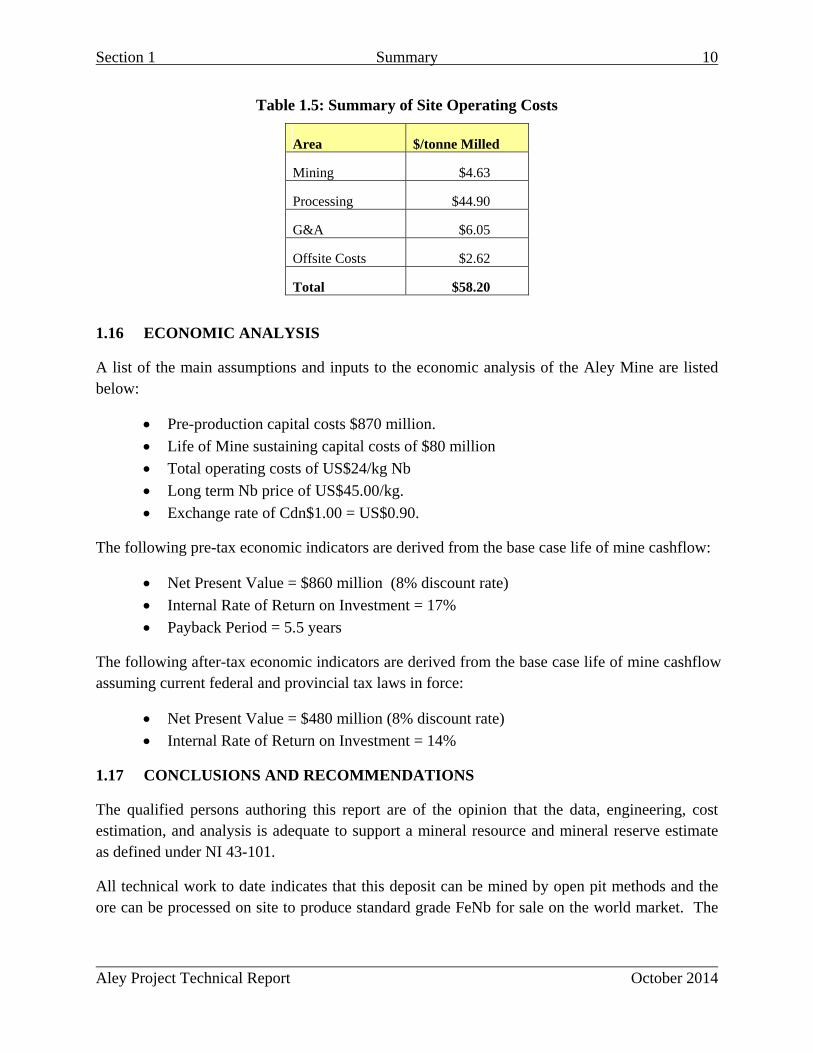
Table 1.5: Summary of Site Operating Costs ............................................................................... 10
Section 1 Summary 1
Aley Project Technical Report October 2014
1.0 Summary
1.1 INTRODUCTION
This technical report has been prepared for Taseko Mines Limited (“Taseko”). The work summarized in this report has been carried out to a minimum of a prefeasibility level of confidence and it documents the mineral reserve estimate announced in Taseko’s News Release dated September 15, 2014 in the format prescribed in National Instrument 43-101, Form 43-101F1.
Scott Jones, P.Eng. has provided oversight for this study and supervised the preparation of this full report as the primary Qualified Person (QP). Other QPs (authors) responsible for sections of this report are Keith Merriam, P.Eng., Greg Yelland, P. Eng., Robert Rotzinger, P.Eng., and Ronald G. Simpson, P.Geo.
The mineral reserve estimate provided is based upon the current geological interpretation, and exploration and engineering results obtained up to the effective date of September 15, 2014.
1.2 OWNERSHIP AND LOCATION
The Aley Property is 100% owned by Aley Corporation which is a wholly-owned subsidiary of Taseko. The project is located in northeastern British Columbia within the Omineca Mining Division. The property lies approximately 20 km northeast of the head of the Ospika Arm of Williston Lake.
The property comprises 109 mineral claims covering 43,763 hectares. The Aley claims are centered on 56° 27’ N 123° 44’ W, NTS mapsheets 94B.041 and 94B.042. An application has been submitted to the BC Mineral Titles Office to convert those claims covering the deposit and site infrastructure to mining leases.
There are no title encumbrances, surface rights issues or legal access obligations that must be met in order for Aley Corporation to retain this property. The Aley Property is not subject to any royalty terms, back-in rights, payments or any other agreements or encumbrances.
1.3 ACCESSIBILITY, CLIMATE, LOCAL RESOURCES AND PHYSIOGRAPHY
The access between the nearest community of Mackenzie and the mine site will be via road, barge and aircraft. Power will be provided through a proposed 150 km. long, 138 kV power transmission line beginning at the existing infrastructure in the community of Mackenzie.
Sufficient water is available on the property for the mining operation proposed in this report.
The Canadian National Railway (CN) services rail sidings in Mackenzie and has the ability to move supplies and product throughout North America.
Section 1 Summary 2
Aley Project Technical Report October 2014
Elevations range from 800 m in the valleys to the west and south of the property to 2,233 m on the ridge above the pit. The landscape is primarily mountainous with avalanche terrain evident on some of the steeper slopes.
The area is subject to a range of weather conditions throughout the year. Summers last from June to late September and are variably dry to wet. Local storms of heavy rainfall or even snow may occur at any time. Fall is short with the onset of snowstorms and heavy rains starting in late September. Snow remains on the ground from October through early June.
1.4 PROJECT HISTORY
Cominco Ltd. (“Cominco”) acquired the property in 1980 after following up on base metals soil anomalies in the northern part of the property. Samples collected in the Aley area showed evidence of carbonatite including the presence of pyrochlore. Cominco staked a series of claims from 1982 through 1986.
Cominco field work from 1983 through 1986 included access trail construction, ground magnetic and scintillometer surveys, geologic mapping, soil and rock chip sampling and drilling of 19 core holes (3,046 m). Preliminary metallurgical work followed in 1983-85 using material from a 5 ton bulk sample.
Following the acquisition of control of the mineral claims by Aley Corporation in 2004, exploration efforts concentrated on trench sampling for metallurgical material and the confirmation of previous geology and drill hole collar locations.
In 2006, metallurgical test work was conducted by Process Research Associates (“PRA”) laboratories in Vancouver on surface samples blasted from the Saddle and Central Zone trenches for metallurgical work.
In 2007 Taseko acquired the project and completed a program of helicopter supported exploration drilling comprising a total of 1,369m in 11 holes.
In 2010, an additional exploration program was completed comprising geological mapping and diamond drilling of 23 drill holes for a total of 4,460 metres.
In 2011 Taseko completed an additional 70 exploration core holes totaling 17,093 m.
Since 2011, Taseko has been focusing on metallurgical testing of the ore and developing a viable process for producing ferroniobium, (FeNb). Mine planning, infrastructure options, environmental baseline work and water management design work have also been carried out during this period.

Section 1 Summary 3
Aley Project Technical Report October 2014
1.5 GEOLOGY AND MINERALIZATION
The Aley Carbonatite complex intrudes Cambrian to Ordovician sedimentary rocks of the Kechika (limestone), Skoki (dolomite to volcaniclastics) and Road River Group formations (clastic sedimentary rocks). The intrusion is ovoid in plan with a diameter of approximately 2 km and surrounded by a fenite aureole up to 500 m. The complex is predominantly composed of dolomite carbonatite (CD) with minor calcite carbonatite (CC). Texturally, relationships suggest CD to be metasomatic in origin while CC is interpreted to be primary.
Niobium (Nb) bearing minerals at Aley are pyrochlore, fersmite and columbite, the latter two being alteration products of pyrochlore. Alteration at Aley has followed a general sequence: pyrochlore has altered to fersmite then fersmite has altered to columbite.
1.6 DRILL HOLE AND ASSAY DATABASE
The sample database for the Aley project contains results from 104 core holes drilled between 1985 and the end of 2011. The Central Zone has been tested by 96 holes (21,434m) all of which were entirely within the carbonatite complex. Six of these were drilled by Cominco in 1986 with the balance drilled by Taseko.
The QA/QC team applies industry standard practises to validate all assay results and provides advice to the laboratory for analytical re-runs on erroneous and/or questionable results whenever necessary. If re-runs are made, the database is again modified to reflect the corrected and updated data.
The project database is continuously and regularly processed and reviewed whenever additional information becomes available. A series of validation is done to maintain a clean and current database.
1.7 METALLURGICAL TESTING
The metallurgical testing that was used as the basis for design was conducted at SGS Laboratory in Vancouver, and at XPS in Sudbury. The test program included: mineralogical work, liberation analysis, comminution test work, gravity work, magnetic separation, several flotation programs and leach test work. The niobium concentrate produced from the work at SGS was sent to XPS for conversion test work.
The final flow sheet developed from the test work includes comminution, magnetic separation, flotation, leaching and final conversion.
The overall results from the series of tests conducted at the labs show that a process plant recovery of 71% was achieved in repeatable and stable locked cycle tests and a leach recovery average of 95% was achieved over all leach tests. The overall ferro-niobium grade achieved was 63% Nb at a recovery to ferro-niobium alloy of 65%.
Section 1 Summary 4
Aley Project Technical Report October 2014
1.8 RESOURCE ESTIMATE
The Resource Estimate is documented in the technical report titled “Technical Report Aley Carbonatite Niobium Project Omineca Mining District British Columbia, Canada” by Ronald G. Simpson, P. Geo, dated March 29, 2012, filed on www.sedar.com. That information remains current as there have been no additional relevant exploration results since that time within the resource area. As such, the resource estimate is current as of the effective date of this report.
The estimate utilized analytical results from the 96 core holes drilled on the Central Zone to date. Assays were composited in 6 metre down-hole intervals. Grades were not capped as no significant outlier population was identified.
Block grades were estimated by means of ordinary kriging in three passes using incremental search distances. The first pass used a maximum anisotropic search of 50m equivalent to ¼ of the maximum variogram range. The second pass search was set at ¾ of the variogram range at 150m and the final pass search was extended to the maximum range of 200m.
Model verification was initially carried out by visual comparison of blocks and sample grades in plan and section views. The estimated block grades showed reasonable correlation with adjacent composite grades. Swath plots were generated to assess the model for global bias by comparing kriged, ID2 and nearest-neighbor estimates on panels through the deposit. Results show a reasonable comparison between the methods.
Blocks were classified as ‘Measured’ if there were two composites from at least two drill holes within 50 m of the block centroid based on the anisotropic search parameters. Blocks not meeting the criteria for ‘Measured’ were classified as ‘Indicated’ if there were two composites from at least two drill holes within 100m of the block centroid. All other estimated blocks were classified as ‘Inferred’.
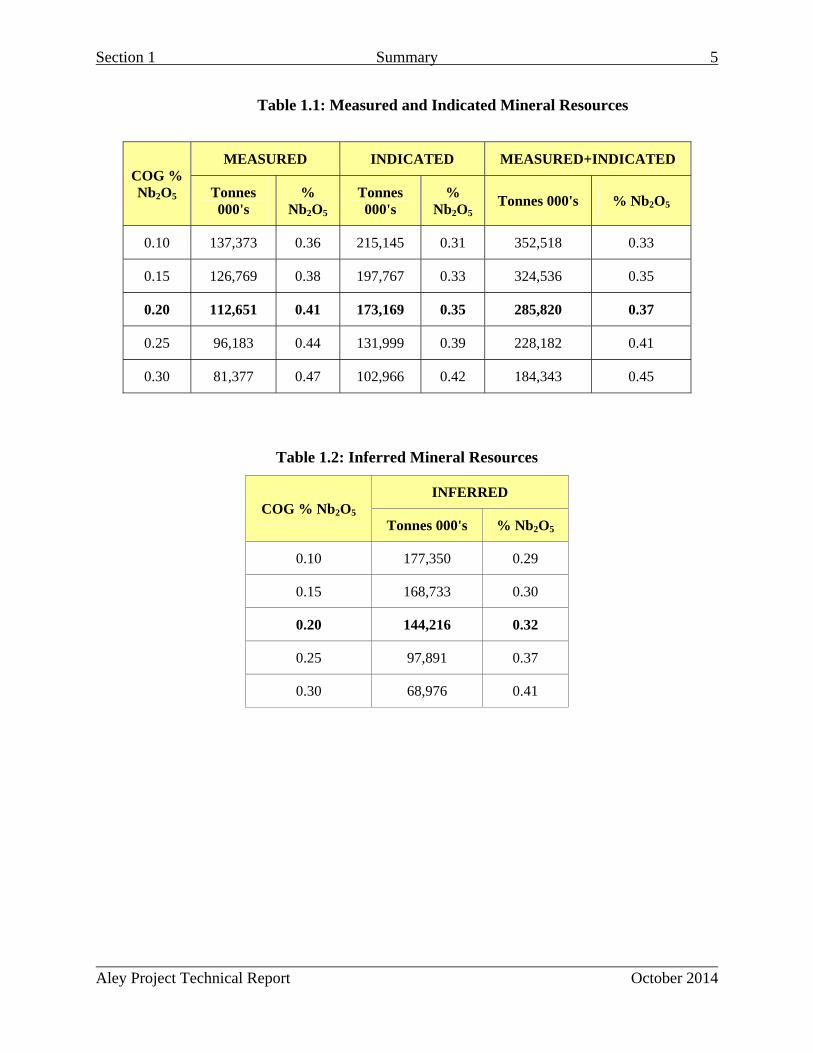
The in-pit mineral resource for the Aley Deposit is summarized in the Tables 1.1 and 1.2 for a range of cutoff grades with the base case of 0.2% Nb2O5 in boldface. The mineral resources stated are inclusive of mineral reserves.
Section 1 Summary 5
Aley Project Technical Report October 2014
Table 1.1: Measured and Indicated Mineral Resources
Table 1.2: Inferred Mineral Resources
COG % Nb2O5 INFERRED
Tonnes 000's % Nb2O5
0.10 177,350 0.29
0.15 168,733 0.30
0.20 144,216 0.32
0.25 97,891 0.37
0.30 68,976 0.41
COG % Nb2O5
MEASURED INDICATED MEASURED+INDICATED
Tonnes 000's
% Nb2O5
Tonnes 000's
% Nb2O5
Tonnes 000's % Nb2O5
0.10 137,373 0.36 215,145 0.31 352,518 0.33
0.15 126,769 0.38 197,767 0.33 324,536 0.35
0.20 112,651 0.41 173,169 0.35 285,820 0.37
0.25 96,183 0.44 131,999 0.39 228,182 0.41
0.30 81,377 0.47 102,966 0.42 184,343 0.45
Section 1 Summary 6
Aley Project Technical Report October 2014
1.9 RESERVE ESTIMATE
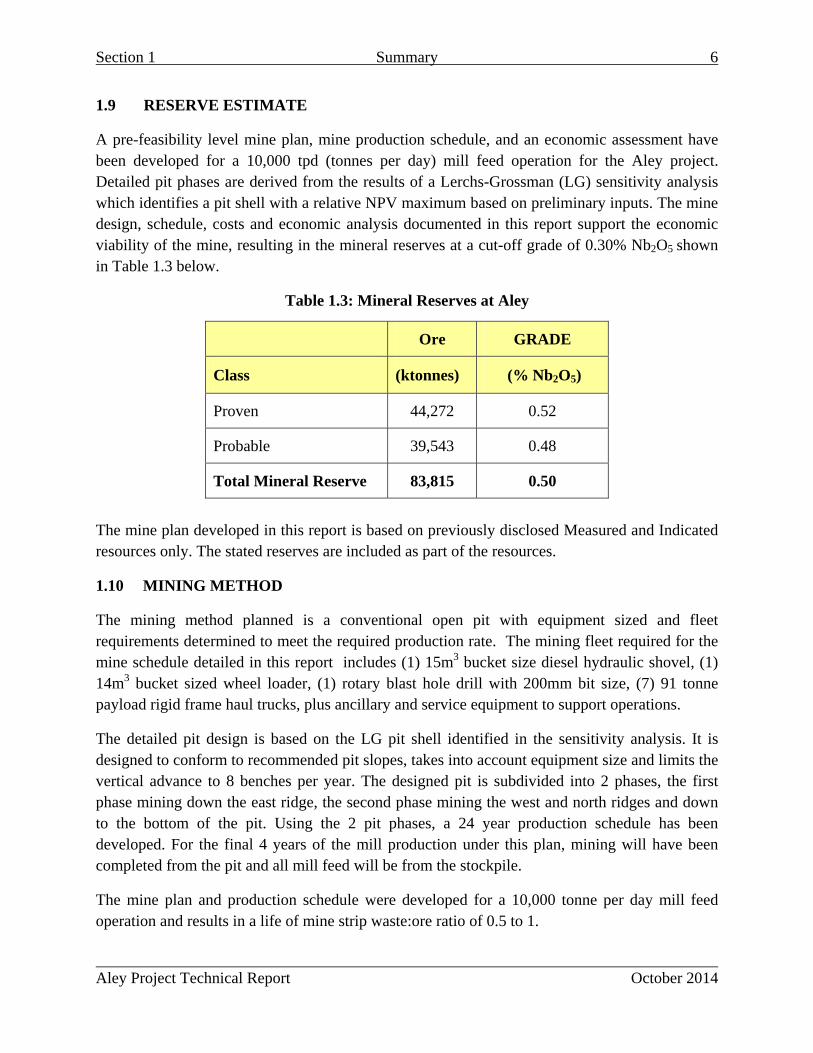
A pre-feasibility level mine plan, mine production schedule, and an economic assessment have been developed for a 10,000 tpd (tonnes per day) mill feed operation for the Aley project. Detailed pit phases are derived from the results of a Lerchs-Grossman (LG) sensitivity analysis which identifies a pit shell with a relative NPV maximum based on preliminary inputs. The mine design, schedule, costs and economic analysis documented in this report support the economic viability of the mine, resulting in the mineral reserves at a cut-off grade of 0.30% Nb2O5 shown in Table 1.3 below.
Table 1.3: Mineral Reserves at Aley
The mine plan developed in this report is based on previously disclosed Measured and Indicated resources only. The stated reserves are included as part of the resources.
1.10 MINING METHOD
The mining method planned is a conventional open pit with equipment sized and fleet requirements determined to meet the required production rate. The mining fleet required for the mine schedule detailed in this report includes (1) 15m3 bucket size diesel hydraulic shovel, (1) 14m3 bucket sized wheel loader, (1) rotary blast hole drill with 200mm bit size, (7) 91 tonne payload rigid frame haul trucks, plus ancillary and service equipment to support operations.
The detailed pit design is based on the LG pit shell identified in the sensitivity analysis. It is designed to conform to recommended pit slopes, takes into account equipment size and limits the vertical advance to 8 benches per year. The designed pit is subdivided into 2 phases, the first phase mining down the east ridge, the second phase mining the west and north ridges and down to the bottom of the pit. Using the 2 pit phases, a 24 year production schedule has been developed. For the final 4 years of the mill production under this plan, mining will have been completed from the pit and all mill feed will be from the stockpile.
The mine plan and production schedule were developed for a 10,000 tonne per day mill feed operation and results in a life of mine strip waste:ore ratio of 0.5 to 1.
Ore GRADE
Class (ktonnes) (% Nb2O5)
Proven 44,272 0.52
Probable 39,543 0.48
Total Mineral Reserve 83,815 0.50

Section 1 Summary 7
Aley Project Technical Report October 2014
1.11 RECOVERY METHOD
The proposed processing facilities for the Aley project are sized for a minimum 10,000 tpd throughput with an overall processing plant availability of 92%. Run of mine ore is to be delivered to a single stage crushing facility. Crushed product is then transferred via conveyor to a single coarse ore stockpile. This stockpile is used to feed a three stage comminution circuit that consists of a semi autogenous grinding (SAG) mill, a ball mill, and a fine grinding mill with the appropriate size classification circuits. Final comminution product is fed to the concentration plant, details of which are proprietary and confidential. An upgraded concentrate from the concentrator is fed to a leach facility for further processing, while waste streams produced in the concentrator are recombined and pumped to a sand storage management facility. Leached concentrate residue is then processed through a calciner and proceeds to ferro-niobium conversion. Converter waste is stored in a secure containment facility and final product ferro-niobium is delivered to market.
1.12 PROJECT INFRASTRUCTURE
The following site infrastructure will be required and has been taken into account in the calculation of capital and operating costs:
Site access;
Power supply and site electrical distribution system;
Plant site roads and yard areas;
Permanent process, maintenance and storage buildings;
Camp facilities for construction personnel and operating personnel;
Security, safety and first aid facilities;
Potable water supply, storage and distribution;
Reclaim water collection, storage and distribution;
Fire Protection;
Fuel storage and dispensing or distribution;
Sewage collection and treatment;
Plant site drainage;
Site sediment control;
Sand storage management facility;
Overburden, waste rock and ore stockpiles.
1.13 MARKET STUDIES
The proposed end product of the Aley project is HSLA-grade (or standard-grade) FeNb, by far the most important current use of niobium, accounting for about 90% of total global niobium usage in terms of niobium units. It has applications in the production of HSLA steels, and stainless and heat-resistant steels.
Section 1 Summary 8
Aley Project Technical Report October 2014
Over 95% of the world supply of FeNb comes from three producers in Brazil and Canada:
Companhia Brasileira de Metalurgia e Mineracao (CBMM), Brazil
Mineracao Catalao de Goias (Catalao), Brazil, owned by Anglo American
Niobec, Canada, owned by IAMGOLD but currently in an acquisition process.
CBMM currently supplies 83% of the world FeNb market, with the balance of world production split evenly between Niobec and Catalao. With the market demand for FeNb projected to grow in the future, there is room for another producer. The proposed Aley production rate is approximately 14 million kilograms of FeNb per year which is equivalent to approximately nine million kilograms of contained niobium or approximately 13% of the worlds projected 2017 demand.
FeNb pricing is reported in United States dollars per kilogram of contained niobium metal (US$/kg Nb). With only three primary producers there is no centralized exchange for FeNb as there is for base or precious metals and niobium is generally subject to confidential long term pricing contracts. Taseko has used three sources of information to inform FeNb pricing; pricing from the spot market, market analysis from firms such as Roskill Information Services, and inferences from public disclosure of producers.
The long term price used in the economic analysis of this project is US$45/kg contained Nb in FeNb which is approximately the mid-point of pricing data sources.
1.14 ENVIRONMENTAL CONSIDERATIONS
A background data review of existing information on the physical and biological conditions in the Project area has been conducted by various consultants. Following the completion of background review and desktop studies, a suite of site specific baseline studies was initiated in 2011. Project studies cover geochemistry, climate, air quality, noise, terrain and soils, hydrology, hydrogeology, water quality, noise, aquatic ecology, fish and fish habitat, vegetation, and wildlife. These studies will be used to characterize baseline physical and biological conditions for purposes of evaluating the environmental effects of the Project through the environmental assessment process, and for monitoring as may be dictated by future permits. No issues have been identified to date that could materially impact Taseko’s ability to extract the mineral reserves.
Current engagement with potentially affected First Nations and other local communities is premised on Taseko’s responsible mineral development philosophy, to develop a respectful and collaborative working relationship with potentially affected communities and invite active First Nation participation in project planning and EA field study programs. In May 2012, Tsay Keh Dene and Taseko entered into an Exploration Cooperation and Benefits Agreement associated with the exploration program and environmental studies.
Section 1 Summary 9
Aley Project Technical Report October 2014
1.15 CAPITAL AND OPERATING COSTS
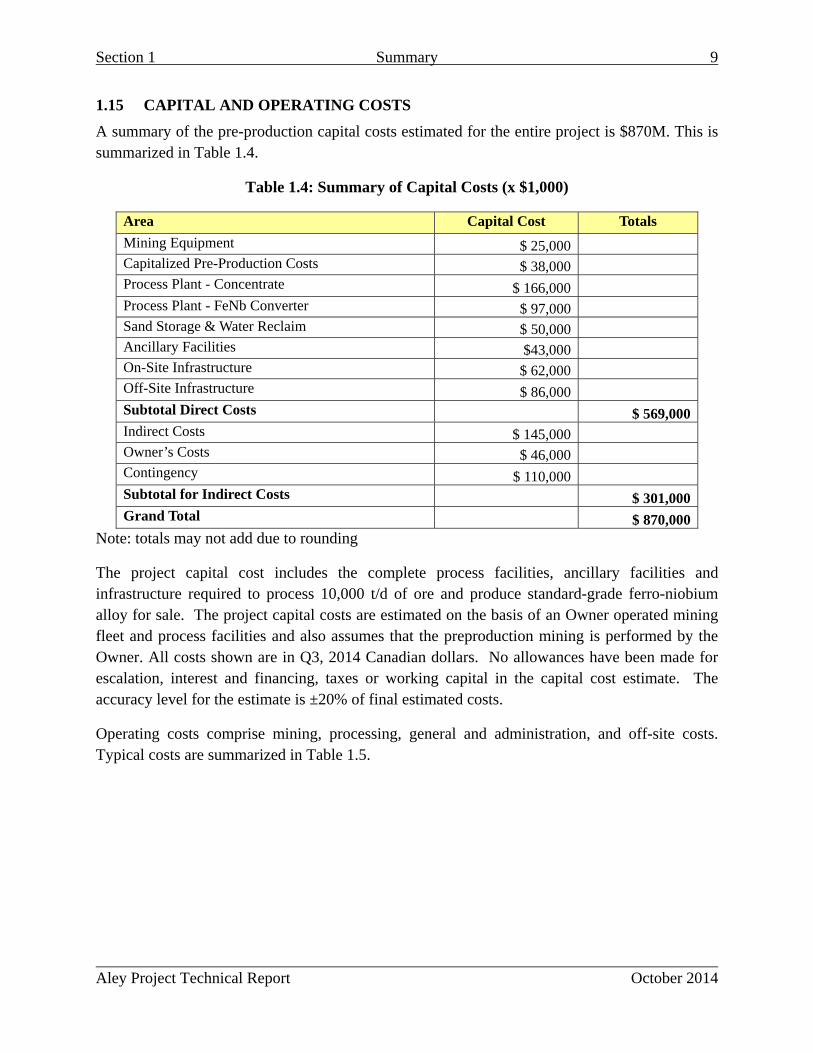
A summary of the pre-production capital costs estimated for the entire project is $870M. This is summarized in Table 1.4.
Table 1.4: Summary of Capital Costs (x $1,000)
Area Capital Cost Totals
Mining Equipment $ 25,000 Capitalized Pre-Production Costs $ 38,000 Process Plant - Concentrate $ 166,000 Process Plant - FeNb Converter $ 97,000 Sand Storage & Water Reclaim $ 50,000 Ancillary Facilities $43,000 On-Site Infrastructure $ 62,000 Off-Site Infrastructure $ 86,000 Subtotal Direct Costs $ 569,000 Indirect Costs $ 145,000 Owner’s Costs $ 46,000 Contingency $ 110,000 Subtotal for Indirect Costs $ 301,000 Grand Total $ 870,000
Note: totals may not add due to rounding
The project capital cost includes the complete process facilities, ancillary facilities and infrastructure required to process 10,000 t/d of ore and produce standard-grade ferro-niobium alloy for sale. The project capital costs are estimated on the basis of an Owner operated mining fleet and process facilities and also assumes that the preproduction mining is performed by the Owner. All costs shown are in Q3, 2014 Canadian dollars. No allowances have been made for escalation, interest and financing, taxes or working capital in the capital cost estimate. The accuracy level for the estimate is ±20% of final estimated costs.
Operating costs comprise mining, processing, general and administration, and off-site costs. Typical costs are summarized in Table 1.5.
Section 1 Summary 10
Aley Project Technical Report October 2014
Table 1.5: Summary of Site Operating Costs
Area $/tonne Milled
Mining $4.63
Processing $44.90
G&A $6.05
Offsite Costs $2.62
Total $58.20
1.16 ECONOMIC ANALYSIS
A list of the main assumptions and inputs to the economic analysis of the Aley Mine are listed below:
Pre-production capital costs $870 million.
Life of Mine sustaining capital costs of $80 million
Total operating costs of US$24/kg Nb
Long term Nb price of US$45.00/kg.
Exchange rate of Cdn$1.00 = US$0.90.
The following pre-tax economic indicators are derived from the base case life of mine cashflow:
Net Present Value = $860 million (8% discount rate)
Internal Rate of Return on Investment = 17%
Payback Period = 5.5 years
The following after-tax economic indicators are derived from the base case life of mine cashflow assuming current federal and provincial tax laws in force:
Net Present Value = $480 million (8% discount rate)
Internal Rate of Return on Investment = 14%
1.17 CONCLUSIONS AND RECOMMENDATIONS
The qualified persons authoring this report are of the opinion that the data, engineering, cost estimation, and analysis is adequate to support a mineral resource and mineral reserve estimate as defined under NI 43-101.
All technical work to date indicates that this deposit can be mined by open pit methods and the ore can be processed on site to produce standard grade FeNb for sale on the world market. The

Section 1 Summary 11
Aley Project Technical Report October 2014
economics of mining this deposit and producing FeNb are robust and will withstand large changes in the major monetary and operational variables that drive the cash-flow of this project.
It is recommended that all further work needed to advance this project to an environmental assessment and to optimize recovery and operating costs be conducted.

Aley Project Technical Report October 2014
SECTION 2: INTRODUCTION

Aley Project Technical Report October 2014
Table of Contents 2.0 Introduction ............................................................................................................................. 1
Section 2 Introduction 1
Aley Project Technical Report October 2014
2.0 Introduction
This technical report has been prepared for Taseko Mines Limited. Taseko Mines Limited was incorporated on April 15, 1966, pursuant to the Company Act of the Province of British Columbia. This corporate legislation was superseded in 2004 by the British Columbia Business Corporations Act which is now the corporate law statute that governs Taseko. Taseko has one active material subsidiary, Gibraltar Mines Ltd. (“Gibraltar”), a second active but not yet material subsidiary, Aley Corporation, and two wholly-owned non-material, inactive subsidiaries, 688888 BC Ltd. and Taseko Acquisitionsub Ltd. Taseko owns 100% of the common shares of Gibraltar Mines Ltd but none of Gibraltar’s issued tracking preferred shares. On March 31, 2010, the Company established a joint venture with Cariboo Copper Corp. (“Cariboo”) over the Gibraltar mine, whereby Cariboo acquired a 25% interest in the mine and Gibraltar retained a 75% interest.
The head office of Taseko is located at 15th Floor, 1040 West Georgia Street, Vancouver, British Columbia, Canada V6E 4H8, telephone (778) 373-4533, facsimile (778) 373-4534. The Company’s legal registered office is in care of its Canadian attorneys McMillan LLP, Suite 1500, 1055 West Georgia Street, Vancouver, British Columbia, Canada V6E 4N7, telephone (604) 689-9111, facsimile (604) 685-7084.
The purpose of this report is to summarize the pre-feasibility study and document the mineral reserve estimate announced in Taseko’s News Release dated September 15, 2014 in the format prescribed in National Instrument 43-101, Form 43-101F1.
The information, conclusions, opinions, and estimates contained herein are based on:
information available to Taseko at the time of preparation of this report,
assumptions, conditions, and qualifications as set forth in this report, and,
data, reports, and opinions supplied by Taseko and other third party sources listed as references.
Contributing consultants, Hunter Dickinson Inc. (HDI), Hatch, Geosim, Knight Piésold Ltd, AECOM, Ausenco, Valard Construction LP, Moose Mountain Technical Services, SGS Canada Inc., Inspectorate and XPS Test Work and Consulting Services are independent of both Aley Corporation and Taseko Mines Limited, and have no beneficial interest in the Aley Niobium Project. Fees for technical input are not dependent in whole or in part on any prior or future engagement or understanding resulting from the conclusions of resulting reports. Taseko has relied upon technical reports from these consultants to derive relevant aspects of this report. Reports developed by each consultant have been supplied to each of the other consultants as appropriate to support their own work and help derive the information, data and results that make up the content of this report.
Section 2 Introduction 2
Aley Project Technical Report October 2014
HDI provided oversight on the sampling, chain of custody, assaying and geological database management of this project. Geosim carried out the geostatistics, built the geological block model and estimated the mineral resource. Moose Mountain Technical Services relied on the geological block model supplied by Geosim in order to carry out pit design and mine planning in support of the mineral reserve estimate. Knight Piesold supplied the geotechnical parameters used in the pit and plant design, carried out a sand storage location assessment, provided the water balance and the sand storage dam and water management layouts. AECOM and Knight Piesold completed the environmental baseline work to date. Hatch assisted with the concentrator design, and Ausenco designed the convertor. Valard provided the design and cost estimate for the transmission line. Metallurgical test work programs that have contributed to the performance predictions have been complete by Inspectorate, SGS, and XPS. Taseko personnel have worked closely with and have overseen the work carried out by these consultants and have supervised all of the laboratory and metallurgical test work.
Scott Jones, P.Eng. has provided oversight for this study and supervised the preparation of this full report as the primary Qualified Person (QP). Other QPs (authors) responsible for sections of this report are Keith Merriam, P.Eng., Greg Yelland, P. Eng., Robert Rotzinger, P.Eng., and Ronald G. Simpson, P.Geo..
Mr. Jones has supervised the preparation of all sections of this report with a primary focus on Sections 1 through 6, 20, 22 through 26 of this report and has reviewed the methods used to determine the pit design, the long range mine plan, capital and operating cost estimates, and directed the updated economic evaluation. Mr. Jones current position is Vice-President, Engineering and he has direct knowledge of the project, having been employed by Taseko Mines since May, 2006. Mr. Jones visited the site on September 1-2, 2011 to review the geology, geotechnical factors, terrain, environment and the logistics of developing a mine in this area.
Mr. Merriam has supervised the preparation of Sections 13, 17, 19 and 21 of this report, and has reviewed the laboratory analytical methods as well as the test work methodology used to determine the metallurgical and recovery projections used in the economic analysis accompanying this report. Mr. Merriam’s current position is Manager, Process Engineering and he has direct knowledge of the project site, having been employed by Taseko Mines since May of 2008. Mr. Merriam visited the site on July 20th through 22nd 2011 and August 15th through 23rd 2012 to review site drilling work, the geology and mineralization encountered, and the collection of core material later used in metallurgical test programs.
Mr. Yelland has supervised the preparation of Sections 7 through 12, 15, and 16 of this report, and has reviewed the mine operating costs, mine equipment capital costs, the mineral resource estimate and the economic analysis. Mr. Yelland’s current position is Chief Engineer, and he has direct knowledge of the project, having been employed by Taseko Mines since March, 2010. Mr. Yelland visited the site on September 1-2, 2011 to review the geology, geotechnical factors, terrain, environment and the logistics of developing a mine in this area.
Section 2 Introduction 3
Aley Project Technical Report October 2014
Mr. Rotzinger has supervised the preparation of Sections 18 and 21 of this report and has reviewed the processing facility and infrastructure capital cost estimates used in the economic analysis accompanying this report. Mr. Rotzinger’s current position is Vice President, Capital Projects and has direct knowledge of the project, having been employed by Taseko Mines since June of 1999.
Mr. Simpson has supervised the preparation of Section 14 of this report. He conducted a site visit to the Project site on August 29, 2011. The purpose of the visit was to review the geology and mineralization encountered in the drill holes completed to date. In addition, drilling, sampling, quality assurance/quality control (QA/QC), sample preparation and analytical protocols and procedures, and database structure were reviewed.
All measurement units used in this report are metric, and currency is expressed in Canadian dollars unless stated otherwise.
Section 2 Introduction 4
Aley Project Technical Report October 2014
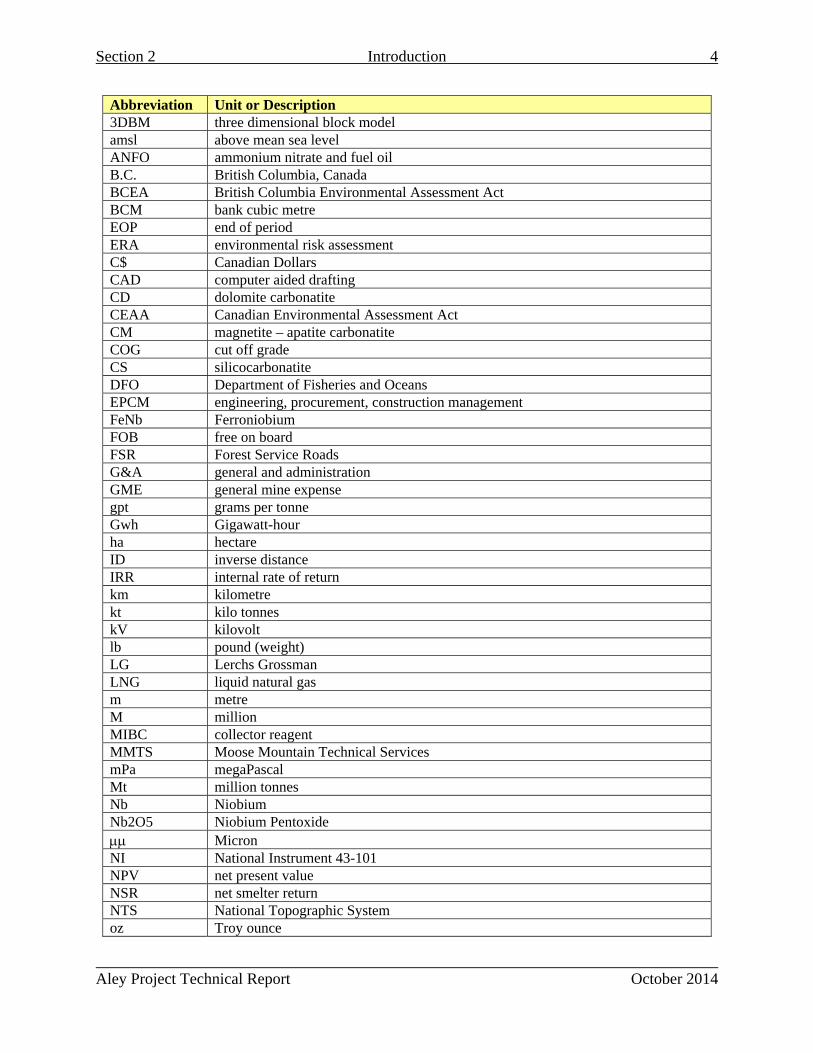
Abbreviation Unit or Description 3DBM three dimensional block model amsl above mean sea level ANFO ammonium nitrate and fuel oil B.C. British Columbia, Canada BCEA British Columbia Environmental Assessment Act BCM bank cubic metre EOP end of period ERA environmental risk assessment C$ Canadian Dollars CAD computer aided drafting CD dolomite carbonatite CEAA Canadian Environmental Assessment Act CM magnetite – apatite carbonatite COG cut off grade CS silicocarbonatite DFO Department of Fisheries and Oceans EPCM engineering, procurement, construction management FeNb Ferroniobium FOB free on board FSR Forest Service Roads G&A general and administration GME general mine expense gpt grams per tonne Gwh Gigawatt-hour ha hectare ID inverse distance IRR internal rate of return km kilometre kt kilo tonnes kV kilovolt lb pound (weight) LG Lerchs Grossman LNG liquid natural gas m metre M million MIBC collector reagent MMTS Moose Mountain Technical Services mPa megaPascal Mt million tonnes Nb Niobium Nb2O5 Niobium Pentoxide Micron NI National Instrument 43-101 NPV net present value NSR net smelter return NTS National Topographic System oz Troy ounce

Section 2 Introduction 5
Aley Project Technical Report October 2014
Abbreviation Unit or Description % percent PAG potentially acid generating PM preventative maintenance QA/QC quality assurance and quality control QP qualified person ROM run of mine SAG semi autogenous grinding SG specific gravity SIBX collector reagent SMU service meter unit SSMF Sand storage management facility t tonne (metric) tpd tonnes per day US$ United States Dollars TWC 314 mill reagent TWC 401 mill reagent

Aley Project Technical Report October 2014
SECTION 3: RELIANCE ON OTHER EXPERTS

Aley Project Technical Report October 2014
Table of Contents
3.0 Reliance on Other Experts .......................................................................................................1

Section 3 Reliance on Other Experts 1
Aley Project Technical Report October 2014
3.0 Reliance on Other Experts
Standard professional procedures have been followed in the preparation of this Technical Report. Data used in this report has been verified where possible and the authors have no reason to believe that data was not collected in a professional manner and no information has been withheld that would affect the conclusions of this report.
The information, conclusions, opinions, and estimates contained herein are based on:
Information available to Taseko as of the effective date of this report, and
Assumptions, conditions, and qualifications as stated in this report.
For the purposes of this report, the authors have relied on title and property ownership provided by the Mineral Titles Branch, Mines and Mineral Resources Division of the B.C Ministry of Energy and Mines and Responsible for Core Review as of September 15, 2014.
Tax information has been provided by Taseko’s tax consultant.
Except for the purposes legislated under provincial securities laws, any use of this report by any third party is at that party’s sole risk.

Aley Project Technical Report October 2014
SECTION 4: PROPERTY DESCRIPTION AND LOCATION

Aley Project Technical Report October 2014
Table of Contents
4.0 Property Description and Location ..........................................................................................1
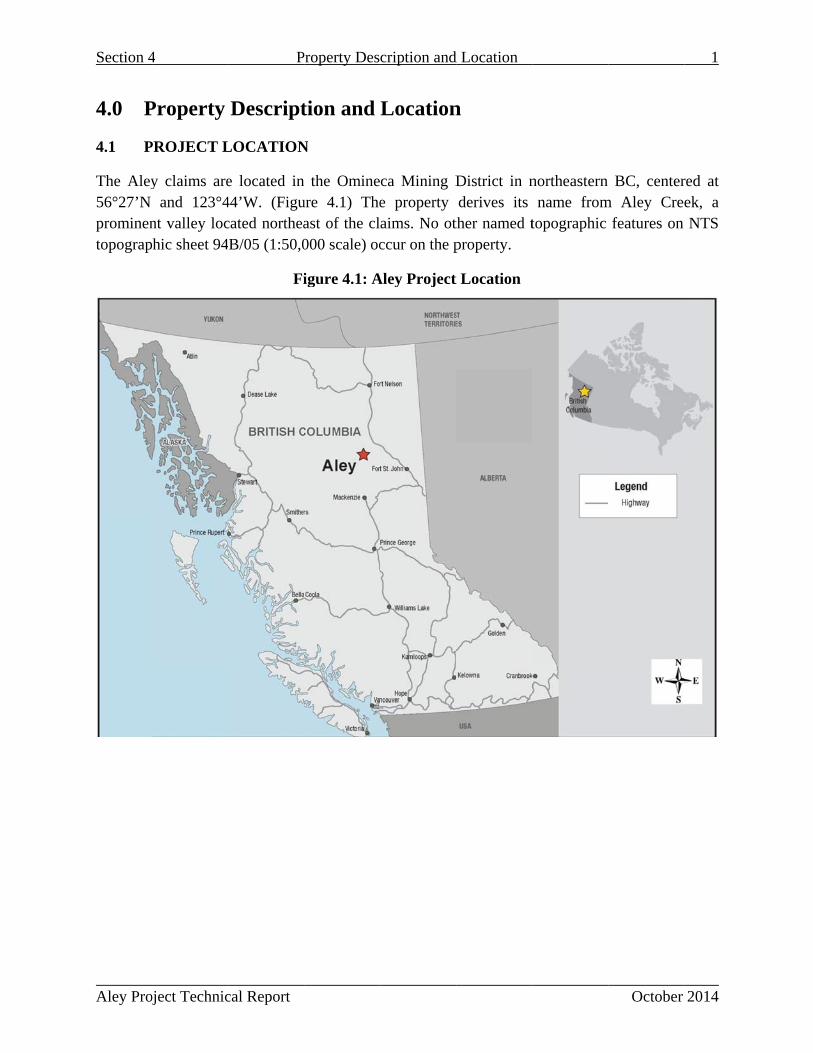
4.1 Project Location .....................................................................................................................1
4.2 Land Tenure ...........................................................................................................................2
4.3 Nature and Extent of Issuer’s Title ........................................................................................7
4.4 Permits & Environmental Liabilities .....................................................................................7
List of Tables
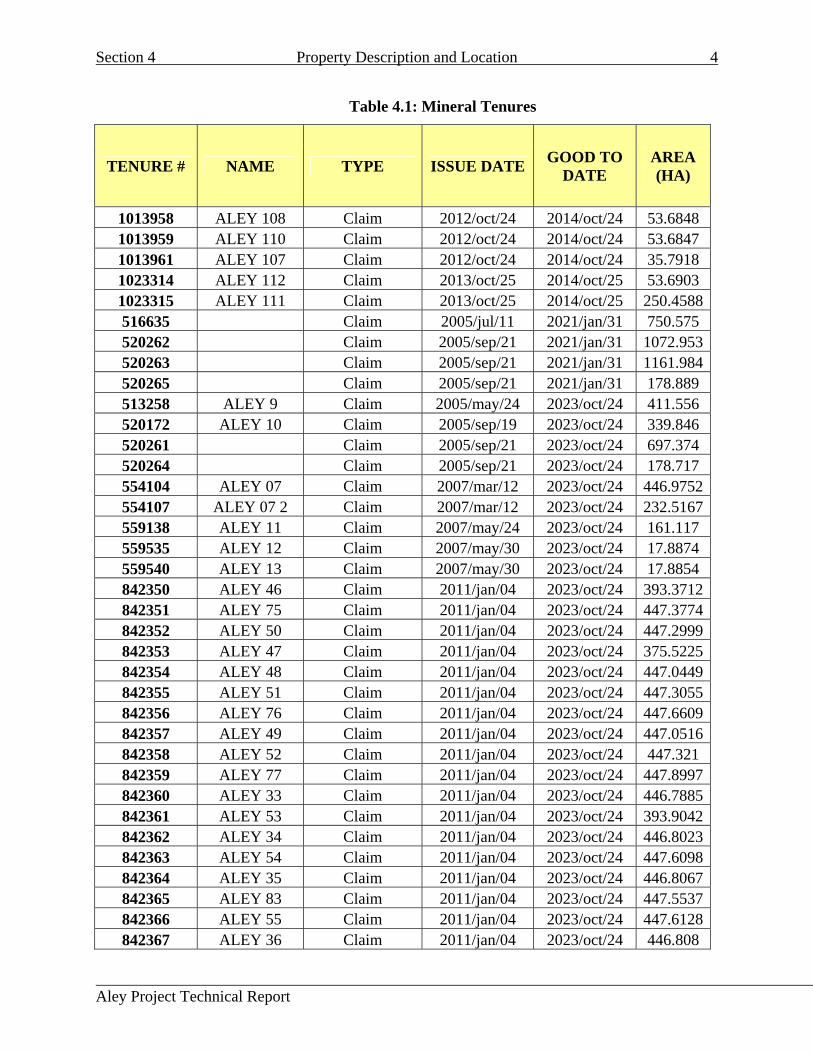
Table 4.1: Mineral Tenures ............................................................................................................. 4
Table of Figures
Figure 4.1: Aley Project Location ................................................................................................... 1
Figure 4.2: Mineral Tenures ........................................................................................................... 3
Section 4
Aley Proj
4.0 P
4.1 P
The Aley56°27’N prominentopograp
4
oject Technic
Property
PROJECT L
y claims areand 123°4
nt valley lochic sheet 94
P
cal Report
Descript
LOCATION
e located in44’W. (Figucated northeaB/05 (1:50,0
Fi
Property Des
tion and
N
the Omineure 4.1) Theast of the cl000 scale) oc
igure 4.1: A
cription and
Location
ca Mining De property aims. No otccur on the p
Aley Project
d Location
n
District in nderives its
ther named tproperty.
t Location
northeastern name from
topographic
October
BC, centerm Aley Cree
features on
1
2014
red at ek, a NTS
Section 4 Property Description and Location 2
Aley Project Technical Report October 2014
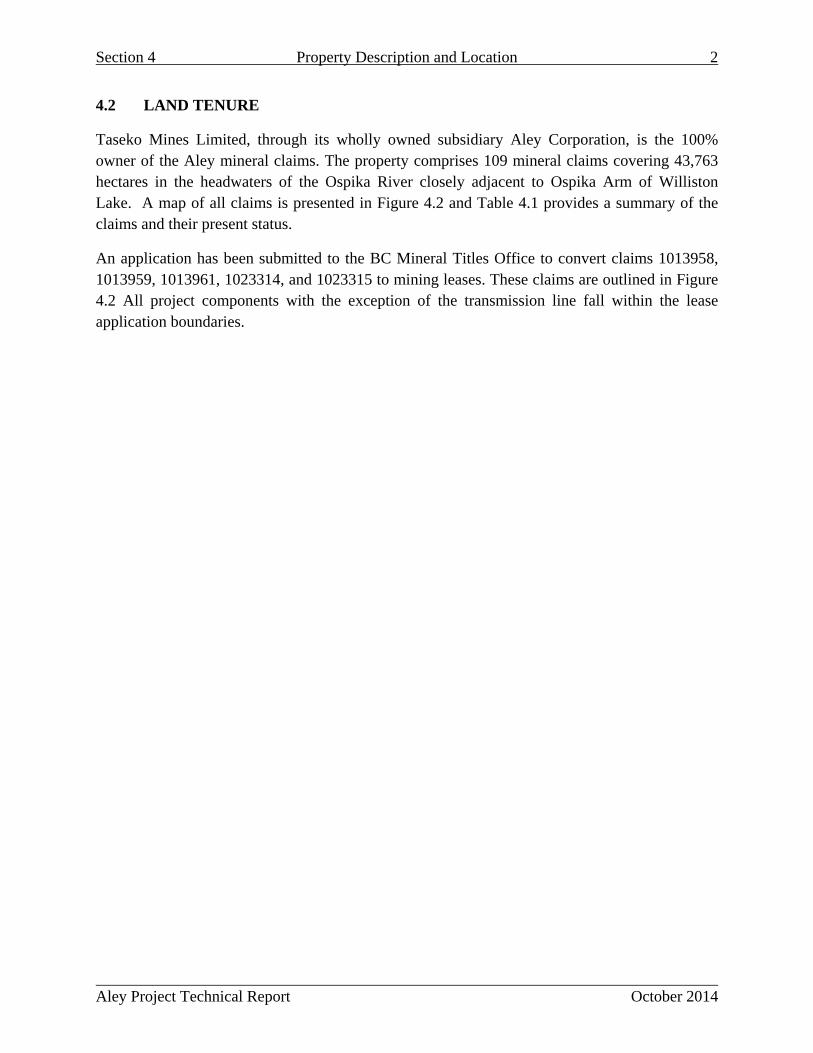
4.2 LAND TENURE
Taseko Mines Limited, through its wholly owned subsidiary Aley Corporation, is the 100% owner of the Aley mineral claims. The property comprises 109 mineral claims covering 43,763 hectares in the headwaters of the Ospika River closely adjacent to Ospika Arm of Williston Lake. A map of all claims is presented in Figure 4.2 and Table 4.1 provides a summary of the claims and their present status.
An application has been submitted to the BC Mineral Titles Office to convert claims 1013958, 1013959, 1013961, 1023314, and 1023315 to mining leases. These claims are outlined in Figure 4.2 All project components with the exception of the transmission line fall within the lease application boundaries.

S
A
Section
Aley Pro
4
oject Te
chnical
Report
Prooperty D
Figure
Descriptio
4.2: Mi
on and L
ineral T
Location
Tenures
n
Octtober 20
3
14
Section 4 Property Description and Location 4
Aley Project Technical Report
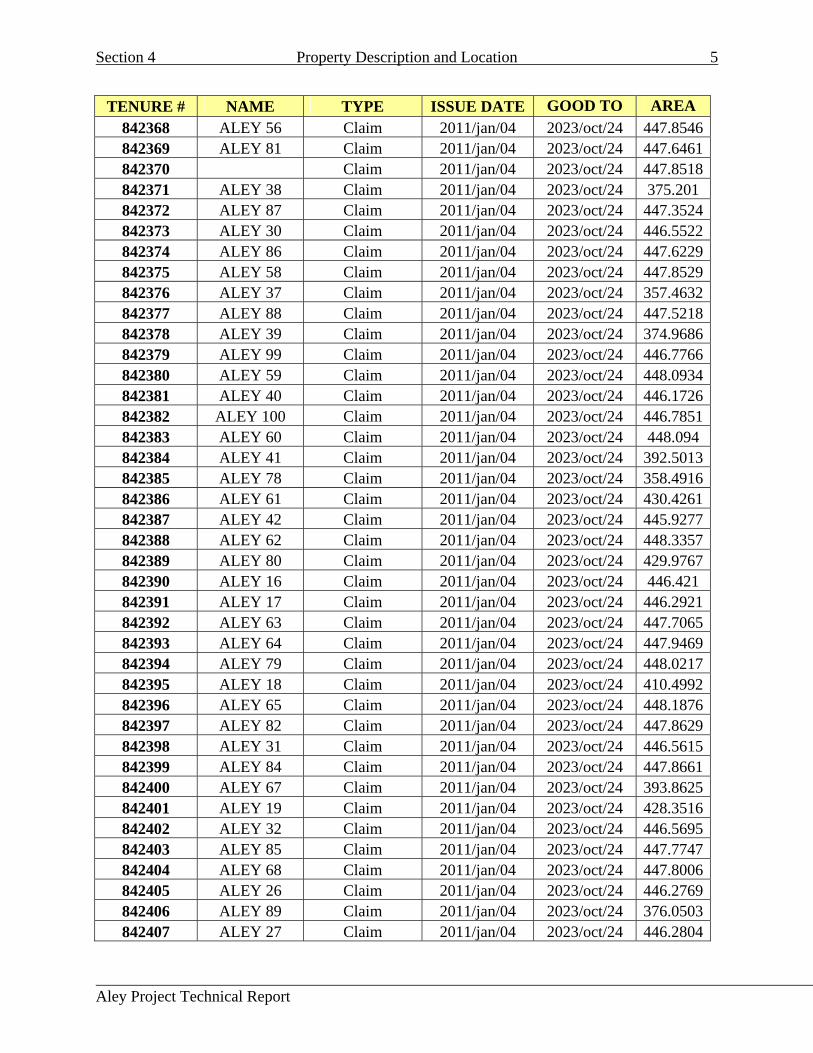
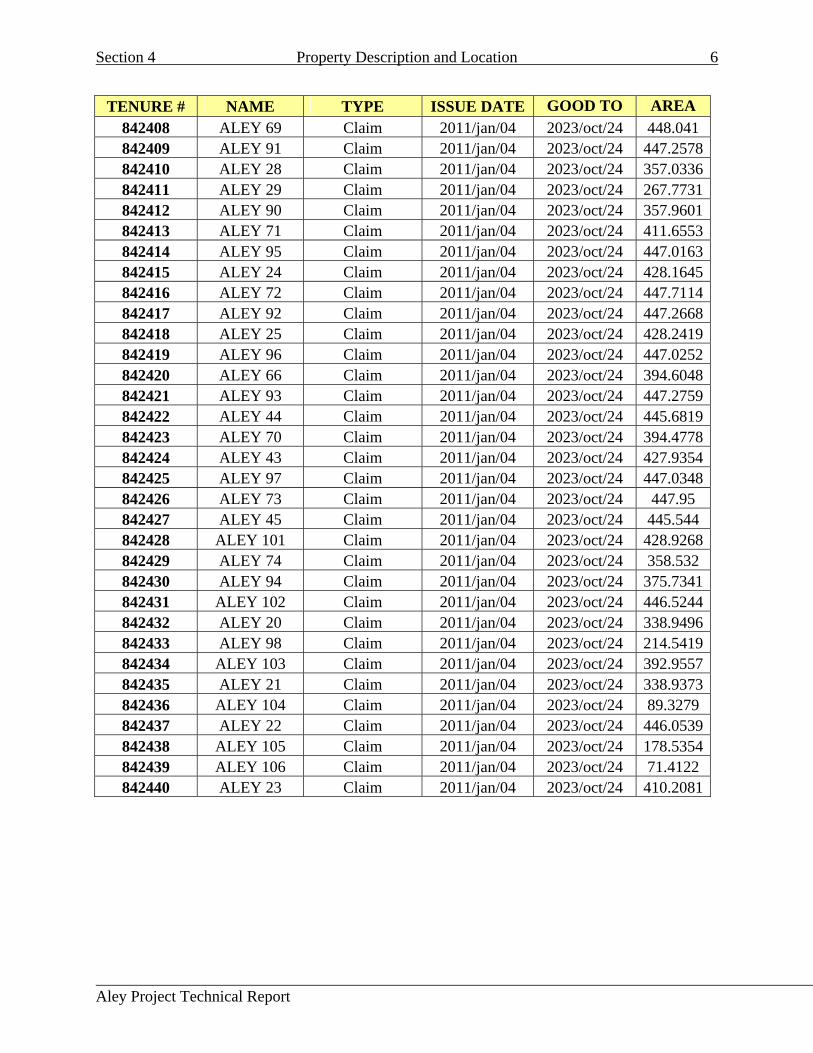
Table 4.1: Mineral Tenures
TENURE # NAME TYPE ISSUE DATE GOOD TO
DATE AREA (HA)
1013958 ALEY 108 Claim 2012/oct/24 2014/oct/24 53.6848 1013959 ALEY 110 Claim 2012/oct/24 2014/oct/24 53.6847 1013961 ALEY 107 Claim 2012/oct/24 2014/oct/24 35.7918 1023314 ALEY 112 Claim 2013/oct/25 2014/oct/25 53.6903 1023315 ALEY 111 Claim 2013/oct/25 2014/oct/25 250.4588516635 Claim 2005/jul/11 2021/jan/31 750.575 520262 Claim 2005/sep/21 2021/jan/31 1072.953520263 Claim 2005/sep/21 2021/jan/31 1161.984520265 Claim 2005/sep/21 2021/jan/31 178.889 513258 ALEY 9 Claim 2005/may/24 2023/oct/24 411.556 520172 ALEY 10 Claim 2005/sep/19 2023/oct/24 339.846 520261 Claim 2005/sep/21 2023/oct/24 697.374 520264 Claim 2005/sep/21 2023/oct/24 178.717 554104 ALEY 07 Claim 2007/mar/12 2023/oct/24 446.9752554107 ALEY 07 2 Claim 2007/mar/12 2023/oct/24 232.5167559138 ALEY 11 Claim 2007/may/24 2023/oct/24 161.117 559535 ALEY 12 Claim 2007/may/30 2023/oct/24 17.8874 559540 ALEY 13 Claim 2007/may/30 2023/oct/24 17.8854 842350 ALEY 46 Claim 2011/jan/04 2023/oct/24 393.3712842351 ALEY 75 Claim 2011/jan/04 2023/oct/24 447.3774842352 ALEY 50 Claim 2011/jan/04 2023/oct/24 447.2999842353 ALEY 47 Claim 2011/jan/04 2023/oct/24 375.5225842354 ALEY 48 Claim 2011/jan/04 2023/oct/24 447.0449842355 ALEY 51 Claim 2011/jan/04 2023/oct/24 447.3055842356 ALEY 76 Claim 2011/jan/04 2023/oct/24 447.6609842357 ALEY 49 Claim 2011/jan/04 2023/oct/24 447.0516842358 ALEY 52 Claim 2011/jan/04 2023/oct/24 447.321 842359 ALEY 77 Claim 2011/jan/04 2023/oct/24 447.8997842360 ALEY 33 Claim 2011/jan/04 2023/oct/24 446.7885842361 ALEY 53 Claim 2011/jan/04 2023/oct/24 393.9042842362 ALEY 34 Claim 2011/jan/04 2023/oct/24 446.8023842363 ALEY 54 Claim 2011/jan/04 2023/oct/24 447.6098842364 ALEY 35 Claim 2011/jan/04 2023/oct/24 446.8067842365 ALEY 83 Claim 2011/jan/04 2023/oct/24 447.5537842366 ALEY 55 Claim 2011/jan/04 2023/oct/24 447.6128842367 ALEY 36 Claim 2011/jan/04 2023/oct/24 446.808
Section 4 Property Description and Location 5
Aley Project Technical Report
TENURE # NAME TYPE ISSUE DATE GOOD TO AREA
842368 ALEY 56 Claim 2011/jan/04 2023/oct/24 447.8546842369 ALEY 81 Claim 2011/jan/04 2023/oct/24 447.6461842370 Claim 2011/jan/04 2023/oct/24 447.8518842371 ALEY 38 Claim 2011/jan/04 2023/oct/24 375.201 842372 ALEY 87 Claim 2011/jan/04 2023/oct/24 447.3524842373 ALEY 30 Claim 2011/jan/04 2023/oct/24 446.5522842374 ALEY 86 Claim 2011/jan/04 2023/oct/24 447.6229842375 ALEY 58 Claim 2011/jan/04 2023/oct/24 447.8529842376 ALEY 37 Claim 2011/jan/04 2023/oct/24 357.4632842377 ALEY 88 Claim 2011/jan/04 2023/oct/24 447.5218842378 ALEY 39 Claim 2011/jan/04 2023/oct/24 374.9686842379 ALEY 99 Claim 2011/jan/04 2023/oct/24 446.7766842380 ALEY 59 Claim 2011/jan/04 2023/oct/24 448.0934842381 ALEY 40 Claim 2011/jan/04 2023/oct/24 446.1726842382 ALEY 100 Claim 2011/jan/04 2023/oct/24 446.7851842383 ALEY 60 Claim 2011/jan/04 2023/oct/24 448.094 842384 ALEY 41 Claim 2011/jan/04 2023/oct/24 392.5013842385 ALEY 78 Claim 2011/jan/04 2023/oct/24 358.4916842386 ALEY 61 Claim 2011/jan/04 2023/oct/24 430.4261842387 ALEY 42 Claim 2011/jan/04 2023/oct/24 445.9277842388 ALEY 62 Claim 2011/jan/04 2023/oct/24 448.3357842389 ALEY 80 Claim 2011/jan/04 2023/oct/24 429.9767842390 ALEY 16 Claim 2011/jan/04 2023/oct/24 446.421 842391 ALEY 17 Claim 2011/jan/04 2023/oct/24 446.2921842392 ALEY 63 Claim 2011/jan/04 2023/oct/24 447.7065842393 ALEY 64 Claim 2011/jan/04 2023/oct/24 447.9469842394 ALEY 79 Claim 2011/jan/04 2023/oct/24 448.0217842395 ALEY 18 Claim 2011/jan/04 2023/oct/24 410.4992842396 ALEY 65 Claim 2011/jan/04 2023/oct/24 448.1876842397 ALEY 82 Claim 2011/jan/04 2023/oct/24 447.8629842398 ALEY 31 Claim 2011/jan/04 2023/oct/24 446.5615842399 ALEY 84 Claim 2011/jan/04 2023/oct/24 447.8661842400 ALEY 67 Claim 2011/jan/04 2023/oct/24 393.8625842401 ALEY 19 Claim 2011/jan/04 2023/oct/24 428.3516842402 ALEY 32 Claim 2011/jan/04 2023/oct/24 446.5695842403 ALEY 85 Claim 2011/jan/04 2023/oct/24 447.7747842404 ALEY 68 Claim 2011/jan/04 2023/oct/24 447.8006842405 ALEY 26 Claim 2011/jan/04 2023/oct/24 446.2769842406 ALEY 89 Claim 2011/jan/04 2023/oct/24 376.0503842407 ALEY 27 Claim 2011/jan/04 2023/oct/24 446.2804
Section 4 Property Description and Location 6
Aley Project Technical Report
TENURE # NAME TYPE ISSUE DATE GOOD TO AREA
842408 ALEY 69 Claim 2011/jan/04 2023/oct/24 448.041 842409 ALEY 91 Claim 2011/jan/04 2023/oct/24 447.2578842410 ALEY 28 Claim 2011/jan/04 2023/oct/24 357.0336842411 ALEY 29 Claim 2011/jan/04 2023/oct/24 267.7731842412 ALEY 90 Claim 2011/jan/04 2023/oct/24 357.9601842413 ALEY 71 Claim 2011/jan/04 2023/oct/24 411.6553842414 ALEY 95 Claim 2011/jan/04 2023/oct/24 447.0163842415 ALEY 24 Claim 2011/jan/04 2023/oct/24 428.1645842416 ALEY 72 Claim 2011/jan/04 2023/oct/24 447.7114842417 ALEY 92 Claim 2011/jan/04 2023/oct/24 447.2668842418 ALEY 25 Claim 2011/jan/04 2023/oct/24 428.2419842419 ALEY 96 Claim 2011/jan/04 2023/oct/24 447.0252842420 ALEY 66 Claim 2011/jan/04 2023/oct/24 394.6048842421 ALEY 93 Claim 2011/jan/04 2023/oct/24 447.2759842422 ALEY 44 Claim 2011/jan/04 2023/oct/24 445.6819842423 ALEY 70 Claim 2011/jan/04 2023/oct/24 394.4778842424 ALEY 43 Claim 2011/jan/04 2023/oct/24 427.9354842425 ALEY 97 Claim 2011/jan/04 2023/oct/24 447.0348842426 ALEY 73 Claim 2011/jan/04 2023/oct/24 447.95 842427 ALEY 45 Claim 2011/jan/04 2023/oct/24 445.544 842428 ALEY 101 Claim 2011/jan/04 2023/oct/24 428.9268842429 ALEY 74 Claim 2011/jan/04 2023/oct/24 358.532 842430 ALEY 94 Claim 2011/jan/04 2023/oct/24 375.7341842431 ALEY 102 Claim 2011/jan/04 2023/oct/24 446.5244842432 ALEY 20 Claim 2011/jan/04 2023/oct/24 338.9496842433 ALEY 98 Claim 2011/jan/04 2023/oct/24 214.5419842434 ALEY 103 Claim 2011/jan/04 2023/oct/24 392.9557842435 ALEY 21 Claim 2011/jan/04 2023/oct/24 338.9373842436 ALEY 104 Claim 2011/jan/04 2023/oct/24 89.3279 842437 ALEY 22 Claim 2011/jan/04 2023/oct/24 446.0539842438 ALEY 105 Claim 2011/jan/04 2023/oct/24 178.5354842439 ALEY 106 Claim 2011/jan/04 2023/oct/24 71.4122 842440 ALEY 23 Claim 2011/jan/04 2023/oct/24 410.2081
Section 4 Property Description and Location 7
Aley Project Technical Report
4.3 NATURE AND EXTENT OF ISSUER’S TITLE
The extent of Aley Corporation’s title to the Aley property is the claims listed in Table 4.1.
There are no title encumbrances, surface rights issues or legal access obligations that must be met in order for Aley Corporation to retain this property. The Aley Property is not subject to any royalty terms, back-in rights, payments or any other agreements or encumbrances.
4.4 PERMITS & ENVIRONMENTAL LIABILITIES
The Aley property is subject to environmental liabilities related to the rehabilitation of drill sites and exploration access roads associated with the work permits received for the 2010, 2011 exploration drilling programs and the road right of way construction undertaken in 2012. Funds to cover the expense of these reclamation activities are held in trust and are fully recoverable by Aley Corporation once the site has been rehabilitated to the satisfaction of the Inspector of Mines. There are no other environmental liabilities to which the property is subject.
At this stage, further exploration work and road right of way construction is being carried out under stipulations assigned through Notices of Work and Reclamation Programs held under Mines Act Permit # MX-13-141. Licenses to cut, and Road use Permits required to carry out all planned work are in place and valid.
Aley Project Technical Report October 2014
SECTION 5: ACCESSIBILITY, CLIMATE, LOCAL RESOURCES, INFRASTRUCTURE AND PHYSIOGRAPHY

Aley Project Technical Report October 2014
Table of Contents
5.0 Accessibility, Climate, Local Resources, Infrastructure and Physiography ............................1
5.1 Accessibility ..........................................................................................................................1
5.2 Local Resources Infrastructure ..............................................................................................3
5.3 Physiography .........................................................................................................................3
5.4 Climate ..................................................................................................................................3
Table of Figures
Figure 5.1: Infrastructure in the Vicinity of Aley ........................................................................... 2
Section 5 Accessibility, Climate, Local Resources, Infrastructure and Physiography 1
Aley Project Technical Report October 2014
5.0 Accessibility, Climate, Local Resources, Infrastructure and Physiography
5.1 ACCESSIBILITY
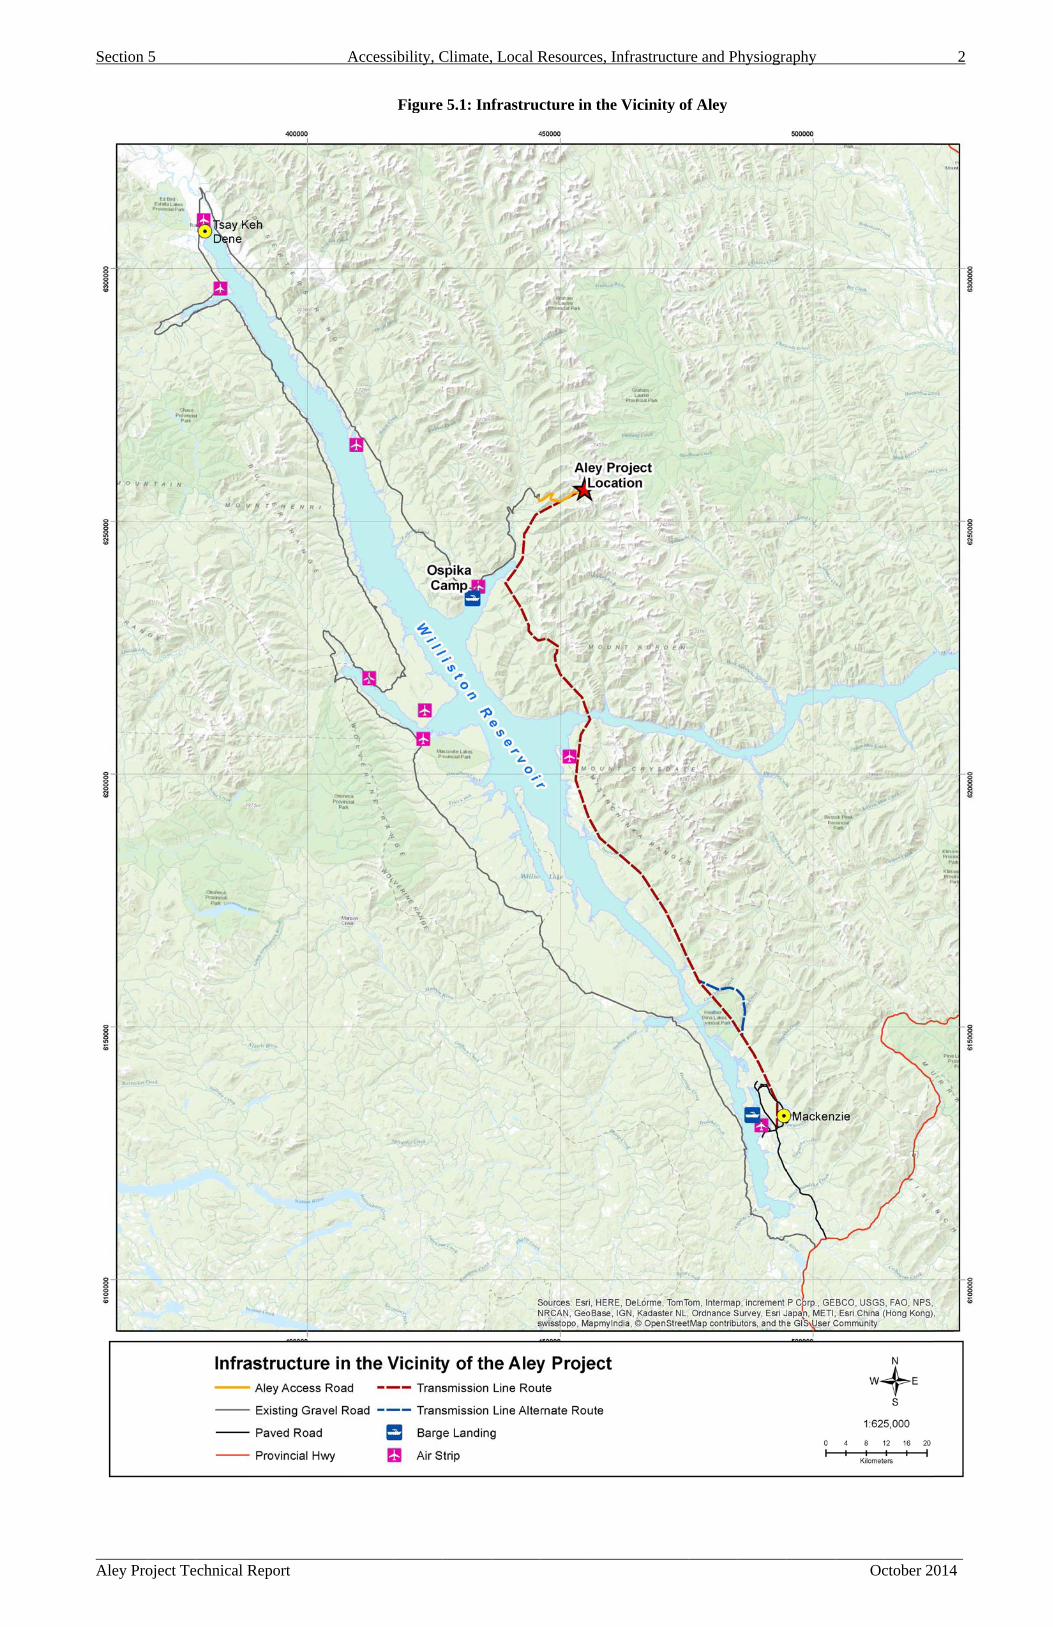
The property lies approximately 20 km northeast of the head of the Ospika Arm of Williston Lake. The access between the community of Mackenzie and the mine site (see Figure 5.1) will comprise a portion of the following;
Site Access Route – The site access route is to be from Mackenzie along approximately 610 km of existing road infrastructure on the west side of Williston Reservoir, returning down the east side to the Ospika arm. This transportation corridor would be used for transporting supplies and equipment to the mine site during all phases of the Project from construction through to closure and product from the mine site during operations. Roughly 570 km of existing Forest Service Roads (FSR) along Williston Reservoir and the Ospika arm are currently the main artery for industrial traffic for the forest sector and can accommodate the traffic proposed by the Project with no significant upgrading. Approximately 40 km of existing access will be upgraded to connect the FSR from Canfor’s Logging Camp near the Ospika landing to the mine site, including 12 km of new trail currently under construction.
Air Access –The majority of personnel will be transported by air from Mackenzie to the existing airstrip at Ospika.
Barge – Barge service is available on Williston Reservoir and will be used as economically appropriate to transport commercial material, supplies and equipment, both to and from the site, to support construction and operational activities. An existing barge landing and access road is present at the Ospika Camp. No additional infrastructure would be required to support barging of materials. Due to fluctuations in water levels in the reservoir and formation of ice during the winter, barging activities would likely be restricted to seasonal use.
S
A
Section
Aley Pro
5
oject Te
chnical
Report
Accessiibility, C
Figure
Climate,
e 5.1: In
, Local R
frastruc
Resourc
cture in
es, Infra
n the Vic
astructur
cinity of
re and P
f Aley
hysiograaphy
Oc
ctober 20
2
014

Section 5 Accessibility, Climate, Local Resources, Infrastructure and Physiography 3
Aley Project Technical Report October 2014
5.2 LOCAL RESOURCES AND INFRASTRUCTURE
The community of Mackenzie currently supplies goods and services to other regional operators such as forestry, pulp and paper and mining.
The W.A.C. Bennett hydroelectric dam is located approximately 120 km east-southeast of the project site at Hudson’s Hope. The Project includes a proposed 138 kV power transmission line in order to supply anticipated electrical power requirements (~30 MW). The proposed regional power connection would begin at the existing infrastructure in the community of Mackenzie. The proposed transmission line route is approximately 150 km long from Mackenzie to the mine site.
Sufficient water is available on the property for this proposed mining operation.
A transfer Station located in Mackenzie could handle product transported from the site to Mackenzie via truck. The rail siding infrastructure and appropriately zoned industrial properties are currently available in Mackenzie. The Canadian National Railway (CN) services rail sidings in Mackenzie and has the ability to move supplies and product throughout North America.
5.3 PHYSIOGRAPHY
The property lies within the Omineca Mining Division in the Northeastern Rocky Mountains. Elevations range from 800 m in the valleys to the west and south of the property to 2,233 m on the ridge above the pit. The landscape primarily comprises steep mountainous terrain with U shaped glacial valleys, with avalanche terrain on some of the steeper slopes. Small seasonal creeks drain from several peaks within the property with flows varying as a function of snow melt, rain, and winter freezing. While boreal forest covers the area below the tree line (~1600m) the central part of the claims lies above the tree line, an area dominated by alpine shrubs and grasses. The highest elevations at the property are commonly covered by sparse grass, broken scree, and outcrop.
5.4 CLIMATE
The northern boreal forest region is subject to a range of weather conditions throughout the year. Summers last from June to late September and are variably dry to wet. Local storms of heavy rainfall or even snow may occur at any time. Fall is short with the rapid onset of snowstorms starting in late September. Snow remains on the ground from October through early June. Based on MSCB climate data, the average annual air temperature is estimated as -2.4 °C, with monthly average temperatures ranging from -15.7°C in January to 10.0°C in July. Total precipitation is estimated as 1200 mm, with minimum monthly averages of 33 mm in April and maximum 153 mm in July. Rainfall constitutes 44% of the total precipitation in a year and occurs between April and October.
.

Aley Project Technical Report October 2014
SECTION 6: HISTORY

Aley Project Technical Report October 2014
Table of Contents
6.0 History......................................................................................................................................1
Section 6 History 1
Aley Project Technical Report October 2014
6.0 History
Cominco Ltd. (“Cominco”) acquired the property after following up on regional base metals anomalies north of the property in 1980. While following the stratigraphy southeast from the anomalies they encountered the carbonatite complex. Samples showed evidence of carbonatite including the presence of pyrochlore. In 1982, Cominco revisited the property to collect additional samples and assess the scale of the carbonatite and in October 1982, the claims Aley 1 through Aley 4 (80 units total) were staked to cover the carbonatite complex. Aley 5 through Aley 7 (32 units) were staked in 1986 and the final claim Aley 8 was added in March 1986 (20 units).
Field work by Cominco commenced in 1983 and continued regularly through the 1986 field season. The work included access trail construction, ground magnetic and scintillometer surveys, geologic mapping, soil and rock chip sampling and drilling of 19 core holes (3,046 m). Preliminary metallurgical work followed in 1983-85 using material from a 5 ton bulk sample. No exploration was completed by Cominco after September 1986. There is no record of why Cominco suspended work on the property.
Following the acquisition of control of the mineral claims by Aley Corporation in 2004, exploration efforts concentrated on trench sampling for metallurgical material and the confirmation of previous geology and drill hole collar locations.
In 2006, some metallurgical test work continued on surface samples blasted from the Saddle and Central Zone trenches. Approximately 1200 kg of material was shipped to Process Research Associates (“PRA”) laboratories in Vancouver for metallurgical work.
In 2007 Taseko acquired the project and completed a program of helicopter supported exploration drilling comprising a total of 1,369 m in 11 holes.
In 2010, an additional exploration program was completed comprising geological mapping and diamond drilling of 23 drill holes for a total of 4,460 m.
In 2011 Taseko completed an additional 70 exploration core holes totaling 17,093 m.
Since 2011, Taseko has been focusing on metallurgical testing of the ore and developing a viable process for producing ferroniobium, (FeNb). Mine planning, infrastructure options, environmental baseline work and water management design work have also been carried out during this period.
The authors are not aware of any historical mineral resource and mineral reserve estimates associated with the property.
There has been no production from this property.
Aley Project Technical Report October 2014
SECTION 7: GEOLOGICAL SETTING AND MINERALIZATION
Aley Project Technical Report October 2014
Table of Contents
7.0 Geological Setting and Mineralization .....................................................................................1
7.1 Regional Geology ..................................................................................................................1
7.2 Local and Property Geology ..................................................................................................3
7.3 Mineralization ........................................................................................................................9
List of Tables
Table 7.1: Lithology and Modifier Codes...................................................................................... 7
Table of Figures
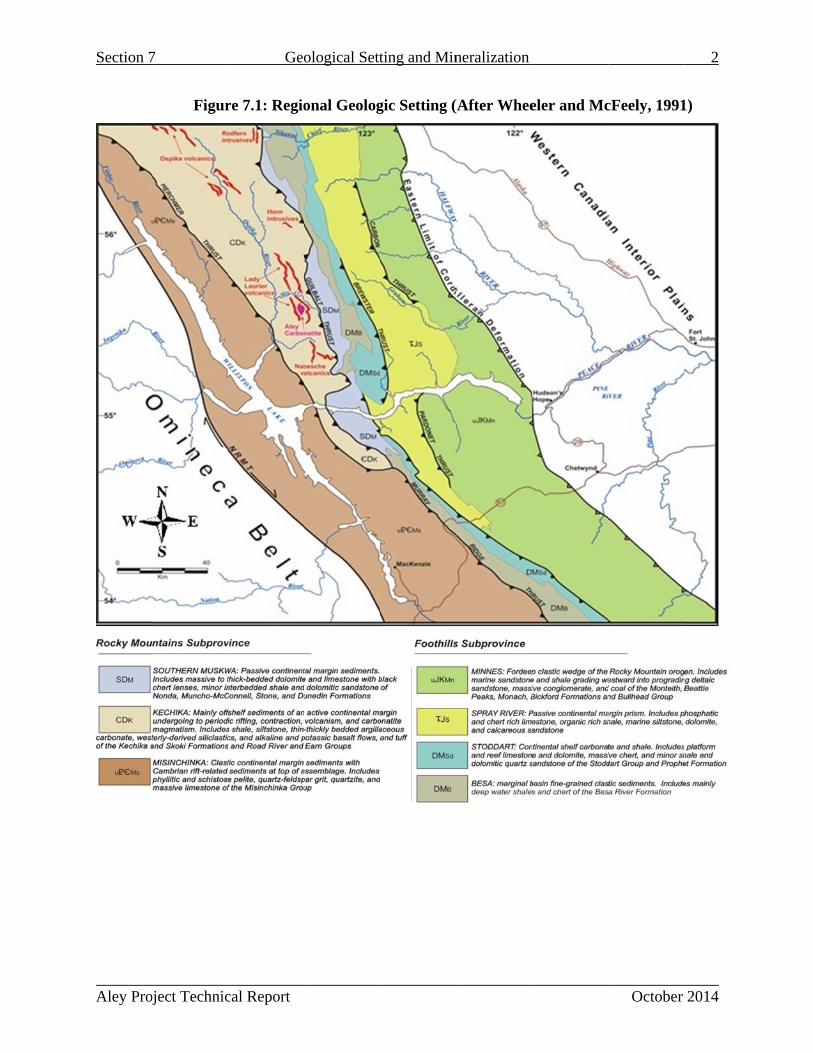
Figure 7.1: Regional Geologic Setting (After Wheeler and McFeely, 1991) ................................. 2
Figure 7.2: Stratigraphic Column (McLeish, 2013)........................................................................ 4
Figure 7.3: Aley Carbonatite Complex and Host Stratigraphy (After McLeish, 2013) ................. 5
Figure 7.4: Cross Section through Carbonatite Complex Looking North (McLeish, 2013) .......... 6
Section 7 Geological Setting and Mineralization 1
Aley Project Technical Report October 2014
7.0 Geological Setting and Mineralization
7.1 REGIONAL GEOLOGY
Reference: McLeish, 2013 – Stratigraphy, Structure, and Geochronology of the Aley Carbonatite Complex.
The Aley region lies within the Western Foreland belt of the Rocky Mountains. It is characterized by Early to Middle Paleozoic deep water carbonates and shales (Figure 7.1). These slope to off-shelf deep water strata defining the paleogeographic Kechika Trough. In the Aley region, the north-south trending, 50 km wide trough is bound to the west by the Northern Rocky Mountain Trench (NRMT), which is host to an Eocene dextral strike-slip fault interpreted to have accommodated >400 km of dextral strike-slip displacement; and to the east by a facies boundary defined by the western limit of shallow water carbonates of the Macdonald Platform. North of 59 degrees N Latitude, the Kechika Trough widens into the Selwyn Basin. The trough terminates immediately south of the Aley region, where the facies boundary marking the east margin of the trough curves around to the west, and is truncated against the NRMT fault. Strata on the western side of the NRMT are: (1) lithologically similar Palezoic continental margin sediments, (2) assigned to the Kechika formation, and (3) form part of the Cassiar terrane, a continental block of uncertain paleogeographic affinity (Pope and Sears, 1997).
The Aley Creek area lies near the eastern limit of Paleozoic volcanism and coarse clastic sedimentation in the Foreland Belt. The Lady Laurier volcanics and westerly derived Earn Group conglomerates, exposed to the immediate north and west of the Aley carbonatite (Figure 7.1), have been cited as evidence for tectonism in the mid-Paleozoic (e.g. Gordey et al., 1987). Synmagmatic contractional deformation structures in continental margin strata that is host to the Aley carbonatite suggest that this activity was (1) at least in part the result of convergence along the parent margin and (2) associated with carbonatite emplacement (McLeish, 2011).
Section 7
Aley Proj
7
oject Technic
Figur
Geo
cal Report
re 7.1: Regio
ological Sett
onal Geolog
ting and Min
gic Setting (
neralization
(After Wheeeler and Mc
October
cFeely, 1991
2
2014
1)
Section 7 Geological Setting and Mineralization 3
Aley Project Technical Report October 2014
7.2 LOCAL AND PROPERTY GEOLOGY
The Aley Carbonatite complex intrudes Cambrian to Ordovician sedimentary rocks of the Kechika (limestone), Skoki (dolomite to volcaniclastics) and Road River Group formations (clastic sedimentary rocks). The stratigraphic column is presented in Figure 7.2. The intrusion is ovoid in plan view with a diameter of approximately 2 km and surrounded by a fenite aureole up to 500 m thick that has previously been mapped as “amphibolite” (Pride, Cominco Ltd. , 1987) and “syenite” (Mäder, 1986). The intrusive contacts are parallel to bedding and lie at a uniform stratigraphic level near the base of the Kechika Formation. Three principal units within the carbonatite have been identified:
1) a volumetrically dominant fersmite- and pyrite-bearing dolomite-apatite carbonatite unit that forms the core of the sill;
2) a magnetite, pyrochlore, phlogopitebearing calcite-apatite carbonatite unit that forms the margins of the sill where it is in contact with the Kechika Formation; and
3) a banded magnetite-apatite unit in the dolomite core
An overview of the property geology is presented in Figure 7.3. McLeish (2013) presents evidence that the entire stratigraphic package in the area is overturned and occupies the lower limb of a recumbent nappe. The carbonatite intruded along the base of the Kechika Formation in the Late Devonian followed by a contractional deformation event. The deformation formed a south-verging nappe cored by carbonatite which was subsequently folded during Rocky Mountain deformation. Cenozoic erosion removed the upper limb of the nappe exposing the carbonatite core. Figure 7.4 depicts this process.
K-Ar cooling ages of 349 ± 12 and 339 ± 12 Ma on phlogopite separated from samples of lamprophyre dykes that intrude and post-date the fenitized contact aureole to the carbonatite, imply an Early Mississippian or earlier age of for the intrusion (Pride et al., 1986). The maximum possible age of the carbonatite is constrained by the Early Devonian age of the Road River Group, the youngest strata intruded by carbonatite dykes. The nearby Ospika diatreme pipe which is believed to be part of the same magmatic event yielded a 206Pb/238U isochron age of 365.9 +/- 2.1 Ma (McLesih, 2013).

Section 7
Aley Proj
7
oject Technic
Geo
cal Report
Figur
ological Sett
re 7.2: Strat
ting and Min
tigraphic C
neralization
olumn (McLLeish, 2013
October
3)
4
2014

Section 7
Aley Proj
Figu
7
oject Technic
re 7.3: Aley
Geo
cal Report
y Carbonati
ological Sett
te Complex
ting and Min
x and Host S
neralization
Stratigraphyy (After Mc
October
cLeish, 2013
5
2014
3)

Section 7
Aley Proj
Figure
Followinexploratiharmonizstandardimodifiedfabric an(also ind7.1. Thecarbonatiusing anmeetingsbetween
7
oject Technic
7.4: Cross
ng a detaileion programzed core-logized compos
d by prefixesnd texture (iicated in lowe various coite would be
n MSAccesss, led by eithcore-shack p
Geo
cal Report
Section thro
d petrograpm, a systemgging and asite nomencs designed tondicated in
wer case). Tdes can be c
e represented-based logg
her the seniopersonnel.
ological Sett
ough Carbo
phic study om of geolog
s a basis foclature basedo capture inflower case)he underlyincombined; fd as “blpCMging system or or project
ting and Min
onatite Com
of the Aleygical codes or geologicad on primaryformation pe) and suffixeng basis for for example,
M”. Such datadeveloped geologist, a
neralization
mplex Looki
y carbonatitewas estab
al interpretaty lithology ertinent to thes formulatethis coding
, banded lama are input diby Hunter
are held to e
ng North (M
e complex lished for tion. This s(represented
he style of med to recordsystem is pr
minated porpirectly by thDickinson I
ensure consis
October
McLeish, 20
during the the purposeystem compd in upper cmineralizatiod structural dresented in Tphyritic cumhe field geoloInc. Regularstency of log
6
2014
013)
2010 es of prises case), on, its detail Table
mulate ogists r site gging
Section 7 Geological Setting and Mineralization 7
Aley Project Technical Report October 2014
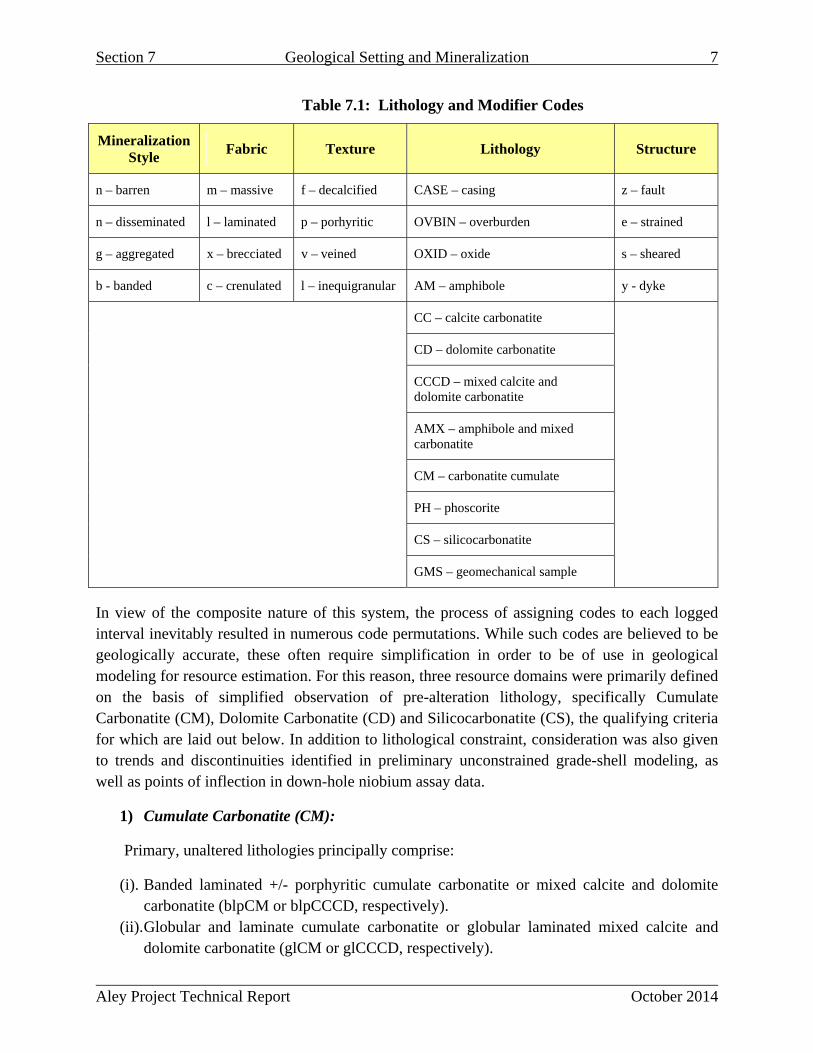
Table 7.1: Lithology and Modifier Codes
Mineralization Style
Fabric Texture Lithology Structure
n – barren m – massive f – decalcified CASE – casing z – fault
n – disseminated l – laminated p – porhyritic OVBIN – overburden e – strained
g – aggregated x – brecciated v – veined OXID – oxide s – sheared
b - banded c – crenulated l – inequigranular AM – amphibole y - dyke
CC – calcite carbonatite
CD – dolomite carbonatite
CCCD – mixed calcite and dolomite carbonatite
AMX – amphibole and mixed carbonatite
CM – carbonatite cumulate
PH – phoscorite
CS – silicocarbonatite
GMS – geomechanical sample
In view of the composite nature of this system, the process of assigning codes to each logged interval inevitably resulted in numerous code permutations. While such codes are believed to be geologically accurate, these often require simplification in order to be of use in geological modeling for resource estimation. For this reason, three resource domains were primarily defined on the basis of simplified observation of pre-alteration lithology, specifically Cumulate Carbonatite (CM), Dolomite Carbonatite (CD) and Silicocarbonatite (CS), the qualifying criteria for which are laid out below. In addition to lithological constraint, consideration was also given to trends and discontinuities identified in preliminary unconstrained grade-shell modeling, as well as points of inflection in down-hole niobium assay data.
1) Cumulate Carbonatite (CM):
Primary, unaltered lithologies principally comprise:
(i). Banded laminated +/- porphyritic cumulate carbonatite or mixed calcite and dolomite carbonatite (blpCM or blpCCCD, respectively).
(ii). Globular and laminate cumulate carbonatite or globular laminated mixed calcite and dolomite carbonatite (glCM or glCCCD, respectively).
Section 7 Geological Setting and Mineralization 8
Aley Project Technical Report October 2014
Secondary, dolomitized lithologies principally comprise:
(iii). Banded laminated +/- porphyritic dolomite carbonatite or banded, massive porphyritic dolomite carbonatite (blpCD or bmpCD, respectively).
2) Dolomite Carbonatite (CD)
(i). Due to the propensity of this domain to exhibit intensely oxidized to calcitized and highly fractured intervals near surface or in the vicinity of faults, these intervals commonly exhibit brecciation, decalcification and faulting, as well as inequigranularity, in association with the principal dolomite carbonatite (CD) identifier. In addition, due to the close textural association of the dolomite carbonatite domain with the cumulate magnetite domain it is common for, disseminated, banded, massive and laminated textures to be associated with the domain. Assay results are generally required to distinguish the dolomite carbonatite domain from the cumulate carbonatite domain and delimit boundaries with greater certainty.
3) Silicocarbonatite (CS)
Primary, unaltered lithologies principally comprise
(i). aggregated, laminated +/- porphyritic silicocarbonatite or aggregated and massive silicocarbonatite or disseminated, massive and porphyritc silicocarbonatite or massive, laminate and porphyritic silicocarbonatite (glpCS or gmCS or dmpCS or mlpCS, respectively).
(ii). aggregated phoscorite (gPH) (iii). banded, laminated +/- porphyritic mixed calcite and dolomite carbonatitie obanded,
massive +/ -porphyritic mixed calcite and dolomite carbonatitie (blpCCCD or bmpCCCD)
(iv). aggregated, laminated and porphyritic cumulate carbonatite or aggregated and massive cumulate carbonatite or banded, laminated and porphyritc cumulate carbonatite (glpCM or gmCM or blpCM)
Secondary, dolomitized lithogies comprise:
(i). +/- disseminated, +/- laminated and porphyritic dolomite carbonatite (dlpCD)
The significant range in lithological codes associated with the silicocarbonatite occurs due to the fact that the domain contains texturally variable lithologies (Table 7.1).
For each of the three geological domains the modifiers for mineralization style, fabric, texture and structure have potential to be associated with fenite, giving rise to AMX intervals and in general would represent the characteristic of the carbonatite in which the fenite was hosted. In such situations, unless the fenite clasts or blocks were encapsulated in clearly-defined intervals
Section 7 Geological Setting and Mineralization 9
Aley Project Technical Report October 2014
with little ambiguity, core-logs and core photos were used to confirm the domain to which it was assigned.
Under circumstances where ambiguity remained as to which domain to which the interval was attributed, core-logs and core photos were consulted, and where appropriate drill core re-examined to establish the nature of the interval. In instances where uncertainty still remained subsequent to drill core examination, assay records were applied in further characterization of the intervals.
7.3 MINERALIZATION
The niobium (Nb) minerals at Aley consist of pyrochlore, fersmite, and columbite. The alteration follows a general sequence whereby pyrochlore, and to a lesser degree, columbite, alter to fersmite. The chemistry of the alteration minerals appears to be inherited from the parent mineral. At Aley, no significant amount of tantalum (Ta) has been noted in the pyrochlore and the alteration minerals also do not contain it. Likewise, the reduction of solid solution capacity in the minerals reduces in the alteration sequence. The iron (Fe) content appears to increase in atomic proportion towards columbite.
The term Pyrochlore applies to a broad group of minerals, one of three subgroups and one mineral in a subgroup of the same name (Hogarth, 1977). The mineral pyrochlore has generic formula: A2-m B2O6(O,OH,F)1-n .pH2O. Subgroups are divided according to B-atoms (Nb, Ta, Ti) and species according to A-atoms (K, Sn, Ba, REE, Pb, Bi, U). Pyrochlore forms euhedral to subhedral octahedral crystals 0.2 to 4-mm in size concentrated in the heavy mineral bands.
Fersmite is a relatively rare Nb oxide mineral found in carbonatites and certain pegmatites. It has been recorded in less than 15 places globally. It has the generic formula AB2(O,OH,F)6 , where A = (Ca, Na, Ce) and B = (Nb, Ti, Fe, Ta). Fe is a potential but not essential element. There appears to be a range of solid solution that may accommodate Ta, but it isn’t an essential element. It forms as fine granular anhedral, subhedral, and rarely euhedral crystals growing within the boundaries of pyrochlore octahedral with lesser amounts of primary fersmite growing as sprays and single crystals in carbonate.
Columbite is an end-member of the columbite-tantalite series with the formula (Fe, Mn)(Nb,Ta)2O6. The Nb-rich member is columbite. Fe is an essential element. Columbite can be ferroan or manganoan, depending on the dominance in the elements in the A-sites. It occurs at Aley only as an alteration of fersmite. Limited data suggests it occurs more persistently, perhaps as a majority Nb-mineral, in the Central Zone in dolomite carbonatite (McLeod, 1986d).
The two largest exploration targets are the Central and Saddle zones (Figure 7.3). The Central Zone occupies the core of the carbonatite complex and has a strike varying from 070° to 120° (predominantly 120) and dips 60° to 70° to the south. It is roughly ovoid in shape and extends some 1400 m E-W, up to 725 m N-S, and over a vertical range of 650 m. Mineralization is

Section 7 Geological Setting and Mineralization 10
Aley Project Technical Report October 2014
associated with bands and swirls of magnetite. The Saddle zone occupies the northern part of the carbonatite complex in proximity to the contact with the amhibolite annulus and has a strike of 070° to 090° dipping at 60° to 70° to the north. Mineralization is associated with alternating bands of pyritic calcite (varying in width from 5cm to 5m) with dolomitic or calcitic carbonatite.
Mineralization in the Saddle Zone does not exhibit the continuity present in the Central Zone and it is not included in the Mineral Resource estimate.

Aley Project Technical Report October 2014
SECTION 8: DEPOSIT TYPE

Aley Project Technical Report October 2014
Table of Contents
8.0 Deposit Type ............................................................................................................................1

Section 8 Deposit Type 1
Aley Project Technical Report October 2014
8.0 Deposit Type
In the Aley deposit, niobium occurs in pyrochlore that formed as early-stage mineral precipitates in primary magma. Alteration of the dolomite carbonatite by unknown factors created the Nb bearing alteration minerals fersmite and columbite. The changes are believed to have occurred largely in situ, and as such there has been less scope for transport or concentration of Nb by secondary processes. The type of deposit is considered to be that of magmatic segregation.
Fluid dynamics in the liquid magma provided the primary influence on Nb distribution. Magmatic carbonate differs from silicate magmas by not exhibiting the polymerisation of the latter and thus remaining more liquid until the initial stages of solidification. Fluid flow within the magma chamber is relatively rapid and turbulent. Mäder (Mäder, 1986g) notes that apatite and pyrochlore precipitated early in the dolomite carbonate magma, and pyrochlore, apatite, magnetite, richterite, and biotite precipitated early in the calcite carbonate magma. These heavier minerals were then lifted by thermal convection currents within the lighter, high carbonate magmas, only to be entrained by and settle within counterflow currents. These currents concentrate the minerals into sub-vertical bands or sheets that have significant vertical and lateral continuity, even though they may be less than several metres wide. The rapid convection means that the heavy minerals will not settle into sub-horizontal layers, as occurs in silicate magmas, such as immiscible sulphides in ultramafic magmas. The bands were blocked during solidus. Some streaming and attenuation likely occurred during emplacement of the Aley carbonatite in its sub-solidus (crystal mush) state. Recent work by McLeish (2013) points to a syn-carbonatite-emplacement deformation event which is interpreted to have played a key role in controlling the primary distribution of niobate mineralization.
Aley Project Technical Report October 2014
SECTION 9: EXPLORATION
Aley Project Technical Report October 2014
Table of Contents
9.0 Exploration ...............................................................................................................................1
9.1 Cominco Ltd. (1982 - 1986) ..................................................................................................1
9.2 Aley Corporation (2004 - 2006) ............................................................................................2
9.3 Taseko Mines Ltd. (2007 - 2010) ..........................................................................................2
9.4 Taseko Mines Ltd. (2011) .....................................................................................................3
9.5 Taseko Mines Ltd. (2012) .....................................................................................................4
9.5.1 Drilling .............................................................................................................................4
9.5.2 Testing Pitting ..................................................................................................................4
9.5.3 Road Construction ............................................................................................................6
9.5.4 Karst Study .......................................................................................................................8
List of Tables
Table 9.1: Summary of Test Pits Completed in the 2012 Program ............................................... 5
Table of Figures
Figure 9.1: 2012 Road Construction Map...................................................................................... 7

Section 9 Exploration 1
Aley Project Technical Report October 2014
9.0 Exploration
9.1 COMINCO LTD. (1982 – 1986)
Cominco Ltd. acquired the property subsequent to an initiative in 1980 that was originally focused on the follow-up of regional base metal anomalies to the north of the current property location. This initial prospecting work had confirmed the occurrence of a Nb-mineralized carbonatite complex prompting the company to stake the first group of claims (Aley 1 to 4) in October, 1982. More detailed field assessments commenced during the 1983 summer season and the periodic ground work continued yearly until 1986. Through the course of the mapping and sampling work, the extent of the carbonatite was traced out further and by 1986, additional claims (Aley 5 to 8) were staked to fully cover the delineated mineralized zones.
Further to the geologic assessments, metallurgical studies were also carried out from 1983 to 1985. No additional exploration work was undertaken in the property from September 1986 until September 2004 when Aley Corporation acquired control of the property from Teck-Cominco.
Work performed by Cominco included:
The construction of a 20km bulldozer access trail from the Ospika barge landing site to the Aley camp (1984), now partially superseded by the recent logging roads and CANFOR’s Ospika Camp.
The development of approximately 28 km of Caterpillar trails to drill sites accessible by means of 4x4 Land Cruiser from a small camp located near the centre of the carbonatite intrusion.
The preparation of orthophotographic base maps (1983).
Magnetometer surveys at both reconnaissance and detailed local grid scale (17 line-kilometers); reconnaissance scintillometer surveys.
Geological mapping at a scale of 1:5,000 over claims Aley 1-7, and at a 1:500 scale in the case of exploration trenching.
Soil sampling on contour lines and along road banks.
Rock chip sampling of outcrops, talus, road cuts with outcrop/sub-crop, and all trenches (5-m contiguous samples).
Diamond drilling in two campaigns totaling 3,062m over 20 holes in two areas of interest, namely the Saddle and Central Zones. NQ core was drilled in 1985 and BQ in 1986. All cores were stored on site and sample preparation work was undertaken in the field. Further details on historical drilling activities at the property are presented in Section 10 of this report.
An environmental baseline study was initiated during the 1985 and 1986 field seasons by Norelco.
Metallurgical testing using gravity separation on a 4 ton bulk sample in 1983 and 1984.
Section 9 Exploration 2
Aley Project Technical Report October 2014
Mineralogical studies conducted on samples throughout the programs.
9.2 ALEY CORPORATION (2004 – 2006)
Following the acquisition of control of the mineral claims by Aley Corporation in 2004, exploration efforts concentrated on trench sampling for metallurgical test materials, confirmation of locations of the previously drilled holes and review of the property’s geology. Trenches were excavated by means of drilling and blasting in the vicinity of the old Cominco trenches cut in 1985 and 1986. The purpose of these trenches was twofold, to acquire materials suitable for metallurgical testwork and to confirm the assay results from Cominco’s samples during the 1980’s.
Samples were collected from trenches in the Central Zone near the location of CZ-85-6, CZ-85-6A and CZ-85-8, and in the Saddle Zone at SZ-84-4. A total of 912 kg of samples for assaying and metallurgical test purposes were collected from the trenches. During the same period, all the major mineralized zones identified by Cominco in their previous work were visited and old drill sites were located using GPS. The GPS-based ground checks were carried out to validate the previous mapping and survey work which utilized conventional compass mapping procedures. In this manner, identification of possible systematic errors from Cominco’s previous work was effectively carried out. Aley Corporation eventually reported a “reasonable positive correlation” between its own survey work and that of Cominco’s.
In 2006, compilation and geological review of previous drilling and trenching data were completed. The objective of this exercise was to evaluate mineralization at the Property and to plan for the 2006 field program. Due to a variety of considerations, no such program was executed. Aley Corporation conducted further metallurgical test work in 2006, at which time approximately 1,200 kg of material collected from the same trenches as previously sampled in the Saddle and Central Zones was submitted to PRA in Vancouver.
9.3 TASEKO MINES LTD. (2007 - 2010)
Taseko acquired the Property in 2007 and in the same year implemented a helicopter-supported drilling program comprising 11 holes with an aggregate down-hole depth of 1369 m at NQ2 and BTW diameter. This program was aimed at confirming the findings of the 1985-1986 Cominco programs in the Saddle Zone, and to provide a basis for the establishment of a better understanding of the geology and geometry of the deposit.
A total of 388 drill core samples, in addition to 22 duplicate, 11 blank and 23 standard reference samples were consigned for assay. Assay samples were collected according to geological intervals or sub-intervals thereof, at an average length of approximately 3 m. Competent 30 cm core sections were also collected every 8-10 m interval for water immersion specific gravity measurements.

Section 9 Exploration 3
Aley Project Technical Report October 2014
In 2009, and independently of Taseko, a five-week academically-oriented mapping campaign was conducted on the Aley property by Duncan F. McLeish and Dr. Stephen T. Johnston of the University of Victoria, and Mitch G. Mihalynuk of the MEMPR. The work at the Property formed part of a greater program aimed at gaining a better understanding of the tectonic and structural controls upon, as well as of the timing of emplacement of the carbonatites in the Canadian Cordillera. At the request of Taseko, Duncan McLeish returned to the site in 2010 to conduct a 2-week follow-up mapping exercise with the objective of gaining an improved understanding of the structural characteristics of the carbonatite. On this occasion, he was joined by Anton Chakhmouradian and Ryan Kressal of the University of Manitoba who provided expertise in the geochemical mineralogical and petrographic characterization of the deposit as a basis for drill target definition.
A total of 88 outcrop and drill core samples from the 2007 drilling campaign were submitted for whole-rock analysis in an orientation geochemical characterization exercise.
In 2010, Taseko implemented a diamond drilling program in the Central Zone which comprised 23 holes (2010-012 to 2010-034) and with an aggregate down hole depth of 4,460m. The holes also served to confirm the 1985-1986 exploration findings of Cominco. Aside from collecting more geological information to better understand the nature of the deposit, the completed drilling program also aimed at collecting more mineralized materials to be used for additional metallurgical test work.
A total of 1,312 NQ-size drill core split samples (in addition to 75 duplicate, 75 standard reference and 25 blank samples) were sent to the laboratory for chemical analysis. The samples were assayed for Nb, Ta, U, Th and REE’s as well as for the standard multi-element suite, by Inspectorate Laboratories of Richmond, BC.
9.4 TASEKO MINES LTD. (2011)
Taseko completed a helicopter-supported drilling program comprising 65 exploration holes (2011-035 through 2011-099), 3 geo-mechanical holes (2011-GM11-01 through GM11-03) and 2 geotechnical holes (GTF-4 and GTF-5) with an aggregate downhole depth of 17,136 m during the field season in 2011. Most of the holes were drilled within the Central Zone area with the primary objective of better defining the continuity and extent of mineralization, and acquire more detailed sub-surface geological and structural information. Aside from obtaining geotechnical information for the potential mine infrastructure locations, GTF-4 and GTF-5 also served to define the extent of the carbonatite to the south of the Central Zone. The data gathered in 2011 subsequently served as basis for geological constraint of resource estimation as well for initial pit design studies.
While basic geotechnical logging of drill core was routinely performed by Taseko personnel for all the exploration drill core, Knight Piesold conducted the geotechnical logging of core from the
Section 9 Exploration 4
Aley Project Technical Report October 2014
geo-mechanical holes. Detailed geological logging of all drill core was undertaken by Taseko personnel for all the holes completed during the year.
A 3D geological solid model of the Central Zone based on all of the 2010 and 2011 drilling data was completed in 2011. The model was based on the establishment of a simplified 3-lithofacies classification (Section 7.2) derived from consideration of down hole geology and assay results and has been used to constrain mineralization at the property. Although mineralization appears to taper off along the northern and western margins of the deposit, its eastern and southern extents remain open, beyond which the potential for further mineralization should be tested.
Taseko released a NI43-101-compliant technical report authored by Ronald G. Simpson of GeoSim Services Inc for the Aley Niobium property in March 2012. In this report, a resource estimate based on drilling data collected up to 2011 was presented.
9.5 TASEKO MINES LTD. (2012)
In 2012, exploration at the property comprised drilling, test pitting, road construction and studies on potential karst conditions. All field work was conducted between June 24 and October 11, 2012.
9.5.1 DRILLING
A total of 23 holes with an aggregate down-hole depth of 2,607 m were completed in 2012. Most drilling was performed in support of engineering studies on proposed mine infrastructure sites and primarily comprised geotechnical, geo-mechanical and water monitoring holes. 2 exploration holes situated approximately 600m SE of the deposit area were drilled during the course of the season and served the purpose of condemnation between the main deposit area and the proposed mine infrastructure sites. All drilling works were conducted via helicopter support.
9.5.2 TEST PITTING
15 test pits with an aggregate depth of 25 m were excavated during the 2012 field season, all of which were completed using a helicopter-portable mini-excavator. The pits were excavated to a depth of approximately 2 m and the information obtained was useful in initial characterization work. A summary of test pits is presented in Table 9.1.
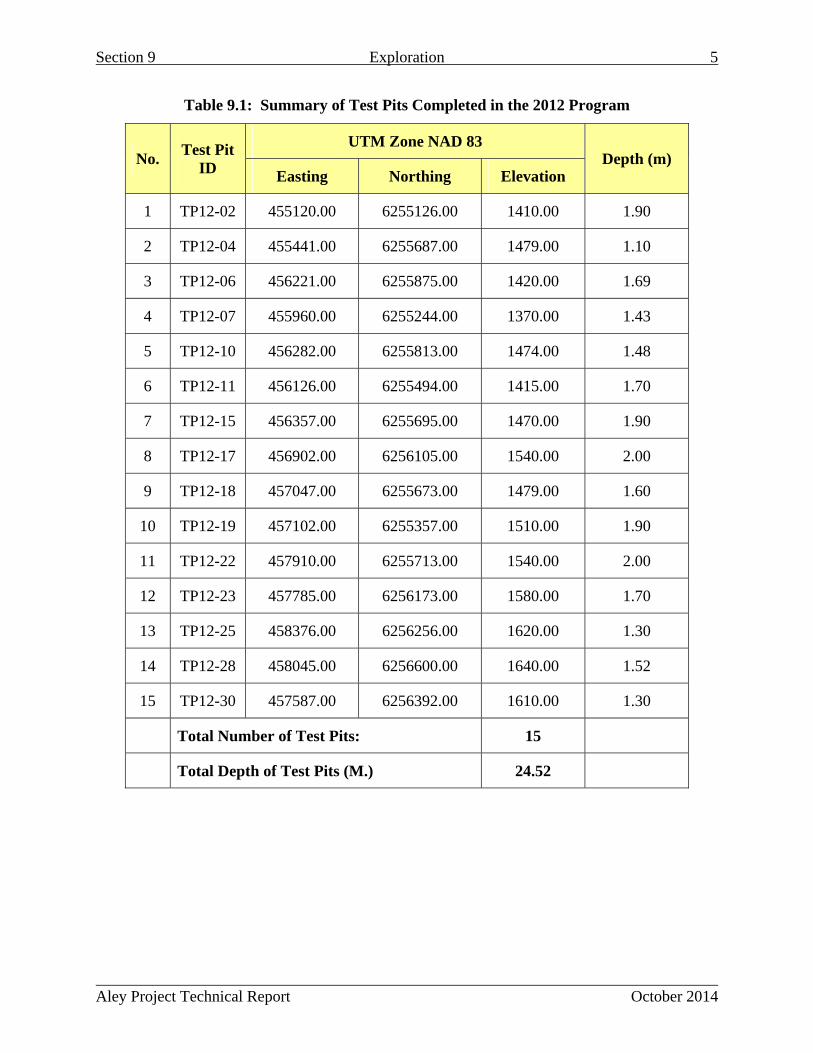
Section 9 Exploration 5
Aley Project Technical Report October 2014
Table 9.1: Summary of Test Pits Completed in the 2012 Program
No. Test Pit
ID
UTM Zone NAD 83 Depth (m)
Easting Northing Elevation
1 TP12-02 455120.00 6255126.00 1410.00 1.90
2 TP12-04 455441.00 6255687.00 1479.00 1.10
3 TP12-06 456221.00 6255875.00 1420.00 1.69
4 TP12-07 455960.00 6255244.00 1370.00 1.43
5 TP12-10 456282.00 6255813.00 1474.00 1.48
6 TP12-11 456126.00 6255494.00 1415.00 1.70
7 TP12-15 456357.00 6255695.00 1470.00 1.90
8 TP12-17 456902.00 6256105.00 1540.00 2.00
9 TP12-18 457047.00 6255673.00 1479.00 1.60
10 TP12-19 457102.00 6255357.00 1510.00 1.90
11 TP12-22 457910.00 6255713.00 1540.00 2.00
12 TP12-23 457785.00 6256173.00 1580.00 1.70
13 TP12-25 458376.00 6256256.00 1620.00 1.30
14 TP12-28 458045.00 6256600.00 1640.00 1.52
15 TP12-30 457587.00 6256392.00 1610.00 1.30
Total Number of Test Pits: 15
Total Depth of Test Pits (M.) 24.52
Section 9 Exploration 6
Aley Project Technical Report October 2014
9.5.3 ROAD CONSTRUCTION
Construction of the exploration access road linking the existing logging road network and the Aley deposit area commenced on August 1, 2012 and continued until October 7, 2012, timber clearance having occurred along the full 30 m wide right-of-way during the spring of the same year.
Construction activities principally comprised dozing, stripping, grubbing and grading, gravel surfacing work making use of materials sourced from an old Canfor quarry along the 4000 Road, and the installation of a temporary 30 ft work bridge across one of the major creeks (Figure 9.1). By the end of the season, the road had been completed to 5.6 km, approximately half-way to the end of the right-of-way.

Section 9
Aley Proj
9
oject Techniccal Report
Figure
Ex
e 9.1: 2012
xploration
Road Consstruction Map
October
7
2014

Section 9 Exploration 8
Aley Project Technical Report October 2014
9.5.4 KARST STUDY
The inherent carbonate-rich nature of the host rocks of the Nb deposit and the somewhat calcareous nature of formations underlying portions of the proposed mine infrastructure sites were considered from the perspective of their potential for karst formation. Recognizing the hydrological significance of such potential, Taseko initiated a karst evaluation study at the property in 2012. This study, which involved literature research, review of all relevant field data, field mapping and drill core examination was performed in September 2012. All data thus gathered from these were correlated with information derived from the geotechnical drilling program. Currently, no significant karst formations have been identified, however the potential for these formations have been taken into account and their possible locations have been avoided when designing the position of infrastructure on the property.

Aley Project Technical Report October 2014
SECTION 10: DRILLING

Aley Project Technical Report October 2014
Table of Contents
10.0 Drilling ...................................................................................................................................1
10.1 Historical Drilling (1985-1986) ...........................................................................................1
10.2 2007 Drilling .......................................................................................................................2
10.3 2010 Drilling .......................................................................................................................5
10.4 2011 Drilling .......................................................................................................................7
10.5 2012 Drilling .....................................................................................................................11
List of Tables
Table 10.1: Drill Hole Summary .................................................................................................... 2
Table 10.2: 2007 Drill Hole Summary ........................................................................................... 5
Table 10.3: 2010 Drill Hole Summary ........................................................................................... 6
Table 10.4: 2011 Drill Hole Summary ........................................................................................... 9
Table 10.5: 2012 Drill Hole Summary ......................................................................................... 14
Table of Figures
Figure 10.1: Location Map of Taseko Drill Holes .......................................................................... 4
Section 10 Drilling 1
Aley Project Technical Report October 2014
10.0 Drilling
10.1 HISTORICAL DRILLING (1985-1986)
During initial drill-testing, ten diamond drill holes (A85-01 to A85-10) with an aggregate depth of 1,581 m were completed. In the following year, a further ten diamond drill holes (A86-11 to A86-20) with an aggregate down-hole depth of 1,481 m were drilled.
Such holes were drilled at a variety of orientations, with azimuths ranging from 20° to 345° and dips ranging from -45° to -65°. Although no down-hole surveys were conducted in 1985, all of the holes drilled during the 1986 program were surveyed. Assessment reports do not however indicate the down-hole survey method employed at that time. Drilling at this time was undertaken over the Central and Saddle Zones, and comprised a combination of NQ (47.6mm) and BQ (36.4mm) diameter coring. While core recovery data were not retrieved, the assessment reports indicate an average recovery percentage of over 85%. All drill cores were logged and, split and crushed on site. A total of 1,031 core samples with a median length of 3 m per sample were collected.
The 1985-1986 drill hole summary is shown in Table 10.1.
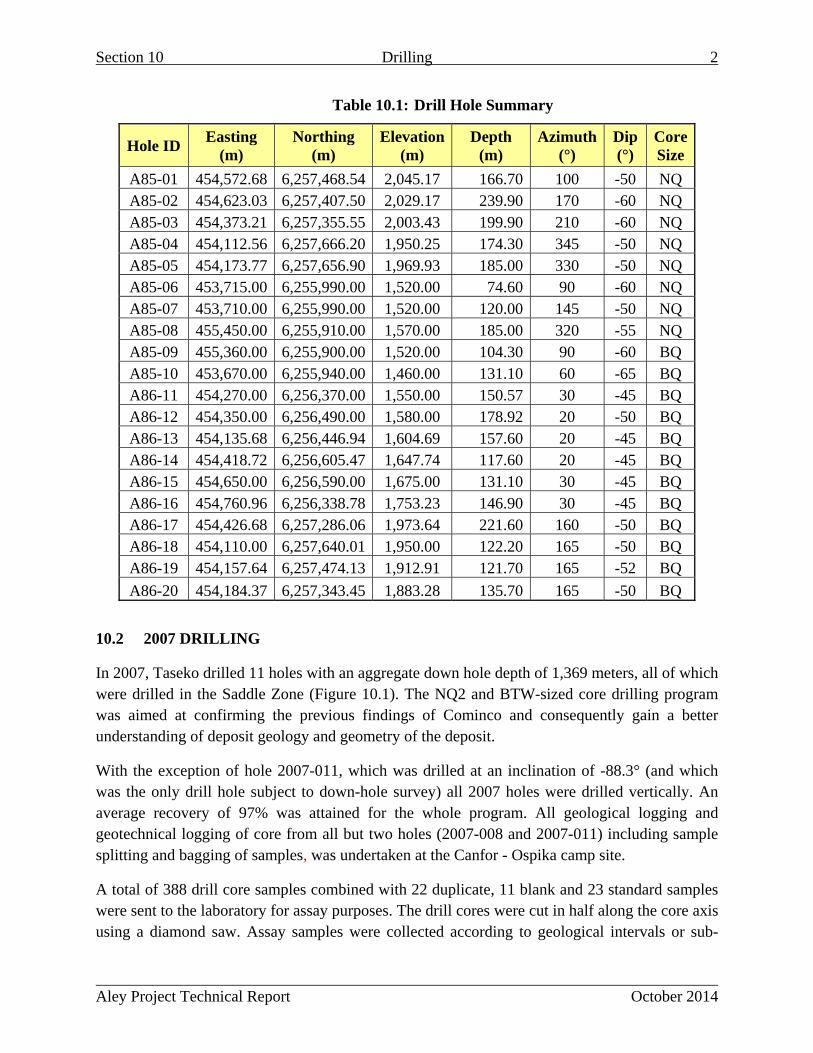
Section 10 Drilling 2
Aley Project Technical Report October 2014
Table 10.1: Drill Hole Summary
Hole ID Easting
(m) Northing
(m) Elevation
(m) Depth
(m) Azimuth
(°) Dip (°)
Core Size
A85-01 454,572.68 6,257,468.54 2,045.17 166.70 100 -50 NQ A85-02 454,623.03 6,257,407.50 2,029.17 239.90 170 -60 NQ A85-03 454,373.21 6,257,355.55 2,003.43 199.90 210 -60 NQ A85-04 454,112.56 6,257,666.20 1,950.25 174.30 345 -50 NQ A85-05 454,173.77 6,257,656.90 1,969.93 185.00 330 -50 NQ A85-06 453,715.00 6,255,990.00 1,520.00 74.60 90 -60 NQ A85-07 453,710.00 6,255,990.00 1,520.00 120.00 145 -50 NQ A85-08 455,450.00 6,255,910.00 1,570.00 185.00 320 -55 NQ A85-09 455,360.00 6,255,900.00 1,520.00 104.30 90 -60 BQ A85-10 453,670.00 6,255,940.00 1,460.00 131.10 60 -65 BQ A86-11 454,270.00 6,256,370.00 1,550.00 150.57 30 -45 BQ A86-12 454,350.00 6,256,490.00 1,580.00 178.92 20 -50 BQ A86-13 454,135.68 6,256,446.94 1,604.69 157.60 20 -45 BQ A86-14 454,418.72 6,256,605.47 1,647.74 117.60 20 -45 BQ A86-15 454,650.00 6,256,590.00 1,675.00 131.10 30 -45 BQ A86-16 454,760.96 6,256,338.78 1,753.23 146.90 30 -45 BQ A86-17 454,426.68 6,257,286.06 1,973.64 221.60 160 -50 BQ A86-18 454,110.00 6,257,640.01 1,950.00 122.20 165 -50 BQ A86-19 454,157.64 6,257,474.13 1,912.91 121.70 165 -52 BQ
A86-20 454,184.37 6,257,343.45 1,883.28 135.70 165 -50 BQ
10.2 2007 DRILLING
In 2007, Taseko drilled 11 holes with an aggregate down hole depth of 1,369 meters, all of which were drilled in the Saddle Zone (Figure 10.1). The NQ2 and BTW-sized core drilling program was aimed at confirming the previous findings of Cominco and consequently gain a better understanding of deposit geology and geometry of the deposit.
With the exception of hole 2007-011, which was drilled at an inclination of -88.3° (and which was the only drill hole subject to down-hole survey) all 2007 holes were drilled vertically. An average recovery of 97% was attained for the whole program. All geological logging and geotechnical logging of core from all but two holes (2007-008 and 2007-011) including sample splitting and bagging of samples, was undertaken at the Canfor - Ospika camp site.
A total of 388 drill core samples combined with 22 duplicate, 11 blank and 23 standard samples were sent to the laboratory for assay purposes. The drill cores were cut in half along the core axis using a diamond saw. Assay samples were collected according to geological intervals or sub-

Section 10 Drilling 3
Aley Project Technical Report October 2014
intervals thereof, averaging approximately 3 m sampling lengths. The standard reference samples are of 2 types, a low grade Aley carbonatite and a Canmet standard (OKA-1). In addition, competent 30 cm core sections were also collected every 8-10 m interval for wax immersion specific gravity measurements.
All drill core samples from the Ospika site were shipped to PRA Laboratories in Vancouver, BC for preparation and thence to the International Plasma Labs Ltd. (IPL) in Richmond, BC for chemical analysis. Analyses for Nb, Ta, U, and Th were performed in addition to the standard multi-element analysis. Duplicates for quality control were forwarded to Global Discovery Labs (Teck Cominco) for XRF analysis. The remaining sawn core splits were placed in core boxes and initially kept in a secure storage at the Ospika Camp. Core from the 2007 drilling program is presently in storage at Taseko-operated premises in Mackenzie, BC.
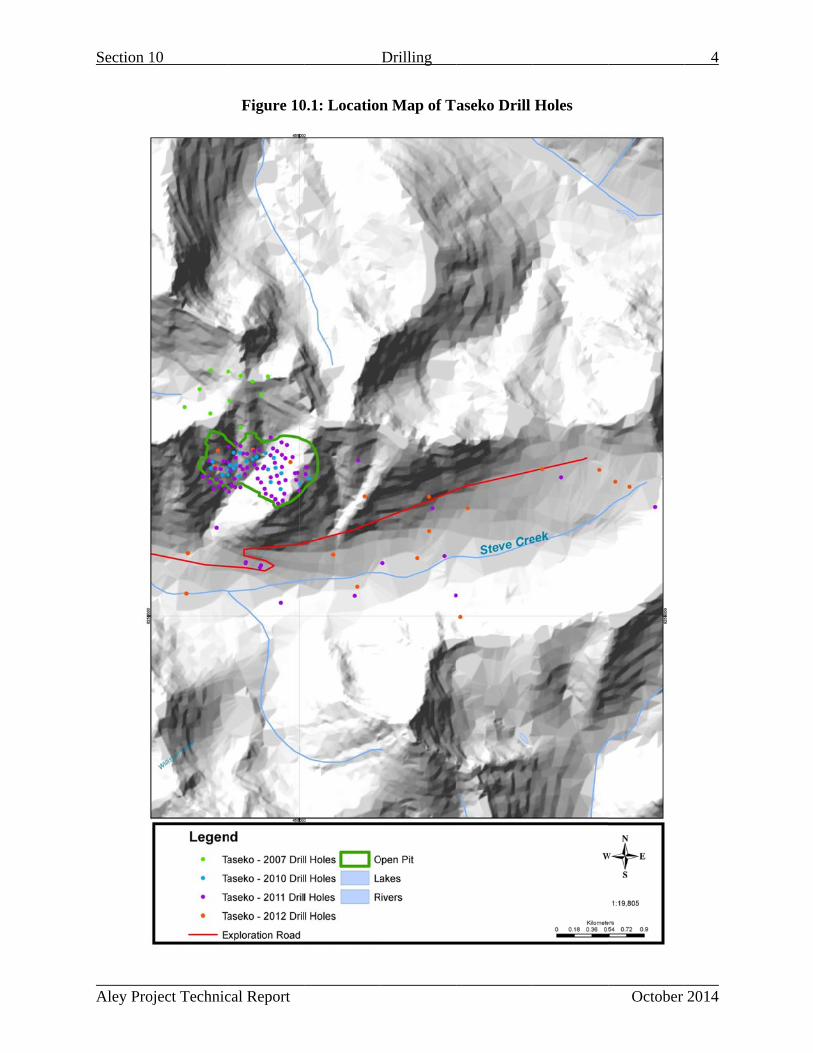
Section 1
Aley Proj
10
oject Techniccal Report
Figure 100.1: Location
Drilling
n Map of Taseko Drill Holes
October
4
2014

Section 10 Drilling 5
Aley Project Technical Report October 2014
The 2007 drill holes are summarized in Table 10.2 below.
Table 10.2: 2007 Drill Hole Summary
Hole ID Easting
(m) Northing
(m) Elevation
(m) Depth
(m) Azimuth
(°) Dip (°)
Core Size
2007-001 453,978.32 6,257,327.21 1,784.08 152.40 0 -90 NQ 2007-002 453,825.24 6,257,142.92 1,784.90 152.40 0 -90 NQ 2007-003 454,284.57 6,257,208.81 1,922.17 97.30 0 -90 BTW2007-004 454,088.19 6,257,078.25 1,870.00 86.86 0 -90 NQ 2007-005 454,608.87 6,257,272.65 1,956.81 115.90 0 -90 BTW2007-006 454,093.63 6,257,520.72 1,905.27 152.40 0 -90 NQ 2007-007 454,271.86 6,257,511.31 1,981.84 134.12 0 -90 NQ 2007-008 454,403.93 6,256,938.10 1,798.42 127.41 0 -90 BTW2007-009 454,522.17 6,257,406.25 2,028.86 118.56 0 -90 BTW2007-010 454,403.00 6,257,465.00 2,065.00 79.25 0 -90 NQ
2007-011 454,680.09 6,257,458.89 2,063.87 152.40 20 -90 BTW 10.3 2010 DRILLING
Taseko’s 2010 drilling program comprised 23 NQ-diameter diamond drill holes (2010-012 to 2010-034) with an aggregate down hole depth of 4,516 m (Table 10.3). All such holes were drilled in the Central Zone (Figure 10.1) and were inclined and oriented to the northeast; core from all but four holes (2010-031 to 2010-034) was logged geotechnically.
Aside from confirming the results of Cominco’s 1985-1986 program, the objective of the 2010 program was to gather more geological information as a basis for building a better understanding of the Aley deposit, and for the collection of mineralized material for metallurgical test work.
As in 2007, Taseko’s drilling activities in 2010 were all helicopter-supported. All drill core was transported by helicopter from the drill sites to the nearby Ospika Camp where geotechnical and geological logging were undertaken. Geotechnical data were collected from all core drilled except for that from 2010-031, 2010-032, 2010-033 and 2010-034. Measurements were taken from 1,178 drill runs with each run having a median length of 3.2 meters. Overall, an average drill core recovery of 97% was achieved.
After logging, samples were collected by sawing the core in half along its axis. Drill cores from the first six holes were sawn at the Ospika camp and those from the remaining 17 drill holes were sawn at the Gibraltar Mine. All such sampling procedures were completed under the supervision of Taseko personnel.
The sawn, bagged and tagged samples were trucked from the Gibraltar Mine by commercial carrier to Inspectorate Exploration & Mining Services Ltd. in Richmond, BC for preparation and
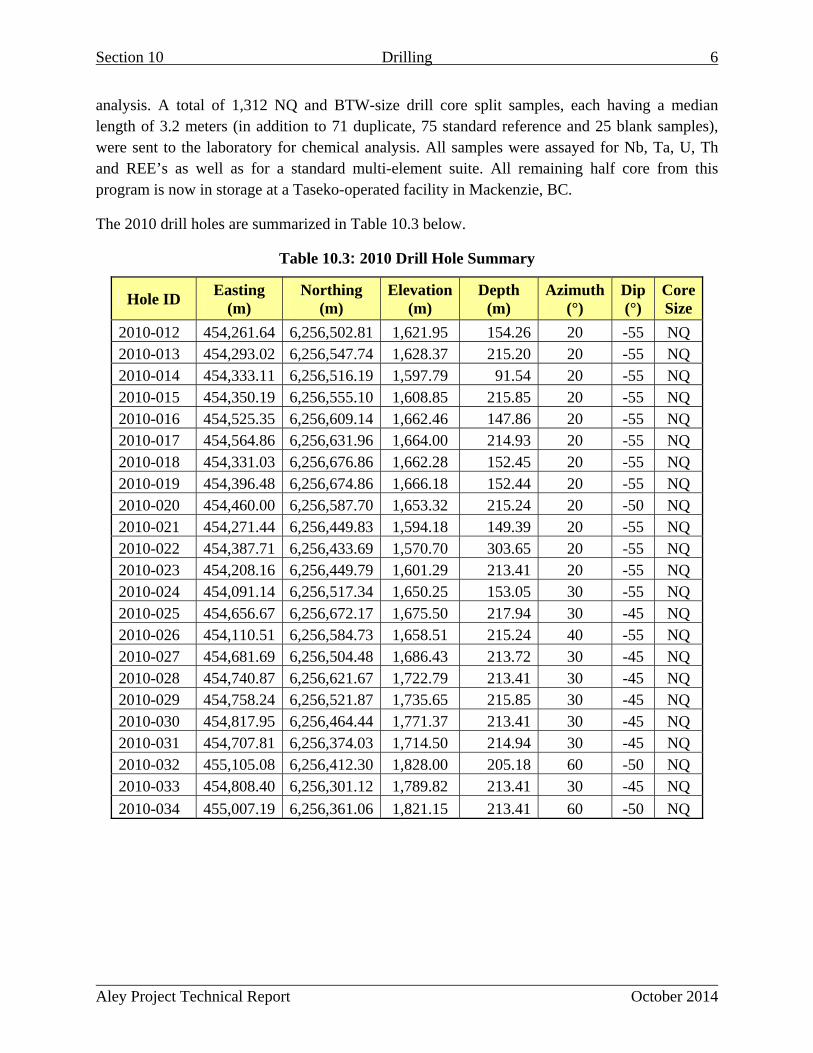
Section 10 Drilling 6
Aley Project Technical Report October 2014
analysis. A total of 1,312 NQ and BTW-size drill core split samples, each having a median length of 3.2 meters (in addition to 71 duplicate, 75 standard reference and 25 blank samples), were sent to the laboratory for chemical analysis. All samples were assayed for Nb, Ta, U, Th and REE’s as well as for a standard multi-element suite. All remaining half core from this program is now in storage at a Taseko-operated facility in Mackenzie, BC.
The 2010 drill holes are summarized in Table 10.3 below.
Table 10.3: 2010 Drill Hole Summary
Hole ID Easting
(m) Northing
(m) Elevation
(m) Depth
(m) Azimuth
(°) Dip (°)
Core Size
2010-012 454,261.64 6,256,502.81 1,621.95 154.26 20 -55 NQ 2010-013 454,293.02 6,256,547.74 1,628.37 215.20 20 -55 NQ 2010-014 454,333.11 6,256,516.19 1,597.79 91.54 20 -55 NQ 2010-015 454,350.19 6,256,555.10 1,608.85 215.85 20 -55 NQ 2010-016 454,525.35 6,256,609.14 1,662.46 147.86 20 -55 NQ 2010-017 454,564.86 6,256,631.96 1,664.00 214.93 20 -55 NQ 2010-018 454,331.03 6,256,676.86 1,662.28 152.45 20 -55 NQ 2010-019 454,396.48 6,256,674.86 1,666.18 152.44 20 -55 NQ 2010-020 454,460.00 6,256,587.70 1,653.32 215.24 20 -50 NQ 2010-021 454,271.44 6,256,449.83 1,594.18 149.39 20 -55 NQ 2010-022 454,387.71 6,256,433.69 1,570.70 303.65 20 -55 NQ 2010-023 454,208.16 6,256,449.79 1,601.29 213.41 20 -55 NQ 2010-024 454,091.14 6,256,517.34 1,650.25 153.05 30 -55 NQ 2010-025 454,656.67 6,256,672.17 1,675.50 217.94 30 -45 NQ 2010-026 454,110.51 6,256,584.73 1,658.51 215.24 40 -55 NQ 2010-027 454,681.69 6,256,504.48 1,686.43 213.72 30 -45 NQ 2010-028 454,740.87 6,256,621.67 1,722.79 213.41 30 -45 NQ 2010-029 454,758.24 6,256,521.87 1,735.65 215.85 30 -45 NQ 2010-030 454,817.95 6,256,464.44 1,771.37 213.41 30 -45 NQ 2010-031 454,707.81 6,256,374.03 1,714.50 214.94 30 -45 NQ 2010-032 455,105.08 6,256,412.30 1,828.00 205.18 60 -50 NQ 2010-033 454,808.40 6,256,301.12 1,789.82 213.41 30 -45 NQ
2010-034 455,007.19 6,256,361.06 1,821.15 213.41 60 -50 NQ
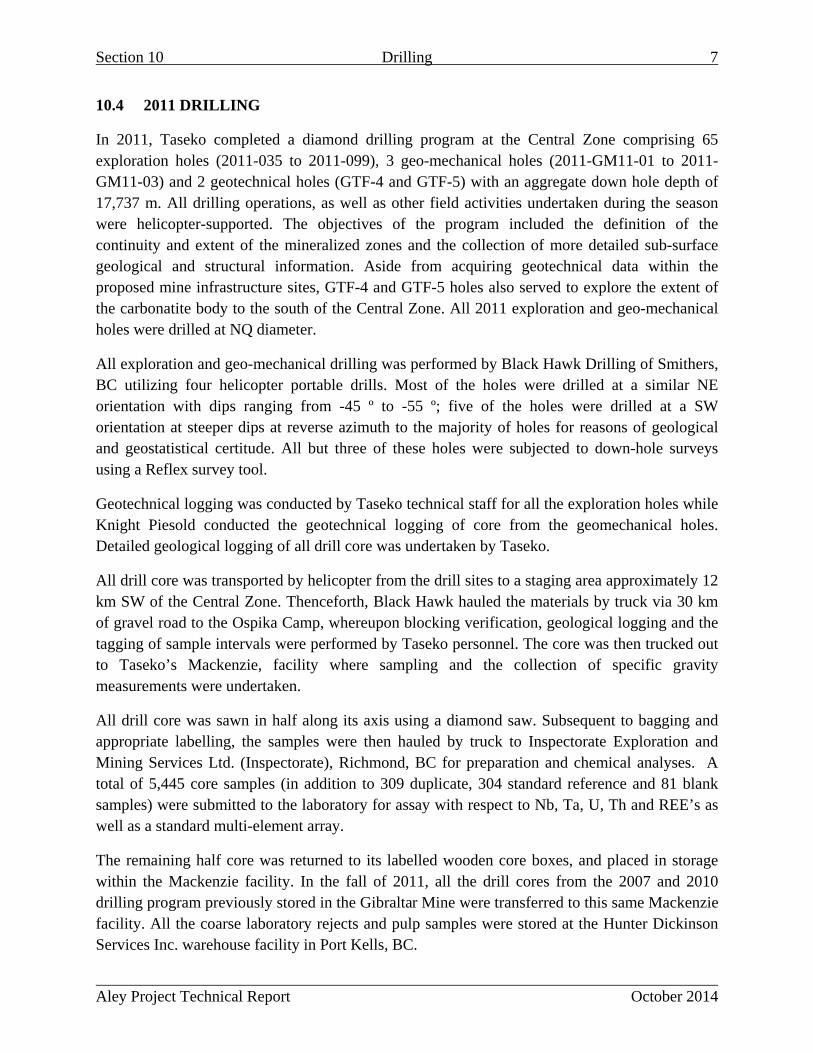
Section 10 Drilling 7
Aley Project Technical Report October 2014
10.4 2011 DRILLING
In 2011, Taseko completed a diamond drilling program at the Central Zone comprising 65 exploration holes (2011-035 to 2011-099), 3 geo-mechanical holes (2011-GM11-01 to 2011-GM11-03) and 2 geotechnical holes (GTF-4 and GTF-5) with an aggregate down hole depth of 17,737 m. All drilling operations, as well as other field activities undertaken during the season were helicopter-supported. The objectives of the program included the definition of the continuity and extent of the mineralized zones and the collection of more detailed sub-surface geological and structural information. Aside from acquiring geotechnical data within the proposed mine infrastructure sites, GTF-4 and GTF-5 holes also served to explore the extent of the carbonatite body to the south of the Central Zone. All 2011 exploration and geo-mechanical holes were drilled at NQ diameter.
All exploration and geo-mechanical drilling was performed by Black Hawk Drilling of Smithers, BC utilizing four helicopter portable drills. Most of the holes were drilled at a similar NE orientation with dips ranging from -45 º to -55 º; five of the holes were drilled at a SW orientation at steeper dips at reverse azimuth to the majority of holes for reasons of geological and geostatistical certitude. All but three of these holes were subjected to down-hole surveys using a Reflex survey tool.
Geotechnical logging was conducted by Taseko technical staff for all the exploration holes while Knight Piesold conducted the geotechnical logging of core from the geomechanical holes. Detailed geological logging of all drill core was undertaken by Taseko.
All drill core was transported by helicopter from the drill sites to a staging area approximately 12 km SW of the Central Zone. Thenceforth, Black Hawk hauled the materials by truck via 30 km of gravel road to the Ospika Camp, whereupon blocking verification, geological logging and the tagging of sample intervals were performed by Taseko personnel. The core was then trucked out to Taseko’s Mackenzie, facility where sampling and the collection of specific gravity measurements were undertaken.
All drill core was sawn in half along its axis using a diamond saw. Subsequent to bagging and appropriate labelling, the samples were then hauled by truck to Inspectorate Exploration and Mining Services Ltd. (Inspectorate), Richmond, BC for preparation and chemical analyses. A total of 5,445 core samples (in addition to 309 duplicate, 304 standard reference and 81 blank samples) were submitted to the laboratory for assay with respect to Nb, Ta, U, Th and REE’s as well as a standard multi-element array.
The remaining half core was returned to its labelled wooden core boxes, and placed in storage within the Mackenzie facility. In the fall of 2011, all the drill cores from the 2007 and 2010 drilling program previously stored in the Gibraltar Mine were transferred to this same Mackenzie facility. All the coarse laboratory rejects and pulp samples were stored at the Hunter Dickinson Services Inc. warehouse facility in Port Kells, BC.

Section 10 Drilling 8
Aley Project Technical Report October 2014
In addition to drilling activities in the Central Zone, Taseko also completed 6 vertical water monitoring wells (2011-MW01 to MW06) and 3 geotechnical holes (2011-GT01 to 2011-GT03) at potential infrastructure locations with respect to engineering studies. All such drilling was performed by Foundex Explorations Ltd. of Surrey, BC. None of the holes in question were subjected to down-hole surveys.
The 2011 drill holes are summarized in Table 10.4 below.

Section 10 Drilling 9
Aley Project Technical Report October 2014
Table 10.4: 2011 Drill Hole Summary
Hole ID Easting
(m) Northing
(m) Elevation
(m) Depth
(m) Azimuth
(°) Dip (°)
Core Size
2011-035 454,340.28 6,256,408.95 1,557.08 201.17 21 -55 NQ 2011-036 454,308.55 6,256,334.43 1,534.30 64.31 21 -55 NQ 2011-037 454,397.36 6,256,537.45 1,614.78 326.80 19 -55 NQ 2011-038 454,235.49 6,256,311.74 1,537.85 329.18 19 -55 NQ 2011-039 454,302.44 6,256,499.98 1,602.80 216.41 19 -55 NQ 2011-040 454,347.24 6,256,623.91 1,635.11 213.36 21 -55 NQ 2011-041 454,426.32 6,256,668.40 1,676.45 246.89 19 -55 NQ 2011-042 454,400.29 6,256,746.45 1,702.41 142.34 19 -55 NQ 2011-043 454,274.49 6,256,575.79 1,649.29 274.31 19 -55 NQ 2011-044 454,192.77 6,256,507.61 1,628.99 295.66 19 -56 NQ 2011-045 454,149.00 6,256,402.89 1,589.41 252.98 19 -55 NQ 2011-046 454,197.67 6,256,370.94 1,558.56 304.80 19 -56 NQ 2011-047 454,221.43 6,256,587.81 1,674.92 283.46 21 -55 NQ 2011-048 454,280.88 6,256,277.08 1,510.81 344.42 19 -45 NQ 2011-049 454,137.29 6,256,512.74 1,623.03 204.22 19 -53 NQ 2011-050 454,423.61 6,256,505.86 1,607.92 152.41 19 -55 NQ 2011-051 454,069.61 6,256,592.62 1,672.30 228.60 19 -54 NQ 2011-052 454,444.41 6,256,456.15 1,581.88 304.80 21 -55 NQ 2011-053 454,060.55 6,256,432.24 1,634.09 207.26 21 -55 NQ 2011-054 454,009.00 6,256,433.52 1,664.76 251.46 20 -50 NQ 2011-055 454,469.38 6,256,521.60 1,616.65 304.19 21 -55 NQ 2011-056 454,086.94 6,256,378.81 1,615.22 195.07 19 -55 NQ 2011-057 454,469.09 6,256,665.87 1,692.94 316.99 21 -55 NQ 2011-058 454,540.78 6,256,693.14 1,704.52 234.70 21 -55 NQ 2011-059 454,118.18 6,256,308.74 1,586.44 292.60 21 -55 NQ 2011-060 454,399.60 6,256,319.44 1,549.87 314.55 21 -55 NQ 2011-061 454,592.31 6,256,703.78 1,691.50 202.39 21 -55 NQ 2011-062 454,707.23 6,256,650.05 1,702.37 258.08 28 -55 NQ 2011-063 454,345.43 6,256,321.15 1,514.01 307.85 21 -55 NQ 2011-064 454,544.40 6,256,554.89 1,627.20 271.27 21 -55 NQ 2011-065 454,731.29 6,256,720.61 1,728.45 240.79 28 -45 NQ 2011-066 454,631.30 6,256,516.53 1,654.34 188.06 28 -45 NQ 2011-067 454,646.51 6,256,304.80 1,693.79 262.13 28 -45 NQ 2011-068 454,774.49 6,256,692.20 1,747.69 210.31 28 -45 NQ 2011-069 454,772.92 6,256,439.09 1,742.95 231.65 28 -45 NQ 2011-070 454,609.44 6,256,370.16 1,652.91 292.61 28 -45 NQ
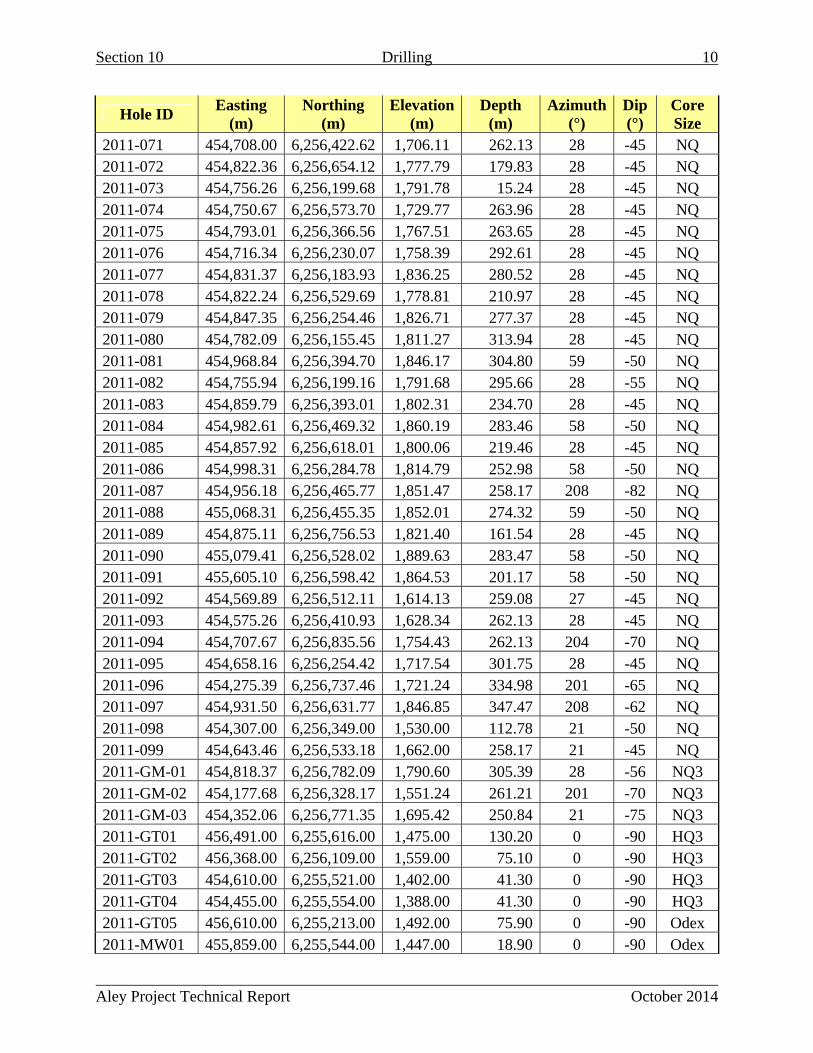
Section 10 Drilling 10
Aley Project Technical Report October 2014
Hole ID Easting
(m) Northing
(m) Elevation
(m) Depth
(m) Azimuth
(°) Dip (°)
Core Size
2011-071 454,708.00 6,256,422.62 1,706.11 262.13 28 -45 NQ 2011-072 454,822.36 6,256,654.12 1,777.79 179.83 28 -45 NQ 2011-073 454,756.26 6,256,199.68 1,791.78 15.24 28 -45 NQ 2011-074 454,750.67 6,256,573.70 1,729.77 263.96 28 -45 NQ 2011-075 454,793.01 6,256,366.56 1,767.51 263.65 28 -45 NQ 2011-076 454,716.34 6,256,230.07 1,758.39 292.61 28 -45 NQ 2011-077 454,831.37 6,256,183.93 1,836.25 280.52 28 -45 NQ 2011-078 454,822.24 6,256,529.69 1,778.81 210.97 28 -45 NQ 2011-079 454,847.35 6,256,254.46 1,826.71 277.37 28 -45 NQ 2011-080 454,782.09 6,256,155.45 1,811.27 313.94 28 -45 NQ 2011-081 454,968.84 6,256,394.70 1,846.17 304.80 59 -50 NQ 2011-082 454,755.94 6,256,199.16 1,791.68 295.66 28 -55 NQ 2011-083 454,859.79 6,256,393.01 1,802.31 234.70 28 -45 NQ 2011-084 454,982.61 6,256,469.32 1,860.19 283.46 58 -50 NQ 2011-085 454,857.92 6,256,618.01 1,800.06 219.46 28 -45 NQ 2011-086 454,998.31 6,256,284.78 1,814.79 252.98 58 -50 NQ 2011-087 454,956.18 6,256,465.77 1,851.47 258.17 208 -82 NQ 2011-088 455,068.31 6,256,455.35 1,852.01 274.32 59 -50 NQ 2011-089 454,875.11 6,256,756.53 1,821.40 161.54 28 -45 NQ 2011-090 455,079.41 6,256,528.02 1,889.63 283.47 58 -50 NQ 2011-091 455,605.10 6,256,598.42 1,864.53 201.17 58 -50 NQ 2011-092 454,569.89 6,256,512.11 1,614.13 259.08 27 -45 NQ 2011-093 454,575.26 6,256,410.93 1,628.34 262.13 28 -45 NQ 2011-094 454,707.67 6,256,835.56 1,754.43 262.13 204 -70 NQ 2011-095 454,658.16 6,256,254.42 1,717.54 301.75 28 -45 NQ 2011-096 454,275.39 6,256,737.46 1,721.24 334.98 201 -65 NQ 2011-097 454,931.50 6,256,631.77 1,846.85 347.47 208 -62 NQ 2011-098 454,307.00 6,256,349.00 1,530.00 112.78 21 -50 NQ 2011-099 454,643.46 6,256,533.18 1,662.00 258.17 21 -45 NQ 2011-GM-01 454,818.37 6,256,782.09 1,790.60 305.39 28 -56 NQ3 2011-GM-02 454,177.68 6,256,328.17 1,551.24 261.21 201 -70 NQ3 2011-GM-03 454,352.06 6,256,771.35 1,695.42 250.84 21 -75 NQ3 2011-GT01 456,491.00 6,255,616.00 1,475.00 130.20 0 -90 HQ3 2011-GT02 456,368.00 6,256,109.00 1,559.00 75.10 0 -90 HQ3 2011-GT03 454,610.00 6,255,521.00 1,402.00 41.30 0 -90 HQ3 2011-GT04 454,455.00 6,255,554.00 1,388.00 41.30 0 -90 HQ3 2011-GT05 456,610.00 6,255,213.00 1,492.00 75.90 0 -90 Odex 2011-MW01 455,859.00 6,255,544.00 1,447.00 18.90 0 -90 Odex
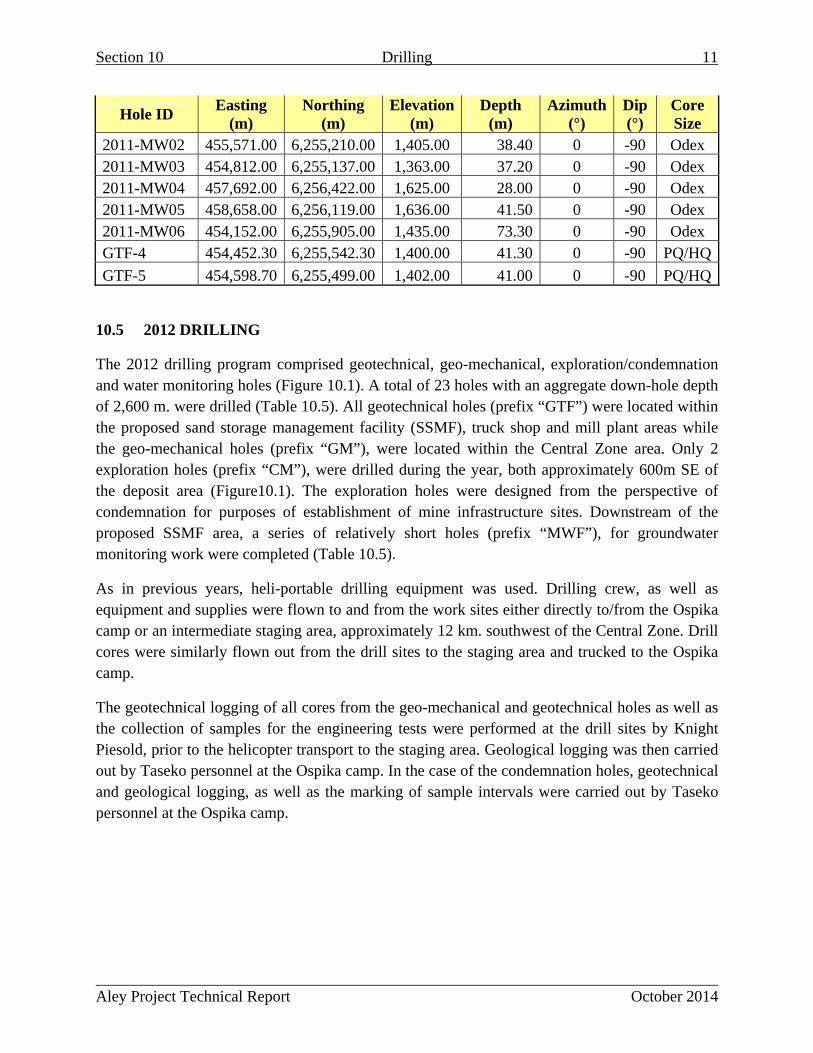
Section 10 Drilling 11
Aley Project Technical Report October 2014
Hole ID Easting
(m) Northing
(m) Elevation
(m) Depth
(m) Azimuth
(°) Dip (°)
Core Size
2011-MW02 455,571.00 6,255,210.00 1,405.00 38.40 0 -90 Odex 2011-MW03 454,812.00 6,255,137.00 1,363.00 37.20 0 -90 Odex 2011-MW04 457,692.00 6,256,422.00 1,625.00 28.00 0 -90 Odex 2011-MW05 458,658.00 6,256,119.00 1,636.00 41.50 0 -90 Odex 2011-MW06 454,152.00 6,255,905.00 1,435.00 73.30 0 -90 Odex GTF-4 454,452.30 6,255,542.30 1,400.00 41.30 0 -90 PQ/HQ
GTF-5 454,598.70 6,255,499.00 1,402.00 41.00 0 -90 PQ/HQ
10.5 2012 DRILLING
The 2012 drilling program comprised geotechnical, geo-mechanical, exploration/condemnation and water monitoring holes (Figure 10.1). A total of 23 holes with an aggregate down-hole depth of 2,600 m. were drilled (Table 10.5). All geotechnical holes (prefix “GTF”) were located within the proposed sand storage management facility (SSMF), truck shop and mill plant areas while the geo-mechanical holes (prefix “GM”), were located within the Central Zone area. Only 2 exploration holes (prefix “CM”), were drilled during the year, both approximately 600m SE of the deposit area (Figure10.1). The exploration holes were designed from the perspective of condemnation for purposes of establishment of mine infrastructure sites. Downstream of the proposed SSMF area, a series of relatively short holes (prefix “MWF”), for groundwater monitoring work were completed (Table 10.5).
As in previous years, heli-portable drilling equipment was used. Drilling crew, as well as equipment and supplies were flown to and from the work sites either directly to/from the Ospika camp or an intermediate staging area, approximately 12 km. southwest of the Central Zone. Drill cores were similarly flown out from the drill sites to the staging area and trucked to the Ospika camp.
The geotechnical logging of all cores from the geo-mechanical and geotechnical holes as well as the collection of samples for the engineering tests were performed at the drill sites by Knight Piesold, prior to the helicopter transport to the staging area. Geological logging was then carried out by Taseko personnel at the Ospika camp. In the case of the condemnation holes, geotechnical and geological logging, as well as the marking of sample intervals were carried out by Taseko personnel at the Ospika camp.
Section 10 Drilling 12
Aley Project Technical Report October 2014
10.5.1 GEOTECHNICAL HOLES
Foundex Explorations Ltd. (Foundex) of Surrey, BC, using a HT-700 geotechnical rig, carried out the initial component of the 2012 geotechnical drilling program, and Black Hawk Drilling Ltd. of Smithers, BC, completed two holes in an extension to this campaign with an A-500 rig during the latter part of the field season. The program comprised a total of 12 holes with an aggregate down hole depth of 1,133 m, all of which were drilled vertically, with the exception of GTF12-15 and GTF12-16/16A which were drilled at -60° and -45°, respectively. Although most holes utilized diamond coring procedures, some were drilled in combination with the ODEX (percussion down the hole) method in order to penetrate relatively thick accumulations of loose overburden.
All of the geotechnical holes were drilled at HQ3 diameter to depths in the order of 30 m in the proposed truck shop and plant site areas and up to 161 m in the SSMF area (Figure 10.1). Standard Penetration Tests (SPT) in overburden and Ludgeon packer tests in bedrock were conducted in addition to the routine detailed geotechnical logging of drill cores and drill cuttings. Upon completion of drilling, standpipe piezometers were installed in 11 of the 12 holes drilled. All monitoring wells were developed and response testing implemented immediately thereafter.
Apart from gathering additional sub-surface geological information, the holes also served to facilitate a better understanding of the hydro-geologic regime within the proposed SSMF area, as well as the overburden characteristics of these areas. Such information has been used in support of the design of the SSMF, truck shop and plant facilities and will contribute towards the project’s future Environmental Assessment.
The soil samples collected in conjunction with the on-site SPTs were sent to the KP soils laboratory in Denver, Colorado. While all such samples were tested for particle size distribution selected materials were subjected to Atterberg Limits, Standard Proctor Compaction, and Triaxial and Permeability tests. All tests were performed in accordance with ASTM standards for soil testing.
10.5.2 GEO-MECHANICAL HOLES
Five geo-mechanical holes with a cumulative down hole depth of 1,142 m were drilled within the Central Zone. Each of these holes was inclined such as to transect defined mineralization, and to pass thereafter beyond the conceptualized pit limit (Figure 10.1) with the objective of collecting pit wall geotechnical information for use in pit design activities. Black Hawk Drilling Ltd. performed all such drilling: while it had originally been intended that such drilling be implemented at HQ3 diameter, ground conditions precipitated reduction to NQ diameter in certain holes at depth.
As was the case with the geotechnical holes, oversight of all geo-mechanical drilling was carried out by KP. During drilling, hydraulic conductivity tests using a combination of falling head and

Section 10 Drilling 13
Aley Project Technical Report October 2014
Lugeon methods, through a water-inflatable packer system, were applied in all holes at a variety of intervals. Core orientation was undertaken using the Reflex ACT II system at intervals of 50 feet in each hole. Point load tests were conducted in situ for selected intervals; unconfined compressive strength tests were undertaken in the laboratory on a total of 24 samples collected from 5 holes. Upon completion of each hole, KP also installed vibrating wire piezometers for groundwater monitoring purposes.
10.5.3 WATER MONITORING HOLES
Four water monitoring holes were completed by Foundex within the valley downstream of the proposed SSMF area (Figure 10.1), such drilling occurring at 2 sites each with a pair of holes drilled approximately 1 m apart to depths of approximately 20 m and 40 m respectively (for a program total of 115m). All holes were drilled using the ODEX system, and after completion of drilling 2” diameter PVC standpipe piezometers were installed in each hole.
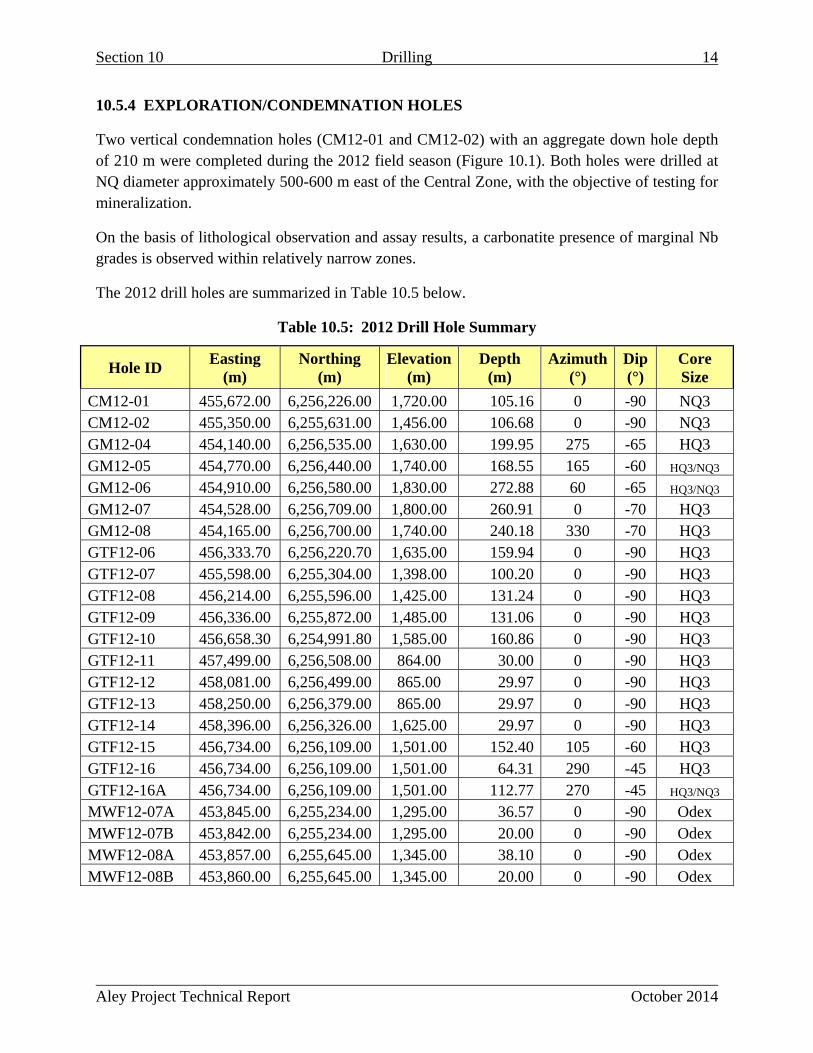
Section 10 Drilling 14
Aley Project Technical Report October 2014
10.5.4 EXPLORATION/CONDEMNATION HOLES
Two vertical condemnation holes (CM12-01 and CM12-02) with an aggregate down hole depth of 210 m were completed during the 2012 field season (Figure 10.1). Both holes were drilled at NQ diameter approximately 500-600 m east of the Central Zone, with the objective of testing for mineralization.
On the basis of lithological observation and assay results, a carbonatite presence of marginal Nb grades is observed within relatively narrow zones.
The 2012 drill holes are summarized in Table 10.5 below.
Table 10.5: 2012 Drill Hole Summary
Hole ID Easting
(m) Northing
(m) Elevation
(m) Depth
(m) Azimuth
(°) Dip (°)
Core Size
CM12-01 455,672.00 6,256,226.00 1,720.00 105.16 0 -90 NQ3 CM12-02 455,350.00 6,255,631.00 1,456.00 106.68 0 -90 NQ3 GM12-04 454,140.00 6,256,535.00 1,630.00 199.95 275 -65 HQ3 GM12-05 454,770.00 6,256,440.00 1,740.00 168.55 165 -60 HQ3/NQ3
GM12-06 454,910.00 6,256,580.00 1,830.00 272.88 60 -65 HQ3/NQ3
GM12-07 454,528.00 6,256,709.00 1,800.00 260.91 0 -70 HQ3 GM12-08 454,165.00 6,256,700.00 1,740.00 240.18 330 -70 HQ3 GTF12-06 456,333.70 6,256,220.70 1,635.00 159.94 0 -90 HQ3 GTF12-07 455,598.00 6,255,304.00 1,398.00 100.20 0 -90 HQ3 GTF12-08 456,214.00 6,255,596.00 1,425.00 131.24 0 -90 HQ3 GTF12-09 456,336.00 6,255,872.00 1,485.00 131.06 0 -90 HQ3 GTF12-10 456,658.30 6,254,991.80 1,585.00 160.86 0 -90 HQ3 GTF12-11 457,499.00 6,256,508.00 864.00 30.00 0 -90 HQ3 GTF12-12 458,081.00 6,256,499.00 865.00 29.97 0 -90 HQ3 GTF12-13 458,250.00 6,256,379.00 865.00 29.97 0 -90 HQ3 GTF12-14 458,396.00 6,256,326.00 1,625.00 29.97 0 -90 HQ3 GTF12-15 456,734.00 6,256,109.00 1,501.00 152.40 105 -60 HQ3 GTF12-16 456,734.00 6,256,109.00 1,501.00 64.31 290 -45 HQ3 GTF12-16A 456,734.00 6,256,109.00 1,501.00 112.77 270 -45 HQ3/NQ3
MWF12-07A 453,845.00 6,255,234.00 1,295.00 36.57 0 -90 Odex MWF12-07B 453,842.00 6,255,234.00 1,295.00 20.00 0 -90 Odex MWF12-08A 453,857.00 6,255,645.00 1,345.00 38.10 0 -90 Odex MWF12-08B 453,860.00 6,255,645.00 1,345.00 20.00 0 -90 Odex

Aley Project Technical Report October 2014
SECTION 11: SAMPLE PREPARATION, ANALYSIS AND SECURITY
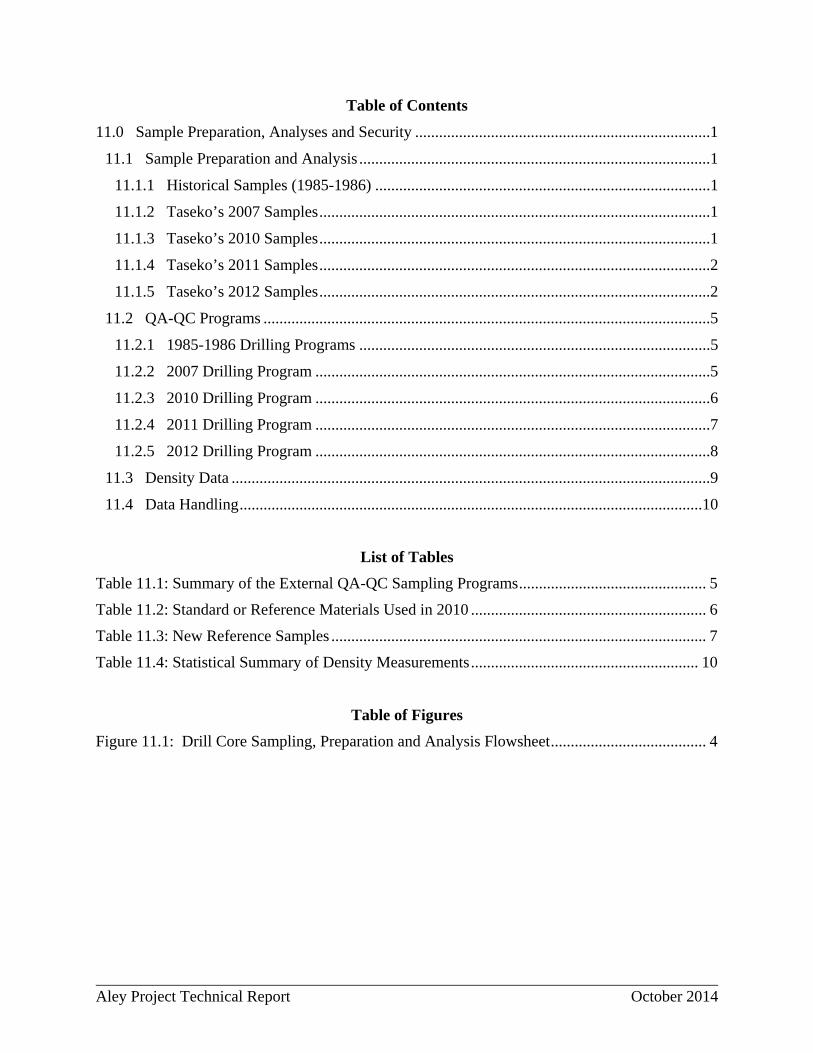
Aley Project Technical Report October 2014
Table of Contents
11.0 Sample Preparation, Analyses and Security ..........................................................................1
11.1 Sample Preparation and Analysis ........................................................................................1
11.1.1 Historical Samples (1985-1986) ....................................................................................1
11.1.2 Taseko’s 2007 Samples ..................................................................................................1
11.1.3 Taseko’s 2010 Samples ..................................................................................................1
11.1.4 Taseko’s 2011 Samples ..................................................................................................2
11.1.5 Taseko’s 2012 Samples ..................................................................................................2
11.2 QA-QC Programs ................................................................................................................5
11.2.1 1985-1986 Drilling Programs ........................................................................................5
11.2.2 2007 Drilling Program ...................................................................................................5
11.2.3 2010 Drilling Program ...................................................................................................6
11.2.4 2011 Drilling Program ...................................................................................................7
11.2.5 2012 Drilling Program ...................................................................................................8
11.3 Density Data ........................................................................................................................9
11.4 Data Handling ....................................................................................................................10
List of Tables
Table 11.1: Summary of the External QA-QC Sampling Programs ............................................... 5
Table 11.2: Standard or Reference Materials Used in 2010 ........................................................... 6
Table 11.3: New Reference Samples .............................................................................................. 7
Table 11.4: Statistical Summary of Density Measurements ......................................................... 10
Table of Figures
Figure 11.1: Drill Core Sampling, Preparation and Analysis Flowsheet ....................................... 4
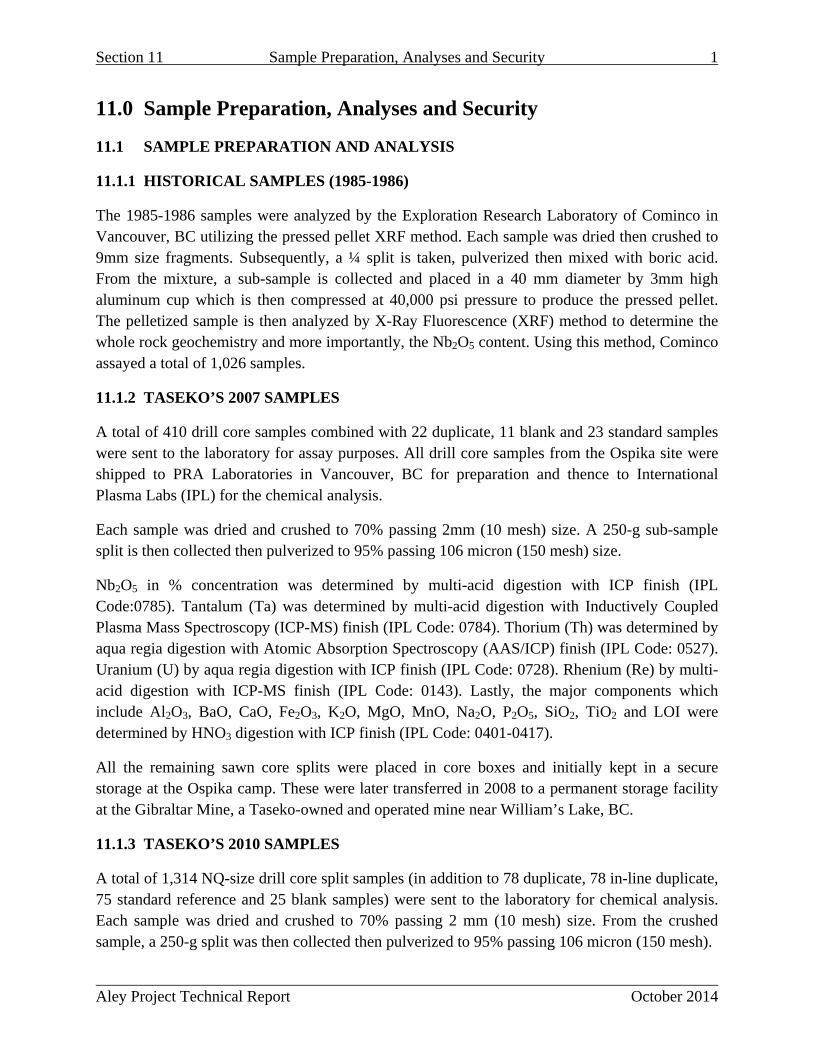
Section 11 Sample Preparation, Analyses and Security 1
Aley Project Technical Report October 2014
11.0 Sample Preparation, Analyses and Security
11.1 SAMPLE PREPARATION AND ANALYSIS
11.1.1 HISTORICAL SAMPLES (1985-1986)
The 1985-1986 samples were analyzed by the Exploration Research Laboratory of Cominco in Vancouver, BC utilizing the pressed pellet XRF method. Each sample was dried then crushed to 9mm size fragments. Subsequently, a ¼ split is taken, pulverized then mixed with boric acid. From the mixture, a sub-sample is collected and placed in a 40 mm diameter by 3mm high aluminum cup which is then compressed at 40,000 psi pressure to produce the pressed pellet. The pelletized sample is then analyzed by X-Ray Fluorescence (XRF) method to determine the whole rock geochemistry and more importantly, the Nb2O5 content. Using this method, Cominco assayed a total of 1,026 samples.
11.1.2 TASEKO’S 2007 SAMPLES
A total of 410 drill core samples combined with 22 duplicate, 11 blank and 23 standard samples were sent to the laboratory for assay purposes. All drill core samples from the Ospika site were shipped to PRA Laboratories in Vancouver, BC for preparation and thence to International Plasma Labs (IPL) for the chemical analysis.
Each sample was dried and crushed to 70% passing 2mm (10 mesh) size. A 250-g sub-sample split is then collected then pulverized to 95% passing 106 micron (150 mesh) size.
Nb2O5 in % concentration was determined by multi-acid digestion with ICP finish (IPL Code:0785). Tantalum (Ta) was determined by multi-acid digestion with Inductively Coupled Plasma Mass Spectroscopy (ICP-MS) finish (IPL Code: 0784). Thorium (Th) was determined by aqua regia digestion with Atomic Absorption Spectroscopy (AAS/ICP) finish (IPL Code: 0527). Uranium (U) by aqua regia digestion with ICP finish (IPL Code: 0728). Rhenium (Re) by multi-acid digestion with ICP-MS finish (IPL Code: 0143). Lastly, the major components which include Al2O3, BaO, CaO, Fe2O3, K2O, MgO, MnO, Na2O, P2O5, SiO2, TiO2 and LOI were determined by HNO3 digestion with ICP finish (IPL Code: 0401-0417).
All the remaining sawn core splits were placed in core boxes and initially kept in a secure storage at the Ospika camp. These were later transferred in 2008 to a permanent storage facility at the Gibraltar Mine, a Taseko-owned and operated mine near William’s Lake, BC.
11.1.3 TASEKO’S 2010 SAMPLES
A total of 1,314 NQ-size drill core split samples (in addition to 78 duplicate, 78 in-line duplicate, 75 standard reference and 25 blank samples) were sent to the laboratory for chemical analysis. Each sample was dried and crushed to 70% passing 2 mm (10 mesh) size. From the crushed sample, a 250-g split was then collected then pulverized to 95% passing 106 micron (150 mesh).

Section 11 Sample Preparation, Analyses and Security 2
Aley Project Technical Report October 2014
All the samples were analyzed by Inspectorate Exploration and Mining Services Ltd. (Inspectorate) of Richmond, BC. The %Nb2O5 concentration was determined by multi-acid digestion with ICP finish (Inspectorate Code: Nb2O5-AD3-OR-ICP). Tantalum (Ta) by 4-acid digestion with ICP finish (Inspectorate code: Ta-4A-LL-ICP). Thorium (Th) by 4-acid digestion with ICP finish (Inspectorate Code: Th-4A-LL-ICP). Uranium (U) by 4-acid digestion with ICP finish (Inspectorate Code: U-4A-OR-ICP). Rare Earth Elements (REE) group by lithium borate fusion with ICP-MS finish (Inspectorate Code: REE-LB-MS). The whole rock oxide components which include Al2O3, BaO, CaO, Fe2O3, K2O, MgO, MnO, Na2O, P2O5, SiO2, TiO2 and LOI were detected by lithium borate fusion with ICP finish (Inspectorate Code: WR-FS-ICP). A 30-element suite was also included in the 2010 program and determinations were done through 4-acid digestion with ICP finish (Inspectorate Code: 30-4A-TR).
11.1.4 TASEKO’S 2011 SAMPLES
A total of 5,437 core samples (aside from 306 duplicate, 302 standard reference and 81 blank samples) were submitted to the Inspectorate laboratory in Richmond, BC for preparation and chemical analyses. Each sample was dried and crushed to 70% passing 2 mm (10 mesh) size. From the crushed sample, a 250-g split was then collected then pulverized to 95% passing 106 micron (150 mesh).
Inspectorate followed the same methods of chemical analysis used in 2010 for all the samples collected in 2011. The % Nb2O5 concentration was determined by multi-acid digestion with ICP finish (Inspectorate Code: Nb2O5-AD3-OR-ICP). Tantalum (Ta) by 4-acid digestion with ICP finish (Inspectorate code: Ta-4A-LL-ICP). Thorium (Th) by 4-acid digestion with ICP finish (Inspectorate Code: Th-4A-LL-ICP). Uranium (U) by 4-acid digestion with ICP finish (Inspectorate Code: U-4A-OR-ICP). Rare Earth Elements (REE) group by lithium borate fusion with ICP-MS finish (Inspectorate Code: REE-LB-MS). The whole rock oxide components which include Al2O3, BaO, CaO, Fe2O3, K2O, MgO, MnO, Na2O, P2O5, SiO2, TiO2 and LOI were detected by lithium borate fusion with ICP finish (Inspectorate Code: WR-FS-ICP). A 30-element suite was also included in the 2010 program and determinations were done by 4-acid digestion with ICP finish (Inspectorate Code: 30-4A-TR).
The drill core sample sampling, preparation and analytical flowsheet is shown in Figure 11.1.
11.1.5 TASEKO’S 2012 SAMPLES
Using a circular diamond saw and under the direct supervision of a Taseko geologist, drill cores were sawn in half along the length of the core axis to obtain samples for assaying. The sample splits were placed in properly labeled plastic bags with tags containing pre-determined sample numbers. For the 2012 program, only the condemnation holes (CM12-01 and CM12-02) had been sampled.

Section 11 Sample Preparation, Analyses and Security 3
Aley Project Technical Report October 2014
A total of 68 drill core samples (in addition to 3 duplicate, 4 standard reference and 2 blank samples) were sent to the Inspectorate Laboratory in Richmond, BC for chemical analysis. Samples were dried and crushed to 70% passing 2 mm (10 mesh). Then 250- g. sub-samples were split and pulverized to >85% passing 200 mesh. Using the same methods in 2011, all the 2012 samples were assayed for Nb, Ta, U, Th, REE’s and the standard set of 30 elements. The sample preparation and analytical preparation flow chart is shown in Figure 11.1.
After the chemical analyses, all coarse rejects and pulp samples were temporarily stored at the Inspectorate laboratory and then moved to a permanent storage facility of Hunter Dickinson Inc. in Port Kells, BC.
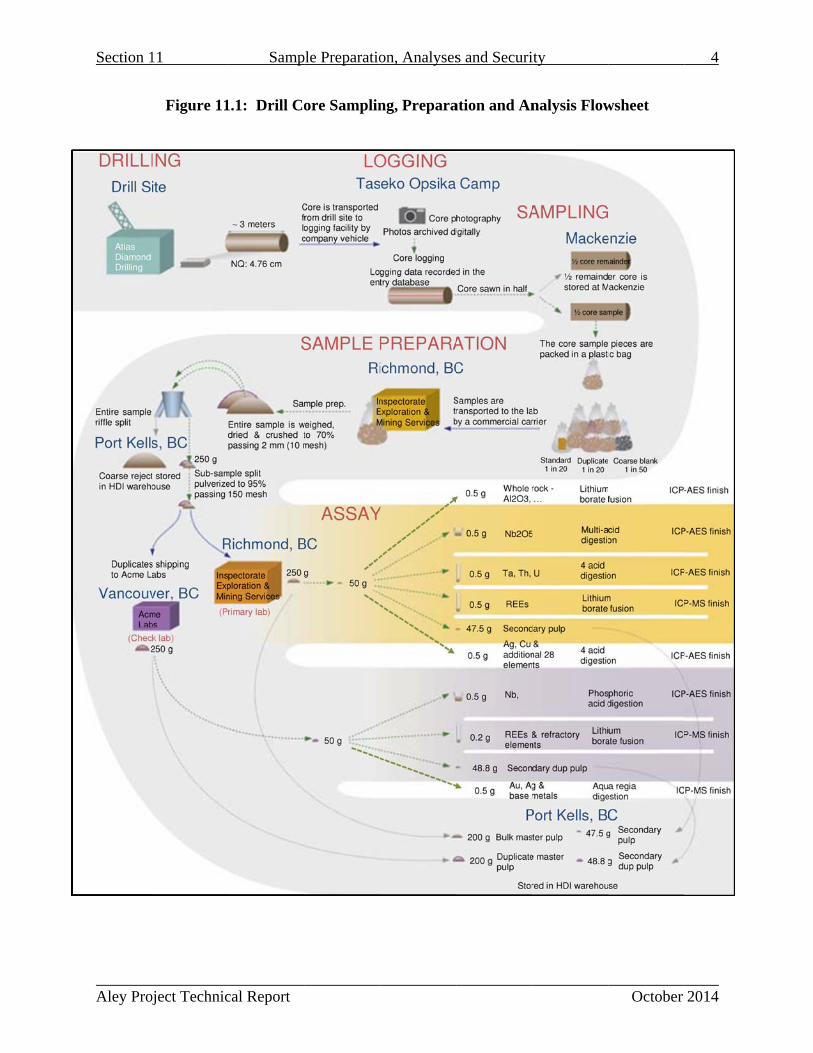
Section 1
Aley Proj
11
oject Technic
Figure 11
Samp
cal Report
1.1: Drill Co
ple Preparatio
ore Samplin
on, Analyses
ng, Prepara
s and Securi
ation and An
ity
nalysis Flow
October
wsheet
4
2014

Section 11 Sample Preparation, Analyses and Security 5
Aley Project Technical Report October 2014
11.2 QA-QC PROGRAMS
Table 11.1 shows the summary of the external QA-QC sampling programs implemented in the various periods throughout the project’s exploration history.
Table 11.1: Summary of the External QA-QC Sampling Programs
Year MS DP DX SD ST BL Total
1985 440 0 0 0 0 0 440
1986 586 0 0 0 0 0 586
2007 410 22 0 0 23 11 466
2010 1,314 0 78 0 75 25 1,492
2011 5,437 0 306 302 0 81 6,126
2012 68 0 3 0 4 2 77
Total 8,255 22 387 302 102 119 9,187
MS – Main Stream; DP – Duplicate; DX – In-line Duplicate; ST – Standard
SD – Standard Duplicate; BL – Blank
11.2.1 1985-1986 DRILLING PROGRAMS
The Exploration Research Laboratory of Cominco was an established and well accepted facility in the mineral exploration industry. Although regarded with high quality analytical performance, there were no records on file which indicate that the company employed an external QA/QC system in the analysis of its drill core samples from 1985 to 1986.
11.2.2 2007 DRILLING PROGRAM
Taseko implemented an external QA/QC system for its sampling and analysis program in 2007. Inserted into the sample stream of 410 drill core samples were: 22 duplicates, 11 blanks and 23 standard samples. The standard reference samples used are of 2 types, a matrix-matched and project-based standard (low grade Aley carbonatite - AHG1), and a Canmet standard (OKA-1).
Check assays for Nb, Ta, Th, Nd, Ce, La and the major oxides were undertaken on 92 duplicate and 6 standard pulp samples by Corem Laboratory in Quebec, QC. From the same set of samples, 22 duplicates and 2 standards were also sent to Global Discovery Labs (Teck Cominco) for Nb, Th and U analysis by pressed pellet XRF method. In addition, this laboratory also performed whole rock analysis on the major oxides by Li borate fusion XRF.
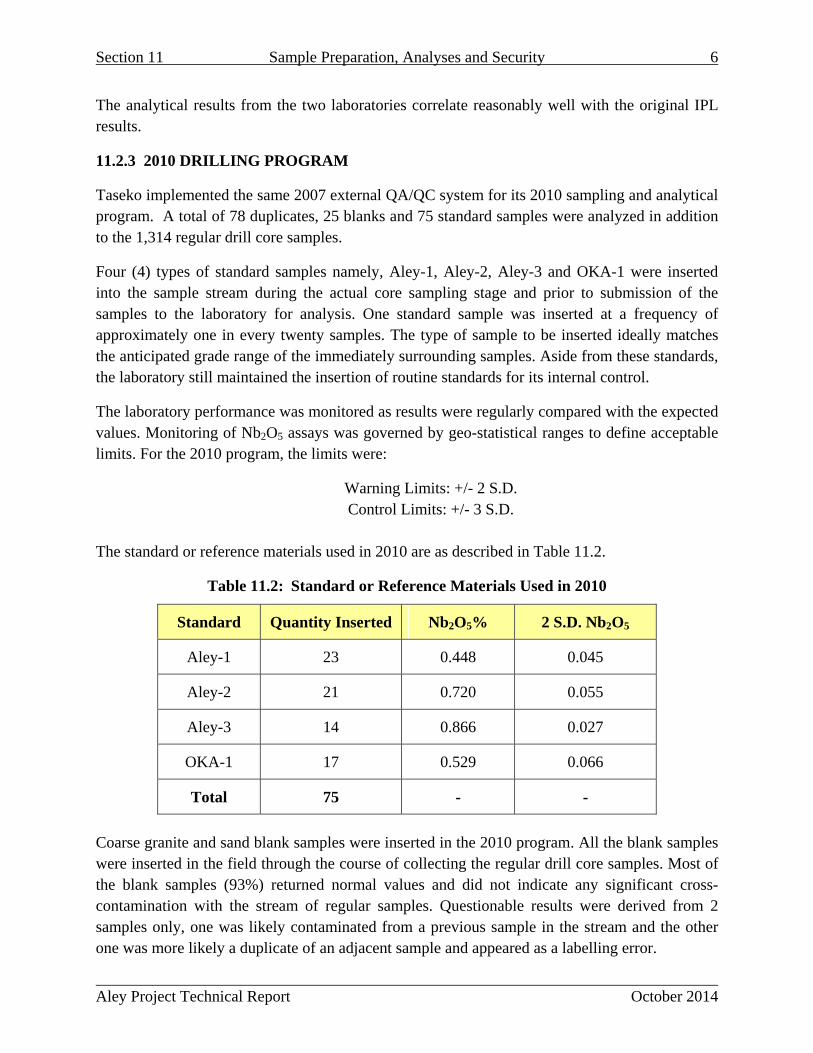
Section 11 Sample Preparation, Analyses and Security 6
Aley Project Technical Report October 2014
The analytical results from the two laboratories correlate reasonably well with the original IPL results.
11.2.3 2010 DRILLING PROGRAM
Taseko implemented the same 2007 external QA/QC system for its 2010 sampling and analytical program. A total of 78 duplicates, 25 blanks and 75 standard samples were analyzed in addition to the 1,314 regular drill core samples.
Four (4) types of standard samples namely, Aley-1, Aley-2, Aley-3 and OKA-1 were inserted into the sample stream during the actual core sampling stage and prior to submission of the samples to the laboratory for analysis. One standard sample was inserted at a frequency of approximately one in every twenty samples. The type of sample to be inserted ideally matches the anticipated grade range of the immediately surrounding samples. Aside from these standards, the laboratory still maintained the insertion of routine standards for its internal control.
The laboratory performance was monitored as results were regularly compared with the expected values. Monitoring of Nb2O5 assays was governed by geo-statistical ranges to define acceptable limits. For the 2010 program, the limits were:
Warning Limits: +/- 2 S.D. Control Limits: +/- 3 S.D.
The standard or reference materials used in 2010 are as described in Table 11.2.
Table 11.2: Standard or Reference Materials Used in 2010
Standard Quantity Inserted Nb2O5% 2 S.D. Nb2O5
Aley-1 23 0.448 0.045
Aley-2 21 0.720 0.055
Aley-3 14 0.866 0.027
OKA-1 17 0.529 0.066
Total 75 - -
Coarse granite and sand blank samples were inserted in the 2010 program. All the blank samples were inserted in the field through the course of collecting the regular drill core samples. Most of the blank samples (93%) returned normal values and did not indicate any significant cross-contamination with the stream of regular samples. Questionable results were derived from 2 samples only, one was likely contaminated from a previous sample in the stream and the other one was more likely a duplicate of an adjacent sample and appeared as a labelling error.
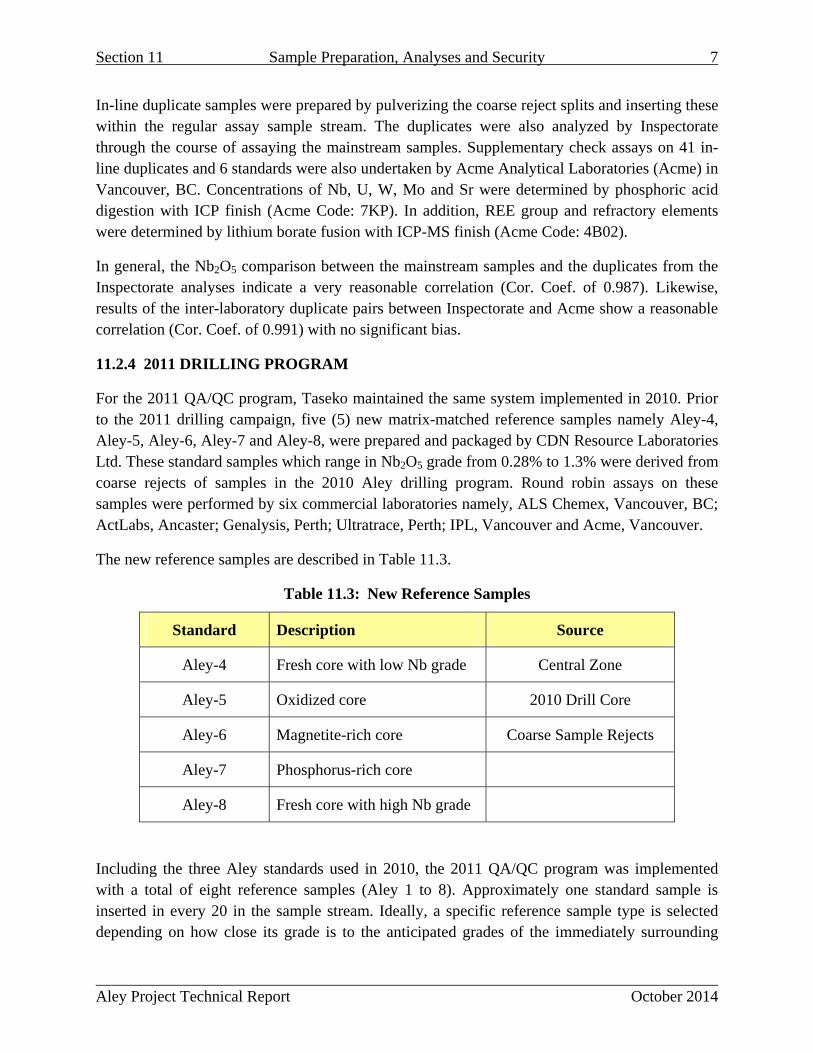
Section 11 Sample Preparation, Analyses and Security 7
Aley Project Technical Report October 2014
In-line duplicate samples were prepared by pulverizing the coarse reject splits and inserting these within the regular assay sample stream. The duplicates were also analyzed by Inspectorate through the course of assaying the mainstream samples. Supplementary check assays on 41 in-line duplicates and 6 standards were also undertaken by Acme Analytical Laboratories (Acme) in Vancouver, BC. Concentrations of Nb, U, W, Mo and Sr were determined by phosphoric acid digestion with ICP finish (Acme Code: 7KP). In addition, REE group and refractory elements were determined by lithium borate fusion with ICP-MS finish (Acme Code: 4B02).
In general, the Nb2O5 comparison between the mainstream samples and the duplicates from the Inspectorate analyses indicate a very reasonable correlation (Cor. Coef. of 0.987). Likewise, results of the inter-laboratory duplicate pairs between Inspectorate and Acme show a reasonable correlation (Cor. Coef. of 0.991) with no significant bias.
11.2.4 2011 DRILLING PROGRAM
For the 2011 QA/QC program, Taseko maintained the same system implemented in 2010. Prior to the 2011 drilling campaign, five (5) new matrix-matched reference samples namely Aley-4, Aley-5, Aley-6, Aley-7 and Aley-8, were prepared and packaged by CDN Resource Laboratories Ltd. These standard samples which range in Nb2O5 grade from 0.28% to 1.3% were derived from coarse rejects of samples in the 2010 Aley drilling program. Round robin assays on these samples were performed by six commercial laboratories namely, ALS Chemex, Vancouver, BC; ActLabs, Ancaster; Genalysis, Perth; Ultratrace, Perth; IPL, Vancouver and Acme, Vancouver.
The new reference samples are described in Table 11.3.
Table 11.3: New Reference Samples
Standard Description Source
Aley-4 Fresh core with low Nb grade Central Zone
Aley-5 Oxidized core 2010 Drill Core
Aley-6 Magnetite-rich core Coarse Sample Rejects
Aley-7 Phosphorus-rich core
Aley-8 Fresh core with high Nb grade
Including the three Aley standards used in 2010, the 2011 QA/QC program was implemented with a total of eight reference samples (Aley 1 to 8). Approximately one standard sample is inserted in every 20 in the sample stream. Ideally, a specific reference sample type is selected depending on how close its grade is to the anticipated grades of the immediately surrounding
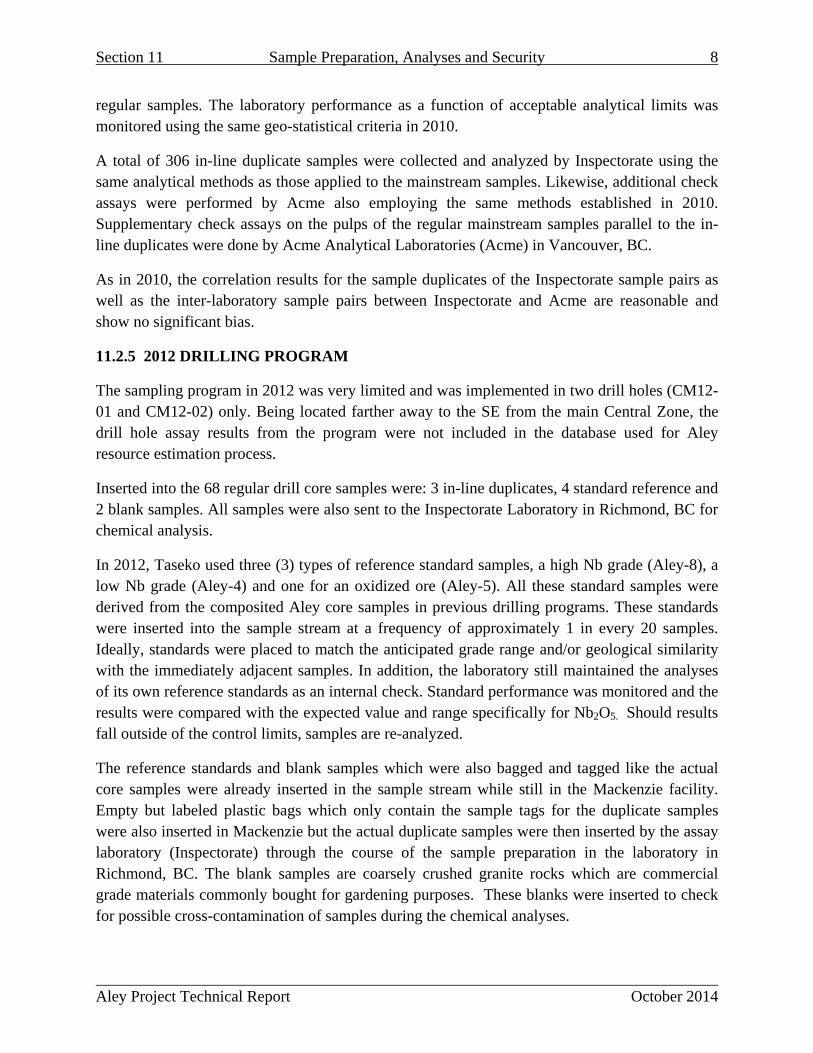
Section 11 Sample Preparation, Analyses and Security 8
Aley Project Technical Report October 2014
regular samples. The laboratory performance as a function of acceptable analytical limits was monitored using the same geo-statistical criteria in 2010.
A total of 306 in-line duplicate samples were collected and analyzed by Inspectorate using the same analytical methods as those applied to the mainstream samples. Likewise, additional check assays were performed by Acme also employing the same methods established in 2010. Supplementary check assays on the pulps of the regular mainstream samples parallel to the in-line duplicates were done by Acme Analytical Laboratories (Acme) in Vancouver, BC.
As in 2010, the correlation results for the sample duplicates of the Inspectorate sample pairs as well as the inter-laboratory sample pairs between Inspectorate and Acme are reasonable and show no significant bias.
11.2.5 2012 DRILLING PROGRAM
The sampling program in 2012 was very limited and was implemented in two drill holes (CM12-01 and CM12-02) only. Being located farther away to the SE from the main Central Zone, the drill hole assay results from the program were not included in the database used for Aley resource estimation process.
Inserted into the 68 regular drill core samples were: 3 in-line duplicates, 4 standard reference and 2 blank samples. All samples were also sent to the Inspectorate Laboratory in Richmond, BC for chemical analysis.
In 2012, Taseko used three (3) types of reference standard samples, a high Nb grade (Aley-8), a low Nb grade (Aley-4) and one for an oxidized ore (Aley-5). All these standard samples were derived from the composited Aley core samples in previous drilling programs. These standards were inserted into the sample stream at a frequency of approximately 1 in every 20 samples. Ideally, standards were placed to match the anticipated grade range and/or geological similarity with the immediately adjacent samples. In addition, the laboratory still maintained the analyses of its own reference standards as an internal check. Standard performance was monitored and the results were compared with the expected value and range specifically for Nb2O5. Should results fall outside of the control limits, samples are re-analyzed.
The reference standards and blank samples which were also bagged and tagged like the actual core samples were already inserted in the sample stream while still in the Mackenzie facility. Empty but labeled plastic bags which only contain the sample tags for the duplicate samples were also inserted in Mackenzie but the actual duplicate samples were then inserted by the assay laboratory (Inspectorate) through the course of the sample preparation in the laboratory in Richmond, BC. The blank samples are coarsely crushed granite rocks which are commercial grade materials commonly bought for gardening purposes. These blanks were inserted to check for possible cross-contamination of samples during the chemical analyses.
Section 11 Sample Preparation, Analyses and Security 9
Aley Project Technical Report October 2014
11.3 DENSITY DATA
A total of 3,818 density and specific gravity (SG) measurements were taken on the Aley drill core samples during the 2007, 2010 and 2011 programs. From drill core samples collected in the Saddle Area in 2007, Process Research Associates Ltd. (PRA) took 88 density measurements using the wax coat method. The Taseko staff took 481 and 3,249 measurements in 2010 and 2011 respectively, using an uncoated water immersion method from whole drill core samples. Most of the SG determinations by Taseko were from drill core samples collected in the Central Zone deposit area.
The procedure for the 2007 PRA wax-coated density determination method is as follows:
A piece of drill core sample is dried in the oven overnight under low temperature setting.
A single piece of drill core is weighed, coated with molten wax then weighed again.
Graduated cylinder is filled with water, bubbles are removed and volume is determined.
Waxed sample is placed in water-filled graduated cylinder.
The change in volume is recorded and specific gravity measurement is computed taking into account the specific gravity of wax from literature.
The procedure for Taseko’s 2010 and 2011 uncoated and water immersion method is as follows:
A whole drill core sample representing a specific rock type is collected and dried.
One sample is collected roughly every 10m down the hole or 1 sample in every 10 assay samples.
Determine the sample weight in air (Ma).
Determine the sample weight while suspended in water (Mw) making sure that weight is taken quickly as soon as the balance has stabilized in order to minimize water incursion into the rock pores.
In 2010, all the higher density values correspond with higher iron content mainly in the form of magnetite. These values were deemed reasonable and accepted to be included in the database. However, sixteen readings from the upper levels of hole 2010-022 were deemed unreasonably low (lower than 2.0) and were removed from the database.
In 2011, each sample was weighed 2 to 3 times in air and then once in water. All data collected were validated by HDI to identify any data entry or test errors. Subsequently, the erroneous records were removed from the data set. The standard weight records in the calibration process were also checked to ensure that the relative error (RSD) is acceptable.
Table 11.4 shows the statistical summary of the density measurements.
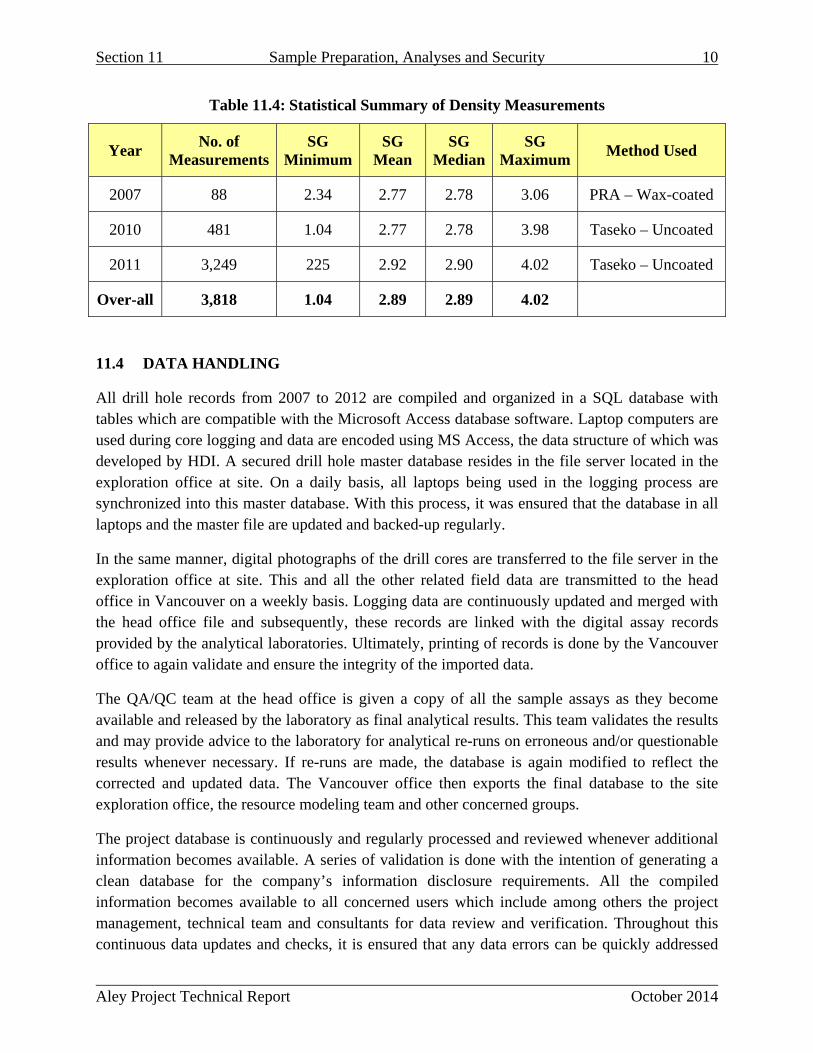
Section 11 Sample Preparation, Analyses and Security 10
Aley Project Technical Report October 2014
Table 11.4: Statistical Summary of Density Measurements
Year No. of
Measurements SG
MinimumSG
Mean SG
MedianSG
Maximum Method Used
2007 88 2.34 2.77 2.78 3.06 PRA – Wax-coated
2010 481 1.04 2.77 2.78 3.98 Taseko – Uncoated
2011 3,249 225 2.92 2.90 4.02 Taseko – Uncoated
Over-all 3,818 1.04 2.89 2.89 4.02
11.4 DATA HANDLING
All drill hole records from 2007 to 2012 are compiled and organized in a SQL database with tables which are compatible with the Microsoft Access database software. Laptop computers are used during core logging and data are encoded using MS Access, the data structure of which was developed by HDI. A secured drill hole master database resides in the file server located in the exploration office at site. On a daily basis, all laptops being used in the logging process are synchronized into this master database. With this process, it was ensured that the database in all laptops and the master file are updated and backed-up regularly.
In the same manner, digital photographs of the drill cores are transferred to the file server in the exploration office at site. This and all the other related field data are transmitted to the head office in Vancouver on a weekly basis. Logging data are continuously updated and merged with the head office file and subsequently, these records are linked with the digital assay records provided by the analytical laboratories. Ultimately, printing of records is done by the Vancouver office to again validate and ensure the integrity of the imported data.
The QA/QC team at the head office is given a copy of all the sample assays as they become available and released by the laboratory as final analytical results. This team validates the results and may provide advice to the laboratory for analytical re-runs on erroneous and/or questionable results whenever necessary. If re-runs are made, the database is again modified to reflect the corrected and updated data. The Vancouver office then exports the final database to the site exploration office, the resource modeling team and other concerned groups.
The project database is continuously and regularly processed and reviewed whenever additional information becomes available. A series of validation is done with the intention of generating a clean database for the company’s information disclosure requirements. All the compiled information becomes available to all concerned users which include among others the project management, technical team and consultants for data review and verification. Throughout this continuous data updates and checks, it is ensured that any data errors can be quickly addressed

Section 11 Sample Preparation, Analyses and Security 11
Aley Project Technical Report October 2014
and any material changes to those stated in previous disclosures can be easily tracked and managed.

Aley Project Technical Report October 2014
SECTION 12: DATA VERIFICATION
Aley Project Technical Report October 2014
Table of Contents
12.0 Data Verification ....................................................................................................................1
12.1 Verificaton of Drill and Assay Data ....................................................................................1
12.2 Verification of Metallurgical Data ......................................................................................1
12.3 Other Data Verification .......................................................................................................2
12.4 Conclusion ...........................................................................................................................2
Section 12 Data Verification 1
Aley Project Technical Report October 2014
12.0 Data Verification
12.1 VERIFICATION OF DRILL AND ASSAY DATA
The Taseko technical staff and consultants have reviewed all available records on the property including but not limited to surface geologic data, trench and drill assays, and other various ground surveys. The validation process involved the following:
Creation of a drill hole database with table structures that are compatible with Gemcom GEMS mining and exploration software.
Verification of assay results in the database against the original laboratory assay certificates.
Verification of data using the automatic check functions of the GEMS software i.e., duplicate check, un-matched samples check, maximum/minimum value, etc.
Review of the results of the QA/QC samples. Laboratory analytical re-runs were done when external standards fell outside of acceptable limits. QA/QC methodology and results are summarized in Section 11.2.
Evaluation and comparison of all the assay methods implemented and the corresponding assay results generated throughout the history of the project.
Data corrections, updates and validation were performed regularly.
The authors are of the opinion that the drilling and assay data is of good quality and adequate to support the mineral reserve estimate as defined under NI 43-101.
Prior to commencing the Aley resource estimation process and the subsequent preparation of the NI 43-101 reports, Ronald G. Simpson of Geosim Services Inc. visited the Aley project site on August 29, 2011. During the field visit, Mr. Simpson:
Inspected drill core in review of the property’s geology and mineralized characteristics.
Verified 11 drill hole collar locations by means of hand-held GPS.
Reviewed all drilling, core sampling and site QA/QC protocols.
Mr. Simpson also reviewed the sample preparation, QA/QC and analytical protocols of Inspectorate Laboratory. No samples were collected during his site visit.
Mr. Simpson is of the opinion that the data is adequate to support the measured, indicated and inferred mineral resource estimate as defined under NI 43-101.
12.2 VERIFICATION OF METALLURGICAL DATA
Data used in the preparation of the metallurgical prediction, recovery method and process operating cost was from a test program conducted at SGS Vancouver’s integrated test facility under the supervision of Keith P. Merriam. SGS is an internationally recognized lab that uses
Section 12 Data Verification 2
Aley Project Technical Report October 2014
industry standard equipment and methods which are suitably validated and internationally recognized. SGS Vancouver is accredited by the Standards Council of Canada under CAN-P-1579, CAN-P-1587, and CAN-P-4E (ISO/IEC 17025:2005).
Mr. Merriam, the Metallurgical QP, visited the Aley Property on July 20th through 22nd 2011 and August 15th through 23rd 2012. A Senior Metallurgist from the corporate office directly reporting to Mr. Merriam was seconded to the SGS facility during test work and witnessed in excess of 95 % of the tests. Mr. Merriam attended the lab periodically, and at key test junctures. Lab procedures and QA/QC were evaluated during these site visits. Mr. Merriam is of the opinion that the data is adequate to support a mineral reserve estimate as defined under NI 43-101.
12.3 OTHER DATA VERIFICATION
Verification of mine and process design and cost estimates are discussed in the relevant sections of this Report. The data is concluded to be adequate to support a pre-feasibility level of study.
12.4 CONCLUSION
The QP’s are of the opinion that the data is adequate to support a mineral resource and mineral reserve estimate as defined under NI 43-101.

Aley Project Technical Report October 2014
SECTION 13: MINERAL PROCESSING AND METALLURGICAL TESTING

Aley Project Technical Report October 2014
Table of Contents
13.0 Mineral Processing and Metallurgical Testing ......................................................................1
13.1 Metallurgocal Testing History .............................................................................................1
13.2 Niobium Processing – Current Industrial Practice ..............................................................2
13.3 Ore Characterization ............................................................................................................3
13.3.1 Mineralogy and Liberation Analysis ..............................................................................4
13.3.2 Comminution Studies .....................................................................................................6
13.4 Mineral Processing Studies .................................................................................................8
13.4.1 Conventional Flotation ...................................................................................................8
13.4.2 Alternative Niobium Flotation Batch Work .................................................................11
13.4.3 Alternative Niobium Flotation – Locked Cycle ...........................................................14
13.4.4 Flotation Variability Test Work ...................................................................................17
13.5 Concentrate Treatment ......................................................................................................19
13.5.1 Hydrochloric Acid Leaching of Floation Concentrate .................................................19
13.5.2 Caustic Leaching of Residue ........................................................................................21
13.5.3 Caustic Cracking ..........................................................................................................21
13.6 Ferrous Niobium Conversion ............................................................................................21
13.7 Recovery Predictions .........................................................................................................23
List of Tables
Table 13.1: Master Composite Analysis ......................................................................................... 3
Table 13.2: Significant Head Assays .............................................................................................. 4
Table 13.3: QEMSCAN Analysis of Master Composite ................................................................ 5
Table 13.4: Niobium Mineral Association Analysis ....................................................................... 6
Table 13.5: Grindability Test Summary ......................................................................................... 7
Table 13.6: Bond Work Index Results ............................................................................................ 8
Table 13.7: Initial Scoping Test Conditions ................................................................................... 9
Table 13.8: Initial Scoping Batch Test Results ............................................................................. 10
Table 13.9: Initial Scoping Locked Cycle Test Results ................................................................ 10
Table 13.10: Alternative Niobium Flotation Test Results ............................................................ 11
Table 13.11: Comparison of Initial Locked Cycle Results ........................................................... 14
Table 13.12: Comparison of Reproducible Locked Cycle Tests .................................................. 15
Aley Project Technical Report October 2014
Table 13.13: Evaluation of Confidence Interval for Reproducible Locked cycle Tests ............... 15
Table 13.14: Comparison of Head and Concentrate Assays of Variability Tests to Alternative Niobium Flotation Batch and Locked Cycle Tests ................................................. 17
Table 13.15: Results of Initial Leaching Treatment ..................................................................... 19
Table 13.16: Initial Leaching Treatment of Concentrate from Alternative Niobium Flotation Batch Test ................................................................................................................ 20
Table 13.17: Results from 2013 Niobium Conversion Testing .................................................... 22
Table 13.18: Results from 2014 Niobium Conversion Testing .................................................... 22
Table of Figures
Figure 13.1: QEMSCAN Analysis of Master Composite ............................................................... 5
Figure 13.2: Niobium Mineral Association Analysis ..................................................................... 6
Figure 13.3: Nb2O5 Recovery versus P2O5 Recovery Curve ....................................................... 12
Figure 13.4: Nb2O5 Recovery versus Sulphur Recovery Curve ................................................... 13
Figure 13.5: Nb2O5 Recovery versus Carbonate Recovery Curve ............................................... 13
Figure 13.6: Nb2O5 Recovery versus P2O5, Sulphur and Carbonate Recovery for Alternative Niobium Flotation Locked Cycle Test Concentrates ................................................ 16
Figure 13.7: Nb2O5 Recovery versus P2O5 Recovery for Variability Tests ................................. 18
Figure 13.8: Nb2O5 Recovery versus Carbonate Recovery for Variability Tests ......................... 18
Section 13 Mineral Processing and Metallurgical Testing 1
Aley Project Technical Report October 2014
13.0 Mineral Processing and Metallurgical Testing
The metallurgical testing that was used as the basis for design was conducted at SGS Laboratory in Vancouver, and XPS in Sudbury. The test program included: mineralogical work, liberation analysis, comminution test work, gravity work, magnetic separation, several flotation programs and leach test work. The niobium concentrate produced from the work at SGS was sent o XPS for conversion test work.
The final flow sheet developed from the test work includes comminution, magnetic separation, flotation, leaching and final conversion.
The overall results from the series of tests conducted at the labs show that a process plant recovery of 71% was achieved in repeatable and stable locked cycle tests and a leach recovery average of 95% was achieved over all leach tests. The overall ferr-niobium grade achieved was 63% Nb at a recovery to ferr-niobium alloy of 65%.
13.1 METALLURGICAL TESTING HISTORY
Metallurgical test work on the deposit dates back to shortly after its discovery by Cominco in 1980. Drilling in the area identified three zones of mineralization; Central, Saddle and Saddle West, as well as three additional zones of interest; Bear, Goat and Saddle East. Initial testing by Cominco focused on the Bear Zone, and sink-float (dense media) and gravity tests were carried out to produce a concentrate with a grade of 28% Nb2O5. Subsequent tests then focused on using similar metallurgical flotation procedures to those being implemented at Niobec’s operation in Quebec. Over the next several years, flotation tests were performed on Central Zone material at Cominco’s laboratory in Trail, British Columbia. Testing resulted in low recoveries, with concentrate grades not exceeding 7.5% Nb2O5 (Madeley, 2011).
In 2004, seventeen trenched samples and eleven drill core samples from the Central Zone were shipped by Aley Corporation (property owner at the time) to Process Research Associates (PRA) in Richmond, British Columbia, for metallurgical testing. The purpose of the test work was to evaluate the Niobec process flow sheet on Aley ore. Results appeared to be comparable to reported process results from the Niobec concentrator (Madeley, 2011).
In 2005, five drill core samples from the Saddle Zone were shipped to PRA for metallurgical testing. Grind size, de-sliming, gravity concentration, magnetic separation and flotation testing were conducted and the subsequent test results were encouraging, achieving a concentrate grade of 30% Nb2O5 at a recovery of 55% (Madeley, 2011).
After the acquisition of the property by Taseko Mines in 2006, testing continued at PRA on Saddle Zone material in 2008. The 2008 Saddle Zone study included the evaluation of coarser grind sizes incorporating the flow sheet developed during the 2004 test program. Qualitative mineralogy was also performed on the flotation concentrate product.
Section 13 Mineral Processing and Metallurgical Testing 2
Aley Project Technical Report October 2014
Metallurgical test work conducted prior to 2007 by Cominco and Aley Corporation preceding Taseko’s acquisition of Aley Corporation is considered historical. These tests were conducted using material from drill or trenching programs that do not have documentation available with regards to sample preparation, analysis procedures, or QA/QC. The metallurgical composites generated for these tests are not representative of what has now been identified as a mineral resource or a mineral reserve. While these test programs are indicative in nature and provide valuable information with regards to the process conditions and response of the Aley mineralization, the analytical issues preclude using the results for predictive purposes.
In 2010 an extensive exploration drill program was commenced on the Central Zone deposit and was followed up in 2011 with 66 infill drill holes. Drill core from the 2010 program was shipped to Inspectorate Labs (formerly PRA) for metallurgical testing and flow sheet development.
A subsequent test program was initiated at SGS (Vancouver). This test program provides the basis for the information used in process design, costing and recovery predictions.
13.2 NIOBIUM PROCESSING – CURRENT INDUSTRIAL PRACTICE
Industrial practice in primary niobium production consists of unit processes that are widely used across mineral processing and metallurgical facilities around the world. However, the specific details of the sizing, arrangement in the flow sheet, and operating practices are closely held as confidential information by the producers themselves. The general processing route for primary niobium production can be determined by examining publically available information. This route consists of a comminution circuit that is typically designed to prevent the production of excessive amounts of fine or coarse material. Once the appropriate particle size is achieved, a series of separation processes are employed to remove materials that would either interfere with the recovery of niobium minerals or adversely impact the final product in the form of impurities prior to niobium flotation. These processes are largely focused on the removal of magnetite, pyrite, and carbonates.
Once the selected mineral removal stages have been conducted, niobium flotation is undertaken. Flotation is conducted in a number of dilution cleaning stages. Concentrates produced are generally in the order of ~ 50 – 55% Nb2O5 grade at flotation recoveries of ~50% after flotation cleaning.
Subsequent to flotation recovery, the concentrate is subjected to a leach process, generally HCl, to remove residual carbonatite minerals. The leach residue is then dried and subjected to aluminothermic conversion to a ferrous niobium alloy, which is the final process product. Niobium recovery at the converting stage is generally stated at 97%.
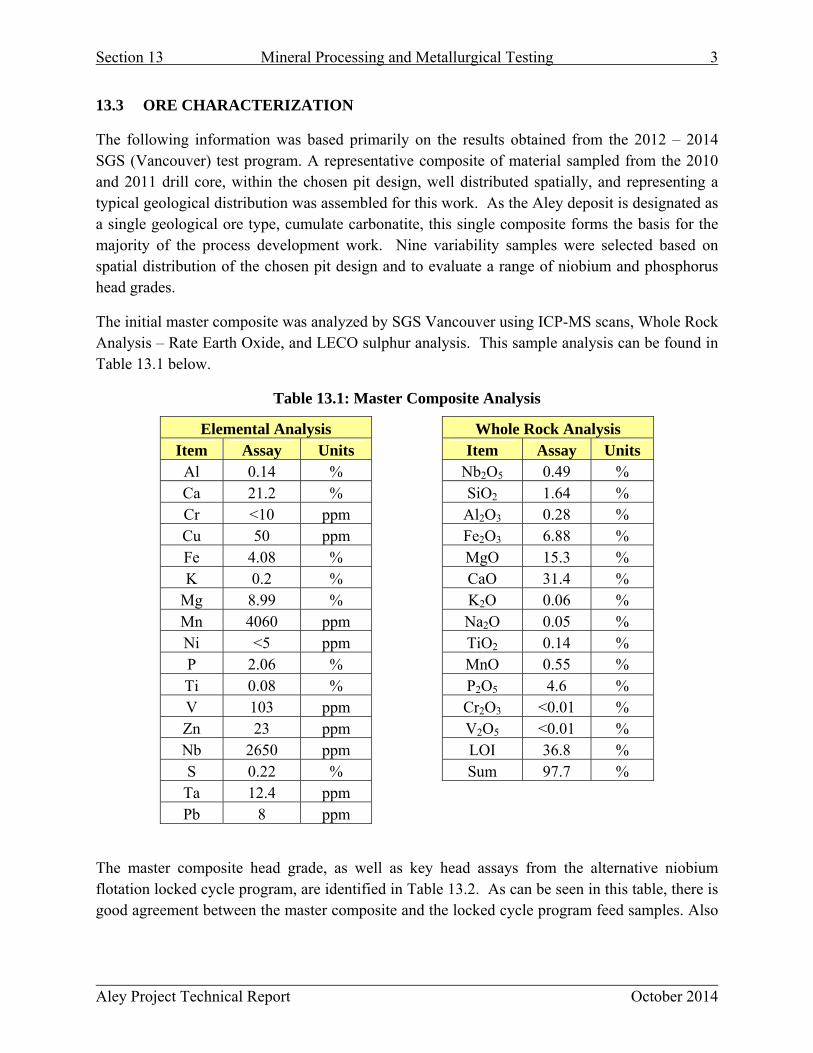
Section 13 Mineral Processing and Metallurgical Testing 3
Aley Project Technical Report October 2014
13.3 ORE CHARACTERIZATION
The following information was based primarily on the results obtained from the 2012 – 2014 SGS (Vancouver) test program. A representative composite of material sampled from the 2010 and 2011 drill core, within the chosen pit design, well distributed spatially, and representing a typical geological distribution was assembled for this work. As the Aley deposit is designated as a single geological ore type, cumulate carbonatite, this single composite forms the basis for the majority of the process development work. Nine variability samples were selected based on spatial distribution of the chosen pit design and to evaluate a range of niobium and phosphorus head grades.
The initial master composite was analyzed by SGS Vancouver using ICP-MS scans, Whole Rock Analysis – Rate Earth Oxide, and LECO sulphur analysis. This sample analysis can be found in Table 13.1 below.
Table 13.1: Master Composite Analysis
Elemental Analysis Whole Rock Analysis Item Assay Units Item Assay Units Al 0.14 % Nb2O5 0.49 % Ca 21.2 % SiO2 1.64 % Cr <10 ppm Al2O3 0.28 % Cu 50 ppm Fe2O3 6.88 % Fe 4.08 % MgO 15.3 % K 0.2 % CaO 31.4 %
Mg 8.99 % K2O 0.06 % Mn 4060 ppm Na2O 0.05 % Ni <5 ppm TiO2 0.14 % P 2.06 % MnO 0.55 % Ti 0.08 % P2O5 4.6 % V 103 ppm Cr2O3 <0.01 % Zn 23 ppm V2O5 <0.01 % Nb 2650 ppm LOI 36.8 % S 0.22 % Sum 97.7 % Ta 12.4 ppm Pb 8 ppm
The master composite head grade, as well as key head assays from the alternative niobium flotation locked cycle program, are identified in Table 13.2. As can be seen in this table, there is good agreement between the master composite and the locked cycle program feed samples. Also

Section 13 Mineral Processing and Metallurgical Testing 4
Aley Project Technical Report October 2014
included in the table below are the 9 spatially distributed variability samples. These samples were selected in order to evaluate a range of niobium and phosphorus head grades.
Table 13.2: Significant Head Assays
Sample ID Type Range Assay (%)
Fe2O3 MgO CaO P2O5 Nb2O5 Master Composite 6.88 15.30 31.40 4.60 0.49
LCT5-3 6.93 15.16 31.27 4.64 0.48 LCT5-5 6.99 15.38 31.75 4.72 0.48 LCT5-6 6.95 15.20 31.36 4.65 0.48
LCT-AVG 6.96 15.25 31.46 4.67 0.48 VAR-01 Nb2O5 Low 4.57 17.3 30.8 2.12 0.25
VAR-02 Nb2O5
Low-Med 5.65 16.0 30.8 4.25 0.37
VAR-03 Nb2O5 Med 14.5 13.4 28.7 5.04 0.63
VAR-04 Nb2O5
Med-High 7.71 14.4 32.3 5.53 0.70
VAR-05 Nb2O5 High 11.4 13.3 28.7 7.23 1.16 VAR-06 P2O5 Low 6.32 15.5 27.3 1.92 0.14 VAR-07 P2O5 Low 4.50 16.5 32.0 3.90 0.30 VAR-08 P2O5 Med 14.8 11.5 30.0 6.45 1.03 VAR-09 P2O5 Med 8.58 14.0 31.9 7.29 0.70
13.3.1 MINERALOGY AND LIBERATION ANALYSIS
Extensive geological analysis has been conducted on the Aley project. Six lithological units have been defined in the potential deposit area. However, only one of these units, cumulate carbonatite (CM), is scheduled for delivery as feed to the processing facilities. Cumulate carbonatite is defined by the presence of magnetite-apatite-zircon-columbite or pyrochlore cumulates. Discussions regarding the mineralogy of the Aley deposit from a geological standpoint are found in other sections of this report. This section discusses mineralogical analyses conducted on material used in the metallurgical test program.
Quantitative mineralogy evaluations of the 2011 Central Zone sample supported that an 80 percent passing size between 90 and 110 μm test program be conducted from an economic standpoint. This was due to the fact that improved liberation appeared to taper off below a p80 of 90 μm and only begin to increase again below 60 um, which could incur a significant increase in grinding operating costs in a real world plant.

Section 1
Aley Proj
More deMicroscosamples, QEMSCAassociatio
The masW3 and approximNiobiummineralobelow.
Ca
13
oject Technic
etailed QEMopy) techniq
and produAN provideon.
ter composiW4) were
mately ~90%m mineraliza
gical analys
T
Samp
alculated Pa
Mineral M
F
Minera
cal Report
MSCAN (Qques were uuct sampleses informatio
ite blend usesubjected t
% by mass oation in bothsis from the
Table 13.3: Q
ple
article Size
Mass (%)
igure 13.1:
al Processing
Quantitative sed to analys to guide on on miner
ed for metalto QEMSCA
of the ore is h samples QEMSCAN
QEMSCAN
Pyrochlor
Columbit
Pyrite
Fe Oxide
Carbonate
Apatite
Other
QEMSCAN
g and Metall
Evaluationyse a variety
the metallral species p
llurgical testAN analysiscomposed owas identif
N work can
N Analysis o
W3
21
re 0.7
e 0.3
1.3
s 4.1
es 76.4
13.6
3.6
N Analysis o
lurgical Test
n of Matery of feed salurgical propresent, min
t work and s. As can bof carbonate
fied as pyrobe seen in
of Master Co
3 W
20
0.
0.
1.
4
4 76
6 13
3.
of Master C
ting
rials by Scamples, inteogram at Sneral liberat
two subsambe seen in es, apatite, aochlore and
Table 13.3
omposite
W4 Mast
0
7
3
4
4
6.3
.8
5
Composite
October
canning Elermediate pr
SGS Vancotion, and mi
mples (designthe table beand other ox
d columbite.and Figure
ter Comp
16
0.9
0.4
1.7
5.5
73.9
13.9
3.7
5
2014
ectron ocess
ouver. ineral
nated elow, xides. The 13.1
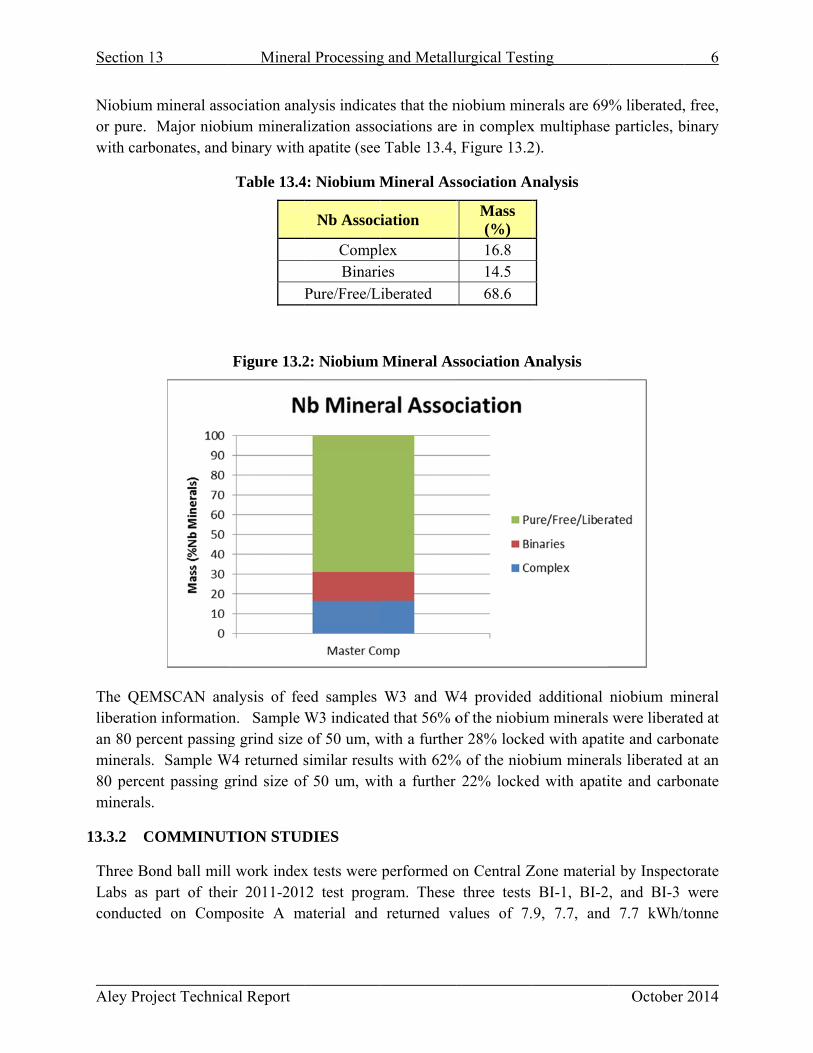
Section 1
Aley Proj
Niobiumor pure. with carb
The QEMliberationan 80 perminerals.80 perceminerals.
13.3.2 C
Three BoLabs as conducte
13
oject Technic
m mineral assMajor niob
bonates, and
MSCAN ann informatiorcent passing. Sample Wnt passing g.
COMMINUT
ond ball millpart of the
ed on Comp
Minera
cal Report
sociation anaium mineralbinary with
Table 13.4
Figure 13.2
alysis of fen. Sample g grind size
W4 returned sgrind size of
TION STUD
l work indexir 2011-201posite A m
al Processing
alysis indicatlization asso
h apatite (see
4: Niobium M
Nb Assoc
ComplBinari
Pure/Free/L
2: Niobium
ed samples W3 indicateof 50 um, w
similar resulf 50 um, wi
DIES
x tests were 2 test prog
material and
g and Metall
tes that the nociations are Table 13.4,
Mineral As
iation
lex ies
iberated
Mineral As
W3 and W
ed that 56% owith a furthelts with 62%ith a further
performed ogram. These
returned v
lurgical Test
niobium mine in complex Figure 13.2
sociation A
Mass (%) 16.8 14.5
68.6
ssociation A
W4 provided of the niobiu
er 28% locke% of the niob
22% locked
on Central Zthree tests
values of 7.
ting
nerals are 69x multiphase2).
nalysis
Analysis
additional um minerals ed with apatbium minerad with apati
Zone materiaBI-1, BI-2
9, 7.7, and
October
% liberated,e particles, b
niobium mi were liberat
tite and carbals liberated ite and carb
al by Inspect, and BI-3
d 7.7 kWh/t
6
2014
, free, binary
ineral ted at onate at an onate
torate were
tonne
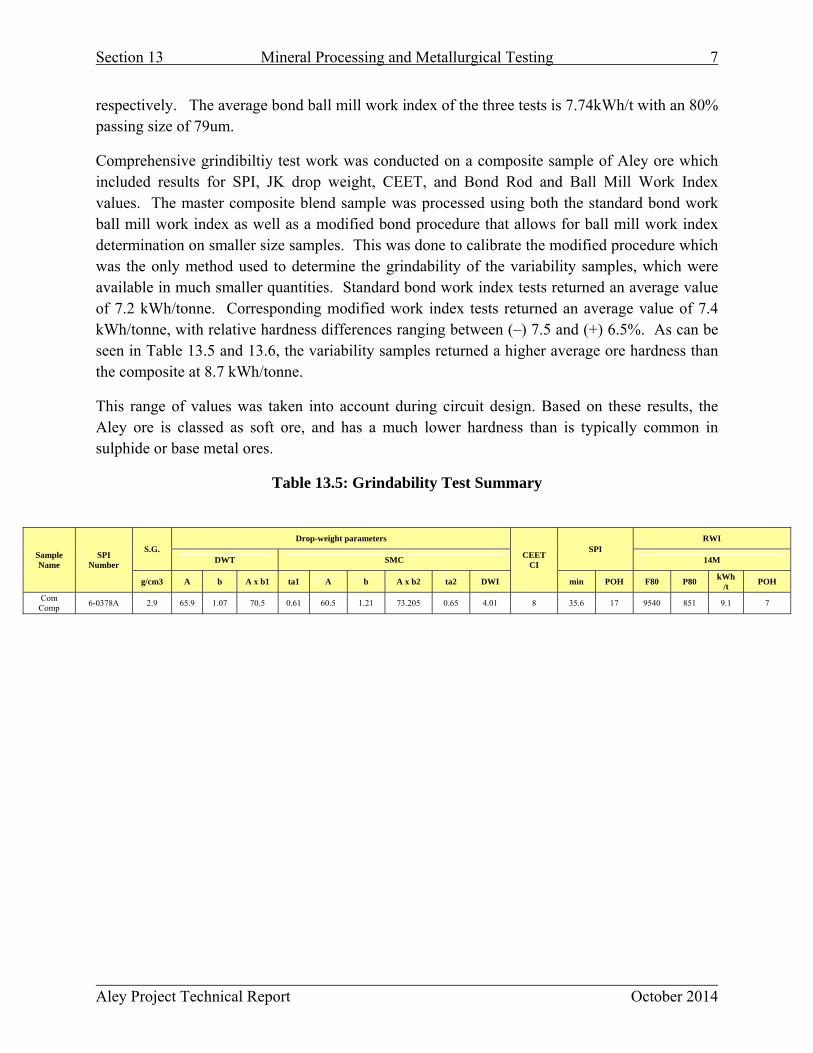
Section 13 Mineral Processing and Metallurgical Testing 7
Aley Project Technical Report October 2014
respectively. The average bond ball mill work index of the three tests is 7.74kWh/t with an 80% passing size of 79um.
Comprehensive grindibiltiy test work was conducted on a composite sample of Aley ore which included results for SPI, JK drop weight, CEET, and Bond Rod and Ball Mill Work Index values. The master composite blend sample was processed using both the standard bond work ball mill work index as well as a modified bond procedure that allows for ball mill work index determination on smaller size samples. This was done to calibrate the modified procedure which was the only method used to determine the grindability of the variability samples, which were available in much smaller quantities. Standard bond work index tests returned an average value of 7.2 kWh/tonne. Corresponding modified work index tests returned an average value of 7.4 kWh/tonne, with relative hardness differences ranging between (–) 7.5 and (+) 6.5%. As can be seen in Table 13.5 and 13.6, the variability samples returned a higher average ore hardness than the composite at 8.7 kWh/tonne.
This range of values was taken into account during circuit design. Based on these results, the Aley ore is classed as soft ore, and has a much lower hardness than is typically common in sulphide or base metal ores.
Table 13.5: Grindability Test Summary
Sample Name
SPI Number
S.G. Drop-weight parameters
CEET CI
SPI RWI
DWT SMC 14M
g/cm3 A b A x b1 ta1 A b A x b2 ta2 DWI min POH F80 P80 kWh
/t POH
Com Comp
6-0378A 2.9 65.9 1.07 70.5 0.61 60.5 1.21 73.205 0.65 4.01 8 35.6 17 9540 851 9.1 7

Section 13 Mineral Processing and Metallurgical Testing 8
Aley Project Technical Report October 2014
Table 13.6: Bond Work Index Results
Sample Name
BWI Mod Bond
100M F80 P80 kWh/t POH kWh/t
Com Comp
2415 121 7.5 3.0 --
Blend 1 1416 168 8.0 3.7 8.2 Blend 2 1350 169 7.1 2.1 -- Blend 3 1412 167 6.2 1.4 6.6 Blend 4 1381 169 6.2 1.4 -- Blend 5 1378 169 8.0 3.6 7.4 Var 1 8.6 Var 2 9.1 Var 3 8.2 Var 4 8.0 Var 5 8.9 Var 6 8.8 Var 7 9.1 Var 8 9.1
Var 9 8.3
13.4 MINERAL PROCESSING STUDIES
Metallurgical test programs have been undertaken to produce a niobium flotation concentrate which falls into one of two categories; conventional processing and alternative niobium flotation. Conventional flotation test work was conducted both with and without gravity concentration as part of the flow sheet to the locked cycle level. Alternative niobium flotation was also conducted to the locked cycle level. The Alternative niobium flotation flow sheet was selected as the basis for metallurgical recovery predictions, and material from this program was taken forward to leaching and subsequent ferrous niobium production.
13.4.1 CONVENTIONAL FLOTATION
A conventional niobium flotation circuit program consisting of 81 separate batch flotation tests was conducted in a series designated the “F” series. At the beginning of the F series tests the flow sheet consisted of magnetic separation, followed by pyrite flotation, then carbonate flotation, and finally by niobium flotation.
This portion of the test program consisted of staged kinetic flotation test work that evaluated the impact of specific flotation conditions that included:

Section 13 Mineral Processing and Metallurgical Testing 9
Aley Project Technical Report October 2014
Flotation feed particle size
Conventional single pass grinding
Staged grinding with screening between stages
Magnetic separation
Gravity separation
Flotation chemicals and their dosages
Flotation Time
The gravity and conventional flotation program is best illustrated by tests F72, F73, F74, and F75. These four tests were conducted in order to produce material for a scoping ferrous niobium conversion test at the mature processing parameters determined at that time. This circuit consisted of primary grinding to 50 um, gravity separation, magnetic separation, pyrite flotation, carbonate flotation, and finally niobium flotation. Typical test conditions are in Table 13.7.
Table 13.7: Initial Scoping Test Conditions
Typical Test Conditions - F72 Ore Pretreatment 1 Gravity Concentration
2 Low Intensity Magnetic Separation
Processing Stage PAX MIBC
Carbonatite Collector
Dispersant pH
Modifier Activator
Nb Collector
(g/t) (g/t) (g/t) (g/t) (g/t) (g/t) (mg/L) Pyrite Flotation 45 47
Carbonatite Flotation 871 3178 12227 Niobium Flotation 4722 27
These test conditions returned results that were consistent with the grade recovery curve that was developed for these conditions. Table 13.8 shows test feed and end products.
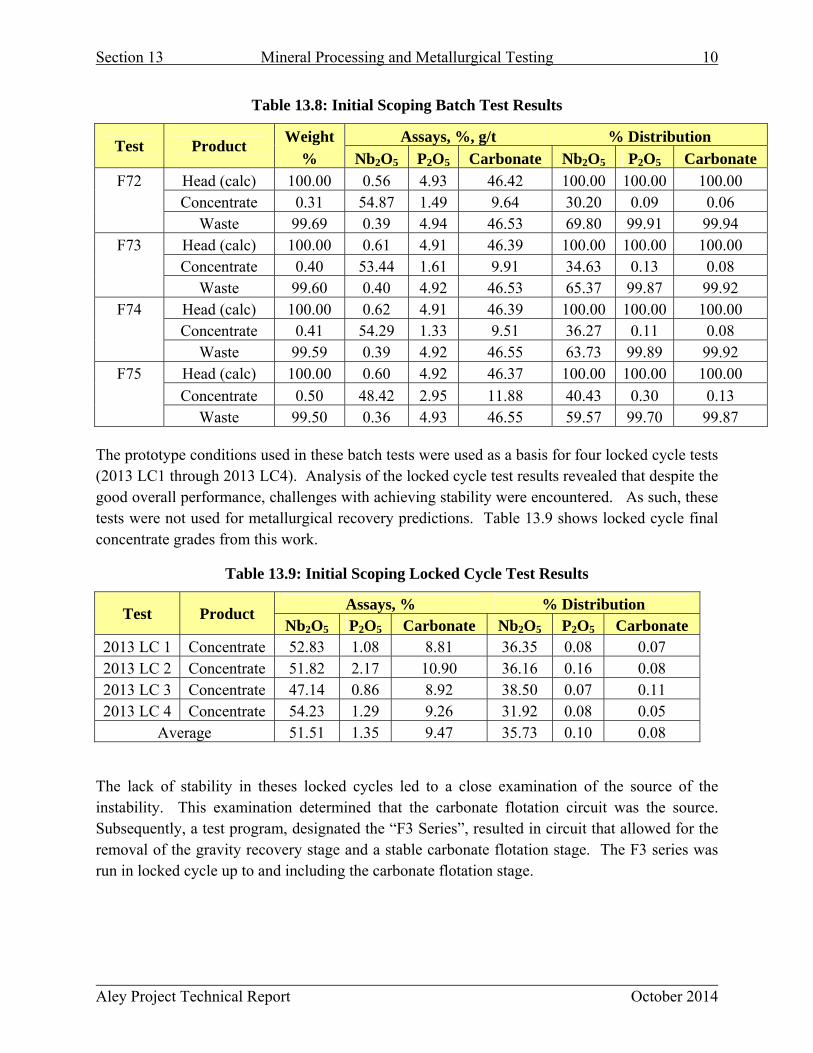
Section 13 Mineral Processing and Metallurgical Testing 10
Aley Project Technical Report October 2014
Table 13.8: Initial Scoping Batch Test Results
Test Product Weight Assays, %, g/t % Distribution
% Nb2O5 P2O5 Carbonate Nb2O5 P2O5 Carbonate
F72 Head (calc) 100.00 0.56 4.93 46.42 100.00 100.00 100.00 Concentrate 0.31 54.87 1.49 9.64 30.20 0.09 0.06 Waste 99.69 0.39 4.94 46.53 69.80 99.91 99.94
F73 Head (calc) 100.00 0.61 4.91 46.39 100.00 100.00 100.00 Concentrate 0.40 53.44 1.61 9.91 34.63 0.13 0.08 Waste 99.60 0.40 4.92 46.53 65.37 99.87 99.92
F74 Head (calc) 100.00 0.62 4.91 46.39 100.00 100.00 100.00 Concentrate 0.41 54.29 1.33 9.51 36.27 0.11 0.08 Waste 99.59 0.39 4.92 46.55 63.73 99.89 99.92
F75 Head (calc) 100.00 0.60 4.92 46.37 100.00 100.00 100.00
Concentrate 0.50 48.42 2.95 11.88 40.43 0.30 0.13 Waste 99.50 0.36 4.93 46.55 59.57 99.70 99.87
The prototype conditions used in these batch tests were used as a basis for four locked cycle tests (2013 LC1 through 2013 LC4). Analysis of the locked cycle test results revealed that despite the good overall performance, challenges with achieving stability were encountered. As such, these tests were not used for metallurgical recovery predictions. Table 13.9 shows locked cycle final concentrate grades from this work.
Table 13.9: Initial Scoping Locked Cycle Test Results
Test Product Assays, % % Distribution
Nb2O5 P2O5 Carbonate Nb2O5 P2O5 Carbonate 2013 LC 1 Concentrate 52.83 1.08 8.81 36.35 0.08 0.07 2013 LC 2 Concentrate 51.82 2.17 10.90 36.16 0.16 0.08 2013 LC 3 Concentrate 47.14 0.86 8.92 38.50 0.07 0.11 2013 LC 4 Concentrate 54.23 1.29 9.26 31.92 0.08 0.05
Average 51.51 1.35 9.47 35.73 0.10 0.08
The lack of stability in theses locked cycles led to a close examination of the source of the instability. This examination determined that the carbonate flotation circuit was the source. Subsequently, a test program, designated the “F3 Series”, resulted in circuit that allowed for the removal of the gravity recovery stage and a stable carbonate flotation stage. The F3 series was run in locked cycle up to and including the carbonate flotation stage.

Section 13 Mineral Processing and Metallurgical Testing 11
Aley Project Technical Report October 2014
13.4.2 ALTERNATIVE NIOBIUM FLOTATION BATCH WORK
During the test work campaign that included both gravity separation and conventional flotation a significant portion of the niobium in the feed was lost to the gravity waste stream. As such an independent program was undertaken to determine if an alternative process could be used in order to recover a portion of this material through alternative niobium flotation. Initial results from this test work became available at the same time as the carbonate circuit optimization work was being conducted. Subsequently, the two programs were conducted in parallel until such time as the alternative flotation process was selected as the sole process route.
Details of the alternative flotation process conditions are proprietary and confidential. Unit processes used are standardly applied to mineral processing circuits and include comminution, magnetic separation, and flotation.
A series of tests were conducted at the SGS Vancouver on a representative feed composite that was designated the “F5” Series. A methodical step wise approach was conducted in order to determine the primary grind size (selected at an 80 % passing size of ~50 um), unit processes required, the order of the unit processes, and specific conditions to be applied to each unit process. This test program consisted of a progression of in excess of seventy six batch tests. Table 13.10 shows the development of this batch process program.
Table 13.10: Alternative Niobium Flotation Test Results
Test Product Weight
% Assays, %, g/t % Distribution
Nb2O5 P2O5 Carbonate Nb2O5 P2O5 Carbonate F5-23 Head (calc) 100.00 0.49 4.69 47.05 100.00 100.00 100.00
Concentrate 5.72 7.30 3.66 31.47 85.65 4.46 3.83 Waste 94.29 0.07 4.75 47.99 14.35 95.54 96.18
F5-32 Head (calc) 100.00 0.50 4.70 46.93 100.00 100.00 100.00 Concentrate 4.66 9.16 3.15 28.80 85.60 3.12 2.86 Waste 95.34 0.08 4.78 47.82 14.40 96.88 97.14
F5-45 Head (calc) 100.00 0.51 4.68 47.04 100.00 100.00 100.00 Concentrate 3.76 11.01 2.94 25.28 81.76 2.36 2.02 Waste 96.24 0.10 4.75 47.89 18.24 97.64 97.98
F5-64 Head (calc) 100.00 0.48 4.62 46.40 100.00 100.00 100.00 Concentrate 2.47 15.31 2.43 16.65 79.13 1.30 0.89 Waste 97.53 0.10 4.68 47.16 20.87 98.70 99.11
F5-76 Head (calc) 100.00 0.47 4.65 46.81 100.00 100.00 100.00 Concentrate 2.00 18.12 2.10 13.28 76.48 0.90 0.57 Waste 98.00 0.12 4.81 46.81 23.52 99.10 99.43
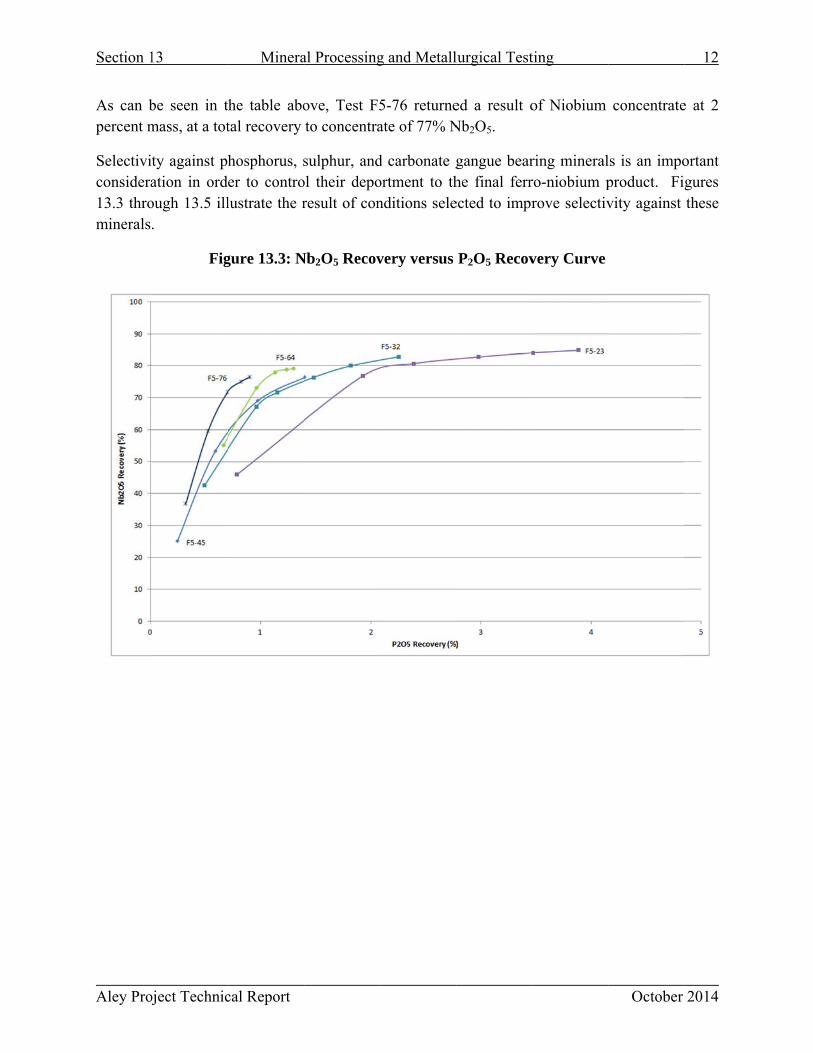
Section 1
Aley Proj
As can bpercent m
Selectivitconsidera13.3 throminerals.
13
oject Technic
be seen in tmass, at a tot
ty against phation in ordough 13.5 ill.
Fig
Minera
cal Report
he table abotal recovery
hosphorus, ser to controlustrate the r
gure 13.3: N
al Processing
ove, Test F5to concentra
sulphur, andol their deporesult of con
Nb2O5 Recov
g and Metall
5-76 returneate of 77% N
d carbonate gortment to thnditions sele
very versus
lurgical Test
ed a result oNb2O5.
gangue bearhe final ferrected to impr
P2O5 Recov
ting
of Niobium
ring mineralro-niobium prove selectiv
very Curve
October
concentrate
ls is an impoproduct. Fivity against
12
2014
e at 2
ortant gures these

Section 1
Aley Proj
13
oject Technic
Figu
Figure
Minera
cal Report
re 13.4: Nb2
e 13.5: Nb2O
al Processing
2O5 Recover
O5 Recovery
g and Metall
ry versus Su
y versus Ca
lurgical Test
ulphur Rec
arbonate Re
ting
overy Curv
ecovery Cur
October
ve
rve
13
2014
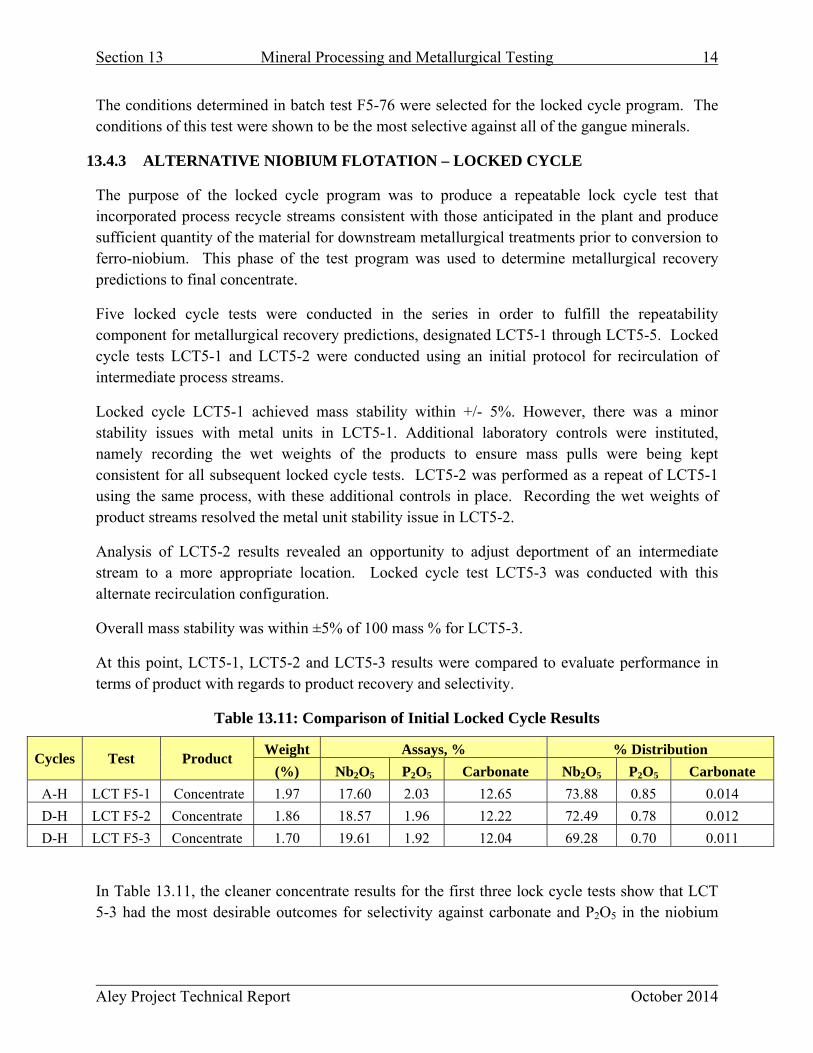
Section 13 Mineral Processing and Metallurgical Testing 14
Aley Project Technical Report October 2014
The conditions determined in batch test F5-76 were selected for the locked cycle program. The conditions of this test were shown to be the most selective against all of the gangue minerals.
13.4.3 ALTERNATIVE NIOBIUM FLOTATION – LOCKED CYCLE
The purpose of the locked cycle program was to produce a repeatable lock cycle test that incorporated process recycle streams consistent with those anticipated in the plant and produce sufficient quantity of the material for downstream metallurgical treatments prior to conversion to ferro-niobium. This phase of the test program was used to determine metallurgical recovery predictions to final concentrate.
Five locked cycle tests were conducted in the series in order to fulfill the repeatability component for metallurgical recovery predictions, designated LCT5-1 through LCT5-5. Locked cycle tests LCT5-1 and LCT5-2 were conducted using an initial protocol for recirculation of intermediate process streams.
Locked cycle LCT5-1 achieved mass stability within +/- 5%. However, there was a minor stability issues with metal units in LCT5-1. Additional laboratory controls were instituted, namely recording the wet weights of the products to ensure mass pulls were being kept consistent for all subsequent locked cycle tests. LCT5-2 was performed as a repeat of LCT5-1 using the same process, with these additional controls in place. Recording the wet weights of product streams resolved the metal unit stability issue in LCT5-2.
Analysis of LCT5-2 results revealed an opportunity to adjust deportment of an intermediate stream to a more appropriate location. Locked cycle test LCT5-3 was conducted with this alternate recirculation configuration.
Overall mass stability was within ±5% of 100 mass % for LCT5-3.
At this point, LCT5-1, LCT5-2 and LCT5-3 results were compared to evaluate performance in terms of product with regards to product recovery and selectivity.
Table 13.11: Comparison of Initial Locked Cycle Results
Cycles Test Product Weight Assays, % % Distribution
(%) Nb2O5 P2O5 Carbonate Nb2O5 P2O5 Carbonate
A-H LCT F5-1 Concentrate 1.97 17.60 2.03 12.65 73.88 0.85 0.014
D-H LCT F5-2 Concentrate 1.86 18.57 1.96 12.22 72.49 0.78 0.012
D-H LCT F5-3 Concentrate 1.70 19.61 1.92 12.04 69.28 0.70 0.011
In Table 13.11, the cleaner concentrate results for the first three lock cycle tests show that LCT 5-3 had the most desirable outcomes for selectivity against carbonate and P2O5 in the niobium
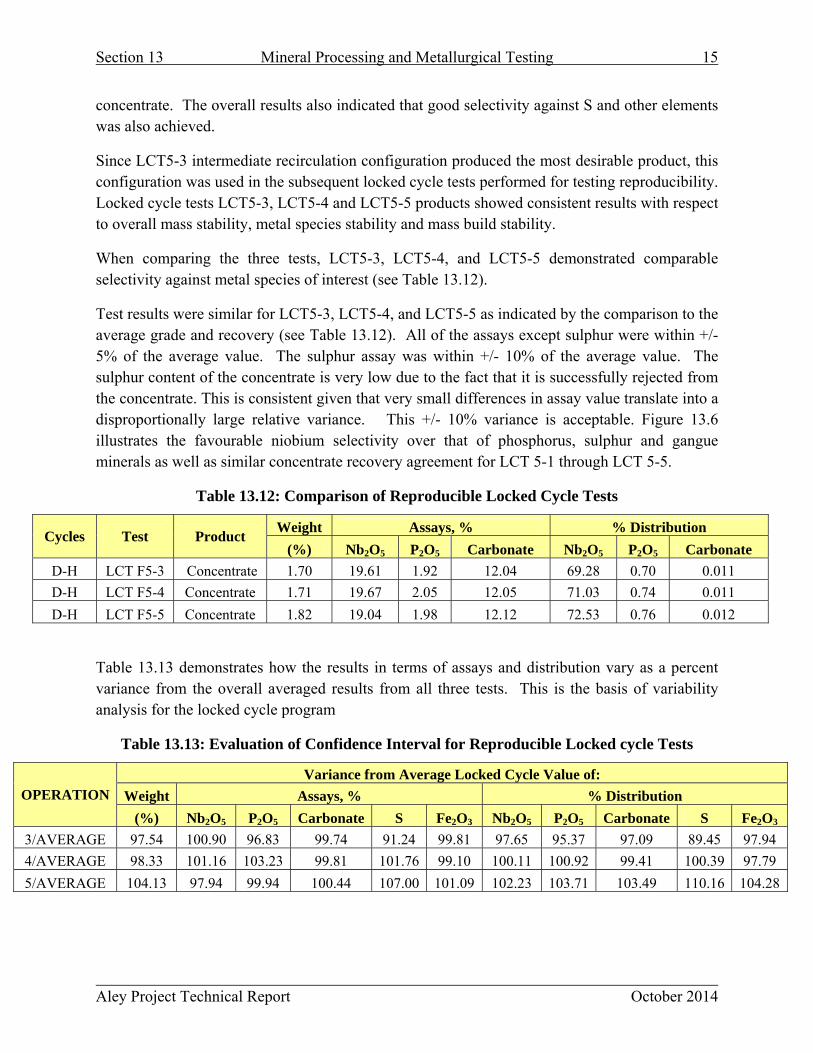
Section 13 Mineral Processing and Metallurgical Testing 15
Aley Project Technical Report October 2014
concentrate. The overall results also indicated that good selectivity against S and other elements was also achieved.
Since LCT5-3 intermediate recirculation configuration produced the most desirable product, this configuration was used in the subsequent locked cycle tests performed for testing reproducibility. Locked cycle tests LCT5-3, LCT5-4 and LCT5-5 products showed consistent results with respect to overall mass stability, metal species stability and mass build stability.
When comparing the three tests, LCT5-3, LCT5-4, and LCT5-5 demonstrated comparable selectivity against metal species of interest (see Table 13.12).
Test results were similar for LCT5-3, LCT5-4, and LCT5-5 as indicated by the comparison to the average grade and recovery (see Table 13.12). All of the assays except sulphur were within +/- 5% of the average value. The sulphur assay was within +/- 10% of the average value. The sulphur content of the concentrate is very low due to the fact that it is successfully rejected from the concentrate. This is consistent given that very small differences in assay value translate into a disproportionally large relative variance. This +/- 10% variance is acceptable. Figure 13.6 illustrates the favourable niobium selectivity over that of phosphorus, sulphur and gangue minerals as well as similar concentrate recovery agreement for LCT 5-1 through LCT 5-5.
Table 13.12: Comparison of Reproducible Locked Cycle Tests
Cycles Test Product Weight Assays, % % Distribution
(%) Nb2O5 P2O5 Carbonate Nb2O5 P2O5 Carbonate
D-H LCT F5-3 Concentrate 1.70 19.61 1.92 12.04 69.28 0.70 0.011
D-H LCT F5-4 Concentrate 1.71 19.67 2.05 12.05 71.03 0.74 0.011
D-H LCT F5-5 Concentrate 1.82 19.04 1.98 12.12 72.53 0.76 0.012
Table 13.13 demonstrates how the results in terms of assays and distribution vary as a percent variance from the overall averaged results from all three tests. This is the basis of variability analysis for the locked cycle program
Table 13.13: Evaluation of Confidence Interval for Reproducible Locked cycle Tests
OPERATION
Variance from Average Locked Cycle Value of:
Weight Assays, % % Distribution
(%) Nb2O5 P2O5 Carbonate S Fe2O3 Nb2O5 P2O5 Carbonate S Fe2O3
3/AVERAGE 97.54 100.90 96.83 99.74 91.24 99.81 97.65 95.37 97.09 89.45 97.94
4/AVERAGE 98.33 101.16 103.23 99.81 101.76 99.10 100.11 100.92 99.41 100.39 97.79
5/AVERAGE 104.13 97.94 99.94 100.44 107.00 101.09 102.23 103.71 103.49 110.16 104.28

Section 1
Aley Proj
Fig
13
oject Technic
gure 13.6: NAltern
Minera
cal Report
Nb2O5 Recovnative Niob
al Processing
very versus bium Flotati
g and Metall
P2O5, Sulphion Locked
lurgical Test
hur and CaCycle Test
ting
arbonate ReConcentrat
October
ecovery for tes
16
2014
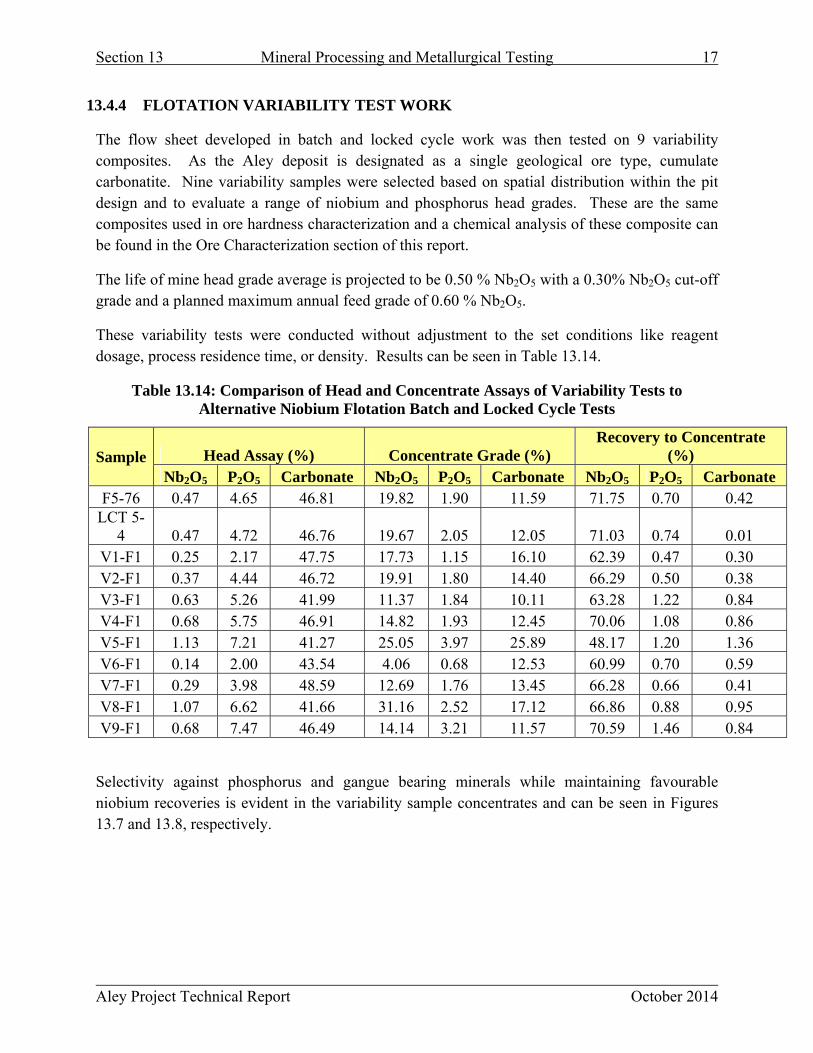
Section 13 Mineral Processing and Metallurgical Testing 17
Aley Project Technical Report October 2014
13.4.4 FLOTATION VARIABILITY TEST WORK
The flow sheet developed in batch and locked cycle work was then tested on 9 variability composites. As the Aley deposit is designated as a single geological ore type, cumulate carbonatite. Nine variability samples were selected based on spatial distribution within the pit design and to evaluate a range of niobium and phosphorus head grades. These are the same composites used in ore hardness characterization and a chemical analysis of these composite can be found in the Ore Characterization section of this report.
The life of mine head grade average is projected to be 0.50 % Nb2O5 with a 0.30% Nb2O5 cut-off grade and a planned maximum annual feed grade of 0.60 % Nb2O5.
These variability tests were conducted without adjustment to the set conditions like reagent dosage, process residence time, or density. Results can be seen in Table 13.14.
Table 13.14: Comparison of Head and Concentrate Assays of Variability Tests to Alternative Niobium Flotation Batch and Locked Cycle Tests
Sample Head Assay (%) Concentrate Grade (%) Recovery to Concentrate
(%) Nb2O5 P2O5 Carbonate Nb2O5 P2O5 Carbonate Nb2O5 P2O5 Carbonate
F5-76 0.47 4.65 46.81 19.82 1.90 11.59 71.75 0.70 0.42 LCT 5-
4 0.47 4.72 46.76 19.67 2.05 12.05 71.03 0.74 0.01 V1-F1 0.25 2.17 47.75 17.73 1.15 16.10 62.39 0.47 0.30 V2-F1 0.37 4.44 46.72 19.91 1.80 14.40 66.29 0.50 0.38 V3-F1 0.63 5.26 41.99 11.37 1.84 10.11 63.28 1.22 0.84 V4-F1 0.68 5.75 46.91 14.82 1.93 12.45 70.06 1.08 0.86 V5-F1 1.13 7.21 41.27 25.05 3.97 25.89 48.17 1.20 1.36 V6-F1 0.14 2.00 43.54 4.06 0.68 12.53 60.99 0.70 0.59 V7-F1 0.29 3.98 48.59 12.69 1.76 13.45 66.28 0.66 0.41 V8-F1 1.07 6.62 41.66 31.16 2.52 17.12 66.86 0.88 0.95 V9-F1 0.68 7.47 46.49 14.14 3.21 11.57 70.59 1.46 0.84
Selectivity against phosphorus and gangue bearing minerals while maintaining favourable niobium recoveries is evident in the variability sample concentrates and can be seen in Figures 13.7 and 13.8, respectively.

Section 1
Aley Proj
Fi
These reNb2O5 fehead gra
13
oject Technic
Figure 13.
igure 13.8: N
esults indicateed grade. Tade. In fur
Minera
cal Report
.7: Nb2O5 R
Nb2O5 Reco
te that thereThis relationrther test w
al Processing
Recovery ver
overy versus
e is relationnship holds iwork, it wou
g and Metall
rsus P2O5 R
s Carbonate
nship of incrin general upuld be appr
lurgical Test
Recovery for
e Recovery
reasing Nb2Oup until doubropriate to
ting
r Variability
for Variabi
O5 recoveryble the predimodify the
October
y Tests
ility Tests
y with increicted life of
general pr
18
2014
easing mine ocess

Section 13 Mineral Processing and Metallurgical Testing 19
Aley Project Technical Report October 2014
conditions to account for this significantly higher head grade. This would allow for optimization of the recovery at higher head grades. However, these extremely high head grades are not anticipated in the production plant. Recovery at head grades near the predicted head grade show similar results, as in test V2-F1. Niobium recovery consistently drops off to a low of 62% for test V1-F1 which had a 0.25% Nb2O5 head grade. This represents a 21% reduction in head grade with only a 7% reduction in recovery from the locked cycle results. This is an expected behaviour that can be optimized with future test work.
13.5 CONCENTRATE TREATMENT
13.5.1 HYDROCHLORIC ACID LEACHING OF FLOTATION CONCENTRATE
Industry practice suggests that hydrochloric acid leaching is conducted on niobium flotation concentrates to reduce the grade of the phosphorus in the concentrate prior to conversion. Phosphorus is a known impurity in steel making, and by reducing the phosphorus levels the concentrate may increase the number of steel producers who utilize the end product based on the phosphorous content of their other feed stocks.
Initial leaching tests were conducted on combined concentrate from the gravity-flotation process to determine if hydrochloric leaching would reduce the phosphorus levels in the flotation concentrate. A series of tests were conducted at room temperature (25C) and at 50C. The tests were conducted with a target of 100g/L free acid throughout a 6 hour test. The results are summarized below in Table 13.15.
Table 13.15: Results of Initial Leaching Treatment
Test Time (hrs)
Temperature[°C]
Chemical
Solid (%)
before reagent
Element
Nb C Ti Si P Mn S V Cr
LX2 Residue
6 28.9 HCl 20.0 40.89 3.09 1.46 0.23 0.20 0.05 <0.01
LX3 Residue
6 50.0 HCl 20.0 42.92 3.16 1.50 0.25 0.19 0.06 <0.01
LX4 Residue
6 53.8 HCl 19.8 36.84 0.36 2.76 1.87 0.34 0.17 0.76 0.04 <0.01
LX5 Residue
6 25.9 HCl 19.4 41.45 0.36 3.12 1.43 0.22 0.20 0.76 0.06 <0.01
These tests showed amenability to this process as phosphorus levels were reduced by hydrochloric acid leaching.
A test was also done on a gravity concentrate only to determine if the gravity concentrate could be upgraded without flotation. The results of this test showed that the material was able to be upgraded. These leach paths were not explored into further depth, as the method of production
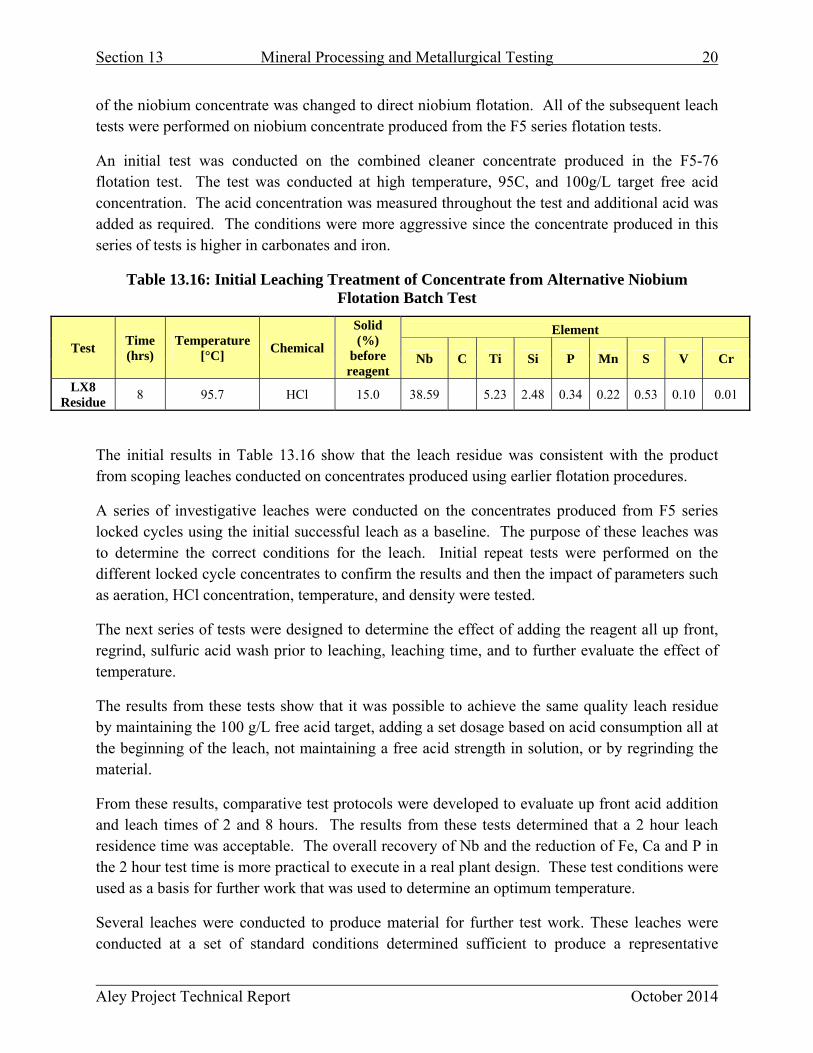
Section 13 Mineral Processing and Metallurgical Testing 20
Aley Project Technical Report October 2014
of the niobium concentrate was changed to direct niobium flotation. All of the subsequent leach tests were performed on niobium concentrate produced from the F5 series flotation tests.
An initial test was conducted on the combined cleaner concentrate produced in the F5-76 flotation test. The test was conducted at high temperature, 95C, and 100g/L target free acid concentration. The acid concentration was measured throughout the test and additional acid was added as required. The conditions were more aggressive since the concentrate produced in this series of tests is higher in carbonates and iron.
Table 13.16: Initial Leaching Treatment of Concentrate from Alternative Niobium Flotation Batch Test
Test Time (hrs)
Temperature [°C]
Chemical
Solid (%)
before reagent
Element
Nb C Ti Si P Mn S V Cr
LX8 Residue
8 95.7 HCl 15.0 38.59 5.23 2.48 0.34 0.22 0.53 0.10 0.01
The initial results in Table 13.16 show that the leach residue was consistent with the product from scoping leaches conducted on concentrates produced using earlier flotation procedures.
A series of investigative leaches were conducted on the concentrates produced from F5 series locked cycles using the initial successful leach as a baseline. The purpose of these leaches was to determine the correct conditions for the leach. Initial repeat tests were performed on the different locked cycle concentrates to confirm the results and then the impact of parameters such as aeration, HCl concentration, temperature, and density were tested.
The next series of tests were designed to determine the effect of adding the reagent all up front, regrind, sulfuric acid wash prior to leaching, leaching time, and to further evaluate the effect of temperature.
The results from these tests show that it was possible to achieve the same quality leach residue by maintaining the 100 g/L free acid target, adding a set dosage based on acid consumption all at the beginning of the leach, not maintaining a free acid strength in solution, or by regrinding the material.
From these results, comparative test protocols were developed to evaluate up front acid addition and leach times of 2 and 8 hours. The results from these tests determined that a 2 hour leach residence time was acceptable. The overall recovery of Nb and the reduction of Fe, Ca and P in the 2 hour test time is more practical to execute in a real plant design. These test conditions were used as a basis for further work that was used to determine an optimum temperature.
Several leaches were conducted to produce material for further test work. These leaches were conducted at a set of standard conditions determined sufficient to produce a representative
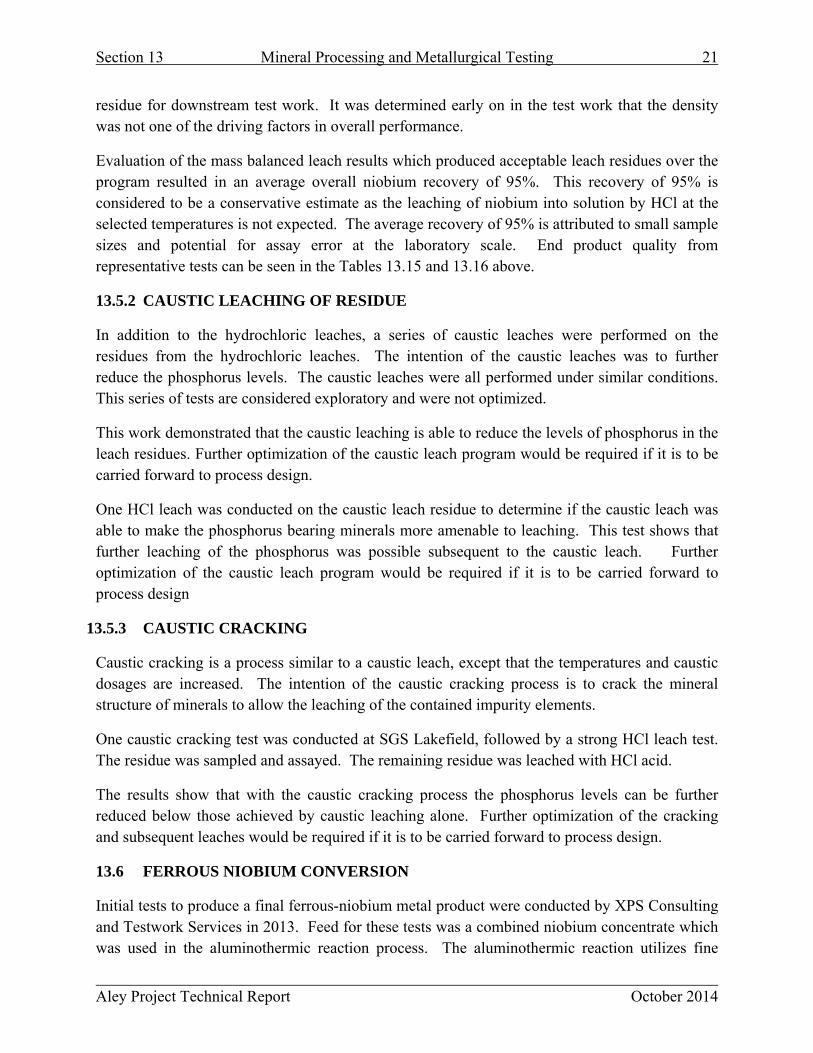
Section 13 Mineral Processing and Metallurgical Testing 21
Aley Project Technical Report October 2014
residue for downstream test work. It was determined early on in the test work that the density was not one of the driving factors in overall performance.
Evaluation of the mass balanced leach results which produced acceptable leach residues over the program resulted in an average overall niobium recovery of 95%. This recovery of 95% is considered to be a conservative estimate as the leaching of niobium into solution by HCl at the selected temperatures is not expected. The average recovery of 95% is attributed to small sample sizes and potential for assay error at the laboratory scale. End product quality from representative tests can be seen in the Tables 13.15 and 13.16 above.
13.5.2 CAUSTIC LEACHING OF RESIDUE
In addition to the hydrochloric leaches, a series of caustic leaches were performed on the residues from the hydrochloric leaches. The intention of the caustic leaches was to further reduce the phosphorus levels. The caustic leaches were all performed under similar conditions. This series of tests are considered exploratory and were not optimized.
This work demonstrated that the caustic leaching is able to reduce the levels of phosphorus in the leach residues. Further optimization of the caustic leach program would be required if it is to be carried forward to process design.
One HCl leach was conducted on the caustic leach residue to determine if the caustic leach was able to make the phosphorus bearing minerals more amenable to leaching. This test shows that further leaching of the phosphorus was possible subsequent to the caustic leach. Further optimization of the caustic leach program would be required if it is to be carried forward to process design
13.5.3 CAUSTIC CRACKING
Caustic cracking is a process similar to a caustic leach, except that the temperatures and caustic dosages are increased. The intention of the caustic cracking process is to crack the mineral structure of minerals to allow the leaching of the contained impurity elements.
One caustic cracking test was conducted at SGS Lakefield, followed by a strong HCl leach test. The residue was sampled and assayed. The remaining residue was leached with HCl acid.
The results show that with the caustic cracking process the phosphorus levels can be further reduced below those achieved by caustic leaching alone. Further optimization of the cracking and subsequent leaches would be required if it is to be carried forward to process design.
13.6 FERROUS NIOBIUM CONVERSION
Initial tests to produce a final ferrous-niobium metal product were conducted by XPS Consulting and Testwork Services in 2013. Feed for these tests was a combined niobium concentrate which was used in the aluminothermic reaction process. The aluminothermic reaction utilizes fine
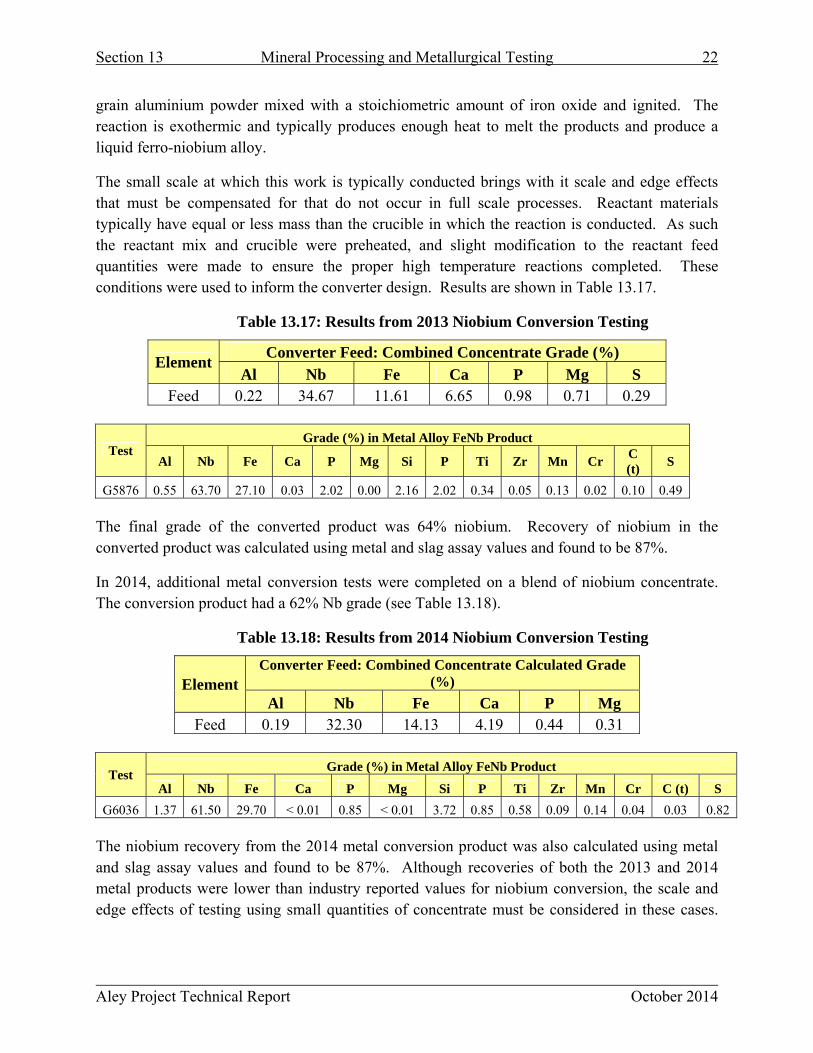
Section 13 Mineral Processing and Metallurgical Testing 22
Aley Project Technical Report October 2014
grain aluminium powder mixed with a stoichiometric amount of iron oxide and ignited. The reaction is exothermic and typically produces enough heat to melt the products and produce a liquid ferro-niobium alloy.
The small scale at which this work is typically conducted brings with it scale and edge effects that must be compensated for that do not occur in full scale processes. Reactant materials typically have equal or less mass than the crucible in which the reaction is conducted. As such the reactant mix and crucible were preheated, and slight modification to the reactant feed quantities were made to ensure the proper high temperature reactions completed. These conditions were used to inform the converter design. Results are shown in Table 13.17.
Table 13.17: Results from 2013 Niobium Conversion Testing
Element Converter Feed: Combined Concentrate Grade (%)
Al Nb Fe Ca P Mg S Feed 0.22 34.67 11.61 6.65 0.98 0.71 0.29
Test Grade (%) in Metal Alloy FeNb Product
Al Nb Fe Ca P Mg Si P Ti Zr Mn Cr C (t)
S
G5876 0.55 63.70 27.10 0.03 2.02 0.00 2.16 2.02 0.34 0.05 0.13 0.02 0.10 0.49 The final grade of the converted product was 64% niobium. Recovery of niobium in the converted product was calculated using metal and slag assay values and found to be 87%.
In 2014, additional metal conversion tests were completed on a blend of niobium concentrate. The conversion product had a 62% Nb grade (see Table 13.18).
Table 13.18: Results from 2014 Niobium Conversion Testing
Element Converter Feed: Combined Concentrate Calculated Grade
(%)
Al Nb Fe Ca P Mg Feed 0.19 32.30 14.13 4.19 0.44 0.31
Test Grade (%) in Metal Alloy FeNb Product
Al Nb Fe Ca P Mg Si P Ti Zr Mn Cr C (t) S
G6036 1.37 61.50 29.70 < 0.01 0.85 < 0.01 3.72 0.85 0.58 0.09 0.14 0.04 0.03 0.82
The niobium recovery from the 2014 metal conversion product was also calculated using metal and slag assay values and found to be 87%. Although recoveries of both the 2013 and 2014 metal products were lower than industry reported values for niobium conversion, the scale and edge effects of testing using small quantities of concentrate must be considered in these cases.
Section 13 Mineral Processing and Metallurgical Testing 23
Aley Project Technical Report October 2014
Converter recovery was selected as 97% based on knowledge of the scale and edge effects on this type of pyrometallurgical test work, industrially reported values and consultation with XPS.
While there are some FeNb product characteristics available from individual producers, there are no product specifications from steel manufacturers themselves. There is an indication that a range of product characteristics are utilized by the steel manufacturers, largely dependent upon the chemical compositions of the other feed stock materials that they use and guided by ASTM International High strength/low alloy steel (HSLA) specifications. ASTM International has developed a variety of specification for niobium content in HSLA steel standards for grades in the A 588, A 618, A 633, A 656, A 709, A 808, A812, and A 841 ranges.
ASTM specifications for HSLA steels and the chemical characteristics of the ferro-niobium product from test G6036 were used to determine the actual percentage contribution of the ASTM specified elements from the Aley ferro-niobium that would report to the final steel product. The contribution of these specified elements is, on average, between 1.7 and 2.3% of the mass allowed in the final steel product.
13.7 RECOVERY PREDICTIONS
Recovery predictions were based on test work results, practical industrial experience and guidance from both SGS Vancouver and XPS. Flotation recovery of niobium was based on repeatable locked cycle performance at 71%. Leach recovery was based on the average mass balance result across all leaches at 95%. Converter recovery was selected as 97% based on knowledge of the scale and edge effects on this type of pyrometallurgical test work, industrially reported values and consultation with XPS.
From these stage recoveries, an overall process recovery of 65% niobium to ferro-niobium product is predicted.
Aley Project Technical Report October 2014
SECTION 14: MINERAL RESOURCE ESTIMATE

Aley Project Technical Report October 2014
Table of Contents
14.0 Mineral Resource Estimate ....................................................................................................1
14.1 Key Assumptions/Basis of Estimate ...................................................................................1
14.2 Exploratory Data Analysis ..................................................................................................1
14.3 Outlier Analysis ...................................................................................................................3
14.4 Deposit Modeling ................................................................................................................4
14.5 Compositing ........................................................................................................................5
14.6 Density .................................................................................................................................6
14.7 Variogram Analysis .............................................................................................................6
14.8 Block Model and Grade Estimation Procedures..................................................................6
14.9 Mineral Resource Classification ........................................................................................10
14.10 Model Validation .............................................................................................................13
14.11 Mineral Resource Statement ............................................................................................16
14.12 Factors That May Affect the Mineral Resource Estimate ...............................................16
List of Tables
Table 14.1: Sample Statistics Nb2O5 .............................................................................................. 3
Table 14.2: Composite Statistics Nb2O5 ......................................................................................... 6
Table 14.3: Density Statistics by Domain....................................................................................... 6
Table 14.4: Variogram Model of Central Zone .............................................................................. 6
Table 14.5: Block Model Extents ................................................................................................... 7
Table 14.6: Block Model Search Parameters .................................................................................. 7
Table 14.7: Global Mean Comparison .......................................................................................... 13
Table 14.8: Mineral Resource Estimate ........................................................................................ 16
Table 14.9: Inferred Mineral Resource Estimate .......................................................................... 16
Table of Figures
Figure 14.1: Frequency Distribution of Nb2O5 in CD Domain ...................................................... 2
Figure 14.2: Frequency Distribution of Nb205 in CM Domain ....................................................... 2
Figure 14.3: Frequency Distribution of Nb2O5 in CS Domain ....................................................... 3
Figure 14.4: Cumulative Log Probability Plot for Nb2O5............................................................... 4
Figure 14.5: Aley Zone Domains.................................................................................................... 5
Figure 14.6: Block Model Grades – 1550 Level............................................................................. 8

Aley Project Technical Report October 2014
Figure 14.7: Block Model Grades – Section 6256600 N ................................................................ 8
Figure 14.8: Block Model Grades – Section 5 ................................................................................ 9
Figure 14.9: Block Model Grades – Section 9 ................................................................................ 9
Figure 14.10: Block Model Grades – Section 15 .......................................................................... 10
Figure 14.11: Block Classification – 1550 Level ......................................................................... 12
Figure 14.12: Block Classification - Section 6256600 N ............................................................. 12
Figure 14.13: Perspective View of Estimated Blocks and Resource Pit Shell ............................. 13
Figure 14.14: Swath Plot (E-W) From 6256560 – 6256605N ...................................................... 14
Figure 14.15: Swath Plot (S-N) From 454250-424295E .............................................................. 14
Figure 14.16: Swath plot (S-N) From 45790 – 454835E.............................................................. 15
Figure 14.17: Swath Plot (Vertical) From 6256560-6256605N ................................................... 15
Section 14 Mineral Resource Estimate 1
Aley Project Technical Report October 2014
14.0 Mineral Resource Estimate
14.1 KEY ASSUMPTIONS/BASIS OF ESTIMATE
Drilling to date on the Project has partially defined the Central Zone, which comprises a continuous body of near-surface niobium mineralization within an area measuring 1400 m E-W up to 750 m N-S and over a vertical range of 650 m. The ultimate limits have yet to be defined.
The most recent Aley Mineral Resource was estimated in 2012 as documented in the technical report titled “Technical Report Aley Carbonatite Niobium Project Omineca Mining District British Columbia, Canada” by Ronald G. Simpson, P. Geo, dated March 29, 2012, filed on www.sedar.com. That information remains current as there have been no additional relevant exploration results since that time within the resource area. As such, the resource estimate is current as of the effective date of this report.
The sample database for the Aley project contains results from 104 core holes drilled between 1985 and the end of 2011. The Central Zone has been tested by 98 holes (21,644 m) all of which were entirely within the carbonatite complex. Six of these were drilled by Cominco in 1986 and 90 by Taseko Mines in 2010 and 2011. Two condemnation holes were drilled in 2012 well outside of the Central Zone resource area and did intersect some anomalous Nb2O5 mineralization. Seventeen geomechanical and geotechnical holes were also completed in 2012 but not assayed.
14.2 EXPLORATORY DATA ANALYSIS
For the purposes of the resource estimate three primary domains were identified on the basis of lithofacies. The bulk of the Nb2O5 mineralization is hosted by the magnetite-apatite carbonatite cumulate domain (CM). Some mineralization is hosted in the dolomite carbonatite (CD) domain with lesser amounts in the silicocarbonatite (CS). Further detail on the lithological domains is available in the Technical Report on the Aley Carbonatite Niobium Project (March 9th 2012) by Ronald G. Simpson of GeoSim Services Inc. and in Section 7 of this report.
Cumulative frequency distribution for the Nb2O5 samples within the three main domains of the Central Zone is illustrated in Figure 14.1 to Figure 14.3. The sample population within the CD and CM domains is moderately skewed approaching log normal distribution with no significant bimodality evident. The CS domain exhibits possible bimodal character but primarily represents sub-economic grades of Nb2O5.
Basic statistics for the individual and collective domains are shown in Table 14.1.

Section 1
Aley Proj
14
oject Technic
Figu
Figu
cal Report
ure 14.1: Fre
ure 14.2: Fr
Mineral R
equency Dis
equency Dis
Resource Est
stribution o
stribution o
timate
of Nb2O5 in
of Nb205 in C
CD Domain
CM Domain
October
n
n
2
2014
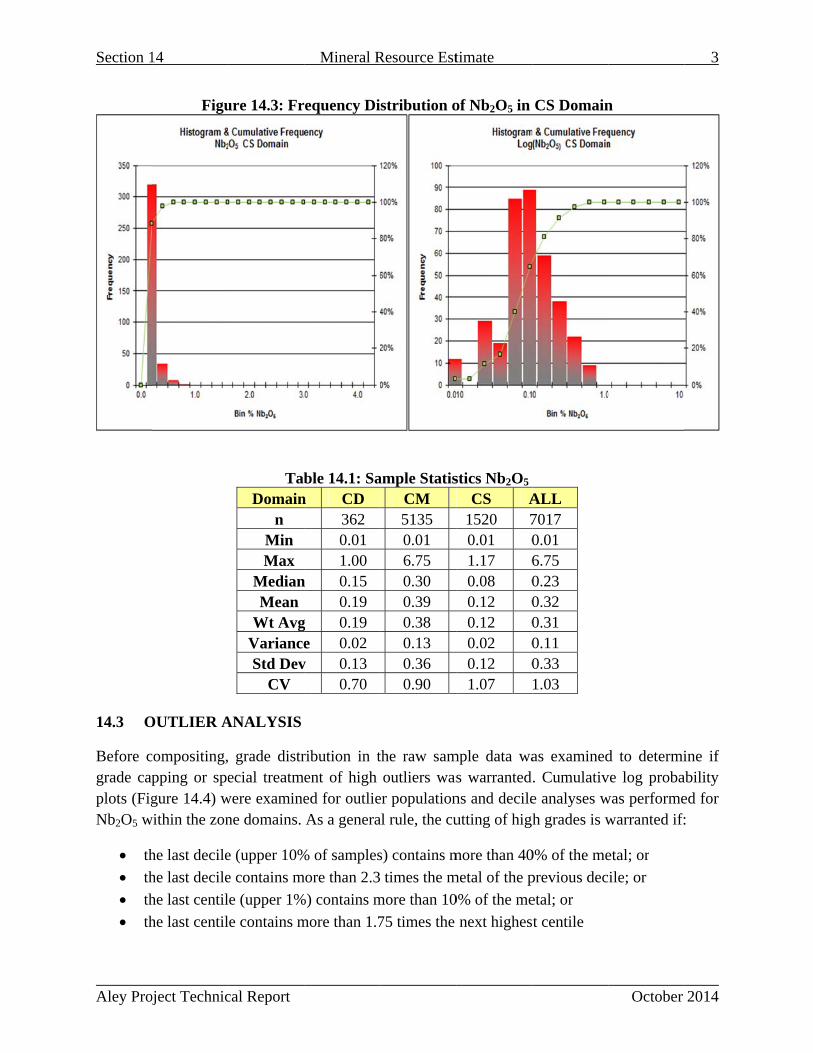
Section 1
Aley Proj
14.3 O
Before cgrade capplots (FigNb2O5 w
th
th
th
th
14
oject Technic
Figu
OUTLIER A
compositing,pping or spegure 14.4) w
within the zon
he last decile
he last decile
he last centil
he last centil
cal Report
ure 14.3: Fr
TabDomain
n Min Max
MedianMean
Wt AvgVarianceStd Dev
CV
ANALYSIS
grade distrecial treatm
were examinene domains.
e (upper 10%
e contains m
le (upper 1%
le contains m
Mineral R
requency Di
ble 14.1: San CD
362 0.01 1.00
n 0.15 0.19
g 0.19 e 0.02
v 0.13 0.70
ribution in tent of high ed for outlieAs a genera
% of samples
more than 2.3
%) contains m
more than 1.7
Resource Est
stribution o
ample StatisCM 5135 0.01 6.75 0.30 0.39 0.38 0.13 0.36 0.90
the raw samoutliers was
er populational rule, the cu
s) contains m
times the m
more than 10
75 times the
timate
of Nb2O5 in
stics Nb2O5
CS A1520 70.01 01.17 60.08 00.12 00.12 00.02 00.12 01.07
mple data was warrantedns and decileutting of high
more than 40
metal of the p
0% of the me
next highes
CS Domain
ALL 7017 0.01 6.75 0.23 0.32 0.31 0.11 0.33 1.03
as examined. Cumulative analyses wh grades is w
0% of the me
previous dec
etal; or
t centile
October
n
d to determive log probawas performewarranted if:
etal; or
ile; or
3
2014
ine if ability ed for :
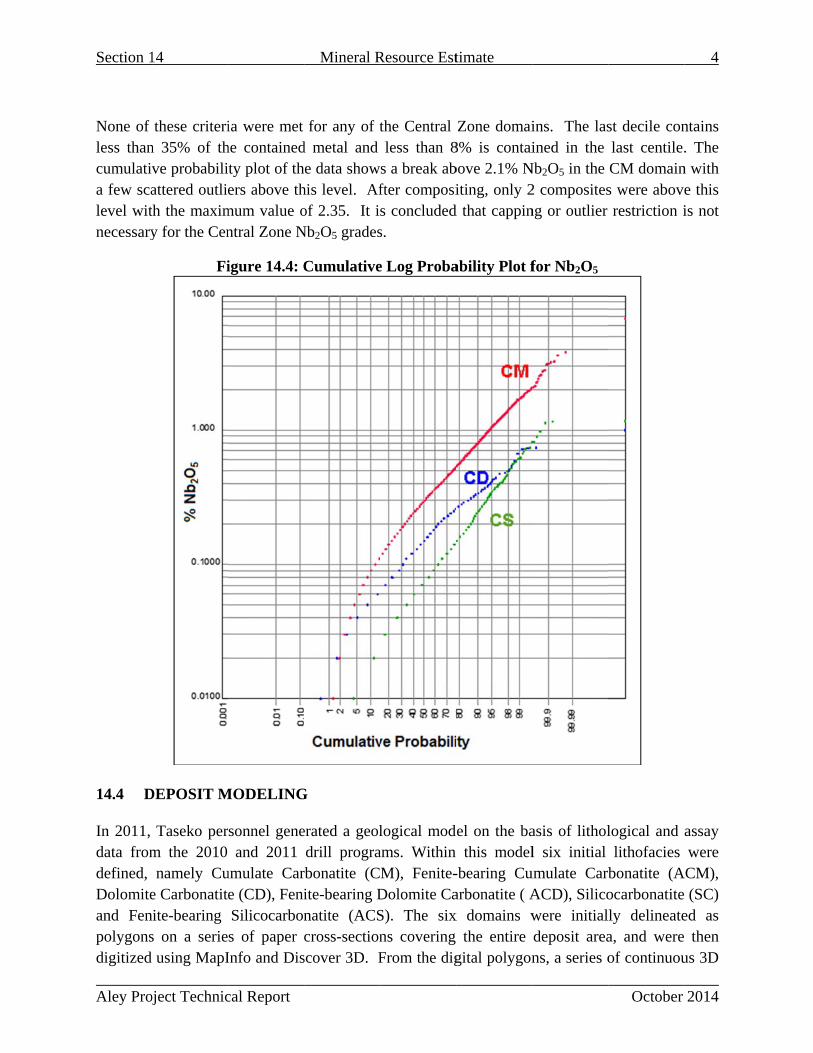
Section 1
Aley Proj
None of less thancumulativa few scalevel witnecessary
14.4 D
In 2011, data fromdefined, Dolomiteand Fenpolygonsdigitized
14
oject Technic
these criterin 35% of thve probabiliattered outlieth the maximy for the Cen
Fi
DEPOSIT M
Taseko perm the 2010 namely Cu
e Carbonatitnite-bearing s on a serie
using MapI
cal Report
ia were met he containedty plot of thers above th
mum value ontral Zone N
igure 14.4: C
MODELING
rsonnel geneand 2011
umulate Care (CD), FeniSilicocarbons of paper cInfo and Dis
Mineral R
for any of td metal and e data show
his level. Afof 2.35. It i
Nb2O5 grades
Cumulative
G
erated a geoldrill progra
rbonatite (Cite-bearing Dnatite (ACScross-section
scover 3D. F
Resource Est
the Central less than 8
s a break abfter composis concludeds.
e Log Proba
logical modams. Within M), Fenite-
Dolomite CaS). The sixns covering From the dig
timate
Zone domai8% is contaibove 2.1% Niting, only 2
d that cappin
ability Plot f
del on the ba this model-bearing Cuarbonatite ( Ax domains w
the entire gital polygon
ins. The lasined in the
Nb2O5 in the 2 compositesng or outlier
for Nb2O5
asis of litholl six initial
umulate CarbACD), Silicowere initialdeposit areans, a series o
October
st decile conlast centile.CM domains were aboverestriction i
logical and lithofacies
bonatite (Aocarbonatitely delineatea, and wereof continuou
4
2014
ntains . The
n with e this is not
assay were
ACM), (SC) ed as then
us 3D
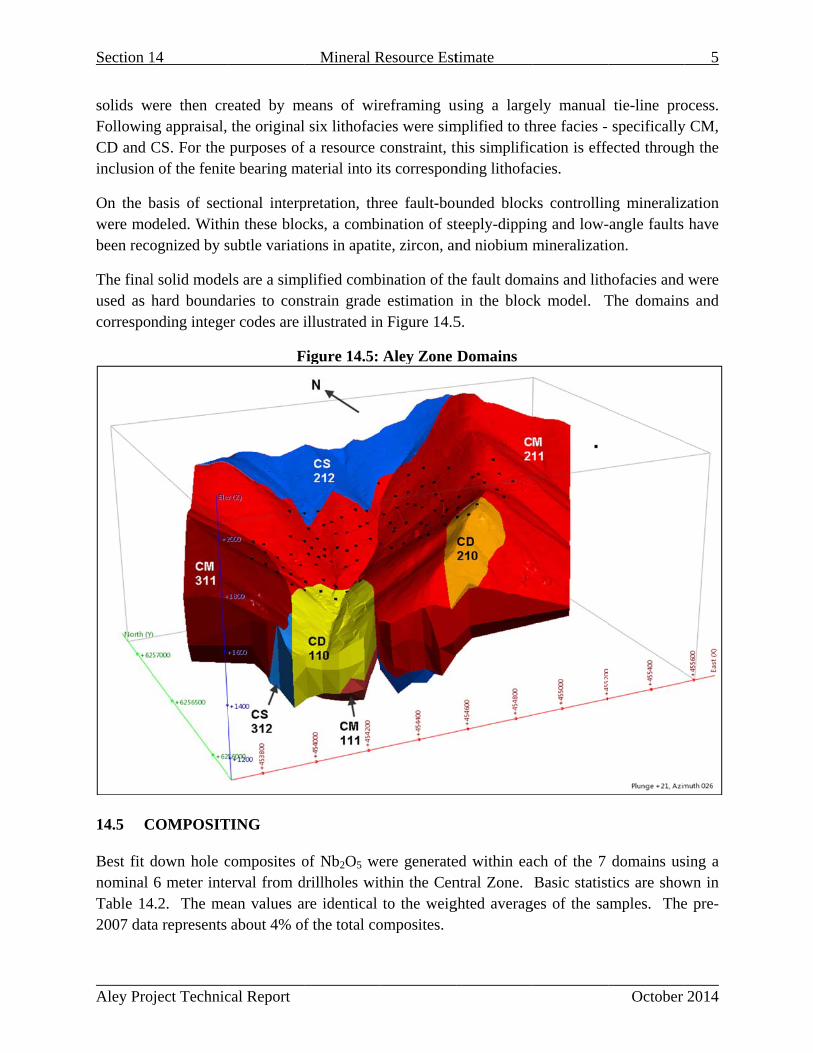
Section 1
Aley Proj
solids wFollowinCD and Cinclusion
On the bwere mobeen reco
The finalused as hcorrespon
14.5 C
Best fit dnominal Table 142007 data
14
oject Technic
were then creng appraisal, CS. For the
n of the fenit
basis of sectdeled. Withiognized by s
l solid modehard boundanding intege
COMPOSIT
down hole c6 meter inte
4.2. The mea represents
cal Report
eated by mthe originalpurposes of
te bearing ma
tional interpin these blocsubtle variati
ls are a simparies to coner codes are i
F
TING
composites oerval from dean values aabout 4% of
Mineral R
means of wirl six lithofacf a resource aterial into i
pretation, thrcks, a combiions in apatit
plified combstrain gradeillustrated in
Figure 14.5:
of Nb2O5 wedrillholes witare identical f the total co
Resource Est
reframing uies were simconstraint, thts correspon
ree fault-bouination of stte, zircon, an
bination of the estimation n Figure 14.5
Aley Zone
ere generatethin the Cento the weig
omposites.
timate
using a largemplified to thhis simplific
nding lithofa
unded blockteeply-dippinnd niobium m
he fault domin the bloc
5.
Domains
ed within eantral Zone. ghted averag
ely manual hree facies - cation is effeacies.
ks controllinng and low-mineralizati
mains and lithck model. T
ach of the 7 Basic statist
ges of the sa
October
tie-line prospecifically
ected throug
ng mineralizangle faults on.
hofacies and The domains
domains ustics are show
amples. The
5
2014
ocess. y CM, gh the
zation have
were s and
sing a wn in e pre-

Section 14 Mineral Resource Estimate 6
Aley Project Technical Report October 2014
Table 14.2: Composite Statistics Nb2O5 CD CM CS Combined
n 191 2621 825 3637 Min 0.03 0.01 0.01 0.01 Max 0.54 2.75 0.58 2.75
Median 0.16 0.32 0.09 0.25 Mean 0.19 0.38 0.12 0.31
Variance 0.01 0.07 0.01 0.07 Std Dev 0.10 0.27 0.09 0.26
CV 0.54 0.70 0.81 0.83
14.6 DENSITY
A total of 1538 density measurements were made on drill core from the central zone. Statistics for density measurements within the zone domains are presented in Table 14.3. The mean values were assigned to blocks within the corresponding domains. A value of 2 was assumed for overburden.
Table 14.3: Density Statistics by Domain
Domain n min max mean medianStd Dev
CV
CD 58 2.77 3.02 2.90 2.91 0.05 0.02 CM 1106 2.25 4.02 2.89 2.88 0.19 0.07 CS 343 2.44 3.45 2.88 2.88 0.15 0.05
ALL 1507 2.25 4.02 2.89 2.88 0.18 0.06
14.7 VARIOGRAM ANALYSIS
Directional semi-variograms were modeled for the main CM domain using the 6m composites. A nested spherical model was interpreted with moderate anisotropy. The model parameters are shown in Table 14.4.
Table 14.4: Variogram Model of Central Zone Axis Azim Dip co c1 r1 c2 r2
Major 87 0 0.335 0.367 40 0.298 200 S-Major 177 -60 0.335 0.367 30 0.298 150 Minor 357 -30 0.335 0.367 23.4 0.298 120
14.8 BLOCK MODEL AND GRADE ESTIMATION PROCEDURES
A block model was set up in Gemcom Surpac© software with block dimensions of 10 x 10 x 10m. Model extents are shown in Table 14.5.
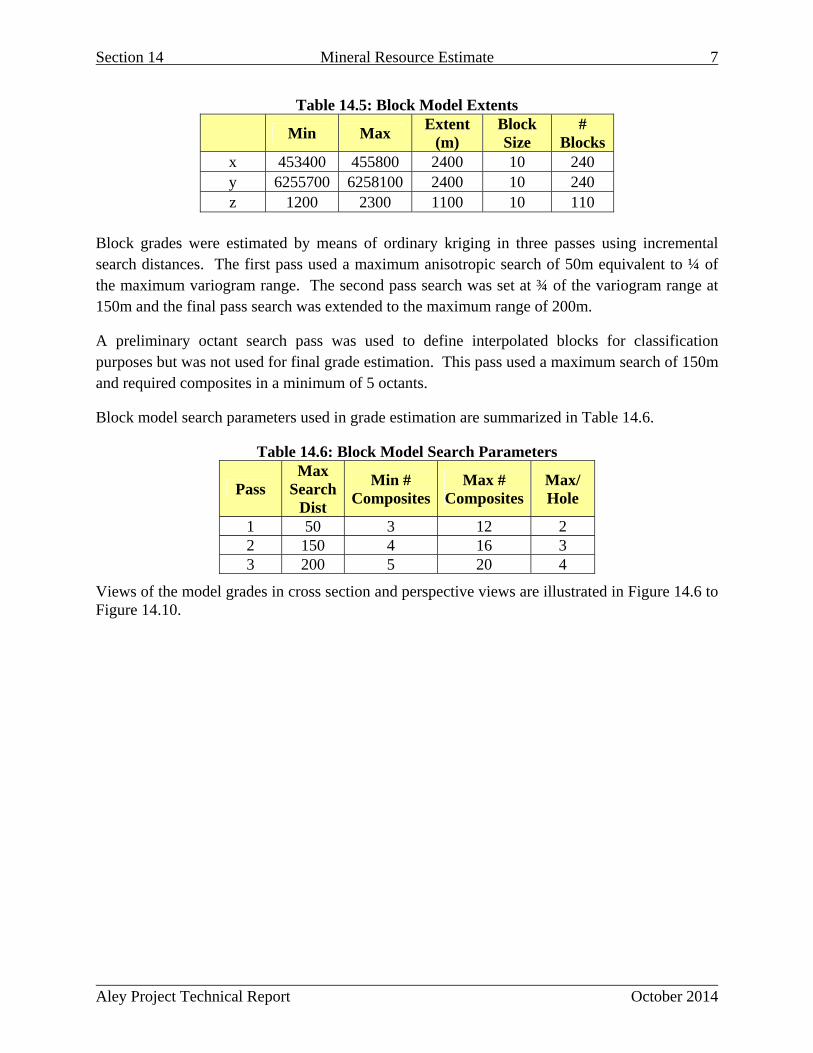
Section 14 Mineral Resource Estimate 7
Aley Project Technical Report October 2014
Table 14.5: Block Model Extents
Min Max
Extent (m)
Block Size
# Blocks
x 453400 455800 2400 10 240 y 6255700 6258100 2400 10 240 z 1200 2300 1100 10 110
Block grades were estimated by means of ordinary kriging in three passes using incremental search distances. The first pass used a maximum anisotropic search of 50m equivalent to ¼ of the maximum variogram range. The second pass search was set at ¾ of the variogram range at 150m and the final pass search was extended to the maximum range of 200m.
A preliminary octant search pass was used to define interpolated blocks for classification purposes but was not used for final grade estimation. This pass used a maximum search of 150m and required composites in a minimum of 5 octants.
Block model search parameters used in grade estimation are summarized in Table 14.6.
Table 14.6: Block Model Search Parameters
Pass Max
Search Dist
Min # Composites
Max # Composites
Max/ Hole
1 50 3 12 2 2 150 4 16 3 3 200 5 20 4
Views of the model grades in cross section and perspective views are illustrated in Figure 14.6 to Figure 14.10.

Section 1
Aley Proj
14
oject Technic
F
cal Report
Figure 1
Figure 14.7:
Mineral R
14.6: Block M
Block Mod
Resource Est
Model Grad
del Grades –
timate
des – 1550 L
– Section 62
Level
256600 N
October
8
2014

Section 1
Aley Proj
14
oject Techniccal Report
Figure
Figure
Mineral R
14.8: Block
14.9: Block
Resource Est
Model Gra
Model Gra
timate
ades – Sectio
ades – Sectio
on 5
on 9
October
9
2014

Section 1
Aley Proj
14.9 M
ResourceInstrume
Mineral
A Minermaterial,and induquality thgeologicainterprete
Measure A ‘Measquality, estimatedeconomicthe depoinformati
14
oject Technic
MINERAL R
e classificatint 43-101:
Resource
ral Resource or natural strial minerahat it has real charactered from spec
ed Mineral R
ured Mineradensities, s
d with confc parameters
osit. The estion gathered
cal Report
Figure 1
RESOURCE
ions used in
e is a concsolid fossilials in or on thasonable proristics and cific geologi
Resource
al Resource’hape, physifidence suffs, to supporttimate is bad through ap
Mineral R
4.10: Block
E CLASSIF
n this study
centration orzed organiche Earth’s cospects for econtinuity o
ical evidence
is that part ical characteficient to alt production sed on detappropriate te
Resource Est
Model Gra
FICATION
conform to
r occurrence material inrust in such economic exof a Minere and knowle
of a Mineraeristics are llow the applanning an
ailed and relechniques fr
timate
ades – Sectio
the followin
e of diamonncluding bas
form and quxtraction. Tral Resourceedge.
al Resource so well es
ppropriate and evaluationliable explorom location
on 15
ng definition
nds, naturalse and preciuantity and oThe locatione are know
for which qstablished thapplication on of the econration, samp
n such as ou
October
ns from Nat
l solid inorous metals, of such a gra, quantity, g
wn, estimate
quantity, grahat they caof technicalnomic viabilpling and teutcrops, tren
10
2014
tional
ganic coal,
ade or grade, ed or
ade or an be l and ity of esting nches,
Section 14 Mineral Resource Estimate 11
Aley Project Technical Report October 2014
pits, workings and drill holes that are spaced closely enough to confirm both geological and grade continuity.
Indicated Mineral Resource
An ‘Indicated Mineral Resource’ is that part of a Mineral Resource for which quantity, grade or quality, densities, shape and physical characteristics can be estimated with a level of confidence sufficient to allow the appropriate application of technical and economic parameters, to support mine planning and evaluation of the economic viability of the deposit. The estimate is based on detailed and reliable exploration and testing information gathered through appropriate techniques from locations such as outcrops, trenches, pits, workings and drill holes that are spaced closely enough for geological and grade continuity to be reasonably assumed.
Inferred Mineral Resource
An ‘Inferred Mineral Resource’ is that part of a Mineral Resource for which quantity and grade or quality can be estimated on the basis of geological evidence and limited sampling and reasonably assumed, but not verified, geological and grade continuity. The estimate is based on limited information and sampling gathered through appropriate techniques from locations such as outcrops, trenches, pits, workings and drill holes.
Resource Classification
Blocks were classified as ‘Measured’ if there were two composites from at least two drill holes within 50 m of the block centroid based on the anisotropic search parameters. Blocks not meeting the criteria for ‘Measured’ were classified as ‘Indicated’ if there were two composites from at least two drill holes within 100m of the block centroid. All other estimated blocks were classified as ‘Inferred’.
In order to meet the requirements of N143-101 with respect to reasonable prospects of economic extraction by open pit mining methods, a 45º wall slope Lerchs-Grossman pit was generated to constrain the resource within the block model. Metal prices assumed were $50/kg Nb with process recovery of 50%. General & Administration, Processing and Ore Mining costs were assumed to be $30/tonne. Base waste mining costs were assumed to be $1.50/tonne.
Block classification on plan and section are illustrated in Figure 14.11 and Figure 14.12. A perspective view of the resource pit shell, as defined in Section 14.9, is illustrated in Figure 14.13.
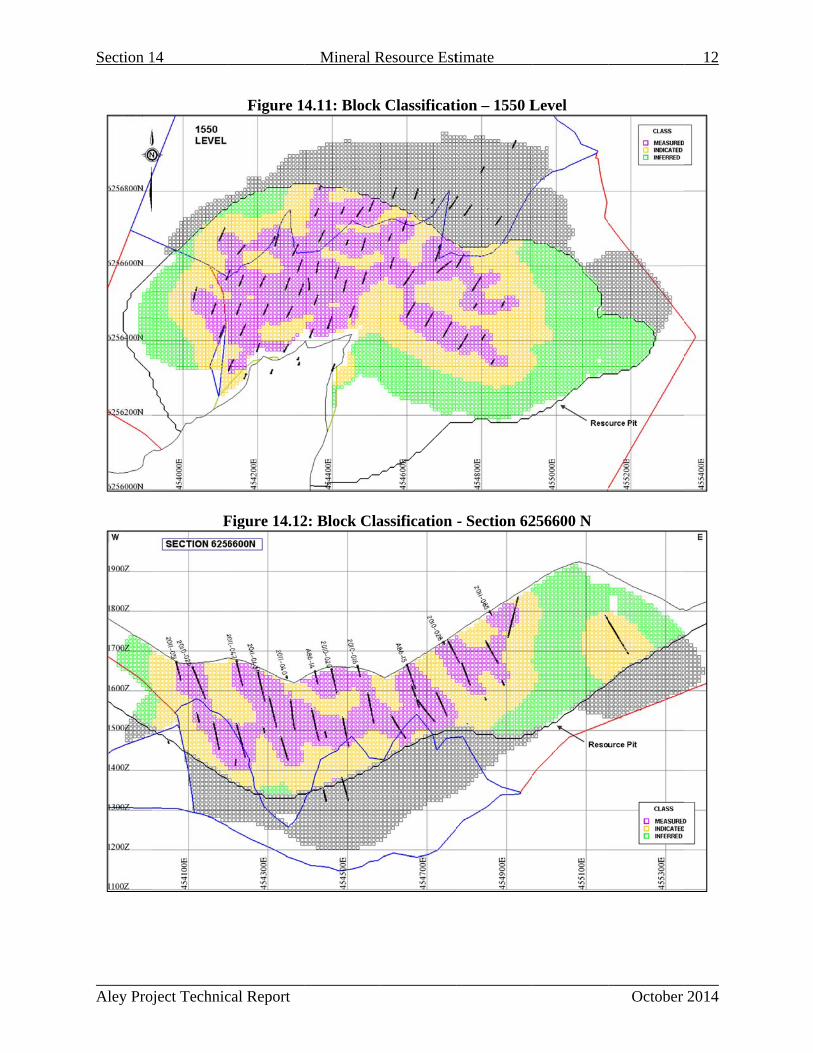
Section 1
Aley Proj
14
oject Technic
F
cal Report
Figure 1
Figure 14.12
Mineral R
4.11: Block
2: Block Cla
Resource Est
k Classificati
assification
timate
ion – 1550 L
- Section 62
Level
256600 N
October
12
2014

Section 1
Aley Proj
14.10 M
Model veplan and composit
Block grmean valcomposit
Swath plnearest-nbetween
14
oject Technic
Figure 14.1
MODEL VA
erification wsection view
te grades.
rades were elues within ttes and block
lots were geneighbor estithe methods
cal Report
13: Perspect
ALIDATION
was initially cws. The esti
stimated usithe grade shk model valu
Tab
enerated to aimates on pas, particularl
Mineral R
tive View of
N
carried out bimated block
ing ID and nhell domain ues (Table 1
ble 14.7: GloData Se
Samples (WtComposit
Kriged BloID2 Bloc
Nearest Neig
assess the manels throughly in the mai
Resource Est
f Estimated
by visual comk grades show
nearest neighshows a rea4.7).
obal Mean Cet % t Avg) tes ocks ks
ghbour
model for gloh the depositin portions o
timate
Blocks and
mparison of wed reasona
hbour methoasonably clos
Comparison Nb2O5 0.31 0.31 0.26 0.26 0.26
obal bias byt. Results shof the depos
d Resource P
f blocks and able correlat
ods. A comse relationsh
n
y comparinghow a reasonsit indicated
October
Pit Shell
sample gradtion with adj
mparison of ghip with sam
g kriged, IDnable compaby the bar c
13
2014
des in acent
global mples,
2 and arison charts

Section 14 Mineral Resource Estimate 14
Aley Project Technical Report October 2014
as shown in Figure 14.14 to Figure 14.17.
Figure 14.14: Swath Plot (E-W) From 6256560 – 6256605N
Figure 14.15: Swath Plot (S-N) From 454250-424295E
0
1000000
2000000
3000000
4000000
5000000
6000000
0
0.1
0.2
0.3
0.4
0.5
0.6
Tonnes
Average
Grade % Nb2O
5
Easting (m)
45 m Swath Plot X Drift6256560‐6256605N
Tonnes Kriged Grade ID2 Grade NN Grade
0
1000000
2000000
3000000
4000000
5000000
6000000
0
0.1
0.2
0.3
0.4
0.5
0.6
0.7
Tonnes
Average
Grade % Nb2O
5
Easting (m)
45 m Swath Plot Y Drift454250‐454295E
Tonnes Kriged Grade ID2 Grade NN Grade
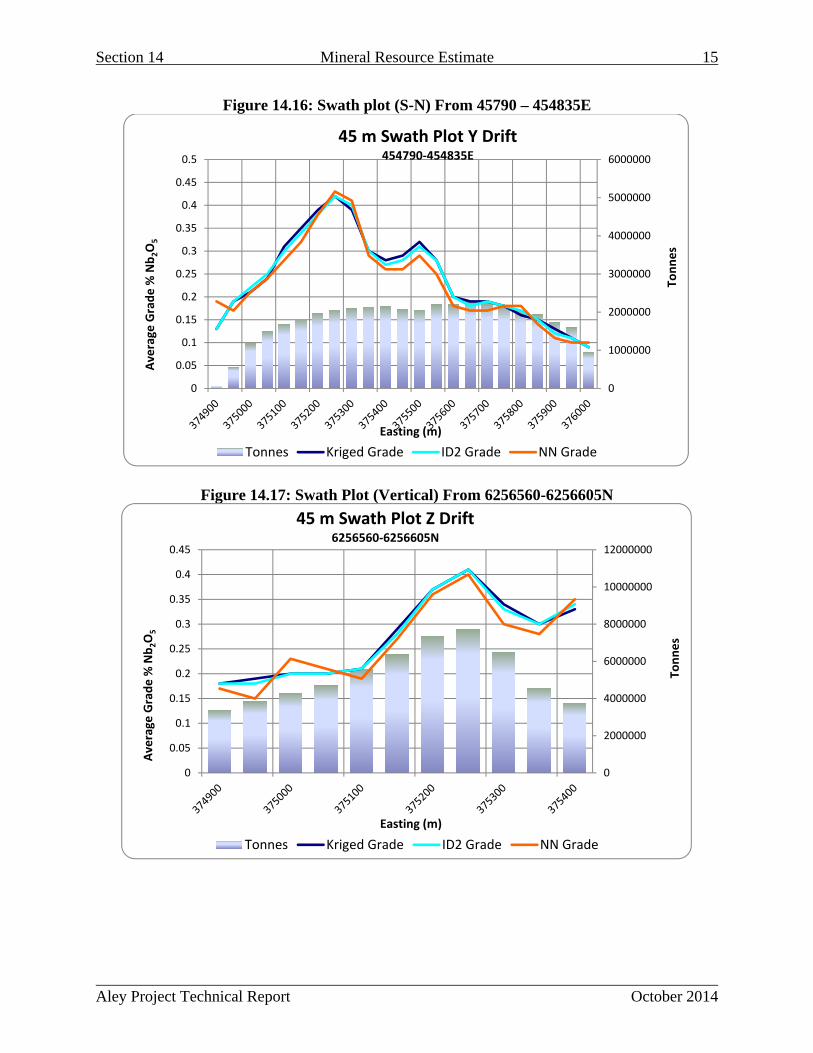
Section 14 Mineral Resource Estimate 15
Aley Project Technical Report October 2014
Figure 14.16: Swath plot (S-N) From 45790 – 454835E
Figure 14.17: Swath Plot (Vertical) From 6256560-6256605N
0
1000000
2000000
3000000
4000000
5000000
6000000
0
0.05
0.1
0.15
0.2
0.25
0.3
0.35
0.4
0.45
0.5
Tonnes
Average
Grade % Nb2O
5
Easting (m)
45 m Swath Plot Y Drift454790‐454835E
Tonnes Kriged Grade ID2 Grade NN Grade
0
2000000
4000000
6000000
8000000
10000000
12000000
0
0.05
0.1
0.15
0.2
0.25
0.3
0.35
0.4
0.45
Tonnes
Average
Grade % Nb2O
5
Easting (m)
45 m Swath Plot Z Drift6256560‐6256605N
Tonnes Kriged Grade ID2 Grade NN Grade
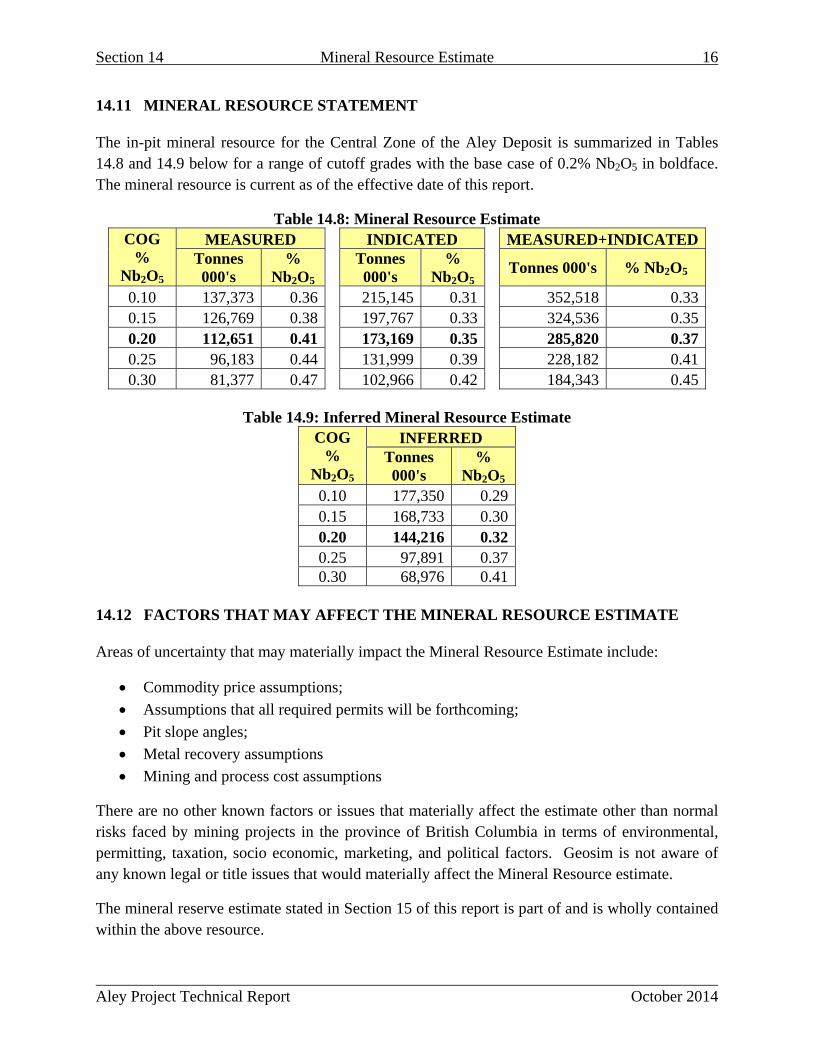
Section 14 Mineral Resource Estimate 16
Aley Project Technical Report October 2014
14.11 MINERAL RESOURCE STATEMENT
The in-pit mineral resource for the Central Zone of the Aley Deposit is summarized in Tables 14.8 and 14.9 below for a range of cutoff grades with the base case of 0.2% Nb2O5 in boldface. The mineral resource is current as of the effective date of this report.
Table 14.8: Mineral Resource Estimate COG
% Nb2O5
MEASURED INDICATED MEASURED+INDICATEDTonnes 000's
% Nb2O5
Tonnes 000's
% Nb2O5
Tonnes 000's % Nb2O5
0.10 137,373 0.36 215,145 0.31 352,518 0.330.15 126,769 0.38 197,767 0.33 324,536 0.350.20 112,651 0.41 173,169 0.35 285,820 0.370.25 96,183 0.44 131,999 0.39 228,182 0.410.30 81,377 0.47 102,966 0.42 184,343 0.45
Table 14.9: Inferred Mineral Resource Estimate
COG %
Nb2O5
INFERRED Tonnes 000's
% Nb2O5
0.10 177,350 0.290.15 168,733 0.300.20 144,216 0.320.25 97,891 0.370.30 68,976 0.41
14.12 FACTORS THAT MAY AFFECT THE MINERAL RESOURCE ESTIMATE
Areas of uncertainty that may materially impact the Mineral Resource Estimate include:
Commodity price assumptions;
Assumptions that all required permits will be forthcoming;
Pit slope angles;
Metal recovery assumptions
Mining and process cost assumptions
There are no other known factors or issues that materially affect the estimate other than normal risks faced by mining projects in the province of British Columbia in terms of environmental, permitting, taxation, socio economic, marketing, and political factors. Geosim is not aware of any known legal or title issues that would materially affect the Mineral Resource estimate.
The mineral reserve estimate stated in Section 15 of this report is part of and is wholly contained within the above resource.

Aley Project Technical Report October 2014
SECTION 15: MINERAL RESERVE ESTIMATE
Aley Project Technical Report October 2014
Table of Contents
15.0 Mineral Reserve Estimate ......................................................................................................1
15.1 Reserve Summary ................................................................................................................1
15.2 13D Block Model Set Up and Validation ............................................................................1
15.3 Design Basis Pit Shell Determination .................................................................................2
15.4 Design, Schedule, Costs and Economic Analysis ...............................................................7
15.5 Reserve Basis Cut-Off Grade ..............................................................................................7
15.6 Reserves ...............................................................................................................................8
List of Tables
Table 15.1: Mineral Reserves at Aley ............................................................................................. 1
Table 15.2: Resources Contained within Detailed Pit Design ........................................................ 7
Table 15.3: Mineral Reserves at Aley ............................................................................................. 9
Table of Figures
Figure 15.1: Resource and Reserve Basis LG Shell Outlines and Sections ................................... 3
Figure 15.2: LG Pits Cross Section A-A’ ....................................................................................... 4
Figure 15.3: LG Pits Cross Section B-B’ ....................................................................................... 5
Figure 15.4: LG Pits Cross Section L-L' ......................................................................................... 6
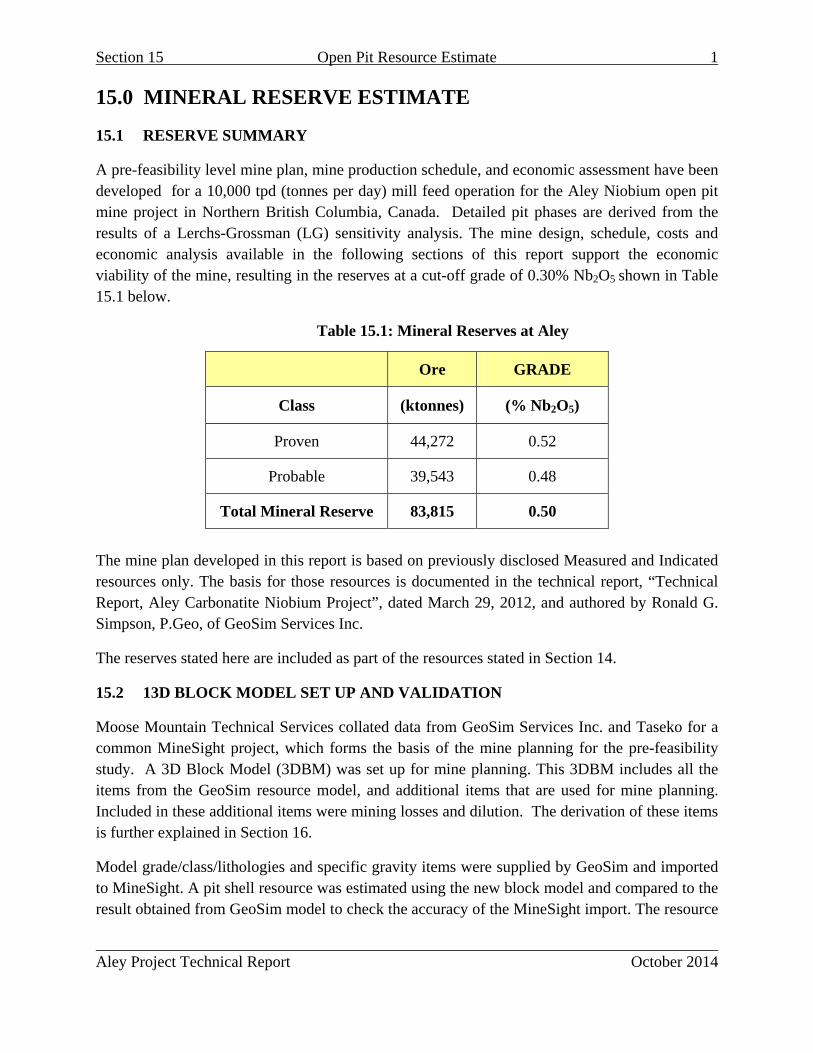
Section 15 Open Pit Resource Estimate 1
Aley Project Technical Report October 2014
15.0 MINERAL RESERVE ESTIMATE
15.1 RESERVE SUMMARY
A pre-feasibility level mine plan, mine production schedule, and economic assessment have been developed for a 10,000 tpd (tonnes per day) mill feed operation for the Aley Niobium open pit mine project in Northern British Columbia, Canada. Detailed pit phases are derived from the results of a Lerchs-Grossman (LG) sensitivity analysis. The mine design, schedule, costs and economic analysis available in the following sections of this report support the economic viability of the mine, resulting in the reserves at a cut-off grade of 0.30% Nb2O5 shown in Table 15.1 below.
Table 15.1: Mineral Reserves at Aley
The mine plan developed in this report is based on previously disclosed Measured and Indicated resources only. The basis for those resources is documented in the technical report, “Technical Report, Aley Carbonatite Niobium Project”, dated March 29, 2012, and authored by Ronald G. Simpson, P.Geo, of GeoSim Services Inc.
The reserves stated here are included as part of the resources stated in Section 14.
15.2 13D BLOCK MODEL SET UP AND VALIDATION
Moose Mountain Technical Services collated data from GeoSim Services Inc. and Taseko for a common MineSight project, which forms the basis of the mine planning for the pre-feasibility study. A 3D Block Model (3DBM) was set up for mine planning. This 3DBM includes all the items from the GeoSim resource model, and additional items that are used for mine planning. Included in these additional items were mining losses and dilution. The derivation of these items is further explained in Section 16.
Model grade/class/lithologies and specific gravity items were supplied by GeoSim and imported to MineSight. A pit shell resource was estimated using the new block model and compared to the result obtained from GeoSim model to check the accuracy of the MineSight import. The resource
Ore GRADE
Class (ktonnes) (% Nb2O5)
Proven 44,272 0.52
Probable 39,543 0.48
Total Mineral Reserve 83,815 0.50

Section 15 Open Pit Resource Estimate 2
Aley Project Technical Report October 2014
estimate checked to within 0.15%. The variance is not significant and the model setup was deemed complete and accurate.
The block size is 10 m long x 10 m wide x 10 m high, with no sub-blocking. Specific gravities of 2.88 are applied in most blocks, with a lower specific gravity of 2.00 applied in the overburden. Since moisture is not available in the block model it is assumed that insitu specific gravity is equal to dry block density (t/m3), and all reported tonnes are on a dry basis. These densities were assigned to the 3DBM and used for the tonnage estimates.
15.3 DESIGN BASIS PIT SHELL DETERMINATION
The design basis pit shell for determining mineral reserves was derived using the MSEP optimization routines in MineSight which are based on the Lerchs Grossman (LG) algorithm. The LG algorithm evaluates the costs and revenues of the blocks within potential pit shells. The routine uses preliminary input costs, commodity prices, plant recoveries, and overall pit slope angles, and expands a pit shell downwards and outwards from previous interim economic 3D surfaces, until the last pit shell increment is at break-even economics.
In this study, various cases or pit shells are generated by varying the Nb price. A series of pit shells were produced with the corresponding resultant waste tonnages, ore tonnages, and grades for each pit shell.
Only measured and indicated class blocks were included as resources in the LG analysis. Inferred class material is considered waste in the economics. The resources within the pit shells produced were all reported above a preliminary cut-off grade of 0.20% Nb2O5 in order to provide a common basis upon which to compare the tonnes and grades available in each shell.
Once the series of different size pit shells had been produced through the LG algorithm, a rough mining schedule and cash flow was determined for each pit using common cost and revenue inputs. The net present value (NPV) of each of the schedules was compared relative to each other to determine the pit configuration that produced the highest relative NPV. The purpose of this exercise was not to determine final NPV of the project, but rather to determine the pit shell that approximates an NPV optimum to be used as the basis for the detailed mine design. The detailed mine design is then consequently used as the basis for the mine scheduling and final economic analysis.
Figure 15.1 shows the plan views of the LG shells used as a design basis for the mineral reserves and to define the resource discussed in Section 14. Figures 15.2 through 15.4 provide selected cross sections through both of these shells.

Section 1
Aley Proj
15
oject Technic
Figur
cal Report
re 15.1: Res
Open Pit R
source and
Resource Es
Reserve Ba
stimate
asis LG Shelll Outlines a
October
and Section
3
2014
ns
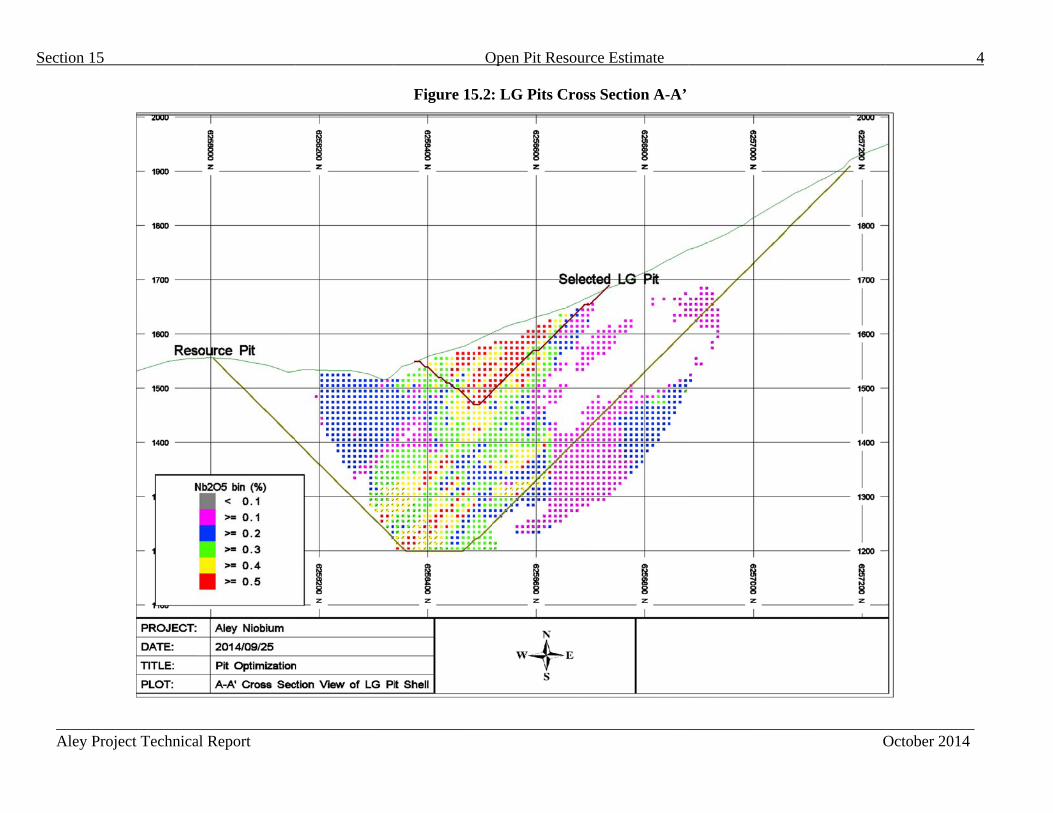
Section 15
______ Aley P
5
_____________Project Technica
_____________al Report
______________
O
_____________
Figure 15.2
Open Pit Resour
______________
: LG Pits Cross
rce Estimate
______________
s Section A-A’
_____________
_____________ O
4
____________ October 2014
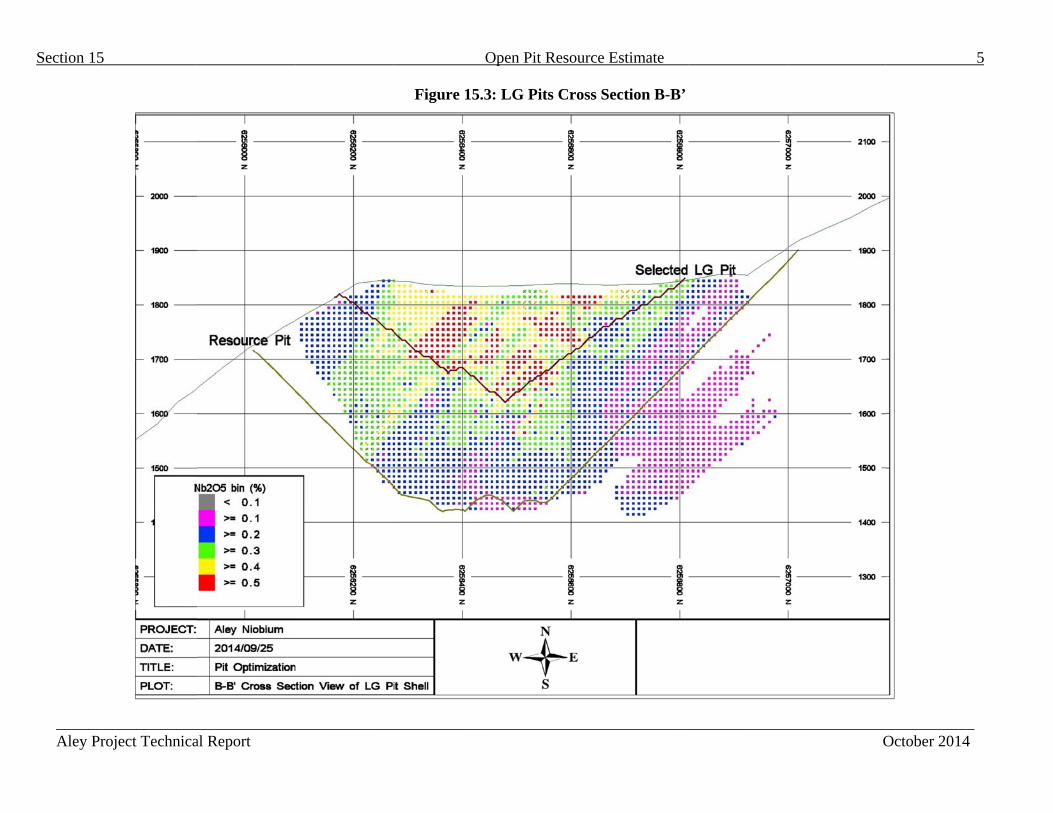
Section 15
______ Aley P
5
_____________Project Technica
_____________al Report
______________
O
_____________
Figure 15.3
Open Pit Resour
______________
: LG Pits Cros
rce Estimate
______________
s Section B-B’
_____________
_____________ O
5
____________ October 2014
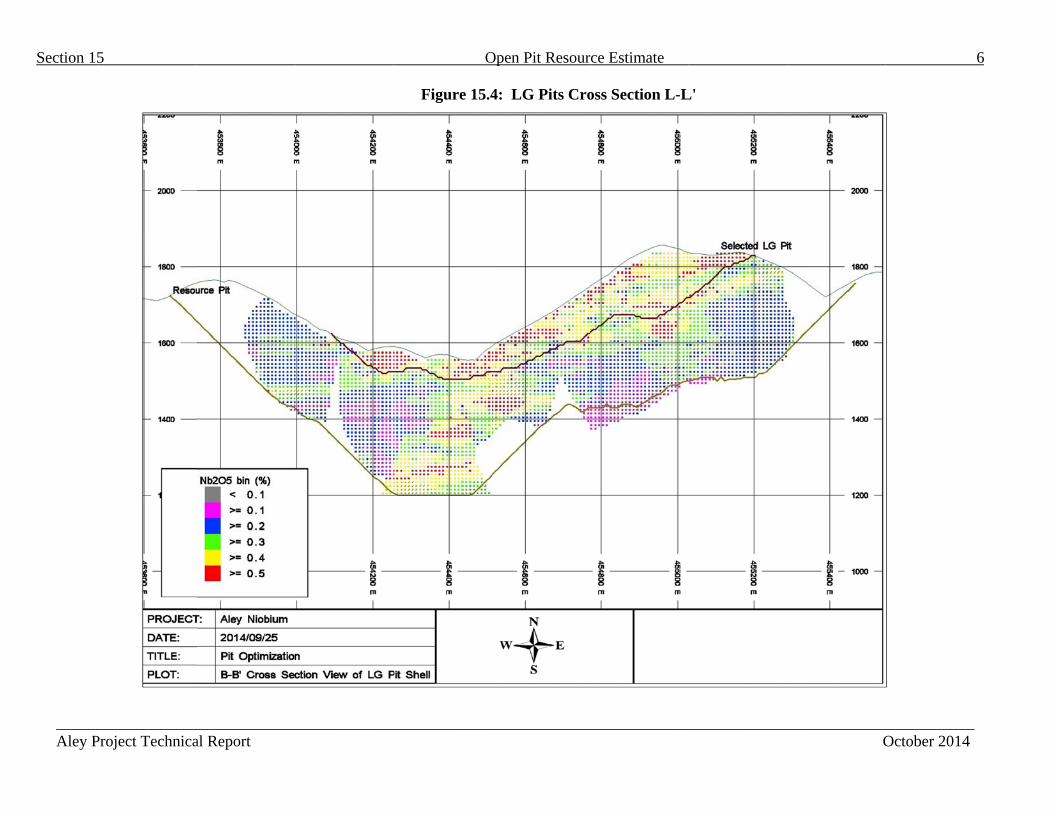
Section 15
______ Aley P
5
_____________Project Technica
_____________al Report
______________
O
_____________
Figure 15.4
Open Pit Resour
______________
4: LG Pits Cro
rce Estimate
______________
oss Section L-L
_____________
L'
_____________ O
6
____________ October 2014

Section 15 Open Pit Resource Estimate 7
Aley Project Technical Report October 2014
15.4 DESIGN, SCHEDULE, COSTS AND ECONOMIC ANALYSIS
The detailed design of the pit, using the design basis shell, and a mine schedule based on that design are discussed further in Section 16.
Capital and operating costs as well as an economic analysis consistent with the project design are discussed in Sections 21 and 22 respectively.
15.5 RESERVE BASIS CUT-OFF GRADE
A reserve basis cut-off grade of 0.30% Nb2O5 was selected for the Aley Mine on the basis of the cost and revenue estimates supported in Sections 21 and 22.
These are summarized as follows:
Revenue
o Average long term Niobium price of US$45.00 per kg. o A US$/Cdn$ exchange rate of 0.90. o Process Recovery of 65.4% o Resultant Revenue of 0.30% Nb2O5 Concentrator Feed = $68.48 / tonne milled
Costs o Total operating costs of $55.56/tonne milled o Sustaining Capital costs of $0.23/tonne milled o Total Cost = $55.79 / tonne milled
The result is a margin of $12.69 /tonne milled on concentrator feed grading 0.30% Nb2O5. The cut-off grade used to define reserves is robust.
The tonnages and average grade of the deposit within the detailed pit design at varying cut-off grades are shown in Table 15.2 below.
Table 15.2: Resources Contained within Detailed Pit Design
CLASS
Nb2O5 Ore Nb2O5 Mined Strip Cutoff GRADE Waste Ratio
(%) (kt) (%) (kt)
Total Measured 0.2 94,013 0.47 34,131 0.36 and Indicated 0.3 83,815 0.50 44,329 0.53
0.4 66,482 0.53 61,662 0.93 0.5 37,725 0.60 90,419 2.40 0.6 15,984 0.69 112,160 7.02
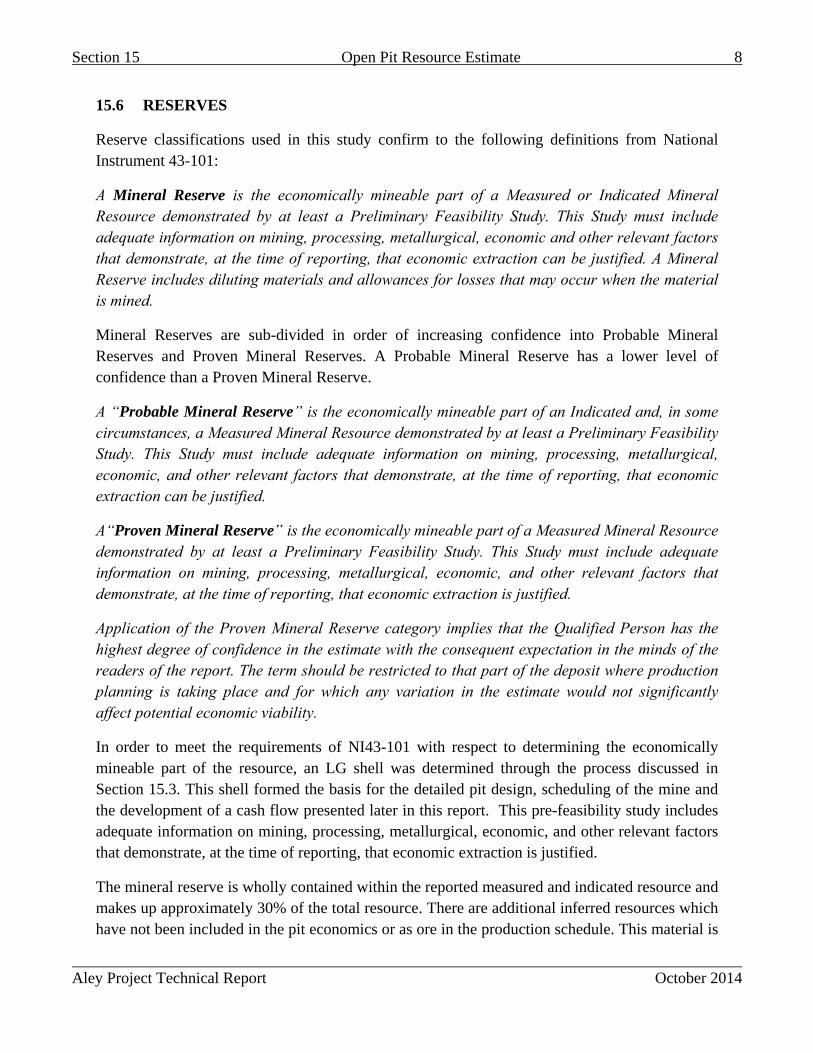
Section 15 Open Pit Resource Estimate 8
Aley Project Technical Report October 2014
15.6 RESERVES
Reserve classifications used in this study confirm to the following definitions from National Instrument 43-101:
A Mineral Reserve is the economically mineable part of a Measured or Indicated Mineral Resource demonstrated by at least a Preliminary Feasibility Study. This Study must include adequate information on mining, processing, metallurgical, economic and other relevant factors that demonstrate, at the time of reporting, that economic extraction can be justified. A Mineral Reserve includes diluting materials and allowances for losses that may occur when the material is mined.
Mineral Reserves are sub-divided in order of increasing confidence into Probable Mineral Reserves and Proven Mineral Reserves. A Probable Mineral Reserve has a lower level of confidence than a Proven Mineral Reserve.
A “Probable Mineral Reserve” is the economically mineable part of an Indicated and, in some circumstances, a Measured Mineral Resource demonstrated by at least a Preliminary Feasibility Study. This Study must include adequate information on mining, processing, metallurgical, economic, and other relevant factors that demonstrate, at the time of reporting, that economic extraction can be justified.
A“Proven Mineral Reserve‟ is the economically mineable part of a Measured Mineral Resource demonstrated by at least a Preliminary Feasibility Study. This Study must include adequate information on mining, processing, metallurgical, economic, and other relevant factors that demonstrate, at the time of reporting, that economic extraction is justified.
Application of the Proven Mineral Reserve category implies that the Qualified Person has the highest degree of confidence in the estimate with the consequent expectation in the minds of the readers of the report. The term should be restricted to that part of the deposit where production planning is taking place and for which any variation in the estimate would not significantly affect potential economic viability.
In order to meet the requirements of NI43-101 with respect to determining the economically mineable part of the resource, an LG shell was determined through the process discussed in Section 15.3. This shell formed the basis for the detailed pit design, scheduling of the mine and the development of a cash flow presented later in this report. This pre-feasibility study includes adequate information on mining, processing, metallurgical, economic, and other relevant factors that demonstrate, at the time of reporting, that economic extraction is justified.
The mineral reserve is wholly contained within the reported measured and indicated resource and makes up approximately 30% of the total resource. There are additional inferred resources which have not been included in the pit economics or as ore in the production schedule. This material is
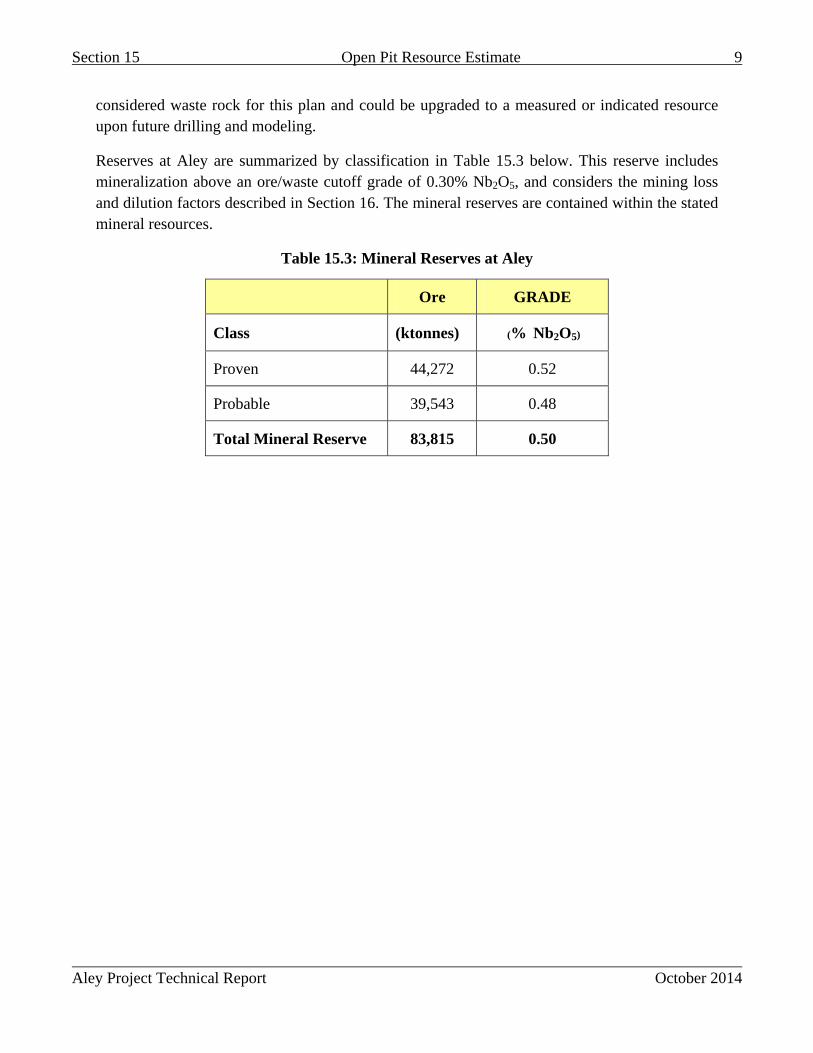
Section 15 Open Pit Resource Estimate 9
Aley Project Technical Report October 2014
considered waste rock for this plan and could be upgraded to a measured or indicated resource upon future drilling and modeling.
Reserves at Aley are summarized by classification in Table 15.3 below. This reserve includes mineralization above an ore/waste cutoff grade of 0.30% Nb2O5, and considers the mining loss and dilution factors described in Section 16. The mineral reserves are contained within the stated mineral resources.
Table 15.3: Mineral Reserves at Aley
Ore GRADE
Class (ktonnes) (% Nb2O5)
Proven 44,272 0.52
Probable 39,543 0.48
Total Mineral Reserve 83,815 0.50

Aley Project Technical Report October 2014
SECTION 16: MINING METHOD

Aley Project Technical Report October 2014
Table of Contents
16.0 Mining Method ...................................................................................................................... 1
16.1 Project Production Rate Consideration ............................................................................... 1
16.2 Detailed Pit Design ............................................................................................................. 1
16.2.1 Designed Pit Wall Angles .............................................................................................. 1
16.2.2 Mine Equipment Selection ............................................................................................ 2
16.2.3 Haul Road Design Parameters ....................................................................................... 3
16.2.4 Minimum Mining Width ............................................................................................... 4
16.2.5 Access Considerations ................................................................................................... 4
16.3 Design Results .................................................................................................................... 4
16.3.1 Access Haul Roads ........................................................................................................ 4
16.3.2 East Ridge Pit, (Phase 1) ............................................................................................... 4
16.3.3 Final Pit, (Phase 2) ......................................................................................................... 5
16.4 Pre-Production Mining ......................................................................................................... 8
16.5 Diluation and Ore Loss ....................................................................................................... 8
16.6 Production Schedule Considerations .................................................................................. 9
16.7 Production Schedule ........................................................................................................... 9
16.8 Waste Rock Storage ............................................................................................................ 9
16.9 End of Period Maps........................................................................................................... 10
16.10 Direct Mining Unit Operations ....................................................................................... 16
16.10.1 Drilling and Blasting ................................................................................................. 16
16.10.2 Loading ...................................................................................................................... 17
16.10.3 Hauling ...................................................................................................................... 17
16.10.4 Pit Services ................................................................................................................ 17
16.10.5 Mine Maintenance ..................................................................................................... 17
16.10.6 GME and Technical ................................................................................................... 18
16.11 Mine Operations Organizational Chart ............................................................................ 19
Table of Figures
Figure 16.1: Geotechnical Pit Sectors and Overall Pit Slope Criteria ............................................. 2
Figure 16.2: Haul Road Width ....................................................................................................... 3
Figure 16.3: East Ridge Phase 1 ...................................................................................................... 6
Aley Project Technical Report October 2014
Figure 16.4: Final Pit Phase 2 ......................................................................................................... 7
Figure 16.5: Pre-Production Mining Activities – Year 1 ................................................................ 8
Figure 16.6: Waste Dump Locations – Year 22 ............................................................................ 10
Figure 16.7: Year 1 End of Period Maps....................................................................................... 11
Figure 16.8: Year 5 End of Period Map ........................................................................................ 12
Figure 16.9: Year 10 End of Period Map ...................................................................................... 13
Figure 16.10: Year 15 End of Period Map .................................................................................... 14
Figure 16.11: Year 22 End of Period Map .................................................................................... 15
Figure 16.12: Mine Operations Organizational Chart ................................................................... 19
Section 16 Mining Method 1
Aley Project Technical Report October 2014
16.0 Mining Method
The Aley open pit will be mined by a conventional truck and shovel operation. Due to the production rate, location of the deposit and the width of the mining cuts, the equipment utilized in this operation will be approximately one third of the size of typical equipment found in today’s large open pit operations.
16.1 PROJECT PRODUCTION RATE CONSIDERATION
The production rate of 10,000 tpd ore was selected as a base case for project design and costing on the basis of balancing economies of scale and niobium market conditions.
16.2 DETAILED PIT DESIGN
The LG shell as discussed in Section 15 was used as the basis upon which to carry out the detailed design of the pit. The detailed design considered the following objectives in order to ensure efficient and practical mining operations:
Highwall ramps should allow access to the lower benches but should exit the pit at the lowest elevation possible to keep the strip ratio reduced.
Maintain sufficient mining width on each bench for efficient operations in each phase.
The bench face angle/berm width combination, inter-ramp slope angles, and highwall roads must meet the limiting overall pit slope angle for the final wall.
Limit vertical bench mining rate to no more than 8 benches per year.
Supply enough waste rock to meet construction material requirements for any necessary ex-pit infrastructure.
Minimize switchbacks and flat grade segments.
16.2.1 DESIGNED PIT WALL ANGLES
Designs for the Aley pit phases use a fixed face slope angle of 65 degrees and safety berm widths of 10m for every two vertical 10m benches, for a standard inter-ramp slope angle of 46 degrees.
Knight Piesold’s recommended inter-ramp pit slopes for different sectors of the pit are:
10m vertical benches, double benching configuration (safety berm every 20m)
North Sector: 70 degree face angle, 50 degree inter-ramp angle, berm width of 9.5m
North-East Sector: 65 degree face angle, 48 degree inter-ramp angle, berm width of 9m.
South-East Sector: 70 degree face angle, 50 degree inter-ramp angle, berm width of 9.5m
West Sector: 65 degree face angle, 45 degree inter-ramp angle, berm width of 11m.
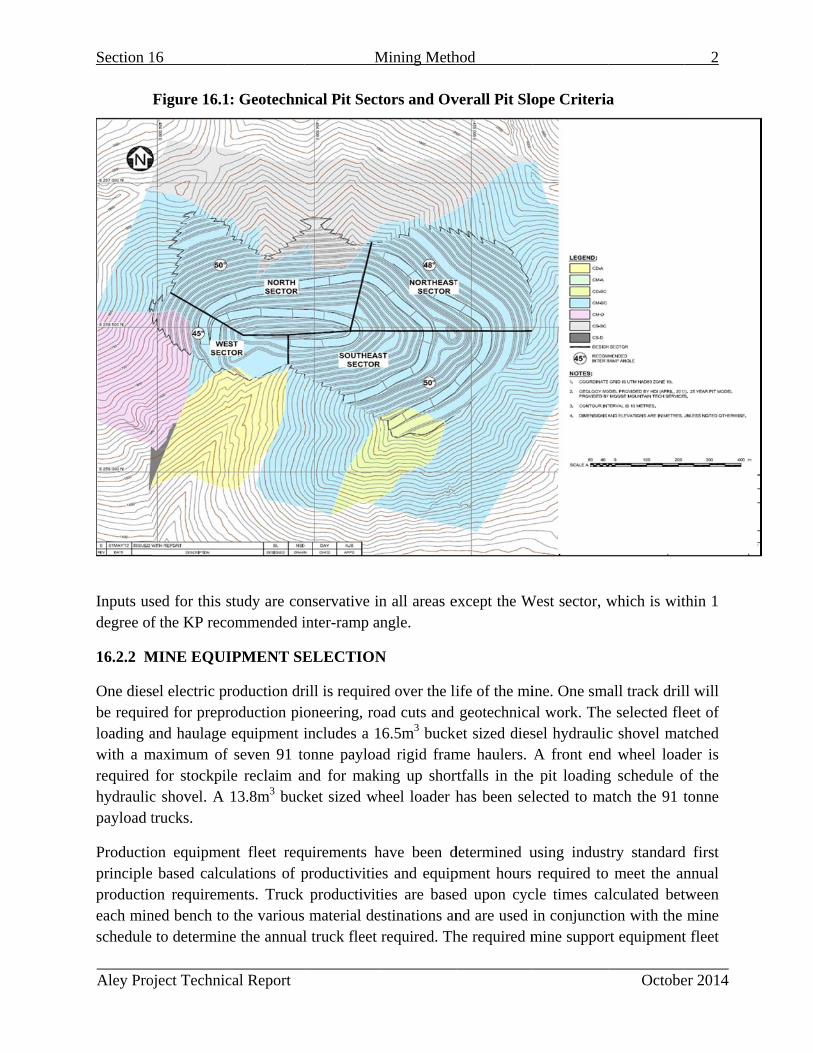
Section 1
Aley Pro
Inputs usdegree of
16.2.2 M
One diesbe requirloading awith a mrequired hydraulicpayload t
Productioprincipleproductioeach minschedule
16
oject Technic
Figure 16.1
sed for this sf the KP reco
MINE EQUI
el electric prred for preprand haulage
maximum of for stockpil
c shovel. A trucks.
on equipme based calcuon requiremned bench to
to determin
cal Report
1: Geotechni
study are coommended i
IPMENT SE
roduction drroduction pioequipment i
f seven 91 tole reclaim a13.8m3 buck
nt fleet requlations of p
ments. Truck o the variousne the annual
M
ical Pit Sect
nservative ininter-ramp an
ELECTION
rill is requireoneering, roincludes a 1onne payloa
and for makket sized wh
uirements hproductivitie
productivit material del truck fleet
Mining Meth
tors and Ov
n all areas engle.
N
ed over the lioad cuts and
6.5m3 buckead rigid framing up shorheel loader h
have been des and equipies are base
estinations anrequired. Th
hod
verall Pit Slo
except the W
ife of the migeotechnicaet sized dies
me haulers.rtfalls in thehas been sel
determined upment hours ed upon cycnd are used he required m
ope Criteria
West sector, w
ine. One smaal work. Thesel hydraulicA front end
e pit loadinglected to ma
using industrequired to
cle times cain conjunctimine suppor
Octobe
a
which is wit
all track drile selected flec shovel matd wheel loadg schedule oatch the 91 t
try standard meet the anlculated betion with the rt equipment
2
er 2014
thin 1
ll will eet of tched der is of the tonne
d first nnual tween mine
t fleet
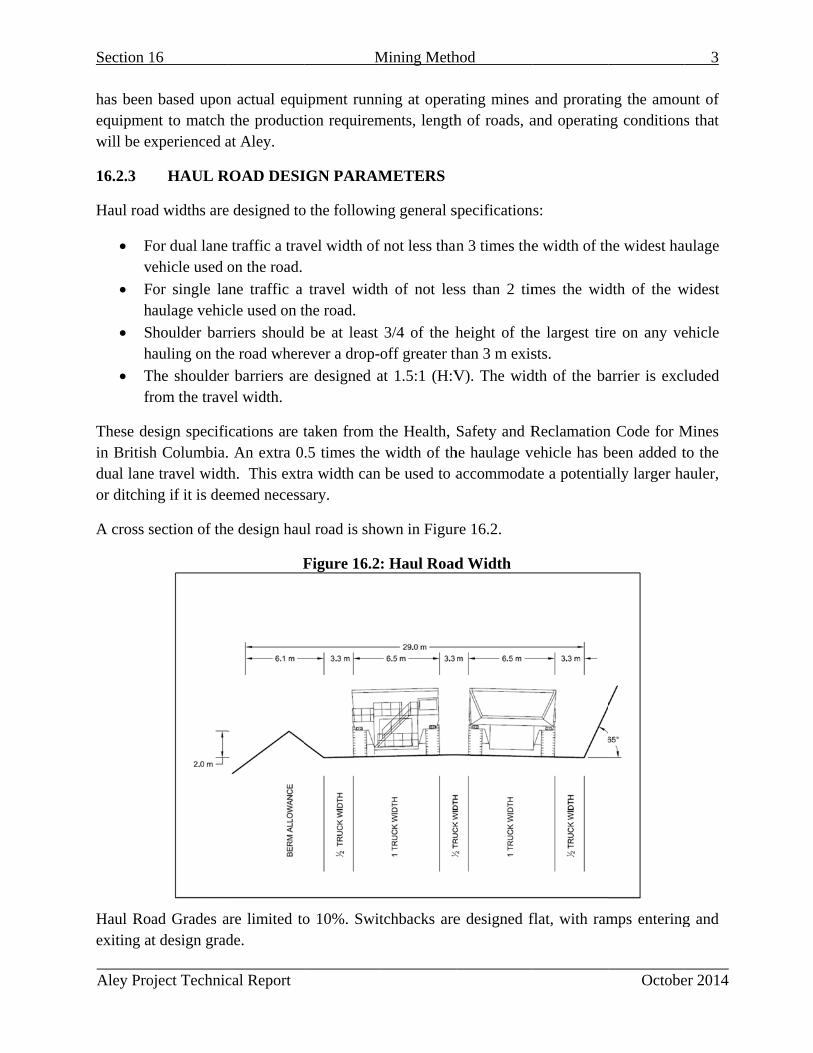
Section 1
Aley Pro
has beenequipmenwill be ex
16.2.3
Haul road
Fv
Fh
Sh
Tfr
These dein Britishdual laneor ditchin
A cross s
Haul Roaexiting at
16
oject Technic
n based uponnt to match xperienced a
HAUL R
d widths are
or dual lane ehicle used o
or single laaulage vehic
houlder barrauling on th
The shoulderrom the trave
esign specifih Columbia.e travel widthng if it is dee
section of the
ad Grades at design grad
cal Report
n actual equithe producti
at Aley.
ROAD DESI
e designed to
traffic a travon the road.
ane traffic a cle used on t
riers shoulde road where
r barriers areel width.
cations are t An extra 0h. This extremed necess
e design hau
F
are limited tode.
M
ipment runnion requirem
IGN PARAM
o the followin
vel width of
travel widtthe road.
d be at least ever a drop-
e designed a
taken from t.5 times the ra width cansary.
ul road is sho
Figure 16.2
o 10%. Swit
Mining Meth
ning at operaments, length
METERS
ng general s
f not less than
th of not les
3/4 of the hoff greater th
at 1.5:1 (H:V
the Health, width of th
n be used to a
own in Figur
: Haul Road
tchbacks are
hod
ating mines h of roads, a
specification
n 3 times the
ss than 2 tim
height of thhan 3 m exis
V). The wid
Safety and Rhe haulage vaccommoda
re 16.2.
d Width
e designed f
and proratinand operatin
ns:
e width of th
mes the wid
he largest tirsts.
dth of the ba
Reclamationvehicle has bate a potentia
flat, with ram
Octobe
ng the amoung conditions
he widest ha
dth of the w
re on any ve
arrier is excl
n Code for Mbeen added tally larger ha
mps entering
3
er 2014
unt of s that
aulage
widest
ehicle
luded
Mines to the auler,
g and

Section 16 Mining Method 4
Aley Project Technical Report October 2014
16.2.4 MINIMUM MINING WIDTH
The minimum mining width used in the Aley pit design is 100m, which provides sufficient room for 2-sided truck loading.
In areas where minimum shovel mining width is not achieved, such as initial outcrop benches, drill and blast ramps will be cut and crawler-dozers or loader tramming will be utilized for excavation. Full truck/shovel fleet excavation of the dozed or trammed material will be done from lower benches where sufficient bench width has been achieved.
16.2.5 ACCESS CONSIDERATIONS
In this study, two-way haul roads are designed in areas where high traffic volumes require the extra width to allow efficient passing of trucks. Access ramps are not designed for the last two benches of the pit bottom as the last ramps will be in ore and they will be removed using retreat mining. The bottom two ramped benches of the pit use one-way haul roads since bench volumes and traffic flow are reduced. This reduces the extra waste mining required for wider roads in the highwall.
Consideration for runaway lanes and/or retardation barriers where conditions or risks warrant, will be designed on the highwall berms and external pit roads during the detailed engineering phase.
To minimize the waste mining required to accommodate the highwall ramp to the pit bottom, the road is designed to exit the pit at the 1,790m bench, ramping downward to the ultimate pit bottom. Benches above 1,790m are accessed by external ramps built on the original hill side slopes. All benches within the starter phase are also accessed by external ramps built on the original hill side slopes. Pit exits also exist at the 1,540m and 1,680m benches, minimizing the need for hauling the material mined on lower benches to higher elevations than necessary.
16.3 DESIGN RESULTS
The detailed pit design is based upon the LG pit shell and the design considerations outlined above. The resultant pit phase designs are discussed in the following subsections.
16.3.1 ACCESS HAUL ROADS
In order to access the upper benches of the pit, as well as the sand storage management facility (SSMF) and the crusher, internal and external pit haul roads have been designed to a pre-
feasibility level using MineSight CAD software.
16.3.2 EAST RIDGE PIT, (Phase 1)
A plan view of the East Ridge Pit is shown in Figure 16.3.
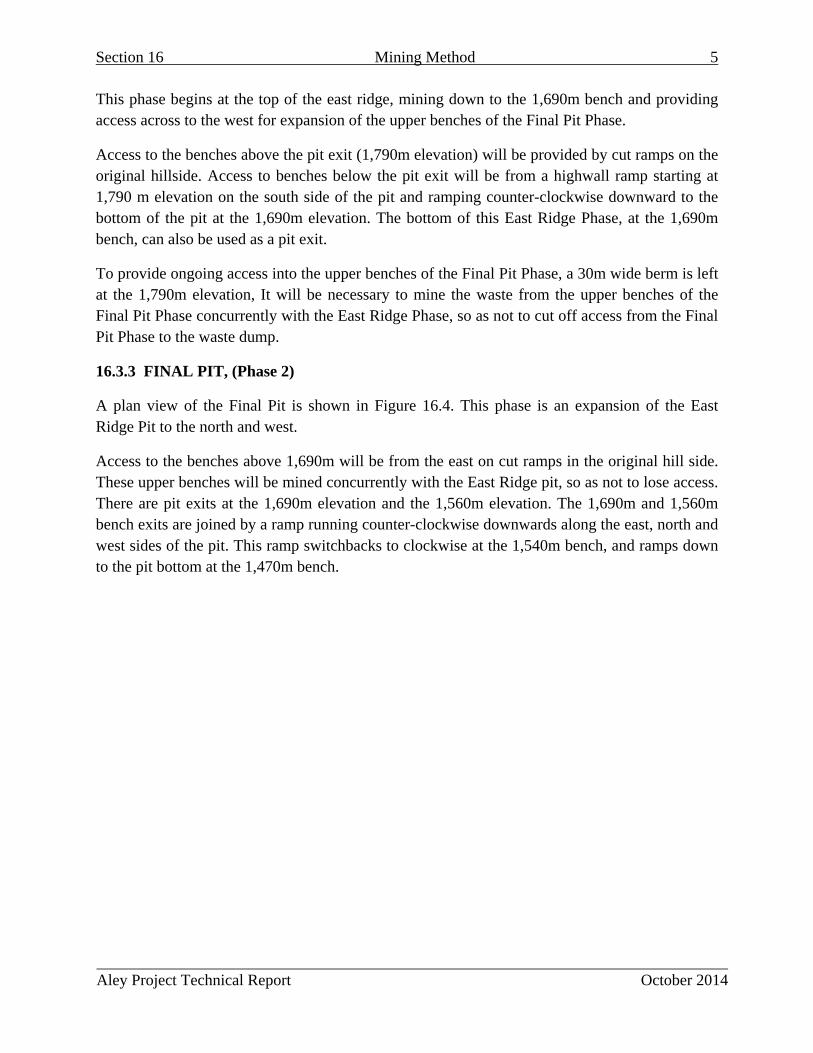
Section 16 Mining Method 5
Aley Project Technical Report October 2014
This phase begins at the top of the east ridge, mining down to the 1,690m bench and providing access across to the west for expansion of the upper benches of the Final Pit Phase.
Access to the benches above the pit exit (1,790m elevation) will be provided by cut ramps on the original hillside. Access to benches below the pit exit will be from a highwall ramp starting at 1,790 m elevation on the south side of the pit and ramping counter-clockwise downward to the bottom of the pit at the 1,690m elevation. The bottom of this East Ridge Phase, at the 1,690m bench, can also be used as a pit exit.
To provide ongoing access into the upper benches of the Final Pit Phase, a 30m wide berm is left at the 1,790m elevation, It will be necessary to mine the waste from the upper benches of the Final Pit Phase concurrently with the East Ridge Phase, so as not to cut off access from the Final Pit Phase to the waste dump.
16.3.3 FINAL PIT, (Phase 2)
A plan view of the Final Pit is shown in Figure 16.4. This phase is an expansion of the East Ridge Pit to the north and west.
Access to the benches above 1,690m will be from the east on cut ramps in the original hill side. These upper benches will be mined concurrently with the East Ridge pit, so as not to lose access. There are pit exits at the 1,690m elevation and the 1,560m elevation. The 1,690m and 1,560m bench exits are joined by a ramp running counter-clockwise downwards along the east, north and west sides of the pit. This ramp switchbacks to clockwise at the 1,540m bench, and ramps down to the pit bottom at the 1,470m bench.

Section 16
Aley Proje
6
ect Technical Re
eport
F
Figure 16.3: Ea
Mining Meth
ast Ridge Phas
hod
e 1
6
October 2014
6
4
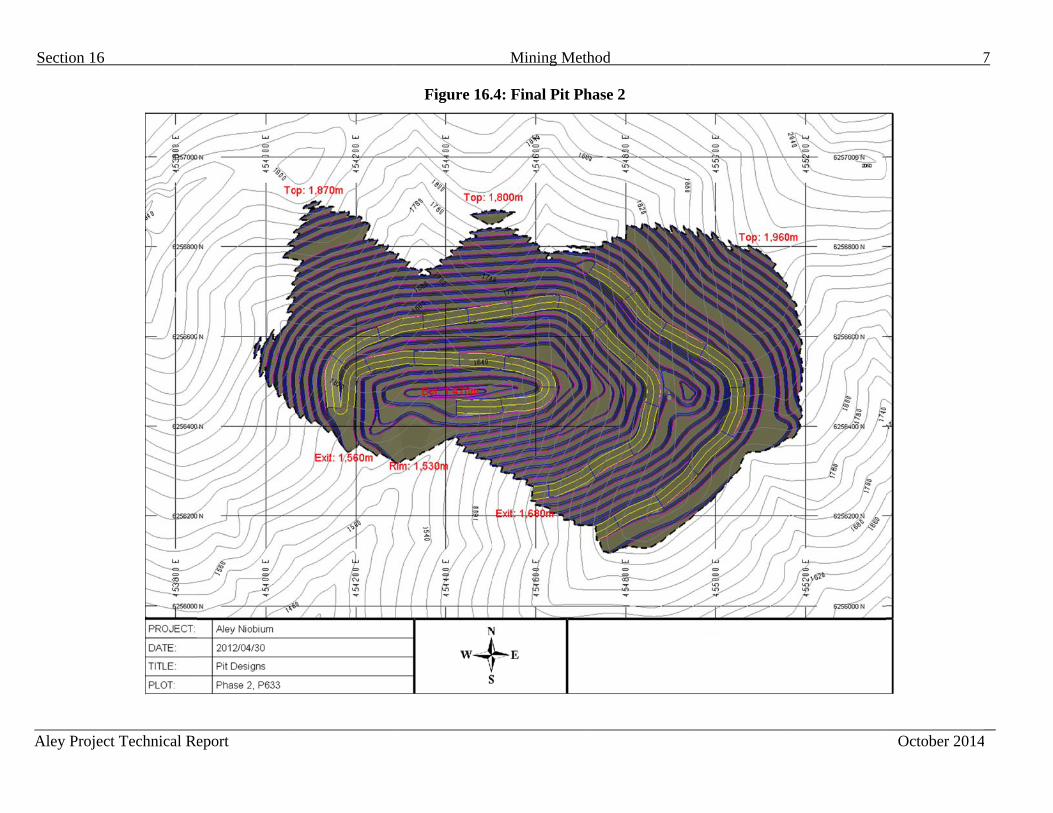
Section 16
Aley Proje
6
ect Technical Re
eport
Figure 16.
Mining Meth
.4: Final Pit Ph
hod
hase 2
7
October 2014
7
4
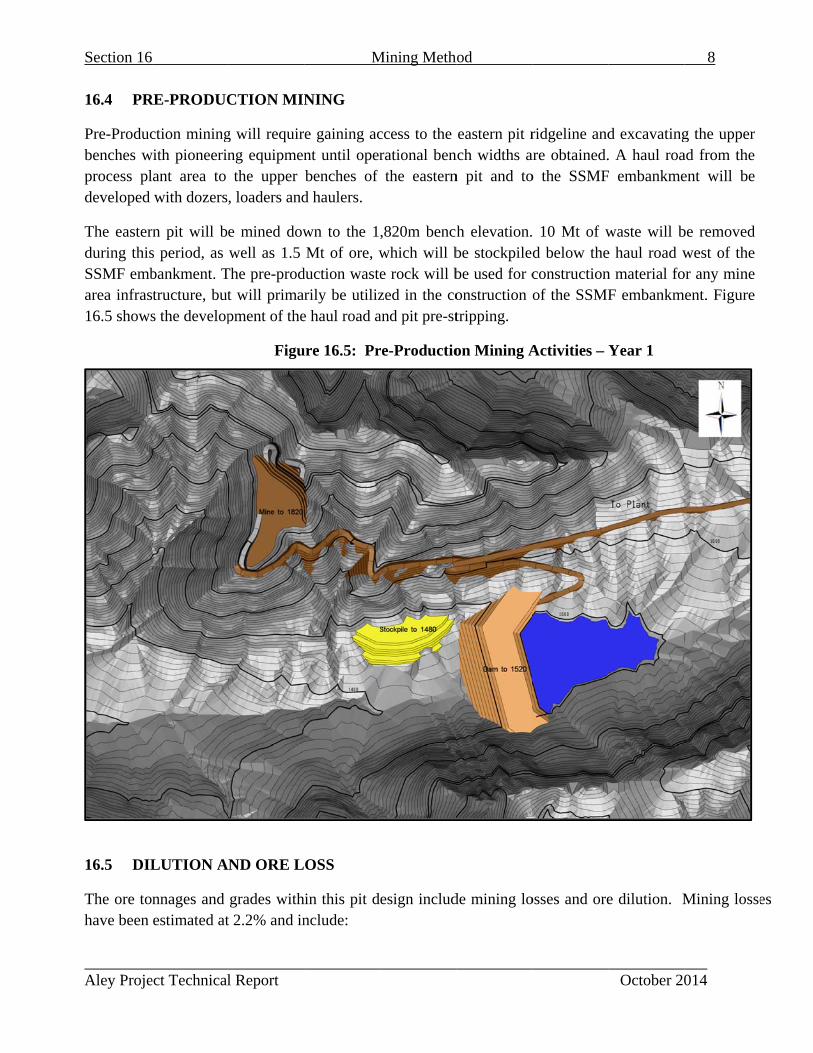
Section 16
Aley Proje
16.4 PR
Pre-Producbenches wprocess pldeveloped
The easterduring thisSSMF embarea infras16.5 shows
16.5 DIL
The ore tohave been
ect Technical
RE-PRODUC
ction miningwith pioneerin
ant area to with dozers
rn pit will bs period, as bankment. Ttructure, buts the develop
LUTION A
nnages and estimated at
l Report
CTION MIN
g will requirng equipmenthe upper
, loaders and
e mined dowwell as 1.5
The pre-prodt will primarpment of the
Figu
ND ORE L
grades witht 2.2% and in
M
NING
e gaining acnt until operbenches of
d haulers.
wn to the 1Mt of ore, w
duction wasterily be utiliz
e haul road a
ure 16.5: Pr
OSS
hin this pit dnclude:
Mining Meth
ccess to the rational benthe eastern
,820m benchwhich will be rock will bzed in the coand pit pre-st
re-Productio
esign includ
hod
eastern pit rnch widths an pit and to
h elevation.be stockpilebe used for construction tripping.
on Mining A
de mining lo
ridgeline andare obtained.o the SSMF
10 Mt of wd below theconstructionof the SSMF
Activities – Y
osses and ore
October 20
d excavating. A haul roa
F embankme
waste will be haul road wn material foF embankm
Year 1
e dilution. M
8
014
g the upper ad from the ent will be
be removed west of the
or any mine ment. Figure
Mining lossees

Section 16 Mining Method 9
Aley Project Technical Report October 2014
Carry back (1%): A percentage of the volume of ore in the haul trucks may build-up in the box due to frozen or wet and sticky material.
Stockpile Reclaim (0.7%): Assuming that a 1 m layer at the base of the ore stockpiles will be wasted as it mixes with stockpile foundation material.
Misdirected Loads (0.5%): An allowance has been made for misdirected loads.
Mining dilution was derived by determining which ore blocks (within the pit) abutted against waste blocks. The grade of Nb2O5 within the waste blocks and the number of waste blocks abutting the ore block were determined in order to calculate the overall amount of waste dilution and the grade of the dilution. The total diluted tonnage included as ore is 2.2% of the total ore. The grade of the diluted tonnage is 0.12% Nb2O5.
16.6 PRODUCTION SCHEDULE CONSIDERATIONS
The following parameters were used to drive the production schedule and equipment requirements:
Annual mill feed of 3,650 ktpa is targeted based on 10,000 tonnes/day ore milling.
Year 1 milling target of 7,500 tonnes/day.
Year 2 milling target of 9,675 tonnes/day.
Year 3 onwards milling target of 10,000 tonnes/day.
Cut off grade of 0.3% Nb2O5 as discussed in Section 22.
The annual periods for mining are 360 operating days assuming 5 days down due to weather.
16.7 PRODUCTION SCHEDULE
The summarized production schedule results are provided in Table 22.1 in the Economic Analysis section of this report.
16.8 WASTE ROCK STORAGE
The total pit waste rock produced is 44,329,000 tonnes or 17,058,000 BCM’s (includes excess cuts from external haul roads).
10,903 kt of Overburden type waste rock, with a density of 2.0 t/BCM
33,426 kt of non-overburden waste rock, with a density of 2.9 t/BCM
Waste rock is used primarily to construct the SSMF embankment, with the exception of 630,000 BCMs that will be placed in the pit area in year 4 of the mine schedule. This pit area waste will be used to create a road to haul material out of the 1540 pit exit and tie in with the external road across the valley. Surplus rock not designated for embankment construction will be placed on the downstream shell of the SSMF embankment. This will provide additional strength and reinforcement to the SSMF while also supporting the objective of keeping the mine infrastructure in one watershed, minimizing the project footprint.

Section 16
Aley Proje
Both the S
The SSMFthe mine. Wthroughoutconstructiowithin the
16.9 EN
The followschedule. Tschedule pthe crusher
ect Technical
SMF emban
F embankmeWaste rock t the mine on needs. TSSMF area b
ND OF PERI
wing figures The figures eriods. Fromr to feed the
l Report
nkment waste
Figur
ent has been production life and noThe embankbasin.
IOD MAPS
show End oshow all pi
m years 20 tomill over th
M
e rock and th
re 16.6: Wa
scheduled tfrom the pitextra wast
kment’s cor
S
of Period (Eits, waste duo 24 the 15M
hese final yea
Mining Meth
he pit area w
ste Dump L
to be construt exceeds thte stripping e material i
OP) maps atumps and hMt of stockpars.
hod
waste rock ar
Locations –
ucted in a sehe constructi
from the pis assumed
at years 1, 5,haul roads atpiled lower g
re shown in F
Year 22
eries of 8 lifion needs of
pit is anticipto be sourc
, 10, 15, andt the end of
grade ore wil
October 20
Figure 16.6.
fts over the f the embanpated to meced from m
d 22 of the pf these prodll be re-hand
10
014
life of nkment eet the
material
project duction dled to
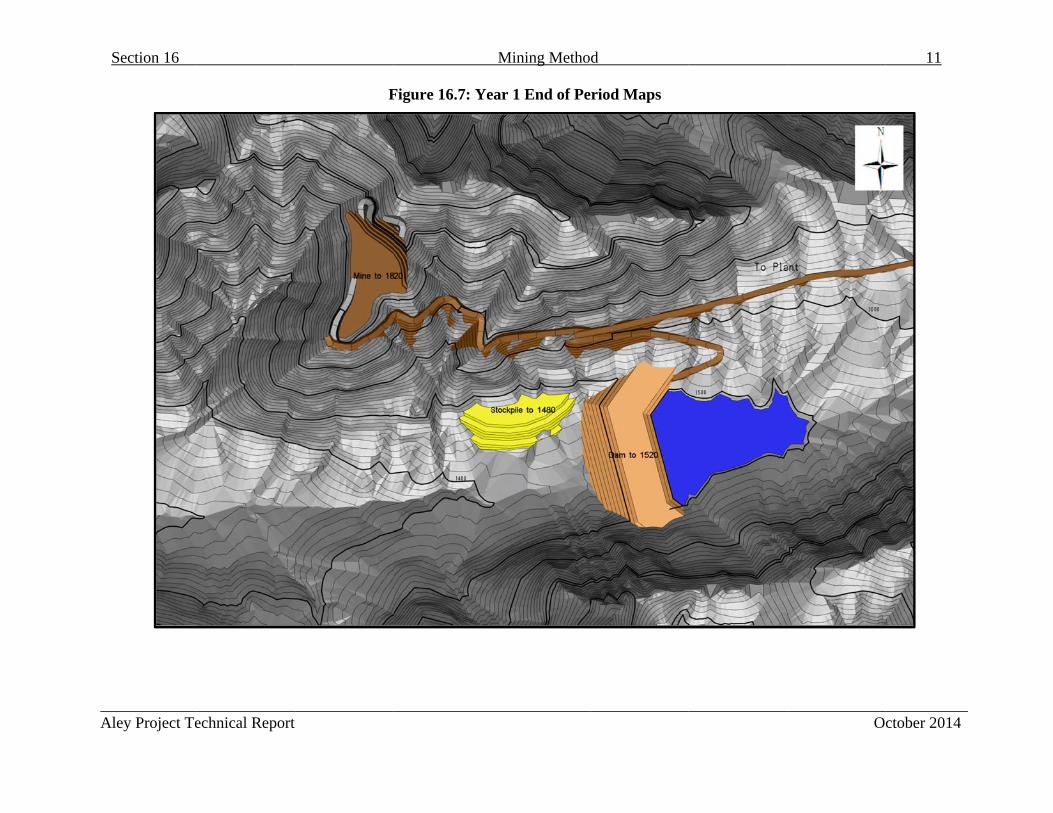
Section 16
Aley Project Te
echnical Report
F
Figure 16.7: Ye
Mining Metho
ear 1 End of Pe
d
eriod Maps
O
11
ctober 2014
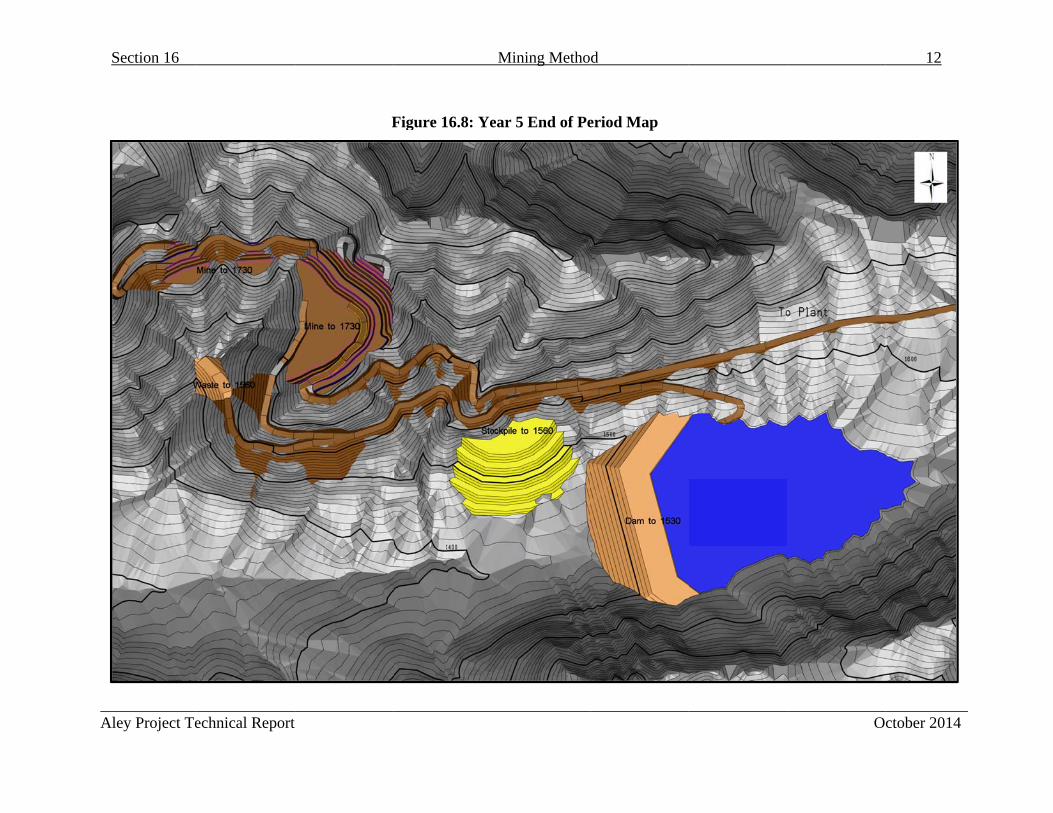
Section 16
Aley Project Te
echnical Report
F
Figure 16.8: Ye
Mining Metho
ear 5 End of Pe
d
eriod Map
O
12
ctober 2014
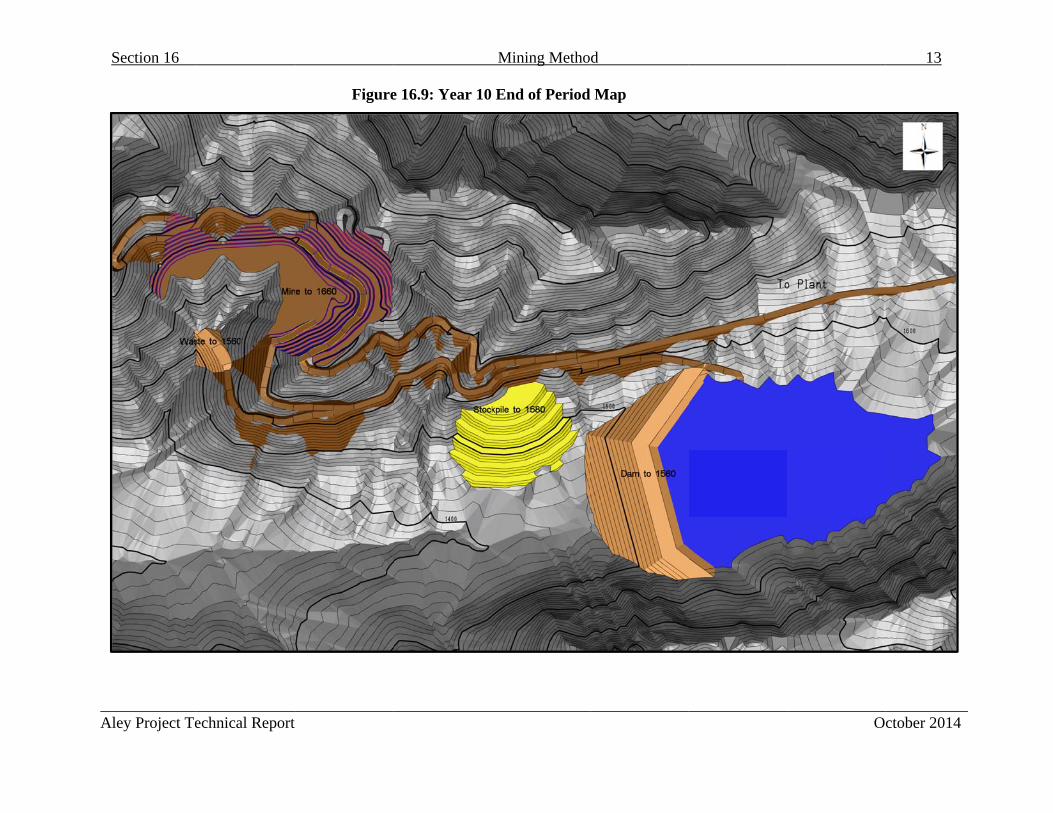
Section 16
Aley Project Te
echnical Report
Figure
e 16.9: Year 10
Mining Metho
End of Period
d
Map
O
13
ctober 2014

Section 16
Aley Project Te
echnical Report
F
igure 16.10: Ye
Mining Metho
ear 15 End of P
d
Period Map
O
14
ctober 2014

Section 16
Aley Project Te
echnical Report
F
igure 16.11: Ye
Mining Metho
ear 22 End of P
d
Period Map
O
15
ctober 2014
Section 16 Mining Method 16
Aley Project Technical Report October 2014
16.10 DIRECT MINING UNIT OPERATIONS
The mining operations will be typical of similar open pit operations in mountainous terrain. Direct Mining includes, drilling, blasting, loading, hauling, pit support, ground support and unallocated labour activities in the mine.
The general mine expense items, (GME) includes the Supervision for the direct mining activities, including Supervision for the mine fleet maintenance department. More detailed descriptions of the mine organization and the unit mining activities follows.
Technical support requirements from Mine Engineering, Geology, Geotechnical, Environmental and Avalanche Control functions fall under the site G&A (General and Administration) department, and are not included as part of the mining operations costs.
16.10.1 DRILLING AND BLASTING
The rock at Aley will require drilling and blasting. The initial access road dozer cuts will require specialty drilling (Airtrack or tank drills). When loader/hauler operations commence, dozers will prepare drill pattern areas on the bench floors to enable drilling of holes on the spacing and burden specified. On hill-side benches, ramps will be cut on the slope where the flat bench doesn’t exist to provide drill access. One rotary diesel drill has been specified for the Aley project on the basis of pattern and drill performance experienced in similar conditions.
The production drill will also be adequate for highwall geotechnical drilling for pre-shearing or buffer blasting on the ultimate pit limits.
Based on similar operations in northern British Columbia a target powder factor of 0.23 kg/t (0.66 kg/BCM) is proposed for the Aley operation. This powder factor is achieved through the mix of explosives used and by appropriate drill hole spacing.
The type of explosive that will be used is a Mixed Emulsion solution. For dry holes the mixture used is estimated to be 65% ANFO (ammonium nitrate and fuel oil) and 35% emulsion product. For wet holes the mixture is assumed to be 30% ANFO and 70% emulsion product. It is assumed that 60% of the holes will be dry, and 40% of the holes will be wet.
A contract explosives supplier will provide the blasting materials and technology for the mine. Because of the remote nature of the operation, an explosives storage facility will be built on site.
Loading of the explosives will be done with bulk explosives loading trucks. The holes will also be stemmed to avoid fly-rock and excessive air blasts. Blasthole cuttings will be used for stemming, and a small wheel loader will be available for loading crushed rock into the blast holes.
The blasting crew will coordinate the drilling and blasting activities to ensure a minimum 2 weeks of broken material inventory is maintained.
Section 16 Mining Method 17
Aley Project Technical Report October 2014
16.10.2 LOADING
Pit operation requires one 16.5m3 bucket sized diesel hydraulic shovel and one 13.8m3 bucket sized rubber tired front end wheel loader, which are sized to match the 91 tonne payload rigid frame haulers and to meet the production requirements of the mining schedule.
Hydraulic shovels have a higher operating cost compared to electric rope shovels, but are more suited to Aley due to the production rate, the flexibility required and the lack of available electric power in the pit. The wheel loader is also specified for re-handling stockpiled material, pit clean up, road construction, snow removal, or as an alternate to load trucks in the pit if the shovel is not available.
Loading productivities are based on industry standard first principle calculations to derive productivities and required operating hours.
16.10.3 HAULING
Ore and waste rock haulage will be handled by off-highway rigid frame haul trucks with a 91 tonne payload. Haulage profiles have been estimated from pit centroids at each bench to designated dumping points for each time period. These haul profiles are inputs to the truck haul cycle simulation program and the resulting cycle times, are used in conjunction with the mine schedule to determine the annual truck fleet required. A maximum of 7 trucks are required over the life of the mine.
16.10.4 PIT SERVICES
Pit services including haul road maintenance, loader face maintenance, waste dump maintenance, ditching, dewatering, lighting, safety and transporting personnel and operating supplies, will be directed by the Mine General Foreman. Manpower and equipment costs are included for these activities. An allowance in the mine operations for maintaining the site access road has also been included.
16.10.5 MINE MAINTENANCE
Mine maintenance activities will be generally performed in the truck shop under the direction of the Mine Maintenance General Foreman who will assume overall responsibility for mine maintenance and will report to the Mine Superintendent. Maintenance planners will co-ordinate planned maintenance schedules. The daily maintenance shift co-ordination will be carried out by Mine Maintenance Foremen.
The Mine Maintenance department will perform break-down maintenance, field maintenance and repairs, regular PM maintenance, component change-outs, and field fuel, lube and tire change-outs. The maintenance shops and fuel storage will be located near the plant site. Fuel, lube and maintenance support in the pit will be by a mobile service truck.
Section 16 Mining Method 18
Aley Project Technical Report October 2014
16.10.6 GME AND TECHNICAL
Mine GME will include mine operations and maintenance supervision down to the Foreman level.
A Mine Superintendent will assume responsibility for overall supervision for the mining and mine maintenance operations. A Mine Clerk will also report to the Mine Superintendent. The Mine Superintendent and Mine Clerk roles will be included as part of the site G&A, and not included under the mine operations costs.
A General Mine Foreman will be responsible for overall open pit supervision and equipment coordination. A Mine shift Foreman is required on each 12-hour shift, with overall responsibility for the shift operation.
A Mine Maintenance General Foreman will be responsible for overall open pit maintenance department supervision. A Mine Maintenance shift Foreman is required on each 12-hour shift, with overall responsibility for the shift operation. A Maintenance Planner will be responsible for planning out all scheduled maintenance activities on the mobile mine fleet.
Initial training and equipment operation will be provided by experienced operators.
Mine technical departments will be included as part of general site G&A, and not part of the mine operations costs, and will include mine engineering, geology, geotechnical, environmental and avalanche control services.
The Technical Services Superintendent will oversee all technical services departments.
A Senior Mine Engineer will co-ordinate the Engineers, the mine planning group, geotechnical monitoring, and the Surveyors.
The Geotechnical Engineer will assume responsibility for all mine geotechnical issues including pit slope stability and SSMF embankment construction quality control. An Avalanche Control Technician will report to the Geotechnical Engineer and will manage site wide avalanche monitoring and control.
The Geology department will include a Geologist and Ore Grade Technicians. This department will be responsible for local step out and infill drill programs for onsite exploration activities and updating the long range ore body models. The Geology department will also provide grade control support to mine operations, managing and executing the blast hole sampling and blast hole modeling of the short range blast hole models for operations planning and ore grade definition.
A Senior Environmental Engineer will assume responsibility for all environmental permitting, monitoring and control. An Environmental Technician will report to the Senior Environmental Engineer, and will be responsible for all on site environmental sampling and analysis.

Ha
Section 1
Aley Proje
16.11 MI
The followdepartmentincluded in
MinFo
Shift Foreman (4)
Drill Operators
(Y5:3)
(Y10:1)
Loader /Excavator Operators
(Y5:6)
(Y10:3)
aul Truck Operators
(Y5:28)
(Y10:16)
Grader Operators
(Y5:3)
(Y10:2)
Dozer Operators
(Y5:3)
(Y10:2)
16
ect Technical
INE OPERA
wing Mine t staff and hn site G&A,
ne General oreman(1)
Blasters (2)
Blaster's H(2)
l Report
ATIONS OR
Organizatiohourly labouand not cove
Figure
Helpers
MGe
Maintenance Pla(1)
M
RGANIZAT
onal Chart ur for the Alered under th
e 16.12: Min
Mine Maintenance eneral Foreman (1)
anner MaintenaForemen
Mechan
(
(Y
MachW
(
(Y
Crane
(
(Y
Tire
(
(Y
Elec
(
(Y
Lab
(Y
(Y
Admin
Mining Meth
TIONAL CH
describes tley project. he mine ope
ne Operatio
Mine Superintend(1)
nce (4)
nics : HD and LD
(Y5:8)
Y10:5)
hinists and Welders
(Y5:2)
Y10:1)
e Operators
(Y5:1)
Y10:1)
epersons
(Y5:1)
Y10:1)
ctricians
(Y5:1)
Y10:1)
bourers
Y5:1)
Y10:1)
Senior
Mine
S
n / Mine Clerk (1)
hod
HART
the structur The gold b
erations direc
ons Organiz
dent
TeSu
r Mine Engineer (1)
e Engineer (1)
Surveyor/Technicians (1)
e of the pboxes represctly.
zational Cha
echnical Services uperintendent (1)
Geologist (1)
Ore GradeTechnician (1)
October 20
planned minent staff tha
art
Geotechnical Engineer (1)
Avalanche Technician (1)
EnE
19
014
ning at is
Senior nvironmental Engineer (1)
Environmental Technicians (1)
Aley Project Technical Report October 2014
SECTION 17: RECOVERY METHOD

Aley Project Technical Report October 2014
Table of Contents
17.0 Recovery Method ...................................................................................................................1
17.1 General Process Description ................................................................................................1
17.2 Crushing and Comminution ................................................................................................4
17.3 Flotation ...............................................................................................................................5
17.4 Leaching ..............................................................................................................................5
17.5 Sand Storage Management Facility and Fresh Water Reclaim ...........................................6
17.6 Converter .............................................................................................................................6
17.6.1 Calciner .........................................................................................................................6
17.6.2 Reagent Preparation .......................................................................................................7
17.6.3 Aluminothermic Reaction ..............................................................................................7
17.6.4 Metal Finishing Plant .....................................................................................................7
17.7 Energy Requirements ..........................................................................................................8
17.8 Staffing Requirements .........................................................................................................8
17.8.1 Organizational Chart ......................................................................................................8
List of Tables
Table 17.1: Aley Project Simplified Mass and Water Balance ....................................................... 2
Table 17.2: Simplified Process Design Criteria .............................................................................. 3
Table of Figures
Figure 17.1: Aley Project Simplified Block Flow Diagram ........................................................... 2
Figure 17.2: General Site Arrangement .......................................................................................... 4
Figure 17.3: Process Organizational Chart Title ............................................................................. 9
Section 17 Recovery Method 1
Aley Project Technical Report October 2014
17.0 Recovery Method The recovery method for the Aley Project is based on test work conducted by two independent laboratories, SGS Vancouver, and Xtrata Process Support. The details of this work are discussed in Section 13 of this report.
The work conducted at SGS Vancouver’s Burnaby, British Columbia location was used to inform the comminution, mineral processing and concentrate leaching sections of the processing facilities. Taseko’s design based on this test work includes a process flow diagram, mass balance, process design criteria, general arrangement drawings, and an equipment list. The design includes supporting infrastructure like HVAC, reagent storage and distribution, process water supply, and building heating.
Work conducted at Xtrata Process Support in Sudbury, Ontario was used to inform the concentrate preparation and converter facilities. The details of this work are discussed in Section 13 of this report. Ausenco Minerals and Metals completed the converter design work including a process flow diagram, mass balance, process design criteria, general arrangement drawings, and an equipment list.
17.1 GENERAL PROCESS DESCRIPTION
The proposed processing facilities for the Aley project are all sized for a minimum 10,000 tpd throughput with an overall processing plant availability of 92 %. Run of mine ore is to be delivered to a single stage crushing facility. Crushed product is then transferred via conveyor to a single coarse ore stockpile. This stockpile is used to feed a three stage comminution circuit that consists of a semi autogenous grinding (SAG) mill, a ball mill, and a fine grinding mill with the appropriate size classification circuits. Final comminution product is fed to the concentration plant, details of which are proprietary and confidential. An upgraded concentrate from the concentrator is fed to a leach facility for further processing, while waste streams produced in the concentrator are recombined and pumped to a sand storage management facility (SSMF). Leached concentrate residue is then processed through a calciner and proceeds to ferro-niobium conversion. Converter waste is stored in a secure containment facility and final product ferro-niobium is delivered to market.
A simplified block diagram of the overall process can be seen below in Figure 17.1.
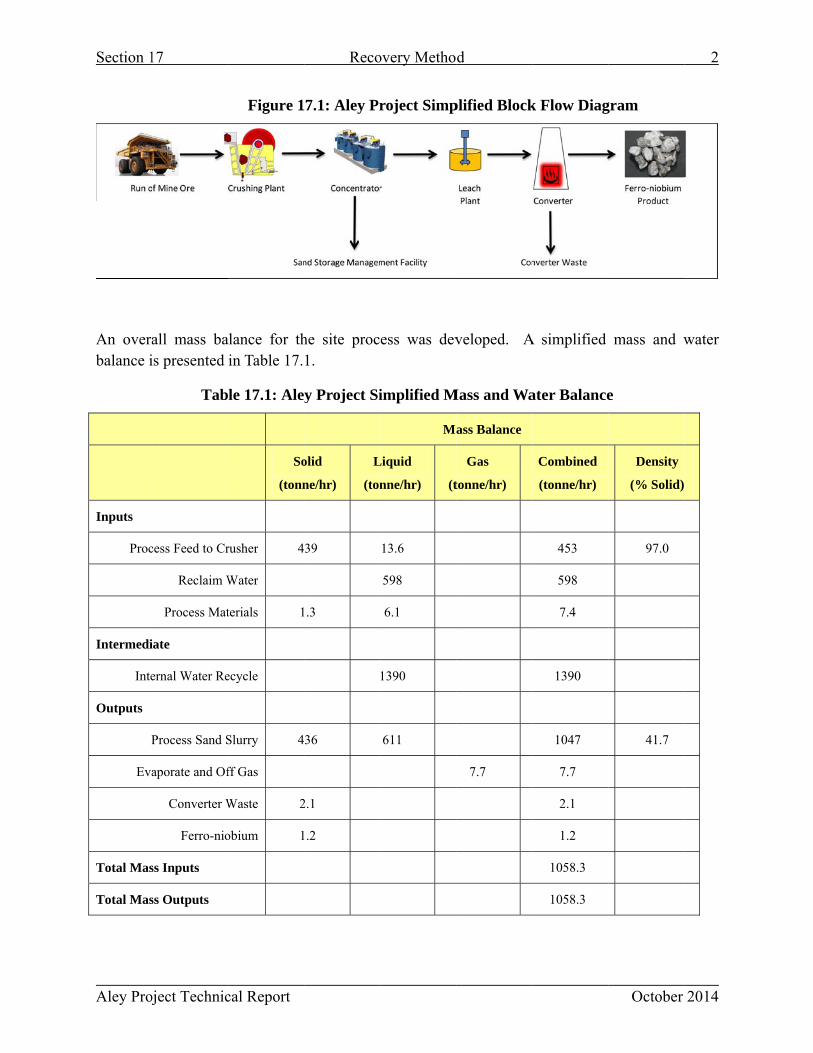
Section 1
Aley Proj
An overabalance i
Inputs
Proc
Intermedi
Inte
Outputs
P
Eva
Total Mas
Total Mas
17
oject Technic
all mass bais presented
Tab
cess Feed to Cr
Reclaim W
Process Mat
iate
ernal Water Re
Process Sand S
aporate and Of
Converter W
Ferro-nio
ss Inputs
ss Outputs
cal Report
Figure 1
alance for thin Table 17.
le 17.1: Ale
So
(tonn
rusher 4
Water
terials 1
ecycle
Slurry 4
ff Gas
Waste 2
obium 1
Reco
7.1: Aley Pr
he site proc1.
y Project Si
olid
ne/hr)
L
(ton
39
1.3
36
2.1
1.2
overy Metho
roject Simp
ess was dev
implified M
Ma
Liquid
nne/hr) (t
13.6
598
6.1
1390
611
d
plified Block
veloped. A
Mass and Wa
ass Balance
Gas
tonne/hr)
7.7
k Flow Diag
A simplified
ater Balance
Combined
(tonne/hr)
453
598
7.4
1390
1047
7.7
2.1
1.2
1058.3
1058.3
October
gram
mass and w
e
Density
(% Solid)
97.0
41.7
2
2014
water
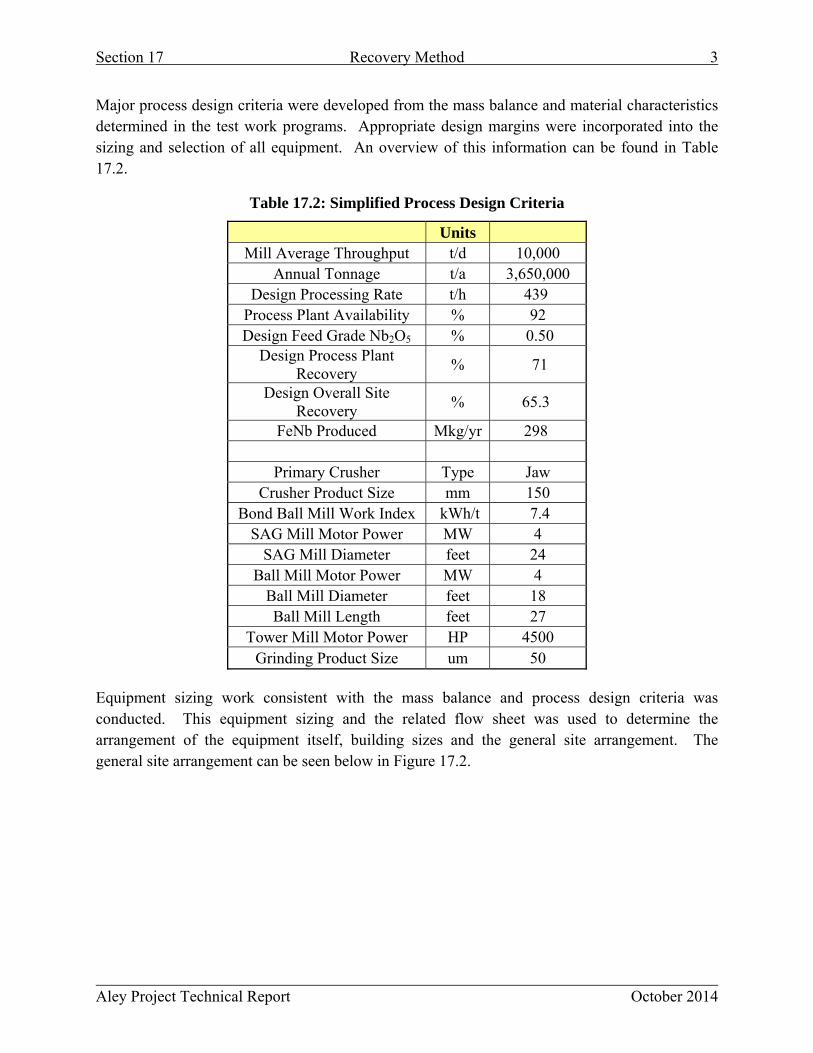
Section 17 Recovery Method 3
Aley Project Technical Report October 2014
Major process design criteria were developed from the mass balance and material characteristics determined in the test work programs. Appropriate design margins were incorporated into the sizing and selection of all equipment. An overview of this information can be found in Table 17.2.
Table 17.2: Simplified Process Design Criteria
Units Mill Average Throughput t/d 10,000
Annual Tonnage t/a 3,650,000 Design Processing Rate t/h 439
Process Plant Availability % 92 Design Feed Grade Nb2O5 % 0.50
Design Process Plant Recovery
% 71
Design Overall Site Recovery
% 65.3
FeNb Produced Mkg/yr 298
Primary Crusher Type Jaw Crusher Product Size mm 150
Bond Ball Mill Work Index kWh/t 7.4 SAG Mill Motor Power MW 4
SAG Mill Diameter feet 24 Ball Mill Motor Power MW 4
Ball Mill Diameter feet 18 Ball Mill Length feet 27
Tower Mill Motor Power HP 4500 Grinding Product Size um 50
Equipment sizing work consistent with the mass balance and process design criteria was conducted. This equipment sizing and the related flow sheet was used to determine the arrangement of the equipment itself, building sizes and the general site arrangement. The general site arrangement can be seen below in Figure 17.2.

Section 1
Aley Proj
17.2 C
Run-of-mcrusher aconveyorcrusher. conveyorlocated a
Crushed mill at 1The prodto the fecluster. Tmotor to SAG mil
17
oject Technic
CRUSHING
mine (ROM)and dumpedr and transp The jaw crr transports
adjacent to th
ore from th0,000 tpd. T
duct is dischaed of the SAThe cyclone
the SAG mll discharge s
cal Report
G AND COM
) ore from thd onto a vibrported to a crusher crushthe crushed
he concentra
he stockpile The coarse oarged onto aAG mill. Sce underflow mill. Ball mscreen under
Reco
Figure 17.2
MMINUTIO
he open pit mrating grizzlcoarse ore shes the ore d ore to a coator building
is reclaimedore is fed to a 2.4m x 6.1mcreen underfeeds the 1
mill dischargerflow.
overy Metho
2: General S
ON
mining operaly screen. Stockpile. Ovto a producoarse ore sto.
d by a set o24’ diamete
m screen whsize slurry p8’ x 27’ bale reports to
d
Site Arrang
ation is truckScreen undeversize matect size of 80ockpile with
of three 25Her SAG millhere the overproduct is pll mill, whicthe same cy
gement
ked to the 35ersize materierial reports0% passing h a live cap
HP apron feewith a 536
rsize productpumped to a ch is sized wyclone feed
October
0HP primaryial is passed back to the150 mm. A
pacity of 15,
eders, feedin1HP drive mt is recycledprimary cy
with an idenpump box a
4
2014
y jaw d to a e jaw
A belt ,000t,
ng the motor. d back clone ntical as the

Section 17 Recovery Method 5
Aley Project Technical Report October 2014
Primary cyclone overflow, at a size of 140um, is collected in a pump box and pumped to a secondary cyclone cluster. The cyclone underflow feeds a 4500HP tower mill. The tower mill discharges back to the primary cyclone overflow pump box. This tertiary stage of grinding is designed to produce a product size of 80% passing 50 μm.
An equipment list has been developed for the crushing and comminution sections of the process facilities. This portion of the equipment list details the characteristics and specifications for over 250 separate pieces of equipment. Total peak power in crushing and comminution is 12,500 kW. Major equipment connected power in crushing includes one 20 kW scalping grizzly screen, one 260 kW jaw crusher, and two coarse ore feed conveyors totalling 395 kW. The balance of the crushing connected power is distributed among support and ancillary area equipment such as heaters, lube skids, and air supply. Major equipment connected power in the comminution section includes three 75 kW apron feeders, one 4000 kW SAG mill, one 4000 kW ball mill, one 3400 kW vertical grinding mill, and 2400 kW in major pumping stages. The balance of the comminution connected power is distributed among support and ancillary area equipment such as slurry pumps, heaters, lube skids, and air supply.
17.3 FLOTATION
Details of the direct flotation process conditions are proprietary and confidential. Unit processes used in the concentrator are standard processes applied to mineral processing circuits and include magnetic separation, flotation, pumping, thickening and filtration. An equipment list has been developed for this portion of the process which details the characteristics and specification of over 170 separate pieces of equipment for a total peak power of 6,100 kW.
The equipment in this area can be described as standard for the industry: magnetic separators with capacities up to 360m3/h, flotation tank cells ranging in sizes from 160m3 to 10m3, thickeners from 50m to 15m in diameter, and vertical plate filters. The retention time in the flotation circuit ranges from 76 to 27 minutes, which allows sufficient time for the separation of a niobium concentrate from the gangue minerals. The waste streams from the process are thickened and combined in a process sand slurry pump box before being pumped to the SSMF. The concentrate is thickened before being sent to the leach facility.
17.4 LEACHING
Details of the leach process conditions are proprietary and confidential. Unit processes used in the leach facility are standard processes applied in leaching process circuits and include leaching, thickening, filtration and acid regeneration. A series of tanks; used for storage, agitation, and leaching; range in size from 350m3 to 4m3. The overall leaching reaction time was designed at 16 hours. Leach residues are thickened in 15m thickeners, and filtered using belt filters, thickener overflow and filtrate streams will be recycled. All of the materials of construction will be consistent with materials compatible with an acid environment.

Section 17 Recovery Method 6
Aley Project Technical Report October 2014
The final leach residue is filtered and discharged onto a conveyor which feeds the calciner in the converter.
An equipment list has been developed for this portion of the process which details the characteristics and specification of over 210 separate pieces of equipment for a total peak power of 1,700 kW.
17.5 SAND STORAGE MANAGEMENT FACILITY AND FRESH WATER RECLAIM
After the concentrator process, waste streams are combined and pumped to the SSMF at a density of 41% solids. The thickener overflow streams are recycled in the process plant as process water.
The process sand is deposited in the SSMF using a series of spigots located along the SSMF embankment.
Fresh water is reclaimed from the SSMF using a floating reclaim barge. The barge holds four 250HP vertical turbine pumps which discharge into a 4000m3 outdoor fresh water tank.
17.6 CONVERTER
The Aley conversion process can be defined by three areas: calcine and reagent preparation area, the aluminothermic reaction area and the metal finishing area. The overall converter area is designed to treat 100t/d of niobium leach residue produced by the preceding processes. The overall converter product will be a standard grade ferro-niobium.
The calciner will operate on a continuous basis, while the reagent preparation, reaction, and metal finishing areas are operated 12 hours a day. The reagent preparation and metal finishing will occur on day shift while reactions will take place on night shift.
An equipment list has been developed for the converter section of the process facilities. This equipment list details the characteristics and specification of over 141 separate pieces of equipment. Total peak power in the converter is 1,000 kW. Major equipment is discussed in the appropriate subsections below.
17.6.1 CALCINER
The calciner area consists of a leach residue storage bin from which the material is reclaimed by a screw feeder and discharges into a rotary kiln. The calcined product is cooled and stored in a storage bin. The calcined product is loaded into bulk bags to accurately control the weight of the calcine product. The off-gas is cooled and treated before being released to the atmosphere. Dust generated in this area is captured by a dust collector.
Section 17 Recovery Method 7
Aley Project Technical Report October 2014
17.6.2 REAGENT PREPARATION
Reagents are delivered to site in bulk bags. The reagents, other than the calcine product, consist of aluminum powder, iron, lime, fluorspar, and sodium nitrate. The reagents are delivered to the preparation area on a daily basis from separate storage areas.
The reagent additions are calculated to determine the appropriate proportion to produce required amount of Nb in the final product. The reagents are carefully mixed with the calcined product before being transferred to the reactor vessel. The overall batch size, including calcine product and all reagents is approximately 6800kg.
Dust from this area is collected in a dust collector.
17.6.3 ALUMINOTHERMIC REACTION
The reactor vessels are refractory lined, nested in a bed of sand, and sit on top of a rail car. The rail system allows for the vessels to be moved around the reaction area. The filled reactor vessels are positioned under the reaction hood and the reaction is triggered by lighting a fuse. The reaction time varies between 10 to 15 minutes. The aluminum in the reaction reduces the niobium and the iron present to form the ferroniobium, while the alumina reports to the converter refuse.
Once the reaction is complete the molten material is transported along the rails to a refuse tapping hood, where the molten refuse is tapped into containers. The refuse containers are also on a rail system, and once filled are transferred to a refuse cooling area, before transportation to a refuse disposal area.
The metal remaining in the vessel is allowed to partially cool before being removed from the vessel. The reactor vessels are reused for future reactions. The metal is thoroughly cooled in the metal cooling area.
The off-gases produced at the reaction area and tapping area are collected and treated.
17.6.4 METAL FINISHING PLANT
After final cooling, the metal is transferred to the metal finishing plant. The metal is sampled for quality control. The metal is classified with a series of crushers and screens. The classification circuit is designed to be flexible by using mobile reversible conveyors and a series of screens, ranging from 30mm to 2mm, the final product will be sized to meet specific customer requirements. The product is packaged according to customer specifications.
Dust collected in this area is recycled to the reagent preparation area and reused.

Section 17 Recovery Method 8
Aley Project Technical Report October 2014
17.7 ENERGY REQUIREMENTS
The overall Aley site will require 31.3 MW of connected power, with operational peak power of 22.2 MW. The power line supplying this power is discussed in Section 18.
Electrical power will be used for all of the fixed equipment installations. The crushing and process plant consume the majority of the power, requiring up to 18.6 MW of the total peak power, while the leaching and converter plants only require up to 2.7 MW of peak power, with the remaining power requirements from various other site activities.
In addition to electrical power natural gas will be used as a fuel source. The differences in temperature for process requirement versus the local average ambient temperature require the heating of buildings and process streams, depending on the season. On average, the buildings will require 81,700 GJ/year and the various process streams, including the calciner, will require 537,500 GJ/year.
17.8 STAFFING REQUIREMENTS
The process plant and the converter are designed to run 24 hours a day, 365 days a year. The staff will be composed of technical, operational and mechanical personnel. The process manager will be in charge of managing the discipline leads for each of the core groups.
17.8.1 ORGANIZATIONAL CHART
The organizational chart shown in Figure 17.3 describes the staffing requirements for all aspects of niobium recovery and conversion to ferroniobium.

Section 1
Aley Proj
The procfrom theprovide oprocess departme
The mainplanned supportedis suppor
The milresponsibsupport aforman asection.
MechanicaLead (2)
Bricklay
Millwrigh
Pipefitte
17
oject Technic
cess managere site procesoversight anmanager ov
ents, the con
ntenance supmaintenanced by a generrted by lead r
l superintenble for samand technicaand shift for
Safety/Trainer(2)
MaG
Fo
l
yer (2)
ts (20)
ers (8)
Electrical Lead(1)
Electrician
cal Report
Figu
r is responsiss plants. T
nd training foversees the centrator an
perintendente work and ral foreman responsibilit
ndent is supmpling, assaal project exeremen who p
s Maintenance Superintendent
(1)
aintenance General reman (1)
d
s (10)
Instrumentation Lead (1)
InstrumentaControl
Technicians
MainPlan
Reco
ure 17.3: Pr
ible for overTwo safety/tor all staff anwork of thd the conver
t will oversebreakdown and two platies in each f
pported by aying, metalecution. Thprovide dire
ation
s (4)
Welders (4)
ntenance nner (2) M
overy Metho
rocess Orga
rall safety, etrainers repond hourly em
he maintenanrter.
ee the safe mmaintenanc
anners. Mainfunctional gr
a chief mllurgical ac
he mill superection to ope
Process Manager (1)
Supe
Chief Metallurgist (1)
Metallurgists (4)
Assayers (11)
d
anizational C
environmentaort directly mployees innce departm
maintenancece. The mntenance woroup.
metallurgist counting, orintendent iserational cre
Mill erintendent
(1)
Mill OperaGener
Foreman
Process Plant Foreman (4)
Control Room Operator (4)
Crusher Operators (8)
Grinding Operators (12)
Flotation Operators (14)
Tailings Operators (4)
Chart Title
al protectionto the proce
n support of ment and th
e of all site maintenance ork is conduc
and supporoperations tes also suppoews as orga
ations ral n (1)
Leach Plant Foreman (4)
Leach Operators (16)
S
Converter PMetallurgist
October
n, and produess managerthese goals.
he two oper
facilities insuperintendected by trad
rt technical echnical prrted by a genized by pr
Converter Superintendent
(1)
Plant ts (4)
Converter FlForeman (4
ConvControlOperat
ConvOperato
9
2014
uction r and The rating
n both ent is e and
staff ocess
eneral ocess
loor 4)
verter l Room tors (4)
verter ors (54)

Section 17 Recovery Method 10
Aley Project Technical Report October 2014
The converter superintendent is supported by a satellite technical crew overseen by the chief metallurgist who is responsible for the same areas as the concentrator technical crew. The converter superintendent is also supported by converter floor foremen who oversee the converter operational crews.

Aley Project Technical Report October 2014
SECTION 18: PROJECT INFRASTRUCTURE
Aley Project Technical Report October 2014
Table of Contents
18.0 Project Infrastructure .............................................................................................................1
18.1 Overview .............................................................................................................................1
18.2 Site Access ...........................................................................................................................4
18.3 Power Supply and Site Electrical Distribution ....................................................................6
18.3.1 Main Substation .............................................................................................................6
18.3.2 Site Power Distribution ..................................................................................................7
18.3.3 Emergency Power ..........................................................................................................8
18.4 Site Roads and Yard Areas ..................................................................................................8
18.5 Permanent Process, Maintenance and Storage Buildings ....................................................9
18.5.1 Crusher Buildings ...........................................................................................................9
18.5.2 Concentrator Building ....................................................................................................9
18.5.3 Thickener Building .......................................................................................................10
18.5.4 Leach Plant Buildings ..................................................................................................10
18.5.5 Converter Building .......................................................................................................10
18.5.6 Assay Lab .....................................................................................................................11
18.5.7 Reagent Building ..........................................................................................................11
18.5.8 Truck Shop ...................................................................................................................11
18.5.9 Rebuild Shop ................................................................................................................11
18.5.10 Warehouse Building ...................................................................................................11
18.5.11 Cold Storage Building ................................................................................................12
18.6 Camp Facilities ..................................................................................................................12
18.6.1 Construction Camp .......................................................................................................12
18.6.2 Permanent Camp Buildings ..........................................................................................12
18.6.3 Administration Building ...............................................................................................12
18.6.4 Food Waste ...................................................................................................................12
18.6.5 Mine Dry Building .......................................................................................................13
18.7 Security, Safety and First Aid ...........................................................................................13
18.8 Potable Water Supply, Storage and Distribution ...............................................................13
18.9 Reclaim Water Storage and Distribution ...........................................................................13
18.10 Fire Protection .................................................................................................................14
18.11 Fuel Storage, Dispension and Distribution ......................................................................14
Aley Project Technical Report October 2014
18.12 Sewage Collection and Treatment ...................................................................................14
18.13 Plant Site Drainage ..........................................................................................................14
18.14 Site Sediment Control ......................................................................................................15
18.15 Sand Storage Management Facility .................................................................................15
18.16 Overburden, Waste Rock and Ore Stockpiles .................................................................18
List of Tables
Table 18.1: Embankment Construction Material Requirements ................................................... 17
Table of Figures
Figure 18.1: Plant Site Layout ........................................................................................................ 2
Figure 18.2: General Site Layout ................................................................................................... 3
Figure 18.3: Access and Transportation Infrastructure Locations .................................................. 5
Figure 18.4: Proposed Transmission Line Corridor ....................................................................... 7
Figure 18.5: Main Embankment ................................................................................................... 16

Section 18 Project Infrastructure 1
Aley Project Technical Report October 2014
18.0 Project Infrastructure
18.1 OVERVIEW
The infrastructure, services and ancillary facilities required for the project include the following:
Site access;
Power supply and site electrical distribution system;
Plant site roads and yard areas;
Permanent process, maintenance and storage buildings;
Camp facilities for construction personnel and operating personnel;
Security, safety and first aid facilities;
Potable water supply, storage and distribution;
Reclaim water collection, storage and distribution;
Fire Protection;
Fuel storage and dispensing or distribution;
Sewage collection and treatment;
Plant site drainage;
Site sediment control;
Sand storage management facility (SSMF);
Overburden, waste rock and ore stockpiles.
The plant site layout is shown in Figure 18.1 and the general site layout is included in Figure 18.2.
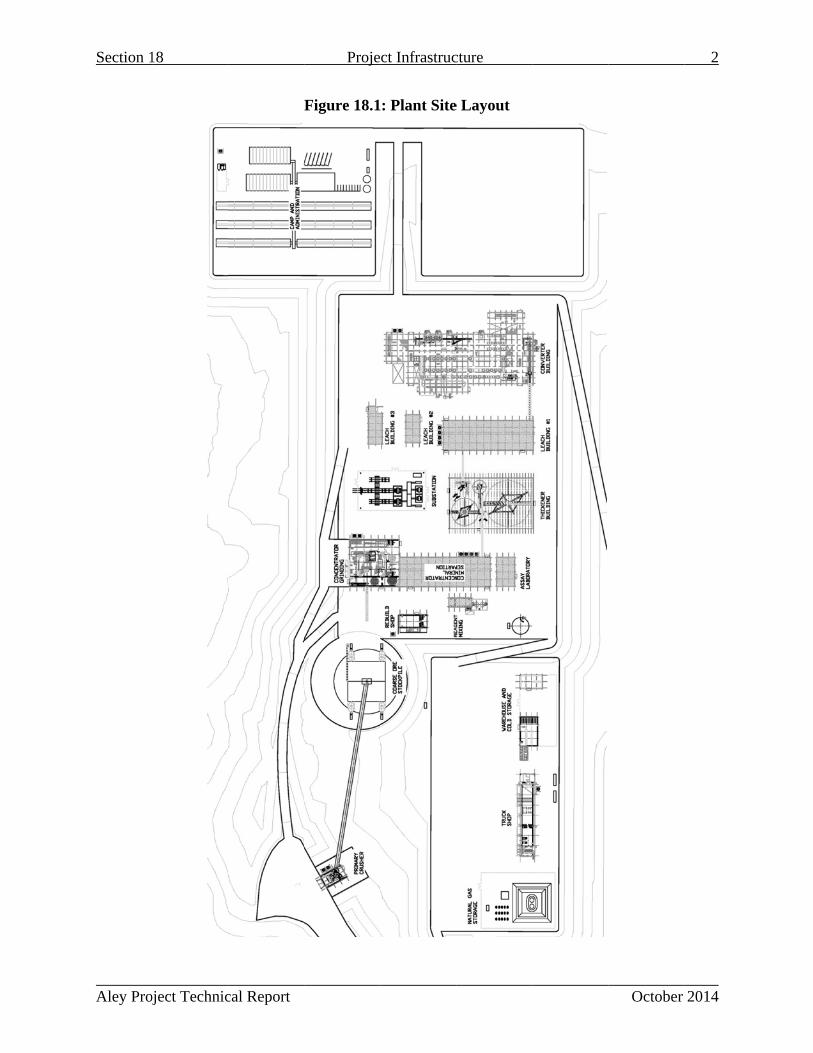
Section 1
Aley Proj
18
oject Technic
cal Report
Proje
Figure 18.1
ct Infrastruc
: Plant Site
cture
e Layout
October
2
2014
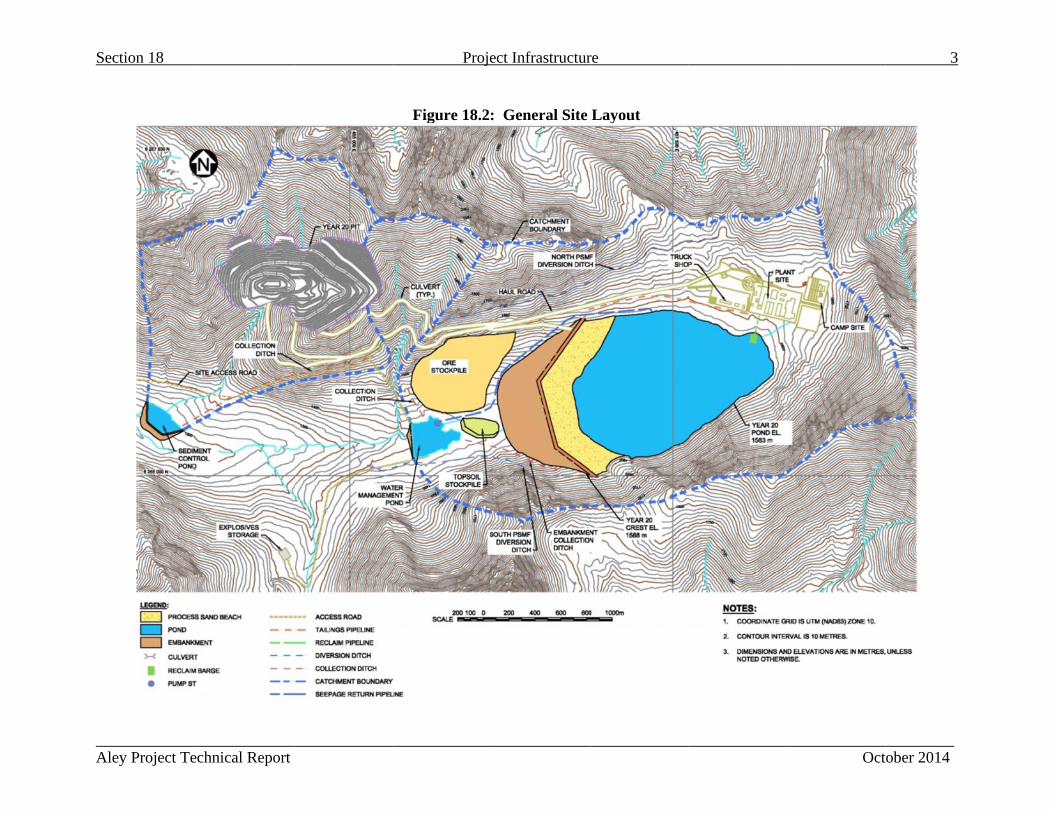
S
A
Section 18
Aley Project Te
chnical Report
Proje
Figure 18.2:
ect Infrastructur
: General Site
re
Layout
Oct
3
ober 2014
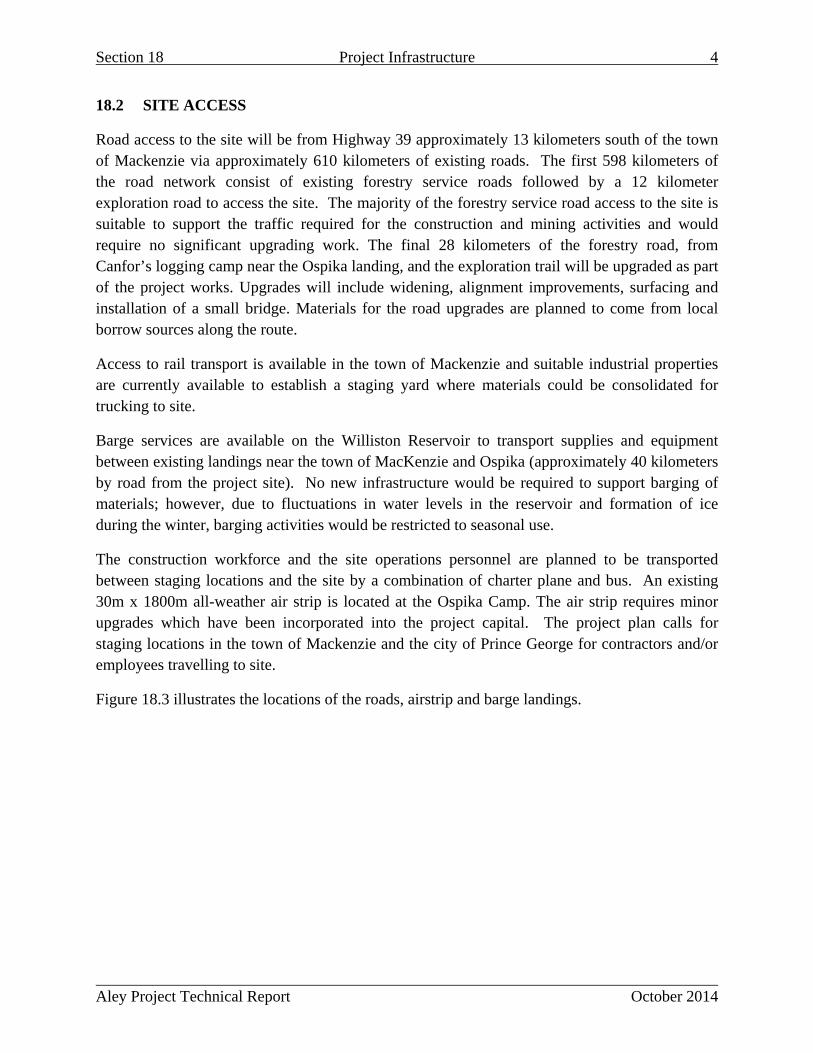
Section 18 Project Infrastructure 4
Aley Project Technical Report October 2014
18.2 SITE ACCESS
Road access to the site will be from Highway 39 approximately 13 kilometers south of the town of Mackenzie via approximately 610 kilometers of existing roads. The first 598 kilometers of the road network consist of existing forestry service roads followed by a 12 kilometer exploration road to access the site. The majority of the forestry service road access to the site is suitable to support the traffic required for the construction and mining activities and would require no significant upgrading work. The final 28 kilometers of the forestry road, from Canfor’s logging camp near the Ospika landing, and the exploration trail will be upgraded as part of the project works. Upgrades will include widening, alignment improvements, surfacing and installation of a small bridge. Materials for the road upgrades are planned to come from local borrow sources along the route.
Access to rail transport is available in the town of Mackenzie and suitable industrial properties are currently available to establish a staging yard where materials could be consolidated for trucking to site.
Barge services are available on the Williston Reservoir to transport supplies and equipment between existing landings near the town of MacKenzie and Ospika (approximately 40 kilometers by road from the project site). No new infrastructure would be required to support barging of materials; however, due to fluctuations in water levels in the reservoir and formation of ice during the winter, barging activities would be restricted to seasonal use.
The construction workforce and the site operations personnel are planned to be transported between staging locations and the site by a combination of charter plane and bus. An existing 30m x 1800m all-weather air strip is located at the Ospika Camp. The air strip requires minor upgrades which have been incorporated into the project capital. The project plan calls for staging locations in the town of Mackenzie and the city of Prince George for contractors and/or employees travelling to site.
Figure 18.3 illustrates the locations of the roads, airstrip and barge landings.
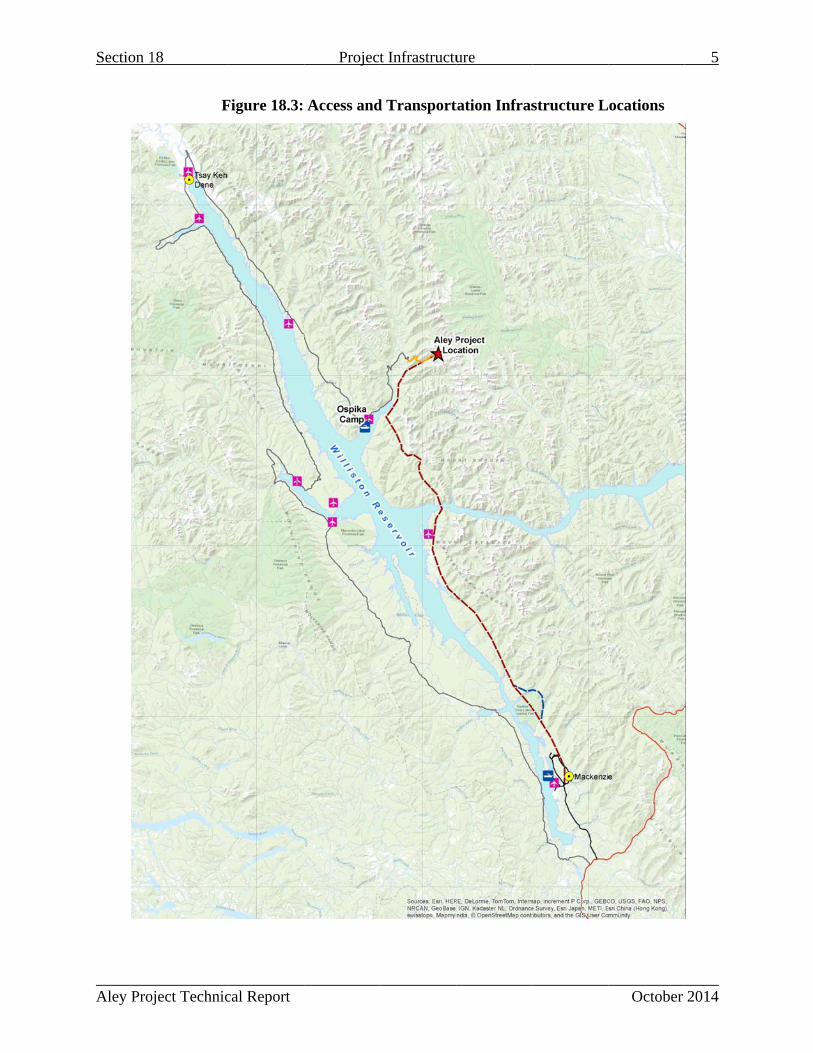
Section 1
Aley Proj
18
oject Technic
F
cal Report
Figure 18.3:
Project
Access and
t Infrastructu
d Transport
ure
tation Infrasstructure L
October
ocations
5
2014

Section 18 Project Infrastructure 6
Aley Project Technical Report October 2014
18.3 POWER SUPPLY AND SITE ELECRICAL DISTRIBUTION
Electrical power for the project will be supplied by BC Hydro. Three potential points of interconnection to the provincial grid were considered and a preferred option was selected based on a combination of technical feasibility, capital costs and operating costs. The preferred option would see the site connected to the BC Hydro Morfee substation in the community of Mackenzie via a company owned and constructed overhead transmission line which is approximately 155 kilometers in length. The proposed route alignment as shown in Figure 18.4.
The overhead transmission line will terminate on the mine site at a new main substation which will be fed at the 138kV transmission voltage level and provide the 13.8kV and 4.16kV site distribution voltage levels. Power factor correction will be achieved by means of substation switching capacitors and large process equipment synchronous motors.
The anticipated electrical load for the Aley Mine project is as follows:
• Connected load 32MW • Peak load 22MW • Average load 20MW
18.3.1 MAIN SUBSTATION
The main substation will include protective and isolating electrical equipment, two oil-filled power transformers rated at 35/46.67/52.27 MVA, 138-13.8 kV and two oil filled distribution transformers rated at 20/26.67/30MVA, 13.8-4.16kV. The transformers are sized for redundancy with one transformer of each size able to handle the required load for full operations.
Each power transformer will feed a 15kV rated switchgear line-up located inside a pre-fabricated electrical room within the substation area. The switchgear will provide feeds for the site wide overhead power lines and the distribution transformers.
The site layout allows the main substation to be constructed in close proximity to the process facilities which will minimize both cabling costs and power losses.
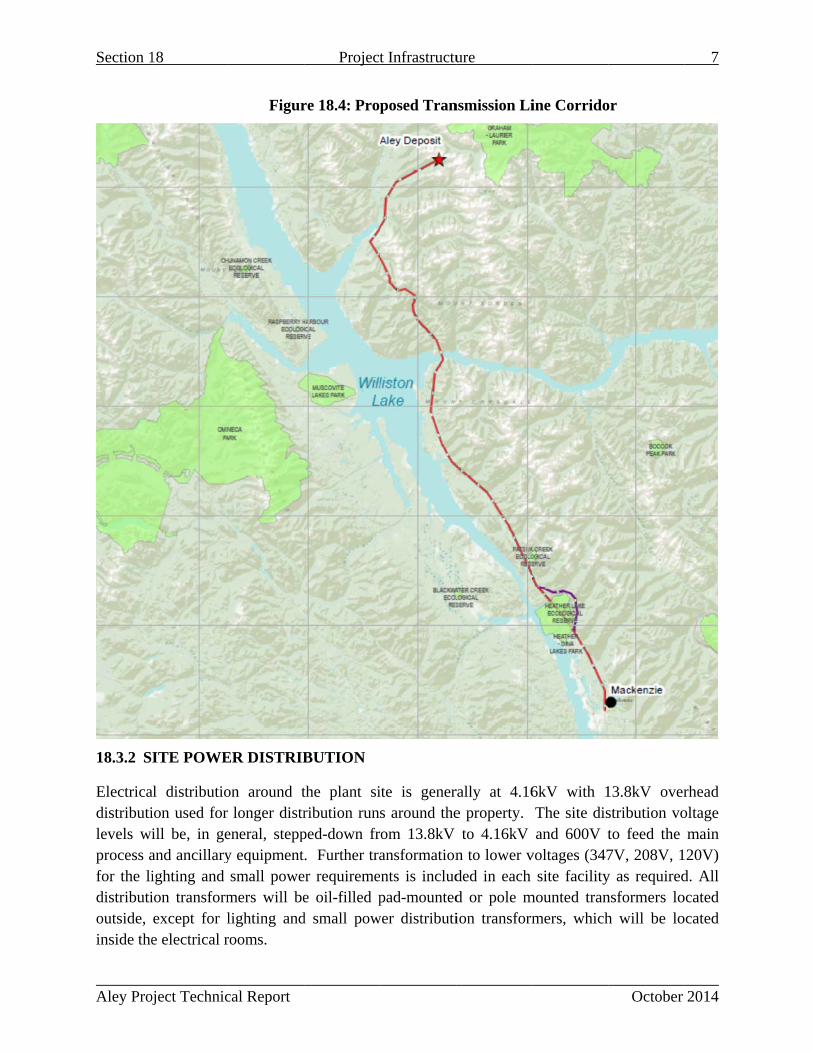
Section 1
Aley Proj
18.3.2 S
Electricadistributilevels wiprocess afor the lidistributioutside, inside the
18
oject Technic
ITE POWE
al distributioion used for ill be, in geand ancillaryighting and ion transformexcept for le electrical r
cal Report
Figur
ER DISTRIB
on around tlonger distr
eneral, steppy equipmentsmall powe
mers will belighting androoms.
Project
re 18.4: Prop
BUTION
the plant siribution runsped-down fr. Further tra
er requiremee oil-filled p
d small pow
t Infrastructu
posed Tran
ite is geners around theom 13.8kV ansformationnts is includpad-mounted
wer distributi
ure
nsmission Li
rally at 4.16e property.
to 4.16kV n to lower vded in each d or pole mion transform
ine Corrido
6kV with 1The site disand 600V t
voltages (347site facility
mounted tranmers, which
October
or
13.8kV overstribution voto feed the 7V, 208V, 1y as requirednsformers loh will be lo
7
2014
rhead oltage main 20V)
d. All ocated ocated

Section 18 Project Infrastructure 8
Aley Project Technical Report October 2014
The mineral processing plant will consume approximately 75% of the site power requirements with the remainder being used by the crusher, converter, process sand, reclaim water and general site infrastructure. The pit will utilize all diesel powered production equipment and the pit will be electrified with 13.8kV overhead power line to support only small loads such as lighting and pit dewatering.
The mineral processing plant will have a concentration of 4.16kV distribution switchgear to feed its process equipment and infrastructure loads. A main electrical room will be located inside the mineral processing grinding area which is in close proximity to the largest loads. Modular electrical rooms will be distributed through-out the site located close to the loads being fed. The electrical rooms will house all switchgear and motor control centers required for the power distribution and will be installed in elevated positions to allow bottom entry cabling.
In general, cables routed along cable trays will be interlocked aluminum armoured, with jacketed copper conductors. In certain instances duct-banks and engineered cable runs will be used.
18.3.3 EMERGENCY POWER
Emergency power for the site will be provided by a stand-by generator station sized to provide power to the permanent camp as well as critical process and infrastructure equipment in the event of prolonged power outages. The generator station will be fueled by natural gas.
A dedicated 13.8kV overhead line is used to connect the generator station to the main substation due to the distance between the facilities. Automatic transfer switches are incorporated into the design to start the generators when required, keeping power interruptions to a minimum.
Uninterruptible power supplies will be used to provide backup power to critical control systems. Emergency battery power packs will be available for backup power to the fire alarm system and emergency egress lighting fixtures.
18.4 SITE ROADS AND YARD AREAS
The project plant site consists of several tiered benches as shown in Figure 18.1. The plant site is generally divided into four areas:
Primary crushing and coarse ore stockpile;
Mine maintenance and warehousing;
Process facilities;
Camp and administration;
Equipment and materials laydown.
The yard areas are designed to include adequate space between structures to allow for efficient construction of the facilities as well as access for long term maintenance and transportation of
Section 18 Project Infrastructure 9
Aley Project Technical Report October 2014
materials and personnel during operations. Sufficient equipment and material laydown space is constructed for both project execution and mine operations.
Site roads are divided into haul roads and service roads. The site haul roads are 29 meters wide and connect the open pit with the primary crusher facility, truck maintenance area, main SSMF embankment and stockpile areas. Service roads on site are 10m wide and connect the plant site benches, laydown areas, explosives storage area, water management pond and reclaim water pumping system.
18.5 PERMANENT PROCESS, MAINTENANCE AND STORAGE BUILDINGS
18.5.1 CRUSHER BUILDINGS
The primary crusher building will be a pre-engineered metal building with foam core cladding to provide weather protection for the vendor supplied primary crusher station package. The building will be 22 meters by 20 meters and will utilize a flat membrane roof system with internal gutters and include sections of translucent wall panel to allow natural light into the facility. The building includes an overhead bridge crane with a 50T/10T capacity and the majority of the building area will be serviceable using the overhead crane. The area control room and washroom facilities will be housed in modular pre-fabricated buildings. A mechanically stabilized earth (MSE) retaining wall structure is incorporated into the design to retain the crusher pad.
The coarse ore stockpile cover building will be an A-frame, steel clad, un-insulated building to minimize the ingress of rain and snow into the stockpiled ore as well as minimize fugitive dust emissions from the stockpile. The approximate size of the building is 70 meters by 36 meters.
18.5.2 CONCENTRATOR BUILDING
The concentrator building will be a pre-engineered metal building with foam core cladding comprised of two distinct sections. The first section is the grinding area which will contain the primary, secondary and tertiary grinding mills as well as all of the associated ancillary support equipment. The grinding area dimensions will be approximately 54 meters by 55 meters. The north wall of the grinding building incorporates a concrete retaining wall and this combined with two MSE retaining walls allows an earthfill access for vehicle traffic to the operating floor level. The second building section is the mineral separation area where the flotation, magnetic separation and other separation equipment is housed. The mineral separation area dimensions will be 32 meters by 98 meters.
The building structures include several internal levels to provide support and access to the process equipment. Modular pre-fabricated buildings are used to provide the area control room, worker lunchroom, offices and washroom facilities. Internal building partitions are provided to ensure equipment cleanliness and reduce fugitive noise where appropriate. The building design
Section 18 Project Infrastructure 10
Aley Project Technical Report October 2014
utilizes a flat membrane roof system with internal gutters and includes sections of translucent wall panel to allow natural light into the facility. The building includes three overhead bridge cranes (50T/10T capacity and two 7.5T capacity). The majority of the building areas will be serviceable using the overhead cranes and the cranes will be used during construction to assist with the installation of the process equipment and associated services.
18.5.3 THICKENER BUILDING
The thickener building will be an insulated stressed membrane structure to provide weather protection for the process and ancillary equipment in the area. The building dimensions will be approximately 55 meters by 107 meters and will incorporate translucent panels to allow natural light into the structure.
18.5.4 LEACH PLANT BUILDINGS
The leach plant area consists of three pre-engineered metal buildings all with foam core cladding. The first building dimensions will be approximately 32 meters by 98 meters, the second 15 meters by 41 meters and the third 15 meters by 30 meters. The first and second buildings utilize flat membrane roof systems with internal gutters while the third building utilizes a pitched gable roof. All of the buildings include sections of translucent wall panel.
The building structures include several internal levels to provide support and access to the associated process equipment. Modular pre-fabricated buildings are used to provide the area control room, worker lunchroom, offices and washroom facilities for the area. The leach buildings include four overhead bridge cranes (two 7.5T capacity, one 10T capacity and one 15T capacity). The majority of the building areas will be serviceable using the overhead cranes and the cranes in two of the areas will be used during construction to assist with the installation of the process equipment and associated services.
18.5.5 CONVERTER BUILDING
The converter building is an insulated pre-engineered metal building consisting of two distinct main structures with three attached lean-to structures. The dimensions of the main structures will be approximately 54 meters by 108 meters and 30 meters by 54 meters. The main structures utilize gabled roofs. The attached lean-to structures will be 24 meters by 30 meters, 24 meters by 36 meters and 9 meters by 54 meters. All of the structures include sections of translucent wall panel.
An area control room, worker lunchroom, offices and washroom facilities are included in the design. All process equipment support and access requirements are met with freestanding structures in this area. The buildings include three overhead bridge cranes (25T capacity, 5T capacity and 7.5T capacity). The majority of the building areas will be serviceable using the overhead cranes.

Section 18 Project Infrastructure 11
Aley Project Technical Report October 2014
18.5.6 ASSAY LAB
The assay laboratory building will be a pre-engineered metal building with foam core cladding and a gabled roof. The building will house all of the assay equipment, services and facilities required for the site. The assay laboratory building dimensions will be 20 meters by 30 meters.
18.5.7 REAGENT BUILDING
The reagent building will be a pre-engineered metal building with foam core cladding and a gabled roof. The building will house all of the equipment necessary to make-up, store and dose the reagents for the concentrator. The reagent building dimensions will be 10 meters by 25 meters.
The building includes an overhead bridge crane with a 5T capacity. The majority of the building area will be serviceable using the overhead crane and the crane will be used during construction to assist with the installation of the process equipment and associated services.
18.5.8 TRUCK SHOP
The truck shop building will be a pre-engineered metal building with foam core cladding and a flat membrane roof with internal gutters. The shop provides a wash bay and six service bays for haul truck maintenance, welding and light vehicle maintenance. One service bay and the wash bay will have armoured floors to allow travel with tracked equipment without damaging the floor surface. All of the bays will utilize vertical fabric folding doors and are suitably sized for haul trucks up 136T.
The building includes an overhead bridge crane with a 50/15T capacity as well as the exhaust and HVAC systems required for vehicle maintenance activities. Offices as well as worker lunchroom and washroom facilities are provided as is a mezzanine storage area.
18.5.9 REBUILD SHOP
The rebuild shop building will be a pre-engineered metal building with foam core cladding and a flat membrane roof with internal gutters. The shop provides a separate, clean workspace for component rebuilds for both the stationary and mobile equipment maintenance. The building dimensions will be 15 meters by 30 meters and the building includes an overhead bridge crane with a 15T capacity. A modular pre-fabricated building is included to provide the area worker lunchroom, offices and washroom facilities.
18.5.10 WAREHOUSE BUILDING
The warehouse building will be a pre-engineered metal building with foam core cladding and a flat membrane roof with internal gutters. The warehouse building will be used for storage of parts and materials required for mine and plant operations which required heated storage. The area also houses the site shipping and receiving area. The building dimensions will be 20 meters
Section 18 Project Infrastructure 12
Aley Project Technical Report October 2014
by 32 meters and a modular pre-fabricated building is included to provide a worker lunchroom, offices and washroom facilities for the area.
18.5.11 COLD STORAGE BUILDING
The cold storage building is a pre-engineered metal building with epoxy coated steel cladding and a gabled roof. The building will be used for storage of parts and materials required for mine and plant operations which require covered but not heated storage. A fenced yard area is provided adjacent to the cold storage area for items which can be safely stored outside. The cold storage building dimensions will be 15 meters by 25 meters.
18.6 CAMP FACILITIES
18.6.1 CONSTRUCTION CAMP
The construction camp buildings will be single story pre-fabricated modular buildings to support a peak construction workforce of 500 personnel (not including the owner’s personnel and EPCM personnel that will be housed in the permanent camp at the peak of the construction work). A full service construction camp inclusive of dormitories; kitchen and dining facilities; recreation and fitness facilities; construction offices; mine dry facilities as well as ancillary facilities like sewage treatment will be leased and installed adjacent to the permanent camp location. These facilities will be removed after construction is completed.
18.6.2 PERMANENT CAMP BUILDINGS
The permanent camp buildings will be single story pre-fabricated modular buildings consisting of 6 dormitories, a central building and artic corridors to connect the structures. The six dormitories will house a total of 228 persons and each room will be private with its own separate washroom and shower facilities. Each dormitory will have a common laundry room and will be approximately 8 meters by 73 meters in dimensions. The central building will house the camp kitchen, food storage, serving line, dining area, fitness facility and recreation facilities as well as the site first aid facility. The central building will be 18 meters by 48 meters.
18.6.3 ADMINISTRATION BUILDING
The administration building will be a single story pre-fabricated modular building. The administration building will include a reception area, twenty eight offices, three meeting rooms, a break room and washroom facilities. The building dimensions will be approximately 18 meters by 44 meters.
18.6.4 FOOD WASTE
Food waste from the camp facilities will be temporarily stored in steel containers contained in a fenced area. This waste will then by batch processed in a packaged natural gas fired incinerator. Ash from the incinerator will be permanently stored in the SSMF.

Section 18 Project Infrastructure 13
Aley Project Technical Report October 2014
18.6.5 MINE DRY BUILDING
The mine dry building with be a cinder block structure with a trussed gable roof. The dry building includes in-floor heating, clean and dirty side lockers, a locker drying system, showers, washroom facilities as well as a crew line-up area and offices for mine personnel. The mine dry has separate facilities for both genders and is sized for 400 persons to allow site workers to have permanent locker assignments. The facility dimensions will be approximately 20 meters by 41 meters.
18.7 SECURITY, SAFETY AND FIRST AID
A gatehouse building will be located at the entrance to the site to provide control of vehicle and personnel access onto the property. Limited fencing is required to secure the property due to the location and topography. Safety and first aid personnel and facilities are located in the permanent camp.
18.8 POTABLE WATER SUPPLY, STORAGE AND DISTIBUTION
Potable water for the site will be provided from three planned wells near the permanent camp location. The water from the wells will be treated in a vendor supplied packaged water treatment plant and stored in a 300 cubic meter lined tank. The water treatment is used to insure that the entire potable water system remains sanitary. The potable water tank will be insulated and protected from freezing with a permanently installed immersion heater.
Potable water is distributed throughout the plant site in a dedicated network of underground pipes.
18.9 RECLAIM WATER STORAGE AND DISTRIBUTION
Reclaim water to feed the site process facilities will be pumped from the SSMF supernatant pond to the plant site by a vendor supplied floating pump station. The pump station includes four 250 horsepower vertical turbine pumps and a separate de-icing pump and bubbler system for winter operations on an approximately 11 meter by 20 meter barge hull. The pump station includes a steel framed insulated building to house the pumps and on-board electrical room. A 3T capacity maintenance overhead bridge crane is included in the building. The barge is connected to shore via an 18 meter walkway complete with discharge pipe.
A 1.1 kilometer 18” diameter HDPE pipeline installed on grade connects the reclaim barge to the reclaim water tank on the plant site. The reclaim water tank has sufficient storage capacity to support operation of the process facilities for in excess of six hours.
Reclaim water from the tank is distributed throughout the plant site via a network of underground pipes.
Section 18 Project Infrastructure 14
Aley Project Technical Report October 2014
18.10 FIRE PROTECTION
A fire water tank, fire water pump station package, underground fire water distribution piping network and twenty five fire hydrants are provided to protect all of the plant site buildings and infrastructure. The fire water pump station includes a jockey pump, electric fire pump and diesel driven fire pump to keep the piping system pressured even in the event of a power outage during a fire. The 400 cubic meter fire water tank is insulated and protected against freezing in the winter by an immersion heating system. The fire water system can be charged with either potable or reclaim water.
The site also includes automatic fire protection systems for all of the electrical rooms and a site wide fire detection and annunciation system.
18.11 FUEL STORAGE, DISPENSING AND DISTRIBUTION
Diesel fuel for the mining and ancillary equipment will be supplied from a diesel fuel storage facility comprised of above ground double wall vacuum monitored tanks. The site capacity for diesel fuel will be 160,000 liters. A small supply of gasoline will also be maintained on-site in a 10,000 liter above ground double wall vacuum monitored tank.
Liquefied natural gas (LNG) will be stored on-site in two 190,000 liter tanks. The LNG tanks and vaporization system will be installed and operated by the natural gas provider and the cost of these facilities will be included in the cost of the natural gas consumed by the site. The required earthworks for the LNG facility including the tank containment bunds will be constructed by the project and are included in the capital costs.
Vaporized natural gas is distributed throughout the plant site in an underground distribution piping network.
18.12 SEWAGE COLLECTION AND TREATMENT
Sewage will be treated in a membrane style waste water bioreactor treatment plants. The site will utilize a leased plant to treat the sewage from the construction camp while it is on-site and will install a permanent plant to treat sewage from the permanent camp and site facilities.
Sewage from site will be collected in an unground network of sewage pipes which will feed the site waste water treatment plant. Treated water from the plant will be discharged by pipe to the SSMF.
18.13 PLANT SITE DRAINAGE
The plant site is contoured to direct drainage to an underground storm drainage system that will collect rainfall and runoff from the site and direct it to the SSMF. An intercept ditch above the plant site prevents non-contact surface water from the uplands from entering the plant site area.
Section 18 Project Infrastructure 15
Aley Project Technical Report October 2014
18.14 SITE SEDIMENT CONTROL
A sediment control pond and collection ditch network will be constructed below the pit area to collect any sediment in the runoff from the active mining area prior to release of the water to the environment. The sediment control pond requirements were specified by Knight-Piesold.
18.15 PROCESS SAND MANAGEMENT FACILITY
The project will include the construction of a rock fill embankment to impound process sand and water management facilities which will intercept, store and convey contact water as well as safely divert non-contact sources of water to the downstream receiving environment. Converter waste will be impounded in a separate lined facility.
For the purposes of this study the SSMF has been designed by Knight-Piesold for secure and permanent storage of 77Mt of process sand during the first 22 years of the mine life, after which the remaining 17 Mt of process sand will be stored in the open pit. Process sand storage in the open pit is possible once the mill feed transitions from mined ore to stockpiled ore in year 22. The SSMF location will accommodate additional storage capacity in the event of extended mine life.
The SSMF is located in a small catchment with favourable topography allowing diversion of upstream runoff from the area to the north which reduces the quantity of water that must be managed within the facility. The SSMF includes a water retaining main embankment, process slurry delivery and distribution pipe works, freshwater channel diversions, a seepage collection system, and a reclaim system to recycle water to the plant site.
The main embankment will be a combination zoned earthfill-rockfill embankment with a low-permeable central core and an upstream process sand beach; it will be constructed using the centreline technique (Figure 18.5). Rock fills materials and drainage materials for construction will be obtained from local borrow areas and the open pit development. On-going expansions will include centreline embankment raises with a low permeability compacted core zone, adjacent filter zones and upstream and downstream shell zones. Suitable quality waste rock available from the open pit will be used to construct the stabilizing downstream shell zone and processed waste rock will provide appropriate filter zone materials to be placed between the low-permeability core zone and the downstream shell. The core zone will consist of glacial till excavated from borrow sources located in the vicinity of the embankment. The core zone will be keyed into the bedrock foundation and flared out at the abutment contacts using a cut off trench and grouting (spot or curtain) will be used to provide additional seepage control. The material requirements for embankment construction are shown in Table 18.1.
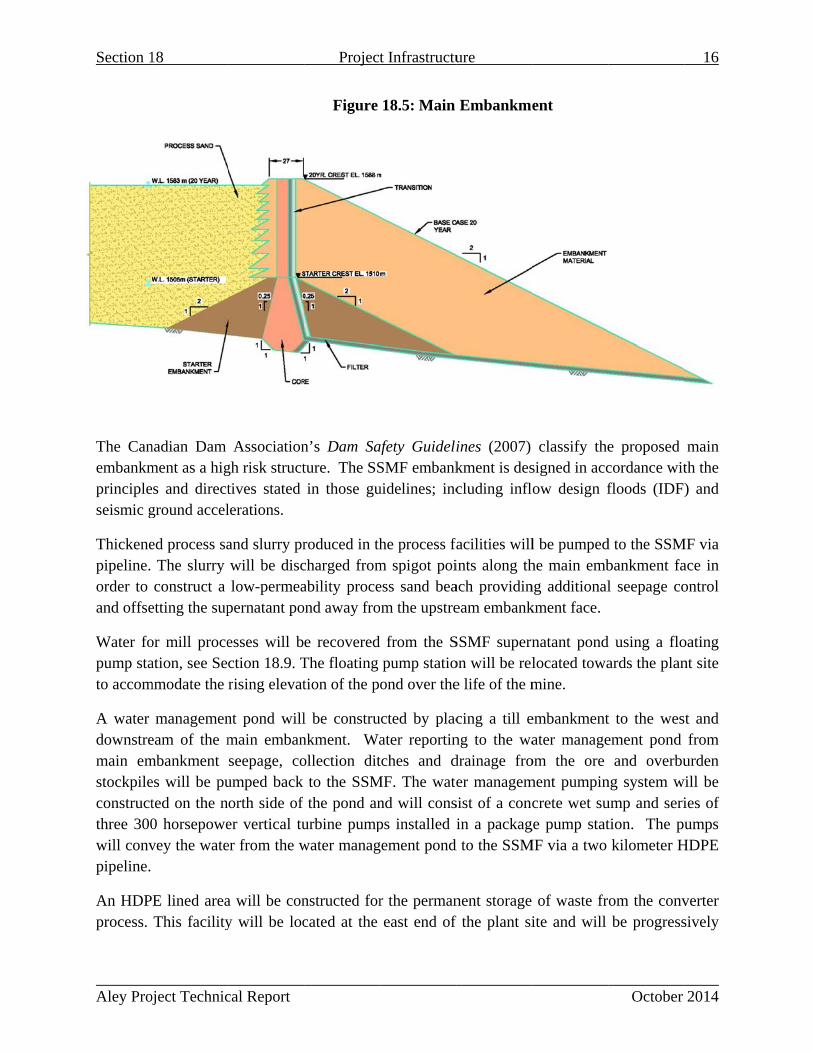
Section 1
Aley Proj
The Canembankmprincipleseismic g
Thickenepipeline. order to and offse
Water fopump stato accom
A water downstremain emstockpileconstructthree 300will convpipeline.
An HDPprocess.
18
oject Technic
nadian Dam ment as a higs and direct
ground accel
ed process saThe slurry construct a
etting the sup
or mill proceation, see Se
mmodate the
managemeneam of the mmbankment es will be puted on the n0 horsepowevey the wate
E lined areaThis facility
cal Report
Associationgh risk structtives stated lerations.
and slurry prwill be disclow-permea
pernatant po
esses will bction 18.9. Trising elevat
nt pond willmain embanseepage, co
umped back orth side of er vertical tuer from the w
a will be cony will be loc
Project
Figure
n’s Dam Safture. The SSin those gu
roduced in thcharged fromability proceond away fro
e recovered The floating tion of the po
l be construnkment. Waollection dit
to the SSMf the pond anurbine pumpwater manag
nstructed forcated at the
t Infrastructu
18.5: Main
afety GuideliSMF embankuidelines; inc
he process fam spigot poiess sand beam the upstre
from the Spump statioond over the
ucted by placater reportintches and d
MF. The watend will consps installed igement pond
r the permaneast end of
ure
Embankme
ines (2007) kment is descluding infl
facilities willints along thach providineam embank
SSMF supernon will be rele life of the m
cing a till eng to the wadrainage froer managem
sist of a concin a packag
d to the SSM
nent storage f the plant si
ent
classify thesigned in accow design f
l be pumpedhe main embng additionalkment face.
natant pondlocated towamine.
embankmentater manage
om the ore ment pumpin
crete wet suge pump stat
MF via a two
of waste frite and will
October
e proposedcordance witfloods (IDF)
d to the SSMbankment fal seepage co
d using a floards the plan
t to the wesement pond
and overbung system wump and serition. The pukilometer H
om the convbe progress
16
2014
main th the ) and
MF via ace in ontrol
oating nt site
t and from
urden will be
ies of umps
HDPE
verter sively
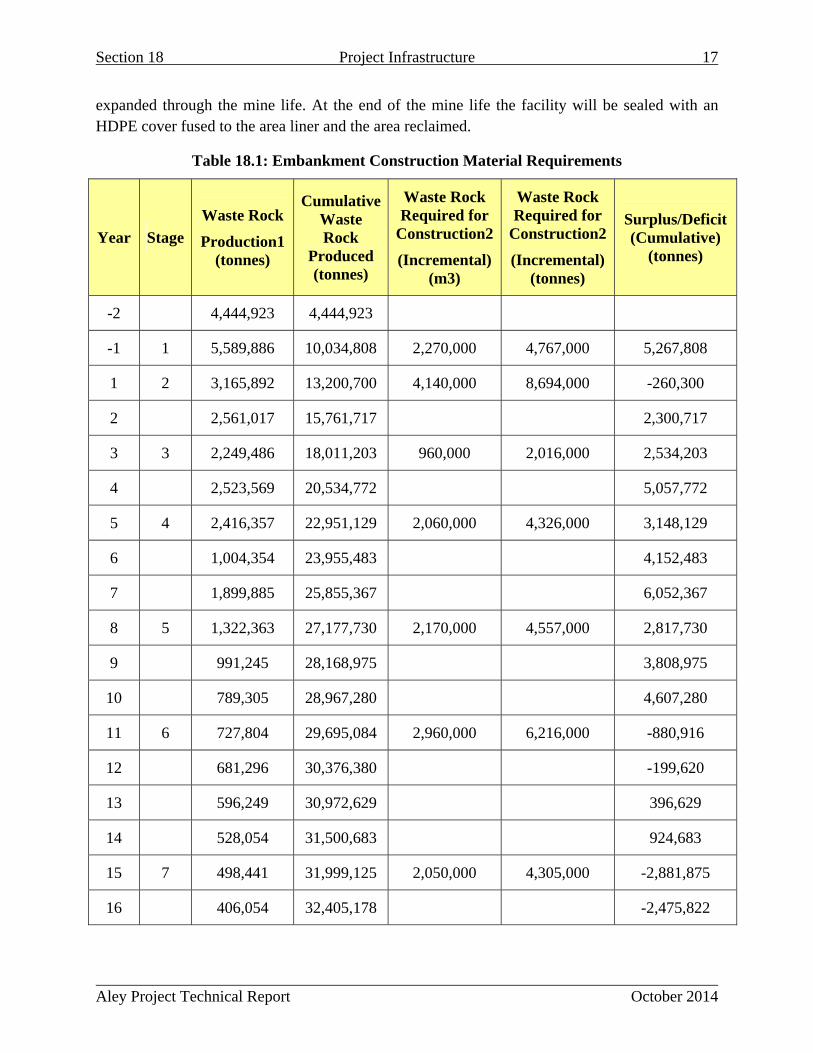
Section 18 Project Infrastructure 17
Aley Project Technical Report October 2014
expanded through the mine life. At the end of the mine life the facility will be sealed with an HDPE cover fused to the area liner and the area reclaimed.
Table 18.1: Embankment Construction Material Requirements
Year Stage
Waste Rock
Production1 (tonnes)
Cumulative Waste Rock
Produced (tonnes)
Waste Rock Required for
Construction2
(Incremental) (m3)
Waste Rock Required for
Construction2
(Incremental) (tonnes)
Surplus/Deficit (Cumulative)
(tonnes)
-2 4,444,923 4,444,923
-1 1 5,589,886 10,034,808 2,270,000 4,767,000 5,267,808
1 2 3,165,892 13,200,700 4,140,000 8,694,000 -260,300
2 2,561,017 15,761,717 2,300,717
3 3 2,249,486 18,011,203 960,000 2,016,000 2,534,203
4 2,523,569 20,534,772 5,057,772
5 4 2,416,357 22,951,129 2,060,000 4,326,000 3,148,129
6 1,004,354 23,955,483 4,152,483
7 1,899,885 25,855,367 6,052,367
8 5 1,322,363 27,177,730 2,170,000 4,557,000 2,817,730
9 991,245 28,168,975 3,808,975
10 789,305 28,967,280 4,607,280
11 6 727,804 29,695,084 2,960,000 6,216,000 -880,916
12 681,296 30,376,380 -199,620
13 596,249 30,972,629 396,629
14 528,054 31,500,683 924,683
15 7 498,441 31,999,125 2,050,000 4,305,000 -2,881,875
16 406,054 32,405,178 -2,475,822
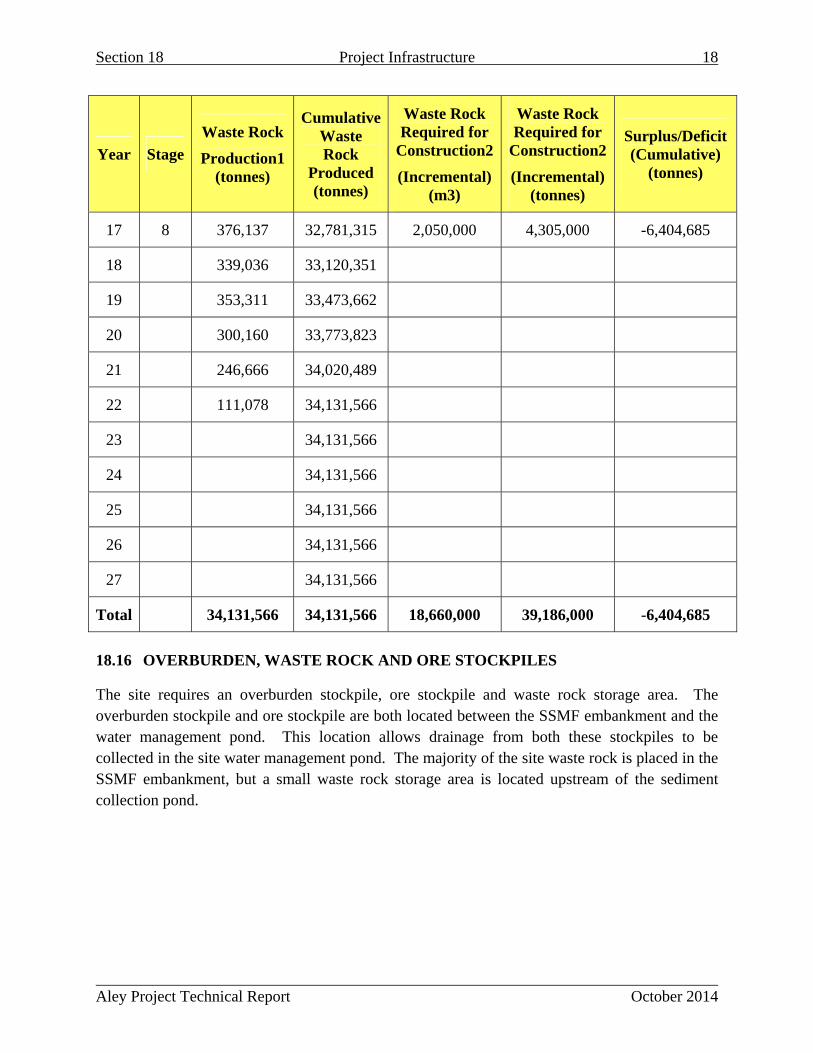
Section 18 Project Infrastructure 18
Aley Project Technical Report October 2014
Year Stage
Waste Rock
Production1 (tonnes)
Cumulative Waste Rock
Produced (tonnes)
Waste Rock Required for
Construction2
(Incremental) (m3)
Waste Rock Required for
Construction2
(Incremental) (tonnes)
Surplus/Deficit (Cumulative)
(tonnes)
17 8 376,137 32,781,315 2,050,000 4,305,000 -6,404,685
18 339,036 33,120,351
19 353,311 33,473,662
20 300,160 33,773,823
21 246,666 34,020,489
22 111,078 34,131,566
23 34,131,566
24 34,131,566
25 34,131,566
26 34,131,566
27 34,131,566
Total 34,131,566 34,131,566 18,660,000 39,186,000 -6,404,685
18.16 OVERBURDEN, WASTE ROCK AND ORE STOCKPILES
The site requires an overburden stockpile, ore stockpile and waste rock storage area. The overburden stockpile and ore stockpile are both located between the SSMF embankment and the water management pond. This location allows drainage from both these stockpiles to be collected in the site water management pond. The majority of the site waste rock is placed in the SSMF embankment, but a small waste rock storage area is located upstream of the sediment collection pond.

Aley Project Technical Report October 2014
SECTION 19: MARKET STUDIES AND CONTRACTS
Aley Project Technical Report October 2014
Table of Contents
19.0 Market Studies and Contracts ................................................................................................1
19.1 End Uses for Niobium .........................................................................................................1
19.2 Market Outlook ...................................................................................................................2
19.3 Contracts ..............................................................................................................................4
19.4 Market License ....................................................................................................................4
19.5 Product Specification Requirements ...................................................................................4
Table of Figures
Figure 19.1: Estimated 2012 Consumption of FeNb by Application (Source; Roskill) ................. 2
Section 19 Market Studies and Contracts 1
Aley Project Technical Report October 2014
19.0 Market Studies and Contracts
Roskill Information Services is a commodity and market research firm which periodically produces a niobium (Nb) market survey report. The two most recent of these were published in 2009 and 2013. Taseko also commissioned a market study from Roskill Information Services in 2011. The commodity price projections and market analysis from these reports along with further pricing research by Taseko on historical and forecast niobium pricing has been used as the basis for the economic analysis of this project.
19.1 END USES FOR NIOBIUM
Niobium, a ductile, shiny metal is also sometimes known as columbium. Niobium is soft and ductile, resists corrosion, and maintains excellent physical properties at high temperatures.
Niobium is used mainly as an alloying addition to steel in the form of ferroniobium (FeNb) which contains approximately 63% to 65% niobium. High-strength low alloy (HSLA) steels typically contain a maximum of only 0.15 % niobium by weight. This low niobium addition reduces grain size and improves carbide dispersion, thereby increasing both the yield strength and toughness of the steel. Additional benefits of niobium addition to HSLA steel include increased high-temperature strength and corrosion resistance. The improved steel characteristics enable significant reductions in the steel quantity required to achieve design criteria.
The proposed end product of the Aley project is HSLA-grade (or standard-grade) FeNb, by far the most important use of niobium, accounting for about 90% of total global niobium usage in terms of niobium units. It has applications in the production of HSLA steels, and stainless and heat-resistant steels. The principal markets for these steels are automobiles, gas linepipe, heavy engineering, and petrochemical and power plants. The estimated 2012 consumption of FeNb by application is shown in Figure 19.1.
Structural steels, primarily plate, accounted for an estimated 45% of world FeNb consumption in 2012. Demand from the construction industry was the main driving force behind the development of high-strength steels that exhibit good uniformity of properties throughout thick sections. High-strength steels used for general structures, such as bridges and high-rise buildings, are used to achieve reductions in weight. There are numerous well-documented cases where the use of niobium-bearing HSLA steels has resulted in significant economic benefit. In France, the use of HSLA plate containing 0.025% Nb in the Millau Valley Bridge provided a 60% reduction in the overall weight of the bridge (steel and concrete). Similarly, the Øresund Bridge between Denmark and Sweden was built using HSLA plate (0.022% Nb), with a resulting cost saving estimated at US$25M.
Automotive steels accounted for an estimated 23% of world FeNb consumption in 2012.The motor vehicle industry is a major consumer of HSLA steels containing FeNb. There is growing emphasis in the automobile industry on improving fuel efficiency, reducing weight and emissions, and increasing passenger safety. This has led to the introduction and increased use of lighter materials at the expense of mild steel.

Section 1
Aley Proj
HSLA liestimatedlevel of sin the eve
Figu
Roskill id
19.2 M
Consumpto the facto produ2002. Th2008. Fethan mocontainedThis use growth inRoskill Inthe 2012
19
oject Technic
inepipe is tyd 16% of wostrength to cent of extern
ure 19.1: Est
dentifies 60 m
MARKET O
ption of FeNct that it is thcer. World his consumpeNb consumst commodid niobium inis divided a
n demand hnformation Slevel of con
cal Report
ypically useorld FeNb contain high-
nal forces, su
timated 201
major purcha
OUTLOOK
Nb is expresshe pricing ba
consumptioption rose to
mption was imities, recoven 2011 and gamongst ste
has come abServices connsumption b
Market Stu
d in gas traconsumption-pressure gasuch as earthq
2 Consump
asers of FeNb
sed in termsasis of the pron of FeNbo approximatmpacted by ering swiftlygrowing to 5eel producersbout as a resnservatively by 2017. At
udies and Co
ansmission pn in 2012. Gs, as well as quakes.
ption of FeN
b for HSLA s
s of millionsroduct and Nwas 23 miltely 54.3 mithe global e
y in 2010,53.5 million ks in the EUsult of increestimated ththe present t
ontracts
pipes. LinepGas transmiss
acceptable t
Nb by Applic
steel producti
s of kilogramNb content inllion kilograillion kilograeconomic crireturning tokilograms o
U, North Ameasing globahat FeNb demtime niobium
pipe steels asion linepiptoughness to
cation (Sou
ion worldwid
ms of contain FeNb vari
ams of contaams of contisis in 2008 o 52.2 millif contained
merica, Chinaal productionmand will grm is contain
October
accounted foe requires ao prevent fra
rce; Roskill
de.
ined niobiumies from prodained niobiuained niobiuto a lesser e
ion kilogramniobium in 2a and Japann of HSLA row by 20% ned in 15% o
2
2014
for an a high acture
l)
m due ducer um in um in extent ms of 2012. . The steel. from
of the

Section 19 Market Studies and Contracts 3
Aley Project Technical Report October 2014
steel produced worldwide. Roskill Information Services 2011 estimates that this could increase to 20% in the future, which is the current level of usage in developed countries.
Over 95% of the world supply of FeNb comes from three producers in Brazil and Canada:
Companhia Brasileira de Metalurgia e Mineracao (CBMM), Brazil
Mineracao Catalao de Goias (Catalao), Brazil, owned by Anglo American
Niobec, Canada, owned by IAMGOLD but currently in an acquisition process.
With the market demand for FeNb projected to grow in the future, there is room for another producer. This opportunity is tempered by the fact that CBMM currently supplies 83% of the market, with the balance of world production split evenly between Niobec and Anglo American Brazil. The proposed Aley production rate is approximately 14 million kilograms of FeNb per year which is equivalent to approximately nine million kilograms of contained niobium or approximately 13% of the worlds projected 2017 demand. The production level considered at Aley takes into account the opportunity provided by an expanding market. It should be noted that one of the barriers to adoption of the use of niobium by steel manufacture is the perceived limited supply, particularly the fact that there are only three major producers. As more producers enter the marketplace, steel manufacturers are less likely to perceive supply risk and more prone to adopt the use of niobium.
FeNb pricing is reported in United States dollars per kilogram of contained niobium metal (US$/kg Nb). With only three primary producers there is no centralized exchange for FeNb as there is for base or precious metals and niobium is generally subject to confidential long term pricing contracts. However, there are three sources of information that can be used to inform FeNb pricing; pricing from the spot market, market analysis from firms such as Roskill Information Services, and inferences from public disclosure of producers.
While the spot market makes up a small percentage of the total FeNb market, it has provided the following information. The pricing on the spot market rose steadily between 2006 and 2007 where it stabilized at a mean annual price of US$47.39/kg Nb. Since that time, prices have stayed in that range, with the five year trailing average at US$50.81/kg Nb.
Market research indicates that this price rise in the spot market was mirrored in long term contract pricing. Long term contract FeNb pricing had held at approximately US$15/kg Nb through the 1990s and prior to 2006, but sharply increased in 2007 and 2008. Since that time the price has steadily risen to the 2012 price of US$42.91/kg Nb. Roskill Information Services notes that FeNb is added to steel in such small amounts that its contribution to the production cost of steel is negligible and far outweighed by the value it adds. They also note that long term prices have shown to be inelastic to demand, and assuming a conservative 3% growth rate is expected to reach US$49 /kg by 2017.
Section 19 Market Studies and Contracts 4
Aley Project Technical Report October 2014
Two publicly traded companies that own and operate niobium mines provide limited financial disclosure about their niobium operations. Iamgold, the owner/operator of the Niobec Mine in Canada provided sales data in its 2013 Annual Report that would infer an average realized price of approximately US$41/kg niobium. Additionally, for 2013, Iamgold used US$45/kg niobium to estimate Niobec’s niobium mineral reserves. Anglo American, the owner/operator of the Catalao Mine in Brazil stated an average realized price of US$39/kg of contained niobium in 2013.
CBMM, a private Brazilian company and owner/operator of the world’s largest niobium mine, does not disclose any financial information.
The long term price used in the economic analysis of this deposit is US$45/kg contained Nb in FeNb, and assumes incoterms EXW (Ex Works) or FCA (Free Carrier). Ex Works is a contract term used to indicate that the seller makes the goods available at his/her premises. Free Carrier is a contract term used to indicate that the seller delivers the goods, cleared for export, to the carrier nominated by the buyer at a specified place, generally a warehouse.
19.3 CONTRACTS
Currently Taseko has no contracts in place with consumers of FeNb. Standard procurement contracts will be required for construction, materials delivery and some site services. The offsite costs associated with material transport, FeNb transport, port storage, stevedoring and shipping have been incorporated into the economic analysis of the project based upon Taseko’s experience transporting copper concentrate produced at its Gibraltar mine.
19.4 MARKET LICENSE
Taseko has included cost allocations for a European Licensing fee and ongoing production based marketing costs that are within industry norms for licencing in the European market and product marketing.
19.5 PRODUCT SPECIFICATION REQUIREMENTS
Taseko is assessing the project based upon processing, producing and packaging a FeNb final product on site. While there are some FeNb product characteristics available from individual producers, there are no product specifications from steel manufacturers themselves. There is an indication that a range of product characteristics are utilized by the steel manufacturers, largely dependent upon the chemical compositions of the other feed stock materials that they use and guided by ASTM International high-strength low-alloy steel (HSLA) specifications. Facility design has been conducted such that a range of chemical specification and particle size requirements for a FeNb product can be achieved. Sufficient flexibility has been provided for in the plant design such that specialised requirements for chemical content and particle size can be accommodated.

Aley Project Technical Report October 2014
SECTION 20: ENVIRONMENTAL STUDIES, PERMITTING AND SOCIAL OR COMMUNITY IMPACT
Aley Project Technical Report October 2014
Table of Contents
20.0 Environmental Studies, Permitting, and Social or Community Impact .................................1
20.1 Environmental Studies .........................................................................................................1
20.1.1 Physical Environment ....................................................................................................1
20.1.2 Biological Environment .................................................................................................3
20.2 Waste Rock and Process Sand Disposal, Water Management and Site Monitoring ...........4
20.2.1 Sand Storage Management Facility ...............................................................................4
20.2.2 Waste Rock Storage Area ..............................................................................................4
20.2.3 Water Management ........................................................................................................5
20.2.4 Monitoring ......................................................................................................................5
20.3 Social and Community Rights .............................................................................................6
20.3.1 Communities ..................................................................................................................7
20.3.2 Resource Users ...............................................................................................................8
20.3.3 Economic Benefits .........................................................................................................9
20.3.4 Cultural Heritage Impacts ..............................................................................................9
20.3.5 Agreements and Negotiations ......................................................................................10
20.4 Permitting ..........................................................................................................................10
20.4.1 Environmnental Assessment ........................................................................................10
20.4.2 Federal Permits, Licenses, Authorizations and Approvals ..........................................11
20.4.3 BC Permits, Licenses, Authorizations and Approvals .................................................11
20.5 Mine Closure and Costs .....................................................................................................13
20.5.1 Reclamation and Closure .............................................................................................13
20.5.2 Mine Closure Costs ......................................................................................................13

Section 20 Environmental Studies, Permitting, and Social or Community Impact 1
Aley Project Technical Report October 2014
20.0 Environmental Studies, Permitting, and Social or Community Impact
20.1 ENVIRONMENTAL STUDIES
A background data review of existing information on the physical and biological conditions in the Project area has been conducted by AECOM, Knight Piésold Ltd. and SRK Consulting. Following the completion of background review and desktop studies, a suite of site specific baseline studies was initiated in 2011. Project studies cover geochemistry, climate, air quality, noise, terrain and soils, hydrology, hydrogeology, water quality, noise, aquatic ecology, fish and fish habitat, vegetation, and wildlife. These studies will be used to characterize baseline physical and biological conditions for purposes of evaluating the environmental effects of the Project through the environmental assessment process, and for monitoring as may be dictated by future permits.
No issues have been identified to date that could materially impact Taseko’s ability to extract the mineral reserves.
The following sections provide a brief summary of the environmental baseline studies associated with the proposed mine site.
20.1.1 PHYSICAL ENVIRONMENT
Geochemistry
Appropriate mineralogical studies, static testing (acid-base accounting and elemental analyses), laboratory kinetic testing (humidity cells) and on-site kinetic testing (barrel tests) of drill core samples are being used to investigate metal leaching (ML) and acid rock drainage (ARD) potential of the waste rock, ore and process sand.
Climate, Air and Noise
Historical climate data from government stations located near the Project study area have been augmented by project-specific climate data collection at site since 2011. Data collected from the onsite climate station to date is consistent with the characterization of regional climate. Site specific data has been used to inform the site water balance.
A baseline air quality program has been initiated at the site which focuses on the collection and analysis of dustfall. Results are typical for remote undisturbed areas in Canada. The sources of air contaminants for the Project will be typical of an open pit mine while the scale of the proposed operation will be smaller than typical BC open pit operations. Impacts to air quality associated with the project are expected to be minimal.

Section 20 Environmental Studies, Permitting, and Social or Community Impact 2
Aley Project Technical Report October 2014
Ambient noise data has been collected at the site. The main sources of noise that would elevate sound levels in the Project area are typical of open pit mine activities. Considering that the nearest residential area is Tsay Keh Dene Village, 90 km away, noise impacts are minimal and limited to workers on-site, and wildlife and individuals using the immediate area or transportation corridor for traditional or recreational purposes.
Soils and Terrain
Topography in the Project area consists of steep mountain terrain with U shaped glacial valleys. Snow avalanche paths are common on most valley sides of the tributaries draining into the Ospika River valley. These geohazards in the vicinity of the Project are being assessed and management of any hazards will be incorporated into the Project detailed design. Soil and terrain field survey programs have been conducted in support of baseline assessments of the Project area and used to identify the quality and quantity of soils and overburden to be stripped and stockpiled for reclamation at closure.
Hydrology
Regional government hydrology data has been augmented by project specific stream flow stations since 2011. Assessments are ongoing to identify the potential for hydrological impacts such as reduced downstream flows which could result from the Project such that any appropriate mitigation measures can be incorporated in the water management plan if required.
Hydrogeology
Groundwater data collection has been ongoing since 2011 and will be used to develop and support the hydrogeological effects assessment for the environmental assessment and permitting processes.
Water Quality
Baseline water quality data collection has been ongoing since 2011. Initial analysis of the data indicates that in some locations total concentrations of some elements exceed an aquatic life guideline, which is commonly experienced in mineralized zones, but that dissolved concentrations of these same elements are consistently at or below the limits of detection. Potential effects on surface water quality from construction, operation and closure of the Project will be evaluated for tributaries in close proximity to the Project, and during the environmental assessment process, water management and mitigation measures will be designed as appropriate. Water monitoring plans will be detailed during permitting. The overall facility design can accommodate all contact mine water within the Project footprint and, if necessary, provide appropriate water quality mitigation prior to discharge.
Section 20 Environmental Studies, Permitting, and Social or Community Impact 3
Aley Project Technical Report October 2014
20.1.2 BIOLOGICAL ENVIRONMENT
Aquatic Ecology, Fish and Fish Habitat
The aquatic environment in the Project area generally consists of small mountainous streams flowing into the Ospika River which is a tributary of Williston Reservoir. Field studies have identified 4 to 5 m high waterfalls on Steve Creek, the creek draining the Project watershed, several kilometres below the Project site. These falls are barriers to fish movement upstream to the Project area. Fish sampling has identified species present in the lower reaches of Steve Creek, below the falls, but no fish have been captured above the falls. Evidence to date suggests fish are not present in the upper reaches of Steve Creek, within the vicinity of the Project.
Potential Project effects include minor reductions in fish habitat in the lower sections of Steve Creek that might result from the diversion of any flows in the upper watershed as part of mine water management.
The transmission line will cross a number of streams and rivers over its 150 km length. Any alteration of vegetation communities, riparian ecosystems or habitat is expected to be temporary. Measures to mitigate the impacts during construction will be incorporated into environmental management plans, and reclamation of the transmission corridor at the end of the Project will fully mitigate effects.
Vegetation
Vegetation data, combined with soils and terrain data, have been collected to generate terrestrial ecosystem mapping for the Project area and will be used to characterize wildlife habitat values. Detailed sampling of plant communities and rare plant surveys have been conducted within the vicinity of the proposed Project site. No red or blue listed ecosystems or rare plant species have been identified as occurring in proposed disturbance area for the Project.
Wildlife
Wildlife species in the Ospika Valley and generally around Williston Reservoir have been well studied. Data has been gathered on a wide ranging list of species from government online databases. Wildlife species of potential interest in the Project area include: mountain goats, grizzly bear, moose, songbirds, wolverine, hoary marmot, amphibians and insects. No critical winter habitat for caribou has been identified in the proposed mine site area. Caribou have been well studied elsewhere in Williston Reservoir area, and impacts on the Graham River herd as a result of mine development in the Aley Creek area are expected to be negligible to low.
Data will be used for determining mitigation measures to minimize habitat loss and disturbance to wildlife during the environmental review process, and to inform reclamation plans for closure, a requirement of permitting.
Section 20 Environmental Studies, Permitting, and Social or Community Impact 4
Aley Project Technical Report October 2014
20.2 WASTE ROCK AND PROCESS SAND DISPOSAL, WATER MANAGEMENT AND SITE MONITORING
20.2.1 SAND STORAGE MANAGEMENT FACILITY
The sand storage management facility (SSMF) is located in the valley below the processing plant in a location that will minimize potential effects on the watershed and has the capacity to contain the process sand anticipated to be produced over the life of the mine.
The SSMF will be a conventional slurried process sand storage area. A starter embankment will be used followed by process sand deposition and sequential embankment construction in order to progressively build the process sand beach and embankment height. The embankment construction is to follow a centerline-type design being raised over the life of operations and will be constructed of compacted glacial till, overburden and waste rock.
All concentrator waste streams will be sent to the SSMF located southeast (and down gradient) of the plant site location, by gravity. The converter will produce ferrous niobium (FeNb). The mineral processing system will result in a single shipped product stream in the form of FeNb, a single process sand stream from the flotation plant, and a refuse product from the converter. The converter refuse will be deposited in the SSMF. Placement of converter refuse would be such that these materials would be encapsulated in process sand and below the liquid interface.
The following measures are incorporated into the Project design to ensure that the SSMF is stable and self-sustaining: engineered zoned embankment designed as per the Canadian Dam Association Guidelines; long beaches to keep the SSMF pond away from the embankment crests; a constructed spillway sufficient to prevent overtopping and eroding of the embankments, as well as maintaining the SSMF pond at the desired elevation; and, the inclusion of vibrating wire piezometers within the embankment to allow for on-going monitoring of the structure’s stability.
At mine closure, the SSMF will be reclaimed using the following methods:
With the exception of the shoreline, the process sand beach surfaces will be capped with 50 cm of salvaged soils from stockpiles.
Embankments will be resloped to 2H:1V and capped with 50 cm of soil.
Surfaces will be revegetated to meet end land use objectives, and prevent erosion and invasive plant establishment on bare soils. Rocks and coarse woody debris will be placed in piles across the beach surface for line of sight breaks and habitat enhancement.
20.2.2 WASTE ROCK STORAGE AREA
Mined waste rock will be used to construct the SSMF embankment. Surplus rock not designated for embankment construction will be placed on the downstream embankment. This will provide additional strength and reinforcement to the SSMF while also supporting the objective of keeping the mine infrastructure in one watershed, minimizing the project footprint.
Section 20 Environmental Studies, Permitting, and Social or Community Impact 5
Aley Project Technical Report October 2014
20.2.3 WATER MANAGEMENT
The water management plan enables control of all surface water within the mine area. The main objective of the water management plan is to control all water that originates from within the mine to supply the milling process and related mining activities and eliminate the demand for external make-up water. Key water management activities include the following:
During operations – o Controlling, collecting, and utilizing surface water runoff upstream of the mine
area; o Optimizing the volume of water stored in the SSMF supernatant pond to meet
operations and closure requirements; o Collecting and recycling surficial site water and seepage from the SSMF and
stockpiles; o Diverting clean water around the mine site where feasible; o Monitoring and, if required, treating surplus water from pit dewatering and clean
water diversions to meet suspended solids criteria to prior to release to the environment (Steve Creek).
For closure – o Collecting, monitoring and, if required, treating all site water prior to its release to
the environment (Steve Creek); at this time water quality is predicted to meet water quality guidelines.
During construction and operations, surficial and groundwater collected in and around the pit will be managed for suspended solids prior to release to the environment. Water that comes in contact with the WRSAs will be collected through a series of diversion ditches and routed to sedimentation ponds and/or the SSMF seepage collection pond. The SSMF seepage will be returned to the impounded area located upstream of the SSMF embankment. Although not predicted as being required at this time, the likelihood for passive or chemical water treatment being required at closure prior to release of water into Steve Creek will be confirmed through modeling of water quality for the environmental assessment.
20.2.4 MONITORING
Taseko will hold and maintain necessary permits for any work that takes place in, on, or about the mine and will comply with all provisions of provincial and federal legislation, regulations, conditions of permits issued, and the BC Mines Act “Health, Safety and Reclamation Code for Mines in British Columbia” (Code). A full list of monitoring and reporting obligations associated the Project will be developed during the permitting process. Monitoring activities associated with necessary permits, authorizations, licenses, regulations and the Code may include:

Section 20 Environmental Studies, Permitting, and Social or Community Impact 6
Aley Project Technical Report October 2014
Workplace contaminants to ensure employees are not exposed to airborne concentrations of chemical agents or noise in excess of the levels specified in Section 2.1.1 of the Health, Safety and Reclamation Code.
Surface and ground water quality monitoring downstream of the Project area
Air quality in the vicinity of the Project infrastructure and emission sources
Aquatic life downstream of the Project area
Development and maintenance of an annual inventory of GHG emissions
Soils handling and reclamation throughout mine life to ensure that reclamation is successful and that a self-sustaining vegetation which cover meets end land use objectives is established
Geotechnical stability of structures, including pit walls and embankments
Process sand performance
Waste rock handling including material volumes
If any post-closure activities are required, they may include a continuation of environmental monitoring conducted during the history of the Project. These may include:
Periodic geotechnical inspections, such as the SSMF embankments
Continued evaluation of water quality and flow rates downstream of the Project
Continued evaluation of aquatic life downstream of the Project, and
Soil and vegetation monitoring on reclaimed landscapes.
Taseko will be responsible for all environmental monitoring and reclamation programs until such time as all permit conditions have been fulfilled and Taseko has been released from all obligations under the BC Mines Act.
20.3 SOCIAL AND COMMUNITY IMPACTS
A background data review of existing information on the social conditions for the Project area has been conducted by AECOM. Following the completion of background review, baseline studies were initiated in 2011 on socio-economic conditions, communities, traditional land use and cultural heritage for purposes of evaluating the environmental effects of the Project through the environmental assessment process.
No issues have been identified to date that could materially impact Taseko’s ability to extract the mineral reserves.
The following sections provide a brief summary of the baseline studies of existing social and community conditions associated with the proposed mine site.
Section 20 Environmental Studies, Permitting, and Social or Community Impact 7
Aley Project Technical Report October 2014
20.3.1 COMMUNITIES
The mine site is located in a remote area of the Peace River Regional District in northeastern British Columbia. Many of the local communities have diversified economies, and familiarity and experience with the resource extraction industries. Engagement and consultation with potentially affected First Nations and other local communities are important components of the environmental review process and Project success. Current engagement is premised on Taseko’s responsible mineral development philosophy, to develop a respectful and collaborative working relationship with potentially affected communities and invite active First Nation participation in project planning and EA field study programs. The following sections provide a brief description of the principal communities in the region of the Project.
Tsay Keh Dene
The Project area is within the Tsay Keh Dene traditional territory. The community of Tsay Keh Dene (known as Tsay Keh Dene Village) is located at the north end of the Williston Reservoir, approximately 90 kilometres in a direct line from the Project area. Tsay Keh Dene Village is the closest community to the Project. Tsay Keh Dene’s registered population is approximately 450, of whom about 245 live in Tsay Keh Dene Village.
Employment for Tsay Keh members consists primarily of seasonal jobs in the forestry and mining sectors. The Tsay Keh Dene Government is also a source of employment for members. Tsay Keh Dene currently operate several band owned businesses.
Traditional pursuits including hunting, fishing and gathering, still feature very prominently in the lives of most Tsay Keh Dene members. Some maintain trap lines from which they earn a modest living.
Treaty 8 First Nations
The Project site is also in the region identified by Halfway River First Nation and West Moberly First Nations as being within the western limits of their traditional territories and the historical boundaries of Treaty 8, as claimed by the BC Treaty 8 Tribal Association. In addition to passing through Halfway River and West Moberly traditional territories, the proposed transmission line corridor also passes through McLeod Lake Indian Band traditional territory.
Mackenzie
Mackenzie, with a population of approximately 4,000, is the next closest community to the Project site, located 140 km to the south at the southern end of Williston Reservoir. Mackenzie’s economy is largely forestry dependent and the community was affected by the downturn in the forest industry in 2008. Although the economic outlook in Mackenzie has rebounded in recent years, the community is working to diversify its forestry-based economy by acting as a service hub to mining operations and exploration in the area. Thompson Creek Metals Corporation
Section 20 Environmental Studies, Permitting, and Social or Community Impact 8
Aley Project Technical Report October 2014
recently completed construction of the Mount Milligan Mine, about 90 km west of Mackenzie. The Mount Milligan Mine has an estimated mine life of 22 years.
Hudson’s Hope
Hudson’s Hope has a population of approximately 1,000 and is located 118 km to the southeast of the Project. BC Hydro is the main industrial employer and is the basis of the local economy. In recent years, Hudson’s Hope has experienced increasing investment due to new industrial activity related to mining and energy projects. Other economic activities include agriculture as well as guiding and outfitting and eco-tourism.
Prince George
Prince George, approximately 300km to the south/southwest of the Project, is the largest urban centre in the region, with a population of approximately 75,000. Prince George’s economy is primarily based on the forest industry. Transportation, tourism and recreation, healthcare, education and retail activities also contribute to Prince George's economic base.
Fort St. John
Fort St. John is approximately 180 km east of the Project and has a population of approximately 20,000. It is the largest regional service center in northeastern BC. The economy of Fort St. John is primarily based on the oil and gas sector but is also bolstered by agriculture and forestry.
Future community engagement activities will be planned with the goal that community members and stakeholders can meaningfully participate in a discussion of the potential impacts and opportunities related to the Project. Taseko will continue to engage with First Nations, community groups, and stakeholders in the form of open houses and information session, or other methods of communication as appropriate.
20.3.2 RESOURCE USERS
The Project’s mine footprint will be located on provincial Crown land. Recreational sensitivity and significance is designated as low and low to moderate at the Project site. There are two licensed guide outfitters operating within 10 km of the site and three trapline holders who have licensed areas within 10 km of the Project footprint. There are no forestry cut blocks in direct proximity to the Project site. The nearest protected area to the Project is Graham-Laurier Provincial Park, whose nearest limit is six kilometres to the northeast of the proposed footprint. Other protected areas are more than 49 km away.
The proposed transmission line route is approximately 150 km long, from Mackenzie to the mine site. Between Mackenzie and the Peace Arm crossing there are a number of different land tenures starting from within 10 km of Mackenzie. These include Heather-Dina Lakes Park, Heather Lake Ecological Reserve, and Patsuk Creek Ecological Reserve, as well as residential
Section 20 Environmental Studies, Permitting, and Social or Community Impact 9
Aley Project Technical Report October 2014
and other tenures. There are existing roads and other development in this area. The transmission line may run for approximately eight kilometres along the Parsnip West FSR through Heather Dina Provincial Park, but along an existing road right-of-way. In early engagement discussions with First Nations, Taseko has heard that the First Nations’ preference is for the road to follow existing disturbance as much as possible.
20.3.3 ECONOMIC BENEFITS
The Project has the potential to create approximately 700 direct jobs during construction (equivalent to approximately 900 person-years) and 350 direct jobs during operations. It is also expected to create on the order of 700 to 1000 indirect jobs as a result of the increased economic activity created by the Project. These would be positive impacts for an area with limited long-term, stable employment opportunities. The project would also bring economic diversity to the local area where employment opportunities are primarily forestry sector dependant and forecasted to be impacted by the effects of mountain pine beetle infestation.
The Project is expected to generate local and provincial economic value in the following ways:
The demand for labour during construction and operations will have a positive effect on direct and indirect employment.
Wages during operations are anticipated to be higher than the average personal income in the region.
New opportunities will be created for contractors and suppliers.
The Project has the potential to create benefits in local communities that have been negatively affected from changes in the forestry sector.
Government revenues would increase through corporate, income, and consumption taxes payable as a result of the Project proceeding to operations.
Principal services have been identified within the region, including medical facilities, fire, police, airport, rail access, and schools. Secondary information has been collected on numerous health and community well-being indicators, which will be supplemented with primary information gathered through interviews and/or consultation during the EA process. These data will be used to assess any socio-economics effects or impacts on services as a result of the Project. If capacity issues are identified, mitigation measures may be developed in conjunction with local service providers.
20.3.4 CULTURAL HERITAGE IMPACTS
An Archaeological Overview Assessment (AOA) was conducted over an area of 17,000 ha containing the mine footprint, portions of proposed and related ancillary developments, and the adjacent general surroundings that would not be affected. There were no previously recorded, known, or otherwise identified archaeological, cultural or heritage sites within the study area.

Section 20 Environmental Studies, Permitting, and Social or Community Impact 10
Aley Project Technical Report October 2014
An Archaeological Impact Assessment (AIA) of a 993 ha area was initiated in 2011 which focused on the proposed mine footprint and areas immediately adjacent. The AIA identified four previously unrecorded archaeological sites. Additional archaeological work is expected to be carried out in the mine site and transmission line areas to further evaluate archaeological resources and to address provincial archaeology requirements. Where avoidance of sites is not feasible, further documentation of the heritage resources will occur prior to disturbance, as directed by the provincial Archaeology Branch under a permit. To date, studies have not identified the archeological resources as having a high risk to Project development.
20.3.5 AGREEMENTS AND NEGOTIATIONS
In May 2012, Tsay Keh Dene and Taseko entered into an Exploration Cooperation and Benefits Agreement associated with the exploration program and environmental studies which aims to enhance understanding and cooperation between Tsay Keh Dene and Taseko regarding the exploration program and environmental studies. The agreement also provides for the negotiation of a Comprehensive Cooperation and Benefits Agreement between Tsay Keh Dene and Taseko with the mutual intent that an agreement will be concluded before the EA process for development of a mine is completed.
20.4 PERMITTING
20.4.1 ENVIRONMENTAL ASSESSMENT
A mining project of the scale proposed for the Project typically goes through a formal environmental review process and if approved can then receive the necessary permits and approvals for construction and operation.
The Aley Project is currently in the pre-application phase of the environmental assessment. Project Descriptions have been submitted to the BC Environmental Assessment Office (BCEAO) which administers the BC Environmental Assessment Act (BCEAA), and the Canadian Environmental Assessment Agency (CEA Agency) which administers the Canadian Environmental Assessment Act, 2012 (CEAA 2012).
The BC review process was triggered by submission of the Project Description as the BC EAA’s Reviewable Projects Regulations stipulates that any new mineral mine that has a production capacity of 75,000 tonnes per year or more is reviewable under the BC EAA. The current plan estimates processing of 3.6 Mtpy of ore. BCEAO is expected to confirm that an assessment is required by issuing a EAA Section 10 Order before the end of September which will state that, in order for the Project to proceed, an EA certificate needs to be issued after the review of the EA Application.
CEAA 2012 came into effect in July 2012 and applies to projects described in the Regulations Designating Physical Activities (a regulation defining which projects are subject to the CEAA).
Section 20 Environmental Studies, Permitting, and Social or Community Impact 11
Aley Project Technical Report October 2014
This regulation identifies metal mines with ore production capacity of 3,000 tonnes per day or more, or a metal mill with an ore input capacity of 4,000 tonnes per day or more, as potentially requiring an EA. As the Project exceeds these capacities, a Project Description was submitted to the CEA Agency for determination of whether a federal EA is required.
Following BC’s issuance of a Section 10 Order, BC is expected to request ‘substitution’ under CEAA 2012, where the federal minister retains federal decision-making authority using the results of the provincial EA. CEAA’s review of the Project Description and request for substitution follow a regulated timeline; therefore, CEAA’s determination that a federal decision is required and acceptance of BC’s process for substitution can be expected before the end of November.
20.4.2 FEDERAL PERMITS, LICENSES, AUTHORIZATIONS AND APPROVALS
For explosives storage, approval will be required under the Explosives Act. An authorization from Transport Canada will be required for aeronautical clearance for the overhead transmission line crossing of the Peace Arm. Other federal permits, licenses or approvals that may be required for the construction, operation, or closure of the Project are the following:
Environment Canada – Metal Mining Effluent Regulations (MMER) under the Fisheries Act, as water may be discharged from the pit during operations and from the SSMF in closure; however, the Project’s current design does not discharge water into fish-bearing streams or water bodies.
Fisheries and Oceans Canada – Fisheries Act authorizations may be required, although current field data and presence of downstream barriers suggests that the mine site area is not providing habitat to any fish species, and proposed transmission line crossings will be designed to avoid habitat disruption in riparian areas.
As a Project design feature, water may be discharged from the pit during operations and from the SSMF in closure. Taseko will carry out the appropriate monitoring and control of discharge. As a result, the mine will be required to meet Environment Canada regulatory requirements under the Metal Mining Effluent Regulations (MMER) as per the Fisheries Act during both operations and in closure.
It is expected that during the EA process and further discussion with federal departments the nature of any federal authorizations will be confirmed.
20.4.3 BC PERMITS, LICENSES, AUTHORIZATIONS AND APPROVALS
A list of provincial permits, licences and approvals that may be required for the Project follows:
BC Ministry of Energy, Mines and Natural Gas (MEMNG) o Mineral Tenure Act
Mining Lease
Section 20 Environmental Studies, Permitting, and Social or Community Impact 12
Aley Project Technical Report October 2014
o Mines Act Permit: Approval of the Mine Plan Approval of the Reclamation Plan
BC Ministry of Forests, Lands and Natural Resource Operations (BCMFLNRO) o Land Act Authorizations
Licence of Occupation o Water Act
Approvals for “Changes In and About a Stream” (Section 9) Water licences new sediment control/detention ponds and surface water
diversion, storage and use o Forestry Act Licence:
Occupation Licence to cut o Heritage Conservation Act
Section 14, Inspection Permit Section 12, Site Alteration Permit
o Provincial Forest Use Regulation Special Use Permit for use of new and existing road access
BC Ministry of Environment (BCMOE) o Environmental Management Act permits
Effluent Discharge Permit (e.g., SSMF, sewage, etc.) Air Discharge Permit Discharge to Land Permit – disposal of refuse Fuel Storage Permit Sewage Registration – sewage disposal facility
Ministry of Transportation (MOT) o Transportation Act, Motor Vehicles Act
Utility Permit
BC Northern Health Authority (BCNHA) o Public Health Act
Food Premises Permit Drinking water Filing of Certification Letter for sewage disposal facility
o Drinking Water Protection Act and Regulations Construction Permit Operating Permit
It is expected that during the EA process and the exchanges with BC authorities, more specific requirements will be refined.

Section 20 Environmental Studies, Permitting, and Social or Community Impact 13
Aley Project Technical Report October 2014
20.5 MINE CLOSURE AND COSTS
20.5.1 RECLAMATION AND CLOSURE
In BC, companies are required to reclaim mine activities once work is completed. In accordance with the Code for mines in BC, reclamation is to be conducted to ensure: land and watercourses are consistent with the adjacent landforms; land is revegetated to a self-sustaining state; prior to abandonment, all machinery equipment and building superstructures are removed; and, roads and other features are reclaimed to ensure long-term stability.
The definitive closure phase will begin at the cessation of process sand production. Decommissioning of site infrastructure and reclamation will be completed early in this period. The following are key activities related to closure of each Project component:
Aley Open Pit – appropriate erosion control features for pit lake discharge
SSMF – stabilization and revegetation of the embankment and beach
Plantsite - removal of buildings and infrastructure, recontouring of site and revegetation
Access and Haul Roads – general recontouring and revegetation of access and haul roads. Sufficient road access will remain to maintain post closure monitoring activities.
Transmission Line – remove power line and poles. Where appropriate reclaim any access routes that were used for maintenance.
The post-closure phase begins when the open pit has filled with water and begins to discharge to Steve Creek. Activities in this period are all related to environmental monitoring and follow-up and will include monitoring of water quality, reclamation success monitoring, stability of remaining site infrastructure, and follow-up and repair if required and annual reporting to government. Further discussion of post-closure requirements will occur during the EA and subsequent permitting processes. This period will continue until all conditions of the Code and permits have been fulfilled and Taseko has been released from all regulatory obligations.
20.5.2 MINE CLOSURE COSTS
Before any work on a site is conducted, the province, through the BC Mines Act and the Code, requires companies to post security which will cover the cost of site reclamation and maintenance in the event that a company is unable to complete the decommissioning works. This security provides certainty that once mining activities at a site are complete, that the site will be returned to an acceptable state.
Reclamation of the mine site disturbed areas will take place as they become available during the operation of the mine. Based upon Blue Book equipment rates, topsoil placement, resloping, seeding, tree planting and fertilization costs, the reclamation of the remaining disturbed land at closure is estimated to cost $3 million. The cost of decommissioning of the site infrastructure and buildings is expected to be offset by the salvage value of the material and equipment

Section 20 Environmental Studies, Permitting, and Social or Community Impact 14
Aley Project Technical Report October 2014
removed from the site. The net present cost of the monitoring and maintenance of the closed mine site is estimated to be $5 million. The total mine closure cost is estimated to be $8 million.
Security bond requirements are typically fulfilled once the mine has completed a capital payback period rather than funding at the outset.

SECTION 21: CAPITAL AND OPERATING COSTS

Table of Contents
21.0 Capital and Operating Costs ..................................................................................................1
21.1 Pre-Production Capital Cost Estimates ...............................................................................1
21.1.1 Currency .........................................................................................................................1
21.1.2 Basis of Estimate ............................................................................................................2
21.1.3 Labour Schedule and Rates ............................................................................................3
21.1.4 Mine Capital ...................................................................................................................4
21.1.5 Process Plant – Concentrate Proudction Capital ............................................................5
21.1.6 Process Plant – FeNb Production Capital ......................................................................5
21.1.7 Sand Storage Management Facility and Water Reclaim Capital ...................................6
21.1.8 Ancillary Facilities .........................................................................................................6
21.1.9 On-Site Infrastructure Capital ........................................................................................6
21.1.10 Off-Site Infrastructure Capital .....................................................................................7
21.1.11 Indirect Capital .............................................................................................................7
21.1.12 Contingency ...............................................................................................................10
21.1.13 Sustaining Capital ......................................................................................................10
21.1.14 Capital Cost Exclusions .............................................................................................10
21.2 Operating Costs .................................................................................................................11
21.2.1 Summary ......................................................................................................................11
21.2.2 Mine Operating Costs ..................................................................................................11
21.2.3 Process Operating Costs ...............................................................................................12
21.3 General and Administration Costs .....................................................................................15
21.4 Personnel ...........................................................................................................................17
21.4.1 Mine Operatings and Maintenance Personnel ..............................................................17
21.4.2 Process Plant Labour ....................................................................................................17
21.4.3 G&A Labour ................................................................................................................18
List of Tables
Table 21.1: Summary of Capital Costs (x $1,000) ......................................................................... 1
Table 21.2: Foreign Currency Exchange Rates .............................................................................. 1
Table 21.3: Mine Capital (x $1,000) ............................................................................................... 4
Table 21.4: Concentrator Direct Capital (x $1,000) ....................................................................... 5
Table 21.5: FeNb Converter Direct Capital (x $1,000) .................................................................. 5
Table 21.6: SSMF and Water Reclaim Direct Capital (x $1,000) .................................................. 6

Table 21.7: Ancillary Facilities Direct Capital (x $1,000) ............................................................. 6
Table 21.8: Site Development Direct Capital (x $1,000) ............................................................... 7
Table 21.9: Off-Site Infrastructure Direct Capital (x $1,000) ........................................................ 7
Table 21.10: Indirect Capital (x $1,000) ......................................................................................... 7
Table 21.11: Summary of Site Operating Costs ........................................................................... 11
Table 21.12: Unit Mining Costs.................................................................................................... 12
Table 21.13: Process Operating Costs ($ x 1,000) ........................................................................ 13
Table 21.14: General & Administration Costs ............................................................................. 16
Table 21.15: Summary of G&A Personnel Requirements ............................................................ 18
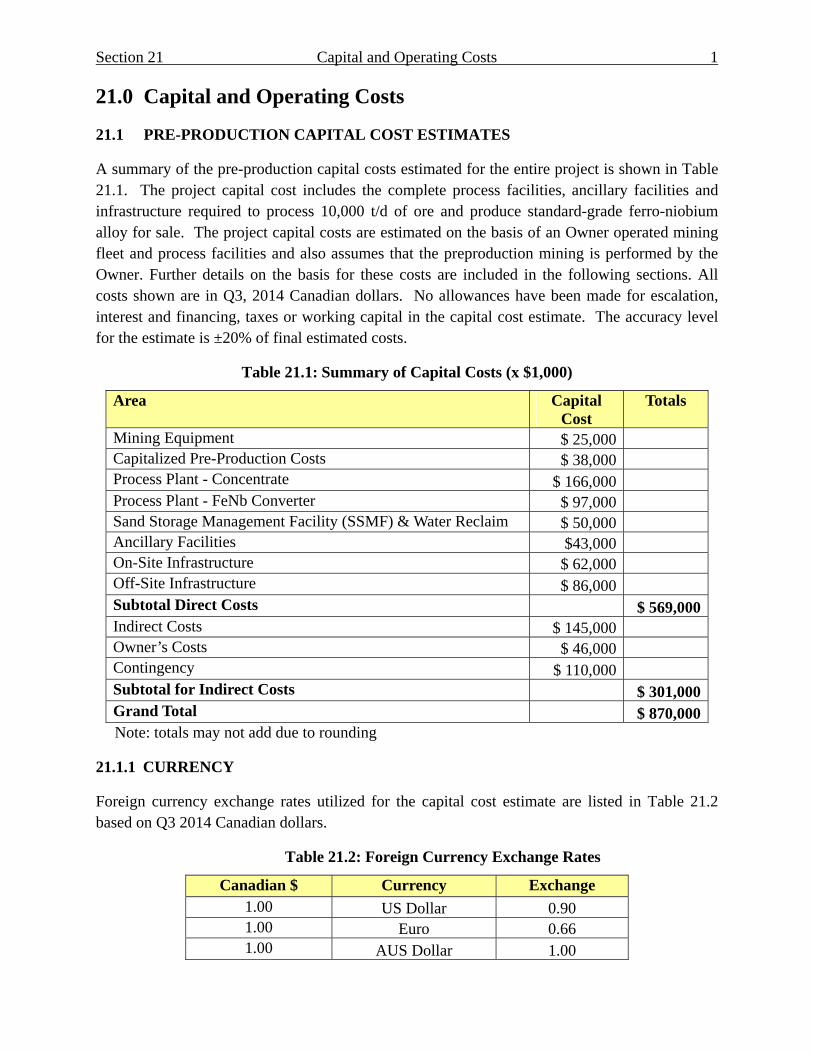
Section 21 Capital and Operating Costs 1
21.0 Capital and Operating Costs
21.1 PRE-PRODUCTION CAPITAL COST ESTIMATES
A summary of the pre-production capital costs estimated for the entire project is shown in Table 21.1. The project capital cost includes the complete process facilities, ancillary facilities and infrastructure required to process 10,000 t/d of ore and produce standard-grade ferro-niobium alloy for sale. The project capital costs are estimated on the basis of an Owner operated mining fleet and process facilities and also assumes that the preproduction mining is performed by the Owner. Further details on the basis for these costs are included in the following sections. All costs shown are in Q3, 2014 Canadian dollars. No allowances have been made for escalation, interest and financing, taxes or working capital in the capital cost estimate. The accuracy level for the estimate is ±20% of final estimated costs.
Table 21.1: Summary of Capital Costs (x $1,000)
Area Capital Cost
Totals
Mining Equipment $ 25,000 Capitalized Pre-Production Costs $ 38,000 Process Plant - Concentrate $ 166,000 Process Plant - FeNb Converter $ 97,000 Sand Storage Management Facility (SSMF) & Water Reclaim $ 50,000 Ancillary Facilities $43,000 On-Site Infrastructure $ 62,000 Off-Site Infrastructure $ 86,000 Subtotal Direct Costs $ 569,000 Indirect Costs $ 145,000 Owner’s Costs $ 46,000 Contingency $ 110,000 Subtotal for Indirect Costs $ 301,000 Grand Total $ 870,000Note: totals may not add due to rounding
21.1.1 CURRENCY
Foreign currency exchange rates utilized for the capital cost estimate are listed in Table 21.2 based on Q3 2014 Canadian dollars.
Table 21.2: Foreign Currency Exchange Rates
Canadian $ Currency Exchange 1.00 US Dollar 0.90 1.00 Euro 0.66 1.00 AUS Dollar 1.00
Section 21 Capital and Operating Costs 2
21.1.2 BASIS OF ESTIMATE
Project Direct Costs were estimated based on the following information:
Site layout and preliminary general arrangement drawings, process flow diagrams, equipment list, electrical single line diagrams and some drawings from previously constructed projects where applicable.
Budget quotations for supply of major equipment based on equipment datasheets.
Secondary and ancillary equipment prices based on a combination of budget quotations and database prices from recently completed projects.
Budget quotations for the supply and erection of the major process and ancillary buildings.
Prices for bulk construction materials were based on database prices from recently completed projects.
Process plant and site infrastructure material take-offs based on layout drawings, preliminary general arrangement drawings and sketches. Normal and acceptable allowances were included for each discipline as appropriate. Conceptual quantities were developed where drawings were not available.
SSMF and site water management material take-offs provided by Knight-Piesold.
Topographic information was based on a LIDAR survey of the site with contours at 1 m intervals.
Labour rates were sourced from contractors in the Province of British Columbia. Labour efficiency was based on recent project experience and adjusted for site specific conditions.
Installation hours for mechanical equipment are based on in-house data and vendor guidelines where appropriate.
Geotechnical information and recommendations were provided by Knight-Piesold.
Freight costs for moving materials and equipment to site were estimated as a combination of budget price quotations and recent project experience.
A total of greater than eighty percent of the mechanical equipment costs and greater than seventy percent of the electrical equipment costs included in the capital cost estimate were obtained from vendor budget quotations.
Escalation and currency fluctuations are not included in the capital cost estimate.
Direct Costs
The capital cost estimate is based on the use of all new equipment and materials for the project. The direct cost estimate includes supply and installation of the equipment and materials required to construct all of the permanent facilities associated with the project. The major permanent facilities for the project scope are:

Section 21 Capital and Operating Costs 3
Pre-production mining and pit equipment;
Infrastructure, roads and site preparation;
Process buildings,
Crushing, material handling and process facilities;
Assay laboratory;
Camp facilities;
Administration building;
Warehouse;
Cold Storage;
Truck Shop;
Fuel Storage;
Rebuild Shop;
Mine Dry;
Power supply and distribution;
Emergency generators;
Plant site services and utility systems;
SSMF and water reclaim system;
Plant mobile equipment.
Indirect Costs
The capital cost estimate includes the following indirect costs:
Temporary construction facilities including a worker camp, temporary buildings, construction power, equipment and material laydown area, etc.;
Temporary construction services including worker transportation, site maintenance, waste removal, scaffolding services, etc.;
Engineering, procurement and construction management services; Safety, security, survey and quality assurance services; Vendor representatives; Capital Spares; First fills including maintenance spares; Warehouse; Freight; Owner’s construction equipment; Owner’s costs; Commissioning and start-up.
21.1.3 LABOUR SCHEDULE AND RATES
Labour rates for each required construction trade were set based on current rates received from British Columbia contractors. A crew composite labour rate for each trade was calculated which includes:
Base labour wage rate;

Section 21 Capital and Operating Costs 4
Benefits and burdens;
Overtime allowance;
Small tools and consumables;
Safety supplies;
Contractor overhead and profit;
Appropriate crew compositions;
Contractor travel allowance.
The site work schedules will be varied based on the employee or contractor requirements. The anticipated rotations included in the capital cost estimate are 4 days on 3 days off, 7 days on 7 days off and 20 days on 8 days off. Construction activities are scheduled for 10 hour work days and pre-production mining is scheduled for 12 hour work days.
The capital cost estimate includes a total of approximately 1.6M man hours of direct and indirect labour associated with construction activities. 1.2M man hours of the total are associated with direct construction activities. The average labour rate in the estimate for all construction activities is approximately $106 per man hour.
21.1.4 MINE CAPITAL
The capital cost estimates are from the Moose Mountain equipment cost database and from budget costs supplied by equipment manufacturers. All capital costs are FOB to the project site, include recommended options, tires, assembly and commissioning. The capitalized pre-production mining costs are derived from the mine operating costs estimated for the material mined in the two years prior to mill start up.
Major mining equipment has been assumed to be leased at current mine equipment lease terms over a period of five years.
Table 21.3: Mine Capital (x $1,000)
Capital Item Capital Cost Subtotals
Major Mine Equipment* $14,000 Secondary Mine Equipment $7,000
Mine Supplies/ Maintenance Equipment $ 4,000 Subtotal All Mine Equipment $ 25,000
Other Mine Capital Capitalized Pre-Production Op. Costs $ 38,000
Subtotal Other Mine Capital $ 38,000 Total Mine Capital $ 63,000
* Includes down payment and lease costs in preproduction years only.
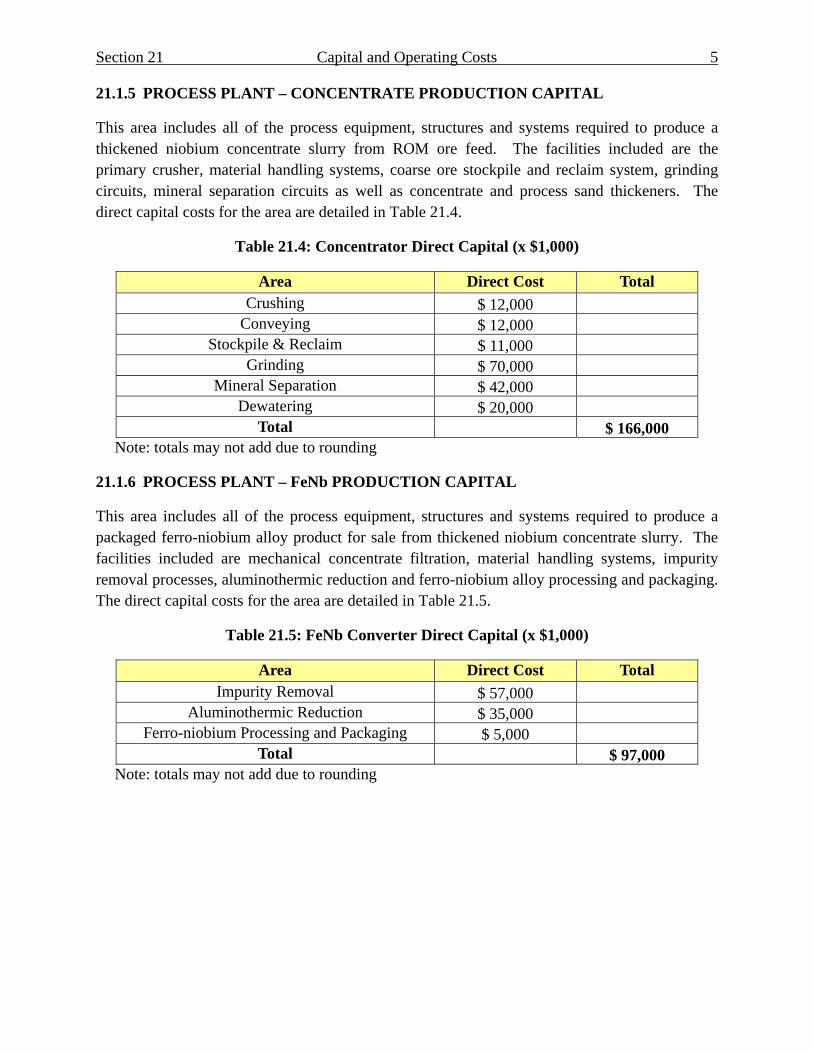
Section 21 Capital and Operating Costs 5
21.1.5 PROCESS PLANT – CONCENTRATE PRODUCTION CAPITAL
This area includes all of the process equipment, structures and systems required to produce a thickened niobium concentrate slurry from ROM ore feed. The facilities included are the primary crusher, material handling systems, coarse ore stockpile and reclaim system, grinding circuits, mineral separation circuits as well as concentrate and process sand thickeners. The direct capital costs for the area are detailed in Table 21.4.
Table 21.4: Concentrator Direct Capital (x $1,000)
Area Direct Cost Total Crushing $ 12,000
Conveying $ 12,000 Stockpile & Reclaim $ 11,000
Grinding $ 70,000 Mineral Separation $ 42,000
Dewatering $ 20,000 Total $ 166,000
Note: totals may not add due to rounding
21.1.6 PROCESS PLANT – FeNb PRODUCTION CAPITAL
This area includes all of the process equipment, structures and systems required to produce a packaged ferro-niobium alloy product for sale from thickened niobium concentrate slurry. The facilities included are mechanical concentrate filtration, material handling systems, impurity removal processes, aluminothermic reduction and ferro-niobium alloy processing and packaging. The direct capital costs for the area are detailed in Table 21.5.
Table 21.5: FeNb Converter Direct Capital (x $1,000)
Area Direct Cost Total Impurity Removal $ 57,000
Aluminothermic Reduction $ 35,000 Ferro-niobium Processing and Packaging $ 5,000
Total $ 97,000 Note: totals may not add due to rounding

Section 21 Capital and Operating Costs 6
21.1.7 SAND STORAGE MANAGEMENT FACILITY AND WATER RECLAIM CAPITAL
This area includes all of the systems, structures and equipment for the SSMF and reclaim water system. The area includes the main embankment, seepage embankment, non-contact water diversion ditches, collection ditches, process sand slurry pumping system, process sand slurry pipeline and spigot system, seepage return pumping system and pipeline and the reclaim water pumping system and pipeline as well as the roads required to access all of this infrastructure. The direct capital costs for this area are detailed in Table 21.6.
Table 21.6: SSMF and Water Reclaim Direct Capital (x $1,000)
Activity Capital Cost Total Process Sand Pumping and Embankment $ 32,000
Seepage Collection and Return $ 8,000 Reclaim Water Pumping and Piping $ 9,000
Total $ 50,000 Note: totals may not add due to rounding
21.1.8 ANCILLARY FACILITIES
This area includes the ancillary systems and structures required to support the site mining and processing operations. The area includes the mobile equipment shop, warehouse, fuel storage, explosives magazines, assay laboratory, reagent storage, reagent make-up, rebuild shop, permanent camp, waste incinerator, main office, mine dry, potable water system and sewage treatment plant. The direct capital costs for this area are detailed in Table 21.7.
Table 21.7: Ancillary Facilities Direct Capital (x $1,000)
Area Direct Cost Total Mine Ancillary Facilities $ 17,000
Process Ancillary Facilities $ 10,000 Site Ancillary Facilities $ 17,000
Total $ 43,000 Note: totals may not add due to rounding
21.1.9 ON-SITE INFRASTRUCTURE CAPITAL
This area includes the infrastructure on the mine site required to support the site mining and processing operations. The area includes the plant site preparation, bulk site earthworks, plant site roads, converter waste storage area, site erosion control, sediment ponds, fire protection systems, underground services, main substation, site power distribution network, emergency power generators, site communications network and process control system. The direct capital costs for this area are detailed in Table 21.8.
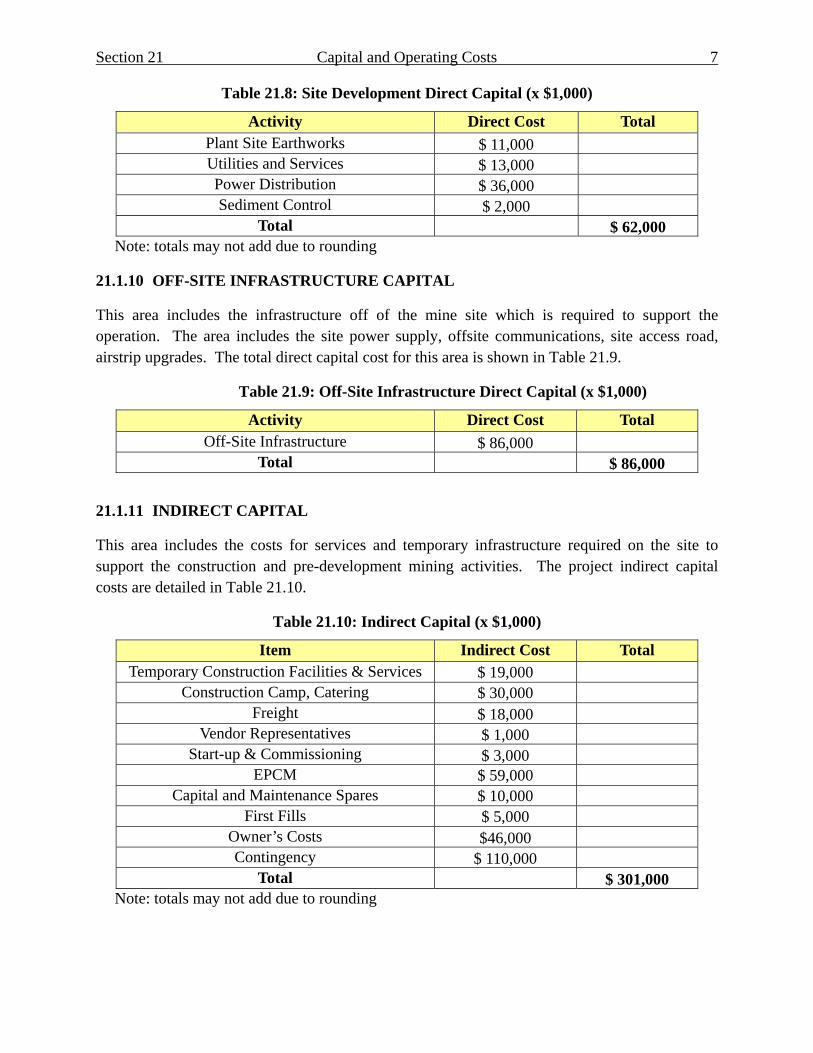
Section 21 Capital and Operating Costs 7
Table 21.8: Site Development Direct Capital (x $1,000)
Activity Direct Cost Total Plant Site Earthworks $ 11,000 Utilities and Services $ 13,000 Power Distribution $ 36,000 Sediment Control $ 2,000
Total $ 62,000 Note: totals may not add due to rounding
21.1.10 OFF-SITE INFRASTRUCTURE CAPITAL
This area includes the infrastructure off of the mine site which is required to support the operation. The area includes the site power supply, offsite communications, site access road, airstrip upgrades. The total direct capital cost for this area is shown in Table 21.9.
Table 21.9: Off-Site Infrastructure Direct Capital (x $1,000)
Activity Direct Cost Total Off-Site Infrastructure $ 86,000
Total $ 86,000
21.1.11 INDIRECT CAPITAL
This area includes the costs for services and temporary infrastructure required on the site to support the construction and pre-development mining activities. The project indirect capital costs are detailed in Table 21.10.
Table 21.10: Indirect Capital (x $1,000)
Item Indirect Cost Total Temporary Construction Facilities & Services $ 19,000
Construction Camp, Catering $ 30,000 Freight $ 18,000
Vendor Representatives $ 1,000 Start-up & Commissioning $ 3,000
EPCM $ 59,000 Capital and Maintenance Spares $ 10,000
First Fills $ 5,000 Owner’s Costs $46,000 Contingency $ 110,000
Total $ 301,000 Note: totals may not add due to rounding
Section 21 Capital and Operating Costs 8
Temporary Construction Facilities & Services
This area includes all of the temporary infrastructure required to execute the project as well as construction support services and mobile equipment not supplied by the construction contractors. The estimate was based on the anticipated project schedule and recent project experience. The items estimated in this cost include, but are not limited to, the following:
Temporary construction service and warehouse facilities;
Construction and site maintenance equipment not supplied by contractors;
Materials testing and quality assurance;
Site survey;
Site maintenance;
Waste management;
Material off-loading and construction warehouse services;
Construction power supply;
Scaffolding;
Site security, safety and fire protection;
Janitorial services;
Owner supplied worker transportation to site.
Construction Camp
This area includes the mobilization, operation, maintenance and demobilization of the temporary construction camp. The camp sizing is based on the total estimated worker requirements, anticipated shift schedules, project schedule and loading curves. The project costs include rental of a temporary earthworks camp with a capacity of 50 people during the initial site works until the area is prepared for the installation of the construction camp. The construction camp will also be rented and will have an initial capacity of 300 persons and be expanded in the second year of construction to a capacity of 500 persons. Owner and EPCM personnel at site will be housed in the construction camp initially and then relocate into the permanent camp when it is completed. The combination of the construction and permanent camps will allow a maximum site manpower of 728 persons. The costs for the permanent camp are included in the project direct costs. Average camp operating costs are estimated at $75 per person day.
Freight
The freight costs to site were estimated on the basis of all equipment and materials being transported to site via the site access road. The freight costs are based on a combination of vendor quotations, previous experience and historical project data.
Vendor Representatives
Vendor representative costs were based on historical project data and include both vendor requirements during construction and commissioning. The costs include the vendor service rates as well as the anticipated vendor travel, lodging and expenses costs.
Section 21 Capital and Operating Costs 9
Start-up & Commissioning
These costs include the required contract support to start-up and commission the site facilities. The Owner’s team costs related to start-up and commissioning are included in Owner’s Costs. The items included in this area are:
Contractor support for six weeks to assist with the pre-commissioning and commissioning of the facilities;
Electrical equipment and protective relay setting and testing;
Contract process control system support;
EPCM commissioning support.
EPCM
The project EPCM costs were estimated on a percentage basis from the project direct costs accounting for items which were quoted design build and items which will be managed by the Owner.
Capital & Maintenance Spares
The capital and maintenance spares were estimated based on a percentage of the purchase cost for mechanical and electrical equipment with an additional allowance for a spare grinding mill motor. The mechanical spares were estimated based on 5% of mechanical equipment and electrical spares were estimated based on 4% of electrical equipment.
First Fills
The first fills costs include the costs for purchase of the necessary consumables to commence operations at the site. Costs for the purchase of grinding media, reagents, lubricants, fuel and miscellaneous supplies are included in the estimate.
Owner’s Costs
The Owner’s Costs estimated for the project include the anticipated costs incurred by the Owner from the time the project is authorized to proceed through to production. Costs for work preceding a project authorization are not included in the estimate. The items estimated in this cost include, but are not limited to, the following:
Owner’s project management personnel;
Pre-production mine engineering personnel;
Ramp up and training of permanent operations, maintenance and administration personnel;
Field office costs and supplies;
Environmental testing and monitoring;

Section 21 Capital and Operating Costs 10
Recruiting and relocation;
Transportation and accommodations costs for Owner’s personnel;
Insurance;
Taxes, fees and licenses;
Product marketing costs;
Off-site road maintenance.
21.1.12 CONTINGENCY
The capital cost estimate includes separate contingencies on the pre-production mining and the construction of the process facilities and associated infrastructure to cover unforeseeable costs within the scope of the estimate. A 10% contingency has been applied on the acquisition of the mining fleet and the preproduction mining costs. A 15% contingency has been applied to the construction of process facilities and associated infrastructure including indirect costs. The contingency levels were determined by the project team based what they believe is appropriate for the level of engineering work performed for this study.
21.1.13 SUSTAINING CAPITAL
Sustaining capital is estimated to be $79.6M for the life of the project. The sustaining capital estimate includes leased mining equipment, staged SSMF embankment construction and equipment replacement through the life of the mine.
21.1.14 CAPITAL COST EXCLUSIONS
The follow items are excluded from the capital cost estimate:
Escalation;
Financing costs and interest during construction except for leased mining equipment;
Costs due to currency fluctuations;
Scope changes;
Schedule delays, such as associated with: o Permit timing, o Land Acquisition o Delay in notice to proceed, o Schedule acceleration or recovery, o Labour disputes, o Undefined ground conditions, o Unavailability or inexperienced craft labour, o Other external influences
Working capital;
Reclamation bonding;
Closure costs;
Salvage values
Section 21 Capital and Operating Costs 11
21.2 OPERATING COSTS
21.2.1 SUMMARY
Operating costs comprise mining, processing, general and administration, and off-site costs. Typical costs are summarized in Table 21.11.
Table 21.11: Summary of Site Operating Costs
Area $/tonne Milled
Mining $4.63
Processing $44.90
G&A $6.05
Offsite Costs $2.62
Total $58.20
21.2.2 MINE OPERATING COSTS
The mine operating cost estimates are derived from data within Moose Mountain Technical Services’ (MMTS) equipment cost database. Table 21.12 below summarizes the mining operating costs used in this study. Equipment operating costs are built up from first principles (includes fuel, lube, tire, undercarriage, ground engaging tools, drill bits/rods/strings costs and consumption rates, parts costs and replacement intervals, operating and maintenance labour factors).
From the basic operating capacities of the equipment, the travel speed characteristics of the haulers, and the haul road profiles, the equipment productivities for the loaders and haulers are calculated from the MineSight production scheduling program. The truck speeds and cycle times for the various haul cycles were calculated by using CAT’s FPC simulation program. The equipment productivity and the scheduled production are used in the scheduling program to calculate the required equipment operating hours. These operating hours are converted to service meter unit (SMU) hours, or actual equipment running hours. SMU hours are multiplied by the hourly consumables consumption rates and unit operating costs to calculate the total equipment operating costs for each year.
Blasting costs are based on a per kg cost of explosives from historical data collected by MMTS. The amount of explosives is calculated from an estimated powder factor of kilograms of explosive per tonne of rock blasted. The powder factor is estimated by MMTS, based on historical figures from projects with similar rock properties. Blasting accessories costs are based on the calculated number of blastholes and unit costs of accessories per hole.
Labour factors in Man Hours/equipment SMU hour are also assigned to each of the pieces of equipment. Labour costs are calculated by multiplying the labour factor by the equipment SMU

Section 21 Capital and Operating Costs 12
hours and the appropriate labour rate. Labour costs are allocated to the specific equipment where labour has been assigned. The total hours required for each job type on all the equipment are summated, and any additional labour required to complement (round up) a crew is assigned to unallocated labour. For mine operations, it is assumed that the drill, loader, hauler, dozer and grader operators are inter-changeable when calculating unallocated labour. For mine maintenance, it is assumed that the heavy duty and light duty mechanics, as well as the welders and millwrights are inter-changeable when calculating unallocated labour.
Technical services are allocated to G&A.
Table 21.12: Unit Mining Costs
Mine Operating Costs Per tonne Mined Per tonne Milled
Drilling - $/t $0.11 $0.16
Blasting - $/t $0.27 $0.38
Loading - $/t $0.53 $0.74
Hauling - $/t $1.39 $1.94
Primary Pit Support - $/t $0.42 $0.58
Secondary Pit Support - $/t $0.18 $0.25
Geotechnical - $/t $0.03 $0.04
Unallocated Labour - $/t $0.08 $0.11
General Mine Expense - $/t $0.32 $0.45
Total Mining Cost - $/t $3.33 $4.63
21.2.3 PROCESS OPERATING COSTS
Process operating costs for the proposed Aley project incorporate Crushing, Concentrating, Leaching, and Conversion costs. The site infrastructure operating costs associated with electrical power, energy for heating, and ongoing building maintenance are also included. Additionally, operating costs associated with the transportation of materials to and from site are discussed in this section. Table 21.13 summarizes typical annual and unit costs by area and category.

Section 21 Capital and Operating Costs 13
Table 21.13: Process Operating Costs ($ x 1,000)
Description Per year $/t feed ore
Transportation 9,200 2.52
Site 800 0.20
Maintenance 400 0.11
Power 100 0.02
LNG 300 0.08
Crusher 2,100 0.56
Maintenance 300 0.08
Power 400 0.10
LNG 0 0.00
Labour 1,300 0.36
Consumables 100 0.02
Concentrator 105,000 28.78
Maintenance 1,800 0.50
Power 7,100 1.95
LNG 1,400 0.37
Labour 12,400 3.41
Consumables 82,300 22.54
Leaching 16,700 4.29
Maintenance 600 0.16
Power 2,300 0.36
LNG 7,400 2.04
Labour 2,000 0.54
Consumables 4,400 1.20

Section 21 Capital and Operating Costs 14
Description $1000/a $/t feed ore $/t Converter Feed
Converter 31,100 8.55 1851
Maintenance 400 0.11 24
Power 400 0.11 24
LNG 1,100 0.31 67
Labour 7,900 2.18 471
Consumables 21,300 2.84 1265
Total 164,900 44.90
Transportation
Transportation costs were calculated using the mass of mining, milling and infrastructure consumables (or volumes where appropriate) needed to be move to site on an annual basis. Trip distances were determined based on likely commodity pickup location of Mackenzie, Prince George, or Vancouver. Ferro-niobium product deliveries were assumed to be in the back haul of these commodity deliveries. Trucking distances were then converted to travel times and CDN$/hr trucking cost based on Gibraltar experience was applied.
Maintenance
The site’s operating maintenance costs are based on the capital cost estimate for major mechanical equipment in each of the defined areas as developed from the major equipment list. An industry standard factor of annual maintenance cost being equal to 3 % of the capital installation cost was applied to derive the maintenance cost for each of the defined areas.
Power
The site’s general power demand is based on the estimated motor load and plant utilisation accounted by the equipment list and infra-structure loads. The equipment list is comprised of the process design criteria incorporating the availability, load, efficiency and power factors of the equipment to determine energy consumed for operation. Infra-structure loads are made up of estimated lighting and small power distribution required throughout the site. The current BC Hydro industrial power rate realized at the Gibraltar mine was applied to these calculated loads.
Natural Gas
The site’s liquefied natural gas (LNG) costs are composed of two major elements; LNG consumption to provide heat for buildings, and LNG consumption for process heating. LNG required for heating was determined from climatic data and experience heating similar buildings
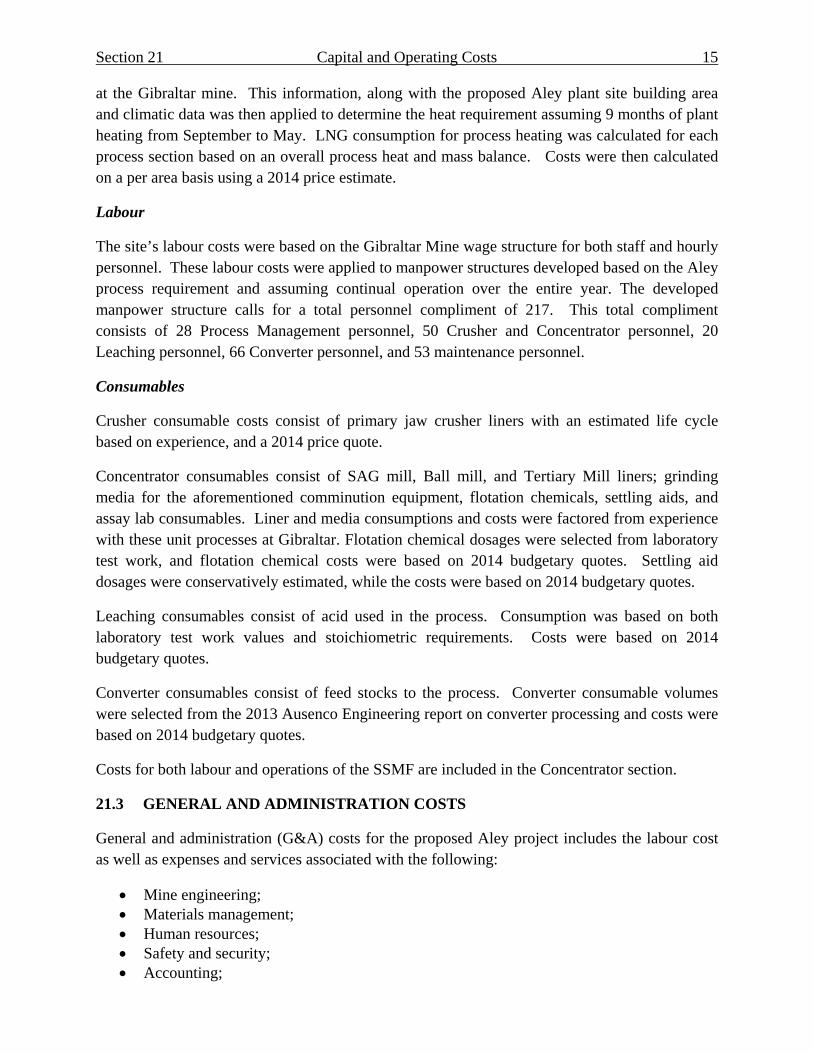
Section 21 Capital and Operating Costs 15
at the Gibraltar mine. This information, along with the proposed Aley plant site building area and climatic data was then applied to determine the heat requirement assuming 9 months of plant heating from September to May. LNG consumption for process heating was calculated for each process section based on an overall process heat and mass balance. Costs were then calculated on a per area basis using a 2014 price estimate.
Labour
The site’s labour costs were based on the Gibraltar Mine wage structure for both staff and hourly personnel. These labour costs were applied to manpower structures developed based on the Aley process requirement and assuming continual operation over the entire year. The developed manpower structure calls for a total personnel compliment of 217. This total compliment consists of 28 Process Management personnel, 50 Crusher and Concentrator personnel, 20 Leaching personnel, 66 Converter personnel, and 53 maintenance personnel.
Consumables
Crusher consumable costs consist of primary jaw crusher liners with an estimated life cycle based on experience, and a 2014 price quote.
Concentrator consumables consist of SAG mill, Ball mill, and Tertiary Mill liners; grinding media for the aforementioned comminution equipment, flotation chemicals, settling aids, and assay lab consumables. Liner and media consumptions and costs were factored from experience with these unit processes at Gibraltar. Flotation chemical dosages were selected from laboratory test work, and flotation chemical costs were based on 2014 budgetary quotes. Settling aid dosages were conservatively estimated, while the costs were based on 2014 budgetary quotes.
Leaching consumables consist of acid used in the process. Consumption was based on both laboratory test work values and stoichiometric requirements. Costs were based on 2014 budgetary quotes.
Converter consumables consist of feed stocks to the process. Converter consumable volumes were selected from the 2013 Ausenco Engineering report on converter processing and costs were based on 2014 budgetary quotes.
Costs for both labour and operations of the SSMF are included in the Concentrator section.
21.3 GENERAL AND ADMINISTRATION COSTS
General and administration (G&A) costs for the proposed Aley project includes the labour cost as well as expenses and services associated with the following:
Mine engineering; Materials management; Human resources; Safety and security; Accounting;
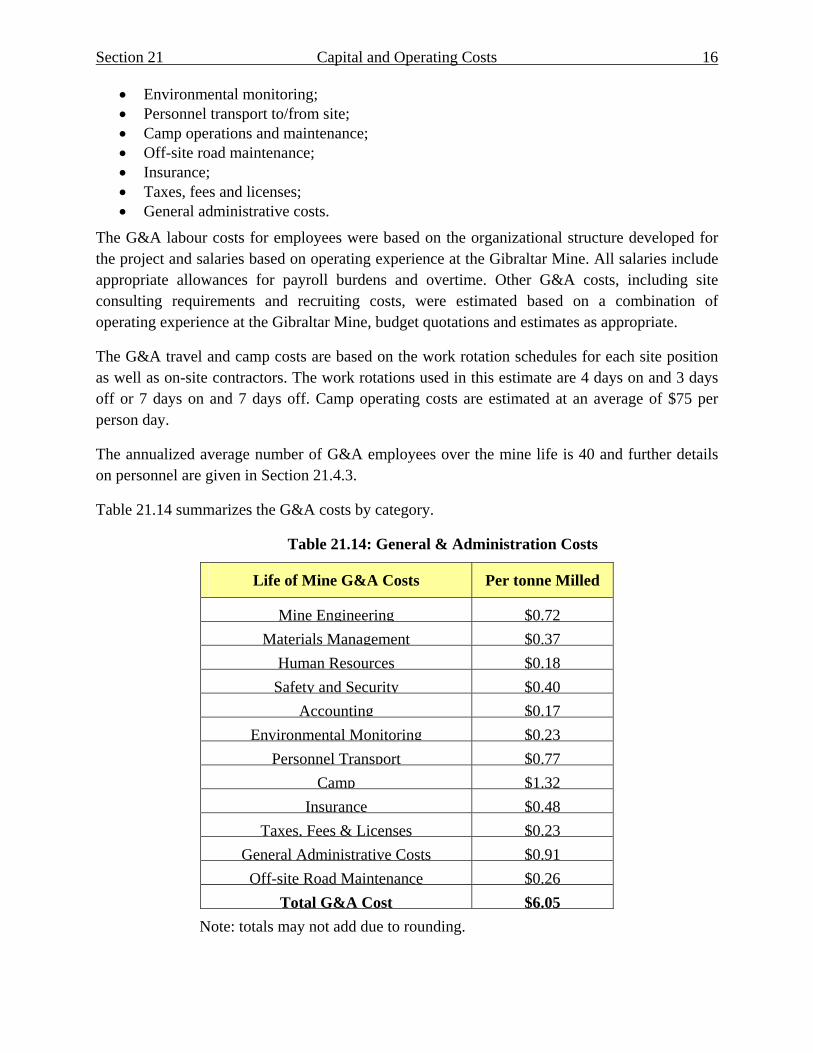
Section 21 Capital and Operating Costs 16
Environmental monitoring; Personnel transport to/from site; Camp operations and maintenance; Off-site road maintenance; Insurance; Taxes, fees and licenses; General administrative costs.
The G&A labour costs for employees were based on the organizational structure developed for the project and salaries based on operating experience at the Gibraltar Mine. All salaries include appropriate allowances for payroll burdens and overtime. Other G&A costs, including site consulting requirements and recruiting costs, were estimated based on a combination of operating experience at the Gibraltar Mine, budget quotations and estimates as appropriate.
The G&A travel and camp costs are based on the work rotation schedules for each site position as well as on-site contractors. The work rotations used in this estimate are 4 days on and 3 days off or 7 days on and 7 days off. Camp operating costs are estimated at an average of $75 per person day.
The annualized average number of G&A employees over the mine life is 40 and further details on personnel are given in Section 21.4.3.
Table 21.14 summarizes the G&A costs by category.
Table 21.14: General & Administration Costs
Life of Mine G&A Costs Per tonne Milled
Mine Engineering $0.72
Materials Management $0.37
Human Resources $0.18
Safety and Security $0.40
Accounting $0.17
Environmental Monitoring $0.23
Personnel Transport $0.77
Camp $1.32
Insurance $0.48
Taxes, Fees & Licenses $0.23
General Administrative Costs $0.91
Off-site Road Maintenance $0.26
Total G&A Cost $6.05
Note: totals may not add due to rounding.
Section 21 Capital and Operating Costs 17
21.4 PERSONNEL
21.4.1 MINE OPERATIONS AND MAINTENANCE PERSONNEL
Mine operations and maintenance labour costs are based on labour factor estimates for each piece of operating equipment in the mine fleet. Labour costs are allocated to each piece of equipment. Salaried labour is estimated based on the size of operation proposed and the suitable supervision required. The maximum number of employees required for mine operations is 50. The maximum number of employees required for mine maintenance is 14. The maximum number of employees required for mine supervision is 11 and the maximum number of employees required for mine engineering is 11. (The cost of mine engineering salaries are included in the G&A costs)
For the purposes of this study, hourly employees annual hours are based on a shift schedule of 7 days on site work followed by 7 days off site. There are two 12 hours shifts per day, for a total of four complete crews. The hourly wages are based upon the 2014 Gibraltar Mine’s collective agreement and the staff salaries were based upon the Gibraltar salary matrix as well as the Mercer mining salary survey. An added 10% premium for being a fly in/fly out operation was included in the hourly wages and 15% was included in the staff salaries.
21.4.2 PROCESS PLANT LABOUR
The process plant, comprised of the crusher, concentrator, and the converter will be managed by the process manager who will oversee the concentrator and furnace superintendents, as well as the maintenance superintendent and the concentrator operations foreman. The manpower structure and labour rates are based on a combination of Gibraltar Mine manpower structure and industry standards.
The site’s labour costs were based on the Gibraltar Mine wage structure for both staff and hourly personnel. These labour costs were applied to manpower structures developed based on the Aley process requirement and assuming continual operation over the entire year. All salaries include an allowance for burdens, and an overtime allowance for the appropriate staff and hourly personnel.
For the purposes of this study, the manpower structure is based on all process plant employees working 12-hour shifts on a seven days on, seven days off rotation. Each operator position will therefore require four personnel to cover day shift and night shift for two rotations. The process manager will work a four on and three day off rotation while the operations foreman will cross shift with the maintenance superintendent and the concentrator superintendent will cross shift with the furnace superintendent and chief metallurgist. The process plant will require a total compliment of 217 employees. This complement is composed of 28 process management personnel, 50 concentrator personnel, 20 leaching personnel, 66 converter personnel, and 53 maintenance personnel.
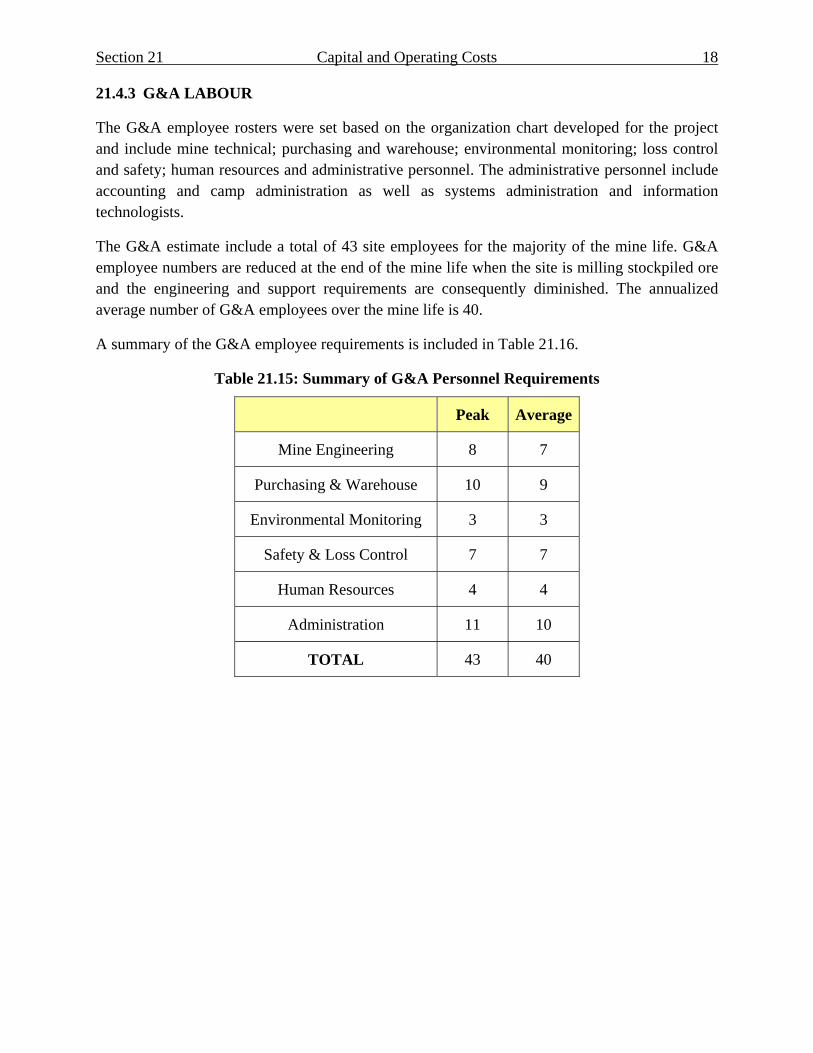
Section 21 Capital and Operating Costs 18
21.4.3 G&A LABOUR
The G&A employee rosters were set based on the organization chart developed for the project and include mine technical; purchasing and warehouse; environmental monitoring; loss control and safety; human resources and administrative personnel. The administrative personnel include accounting and camp administration as well as systems administration and information technologists.
The G&A estimate include a total of 43 site employees for the majority of the mine life. G&A employee numbers are reduced at the end of the mine life when the site is milling stockpiled ore and the engineering and support requirements are consequently diminished. The annualized average number of G&A employees over the mine life is 40.
A summary of the G&A employee requirements is included in Table 21.16.
Table 21.15: Summary of G&A Personnel Requirements
Peak Average
Mine Engineering 8 7
Purchasing & Warehouse 10 9
Environmental Monitoring 3 3
Safety & Loss Control 7 7
Human Resources 4 4
Administration 11 10
TOTAL 43 40

Aley Project Technical Report October 2014
SECTION 22: ECONOMIC ANALYSIS
Aley Project Technical Report October 2014
Table of Contents
22.0 Economic Analysis ................................................................................................................1
22.1 Assumptions ........................................................................................................................1
22.2 Cash Flow ............................................................................................................................1
22.3 Economic Indicators ............................................................................................................3
22.4 Taxes and Royalties .............................................................................................................3
22.4.1 Taxes ..............................................................................................................................3
22.5 Sensitivity Analysis .............................................................................................................5
List of Tables
Table 22.1: Base Case Cashflow .................................................................................................... 2
Table 22.2: Estimated Aley Project Taxes ...................................................................................... 3
List of Figures
Figure 22.1: Life of Mine Free Cashflow Sensitivity ..................................................................... 5
Figure 22.2: NPV Sensitivity .......................................................................................................... 6
Figure 22.3: IRR Sensitivity ........................................................................................................... 6
Figure 22.4: LOM Average Margin Sensitivity .............................................................................. 7
Section 22 Economic Analysis 1
Aley Project Technical Report October 2014
22.0 Economic Analysis
22.1 ASSUMPTIONS
A list of the main assumptions and inputs to the economic analysis of the Aley Mine are listed below:
Capital costs and the basis of estimate are provided in Section 21 of this report;
Operating costs and the basis of estimate are provided in Section 21 of this report;
The basis for the annual production schedule is provided in Section 16 of this report;
Long term Fe price of US$ 45.00/kg is justified in Section 19;
Exchange rate of US$0.90 = Cdn$1.00. The exchange rate selected is based on Bloomberg’s summary of analysts’ forecasts as of the effective date of this report. The mean value of those forecasts is consistently US$ 0.90: CDN$ 1:00 over the period 2015 through 2018. Over the last 25 years the exchange rate has averaged US$ 0.82: CDN$ 1:00;
The economic analysis assumes no debt financing.
22.2 CASH FLOW
The project base case cashflow is presented in Table 22.1

Section 22 Economic Analysis 2
Aley Project Technical Report October 2014
Table 22.1: Base Case Cashflow
PERI
ODye
ars
-2-1
12
34
56
78
910
1112
1314
1516
1718
1920
2122
2324
Tota
l
PROD
UCTI
ON
Total
Ton
nes M
ined
000's
4,50
07,
000
8,10
08,
100
8,10
08,
500
8,50
08,
500
8,50
08,
500
4,80
04,
800
4,80
04,
800
4,80
04,
200
4,20
04,
200
4,20
04,
200
4,20
064
512
8,14
5
Total
Ton
nes M
illed
000's
2,75
03,
550
3,65
03,
650
3,65
03,
650
3,65
03,
650
3,65
03,
650
3,65
03,
650
3,65
03,
650
3,65
03,
650
3,65
03,
650
3,65
03,
650
3,65
03,
650
3,65
086
583
,815
Niob
ium G
rade
Mille
d%
Nb2
O50.
52%
0.52
%0.
52%
0.52
%0.
52%
0.52
%0.
52%
0.52
%0.
52%
0.52
%0.
52%
0.52
%0.
52%
0.52
%0.
52%
0.52
%0.
52%
0.52
%0.
52%
0.46
%0.
36%
0.36
%0.
36%
0.36
%0.
50%
FeNb
Pro
duce
d Ki
logra
ms
000's
7,10
012
,800
13,8
0013
,800
13,8
0013
,800
13,8
0013
,800
13,8
0013
,800
13,8
0013
,800
13,8
0013
,800
13,8
0013
,800
13,8
0013
,800
13,8
0012
,200
9,50
09,
500
9,50
02,
300
297,
500
Nb P
rodu
ced
Kilog
ram
s00
0's4,
500
8,10
08,
700
8,70
08,
700
8,70
08,
700
8,70
08,
700
8,70
08,
700
8,70
08,
700
8,70
08,
700
8,70
08,
700
8,70
08,
700
7,70
06,
000
6,00
06,
000
1,40
018
7,60
0
REVE
NUE
Total
Gro
ss R
even
ue$C
DN 0
00,0
00's
225
403
434
434
434
434
434
434
434
434
434
434
434
434
434
434
434
434
434
383
300
300
300
719,
364
COST
SUM
MAR
Y
Total
Ope
ratin
g Ex
pend
iture
s$CDN
000
,000
's21
924
823
123
123
123
122
922
422
122
022
022
022
022
022
021
921
821
821
720
319
419
419
447
5,08
6
NET
OPER
ATIN
G CA
SHFL
OW
Oper
ating
Pro
fit (E
BITD
A)$C
DN 0
00,0
00's
615
620
420
420
420
420
621
021
421
421
421
421
421
521
521
521
621
621
718
110
610
610
624
4,27
9
Total
Cap
ital
$CDN
000
,000
's35
651
410
1010
54
44
43
33
33
33
33
11
095
0
Proje
ct Ca
shflo
w$C
DN 0
00,0
00's
-356
-514
-414
519
319
820
020
020
220
721
121
121
121
121
121
221
221
221
321
621
718
110
610
610
624
3,32
9
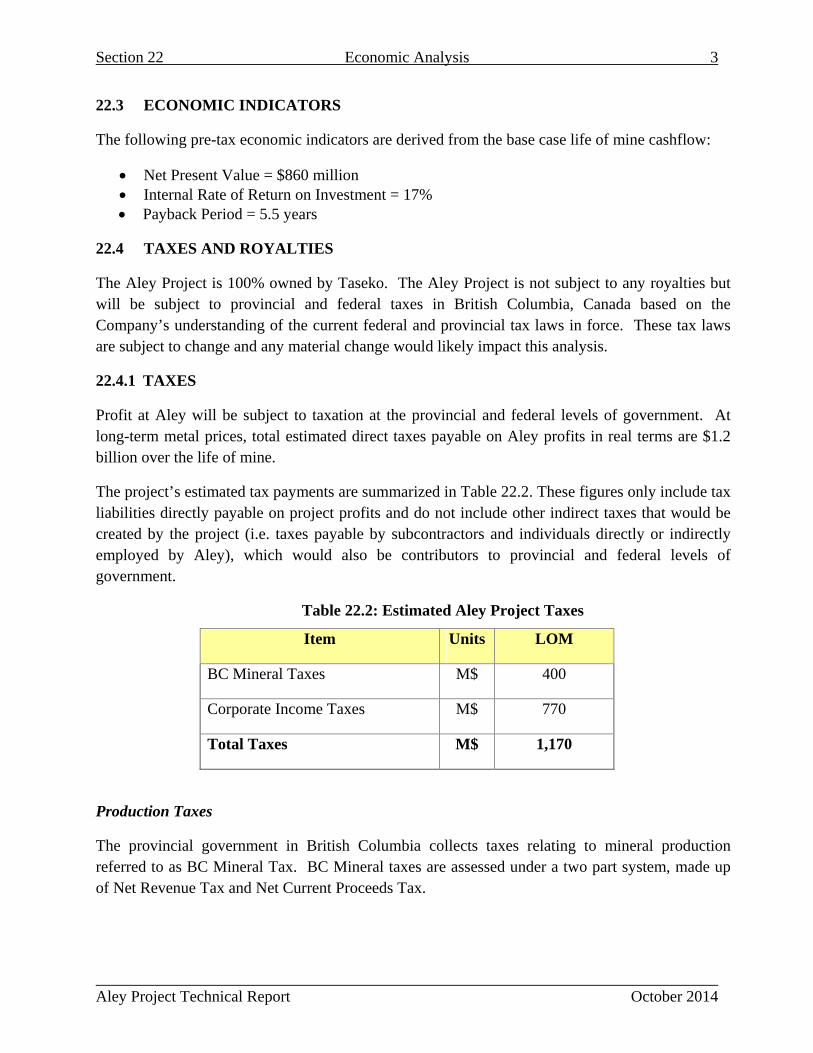
Section 22 Economic Analysis 3
Aley Project Technical Report October 2014
22.3 ECONOMIC INDICATORS
The following pre-tax economic indicators are derived from the base case life of mine cashflow:
Net Present Value = $860 million Internal Rate of Return on Investment = 17% Payback Period = 5.5 years
22.4 TAXES AND ROYALTIES
The Aley Project is 100% owned by Taseko. The Aley Project is not subject to any royalties but will be subject to provincial and federal taxes in British Columbia, Canada based on the Company’s understanding of the current federal and provincial tax laws in force. These tax laws are subject to change and any material change would likely impact this analysis.
22.4.1 TAXES
Profit at Aley will be subject to taxation at the provincial and federal levels of government. At long-term metal prices, total estimated direct taxes payable on Aley profits in real terms are $1.2 billion over the life of mine.
The project’s estimated tax payments are summarized in Table 22.2. These figures only include tax liabilities directly payable on project profits and do not include other indirect taxes that would be created by the project (i.e. taxes payable by subcontractors and individuals directly or indirectly employed by Aley), which would also be contributors to provincial and federal levels of government.
Table 22.2: Estimated Aley Project Taxes
Item Units LOM
BC Mineral Taxes M$ 400
Corporate Income Taxes M$ 770
Total Taxes M$ 1,170
Production Taxes
The provincial government in British Columbia collects taxes relating to mineral production referred to as BC Mineral Tax. BC Mineral taxes are assessed under a two part system, made up of Net Revenue Tax and Net Current Proceeds Tax.
Section 22 Economic Analysis 4
Aley Project Technical Report October 2014
Net Revenue Tax is applied to a producer’s profit at 13% that is in excess of a normal return on investment over the life of a mine. This tax is not applicable to a producer until its initial investment and a reasonable rate of return has been recovered.
Net Current Proceeds Tax applies at a rate of 2% to operating cash flow from production. This tax applies during the period that the producer is recovering its initial investment and reasonable rate of return.
The total tax collected under both Net Revenue Tax and Net Current Proceeds Tax will not exceed 13% of a producer’s profit, meaning that if both taxes are applicable to the producer, Net Current Proceeds Tax will be deducted from Net Revenue Tax.
BC Mineral taxes are deductible against corporate income taxes.
Income Taxes
Corporate taxpayers resident in Canada are subject to a federal income tax rate of 15%. Taxpayers resident in British Columbia are subject to a further 11%, for a total combined corporate income tax rate of 26%.
Taxable losses generated in a given year may be carried forward for 20 years and applied to taxable income when it arises, and carried back 3 years and applied against taxable income if applicable from the project in those years.
Costs associated with exploration and development are allocated to certain resource pools and deductible against taxable income. Canadian Exploration Expenses (CEE) may be carried forward indefinitely and is fully deductible against taxable income. Canadian Development Expenses (CDE) may be carried forward indefinitely and is deductible against taxable income up to a maximum of 30% per year on a declining balance basis.
Canadian tax laws also allow for an accelerated depreciation deduction on certain capital expenditures related to mining production equipment at a rate of 100%, subject to certain conditions. However; this incentive is being phased out commencing in 2017 and will be fully phased out by 2020. Regular depreciation rates of 25% per year would apply to other mining equipment not subject to the accelerated depreciation pools.
The provincial government offers an incentive to exploration companies that incur grassroots CEE on eligible activities within areas impacted by the Mountain Pine Beetle within British Columbia. The province offers a refundable investment tax credit at a rate of 20% or 30%, depending on the area where the CEE is incurred. The Aley Project is subject to the 30% investment tax credit on qualifying expenses.
Combined with BC Mineral taxes, the total effective income tax rate on the Aley Project is 27%.

Section 22 Economic Analysis 5
Aley Project Technical Report October 2014
The following after-tax economic indicators are derived from the base case life of mine cashflow assuming current federal and provincial tax laws in force:
Net Present Value = $480 million
Internal Rate of Return on Investment = 14%
Payback Period = 5.8 years
22.5 SENSITIVITY ANALYSIS
Figure 22.1 shows sensitivity of the life of mine free cashflow to primary inputs, demonstrating that the reserve is robust. It is most sensitive to commodity price and recovery and least sensitive to capital costs.
Figure 22.1: Life of Mine Free Cashflow Sensitivity
The sensitivity of the base case project economics to primary inputs on a series of metrics is presented in Figures 22.2 through 22.4.
$1.0
$1.5
$2.0
$2.5
$3.0
$3.5
$4.0
$4.5
$5.0
‐15% ‐10% ‐5.0% 0.0% 5.0% 10.0% 15.0%
LOM Undiscounted Free CashflowCDN $
Billions
Change in Input
Recovery Nb Price $/kg Operating Costs Capital Costs FX

Section 22 Economic Analysis 6
Aley Project Technical Report October 2014
Figure 22.2: NPV Sensitivity
NPV is most sensitive to commodity price and recovery and least sensitive to capital cost.
Figure 22.3: IRR Sensitivity
IRR is most sensitive to commodity price and recovery and less sensitive on a roughly equivalent basis to capital and operating costs and exchange rate.
$0
$200
$400
$600
$800
$1,000
$1,200
$1,400
$1,600
‐15% ‐10% ‐5.0% 0.0% 5.0% 10.0% 15.0%
NPV (@8%)
Millions
Change in Input
Recovery Nb Price $/kg Operating Costs Capital Costs FX
10%
12%
14%
16%
18%
20%
22%
24%
‐15% ‐10% ‐5.0% 0.0% 5.0% 10.0% 15.0%
IRR
Change in Input
Recovery Nb Price $/kg Operating Costs Capital Costs FX

Section 22 Economic Analysis 7
Aley Project Technical Report October 2014
Figure 22.4: LOM Average Margin Sensitivity
The figure demonstrates that the life of mine average margin remains strongly positive despite variance in primary inputs but is most sensitive to commodity price followed by operating costs.
$10
$12
$14
$16
$18
$20
$22
$24
$26
$28
$30
‐15% ‐10% ‐5.0% 0.0% 5.0% 10.0% 15.0%
Margin ‐US$/kg Nb Produced
Change in Input
Recovery Nb Price $/kg Operating Costs Capital Costs FX

Aley Project Technical Report October 2014
SECTION 23: ADJACENT PROPERTIES

Aley Project Technical Report October 2014
Table of Contents
23.0 Adjacent Properties ................................................................................................................1
Section 23 Adjacent Properties 1
Aley Project Technical Report October 2014
23.0 Adjacent Properties
There are no operating mines near or adjacent to the proposed Aley Niobium Mine; however there are several claims, owned by Chancellor Corporation within the Aley claim block. These claims have had some exploration / technical work performed upon them by Chancellor and the cost of this work has been assessed against the annual cost of holding these claims. The results of this work are not available to the public until December of 2014, at which time it will be available on the ARIS database. The Chancellor claims are north and south of the Aley claims over which Taseko has applied for a mining lease and lay well outside any proposed project infrastructure. As such, any findings of mineralization on the Chancellor claims would be immaterial to the valuation of the Aley deposit.

Aley Project Technical Report October 2014
SECTION 24: OTHER RELEVANT DATA AND INFORMATION

Aley Project Technical Report October 2014
Table of Contents
24.0 Other Relevant Data and Information ....................................................................................1

Section 24 Other Relevant Data and Information 1
Aley Project Technical Report October 2014
24.0 Other Relevant Data and Information
In the opinion of the authors there is no additional information necessary in order to make the technical report understandable and not misleading beyond that included in this report.
Aley Project Technical Report October 2014
SECTION 25: INTERPRETATION AND CONCLUSIONS

Aley Project Technical Report October 2014
Table of Contents
25.0 Interpretation and Conclusions ..............................................................................................1
25.1 Tenure and Environmental Liabilities .................................................................................1
25.2 Exploration and Geology .....................................................................................................1
25.3 Mining .................................................................................................................................1
25.4 Metallurgy and Processing ..................................................................................................2
25.5 Infrastructure .......................................................................................................................2
25.6 Environment ........................................................................................................................2
25.7 Capital and Operating Costs ................................................................................................3
25.8 Economics ...........................................................................................................................3
25.9 Risks and Opportunities ......................................................................................................3
Section 25 Interpretation and Conclusions 1
Aley Project Technical Report October 2014
25.0 Interpretation and Conclusions 25.1 TENURE AND ENVIRONMENTAL LIABILITIES
Taseko’s tenure position is secure and the property is not subject to any royalty terms, back-in rights, payments or any other agreements or encumbrances.
Environmental liabilities are limited to the rehabilitation of drill sites and exploration access roads completed to date. Funds to cover the expense of these reclamation activities are held in trust.
25.2 EXPLORATION AND GEOLOGY
Evaluation of the exploration programs and results available to the effective date of this report indicates that:
The geology is sufficiently well understood to support the mineral resource and mineral reserve estimations presented in this report.
Core drilling has identified a continuous body of near-surface niobium mineralization within an area measuring 1400m E-W by 500m N-S and to a depth below surface of about 250 m. The ultimate limits have not been defined.
Data collection to the end of 2011 at the drill site is acceptable.
The database contains all drilling data collected on the project to date and has been structured for resource estimation.
QA/QC with respect to the results received to date for the Taseko 2007, 2010 and 2011 exploration programs is acceptable and protocols have been well documented.
As of September 15, 2014, the Aley deposit is estimated to contain a measured and indicated resource of 286 million tonnes grading 0.37% Nb2O5 using a cut-off grade of 0.2% Nb2O5. An additional 144 million tonnes averaging 0.32% Nb2O5 is classified as inferred.
As of September 15, 2014, the Aley deposit is estimated to contain a proven and probable reserve of 84 million tonnes grading 0.50% Nb2O5 using a cut-off grade of 0.3% Nb2O5. This reserve is contained within the resource stated above.
25.3 MINING
The evaluations of the mining options available to effectively recover niobium from this deposit indicate that:
The Aley Property contains adequate Nb2O5 mineral resources to develop an open pit mine and supply a process plant with 10,000tpd of economic ore for a period of at least 24 years.

Section 25 Interpretation and Conclusions 2
Aley Project Technical Report October 2014
The detailed pit design is consistent with the design basis LG shell and meets the recommended geotechnical design parameters. The final pit limit can be subdivided into 2 phases with adequate working width for the selected mine fleet and a ramp system is included, providing access between the mining benches, the waste dumps, and the primary crusher.
The 2 phase mine design provides a reasonable basis for the production schedule meeting the targeted mill feed rate of 10,000 tpd with a consistently sized mining fleet.
Equipment and fleet sizing is based on appropriate assumptions and is adequate for the operation proposed.
Mining losses and average mining dilution are appropriately considered.
The design and mine schedule are to a pre-feasibility level of study.
The mine schedule uses only Measured and Indicated blocks within the resource estimate. Inferred resources are treated as waste.
25.4 METALLURGY AND PROCESSING
The evaluation of the metallurgy and processing options available to effectively recover niobium from this deposit indicate that:
A process that utilizes commercially available mineral processing unit operations consisting of crushing, grinding, flotation, magnetic separation, leaching and metal conversion can be used to produce a ferro-niobium alloy final product from Aley ore.
Recovery of niobium to final product ferro-niobium alloy can be expected to be 65%.
Niobium content in final product ferro-niobium can be expected to be 63 % Nb.
A processing facility can be constructed to at a nominal through put of 3.65 million tonnes per year of feed ore.
Process sand from the concentrator and the convertor can be co-deposited in a sand storage management facility located in the same valley as the processing facilities.
25.5 INFRASTRUCTURE
The infrastructure required for the project is typical of remote projects. The design and cost estimation is to a pre-feasibility level and there are no known conditions that would preclude the establishment of the infrastructure as designed.
25.6 ENVIRONMENT
Environmental baseline studies to date have been advanced by a number of consultant groups.
Baseline studies are advanced to a level typical of the stage of the Aley project.
No issues have been identified to date that could materially impact Taseko’s ability to extract the mineral reserves.
Section 25 Interpretation and Conclusions 3
Aley Project Technical Report October 2014
25.7 CAPITAL AND OPERATING COSTS
The estimation of capital and operating costs are based on a pre-feasibility level of engineering and are current to Q3 2014.
25.8 ECONOMICS
The economics of mining and processing the stated reserves of this project are robust. The cut-off grade and reserve will withstand large changes in the major monetary and operational variables that drive the cash-flow of this project.
25.9 RISKS AND OPPORTUNITIES
The following project risks and opportunities have been identified:
Risks
Should the refuse generated from the converter have a significant deleterious mineral component, alternative disposal methods or more stringent long term storage methods may be required.
Additional geotechnical drilling is required to define the ground conditions for the location of the stockpile and process facilities.
Should the ore processed in the plant be different than the current master composite, process recoveries, grades, and quantities may be different.
Should marketing evaluations indicate that there is a requirement to reduce the levels of specified elements in the ASTM HSLA steel standards reporting to the final product, alternative or modified process conditions or flowsheet may be required. Predictions on expected unit process recoveries may be different than those achievable in a pilot or industrial scale plant.
The reclaim water is in closed circuit with the mill and the potential exists for the gradual build-up of precipitants and/or impurities that conflict with the flotation chemistry.
Should the costs or availability of process reagents, lixiviants, or converter feed materials materially change, this could materially change the operating costs.
The viability of the project is directly related and sensitive to the price of niobium. While niobium prices appear to have remained stable over the last 5 years they are affected by numerous factors beyond the Company’s control, including supply dominated by a single supplier, demand growth, expectations with respect to the rate of inflation, the exchange rates of the United States dollar to other currencies, interest rates, and global or regional political, economic or financial situations.
The project will require licenses and permits from various governmental authorities. There can be no assurances that Taseko will be able to obtain all necessary licenses and permits that may be required to carry out all proposed development and operations.

Section 25 Interpretation and Conclusions 4
Aley Project Technical Report October 2014
Typical mining risks also include adverse geological or ground conditions, adverse weather conditions, potential labour problems, and availability and cost of equipment procurement and repairs.
Opportunities
The co-disposal of the converter refuse with the process sand will reduce the refuse handling costs and the requirement for a refuse stockpile.
The ore hardness is relatively low, thus an alternative comminution circuit, incorporating crushing or HGPR technology as an alternate to the SAG mill, may have capital and operating cost (power) advantages.
The implementation of a flash calciner, replacing the rotary kiln could offer a reduction in capital cost.
Industrial scale continuous process results could impact reagent recycle and utilization efficiency when compared to the batch and semi continuous test results obtained, lowering operating cost.
If the conservatively selected leach recovery of 95 % is a result of the small scale and mass balance used to analyze the data, but not a result of mineral leaching, the overall plant recovery may be higher.
There are significant opportunities to optimize recovery and processing cost in the proprietary component of the concentrator.
The cut-off grade of 0.30% utilized in this mine plan is considered conservative. Further work to optimize the cut-off grade could further enhance the economics of this project.
The pit slopes used in the pit design are considered conservative. A reduction in the strip ratio and mining costs is available if the pit walls are constructed steeper than the present design.
The large resource of the project provides a high probability of a mine life extended beyond that considered in this report.

Aley Project Technical Report October 2014
SECTION 26: RECOMMENDATIONS

Aley Project Technical Report October 2014
Table of Contents
26.0 Recommendations ..................................................................................................................1
26.1 Environmental Assessment..................................................................................................1
26.2 Process Optimization ...........................................................................................................1

Section 26 Recommendations 1
Aley Project Technical Report October 2014
26.0 Recommendations
The following section identifies recommendations for two phases of work to advance the Aley project towards a production decision. The two phases are not contingent on one another.
26.1 ENVIRONMENTAL ASSESSMENT
As per the provincial and federal regulatory requirements outlined in Section 20.4 it is a reasonable assumption that an environmental assessment of the Aley project will be required before the Project can proceed to obtain permits for construction and operation.
Although a significant amount of baseline data has been collected in support of an environmental assessment, additional site investigation data and preparation of an Environmental Impact Statement (EIS) is required to proceed through an environmental assessment. It is recommended that this work be completed.
A summary of the scope and cost of this work is as follows:
Access road completion $2M Geotechnical drilling, geophysics and test pitting $3M Hydrogeological drilling $1M Transportation and Accommodation $1M Site investigation supervision and data analysis $1M EIS preparation $2M Total $10M
26.2 PROCESS OPTIMIZATION
Metallurgical testwork completed to date is consistent with the design, costing, and recovery which supports the mineral reserve that is the subject of this technical report. The authors are of the opinion that there is significant opportunity to optimize the cost and recovery of the processing facilities through additional metallurgical testwork. It is recommended that this work be completed before advancing to detailed design on the project.
A summary of the scope and cost of this work is as follows:
Metallurgical bench and locked cycle testwork $1M Bulk sample collection $1M Pilot Plant testwork $2M Total $4M
While this metallurgical work may be conducted independently of work associated with the environmental assessment, there would cost synergies associated with the collection of bulk

Section 26 Recommendations 2
Aley Project Technical Report October 2014
sample material if this aspect of the work was conducted at the same time as site investigation work.

Aley Project Technical Report October 2014
SECTION 27: REFERENCES

Aley Project Technical Report October 2014
Table of Contents
27.0 References ..............................................................................................................................1

Section 27 References 1
Aley Project Technical Report October 2014
27.0 References
1. Canadian Institute Of Mining, Metallurgy And Petroleum “Form 43-101F1 Technical Report Instructions” June 30, 2011
2. Caterpillar, “Caterpillar Performance Handbook, ed. 41” January 2011
3. Simpson, Ronald G., P.Geo., "Technical Report Aley Carbonatite Niobium Project", March 29, 2012
4. Knight Piesold Report: Water and Waste Management Plan (REF. NO. VA101-314/6-3)
5. McLeish, 2011 – Technical Report on Structural Geology, Aley Carbonatite Niobium Project
6. Nethery, 2006 – Report of Technical Exploration and Development – 2006 Evaluation and Exploration Planning on the Aley Carbonatite Property
7. Dufresne, C., and Goyette, G., “The Production of Ferroniobium at the Niobec Mine”, http://www.cbmm.com.br/portug/sources/techlib/science_techno/table_content/sub_1/images/pdfs/start.pdf, Retrieved: May 24, 2012.
8. Madeley, D., “A Review of Historical Metallurgical Data Concerning the Aley Niobium Deposits”, Prepared for Taseko Mines: May 9, 2011.
9. Simpson, R., “Technical Report: Aley Carbonatite Niobium Project”, Prepared for Aley Corporation: October 26, 2011.
10. Elzéar Belzile, Belzile Solutions Inc. “Technical Report for Niobec Mine – February, 2009”. http://www.iamgold.com/Theme/IAmGold/files/operations/43-101%20Technical%20Report%20Niobec,%20February18_2009.pdf
11. Guimarães, H and Weiss, R. “The complexity of the niobium deposits in the alkaline-ultramafic intrusions Catalão I and II – Brazil”. www.cbmm.com.br/portug/sources/techlib/science.../002A.pdf
12. Somot, S., Proulx, E., Marois, J.S., Bouajila, A., Gagnon, C., Ourriban, M., Drouin, M. and Blatter, P., “In-Plant Hydrogeochemical Mapping: A Tool to Localise Potential Deletrious Reactions Due to Water Quality in a Process”, Presented at The 44th Annual Canadian Mineral Processors Operators Conference, January, 2012
13. Sousa, C. and Pereira, A. Recent Developments in Ferro-niobium Manufacturing at CBMM. TIC Conference, San Francisco, 2000
Section 27 References 2
Aley Project Technical Report October 2014
14. BC Hydro, 2011. Peace Project Water Use Plan. http://www.bchydro.com/etc/medialib/internet/documents/planning_regulatory/wup/northern_interior/2011q3/gmsworks-22_yr2_2011-01-01.Par.0001.File.GMSWORKS-22-Yr2-2011-01-01.pdf, Viewed May 8th, 2012.
15. BC Stats. 2011. Hudson's Hope - Community Facts. www.bcstats.gov.bc.ca/StatisticsBySubject/SocialStatistics/CommunityFacts.aspx, Viewed November 17th, 2011.
16. BC Stats. 2012. British Columbia Municipal Census Populations, 1986-1996. http://www.bcstats.gov.bc.ca/StatisticsBySubject/Demography/PopulationEstimates.aspx, Viewed April 5th, 2012.
17. BC Stats and the BC Ministry of Jobs, Tourism and Innovation. 2011. About Cariboo. A Guide to the BC Economy and Labour Market. www.guidetobceconomy.org/bcs_economy/cariboo.htm, Viewed November 17th, 2011.
18. British Columbia & Treaty 8 First Nations (BC & T8FNs). 2009. Amended Economic Benefits Agreement. 30 p. http://www.gov.bc.ca/arr/treaty/key/down/amended_economic_benefits_agreement.pdf. December 17th, 2009
19. Burns Lake Lakes District News. 2012. Advice from Mackenzie for the Village of Burns Lake. www.ldnews.net/news/141642973.html, Viewed April 10th, 2012.
20. City of Prince George, 2011. A Regional Centre. http://princegeorge.ca/cityhall/aboutourcity/regionalcentre/Pages/Default.aspx. Viewed November 17th, 2012
21. Discover the Peace Country, 2011. Fort St. John. www.discoverthepeacecountry.com/htmlpages/fortstjohn.html. Viewed November 17th, 2011.
22. District of Hudson's Hope. n.d. Official Community Plan. 3 p. http://www.dist.hudsons-hope.bc.ca/PDF/OCP.pdf. Viewed April 5th, 2012.
23. District of Hudson's Hope, 2011. Today's Vibrant Economy. www.hudsonshope.ca/business.html. Viewed November 19th, 2011.
24. District of Mackenzie. 2009. Community Profile. www.district.mackenzie.bc.ca/Files/Media/0247/MackenzieProfileMar2009.pdf, Viewed April 9th, 2012.
25. Fort St. John. 2011. Fort St. John. www.fortstjohn.ca. Viewed 2011
Section 27 References 3
Aley Project Technical Report October 2014
26. Initiatives Prince George, 2012. Sectors. www.initiativespg.com/Sectors/index.php. Viewed May 8th, 2012.
27. Institute of Chartered Accountants of BC. 2011. Cariboo Development Region - BC Check-Up. www.bccheckup.com/bccheckup.php?cat=83. Viewed November 17th, 2012.
28. Mader, U.K. 1986. The Aley Carbonatite Complex, Northern Rocky Mountains, British Columbia (94B/5). British Columbia Ministry of Energy, Mines and Petroleum Resources, Geological Fieldwork, 1986, Paper 1987-1.
29. Nowac, B. C., J-M Obrecht, M. Schluep, R. Schulin, W. Hansmann, and V. Koppel. 2001. Elevated land and zinc contents in remote alpine soils of the Swiss National Park. Journal of Environmental Quality 30:919-926.
30. Sheppard, S.C., M.I. Sheppard, and B Sanipelli. May 2011. Review of Environmental Radioactivity in Canada Nuclear Waste Management Organization Report No.: NWMO TR-2011-17.
31. Statistics Canada. 2006. Labour Force Activity. http://www12.statcan.gc.ca/census-recensement/2006/dp-pd/tbt/Rp-eng.cfm?TABID=5&LANG=E&APATH=3&DETAIL=0&DIM=0&FL=A&FREE=1&GC=0&GID=776801&GK=0&GRP=1&PID=92113&PRID=0&PTYPE=88971,97154&S=0&SHOWALL=0&SUB=741&Temporal=2006&THEME=74&VID=0&VNAMEE=&VNAMEF=&D1=0&D2=0&D3=0&D4=0&D5=0&D6=0, Viewed November 23rd , 2011
32. Tsay Keh Dene First Nation. 2010. Tsay Keh Dene Economic Development Plan: 2010 – 2030. 43 p. http://fnbc.info/sites/default/files/documents/TKDBCommEcDevPlan100324c.pdf
33. Knight Piesold, Preliminary Pit Slope Design Report, VA101-314/6-4, Rev 0, May 3,
34. Knight Piesold, 2012 Geotechnical and Hydrogeological Site Investigation Factual Data Report, VA101-314/6-5, Rev 0, January 28, 2013
35. Knight Piesold, Revised Mine Waste and Water Management Plan, VA101-314/15-1, Rev 0, January 9, 2014
36. Knight Piesold, Aley Project – Waste and Water Management Quantity Update for 10,000 tpd Mine Plan Memo Report, VA101-314/13-A.01, July 25,2014
37. Duncan McLeish, Technical Report on Structural Geology, Aley Carbonatite Niobium Project, British Columbia, Canada, August 7,2011

Section 27 References 4
Aley Project Technical Report October 2014
38. GeoSim Services Inc. Technical Report, Aley Carbonatite Niobium Project, October 26, 2011
39. GeoSim Services Inc. Technical Report, Aley Carbonatite Niobium Project, March 21,2012
40. Moose Mountain Technical Services, Aley Niobium Preliminary Economic Assessment, Mining Section, July21, 2012
41. Canadian Institute Of Mining, Metallurgy And Petroleum “Form 43-101F1 Technical Report Instructions” June 30, 2011
42. Caterpillar, “Caterpillar Performance Handbook, ed. 41” January 2011
43. Roskill Information Services Ltd. “Niobium: Market Outlook to 2017, Twelfth Edition, 2013” April 2013
44. Roskill Consulting Group Ltd. “Taseko Mines Ltd., Analysis of the global niobium market. Final Report” October 13, 2011

Aley Project Technical Report October 2014
Scott Jones, P.Eng. Suite 1020-800 West Pender Street
Vancouver, BC V6C 2V6
I, Scott S. Jones, P.Eng., of Vancouver, British Columbia, hereby certify that:
1. I am an employee of Taseko Mines Ltd., with a business office at 15th Floor, 1040 Georgia street, Vancouver, British Columbia. In my position as Vice President, Engineering, on behalf of Taseko Mines Limited, I co-authored this technical report on the mineral reserves at the Aley Project which was announced on September 15, 2014.
2. This certificate applies to the technical report titled “Technical Report on the
Mineral Reserves at the Aley Project, British Columbia, Canada”, dated October 30, 2014.
3. I am a graduate of McGill University in Montreal, Quebec (B.Eng. Mining). I have practiced my profession for 29 years since graduation in 1985. I am a member in good standing of the Association of Professional Engineers and Geoscientists of British Columbia, license number 29486. As a result of my experience and qualifications, I am a Qualified Person under National Instrument 43-101.
4. I am responsible for Sections 1 through 6, 20, and 22 through 26 of this report.
5. I am not independent of Taseko Mines Limited.
6. I visited the Aley Project on September 1-2, 2011.
7. I have read National Instrument 43-101.
8. I, as of the date of the certificate and to the best of my knowledge and information, believe the technical report contains all scientific and technical information that is required to be disclosed to make the technical report not misleading.
9. I consent to the use of this Technical Report for disclosure purposes of Taseko Mines Limited.
Signed at Vancouver, British Columbia on the 30th day of October, 2014.
“Signed and Sealed”
Scott S. Jones, P.Eng.
Aley Project Technical Report October 2014
Keith Merriam, P.Eng. Suite 1020-800 West Pender Street
Vancouver, BC V6C 2V6
I, Keith Merriam, P.Eng., of Pitt Meadows, British Columbia, hereby certify that:
1. I am an employee of Taseko Mines Ltd., with a business office at 15th Floor, 1040 Georgia street, Vancouver, British Columbia. In my position as Manager, Process Engineering, on behalf of Taseko Mines Limited, I co-authored this technical report on the mineral reserves at the Aley Project which was announced on September15, 2014.
2. This certificate applies to the technical report titled “Technical Report on the
Mineral Reserves at the Aley Project, British Columbia, Canada”, dated October 30, 2014.
3. I am a graduate of The University of Alberta, in Edmonton, Alberta (B. Sc.
Metallurgical Engineering). I have practiced my profession for 16 years since graduation in 1998. I am a member in good standing of the Association of Professional Engineers and Geoscientists of British Columbia, license number 32234. As a result of my experience and qualifications, I am a Qualified Person under National Instrument 43-101.
4. I am responsible for Sections 13, 17, 19 and 21 of this report.
5. I am not independent of Taseko Mines Limited.
6. I visited the Aley Project on July 20th through 22nd 2011 and August 15th through 23rd 2012
7. I have read National Instrument 43-101.
8. I, as of the date of the certificate and to the best of my knowledge and information, believe the technical report contains all scientific and technical information that is required to be disclosed to make the technical report not misleading.
9. I consent to the use of this Technical Report for disclosure purposes of Taseko Mines Limited.
Signed at Vancouver, British Columbia on the 30thth day of October, 2014. “Signed and Sealed”
Keith Merriam, P.Eng.
Aley Project Technical Report October 2014
Greg Yelland, P.Eng. 15th Floor, 1040 West Georgia Street
Vancouver, BC V6E 4H1
I, Greg J. Yelland, P.Eng. of Vancouver, British Columbia, hereby certify that:
1. I am an employee of Taseko Mines Ltd., with a business office at 15th Floor, 1040 Georgia Street, Vancouver, British Columbia. In my position as Chief Engineer, on behalf of Taseko Mines Limited, I co-authored this technical report on the mineral reserves at the Aley Project which was announced on September 15, 2014.
2. This certificate applies to the technical report titled “Technical Report on the
Mineral Reserves at the Aley Project, British Columbia, Canada”, dated October 30, 2014.
3. I am a graduate of Queens University in Kingston, Ontario (B.Sc. Mine Engineering). I have practiced my profession for 31 years since graduation in 1983. I am a member in good standing of the Association of Professional Engineers and Geoscientists of British Columbia, license number 30188. As a result of my experience and qualifications, I am a Qualified Person under National Instrument 43-101.
4. I am responsible for Sections 7 through 12, 15, and 16 of this report.
5. I am not independent of Taseko Mines Limited.
6. I visited the Aley Project on September 1-2, 2011.
7. I have read National Instrument 43-101.
8. I, as of the date of the certificate and to the best of my knowledge and information, believe the technical report contains all scientific and technical information that is required to be disclosed to make the technical report not misleading.
9. I consent to the use of this Technical Report for disclosure purposes of Taseko Mines Limited.
Signed at Vancouver, British Columbia on the 30th day of October, 2014.
“Signed and Sealed”
Greg J. Yelland, P.Eng.

Aley Project Technical Report October 2014
Robert J. Rotzinger, P.Eng. Suite 1500-1040 West Georgia Street
Vancouver, BC V6E 4H1
I, Robert J. Rotzinger, P.Eng., of Vancouver, British Columbia, hereby certify that:
1. I am an employee of Taseko Mines Ltd., with a business office at 15th Floor, 1040 Georgia Street, Vancouver, British Columbia. In my position as Vice President, Capital Projects, on behalf of Taseko Mines Limited, I co-authored this technical report on the mineral reserves at the Aley Project which was announced on September 15th, 2014.
2. This certificate applies to the technical report titled “Technical Report on the
Mineral Reserves at the Aley Project, British Columbia, Canada”, dated October 30, 2014.
3. I am a graduate of the University of British Columbia in Vancouver, British Columbia (BASc Mechanical). I have practiced my profession for 22 years since graduation in 1992. I am a member in good standing of the Association of Professional Engineers and Geoscientists of British Columbia, license number 23449. As a result of my experience and qualifications, I am a Qualified Person under National Instrument 43-101.
4. I am responsible for Sections 18 and 21 of this report.
5. I am not independent of Taseko Mines Limited.
6. I have read National Instrument 43-101.
7. I, as of the date of the certificate and to the best of my knowledge and information, believe the technical report contains all scientific and technical information that is required to be disclosed to make the technical report not misleading.
8. I consent to the use of this Technical Report for disclosure purposes of Taseko Mines Limited.
Signed at Vancouver, British Columbia on the 30th day of October, 2014.
“Signed and Sealed”
Robert J. Rotzinger, P.Eng.
Aley Project Technical Report October 2014
I, Ronald G. Simpson, P.Geo, residing at 1975 Stephens St., Vancouver, British Columbia, V6K 4M7, do hereby certify that:
1. I am employed as a Professional Geoscientist with GeoSim Services Inc.
2. This certificate applies to the Technical Report entitled “Technical Report on the Mineral Reserves at the Aley Project, British Columbia, Canada” dated October 30, 2014.
3. I am a Professional Geoscientist (19513) in good standing with the Association of Professional Engineers and Geoscientists of British Columbia. I graduated with a Bachelor of Science in Geology from the University of British Columbia, May 1975.
4. I have practiced my profession continuously for 39 years. I have been directly involved in mineral exploration, mine geology and resource estimation with practical experience from feasibility studies.
5. As a result of my experience and qualifications, I am a qualified person as defined in National Instrument 43 – 101 Standards of Disclosure for Mineral Projects (“NI 43 – 101”).
6. I have visited the property on August 30, 2011.
7. I have had prior involvement with the property that is the subject of the Technical Report, the nature of which involves the preparation of two technical reports prepared for Aley Corporation dated October 26, 2011 and March 29, 2012, both titled “Technical Report, Aley Carbonatite Niobium Project, Omineca Mining District, British Columbia”.
8. I am responsible for Section 14 of this report.
9. I am independent of the issuer applying all of the tests in section 1.4 of NI 43 101.
10. I have read NI 43-101 and Form 43-101F1, and the Technical Report has been prepared in compliance with that instrument and form.
11. As of the date of this certificate, to the best of my knowledge, information and belief, the Technical Report contains all scientific and technical information that is required to be disclosed to make the Technical Report not misleading
12. I consent to the filing of the Technical Report with any stock exchange and other regulatory authority and any publication by them, including electronic publication in the public company files on their websites accessible by the public, of the Technical Report.
DATED this 30th day of October, 2014
“Signed and Sealed”
Ronald G. Simpson, P.Geo.