TECHNICAL MANUAL FOR INADEQUATE CORE COOLING ...
44
Westinghouse Class 3 A. TECHNICAL MANUAL FOR INADEQUATE CORE COOLING MONITOR-86 Watts Bar Units 1 and 2 Tennessee Valley Authority December 1989 Volume I of III WESTINGHOUSE ELECTRIC CORPORATION Nuclear instrumentation and Control Products Department Pittsburgh, PA 15230 29748 9202030092 920124 PDR ADOCK 05000390 A PDR
-
Upload
khangminh22 -
Category
Documents
-
view
0 -
download
0
Transcript of TECHNICAL MANUAL FOR INADEQUATE CORE COOLING ...
Westinghouse Class 3
A.
TECHNICAL MANUAL
FOR
INADEQUATE CORE COOLING
MONITOR-86
Watts Bar Units 1 and 2
Tennessee Valley Authority
December 1989
Volume I of III
WESTINGHOUSE ELECTRIC CORPORATIONNuclear instrumentation and Control Products Department
Pittsburgh, PA 15230
29748
9202030092 920124PDR ADOCK 05000390A PDR
INADEQUATE CORE COOLING MONITOR-86
SECTION 5REMOTE DISPLAY INFORMATION
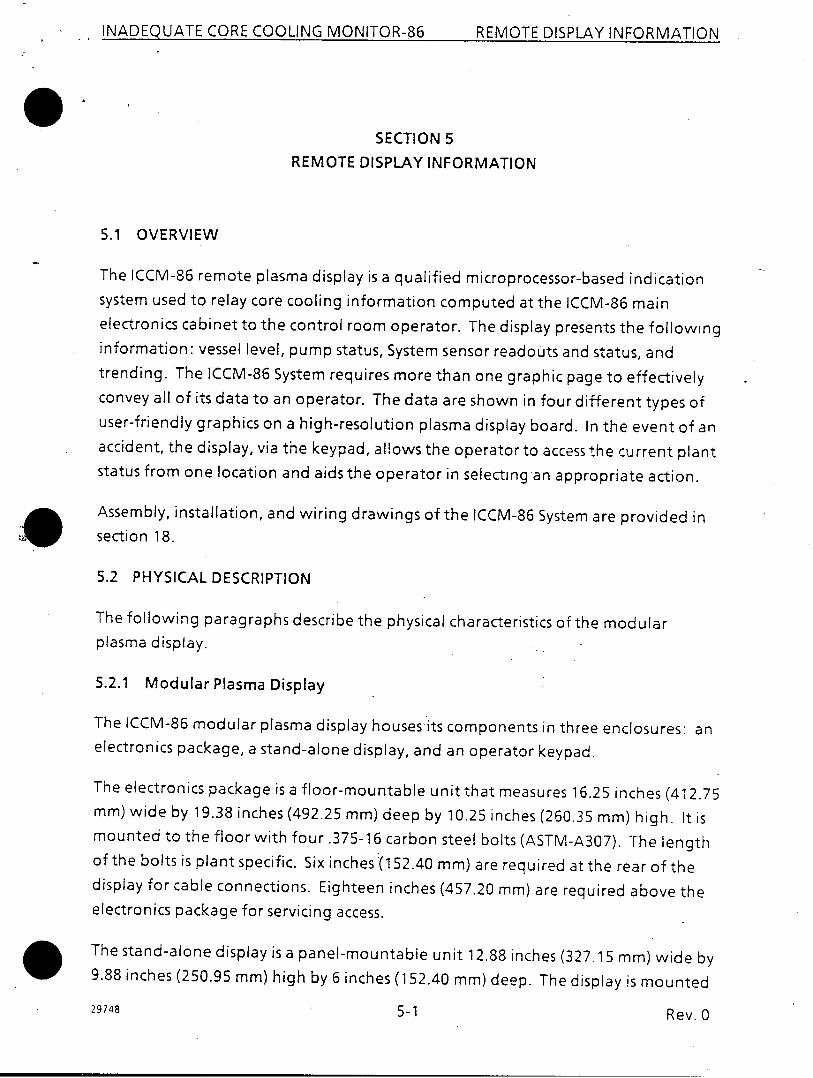
5.1 OVERVIEW
The ICCM-86 remote plasma display is a qualified microprocessor-based indicationsystem used to relay core cooling information computed at the ICCM-86 mainelectronics cabinet to the control room operator. The display presents the followinginformation: vessel level, pump status, System sensor readouts and status, andtrending. The ICCM-86 System requires more than one graphic page to effectivelyconvey all of its data to an operator. The data are shown in four different types ofuser-friendly graphics on a high-resolution plasma display board. In the event of anaccident, the display, via the keypad, allows the operator to access the current plantstatus from one location and aids the operator in selecting an appropriate action.
Assembly, installation, and wiring drawings of the ICCM-86 System are provided insection 18.
5.2 PHYSICAL DESCRIPTION
The following paragraphs describe the physical characteristics of the modularplasma display.
5.2.1 Modular Plasma Display
The ICCM-86 modular plasma display houses its components in three enclosures: anelectronics package, a stand-alone display, and an operator keypad.
The electronics package is a floor-mountable unit that measures 16.25 inches (412.75mm) wide by 19.38 inches (492.25 mm) deep by 10.25 inches (260.35 mm) high. It ismounted to the floor with four .375-16 carbon steel bolts (ASTM-A307). The lengthof the bolts is plant specific. Six inches (152.40 mm) are required at the rear of thedisplay for cable connections. Eighteen inches (457.20 mm) are required above theelectronics package for servicing access.
The stand-alone display is a panel-mountable unit 12.88 inches (327.15 mm) wide by9.88 inches (250.95 mm) high by 6 inches (152.40 mm) deep. The display is mounted
Rev. 0
REMOTE DISPLAY IN-FORMATION
29748 5-1
I INADEQUATE CORE COOLING MONITOR-86
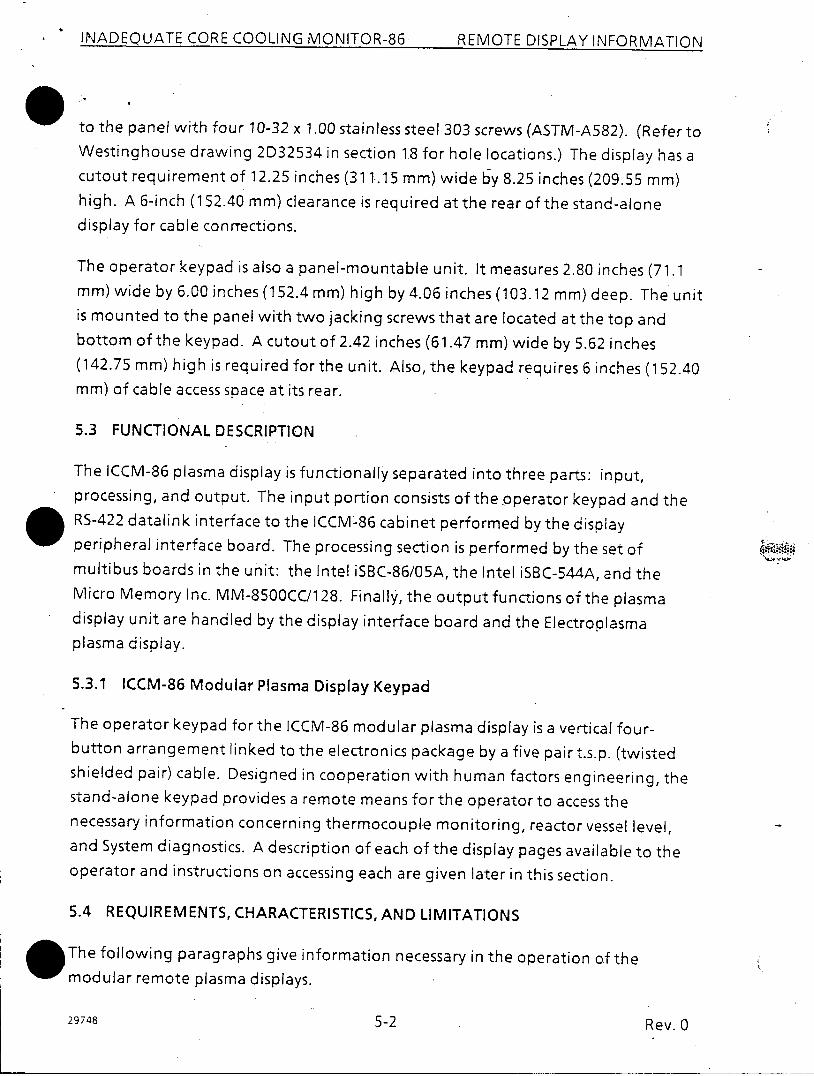
to the panel with four 10-32 x 1.00 stainless steel 303 screws (ASTM-A582). (Refer toWestinghouse drawing 2D32534 in section 18 for hole locations.) The display has acutout requirement of 12.25 inches (311.15 mm) wide by 8.25 inches (209.55 mm)high. A 6-inch (152.40 mm) clearance is required at the rear of the stand-alonedisplay for cable conrrections.
The operator keypad is also a panel-mountable unit. It measures 2.80 inches (71.1mm) wide by 6.00 inches (152.4 mm) high by 4.06 inches (103.12 mm) deep. The unitis mounted to the panel with two jacking screws that are located at the top andbottom of the keypad. A cutout of 2.42 inches (61.47 mm) wide by 5.62 inches(142.75 mm) high is required for the unit. Also, the keypad requires 6 inches (152.40mm) of cable access space at its rear.
5.3 FUNCTIONAL DESCRIPTION
The ICCM-86 plasma display is functionally separated into three parts: input,processing, and output. The input portion consists of the operator keypad and theRS-422 datalink interface to the ICCM-86 cabinet performed by the displayperipheral interface board. The processing section is performed by the set ofmultibus boards in the unit: the Intel iSBC-86/05A, the Intel iSBC-544A, and theMicro Memory Inc. MM-8500CC/128. Finally, the output functions of the plasmadisplay unit are handled by the display interface board and the Electroplasmaplasma display.
5.3.1 ICCM-86 Modular Plasma Display Keypad
The operator keypad for the ICCM-86 modular plasma display is a vertical four-button arrangement linked to the electronics package by a five pair t.s.p. (twistedshielded pair) cable. Designed in cooperation with human factors engineering, thestand-alone keypad provides a remote means for the operator to access thenecessary information concerning thermocouple monitoring, reactor vessel level,and System diagnostics. A description of each of the display pages available to theoperator and instructions on accessing each are given later in this section.
5.4 REQUIREMENTS, CHARACTERISTICS, AND LIMITATIONS
The following paragraphs give information necessary in the operation of themodular remote plasma displays.
29748 5-2 Rev 0
REMOTE DISPLAY INFORMATION
INADEQUATE CORE COOLING MONITOR-86 REMOTE DISPLAY INFORMATION
A..
.4.1 Power Requirements
The power requirements for the modular plasma display are separated into thepower required by each piece.
Electronics package - 200 watts, supplied by a 120 V ( + /- 10 percent) 60 Hz (+ /- 5percent) ac bus
Stand-alone display - 18 watts supplied by a 120 V ( + /- 10 percent) 60 Hz ( + /- 5percent) ac bus (This represents only the power needed by thefan. All Electroplasma display power requirements aresupplied from the electronics package.)
Operator keypad - 0 watts (All keypad power requirements are supplied by theelectronics package.)
5.4.2 Interconnect Cable Lengths
Interconnection cabling between the electronics package and the stand-alonedisplay must be less than 100 feet (30 m) in length because of the high frequency ofdata transmission between the two devices.
Interconnect cabling between the keypad and electronics package can be up to 250feet (75 m), if necessary.
5.4.3 Installation Procedure
The following paragraphs outline the procedures necessary in mounting these threecomponents of the modular plasma display: electronics package, stand-alonedisplay, and operator keypad. Specific procedures for each piece will be described ina separate paragraph.
First, the electronics package should be floor mounted with four .375-16 diameterbolts. Note that the material for these is specified as type ASTM-A307 carbon steelon the outline/installation drawing found in section 18. (Refer to outline/installationdrawing 2D32533 in section 18 for hole spacing required on the electronics packagebase.)
29748 5-3 Rev. 0
INADEQUATE CORE COOLING MONITOR-86 REMOTE DISPLAY INFORMATION
To rnount the stand-alone display package, merely slide the unit into its prescribed Ccutout, then insert four 10-32 type 303 stainless steel screws into the panel. If theholes in the panel are not tapped, place the four lockwashers and hex nuts on theback side of the panel and tighten until snug. The cutout dimensions for the stand-alone display are given in paragraph 5.2 and on the outline/installation drawing2D32534 located in section 18.
To mount the operator keypad, remove both mounting brackets from the keypadchassis and slide the keypad into the panel from the front. Mount the brackets backto the keypad chassis with the 6-32 screws. Reinsert the two jacking screws withlocking nuts into the mounting brackets and tighten against the panel. Next, lockthe jacking screws in place with the hex nuts. (Refer to drawing 2D32535 in section18 for cutout dimensions of the keypad.)
Install the interconnecting cabling per Westinghouse drawing 5360C78 located insection 18.
5.4.4 External Connections
External connections for the ICCM-86 plasma display consist of the power anddatalink connections.
The power for the ICCM-86 electronics package and stand-alone display should betaken from a I E regulated 120 V bus. Connections for this power are providedthrough the Burndy Connectors P2 and P8 (P/N G6F10-4SNH). (P2 is the ac connectorfor the train A and train B remote displays.) These connections should be as follows:
Pin Signal
A Ac high
B Ac ground
C Ac low
29748 5-4 Rev. 0
irHADQQUA FE CORE COOLING MONITOR-86 REMOTE DISPLAY INFORMATION
The datalink connections to the ICCM-86 cabinet are to be made to the P1 connector(P/N G6F14-92SNH) for the train A and train B remote displays in the followingmanner:
Pin Signal
A Data low
B Shield
C Data high
Please refer to the ICCM-86 System external connection drawing in section 18 formore information.
5.5 CIRCUIT BOARDS
5.5.1 CPU Board
The central processing unit (CPU) board is an iSBC-86/05A single board computerfrom Intel. It is a 16-bit multibus compatible board which includes an 8086-2microprocessor, an 8087 math co-processor, 8K of random-access memory (RAM),256K bytes of read-only memory (ROM), 24 programmable input/output (I/O) lines,three programmable interval timers, a programmable interrupt controller, and oneprogrammable serial. I/O port.
The CPU board communicates with the System boards via the Intel iSBC multibus andis found in the Al slot of the card cage.
Although the CPU board is an Intel iSBC product, it has been modified and qualifiedby Westinghouse for use in specific applications by Westinghouse customers. The Alboard configuration drawing (1772E77) is provided in section 18.
5.5.2 CMIOS RAM Board
The Micro Memory MM-8500CC/128 is a 128K byte nonvolatile CMOS random-accessmemory (RAM) board which is multibus compatible. It has onboard nickel-cadmiumbatteries for data retention while the main power to the board is off. It also has a
29748
Rev. 05)-5-1
INADEQUATE CORE COOLING MONITOR-86 REMOTE DISPLAY INFORMATION
built-in programmable real-time clock and calendar. The current configuration ofthe board is populated with RAM chips which provide 128K of System RAM memory.
This MM-8500CC/128 board communicates with the Intel iSBC-86/05A board throughthe multibus. It is located in slot A2 of the card cage. The A2 board configurationdrawing (1776E02) is provided in section 18.
5.5.3 Communications Board
The Intel iSBC-544A intelligent communications controller board is a multibuscompatible communications board which includes an 8085A microprocessor foronboard processing, four programmable synchronous and asynchronous serial I/Ochannels with RS-232C buffering, one parallel I/O port, seven programmable timers,eight programmable priority interrupts, 8K bytes of read-only memory, and amaximum of 16K bytes of random-access memory. This board works in conjunctionwith a master CPU board in the System which allows all outside communications totake place on this board and relieves this function from the master CPU board.
This board communicates with the Intel iSBC-86/05A board through the multibusand is located in slot A3 of the card cage. In this particular system the board uses oneserial I/O channel for receiving an RS-232C input from the display peripheralinterface board (A4). The A3 board configuration drawing (1772E76) is located insection 18.
5.5.4 Display Peripheral Interface Board
The display peripheral interface board performs all utility functions required tointerface the separate components of the ICCM-86 plasma display unit. Located inthe A4 slot of the card cage, it serves as an RS-422 to RS-232C converter so that thedatalink signal from the cabinet is compatible with the Intel iSBC-544Acommunications board. It serves as a keypad interface by instructing the CPU boardto display the appropriate display page. Also, it provides a deadman timer for theCPU. An onboard green LED indicates that the CPU is running properly. An onboardred LED will light when the CPU has timed out. Finally, -the board transmits thesignals sent from the CPU board (A1) and destined for the plasma display via thedisplay interface board (A5).
29748 5-6 Rev. 0

INADEQUATE CORE COOLING MONITOR-S6 REMOTE DISPLAY INFORMATION
The board is designed and built by Westinghouse. It is multibus compatible and hasbeen qualified and tested to meet all customer requirements.
5.5.5 Plasma Display
The plasma display is the attractive feature of the ICCM-86 remote display module.A 4.25 inch by 8.50 inch (108 mm by 216 mm) flat panel presents alphanumeric andgraphics information to the control room operator. Supplied by ElectroplasmaIncorporated, its design has been modified to meet packaging requirements andWestinghouse qualification standards.
Functionally, the display takes the serial RS-422 data from the display interfaceboard, processes it, and refreshes the information presented on the screen. Newinformation is presented every 2 seconds as long as the processor is running. In caseof a processor failure, the display is not blanked. An onboard nonvolatile memoryallows it to retain the data shown at the time of the processor failure.
5.5.6 Display Interface Board
The display interface board (A5) is responsible for controlling the interface betweenthe plasma display and the electronics. It performs the following operations for theSystem:
o Changes the data signals to the display from transistor-transistor levels(TTL) to RS-422 levels for greater transmission capabilities.
o Controls the display brightness and its read/write capabilities.
The display interface board is supplied by Electroplasma, but has been modified (perdrawing 2D31911 provided in section 18) by Westinghouse to meet Systempackaging and qualification requirements.
5.5.7 High-Voltage Power Supply
The high-voltage power supply board (A6) is a Westinghouse design that suppliesthe plasma display power requirements. A compact design, the board provides the135-volt and 55-volt sources, as well as the lower level voltages, with two Spraguepower supply modules mounted on a 3.4 inch by 5.0 inch (86.4 mm by 127.0 mm)
29748 5-7 Rev. 0
INADEQUATE CORE COOLING MONITOR-86 REMOTE DISPLAY INFORMATION
printed circuit board. The board has been qualified to meet IEEE 323-1974 and IEEE344-1975 standards.
5.5.8 Keypad Encoder/Driver Board
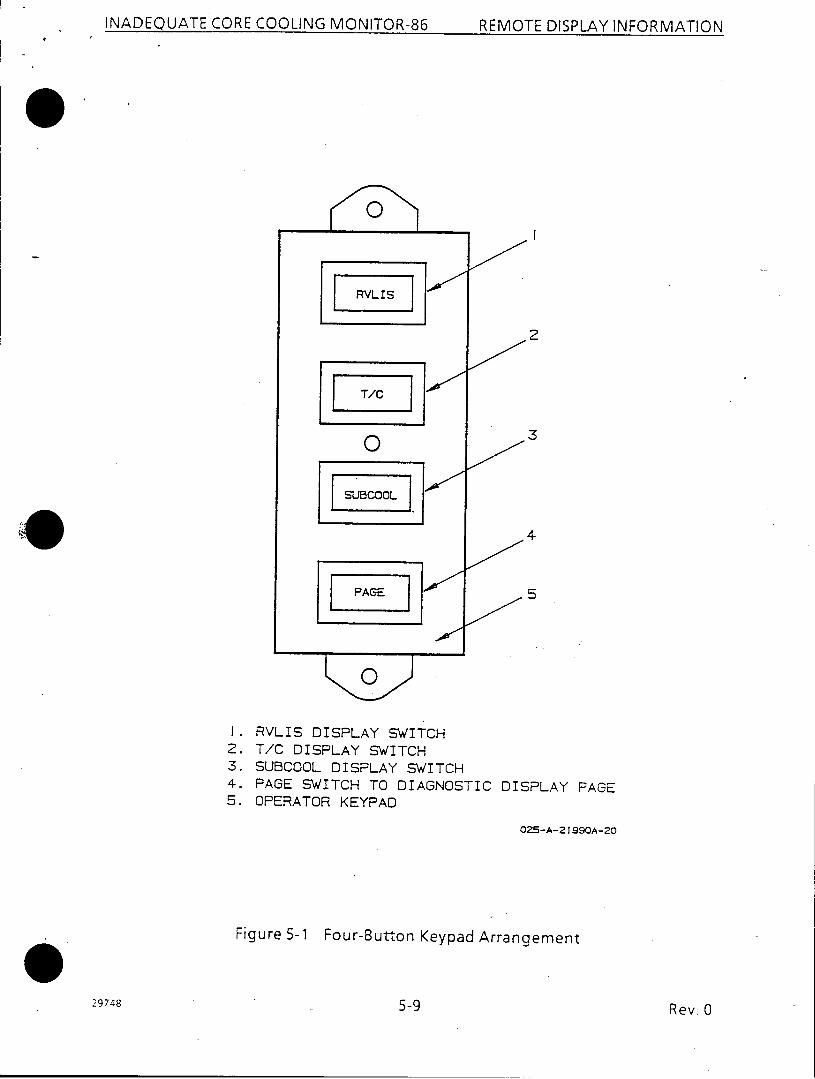
The keypad encoder/driver board mounted in the modular display keypad is a utilityboard designed and manufactured by Westinghouse. Packaged on a 1 inch (25.4mm) by 2.75 inches (69.85 mm) printed circuit board, the encoder/driver accepts upto eight inputs from the operator keypad and encodes them for properinterpretation by the central processing unit (CPU). See figure 5-1 for a view of themodular display keypad. The board also generates a flag which informs the CPU thata button has been pushed. Each of the signals are then converted from transistor-transistor logic (TTL) level to RS-422 for long distance transmission. No localizedpower supply is required. The power for board operation is provided through thefive pair cable which links the keypad to the electronics package.
5.6 RECEIVING/UNPACKING
The remote displays are shipped packaged separately. Each package should be kept (in the position indicated by the markings on the exterior of the packing material.Rough handling must be avoided, and each package must be inspected for damageupon delivery. All observable damage should be indicated on the carrier's deliveryreceipt to expedite any insurance claims against the carrier.
At the installation site, all packaged units should be moved from the transportationvehicle to the point of storage or installation by hand, hand truck, or similar method.Shipment of the units from the factory to installation site is to be done in accordancewith the uniform freight classification rules.
No special tools are required to open the packing cases. A hammer, nail puller, largescrewdriver, adjustable-end wrench, and metal cutting shears are sufficient to openany packing case. The use of chisels, crowbars, and wrecking bars must be avoidedsince these tools may cause damage to the equipment when inserted into the case.
29748 5-8 Rev. 0
INADEQUATE CORE COOLING MONITOR-86
I.2.3.4.5.
2
3
4
5
RVLIS DISPLAY SWITCHT/C DISPLAY SWITCHSUBCOOL DISPLAY SWITCHPAGE SWITCH TO DIAGNOSTIC DISPLAY PAGEOPERATOR KEYPAD
025-A-2 1 99CA-20
Figure 5-1 Four-Button Keypad Arrangement
29748 Rev. 0
REMOTE DISPLAY INFORMATION
5-9
INADEQUATE CORE COOLING MONITOR-86 REMOTE DISPLAY INFORMATION
The remote displays are packaged in corrugated cardboard. To remove the packingfrom the displays the following procedure must be followed.
(1) Remove or open the top of the crate.
(2) Remove the internal shipping blocks or bracing.
(3) Lift out the assembly.
(4) Remove the protective wrapping.
5.7 INSPECTION
Upon receipt, the condition of the packing material and System components shouldbe noted. Any observable damage to any item should be indicated on the carrier'sdelivery receipt.
After unpacking all equipment, proceed with the inspection as follows:
(1) Examine the exterior of each item for dents, scratches, corrosion, dirt, andso forth.
(2) Examine the interior of each item as applicable and remove any foreignobjects or packing material that may be present.
(3) Perform a visual and mechanical inspection to verify that there are noloose ordamaged wires, wire harnesses, orwire interconnections. Also,confirm that all mechanical fasteners are in place and tight.
(4) Check that all printed circuit cards are properly seated with their matingconnector(s) and plug(s).
(5) Inspect for missing or broken lenses or parts.
(6) Verify that the power supply fuses are in their respective fuse holders andare not broken or jammed.
(7) Operate all switches to ascertain that they are not broken or jammed.
(8) Ensure that all slide rails operate freely without binding.
29748 5-10 Rev. 0
iue , I C t tJOULIi\W MvOUMI iOR-86 REMO-FE DISPLAY INFORMATION
5.8 STORAGE
All equipment should be stored in its original shipment packing, or suitableequivalent, until the time of final installation. Items should be maintained in theposition indicated on their original packaging.
The storage facility should be a fire-resistant, weather-tight, rodent-proof, well-ventilated structure. It should NOT be subject to liquid seepage or flooding.Provisions should be made for minimizing dust within the building.
The overall general requirements for storage are that the storage be in accordancewith ANSI N45.2.2.-1972, Level B.
The following environment must be maintained:
(1) The temperature must be between the limits of 40'F (50C) and 1200F (500C).
(2) The relative humidity must be between the limits of 15 and 95 percent.
5.9 PREOPERATIONAL CHECKOUT
Once the external connections of the display have been completed, the unit is readyfor a preoperational checkout.
Before powering up the System, loosen the four captive screws at the front of thedisplay and slide the electronics drawer out. Verify that all ribbon cables at the topof the card cage are seated properly. Also, check that no excessive amount of dirt ordebris has entered the chassis. Slide the electronics back into the mounting case andtighten the four captive screws until snug. Next, verify that the fuse F1 at the rear ofthe electronics package is still intact. The fuse in the stand-alone display should alsobe checked before connecting power to the unit.
After this visual check, the display should be ready for use. If not already done,connect cables to P1, P2, and P8. Turn switch S1 on. The display should show anintroductory page for the operator. Depressing any of the buttons should bring upanother page. Resetting the unit via the white reset switch on the rear of theelectronics package should return the introductory page to the display screen.Figure 5-2 shows the introductory page.
29748 5-11 Rev. 0
ICCM-8G
W A TTS BRf
TENNESSEE VALLEY AUTHORITYWATTS BAR NUCLEAR UNIT 1 (UBNP)TRRIN ACOPYRIGHT © 1989WESTINGHOUSE ELECTRIC CORPORATIONREMOTE DISPLAY SOFTWRRE VERSION 1.0 TVA NUCLEA
Figure 5-2 Typical Introductory Page
5.10 ICCM-86 DISPLAY PAGE DESCRIPTION
The ICCM-86 remote display consists of various graphic display pages which aredivided into the following four different types:
o Reactor coolant system (RCS) level displays
o Thermocouple displays
o Subcooling displays
o Miscellaneous displays
The reactor coolant system (RCS) level display pages include the RCS level summarypage, the RCS level sensor status page, the RCS level trend pages, and the RCSdiagnostics page. The thermocouple displays include the T/C quadrant summary
5-12 Rev. C)
INADEQUATE CORE COOLING MONITOR-86 REMOTFE DISPLAY INFORMATION
29748
INADEQUATE CORE COOLING MONITOR-86
page, tire T/C map page, the individual T/C quadrant page, the T/C averagetemperature trend page, the auctioneered high core quadrant average temperaturetrend page, and the T/C diagnostics pages. The subcooling displays include thesubcooling trend page, the heatup limit pressure-temperature curve page, thecooldown limit pressure-temperature curve page, and the subcooling diagnosticspage. There are two other pages which are categorized as miscellaneous displaypages and include the introductory page and the datalink failure page.
5.10.1 Display Page Access
Accessing the display pages requires using the four-button operator keypad. On thekeypad are buttons labeled "RVLIS," "T/C," "SUBCOOL," and "PAGE." Figure 5-1shows the ICCM-86 keypad button arrangement.
When the ICCM-86 remote plasma display is first powered up, the introductory pageis displayed. Figure 5-2 is an example of the introductory page. Once any of thebuttons on the operator keypad is pushed, this introductory page is erased and isreplaced with one of the graphic display pages. To reaccess the introductory page, ahardware reset must be applied to the display unit.
Pushing the "RVLIS" button on the keypad allows the operatorto access the vessellevel section of the software. This action brings up the RVLIS summary pagedescribed later in this section. The other displays in the vessel level monitoringsection can be accessed by pushing the "PAGE" button on the keypad. Pushing the"PAGE" button when the unit is displaying the RVLIS diagnostics page returns theoperator to the RVLIS summary page. Pushing the "RVLIS" button at any timereturns the operator to the RVLIS summary page. The display sequence for the vessellevel monitoring section is as follows:
(1) RVLIS Summary Page
(2) RVLIS Static Head Trend Page
(3) RVLIS Dynamic Head Trend Page
(4) RVLIS Sensor Display Page
(5) RVLIS Diagnostics Page
5-13 Rev. 0
REMOTE DISPLAY INFORMATION
29748
AD A CR O N OI RP T flRP - I N1 41 \rnMV It-, I AA -.4 IN
Pushing the "T/C" button on the keypad allows the operator to access thethermocouple monitoring section of the software. This action brings up the T/C mappage described later in this section. The other displays in the thermocouplemonitoring section can be accessed by pushing the "PAGE" button on the keypad.Pushing the "PAGE" button when the unit is displaying the T/C diagnostics pagereturns the user to the T/C map page. Pushing the "T/C" button at any time returnsthe operator immediately to the T/C map page. The display sequence for thethermocouple monitoring section is as follows:
(1) Incore T/C Map Page
(2) T/C Quadrant Summary Page
(3) Individual T/C Quadrant Page
(4) T/C Average Temperature Trend Page
(5)- Auctioneered High Core Quadrant Average Temperature Trend Page
(6) T/C Diagnostics Page 1
(7) T/C Diagnostics Page 2
When the "SUBCOOL" button is pressed, the subcooling trend page is displayed.The other subcooling pages are accessed as previously described. The displaysequence is as follows:
(1) Subcooling Trend Page
(2) Heatup Limit P-T Curve Page
(3) Cooldown Limit P-T Curve Page
(4) Subcooling Diagnostics Page
5.10.2 Miscellaneous Pages
Two pages of the plasma display graphics cannot be grouped into the functionalmonitoring areas and cannot be accessed by the operator. These are theintroductory page and the datalink failure page.
29748 Rev. 0
INADEQUATE CORE COOLING MONITOR-86 RFNAC)TP nirpi AY INICn>"IN AT~t-)l
5-14
INADEQUATE CORE COO[ING M(mnITfnP-qr. . .,w,- -- -- .. -. .-. S.,'-'. IV I..J I C L.'I.)rLM IT i\,-UMIVIAA I UIONA
5.10.2.1 Introductory Page
When the remote display is first powered up, an introductory page appears whichcontains the logos of both the utility and Westinghouse. In addition, the pageidentifies the plant and version number for which the software is applicable and theinstrumentation train orientation. Figure 5-2 shows a typical introductory page.
5.10.2.2 Datalink Failure Page
In the event of a datalink failure between the ICCM-86 main electronics cabinet andthe ICCM-86 System remote plasma display unit, a software monitor blanks thepreviously requested page and presents "DATALINK FAILURE" in bold letters on thescreen. A typical display of the datalink failure page is shown in figure 5-3.
Figure 5-3 Typical Datalink Failure Display Page
29748Rev. 0
DI: N An =! I", IC M I A\/ I h lr'l--l n � AA � I - � I
in
5-1 5
INADEQUATE CORE COOLING MONITOR-86 REMOTE DISPLAY INFORMATION
The display software monitor allows 10 seconds before displaying this message. Thepreviously requested page returns once the datalink is reestablished.
A datalink failure can be caused by the following:
o The ICCM-86 System main electronics cabinet is powered down.
o The ICCM-86 System main electronics cabinet has a malfunction associatedwith the display datalink while the cabinet is in the online mode.
o The ICCM-86 System main electronics cabinet is in a cold self-calibrationmode (cold start).
o The ICCM-86 System main electronics cabinet is in the offline mode (offlinemenus).
5.10.3 Vessel Level Monitoring
This group of display pages allows an operatorto monitor coolant levels in thereactor vessel. Five pages are necessary and are as follows:
o RVLIS Summary Page
o RVLIS Static Head Trend Page
o RVLIS Dynamic Head Trend Page
o RVLIS Sensor Display Page
o RVLIS Diagnostics Page
These pages are explained in detail in the following paragraphs.
5.10.3.1 RCS Level Summary Display Page
The RCS level display pages allow an operator to monitor levels readings in the hotleg and the reactor vessel. The following five pages are necessary and are describedin the following sections:
o RCS Level Summary
29748 AV- I U Rev. 0

A Q- aE C E C OLI -IR L rf I I- I I V R I -I I I V -A I N
o RCS Static Head Level Trend
o RCS Dynamic Head Level Trend
o RCS Level Sensor Status
o RCS Diagnostics
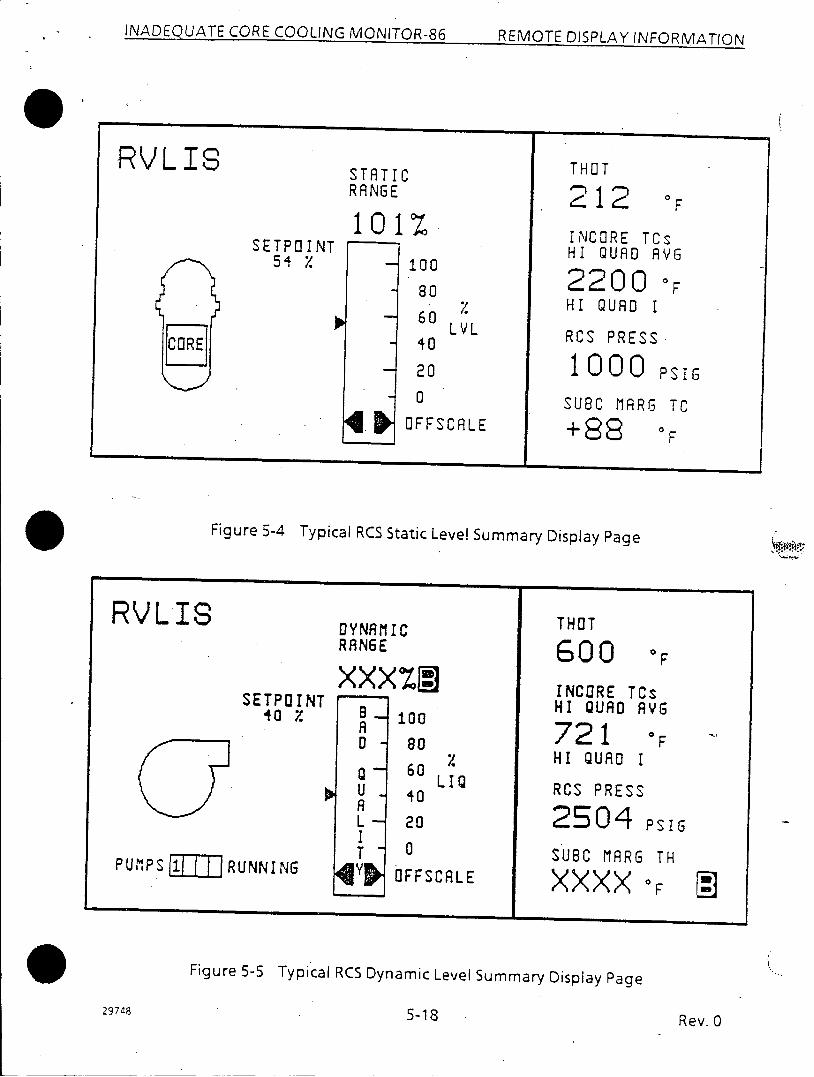
As illustrated in figures 5-4 and 5-5, the RCS level summary page has a verticalsimulated meter for indicating either the static or dynamic vessel level range, agraphic representation of either the reactor vessel or a reactor coolant pump (RCP),and a vertical listing of other System parameters. These graphic examples arepresented only to familiarize the operator with the mechanics of the ICCM-86System, and do not necessarily represent an exact replica of the display page thatactually appears on the screen,
This display page layout will depict viewing left to right:
o A representative layout of the reactor vessel or a reactor coolant pump(RCP)
o The static or dynamic range meter
o The listing of System parameters
The static/dynamic range meter is scaled from zero to 100 percent. A pointer insidethe vertical meter scale indicates the current level reading. A pointer and numericvalue outside the meter indicate the critical vessel level setpoint. Above thestatic/dynamic range meter is the rounded whole number value for the current levelreading. The heading "Static Range" or "Dynamic Range," depending on thecurrent conditions of the reactor, will also appear above the scaled meter.
A calculated analog input point quality code of BAD associated with vessel headlevel will cause the word BAD QUALITY to be vertically displayed inside thestatic/dynamic range meter. The level indicator will default to an offscale lowposition and any numeric values associated with vessel head level will be replacedwith the value XXXB. The "B" will appear in reverse video.
29748 5-17 Rev. 0
INDQATE CORE COOLING MONITOR-86 REMnTP: nirP1 AY 1K1--nP1\AaTlnN
INADEQUATE CORE COOLING MONITOR-86
STRT I CRANGE
SETPOINT54 %.
101
4'1~
100
80
60 LVL40
20
0
OFFSCALE
RVLIS
I
Figure 5-4 Typical RCS Static Level Summary Display Page
RVLIS
SETPOINT40 %
PUMPS 1 RUNNING
0?YNRAtICRANGE
xxx~zmOIYR IC
0 -
a-U-AL-
TI
4VO
100
80
60 LIQ
40
20
0
OFFSCALE
I
THOT
600 OF
INCURE TCsHI QUAD AVG
72 1 FHI QUAD I
RCS PRESS
2504 PSIG
SUBC MARG TH
XXXX OF
Figure 5-5 Typical RCS Dynamic Level Summary Display Page
5-1829748Rev. 0
THOT
2 12 F
INCORE TCsHI QUAD AVG
2200 OFHI QUAD I
RCS PRESS
1 000 PSIG
SUBC MRR6 TC
+88 OF
I
-
--
REMOTE DISPLAY INFORMATION
I --1
ipi@isr1',.s
INADEQUATE CORE COOLING MONITOR-86
If the current level percentage is "Offscale," either high or low, the pointer inside ofthe range meter will default to the position labeled "OFFSCALE." A quality code of"POOR" will then be assigned to level readings.
A calculated analog input point quality code of POOR associated with vessel headlevel will cause a reverse video "P" to follow any numeric values associated withvessel head level.
During dynamic operations, the status of the RCPs will be displayed in a blockrepresentation identified by a "PUMPS RUNNING" descriptor. If a pump is running,the number of that pump (1,2,3, or 4) will appear in the appropriate box within theblock. If a pump is not running, the box will appear empty. If an RCP goes BAD, thena reverse video upper case "B" will appear in the appropriate block.
Whenever an RCP is in the start-up or coastdown mode, the display will indicate boththe mode and pump number involved. The message "RVLIS INACCURATE" will alsobe displayed during either of these modes. A quality code of "Poor" will be assignedto RVLIS level during the startup or coastdown period.
In addition to the RVLIS on this page, the current rounded whole number values forINCORE TCs HI QUAD AVG, HI QUAD, THOT, RCS PRESS, and SUBC MARG (TC or TH)are given on the right-hand side of this display page. If the value for SUBC MARG (TCor TH) turns less than some critical setpoint, then its respective value will bedisplayed in reverse video.
If a calculated analog input point quality code of BAD or SUSPECT (without amanually entered value) is assigned to any of these values, then a reverse video "B"or "S," respectively, will be displayed next to the new value of X's, for a "BAD"quality code, or D's, for a "SUSPECT" quality code.
If a quality code of SUSPECT (with a manually entered value) is assigned to any ofthese values, then a reverse video "S" will be displayed next to the current numericvalue.
If a calculated analog input point quality code of POOR is assigned to any of thesevalues, then a reverse video "P" will be displayed next to the current numeric-value.
5-19 Rev. 0
REOT DISLA IFRATIN
29748
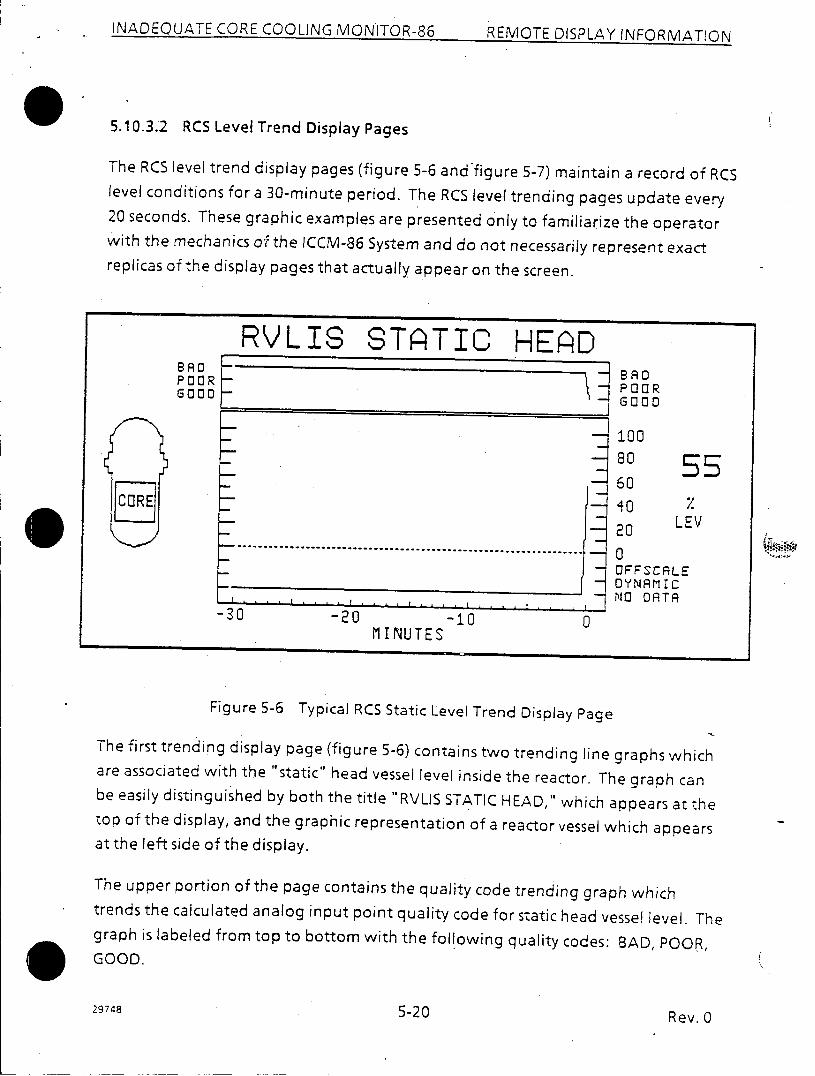
5.10.3.2 RCS Level Trend Display Pages
The RCS level trend display pages (figure 5-6 and figure 5-7) maintain a record of RCSlevel conditions for a 30-minute period. The RCS level trending pages update every20 seconds. These graphic examples are presented only to familiarize the operatorwith the mechanics ofthe ICCM-86 System and do not necessarily represent exactreplicas of the display pages that actually appear on the screen.
RVLIG STATIC HEAD
.-.. -.
-30 -20 -10 0MI NUTES
BADPOORGOOI
100
80 556040 %/
20 LEV0OFFSCALEDYNAR ICpNO DATA
Figure 5-6 Typical RCS Static Level Trend Display Page
The first trending display page (figure 5-6) contains two trending line graphs whichare associated with the "static" head vessel level inside the reactor. The graph canbe easily distinguished by both the title "RVLIS STATIC HEAD," which appears at thetop of the display, and the graphic representation of a reactor vessel which appearsat the left side of the display.
The upper portion of the page contains the quality code trending graph whichtrends the calculated analog input point quality code for static head vessel level. Thegraph is labeled from top to bottom with the following quality codes: BAD, POOR,GOOD.
29748 5-20 Rev. 0
POORGOOD
REMOTE DISPLAY INFORMATION
I,;4tI.- .,
INADEQUATE CORE COOLING MONITOR-86
NADEQUAT CORE COO-. G , T - I PIF V I L. lII LAV I Il Dr TINVI1 i %-.NI
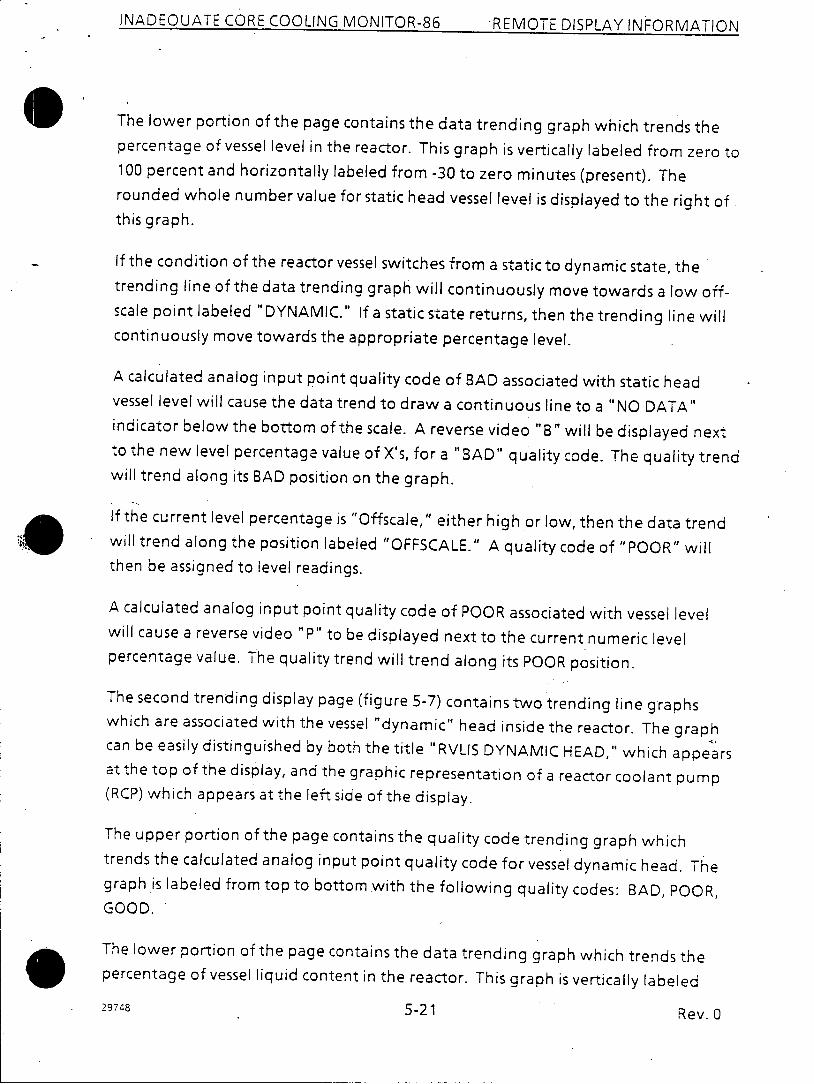
The lower portion of the page contains the data trending graph which trends thepercentage of vessel level in the reactor. This graph is vertically labeled from zero to100 percent and horizontally labeled from -30 to zero minutes (present). Therounded whole number value for static head vessel level is displayed to the right ofthis graph.
If the condition of the reactor vessel switches from a static to dynamic state, thetrending line of the data trending graph will continuously move towards a low off-scale point labeled "DYNAMIC." If a static state returns, then the trending line willcontinuously move towards the appropriate percentage level.
A calculated analog input point quality code of BAD associated with static headvessel level will cause the data trend to draw a continuous line to a "NO DATA"indicator below the bottom of the scale. A reverse video "B" will be displayed nextto the new level percentage value of X's, for a "BAD" quality code. The quality trendwill trend along its BAD position on the graph.
If the current level percentage is "Offscale," either high or low, then the data trendwill trend along the position labeled "OFFSCALE." A quality code of "POOR" willthen be assigned to level readings.
A calculated analog input point quality code of POOR associated with vessel levelwill cause a reverse video "P" to be displayed next to the current numeric levelpercentage value. The quality trend will trend along its POOR position.
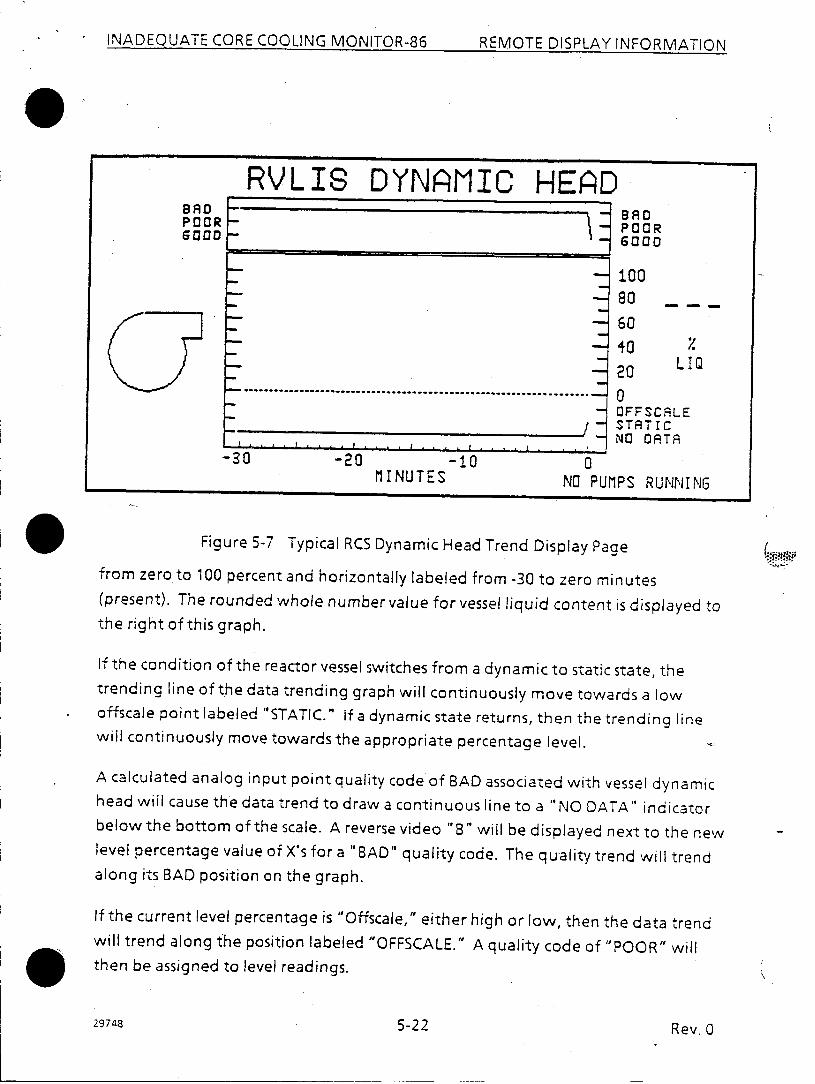
The second trending display page (figure 5-7) contains two trending line graphswhich are associated with the vessel "dynamic" head inside the reactor. The graphcan be easily distinguished by both the title "RVLIS DYNAMIC HEAD," which appearsat the top of the display, and the graphic representation of a reactor coolant pump(RCP) which appears at the left side of the display.
The upper portion of the page contains the quality code trending graph whichtrends the calculated analog input point quality code for vessel dynamic head. Thegraph is labeled from top to bottom with the following quality codes: BAD, POOR,GOOD.
The lower portion of the page contains the data trending graph which trends thepercentage of vessel liquid content in the reactor. This graph is vertically labeled
29748 5-21 Rev. 0
INADEQUATE CORE COOLING MONITOR-86; PP111t)7F n)iIZD AV IxeNI~-)RAA-rlnh
INADEQUATE CORE COOLING MONITOR-86
Figure 5-7 Typical RCS Dynamic Head Trend Display Page
from zero to 100 percent and horizontally labeled from -30 to zero minutes(present). The rounded whole number value for vessel liquid content is displayed tothe right of this graph.
If the condition of the reactor vessel switches from a dynamic to static state, thetrending line of the data trending graph will continuously move towards a lowoffscale point labeled "STATIC." If a dynamic state returns, then the trending linewill continuously move towards the appropriate percentage level. -)
A calculated analog input point quality code of BAD associated with vessel dynamichead will cause the data trend to draw a continuous line to a "NO DATA" indicatorbelow the bottom of the scale. A reverse video "B" will be displayed next to the newlevel percentage value of X's for a "BAD" quality code. The quality trend will trendalong its BAD position on the graph.
If the current level percentage is "Offscale," either high or low, then the data trendwill trend along the position labeled "OFFSCALE." A quality code of "POOR" willthen be assigned to level readings.
5-22 Rev. 0
REMOTE DISPLAY INFORMATION
29748
INADEQUATE CORE COOLING MONITOR-86
A calculated analog input point quality code of POOR associated with vessel dynamichead will cause a reverse video "P" to be displayed next to the current numeric levelpercentage value. The quality trend will trend along its POOR position.
(The following paragraphs apply to both RVLIS trend pages.)
When the reactor vessel is in a dynamic state, the status of the RCPs will be displayedin a block representation identified by a "PUMPS RUNNING" descriptor. If a pump isrunning, the number of that pump (1,2,3, or 4) will appear in the appropriate boxwithin the block. If a pump is not running, the box will appear empty. If an RCP goesBAD, then a reverse video upper case "B" will appear in the appropriate block.
Whenever a RCP is in the startup or coastdown mode, the display will indicate boththe mode and the message "RVLIS INACCURATE."
In the event of a datalink failure, the trending line graphs are driven to their "NODATA" positions once the datalink returns.
5.10.3.3 Sensor Status Display Pages
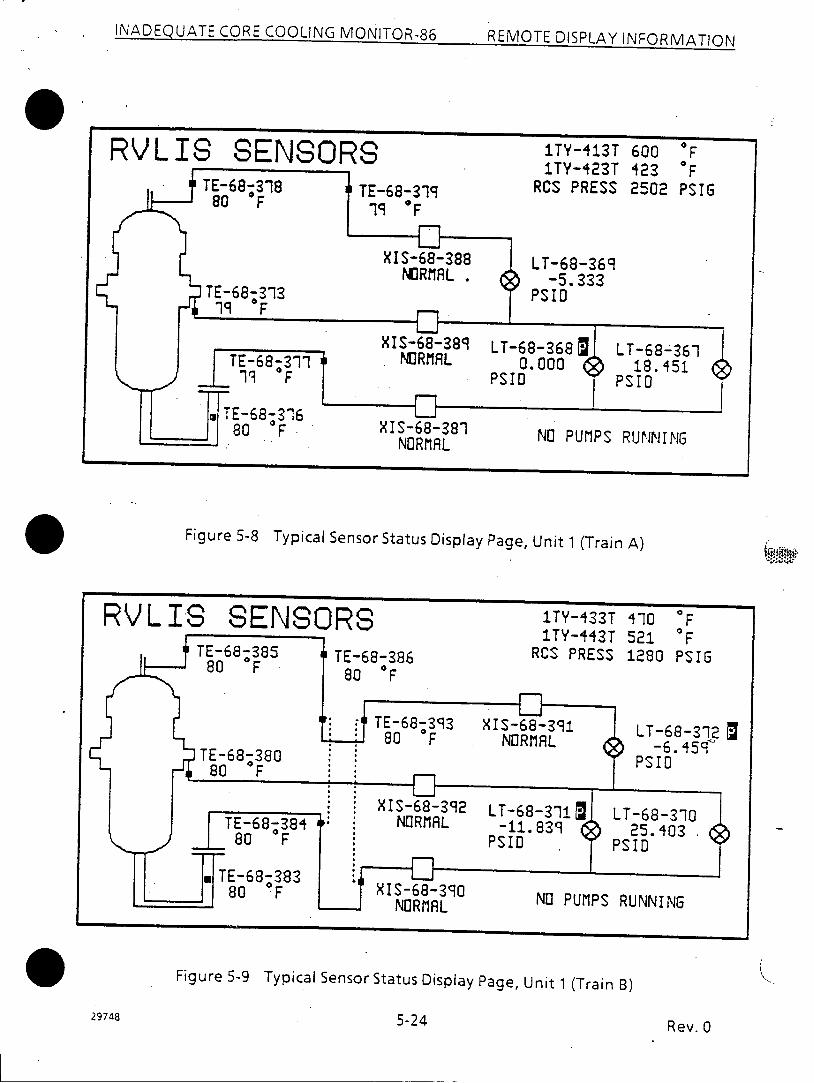
The RCS level sensor status display pages (figures 5-8 and 5-9) show a brief layout ofthe RCS level system. A representation of the reactor vessel is given along with thelocation of the compensation RTDs, the hydraulic isolators, and the RCS level D/Ptransmitters. These graphic examples are presented only to familiarize the operatorwith the mechanics of the ICCM-86 System, and do not necessarily represent exactreplicas of the display pages that actually appear on the screen.
If a sensor malfunction event occurs, a message is displayed next to the sensordescribing its condition. A listing of the sensors and messages associated with each isgiven in tables 5-1 and 5-2.
5-23 Rev. 0
REMOTE DISPLAY INFORMATION
29748
INADEQUATE CORE COOLING MONITOR-86 REMOTE DISPLAY INFORMATION
RVLIS SENSORSTE-68;318 TE-68-319II80 F 19 "
TE-68-3131q F
;316F
ITY-413T 600 FITY-423T 423 F
RCS PRESS 2502 PSIG
LT-68-369-5.333
PSID
NO PUM1PS RUNrNING
Figure 5-8 Typical Sensor Status Display Page, Unit 1 (Train A)
Figure 5-9 Typical Sensor Status Display Page, Unit 1 (Train B)
29748 5-24 Rev. 0
I r- i Cult: tULII\jG NONITOR-86 REMOTE DISPLAY INFORMATION
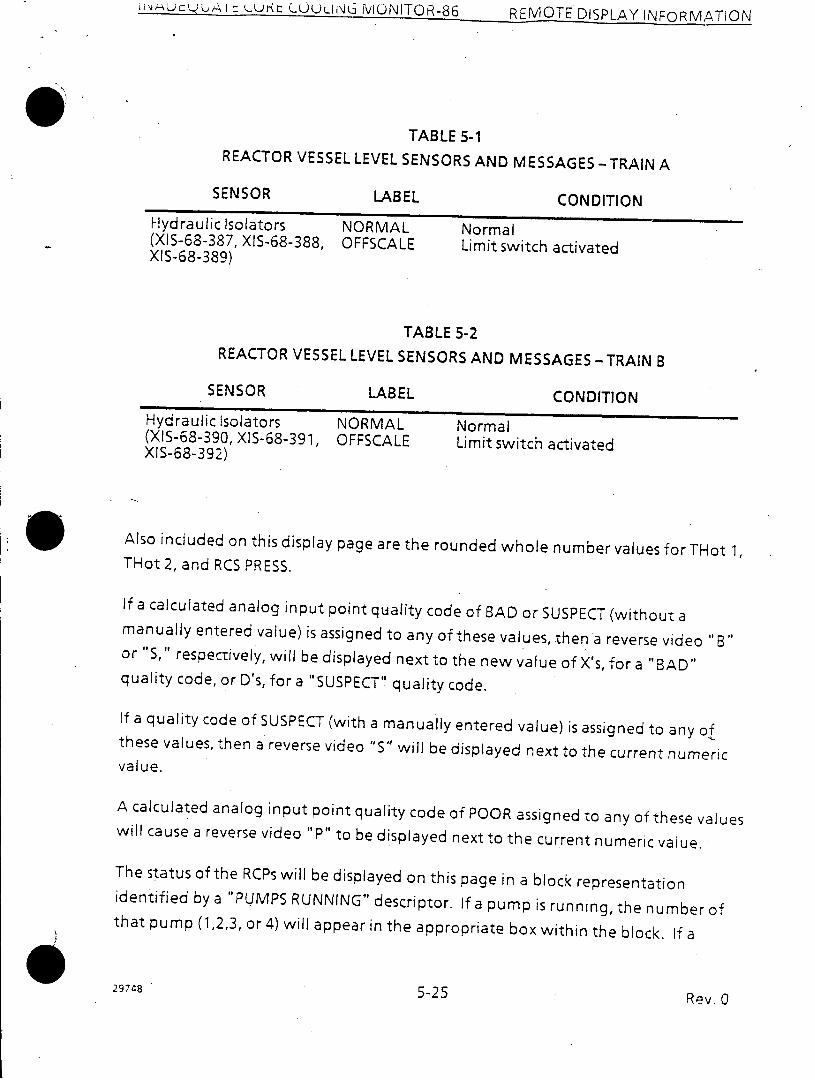
TABLE 5-1REACTOR VESSEL LEVEL SENSORS AND MESSAGES -TRAIN A
SENSOR LABEL CONDITION
Hydraulic Isolators NORMAL Normal(XIS-68-387, XIS-68-388, OFFSCALE Limit switch activatedXIS-68-389)
TABLE 5-2REACTOR VESSEL LEVEL SENSORS AND MESSAGES -TRAIN B
SENSOR LABEL CONDITION
Hydraulic Isolators NORMAL Normal(XIS-68-390, XIS-68-391, OFFSCALE Limit switch activatedXIS-68-392)
Also incduded on this display page are the rounded whole number values for THot 1,THot 2, and RCS PRESS.
If a calculated analog input point quality code of BAD or SUSPECT (without amanually entered value) is assigned to any of these values, then a reverse video "B"or "S," respectively, will be displayed next to the new value of X's, for a " BAD "quality code, or D's, for a "SUSPECT" quality code.
If a quality code of SUSPECT (with a manually entered value) is assigned to any ofthese values, then a reverse video "S" will be displayed next to the current numericvalue.
A calculated analog input point quality code of POOR assigned to any of these valueswill cause a reverse video "P" to be displayed next to the current numeric value.
The status of the RCPs will be displayed on this page in a block representationidentified by a "PUMPS RUNNING" descriptor. If a pump is running, the number ofthat pump (1,2,3, or 4) will appear in the appropriate box within the block. If a
29748 5-25 Rev. 0
INADEQUATE CORE COOLING MONITOR-86 REMOTE DISPLAY INFORMATION
pump is not running, the box will appear empty. If an RCP goes BAD, then a reversevideo upper case "B" will appear in the appropriate block.
Whenever an RCP is in the startup or coastdown mode, the display will indicate boththe mode and pump number involved. The message "RVLIS INACCURATE" will alsobe displayed during either of these modes.
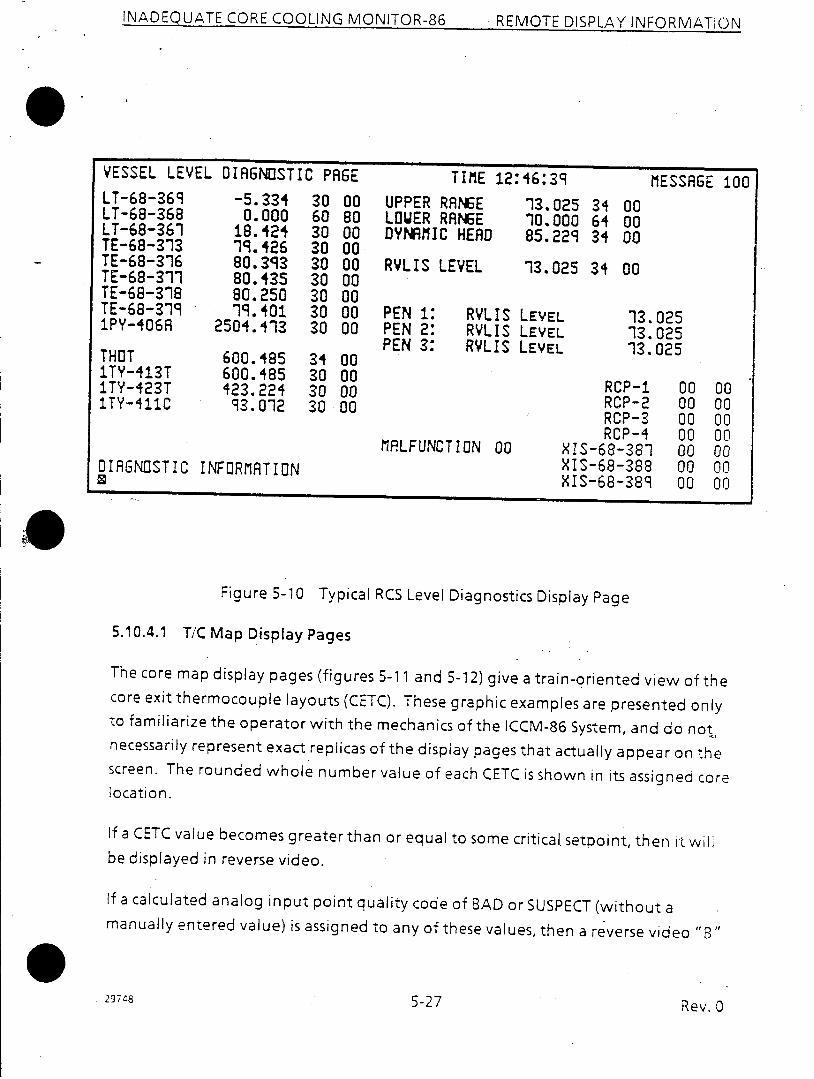
5.10.3.4 Vessel Level Diagnostics Page
The vessel level diagnostics page handles the vessel level portion of the ICCM-86System. This page displays diagnostic information for the RVLIS inputs and outputs.
At the bottom of the display page is an area reserved for diagnostic informationmessages. The ti me and message number appear at the top of the display page. Thetime and message number will update every 2 seconds if the datalink is workingproperly. Figure 5-10 shows a vessel level diagnostics page. This graphic example is arepresentative example of the display that appears. However, it should be notedthat the numerical values shown are arbitrary numbers used solely to generate theexample. The numerical values are a dynamic element and will change.
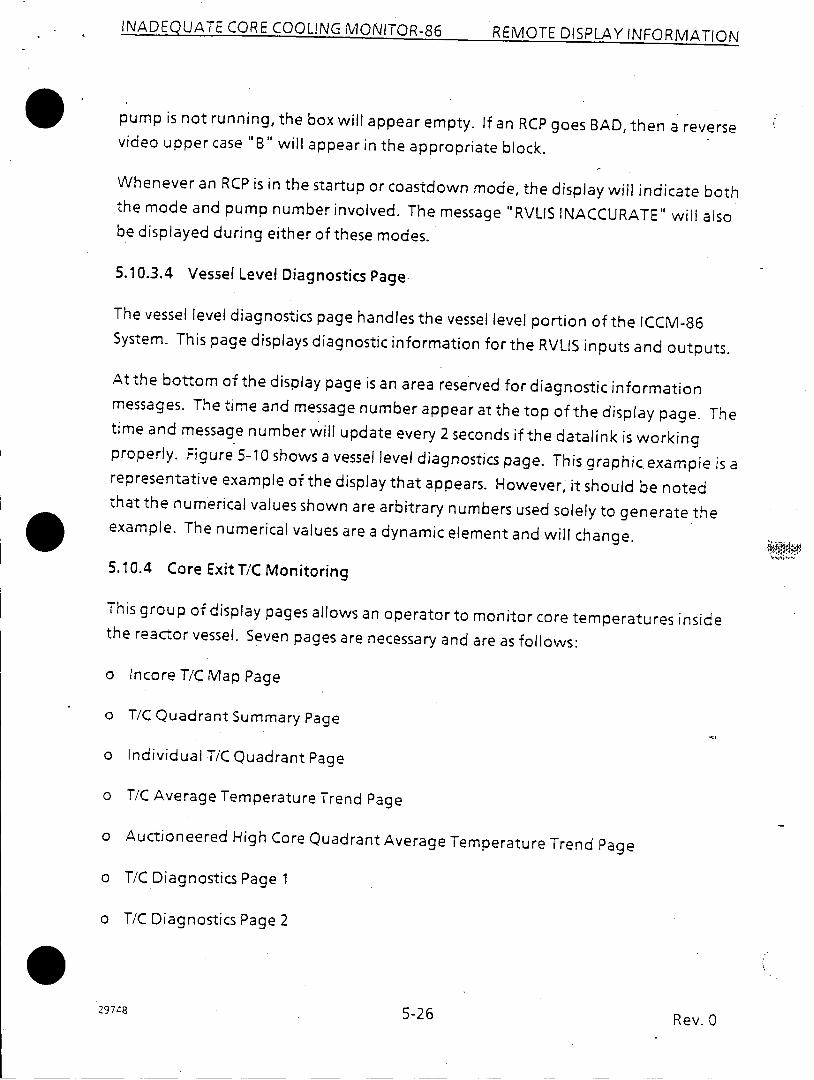
5.10.4 Core ExitT/C Monitoring
This group of display pages allows an operator to monitor core temperatures insidethe reactor vessel. Seven pages are necessary and are as follows:
o Incore T/C Map Page
o T/C Quadrant Summary Page
o Individual T/C Quadrant Page
o T/C Average Temperature Trend Page
o Auctioneered High Core Quadrant Average Temperature Trend Page
o T/C Diagnostics Page 1
o T/C Diagnostics Page 2
29748 5-26 Rev. 0
INADEQATE C. ORE COOLIN N IF R | f v LT [ A-,r IIVI II I C' DI\A IINI
Or cf r I I| r Ifr-l ny - - - -c---.-.-.-
LT-68-369LT-68-368LT-68-361TE-68-313TE-68-316TE-68-311TE-68-318TE-68-3191PY-406R
THOTITY-413TITY-423TITY-411C
TIME 12:46:39-5.3340. 000
18.42419.42680.39380. 43580.25019. 401
2504. 413
600. 485600. 485423. 22493.012
306030303030303030
34303030
008000000000000000
00000000
UPPER RANGELOUER RANGEDYNAMIC HERD
RYLIS LEVEL
PEN 1:PEN 2:PEN 3:
RYLISRVILISRYLIS
MALFUNCTION 00DIAGNOSTIC INFORMRATION
13.02510.00085.229
13.025
LEVELLEVELLEVEL
MESSRGE 10034 0064 0034 00
34 00
13.02513.02513.025
RCP-1RCP-2RCP-3RCP-4
XI S-68-381XIS-68-388XIS-68-389XIS-68-389 00 00
Figure 5-10 Typical RCS Level Diagnostics Display Page
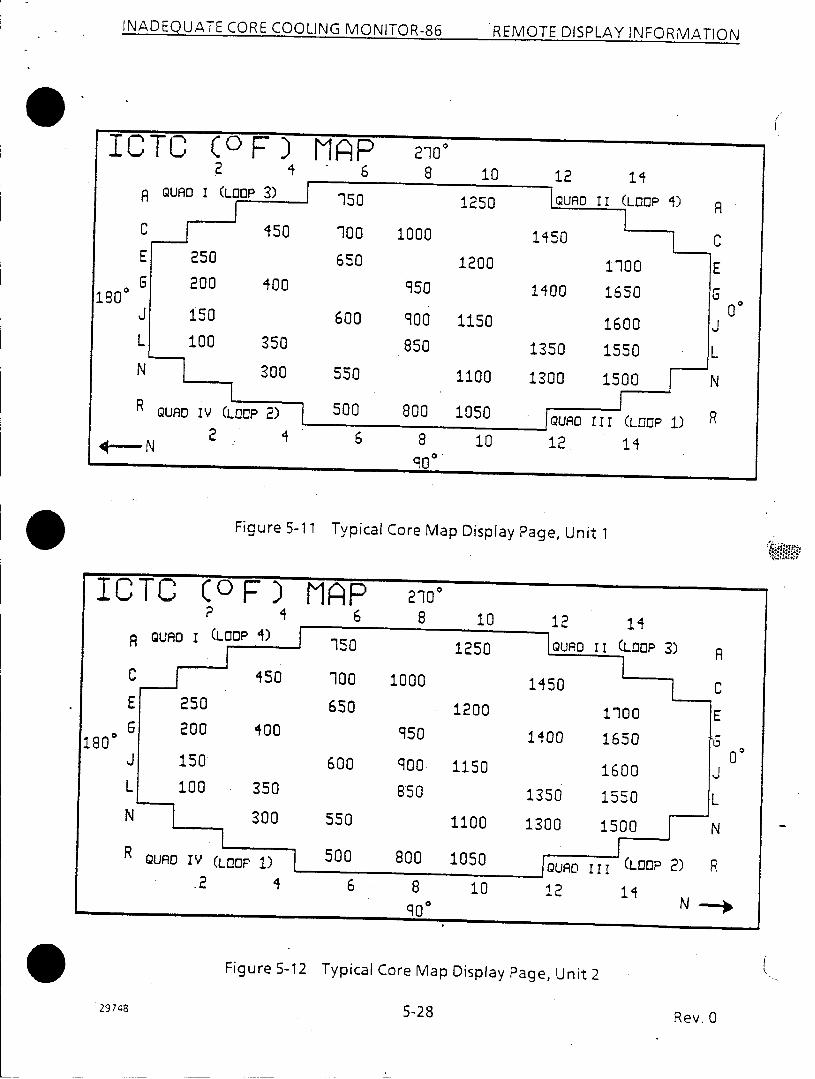
5.10.4.1 T/C Map Display Pages
The core map display pages (figures 5-11 and 5-12) give a train-oriented view of thecore exit thermocouple layouts (CETC). These graphic examples are presented onlyto familiarize the operator with the mechanics of the ICCM-86 System, and do not,necessarily represent exact replicas of the display pages that actually appear on thescreen. The rounded whole number value of each CETC is shown in its assigned corelocation.
If a CETC value becomes greater than or equal to some critical. setpoint, then itC wilibe displayed in reverse video.
If a calculated analog input point quality code of BAD or SUSPECT (without amanually entered value) is assigned to any of these values, then a reverse video "B"
297 8 5-27 Rev. 0
00000000000000
00000000000000
INADEQUATE CORE COOLING MONITOR-86; PP NA )TP K IA In9P Nv Irnlsn ATWIN I
TC.),zL LCVCL UIMUM., 1 U VRbEI
REMOTE DISPLAY INFORMATION
ICTCA QURE
C
E
180° 6J
L
N
R QUAD
*- N
f/ % I-- N , kA -I r-
2 41-1HH
6210°
8 10 12
10P i) A
0o
2 4 6 8 10 12-qn I
Figure 5-11 Typical Core Map Display Page, Unit 1
ICTCR QUA(
CE
18
f- )4
MiSH 21006 8 10 12 14
-In, -- -
.2 4 6 8 10 12
Mu
Figure 5-12 Typical Core Map Display Page, Unit 2
5-28 Rev. 0
0
- N --
-
A - - -- -.11 f-% I-- -�' � I - -
I
?u
Nano
29 748
INADEQUATE CORE COOLING MONITOR-86
INADEQUATE CORE COOLING MONITOR-86
or "S," respectively, will be displayed next to the new value of X's, for a "BAD"quality code, or D's, for a "SUSPECT" quality code.
If a quality code of SUSPECT (with a manually entered value) is assigned to any ofthese values, then a reverse video "S" will be displayed next to the current numericvalue.
A calculated analog input point quality code of POOR assigned to any of these valueswill cause a reverse video "P" to be displayed next to the current numeric value.
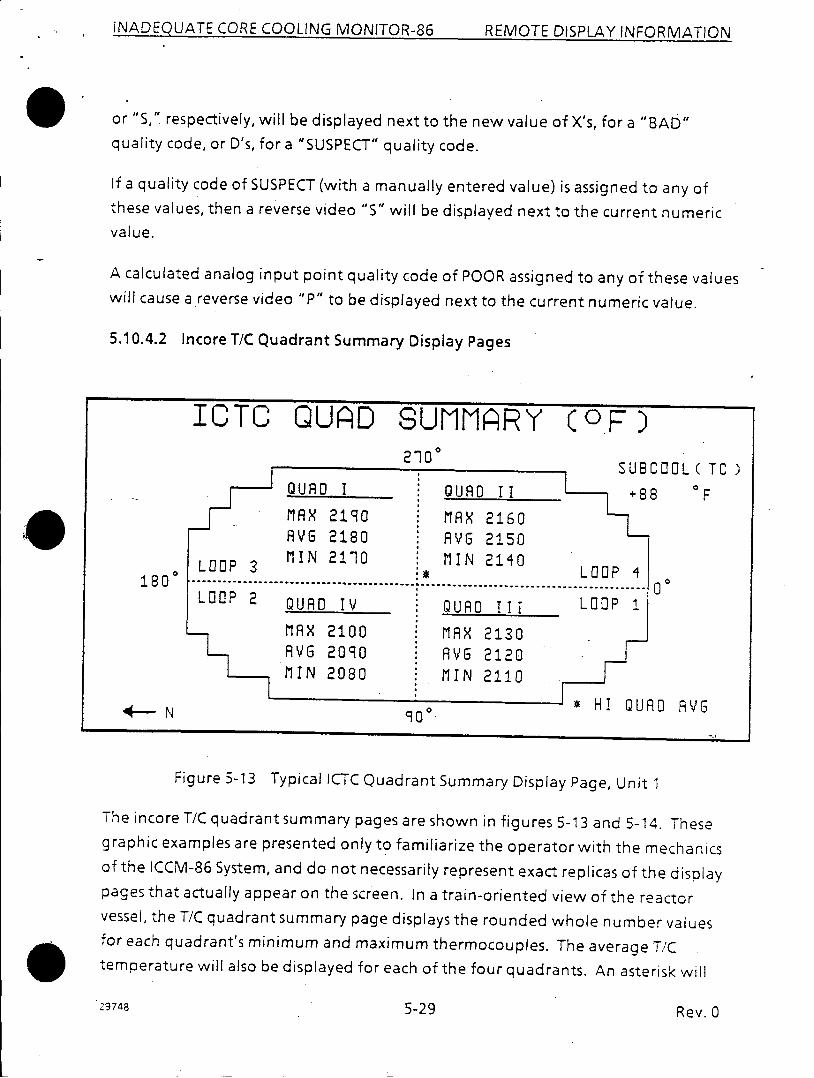
5.10.4.2 Incore T/C Quadrant Summary Display Pages
ICTC QUAD GUNNARY (OF)210°
QUAD I QUAD IIfMAX 2190 MAX 2160AVG 2180 RVG 2150
oLOOP 3 MIN 2110 MIN 2140 LOOP80U -------------------------- 1 ....................
LOOP 2 QUAD IV ,QURD III LOOP1
MR 2100 . MAX 2130A VG 2090 A VG 2120
- MIN 2080 .MIN 2110
4-- N * 31 HI QU900
!COOL( TC )38 °F
O 0
RD RAVG
Figure 5-13 Typical ICTC Quadrant Summary Display Page, Unit 1
The incore T/C quadrant summary pages are shown in figures 5-13 and 5-14. Thesegraphic examples are presented only to familiarize the operator with the mechanicsof the ICCM-86 System, and do not necessarily represent exact replicas of the displaypages that actually appear on the screen. In a train-oriented view of the reactorvessel, the T/C quadrant summary page displays the rounded whole number valuesfor each quadrant's minimum and maximum thermocouples. The average T/Ctemperature will also be displayed for each of the four quadrants. An asterisk will
5-29 Rev. 0
- - -
REMOTE DISPLAY INFORMATION
29748
-~ H P
1WALuttUA I-t UKt (.UULJN(j MONITOR-86 -- REMOTE DISPLAY INFORMATION
ICTC QUAD GUNNARY (OF27100
2 n 0 , ~SU BC O OL (T C)Q UARD I Q UARD I I + 8 8 FMAX 2100 MAX 2160AVG 2180 AVG 2150
N 2110 MIN 2140
Figure 54 TpclITQudatSm ryDs La Pae Ui
1 8 0 -- - - -- - - - -- - - - -- - - - -- - - - .............................................. ......................................L O OP I Q U. D I V .QU.ARD I I I LOO DP 2
MARX 2 1 00 MA nRX 2 13 0
MnI N 2 0 80 .MnIN 2 11 0
N ' --H q O ° £ H I Q UA R ARVG6
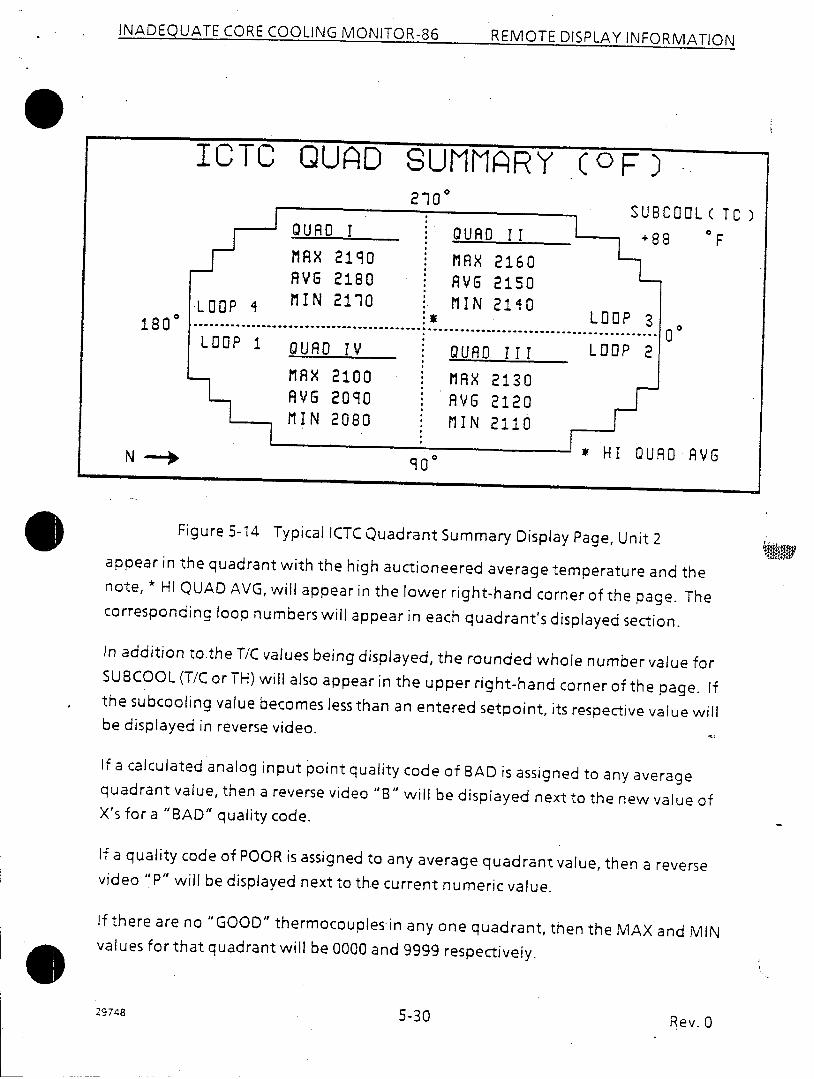
Figure 5-14 Typical ICTC Quadrant Summary Display Page, Unit 2appear in the quadrant with the high auctioneered average temperature and thenote, * HI QUAD AVG, will appear in the lower right-hand corner of the page. Thecorresponding loop numbers will appear in each quadrant's displayed section.
In addition to the T/C values being displayed, the rounded whole number value forSUBCOOL (T/C orTH) will also appear in the upper right-hand corner of the page. Ifthe subcooling value becomes less than an entered setpoint, its respective value willbe displayed in reverse video.
If a calculated analog input point quality code of BAD is assigned to any averagequadrant value, then a reverse video "B" will be displayed next to the new value ofX's for a "BAD" quality code.
If a quality code of POOR is assigned to any average quadrant value, then a reversevideo "P" will be displayed next to the current numeric value.
If there are no "GOOD" thermocouples-in any one quadrant, then the MAX and MINvalues for that quadrant will be 0000 and 9999 respectively.
29748 5-30 C'r[ev. U
I h IA r% r-1-% 1 1 . -1 -- - - -- - . , . . - . - - - _ - -
NAD-UATE COR COLNG l lK- aI l l1 I II\ATI
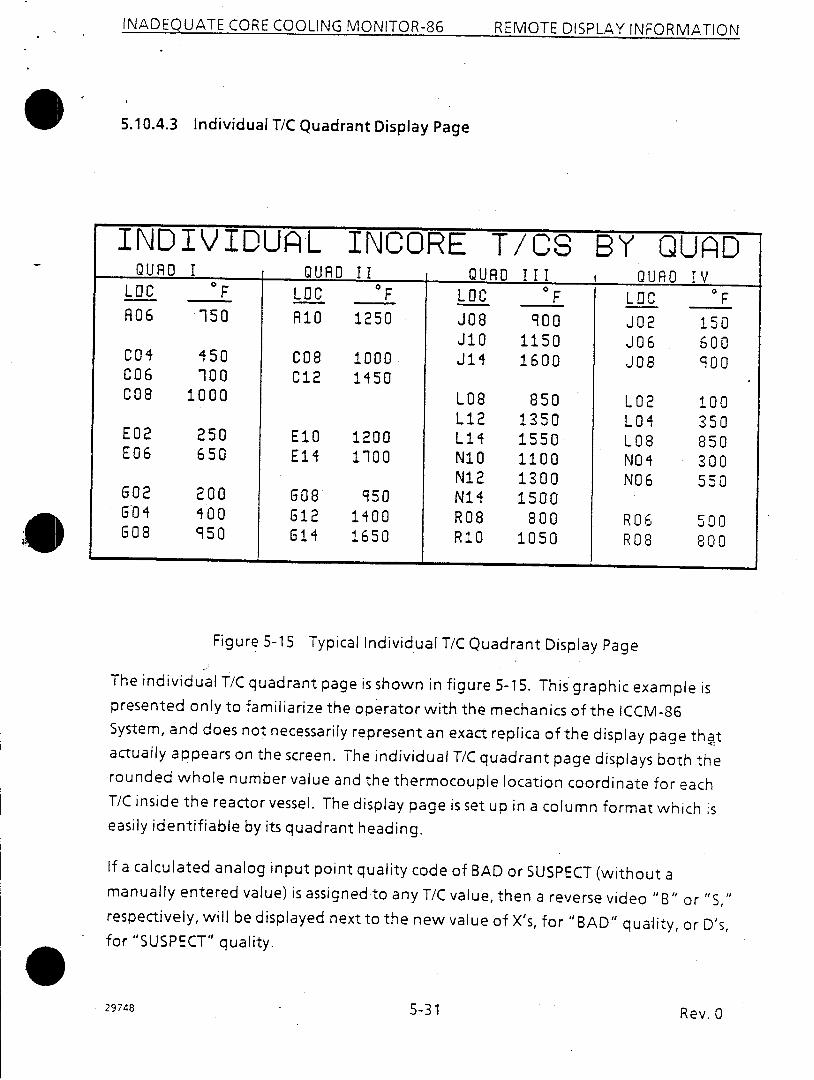
5.10.4.3 Individual T/C Quadrant Display Page
Figure 5-15 Typical Individual T/C Quadrant Display Page
The individual T/C quadrant page is shown in figure 5-15. This graphic example ispresented only to familiarize the operator with the mechanics of the ICCM-86System, and does not necessarily represent an exact replica of the display page thatactually appears on the screen. The individual T/C quadrant page displays both therounded whole number value and the thermocouple location coordinate for eachT/C inside the reactor vessel. The display page is set up in a column format which iseasily identifiable by its quadrant heading.
If a calculated analog input point quality code of BAD or SUSPECT (without amanually entered value) is assigned to any T/C value, then a reverse video "B" or "S,"respectively, will be displayed nextto the new value of X's, for "BAD" quality, or D's,for "SUSPECT" quality.
29748 5-31 Rev. 0
INDIVIDURAL INCORE T/CS BY QUADOURO I QUAD II QUAD III QUAD IV
LOC F LOC F LOC F LOC °FA06 150 R10 1250 J08 900 J02 150
J10 1150 JO6 600C04 450 C08 1000 J14 1600 JO8 900CO6 100 C12 1450COB 1000 L08 850 L02 100
L12 1350 L04 350E02 250 E10 1200 L14 1550 L08 850E06 650 E14 100 N10 1100 N04 300
N12 1300 N06 550G10 2 2 00 G08 q9O N14 1500GR04 400 G12 1400 R08 800 R06 500G08 950 G14 1650 R1O 1050 R08 800
INADEQUATE CORE COOLING MONITOR-86; REMnTP nKqPI AV 1Ki~nIF\/AtTI<A
INADEQUATE CORE COOLING MONITOR-86 REMOTE DISPLAY INFORMATION
If a quality code of SUSPECT (with a manually entered value) is assigned to any ofthese values, then a reverse video "S" will be displayed next to the current numericvalue.
If a quality code of POOR is assigned to any T/C value, then a reverse video "P" willbe displayed next to that current numeric value.
If a thermocouple becomes greater than or equal to some critical setpoint, then itsvalue will be displayed in reverse video.
5.10.4.4 Incore Thermocouple Trend Display Page
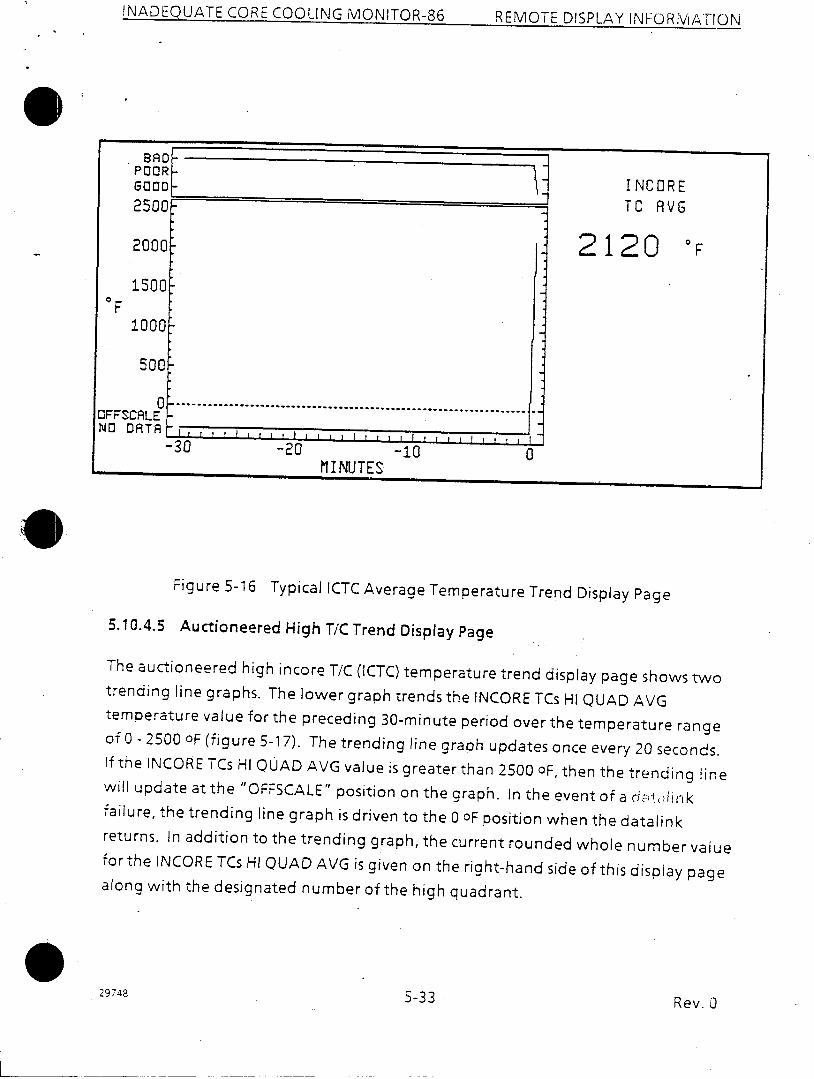
The incore thermocouple (ICTC) average temperature trend display page shows twotrending line graphs. The lower graph trends the INCORE TCs AVG temperaturevalue for the preceding 30-minute period over the temperature range of 0 - 2500degrees Fahrenheit (figure 5-16). The trending line graph updates once every 20seconds. If the INCORE T/Cs AVG value is greaterthan 2500 degrees Fahrenheit, thetrending line will update at the 'OFFSCALE" position on the graph. In the event of adatalink failure, the trending line graph is driven to the "NO DATA" position whenthe datalink returns. In addition to the trending graph, the current rounded wholenumber value for the INCORE TCs AVG is given on the right side of this display page.
The upper graph trends the calculated analog input point quality code for theINCORE TCs AVG temperature. The graph is labeled from top to bottom with thefollowing quality codes: BAD, POOR, GOOD.
A calculated analog input point quality code of BAD associated with the INCORE TCsAVG temperature will cause the data trend (lower graph) to draw a continuous lineto the "NO DATA" indicator below the bottom of the scale. A reverse video " B " willbe displayed next to the new average temperature value of X's for a "BAD" qualitycode. The quality trend (upper graph) will trend along its BAD position on thegraph.
A calculated analog input point quality code of POOR associated with INCORE TCsAVG temperature will cause a reverse video "P" to be displayed next to the currentaverage temperature value. The quality trend will trend along its POOR position.
29748 5-32 Rev. 0
INADEQUATE CORE COOLING MONITOR-86 REMOTE DISPLAY INFOKMATION
Figure 5-16 Typical ICTC Average Temperature Trend Display Page
5.10.4.5 Auctioneered High T/C Trend Display Page
The auctioneered high incore T/C (ICTC) temperature trend display page shows twotrending line graphs. The lower graph trends the INCORE TCs Hi QUAD AVGtemperature value for the preceding 30-minute period over the temperature rangeof 0 - 2500 OF (figure 5-17). The trending line graph updates once every 20 seconds.If the INCORE TCs HI QUAD AVG value is greater than 2500 OF, then the trending linewill update at the "OFFSCALE" position on the graph. In the event of a d)tdilnkfailure, the trending line graph is driven to the 0 OF position when the datalinkreturns. In addition to the trending graph, the current rounded whole number valuefor the INCORE TCs Hi QUAD AVG is given on the right-hand side of this display pagealong with the designated number of the high quadrant.
29748Rev. 05-33

INADEQUATE CORE COOLING MONITOR-86 REMOTE DISPLAY INFORMATION
Figure 5-17 Typical Auctioneered High ICTC Temperature Trend Display Page
The upper graph trends the calculated analog input point quality code for theINCORE TCs Hi QUAD AVG temperature. The graph is labeled from top to bottomwith the following quality codes: BAD, POOR, GOOD.
A calculated analog input point quality code of BAD associated with the INCORE TCsAVG temperature will cause the data trend (lower graph) to draw a continuous lineto a "NO DATA" position below the bottom of the scale. A reverse video "B" will bedisplayed next to the defaulted average temperature value of X's for a "BAD "quality code. The quality trend (upper graph) will trend along its BAD position onthe graph.
A calculated analog input point quality code of POOR associated with INCORE TCsAVG temperature will cause a reverse video "P" to be displayed next to the currentaverage temperature value. The quality trend will trend along its POOR position.
29748 5-34 Rev. 0
I,.I
INADEQUITI CORE.. .COOLNC.M lN fl, I....) rI ALlv x c r \VI, I IATIqN
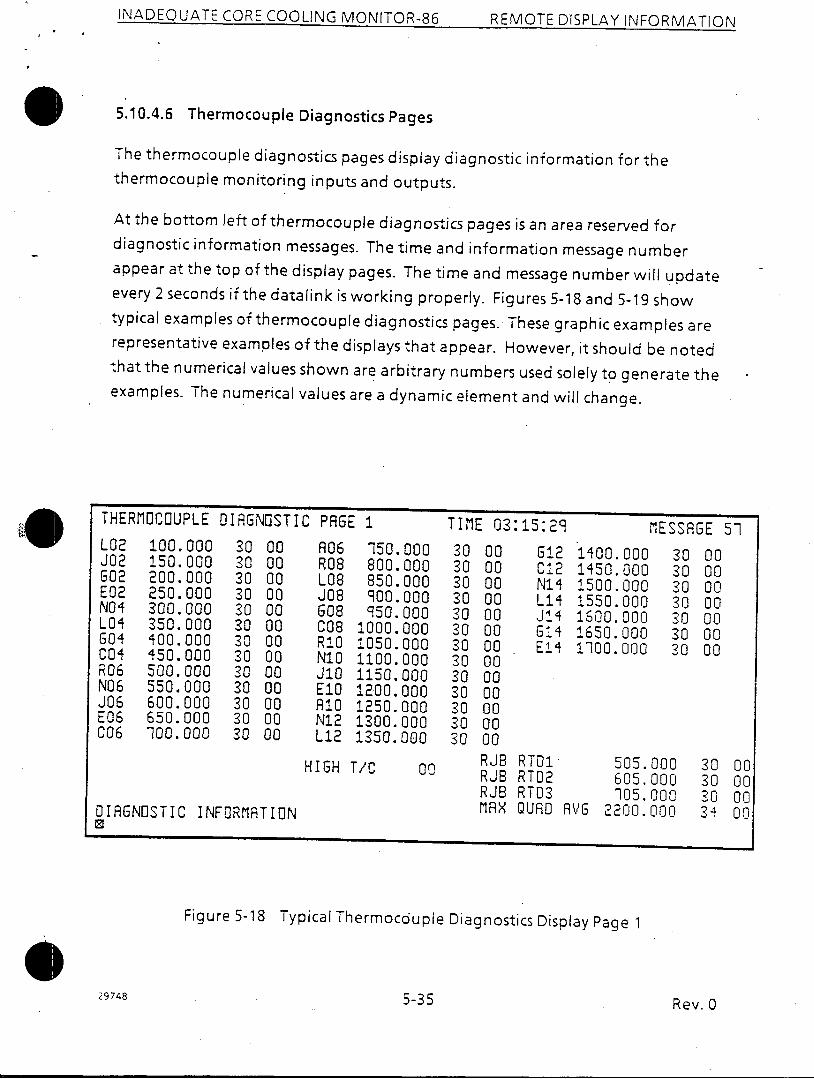
5.10.4.6 Thermocouple Diagnostics Pages
The thermocouple diagnostics pages display diagnostic information for thethermocouple monitoring inputs and outputs.
At the bottom left of thermocouple diagnostics pages is an area reserved fordiagnostic information messages. The time and information message numberappear at the top of the display pages. The time and message number will updateevery 2 seconds if the datalink is working properly. Figures 5-18 and 5-19 showtypical examples of thermocouple diagnostics pages. These graphic examples arerepresentative examples of the displays that appear. However, it should be notedthatthe numerical values shown are arbitrary numbers used solely to generate theexamples. The numerical values are a dynamic element and will change.
THERMOCOUPLE
L02 100.000J02 150.000G02 200.000E02 250.000N01 300.000L04 350.000604 o00.000C04 i50.000R06 500.000N06 550.000J06 600.000E06 650.000C06 100.000
DIAGNOSTIC
30 0030 0030 0030 0030 0030 0030 0030 0030 0030 0030 0030 0030 00
H
PAGE
R06R08L08J08G08C08R10N10J10E10RioN12L12
I GH
El
150. 000800. 000850. 000900. 000950. 000
1000. 0001050. 0001100. 0001150. 0001200. 0001250. 0001300.0001350. 000
T/C 00
DIAGNOSTIC INFORMATION0
TIME 03:15:29
30 00 G1230 00 C1230 00 N1430 00 L1430 00 J1430 00 G1430 00 E1l30 0030 0030 0030 0030 0030 00
RJB RTD1RJB RTD2RJB RTD3MAX QUAD F
1400. 00C1450. 0oc1500. 0001550. 00C1600. 0001650. 0001100.000
IVG
MESSAGE 51
D 30 00D 30 00
30 0030 00
I 30 001 30 001 30 00
505. 000605.000105. 000
2200.000
30 0030 0030 0034 00
Figure 5-18 Typical Thermocouple Diagnostics Display Page 1
5-35 Rev. 0
I
29748
INADEQUATE CORE COOL-ING, MOnmTnPRr, PI NA M nTF: 7 I (ZD I AV IN I Al a\0 A AA r I /"IN I
I
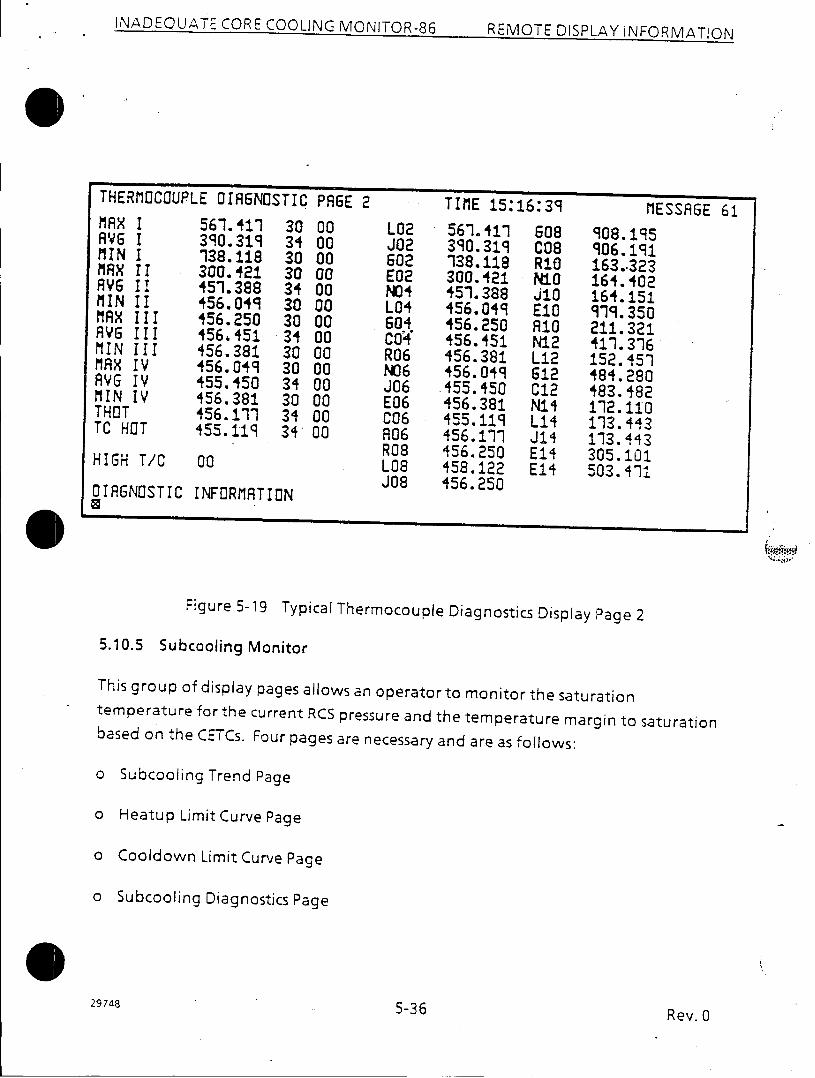
Figure 5-19 Typical Thermocouple Diagnostics Display Page 2
5.10.5 Subcooling Monitor
This group of display pages allows an operatorto monitor the saturationtemperature for the current RCS pressure and the temperature margin to saturationbased on the CETCs. Four pages are necessary and are as follows:
o Subcooling Trend Page
o Heatup Limit Curve Page
o Cooldown Limit Curve Page
o Subcooling Diagnostics Page
29 748 5-36 Rev. 0
INADEQUATE CORE COOLING MONITOR-86 REMOTE DISPLAY INFORMATION
A C - - -R -I -.M . . -. .R- I - . . I . I - .l- R - WA I I I M I a I I I V I I I V. |
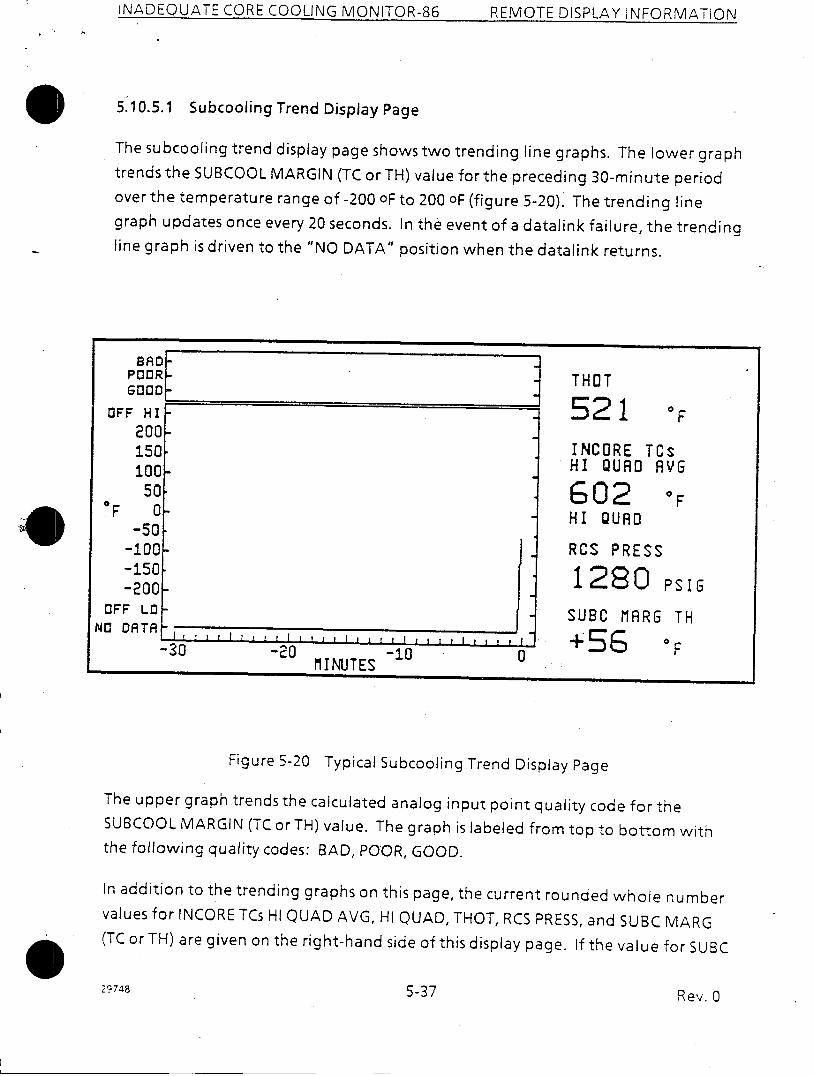
5.10.5.1 Subcooling Trend Display Page
The subcooling trend display page shows two trending line graphs. The lower graphtrends the SUBCOOL MARGIN (TC or TH) value forthe preceding 30-minute periodover the temperature range of -200 oF to 200 OF (figure 5-20). The trending linegraph updates once every 20 seconds. In the event of a datalink failure, the trendingline graph is driven to the "NO DATA" position when the datalink returns.
Figure 5-20 Typical Subcooling Trend Display Page
The upper graph trends the calculated analog input point quality code for theSUBCOOL MARGIN (TC or TH) value. The graph is labeled from top to bottom withthe following quality codes: BAD, POOR, GOOD.
In addition to the trending graphs on this page, the current rounded whole numbervalues for INCORE TCs HI QUAD AVG, HI QUAD, THOT, RCS PRESS, and SUBC MARG(TC or TH) are given on the right-hand side of this display page. If the value for SUBC
29748 Rev. 0
BAD I.4POORF- -4 THOTGOOD ~_ _ _ _ _ _ _ _ _ _ _ _ _ _ _ _ _ _ _ _ _
OFF HI 521 F200-150 INCORE TCs100 HI QUAD AVG
0 50 G 02 °FF - HI QUAD
-50-100 RCS PRESS-150 12 0 sG-200 I 2sIs
OFF LO - UBC MARG THNO DATA -
-30 -20 -in +.SG FM IMNIUTFP
I
INADEQUATE CORE COOLING MONITOR-86; REMOTE DISrPLAY INFOP_)RM1ATI)N1
U
5-37
INADEQUATE CORE COOLING MONITOR-86 REMOTE DISPLAY INFORMATION
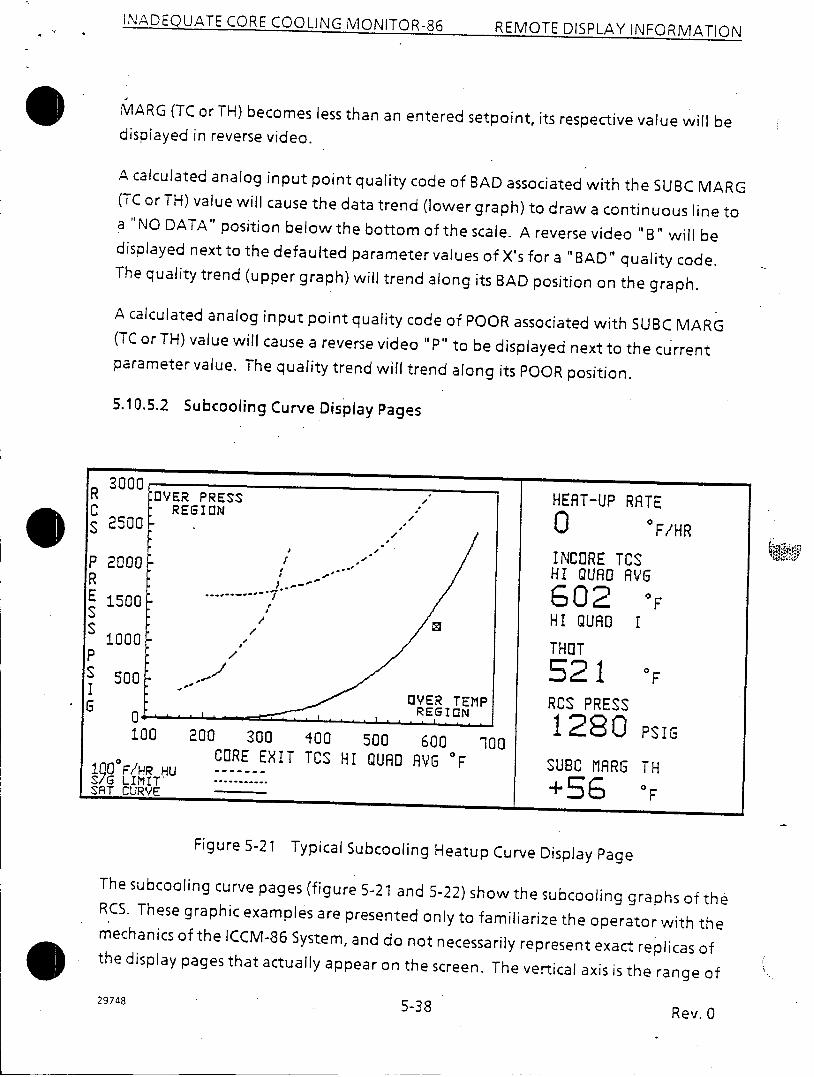
MARG (TC or TH) becomes less than an entered setpoint, its respective value will bedisplayed in reverse video.
A calculated analog input point quality code of BAD associated with the SUBC MARG(TC or TH) value will cause the data trend (lower graph) to draw a continuous line toa "NO DATA" position below the bottom of the scale. A reverse video "B" will bedisplayed next to the defaulted parameter values of X's for a "BAD" quality code.The quality trend (upper graph) will trend along its BAD position on the graph.
A calculated analog input point quality code of POOR associated with SUBC MARG(TC or TH) value will cause a reverse video "P" to be displayed next to the currentparameter value. The quality trend will trend along its POOR position.
5.10.5.2 Subcooling Curve Display Pages
3000 EI,30VER PRESSREGION
2D000 . , --
1500 - ;
1000
500OVER TEMP
0- REGION
100 200 300 '00 500 600 100CORE EXIT TCS HI QUAD AVG F20 F/HR HU -------G LMITT' -----------
sst cfo~Qt
HERT-UP RATE
0 *F/HR
INCORE TCSHI QUAD RAG
602 OFHI QUAD I
THOT
3521 F
RCS PRESS
12 80 PSIG
+35 6 OF
Figure 5-21 Typical Subcooling Heatup Curve Display Page
The subcooling curve pages (figure 5-21 and 5-22) show the subcooling graphs of theRCS. These graphic examples are presented only to familiarize the operator with themechanics of the ICCM-86 System, and do not necessarily represent exact replicas ofthe display pages that actually appear on the screen. The vertical axis is the range of
29748 5-38 Rev. 0
RCS
PRESS
PSIG
ItS.,
SUBC MARS T W
INADEQUATE CORE COOLING MONITOR-86 REMOTE DISPLAY INFORMATION
R w hewDVEC RlS 2500 R
P 2000 .RE 1500S
1000PS 500IG 0
100
190 F/HR CD9 LIMITSAT-CURVE
200 300 400 500 600CORE EXIT TCS HI QUAD AVG F... .. .......
100
COOL-ODOUN RRTE
0 F/HR
INCORE TCSHI QUAD RVG
G02 *FHI QUAD I
THOT
521 OF
RCS PRESS -
1280 PsiGSUBC MARG
+ 53TH0
I
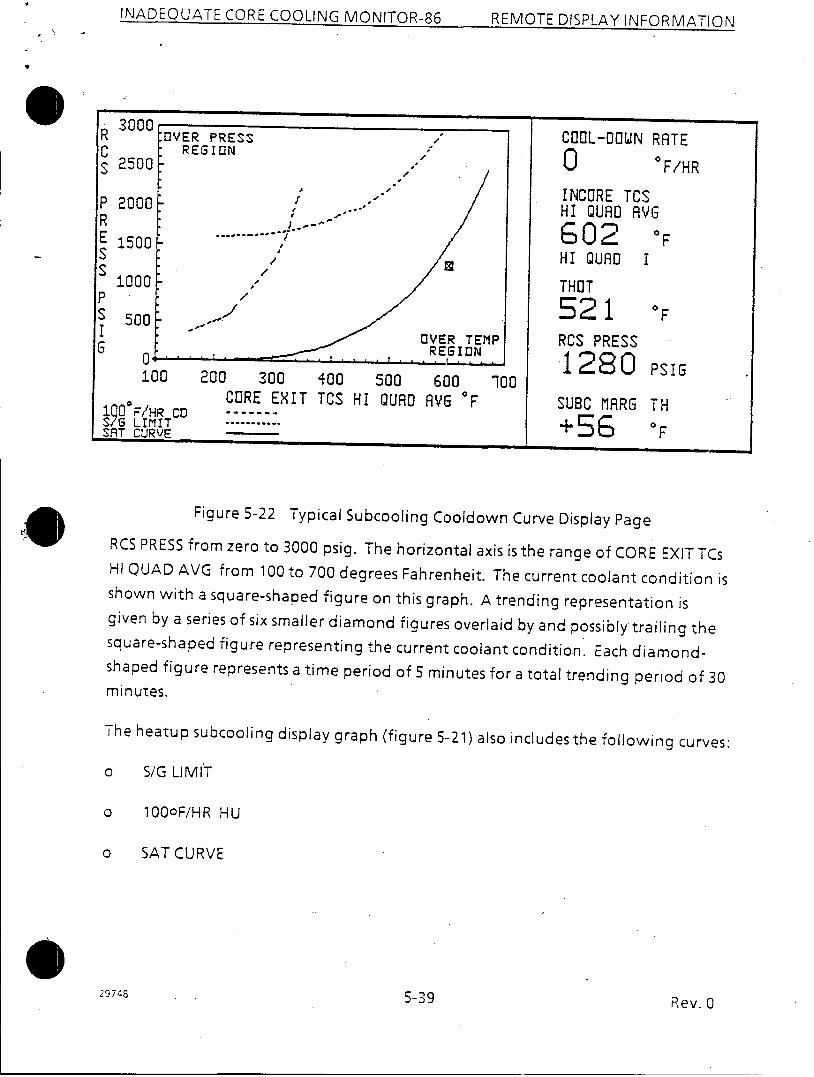
Figure 5-22 Typical Subcooling Cooldown Curve Display PageRCS PRESS from zero to 3000 psig. The horizontal axis is the range of CORE EXIT TCsHI QUAD AVG from 100 to 700 degrees Fahrenheit. The current coolant condition isshown with a square-shaped figure on this graph. A trending representation isgiven by a series of six smaller diamond figures overlaid by and possibly trailing thesquare-shaped figure representing the current coolant condition. Each diamond-shaped figure represents a time period of 5 minutes for a total trending period of 30minutes.
The heatup subcooling display graph (figure 5-21) also includes the following curves:
o S/G LIMIT
o 100oF/HR HU
o SAT CURVE
29748Rev. 05 -39
2nnn
INADEQUATE CORE COOLING MONITOR-86 REMOTE- DISP -_.I AY --. , INPOJPMAiC- N
The cooldown subcooling display graph (figure 5-22) also includes the followingcurves:
o S/G LIMIT
o 1000F/HR CD
o SAT CURVE
In addition to the subcooling on these pages, the current rounded whole numbervalues for INCORE TCs HI QUAD AVG, HI QUAD, THOT, RCS PRESS, SUBC MARG (TC orTH) and HEATUP RATE (for the heatup curve display page) or COOLDOWN RATE (forthe cooldown curve display page) are given on the right-hand side of these displaypages. If the value for SUBC MARG (TC or TH) becomes less than an entered setpoint,inLs respective value will be displayed in reverse video. Quality coding will beimplemented as discussed previously.
5.10.5.3 Subcooling Diagnostics Page
The subcooling diagnostics page handles the subcooling portion of the ICCM-86System. This page displays diagnostic information for the subcooling inputs andoutputs.
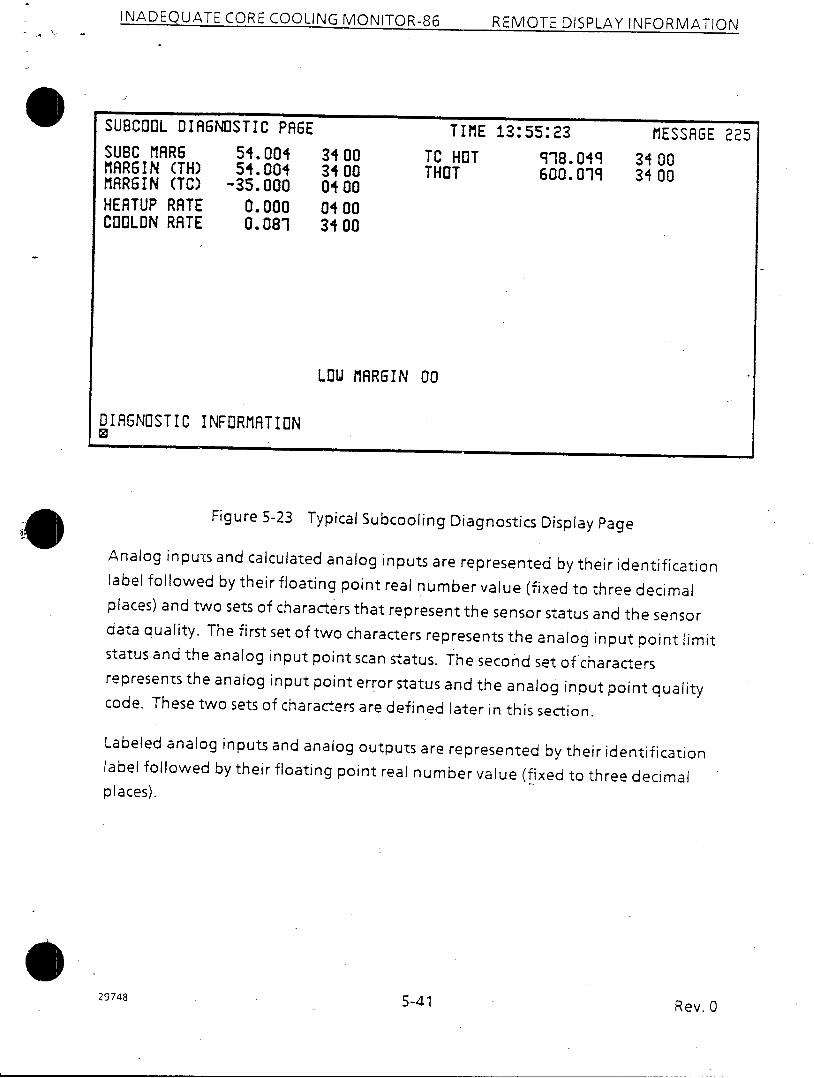
At the bottom of the display page is an area reserved for diagnostic informationmessages. The time and message number appear at the top of the display page. Thetime and message number will update every 2 seconds if the datalink is workingproperly. Figure 5-23 shows a subcooling diagnostics page. This graphic example is arepresentative example of the display that appears. However, it should be notedthat the numerical values shown are arbitrary numbers used solely to generate theexample. The numerical values are a dynamic element and will change.
5.10.6 System Diagnostics
The diagnostics pages are used to display the information sent over the datalinkfrom the ICCM-86 main electronics cabinet. This information includes analog inputs,calculated analog inputs, labeled analog inputs, analog outputs, digital outputs,digital inputs, time message number, and diagnostic information messages.
29748 5-40 Rev. 0
REMOTE DISPL AY INFOPR~ATInNI
INADEQUATE CORE COOLING MONITOR-86 REMOTE DISPLAY INFORMATION
SUBCOOL DIAGNOSTIC PAGE
SUBC MARG 54.004MRR6IN (TH) 54.004MARGIN (TC) -35.000HEATUP RATE 0.000COOLON RATE 0.081
TIME 13:55:23
TC HOT 918.049THOT 600.019
34003400040004 003400
MESSAGE 225
34 003400
LOW MARGIN 00
DIAGNOSTIC INFORMATION0
Figure 5-23 Typical Subcooling Diagnostics Display Page
Analog inputs and calculated analog inputs are represented by their identificationlabel followed by their floating point real number value (fixed to three decimalplaces) and two sets of characters that represent the sensor status and the sensordata quality. The first set of two characters represents the analog input point limitstatus and the analog input point scan status. The second set of charactersrepresents the analog input point error status and the analog input point qualitycode. These two sets of characters are defined later in this section.
Labeled analog inputs and analog outputs are represented by their identificationlabel followed by their floating point real number value (fixed to three decimalplaces).
29748Rev. 05-41
. .
- - ... - . - -. ,- . -. ... .'I. rv, rnhI, , _'4
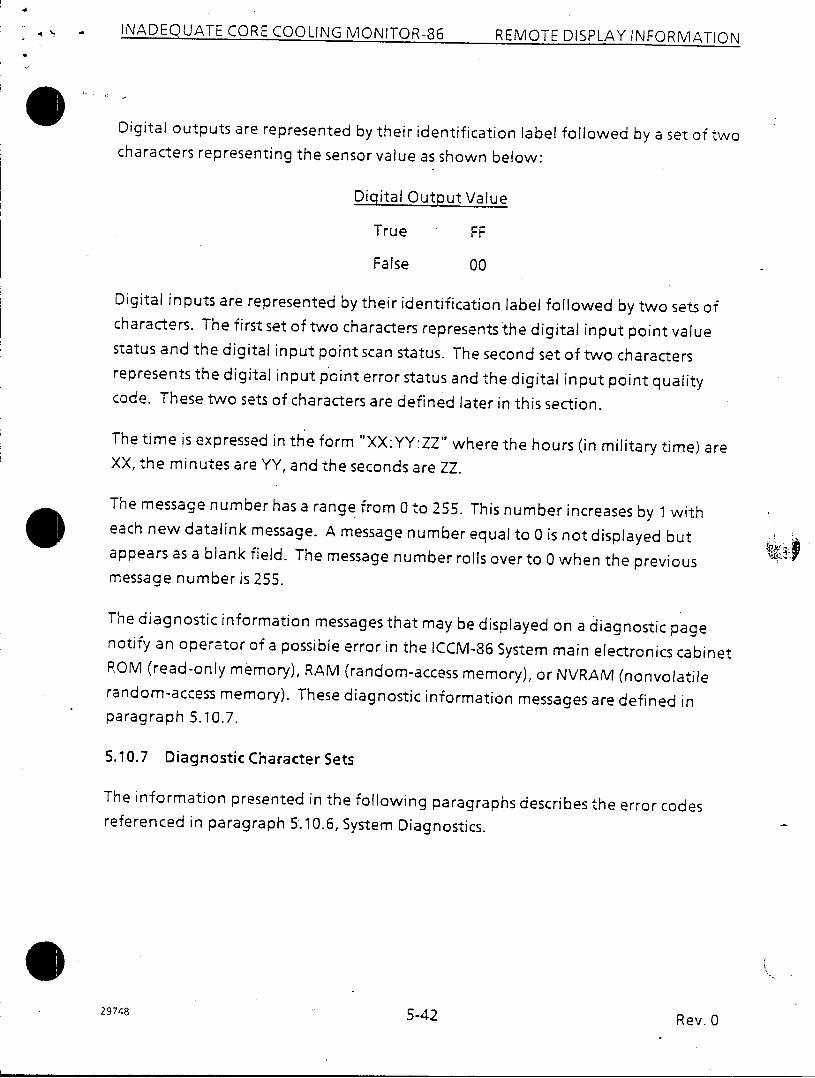
Digital outputs are represented by their identification label followed by a set of twocharacters representing the sensor value as shown below:
Digital Output Value
Tru e FF
False 00
Digital inputs are represented by their identification label followed by two sets ofcharacters. The first set of two characters represents the digital input point valuestatus and the digital input point scan status. The second set of two charactersrepresents the digital input point error status and the digital input point qualitycode. These two sets of characters are defined later in this section.
The time is expressed in the form "XX:YY:ZZ" where the hours (in military time) areXX, the minutes are YY, and the seconds are ZZ.
The message number has a range from 0 to 255. This number increases by 1 witheach new datalink message. A message number equal to 0 is not displayed butappears as a blank field. The message number rolls over to 0 when the previousmessage number is 255.
The diagnostic information messages that may be displayed on a diagnostic pagenotify an operator of a possible error in the ICCM-86 System main electronics cabinetROM (read-only memory), RAM (random-access memory), or NVRAM (nonvolatilerandom-access memory). These diagnostic information messages are defined inparagraph 5.10.7.
5.10.7 Diagnostic Character Sets
The information presented in the following paragraphs describes the error codesreferenced in paragraph 5.10.6, System Diagnostics.
29748 5-42 Rev. 0
INADEQUATE CORE COOLING MONITOR-86 REMOTE: DISPLAY 1ji:ni:f\liATnN1
4h a ' -
ENCLOSURE 2
WATTS BAR NUCLEAR PLANT (WBN) UNITS 1 AND 2
NUREG-0737, ITEM II.F.2
LIST OF COMMITMENTS
1. The Westinghouse Inadequate Core Cooling Monitor 86 (ICCM-86) and
associated hardware will be installed before initial fuel loading of the
respective units.
2. Preoperational testing will be performed on the Inadequate Core Cooling
(ICC) System before initial fuel loading of the respective units.
3. Preliminary calibration and scaling of the ICC System will be performed
before initial fuel loading of the respective units.
4. Final calibration and scaling for the ICC System will be performed
before initial criticality of the respective units.