Technical Efficiency of Fish Catch and Its Socio-Economic ...
12
Journal of Economics and Sustainable Development www.iiste.org ISSN 2222-1700 (Paper) ISSN 2222-2855 (Online) Vol.6, No.9, 2015 182 Technical Efficiency of Fish Catch and Its Socio-Economic Determinants – A Study on Traditional Fishermen of Karimganj District of Assam Manish Roy Assistant Professor, Dept. of Economics, S. K. Roy College, Katlicherra, District Hailakandi Ritwik Mazumder Assistant Professor, Dept. of Economics, Assam University, Silchar Abstract This paper has measured the technical efficiency of fish catch and its socio-economic determinants among traditional fishermen dwelling in the neighbourhood of the Shon Beel in Karimganj district of Assam, India. Empirical estimations are on the basis of primary data collected from a sample of fishermen during the peak fishing season of 2014. The study uses a log-linear stochastic production frontier with inefficiency effects where selected non-input socioeconomic variables are hypothized to explain variations in catch efficiency across fishing teams. The study finds that technical efficiency of fish catch at the fishing team level is influenced positively by experience and per –capita household expenditure. Non-fishing income, dependency ratio, and education are found to have a dampening effect on catch efficiency. The study opines that excessive fishing in the Sone Beel in recent years has necessitated greater catch effort to get the same quantity of catch. This is indicative of falling fish stock, premature catch, and consequently falling average size of catch irrespective of species. Keywords: Fish catch, Technical Efficiency, Inefficiency Effects Model, Stochastic Production Frontier, Non- input Factors. JEL classification: Q 22, C 21. 1. Introduction For a long time, fishing has been regarded as one of the most important means of livelihood of thousands of households living in the neighborhood of the Sone Beel Haor in Karimganj district of Assam. The Sone Beel is the largest wet land and catchment area of the region. Numerous small rivers and canals in the region flow into the Sone Beel. The fisheries sector in Karimganj is almost entirely dominated by small scale, poor fishing households dwelling in the vicinity of the Sone Beel. In fact total fish catch in the Sone Beel can account for around 70 percent of the total fresh water fish catch of the district (Source: Comprehensive District Agricultural Plan Report of 2011-12, District of Karimganj, Government of Assam, pp. 27-28). Most informed people in the region (that includes fishermen) have a perception that there has been over-crowding of catchers in the Sone Beel in recent years the due to the complete absence of entry restrictions during the peak fishing season. Moreover lack of modern skills, capital and knowhow prevents the fishing households to go beyond the traditional methods. With the scarce resources and growing fish demand, decision makers (policy makers and households) face the challenge of developing a sustainable small-scale fisheries sector, which can integrate socio-economic and environmental objectives in their planning decisions. The key issues of concern as identified by the fishermen themselves include poor and inefficient fishing gears and vessels, lack of capital, poor fisheries management, limited access to larger markets (e.g. Silchar, Guwahati and Agartala) coupled with poor handling facilities, poor infrastructure and high post-harvest losses. Lack of alternative employment opportunities and rising number of fishing households have possibly been the main cause of over-crowding of catchers leading to over-exploitation of the resource and degradation of fish stock. Almost all fishing households around the Sone Beel continue to be trapped in poverty and this has been their status over generations. The key objective of planners and policy makers of the district and region is to create sufficient levels of non-fishing employment opportunities for fishing households so that no one is forced to take up fishing as the only livelihood. This would also address the problem of overcrowding in the Sone Beel. Since, the principal occupation of people residing around the Sone Beel is fishing, standard of living of the fishing household is indisputably linked with, (i) the productivity and efficiency (though they are different concepts) of fish catch with respect to catch-effort or labour time spent, along with the revenue earned from it and, (ii) the income from non-fishing occupation – say for example from agriculture and allied activities, or even from other petty businesses. However the efficiency of fish catch may in turn depend on several factors that are not used as inputs by fishermen. In other words several non-input socio-economic factors may influence the efficiency of fish CORE Metadata, citation and similar papers at core.ac.uk Provided by International Institute for Science, Technology and Education (IISTE): E-Journals
-
Upload
khangminh22 -
Category
Documents
-
view
4 -
download
0
Transcript of Technical Efficiency of Fish Catch and Its Socio-Economic ...

Journal of Economics and Sustainable Development www.iiste.org
ISSN 2222-1700 (Paper) ISSN 2222-2855 (Online)
Vol.6, No.9, 2015
182
Technical Efficiency of Fish Catch and Its Socio-Economic
Determinants – A Study on Traditional Fishermen of Karimganj
District of Assam
Manish Roy
Assistant Professor, Dept. of Economics, S. K. Roy College, Katlicherra, District Hailakandi
Ritwik Mazumder
Assistant Professor, Dept. of Economics, Assam University, Silchar
Abstract
This paper has measured the technical efficiency of fish catch and its socio-economic determinants among
traditional fishermen dwelling in the neighbourhood of the Shon Beel in Karimganj district of Assam, India.
Empirical estimations are on the basis of primary data collected from a sample of fishermen during the peak
fishing season of 2014. The study uses a log-linear stochastic production frontier with inefficiency effects where
selected non-input socioeconomic variables are hypothized to explain variations in catch efficiency across
fishing teams. The study finds that technical efficiency of fish catch at the fishing team level is influenced
positively by experience and per –capita household expenditure. Non-fishing income, dependency ratio, and
education are found to have a dampening effect on catch efficiency. The study opines that excessive fishing in
the Sone Beel in recent years has necessitated greater catch effort to get the same quantity of catch. This is
indicative of falling fish stock, premature catch, and consequently falling average size of catch irrespective of
species.
Keywords: Fish catch, Technical Efficiency, Inefficiency Effects Model, Stochastic Production Frontier, Non-
input Factors.
JEL classification: Q 22, C 21.
1. Introduction
For a long time, fishing has been regarded as one of the most important means of livelihood of thousands of
households living in the neighborhood of the Sone Beel Haor in Karimganj district of Assam. The Sone Beel is
the largest wet land and catchment area of the region. Numerous small rivers and canals in the region flow into
the Sone Beel. The fisheries sector in Karimganj is almost entirely dominated by small scale, poor fishing
households dwelling in the vicinity of the Sone Beel. In fact total fish catch in the Sone Beel can account for
around 70 percent of the total fresh water fish catch of the district (Source: Comprehensive District Agricultural
Plan Report of 2011-12, District of Karimganj, Government of Assam, pp. 27-28).
Most informed people in the region (that includes fishermen) have a perception that there has been
over-crowding of catchers in the Sone Beel in recent years the due to the complete absence of entry restrictions
during the peak fishing season. Moreover lack of modern skills, capital and knowhow prevents the fishing
households to go beyond the traditional methods. With the scarce resources and growing fish demand, decision
makers (policy makers and households) face the challenge of developing a sustainable small-scale fisheries
sector, which can integrate socio-economic and environmental objectives in their planning decisions.
The key issues of concern as identified by the fishermen themselves include poor and inefficient
fishing gears and vessels, lack of capital, poor fisheries management, limited access to larger markets (e.g.
Silchar, Guwahati and Agartala) coupled with poor handling facilities, poor infrastructure and high post-harvest
losses. Lack of alternative employment opportunities and rising number of fishing households have possibly
been the main cause of over-crowding of catchers leading to over-exploitation of the resource and degradation of
fish stock. Almost all fishing households around the Sone Beel continue to be trapped in poverty and this has
been their status over generations. The key objective of planners and policy makers of the district and region is
to create sufficient levels of non-fishing employment opportunities for fishing households so that no one is
forced to take up fishing as the only livelihood. This would also address the problem of overcrowding in the
Sone Beel.
Since, the principal occupation of people residing around the Sone Beel is fishing, standard of living of
the fishing household is indisputably linked with, (i) the productivity and efficiency (though they are different
concepts) of fish catch with respect to catch-effort or labour time spent, along with the revenue earned from it
and, (ii) the income from non-fishing occupation – say for example from agriculture and allied activities, or even
from other petty businesses.
However the efficiency of fish catch may in turn depend on several factors that are not used as inputs
by fishermen. In other words several non-input socio-economic factors may influence the efficiency of fish
CORE Metadata, citation and similar papers at core.ac.uk
Provided by International Institute for Science, Technology and Education (IISTE): E-Journals
Journal of Economics and Sustainable Development www.iiste.org
ISSN 2222-1700 (Paper) ISSN 2222-2855 (Online)
Vol.6, No.9, 2015
183
catch. These include health status (level of physical fitness and physical capability) of the fishermen, experience,
knowledge and awareness, standards of living, indebtedness, understanding within the fishing team members and
income sources other than fishing, e.g. agricultural or petty business income. Thus the present study also looks
into how these non-input socio-economic variables influence the technical efficiency of fish catch.
A production frontier represents the minimum input bundles required to produce different levels of
output. Not all producers are successful in producing the maximum output using given levels of inputs or are
able to use the minimum levels of inputs to produce a target level of output for a given technology. Both are
tantamount to production below the production frontier. In other words not all producers are technically efficient.
The presence of inefficiency in the production process leads to four major consequences. First, it reduces the
quantity of output for a given set of inputs. Second, some of the inputs will be either under-utilised or over-
utilised. Third, it raises the cost of production. Finally, there will be a loss in profit. We classify efficiency into
three categories, technical, allocative and scale. Technical efficiency refers to production of actual output relative
to the frontier output for a given quantity of inputs. Allocative efficiency is related to producer’s choice of
optimal input combination. And finally, scale efficiency is a situation of choice of right quantity of output, where
price and marginal cost of production are assumed to be equal.
The objectives of the study are summarized as follows.
1. To measure the technical efficiency of fish catch of traditional fishermen fishing in the Sone Beel.
2. To identify key non-input and socioeconomic factors that influences the technical efficiency of fish catch
and to measure their marginal impacts.
3. To outline policy prescriptions aimed at raising technical efficiency of fish catch and improving overall
quality of life of fishing households dependent on the Sone Beel.
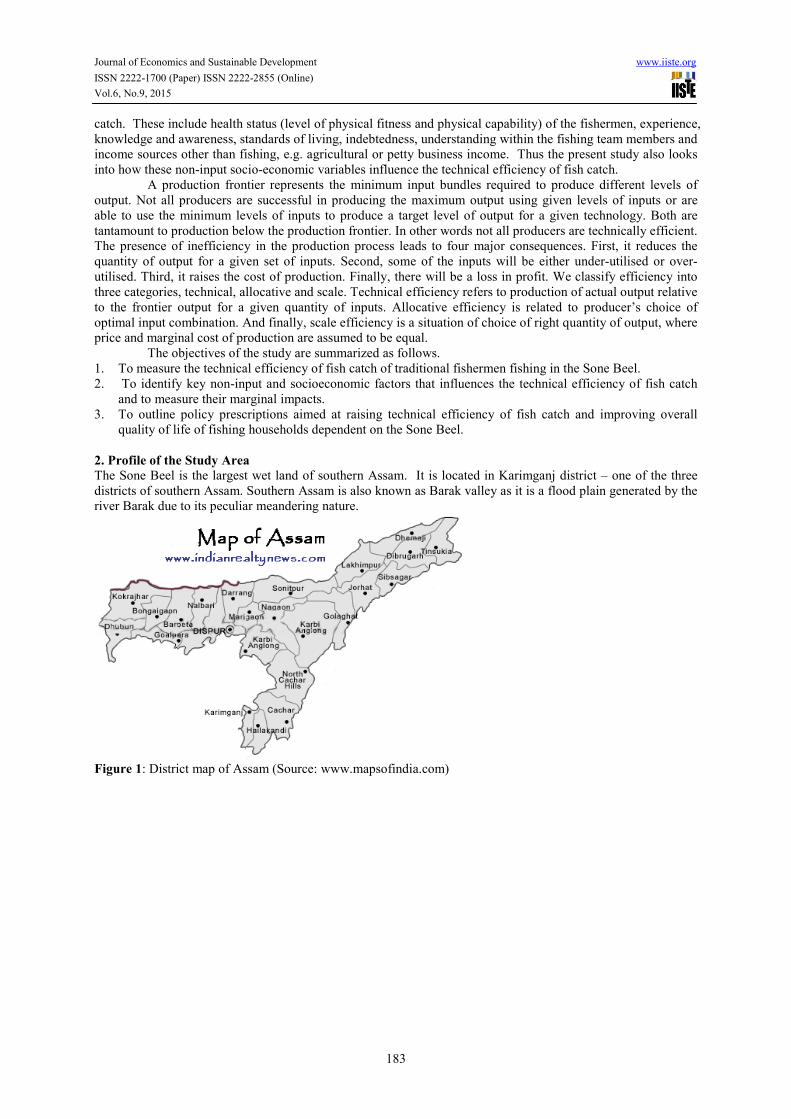
2. Profile of the Study Area
The Sone Beel is the largest wet land of southern Assam. It is located in Karimganj district – one of the three
districts of southern Assam. Southern Assam is also known as Barak valley as it is a flood plain generated by the
river Barak due to its peculiar meandering nature.
Figure 1: District map of Assam (Source: www.mapsofindia.com)

Journal of Economics and Sustainable Development www.iiste.org
ISSN 2222-1700 (Paper) ISSN 2222-2855 (Online)
Vol.6, No.9, 2015
184
Figure 2: District map of Karimganj (Source: www.mapsofindia.com)
The study region is depicted in the above figures (maps). The geographical location of the district is
between 92°15' - 92°35' east and 24°15' - 25°55' north. The district head quarter is 338 km away from the state
capital Guwahati. As is evident from the map, Karimganj is a border district and shares international borders
with Bangladesh both on the north and west. Kushiara, Longai, Singla, and Barak are the four major rivers of the
district. As per the 2011 census the population of the district was 12, 17,000 with a literacy rate of almost 80
percent. Bengali is the major language of the district and the region and is officially recognized as the official
language. The population density is 673 per square km. Sex ratio in the district is 961 females per 1000 males
according to the latest census. Sone Beel is around 17 km away (south) from Karimganj town which is lies on
the northern border of the district.
Sone Beel Fisherman’s Co-operative Society Limited is perhaps the largest fishing society of Assam.
Located in Karimganj District of southern Assam the society was established on February 14, 1975. It covers
eight Gram Panchyats (GPs) namely, Anandapur, Gamaria, Nagendra Nagar, Bhairav Nagar, Nayatilla, Gandhi
Nagar, Baruala, and Shaila Nagar. Among these, the three most important GPs from the point of view of fishing
community concentration are Anandapur, Gamaria, and Nagendra Nagar.
At present the society consists of 4934 share holders who reside in the said region. All share holders
belong to traditional fishing community. Fishing is the major or in many cases, the only source of income for the
shareholders. In order to be a shareholder of this society a traditional fisherman residing in the region is required
to register his name under this society. The society is structurally well constituted and has formally an elected
President, a Vice President, a Secretary, and other officials. The executive members are authorized to run the
society for a period of three years. In order to run the society a general body meeting is held every year. The
society is entitled to issue permits to an individual for fish cultivation (planned culture) but these permits (fishing
restrictions) are applicable only during the dry months of November to April each year. A person may be given
fishing permits for the same area for a maximum period of five years at a single go. Since 2009-10 the
maximum area limited for an individual permit holder is 4 bigha only. Annually the society pays a tax to the
state government that amounts to nearly Rupees six lakhs every year.
The whole year is divided into two seasons – peak season and slack season. During peak season the
wet land acts as a catchment area and hence water volume rises many folds. During peak season the fishermen
are allowed free access to fishing and therefore are motivated to have maximum haul or catch as because no

Journal of Economics and Sustainable Development www.iiste.org
ISSN 2222-1700 (Paper) ISSN 2222-2855 (Online)
Vol.6, No.9, 2015
185
fishing permits are required during this period. During the peak season some major techniques of fish catch are
applied. However during slack season the water body shrinks in size, fish stock is limited and the area under
water is partitioned into a number of segments or sub-areas. There are almost 24 fishing areas which are located
for fishing convenience. Free or open access fishing is not allowed during this period. These partitions or sub-
areas vary in size from around 0.7 bigha to 4 bigha.
The principal techniques of fish catch in the Sone Beel are, (i) two or three catchers with a single boat,
(ii) four to six catchers with two boats and (iii) eight to twelve catchers with motorized boats. The type of net
varies across methods.
Quite a large number of studies on the nature, patterns and determinants of technical efficiency of fish
catch among backward fishing communities in rural areas are reported in literature at the international level but
similar studies at the national level are rare. A few influential works in the area of measurement of technical
efficiency among backward fishing communities of developing countries in recent years are due to Sesabo and
Tol (2008), Singh, Dey, Rabbani, Sudhakaran and Thapa (2009), Akanni (2008), Ekunwe and Emokaro (2009),
Zen, Abdullah and Yew (2002), Squires, Grafton, Alam and Omar (2003), Rahman, Haque, Akhteruzzaman and
Khan (2002) and Kompas, Che, and Grafton (2004) among many others.
3. Methodology and Data
3.1 Econometric Approach: The Stochastic Production Frontier
The present study uses the technical inefficiency effects model [originally due to Kumbhakar, Ghosh and
McGuckin (1991)], and estimates the stochastic frontier and the inefficiency effects model parameters
simultaneously, given appropriate distributional assumptions on the inefficiency random variable (Battese and
Coelli, 1995). The simultaneous estimation of the stochastic production frontiers and models of technical
inefficiency using maximum likelihood techniques have also been further developed by Reifschneider and
Stevenson (1991), Huang and Liu (1994), and Battese and Coelli (1995). This approach has been applied
empirically by Coelli and Battese (1996) and Battese and Broca (1997).
The present study follows a Kumbhakar et al (1991) approach to simultaneously measure the level of
technical efficiency of the fishing team and to examine the impact of a few (selected) non-input factors on the
level of technical inefficiency of fishermen dependent on the Shon Beel of Karimganj District on the basis of
primary data. Exact description of all relevant variables used in the study is essential.
The variables along with their units of measurement for estimation of the trans-log production frontier
model are as follows. Since the catch is heterogeneous inside the team and obviously across teams output (Y) is
measured in terms of rupee value of fish caught per week by the fishing team. Labour input is measured in terms
of total number of man-days spent per week by the fishing team. Length of the fishing vessel and length of net in
metres capture the capacity of the fishing gears used by the team. Depreciation is ignored. The dimension index
calculation methodology for computing the UNDP HDI is applied to labour, boat and net to find the team level
labour index, boat index and the net index. Simple mean of these three indexes is taken as the catch effort index
E in the present study. E rises in value if at least one component rises other things remaining the same.
The non-input variables that influence fish catch efficiency are listed along with their units of
measurement, (i) education measured by the average years of schooling of the team, (ii) average age of team
members (proxy for experience), (iii) physical standards of living as captured by the sum of average per capita
plinth area index and monthly per capita expenditure index (both calculated as per the UNDP dimension index
formula), (iv) existing loans, and (v) non-fishing income of all team members taken together. The following
econometric model is used to fulfill the desired objectives.
The stochastic production frontier developed separately by Aigner, Lovell and Schmidt (1977) and
Meeusen and van den Broeck (1977) decomposes the error term of the usual econometric production function
model into a white random noise component and a one sided inefficiency random component. For the present,
we assume a cross-sectional stochastic production frontier model (specified in Kumbhakar et al, 1991) as
ln ln ( ; )i i iy f x v uβ= + − (1.1)
i i iu zγ ε′= + (1.2)
The random noise component in the production process is introduced through the error component iv which is
),0( 2
vNiid σ in equation (1.1). The second error component which captures the effects of technical
inefficiency has a systematic component izγ ′ associated with the firm specific variables and exogenous
variables along with a random component iε . Inserting equation (1.2) in (1.1) gives the single stage production
frontier model

Journal of Economics and Sustainable Development www.iiste.org
ISSN 2222-1700 (Paper) ISSN 2222-2855 (Online)
Vol.6, No.9, 2015
186
ln ln ( ; ) ( )i i i i iy f x v zβ γ ε= + − + . (1.3)
The condition that ui ≥ 0 requires that i izε γ ′≥− which does not require 0
izγ ′ ≥ for each producer. It is now
necessary to impose distributional assumptions on vi and εi and to impose the restriction i izε γ ′≥− in order to
derive the likelihood function.
Kumbhakar et al (1991) imposed distributional assumptions on vi and ui and ignored εi. They assumed that
iu ̴ ),( 2
uizN σγ ′+i.e., the one-sided technical inefficiency error component has truncated normal structure
with variable mode depending on zi. It is still not necessary that 0i
zγ ′ ≥ . If z1i= 1 and 2 3 0,Qγ γ γ= = =LL
this model collapses to Stevenson’s (1980) truncated normal stochastic frontier model with constant mode 1γ ,
which further collapses to the Aigner, Lovell and Schmidt (1977) half normal stochastic frontier model with zero
mode if 10.γ = Each of these restrictions can be statistically tested. Finally if ui and vi are independently
distributed, all parameters of equation (1.1) can be estimated by using maximum likelihood estimation method.
The log likelihood function is a simple generalization of that of Stevenson’s (1980) truncated normal model
having constant mode µ , with only one change. Constant mode µ is now replaced by the variable mode
,i i
zµ γ ′= so that the log likelihood function is
22 2
2 21 1 1
( )1ln tan ln ( ) ln ln
2 2
N N Ni i i i
v u
i i iu u v
z e zNL cons t
γ µ γσ σ
σ σ σ σ
∗
∗= = =
′ ′ += − + − Φ + Φ −
+ ∑ ∑ ∑
(1.4)
where
2 2*
2 2
v i u ii
v u
z eσ γ σµ
σ σ
′ −=
+,
2 2*2
2 2
v u
v u
σ σσ
σ σ=
+
and the ln ln ( ; )i i ie y f x β= − are the residuals obtained from estimating equation (1.1) simply by OLS. The
log likelihood function of (1.4) can be maximized to obtain ML estimates of 2 2( , , , ).v uβ γ σ σ These estimates
can then be used to obtain producer specific estimates of technical efficiency, employing the Jondrow, Lovell,
Materov and Schmidt (1982) approach to find the best point estimates of technical efficiency. These estimates
are either * *
* *
* *
( / )( / )
( / )
ii i i
i
E u eφ µ σ
µ σµ σ
= +Φ
(1.5)
or * * 0
( / )0 .
i i
i i
ifM u e
otherwise
µ µ ≥=
(1.6)
Once technical efficiency has been estimated, the effect of each exogenous or environmental variable on
technical efficiency can be calculated from either [ ( / ) / ] [ ( / ) / ]i i ik i i ik
E u e z or M u e z∂ ∂ ∂ ∂ . Battese and
Coelli (1995) model is an improvement over the Kumbhakar et al (1991) model as, (i) it is based on panel data
and (ii) the non-negativity requirement ( ) 0i i i
u zγ ε′= + ≥ is modeled as iε ̴ ),0( 2
εσN with the
distribution of iε bounded below by the variable truncation point i
zγ ′− . Battese and Coelli (1995) have
verified that this new distributional assumption on iε is consistent with the distributional assumption on ui that
iu ̴ ),( 2
uizN σγ ′+. We assume a log-linear production function in value of output and catch effort index E to
specify the underlying technology.
Exf e ln);(ln 0 βββ += (1.7)
Here the left hand side represents total value of fish catch of the team per week during peak fishing season in
rupee terms.
Further iiiiii zzzzzz 66554433221 γγγγγγγ +++++=′ (1.8)
Where, the zi’s are firm specific non-inputs variables which may influence the technical efficiency of fishermen

Journal of Economics and Sustainable Development www.iiste.org
ISSN 2222-1700 (Paper) ISSN 2222-2855 (Online)
Vol.6, No.9, 2015
187
of the fishing team. Specifically,
2iz = average age of members the fishing team (years), as a proxy for experience.
3iz = education of the fishermen as measured by average number of years of formal schooling.
4iz = average standard of living index in the team,
iz5 = non-fishing income of the team,
iz6 = average existing loans of the team,
Testing the null hypothesis no technical inefficiency is important. The null hypothesis of no technical
inefficiency can be tested by applying the Likelihood Ratio Test.
The likelihood ratio test is based on the likelihood ratio statistic (LR) defined as,
LR = - 2ln [L(H0) / L(HA)]
whereL(H0) and L(HA) are the values of the likelihood function (optimum) under the null and
alternative hypotheses respectively. But since the hypothesized value of λ lies on the boundary of the parameter
space it is difficult to interpret the test statistic. It can be shown that the LR statistic follows a mixed χ2
distribution that asymptotically approaches χ2 distribution with degrees of freedom equal to the number of
restrictions imposed in the model (Coelli, 1995). Similar is the test of the hypothesis that inefficiency effects are
absent in the model. The Battese and Coelli (1995) inefficiency effects model was adopted.
3.2 Data
The study is based on primary data. First random selection of 347 fishermen was done from the cooperative
society register. The data is collected in a household level socio-economic survey (during the peak seasons). All
catchers are found to be concentrated in 3 Gram Panchayats surrounding the Sone Beel Haor. The data is
collected using a well structured pretested schedule by employing the direct interview method. The total sample
size (fishing households) covered in the present study is 350. This is just less 5% of the population size as
because all fishermen are not registered. Detailed information on fishing effort, fish catch (physical and nominal),
fishing equipments, asset holding patterns, food and nutritional status, health status, alternative occupation and
earnings from them, existing loans with sources, and all relevant socioeconomic information was collected
through the survey. The data consists of 166 fishermen with single boats, 94 fishermen with two boats, and 87
fishermen with two motorized boats. Exact population distributions of fishing teams according to method of
catch are unknown.
4. Empirical Results
Table 1. Distribution of Fishermen and Fishing Teams across Catch Methods*
Categories of fishing team Catchers (teams)
Single Boat and Two Catchers 166 (83)
Two Boats with 3 Catchers 13 (4)
Two Boats with 4 Catchers 29 (7)
Two Boats with 6 Catchers 19 (3)
Two Boats with 8 Catchers 33 (4)
Two Motorized Boats with 8 Catchers 87 (11)
Total sample of fishermen (catchers) 347 (112)
*No. of fishing teams are given in parenthesis. Source: Primary data.
Table 1 shows distribution of Fishermen and Fishing Teams across Catch Methods during the peak
season. During peak season the wet land acts as a catchment area and hence water volume rises many folds.
During peak season the fishermen are allowed free access to fishing and therefore are motivated to have
maximum haul or catch as because no fishing permits are required during this period. During the peak season
some major techniques of fish catch are applied. Some major technique of fish catch methods is highlighted in
table1 and numbers of fishing teams are given in parenthesis. Here technical efficiency is measured on fishing
teams and not individual catchers.

Journal of Economics and Sustainable Development www.iiste.org
ISSN 2222-1700 (Paper) ISSN 2222-2855 (Online)
Vol.6, No.9, 2015
188
Table 2. Average Catch Composition According to Species
Fish Typesǂ Weight of Catch (kg)
Single Boat Paired Boats
Tengra (Batasio batasio) 1.5
Pabda (Ompok pabo) 1.8 3.1
Moka 2.6
Kajri 1.7
Punthi (Puntius chola) 2.9 7.5
Bele (Glossogobius giuris) 2.1
Koi (Anabas testudineus) 0.7
Khoira 1.9
Shol ( Channa striata) 1.1
Shingi/magur (Gagata youssoufi) 1.5
Kharish 2.3 2.6
bacha 0.7
Rohu (Labeo rohita) 8.7
Katla (Catla catla) 7.2
Boal (Wallago attu ) 1.4 4.4
Aar (Sperata aor) 1.6 3.9 ǂ scientific names are provided in parenthesis. Source: Authors’ estimates based on primary data.
Table 2 shows average catch composition of Fish species in single boat and paired boat is recorded in
kg. According to Fish diversity in Sone Beel of Assam, 69 species of fishes belonging to 49 genera under
families and 11 orders have been recorded in Sone Beel (Devashish Kar et al., 2006). However some common
types fishes with their scientific name provided in the parenthesis generally found in Sone Beel Lake. There are
average number of small fish species such as moka, puthi, tengra, shol catches by using gill net and non net
fishing inputs for fish trap like cylindrical drum trap, vertical slit trap (locally called dari and kati) popularly used
in South Asian Countries (Northeast India, Bangladesh, Mekong and others). While large quantity (kg) of big
fishes like (Rohu, Katla, Boal, Aar) etc. are being caught by using seine net or drag net by the paired boat teams.
Table 3. Counting Boat Sightings and Arrival in the Sone Beel during Survey Week
Date Sightings at 6:00 AM Arrival at 7:00 AM
23.07.2013 49 52
24.07. 2013 57 49
25.07. 2013 42 56
26.07. 2013 56 63
27.07. 2013 61 48
28.07. 2013 54 39
29.07. 2013 78 58
Source: Authors’ estimates based on primary data.
Table 3 presents the number of counting boat sightings and arrival in the Sone Beel during Survey
Week. The observation has been done from fish-landing sites during the survey week and found that almost 50 to
60 fishing teams with their boat landed in the fish-landing sites. The total crewmembers ranges from two to four
persons appear for selling and grading to the fish auctions (called macher arath, i.e., the whole sale trading and
transaction place). The number of fish auctions appearing in the landing site is 3 to 4 and this number is
fluctuating depending on fish transaction. However, only 2-3 auctions are regularly and continuously in activity.

Journal of Economics and Sustainable Development www.iiste.org
ISSN 2222-1700 (Paper) ISSN 2222-2855 (Online)
Vol.6, No.9, 2015
189
Table 4. Summary Statistics of all Variables
Variables Min. Max. Mean S.D.
Age (years) 31 39 34.4 9.78
Existing Loans (Rs) 1900 9100 6755 43.89
Education (years) 4 7 5.7 3.26
Non-fishing income (Rs/month) 1250 5800 3890.55 38.87
SOL Index 0.29 0.90 0.68 0.98
Per capita Food Expenditure (Rs/month) 460 1340 870.65 51.02
Per capita Living Area (sqft) 48 64.14 58.33 22.36
Output (Rs/week) 2340 8750 5567.9 59.32
Net (meters) 29.00 62.00 39.67 27.65
Boat (meters) 3.90 7.1 5.11 8.6
Labour (man-hours/week) 32 115 69.45 68.99
Catch Effort Index (E) 0.49 0.94 0.77 1.01
Source: Author’s estimates based on primary data.
Descriptive statistic: The descriptive statistics of variables for the production frontier estimation are
presented in Table 4. The result revealed that the average total value of fish caught (obtained by adding cash
receipt from selling of fish on weekly) is ₹2340 with a standard deviation of ₹59.32. The large value of
standard deviation implies that the fishers are operating at different number of fishing gears and this tends to
influence their output levels. The minimum value of boat length is 3.90 m, while maximum was 7.10 m. The
mean length of boat is 5.11 m with a standard deviation of 8.6 m. The variability in length of boat measured by
the minimum, maximum values and confirm by standard deviation may be due to the high cost of fishing gears
in study areas. The average monthly non fishing income of fish catchers earning from agriculture or allied
activities is recorded as ₹ 3890.55 with standard deviation ₹38.87 which implies that there is a considerable
variability of non fishing income across fishing teams. The average age of the farmers was 34.4 years with a
standard deviation of 9.78 years. This shows that most farmers are relatively middle aged people. The average
year of schooling was 5.7 with standard deviation of 3.26, showing that most of the farmers attended at least a
Primary School. The physical standards of living (SOL) index as captured by the sum of average per capita
plinth area index and monthly per capita expenditure index is 0.68. Catch-effort Index (E) is measured by simple
mean of labour index, boat index and the net index is taken as the catch effort index in the present study. The
mean value of catch effort index is 0.77 which is positively influence on fish caught. E rises in value if at least
one component rises other things remaining the same.
Table 5. Maximum Likelihood Estimates of Parameters of Log-linear Production Frontier (n = 112)
Coefficients of Estimated Value t- Value
Constant 1.096 1.008
Ln(E)^ 0.039 2.890
Variance parameters 2 2 2
v uσ σ σ= + 0.035 8.005*
/u vλ σ σ= (Aigner et al 1977) 0.359 2.500*
2
vσ 0.031
2
uσ 0.004
Log Likelihood
3rd
Central Moment of OLS Residuals
OLS Log Likelihood
LR Stat [λ = 0] (5% Critical χ2=8.01)
-1.110
-79.011
-10.805
19.39*
Source: Author’s estimation based on primary data. ^E= (effort index multiplied by 100)
*: Statistical significance at 5 %.
Stochastic frontier production analysis: The maximum likelihood estimates of the log-linear
stochastic frontier production function of sample fishing teams across catch methods (no. teams) in the study
area are presented in Table 5. This suggests that the fishing teams are operating below the output oriented
frontier and that the traditional response function, i.e. ordinary least square is not an adequate representation of
data in the study. This is also confirmed by the estimated value of the variance parameter, λ, which is statistically
different from zero. The null hypothesis that there is no inefficiency in the fishing team of all methods of Sone
Beel region is rejected at 5 percent level of significant. Furthermore, elasticity of output with respect to effort

Journal of Economics and Sustainable Development www.iiste.org
ISSN 2222-1700 (Paper) ISSN 2222-2855 (Online)
Vol.6, No.9, 2015
190
index is positive but low at 0.039.
Table 6. Estimated Coefficients of the Inefficiency Effects Variables
Coefficients of Estimated Value t- Ratios
Constant 0.006 1.991*
Age (experience) -0.256 -1.819*
Dependency ratio 1.956 2.658*
Education 0.007 1.008
Non-fishing income 3.476 1.033
Household expenditure PC -0.90 -1.901*
Source: Authors’ estimates based on primary data. *: Statistical significance at 5 %.
The inefficiency model estimates: The stochastic frontier production function inefficiency analysis
result depicted in table 6. The coefficients in the inefficiency model indicated that age and physical standards of
living (as measured by per capita household expenditure) is estimated to be positive and significant. This result
suggests that increasing these variables will decrease technical inefficiency i.e. increase technical efficiency.
This means that old catchers are technically more efficient than the younger ones this is due to the technical
knowledge of fish catch. The coefficient of non fishing income in the technical inefficiency is estimated to be
positive but insignificant; the incomes from other than fishing activities accruing to fishers have a negative
impact on technical efficiency. The percapita house holds expenditure which gives an approximate measure on
physical conditions and overall standard of living positively influence on technical efficiency. The coefficients
dependency ratio and education have negatively influence of technical efficiency.
Table 7. Distribution of Technical Efficiency of all Teams (n = 112)
TE(%) intervals Frequency Distribution (%)
40-50 8 7.14
50-60 13 11.61
60-70 23 20.54
70-80 31 27.68
80-90 23 20.54
90-100 14 12.50
Total 112 100
Mean TE 73.03
Max. TE 93.45
Min. TE 45.88
S.D. 27.78
Source: Authors’ estimates based on primary data.
Technical efficiency scores analysis: The frequency distributions of technical efficiency scores are also
presented in Table 7. The result indicates that about 78 % of fishermen are operating at 80% or more technical
efficiency levels. Furthermore, about 60.72 % of fishing teams across all methods are operating at a technical
efficiency level of 70 % or more. Also about 39.29 % of the fishing teams are operating at technical efficiency
level of 60 % or less. The results further reveal that technical efficiency for all teams ranges between 45.88-
93.45 percent with a mean technical efficiency of 73.03 percent. This suggest a relatively high technical
efficiency level existing in the fishing teams across all methods, pointing to a frightening level of exploitation
and a wide range of efficiency level existing in the fishing teams.
.
Table 8. Distribution of Technical Efficiency of Single Boat and Paired Boat Teams
TE (%) Frequency (n = 83) Distribution (%) Frequency (n = 29) Distribution (%)
40-50 9 10.84 1 3.45
50-60 15 18.07 5 17.24
60-70 14 16.87 9 31.03
70-80 21 25.30 5 17.24
80-90 17 20.48 7 24.14
90-100 7 8.43 3 10.34
Total 83 100 29 100.00
Mean TE 70.66 74.48
S.D. 22.45 31.33
Source: Authors’ estimates based on primary data
Users of single boats (83) have a mean technical efficiency of 70.66 per cent while the same for paired

Journal of Economics and Sustainable Development www.iiste.org
ISSN 2222-1700 (Paper) ISSN 2222-2855 (Online)
Vol.6, No.9, 2015
191
boat users is substantially higher at 74.48 per cent (29) presented in tables 8. This result indicates that paired boat
users are technically more efficient as their fishing equipments and labour effort gives maximum potentialities of
carrying large quantity of output. Whereas the same for single boat users are compare ably less efficient of
carrying potential level of output.
5. Summary and conclusions
The estimated results reveal that catch experience and physical standards of living positively (as measured by per
capita household expenditure) influence the technical efficiency positively while non-fishing income,
dependency ratio and education have dampening effects on the same. Elasticity of output with respect to effort
index is positive but low at 0.039. From the inefficiency model it is observed Education is found to have an
insignificant effect on efficiency. The mean technical efficiency of all catchers is estimated at 73.03 per cent.
Users of single boats (83) have a mean technical efficiency of 70.66 per cent while the same for paired boat users
is substantially higher at 74.48 per cent (29). The study is of the opinion that excessive fishing in the Sone Beel
in recent years has necessitated greater catch effort to get the same quantity of catch. This is indicative of falling
fish stock, premature catch, and consequently falling average size of catch irrespective of species. Most
fishermen are unwilling to stay in this occupation although it has been their traditional occupation. The key
reasons cited are, (i) falling fish population in the Sone Beel which has leads to higher effort for same or
sometimes lower catch, (ii) low offer price faced during sale of catch and (ii) attraction towards other non-
fishing occupations that are physically less involving.
Bibliography
1. Aigner, D. Lovell, C.A.K. and Schmidt, P. (1977), “Formulation and Estimation of Stochastic Production
Models”, Journal of Econometrics, Vol 6, pp. 21-37.
2. Jondrow, J., C.A.K. Lovell, I. Materov, and P. Schmidt (1982), “On the Estimation of Technical
Inefficiency in the Stochastic Frontier Production Function Model”, Journal of Econometrics, Vol. 19, pp.
239-285.
3. Kar, Devashish, A. V. Nagarathna, T. V. Ramacchandra and S. C. Dey (2006) “Fish Diversity and
Conservation Aspects in an Aquatic Ecosystem in Northeastern India”, zoo’s print journal vol.21 (7): 2308-
2315.
4. Kirkley, J., D. Squires, and I. Strand (1998), “Characterizing Managerial Skill and Technical Efficiency in a
Fishery”, Journal of Productivity Analysis, Vol. 9, pp. 145-160.
5. Kirkley, J., D. Squires, and I. Strand, Jr.(1995), “Assessing Technical Efficiency in Commercial Fisheries:
The Mid-Atlantic Sea Scallop Fishery”, American Journal of Agricultural Economics,Vol. 77, pp. 686-697.
6. Kodde, D. and F. Palm (1986), “Wald Criteria for Jointly Testing Equality and Inequality Restrictions”,
Econometrica, Vol. 54, pp. 1243-1248.
7. Kumbhakar, S. (1987), “The Specification of Technical and Allocative Inefficiency in Stochastic
Production and Profit Frontiers”, Journal of Econometrics Vol. 34, pp. 335-348.
8. Kumbhakar, S. C. (1987), “The Specification of Technical and Allocative Inefficiency in Stochastic
Production and Profit Frontiers”, Journal of Econometrics,Vol.34, March, pp. 335-348.
9. Kumbhakar, S., S.C. Ghosh, and J.T. McGuckin(1991), “A Generalised Production Frontier approach for
Estimating Determinants of Inefficiency in U.S. Dairy Farms”, Journal of Business and Economic Statistics,
Vol. 9, pp. 279-286.
10. Kumbhakar, S. l C. (1990), “Production Frontiers, Panel Data and Time Varying Technical Inefficiency”,
Journal of Econometrics,Vol. 46, pp.201-212.
11. Kumbhakar, Subal C. (1989), “Short-run Returns to Scale, Farm-size and Economic Efficiency”, Review of
Economics and Statistics,Vol. 71,
12. Kumbhakar, Subal C. and Bhattacharyya, A. (1992), “Price Distortions and Resource Use Efficiency in
Indian Agriculture: A Restricted Profit Function Approach”, Review of Economics and Statistics, vol.
LXXIV, pp. 231-239.
13. Kumbhakar, Subal C., Basudeb Biswas and Do Von Bailey (1989), “A Study of Economic Efficiency of
Utah Dairy Farmers: A System Approach”, Review of Economics and Statistics, Vol 71, pp. 595-604.
14. Kumbhakar, Subal C., Ghosh, S. and McGuckin, J.T. (1991), “A Generalised Production Frontier Approach
for Estimating Determinants of Inefficiency in U.S. Dairy Farms”, Journal of Business and Economic
Statistics, Vol. 9, pp. 287-296.
15. Kuperan, K. and J.G. Sutinen, 1998, Blue Water Crime: Deterrence, Legitimacy, and Compliance in
Fisheries, Law and Society Review, Vol. 32, pp. 309-337.
16. Lawson, R.M., 1984. Economics of Fisheries Development, New York: Praeger Publishers.
17. Lee, L.F. and Pitt, M.M. (1978), “Pooling Cross-section and Time-series Data in the Estimation of
Journal of Economics and Sustainable Development www.iiste.org
ISSN 2222-1700 (Paper) ISSN 2222-2855 (Online)
Vol.6, No.9, 2015
192
Stochastic Production Function Models”, Unpublished manuscript.
18. Loayza, E.A. and L.M. Sprague, 1992. A Strategy for Fisheries Development, World Bank Discussion
Paper 135, Washington D.C.
19. Lovell, C.A.K. and Sickles, R.C. (1983), “Testing Efficiency Hypothesis in Joint Production: A Parametric
Approach”, Review of Economics and Statistics, Vol. 65, pp. 51-58.
20. Lovell, C.A.K.and Schmidt, P. (1988), “A Comparison of Alternative Approaches to the Measurement of
Productive Efficiency”, in, Ali Dogramaci and Rolf Fare, eds, Applications of Modern Production Theory:
Efficiency and Production, Boston: Kluwer Academic Publishers.
21. Majid, S.A. (1985), Controlling Fishing Effort: Malaysia’s Experience and Problems. FAO Fisheries
Technical Report 289, Supplement 3. Rome: Food and Agriculture Organization of the United Nations.
22. Meeusen,W. and van den Broeck, J. (1977), “Efficiency Estimation From Cobb-Douglas Production
Functions with Composed Error”, International Economic Review, Vol. 18, pp.435-444.
23. Meeusen,W. and van den Broeck, J. (1977b), “Technical Efficiency and Dimension of the Firm: Some
Results on the Use of Frontier Production Functions”, Empirical Economics, Vol.2, pp.109-122.
24. Meeusen. W. and J. van den Broeck. (1977), “Efficiency Estimation from Cobb-Douglas Production
Functions with Composed Error.” International Economic Review, Vol. 18, pp. 435-444.
25. Ooi, Jin Bee (1990), Development Problems of an Open- Access Resource: The Fisheries of Peninsular
Malaysia. Singapore: Southeast Asian Studies.
26. Pitt, M.M and. Lee, L.F. (1981), “The Measurement and Sources of Technical Inefficiency in the
Indonesian Weaving Industry”, Journal of Development Economics, Vol. 9, pp.43-64.
27. Schmidt, P. and Lin, T.F. (1984), “Simple Tests of Alternative Specifications in Stochastic Frontier
Models”, Journal of Econometrics, Vol. 24, pp. 349-361.
28. Schmidt, P. and Sickles, R. (1984), “Production Frontiers and Panel Data”, Journal of Business and
Economic Statistics,Vol. 2, pp. 367-374.
29. Schmidt, P.(1976), “On the Statistical Estimation of Parametric Frontier Production Functions”, Review of
Economics and Statistics,Vol. 58, pp.238-239.
30. Schmidt, P., (1978), “On the Statistical Estimation of Parametric Frontier Production Functions: Rejoinder”,
Review of Economics and Statistics,Vol. 60, pp. 481-82.
31. Schmidt, P., (1984), “Estimation of a Fixed-effect Cobb-Douglas System Using Panel Data”, Unpublished,
Michigan State University.
32. Schmidt, P., (1984a), “An Error Structure for Systems of Translog Cost and Share Equations”, Workshop
Paper No. 8309, Michigan State University.
33. Schmidt, P., (1985-86), “Frontier Production Functions”, Econometric Reviews,Vol. 4, pp. 289-328.
34. Schmidt, Peter and C.A. Knox Lovell (1979), “Estimating Technical and Allocative Inefficiency Relative
to Stochastic Production and Cost Frontiers”, Journal of Econometrics, Vol.9, pp. 343-366.
35. Schmidt, Peter and C.A. Knox Lovell (1980), “Estimating Stochastic Production and Cost Frontiers When
Technical and Allocative Inefficiency are Correlated”, Journal of Econometrics, Vol. 13, pp. 83-100.
36. Sesabo, J. K. and R. S. J. Tol (2005), Technical Efficiency and Small-scale Fishing Households in
Tanzanian coastal Villages: An Empirical Analysis, FNU-95(submitted)
37. Timmer, C.P. (1970), “On Measuring Technical Efficiency”, Food Research Institute Studies, Vol.9, pp.
99-171.
38. Timmer, C.P. (1971), “Using a Probabilistic Frontier Function to Measure Technical Efficiency”, Journal
of Political Economy, Vol.79, pp. 776-794.
39. Varian, H. (1984a), “The Non-parametric Approach to Production Analysis”, Econometrica, Vol.52, pp.
579-597.
40. Varian, H. (1984b), “Non-parametric Analysis of Optimising Behaviour with Measurement Error”,
Unpublished, University of Michigan.
41. Yotopoulos, P.A. and Lau, L.J. (1973), “A Test for Relative Economic Efficiency”, American Economic
Review, Vol. 63, pp. 214-223.
The IISTE is a pioneer in the Open-Access hosting service and academic event management.
The aim of the firm is Accelerating Global Knowledge Sharing.
More information about the firm can be found on the homepage:
http://www.iiste.org
CALL FOR JOURNAL PAPERS
There are more than 30 peer-reviewed academic journals hosted under the hosting platform.
Prospective authors of journals can find the submission instruction on the following
page: http://www.iiste.org/journals/ All the journals articles are available online to the
readers all over the world without financial, legal, or technical barriers other than those
inseparable from gaining access to the internet itself. Paper version of the journals is also
available upon request of readers and authors.
MORE RESOURCES
Book publication information: http://www.iiste.org/book/
Academic conference: http://www.iiste.org/conference/upcoming-conferences-call-for-paper/
IISTE Knowledge Sharing Partners
EBSCO, Index Copernicus, Ulrich's Periodicals Directory, JournalTOCS, PKP Open
Archives Harvester, Bielefeld Academic Search Engine, Elektronische Zeitschriftenbibliothek
EZB, Open J-Gate, OCLC WorldCat, Universe Digtial Library , NewJour, Google Scholar