Technical Committee and Subcommittee Reports
47
210 Technical Committee and Subcommittee Reports 2009–2010 Report of the Technical Committee Committee Members: D. Sedin, Chair; C. Benedict; J. Cornell; M. Eurich; A. Fristsch; R. Jennings; G. Kelly; K. Lakenburges; A. Porter; C. Powell; S. Thompson; and R. Foster (senior advisor) Activity in 23 subcommittees was conducted by the ASBC Tech- nical Committee and Subcommittee chairs during 2009–2010. As a result, four methods are being recommended for inclusion in the ASBC Methods of Analysis (MOA): • IBU of Dry-Hopped Beer, chaired by Ruth Martin (Sierra Ne- vada Brewing Company) • Malt-4 Extract Mills and Mashing, chaired by Aaron MacLeod (Canadian Grain Commission) • EMAST Standard, chaired by Jolanta Menert (Bush Agricul- tural Resources LLC). • Malt-8 Protein (Barley Standard Versus EDTA), chaired by Rebecca Jennings (Rahr Malting) Additionally, a review of four sections of the MOA was com- pleted: • Wort, chaired by Mark Eurich (MillerCoors) • Sensory Analysis, chaired by Sue Thompson (MillerCoors) • Microbiology, chaired by Chris Powell (University of Notting- ham) • Processing Aids, chaired by Aaron Porter (Sierra Nevada Brewing Company) The following methods will continue for another year of col- laborative study: • Solid-Phase Microextraction–Gas Chromatography/Mass Se- lective Detection (SPME-GC/MS) Fingerprint of Beer Vola- tiles and Semivolatiles, chaired by Roman Ortiz (MillerCoors) • Wort and Beer Fermentable and Total Carbohydrates by HPLC, chaired by Mark Eurich (MillerCoors) • ATP, chaired by Caroline Pachello (MillerCoors) • Alpha-amylase Automated Flow Using Potassium Ferricya- nide, chaired by Al Budde (USDA/ARS) • Deoxynivalenol Analysis by ELISA, chaired by Shayne Bart- lett (Cargill Malt) • Miniature Fermentation Assay, chaired by Alex Speers (Dal- housie University) • Sortimat, chaired by Paul Ritchie (Canada Malting) • GC-FID Analysis for Beer Volatiles, chaired by Joe Palausky (Boulevard Brewing) The following five methods are being recommended for collabo- rative study in 2010–2011: • Iso-alpha-acids in Beer and Wort by HPLC, chair TBD, ex of- ficio is Aaron Porter • IBU in Wort by Spectrophotometer, chair TBD, ex officio is Bob Foster • IBU in Wort by Segmented Flow Analysis, chair TBD, ex of- ficio is Mark Eurich • Beta-glucans in Wort by Segmented Flow Analysis, chaired by Aaron MacLeod (Canadian Grain Commission) • Free Amino Nitrogen in Wort by Segmented Flow Analysis, chaired by Aaron MacLeod (Canadian Grain Commission) As in previous years, the following eight standing subcommit- tees continue: • Soluble Starch, chaired by Rebecca Jennings (Rahr Malting) • Check Services, Jim Munroe (Anheuser-Busch, retired), Sue Casey (ASBC), Stephen Kenny (Washington State University IAREC), and John Barr (North Dakota State University). • New and Alternate Methods of Analysis, chaired by Karl Lakenburges (Anheuser-Busch InBev). • International Methods, chaired by Dana Sedin (MillerCoors) • Craft Brewers, chaired by Gina Kelly (New Belgium Brew- ing Company) • Sensory Science, chaired by Annette Fritsch (Annette Fritsch Consulting) and Sue Thompson (MillerCoors) • International Hop Standards Subcommittee, chaired by Bob Foster (MillerCoors) • Packaging Methods, chaired by Chaz Benedict (Hach) and Aaron Porter (Sierra Nevada Brewing Company) Jim Monroe (Anheuser-Busch InBev, retired) continues to pro- vide statistical input and recommendations to the Check Services Program. Sue Casey, Stephen Kenny, and John Barr continue in their roles as Check Service managers for Beer Analysis, Hop Analy- sis, and Malt and Barley Analyses, respectively. Their hard work and dedication are greatly appreciated! The ASBC Board of Directors has instituted a grant program to be administered by the ASBC Technical Committee. The program will be used to fund projects that will provide new methods or pro- grams of value to ASBC members. The first grant of $2,000 has been awarded to Mark Zunkel for the development of a beer fla- vor database. The next proposed grant will be for the investigation of beer-degassing methods to determine the optimal degassing proc- ess(es) to utilize for the ASBC MOA. I would like to thank the subcommittee chairs for their hard work and dedication in conducting their respective collaborative studies throughout the past year. I would also like to recognize the many subcommittee members who participated this past year. Finally, I would like to recognize the dedication and hard work put forth by the Technical Committee. Coordination of New and Alternate Methods of Analysis (Karl Lakenburges, [email protected]) This is a standing subcommittee whose function is to collect, from various sources, including polling membership, new and al- ternate methods of analysis that may be useful for the industries our Society serves. These methods are reviewed to establish their merit and utility. doi:10.1094 /ASBCJ-2010-0824-01 © 2010 American Society of Brewing Chemists, Inc.
-
Upload
khangminh22 -
Category
Documents
-
view
0 -
download
0
Transcript of Technical Committee and Subcommittee Reports
210
Technical Committee and Subcommittee Reports
2009–2010 Report of the Technical Committee
Committee Members: D. Sedin, Chair; C. Benedict; J. Cornell; M. Eurich; A. Fristsch; R. Jennings; G. Kelly; K. Lakenburges; A. Porter; C. Powell; S. Thompson; and R. Foster (senior advisor)
Activity in 23 subcommittees was conducted by the ASBC Tech-nical Committee and Subcommittee chairs during 2009–2010. As a result, four methods are being recommended for inclusion in the ASBC Methods of Analysis (MOA):
• IBU of Dry-Hopped Beer, chaired by Ruth Martin (Sierra Ne-vada Brewing Company)
• Malt-4 Extract Mills and Mashing, chaired by Aaron MacLeod (Canadian Grain Commission)
• EMAST Standard, chaired by Jolanta Menert (Bush Agricul-tural Resources LLC).
• Malt-8 Protein (Barley Standard Versus EDTA), chaired by Rebecca Jennings (Rahr Malting)
Additionally, a review of four sections of the MOA was com-pleted:
• Wort, chaired by Mark Eurich (MillerCoors)
• Sensory Analysis, chaired by Sue Thompson (MillerCoors)
• Microbiology, chaired by Chris Powell (University of Notting-ham)
• Processing Aids, chaired by Aaron Porter (Sierra Nevada Brewing Company)
The following methods will continue for another year of col-laborative study:
• Solid-Phase Microextraction–Gas Chromatography/Mass Se-lective Detection (SPME-GC/MS) Fingerprint of Beer Vola-tiles and Semivolatiles, chaired by Roman Ortiz (MillerCoors)
• Wort and Beer Fermentable and Total Carbohydrates by HPLC, chaired by Mark Eurich (MillerCoors)
• ATP, chaired by Caroline Pachello (MillerCoors)
• Alpha-amylase Automated Flow Using Potassium Ferricya-nide, chaired by Al Budde (USDA/ARS)
• Deoxynivalenol Analysis by ELISA, chaired by Shayne Bart-lett (Cargill Malt)
• Miniature Fermentation Assay, chaired by Alex Speers (Dal-housie University)
• Sortimat, chaired by Paul Ritchie (Canada Malting)
• GC-FID Analysis for Beer Volatiles, chaired by Joe Palausky (Boulevard Brewing)
The following five methods are being recommended for collabo-rative study in 2010–2011:
• Iso-alpha-acids in Beer and Wort by HPLC, chair TBD, ex of-ficio is Aaron Porter
• IBU in Wort by Spectrophotometer, chair TBD, ex officio is Bob Foster
• IBU in Wort by Segmented Flow Analysis, chair TBD, ex of-ficio is Mark Eurich
• Beta-glucans in Wort by Segmented Flow Analysis, chaired by Aaron MacLeod (Canadian Grain Commission)
• Free Amino Nitrogen in Wort by Segmented Flow Analysis, chaired by Aaron MacLeod (Canadian Grain Commission)
As in previous years, the following eight standing subcommit-tees continue:
• Soluble Starch, chaired by Rebecca Jennings (Rahr Malting)
• Check Services, Jim Munroe (Anheuser-Busch, retired), Sue Casey (ASBC), Stephen Kenny (Washington State University IAREC), and John Barr (North Dakota State University).
• New and Alternate Methods of Analysis, chaired by Karl Lakenburges (Anheuser-Busch InBev).
• International Methods, chaired by Dana Sedin (MillerCoors)
• Craft Brewers, chaired by Gina Kelly (New Belgium Brew-ing Company)
• Sensory Science, chaired by Annette Fritsch (Annette Fritsch Consulting) and Sue Thompson (MillerCoors)
• International Hop Standards Subcommittee, chaired by Bob Foster (MillerCoors)
• Packaging Methods, chaired by Chaz Benedict (Hach) and Aaron Porter (Sierra Nevada Brewing Company)
Jim Monroe (Anheuser-Busch InBev, retired) continues to pro-vide statistical input and recommendations to the Check Services Program. Sue Casey, Stephen Kenny, and John Barr continue in their roles as Check Service managers for Beer Analysis, Hop Analy-sis, and Malt and Barley Analyses, respectively. Their hard work and dedication are greatly appreciated!
The ASBC Board of Directors has instituted a grant program to be administered by the ASBC Technical Committee. The program will be used to fund projects that will provide new methods or pro-grams of value to ASBC members. The first grant of $2,000 has been awarded to Mark Zunkel for the development of a beer fla-vor database. The next proposed grant will be for the investigation of beer-degassing methods to determine the optimal degassing proc-ess(es) to utilize for the ASBC MOA.
I would like to thank the subcommittee chairs for their hard work and dedication in conducting their respective collaborative studies throughout the past year. I would also like to recognize the many subcommittee members who participated this past year. Finally, I would like to recognize the dedication and hard work put forth by the Technical Committee.
Coordination of New and Alternate Methods of Analysis (Karl Lakenburges, [email protected])
This is a standing subcommittee whose function is to collect, from various sources, including polling membership, new and al-ternate methods of analysis that may be useful for the industries our Society serves. These methods are reviewed to establish their merit and utility.
doi:10.1094 /ASBCJ-2010-0824-01
© 2010 American Society of Brewing Chemists, Inc.
Technical Committee Report / 211
Soluble Starch (Rebecca Jennings, [email protected])
This is a standing subcommittee whose goal is to coordinate a testing program for soluble starch that will ensure a consistent sup-ply of quality soluble starch for the Society. To further this goal, the subcommittee monitors process methodology utilized in the pro-duction of starch, investigates improved methods for starch quality testing, and evaluates potential new suppliers of starch.
Craft Brewers (Gina Kelly, [email protected])
The mandate of the Craft Brewers Subcommittee is to connect with the craft brewing membership of the ASBC and explore op-portunities to make the Society more relevant to those individuals. Additionally, the subcommittee will develop and pursue strategies to bring craft brewers who are not members of the Society into ASBC. Accomplishments and activities in previous years include launching the Craft Brewers Check Service; roll-out of a Craft Brew-ers community on ASBCnet with Ask the Expert and Forum sec-tions; and promoting ASBC to craft brewers at their events, such as the Great American Beer Festival and the Craft Brewers Confer-ence. This year, the subcommittee’s plans include continuing the Ask the Expert and Forum interactive series on ASBCnet; continu-ing a craft brewers focus group monthly conference call; and poll-ing ASBC Local Section chairs on how to increase craft brewer membership at their level.
Sensory Science (Annette Fritsch, [email protected])
This is a standing subcommittee. It was formed on recommen-dation from the Technical Committee to bring more focus to sen-sory science in ASBC and provide a forum for sensory scientists in the brewing industry to share and discuss current methodology and propose new methodology for collaborative testing. Activities in previous years include developing a panel performance-moni-toring tool that will be included in an upcoming version of the MOA, developing a list of reference standards that can be used for train-ing beer sensory panels, and reviewing the revised triangle test meth-odology with the EBC to retain International Collaborative Method status. The next project involves updating the beer flavor wheel.
Solid-Phase Microextraction–Gas Chromatography/Mass Selective Detection (SPME-GC/MS) Fingerprint of Beer Volatiles and Semivolatiles (Roman Ortiz, [email protected])
This subcommittee was formed to evaluate the use of solid-phase microextraction as a sampling technique, coupled with gas chromat-ographic separation and mass selective detection, to yield volatile and semivolatile fingerprints of finished beer. Currently in the scien-tific literature, there are various methods described that employ this technique as a fingerprint methodology. Variations include type of SPME fiber utilized, whether the sampling of the beer is from the liquid or the headspace, and type of mass selective detection used (ion trap, quadrapole, or time-of-flight).
Wort and Beer Fermentable and Total Carbohydrates by HPLC (Mark Eurich, [email protected])
The subcommittee has been tasked to update ASBC methods Wort-14B and Beer-41B to methods currently employed in the brewing industry. Polling and key findings from previous years indicated great interest in these two methods. Significant techno-logical gains would also deem that these methods be brought up to industry standards.
ATP (Caroline Pachello, [email protected])
There are a number of different commercially available kits that can be used to determine adenosine triphosphate (ATP) biolumi-nescence as a means of assessing water hygiene. However, while such methods are employed by many brewers, there has been no formal evaluation of the technology. This is largely because kits pro-duced by different manufacturers provide data that cannot be ac-curately compared, leading to brewery-specific criteria for the amount of ATP detected and its significance in terms of microbial loading. The objective of this collaborative is to assess whether reproducible results regarding water hygiene can be obtained across multiple labo-ratories with multiple instruments when utilizing a common ATP bioluminescence instrument.
Alpha-amylase Automated Flow Using Potassium Ferricyanide (Al Budde, [email protected])
There has been concern over the use of iodine for the determi-nation of α-amylase across a wide spectrum. It has been suggested that ASBC look into creating an alternative method for the deter-mination of α-amylase using automated flow analysis. However, instead of using iodine and β-limit dextrin, the method would uti-lize potassium ferricyanide.
Deoxynivalenol Analysis by ELISA (Shayne Bartlett, [email protected])
Laboratories are looking for accurate methods that are easy to use and that can produce results in a quick and efficient manner. There are methods in practice that do just this for the determina-tion of deoxynivalenol (DON). DON is a vomitoxin produced by Fusarium that can lead to brewing performance issues. It has been suggested that ASBC look into creating an alternative method for the determination of DON using an ELISA method and a rapid meth-od by Diagnostix called EZ-Tox. Both of these methods are enzyme immunoassays that incorporate homogeneous assay technology. The difference is that EZ-Tox yields results in about 5 min com-pared to the 15 min needed for a regular ELISA method. This sub-committee will look at both methods for addition to the Malt sec-tion of the MOA.
Miniature Fermentation Assay (Alex Speers, [email protected])
To assess the phenotypic characteristics of brewing yeast, small-scale fermentation vessels are often employed to replicate or mimic full-scale vessels. Currently, there are a number of different small-scale vessels that are widely used, ranging from 2-L EBC tall tubes to smaller conical (Erlenmeyer) shake flasks. However, despite their relatively small size, these are often still too large in volume for high-throughput analysis. Currently, a standard miniature-scale fer-mentation technique does not exist, and this subcommittee aims to assess alternative methods to perform and monitor such fermenta-tions. One possible technique is the method described and used in studies of premature yeast flocculation (PYF), as published in the ASBC Journal by Lake et al (2008).
Sortimat (Paul Richie, [email protected])
Laboratories are looking for accurate methods that are easy to use and that can produce results in a quick and efficient manner. It has been recommended that ASBC look into an alternative meth-od for assortment. There are very few Eureka-Niagara barley grad-ers in use. Several companies are using a Sortimat grader from Pfueffer.
212 / Sedin, D.
International Hop Standards Subcommittee (Bob Foster, [email protected])
This subcommittee has existed for 14 years, previously as the In-ternational Subcommittee for Isomerized Hop Alpha-acids Stan-dards (ISIHAS), and is a standing subcommittee whose goal is to produce, purify, and verify isomerized and unisomerized hop stan-dards for the brewing, hops, and related industries.
GC-FID Analysis for Beer Volatiles (Joe Palausky, [email protected])
This subcommittee was formed to evaluate a potentially more accessible and lower cost gas chromatographic method (than one using mass spectrometry) to measure esters and alcohols. Based on 2009 polling results and references in the literature, a method will be designed for collaborative testing.
Iso-alpha-acids in Beer and Wort by HPLC (Aaron Porter, ex officio)
This subcommittee was formed to evaluate a high-performance liquid chromatography (HPLC) method for the analysis of iso-α-acids (IAA) in beer and wort. Many common IAA HPLC meth-odologies exist; this subcommittee will be tasked with evaluating available methods and determining the method best suited for col-laborative testing. A chair has not been identified for this subcom-mittee.
IBU in Wort by Spectrophotometer (Bob Foster, ex officio)
This subcommittee was formed to adapt the current method(s) used for measuring IBU in packed product for wort samples. A chair has not been identified for this subcommittee.
IBU in Wort by Segmented Flow Analysis (Mark Eurich, ex officio)
This subcommittee was formed to adapt the current method(s) used for measuring IBU in packed product by segmented flow analy-sis for wort samples. A chair has not been identified for this sub-committee.
Beta-glucans in Wort by Segmented Flow Analysis (Aaron MacLeod, [email protected])
In conducting the 2009–2010 review of the Wort section of the MOA, it was recommended that segmented flow analysis for β-glu-cans in wort be considered for collaborative study. Segmented flow analysis is commonly utilized in industry for the analysis of β-glu-cans, and this would bring the MOA in line with current method-ology.
Free Amino Nitrogen in Wort by Segmented Flow Analysis (Aaron MacLeod, [email protected])
In conducting the 2009–2010 review of the Wort section of the MOA, it was recommended that segmented flow analysis for free amino nitrogen (FAN) in wort be considered for collaborative study. Segmented flow analysis is commonly utilized in industry for the analysis of FAN, and this would bring the MOA in line with cur-rent methodology.
Packaging Methods (Chaz Benedict, [email protected])
This is a standing subcommittee. It was formed to evaluate pack-aging methodology, review packaging methods within the MOA, and act as a liaison position between ASBC and other packaging-related organizations. This subcommittee has recently been tasked with de-veloping best practice guidelines and recommendations for topics such as how to identify and troubleshoot high in-package oxygen.
213
Determination of Bitterness Units and Iso-α-acid Levels in Dry-Hopped Beers Using the Iso-α-acids Spectrophotometric Method
Subcommittee Members: R. Martin, Chair; S. Bruslind; D. Collazo; C. Geiger; C. Guy; F. Hamp; B. Jaskula-Goiris (EBC); B. Jordan; J. Jordyn; R. Juzeler; S. Krug; K. Lee; J. Mastin; K. McGivney; S. Mulqueen; A. Porter; J. Schmid; R. Schmidt; R. Smith; S. Steele; C. Taylor; S. Taylor; and R. Foster (ex officio)
Keywords: HPLC, IAA, IBU
CONCLUSIONS
1. Repeatability and reproducibility coefficients of variation for the determination of iso-α-acids (IAA), ASBC method Beer-23B (1), ranged from 4.3 to 8.0% and 20.3 to 34.7%, respectively, and were judged acceptable.
2. A t test was performed on the IAA spectrophotometric and HPLC methods and showed no significant difference in mean values at the 95% confidence level.
3. The IAA spectrophotometric mean better estimated the IAA lev-els determined by HPLC compared with the isohumulone bitter-ness units (IBU) spectrophotometric method (2) for dry-hopped beers.
RECOMMENDATIONS
1. The subcommittee recommends that the archived ASBC IAA spectrophotometric method used for estimating IAA levels in dry- and traditionally hopped beers be reinstated as ASBC meth-od Beer-23B (1).
2. Discharge the subcommittee.
This was the third year of the subcommittee’s evaluation of the archived IAA method compared with the IBU method and refer-enced with the HPLC IAA method (4). The committee was started at the request of brewers producing dry-hopped beers who have asked for a spectrophotometric method to determine the true bit-terness of their beers, since some of their “dry-hopped” products have very high IBU values but do not taste that bitter from a sen-sory standpoint.
During the first year, a ruggedness test was performed with se-lect collaborators to test the accuracy and feasibility of the ASBC archived IAA spectrophotometric method. During the second year, sample pairs with different production dates were not sent to col-laborators, and Youden unit block testing (3) could not be per-formed. However, standard statistical analysis indicated the archived spectrophotometric IAA method was accurate. This year the sub-committee recommended sending sample pairs with different pro-duction dates in order to utilize the Youden unit block testing pro-cedure (2), as well as evaluate the ruggedness of the method for dry-hopped beers covering a range of concentrations (low, medium, and high). The subcommittee members also recommended includ-ing the evaluation of a non–dry-hopped, lager beer sample pair for comparison. HPLC analysis (4) was used as a comparison with IAA measurement in this study because it is the standard method used in the industry to determine accurate IAA content in beer.
PROCEDURE
Four sample pairs were sent to each collaborator. Each pair was from the same brand but from different production dates and was selected to cover a range of IAA concentrations, as was recom-mended the previous year by the subcommittee collaborators. The samples consisted of two non–dry-hopped beers (A1/A2), two low dry-hopped beers (B1/B2), two medium dry-hopped beers (C1/C2), and two high dry-hopped beers (D1/D2). Participants were asked to follow the methods as close as possible. Results were evaluated using the Youden unit block design (2).
RESULTS AND DISCUSSION
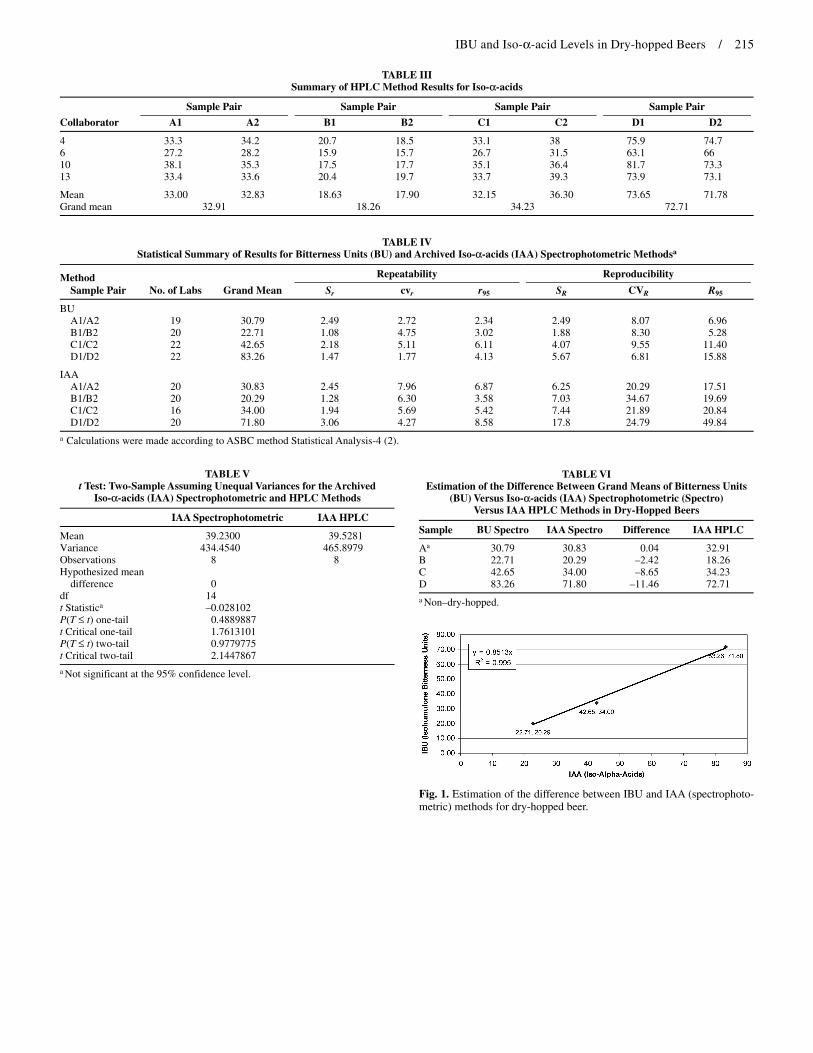
Results from 22 collaborators were received for sample pairs A1/A2, B1/B2, C1/C2, and D1/D2 for the IBU method. Results for the IAA method were received from 21 collaborators for all sample pairs. The results are summarized in Tables I and II, respectively. Outliers were identified using Dixon’s ratio test described in the Youden unit block procedure (2). Both test results for the sample pairs were excluded from data analyses for the six outliers identi-fied. In discussing the method with one of the outlier collabora-tors, it was found that the solvent layers had mixed after setting out for a short time. This could have affected the results because it was stated in the method that this step be done as soon as possible. One known reason for error with the outliers was pipetting inex-perience, where some outliers inadvertently aspirated a small amount of the emulsion layer into the alkaline methanol. This resulted in slightly higher results. Additionally, results from four collaborators using a modified version of EBC method 7.9 (4) were received for all pairs and are summarized in Table III.
The statistical summary of the IBU and IAA data for both ana-lytical methods is presented in Table IV. Repeatability and repro-ducibility coefficients of variation for the IBU method ranged from 1.8 to 5.1% and 6.8 to 9.6%, respectively, and were judged accept-able. Repeatability and reproducibility coefficients of variation for the determination of IAA, ASBC method Beer-23B (1), ranged from 4.3 to 8.0% and 20.3 to 34.7%, respectively, and were judged ac-ceptable. The high level of reproducibility coefficients of variation for the IAA method might be due to unfamiliarity with the meth-od, as well as insufficient separation of the solvent layers and in-clusion of the emulsion layer in the sample cell.
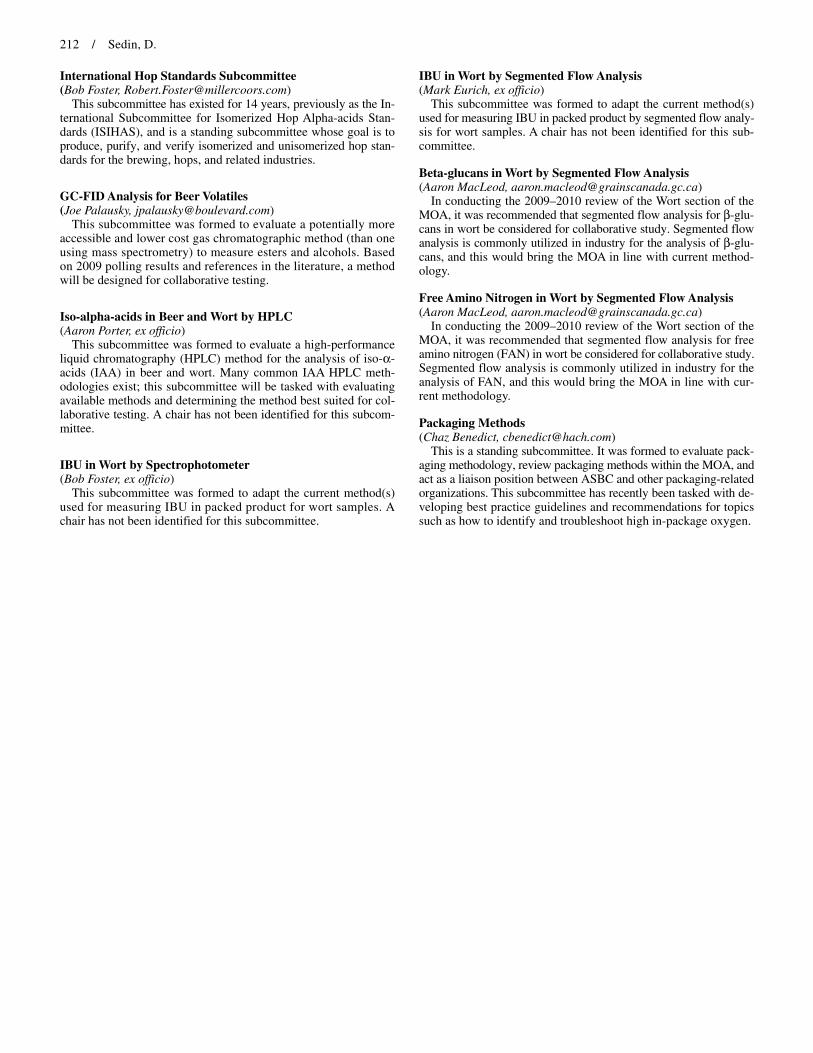
A paired t test was performed to evaluate the difference in means between the spectrophotometric and HPLC methods for testing IAA levels. Table V shows that there was no significant difference be-tween the two methods for the means at the 95% confidence level, and the archived spectrophotometric IAA procedure was judged an acceptable method. Table VI shows the differences between the samples for the IBU and IAA grand means and the reference HPLC IAA method. When only the dry-hopped IBU and IAA grand means were plotted against each other, the relationship had a linear func-tion of y = 0.8513×, with an R2 value of 0.995 (Fig. 1).
The IAA method delivered a result that is lower than the IBU method, which was expected. Using the formula from the line cre-ated in Table VI, one can estimate the IAA level by multiplying the IBU result by 0.8513. It was determined that the archived IAA method with its new modifications qualifies as a practical spec-trophotometric method for estimating IAA levels in dry-hopped beers.
doi:10.1094 /ASBCJ-2010-0825-01
© 2010 American Society of Brewing Chemists, Inc.

214 / Martin, R.
LITERATURE CITED
1. American Society of Brewing Chemists. Methods of Analysis, 6th ed. Beer-23B Iso-α-acids (IAA). The Society, St. Paul, MN, 1958 (archived 1976).
2. American Society of Brewing Chemists. Methods of Analysis, 2009 ed. Beer-23A Beer bitterness (BU); Statistical Analysis-4 Youden unit block collaborative testing procedure, -5 Comparison of tests methods. The
Society, St. Paul, MN, 2009. 3. American Society of Brewing Chemists. Report of the Subcommittee
for Determination of Bitterness Units (BU) and Iso-α-acid Levels in Dry-hopped Beers Using the Archived Iso-α-acids Spectrophotometric Meth-od. J. Am. Soc. Brew. Chem. 67:253-254, 2009.
4. European Brewery Convention. Analytica–EBC. Section 7 Hops Method 7.9, Iso-alpha-acids and reduced iso-alpha-acids in hop products by HPLC. Fachverlag Hans Carl, Nürnberg, Germany, 1998.
TABLE I Results for Bitterness Units Spectrophotometric Method—Beer-23A
Sample Pair Sample Pair Sample Pair Sample Pair
Collaborator A1 A2 B1 B2 C1 C2 D1 D2
1 33.0 34.0 25.0 24.0 43.5 49.0 89.0 89.0 2 29.5 30.0 21.5 21.0 38.5 42.5 80.0 81.0 3 31.5 33.5 24.5 24.5 44.5 48.0 88.5 87.5 4 27.0 30.0 25.5 22.5 45.0 41.0 88.5 89.0 5 29.0 29.0 20.0 20.0 41.0 37.0 81.5 80.5 6 27.0 29.0 20.0 20.5 36.5 34.0 68.0 70.0 7 33.0 33.5 25.0 23.5 44.0 48.0 88.5 89.5 8 24.5 25.5 26.0a 34.0a 49.5 48.0 87.5 87.5 9 32.0 32.0 23.0 22.0 42.0 48.0 84.5 83.5 10 31.5 31.5 23.0 23.0 43.5 47.0 86.5 86.0 11 31.5 31.5 23.5 22.5 41.5 45.5 85.0 82.0 12 32.5 35.5 25.0 23.5 43.5 47.5 88.0 90.0 13 26.0a 37.0a 25.5 19.0 33.5 35.5 77.5 78.5 14 28.0 32.0 24.0 22.0 38.5 43.0 84.5 78.5 15 28.5 29.5 22.0 20.5 38.0 42.0 80.5 81.0 16 29.0 30.5 22.0 21.5 39.5 44.5 79.5 80.0 17 24.0a 25.0a 18.0 19.5 38.0 37.5 71.0 71.5 18 36.0a 31.5a 19.0 18.5 39.0 41.5 83.0 86.5 19 28.0 30.0 24.5 21.5 40.5 46.5 78.5 81.0 20 31.5 31.5 24.0 22.5 42.0 46.0 87.5 84.0 21 33.5 34.5 25.5 24.5 42.5 46.5 85.0 85.5 22 33.0 33.5 25.0 24.0 44.5 49.0 89.5 89.5
Meanb 30.18 31.39 23.38 22.05 41.32 43.98 83.27 83.25 Grand meanb 30.79 22.71 42.65 83.26
a Outlier at P < 0.05 based on totals and differences. b Calculated excluding outliers.
TABLE II Results for Archived Iso-α-acids Spectrophotometric Method—Beer-23B
Sample Pair Sample Pair Sample Pair Sample Pair
Collaborator A1 A2 B1 B2 C1 C2 D1 D2
1 30.0 28.5 15.0 14.5 34.5 35.0 67.0 62.0 2 32.0 32.0 22.0 20.0 35.5 39.5 77.0 77.5 3 31.5 32.5 22.5 24.0 39.0 41.0 79.5 75.0 4 33.0 33.0 28.5 29.0 65.0a 37.5a 112.5 118.0 5 22.0 23.0 15.5 15.0 25.0 25.0 50.5 49.0 6 34.0 34.0 22.0 21.5 23.5 26.5 73.5 68.5 7 30.0 34.0 20.0 20.0 36.0 41.5 79.0 76.0 8 49.5 40.5 29.5 27.0 40.5a 25.0a 79.5 81.5 9 35.5 32.0 20.0 21.5 45.0 48.5 95.5 90.5 10 30.5 34.0 21.5 18.5 32.0 40.5 67.5 72.0 11 20.5a 51.0a 13.5a 85.0a 23.5a 40.0a 41.0a 113.0a 12 33.5 33.5 37.5 42.0 21.0 21.0 77.0 77.0 13 30.5 29.5 17.0 16.0 30.5 34.5 71.0 65.0 14 25.0 27.0 15.0 15.5 23.5 29.0 45.5 48.0 15 21.5 22.0 10.5 9.5 15.5a 19.0a 30.5 31.0 16 42.5 36.5 24.5 24.5 39.5 48.0 89.5 93.0 17 28.5 28.5 17.0 18.0 113.5a 37.5a 72.5 74.5 18 30.5 35.5 18.0 17.0 32.5 38.0 59.0 68.0 19 17.5 17.0 10.0 6.5 27.0 27.5 63.0 63.5 20 33.0 27.5 19.5 17.5 33.5 36.0 77.0 69.5 21 33.0 29.0 24.5 24.0 38.5 40.0 72.5 73.5 22 … … … … … … … …
Meanb 31.18 30.48 20.50 20.08 32.28 35.72 71.95 71.65 Grand meanb 30.83 20.29 34.00 71.80
a Outlier at P < 0.05 based on totals and differences. b Calculated excluding outliers.
IBU and Iso-α-acid Levels in Dry-hopped Beers / 215
TABLE III Summary of HPLC Method Results for Iso-α-acids
Sample Pair Sample Pair Sample Pair Sample Pair
Collaborator A1 A2 B1 B2 C1 C2 D1 D2
4 33.3 34.2 20.7 18.5 33.1 38 75.9 74.7 6 27.2 28.2 15.9 15.7 26.7 31.5 63.1 66 10 38.1 35.3 17.5 17.7 35.1 36.4 81.7 73.3 13 33.4 33.6 20.4 19.7 33.7 39.3 73.9 73.1
Mean 33.00 32.83 18.63 17.90 32.15 36.30 73.65 71.78 Grand mean 32.91 18.26 34.23 72.71
TABLE IV Statistical Summary of Results for Bitterness Units (BU) and Archived Iso-α-acids (IAA) Spectrophotometric Methodsa
Method Repeatability Reproducibility
Sample Pair No. of Labs Grand Mean Sr cvr r95 SR CVR R95
BU A1/A2 19 30.79 2.49 2.72 2.34 2.49 8.07 6.96 B1/B2 20 22.71 1.08 4.75 3.02 1.88 8.30 5.28 C1/C2 22 42.65 2.18 5.11 6.11 4.07 9.55 11.40 D1/D2 22 83.26 1.47 1.77 4.13 5.67 6.81 15.88
IAA A1/A2 20 30.83 2.45 7.96 6.87 6.25 20.29 17.51 B1/B2 20 20.29 1.28 6.30 3.58 7.03 34.67 19.69 C1/C2 16 34.00 1.94 5.69 5.42 7.44 21.89 20.84 D1/D2 20 71.80 3.06 4.27 8.58 17.8 24.79 49.84
a Calculations were made according to ASBC method Statistical Analysis-4 (2).
TABLE V t Test: Two-Sample Assuming Unequal Variances for the Archived
Iso-α-acids (IAA) Spectrophotometric and HPLC Methods
IAA Spectrophotometric IAA HPLC
Mean 39.2300 39.5281 Variance 434.4540 465.8979 Observations 8 8 Hypothesized mean
difference
0
df 14 t Statistica –0.028102 P(T ≤ t) one-tail 0.4889887 t Critical one-tail 1.7613101 P(T ≤ t) two-tail 0.9779775 t Critical two-tail 2.1447867
a Not significant at the 95% confidence level.
TABLE VI Estimation of the Difference Between Grand Means of Bitterness Units
(BU) Versus Iso-α-acids (IAA) Spectrophotometric (Spectro) Versus IAA HPLC Methods in Dry-Hopped Beers
Sample BU Spectro IAA Spectro Difference IAA HPLC
Aa 30.79 30.83 0.04 32.91 B 22.71 20.29 –2.42 18.26 C 42.65 34.00 –8.65 34.23 D 83.26 71.80 –11.46 72.71
a Non–dry-hopped.
Fig. 1. Estimation of the difference between IBU and IAA (spectrophoto-metric) methods for dry-hopped beer.

216
Mill and Mashing Apparatus for Determination of Malt Extract
Subcommittee Members: A. MacLeod, Chair; D. Allsopp; B. Amundsen; S. Bartlett; P. Bolin; K. Churchill; R. Joy; J. McCann; P. Ritchie; A. Stern; T. Whittaker; and R. Jennings (ex officio)
Keywords: Coarse extract, Congress mash, Fine extract, Malt mill, Mash bath
CONCLUSIONS
1. Repeatability and reproducibility coefficients of variation for fine-grind extract ranged from 0.2 to 0.3% and 0.3 to 0.4%, re-spectively, and were judged acceptable.
2. Repeatability and reproducibility coefficients of variation for coarse-grind extract ranged from 0.3 to 0.4% and 0.4 to 0.6%, respectively, and were judged acceptable.
RECOMMENDATIONS
1. The subcommittee recommends that the descriptions of the mill and mashing apparatus in the current ASBC official method for extract (Malt-4) be revised as follows: a. Mill, Fine and Coarse Grind. Laboratory mill of Buhler-type
DFLU disc mill. b. Mashing Apparatus. Water bath that will firmly hold a num-
ber of mash beakers. Bath water is circulated to ensure uni-formity of temperature in entire bath. Water level must be held above maximum level of mash in mash beakers. Heat-ing arrangement for bath must be capable of raising mash temperature 1 degree Celsius/min up to 70°C. Each mash-ing beaker has a stirrer provided to cause an upward motion of mash. Stirring gear drives each stirrer at same speed (80–100 rpm.)
2. Discharge the subcommittee.
This is the subcommittee’s first year of existence. The subcom-mittee was started on the recommendation of the subcommittee for Methods of Analysis Malt Review (2). Revisions were made to the official method for extract, Malt-4 (1), during the 2009 methods re-view to reflect current laboratory practices. The most significant changes were made to the descriptions of the malt mill and mash-ing apparatus. The Buhler DFLU disc mill has become the stan-dard in the industry, replacing the Miag-Seck–type cone mill. The
description of the mash bath was modified to include models that employ a magnetic stirring mechanism, which is now more com-mon than the propeller blade (overhead stirrer) method. This col-laborative study was performed to determine the repeatability and reproducibility for the updated method using modern mill and mash-ing equipment.
PROCEDURE
A total of eight malt samples representing four sample pairs with a range of extract levels was sent to each collaborator. Sample pairs A/B and C/D were different 2-row barley varieties from different production dates, and sample pairs E/F and G/H were different 6-row barley varieties from different production dates. For each sample, the collaborator prepared a Congress mash using the Buhler DFLU disc mill and their own mashing equipment following the Malt-4 procedure. The Buhler-Miag DFLU disc mill was calibrated accord-ing to the Malt-4 method for fine and coarse grinds. Results were evaluated using the Youden unit block design (1).
RESULTS AND DISCUSSION
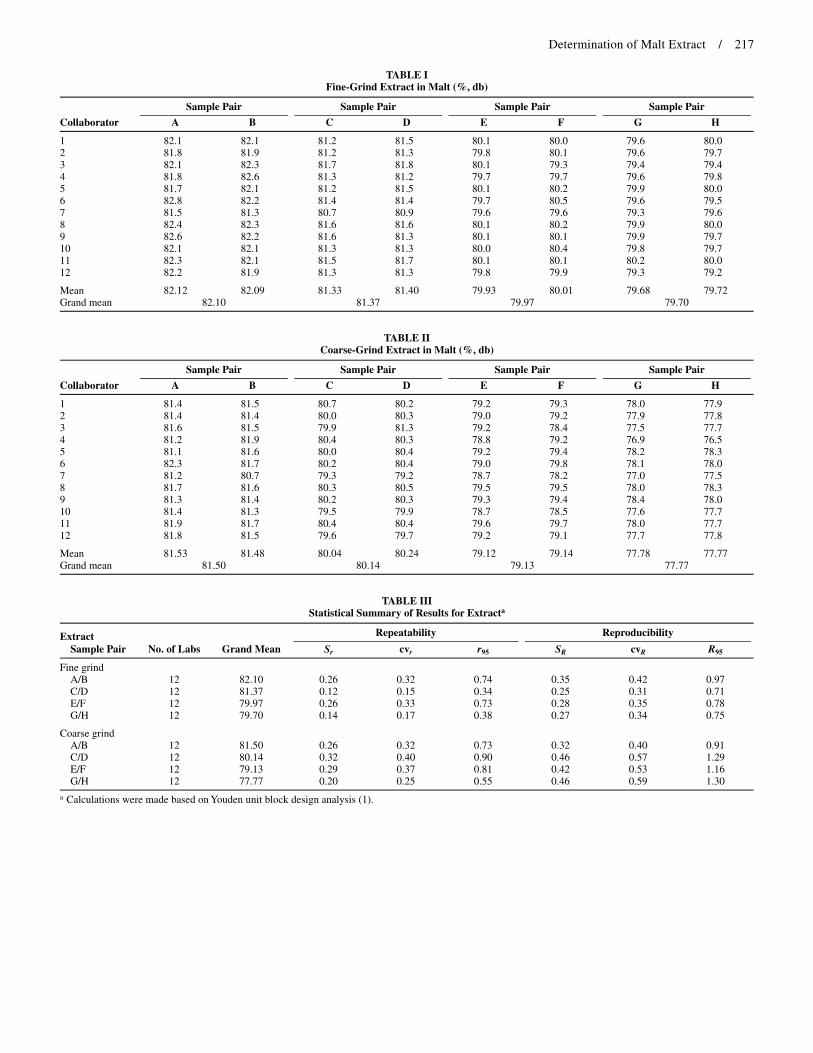
Twelve collaborators submitted results for all four sample pairs (A/B, C/D, E/F, and G/H). Although outliers were identified using Dixon’s ratio test (1), no data were excluded from the statistical analysis since no deviations from protocol were found. Data for fine- and coarse-grind extracts are presented in Tables I and II, respec-tively. Mash baths using magnetic stirring devices were used by 10 collaborators, while baths employing propeller stirring were used by 2 collaborators. Although there were not enough participating laboratories for a direct statistical comparison of variations in ex-tract results between stirring methods, no differences were observed when the stirring methods were analyzed separately.
The statistical summary of the extract data is presented in Table III. Repeatability and reproducibility coefficients of variation for fine-grind extract ranged from 0.2 to 0.3% and 0.3 to 0.4%, respectively, and were judged acceptable. Repeatability and reproducibility co-efficients of variation for coarse-grind extract ranged from 0.3 to 0.4% and 0.4 to 0.6%, respectively, and were judged acceptable.
LITERATURE CITED
1. American Society of Brewing Chemists. Methods of Analysis, 2009 ed. Malt-4 Extract; Statistical Analysis-4 Youden unit block collaborative testing procedure. The Society, St. Paul, MN, 2009.
2. American Society of Brewing Chemists. Report of the Subcommittee for Methods of Analysis Malt Review. J. Am. Soc. Brew. Chem. 67:262, 2009.
doi:10.1094 /ASBCJ-2010-0902-01
© 2010 American Society of Brewing Chemists, Inc.
Determination of Malt Extract / 217
TABLE I Fine-Grind Extract in Malt (%, db)
Sample Pair Sample Pair Sample Pair Sample Pair
Collaborator A B C D E F G H
1 82.1 82.1 81.2 81.5 80.1 80.0 79.6 80.0 2 81.8 81.9 81.2 81.3 79.8 80.1 79.6 79.7 3 82.1 82.3 81.7 81.8 80.1 79.3 79.4 79.4 4 81.8 82.6 81.3 81.2 79.7 79.7 79.6 79.8 5 81.7 82.1 81.2 81.5 80.1 80.2 79.9 80.0 6 82.8 82.2 81.4 81.4 79.7 80.5 79.6 79.5 7 81.5 81.3 80.7 80.9 79.6 79.6 79.3 79.6 8 82.4 82.3 81.6 81.6 80.1 80.2 79.9 80.0 9 82.6 82.2 81.6 81.3 80.1 80.1 79.9 79.7 10 82.1 82.1 81.3 81.3 80.0 80.4 79.8 79.7 11 82.3 82.1 81.5 81.7 80.1 80.1 80.2 80.0 12 82.2 81.9 81.3 81.3 79.8 79.9 79.3 79.2
Mean 82.12 82.09 81.33 81.40 79.93 80.01 79.68 79.72 Grand mean 82.10 81.37 79.97 79.70
TABLE II Coarse-Grind Extract in Malt (%, db)
Sample Pair Sample Pair Sample Pair Sample Pair
Collaborator A B C D E F G H
1 81.4 81.5 80.7 80.2 79.2 79.3 78.0 77.9 2 81.4 81.4 80.0 80.3 79.0 79.2 77.9 77.8 3 81.6 81.5 79.9 81.3 79.2 78.4 77.5 77.7 4 81.2 81.9 80.4 80.3 78.8 79.2 76.9 76.5 5 81.1 81.6 80.0 80.4 79.2 79.4 78.2 78.3 6 82.3 81.7 80.2 80.4 79.0 79.8 78.1 78.0 7 81.2 80.7 79.3 79.2 78.7 78.2 77.0 77.5 8 81.7 81.6 80.3 80.5 79.5 79.5 78.0 78.3 9 81.3 81.4 80.2 80.3 79.3 79.4 78.4 78.0 10 81.4 81.3 79.5 79.9 78.7 78.5 77.6 77.7 11 81.9 81.7 80.4 80.4 79.6 79.7 78.0 77.7 12 81.8 81.5 79.6 79.7 79.2 79.1 77.7 77.8
Mean 81.53 81.48 80.04 80.24 79.12 79.14 77.78 77.77 Grand mean 81.50 80.14 79.13 77.77
TABLE III Statistical Summary of Results for Extracta
Extract Repeatability Reproducibility
Sample Pair No. of Labs Grand Mean Sr cvr r95 SR cvR R95
Fine grind A/B 12 82.10 0.26 0.32 0.74 0.35 0.42 0.97 C/D 12 81.37 0.12 0.15 0.34 0.25 0.31 0.71 E/F 12 79.97 0.26 0.33 0.73 0.28 0.35 0.78 G/H 12 79.70 0.14 0.17 0.38 0.27 0.34 0.75
Coarse grind A/B 12 81.50 0.26 0.32 0.73 0.32 0.40 0.91 C/D 12 80.14 0.32 0.40 0.90 0.46 0.57 1.29 E/F 12 79.13 0.29 0.37 0.81 0.42 0.53 1.16 G/H 12 77.77 0.20 0.25 0.55 0.46 0.59 1.30
a Calculations were made based on Youden unit block design analysis (1).
218
Megazyme E-MAST Standard for Segmented Flow Analysis of α-Amylase in Malt
Subcommittee Members: J. Menert, Chair; C. Adams; B. Amundsen; P. Bolin; A. Fox; K. French; R. Joy; A. MacLeod; A. Stern; and R. Jennings (ex officio)
Keywords: SFA
CONCLUSIONS
1. Repeatability coefficients of variation for the determination of α-amylase by segmented flow analysis, ASBC method Malt-7C, using E-MAST as the standard, ranged from 1.6 to 6.0% and were judged acceptable.
2. Reproducibility coefficients of variation for the determination of α-amylase by segmented flow analysis, ASBC method Malt-7C, using E-MAST as the standard, ranged from 9.8 to 19.6% and were judged acceptable.
RECOMMENDATIONS
1. The subcommittee recommends that the Megazyme E-MAST product be adopted for inclusion in ASBC method Malt-7C (1).
2. Discharge the subcommittee.
This was the first year of the subcommittee’s existence. Based on the recommendation of the Subcommittee for Methods of Analy-
sis Malt Review (2), this subcommittee was formed to evaluate the Megazyme E-MAST (3) product as a standard for method Malt-7C. The Megazyme E-MAST standard was tested as a replacement prod-uct for Sigma Alpha Amylase Type VIII-A (A-2771-500), which is no longer available.
PROCEDURE
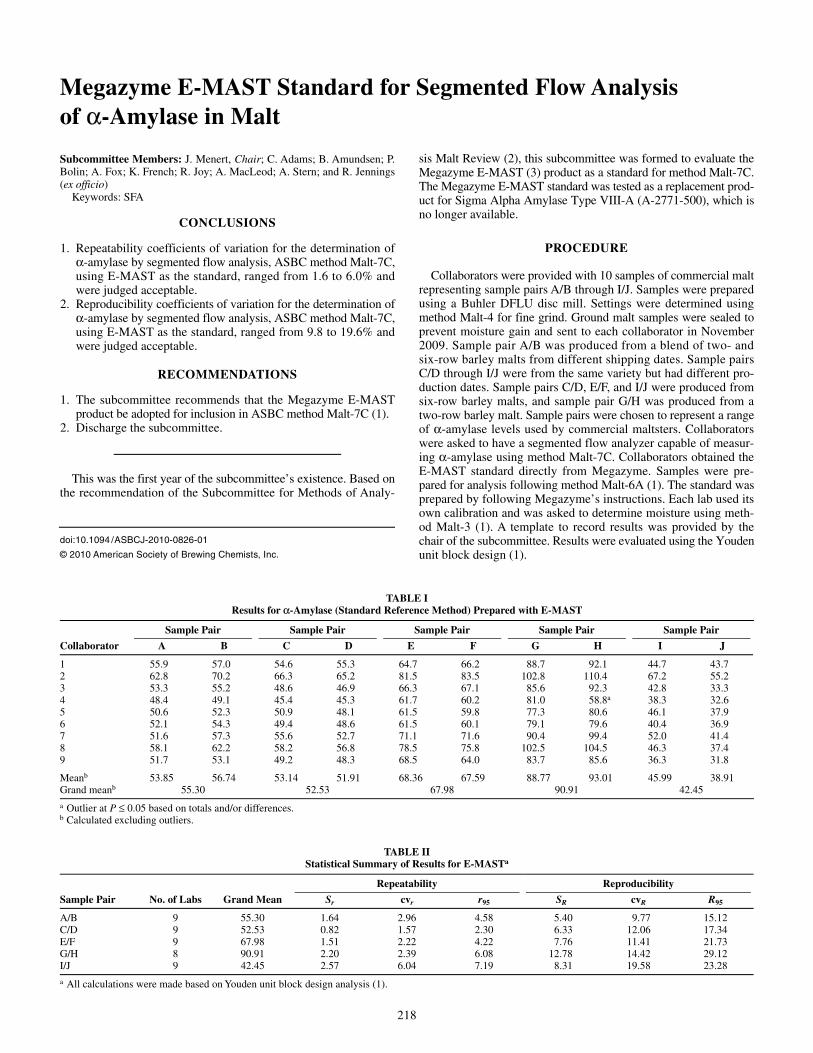
Collaborators were provided with 10 samples of commercial malt representing sample pairs A/B through I/J. Samples were prepared using a Buhler DFLU disc mill. Settings were determined using method Malt-4 for fine grind. Ground malt samples were sealed to prevent moisture gain and sent to each collaborator in November 2009. Sample pair A/B was produced from a blend of two- and six-row barley malts from different shipping dates. Sample pairs C/D through I/J were from the same variety but had different pro-duction dates. Sample pairs C/D, E/F, and I/J were produced from six-row barley malts, and sample pair G/H was produced from a two-row barley malt. Sample pairs were chosen to represent a range of α-amylase levels used by commercial maltsters. Collaborators were asked to have a segmented flow analyzer capable of measur-ing α-amylase using method Malt-7C. Collaborators obtained the E-MAST standard directly from Megazyme. Samples were pre-pared for analysis following method Malt-6A (1). The standard was prepared by following Megazyme’s instructions. Each lab used its own calibration and was asked to determine moisture using meth-od Malt-3 (1). A template to record results was provided by the chair of the subcommittee. Results were evaluated using the Youden unit block design (1).
TABLE I Results for α-Amylase (Standard Reference Method) Prepared with E-MAST
Sample Pair Sample Pair Sample Pair Sample Pair Sample Pair
Collaborator A B C D E F G H I J
1 55.9 57.0 54.6 55.3 64.7 66.2 88.7 92.1 44.7 43.7 2 62.8 70.2 66.3 65.2 81.5 83.5 102.8 110.4 67.2 55.2 3 53.3 55.2 48.6 46.9 66.3 67.1 85.6 92.3 42.8 33.3 4 48.4 49.1 45.4 45.3 61.7 60.2 81.0 58.8a 38.3 32.6 5 50.6 52.3 50.9 48.1 61.5 59.8 77.3 80.6 46.1 37.9 6 52.1 54.3 49.4 48.6 61.5 60.1 79.1 79.6 40.4 36.9 7 51.6 57.3 55.6 52.7 71.1 71.6 90.4 99.4 52.0 41.4 8 58.1 62.2 58.2 56.8 78.5 75.8 102.5 104.5 46.3 37.4 9 51.7 53.1 49.2 48.3 68.5 64.0 83.7 85.6 36.3 31.8
Meanb 53.85 56.74 53.14 51.91 68.36 67.59 88.77 93.01 45.99 38.91 Grand meanb 55.30 52.53 67.98 90.91 42.45
a Outlier at P ≤ 0.05 based on totals and/or differences. b Calculated excluding outliers.
TABLE II Statistical Summary of Results for E-MASTa
Repeatability Reproducibility
Sample Pair No. of Labs Grand Mean Sr cvr r95 SR cvR R95
A/B 9 55.30 1.64 2.96 4.58 5.40 9.77 15.12 C/D 9 52.53 0.82 1.57 2.30 6.33 12.06 17.34 E/F 9 67.98 1.51 2.22 4.22 7.76 11.41 21.73 G/H 8 90.91 2.20 2.39 6.08 12.78 14.42 29.12 I/J 9 42.45 2.57 6.04 7.19 8.31 19.58 23.28
a All calculations were made based on Youden unit block design analysis (1).
doi:10.1094 /ASBCJ-2010-0826-01
© 2010 American Society of Brewing Chemists, Inc.
Segmented Flow Analysis of α-Amylase / 219
RESULTS AND DISCUSSION
Results from nine collaborators were received for the five sample pairs. Results for sample H from lab 4 was considered outliers; there-fore, results for sample pair G/H from lab 4 were excluded from the calculations. The results for α-amylase using E-MAST as the standard are presented in Table I. Outliers were identified using Dix-on’s ratio test (1).
The statistical summary of the α-amylase data for the Megazyme E-MAST standard using method Malt-7C are presented in Table II. Repeatability and reproducibility coefficients of variation ranged from 1.6 to 6.0% and 9.8 to 19.6%, respectively, and were judged acceptable. The E-MAST standard is viscous, and usage of a posi-tive-displacement pipette is necessary. Even though the coefficient
of variation is high, it is comparable to the original method and stan-dard.
LITERATURE CITED
1. American Society of Brewing Chemists. Methods of Analysis, 2009 ed. Malt-3 Moisture, -6A Diastatic power, -6C Diastatic power, automated flow analysis, -7C Alpha-amylase; Statistical Analysis-4 Youden unit block collaborative testing procedure, and Appendix-IA Methods for cali-bration of spectrophotometer. The Society, St. Paul, MN, 2009.
2. American Society of Brewing Chemists. Report of the Subcommittee for Methods of Analysis Malt Review. J. Am. Soc. Brew. Chem. 67:262, 2009.
3. Megazyme International Ireland Ltd. Data Booklet on Malt α-Amylase/ β-Amylase Standard (Lot 70304), E-MAST 05/07. Megazyme, Bray, Ire-land, 2007.
220
Ethylenediaminetetraacetate Acid (EDTA) Versus Barley as a Calibration Standard for Determining Protein in Malt Using Combustion Analysis
Subcommittee Members: R. Jennings, Chair/Ex officio; K. Allder (EBC); S. Bartlett; A. Budde; T. Chicos; G. Fox (EBC); J. Kahle; A. MacLeod; D. Pickett; M. Schmitt (EBC); and T. Whittaker
Keywords: EDTA, Nitrogen
CONCLUSIONS
1. Repeatability and reproducibility coefficients of variation for de-termination of protein by combustion analysis using National Institute of Standards and Technology (NIST)-certified ethyl-enediaminetetraacetate acid (EDTA) as the calibration standard ranged from 0.328 to 1.739% and 0.512 to 1.932%, respectively, and were judged acceptable.
2. Repeatability and reproducibility coefficients of variation for de-termination of protein by combustion analysis using NIST-cer-tified barley as the calibration standard ranged from 0.544 to 1.098% and 0.770 to 1.243%, respectively, and were judged ac-ceptable.
3. Based on the paired t test for differences in means for protein analyses, the NIST-certified EDTA and barley standards were significantly different at the 95% confidence level.
RECOMMENDATIONS
1. The subcommittee recommends the NIST-certified barley stan-dard be adopted for inclusion in ASBC method Malt-8B.
2. Discharge the subcommittee.
This was the first year of the subcommittee’s existence. Based on the recommendation of the Subcommittee for Methods of Anal-ysis Malt Review (2), this subcommittee was formed to evaluate the NIST-certified barley standard as an alternative to the NIST-certified EDTA standard for protein analysis as listed in method Barley-7C (1).
PROCEDURE
Collaborators were provided with 10 samples of commercial malt, representing sample pairs A/B through I/J, and one sample each of NIST-certified EDTA and barley. Sample pairs were chosen to rep-resent malt with varying protein levels. Samples were prepared us-ing a Buhler DFLU disc mill with settings determined by method Malt-4 for fine grind. Ground malt samples were sealed to prevent moisture gain and sent to each collaborator in October 2009. Sample pair A/B was produced from a blend of two 2-row barley varieties, sample pairs C/D and G/H were produced from different 2-row bar-ley varieties, sample pair E/F was produced from distiller’s material, and sample pair I/J was produced from 6-row barley of the same
variety. All sample pairs were from different production dates. The instruments were set to the manufacturer’s recommended settings and calibrated with NIST-certified EDTA for one set of results and with NIST-certified barley for another set of results. Results were evaluated using the Youden unit block design (1) and Minitab sta-tistical software for the paired t test for differences in means at the 95% confidence level.
RESULTS AND DISCUSSION
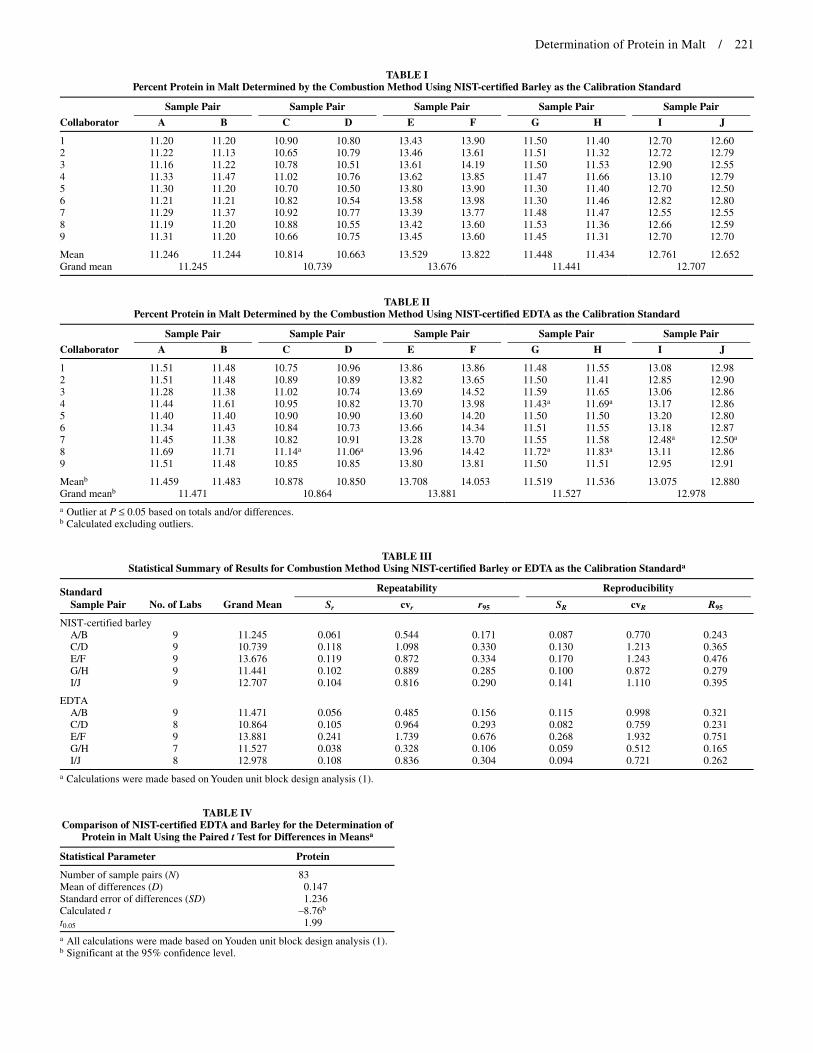
Results from 11 collaborators were received for sample pairs A/B, C/D, E/F, G/H, and I/J. Results from two collaborators were excluded prior to statistical analysis because of known deviations from the prescribed experimental protocol. The results for protein determi-nation using NIST-certified barley and EDTA are summarized in Tables I and II, respectively. Outliers were determined using Dix-on’s ratio test (1).
The statistical summary of the protein data for both NIST-certi-fied EDTA and barley used in determination of protein by com-bustion analysis is presented in Table III. Repeatability and repro-ducibility coefficients of variation for NIST-certified EDTA ranged from 0.328 to 1.739% and 0.512 to 1.932%, respectively, and were judged acceptable. Repeatability and reproducibility coefficient of variations for NIST-certified barley ranged from 0.544 to 1.098% and 0.770 to 1.243%, respectively, and were judged acceptable.
The results of the paired t test for comparison of differences in protein analyses means when using NIST-certified EDTA or barley (combustion method, Barley-7C) are presented in Table IV. The paired t test results indicate the two standards were significantly different at the 95% confidence level for all samples, except C, G, and E. All of the EDTA protein levels were higher than the barley protein levels. EDTA is a chemical synthesized from ethylenedi-amine (1,2-diaminoethane), formaldehyde, and sodium cyanide. It was originally designed to sequester metal ions. At the time that method Barley-7C was collaboratively studied, EDTA was what was commonly available for use. EDTA results in protein levels in the range typically seen for meat products. Since combustion analysis does not actually measure protein, but rather the nitrogen that is given off during combustion, the protein in EDTA and barley is de-rived by multiplying the nitrogen reading by 6.25. Verification of the protein level for NIST-certified barley has been performed us-ing method Barley-7A (1). However, the protein level for EDTA has not been determined using this method. Even though the t test results showed a significant difference between the two standards, this can be explained by the consistently higher values that EDTA provides for protein.
LITERATURE CITED
1. American Society of Brewing Chemist. Methods of Analysis, 2009 ed. Malt-8 Protein (N × 6.25); Barley-7A Protein (N × 6.25) by Kjeldahl, -7C Protein (N × 6.25) by combustion; Statistical Analysis-4 Youden unit block collaborative testing procedure, -5 Comparison of test meth-ods. The Society, St. Paul, MN, 2009.
2. American Society of Brewing Chemists. Report of the Subcommittee for Methods of Analysis Malt Review. J. Am. Soc. Brew. Chem. 67:262, 2009.
doi:10.1094 /ASBCJ-2010-0827-01
© 2010 American Society of Brewing Chemists, Inc.
Determination of Protein in Malt / 221
TABLE I Percent Protein in Malt Determined by the Combustion Method Using NIST-certified Barley as the Calibration Standard
Sample Pair Sample Pair Sample Pair Sample Pair Sample Pair
Collaborator A B C D E F G H I J
1 11.20 11.20 10.90 10.80 13.43 13.90 11.50 11.40 12.70 12.60 2 11.22 11.13 10.65 10.79 13.46 13.61 11.51 11.32 12.72 12.79 3 11.16 11.22 10.78 10.51 13.61 14.19 11.50 11.53 12.90 12.55 4 11.33 11.47 11.02 10.76 13.62 13.85 11.47 11.66 13.10 12.79 5 11.30 11.20 10.70 10.50 13.80 13.90 11.30 11.40 12.70 12.50 6 11.21 11.21 10.82 10.54 13.58 13.98 11.30 11.46 12.82 12.80 7 11.29 11.37 10.92 10.77 13.39 13.77 11.48 11.47 12.55 12.55 8 11.19 11.20 10.88 10.55 13.42 13.60 11.53 11.36 12.66 12.59 9 11.31 11.20 10.66 10.75 13.45 13.60 11.45 11.31 12.70 12.70
Mean 11.246 11.244 10.814 10.663 13.529 13.822 11.448 11.434 12.761 12.652 Grand mean 11.245 10.739 13.676 11.441 12.707
TABLE II Percent Protein in Malt Determined by the Combustion Method Using NIST-certified EDTA as the Calibration Standard
Sample Pair Sample Pair Sample Pair Sample Pair Sample Pair
Collaborator A B C D E F G H I J
1 11.51 11.48 10.75 10.96 13.86 13.86 11.48 11.55 13.08 12.98 2 11.51 11.48 10.89 10.89 13.82 13.65 11.50 11.41 12.85 12.90 3 11.28 11.38 11.02 10.74 13.69 14.52 11.59 11.65 13.06 12.86 4 11.44 11.61 10.95 10.82 13.70 13.98 11.43a 11.69a 13.17 12.86 5 11.40 11.40 10.90 10.90 13.60 14.20 11.50 11.50 13.20 12.80 6 11.34 11.43 10.84 10.73 13.66 14.34 11.51 11.55 13.18 12.87 7 11.45 11.38 10.82 10.91 13.28 13.70 11.55 11.58 12.48a 12.50a 8 11.69 11.71 11.14a 11.06a 13.96 14.42 11.72a 11.83a 13.11 12.86 9 11.51 11.48 10.85 10.85 13.80 13.81 11.50 11.51 12.95 12.91
Meanb 11.459 11.483 10.878 10.850 13.708 14.053 11.519 11.536 13.075 12.880 Grand meanb 11.471 10.864 13.881 11.527 12.978
a Outlier at P ≤ 0.05 based on totals and/or differences. b Calculated excluding outliers.
TABLE III Statistical Summary of Results for Combustion Method Using NIST-certified Barley or EDTA as the Calibration Standarda
Standard Repeatability Reproducibility
Sample Pair No. of Labs Grand Mean Sr cvr r95 SR cvR R95
NIST-certified barley A/B 9 11.245 0.061 0.544 0.171 0.087 0.770 0.243 C/D 9 10.739 0.118 1.098 0.330 0.130 1.213 0.365 E/F 9 13.676 0.119 0.872 0.334 0.170 1.243 0.476 G/H 9 11.441 0.102 0.889 0.285 0.100 0.872 0.279 I/J 9 12.707 0.104 0.816 0.290 0.141 1.110 0.395
EDTA A/B 9 11.471 0.056 0.485 0.156 0.115 0.998 0.321 C/D 8 10.864 0.105 0.964 0.293 0.082 0.759 0.231 E/F 9 13.881 0.241 1.739 0.676 0.268 1.932 0.751 G/H 7 11.527 0.038 0.328 0.106 0.059 0.512 0.165 I/J 8 12.978 0.108 0.836 0.304 0.094 0.721 0.262
a Calculations were made based on Youden unit block design analysis (1).
TABLE IV Comparison of NIST-certified EDTA and Barley for the Determination of
Protein in Malt Using the Paired t Test for Differences in Meansa
Statistical Parameter Protein
Number of sample pairs (N) 83 Mean of differences (D) 0.147 Standard error of differences (SD) 1.236 Calculated t –8.76b t0.05 1.99
a All calculations were made based on Youden unit block design analysis (1). b Significant at the 95% confidence level.
222
Methods of Analysis Wort Review
Subcommittee Members: M. Eurich, Chair; A. Budde; R. Jennings; K. Lakenburges; A. MacLeod; and A. Porter
CONCLUSIONS
1. The subcommittee reviewed the ASBC Methods of Analysis (MOA) Wort section. Many of the methods have alternatives that are used in the industry, and many need modifications. The methods were reviewed for accuracy of citations and availabil-ity of described supplies.
2. Several of the MOA Wort methods require additional work, which would include alternative methods. These methods may not be modified completely until additional input is provided.
RECOMMENDATIONS
1. The subcommittee recommends that revisions to the MOA Wort methods be adopted for inclusion in the 2010 ASBC MOA.
2. The subcommittee recommends Wort-11, Reducing Sugars (Cop-per Reducing Substances) be archived.
3. The subcommittee recommends a collaborative study to evalu-ate Wort-13, Viscosity (International Method) for an alternative using instruments such as that manufactured by Anton Paar and other manufacturers.
4. The subcommittee recommends that segmented flow analysis be evaluated by collaborative study for the following methods: a. Wort-12, Free Amino Nitrogen (International Method) b. Wort-18, β-Glucan in Congress Wort by Fluorescence c. Beer-23, Beer Bitterness (add wort analysis to the current
method) 5. The subcommittee recommends evaluation of Wort-17 for de-
termination of protein in hopped worts, as in unhopped worts. 6. The subcommittee recommends updates to the Wort Glossary.
The subcommittee also recommends that for any future changes to the Wort Glossary all title words be explained or expounded on in the method itself.
This is the first year of the subcommittee’s existence. Based on member polling, the Technical Committee recommended forma-tion of this subcommittee to update the Wort section of the MOA. Current methods used in the industry may not coincide with those listed in the MOA. These differences are most likely due to tech-nological gains made since these methods were published.
PROCEDURE
A short note was sent out to potential subcommittee members to determine interest in joining the MOA Wort Review Subcom-mittee. Subcommittee members were provided with each Wort method or those that they are familiar with and asked to review them for accuracy (i.e., spelling, calculations, conformity to labo-ratory practices, etc.). Subcommittee members participated in two conference calls for open discussion of the methods and glossary.
Following the review process all minor revisions and updates will be made to the methods. An additional list of new methods may
be generated based on new technology or methods currently used within the industry.
RESULTS AND DISCUSSION
The results of the MOA Wort methods review are listed by method.
1. Wort-1, Sampling a. In footnote, update filter paper to include “currently avail-
able filter paper or Ahlstrom, which is located in Helsinki, Finland.” Remove Shliecher and Schuell Inc.
2. Wort-2, Specific Gravity a. Minor grammatical changes only.
3. Wort-3, Extract a. Add an update to the method in order to reference the use
of a density meter to obtain Plato value using a density meter programmed with a Plato table.
4. Wort-4, Apparent Extract by Hydrometer a. No changes recommended.
5. Wort-5, Yeast Fermentable Extract a. Update to include instrumental methods listed in Beer-4. b. Add definition in Calculation section for real degree of fer-
mentation (RDF)—A measure of the extent to which the extract (dissolved solids) has been fermented. It is roughly the difference of the extract of the original wort and the real extract of the beer divided by the original extract.
c. Add definition in Calculation section for real extract (RE)—The actual extract (dissolved solids) of a beer devoid of al-cohol and carbon dioxide. For wort, since no alcohol or carbon dioxide is present, it is proportional to the carbo-hydrate concentration of the wort.
6. Wort-6, Iodine Reaction a. Method archived.
7. Wort-7, Total Acidity a. Minor grammatical changes only.
8. Wort-8, pH (Hydrogen Ion Concentration) a. Recommend that the method be changed to report results
to nearest 0.01 rather than 0.05.
9. Wort-9, Method for Preparation of Wort for Color Determina-tion a. Recommend the addition that “color measurement should
be performed within 30 min to ensure accuracy, as evapo-ration of the sample will cause false high color results.”
b. Replace Johns Manville as supplier with World Minerals and Sigma.
c. Other minor grammatical changes only.
10. Wort-10, Protein a. Replace result of 0.126 in N % by wt value in Example with
correct value of 0.015. Replace 0.126 with 0.015 in pro-tein % by wt calculation and with corrected result of 0.09 in place of 0.79.
b. Other minor grammatical changes only.
11. Wort-11, Reducing Sugars (Copper Reducing Substances) a. Recommend method be archived.
12. Wort-12, Free Amino Nitrogen (International Method) a. Recommend this method for collaborative study using seg-
mented flow analysis (SFA) as an alternative. b. Recommend adding CAS registry number for all suppliers.
doi:10.1094 /ASBCJ-2010-0913-02
© 2010 American Society of Brewing Chemists, Inc.
MOA Wort Section Review / 223
c. Add concentration units of mg/L directly after “= 150” un-der Examples.
13. Wort-13, Viscosity (International Method) a. Recommend removing chromic acid as a viable cleaning
solution throughout entire MOA. Replace all references to chromic acid with Nochromix or other similar type of clean-ing agent as an alternative.
b. A collaborative study is recommended to evaluate any in-struments, such as that manufactured by Anton Paar.
14. Wort-14, Fermentable Saccharides by Chromatography a. Under method A, Reagents (d), replace Nutritional Bio-
chemicals Co. as resource with “CAS# 1464-44-4.” b. Under method A, Reagents (e) and (f), and under method
B, Reagents (e) and (f), add “J. T.” prior to “Baker.” c. Under method B, Apparatus (a), replace the city of “Rich-
mond” with “Hercules.” d. Under method B, Apparatus (h), add the word “Classic”
directly after “Sep-Pak.” e. Under method B, Apparatus (h), replace “Associates” with
“Technologies Corp., Milford, MA.” Also replace “part No 91910” with “WAT051910.”
f. Other minor grammatical changes only.
15. Wort-15, Magnesium by Atomic Absorption Spectrophotometry a. Under Reagents, add an additional section (d), with “Re-
agent water.” b. Other minor grammatical changes only.
16. Wort-16, Zinc by Atomic Absorption Spectrophotometry a. Under Reagents, add an additional section (d), with “Re-
agent water.”
17. Wort-17, Protein in Unhopped Wort by Spectrophotometry a. Under Reagents (a), replace all wording after “0.5% w/v.”
with “Accurately perform a 100-old dilution using the 0.5% w/v reagent.”
b. Under Apparatus (a), add “grating spectrophotometers” di-rectly after “calibrate.”
c. Most laboratories no longer perform Kjeldahl analyses. It is recommended that Beer-11B be referenced as the pre-ferred method and list the Kjeldahl method, Beer-11A, as an alternative. Recommend removal of all wording with regard to the Kjeldahl method.
d. Recommend this method for collaborative study using hopped worts.
18. Wort-18, β-Glucan in Congress Wort by Fluorescence a. Under Reagents (d), add Megazyme as the supplier and re-
move Polysciences. b. Under Reagents, add an additional section (f), with “Re-
agent water.” c. Under Apparatus, add an additional section (I), with “Am-
ber bottle.” d. Under Apparatus, remove sections (c) and (d) and refer to
Reagents (a) for dilution. e. Recommend this method for collaborative study using seg-
mented flow analysis (SFA) as an alternative. f. Other minor grammatical changes only.
19. Wort-19, Fermentable Carbohydrates by Cation Exchange HPLC a. Recommend potentially moving this method to Wort-14 as
an alternative and listing it as method C.
20. Wort-20, Elemental Analysis by Inductively Coupled Plasma-Atomic Emission Spectroscopy a. No changes recommended.
21. Wort-21, Thiobarbituric Acid Index a. No changes recommended.
22. Wort Glossary a. Recommend updates.
LITERATURE CITED
1. American Society of Brewing Chemists. Methods of Analysis, 9th ed. The Society, St. Paul, MN, 2009.

224
Methods of Analysis Sensory Analysis Review
Subcommittee Members: S. Thompson, Chair; A. Benson; G. Conley; A. Fritsch; C. Haddock; J. Helber; T. Horner; L. Salazar; and K. Zigich
CONCLUSIONS
1. The subcommittee reviewed the Sensory Analysis section of the ASBC Methods of Analysis (MOA). The methods were reviewed for accuracy of citations and applicability to the current state of sensory science.
2. One of the Sensory Analysis methods requires additional work.
RECOMMENDATIONS
1. The subcommittee recommends that revisions to the Sensory Analysis section of the MOA be adopted for inclusion in the 2010 ASBC MOA.
2. Maintain the subcommittee to revise Sensory Analysis-12, Fla-vor Terminology and Reference Standards.
3. There are no methods the subcommittee is recommending be archived.
This subcommittee was formed based on the recommendation of the ASBC Technical Committee to evaluate the accuracy of the Sensory Analysis section of the MOA.
PROCEDURE
Subcommittee members were provided with 4–5 of the 13 Sen-sory Analysis methods and asked to review them for accuracy (i.e., spelling, calculations, conformity to sensory practices, etc.). Fol-lowing the review process, all minor revisions and updates were made to the methods. Significant changes to the methods are listed in the Results and Discussion section with an explanation of why the change is required.
RESULTS AND DISCUSSION
The results of the MOA Sensory Analysis review are listed by method.
1. Sensory Analysis-1, Terms and Definitions Difference-from-control test was added as a term and defined because Sensory Analysis-13 was added to the MOA in 1999, after the writing of Sensory Analysis-1.
2. Sensory Analysis-2, Test Room, Equipment, Conduct of Test Reference to a digitizer and the associated reference article were removed because computers have replaced the use of digitizers for data capture in sensory laboratories. The note for specific ruby-colored glassware was deleted because that glassware is no longer available through any supplier. The figure of a sen-sory booth was updated to include a computer.
3. Sensory Analysis-3, Choice of Method Reference to the triangular test being appropriate where only 6, 7, or 8 assessors are available was deleted because the cur-rent view is that a triangular test should not be conducted with so few assessors.
4. Sensory Analysis-7, Triangular Test EBC published a revised triangular test method that ASBC par-ticipated in reviewing in 2008. This revised method will replace the Triangular Test Method in the current MOA.
5. Sensory Analysis-10, Descriptive Analysis Additional statistical analysis procedures utilized for analyzing descriptive data, which are detailed in Sensory Analysis-13, were included. A reference for these statistical procedures was added.
6. Sensory Analysis-12, Flavor Terminology and Reference Stan-dards It is recommended that the committee work on revising the meth-od on Flavor Terminology and Reference Standards, including updating the flavor wheel.
LITERATURE CITED
1. American Society of Brewing Chemists. Methods of Analysis, 2009 ed. Sensory Analysis section. The Society, St. Paul, MN, 2009.
doi:10.1094 /ASBCJ-2010-0914-01
© 2010 American Society of Brewing Chemists, Inc.
225
Methods of Analysis Filter Aid Review
Subcommittee Members: A. Porter, Chair/Ex officio; K. Bacigalupo; R. Martin; and B. Sheffield
CONCLUSIONS
1. The subcommittee reviewed the Methods of Analysis (MOA) Filter Aid section. These methods have no alternatives that are used in the industry, but some may need modification. The meth-ods were reviewed for accuracy of citations and availability of described supplies.
2. There are currently only four Filter Aid methods. The subcommit-tee found only minor grammatical errors, one update for a refer-ence method, and some questions to answer as a group.
RECOMMENDATIONS
1. The subcommittee recommends the revisions to the MOA Filter Aid methods be adopted for inclusion in the 2010 ASBC MOA.
2. Maintain the subcommittee for additional review or testing af-ter Technical Committee recommendations.
3. The subcommittee recommends the following changes be made to the Filter Aid methods: a. Correct some misspellings. b. Add Beer-45 (ICP method) as an additional method for iron
determination. c. Have the ASBC Technical Committee decide if it’s necessary
to include similar tests for PVPP and/or silica gel. d. For Filter Aid-3, change the sample size from 32 to 12 oz of
beer and change the filter aid addition to beer from 2.5 to 1.0 g.
4. At this time the subcommittee has no recommendations for col-laborative studies.
5. There are no methods the subcommittee is recommending be archived.
This is the first year of the subcommittee’s existence. This sub-committee was formed based on the recommendation of the ASBC Technical Committee to evaluate the accuracy of the Filter Aid sec-tion of the MOA. This subcommittee was also tasked with sug-gesting additional elements to be added to the methodology, as well as archiving methods no longer in use.
PROCEDURE
A short note was sent out to potential subcommittee members to determine interest in joining the MOA Filter Aid Review Sub-committee. Subcommittee members were provided with each Fil-ter Aid method and asked to review it for accuracy (i.e., spelling, calculations, conformity to laboratory practices, etc.). Subcommit-tee members were asked to participate in one meeting for the dis-cussion of methods. Recommended changes and questions about the methods are listed in the Results and Discussion section with an explanation of why the change is required.
RESULTS AND DISCUSSION
The results of the MOA Filter Aid review are listed by method.
1. Filter Aid-1, Sampling Question: Do we want to include silica gel and PVPP (for all four methods)?
2. Filter Aid-2, pH of Water Suspension It is recommended that 0.2M disodium phosphate (Na2HPO4) be changed to 0.2M disodium hydrogen phosphate (Na2HPO4) and that “stirrir” be changed to “stirrer.”
3. Filter Aid-3, Effects of Odor and Taste It is recommended that 32-oz bottles of beer be changed to 12-oz bottles of beer and that “recrown” be changed to “re-crown.”
4. Filter Aid-4, Iron Pickup by Beer It is recommended that Beer-45 be added as an alternative meth-od for iron determination. We also recommend that it be noted that the control beer should undergo the same procedure as the test beer minus the filter aid addition.
LITERATURE CITED
1. American Society of Brewing Chemists. Methods of Analysis, 2009 ed. Filter Aid section. The Society, St. Paul, MN, 2009.
doi:10.1094 /ASBCJ-2010-0916-01
© 2010 American Society of Brewing Chemists, Inc.
226
Adenosine Triphosphate (ATP) Rapid Testing for Water and Rinse Water Hygiene
Subcommittee Members: C. Pachello, Chair; E. Belden; D. Bendiak; R. Eidman; S. Gallegos; T. Gojanovic (statistician); N. Hodgson; C. Hughes; G. Kelly; R. Mancebo; L. Marques; A. Mercier; L. White; and C. Powell (ex officio)
Keywords: Adenosine triphosphate, ATP, Rapid test, Water
CONCLUSIONS
1. For measuring adenosine triphosphate (ATP) in water containing yeast, 54 of 60 data sets within a laboratory had a coefficient of variation of <10% and were considered to be acceptable.
2. Analysis of data between different laboratories using a linear regression model indicated that 72.2% of the variability in the yeast in water data set was captured in the model and was con-sidered to be acceptable.
3. For measuring ATP in water containing bacteria, 39 of 44 data sets within a laboratory had a coefficient of variation of <10% and were considered to be acceptable.
4. Analysis of data between different laboratories using a linear regression model indicated that 16.2% of the variability in the bacteria in water data set was captured by the model and was considered to be unacceptable.
RECOMMENDATIONS
1. The current data suggest that the evaluated method can be used for the accurate assessment of yeast in water samples. However, the subcommittee recommends that further analysis be performed for the assessment of samples containing bacteria.
2. An alternative protocol for culturing bacterial microbes will be used in an attempt to standardize the metabolic state of bacte-ria, leading to an improved correlation in ATP results between laboratories.
The aim of this subcommittee is to evaluate the use of biolumi-nescence to detect adenosine triphosphate (ATP) as a means of as-sessing water hygiene. This was the second year for the subcommit-tee, which was formed based on polling at the 2008 ASBC Annual Meeting. During the first year, insufficient collaborators were ob-tained to initiate collaborative trials. However, polling was performed to ascertain the range of equipment and test methodologies cur-rently employed in breweries. Based on this information, the sub-committee decided to assess the 3M Clean-Trace total ATP water tests and the Clean-Trace NG luminometer during the second year. It should be noted that similar instruments and test reagents are available from a number of other manufacturers. While each brand may vary in sensitivity, precision, and cost, the main focus of this collaborative study was to assess the ability of ATP technology to detect yeast and bacteria in water samples.
PROCEDURE
A bacteria strain (Lactobacillus brevis) and a lager yeast culture (Saccharomyces pastorianus) were sent to each of 12 collaborators.
Participants were also provided with universal beer agar (UBA) plates made with low-hopped beer and supplemented with Tween 80 for the purpose of cultivating each microorganism. Collabora-tors grew microbes aerobically for 3–5 days at 28–31°C and sub-sequently analyzed each fresh culture. Care was taken to ensure that cultures were not allowed to overgrow, in order to maintain cell vitality. Stationary phase cultures were diluted in sterile dis-tilled water to achieve a stock suspension with a target absorbance of approx. 0.05 for yeast and 0.06 for bacteria at a wavelength of 600 nm. A series of dilutions was performed on each stock to en-able ATP measurements to be obtained at varying cell concentra-tions. Dilutions for yeast included 1:2, 1:10, 1:100, 1:500, and 1:1,000, while dilutions for bacteria included 1:2, 1:10, and 1:100. Since bacteria have less ATP per unit cell compared to yeast, the higher dilution rates were eliminated. Each culture was divided and analyzed in triplicate for detectable ATP, utilizing the 3M Clean-Trace NG luminometer and Clean-Trace total ATP water test, and data were expressed in arbitrary relative light units (RLU). To pro-vide an estimate of the number of colony forming units (CFU) pres-ent in the original cultures, each solution was also membrane filtered and cultivated on UBA for 5–7 days at 28–31°C prior to enumera-tion.
RESULTS AND DISCUSSION
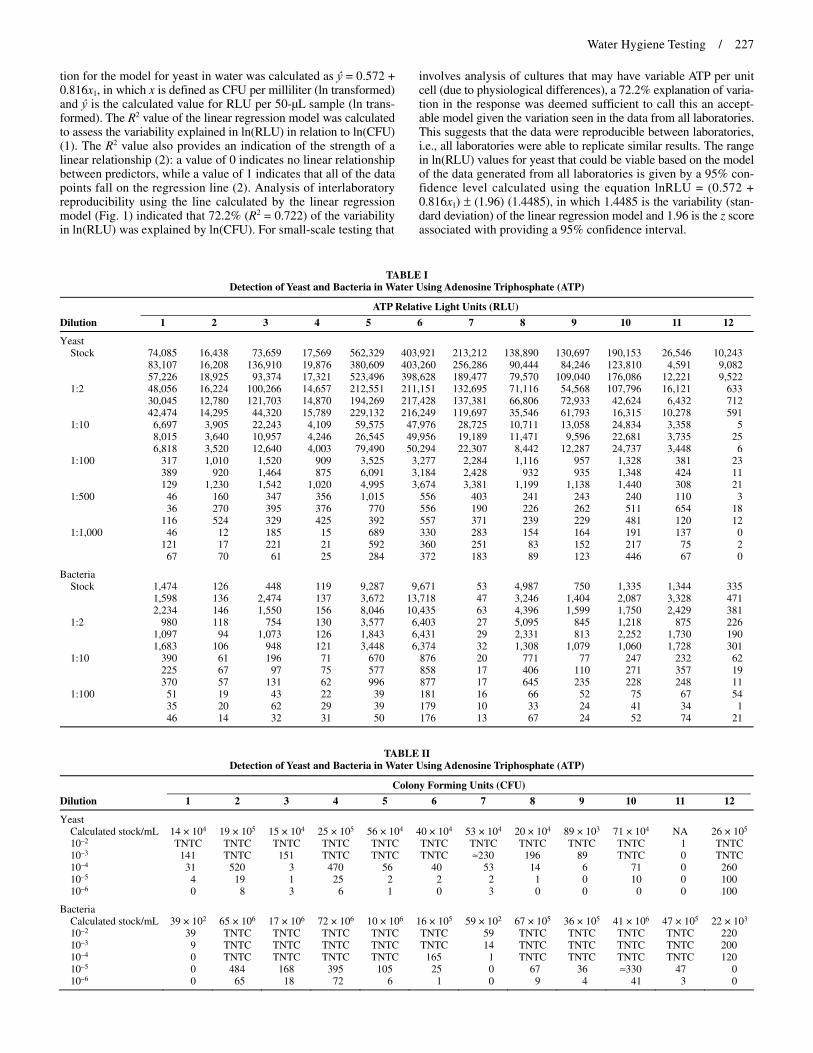
Results for the analysis of water samples containing either yeast or bacteria using ATP bioluminescence were obtained from 12 col-laborators (Table I). Data produced by collaborator 11 for yeast in water were excluded because an accurate representation of CFU could not be obtained (Table II). Results from analyses of yeast and bacteria in water from collaborator 12 were excluded due to con-tamination of cultures either during shipment or cultivation. Each remaining collaborator was able to detect ATP in diluted samples of yeast and bacteria in water (Table I). The ATP data reported were used to determine the coefficient of variation (CV) (Table III), and the estimated CFU present in the original culture, along with the measured RLU, were used to produce linear regression models (Figs. 1 and 2).
The CV is a measure of relative variability given by standard de-viation/mean. The CV is a unitless measure that allows one to com-pare the relative variability of different data sets with different units of measure. Lower CV values are typically indicative of less varia-tion in a data set. For analysis of ATP in water samples containing yeast, 54 of 60 data sets exhibited a CV of <10%, indicating good repeatability of the method within laboratories, with a maximum CV of 29.3% observed. It should be noted that variation was more common as the yeast concentration decreased, as indicated by the increasing frequency at which a CV value of >10% occurred (Table III). For analysis of ATP in water samples containing bacteria, 39 of 44 data sets exhibited a CV of <10%, indicating good repeat-ability of the method within individual laboratories (Table III), with a maximum CV value of 13.0% observed. Similar to the data ob-tained for yeast samples, the frequency of CV values of >10% in-creased as bacteria concentrations decreased.
Linear regression is a statistical method that utilizes the relation-ship between variables to develop a measure of prediction from one variable to another. The data obtained in this study were uti-lized to calculate predictive models of ATP in water for yeast and bacteria, as measured by RLU compared with CFU. The linear equa-
doi:10.1094 /ASBCJ-2010-0928-02
© 2010 American Society of Brewing Chemists, Inc.
Water Hygiene Testing / 227
tion for the model for yeast in water was calculated as ŷ = 0.572 + 0.816x1, in which x is defined as CFU per milliliter (ln transformed) and ŷ is the calculated value for RLU per 50-µL sample (ln trans-formed). The R2 value of the linear regression model was calculated to assess the variability explained in ln(RLU) in relation to ln(CFU) (1). The R2 value also provides an indication of the strength of a linear relationship (2): a value of 0 indicates no linear relationship between predictors, while a value of 1 indicates that all of the data points fall on the regression line (2). Analysis of interlaboratory reproducibility using the line calculated by the linear regression model (Fig. 1) indicated that 72.2% (R2 = 0.722) of the variability in ln(RLU) was explained by ln(CFU). For small-scale testing that
involves analysis of cultures that may have variable ATP per unit cell (due to physiological differences), a 72.2% explanation of varia-tion in the response was deemed sufficient to call this an accept-able model given the variation seen in the data from all laboratories. This suggests that the data were reproducible between laboratories, i.e., all laboratories were able to replicate similar results. The range in ln(RLU) values for yeast that could be viable based on the model of the data generated from all laboratories is given by a 95% con-fidence level calculated using the equation lnRLU = (0.572 + 0.816x1) ± (1.96) (1.4485), in which 1.4485 is the variability (stan-dard deviation) of the linear regression model and 1.96 is the z score associated with providing a 95% confidence interval.
TABLE IDetection of Yeast and Bacteria in Water Using Adenosine Triphosphate (ATP)
ATP Relative Light Units (RLU)
Dilution 1 2 3 4 5 6 7 8 9 10 11 12
Yeast Stock 74,085 16,438 73,659 17,569 562,329 403,921 213,212 138,890 130,697 190,153 26,546 10,243
83,107 16,208 136,910 19,876 380,609 403,260 256,286 90,444 84,246 123,810 4,591 9,082 57,226 18,925 93,374 17,321 523,496 398,628 189,477 79,570 109,040 176,086 12,221 9,522
1:2 48,056 16,224 100,266 14,657 212,551 211,151 132,695 71,116 54,568 107,796 16,121 633 30,045 12,780 121,703 14,870 194,269 217,428 137,381 66,806 72,933 42,624 6,432 712 42,474 14,295 44,320 15,789 229,132 216,249 119,697 35,546 61,793 16,315 10,278 591
1:10 6,697 3,905 22,243 4,109 59,575 47,976 28,725 10,711 13,058 24,834 3,358 5 8,015 3,640 10,957 4,246 26,545 49,956 19,189 11,471 9,596 22,681 3,735 25 6,818 3,520 12,640 4,003 79,490 50,294 22,307 8,442 12,287 24,737 3,448 6
1:100 317 1,010 1,520 909 3,525 3,277 2,284 1,116 957 1,328 381 23 389 920 1,464 875 6,091 3,184 2,428 932 935 1,348 424 11 129 1,230 1,542 1,020 4,995 3,674 3,381 1,199 1,138 1,440 308 21
1:500 46 160 347 356 1,015 556 403 241 243 240 110 3 36 270 395 376 770 556 190 226 262 511 654 18 116 524 329 425 392 557 371 239 229 481 120 12
1:1,000 46 12 185 15 689 330 283 154 164 191 137 0 121 17 221 21 592 360 251 83 152 217 75 2 67 70 61 25 284 372 183 89 123 446 67 0
Bacteria Stock 1,474 126 448 119 9,287 9,671 53 4,987 750 1,335 1,344 335
1,598 136 2,474 137 3,672 13,718 47 3,246 1,404 2,087 3,328 471 2,234 146 1,550 156 8,046 10,435 63 4,396 1,599 1,750 2,429 381
1:2 980 118 754 130 3,577 6,403 27 5,095 845 1,218 875 226 1,097 94 1,073 126 1,843 6,431 29 2,331 813 2,252 1,730 190 1,683 106 948 121 3,448 6,374 32 1,308 1,079 1,060 1,728 301
1:10 390 61 196 71 670 876 20 771 77 247 232 62 225 67 97 75 577 858 17 406 110 271 357 19 370 57 131 62 996 877 17 645 235 228 248 11
1:100 51 19 43 22 39 181 16 66 52 75 67 54 35 20 62 29 39 179 10 33 24 41 34 1 46 14 32 31 50 176 13 67 24 52 74 21
TABLE II Detection of Yeast and Bacteria in Water Using Adenosine Triphosphate (ATP)
Colony Forming Units (CFU)
Dilution 1 2 3 4 5 6 7 8 9 10 11 12
Yeast Calculated stock/mL 14 × 104 19 × 105 15 × 104 25 × 105 56 × 104 40 × 104 53 × 104 20 × 104 89 × 103 71 × 104 NA 26 × 105 10–2 TNTC TNTC TNTC TNTC TNTC TNTC TNTC TNTC TNTC TNTC 1 TNTC 10–3 141 TNTC 151 TNTC TNTC TNTC ≈230 196 89 TNTC 0 TNTC 10–4 31 520 3 470 56 40 53 14 6 71 0 260 10–5 4 19 1 25 2 2 2 1 0 10 0 100 10–6 0 8 3 6 1 0 3 0 0 0 0 100
Bacteria Calculated stock/mL 39 × 102 65 × 106 17 × 106 72 × 106 10 × 106 16 × 105 59 × 102 67 × 105 36 × 105 41 × 106 47 × 105 22 × 103 10–2 39 TNTC TNTC TNTC TNTC TNTC 59 TNTC TNTC TNTC TNTC 220 10–3 9 TNTC TNTC TNTC TNTC TNTC 14 TNTC TNTC TNTC TNTC 200 10–4 0 TNTC TNTC TNTC TNTC 165 1 TNTC TNTC TNTC TNTC 120 10–5 0 484 168 395 105 25 0 67 36 ≈330 47 0 10–6 0 65 18 72 6 1 0 9 4 41 3 0

228 / Pachello, C.
With respect to the analysis of ATP in water samples containing bacteria, although CV values indicated good repeatability of the method within a laboratory a comparison of the linear relationship between CFU and RLU between laboratories (Fig. 2) indicated that only 16.2% (R2 = 0.162) of the variability of ln(RLU) for bacteria was explained, due to a significant number of outliers and a high dispersion of data between laboratories, and was deemed to be un-acceptable.
Although data from analysis of ATP in water containing bacteria did not yield a good statistically predictive linear regression model, it should be noted that an increase in RLU was observed with in-creasing cell concentrations within individual data sets. This indi-cates there is an increase in ATP as a consequence of greater num-bers of bacteria, even though each collaborator reported variation in the RLU obtained. It is suggested that the variability in the data may be the result of differences in terms of cellular energy between
TABLE III Individual Collaborator Precision for the Detection of Bacteria and Yeast in Water Using Adenosine Triphosphate (ATP)a
Dilution Collaborator Mean Median Min Max SD CV (%)
Bacteria None 1 7.46 7.38 7.30 7.71 0.22 3.0
2 4.91 4.91 4.84 4.98 0.07 1.5 3 7.09 7.35 6.10 7.81 0.88 12.5 4 4.92 4.92 4.78 5.05 0.14 2.8 5 8.78 8.99 8.21 9.14 0.50 5.7 6 9.32 9.25 9.18 9.53 0.18 2.0 7 3.99 3.97 3.85 4.14 0.15 3.7 8 8.33 8.39 8.09 8.51 0.22 2.6 9 7.08 7.25 6.62 7.38 0.40 5.7 10 7.44 7.47 7.20 7.64 0.23 3.0 11 7.70 7.80 7.20 8.11 0.46 6.0
1:2 1 7.11 7.00 6.89 7.43 0.29 4.0 2 4.66 4.66 4.54 4.77 0.11 2.4 3 6.82 6.85 6.63 6.98 0.18 2.6 4 4.83 4.84 4.80 4.87 0.04 0.7 5 7.95 8.15 7.52 8.18 0.37 4.7 6 8.76 8.76 8.76 8.77 0.00 0.1 7 3.38 3.37 3.30 3.47 0.09 2.5 8 7.82 7.75 7.18 8.54 0.68 8.7 9 6.81 6.74 6.70 6.98 0.15 2.3 10 7.26 7.10 6.97 7.72 0.40 5.5 11 7.23 7.45 6.77 7.46 0.39 5.4
1:10 1 5.81 5.91 5.54 5.97 0.23 4.0 2 4.12 4.11 4.04 4.20 0.08 2.0 3 4.91 4.88 4.57 5.28 0.35 7.2 4 4.24 4.26 4.13 4.32 0.10 2.3 5 6.59 6.51 6.36 6.90 0.28 4.3 6 6.77 6.78 6.75 6.78 0.01 0.2 7 2.89 2.83 2.83 3.00 0.09 3.2 8 6.37 6.47 6.01 6.65 0.33 5.2 9 4.83 4.70 4.34 5.46 0.57 11.8 10 5.51 5.51 5.43 5.60 0.09 1.6 11 5.61 5.51 5.45 5.88 0.23 4.1
1:100 1 3.77 3.83 3.56 3.93 0.19 5.2 2 2.86 2.94 2.64 3.00 0.19 6.7 3 3.78 3.76 3.47 4.13 0.33 8.8 4 3.30 3.37 3.09 3.43 0.18 5.5 5 3.75 3.66 3.66 3.91 0.14 3.8 6 5.19 5.19 5.17 5.20 0.01 0.3 7 2.55 2.56 2.30 2.77 0.24 9.2 8 3.96 4.19 3.50 4.20 0.40 10.2 9 3.44 3.18 3.18 3.95 0.45 13.0 10 3.99 3.95 3.71 4.32 0.30 7.6 11 4.01 4.20 3.53 4.30 0.42 10.6
Yeast
None 1 11.17 11.21 10.95 11.33 0.19 1.7 2 9.75 9.71 9.69 9.85 0.09 0.9 3 11.49 11.44 11.21 11.83 0.31 2.7 4 9.81 9.77 9.76 9.90 0.08 0.8 5 13.09 13.17 12.85 13.24 0.21 1.6 6 12.90 12.91 12.90 12.91 0.01 0.1 7 12.29 12.27 12.15 12.45 0.15 1.2 8 11.51 11.41 11.28 11.84 0.29 2.5 9 11.57 11.60 11.34 11.78 0.22 1.9 10 11.99 12.08 11.73 12.16 0.23 1.9
(continued on next page)
a Valid N = 3.

Water Hygiene Testing / 229
sample groups. This is likely to have arisen due to variation in the physiological condition of each culture between laboratories. Con-sequently, it is suggested that the evaluation of water containing bac-teria should be repeated with more precise directions regarding the growth, maintenance, and handling of bacterial cultures. It is antici-pated that this will lead to improved physiological consistency of bacterial cultures and more precise data.
LITERATURE CITED
1. Bender, F. E., Douglas, L. W., and Kramer, D. S. Statistical Methods for Food and Agriculture. The AVI Publishing Company, Inc., Westport, CT. Pp.169-190, 1982.
2. Kiemele, M. J., and Schmidt, S. R. Basic Statistics: Tools for Continu-ous Improvement, 3rd ed. Air Academy Press, Colorado Springs, CO. Pp. 21-22, 1993.
TABLE III (continued from preceding page)a
Dilution Collaborator Mean Median Min Max SD CV (%)
Yeast 1:2
1
10.58
10.66
10.31
10.78
0.24
2.3
2 9.57 9.57 9.46 9.69 0.12 1.2 3 11.31 11.52 10.70 11.71 0.54 4.7 4 9.62 9.61 9.59 9.67 0.04 0.4 5 12.26 12.27 12.18 12.34 0.08 0.7 6 12.28 12.28 12.26 12.29 0.02 0.1 7 11.77 11.80 11.69 11.83 0.07 0.6 8 10.92 11.11 10.48 11.17 0.38 3.5 9 11.05 11.03 10.91 11.20 0.15 1.3 10 10.65 10.66 9.70 11.59 0.94 8.9
1:10 1 8.88 8.83 8.81 8.99 0.10 1.1 2 8.21 8.20 8.17 8.27 0.05 0.6 3 9.59 9.44 9.30 10.01 0.37 3.9 4 8.32 8.32 8.29 8.35 0.03 0.4 5 10.82 10.99 10.19 11.28 0.57 5.3 6 10.81 10.82 10.78 10.83 0.03 0.2 7 10.05 10.01 9.86 10.27 0.20 2.0 8 9.22 9.28 9.04 9.35 0.16 1.7 9 9.35 9.42 9.17 9.48 0.16 1.7 10 10.09 10.12 10.03 10.12 0.05 0.5
1:100 1 5.53 5.76 4.86 5.96 0.59 10.6 2 6.95 6.92 6.82 7.11 0.15 2.1 3 7.32 7.33 7.29 7.34 0.03 0.4 4 6.84 6.81 6.77 6.93 0.08 1.2 5 8.47 8.52 8.17 8.71 0.28 3.3 6 8.12 8.09 8.07 8.21 0.08 0.9 7 7.88 7.79 7.73 8.13 0.21 2.7 8 6.98 7.02 6.84 7.09 0.13 1.9 9 6.91 6.86 6.84 7.04 0.11 1.6 10 7.22 7.21 7.19 7.27 0.04 0.6
1:500 1 4.06 3.83 3.58 4.75 0.62 15.2 2 5.65 5.60 5.08 6.26 0.59 10.5 3 5.87 5.85 5.80 5.98 0.09 1.6 4 5.95 5.93 5.87 6.05 0.09 1.5 5 6.51 6.65 5.97 6.92 0.49 7.5 6 6.32 6.32 6.32 6.32 0.00 0.0 7 5.72 5.92 5.25 6.00 0.41 7.20 8 5.46 5.48 5.42 5.48 0.03 0.6 9 5.50 5.49 5.43 5.57 0.07 1.2 10 5.96 6.18 5.48 6.24 0.42 7.0
1:1,000 1 4.28 4.20 3.83 4.80 0.49 11.4 2 3.19 2.83 2.48 4.25 0.93 29.3 3 4.91 5.22 4.11 5.40 0.70 14.2 4 2.99 3.04 2.71 3.22 0.26 8.7 5 6.19 6.38 5.65 6.54 0.47 7.7 6 5.87 5.89 5.80 5.92 0.06 1.1 7 5.46 5.53 5.21 5.65 0.23 4.1 8 4.65 4.49 4.42 5.04 0.34 7.3 9 4.98 5.02 4.81 5.10 0.15 3.0 10 5.58 5.38 5.25 6.10 0.46 8.2

230 / Pachello, C.
Fig. 1. Yeast regression model. Fig. 2. Bacteria regression model.
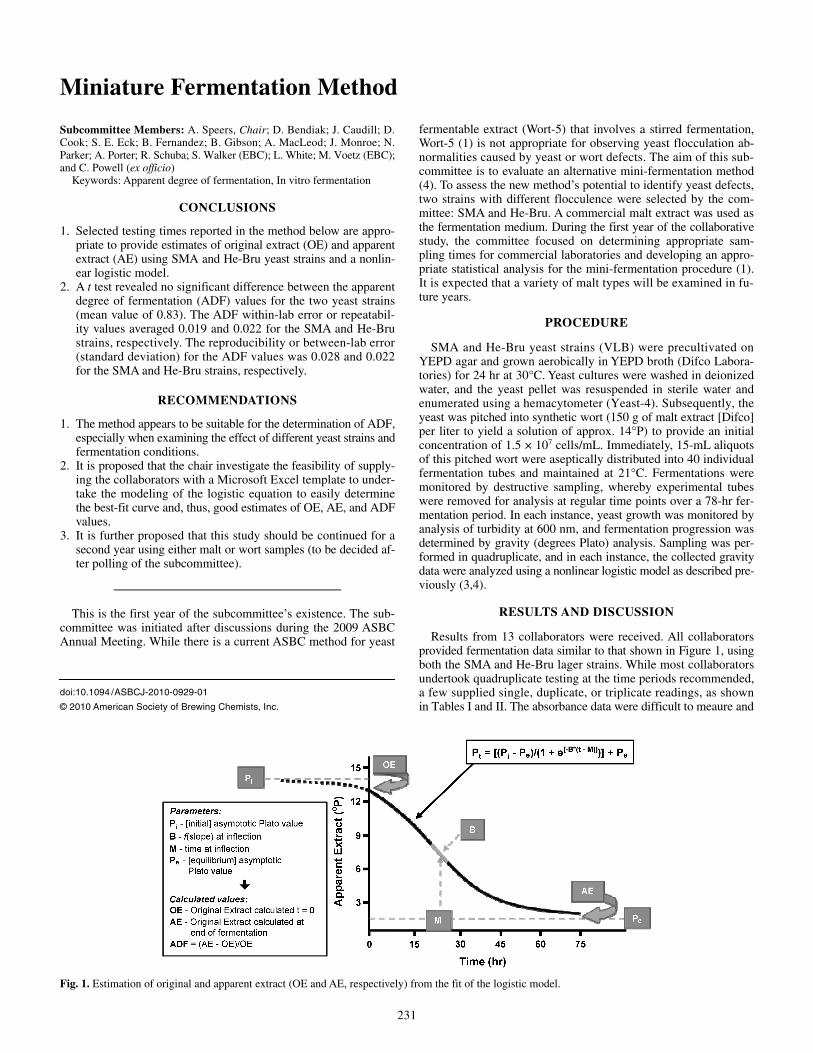
231
Miniature Fermentation Method
Subcommittee Members: A. Speers, Chair; D. Bendiak; J. Caudill; D. Cook; S. E. Eck; B. Fernandez; B. Gibson; A. MacLeod; J. Monroe; N. Parker; A. Porter; R. Schuba; S. Walker (EBC); L. White; M. Voetz (EBC); and C. Powell (ex officio)
Keywords: Apparent degree of fermentation, In vitro fermentation
CONCLUSIONS
1. Selected testing times reported in the method below are appro-priate to provide estimates of original extract (OE) and apparent extract (AE) using SMA and He-Bru yeast strains and a nonlin-ear logistic model.
2. A t test revealed no significant difference between the apparent degree of fermentation (ADF) values for the two yeast strains (mean value of 0.83). The ADF within-lab error or repeatabil-ity values averaged 0.019 and 0.022 for the SMA and He-Bru strains, respectively. The reproducibility or between-lab error (standard deviation) for the ADF values was 0.028 and 0.022 for the SMA and He-Bru strains, respectively.
RECOMMENDATIONS
1. The method appears to be suitable for the determination of ADF, especially when examining the effect of different yeast strains and fermentation conditions.
2. It is proposed that the chair investigate the feasibility of supply-ing the collaborators with a Microsoft Excel template to under-take the modeling of the logistic equation to easily determine the best-fit curve and, thus, good estimates of OE, AE, and ADF values.
3. It is further proposed that this study should be continued for a second year using either malt or wort samples (to be decided af-ter polling of the subcommittee).
This is the first year of the subcommittee’s existence. The sub-committee was initiated after discussions during the 2009 ASBC Annual Meeting. While there is a current ASBC method for yeast
fermentable extract (Wort-5) that involves a stirred fermentation, Wort-5 (1) is not appropriate for observing yeast flocculation ab-normalities caused by yeast or wort defects. The aim of this sub-committee is to evaluate an alternative mini-fermentation method (4). To assess the new method’s potential to identify yeast defects, two strains with different flocculence were selected by the com-mittee: SMA and He-Bru. A commercial malt extract was used as the fermentation medium. During the first year of the collaborative study, the committee focused on determining appropriate sam-pling times for commercial laboratories and developing an appro-priate statistical analysis for the mini-fermentation procedure (1). It is expected that a variety of malt types will be examined in fu-ture years.
PROCEDURE
SMA and He-Bru yeast strains (VLB) were precultivated on YEPD agar and grown aerobically in YEPD broth (Difco Labora-tories) for 24 hr at 30°C. Yeast cultures were washed in deionized water, and the yeast pellet was resuspended in sterile water and enumerated using a hemacytometer (Yeast-4). Subsequently, the yeast was pitched into synthetic wort (150 g of malt extract [Difco] per liter to yield a solution of approx. 14°P) to provide an initial concentration of 1.5 × 10⁷ cells/mL. Immediately, 15-mL aliquots of this pitched wort were aseptically distributed into 40 individual fermentation tubes and maintained at 21°C. Fermentations were monitored by destructive sampling, whereby experimental tubes were removed for analysis at regular time points over a 78-hr fer-mentation period. In each instance, yeast growth was monitored by analysis of turbidity at 600 nm, and fermentation progression was determined by gravity (degrees Plato) analysis. Sampling was per-formed in quadruplicate, and in each instance, the collected gravity data were analyzed using a nonlinear logistic model as described pre-viously (3,4).
RESULTS AND DISCUSSION
Results from 13 collaborators were received. All collaborators provided fermentation data similar to that shown in Figure 1, using both the SMA and He-Bru lager strains. While most collaborators undertook quadruplicate testing at the time periods recommended, a few supplied single, duplicate, or triplicate readings, as shown in Tables I and II. The absorbance data were difficult to meaure and
Fig. 1. Estimation of original and apparent extract (OE and AE, respectively) from the fit of the logistic model.
doi:10.1094 /ASBCJ-2010-0929-01
© 2010 American Society of Brewing Chemists, Inc.
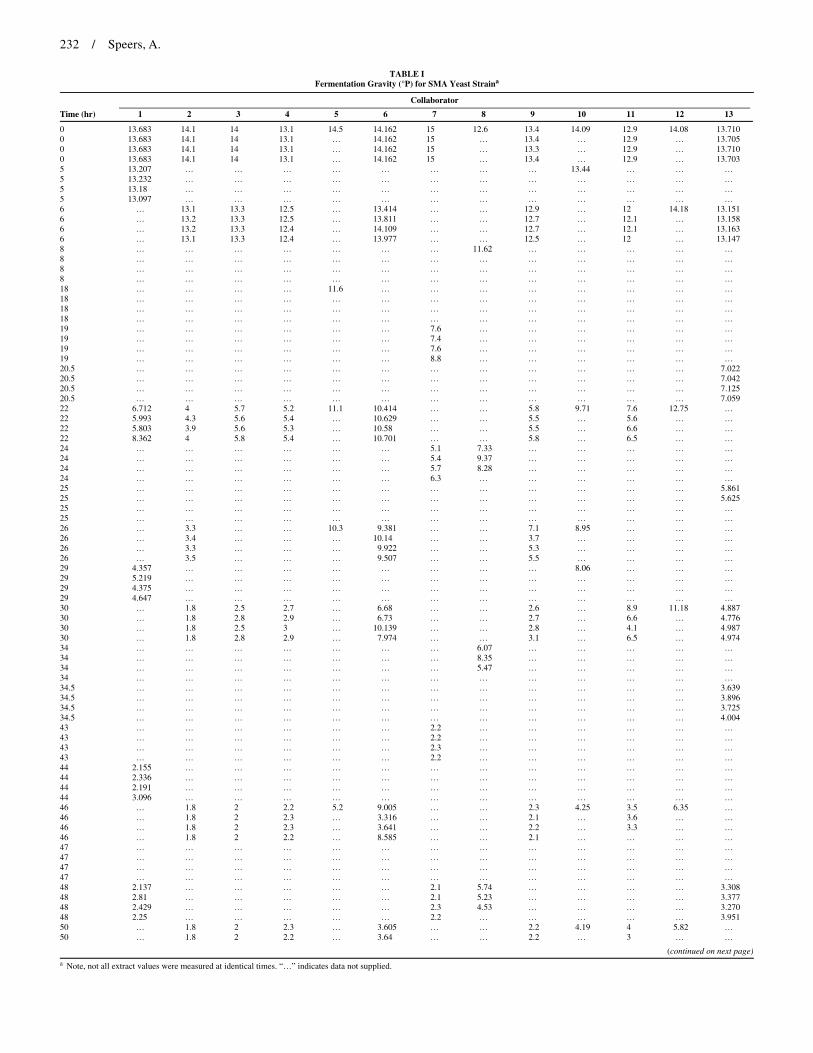
232 / Speers, A.
TABLE I Fermentation Gravity (°P) for SMA Yeast Straina
Collaborator
Time (hr) 1 2 3 4 5 6 7 8 9 10 11 12 13
0 13.683 14.1 14 13.1 14.5 14.162 15 12.6 13.4 14.09 12.9 14.08 13.710 0 13.683 14.1 14 13.1 … 14.162 15 … 13.4 … 12.9 … 13.705 0 13.683 14.1 14 13.1 … 14.162 15 … 13.3 … 12.9 … 13.710 0 13.683 14.1 14 13.1 … 14.162 15 … 13.4 … 12.9 … 13.703 5 13.207 … … … … … … … … 13.44 … … … 5 13.232 … … … … … … … … … … … … 5 13.18 … … … … … … … … … … … … 5 13.097 … … … … … … … … … … … … 6 … 13.1 13.3 12.5 … 13.414 … … 12.9 … 12 14.18 13.151 6 … 13.2 13.3 12.5 … 13.811 … … 12.7 … 12.1 … 13.158 6 … 13.2 13.3 12.4 … 14.109 … … 12.7 … 12.1 … 13.163 6 … 13.1 13.3 12.4 … 13.977 … … 12.5 … 12 … 13.147 8 … … … … … … … 11.62 … … … … … 8 … … … … … … … … … … … … … 8 … … … … … … … … … … … … … 8 … … … … … … … … … … … … … 18 … … … … 11.6 … … … … … … … … 18 … … … … … … … … … … … … … 18 … … … … … … … … … … … … … 18 … … … … … … … … … … … … … 19 … … … … … … 7.6 … … … … … … 19 … … … … … … 7.4 … … … … … … 19 … … … … … … 7.6 … … … … … … 19 … … … … … … 8.8 … … … … … … 20.5 … … … … … … … … … … … … 7.022 20.5 … … … … … … … … … … … … 7.042 20.5 … … … … … … … … … … … … 7.125 20.5 … … … … … … … … … … … … 7.059 22 6.712 4 5.7 5.2 11.1 10.414 … … 5.8 9.71 7.6 12.75 … 22 5.993 4.3 5.6 5.4 … 10.629 … … 5.5 … 5.6 … … 22 5.803 3.9 5.6 5.3 … 10.58 … … 5.5 … 6.6 … … 22 8.362 4 5.8 5.4 … 10.701 … … 5.8 … 6.5 … … 24 … … … … … … 5.1 7.33 … … … … … 24 … … … … … … 5.4 9.37 … … … … … 24 … … … … … … 5.7 8.28 … … … … … 24 … … … … … … 6.3 … … … … … … 25 … … … … … … … … … … … … 5.861 25 … … … … … … … … … … … … 5.625 25 … … … … … … … … … … … … … 25 … … … … … … … … … … … … … 26 … 3.3 … … 10.3 9.381 … … 7.1 8.95 … … … 26 … 3.4 … … … 10.14 … … 3.7 … … … … 26 … 3.3 … … … 9.922 … … 5.3 … … … … 26 … 3.5 … … … 9.507 … … 5.5 … … … … 29 4.357 … … … … … … … … 8.06 … … … 29 5.219 … … … … … … … … … … … … 29 4.375 … … … … … … … … … … … … 29 4.647 … … … … … … … … … … … … 30 … 1.8 2.5 2.7 … 6.68 … … 2.6 … 8.9 11.18 4.887 30 … 1.8 2.8 2.9 … 6.73 … … 2.7 … 6.6 … 4.776 30 … 1.8 2.5 3 … 10.139 … … 2.8 … 4.1 … 4.987 30 … 1.8 2.8 2.9 … 7.974 … … 3.1 … 6.5 … 4.974 34 … … … … … … … 6.07 … … … … … 34 … … … … … … … 8.35 … … … … … 34 … … … … … … … 5.47 … … … … … 34 … … … … … … … … … … … … … 34.5 … … … … … … … … … … … … 3.639 34.5 … … … … … … … … … … … … 3.896 34.5 … … … … … … … … … … … … 3.725 34.5 … … … … … … … … … … … … 4.004 43 … … … … … … 2.2 … … … … … … 43 … … … … … … 2.2 … … … … … … 43 … … … … … … 2.3 … … … … … … 43 … … … … … … 2.2 … … … … … … 44 2.155 … … … … … … … … … … … … 44 2.336 … … … … … … … … … … … … 44 2.191 … … … … … … … … … … … … 44 3.096 … … … … … … … … … … … … 46 … 1.8 2 2.2 5.2 9.005 … … 2.3 4.25 3.5 6.35 … 46 … 1.8 2 2.3 … 3.316 … … 2.1 … 3.6 … … 46 … 1.8 2 2.3 … 3.641 … … 2.2 … 3.3 … … 46 … 1.8 2 2.2 … 8.585 … … 2.1 … … … … 47 … … … … … … … … … … … … … 47 … … … … … … … … … … … … … 47 … … … … … … … … … … … … … 47 … … … … … … … … … … … … … 48 2.137 … … … … … 2.1 5.74 … … … … 3.308 48 2.81 … … … … … 2.1 5.23 … … … … 3.377 48 2.429 … … … … … 2.3 4.53 … … … … 3.270 48 2.25 … … … … … 2.2 … … … … … 3.951 50 … 1.8 2 2.3 … 3.605 … … 2.2 4.19 4 5.82 … 50 … 1.8 2 2.2 … 3.64 … … 2.2 … 3 … …
(continued on next page)a Note, not all extract values were measured at identical times. “…” indicates data not supplied.
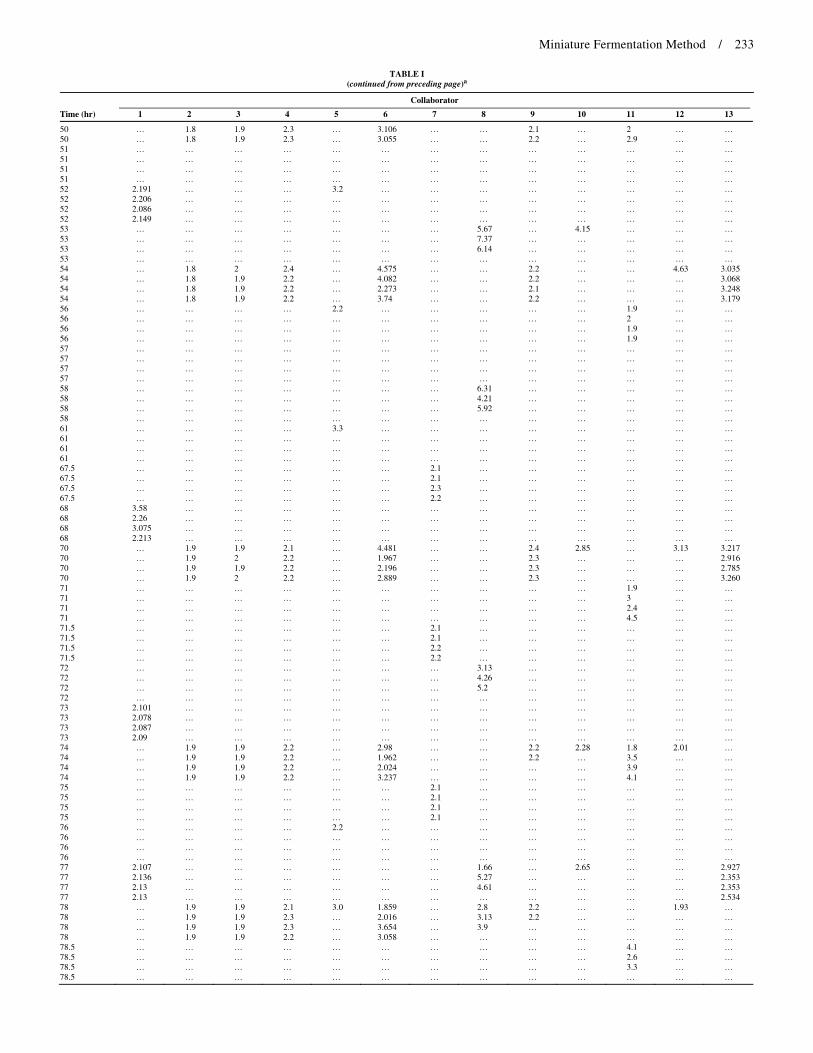
Miniature Fermentation Method / 233
TABLE I (continued from preceding page)a
Collaborator
Time (hr) 1 2 3 4 5 6 7 8 9 10 11 12 13
50 … 1.8 1.9 2.3 … 3.106 … … 2.1 … 2 … … 50 … 1.8 1.9 2.3 … 3.055 … … 2.2 … 2.9 … … 51 … … … … … … … … … … … … … 51 … … … … … … … … … … … … … 51 … … … … … … … … … … … … … 51 … … … … … … … … … … … … … 52 2.191 … … … 3.2 … … … … … … … … 52 2.206 … … … … … … … … … … … … 52 2.086 … … … … … … … … … … … … 52 2.149 … … … … … … … … … … … … 53 … … … … … … … 5.67 … 4.15 … … … 53 … … … … … … … 7.37 … … … … … 53 … … … … … … … 6.14 … … … … … 53 … … … … … … … … … … … … … 54 … 1.8 2 2.4 … 4.575 … … 2.2 … … 4.63 3.035 54 … 1.8 1.9 2.2 … 4.082 … … 2.2 … … … 3.068 54 … 1.8 1.9 2.2 … 2.273 … … 2.1 … … … 3.248 54 … 1.8 1.9 2.2 … 3.74 … … 2.2 … … … 3.179 56 … … … … 2.2 … … … … … 1.9 … … 56 … … … … … … … … … … 2 … … 56 … … … … … … … … … … 1.9 … … 56 … … … … … … … … … … 1.9 … … 57 … … … … … … … … … … … … … 57 … … … … … … … … … … … … … 57 … … … … … … … … … … … … … 57 … … … … … … … … … … … … … 58 … … … … … … … 6.31 … … … … … 58 … … … … … … … 4.21 … … … … … 58 … … … … … … … 5.92 … … … … … 58 … … … … … … … … … … … … … 61 … … … … 3.3 … … … … … … … … 61 … … … … … … … … … … … … … 61 … … … … … … … … … … … … … 61 … … … … … … … … … … … … … 67.5 … … … … … … 2.1 … … … … … … 67.5 … … … … … … 2.1 … … … … … … 67.5 … … … … … … 2.3 … … … … … … 67.5 … … … … … … 2.2 … … … … … … 68 3.58 … … … … … … … … … … … … 68 2.26 … … … … … … … … … … … … 68 3.075 … … … … … … … … … … … … 68 2.213 … … … … … … … … … … … … 70 … 1.9 1.9 2.1 … 4.481 … … 2.4 2.85 … 3.13 3.217 70 … 1.9 2 2.2 … 1.967 … … 2.3 … … … 2.916 70 … 1.9 1.9 2.2 … 2.196 … … 2.3 … … … 2.785 70 … 1.9 2 2.2 … 2.889 … … 2.3 … … … 3.260 71 … … … … … … … … … … 1.9 … … 71 … … … … … … … … … … 3 … … 71 … … … … … … … … … … 2.4 … … 71 … … … … … … … … … … 4.5 … … 71.5 … … … … … … 2.1 … … … … … … 71.5 … … … … … … 2.1 … … … … … … 71.5 … … … … … … 2.2 … … … … … … 71.5 … … … … … … 2.2 … … … … … … 72 … … … … … … … 3.13 … … … … … 72 … … … … … … … 4.26 … … … … … 72 … … … … … … … 5.2 … … … … … 72 … … … … … … … … … … … … … 73 2.101 … … … … … … … … … … … … 73 2.078 … … … … … … … … … … … … 73 2.087 … … … … … … … … … … … … 73 2.09 … … … … … … … … … … … … 74 … 1.9 1.9 2.2 … 2.98 … … 2.2 2.28 1.8 2.01 … 74 … 1.9 1.9 2.2 … 1.962 … … 2.2 … 3.5 … … 74 … 1.9 1.9 2.2 … 2.024 … … … … 3.9 … … 74 … 1.9 1.9 2.2 … 3.237 … … … … 4.1 … … 75 … … … … … … 2.1 … … … … … … 75 … … … … … … 2.1 … … … … … … 75 … … … … … … 2.1 … … … … … … 75 … … … … … … 2.1 … … … … … … 76 … … … … 2.2 … … … … … … … … 76 … … … … … … … … … … … … … 76 … … … … … … … … … … … … … 76 … … … … … … … … … … … … … 77 2.107 … … … … … … 1.66 … 2.65 … … 2.927 77 2.136 … … … … … … 5.27 … … … … 2.353 77 2.13 … … … … … … 4.61 … … … … 2.353 77 2.13 … … … … … … … … … … … 2.534 78 … 1.9 1.9 2.1 3.0 1.859 … 2.8 2.2 … … 1.93 … 78 … 1.9 1.9 2.3 … 2.016 … 3.13 2.2 … … … … 78 … 1.9 1.9 2.3 … 3.654 … 3.9 … … … … … 78 … 1.9 1.9 2.2 … 3.058 … … … … … … … 78.5 … … … … … … … … … … 4.1 … … 78.5 … … … … … … … … … … 2.6 … … 78.5 … … … … … … … … … … 3.3 … … 78.5 … … … … … … … … … … … … …
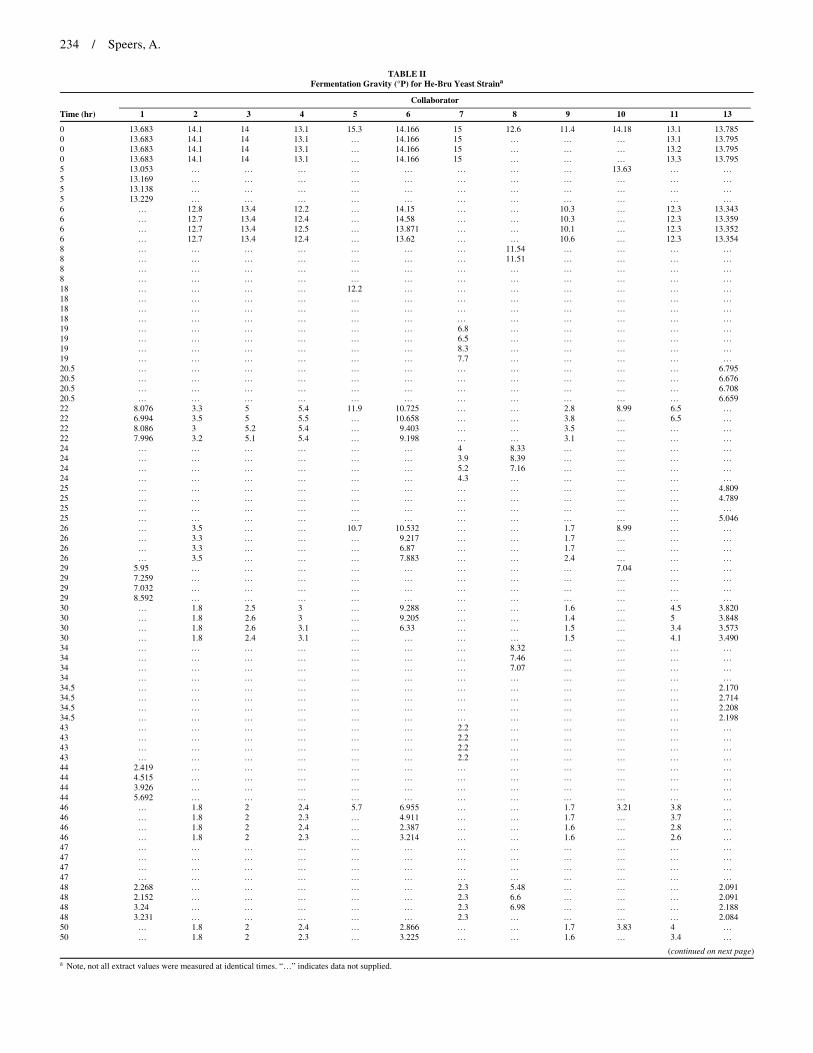
234 / Speers, A.
TABLE II Fermentation Gravity (°P) for He-Bru Yeast Straina
Collaborator
Time (hr) 1 2 3 4 5 6 7 8 9 10 11 13
0 13.683 14.1 14 13.1 15.3 14.166 15 12.6 11.4 14.18 13.1 13.785 0 13.683 14.1 14 13.1 … 14.166 15 … … … 13.1 13.795 0 13.683 14.1 14 13.1 … 14.166 15 … … … 13.2 13.795 0 13.683 14.1 14 13.1 … 14.166 15 … … … 13.3 13.795 5 13.053 … … … … … … … … 13.63 … … 5 13.169 … … … … … … … … … … … 5 13.138 … … … … … … … … … … … 5 13.229 … … … … … … … … … … … 6 … 12.8 13.4 12.2 … 14.15 … … 10.3 … 12.3 13.343 6 … 12.7 13.4 12.4 … 14.58 … … 10.3 … 12.3 13.359 6 … 12.7 13.4 12.5 … 13.871 … … 10.1 … 12.3 13.352 6 … 12.7 13.4 12.4 … 13.62 … … 10.6 … 12.3 13.354 8 … … … … … … … 11.54 … … … … 8 … … … … … … … 11.51 … … … … 8 … … … … … … … … … … … … 8 … … … … … … … … … … … … 18 … … … … 12.2 … … … … … … … 18 … … … … … … … … … … … … 18 … … … … … … … … … … … … 18 … … … … … … … … … … … … 19 … … … … … … 6.8 … … … … … 19 … … … … … … 6.5 … … … … … 19 … … … … … … 8.3 … … … … … 19 … … … … … … 7.7 … … … … … 20.5 … … … … … … … … … … … 6.795 20.5 … … … … … … … … … … … 6.676 20.5 … … … … … … … … … … … 6.708 20.5 … … … … … … … … … … … 6.659 22 8.076 3.3 5 5.4 11.9 10.725 … … 2.8 8.99 6.5 … 22 6.994 3.5 5 5.5 … 10.658 … … 3.8 … 6.5 … 22 8.086 3 5.2 5.4 … 9.403 … … 3.5 … … … 22 7.996 3.2 5.1 5.4 … 9.198 … … 3.1 … … … 24 … … … … … … 4 8.33 … … … … 24 … … … … … … 3.9 8.39 … … … … 24 … … … … … … 5.2 7.16 … … … … 24 … … … … … … 4.3 … … … … … 25 … … … … … … … … … … … 4.809 25 … … … … … … … … … … … 4.789 25 … … … … … … … … … … … … 25 … … … … … … … … … … … 5.046 26 … 3.5 … … 10.7 10.532 … … 1.7 8.99 … … 26 … 3.3 … … … 9.217 … … 1.7 … … … 26 … 3.3 … … … 6.87 … … 1.7 … … … 26 … 3.5 … … … 7.883 … … 2.4 … … … 29 5.95 … … … … … … … … 7.04 … … 29 7.259 … … … … … … … … … … … 29 7.032 … … … … … … … … … … … 29 8.592 … … … … … … … … … … … 30 … 1.8 2.5 3 … 9.288 … … 1.6 … 4.5 3.820 30 … 1.8 2.6 3 … 9.205 … … 1.4 … 5 3.848 30 … 1.8 2.6 3.1 … 6.33 … … 1.5 … 3.4 3.573 30 … 1.8 2.4 3.1 … … … … 1.5 … 4.1 3.490 34 … … … … … … … 8.32 … … … … 34 … … … … … … … 7.46 … … … … 34 … … … … … … … 7.07 … … … … 34 … … … … … … … … … … … … 34.5 … … … … … … … … … … … 2.170 34.5 … … … … … … … … … … … 2.714 34.5 … … … … … … … … … … … 2.208 34.5 … … … … … … … … … … … 2.198 43 … … … … … … 2.2 … … … … … 43 … … … … … … 2.2 … … … … … 43 … … … … … … 2.2 … … … … … 43 … … … … … … 2.2 … … … … … 44 2.419 … … … … … … … … … … … 44 4.515 … … … … … … … … … … … 44 3.926 … … … … … … … … … … … 44 5.692 … … … … … … … … … … … 46 … 1.8 2 2.4 5.7 6.955 … … 1.7 3.21 3.8 … 46 … 1.8 2 2.3 … 4.911 … … 1.7 … 3.7 … 46 … 1.8 2 2.4 … 2.387 … … 1.6 … 2.8 … 46 … 1.8 2 2.3 … 3.214 … … 1.6 … 2.6 … 47 … … … … … … … … … … … … 47 … … … … … … … … … … … … 47 … … … … … … … … … … … … 47 … … … … … … … … … … … … 48 2.268 … … … … … 2.3 5.48 … … … 2.091 48 2.152 … … … … … 2.3 6.6 … … … 2.091 48 3.24 … … … … … 2.3 6.98 … … … 2.188 48 3.231 … … … … … 2.3 … … … … 2.084 50 … 1.8 2 2.4 … 2.866 … … 1.7 3.83 4 … 50 … 1.8 2 2.3 … 3.225 … … 1.6 … 3.4 …
(continued on next page)a Note, not all extract values were measured at identical times. “…” indicates data not supplied.

Miniature Fermentation Method / 235
TABLE II (continued from preceding page)a
Collaborator
Time (hr) 1 2 3 4 5 6 7 8 9 10 11 13
50 … 1.8 2 2.3 … 7.453 … … 1.6 … 3.3 … 50 … 1.8 1.9 2.3 … 2.036 … … 1.6 … 3.4 … 51 … … … … … … … … … … … … 51 … … … … … … … … … … … … 51 … … … … … … … … … … … … 51 … … … … … … … … … … … … 52 4.81 … … … 4.5 … … … … … … … 52 2.326 … … … … … … … … … … … 52 3.174 … … … … … … … … … … … 52 7.103 … … … … … … … … … … … 53 … … … … … … … 7.34 … 2.23 … … 53 … … … … … … … 6.07 … … … … 53 … … … … … … … 4.46 … … … … 53 … … … … … … … … … … … … 54 … 1.8 2 2.4 … 4.488 … … 1.8 … … 2.058 54 … 1.8 1.9 2.3 … 4.278 … … 1.6 … … 2.063 54 … 1.8 2 2.3 … 3.03 … … 1.6 … … 2.112 54 … 1.8 2 2.4 … 4.756 … … 1.6 … … 2.066 56 … … … … 2.3 … … … … … 4.1 … 56 … … … … … … … … … … 3.5 … 56 … … … … … … … … … … 3.5 … 56 … … … … … … … … … … 3.3 … 57 … … … … … … … … … … … … 57 … … … … … … … … … … … … 57 … … … … … … … … … … … … 57 … … … … … … … … … … … … 58 … … … … … … … 4.53 … … … … 58 … … … … … … … 5.69 … … … … 58 … … … … … … … 5 … … … … 58 … … … … … … … … … … … … 61 … … … … 3.7 … … … … … … … 61 … … … … … … … … … … … … 61 … … … … … … … … … … … … 61 … … … … … … … … … … … … 67.5 … … … … … … 2.2 … … … … … 67.5 … … … … … … 2.2 … … … … … 67.5 … … … … … … 2.2 … … … … … 67.5 … … … … … … 2.2 … … … … … 68 5.749 … … … … … … … … … … … 68 2.171 … … … … … … … … … … … 68 2.147 … … … … … … … … … … … 68 2.128 … … … … … … … … … … … 70 … 1.8 1.9 2.4 … 2.316 … … 1.7 2.77 … 2.053 70 … 1.9 1.9 2.4 … 1.918 … … 1.8 … … 2.058 70 … 1.8 1.9 2.4 … 5.1 … … 1.7 … … 2.061 70 … 1.9 1.9 2.3 … 3.584 … … 1.7 … … 2.056 71 … … … … … … … … … … 2.5 … 71 … … … … … … … … … … 2 … 71 … … … … … … … … … … 1.9 … 71 … … … … … … … … … … 1.8 … 71.5 … … … … … … 2.2 … … … … … 71.5 … … … … … … 2.2 … … … … … 71.5 … … … … … … 2.2 … … … … … 71.5 … … … … … … 2.2 … … … … … 72 … … … … … … … 5.89 … … … … 72 … … … … … … … 6.1 … … … … 72 … … … … … … … 4 … … … … 72 … … … … … … … … … … … … 73 2.077 … … … … … … … … … … … 73 2.091 … … … … … … … … … … … 73 2.109 … … … … … … … … … … … 73 3.223 … … … … … … … … … … … 74 … 1.9 1.9 2.4 … 2.05 … … … 2.8 3.5 … 74 … 1.9 1.9 2.4 … 3.14 … … … … 2.9 … 74 … 1.9 1.9 2.4 … 3.873 … … … … 2 … 74 … 1.9 1.9 2.4 … 2.921 … … … … 1.8 … 75 … … … … … … 2 … … … … … 75 … … … … … … 2.1 … … … … … 75 … … … … … … 2.1 … … … … … 75 … … … … … … 2.1 … … … … … 76 … … … … 2.3 … … … … … … … 76 … … … … … … … … … … … … 76 … … … … … … … … … … … … 76 … … … … … … … … … … … … 77 2.14 … … … … … … 5.9 … 2.68 … 1.880 77 2.105 … … … … … … 4 … … … 1.837 77 2.151 … … … … … … 4.04 … … … 1.888 77 2.106 … … … … … … … … … … 1.885 78 … 1.9 2 2.3 2.6 1.962 … 5.18 1.8 … … … 78 … 1.9 2 2.2 … 1.842 … 5.64 1.7 … … … 78 … 1.9 2 2.3 … 2.139 … 5.9 1.7 … … … 78 … 1.9 2 2.3 … 1.828 … … 1.7 … … … 78.5 … … … … … … … … … … 1.7 … 78.5 … … … … … … … … … … 1.7 … 78.5 … … … … … … … … … … 1.7 … 78.5 … … … … … … … … … … 1.7 …
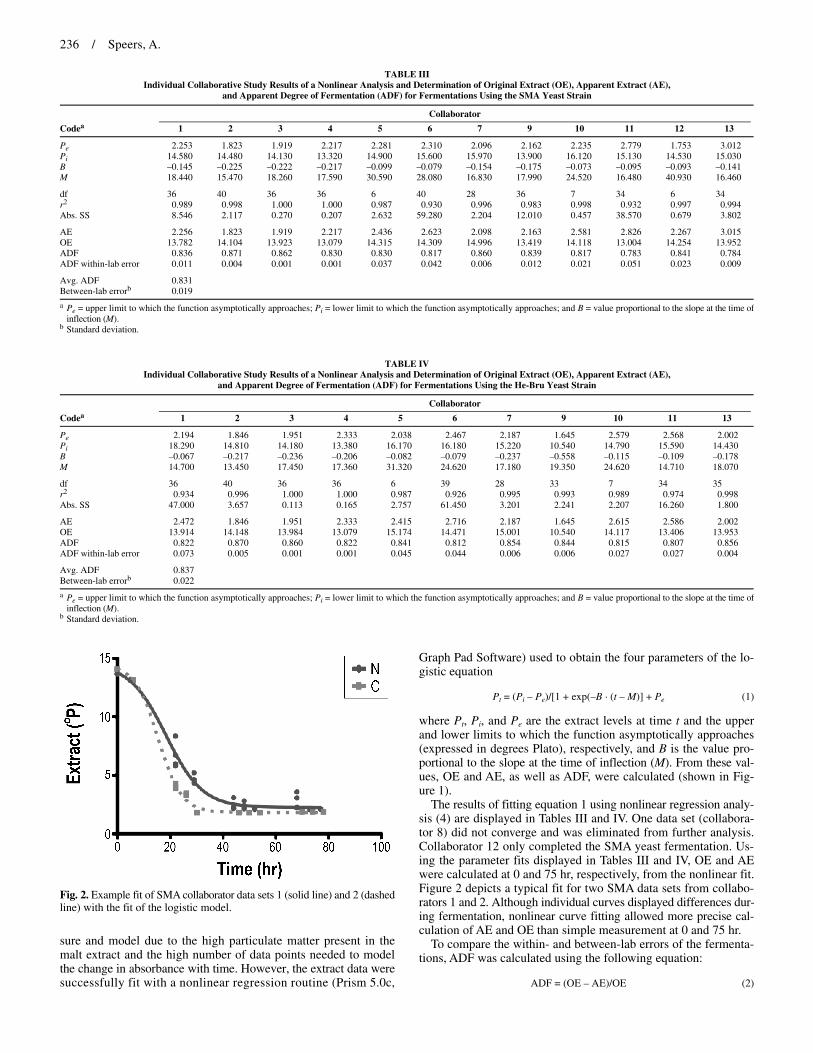
236 / Speers, A.
sure and model due to the high particulate matter present in the malt extract and the high number of data points needed to model the change in absorbance with time. However, the extract data were successfully fit with a nonlinear regression routine (Prism 5.0c,
Graph Pad Software) used to obtain the four parameters of the lo-gistic equation
Pt = (Pi – Pe)/[1 + exp(–B · (t – M)] + Pe (1)
where Pt, Pi, and Pe are the extract levels at time t and the upper and lower limits to which the function asymptotically approaches (expressed in degrees Plato), respectively, and B is the value pro-portional to the slope at the time of inflection (M). From these val-ues, OE and AE, as well as ADF, were calculated (shown in Fig-ure 1).
The results of fitting equation 1 using nonlinear regression analy-sis (4) are displayed in Tables III and IV. One data set (collabora-tor 8) did not converge and was eliminated from further analysis. Collaborator 12 only completed the SMA yeast fermentation. Us-ing the parameter fits displayed in Tables III and IV, OE and AE were calculated at 0 and 75 hr, respectively, from the nonlinear fit. Figure 2 depicts a typical fit for two SMA data sets from collabo-rators 1 and 2. Although individual curves displayed differences dur-ing fermentation, nonlinear curve fitting allowed more precise cal-culation of AE and OE than simple measurement at 0 and 75 hr.
To compare the within- and between-lab errors of the fermenta-tions, ADF was calculated using the following equation:
ADF = (OE – AE)/OE (2)
TABLE III Individual Collaborative Study Results of a Nonlinear Analysis and Determination of Original Extract (OE), Apparent Extract (AE),
and Apparent Degree of Fermentation (ADF) for Fermentations Using the SMA Yeast Strain
Collaborator
Codea 1 2 3 4 5 6 7 9 10 11 12 13
Pe 2.253 1.823 1.919 2.217 2.281 2.310 2.096 2.162 2.235 2.779 1.753 3.012 Pi 14.580 14.480 14.130 13.320 14.900 15.600 15.970 13.900 16.120 15.130 14.530 15.030 B –0.145 –0.225 –0.222 –0.217 –0.099 –0.079 –0.154 –0.175 –0.073 –0.095 –0.093 –0.141 M 18.440 15.470 18.260 17.590 30.590 28.080 16.830 17.990 24.520 16.480 40.930 16.460
df 36 40 36 36 6 40 28 36 7 34 6 34 r2 0.989 0.998 1.000 1.000 0.987 0.930 0.996 0.983 0.998 0.932 0.997 0.994 Abs. SS 8.546 2.117 0.270 0.207 2.632 59.280 2.204 12.010 0.457 38.570 0.679 3.802
AE 2.256 1.823 1.919 2.217 2.436 2.623 2.098 2.163 2.581 2.826 2.267 3.015 OE 13.782 14.104 13.923 13.079 14.315 14.309 14.996 13.419 14.118 13.004 14.254 13.952 ADF 0.836 0.871 0.862 0.830 0.830 0.817 0.860 0.839 0.817 0.783 0.841 0.784 ADF within-lab error 0.011 0.004 0.001 0.001 0.037 0.042 0.006 0.012 0.021 0.051 0.023 0.009
Avg. ADF 0.831 Between-lab errorb 0.019
a Pe = upper limit to which the function asymptotically approaches; Pi = lower limit to which the function asymptotically approaches; and B = value proportional to the slope at the time of inflection (M).
b Standard deviation.
TABLE IV Individual Collaborative Study Results of a Nonlinear Analysis and Determination of Original Extract (OE), Apparent Extract (AE),
and Apparent Degree of Fermentation (ADF) for Fermentations Using the He-Bru Yeast Strain
Collaborator
Codea 1 2 3 4 5 6 7 9 10 11 13
Pe 2.194 1.846 1.951 2.333 2.038 2.467 2.187 1.645 2.579 2.568 2.002 Pi 18.290 14.810 14.180 13.380 16.170 16.180 15.220 10.540 14.790 15.590 14.430 B –0.067 –0.217 –0.236 –0.206 –0.082 –0.079 –0.237 –0.558 –0.115 –0.109 –0.178 M 14.700 13.450 17.450 17.360 31.320 24.620 17.180 19.350 24.620 14.710 18.070
df 36 40 36 36 6 39 28 33 7 34 35 r2 0.934 0.996 1.000 1.000 0.987 0.926 0.995 0.993 0.989 0.974 0.998 Abs. SS 47.000 3.657 0.113 0.165 2.757 61.450 3.201 2.241 2.207 16.260 1.800
AE 2.472 1.846 1.951 2.333 2.415 2.716 2.187 1.645 2.615 2.586 2.002 OE 13.914 14.148 13.984 13.079 15.174 14.471 15.001 10.540 14.117 13.406 13.953 ADF 0.822 0.870 0.860 0.822 0.841 0.812 0.854 0.844 0.815 0.807 0.856 ADF within-lab error 0.073 0.005 0.001 0.001 0.045 0.044 0.006 0.006 0.027 0.027 0.004
Avg. ADF 0.837 Between-lab errorb 0.022
a Pe = upper limit to which the function asymptotically approaches; Pi = lower limit to which the function asymptotically approaches; and B = value proportional to the slope at the time of inflection (M).
b Standard deviation.
Fig. 2. Example fit of SMA collaborator data sets 1 (solid line) and 2 (dashedline) with the fit of the logistic model.
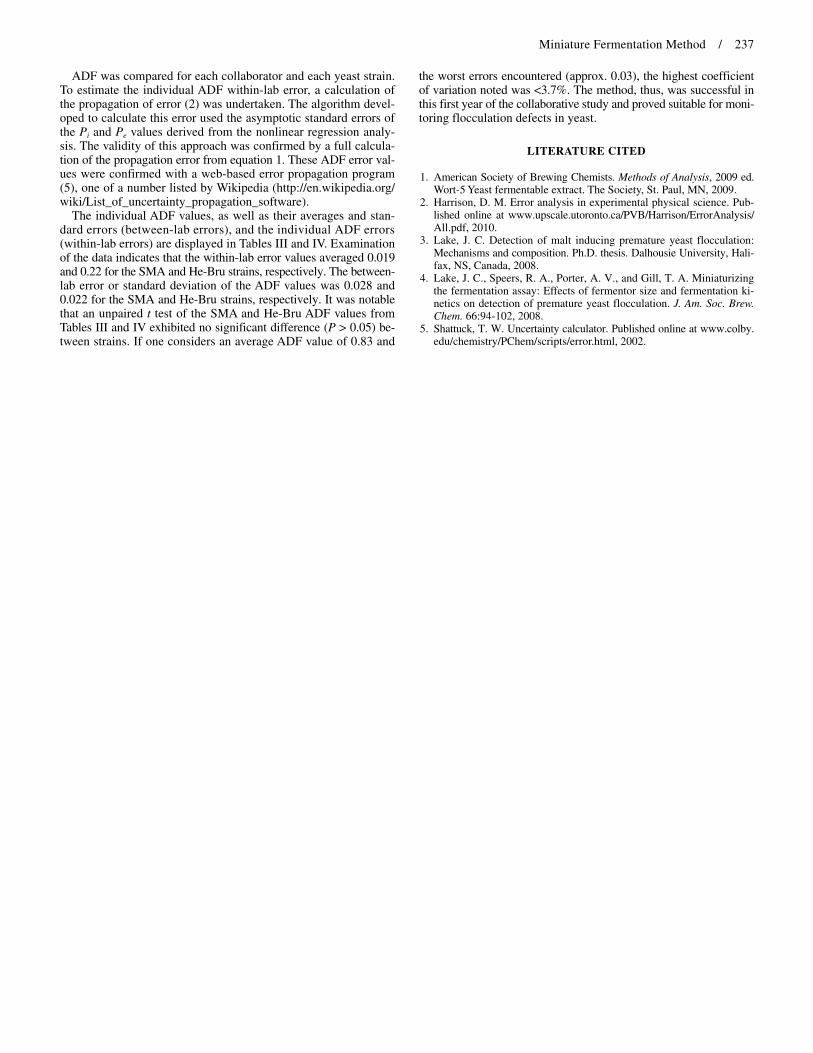
Miniature Fermentation Method / 237
ADF was compared for each collaborator and each yeast strain. To estimate the individual ADF within-lab error, a calculation of the propagation of error (2) was undertaken. The algorithm devel-oped to calculate this error used the asymptotic standard errors of the Pi and Pe values derived from the nonlinear regression analy-sis. The validity of this approach was confirmed by a full calcula-tion of the propagation error from equation 1. These ADF error val-ues were confirmed with a web-based error propagation program (5), one of a number listed by Wikipedia (http://en.wikipedia.org/ wiki/List_of_uncertainty_propagation_software).
The individual ADF values, as well as their averages and stan-dard errors (between-lab errors), and the individual ADF errors (within-lab errors) are displayed in Tables III and IV. Examination of the data indicates that the within-lab error values averaged 0.019 and 0.22 for the SMA and He-Bru strains, respectively. The between-lab error or standard deviation of the ADF values was 0.028 and 0.022 for the SMA and He-Bru strains, respectively. It was notable that an unpaired t test of the SMA and He-Bru ADF values from Tables III and IV exhibited no significant difference (P > 0.05) be-tween strains. If one considers an average ADF value of 0.83 and
the worst errors encountered (approx. 0.03), the highest coefficient of variation noted was <3.7%. The method, thus, was successful in this first year of the collaborative study and proved suitable for moni-toring flocculation defects in yeast.
LITERATURE CITED
1. American Society of Brewing Chemists. Methods of Analysis, 2009 ed. Wort-5 Yeast fermentable extract. The Society, St. Paul, MN, 2009.
2. Harrison, D. M. Error analysis in experimental physical science. Pub-lished online at www.upscale.utoronto.ca/PVB/Harrison/ErrorAnalysis/ All.pdf, 2010.
3. Lake, J. C. Detection of malt inducing premature yeast flocculation: Mechanisms and composition. Ph.D. thesis. Dalhousie University, Hali-fax, NS, Canada, 2008.
4. Lake, J. C., Speers, R. A., Porter, A. V., and Gill, T. A. Miniaturizing the fermentation assay: Effects of fermentor size and fermentation ki-netics on detection of premature yeast flocculation. J. Am. Soc. Brew. Chem. 66:94-102, 2008.
5. Shattuck, T. W. Uncertainty calculator. Published online at www.colby. edu/chemistry/PChem/scripts/error.html, 2002.
238
Enzyme-Linked Immunosorbent Assay Method for Deoxynivalenol Analysis in Malt
Subcommittee Members: S. Bartlett, Chair; J. Barr; P. Bolin; T. Chicos; K. Churchill; Y. Dong; M. Einarson; J. Greene; D. Hanson; R. Joy; M. Jutras; R. Kuhl; J. MacDonald; A. MacLeod; J. McCann; D. Miller; A. Mundy (EBC); J. Pollhammer; P. Ritchie; K. Rugroden; A. Stern; B. Szeto; J. Trautman; N. Yamaura (BCOJ); and R. Jennings (ex officio)
Keywords: DON, ELISA
CONCLUSIONS
1. Repeatability and reproducibility coefficients of variation for the determination of deoxynivalenol (DON) using the Neogen Ver-atox enzyme-linked immunosorbent assay (ELISA) kit ranged from 6.277 to 45.80% and 13.790 to 78.798%, respectively, and were judged unacceptable.
2. Repeatability and reproducibility coefficients of variation for the determination of DON using the Diagnostix EZ-Tox ELISA kit ranged from 0.000 to 20.702% and 8.958 to 162.617%, respec-tively, and were judged unacceptable.
3. Based on the t test assuming unequal variances, Malt-13 and the Neogen Veratox ELISA kit were significantly different at the 95% confidence level for all samples.
4. Based on the t test assuming unequal variances, Malt-13 and the Diagnostic EZ-Tox ELISA kit were significantly different at the 95% confidence level only for samples G and H.
5. Based on the t test assuming unequal variances, the Neogen Veratox and Diagnostix EZ-Tox ELISA kits were significantly different at the 95% confidence level for all samples, except A.
RECOMMENDATIONS
1. The subcommittee recommends repeating this collaborative study for a second year.
2. The subcommittee recommends adding barley samples to this collaborative study.
This was the first year of the subcommittee’s existence. Based on the recommendation of the Subcommittee for Methods of Analy-sis Malt Review (2), this subcommittee was formed to evaluate two ELISA kits as alternatives to Malt-13 for analysis of DON (1). Lev-els of DON in grain are regulated by the USDA and FDA. Food products for consumption by humans cannot contain more than 1 ppm DON.
PROCEDURE
Collaborators were provided with eight samples of commercial malt, representing sample pairs A/B through G/H. Sample pairs were chosen to represent malts with varying levels of DON. Samples were prepared using a Buhler DFLU disc mill with settings deter-mined by method Malt-4 for fine grind. Ground malt samples were sealed to prevent moisture gain and sent to each collaborator in late November 2009. Sample pair A/B was produced from a blend of two 2-row varieties. Sample pair C/D was the same 2-row vari-ety with different production dates. Sample pair E/F was produced
from a blend of two 6-row varieties, and sample pair G/H was a 6-row variety with different production dates. Results were evalu-ated using the Youden unit block design (1) and the t test assum-ing unequal variances at the 95% confidence level.
RESULTS AND DISCUSSION
Results for the Neogen Veratox ELISA kit were received from 11 collaborators for sample pairs A/B, C/D, E/F, and G/H; 7 col-laborators reported results for the Diagnostix EZ-Tox ELISA kit; and 4 collaborators reported results for the Malt-13 method. Re-sults from one collaborator using EZ-Tox ELISA were excluded prior to statistical analysis because of known deviations from the prescribed experimental protocol. The results for DON levels mea-sured by Veratox ELISA, Malt-13, and EZ-Tox ELISA are summa-rized in Tables I–III, respectively. Outliers were determined using Dixon’s ratio test; however, no outliers were removed from statis-tical analysis. Outliers were not excluded because of the very small values that were observed, and no known deviations from proto-col were noted.
The statistical summary of the DON data for both the Veratox and EZ-Tox ELISA kits are presented in Table IV. The repeatabil-ity and reproducibility coefficients of variation for the determina-tion of DON using the Veratox ELISA kit ranged from 6.277 to 45.80% and 13.790 to 78.798%, respectively, and were judged un-acceptable. The repeatability and reproducibility coefficients of varia-tion for the determination of DON using the EZ-Tox ELISA kit ranged from 0.000 to 20.702% and 8.958 to 162.617%, respectively, and were judged unacceptable. Samples A and B had very small DON values, leading to extremely large coefficients of variation. Even if samples A and B were thrown out, the repeatability and reproducibility coefficients of variation would still be higher than is acceptable. Results for the four sample pairs indicated an in-creasing percentage for repeatability and reproducibility coefficients of variation. As the sample value decreased, the coefficients of vari-ation increased. This was taken into consideration when evaluating this method. For future study it is recommended that the collabo-rative study exclude samples that have 0 ppm DON.
The results of the t test assuming unequal variances are presented in Tables V–VII. The t test assuming unequal variances was used for comparison of the different methods due to the different num-ber of collaborators for each method. Based on the t test assuming unequal variances, Malt-13 and EZ-Tox ELISA were significantly different at the 95% confidence level only for samples G and H; Malt-13 and Veratox ELISA were significantly different at the 95% confidence level for all samples; and Veratox and EZ-Tox ELISA kits were significantly different at the 95% confidence level for all samples, except A.
The recommendation to repeat this collaborative study for an-other year is strictly due to the sample set. Samples need to conform to USDA and FDA regulations for grain for human consumption.
LITERATURE CITED
1. American Society of Brewing Chemists. Methods of Analysis, 2009 ed. Malt-13 Deoxynivalenol by gas chromatography; Statistical Analysis-4 Youden unit block collaborative testing procedure, -5 Comparison of test methods. The Society, St. Paul, MN, 2009.
2. American Society of Brewing Chemists. Report of the Subcommittee for Methods of Analysis Malt Review. J. Am. Soc. Brew. Chem. 67:262, 2009.
doi:10.1094 /ASBCJ-2010-0921-02
© 2010 American Society of Brewing Chemists, Inc.
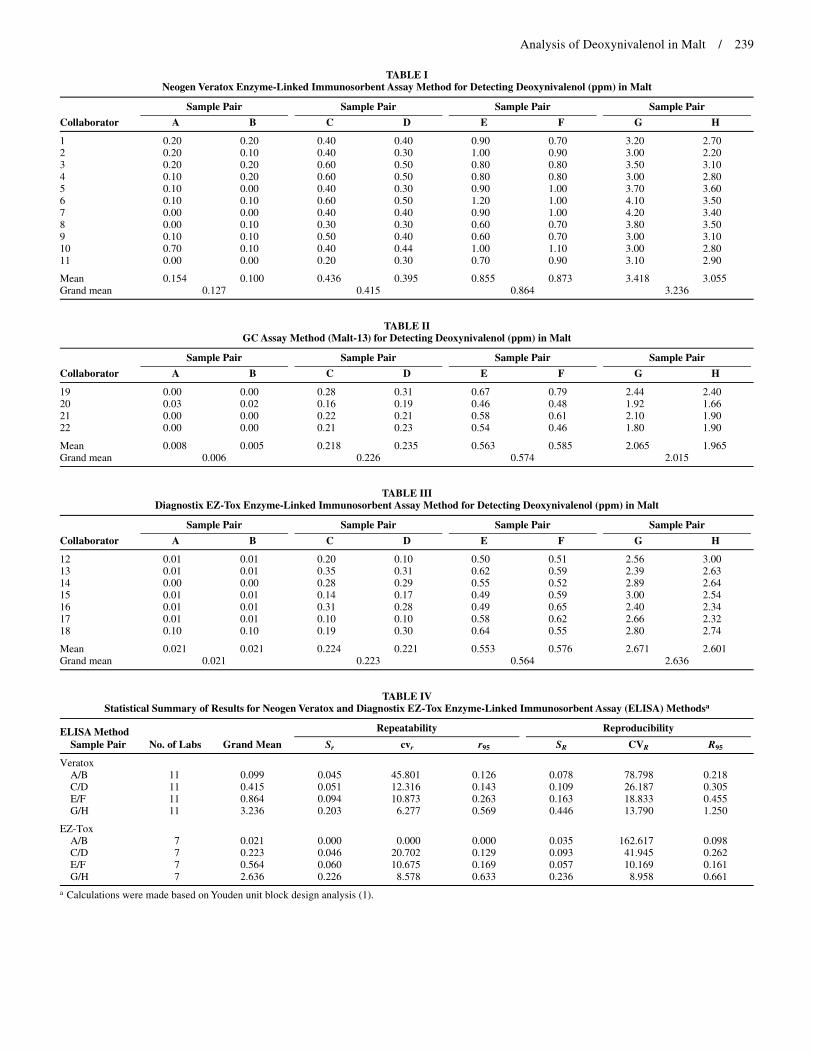
Analysis of Deoxynivalenol in Malt / 239
TABLE I Neogen Veratox Enzyme-Linked Immunosorbent Assay Method for Detecting Deoxynivalenol (ppm) in Malt
Sample Pair Sample Pair Sample Pair Sample Pair
Collaborator A B C D E F G H
1 0.20 0.20 0.40 0.40 0.90 0.70 3.20 2.70 2 0.20 0.10 0.40 0.30 1.00 0.90 3.00 2.20 3 0.20 0.20 0.60 0.50 0.80 0.80 3.50 3.10 4 0.10 0.20 0.60 0.50 0.80 0.80 3.00 2.80 5 0.10 0.00 0.40 0.30 0.90 1.00 3.70 3.60 6 0.10 0.10 0.60 0.50 1.20 1.00 4.10 3.50 7 0.00 0.00 0.40 0.40 0.90 1.00 4.20 3.40 8 0.00 0.10 0.30 0.30 0.60 0.70 3.80 3.50 9 0.10 0.10 0.50 0.40 0.60 0.70 3.00 3.10 10 0.70 0.10 0.40 0.44 1.00 1.10 3.00 2.80 11 0.00 0.00 0.20 0.30 0.70 0.90 3.10 2.90
Mean 0.154 0.100 0.436 0.395 0.855 0.873 3.418 3.055 Grand mean 0.127 0.415 0.864 3.236
TABLE II GC Assay Method (Malt-13) for Detecting Deoxynivalenol (ppm) in Malt
Sample Pair Sample Pair Sample Pair Sample Pair
Collaborator A B C D E F G H
19 0.00 0.00 0.28 0.31 0.67 0.79 2.44 2.40 20 0.03 0.02 0.16 0.19 0.46 0.48 1.92 1.66 21 0.00 0.00 0.22 0.21 0.58 0.61 2.10 1.90 22 0.00 0.00 0.21 0.23 0.54 0.46 1.80 1.90
Mean 0.008 0.005 0.218 0.235 0.563 0.585 2.065 1.965 Grand mean 0.006 0.226 0.574 2.015
TABLE III Diagnostix EZ-Tox Enzyme-Linked Immunosorbent Assay Method for Detecting Deoxynivalenol (ppm) in Malt
Sample Pair Sample Pair Sample Pair Sample Pair
Collaborator A B C D E F G H
12 0.01 0.01 0.20 0.10 0.50 0.51 2.56 3.00 13 0.01 0.01 0.35 0.31 0.62 0.59 2.39 2.63 14 0.00 0.00 0.28 0.29 0.55 0.52 2.89 2.64 15 0.01 0.01 0.14 0.17 0.49 0.59 3.00 2.54 16 0.01 0.01 0.31 0.28 0.49 0.65 2.40 2.34 17 0.01 0.01 0.10 0.10 0.58 0.62 2.66 2.32 18 0.10 0.10 0.19 0.30 0.64 0.55 2.80 2.74
Mean 0.021 0.021 0.224 0.221 0.553 0.576 2.671 2.601 Grand mean 0.021 0.223 0.564 2.636
TABLE IV Statistical Summary of Results for Neogen Veratox and Diagnostix EZ-Tox Enzyme-Linked Immunosorbent Assay (ELISA) Methodsa
ELISA Method Repeatability Reproducibility
Sample Pair No. of Labs Grand Mean Sr cvr r95 SR CVR R95
Veratox A/B 11 0.099 0.045 45.801 0.126 0.078 78.798 0.218 C/D 11 0.415 0.051 12.316 0.143 0.109 26.187 0.305 E/F 11 0.864 0.094 10.873 0.263 0.163 18.833 0.455 G/H 11 3.236 0.203 6.277 0.569 0.446 13.790 1.250
EZ-Tox A/B 7 0.021 0.000 0.000 0.000 0.035 162.617 0.098 C/D 7 0.223 0.046 20.702 0.129 0.093 41.945 0.262 E/F 7 0.564 0.060 10.675 0.169 0.057 10.169 0.161 G/H 7 2.636 0.226 8.578 0.633 0.236 8.958 0.661
a Calculations were made based on Youden unit block design analysis (1).

240 / Bartlett, S.
TABLE V t Test Comparison of Neogen Veratox Enzyme-Linked Immunosorbent Assay and GC Assay (Malt-13) Methods for Detecting Deoxynivalenol in Malta
Parameter Sample A Sample B Sample C Sample D Sample E Sample F Sample G Sample H
Mean over two methods 0.082 0.053 0.327 0.315 0.709 0.729 2.742 2.510 N for Veratox 11 11 11 11 11 11 11 11 N for GC 4 4 4 4 4 4 4 4 Degrees of freedom 10 11 13 9 11 5 9 7 Calculated t 2.459b 3.978b 4.764b 4.359b 4.180b 3.298b 6.850b 5.392b t0.05 2.228 2.201 2.160 2.262 2.201 2.571 2.262 2.365
a All calculations were made based on Youden unit block design analysis (1). b Significant at the 95% confidence level.
TABLE VI t Test Comparison of Diagnostix EZ-Tox Enzyme-Linked Immunosorbent Assay and GC Assay (Malt-13) Methods for Detecting Deoxynivalenol in Malta
Parameter Sample A Sample B Sample C Sample D Sample E Sample F Sample G Sample H
Mean over two methods 0.015 0.013 0.221 0.228 0.558 0.581 2.368 2.283 N for EZ-Tox 7 7 7 7 7 7 7 7 N for GC 4 4 4 4 4 4 4 4 Degrees of freedom 9 8 9 9 5 3 6 5 Calculated t 0.919b 1.166b 0.159b –0.305b –0.194b –0.118b 3.659c 3.551c t0.05 2.262 2.306 2.262 2.262 2.571 3.182 2.447 2.571
a All calculations were made based on Youden unit block design analysis (1). b Not significant at the 95% confidence level. c Significant at the 95% confidence level.
TABLE VII t Test Comparison of Neogen Veratox and Diagnostix EZ-Tox Enzyme-Linked Immunosorbent Assay Methods for Detecting Deoxynivalenol in Malta
Parameter Sample A Sample B Sample C Sample D Sample E Sample F Sample G Sample H
Mean over two methods 0.088 0.061 0.330 0.308 0.704 0.724 3.045 2.828 N for EZ-Tox 7 7 7 7 7 7 7 7 N for Veratox 11 11 11 11 11 11 11 11 Degrees of freedom 11 15 16 12 13 14 16 16 Calculated t 2.190b 2.930c 4.075c 3.930c 5.074c 6.311c 4.491c 2.894c t0.05 2.201 2.131 2.120 2.179 2.160 2.145 2.120 2.120
a All calculations were made based on Youden unit block design analysis (1). b Not significant at the 95% confidence level. c Significant at the 95% confidence level.
241
Headspace Gas Chromatography–Flame Ionization Detector Analysis for Beer Volatiles
Subcommittee Members: J. Palausky, Chair; M. Aistrope; M. Christoph-erson; L. Dennison; V. Kellner (EBC); L. Marques; R. Ortiz; N. Parker; F. Sitjas (EBC); and K. Lakenburges (ex officio)
Keywords: Alcohols, Aldehydes, Esters, FID, GC
CONCLUSIONS
1. Repeatability and reproducibility coefficients of variation for the determination of acetaldehyde by headspace gas chromatog-raphy–flame ionization detector (GC-FID) analysis ranged from 0.70 to 12% and 14 to 28%, respectively, and were judged un-acceptable.
2. Repeatability and reproducibility coefficients of variation for the determination of ethyl acetate by headspace GC-FID analysis ranged from 0.96 to 4.3% and 8.2 to 8.9%, respectively, and were judged acceptable.
3. Repeatability coefficients of variation for the determination of isoamyl acetate by headspace GC-FID analysis ranged from 0.42 to 10% and were judged acceptable. Reproducibility coef-ficients of variation for the determination of isoamyl acetate by headspace GC-FID analysis ranged from 14 to 32% and were judged unacceptable.
4. Repeatability and reproducibility coefficients of variation for the determination of isoamyl alcohol by headspace GC-FID analy-sis ranged from 3.9 to 12% and 12 to 18%, respectively, and were judged unacceptable.
RECOMMENDATION
1. Due to the unacceptable statistical data, the subcommittee rec-ommends that the collaborative study be repeated in 2010–2011 following ruggedness evaluation.
Based on polling by the Subcommittee for Coordination of New and Alternative Methods of Analysis (2), this subcommittee was formed to evaluate the applicability of headspace GC-FID analy-sis for the determination of volatile organic compounds in beer. The volatile target compounds were selected because they repre-sent a range of chemical functionality (e.g., alcohols, aldehydes, and esters) and they are present in all beers.
PROCEDURE
Four sample pairs of commercial beers were sent to each col-laborator. Each pair was of the same brand but from different pro-duction times. Two sample pairs were commercially available ales (A/B and C/D), and two sample pairs were commercial light beers
(E/F and G/H) selected to cover a broad range of volatile concen-trations. Calibration was accomplished by standard additions of volatiles, with 1-butanol as an internal standard. Results were eval-uated using the Youden unit block design (1).
RESULTS AND DISCUSSION
Results from eight collaborators were received for the four sample pairs. Results for ethyl acetate, isoamyl acetate, and isoamyl alco-hol from one collaborator were excluded prior to statistical analy-ses because of known deviations from the prescribed experimental protocol. Data for acetaldehyde, ethyl acetate, isoamyl acetate, and isoamyl alcohol are presented in Tables I–IV, respectively. Outliers were identified using Dixon’s ratio test (1).
The statistical summary of the volatile data is shown in Table V. The repeatability coefficients of variation were judged acceptable for two of four compounds tested. The repeatability coefficients of variation for ethyl acetate and isoamyl acetate ranged from 0.96 to 4.3% and 0.42 to 10%, respectively, and were judged acceptable. The repeatability coefficients of variation for acetaldehyde and iso-amyl alcohol ranged from 0.70 to 12% and 3.9 to 12%, respec-tively, and were judged unacceptable.
Repeatability for acetaldehyde may have been affected by the nature of the ales provided for testing. The ales were bottle-con-ditioned, which can produce different levels of acetaldehyde de-pending on the length of time between production and analysis. Future collaborative tests should utilize non–bottle-conditioned prod-ucts.
Repeatability for isoamyl alcohol may have been affected by chromatographic coelution of two amyl alcohols on the selected column. Ruggedness testing should be conducted to determine the potential effect of chromatographic coelution.
The reproducibility coefficients of variation were judged unac-ceptable for three of four compounds tested. The reproducibility coefficients of variation for ethyl acetate ranged from 8.2 to 8.9% and were judged acceptable. The reproducibility coefficients of vari-ation for acetaldehyde, isoamyl acetate, and isoamyl alcohol ranged from 14 to 28%, 14 to 32%, and 12 to 18%, respectively, and were judged unacceptable.
Reproducibility of results for acetaldehyde, isoamyl acetate, and isoamyl alcohol may have been affected by sampling errors. A few collaborators indicated difficulty with sampling carbonated bever-ages using glass pipettes. The sampling technique should be evalu-ated by ruggedness testing for inclusion in future collaborative test-ing. Future sample testing will attempt to cover a broader range of analytes.
LITERATURE CITED
1. American Society of Brewing Chemists. Methods of Analysis, 2009 ed. Statistical Analysis-4 Youden unit block collaborative testing procedure. The Society, St. Paul, MN, 2009.
2. American Society of Brewing Chemists. Report of the Subcommittee for Coordination of New and Alternate Methods of Analysis. J. Am. Soc. Brew. Chem. 67:249, 2009.
doi:10.1094 /ASBCJ-2010-0923-02
© 2010 American Society of Brewing Chemists, Inc.

242 / Palausky, J.
TABLE I Determination of Acetaldehyde (mg/L) in Beer by Headspace Gas Chromatography–Flame Ionization Detector Analysis
Sample Pair Sample Pair Sample Pair Sample Pair
Collaborator A B C D E F G H
1 4.89 5.67 2.76 3.50 1.82 1.77 6.12 5.96 2 7.67a 9.41a 6.69a 6.85a 3.58a 3.87a 8.21a 6.39a 3 5.63 6.90 3.17 4.80 1.08 0.95 4.73 4.61 4 5.24 4.05 3.58 3.66 2.40 2.18 5.78 5.69 5 7.59a 13.9a 4.91a 8.58a 3.00a 2.68a 8.11a 7.35a 7 6.92 8.85 4.54 6.39 1.89 1.75 5.87 5.67 8 6.80 8.14 4.87 6.19 2.05 1.93 5.78 5.72 9 5.01 5.93 2.87 3.88 1.38 1.21 4.29 4.20
Meanb 5.747 6.590 3.631 4.736 1.769 1.631 5.428 5.308 Grand meanb 6.168 4.184 1.700 5.368
a Outlier at P < 0.05 based on totals and/or differences (1). b Calculated excluding outliers.
TABLE II Determination of Ethyl Acetate (mg/L) in Beer by Headspace Gas Chromatography–Flame Ionization Detector Analysis
Sample Pair Sample Pair Sample Pair Sample Pair
Collaborator A B C D E F G H
1 19.9 19.7 16.8 15.4 16.9 16.1 16.4 19.7 2 …a … … … … … … … 3 17.7 17.8 15.8 16.9 15.2 14.7 14.0 16.7 4 27.2b 23.8b 23.9b 25.0b 23.7b 21.3b 21.8b 21.2b 5 19.0 18.8 17.8 18.8 17.3 16.7 16.1 19.2 7 18.6 19.3 16.7 18.0 16.9 15.8 14.8 17.8 8 17.2 16.9 15.6 16.6 14.6 14.0 13.9 17.0 9 21.7 21.2 19.0 20.5 19.1 18.3 16.9 21.1
Meanc 19.02 18.94 16.95 17.69 16.66 15.92 15.35 18.57 Grand meanc 18.98 17.32 16.29 16.96
a Data were deleted from all calculations due to known deviation from protocol. b Outlier at P < 0.05 based on totals and/or differences (1). c Calculated excluding outliers.
TABLE III Determination of Isoamyl Acetate (mg/L) in Beer by Headspace Gas Chromatography–Flame Ionization Detector Analysis
Sample Pair Sample Pair Sample Pair Sample Pair
Collaborator A B C D E F G H
1 1.24 1.22 1.15 1.19 1.25 1.24 1.48 1.43 2 …a … … … … … … … 3 0.615 0.645 0.650 0.680 1.41 1.45 1.39 1.85 4 1.41b 1.28b 1.45b 1.45b 2.68b 2.75b 2.67b 2.99b 5 0.574 0.592 0.618 0.658 1.32 1.37 1.32 1.74 7 0.733 0.823 0.771 0.802 1.74 1.73 1.68 2.24 8 0.568 0.600 0.621 0.654 1.24 1.27 1.27 1.71 9 0.738 0.747 0.749 0.790 1.62 1.67 1.54 2.16
Meanc 0.7443 0.7712 0.7598 0.7951 1.429 1.454 1.447 1.854 Grand meanc 0.7577 0.7774 1.442 1.651
a Data were deleted from all calculations due to known deviation from protocol. b Outlier at P < 0.05 based on totals and/or differences (1). c Calculated excluding outliers.

GC–FID Analysis for Beer Volatiles / 243
TABLE IV Determination of Isoamyl Alcohol (mg/L) in Beer by Headspace Gas Chromatography–Flame Ionization Detector Analysis
Sample Pair Sample Pair Sample Pair Sample Pair
Collaborator A B C D E F G H
1 31.8a 33.7a 33.2a 29.6a 69.5a 70.0a 71.4a 97.7a 2 …b … … … … … … … 3 32.9 32.3 31.1 33.0 29.7 29.8 34.7 32.9 4 42.7 37.1 39.9 38.8 41.3 41.1 39.3 38.5 5 45.8 46.5 35.1 44.3 30.5 45.8 35.1 37.5 7 33.2 33.0 33.2 36.5 32.6 31.6 35.9 34.7 8 43.9 41.8 40.8 42.8 43.3 42.4 51.1 47.7 9 45.3 44.5 41.8 43.2 45.6 45.0 51.0 47.1
Meanc 40.63 39.19 36.98 39.76 37.16 39.28 41.18 39.73 Grand meanc 39.91 38.37 38.22 40.45
a Outlier at P < 0.05 based on totals and/or differences (1). b Data were deleted from all calculations due to known deviation from protocol. c Calculated excluding outliers.
TABLE V Statistical Summary of Results for Determination of Volatile Organic Compounds in Beer
by Headspace Gas Chromatography–Flame Ionization Detector Analysisa
Compound Repeatability Reproducibility
Sample Pair No. of labs Grand Mean Sr cvr r95 SR cvR R95
Acetaldehyde A/B 6 6.168 0.759 12 2.124 1.392 23 3.899 C/D 6 4.184 0.455 11 1.273 1.104 26 3.092 E/F 6 1.700 0.040 2.4 0.112 0.468 28 1.311 G/H 6 5.368 0.037 0.70 0.105 0.728 14 2.040
Ethyl acetate A/B 6 18.98 0.308 1.6 0.863 1.557 8.2 4.361 C/D 6 17.32 0.741 4.3 2.074 1.547 8.9 4.331 E/F 6 16.29 0.156 0.96 0.437 1.552 9.5 4.345 G/H 6 16.96 0.348 2.1 0.976 1.505 8.9 4.213
Isoamyl acetate A/B 6 0.7577 0.026 3.5 0.074 0.244 32 0.684 C/D 6 0.7774 0.003 0.42 0.009 0.202 26 0.566 E/F 6 1.442 0.019 1.3 0.053 0.205 14 0.573 G/H 6 1.651 0.170 10 0.475 0.240 15 0.671
Isoamyl alcohol A/B 6 39.91 1.580 4.0 4.425 5.967 15 16.71 C/D 6 38.37 2.449 6.4 6.857 4.442 12 12.44 E/F 6 38.22 4.573 12 12.81 6.951 18 19.46 G/H 6 40.45 1.596 3.9 4.470 7.076 17 19.81
a All calculations were made based on Youden unit block design analysis (1).
244
Coordination of New and Alternate Methods of Analysis
Subcommittee Members: K. Lakenburges, Chair; C. Benedict; J. Cornell; M. Eurich; B. Foster; A. Fritsch; R. Jennings; G. Kelly; A. Porter; C. Pow-ell; S. Thompson; and D. Sedin (ex officio) Associate Members: J. Angres; R. Duffy-Krywicki; J. Masschelin (TTB); and T. Nielsen Corresponding Members: K. Harayama (BCOJ); and E. Welten (EBC)
Keywords: Accelerated aging, Allergens, Amino acids, Bitterness, De-carbonation, FAN, Free amino nitrogen, β-Glucan, Gluten, HPLC, Iso-α-acids, Propylene glycol, Segmented flow analysis, Sensory, SFA, Volatile sulfur compounds, Wort viscosity
RECOMMENDATIONS
1. Conduct online polling to obtain input on new and alternative methods.
2. Gather additional information on methods for the determination of amino acids in wort to determine interest in the formation of a subcommittee and the execution of collaborative testing.
The function of this subcommittee is to collect, from various sources, new and alternate methods of analysis that may be useful to the industries our Society serves. These methods are reviewed to establish their merit and usefulness, and a recommendation re-garding collaborative testing is made to the Technical Committee. The subcommittee tracks and records the disposition of each meth-od considered. The subcommittee is also charged with the respon-sibility of periodically reviewing existing methods for accuracy and usefulness.
STATUS OF SUBCOMMITTEE
Membership and Meetings Given the very close ties this subcommittee has with the Techni-
cal Committee, it has been decided to make the Subcommittee for the Coordination of New and Alternate Methods an integral part of the Technical Committee’s activities and align membership of the two groups. Additional subject matter experts will be added to this subcommittee or consulted with on an as-needed basis.
The subcommittee meeting at the 2009 Annual Meeting in Tucson, AZ, was very well attended, with 50+ members in attendance. Top-ics of interest and discussion included
• Iso-α-acids analysis in beer by high-performance liquid chro-matography (HPLC) (adapting the EBC method for hop ex-tracts for analysis in wort and/or beer)
• Allergen analysis, with special interest in wheat
• Use of test kits
• Use of a tannometer for tannoids haze
• Hach spectrophotometer methods
• Reducing sugars method
• Amino acids methods (by HPLC)
Topics for Polling Polling questions were developed for online polling to gather in-
formation on potential new methods for collaborative study. These questions were formatted into a web-based survey with assistance
and administration by ASBC staff. The topics in the online poll, along with background information, are described below. Results from the poll can be found in the Appendix of this report.
Input on New and Alternative Methods. This subcommittee and the Technical Committee receive input on potential new and alter-native methods throughout the year. Much of the input comes through the ASBC Annual Meeting, but the poll is another valu-able tool for gathering additional information.
Segmented Flow Analysis (Bitterness [BU], Free Amino Ni-trogen [FAN], β-Glucan). This idea stems from the six responses for the determination of sulfur dioxide (SO2) in beer in 2007 given at the annual meeting in Victoria, BC, Canada, and the resulting sub-committee formation followed by successful collaborative testing. Polling in 2009 yielded responses from 17 members, 14 of whom use segmented flow (SFA) for nonmalt analysis. The 2010 poll yielded responses from 15 members who currently use SFA for nonmalt analysis: bitterness (6 responses), FAN (12 responses), β-glucan (10 responses), and SO2 (2 responses). A total of 11 respondents ex-pressed their willingness to participate in ASBC subcommittee col-laborative evaluations of the methods: bitterness (6 respondents), FAN (10 respondents) and β-glucan (9 respondents).
Iso-α-acids in Wort and Beer Determined by HPLC. This topic was suggested in response to the 2009 poll and was briefly discussed at the subcommittee meeting at the 2009 annual meet-ing in Tucson. Adaptation of an EBC method for determination in hop extracts was suggested, and the 2010 poll received 16 responses from labs currently using an HPLC method for iso-α-acids analysis. A total of 17 respondents expressed their willingness to participate in an ASBC subcommittee collaborative evaluation of the method.
Amino Acids in Wort Determined by HPLC. Six people ex-pressed interest in a potential subcommittee at the annual meeting in Victoria in 2007. Additional polling online may provide details on methods in use and potential modifications developed in light of past and possible future shortages of acetonitrile (3).
Researching Methods/Subcommittee Chairs Needed Volatile Sulfur Compounds in Beer. This topic has been of in-
terest for several years, but a subcommittee chair is needed to iden-tify a method and coordinate collaborative testing. This topic will be kept as a current need but will not be advanced as a subcom-mittee until such time as a suitable chair can be found (4–6).
Decarbonation of Beer. Several methods are used for the de-carbonation of beer. Further, many analytical methods require a de-gassing step for beer samples prior to analysis. Not all methods for degassing are compatible with all of the analytical methods that re-quire a decarbonation step, so there is a need to determine accept-able combinations of the two. The subcommittee is seeking a vol-unteer to
• Take on a review of the current key published work on de-carbonation of beer and summarize the findings (1,2,7)
• Provide a recommendation to the Technical Committee for a collaborative study that tests selected decarbonation methods against common ASBC methods that require degassing
Packaging Methods. In an effort to update the Packaging Meth-ods section of the ASBC Methods of Analysis (MOA), the Techni-cal Committee is seeking to evaluate and update packaging meth-ods. Methods are being reviewed, and questions are being developed to include in future polling.
Propylene Glycol. This method was suggested at the fall 2008 Technical Committee meeting. Propylene glycol can be measured as a fermentation by-product or as a contaminant from defective heat
doi:10.1094 /ASBCJ-2010-0924-01
© 2010 American Society of Brewing Chemists, Inc.
New and Alternate Methods of Analysis / 245
exchangers. Method(s) are needed, and this is a possible future poll-ing topic and posting at the annual meeting.
Wort Viscosity Determined by Automated Instrument. This idea came from the 2010 review of the Wort section of the MOA.
Sensory. ASBC and EBC are working toward updating the fla-vor wheel.
Lab Work/Publication Required Accelerated Aging of Seed (Viability, Vigor Testing). The final
year of the NDSU study was due to be completed in 2008. Polling will be conducted or a subcommittee established once the method has been published.
Topics to Continue to Monitor Labeling/Allergens in Beer. The subcommittee will continue to
monitor this topic, along with the Emerging Issues Committee. Po-tential labeling requirements and method selection for gluten in beer continue to be key items to watch.
Topics to Archive None.
LITERATURE CITED
1. American Society of Brewing Chemists. Methods of Analysis, 2009 ed. Beer-1A Preparation of sample for chemical and physical analysis, -1D Decarbonation by rotary shaker; Malt-2B Assortment. The Society, St. Paul, MN, 2009.
2. Constant, M., and Collier, J. Alternative techniques for beer decarbona-tion. J. Am. Soc. Brew. Chem. 51:29-35, 1993.
3. Garza-Ulloa, H., Garza Cantú, R., and Gajá, A. Determination of amino acids in wort and beer by reverse-phase high-performance liquid chro-matography. J. Am. Soc. Brew. Chem. 44:47-51, 1986.
4. Hill, P. G., and Smith, R. M. Determination of sulphur compounds in beer using headspace solid phase microextraction and gas chromato-graphic analysis with pulsed flame photometric detection. J. Chroma-togr. A 872:203-213, 2000.
5. Kancler, J. Low-level analysis of sulfur compounds in beer by purge and trap. Tekmar Application Note, 2003.
6. OI. Low-level sulfur compounds in beer by purge and trap with a pulsed flame photometric detector (PFPD). OI Analytical Application Note 16181100, 2005.
7. Smith, P. A., and Marinelli, L. J. Evaluation of established methods of decarbonating beer. J. Am. Soc. Brew. Chem. 50:102-105, 1992.
APPENDIX
Summarized Results from 2010 Online Polling
Top Line Results – 156 responses were received – 37 respondents (24%) submitted ideas for new and alterna-
tive methods – 78 respondents (50%) provided their contact information – 17 respondents answered questions regarding iso-α-acids
analysis by HPLC – 14 respondents answered questions regarding segmented flow
analysis
Suggestions and Input for New Methods – Revision of Congress mash – Mycotoxins in raw materials, wort, and beer – Malt/beer gushing inducer – Microorganism identification – KOH for gram staining – Yeast vitality (3 responses) – Measuring dissolved oxygen in bottled and canned prod-
ucts – Measurement of DP enzymes – Monitoring yeast physiological state during fermentation by
quantitative cell morphogenesis analysis – Zinc in wort and beer – Amino acids in wort and beer (2 responses) – Rapid methods for beer-spoilage bacterium (2 responses) – Correlation of fermentation technology in the brewing in-
dustry to fermentation in the distillation industry – Use of an ebulliometer to measure alcohol
– Distilled spirits profile analysis: GC, color, and other analytes that can be measured by spectrophotometer
– SO2 in beer by headspace GC – Phenolic acids – TPO, differential measurement of headspace oxygen and dis-
solved oxygen – Flow cytometry assays – Hop analysis – Organic certification – Gluten level assessment – Shelf-life prediction – SO2 analysis – Homogeneity of barley – LPT proteins that are more involved in foam formation – Flavor stability – β-Glucans in beer – Anthocyanogens in beer – Coagulable nitrogen – SPME GC/MS – Beer flavor analysis – Gelatinization temperature of barley and malt using RVA – Malt lipoxygenase – Arabinoxylans (2 responses) in barley, malt, and wort – β-Glucans determined by HPLC – Crease mold in or on barley – Health – Indole – Microbiology
246
Method for Determining Alpha-Amylase in Malt by Segmented Flow Analysis Using Potassium Ferricyanide
Subcommittee Members: A. Budde, Chair; J. Barr; S. Bartlett; T. Chicos; K. Churchill; D. Frey; A. MacLeod; M. Maurice; J. Menting; A. Stern; and R. Jennings (ex officio)
Keywords: SFA
CONCLUSIONS
1. Repeatability coefficients of variation for the determination of α-amylase using potassium ferricyanide ranged from 0.86 to 5.01% and were judged acceptable.
2. Reproducibility coefficients of variation for the determination of α-amylase using potassium ferricyanide ranged from 2.55 to 15.17% and were judged unacceptable.
RECOMMENDATIONS
1. The subcommittee recommends that collaborative testing be re-peated.
2. Attempts should be made to develop a protocol that yields more consistent results.
3. An attempt should be made to involve more standard reference method (SRM) collaborators. If no more are available, it is rec-ommended that this method be tested against Malt-7C, Seg-mented Flow Analysis for Alpha-Amylase Using Iodine.
This was the first year of this subcommittee’s evaluation of an alternative method for determining α-amylase activities in malt by segmented flow analysis utilizing potassium ferricyanide for de-tection. The subcommittee was formed based on the recommenda-tion of Subcommittee for the Methods of Analysis Malt Review (2). Some members had expressed concern that the current ap-proved method (Malt-7C) for segmented flow analysis (1), which uses β-limit dextrin and iodine for detection, might not have the dynamic range to accurately cover a broader spectrum of malts with very high or very low levels of α-amylase activity.
Previous attempts to establish α-amylase activity by segmented flow analysis experienced high reproducibility coefficients of varia-tion (3). Since most analytical labs were performing segmented flow analyses and the numbers of labs routinely using the SRM were decreasing, an effort was made to include only collaborators using the most prevalent methodology (segmented flow analysis with iodine for detection). Satisfactory results from this collabora-tive study resulted in approval of Malt-7C as a method for deter-mination of α-amylase (4). Segmented flow analysis utilizing po-tassium ferricyanide to determine α-amylase activity might allow for more accurate assessment of very low or very high activities compared with Malt-7C, while yielding similar results in the 40–60 DU range. It is recommended that for future studies the potas-sium ferricyanide method be compared with Malt-7C.
PROCEDURE
A total of 10 malt samples representing commercial varieties malted on separate days (similar but distinct) were ground on a
Buhler DFLU disc mill according to Malt-4 for fine grind, vacuum packed, and sent to each collaborator. The 10 malts consisted of 5 sample pairs (A/B to I/J) that spanned a wide range of α-amyl-ase levels. These samples were identical to the malts used by the subcommittee examining the Megazyme E-MAST standard as a replacement for the Sigma product that is no longer available. Cali-bration of the method was via D-glucose solutions, as described in Malt-6C, and sample A was used as the internal standard to anchor the experimental values. Raw analytical results were generated from the linear regression determined by the glucose standards, with the final values determined by multiplying results of the measured raw value by the averaged SRM value of sample A divided by the av-eraged raw values of sample A used as an internal standard. Re-sults were evaluated using the Youden unit block design (1).
RESULTS AND DISCUSSION
Results from eight collaborators were received for the five sample pairs and are presented in Table I. The sample pairs were also ana-lyzed by Malt-7A and -7B (SRM); the results are presented in Table II. Outliers were identified using Dixon’s ratio test (1).
The statistical summary for the determination of α-amylase using potassium ferricyanide are presented in Table III. Repeatability co-efficients of variation for the determination of α-amylase using po-tassium ferricyanide ranged from 0.86 to 5.01% and were judged acceptable. Reproducibility coefficients of variation for the deter-mination of α-amylase using potassium ferricyanide ranged from 2.55 to 15.17% and were judged unacceptable.
Values for sample pair A/B were very consistent, as would be expected when using sample A as an internal standard. Of concern were the results of analyses of the sample pairs representing low and high activities (sample pair I/J had low activity based on SRM, while G/H had high activity based on SRM). The reproducibility coefficients of variation for these pairs were high at 10.88 and 15.17%, respectively, while the grand mean values for these two pairs did not reflect the fact that these malts had the lowest and highest activities. The premise that the potassium ferricyanide meth-od has a more dynamic range than the iodine method should be examined more closely. A comparison of the SRM and α-amylase determined using potassium ferricyanide could not be performed due to the lack of SRM collaborators. It is hypothesized that the use of the internal standard smoothed out the values for each sample. It is recommended that the true values from each collaborator be used for future studies.
LITERATURE CITED
1. American Society of Brewing Chemists. Methods of Analysis, 2009 ed. Malt-7C Alpha-amylase by automated analysis; Statistical Analysis-4 Youden unit block collaborative testing procedure. The Society, St. Paul, MN, 2009.
2. American Society of Brewing Chemists. Report of the Subcommittee on the Methods of Analysis Malt Review. J. Am. Soc. Brew. Chem. 67:262, 2009.
3. American Society of Brewing Chemists. Report of the Subcommittee on Determination of Alpha-Amylase by Automated Flow Analysis. J. Am. Soc. Brew. Chem. 64:248-251, 2006.
4. American Society of Brewing Chemists. Report of the Subcommittee for Determination of Alpha-Amylase by Automated Flow Analysis. J. Am. Soc. Brew. Chem. 65:241-243, 2007.
doi:10.1094 /ASBCJ-2010-0921-01
© 2010 American Society of Brewing Chemists, Inc.
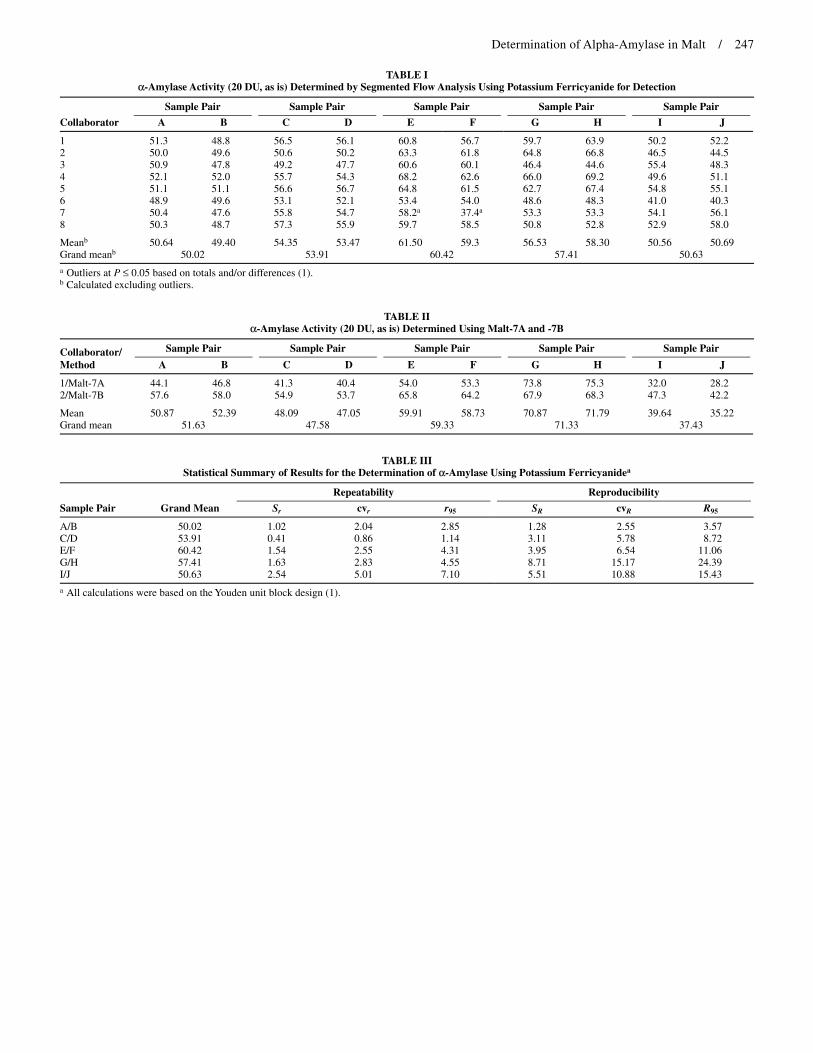
Determination of Alpha-Amylase in Malt / 247
TABLE I α-Amylase Activity (20 DU, as is) Determined by Segmented Flow Analysis Using Potassium Ferricyanide for Detection
Sample Pair Sample Pair Sample Pair Sample Pair Sample Pair
Collaborator A B C D E F G H I J
1 51.3 48.8 56.5 56.1 60.8 56.7 59.7 63.9 50.2 52.2 2 50.0 49.6 50.6 50.2 63.3 61.8 64.8 66.8 46.5 44.5 3 50.9 47.8 49.2 47.7 60.6 60.1 46.4 44.6 55.4 48.3 4 52.1 52.0 55.7 54.3 68.2 62.6 66.0 69.2 49.6 51.1 5 51.1 51.1 56.6 56.7 64.8 61.5 62.7 67.4 54.8 55.1 6 48.9 49.6 53.1 52.1 53.4 54.0 48.6 48.3 41.0 40.3 7 50.4 47.6 55.8 54.7 58.2a 37.4a 53.3 53.3 54.1 56.1 8 50.3 48.7 57.3 55.9 59.7 58.5 50.8 52.8 52.9 58.0
Meanb 50.64 49.40 54.35 53.47 61.50 59.3 56.53 58.30 50.56 50.69 Grand meanb 50.02 53.91 60.42 57.41 50.63
a Outliers at P ≤ 0.05 based on totals and/or differences (1). b Calculated excluding outliers.
TABLE II α-Amylase Activity (20 DU, as is) Determined Using Malt-7A and -7B
Collaborator/ Sample Pair Sample Pair Sample Pair Sample Pair Sample Pair
Method A B C D E F G H I J
1/Malt-7A 44.1 46.8 41.3 40.4 54.0 53.3 73.8 75.3 32.0 28.2 2/Malt-7B 57.6 58.0 54.9 53.7 65.8 64.2 67.9 68.3 47.3 42.2
Mean 50.87 52.39 48.09 47.05 59.91 58.73 70.87 71.79 39.64 35.22 Grand mean 51.63 47.58 59.33 71.33 37.43
TABLE III Statistical Summary of Results for the Determination of α-Amylase Using Potassium Ferricyanidea
Repeatability Reproducibility
Sample Pair Grand Mean Sr cvr r95 SR cvR R95
A/B 50.02 1.02 2.04 2.85 1.28 2.55 3.57 C/D 53.91 0.41 0.86 1.14 3.11 5.78 8.72 E/F 60.42 1.54 2.55 4.31 3.95 6.54 11.06 G/H 57.41 1.63 2.83 4.55 8.71 15.17 24.39 I/J 50.63 2.54 5.01 7.10 5.51 10.88 15.43
a All calculations were based on the Youden unit block design (1).
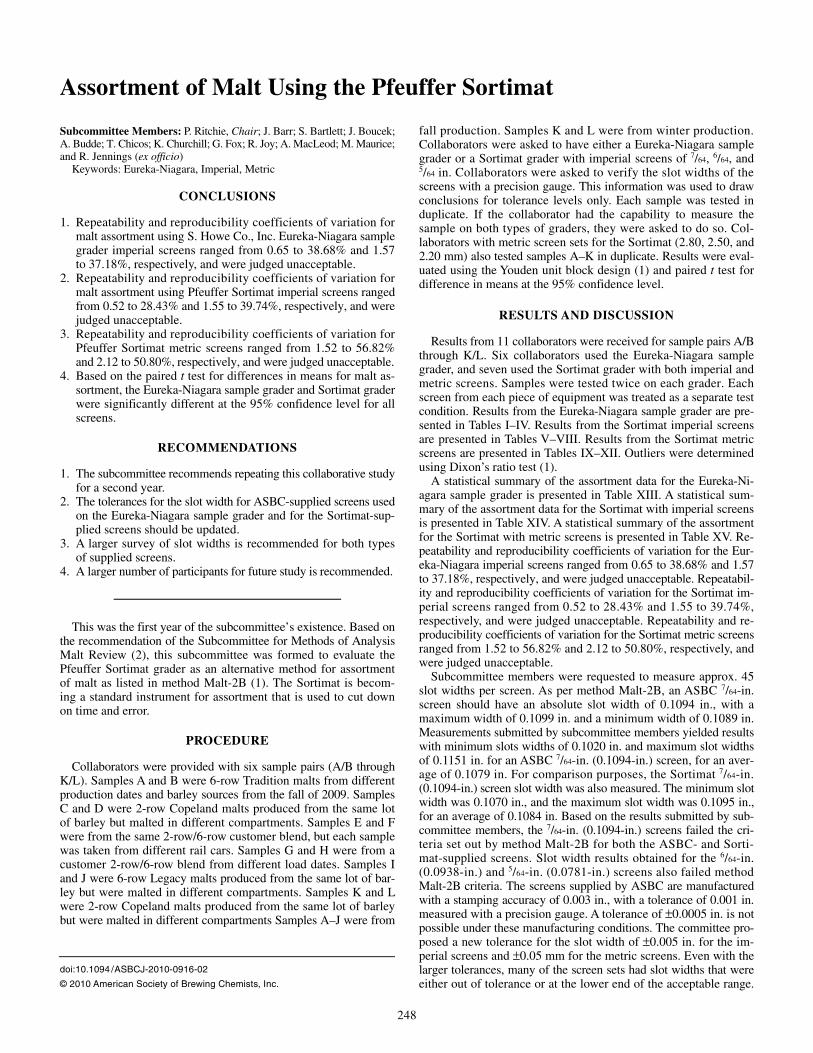
248
Assortment of Malt Using the Pfeuffer Sortimat
Subcommittee Members: P. Ritchie, Chair; J. Barr; S. Bartlett; J. Boucek; A. Budde; T. Chicos; K. Churchill; G. Fox; R. Joy; A. MacLeod; M. Maurice; and R. Jennings (ex officio)
Keywords: Eureka-Niagara, Imperial, Metric
CONCLUSIONS
1. Repeatability and reproducibility coefficients of variation for malt assortment using S. Howe Co., Inc. Eureka-Niagara sample grader imperial screens ranged from 0.65 to 38.68% and 1.57 to 37.18%, respectively, and were judged unacceptable.
2. Repeatability and reproducibility coefficients of variation for malt assortment using Pfeuffer Sortimat imperial screens ranged from 0.52 to 28.43% and 1.55 to 39.74%, respectively, and were judged unacceptable.
3. Repeatability and reproducibility coefficients of variation for Pfeuffer Sortimat metric screens ranged from 1.52 to 56.82% and 2.12 to 50.80%, respectively, and were judged unacceptable.
4. Based on the paired t test for differences in means for malt as-sortment, the Eureka-Niagara sample grader and Sortimat grader were significantly different at the 95% confidence level for all screens.
RECOMMENDATIONS
1. The subcommittee recommends repeating this collaborative study for a second year.
2. The tolerances for the slot width for ASBC-supplied screens used on the Eureka-Niagara sample grader and for the Sortimat-sup-plied screens should be updated.
3. A larger survey of slot widths is recommended for both types of supplied screens.
4. A larger number of participants for future study is recommended.
This was the first year of the subcommittee’s existence. Based on the recommendation of the Subcommittee for Methods of Analysis Malt Review (2), this subcommittee was formed to evaluate the Pfeuffer Sortimat grader as an alternative method for assortment of malt as listed in method Malt-2B (1). The Sortimat is becom-ing a standard instrument for assortment that is used to cut down on time and error.
PROCEDURE
Collaborators were provided with six sample pairs (A/B through K/L). Samples A and B were 6-row Tradition malts from different production dates and barley sources from the fall of 2009. Samples C and D were 2-row Copeland malts produced from the same lot of barley but malted in different compartments. Samples E and F were from the same 2-row/6-row customer blend, but each sample was taken from different rail cars. Samples G and H were from a customer 2-row/6-row blend from different load dates. Samples I and J were 6-row Legacy malts produced from the same lot of bar-ley but were malted in different compartments. Samples K and L were 2-row Copeland malts produced from the same lot of barley but were malted in different compartments Samples A–J were from
fall production. Samples K and L were from winter production. Collaborators were asked to have either a Eureka-Niagara sample grader or a Sortimat grader with imperial screens of 7/64, 6/64, and 5/64 in. Collaborators were asked to verify the slot widths of the screens with a precision gauge. This information was used to draw conclusions for tolerance levels only. Each sample was tested in duplicate. If the collaborator had the capability to measure the sample on both types of graders, they were asked to do so. Col-laborators with metric screen sets for the Sortimat (2.80, 2.50, and 2.20 mm) also tested samples A–K in duplicate. Results were eval-uated using the Youden unit block design (1) and paired t test for difference in means at the 95% confidence level.
RESULTS AND DISCUSSION
Results from 11 collaborators were received for sample pairs A/B through K/L. Six collaborators used the Eureka-Niagara sample grader, and seven used the Sortimat grader with both imperial and metric screens. Samples were tested twice on each grader. Each screen from each piece of equipment was treated as a separate test condition. Results from the Eureka-Niagara sample grader are pre-sented in Tables I–IV. Results from the Sortimat imperial screens are presented in Tables V–VIII. Results from the Sortimat metric screens are presented in Tables IX–XII. Outliers were determined using Dixon’s ratio test (1).
A statistical summary of the assortment data for the Eureka-Ni-agara sample grader is presented in Table XIII. A statistical sum-mary of the assortment data for the Sortimat with imperial screens is presented in Table XIV. A statistical summary of the assortment for the Sortimat with metric screens is presented in Table XV. Re-peatability and reproducibility coefficients of variation for the Eur-eka-Niagara imperial screens ranged from 0.65 to 38.68% and 1.57 to 37.18%, respectively, and were judged unacceptable. Repeatabil-ity and reproducibility coefficients of variation for the Sortimat im-perial screens ranged from 0.52 to 28.43% and 1.55 to 39.74%, respectively, and were judged unacceptable. Repeatability and re-producibility coefficients of variation for the Sortimat metric screens ranged from 1.52 to 56.82% and 2.12 to 50.80%, respectively, and were judged unacceptable.
Subcommittee members were requested to measure approx. 45 slot widths per screen. As per method Malt-2B, an ASBC 7/64-in. screen should have an absolute slot width of 0.1094 in., with a maximum width of 0.1099 in. and a minimum width of 0.1089 in. Measurements submitted by subcommittee members yielded results with minimum slots widths of 0.1020 in. and maximum slot widths of 0.1151 in. for an ASBC 7/64-in. (0.1094-in.) screen, for an aver-age of 0.1079 in. For comparison purposes, the Sortimat 7/64-in. (0.1094-in.) screen slot width was also measured. The minimum slot width was 0.1070 in., and the maximum slot width was 0.1095 in., for an average of 0.1084 in. Based on the results submitted by sub-committee members, the 7/64-in. (0.1094-in.) screens failed the cri-teria set out by method Malt-2B for both the ASBC- and Sorti-mat-supplied screens. Slot width results obtained for the 6/64-in. (0.0938-in.) and 5/64-in. (0.0781-in.) screens also failed method Malt-2B criteria. The screens supplied by ASBC are manufactured with a stamping accuracy of 0.003 in., with a tolerance of 0.001 in. measured with a precision gauge. A tolerance of ±0.0005 in. is not possible under these manufacturing conditions. The committee pro-posed a new tolerance for the slot width of ±0.005 in. for the im-perial screens and ±0.05 mm for the metric screens. Even with the larger tolerances, many of the screen sets had slot widths that were either out of tolerance or at the lower end of the acceptable range.
doi:10.1094 /ASBCJ-2010-0916-02
© 2010 American Society of Brewing Chemists, Inc.
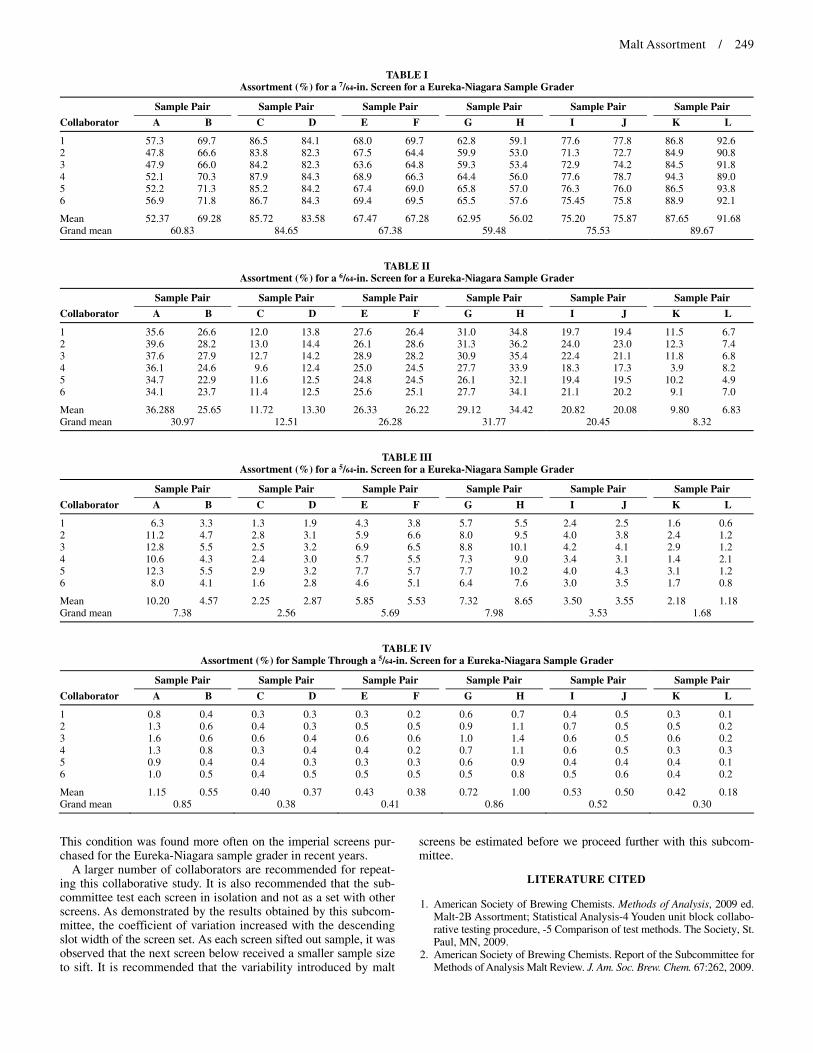
Malt Assortment / 249
This condition was found more often on the imperial screens pur-chased for the Eureka-Niagara sample grader in recent years.
A larger number of collaborators are recommended for repeat-ing this collaborative study. It is also recommended that the sub-committee test each screen in isolation and not as a set with other screens. As demonstrated by the results obtained by this subcom-mittee, the coefficient of variation increased with the descending slot width of the screen set. As each screen sifted out sample, it was observed that the next screen below received a smaller sample size to sift. It is recommended that the variability introduced by malt
screens be estimated before we proceed further with this subcom-mittee.
LITERATURE CITED
1. American Society of Brewing Chemists. Methods of Analysis, 2009 ed. Malt-2B Assortment; Statistical Analysis-4 Youden unit block collabo-rative testing procedure, -5 Comparison of test methods. The Society, St. Paul, MN, 2009.
2. American Society of Brewing Chemists. Report of the Subcommittee for Methods of Analysis Malt Review. J. Am. Soc. Brew. Chem. 67:262, 2009.
TABLE I Assortment (%) for a 7/64-in. Screen for a Eureka-Niagara Sample Grader
Sample Pair Sample Pair Sample Pair Sample Pair Sample Pair Sample Pair
Collaborator A B C D E F G H I J K L
1 57.3 69.7 86.5 84.1 68.0 69.7 62.8 59.1 77.6 77.8 86.8 92.6 2 47.8 66.6 83.8 82.3 67.5 64.4 59.9 53.0 71.3 72.7 84.9 90.8 3 47.9 66.0 84.2 82.3 63.6 64.8 59.3 53.4 72.9 74.2 84.5 91.8 4 52.1 70.3 87.9 84.3 68.9 66.3 64.4 56.0 77.6 78.7 94.3 89.0 5 52.2 71.3 85.2 84.2 67.4 69.0 65.8 57.0 76.3 76.0 86.5 93.8 6 56.9 71.8 86.7 84.3 69.4 69.5 65.5 57.6 75.45 75.8 88.9 92.1
Mean 52.37 69.28 85.72 83.58 67.47 67.28 62.95 56.02 75.20 75.87 87.65 91.68 Grand mean 60.83 84.65 67.38 59.48 75.53 89.67
TABLE II Assortment (%) for a 6/64-in. Screen for a Eureka-Niagara Sample Grader
Sample Pair Sample Pair Sample Pair Sample Pair Sample Pair Sample Pair
Collaborator A B C D E F G H I J K L
1 35.6 26.6 12.0 13.8 27.6 26.4 31.0 34.8 19.7 19.4 11.5 6.7 2 39.6 28.2 13.0 14.4 26.1 28.6 31.3 36.2 24.0 23.0 12.3 7.4 3 37.6 27.9 12.7 14.2 28.9 28.2 30.9 35.4 22.4 21.1 11.8 6.8 4 36.1 24.6 9.6 12.4 25.0 24.5 27.7 33.9 18.3 17.3 3.9 8.2 5 34.7 22.9 11.6 12.5 24.8 24.5 26.1 32.1 19.4 19.5 10.2 4.9 6 34.1 23.7 11.4 12.5 25.6 25.1 27.7 34.1 21.1 20.2 9.1 7.0
Mean 36.288 25.65 11.72 13.30 26.33 26.22 29.12 34.42 20.82 20.08 9.80 6.83 Grand mean 30.97 12.51 26.28 31.77 20.45 8.32
TABLE III Assortment (%) for a 5/64-in. Screen for a Eureka-Niagara Sample Grader
Sample Pair Sample Pair Sample Pair Sample Pair Sample Pair Sample Pair
Collaborator A B C D E F G H I J K L
1 6.3 3.3 1.3 1.9 4.3 3.8 5.7 5.5 2.4 2.5 1.6 0.6 2 11.2 4.7 2.8 3.1 5.9 6.6 8.0 9.5 4.0 3.8 2.4 1.2 3 12.8 5.5 2.5 3.2 6.9 6.5 8.8 10.1 4.2 4.1 2.9 1.2 4 10.6 4.3 2.4 3.0 5.7 5.5 7.3 9.0 3.4 3.1 1.4 2.1 5 12.3 5.5 2.9 3.2 7.7 5.7 7.7 10.2 4.0 4.3 3.1 1.2 6 8.0 4.1 1.6 2.8 4.6 5.1 6.4 7.6 3.0 3.5 1.7 0.8
Mean 10.20 4.57 2.25 2.87 5.85 5.53 7.32 8.65 3.50 3.55 2.18 1.18 Grand mean 7.38 2.56 5.69 7.98 3.53 1.68
TABLE IV Assortment (%) for Sample Through a 5/64-in. Screen for a Eureka-Niagara Sample Grader
Sample Pair Sample Pair Sample Pair Sample Pair Sample Pair Sample Pair
Collaborator A B C D E F G H I J K L
1 0.8 0.4 0.3 0.3 0.3 0.2 0.6 0.7 0.4 0.5 0.3 0.1 2 1.3 0.6 0.4 0.3 0.5 0.5 0.9 1.1 0.7 0.5 0.5 0.2 3 1.6 0.6 0.6 0.4 0.6 0.6 1.0 1.4 0.6 0.5 0.6 0.2 4 1.3 0.8 0.3 0.4 0.4 0.2 0.7 1.1 0.6 0.5 0.3 0.3 5 0.9 0.4 0.4 0.3 0.3 0.3 0.6 0.9 0.4 0.4 0.4 0.1 6 1.0 0.5 0.4 0.5 0.5 0.5 0.5 0.8 0.5 0.6 0.4 0.2
Mean 1.15 0.55 0.40 0.37 0.43 0.38 0.72 1.00 0.53 0.50 0.42 0.18 Grand mean 0.85 0.38 0.41 0.86 0.52 0.30
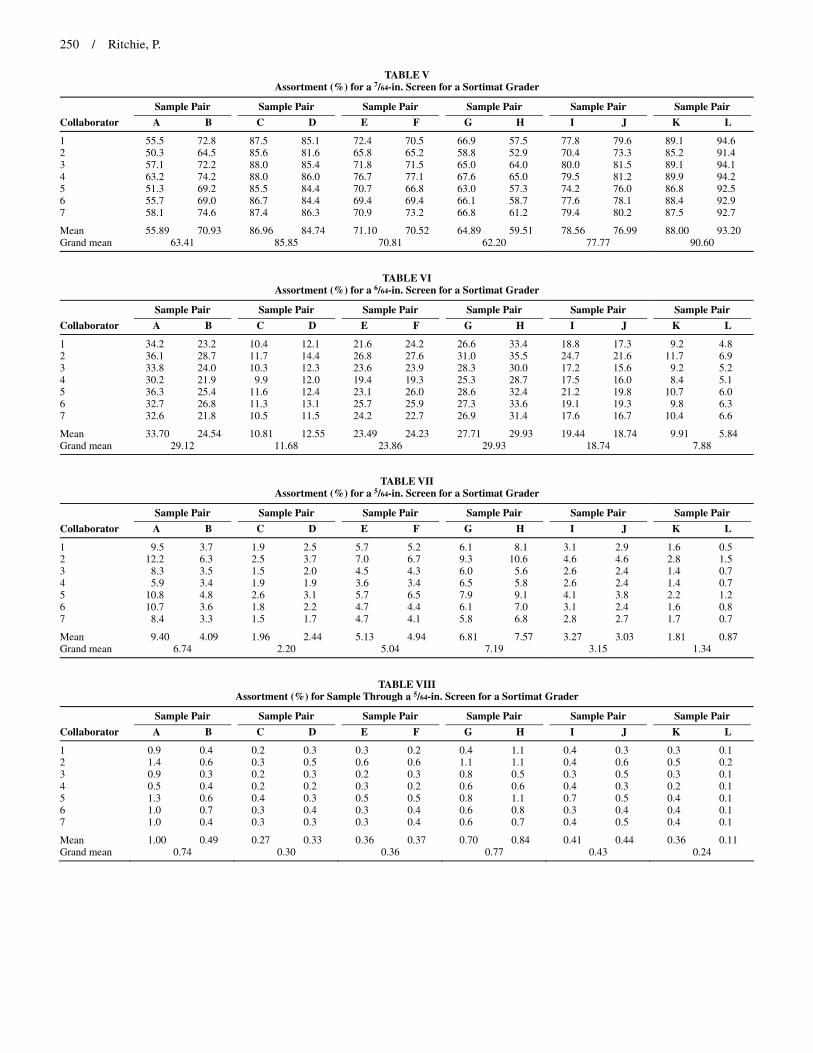
250 / Ritchie, P.
TABLE V Assortment (%) for a 7/64-in. Screen for a Sortimat Grader
Sample Pair Sample Pair Sample Pair Sample Pair Sample Pair Sample Pair
Collaborator A B C D E F G H I J K L
1 55.5 72.8 87.5 85.1 72.4 70.5 66.9 57.5 77.8 79.6 89.1 94.6 2 50.3 64.5 85.6 81.6 65.8 65.2 58.8 52.9 70.4 73.3 85.2 91.4 3 57.1 72.2 88.0 85.4 71.8 71.5 65.0 64.0 80.0 81.5 89.1 94.1 4 63.2 74.2 88.0 86.0 76.7 77.1 67.6 65.0 79.5 81.2 89.9 94.2 5 51.3 69.2 85.5 84.4 70.7 66.8 63.0 57.3 74.2 76.0 86.8 92.5 6 55.7 69.0 86.7 84.4 69.4 69.4 66.1 58.7 77.6 78.1 88.4 92.9 7 58.1 74.6 87.4 86.3 70.9 73.2 66.8 61.2 79.4 80.2 87.5 92.7
Mean 55.89 70.93 86.96 84.74 71.10 70.52 64.89 59.51 78.56 76.99 88.00 93.20 Grand mean 63.41 85.85 70.81 62.20 77.77 90.60
TABLE VI Assortment (%) for a 6/64-in. Screen for a Sortimat Grader
Sample Pair Sample Pair Sample Pair Sample Pair Sample Pair Sample Pair
Collaborator A B C D E F G H I J K L
1 34.2 23.2 10.4 12.1 21.6 24.2 26.6 33.4 18.8 17.3 9.2 4.8 2 36.1 28.7 11.7 14.4 26.8 27.6 31.0 35.5 24.7 21.6 11.7 6.9 3 33.8 24.0 10.3 12.3 23.6 23.9 28.3 30.0 17.2 15.6 9.2 5.2 4 30.2 21.9 9.9 12.0 19.4 19.3 25.3 28.7 17.5 16.0 8.4 5.1 5 36.3 25.4 11.6 12.4 23.1 26.0 28.6 32.4 21.2 19.8 10.7 6.0 6 32.7 26.8 11.3 13.1 25.7 25.9 27.3 33.6 19.1 19.3 9.8 6.3 7 32.6 21.8 10.5 11.5 24.2 22.7 26.9 31.4 17.6 16.7 10.4 6.6
Mean 33.70 24.54 10.81 12.55 23.49 24.23 27.71 29.93 19.44 18.74 9.91 5.84 Grand mean 29.12 11.68 23.86 29.93 18.74 7.88
TABLE VII Assortment (%) for a 5/64-in. Screen for a Sortimat Grader
Sample Pair Sample Pair Sample Pair Sample Pair Sample Pair Sample Pair
Collaborator A B C D E F G H I J K L
1 9.5 3.7 1.9 2.5 5.7 5.2 6.1 8.1 3.1 2.9 1.6 0.5 2 12.2 6.3 2.5 3.7 7.0 6.7 9.3 10.6 4.6 4.6 2.8 1.5 3 8.3 3.5 1.5 2.0 4.5 4.3 6.0 5.6 2.6 2.4 1.4 0.7 4 5.9 3.4 1.9 1.9 3.6 3.4 6.5 5.8 2.6 2.4 1.4 0.7 5 10.8 4.8 2.6 3.1 5.7 6.5 7.9 9.1 4.1 3.8 2.2 1.2 6 10.7 3.6 1.8 2.2 4.7 4.4 6.1 7.0 3.1 2.4 1.6 0.8 7 8.4 3.3 1.5 1.7 4.7 4.1 5.8 6.8 2.8 2.7 1.7 0.7
Mean 9.40 4.09 1.96 2.44 5.13 4.94 6.81 7.57 3.27 3.03 1.81 0.87 Grand mean 6.74 2.20 5.04 7.19 3.15 1.34
TABLE VIII Assortment (%) for Sample Through a 5/64-in. Screen for a Sortimat Grader
Sample Pair Sample Pair Sample Pair Sample Pair Sample Pair Sample Pair
Collaborator A B C D E F G H I J K L
1 0.9 0.4 0.2 0.3 0.3 0.2 0.4 1.1 0.4 0.3 0.3 0.1 2 1.4 0.6 0.3 0.5 0.6 0.6 1.1 1.1 0.4 0.6 0.5 0.2 3 0.9 0.3 0.2 0.3 0.2 0.3 0.8 0.5 0.3 0.5 0.3 0.1 4 0.5 0.4 0.2 0.2 0.3 0.2 0.6 0.6 0.4 0.3 0.2 0.1 5 1.3 0.6 0.4 0.3 0.5 0.5 0.8 1.1 0.7 0.5 0.4 0.1 6 1.0 0.7 0.3 0.4 0.3 0.4 0.6 0.8 0.3 0.4 0.4 0.1 7 1.0 0.4 0.3 0.3 0.3 0.4 0.6 0.7 0.4 0.5 0.4 0.1
Mean 1.00 0.49 0.27 0.33 0.36 0.37 0.70 0.84 0.41 0.44 0.36 0.11 Grand mean 0.74 0.30 0.36 0.77 0.43 0.24
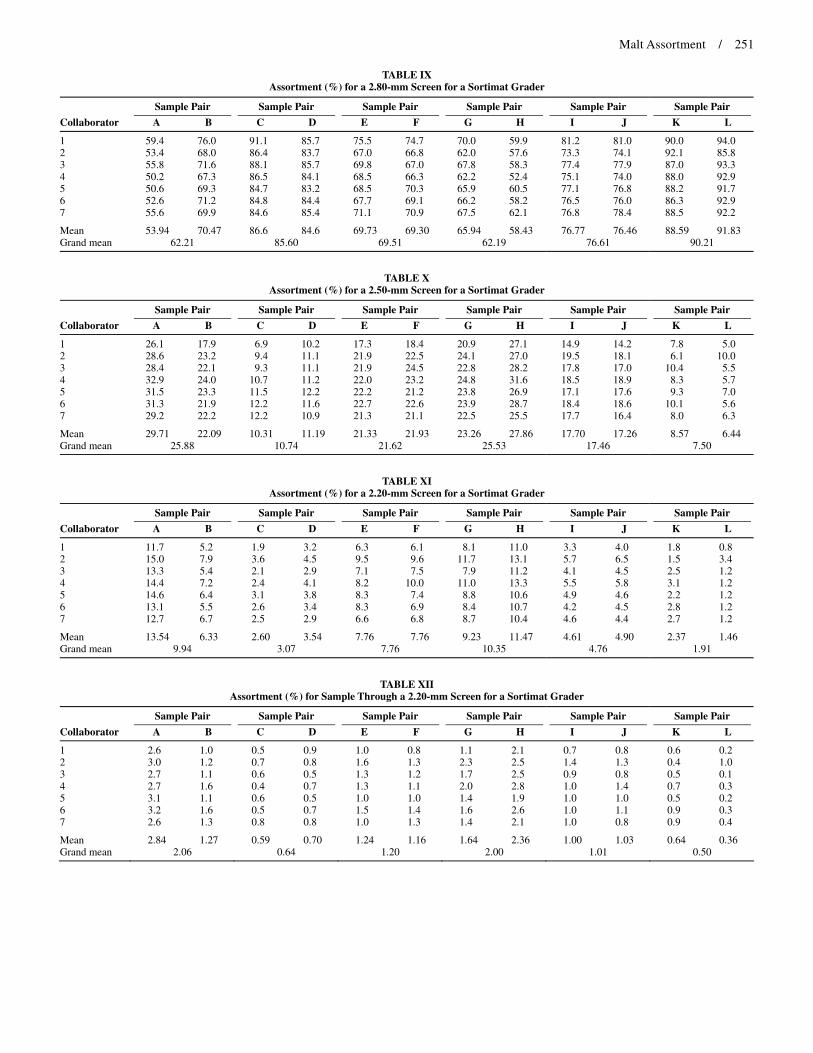
Malt Assortment / 251
TABLE IX Assortment (%) for a 2.80-mm Screen for a Sortimat Grader
Sample Pair Sample Pair Sample Pair Sample Pair Sample Pair Sample Pair
Collaborator A B C D E F G H I J K L
1 59.4 76.0 91.1 85.7 75.5 74.7 70.0 59.9 81.2 81.0 90.0 94.0 2 53.4 68.0 86.4 83.7 67.0 66.8 62.0 57.6 73.3 74.1 92.1 85.8 3 55.8 71.6 88.1 85.7 69.8 67.0 67.8 58.3 77.4 77.9 87.0 93.3 4 50.2 67.3 86.5 84.1 68.5 66.3 62.2 52.4 75.1 74.0 88.0 92.9 5 50.6 69.3 84.7 83.2 68.5 70.3 65.9 60.5 77.1 76.8 88.2 91.7 6 52.6 71.2 84.8 84.4 67.7 69.1 66.2 58.2 76.5 76.0 86.3 92.9 7 55.6 69.9 84.6 85.4 71.1 70.9 67.5 62.1 76.8 78.4 88.5 92.2
Mean 53.94 70.47 86.6 84.6 69.73 69.30 65.94 58.43 76.77 76.46 88.59 91.83 Grand mean 62.21 85.60 69.51 62.19 76.61 90.21
TABLE X Assortment (%) for a 2.50-mm Screen for a Sortimat Grader
Sample Pair Sample Pair Sample Pair Sample Pair Sample Pair Sample Pair
Collaborator A B C D E F G H I J K L
1 26.1 17.9 6.9 10.2 17.3 18.4 20.9 27.1 14.9 14.2 7.8 5.0 2 28.6 23.2 9.4 11.1 21.9 22.5 24.1 27.0 19.5 18.1 6.1 10.0 3 28.4 22.1 9.3 11.1 21.9 24.5 22.8 28.2 17.8 17.0 10.4 5.5 4 32.9 24.0 10.7 11.2 22.0 23.2 24.8 31.6 18.5 18.9 8.3 5.7 5 31.5 23.3 11.5 12.2 22.2 21.2 23.8 26.9 17.1 17.6 9.3 7.0 6 31.3 21.9 12.2 11.6 22.7 22.6 23.9 28.7 18.4 18.6 10.1 5.6 7 29.2 22.2 12.2 10.9 21.3 21.1 22.5 25.5 17.7 16.4 8.0 6.3
Mean 29.71 22.09 10.31 11.19 21.33 21.93 23.26 27.86 17.70 17.26 8.57 6.44 Grand mean 25.88 10.74 21.62 25.53 17.46 7.50
TABLE XI Assortment (%) for a 2.20-mm Screen for a Sortimat Grader
Sample Pair Sample Pair Sample Pair Sample Pair Sample Pair Sample Pair
Collaborator A B C D E F G H I J K L
1 11.7 5.2 1.9 3.2 6.3 6.1 8.1 11.0 3.3 4.0 1.8 0.8 2 15.0 7.9 3.6 4.5 9.5 9.6 11.7 13.1 5.7 6.5 1.5 3.4 3 13.3 5.4 2.1 2.9 7.1 7.5 7.9 11.2 4.1 4.5 2.5 1.2 4 14.4 7.2 2.4 4.1 8.2 10.0 11.0 13.3 5.5 5.8 3.1 1.2 5 14.6 6.4 3.1 3.8 8.3 7.4 8.8 10.6 4.9 4.6 2.2 1.2 6 13.1 5.5 2.6 3.4 8.3 6.9 8.4 10.7 4.2 4.5 2.8 1.2 7 12.7 6.7 2.5 2.9 6.6 6.8 8.7 10.4 4.6 4.4 2.7 1.2
Mean 13.54 6.33 2.60 3.54 7.76 7.76 9.23 11.47 4.61 4.90 2.37 1.46 Grand mean 9.94 3.07 7.76 10.35 4.76 1.91
TABLE XII Assortment (%) for Sample Through a 2.20-mm Screen for a Sortimat Grader
Sample Pair Sample Pair Sample Pair Sample Pair Sample Pair Sample Pair
Collaborator A B C D E F G H I J K L
1 2.6 1.0 0.5 0.9 1.0 0.8 1.1 2.1 0.7 0.8 0.6 0.2 2 3.0 1.2 0.7 0.8 1.6 1.3 2.3 2.5 1.4 1.3 0.4 1.0 3 2.7 1.1 0.6 0.5 1.3 1.2 1.7 2.5 0.9 0.8 0.5 0.1 4 2.7 1.6 0.4 0.7 1.3 1.1 2.0 2.8 1.0 1.4 0.7 0.3 5 3.1 1.1 0.6 0.5 1.0 1.0 1.4 1.9 1.0 1.0 0.5 0.2 6 3.2 1.6 0.5 0.7 1.5 1.4 1.6 2.6 1.0 1.1 0.9 0.3 7 2.6 1.3 0.8 0.8 1.0 1.3 1.4 2.1 1.0 0.8 0.9 0.4
Mean 2.84 1.27 0.59 0.70 1.24 1.16 1.64 2.36 1.00 1.03 0.64 0.36 Grand mean 2.06 0.64 1.20 2.00 1.01 0.50
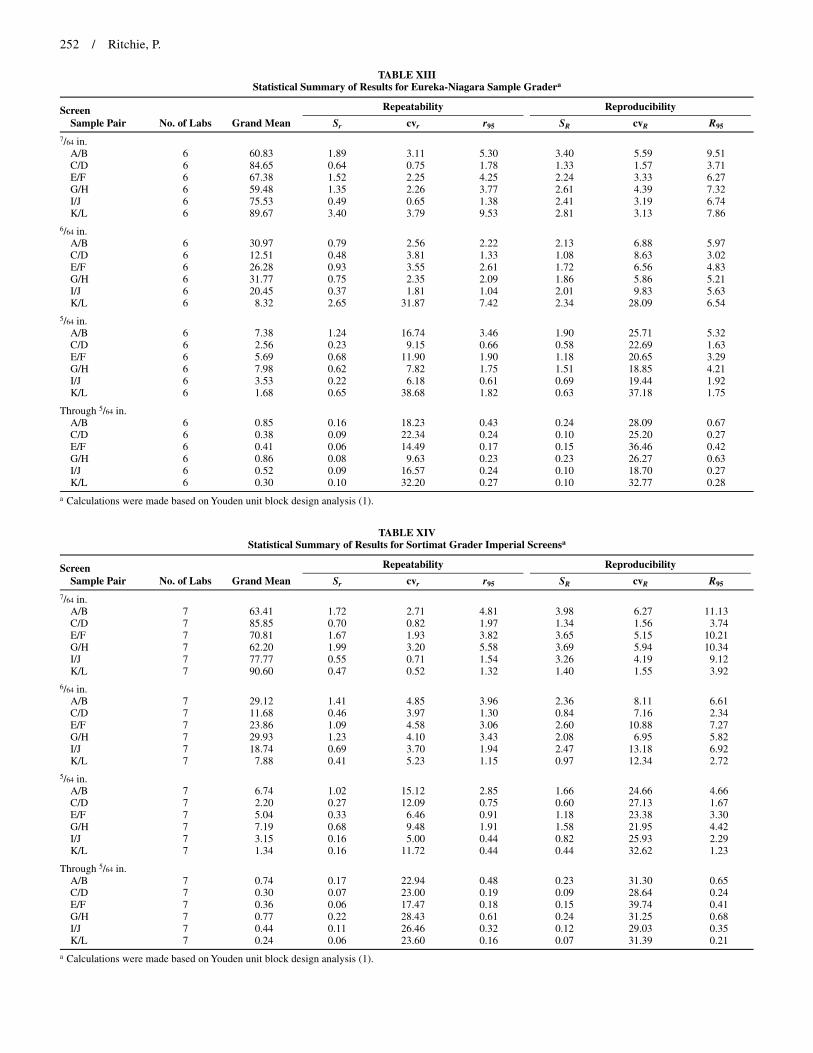
252 / Ritchie, P.
TABLE XIII Statistical Summary of Results for Eureka-Niagara Sample Gradera
Screen Repeatability Reproducibility
Sample Pair No. of Labs Grand Mean Sr cvr r95 SR cvR R95 7/64 in.
A/B 6 60.83 1.89 3.11 5.30 3.40 5.59 9.51 C/D 6 84.65 0.64 0.75 1.78 1.33 1.57 3.71 E/F 6 67.38 1.52 2.25 4.25 2.24 3.33 6.27 G/H 6 59.48 1.35 2.26 3.77 2.61 4.39 7.32 I/J 6 75.53 0.49 0.65 1.38 2.41 3.19 6.74 K/L 6 89.67 3.40 3.79 9.53 2.81 3.13 7.86
6/64 in. A/B 6 30.97 0.79 2.56 2.22 2.13 6.88 5.97 C/D 6 12.51 0.48 3.81 1.33 1.08 8.63 3.02 E/F 6 26.28 0.93 3.55 2.61 1.72 6.56 4.83 G/H 6 31.77 0.75 2.35 2.09 1.86 5.86 5.21 I/J 6 20.45 0.37 1.81 1.04 2.01 9.83 5.63 K/L 6 8.32 2.65 31.87 7.42 2.34 28.09 6.54
5/64 in. A/B 6 7.38 1.24 16.74 3.46 1.90 25.71 5.32 C/D 6 2.56 0.23 9.15 0.66 0.58 22.69 1.63 E/F 6 5.69 0.68 11.90 1.90 1.18 20.65 3.29 G/H 6 7.98 0.62 7.82 1.75 1.51 18.85 4.21 I/J 6 3.53 0.22 6.18 0.61 0.69 19.44 1.92 K/L 6 1.68 0.65 38.68 1.82 0.63 37.18 1.75
Through 5/64 in. A/B 6 0.85 0.16 18.23 0.43 0.24 28.09 0.67 C/D 6 0.38 0.09 22.34 0.24 0.10 25.20 0.27 E/F 6 0.41 0.06 14.49 0.17 0.15 36.46 0.42 G/H 6 0.86 0.08 9.63 0.23 0.23 26.27 0.63 I/J 6 0.52 0.09 16.57 0.24 0.10 18.70 0.27 K/L 6 0.30 0.10 32.20 0.27 0.10 32.77 0.28
a Calculations were made based on Youden unit block design analysis (1).
TABLE XIV Statistical Summary of Results for Sortimat Grader Imperial Screensa
Screen Repeatability Reproducibility
Sample Pair No. of Labs Grand Mean Sr cvr r95 SR cvR R95 7/64 in.
A/B 7 63.41 1.72 2.71 4.81 3.98 6.27 11.13 C/D 7 85.85 0.70 0.82 1.97 1.34 1.56 3.74 E/F 7 70.81 1.67 1.93 3.82 3.65 5.15 10.21 G/H 7 62.20 1.99 3.20 5.58 3.69 5.94 10.34 I/J 7 77.77 0.55 0.71 1.54 3.26 4.19 9.12 K/L 7 90.60 0.47 0.52 1.32 1.40 1.55 3.92
6/64 in. A/B 7 29.12 1.41 4.85 3.96 2.36 8.11 6.61 C/D 7 11.68 0.46 3.97 1.30 0.84 7.16 2.34 E/F 7 23.86 1.09 4.58 3.06 2.60 10.88 7.27 G/H 7 29.93 1.23 4.10 3.43 2.08 6.95 5.82 I/J 7 18.74 0.69 3.70 1.94 2.47 13.18 6.92 K/L 7 7.88 0.41 5.23 1.15 0.97 12.34 2.72
5/64 in. A/B 7 6.74 1.02 15.12 2.85 1.66 24.66 4.66 C/D 7 2.20 0.27 12.09 0.75 0.60 27.13 1.67 E/F 7 5.04 0.33 6.46 0.91 1.18 23.38 3.30 G/H 7 7.19 0.68 9.48 1.91 1.58 21.95 4.42 I/J 7 3.15 0.16 5.00 0.44 0.82 25.93 2.29 K/L 7 1.34 0.16 11.72 0.44 0.44 32.62 1.23
Through 5/64 in. A/B 7 0.74 0.17 22.94 0.48 0.23 31.30 0.65 C/D 7 0.30 0.07 23.00 0.19 0.09 28.64 0.24 E/F 7 0.36 0.06 17.47 0.18 0.15 39.74 0.41 G/H 7 0.77 0.22 28.43 0.61 0.24 31.25 0.68 I/J 7 0.44 0.11 26.46 0.32 0.12 29.03 0.35 K/L 7 0.24 0.06 23.60 0.16 0.07 31.39 0.21
a Calculations were made based on Youden unit block design analysis (1).
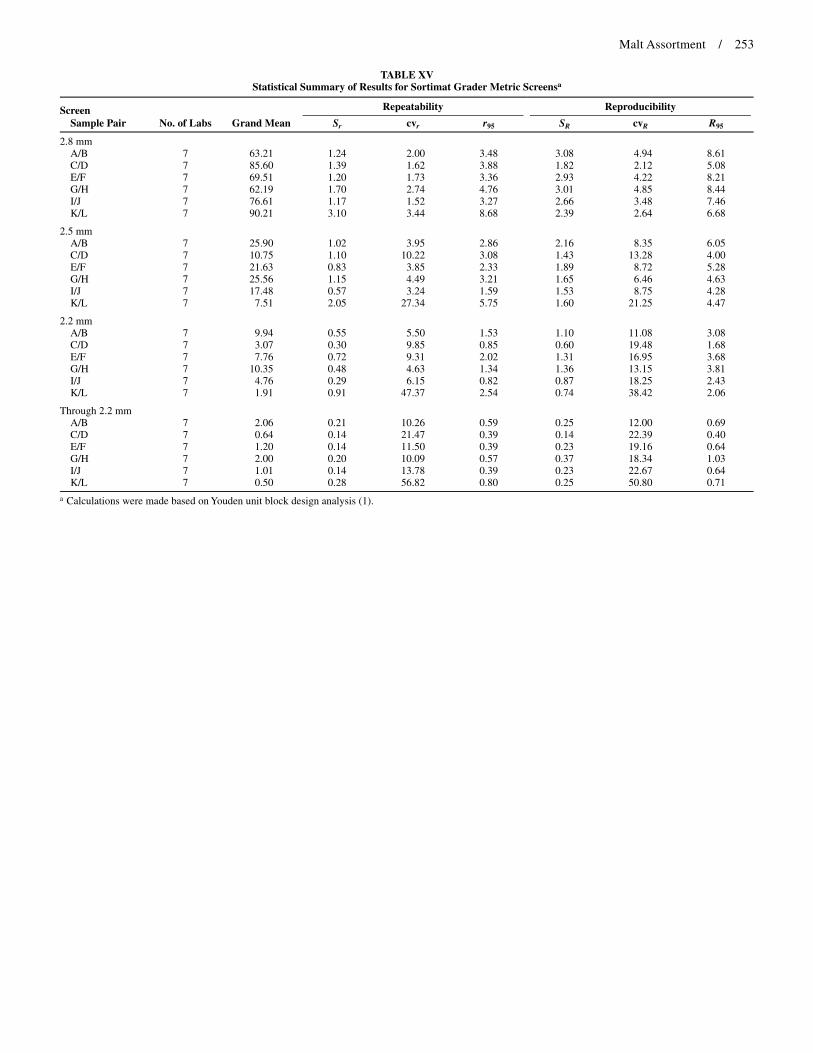
Malt Assortment / 253
TABLE XV Statistical Summary of Results for Sortimat Grader Metric Screensa
Screen Repeatability Reproducibility
Sample Pair No. of Labs Grand Mean Sr cvr r95 SR cvR R95
2.8 mm A/B 7 63.21 1.24 2.00 3.48 3.08 4.94 8.61 C/D 7 85.60 1.39 1.62 3.88 1.82 2.12 5.08 E/F 7 69.51 1.20 1.73 3.36 2.93 4.22 8.21 G/H 7 62.19 1.70 2.74 4.76 3.01 4.85 8.44 I/J 7 76.61 1.17 1.52 3.27 2.66 3.48 7.46 K/L 7 90.21 3.10 3.44 8.68 2.39 2.64 6.68
2.5 mm A/B 7 25.90 1.02 3.95 2.86 2.16 8.35 6.05 C/D 7 10.75 1.10 10.22 3.08 1.43 13.28 4.00 E/F 7 21.63 0.83 3.85 2.33 1.89 8.72 5.28 G/H 7 25.56 1.15 4.49 3.21 1.65 6.46 4.63 I/J 7 17.48 0.57 3.24 1.59 1.53 8.75 4.28 K/L 7 7.51 2.05 27.34 5.75 1.60 21.25 4.47
2.2 mm A/B 7 9.94 0.55 5.50 1.53 1.10 11.08 3.08 C/D 7 3.07 0.30 9.85 0.85 0.60 19.48 1.68 E/F 7 7.76 0.72 9.31 2.02 1.31 16.95 3.68 G/H 7 10.35 0.48 4.63 1.34 1.36 13.15 3.81 I/J 7 4.76 0.29 6.15 0.82 0.87 18.25 2.43 K/L 7 1.91 0.91 47.37 2.54 0.74 38.42 2.06
Through 2.2 mm A/B 7 2.06 0.21 10.26 0.59 0.25 12.00 0.69 C/D 7 0.64 0.14 21.47 0.39 0.14 22.39 0.40 E/F 7 1.20 0.14 11.50 0.39 0.23 19.16 0.64 G/H 7 2.00 0.20 10.09 0.57 0.37 18.34 1.03 I/J 7 1.01 0.14 13.78 0.39 0.23 22.67 0.64 K/L 7 0.50 0.28 56.82 0.80 0.25 50.80 0.71
a Calculations were made based on Youden unit block design analysis (1).
254
Measurement of Volatile Aldehydes in Beer by Solid-Phase Microextraction–Gas Chromatography/Mass Spectrometry
Subcommittee Members: R. Ortiz, Chair; T. Ishihara (BCOJ); V. Kellner (EBC); and J. Cornell (ex officio)
Keywords: Beer staling, Benzaldehyde, Carbonyl, Flavor stability, 2-Fural-dehyde, GC/MS, 2-Methyl-butanal, 3-Methyl-butanal, 2-Methyl-propanal, Phenylacetaldehyde, SPME, trans-2-Nonenal
CONCLUSIONS
1. Standard deviations for the measurement of seven compounds by solid-phase microextraction–gas chromatography/mass spec-trometry (SPME GC/MS) in packaged American lager beer were determined. With limited results, the range of standard devia-tions and relative standard deviations for the seven compounds studied for fresh beer sample pair A/C was 0.05008–25.24 µg/L and 8.845–112.1%, respectively, and was judged unacceptable.
2. With limited results, the range of standard deviations and rela-tive standard deviations for the seven compounds studied for aged beer sample pair B/D was 0.07548–89.99 µg/L and 0.7463–77.28%, respectively, and was judged unacceptable.
RECOMMENDATION
1. The subcommittee chair recommends the collaborative study be repeated with the existing subcommittee members and additional collaborators to achieve enough data sets for standard statistical treatment. Additional efforts to minimize sample and analytical variability will also be applied to the next study.
This is the first interlaboratory collaborative study conducted since the formation of the subcommittee. Based on membership polling, the Technical Committee recommended forming this subcommittee in 2008 to evaluate measurement methods for beer volatiles using SPME GC/MS (1). The method used for the collaborative was based on several published methods (3,4,5), as well as the method used by the subcommittee chair’s laboratory.
The aldehydes selected to be quantified by this method are only a fraction of the aldehydes and carbonyl compounds that are present in beer, but they have been observed to have characteristics indica-tive of the changes in flavor stability and the resulting changes in taste and aroma of packaged beers (2). The aldehydes measured by this method were 2-methyl-propanal (or isobutyraldehyde), 2-methyl-butanal (or 2-methylbutyraldehyde), 3-methyl-butanal (or isovaler-aldehyde), 2-furaldehyde, benzaldehyde, phenylacetaldehyde, and trans-2-nonenal.
PROCEDURE
Collaborators were provided with four cans of American light la-ger beer: samples A, B, C, and D. Samples A and C were the same brand but were from different packaging runs; they were stored at 4°C until shipping. Samples B and D were created by subsam-pling from the A and C cartons (respectively) and were force aged at 50°C for 7 days. This created sample pairs A/C (fresh) and B/D
(aged). The elevated temperature samples B and D were subjected to for 7 days force aged the beer samples to increase the levels of staling aldehydes studied. In contrast, beer samples A and C were kept at 4°C to maintain fresh beer flavor and, likely, correspond-ingly lower levels of aldehydes.
The samples were packed with cold packs in thermally protected containers and shipped to the collaborators cold. The collabora-tors were instructed to place the samples in a refrigerator upon re-ceipt and store them there until ready to analyze to minimize any changes in aldehyde concentrations prior to analysis.
The collaborators were instructed to analyze samples within two weeks of receipt and report results using a data sheet provided by the subcommittee chair.
RESULTS AND DISCUSSION
Results were received from only three of the seven collaborators. The results for each of the measured aldehydes for sample pairs A/C and B/D are listed in Tables I–VII. With limited data avail-able, Youden Block statistical analysis could not be performed. In-stead, standard deviations and percent relative standard deviations were determined for the results. The range of standard deviations and relative standard deviations for the seven compounds studied for fresh beer sample pair A/C was 0.05008–25.24 µg/L and 8.845–112.1%, respectively. The range of standard deviations and relative standard deviations for the seven compounds studied for aged beer sample pair B/D was 0.07548–89.99 µg/L and 0.7463–77.28%, re-spectively. These results confirmed there was high variation in the reported concentrations for most compounds in both sample pairs. The subcommittee chair expected the possibility of higher results reported compared with his own, particularly from labs outside the United States due to possible temperature increase during shipping, which would drive increases in staling aldehyde concentrations in those samples. However, the data did not indicate this occurred. Another potential variable was the relative lack of experience some collaborators had with this SPME-GC/MS method and the limited time allowed to work on the project. Follow-up with collaborators from this round will be valuable in obtaining feedback to improve the method and study instructions.
LITERATURE CITED
1. American Society of Brewing Chemists. Report of the Subcommittee for Measurement of Volatile Aldehydes in Beer by Solid-Phase Micro-extraction–Gas Chromatography/Mass Spectrometry. J. Am. Soc. Brew. Chem. 67:256-258, 2009.
2. Simpson, B., and Mairs, J. Trainer in a Box: The Beer Flavour Hand-book, version 2.1. FlavorActiV Limited, Chinnor, UK. Pp. 41, 43, 59, 2005.
3. Saison, D., De Schutter, D. P., Delvaux, F., and Delvaux, F. R. Optimi-zation of a complete method for the analysis of volatiles involved in the flavor stability of beer by solid-phase microextraction in combina-tion with gas chromatography and mass spectrometry. J. Chromatogr. A 1190:342-349, 2008.
4. Sugaya, N., Nakagawa, T., Sakurai, K., Morita, M., and Onodera, S. Analysis of aldehydes in water by headspace-GC/MS. J. Health Sci. 47(1):21-27, 2001.
5. Vesely, P., Lusk, L., Basarova, G., Seabrooks, J., and Ryder, D. Analy-sis of aldehydes in beer using solid-phase microextraction with on-fiber derivatization and gas chromatography/mass spectrometry. J. Agric. Food Chem. 51:6941-6944, 2003.
doi:10.1094 /ASBCJ-2010-0913-01
© 2010 American Society of Brewing Chemists, Inc.
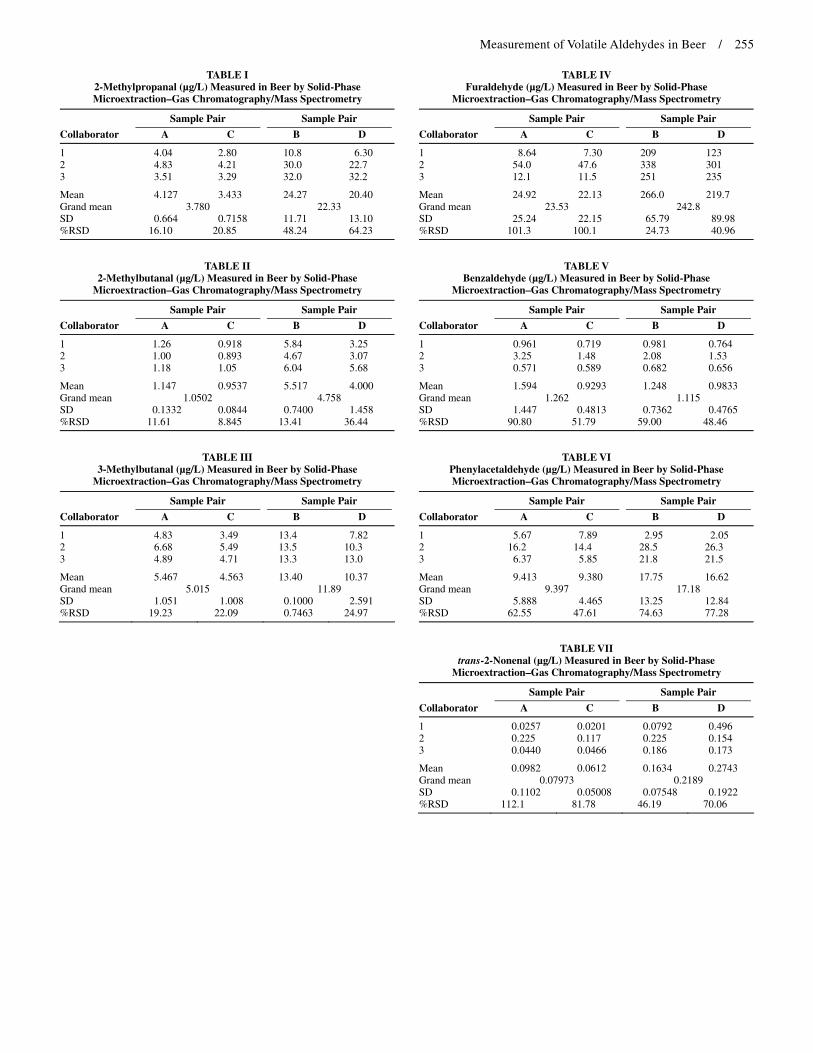
Measurement of Volatile Aldehydes in Beer / 255
TABLE I 2-Methylpropanal (µg/L) Measured in Beer by Solid-Phase Microextraction–Gas Chromatography/Mass Spectrometry
Sample Pair Sample Pair
Collaborator A C B D
1 4.04 2.80 10.8 6.30 2 4.83 4.21 30.0 22.7 3 3.51 3.29 32.0 32.2
Mean 4.127 3.433 24.27 20.40 Grand mean 3.780 22.33 SD 0.664 0.7158 11.71 13.10 %RSD 16.10 20.85 48.24 64.23
TABLE II 2-Methylbutanal (µg/L) Measured in Beer by Solid-Phase
Microextraction–Gas Chromatography/Mass Spectrometry
Sample Pair Sample Pair
Collaborator A C B D
1 1.26 0.918 5.84 3.25 2 1.00 0.893 4.67 3.07 3 1.18 1.05 6.04 5.68
Mean 1.147 0.9537 5.517 4.000 Grand mean 1.0502 4.758 SD 0.1332 0.0844 0.7400 1.458 %RSD 11.61 8.845 13.41 36.44
TABLE III 3-Methylbutanal (µg/L) Measured in Beer by Solid-Phase
Microextraction–Gas Chromatography/Mass Spectrometry
Sample Pair Sample Pair
Collaborator A C B D
1 4.83 3.49 13.4 7.82 2 6.68 5.49 13.5 10.3 3 4.89 4.71 13.3 13.0
Mean 5.467 4.563 13.40 10.37 Grand mean 5.015 11.89 SD 1.051 1.008 0.1000 2.591 %RSD 19.23 22.09 0.7463 24.97
TABLE IV Furaldehyde (µg/L) Measured in Beer by Solid-Phase
Microextraction–Gas Chromatography/Mass Spectrometry
Sample Pair Sample Pair
Collaborator A C B D
1 8.64 7.30 209 123 2 54.0 47.6 338 301 3 12.1 11.5 251 235
Mean 24.92 22.13 266.0 219.7 Grand mean 23.53 242.8 SD 25.24 22.15 65.79 89.98 %RSD 101.3 100.1 24.73 40.96
TABLE V Benzaldehyde (µg/L) Measured in Beer by Solid-Phase
Microextraction–Gas Chromatography/Mass Spectrometry
Sample Pair Sample Pair
Collaborator A C B D
1 0.961 0.719 0.981 0.764 2 3.25 1.48 2.08 1.53 3 0.571 0.589 0.682 0.656
Mean 1.594 0.9293 1.248 0.9833 Grand mean 1.262 1.115 SD 1.447 0.4813 0.7362 0.4765 %RSD 90.80 51.79 59.00 48.46
TABLE VI Phenylacetaldehyde (µg/L) Measured in Beer by Solid-Phase Microextraction–Gas Chromatography/Mass Spectrometry
Sample Pair Sample Pair
Collaborator A C B D
1 5.67 7.89 2.95 2.05 2 16.2 14.4 28.5 26.3 3 6.37 5.85 21.8 21.5
Mean 9.413 9.380 17.75 16.62 Grand mean 9.397 17.18 SD 5.888 4.465 13.25 12.84 %RSD 62.55 47.61 74.63 77.28
TABLE VII trans-2-Nonenal (µg/L) Measured in Beer by Solid-Phase
Microextraction–Gas Chromatography/Mass Spectrometry
Sample Pair Sample Pair
Collaborator A C B D
1 0.0257 0.0201 0.0792 0.496 2 0.225 0.117 0.225 0.154 3 0.0440 0.0466 0.186 0.173
Mean 0.0982 0.0612 0.1634 0.2743 Grand mean 0.07973 0.2189 SD 0.1102 0.05008 0.07548 0.1922 %RSD 112.1 81.78 46.19 70.06
256
Soluble Starch
Subcommittee Members: R. Jennings, Chair/Ex officio; B. Amundsen; S. Bartlett; M. Gastl; M. Goldsmith; R. Joy; M. Joyce; A. MacLeod; J. Menert; A. Mundy; M. Omillian; and P. Ritchie
RECOMMENDATION
1. The subcommittee recommends continuing to provide this lot of modified potato starch for the upcoming year.
This subcommittee is a standing subcommittee whose goal is to coordinate a testing program for modified potato soluble starch that
will ensure a consistent supply of high-quality soluble starch for the Society. The subcommittee monitors process methodology utilized in the production of starch, investigates improved methods for starch quality testing, and evaluates potential new suppliers of starch. Starch lot no. 8621J was collaboratively tested and approved for sale by the Society during the summer of 2008 (1). As of February 17, 2010, 858 kg (429 units) of starch lot no. 8621J were available for sale.
The subcommittee recommends evaluation of a new lot of starch when current supplies fall below 350 kg. It is anticipated that at the current rate of depletion a new lot will not need to be evaluated prior to 2012. The chair will monitor the soluble starch inventory and initiate the study when necessary.
LITERATURE CITED
1. American Society of Brewing Chemists. Report of the Subcommittee for Soluble Starch. J. Am. Soc. Brew. Chem. 66:257-258, 2008.
Craft Brewers Annual Meeting Report
Subcommittee Members: G. Kelly, Chair; J. Palausky; F. Strachan; and D. Wilson
COMMITTEE UPDATE
• There are now questions put in the monthly ASBC Buzz in lieu of polling members about their ASBC Local Sections in order to informally gather demographics about ASBC mem-bership and to gather feedback.
• A suggestion was made to create an “Add a Local Section” link on the ASBC website so individuals who have an interest in starting a Local Section can contact ASBC headquarters di-rectly.
• Local Section officers have been contacted to find out how their sections are doing and to find out if there is anything either myself or ASBC can do to help their sections out more. These were the questions sent out to the section officers listed on the ASBC website:
1. How often does your Section meet a year? 2. How many attendees do you see at your meetings? What
percentage of those attendees are from small breweries/ brewpubs?
3. What would you say is the biggest challenge for your Section?
4. What could ASBC do better to support your Section? 5. Other needs or suggestions for ASBC either at the national
or local level?
There was low response to these questions.
doi:10.1094 /ASBCJ-2010-0928-01
© 2010 American Society of Brewing Chemists, Inc.
doi:10.1094 /ASBCJ-2010-0924-02
© 2010 American Society of Brewing Chemists, Inc.