Technical Advisory Group for the Australian Early Development Index: Building Better Communities for...
23
1 Construct and concurrent validity of the Australian Early Development Index A report to the Technical Advisory Group for the Australian Early Development Index: Building Better Communities for Children Project from Sally Brinkman, Sven Silburn, David Lawrence and the Australian Early Development Index Partnership 1 August 2006 1 The Australian Early Development Index Partnership members are (Professor Frank Oberklaid, Dr Sharon Goldfeld, Mary Sayers and Melissa Coutts from the Centre for Community Child Health, Professor Sven Silburn from the Telethon Institute for Child Health Research, Dr Bret Hart and Sally Brinkman from the North Metropolitan Area Health Service)
-
Upload
independent -
Category
Documents
-
view
1 -
download
0
Transcript of Technical Advisory Group for the Australian Early Development Index: Building Better Communities for...

1
Construct and concurrent validity of the
Australian Early Development Index
A report to the Technical Advisory Group for the Australian Early Development Index:
Building Better Communities for Children Project
from
Sally Brinkman, Sven Silburn, David Lawrence and the Australian Early Development Index Partnership1
August 2006
1
The Australian Early Development Index Partnership members are (Professor Frank Oberklaid, Dr Sharon Goldfeld, Mary Sayers and Melissa Coutts from the Centre for Community Child Health, Professor Sven Silburn from the Telethon Institute for Child Health Research, Dr Bret Hart and Sally Brinkman from the North Metropolitan Area Health Service)
2
TABLE OF CONTENTS
Acknowledgements ………………………………………………. 3 Executive summary ………………………………………………. 4 Introduction ………………………………………………………. 5 Methods …………………………………………………………... 6 Results ……………………………………………………………11 Discussion and Conclusion…………………...…………………. 20 References ………………………………………………………. 22 Appendices ……………………………………………………… 24 Appendix 1. AEDI developmental domains and sub-constructs… 24 Appendix 2. Details of LSAC measures used in this analysis…. 26

3
ACKNOWLEDGEMENTS
This study is an integral component of the Australian Early Development Index: Building Better Communities for Children Project (AEDI Project) funded by the Commonwealth Department of Family and Community Services and conducted by the Centre for Community Child Health in partnership with the Telethon Institute for Child Health Research. The capacity of the AEDI partnership to undertake the validation study was made possible through supplementary funding provided by Shell Australia. This supported payments for teacher relief for the collection of AEDI materials as part of the Longitudinal Study of Australian Children (LSAC) and provided the salary component for the contribution of the Telethon Institute for Child Health Research to the AEDI partnership. The validation study was also enabled by the approval of the Australian Government, Department of Family and Community Services and Indigenous Affairs, the Australian Institute of Family Studies and the LSAC Consortium Advisory Group for the AEDI to be administered to a sub-set of the age 4 cohort within the LSAC national sample.

4
EXECUTIVE SUMMARY
The Australian Early Development Instrument (AEDI) is an Australian adaptation of the Canadian Early Development Instrument (EDI).
This paper adds to the ongoing evaluation of the AEDI by reporting its construct and concurrent validity with a sub-sample of 642 children assessed as part of the Longitudinal Study of Australian Children (LSAC) in Western Australia, Victoria and Queensland for whom AEDI data were also collected as a supplementary measure.
Individual level assessments of children’s developmental status on a range of other established measures utilised in the LSAC relevant to each of the five AEDI developmental domains were examined within the age four cohort of the first wave of the LSAC data collection during the third school term of 2004.
Construct validity was examined by consideration of the logical consistency of the network of correlations between each of the AEDI developmental domains and sub-construct scores and other independently reported measures of early learning skills and other aspects of child development collected contemporaneously by the LSAC.
Large and moderate levels of correlation were observed between each of the five AEDI developmental domains and their sub-construct scales and the relevant teacher rated LSAC measures assessing comparable constructs. Generally lower levels of association were observed between the LSAC parent rated measures and the teacher completed AEDI.
Concurrent validity was examined by assessing the extent to which the aggregate overall AEDI identification of children who were “developmentally vulnerable” or “performing well” corresponded with the LSAC Outcome Index’s classification of children who were “developmentally at risk” or “developing well”. The results showed robust discrimination particularly for the LSAC Negative Outcome index (X2 = 309.6, p<0.001), and the Negative Learning Cut-off (X 2 = 209, p<0.001).
The predictive validity of the AEDI in assessing children’s “readiness for school learning” will be reported in a subsequent report based on the data collected from schools and families in the 2006 second wave of the LSAC data collection once this becomes available for analysis in early 2007.
In conclusion, the opportunity for this study to collect AEDI data from a sub-sample of the nationally representative Longitudinal Study of Australian Children (LSAC) has provided a unique opportunity to demonstrate the value of the AEDI as a population level indicator of children’s current developmental status.

5
INTRODUCTION The Australian Early Development Index (AEDI)
The Australian Early Development Index (AEDI) is a revised version of the Canadian EDI adapted for use with Australian populations. The first step of this revision involved testing its community acceptability and utility as community-level measure of early child development and readiness for school learning when used in the Australian context. This was undertaken by the collaboration between the Perth North Metropolitan Health Service, the Swan and West Coast District Education Offices and the Offord Centre for Child Studies, McMaster University (Hart, Brinkman and Blackmore, 2003). Apart from minor wording changes to reflect usual Australian language usage, the overall content and structure of the initial revision remained essentially unchanged from the original Canadian version (Janus & Offord 2000, Janus & Offord in press). After the initial piloting with 200 students, the initial revision of the instrument was administered by the teachers of 4,319 children aged 4–5 years attending government and non-government pre-schools in the Perth north metropolitan health region (Hart, Brinkman and Blackmore, 2003).
The next step in the revision process involved using Rasch scaling analysis to examine the psychometric properties of each of the five EDI scales: Physical health and wellbeing (PHW), Social competence (SC), Emotional Maturity (EM), Language and cognitive development (LCD) and Communication and General knowledge (CGK). This analysis established that while all five scales had excellent reliability and validity in terms of the Rasch model, four of the scales (PHW, SC, EM, CS) could be further improved if they were modified from their existing five ordered response categories to three such categories (Andrich and Styles, 2004). The Rasch analysis identified nine items that could be safely eliminated without any loss of scale precision. Finally, it also showed significant gender differences in the performance of the scales with girls being assessed higher than the boys in each case.
The changes to the instrument recommended from the Rasch analysis were then considered and approved by the AEDI Project Technical Reference Group in consultation with Dr Janus (author of the original EDI). Authorisation for the final revisions to be published and used in the national implementation of the Australia Early Development Index: Building Better Communities for Children project was then formalised through a memorandum of understanding between the Offord Centre for Child Studies, the Centre for Community Child Health, The North Metropolitan Population Health Program and the Telethon Institute for Child Health Research (The Australian Early Development Index Partnership, 2005).
The Longitudinal Study of Australian Children (LSAC)
The first wave of the Longitudinal Study of Australian Children (LSAC) commenced in May 2004 and has collected a wide range of data on the early development, health, education and living circumstances of a nationally representative sample of two cohorts of Australian children: 5,104 infants and 4,976 four year olds (Sanson et al, 2003). This information was gathered from face-to-face interviews with parents, parent self-completed questionnaires, interviewer observation and direct child assessment and teacher/caregiver completed questionnaires. One of the original goals of the LSAC study was that it should include multiple measures of early child development aspects that could be used in the development of a composite summary measure of a child’s early child development and readiness for school learning. This has resulted in the development of the LSAC Outcome Index as a means of summarising children’s overall wellbeing (Sanson et al, 2005).
The LSAC Outcome Index is a composite measure derived from existing LSAC scales and items in three broad domains indicative of the way in which a child is developing (physical, social/emotional and learning) and nine sub-domains (motor, health, social competence, internalising, externalising, language, literacy, numeracy and approach to learning) (Sanson et.al. 2005). As the LSAC tracks the development of children across multiple domains, the Outcome Index provides a convenient means of summarizing this complex information for policy makers, the media, the general public, as well as potential data users. In contrast to other such indices which focus on problems e.g Vulnerability Index (NLSCY; Willms, 2002), the Outcome Index is designed to incorporate both strengths and weaknesses which reflects the fact that most children have good developmental outcomes. This means it can be used to identify groups of children who are developing poorly as well as those developing well.

6
As the LSAC measures for the four year old cohort also included a range of other established instruments covering all five of the domains of development described by the AEDI scales, the national AEDI project team submitted a proposal to the Australian Government’s Department of Family and Community Services and Indigenous Affairs (FACSIA), the Australian Institute of Family Studies (AIFS) and the LSAC Consortium Advisory Group in late 2003 for assessing the AEDI’s concurrent, construct and predictive validity in a nested study of a sub-sample of the LSAC age 4 cohort. Once formal approvals and ethics clearances were secured, the newly revised AEDI was administered with a sub-sample of the LSAC 4 year old cohort. Funding from Shell Australia enabled the AEDI to be administered in addition to the other teacher completed LSAC instruments.
METHODS
LSAC Study design and Survey instrument timing. The LSAC is a clustered (by area) sample design. The clustered design was to provide the opportunity to gather multiple observations within a community and to increase the capacity of the study to analyse community level effects; along with the opportunity to cost-effectively conduct face-to-face interviews. Postcodes with less than 20 active children in the target population were excluded from the selection process (605 postcodes excluded). The remaining 1976 postcodes were stratified by state/ territory and by capital city statistical division vs. rest of state (‘met’/exmet’) to ensure the sample was distributed across strata in the same proportions as children in the target populations. The resultant response rate was 59.4% for the 4 year old cohort. (Solof, Lawrence, Johnston, 2005) The first wave of LSAC initially involved an interviewer spending 1-2 hours in the home where they:
• obtained detailed information about the child, plus some information on the parent, from Parent 1. This information covered the key areas of health, family functioning, parenting, education, childcare and social support;
• obtained socio-demographic information on the family (such as household structure and parental labour force status, educational attainment and income);
• left behind self-complete modules for both Parent 1 and Parent 2, covering aspects of family functioning, health and support. Where time permitted, these modules were completed while the interviewer was in the home;
• undertook physical measurement of the child (such as height, weight, girth and head circumference);
• administered the 'Who am I?' school readiness test and Peabody Picture Vocabulary Test of receptive language; and
• obtained consent to contact any non-resident parent or child care provider or teacher. Where consent was obtained, questionnaires were sent to the child’s teacher as soon as feasible after completion of the home interview (Solof, Millward, Sanson, 2003) however on average there was a 2 month gap between the home interview and teacher completed instrumentation.
Sample size and power for the AEDI LSAC Sub sample. For the purposes of establishing the statistical power available with a sample of 700 for this validation study and for other analyses utilizing the AEDI-LSAC sub-sample, it was assumed that the bottom centile can be defined as an ‘at-risk’ group on each of the five AEDI domain scores. The following analyses were performed to determine the power for detecting different types of association between the five AEDI domain scores and other potentially related variables collected by the LSAC. For the purposes of these calculations it was assumed that the prevalence of a key LSAC outcome of interest (e.g. SDQ problem behaviour) would be approximately 18%.

7
a) Power for two-way analysis Where the association between being in the bottom centile on an AEDI scale and an LSAC outcome of interest is to be analysed by a two-way table, or a logistic regression model with no interaction terms, we used the method of Self & Mauritzen (1988) to establish the power associated with an estimated sample size of 700 to significantly detect different strengths of association (See table 1 below). For this overall test of association the estimated sample of 700 has sufficient power to reliably detect moderate to strong associations.
Table 1: Power of association between an AEDI scale and a key LSAC outcome Odds Ratio 1.0 1.5 2.0 2.5 3.0 Power 0 0.24 0.63 0.91 0.98
b) Power for sub-group analysis While the current report does not include sub-group analyses it is expected that these may be required for subsequent reports or could be useful to other researchers utilizing these data. In such analyses the relationships between low scores on an AEDI scale and an LSAC outcome would be cross-classified by further variables (e.g. sex or SEIFA) and the entry of the third variable would reduce the power of the analysis. Thus, if the percentage of children in the bottom centile of an AEDI scale with a poor outcome differs between groups by some value d, the number of groups and their relative size will determine the power to detect the difference d in the study. Table 2 below shows the power available to detect the difference between groups, for two cases - where there are two groups of similar size (e.g. sex, WA vs Queensland) and where there are four groups of similar size (e.g. quartiles of SEIFA or family income). This shows that with the estimated sample of 700, the study has only limited power to detect small differences between groups but adequate power to detect strong differences. Table 2: Power for test of association between an AEDI scale and a key LSAC outcome classified by a third variable
Difference (%) 0.05 0.10 0.15 0.20 0.25 Two groups (e.g. sex) Power 0.11 0.31 0.59 0.83 0.95
Difference (%) 0.05 0.10 0.15 0.20 0.25 Four groups (e.g. SEIFA) Power 0.08 0.18 0.34 0.54 0.73

8
Assessing Construct Validity
The construct validity of the AEDI as a general measure of “early child development” and as a predictor of “readiness for school learning” can only be examined indirectly from a variety of analyses as the constructs which the AEDI seeks to measure are ‘latent’ in that they are not directly observable or immediately measurable (Cronbach and Meehl, 1967). Investigation of this aspect of the AEDI’s validity thus involves demonstrating from the set of available observations that the overall scale score and each of the domain and sub-component scores correlate consistently with other relevant measures of early child development (see Table 3 below). Given that the analysis of the AEDI’s prediction of “readiness for school learning” is contingent on the availability of data from the LSAC second wave of data collection which is only due for release in early 2007, the current report is confined to analysis of the associations of the AEDI domain and sub-component scores with the concurrently available data from the first wave of LSAC collected in 2004-2005. The analysis of its predictive validity will be the subject of a separate report to be available later in 2007.
The strength of association between each of the relevant AEDI and LSAC variables was assessed by calculating Spearman correlation coefficients (SPSS13). Table 3 below outlines the convention recommended by Hopkins (1997) to describe the correlation strength of paired observations for a sample of n = 600. A sample of this size provides 95% confidence intervals of less than 0.1 across the full range of possible correlations (i.e. from “little or none” to “very large”).
Table 3. Guide to interpreting correlation size in this analysis Correlation coefficient (r) Interpretation R2 (variance explained)
0.90 to 1.00 “Very large” 81% to 100%
0.70 to 0.89 “Large” 49% to 80%
0.50 to 0.69 “ Moderate” 25% to 48%
0.30 to 0.49 “Small” 9% to 24%
0.00 to 0.29 “Little or none” 0% to 8%

9
Table 4: LSAC measures of relevance to AEDI domains and sub-components AEDI LSAC
Developmental domain
Sub-component Measures Data items
Language & Cognitive Development
a) Basic literacy b) Interest and memory c) Complex literacy d) Basic literacy and numeracy
Parent reported measures: PEDS QL Expressive language concern PEDS QL Receptive Speech therapy via school Reading competencies scale Home activities Teacher reported measures: Reading competencies Writing competencies Numeracy competencies Direct assessment Peabody Picture Vocabulary Test(PPVT) Who am I (WAI)
apedselc apedsrlc k1pb29e areadcmp ap1hact areadcmp awritcmp anumbcmp appvt awai2
Social Competence
a) Overall social competence with peers b) Respect and responsibility c) Independence and adjustment
Parent reported measures: PEDS-QL Social functioning scale STSC sociability scale SDQ pro-social scale SDQ peer problem scale SDQ conduct scale Teacher reported measures: Child separation behaviour Child reunion behaviour SDQ pro-sociality scale SDQ peer problem scale SDQ conduct scale Total relationship score
apedssof asocial ap1psoc ap1peer ap1cond atchpsep atchpreu atchpsoc atchpeer atchcond atchqrel
Emotional Maturity
a) Pro-social and helping behaviour b) Aggressive behaviour c) Hyperactive and inattentive behaviour
Parent reported measures: SDQ pro-social behaviour scale SDQ hyperactivity scale construct SDQ emotionality scale STSC reactivity scale PEDS-QL emotional functioning Teacher reported measures: SDQ pro-sociality scale SDQ hyperactivity scale SDQ emotionality Warmth factor Conflict / anger Interviewer observation: Fear towards interviewer
ap1psoc ap1hypr ap1emot areact apedsef atchpsoc atchhypr atchemot atchwarm atchconf k1cn7
Physical Health and Wellbeing
a) Gross and fine motor skills
Parent reported measures: Global health measure PEDS QL physical health summary Teacher reported measures: Teacher rating fine motor skills Teacher rating gross motor skills
k1cb23 apedsphy k1tc4 k1tc3
Communication and General Knowledge
a) Communication skills Parent reported measures: Reading competencies scale Teacher reported measures: Open communication factor Reading competencies Writing competencies Numeracy competencies Direct assessment Peabody Picture Vocabulary (PPVT) Who am I (WAI)
areadcmp atchocom areadcmp awritcmp anumbcmp awai2 appvt2

10
Assessing Concurrent Validity
In addition to the correlational analyses conducted to describe the ‘nomological’ network of associations between the various developmental constructs measured in both the AEDI and the LSAC, the extent to which the AEDI and LSAC Outcome Index agreed in their identification of children who may be considered “developmentally vulnerable” or who were “on track” was also examined. Similarly, the extent of agreement between AEDI domain scores and other specific LSAC measures having defined thresholds for identifying children who are “at risk’ in terms of specific aspects of development were also examined e.g. the Strengths and Difficulties Questionnaire (SDQ). Table 5 below outlines specific comparisons undertaken.
Table 5. Developmental outcome thresholds assessed by AEDI and LSAC
AEDI Measure Data Item
Vulnerable Physical Health & Wellbeing Vulnphys
Vulnerable Social Competence Vulnsoc
Vulnerable Emotional Maturity Vulnemot
Vulnerable Language & Cognitive Dev. vulnlang
Vulnerable Communication Skills & General Knowledge Vulncomg
No of AEDI domains vulnerable on vulntot
LSAC Measure Data item
Negative Physical Health cut off Anpco
Positive physical health cut off Appco
Negative social and emotional cut off Ansco
Positive social and emotional cut off apsco
Negative Learning cut off Anlco
Positive learning cut off aplco
LSAC Negative Outcome Index noi
LSAC Positive Outcome Index poi

11
RESULTS Sample characteristics Of the 720 eligible children for whom household interviews were completed in the third and fourth workloads of the first wave of LSAC data collection in Queensland, Victoria and Western Australia, there were 642 children for whom teacher completed LSAC and AEDI assessments were returned from schools. Forty six percent (46.4%) of the LSAC/AEDI sample were from Victoria, 33% from Queensland and 20.4% from Western Australia. Because the third and fourth LSAC workloads occurred later in the in the school year, these children were between 2 and 3 months older than the overall (i.e. national) LSAC age four cohort at the time of their teacher assessments. In terms of other demographic characteristics, there were no systematic differences observed between the AEDI sub-sample and the overall LSAC cohort. English was the main language spoken at home with the child for 87.5% of the AEDI sub-sample and 89.2 of the overall LSAC cohort. Children of Aboriginal or Torres Strait Islander descent comprised 2.1% of the AEDI sub-sample and 3.9% of the overall LSAC cohort. No significant difference was observed between the mean Socio Economic Indicators for Areas (SEIFA) for Advantage/Disadvantage index for the AEDI sub-sample (mean=1003.3 vs. 1005.0). In summary, apart from being around 2-3 months older at the time of their teacher completed assessments, the AEDI sub-sample was demographically very similar to the overall LSAC sample and can thus be considered to be representative of the general Australian population of children aged 4-5 years. Tables 6 below details the summary descriptive statistics for each of the AEDI variables included in the analysis. This shows the number of children with valid data, the mean, standard error (SE), median, maximum and minimum value for each variable. Table 7 (over) shows the equivalent descriptive statistics for each of the LSAC variables included in the analysis.

12
Table 6. Descriptive statistics for AEDI variables included in the analysis AEDI Variable N Mean SE Median Min Max Domain Physical well-being domain score 639 6.94 0.05 7.27 0.91 9.09 Emotional maturity domain score 634 7.89 0.05 8.08 4.62 10.00 Social competence domain score 638 7.85 0.07 8.33 0.43 10.00 Language and cognitive development domain 611 6.58 0.08 6.92 0.00 10.00 Communication and general knowledge domain
640 7.38 0.10 8.13 0.00 10.00Vulnerable Vulnerable Physical well-being 642 0.14 0.01 0.00 0.00 1.00 Vulnerable Emotional 642 0.10 0.01 0.00 0.00 1.00 Vulnerable Social 642 0.13 0.01 0.00 0.00 1.00 Vulnerable Language and cognitive development 642 0.12 0.01 0.00 0.00 1.00 Vulnerable Communication and general knowledge
642 0.12 0.01 0.00 0.00 1.00
Sub-constructs Physical readiness for school work 639 6.35 0.05 6.67 0.00 10.00 Physical independence 640 6.38 0.04 6.67 0.00 10.00 Gross & fine motor skills 640 7.60 0.09 8.00 0.00 10.00 Prosocial and helping behaviour 638 5.20 0.11 5.00 0.00 10.00 Anxious and fearful behaviour 638 9.18 0.05 10.00 5.00 10.00 Aggressive behaviour 639 9.22 0.05 10.00 5.00 10.00 Hyperactive and inattentive behaviour 639 8.73 0.06 9.17 5.00 10.00 Overall social competence with peers 640 7.18 0.10 7.50 0.00 10.00 Respect and responsibility 640 8.15 0.08 8.75 0.00 10.00 Independence and adjustment 640 7.65 0.08 8.13 0.00 10.00 Readiness to explore new things 638 8.20 0.09 8.75 0.00 10.00 Basic literacy 640 7.86 0.09 8.75 0.00 10.00 Interest and memory 640 8.25 0.10 10.00 0.00 10.00 Complex literacy skills 636 1.93 0.09 1.67 0.00 10.00 Basic literacy and numeracy 640 8.15 0.09 8.57 0.00 10.00 Communication skills 640 7.38 0.10 8.13 0.00 10.00

13
Table 7. Descriptive statistics for LSAC variables included in the analysis
LSAC Variable N Mean SE Median Min MaxPEDS Expressive Language Concern 641 1.75 0.02 2.00 1.00 2.00PEDS Receptive Language Concern 642 1.92 0.01 2.00 1.00 2.00Use of services in last 12 months - speech therapy 637 -1.29 0.13 0.00 -9.00 1.00Reading competencies index 641 0.34 0.03 0.00 0.00 3.00Home Activities index 642 1.74 0.02 1.71 0.00 3.00Teacher - Reading competencies 622 1.67 0.03 2.00 0.00 5.00Teacher - Writing competencies 623 3.02 0.06 3.00 0.00 6.00Teacher - Numeric Competencies 620 3.33 0.05 3.00 0.00 5.00PPVT score (integers) 567 64.05 0.34 65.00 20.00 84.00WAI score (integers) 631 62.41 0.29 63.00 35.00 86.00PEDS Social functioning 541 82.91 0.66 85.00 18.75 100.00Sociability scale 542 3.74 0.05 3.75 1.00 6.00Prosociality scale 638 7.78 0.07 8.00 1.00 10.00Peer problems scale 638 1.63 0.06 1.00 0.00 9.00Conduct problems scale 638 2.50 0.08 2.00 0.00 10.00Teacher - Behaviour on separation from parent 614 3.36 0.02 3.38 1.38 4.00Teacher - Behaviour on reunion with parent 613 3.39 0.02 3.43 1.71 4.00Teacher - Prosociality scale 633 6.55 0.09 6.00 0.00 10.00Teacher - Peer problems scale 633 1.73 0.08 1.00 0.00 9.00Teacher - Conduct problems scale 633 1.15 0.07 0.00 0.00 10.00Teacher - Relationship quality scale 632 4.43 0.02 4.60 2.47 5.00Hyperactivity scale 638 3.43 0.09 3.00 0.00 10.00Emotional symptoms scale 637 1.62 0.07 1.00 0.00 8.00Reactivity scale 542 2.69 0.04 2.75 1.00 5.75PEDS Emotional functioning 542 72.09 0.63 75.00 20.00 100.00Teacher - Hyperactivity scale 633 2.67 0.10 2.00 0.00 10.00Teacher - Emotional problems scale 632 1.09 0.06 0.00 0.00 8.00Teacher - Warm relationship scale 632 4.41 0.02 4.60 1.40 5.00Teacher - Conflict scale 632 1.48 0.03 1.24 1.00 4.43Extent to which Study Child shows fear towards interviewer 642 3.84 0.02 4.00 -2.00 4.00Global health measure 642 1.58 0.03 1.00 1.00 4.00PEDS Physical health summary 542 82.88 0.50 84.38 25.00 100.00Teacher - How Study Child compares to others - Fine motor 636 1.89 0.05 2.00 -9.00 4.00Teacher - How Study Child compares to others - Gross motor 639 1.93 0.05 2.00 -9.00 4.00Teacher - Open communication scale 632 4.24 0.03 4.33 1.00 5.00Negative Physical cutoff 642 0.13 0.01 0 0 1Positive Physical cutoff 642 0.14 0.01 0 0 1Negative Social/Emotional cutoff 638 0.13 0.01 0 0 1Positive Social/Emotional cutoff 638 0.15 0.01 0 0 1Negative Learning cutoff 642 0.20 0.02 0 0 1Positive Learning cutoff 642 0.10 0.01 0 0 1Positive Outcome Index 638 0.40 0.02 0 0 3Negative Outcome Index 638 0.45 0.03 0 0 3

14
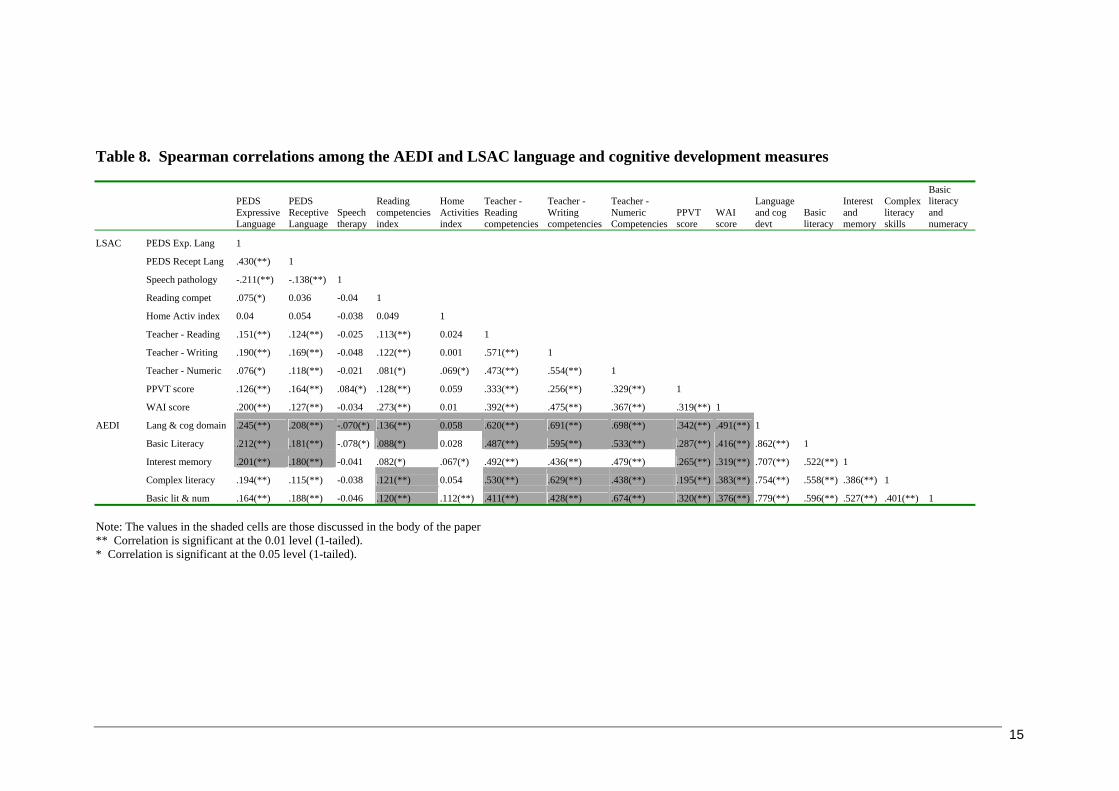
Construct Validity Findings
AEDI Language and cognitive development domain (Table 8): The LSAC teacher rated measures of writing, reading and numeric competencies were found to have the strongest correlations with the AEDI Language and cognitive development domain (0.69, 0.62 and 0.70). These LSAC measures also had moderate correlations with the AEDI Basic Literacy sub-construct (0.49, 0.60 and 0.53). Similar moderately large correlations were evident between the LSAC teacher measures and the AEDI construct of Basic Literacy and Numeracy, and Complex Literacy. Small correlations were seen between the LSAC teacher measures and the AEDI Interest and Memory sub-construct (0.44 and 0.49). In contrast, little correlation was observed between parent reported PEDS expressive language concern, receptive language concern and the teacher rated AEDI language and cognitive development domain with scores ranging from 0.18 to 0.25. The directly assessed LSAC measures, PPVT and the “Who am I” showed small to moderate correlations with the AEDI Language and Cognitive Development domain (0.34, 0.49). AEDI Social Competence domain (Table 9): A large to moderate correlation was observed between the LSAC teacher rated Prosociality scale and the AEDI Social Competence domain score (0.69) and similar moderate correlations were observed with the AEDI Overall Social Competence with Peers, Respect and Responsibility, and Independence and Adjustment sub-construct scores (0.57, 0.64 and 0.59). The LSAC teacher reported Relationship Quality scale was also correlated strongly with the AEDI Social Competence domain score (0.62) and moderately with the AEDI Overall Social Competence with Peers, Respect and Responsibility, and Independence and Adjustment sub-construct scores (0.54, 0.59, and 0.50). In contrast the LSAC teacher rated Conduct Problems Scale was negatively correlated with the AEDI Social Competence domain score, and the Respect and Responsibility, and Independence and Adjustment sub-construct scores (-0.53, -0.64 and -0.45). Finally, the LSAC teacher rated Peer Problems scale was moderately correlated with the AEDI Social Competence domain score and Overall Social Competence with Peers sub-construct score (-0.46 and -0.58).
AEDI Emotional Maturity domain (Table 10): The strongest correlation was observed between the teacher rated LSAC measure of Pro-sociality and the AEDI Emotional Maturity domain scores (0.75). The LSAC teacher rated Hyperactivity SDQ measure showed a moderate negative correlation with the AEDI Emotional Maturity domain score (-0.63), and the AEDI Hyperactivity and Inattentive Behaviours sub-constructs (-0.42 and -0.69). Moderate negative correlations were observed between the LSAC teacher rated Conflict scale and the AEDI Aggressive Behaviour and Hyperactive and Inattentive Behaviour sub-constructs (-0.55 and -0.44). While the parent rated SDQ Hyperactivity scale was moderately correlated with the AEDI Hyperactive and Inattentive Behaviour sub-domain score (-0.32), little or no correlation was observed between the parent rated PEDS Emotional Functioning and the AEDI Emotional Maturity Domain and sub-construct scores. AEDI Physical Health and Wellbeing domain (Table 11): The LSAC Global Health Measure showed no significant association and the PEDS Physical Health Summary showed only a weak correlation with the AEDI Physical Health and Wellbeing domain score (0.091). These observations suggest that very different aspects of physical health and wellbeing are being measured in these components of the LSAC and AEDI. However, small correlations were observed between the LSAC teacher rated Fine Motor Skills and Gross Motor Skills and the AEDI Gross and Fine Motor Skills sub-construct (- 0.50 and -0.38). AEDI Communication and General Knowledge domain (Table 12): The LSAC teacher rated Open Communication and Numeric Competencies scales both correlated moderately with the AEDI Communication and General Knowledge domain scores (0.47 and 0.40). Weak correlation was also evident between the LSAC “Who am I” score and the AEDI Communication and General Knowledge domain score (0.32). Finally, the LSAC PPVT showed weak but significant correlations with AEDI Communication and General Knowledge domain score (0.295).
15
Table 8. Spearman correlations among the AEDI and LSAC language and cognitive development measures
PEDS Expressive Language
PEDS Receptive Language
Speech therapy
Reading competencies index
Home Activities index
Teacher - Reading competencies
Teacher - Writing competencies
Teacher - Numeric Competencies
PPVT score
WAI score
Language and cog devt
Basic literacy
Interest and memory
Complex literacy skills
Basic literacy and numeracy
LSAC PEDS Exp. Lang 1
PEDS Recept Lang .430(**) 1
Speech pathology -.211(**) -.138(**) 1
Reading compet .075(*) 0.036 -0.04 1
Home Activ index 0.04 0.054 -0.038 0.049 1
Teacher - Reading .151(**) .124(**) -0.025 .113(**) 0.024 1
Teacher - Writing .190(**) .169(**) -0.048 .122(**) 0.001 .571(**) 1
Teacher - Numeric .076(*) .118(**) -0.021 .081(*) .069(*) .473(**) .554(**) 1
PPVT score .126(**) .164(**) .084(*) .128(**) 0.059 .333(**) .256(**) .329(**) 1
WAI score .200(**) .127(**) -0.034 .273(**) 0.01 .392(**) .475(**) .367(**) .319(**) 1
AEDI Lang & cog domain .245(**) .208(**) -.070(*) .136(**) 0.058 .620(**) .691(**) .698(**) .342(**) .491(**) 1
Basic Literacy .212(**) .181(**) -.078(*) .088(*) 0.028 .487(**) .595(**) .533(**) .287(**) .416(**) .862(**) 1
Interest memory .201(**) .180(**) -0.041 .082(*) .067(*) .492(**) .436(**) .479(**) .265(**) .319(**) .707(**) .522(**) 1
Complex literacy .194(**) .115(**) -0.038 .121(**) 0.054 .530(**) .629(**) .438(**) .195(**) .383(**) .754(**) .558(**) .386(**) 1
Basic lit & num .164(**) .188(**) -0.046 .120(**) .112(**) .411(**) .428(**) .674(**) .320(**) .376(**) .779(**) .596(**) .527(**) .401(**) 1 Note: The values in the shaded cells are those discussed in the body of the paper ** Correlation is significant at the 0.01 level (1-tailed). * Correlation is significant at the 0.05 level (1-tailed).

16
Table 9. Spearman correlations among the AEDI and LSAC social competence measures
PEDS Social functioning
Sociability scale
Prosociality scale
Peer problems scale
Conduct problems scale
Teacher - Behaviour on seperation from parent
Teacher - Behaviour on reunion with parent
Teacher - Prosociality scale
Teacher - Peer problems scale
Teacher - Conduct problems scale
Teacher - Relationship quality scale
Social competence
overall social competence with peers
respect and responsibility
independence and adjustment
LSAC PEDS Social funct 1
Sociability scale .197(**) 1
Prosociality scale .245(**) .135(**) 1
Peer problems scale -.395(**) -.258(**) -.193(**) 1
Conduct problems scale -.214(**) 0.018 -.362(**) .231(**) 1
Tch –Sep from parent .126(**) .238(**) 0.061 -.193(**) -.101(**) 1
Tch- Reun with parent .105(**) -0.064 .079(*) -.082(*) -.105(**) 0.041 1
Tch - Prosociality scale .145(**) -0.036 .177(**) -.195(**) -.244(**) .379(**) .348(**) 1
Tch - Peer problems -.270(**) -.115(**) -.108(**) .344(**) .154(**) -.416(**) -.077(*) -.420(**) 1
Tch - Conduct problems -.076(*) .175(**) -.133(**) .107(**) .242(**) -.196(**) -.331(**) -.512(**) .219(**) 1
Tch - Relationship qual .124(**) -0.001 .200(**) -.183(**) -.201(**) .445(**) .310(**) .639(**) -.410(**) -.530(**) 1
AEDI Social competence .239(**) -0.023 .201(**) -.273(**) -.216(**) .398(**) .280(**) .690(**) -.457(**) -.533(**) .626(**) 1
Overall social compt .225(**) .098(**) .176(**) -.289(**) -.166(**) .454(**) .157(**) .572(**) -.579(**) -.350(**) .535(**) .788(**) 1
Respect and responsib .193(**) -.078(*) .168(**) -.217(**) -.233(**) .316(**) .316(**) .642(**) -.336(**) -.639(**) .585(**) .874(**) .583(**) 1
Indep & adjustment .235(**) -.082(*) .164(**) -.218(**) -.205(**) .260(**) .261(**) .586(**) -.330(**) -.445(**) .497(**) .905(**) .579(**) .762(**) 1 Note: The values in the shaded cells are those discussed in the body of the paper ** Correlation is significant at the 0.01 level (1-tailed). * Correlation is significant at the 0.05 level (1-tailed).

17
Table 10. Spearman correlations among the AEDI and LSAC emotional maturity measures
Prosociality scale
Hyperactivity scale
Emotional symptoms scale
Reactivity scale
PEDS Emotional functioning
Teacher - Prosociality scale
Teacher - Hyperactivity scale
Teacher - Emotional problems scale
Teacher - Warm relationship scale
Teacher - Conflict scale
Extent to which Study Child shows fear towards interviewer
Emotional maturity
Prosocial and helping behaviour
Aggressive behaviour
Hyperactive and inattentive behaviour
LSACo Prosociality scale 1
Hyperactivity scale -.367(**) 1
Emotional sympt -0.03 .172(**) 1
Reactivity scale -.287(**) .307(**) .189(**) 1
PEDS Emot funct .116(**) -.153(**) -.364(**) -.342(**) 1
Tch - Prosociality .177(**) -.257(**) -.066(*) -.256(**) 0.055 1
Tch - Hyperactivity -.158(**) .348(**) 0.014 .197(**) -0.05 -.563(**) 1
Tch - Emot prob -0.048 -0.019 .219(**) 0.068 -.152(**) -.126(**) .109(**) 1
Teacher - Warm .142(**) -.071(*) -0.007 -.142(**) 0.027 .531(**) -.284(**) -.157(**) 1
Tch - Conflict -.155(**) .223(**) -0.057 .164(**) -0.043 -.471(**) .480(**) .137(**) -.325(**) 1
Chld fear interview .068(*) -0.026 -.091(**) -.106(**) 0.002 .137(**) -0.027 -.136(**) 0.062 .071(*) 1
AEDI Emotional maturity .185(**) -.273(**) -.097(**) -.202(**) 0.032 .745(**) -.633(**) -.264(**) .457(**) -.495(**) .106(**) 1
Prosocial & help .194(**) -.201(**) -.102(**) -.176(**) 0.023 .729(**) -.451(**) -.172(**) .470(**) -.303(**) .154(**) .870(**) 1
Aggressive behav .109(**) -.218(**) .064(*) -.151(**) 0.015 .424(**) -.423(**) -0.015 .192(**) -.546(**) -0.019 .570(**) .286(**) 1
Hyperact & inatten .151(**) -.320(**) -0.034 -.137(**) 0.027 .446(**) -.689(**) -.103(**) .247(**) -.439(**) 0.013 .683(**) .383(**) .510(**) 1 Note: The values in the shaded cells are those discussed in the body of the paper ** Correlation is significant at the 0.01 level (1-tailed). * Correlation is significant at the 0.05 level (1-tailed).

18
Table 11. Spearman correlations among the AEDI and LSAC physical health and wellbeing measures
Global health measure
PEDS Physical health summary
Teacher - How Study Child compares to others - Fine motor skills
Teacher - How Study Child compares to others -Gross motor skills Physical well-being
Gross & fine motor skills
LSAC Global health measure 1 PEDS Physical health -.179(**) 1 Tch - Fine motor skills .063(*) -.101(**) 1 Tch Gross motor skills 0.037 -.109(**) .401(**) 1 AEDI Physical well-being -0.06 .091(*) -.448(**) -.370(**) 1 Gross & fine motor skills -0.054 .088(*) -.449(**) -.378(**) .960(**) 1 Note: The values in the shaded cells are those discussed in the body of the paper ** Correlation is significant at the 0.01 level (1-tailed). * Correlation is significant at the 0.05 level (1-tailed). Table 12. Spearman correlations among the AEDI and LSAC communication and general knowledge measures
Teacher - Open communication scale
Teacher - Writing competencies
Teacher - Numeric Competencies
PPVT score (integers)
WAI score (integers)
Communication and gen knowledge
LSAC Teacher - Open communication 1 Teacher - Writing competencies .260(**) 1
Teacher - Numeric Competencies .233(**) .554(**) 1
PPVT score .180(**) .256(**) .329(**) 1 WAI score .133(**) .475(**) .367(**) .319(**) 1
AEDI Communicat and gen knowledge .467(**) .361(**) .403(**) .295(**) .315(**) 1
Note: The values in the shaded cells are those discussed in the body of the paper ** Correlation is significant at the 0.01 level (1-tailed). * Correlation is significant at the 0.05 level (1-tailed).

19
Concurrent Validity Findings
Table 13 below shows the strength of concurrence between each of the specific LSAC and AEDI measures of developmental vulnerability, the closest agreement was evident for the variable “number of AEDI domains on which the child was assessed to be vulnerable” (i.e. approximately below the 10th percentile) and the LSAC Negative Outcome Index (X2 = 309.6, p<0.01) and the LSAC Negative Learning cut-off (X2 =209, p=<0.01).
Table 13. Concurrent validity: X2 and Pearson correlation coefficients LSAC measures AEDI measures
Negative Physical Health
Positive Physical Health
Negative Social/ Emotional
Positive Social/ Emotional
Negative Learning
Positive Learning
Positive Outcome Index
Negative Outcome Index
Vulnerable Physical health and wellbeing
χ=20.41** 0.178**
χ=1.74 -0.052
Vulnerable Social competence
χ=15.17** 0.154**
χ=7.525** -0.109**
Vulnerable Emotional maturity
χ=24.50**0.184**
χ=2.88* -0.067
Vulnerable Language Cognitive
χ=217.14** 0.582**
χ=10.38** -0.127**
Vulnerable Communic & Gen knwledg
χ=119.13** 0.431**
χ=3.52* -0.074
No. of AEDI domains on which child is vulnerable
χ=209.02** 0.563**
χ=21.10** -0.151**
χ=24.57** -0.176**
χ=309.61** 0.554**
** Significant at the 0.01 level (1-tailed). * Significant at the 0.05 level (1-tailed).
The extent to which the LSAC Outcome Index and AEDI correspond in predicting children classified as “vulnerable” on one or more of their respective domains of early child development is shown below in Table 14. On the AEDI, children scoring below the 10th percentile on a domain scale are considered vulnerable for that particular domain. For the LSAC Negative Outcome Index, children scoring below the 15th percentile of the continuous Outcome Index score on either of the Physical Health, Social/Emotional and Learning/Language domains are considered to be “performing poorly” for that domain. In this table it can be seen that with increasing numbers of the LSAC Negative Outcome domains in the vulnerable range, there is a corresponding increase in the number of AEDI domains falling in the vulnerable range – particularly at the extreme values of each variable. Table 14. Number of AEDI and LSAC outcome domains on which child is considered vulnerable Number of LSAC Negative Outcome domains 0 1 2 3 Total
0 355 81 19 0 455 1 43 31 9 0 83 2 16 23 4 1 44 3 4 10 5 1 20 4 0 14 2 8 24
Number of Domains Considered Vulnerable on AEDI
5 1 2 4 5 12 Total 419 161 43 15 638
Finally, a summary view of the level of agreement between the AEDI and LSAC measures of developmental vulnerability is shown below in Table 15. This indicates the number of children with one or more AEDI and/or LSAC domains considered vulnerable and those with no vulnerability on each of these outcome measures.

20
Table 15. Vulnerability on one or more AEDI or LSAC outcome domains LSAC Outcome Domains considered Vulnerable
0 1 or more Total 0 355 100 455 AEDI Domains
Considered vulnerable 1 or more 64 119 183 Total 419 219 638
From this simple ‘two-by-two’ table, a number of different indices of overall ‘diagnostic effectiveness’ can be described regarding to the extent to which children considered vulnerable on one or more of the LSAC outcome domains are also likely to be ‘performing poorly’ on one or more of the LSAC outcome domains. These include a) Sensitivity, b) Specificity, c) Positive Predictive Ratio, and d) Positive Diagnostic Likelihood Ratio.2 The observed sensitivity was 0.85 which indicates a high probability of a true positive observation, while the specificity was 0.54 indicates a modest but satisfactory probability of observing a true negative result. The positive predictive ratio of 0.65 suggests that around two-thirds of the children identified as vulnerable on one or more domains on the AEDI would also be expected to be ‘performing poorly’ on one or more of the LSAC outcome domains. Finally, the positive diagnostic likelihood ratio of 1.8 indicates that children identified as ‘vulnerable’ on one or more domains of the AEDI were almost twice as likely to be ‘performing poorly’ on one or more of the LSAC outcome domains than children not identified as vulnerable on any of the AEDI domains.
DISCUSSION AND CONCLUSIONS Although there are a number of descriptions of the reliability, concurrent and predictive validity of the original Canadian Early Development Index (EDI), this is the first description of the way in which its Australian adaptation performs in relation to other measures of early child development assessed by parent interview, direct assessment and teacher ratings (Janus and Offord, 2000 in press; Janus, Offord and Walsh 2001, Janus, 2002).
The opportunity for this study to collect AEDI data from a sub-sample of the nationally representative Longitudinal Study of Australian Children (LSAC) has provided a unique means of determining the value of the AEDI as a population level indicator of children’s current developmental status. Also, the prospective nature of the LSAC will enable examination of the extent to which children’s developmental status, as measured by the AEDI at age 4-5 years, is predictive of their subsequent trajectories of school learning and behaviour as well as their longer-term social and emotional adjustment.
Moderate to large correlations were observed between each of the five AEDI developmental domains and their sub-construct scales and the relevant teacher rated LSAC measures assessing comparable constructs. The strongest associations were evident for the AEDI Language and Cognitive Development domain where correlations with teacher rated measures of reading, writing and numeric competencies were (0.69, 0.62 and 0.70). The AEDI Social Competence and Emotional Maturity domain and sub-construct scores also showed moderate to strong correlations with the LSAC teacher reported SDQ pro-social behaviour (0.57 to 0.75), peer problems (0.33 to 0.47), conduct problems (0.35 to 0,64) and hyperactivity (0.63 - 0.69). While the parent reported LSAC social and emotional competence measures also showed a consistent pattern of significant associations with the AEDI Social Competence and Emotional Maturity domain and sub-construct scores, these correlations were generally much weaker than those for the comparable teacher ratings. In general parent rated instrumentation did not correlate as well to the AEDI in comparison to other teacher related instrumentation and the AEDI. These results are consistent when reviewing the correlations found between the LSAC teacher rated instrumentation and the LSAC parent rated instrumentation. These results may be partially explained by the lag time between 2 Sensitivity = True Positive/(True Positive + False Negative) Specificity = True Negative/(True Negative + False Positive) Positive Predictive Value = True Positive/(True Positive/True Positive + False Positive) Positive Diagnostic Likelihood Ratio = Sensitivity/(1- Specificity) .
21
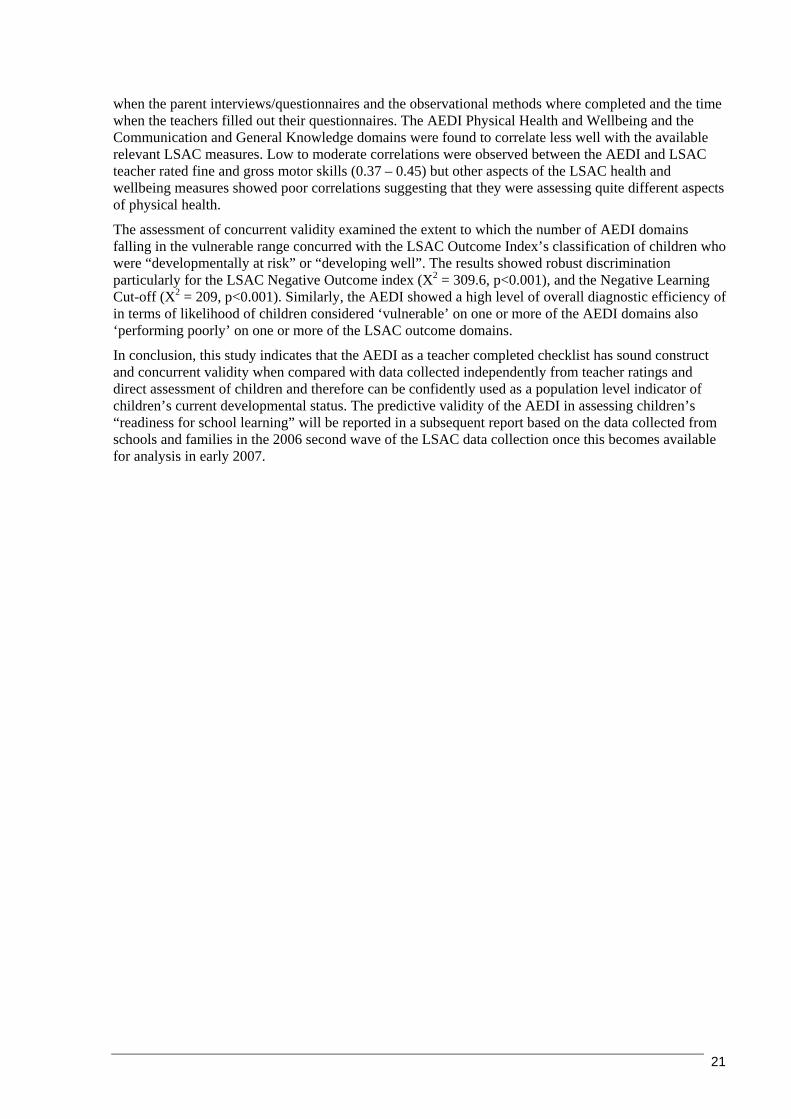
when the parent interviews/questionnaires and the observational methods where completed and the time when the teachers filled out their questionnaires. The AEDI Physical Health and Wellbeing and the Communication and General Knowledge domains were found to correlate less well with the available relevant LSAC measures. Low to moderate correlations were observed between the AEDI and LSAC teacher rated fine and gross motor skills (0.37 – 0.45) but other aspects of the LSAC health and wellbeing measures showed poor correlations suggesting that they were assessing quite different aspects of physical health.
The assessment of concurrent validity examined the extent to which the number of AEDI domains falling in the vulnerable range concurred with the LSAC Outcome Index’s classification of children who were “developmentally at risk” or “developing well”. The results showed robust discrimination particularly for the LSAC Negative Outcome index (X2 = 309.6, p<0.001), and the Negative Learning Cut-off (X2 = 209, p<0.001). Similarly, the AEDI showed a high level of overall diagnostic efficiency of in terms of likelihood of children considered ‘vulnerable’ on one or more of the AEDI domains also ‘performing poorly’ on one or more of the LSAC outcome domains.
In conclusion, this study indicates that the AEDI as a teacher completed checklist has sound construct and concurrent validity when compared with data collected independently from teacher ratings and direct assessment of children and therefore can be confidently used as a population level indicator of children’s current developmental status. The predictive validity of the AEDI in assessing children’s “readiness for school learning” will be reported in a subsequent report based on the data collected from schools and families in the 2006 second wave of the LSAC data collection once this becomes available for analysis in early 2007.

22
REFERENCES
1. The Australian Early Development Index Partnership (2005) Australian Early Development Index: Building Better Communities, Community Results 2004 – 2005. Centre for Community Child Health (Melbourne) and Telethon Institute for Child Health Research (Perth). ISBN: 0957828691 (Available online at: http://www.rch.org.au/emplibrary/australianedi/AEDI_report_web2.pdf).
2. Andrich D and Styles I (2004) Report on the psychometric analysis of the Early Development Instrument (EDI) using the Rasch model. Report commissioned by the Australian Early Development Index project. Available on line at: http://www.rch.org.au/emplibrary/australianedi/SecondRaschReport.pdf
3. Cronbach LJ and Meehl PE ( 1967) Construct Validity in Psychological Tests. In DN Jackson and S Messick (Eds) Problems in Human Assessment. New York: McGraw-Hill.
4. Hart B, Brinkman S & Blackmore S (2003) How Well are we Raising our Children in the North Metropolitan Area? Early Development Index 2003. Perth: North Metropolitan Health Service (WA).
5. Hopkins WG (1997) A New View of Statistics: Confidence Limits for Correlations. eTextbook available online at: http://sprotssci.org/resources/stats/sonthefly.html (last update13 June 97).
6. Janus, M., & Offord, D. (in press) Development and psychometric properties of the Early Development Instrument (EDI): A measure of children’s school readiness. Canadian Journal of Behavioural Science.
7. Janus M and Offord DR (2000) Reporting on readiness to learn in Canada. ISUMA Canadian Journal of Policy Research; 1:71-75
8. Janus M (2002) Validation of a Teacher Measure of School Readiness with Parent and Child-Care Reports. Poster presented at Department of Psychiatry Research Day, McMaster University, Ontario, May 2001.
9. O’Brien RG (1998) A tour of UnifyPow: A SAS Macro for sample size analysis. Proceedings of the 23rd Annual SAS Users Group International Conference, Cary NC: SAS Institute., 1346-1355.
10. Sanson A, Nicholon J, Ungerer J, Zubrick S, Wilson K, Ainley J, Berthelsen D, Bittman M, Broom D, Harrison L, Rodgers B, Sawyer M, Silburn S, Strazdins L, Vimpani G, Wake M. Introducing the longitudinal study of Australian children. Canberra: Australian Institute of Family Studies; 2002.
11. Sanson A, Misson S, Wake M, Zubrick SR, Silburn SR, Rothman S and Dickenson J (2005) Summarising children’s wellbeing: the LSAC Outcome Index.. LSAC Technical Paper #2. Melbourne: Australian Government and Australian Institute of Family Studies.
12. Self SD, Mauritsen RH (1988) Power/Size calculations for generalised linear models. Biometrics. 44: 79-96.
13. Self SG, Mauritsen RH, O’Hara J (1992) Power calculations for likelihood ratio tests in generalised linear models. Biometrics 48: 31-39.
14. Soloff C, Lawrence D, Johnstone R. (2005) The Longitudinal Study of Australian Children: an Australian Government initiative. LSAC Technical Paper No. 1 Sample design. ISSN 1832-9918 (Online)
15. Soloff C, Millward C, Sanson A. (2003) Growing Up In Australia: The Longitudinal Study of Australian Children - Discussion Paper No. 2 Proposed Study Design and Wave 1 Data Collection. ISBN 0 642 39505 5; ISSN 1447-1566 (Online).
16. SPSS (2003) SPSS 13.0 Syntax Reference Guide. SPSS Inc.: Chicago, Illinois.

23
17. Willms JD (Ed) (2002) Vulnerable Children. Alberta: University of Alberta Press.