Teachers Tutorial
129
How Digital Tools can Motivate and Attract Students to Science Teachers Tutorial
-
Upload
khangminh22 -
Category
Documents
-
view
0 -
download
0
Transcript of Teachers Tutorial

How Digital Tools can Motivate and Attract Students to Science
Teachers Tutorial

2
Welcome Welcome to the tutorial ‘How digital tools can make your science lessons more attractive’. This tutorial is one of the products from the
MASS project and shall serve as a resource for you and your colleague teachers to make science education more motivating and attracting
to your students by using digital tools.
We are aware of the existing challenges in the field of education such as limited time and space. And of course the large number of
students in most of the classrooms. In this tutorial we try to lower those barriers as much as we can by giving practical tips and tricks,
‘ready to go’ good practices and easy to implement tools and examples.
This tutorial discusses the following types of digital tools:
Geo-media
» Geographic Information Systems
» Satellite Remote Sensing
Serious Games
(Apps for) Smartphones and Tablets
Social Media
Each chapter starts with a general description of the tool, followed by information about the didactical concept. Then we provide some
practical tips about how to use this tool in your ‘everyday’ classes, with good practices, more tips and tricks and in the end some links you
can visit to learn more.

3
The given examples for classroom implementation are always tagged with one or more of the following symbols, each representing a certain science
subject. In this way it will be visible at a glance which sections are the most interesting ones for you.
Symbols used in the tutorial
Biology
Chemistry
Geography
Mathematics
Physics
To keep the tutorial easy to read, we did not put references in the running text. Instead you can find a list of all sources we used at the end
of the document, grouped by chapter.
Thanks and good luck!
The MASS project partners
4
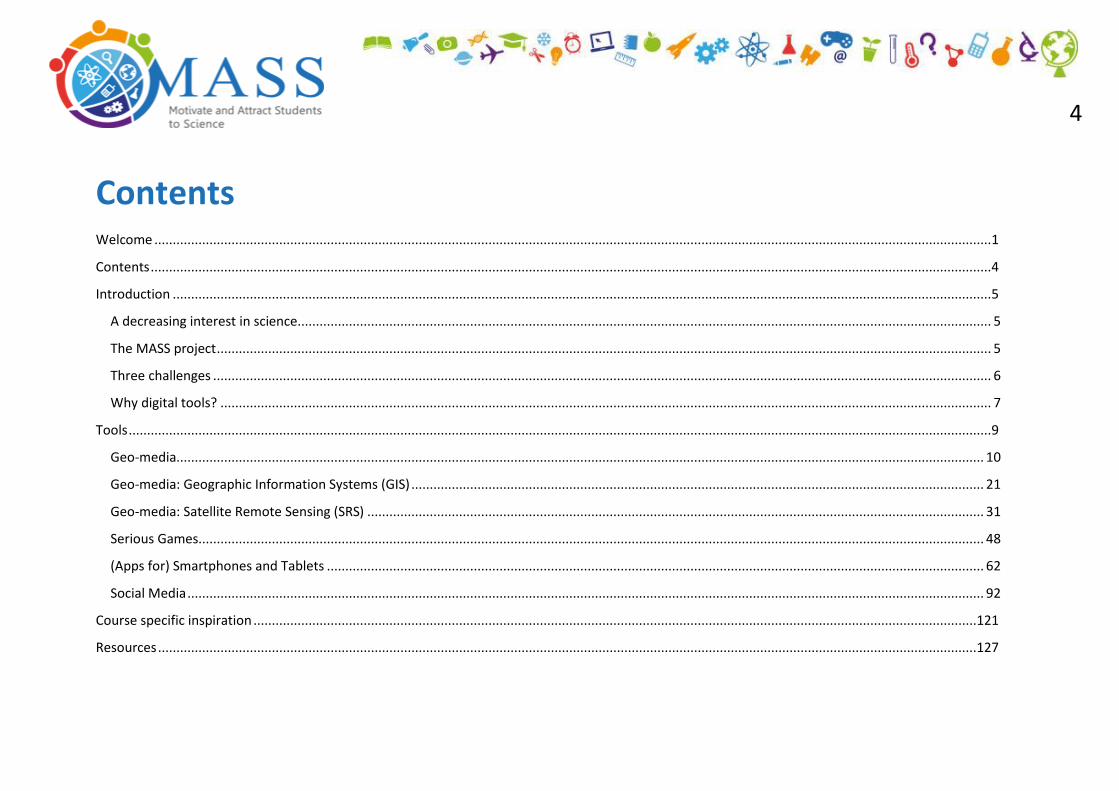
Contents Welcome .................................................................................................................................................................................................................................... 1
Contents ..................................................................................................................................................................................................................................... 4
Introduction ............................................................................................................................................................................................................................... 5
A decreasing interest in science............................................................................................................................................................................................. 5
The MASS project ................................................................................................................................................................................................................... 5
Three challenges .................................................................................................................................................................................................................... 6
Why digital tools? .................................................................................................................................................................................................................. 7
Tools ........................................................................................................................................................................................................................................... 9
Geo-media............................................................................................................................................................................................................................ 10
Geo-media: Geographic Information Systems (GIS) ............................................................................................................................................................ 21
Geo-media: Satellite Remote Sensing (SRS) ........................................................................................................................................................................ 31
Serious Games...................................................................................................................................................................................................................... 48
(Apps for) Smartphones and Tablets ................................................................................................................................................................................... 62
Social Media ......................................................................................................................................................................................................................... 92
Course specific inspiration .....................................................................................................................................................................................................121
Resources ...............................................................................................................................................................................................................................127
5
Introduction
A decreasing interest in science Evidence shows that there is a decreasing interest in science disciplines amongst youth all over Europe. While there is a growing consensus
about the needs to change the way science is traditionally taught and how effective science education should look like, the major task
remains to translate these general recommendations into an everyday classroom practice.
The MASS project So how can we make science education more attractive and accessible for students? This is the main question in the Motivate and Attract
Students to Science (MASS) project.
We found that issues of sustainable environmental education lend themselves particularly well for this purpose since they provide the
motivational advantage of relating to students everyday live, are often subject of the public discourse and provide direct links to different
science disciplines, enabling cross disciplinary interactions including not only the sciences but also the human dimension.

6
Eight countries (Czech Republic, Poland, Estonia, Latvia, Germany, Greece, Cyprus and The Netherlands)
combined their expertise and joined forces to find answers to this question. Good practices from all
countries were collected and analysed and are now disseminated throughout Europe. The MASS-project
hopes to support teachers in their endeavour to provide attractive and motivating approaches in teaching
science, which will hopefully help to make the student’s learning experience in science more relevant, fun
and accessible.
Three challenges The MASS project has identified three major challenges in making science education more attractive for students.
1. Science through digital learning
The majority of today´s generation of students use digital devices, internet applications or social media on a daily basis. The MASS project
shares good practices and experiences on using digital tools and media to make science education more meaningful.
2. Early Inquiry
Inquiry has proven to be an effective method to attract children to science to increase their learning success, especially at a young age. The
MASS project analyses barriers of using inquiry-based methods at schools and shows successful implementation of these methods to the
science classroom practice, with a special focus on primary schools learners.
Science through digital
learning
Early Inquiry
Low achievers in Science
Other MASS-products
7
3. Low achievers in science
Science is a setting where we learn important lessons about the real
world; that is why it must be delivered to every child. The MASS project
collects, pilots, adapts and shares practices that deal with attracting low
achievers to science and help them develop some of the key Competencies
that are basic-life skills at the same time.
For all of these challenges products (i.e. tutorials, trainings, lesson plans)
have been developed.
Check the MASS website www.mass4education.eu for the latest updates.
The partners in the MASS project believe that by addressing these three
challenges, we make a significant contribution to show the relevance of
science in real life that concerns every one of us. If we start speaking the language and using the tools which are attractive to our students,
we can make science education more popular.
Why digital tools? Today´s generation of students is widely characterised as ‘Digital Learners’ (Generation Y and Z). Most of them use digital devices, internet
applications and/or social media on a daily basis, mostly for communication and entertainment. When the traditional “talk and chalk”
teaching approach fails with these students, we have to take up the challenge to offer teaching methods resonating with their way of
learning.
8
Furthermore, the digital competence has been acknowledged as one of the eight key competencies for a
lifelong learning by the European Union.
The digital competence can be broadly defined as the confident, critical and creative use of ICT
(Information and Communication Technologies) to achieve goals related to work, employability, learning,
leisure, inclusion and/or participation in society. It is practically a transversal key competence which, as
such, enables acquiring other competencies (e.g. maths, science, learning to learn).
According to comparative research executed in the MASS project teachers find significant ‘added value’ in
using digital tools compared to conventional tools. A survey conducted within the MASS-project showed
that the majority of the respondents state that using digital tools in science classes:
a. Is more attractive for students.
b. Is more effective for the learning process.
c. Is easier for students because they are familiar with these tools.
d. Helps a self-paced learning.
e. It’s time saving.
f. Provides the possibility to evaluate the students and the learning process.
In this tutorial we will give you an overview of five types of digital tools and how these tools can help you to make your science lessons
more attractive and motivating for your students.
Geographic Information
Systems
Satellite Remote Sensing
Serious Games
(Apps for) Smartphones and
Tablets
Social Media
Tools

9
Tools
10
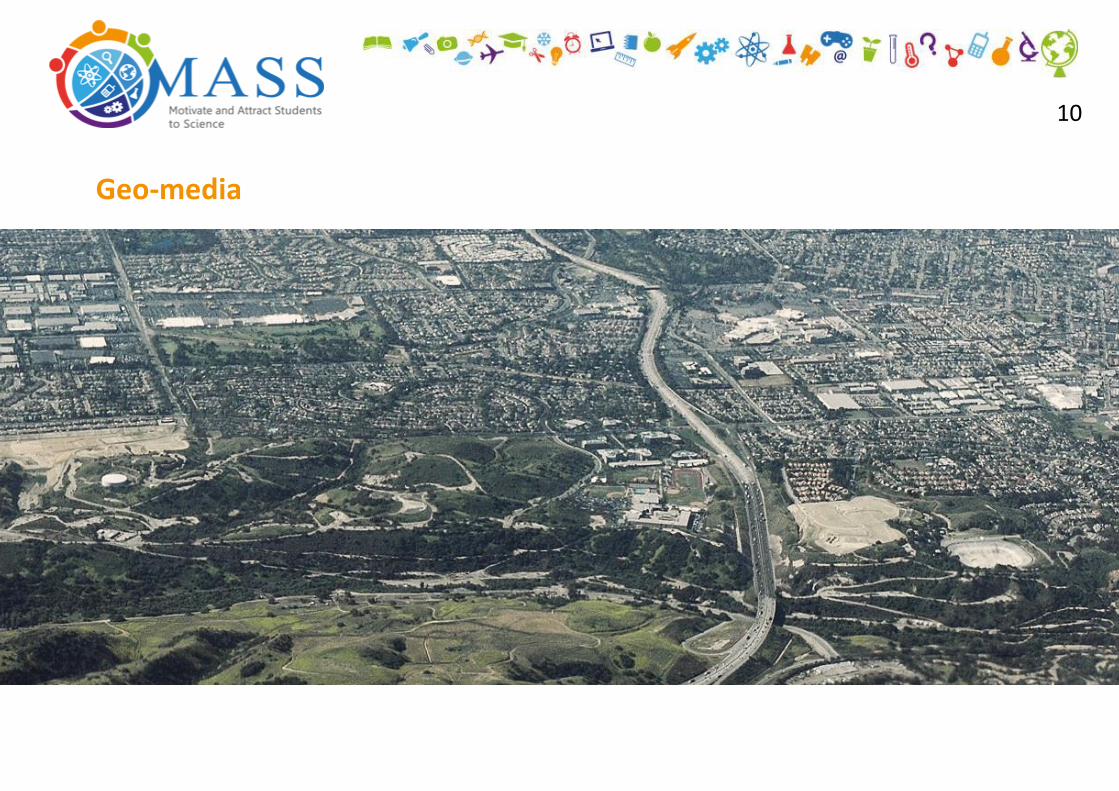
Geo-media
11
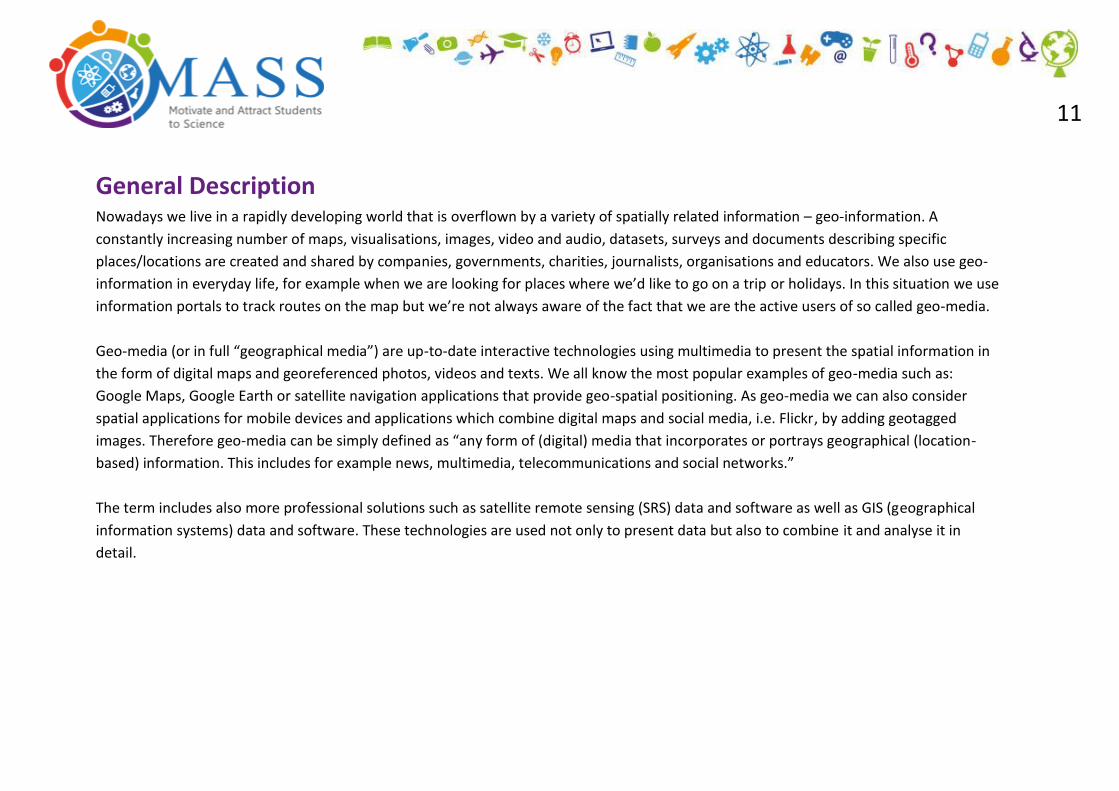
General Description Nowadays we live in a rapidly developing world that is overflown by a variety of spatially related information – geo-information. A
constantly increasing number of maps, visualisations, images, video and audio, datasets, surveys and documents describing specific
places/locations are created and shared by companies, governments, charities, journalists, organisations and educators. We also use geo-
information in everyday life, for example when we are looking for places where we’d like to go on a trip or holidays. In this situation we use
information portals to track routes on the map but we’re not always aware of the fact that we are the active users of so called geo-media.
Geo-media (or in full “geographical media”) are up-to-date interactive technologies using multimedia to present the spatial information in
the form of digital maps and georeferenced photos, videos and texts. We all know the most popular examples of geo-media such as:
Google Maps, Google Earth or satellite navigation applications that provide geo-spatial positioning. As geo-media we can also consider
spatial applications for mobile devices and applications which combine digital maps and social media, i.e. Flickr, by adding geotagged
images. Therefore geo-media can be simply defined as “any form of (digital) media that incorporates or portrays geographical (location-
based) information. This includes for example news, multimedia, telecommunications and social networks.”
The term includes also more professional solutions such as satellite remote sensing (SRS) data and software as well as GIS (geographical
information systems) data and software. These technologies are used not only to present data but also to combine it and analyse it in
detail.

12
Types of geo-media
The term geo-media includes a wide range of technological solutions enabling to apply geo-context into educational
processes through different ways. The most popular and well-known geo-media types are:
Interactive maps
The functionality of such maps is aimed mainly at browsing available data or searching for necessary information, e.g. determining a route
(how to get to school from home), finding a specified object (where is the nearest health facility) or getting detailed information about it
(what is it’s exact address). It is possible to make simple measurements such as distance or area and often also generate a link to a specific
map view in order to send it by e-mail to another person who then can open the link and see it on his/her own computer exactly the same
thing we see on ours. Well-known examples of interactive maps are Google Maps and Apple Maps.
Geoportals
A geoportal can be defined as a web portal used to find and access geographic information (geospatial information). In contrast to the
interactive maps, geoportals combine the data provided from various sources (including official resources) and enable us to display, edit
and analyse this data. Over the geoportals users get access to associated services by adding Web Map Services (WMS). It’s the term for a
standard protocol for serving georeferenced map images which a map server generates using data from a GIS database. Each of the EU
countries has its own national geoportal. Students could get inspired by the use of professional spatial information resources that were
created with the "serious" specialist use in mind. This makes the young people more motivated to follow instructions and complete their
school's tasks.
National geoportals of MASS partners’ countries:
Czech Republic
Cyprus

13
Estonia
Germany
Greece
Latvia
Netherlands
Poland
Virtual globes
A virtual globe is a 3D representation of the Earth, providing the user with the ability to move around by changing the viewing
angle and position. Virtual globes have the possibility of displaying additional information on the surface of the Earth –
geographical features, man-made features (roads, buildings), or representations of different demographic (population) and
natural quantities (earthquakes). There are lots of examples of virtual globes such as Earth Browser, NASA World Wind,
OpenWebGlobe, but the most popular and recognisable is Google Earth.
GPS devices and location-based applications
GPS (Global Positioning System) is a space-based navigation system. It is used to provide us with information about location and
time. GPS receivers and geolocation-based apps provide an opportunity for everyone to locate themselves, find the proper way
(for example during field work) as well as to demonstrate the relationships between the real space and the map. GPS devices
and some of the GPS-based apps (such as the PDF Maps - app) also allow users to gather their own data (e.g. results of the field
measurements). GPS devices and location-based applications are great tools to support outside activities (organising field trips,
exploring nature, and collecting data). Using GPS receivers and mobile apps is very attractive for students, as it combines learning with fun.

14
Geotagged videos/images/posts, etc.
Maybe this surprising, but also geotagged images or videos, so widely used in social media, are examples of geo-media. If you share your
photos and add information about the exact location or when you “check-in” on Facebook and post a message to your friends from a
specific place, it’s also a form of geospatial metadata.
All of the tools, that are widely available today for everyone, were developed on the basis of more advanced technologies such as satellite
remote sensing and GIS solutions. These technologies were firstly used by experts/specialists and are nowadays also available to a broad
range of users; e.g. students and teachers.
Open source/ commercial software for remote sensing
Nowadays satellite images are widely available through simple browsing tools such as interactive maps. In most cases they are used as a
background to present some other phenomena (earthquakes for example). More professional remote sensing software is used not only to
access and view, but also to analyse data acquired by satellites (filter data, perform classification and even radar decomposition). Teachers
can successfully use these tools, even with young students. They are easy to use and students are eager to try them because this is
software used by professionals (experts and researchers).
There are two types of software available: commercial software and open source software (available for free). Open source remote sensing
software (For example: MultiSpec, SAGA GIS, GRASS, InterImage, ILWIS) enables to process data without the big financial expenses.
Depending on the needs and discipline you can choose the appropriate software. Commercial software (For example: ERDAS IMAGINE,
ENVI, eCognition Developer, IDRISI Selva) provide more advanced packages of tools.
15
Open source/commercial GIS software
The interactive maps and geoportals that are mentioned above offer a basic set of opportunities to work with spatial data (searching,
browsing, combining andsometimes simple analyses). If we want to extend the range of opportunities to work with spatial data, it's worth
reaching for desktop-types of GIS software installed directly on the user’s computer. The GIS software allows to analyse data in a more
advanced way, to create our own set of data and to prepare thematic maps.
There are two types of software available: commercial software and open source software (available for free). Both, open source software
(QGIS) and commercial software (ArcGIS) offer a wide range of tools and it’s user-friendly. Some tools (ArcGIS Online) offer access through
the web browser (so users don’t have to install anything on the computer) and store data in the Cloud. Most of the GIS software is also
available in a mobile version so it can be used on tablets during field work.
Because satellite remote sensing and GIS solutions are not as well-known as other types of geo-media we decided to focus on those two
types of geo-media and describe them in the Tutorial in detail.

16
Didactical Concept
The term geo-media is also used in aneducational context. They are great tools for supporting teaching and learning. They offer many
opportunities for designing contemporary, relevant and challenging instruction methods in which students learn to analyse and solve
spatial problems. Education with geo-media is often consistent with the ideals of inquiry-based education within authentic contexts. Geo-
media can support every aspect of the spatial enquiry process. As it allows teachers and students to engage in more sophisticated
investigations than otherwise possible. Geo-media have the ability to radically change the way subjects are taught. Geo-media could be
included in all science subjects.
Competencies
Using geo-media in an educational context provides many benefits:
It enhances personal competencies by improving the spatial literacy (reading,
orientating, combining, interpreting, measuring, comparing and querying).
It improves social competencies such as collaborative activities, sharing and discussing.
It improves professional competencies by bringing the real world to the classroom, also
constructive and active learning practices like problem solving, project-based learning,
fieldwork strategies and inquiry approaches.
Figure 1 - Source: www.digital-earth.eu

17
You should start using geo-media during your lessons because of some important arguments:
Professional – geo-media are widely used now in many companies and institutions by people working in such domains as spatial
planning, logistics, infrastructure, agriculture, disaster mitigation, water management and climate change research;
Employability – The geo-media sector is rapidly developing so these competencies become really important in many professions;
Citizenship – geo-media enables to follow crime data, spatial plans and the location of services through digital maps. They also prepare
students for being active people in their local society. Lastly geo-media allows them to travel virtually to places that are remote and
inaccessible to them, to learn about objects and phenomena and follow processes happening in the world.
Good practices
Below you can find two examples of lessons using different types of geo-media for a one
topic:
Brazil – the country of rainforests and overpopulated cities
Subject:
Duration: 60 min
Level: Junior and senior (13-16 years)
Main goal
Developing skills to describe and explain the relationships and dependencies between
human activities and the natural environment.
18
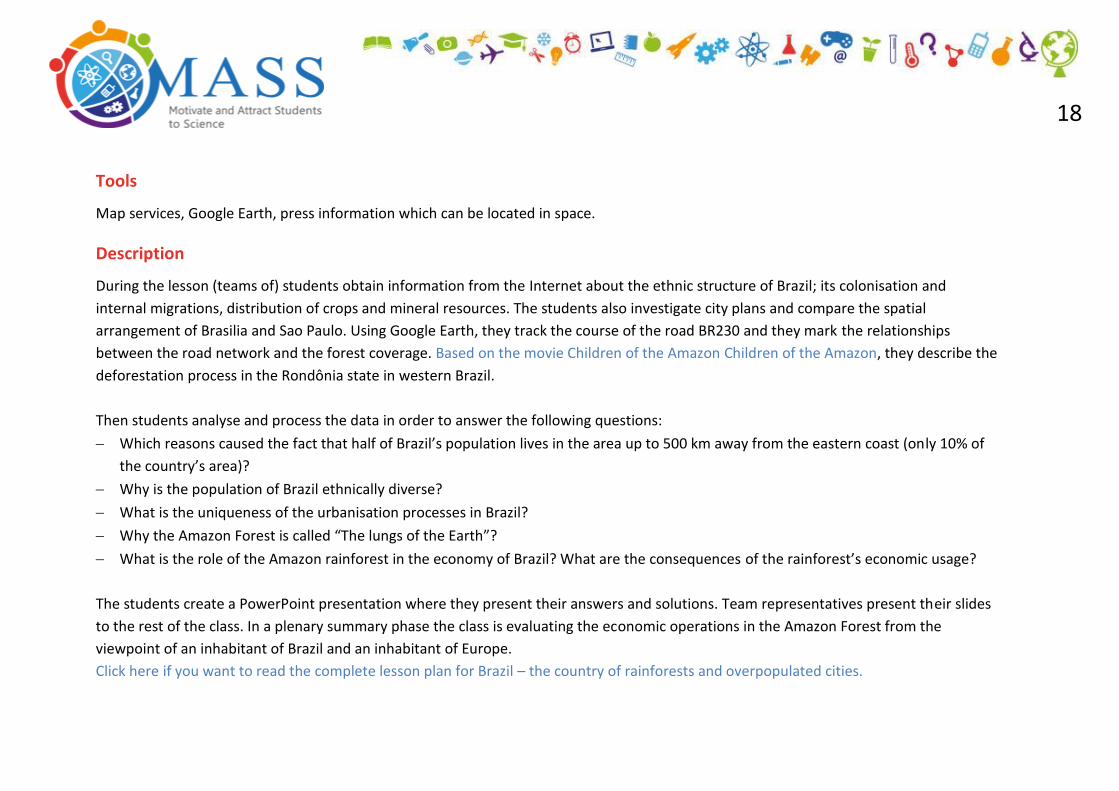
Tools
Map services, Google Earth, press information which can be located in space.
Description
During the lesson (teams of) students obtain information from the Internet about the ethnic structure of Brazil; its colonisation and
internal migrations, distribution of crops and mineral resources. The students also investigate city plans and compare the spatial
arrangement of Brasilia and Sao Paulo. Using Google Earth, they track the course of the road BR230 and they mark the relationships
between the road network and the forest coverage. Based on the movie Children of the Amazon Children of the Amazon, they describe the
deforestation process in the Rondônia state in western Brazil.
Then students analyse and process the data in order to answer the following questions:
Which reasons caused the fact that half of Brazil’s population lives in the area up to 500 km away from the eastern coast (only 10% of
the country’s area)?
Why is the population of Brazil ethnically diverse?
What is the uniqueness of the urbanisation processes in Brazil?
Why the Amazon Forest is called “The lungs of the Earth”?
What is the role of the Amazon rainforest in the economy of Brazil? What are the consequences of the rainforest’s economic usage?
The students create a PowerPoint presentation where they present their answers and solutions. Team representatives present their slides
to the rest of the class. In a plenary summary phase the class is evaluating the economic operations in the Amazon Forest from the
viewpoint of an inhabitant of Brazil and an inhabitant of Europe.
Click here if you want to read the complete lesson plan for Brazil – the country of rainforests and overpopulated cities.

19
What are natural and cultural values of ‘Kozienicka Forest’? A field trip project
Subject:
Duration: 45 min (introduction in the classroom) + 150 min (field trip) + 45 min (summary in the classroom)
Level: secondary school (13-16 years)
Main goal
Foster the interest in natural and cultural values of Kozienicka Forest in central Poland.
Tools
Google Earth, national geoportal, GPS devices.
Description
At the beginning of the lesson, students are taught how to work with GPS devices. They determine the latitude and longitude of the
starting and destination point of the trip. They also select other points of the trip route (5 points at the most) based on the various map
services. Then, they measure the length of the planned trip using the selected map services. Next part of the activity includes field work.
Students work in groups. Every group has the same task: register the starting and destination points using GPS to navigate to consecutive
pre-selected points of the route. At every point of the route they register the GPS location (geographic coordinates) of the point. They also
take pictures of the selected interesting natural/cultural objects. They also must fill out their worksheets. Finally, every team uploads the
points and tracks, collected during the fieldwork, to Google Earth. Moreover, they add descriptions from their worksheets and pictures

20
(visualisation of data gathered during the field work). In the summary phase the students make a multimedia presentation showing the
natural and cultural values of the Kozienicka Forest.
Click here if you want to read the complete lesson plan for the field project: What are natural and cultural values of Puszcza Kozienicka
(Kozienicka Forest)?
Tips & Tricks
Explore the Universe with Google Earth – the most interesting features are:
The Moon - See 3D models of a spacecraft and zoom into 360-degree photos from past space missions.
3D Buildings - Explore cities, buildings and structures with the 3D Buildings layer.
Mars - View NASA images, take tours, see 3D rover models and browse 360-degree panoramas.
The Sky - Zoom to distant galaxies, view constellations and learn about celestial research from the experts.
The Ocean - Dive beneath the surface and explore lost shipwrecks, surf spots, and see the latest research discoveries.
Historical Imagery - Travel back in time with Historical Imagery. Compare the landscape of the past with the present day.
Use Google Maps or Apple Maps for planning a trip:
Check your current location and mark your starting point;
Search for interesting places you can visit. Use Google Street View to see how these places look in real life;
Choose a destination point;
Estimate the distance and time duration;
Check the traffic;
Can you go to this place by public transport or by bike? – Use Transit and Bicycling;
Share the created map to your friend.
21
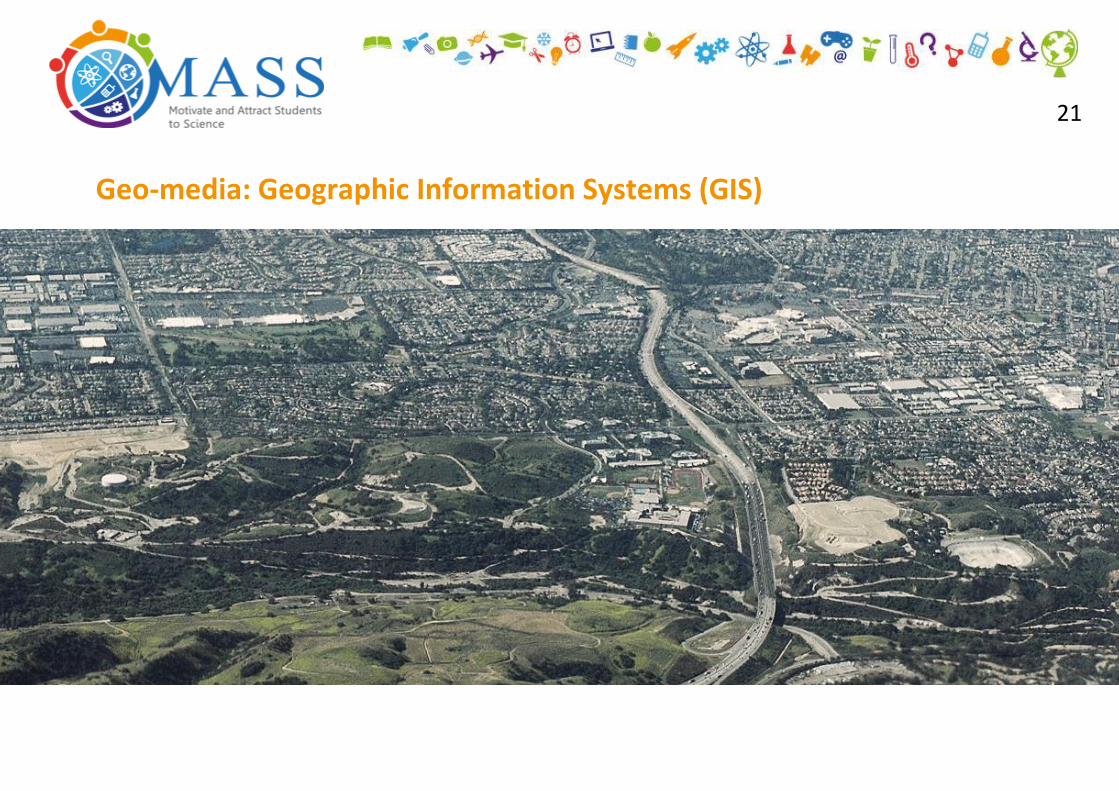
Geo-media: Geographic Information Systems (GIS)

22
General Description
Geographic Information System, acronym GIS, is a system designed to capture,
manage, visualise, analyse, andinterpret spatial/geographical data and
disseminate the results of those analyses in a form of specific information, so
called geo-information. Geo-information is information about the world saved in
a digital format. It includes not only the location and extent of specific objects or
phenomena but it also includes more detailed characteristics (attributes) – type,
diversity, continuity, intensity and other properties.
Effective use of GIS tools depends on the integration of a few components:
Data - the most important component of GIS. The data can be stored in
various formats (vector data, raster data, attribute data, etc.). Free and open access to
geo-data is crucial to use GIS.
Software/hardware - commercial or open source software installed on selected types of
devices (PC, laptops, and mobile devices) or integrated with web browsers. Access to the
Internet can be also needed sometimes (to use the resources available online through so
called web services). Printers and plotters are needed if users want to share their maps.
GPS devices can be helpful when collecting data during field work;
People - users who work with GIS software and browse, analyse, create and disseminate
data. The group of GIS users is nowadays really impressive. It includes specialists such as
administrators, managers, GIS technicians and application experts who develop and
manage software, geo-databases, etc. providing fast and easy access to data and software
for other users.
Figure 2 Examples of GIS data. Source: www.in.gov
Figure 3. Fundamentals of GIS. Source: gisresources.com
23
Approaches - procedures used to process the data and evaluate the quality of the final products (compare results of analyses). They
include methodology and specific rules which describe how GIS is applied. Examples of these approaches are: guidelines, specification,
standards, procedures, etc.
Didactical Concept
Competencies
Teaching with the help of GIS supports development of the ability to perceive and determine spatial relationships.
Different groups of researchers and educators working in the frames of European projects tried to make lists of competencies developed
while using GIS tools.
Amongst skills related to map reading and understanding, S. Bednarz (2001) listed the following competencies:
Determining map information layers and decomposing the map into separate layers – identifying components of map presentations,
including reference, background and thematic layers;
Aggregating data - indicating means of generalising map contents; vector, raster, and database formats and functionalities;
Correlating data - indicating map contents that are interrelated and interdependent (e.g. soil type and habitat fertility);
Evaluating spatial distribution of phenomena: either regularity (e.g. higher population density in urban areas compared to rural areas),
or randomness (e.g. occurrence of natural disasters such as fires);
Assessing similarities between objects (e.g. vegetation types within the same climate zone in various locations on Earth);
Forming hierarchies between objects (e.g. identifying various parts of the river, its tributaries and finally the borders of the river basin);
Map measurements (e.g. distance, area, calculations according to the map scale or even taking into account map projection).

24
Results of the EduGIS Academy project revealed that in the group of competencies that are challenging to the students, and have a direct
relation with the science subjects (physics, chemistry and mathematics), are skills associated with spatial data and databases. Here we can
find primarily:
Classifying data - quantitative and qualitative methods;
Reading, on the map, the results of these classifications (e.g. regarding continuous and discrete phenomena);
Sorting the data in the ascending or descending order, identifying maximum and minimum values, determining mean values;
Formulating queries, i.e., simply speaking, the ability to search the data according to specific criteria: value, data attribute, boundary
conditions.
See more information about the GIS competencies developed within:
EduGIS Academy
HERODOT Thematic network for Geography
The SPACIT project
How to organise this in your classroom
QGIS
QGIS is a user friendly Open Source Geographic Information System (GIS) type of software that is licensed under the GNU General Public
License. It’s a free software license, which guarantees all users to freely run, study, share and modify the software. QGIS is an official
project of the Open Source Geospatial Foundation (OSGeo). It runs on Linux, Unix, Mac OSX, Windows and Android and supports numerous
vector, raster, and database formats and functionalities. It is available free of charge and you can download it at www.qgis.org

25
Read the following instruction to find out more: Where and how can I download the QGIS software?
Free and open geospatial data
Copernicus Program
Copernicus is a European system for monitoring the Earth. Copernicus consists of a complex set of systems which collects data from
multiple sources: earth observation satellites and in situ sensors such as ground stations, airborne and seaborne sensors. It processes these
data and provides users with reliable and up-to-date information through a set of services related to environmental and security issues:
land, marine, atmosphere, climate change, emergency management and security.
The data provided in the frame of the Copernicus Program, mainly concerns land use and land cover themes. You can find more details
below.
CORINE Land Cover - The CORINE Land Cover (CLC) inventory was initiated in 1985 (reference year 1990). Updates have been produced
in 2000 and 2006, and the latest 2012 update is under production. It consists of an inventory of land cover in 44 classes. CLC uses a
Minimum Mapping Unit (MMU) of 25 hectares (ha) for areal phenomena and a minimum width of 100 m for linear phenomena.
Urban Atlas - The Urban Atlas is providing pan-European comparable land use and land cover data for Functional Urban Areas (FUA).
The Urban Atlas is a joint initiative of the European Commission Directorate-General for Regional and Urban Policy and the Directorate-
General for Enterprise and Industry with the support of the European Space Agency and the European Environment Agency.
See some instructions to find out more:
» How can I download Urban Atlas data for my city?
» How can I add the Urban Atlas data for my city to QGIS?
» Get to know more about Urban Atlas
http://mass4education.eu/images/materials/How_can_I_add_the_data_for_my_city_to_the_QGIS_project.pdf
26
Riparian Zones - Riparian zones represent transitional areas occurring between land and freshwater ecosystems, characterised by
distinctive hydrology, soil and biotic conditions and strongly influenced by the water stream. They provide a wide range of riparian
functions (e.g. chemical filtration, flood control, bank stabilisation, aquatic life and riparian wildlife support, etc.) and ecosystem
services.
Natura 2000 - Natura 2000 (an EU-wide network of nature protection areas established under the 1992 Habitats Directive) is the centre
piece of the EU nature & biodiversity policy. The aim of the network is to assure the long-term survival of Europe's most valuable and
threatened species and habitats.
High Resolution Layers - Pan-European High Resolution Layers (HRL) provide information on specific land cover characteristics, and are
complementary to land cover / land use mapping such as in the CORINE land cover (CLC) datasets. The HRLs are produced from 20 m
resolution satellite imagery through a combination of automatic processing and interactive rule based classification. Five themes have
been identified so far, corresponding with the main themes from CLC, i.e. the level of sealed soil (imperviousness), tree cover density
and forest type, (semi-) natural grasslands, wetlands and permanent water bodies.
European Environment Agency
You can download a big package of data about Europe’s environment from EEA’s website. The data concerns various themes, i.e.
agriculture, air pollution, biodiversity, climate change, coasts and sea, energy, environment and health, environmental scenarios,
environmental technology, fisheries, green economy, household consumption, industry, land use, natural resources, noise, soil, specific
regions, tourism, transport, waste and material resources, water. This variety of topics causes that you can simply include geospatial data
into your lesson’s scenario.
Other sources
Natural Earth – Natural Earth is a global data resource. All themes are available in three levels of detail. For each scale, themes are
listed on Cultural, Physical, and Raster category pages;

27
Global Elevation Map - GMTED2010 (Global Multi-resolution Terrain Elevation Data 2010) is a suite of seven raster data products:
minimum elevation, maximum elevation, mean elevation, median elevation, standard deviation of elevation, systematic subsample,
and break line emphasis. The spatial resolution of GMTED2010 ranges from 1 kilometre, 500 meters and 250 meters;
WorldClim - Free climate data for ecological modelling and GIS;
International Human Development Indicators - Human development data from around the world in the form of an interactive tool;
Good practices
In order to illustrate the use of GIS in classrooms we have listed some examples of good practices below:
Analysis of socioeconomic differences in the development of the world
Subject:
Duration: 90 min
Level: Junior & Senior (14 – 18 years)
Main goals
Increasing awareness of differences in the socioeconomic
development of various countries of the world.
Understanding what measures (indicators) are used to describe the
socioeconomic development.
28
Understanding the reasons behind classifying countries into different groups, depending on the level of their social and economic
development.
Acquiring skills on using GIS to analyse the socioeconomic development of the world.
Tools
Quantum GIS, Google Earth anddatabases available in the Internet
Description
First of all, students are introduced to the topic through a moderated discussion.
Next, they formulate a research hypothesis together. Students are then divided into 3 groups. Each group collects data on different
International Human Development Indicators: HDI (Human Development Index), GDP (Gross Domestic Product) per capita in USD and the
average life expectancy at birth. They convert the data to dbf files (database files). The next step includes downloading vector data with
administrative boundaries (countries) and various data from the GEO Data Portal UNEP.
The students merge the data from the attribute tables with the data in the .dbf format. They work together in teams. Finally, the students
create maps presenting selected indicators and they determine the geographical distribution of countries with different levels of
development. They also try to provide causes of the uneven socioeconomic development of the World. In the summary phase some of
students present results (multimedia presentation) of each group. They show their research hypothesis, analysis of development indicators
and they finish with the conclusions and evaluation of the research hypothesis.
Click here to see the complete lesson plan for the project: Analysis of socioeconomic differences in the development of the world with the
use of GIS.
29
Tips & Tricks
GIS is a supportive tool that allows your students for faster and better understanding of the topic while they have access to real and up-
to date information. The main topic of a lesson needs to be clearly defined to use GIS tools as a support for reaching your goals.
Cooperate with other teachers and educators: Establish a cooperation with institutions involved in environmental education in your
area: educators in the national and landscape parks. Organise joint activities and field trips. These partners often have access to
equipment that is not available in schools: measuring equipment, GPS devices, and tablets. They are usually happy to lend it for the
classes, so that the young people can learn how to operate it.
Using GIS in your classroom might result in using new software and new technology. This can be scary, especially because students
might cope better with this new technology than you do. Don’t let this scare you off and try to investigate new options together with
your students.
Try to anticipate that technical problems might occur. Every piece of equipment can fail (e.g. power outage, failure of the Internet
connection etc.); therefore it is important to anticipate on such events, so that you won't be surprised during the class. Think in
advance about such possibilities and for example copy the appropriate amount of information from Internet databases and take
screenshots of interactive maps and geoportals so that you can use them as offline resources during the class.
If you want to learn more about GIS technology you could look for e-learning courses, find information on the Internet or try to find
another teacher in your area who already uses GIS to teach. And if you are not comfortable enough with introducing geo-media at your
standard lessons, begin with a smaller group of students. This could be a group of students that are exceptionally interested in
technology or need an interesting topic for their high school project. See also ‘Learn More’.
Use equipment available outside of your classroom/lab: teamwork is everything. Cooperation with an IT teacher can result in easier
access to a computer lab (in case you don’t have computers in your own subject lab).
Go into the field: Learning natural subjects without field classes is like a driving course without actual driving practice, or a cooking
course without the participants even touching the pots.. Geo-media are perfect tools to be used during field work with your students.
30
Organise activities for students at home: If students can use geotechnology to solve problems and verify their hypothesis, they will be
more engaged in individual and self-sufficient work. Using Internet databases, interactive maps, geoportals, or even GIS software for
preparing information for the next lesson can be an excellent homework idea.
Learn more
GIS Tutorials:
[EN] QGIS Tutorials: QGIS in fewer than 10 minutes – Free videos available on YouTube.
[EN] ArcGIS Tutorials – Free videos available on YouTube.
[EN] QGIS Tutorials and Tips - Tutorials/tips that show you how to tackle common GIS problems.
[EN] QGIS Training Manual – The free official training manual for QGIS.
[EN] Beginner’s Guide to QGIS – The tutorial covering all the basics of QGIS.
GIS Trainings:
[EN] GIS in School Instruction – Materials prepared by the ESRI Education Team.
[EN] Free Training Courses - Hundreds of training options on GIS, ArcGIS technology, and related topics offered by ESRI. Especially
recommended courses are Getting Started with GIS and Teaching with GIS: Introduction to Using GIS in the Classroom.
Inspiration for your GIS lessons:
[EN] EdCommunity of ESRI – homepage of education community using GIS in education at schools – some lessons plans available.
[EN] GIS at school - Guidebook for biology, geography, and science teachers.
[EN] DigitalEarth.ue - Materials developed within the Digital-earth.eu project

31
Geo-media: Satellite Remote Sensing (SRS)

32
General Description
Remote Sensing is making measurements about an object without the instrument
being in direct contact with the object. Eyesight for example, is a form of remote
sensing. When the eye sees an object, the electromagnetic radiation (reflected
light) from the surface of the object is registered and the contained information
about the surface can be seen as colour.
Satellites are using sensors that work like our eyes. Important difference is that
satellite images are not only from the visible region but from the whole
electromagnetic spectrum. Satellites collect images from different parts of the
earth and are continuously monitoring the earth from space.
Depending on the satellite sensor, images could be of high or low resolution. The
satellite scanning procedure converts the area into a grid (Figure 1) according to the
satellite spatial resolution. The spatial resolution specifies the pixel size of the satellite
image (Figure 2). The smaller the pixel size, the better the spatial resolution, which
results in a more detailed image.
There are many earth observation satellites active in space with different characteristics,
enabling the use of satellite data in many applications of the scientific community. Apart
from the scientific community, several public entities use satellite images for varying
applications. For example military operations, disaster monitoring, infrastructure
development planning and monitoring, etc.
Nowadays, more people are becoming familiar with satellite images as satellite remote
sensing is used in everyday life. Characteristic examples are:
Figure 1. Satellite scanning procedure (Source: The COMET® Program)
Figure 2. Spatial resolution specifies the pixel size of satellite images.

33
Google Earth which uses satellite images in different spatial resolutions according to the population and density of each area.
The weather forecasting report that uses satellite images to show weather fronts and forthcoming weather.
Didactical Concept
The value of satellite remote sensing as a digital tool for supporting (science) education is highlighted through:
The vast variety of applications for the real world;
The different ways of presenting (textbook, animation, Internet) and assimilating the data (interpreting colours or processing images
with software);
The rich content of satellite images that offers a lot of knowledge in short time about many topics;
Strengthening of natural science education while working on present questions;
The opportunity to visualise real and present topics and questions concerning the earth atmosphere and environment with near real
time images, which is extremely motivating.
Satellite remote sensing can support learning activities in multiple science classes. Satellite images can be stimulating for students and
helps to enhance their understanding of science (education). The abundance of existing satellite remote sensing applications covers
different educational levels and provides a good opportunity for cross-curriculum teaching.
Satellite remote sensing applications can serve different learning styles since satellite images can be involved in a lesson plan as photos or
videos, projected or printed material, totally guided or a totally independent exercise.
Also it can be used as a case study of an environmental issue related to a real life situation and can be interpreted within a working group
or individually. This offers the possibility to develop lesson plans for all types of learners and difficulty levels, whose teaching needs vary
from lectures and brainstorming to field work and observations.

34
Furthermore, satellite images can enhance or even replace some teaching methods. For example, a satellite image can be additional
material to the Earth globe sphere, used for a geography lesson or it can replace a common map in an exercise for spatial scales. Also, in
the environmental science lesson and especially in the chapter of natural disasters and human induced environmental changes satellite
images are key tools for the learning process.
Competencies
Using satellite remote sensing helps to develop and improve a wide range of student’s competencies and skills, such as:
Spatial orientation competence, method competence, evaluating and practice skills;
Multidisciplinary knowledge and thinking;
Problem solving;
Enhanced critical thinking;
Environmental awareness;
Digital and technological competencies;
Working in teams;
Problem-oriented working.

35
How to organise this in your classroom
Near real time satellite images
Satellite data are easily accessible as they can be found for example on the websites of
organisations as ESA, NASA, etc. Near real time satellite images, archives with older
data and recent case studies that concern people worldwide (i.e. environmental
accidents, natural disasters, extreme weather, etc.) are provided free of charge.
Click here to observe and discuss the present weather with Meteosat images (Figure 3)
for all countries in Europe and Africa free, simple and without registration.
See also the following instruction videos:
Watch online and download B&W Satellite Images
Watch online and download Coloured Satellite Images
Watch the downloaded Satellite Images
Figure 3 Meteosat image for central Europe – Airmass rgb composite

36
Multispec and Landsat images
You can use specialised software for analysing and processing images and data. For example you can use Multispec that is a freeware
Multispectral Image Data Analysis System developed at Purdue University. Multispec is suitable for introducing students to satellite remote
sensing through the use of basic remote sensing techniques (classification, RGB analysis, histogram analysis, etc.). For example you can
analyse the characteristics of an area of your preference through satellite image RGB combinations.
Landsat satellite images are appropriate for analysing the characteristics of an area
due to their spatial resolution. Landsat 8 images consist of nine spectral bands with
a spatial resolution of 30 meters for Bands 1 to 7 and 9. Thermal bands 10 and 11
are useful in providing more accurate surface temperatures and are collected at
100 meters. More information about Landsat 8 images or earlier you can find here.
(Registration is required in order to download free Landsat images)
In order to process Landsat images in Multispec you can follow the steps:
Step 1: Download MultiSpec (Instruction video: Download MultiSpec)
Step 2: Install MultiSpec (Instruction video: Install MultiSpec)
Step 3: Sign in and download Landsat Images
Step 4: Import and process Landsat images in MultiSpec (Tutorial video: Import
and process Landsat Images in MultiSpec)
Click here for some more theoretical background.
Figure 4. BliF Web application depicting New York

37
BliF
Teachers can also use BliF (see screenshot in Figure 4) to interpret and analyse satellite images. BliF is a web application for analysing
satellite images. It is designed primarily for the use in education and has a user friendly interface. Instructors can use BliF to teach remote
sensing techniques without the use of advanced software, free of charge and with a lot of supportive material. BliF has three levels
(beginners, advanced learners and professional users) and also provides an assistant guided mode.
In order to use BliF in your classroom you should visit this web page and send a message to retrieve a user name and a password.
Afterwards you will be able to launch the application. The application has an archive of satellite images. For the moment BliF is only
available in German.
38
Good practices
The examples below, demonstrate that satellite remote sensing applications on education can stimulate your students’ interest to solve
and analyse environmental, physics and mathematics problems.
Land Cover Change Analysis
Subject:
Duration: 45 minutes
Level: This lesson is most suitable for students in high school (14-18 years old).
Main goal
Students can track changes to the landscape over time and realise the man footprint.
Tools
PCs with downloaded Landsat images and installed Multispec software (see How to organise this in your classroom)
Description
This lesson is designed for senior high school students and can be implemented in different areas. The lesson will guide students in the
process of analysing land cover change, using Landsat images.

39
Firstly, the teacher introduces the impacts (increase of surface temperature, environmental
deterioration, etc.) of land cover changes to local and global climate to his or her students.
Subsequently, students discuss in small groups ways of monitoring and detecting changes in
the environment, while the teacher leads the discussions to Earth observation by Satellite
images. Students then use the Multispec image processing software and two Landsat images
from two different time periods. Each group of students experiments with the band
combinations and discusses which band combination is better for detecting land cover
changes.
Students use the natural colour band combination, in which the changes are clearly depicted.
A qualitative analysis regarding the extent of land cover change during the time period
between image acquisitions follows. Students have to identify areas of change in land cover
and analyse their spatial distribution in their city.
After the above data analysis and processing, students will be able to answer and discuss in
groups the following questions:
Do you see any changes in the land cover?
Can you recognise the use associated with the change?
Can you think of any reason that the change in land cover took place in that specific area?
Did the vegetated areas increase or decrease?
Are any of the changes connected to urbanisation?
40
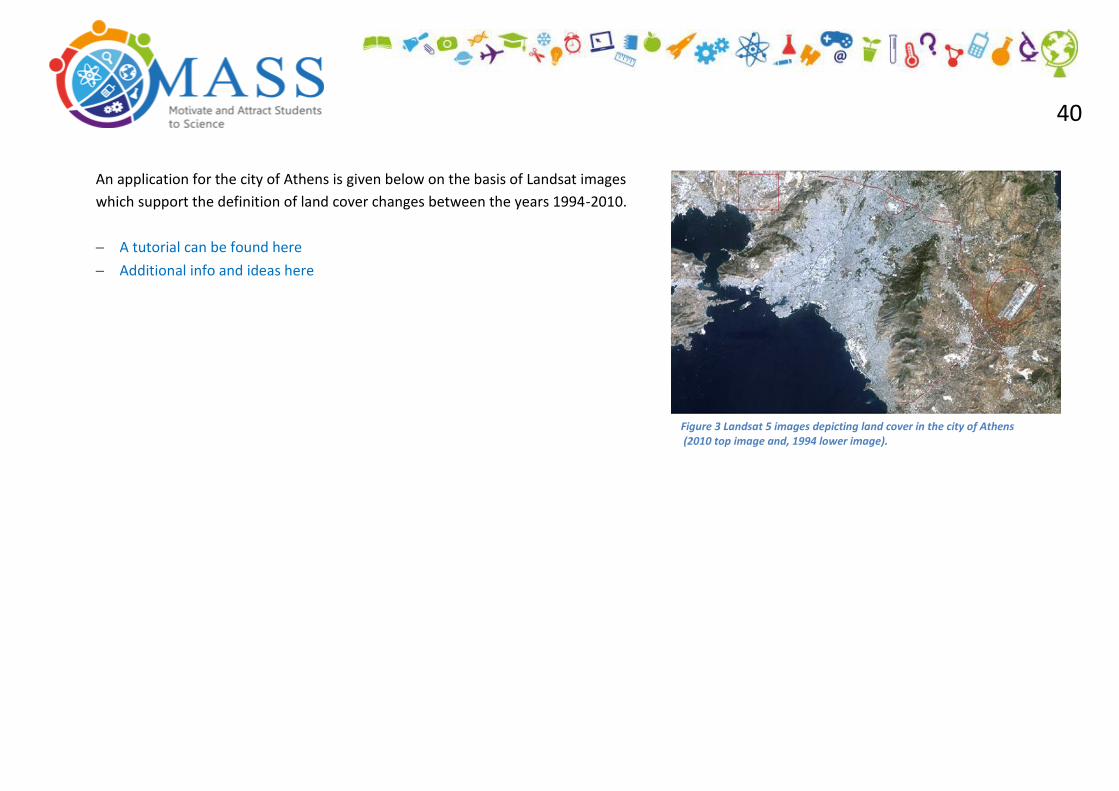
An application for the city of Athens is given below on the basis of Landsat images
which support the definition of land cover changes between the years 1994-2010.
A tutorial can be found here
Additional info and ideas here
Figure 3 Landsat 5 images depicting land cover in the city of Athens (2010 top image and, 1994 lower image).

41
Climate Research Campaign: satellite data in climate change education
Subject:
Duration of each lesson scenario: 45 minutes
Level: This lesson is most suitable for students in high school (13-18 years
old).
Main goals
Improve students’ ICT competencies through the search for information,
such as satellite data related to climate change.
Learn and understand the use of mathematics.
Understand phenomena like ‘Earth’s atmosphere’.
Tools
Adequate technical resources (computers, GPS devices, etc.), Internet connection
Description
This project consists of various lesson scenarios that are ready to use and are related to environmental phenomena and problems. The
developed scenarios are based on the use of satellite data and students use the Internet as a source of information for the scenarios.
Since the project was implemented in close cooperation with teachers who developed lesson scenarios and tested them with their own
students, teachers only have to choose a topic of their interest and follow the well organised and detailed materials.
42
An example of a developed scenario concerns the impact of climate change in the Arctic ecosystem, while the shrinking of the sea ice
coverage in the Northern Hemisphere is studied with multitemporal satellite images.
The project was conducted in the frame of module C of the Climate research Campaign, which is part of the Globe Program in Poland.
For more information see the MASS website or the GLOBE Program in Poland

43
Materials in a city
Subject:
Duration: 45 minutes
Level: This lesson is most suitable for students in high school (13-16 years old).
Main goals
To understand the properties of certain materials as they influence the microclimate in cities.
Tools
A landsat image in the visible band, a table with colour, reflectivity and materials.
Description
The teacher introduces to students the theoretical background of solar radiation principles (reflection, absorption, etc.) and explains the
relation between these and the thermal environment that we live in.
Students solve a simple radiation problem such as:
Problem 1:
Solar radiation falls at a body. Part of the solar radiation is absorbed, contributing to warm up the body, and the rest is reflected.
Reflectivity is measured in percentages and the combination of reflectivity and absorption must add up to 100%.

44
If 1000 watts of radiation falls on a body, and the reflectivity measured is 300 watts, what is the reflectivity of the body? Can you guess the
material?
Students in small groups open a Landsat image in the visible band (channel 3) that depicts the reflected radiation of the surface. The
teacher explains that different colours (different reflectivity) represent different materials. Using the table below, students match the
colours in the image with the respective materials and reflectivity.
Subsequently, students answer Problem 2.
Problem 2:
Find the difference in reflectivity between the darkest and the brightest area. What do these materials represent?
Can you find on the image the material that corresponds to the reflectivity found in Problem 1?
45
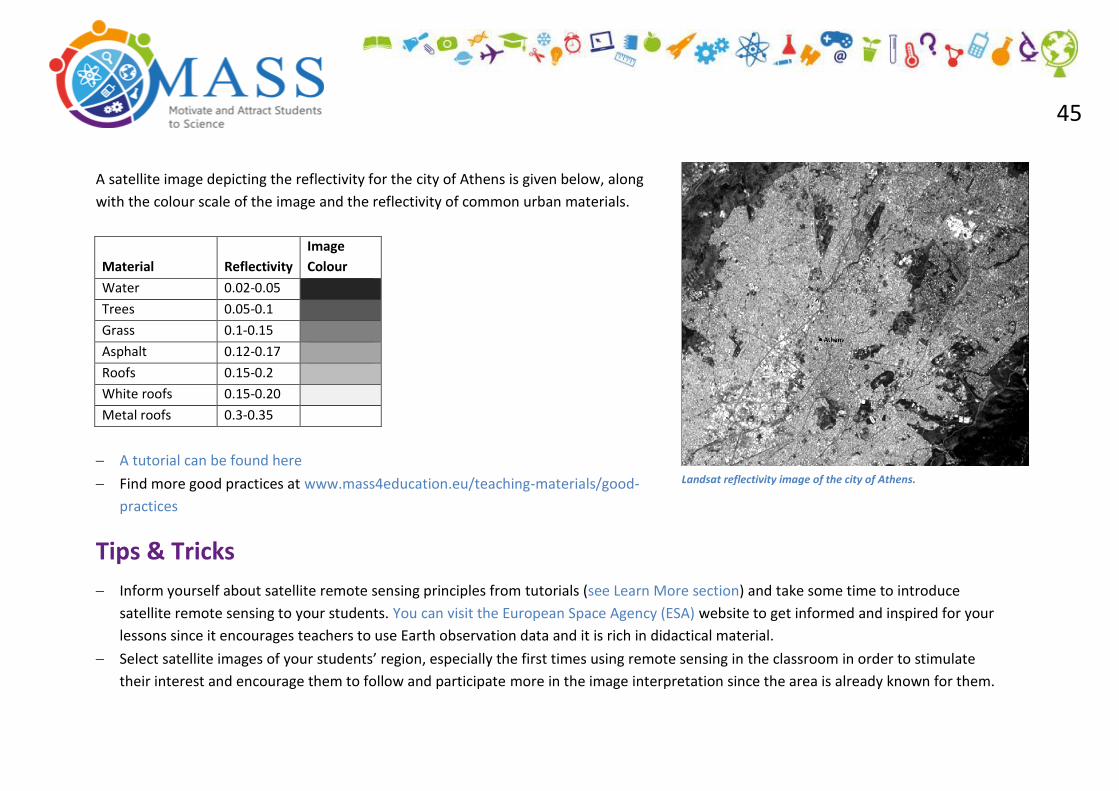
A satellite image depicting the reflectivity for the city of Athens is given below, along
with the colour scale of the image and the reflectivity of common urban materials.
Material Reflectivity
Image
Colour
Water 0.02-0.05
Trees 0.05-0.1
Grass 0.1-0.15
Asphalt 0.12-0.17
Roofs 0.15-0.2
White roofs 0.15-0.20
Metal roofs 0.3-0.35
A tutorial can be found here
Find more good practices at www.mass4education.eu/teaching-materials/good-
practices
Tips & Tricks
Inform yourself about satellite remote sensing principles from tutorials (see Learn More section) and take some time to introduce
satellite remote sensing to your students. You can visit the European Space Agency (ESA) website to get informed and inspired for your
lessons since it encourages teachers to use Earth observation data and it is rich in didactical material.
Select satellite images of your students’ region, especially the first times using remote sensing in the classroom in order to stimulate
their interest and encourage them to follow and participate more in the image interpretation since the area is already known for them.
Landsat reflectivity image of the city of Athens.

46
When trying to develop your own lesson keep in mind that satellite images can support learning activities in multiple science classes for
different learning styles and different difficulty levels. First define the topic of the lesson and the desired learning outcome. Afterwards,
incorporate the satellite data depending on yours and your students’ knowledge according to the methods described above (see
Didactical Concept section)
Participate in teacher training seminars or webinars for teachers on how to use satellite data (such as those organised by the GLOBE
programme in the framework of the GLOBE campaigns related to NASA missions). For more info have a look at our Learn More section.
Learn more
Satellite Remote Sensing Tutorials:
[EN] Introduction to Remote Sensing – Materials prepared by Science Education through Earth Observation for High Schools (SEOS)
project.
[EN] Principles of Remote Sensing – Material prepared by the Centre of Remote Imaging, Sensing and Processing (CRISP).
[EN] MultiSpec Documentation – How to use and analyse data with MultiSpec.
[EN] MultiSpec Tutorials – Multispec tutorials used in the GLOBE Programme to analyse Landsat images and to produce electronically
assisted Land Cover maps.
[EN] Remote Sensing in School – An academic study about the theoretical concept and the practical implementation of Remote Sensing
in School. (University of Education Heidelberg, Germany)
Satellite Remote Sensing Trainings:
[EN] GPM-GLOBE Webinars - For teachers wishing to know how to use satellite data or how to participate in the satellite remote
sensing related GLOBE campaigns.
[EN] Some MultiSpec Tutorials/Exercises - Small tutorials or exercises that one can follow to gain some experience with using MultiSpec

47
Inspiration for your Satellite Remote Sensing lessons:
[EN] ESA – Teacher’s Corner – Lesson plans using satellite images of the Earth to investigate environmental issues.
[EN] NASA Education – Materials developed from NASA for educators, students and kids.
[EN] USGS – Education and Outreach – Materials that provide educational and outreach opportunities associated with the Earth, space,
and biological sciences.
[EN] ESA - Eduspace - The Eduspace website encourages teachers to use Earth observation data in their curriculum by providing ready-
made projects.
[EN] FIS Project – A package of scenarios split into 5 school subjects: biology, geography, informatics, maths, and physics.

48
Serious Games
49
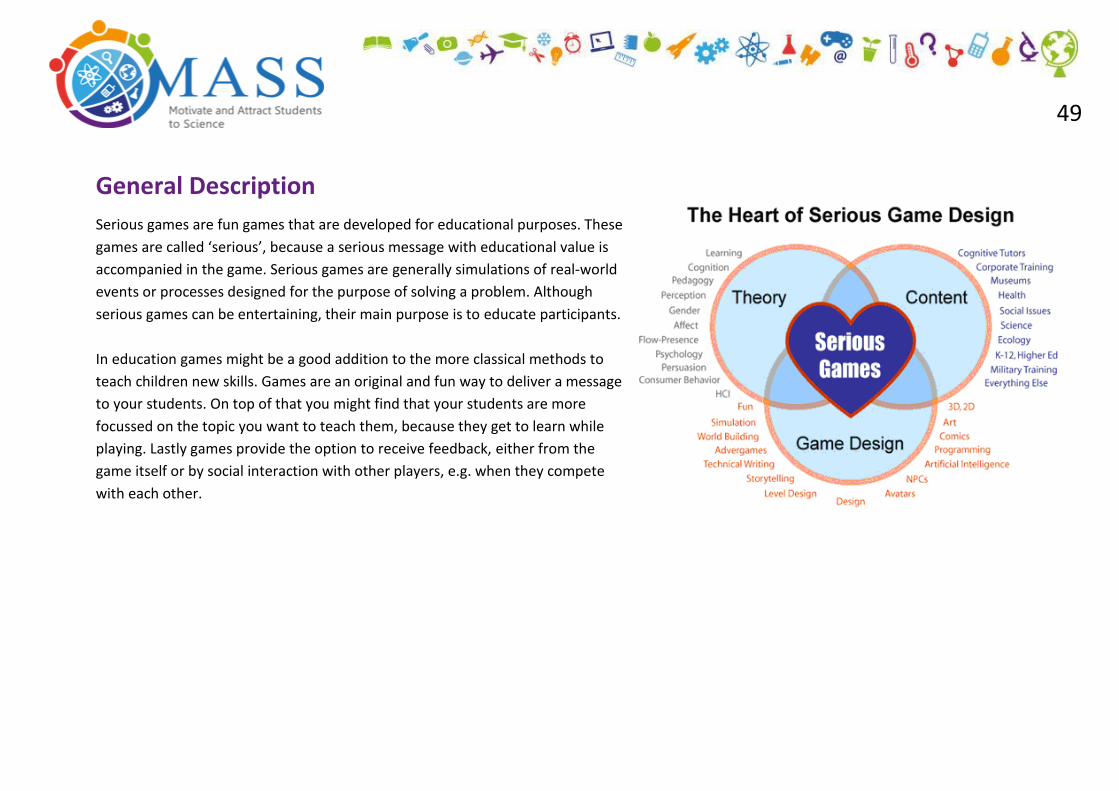
General Description
Serious games are fun games that are developed for educational purposes. These
games are called ‘serious’, because a serious message with educational value is
accompanied in the game. Serious games are generally simulations of real-world
events or processes designed for the purpose of solving a problem. Although
serious games can be entertaining, their main purpose is to educate participants.
In education games might be a good addition to the more classical methods to
teach children new skills. Games are an original and fun way to deliver a message
to your students. On top of that you might find that your students are more
focussed on the topic you want to teach them, because they get to learn while
playing. Lastly games provide the option to receive feedback, either from the
game itself or by social interaction with other players, e.g. when they compete
with each other.

50
Didactical Concept
Serious gaming enhances the intrinsic motivation of students by providing them with challenges, giving
them control and stimulating their curiosity and imagination. Also when playing the game they are put in
the shoes of their character which triggers empathy, so it also has a social aspect.
The challenges and curiosity generated by the uncertainty during the game activate the desire to continue
the (learning) activity. On top of that, the feeling of control resulting from the freedom of choice makes the
player the master of the game so that they feel they can guide its progress towards the desired goal.
Serious Games can reduce anxiety associated with the learning process and allow the learner to learn easily
without even being aware. The use of a reward in a behavioural sense is also a powerful tool in serious
games and is even stronger, thus motivating, when experiencing competition from peers. Serious gaming
also provides the possibility to experiment freely in a certain situation without having to worry about possible consequences.
Serious Games are able to address different level of difficulty so each student can learn at their own pace and benefit from it. In this sense
the low achievers would be challenged in the first, more basic, levels whereas the high achievers would go faster through those levels in
order to find their challenges in the more advanced levels further in the game.
Geographic Information
Systems
Satellite Remote Sensing
Serious Games
(Apps for) Smartphones and
Tablets
Social Media
Tools

51
Competencies
A lot of competencies are addressed when playing a serious game. Amongst others these are the main competencies:
Problem solving: the learner is confronted with a novel situation and must use previous knowledge to solve the problem.
Strategical thinking
Recognising connections between two or more concepts.
Environmental awareness (cause and effect of human behaviour on the planet)
How to organise this in your classroom
First of all when choosing a serious game, think about what results you want to achieve with it. Is the game leading or supporting in
achieving those outcomes? Try to connect the content of the game to the learning goals that are set, when possible even connecting it to
the teaching method.
How to choose a suitable game?
Make sure the game is connected to your student’s learning goals and curricula.
Make sure that the game you choose tickles your student’s fantasy. Games with some action in it are very suitable. This helps your
students to immerse inside the story of the game and to feel motivated.
The game must be challenging. Each level of the game should be a little bit more difficult than the previous one. And ideally just a little
bit above your students’ capacity so they students get eager to improve themselves.
The game must have clear rules and restrictions. Otherwise it will be more likely your student will quit the game.
It is important that there is competition in the game, either with oneself or with other students.

52
Make sure all learning styles from Kolb’s theory are being addressed so every student can benefit from the game. Most games would
already cater for the learning by doing and learning by experiencing styles, so make sure you cover the reflective observation and
abstract conceptualisation by providing some additional tasks. E.g. after a game you can let students create an infographic or a blog
about what they have learnt from the game. Or before they start the game you can let them do some research on the topic and collect
what they have found on a board in Pinterest.

53
Use the following two grids to help you select a suitable game:
When you choose a game, first play it yourself. Then you can score the game in the grids provided. In one grid you can score the game on
fantasy, curiosity, control and challenge. In the other grid you can score the game on rules, goal, opposition and representation of the real
world. You can print the two Grids here.
Rubric Malone Rubric minimale game

54
Also keep in mind:
That introducing and playing a serious game in your class can take up some time. Therefore it is important to see if you need to split
the game up into more parts. In general you could take 30-40 minutes for playing the game and take 20-30 minutes for reflection.
That you make sure that the required devices are available and working. Take into account: necessary hardware, sound system,
headphones, and the option to play through the school network.

55
Good practices
Enercities
Level Junior and senior - Duration 20-45 minutes - Subject
Description and goal
EnerCities offers an online e-learning game for young people (12-16 years) to experience
energy-related implications. EnerCities is about building your own city and learning more
about energy. The goal of the game is to create and expand virtual cities dealing with pollution, energy shortages, renewable energy etc.
This game can be played individually or in groups. The game is web-based.
Play here www.enercities.eu
Connection to curriculum
Students learn how to build a sustainable city and what kind of investments they can do in order to create a balanced economy and a
metropolis that can stand the test of time.
How to integrate this game into your science lesson
This game can be coupled to the three aspects of sustainability: People, Planet and Profit. Embed the EnerCities game experience in a
learning unit about energy and the role of energy in our society. Before starting the game give your students the task to collect
opportunities for saving energy and innovative ways to use renewable energy. The game experience will stimulate the students’ awareness
of these topics.

56
Floodsim
Level Senior - Duration 60 minutes - Subject
Description and goal
The serious game Floodsim is an interactive game that is designed to create
awareness of the increasing risk of flooding. It highlights measures and policies
and can be used to gain more insight in flood management education.
Play here www.playgen.com/play/floodsim
Connection to curriculum
With this game students will learn about the damage caused by floods and they learn what measures can be taken in order to protect
residents against flood damages.
How to integrate this game into your science lesson
First let your students have a look at this video to give them a broad idea of how the game is played. Next, ask students to play the game
themselves and let them experience the situation in Great Britain. After students played the game, ask them to map the current situation
in their own area (city, province or country). Students can focus on different policies of the (local) government and different measures that
are taken to prevent flooding. This will raise awareness of the potential dangers of floods in the area where students live. On top of that,
ask students to present their findings to the rest of the class and let them prepare an advice for policy makers. They can present their
findings via infographics, Edmodo or another form of Social Media that can be used for presentations.

57
Stop Disaster Game
Level Junior & senior - Duration 1 hour (for 2 games and evaluation) - Subject
Description and goal
Disasters triggered by natural hazards destroy lives and affect millions of people every year.
Your goal in this game is to plan and construct a safer environment for your population. You
must assess the disaster risk and try to limit the human physical and financial costs. This game
teaches students to understand the risks of different natural hazards such as floods, wildfires,
tsunami’s earthquakes and hurricanes. Furthermore, they learn to apply different methods of
prevention and mitigation and experience the investments and cost effectiveness of these
measures.
Play here www.stopdisastersgame.org/en/playgame.html
Connection to curriculum
With this game students will increase their understanding of the effects of climate change and mitigation measures that can be taken by
governments.
How to integrate this game into your science lesson
Ask your students to make a list of natural disasters and a corresponding set of suitable countermeasures for each listed disaster.
Afterwards students can map the potential risk of disasters in their own environment. Also ask them to find out what measures are taken
by the (local) government to minimise the damage and casualties.
58
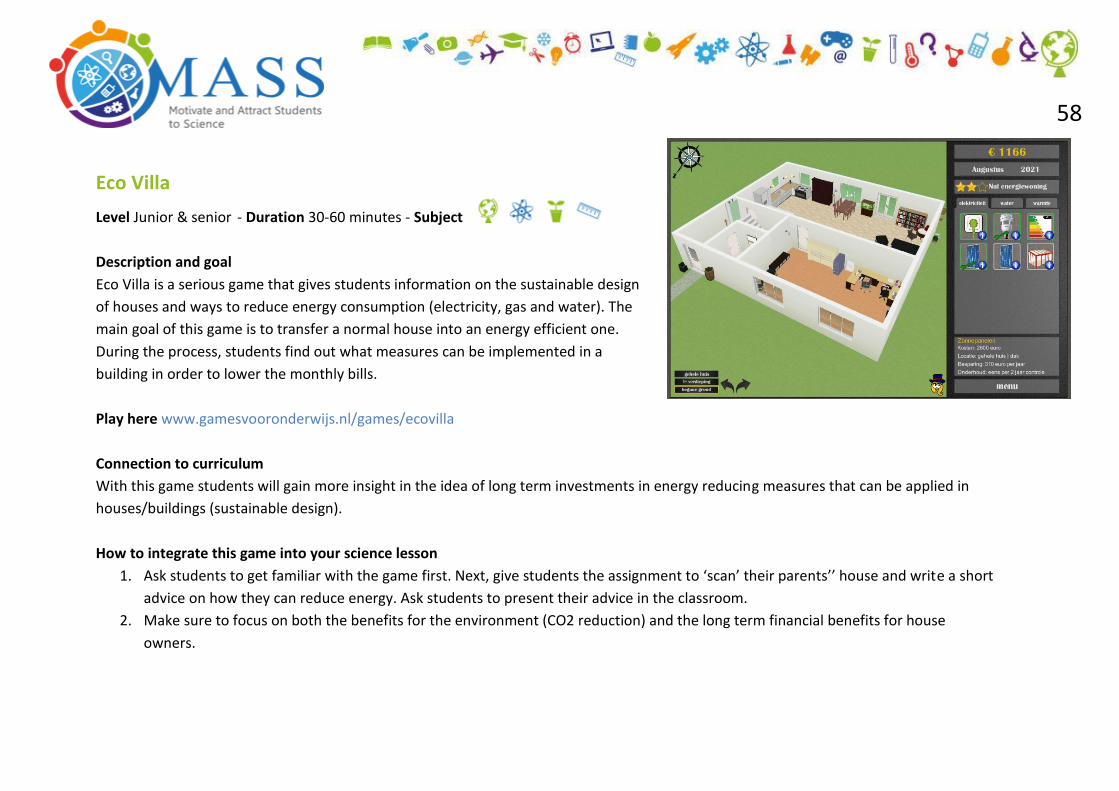
Eco Villa
Level Junior & senior - Duration 30-60 minutes - Subject
Description and goal
Eco Villa is a serious game that gives students information on the sustainable design
of houses and ways to reduce energy consumption (electricity, gas and water). The
main goal of this game is to transfer a normal house into an energy efficient one.
During the process, students find out what measures can be implemented in a
building in order to lower the monthly bills.
Play here www.gamesvooronderwijs.nl/games/ecovilla
Connection to curriculum
With this game students will gain more insight in the idea of long term investments in energy reducing measures that can be applied in
houses/buildings (sustainable design).
How to integrate this game into your science lesson
1. Ask students to get familiar with the game first. Next, give students the assignment to ‘scan’ their parents’’ house and write a short
advice on how they can reduce energy. Ask students to present their advice in the classroom.
2. Make sure to focus on both the benefits for the environment (CO2 reduction) and the long term financial benefits for house
owners.
59
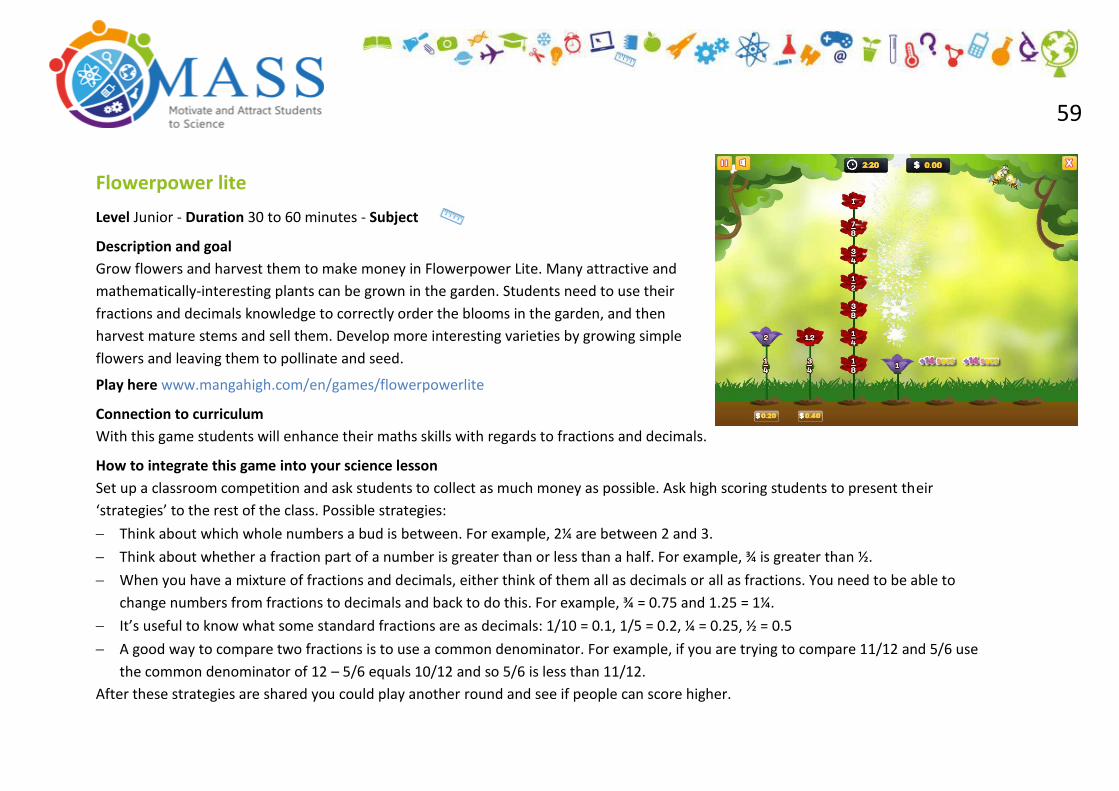
Flowerpower lite
Level Junior - Duration 30 to 60 minutes - Subject
Description and goal
Grow flowers and harvest them to make money in Flowerpower Lite. Many attractive and
mathematically-interesting plants can be grown in the garden. Students need to use their
fractions and decimals knowledge to correctly order the blooms in the garden, and then
harvest mature stems and sell them. Develop more interesting varieties by growing simple
flowers and leaving them to pollinate and seed.
Play here www.mangahigh.com/en/games/flowerpowerlite
Connection to curriculum
With this game students will enhance their maths skills with regards to fractions and decimals.
How to integrate this game into your science lesson
Set up a classroom competition and ask students to collect as much money as possible. Ask high scoring students to present their
‘strategies’ to the rest of the class. Possible strategies:
Think about which whole numbers a bud is between. For example, 2¼ are between 2 and 3.
Think about whether a fraction part of a number is greater than or less than a half. For example, ¾ is greater than ½.
When you have a mixture of fractions and decimals, either think of them all as decimals or all as fractions. You need to be able to
change numbers from fractions to decimals and back to do this. For example, ¾ = 0.75 and 1.25 = 1¼.
It’s useful to know what some standard fractions are as decimals: 1/10 = 0.1, 1/5 = 0.2, ¼ = 0.25, ½ = 0.5
A good way to compare two fractions is to use a common denominator. For example, if you are trying to compare 11/12 and 5/6 use
the common denominator of 12 – 5/6 equals 10/12 and so 5/6 is less than 11/12.
After these strategies are shared you could play another round and see if people can score higher.

60
EnvKids
Level Junior - Duration Depends on part of the application chosen. 1-2 hours minimum
Subject
Description and goal
EnvKids is a serious game for students that aims at the students' understanding of the
concept of environmental sustainability. It consists of educational activities that are
designed as a series of simple steps that children can follow easily. The aim is to raise
awareness of environmental sustainability. This game helps students to understand how
everyday practice affects the environment on three different levels (home, town and
planet) and introduces environmental-friendly solutions for this, such as: solar energy
production, turning off idle electronic devices, water consumption etc.
Play here ohmpro.org/envkids/index.php?option=com_content&view=article&id=133&Itemid=133
See the MASS website for more information about EnvKids.
Connection to curriculum
With this game students will learn about urban planning, environmental sustainability,the relation between these concepts and their own
behaviour.
How to integrate this game into your science lesson
Ask students to simulate / rebuild a part of their own city. They can use satellite images of Google maps for a good overview. Next, ask
students to think of solutions to make their own city greener.

61
Tips & Tricks
Make sure games connect to learning goals and competencies that have to be acquired.
Make sure there’s a balance between the gaming part and the educational part.
Introduce games to your high achievers first so they can play it after finishing their mandatory tasks. If you decide to introduce the
game to the rest of the class in a later stage, the high achievers would be able to help you provide some support for the other students.
It would be good if you can access some IT-support when you are playing the game.
Learn more
Game Design And Theory 01 - What Is A Game?
What is a serious game?
Ted talk about serious games

62
(Apps for) Smartphones and Tablets

63
General Description
(One of) the biggest advantages of smartphones and tablets is their mobility and the fact that they are so
called all-in-one devices. Next to common functionalities such as reading, writing and drawing, they also
allow you to take pictures or record audio or video files. Most of them, unlike laptops, have a GPS sensor, or
other special sensors (e.g. acceleration, tilt, light sensors).
Therefore smartphones and tablets are well-suited to support research activities such as investigation or
collecting data and information and they are a great addition on a field trip. Another big advantage is that
most students have a smartphone and/or tablet so you don’t necessarily have to invest in buying them.
Apps A further benefit of smartphones and tablets are the so called applications, or apps. Apps provide a functionality for students to combine
practical work with theoretical knowledge. The use of apps in school lessons makes learning multidimensional and can reduce the
complexity of science topics. Many high-quality educational apps are freely available that can contribute to the learning processes within
different subject areas. Apps can be used in each part of a lesson. Videos,
pictures and short films can work as an impulse at the beginning
(introduction) of a lesson. Special programmes like goREACT (see our list of
apps) may be useful during the working section. At the end of a lesson,
students might document their work (videos, pictures, short notes), tag
them with QR-codes and send them to web based platforms like Moodle,
Dropbox or Huddle. If teachers want to separate a class in several groups
with each group working on different aspects and in different locations, all
students are able to communicate via text messaging or applications such
as WhatsApp or Skype.
App used for biology
Apps used for geography
General supporting apps in
your classroom
Other MASS-products

64
Also applications such as Facebook or Twitter help students to communicate instantly, discuss topics faster
and create something like a collective intelligence (see also the chapter of Social Media in this tutorial).
Didactical Concept
Smartphones and tablets support the different steps in scientific research
In this digital age digital devices have become indispensable for scientific research in terms of scientific
measurements, data collecting and data analysis. Therefore it is essential to prepare students for these
important functions and to train both their digital skills as well as their critical reflection on digital devices.
Familiarising students with the opportunities of digital devices and apps is moreover highly relevant for
employment opportunities, to develop citizenship and of course for a scientific way of working.
Geographic Information
Systems
Satellite Remote Sensing
Serious Games
(Apps for) Smartphones and
Tablets
Social Media
Tools

65
Smartphones and tablets can support the different stages of scientific research and inquiry based educational approaches as the following
table shows.
Scientific step Support by smartphones and tablets
Gathering Information, Literature Research
Smartphones and tablets offer multiple sources of information. Even on field trips and outside in nature you can gather information via internet resources, geo-media services andr by apps installed on your smartphone or tablet. For example the ‘Map of Life’-app can help students to identify species of insects, birds and plants in the surrounding nature and provide them with annotations.
Posing research questions, formulating a hypothesis
In inquiry based approaches students pose research questions and formulate a hypothesis. Digital applications such as the app ‘Socrative’ or Social media platforms can help to collect such questions within a class and collaboratively decide on the most significant question and hypothesis students want to investigate.
Conducting experiments Smartphones and tablets are well suited to support experimental investigations especially if they are performed outside of the classroom. Experimental data can be recorded in various digital formats. Furthermore special sensors on smartphones and tablets allow you to record diverse physical and chemical parameters (e.g. with the ’Sensor Kinetic’- app). It is possible to stream sensor collected data via Data sharing apps (e.g. Vernier data collection). In physics or chemistry classes, students can film their experiments with their smartphones or tablets and watch it again later to clarify details or problematic parts of the experiment or to review the experience.
Data Analysis, Drawing Conclusions
For data analysis various apps are available supporting analysis and interpretation of data (e.g. the app ‘Statistics and Sample Size’). Moreover you can search the internet to obtain reference data for result comparison.
Presentations Via graphical applications such as the ‘SlideShare’- app students can compile their scientific work in (PowerPoint) slides and share these with others via social networks. Also discussion about the results is possible by this way: using a blog format or a discussion format, students can train scientific reasoning and evidence based documentation in public media. Furthermore mobile devices can be used to contact scientific experts to obtain their opinion, i.e. via Twitter.
Visualisation/Digital models/ Simulations
Visualisation of scientific content by animations, pictures or digital models help students to make abstract processes and concepts better understandable. Moreover phenomena that occur on very small (e.g. microscopic) or very large (e.g. geological) scales can be illustrated.A nice example is the iCell-app.
Table 1. Smartphones and Tablets can support the different steps within research progress.
66
Smartphones and tablets boost students’ motivation
Integrating smartphones or tablets in your science lesson will most likely enhance students’ motivation. Digital tools are part of their
everyday experience, thus connecting particularly well with their habits and interests. Therefore they will feel comfortable and may act
particularly engaged in fulfilling a smartphone or tablet connected task.
Students say that at first they feel a bit surprised when they are invited to use their smartphone in class and then soon feel motivated to
commit to their tasks while enjoying it because it is something new and it is fun for them.
Competencies
Implementing smartphones and tablets in your classroom can benefit a wide range of competencies, such as:
Accessing information quickly and easily
Enhancing of communication skills
Multidimensional learning: Learning in a variety of ways (polls, videos, pictures, audio files, GIS, GPS)
Situated and individual learning: for example using a smartphones in the forest while learning something about forests
Visualising data, structures and processes (graphs, diagrams)
Scientific analysis and evaluation of data with support of specific computer applications.

67
How to organise this in your classroom
To work with smartphones and/or tablets in your classroom is fairly easy. Almost every student has one of these devices and knows how to
use it. Furthermore most apps are available free of charge. We do however want to provide you with some advice on how to organise this
in your classroom.
First of all it is important to select your material/apps carefully (age appropriate, useful for your purpose, costs). There are so many apps
that it might be a challenge to choose one that is suitable. Check if the educational app you want to incorporate in your lesson plan match
your teaching concept. The following guidelines may help you:
Guidelines for choosing a suitable educational app
Is the app free of charge?
Is the app visually appealing and appropriate, and is the user interface of the app intuitive?
Does the app provide new teaching opportunities or tools that are not otherwise available?
Are the topic and the app-design appropriate for the target group?
Does the app fit to the pedagogical concept?
Does the app effectively deal with the topic and is it useful for the specific learning goal?
Does the app meet the requirements for different proficiency levels of students?
Finally make sure all devices are fully charged and all software/apps are up-to-date. You might even want to inform your students about
your plan to make a lesson with smartphones so that all students can bring their devices to school.
68
Good practices
Here is a list of great apps that can support you during your classes. All selected apps are available at least in English, so it will be useful for
all countries. And as a plus it enhances student’s language skills. All apps can be downloaded via the App Store (iOS/Apple) or Google Play
(Android). To see if they are also available for Windows Phone check out the Windows Store.
Food Web
Subject
Duration 20-45 minutes
Description and goal
The Food Webs app lets you play with feeding relationships between unique plants and animals found in Western
Australia. The goal is to create a complete food web using sets of organism disks that represent producers, herbivores
and carnivores in an ecosystem. You can learn about these species and their roles by flipping the disks to view photos
and diet information.
When your food web is complete you can also add one of Australia's most destructive introduced species - the cane
toad, and see the threat it presents to native animals.
Guides and instructions help you to connect the food webs and learn about organisms and their relationships in an
ecosystem.
Download here itunes.apple.com/nl/app/food-web/id565839214?mt=8
Connection to curriculum
With this game students can acquire a deeper conceptual understanding of the relationships and dynamics within an
ecosystem.
Getting started Download the app on your smartphone or tablet. The app is available for iOS only at the moment. The app is free of
charge.
The advanced levels are quite difficult. Take some time to carefully read the instructions before playing the game
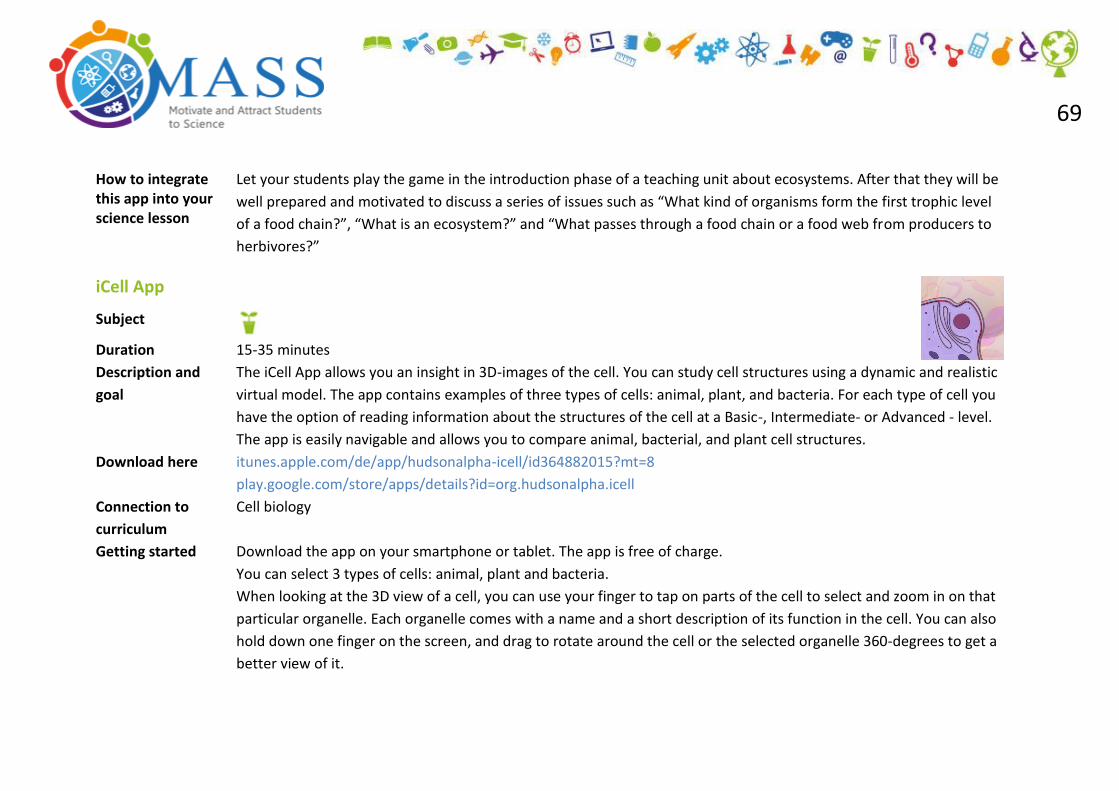
69
How to integrate this app into your science lesson
Let your students play the game in the introduction phase of a teaching unit about ecosystems. After that they will be
well prepared and motivated to discuss a series of issues such as “What kind of organisms form the first trophic level
of a food chain?”, “What is an ecosystem?” and “What passes through a food chain or a food web from producers to
herbivores?”
iCell App
Subject
Duration 15-35 minutes
Description and
goal
The iCell App allows you an insight in 3D-images of the cell. You can study cell structures using a dynamic and realistic
virtual model. The app contains examples of three types of cells: animal, plant, and bacteria. For each type of cell you
have the option of reading information about the structures of the cell at a Basic-, Intermediate- or Advanced - level.
The app is easily navigable and allows you to compare animal, bacterial, and plant cell structures.
Download here itunes.apple.com/de/app/hudsonalpha-icell/id364882015?mt=8
play.google.com/store/apps/details?id=org.hudsonalpha.icell
Connection to
curriculum
Cell biology
Getting started Download the app on your smartphone or tablet. The app is free of charge.
You can select 3 types of cells: animal, plant and bacteria.
When looking at the 3D view of a cell, you can use your finger to tap on parts of the cell to select and zoom in on that
particular organelle. Each organelle comes with a name and a short description of its function in the cell. You can also
hold down one finger on the screen, and drag to rotate around the cell or the selected organelle 360-degrees to get a
better view of it.
70
How to integrate
this app into your
science lesson
1. Introduce the cell organelles and the corresponding vocabulary through the iCell app. 2. Give students the task to compare an illustrated plant cell with an animal cell (and additionally with a bacterial cell).
3. Students can use the 3D models of a cell to quiz each other.
Map of Life
Subject
Duration Minimum 15 minutes, time consumption depends on the intended purpose.
Description and
goal
Map of Life app delivers a simple field-guide for tens of thousands of species worldwide to the palm of your hand and tailored to where you are. With continiously growing coverage and functions it allows you to instantly record species and potentially contribute important data for research and conservation. The app is available in six languages and it’s planning to add more in the near future.
Download here play.google.com/store/apps/details?id=org.mol.android
itunes.apple.com/us/app/map-of-life/id983715827?ls=1&mt=8
Connection to
curriculum
This app allows students to classify animals and plants and to learn more about the different types of plants and animals in the local environment.
Getting started The app menu offers different options:
The “What’s around me”-option refers to the geolocation of the user and provides information and photos about species expected in this area.
The “Search the map” functions allow you to enter a place name or to click on the map and the expected species at the chosen location are shown.
The “Search for species”-function enables you to search by the common or scientific name.
The “My records”-function allows you to upload your sightings after opening a free account.
The information for each species includes a data sheet with a description taken from Wikipedia, a map of geographical distribution and multiple images, in addition to the classification of the IUCN Red List.
71
How to integrate
this app into your
science lesson
1. Your students can use the app during a field trip or an excursion into the forest to identify and explore the animals and plants around them.
2. Give your students the task to take pictures of a certain number of species. They should note down their observations and try to identify those organisms with the help of the app.

72
Classify IT
Subject
Duration 20-45 minutes
Description and
goal
This app is a kind of science game that challenges students to sort and group living organism based on shared characteristics such as the habit to build a nest or according to their assignment to different taxonomic ranks (e.g. the class Mammalia or the order Carnivores). Students can learn a lot about species classification in a playful manner. App users have to choose a level and then tap all the organisms that fit into a given category. If they receive 100 percent on a level, they earn a creature card, which includes information and fun facts about an organism. Three main levels of difficulty make the game adaptable to many skill levels. Hints about the classification categories help students with low achievement.
Download here itunes.apple.com/de/app/classify-it!/id911484593?mt=8
play.google.com/store/apps/details?id=com.aaas.classifyit&hl=de
Connection to
curriculum
You can use this app when you introduce the general concepts of biology to your students.
The app fits the curriculum goal of teaching students how living things are classified according to common characteristics
and similarities.
Getting started A brief instruction menu helps to get started. Once you start the app the game begins and you are given a category and several organisms you must classify. For example, the category might be "Living Things That Are Mammals," and you have to tap on all the organisms that are mammals. You can get a hint about the category. You need at least an 80 percent correct answers score to pass the level. If your selected answers are 100 percent correct you earn a fun, fact-filled creature card.
How to integrate
this app into your
science lesson
1. After the students get familiar with the app and played the game for a while you can discuss with your students why scientific classification is important and how it works. Start by asking the students after which different criteria they sorted the given organisms.
2. Then you can introduce taxonomic classification of life and explain that taxonomists classify animals and other living organism according to the following nested groups, ranging from the general to the particular: Kingdom, Phylum, Class, Order, Family, genus and species.

73
goREACT
Subject
Duration 20-40 minutes
Description and
goal
This app is a virtual chemistry laboratory where you can combine elements from the Periodic Table of the Elements. You
can click various elements from the periodic table and drag them to the reaction field to see if they will react to a new
compound. If a compound is formed, an image of the compound will appear plus a brief message explaining about the
compound and its uses.
Download here itunes.apple.com/us/app/goreact/id649585694?mt=8
play.google.com/store/apps/details?id=com.goReact
Connection to
curriculum
This app can support the introduction of the Periodic Table of the Elements. Moreover it can be implemented in learning
units regarding the chemical bonding (in particular ionic- and covalent bonding).
Getting started Touch the symbols of any element in the periodic table and the app will inform you about the name of the element,
important properties and uses.
By touching the app’s menu icon, you can choose a ‘Standard View’ of the Periodic Table or an ‘Atomic View’ that shows
the atomic mass of each element.
Double-tap elements in the Periodic Table to place them in the app’s Reaction area at the bottom of the page, where the
elements can form any of the nearly 300 notated compounds. In most cases, when you place an element in the reaction
area, the app will guide you through choices that yield one of these pre-loaded compounds, and then explains how the
compound is used with a photo or video.
Students can also learn about the organisation of the Periodic Table by selecting ‘Help + Information’ in the menu, then
touching the contents icon and selecting the Periodic Table.

74
How to integrate
this app into your
science lesson
1. During the learning unit „Periodic System of Elements“ the students use the app in the Working Phase to get familiar
with the elements and to understand the principle that the atoms of an element react with each other to form
chemical compounds.
2. Students can edit a concrete task of a worksheet with support of the app. For example the task can be to complete
the following table: in the first column some common chemical elements are listed and students are prompted to
create compounds which contain these elements. In the free columns of the table they can note the elements they
added and the resulting compounds. Moreover they record in the table characteristic features and usage of each
chemical compound.
iQuakeLite
Subject
Duration 15-45 minutes
Description and
goal
iQuakeLite allows you to monitor earthquakes around the world. iQuakeLite displays the latest earthquakes using heat
maps. The graphic representation will show you instantly where, how big and when an event happened.
The maps give a nice overview of the anfractuosities and tectonic plates and provide extra information about the
depth, strength and location of the earthquake.
Download here itunes.apple.com/us/app/iquakelite/id364895287?mt=8
Connection to
curriculum
This app needs to be embedded in a class about earthquakes.
Getting started Download the app on your smartphone or tablet. The app is available for iOS only at the moment. The app is free of
charge. An Earthquake table lists the most recent events with coloured visual cues for the magnitude. Clicking on a line
will send you to the map and display the corresponding quake. An info disclosure displays the USGS information in real
time for the corresponding earthquake.

75
How to integrate
this app into your
science lesson
Let your students create “profiles” for the latest earthquakes containing features such as time, location and
magnitude. With the app-feature ‘tectonic plate overlay’ they should formulate their assumptions concerning the
cause of the earthquake.
NASA’s Earth Now
Subject
Duration 15-35 minutes
Description and
goal
“Earth Now” is a free NASA application. It visualises global climate data from Earth Science satellites. The data are
regularly updated. Data sets are visually described using "false colour" maps.
In the app you can find the following thematic data:
Air temperature
Carbon Dioxide
Carbon Monoxide
Gravity Field
Ozone
Sea level
Sea Surface Salinity
Visible Earth
Water Vapour
The data are available for various intervals, for example, air temperature contains measurements for one day and
carbon dioxide contains data for one month. The main view shows a 3D model of the Earth. It may be rotated by a
single finger stroke, and may also be zoomed in or out by pinching 2 fingers. It also presents the active satellites
orbiting the Earth.
After clicking on the name of satellites, the short information about it will be displayed. From the menu you can select
the vital signs. The following elements are available for each of the parameters:
The visualisation of its distribution in the global scale;
Colour-coded legends indicating the relative strength or weakness of environmental conditions;
A running animation showing its values during a given period of time (various for each of the indicators).

76
Download here itunes.apple.com/de/app/earth-now/id494633346?mt=8
play.google.com/store/apps/details?id=gov.nasa.jpl.earthnow.activity
Connection to
curriculum
The app is consistent with learning contents referring to climate, weather and atmosphere.
Getting started Once the app has finished downloading, open it.
A 3D model of the earth will appear which can be rotated by a single finger stroke.
Zooming in or out can be realised by pinching 2 fingers.
Satellites, orbiting Earth are displayed. Via the button “Where are they now” you can observe their current position. After clicking on the name of satellites, brief information about it appears.
Tap the “vital signs” button (it occurs in the left bottom of the screen) in the menu and you are invited to select a dataset. You can choose between different climate data recorded by satellites, for example: surface air temperature, carbon dioxide, carbon monoxide, ozone, and water vapour as well as gravity and sea level variations.
Choose a parameter, then the data will be displayed as a colour map projected over the 3D Earth model (loading the content will take a few seconds, depending on your Wi-Fi / data signal strength).
Below the earth-map a colour-coded legend is provided which indicates relative strength or weakness of the respective parameter.
Via the button “Details” helpful descriptions provide background information on each data set.
Via the button “Details” animated datasets are accessible showing the selected parameter during a given period of time (various for each of the indicators).
How to integrate
this app into your
science lesson
1. Combine the app-experience with distinct research tasks for your students. For example students are entrusted with the task to find out about the ozone levels above Antarctica, Canada and Australia or they should identify areas with currently high carbon dioxide and carbon monoxide levels. Results can be compared and discussed in groups. 2. Figure out in a group discussion the benefits of satellites delivering actual Earth parameters.
Tips and tricks The updating of the data usually takes a few minutes (depending on the speed of your Internet connection). The data from the app can be rather used for general conclusions because they aren’t detailed.

77
Skeptical Science
Subject
Duration Minimum 25 minutes, time consumption depends on the intended purpose.
Description and
goal
Skeptical Science refers to the topic of global warming and is presenting arguments of people who deny that a
man-made climate change is occurring. Each argument is followed by a section entitled “The Science Says” which
includes a concise, science-based response or objection to the argument. The app presents serious scientific data
including diagrams and links. The goal of the app is to promote a better understanding of climate science, and to
critically examine arguments that have been made against global warming and see if they have any scientific
basis. The app allows you to argue/reason global warming misinformation.
Download here itunes.apple.com/de/app/skeptical-science/id353938484?mt=8
play.google.com/store/apps/details?id=com.shinetech.skepticalscience
Connection to
curriculum
With this app students will gain more insight in the central issues of climate change.
Getting started Download the app and open it. Four sections appear which group anti-global-warming arguments into four categories: It's
not happening, It's not us, It's not bad, and It's too hard. When you click on one of the categories, a drop-down menu
appears listing all the arguments related to that category. Each argument, referred to as ‘Sceptic Arguments’ in the app,
consists of individual statements or arguments that have been made to contradict the consensus that global warming is a
real phenomenon that is largely caused by human activities. Clicking on an argument brings up more detailed information,
pros and cons, and a discussion of the argument's merits. Across the bottom of the screen are five buttons. The first, labelled
“Browse”, gets you back to the Home screen with the four main categories. The second button, “Top 10”, cites and links to
the 10 most commonly used arguments. The third, “Reported”, shows you a list of the arguments you've reported. The
fourth button, “News”, links to recent stories added to the app, while the last button, “About”, gives information about the
app and its developer and the author.

78
How to integrate
this app into your
science lesson
Distribute different “anti-global-warming arguments” listed in the app to your students (they can work in pairs). With
the scientific material provided by the app students should deal with this argument and prepare a short presentation
where they scientifically argue against this statement.
PDF Maps
Subject
Duration Time consumption depends on the intended purpose.
Description and
goal
The PDF Maps app is not only a geospatial map reader (which supports PDF, GeoPDF and GeoTIFF formats) but moreover it allows the interaction with such spatially referenced maps. You can record GPS tracks, add placemarks, find places and also view your location. Once a map has been downloaded (a huge offer of free maps is available e.g. at PDF Map Store) to your smartphone or tablet you can access this map even when you are offline.
Download here play.google.com/store/apps/details?id=com.Avenza itunes.apple.com/de/app/avenza-pdf-maps/id388424049?mt=8
Connection to
curriculum
This app supports the geography curriculum requirement that students should develop skills in map work such as interpreting, recording and communicating spatial informations through the use of geographical maps. Their competencies in using maps through practical activities will be developed.
Getting started Once you have downloaded and opened the app you are able to view the listed maps. Tap the ‘Import Map’- button (the plus sign within the navigation bar) to add more maps from the web, from Dropbox or from a storage device. By tapping the shoping cart symbol you can download maps from the PDF Maps Store. The store contains transit, tourist and special interest maps from around the world. Many maps are available for free, some you have to purchase. You can easily navigate within a selected map because you have to apply standard gestures: flick to pan, pinch / expand to zoom and double tap to zoom and center. The navigation bar above the selected map offers different options and tools: 1. Tap the GPS button to locate your current position on a geospatial PDF map. Of course this is just possible if you
are in the map’s display range. 2. Add placemarks: You can add placemark pins anywhere on the map with the tap of a finger.

79
3. Edit placemark attributes: You are able to add / edit attributes at any placemark: e.g. adding notes, custom fields, field values and much more.
4. Under the ‘Map Tools’ - button you have access to the following functions: » Find by Coordinates: display the coordinates of interest on a map in popular formats including
Latitude/Longitude (Map default or WGS84), Northing/Easting, and Military Grid Reference System/United States National Grid.
» Find places: search for points of interest on any map by entering an address or a keyword. Places are based on search engine results. Save the found places as placemarks that can be visible or hidden as required.
» Plot Photos: Upload a geotagged photo and the placemark will drop in the corresponding place on the map. » Record GPS Tracks: Tap ‘Record GPS Tracks’ –button and the ‘Play’ icon on the map to begin recording. Your
movements will be recorded when the app is open or when it is minimised to the background. Tap ‘Done’ at any time to stop recording and to automatically save the track to the Tracks folder.
» Measure Distance or Area: Use the ‘Measure Distance’ tool to measure how far you need to travel and the ‘Measure Area’ option to measure the size of an area.
» Open View in Google Maps: Use the ‘Open in Maps’ tool to view the current map extents in the Maps app. Perform more detailed searching by opening placemark locations in the Maps app based on its coordinates.
How to integrate
this app into your
science lesson
1. Your students can use the app during a field trip or city excursion to find and track the route and gather their own data.
2. With this app you can organise the path of an outdoor learning activity by creating a route map containing placemarks with informations or tasks for your students.

80
Wundermap /Weather underground
Subject
Duration 15-40 minutes
Description and
goal
Wundermap Weather Underground is an advanced weather application. It gives current information about
temperature, rainfall, wind speed and direction, UV index, air quality (ozone, fine dust, and pollen), sunrise and sunset,
Moon and data about hay fever.
This information is organised under different sections such as weather, health and other sections. The app also gives a
forecast for the next 10 days and users can view temperature, rainfall and wind conditions for each hour of the day.
The app is designed in clear colours and structures. If you close the app, a small weather sign with the temperature
will stay on the front screen (widget function). Information such as UV index and air quality is further described with
small texts. In the main menu users can also navigate to sections about hurricanes and tropical cyclones (hurricanes)
with on time information (including sea surface temp.), to sections about skiing weather, weather radio and social
media.
The app is also linked with web-based pages about climate change, historical weather, pictures and videos, maps and
radar, news and blogs as well as activities.
Download here www.wunderground.com/download/index.asp
Connection to
curriculum
The app is consistent with learning contents referring to weather, climate and atmosphere.
Getting started The menu offers a variety of weather layers, for example the current weather conditions received from nearby
weather stations, severe weather warnings, animated radar and satellite images, live webcam images, hurricane tracks
and more.
81
How to integrate
this app into your
science lesson
Students can monitor weather conditions (e.g. while talking about the weather some students might check the
conditions. Or they can reconstruct the weather throughout a day and compare their observations with the data. In
summer time UV index and ozone will become more interesting). Combine the weather data presented in the app with
your own measurements (see for example www.globe.gov/de/do-globe/globe-teachers-guide/atmosphere. and check
if the measurements fit
Tips and tricks
Provide clear instructions on what to do because there are a lot of possible ways to use this app and students can get
lost.
Additional information should be used because some graphs are not perfectly right (temperature throughout the day),
maybe combined with worksheets or GLOBE protocols. It supports critical thinking.
The Economist World in Figures
Subject
Duration Minimum 15 minutes
Description and
goal
The World in Figures iPhone app puts essential data and unexpected knowledge in your pocket with statistics on more
than 190 countries around the world. Based on The Economist’s annual book, it enables you to:
View and compare world statistics on topics that range from transport to tourism and commodities to cinema.
Access important socioeconomic data from anywhere.
Share fun facts on Twitter and Facebook. More detailed information is only available when you purchase the app. (€5.99 each month)
Read more at www.economist.com/world-in-figures#bYHzds8qSLui5t0l.99
Download here itunes.apple.com/de/app/economist-world-in-figures/id497729555?mt=8
play.google.com/store/apps/details?id=com.economist.wif
Connection to
curriculum
This app allows students to gain knowledge of the world’s countries including an assessment of different spatial,
cultural and political contexts.

82
Getting started Once the app has finished downloading, open it.
Once you have registered for a free trial you can chose between 4 main options:
The option “Fact quest” offers a quiz.
The option “Ranking topics” allows you to determine e.g. the fastest growing cities, the countries with the highest or
lowest economic growth and much more ranking criteria.
With the option “Country profiles” you get access to a lot of country related data and statistics, covering a wide range
of topics e.g. people, economy and trade.
With the option “Comparison tool” you can build your own country comparison charts.
How to integrate
this app into your
science lesson
1. Students can study different countries, create country profiles and compare countries using certain sets of criteria. Students can compare the country profiles and draw conclusions.
2. Students can choose a demographic variable (birth rate, per capita GNI, life expectancy etc.) and map the distribution of that indicator in a certain area (e.g. in Europe) of a map using the app as a data source.
3. Once students have become familiar with the app and the characteristic facts describing each country, they should think about the question “Which criteria are suitable to classify countries into Industrial Countries and Developing Countries?”
MalMath
Subject
Duration 30-60 minutes
Description and
goal
MalMath is a an android application which solves math problems by offering step by step descriptions with detailed
explanations and a graph view. It is free and works offline. Moreover this application generates random math
problems with several categories and difficulty levels. The user can save and share solutions and graphs.
Currently available languages: English, German, Spanish, Italian, French, Turkish, Albanian, Croatian andArabic.
Download here play.google.com/store/apps/details?id=com.malmath.apps.mm

83
Connection to
curriculum
This app can support the learning and understanding of diverse mathematical topics.
Getting started Type in your mathematical problem in the appropriate field and click “solve”. The application delivers the solution.
By clicking the “Show steps” button each step and sub-step of the problem is shown and described in detail.
In the right part of each step you see a button showing the letter “I” in a circle. This is the “highlight” icon which
highlights the part from the expression which was changed from the previous step to the actual step.
The “show steps” button solves a mathematical problem step by step and shows the solving process with an
animation.
You can plot functions with MalMath, even multiple functions are supported: you can plot two functions in parallel
and compare their graphs. MalMath also makes the analysis of the graphs.
How to integrate
this app into your
science lesson
1. Introduce MalMath to your students to offer them a possibility to train and improve their mathematical skills. 2. Introduce the formula for population growth:
P = P0ert
With P = final population after time t,
P0 = starting population,
r = rate of growth,
t = time,
e = Euler number = 2,71828
Give your students the task to calculate with MalMath the time point when the world’s population will reach the 8
billion mark: at the beginning of 2016 the world’s population was 7,432,663,275 and the current (2016) growth
rate is approximately 1,13 % per year.
Start a discussion concerning the main problems of a growing world population. The major problem is not space,
but an imbalance in food and fuel, with 5% of the earth’s population consuming 23% of the world’s energy. 13% of
the people do not have clean drinking water and 40% do not have adequate sanitation and sewerage treatment.
84
3. The problem generator function of MalMath provides your students with a lot of exercises to challenge their
understanding in a certain mathematical field (problems are generated from various mathematical topics:
Aagebra, trigonometry, limits, differentiations and integrals. There are three difficulty levels available). This might
be helpful especially before a maths tests.
Sensor Kinetics
Subject
Duration 15-50 minutes
Description and
goal
Sensor Kinetics demonstrates the physics of gravity, acceleration, rotation, magnetism and more as these forces are
measured by your smartphone sensors, including the gyroscope and accelerometer. The app includes comprehensive
help files with easy to understand information and experiments that you can perform with the sensors. It is a great
hands-on tool for physics courses on classical mechanics.
Download here itunes.apple.com/de/app/sensor-kinetics/id579040333?mt=8
https://play.google.com/store/apps/details?id=com.innoventions.sensorkinetics
Connection to
curriculum
This app supports the understanding of general physics concepts such as motion and forces, magnetism and gravity by
performing simple experiments.
Getting started Once you have downloaded the app and opened it you come to the main screen. Allll the sensors available on your
Android device are listed here. Each chart screen displays the data in real time as it is captured on your device.
Sensor Kinetics also measures data from your Android device's scalar sensors, including temperature, air pressure,
light and more.
The “help function” (question mark symbol in the upper right corner) provides complete descriptions of what each
sensor does and also gives advices for conducting experiments with this app.
Charts can be viewed in either portrait or landscape mode.

85
How to integrate
this app into your
science lesson
1. With this app a lot of experiments are possible, for example the movement analysis of a children’s swing. Fix your smartphone to the swing chain and record the swing movement with the accelerometer function. The resulting graph plots centripetal acceleration (Y-axis) against time and allows students to analyse the behaviour of a simple pendulum.
2. With the magnetometer sensor you can detect the orientation of your device relative to the Earth's magnetic north. When experimenting with this sensor, you can see the effect of the device rotation relative to the magnetic north, or you can see which influences the presence of ferromagnetic material has on the value of the local magnetic field of the earth (e.g.: move a magnet near your device).
Tips and tricks See more at: www.rotoview.com/sensor_kinetics_pro.htm#sthash.PGsFlb3s.dpuf
86
Socrative
Subject
Duration 15-50 minutes
Description and
goal
Socrative is a free educational application that represents an online response system for students. It is based on the
principle that the teachers can post educational exercises. The students give their digital answers and the teacher can
monitor the responses of all students. Through the use of real time questioning, instant result aggregation and
visualisation the teacher can identify and evaluate the level of performance and understanding within the whole class
in a very easy way! Socrative saves your time so the class can further collaborate, discuss, extend and grow as a
community of learners. There are two app versions, one teacher app and another one for students. Educators use the
Socrative-teacher app version to create a virtual room and prepare quiz questions in various formats, students enter
the room via the Socrative-student app.
Download here itunes.apple.com/nl/app/socrative-teacher/id477620120?mt=8
play.google.com/store/apps/developer?id=Socrative+Inc.
Connection to
curriculum
Versatilely applicable.
Getting started Watch this video: www.youtube.com/watch?v=vqCgSEtLWlU. It shows you how to use Socrative and how to conduct a
quiz in your classroom using this tool.
Create your teachers account here:
Teachers login through their device and select an activity which controls the flow of questions and games.
Students simply login with their device and interact real time with the content.
87
How to integrate
this app into your
science lesson
1. Via the Quick Question function the teacher can ask questions of understanding on the current topic at the end of a lesson to get feedback regarding the learning success of the entire class. Ask a question on a new topic or a natural phenomenon you would like to introduce to your students via the Socrative Quick Question Function. Every student can give an answer in the anonymous virtual mode. Allow your students to see the answers from the whole class and ask them to vote for the answers they like best.
2. In inquiry based science education you can use Socrative for posing research questions and hypotheses on a certain topic. For example introduce a scientific phenomenon by a picture or by an experiment without explaining the topic. Then prompt your students to post the (research) questions which come to their minds in terms of the considered phenomenon. Then the most preferred research questions will be selected by voting. You can apply the same procedure for selecting a research hypothesis within the class.
3. You can use this tool to receive anonymous feedback on your science lesson.
Answer Garden
Subject
Duration 15-35 minutes
Description and
goal
Answer Garden is a simple Web 2.0 tool used for getting feedback from a group. It can be used to determine the
knowledge level of students on a given topic. No registration is required. After creating an answer garden your
students can answer your question by going to the website and logging in with a code that is provided to them. Once a
question is typed in, students can submit answers on the website or the Answer Garden can be embedded on a blog or
on another website.
Answers are limited to 20 characters so students must be short with their answers. Twenty-five answers are visible per
garden, but if students submit the same answer, that word grows bigger.
Download here itunes.apple.com/us/app/answergarden/id886601928?mt=8
Connection to
curriculum
Versatilely applicable.
88
Getting started answergarden.ch/Quickstart-Guide
1. Go to: answergarden.ch/create
2. Enter a topic
3. Choose your settings
4. Send your question/poll out to your students
How to integrate
this app into your
science lesson
1. Answer Garden can be used to activate prior knowledge before a lesson and as an "exit card" to determine the level of understanding following a lesson.
2. Students can use this website to work collaboratively, e.g brainstorming. Answer Garden engages students by letting them see each other's answers. It also provides a good visual tool because if the same words are frequently typed in as answers those words in the word cloud become larger. By resting your cursor over an answer the number of respondents is shown. The resulting word cloud can also be exported to different design programmes to make the word cloud look more appealing. For this you can click on ‘Export to and choose either Tagxedo (only works well with Internet Explorer) or Wordle.
Tips and tricks Here's an example of Answer Garden used in an ESL classroom.

89
Lino
Subject
Duration 15-25 minutes
Description and
goal
Lino is a free service that allows you to create an online-pin board on which “sticky notes” can be posted. In addition to basic texts, the sticky notes you place on your canvas can contain videos, images, and file attachments.
Download here play.google.com/store/apps/details?id=com.linoit.lino
itunes.apple.com/us/app/lino-sticky-photo-sharing/id416718906?mt=8
Connection to
curriculum
Versatilely applicable.
Getting started Create your account on Lino.
Once you have logged in you can create a new canvas which is comparable to an online-pin board.
You can make your canvases and notes public or private. If you choose to make a canvas public other users can add
sticky notes to it and read all of the notes on it.
How to operate on the canvas:
Moving the canvas: Hold the left mouse button on an empty canvas area and drag it around.
Click on a sticky note in the upper right corner.
Drag and drop it to the place you want it.
Type in your text.
Add a sticky to canvas by tapping the “POST”-button in the lower right corner.
Some additional options are offered: You can have tags, change size or colour of the font, choose an icon, use a due date, change the sticky colour etc.
You have the option to post pictures, PDFs, movies or other documents by selecting the corresponding icon in the
upper right corner under the stickies.

90
How to integrate
this app into your
science lesson
Use Lino for a digital brainstorming session for example when you introduce a new topic. Encourage your students that
they should add everything to the lino-canvas which comes up to their minds concerning the current topic: facts,
keywords, images, videos, ideas etc.
Tips and tricks
When a whole class delivers contributions the jointly created online-pin board can become a little bit unstructured and
chaotic. The teacher can help to structure it by rearranging the contributions. Or the teacher can entrust the students
with the task to structure the sticky notes by certain criteria.
91
Tips & Tricks
Make sure not too much data traffic will be consumed (maximum of 8-16 mb) if you want to use web-based apps outdoors.
Make sure files have a compatible format for all students and all sorts of devices (Android, iOS, other).
Give precise instructions for your students to avoid side-tracking.
Communicate with colleagues about their experience with digital tools and materials (apps, devices and software).
Visit teachers training seminars and inform yourself through public institutions (libraries, museums), scientific literature,
pedagogical books and Internet.
Learn more
Tablets in schools (tablet initiatives around the world)
To find some more science related apps, have a look at:
http://blog.iat.com/2014/12/29/25-stem-education-apps-you-need-in-2015
http://sciencenetlinks.com/collections/science-apps
An interesting article about the advantages in mobile wireless and sensor technologies and their possibilities for supporting learning
activities
Teachers from 14 European countries worked out eleven interesting teaching units that show how to integrate Smartphones at maths,
physics, chemistry and biology classes.
An interesting Master’s thesis (Henrik Egholm Wessel) on the topic “Smartphones as scientific instruments in Inquiry Based Science
Education”
A chemistry lesson plan incorporating smartphones (and a free colour match app) to determine the concentration of a dissolved
colorant.

92
Social Media

93
General description Social Media is a collective term for online platforms where users provide content and interact with each
other. Via platforms such as Facebook, Twitter and YouTube users share information with each other and
they create an online network.
Social Media platforms can have different functions or can be used for different purposes: some are mostly
used for gaining knowledge or for following other users, while others are mainly aimed at sharing
information with the user’s own network. Ultimately there is a category aimed at presentation. A mixture of
these different functions and purposes is also possible.
What they all have in common is the social part. Through all these platforms users are able to communicate
with other users, leave comments and share stories. Social media allows people to connect with other people who share similar interests.
It can help you to quickly access information and to promote your ideas or activities.
Geograhic Information
Systems
Satellite Remote Sensing
Serious Games
(Apps for) Smartphones and
Tablets
Social Media
Tools

94
Didactical Concept
In the emerging digital world, education cannot stay behind. Social Media is a tool that can be used to
improve the quality of your student’s learning in many ways. Using Social Media in your lessons will most
likely enhance your student’s motivation. This is because Social Media already plays a big role in their
everyday lives. By incorporating Social Media in your lessons, you connect with your students’ every day
experience.
Benefits of using Social Media in your lessons
Research on the topic of Social Media and learning has shown that people learn most effectively when
they interact with other (similar) learners. This can be stimulated by using Social Media in your classroom and organising your students
into virtual groups.
Social Media could also be used in (digital) classrooms to share knowledge and ideas. Interesting video’s or presentations can be shared
very easily with the whole class with just a few clicks.
Furthermore, social media can offer students a platform to express one self. Sometimes in classrooms students can be a little shy and
hold back from expressing their ideas when asked. Social Media can help these quiet students to find their voice and speak up.
Students like to have an online space where they can ask questions and collaborate with teachers and students whenever they want.
Social Media can help to create this online classroom.
Social media used to gain
knowledge
Apps used for geography
General supporting apps in
your classroom
Social Media

95
Competencies
Implementing Social Media in your classroom can benefit a wide range of competencies, such as:
Enhancing digital communication skills;
Supporting creative thinking;
Raising media awareness and the ability to see how media influences reality;
Retrieving and processing large amounts of information ;
Creating content that helps you to bring a message across to a wide audience.
Good Practices
We will provide you with a couple of social media platforms of which we think that can be seen as a good practice to Motivate and Attract
Students to Science. Also we categorized the platforms so it’s easier to understand their main purpose. All Social media platforms can be
used within all subjects. Within the description of each platform however, suggestions on how to implement it in the classroom will be
provided. These suggestions are linked to the different subjects by an icon so you can see it in a glance.
Social media used to gain knowledge
YouTube
YouTube is a video-sharing website. The site allows viewing, uploading and sharing videos.
Available content includes video clips, TV clips, music videos, and other content such as video blogging, short original
videos, and educational videos.

96
Getting started
Create a special teacher's account. YouTube is owned by Google and that means that personal and business content will be mixed
when you use your personal Gmail account.
After registration you can go to Youtube.com and click login at the top right of your screen
You can now either browse the search bar at the top of your screen or start uploading your videos. If you want to upload a video click
on the upload button at the top right of your screen.
Also at the top right you will find an icon in blue. If you click that icon and then click the little wheel you can change your settings.
How to integrate YouTube into your science lesson
Try to Flip your classroom! This means that students prepare for the class at home by watching your instructions online. And for the
low achievers this means that they can watch it several times, if needed, in order to understand it better. Afterwards the topic will be
discussed in class. To do so you would first have to record an instruction and then upload it to YouTube. You can easily record
instructions by using the video recorder on your mobile device.
Subject:
Level: junior and senior
Duration: 1 hour
YouTube’s National Geographic channel offers a range of videos on diverse topics that are suitable for science education. Also you can
search this channel for interesting videos by using the search bar.
Subject:
Level: junior and senior
Duration: 10-30 minutes

97
Khan Academy’s mission is to provide world-class education for anyone, anywhere. Check out this video about the concept of energy in
nature.
Subject:
Level: senior
Duration: 10-30 minutes
Educational TED Talks. Try for example this one about the global challenges of sustainability or this one dealing with the future of
renewable energy.
Subject:
Level: junior and senior
Duration: 20-40 minutes
Tips & Tricks
You can upload any type of video file with your account. Be careful with copyright of certain elements such as music, pictures or sample
videos.
Explore the channels and individual videos. There is a lot of useful content, but quality isn’t always guaranteed.
Try to be careful with publishing videos with students in them or, even better, avoid it. Especially without explicit (parental) permission.
To structure your videos put them into different categories.

98
Sporcle Sporcle is a trivia quiz website on which users have a set time limit to name all the items within a given
subject, such as the most polluting countries in the world.
Students or teachers can create their own quiz in their own language. Also many existing quizzes can be played. What makes it unique is
the ability to challenge other students.
Getting started
Create your account on Sporcle and click the ‘join for free’ button’.
Go to your personal profile, upload your own quiz on Sporcle and challenge your students or let your students put together a quiz for
you.
Also you can browse the site for relevant quizzes. Found one? Just hit play. The fun thing about Sporcle is that a timer is set when you
start your quiz. This makes it more exiting.
How to integrate Sporcle into your science lesson
Let your students challenge each other in the quizzes and see who of them gets the highest score. To do this you have to connect
Sporcle to Facebook. The website will ask you to link these two platforms when you choose the ‘challenge’ option.
Subject:
Level: junior and senior
Duration: 10-30 minutes

99
Can your students name all the elements of the periodic table?
Subject:
Level: senior.
Duration: 15 minutes
How many facts about deforestation do your students know? Let’s find that out by taking this quiz. You can let your students use
Google to find the answers to the quiz or make them guess the answers so you have something to discuss.
Subject:
Level: senior
Duration: 10 minutes
Can your students name the assortments of physics, chemistry, and astronomy terms? Let’s find out.
Subject:
Level: senior
Duration: 10 minutes
Do they have any idea which countries are amongst the top 25 of polluting countries?
Subject:
Level: junior and senior
Duration: 5 minutes
100
If everyone in the world lived like people do in France, we'd need 2½ Earths to cope with the food and pollution. But which ten
countries would need the most?
Subject:
Level: junior and senior
Duration: 5 minutes
Use a Sporcle quiz as homework for your students
Students can use the site to study, by taking quizzes relating to anatomy, the Periodic Table of Elements, geography, and other academic
subjects as useful for their learning.
Tips and tricks
Choose quizzes for your students yourself rather than letting them look for them. There are many distractions on this website; you
don’t want to have your students stuck on the ‘Entertainment’ or ‘Just for fun sections’.
When selecting an appropriate quiz check the ranking of that quiz and try it yourself first! Also check the comments that are given.
With Sporcle you can also create a game. This YouTube video shows you how.
Find out How to make a picture quiz

101
Social media used to follow and share
Facebook is the world’s largest online social networking service.
After registration, users can create a user profile, add other users as "friends", exchange messages, post status
updates and photos, share videos and receive notifications when others update their profiles.
Additionally, users may join common-interest user groups, organised by workplace, school or college, or other
characteristics. It’s possible to create school, class or project pages and manage them separately.
Getting started
If you don’t have it already, create an account on Facebook.
Establish a private Facebook group for your class or a project and invite your students to this group you’ll see the option is available to
you on the left side of the page.
Share the content you want with your students.

102
How to integrate Facebook into your science lesson
Organise a class about a vegan lifestyle. Gather pros and cons for a vegan lifestyle by visiting the Facebook page of Cowspiracy and
discuss the effects of eating meat and fish on the environment and the climate. As an introduction you can watch the trailer (or the
whole documentary) of Cowspiracy on YouTube. Also you can let your students watch this at home and discuss it in the class
afterwards.
Subject:
Level: senior
Duration: 60 minutes
Facebook has many interesting pages that are well worth a visit. You can use them to find information on a certain topic. On Facebook,
facts, pictures and videos all come together so you mind fight an interesting video on a page that you could use as an introduction for your
lesson or you can come across a funny comic that will trigger your students’ brains.
Here are some interesting Facebook pages:
I Fucking love science
News from Science
National Geographic
Nobel Prize
National Science Foundation (NSF)
EU Life Programme
Eco-Schools
103
Tips and tricks
You might want to create a special teacher’s account when using Facebook to separate personal and business purposes.
Check your privacy setting. By default everything is set to public. If you want to share content with a specified group you can alter your
settings to i.e. ‘friends’.
Beware: students are easily distracted.
Do not add your students as friends on your personal Facebook account.
Twitter is an online social networking service that enables users to send and read short 140-character messages called
"tweets". Registered users can read and post tweets, but unregistered users can only read them. Users access Twitter
through the website or mobile device app. The biggest advantage of Twitter is that there is no need to become friends
with someone before you can contact him or her. This makes first hand contact to (in theory) everybody in the world
possible.
Getting started
Create your (project) account on Twitter.
Share the content you want with your students by writing your first tweet
Get your students to follow you by sharing your Twitter name with your students. They can then do a request to follow you.
By default your account is set to public. Everyone can see your tweets. If you don’t want that then adjust your security and privacy
settings.
104
How to integrate Twitter into your science lesson
Teachers consult: Set up your own Twitter consulting hour where students can ask their questions about homework for example. Do
this by establishing your own Twitter group and adding your students to that group.
Subject:
Level: junior and senior
Duration: 10-30 minutes
Recap! Let students recap what they learnt by having them write a summary tweet of max. 140 digits. It enhances their analytical skills
and their writing skills at the same time.
Subject:
Level: junior and senior
Duration: 5 minutes
Who said what on Twitter? Try to fuel up a discussion on a certain topic and let your students do a little research on Twitter on what
others have said about this. Let them then adopt this opinion. Divide your class into two parts (1 supporting the idea, one opposing it)
Subject:
Level: junior and senior
Duration: 30 minutes
105
Tips & Tricks
Almost every news source, science organisation, university etc. has their own Twitter account. Follow them to be up to date with the
latest news.
Check before you choose your hashtag i.e. #mass can be taken by many different sources already with very different purposes.
Do not follow your students on Twitter. Keep school and private lives apart as much as you can.
Follow Twitter accounts of interesting scientists.
Pinterest is a website that allows you to "pin" things online, just as you would pin them on a real life bulletin board.
Furthermore, you can follow friends on Pinterest, "repin" interesting content or browse a live feed of items that are being
pinned by others when you're searching for inspiration. What makes Pinterest unique is that it is super visual. Everything
you look for is shown in clear images and/or video. Furthermore, Pinterest is becoming increasingly popular with more
and more users. You can imagine this network is very resourceful.
Getting started
Create your account on Pinterest.
Create some boards by clicking the + ‘create a board’ button. Give your board a name, e.g. inspiration science class, physics, chemistry,
etc. Most of all, Pinterest is an online space where you can get inspiration. Need any ideas on your science class? Type i.e. ‘science class
ideas’ in the search field at the top of the page and Pinterest will search content for you that others have pinned before.
Found something interesting? Pin it to your own board. People that follow you will automatically see this

106
How to integrate Pinterest into your science lesson
Teachbytes offers a few suggestions: Whenever researching a topic, let your students create a board on Pinterest so they can pin
relevant stuff on it. Create a board that is focused on scientists from a certain era. Then let your students each present their own board
to the rest of the class so everyone can benefit from their presentations. This task can also be carried out in groups of course.
Subject:
Level: junior and senior
Duration: 30 minutes
Create a public board on a certain theme, such as the theme of plastic soup/microbeads and invite your students to add pins to this
board. You could either use it as a means of gathering the pre knowledge that your students have or you could use it to gather new
information on the issue.
Level: junior and senior.
Subject:
Level: junior and senior
Duration: 30 minutes
Tips and tricks
It is very easy to get lost in all the pins with Pinterest. It might be a good idea to limit the time for this part.
Pinterest has the so called ‘pin it-button’ which you can download for your browser. This button allows you to pin content from
anywhere on the Internet to your boards.
When searching on Pinterest try for example ‘citizen science’ and look for interesting ideas that you can carry out with your class.
107
Instagram is an online mobile photo-sharing, video-sharing and social networking service that enables its users to
take pictures and videos, and share them on a variety of social networking platforms, such as Facebook or Twitter.
Getting started
Create your teachers account on Instagram.
Upload your photos and adjust the colours to your own preference by choosing one of the filters. The app will
ask you to write a caption, which means a description, for your photo. You can also choose to tag people. You can only tag people that
have an Instagram account. Click the checkmark when you’re done and upload your photo.
Also your students need an Instagram account. If they don’t want to use their personal account you can ask them to create a second,
students account. Or you can create a few student accounts and give the login details to your students. They can use the accounts
when working in groups for example.

108
How to integrate Instagram into your science lesson
The community of weareteachers.com has some great ideas:
Use photos to explain a scientific process. Record steps in a science experiment and post them online
Subject:
Level: junior and senior
Duration: 5 minutes
Watch as a plant unfurls or a chemical compound slowly changes colours - and keep the changes preserved on Instagram.
Subject:
Level: junior and senior
Duration: 5 minutes
Imagine how a famous scientist in history would use Instagram. Have students browse historical photos and create a bulletin board or
poster display showing Einstein’s or Galilei’s Instagram feed.
Subject:
Level: junior
Duration: 30 minutes

109
Go on a scavenger hunt. Challenge your students by uploading pictures of things they need to find. These things can be either found in
nature or in the classroom. And when they found the object or phenomena let them post a picture of it to your account to prove it.
After that you will post the second photo and so on.
Subject:
Level: junior
Duration: 45 minutes
If you're considering using Instagram to deliver a class-based scavenger hunt, read the advice from this seasoned teacher.
1. Design a list of items or clues.
2. Create a public account for class use. Be sure to get a photo release from your students (and set rules for student images as well)
3. Share the account name and hashtag with your students. Have students use the hashtag on every image
4. Have students include additional information about the item when they upload it
5. Click the hashtag under any photo and see all the photos your students have posted.
Tips & Tricks
When you want your post to be easily found by a wider public do use #hashtags for your post and put them in your ‘caption space’ For
example you uploaded a picture of windmills and you want others to find this post you can ‘tag’ your photo like this: #windmills
#airquality #sustainability.
When you want to upload multiple pictures at once try using a photo collage app. You install this app on your phone and open it. You
can then select how many pictures you want to add to your collage and simply add them. The app will create a collage and gives you
the options to change the colours or shape of the picture and the frame.
If you don’t want your posts marked as public you can also go to your settings and change your account status to ‘private’
110
Edmodo
Edmodo is an online networking application for teachers and students in a safe and controlled environment
appropriate for school. Edmodo is primarily a tool for within-class communication, but it also provides several ways
for teachers to connect with other teachers.
Getting started
Create your account on Edmodo.
Set up your first online classroom by clicking on the create group button. Fill out the details.
Then add your students to the group. Adding students is super easy. Once you create a group, you will be given a unique group code to
share with your students. Students can use the code to create their Edmodo account, and they will automatically be entered into that
group.
Edmodo has a lot more options. You can explore them in the full introduction guide at the Learn More section.
111
How to integrate Edmodo into your science lesson
Find out how science is taught across the world and give students the opportunity to not only learn about their own subject but also
about another cultural view on that. Connect your classroom with another classroom in e.g. Germany via an Edmodo group.
Subject:
Level: junior and senior
Duration: 20 minutes
Use Edmodo to communicate with your students when you’re out of the classroom or provide updates to students who are absent
from class.
Subject:
Level: junior and senior.
Duration: 20 minutes
Award a badge to a student that excelled in the task given. This is a nice digital motivator to keep up the good work. Click here to find
out how to award a badge.
Subject:
Level: junior and senior.
Duration: 5 minutes

112
Tips & Tricks
The nice thing about Edmodo is that it’s a world wide community. This means you can get some community support from teachers all
around the world. Type your question in here and teachers around the world will be able to read your request and help you.
Post a quiz for students to take. You can attach links and files to each question. This allows you to post a document and ask students to
read and respond to it. Quizzes can be in multiple choice, true/ false, fill in the blank or short answer form. You can allow students to
see their scores immediately or you can disable that option
Use the Google Chrome extension or browser bookmark to quickly add content to your Edmodo library. Anytime you find something on
the web, click the Edmodo extension or bookmark to save it in your Edmodo library.

113
Social media used for presentation
Piktochart
Presenting your data doesn’t have to be boring at all. Neither does it take a lot of work. There are ways to create beautiful visualisations of
your data without too much of an effort. Try it. Your students will like to add some creativity to their data processing.
Getting started
Create an account on www.piktochart.com
Choose a template that you like. They are displayed at the top of your screen. You can choose from infographic, presentation, poster
and report. Choose one from the section that says ‘free templates’ and click ‘create’.
Edit your visual to your own preferences (you can change colours, text, etc.) and insert your own scientific data
That’s it. You can now safe your infographic as an image or pdf by clicking the download button at the top right of your screen or share
it with followers on other social media.

114
How to integrate Piktochart into your science lesson
Watch the documentary ‘An Inconvenient Truth’ and let your students create an infographic on global warming. You can do this with
any documentary of course. You can find some interesting documentaries on the topic of sustainability on the website of Films for
Action. And a list about animal documentaries can be found here.
Subject:
Level: junior and senior
Duration film: 2,5 hours (An Inconvenient Truth)
Duration creating an infographic: 30 minutes
Let your students create and publish a beautiful visualisation of the data found in their own research.
Subject:
Level: junior and senior
Duration: 30 minutes
Use it as a tool during presentations, instead of PowerPoint or another presentation tool.
Subject:
Level: junior and senior
Duration: 30 minutes

115
Tips & Tricks
Give your infographic a title to make sure you’ll be able to find it back easily by going to the top middle of your screen and click on
‘Untitled infographic’. Then change the title to your own preferences.
With Piktochart you have a lot of options to insert maps, videos, pictures and change all the colours but don’t overdo it. Less is more!
Although Piktochart is very easy to work with. We did find some tips and tricks you did not know yet. Watch this 2 minute video to find
out how you can move all objects at once, mask images and other useful tricks.
SlideShare
SlideShare is a community for sharing presentations and other professional content. Did you or your students create
a powerful presentation? Or are you looking for a presentation about a specific subject that is already there?
SlideShare is a database with millions of users all spreading their presentations and therefore contributing to a world
of knowledge. Presentations are freely available and you can browse through the different categories.
Getting started
Firstly go to http://www.slideshare.net/ss/creators/get-startedto see a small presentation on how it works
Then create your own account by clicking the sign up button at the top right of your screen
To make it easier you can also link your SlideShare account to your Facebook or LinkedIn account.
You can start by browsing the ‘Education Section’.
Found something you like? Click on the download button. You can skip the notification about ‘clipping’ and continue to download as a
PowerPoint presentation that you can safe right to your computer or mobile device.
Do you want to upload a presentation of your own? Click on the orange ‘upload’ button on the top right of your screen.

116
How to integrate SlideShare into your science lesson
Others have created great slide share presentations. Have a look and feel inspired.
Here is a presentation on the topic of air pollution that discusses the different types, the causes and the effects
and here is one on the topic of recycling. It gives information about the purpose of recycling and also provides you with some creative
recycling ideas for your everyday stuff.
Subject:
Level: senior
Duration: 1 hour
And this one about global warming so you can teach your students about the difference between global warming and climate change.
It also puts emphasis on solutions and responsibility and puts it in a broader, historical context so you can use it to fuel up a good
discussion.
Subject:
Level: senior
Duration: 30 minutes
Let your students create a presentation about a topic of choice and upload it to SlideShare to see how many people you can inspire
with your presentation. Make sure you make a nice and visual presentation and use a catchy title that describes the context well.
Subject:
Level: junior and senior
Duration: 30 minutes
117
Tips & Tricks
To get an idea of the quality of the presentation you are viewing you can see how many ‘likes’ it’s been given. Also below the
presentation you can view comments of others on this presentation.
Also to avoid presentations that are too long you can see how many slides it contains. Ideally you would stay under 50!
On the right of your screen you can see other recommended presentations
Blogger
A nice way to motivate and attract students to science is by keeping a blog. A blog is a
frequently updated online personal journal or diary. It is a place to express yourself to the
world. A place to share your thoughts and your passions. You can say that a blog is your own
website that you are going to update on an ongoing basis. Blog is a short for the word weblog.
Blogger is a great blogging platform which is also very easy to work with.
Getting started
Create an account on Blogger.
What makes it easier is that also Blogger is a service of Google and you can therefore use your own Gmail address. Or create a special
teachers account if you haven’t already.
Register yourself by clicking ‘new blog’ and choose a template and a blog name that you like. The blog name will appear for example
like this: MASS2016.blogspot.com
After creating a blog you will be lead to your overview page. From here you can start creating a blog by clicking on ‘new message’. You
can type in your text and if you like you can add videos and photos too

118
How to integrate Blogger into your science lesson
It might be still a bit challenging to get you started. Don’t be afraid to ask one of your saffy students for help or watch this video
There are some science teachers around who have some interesting blogs. Let your students visit these blogs and comment on it to
fuel up the discussion. Here are some interesting blogs that are worth a visit:
www.teachercertificationdegrees.com/top-blogs/science-teacher
www.popsci.com/blog-network
Subject:
Level: junior and senior.
Duration: 15 minutes
Pass the ‘pen’ to your students and let them write a blog about a topic of choice (you could help with the selection). So every week for
example another student can write a blog and others have to comment on it.
Subject:
Level: junior and senior.
Duration: 30 minutes
Tips & Tricks
Keep in mind a few things when writing a blog or assigning your students to do so. Set a maximum amount of characters so you make
sure blogs aren’t too lengthy thus boring to read. Also let your students separate their blog in maximum 4 different parts so it’s easier
to read. Let them start with a hypothesis and finish with a conclusion or recommendations. This way you can combine the scientific
content level with some writing skills.
Publish the best blogs on your Twitter or Facebook account and see how many likes and shares they can get.

119
Learn more
YouTube
How to create a YouTube channel?
How to flip your classroom and record the videos to do it?
Sporcle
How to upload your own quiz on Sporcle
How to create and manage a group on Facebook?
How to post images and quotes on Facebook?
How to use Twitter and how to write a tweet?
How to send a direct message to someone?
How to create a group on Twitter?
How to use Pinterest?
How to pin things you found on the web?
How to search on Pinterest?
How to create a collaborative pin board

120
Piktochart
How to create an infographic
How to add images and text to your infographic?
How to customise charts and data on Piktochart?
How to use Instagram on your Android device?
How to send a direct message on Instagram?
SlideShare
How to use SlideShare?
Edmodo
How to work with Edmodo? - Full introduction
How to work with Edmodo? Prezi presentation
Why Edmodo is like Facebook and other questions
How to use quizzes and assignments in your Edmodo classroom?
How to work with groups on Edmodo? (Last video)
Blogger
How to create a blog?
Articles/research about social media in the classroom
Guidebook Social Media in classroom
Publication ‘How to use Social Media as a learning tool in the classroom’

121
Course specific inspiration

122
General Description
Digital tools are modern interactive multimedia technologies which successfully support school science education. Their use is not limited
to any subject. They can be used on geography, biology, chemistry, mathematics or physics.
In this tutorial you can find many examples of using digital tools for many subjects. Below you can find a list of these and some extra
examples that may inspire you.
If you have your own ideas on how integrate digital tools in your classroom, please share them with us by sending an email or posting
on the MASS Facebook group.
Geography
Use the Map of Life to show students which species live in their region. The Map of Life assembles and integrates different sources of
data describing species distributions worldwide. These data include expert species range maps, species occurrence points, ecoregions,
and protected areas from providers like IUCN, WWF, GBIF, and more. All data assets are stored, managed, backed up, and accessed
using a hosted cloud instance. Map of Life also provides a mobile app so you can go together for a field trip.
Use Google Earth to investigate glacial landforms in 3D.
Study the distribution and access to the supermarkets with the use of ArcGIS online tool.
Increase your student’s awareness of differences in the socioeconomic development of various countries of the world.
Track changes to the landscape over time and realise the man footprint.
Understand material properties as they influence microclimate in cities.
Khan Academy’s mission is to provide world-class education for anyone, anywhere. Check out this video about the concept of energy in
nature.

123
Visualise global climate data from Earth Science satellites with the NASA Earth NOW app.
Check temperature, rainfall, wind speed and direction, UV index, air quality (ozone, fine dust, and pollen), sunrise and sunset, moon
and data about hay fever with the Weather Underground app.
EnvKids is a serious game for students that aims at students' understanding of the concept of environmental sustainability.
Disasters triggered by natural hazards destroy lives and affect millions of people every year. Your goal in this game is to plan and
construct a safer environment for your population.
The serious game Floodsim is an interactive solution to create awareness of the increasing risk of flooding.
EnerCities offers an online e-learning game for young people (12-16) to experience energy-related implications.
Use map application and geoportals or georeferenced apps such as PDF Maps to design an educational path in your region.
Biology
Use the Map of Life to show students which species live in their region. The Map of Life assembles and integrates different sources of
data describing species distributions worldwide. These data include expert species range maps, species occurrence points, ecoregions,
and protected areas from providers like IUCN, WWF, GBIF, and more. All data assets are stored, managed, backed up, and accessed
using a hosted cloud instance. Map of Life also provides a mobile app so you can go together for a field trip.
Use map application and geoportals or georeferenced apps such as PDF Maps to design an educational path in your region to help
students get familiar with biodiversity. Combine different sources of data (especially national resources) considering precious natural
areas and protected zones. Make a map of your path using for example QGIS. See some examples developed for the Middle Vistula
valley.
Watch as a plant unfurls or a chemical compound slowly changes colours - and keep the changes preserved on Instagram.
EnerCities offers an online e-learning game for young people (12-16) to experience energy-related implications.

124
Go on a scavenger hunt with Instagram. Challenge your students by uploading pictures of things they need to find. These things can be
either found in nature or in the classroom. And when they found the object or phenomena let them post a picture of it to your account
to prove it. After that you will post the second photo and so on.
Study cell structures using a dynamic and realistic virtual model with the iCell app.
This app is a kind of science game that challenges students to sort and group living organism based on shared characteristics.
EnvKids is a serious game for students that aims at students' understanding of the concept of environmental sustainability.
Disasters triggered by natural hazards destroy lives and affect millions of people every year. Your goal in this game is to plan and
construct a safer environment for your population.
Eco Villa is a serious game that gives students information on sustainable design of houses and ways to reduce energy (electricity, gas
and water).
The serious game Floodsim is an interactive solution to create awareness of the increasing risk of flooding.
Chemistry
Use map applications, for example Air Pollution in World: Real-time Air Quality Index Visual Map, to estimate the concentration of
chemical substances in the air. Compare the level of air pollutions with current restrictions. Explain the term “Air Quality Index” and
what it means for human’s health.
Can your students name all the elements of the periodic table?
Create a public board on a certain theme, such as the theme of plastic soup/microbeads and invite your students to add pins to this
board.
This app is a virtual chemistry laboratory where you can combine elements from the Periodic table of elements.
Visualise global climate data from Earth Science satellites with the NASA Earth NOW app
125
Physics
Use satellite data and GPS receivers to show how satellites work;
Use the Light Pollution Map for estimating the level of light pollution on a global scale. Students can ask for the following questions: In
which regions occurs the highest level? What about your region – is it high or low light polluted? Has light pollution increased over the
past years? Can you indicate any hazards associated with light pollution? How can we measure the darkness of the sky?
Can your students name the assortments of physics, chemistry, and astronomy terms? Let’s find out.
Let your students create a board on Pinterest so they can pin relevant stuff on it. Create a board that is focused on scientists from a
certain era.
Imagine how a famous scientist in history would use Instagram. Have students browse historical photos and create a bulletin board or
poster display showing Einstein’s or Galilei’s Instagram feed.
iQuakeLite allows you to monitor earthquakes around the world.
Check temperature, rainfall, wind speed and direction, UV index, air quality (ozone, fine dust, and pollen), sunrise and sunset, moon
and data about hay fever with the Weather Underground app.
Sensor Kinetics demonstrates the physics of gravity, acceleration, rotation, magnetism and more as these forces are measured by your
smartphone sensors, including the gyroscope and accelerometer
EnerCities offers an online e-learning game for young people (12-16) to experience energy-related implications.
Visualise global climate data from Earth Science satellites with the NASA Earth NOW app.
EnvKids is a serious game for students that aims at students' understanding of the concept of environmental sustainability.
Eco Villa is a serious game that gives students information on sustainable design of houses and ways to reduce energy (electricity, gas
and water)
126
Mathematics
Climate Research Campaign: satellite data in climate change education.
With Flowerpower Lite, students can enhance their skills with regards to fractions and decimals.
MalMath is a an android application which solves math problems thereby offering step by step descriptions with detailed explanations
and graph viewMalMath is a an android application which solves math problems by offering step by step descriptions with detailed
explanations and a graph view
127
Resources
Introduction
Rocard et al. (Science Education NOW, 2007)
Geo-media
Donert K., Parkinson A., Geo-media Case Studies in the Curriculum. Retrieved on 15 December 2015 from:
http://moodle.eurogeography.eu/course/view.php?id=21
Digital-earth.eu, 2012. Project Progress Report. Retrieved from: http://tinyurl.com/k44damr
Geo-media in the curriculum. For a better world! Brochure, Retrieved from:
http://moodle.eurogeography.eu/pluginfile.php/2287/mod_resource/content/0/SIG4/D5.2-Brochure_3_2012_v2.pdf
GIS
Bednarz S., 2001, Thinking Spatially: Incorporating Geographic Information Science in Pre- and Post-Secondary Education. Retrieved
from: http://www.geography.org.uk/download/EVbednarzthink.doc
Mikołajczyk P. et al., 2011. GIS w szkole. Poradnik dla nauczycieli przedmiotów przyrodniczych, Centrum UNEP/GRID-Warszawa.
Digital-earth.eu, 2012. Project Progress Report. Retrieved from: http://tinyurl.com/k44damr

128
Satellite Remote Sensing
Voss K., Goetzke R., Hodam H., Rienow, A. Remote sensing, New Media and Scientific Literacy-A New integrated Learning Portal for
Schools Using Satellite Images. In Learning with GI, Jekel, T, Koller, A., Donert, K. & Vogler, R. (Eds.) (2011), Herbert Wichmann Verlag,
VDE VERLAG GMBH, Berlin/Offenbach. ISBN 978-3-87907-510-2.
Yusoff N., Mohd Shafri H., Mohamed A. 2008. Remote sensing educational ground receiving System for interest creation in space
science and technology in education. IJEDIC, 4:171-182.
Serious Games
Kaspar Janssen. Gamedidactiek, 2015
Houda Mouaheb, Ahmed Fahli, Mohammed Moussetad, Said Eljamali. The Serious Game: What Educational Benefits?, 2012
www.sciencedirect.com/science/article/pii/S187704281202201X
Egenfeldt-Nielsen, Simon. The basic learning approach behind Serious Games.
http://media.seriousgames.dk/downloads/the_basic_learning_approach.pdfApril 2005
Frankwatching: Serious gaming met tochtige koeien case (2012). (IN DUTCH)
Frankwatching: Groeiende rol binnen het Europees onderwijs (2015). (IN DUTCH)
(Apps for) Smartphones and Tablets
Breiter, A., Welling, S. & Stolpmann, B.J. 2010. Medienkompetenz in der Schule. Integration von Medien in den weiterführenden
Schulen in Nordrhein-Westfalen, Düsseldorf: Vistas www.lfm-nrw.de/fileadmin/lfm-nrw/Forschung/LfM-Band-64.pdf
Gikas, J., Grant, M. M. 2013. Mobile computing devices in higher education: student’s perspectives on learning with cell phones,
smartphones & social media. Internet and Higher Education 19, 18-26.

129
Levy, P., 2001. Cyber culture. University of Minnesota Press, Minneapolis.
Michel, E., Decrouppé, T., Wiesner, J., 2014. eGeo-Riddle – videounterstützte eExkursionen zur Physischen Geographie. Zeitschrift für
Hochschulentwicklung, Ruhr-Universität Bochum.
Motiwalla, L. F., 2007. Mobile Learning: A framework and evaluation. Computers in Education 49 (3), 581-596.
Schaumburg, H., Prasse, D., Tschackert, K., Blömeke, S. 2007. Lernen in Notebook-Klassen. Endbericht zur Evaluation des Projekts
„1000mal1000: Notebooks im Schulranzen“. Bonn: Schulen ans Netz e.V. www.willigis-online.de/wp-
content/uploads/2013/07/n21evaluationsbericht.pdf