tda triennial performance audit for fy 2004-2006 - SBCAG
368
CITY OF LOMPOC TRANSIT (COLT) TDA TRIENNIAL PERFORMANCE AUDIT FOR FY 2004-2006 Fiscal Years Ending June 30 th Prepared by In Association With OCTOBER 20, 2007
-
Upload
khangminh22 -
Category
Documents
-
view
1 -
download
0
Transcript of tda triennial performance audit for fy 2004-2006 - SBCAG

CITY OF LOMPOC TRANSIT (COLT) TDA TRIENNIAL PERFORMANCE
AUDIT FOR FY 2004-2006 Fiscal Years Ending June 30th
Prepared by
In Association With
OCTOBER 20, 2007

City of Lompoc Transit TDA Triennial Performance Audit Page i
TABLE OF CONTENTS
EXECUTIVE SUMMARY.................................................................... 1
Purpose of Audit.........................................................................................1
Findings......................................................................................................1
Recommendations .....................................................................................4
I. INTRODUCTION....................................................................... 5
Performance Audit Objectives and Approach.............................................5
System Overview .......................................................................................6
II. COMPLIANCE REVIEW......................................................... 11
Regulatory Requirements.........................................................................11
Progress To Implement Prior Audit Recommendations ...........................15
Data Verification.......................................................................................17
TDA Performance Indicator Trends..........................................................23
III. FUNCTIONAL AREA PERFORMANCE RESULTS............... 30
Transportation Operations........................................................................30
Vehicle Maintenance................................................................................33
Administration & Planning ........................................................................34
IV. RECOMMENDATIONS........................................................... 39
O’Melia Consulting in association with Kelly Hines Consulting

City of Lompoc Transit TDA Triennial Performance Audit Page ii
LIST OF EXHIBITS
Exhibit 1 – Performance Audit Sources ................................................................6
Exhibit 2 – Organization Chart ..............................................................................7
Exhibit 3 – COLT Fixed Route Fares ....................................................................8
Exhibit 4 – Regulatory Compliance Matrix ..........................................................11
Exhibit 5 – 50% Expenditure Limitation Calculation ............................................14
Exhibit 6 – Cost per Hour Calculations ...............................................................15
Exhibit 7 – Progress To Implement Prior Audit Recommendations.....................16
Exhibit 8 – Verified Data Elements for TDA Performance Indicators ..................18
Exhibit 9 – Financial Data Consistency Review ..................................................21
Exhibit 10 – Operational Data Consistency Review – Fixed Route.....................22
Exhibit 11 – Operational Data Consistency Review – Demand Response .........23
Exhibit 12 – TDA Performance Indicators – Total System ..................................24
Exhibit 13 – COLT Service Expansion During the Audit Period ..........................26
Exhibit 14 – Upper End Estimate of COLT Farebox Recovery ...........................27
Exhibit 15 – TDA Performance Indicators – Fixed Route Mode..........................28
Exhibit 16 – TDA Performance Indicators – Demand Response Mode...............29
Exhibit 17 – COLT Vehicle Inventory ..................................................................33
Exhibit 18 – Santa Barbara County Transit Fares...............................................35
Exhibit 19 – COLT 2006 Performance & Regional Standards ............................37
O’Melia Consulting in association with Kelly Hines Consulting

City of Lompoc TDA Triennial Performance Audit Page 1
EXECUTIVE SUMMARY
Purpose of Audit
As the Regional Transportation Planning Agency (RTPA) for Santa Barbara County, the Santa Barbara County Association of Governments (SBCAG) is required by the Public Utilities Code (PUC) Sections 99246 and 99248 to contract for a third party performance audit of itself and each of the transit operators to which Transportation Development Act (TDA) funds are allocated. These audits are to be conducted in accordance with the California Department of Transportation, Performance Audit Guidebook for Transit Operators and Regional Transportation Entities. Performance audits are required to:
• Determine compliance with regulatory requirements
• Assess progress to implement prior performance audit recommendations
• Verify performance indicators and validate basic data used to calculate indicators
• Evaluate the effectiveness and efficiency of agency functions.
This performance audit of the City of Lompoc Transit (COLT) is for Fiscal Years 2004, 2005 and 2006 -- the period of time beginning July 1, 2003 and ending June 30, 2006.
Findings
• The City of Lompoc operates a fixed route and paratransit system called City of Lompoc Transit or COLT. The service is administered by the City, but operated under contract by AmericanStar Transportation, which successfully re-bid on the last operations procurement for a three-year period beginning in July 2006.
• COLT received the California Transit Association’s (CTA) Transit Excellence Award in November 2006, just after the end of the audit
O’Melia Consulting in association with Kelly Hines Consulting

City of Lompoc TDA Triennial Performance Audit Page 2
period. The award is made to agencies that demonstrate innovative service that promotes a positive image of transit in the community.
• The City of Lompoc continues to allocate TDA funds to Streets and Roads. However, this has not limited COLT’s ability to expand service during the audit period, as service hours increased by more than 28% over the audit period.
• COLT is in compliance with most PUC requirements. A finding of non-compliance was made for failure to meet the required 20% farebox recovery ratio. This finding is mitigated by compliance with the 50% expenditure limitation (PUC 99268). In addition, PUC Section 99268.8 states that the ratio of fare revenues to operating costs shall not apply to an extension of public transportation services until two years after the end of the fiscal year in which the service is implemented. COLT implemented a number of new services, route extensions, and route re-alignments during the audit period that would have qualified under TDA law to be exempted from farebox recovery requirements for two years. However, California Administrative Code 6633.8 requires that a transit operator seeking to exempt service from the farebox recovery calculation submit a report on the extension of service to SBCAG within 90 days after the fiscal year. COLT did not provide this report. In order to prepare this report in the future, COLT would need to keep fare revenues and operating statistics separate for services to be excluded so that calculations may be verified for adherence to the proposed approach.
• A finding of partial compliance was made for PUC 99243 as the
State Controller reports were submitted on-time but separate reports were not submitted for the fixed route and ADA paratransit service.
• COLT implemented one of five prior audit recommendations related to including more service information in monthly reports from the contract operator. COLT partially implemented a recommendation to establish a formal screening process for ADA paratransit customers. A process was established but is not followed. Similarly, COLT partially implemented recommended no-show and cancellation policies for its paratransit service, but these policies
O’Melia Consulting in association with Kelly Hines Consulting

City of Lompoc TDA Triennial Performance Audit Page 3
are not enforced. COLT did not implement three recommendations to 1) separate fixed route and paratransit service in reports to the State Controller, 2) improve the consistency in data reported to external agencies, and 3) accurately calculate full-time equivalent (FTE) employees in the State Controller’s report.
• COLT is in partial compliance with data collection and reporting requirements, as data is not reported separately by mode in State Controller’s reports despite being provided by mode to the City by the contract operator. The contractor is adhering to data collection requirements for operating costs, passenger, service hours, and service miles. The City does not collect employee pay hours from the contractor and incorrectly reports total employees in the State Controller’s report.
• COLT’s system-wide cost per passenger, a measure of cost effectiveness, demonstrated positive performance as it grew 9.6%, which is less than the 11.9% inflation during the audit period. Service productivity, measured by passengers per hour and passengers per mile, improved over the audit period as passengers per hour grew from 9.1 to 11.1 and passengers per mile increased from 0.61 to 0.84. Cost per hour, however, grew at three times the rate of inflation due to a new operations contract in FY04, which accounted for 84% of the growth in cost per hour during the period. Growth in the cost per hour between FY04 and FY06 was just half of the growth in the CPI.
• COLT’s farebox recovery declined over the audit period from 19% in FY03 to 13.3% in FY06. COLT last raised its fares in 2002, and maintains a paratransit fare that is half of the fixed route base fare. A review of the fare structure could happen in FY08 but the City’s biennial budget (FY08 to FY09) does not include any additional fare revenues.
• COLT continues to maintain a highly flexible demand response service in terms of enforcement of ADA and age-based criteria for service eligibility. However, the growth in the demand for this service in light of poor farebox recovery performance warrants a careful review of the eligibility and enforcement process.
O’Melia Consulting in association with Kelly Hines Consulting

City of Lompoc TDA Triennial Performance Audit Page 4
• COLT has a regular fleet replacement program in place. Six of COLT’s twelve active vehicles were replaced during the audit period with two new vehicles scheduled for delivery in both FY07 and FY08. COLT is gradually introducing smaller capacity vehicles into its cutaway vehicle fleet with a minivan as one of the two vehicles due in FY07.
• COLT last prepared a Short Range Transit Plan (SRTP) in 2003 with another scheduled for the FY09 to FY10 timeframe. Many of the fixed route service recommendations made as part of the FY04-FY08 Short Range Transit Plan have been implemented including increasing the span of service, re-configuring Route 3, providing bi-directional service on Route 2, and adjusting route schedules. COLT implemented two of four demand response recommendations including implementation of evening service and limiting the annual number of demand response service hours. A third recommendation called for establishment and implementation of an ADA certification process. COLT established a certification process but has not enforced its application. Analysis of modal performance should be conducted on a more regular basis (e.g., monthly or quarterly) and not left to the SRTP process every four or five years.
Recommendations
Two recommendations are offered for consideration by COLT.
1. The City of Lompoc should take measures to improve its farebox recovery ratio.
2. The City of Lompoc should more carefully report transit system statistical – passengers, service hours, service miles, and employee full-time equivalents (FTEs) – and financial data in reports to oversight agencies, including reporting information by mode.
O’Melia Consulting in association with Kelly Hines Consulting

City of Lompoc TDA Triennial Performance Audit Page 5
I. INTRODUCTION
Performance Audit Objectives and Approach
As the Regional Transportation Planning Agency (RTPA) for Santa Barbara County, the Santa Barbara County Association of Governments (SBCAG) is required by the Public Utilities Code (PUC) Sections 99246 and 99248 to contract for a third party performance audit of itself and each of the transit operators to which Transportation Development Act (TDA) funds are allocated. These audits are to be conducted in accordance with the California Department of Transportation, Performance Audit Guidebook for Transit Operators and Regional Transportation Entities. Performance audits are required to:
• Determine compliance with regulatory requirements
• Assess progress to implement prior performance audit recommendations
• Verify performance indicators and validate basic data used to calculate indicators
• Evaluate the effectiveness and efficiency of agency functions.
This performance audit of COLT is for Fiscal Years 2004, 2005 and 2006 -- the period of time beginning July 1, 2003 and ending June 30, 2006.
While the performance audit is being conducted in response to State requirements, such audits can and should be constructive and useful to governing boards, SBCAG and transit operator management.
It is the Auditor’s responsibility to provide objective and balanced reporting of results. This is important because very few agencies are all good or all bad. It is the auditor's responsibility to conduct thorough and accurate analyses and objectively report performance findings. Significant accomplishments and positive performance trends are discussed as well as opportunities for improvement.
O’Melia Consulting in association with Kelly Hines Consulting

City of Lompoc TDA Triennial Performance Audit Page 6
The methodology for this audit includes interviews with key staff and management involved in the provision of transit services, a site visit for review of operations and data collection practices, review of operational and financial data, and review of relevant documents. Highlights of this review are presented below in Exhibit 1.
Exhibit 1 – Performance Audit Sources
Interviews – Name, Title and Agency
Richard Fernbaugh, Transit Administrator, City of Lompoc Trisha Charbonneau, Accountant, City of Lompoc
Jonathan Dotson, Project Manager, AmericanStar Transportation Matt Dobberteen, Alternative Transportation Manager, County of Santa Barbara
Site Visit(s)
COLT Operations Facility, May, 15, 2007 City of Lompoc City Hall, May 15, 2007
Background Materials Reviewed
Comprehensive Annual Financial Reports, Fiscal Years 2004-2006 Annual Report of Financial Transactions of Transit Operations -- State Controllers
Annual Reports, Fiscal Years 2004-2006 TDA Triennial Performance Audit Report For Fiscal Years Ending June 30, 2003
Annual TDA and STA Claim Forms, Fiscal Years 2004-2006 National Transit Database Reports, Fiscal Years 2004-2006
California Highway Patrol Pull-Notice and Terminal Inspection Certifications Purchased Transportation Service Agreement
Short Range Transit Plan Organizational Chart and Annual Budgets, Fiscal Years 2004-2006
Monthly Contractor Invoice and Operations Management Report Public Information – Website, Timetables & Schedules, Brochures
System Overview Organization & Policy Decisions
COLT service is provided through the City’s Public Works Department, under the direction of the Aviation Transportation Administrator who reports to the City Engineer. Supporting the Transportation Administrator is an Office Assistant and a Senior Maintenance Worker as shown in Exhibit 2.
O’Melia Consulting in association with Kelly Hines Consulting

City of Lompoc TDA Triennial Performance Audit Page 7
Exhibit 2 – Organization Chart Director of
Public Works
Senior Maintenance
Worker
Aviation TransportationAdministrator
City Engineer
AmericanStarTransportation (Operations)
Office Staff
Assistant
Director of Public Works
Senior Maintenance
Worker
Aviation TransportationAdministrator
City Engineer
AmericanStarTransportation (Operations)
Office Staff
Assistant
Of the City positions responsible for transit-related functions, only 1.65 employee FTEs are supported by the Transit budget with 75% of the Administrator’s time, 55% of the Maintenance Worker’s time, and 47% of the Office Assistant’s (employed ¾ time) time is dedicated (i.e., charged to) oversight and administration of the transit system. An additional 6% of the City Engineer’s time is transit-related. Transit also benefits from the assistance of a City accountant, whose costs are allocated to Transit as part of general City overhead. The Transportation Administrator is responsible for oversight of the contract operator, AmericanStar Transportation.
As a City-provided service, COLT policy direction is provided by the City Council. The Council consists of five members, and is chaired by the City of Lompoc Mayor. The Council approves department budgets and budget amendments, approves City contracts, holds public hearings as required for service and fare changes, and approves TDA claims.
As a funding partner of the COLT service, the County also provides input into the City’s planning processes for the COLT services. The County’s involvement in the COLT planning process is discussed in Chapter III.
Fixed Route Bus Service Characteristics
COLT serves the City of Lompoc in addition to the communities of Mission Hills and Vandenberg Village in the County of Santa Barbara –
O’Melia Consulting in association with Kelly Hines Consulting

City of Lompoc TDA Triennial Performance Audit Page 8
an area of 40 square miles with a population of 65,500 according to SBCAG’s Regional Growth Forecast.
During the audit period, COLT’s fixed route system was made up of four routes operating Monday through Friday from 6:30 am to 8:00 pm, and Saturday from 9:00 am to 5:00 pm. COLT does not operate on Sundays or legal holidays. In the first six months after the end of this audit period, COLT implemented two new routes:
1) In August 2006, COLT implemented an evening service for students at Hancock College. Students can select one of four nightly departures at 8:10 pm, 8:40 pm, 9:10 pm, and 9:40 pm, Monday through Thursday and get dropped off at their home.
2) In December 2006, COLT added a fifth route to its fixed route system, serving Mission Plaza and Lompoc Community Center.
COLT’s fixed route fares are shown in Exhibit 3.
Exhibit 3 – COLT Fixed Route Fares
Within City Limits Outside City Limits (Mission Hills, Vandenberg Village)
Adults & Students $1.00 $1.50
Seniors (62+), Persons with Disabilities & Medicare
Cardholders $0.50 $0.75
Monthly Fare Saver Pass $18 $9
Reduced Fare Saver Pass $34 $17
Transfer Free Free
The fixed route vehicle fleet was comprised of nine vehicles throughout the audit period. In FY04 and FY05, five vehicles were required for peak service. Six vehicles were required in FY06. A detailed list of the COLT fleet is provided in Section III of this report.
Demand Response Service Characteristics
COLT’s demand response service is a complementary ADA paratransit service but is open to both persons with disabilities as required by ADA and seniors 62 years of age and older. However, preference is given
O’Melia Consulting in association with Kelly Hines Consulting

City of Lompoc TDA Triennial Performance Audit Page 9
to persons with disabilities in scheduling trips. The demand response service area is the same as that for the fixed route system
The demand response system operates during the same times and days as the fixed route system, and charges the same fare - $0.50 within City limits and $0.75 outside City limits. Three vehicles are available for the demand response service but only two are used in peak service.
An additional component of COLT’s demand response service is the Santa Barbara Shuttle, formerly the County Health Service operated by SMAT. This shuttle service, which requires reservations, provides twice weekly (Tuesday and Thursday) trips to Santa Barbara, departing from Mission Plaza at 8:30 am and departing from Santa Barbara MTD’s Bus Depot at 3:30 pm. Dial-a-ride passengers eligible for door-to-door service are picked up prior to the morning departure and after the afternoon scheduled departure.
The Breeze
The Breeze provides inter-community service between Santa Maria, Vandenberg Air Force Base (County of Santa Barbara), and Lompoc. Each of these three jurisdictions contributes 1/3 of the operating cost of the system after the deduction of CMAQ grant funds which covers about 88% of operating costs for the first three years of service. Breeze operating and service data, however, is included as part of Santa Maria Area Transit’s audit.
Clean Air Express
The Clean Air Express is operated by Traffic Solutions, the County’s Ridesharing Agency and a division of SBCAG. Clean Air Express offers daily round trip service between Santa Maria and Lompoc to Goleta and Santa Barbara. COLT owns the vehicles used to provide the Lompoc Clean Air Express Service and, as such, reports service statistics for the Clean Air Express in its National Transit Database report. COLT does not subsidize the cost of this service. Data for the Clean Air Express has been excluded in the analysis of COLT system performance presented in this performance audit.
O’Melia Consulting in association with Kelly Hines Consulting

City of Lompoc TDA Triennial Performance Audit Page 10
Achievements and Challenges During the Audit Review Period
During the performance audit review period (i.e., July 1, 2003 and June 30, 2006), COLT has successfully implemented a number of changes with a positive impact on performance. COLT has also been faced with a number of challenges. These are highlighted below.
• COLT has seen a 58% increase in ridership over the audit period, from 219,584 in FY03 to 346,223 in FY06. Most of this growth is attributable to the fixed route system, which saw ridership grow by 124,000 passengers in three years. As service levels have grown at just half this pace, service productivity has improved as well with nearly 14 passengers per hour on the fixed route service in FY06.
• Just after the audit period, in November 2006, COLT received the Transit Excellence Award from the California Transit Association. Elements of the COLT system cited as the basis for the award included Spanish-oriented marketing materials, student-based service to Hancock College, and participation in community festivals and events.
• COLT saw a steady decline in its farebox recovery ratio during the audit period, falling to 13.3% in FY06 from 19% in FY03. Increasing costs have not been matched by growth in either fare revenues or local support funds (e.g., Measure D). COLT’s last fare increase was in 2002.
O’Melia Consulting in association with Kelly Hines Consulting

City of Lompoc TDA Triennial Performance Audit Page 11
II. COMPLIANCE REVIEW
Regulatory Requirements
COLT is in compliance with the majority of regulatory requirements, as shown below in Exhibit 4. Areas of partial or non-compliance for staff and management to be aware of include:
• PUC Sections 99268.2-5 & .12 – COLT’s farebox recovery did not meet the required 20% over the audit period, falling from 15.6% in FY04 to 13.5% in FY06.
• PUC Section 99268 – Non-compliance with required farebox recovery ratios per PUC Sections 99268.2-5 & .12 (above), requires verification of compliance with this section, which requires that TDA funding make up no more than 50% of operating and capital expenses after federal grants, and STA funds are deducted. COLT’s TDA funding applied to operations was within allowable limits during the audit period.
Exhibit 4 – Regulatory Compliance Matrix
Regulatory Code Compliance Requirement Compliance
Finding Verification Information
PUC Section 99243
Submit an annual report to the State Controller based upon the Uniform System of Accounts and Records established by the State Controller. Due dates varied during the audit period: FY04: 11/24/04 (paper) or 12/14/04 (electronic), FY05: 9/28/05 (paper) or 10/18/05 (electronic) FY06: 10/12/06 (paper) or 11/1/06 (electronic)
Partial Compliance
Report Submission Dates: FY 2004: 10/13/04 FY 2005: 10/11/05 FY 2006: 10/4/06 Reports submitted in a timely fashion but incorrectly combined fixed route and demand response service modes.
O’Melia Consulting in association with Kelly Hines Consulting

City of Lompoc TDA Triennial Performance Audit Page 12
Regulatory Code Compliance Requirement Compliance
Finding Verification Information
PUC Section 99245
Submit annual fiscal and compliance audit to State Controller within 180 days of year end, or has received a 90-day extension allowed by law.
Full Compliance
Auditor Report Dates: FY 2004: 12/16/04 FY 2005: 11/21/05 FY 2006: 11/16/06
PUC Section 99251
Submit CHP certification of compliance with Pull Notice within 13 months period prior to TDA claim
Full Compliance
CHP Certification Dates: FY 2004: 5/20/04 FY 2005: 6/16/05 FY 2006: 6/13/06
PUC Section 99261
Submit TDA Claim in compliance with rules and regulations adopted by RTPE
Full Compliance
TDA Claims were submitted to and funds approved by SBCAG in all three years.
PUC Section 99264
The operator does not routinely staff public transportation vehicles designed to be operated by one person with two or more persons
Full Compliance
Review of staffing assignments indicates that one person is responsible for vehicle operations.
PUC Section 99266
Operating budget has not increased by more than 15% over preceding year unless reasonable justification for the change has been provided
Full Compliance
% Change Per State Controller Report FY 2003 to 2004: 13% FY 2004 to 2005: -2% FY 2005 to 2006: 1%
PUC Sections 99268.2-5 & .12
Operator has maintained a ratio of revenues to operating costs equal to 20% for urban areas and 10% for rural areas and specialized services or 15% in areas with a population less than 500,000 if determined by RTPA
Non-Compliant,
all three years were below the required
20%.
Farebox Recovery Ratio Per Financial Audits: FY 2004: 15.2% FY 2005: 14.6% FY 2006: 13.3%
PUC Section 99268
Operator TDA funding is no more than 50% of operating, maintenance, capital, and debt service requirements after federal grants and STA revenues are deducted
Full Compliance
See Exhibit 5 below for compliance calculations.
O’Melia Consulting in association with Kelly Hines Consulting

City of Lompoc TDA Triennial Performance Audit Page 13
Regulatory Code Compliance Requirement Compliance
Finding Verification Information
PUC Section 99271
The retirement system is fully funded, or the Operator is implementing a plan that will fully fund the retirement system within 40 years.
Full Compliance
City of Lompoc employees are covered by the Public Employees Retirement System (PERS).
PUC Section 99314.5
If the Operator receives STA funds, the Operator is not precluded by contract from employing part-time drivers or from contracting with common carriers
Full Compliance
COLT service is provided by a private carrier.
PUC Section 99314.6
If the Operator receives STA funds for operating purposes: (1) the Operator’s total operating cost per revenue hour does not exceed the prior year’s cost per revenue hour adjusted for inflation using the CPI; or (2) the Operator’s average total operating cost per revenue hour in the past three years does not exceed the sum of the average of the preceding three years, adjusted for inflation using the CPI.
Full Compliance
See Exhibit 6 below for compliance calculations.
CCR Section 6754 (a) (3)
Available Federal funds are used prior to claiming STA funds
Full Compliance
Federal grant funds claimed per Financial Audit:FY 2004: $545,000 FY 2005: $454,757 FY 2006: $769,865 All funds applied to Transit Operations.
Exhibit 5 provides the calculation of the 50% expenditure limitation requirement using data in the annual Financial Statements for FY04, FY05, and FY06. LTF funds applied to transit operations were within maximum allowable limits under PUC 99268 for all three fiscal years. Again, the 50% expenditure limitation rule only applies if the farebox recovery requirement is not met.
O’Melia Consulting in association with Kelly Hines Consulting

City of Lompoc TDA Triennial Performance Audit Page 14
Exhibit 5 – 50% Expenditure Limitation Calculation (PUC 99268)
Line # Description $ Amount $ Subtotal $ Amount $ Subtotal $ Amount $ Subtotal
1. Total Operating Cost $ 1,305,135 $ 1,482,838 $ 1,687,774
2. Total Depreciation* $ 228,138 $ 202,995 $ 265,856
3. Total Capital Outlay $ 10,354 $ 372,183 $ 188,988
4. Total Lines 1, 2 & 3 $ 1,543,627 $ 2,058,016 $ 2,142,618
5. Less Federal Grants Received $ 545,000 $ 724,357 $ 769,865
6. Less LTF Capital Intensive $ 10,354 $ 102,583 $ 188,988
7. Less STAF Received $ 96,833 $ 105,038 $ 171,000
8. Total Lines 5, 6 & 7 $ 652,187 $ 931,978 $ 1,129,853
9. Total Line 4 Less Line 8 $ 891,440 $ 1,126,038 $ 1,012,765
10. 50% of Line 9 $ 445,720 $ 563,019 $ 506,383
11.Add amount of LTF Claimed in Excess of Line 9 for Match to Federal Operating Grant
$ 136,250 $ 113,689 $ 192,466
12. Add LTF Capital Intensive $ 10,354 $ 102,583 $ 188,988
13. Total permissible LTF Expenditure $ 592,324 $ 779,291 $ 887,837
14. Total LTF applied to Operations 444,072$ $ 715,673 $ 863,023
FY06
All data from COLT Financial Statements except line item 14 which uses LTF funds allocated to COLT as provided by SBCAG less the amount used for capital.
FY04 FY05
Exhibit 6 provides the calculations for the cost per hour requirement (PUC Section 99314.6) for the receipt of STA funds. COLT was in compliance for cost per hour growth in FY05 and FY06 when compared to prior year cost per hour adjusted for inflation. FY04 cost per hour grew 18.7% compared to CPI growth of 2.5% from FY03 to FY04. However, comparing the three-year average cost per hour from FY01 to FY03 adjusted for inflation at $50.06 to the FY02 to FY04 average cost per hour of $48.60, COLT is in compliance as the FY02 to FY04 average is less than the inflation-adjusted average cost per hour between FY01 and FY03.
O’Melia Consulting in association with Kelly Hines Consulting

City of Lompoc TDA Triennial Performance Audit Page 15
Exhibit 6 – Cost per Hour Calculations (PUC Section 99314.6)
Fiscal Year FY01 FY02 FY03 FY04 FY05 FY06Operating Costs 924,793$ 1,017,161$ 976,645$ 1,305,135$ 1,482,838$ 1,687,774$ Revenue Service Hours 19,273 20,301 22,317 25,134 27,878 31,118 Cost Per Revenue Service Hour 47.98$ 50.10$ 43.76$ 51.93$ 53.19$ 54.24$ % Change Prior Year 18.7% 2.4% 2.0%% Change CPI 2.5% 4.2% 4.8%Compliance Determination Non-Compliant Compliant Compliant
FY01-FY03 FY02-FY04 FY03-FY05 FY04-FY0647.28$ 48.60$ 49.63$ 53.12$
5.9% 5.7% 6.8% 9.2%50.06$ 51.35$ 53.01$ 57.98$
$ 1.46 $ 1.72 $ (0.11)
CPI Urban Wage Earners & Clerical Workers -- Los Angeles/Riverside/Orange Counties, California (figures calculated on a Fiscal Year)
167.79 172.36 177.63 182.13 189.73 198.79
FY01 and FY03 financial and operating data from previous audit report. FY04 to FY06 financial data from annual Financial Statements, and operating data from Contractor Summary report.
Inflated 3-Year Avg Cost Per Hour Compared to Most Recent 3-Year Avg Cost Per Hour (Positive # is Compliant)
3-Year Avg Cost Per Hour% Change CPI 3-Year PeriodInflated 3-Year Avg Cost Per Hour
Progress To Implement Prior Audit Recommendations
The prior TDA Performance Audit, completed in June 2004, made four recommendations for improved compliance and performance. COLT progress to implement prior audit recommendations includes full implementation of one recommendation, partial implementation of two and no progress on the one recommendation. Key questions included in this analysis of progress to implement prior audit recommendations are:
• What action(s) have been taken to implement the recommendation? Has performance improved as a result of actions taken?
• Is the issue to be addressed by the prior performance audit recommendation still valid today? Why or why not?
• If there has been little or no progress, are future actions planned? Was a different approach selected and if so, what is the status of this activity?
Exhibit 7 summarizes progress relative to prior performance audit recommendations. Findings of “Implemented, Partially Implemented, or Not Implemented” are made for each recommendation.
O’Melia Consulting in association with Kelly Hines Consulting

City of Lompoc TDA Triennial Performance Audit Page 16
Exhibit 7 – Progress To Implement Prior Audit Recommendations
Prior Audit Recommendations
Prior Audit Findings Leading to
Recommendation Compliance
Finding Implementing Actions &
Results
1. Enhance monthly management reports by including more information about COLT’s operations. Data that should be included are accidents and road calls, customer complaints and commendations, and schedule adherence.
Monthly management reports included basic information such as ridership, hour and miles, and farebox revenues but did not include information about service quality or reliability. Additionally, having such information on a regular basis provides documentation when, and if, conflicting reports or findings are made.
Implemented Contractor monthly invoices include an attached Operations Management Report that provides service statistics (passengers, hours, miles) by mode – fixed route (further broken down by City and County), demand response, and Santa Barbara Shuttle (health service). Also included is information for complaints, late trips, missed trips, roadcalls, and accidents.
2. When preparing reports and official documents, the operator should separate data (i.e., operating costs, operating statistics, performance measures) for its fixed route and demand responsive-services.
Data shown in reports such as that for the State Controller was combined for both fixed route and demand response services, making it difficult to assess performance of the two modes with different operational characteristics.
Not Implemented
Data continues to be combined in the State Controller’s report as total system costs and motorbus service statistics.
3. Develop and implement a formal ADA eligibility screening process.
This recommendation was carried over from the previous audit. COLT did not enforce its ADA eligibility criteria.
Partially Implemented
A formal screening process is in place but is not followed. There is an application that requires a physician’s signature but the application is not available on the website and the recently developed FAQs about the service indicate that a letter from a physician is all that is required. There are no background or verification checks conducted as part of the approval process.
O’Melia Consulting in association with Kelly Hines Consulting

City of Lompoc TDA Triennial Performance Audit Page 17
Prior Audit Recommendations
Prior Audit Findings Leading to
Recommendation Compliance
Finding Implementing Actions &
Results
4. Prepare and issue a no-show and cancellation policy for COLT’s DAR service. Ensure that the policies are clear and well publicized so passengers are familiar with them and understand consequences (if any).
Though no-shows were not reported to be a problem, the prior auditor found that there was not an established policy for no-shows and recommended that one be established before no-shows became a problem.
Partially Implemented
COLT did prepare a list of frequently asked questions (FAQs) for the dial-a-ride service but policies and consequences for no-shows and cancellations are not included.
5. Improve the line of communication and exchange of documents between the contract operator, City transit staff, and the City’s Finance Department.
The prior auditor found discrepancies in reported service statistics among the SRTP, State Controller’s report, and Finance Department Records suggesting that data transfer from the contractor to the Transportation Administrator to the Finance Department could be improved.
Not Implemented
Significant discrepancies in reported data were also found during this audit period.
6. Accurately calculate and report full-time employee equivalents (FTEs).
Not all contractor positions were included in the calculation of FTEs.
Not Implemented
FTEs are reported as headcounts rather than employee pay hours divided by 2,000.
The City of Lompoc has, to date, made the decision to not rigidly enforce requirements for ADA system use. However, it should be noted that implementation of these recommendations is still warranted given poor system performance relative to farebox recovery requirements. In this respect, the intent of these recommendations is carried forward in the first recommendation made as part of this audit.
Data Verification
Included in the review of transit operators is the regulatory requirement (i.e., PUC Section 99247) that performance audits include a verification of five data items including:
O’Melia Consulting in association with Kelly Hines Consulting

City of Lompoc TDA Triennial Performance Audit Page 18
• Operating Cost. The total cost of running a transit operation, exclusive of capital expenditures, depreciation, direct costs of providing charter service and vehicle lease costs.
• Total Passengers. The total number of unlinked trips; all passenger boardings whether revenue producing or not.
• Total Vehicle Service Hours. The total annual number of hours that vehicles are in revenue service. Excluded is travel to and from storage facilities and other deadhead travel. Also referred to as Revenue Hours.
• Total Vehicle Service Miles. The total annual number of miles that vehicles are in revenue service. Miles traveled to and from storage facilities and other deadhead travel are excluded. Also referred to as Revenue Miles.
• Employee Equivalents. The total actual regular and overtime employee pay hours divided by 2,000 hours. Contract employees are included, but not volunteers. Also referred to as FTEs.
COLT is in partial compliance with four of five data definitions and methods of data collection as summarized in Exhibit 8. A finding of partial compliance is made for operating costs, passengers, service hours, and service miles as the data is not reported separately by mode as required by TDA. A finding of non-compliance is made for employee equivalents as the data is not reported separately by mode nor per the TDA definition of total employee pay hours divided by 2,000 but instead as an employee headcount.
Exhibit 8 – Verified Data Elements for TDA Performance Indicators
Data Items & Mode
Fiscal Year 2004
Fiscal Year 2005
Fiscal Year 2006
Operating Costs (Demand Response)
Partial Compliance: Contractor reports costs on an hourly basis and segregates by mode. City allocates non-contractor operating costs to each mode on the basis of a 75/25 modal split instead of on actual costs.
Partial Compliance: Contractor reports costs on an hourly basis and segregates by mode. City allocates non-contractor operating costs to each mode on the basis of a 75/25 modal split instead of on actual costs.
Partial Compliance: Contractor reports costs on an hourly basis and segregates by mode. City allocates non-contractor operating costs to each mode on the basis of a 75/25 modal split instead of on actual costs.
O’Melia Consulting in association with Kelly Hines Consulting

City of Lompoc TDA Triennial Performance Audit Page 19
Data Items & Mode
Fiscal Year 2004
Fiscal Year 2005
Fiscal Year 2006
Total Passengers (Demand Response)
Partial Compliance: Contractor reports ridership separately by each mode, counting all passenger boardings. However, the City continues to report total system data in the State Controller’s Report instead of separately by mode.
Partial Compliance: Contractor reports ridership separately by each mode, counting all passenger boardings. However, the City continues to report total system data in the State Controller’s Report instead of separately by mode
Partial Compliance: Contractor reports ridership separately by each mode, counting all passenger boardings. However, the City continues to report total system data in the State Controller’s Report instead of separately by mode
Total Vehicle Service Hours (Demand Response)
Partial Compliance: Contractor reports service hours separately by each mode, subtracting out deadhead. However, the City continues to report total system data in the State Controller’s Report instead of separately by mode.
Partial Compliance: Contractor reports service hours separately by each mode, subtracting out deadhead. However, the City continues to report total system data in the State Controller’s Report instead of separately by mode.
Partial Compliance: Contractor reports service hours separately by each mode, subtracting out deadhead. However, the City continues to report total system data in the State Controller’s Report instead of separately by mode.
Total Vehicle Service Miles (Demand Response)
Partial Compliance: Contractor reports service miles separately by each mode, subtracting out deadhead. However, the City continues to report total system data in the State Controller’s Report instead of separately by mode.
Partial Compliance: Contractor reports service miles separately by each mode, subtracting out deadhead. However, the City continues to report total system data in the State Controller’s Report instead of separately by mode.
Partial Compliance: Contractor reports service miles separately by each mode, subtracting out deadhead. However, the City continues to report total system data in the State Controller’s Report instead of separately by mode.
Employee Equivalents (Demand Response)
Non-compliant, contractor does not provide employee pay hours and City reports number of employees.
Non-compliant, contractor does not provide employee pay hours and City reports number of employees.
Non-compliant, contractor does not provide employee pay hours and City reports number of employees.
O’Melia Consulting in association with Kelly Hines Consulting

City of Lompoc TDA Triennial Performance Audit Page 20
Data Items & Mode
Fiscal Year 2004
Fiscal Year 2005
Fiscal Year 2006
Operating Costs (Fixed Route)
Partial Compliance: Contractor reports costs on an hourly basis and segregates by mode. City separately tracks depreciation as required, but allocates non-contractor operating costs to each mode on the basis of a 75/25 split between fixed route and demand response instead of on the basis of actual contractor costs by mode.
Partial Compliance: Contractor reports costs on an hourly basis and segregates by mode. City separately tracks depreciation as required, but allocates non-contractor operating costs to each mode on the basis of a 75/25 split between fixed route and demand response instead of on the basis of actual contractor costs by mode.
Partial Compliance: Contractor reports costs on an hourly basis and segregates by mode. City separately tracks depreciation as required, but allocates non-contractor operating costs to each mode on the basis of a 75/25 split between fixed route and demand response instead of on the basis of actual contractor costs by mode.
Total Passengers (Fixed Route)
Partial Compliance: Contractor reports ridership separately by each mode, counting all passenger boardings. However, the City continues to report total system data in the State Controller’s Report instead of separately by mode.
Partial Compliance: Contractor reports ridership separately by each mode, counting all passenger boardings. However, the City continues to report total system data in the State Controller’s Report instead of separately by mode
Partial Compliance: Contractor reports ridership separately by each mode, counting all passenger boardings. However, the City continues to report total system data in the State Controller’s Report instead of separately by mode
Total Vehicle Service Hours (Fixed Route)
Partial Compliance: Contractor reports service hours separately by each mode, subtracting out deadhead. However, the City continues to report total system data in the State Controller’s Report instead of separately by mode.
Partial Compliance: Contractor reports service hours separately by each mode, subtracting out deadhead. However, the City continues to report total system data in the State Controller’s Report instead of separately by mode.
Partial Compliance: Contractor reports service hours separately by each mode, subtracting out deadhead. However, the City continues to report total system data in the State Controller’s Report instead of separately by mode.
O’Melia Consulting in association with Kelly Hines Consulting

City of Lompoc TDA Triennial Performance Audit Page 21
Data Items & Mode
Fiscal Year 2004
Fiscal Year 2005
Fiscal Year 2006
Total Vehicle Service Miles (Fixed Route)
Partial Compliance: Contractor reports service miles separately by each mode, subtracting out deadhead. However, the City continues to report total system data in the State Controller’s Report instead of separately by mode.
Partial Compliance: Contractor reports service miles separately by each mode, subtracting out deadhead. However, the City continues to report total system data in the State Controller’s Report instead of separately by mode.
Partial Compliance: Contractor reports service miles separately by each mode, subtracting out deadhead. However, the City continues to report total system data in the State Controller’s Report instead of separately by mode.
Employee Equivalents (Fixed Route)
Non-compliant, contractor does not provide employee pay hours and City reports number of employees.
Non-compliant, contractor does not provide employee pay hours and City reports number of employees.
Non-compliant, contractor does not provide employee pay hours and City reports number of employees.
Data Consistency
Exhibit 9 compares financial data as reported in a number of separate documents. As the City of Lompoc does not report financial information separately for the two modes of service, data shown is for the total system. Clean Air Express costs have been backed out of COLT’s National Transit Database costs based on annual statistical summaries prepared by SBCAG.
Exhibit 9 – Financial Data Consistency Review
FY 2004 FY 2005 FY 2006National Transit Database 1,253,003$ 1,482,836$ 1,695,927$ Financial Audit 1,305,135$ 1,482,838$ 1,687,774$ State Controller's Report 1,304,935$ 1,482,836$ 1,695,927$ National Transit Database 105,556$ 124,745$ 129,895$ Financial Audit 105,556$ 124,745$ 129,895$ State Controller's Report 105,556$ 124,745$ 129,895$
NTD costs are reported less costs for Clean Air Express.
TDA Statistic Audit Review PeriodSource
Operating Costs
Passenger Revenues
The City of Lompoc maintains a separate operational unit for COLT operations. The City correctly tracks depreciation expense separately and the numbers shown in Exhibit 6 are net of depreciation expense. About 55% of COLT’s operating costs are attributable to contract operations, billed to the City on the basis of hours of service provided.
O’Melia Consulting in association with Kelly Hines Consulting

City of Lompoc TDA Triennial Performance Audit Page 22
Additional cost elements include City overhead, vehicle maintenance and repair costs, bus stop maintenance, and fuel.
Operating costs were reported consistently in FY05 with minor inconsistencies shown in FY04 and FY06. During FY04 and FY06, two of three reports show the same operating costs with the FY04 NTD and FY06 financial audit reporting lower costs.
Farebox revenues were reported consistently across all three reports in all three years of the audit period.
Exhibit 10 presents passengers, vehicle service hours, vehicle service miles, and employee equivalents for the fixed route portion of COLT as reported in three separate documents.
Exhibit 10 – Operational Data Consistency Review – Fixed Route
FY 2004 FY 2005 FY 2006NTD less Clean Air Express 178,691 250,882 252,875 Contractor Summary 178,239 229,529 252,958 State Controller's Report 200,321 253,688 252,958 NTD less Clean Air Express N/A 20,139 23,513 Contractor Summary 18,175 20,111 23,397 State Controller's Report 25,134 27,878 31,118 NTD less Clean Air Express 234,717 275,184 334,797 Contractor Summary 234,717 275,184 334,797 State Controller's Report 305,999 352,081 414,121 Paid Work Hours from Source: N/A N/A N/AState Controller's Report 15 34 34
Vehicle Service Hours
Vehicle Service Miles
Employee Full-Time Equivalents
TDA Statistic Source Audit Review Period
Passengers
With the exception of passengers in FY06, fixed route service data is reported inconsistently across published reports. Inconsistencies in data reported in the State Controller’s Reports are largely due to the fact that the City reports system-wide rather than modal data in these reports; the exception to this reporting error is the FY06 passenger data. Data in the NTD reports and the Contractor Summary reports is largely consistent. Only one report provides Employee Full-Time Equivalents (FTEs) but the data, as reported, reflects headcount and not employee pay hours divided by 2,000 per definition.
Exhibit 11 presents passengers, vehicle service hours, and vehicle service miles for the demand response portion of COLT as reported in two separate documents.
O’Melia Consulting in association with Kelly Hines Consulting

City of Lompoc TDA Triennial Performance Audit Page 23
Exhibit 11 – Operational Data Consistency Review – Demand Response
FY 2004 FY 2005 FY 2006National Transit Database 22,084 23,920 22,586Contractor Summary 22,082 23,955 22,605National Transit Database 6,836 7,708 7,742Contractor Summary 6,959 7,767 7,721National Transit Database 70,792 76,678 79,368Contractor Summary 71,312 76,668 79,264
TDA Statistic Source Audit Review Period
Passengers
Vehicle Service Hours
Vehicle Service Miles
Demand response data is reported consistently in the two reports that separate demand response data from fixed route – the NTD report and the Contractor Summary report. FTE data is not available for the demand response mode as the State Controller’s Report is the only report that provides this information and demand response data is not reported separate from fixed route in this report.
The process for compiling and/or calculating the four service data items is as follows:
• Passengers – 100% headcount of passenger boardings.
• Vehicle Service Hours – fixed route data based on scheduled service, adjusted for exceptions. Demand response data based on driver logs of actual service provided.
• Vehicle Service Miles – same as vehicle service hours.
• Employee Full-Time Equivalents – data reported in the State Controller’s report reflects an employee headcount and not employee pay hours divided by 2,000 as required by definition. The contractor does not provide the City with employee pay hours. The City should require the Contractor to report these hours and then include any City staff hours charged directly to Transit but not time for staff that are included in the Transit allocation of City overhead. Total employee pay hours should then be divided by 2,000 to arrive at FTEs.
TDA Performance Indicator Trends
California Public Utilities Code Section 99246 (d) states that performance audits of transit operators shall include a verification of
O’Melia Consulting in association with Kelly Hines Consulting

City of Lompoc TDA Triennial Performance Audit Page 24
performance indicators defined in the Public Utilities Code Section 99247. These performance indicators include:
• Operating Cost Per Vehicle Service Hour • Operating Cost Per Passenger • Passengers Per Vehicle Service Hour • Passengers Per Vehicle Service Mile • Vehicle Service Hours Per Employee.
Trends for these five TDA performance indicators are presented below by mode (i.e., motor bus and/or demand response). Performance indictor trends involving costs are also compared to the Consumer Price Index -- Urban Wage Earners and Clerical Workers for the Los Angeles-Riverside-Orange County area.
TDA Performance Indicator Trends – Total System
Exhibit 12 presents TDA performance indicators for COLT’s total system.
Exhibit 12 – TDA Performance Indicators – Total System
FY 2004 FY 2005 FY 2006Operating Costs $ 976,645 $ 1,305,135 $ 1,482,838 $ 1,687,774 72.8%Passengers 219,584 200,321 331,809 346,223 57.7%Vehicle Service Hours 24,246 25,134 27,878 31,118 28.3%Vehicle Service Miles 357,198 306,029 351,852 414,061 15.9%Employee Full-Time Equivalents 15.0 15.0 34.0 34.0 126.7%Farebox Revenues $95,671 $105,556 $124,745 $129,895 35.8%Local Subsidies & Auxiliary Revenues $90,351 $92,873 $91,900 $95,011 5.2%Operating Cost Per Vehicle Service Hour $ 40.28 $ 51.93 $ 53.19 $ 54.24 34.6%Operating Cost Per Passenger $ 4.45 $ 6.52 $ 4.47 $ 4.87 9.6%Passengers Per Vehicle Service Hour 9.1 8.0 11.9 11.1 22.9%Passengers Per Vehicle Service Mile 0.61 0.65 0.94 0.84 36.0%Vehicle Service Hours Per Employee FTE 1,616 1,676 820 915 -43.4%Farebox Recovery 9.8% 8.1% 8.4% 7.7% -21.4%Farebox Recovery with Local Subsidies 19.0% 15.2% 14.6% 13.3% -30.0%Percent Change in the CPI - 2.5% 4.2% 4.8% 11.9%
FY03 service data from previous audit report. FY04 through FY06 operating data from Contractor Summary report.Total operating costs do not match the sum of costs by mode (in Exhibits 10 and 11) due to discrepancies in NTD modal operating costs and financial audit total system operating costs.
Verified TDA Statistics & Performance Indicators
Base Year FY 2003
Audit Review Period Percent Change FY 2003 to FY 2006
Financial data from Financial audits except for FY03 Local Subsidies which uses data from Financial Audit (interest income and miscellaneous income) and FY04 TDA Claim (Measure D).
• Operating Cost Per Vehicle Service Hour is a measure of cost efficiency. During the audit review period, cost per hour grew at twice the rate of inflation, up 34.6%. The biggest increase occurred from FY03 to FY04, coinciding with a new operations contract. Cost per hour has decreased slightly from FY04 to FY06.
O’Melia Consulting in association with Kelly Hines Consulting

City of Lompoc TDA Triennial Performance Audit Page 25
• Operating Cost Per Passenger is a measure of cost effectiveness. During the audit period, cost per passenger has increased less than inflation (i.e., up 9.6% compared to 11.9% CPI). While total system costs are up 73%, passengers have increased by nearly 60%, up to 346,223 boardings in FY06.
• Passengers Per Vehicle Service Hour is a measure of service productivity. During the audit review period, passengers per hour improved by 23%, increasing from 9.1 to 11.1 between FY03 and FY06. As shown in Exhibits 12 and 13 below, the increase in productivity is attributable to fixed route service as demand response service productivity declined over the period.
• Passengers Per Vehicle Service Mile also measures service productivity. During the audit review period, passengers per mile improved to 0.84 in FY06, up from 0.61 in FY03. This is an increase of 36%. The biggest improvement occurred between FY04 and FY05, when service miles level increased by 15% and passengers increased by 65% as a result of service improvements.
• Vehicle Service Hours Per Employee measures labor productivity. Performance with respect to this indicator cannot be conclusively assessed as COLT did not provide employee FTEs per the TDA definition during the audit period. While reported data indicate a decline in labor productivity, the significant increase in service levels during the last two years of the audit period compared to employee headcounts indicates an improvement in labor productivity.
System-wide farebox recovery is down 30% over the audit period, declining from 19% in FY03 to 13.3% in FY06. Farebox revenues were up 36% over the period, more than keeping pace with the 28.3% growth in service hours but growing half as quickly as operating costs, which were up 73%.
PUC Section 99268.8 states that the ratio of fare revenues to operating costs shall not apply to an extension of public transportation services until two years after the end of the fiscal year in which the service is implemented. COLT implemented a number of new services, route extensions, and route re-alignments during the audit period as highlighted in Exhibit 13.
O’Melia Consulting in association with Kelly Hines Consulting

City of Lompoc TDA Triennial Performance Audit Page 26
Exhibit 13 – COLT Service Expansion During the Audit Period
Service Description Date Implemented
Exemption Period Expires (two years after the end of the fiscal year in which the extension of services was
put into operation) Hancock College evening service and demand response service to 10 p.m.
August 16, 2003 June 30, 2006
Addition of Route 5 December 15, 2003 June 30, 2006
Extended hours of operation December 15, 2003 June 30, 2006 Implementation of Santa Barbara Shuttle July 1, 2004 June 30, 2007
Extension of Route 5 to Bridge House January 3, 2005 June 30, 2007
Addition of bi-directional service on Route 2 July 1, 2005 June 30, 2008
Adjustment of Route 3 to bi-directional service July 1, 2005 June 30, 2008
In order to qualify for the two year exemption, expanded services must consist of additions of geographic areas or route miles, reflect an increase in service frequency or hours of service greater than 25 percent of the route total, or the addition of new days of service or new types of service (e.g., van, taxi, bus). Under these criteria, bi-directional routing implemented for Routes 2 and 3 would not qualify unless service hours on these routes increased by more than 25 percent.
Additionally, CCR 6633.8 requires that a transit operator seeking to exempt service from the farebox recovery calculation submit a report on the extension of service to SBCAG within 90 days after the fiscal year. COLT did not submit the required report and, as such, the new and expanded services were included in the farebox recovery calculations shown above. Future reports requesting service exemptions from farebox recovery requirements requests for exemptions must include, but not be limited to, the following:
• Description of the area served and the routes included.
• The amount of fare revenues generated by the extension and the method used to derive the amount.
O’Melia Consulting in association with Kelly Hines Consulting
City of Lompoc TDA Triennial Performance Audit Page 27
• The amount of the operating cost for the extension and the method used to allocate costs between the extension of services and the claimant’s other services.
In order to prepare this report, COLT would need to keep fare revenues and operating statistics separate for services to be excluded so that calculations may be verified for adherence to the proposed approach.
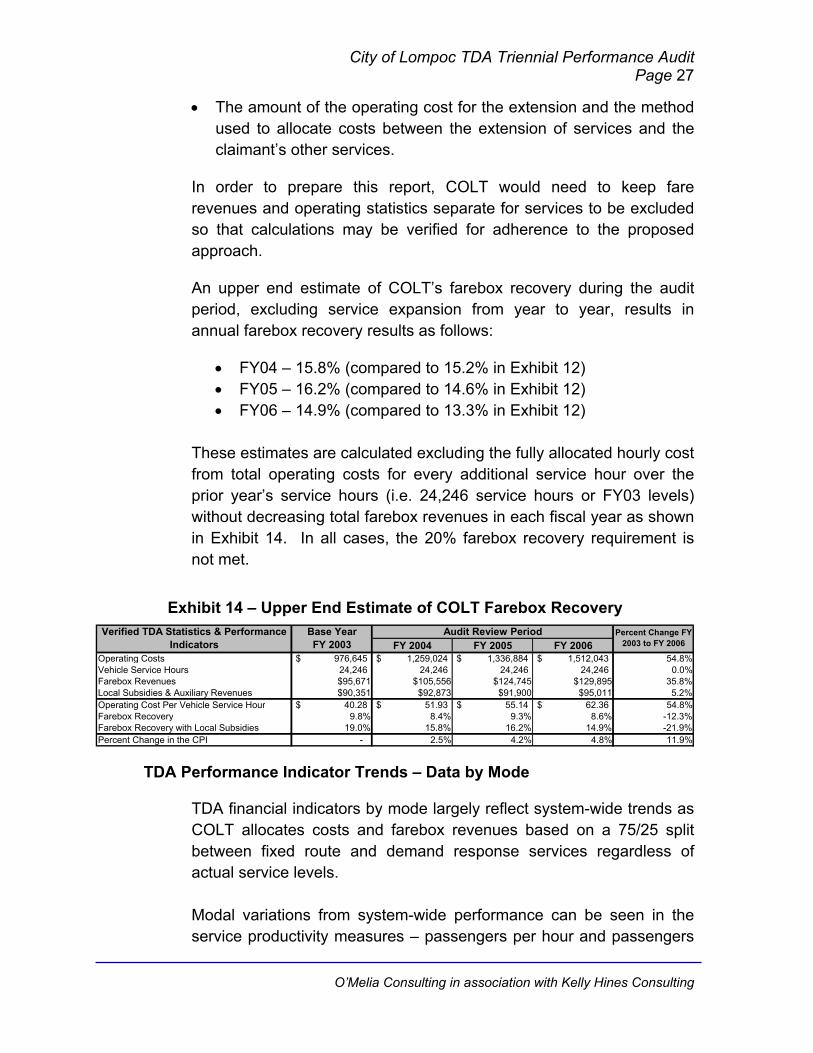
An upper end estimate of COLT’s farebox recovery during the audit period, excluding service expansion from year to year, results in annual farebox recovery results as follows:
• FY04 – 15.8% (compared to 15.2% in Exhibit 12) • FY05 – 16.2% (compared to 14.6% in Exhibit 12) • FY06 – 14.9% (compared to 13.3% in Exhibit 12)
These estimates are calculated excluding the fully allocated hourly cost from total operating costs for every additional service hour over the prior year’s service hours (i.e. 24,246 service hours or FY03 levels) without decreasing total farebox revenues in each fiscal year as shown in Exhibit 14. In all cases, the 20% farebox recovery requirement is not met.
Exhibit 14 – Upper End Estimate of COLT Farebox Recovery
FY 2004 FY 2005 FY 2006Operating Costs $ 976,645 $ 1,259,024 $ 1,336,884 $ 1,512,043 54.8%Vehicle Service Hours 24,246 24,246 24,246 24,246 0.0%Farebox Revenues $95,671 $105,556 $124,745 $129,895 35.8%Local Subsidies & Auxiliary Revenues $90,351 $92,873 $91,900 $95,011 5.2%Operating Cost Per Vehicle Service Hour $ 40.28 $ 51.93 $ 55.14 $ 62.36 54.8%Farebox Recovery 9.8% 8.4% 9.3% 8.6% -12.3%Farebox Recovery with Local Subsidies 19.0% 15.8% 16.2% 14.9% -21.9%Percent Change in the CPI - 2.5% 4.2% 4.8% 11.9%
Verified TDA Statistics & Performance Indicators
Base Year FY 2003
Audit Review Period Percent Change FY 2003 to FY 2006
TDA Performance Indicator Trends – Data by Mode
TDA financial indicators by mode largely reflect system-wide trends as COLT allocates costs and farebox revenues based on a 75/25 split between fixed route and demand response services regardless of actual service levels.
Modal variations from system-wide performance can be seen in the service productivity measures – passengers per hour and passengers
O’Melia Consulting in association with Kelly Hines Consulting

City of Lompoc TDA Triennial Performance Audit Page 28
per mile – as this data is tracked and reported separately by mode by the contract operator.
TDA Performance Indicator Trends – Fixed Route Mode
Exhibit 15 presents TDA performance indicators for COLT’s fixed route service.
Exhibit 15 – TDA Performance Indicators – Fixed Route Mode
FY 2004 FY 2005 FY 2006Operating Costs $ 732,515 $ 939,752 $ 1,112,127 $ 1,271,945 73.6%Passengers 199,714 178,239 307,854 323,618 62.0%Vehicle Service Hours 17,862 18,175 20,111 23,397 31.0%Vehicle Service Miles 295,078 234,717 275,184 334,797 13.5%Farebox Revenues $ 71,753 $ 79,167 $ 93,559 $ 97,421 35.8%Operating Cost Per Vehicle Service Hour $ 41.01 $ 51.71 $ 55.30 $ 54.36 32.6%Operating Cost Per Passenger $ 3.67 $ 5.27 $ 3.61 $ 3.93 7.2%Passengers Per Vehicle Service Hour 11.2 9.8 15.3 13.8 23.7%Passengers Per Vehicle Service Mile 0.68 0.76 1.12 0.97 42.8%Farebox Recovery 9.8% 8.4% 8.4% 7.7% -21.8%Percent Change in the CPI - 2.5% 4.2% 4.8% 11.9%
Verified TDA Statistics & Performance Indicators
Base Year FY 2003
Audit Review Period Percent Change FY 2003 to FY 2006
FY04 through FY06 financial data from National Transit Database Reports.FY04 through FY06 operating data from Contractor Summary report.FY03 data calculated by subtracting total system data as shown in the prior performance audit less demand response financial data as reported in National Transit Database and operating statistics as reported in Contractor Summary.
• Operating Cost Per Vehicle Service Hour grew by 33% over the audit period, exceeding the growth in CPI of 11.9%. Fixed route performance is slightly better than that for the total system as fixed route service hours increased by 31% compared to 28.3% system-wide.
• Operating Cost Per Passenger demonstrated improved cost effectiveness as the growth in fixed route ridership nearly matched the growth in operating costs – up just 7.2%.
• Passengers Per Vehicle Service Hour improved over the audit period, increasing from 11.2 in FY03 to 13.8 in FY06 after a high of 15.3 in FY05.
• Passengers Per Vehicle Service Mile also improved over the audit period, up nearly 43% from FY03 to FY06 with a peak in FY05 of 1.12.
• Vehicle Service Hours Per Employee was not evaluated as COLT does not report employee FTEs by mode.
O’Melia Consulting in association with Kelly Hines Consulting

City of Lompoc TDA Triennial Performance Audit Page 29
TDA Performance Indicator Trends – Demand Response Mode
Exhibit 16 presents TDA performance indicators for COLT’s demand response service.
Exhibit 16 – TDA Performance Indicators – Demand Response Mode
FY 2004 FY 2005 FY 2006Operating Costs $ 244,130 $ 313,251 $ 370,709 $ 423,982 73.7%Passengers 19,870 22,082 23,955 22,605 13.8%Vehicle Service Hours 6,384 6,959 7,767 7,721 20.9%Vehicle Service Miles 62,120 71,312 76,668 79,264 27.6%Farebox Revenues $ 23,918 $ 26,389 $ 31,186 $ 32,474 35.8%Operating Cost Per Vehicle Service Hour $ 38.24 $ 45.01 $ 47.73 $ 54.91 43.6%Operating Cost Per Passenger $ 12.29 $ 14.19 $ 15.48 $ 18.76 52.7%Passengers Per Vehicle Service Hour 3.1 3.2 3.1 2.9 -5.9%Passengers Per Vehicle Service Mile 0.32 0.31 0.31 0.29 -10.8%Farebox Recovery 9.8% 8.4% 8.4% 7.7% -21.8%Percent Change in the CPI - 2.5% 4.2% 4.8% 11.9%
Percent Change FY 2003 to FY 2006
FY03 through FY06 financial data from National Transit Database Reports.
Verified TDA Statistics & Performance Indicators
Base Year FY 2003
FY03 through FY06 operating data from Contractor Summary report.
Audit Review Period
• Operating Cost Per Vehicle Service Hour grew by nearly four times the rate of inflation, up more than 43% over the audit period. COLT operation of the Santa Barbara Shuttle (former County Health Service) contributed to cost growth through increased fuel costs from the longer travel distances of this service.
• Operating Cost Per Passenger grew by 53% during the audit period as passenger growth did not match the growth in operating costs. Like cost per hour, the increase in fuel expenses from operation of the Santa Barbara Shuttle contributed to the negative performance.
• Passengers Per Vehicle Service Hour declined slightly over the audit period, from 3.1 in FY03 to 2.9 in FY05. Again, the impact of the Santa Barbara Shuttle is evident. Despite having higher passenger loads than typical demand response service, the passengers carried per hour declines due to the longer trip time.
• Passengers Per Vehicle Service Mile also declined over the audit period, down by 10.8%, reflecting the impact of the long distance Santa Barbara Shuttle.
• Vehicle Service Hours Per Employee was not evaluated as COLT does not report employee FTEs by mode.
O’Melia Consulting in association with Kelly Hines Consulting

City of Lompoc TDA Triennial Performance Audit Page 30
III. FUNCTIONAL AREA PERFORMANCE RESULTS
A high level review of functional area performance was conducted for select functions including:
• Transportation Operations • Vehicle Maintenance • Administration and Planning Information used in this section was obtained through document reviews, management interviews, and reports such as the State Controller Report and Financial Audits.
Transportation Operations Staffing
AmericanStar Transportation provides COLT transit services using a crew of 25 employees:
• Seventeen drivers, three of which are part-time and one is the Road Supervisor/Trainer. AmericanStar reports they are currently short four drivers (two full-time and two part-time) as they would like to have 21 drivers on staff.
• One Project Manager position, which is shared with the City of Solvang – 80% of this person’s time is spent at the COLT facility.
• Three Dispatchers (two full-time, one part-time).
• Four Bus Washers (one full-time, three part-time).
AmericanStar dispatchers and field supervisor are responsible for counting fare revenues deposited into the vault by bus drivers. The dispatchers count fares every evening and verify counts against passenger trip logs. The field supervisor verifies fare counts in the morning. Any discrepancy of $3.00 or more is investigated. AmericanStar management personnel occasionally conduct surprise audits of fare handling activities.
O’Melia Consulting in association with Kelly Hines Consulting

City of Lompoc TDA Triennial Performance Audit Page 31
During the audit period, the evening dial-a-ride driver made twice weekly deposits to the City’s bank account. In an effort to tighten up its financial controls, the City implemented an armored car pick-up service, which collects fare revenues daily from the City Yard (after the AmericanStar counts have been completed).
AmericanStar shares office space with the City’s Transportation Administrator and Office Staff Assistant at the City Yard. The City Yard also houses staff and vehicles of the Streets and Roads, Forestry, and Water and Power Departments of the City. City staff report that the location is at capacity and would like to re-locate to a joint Transfer and Operations Center.
Driver Training
Driver qualifications, standards, and training requirements are documented in the contractor’s Scope of Services and include the following elements:
• Drivers must be employees of the contractor
• Drivers must possess a valid Class A or B license, Transit Certificate, passenger endorsement, and air brake endorsement
• Not more than two moving violations in five years and no DWI/DUI convictions in last seven years
• No felony conviction history
• Must Pass Federal Drug and Alcohol test
• New driver training that exceeds State requirements – 80 hours training (32 behind the wheel) and must include 8 hours of system orientation. Additional topics include disability awareness, sexual harassment, passenger control/difficult passenger, and defensive driving.
Additional AmericanStar requirements include completion of a hire packet and agreement to abide by Company policies; successful completion of the DMV driving exam with ten or fewer mistakes; and, Transit Safety Institute certification.
O’Melia Consulting in association with Kelly Hines Consulting

City of Lompoc TDA Triennial Performance Audit Page 32
As allowed under the contract, AmericanStar has implemented a modified training program for new drivers with recent transit experience, which includes 40 hours of classroom training and 20 hours of system orientation training.
ADA Eligibility
During the audit period, COLT established a formal ADA screening process including an application and certification form. COLT also prepared a list of frequently asked questions (FAQs) about the dial-a-ride service. Information is provided in printed form as well as on the COLT website. However, neither the application nor the FAQs are available on the COLT website.
The ADA application process is not enforced and any request for service is honored. The leniency with which COLT operates the ADA paratransit service is evidenced by the fact that the rules for use of the service are not consistently communicated to the public. For example, the COLT website indicates trips may be made up to 14 days in advance while the FAQs indicate that trips are to be scheduled the day before. Similarly, the website indicates passengers should allow for a 15-minute window on either side of their scheduled pick-up time while the FAQs indicate a 10-minute window.
The formal application process has been abbreviated such that proof of age for seniors or a signed letter from a health care professional for ADA service are all that is required for use of the service. There are no background or verification checks conducted as part of the approval process. Further, there are no cancellation or no-show policies.
The City of Lompoc City Council has intentionally made use of the dial-a-ride service easy for area residents as the service is so popular. However, the growth in the dial-a-ride service is becoming problematic on several fronts. The cost of transporting passengers with a curb-to-curb service is high relative to fixed route. In FY06, COLT spent $18.76 per Dial-a-Ride passenger versus $3.93 for a fixed route passenger. Continuation of this trend will negatively impact COLT’s farebox recovery. Additionally, there is anecdotal evidence (i.e., customer complaint) that the lax enforcement of the paratransit service rules is impacting the core mission of the dial-a-ride service as an ADA paratransit service as customers that are ADA certified are being
O’Melia Consulting in association with Kelly Hines Consulting

City of Lompoc TDA Triennial Performance Audit Page 33
denied service while those that are neither 62 years of age nor ADA certified are being allowed to ride what is known as the Express bus. Finally, AmericanStar reports that the increased ridership is impacting their insurance costs as their exposure increases with increased ridership.
Vehicle Maintenance
Routine vehicle maintenance, including preventative maintenance, is performed by a City Maintenance Worker. Major engine and transmission work is performed by the automotive dealer. Several vehicles were still under warranty during the audit period so warranty work was also performed by the automotive dealer. COLT follows manufacturer guidelines for preventative maintenance, every 3,000 miles ± 10%.
COLT’s active transit fleet is made up of twelve vehicles as shown in Exhibit 17. The average vehicle age of the fleet at the end of the audit period was 2.9 years compared to 2.8 during the final year of the last audit period. COLT is committed to a regular fleet replacement schedule and is due for delivery of two new vehicles in FY08 and two more in early FY09. Included in the FY08 delivery will be a mini-van for demand response service as COLT tries to better match service productivity levels with vehicle capacity. While the demand response service is growing, another 30-foot coach is not warranted to meet the additional demand. As of FY04, COLT had replaced all of its remaining CNG vehicles and now uses only diesel and gasoline vehicles.
Exhibit 17 – COLT Vehicle Inventory Number of Vehicles Year Make Seating
Capacity Mode
1 2005 Chevrolet 30 DR
2 2006 Chevrolet 30 DR
3 2005 Chevrolet 30 FR
4 2001 Ford 22 FR
1 1999 Ford 22 FR
1 1998 Ford 22 FR
O’Melia Consulting in association with Kelly Hines Consulting

City of Lompoc TDA Triennial Performance Audit Page 34
The City also owns four MCI coaches with a seating capacity of 51, which are used by SBCAG for the Clean Air Express.
Administration & Planning Contract Administration & Data Reporting
AmericanStar’s Project Manager reports directly to the City’s Transportation Administrator who is responsible for contract compliance and invoice approval including receipt of operating statistics (as required by the contract) and included in the monthly invoice. The Transportation Administrator works with City Finance staff to prepare external reports to oversight agencies. The Transportation Administrator prepares NTD Safety and Security Reports and operating statistics portion of the TDA Claim. City Finance staff prepares NTD and State Controller’s reports and the financial elements of the TDA Claim.
Both the contractor and City staff report open and candid communications and there have been no significant operational issues over the audit period. City staff is involved in operational activities on a daily basis, as the contractor and City staff are co-located at the City Yard.
There are no performance incentives or penalties in the contract. While there does not appear to be any cause for concern under the current contract, the City may wish to consider incorporating these elements into future contracts to make the contract operator a vested partner in the operational performance of the COLT system.
Given the discrepancies in data reporting and the decline in farebox recovery discussed in Section II, City staff would benefit from more diligent performance monitoring. From a contract perspective, AmericanStar is providing service statistics as required but the extent to which that information is utilized by City staff to monitor and improve system performance is limited.
For example, COLT allocates costs 75/25 between fixed route and demand response. However, COLT pays its contract operator the same hourly rate for both service modes so allocation of costs on the basis of modal service hours would be a better reflection of actual
O’Melia Consulting in association with Kelly Hines Consulting
City of Lompoc TDA Triennial Performance Audit Page 35
service modes. Fortunately, over the audit period, service hour shares were close to the 75/25 split as shown below:
• FY03 – 74/26 • FY04 – 72/28 • FY05 – 72/28 • FY06 – 75/25
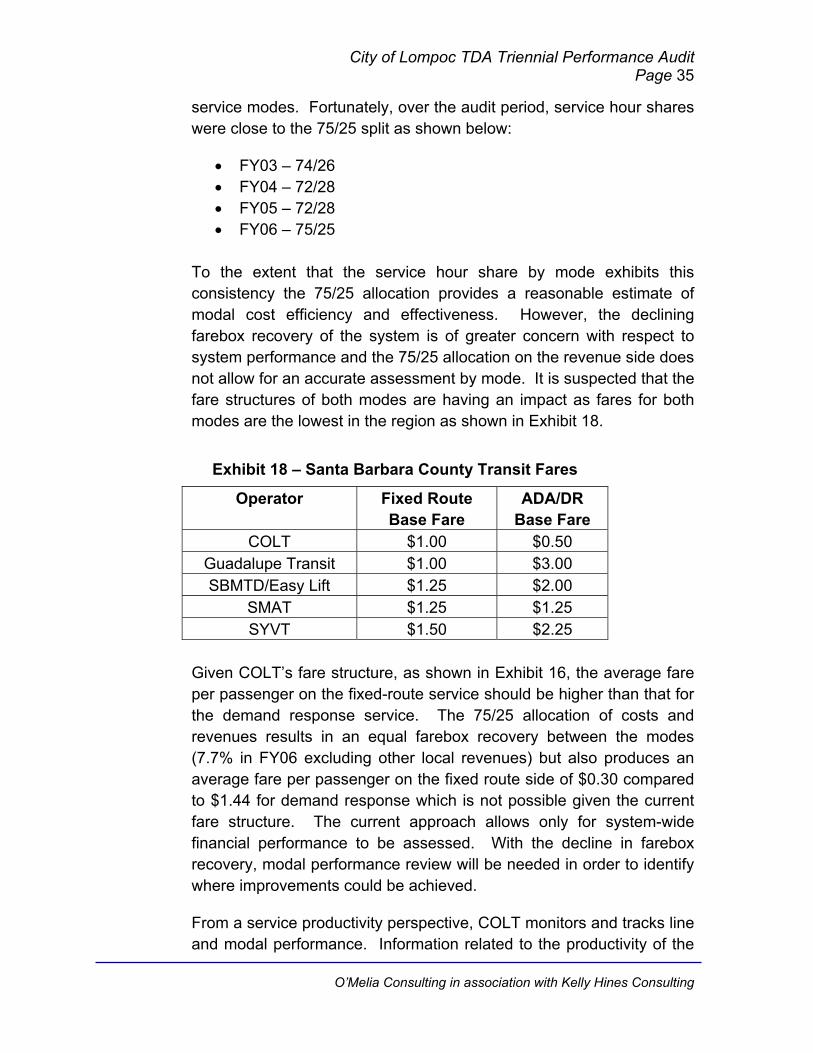
To the extent that the service hour share by mode exhibits this consistency the 75/25 allocation provides a reasonable estimate of modal cost efficiency and effectiveness. However, the declining farebox recovery of the system is of greater concern with respect to system performance and the 75/25 allocation on the revenue side does not allow for an accurate assessment by mode. It is suspected that the fare structures of both modes are having an impact as fares for both modes are the lowest in the region as shown in Exhibit 18.
Exhibit 18 – Santa Barbara County Transit Fares
Operator Fixed Route Base Fare
ADA/DR Base Fare
COLT $1.00 $0.50 Guadalupe Transit $1.00 $3.00 SBMTD/Easy Lift $1.25 $2.00
SMAT $1.25 $1.25 SYVT $1.50 $2.25
Given COLT’s fare structure, as shown in Exhibit 16, the average fare per passenger on the fixed-route service should be higher than that for the demand response service. The 75/25 allocation of costs and revenues results in an equal farebox recovery between the modes (7.7% in FY06 excluding other local revenues) but also produces an average fare per passenger on the fixed route side of $0.30 compared to $1.44 for demand response which is not possible given the current fare structure. The current approach allows only for system-wide financial performance to be assessed. With the decline in farebox recovery, modal performance review will be needed in order to identify where improvements could be achieved.
From a service productivity perspective, COLT monitors and tracks line and modal performance. Information related to the productivity of the
O’Melia Consulting in association with Kelly Hines Consulting

City of Lompoc TDA Triennial Performance Audit Page 36
unique services provided by COLT including the Santa Barbara Shuttle and the Hancock College student service are readily available and often cited as evidence of the popularity of the service.
Planning
COLT’s last Short Range Transit Plan (SRTP) was prepared in June 2003 and covers the period FY04 through FY08. Unlike the data reporting to the NTD or the State Controller, the SRTP provides a detailed financial analysis by mode, including cost per hour, cost per passenger, and farebox recovery. Per the details in the SRTP, the average fare per passenger of a demand response rider is projected at $0.49 throughout the audit period with a 2.5% farebox recovery estimate. Allocation of the City’s Measure D revenues to “buy down” the demand response fare brings the demand response farebox recovery to 10% according to the financial projections in the SRTP. Continuation of this operational policy to “buy down” the demand response fare places the burden on the fixed route service for increasing farebox revenues to the level required to meet COLT’s 20% farebox recovery requirement.
Demand response recommendations included in the SRTP speak directly to the lack of demand response enforcement of eligibility criteria as discussed above. The SRTP recommendation to “establish and implement [an] ADA certification process” includes elements such as development of an application, review of applications by City staff or other designee familiar with ADA requirements, period-based approvals based on permanent or temporary disability, recertification process, and a no-show and cancellation policy. To date, only the application has been developed but it has not been enforced.
The last SRTP compared performance against key performance indicators such as those shown in Exhibit 19. In FY06, COLT’s performance was largely in line with regional standards for cost per passenger, cost per hour, and passengers per hour. A new service contract put in place at the beginning of the audit period increased COLT’s cost per hour from $41 to $51, accounting for 83% of the growth in cost per hour over the audit period.
O’Melia Consulting in association with Kelly Hines Consulting

City of Lompoc TDA Triennial Performance Audit Page 37
Exhibit 19 – COLT 2006 Performance & Regional Standards Operating Cost per Passenger
Operating Cost per Service Hour
Passengers per Hour
Farebox Recovery Ratio
Standard <$5.00 $50 15 20%COLT FR (FY06) $3.93 $54.36 13.8 13.3%Standard <$14.00 $50 3 10%COLT DR (FY06) $18.76 $54.91 2.9 13.3%Standard as indicated in the North Santa Barbara County Transit Plan (10/19/2006)
As a funding partner of COLT, the County plays an active role in the COLT planning activities including SRTP development, community Unmet Needs meetings, and other public forums. The County joined City of Lompoc staff in holding the Unmet Needs hearing in the City of Lompoc. With the high level of public support of COLT demonstrated at the public hearing, particularly for the mix of fixed route and demand response service in the community, the County mirrored a major finding of this audit in expressing concern over farebox recovery moving forward as costs continue to increase. Additionally, improved service coordination with the Breeze was suggested. Currently, the COLT system does not provide service early enough to meet the first Breeze departure from Lompoc. COLT, however, does offer free transfers to the COLT system for Breeze riders.
County input into the COLT planning process is further gathered through the County’s participation on several SBCAG advisory committees including the Santa Barbara County Transit Advisory Council (SBCTAC) which oversees the County’s annual Unmet Transit Needs process, and the Technical Transportation Advisory Committee which also comments on the Unmet Needs findings as well as reviewing and making policy recommendations on fund allocations (TDA and Measure D), special studies, planning documents (RTIP) and other transportation matters that come before the SBCAG Board. Additionally, the County participates in technical advisory groups for special transportation studies affecting COLT, the most recent of which was the North Santa Barbara County Transit Plan completed in October 2006.
The County’s financial contribution to the COLT system is determined based on the service hours provided in the County communities of Mission Hills and Vandenberg Village. These two communities are
O’Melia Consulting in association with Kelly Hines Consulting

City of Lompoc TDA Triennial Performance Audit Page 38
served by route 4, which connects to COLT’s four other intra-city routes at Mission Plaza.
As part of the annual budget process, program goals and objectives for the COLT system are adopted. Specific performance objectives in the FY06/FY07 biennial budget include:
• Increase ridership by 2% per year
• Ensure that maintenance cost per transit vehicle service mile does not increase more than 10% per year
• Appeal to new ridership groups by expending a minimum of 5% of operating budget on marketing efforts
• Hold operating cost increases to less than 25% per year
• Maintain local revenues of at least 20% of operating cost.
City staff has established the foundation for a routine performance program, but the process could be improved by comparing actual performance to existing year budget objectives in setting and identifying objectives in each new budget period. Additionally, the performance objectives could be refined to assess efficiency and effectiveness measures instead of overall cost or ridership measures. For example, instead of “hold cost increases to less than 25% per year”, a measure such as maintain cost per hour within CPI growth allows performance to be tempered against the level of system expansion. Cost growth of 25% with no increase in service levels would be exceptionally high; whereas, 25% cost growth with a 30% increase in service hours would be commendable. Similarly, 2% ridership growth per year is a good target if service levels don’t increase. If service levels were to increase by 20%, for example, ridership growth might be expected to be 22% (20% based on service levels and 2% based on targeted annual growth).
O’Melia Consulting in association with Kelly Hines Consulting

City of Lompoc TDA Triennial Performance Audit Page 39
IV. RECOMMENDATIONS
Two recommendations are offered for consideration by COLT. Both recommendations are related to compliance issues, though implementation should have a positive impact on system performance with respect to farebox recovery.
1. The City of Lompoc should take measures to improve its farebox recovery ratio.
Findings: Over the audit period, COLT saw a decline in the farebox recovery of its service from 9.8% in FY03 to 7.7% in FY06. Adding in local subsidies and auxiliary revenues, the farebox recovery in FY03 was 19.6% compared to 13.5% for FY06. COLT is still below the required farebox recovery of 20%. A recommendation is being made to SBCAG to investigate whether COLT’s demand response farebox recovery requirement should instead be 10% under PUC Section 99268.5. However, since COLT does not track farebox revenues by mode and instead allocates costs and revenues 75/25 between fixed route and demand response modes, it is difficult to determine how each mode would perform against requirements of 20% and 10%, respectively. On the one hand, the lower fares of the demand response service suggest that the demand response farebox recovery would be lower than the system average if it were tracked separately. On the other hand, the application of Measure D revenues from both the City and the County to the demand response service would lower the fixed route farebox recovery relative to the system average.
City staff reports that fares were last raised in 2002 and may be considered again during the current fiscal year (FY08) though the operating budget does not include additional revenues from a fare increase.
There are five options for meeting farebox recovery requirements:
• Increase farebox revenue through increased ridership • Increase farebox revenue with higher fares
O’Melia Consulting in association with Kelly Hines Consulting

City of Lompoc TDA Triennial Performance Audit Page 40
• Reduce costs • Increase local contributions or other operating revenue such as
advertising revenue.
Suggested Actions. It is recommended that City staff consider the following options for meeting its farebox recovery requirements:
a) Changing its fare structure which could include:
i) Adjusting the relationship between the fixed route base cash fare and the demand response fare - COLT’s base cash fare of $1.00 is among the lowest in the County. Seniors and persons with disabilities pay only 50¢ to ride the bus. COLT’s ADA demand response fare is also 50¢ and is half of the fixed route base fare despite being allowed, under ADA guidelines, to be as high as twice the base cash fare. There is no price incentive for seniors and persons with disabilities who can use fixed route bus service to do so. The customer pays 50¢ for curb-to-curb demand response service or the same for fixed route bus service. Because of the higher cost per passenger for demand response service, persons who have a choice should be encouraged to ride fixed route bus service. The 50¢ fare for both services provides no incentive for senior or disabled riders to make their trips on the fixed route service.
ii) Increasing the cost of the monthly pass – The monthly pass price for City limit trips is $18.00, the equivalent of only 18 rides (9 round-trips) made using cash. Similarly, the monthly pass for out-of-City travel is $34.00, the equivalent of 22.6 rides (11+ round-trips) made using cash. Nationally, monthly pass multiples are more typically in the 32 to 40 range (16 to 20 round-trips). The appropriate multiple for COLT would depend on current pass utilization rates which may be determined by asking your customers how many times a week do they use the service, counting one trip for each pick-up.
iii) Eliminating the free transfer – Charging for transfers may be an alternative to significant increases in the cash fare, especially if there is a high rate of transfer activity on the
O’Melia Consulting in association with Kelly Hines Consulting

City of Lompoc TDA Triennial Performance Audit Page 41
COLT system. Alternatively, transfers could be eliminated altogether with the introduction of a Day Pass. The Day Pass price should be set according to the travel behavior of COLT’s riders but should be in the three to five cash fare multiple range.
b) Identify opportunities to increase operating revenues through advertising on buses and at bus stops.
c) Tighten and enforce the eligibility requirements for the ADA service. This will be particularly important over the coming years as the City’s senior population is expected to increase. COLT may wish to increase the age at which seniors are eligible for discounts or to use the demand response service.
d) Implement a mobility-training program to teach and encourage demand response service riders to use the fixed route service. Success of the program will depend largely on the extent to which there is a price incentive to use fixed route service. Absent a shift in the relationship between the fixed route and demand response fare, fixed route service could be made free to ADA-eligible patrons. The benefits of a program such as this on COLT’s farebox recovery will depend on a careful assessment of the actual farebox recovery of each mode separately.
e) Investigate the pass sales and fare collection process to eliminate any revenues losses that may be occurring due to lack of enforcement of fare payment or fraudulent activity. It should be noted, however, that nothing uncovered during the conduct of this audit suggests that any fraudulent activity is occurring.
Additionally, COLT should submit the required report to SBCAG for exclusion of new services from the farebox recovery requirement if doing so would improve short-term farebox recovery.
• Expected Results. Implementation of this recommendation would assist COLT in achieving compliance with farebox recovery requirements (PUC 99268).
O’Melia Consulting in association with Kelly Hines Consulting

City of Lompoc TDA Triennial Performance Audit Page 42
2. The City of Lompoc should more carefully report transit system statistical – passengers, service hours, service miles, and employee full-time equivalents (FTEs) – and financial data in reports to oversight agencies, including reporting information by mode.
• Findings: Many discrepancies were found in reported system statistical data over the audit period. The City of Lompoc is not separately reporting fixed route and ADA paratransit financial and system information as required by the State Controller in the annual State Controller’s Report. In the National Transit Database, where financial and system information is reported separately by mode, operating costs and farebox revenues are split 75/25 between fixed route and demand response rather than reflecting actual modal costs and farebox revenues.
Finally, FTEs as reported in the State Controller report reflect employee headcount of contractor and City staff instead of employee pay hours divided by 2,000 per the definition of a full-time equivalent.
• Suggested Actions. It is recommended that City staff take the following actions to implement this recommendation:
a) Report financial and operating data separately for the fixed route and ADA paratransit modes in the annual State Controller’s Report, which will require filing two separate reports – one for each mode. Data is segregated by mode in the Monthly Service Report and Operations Management Report from the Contractor. Where other system revenues (e.g., TDA, STA funds) or costs (e.g., City overhead) cannot be segregated by mode, allocation of these costs and revenues can easily be done on the basis of contractor modal operating costs (i.e., service hours) as the City pays the same cost per hour for both modes of service.
b) Request AmericanStar to report employee pay hours as part of its monthly invoice to the City and include these hours as part of the FTE calculation.
c) Identify pay hours of City staff that charge directly to the Transit Fund (i.e., Transit Department) and include these hours as part
O’Melia Consulting in association with Kelly Hines Consulting

City of Lompoc TDA Triennial Performance Audit Page 43
O’Melia Consulting in association with Kelly Hines Consulting
of the FTE calculation. Hours associated with general City overhead charged to the Transit Department need not be included in the FTE calculation.
a) The City should clearly define the responsibilities of each staff member with respect to the collection and reporting of system operating and financial data specifically as they relate to the monthly segregation of modal operating costs and service statistics and preparation of timely and consistent external reports to oversight agencies including the State Controller, FTA, and SBCAG.
• Expected Results. Implementation of this recommendation will bring the City of Lompoc into compliance with TDA data definition (PUC 99247) and potentially improve compliance with fiscal (PUC 99268) requirements. Having accurate modal cost and revenue information will help COLT make better decisions about service deployment, performance and fare pricing.

SANTA BARBARA COUNTY TRANSIT (CUYAMA TRANSIT AND LOS ALAMOS SHUTTLE) TDA TRIENNIAL PERFORMANCE
AUDIT FOR FY 2004-2006 Fiscal Years Ending June 30th
Prepared by
In Association With
OCTOBER 4, 2007

Santa Barbara County Transit TDA Triennial Performance Audit Page i
TABLE OF CONTENTS
EXECUTIVE SUMMARY.................................................................... 1
Purpose of Audit.........................................................................................1
Findings......................................................................................................2
Recommendations .....................................................................................3
I. INTRODUCTION....................................................................... 5
Performance Audit Objectives and Approach.............................................5
System Overview .......................................................................................6
II. COMPLIANCE REVIEW......................................................... 10
Regulatory Requirements.........................................................................10
Progress To Implement Prior Audit Recommendations ...........................13
Data Verification.......................................................................................15
TDA Performance Indicator Trends..........................................................20
III. FUNCTIONAL AREA PERFORMANCE RESULTS............... 24
Operations................................................................................................24
Vehicle Maintenance................................................................................26
Administration, Planning, and Budget ......................................................27
IV. RECOMMENDATIONS........................................................... 30
O’Melia Consulting in association with Kelly Hines Consulting

Santa Barbara County Transit TDA Triennial Performance Audit Page ii
LIST OF EXHIBITS
Exhibit 1 – Performance Audit Sources ................................................................6
Exhibit 2 – Organization Chart ..............................................................................7
Exhibit 3 – Regulatory Compliance Matrix ..........................................................10
Exhibit 4 – Progress To Implement Prior Audit Recommendations.....................14
Exhibit 5 – Verified Data Elements for TDA Performance Indicators ..................16
Exhibit 6 – Data Consistency Review .................................................................18
Exhibit 7 – TDA Performance Indicators – Cuyama Transit ................................21
Exhibit 8 – TDA Performance Indicators – Los Alamos Shuttle ..........................22
Exhibit 9 – Farebox Recovery – County Transit..................................................23
Exhibit 10 – County Transit Performance & Regional Standards.......................29
O’Melia Consulting in association with Kelly Hines Consulting

Santa Barbara County Transit TDA Triennial Performance Audit Page 1
EXECUTIVE SUMMARY
Purpose of Audit
As the Regional Transportation Planning Agency (RTPA) for Santa Barbara County, the Santa Barbara County Association of Governments (SBCAG) is required by the Public Utilities Code (PUC) Sections 99246 and 99248 to contract for a third party performance audit of itself and each of the transit operators to which Transportation Development Act (TDA) funds are allocated. These audits are to be conducted in accordance with the California Department of Transportation, Performance Audit Guidebook for Transit Operators and Regional Transportation Entities. Performance audits are required to:
• Determine compliance with regulatory requirements
• Assess progress to implement prior performance audit recommendations
• Verify performance indicators and validate basic data used to calculate indicators
• Evaluate the effectiveness and efficiency of agency functions.
This performance audit of Santa Barbara County transit services is for Fiscal Years 2004, 2005 and 2006 -- the period of time beginning July 1, 2003 and ending June 30, 2006.
This performance audit of Santa Barbara County Transit focuses on those services, which are funded 100% with County TDA funds and includes Cuyama Transit and the Los Alamos Shuttle. Both services provide transit connections between non-incorporated areas of North County Santa Barbara and the City of Santa Maria.
Santa Barbara County also contributes funds transit services across the county, providing pass through TDA revenues to Lompoc (COLT), Santa Maria (SMAT), and the Santa Ynez Valley (SYVT) for fixed route and paratransit operations in County areas adjacent to the each of
O’Melia Consulting in association with Kelly Hines Consulting

Santa Barbara County Transit TDA Triennial Performance Audit Page 2
these three transit operating/municipal agencies. Separate performance audits have been prepared for each of these agencies.
Findings
• Cuyama Transit has maintained a successful operation over the audit period, generating nearly twice its required farebox recovery despite a slight decline in ridership as a result of acquiring a lower capacity vehicle in the final year of the audit period.
• Los Alamos Shuttle began operation in April 2004, and now provides two daily round trips every Tuesday and Saturday between Los Alamos and Santa Maria. As a startup service, the Shuttle was not required to achieve a 10% farebox recovery requirement as a rural operation. However, beginning in FY07 (full two fiscal years following start-up), the Los Alamos Shuttle is subject to the 10% farebox recovery requirement. In the last year of this performance audit (FY06), the Shuttle earned just a 6.4% farebox recovery making it vulnerable to cancellation if costs cannot be lowered or additional revenues generated.
• Santa Barbara County Transit is in compliance with most PUC requirements, the single exception being failure of Cuyama Transit to undergo annual CHP inspections prior to filing of TDA claims by the County during the audit period. Cuyama Transit is now exempt from this requirement as its new vehicle’s capacity is ten passengers (including the driver).
• All prior audit recommendations applied to Cuyama Transit only. Cuyama Transit implemented two of four prior audit recommendations. One related to revising the reporting of passenger and trip data in monthly invoices to the County was not implemented. A prior recommendation to acquire a back-up vehicle was not implemented, but determined to be inappropriate given the small, community-based nature of the service. A revised recommendation relative to availability of a back-up vehicle is made as part of this performance audit.
• A review of contractor-provided data and data reported in reports to external agencies including the State Controller’s Report and annual Financial Statements uncovered inconsistencies in
O’Melia Consulting in association with Kelly Hines Consulting

Santa Barbara County Transit TDA Triennial Performance Audit Page 3
operating costs, farebox revenues, passenger hours, and passenger miles. FTEs (full-time equivalent employees) were not reported in any data source.
• Cuyama Transit’s cost per hour grew in excess of inflation during the audit period but at just $22.60 per hour is well below regional standards of performance. Cost per passenger increased by more than 30% due to a slight decline in ridership resulting from acquisition of a smaller vehicle in the final year of the audit period. With a cost per passenger of $7.87, Cuyama Transit is significantly lower than the regional standard of $14.00 – this is good performance. Service productivity on Cuyama Transit declined as a result of a lower capacity vehicle put into operation in FY06. Nearly every round-trip made in FY06 carried the maximum number of passengers. Cuyama Transit’s farebox recovery was 17% in FY06 – 70% higher than the required 10%.
• Los Alamos Shuttle cost per hour increased by 5.8% between FY05 and FY06, the first two full years of service, from $40.25 to $42.58. The County provides a fixed monthly sum to the Santa Maria Organization of Transit Helpers (SMOOTH), the North County Consolidated Transportation Service Agency (CTSA), for operation of the Los Alamos Shuttle, including provision of a cutaway vehicle. With ridership doubling between FY05 and FY06, cost per passenger declined by 36% while service productivity improved as passengers per hour and mile increased by 65.6% and 74%, respectively.
Recommendations
Three recommendations are offered for consideration by Santa Barbara County for Cuyama Transit and the Los Alamos Shuttle services. Detailed recommendations are included in Chapter IV.
1. Update contractor reporting practices to reflect accurate calculation of required data elements including service hours, service miles, and FTEs and include all contractor-reported data in the State Controller’s Report.
O’Melia Consulting in association with Kelly Hines Consulting

Santa Barbara County Transit TDA Triennial Performance Audit Page 4
2. Investigate the opportunity to set up agreement with SMOOTH (or SMAT) to provide a back-up vehicle to Cuyama Transit should their vehicle go out of service unexpectedly.
3. The County should take measures to improve the farebox recovery ratio of the Los Alamos Shuttle.
O’Melia Consulting in association with Kelly Hines Consulting

Santa Barbara County Transit TDA Triennial Performance Audit Page 5
I. INTRODUCTION
Performance Audit Objectives and Approach
As the Regional Transportation Planning Agency (RTPA) for Santa Barbara County, the Santa Barbara County Association of Governments (SBCAG) is required by the Public Utilities Code (PUC) Sections 99246 and 99248 to contract for a third party performance audit of itself and each of the transit operators to which Transportation Development Act (TDA) funds are allocated. These audits are to be conducted in accordance with the California Department of Transportation, Performance Audit Guidebook for Transit Operators and Regional Transportation Entities. Performance audits are required to:
• Determine compliance with regulatory requirements
• Assess progress to implement prior performance audit recommendations
• Verify performance indicators and validate basic data used to calculate indicators
• Evaluate the effectiveness and efficiency of agency functions.
This performance audit of Santa Barbara County transit services is for Fiscal Years 2004, 2005 and 2006 -- the period of time beginning July 1, 2003 and ending June 30, 2006.
While the performance audit is being conducted in response to State requirements, such audits can and should be constructive and useful to governing boards, SBCAG and transit operator management.
It is the Auditor’s responsibility to provide objective and balanced reporting of results. This is important because very few agencies are all good or all bad. It is the auditor's responsibility to conduct thorough and accurate analyses and objectively report performance findings. Significant accomplishments and positive performance trends are discussed as well as opportunities for improvement.
O’Melia Consulting in association with Kelly Hines Consulting

Santa Barbara County Transit TDA Triennial Performance Audit Page 6
The methodology for this audit include interviews with key staff and management involved in the provision of transit services, a site visit for review of operations and data collection practices, review of operational and financial data, and review of relevant documents. Highlights of this review are presented below in Exhibit 1.
Exhibit 1 – Performance Audit Sources
Interviews – Name, Title and Agency
Matt Dobberteen, Alternative Transportation Manager, County of Santa Barbara Dorothy Batiste, Director, Cuyama Recreation District
Jim Talbott, Executive Director, SMOOTH
Site Visit(s)
Cuyama Recreation District, Tuesday, May 8, 2007 SMOOTH Administrative Offices, Wednesday, May 16, 2007
Background Materials Reviewed
Comprehensive Annual Financial Reports, Fiscal Years 2004-2006 Annual Report of Financial Transactions of Transit Operations -- State Controllers
Annual Reports, Fiscal Years 2004-2006 TDA Triennial Performance Audit Report For Fiscal Years Ending June 30, 2003
Annual TDA and STA Claim Forms, Fiscal Years 2004-2006 California Highway Patrol Pull-Notice and Terminal Inspection Certifications
Purchased Transportation Service Agreements Contractor Monthly Invoices
Public Information –Timetables & Schedules, Brochures
System Overview
This performance audit of Santa Barbara County Transit focuses on those services, which are funded 100% with County TDA funds and includes Cuyama Transit and the Los Alamos Shuttle. Both services provide transit connections between non-incorporated areas of North County Santa Barbara and the City of Santa Maria.
Santa Barbara County also contributes funds for transit services across the county, providing pass through TDA revenues to Lompoc (COLT), Santa Maria (SMAT), and the Santa Ynez Valley (SYVT) for fixed route and paratransit operations in County areas adjacent to the
O’Melia Consulting in association with Kelly Hines Consulting

Santa Barbara County Transit TDA Triennial Performance Audit Page 7
each of these three transit operating/municipal agencies. Separate performance audits have been prepared for each of these agencies.
Organization & Policy Decisions
Santa Barbara County Public Works Department has two separate agreements in place – one with the Cuyama Valley Recreation District (District) and one with SMOOTH – for the provision of Cuyama Transit and Los Alamos Shuttle transit services, respectively. The Cuyama Transit service dates back to a 1985 agreement between the District and the County when the service was started to document the “reasonableness to meet” criteria of the unmet transit needs finding for service between New Cuyama and Santa Maria. Similarly, the Los Alamos Shuttle was first put into place in April 2004 to address a potential unmet transit needs finding for service between Los Alamos and Santa Maria.
Exhibit 2 – Organization Chart Alternative Transportation Manager,
Santa Barbara County Public Works Department
Executive Director, Santa Maria Organization of Transit Helpers (SMOOTH)
Director, Cuyama Valley Recreation District
Alternative Transportation Manager, Santa Barbara County Public Works
Department
Executive Director, Santa Maria Organization of Transit Helpers (SMOOTH)
Director, Cuyama Valley Recreation District
The agreement with the Cuyama Valley Recreation District was last renewed in 1997 (for FY98), but included provisions for the annual renewal of the agreement for four years subject to the availability of TDA funds. The service has been provided without interruption since the agreement was last updated but a new agreement was not entered into for FY03 and beyond. The agreement with SMOOTH is also funded by TDA revenues and must be renewed every year.
Each agreement stipulates the amount of service to be provided. The District invoices the County monthly for actual expenses incurred less the amount of fare revenues retained. SMOOTH also invoices the County monthly for actual expenses incurred less fare revenues retained up to a maximum per month ($2,500 for FY06).
O’Melia Consulting in association with Kelly Hines Consulting

Santa Barbara County Transit TDA Triennial Performance Audit Page 8
While the County sets service levels in each of the agreements, both the District and SMOOTH work with the County’s Alternative Transportation Manager to arrive at service levels and schedules that best respond to customers’ needs. For example, the Los Alamos Shuttle schedule has changed several times since the service’s inception, changing from a pure fixed-route to a deviated fixed-route service and changing its service days from Tuesday/Thursday to Tuesday/Saturday. Cuyama Transit’s service has not changed for many years.
Both the District and SMOOTH have separate policy boards that oversee their activities. The District’s board is made up of five members whom are all New Cuyama residents. SMOOTH’s board is made up of a variable number of members (averaging ten during most of the audit period but peaking at 13 at one point). Both Boards meet monthly. Neither board sets policy for the transit service provided on behalf of the County.
Cuyama Transit Service Characteristics
Cuyama Transit provides round trip service between New Cuyama and the City of Santa Maria every Tuesday and Thursday, a one-way distance of approximately 56 miles. The van departs New Cuyama at 9:00 am from Montgomery Hall, and will pick up passengers who live in the town proper. Residents from outlying areas are required to meet the van at Montgomery Hall. Once in Santa Maria, the van operates in demand response mode, dropping off and picking up passengers throughout the day and returning to New Cuyama by 5:00 pm. Passengers may arrange pick-up times in Santa Maria with the driver before alighting the vehicle or may call the van’s cell phone if they require a flexible pick-up time.
The round-trip fare is $6.00, with a reduced fare of $4.00 for children 12 years of age and under and seniors 55 years of age and older. Most passengers make round trips on the service but one-way service is also provided. While in Santa Maria, drivers will also pick-up prescription medication for New Cuyama residents who have made arrangements for such service in advance. A fee of $3.00 is charged for this service. The District employs a single driver for operation of Cuyama Transit.
O’Melia Consulting in association with Kelly Hines Consulting

Santa Barbara County Transit TDA Triennial Performance Audit Page 9
The Recreation District purchased a new ten-passenger van in July 2005, replacing the 15-passenger vehicle used previously. The County allowed the District to trade-in the prior vehicle on the new van. Vehicle payments are charged to the County as part of the monthly invoice.
Los Alamos Service Characteristics
The Los Alamos Shuttle was implemented in April 2004 to address a potential unmet transit need finding for service between the unincorporated community of Los Alamos and the City of Santa Maria. At inception, the service was offered two days a week on Tuesdays and Thursdays and was a fixed-route service between Los Alamos and defined destinations in Santa Maria. Since that time, the service has been modified to meet customer needs and now operates on Tuesdays and Saturdays, providing deviated fixed-route service in Santa Maria. This new configuration allows more flexibility in transporting customers to specific destinations in Santa Maria. The vehicle departs Los Alamos at 8:00 am and 11:00 am, returning to Los Alamos from Santa Maria at 10:00 am and 3:00 pm on Tuesdays. The service operates in the same fashion on Saturdays with 10:00 am and 2:00 pm departure times from Los Alamos and 1:00 pm and 5:00 pm departures from Santa Maria. SMOOTH uses a single cutaway vehicle to provide the Los Alamos Shuttle service.
Fare for the service is $3.00 round trip ($1.50 each way). Seniors 60 years of age and over, minors, and students with valid ID pay a reduced fare of $2.00 round trip ($1.00 each way). Los Alamos Shuttle passengers can transfer for free to SMAT.
O’Melia Consulting in association with Kelly Hines Consulting

Santa Barbara County Transit TDA Triennial Performance Audit Page 10
II. COMPLIANCE REVIEW
Regulatory Requirements
County Transit services – Cuyama Transit and Los Alamos Shuttle – are in compliance with regulatory requirements, as shown below in Exhibit 3. There are no areas of non-compliance though staff should continue to monitor passenger loads on the Cuyama Transit vehicle to ensure that loads do not exceed ten passengers (including the driver). Passenger loads in excess of ten passengers would trigger the need for CHP Pull Notice inspections (PUC Section 99251), which have not been conducted for Cuyama Transit. Los Alamos Shuttle is in compliance with CHP inspection requirements through the inspections of SMOOTH, the service provider under contract to the County.
Exhibit 3 – Regulatory Compliance Matrix
Regulatory Code
Compliance Requirement
Compliance Finding Verification Information
PUC Section 99243
Submit an annual report to the State Controller based upon the Uniform System of Accounts and Records established by the State Controller. Due dates varied during the audit period: FY04: 11/24/04 (paper) or 12/14/04 (electronic), FY05: 9/28/05 (paper) or 10/18/05 (electronic) FY06: 10/12/06 (paper) or 11/1/06 (electronic)
Full Compliance Report Submission Dates: FY 2004: 10/12/04 FY 2005: 9/14/05 FY 2006: 10/11/06
PUC Section 99245
Submit annual fiscal and compliance audit to State Controller within 180 days of year end, or has received a 90-day extension allowed by law.
Full Compliance Auditor Report Dates: FY 2004: 12/2/04 FY 2005: 11/16/05 FY 2006: 11/20/06
O’Melia Consulting in association with Kelly Hines Consulting

Santa Barbara County Transit TDA Triennial Performance Audit Page 11
Regulatory Code
Compliance Requirement
Compliance Finding Verification Information
PUC Section 99251
Submit CHP certification of compliance with Pull Notice within 13 months period prior to TDA claim
Partial Compliance
CHP Certification Dates for Los Alamos Shuttle: FY 2004 Claim: 12/13/02 FY 2005 Claim: 12/12/03 FY 2006 Claim: 12/14/04 With the purchase of its new service vehicle in 2005 (beginning of FY06), the vehicle capacity is ten passengers (including the driver) and thus exempts Cuyama Transit from CHP certification requirements from this point forward. Trip logs for Cuyama Transit show that Cuyama Transit did not carry more than ten passengers (including the driver). However, the prior Cuyama vehicle had a capacity of 15 passengers and routinely carried more than ten passengers, which required a CHP inspection.
PUC Section 99261
Submit TDA Claim in compliance with rules and regulations adopted by RTPE
Full Compliance TDA Claims were submitted to and funds approved by SBCAG in all three years.
PUC Section 99264
The operator does not routinely staff public transportation vehicles designed to be operated by one person with two or more persons
Full Compliance Review of staffing assignments indicates that one person is responsible for vehicle operations.
PUC Section 99266
Operating budget has not increased by more than 15% over preceding year unless reasonable justification for the change has been provided
Full Compliance, growth from
FY04 to FY05 due to
introduction of the Los Alamos
Service.
% Change Per State Controller Report FY 2003 to 2004: 2% FY 2004 to 2005: 195% FY 2005 to 2006: 0%
O’Melia Consulting in association with Kelly Hines Consulting

Santa Barbara County Transit TDA Triennial Performance Audit Page 12
Regulatory Code
Compliance Requirement
Compliance Finding Verification Information
PUC Sections 99268.2-5 & .12
Operator has maintained a ratio of revenues to operating costs equal to 20% for urban areas and 10% for rural areas and specialized services or 15% in areas with a population less than 500,000 if determined by RTPA
Full Compliance Cuyama Transit: Farebox Recovery Ratio Per Contractor Monthly Reports: FY 2004: 19.5% FY 2005: 15% FY 2006: 17% Los Alamos Shuttle exempt from farebox recovery requirement first two years of operation (PUC Section 99268.8).
PUC Section 99268
Operator TDA funding is no more than 50% of operating, maintenance, capital, and debt service requirements after federal grants are deducted
Not applicable as Cuyama Transit
met farebox recovery
requirement during the audit
period.
TDA Funds As % of Total Annual Costs (less Federal Grants) Per Financial Audit:FY 2004: N/A FY 2005: N/A FY 2006: N/A
PUC Section 99271
The retirement system is fully funded, or the Operator is implementing a plan that will fully fund the retirement system within 40 years.
Full Compliance County of Santa Barbara employees are part of the Public Employees Retirement System (PERS).
PUC Section 99314.5
If the Operator receives STA funds, the Operator is not precluded by contract from employing part-time drivers or from contracting with common carriers
Not applicable as STA funds were not applied to County transit
services.
CAC Section 6754 (a) (3)
Available Federal funds are used prior to claiming STA funds
Not applicable as STA funds were not applied to County transit
services.
O’Melia Consulting in association with Kelly Hines Consulting

Santa Barbara County Transit TDA Triennial Performance Audit Page 13
Regulatory Code
Compliance Requirement
Compliance Finding Verification Information
PUC Section 99314.6
If the Operator receives STA funds for operating purposes: (1) the Operator’s total operating cost per revenue hour does not exceed the prior year’s cost per revenue hour adjusted for inflation using the CPI; or (2) the Operator’s average total operating cost per revenue hour in the past three years does not exceed the sum of the average of the preceding three years, adjusted for inflation using the CPI.
Not applicable as STA funds were not applied to County transit
services.
Progress To Implement Prior Audit Recommendations
The prior TDA Performance Audit, completed in June 2004, made four recommendations for improved compliance and performance. Progress to implement prior audit recommendations includes full implementation of two recommendations, and no progress on the other two recommendations though the last recommendation is not feasible for Cuyama Transit to implement. Key questions included in this analysis of progress to implement prior audit recommendations are:
• What action(s) have been taken to implement the recommendation? Has performance improved as a result of actions taken?
• Is the issue to be addressed by the prior performance audit recommendation still valid today? Why or why not?
• If there has been little or no progress, are future actions planned? Was a different approach selected and if so, what is the status of this activity?
Exhibit 4 summarizes progress relative to prior performance audit recommendations. Findings of “Implemented, Partially Implemented,
O’Melia Consulting in association with Kelly Hines Consulting

Santa Barbara County Transit TDA Triennial Performance Audit Page 14
or Not Implemented” are made for each recommendation. Prior audit recommendations apply to Cuyama Transit, as the Los Alamos Shuttle did not begin operations until this audit period.
Exhibit 4 – Progress To Implement Prior Audit Recommendations
Prior Audit Recommendations
Prior Audit Findings Leading to
Recommendation Compliance
Finding Implementing Actions &
Results
1. In the fiscal years that it receives TDA funds, Cuyama Transit must comply with the mandatory regulations of submitting annual reports, fiscal audits, and compliance audits to the RTPE and arrange for CHP vehicle inspections.
Cuyama Transit did not arrange for fiscal and compliance audits nor did they undergo any CHP inspections during the last audit period.
Implemented Required compliance and financial audits were conducted for the County of Santa Barbara during the audit period. As the Cuyama Transit van does not carry more than ten passengers, CHP inspections are not required.
2. Consider expanding the number of service policies for Cuyama Transit to inform passengers about how to use the service.
The prior auditor suggested adding a few service policies to its “Administrative Regulations for Van Passengers” including baggage limits and no playing of radios.
Implemented Cuyama Transit has a comprehensive list of service policies which address food or beverage on board the vehicle, baggage limitations, and reservation requirements.
3. Revised the method for recording the number of trips and number of passengers in monthly statements.
Monthly reports provided to the County reported identical numbers for both passengers and trips.
Not Implemented
During the audit period, Cuyama Transit continued to report identical numbers for both trips and passengers. During the site visit for this audit, the recommendation was again made to the Recreation District Director and reports were to have been changed beginning with the July 2007 monthly report.
O’Melia Consulting in association with Kelly Hines Consulting

Santa Barbara County Transit TDA Triennial Performance Audit Page 15
Prior Audit Recommendations
Prior Audit Findings Leading to
Recommendation Compliance
Finding Implementing Actions &
Results
4. The County and town should strategize to acquire a back-up van.
With the prescription pick-up component of the Cuyama Transit service, the lack of a back-up van to provide service should the existing vehicle go out of service would cause a hardship for New Cuyama residents.
Not Implemented
Cuyama Transit acquired a new van in 2005. The costs of acquiring a back-up van would place an inordinate financial burden on Cuyama Transit and the County with limited benefit in return. With service only offered two days a week, scheduling for routine maintenance is not a problem. When the vehicle is unexpectedly out of service, a back-up vehicle is rented. The Recreation Director personally responds to in- service breakdowns.
Data Verification
Included in the review of transit operators is the regulatory requirement (i.e., PUC Section 99247) that performance audits include a verification of five data items including:
• Operating Cost. The total cost of running a transit operation, exclusive of capital expenditures, depreciation, direct costs of providing charter service and vehicle lease costs.
• Total Passengers. The total number of unlinked trips. All passenger boardings whether revenue producing or not.
• Total Vehicle Service Hours. The total annual number of hours that vehicles are in revenue service. Excluded is travel to and from storage facilities and other deadhead travel. Also referred to as Revenue Hours.
• Total Vehicle Service Miles. The total annual number of miles that vehicles are in revenue service. Miles traveled to and from storage facilities and other deadhead travel are excluded. Also referred to as Revenue Miles.
O’Melia Consulting in association with Kelly Hines Consulting

Santa Barbara County Transit TDA Triennial Performance Audit Page 16
• Employee Equivalents. The total actual regular and overtime employee pay hours divided by 2,000 hours. Contract employees are included, but not volunteers. Also referred to as FTEs.
The County of Santa Barbara is in full compliance with two of five, and in partial compliance with three of five data definitions and methods of data collection as summarized in Exhibit 6 and described below.
Exhibit 5 – Verified Data Elements for TDA Performance Indicators
Data Items & Mode Fiscal Year 2004 Fiscal Year
2005 Fiscal Year
2006
Operating Costs
Full Compliance: County reports operating costs based on invoices received from the operators. Depreciation is excluded.
Full Compliance: County reports operating costs based on invoices received from the operators. Depreciation is excluded.
Full Compliance: County reports operating costs based on invoices received from the operators. Depreciation is excluded.
Total Passengers
Full Compliance: Passengers reflect a 100% headcount of passenger boardings for Cuyama Transit and the Los Alamos Shuttle.
Full Compliance: Passengers reflect a 100% headcount of passenger boardings for Cuyama Transit and the Los Alamos Shuttle.
Full Compliance: Passengers reflect a 100% headcount of passenger boardings for Cuyama Transit and the Los Alamos Shuttle.
Total Vehicle Service Hours
Partial Compliance: Cuyama Transit reports service hours to the County per the correct definition. SMOOTH counts all hours that a driver is behind-the-wheel as a service hour rather than only those hours when a vehicle is transporting passengers (i.e. during scheduled service hours).
Partial Compliance: Cuyama Transit reports service hours to the County per the correct definition. SMOOTH counts all hours that a driver is behind-the-wheel as a service hour rather than only those hours when a vehicle is transporting passengers (i.e. during scheduled service hours).
Partial Compliance: Cuyama Transit reports service hours to the County per the correct definition. SMOOTH counts all hours that a driver is behind-the-wheel as a service hour rather than only those hours when a vehicle is transporting passengers (i.e. during scheduled service hours).
O’Melia Consulting in association with Kelly Hines Consulting

Santa Barbara County Transit TDA Triennial Performance Audit Page 17
Data Items & Mode Fiscal Year 2004 Fiscal Year
2005 Fiscal Year
2006
Total Vehicle Service Miles
Partial Compliance: Cuyama Transit reports service miles to the County per the correct definition. SMOOTH counts all miles for which a driver is behind-the-wheel as a service hour rather than only those miles when a vehicle is transporting passengers (i.e. during scheduled service hours).
Partial Compliance: Cuyama Transit reports service miles to the County per the correct definition. SMOOTH counts all miles for which a driver is behind-the-wheel as a service hour rather than only those miles when a vehicle is transporting passengers (i.e. during scheduled service hours).
Partial Compliance: Cuyama Transit reports service miles to the County per the correct definition. SMOOTH counts all miles for which a driver is behind-the-wheel as a service hour rather than only those miles when a vehicle is transporting passengers (i.e. during scheduled service hours).
Employee Equivalents
Partial Compliance: Cuyama Transit does not report FTEs but they can be calculated with reported data. SMOOTH does not report FTEs but does calculate FTEs. The data should be provided to the County.
Partial Compliance: Cuyama Transit does not report FTEs but they can be calculated with reported data. SMOOTH does not report FTEs but does calculate FTEs. The data should be provided to the County.
Partial Compliance: Cuyama Transit does not report FTEs but they can be calculated with reported data. SMOOTH does not report FTEs but does calculate FTEs. The data should be provided to the County.
Data Consistency
Exhibit 6 compares system-wide financial and operating data as reported in the County’s State Controller’s Reports and Financial Audits compared to contractor data for Cuyama Transit and Los Alamos Shuttle.
O’Melia Consulting in association with Kelly Hines Consulting

Santa Barbara County Transit TDA Triennial Performance Audit Page 18
Exhibit 6 – Data Consistency Review
FY 2004 FY 2005 FY 2006Cuyama Transit - Invoices 16,134$ 20,821$ 31,081$ Los Alamos Shuttle - SMOOTH Profit & Loss Statements 5,779$ 23,464$ 25,846$ County Misc Costs as Reported in State Controller's Report 2,941$ 4,327$ 1,664$ Contract Operator Totals 24,854$ 48,612$ 58,591$ State Controller's Report 15,935$ 59,274$ 57,116$ Financial Statement 15,935$ 59,274$ 57,117$ Cuyama Transit - Invoices 3,148$ 3,113$ 3,043$ Los Alamos Shuttle - SMOOTH Profit & Loss Statements 130$ 960$ 1,656$ Contract Operator Totals 3,278$ 4,073$ 4,699$ State Controller's Report 2,830$ 4,120$ 4,312$ Financial Statement 2,830$ 4,121$ 4,312$ Cuyama Transit - Invoices 2,577 2,525 2,271Los Alamos Shuttle - Service Summary 121 655 1,129Contract Operator Totals 2,698 3,180 3,400State Controller's Report 2,577 3,012 3,076Cuyama Transit - Invoices 823 796 791Los Alamos Shuttle - Service Summary 144 583 607Contract Operator Totals 967 1,379 1,398State Controller's Report 823 1,527 1,339Cuyama Transit - Invoices 16,496 15,792 15,920Los Alamos Shuttle - Service Summary 2,846 12,928 12,808Contract Operator Totals 19,342 28,720 28,728State Controller's Report 16,496 27,411 27,520
TDA Statistic Audit Review PeriodSource
Vehicle Service Hours
Vehicle Service Miles
Passengers
Passenger Revenues
Operating Costs
All data items were reported inconsistently over the audit period with the exception of FTEs, which were not reported in the State Controller’s Report. The process for compiling and/or calculating the five required data elements and an assessment of their consistency across data sources is as follows:
• Operating Costs – Operating costs reported by each contractor do not correspond to operating costs as reported in both the State Controller’s Report and the Financial Audits. In FY04, the State Controller’s Report and the Financial Audit did not include the first three months of the new Los Alamos Shuttle service that began in April 2004 and was missing one month of Cuyama Transit service (June 2004). In FY05, the County incurred additional costs for a planning study that would not have been captured in contractor
O’Melia Consulting in association with Kelly Hines Consulting

Santa Barbara County Transit TDA Triennial Performance Audit Page 19
data and accounts for the difference in reported operating costs. In FY06, the discrepancy between contractor-provided data and the State Controller’s Report and Financial Audit was small. FY06 operating cost data in the State Controller’s Report includes vehicle payments for the Cuyama Transit service. The County should be sure to include fare revenues retained by either contract operator in reported operating costs.
• Passengers – The data definitions used by the contractors to report passenger data are misleading. Both the Cuyama Valley Recreation District and SMOOTH are asked to provide the number of trips and the number of passengers but there is no distinction provided as to what the difference is between these two statistics. Cuyama Transit, in fact, reports the same number for both statistics, which is the total boardings count, as required by TDA. Los Alamos ridership as provided by SMOOTH also reflects the correct total boardings figure. Passenger totals provided by the contract operators do not match ridership data in the State Controller’s Report. The lower figures reported in the State Controller’s Report during each year of the audit period suggest that the County may be combining trip (i.e. boarding) data from one contractor and passenger (i.e., one passenger per round trip) data from the other.
• Vehicle Service Hours – SMOOTH, for the Los Alamos Shuttle, counts service or “revenue” hours from the perspective of revenue-generation for SMOOTH instead of revenue-generation from the perspective of passenger payment of fare revenue. As such, SMOOTH counts as service hours every hour that a driver is behind the wheel on services for which SMOOTH is paid “portal to portal” or upon leaving the yard to returning to the yard which reflects total hours rather than service hours. Cuyama Transit data is reported as service hours per the correct definition. Data definitions aside, the data as reported by each contractor do not correspond to data reported by the County in the State Controller’s Report. In FY04, the State Controller’s Report did not include the Los Alamos Shuttle data. In FY05, the State Controller’s report is higher than contractor reported data. FY06 data is more consistent with information reported to the State Controller being only slightly lower than contractor reported data.
O’Melia Consulting in association with Kelly Hines Consulting

Santa Barbara County Transit TDA Triennial Performance Audit Page 20
• Vehicle Service Miles – Like vehicle service hours, vehicle service miles for the Los Alamos Shuttle reflect total miles rather than in –service miles. Cuyama Transit data is reported per the correct definition. Again, the FY04 State Controller’s report does not include data for the Los Alamos Shuttle. Consistency between the State Controller’s Report and contractor data improved in FY05 and FY06 with only minor differences in the last two years of the audit period.
TDA Performance Indicator Trends
California Public Utilities Code Section 99246 (d) states that performance audits of transit operators shall include a verification of performance indicators defined in the Public Utilities Code Section 99247. These performance indicators include:
• Operating Cost Per Vehicle Service Hour • Operating Cost Per Passenger • Passengers Per Vehicle Service Hour • Passengers Per Vehicle Service Mile • Vehicle Service Hours Per Employee.
Trends for these five TDA performance indicators are presented below by service – Cuyama Transit and Los Alamos Shuttle. Performance indictor trends involving costs are also compared to the Consumer Price Index -- Urban Wage Earners and Clerical Workers for the Los Angeles-Riverside-Orange County area.
TDA Performance Indicator Trends – Cuyama Transit
Exhibit 7 presents TDA performance indicators for Cuyama Transit.
• Operating Cost Per Vehicle Service Hour is a measure of cost efficiency. During the audit review period, cost per hour increased by 17%. Costs increased by 16.3% reflecting an increase in the driver wage from $9.00 in FY03 to $10.00 in FY06, and in gasoline costs which were up 33% from FY03 ($2,993 to $4,084). The temporary peak in FY05 operating costs reflects a second worker’s compensation payment made in FY05 for FY04 of $2,238. At $22.60 per hour in FY06, the cost of Cuyama Transit is extremely reasonable compared to other transit operators in the County.
O’Melia Consulting in association with Kelly Hines Consulting

Santa Barbara County Transit TDA Triennial Performance Audit Page 21
Exhibit 7 – TDA Performance Indicators – Cuyama Transit
FY04 FY05 FY06Operating Costs $ 15,375 $ 16,134 $ 20,821 $ 17,876 16.3%Unlinked Passengers 2,554 2,577 2,525 2,271 -11.1%Vehicle Service Hours 799 823 796 791 -1.0%Vehicle Service Miles 15,808 16,496 15,792 15,920 0.7%Employee Full-Time Equivalents 0.4 0.4 0.4 0.4 -1.0%Farebox Revenues $ 3,482 $ 3,148 $ 3,113 $ 3,043 -12.6%Cost Per Hour $ 19.24 $ 19.60 $ 26.16 $ 22.60 17.4%Cost Per Passenger $ 6.02 $ 6.26 $ 8.25 $ 7.87 30.7%Passengers Per Hour 3.2 3.1 3.2 2.9 -10.2%Passengers Per Mile 0.16 0.16 0.16 0.14 -11.7%Hours Per Employee FTE 2,000 2,000 2,000 2,000 0.0%Farebox Recovery 22.6% 19.5% 15.0% 17.0% -24.8%Percent Change in the CPI - 2.5% 4.2% 4.8% 11.9%Data from Monthly Statements prepared by Cuyama Transit for submission to the County and excludes vehicle loan payments in FY03 and FY06. Does not include County miscellaneous costs reported in the State Controller's Reports.FTEs estimated from driver hours (equal to vehicle service hours). Does not include time for the Cuyama Valley Recreation District Director nor the County Alternative Transportation Manager - neither of whom charge time or overhead to the service.
Verified TDA Statistics & Performance Indicators FY03 Audit Review Period Percent Change FY
2003 to FY 2006
• Operating Cost Per Passenger is a measure of cost effectiveness. During the audit period, cost per passenger increased by 31%, up to $7.87 in FY06 after peaking in FY05 at $8.25. Passengers declined by 11% by FY06, after remaining virtually constant from FY03 to FY05. The decline in passengers in FY06 is due to the smaller capacity of the new transit vehicle (ten passenger limit) versus the 15-passenger van used previously. The high cost per passenger is reflective of the long-distance nature of the service, which incurs higher costs with respect to driver pay hours and fuel expenses, but fewer passengers against which these costs can be allocated due to the limited capacity of the transit vehicle.
• Passengers Per Vehicle Service Hour is a measure of service productivity. During the audit review period, passengers per hour fell by 10%, again reflecting the smaller passenger loads of the new vehicle.
• Passengers Per Vehicle Service Mile also measures service productivity. Passengers per mile remained constant from FT03 to FY05 at 0.16, then declined to 0.14 in tFY06.
• Vehicle Service Hours Per Employee measures labor productivity and was unchanged as a single part-time driver provides all labor hours associated with the service. Neither the Recreation District’s Executive Director, nor the County’s Alternative Transportation Manager, bill any hours or charge any overhead to the service.
O’Melia Consulting in association with Kelly Hines Consulting

Santa Barbara County Transit TDA Triennial Performance Audit Page 22
TDA Performance Indicator Trends – Los Alamos Shuttle
Exhibit 8 presents TDA performance indicators for Los Alamos Shuttle. Because, the Los Alamos Shuttle was provided for only three months in FY04, TDA indicators as shown in Exhibit 8 assess percentage changes between FY04 and FY06, and FY05 to FY06. While the three-year trend covers the entire history of the Los Alamos Shuttle service, the two-year comparison – FY05 to FY06 – provides a better estimate of service performance.
Exhibit 8 – TDA Performance Indicators – Los Alamos Shuttle Audit Review Period
FY04 FY05 FY06Operating Costs $ 5,779 $ 23,464 $ 25,846 347.2% 10.2%Unlinked Passengers 121 655 1,129 833.1% 72.4%Vehicle Service Hours 144 583 607 321.5% 4.1%Vehicle Service Miles 2,846 12,928 12,808 350.0% -0.9%Employee Full-Time Equivalents 0.07 0.29 0.30 321.5% 4.1%Farebox Revenues $ 130 $ 960 $ 1,656 72.5% 72.5%Cost Per Hour $ 40.13 $ 40.25 $ 42.58 6.1% 5.8%Cost Per Passenger $ 47.76 $ 35.82 $ 22.89 -52.1% -36.1%Passengers Per Hour 0.8 1.1 1.9 121.4% 65.6%Passengers Per Mile 0.04 0.05 0.09 107.3% 74.0%Hours Per Employee FTE 2,000 2,000 2,000 0.0% 0.0%Farebox Recovery 2.2% 4.1% 6.4% 184.8% 56.6%Percent Change in the CPI 4.2% 4.8% 9.2% 4.8%
Operating data provided by SMOOTH.
Percent Change FY 2005 to FY 2006
Operating costs and farebox revenues from SMOOTH Profit and Loss Statements which document income received (including retained fare revenues) for operation of the Los Alamos Shuttle service.
FTEs estimated from driver hours (equal to vehicle service hours).
Percent Change FY 2004 to FY 2006
Verified TDA Statistics & Performance Indicators
• Operating Cost Per Vehicle Service Hour is a measure of cost efficiency. From FY05 to FY06, cost per hour grew by 5.8%, compared to a 4.8% increase in the CPI. Costs increased by 10%, due in part to an increase of 4% in vehicle service hours. Increasing fuel costs also contributed to cost increasing more than inflation. The contract for service between the County and SMOOTH provides for a maximum monthly payment of $2,500 ($30,000 annually) to SMOOTH for the actual cost of providing the service.
• Operating Cost Per Passenger is a measure of cost effectiveness. Cost per passenger fell by more than 36% from FY05 to FY06 as the new service was more established in FY06 with a resulting 65% increase in ridership.
• Passengers Per Vehicle Service Hour is a measure of service productivity. From FY05 to FY06, passengers per hour improved
O’Melia Consulting in association with Kelly Hines Consulting

Santa Barbara County Transit TDA Triennial Performance Audit Page 23
by 65% as ridership nearly doubled in the second full year of service. However, the low number of passengers per hour of 1.3 again reflects the fact that service hours as reported is a total hours measure. Passengers per revenue hour are more likely in the 2.1 to 2.3 passengers per hour range.
• Passengers Per Vehicle Service Mile also measures service productivity. During the audit review period, passengers per mile improved by 74% but still appear low due to the problem reporting of total miles rather than service miles.
• Vehicle Service Hours Per Employee measures labor productivity. During the audit review period, labor productivity remained unchanged as Full-Time Employees are calculated based on the number of hours a driver is behind the wheel of the Los Alamos Shuttle vehicle or total hours of service (i.e. service hours as reported by SMOOTH).
By the end of its second full year of operation, the Los Alamos Shuttle farebox recovery was up to 6.4%, compared to just 2.2% during its three months of operation in FY04.
Farebox Recovery – Cuyama Transit and Los Alamos Shuttle
Exhibit 9 provides the total farebox recovery for County Transit services.
Exhibit 9 – Farebox Recovery – County Transit
FY04 FY05 FY06Operating Costs $ 15,375 $ 21,913 $ 44,285 $ 43,722 184.4%Farebox Revenues $ 3,482 $ 3,278 $ 4,073 $ 4,699 35.0%Farebox Recovery 22.6% 15.0% 9.2% 10.7% -52.5%Percent Change in the CPI - 2.5% 4.2% 4.8% 11.9%Operating Costs and Farebox Revenues reflect the sum of Cuyama Transit and Los Alamos Shuttle data as reported by each contract operator. County miscellaneous costs are not included.
Verified TDA Statistics & Performance Indicators FY03 Audit Review Period Percent Change FY
2003 to FY 2006
Overall, the County transit services are required to maintain a 10% farebox recovery ratio as both services operate in rural areas. This ratio was not met in FY05, the first full year of Los Alamos Shuttle service. The improved farebox recovery of this service in FY06 brought system-wide recovery back into compliance in FY06, but lower than that achieved by Cuyama Transit alone.
O’Melia Consulting in association with Kelly Hines Consulting

Santa Barbara County Transit TDA Triennial Performance Audit Page 24
III. FUNCTIONAL AREA PERFORMANCE RESULTS
A high level review of functional area performance was conducted for select functions of Cuyama Transit and the Los Alamos Shuttle including:
• Operations • Vehicle Maintenance • Administration, Planning, and Budget
Information used in this section was obtained through document reviews, management interviews, and reports such as the State Controller Report and Financial Audits.
Operations Cuyama Transit
During most of the audit period, there was a regular driver as well as a back-up driver. Currently, a single driver, with a Commercial Driver’s License, provides Cuyama Transit service with the District’s Director serving as the back-up driver when required. The District’s Director handles all administrative tasks for the service including reservation taking, fare handling, record-keeping, and invoicing but does not charge the County for these activities. The Director also handles all marketing and customer outreach/service activities in the small New Cuyama community of approximately 700 residents, interacting with many residents face-to-face and providing service information in the community’s monthly newsletter.
In exchange for the efficient operation of the service and recognition of the time spent administering the service at no cost by the Director, the County allows the District Director to utilize the van for District purposes when not in transit service. The District’s Director operates the van when used for other District purposes. Only expenses incurred when providing Cuyama Transit services are billed to the County.
O’Melia Consulting in association with Kelly Hines Consulting

Santa Barbara County Transit TDA Triennial Performance Audit Page 25
The Director has also developed a comprehensive list of Van Rules, which are provided to each passenger. Topics covered in the document include service days and times, fares, pick-up and drop-off guidelines, reservation requirements, and the phone number of the District Director as well as those for both SMAT and SMOOTH for those extending their stay in Santa Maria. The Van Rules request that passengers cancel trips that they are unable to make but does not have a rule for excessive no-shows; nor do they limit how far in advance trip reservations can be made. Neither issue – no-shows nor advance reservations – has posed a problem for the service with respect to constraining capacity of the service. These issues, however, should be closely monitored to ensure that service capacity issues do not emerge, particularly in light of the smaller vehicle now in service.
Los Alamos Shuttle
As the Los Alamos Shuttle service is provided by SMOOTH, there is not a single dedicated driver for the Los Alamos Shuttle. To the extent possible, SMOOTH policy is for cross-training of drivers on all of SMOOTH’s services to maximize the availability of drivers to meet service demands. SMOOTH’s driver training program consists of 20 hours of classroom, 20 hours of behind-the-wheel training, as well as route familiarization training.
SMOOTH drivers hold a Class B license with Passenger Endorsement, Air Brakes, and Transit Certificate. All new drivers receive a 90-day evaluation, and are evaluated annually thereafter. Additionally, SMOOTH carefully tracks the required eight hours of annual re-training required of commercial passenger drivers. Mandatory safety meetings are held monthly.
The County’s Alternative Transportation Manager indicates that driver professionalism, vehicle cleanliness, and on-time performance all met expectations when ride-checks were conducted. A County request to improve the signage for the Los Alamos Shuttle on a SMOOTH vehicle was immediately addressed by SMOOTH.
The agreement between the County and SMOOTH dictates how service promotion is to be carried out. In addition to required bus signage, SMOOTH is responsible for distribution of service flyers to
O’Melia Consulting in association with Kelly Hines Consulting
Santa Barbara County Transit TDA Triennial Performance Audit Page 26
retail establishments, the Post Office, and the Senior Center in Los Alamos as well as publication in the Olga Reed School bulletin. During the audit period, SMOOTH has performed in excess of these requirements, participating in the Los Alamos Days festival by providing a vehicle and making SMOOTH employees available to talk to residents about the service.
The Los Alamos Shuttle service schedule has been changed over the audit period in response to customer input. Service days were changed from Tuesday/Thursday to Tuesday/Saturday and the deviated fixed route service in Santa Maria was introduced.
Vehicle Maintenance Cuyama Transit
Cuyama Transit’s vehicle was purchased in July 2005 on a three-year amortization schedule. The Recreation District is responsible for making van payments which it then bills the County for in the monthly invoice. The District is responsible for all vehicle maintenance and uses outside repair shops for maintenance. The van is fueled in the City of Santa Maria. Vehicle maintenance is scheduled around van in-service requirements. On the rare occasions when in-service maintenance issues arise, the District rents a back-up vehicle to transport passengers.
Los Alamos Shuttle
SMOOTH is required to provide a 14-passenger handicap-accessible vehicle for the Los Alamos Shuttle service. All but two of SMOOTH’s 16 vehicle cutaway fleet meet these capacity requirements. SMOOTH employs a single part-time mechanic for the preventive maintenance and safety inspections scheduled every 45-days. Heavy repair work is performed by outside vendors, with any warranty work on covered vehicles performed by authorized shops. All vehicles are fueled by drivers at the City of Santa Maria City Yard under a Memorandum of Understanding between the City and SMOOTH.
Given the small passenger loads and higher fuel costs associated with the cutaway vehicle, the County has contemplated going to a smaller capacity vehicle to get costs down and meet the required 10% farebox
O’Melia Consulting in association with Kelly Hines Consulting

Santa Barbara County Transit TDA Triennial Performance Audit Page 27
recovery. Whether this vehicle would be purchased by the County or by SMOOTH on behalf of the County has not yet been determined. An alternative option would be to use the Cuyama van for the Los Alamos service and procure a somewhat larger ADA-accessible vehicle for the Cuyama service. If an ADA-accessible vehicle is required for Los Alamos deviated pick-ups, then SMOOTH would have alternative vehicles available for the service.
Administration, Planning, and Budget
The two operating entities – the Cuyama Valley Recreation District and SMOOTH – are responsible for the day-to-day administrative activities including scheduling, reservation-taking, and invoicing. The County’s Alternative Transportation Manager is responsible for the overall administration of the service, including contractor oversight, paying invoices, and annual budget development.
As indicated previously, the SMOOTH agreement is renewed each year, with a new purchase order issued to extend the service. The last Cuyama Transit service agreement dates back to 1997 with annual TDA fund allocations to the Cuyama Valley Recreation District handled through the County’s budget development process.
The County and SMOOTH are currently working on a new farmworker vanpool program to replace the specialized transportation service offered by riterios. This new service will be funded with County TDA revenues plus a Caltrans grant through the Agricultural Worker Transportation Program. The need for such service was identified through the Unmet Needs process though it was not identified as an unmet transit need under SBCAG criteria.
Recent planning activities for Santa Barbara County Transit services include the annual Unmet Transit Needs process, the North County Santa Barbara Transit Plan, and ongoing service monitoring activities. The 2007 Transit Needs Assessment documented requests for an inter-regional service stop in Los Alamos (i.e., Clean Air Express), while the North County Santa Barbara Transit Plan included this as a recommendation for the Los Alamos community. There were no changes recommended for the Los Alamos Shuttle.
O’Melia Consulting in association with Kelly Hines Consulting

Santa Barbara County Transit TDA Triennial Performance Audit Page 28
Neither plan included any recommendations for the Cuyama Transit service, but the 2007 Needs Assessment did include a request to offer an additional day of service on Cuyama Transit. In response, the County agreed to examine the feasibility of adding additional Cuyama Transit service and is now monitoring capacity issues on Cuyama Transit.
Alternatives for expanding service in Cuyama include directing more County TDA revenues currently used for Streets and Roads to Cuyama Transit and increasing fares to fund additional an additional day(s) of service. Fares for Cuyama Transit have not increased since at least 1997 when the last agreement was adopted. At just $6.00 and $4.00 for a 100+ mile round trip, Cuyama Transit is earning just $0.01 per mile of transit service. With a 17% farebox recovery, Cuyama is exceeding its farebox recovery requirement by 70% and has the lowest operating cost per hour in the region so the suggestion to examine its fare structure is offered strictly as a means of funding additional transit service to New Cuyama residents.
With respect to Los Alamos Shuttle, ongoing monitoring activities are focused on the low farebox recovery of the service. Like Cuyama Transit, the Los Alamos Shuttle is essentially a lifeline service that is valued by the community. As previously indicated, the County is working with SMOOTH to explore opportunities to reduce costs and is considering purchasing a smaller capacity vehicle in the FY09 timeframe to reduce maintenance and fuel costs.
As shown in Exhibit 10, Los Alamos Shuttle was operated within regional cost efficiency standards (e.g., cost per hour) but is not meeting cost effectiveness (cost per passenger) and service productivity (passengers per hour) standards. The County reports that service productivity has improved through FY07. Even Cuyama Transit, given the long trip distances, did not meet the regional service productivity standard of three passengers per hour. Cuyama Transit did, however, exceed cost per passenger and cost per hour standards, as well as its farebox recovery requirement.
O’Melia Consulting in association with Kelly Hines Consulting

Santa Barbara County Transit TDA Triennial Performance Audit Page 29
Exhibit 10 – County Transit Performance & Regional Standards Operating Cost per Passenger
Operating Cost per Service Hour
Passengers per Hour
Farebox Recovery Ratio
Standard - Regional Service <$15.00 $80 15 10%Standard - Lifeline Service <$20.00 $50 3 10%Cuyama Transit (FY06) $7.87 $22.60 2.9 17.0%Los Alamos Shuttle (FY06) $22.89 $42.58 1.9 6.4%Standard as indicated in the North Santa Barbara County Transit Plan (10/19/2006), except Farebox Recovery which is TDA requirement.
As previously shown in Exhibit 9 in Section III, the Santa Barbara County Transit system met the 10% farebox recovery requirement for rural services. Improvement in the Los Alamos Shuttle is needed, however, to maintain the required level for County Transit as a whole. Alternatives for consideration by the County of Santa Barbara are offered in Section IV. While Cuyama Transit has exceeded the 10% farebox requirement to date, vehicle capacity constraints and fares that have been kept low for at least a decade will be outpaced by growth in labor, maintenance, and fuel costs resulting in a declining farebox recovery ratio.
O’Melia Consulting in association with Kelly Hines Consulting

Santa Barbara County Transit TDA Triennial Performance Audit Page 30
IV. RECOMMENDATIONS
Three recommendations are offered for consideration by County Transit. This includes two recommendations related to compliance, and one aimed at improving effectiveness and efficiency of operations.
1. Update contractor reporting practices to reflect accurate calculation of required data elements including service hours, service miles, and FTEs and include all contractor-reported data in the State Controller’s Report.
• Findings. During the audit period, several deficiencies in the State Controller Report were identified including missing data in FY04 (only 11 months of Cuyama Transit data and no Los Alamos Shuttle data); no reported FTEs in any reports submitted for the audit period; all service hours data reported as weekday service when the Los Alamos Shuttle operates on Saturday; minor inconsistencies in vehicle service hours, service miles, and passengers as compared to contractor provided information; and, incorrect classification of transit revenues used to fund these services as Local Sales Tax funds instead of Local Transportation Fund (TDA) revenues.
• Suggested Actions. It is recommended that County staff take the following actions to implement this recommendation:
a) Request SMOOTH to report employee pay hours as part of its monthly invoice to the County for the Los Alamos Shuttle and combine these hours with that provided by Cuyama Transit for inclusion in the State Controller’s Report. Cuyama Transit already provides driver pay hours on monthly invoices.
b) Request SMOOTH to revise its data collection processes to exclude deadhead hours and miles when reporting revenue hours and miles to the County.
O’Melia Consulting in association with Kelly Hines Consulting

Santa Barbara County Transit TDA Triennial Performance Audit Page 31
c) Revise the next versions of the operating agreements with both the Cuyama Valley Recreation District and SMOOTH to clarify the definitions of required statistical information:
- Transit Vehicle Miles Traveled – should be revenue vehicle miles traveled (total miles traveled may also be required but revenue vehicle miles is required for TDA reporting purposes).
- Driver hours worked per driver – should separately be revenue hours of service provided and driver pay hours. Driver pay hours will provide the information necessary to calculate FTEs.
- Number of transit system operating hours – should be the same as revenue hours of service and would not be needed if revenue hours are included in the statistical information.
- Number of transit trips and Number of passengers – requested information is fine but should include description of the difference between the two data items. Transit trips should reflect the total number of persons using the service on any day while passengers should be a count of each time an individual boards a vehicle.
d) Segregate the service hours and vehicles in operation data for the Saturday Los Alamos Shuttle service in the State Controller’s Report.
e) Record revenues applied to Cuyama Transit and Los Alamos Shuttle as Local Transportation Fund (or TDA ¼ cent sales tax) instead of Local Sales Tax, which would be used if Measure D revenues were used to fund the services.
f) Include financial and operating data for all services operated during the year even if not operated during the entire year. This will be an issue for the County during the next audit period as it implements the farm worker vanpool program. Vanpool services are a separate mode from fixed route bus and demand response services and statistics should be kept separately.
O’Melia Consulting in association with Kelly Hines Consulting

Santa Barbara County Transit TDA Triennial Performance Audit Page 32
g) Separate Los Alamos Shuttle service and Cuyama Transit service by mode in the State Controller’s Report, reporting Los Alamos Shuttle as fixed-route service and Cuyama Transit as demand response. Similarly, the farm worker vanpool program should be reported as “Other” when the service is implemented.
h) Designate a single person to be responsible for the final review of the State Controller’s Report before submittal to ensure completeness, accuracy, and consistency with other reports such as contractor-provided information and financial audits.
• Expected Results. Implementation of this recommendation will bring Santa Barbara County Transit into compliance with TDA data definition (PUC 99247) and fiscal (PUC 99268) requirements.
2. Investigate the opportunity to set up agreement with SMOOTH (or SMAT) to provide a back-up vehicle to Cuyama Transit should their vehicle go out of service unexpectedly.
• Findings. The prior audit included a recommendation that Cuyama Transit acquire a back-up vehicle. However, given the small, community-oriented nature of the service, acquiring a back-up van would be an inefficient use of resources as the van would sit unused in all but extreme circumstances. The current approach of using a rental vehicle for planned vehicle maintenance or even to provide in-service relief for breakdowns has not posed a problem to date, but could in the future if the appropriately sized vehicle is unavailable.
• Suggested Actions. It is recommended that the County and Cuyama Transit develop an agreement with Santa Maria Area Transit (SMAT) or SMOOTH that would provide Cuyama Transit with a back-up vehicle in the event of a roadside breakdown or other unplanned service disruption. This is provided as an option to acquiring a back-up vehicle directly that would go largely unused. Utilizing a vehicle from another transit operator, as opposed to a public rental, addresses the issues of vehicle accessibility when the back-up vehicle is required.
O’Melia Consulting in association with Kelly Hines Consulting

Santa Barbara County Transit TDA Triennial Performance Audit Page 33
• Expected Results. Implementation of this recommendation would allow Cuyama Transit to ensure service continuity when the regular van cannot be put into service on a regularly scheduled trip.
3. The County should take measures to improve the farebox recovery ratio of the Los Alamos Shuttle.
Findings: Over the audit period, the Los Alamos Shuttle was not subject to farebox recovery requirements as it was a new service exempting it from the requirement. Under TDA law, new services are exempt from the farebox recovery requirement until two years after the end of the fiscal year in which the service was put into operation. As of June 30, 2006 – the end of this audit period – Los Alamos Shuttle became subject to a 10% farebox recovery requirement. Los Alamos Transit achieved a farebox recovery of just 6.4% in FY06.
Suggested Actions. There are four options for meeting farebox recovery requirements:
• Increase farebox revenue through increased ridership • Increase farebox revenue with higher fares • Reduce costs • Increase local contributions or other operating revenue.
Some options are more viable than others. At $1.50 for a one-way trip of approximately 20 miles, the service is a much greater value than MTD, COLT, or SMAT which charges fares of $1.25, $1.00, and $1.25 for average trip distances of 5.5, three, and six miles, respectively. However, raising fares will result in some loss of ridership. With the current farebox recovery at 64% of its requirement, fares would have to be increased by 56% (with no loss in ridership) or ridership would have to grow by 56% to meet the farebox recovery requirement.
With the County’s Measure D revenues allocated elsewhere and the renewal of Measure D still an uncertainty, alternative revenue sources to “buy-down” fare revenues is not a viable solution.
Perhaps the most viable solution would be a reduction in the operating costs of the service. The County has indicated a desire to acquire a smaller handicap-accessible vehicle to replace the cut-
O’Melia Consulting in association with Kelly Hines Consulting

Santa Barbara County Transit TDA Triennial Performance Audit Page 34
O’Melia Consulting in association with Kelly Hines Consulting
away vehicle provided by SMOOTH currently. A smaller vehicle would help to reduce operating costs largely through fuel savings. Should this option be implemented, a back-up vehicle agreement like that recommended for Cuyama Transit in recommendation two would be advisable.
Another option might be to duplicate the arrangement under which the Cuyama Transit service is offered. The Los Alamos Community Services District could function like the Cuyama Recreation District, hiring a van driver to make twice daily round trips to Santa Maria. At a minimum, the County and SMOOTH should explore the possibility of leaving the vehicle used for the Los Alamos Shuttle parked in Los Alamos which would reduce the deadhead incurred in driving a vehicle to Los Alamos from Santa Maria each morning and again at the end of the day. A smaller capacity vehicle purchased exclusively for the Los Alamos Shuttle service would make this a more viable option. Or alternatively, using the smaller Cuyama vehicle for the Los Alamos service and procuring a larger vehicle for Cuyama may be considered.
Finally, the County should request that SMOOTH identify any vehicle lease costs that may be included in SMOOTH’s actual operating cost billed to the County each month. Such costs are excludable from operating costs for purposes of calculating the farebox recovery ratio.
• Expected Results. Implementation of this recommendation would assist the County in achieving compliance with the 10% farebox recovery requirement County Transit services (PUC 99268) and for the Los Alamos Shuttle service to be continued.

EASY LIFT TDA TRIENNIAL PERFORMANCE
AUDIT FOR FY 2004-2006 Fiscal Years Ending June 30th
Prepared by
In Association With
OCTOBER 22, 2007

Easy Lift TDA Triennial Performance Audit Page i
TABLE OF CONTENTS
EXECUTIVE SUMMARY.................................................................... 1
Purpose of Audit.........................................................................................1
Findings......................................................................................................1
Recommendations .....................................................................................3
I. INTRODUCTION....................................................................... 5
Performance Audit Objectives and Approach.............................................5
System Overview .......................................................................................6
II. COMPLIANCE REVIEW......................................................... 10
Regulatory Requirements.........................................................................10
Progress To Implement Prior Audit Recommendations ...........................12
Data Verification.......................................................................................15
TDA Performance Indicator Trends..........................................................18
III. FUNCTIONAL AREA PERFORMANCE RESULTS............... 21
Transportation Operations........................................................................21
Vehicle Maintenance................................................................................25
Budget and Planning................................................................................25
IV. RECOMMENDATIONS........................................................... 28
O’Melia Consulting in association with Kelly Hines Consulting

Easy Lift TDA Triennial Performance Audit Page ii
LIST OF EXHIBITS
Exhibit 1 – Performance Audit Sources ................................................................6
Exhibit 2 – Organization Chart ..............................................................................7
Exhibit 3 – Regulatory Compliance Matrix ..........................................................10
Exhibit 4 – Progress To Implement Prior Audit Recommendations.....................13
Exhibit 5 – Verified Data Elements for TDA Performance Indicators ..................16
Exhibit 6 – Financial Data Consistency Review ..................................................17
Exhibit 7 – Passenger Data Consistency Review ...............................................17
Exhibit 8 – TDA Performance Indicators .............................................................19
Exhibit 9 – Operating Costs ................................................................................21
Exhibit 10 – Santa Barbara County Transit Fares...............................................24
Exhibit 11 – Easy Lift Vehicle Inventory ..............................................................25
Exhibit 12 – Easy Lift Revenues by Source, FY06 Budget ...............................26
O’Melia Consulting in association with Kelly Hines Consulting

Easy Lift TDA Triennial Performance Audit Page 1
EXECUTIVE SUMMARY
Purpose of Audit
As the Regional Transportation Planning Agency (RTPA) for Santa Barbara County, the Santa Barbara County Association of Governments (SBCAG) is required by the Public Utilities Code (PUC) Sections 99246 and 99248 to contract for a third party performance audit of itself and each of the transit operators to which Transportation Development Act (TDA) funds are allocated. These audits are to be conducted in accordance with the California Department of Transportation, Performance Audit Guidebook for Transit Operators and Regional Transportation Entities. Performance audits are required to:
• Determine compliance with regulatory requirements
• Assess progress to implement prior performance audit recommendations
• Verify performance indicators and validate basic data used to calculate indicators
• Evaluate the effectiveness and efficiency of agency functions.
This performance audit of Easy Lift is for Fiscal Years 2004, 2005 and 2006 -- the period of time beginning July 1, 2003 and ending June 30, 2006.
Findings
• Easy Lift is the Consolidated Transportation Services Agency (CTSA) for the South County region of Santa Barbara County. As the CTSA, Easy Lift is responsible for the coordination of social service transportation (e.g., services for seniors, the disabled, the young, and low-income individuals) in the South County region. In addition, Easy Lift is the ADA paratransit service provider for the Santa Barbara Metropolitan Transportation District.
O’Melia Consulting in association with Kelly Hines Consulting

Easy Lift TDA Triennial Performance Audit Page 2
• During the audit period and continuing through the first half of FY07, Easy Lift acquired thirteen new vehicles, replacing 72% of its fleet during that time. Easy Lift’s emphasis in its vehicle replacement program is to acquire smaller mini-van type vehicles to maximize fuel economy.
• Easy Lift has also streamlined its administrative activities over the audit period. Three administrative positions were eliminated, leaving just an Executive Director and Accounting and Human Resources Administrator. All other positions are directly involved in the day-to-day passenger transportation activities including drivers, reservation takers, field supervisor/trainer, and the Operations Manager.
• Easy Lift has continued to struggle with the location of its administrative and operations facility, which is on the northern-most end of its service area. In addition to the difficulties the remote location creates for passenger scheduling and service productivity, it increases costs as well. For every three hours of productive service time, an additional hour was spent in getting the vehicle to/from passenger pick-up/drop-off locations.
• Easy Lift was in compliance with all TDA regulations for all three years of the audit period.
• Easy Lift fully implemented five of nine prior performance audit recommendations. Partial implementation was achieved for two other recommendations. A finding of partial implementation was made for the recommendation to prepare consistent and clear performance reports because, while Easy Lift has more carefully tracked and reported ridership for its CTSA, ADA, and charter passenger trips, inconsistencies in reported data were still found in published reports. The recommendation to continue efforts to locate a new administrative facility has been partially implemented as possibilities for relocation have been explored but Easy Lift’s location has not changed. Findings of “not implemented” were made for two recommendations related to the correct calculation of employee full-time equivalents (FTEs) and policy changes to improve service productivity.
O’Melia Consulting in association with Kelly Hines Consulting

Easy Lift TDA Triennial Performance Audit Page 3
• While Easy Lift improved its data collection processes during the audit period, most notably tracking ridership separately for the various components of its service, there continues to be inconsistencies in the data reported to external agencies for the CTSA and charter elements of the operation.
• Easy Lift’s cost per hour fell by 26.6% over the audit period as vehicle service hours increased by 40% while costs increased by just 2.8%. Easy Lift changed its vehicle maintenance provider during the audit period. Together with a shift to smaller mini-van vehicles, Easy Lift’s maintenance costs fell by 35% during the audit period. Other factors leading to reductions in costs include negotiation out of two service contracts that were costing Easy Lift more than it was receiving in revenue and elimination of three administrative staff positions.
• Service productivity declined over the audit period, as 40% more service hours were required to serve 2% fewer passengers. Several factors are contributing to this performance include the remote location of the Easy Lift operations facility, the continued policy of zero trip denials, and the shift to smaller vehicles.
• Measure D revenues account for approximately 28% of Easy Lift’s annual revenues, with another 52% coming from TDA and MTD (for complementary ADA service). As evidenced by the growth in demand in FY06, Easy Lift is already feeling the impact of the growth in the County’s elderly population. If Measure D is not renewed, the potential loss of Measure D funding will place further financial pressure on both Easy Lift and MTD to meet the growing demand for ADA paratransit service in the County.
Recommendations
Four recommendations are offered for consideration by Easy Lift.
1. Report FTEs rather than employee headcount in State Controller Reports, and check published reports for accuracy and consistency with other reports both internal and external.
O’Melia Consulting in association with Kelly Hines Consulting

Easy Lift TDA Triennial Performance Audit Page 4
2. Easy Lift should expand its customer satisfaction survey to include vendors and incorporate findings into a CTSA Operations Plan (see Recommendation three).
3. Easy Lift should assess the operational and financial impacts on Easy Lift services – complementary ADA paratransit, CTSA services, and charter/contract services – in light of increasing demand for complementary ADA paratransit and the potential loss of Measure D revenues.
4. Easy Lift should include findings of compliance as required by CAC 6667 as part of annual financial and compliance audit required by PUC Section 99245.
O’Melia Consulting in association with Kelly Hines Consulting

Easy Lift TDA Triennial Performance Audit Page 5
I. INTRODUCTION
Performance Audit Objectives and Approach
As the RTPA for Santa Barbara County, the Santa Barbara County Association of Governments (SBCAG) is required by the Public Utilities Code (PUC) Sections 99246 and 99248 to contract for a third party performance audit of itself and each of the transit operators to which Transportation Development Act (TDA) funds are allocated. These audits are to be conducted in accordance with the California Department of Transportation, Performance Audit Guidebook for Transit Operators and Regional Transportation Entities. Performance audits are required to:
• Determine compliance with regulatory requirements
• Assess progress to implement prior performance audit recommendations
• Verify performance indicators and validate basic data used to calculate indicators
• Evaluate the effectiveness and efficiency of agency functions.
This performance audit of Easy Lift is for Fiscal Years 2004, 2005 and 2006 -- the period of time beginning July 1, 2003 and ending June 30, 2006.
While the performance audit is being conducted in response to State requirements, such audits can and should be constructive and useful to governing boards, SBCAG and transit operator management.
It is the Auditor’s responsibility to provide objective and balanced reporting of results. This is important because very few agencies are all good or all bad. It is the auditor's responsibility to conduct thorough and accurate analyses and objectively report performance findings. Significant accomplishments and positive performance trends are discussed as well as opportunities for improvement.
O’Melia Consulting in association with Kelly Hines Consulting

Easy Lift TDA Triennial Performance Audit Page 6
The methodology for this audit include interviews with key staff and management involved in the provision of transit services, a site visit for review of operations and data collection practices, review of operational and financial data, and review of relevant documents. Highlights of this review are presented below in Exhibit 1.
Exhibit 1 – Performance Audit Sources
Interviews – Name, Title and Agency
Ernesto Paredes, Executive Director, Easy Lift Bob Westwick, Former Executive Director and Current Board Member, Easy Lift
Polly Rice, Accounting and Human Resources Manager, Easy Lift Sherrie Fisher, General Manager, Santa Barbara MTD
Steven Maas, Manager of Strategic Planning & Compliance, SBMTD
Site Visit(s)
Monday, May 14, 2007
Background Materials Reviewed
Comprehensive Annual Financial Reports, Fiscal Years 2004-2006 Annual Report of Financial Transactions of Transit Operations -- State Controllers
Annual Reports, Fiscal Years 2004-2006 TDA Triennial Performance Audit Report For Fiscal Years Ending June 30, 2003
Annual TDA and STA Claim Forms, Fiscal Years 2004-2006 National Transit Database Reports, Fiscal Years 2004-2006
California Highway Patrol Pull-Notice and Terminal Inspection Certifications Organizational Chart and Annual Budgets, Fiscal Years 2004-2006
Driver’s Stop Sheets Public Information – Website, Rider’s Guide
System Overview Organization & Policy Decisions
Easy Lift is the Consolidated Transportation Services Agency (CTSA) for the South County region. As the CTSA, Easy Lift is responsible for coordination of social service transportation (e.g., services for seniors, the disabled, the young, and low-income individuals). Through its dial-a-ride program, Easy Lift also meets the ADA paratransit service requirement for the Santa Barbara Metropolitan Transit District (MTD).
O’Melia Consulting in association with Kelly Hines Consulting

Easy Lift TDA Triennial Performance Audit Page 7
Easy Lift policy direction is provided by a Board of Directors, which can have a membership of from five to eighteen Directors. During the audit period, the Board was made up of seven members and now includes the former Easy Lift Executive Director. The Board meets once a month. Board members are recruited by other Board members. Current recruitment efforts are focused on finding a Director with fund-raising experience.
Management & Staffing
Easy Lift’s Executive Director reports directly to the Board. Supporting the Executive Director is an Accounting and Human Resources Manager and the Operations Manager to whom all other Easy Lift employees from drivers to trainers to dispatch personnel report. Easy Lift’s management organization is shown in Exhibit 2.
Exhibit 2 – Organization Chart Board of
Directors
Operations ManagerAccounting & Human Resources Manager
Executive Director
Board of Directors
Operations ManagerAccounting & Human Resources Manager
Executive Director
The current management structure at Easy Lift is very different from that in place during the last audit period. Three administrative positions were eliminated during the audit period – the Assistant Executive Director, the Information Technology position, and the Reporting/Administrative Assistant. All other Easy Lift positions report directly or indirectly to the Operations Manager and include drivers, reservation takers, the trainer/field supervisor, and the transportation coordinator.
CTSA Service Characteristics
Easy Lift’s service area runs along the Santa Barbara County coast from Carpinteria to North Goleta, covering a service area of 52 square
O’Melia Consulting in association with Kelly Hines Consulting

Easy Lift TDA Triennial Performance Audit Page 8
miles and a population of nearly 209,000 in 2005 according to the SBCAG Regional Growth Forecast. As the CTSA, Easy Lift directly provided or facilitated transportation services through a number of various services and agreements during the audit period including:
• Dial-a-Ride – Paratransit service provided to ADA-eligible riders. This service meets the ADA paratransit requirement for the MTD fixed-route system. The ADA fare is $2.00 and was last increased in FY01. MTD fares were increased from $1.00 to $1.25 in FY04, so an increase in Easy Lift fares to $2.50 for the dial-a-ride service is an option.
• Contract and Charter Services – Easy Lift provides group transportation services through its contract and charter services. Contract services, recurring service billed hourly, provided during the audit period included the Tri-County Regional Center dial-a-ride service for Center clients and the County Bowl shuttle service. Easy Lift negotiated out of the Tri-County Regional Center service during the audit period due to the low hourly rate charged for the service and the inability of the Center to continue funding the service. Additional charter services are provided as needed, and as resources are available, for group (i.e., two or more passengers) trips during evening and weekend hours.
• Carpinteria Area Rapid Transit (CART) – This general public dial-a-ride service, provided under agreement with the City of Carpinteria, was replaced by a fixed route electric shuttle operated by MTD in the first year of the audit period.
• Loaner Vehicle Program – Easy Lift loans vehicles free of charge to other governmental entities that want to provide transportation services to their clients but cannot afford to maintain their own vehicles. Easy Lift pays for maintenance and fuel costs.
• Mobility Training – Easy Lift provides training to seniors and the physically challenged on how to use the MTD fixed route system. Training includes how to read schedules, identify stops, and multiple ride-alongs with a mobility trainer to get the customer comfortable with using the MTD service.
O’Melia Consulting in association with Kelly Hines Consulting

Easy Lift TDA Triennial Performance Audit Page 9
• Project Safe Streets – Easy Lift provides driver training to other governmental agencies and non-profits organizations that have their own vehicles and drivers but no in-house training capabilities.
• Radio Dispatch Service – Easy Lift provides radio dispatch services from its operations facility, dispatching nearly 40 vans daily in addition to their own vehicles. Easy Lift does charge a nominal monthly fee for the service.
An assessment of Easy Lift revenue sources and corresponding service offerings is provided in Section III of this report.
Achievements and Challenges During the Audit Review Period
During the performance audit review period (i.e., July 1, 2003 and June 30, 2006), Easy Lift has successfully implemented a number of changes with a positive impact on performance. Easy Lift has also been faced with a number of challenges. These are highlighted below.
• Easy Lift, through changing vehicle maintenance providers and acquiring smaller vehicle through its vehicle replacement program, achieved a 35% decline in vehicle maintenance costs during the audit period.
• Easy Lift negotiated out of two service contracts that were costing the agency more than was being received in revenue and drawing away resources (vehicles and drivers) from other service elements. This shift in resources has allowed Easy Lift to maintain its zero trip denial policy. However, the growing demand for trips and the declining service productivity of the system has recently caused Easy Lift management to re-evaluate this policy.
• As part of its administrative staff reduction effort, Easy Lift eliminated its Programmer/Information Technology position. Easy Lift developed its own scheduling software, Sched Pro, in the mid 1990’s and sold license agreements to a dozen plus agencies throughout the State. Revenue generation from the licensing fees and software support ended in FY05. Easy Lift now contracts for as-needed software support.
O’Melia Consulting in association with Kelly Hines Consulting

Easy Lift TDA Triennial Performance Audit Page 10
II. COMPLIANCE REVIEW
Regulatory Requirements
Easy Lift is in compliance with all regulatory requirements, as shown below in Exhibit 3.
Exhibit 3 – Regulatory Compliance Matrix
Regulatory Code Compliance Requirement Compliance
Finding Verification Information
PUC Section 99243
Submit an annual report to the State Controller based upon the Uniform System of Accounts and Records established by the State Controller. Due dates varied during the audit period: FY04: 11/24/04 (paper) or 12/14/04 (electronic), FY05: 9/28/05 (paper) or 10/18/05 (electronic) FY06: 10/12/06 (paper) or 11/1/06 (electronic)
Full Compliance
Report Submission Dates: FY 2004: 10/19/04 FY 2005: 10/15/05 FY 2006: 10/30/06
PUC Section 99245
Submit annual fiscal and compliance audit to State Controller within 180 days of year end, or has received a 90-day extension allowed by law.
Full Compliance
Auditor Report Dates: FY 2004: 8/4/04 FY 2005: 9/14/05 FY 2006: 9/26/06
PUC Section 99251
Submit CHP certification of compliance with Pull Notice within 13 months period prior to TDA claim
Full Compliance
CHP Certification Dates: FY 2004 Claim: 2/26/03 FY 2005 Claim: 2/9/04 FY 2006 Claim: 2/18/05
PUC Section 99261
Submit TDA Claim in compliance with rules and regulations adopted by RTPE
Full Compliance
TDA Claims were submitted to and funds approved by SBCAG in all three years.
O’Melia Consulting in association with Kelly Hines Consulting

Easy Lift TDA Triennial Performance Audit Page 11
Regulatory Code Compliance Requirement Compliance
Finding Verification Information
PUC Section 99264
The operator does not routinely staff public transportation vehicles designed to be operated by one person with two or more persons
Full Compliance
Review of staffing assignments indicates that one person is responsible for vehicle operations.
PUC Section 99266
Operating budget has not increased by more than 15% over preceding year unless reasonable justification for the change has been provided
Full Compliance
% Change Per State Controller Report FY 2003 to 2004: 7% FY 2004 to 2005: -4% FY 2005 to 2006: 10%
PUC Sections 99268.2-5 & .12
Operator has maintained a ratio of revenues to operating costs equal to 20% for urban areas and 10% for rural areas and specialized services or 15% in areas with a population less than 500,000 if determined by RTPE
Full Compliance
Farebox Recovery Ratio Per Financial Audits: FY 2004: 45.7% FY 2005: 41.9% FY 2006: 33.4% Figures do not include Local Subsidies & Auxiliary Revenues.
PUC Section 99268
Operator TDA funding is no more than 50% of operating, maintenance, capital, and debt service requirements after federal grants are deducted
Not applicable
as Easy Lift met Farebox
Recovery Ratio
TDA Funds As % of Total Annual Costs (less Federal Grants) Per Financial Audit:FY 2004: FY 2005: FY 2006:
PUC Section 99271
The retirement system is fully funded, or the Operator is implementing a plan that will fully fund the retirement system within 40 years.
Full Compliance
Easy Lift provides employees with the opportunity to participate in a 403(b) plan, which does not include an employer contribution.
PUC Section 99314.5
If the Operator receives STA funds, the Operator is not precluded by contract from employing part-time drivers or from contracting with common carriers
Full Compliance
Easy Lift is not precluded from contracting with common carriers and employs part-time drivers.
O’Melia Consulting in association with Kelly Hines Consulting
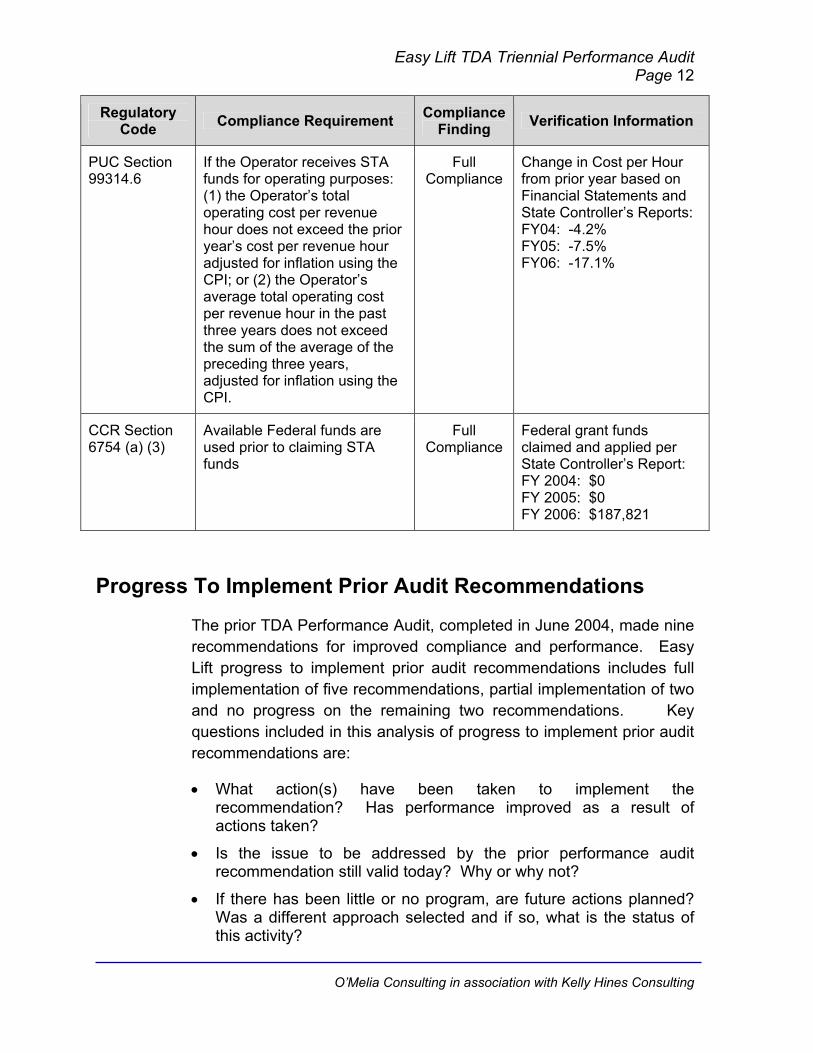
Easy Lift TDA Triennial Performance Audit Page 12
Regulatory Code Compliance Requirement Compliance
Finding Verification Information
PUC Section 99314.6
If the Operator receives STA funds for operating purposes: (1) the Operator’s total operating cost per revenue hour does not exceed the prior year’s cost per revenue hour adjusted for inflation using the CPI; or (2) the Operator’s average total operating cost per revenue hour in the past three years does not exceed the sum of the average of the preceding three years, adjusted for inflation using the CPI.
Full Compliance
Change in Cost per Hour from prior year based on Financial Statements and State Controller’s Reports: FY04: -4.2% FY05: -7.5% FY06: -17.1%
CCR Section 6754 (a) (3)
Available Federal funds are used prior to claiming STA funds
Full Compliance
Federal grant funds claimed and applied per State Controller’s Report: FY 2004: $0 FY 2005: $0 FY 2006: $187,821
Progress To Implement Prior Audit Recommendations
The prior TDA Performance Audit, completed in June 2004, made nine recommendations for improved compliance and performance. Easy Lift progress to implement prior audit recommendations includes full implementation of five recommendations, partial implementation of two and no progress on the remaining two recommendations. Key questions included in this analysis of progress to implement prior audit recommendations are:
• What action(s) have been taken to implement the recommendation? Has performance improved as a result of actions taken?
• Is the issue to be addressed by the prior performance audit recommendation still valid today? Why or why not?
• If there has been little or no program, are future actions planned? Was a different approach selected and if so, what is the status of this activity?
O’Melia Consulting in association with Kelly Hines Consulting

Easy Lift TDA Triennial Performance Audit Page 13
Exhibit 4 summarizes progress relative to prior performance audit recommendations. Findings of “Implemented, Partially Implemented, or Not Implemented” are made for each recommendation.
Exhibit 4 – Progress To Implement Prior Performance Audit Recommendations
Prior Audit Recommendations
Prior Audit Findings Leading to
Recommendation Compliance
Finding Implementing Actions &
Results
1. Easy Lift should consider possible policy and operational changes to enhance the productivity of its service.
During the last audit period, Easy Lift addressed the elimination of trip denials through securing additional funding and increasing driver hours. Productivity enhancements through improved scheduling and dispatching methods were recommended as another way to meet increased demand.
Not Implemented
Easy Lift has continued to maintain a zero denial policy but recognizes that it is becoming increasingly difficult to do so. Productivity has declined over the audit period from 3.3 to 2.3 passengers per hour due to increasing requests for trips and the remote location of the Easy Lift operations facility.
2. Prepare consistent and clear performance reports.
Inconsistency in ridership data between internal reports and State Controller’s Reports was attributed to a change in reporting practices and a decline in accuracy of data reporting as volunteers did the data entry. It was recommended that Easy Lift count all ridership, but track the data by source – CTSA, Dial-a-Ride, and possibly charter service.
Partially Implemented
Easy Lift now tracks data by CTSA, ADA, and Charter (e.g., County Bowl) trips. However, discrepancies between internal reports and data included in State Controller’s reports still exist.
3. Review County Bowl Service.
Easy Lift recorded in its ridership data general public transportation provided as part of the County Service. It was recommended that general public transportation be recorded and tracked separately.
Implemented Easy Lift now tracks data by CTSA, ADA, and County Bowl trips. ADA trips provided through the County Bowl service are counted as CTSA trips rather than County Bowl trips.
O’Melia Consulting in association with Kelly Hines Consulting

Easy Lift TDA Triennial Performance Audit Page 14
Prior Audit Recommendations
Prior Audit Findings Leading to
Recommendation Compliance
Finding Implementing Actions &
Results
4. In future reports to the State Controller, submit all data requested.
During the last audit period, passenger revenues was not reported separately by type – passenger fares, special transit fares, and charter services. Additionally, service hours were not reported for Saturdays and Sundays.
Implemented Passenger revenues were reported by type – passenger fares, special transit fares, and charter revenues – and service hours were reported for Saturday and Sunday service in all three State Controller’s Reports submitted for the audit period.
5. In future reports to the State Controller, correctly calculate FTE.
Easy Lift used 2,080 rather than 2,000 hours as the standard for FTE calculation.
Not Implemented
Easy Lift reported total employees rather than FTEs.
6. Continue efforts to locate a new administrative and operations facility.
Easy Lift’s location in Goleta was outside its core service area and resulted in additional unproductive deadhead.
Partially Implemented
Easy Lift has continued efforts to find a new operations and administrative facility. Efforts include consulting with two commercial real estate brokers and discussing the possibility of co-locating several Easy Lift vehicles at MTD’s facility.
7. Seek to moderate the increasing cost of vehicle maintenance.
Maintenance costs grew by 35% during the last audit period. It was recommended that Easy Lift address this issue through vehicle replacement and review of its maintenance agreement with a private garage.
Implemented Easy Lift changed vehicle maintenance providers, using a shop located less than a mile from their current location (the prior shop was more distant, located closer to Easy Lift’s old facility). Over the audit period, vehicle maintenance costs declined 35% over this audit period.
8. Track preventable accident rates and establish a performance standard.
Accidents were not tracked separately by preventable and non-preventable during the last audit period.
Implemented Easy Lift produces incident reports for all accidents including an assessment of causal factors for determination of preventable versus non-preventable.
O’Melia Consulting in association with Kelly Hines Consulting

Easy Lift TDA Triennial Performance Audit Page 15
Prior Audit Recommendations
Prior Audit Findings Leading to
Recommendation Compliance
Finding Implementing Actions &
Results
9. Discuss an enhanced ADA eligibility process with MTD.
Easy Lift’s ADA certification process was found to be permissive, resulting in individuals being registered for the service who likely weren’t qualified. It was recommended that Easy Lift consult with MTD to address the eligibility criteria and certification process for the service.
Implemented Over the audit period, the ADA screening process was changed to require a more thorough written application instead of an over-the-phone application. Easy Lift performs the initial intake and provides a recommendation about eligibility, which is forwarded to MTD’s ADA Committee for final approval.
Data Verification
Included in the review of transit operators is the regulatory requirement (i.e., PUC Section 99247) that performance audits include a verification of five data items including:
• Operating Cost. The total cost of running a transit operation, exclusive of capital expenditures, depreciation, direct costs of providing charter service and vehicle lease costs.
• Total Passengers. The total number of unlinked trips; all passenger boardings whether revenue producing or not.
• Total Vehicle Service Hours. The total annual number of hours that vehicles are in revenue service. Excluded is travel to and from storage facilities and other deadhead travel. Also referred to as Revenue Hours.
• Total Vehicle Service Miles. The total annual number of miles that vehicles are in revenue service. Miles traveled to and from storage facilities and other deadhead travel are excluded. Also referred to as Revenue Miles.
• Employee Equivalents. The total actual regular and overtime employee pay hours divided by 2,000 hours. Contract employees are included, but not volunteers. Also referred to as FTEs.
O’Melia Consulting in association with Kelly Hines Consulting

Easy Lift TDA Triennial Performance Audit Page 16
Easy Lift is in full compliance with four of five, and in non-compliance with one of five data definitions and methods of data collection as summarized in Exhibit 5 and described below.
Exhibit 5 – Verified Data Elements for TDA Performance Indicators
Data Items & Mode Fiscal Year 2004 Fiscal Year
2005 Fiscal Year
2006
Operating Costs
Full Compliance: Easy lift correctly excludes capital expenditures and depreciation from operating costs. Charter services are included in total operating costs as they are a routine part of Easy Lift’s operation as a coordinated transportation service provider.
Full Compliance: Easy lift correctly excludes capital expenditures and depreciation from operating costs. Charter services are included in total operating costs as they are a routine part of Easy Lift’s operation as a coordinated transportation service provider.
Full Compliance: Easy lift correctly excludes capital expenditures and depreciation from operating costs. Charter services are included in total operating costs as they are a routine part of Easy Lift’s operation as a coordinated transportation service provider.
Total Passengers
Full Compliance: Passengers reflect a 100% headcount of passenger boardings.
Full Compliance: Passengers reflect a 100% headcount of passenger boardings.
Full Compliance: Passengers reflect a 100% headcount of passenger boardings.
Total Vehicle Service Hours
Full Compliance: Easy Lift tracks revenue hours from the first passenger pick up to the last passenger drop off, excluding driver breaks.
Full Compliance: Easy Lift tracks revenue hours from the first passenger pick up to the last passenger drop off, excluding driver breaks.
Full Compliance: Easy Lift tracks revenue hours from the first passenger pick up to the last passenger drop off, excluding driver breaks.
Total Vehicle Service Miles
Full Compliance: Easy Lift tracks revenue miles from the first passenger pick up to the last passenger drop off, excluding driver breaks.
Full Compliance: Easy Lift tracks revenue miles from the first passenger pick up to the last passenger drop off, excluding driver breaks.
Full Compliance: Easy Lift tracks revenue miles from the first passenger pick up to the last passenger drop off, excluding driver breaks.
Employee Equivalents
Non-Compliance: Easy Lift provides an employee headcount rather than FTEs in State Controller’s reports.
Non-Compliance: Easy Lift provides an employee headcount rather than FTEs in State Controller’s reports.
Non-Compliance: Easy Lift provides an employee headcount rather than FTEs in State Controller’s reports.
O’Melia Consulting in association with Kelly Hines Consulting

Easy Lift TDA Triennial Performance Audit Page 17
The process for compiling and/or calculating the five required data elements is as follows:
• Operating Costs – Easy Lift separately tracks costs associated with the program services (transportation activities), management, and fundraising elements of its operation, as well as by its ADA complementary services provided on behalf of MTD. Depreciation and capital expenditures are excluded. Easy Lift owns all its vehicles so there are no vehicle lease costs. Charter services are included in Easy Lift’s operating costs as these services are part of routine transit system operation for Easy Lift as the CTSA. Exhibit 6 compares financial data elements – operating cost and passenger revenues – as reported in State Controller’s Reports and Financial Statements.
Exhibit 6 – Financial Data Consistency Review
FY 2004 FY 2005 FY 2006Financial Audit 1,384,136$ 1,206,727$ 1,429,513$ State Controller's Report 1,384,137$ 1,206,726$ 1,407,830$ Financial Audit 633,035$ 505,642$ 477,214$ State Controller's Report 633,036$ 505,642$ 477,214$
Operating Costs
Passenger Revenues
TDA Statistic Audit Review PeriodSource
Data was reported consistently over the audit period with the exception of a operating costs in FY06 in which the Financial Audit reports approximately $22,000 more in costs than the State Controller’s report.
• Passengers – 100% headcount of passenger boardings. Beginning in FY06, Easy Lift began to track ridership separately for CTSA and charter services which were previously reported together as CTSA trips. Prior to FY06, passengers were recorded as either ADA complementary trips (under the MTD requirement for services) or CTSA trips. Exhibit 7 provides a comparison of ridership data between internal reports and data submitted to external agencies.
Exhibit 7 – Passenger Data Consistency Review
FY 2004 FY 2005 FY 2006National Transit Database (ADA only) 21,440 24,820 38,689 Easy Lift Internal Reports - ADA 21,440 24,820 38,740 Easy Lift Internal Reports - CTSA 35,586 23,274 9,032 Easy Lift Internal Reports - Charter -- -- 10,622 Esay Lift Internal Reports - Total 57,026 48,094 58,394 State Controller's Report 58,075 53,034 60,206
Passengers
TDA Statistic Source Audit Review Period
O’Melia Consulting in association with Kelly Hines Consulting

Easy Lift TDA Triennial Performance Audit Page 18
Only ADA complementary service provided on behalf of MTD is reported in the National Transit Database. Data reported in NTD is largely consistent with internal performance reports. There are larger discrepancies between internal reports and State Controller’s Reports – both of which count/report all Easy Lift ridership – ADA, CTSA, and Charter services. The biggest discrepancy occurred in FY05 when ridership reported in the State Controller’s Report was 10% higher than internal reports.
• Vehicle Service Hours – Easy Lift correctly reports vehicle service hours as time from the first passenger pick-up to the last passenger drop-off. The information is recorded for each vehicle each day. Each trip sheet records the driver’s sign in and sign out times as well as the in-service minutes between first pick-up and last drop-off. Out of service minutes (i.e., driver breaks) are also recorded. This trip sheet is compared to the Driver’s Stop Sheet, produced by Easy Lift’s scheduling software, Sched Pro, which includes the scheduled pick-ups and drop-offs for the day. The arrival and departure times for each scheduled pick are noted on the Stop Sheet, as are cancellations and no-shows.
• Vehicle Service Miles – Same as vehicle service hours. Daily trip sheets summarize detailed trip activity recorded on the Driver’s Stop Sheet.
• Employee Full-Time Equivalents – Employee counts in the State Controller’s Reports reflect employee headcounts rather than paid work hours divided by 2,000.
TDA Performance Indicator Trends
California Public Utilities Code Section 99246 (d) states that performance audits of transit operators shall include a verification of performance indicators defined in the Public Utilities Code Section 99247. These performance indicators include:
• Operating Cost Per Vehicle Service Hour • Operating Cost Per Passenger • Passengers Per Vehicle Service Hour • Passengers Per Vehicle Service Mile • Vehicle Service Hours Per Employee.
O’Melia Consulting in association with Kelly Hines Consulting

Easy Lift TDA Triennial Performance Audit Page 19
Trends for these five TDA performance indicators are presented below by mode (i.e., motor bus and/or demand response). Performance indictor trends involving costs are also compared to the Consumer Price Index -- Urban Wage Earners and Clerical Workers for the Los Angeles-Riverside-Orange County area.
TDA Performance Indicator Trends
Exhibit 8 presents TDA performance indicators for Easy Lift.
Exhibit 8 – TDA Performance Indicators
FY 2004 FY 2005 FY 2006Operating Costs $ 1,390,448 $ 1,384,136 $ 1,206,727 $ 1,429,513 2.8%Passengers 61,467 58,075 53,034 60,206 -2.1%Vehicle Service Hours 18,691 19,433 18,314 26,182 40.1%Vehicle Service Miles 278,380 276,250 247,926 339,109 21.8%Employee Full-Time Equivalents 22.0 25.0 27.0 34.0 54.5%Farebox Revenues $ 517,708 $ 633,035 $ 505,642 $ 477,214 -7.8%Local Subsidies & Auxiliary Revenues $ 513,246 $ 517,959 $ 543,884 $ 523,217 1.9%Operating Cost Per Vehicle Service Hour $ 74.39 $ 71.23 $ 65.89 $ 54.60 -26.6%Operating Cost Per Passenger $ 22.62 $ 23.83 $ 22.75 $ 23.74 5.0%Passengers Per Vehicle Service Hour 3.3 3.0 2.9 2.3 -30.1%Passengers Per Vehicle Service Mile 0.22 0.21 0.21 0.18 -19.6%Vehicle Service Hours Per Employee FTE 850 777 678 770 -9.4%Farebox Recovery Ratio 37.2% 45.7% 41.9% 33.4% -10.3%Farebox Recovery Ratio (with Local Subsidies & Auxiliary Revenues)
74.1% 83.2% 87.0% 70.0% -5.6%
Percent Change in the CPI - 2.5% 4.2% 4.8% 11.9%Financial data from Annual Financial Statements. Operating data from State Controller's Reports.Local Subsidies & Auxiliary Revenues includes Measure D funds, contributions, and software fees.
Verified TDA Statistics & Performance Indicators
Base Year FY 2003
Audit Review Period Percent Change FY 2003 to FY 2006
• Operating Cost Per Vehicle Service Hour is a measure of cost efficiency. During the audit review period, cost per hour declined from $74.39 in FY03 to $54.60 in FY06. Operating costs increased by less than 3% over the audit period while vehicle service hours increased by 40%. In addition to changing vehicle maintenance providers which led to a decline in maintenance costs of 30% from FY03 to FY06, Easy Lift negotiated out of two service arrangements that were costing the agency more than they were receiving in revenue – the Tri-Counties Regional Center service and the Carpinteria Area Rapid Transit service, and eliminated three management and administrative positions. The savings were re-directed into increased service levels. See Section III – Functional Area Performance Results for a more thorough discussion of efficiency improvements implemented by Easy Lift during the audit period.
O’Melia Consulting in association with Kelly Hines Consulting
• Operating Cost Per Passenger is a measure of cost effectiveness. During the audit period, cost per passenger

Easy Lift TDA Triennial Performance Audit Page 20
increased by just 5%, well below the rate of inflation. As shown in Exhibit 7, Easy Lift has experienced significant growth in its ADA service, which in FY06, made up 67% of Easy Lift ridership compared to just 37% in FY03. The growth in ADA ridership was offset by a decline in CTSA and charter service passengers, leaving overall ridership largely unchanged.
• Passengers Per Vehicle Service Hour is a measure of service productivity. During the audit review period, passengers per hour fell by 30% as total passengers declined by just 2% and vehicle service hours increased by 40%. The change in performance is a result of the shift in ridership between higher productivity CTSA/charter services to lower productivity ADA service.
• Passengers Per Vehicle Service Mile also measures service productivity. During the audit review period, passengers per mile fell by 19% as vehicle service miles increased by 22% - again, due to the shift in ridership to ADA service from higher productivity CTSA/charter services
• Vehicle Service Hours Per Employee measures labor productivity. Labor productivity fell by 9% between FY03 and FY06 based on reported data. However, as employee data was reported as employee headcount rather than FTEs, the statistic is low as Easy Lift does employ part-time drivers.
O’Melia Consulting in association with Kelly Hines Consulting

Easy Lift TDA Triennial Performance Audit Page 21
III. FUNCTIONAL AREA PERFORMANCE RESULTS
A high level review of functional area performance was conducted for select functions including:
• Transportation Operations • Vehicle Maintenance • Budget and Planning
Information used in this section was obtained through document reviews, management interviews, and reports such as the State Controller Report and Financial Audits.
Transportation Operations Operating Costs
Over the audit period, Easy Lift has experienced a 4.7% increase in operating costs, half the rate of growth in inflation over the three years. Reflecting the efforts on the part of Easy Lift management to control costs, personnel costs were down by 6.3% over the period and maintenance costs fell by 34.9% as shown in Exhibit 9. Together, these two cost elements accounted for 65% of costs in FY06, down from 76% in FY03.
Exhibit 9 – Operating Costs
FY 2004 FY 2005 FY 2006Personnel Costs (Salaries/Wages, Benefits, Taxes) $ 874,143 $ 825,282 $ 655,985 $ 819,508 -6.3%Workers' Comp Insurance $ 71,852 $ 123,591 $ 129,997 $ 152,788 112.6%Repairs and Maintenance $ 158,880 $ 125,111 $ 111,930 $ 103,382 -34.9%Fuel and Oil $ 79,917 $ 92,180 $ 81,946 $ 129,843 62.5%Insurance $ 66,690 $ 65,724 $ 76,468 $ 67,455 1.1%Professional Fees $ 23,569 $ 26,642 $ 42,668 $ 33,189 40.8%Work Study Iinterns $ - $ 2,766 $ 6,829 $ 5,581 --Postage, Printing & Supplies $ 22,265 $ 21,728 $ 18,590 $ 13,441 -39.6%Rent $ 19,773 $ 31,095 $ 32,139 $ 33,564 69.7%Utilities $ 19,834 $ 18,832 $ 18,106 $ 19,736 -0.5%Equipment Rental $ 6,352 $ 7,213 $ 8,366 $ 13,058 105.6%Travel and Meetings $ 4,933 $ 4,266 $ 1,647 $ 4,552 -7.7%Fundraising $ 3,422 $ 30,632 $ 14,494 $ 25,063 632.4%Licenses and Fees $ 3,744 $ 4,186 $ 1,778 $ 3,083 -17.7%Miscellaneous Costs $ 10,079 $ 4,888 $ 5,784 $ 5,280 -47.6%TOTAL $ 1,365,453 $ 1,384,136 $ 1,206,727 $ 1,429,523 4.7%Percent Change in the CPI 2.5% 4.2% 4.8% 11.9%From Annual Financial Statements. Additional cost in FY03 for Bad Debt in the amount of $24,995 not included in the total.
Verified TDA Statistics & Performance Indicators
Base Year FY 2003
Audit Review Period Percent Change FY 2003 to FY 2006
O’Melia Consulting in association with Kelly Hines Consulting

Easy Lift TDA Triennial Performance Audit Page 22
Areas of significant cost growth include Workers’ Comp and fuel, up 112% and 62.5% respectively. The growth in Workers’ Comp is consistent with the doubling of the driver workforce over the audit period from 15 in FY03 to 30 in FY07. Easy Lift has also seen an increase in costs associated with its fund-raising efforts though the expenditure has had a high benefit-cost ratio with four dollars in fund-raising revenue generated for every dollar spent in fund-raising activities in FY06 ($99,544 versus $25,063).
Service Eligibility
Easy Lift’s dial-a-ride service is provided to those individuals who are unable to ride MTD fixed-route service based on a physical, visual, or mental impairment. Easy Lift, together with MTD, implemented a formal ADA eligibility application process during the audit period, replacing the over-the-phone approval process in place during the prior audit period. Easy Lift staff assists customers with completing the application, accept applications, and do a preliminary review of applications before advancing to MTD’s ADA Committee for the final decision. Per the application guidelines, the approval process can take up to three weeks. If a decision is not made on a customer’s application within 21 days, the customer is allowed to ride the service until a final decision has been made. However, Easy Lift has not enforced this provision and does provide service to customers throughout the application review period. Senior use of Easy Lift services is allowed but is based on frailty rather than age.
Easy Lift’s span of service is consistent with MTD’s fixed route service schedule:
• Monday through Friday – 5:25 am to 12:00 am
• Saturday – 6:00 am to 11:20 pm
• Sunday – 6:20 am to 10:20 pm
Easy Lift does go beyond the ¾ mile boundary of MTD’s fixed route system. Reservations are taken up to two weeks in advance, and two rides may be scheduled in one call. Easy Lift will provide same day service if possible, but the requirement is to make reservations at least a day in advance. Reservations are taken seven days a week from 8:00 am to 12:00 pm and 1:00 pm to 5:00 pm. Cancellations require 24 hours notice or the customer is subject to a $5.00 charge. The
O’Melia Consulting in association with Kelly Hines Consulting

Easy Lift TDA Triennial Performance Audit Page 23
same charge is assessed for no-shows. Easy Lift has not strictly enforced this policy as the intent is to change behavior, not to raise revenue. In FY06, only $200 was earned in cancellation/no-show fees, equaling just 40 enforced fines during the year. Easy Lift uses its own proprietary scheduling system, Sched Pro.
Easy Lift has developed a comprehensive Rider’s Guide that includes a description of the complementary paratransit service, how to book a ride, how to cancel a ride, hours of operation, fare information, and a description of Easy Lift’s flexible scheduling approach to maximize the number of rides that can be provided. The guide also includes descriptions of other Easy Lift services including Mobility Training, charter and contract services, Project Safe Streets, and radio dispatch services. Rider information is also available on Easy Lift’s website.
System Productivity
A high number of trip denials was cited as a problem in prior triennial audits and was the cause of some disagreement between Easy Lift and MTD over the level of MTD funding support. At the end of the last audit period, FY03, Easy Lift increased service levels to implement a zero trip denial policy, which it has adhered to throughout this audit period.
The impact of Easy Lift’s shift from Regional Center group trips to more ADA paratransit trips is evident in the 21% decline in service productivity in the final year of the audit period when passengers per hour fell from 2.9 to 2.3.
From FY05 to FY06, the number of passengers increased by 14% and service levels increased by 43%. To meet the growth in demand and corresponding growth in service levels, Easy Lift has added to its driver force and now employs 30 drivers compared to 25 in FY03. Of the 30 drivers, 19 are relief, part-time, or weekend drivers. Easy Lift reports recent difficulty in recruiting and retaining part-time drivers and, as a result, has been incurring overtime expenses for full-time operators to cover part-time weekend shifts. Additionally, Easy Lift has been placing a greater reliance on Operations office staff such as the Mobility Trainer and dispatchers. Easy Lift is also reviewing the patterns of demand and has found seasonal (i.e., higher demand in the summer) and daily (e.g., higher demand mid-week) fluctuation in
O’Melia Consulting in association with Kelly Hines Consulting

Easy Lift TDA Triennial Performance Audit Page 24
demand and is adjusting its operator recruitment efforts to better match demand patterns. For example, Easy Lift recently participated in two job fairs with local colleges, targeting students who are more likely to want part-time and/or summer work. Easy Lift has had success employing students in office positions and is considering their suitability as operators, keeping in mind that they must be 21 years of age and pass a drug test.
Easy Lift increased its starting wage to $11.18 in 2004 and offers 100% employer-paid medical, dental, and life insurance coverage in addition to paid holidays and vacation accrual. Part-time drivers do not receive medical, dental, or life insurance coverage but do accrue vacation. All drivers receive classroom and one-on-one behind the wheel training. All drivers are required to attend a monthly safety meeting. Any accident triggers driver re-training and all drivers undergo routine performance reviews by Easy Lift’s field supervisor.
Fare Structure
Easy Lift’s last fare increase was in 2001, when the fare increased from $1.00 to $2.00 per one-way trip. Santa Barbara MTD increased its base fare from $1.00 to $1.25 in FY04 but the Easy Lift fare was not changed. Easy Lift, in coordination with MTD, is allowed to charge up to $2.50 for the ADA complementary paratransit service under ADA law. Easy Lift’s $2.00, while less than that allowed by ADA, is comparable to other paratransit fares in Santa Barbara County as shown in Exhibit 10.
Exhibit 10 – Santa Barbara County Transit Fares
Operator Fixed Route Base Fare
ADA/DR Base Fare
ADA/DR Fare as % of FR Fare
COLT $1.00 $0.50 50% Guadalupe Transit $1.00 $3.00 300% SBMTD/Easy Lift $1.25 $2.00 160%
SMAT $1.25 $1.25 100% SYVT $1.50 $2.25 150%
Easy Lift also sells 10-ride ticket books for $20.00 at its administrative and operations facility and through the mail. In FY06, ticket book sales accounted for 40% of Easy Lift passenger fare revenue.
O’Melia Consulting in association with Kelly Hines Consulting

Easy Lift TDA Triennial Performance Audit Page 25
Vehicle Maintenance
Vehicle repair and maintenance costs were down nearly 35% over the audit period as shown in Exhibit 9. During the first year of the audit period, Easy Lift changed vehicle maintenance providers, securing non-profit pricing from the provider and reducing the vehicle time lost to maintenance by using a repair shop less than a mile from its administrative and operations facility.
During the last audit period, the average age of Easy Lift’s fleet was seven years. Easy Lift replaced 13 of 18 vehicles during this audit period, and now has an average vehicle age of just three years. While the vehicle age has gone down by more than half, the number of seats has dropped dramatically as well – 9.5 in FY03 versus 5.3 today. Easy Lift’s current vehicle inventory is shown in Exhibit 11.
Exhibit 11 – Easy Lift Vehicle Inventory Number of Vehicles Year Make Number of Seats
1 1995 Ford 4 1 1998 Chevrolet 11 1 1999 Chevrolet 11 1 1999 Ford 11 1 2001 Dodge 4 4 2005 Chevrolet 5 1 2005 Chevrolet 3 8 2007 Chevrolet 4
Three of the oldest vehicles – the ’95 Ford, the ’98 Chevrolet, and the ’99 Ford are used as backup vehicles only. The ’98 Chevrolet and the ’99 Chevrolet are scheduled to be replaced this year.
Easy Lift is exploring alternative fuel options for future vehicle procurements. At this time, the most viable alternative fuel option is bio-diesel which would require a diesel vehicle to be purchased and then retrofit to run on biodiesel fuel.
Budget and Planning
Easy Lift’s budget process begins in the Spring of each year The baseline for budget development are current year-to-date actuals and projected CPI-growth. Historically, budget development for items such
O’Melia Consulting in association with Kelly Hines Consulting

Easy Lift TDA Triennial Performance Audit Page 26
O’Melia Consulting in association with Kelly Hines Consulting
as maintenance and fuel has been more difficult given the volatility in fuel costs and the high maintenance costs Easy Lift incurred prior to switching maintenance service providers and replacing its vehicle fleet. A draft budget is presented to the Easy Lift Board in May with a final budget adopted in June. A second Board meeting may be held in June if questions arise on the budget during the regular June Board meeting. The annual budget includes all salary actions for the fiscal year, with all salary increases going into effect on July 1. A mid-year budget review is done in January.
Easy Lift is the complementary ADA paratransit service provider for MTD and received 28% of budgeted revenues in FY06 from MTD as shown in Exhibit 12. As the CTSA for the South County region, Easy Lift files its own TDA claim and received 27% of its FY06 revenues from Article 4.5. Easy Lift receives an equal amount of Measure D funds, 28% of budgeted FY06 revenues. As the CTSA and per the Measure D expenditure plan, CTSA receives the South County population allocation for paratransit services directly. This regional allocation of Measure D made up 19% of Easy Lift’s total Measure D revenues. The remaining 81% are passed through to Easy Lift by the South County jurisdictions – County of Santa Barbara, City of Santa Barbara, City of Carpinteria, and City of Goleta – for specialized transportation services. Fundraising, donations, and fare revenues made up 12% of Easy Lift’s FY06 budgeted revenues.
MTD/ADA Revenues28%
TDA27%
Fare Revenues4%
Fundraising/Donations8%
Other Program Fees & Revenues
4%Measure D
28%
STA Capital1%
Exhibit 12 – Easy Lift Revenues by Source, FY06 Budget
Easy Lift negotiated a new three-year funding agreement with MTD for the complementary ADA paratransit services for FY04 through FY06. The agreement was extended through FY07 and a new agreement is under development. The basis of the agreement is the share of rides provided by Easy Lift that meet the requirements for ADA service.

Easy Lift TDA Triennial Performance Audit Page 27
Easy Lift tracks ADA, CTSA, and charter ridership separately per a recommendation from the prior performance audit.
Easy Lift did not undertake any comprehensive planning efforts during the audit period due, in part, to turnover in management positions. Such an effort is warranted given potential changes to funding environment (i.e., renewal of Measure D) and the growing demand for services with the aging population in the County. Development of a CTSA Operations Plan is included as a recommendation of this triennial audit.
O’Melia Consulting in association with Kelly Hines Consulting

Easy Lift TDA Triennial Performance Audit Page 28
IV. RECOMMENDATIONS
Four recommendations are offered for consideration by Easy Lift. This includes two recommendations related to compliance, and two aimed at improving effectiveness and efficiency of operations.
1. Report FTEs rather than employee headcount in State Controller Reports, and check published reports for accuracy and consistency with other reports both internal and external.
• Findings – During the audit period, Easy Lift reported total employees instead of full time equivalents (FTEs) in the State Controller’s Report. Additionally, ridership data reported in the State Controller’s Reports was not consistent with internal performance reports.
• Suggested Actions – The following corrective actions will bring Easy Lift into compliance with TDA data definition requirements and ensure that system productivity (i.e., passengers per hour and per mile) is accurately assessed:
(1) Report FTEs as total paid work hours divided by 2,000. Paid time off should be excluded from the calculation.
(2) The Executive Director should provide final approval of all reports to internal and external stakeholders and oversight agencies to ensure completeness, accuracy, and consistency with other reports.
• Expected Results – Implementation of this recommendation will bring Easy Lift into compliance with State Controller Reporting (PUC 99243) and TDA data definition (PUC 99247) requirements.
2. Easy Lift should expand its customer satisfaction survey to include vendors and incorporate findings into a CTSA Operations Plan (see Recommendation three).
• Findings – Easy Lift has undergone significant changes during the
audit period including a reduction in management and
O’Melia Consulting in association with Kelly Hines Consulting

Easy Lift TDA Triennial Performance Audit Page 29
administrative personnel, a shift to smaller vehicles to improve fuel efficiency, and a decrease in CTSA and charter services with significant growth in complementary ADA service. Following the significant agency re-structuring and staff turnover during the audit period, Easy Lift is now in a position to begin assessing the impacts of the agency’s changes on the quality of the service provided to its customers (i.e., Easy Lift riders and the agencies with which Easy Lift partners to provide service).
• Suggested Actions – As part of its annual ridership survey, it is recommended that Easy Lift include a self-administered partner/stakeholder survey (MTD, Santa Barbara County, agencies to whom vehicles are loaned, and organizations for whom radio-dispatching services are provided).
For an initial effort, the recommendation is made to utilize only self-administered tools to keep the costs of implementing this recommendation at a minimum. The customer satisfaction assessment process could later be expanded as resources allow and/or significant areas of improvement are identified through the self-administered process.
• Expected Results – Implementation of this recommendation will allow Easy Lift to assess the impacts of its re-organization and shifting service priorities on the quality of service provided to its customers. Results from this process should be incorporated into an updated CTSA Operations Plan and corrective actions identified moving forward that will help to position Easy Lift in meeting the social service transportation needs of the South County region. Additionally, positive results of the survey process could be leveraged as part of Easy Lift’s expanding fund-raising efforts.
3. Easy Lift should assess the operational and financial impacts on Easy Lift services – complementary ADA paratransit, CTSA services, and charter/contract services – in light of increasing demand for complementary ADA paratransit and the potential loss of Measure D revenues.
• Findings – In FY04, complementary ADA paratransit provided on
behalf of MTD accounted for 38% of Easy Lift trips. This share increased to 66% in FY06. Through April of 2007, the share was
O’Melia Consulting in association with Kelly Hines Consulting

Easy Lift TDA Triennial Performance Audit Page 30
up to nearly 70%. At the same time, Easy Lift has begun a fleet replacement program that emphasizes smaller, more fuel-efficient vehicles that, while saving on fuel costs, reduces the capacity of the system. The remote location of the Easy Lift operations facility further limits the operational capacity of the system by lowering the productive service time of each vehicle (and driver) placed into service. Finally, the ADA operational practices of going beyond the ¾ mile requirement and providing same-day service place additional pressure on Easy Lift to meet service demand within existing resources.
To date, Easy Lift has successfully met the increased demand for complementary ADA paratransit services through achieving savings in administrative labor and vehicle maintenance costs. However, the increasing demand for ADA services as the South County population continues to age will require more resources to meet the demand at the same time that 22% of Easy Lift revenues are in jeopardy should Measure D not be renewed.
• Suggested Actions – It is recommended that Easy Lift undertake a service efficiency and financial analysis to assess the extent to which service productivity improvements and increased fare and fundraising revenues together can provide sufficient resources to meet the growing demand for ADA paratransit services. Specific items to address include:
(1) Service productivity improvements that may be achieved through tightening ADA service practices (e.g., staying within the ¾ mile requirement, negotiating trip pick-up times within one hour of requested times, providing same day service)
(2) Impact of re-locating multiple vehicles to storage yards closer to Easy Lift’s core service area. It is suggested that Easy Lift explore use of City-owned parking facilities at night and on weekends for this purpose
(3) Feasibility of raising ADA paratransit fares to twice the fixed-route fare
(4) Ability of charitable contributions to increase as a share of total operating revenues.
O’Melia Consulting in association with Kelly Hines Consulting
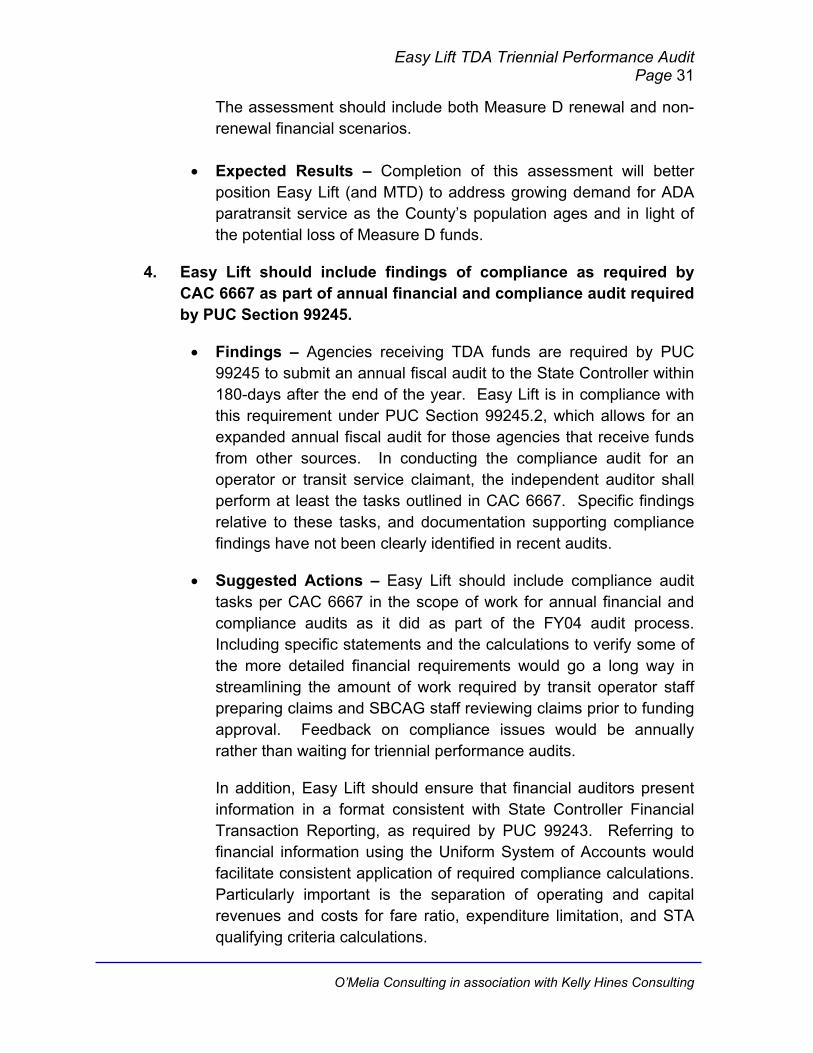
Easy Lift TDA Triennial Performance Audit Page 31
The assessment should include both Measure D renewal and non-renewal financial scenarios.
• Expected Results – Completion of this assessment will better
position Easy Lift (and MTD) to address growing demand for ADA paratransit service as the County’s population ages and in light of the potential loss of Measure D funds.
4. Easy Lift should include findings of compliance as required by CAC 6667 as part of annual financial and compliance audit required by PUC Section 99245.
• Findings – Agencies receiving TDA funds are required by PUC 99245 to submit an annual fiscal audit to the State Controller within 180-days after the end of the year. Easy Lift is in compliance with this requirement under PUC Section 99245.2, which allows for an expanded annual fiscal audit for those agencies that receive funds from other sources. In conducting the compliance audit for an operator or transit service claimant, the independent auditor shall perform at least the tasks outlined in CAC 6667. Specific findings relative to these tasks, and documentation supporting compliance findings have not been clearly identified in recent audits.
• Suggested Actions – Easy Lift should include compliance audit tasks per CAC 6667 in the scope of work for annual financial and compliance audits as it did as part of the FY04 audit process. Including specific statements and the calculations to verify some of the more detailed financial requirements would go a long way in streamlining the amount of work required by transit operator staff preparing claims and SBCAG staff reviewing claims prior to funding approval. Feedback on compliance issues would be annually rather than waiting for triennial performance audits.
In addition, Easy Lift should ensure that financial auditors present information in a format consistent with State Controller Financial Transaction Reporting, as required by PUC 99243. Referring to financial information using the Uniform System of Accounts would facilitate consistent application of required compliance calculations. Particularly important is the separation of operating and capital revenues and costs for fare ratio, expenditure limitation, and STA qualifying criteria calculations.
O’Melia Consulting in association with Kelly Hines Consulting
Easy Lift TDA Triennial Performance Audit Page 32
O’Melia Consulting in association with Kelly Hines Consulting
• Expected Results – Improved compliance with State regulatory requirements is expected to result from this recommendation. A second benefit is that transit operator and SBCAG staff will spend less time determining compliance.

CITY OF GUADALUPE TRANSIT TDA TRIENNIAL PERFORMANCE
AUDIT FOR FY 2004-2006 Fiscal Years Ending June 30th
Prepared by
In Association With
OCTOBER 22, 2007

City of Guadalupe Transit TDA Triennial Performance Audit Page i
TABLE OF CONTENTS
EXECUTIVE SUMMARY.................................................................... 1
Purpose of Audit.........................................................................................1
Findings......................................................................................................1
Recommendations .....................................................................................3
I. INTRODUCTION....................................................................... 4
Performance Audit Objectives and Approach.............................................4
System Overview .......................................................................................5
II. COMPLIANCE REVIEW......................................................... 10
Regulatory Requirements.........................................................................10
Progress To Implement Prior Audit Recommendations ...........................14
Data Verification.......................................................................................16
TDA Performance Indicator Trends..........................................................18
III. FUNCTIONAL AREA PERFORMANCE RESULTS............... 21
Transportation Operations........................................................................21
Vehicle Maintenance................................................................................24
Administration and Planning.....................................................................25
IV. RECOMMENDATIONS........................................................... 28
O’Melia Consulting in association with Kelly Hines Consulting

City of Guadalupe Transit TDA Triennial Performance Audit Page ii
LIST OF EXHIBITS
Exhibit 1 – Performance Audit Sources ................................................................5
Exhibit 2 – Organization Chart ..............................................................................6
Exhibit 3 – SMOOTH Organization Chart .............................................................7
Exhibit 4 – Regulatory Compliance Matrix ..........................................................11
Exhibit 5 – Cost per Hour Calculations ...............................................................13
Exhibit 6 – Cost per Hour Calculations Revised .................................................14
Exhibit 7 – Progress To Implement Prior Audit Recommendations.....................15
Exhibit 8 – Verified Data Elements for TDA Performance Indicators ..................16
Exhibit 9 – Financial Data Consistency Review ..................................................18
Exhibit 10 – TDA Performance Indicators – FY03 to FY06 .................................19
Exhibit 11 -- Guadalupe Transit 2006 Performance & Regional Standards .......27
O’Melia Consulting in association with Kelly Hines Consulting

City of Guadalupe Transit TDA Triennial Performance Audit Page 1
EXECUTIVE SUMMARY
Purpose of Audit
As the Regional Transportation Planning Agency (RTPA) for Santa Barbara County, the Santa Barbara County Association of Governments (SBCAG) is required by the Public Utilities Code (PUC) Sections 99246 and 99248 to contract for a third party performance audit of itself and each of the transit operators to which Transportation Development Act (TDA) funds are allocated. These audits are to be conducted in accordance with the California Department of Transportation, Performance Audit Guidebook for Transit Operators and Regional Transportation Entities. Performance audits are required to:
• Determine compliance with regulatory requirements
• Assess progress to implement prior performance audit recommendations
• Verify performance indicators and validate basic data used to calculate indicators
• Evaluate the effectiveness and efficiency of Guadalupe Transit functions.
This performance audit of the City of Guadalupe Transit is for Fiscal Years 2004, 2005 and 2006 -- the period of time beginning July 1, 2003 and ending June 30, 2006.
Findings
• Guadalupe Transit is comprised of three services – a deviated fixed route service called the Shuttle, an inter-city fixed route service called the Flyer, and ADA paratransit service. System oversight is provided by the City of Guadalupe with transit operations provided by a contract operator, SMOOTH, based in Santa Maria.
• Despite the regulatory reporting deficiencies found during the conduct of this audit, Guadalupe Transit continues to be a
O’Melia Consulting in association with Kelly Hines Consulting

City of Guadalupe Transit TDA Triennial Performance Audit Page 2
productive and efficient transit system with one of the highest farebox recoveries in North County. Guadalupe Transit’s farebox recovery averaged 17.4% during the audit period.
• The City of Guadalupe again experienced staff turnover issues during this audit period, leading to a void in transit administrative and oversight responsibilities. The City has had to rely on its contract operator for meeting various data reporting deadlines. The FY05 financial audit required by TDA was significantly late and the FY06 financial audit and State Controller Report for Transit Services have not yet been completed. Failure to complete these required documents in a timely manner should result in TDA funds being withheld, per CAC 6733.
• The City of Guadalupe has partially addressed two of three prior performance recommendations pertaining to marketing of the ADA paratransit service, and the preparation of a Short Range Transit Plan (SRTP). The City has not, however, addressed the third recommendation related to improving data reporting for the three types of Guadalupe Transit services.
• The service statistics reported by the contract operator could be improved as ADA service was not tracked and reported separately during the audit period. Additionally, errors in bookkeeping on the part of City staff over the audit period resulted in inaccurate data in various reports (City financial reports, financial audits, Cities Financial Transactions report to the State Controller).
• Growth in operating costs per hour exceeded growth in the CPI during the audit period but this was largely due to an old vehicle in use on the fixed route services. This vehicle was replaced in FY05 and the resulting cost per hour growth between in FY05 and FY06 was just 2.4%, half the rate of growth in the CPI.
• With just a 7% increase in service hours, Guadalupe Transit carried 49.4% more passengers between FY03 and FY06, improving service productivity (i.e., passengers per hour) by 39.3%. Guadalupe Transit carried 17 times its City population (approximately 6,000) in FY06.
O’Melia Consulting in association with Kelly Hines Consulting

City of Guadalupe Transit TDA Triennial Performance Audit Page 3
• The City re-procured the operations contract for the Guadalupe Transit service in 2004 and again in 2007. SMOOTH was the successful bidder on both procurements. The 2004 procurement provided for three years of operation at established reimbursement rates with two option years at rates to be negotiated. This negotiable element was found to be in violation of federal procurement rules and the contract was again put out for bid in 2007.
Recommendations
Two recommendations are offered for consideration by Guadalupe Transit.
1. The City must submit required reports (i.e., State Controller’s Report and financial audits) by TDA-mandated deadlines in order to continue receiving TDA funding for operation of the Guadalupe Transit service. As part of the reporting process, the City and SMOOTH should improve the reporting of modal data (i.e., passengers, revenue hours, revenue miles, operating costs, FTEs, and farebox revenues) and ensure that modal data is reported in the required format to the State Controller.
2. The City of Guadalupe should investigate alternative approaches to providing transit system administration and oversight, so that the City and/or its agent provides true value added in continuing to receive TDA funds for transit service and administering that service.
O’Melia Consulting in association with Kelly Hines Consulting

City of Guadalupe Transit TDA Triennial Performance Audit Page 4
I. INTRODUCTION
Performance Audit Objectives and Approach
As the RTPA for Santa Barbara County, the Santa Barbara County Association of Governments (SBCAG) is required by the Public Utilities Code (PUC) Sections 99246 and 99248 to contract for a third party performance audit of itself and each of the transit operators to which Transportation Development Act (TDA) funds are allocated. These audits are to be conducted in accordance with the California Department of Transportation, Performance Audit Guidebook for Transit Operators and Regional Transportation Entities. Performance audits are required to:
• Determine compliance with regulatory requirements
• Assess progress to implement prior performance audit recommendations
• Verify performance indicators and validate basic data used to calculate indicators
• Evaluate the effectiveness and efficiency of Guadalupe Transit functions.
This performance audit of the City of Guadalupe Transit is for Fiscal Years 2004, 2005 and 2006 -- the period of time beginning July 1, 2003 and ending June 30, 2006.
While the performance audit is being conducted in response to State requirements, such audits can and should be constructive and useful to governing boards, SBCAG and transit operator management.
It is the Auditor’s responsibility to provide objective and balanced reporting of results. This is important because very few agencies are all good or all bad. It is the auditor's responsibility to conduct thorough and accurate analyses and objectively report performance findings. Significant accomplishments and positive performance trends are discussed as well as opportunities for improvement.
O’Melia Consulting in association with Kelly Hines Consulting

City of Guadalupe Transit TDA Triennial Performance Audit Page 5
The methodology for this audit include interviews with key staff and management involved in the provision of transit services, a site visit for review of operations and data collection practices, review of operational and financial data, and review of relevant documents. Highlights of this review are presented below in Exhibit 1.
Exhibit 1 – Performance Audit Sources
Interviews – Name, Title and Guadalupe Transit
Carolyn Galloway Cooper, City Administrator, City of Guadalupe Jim Talbott, Executive Director, SMOOTH
Site Visit(s)
Guadalupe City Hall, Wednesday, May 16, 2007 SMOOTH Administrative Offices, Wednesday, May 16, 2007
Background Materials Reviewed
Comprehensive Annual Financial Reports, Fiscal Years 2004-2005 Cities Financial Transactions Reports-- State Controllers Annual Reports, Fiscal
Years 2004-2005 TDA Triennial Performance Audit Report For Fiscal Years Ending June 30, 2003
Annual TDA and STA Claim Forms, Fiscal Years 2004-2006 California Highway Patrol Pull-Notice and Terminal Inspection Certifications
Purchased Transportation Service Agreement ADA Paratransit Plan, May 2006
Public Information – Website, Timetables & Schedules, Brochures
System Overview Organization & Policy Decisions
Guadalupe Transit is funded and managed by the City of Guadalupe with operations provided under contract by the Santa Maria Organization of Transit Helpers (SMOOTH). For the first two years of the audit period, the City’s Finance Director was responsible for oversight of the transit service. This position was vacated in 2005 and was not filled until after the end of the audit period in the Fall of 2006. During that time, the City Administrator was responsible for oversight of the service. Currently, oversight is provided jointly by both the Finance Director and City Administrator, who meet monthly with the
O’Melia Consulting in association with Kelly Hines Consulting

City of Guadalupe Transit TDA Triennial Performance Audit Page 6
SMOOTH Executive Director. The organization structure is shown in Exhibit 2.
Exhibit 2 – Organization Chart
City Administrator
SMOOTH
City Council
Finance Director
City Administrator
SMOOTH
City Council
Finance Director
As a City-provided service, Guadalupe Transit policy direction is provided by a five member City of Guadalupe Council, chaired by the Mayor. The Council approves budgets, City contracts, and TDA claims, as well as fare policy.
Management & Staffing
The day-to-day operation of SMOOTH is overseen by the Executive Director. The Executive Director during most of the audit period left SMOOTH in January 2006 after eight years in the position and was replaced by the former Operations Manager, a SMOOTH employee for more than seven years. Reporting to the Executive Director are the Bookkeeper, Office Manager, Operations Manager, and part-time Fleet Mechanic, as shown in Exhibit 3. The Fleet Mechanic only services the SMOOTH fleet, which is used for Guadalupe’s ADA service. Maintenance and repair work on the City-owned fleet is done by a third party and the City is billed for the work as part of SMOOTH’s monthly invoice to the City.
As shown in Exhibit 9 in Section II, SMOOTH utilizes approximately 3.5 employee FTEs to provide the Guadalupe Transit service – one FTE for the Shuttle service, two FTEs for the Flyer service, and the remaining FTEs for ADA service and contract oversight. SMOOTH’s operator staff is made up of 21 drivers, which includes seven part-time
O’Melia Consulting in association with Kelly Hines Consulting
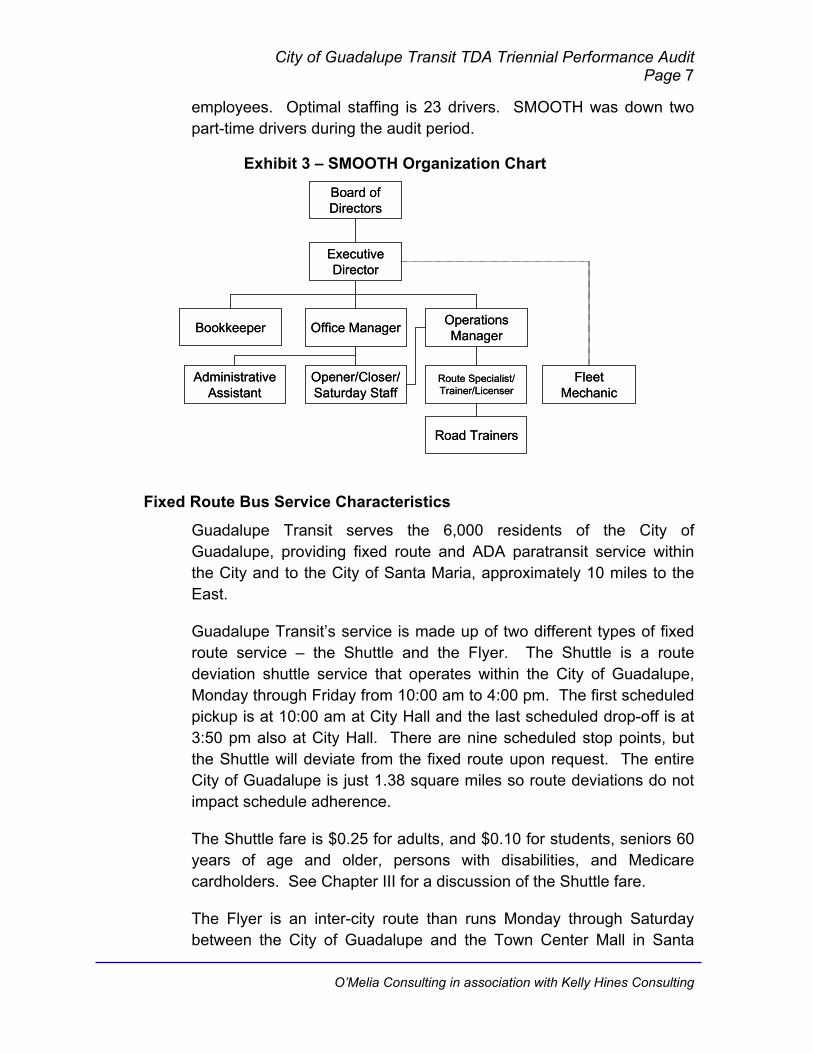
City of Guadalupe Transit TDA Triennial Performance Audit Page 7
employees. Optimal staffing is 23 drivers. SMOOTH was down two part-time drivers during the audit period.
Exhibit 3 – SMOOTH Organization Chart
Board of Directors
Administrative Assistant
Operations ManagerBookkeeper
Executive Director
Office Manager
Fleet Mechanic
Opener/Closer/Saturday Staff
Route Specialist/Trainer/Licenser
Road Trainers
Board of Directors
Administrative Assistant
Operations ManagerBookkeeper
Executive Director
Office Manager
Fleet Mechanic
Opener/Closer/Saturday Staff
Route Specialist/Trainer/Licenser
Road Trainers
Fixed Route Bus Service Characteristics
Guadalupe Transit serves the 6,000 residents of the City of Guadalupe, providing fixed route and ADA paratransit service within the City and to the City of Santa Maria, approximately 10 miles to the East.
Guadalupe Transit’s service is made up of two different types of fixed route service – the Shuttle and the Flyer. The Shuttle is a route deviation shuttle service that operates within the City of Guadalupe, Monday through Friday from 10:00 am to 4:00 pm. The first scheduled pickup is at 10:00 am at City Hall and the last scheduled drop-off is at 3:50 pm also at City Hall. There are nine scheduled stop points, but the Shuttle will deviate from the fixed route upon request. The entire City of Guadalupe is just 1.38 square miles so route deviations do not impact schedule adherence.
The Shuttle fare is $0.25 for adults, and $0.10 for students, seniors 60 years of age and older, persons with disabilities, and Medicare cardholders. See Chapter III for a discussion of the Shuttle fare.
The Flyer is an inter-city route than runs Monday through Saturday between the City of Guadalupe and the Town Center Mall in Santa
O’Melia Consulting in association with Kelly Hines Consulting
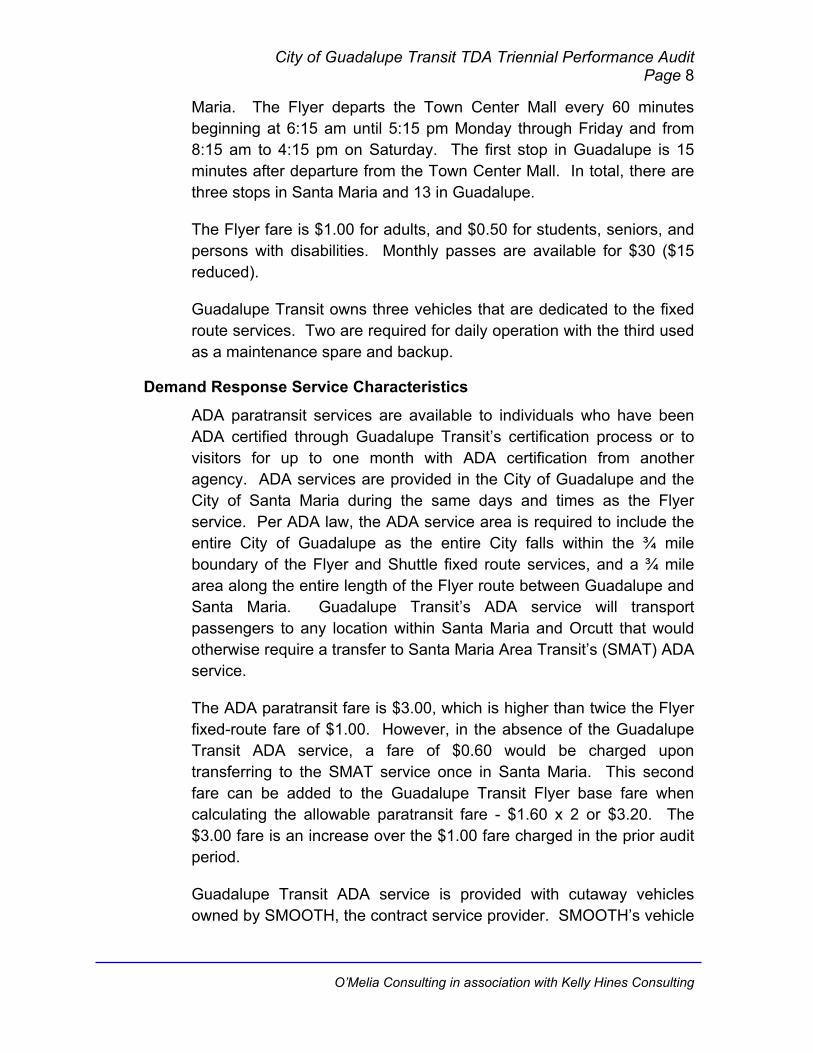
City of Guadalupe Transit TDA Triennial Performance Audit Page 8
Maria. The Flyer departs the Town Center Mall every 60 minutes beginning at 6:15 am until 5:15 pm Monday through Friday and from 8:15 am to 4:15 pm on Saturday. The first stop in Guadalupe is 15 minutes after departure from the Town Center Mall. In total, there are three stops in Santa Maria and 13 in Guadalupe.
The Flyer fare is $1.00 for adults, and $0.50 for students, seniors, and persons with disabilities. Monthly passes are available for $30 ($15 reduced).
Guadalupe Transit owns three vehicles that are dedicated to the fixed route services. Two are required for daily operation with the third used as a maintenance spare and backup.
Demand Response Service Characteristics
ADA paratransit services are available to individuals who have been ADA certified through Guadalupe Transit’s certification process or to visitors for up to one month with ADA certification from another agency. ADA services are provided in the City of Guadalupe and the City of Santa Maria during the same days and times as the Flyer service. Per ADA law, the ADA service area is required to include the entire City of Guadalupe as the entire City falls within the ¾ mile boundary of the Flyer and Shuttle fixed route services, and a ¾ mile area along the entire length of the Flyer route between Guadalupe and Santa Maria. Guadalupe Transit’s ADA service will transport passengers to any location within Santa Maria and Orcutt that would otherwise require a transfer to Santa Maria Area Transit’s (SMAT) ADA service.
The ADA paratransit fare is $3.00, which is higher than twice the Flyer fixed-route fare of $1.00. However, in the absence of the Guadalupe Transit ADA service, a fare of $0.60 would be charged upon transferring to the SMAT service once in Santa Maria. This second fare can be added to the Guadalupe Transit Flyer base fare when calculating the allowable paratransit fare - $1.60 x 2 or $3.20. The $3.00 fare is an increase over the $1.00 fare charged in the prior audit period.
Guadalupe Transit ADA service is provided with cutaway vehicles owned by SMOOTH, the contract service provider. SMOOTH’s vehicle
O’Melia Consulting in association with Kelly Hines Consulting

City of Guadalupe Transit TDA Triennial Performance Audit Page 9
fleet is comprised of 16 wheelchair-equipped vehicles, with one always available for Guadalupe Transit ADA service.
Achievements and Challenges During the Audit Review Period
During the performance audit review period (i.e., July 1, 2003 and June 30, 2006), Guadalupe Transit has achieved operational accomplishments but continues to be faced with administrative challenges:
• Guadalupe Transit ridership grew by nearly 50% during the audit period despite only 7% growth in service hours. Guadalupe Transit provides the equivalent of 17 trips each year to every resident of the City.
• Guadalupe Transit maintained a high farebox recovery throughout the audit period -- 17.4% compared to the required 10% as a rural transit provider.
• The City of Guadalupe did not submit the required Transit Operators Financial Transactions report to the State Controller for all three years of the audit period, despite the recommendation to do so in the last audit. Additionally, the City did not meet the requirement for completion and submission of the annual financial audit within 180 days of the fiscal year end for FY 2004, FY 2005, and FY 2006. SBCAG may grant a 90-day extension but after this period, TDA claims may not be approved until Guadalupe has submitted State Controller and Financial Audit documents to the State.
• The City has experienced turnover and extended vacancy in the Finance Director position, which previously bore the responsibilities for transit oversight and administration activities. As such, the City has relied on its contractor for assistance with administrative activities including preparation of TDA claims and service planning. However, there should be greater separation between the City and the Contractor in claims reporting, particularly with respect to the financial elements of the claims process.
O’Melia Consulting in association with Kelly Hines Consulting

City of Guadalupe Transit TDA Triennial Performance Audit Page 10
II. COMPLIANCE REVIEW
Regulatory Requirements
Guadalupe Transit is in compliance with the majority of these requirements, as shown below in Exhibit 4. Areas of partial or non-compliance for staff and management to be aware of include:
• The City of Guadalupe did not provide a Transit Operators Financial Transactions report to the State Controller in any of the three years of the audit period, providing just the Cities Financial Transactions report. As a recipient of TDA funds, Guadalupe is required to submit the Transit Operators Financial Transactions report to the State Controller per the dates identified in Exhibit 3. SBCAG cannot, by law, approve a TDA claim where this report is delinquent, per CAC 6733.
• The City of Guadalupe did not meet the required submittal deadlines of financial audits per PUC 99245. SBCAG may grant a 90-day extension, but once again, failure to complete this financial audit in a timely manner means that SBCAG cannot, by law, approve a TDA claim, per CAC 6733. The FY06 Financial Audit has not yet been completed.
• The TDA claim forms submitted by the City to SBCAG for transit funds were incomplete and therefore not in compliance.
• A finding of partial compliance was made for growth of the operating budget, as growth between FY05 and FY06 could not be documented as part of this audit. The report of Transit Operator Financial Transactions, which includes budget information necessary to determine compliance, was not completed and the FY06 TDA Claim did not include budget information.
Guadalupe Transit is in full compliance with all other requirements.
O’Melia Consulting in association with Kelly Hines Consulting
City of Guadalupe Transit TDA Triennial Performance Audit Page 11
Exhibit 4 – Regulatory Compliance Matrix
Regulatory Code Compliance Requirement Compliance
Finding Verification Information
PUC Section 99243
Submit an annual report to the State Controller based upon the Uniform System of Accounts and Records established by the State Controller. Due dates varied during the audit period: FY04: 11/24/04 (paper) or 12/14/04 (electronic), FY05: 9/28/05 (paper) or 10/18/05 (electronic) FY06: 10/12/06 (paper) or 11/1/06 (electronic)
Non-Compliant
Report Submission Dates: FY 2004: No report filed FY 2005: No report filed FY 2006: No report filed The reports submitted by the City to the State Controller in each year did not include the forms for Transit Service Operations. Thus the finding of non-compliance.
PUC Section 99245
Submit annual fiscal and compliance audit to State Controller within 180 days of year end, or has received a 90-day extension allowed by law.
Non- Compliant
Auditor Report Dates: FY 2004: 2/2/05 FY 2005: 4/2/07 FY 2006: Not yet complete, estimated completion is 10/1/07
PUC Section 99251
Submit CHP certification of compliance with Pull Notice within 13 months period prior to TDA claim
Full Compliance
CHP Certification Dates (at SMOOTH facility): FY 2004 Claim: 12/13/02 FY 2005 Claim: 12/12/03 FY 2006 Claim: 12/14/04
PUC Section 99261
Submit TDA Claim in compliance with rules and regulations adopted by RTPE
Non-Compliance
TDA Claims were submitted to and funds approved by SBCAG in all three years, despite missing information and failure to fulfill the terms of Self-Certification.
PUC Section 99264
The operator does not routinely staff public transportation vehicles designed to be operated by one person with two or more persons
Full Compliance
Review of staffing assignments indicates that one person is responsible for vehicle operations.
O’Melia Consulting in association with Kelly Hines Consulting
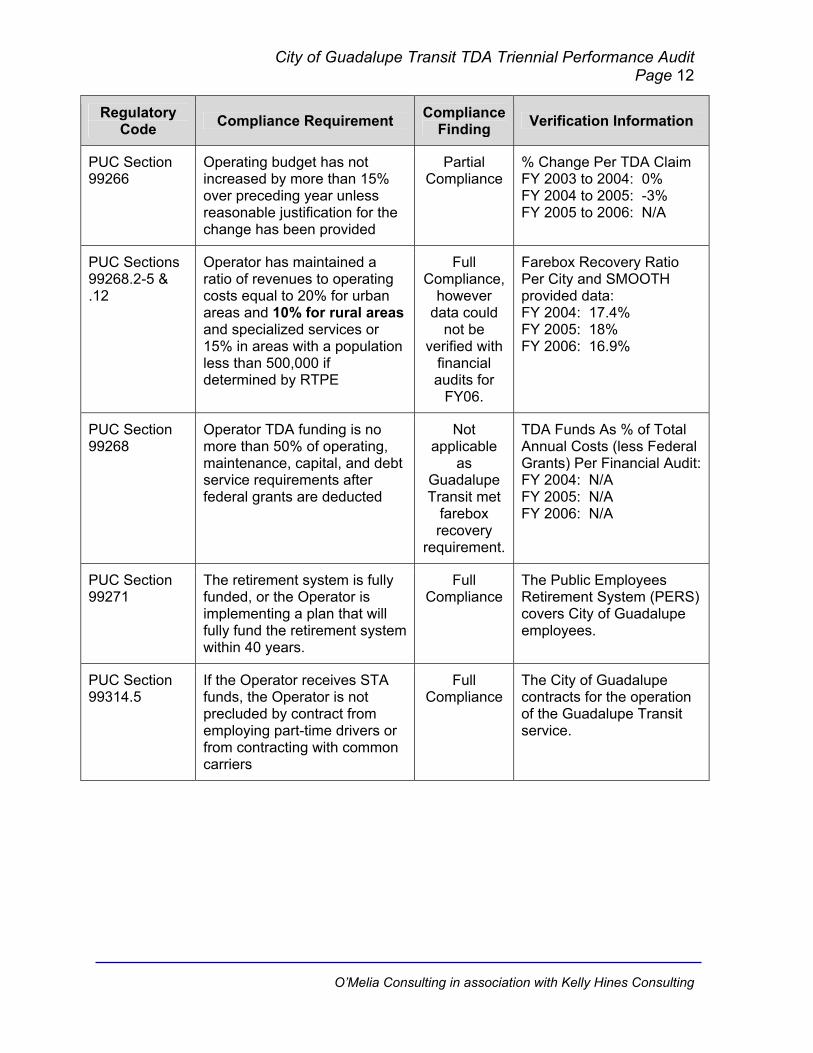
City of Guadalupe Transit TDA Triennial Performance Audit Page 12
Regulatory Code Compliance Requirement Compliance
Finding Verification Information
PUC Section 99266
Operating budget has not increased by more than 15% over preceding year unless reasonable justification for the change has been provided
Partial Compliance
% Change Per TDA Claim FY 2003 to 2004: 0% FY 2004 to 2005: -3% FY 2005 to 2006: N/A
PUC Sections 99268.2-5 & .12
Operator has maintained a ratio of revenues to operating costs equal to 20% for urban areas and 10% for rural areas and specialized services or 15% in areas with a population less than 500,000 if determined by RTPE
Full Compliance,
however data could
not be verified with
financial audits for
FY06.
Farebox Recovery Ratio Per City and SMOOTH provided data: FY 2004: 17.4% FY 2005: 18% FY 2006: 16.9%
PUC Section 99268
Operator TDA funding is no more than 50% of operating, maintenance, capital, and debt service requirements after federal grants are deducted
Not applicable
as Guadalupe Transit met
farebox recovery
requirement.
TDA Funds As % of Total Annual Costs (less Federal Grants) Per Financial Audit:FY 2004: N/A FY 2005: N/A FY 2006: N/A
PUC Section 99271
The retirement system is fully funded, or the Operator is implementing a plan that will fully fund the retirement system within 40 years.
Full Compliance
The Public Employees Retirement System (PERS) covers City of Guadalupe employees.
PUC Section 99314.5
If the Operator receives STA funds, the Operator is not precluded by contract from employing part-time drivers or from contracting with common carriers
Full Compliance
The City of Guadalupe contracts for the operation of the Guadalupe Transit service.
O’Melia Consulting in association with Kelly Hines Consulting

City of Guadalupe Transit TDA Triennial Performance Audit Page 13
Regulatory Code Compliance Requirement Compliance
Finding Verification Information
PUC Section 99314.6
If the Operator receives STA funds for operating purposes: (1) the Operator’s total operating cost per revenue hour does not exceed the prior year’s cost per revenue hour adjusted for inflation using the CPI; or (2) the Operator’s average total operating cost per revenue hour in the past three years does not exceed the sum of the average of the preceding three years, adjusted for inflation using the CPI.
Full Compliance
-- FY06 compliant
under Option 1 and
FY04 & FY05
compliant under
Option 2.
Compliance calculations are shown below in Exhibits 5 and 6.
CCR Section 6754 (a) (3)
Available Federal funds are used prior to claiming STA funds
Full Compliance
No federal funds were claimed during the audit period.
Exhibit 5 provides the cost per hour documentation of the finding of full compliance with PUC Section 99314.6. Guadalupe Transit was compliant with year-to-year growth in cost per hour only in FY06, but achieved compliance in FY04 under the three-year average cost per hour adjusted for CPI while FY05 remained non-compliant. The three-year average provides an allowance for temporary or one-time escalation in cost per hour.
Exhibit 5 – Cost per Hour Calculations
Fiscal Year FY01 FY02 FY03 FY04 FY05 FY06
Operating Costs 368,631$ 267,665$ 222,907$ 251,700$ 288,149$ 308,730$ Revenue Service Hours 5248 5601 5624 4,819 4,901 5,126 Cost Per Revenue Service Hour 70.24$ 47.79$ 39.63$ 52.23$ 58.79$ 60.23$ % Change Prior Year 31.8% 12.6% 2.4%% Change CPI 2.5% 4.2% 4.8%Compliance Determination Non-Compliant Non-Compliant Compliant
FY01-FY03 FY02-FY04 FY03-FY05 FY04-FY0652.56$ 46.55$ 50.22$ 57.08$
5.9% 5.7% 6.8% 9.2%55.64$ 49.19$ 53.64$ 62.31$
$ 9.09 $ (1.03) $ (3.44)
CPI Urban Wage Earners & Clerical Workers -- Los Angeles/Riverside/Orange Counties, California (figures calculated on a Fiscal Year)
167.79 172.36 177.63 182.13 189.73 198.79
FY01 and FY03 financial and operating data from previous audit report. FY04 to FY06 financial data from Guadalupe provided data (FY05 adjusted for missing fare revenue), and operating data from SMOOTH.
Inflated 3-Year Avg Cost Per Hour Compared to Most Recent 3-Year Avg Cost Per Hour (Positive # is Compliant)
3-Year Avg Cost Per Hour% Change CPI 3-Year PeriodInflated 3-Year Avg Cost Per Hour
O’Melia Consulting in association with Kelly Hines Consulting
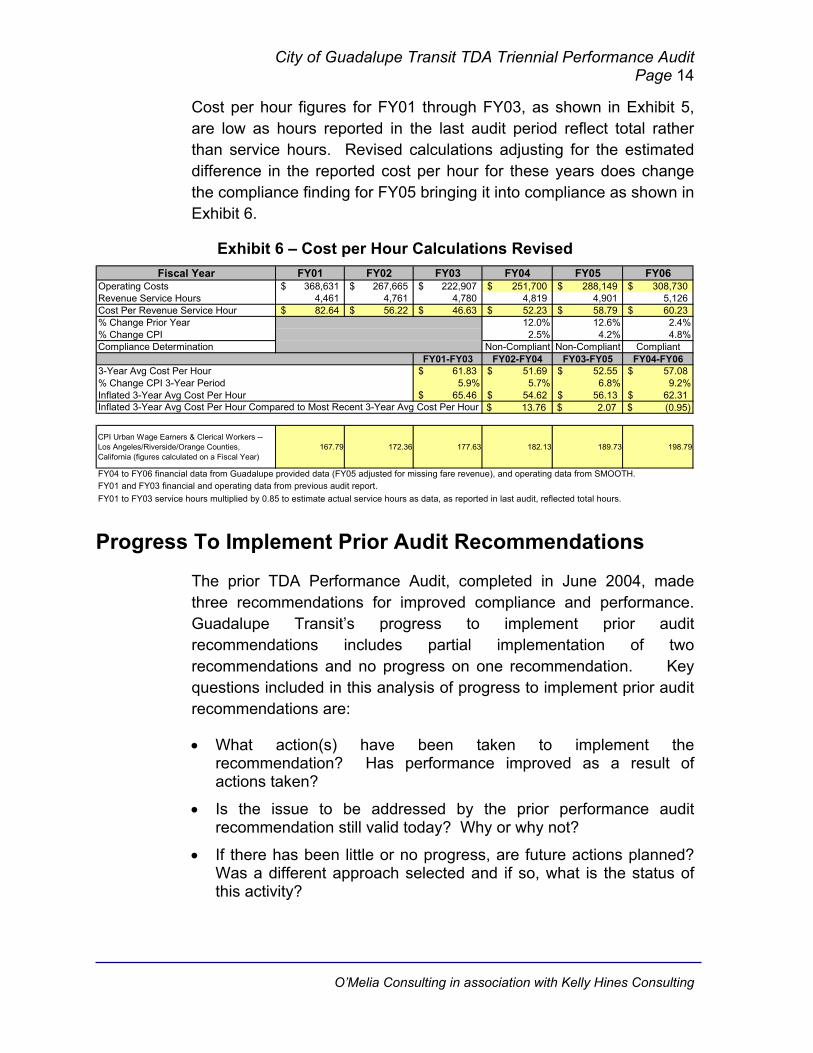
City of Guadalupe Transit TDA Triennial Performance Audit Page 14
Cost per hour figures for FY01 through FY03, as shown in Exhibit 5, are low as hours reported in the last audit period reflect total rather than service hours. Revised calculations adjusting for the estimated difference in the reported cost per hour for these years does change the compliance finding for FY05 bringing it into compliance as shown in Exhibit 6.
Exhibit 6 – Cost per Hour Calculations Revised Fiscal Year FY01 FY02 FY03 FY04 FY05 FY06
Operating Costs 368,631$ 267,665$ 222,907$ 251,700$ 288,149$ 308,730$ Revenue Service Hours 4,461 4,761 4,780 4,819 4,901 5,126 Cost Per Revenue Service Hour 82.64$ 56.22$ 46.63$ 52.23$ 58.79$ 60.23$ % Change Prior Year 12.0% 12.6% 2.4%% Change CPI 2.5% 4.2% 4.8%Compliance Determination Non-Compliant Non-Compliant Compliant
FY01-FY03 FY02-FY04 FY03-FY05 FY04-FY0661.83$ 51.69$ 52.55$ 57.08$ 5.9% 5.7% 6.8% 9.2%
65.46$ 54.62$ 56.13$ 62.31$ $ 13.76 $ 2.07 $ (0.95)
CPI Urban Wage Earners & Clerical Workers -- Los Angeles/Riverside/Orange Counties, California (figures calculated on a Fiscal Year)
167.79 172.36 177.63 182.13 189.73 198.79
FY01 to FY03 service hours multiplied by 0.85 to estimate actual service hours as data, as reported in last audit, reflected total hours.
Inflated 3-Year Avg Cost Per HourInflated 3-Year Avg Cost Per Hour Compared to Most Recent 3-Year Avg Cost Per Hour
FY04 to FY06 financial data from Guadalupe provided data (FY05 adjusted for missing fare revenue), and operating data from SMOOTH.FY01 and FY03 financial and operating data from previous audit report.
3-Year Avg Cost Per Hour% Change CPI 3-Year Period
Progress To Implement Prior Audit Recommendations
The prior TDA Performance Audit, completed in June 2004, made three recommendations for improved compliance and performance. Guadalupe Transit’s progress to implement prior audit recommendations includes partial implementation of two recommendations and no progress on one recommendation. Key questions included in this analysis of progress to implement prior audit recommendations are:
• What action(s) have been taken to implement the recommendation? Has performance improved as a result of actions taken?
• Is the issue to be addressed by the prior performance audit recommendation still valid today? Why or why not?
• If there has been little or no progress, are future actions planned? Was a different approach selected and if so, what is the status of this activity?
O’Melia Consulting in association with Kelly Hines Consulting

City of Guadalupe Transit TDA Triennial Performance Audit Page 15
Exhibit 7 summarizes progress relative to prior performance audit recommendations. Findings of “Implemented, Partially Implemented, or Not Implemented” are made for each recommendation.
Exhibit 7 – Progress To Implement Prior Performance Audit Recommendations
Prior Audit Recommendations
Prior Audit Findings Leading to
Recommendation Compliance
Finding Implementing Actions &
Results
1. Develop a Short-Range Transit Plan, including basic performance standards for the City’s transit services.
The City did not have established goals, objectives or performance measures/standards for its transit services. An SRTP was recommended to identify these standards, and assess performance separately for each type of service.
Not Implemented
The City indicates that development of an SRTP is planned for FY08. The City, in coordination with SMOOTH, did develop an ADA Paratransit Plan, which identified the eligibility criteria, application process, fare structure, reservation policy, and no-show/cancellation policy.
2. Record and track operating costs, service hours, miles, passengers, and fares collected consistently for all of the transit services the City offers. These records should be recorded and reported separately for each of the three services.
During the last audit period, costs were not recorded separately for the three types of service and operating data, though collected separately, was not consistently reported.
Partially Implemented
During the audit period, SMOOTH began to track costs and service hours and miles separately for the two fixed route services but has never separately tracked farebox revenues. ADA passengers and service hours were tracked separately, but not ADA revenue miles or passenger fares.
3. Improve marketing efforts for demand-responsive services.
During the last audit period, availability of ADA service was marketed by ‘word of mouth’. Nothing was in print.
Partially Implemented
In FY04, SMOOTH and the City conducted an outreach campaign to inform Guadalupe residents of the ADA service. This effort consisted of posters on fixed route transit buses and outreach to community groups. Knowledge of the service is still largely spread by word of mouth. There is still no published brochure about the service. The City is in the process of constructing its website which will include information on the ADA service.
O’Melia Consulting in association with Kelly Hines Consulting

City of Guadalupe Transit TDA Triennial Performance Audit Page 16
Data Verification
Included in the review of transit operators is the regulatory requirement (i.e., PUC Section 99247) that performance audits include a verification of five data items including:
• Operating Cost. The total cost of running a transit operation, exclusive of capital expenditures, depreciation, direct costs of providing charter service and vehicle lease costs.
• Total Passengers. The total number of unlinked trips; all passenger boardings whether revenue producing or not.
• Total Vehicle Service Hours. The total annual number of hours that vehicles are in revenue service. Excluded is travel to and from storage facilities and other deadhead travel. Also referred to as Revenue Hours.
• Total Vehicle Service Miles. The total annual number of miles that vehicles are in revenue service. Miles traveled to and from storage facilities and other deadhead travel are excluded. Also referred to as Revenue Miles.
• Employee Equivalents. The total actual regular and overtime employee pay hours divided by 2,000 hours. Contract employees are included, but not volunteers. Also referred to as FTEs.
Guadalupe Transit is in full compliance with two of five, and in partial compliance with three of five data definitions and methods of data collection as summarized in Exhibit 8 and described below.
Exhibit 8 – Verified Data Elements for TDA Performance Indicators
Data Items & Mode Fiscal Year 2004 Fiscal Year
2005 Fiscal Year
2006
Operating Costs
Compliance: Depreciation was identified separately and costs were reported consistently.
Partial Compliance: Depreciation was identified separately but operating costs did not include fare revenues retained by the contract operator.
Could not be determined as FY06 audited data not yet available.
Total Passengers
Full Compliance: Passengers reflect a 100% headcount of passenger boardings.
Full Compliance: Passengers reflect a 100% headcount of passenger boardings.
Full Compliance: Passengers reflect a 100% headcount of passenger boardings.
O’Melia Consulting in association with Kelly Hines Consulting

City of Guadalupe Transit TDA Triennial Performance Audit Page 17
Data Items & Mode Fiscal Year 2004 Fiscal Year
2005 Fiscal Year
2006
Total Vehicle Service Hours
Full Compliance: Service hours are based on scheduled service adjusted for exceptions for fixed route service. ADA service is based on service between first pick up and last drop-off.
Full Compliance: Service hours are based on scheduled service adjusted for exceptions for fixed route service. ADA service is based on service between first pick up and last drop-off.
Full Compliance: Service hours are based on scheduled service adjusted for exceptions for fixed route service. ADA service is based on service between first pick up and last drop-off.
Total Vehicle Service Miles
Partial Compliance: Service miles are based on scheduled service adjusted for exceptions for fixed route service. However, service miles were not tracked for ADA service during the audit period.
Partial Compliance: Service miles are based on scheduled service adjusted for exceptions for fixed route service. However, service miles were not tracked for ADA service during the audit period.
Partial Compliance: Service miles are based on scheduled service adjusted for exceptions for fixed route service. However, service miles were not tracked for ADA service during the audit period.
Employee Equivalents
Partial Compliance: Employee compensation divided by an average hourly rate divided by 2,000. Paid time off is incorrectly included in the calculation.
Partial Compliance: Employee compensation divided by an average hourly rate divided by 2,000. Paid time off is incorrectly included in the calculation.
Partial Compliance: Employee compensation divided by an average hourly rate divided by 2,000. Paid time off is incorrectly included in the calculation.
The process for compiling and/or calculating the five required data elements is as follows:
• Operating Costs – City operating costs for the Guadalupe Transit service consist of contractor payments to SMOOTH and City overhead. Depreciation and capital expenditures are tracked separately for the system. However, in booking contractor invoice payments in FY05, fare revenue retained by the contractor and deducted from the gross costs of the contractor to produce a net invoice amount were not counted as operating costs. The impact of this error is estimated at $52,000 in FY05 – the amount of fare revenue retained by SMOOTH. The consistency of reported financial data for Guadalupe Transit is shown in Exhibit 9. Given the low amounts of fare revenue reported for both FY04 and FY05 in financial audits suggests that the fare revenue retained by the
O’Melia Consulting in association with Kelly Hines Consulting

City of Guadalupe Transit TDA Triennial Performance Audit Page 18
contractor was incorrectly accounted for in FY05 (corresponding to the under-recording costs) and in FY04 though operating costs were correctly recorded in FY04.
Exhibit 9 – Financial Data Consistency Review
FY 2004 FY 2005 FY 2006Guadalupe Provided Data 251,700$ 236,115$ 308,730$ Financial Audit 251,701$ 249,716$ N/ASMOOTH Provided Data 43,712$ 52,004$ 52,128$ Financial Audit 825$ 1,359$ N/A
Operating Costs
Operating Revenue
TDA Statistic Audit Review PeriodSource
• Passengers – As the contract operator, SMOOTH conducts a 100% headcount of passenger boardings.
• Vehicle Service Hours – Schedule based hours, by weekday and Saturday, are multiplied by a fixed revenue hours per day to arrive at total service hours. Exceptions are noted and added or subtracted, as needed, to the schedule-based totals.
• Vehicle Service Miles – Same as vehicle service hours.
• Employee Full-Time Equivalents – SMOOTH employee salaries are divided by an average employee hourly rate and then divided by 2,000. However, this calculation does not exclude paid time off as required by the definition.
A data consistency analysis was not conducted for operating statistics as Guadalupe Transit did not prepare any reports to external agencies against which SMOOTH-provided data could be compared.
TDA Performance Indicator Trends
California Public Utilities Code Section 99246 (d) states that performance audits of transit operators shall include a verification of performance indicators defined in the Public Utilities Code Section 99247. These performance indicators include:
• Operating Cost Per Vehicle Service Hour • Operating Cost Per Passenger • Passengers Per Vehicle Service Hour • Passengers Per Vehicle Service Mile • Vehicle Service Hours Per Employee.
O’Melia Consulting in association with Kelly Hines Consulting

City of Guadalupe Transit TDA Triennial Performance Audit Page 19
Trends for these five TDA performance indicators are presented below for the period FY03 to FY06, and FY04 to FY06 due to suspect data for FY03. Performance indictor trends involving costs are also compared to the Consumer Price Index – Urban Wage Earners and Clerical Workers for the Los Angeles-Riverside-Orange County area.
TDA Performance Indicator Trends – FY03 to FY06 Trends
Exhibit 10 presents TDA performance indicators for Guadalupe Transit for the period FY03 through FY06. As noted previously, service hours reported by SMOOTH for FY03 actually reflect total hours. As such, service hours shown in Exhibit 10 reflect service hours reported in the last performance audit, adjusted downward by 15%. Because of the concern over the quality of the FY03 data, trends for the period FY04 to FY06 are also shown in Exhibit 10.
Additionally, TDA indicators are presented for the entire system as SMOOTH and the City did not track all operating data separately by mode during the audit period. Requests made, as part of this audit, for data by mode has made SMOOTH aware of the need to track all data items separately by mode and SMOOTH has implemented this practice for FY08. SMOOTH began tracking farebox revenue separately by mode in FY07, recognizing the impact of the low Shuttle fares on system-wide farebox recovery.
Exhibit 10 – TDA Performance Indicators – FY03 to FY06
FY 2004 FY 2005 FY 2006Operating Costs $ 222,907 $ 251,700 $ 288,149 $ 308,730 38.5% 22.7%Passengers 68,959 92,120 89,571 103,009 49.4% 11.8%Vehicle Service Hours 4,780 4,819 4,901 5,126 7.2% 6.4%Vehicle Service Miles 56,879 82,130 77,811 76,475 34.5% -6.9%Employee Full-Time Equivalents 5.0 3.5 3.3 3.6 -28.4% 2.0%Farebox Revenues $ 46,538 $ 43,712 $ 52,004 $ 52,128 12.0% 19.3%Operating Cost Per Vehicle Service Hour $ 46.63 $ 52.23 $ 58.79 $ 60.23 29.2% 15.3%Operating Cost Per Passenger $ 3.23 $ 2.73 $ 3.22 $ 3.00 -7.3% 9.7%Passengers Per Vehicle Service Hour 14.4 19.1 18.3 20.1 39.3% 5.1%Passengers Per Vehicle Service Mile 1.21 1.12 1.15 1.35 11.1% 20.1%Vehicle Service Hours Per Employee FTE 956 1,373 1,499 1,432 49.8% 4.3%Farebox Recovery Ratio 20.9% 17.4% 18.0% 16.9% -19.1% -2.8%Percent Change in the CPI - 2.5% 4.2% 4.8% 11.9% 9.2%
Percent Change FY 2004 to FY 2006
Note: Financial data from City financial summaries. FY05 data revised to include farebox revenues that were incorrectly booked by City staff. Service statistics and farebox revenues provided by SMOOTH, the contract operator. FY03 data from previous performance audit - service hours adjusted downward by 15% to account for total hours reported in FY03. Includes intercity fixed route, local fixed route, and demand response service.
Verified TDA Statistics & Performance Indicators
Base Year FY 2003
Audit Review Period Percent Change FY 2003 to FY 2006
• Operating Cost Per Vehicle Service Hour is a measure of cost efficiency. During the audit review period, cost per hour increased by 29.2% compared to CPI growth of 11.9%. However, 12% of this growth (41%) occurred between FY03 and FY04 when the operations contract was re-procured. Costs per hour continued to
O’Melia Consulting in association with Kelly Hines Consulting

City of Guadalupe Transit TDA Triennial Performance Audit Page 20
increase through FY05 due to the age of the Guadalupe Transit fleet. In 2005, a new Gillig bus was received and cost growth leveled off in FY06. The growth in ADA service over the audit period also contributed somewhat to increased costs as a higher cost per hour is paid to SMOOTH for this service, which utilizes SMOOTH-provided vehicles. The impact, however, is small as the number of ADA passengers served in FY06 was just 106.
• Operating Cost Per Passenger is a measure of cost effectiveness. During the audit period, cost per passenger declined by 7.3% as passengers increased by 49%. Guadalupe Transit’s ridership exceeds the City’s population by more than 17 times, equivalent to providing each resident of Guadalupe with 17 transit trips each year.
• Passengers Per Vehicle Service Hour is a measure of service productivity. Passengers per hour increased by more than 39% as 49% more passengers were carried with just 7% more service hours. Passengers per hour of 20.1 in FY06 reflects, in large part, the utilization of the Flyer service by Guadalupe high school students who must commute to Santa Maria each day for school.
• Passengers Per Vehicle Service Mile also measures service productivity. Passengers per service mile also increased over the audit period but not at the rate of growth in passengers per hour, 11.1% versus 39.3%. It is suspected that revenue miles reported in FY03 was not calculated correctly as the Guadalupe Transit schedules have not changed. From FY04 to FY06, passengers per mile did increase from 19.1 to 20.1 – an improvement of 5.2%.
• Vehicle Service Hours Per Employee measures labor productivity. Like service miles, employee FTE data for FY03 is suspect and most likely reflects an employee headcount. From FY04 to FY06, labor productivity improved by 4.2% with an additional 59 service hours provided per FTE in FY06 compared to FY04.
Operating costs presented for FY 2006 are preliminary figures because the FY 2006 Financial Audit has yet to be completed.
O’Melia Consulting in association with Kelly Hines Consulting

City of Guadalupe Transit TDA Triennial Performance Audit Page 21
III. FUNCTIONAL AREA PERFORMANCE RESULTS
A high level review of functional area performance was conducted for select functions including:
• Transportation Operations • Vehicle Maintenance • Administration and Planning
Information used in this section was obtained through document reviews, management interviews, and internal reports.
Transportation Operations Operations Contract
SMOOTH has been the contract operator for Guadalupe Transit since the City took over system administration in 1999. The contract in place during most of the audit period covered FY05 and FY06, and ran through FY07. The contract included provisions for additional option years with hourly rates to be negotiated between the City and SMOOTH. However, the negotiated rate provision was found to be in violation of federal procurement rules and the City was forced to re-procure for transit operations services for FY08. SMOOTH was the successful, and only, bidder on the latest contract, which covers FY08 through FY10 plus three option years.
The Flyer and Shuttle services are paid at the same vehicle revenue hour rate, while the ADA paratransit service is paid at a higher vehicle revenue hour rate reflecting SMOOTH’s use of its own vehicles (and associated maintenance costs) for the ADA service. Insurance costs are passed through to the City; fuel is not.
There are no performance incentives or penalties in the contract. While incorporation of incentives and/or penalties in a service contract is an industry best practice, additional work is required by City Staff to 1) develop appropriate performance standards and benchmarks for its different types of service and, 2) refine data collection processes to
O’Melia Consulting in association with Kelly Hines Consulting

City of Guadalupe Transit TDA Triennial Performance Audit Page 22
support ongoing monitoring of the standards, before contractor performance can be reliably measured and contractually enforced.
ADA Paratransit Program and Policies
In May 2006, the City, in coordination with SMOOTH, completed its ADA Paratransit Plan, which includes the following elements:
• Description of fixed route services
• Description of demand response services including operating hours and service area
• System fares
• Fleet description – both City and SMOOTH vehicles used for paratransit service
• ADA certification process
• Trip reservation policy
• No-show, cancellation, and late arrival policy
Application reviews and eligibility decisions are made by SMOOTH. However, the application is not comprehensive (i.e., no physician’s report is required) and, as such, an application has never been turned down. As the ADA paratransit service has grown in popularity, the City and SMOOTH will need to reconsider its application review process. Between FY06 and FY07, ADA ridership grew by 85%, from 170 in FY06 to 315 in FY07. With an aging population and the higher than average disabled status of City residents (23.4% of Guadalupe residents versus 16% of Santa Barbara County residents), demand for the more expensive ADA service is expected to grow.
SMOOTH accepts trip requests during regular office hours, which are Monday through Friday from 6:15 am to 6:15 pm, and Saturday from 8:15 am to 5:15 pm. Trips may be requested as far in advance as needed, but SMOOTH advises that trips are best made at least 24 hours in advance. SMOOTH has been meeting the ADA requirement of accommodating requests made the day before a trip is needed as opposed to the recommended 24 hours notice in its trip reservation policy. However, as the ADA requirement is the less restrictive “day
O’Melia Consulting in association with Kelly Hines Consulting

City of Guadalupe Transit TDA Triennial Performance Audit Page 23
before” rather than 24 hours notice for a trip, the City and SMOOTH should revise their policy to reflect the “day before” requirement. SMOOTH will provide same day service if space allows.
The City has adopted a no-show, cancellation, and late passenger policy. A trip must be cancelled at least one hour prior to the scheduled pick-up, and a passenger is considered late if they are not at their pick-up location within five minutes of the scheduled pick-up time. After a no-show, improper cancellation, or a late arrival, SMOOTH will follow up with a passenger via telephone to remind them of the policy. Abuse of the policy (i.e. five or more occurrences in four months) will result in a suspension from use of the service for one month. Consideration is given to passengers for events out of their control and any suspension that is imposed may be appealed by the passenger.
While the ADA eligibility process and use policies have been adopted, the information is not summarized in a passenger friendly format such as a brochure or Rider’s Guide, reflecting the loose application of service policies. The City is updating its website which will include such information but a publishable how-to or FAQ guide for distribution on Guadalupe Transit vehicles, at City Hall, and at community centers is warranted. Development and dissemination of an ADA paratransit brochure will improve service quality by making the information readily available to those who need it. While the dissemination of the information could result in additional demand for the ADA service, making the ADA eligibility criteria, application process, and service policies more broadly known will help the City to enforce ADA eligibility criteria and service policies, giving the City more control over the growth of the service.
Driver Training
SMOOTH’s driver training program consists of 20 hours of classroom and 20 hours of behind-the-wheel training, as well as route familiarization training as required by the City of Guadalupe Transit contract. To the extent possible, SMOOTH policy is to cross-train all drivers on all of SMOOTH’s services to maximize the availability of drivers to meet service demands. As any driver could be assigned to a City of Guadalupe route, the level of training required by the Guadalupe contract was adopted as the SMOOTH standard for all new
O’Melia Consulting in association with Kelly Hines Consulting

City of Guadalupe Transit TDA Triennial Performance Audit Page 24
driver training. SMOOTH drivers hold a Class B license with Passenger Endorsement, Air Brakes, and Transit Certificate.
All new drivers receive a 90-day evaluation, and are evaluated annually thereafter. Additionally, SMOOTH carefully tracks the required eight hours of annual re-training required of commercial passenger drivers. Mandatory safety meetings are held monthly.
Fare Handling
Guadalupe Transit buses have standard locked fareboxes, which are removed at the end of each day by the driver or the office closer. Boxes are stored in the Office Manager’s office and counted daily by the Office Manager. Starting in FY07, fares are tracked separately by mode. Cash deposits are made every Monday, Wednesday, and Friday. Bank deposit slips are verified against cash count sheets. Fare revenues are retained by SMOOTH and netted out from the monthly invoice to the City.
The fare handling process could be improved by introducing a second counter into the process. As a precautionary measure, SMOOTH’s Executive Director occasionally counts farebox revenues on a Saturday in advance of staff counts. With a 15% growth in ridership between FY05 and FY06, fare revenues remained virtually unchanged. SMOOTH attributes most of the issue to the volatility in Shuttle fares, which are just $0.25 for regular riders and $0.10 for seniors, the disabled, and youth. At $0.25, the Shuttle fare is consistent with other local community circulator transit services in the state. However, now that farebox revenues are being tracked separately by mode, the City and SMOOTH will be able to more closely track modal farebox recovery performance and identify any areas of concern in the fare collection and reconciliation process.
Vehicle Maintenance
During the audit period, Guadalupe Transit fixed route services were provided with three 29-foot transit vehicles:
• A 2005 Gillig with 32 seated passenger capacity (received during the audit period)
• A 2000 El Dorado with a 28 seated passenger capacity
O’Melia Consulting in association with Kelly Hines Consulting

City of Guadalupe Transit TDA Triennial Performance Audit Page 25
• A 1993 MST with a 26 seated passenger capacity (spare vehicle).
During the conduct of this audit, the City received a new 2007 Gillig, replacing the 1993 MST and lowering the average vehicle age of the fleet from 7.7 years to three years.
During the audit period, SMOOTH was responsible for maintaining City vehicles but the costs were billed to the City of Guadalupe. However, this practice was changed in FY07 and now SMOOTH pays for maintenance work and bills the City as part of the monthly invoice. Warranty work on the City’s new vehicles is performed by Gibbs.
As indicated previously, SMOOTH uses its own vehicles for the Guadalupe ADA paratransit service. As such, SMOOTH is paid a higher hourly rate for this service as it is inclusive of maintenance costs. SMOOTH employs a single part-time mechanic for the routine maintenance activity – 45-day interval A and B inspections – on SMOOTH’s vehicle fleet. Heavy repair work is performed by outside vendors, with any warranty work on covered vehicles performed by authorized shops.
All vehicles are fueled by the drivers at the City of Santa Maria City Yard under a Memorandum of Understanding between the City of Santa Maria and SMOOTH. SMOOTH reports that this agreement is saving them approximately $0.70 per gallon over purchasing fuel in the open market.
Administration and Planning Contract Administration
SMOOTH’s Executive Director reports directly City’s Finance Director with additional oversight and reporting assistance provided by the City Administrator. Invoice review and approval resides with the Finance Director. Both the contractor and the City report open and candid communications and, since the end of the audit period, have established a monthly Transit Meeting to discuss prior month invoices, operational issues, data reporting, and planning activities.
O’Melia Consulting in association with Kelly Hines Consulting

City of Guadalupe Transit TDA Triennial Performance Audit Page 26
While oversight activities have improved since the audit period with the filling of the Finance Director vacancy in the Fall of 2006, the City is still very reliant on SMOOTH for data reporting, planning, and administrative activities in general, reflecting the lack of transit expertise at the City and the lack of a dedicated Transit employee whose sole or primary responsibility is transit system oversight and administration.
The City has benefited tremendously from its relationship with SMOOTH, more so recently with the development of the ADA Paratransit Plan and SMOOTH’s assistance with preparation of TDA claims and federal 5311 reporting. However, as SMOOTH is a competitively-procured contract operator, the division of responsibilities between the City and SMOOTH should be more clearly defined so as to make the City truly responsible for system administration and oversight. The current relationship is more reflective of the first year of Guadalupe Transit service when it was provided through the City of Santa Maria. SRTP development in FY08 (discussed below) will be a critical step in getting the City to have more ownership of the transit service.
Planning
While the City did prepare the ADA Paratransit Plan during the audit period, the Plan was not a service planning document but rather a policy document, defining the operation of the ADA paratransit service. As Guadalupe Transit enters its tenth year of operation, preparation of a Short Range Transit Plan is warranted. The City has recognized this need and is preparing to undertake the SRTP process in FY08.
A major impetus for the SRTP is a potential new development on the southern end of Guadalupe on the DJ Farms property. The development, if approved, will add 50% more residents to the City over a ten-year period. How Guadalupe Transit services will be modified to meet the needs of these new residents will be a primary component of the SRTP. As the City undertakes this process, the following elements should be included in the plan:
• Performance measures and standards such as those assessed as part of this audit process or in the North County Santa Barbara Transit Plan as shown in Exhibit 11, and unique to the
O’Melia Consulting in association with Kelly Hines Consulting

City of Guadalupe Transit TDA Triennial Performance Audit Page 27
different operational characteristics of its three services, should be adopted. Service quality measures to capture roadcall and complaint information should also be included. The City may wish to consider incorporating these performance measures into its next transit operations contract in the form of incentives and/or penalties for meeting (or failing to meet) minimum performance requirements.
Exhibit 11 -- Guadalupe Transit 2006 Performance & Regional Standards Operating Cost per Passenger
Operating Cost per Service Hour
Passengers per Hour
Farebox Recovery Ratio
Standard - Local Service <$5.00 $50 15 10%Standard - Regional Service <$15.00 $80 10 10%Guadalupe Transit $3.00 $60.23 20.1 17%Standard as indicated in the North Santa Barbara County Transit Plan (10/19/2006), except Farebox Recovery which is TDA requirement.
• Examination of farebox recovery by service type – Flyer, Shuttle, and ADA paratransit – to assess the impacts of each on the system-wide farebox recovery ratio.
• An assessment of demand for ADA paratransit demand and future growth, including the cost impacts of meeting this demand, including consideration of the following:
a) Supplementing ADA paratransit service with taxi vouchers
b) Coordination with SMAT’s ADA paratransit services and SMOOTH’s senior dial-a-ride service
c) Implementation of a Mobility Training Program to train current and future paratransit users on how to use the fixed route system.
d) Enforcement of the eligibility criteria for the ADA service.
O’Melia Consulting in association with Kelly Hines Consulting
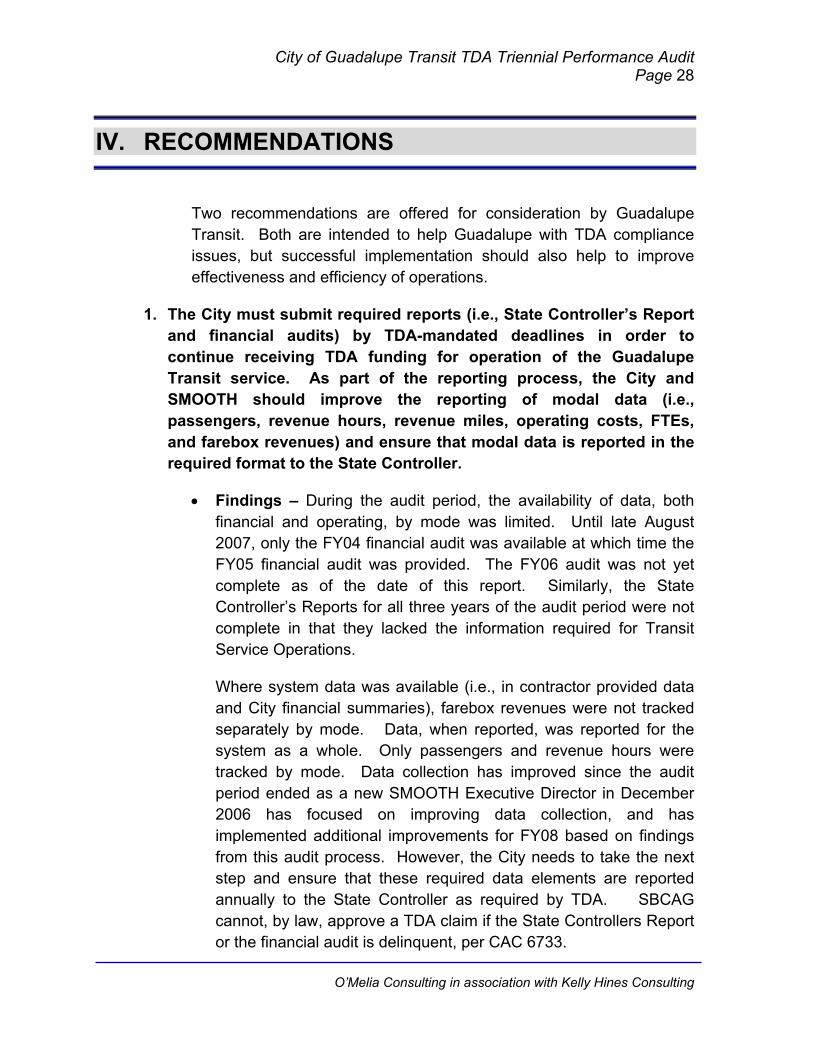
City of Guadalupe Transit TDA Triennial Performance Audit Page 28
IV. RECOMMENDATIONS
Two recommendations are offered for consideration by Guadalupe Transit. Both are intended to help Guadalupe with TDA compliance issues, but successful implementation should also help to improve effectiveness and efficiency of operations.
1. The City must submit required reports (i.e., State Controller’s Report and financial audits) by TDA-mandated deadlines in order to continue receiving TDA funding for operation of the Guadalupe Transit service. As part of the reporting process, the City and SMOOTH should improve the reporting of modal data (i.e., passengers, revenue hours, revenue miles, operating costs, FTEs, and farebox revenues) and ensure that modal data is reported in the required format to the State Controller.
• Findings – During the audit period, the availability of data, both financial and operating, by mode was limited. Until late August 2007, only the FY04 financial audit was available at which time the FY05 financial audit was provided. The FY06 audit was not yet complete as of the date of this report. Similarly, the State Controller’s Reports for all three years of the audit period were not complete in that they lacked the information required for Transit Service Operations.
Where system data was available (i.e., in contractor provided data and City financial summaries), farebox revenues were not tracked separately by mode. Data, when reported, was reported for the system as a whole. Only passengers and revenue hours were tracked by mode. Data collection has improved since the audit period ended as a new SMOOTH Executive Director in December 2006 has focused on improving data collection, and has implemented additional improvements for FY08 based on findings from this audit process. However, the City needs to take the next step and ensure that these required data elements are reported annually to the State Controller as required by TDA. SBCAG cannot, by law, approve a TDA claim if the State Controllers Report or the financial audit is delinquent, per CAC 6733.
O’Melia Consulting in association with Kelly Hines Consulting

City of Guadalupe Transit TDA Triennial Performance Audit Page 29
• Suggested Actions – The City should submit the Transit Operators Financial Transactions report to the State Controller by the required deadline, identified in TDA law as 90 days following the end of the fiscal year (i.e., September 30). However, the State Controller varies the due date from year-to-year depending on the availability of the electronic reporting system. Reports are generally due in September or October. Reports may be submitted electronically or on paper. The due date for the electronically filed report is later than that for the paper report. At the very least, the City needs to submit the FY06 reports to remain eligible for FY08 TDA funds.
Additionally, a separate report is required for fixed route service (Shuttle and Flyer) and the ADA paratransit service. Both reports should contain cost, revenue, and operating data unique to the service(s) in each report.
The City should submit the annual fiscal audit to SBCAG by 180 days following the end of the fiscal year, or request a 90-day extension.
• Expected Results – Implementation of this recommendation will bring the City of Guadalupe into compliance with State Controller Reporting (PUC 99243), financial audit reporting (PUC 99245), and TDA data definition (PUC 99247) requirements.
2. The City of Guadalupe should investigate alternative approaches to providing transit system administration and oversight, so that the City and/or its agent provides true value added in continuing to receive TDA funds for transit service and administering that service.
• Findings – The City is heavily dependent on its contract operator for regulatory reporting requirements such as TDA claims and service planning activities such as SRTP development. Fortunately, the City has benefited from a conscientious contract operator that is dedicated to the success of Guadalupe Transit and has gone above and beyond the typical roles of a contract operator to assist the City with its transit administration activities. However, as a contract operator, SMOOTH may assist the City in reporting
O’Melia Consulting in association with Kelly Hines Consulting

City of Guadalupe Transit TDA Triennial Performance Audit Page 30
and service planning activities, but the City is ultimately responsible for the service and compliance with State reporting requirements.
As a direct recipient of TDA funds, it is expected that the City provide value added in administering and monitoring City of Guadalupe Transit. The reliance on the contract operator for assistance with system performance monitoring, data reporting (including TDA claim preparation), and service planning calls into question the value of the City of Guadalupe (and its associated staff costs) as a recipient and expenditure of TDA funds.
• Suggested Actions – It is recommended that the City of Guadalupe take active steps to strengthen its system administration and oversight function or identify alternative means of providing this service. Several different approaches are in use by Cities in Santa Barbara County. The cities of Lompoc and Santa Maria have dedicated transit staff responsible for contract administration and system oversight. Solvang, on the other hand, relies on its Public Works Director and Finance Director for system oversight with support from an external transit consulting firm for service planning, marketing, and other administrative activities. Like Guadalupe, the City of Solvang has limited resources and is unable to devote a full-time staff person to the transit function. Guadalupe may wish to consider enlisting the assistance of a third party to provide assistance with contract administration, system oversight, and administrative reporting – perhaps adding these functions to the City Engineer’s contract.
Alternatively or additionally, the City should consider obtaining formal training for its staff on transit system management and the basics of transit operations. The National Transit Institute (NTI) offers two classes that may be of value to City staff - the Transit Academy and Transit Planning courses. Information is available on the NTI website. Similarly, the City should consider becoming an active member in a transit industry group such as CalACT or the California Transit Association (CTA) whose mission is to “support the needs of California’s public transit systems through advocacy and education”. Application of knowledge gained through these activities should help City staff gain a comfort level with the data-intensive nature of public transit, and make the data reporting,
O’Melia Consulting in association with Kelly Hines Consulting

City of Guadalupe Transit TDA Triennial Performance Audit Page 31
O’Melia Consulting in association with Kelly Hines Consulting
system monitoring, and service planning elements of public transit administration easier.
• Expected Results – Like the first recommendation, implementation of this recommendation will help the City to meet the regulatory requirements of TDA while, at the same time, empowering City staff to actively manage and improve the Guadalupe Transit system.

SANTA BARBARA METROPOLITAN TRANSIT DISTRICT
TDA TRIENNIAL PERFORMANCE AUDIT FOR FY 2004-2006
Fiscal Years Ending June 30th
Prepared by
OCTOBER 20, 2007

Santa Barbara MTD TDA Triennial Performance Audit Page i
TABLE OF CONTENTS
EXECUTIVE SUMMARY.................................................................... 1
Purpose of Audit.........................................................................................1
Findings......................................................................................................1
Recommendations .....................................................................................3
I. INTRODUCTION....................................................................... 4
Performance Audit Objectives and Approach.............................................4
System Overview .......................................................................................5
II. COMPLIANCE REVIEW......................................................... 12
Regulatory Requirements.........................................................................12
Progress To Implement Prior Audit Recommendations ...........................14
Data Verification.......................................................................................16
TDA Performance Indicator Trends..........................................................18
III. FUNCTIONAL AREA PERFORMANCE RESULTS............... 20
Transportation Operations........................................................................20
Vehicle Maintenance................................................................................22
Administration, Planning, and Budget ......................................................24
IV. RECOMMENDATIONS........................................................... 30
APPENDIX A: FINANCIAL AUDIT EXPENSE DATA ..................... 34
O’Melia Consulting

Santa Barbara MTD TDA Triennial Performance Audit Page ii
LIST OF EXHIBITS
1. Performance Audit Sources ...........................................................................5
2. Organization Chart.........................................................................................6
3. MTD Goals.....................................................................................................7
4. Regulatory Compliance Matrix .....................................................................12
5. Progress To Implement Prior Audit Recommendations ...............................14
6. MTD Performance Standards ......................................................................15
7. Methods of Data Collection..........................................................................16
8. Data Reporting Consistency ........................................................................17
9. TDA Performance Indicators........................................................................18
10. Transportation Operations Performance Indicators ....................................21
11. Vehicle Maintenance Performance Indicators ............................................22
12. Administrative Performance Indicators ........................................................24
13. MTD Loss Claims History............................................................................25
14. Employee Paid Work Hours........................................................................26
15. Planning and Budget Performance Indicators.............................................27
16. Average Daily Boardings ............................................................................28
O’Melia Consulting
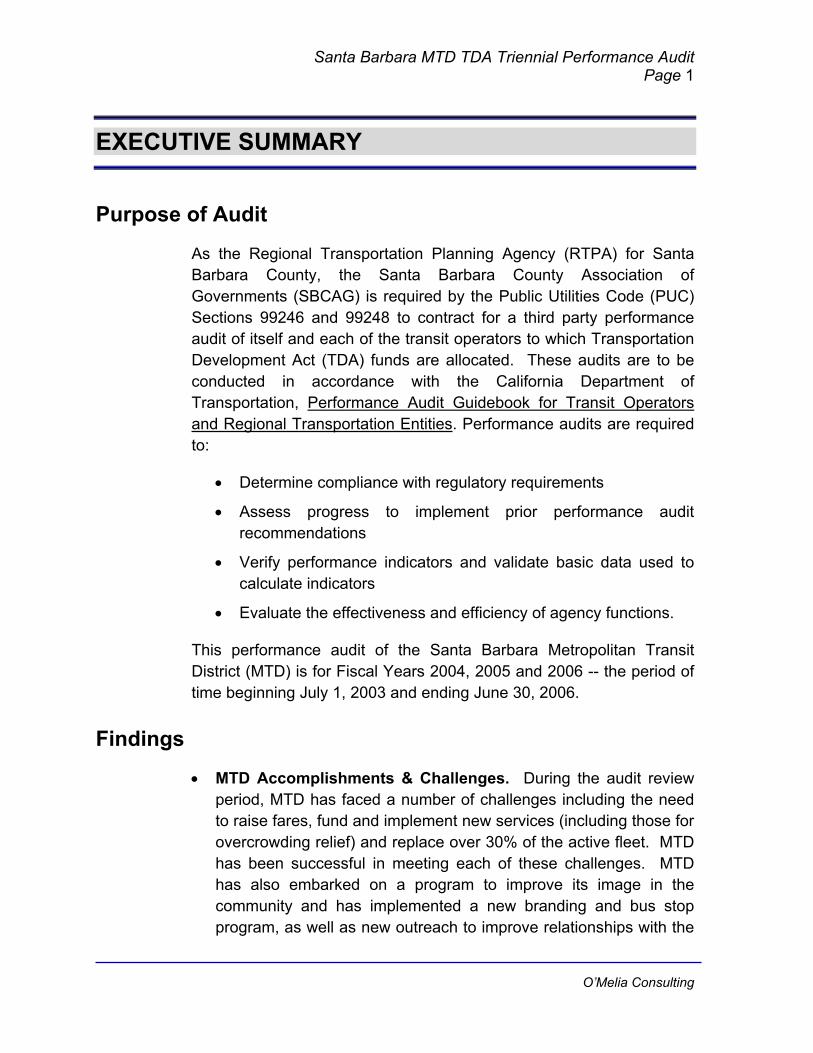
Santa Barbara MTD TDA Triennial Performance Audit Page 1
EXECUTIVE SUMMARY
Purpose of Audit
As the Regional Transportation Planning Agency (RTPA) for Santa Barbara County, the Santa Barbara County Association of Governments (SBCAG) is required by the Public Utilities Code (PUC) Sections 99246 and 99248 to contract for a third party performance audit of itself and each of the transit operators to which Transportation Development Act (TDA) funds are allocated. These audits are to be conducted in accordance with the California Department of Transportation, Performance Audit Guidebook for Transit Operators and Regional Transportation Entities. Performance audits are required to:
• Determine compliance with regulatory requirements
• Assess progress to implement prior performance audit recommendations
• Verify performance indicators and validate basic data used to calculate indicators
• Evaluate the effectiveness and efficiency of agency functions.
This performance audit of the Santa Barbara Metropolitan Transit District (MTD) is for Fiscal Years 2004, 2005 and 2006 -- the period of time beginning July 1, 2003 and ending June 30, 2006.
Findings
• MTD Accomplishments & Challenges. During the audit review period, MTD has faced a number of challenges including the need to raise fares, fund and implement new services (including those for overcrowding relief) and replace over 30% of the active fleet. MTD has been successful in meeting each of these challenges. MTD has also embarked on a program to improve its image in the community and has implemented a new branding and bus stop program, as well as new outreach to improve relationships with the
O’Melia Consulting

Santa Barbara MTD TDA Triennial Performance Audit Page 2
communities served, local jurisdictions and SBCAG. Ridership has increased by 4.3% and modest service increases of 2.2% were implemented. MTD has implemented new scheduling and maintenance software during the audit review period, hired a new General Manager, and made organizational changes in planning, operations, and risk management.
• Regulatory Requirements & Data Verification. MTD is in full compliance with PUC and CAC requirements with the exception that additional information from the Teamsters pension fund should be included in the annual audit. MTD is in compliance with TDA data definitions for operating costs, passengers and employee equivalents. MTD is not in compliance with reporting for revenue hours and revenue miles. Missed trips are not accounted for in the reported statistics. Recommendations to achieve compliance in the two areas noted are included in this audit.
• Progress To Implement Prior Audit Recommendations. MTD has fully implemented the two recommendations from the prior performance audit: (1) Complete the Short Range Transit Plan; and (2) Develop a simplified system of goals and objectives. MTD has a comprehensive system of performance monitoring and more importantly, management uses the results from this process to identify problem areas and take corrective action.
• TDA Performance Indicator Trends. Overall trends are positive for passenger productivity and labor productivity measures. Cost efficiency indicators, however, show increases in excess of inflation due primarily to rising fuel costs and one-time payouts for excess claims and environmental remediation at the Calle Real and Overpass sites.
• Transportation Operations. Transportation cost efficiency declined during the audit review period with costs per total service hour increasing by 18.2% compared to 11.9% inflation. Fuel costs had a negative impact on transportation cost efficiency with the average fuel cost per mile increasing from $0.25 in FY03 to $0.48 in FY06. Labor and fringe benefit costs per total service hour increased by 12.5%. The largest increase in labor and fringe benefit costs per hour came between FY05 and FY06. This is most
O’Melia Consulting

Santa Barbara MTD TDA Triennial Performance Audit Page 3
likely due to a change in paid work hour to platform hour ratio from 1.27 in FY05 to 1.31 in FY06.
• Vehicle Maintenance. In FY04, MTD began replacing 34% of the active fleet, resulting in a significant reduction in average fleet age. This reduction in average fleet age had a positive impact of vehicle reliability and cost efficiency. Miles between roadcalls increased by over 60% during the audit review period. In FY06, MTD operated 6,507 miles between roadcalls compared to a performance standard of 8,000. Vehicle maintenance costs per mile increased by 6.4% compared to an inflationary increase of 11.9%. Maintenance cost efficiency performance trends are positive.
• Administration, Planning and Budget. Administrative trends are mostly positive. Budget adherence is good, the farebox recovery ratio is outstanding, ridership is up, and labor productivity has improved. The possible exception in all of this good news is the cost growth in casualty and liability costs for the entire agency due in part to one time excess payments and an increase in the number of claims in both FY05 and FY06. More recent trends, however, indicate that MTD has taken action to improve safety performance. Training and Risk Management have been reorganized with increased attention being placed on safety, training, and claims management. The results of this strategy are evident in greatly improved results for FY07.
Recommendations
Three recommendations are offered for consideration by MTD.
1. MTD should include findings of compliance as required by CAC 6667 in the annual financial and compliance audit required by PUC Section 99245.
2. In calculating revenue hours and miles for external reporting, MTD should adjust scheduled hours and miles to account for all missed trips as well as unscheduled trippers and booster service.
3. MTD should consider including “Pay to Platform Hours’ as a Transportation Operations performance indicator and “Miles Between Roadcalls” as a Vehicle Maintenance performance indicator. Both areas show potential for improvement.
O’Melia Consulting

Santa Barbara MTD TDA Triennial Performance Audit Page 4
I. INTRODUCTION
Performance Audit Objectives and Approach
As the RTPA for Santa Barbara County, the Santa Barbara County Association of Governments (SBCAG) is required by the Public Utilities Code (PUC) Sections 99246 and 99248 to contract for a third party performance audit of itself and each of the transit operators to which Transportation Development Act (TDA) funds are allocated. These audits are to be conducted in accordance with the California Department of Transportation, Performance Audit Guidebook for Transit Operators and Regional Transportation Entities. Performance audits are required to:
• Determine compliance with regulatory requirements
• Assess progress to implement prior performance audit recommendations
• Verify performance indicators and validate basic data used to calculate indicators
• Evaluate the effectiveness and efficiency of agency functions.
This performance audit of the Santa Barbara Metropolitan Transit District (MTD) is for Fiscal Years 2004, 2005 and 2006 -- the period of time beginning July 1, 2003 and ending June 30, 2006.
While the performance audit is being conducted in response to State requirements, such audits can and should be constructive and useful to governing boards, SBCAG and transit operator management.
It is the Auditor’s responsibility to provide objective and balanced reporting of results. This is important because very few agencies are all good or all bad. It is the auditor's responsibility to conduct thorough and accurate analyses and objectively report performance findings. Significant accomplishments and positive performance trends are discussed as well as opportunities for improvement.
O’Melia Consulting
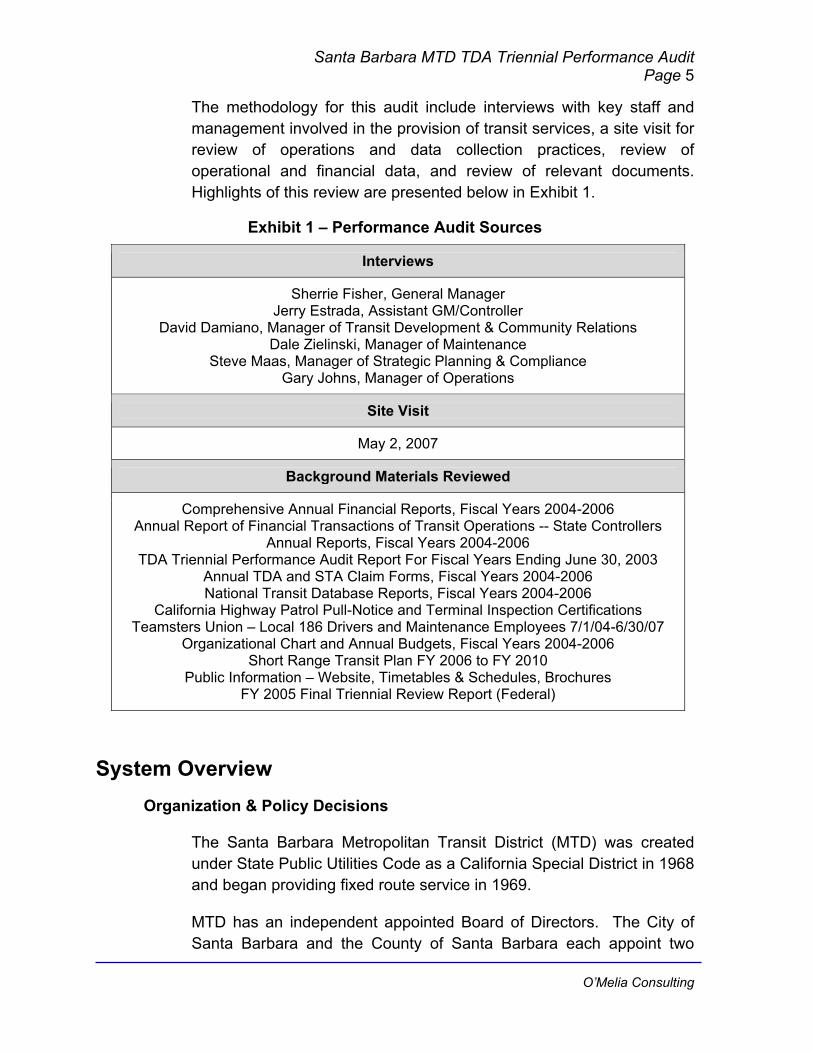
Santa Barbara MTD TDA Triennial Performance Audit Page 5
The methodology for this audit include interviews with key staff and management involved in the provision of transit services, a site visit for review of operations and data collection practices, review of operational and financial data, and review of relevant documents. Highlights of this review are presented below in Exhibit 1.
Exhibit 1 – Performance Audit Sources
Interviews
Sherrie Fisher, General Manager Jerry Estrada, Assistant GM/Controller
David Damiano, Manager of Transit Development & Community Relations Dale Zielinski, Manager of Maintenance
Steve Maas, Manager of Strategic Planning & Compliance Gary Johns, Manager of Operations
Site Visit
May 2, 2007
Background Materials Reviewed
Comprehensive Annual Financial Reports, Fiscal Years 2004-2006 Annual Report of Financial Transactions of Transit Operations -- State Controllers
Annual Reports, Fiscal Years 2004-2006 TDA Triennial Performance Audit Report For Fiscal Years Ending June 30, 2003
Annual TDA and STA Claim Forms, Fiscal Years 2004-2006 National Transit Database Reports, Fiscal Years 2004-2006
California Highway Patrol Pull-Notice and Terminal Inspection Certifications Teamsters Union – Local 186 Drivers and Maintenance Employees 7/1/04-6/30/07
Organizational Chart and Annual Budgets, Fiscal Years 2004-2006 Short Range Transit Plan FY 2006 to FY 2010
Public Information – Website, Timetables & Schedules, Brochures FY 2005 Final Triennial Review Report (Federal)
System Overview Organization & Policy Decisions
The Santa Barbara Metropolitan Transit District (MTD) was created under State Public Utilities Code as a California Special District in 1968 and began providing fixed route service in 1969.
MTD has an independent appointed Board of Directors. The City of Santa Barbara and the County of Santa Barbara each appoint two
O’Melia Consulting

Santa Barbara MTD TDA Triennial Performance Audit Page 6
Directors; these four Directors appoint the fifth Director. The Board of Directors is responsible for policy decisions including establishing fares, approval of service plans and approval of the annual budget. The Board of Directors appoints the General Manager, who is responsible for day-to-day management decisions and implementation of Board policy. A new General Manager was selected in FY 2005. Organizational changes followed in FY 2006.
The organizational chart for MTD as of March 28, 2007 is shown below in Exhibit 2.
Exhibit 2 – Organization Chart
O’Melia Consulting
Driver Trainer (1) Executive Assistant (2)Office Specialist (1)
Manager ofStrategic Planning
& Compliance
IT NetworkAdministrator
Asst. Manager (1)Clerk (1)
Security Officer (1)
Manager ofAccounting
Asst. Mgr.Marketing & CS (1)Graphic Design (1)
Bus StopMaintenance (1)
Asst. Mgr.Planning (1)
Sr. Scheduler (1)QA Officer/ Facilities (1)
Transit Develop.& Community
Relations
Facilities Specialist (1)Analyst (1)
PartsClerk (1)
MaterialsManager (1)
Mechanics (13)Utility Wkr (3)Lead Utility (1)
Srv Wkr (8)
Foreman (1)
Trainer (1)
Superintendent (1)
Manager ofMaintenance
Assistant (1)
Dispatcher (1)
Supervisors (7) Dirvers (134) Lead CS Rep (1)Cust. Serv. Rep(2 FT & 2 PT)
Superintendent (1)
Manager ofOperations
Adminsitrator (1)
Manager of HR& Risk
Management
Assistant GM/Controller
General Manager
Board of DirectorsChair, Vice Chair
Secretary & Directors

Santa Barbara MTD TDA Triennial Performance Audit Page 7
MTD Mission, Goals & Performance Objectives
The mission of MTD is to enhance the personal mobility of South Coast residents and visitors by offering safe, clean, reliable, courteous, accessible and cost-effective transit service throughout the district. MTD has eight goals, shown in Exhibit 3. During the audit review period, MTD reviewed its goals and objectives and developed a system of performance standards, as discussed in Section II of this report on implementation of prior audit recommendations.
Exhibit 3 – MTD Goals
• MTD shall provide a reliable, safe, comfortable and attractive means of transportation to those who lack other options, including elderly persons, persons with disabilities, student, and economically disadvantaged persons; and to those who use mass transit by choice.
• MTD shall maintain fares at the lowest feasible level that enables the recovery of operating expenses consistent with the financial plan contained in the adopted Short Range Transit Plan.
• MTD shall ensure the responsible expenditure of public funds, and shall continually seek improvements in its operating efficiency.
• MTD shall treat all individuals with fairness and respect, including passengers, employees, and all others involved in MTD activities.
• MTD shall work cooperatively with businesses, individuals, community organizations, and government agencies in planning and developing the best transit service possible within the limits of available funding.
• MTD shall comply with regional, state and federal goals of reducing traffic emissions and congestion through provision of an attractive alternative to the personal automobile.
• MTD shall continue to acquire feasible alternatively fueled buses. • MTD shall seek all reasonable means to satisfy public transportation needs.
Service Characteristics
• Service Area. MTD provides service in a 52 square mile area with a total population of 191,612. MTD serves the southern coast of the Santa Barbara County, including the cities of Santa Barbara, Goleta and Carpinteria. Unincorporated areas served include Isla Vista, Montecito, and Summerland. The University of California at Santa Barbara (UCSB), Santa Barbara City College (SBCC), and the Santa Barbara Municipal Airport are also included in the District.
• Fixed Route Bus Service. MTD provides service on 27 fixed routes, including 18 local and trunk routes, four express routes, four shuttle services, and a new commuter service. New services
O’Melia Consulting

Santa Barbara MTD TDA Triennial Performance Audit Page 8
implemented since 2004 include the Valley Express, which began operation in FY 2004, the Calle Real/Old Town Shuttle, Isla Vista/UCSB Shuttle, and the Mesa Loop. The first three years of operation and capital costs are funded with Federal CMAQ funds (80%) and local TDA funds (20%).
• Complementary ADA Paratransit Service. Easy Lift Transportation, Inc. is a private non-profit agency that provides complementary paratransit service throughout the MTD service area. MTD provides TDA funding to Easy Lift for transport of persons with disabilities who have been certified as being ADA eligible, according to a Memorandum of Understanding between the two agencies. Easy Lift submits monthly reports to MTD that enables MTD to fulfill federal requirements. Easy Lift operations, compliance with PUC requirements, and performance statistics are reported in a separate TDA Performance Audit report.
• Days & Hours of Operation. MTD provides service seven days a week, 363 days year – every day except Thanksgiving and Christmas. Weekday service operates from 5:25 am to 12:00 midnight. Saturday service operates from 6:00 am to 11:50 pm. Sunday service operates from 6:15 am to 10:50 pm.
• Fares. MTD increased fares in October 2003, the first year of the audit review period. The regular adult fare was increased from $1.00 to the current $1.25 for all routes except for the Valley Express, which has a base fare of $4.00 and the Downtown-Waterfront and Seaside Shuttle service each with a $0.25 fare due to fare buy-down subsidies from the City of Santa Barbara and the City of Carpinteria. Seniors (age 62 and older) and persons with disabilities pay $0.60 per one-way trip. Transfers are free. UCSB, SBCC and Brooks Institute students ride free with a student registration card and current sticker, the price of fares being included in college registration fees. Children less than 45 inches in height ride free. Discount 10-Ride and 30-Day passes are available. Easy Lift charges a $2.00 fare for one-way ADA paratransit service.
• Vehicles. MTD ended the audit review period with a fleet of 90 vehicles with an average age of seven years. Thirty-one (31) clean-diesel vehicles were delivered in 2004. The fleet includes 20
O’Melia Consulting

Santa Barbara MTD TDA Triennial Performance Audit Page 9
electric 22-ft shuttle vehicles and 70 clean-burning diesel buses of various lengths -- 54 vehicles are 40-ft, 11 are 29-ft vehicles, and five over-the-road coaches.
• Operations Facility & Other Property. MTD operates out of facilities located at 550 Olive Street in Santa Barbara. Completion of the bus storage yard occurred in the summer of 2003, providing space for employee parking and the entire fleet (except for two vehicles housed in Carpinteria for the Seaside Shuttle and four dispatched from Buellton for the Valley Express) to be parked at this location. The Goleta facility (at 5353 Overpass Road) was retired with this final phase of the MTD facility project. MTD also owns a 20-acre property on Calle Real Road in Santa Barbara that was at one time being considered in lieu of the Olive Street facility.
• Transit Center. The MTD Transit Center is located at 1020 Chapala Street, between Carrillo Street and Figueroa Street. The location is one block west of the core of Downtown Santa Barbara and is the primary hub and transfer point of MTD service. During the audit review period, 16 of MTD’s routes served the Transit Center. MTD personnel at this location provide customer information and sell passes and tokens. MTD personnel providing telephone information, supervisory and dispatch personnel are also assigned to this location. Both driver and public restrooms are available. MTD and the City of Santa Barbara Redevelopment Agency are working together on a Transit Village project for this location. A Mixed-Use Transit Project Planning & Feasibility Study has been completed since the end of the audit review period, with summary alternatives under consideration. MTD has also identified four Super Stops in the downtown corridor with contract award in progress as of May 2007.
Achievements and Challenges During the Audit Review Period
During the performance audit review period (i.e., July 1, 2003 and June 30, 2006), MTD has successfully implemented a number of changes with a positive impact on performance as well as addressed a number of challenges. These are highlighted below.
• Fare Increase. The District increased cash fares and provided new discounted passes in October 2003 (i.e., FY 2004). This
O’Melia Consulting

Santa Barbara MTD TDA Triennial Performance Audit Page 10
resulted in an increase in farebox revenues of $627,261 or 11.3% compared to the prior year. The farebox recovery ratio increased from 39.4% in FY 2003 to 40.5% in FY 2004. The average fare per passenger increased from $0.79 to $0.88 in the first year following the fare increase. Ridership remained essentially unchanged despite an increase in fares.
• Vehicle Replacements. Approximately 34% of the fleet was replaced during the audit review period. The District signed a capital lease agreement in February 2004 for 11 buses and began making quarterly payments in May 2004. The District paid off the capital lease in June 2005 and took title to the buses. These 11 vehicles, as well as 20 others, were added to the MTD fleet in 2004. This reduced the average fleet age from about ten years down to 4.5 years.
• Overcrowding. Demand for MTD service, particularly during peak travel hours, has created overcrowded buses. Additional funding for operations and equipment was needed to increase service. Throughout much of the audit review period, overcrowded buses caused passengers to complain. Booster service (trippers to relieve overcrowding) was added to respond to the most severe demands. The FY 2006 to 2010 Short Range Transit Plan, completed in May 2005, identified strategies for dealing with this issue, including increasing service frequencies on a number of core routes. MTD worked with the County, City of Santa Barbara, City of Goleta and UCSB to obtain funding and implement service improvements over a two-year period, ending with the March 5, 2007 service change. Frequencies on Routes 1, 2, 6 and 11 were reduced from 15 minutes to ten and frequencies on Route 3 were reduced from 30 minutes to 20.
• Santa Ynez Valley Express. MTD implemented this commuter express bus service on March 1, 2005. This represented a significant step for MTD, as it is the first service to extend outside the District boundaries. The Valley Express provides four round trips each weekday traveling from stops in Solvang and Buellton to the South Coast in the morning and making return trips in the evening. Service was funded during the audit review period by 80% Federal CMAQ funds, with a 20% TDA match provided by
O’Melia Consulting
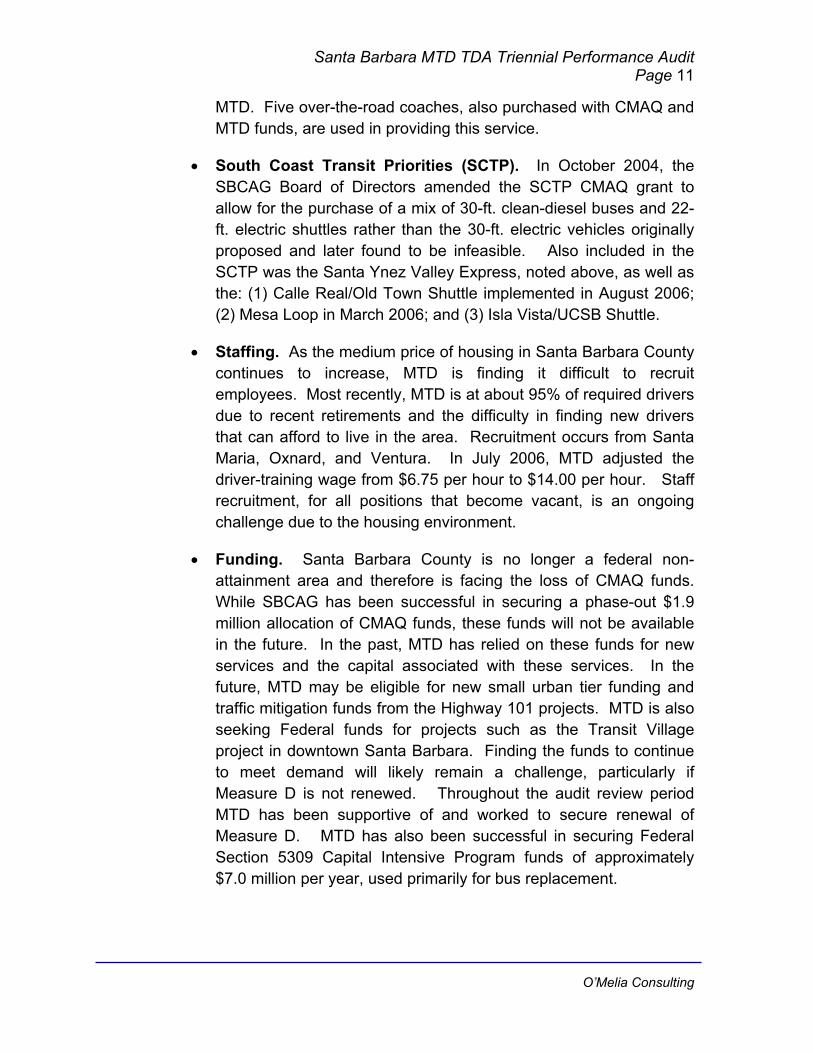
Santa Barbara MTD TDA Triennial Performance Audit Page 11
MTD. Five over-the-road coaches, also purchased with CMAQ and MTD funds, are used in providing this service.
• South Coast Transit Priorities (SCTP). In October 2004, the SBCAG Board of Directors amended the SCTP CMAQ grant to allow for the purchase of a mix of 30-ft. clean-diesel buses and 22-ft. electric shuttles rather than the 30-ft. electric vehicles originally proposed and later found to be infeasible. Also included in the SCTP was the Santa Ynez Valley Express, noted above, as well as the: (1) Calle Real/Old Town Shuttle implemented in August 2006; (2) Mesa Loop in March 2006; and (3) Isla Vista/UCSB Shuttle.
• Staffing. As the medium price of housing in Santa Barbara County continues to increase, MTD is finding it difficult to recruit employees. Most recently, MTD is at about 95% of required drivers due to recent retirements and the difficulty in finding new drivers that can afford to live in the area. Recruitment occurs from Santa Maria, Oxnard, and Ventura. In July 2006, MTD adjusted the driver-training wage from $6.75 per hour to $14.00 per hour. Staff recruitment, for all positions that become vacant, is an ongoing challenge due to the housing environment.
• Funding. Santa Barbara County is no longer a federal non-attainment area and therefore is facing the loss of CMAQ funds. While SBCAG has been successful in securing a phase-out $1.9 million allocation of CMAQ funds, these funds will not be available in the future. In the past, MTD has relied on these funds for new services and the capital associated with these services. In the future, MTD may be eligible for new small urban tier funding and traffic mitigation funds from the Highway 101 projects. MTD is also seeking Federal funds for projects such as the Transit Village project in downtown Santa Barbara. Finding the funds to continue to meet demand will likely remain a challenge, particularly if Measure D is not renewed. Throughout the audit review period MTD has been supportive of and worked to secure renewal of Measure D. MTD has also been successful in securing Federal Section 5309 Capital Intensive Program funds of approximately $7.0 million per year, used primarily for bus replacement.
O’Melia Consulting

Santa Barbara MTD TDA Triennial Performance Audit Page 12
II. COMPLIANCE REVIEW
Regulatory Requirements
MTD is in full compliance with all Public Utilities Code (PUC) and California Administrative Code (CAC) requirements reviewed with one exception, as detailed in Exhibit 4. MTD is in partial compliance with PUC Section 99271.
Exhibit 4 – Regulatory Compliance Matrix
Regulatory Code Compliance Requirement Compliance
Finding Verification Information
PUC Section 99243
Submit an annual report to the State Controller based upon the Uniform System of Accounts and Records established by the State Controller
Compliance Due Dates & Report Submission Dates: Due 14-Dec-04 & Submitted 9-Dec-04. Due18-Oct-05 & Submitted 18-Oct-05. Due 1-Nov-06 & Submitted 1-Nov-06.
PUC Section 99245
Submit annual fiscal and compliance audit to State Controller within 180 days of year end, or has received a 90-day extension allowed by law.
Compliance Auditor Report Dates: FY 2004: 22-Oct-04 FY 2005: 1-Sep-05 FY 2006: 22-Sep-06. MTD submitted audits at the same time as the State Controller Report, as shown immediately above.
PUC Section 99251
Submit CHP certification of compliance with Pull Notice within 13 months period prior to TDA claim
Compliance CHP Certification Dates: FY 2004: 30-Jul-02 & 20-Jun-02 FY 2005: 17-Jul-03 FY 2006: 30-Jul-04. Most recent on file are dated 26-Aug-05 & 23-Aug-06.
PUC Section 99261
Submit TDA Claim in compliance with rules and regulations adopted by RTPA
Compliance TDA Claims were submitted to and funds approved by SBCAG in all three years.
PUC Section 99264
The operator does not routinely staff public transportation vehicles designed to be operated by one person with two or more persons
Compliance Review of staffing assignments indicates that one person is responsible for vehicle operations. Occasional additional staffing is for training or performance ride check purposes only.
O’Melia Consulting

Santa Barbara MTD TDA Triennial Performance Audit Page 13
Regulatory Code Compliance Requirement Compliance
Finding Verification Information
PUC Section 99266
Operating budget has not increased by more than 15% over preceding year unless reasonable justification for the change has been provided
Compliance % Change Per Financial Audit Statements FY 2003 to 2004: 5.6% FY 2004 to 2005: 1.3% FY 2005 to 2006: 6.4%
PUC Sections 99268.2-5 & .12
Operator has maintained a ratio of revenues to operating costs equal to 20% for urban areas and 10% for rural areas and specialized services. MTD qualifies for PUC 99268.2 with a 30.27% farebox recovery ratio requirement, or 34.33% with local support.
Compliance Farebox Recovery Ratio (excluding local support) For MTD Directly Operated Service: FY 2004: 40.5% FY 2005: 42.7% FY 2006: 40.3%
PUC Section 99271
The retirement system is fully funded, or the Operator is implementing a plan that will fully fund the retirement system within 40 years.
Partial Compliance
MTD non-union employees have a 401(k) program, which is audited and included in Audited Financial Statements. Union employees (Teamsters) have a private pension plan to which MTD contributes to but does not manage. Actuarial results from this plan have not been included in Audited Financial Statements for MTD per PUC Sections 99272 and 99273 pertaining to private pension plans and reports.
PUC Section 99314.5
If the Operator receives STA funds, the Operator is not precluded by contract from employing part-time drivers or from contracting with common carriers.
Compliance The labor agreement with the Teamsters does not preclude use of part-time drivers nor does it prohibit contracting with private carriers.
PUC Section 99314.6
If the Operator receives STA funds for operating purposes: (1) the Operator’s total operating cost per revenue hour does not exceed the prior year’s cost per revenue hour adjusted for inflation using the CPI; or (2) the Operator’s average total operating cost per revenue hour in the past three years does not exceed the sum of the average of the preceding three years, adjusted for inflation using the CPI.
Compliance MTD uses STA funds for capital projects only.
O’Melia Consulting

Santa Barbara MTD TDA Triennial Performance Audit Page 14
Regulatory Code Compliance Requirement Compliance
Finding Verification Information
CAC Section 6754 (a) (3)
Available Federal funds are used prior to claiming STA funds
Compliance Federal grant funds claimed per Financial Audit: FY 2004: $9,455,723 (a) FY 2005: $6,673,783 (a) FY 2006: $4,066.474 (a)
(a) Schedule of Expenditures of Federal Awards. FY04 includes $2,696,733 pass through of capital to sub-recipient; FY05 pass through of capital $175,287; FY06 pass through of capital $230,713
Requirements relating to PUC Section 99271, 99272 and 99273 were discussed with MTD management during the exit interview process. MTD has taken action to include required information regarding the Teamsters retirement pension plan in the FY 2007 Annual Fiscal Audit. Findings of compliance that are required in the Annual Fiscal Audit are specified in CAC Section 6667 for transit agencies and is included as a recommendation in this report.
Progress To Implement Prior Audit Recommendations
The prior TDA Performance Audit, completed in June 2004, made two recommendations for improved compliance and performance. MTD has fully implemented both recommendations, as shown in Exhibit 5.
Exhibit 5 – Progress To Implement Prior Audit Recommendations
Prior Audit Recommendations
Prior Audit Findings Leading to
Recommendation Compliance
Finding Implementing Actions &
Results
Complete the Short Range Transit Plan (SRTP).
The prior audit found that the SRTP was out of date and had not been updated in the FY 2000 to FY 2003 time period due to staffing vacancies.
Implemented MTD updated its SRTP in May 2005 for Fiscal Years 2006 to 2010. MTD is in the process of updating the SRTP for the FY 2008 to FY 2012 period. Updating the SRTP every three years is the standard in the transit industry.
O’Melia Consulting

Santa Barbara MTD TDA Triennial Performance Audit Page 15
Prior Audit Recommendations
Prior Audit Findings Leading to
Recommendation Compliance
Finding Implementing Actions &
Results
MTD should develop a simplified system of goals and objectives that can be used for regular performance monitoring.
The District began the process of simplifying its lengthy list of goals and objectives in the evaluation of its route operations. The prior audit recommended that this process continue focusing on a simple set of performance standards against which to evaluate operations, maintenance, and administrative efficiency of the District.
Implemented As part of the FY 2006 to 2010 SRTP update, MTD revised its goals and performance standards. Goals were previously listed in Exhibit 3. Performance standards are shown in Exhibit 6 and are evaluated as part of the SRTP update. MTD tracks these and other statistics on a quarterly basis. Results from the functional review for this audit indicate that MTD may need to add two indicators to quarterly performance reporting.
Exhibit 6 – MTD Performance Standards
Performance Standards Performance Results
At least 95% of all MTD revenue trips shall depart no more than 5 minutes late 5 of 9,552 trips 4th Qtr FY06
At least 98% of all MTD scheduled revenue trips shall be completed 5 of 9,552 trips 4th Qtr FY06
The MTD system shall carry an average of not less than 36 passengers per revenue hour for any 3-year period
40 FY04 to FY06 average
The MTD system shall carry an average of not less than 2.5 passengers per revenue mile for any 3-year period
3.0 FY04 to FY06 average
MTD shall maintain at least a 40% farebox recovery ratio over any 3-year period 41.2% FY04 to FY06 average
The MTD systemwide spare ratio shall not exceed 20% 20% FY06
MTD revenue vehicles shall travel a minimum of 8,000 miles between breakdowns. (A breakdown requires a vehicle exchange.)
6,507 FY06
The MTD shall limit annual passengers transfers to 20% of total annual ridership NA
Passenger complaints shall average no more than 1 complaint per 10,000 MTD boardings
1 per 18,532 boardings
4th Qtr FY06
Source: MTD Quarterly Report period ending June 30, 2006 or FY 2006 annual statistics compiled for this performance audit.
O’Melia Consulting
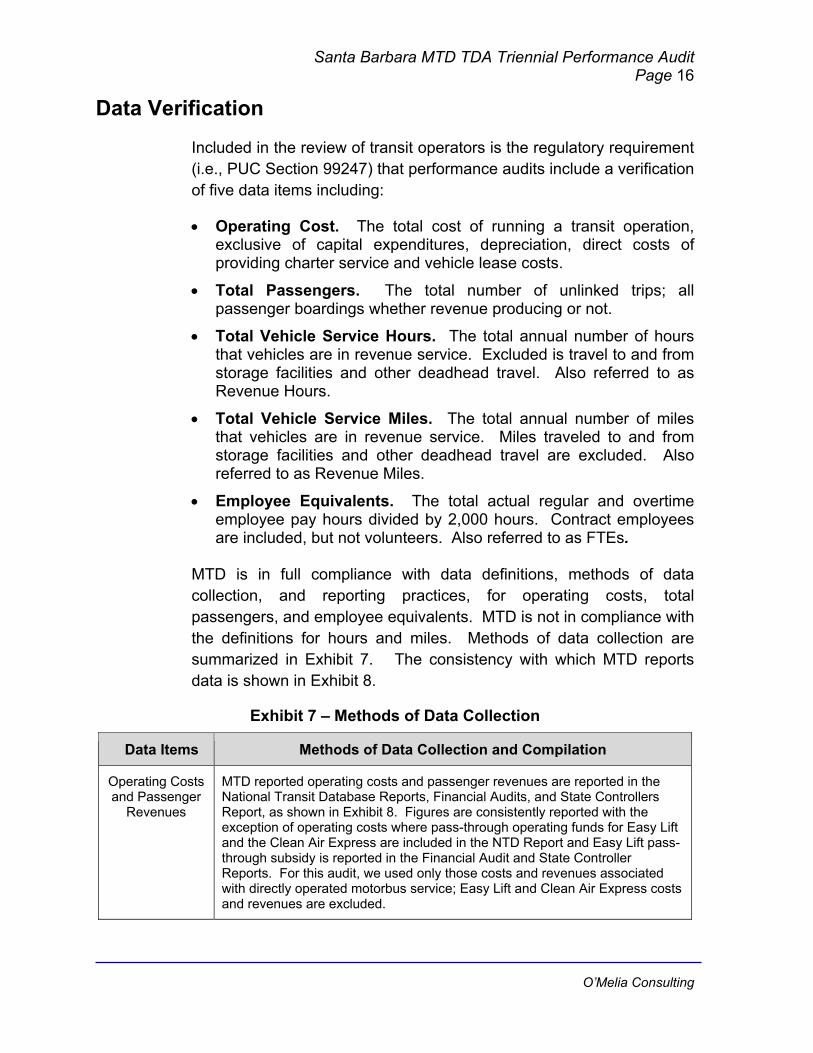
Santa Barbara MTD TDA Triennial Performance Audit Page 16
Data Verification
Included in the review of transit operators is the regulatory requirement (i.e., PUC Section 99247) that performance audits include a verification of five data items including:
• Operating Cost. The total cost of running a transit operation, exclusive of capital expenditures, depreciation, direct costs of providing charter service and vehicle lease costs.
• Total Passengers. The total number of unlinked trips; all passenger boardings whether revenue producing or not.
• Total Vehicle Service Hours. The total annual number of hours that vehicles are in revenue service. Excluded is travel to and from storage facilities and other deadhead travel. Also referred to as Revenue Hours.
• Total Vehicle Service Miles. The total annual number of miles that vehicles are in revenue service. Miles traveled to and from storage facilities and other deadhead travel are excluded. Also referred to as Revenue Miles.
• Employee Equivalents. The total actual regular and overtime employee pay hours divided by 2,000 hours. Contract employees are included, but not volunteers. Also referred to as FTEs.
MTD is in full compliance with data definitions, methods of data collection, and reporting practices, for operating costs, total passengers, and employee equivalents. MTD is not in compliance with the definitions for hours and miles. Methods of data collection are summarized in Exhibit 7. The consistency with which MTD reports data is shown in Exhibit 8.
Exhibit 7 – Methods of Data Collection
Data Items Methods of Data Collection and Compilation
Operating Costs and Passenger
Revenues
MTD reported operating costs and passenger revenues are reported in the National Transit Database Reports, Financial Audits, and State Controllers Report, as shown in Exhibit 8. Figures are consistently reported with the exception of operating costs where pass-through operating funds for Easy Lift and the Clean Air Express are included in the NTD Report and Easy Lift pass-through subsidy is reported in the Financial Audit and State Controller Reports. For this audit, we used only those costs and revenues associated with directly operated motorbus service; Easy Lift and Clean Air Express costs and revenues are excluded.
O’Melia Consulting

Santa Barbara MTD TDA Triennial Performance Audit Page 17
Data Items Methods of Data Collection and Compilation
Passengers MTD uses automated fareboxes that register passenger trip data by fare type. The bus operator is required to punch a code for each passenger. Information is transfers to the PASDAT system for reporting. In the event of equipment failure, MTD estimates passengers for the missing trips. Fareboxes are reliable 92-96% of the time.
Revenue Hours Scheduled revenue hours are clearly defined in standard Trapeze Scheduling Software reports. MTD uses PASDAT to tabulate scheduled hours and then adds in hours for booster service. MTD does not deduct time for missed trips due to roadcalls, accidents and other incidents.
Revenue Miles Scheduled revenue miles are based on GIS information. MTD uses PASDAT to tabulate scheduled miles and then adds in miles for booster service. MTD does not deduct miles for missed trips due to roadcalls, accidents and other incidents.
Employee Equivalents
Payroll data is used to identify paid work hours. MTD then divides this information by 2,000 to arrive at the correct calculation for reporting.
Exhibit 8 – Financial Data Reporting Consistency
Data consistency, with a few exceptions, has been good throughout the audit review period.
FY 2004 FY 2005 FY 2006National Transit Database (b) 15,627,498$ 16,040,473$ 17,867,396$ Financial Audit (c) 15,586,142$ 15,725,977$ 17,366,406$ State Controller's Report (c) 15,658,500$ 15,725,978$ 17,366,406$ National Transit Database 6,174,973$ 6,560,969$ 6,851,139$ Financial Audit 6,174,973$ 6,560,969$ 6,851,139$ State Controller's Report 6,216,329$ 6,560,970$ 6,851,140$ National Transit Database 7,004,053 7,169,752 7,305,879 Financial Audit 7,004,009 7,169,752 7,305,879 State Controller's Report 7,004,053 7,169,752 7,305,879 National Transit Database 178,003 177,270 181,157 Financial Audit 178,003 177,270 180,990 State Controller's Report 172,922 177,270 181,157 National Transit Database 2,351,305 2,320,404 2,443,622 Financial Audit 2,351,305 2,320,404 2,443,622 State Controller's Report 2,351,305 2,320,404 2,443,622 Paid Work Hours from NTD Divided by 2,000 174 171 176
State Controller's Report 174 172 176 (a) Operating costs exclude depreciation and interest costs for capital vehicle lease.(b) NTD Operating costs include purchased transportation costs for Easy Lift in all years and SBCAG Clean Air Express in FY 2006.(c) Financial Audit and State Controller Reports include the LTF subsidy pass through to Easy Lift as costs, a subset of the costs reported for NTD purposes.
Passengers
Vehicle Service Hours
Vehicle Service Miles
Employee Full-Time Equivalents
TDA StatisticAudit Review Period
Source
Operating Costs (a)
Passenger Revenues
O’Melia Consulting

Santa Barbara MTD TDA Triennial Performance Audit Page 18
TDA Perfo
California Public Utilities Code Section 99246 (d) states that rs shall include a verification of
performance indicators defined in the Public Utilities Code Section
• Passengers Per Vehicle Service Hour Mile
indicators are presented in s involving costs are also
compared to the Consumer Price Index -- Urban Wage Earners and
by e of 11.9%. Cost growth in fuel, casualty and liability costs, and environmental
rmance Indicator Trends
performance audits of transit operato
99247. These performance indicators include:
• Operating Cost Per Passenger • Operating Cost Per Vehicle Service Hour
• Passengers Per Vehicle Service• Vehicle Service Hours Per Employee.
Trends for these five TDA performanceExhibit 9. Performance indictor trend
Clerical Workers for the Los Angeles-Riverside-Orange County area. Overall trends are positive for passenger and labor productivity measures. Cost efficiency indicators, however, show increases in excess of inflation due primarily to rising fuel costs and one-time payouts for insurance costs and soil remediation at the Calle Real and Overpass sites.
Exhibit 9 -- TDA Performance Indicators Statistics &
• Operating Cost Per Vehicle Service Hour is a measure of cost efficiency. During the audit review period, cost per hour increased
Vehicle Service Hours 177,237 178,003 177,270 181,157 2.2%Vehicle Service Miles 2,419,260 2,351,305 2,320,404 2,443,622 1.0%Employee Full-Time Equivalents 176 174 171 176 0.0%Operating Cost Per Vehicle Service Hour $ 79.43 $ 85.70 $ 86.75 $ 93.89 18.2%Operating Cost Per Passenger $ 2.01 $ 2.18 $ 2.14 $ 2.33 15.8%Passengers Per Vehicle Service Hour 39.5 39.3 40.4 40.3 2.0%Passengers Per Vehicle Service Mile 2.90 2.98 3.09 2.99 3.2%Vehicle Service Hours Per Employee FTE 1,007 1,023 1,035 1,030 2.3%Percent Change in the CPI - 2.5% 4.2% 4.8% 11.9%
FY 2004 FY 2005 FY 2006Operating Costs $ 14,078,462 $ 15,253,969 $ 15,378,475 $ 17,009,233 20.8%Passengers 7,005,474 7,004,053 7,169,752 7,305,879 4.3%
Verified TDA Performance Indicators
Base Year FY 2003
Audit Review Period % Change FY03 - FY06
18.2% compared to an inflationary increas
cleanup of the Calle Real and Overpass properties account for
O’Melia Consulting

Santa Barbara MTD TDA Triennial Performance Audit Page 19
most of this increase. Operating costs by line item are shown in Appendix A for the audit review period compared to FY 2003.
Operating Cost Per Passenger is a measure of cost effectiveness. During the audit period, cost per passen
• ger
increased 15.8% compared to 11.9% inflation. Costs increased
• d, passengers per hour
improved by 2.0% from 39.5 in FY 2003 to 40.3 in FY 2006.
• it review period, passengers per mile
improved by 3.2% from 2.90 in FY 2003 to 2.99 in FY 2006.
• labor productivity
improved by 2.3%, which is excellent. MTD was able to increase
20.8% while passengers increased 4.3%.
Passengers Per Vehicle Service Hour is a measure of service productivity. During the audit review perio
Productivity declined slightly in FY 2004 following the fare increase but was in full rebound by FY 2005. At 40.3 passengers per hour, MTD may be experiencing overcrowding on some routes at peak times. Passengers increased 4.3% while service hours increased 2.2% over the audit review period. The three-year average productivity was 40 passengers per hour compared to a performance standard of 36.
Passengers Per Vehicle Service Mile also measures service productivity. During the aud
Productivity peaked in FY 2005 at 3.09 passengers per revenue mile. The three-year average productivity was 3.0 passengers per mile compared to a performance standard of 2.5.
Vehicle Service Hours Per Employee measures labor productivity. During the audit review period,
service by 2.2% and meet Wage Order 9 requirements without increasing employee equivalents.
O’Melia Consulting

Santa Barbara MTD TDA Triennial Performance Audit Page 20
III. FUNCTIONAL AREA PERFORMANCE RESULTS
A high level review of functional area performance was conducted for select functions including:
• Transportation Operations • Vehicle Maintenance • Administration, Planning, and Budget
Information used in this section was obtained through document reviews, management interviews, and reports such as the State Controller Report and Financial Audits. Functional area performance indicators are presented, as appropriate, for Fiscal Years 2004, 2005 and 2006. Performance indicators include the last year of the prior performance audit (i.e., FY 2003) as a baseline for comparison.
Transportation Operations
Transportation Operations includes activities such as service operations, driver dispatch, and road supervision. Performance indictors for transportation operations are shown below in Exhibit 10.
• Transportation Cost Efficiency. Transportation cost efficiency declined during the audit review period with costs per total service hour increasing by 18.2% compared to 11.9% inflation. Fuel costs had a negative impact on transportation cost efficiency with the average fuel cost per mile increasing from $0.25 in FY03 to $0.48 in FY06. Labor and fringe benefit costs per total service hour increased by 12.5%. The largest increase in labor and fringe benefit costs per hour came between FY05 and FY06. This is most likely due to a change in paid work hour to platform hour ratio from 1.27 in FY05 to 1.31 in FY06.
O’Melia Consulting

Santa Barbara MTD TDA Triennial Performance Audit Page 21
Santa Barbara MTD TDA Triennial Performance Audit Page 21
O’Melia Consulting
Exhibit 10 -- Transportation Operations Performance Indicators
an employee is paid to work relative to the amount of time actually
TD budget.
Operating Characteristics. The average operating speed remained essentially unchanged during the audit review period, which is fairly amazing given the reported overcrowding that occurred in FY06. The percentage of deadhead travel time was reduced from 18% to 15.9% in FY04 with consolidation of
Transportation Operations CostsLabor $ 4,714,514 $ 4,923,870 $ 5,158,656 $ 5,538,645 17.5%Fringes (a) $ 2,996,463 $ 3,198,199 $ 3,003,838 $ 3,328,386 11.1%Services -14.3%Fuel $ 779,605 $ 975,105 $ 1,298,889 91.8%Tires & Tubes $ 110,381 $ 110,313 $ 104,678 1.1%Total Transportation Operations Costs $ 8,525,690 $ 9,042,627 $ 9,275,774 $ 10,299,631 20.8%Total Vehicle Hours 206,280 204,859 203,808 -2.6%Revenue Vehicle Servic 178,003 177,270 181,157 2.2%Paid Work Hours 38 258,840 259,184 267,790 1.0%Total Vehicle Service Miles 2,685,040 2,719,805 0.1%Revenue Vehicle Servic 2,320,404 2,443,622 1.0%Unlinked Passengers 7,005,474 7,004,053 7,169,752 7,305,879 4.3%Passenger Miles 9.6%Transp. Costs Per Rev. 18.2%Labor & Fringe Costs P 12.5%Paid Work Hour to Platf 3.6%Fuel Costs Per Total Ve 91.6%Average Operating Spe -1.2%Percentage of Deadhea -30.6%Passenger Miles Per Pa 5.1%Passengers Per Reven .3 2.0%Percent Change in the CPI - 2.5% 4.2% 4.8% 11.9%(a) F compensation by function verus total of all costs in Administration.(b) Ex Costs.
% Change 03 - FY06FY 2004 FY 2005 FY 2006
Information Base Year FY 2003
Audit Review PeriodFY
$ 33,879 $ 30,572 $ 27,862 $ 29,033 $ 677,260 $ 103,574
209,164 37 e Hours 177,2
265,2 2,717,496 2,684,510
e Miles 2,419,260 2,351,305
25,612,467 26,580,230 26,109,556 28,080,933 Veh. Serv. Hr. $ 48.10 $ 50.80 $ 52.33 $ 56.85 er Rev. Veh. Serv. $ 43.51 $ 45.63 $ 46.05 $ 48.95 orm Hour Ratio 1.27 1.25 1.27 1.31 hicle Mile $ 0.25 $ 0.29 $ 0.36 $ 0.48 ed 13.6 13.2 13.1 13.5 d Travel Time 18.0% 15.9% 15.6% 12.5%ssenger 3.7 3.8 3.6 3.8
ue Veh Service Hr. 39.5 39.3 40.4 40
Y 2003 Fringes adjusted to include costs (I.e., $765,478) related to workerscludes "Utilities" Costs, which are included in General & Administrative
• Transportation Labor Productivity. Transportation labor productivity is measured by paid work hours to platform hours for all transportation employees. This measures the number of hours that
spent driving vehicles. Productivity declined primarily between FY05 and FY06. New scheduling software was implemented at this time but that is not necessarily the cause, as implementation of booster service may have been a factor as well. Or, it may be that total service hours (and platform hours) are understated based on a change in methodology used to classify layover time at the Transit Center, which should be included as total service and platform hours. In any case, increased paid work hours relative to platform hours are a factor for MTD to review, as transportation labor costs are a significant portion of the M
•
O’Melia Consulting
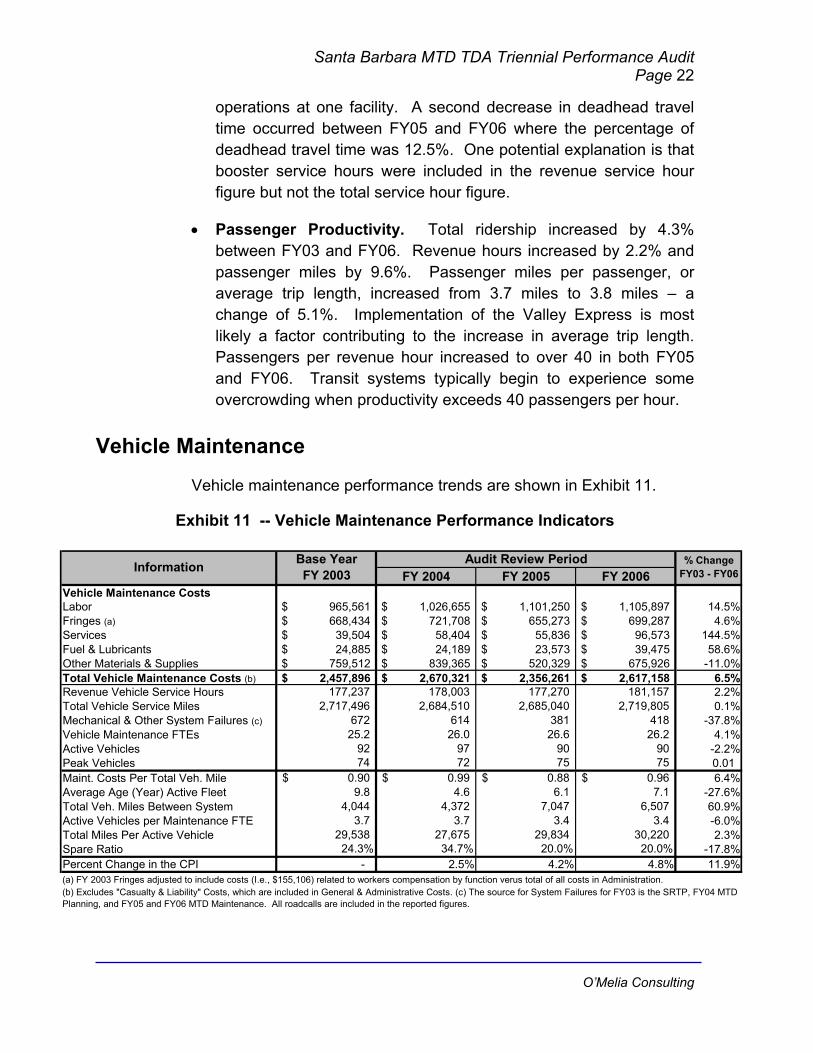
Santa Barbara MTD TDA Triennial Performance Audit Page 22
operations at one facility. A second decrease in deadhead travel time occurred between FY05 and FY06 where the percentage of deadhead travel time was 12.5%. One potential explanation is that booster service hours were included in the revenue service hour figure but not the total service hour figure.
• Passenger Productivity. Total ridership increased by 4.3% between FY03 and FY06. Revenue hours increased by 2.2% and passenger miles by 9.6%. Passenger miles per passenger, or average trip length, increased from 3.7 miles to 3.8 miles – a change of 5.1%. Implementation of the Valley Express is most likely a factor contributing to the increase in average trip length. Passengers per revenue hour increased to over 40 in both FY05 and FY06. Transit systems typically begin to experience some overcrowding when productivity exceeds 40 passengers per hour.
Vehicle Maintenance
Vehicle maintenance performance trends are shown in Exhibit 11.
Exhibit 11 -- Vehicle Maintenance Performance Indicators
Vehicle Maintenance CostsLabor 14.5%Fringes (a) 4.6%Services 44.5%Fuel & Lubricants 58.6%Other Materials & Supplies -11.0%Total Vehicle Maintenance C 6.5%Revenue Vehicle Service Hou 2.2%Total Vehicle Service Miles 0.1%Mechanical & Other System F -37.8%Vehicle Maintenance FTEs 4.1%Active Vehicles -2.2%Peak Vehicles 0.01 Maint. Costs Per Total Veh. Mi 6.4%Average Age (Year) Active Fle -27.6%Total Veh. Miles Between Syst 60.9%Active Vehicles per Maintenan 3.4 3.4 -6.0%Total Miles Per Active Vehicle 29,538 27,675 29,834 30,220 2.3%Spare Ratio 7.8%Percent Change in the CPI 11.9%(a) FY 2003 Fringes adjusted to inclu(b) Excludes "Casualty & Liability" Co TD Planning, and FY05 and FY06 MTD M
- FY06FY 2004 FY 2005 FY 2006
$ 965,561 $ 1,026,655 $ 1,101,250 $ 1,105,897 $ 668,434 $ 721,708 $ 655,273 $ 699,287 $ 39,504 $ 58,404 $ 55,836 $ 96,573 1 $ 24,885 $ 24,189 $ 23,573 $ 39,475 $ 759,512 $ 839,365 $ 520,329 $ 675,926
osts (b) $ 2,457,896 $ 2,670,321 $ 2,356,261 $ 2,617,158 rs 177,237 178,003 177,270 181,157
2,717,496 2,684,510 2,685,040 2,719,805 ailures (c) 672 614 381 418
25.2 26.0 26.6 26.2 92 97 90 90 74 72 75 75
le 0.90$ 0.99$ 0.88$ 0.96$ et 9.8 4.6 6.1 7.1 em 4,044 4,372 7,047 6,507 ce FTE 3.7 3.7
% CFY03
Base Year FY 2003
Audit Review Period hange Information
24.3% 34.7% 20.0% 20.0% -1 - 2.5% 4.2% 4.8%
de costs (I.e., $155,106) related to workers compensation by function verus total of all costs in Administration.sts, which are included in General & Administrative Costs. (c) The source for System Failures for FY03 is the SRTP, FY04 Maintenance. All roadcalls are included in the reported figures.
O’Melia Consulting

Santa Barbara MTD TDA Triennial Performance Audit Page 23
•
6.5%. Materials and supply costs decreased reflecting the benefits of a newer fleet,
•
with noticeable improvement in FY05, where the miles between hed the high of 7,047. However, at 6,507 in FY06,
this indicator is below MTD’s standard of 8,000 miles between et
between 3,000 and 8,000 miles. A review of performance by intenance
standard would be useful in determining a course of action to improve performance.
Subsequent to the draft report for this audit, MTD has reviewed performance by subfleet. The results of this review are twofold. One area to focus on is being proactive during PM servicing of the older buses to replace identified components nearing the end of their useful life. The second area relates to an action plan for newer buses to maintain communication with bus and component vendors to remedy defects in an effective and timely manner.
• Fleet Characteristics. The average fleet age improved from 9.8 years in FY03 to 4.6 in FY04 when MTD replaced 34% of the fleet. The average age at the end of the audit review period was 7.1 years. MTD operates a fleet of electric and clean-diesel vehicles. In FY05, MTD was successful in reducing its spare ratio to the 20% standard common to the transit industry.
• Maintenance Labor Productivity. Vehicle maintenance FTEs increased by one during the audit review period. The number of
Vehicle Maintenance Cost Efficiency. Maintenance costs per total vehicle service mile increased significantly less than inflation (i.e., 6.4% compared to 11.9% inflation). Total service miles remain essentially unchanged during the audit review period while total vehicle maintenance costs increased by
while services and fuel and lubricant costs increased by more than inflation. Labor and fringe benefit costs combined increased by 10.5% compared to 11.9% inflation. Maintenance cost efficiency performance trends are positive.
Maintenance Program Effectiveness. The effectiveness of the maintenance program is measured by the total miles between roadcalls. Miles between roadcalls improved by 60.9% from 4,044 in FY03 to 6,507 in FY06. MTD replaced 34% of the fleet in FY04,
roadcalls reac
roadcalls. The preventive maintenance standard varies by subfle
subfleet compared to the standard and preventive ma
O’Melia Consulting

Santa Barbara MTD TDA Triennial Performance Audit Page 24
active vehicles per maintenance FTE declined by six percent. At the same time, however, the total miles per active vehicle increased by 2.3%. These two factors considered together result in a minor overall decline in productivity of about 1.3% (i.e., 36,723 miles per FTE in FY03 compared to 36,264 in FY06).
ion, Planning, and Budget
inistrative trends are mostly positive, as shown in Exhibit 12. The sible exception is the cost growth
Administrat
Admpos in casualty and liability costs for the entire agency due in part to one time excess payments and an
trenperremsafare
Ex
an inflationary increase
increase in the number of claims in both FY05 and FY06. More recent ds, however, indicate that MTD has taken action to improve safety
formance. Training and Risk Management have both been oved from Operations with increased attention being placed on
ety, training, and claims management. The results of this strategy evident in FY07 preliminary results shown in Exhibit 13.
hibit 12 -- Administrative Performance Indicators
FY 2004 FY 2005 FY 2006sts
$ 1,086,300 $ 1,282,610 $ 868,307 $ 926,308 - $ 472,567 $
tics & ators
Base Year FY 2003
Audit Review Period % ChFY03
•
General Administration CoLabor 14.7%Fringes (a) 634,341 $ 465,140 $ 522,606 10.6%Services $ 578,781 $ 683,776 $ 652,610 $ 803,337 38.8%Other Materials & Supplies 85.9%Utilities (for entire agency) 10.7%Casualty & Liabilty (for entir 4.7%Miscellaneous 206.2%Total General Administrat 32.7%Revenue Vehicle Service H 2.2%Revenue Vehicle Service M 1.0%Administrative FTEs 16.4%Peak Vehicles 1.4%Admin. Costs (Excluding CaLiability) Per Rev. Veh. Serv 19.1%
Administrative FTEs Per Peak Vehicle 0.24 0.24 0.19 0.20 -17.5%Casualty & Liability Cos peVeh. Serv. MilePercent Change in the CPI 11.9%(a) FY 2003 Fringes adjusted to ex nce.
Performance Indic - FY06Verified TDA Statis ange
$ 33,243 $ 38,289 $ 48,914 $ 61,793 $ 219,035 $ 245,504 $ 241,379 $ 242,459
e agency) $ 277,369 $ 181,328 $ 502,568 $ 651,037 13 $ 191,194 $ 252,397 $ 738,731 $ 585,354
ion Costs $ 2,858,489 $ 3,318,245 $ 3,517,649 $ 3,792,894 ours 177,237 178,003 177,270 181,157 iles 2,419,260 2,351,305 2,320,404 2,443,622
17.8 17.6 14.2 14.9 -74 72 75 75
sualty & . Hr. 14.56$ 17.62$ 17.01$ 17.34$
Administrative Cost Efficiency. Administrative costs per vehicle service hour, excluding Casualty & Liability costs for the entire agency, increased by 19.1% compared to
ts r Revenue 0.11$ 0.08$ 0.22$ 0.27$ 132.4%
- 2.5% 4.2% 4.8%clude costs ($920,584) related to workers compensation by function where costs are attributable to operations or maintena
of 11.9%. Declines in labor costs were offset by increased costs for
O’Melia Consulting

Santa Barbara MTD TDA Triennial Performance Audit Page 25
services and other miscellaneous expenses, which include one time environmental cleanup costs.
Labor Productivity. Administrative FTEs, based on paid administrative work hours (taken from NTD
• Reports) divided by
2,000, have declined from 17.8 in FY03 to 14.9 in FY06. le have declined by 17.5%. trol labor costs, particularly
ments in excess of the $250,000 self-insured policy resulted in excess liability insurance coming into play. The figures shown below in Exhibit 13 do not include these excess payments, although they are noted in the footnote. FY07 data is also included to show the impact of programs and actions taken by MTD to address this issue. Preliminary figures for FY07 indicate that performance is much improved over the prior three years.
Exhibit 13 -- MTD Loss Claims History
Administrative FTEs per peak vehicMTD made significant efforts to conthose associated with administrative staff. End of year actual employees by function for the entire agency are shown in Exhibit 14.
• Risk Management. Casualty and liability costs per revenue vehicle service mile increased by 132.4% compared to an inflationary increase of 11.9%. However, one of the largest cost growth areas for MTD has been in the liability category of expense. The number and cost of claim payouts continued to rise throughout the audit review period. In both FY05 and FY06, pay
Year Total # Claims Total # Loss Payment
Total Loss Payments (a)
# Los Payments Per Total #
Claims
Average Payment Per
Claim
FY 2002/03 45 14 34,008$ 31% 2,429$
FY 2003/04 50 19 61,997$ 38% 3,263$
FY 2004/05 71 27 327,440$ 38% 12,127$
FY 2005/06 50 22 296,924$ 44% 13,496$
FY 2006/07 23 5 8,645$ 22% 1,729$
(a) Excludes exSource: FY03 f
cess payment of $1.5 million in FY05 and $250,000 in FY06. igures from prior TDA Performance Audit. Other figures from MTD Risk Management.
O’Melia Consulting

Santa Barbara MTD TDA Triennial Performance Audit Page 26
Whcon employee paid work hours by function and FTEs as of June 30th of each fiscal year (as reported in
freeincposove
MTD is xpenses relative to service levels. MTD is also responsible for ensuring that the mix of revenues and expenses meets a 40% farebox recovery requirement. Exhibit 15 looks at additional performance indicators for planning and budget.
Base Year FY
ile MTD may not control costs like fuel and soil remediation, it can trol staffing levels. Exhibit 14 shows
the NTD). During much of the audit period, MTD has had a hiring ze. Service levels have increased by about two percent without an
rease in paid work hours. Full-time employees decreased by 13 itions while part-time employees increased by six. This is an rall reduction of approximately ten full time positions.
Exhibit 14 -- Employee Paid Work Hours
265,238 258,840 259,184 267,790 50,371 51,963 53,275 52,435
e 1,312 1,907 1,765 1,860 35,598 35,277 28,482 29,768
352,519 347,987 342,706 351,853
115.0 113.0 113.0 112.0 25.0 22.0 22.0 22.0
e 1 1 1 1 21.0 17.0 14.0 14.0
162.0 153.0 150.0 149.0
36.0 35.0 34.0 36.0 6.0 7.0 8.0 8.0 - - 2.0 4.0
42.0 42.0 44.0 48.0
Labor Information 2003 FY 2004 FY 2005 FY 2006 % Difference
Employee Work HoursTransp Operations 1%Vehicle Maintenance 4%Non-Vehicle Maintenanc 42%General Admin -16%Total Labor 0%Full-Time EmployeesTransp Operations -3%Vehicle Maintenance -12%Non-Vehicle Maintenanc 0%General Admin -33%Total Labor -8%Part-Time EmployeesTransp Operations 0%Vehicle Maintenance 33%General Admin - Total Labor 14%
responsible for controlling operating e
O’Melia Consulting

Santa Barbara MTD TDA Triennial Performance Audit Page 27
Ex
• Budget Adherence. During the audit review period, MTD’s budget process resulted in actual costs being within five percent of the adopted budget, as shown above. The biggest budget variance was in FY06 with a 3.8% variance. On a monthly basis, MTD monitors costs and revenues relative to the budget. A system of Authority for Expenditures (AFEs) is used to help ensure that costs do not exceed the budget.
• Auxiliary & Non-Transportation Revenues. This category of revenue includes items such as advertising revenue. During the audit review period, MTD increased efforts to generate revenues from advertising on buses. The results of this program may be seen in the 29.3% increase in auxiliary and non-transportation
sh fare with the base fare increasing from $1.00 to $1.25. Passenger revenue increased each year thereafter with a net improvement of 23.5% between FY03 and FY06. The average farebox recovery for the period was 41.2% compared to MTD’s standard of 40%. The average fare per passenger increased from $0.88 in FY03 to $0.94 by the end of the audit review period.
• Ridership. In FY04, MTD experienced a slight drop in ridership following the fare increase. However, by FY05, ridership had increased over FY03 levels. This trend continued with overall ridership for the period increasing by 4.3%. Exhibit 16 shows average daily ridership by day type. Average weekday ridership
hibit 15 -- Planning and Budget Performance Indicators
FY 2004 FY 2005 FY 2006
get - $ 15,093,760 $ 15,791,384 $ 16,738,477 - $ 15,586,142 $ 15,725,977 $ 17,366,406 - 3.3% -0.4% 3.8%
14,078,462$ 15,253,969$ 15,378,475$ 17,009,233$ 8,198,449$ 8,775,921$ 8,425,050$ 9,728,263$
rtation Revenue 332,301$ 303,075$ 392,456$ 429,831$ 5,547,712$ 6,174,973$ 6,560,969$
stics & Performance cators
Base Year FY 2003
Audit Review Period
SystemwideOperating Expense Bud - Operating Costs - Budget Variance - Operating Costs 20.8%Net Subsidy 18.7%Auxiliary & Non-Transpo 29.3%Passenger Revenues 6,851,139$ 23.5%Passengers 7,005,474 7,004,053 7,169,752 7,305,879 4.3%Net Subsidy Per Passenger 1.18 1.33$ 13.8%Farebox Recovery Ratio 42.7% 40.3% 2.2%Average Fare Per Passenger 0.79$ 0.88$ 0.92$ 0.94$ 18.4%Percent Change in the CPI - 2.5% 4.2% 4.8% 11.9%
Verified TDA StatiIndi
% Change FY03 - FY06
1.17$ 1.25$ $ 39.4% 40.5%
revenues. This increase in revenues equates to a service increase of over 1,000 revenue hours.
• Farebox Recovery Ratio. In October 2003 (FY04) MTD increased the ca
O’Melia Consulting

Santa Barbara MTD TDA Triennial Performance Audit Page 28
increased by 3.8% over the audit review period. However, Saturday and Sunday average daily ridership increased by over five percent.
Exhibit 16 -- Average Daily Boardings
MTD has reorganized to combine Service Development and includes
scheduling, marketing, and bus stop maintenance. Customer service,
Ce
Witincfundeveloping strategies to address these issues. At the same time, it is the responsibility of MTD to educate and inform local jurisdictions and
reqasssermapha
comin indbuscreMT rials, buses and bus stops. The Transit Village and Super Stop projects are
pas Ridtargeted to service improvements and overall name recognition.
FY 2004 FY 2005 FY 2006Weekday 22,889 22,753 23,359 23,762 3.8%Saturday 12,585 12,765 12,657 13,307 5.7%Sunday 9,551 9,562 9,875 10,088 5.6%
FY03 - FY06Boardings FY 2003% Change Average Daily Base Year Audit Review Period
Community Relations into one Department that also
however, is in operations with customer service housed at the Transit nter.
h this reorganization, MTD began to focus on a few key objectives luding efforts to improve relationships with local jurisdictions and ding partners. This involved listening to concerns and issues and
funding partners about issues such as overcrowding, the actions uired to relieve overcrowding and improve service, and the ociated costs. This strategy was successful and resulted in new vices being added during the audit review period, with the local tch for CMAQ funds being provided by local jurisdictions. The final se of service changes was implemented in March 2007.
During the audit review period, MTD worked to improve its image in the munity, as well as increase community involvement. The increase
bus advertising revenues is one indication of success. Other ications are visual. For example, MTD established standards for stops and signage, working to improve brand recognition and ate a consistent visual image to associate with MTD and its service. D has implemented this policy with respect to printed mate
examples of the next steps in the process to create safe and attractive senger waiting areas for transfers and access to the MTD system. ership and performance by route are monitored with marketing
O’Melia Consulting

Santa Barbara MTD TDA Triennial Performance Audit Page 29
MTinc
• e County of Santa Barbara, the cities of Carpinteria,
Goleta, and Santa Barbara, school districts and the APCD
• Inpu ned through public meetings held in Carpinteria, Goleta and Santa Barbara each year in November
• Other sources of public input including passenger comments, email and telephone communication and contact with community
nalysis (compare current performance to system targets and prior year) and the annual service evaluation, which identifies
D has an annual service planning and evaluation process that ludes:
Input from representatives of other agencies including Caltrans, SBCAG, th
t on service needs and issues obtai
representatives and advocacy groups in the area
• Ridership surveys, demographic reviews and line-by-line productivity and cost effectiveness measures used in the annual route a
routes in need of remedial action.
Information collected during this process is used to produce an internal service improvement list, which is evaluated for financial feasibility as part of the budget process. Potential service improvements are presented to the Board in terms of what is affordable and what is not with Board direction provided typically in May, following a public hearing. A final report on service changes is developed in August with changes being implemented in March of each year.
O’Melia Consulting

Santa Barbara MTD TDA Triennial Performance Audit Page 30
IV. RECOMMENDATIONS
Three recommendations are offered for consideration by MTD. This
at i
1. MTD should include findings of compliance as required by CAC 6667 in eSectio
• gencies receiving TDA funds are required by PUC
h allows for an expanded annual fiscal audit for those agencies that receive funds
identified in recent audits with respect to PUC Sections 99271, 99272 and 99273 regarding
g the amount of work required by transit operator staff preparing claims and SBCAG staff reviewing claims prior to funding approval. Feedback on compliance issues would be annually rather than waiting for triennial performance audits.
• Expected Results. Improved compliance with State regulatory requirements is expected to result from this recommendation. A second benefit is that transit operator and SBCAG staff will spend less time determining compliance as part of the claims review process.
includes two recommendations related to compliance, and one aimed mproving effectiveness and efficiency of operations.
th annual financial and compliance audit required by PUC n 99245.
Findings. A99245 to submit an annual fiscal audit to the State Controller within 180-days after the end of the year. MTD is in compliance with this requirement under PUC Section 99245.2, whic
from other sources. In conducting the compliance audit for an operator or transit service claimant, the independent auditor shall perform at least the tasks outlined in CAC 6667. Specific findings relative to these tasks, and documentation supporting compliance findings have not been clearly
retirement funds and private pension plans and reporting.
• Suggested Actions. MTD should include compliance audit tasks per CAC 6667 in the scope of work for annual financial and compliance audits. Including specific statements and the calculations to verify some of the more detailed financial requirements would go a long way in streamlinin
O’Melia Consulting

Santa Barbara MTD TDA Triennial Performance Audit Page 31
2. In calculating revenue hours and miles for external reporting, MTD
and miles to account for all missed trips as well as unscheduled trippers and booster service.
• Findings. MTD is not compliant with TDA definitions for revenue
ns for missed
by date, day type, route and incident type with
ng. As part of this review, MTD may wish to consider updating the process
• ting this recommendation will result in compliance with TDA data definitions for revenue service hours
should adjust scheduled hours
service hours and revenue service miles. MTD uses annualized scheduled hours and miles, adjusted for additional booster service. MTD does not have a process for making deductiotrips due to roadcalls, accidents and other incident types.
• Suggested Actions. MTD may wish to consider keeping a log of missed trips changes to revenue hours and miles. Other factors that MTD may find useful is the time out of service and time service is resumed, as well as deadhead hours and miles. This log may be summarized on an annual basis for preparing external reports. One approach is to track the time that vehicles go out of service and the time that the replacement vehicle goes back into service. This reduction in revenue hours is then multiplied by the system or route average speed to arrive at missed revenue miles. GIS or other means of calculating missed revenue miles may also be used. Note that if a replacement vehicle is deployed, there will be an increase in deadhead time and mileage, which may have an impact on total vehicle service hours and miles required for NTD Reporti
for reporting total service hours and miles as well.
Subsequent to the draft report for this performance audit, MTD staff has indicated that it will “…implement a new system that allows for missed trips that are recorded by the Operations Department to be directly reported to the Transit Development Department. All trips that are reported will be adjusted in the monthly ridership report”.
Expected Results. Implemen
and revenue service miles.
O’Melia Consulting

Santa Barbara MTD TDA Triennial Performance Audit Page 32
3. MTD should consider including “Pay to Platform Hours” as a
iodically throughout the year.
•
ours. Review of paid work hours to platform hours for drivers as part of the
help round out the picture with a labor productivity indicator.
has implemented new maintenance software that appears to allow analysis of subfleet data. It is suggested that MTD use this data to review miles between roadcalls by subfleet and compare these figures to performance standards and PMI schedules. While cost efficiency is important, service reliability is more important from the customers perspective
Transportation Operations performance indicator and “Miles Between Roadcalls” as a Vehicle Maintenance performance indicator.
• Findings. MTD has maintained its paid work to platform hour ratio for operations to 1.27 or less through much of the audit review period, with the exception that it increased to 1.31 in FY06. This change has a significant impact on labor costs and is factor that MTD should review in the budgeting process and per
MTD has a standard of 8,000 miles between roadcalls compared to actual results in FY06 of 6,507. Preventive maintenance schedules vary by subfleet and range from 3,000 to 8,000. MTD currently monitors maintenance cost efficiency by subfleet on a quarterly basis. Review of miles between roadcalls compared to PMI standards would be beneficial in pinpointing the need to adjust PMI schedules.
Suggested Actions. MTD systems support the tracking of paid work hours by cost center as well as platform (total service hours) by month. Putting these two figures together on a quarterly basis could be accomplished with relatively little effort. MTD has recently implemented (FY 2006) new scheduling and runcutting software and therefore should have the analytical tools for a more detailed analysis of driver paid time relative to platform h
runcutting process would also be beneficial where one runcut may be compared to the next and/or compared to budget assumptions. This second figure is one that should be reviewed internally by management prior to service changes. MTD currently evaluates a number of service quality indicators for transportation. This would
MTD currently presents detailed cost efficiency data by subfleet in the quarterly reports. MTD
O’Melia Consulting
Santa Barbara MTD TDA Triennial Performance Audit Page 33
and including such an indicator in the quarterly review would help round out the review of maintenance performance.
• Expected Results. Implementing this recommendation will help to direct management attention to factors that have a significant impact on transportation operations’ costs and on the effectiveness of the vehicle maintenance program.
O’Melia Consulting

Santa Barbara MTD TDA Triennial Performance Audit Page 34
O’Melia Consulting
APPENDIX A: FINANCIAL AUDIT EXPENSE DATA
FY 2005 FY 2006Salary & WagesOperator Wages 3,946,430$ 4,134,833$ 4,304,321$ 4,595,564$ 16.4%Other Salaries & Wages 2,844,156$ 3,133,846$ 2,856,514$ 3,009,141$ 5.8%
Total Salary & Wages 6,790,586$ 7,268,679$ 7,160,835$ 7,604,705$ 12.0%Fringe Benefits Payroll Taxes 604,988$ 637,651$ 649,186$ 686,981$ 13.6%Retirement Plans 814,591$ 892,480$ 845,539$ 908,588$ 11.5%Health & Welfare 918,876$ 945,838$ 1,093,387$ 1,169,945$ 27.3%Workers Compensation 1,045,493$ 1,137,417$ 781,212$ 920,752$ -11.9%Sick Pay 141,184$ 311,806$ 145,919$ 170,080$ 20.5%Holiday Pay 262,491$ 271,348$ 269,761$ 282,073$ 7.5%Vacation Pay 503,485$ 526,014$ 521,468$ 535,098$ 6.3%Other Paid Absences 17,693$ 26,820$ 23,183$ 27,999$ 58.2%Uniforms & Tool Allowance 36,024$ 34,359$ 40,985$ 50,652$ 40.6%
Total Fringe Benefits 4,344,825$ 4,783,733$ 4,370,640$ 4,752,168$ 9.4%Services Profession & Technical (a) 299,460$ 249,905$ 192,478$ 292,325$ -2.4%Outside Service 69,180$ 68,319$ 65,835$ 106,460$ 53.9%Contract Maintenance 178,496$ 181,304$ 186,585$ 241,168$ 35.1%Promotion and Printing 124,349$ 125,450$ 142,958$ 166,897$ 34.2%
Total Services 671,485$ 624,978$ 587,856$ 806,850$ 20.2%Materials & Supplies Fuel and Lubricants 638,855$ 803,794$ 998,678$ 1,338,364$ 109.5%Tires and Tubes 103,574$ 110,381$ 110,313$ 104,678$ 1.1%Bus Parts 695,802$ 794,781$ 476,589$ 678,290$ -2.5%Other Materials & Supplies 176,515$ 140,025$ 167,174$ 192,125$ 8.8%Electric Bus Power 63,290$ 68,899$ 68,460$ 67,657$ 6.9%
Total Materials & Supplies 1,678,036$ 1,917,880$ 1,821,214$ 2,381,114$ 41.9%Utilies & Telephone 219,035$ 199,378$ 191,316$ 195,879$ -10.6%Casualty & Liability Costs 87,901$ 181,329$ 502,568$ 651,037$ 640.6%Purchased Transportation 219,300$ 332,173$ 347,503$ 357,173$ 62.9%Miscellaneous Expense Dues & Subscriptions 25,431$ 25,824$ 26,314$ 27,721$ 9.0%Travel, Meetings & Training 33,075$ 11,626$ 16,809$ 22,077$ -33.3%Purchased Media 42,715$ 17,493$ 34,489$ 56,770$ 32.9%Other Miscellaneous (b) 185,372$ 223,049$ 666,433$ 510,912$ 175.6%
Total Miscellaneous 286,593$ 277,992$ 744,045$ 617,480$ 115.5%Total Before Interest & Depr. $ 14,297,761 $ 15,586,142 $ 15,725,977 $ 17,366,406 21.5%Source: Statement of Expenses, Financial Statements and Required Supplemenatary Information.(a) Including Director Fees; (b) Includes $550,000 Environmental clean-up costs in FY 2005 and $359,090 in FY 2006.
Statement of Exp ange FY03 to FY06FY 2004
enses Base Year FY 2003
% ChAudit Review Period

SANTA BARBARA COUNTY ASSOCIATION OF GOVERNMENTS TDA TRIENNIAL PERFORMANCE
AUDIT FOR FY 2004-2006 Fiscal Years Ending June 30th
Prepared by
OCTOBER 20, 2007

SBCAG TDA Triennial Performance Audit Page i
TABLE OF CONTENTS
EXECUTIVE SUMMARY.................................................................... 1
Purpose of Audit.........................................................................................1
Findings......................................................................................................1
Recommendations .....................................................................................5
I. INTRODUCTION....................................................................... 6
Performance Audit Objectives and Approach.............................................6
Agency Overview .......................................................................................8
II. COMPLIANCE REVIEW......................................................... 16
Regulatory Requirements.........................................................................16
Progress To Implement Prior Audit Recommendations ...........................19
III. FUNCTIONAL AREA PERFORMANCE RESULTS............... 21
Administration and Management..............................................................21
Public Information ....................................................................................23
TDA Administration ..................................................................................24
Unmet Needs Process .............................................................................26
Transportation Planning and Regional Coordination................................30
Transportation Programming & Project Development ..............................32
Traffic Solutions .......................................................................................34
IV. RECOMMENDATIONS........................................................... 38
O’Melia Consulting in association with Kelly Hines Consulting

SBCAG TDA Triennial Performance Audit Page ii
LIST OF EXHIBITS
1. Performance Audit Sources ...........................................................................7
2. Organization Chart.......................................................................................12
3. Regulatory Compliance Matrix .....................................................................17
4. Progress To Implement Prior Audit Recommendations ...............................20
5. Summary of SBCAG Annual Budgets ..........................................................22
6. PUC 99401.5 Requirements To Use TDA Funds For Streets & Roads .......26
7. Transit Service Improvements Summary .....................................................29
8. Sample Farebox Recovery Requirements ...................................................41
O’Melia Consulting in association with Kelly Hines Consulting

SBCAG TDA Triennial Performance Audit Page 1
EXECUTIVE SUMMARY
Purpose of Audit
As the Regional Transportation Planning Agency (RTPA) for Santa Barbara County, the Santa Barbara County Association of Governments (SBCAG) is required by the Public Utilities Code (PUC) Sections 99246 and 99248 to contract for a third party performance audit of itself and each of the transit operators to which Transportation Development Act (TDA) funds are allocated. These audits are to be conducted in accordance with the California Department of Transportation, Performance Audit Guidebook for Transit Operators and Regional Transportation Entities. Performance audits of RTPAs are required to:
• Determine compliance with regulatory requirements
• Assess progress to implement prior performance audit recommendations
• Evaluate the effectiveness and efficiency of agency activities related to transportation planning, programming, coordination and funds administration.
This performance audit of the Santa Barbara County Association of Governments is for Fiscal Years 2004, 2005 and 2006 -- the period of time beginning July 1, 2003 and ending June 30, 2006.
Findings
• Agency Accomplishments & Challenges. During the audit review period significant effort was made to develop consensus around the expenditure plan for Measure D renewal and to educate the public about the benefits of this plan, as well as what had been accomplished to date with Measure D funds. While the expenditure plan was politically acceptable, it failed to gain the required 66% voter approval. Finding adequate funding for transportation projects will be a challenge that SBCAG will continue to face in the future. SBCAG accomplishments during the audit review period
O’Melia Consulting in association with Kelly Hines Consulting

SBCAG TDA Triennial Performance Audit Page 2
include: (1) Development of the 101 In Motion plan; (2) Upgrade of the call box system; (3) Implementation of expanded commuter express service, the Quick Start Vanpool and New Rider Rebate programs; (4) Completion of Measure D operational improvements at three interchanges; (5) Completion of environmental work for Route 154 Group 2 improvements and technical assistance provided for Route 166; (6) Completion of the North County Transit Plan; (7) Establishing the Freeway Service Patrol (FSP); (8) Completing the last year of CMAQ project selection; and (9) Completing the permits and environmental clearance for Phase 1 of the 101 Widening project. Through these many projects and challenges, SBCAG has been able to improve its working relationship with technical committees and processes for involving the public and local agencies in planning and policy development. These accomplishments should be beneficial to SBCAG as it continues efforts to secure funding for transportation projects in Santa Barbara County.
• Regulatory Requirements. SBCAG is in full compliance with the majority of requirements with three exceptions. Two of these were noted in the prior performance audit as recommendations and are listed below. The third area of partial compliance relates to SBCAG ensuring that annual fiscal audits are submitted to the State Controller for each TDA claimant prior to approval of claims. SBCAG approved claims in FY07 and FY08 for TDA funds for the City of Guadalupe despite a two-year delay in the completion of the FY05 audit. The FY06 audit has yet to be completed. SBCAG has notified the City of Guadalupe that FY08 TDA payments will be placed on hold until compliance with FY06 reporting requirements are met. Procedures to ensure that funds are only released when requirements have been met are being implemented by SBCAG.
• Progress To Implement Prior Audit Recommendations. SBCAG did not implement recommendations to: (1) Clarify rules and regulations for claiming TDA Article 3 Bicycle & Pedestrian funds; and (2) Adopt rules and regulations regarding farebox recovery ratios. Both of these recommendations relate to PUC compliance requirements and are included as recommendations in this performance audit.
O’Melia Consulting in association with Kelly Hines Consulting

SBCAG TDA Triennial Performance Audit Page 3
• Administration and Management. SBCAG has a staff of 20 to fulfill its many duties. During the audit review period, the majority of agendas were distributed to Board Members on time and posted on the SBCAG website in accordance with Board policy. Employee evaluations were conducted on time and compensation packages adjusted for SBCAG to remain competitive in the labor market. The need to review compensation and benefit packages is on-going as housing costs and other factors make recruiting a challenge (e.g., SBCAG continues to experience turnover such as six positions in the current year due primarily to resignations).
• Public Information. During the audit review period, SBCAG’s Public Information function was significantly improved and expanded to increase public awareness of transportation issues and SBCAG activities. This includes creation of an electronic newsletter Newswire, which was distributed to more than 740 recipients. Staff presentations were greatly increased and included 44 community organizations and governmental boards in FY 2005, and over 60 presentations in FY 2006. Media coverage was increased and typically surrounded the accomplishments listed above (e.g., completion of the 101 In Motion study, upgrade of callboxes).
• TDA Funds Administration. The SBCAG TDA Claim Manual provides a schedule of events and actions, many of which are required by law. SBCAG is very conscientious about meeting these deadlines and ensuring that claimants receive the maximum funding available in a timely manner. This has been a significant challenge during the audit review period due to staff turnover and vacancies in a number of claimant organizations. Claim forms have been incomplete and/or incorrect. Recommendations contained in this audit are aimed at strengthening the claim review process to reasonably ensure that claimants comply with PUC requirements and includes a recommendation for SBCAG to hold a workshop with potential claimants when the TDA Claim Manual is released each year.
• Unmet Needs Process. SBCAG has made a significant effort to ensure that regulatory requirements are met in the identification, evaluation and funding of transit needs that are reasonable to meet. This includes dealing with legal challenges to its decisions and
O’Melia Consulting in association with Kelly Hines Consulting

SBCAG TDA Triennial Performance Audit Page 4
subsequent settlement agreements. SBCAG has created the SBCTAC in accordance with State requirements and this committee plays a significant and active role in the unmet transit needs process. A number of transit service improvements have resulted from the Transit Needs Assessment process. The definition of unmet transit need and reasonable to meet were revised, public outreach was expanded, and presentation of information was changed to facilitate understanding and reduce ambiguity. SBCAG has a thorough and lengthy process which it follows each year to determine the eligibility of local jurisdictions (e.g., Buellton, Guadalupe, Lompoc, Santa Maria, Solvang, and the County) to receive TDA Article 8 funds for street and road projects. While several of these jurisdictions have since discontinued the use of Article 8 funds for streets and roads, each of these jurisdictions used funds for this purpose in at least one of the three audit review years.
• Transportation Planning and Regional Coordination. SBCAG has continued to meet on-going transportation planning activities (e.g., Regional Transportation Plan, Federal Transportation Improvement Program and Metropolitan Transportation Plan updates, Air Quality Conformity analyses, Congestion Management Program updates, Transit Needs Assessments), provide staff support to SBCAG technical committees and lead agency Highway 101 In Motion project efforts. As a result of the professionalism exhibited in these activities, SBCAG now has a better working relationship with its technical committees and a stronger process for involving the public in planning and decision-making.
• Transportation Programming and Project Development. During the audit review period, SBCAG completed annual Measure D Highway Program Strategic Plan updates, adding a number of new projects in October 2003 including the Clean Air Express, Route 101/Milpass to Cabrillo-Hot Springs, and the Route 101 Ortega Hill Auxiliary Lane. SBCAG completed environmental work for Route 154 Group 2 Operational Improvements as well as work on three interchange projects (i.e., Route 101/SR 154 (North), Route 101/Donovan, and Route 101/Stowell). The Stowell and Donovan projects were completed ahead of schedule. SBCAG allocated between $19 million and $30 million annually in Measure D
O’Melia Consulting in association with Kelly Hines Consulting

SBCAG TDA Triennial Performance Audit Page 5
revenues to local governmental agencies. SBCAG completed a refunding process for Measure D bonds that resulted in a $1.3 million savings. SBCAG has consistently implemented projects as promised and continues to identify funding sources to move projects forward.
• Traffic Solutions. The Traffic Solutions Division provides transportation services and programs designed to improve air quality and reduce congestion by reducing reliance on single occupant vehicle use during peak periods. Traffic Solutions is responsible for implementing vanpool, carpool, and bicycle programs, as well as transit services. In FY 2006, Traffic Solutions’ programs eliminated 485,550 automobile trips and over 16 million vehicle miles of travel. The subsidy per trip eliminated was $3.50 and $0.10 per VMT eliminated. Commuters saved an estimated $6.3 million in travel costs and 650 thousand gallons of fuel from use of these alternative programs.
Recommendations
Five recommendations are offered for consideration by SBCAG. This includes two recommendations related to issues raised in prior TDA Performance Audits, as well as three new recommendations aimed at improving TDA claims and financial audit processes.
1. SBCAG should adopt rules and regulations for submission of claims for bicycle and pedestrian facilities.
2. SBCAG should adopt rules and regulations for farebox recovery ratios and provide guidance in the TDA Claim Manual regarding the application of TDA farebox recovery requirements to specific operations.
3. SBCAG should streamline and update its internal TDA Claims process.
4. SBCAG should provide training and/or conduct a workshop each year upon distribution of the TDA Claims Manual.
5. SBCAG should expand and specify findings of compliance as part of annual financial and compliance audits.
O’Melia Consulting in association with Kelly Hines Consulting
SBCAG TDA Triennial Performance Audit Page 6
I. INTRODUCTION
Performance Audit Objectives and Approach
As the Regional Transportation Planning Agency (RTPA) for Santa Barbara County, the Santa Barbara County Association of Governments (SBCAG) is required by the Public Utilities Code (PUC) Sections 99246 and 99248 to contract for a third party performance audit of itself and each of the transit operators to which Transportation Development Act (TDA) funds are allocated. These audits are to be conducted in accordance with the California Department of Transportation, Performance Audit Guidebook for Transit Operators and Regional Transportation Entities. Performance audits of RTPAs are required to:
• Determine compliance with regulatory requirements
• Assess progress to implement prior performance audit recommendations
• Evaluate the effectiveness and efficiency of agency activities related to transportation planning, programming, coordination and funds administration.
This performance audit of the Santa Barbara County Association of Governments is for Fiscal Years 2004, 2005 and 2006 -- the period of time beginning July 1, 2003 and ending June 30, 2006.
The methodology for this audit includes interviews with management and staff, a site visit for review of records and information necessary to assess compliance and performance, and review of annual budgets, relevant planning documents and agency agendas and minutes. Highlights of this review are presented in Exhibit 1.
SBCAG Board Members were also contacted and offered an opportunity to provide input on agency performance relative to transportation planning, coordination and regional impacts, and internal and external communications between SBCAG stakeholders, Board Members, Committees and staff.
O’Melia Consulting in association with Kelly Hines Consulting

SBCAG TDA Triennial Performance Audit Page 7
Exhibit 1 – Performance Audit Sources
Interviews
Jim Kemp, Executive Director Michael Powers, Deputy Director, Planning
Steve Van Denburgh, Deputy Director, Program & Project Development Sarkes Khachek, Transportation Planner
Britanny Odermann, Transportation Planner Kent Epperson, Administrator
Scott Spaulding, Regional Transit Coordinator Robert Perkins, Administrative Services Officer
Martha Gibbs, Finance Officer Gregg Hart, Public Information and Government Affairs Coordinator
Patricia Mickelson, Caltrans
Site Visits
March 26, 2007 – Kickoff Meeting & Interviews May 1, 2007 Interviews
May 3, 2007 Review Claim Form Files
Background Materials Reviewed
• 101 In Motion Final Report (July 2006) • 2004 Metropolitan Transportation Plan • 2006 Regional Transportation Improvement Program • Clean Air Express Bus Agreement Between SBCAG and Santa Barbara
Airbus • Comprehensive Annual Financial Reports, Fiscal Years 2004-2006 • Comprehensive Budget, Fiscal Years 2004 - 2007 • Intercommunity Transit Service Implementation Plan: Lompoc – VAFB – Santa
Maria (April 2004) • Measure D Regional Program 2006 Strategic Plan • North Santa Barbara County Transit Plan (October 19, 2006) • Overall Work Program, Fiscal Years 2004 - 2007 • Public Information – Website, Timetables & Schedules, Brochures • Public Participation Plan (March 21, 2002) • SBCAG Board Meeting Agendas and Minutes • SBCAG/SLOCAG Joint Meeting Materials (September 2005) • SBCAG/VCTC Joint Meeting Materials (October 2005) • SBCTAC Orientation Packet (May 2007) • TDA Triennial Performance Audit Report (June 2004) • Traffic Solutions Annual Report, Fiscal Years 2004 - 2006 • Transit Needs Assessment, Fiscal Years 2004 – 2007 • Transit Project Selection Procedures (August 17, 2006) • Transportation Development Act Claim Manuals for Fiscal Years 2004 - 2007
O’Melia Consulting in association with Kelly Hines Consulting

SBCAG TDA Triennial Performance Audit Page 8
Agency Overview
The Santa Barbara County Association of Governments was created in 1966 as a voluntary council of governments under a Joint Powers Agreement executed by each of the local government entities in Santa Barbara County.
SBCAG’s responsibilities have evolved over time and now include a full range of regional roles in planning, programming, funding and operation of a number of governmental planning and transportation-related services. SBCAG currently serves in a number of capacities.
• Regional Transportation Planning Agency (RTPA). SBCAG, designated by the State Secretary of Business, Housing and Transportation, is responsible for multi-modal transportation planning, programming, and transportation funds administration required under State law. This includes development of the Regional Transportation Plan and Regional Transportation Improvement Program, as well as allocation of more than $15 million in annual Transportation Development Act (TDA) funds.
• Metropolitan Planning Organization (MPO). SBCAG, designated by the Governor of the State of California, is responsible for all transportation planning and programming activities required under Federal law. This includes development of long-range transportation plans, mulit-year funding programs and approval of transportation projects using Federal funds.
• Local Transportation Authority (LTA). SBCAG administers the ½ cent countywide sales tax authorized by Santa Barbara County voters in 1989 as Measure D. Measure D has contributed approximately $500 million for local and regional transportation projects over 20 years. SBCAG has led the planning and construction of 15 Measure D transportation projects and allocates more than $20 million in Measure D funds annually. Measure D is set to expire in 2010. Efforts to define an Expenditure Plan and garner support for renewal of this sales tax has been significant over the audit review period.
• Congestion Management Agency (CMA). SBCAG is responsible for the development and implementation of the countywide
O’Melia Consulting in association with Kelly Hines Consulting

SBCAG TDA Triennial Performance Audit Page 9
Congestion Management Program (CMP) required of all urban counties in California. The purpose of the CMP is to reduce traffic congestion through capital improvements, TDM, and coordinated land use planning.
• Airport Land Use Commission (ACLU). SBCAG is responsible for protecting public health, safety and welfare by ensuring that vacant lands in the vicinity of airports are planned and zoned for uses compatible with airport operations.
• Service Authority for Freeway Emergencies (SAFE). SBCAG is responsible for the installation, operation and administration of approximately 350 roadside call boxes in Santa Barbara County, financed by a $1.00 per year fee on all motor vehicles registered within the County. SBCAG also implemented a Freeway Service Patrol (FSP) using these fees to reduce congestion in the South Coast 101 Corridor.
• Traffic Solutions. SBCAG administers a Transportation Demand Management (TDM) program that promotes ridesharing, public transportation, bicycling, walking and other transportation alternatives. SBCAG works directly with employers to develop employee transportation programs and administers the Clean Air Express, a commuter bus service.
• Affiliate Census Center. SBCAG, as designated by the State Department of Finance, is an affiliate census center for Santa Barbara County. In this role, SBCAG provides access to census data.
• Other Regional Planning Projects & Programs. SBCAG conducts other regional planning activities on behalf of member agencies including preparation of the Regional Housing Needs Allocation Plan and the development of regional growth forecasts of population, housing, and employment.
Governance and Organization
SBCAG is an independent agency governed by a 13-member Board of Directors consisting of an elected official appointed by each of the eight cities in the County and the five members of the Santa Barbara
O’Melia Consulting in association with Kelly Hines Consulting

SBCAG TDA Triennial Performance Audit Page 10
County Board of Supervisors. Member agencies include the cities of Buellton, Carpinteria, Goleta, Guadalupe, Lompoc, Santa Barbara, Santa Maria, and Solvang, as well as Santa Barbara County. Ex-Officio non-voting members include representatives from Caltrans District 5, Senate Districts 15 and 19, and Assembly Districts 33 and 35. The SBCAG Board of Directors meets monthly, alternating its meeting location between Santa Barbara and Santa Maria.
SBCAG has three standing committees to advise the Board of Directors on regional plan and policy issues, including:
• Technical Planning Advisory Committee (TPAC) consists of staff representatives from the County and eight cities, the Air Pollution Control District (APCD), and SBCAG. Ex-officio non-voting members include representatives from Vandenberg Air Force Base, the Local Agency Formation Commission (LAFCO), County Housing Program, and the University of California at Santa Barbara (UCSB). TPAC meets as needed (e.g., four times in FY06).
• Technical Transportation Advisory Committee (TTAC) consists of staff representatives from the County, eight cities, Caltrans, APCD, Santa Barbara Metropolitan Transit District (SBMTD), and SBCAG. Ex-officio members include representatives from the Federal Highway Administration (FHWA), Federal Transit Administration (FTA), Vandenberg AFB, and USSB. TTAC meets about every month (e.g., ten times in FY06).
• Santa Barbara County Transit Advisory Council (SBCTAC) consists of representatives from fixed route transit and paratransit service providers, social service agencies, non-profit groups providing social services, and transit users. Composition of SBCTAC is specified in part by State law and has a significant role in the transit needs assessment and unmet transit needs findings process. SBCTAC meets nine to ten times each year (e.g., nine times between February and November of FY06).
The committees review and make policy recommendations on fiscal matters, fund allocations, special studies, planning documents and other matters that come before the Board. The committees serve as a communication link to all local governments and departments in the
O’Melia Consulting in association with Kelly Hines Consulting
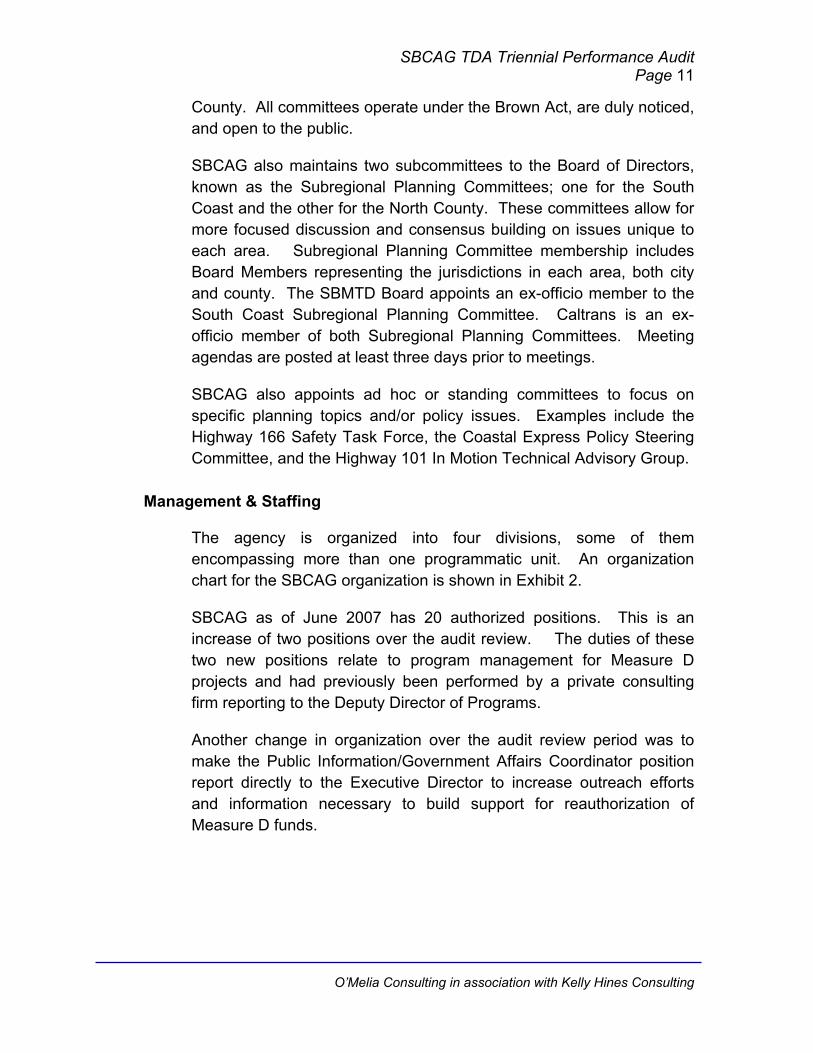
SBCAG TDA Triennial Performance Audit Page 11
County. All committees operate under the Brown Act, are duly noticed, and open to the public.
SBCAG also maintains two subcommittees to the Board of Directors, known as the Subregional Planning Committees; one for the South Coast and the other for the North County. These committees allow for more focused discussion and consensus building on issues unique to each area. Subregional Planning Committee membership includes Board Members representing the jurisdictions in each area, both city and county. The SBMTD Board appoints an ex-officio member to the South Coast Subregional Planning Committee. Caltrans is an ex-officio member of both Subregional Planning Committees. Meeting agendas are posted at least three days prior to meetings.
SBCAG also appoints ad hoc or standing committees to focus on specific planning topics and/or policy issues. Examples include the Highway 166 Safety Task Force, the Coastal Express Policy Steering Committee, and the Highway 101 In Motion Technical Advisory Group.
Management & Staffing
The agency is organized into four divisions, some of them encompassing more than one programmatic unit. An organization chart for the SBCAG organization is shown in Exhibit 2.
SBCAG as of June 2007 has 20 authorized positions. This is an increase of two positions over the audit review. The duties of these two new positions relate to program management for Measure D projects and had previously been performed by a private consulting firm reporting to the Deputy Director of Programs.
Another change in organization over the audit review period was to make the Public Information/Government Affairs Coordinator position report directly to the Executive Director to increase outreach efforts and information necessary to build support for reauthorization of Measure D funds.
O’Melia Consulting in association with Kelly Hines Consulting
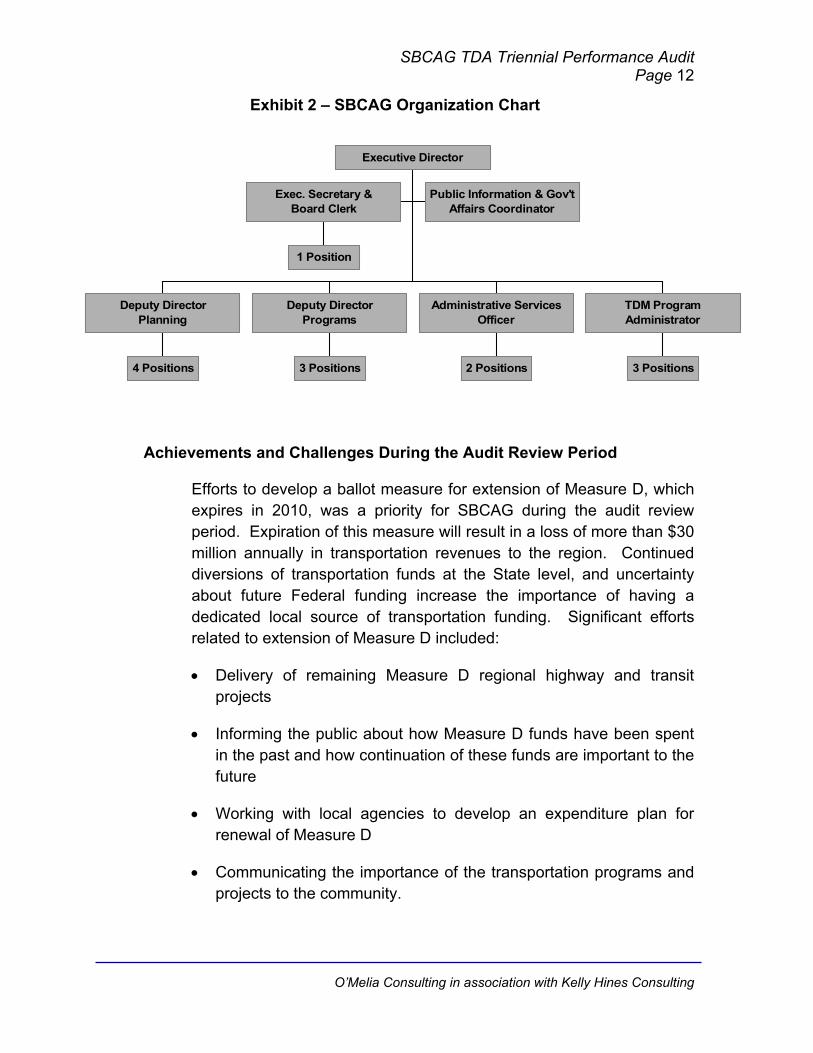
SBCAG TDA Triennial Performance Audit Page 12
Exhibit 2 – SBCAG Organization Chart
1 Position
Exec. Secretary &Board Clerk
Public Information & Gov'tAffairs Coordinator
4 Positions
Deputy DirectorPlanning
3 Positions
Deputy DirectorPrograms
2 Positions
Administrative ServicesOfficer
3 Positions
TDM ProgramAdministrator
Executive Director
Achievements and Challenges During the Audit Review Period
Efforts to develop a ballot measure for extension of Measure D, which expires in 2010, was a priority for SBCAG during the audit review period. Expiration of this measure will result in a loss of more than $30 million annually in transportation revenues to the region. Continued diversions of transportation funds at the State level, and uncertainty about future Federal funding increase the importance of having a dedicated local source of transportation funding. Significant efforts related to extension of Measure D included:
• Delivery of remaining Measure D regional highway and transit projects
• Informing the public about how Measure D funds have been spent in the past and how continuation of these funds are important to the future
• Working with local agencies to develop an expenditure plan for renewal of Measure D
• Communicating the importance of the transportation programs and projects to the community.
O’Melia Consulting in association with Kelly Hines Consulting

SBCAG TDA Triennial Performance Audit Page 13
Despite these efforts, the Measure D renewal effort failed to generate the 66% voter approval required for re-authorization. As a result, many of the efforts put forth by SBCAG related to securing future transportation funds and public information will likely continue through the current period.
While Measure D renewal was a priority, SBCAG did initiate and accomplish a number of important plans, programs, and projects during the audit review period (i.e., July 1, 2003 and June 30, 2006), as highlighted below.
• While significant funds were provided during the audit period through Measure D and the STIP, the future forecast will be greatly impacted by the expiration of Measure D in 2010 and the continued diversion of State Proposition 42 revenues from transportation. During the audit review period, SBCAG completed the 2004 and 2006 STIP updates, which required massive rescheduling of projects, with a number of projects programmed in the 2002 STIP being delayed due to a lack of projected funding.
• Traffic congestion in the US 101 corridor from Goleta to the Ventura County line is an issue on which SBCAG continues to work. Actions during the audit review period included a two-year effort to develop the 101 In Motion and subsequent Implementation Plan, which includes 36 short-term improvements as well as longer term projects for improving mobility within the Highway 101 corridor in the South Coast. This project is one example of SBCAG at its best in terms of public outreach and consensus building.
• Heavy-duty truck traffic on Highway 166 between the Cities of Guadalupe and Santa Maria was analyzed in a study completed in August 2003. Information from this study assisted the City of Santa Maria to address heavy-duty truck traffic on Highway 166, which serves as Santa Maria’s “Main” street, was addressed in an analysis. This project is one example of SBCAG at its best in terms of technical support to local jurisdictions.
• SBCAG continued work and completed a number of Measure D projects including closeout of three interchange projects (i.e., Route 101/154, Route 101/Donovan, and Route 101/Stowell), completion of work on the environmental document for the Route 154 Group 2
O’Melia Consulting in association with Kelly Hines Consulting

SBCAG TDA Triennial Performance Audit Page 14
operational improvements, and implementation of three Route 101 operational improvement projects (i.e., Evans-Sheffield (Ortega Hill) Auxiliary Lane, Milpas-Hot Springs widening, and Evans/Ortega Hill intersection). The opening of the Jameson lane and the groundbreaking for the Ortega Hill freeway both occurred in FY 2006.
• SBCAG’s Traffic Solutions began a number of new projects including the Vanpool Quick Start program, Bike to Work Day Forum, FlexWork Santa Barbara program, real-time carpool matchlist program on the Traffic Solutions website, and expanded service on the Clean Air Express and VISTA Coastal Express. On an annual basis, these programs eliminate over 230,000 vehicle trips and more than 11 million vehicle miles of travel (VMT).
• The region achieved attainment of the Federal 8-hour ozone standard during the audit review period. As a result, the region is no longer eligible for Federal Congestion Mitigation and Air Quality (CMAQ) funds. The remaining $171,000 of CMAQ funds was programmed for use in FY 2006. The loss of these funds impacts funds available for regional inter-community transit services such as the Clean Air Express and Coastal Express. In the past, CMAQ funds have been used to demonstrate the feasibility of new service such as the Breeze Service. While attainment of ozone standards is a good thing, the resulting loss of funds requires that SBCAG develop alternative funding strategies for these successful programs. SBCAG secured $1.9 million in CMAQ phase-out funding through an agreement with the State’s other COG’s that receive CMAQ.
• As the SAFE, SBCAG applied for and received federal grant funds to begin upgrading the highway callbox system from analog to digital service and to make the system more accessible to persons with disabilities using TTY (teletypewriter) keypads. Also during the audit review period, SBCAG developed a new Freeway Service Patrol program for the South Coast 101 Corridor, which was initiated in FY 2006.
• During the audit review period, SBCAG’s Public Information function was significantly improved and expanded to increase public awareness of transportation issues and SBCAG activities.
O’Melia Consulting in association with Kelly Hines Consulting

SBCAG TDA Triennial Performance Audit Page 15
This includes creation of the monthly electronic newsletter Newswire, which was distributed to more than 740 recipients. Staff presentations were greatly increased and included 44 community organizations and governmental boards in FY 2005, and over 60 presentations in FY 2006, resulting in contact with over 2,000 individuals.
• In July 2003, SBCAG moved to the current Casa Nueva location, completing a multi-year relocation project. SBCAG has a long-term office space lease with fixed costs of $1.29 per square foot over 30 years. This cost is approximately 8.7% less per year than the previous location.
• In order to retain and attract staff to fill vacant positions, SBCAG conducted a Compensation and Benefits Study, with implementation during the audit review period. With a full-time staff of 20 persons, more than two vacancies (i.e., ten percent) can have an impact on the ability of SBCAG to complete the work to which it has committed to as part of the annual budget and Overall Work Program (OWP) processes.
O’Melia Consulting in association with Kelly Hines Consulting

SBCAG TDA Triennial Performance Audit Page 16
II. COMPLIANCE REVIEW
Regulatory Requirements
Caltrans’ Performance Audit Guidebook specifies RTPA compliance requirements, summarized below in Exhibit 3 and discussed in this section. During the audit review period, SBCAG has complied with a majority of these requirements. Several areas, however, could be improved, including two items recommended in the prior audit that have not been implemented.
The most significant issue from this compliance review relates to the CAC 6733 which states that SBCAG “shall take no action on a claim at any time that the claimant is delinquent in submitting to the regional entity either the annual report of its operations pursuant to Public Utilities Code Section 99243 or the annual certified fiscal audit report required pursuant to Public Utilities Code Section 99245”. The financial audit for FY05 for the City of Guadalupe was not completed until the first quarter of FY08. The FY06 financial audit and State Controller Report for Transit Services have not been completed as of mid-October 2007. The City of Guadalupe should not have been eligible for TDA funds in FY07 or FY08 until these required audits and reports had been completed and submitted to the State Controller. A recommendation to strengthen the claims review process to include obtaining a copy of required documents has been included in this performance audit. Subsequent to completion of this performance audit, SBCAG has issued a letter to the City of Guadalupe regarding the need to meet these regulatory requirements in order to continue receipt of FY08 TDA funds.
O’Melia Consulting in association with Kelly Hines Consulting

SBCAG TDA Triennial Performance Audit Page 17
Exhibit 3 – Regulatory Compliance Matrix
Regulatory Code Compliance Requirement Compliance
Finding Verification Information
PUC Section 99231
All transportation operators and city or county governments in total claim no more than those LTF moneys apportioned to that area.
Compliance Apportionments are in accordance with PUC requirements and individual allocations within areas of apportionment are based on population. SBCAG allocation resolutions are used to set limits on the amount of funds claimed.
PUC Sections 99238 and 99238.5
The RTPA has established a Social Services Transportation Advisory Council (SSTAC). The RTPA must ensure that there is a citizen participation process that includes at least an annual public hearing.
Compliance The Santa Barbara County Transit Advisory Council (SBCTAC) was formed in 2001 and is the designated SSTAC for Santa Barbara County. SBCAG has an extensive citizen participation process and holds public hearings in the north part of the county, although public hearings were held in the south county during the audit review period. The SBCTAC meets monthly.
PUC Sections 99233.3 and 99234
The RTPA has adopted rules and regulations for submission of claims for Article 3 Pedestrian and Bicycle claims
Non-Compliance
The prior audit recommended that SBCAG adopt rules and regulations. SBCAG has not implemented this recommendation.
PUC Section 99244
The RTPA must annually identify, analyze, and recommend potential productivity improvements that could lower the cost of those operators within the RTPA jurisdiction. Recommendations include, but are not limited to, those made in performance audits.
Partial Compliance
SBCAG monitors progress to implement performance audit recommendations as part of the TDA claims review process. Information submitted, however, does not always include audit recommendations and/or is sometimes incomplete, calling into question the basis for findings.
PUC Section 99245
The RTPA has ensured that all claimants to whom it allocates TDA funds submit to it and to the State Controller an annual certified fiscal and compliance audit within 180 days after the end of the fiscal year.
Partial Compliance
Financial audits have been completed and submitted on time or under a 90-day extension, except for the FY 2005 and FY 2006 Guadalupe audits which were still outstanding as of August 2007. TDA funds should not be released in FY07 or FY08 until these audits are complete. The FY 2005 SMOOTH audit was submitted 90-days past the original 90-day extension.
O’Melia Consulting in association with Kelly Hines Consulting

SBCAG TDA Triennial Performance Audit Page 18
Regulatory Code Compliance Requirement Compliance
Finding Verification Information
PUC Sections 99246 (a) (b) (d) and 99248
The RTPA has designated an independent entity to conduct a performance audit of operators and itself. Transit operator audits include verification of data and other compliance reviews.
Compliance The FY 2000 to FY 2003 TDA Performance Audits of SBCAG and Transit Operators were conducted by Nelson/Nygaard Consulting Associates (June 2004) and included data verification and other compliance reviews.
PUC Section 99246 (c)
The RTPA has submitted a copy of its performance audit to the Director of Caltrans as well as a letter certifying that the performance audits of operators have been completed.
Compliance The FY 2000 to FY 2003 TDA Performance Audit of SBCAG was submitted to Caltrans on July 15, 2004 and included a certification regarding completion of transit operator performance audits.
PUC Sections 99270.1 and 99270.2
The RTPA has established rules and regulations regarding revenue ratios for transportation operators providing services in urbanized and new urbanized areas.
Non-Compliance
SBCAG does not have a Board-adopted policy regarding revenue ratios, as recommended in the prior performance audit. SBCAG does, however, have revenue ratios for determining unmet transit needs that are reasonable to meet. These could be adopted for use in evaluating TDA claims.
PUC Section 99275.5
The RTPA has adopted criteria, rules, and regulations for the evaluation of claims filed under Article 4.5 and the determination of the cost effectiveness of the proposed community transit services.
Compliance SBCAG Resolution No. 90-1 was adopted February 15, 1990 provides rules and regulations for community-based paratransit service receiving Article 4.5 funds.
PUC Sections 99310.5 and 99313.3 and Proposition 116
State transit assistance funds received by the RTPA are allocated only for transportation planning and mass transportation purposes.
Compliance STA Financial Statements indicate that funds were expended for transit operating, transit capital, CTSA, and planning activities only.
PUC Section 99314.3
The amount received pursuant to the Public Utilities Code Section 99314.3 by each RTPA for state transit assistance is allocated to the operators in the area of its jurisdiction as allocated by the State Controllers Office.
Compliance Board resolutions clearly identify allocations by PUC section. Allocations are approved in October of each fiscal year, following release of estimates from the California State Controller’s Office.
O’Melia Consulting in association with Kelly Hines Consulting

SBCAG TDA Triennial Performance Audit Page 19
Regulatory Code Compliance Requirement Compliance
Finding Verification Information
CAC 6662 RTPA will annually complete a fiscal and compliance audit for LTF and STA funds and transmit to the State Controller within 12 months of close of the fiscal year. Funds shall not be commingles.
Compliance SBCAG does not commingle funds and has completed separate audits and submitted to the State Controller as follows: FY 2004: 31-Mar-05 FY 2005: 27-Dec-06 FY 2006: 22-Dec-07 STA and 23-Mar-07 for LTF
PUC Section 99401.5
If TDA funds are not used for transit, specialized transportation, pedestrian and bicycle facilities or transit planning, the RTPA has annually: • Consulted with the SSTAC • Identified transit needs • Adopted definition of
“Reasonable to Meet” and identified unmet transit needs
• Conducted public hearing on unmet transit needs
• Adopted findings on unmet transit needs and reasonable to meet
Compliance SBCAG has fulfilled its responsibilities in each of the audit review years, including dealing with legal challenges to its decisions and subsequent settlement agreements. A number of service improvements resulted from this process. The definition of unmet transit need and reasonable to meet were revised, public outreach was expanded and presentation of information was changed. These changes were implemented primarily in 2006 and impact FY07 TDA funding.
Progress To Implement Prior Audit Recommendations
The prior TDA Performance Audit, completed in June 2004, made two recommendations for improved compliance. SBCAG has not implemented these recommendations, as summarized in Exhibit 4.
SBCAG needs to update its TDA Claim Manual to include rules and regulations relating to submission and evaluation of Article 3 Bicycle & Pedestrian Facilities Claims. SBCAG also needs to identify specific farebox recovery requirements for individual transit operating agencies. Recommendations to this effect are provided in this Performance Audit. Update of the TDA Claim Manual and processes for claims review have compliance implications and need to be made a priority in the upcoming year.
O’Melia Consulting in association with Kelly Hines Consulting

SBCAG TDA Triennial Performance Audit Page 20
Exhibit 4 – Progress To Implement Prior Audit Recommendations
Prior Audit Recommendations
Prior Audit Findings Leading to
Recommendation Finding Implementing Actions &
Results
SBCAG should clarify the current status of its rules and regulations for submission of claims for facilities provided for the exclusive use of pedestrians and bicycles. When the Regional Bikeway Plan is completed, these rules and regulations should specify that these claims be consistent with the Plan, and the Plan should be used in evaluating claims.
The first part of this recommendation is a carryover from the 2001 TDA Performance Audit. SBCAG does not have rules or regulations for the use of Article 3 Bicycle & Pedestrian funds. Funds are allocated based on population and jurisdictions claim the amounts allocated without describing the use of these funds. The Regional Bikeway Plan update could provide a basis for evaluating claims.
Not Implemented
SBCAG has not adopted rules and regulations for the submission of Article 3 claims, as required by PUC Sections 99233.3 and 99234. The Regional Bikeway Plan has not been completed due to staff turnover, higher priority projects, and because it is not mandated. The current FY 2008 OWP has a projected Board approval of the Regional Bikeway Plan in December 2007.
SBCAG should adopt rules and regulations regarding farebox recovery ratio for operators serving a partly urbanized service area, and should provide additional guidance in its TDA Claims Manual regarding the application of TDA fare ratio provisions to specific operators.
Operators that serve an area that is part rural and part urbanized may have an intermediate farebox recovery requirement between 10% and 20% if approved by the SBCAG. In general, SBCAG’s TDA Claims Manual lists PUC sections concerning farebox recovery but does not provide guidance about how they apply to transit providers in the County.
Not Implemented
SBCAG has not updated its TDA Claim Manual regarding farebox recovery requirements. Individual operator requirements remain unclear.
O’Melia Consulting in association with Kelly Hines Consulting

SBCAG TDA Triennial Performance Audit Page 21
III. FUNCTIONAL AREA PERFORMANCE RESULTS
A high level review of functional area performance was conducted for select functions including:
• Administration and Management • Public Information • TDA Administration • Unmet Needs Process • Transportation Planning and Regional Coordination • Transportation Programming and Project Development • Traffic Solutions.
Information used in this section was obtained through review of project documents and Annual OWP and SBCAG Budget reports, as well as management and staff interviews.
Administration and Management
SBCAG has a 20-person organization with responsibilities in a number of planning, programming and service areas, as previously identified in Section I of this report. In order to retain and attract staff to fill vacant positions, SBCAG conducted a Compensation and Benefits Study, which was implemented during the audit review period.
Salaries and wages for SBCAG staff are funded from the General Fund, as shown below in Exhibit 5. Between FY04 and FY06, salaries and wages increased by 19% due to an increase in staffing which reduced consultant costs.
Revenue and expenditure budgets are driven by State and Federal grant availability. During the audit review period, there was a significant increase in Measure D projects, reflecting increased activity associated with implementation of new projects that SBCAG was able to implement during the audit period. Debt service was reduced by 7% during the audit review period and the Traffic Solutions Division was restructured with a reduction in program costs. The 58% reduction
O’Melia Consulting in association with Kelly Hines Consulting

SBCAG TDA Triennial Performance Audit Page 22
includes capital assets (e.g., buses) of more than $3 million in FY 2004 and therefore overstates the degree of change.
Exhibit 5 – Summary of SBCAG Annual Budgets
FY 2004 Budget
FY 2005 Budget
FY 2006 Budget
% Change FY04 - FY06
FY 2007 Budget
2,849,800$ 3,340,600$ 3,462,700$ 22% 2,978,490$ Staff Salaries & Wages 1,659,800$ 1,815,300$ 1,967,200$ 19% 2,064,300$ Services and Supplies 1,155,000$ 1,487,500$ 1,474,400$ 28% 797,800$ Other Charges 9,000$ 7,800$ 9,600$ 7% 7,180$ Fixed Assets 26,000$ 22,800$ 3,900$ -85% 11,400$ Other Financing Uses -$ 7,200$ 7,600$ - 97,810$
4,288,500$ 1,672,200$ 1,793,190$ -58% 2,284,100$ 1,906,400$ 1,818,500$ 2,009,280$ 5% 1,355,100$ 6,017,600$ 11,120,800$ 14,112,100$ 135% 16,914,400$ 4,610,000$ 4,287,200$ 4,285,400$ -7% 4,290,200$
19,672,300$ 22,239,300$ 25,662,670$ 30% 27,822,290$
18.0 18.5 19.5 8% 20.0
Addition of new administrative position 1/2 FTE first year then full-time thereafter - 0.5 1.0 1.0
Transportation Engineer position in Jan-06 to help meet $50M highway program improvements over next five years. 1/2 FTE first year then full-time thereafter.
- - 0.5 1.0
Budget Expenditures by Fund
General Fund
Traffic SolutionsService Authority for Freeway Emergencies (SAFE)Local Transportation Authority (Measure D)Debt ServiceTotal Budget
Number of Positions
SBCAG begins preparation of its annual Overall Work Program (OWP) in December of each year and includes identification of Federal and State funds with review by external agencies and TPAC and TTAC occurring in March. The OWP is approved by the SBCAG Board in April and is the basis for the Budget, which is approved by the SBCAG Board in June.
Administrative duties include:
• Preparing the annual budget and Overall Work Program documents
• Sending out Board agendas eight days prior to meeting date (100% in FY04 and FY05, several Board agendas delayed in FY06 with hand delivery or overnight mail to ensure receipt prior to six-day web posting)
• Posting Board and committee agendas on the website six days prior to meeting date (100% objective attainment in FY04, FY05 and FY06)
• Processing grant applications, invoices and reports in compliance with State and Federal requirements, including quarterly
O’Melia Consulting in association with Kelly Hines Consulting

SBCAG TDA Triennial Performance Audit Page 23
submission of invoices and status reports for Federal grants (100% objective attainment in FY04, FY05 and FY06)
• Administration of Local Measure D funds, including allocation of 70% of these funds to local jurisdictions on the basis of population
• Administration of TDA and STA claims
• Administration of SBCAG payroll and health benefits as well as contracts and facilities (SBCAG moved to the current Casa Nueva location, completing a multi-year relocation project in July 2003)
• Implementing Board approved Compensation & Benefits Study recommendations and conducting recruitments to maintain staffing levels
• Completing the majority of employee performance evaluations on time (94% for FY04 and 95% for FY05 and FY06 – 18 of 19 completed on time)
• Preparing annual financial reports to the State Controller.
Public Information
During the audit review period, SBCAG’s Public Information function was significantly improved and expanded to increase public awareness of transportation issues and SBCAG activities. This includes:
• Informing the public about how Measure D funds have been spent in the past and how continuation of these funds are important to the future
• Working with local agencies to develop an expenditure plan for renewal of Measure D
• Communicating the importance of transportation programs and projects to the community.
Specific projects and efforts aimed at improving communications include the following:
• In January 2004, SBCAG discontinued its printed Quarterly Newsletter and began publishing a new electronic newsletter,
O’Melia Consulting in association with Kelly Hines Consulting

SBCAG TDA Triennial Performance Audit Page 24
NewsWire. This publication was electronically distributed to 685 recipients the first year and grew to more than 750 by the end of the audit review period.
• Staff presentations were greatly increased and included 44 presentations to community organizations and governmental boards in FY 2005 (compared to a goal of 25), and over 60 presentations in FY 2006 (compared to a goal of 50).
• During the audit review period, printing and mailing costs were reduced as a result of more people being able to download information from the SBCAG website, which was redesigned in FY04.
• Increased media coverage of SBCAG activities was achieved through newspaper and television interviews, as well as press coverage for events such as completion of the 101 In Motion “lane and train” solution, groundbreaking for the Ortega Hill Auxiliary Lane, implementation of the new Freeway Service Patrol program, call box upgrades, and opening of the Jameson Lane.
• Conducted two countywide public opinion polls regarding Measure D renewal efforts.
The challenge going into the future will be to figure out what is compelling to North County residents in terms of transportation improvements, projects and needs. Other public information challenges include maintaining the consensus for an expenditure plan in the South Coast area and maintaining a positive image as SBCAG provides technical assistance to local jurisdictions developing plans to comply with new State housing targets.
TDA Administration
TDA administration involves a number of tasks that are performed annually and include the following:
• In February of each year, the County Auditor provides SBCAG with an estimate of TDA revenues for the upcoming fiscal year. SBCAG obtains population statistics from the State Department of Finance and uses these to develop apportionments by area. Potential
O’Melia Consulting in association with Kelly Hines Consulting

SBCAG TDA Triennial Performance Audit Page 25
claimants are advised of these apportionments prior to March 1st of each year.
• In February/March, SBCAG updates the Transportation Development Act Claim Manual and distributes to potential claimants. This document contains instructions and forms for filing Local Transportation fund and State Transit Assistance Fund Claims. Local jurisdictions and transit providers use this document and prepare claim forms, which are due to SBCAG by April 1.
• In April/May, SBCAG reviews claim forms and prepares resolutions for SBCAG Board approval and allocation instructions to the County Auditor for disbursement of funds.
• In June, the SBCAG Board approves allocations and staff conveys instructions to the County Auditor for payments to begin in July.
• During the summer and early fall, the County Auditor advises SBCAG of any carryover funds from the prior fiscal year and the State Controller sends revised STAF estimates to SBCAG. SBCAG advises claimants of funds available for revision of claims. In the past, SBCAG has allowed agencies to revise claims in July in order to claim unallocated carryover funds.
• In October, claimants file STAF claims and other revisions, as appropriate. Claimants and SBCAG are responsible for submitting the annual report to the State Controller in October. SCBAG approves revised claims and STAF allocations in October or early November.
• In December, claimants and SBCAG are responsible for submitting annual fiscal audits to the State Controller.
This approximate schedule is outlined in the TDA Claim Manual and has been followed by SBCAG throughout the audit review period. SBCAG is very conscientious about meeting these deadlines and ensuring that claimants receive the maximum funding available in a timely manner. This has been a significant challenge during the audit review period due to staff turnover and vacancies in a number of claimant organizations. Claim forms have been incomplete and/or incorrect. Claimants are self-certifying compliance with PUC
O’Melia Consulting in association with Kelly Hines Consulting

SBCAG TDA Triennial Performance Audit Page 26
requirements that they have clearly not met (e.g., submission of State Controller Reports and annual fiscal audits).
Recommendations contained in this audit are aimed at updating the Claims Manual and strengthening the claim review process to reasonably ensure that claimants do in fact comply with PUC requirements before SBCAG approval of claims. It is also recommended that SBCAG hold a workshop with potential claimants when the TDA Claim Manual is released each year. This will give claimants an opportunity to be fully briefed regarding requirements prior to starting the claims process.
Unmet Needs Process
During the audit review period, the County of Santa Barbara and the cities of Santa Maria and Lompoc all claimed TDA Article 8 funds for streets and road projects. PUC Section 99401.5 lists a number of requirements that SBCAG must fulfill in order for local jurisdictions to claim TDA Article 8 funds for streets and roads purposes. The Unmet Needs Process is aimed at fulfilling these legislative requirements and ensuring that there are no unmet transit needs that are reasonable to meet. Exhibit 6 summarizes these requirements and SBCAG actions and the timeframe for implementation of each.
Exhibit 6 – PUC 99401.5 Requirements To Use TDA Funds for Streets & Roads
Compliance Requirement
Fiscal Year 2003/04 Activities Impact FY05
Funding Fiscal Year 2004/05
Activities Impact FY06 Funding
Fiscal Year 2005/06 Activities Impact FY07
Funding
Identify transit needs
• Surveys approved 4-Nov-03 NCTAC & 14-Nov-03 SCTAC
• Discuss public testimony 9-Mar-04 NCTAC & 12-Mar-04 SCTAC
• 8-Mar-04 & 1-Apr-04 reviews of 2004 Transit Needs Assessment by TTAC
• 10-Sep-04 SCTAC limited use of surveys and 14-Sep-04 NCTAC use of focus groups to gather data
• 8-Feb-05 NCTAC and 11-Feb-05 SCTAC met to discuss public testimony
• 7-Apr-05 2005 Transit Needs Assessment by TTAC
• 6-Apr-06 and 4-May-06 2006 Transit Needs Assessment by TTAC
• 11-Apr-06 and 9-May-06 SBCTAC review of 2006 Transit Needs Assessment
• 1-Jun-06 TTAC 2006 Transit Needs Assessment recommendation approval
O’Melia Consulting in association with Kelly Hines Consulting

SBCAG TDA Triennial Performance Audit Page 27
Compliance Requirement
Fiscal Year 2003/04 Activities Impact FY05
Funding Fiscal Year 2004/05
Activities Impact FY06 Funding
Fiscal Year 2005/06 Activities Impact FY07
Funding
Conduct public hearing on unmet transit needs
• 15-Jan-04 Santa Maria • 19-Feb-04 Santa
Barbara
• 20-Jan-05 Santa Maria • 17-Feb-05 Santa
Barbara
• 19-Jan-06 Santa Maria • 16-Feb-06 Santa
Barbara
Consult with SSTAC
30-Mar-04 SBCTAC review of 2004 Transit Needs Assessment & Recommendation
12-Apr-05 SBCTAC review of 2005 Transit Needs Assessment & Recommendation
13-Jun-06 SBCTAC review of 2006 Transit Needs & Recommendation
Adopt definition of “Reasonable to Meet” and identify unmet transit needs
SBCAG Resolution No. 98-02 Definition of Terms “Unmet Transit Needs” and “Reasonable to Meet” adopted 19-Mar-98
SBCAG Resolution No. 98-02 Definition of Terms “Unmet Transit Needs” and “Reasonable to Meet” adopted 19-Mar-98. SBCAG committed to reviewing definitions in the upcoming year.
SBCAG Resolution No. 06-01 Definition of Terms of “Unmet Transit Needs” and “Reasonable to Meet” adopted 19-Jan-06. A subsequent resolution by SBCAG on 21-Dec-06, outside the audit review period, has been made.
Adopt findings on unmet transit needs & reasonable to meet
15-Apr-04 SBCAG Board Resolution No. 04-06 approving findings of unmet need and reasonable to meet
16-Jun-05 SBCAG Board Resolution No. 05-11 approving findings of unmet need and reasonable to meet
15-Jun-06 SBCAG Board Resolution No. 06-14 approving findings of unmet need and reasonable to meet
Caltrans Approval Letter
14-Jun-04 for FY05 TDA funding
19-Jul-05 for FY06 TDA Funding
18-Jul-06 for FY07 TDA Funding
The Unmet Needs Process requires a significant amount of effort to obtain public input, conduct analyses of they many transit issues and requests, and document these for committee and policy review. The approximate month for key activities is shown below:
• September – SBCTAC reviews and decides upon public outreach efforts
• October – Transit providers conduct workshops
• December – SBCAG publishes transit needs assessment public hearing notices
• January/February – SBCAG conducts public hearing in Santa Maria
O’Melia Consulting in association with Kelly Hines Consulting

SBCAG TDA Triennial Performance Audit Page 28
• February/March – SBCAG organizes input received and compiles information for analyses, and meets with transit providers regarding requests for new or expanded service
• March – SBCAG staff prepares the Draft Transit Needs Assessment
• April – Draft Transit Needs Assessment is presented to TTAC, SBCTAC and SBCAG Board
• May – SBCAG staff responds to public and committee comments and publishes the final report, which the SBCAG Board then adopts.
During the audit review period, SBCAG made a number of changes to address the terms of a prior year legal settlement as well as new issues that arose during this audit review period (e.g., Farm Worker Transportation). Changes primarily related to improved public outreach and include the following:
• Greater opportunities for public input through conduct of a number of local workshops, sponsored by the local jurisdictions and transit operators in conjunction with SBCAG
• Radio advertisements regarding public input opportunities provided in both English and Spanish
• Increased opportunities for input through on-board surveys, phone-in comment opportunities, web comments, and letters
• Increased documentation of the comments received and the response to each comment, including categorizing as either operational in nature or a potential need requiring analysis and evaluation
• Change in the definitions of “unmet need” and “reasonable to meet” approved by SBCAG Board 15-Jun-06 for use findings that impact FY 2007 TDA allocations.
The Unmet Needs Process is very much related to transit agency service planning activities. The need for specific transit studies and implementation plans are often the result of this process. For example,
O’Melia Consulting in association with Kelly Hines Consulting

SBCAG TDA Triennial Performance Audit Page 29
the Intercommunity Transit Service Implementation Plan: Lompoc-VAFB-Santa Maria was developed as part of the June 2003 settlement agreement relating to the FY 2002 TDA fund allocation. This plan resulted in the Breeze service being implemented in FY 2005.
Recently identified needs resulting from this annual unmet needs process have focused on inter-community service. The Valley Express service linking the Santa Ynez Valley to the South Coast, and the Breeze, linking Santa Maria/VAFB/Lompoc are examples of inter-community service needs identified and implemented during the audit review period. Farm labor transportation has also been a topic of debate but is not an unmet transit need based on existing SBCAG definitions. The settlement agreement for litigation of the 2005-06 Transit Needs Assessment relate to the need for a long range regional transit plan for the North County, the appointment of an agricultural worker representative to the SBCTAC, and implementation of farm worker vanpool program by the County of Santa Barbara.
In other instances, service needs were identified and included in transit operator Short Range Transit Plans or annual service improvements for subsequent implementation. Los Alamos Transit is an example of one such service. Exhibit 7 provides a list of transit improvements implemented during the audit review period.
Exhibit 7 – Transit Service Improvements Summary
Agency or Service Area Fiscal Year 2003/04 Fiscal Year 2004/05 Fiscal Year 2005/06
Los Alamos Transit (Santa Barbara County)
Intercommunity Service – Los Alamos to Santa Maria
The Breeze (SMAT)
Intercommunity Service – Lompoc – Vandenberg Air Force Base – Santa Maria
Valley Express (MTD)
Commuter Services -- Santa Ynez Valley to South Coast
O’Melia Consulting in association with Kelly Hines Consulting

SBCAG TDA Triennial Performance Audit Page 30
Agency or Service Area Fiscal Year 2003/04 Fiscal Year 2004/05 Fiscal Year 2005/06
City of Lompoc Transit (COLT)
• Later Service Hours (end one hour later at 8:00 PM) and to Hancock College until 10:00 PM Monday-Thursday
• Earlier Service Hours (begin ½ hour earlier at 6:30 AM)
• New Service Route 5 • Health Service
Tues/Thurs Lompoc to Santa Barbara
• Expansion of Route 3 • Bi-Directional Service
on Route 2
Clean Air Express (SBCAG)
Increased seating capacity with new buses
Increased Service Frequency
Commuter Service – Santa Maria to Goleta
Santa Maria Area Transit (SMAT)
Sunday Service 9:30 AM to 4:30 PM
Began construction of new transit center
• Improvements to Routes 2, 3, 4 and 7
• New Service – Routes 8 and 24
Santa Ynez Valley Transit (SYVT)
Bi-Directional Service Loop – Solvang to Los Olivos
Santa Barbara MTD
Improvements to Lines 3, 5, 8, 9, 16, 17, 22, 23, 24x 25 and 27
Improvements to Lines 6, 8, 11, 14, 20, 21x, and 22
New Services – Goleta Old Town Shuttle and service to the Westside Community Center
Transportation Planning & Regional Coordination
As the designated RTPA, MPO, CMA, ACLU and affiliate Census Center for Santa Barbara County, SBCAG has a number of important transportation planning and regional coordination activities. Areas of responsibility and accomplishments over the audit review period include the following:
• Travel Demand Modeling and Geographic Information System (GIS). Capabilities to support SBCAG planning activities and project analyses, as well as those requested by member jurisdictions are provided by the Planning Division. Transportation and air quality modeling and conformity analyses, Highway Performance Monitoring System (HPMS), Intelligent Transportation System (ITS), and Congestion Management Program modeling and
O’Melia Consulting in association with Kelly Hines Consulting

SBCAG TDA Triennial Performance Audit Page 31
analysis are programs managed by the Planning Division. During the audit review period, SBCAG completed upgrades to the travel model for High Occupancy Vehicle and GIS capabilities, developing a baseline model and forecast database, collecting and processing traffic counts, and HPMS data, and preparing maps and other analyses to support the Metropolitan Transportation Plan update.
• Affiliate Census Center. Census and other social and economic data, regional population forecasts, regional housing needs analyses, jobs/housing studies and other demographic studies are provided and analyzed by the Planning Division. During the audit review period, SBCAG prepared and distributed results from the 2000 Census, including a new overview on Hispanic population. SBCAG prepared the Regional Jobs/Housing Partnership Study, assisted local jurisdictions update Housing Elements and completed documents for the State funded inter-regional jobs housing project.
• Transportation Planning. During the audit review period, SBCAG updated the Regional Transportation Plan policy chapter, the Metropolitan Transportation Plan, and Congestion Management Program conformance assessments. SBCAG also prepared air quality conformity analysis of the Federal Transportation Improvement Program (FTIP) and the Metropolitan Transportation Plan (MTP), and assisted the APCD in development of the County’s Air Quality Maintenance Plan and update of the 2007 Federal Clean Air Plan.
• Transit Planning. This includes public transit services such as bus, demand response, and rail as well as coordination, regional transportation planning, transit needs assessment, and management of the 5310 grant submission process. SBCAG reviewed and ranked Federal 5310 Grant Applications, administered the annual transit needs assessment process, and prepared the RFP and selected the consultant for the North County Transit Plan, including initiation of a technical advisory committee for the study.
• Special Assignments & Technical Support. The Planning Division managed the Highway 101 In Motion project including, selecting a consultant, forming advisory committees, initiating
O’Melia Consulting in association with Kelly Hines Consulting

SBCAG TDA Triennial Performance Audit Page 32
baseline studies, conducting public workshops, and providing staff support throughout this multi-year project. SBCAG also provided technical assistance to local jurisdictions, including modeling for the Central Avenue/SR 246 project.
• Airport Land Use Planning. Land use planning and airport safety and noise issues analyses are areas that the Planning Division is responsible for reviewing projects and plans submitted by local agencies in airport influence areas for consistency with the Airport Land Use Plan.
• Staffing for SBCAG Committees, including the TTAC, TPAC, 101 In Motion Technical Advisory Group, 101 In Motion Stakeholders Group, APCD Community Advisory Committee, SBCTAC, as well as SBCAG subregional advisory committees and inter-county rail groups including Los-Angeles/San Diego/San Luis Obispo Rail Corridor Agency (LOSSAN) and Coast Rail Coordinating Council (CRCC).
As a result of the professionalism exhibited in these activities, SBCAG now has a better working relationship with its technical committees and a stronger process for involving the public in the planning and decision-making.
The one area that SBCAG Planning was unable to fulfill was the update of the Regional Bikeways Plan. This plan was not completed due to staff turnover, higher priority projects, and because it is not mandated.
Transportation Programming and Project Development
The condition of Santa Barbara County’s highways, roads and bridges continued to be a major issue impacting transportation plans and programs. While significant funds were provided during the audit period through Measure D and the STIP, the future forecast will be greatly impacted by the expiration of Measure D in 2010 and the continued diversion of State Proposition 42 revenues from transportation. The Transportation Programming & Project Development Division has responsibility for managing the programming of these funds. Responsibilities and results achieved during the audit review period include the following:
O’Melia Consulting in association with Kelly Hines Consulting

SBCAG TDA Triennial Performance Audit Page 33
• Federal and State Transportation Improvement Programs (FTIP and STIP, respectively). During the audit review period, SBCAG completed the 2004 and 2006 STIP updates, which required massive rescheduling of projects, with a number of projects programmed in the 2002 STIP being delayed due to a lack of projected funding. SBCAG completed AB 1012 obligation plans for CMAQ and TE funding, fully obligating balances and apportionments. In addition, SBCAG prepared legislation for a CMAQ phase-out program that resulted in about $1.9 million in additional CMAQ funding for the region. SBCAG assisted with TE reauthorization requests for $10.7 million for three projects. An $800,000 appropriation was approved for the South Coast Traffic Management & Operational Improvements Program.
• STIP And FTIP Project Monitoring. During the audit review period, the vast majority of project funds were expended in a timely manner. Exceptions are the City of Solvang lapsed $165,000 in CMAQ funds programmed for bicycle projects and the City of Santa Barbara lapsed $30,000 in CMAQ for the Pershing Park Pathway Project. STIP project funding that lapsed during the audit review period includes $688,000 on the Los Carneros/Highway 101 replacement project when the City of Goleta deferred work and $2,000 by the City of Santa Maria for a school zone signage project.
• Measure D Highway Program. This includes project development and engineering as well as updating the Measure D Strategic Plan and funding priorities. SBCAG completed annual Measure D Highway Program Strategic Plan updates, adding a number of new projects in October 2003 including the Clean Air Express, Route 101/Milpass to Cabrillo-Hot Springs, and the Route 101 Ortega Hill Auxiliary Lane. SBCAG completed environmental work for Route 154 Group 2 Operational Improvements as well as work on three interchange projects (i.e., Route 101/SR 154 (North), Route 101/Donovan, and Route 101/Stowell). The Stowell and Donovan projects were completed ahead of schedule. SBCAG allocated between $19 million and $30 million annually in Measure D revenues to local governmental agencies. SBCAG completed a refunding process for Measure D bonds to reduce interest
O’Melia Consulting in association with Kelly Hines Consulting

SBCAG TDA Triennial Performance Audit Page 34
payments. The 1993 bonded debt refunding resulted in a $1.3 million savings.
• Federal Funding. SBCAG is the recipient of Federal 5307 funds and responsible for distributing these to the Santa Barbara Metropolitan Transit District, Santa Maria Area Transit, and City of Lompoc Transit. New procedures for distributing funds were adopted just outside the audit review period (August 2006). Project funding and distributions are updated every three years with the FTIP.
• Service Authority For Freeway Emergencies (SAFE) Program. During the audit review period, SBCAG inventoried the callbox system, conducted outreach on ADA and safety issues, and implemented a system-wide callbox upgrade and replacement program, including: (1) Installation of callbox upgrades; (2) Implementation of conversion to digital service; and (3) Meet ADA guidelines at all sites. SBCAG has a goal of recovering 90% of knockdown repair costs for all incidents. This goal was matched in each of the audit review years. SBCAG has a 98% operational objective with actual performance of 96.5% due cellular coverage issues and rehabilitation projects on the South Coast.
• Freeway Service Patrol (FSP) Pilot Program For The South Coast. A new pilot project was developed and implemented during the audit review period, with the first year of implementation ending March 2006.
Traffic Solutions
The Traffic Solutions Division provides transportation services and programs designed to improve air quality and reduce congestion by reducing reliance on single occupant vehicle use during peak periods. Traffic Solutions is responsible for implementing Ridesharing and Transportation Demand Management (TDM) programs throughout Santa Barbara County, including vanpool, carpool, bicycle programs, as well as transit services. In FY 2006, Traffic Solutions’ programs eliminated 485,550 automobile trips and over 16 million vehicle miles of travel. The subsidy per trip eliminated was $3.50 and $0.10 per VMT eliminated. Commuters saved an estimated $6.3 million in travel
O’Melia Consulting in association with Kelly Hines Consulting

SBCAG TDA Triennial Performance Audit Page 35
costs and 650 thousand gallons of fuel from use of these alternative programs.
The following highlights programs provided during the audit review period.
• Carpool Programs. In FY 2006, SBCAG developed in-house an on-line Carpool Matchlist program that allows users to generate personalized carpool matchlists. At the end of FY 2006, 1,132 commuters were registered in this program, with 206 being active and 1,517 matchlists being generated. A ten-dollar gas card incentive offered in April 2006 resulted in 154 new commuter registrations.
• Vanpool Programs. SBCAG vanpool programs include referrals to vanpools with vacancies and advertising of vacancies on the Traffic Solutions website and the NewsWire publication. SBCAG also offers a New Rider Rebate program, which provides $100 to new vanpool subscribers after three consecutive months of vanpool subscription. To foster the formation of new vanpools, SBCAG offers the Vanpool Quick Start program, which was restructured in 2004 to provide new vanpools with a subsidy during the first two months of operation (i.e., 50% the first month and 25% the second).
• Bicycle & Pedestrian Programs. In FY 2005, SBCAG began sponsoring the month long bicycle competition in which teams of five track the number of trips by bicycle rather than automobile. This Team Bike Challenge generated 230 teams in FY 2006 with over 1,100 participants. Participants logged a total of 41,318 bike trips and 129,685 miles. SBCAG also publishes and distributes the countywide Bike Map, offers Bicycle Skill classes to community groups and schools, and assists with school Bicycle Rodeo events.
• FlexWork Program. The FlexWork Program is designed to assist employers in developing telecommuting and flexible work schedules throughout the County in order to reduce peak period commuter trips. In May 2004, SBCAG began a pilot program from which case studies could be developed and used as templates for other employers seeking to implement flexwork programs. Five of nine employers with 353 employees participated in the program.
O’Melia Consulting in association with Kelly Hines Consulting
SBCAG TDA Triennial Performance Audit Page 36
• Employer Support. SBCAG offers an Emergency Ride Home program to registered employers (i.e., 146 in FY 2006). Other free services include the conduct of commuter surveys (i.e., 2,664 in FY 2006) and consulting services to create customized TDM programs for businesses. SBCAG provided services to over 15 employers in FY 2006.
• Clean Air Express Program. SBCAG administers the Clean Air Express bus program, serving northern Santa Barbara County residents commuting to jobs in Goleta and Santa Barbara. In FY 2006, there were 11 roundtrips per weekday, including new service between Santa Maria and Goleta. Ridership increased by 27% in FY 2006 as a result of new service, higher fuel prices, and a Free Ride Promotion sponsored by the City of Santa Barbara. In FY 2006, the Clean Air Express achieved a 67% farebox recovery with the net subsidy per trip eliminated of $6.88 and $0.13 per VMT eliminated. In August of 2005, a new contract with Santa Barbara Airbus was executed with a reduced hourly rate due to a change in contract scope.
• VISTA Coastal Express Program. SBCAG assists the Ventura County Transportation Commission (VCTC) in the financing, planning and marketing of the VISTA Coastal Express. The VISTA service provides 28 weekday trips and 18 weekend trips between Ventura, Carpinteria, Santa Barbara and Goleta. In FY 2006, SBCAG contributed $185,500 to the net operating expense of this service, which is primarily managed by VCTC. In FY 2006, VISTA had a 30% ridership increase and achieved a 72% farebox recovery. The average subsidy per trip eliminated was $1.26 or $0.03 per VMT eliminated.
• Informational Services. SBCAG’s Traffic Solutions’ manages four web sites: www.trafficsolutions.info, www.cleanairexpress.com, www.sbbikeweek.com and www.sbflexwork.com designed to highlight specific programs sponsored by SBCAG. In FY 2006, these websites generated over 165,000 hits. Other informational services include direct employer outreach, on-line Commute Cost Calculator to introduce the public to the true costs of commuting, distribution of the NewsWire electronic publication, and participation in the annual Green Awards program, transportation fairs, and other community special events (i.e., over 20 in FY 2006). SBCAG
O’Melia Consulting in association with Kelly Hines Consulting

SBCAG TDA Triennial Performance Audit Page 37
is also a partner in the 963-SAVE commuter hotline designed to field telephone calls from commuters and the general public. In FY 2006, SBCAG opened a North County Office in Santa Maria with the office staffed by Traffic Solutions staff one day a week. The office is shared with other SBCAG staff members and provides for increased outreach opportunities to employers, public agencies and individuals in the North County.
O’Melia Consulting in association with Kelly Hines Consulting

SBCAG TDA Triennial Performance Audit Page 38
IV. RECOMMENDATIONS
Five recommendations are offered for consideration by SBCAG. This includes two recommendations related to issues raised in prior TDA Performance Audits, as well as three new recommendations aimed at improving the TDA claims and financial audit processes.
1. SBCAG should adopt rules and regulations for the submission of claims for bicycle and pedestrian facilities.
• Findings. The prior two TDA performance audits recommended that SBCAG adopt rules and regulations for the submission of claims for bicycle and pedestrian facilities (Article 3). The prior performance audit (completed in June 2004) recommended linking these rules and regulations to the list of projects identified in the Regional Bikeway Plan that was being developed at that time. Since June 2004, SBCAG has not completed the Regional Bikeway Plan and Article 3 claim guidelines remain unchanged.
• Suggested Actions. SBCAG should adopt rules and regulations for the submission of Article 3 claims. The approach suggested is one currently being used by SBCAG for Streets and Highways claims with one additional requirement – provision of a project list and budget. This may be accomplished by adding Document C Part F: Bicycle and Pedestrian Claim Description to the TDA Claim Manual for FY 2008-09 claims. Suggested wording follows.
DOCUMENT C Part F: Bicycle and Pedestrian Facilities Description
1. Complete the Article 3 Project Budget Form.
2. Provide a list of projects to be financed wholly or in part by Article 3 funds.
A sample Article 3 Project Budget Form and Project List Form are included in Appendix A – Page 1. SBCAG may add to these requirements for items such as “consistency with the Regional Bikeway Plan” upon its completion. We suggest that SBCAG have
O’Melia Consulting in association with Kelly Hines Consulting

SBCAG TDA Triennial Performance Audit Page 39
the Board adopt the FY 2008-09 TDA Claim Manual, which would include new Article 3 rules and forms. Other changes, identified in the following recommendations, would also receive Board approval at the same time.
• Expected Results. Compliance with PUC Sections 99233.3 and 99234 that SBCAG adopt rules for Article 3 claims submission.
2. SBCAG should adopt rules and regulations for farebox recovery ratios and provide guidance in the TDA Claim Manual regarding the application of TDA farebox recovery requirements to specific operations.
• Findings. The prior TDA performance audit (completed in June 2004) recommended that SBCAG adopt rules and regulations for farebox recovery requirements. The issue at the time was the farebox recovery ratio for operators serving both an urban and non-urban area having an inter-mediate requirement between 20 and ten percent. TDA requires planning agencies to have rules and regulations specifying how this calculation is to be done. TDA also allows new services to be excluded from the farebox requirement for up to two full years following implementation. SBCAG guidelines do not include specifications for how these exceptions will be calculated, or even if SBCAG will allow such exceptions. Given the number of PUC Sections under which an operator may qualify, policy guidance on the part of SBCAG would help transit operators and those preparing and processing TDA Claims to have a clear and consistent understanding of the requirements.
O’Melia Consulting in association with Kelly Hines Consulting
The need for such guidelines is apparent in this performance audit cycle. For example, the City of Lompoc transit service (COLT) did not meet the 20% farebox recovery ratio required for urbanized areas. Nor did COLT meet the farebox and local support ratio of 15.36% from FY 1979, the base year used in the PUC for older operators. Under TDA regulations, FY07 and FY08 would be penalty years where the TDA funds available to COLT would be reduced by the difference between the 20% farebox requirements and the actual farebox and local support achieved by COLT. COLT did expand existing service and implement new services that may be excluded from farebox recovery requirements. SBCAG guidelines for when and how this exclusion is to be done, however, are not specified and COLT did not submit the required report due

SBCAG TDA Triennial Performance Audit Page 40
within 90-days of the end of the fiscal year (i.e., CAC 6633.8). As an older operator, COLT could qualify under the 50% expenditure limitation criteria of PUC Section 99268.1 rather than the farebox recovery and local support requirement.
• Suggested Actions. SBCAG should adopt rules and regulations regarding revenue ratios for transportation operators. We suggest that SBCAG have the Board adopt the FY 2008-09 TDA Claim Manual, which would include new farebox recovery rules. Other changes, identified in other recommendations, would also receive Board approval at the same time. CAC Section 6645 requires the submission of these rules to Caltrans no later than April 1st prior to the new claim year in which the rules are to take effect. The earliest these new rules could apply is therefore FY 2009. Appendix A – Pages 2-5 include the sample matrix for Option 1 below, as well as a form for calculating the farebox recovery ratio, a form for calculating the 50% expenditure limitation, and a form for calculating the penalty associated with non-compliance. These may be used by SBCAG as it considers its own set of farebox recovery policies.
Three aspects to consider in developing these requirements follow. Options 1 through 3 may be used together or separately.
o Option 1 -- Farebox Revenue Ratios & 50% Expenditure Limitation. The easiest to define are those based on definitions used in the unmet transit needs/reasonable to meet findings process. This is 20% for general public service in urban areas, 10% for non-urban/rural areas, and 10% for non-urbanized areas serving urban areas. Requirements for specialized service for seniors and persons with disabilities and Article 4.5 claims could be 10%, if SBCAG adopts such a policy. This requires that agencies such as SMAT and COLT submit separate claims, State Controller Reports and show calculations in financial audits for each type of service (general public versus specialized). Exhibit 8 provides an example of what these requirements would be and the applicable PUC Section. In this example, SBMTD has a requirement greater than 20% because of its performance in FY 1979.
O’Melia Consulting in association with Kelly Hines Consulting

SBCAG TDA Triennial Performance Audit Page 41
Exhibit 8 – Sample Farebox Recovery Requirements
Farebox Recovery Requirements by Operator PUC Section Farebox Ratio Required
Farebox & Local Support
(from FY79)
Date Service Began Category
City of Guadalupe 99268.4 10.00% NA Jun-98 Rural
City of Lompoc -- COLT General Public Service 99268.2 20.00% 15.36% Urban
City of Lompoc -- COLT Service for Elderly & Disabled Persons 99268.5 10.00% NA Special
City of Santa Maria -- (SMAT) General Public Service 99268.2 20.00% NA Urban
City of Santa Maria -- (SMAT) Service for Elderly & Disabled Persons 99268.5 10.00% NA Special
City of Solvang (SYVT) 99268.4 10.00% NA 7-Jul-95 Rural
Santa Barbara County (Cuyama & Los Alamos) 99268.4 10.00% NA 14-Sep Rural
Santa Barbara MTD 99268.2 30.27% 34.33% 2-Feb-69 Urban
Easy Lift 99268.5 10.00% NA 28-Jul-81 Special
SMOOTH 99268.5 10.00% 8.75% CTSA in 1999 Special
1-Jan-79
9-Jan-78
o Option 2 – Intermediate Revenue Ratio. This applies to general public service that operates in both urban and rural areas. PUC Section 99270.2 allows SBCAG to establish rules for determining an intermediate revenue ratio. A methodology for calculating the intermediate ratio may be:
R = .1 CostRural + .2 CostUrban CostRural + CostUrban
Where:
R = Required Ratio CostRural = Costs of services in non-urbanized areas CostUrban = Costs of services in urbanized areas.
The intermediate farebox calculation is developed and submitted to Caltrans by April 1 preceding the fiscal year for which the calculation takes effect and may not be less than 15%. Once approved by Caltrans, the required ratio cannot be changed. Caltrans must approve or reject the proposed methodology within 60 days after receiving it (CAC 6645). Transit operators using this method would have to document a process for allocating operating costs to urban and non-urban service.
O’Melia Consulting in association with Kelly Hines Consulting

SBCAG TDA Triennial Performance Audit Page 42
Alternative approaches to cost allocation may include percentage of route miles, revenue miles, or revenue hours. These cost allocation alternatives are reasonable and fairly easy to determine during the planning and budget develop processes. Transit operators who select this alternative would need to budget and plan at the route or service level to have the information necessary to develop intermediate fare ratios. Such calculations would need to be made in January or February for submission to and review by SBCAG staff and approval by the SBCAG Board prior to April 1 of each fiscal year.
o Option 3 – Exemption For Extension of Service. PUC Section 99268.8 states that the ratio of fare revenues to operating costs shall not apply to an extension of public transportation services until two years after the end of the fiscal year in which the service is implemented. Extension of public transportation services includes additions of geographic areas or route miles, or improvements in service frequency or hours of service greater than 25 percent of the route total, or the addition of new days of service or new types of service (e.g., van, taxi, bus). CAC 6633.8 requires that a transit operator seeking to exempt service from the farebox recovery calculation submit a report on the extension of service to SBCAG within 90 days after the fiscal year. The report shall include, but not be limited to, the following:
(1) Description of the area served and the routes included.
(2) The amount of fare revenues generated by the extension and the method used to derive the amount.
(3) The amount of the operating cost for the extension and the method used to allocate costs between the extension of services and the claimant’s other services.
Transit operators would need to keep fare revenues and operating statistics separate for services to be excluded so that calculations may be verified for adherence to the proposed approach.
O’Melia Consulting in association with Kelly Hines Consulting

SBCAG TDA Triennial Performance Audit Page 43
Claiming exclusions should never be mandatory as a number of transit agencies in other parts of the State have discovered that if they expand service on the best route, excluding this route from the farebox ratio causes performance to decline rather than improve.
• Expected Results. Compliance with PUC Sections 99270.1 and 99270.2. Transit operators and local jurisdictions would have clearly defined requirements for revenue ratios and a process to follow should they fail to meet the basic requirements outlined in Option 1.
3. SBCAG should streamline and update its internal TDA Claims process.
• Findings. TDA claims were prepared, updated and revised three times a year during the audit review process creating three times as much work. At the same time, critical review processes were not being performed (e.g., compliance with farebox recovery and STA qualifying requirements). SBCAG processed claim forms even though claimants, in a few instances, clearly did not meet SBCAG guidelines (e.g., failed to submit the annual report to the State Controller, financial and compliance audits not completed).
• Suggested Actions. The practice of revising claims in August to account for actual revenues from the prior year could be eliminated. These adjustments could be included in the claim revision of October when claims are revised for STA allocations. Other suggested actions include updating the TDA Claims Manual as outlined below and implementing a claims review checklist to ensure that compliance requirements are met.
o Use a checklist to ensure that all claimants are submitting required documents (See Appendix A – Page 6 for an example).
o Revise Document A – Transportation Development Act Claim Form section on “State Transit Assistance Fund” to allow the claiming of funds by CAC Section, consistent with the way in which data is reported in financial audits and the SBCAG Board authorizing resolution (i.e., CAC 6730(a) Transit Operating, CAC 6730(b) Transit Capital, CAC 6730(d) Community Transit and CAC 6731(b) Administration and Planning).
O’Melia Consulting in association with Kelly Hines Consulting

SBCAG TDA Triennial Performance Audit Page 44
o Revise Document C – Description to include “Part F: Bicycle and Pedestrian Facilities Description”. See Recommendation No. 1 above.
o Revise Document G – Fare and Local Support Ratios to reflect new SBCAG Board policy. See Recommendation No. 2 above.
o Revised Document H – Standard Assurances for Applicants to include subheadings (e.g., 180-Day Certified Fiscal Audit, 90-Day Annual Report) and to include additional compliance requirements of:
(1) CHP Certification. Claimant certifies that it has on file a California Highway Patrol Certification having been conducted in the last 13 months indicating compliance with Section 1808.1 of the Vehicle Code. Note: this is required for transit operators who utilize vehicles that carry ten or more persons including the driver.
(2) Revenue Ratios for Newer Operators. Claimant certifies that it will maintain for the project year a ratio of fare revenues to operating costs at least (a) 20 percent if the claimant is serving an urbanized area pursuant to 99268.3; (b) 10 percent if the claimant is serving a non-urbanized area pursuant to 99268.4; or (c) an intermediate ratio as determined by SBCAG per PUC 99268.12
(3) Fifty Percent Expenditure Limitation for Older Operators. Claimant filing a claim pursuant to 99268.1 certifies that it was in compliance with PUC Section 99268 during the 1978-79 fiscal year, and further certifies that it will remain in compliance with that section during the project year.
(4) Revenue Ratio for Older Operators. Claimant filing a claim pursuant to 99268.2 certifies that it will maintain for the project year a ratio of fare revenues and local support to operating cost which it maintained during the 1978-79 fiscal year, and further assures for the project year that it reasonably anticipates achieving the ratio of fare revenues to operating costs at least equal to the ratio maintained in the 1978-79 fiscal year, or (a) 20 percent if serving an urbanized
O’Melia Consulting in association with Kelly Hines Consulting

SBCAG TDA Triennial Performance Audit Page 45
area, (b) 10 percent if serving a non-urbanized area, whichever is greater, or (c) an intermediate ratio as determined by SBCAG per PUC 99268.12.
(5) Revenue Ratios for Exclusive Services to Senior and Persons with Disabilities. Claimant filing a claim pursuant to PUC 99268.5 certifies that, for the purpose of that claim, it provides services using vehicles for the exclusive use of elderly and handicapped persons.
(6) Extension of Service. Claimant that received an allocation of LTF for an extension of service pursuant to PUC Section 99268.8 certifies that it will file a report of these services pursuant to CAC Section 6633.8b within 90 days of the close of the fiscal year in which the allocation was granted.
(7) Operator Qualifying Criteria. Claimant certifies that it meets the efficiency standards pursuant to PUC Section 99314.6 when claiming State Transit Assistance Funds for transit operations. Note: This does not apply to transit operators who utilize STA funds for capital purposes. (See Appendix A – Page 9 for a sample worksheet for determining compliance with this requirement.)
o Use a checklist to ensure that all claimants are actually meeting requirements of Document H – Standard Assurances (See Appendix A – Pages 7-8 for an example). This may be accomplished using the latest audited financial data and by requiring that specific documents be on file with SBCAG prior to release of funds (e.g., CHP Certifications, State Controller Reports, Financial Audits).
o Revised Appendix II – Instructions for Completing Document C. Revised Part C – Streets and Highways Claim Description to include “3. Attach a project budget”. Include Part F, as outlined in Recommendation No. 1 above. (Sample forms for Streets and Roads and Bicycle and Pedestrian Facilities Projects are provided in Appendix A – Page 10).
o Revise Appendix II – Document C Part E: Progress to Implement Productivity Improvement Recommendations to
O’Melia Consulting in association with Kelly Hines Consulting

SBCAG TDA Triennial Performance Audit Page 46
include a list of TDA performance audit recommendations for individual transit agencies.
o Revise the authorizing resolution to include required findings per CAC 6754 relating to the CHP Pull Notice Program. Suggested language is: “A certification issued by in the last 13 months by the Department of California Highway Patrol verifies that claimants are in compliance with Section 1808.1 of the Vehicle Code as required by PUC Section 99251”.
• Expected Results. Improved compliance with State regulatory requirements is expected to result from this recommendation. A second benefit is that SBCAG and claimant agency staffs will spend less time preparing, reviewing, and revising claim forms. A third benefit is that transit operators will be encouraged to improve cost efficiency and effectiveness in order to meet requirements.
4. SBCAG should provide training and/or conduct a workshop each year upon distribution of the TDA Claims Manual.
• Findings. During the audit review period, there was significant turnover in the individuals responsible for preparing TDA claims and for ensuring that TDA requirements (standard assurances) are met. There are a number of non-compliance findings in this audit cycle indicating that a full understanding of regulatory requirements is missing. SBCAG is responsible for enforcing TDA regulations regardless of the cause of non-compliance.
• Suggested Actions. Providing training to new claimant staff in a workshop setting is one way to help improve claimant compliance. It is more efficient than one-on-one training and allows for local jurisdictions to send more than one person so that there is alternate staff with a basic understanding of requirements in the event of staff turnover.
o SBCAG could start by holding a workshop with transit operators and other claimants to obtain input on proposed changes in the claims process (e.g., farebox recovery requirements, new forms for Article 3 and Article 8a claimants) and to review compliance findings from this performance audit cycle. This includes compliance issues related to claiming FY08 STA funds. As part of this review, SBCAG should include new guidelines for Prop
O’Melia Consulting in association with Kelly Hines Consulting

SBCAG TDA Triennial Performance Audit Page 47
1B STA funds, which are currently being developed. These guidelines for claiming 1B funds should be consolidated with the regular STA processes. This workshop is related, in part, to obtaining feedback, as new processes are developed to implement Recommendation No. 3 above.
o Thereafter, on an annual basis, a workshop should be held with the release of the TDA Claims Manual. The emphasis should be on making sure that claimant staffs understand requirements, forms and SBCAG’s process for reviewing claims. For example, if a claimant knows that SBCAG cannot allocate STA funds for operating purposes if a claimant’s cost per hour fails the STA qualifying criteria, there is less likelihood that funds would be claimed for operating purposes.
• Expected Results. Improved compliance with State regulatory requirements is expected to result from this recommendation. A second benefit is that SBCAG and claimant agency staffs will spend less time preparing, reviewing, and revising claim forms because they know and understand the requirements and therefore have a much better chance of doing it right the first time.
5. SBCAG should expand and specify findings of compliance as part of annual financial and compliance audits.
• Findings. There are a number of compliance findings that SBCAG is responsible for making prior to TDA claim approval. Some of these findings are based on financial data. SBCAG contracts for annual financial and compliance audits of claimants. CAC Sections 6666 and 6667 specify compliance audit tasks for non-transit and transit claimants. Inclusion of these tasks in the financial and compliance audits of all claimants, as appropriate, would provide SBCAG with much of the information necessary to make compliance findings.
• Suggested Actions. SBCAG should include compliance audit tasks per CAC 6666 and 6667 in the scope of work for annual financial and compliance audits. Including specific statements and the calculations to verify some of the more detailed financial requirements would go a long way in streamlining the amount of work required by SBCAG staff reviewing claims. Feedback on
O’Melia Consulting in association with Kelly Hines Consulting

SBCAG TDA Triennial Performance Audit Page 48
O’Melia Consulting in association with Kelly Hines Consulting
many compliance issues would be annually rather than waiting for triennial performance audits.
In addition, SBCAG should ensure that financial auditors present information in a format consistent with State Controller Financial Transaction Reporting, as required by PUC 99243. Referring to financial information using the Uniform System of Accounts would facilitate consistent application of required compliance calculations. Particularly important is the separation of operating and capital revenues and costs for fare ratio, expenditure limitation, and STA qualifying criteria calculations.
• Expected Results. Improved compliance with State regulatory requirements is expected to result from this recommendation. A second benefit is that SBCAG staff will spend less time determining compliance.
SANTA MARIA AREA TRANSIT (SMAT) TDA TRIENNIAL PERFORMANCE
AUDIT FOR FY 2004-2006 Fiscal Years Ending June 30th
Prepared by
In Association With
OCTOBER 4, 2007

Santa Maria Area Transit TDA Triennial Performance Audit Page i
TABLE OF CONTENTS
EXECUTIVE SUMMARY.................................................................... 1
Purpose of Audit.........................................................................................1
Findings......................................................................................................1
Recommendations .....................................................................................3
I. INTRODUCTION....................................................................... 4
Performance Audit Objectives and Approach.............................................4
System Overview .......................................................................................5
II. COMPLIANCE REVIEW......................................................... 11
Regulatory Requirements.........................................................................11
Progress To Implement Prior Audit Recommendations ...........................16
Data Verification.......................................................................................19
TDA Performance Indicator Trends..........................................................25
III. FUNCTIONAL AREA PERFORMANCE RESULTS............... 30
Transportation Operations........................................................................30
Vehicle Maintenance................................................................................33
Administration & Planning ........................................................................35
IV. RECOMMENDATIONS........................................................... 41
O’Melia Consulting in association with Kelly Hines Consulting

Santa Maria Area Transit TDA Triennial Performance Audit Page ii
LIST OF EXHIBITS
Exhibit 1 – Performance Audit Sources ................................................................5
Exhibit 2 – Organization Chart ..............................................................................6
Exhibit 3 – SMAT Fixed Routes ............................................................................7
Exhibit 4 – Regulatory Compliance Matrix ..........................................................11
Exhibit 5 – Farebox Recovery Ratio Calculations ...............................................14
Exhibit 6 – 50% Expenditure Limitation Calculation ............................................15
Exhibit 7 – Cost per Hour Calculations ...............................................................16
Exhibit 8 – Progress To Implement Prior Audit Recommendations.....................17
Exhibit 9 – Verified Data Elements for TDA Performance Indicators ..................20
Exhibit 10 – Financial Data Consistency Review ................................................22
Exhibit 11 – Operational Data Consistency Review – Fixed-Route.....................23
Exhibit 12 – Operational Data Consistency Review – Demand Response .........24
Exhibit 13 – TDA Performance Indicators – Fixed Route Mode..........................26
Exhibit 14 – TDA Performance Indicators – Demand Response Mode...............27
Exhibit 15 – TDA Performance Indicators – Breeze............................................29
Exhibit 16 – Fleet Composition ...........................................................................34
Exhibit 17 – SMAT 2006 Performance & Regional Standards ............................39
O’Melia Consulting in association with Kelly Hines Consulting

Santa Maria Area Transit TDA Triennial Performance Audit Page 1
EXECUTIVE SUMMARY
Purpose of Audit
As the Regional Transportation Planning Agency (RTPA) for Santa Barbara County, the Santa Barbara County Association of Governments (SBCAG) is required by the Public Utilities Code (PUC) Sections 99246 and 99248 to contract for a third party performance audit of itself and each of the transit operators to which Transportation Development Act (TDA) funds are allocated. These audits are to be conducted in accordance with the California Department of Transportation, Performance Audit Guidebook for Transit Operators and Regional Transportation Entities. Performance audits are required to:
• Determine compliance with regulatory requirements
• Assess progress to implement prior performance audit recommendations
• Verify performance indicators and validate basic data used to calculate indicators
• Evaluate the effectiveness and efficiency of agency functions.
This performance audit is for Santa Maria Area Transit (SMAT) for Fiscal Years 2004, 2005 and 2006 -- the period of time beginning July 1, 2003 and ending June 30, 2006.
Findings
• The City of Santa Maria provides fixed route and ADA paratransit service in the City of Santa Maria as well as in the unincorporated County communities of Orcutt and Tanglewood. Additionally, the City administers the Breeze service contract on behalf of the City of Santa Maria, the City of Lompoc, and Santa Barbara County.
• SMAT expanded service significantly during the audit period with Sunday service implemented in April 2004 and new service implemented in January 2006. All expansion resulted from
O’Melia Consulting in association with Kelly Hines Consulting

Santa Maria Area Transit TDA Triennial Performance Audit Page 2
recommendations in the Short Range Transit Plan (SRTP) completed in 2005.
• The City of Santa Maria began operation of the Breeze service in May 2005 on behalf of the City of Santa Maria, the City of Lompoc, and the County of Santa Barbara. The Breeze, started in May of 2005, is an inter-regional service linking Santa Maria, Vandenburg Air Force Base, and Lompoc. The contractor that provides SMAT service, MV Transportation, also provides the Breeze service.
• In the summer of 2004, SMAT’s new operating and maintenance facility was completed. On July 1, 2004, the new contractors, MV Transportation and Santa Maria Diesel took over SMAT operations and maintenance, respectively, out of the new facility.
• Compliance with California Air Resources Board (CARB) emissions requirements presents a challenge for SMAT due to the age of the fixed route fleet – 6.8 years average.
• SMAT is in compliance with all PUC requirements for FY05 and FY06. However, unusually high costs incurred in FY04 resulted in non-compliance with fixed-route farebox recovery requirements.
• SMAT fully addressed two of four prior audit recommendations. Two other recommendations, relating to the accuracy of reported data, were partially implemented and are carried forward as part of the first recommendation of this audit period.
• With the exception of employee full-time equivalents, data is correctly collected per TDA definitions. However, the reporting of the data to external agencies (i.e., State Controller and the FTA through the National Transit Database) could be improved as discrepancies among these reports were noted during the audit.
• SMAT’s TDA indicators for fixed route bus service show positive results. Service effectiveness, as measured by passengers per hour and mile improved by 6.1% and 9.3%, respectively. Fixed route ridership grew by 33.9% during the audit period. Fixed route cost efficiency demonstrated good performance as cost per passenger increased just 9.9% compared to growth in the CPI of 11.9% over the audit period. Cost per hour, a measure of cost effectiveness, declined in performance, growing by 16.7% over the
O’Melia Consulting in association with Kelly Hines Consulting
Santa Maria Area Transit TDA Triennial Performance Audit Page 3
audit period compared CPI increases of 11.9%. However, growth in excess of CPI is not uncommon when a new contractor begins operation as occurred with SMAT operations in July 2004 as well as the increase in fuel costs during the audit review period.
• SMAT’s demand response service maintained its cost per hour increases to well below the rate of growth in the CPI, but declined in both cost effectiveness and service productivity as cost per passenger increased by 27% and passengers per hour and mile both declined by more than 20%.
• The City has incorporated extensive incentives and penalties (liquidated damages) in its operations contract, and requires that detailed performance indicators and service statistics be reported on monthly basis by the contract service provider.
• The City of Santa Maria is developing a new transfer center. Construction and operation of this new facility and services is expected to reduce the amount of TDA funds available for non-transit purposes, as transit has first priority on the use of these funds.
Recommendations
Two recommendations are offered for consideration by SMAT.
1. The City of Santa Maria should examine its data reporting processes and establish new procedures for reporting system financial and operational data to external agencies.
2. The City of Santa Maria should take measures to improve the farebox recovery ratio of its demand response service.
O’Melia Consulting in association with Kelly Hines Consulting

Santa Maria Area Transit TDA Triennial Performance Audit Page 4
I. INTRODUCTION
Performance Audit Objectives and Approach
As the Regional Transportation Planning Agency (RTPA) for Santa Barbara County, the Santa Barbara County Association of Governments (SBCAG) is required by the Public Utilities Code (PUC) Sections 99246 and 99248 to contract for a third party performance audit of itself and each of the transit operators to which Transportation Development Act (TDA) funds are allocated. These audits are to be conducted in accordance with the California Department of Transportation, Performance Audit Guidebook for Transit Operators and Regional Transportation Entities. Performance audits are required to:
• Determine compliance with regulatory requirements
• Assess progress to implement prior performance audit recommendations
• Verify performance indicators and validate basic data used to calculate indicators
• Evaluate the effectiveness and efficiency of agency functions.
This performance audit is for the Santa Maria Area Transit (SMAT) Fiscal Years 2004, 2005 and 2006 -- the period of time beginning July 1, 2003 and ending June 30, 2006.
While the performance audit is being conducted in response to State requirements, such audits can and should be constructive and useful to governing boards, SBCAG and transit operator management.
It is the Auditor’s responsibility to provide objective and balanced reporting of results. This is important because very few agencies are all good or all bad. It is the auditor's responsibility to conduct thorough and accurate analyses and objectively report performance findings. Significant accomplishments and positive performance trends are discussed as well as opportunities for improvement.
O’Melia Consulting in association with Kelly Hines Consulting

Santa Maria Area Transit TDA Triennial Performance Audit Page 5
The methodology for this audit include interviews with key staff and management involved in the provision of transit services, a site visit for review of operations and data collection practices, review of operational and financial data, and review of relevant documents. Highlights of this review are presented below in Exhibit 1.
Exhibit 1 – Performance Audit Sources
Interviews – Name, Title and Agency
Austin Odell, City of Santa Maria Transit Manager Michael Seden-Hansen, City of Santa Maria Transit Coordinator
Mary McKinley, MV Transportation Project Manager Bob Oathout, Santa Maria Diesel Service, Inc. Service Manager
Matt Dobberteen, Senior Planner, Santa Barbara County Public Works Department
Site Visit(s)
City of Santa Maria, May 7, 2007 MV Transportation (at SMAT transit facility), May 7, 2007
Background Materials Reviewed
Comprehensive Annual Financial Reports, Fiscal Years 2004-2006 Annual Report of Financial Transactions of Transit Operations -- State Controllers
Annual Reports, Fiscal Years 2004-2006 TDA Triennial Performance Audit Report For Fiscal Years Ending June 30, 2003
Annual TDA and STA Claim Forms, Fiscal Years 2004-2006 National Transit Database Reports, Fiscal Years 2004-2006
California Highway Patrol Pull-Notice and Terminal Inspection Certifications Annual Reports to City Council, Fiscal Years 2004 & 2005
Purchased Transportation Service Agreement Organizational Chart and Annual Budgets, Fiscal Years 2004-2006
Short Range Transit Plan Transit Fleet Vehicle Maintenance Plan
City Expenditure and Revenue Status Reports, Fiscal Years 2004-2006 Contractor Service Summaries, Fiscal Years 2005 & 2006
Public Information – Website, Timetables & Schedules, Brochures
System Overview Organization & Policy Decisions
Santa Maria Area Transit (SMAT) is administered by the City of Santa Maria Public Works Department and governed by the Santa Maria City Council. Within the Public Works Department are two primary
O’Melia Consulting in association with Kelly Hines Consulting

Santa Maria Area Transit TDA Triennial Performance Audit Page 6
functions – Engineering and Streets and Facilities Maintenance. The Transit Manager and Transit Coordinator, who manage the transit service for the City, report to the City Engineer. The Transit Manager oversees the transit operations, maintenance, and marketing contracts. These include operations and marketing contracts for SMAT service, operations and marketing contracts for Breeze, and one maintenance contract the covers both SMAT and Breeze service. The organization structure for SMAT is depicted in Exhibit 2.
Exhibit 2 – Organization Chart
Director of Public Works
Transit Coordinator
Transit Manager
City Engineer
MV Transportation (Operations)
SMAT BREEZE
Marketing Firm
Marketing Firm
Santa Maria Diesel
(Maintenance)
MV Transportation (Operations)
Director of Public Works
Transit Coordinator
Transit Manager
City Engineer
Director of Public Works
Transit Coordinator
Transit Manager
City Engineer
MV Transportation (Operations)
SMAT BREEZE
Marketing Firm
Marketing Firm
Santa Maria Diesel
(Maintenance)
MV Transportation (Operations)
Other minor contracts managed by the Transit Manager include bus stop maintenance and ADA eligibility evaluation. Together with the Transit Coordinator, the Transit Manager is responsible for budgeting, service and financial planning, and public outreach. The City also provides capital equipment for system operations, including the operating facility, fueling facilities, and vehicles.
As a funding partner of the SMAT service, the County also provides input into the City’s planning processes for the SMAT services. The County’s involvement in the SMAT planning process is discussed in Section III.
O’Melia Consulting in association with Kelly Hines Consulting

Santa Maria Area Transit TDA Triennial Performance Audit Page 7
Fixed Route Bus Service Characteristics
SMAT service is provided in the City of Santa Maria as well as surrounding unincorporated Santa Barbara County communities of Orcutt and Tanglewood. SMAT’s service area is 34 square miles with a population of 130,000.
SMAT’s fixed route service consists of 11 routes that provide service seven days a week, as shown in Exhibit 3. Sunday service was added during the audit review period (April 18, 2004) along the Saturday route structure between 9:30am and 4:30pm. Service on Sunday has since been adjusted based on demand.
Exhibit 3 – SMAT Fixed Routes Route
Number Monday – Friday
Service Saturday Service Sunday Service
1A/1B 6:05 am – 7:25 pm 6:05 am – 7:25 pm 9:15 am – 5:42 pm
(Orcutt Route – 8:30 am – 6:22 pm)
2 6:15 am – 7:10 pm 8:15 am – 5:40 pm 9:15 am – 5:40 pm 20 5:45 am – 7:10 pm 8:45 am – 6:10 pm 9:45 am – 6:10 pm 24 6:30 am – 6:55 pm 8:15 am – 5:40 pm 9:15 am – 5:40 pm
3/3P 6:15 am – 7:12 pm 8:45 am – 6:12 pm 9:45 am – 6:12 pm 4/40 6:19 am – 6:40 pm 8:45 am – 5:40 pm 10:45 am – 5:40 pm
5 7:00 am – 6:25 pm 8:15 am – 5:42 pm 9:15 am – 5:42 pm 7 6:45 am – 10:10 pm 8:15 am – 6:10 pm 9:15 am – 6:10 pm 8 6:27 am – 6:50 pm 8:27 am – 5:50 pm 9:27 am – 5:50 pm 61 7:30 pm – 10:27 pm None None 62 7:15 pm – 10:15 pm None None
The regular one-way fare is $1.25, increased from $1.00 in March 2004. Reduced fares are as follows (prior fare in parentheses):
• Student - $1.00 ($0.75)
• Senior/Disabled/Medicare - $0.60 ($0.50)
• Children under age six – Free
Transfers are free with purchase of the base fare and are good for 60 minutes. Eight-ride punch passes may be purchased for $10.00. Monthly passes are also available for $40 (Student - $25, Senior/Disabled/Medicare - $20).
O’Melia Consulting in association with Kelly Hines Consulting
Santa Maria Area Transit TDA Triennial Performance Audit Page 8
SMAT utilizes a fleet of 15 40-foot coaches to provide fixed-route service, of which ten are required during peak periods.
Demand Response Service Characteristics
SMAT’s demand response service is available to certified ADA individuals, registered by SMAT. Service is also available to area visitors possessing an ADA eligibility card from another public transit operator. The demand response service area includes the City of Santa Maria as well as the communities of Orcutt and Tanglewood. Service is not limited to the 3/4 mile fixed route boundary, serving all of Santa Maria, Orcutt and Tanglewood. Demand response service is provided seven days a week during fixed route service hours.
Service is provided using a fleet of eight cutaway vehicles with an average age of six years. Two vehicles exceed their useful life of seven years. Five vehicles are required for service on a typical weekday though six vehicles are periodically needed.
With the March, 2004 fare change, the demand response fare was increased from $0.75 to $1.25 and now matches the fixed route base fare.
Also included in demand response statistics is the Special Health Service, provided by SMAT on behalf of the City, the City of Lompoc, and the County of Santa Barbara. The service consisted of a single round trip between Santa Maria and Lompoc to medical facilities in Santa Barbara every Tuesday and Thursday. Effective July 1, 2004, the City of Lompoc began operation of their own Health Service and ridership declined dramatically on the SMAT provided service over the audit period with only 139 passengers served in FY05 and just six passengers in FY06. Beginning in FY05, SMOOTH took over operation of the service on behalf of the County with SMAT providing occasional service on an as-needed basis to meet the occasional excess demand.
Breeze Service Characteristics
The Breeze provides inter-community service between Santa Maria, Vandenberg Air Force Base (County of Santa Barbara), and Lompoc. Each of these three jurisdictions contributes 1/3 of the operating cost of
O’Melia Consulting in association with Kelly Hines Consulting
Santa Maria Area Transit TDA Triennial Performance Audit Page 9
the system after the deduction of CMAQ grant funds, which covers about 88% of net operating costs for the first three years of service.
The Breeze operates weekdays between 5:45 am and 6:25 pm, making eight round trips between Santa Maria and Lompoc. The regular one-way fare is $2.00 (Senior/Disabled - $1.00). A coupon book is available for $20 and can be used for ten regular one-way fares or 20 senior/disabled one-way fares. A monthly pass may be purchased for $75 ($37.50 for seniors and the disabled). Transfers are free to either SMAT or COLT (City of Lompoc Transit) service.
Achievements and Challenges During the Audit Review Period
During the performance audit review period (i.e., July 1, 2003 and June 30, 2006), SMAT has successfully implemented a number of changes with a positive impact on performance. SMAT has also been faced with a number of challenges. These are highlighted below.
• SMAT opened its new operations and maintenance facility on July 1, 2004 – the same day that the new contract operator, MV Transportation, took over operations.
• SMAT successfully implemented a fare change in March 2004, raising the fixed route fare to $1.25 from $1.00 and increasing the demand response fare from $0.75 to $1.25.
• SMAT implemented new Sunday service in FY 2004 (i.e., April 18, 2004). Based on recommendations from the 2004/2005 SRTP, SMAT added two new routes in January 2006 - the 8 and 24 – and increased the frequency of service on five others. Later in 2006, SMAT introduced Night Owl Service with the implementation of lines 7N, 61, and 62. Also, during this audit period, the Breeze service began operation.
• Fixed route ridership increased by 33.9% over the audit period and service productivity, measured by passengers per hour, increased by 6.1%. Operating costs per hour grew 16.7% compared to an inflationary increase of 11.9%, reflecting cost increases with a change in contractors and increased fuel prices during the audit review period. The farebox recovery ratio increased from 15.7% in FY03 to 22.2% in FY06. Overall, fixed route service has shown
O’Melia Consulting in association with Kelly Hines Consulting

Santa Maria Area Transit TDA Triennial Performance Audit Page 10
very positive performance improvements over the audit review period.
• SMAT is planning a new transfer center, which represents both an accomplishment and a challenge for the City of Santa Maria. The City recently purchased the land where the transfer center will be located but continues discussions for additional right-of-way acquisition. In May 2007, the City released the Request for Proposals (RFP) for the design of the center.
• SMAT’s demand response farebox recovery declined over the audit period despite an increase in fares in 2004. While ridership was down over the audit period, operating costs remained unchanged and service hours increased slightly. Service productivity, as a result, declined by more than 20%.
• City Transit Staff experienced turnover during the audit period, which contributed to discrepancies in data reporting. The current Transit Manager was hired after the audit period in December 2006. The Transit Coordinator was hired in early 2005.
O’Melia Consulting in association with Kelly Hines Consulting

Santa Maria Area Transit TDA Triennial Performance Audit Page 11
II. COMPLIANCE REVIEW
Regulatory Requirements
SMAT is in compliance with the majority of these requirements, as shown below in Exhibit 4. Areas of partial or non-compliance for staff and management to be aware of include:
• PUC Sections 99268.2-5 & .12 – Fixed Route service did not meet the required farebox recovery of 20% in FY04.
• PUC Section 99314.6 – Demand Response cost per hour increased by more than inflation in FY04. However, SMAT is not required to comply with this PUC Section, as it did not receive STA operating funds during the audit period. Compliance with this requirement is offered simply to provide the City of Santa Maria’s new transit staff with a reference for future compliance.
Where system compliance is determined on a modal basis (including the sections identified above), Breeze data has been excluded from the assessment.
Exhibit 4 – Regulatory Compliance Matrix
Regulatory Code
Compliance Requirement Compliance Finding Verification Information
PUC Section 99243
Submit an annual report to the State Controller based upon the Uniform System of Accounts and Records established by the State Controller. Due dates varied during the audit period: FY04: 11/24/04 (paper) or 12/14/04 (electronic), FY05: 9/28/05 (paper) or 10/18/05 (electronic) FY06: 10/12/06 (paper) or 11/1/06 (electronic)
Full Compliance Report Submission Dates: FY 2004: 11/17/04 FY 2005: 11/14/05 FY 2006: 11/22/06 Agency report is in the required electronic format.
O’Melia Consulting in association with Kelly Hines Consulting
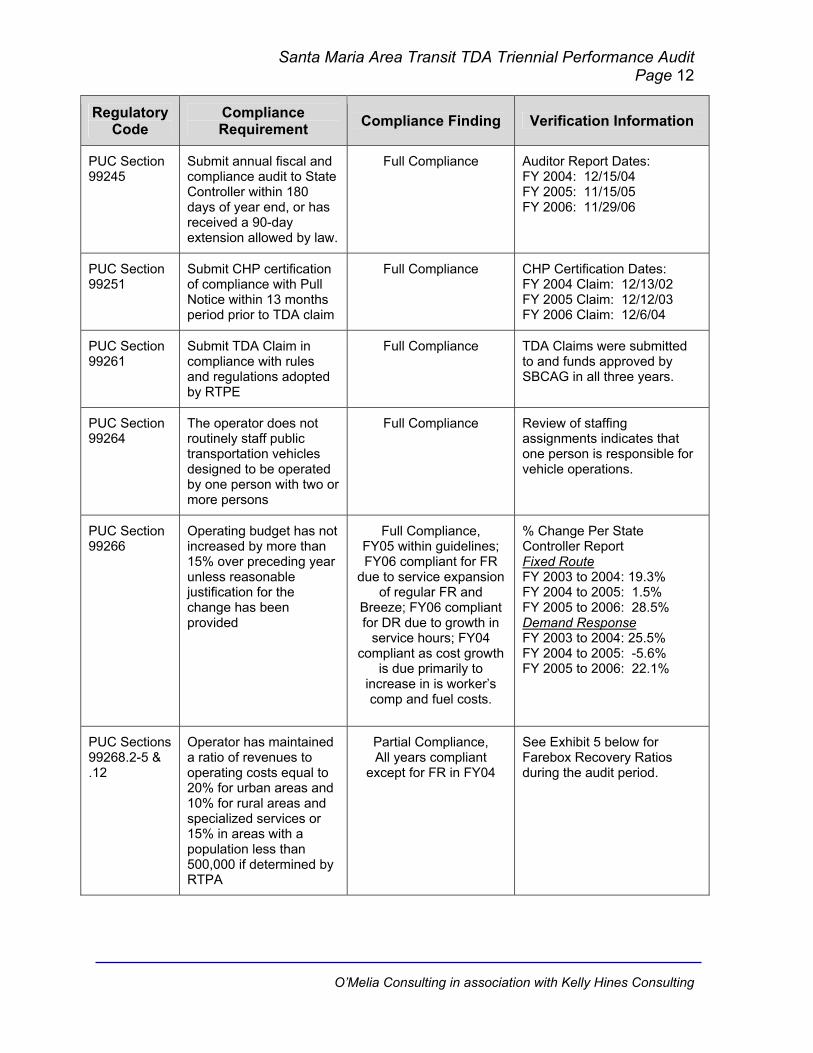
Santa Maria Area Transit TDA Triennial Performance Audit Page 12
Regulatory Code
Compliance Requirement Compliance Finding Verification Information
PUC Section 99245
Submit annual fiscal and compliance audit to State Controller within 180 days of year end, or has received a 90-day extension allowed by law.
Full Compliance Auditor Report Dates: FY 2004: 12/15/04 FY 2005: 11/15/05 FY 2006: 11/29/06
PUC Section 99251
Submit CHP certification of compliance with Pull Notice within 13 months period prior to TDA claim
Full Compliance CHP Certification Dates: FY 2004 Claim: 12/13/02 FY 2005 Claim: 12/12/03 FY 2006 Claim: 12/6/04
PUC Section 99261
Submit TDA Claim in compliance with rules and regulations adopted by RTPE
Full Compliance TDA Claims were submitted to and funds approved by SBCAG in all three years.
PUC Section 99264
The operator does not routinely staff public transportation vehicles designed to be operated by one person with two or more persons
Full Compliance Review of staffing assignments indicates that one person is responsible for vehicle operations.
PUC Section 99266
Operating budget has not increased by more than 15% over preceding year unless reasonable justification for the change has been provided
Full Compliance, FY05 within guidelines; FY06 compliant for FR
due to service expansion of regular FR and
Breeze; FY06 compliant for DR due to growth in
service hours; FY04 compliant as cost growth
is due primarily to increase in is worker’s comp and fuel costs.
% Change Per State Controller Report Fixed Route FY 2003 to 2004: 19.3% FY 2004 to 2005: 1.5% FY 2005 to 2006: 28.5% Demand Response FY 2003 to 2004: 25.5% FY 2004 to 2005: -5.6% FY 2005 to 2006: 22.1%
PUC Sections 99268.2-5 & .12
Operator has maintained a ratio of revenues to operating costs equal to 20% for urban areas and 10% for rural areas and specialized services or 15% in areas with a population less than 500,000 if determined by RTPA
Partial Compliance, All years compliant
except for FR in FY04
See Exhibit 5 below for Farebox Recovery Ratios during the audit period.
O’Melia Consulting in association with Kelly Hines Consulting

Santa Maria Area Transit TDA Triennial Performance Audit Page 13
Regulatory Code
Compliance Requirement Compliance Finding Verification Information
PUC Section 99268
Operator TDA funding is no more than 50% of operating, maintenance, capital, and debt service requirements after federal grants and STA revenues are deducted
Full Compliance. This finding is made for
FY04 only since the Section only applies if the agency does not comply
with PUC Sections 99268.2-5 & .12 above
See Exhibit 6 below for verification calculation.
PUC Section 99271
The retirement system is fully funded, or the Operator is implementing a plan that will fully fund the retirement system within 40 years.
Full Compliance City of Santa Maria employees are part of the California Public Employees Retirement System.
PUC Section 99314.5
If the Operator receives STA funds, the Operator is not precluded by contract from employing part-time drivers or from contracting with common carriers
Not applicable as SMAT did not receive STA
operating funds during the audit period.
Compliance verification offered in Exhibit 7 as a reference for future compliance with this requirement. The City of Santa Maria contracts out the operation of SMAT service. The contractor utilizes part-time drivers.
PUC Section 99314.6
If the Operator receives STA funds for operating purposes: (1) the Operator’s total operating cost per revenue hour does not exceed the prior year’s cost per revenue hour adjusted for inflation using the CPI; or (2) the Operator’s average total operating cost per revenue hour in the past three years does not exceed the sum of the average of the preceding three years, adjusted for inflation using the CPI.
Not applicable as SMAT did not receive STA
operating funds during the audit period.
Compliance calculations are shown below in Exhibit 7 to provide the City’s new transit staff with a reference for future compliance with this requirement.
O’Melia Consulting in association with Kelly Hines Consulting
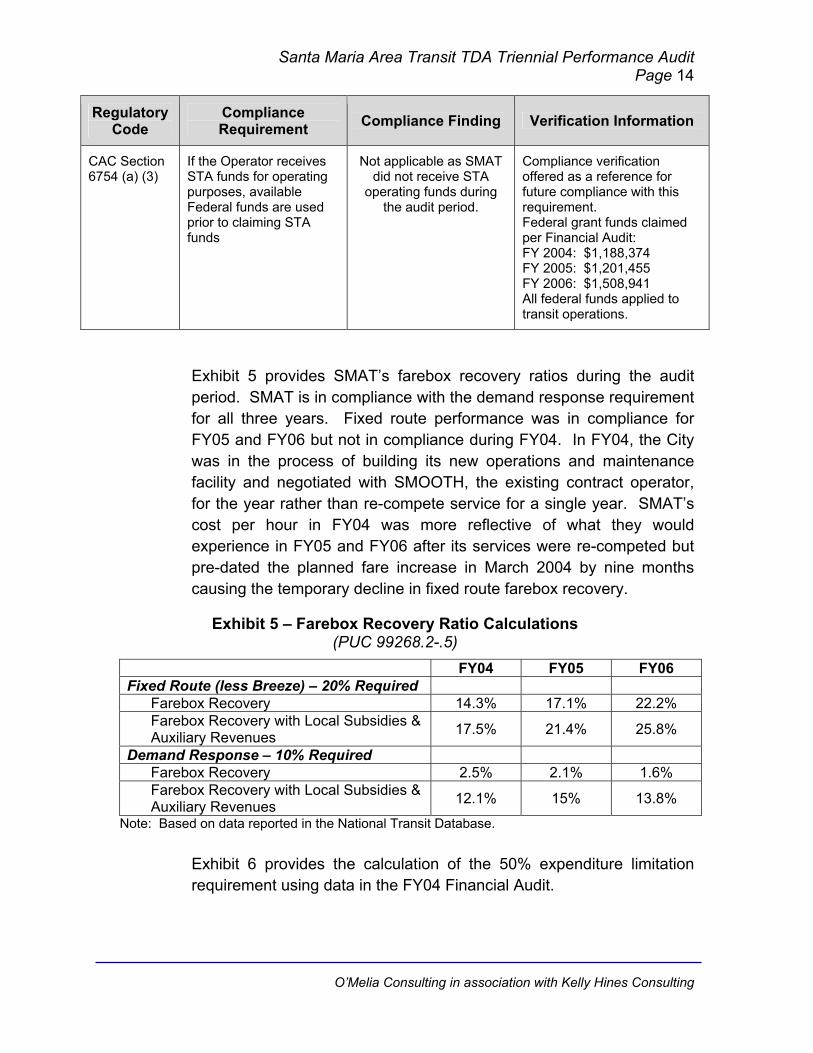
Santa Maria Area Transit TDA Triennial Performance Audit Page 14
Regulatory Code
Compliance Requirement Compliance Finding Verification Information
CAC Section 6754 (a) (3)
If the Operator receives STA funds for operating purposes, available Federal funds are used prior to claiming STA funds
Not applicable as SMAT did not receive STA
operating funds during the audit period.
Compliance verification offered as a reference for future compliance with this requirement. Federal grant funds claimed per Financial Audit: FY 2004: $1,188,374 FY 2005: $1,201,455 FY 2006: $1,508,941 All federal funds applied to transit operations.
Exhibit 5 provides SMAT’s farebox recovery ratios during the audit period. SMAT is in compliance with the demand response requirement for all three years. Fixed route performance was in compliance for FY05 and FY06 but not in compliance during FY04. In FY04, the City was in the process of building its new operations and maintenance facility and negotiated with SMOOTH, the existing contract operator, for the year rather than re-compete service for a single year. SMAT’s cost per hour in FY04 was more reflective of what they would experience in FY05 and FY06 after its services were re-competed but pre-dated the planned fare increase in March 2004 by nine months causing the temporary decline in fixed route farebox recovery.
Exhibit 5 – Farebox Recovery Ratio Calculations (PUC 99268.2-.5)
FY04 FY05 FY06 Fixed Route (less Breeze) – 20% Required
Farebox Recovery 14.3% 17.1% 22.2% Farebox Recovery with Local Subsidies & Auxiliary Revenues 17.5% 21.4% 25.8%
Demand Response – 10% Required Farebox Recovery 2.5% 2.1% 1.6% Farebox Recovery with Local Subsidies & Auxiliary Revenues 12.1% 15% 13.8%
Note: Based on data reported in the National Transit Database.
Exhibit 6 provides the calculation of the 50% expenditure limitation requirement using data in the FY04 Financial Audit.
O’Melia Consulting in association with Kelly Hines Consulting

Santa Maria Area Transit TDA Triennial Performance Audit Page 15
Exhibit 6 – 50% Expenditure Limitation Calculation (PUC 99268)
Line # Description $ Amount $ Subtotal
1. Total Operating Cost $ 2,661,722 2. Total Depreciation* $ 344,104 3. Total Capital Outlay $ 2,648,557 4. Total Lines 1, 2 & 3 $ 5,654,383 5. Less Federal Grants Received $ 2,944,001 6. Less LTF Capital Intensive $ 284,366 7. Less STAF Received $ 457,855 8. Total Lines 5, 6 & 7 $ 3,686,222 9. Total Line 4 Less Line 8 $ 1,968,161
10. 50% of Line 9 $ 984,081
11.Add amount of LTF Calimed in Excess of Line 9 for Match to Federal Operating Grant
$ 594,187
12. Add LTF Capital Intensive $ 284,366
13. Total permissible LFT Expenditure for Operations $ 1,862,634
Total LTF applied to Operations $ 1,089,842
Exhibit 7 provides the calculations for the cost per hour requirement (PUC Section 99314.6) for the receipt of STA funds. As indicated in Exhibit 4, this section does not apply to SMAT, as SMAT did not receive STA operating funds during the audit period. The calculations provided in Exhibit 7 are for informational purposes only and may be used as a reference by City of Santa Maria transit staff for future compliance requirements. Fixed route cost per hour would have been in compliance in FY05 under Option 1, based on annual cost per hour growth against annual CPI growth. FY04 and FY06 would have been in compliance under Option 2, based on a three-year average of cost per hour performance against three-year growth in CPI.
Demand response service would have been in compliance in FY05 and FY06 under Option 1. However, FY04 demand response would not have been in compliance under either option as FY04 cost per hour exceeded growth in CPI as compared to FY03 cost per hour, and FY02 to FY04 average cost per hour exceeded the FY01 to FY03 average cost per hour adjusted for inflation.
O’Melia Consulting in association with Kelly Hines Consulting

Santa Maria Area Transit TDA Triennial Performance Audit Page 16
Exhibit 7 – Cost per Hour Calculations (PUC Section 99314.6)
Fixed Route
FY01 FY02 FY03 FY04 FY05 FY06 Cost Per Hour $54.58 $53.47 $54.38 $60.90 $57.07 $60.98 CPI 1.7% 2.4% 2.5% 4.2% 4.8% Option 1 - Prior Year Adjusted for Inflation $55.74
(Not Compliant)$63.45
(Compliant) $59.81
(Not Compliant)
Option 2 – Three Year Average (FY04)
FY01 to FY03 Average: $54.14 FY01 to FY03 Average with CPI: $56.36 FY02 to FY04 Average: $56.25
Compliant
Option 2 – Three Year Average (FY06)
FY03 to FY05 Average: $57.45 FY03 to FY05 Average with CPI: $61.30 FY04 to FY06 Average: $59.65
Compliant Demand Response
FY01 FY02 FY03 FY04 FY05 FY06 Cost Per Hour $53.58 $43.14 $59.73 $70.05 $58.48 $59.94 CPI 1.7% 2.4% 2.5% 4.2% 4.8% Option 1 - Prior Year Adjusted for Inflation $61.22
(Not Compliant)$72.99
(Compliant) $61.29
(Compliant)
Option 2 – Three Year Average (FY04)
FY01 to FY03 Average: $52.15 FY01 to FY03 Average with CPI: $54.29 FY02 to FY04 Average: $57.64
Not Compliant
During the exit Interview for this performance audit, areas of partial and non-compliance were reviewed with management and staff. Areas of non-compliance date back to FY04. Subsequent to FY04, there has been a change in transit staff and contract operator and system performance has improved. FY04 was simply an aberrant year for SMAT given changes in the operating contract for service and the anticipated move to a new facility.
Progress To Implement Prior Audit Recommendations
The prior TDA Performance Audit, completed in June 2004, made four recommendations for improved compliance and performance. SMAT’s progress to implement prior audit recommendations includes full implementation of two recommendations and partial implementation two recommendations. Key questions included in this analysis of progress to implement prior audit recommendations are:
• What action(s) have been taken to implement the recommendation? Has performance improved as a result of actions taken?
O’Melia Consulting in association with Kelly Hines Consulting

Santa Maria Area Transit TDA Triennial Performance Audit Page 17
• Is the issue to be addressed by the prior performance audit recommendation still valid today? Why or why not?
• If there has been little or no progress, are future actions planned? Was a different approach selected and if so, what is the status of this activity?
Exhibit 8 summarizes progress relative to prior performance audit recommendations. Findings of “Implemented, Partially Implemented, or Not Implemented” are made for each recommendation.
Exhibit 8 – Progress To Implement Prior Audit Recommendations
Prior Audit Recommendations
Prior Audit Findings Leading to
Recommendation Compliance
Finding Implementing Actions &
Results
1. Continue to closely monitor service and make service adjustments to improve performance.
Despite having a performance-monitoring program, the performance standards were not consistently met nor enforced. It was recognized that limited staff resources may have been a contributing factor. The auditor recognized that the SRTP under development during this audit period would be a valuable tool in determining whether performance standards are being met.
Implemented SMAT did complete its SRTP in 2005, which assessed system performance to date and set performance standards for each year through FY09. The SRTP was followed up by an annual report to the City Council assessing performance for FY05. An FY06 report was not prepared due to the departure of the Transit Director in July 2006 with a six-month vacancy in this position. At the time of this audit, all Transit Staff positions were filled and SMAT staff continues to closely monitor system performance and are on-target to complete the FY07 End of Year Report.
O’Melia Consulting in association with Kelly Hines Consulting

Santa Maria Area Transit TDA Triennial Performance Audit Page 18
Prior Audit Recommendations
Prior Audit Findings Leading to
Recommendation Compliance
Finding Implementing Actions &
Results
2. Improve the line of communication and exchange of data between the contract operator, City transit staff, and the City’s Finance Department.
This audit was carried over from the prior audit after finding inconsistencies in various reports including the SRTP, State Controller’s reports, and annual reports to the Council.
Partially Implemented
This recommendation will be carried over as part of this audit as discrepancies in reported data were also prevalent during this audit period. As noted in the last audit, Transit staff do review and evaluate system data using information reported by the contractor. The reporting of this information, however, could be greatly improved. The current Transit Manager, hired just after the end of the audit period, has begun to refine data reporting procedures.
3. SMAT should keep its operating data and statistics separate for each of its three transit services.
Operating data for SMAT’s three services during the last audit period was not consistently reported as sometimes the data was combined and sometimes reported separately. The auditor recommended that the health service element be reported in the Specialized Service State Controller’s Report but as “Other” instead of being grouped with ADA service.
Partially Implemented
While SMAT does maintain separate records for its different services which now include the Breeze, discrepancies in how data is reported in various reports suggests that the data is not being consistently grouped by service types – fixed route and demand response - for reporting purposes. Health service data is reported in the “Other” category in the Specialized Service State Controller’s Report but the data as reported could not be correlated with data reported in Contractor reports nor the National Transit Database. Improvements are expected during the next audit period as the new Transit Manager has implemented a new data reporting procedure.
O’Melia Consulting in association with Kelly Hines Consulting

Santa Maria Area Transit TDA Triennial Performance Audit Page 19
Prior Audit Recommendations
Prior Audit Findings Leading to
Recommendation Compliance
Finding Implementing Actions &
Results
4. Continue to check that insurance costs are included in the calculation of the City’s farebox recovery ratio for the State Controller’s Reports.
This recommendation was carried over from the prior audit, which found that insurance costs were being incorrectly excluded from operating costs in the calculation of the farebox recovery ratio in the State Controller’s Report.
Implemented Insurance costs were included in operating costs reported in the State Controller’s Reports for all three years.
Data Verification
Included in the review of transit operators is the regulatory requirement (i.e., PUC Section 99247) that performance audits include a verification of five data items including:
• Operating Cost. The total cost of running a transit operation, exclusive of capital expenditures, depreciation, direct costs of providing charter service and vehicle lease costs.
• Total Passengers. The total number of unlinked trips; all passenger boardings whether revenue producing or not.
• Total Vehicle Service Hours. The total annual number of hours that vehicles are in revenue service. Excluded is travel to and from storage facilities and other deadhead travel. Also referred to as Revenue Hours.
• Total Vehicle Service Miles. The total annual number of miles that vehicles are in revenue service. Miles traveled to and from storage facilities and other deadhead travel are excluded. Also referred to as Revenue Miles.
• Employee Equivalents. The total actual regular and overtime employee pay hours divided by 2,000 hours. Contract employees are included, but not volunteers. Also referred to as FTEs.
SMAT is in compliance with four of five data definitions and methods of data collection as summarized in Exhibit 9. A finding of partial compliance is made for employee equivalents as reporting practices during the audit period could not be verified due to staff turnover but declines in the number reported during each year of the audit period
O’Melia Consulting in association with Kelly Hines Consulting

Santa Maria Area Transit TDA Triennial Performance Audit Page 20
suggest that SMAT is attempting to apply the correct definition to this statistic. However, TDA claims submitted during the audit period are reporting employee headcount.
Exhibit 9 – Verified Data Elements for TDA Performance Indicators
Data Items & Mode Fiscal Year 2004 Fiscal Year
2005 Fiscal Year
2006
Operating Costs (Demand Response)
Could not be verified as contractor during this period was replaced. Financial Audit did not make any negative findings.
Full Compliance: Contractor reports costs on an hourly basis and segregates by mode. City separately tracks depreciation as required.
Full Compliance: Contractor reports costs on an hourly basis and segregates by mode. City separately tracks depreciation as required.
Total Passengers (Demand Response)
Could not be verified as contractor during this period was replaced.
Full Compliance: Contractor reports ridership separately by each mode, counting all passenger boardings.
Full Compliance: Contractor reports ridership separately by each mode, counting all passenger boardings.
Total Vehicle Service Hours (Demand Response)
Could not be verified as contractor during this period was replaced.
Full Compliance: Contractor reports service hours separately by each mode, subtracting out deadhead.
Full Compliance: Contractor reports service hours separately by each mode, subtracting out deadhead.
Total Vehicle Service Miles (Demand Response)
Could not be verified as contractor during this period was replaced.
Full Compliance: Contractor reports service miles separately by each mode, subtracting out deadhead.
Full Compliance: Contractor reports service miles separately by each mode, subtracting out deadhead.
Employee Equivalents (Demand Response)
Could not be verified as contractor during this period was replaced.
Partial Compliance: Contractor reports employee pay hours to City. Reported FTEs show decline from FY04 implying that the correct definition was applied at least to Contractor pay hours. Staff responsible for actual reported numbers is no longer with the City.
Partial Compliance: Contractor reports employee pay hours to City. Reported FTEs show decline from FY05 implying that the correct definition was applied at least to Contractor pay hours. Staff responsible for reported numbers is no longer with the City.
O’Melia Consulting in association with Kelly Hines Consulting

Santa Maria Area Transit TDA Triennial Performance Audit Page 21
Data Items & Mode Fiscal Year 2004 Fiscal Year
2005 Fiscal Year
2006
Operating Costs (Fixed Route)
Could not be verified as contractor during this period was replaced.
Full Compliance: Contractor reports costs on an hourly basis and segregates by mode. City separately tracks depreciation as required.
Full Compliance: Contractor reports costs on an hourly basis and segregates by mode. City separately tracks depreciation as required.
Total Passengers (Fixed Route)
Could not be verified as contractor during this period was replaced.
Full Compliance: Contractor reports ridership separately by each mode, counting all passenger boardings.
Full Compliance: Contractor reports ridership separately by each mode, counting all passenger boardings.
Total Vehicle Service Hours (Fixed Route)
Could not be verified as contractor during this period was replaced.
Full Compliance: Contractor reports service hours separately by each mode, subtracting out deadhead.
Full Compliance: Contractor reports service hours separately by each mode, subtracting out deadhead.
Total Vehicle Service Miles (Fixed Route)
Could not be verified as contractor during this period was replaced.
Full Compliance: Contractor reports service miles separately by each mode, subtracting out deadhead.
Full Compliance: Contractor reports service miles separately by each mode, subtracting out deadhead.
Employee Equivalents (Fixed Route)
Could not be verified as contractor during this period was replaced.
Partial Compliance: Contractor reports employee pay hours to City. Reported FTEs show decline from FY04 implying that the correct definition was applied at least to Contractor pay hours. Staff responsible for actual reported number is no longer with the City.
Partial Compliance: Contractor reports employee pay hours to City. Reported FTEs show decline from FY05 implying that the correct definition was applied at least to Contractor pay hours. Staff responsible for actual reported number is no longer with the City.
With the exception of employee equivalents, SMAT is in compliance with data collection requirements. Minor discrepancies were found in reported operating costs but the source of the discrepancy was identified as allocated City costs. However, the reporting of verified data elements could use significant improvement as discrepancies
O’Melia Consulting in association with Kelly Hines Consulting

Santa Maria Area Transit TDA Triennial Performance Audit Page 22
were found in reported operational data (passengers, vehicle service hours, vehicle service miles) among published reports.
Data Consistency
Exhibit 10 compares system-wide financial data as reported in a number of separate documents.
Exhibit 10 – Financial Data Consistency Review Total System – Including Breeze
FY 2004 FY 2005 FY 2006National Transit Database 2,561,292$ 2,617,955$ 3,450,548$ Financial Audit 2,661,722$ 2,594,920$ 3,425,899$ State Controller's Report 2,635,292$ 2,617,960$ 3,450,550$ National Transit Database 296,035$ 348,374$ 625,808$ Financial Audit 296,035$ 348,375$ 625,808$ State Controller's Report 296,035$ 348,375$ 625,809$ City Revenue Status Reports 119,853$ 144,897$ 148,042$ State Controller's Report 119,853$ 144,547$ 152,691$
Note: National Transit Database costs include motorbus and demand response services as reported plus Breeze service as reported in financial audits.
TDA Statistic Source Audit Review Period
Operating Costs
Passenger Revenues
Local Subsidies & Auxiliary Revenues
SMAT maintains separate accounts for its administrative function, fixed route operation, demand response service, and Breeze service. Over the audit period, there were some inconsistencies in reported operating costs even after accounting for Breeze operating costs, which were not included in National Transit Database reports. With the exception of FY04, NTD and State Controller Reports are consistent over the period. Differences between State Controller’s reports and Financial Audits in FY05 and FY06 are $23,040 and $24,651, respectively. The difference in FY05 is equal to a cost allocation expense identified in the City’s Expenditure Status Report. The same cost element, in the amount of $23,010, appears in the FY06 Expenditure Report and accounts for most of the FY06 difference. The source of the discrepancies among the three reports in FY04 could not be determined.
Passenger revenues were reported consistently across published reports. Local subsidies and auxiliary revenues were mostly consistent across published reports:
• FY05 – total system revenues reported in the State Controller’s Report and Financial Audit, and shown on the City’s Expenditure Status Report are consistent. There was $350 difference in LTF funding shown in the State Controller’s Report and the Expenditure
O’Melia Consulting in association with Kelly Hines Consulting

Santa Maria Area Transit TDA Triennial Performance Audit Page 23
Status Report with the $350 appearing instead as Measure D revenues in the Expenditure Status Report.
• FY06 – the Financial Audit and State Controller’s report were largely consistent in total system revenues with the Expenditure Status Report showing $4,650 less Other Income than the State Controller’s report and accounting for the difference in local subsidies and auxiliary revenues as shown in Exhibit 6.
Exhibit 11 presents passengers, vehicle service hours, vehicle service miles, and employee equivalents for the fixed route portion of SMAT as reported in various documents.
Exhibit 11 – Operational Data Consistency Review – Fixed-Route (Excluding Breeze)
FY 2004 FY 2005 FY 2006National Transit Database 750,171 766,779 969,454Contractor Report N/A N/A 1,005,478Annual Report to Council 649,030 773,469 N/AState Controller's Report 688,340 777,085 1,005,574National Transit Database 32,323 34,266 40,626Contractor Report N/A N/A 44,853Annual Report to Council 31,796 34,266 N/AState Controller's Report 32,243 34,874 42,459National Transit Database 446,164 492,698 553,142Contractor Report N/A N/A 664,564Annual Report to Council 461,779 482,798 N/AState Controller's Report 450,664 498,388 664,589
Employee Full-Time Equivalents State Controller's Report 46 39 32
Passengers
TDA Statistic Source Audit Review Period
Vehicle Service Hours
Vehicle Service Miles
All data items were reported inconsistently over the audit period with the exception of FTEs, which was only reported in the State Controller’s Report. FTE reporting did improve somewhat over the audit period, approaching the correct definition (pay hours/2,000) from the headcount previously reported as the number of FTEs declined over the period. However, the number reported as a whole number suggests that the definition is still not being applied correctly. Breeze data not being included in NTD reports during the audit period may explain some of the discrepancy between NTD and State Controller’s Reports. However, FY06 data in contractor reports to City staff, in which Breeze and regular SMAT fixed route services are reported separately, does not account for differences in reported vehicle service
O’Melia Consulting in association with Kelly Hines Consulting

Santa Maria Area Transit TDA Triennial Performance Audit Page 24
hours between NTD and State Controller’s Reports though passengers and vehicle service miles are more consistent.
Similarly, FY04 and FY05 data is not consistent between NTD, State Controller’s Reports, and Annual Reports to Council. The Breeze began operation in May, 2005 but the discrepancies are not consistent with two months of Breeze operation.
City Transit Staff are responsible for NTD reporting and preparation of the Annual Report, while City Finance staff prepare the State Controller’s report. Streamlining the reporting responsibilities should improve data reporting for operational data items such as those shown in Exhibit 11.
Exhibit 12 presents passengers, vehicle service hours, vehicle service miles, and employee equivalents for the demand response portion of SYVT as reported in two separate documents.
Exhibit 12 – Operational Data Consistency Review – Demand Response (Including Health Service)
FY 2004 FY 2005 FY 2006National Transit Database 30,681 25,008 24,130Contractor Report N/A 24,013 23,141Annual Report to Council 27,291 23,818 N/AState Controller's Report 25,707 23,818 25,820National Transit Database 8,465 8,080 8,646Contractor Report N/A 8,079 8,479Annual Report to Council 9,665 8,206 N/AState Controller's Report 8,815 8,206 11,530National Transit Database 107,611 118,303 121,904Contractor Report N/A 119,648 119,410Annual Report to Council 141,226 122,573 N/AState Controller's Report 125,060 122,573 119,419
Employee Full Time Equivalents State Controller's Report 12 8 5
Vehicle Service Hours
Vehicle Service Miles
TDA Statistic Source Audit Review Period
Passengers
Like fixed route data, demand response data is reported inconsistently across all published reports. FTE reporting improved over the audit period but the continuous decline in FTEs over the period and the fact that the number reported is always a whole number suggests that the data is not being calculated correctly.
The process for compiling and/or calculating the four service data items is as follows:
O’Melia Consulting in association with Kelly Hines Consulting

Santa Maria Area Transit TDA Triennial Performance Audit Page 25
• Passengers – 100% headcount of passenger boardings.
• Vehicle Service Hours – Fixed route data based on scheduled service with exceptions made for missed trips and replacement vehicles. Demand response data is based on driver run sheets.
• Vehicle Service Miles – Fixed route data based on scheduled service with exceptions made for missed trips and replacement vehicles. Demand response data is based on driver run sheets.
• Employee Full-Time Equivalents – Data as reported during the audit period could not be verified due to turnover in City staff. The significant decline in FTEs reported over the audit period suggest that the correct definition was applied, albeit inconsistently, over the last two years of the audit period. The Contractor does report employee pay hours to the City.
TDA Performance Indicator Trends
California Public Utilities Code Section 99246 (d) states that performance audits of transit operators shall include a verification of performance indicators defined in the Public Utilities Code Section 99247. These performance indicators include:
• Operating Cost Per Vehicle Service Hour • Operating Cost Per Passenger • Passengers Per Vehicle Service Hour • Passengers Per Vehicle Service Mile • Vehicle Service Hours Per Employee.
Trends for these five TDA performance indicators are presented below by mode (i.e., motor bus and/or demand response). Performance indictor trends involving costs are also compared to the Consumer Price Index -- Urban Wage Earners and Clerical Workers for the Los Angeles-Riverside-Orange County area.
Data used in the calculation of performance indicators is based on National Transit Database data as it is the only source that consistently broke out financial data and operational data separately by mode, and exclusive of Breeze data for FY05 and FY06. Excluding Breeze data in the fixed route calculation of TDA indicators was done for two
O’Melia Consulting in association with Kelly Hines Consulting

Santa Maria Area Transit TDA Triennial Performance Audit Page 26
reasons: 1) it was not operated during all three years of the audit period and 2) as a new service, it is not required to meet the performance standards under TDA as assessed in Regulatory Requirements section of this chapter. TDA indicators are calculated for Breeze service for FY06 at the conclusion of this chapter to provide SMAT with an assessment of Breeze performance after one full year of operation.
TDA Performance Indicator Trends – Fixed Route Mode
Exhibit 13 presents TDA performance indicators for SMAT’s fixed route service.
Exhibit 13 – TDA Performance Indicators – Fixed Route Mode (Excluding Breeze)
FY 2004 FY 2005 FY 2006Operating Costs $ 1,683,056 $ 1,968,333 $ 1,955,500 $ 2,477,550 47.2%Passengers 724,090 750,171 766,779 969,454 33.9%Vehicle Service Hours 32,201 32,323 34,266 40,626 26.2%Vehicle Service Miles 451,537 446,164 492,698 553,142 22.5%Employee Full-Time Equivalents 41.0 46.0 39.0 32.0 -22.0%Farebox Revenues $ 264,451 $ 281,215 $ 334,635 $ 550,859 108.3%Local Subsidies & Auxiliary Revenues $ 123,712 $ 62,861 $ 83,372 $ 89,549 -27.6%Operating Cost Per Vehicle Service Hour $ 52.27 $ 60.90 $ 57.07 $ 60.98 16.7%Operating Cost Per Passenger $ 2.32 $ 2.62 $ 2.55 $ 2.56 9.9%Passengers Per Vehicle Service Hour 22.5 23.2 22.4 23.9 6.1%Passengers Per Vehicle Service Mile 1.60 1.68 1.56 1.75 9.3%Vehicle Service Hours Per Employee FTE 785 703 879 1,270 61.6%Farebox Recovery Ratio 15.7% 14.3% 17.1% 22.2% 41.5%Farebox Recovery Ratio with Local Subsidies 23.1% 17.5% 21.4% 25.8% 12.1%Percent Change in the CPI - 2.5% 4.2% 4.8% 11.9%
Verified TDA Statistics & Performance Indicators
Base Year FY 2003
Audit Review Period Percent Change FY 2003 to FY 2006
Note: All data from National Transit Database, except Employee FTEs which is from State Controller's Reports.
• Operating Cost Per Vehicle Service Hour is a measure of cost efficiency. During the audit review period, cost per hour grew in excess of inflation, increasing by 16.7% as vehicle service hours grew only half as much as operating costs. Like costs and passengers, most of the growth in service occurred in FY06 (76%).
• Operating Cost Per Passenger is a measure of cost effectiveness. During the audit period, cost per passenger grew by 9.9% but less than the growth in CPI of 11.9%. While operating costs increased by more than 47%, passengers grew by 34%. Significant expansion in service in FY06 accounts for most of the growth in ridership (86%) and operating costs (66%).
• Passengers Per Vehicle Service Hour is a measure of service productivity. During the audit review period, passengers per hour
O’Melia Consulting in association with Kelly Hines Consulting

Santa Maria Area Transit TDA Triennial Performance Audit Page 27
increased by 6% with nearly 24 passengers carried per hour in FY06.
• Passengers Per Vehicle Service Mile also measures service productivity. During the audit review period, passengers per mile grew by more than 9% increasing from 1.6 in FY03 to 1.75 in FY06.
• Vehicle Service Hours Per Employee measures labor productivity. During the audit review period, labor productivity improved by nearly 60% based on reported data. However, this reflects an improvement in the reporting of FTEs rather than an improvement in labor productivity.
SMAT’s fixed route farebox recovery demonstrated significant growth over the audit period, exceeding the required 20% in FY06 before the inclusion of local subsidies and auxiliary revenues. In FY06, the school district was unable to meet demand for student transportation and purchased approximately 800 SMAT monthly passes leading to SMAT’s significant revenue growth in FY06. Prior to FY06, fare revenues dipped in FY04 but were on the rise in FY05 following a May, 2004 fare increase.
TDA Performance Indicator Trends – Demand Response Service Mode
Exhibit 14 presents TDA performance indicators for SMAT’s demand response service.
Exhibit 14 – TDA Performance Indicators – Demand Response Mode
FY 2004 FY 2005 FY 2006Operating Costs $ 495,742 $ 592,959 $ 472,555 $ 518,269 4.5%Passengers 29,344 30,681 25,008 24,130 -17.8%Vehicle Service Hours 8,347 8,465 8,080 8,646 3.6%Vehicle Service Miles 105,701 107,611 118,303 121,904 15.3%Employee Full-Time Equivalents 12.0 12.0 8.0 5.0 -58.3%Farebox Revenues $ 15,500 $ 14,820 $ 9,872 $ 8,204 -47.1%Local Subsidies & Auxiliary Revenues $ 71,927 $ 56,992 $ 61,175 $ 63,142 -12.2%Operating Cost Per Vehicle Service Hour $ 59.39 $ 70.05 $ 58.48 $ 59.94 0.9%Operating Cost Per Passenger $ 16.89 $ 19.33 $ 18.90 $ 21.48 27.1%Passengers Per Vehicle Service Hour 3.5 3.6 3.1 2.8 -20.6%Passengers Per Vehicle Service Mile 0.28 0.29 0.21 0.20 -28.7%Vehicle Service Hours Per Employee FTE 696 705 1,010 1,729 148.6%Farebox Recovery Ratio 3.1% 2.5% 2.1% 1.6% -49.4%Farebox Recovery Ratio with Local Subsidies 17.6% 12.1% 15.0% 13.8% -21.9%Percent Change in the CPI - 2.5% 4.2% 4.8% 11.9%
Base Year FY 2003
Audit Review Period Percent Change FY 2003 to FY 2006
Note: All data from National Transit Database, except Employee FTEs which is from State Controller's Reports.
Verified TDA Statistics & Performance Indicators
• Operating Cost Per Vehicle Service Hour is a measure of cost
efficiency. From FY04 to FY06, cost per hour fell from $70.05 to $59.94, just 55¢ over the FY03 level. The spike in FY04 appears to
O’Melia Consulting in association with Kelly Hines Consulting
Santa Maria Area Transit TDA Triennial Performance Audit Page 28
be due to the expensive Health Service, which was approximately $98 per hour.
• Operating Cost Per Passenger is a measure of cost effectiveness. During the audit period, cost per passenger grew by 27%, more than double the growth in CPI. However, a significant shift in the nature of the demand response service occurred between FY04 and FY05 when the Health Service component was significantly down-sized and transferred out of the SMAT operation to SMOOTH as the CTSA and COLT for Northern Santa Barbara County. While costs increased only 4.5% over the audit period, growing half as much as inflation, passengers fell by nearly 18% with most of the decline coming between FY04 and FY05 with the change in the Health Service component.
• Passengers Per Vehicle Service Hour is a measure of service productivity. During the audit review period, passengers per hour fell by more than 20%, again reflecting a decline in Health Service provided during the last two years of the audit period. In FY06, passengers per hour were at 2.8, down from 3.5 in FY03 when group trips for Health Services were provided.
• Passengers Per Vehicle Service Mile also measures service productivity. During the audit review period, like passengers per hour, passengers per mile fell (by 28.7%) due to the reduction in Health Service group trips, which tend to have a higher productivity.
• Vehicle Service Hours Per Employee measures labor productivity. During the audit review period, labor productivity (based on reported data) nearly tripled but, like fixed route, this reflects an improvement in the reporting of FTEs rather than an improvement in labor productivity.
Unlike fixed route, demand response farebox recovery fell over the period, down to just 1.6% (13.8% with local subsidies and auxiliary revenues) in FY06 from a high of 3.1% (17.6% with local subsidies and auxiliary revenues) in FY03. SMAT’s demand response fares were also increased in September 2004, but did not result in increased farebox revenues.
O’Melia Consulting in association with Kelly Hines Consulting

Santa Maria Area Transit TDA Triennial Performance Audit Page 29
TDA Performance Indicator Trends – Breeze
Exhibit 15 presents TDA performance indicators for the first full year of Breeze service.
Exhibit 15 – TDA Performance Indicators – Breeze
Operating Costs $ 454,729 Passengers 35,687 Vehicle Service Hours 4,076 Vehicle Service Miles 109,784 Farebox Revenues $ 66,745 Local Subsidies & Auxiliary Revenues $ 6,375 Operating Cost Per Vehicle Service Hour $ 111.56 Operating Cost Per Passenger $ 12.74 Passengers Per Vehicle Service Hour 8.8 Passengers Per Vehicle Service Mile 0.33 Farebox Recovery Ratio 14.7%Farebox Recovery Ratio with Local Subsidies 16.1%Percent Change in the CPI 4.8%
FY 2006
Financial data from Financial Audit; Operating data from Contractor service summary.
Verified TDA Statistics & Performance Indicators
• Operating Cost Per Vehicle Service Hour was $111.56 in FY06,
exceeding the regional standard of $80 identified in the North County Santa Barbara Transit Plan. This higher cost most likely reflects the higher cost of providing peak-period service only.
• Operating Cost Per Passenger is $12.74 – five to six times greater than that for fixed route reflecting the long distance nature of passenger trips made on the Breeze. Cost per passenger mile is a more appropriate measure of cost effectiveness for commuter express services. However, passenger mile data was not collected for the Breeze service during the audit period. This data will be available during the next audit period as the Breeze is incorporated into the passenger mile sampling methodology for NTD reporting.
• Passengers Per Vehicle Service Hour was 8.8 in FY06, again reflecting the long trip distance of Breeze service. Assuming a two-hour average one-way travel time, passenger loads on the Breeze service would be in the 17 to 18 range.
• Passengers Per Vehicle Service Mile was 0.33 in FY06, up slightly from the 0.27 reported for the single month of service in June, 2005 in the City’s Annual Report to City Council.
• Farebox Recovery Ratio (with Local Subsidies & Auxiliary Revenues) reached 16.1% in FY06.
O’Melia Consulting in association with Kelly Hines Consulting

Santa Maria Area Transit TDA Triennial Performance Audit Page 30
III. FUNCTIONAL AREA PERFORMANCE RESULTS
A high level review of functional area performance was conducted for select functions including:
• Transportation Operations • Vehicle Maintenance • Administration & Planning
Information used in this section was obtained through document reviews, management interviews, and reports such as the State Controller Report and Financial Audits. Functional area performance indicators are presented, as appropriate, for Fiscal Years 2004, 2005 and 2006. Performance indicators include the last year of the prior performance audit (i.e., FY 2003) as a baseline for comparison.
Transportation Operations
As contractor operation of SMAT transit, MV transportation is responsible for run-cutting (based on City-provided schedules), driver training and re-training, vehicle fueling, vehicle washing and detailing, demand response reservation taking and scheduling, fare revenue collection and counting, and complaint tracking and response. MV Transportation is not responsible for vehicle maintenance, which represents a significant change in procurement practices for the City of Santa Maria. In FY03 the decision was made to issue separate operations and maintenance Request For Proposals (RFP). City staff report that the separate maintenance contract has resulted in a $10 per hour savings in maintenance labor costs.
MV Transportation utilizes a staff of 42 drivers, seven of whom are part-time, and four dispatchers to provide SMAT fixed route and demand response services. Additional MV personnel include a Project Manager, Training and Safety Manager, field supervisors, data clerk, and bus washers. MV’s drivers are not currently unionized but efforts are underway to organize as part of the Teamsters Union.
O’Melia Consulting in association with Kelly Hines Consulting

Santa Maria Area Transit TDA Triennial Performance Audit Page 31
Regular operator shake-ups are not done, with staffing changes made only when an assignment becomes available (i.e., through driver resignation or implementation of new service). Seniority and qualifications are the criteria for transferring a driver to a new assignment. MV reports that they are chronically one or two drivers below their ideal staffing level but the shortage has not adversely impacted operations. Additionally, MV reports that they do not have a problem with absenteeism. Workers’ Compensation rates for MV Transportation were recently lowered to recognize MV’s good performance, and there is no abuse of FMLA (Family and Medical Leave Act). MV rewards good attendance with certificates and pins. MV also recognizes employees of the month and quarter and selects an Operator of the Year who receives a gold watch as part of a regional and national contest within MV Transportation. SMAT reported 12 accidents in FY05. Based on descriptions provided of these accidents, seven of these accidents were classified as preventable which results in one accident per every 87,286 revenue miles. This is just short of the performance standard provided in the North County Santa Barbara Transit Plan of one preventable accident per every 100,000 revenue miles. FY05 performance was down slightly from that in FY04 when one preventable accident occurred every 92,300 miles.
Driver Training
New drivers are required to undergo 120 hours of training, which includes classroom and behind-the-wheel training. Topics include customer service, disability awareness sensitivity, wheelchair lift operation, map reading, and sexual harassment training. Each new driver, upon receiving their license, is required to drive all SMAT routes. Drivers receive minimum wage while undergoing training. Upon completion of the training period, the current starting wage is $10.06 per hour.
Re-training is triggered by any accident as well as on-going training to meet the DMV-required 16 hours of special training and eight hours or recurrent “transit certificate” training. Each driver receives a quarterly ride-along with field supervision staff, undergoes a monthly road observation, and can be monitored through DriveCam.
O’Melia Consulting in association with Kelly Hines Consulting

Santa Maria Area Transit TDA Triennial Performance Audit Page 32
ADA Eligibility & Rules for Use
All users of the demand response service must be registered with SMAT, or can present an ADA eligibility card from another public transit operator. Riders using non-SMAT cards are required to indicate as such when requesting a ride so that MV can monitor use and ensure that such use is temporary. Applicants who are under review (i.e., have submitted an application for use of the ADA service) may use the service on a temporary basis until their application is approved or denied. City staff are responsible for application review and send out denial letters which include the process for requesting a hearing if the applicant feels there was an error made in reaching the decision to deny. MV sends out ADA cards to approved applicants.
Appointments are taken from 9 am to 4 pm and may be made up to one week in advance. However, only one trip may be scheduled per call. Same day requests will only be accommodated if there is a cancellation. SMAT is currently in the process of updating its ADA guidelines, changing both its ADA brochure and website information to reflect revised service hours based on recent changes to fixed route service hours and changing its trip request policy to allow for next day rather than 24 hour reservations.
SMAT does have a no-show policy. A no-show is defined as failure to cancel a trip within 24 hours. Three no-shows in a month may result in a 30-day suspension from the service. Two instances of turning down a ride or failing to appear for a scheduled ride may also result in a 30-day suspension. MV reports that no-shows are a problem, perhaps reflecting that the suspension rules have not been stringently applied. Given the declining performance of the demand response service over the audit period, enforcing the no show policy is of particular concern as it can directly impact service productivity and thus farebox recovery. Enforcing the no-show policy was identified in the 2004/2005 SRTP as a possible strategy for improving system performance but has not been pursued.
Service Quality/Customer Satisfaction
Service quality and customer satisfaction is a priority for the new Transit Manager. Current mechanisms for proactively soliciting customer input include making comment cards available on all vehicles
O’Melia Consulting in association with Kelly Hines Consulting

Santa Maria Area Transit TDA Triennial Performance Audit Page 33
and regularly scheduled meetings of a citizens advisory group, Santa Maria Area Transit Riders Advisory Council (SMATRAC). SMATRAC, meets every other month to discuss system service quality and customer satisfaction issues. The group is not a standing committee as it does not have a formal charter. Anyone is free to sit on the committee with those who have expressed an interest in the SMAT service invited to attend through letter or e-mail notification. City staff indicates that there are about six individuals who regularly attend.
City staff indicate that they would like to implement a formal process of evaluating customer satisfaction, perhaps through a web-based customer satisfaction survey conducted on a routine (e.g., yearly) basis. The intent would be to develop a Customer Satisfaction Index against which customer satisfaction performance could be evaluated. Staff indicated that an incentive or prize may be offered to encourage rider participation. Another option is to have a self-administered survey on-board the vehicle. Just as SMAT’s systems brochures are now available in both English and Spanish, customer survey tools should also be made available in both English and Spanish versions. Surveys conducted for the 2005 SRTP were conducted in both English and Spanish.
MV is responsible for taking and responding to customer complaints within three days. Each complaint is written up on a complaint form, which are compiled and provided to the City as part of the monthly invoice. During FY05, SMAT received a total of 30 complaints, or one complaint for every 26,000+ passenger trips – far better performance than recommended by the standard identified in the North County Santa Barbara Transit Plan of one complaint per 1,000 boardings.
Vehicle Maintenance
Vehicle maintenance is provided by Santa Maria Diesel, Inc. out of the SMAT operations and maintenance facility, shared with MV Transportation. MV maintains custody of the vehicles and all vehicles are tracked on a white-board with date and mileage of last preventative maintenance. A separate board tracks out of service vehicles undergoing maintenance activity. It is Santa Maria Diesel’s responsibility to track mileage and perform scheduled maintenance on time. City staff reports that co-location of operations and maintenance
O’Melia Consulting in association with Kelly Hines Consulting

Santa Maria Area Transit TDA Triennial Performance Audit Page 34
activities has improved coordination between the two contractors and activities. Prior to the opening of the new facility, operations and maintenance activities were performed at two different locations. Both contractors – MV and Santa Maria Diesel – report no problems with vehicle availability.
Fleet Characteristics
SMAT’s fleet composition is shown in Exhibit 16. The average age of the fixed route fleet is 6.8 years, and the average age of the demand response fleet is six years compared to an expected useful life of seven years.
Exhibit 16 – Fleet Composition
Model Year Make Number Replacement YearFixed Route
2004 Gillig 3 2016 2001 Gillig 6 2012 2001 Bluebird 1 2012 1999 Bluebird 1 2008 1998 Goshen 1 2003 1997 Transmark 1 2006 1995 CityLiner 2 2005
Average Vehicle Age: 6.8 years Demand Response
2003 Aerotech 2 2008 2001 Aerotech 4 2006 1999 Aerotech 2 2004
Average Vehicle Age: 6 years
The useful life of four of SMAT’s 15 fixed route vehicles and six of eight demand response vehicles have expired. SMAT has continued to use older vehicles in order to provide the expanded service implemented in January and July 2006. The 2004/2005 to 2008/2009 SRTP called for vehicle replacement beginning in FY05 but this has been deferred to the FY2007/FY2008 budget as part of the capital program including the new transfer center. The FY2007/FY2008 budget includes funding for six new fixed route and two new ADA buses, which will run on clean-diesel in order to bring SMAT in compliance with CARB regulations. Two of SMAT’s fixed route vehicles are fueled with CNG (compressed natural gas). However, the
O’Melia Consulting in association with Kelly Hines Consulting

Santa Maria Area Transit TDA Triennial Performance Audit Page 35
poor quality of locally available CNG has deterred SMAT from further procurement of CNG buses.
Fleet Maintenance Plan
The Fleet Maintenance Plan calls for preventative maintenance on fixed route vehicles at least every 45 days per CHP requirement. Santa Maria Diesel confirm that this is the schedule that is followed. Demand response vehicles are serviced every 5,000 miles. Both schedules are consistent with or exceed manufacturer’s specifications. The new operations and maintenance facility is equipped with two bus bays for routine maintenance work.
Santa Maria Diesel utilizes a crew of four employees – three mechanics and one foreman – to service SMAT vehicles. Santa Maria Diesel may perform major repairs directly at their primary shop, less than two miles from the SMAT operations facility or can take the work to outside repair shops. All major maintenance costs are billed directly to the City. Prior to May 2007 when the last of SMAT’s vehicles went out of warranty, all warrantable work was sent to the dealership or an authorized repair shop.
All parts are secured in a locked room, only accessible to the foreman or lead mechanic on duty. Tires (provided through a separate contract with Santa Maria Tire) are held in a separate locked room.
Administration & Planning Contract Administration
City Transit staff closely monitor contractor performance under the operations and maintenance contracts. Weekly meetings are held between City Transit staff and MV Transportation. Meetings are also held monthly and include additional City staff, Santa Maria Diesel, and the marketing contractor.
Monthly reports from both the operations and maintenance contractors include detailed statistics and performance indicators. MV Transportation is required to report the following performance indicators on a monthly basis:
• Miles between roadcalls
O’Melia Consulting in association with Kelly Hines Consulting

Santa Maria Area Transit TDA Triennial Performance Audit Page 36
• Miles between maintenance roadcalls • Number and percentage of missed/late pull-outs • Number and percentage of missed/late trips • Number and percentage of on-time performance • Number of complaints/1,000 passengers • Total accidents/100,000 miles • Collision accidents/100,000 miles • Total preventable accidents/100,000 miles • Passenger accidents/100,000 miles
Additional items that must be reported monthly include pass sales activity, wheelchair boardings, drug and alcohol tests, tandem bus revenue hours and miles by route, driver/dispatcher training activities, driver evaluations, requests for service not currently being provided, vehicle maintenance hours, and vehicle maintenance reports. Certain data such as accidents, wheelchair boardings, and late/missed trips must be reported on a daily basis. City Transit staff have the part-time assistance of a Public Works aide who performs field checks of on-street service.
Transit staff also monitor maintenance performance through the maintenance contract requiring that no routine inspections occur after the service interval. Additionally, City staff has access to the contractor’s computerized reporting system.
The City of Santa Maria has also included performance incentives and penalties in its operations contract. Incentives in the amount of $1,000 per month are available for meeting 95% on-time performance, keeping complaints at no more than seven per 100,000 boardings, and less than 2.5 accidents (1.5 preventable) per 100,000 revenue miles. Conversely, the City may assess liquidated damages for the following:
• $500 per day for each vehicle not meeting vehicle condition standards
• $500 for each missed trip • $100 for failure to train each driver assigned to the contract in
accordance with City requirements and City approved training program
• $100 for failure of a non-trainee driver to wear approved uniform
O’Melia Consulting in association with Kelly Hines Consulting

Santa Maria Area Transit TDA Triennial Performance Audit Page 37
• $100 for each late trip, route deviation without prior notification, early departure, or failure to display correct and legible destination message
• $100 for failure to adhere to complaint processing procedure • $100 for failure to conduct an on-board random trip for NTD
reporting • $50 per trip for each failure to announce major intersections,
transfer points, and major activities as required by ADA The City of Santa Maria is the only jurisdiction that has incorporated incentives and penalties in its operations contract. The City may wish to consider incorporating additional incentives particularly those that could lead to improved demand response farebox recovery such as increased passengers per revenue hour.
Planning
The audit period, particularly the last two years, was marked by significant expansion of the SMAT system including evening service, new Sunday service, increased geographic coverage, and implementation of the Breeze. Most of these improvements were included as recommendations in the 2004/2005 SRTP with the Breeze service implemented as the result of SBCAG’s Unmet Needs process.
As a funding partner of SMAT, the County plays an active role in the City’s planning processes including SRTP development, community Unmet Needs meetings, and other public forums. With the high level of public support of SMAT, the County offered a recommendation that service quality be a focus of the SMAT system, perhaps adding more amenities at bus stops. Additionally, improved service coordination with the Breeze was suggested. Currently, the SMAT system does not provide service early enough to meet the first Breeze departure from Santa Maria. SMAT, however, does offer free transfers to the SMAT system for Breeze riders.
SMAT has been responsive to the transit needs of County residents. In FY04, the City hired a consultant to examine service options for the Orcutt community. In January 2006, SMAT introduced a new Route 40 serving the Tanglewood community. Route 62 night owl service was introduced in February 2007, serving the communities of Orcutt and Tanglewood.
O’Melia Consulting in association with Kelly Hines Consulting

Santa Maria Area Transit TDA Triennial Performance Audit Page 38
Inter-regional coordination was identified as a primary objective in SMAT’s SRTP, specifically maintaining good connections with the Guadalupe Flyer and San Luis Obispo County Regional Transit Authority’s Route 10; accommodating regional services in the new transit center development; and, incorporating other regional service information in the SMAT rider’s guide. SMAT services connect with RTA Route 10 and Guadalupe Flyer at the Town Center Mall. In February of 2007, new service was added to SMAT’s Route 20 providing a connection to the RTA Route 10 express leaving Town Center Mall at 6:21 and the earliest Guadalupe Flyer departure at 6:15 am. SMAT’s rider’s guide includes system information for the Flyer, RTA Route 10, as well as The Breeze. The SMAT system does not connect to Clean Air Express, which has three morning departures from Santa Maria at 5:15, 6:00, and 6:30 am. Breeze and Los Alamos Shuttle riders may transfer for free to SMAT fixed route service.
In the 2004/2005 SRTP, SMAT identified performance standards for both its fixed route and ADA services. Standards include the financial standards of cost per passenger and farebox recovery ratio; service quality/reliability standards including on-time performance, passenger complaints per passenger boardings, trips cancelled, and preventable accidents per miles operated; and service design standards including productivity requirements for new service, bus stop spacing, passenger loads, and service headways.
The prior auditor found that City staff had been lax during the prior audit period in monitoring and enforcing service standards. With the completion of the 2004/2005 SRTP, performance standards are clearly defined and improvements to service have been made with these standards in mind.
The City could further reinforce these standards by including an assessment of each as part of the Annual Report to City Council. The last report completed for FY05 failed to include assessment of many of the service quality/reliability standards including on time performance, trip cancellations, and ADA trip denials – all indicators monitored monthly by City Transit staff. Additionally, these performance indicators should be carried forward as part of the next SRTP process to begin in FY08. The City may also wish to consider including in its next SRTP, SMAT performance against regional performance standards such as those identified in Exhibit 17, assessing SMAT
O’Melia Consulting in association with Kelly Hines Consulting

Santa Maria Area Transit TDA Triennial Performance Audit Page 39
performance against regional standards identified in the North County Santa Barbara Transit Plan.
Exhibit 17 – SMAT 2006 Performance & Regional Standards Operating Cost per Passenger
Operating Cost per Service Hour
Passengers per Hour
Farebox Recovery Ratio
Standard <$5.00 $50 15 20%SMAT Fixed Route $2.56 $60.98 23.9 25.8%*Standard <$14.00 $50 3 10%SMAT DAR $21.48 $59.94 2.8 13.8%*
* Includes local revenues and auxiliary revenues.
Standard as indicated in the North Santa Barbara County Transit Plan (10/19/2006), except Farebox Recovery which is TDA requirement.
As the new Transit staff become accustomed to their roles and achieve a more thorough understanding of the SMAT system and the impacts on effectiveness and efficiency of recent service changes, staff may wish to expand the service performance monitoring program to include route-by-route performance standards and evaluation. Such standards may be particularly valuable leading up to and following completion of the new transfer center when route schedules will need to be modified to incorporate the new transfer center location and increased ability for timed transfers due to the increase in vehicle capacity at the new center.
Budgeting
The City of Santa Maria adopts a budget every two years, with the latest adopted in May 2006 for fiscal years 2007 and 2008. Budget modifications can be made at mid-year and year-end. Through FY08, Transit staff reports that TDA funds continued to be allocated to Streets and Roads on the order of $1.3 to $1.6 million per year. With the new transfer center under development, however, the Transit Manager expects that this will be discontinued in the near future.
O’Melia Consulting in association with Kelly Hines Consulting
As the City provides transit service to unincorporated areas of Santa Barbara County adjacent to the City of Santa Maria, the County contributes TDA revenues to the City. The County’s share of 22% (for SMAT service only, not Breeze) reflects the historical County share of the urbanized area’s population. However, as the unincorporated portions of the SMAT service area are expected to grow at a faster rate than the City population and, even now, exceed the 22%, the cost-sharing agreement with the County will need to be re-evaluated. The

Santa Maria Area Transit TDA Triennial Performance Audit Page 40
County share was increased temporarily in FY07 to help fund the acquisition of new transit vehicles in the 2007/2008 timeframe.
With the discontinuation of the Special Health Service in FY05, the City no longer receives funding from the City of Lompoc for this service. The City of Lompoc and the County do continue to contribute 1/3 of the TDA matching funds for the operation of Breeze service.
O’Melia Consulting in association with Kelly Hines Consulting

Santa Maria Area Transit TDA Triennial Performance Audit Page 41
IV. RECOMMENDATIONS
Two recommendations are offered for consideration by SMAT. Both recommendations relate to compliance, but the second could also contribute to overall SMAT efficiency and effectiveness of operations over the next audit period.
1. The City of Santa Maria should examine its data reporting processes and establish new procedures for reporting system financial and operational data to external agencies.
• Findings. Discrepancies were found in reported operational data elements including passengers, vehicle service miles, and vehicle service hours over all three years of the audit period. While the start-up of the Breeze service at the end of FY05 accounts for some of the noted discrepancies, most discrepancies appear to be the result of multiple individuals receiving and adjusting data before inclusion in published reports. The accuracy of system data and consistent inclusion in external reports is being lost as the data passes from the contractor to City Transit staff to City Finance staff. Not including Breeze data in National Transit Database reports also complicates the data reporting process.
Finally, FTEs as reported in the State Controller report reflect actual employee headcount of both contractor and City staff instead of employee pay hours divided by 2,000 per the definition of a full-time equivalent.
• Suggested Actions. It is recommended that City staff take the following actions to implement this recommendation:
a) Include Breeze data in the NTD report.
b) Include Health Service in the Demand Response mode for NTD reporting. Continue to report Health Service separately as “Other” in the State Controller’s Report.
O’Melia Consulting in association with Kelly Hines Consulting

Santa Maria Area Transit TDA Triennial Performance Audit Page 42
c) Request MV Transportation to report employee pay hours as part of its monthly invoice to the City and include these hours as part of the FTE calculation.
d) Identify pay hours of City staff that charge directly to the Transit Fund (i.e., Transit staff) and include these hours as part of the FTE calculation. Hours associated with general City overhead charged to the Transit Department need not be included in the FTE calculation.
e) Segregate operating costs and service statistics separately by mode each month as reported by the Contractor. The information should be tabulated and recorded monthly and provided at the end of the year to the individual responsible for the preparation of external reports to oversight agencies (see item f below).
f) Responsibility for the preparation of external reports to oversight agencies including the State Controller, NTD, and SBCAG (TDA claims and annual financial statements) should be assigned to appropriate City staff. This responsibility could be split between two individuals, if necessary, to address the financial versus operational data elements of each report. It is recommended, however, that a single person be responsible for the final review of each report before submittal to ensure completeness, accuracy, and consistency with other reports.
• Expected Results. Implementation of this recommendation will bring the City of Santa Maria into compliance with TDA data definition (PUC 99247) and fiscal (PUC 99268) requirements.
2. The City of Santa Maria should take measures to improve the farebox recovery ratio of its demand response service.
• Findings. Over the audit period, SMAT saw a decline in the farebox recovery of its demand response service from just 2.5% in FY04 to 1.6% in FY06. SMAT met its required ratio by supplementing farebox revenues with $44,000 in Measure D revenues and $19,000 in interest and advertising revenue. Absent Measure D revenues, which may not be available after FY10, SMAT’s demand response farebox recovery would have been just 5.5% - half of that required by TDA. The impact that a potential
O’Melia Consulting in association with Kelly Hines Consulting

Santa Maria Area Transit TDA Triennial Performance Audit Page 43
O’Melia Consulting in association with Kelly Hines Consulting
loss of Measure D will have on transit in the County, specifically ADA paratransit, is not unique to Santa Maria. However, SMAT is in a unique position in that there are two other paratransit operations within the City of Santa Maria.
• Suggested Actions. It is recommended that City staff consider the following opportunities for improving the demand response farebox recovery ratio as it embarks on its next SRTP process in FY08. This includes two new suggestions as well as three suggestions identified in the 2004/2005 SRTP:
1. Including raising the ADA fare (from SRTP) 2. Incorporating incentives for productivity improvements in the
transit operations contract (from SRTP)
3. Supplementing ADA paratransit service with taxi vouchers (from SRTP)
4. Investigate opportunities to coordinate paratransit service
provision in Santa Maria with the senior service provided by SMOOTH and Guadalupe Transit’s paratransit service (new)
5. Consider implementing a Mobility Training Program that would
train current and future paratransit users on how to use the fixed-route system. An enticement such as a free fare could be offered to encourage fixed route use by paratransit users (new).
• Expected Results. Implementation of this recommendation would
assist SMAT in achieving continued compliance with fiscal (PUC 99268) farebox recovery requirements and could result in improved fixed route and demand response productivity.

SANTA MARIA ORGANIZATION OF TRANSIT HELPERS (SMOOTH)
TDA TRIENNIAL PERFORMANCE AUDIT FOR FY 2004-2006
Fiscal Years Ending June 30th
Prepared by
In Association With
OCTOBER 20, 2007

SMOOTH TDA Triennial Performance Audit Page i
TABLE OF CONTENTS
EXECUTIVE SUMMARY.................................................................... 1
Purpose of Audit.........................................................................................1
Findings......................................................................................................1
Recommendations .....................................................................................3
I. INTRODUCTION....................................................................... 5
Performance Audit Objectives and Approach.............................................5
System Overview .......................................................................................6
II. COMPLIANCE REVIEW......................................................... 12
Regulatory Requirements.........................................................................12
Progress To Implement Prior Audit Recommendations ...........................15
Data Verification.......................................................................................17
TDA Performance Indicator Trends..........................................................21
III. FUNCTIONAL AREA PERFORMANCE RESULTS............... 26
Transportation Operations........................................................................26
Vehicle Maintenance................................................................................30
Budget and Planning................................................................................31
IV. RECOMMENDATIONS........................................................... 33
O’Melia Consulting in association with Kelly Hines Consulting

SMOOTH TDA Triennial Performance Audit Page ii
LIST OF EXHIBITS
Exhibit 1 – Performance Audit Sources ................................................................6
Exhibit 2 – Organization Chart ..............................................................................8
Exhibit 3 – Regulatory Compliance Matrix ..........................................................12
Exhibit 4 – Cost per Hour Calculations ...............................................................15
Exhibit 5 – Progress To Implement Prior Audit Recommendations.....................16
Exhibit 6 – Verified Data Elements for TDA Performance Indicators ..................18
Exhibit 7 – Financial Data Consistency Review ..................................................20
Exhibit 8 – TDA Performance Indicators – CTSA................................................22
Exhibit 9 – TDA Performance Indicators – CTSA less Los Alamos Shuttle ........24
Exhibit 10 -- CTSA Revenue Hours by Service..................................................26
Exhibit 11 -- CTSA Operating Cost Elements ....................................................27
Exhibit 12 -- CTSA Costs As A % Of Total SMOOTH Costs..............................28
Exhibit 13 -- Transportation Operations Performance Indicators .......................29
Exhibit 14 -- SMOOTH 2006 Performance & Regional Standards.....................31
O’Melia Consulting in association with Kelly Hines Consulting

SMOOTH TDA Triennial Performance Audit Page 1
EXECUTIVE SUMMARY
Purpose of Audit
As the Regional Transportation Planning Authority (RTPA) for Santa Barbara County, the Santa Barbara County Association of Governments (SBCAG) is required by the Public Utilities Code (PUC) Sections 99246 and 99248 to contract for a third party performance audit of itself and each of the transit operators to which Transportation Development Act (TDA) funds are allocated. These audits are to be conducted in accordance with the California Department of Transportation, Performance Audit Guidebook for Transit Operators and Regional Transportation Entities. Performance audits are required to:
• Determine compliance with regulatory requirements
• Assess progress to implement prior performance audit recommendations
• Verify performance indicators and validate basic data used to calculate indicators
• Evaluate the effectiveness and efficiency of agency functions.
This performance audit is for the Santa Maria Organization of Transit Helpers (SMOOTH) for Fiscal Years 2004, 2005 and 2006 -- the period of time beginning July 1, 2003 and ending June 30, 2006.
Findings
• SMOOTH is composed of two operating divisions – the Consolidated Transportation Service Agency (CTSA) for the North County Santa Barbara region, and a contract operator providing transit services on behalf of two other jurisdictions in northern Santa Barbara County. This performance audit covers SMOOTH’s CTSA activities.
• Perhaps SMOOTH’s biggest accomplishment arose out of its biggest challenge of the audit period – the loss of the Santa Maria
O’Melia Consulting in association with Kelly Hines Consulting

SMOOTH TDA Triennial Performance Audit Page 2
Area Transit (SMAT) operations contract. Following the loss of the contract at the end of FY04, SMOOTH was forced to reorganize and embarked on a more than two-year effort to bring the agency’s cost efficiency and effectiveness (e.g. cost per hour and cost per passenger) performance back under control and in line with historical performance and regional standards. This effort has extended beyond the audit review period (i.e., July 1, 2003 through June 30, 2006).
• Additional challenges experienced by SMOOTH during the audit period include bringing its vehicle fleet into compliance with California Air Resources Board (CARB) emissions requirements, and recruiting and hiring drivers during the period of significant expansion of non-CTSA service in FY06.
• Additional accomplishments of SMOOTH include the implementation of the new Los Alamos Shuttle in coordination with the County of Santa Barbara in late FY04, and positioning itself to successfully re-procure the City of Guadalupe Transit operations contract in FY07.
• SMOOTH is in compliance with most PUC requirements as a recipient of Transportation Development Act (TDA) and State Transit Assistance (STA) revenues. Areas of compliance needing improvement over the next audit period include annual submission of a State Controller’s Report, and containment of annual increases in the cost per hour within CPI (Consumer Price Index) growth. Timely submittal of the annual State Controller Report is particularly important given that SBCAG cannot approve TDA claims from agencies that are delinquent in submitting this report (CAC 6733). Additionally, as a result of SMOOTH not meeting cost per hour growth requirements per PUC Section 99314.6, SMOOTH may not use STA funds for operations in FY08.
• SMOOTH addressed two of three prior audit recommendations. The final recommendation, to report accidents and roadcalls, was not implemented due, in part, to turnover in the Executive Director position. Much of the progress that has been made in addressing prior audit recommendations has occurred since the new Executive Director was appointed in December 2006.
O’Melia Consulting in association with Kelly Hines Consulting
SMOOTH TDA Triennial Performance Audit Page 3
• SMOOTH improved its data collection and reporting activities during the audit period, which addressed one of the three prior audit recommendations. Additional improvement, however, is warranted as SMOOTH could more carefully track service hours and miles for all services provided.
• TDA performance indicators for the audit review period show mixed results as cost efficiency and effectiveness declined while service productivity improved. Cost per hour and cost per passenger both grew well in excess of inflation during the period as SMOOTH worked to re-organize and balance staff resources with operating levels. SMOOTH reports a 19% decline in cost per hour from FY06 to FY07, following a 76% increase between FY03 and FY06. Service productivity, on the other hand, improved with a 42% improvement in passengers per hour and a 50% improvement in passengers per mile.
• SMOOTH emphasizes cross-training of drivers on all SMOOTH-provided services, not just those provided through the CTSA division. As such, training requirements in the City of Guadalupe Transit contract were adopted as standard for all SMOOTH drivers.
• SMOOTH performs all preventative maintenance on its 16 vehicles in-house, contracting out for heavy repair work. SMOOTH’s new operations and maintenance facility is designed to accommodate 25 vehicles, though the current fleet of 16 is sufficient to meet peak service levels (i.e., 11 peak and five spares for maintenance). Since the end of the audit period, the peak vehicle requirement has increased to 13 vehicles with the recent expansion of the Tri-Counties Regional Center service.
• SMOOTH has not undertaken a comprehensive service planning process since its designation as the North County CTSA in 1999. Given the significant changes during this audit period and those likely to impact performance during the next audit period, a CTSA Operations Plan is warranted.
Recommendations
Four recommendations are offered for consideration by SMOOTH.
O’Melia Consulting in association with Kelly Hines Consulting

SMOOTH TDA Triennial Performance Audit Page 4
1. SMOOTH should revise its data collection process to correctly calculate required TDA data elements, and include such information in an annual State Controller’s Report. This includes submission of the missing FY06 State Controller Report.
2. SMOOTH should conduct a customer satisfaction survey and
incorporate findings into a CTSA Operations Plan (see Recommendation three).
3. SMOOTH should develop a CTSA Operations Plan for the FY08
through FY11 period.
4. SMOOTH should include findings of compliance as required by CAC 6667 as part of annual financial and compliance audit required by PUC Section 99245.
O’Melia Consulting in association with Kelly Hines Consulting

SMOOTH TDA Triennial Performance Audit Page 5
I. INTRODUCTION
Performance Audit Objectives and Approach
As the Regional Transportation Planning Agency (RTPA) for Santa Barbara County, the Santa Barbara County Association of Governments (SBCAG) is required by the Public Utilities Code (PUC) Sections 99246 and 99248 to contract for a third party performance audit of itself and each of the transit operators to which Transportation Development Act (TDA) funds are allocated. These audits are to be conducted in accordance with the California Department of Transportation, Performance Audit Guidebook for Transit Operators and Regional Transportation Entities. Performance audits are required to:
• Determine compliance with regulatory requirements
• Assess progress to implement prior performance audit recommendations
• Verify performance indicators and validate basic data used to calculate indicators
• Evaluate the effectiveness and efficiency of agency functions.
This performance audit is for the Santa Maria Organization of Transit Helpers (SMOOTH) for Fiscal Years 2004, 2005 and 2006 -- the period of time beginning July 1, 2003 and ending June 30, 2006.
While the performance audit is being conducted in response to State requirements, such audits can and should be constructive and useful to governing boards, SBCAG and transit operator management.
It is the Auditor’s responsibility to provide objective and balanced reporting of results. This is important because very few agencies are all good or all bad. It is the auditor's responsibility to conduct thorough and accurate analyses and objectively report performance findings. Significant accomplishments and positive performance trends are discussed as well as opportunities for improvement.
O’Melia Consulting in association with Kelly Hines Consulting

SMOOTH TDA Triennial Performance Audit Page 6
The methodology for this audit include interviews with key staff and management involved in the provision of transit services, a site visit for review of operations and data collection practices, review of operational and financial data, and review of relevant documents. Highlights of this review are presented below in Exhibit 1.
Exhibit 1 – Performance Audit Sources
Interviews – Name, Title and Agency
Jim Talbott, Executive Director Matt Dobberteen, Alternative Transportation Manager, County of Santa Barbara
Carolyn Galloway-Cooper, City Manager, City of Guadalupe
Site Visit(s)
SMOOTH Administrative Offices, Wednesday, May 16, 2007
Background Materials Reviewed
Comprehensive Annual Financial Reports, Fiscal Years 2004-2006 TDA Triennial Performance Audit Report For Fiscal Years Ending June 30, 2003
California Highway Patrol Pull-Notice and Terminal Inspection Certifications Profit & Loss Statements, Fiscal Years 2004-2006
Organizational Chart and Annual Budgets, Fiscal Years 2004-2006 Public Information – Website, Timetables & Schedules, Brochures
System Overview Organization & Policy Decisions
The Santa Maria Organization of Transit Helpers (SMOOTH) is made up of two divisions:
• The Consolidated Transportation Services Agency (CTSA) – As the CTSA, SMOOTH is responsible for coordination of social service transportation (e.g., services for seniors, the disabled, the young, and low-income individuals) in the North County region of Santa Barbara County. During the audit period, SMOOTH had service agreements in place with eight social service, non-profit organizations or government agencies and received TDA funding through SBCAG for specialized transportation services for seniors.
O’Melia Consulting in association with Kelly Hines Consulting

SMOOTH TDA Triennial Performance Audit Page 7
• Transit – As a contract service provider, SMOOTH provided service to the City of Santa Maria, the County of Santa Barbara Public Health Department, and the City of Guadalupe. SMOOTH’s final year of service to the City of Santa Maria was FY04 when the contract for operation of Santa Maria Area Transit (SMAT) was re-procured. As the contract operator for SMAT, SMOOTH provided Special Health Service for the City of Santa Maria, the City of Lompoc, and the County of Santa Barbara. Effective July 1, 2004, the City of Lompoc began operation of its own Health Service and SMOOTH began to take over the Santa Maria portion of the service as SMOOTH instead of the SMAT contract operator. Today, SMOOTH is the primary provider of the County’s Special Health Service with occasional service provided by SMAT to meet occurrences of excess demand. SMOOTH was the contract operator for the City of Guadalupe transit system throughout the audit period, and just successfully re-procured the contract for FY08 through FY10.
This performance audit covers the activities of SMOOTH as the North County CTSA. Services provided by SMOOTH as contract operator are covered in separate performance audits for SMAT and City of Guadalupe Transit. The County Health Service is not part of this TDA performance audit program, as it is not funded with TDA revenues.
A Board of Directors provides policy direction for SMOOTH. At the time of the site visit for this audit, the Board consisted of nine members as one had recently resigned. During the audit period, the Board consisted of as many as 13 members. All Board members are volunteers with new Board members recruited and approved by the existing Board. New Board members are recruited, and approved, on the basis of their civic affiliation or professional skills. The current Board consists of two small business owners, two accountants, television marketing professional, an insurance broker, a Supreme Court judge, a retired architect, and a retired vocational training center professional. The Board meets once a month. Fifty percent of the current Board roster constitutes a quorum.
O’Melia Consulting in association with Kelly Hines Consulting
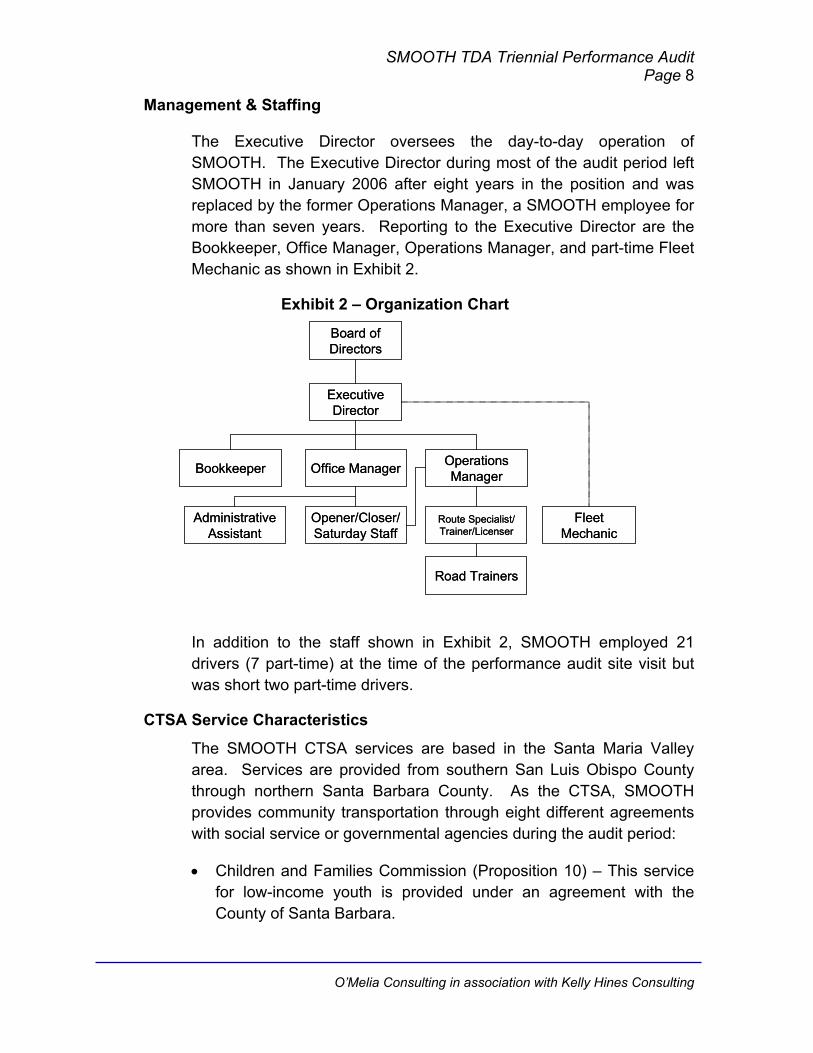
SMOOTH TDA Triennial Performance Audit Page 8
Management & Staffing
The Executive Director oversees the day-to-day operation of SMOOTH. The Executive Director during most of the audit period left SMOOTH in January 2006 after eight years in the position and was replaced by the former Operations Manager, a SMOOTH employee for more than seven years. Reporting to the Executive Director are the Bookkeeper, Office Manager, Operations Manager, and part-time Fleet Mechanic as shown in Exhibit 2.
Exhibit 2 – Organization Chart
Board of Directors
Administrative Assistant
Operations ManagerBookkeeper
Executive Director
Office Manager
Fleet Mechanic
Opener/Closer/Saturday Staff
Route Specialist/Trainer/Licenser
Road Trainers
Board of Directors
Administrative Assistant
Operations ManagerBookkeeper
Executive Director
Office Manager
Fleet Mechanic
Opener/Closer/Saturday Staff
Route Specialist/Trainer/Licenser
Road Trainers
In addition to the staff shown in Exhibit 2, SMOOTH employed 21 drivers (7 part-time) at the time of the performance audit site visit but was short two part-time drivers.
CTSA Service Characteristics
The SMOOTH CTSA services are based in the Santa Maria Valley area. Services are provided from southern San Luis Obispo County through northern Santa Barbara County. As the CTSA, SMOOTH provides community transportation through eight different agreements with social service or governmental agencies during the audit period:
• Children and Families Commission (Proposition 10) – This service for low-income youth is provided under an agreement with the County of Santa Barbara.
O’Melia Consulting in association with Kelly Hines Consulting

SMOOTH TDA Triennial Performance Audit Page 9
• Community Development Block Grant – This service provides transportation to medical facilities for young, pregnant women.
• Life Skills – Also provided under an agreement with the County of Santa Barbara, this service transported youth in foster care to educational institutions to receive instruction in life skills. Due to budgetary cuts, this service was discontinued in FY05.
• Santa Maria Recreation and Parks Department – In partnership with the City of Santa Maria, SMOOTH provides drivers to operate City vehicles to transport residents to City-sponsored recreational activities.
• Senior Dial-a-Ride (SDAR) – This service is funded 100% through TDA funds, and provides transportation services to seniors 60 years of age and over in the Santa Maria area. The SDAR schedule has been enhanced from the original 3 ½ hours per day in the previous audit term to the current six hours per day, Monday through Friday. In addition, SMOOTH has increased the number of drivers assigned on a daily basis from one or two to three to five depending on demand. The fare is $2.00 per trip.
• Tri-Counties Regional Center (R&D Routes) – The R&D service, provided under an agreement with the Tri-Counties Regional Center, provides transportation services to developmentally disabled customers. Just after the audit period, the number of R&D routes was expanded from seven to nine.
• Wisdom Center – This service is also TDA funded and provides transportation services to seniors, many of whom are frail and/or suffer from Alzheimer’s disease.
• Miscellaneous/Charter Services – SMOOTH continues to provide additional as-needed special transportation requests for government, social service and non-profit agencies. Each year, SMOOTH provides up to $5,000 worth of such services on a complimentary basis. Examples of charter services include:
a) Tipsy Taxi service for the annual City of Santa Maria Grapes and Grains Festival
O’Melia Consulting in association with Kelly Hines Consulting

SMOOTH TDA Triennial Performance Audit Page 10
b) Complimentary field trips for the Community Action Commission-Head Start Program.
c) Senior Tour of Lights, which provides complimentary rides for seniors during the Christmas holiday season to see the decorated homes and businesses in the area.
d) The Guadalupe Senior Center is provided two special complimentary trips per year and has included trips to the Tour of Lights, trips to Sea Lion Park north of Cambria, the State Fair in Paso Robles, and an annual trip to the Santa Barbara Zoo on Senior Health Day.
e) SMOOTH assists the Dunes Center during annual fund raising tours and community events.
f) SMOOTH provides field trips for customers of the Guadalupe Beatitude House to Oso Flaco Lake, the YMCA Summer Swim Program, and the Discovery Museum.
g) Several Safe Rides Home were performed for local businesses after these businesses had been unable to find similar services provided by for-profit transportation providers. This service provides employees of local businesses transportation from work-related events that included alcoholic beverages.
In addition, SMOOTH provides Mobility Training to its customers as well as the ADA customers of both SMAT and Guadalupe Transit, educating them on how to use the fixed-route system. SMOOTH also provides transit trip planning services to customers/clients of partner agencies, incorporating all transit options available in the North County region.
Achievements and Challenges During the Audit Review Period
The audit period (i.e., July 1, 2003 and June 30, 2006) was one of significant transition for SMOOTH following the loss of the SMAT operations contract at the end of FY04 when SMOOTH went from 60 employees to just 18, essentially overnight, as most of the operating staff joined MV Transportation following their award of the SMAT contract. While this stands out as the biggest challenge to SMOOTH during the audit period, it is also the agency’s biggest accomplishment as SMOOTH has re-organized and added to its array of services as
O’Melia Consulting in association with Kelly Hines Consulting

SMOOTH TDA Triennial Performance Audit Page 11
the North County CTSA. Additional accomplishments and challenges include:
• Together with the County of Santa Barbara, SMOOTH began operating the Los Alamos Shuttle in April 2004 which now provides two round-trips twice a week between Los Alamos and Santa Maria.
• SMOOTH enhanced its driver training requirements for all SMOOTH drivers to meet Transportation Safety Institute (TSI) training standards as required in the City of Guadalupe Transit contract.
• SMOOTH acquired 12 new vehicles during the audit period (FY04), funded with an $850,000 federal grant. However, as all of these vehicles are diesel-fueled, SMOOTH had to retrofit two of them to meet California Air Resources Board (CARB) emissions requirements.
• SMOOTH continued design of its new operations and maintenance facility, which broke ground in June 2007.
• As one of several transit operators in the Santa Maria area, hiring drivers has been a challenge for SMOOTH. Driver recruitment was particularly difficult in FY06 when SMAT, the higher profile operator in the City of Santa Maria, significantly expanded service and aggressively recruited new drivers.
O’Melia Consulting in association with Kelly Hines Consulting

SMOOTH TDA Triennial Performance Audit Page 12
II. COMPLIANCE REVIEW
Regulatory Requirements
SMOOTH is in compliance with the majority of compliance requirements, as shown below in Exhibit 3. Areas of partial or non-compliance include:
• PUC Section 99243 – SMOOTH has never submitted a State Controller’s Report, unaware that such a report was required. SBCAG has never withheld TDA funding from SMOOTH for failure to submit this report. However, as a recipient of TDA Article 4.5 funding, this report is required. SMOOTH needs to submit the FY06 report to continue to receive funds.
• PUC Section 99314.6 – SMOOTH did not comply with cost per hour growth within CPI limits for FY05 and FY06, a requirement for receipt of STA funds for operations.
Exhibit 3 – Regulatory Compliance Matrix
Regulatory Code
Compliance Requirement
Compliance Finding Verification Information
PUC Section 99243
Submit an annual report to the State Controller based upon the Uniform System of Accounts and Records established by the State Controller
Non-Compliant, SMOOTH was unaware of this
requirement and has never submitted a State Controller’s
Report.
Report Submission Dates: FY 2004: None FY 2005: None FY 2006: None
PUC Section 99245
Submit annual fiscal and compliance audit to State Controller within 180 days of year end, or has received a 90-day extension allowed by law.
Full Compliance Auditor Report Dates: FY 2004: 11/20/04 FY 2005: 10/19/05 FY 2006: 9/22/06
PUC Section 99251
Submit CHP certification of compliance with Pull Notice within 13 months period prior to TDA claim
Full Compliance CHP Certification Dates: FY 2004 Claim: 12/13/02 FY 2005 Claim: 12/12/03 FY 2006 Claim: 12/14/04
O’Melia Consulting in association with Kelly Hines Consulting

SMOOTH TDA Triennial Performance Audit Page 13
Regulatory Code
Compliance Requirement
Compliance Finding Verification Information
PUC Section 99261
Submit TDA Claim in compliance with rules and regulations adopted by RTPE
Full Compliance TDA Claims were submitted to and funds approved by SBCAG in all three years.
PUC Section 99264
The operator does not routinely staff public transportation vehicles designed to be operated by one person with two or more persons
Full Compliance Review of staffing assignments indicates that one person is responsible for vehicle operations.
PUC Section 99266
Operating budget has not increased by more than 15% over preceding year unless reasonable justification for the change has been provided
Full Compliance, FY04 growth due to growth in the final year of the SMAT
operations contract; FY05 within 15%;
FY06 growth due to anticipated increases in Senior Dial-a-Ride
service levels.
% Change Per TDA Claim Forms (Budgets) and Profit & Loss Statements FY 2003 to 2004: 22% FY 2004 to 2005: 11% FY 2005 to 2006: 30%
PUC Sections 99268.2-5 & .12
Operator has maintained a ratio of revenues to operating costs equal to 20% for urban areas and 10% for rural areas and specialized services or 15% in areas with a population less than 500,000 if determined by RTPE
Full Compliance Farebox Recovery Ratio Per Profit & Loss Statements: FY 2004: 81.6% FY 2005: 68.5% FY 2006: 76% Ratios exclude TDA, STA, and interest income/dividends.
PUC Section 99268
Operator TDA funding is no more than 50% of operating, maintenance, capital, and debt service requirements after federal grants are deducted
Full Compliance TDA Funds As % of Total Annual Costs (less Federal Grants) Per Financial Audit: FY 2004: 36.7% FY 2005: 28.2% FY 2006: 29.5%
PUC Section 99271
The retirement system is fully funded, or the Operator is implementing a plan that will fully fund the retirement system within 40 years.
Full Compliance Employees participate in Social Security. SMOOTH offers a 403(b) plan to employees but provides no employer contribution.
O’Melia Consulting in association with Kelly Hines Consulting

SMOOTH TDA Triennial Performance Audit Page 14
Regulatory Code
Compliance Requirement
Compliance Finding Verification Information
PUC Section 99314.5
If the Operator receives STA funds, the Operator is not precluded by contract from employing part-time drivers or from contracting with common carriers
Full Compliance SMOOTH is not precluded from employing part-time drivers or contracting with private carriers.
PUC Section 99314.6
If the Operator receives STA funds for operating purposes: (1) the Operator’s total operating cost per revenue hour does not exceed the prior year’s cost per revenue hour adjusted for inflation using the CPI; or (2) the Operator’s average total operating cost per revenue hour in the past three years does not exceed the sum of the average of the preceding three years, adjusted for inflation using the CPI.
Partial Compliance, SMOOTH did not meet compliance
requirement under Option 1; FY04 is compliant under
Option 2, FY05 and FY06 are not
compliant.
Compliance calculations are shown below in Exhibit 4.
CCR Section 6754 (a) (3)
If the Operator receives STA funds for operating purposes, available Federal funds are used prior to claiming STA funds
N/A SMOOTH did not receive federal funds for operations during the audit period.
Exhibit 4 provides the cost per hour documentation of the finding of partial compliance with PUC Section 99314.6. SMOOTH was not compliant with year-to-year growth in cost per hour, but achieved compliance in FY04 under the three-year average cost per hour adjusted for CPI. The three-year average provides an allowance for temporary or one-time escalation in cost per hour. However, SMOOTH’s recovery period following the loss of the SMAT contract beginning in FY05 extended throughout FY05 and FY06 causing non-compliance for the final two years of the audit period. Cost per hour figures for FY02 and FY03 as shown in Exhibit 4 are low as hours reported in the last audit period reflect total rather than service hours. However, additional calculations adjusting for the estimated difference in the reported cost per hour for these years does not change the
O’Melia Consulting in association with Kelly Hines Consulting

SMOOTH TDA Triennial Performance Audit Page 15
compliance findings for FY05 and FY06. SMOOTH may not use STA funds for operations in FY08 as a result of this finding.
Exhibit 4 – Cost per Hour Calculations
Fiscal Year FY01 FY02 FY03 FY04 FY05 FY06
Operating Costs 330,000$ 414,104$ 516,729$ 522,409$ 649,106$ 731,538$ Revenue Service Hours 4,565 10,205 12,339 10,149 10,738 10,074 Cost Per Revenue Service Hour 72.29$ 40.58$ 41.88$ 51.47$ 60.45$ 72.62$ % Change Prior Year 22.9% 17.4% 20.1%% Change CPI 2.5% 4.2% 4.8%Compliance Determination Non-Compliant Non-Compliant Non-Compliant
FY01-FY03 FY02-FY04 FY03-FY05 FY04-FY0651.58$ 44.64$ 51.27$ 61.51$
5.9% 5.7% 6.8% 9.2%54.61$ 47.17$ 54.76$ 67.14$
$ 9.96 $ (4.09) $ (6.75)
CPI Urban Wage Earners & Clerical Workers -- Los Angeles/Riverside/Orange Counties, California (figures calculated on a Fiscal Year)
167.79 172.36 177.63 182.13 189.73 198.79
FY01 and FY03 financial and operating data from previous audit report. FY04 to FY06 financial data from annual Financial Statements, and operating data from Contractor Summary report.
Inflated 3-Year Avg Cost Per Hour Compared to Most Recent 3-Year Avg Cost Per Hour (Positive # is Compliant)
3-Year Avg Cost Per Hour% Change CPI 3-Year PeriodInflated 3-Year Avg Cost Per Hour
Cost per hour calculations were also adjusted to account for growth in excess of CPI of fuel and insurance costs in FY05 and FY06 as allowed by subdivision (b) of PUC Section 99314.6. However, these exclusions did not change the compliance findings shown in Exhibit 4.
Progress To Implement Prior Audit Recommendations
The prior TDA Performance Audit, completed in June 2004, made three recommendations for improved compliance and performance. Progress by SMOOTH to implement prior audit recommendations includes full implementation of two recommendations and no progress on the final recommendation. Key questions included in this analysis of progress to implement prior audit recommendations are:
• What action(s) have been taken to implement the recommendation? Has performance improved as a result of actions taken?
• Is the issue to be addressed by the prior performance audit recommendation still valid today? Why or why not?
• If there has been little or no progress, are future actions planned? Was a different approach selected and if so, what is the status of this activity?
O’Melia Consulting in association with Kelly Hines Consulting

SMOOTH TDA Triennial Performance Audit Page 16
Exhibit 5 summarizes progress relative to prior performance audit recommendations. Findings of “Implemented, Partially Implemented, or Not Implemented” are made for each recommendation.
Exhibit 5 – Progress To Implement Prior Audit Recommendations
Prior Audit Recommendations
Prior Audit Findings Leading to
Recommendation Compliance
Finding Implementing Actions &
Results
1. Develop written service policies to inform agencies and their clients about driver and passenger expectations and how to use the service.
The prior auditor found that SMOOTH had no service policies in place to manage passenger expectations in using SMOOTH-provided services.
Implemented For those services available to the general public – the Senior Dial-a-Ride and Los Alamos Shuttle – there are tri-fold brochures that describe how to use the service. The remaining “closed services” are overseen by agency staff (e.g., case managers) that work directly with clients in using the SMOOTH service provided for the particular agency. SMOOTH undertakes in-service training with each agency, individualizing the materials to the unique needs of each agency.
2. Regularly report the number of accidents and roadcalls in monthly activity management reports and present to the Board of Directors.
During the prior audit period, service quality and reliability information was not included in monthly reports to the Board of Directors though it was reported anecdotally.
Not Implemented
Since the last audit, a new Executive Director has been appointed and this recommendation has not been implemented as a result. The new Executive Director asked for clarification on how such a statistic would be calculated (e.g., per route, per vehicle or system-wide) and was provided direction to calculate the statistic system-wide, dividing total miles by either accidents or and roadcalls to obtain miles between accidents or miles between roadcalls.
O’Melia Consulting in association with Kelly Hines Consulting

SMOOTH TDA Triennial Performance Audit Page 17
Prior Audit Recommendations
Prior Audit Findings Leading to
Recommendation Compliance
Finding Implementing Actions &
Results
3. Accurately track and report revenue service hours and miles.
Service hours and miles were calculated in the last audit period based on departure from and arrival at the yard instead of first pick-up to last drop-off. Driver breaks were correctly excluded.
Partial Implementation
For those contracts where SMOOTH is not paid when the vehicle leaves the yard, SMOOTH accurately counts revenue hour and miles based on first pick-up and last drop-off. However, SMOOTH has interpreted “revenue” or service hours and miles as revenue-generating for SMOOTH instead of revenue-generating from the perspective of fare revenue from passenger transport, calling these services “portal to portal” revenue generation services. While many of SMOOTH services do not generate fare revenue, the definition still applies to the point from first passenger pick-up to last passenger drop-off for demand response services and first scheduled stop to last scheduled stop for fixed route services less driver breaks. Failure to implement this recommendation is related to a non-compliance finding for data collection and reporting discussed in the following section.
Data Verification
Included in the review of transit operators is the regulatory requirement (i.e., PUC Section 99247) that performance audits include a verification of five data items including:
• Operating Cost. The total cost of running a transit operation, exclusive of capital expenditures, depreciation, direct costs of providing charter service and vehicle lease costs.
O’Melia Consulting in association with Kelly Hines Consulting

SMOOTH TDA Triennial Performance Audit Page 18
• Total Passengers. The total number of unlinked trips; all passenger boardings whether revenue producing or not.
• Total Vehicle Service Hours. The total annual number of hours that vehicles are in revenue service. Excluded is travel to and from storage facilities and other deadhead travel. Also referred to as Revenue Hours.
• Total Vehicle Service Miles. The total annual number of miles that vehicles are in revenue service. Miles traveled to and from storage facilities and other deadhead travel are excluded. Also referred to as Revenue Miles.
• Employee Equivalents. The total actual regular and overtime employee pay hours divided by 2,000 hours. Contract employees are included, but not volunteers. Also referred to as FTEs.
SMOOTH is in full compliance with two of five, and in partial compliance with three of five data definitions and methods of data collection as summarized in Exhibit 6 and described below.
Exhibit 6 – Verified Data Elements for TDA Performance Indicators
Data Items & Mode Fiscal Year 2004 Fiscal Year
2005 Fiscal Year
2006
Operating Costs
Full Compliance: Operator tracks CTSA costs separately from SMOOTH as contract operator costs.
Full Compliance: Operator tracks CTSA costs separately from SMOOTH as contract operator costs.
Full Compliance: Operator tracks CTSA costs separately from SMOOTH as contract operator costs.
Total Passengers
Full Compliance: Passengers reflect a 100% headcount of passenger boardings.
Full Compliance: Passengers reflect a 100% headcount of passenger boardings.
Full Compliance: Passengers reflect a 100% headcount of passenger boardings.
O’Melia Consulting in association with Kelly Hines Consulting

SMOOTH TDA Triennial Performance Audit Page 19
Data Items & Mode Fiscal Year 2004 Fiscal Year
2005 Fiscal Year
2006
Total Vehicle Service Hours
Partial Compliance: Revenue-generation characteristics of hours for SMOOTH as operator instead of revenue-generation from perspective of passenger fare revenue determine a service or “revenue” hour. Some services are correctly counted from first passenger pick-up to last passenger drop-off.
Partial Compliance: Revenue-generation characteristics of hours for SMOOTH as operator instead of revenue-generation from perspective of passenger fare revenue determine a service or “revenue” hour. Some services are correctly counted from first passenger pick-up to last passenger drop-off.
Partial Compliance: Revenue-generation characteristics of hours for SMOOTH as operator instead of revenue-generation from perspective of passenger fare revenue determine a service or “revenue” hour. Some services are correctly counted from first passenger pick-up to last passenger drop-off.
Total Vehicle Service Miles
Partial Compliance: Revenue-generation characteristics of miles for SMOOTH as operator instead of revenue-generation from perspective of passenger fare revenue determine a service or “revenue” mile. Some services are correctly counted from first passenger pick-up to last passenger drop-off.
Partial Compliance: Revenue-generation characteristics of miles for SMOOTH as operator instead of revenue-generation from perspective of passenger fare revenue determine a service or “revenue” mile. Some services are correctly counted from first passenger pick-up to last passenger drop-off.
Partial Compliance: Revenue-generation characteristics of miles for SMOOTH as operator instead of revenue-generation from perspective of passenger fare revenue determine a service or “revenue” mile. Some services are correctly counted from first passenger pick-up to last passenger drop-off.
Employee Equivalents
Partial Compliance: Employee compensation divided by an average hourly rate divided by 2,000.
Partial Compliance: Employee compensation divided by an average hourly rate divided by 2,000.
Partial Compliance: Employee compensation divided by an average hourly rate divided by 2,000.
The process for compiling and/or calculating the five required data elements is as follows:
• Operating Costs - SMOOTH separately tracks costs (and revenues) of its CTSA and SMOOTH as contract operator functions, including separate tracking of SMAT-related activities when SMOOTH was the SMAT contract operator in FY04. Depreciation and capital expenditures are excluded. SMOOTH owns all its vehicles so there are no vehicle lease costs. Charter services are included in SMOOTH’s operating costs as these
O’Melia Consulting in association with Kelly Hines Consulting

SMOOTH TDA Triennial Performance Audit Page 20
services are part of routine transit system operation for SMOOTH as the CTSA. The consistency of reported financial data for the entire SMOOTH organization (CTSA and contract operations) is shown in Exhibit 7. Data is largely consistent with only minor discrepancies between Financial Audits and SMOOTH’s Profit & Loss Statements.
Exhibit 7 – Financial Data Consistency Review
FY 2004 FY 2005 FY 2006SMOOTH Profit & Loss Statement 2,573,815$ 889,446$ 958,669$ Financial Audit 2,574,260$ 890,399$ 965,880$ SMOOTH Profit & Loss Statement 2,952,013$ 922,801$ 1,088,073$ Financial Audit 2,952,458$ 922,801$ 1,091,594$
Operating Costs
Operating Revenue
TDA Statistic Audit Review PeriodSource
• Passengers – 100% headcount of passenger boardings.
• Vehicle Service Hours – SMOOTH counts service or “revenue” hours from the perspective of revenue-generation for SMOOTH instead of revenue-generation from the perspective of passenger payment of fare revenue. As such, SMOOTH counts as service hours every hour that a driver is behind the wheel on services for which SMOOTH is paid “portal to portal” or upon leaving the yard to returning to the yard. SMOOTH correctly counts service hours for those services for which SMOOTH is only paid on the basis of revenue hours per the correct definition. These services include the R&D Routes (scheduling software provides data) and the Wisdom Center and Senior Dial-a-Ride services (based on formulas derived from realistic sample routes).
• Vehicle Service Miles – Same as vehicle service hours.
• Employee Full-Time Equivalents – Employee salaries are divided by an average employee hourly rate and then divided by 2,000. However, this calculation does not exclude paid time off as required by the definition.
A data consistency analysis was not conducted for operating statistics as SMOOTH did not prepare any reports to external agencies against which SMOOTH internal data could be compared.
O’Melia Consulting in association with Kelly Hines Consulting

SMOOTH TDA Triennial Performance Audit Page 21
TDA Performance Indicator Trends
California Public Utilities Code Section 99246(d) states that performance audits of transit operators shall include a verification of performance indicators defined in the Public Utilities Code Section 99247. These performance indicators include:
• Operating Cost Per Passenger • Operating Cost Per Vehicle Service Hour • Passengers Per Vehicle Service Hour • Passengers Per Vehicle Service Mile • Vehicle Service Hours Per Employee.
Trends for these five TDA performance indicators are presented below by mode (i.e., motor bus and/or demand response). Performance indictor trends involving costs are also compared to the Consumer Price Index -- Urban Wage Earners and Clerical Workers for the Los Angeles-Riverside-Orange County area.
TDA Performance Indicator Trends – CTSA Total
Exhibit 8 presents TDA performance indicators for SMOOTH’s CTSA service. Figures shown in Exhibit 8 include the Los Alamos Shuttle service as the service is provided under SMOOTH’s CTSA designation. The Los Alamos Shuttle made up just 6% of CTSA service hours in FY06 (1% in FY04). Statistics for the Los Alamos Shuttle are provided in the County of Santa Barbara performance audit as well.
O’Melia Consulting in association with Kelly Hines Consulting

SMOOTH TDA Triennial Performance Audit Page 22
Exhibit 8 – TDA Performance Indicators – CTSA
FY 2004 FY 2005 FY 2006Operating Costs $ 516,729 $ 522,409 $ 685,691 $ 742,355 43.7%Passengers 39,874 46,775 50,002 46,369 16.3%Vehicle Service Hours 12,339 10,149 10,738 10,074 -18.4%Vehicle Service Miles 244,396 180,500 197,253 190,145 -22.2%Employee Full-Time Equivalents 6.8 10.0 11.8 13.1 93.2%Farebox Revenue N/A $ 3,243 $ 9,374 $ 12,030 271.0%Local Subsidies & Auxiliary Revenues $ 367,998 $ 422,856 $ 460,591 $ 552,163 50.0%Operating Cost Per Vehicle Service Hour $ 41.88 $ 51.47 $ 63.86 $ 73.69 76.0%Operating Cost Per Passenger $ 12.96 $ 11.17 $ 13.71 $ 16.01 23.5%Passengers Per Vehicle Service Hour 3.2 4.6 4.7 4.6 42.4%Passengers Per Vehicle Service Mile 0.16 0.26 0.25 0.24 49.5%Vehicle Service Hours Per Employee FTE 1,815 1,018 911 767 -57.7%Farebox Recovery Ratio N/A 0.6% 1.4% 1.6% 161.0%Farebox Recovery Ratio (with Local Subsidies & Auxiliary Revenues) 71.2% 81.6% 68.5% 76.0% 6.7%Percent Change in the CPI - 2.5% 4.2% 4.8% 11.9%
Local Subsidies & Auxiliary Revenues includes all revenues except TDA, STA, fare revenues, and interest income/dividends.FY03 Farebox Revenue not shown in prior audit so change in Farebox Revenue and Farebox Recovery Ratio calculated based on FY04 to FY06 performance.
Verified TDA Statistics & Performance Indicators
Base Year FY 2003
Audit Review Period Percent Change FY 2003 to FY 2006
Financial Data from SMOOTH, Inc. Profit and Loss Statements for FY04 through FY06. FY03 data from prior audit.Operating data provided by SMOOTH - data not reported in any external report.Includes financial and statistical data for Los Alamos Shuttle.
• Operating Cost Per Vehicle Service Hour is a measure of cost
efficiency. During the audit review period, cost per hour increased by 76% as costs grew by 44% and service hours declined by 18.4%. As previously discussed, this audit period was one of significant change and re-organization for SMOOTH following the loss of the SMAT operations contract. Following the loss of the SMAT contract at the end of FY04, staff and overhead costs previously allocated to the SMAT operation became CTSA operating costs. The loss in SMAT hours, however, does not appear in Exhibit 7, which reflects only CTSA services. Additionally, SMOOTH staff recognized that service hours and miles as reported in FY03 reflected total rather than revenue hours/miles causing the FY03 cost per hour to be under-stated. CTSA service hours remained largely unchanged during the audit period though they did decline in FY06 following a peak in FY05 due to a reduction in Wisdom Center service by 425 hours (28% of the service) and a reduction in R&D routes by 390 hours (5.7% of the service).
SMOOTH reports that costs are now trending downward with the FY07 estimate of cost per hour at $59.78 – up 16% from FY04, but significantly less than the $73.69 rate in FY06 and $63.86 in FY05.
• Operating Cost Per Passenger is a measure of cost effectiveness. During the audit period, cost per passenger increased 24% despite a 16% increase in passengers. Like cost
O’Melia Consulting in association with Kelly Hines Consulting

SMOOTH TDA Triennial Performance Audit Page 23
per hour, the cost per passenger measure was impacted by the growth in CTSA operating costs, which absorbed significantly more overhead and staff time with the loss of the SMAT contract beginning in FY05. Cost per passenger was at $11.17 in FY04 compared to $12.96 in FY03. Estimates of FY07 performance from SMOOTH indicate that cost per passenger is down from FY06 at $15.76 though still in excess of the North County Santa Barbara Transit Plan of less than $14.00 per passenger. However, this measure does not capture the value of SMOOTH resources allocated to non-passenger transportation activities including mobility training and trip planning services that benefit the other fixed route operators in the region.
• Passengers Per Vehicle Service Hour is a measure of service productivity. During the audit review period, passengers per hour remained largely unchanged at 4.6 in FY04, 4.7 in FY05, and 4.6 in FY06. Compared to FY03 data, service productivity improved but, as previously indicated, FY03 data reflects total rather than revenue hours leading to the low passengers per hour figure for FY03.
• Passengers Per Vehicle Service Mile also measures service productivity. During the audit review period, passengers per mile fell slightly between FY04 and FY06, decreasing from 0.26 to 0.24. Ridership was virtually unchanged between FY04 and FY06 while revenue miles increased by 5%.
• Vehicle Service Hours Per Employee measures labor productivity. During the audit review period, labor productivity fell by nearly 60% as the CTSA absorbed more SMOOTH labor from the absence of the SMAT operations contract in FY05 and FY06. After the overnight loss of employees between FY04 and FY05 following the loss of the SMAT contract, SMOOTH spent FY05 and FY06 staffing up in clerical, training, and supervisory positions still required for the SMOOTH CTSA operation. SMOOTH reports that service hours per FTE increased to 890 for FY07, on par with FY05 but still below peak performance in FY04.
SMOOTH continues to maintain a high farebox (operating revenue) recovery ratio with a 76% recovery in FY06, up from 71% in FY03.
O’Melia Consulting in association with Kelly Hines Consulting
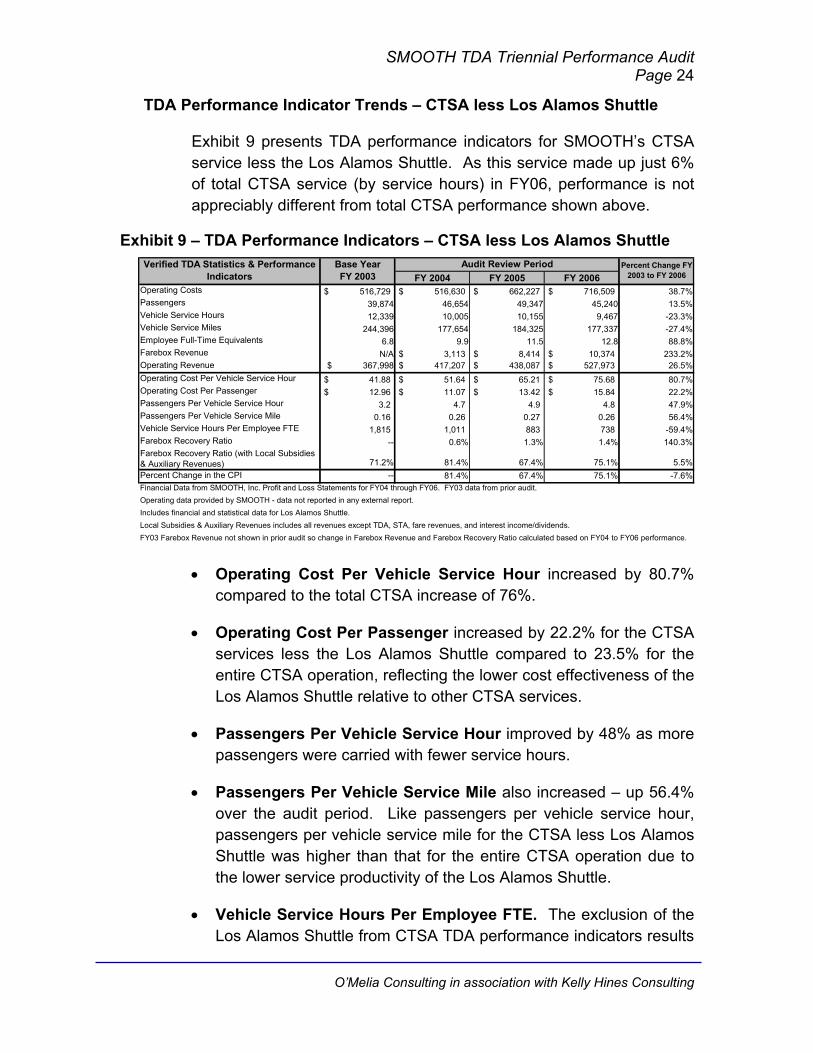
SMOOTH TDA Triennial Performance Audit Page 24
TDA Performance Indicator Trends – CTSA less Los Alamos Shuttle
Exhibit 9 presents TDA performance indicators for SMOOTH’s CTSA service less the Los Alamos Shuttle. As this service made up just 6% of total CTSA service (by service hours) in FY06, performance is not appreciably different from total CTSA performance shown above.
Exhibit 9 – TDA Performance Indicators – CTSA less Los Alamos Shuttle
FY 2004 FY 2005 FY 2006Operating Costs $ 516,729 $ 516,630 $ 662,227 $ 716,509 38.7%Passengers 39,874 46,654 49,347 45,240 13.5%Vehicle Service Hours 12,339 10,005 10,155 9,467 -23.3%Vehicle Service Miles 244,396 177,654 184,325 177,337 -27.4%Employee Full-Time Equivalents 6.8 9.9 11.5 12.8 88.8%Farebox Revenue N/A $ 3,113 $ 8,414 $ 10,374 233.2%Operating Revenue $ 367,998 $ 417,207 $ 438,087 $ 527,973 26.5%Operating Cost Per Vehicle Service Hour $ 41.88 $ 51.64 $ 65.21 $ 75.68 80.7%Operating Cost Per Passenger $ 12.96 $ 11.07 $ 13.42 $ 15.84 22.2%Passengers Per Vehicle Service Hour 3.2 4.7 4.9 4.8 47.9%Passengers Per Vehicle Service Mile 0.16 0.26 0.27 0.26 56.4%Vehicle Service Hours Per Employee FTE 1,815 1,011 883 738 -59.4%Farebox Recovery Ratio -- 0.6% 1.3% 1.4% 140.3%Farebox Recovery Ratio (with Local Subsidies & Auxiliary Revenues) 71.2% 81.4% 67.4% 75.1% 5.5%Percent Change in the CPI -- 81.4% 67.4% 75.1% -7.6%
Includes financial and statistical data for Los Alamos Shuttle.Local Subsidies & Auxiliary Revenues includes all revenues except TDA, STA, fare revenues, and interest income/dividends.
Audit Review Period Percent Change FY 2003 to FY 2006
Financial Data from SMOOTH, Inc. Profit and Loss Statements for FY04 through FY06. FY03 data from prior audit.Operating data provided by SMOOTH - data not reported in any external report.
FY03 Farebox Revenue not shown in prior audit so change in Farebox Revenue and Farebox Recovery Ratio calculated based on FY04 to FY06 performance.
Verified TDA Statistics & Performance Indicators
Base Year FY 2003
• Operating Cost Per Vehicle Service Hour increased by 80.7% compared to the total CTSA increase of 76%.
• Operating Cost Per Passenger increased by 22.2% for the CTSA services less the Los Alamos Shuttle compared to 23.5% for the entire CTSA operation, reflecting the lower cost effectiveness of the Los Alamos Shuttle relative to other CTSA services.
• Passengers Per Vehicle Service Hour improved by 48% as more passengers were carried with fewer service hours.
• Passengers Per Vehicle Service Mile also increased – up 56.4% over the audit period. Like passengers per vehicle service hour, passengers per vehicle service mile for the CTSA less Los Alamos Shuttle was higher than that for the entire CTSA operation due to the lower service productivity of the Los Alamos Shuttle.
• Vehicle Service Hours Per Employee FTE. The exclusion of the Los Alamos Shuttle from CTSA TDA performance indicators results
O’Melia Consulting in association with Kelly Hines Consulting

SMOOTH TDA Triennial Performance Audit Page 25
in little change to Vehicle Service Hours Per Employee as the Los Alamos Shuttle makes up such a small share of the CTSA operation.
The farebox recovery for the SMOOTH CTSA operation, excluding the Los Alamos Shuttle was 75.1% in FY06. Farebox recovery for SMOOTH as the CTSA is more accurately described as an operating revenue recovery as very little revenue is earned through passenger fares, but rather through operating agreements with partner social service agencies who fund the transportation services.
O’Melia Consulting in association with Kelly Hines Consulting

SMOOTH TDA Triennial Performance Audit Page 26
III. FUNCTIONAL AREA PERFORMANCE RESULTS
A high level review of functional area performance was conducted for select functions including:
• CTSA Operations • Vehicle Maintenance • Budget and Planning
Information used in this section was obtained through document reviews, management interviews, and internal performance reports.
Transportation Operations
As indicated previously, there are nine different types of service provided by SMOOTH as CTSA, including the Los Alamos Shuttle. As shown in Exhibit 10, the largest of these is the Tri-Counties Regional Center (R&D Routes). Over the audit period, the R&D routes grew by 11%, outpaced by both the Senior Dial-a-Ride and Los Alamos Shuttle, which grew by 44% and 321.5%, respectively. Growth in service levels for Los Alamos Shuttle, Senior Dial-a-Ride, and R&D Routes was offset by declines in other types of service including the elimination of the Life Skills service. Overall, CTSA service levels remained unchanged during the audit period, down just 75 hours (0.7%) from FY04 to FY06. Together with the Wisdom Center service, the R&D Routes and Senior Dial-a-Ride accounted for 83% of CTSA operations in FY06.
Exhibit 10 – CTSA Revenue Hours by Service
FY 2004 FY 2005 FY 2006Children & Families Commission 757 550 554 -26.8%Community Development Block Grant 149 108 62 -58.4%Life Skills 173 73 0 -100.0%Los Alamos Shuttle 144 583 607 321.5%Santa Maria Recreation & Parks Department 427 188 171 -60.0%Senior Dial-a-Ride 571 593 822 44.0%Tri-County Regional Center 5,788 6,827 6,437 11.2%Wisdom Center 1,789 1,528 1,103 -38.3%Miscellaneous/Charters 351 288 318 -9.4%
TOTAL 10,149 10,738 10,074 -0.7%
Service Hours Audit Review Period Percent Change FY 2004 to FY 2006
O’Melia Consulting in association with Kelly Hines Consulting

SMOOTH TDA Triennial Performance Audit Page 27
CTSA Operating Costs
CTSA operating costs increased by 42% between FY04 and FY06, as shown in Exhibit 11. While the biggest percentage increases were for items such as bond costs (237%), memberships and subscriptions (231.4%), and travel and training (304.3%), the absolute amounts of the cost growth are small compared to additional salary, benefits, and vehicle expenses. The biggest increase in costs occurred between FY04 and FY05, the first year following the loss of the SMAT operations contract when additional management and overhead expenses were borne by the CTSA operating division. Fuel, Insurance and Repair & Maintenance costs all grew more than $10,000 per item or over 40%.
Exhibit 11 – CTSA Operating Cost Elements
FY 2004 FY 2005 FY 2006Salaries/Payroll Taxes
Drivers $ 191,964 $ 227,435 $ 260,284 35.6%Management $ 69,468 $ 86,022 $ 94,078 35.4%Office $ 36,707 $ 77,401 $ 75,280 105.1%Other $ - $ 1,700 $ 7,248 --
Benefits (Workers' Comp, Medical, Physicals, Licenses, Uniforms)
Drivers $ 73,089 $ 64,048 $ 66,235 -9.4%Management $ 14,493 $ 25,067 $ 21,592 49.0%Office $ 8,464 $ 21,445 $ 18,161 114.6%
Vehicle CostsInsurance $ 35,637 $ 47,272 $ 52,893 48.4%Operations (Fuel) $ 51,831 $ 69,207 $ 73,335 41.5%Repair & Maintenance $ 19,742 $ 33,215 $ 34,036 72.4%Licenses & Fees $ 1,434 $ 1,095 $ 1,091 -23.9%
Other ExpensesProfessional Services 944$ 1,300$ 1,125$ 19.2%Employment Advertising 1,076$ 1,420$ 2,260$ 109.9%Bond 581$ 1,761$ 1,956$ 236.9%Crime Policy 114$ 103$ -10.1%Community Service -$ 86$ 3,768$ --Employee Appreciation 203$ 435$ 119$ -41.3%Interest Expense 778$ 851$ 29$ -96.3%Memberships & Subscriptions 519$ 2,390$ 1,721$ 231.4%Rent 6,449$ 11,012$ 13,291$ 106.1%Office Equipment 621$ 1,903$ 1,569$ 152.7%Office Supplies 2,207$ 2,939$ 3,036$ 37.6%Outside Labor 2,411$ 1,262$ 306$ -87.3%Promotion & Publicity 90$ 214$ -$ -100.0%Taxes & Licenses 356$ 253$ 1,045$ 193.4%Telephone 1,747$ 5,851$ 4,887$ 179.8%Travel & Training 718$ -$ 2,905$ 304.4%Utilities 761$ -$ -$ -100.0%
TOTAL 522,406$ 685,584$ 742,355$ 42.1%
Percent Change FY 2004 to FY 2006CTSA Operating Cost Elements Audit Review Period
Drivers that had previously spent portions of their time operating SMAT services were converted to CTSA operations (though some time was
O’Melia Consulting in association with Kelly Hines Consulting

SMOOTH TDA Triennial Performance Audit Page 28
still devoted to the Special Health Service and Guadalupe Transit contracts of SMOOTH as a transit contractor). Similarly, costs for management and administrative personnel previously allocated to the large SMAT contract were re-allocated between CTSA activities and the two remaining service contracts. The impact of this change is documented in Exhibit 12, which shows CTSA costs as a percentage of total SMOOTH costs from FY04 to FY06.
Following the loss of the SMAT operations contract at the end of FY04 SMOOTH went from 60 employees to just 18, essentially overnight, as most of the operating staff joined MV Transportation following their award of the SMAT contract. Among the positions that were lost included three driver trainers, dispatch staff, Saturday office staff, and a mechanic. Growth in labor costs and FTEs from FY05 to FY06 are due to SMOOTH’s efforts to recruit, license/certify, and train the new team of clerical staff, dispatchers, opener/closers, driver trainers, and supervisors.
Vehicle Costs is the only area where the impact of the loss of the SMAT contract did not result in an appreciable difference in share of CTSA costs as SMOOTH used City of Santa Maria vehicles to provide the SMAT service. SMOOTH vehicles were used primarily for CTSA activities with only two exceptions - the SMOOTH vehicle used for the County Health Service and another used for Guadalupe Transit ADA service.
O’Melia Consulting in association with Kelly Hines Consulting

SMOOTH TDA Triennial Performance Audit Page 29
Exhibit 12 – CTSA Costs as a % of Total SMOOTH Costs
FY 2004 FY 2005 FY 2006Salaries/Payroll Taxes
Drivers 18% 74% 72% 295.5%Management 29% 75% 75% 155.1%Office 21% 76% 74% 250.8%
Benefits (Workers' Comp, Medical, Physicals, Licenses, Uniforms)
Drivers 18% 78% 74% 311.9%Management 26% 75% 83% 217.4%Office 22% 76% 74% 241.7%
Vehicle CostsInsurance 23% 84% 98% 337.0%Operations (Fuel) 96% 99% 96% -0.5%Repair & Maintenance 79% 78% 93% 18.5%Licenses & Fees 97% 104% 96% -0.7%
Other Expenses 23% 67% 70% 199.4%
CTSA Costs as a % of Total SMOOTH Costs
Audit Review Period Percent Change FY 2004 to FY 2006
Service Productivity
As previously shown in Exhibit 8 in Chapter II, CTSA service productivity (passengers per hour) improved during the audit period and was up to 4.6 passengers per hour in FY06. However, of particular concern is the high amount of deadhead incurred on SMOOTH’s largest services.
As shown in Exhibit 13, of the 12,040 driver hours on CTSA’s three largest services only 8,362 (69.5%) are spent in the transport of passengers.
O’Melia Consulting in association with Kelly Hines Consulting

SMOOTH TDA Triennial Performance Audit Page 30
Exhibit 13 – Productive Service Hours
Senior Dial-a-Ride 822 1,713 48.0%Tri-County Regional Center 6,437 8,560 75.2%Wisdom Center 1,103 1,767 62.4%
TOTAL 8,362 12,040 69.5%
FY06 Scheduling Efficiency
Revenue Hours Total Hours % Productive
Hours
The Senior Dial-a-Ride service had the least productive scheduling efficiency with less than half of total hours spent in productive passenger service. This performance is expected to improve over the next audit period as SMOOTH implemented Trapeze scheduling software in May 2007 and reports a doubling of passengers per hour from 1.5 to three as a result. Improved service productivity should help to reduce the amount of deadhead associated with these services.
Driver Training
SMOOTH’s driver training program consists of 20 hours of classroom, 20 hours of behind-the-wheel training, as well as route familiarization training as required by the City of Guadalupe Transit contract. To the extent possible, SMOOTH’s policy is to cross-train all drivers on all of SMOOTH’s services to maximize the availability of drivers to meet service demands. As any driver could be assigned to a City of Guadalupe route, the level of training required by the Guadalupe contract was adopted as the SMOOTH standard for all new driver training. SMOOTH drivers hold a Class B license with Passenger Endorsement, Air Brakes, and Transit Certificate.
All new drivers receive a 90-day evaluation, and are evaluated annually thereafter. Additionally, SMOOTH carefully tracks the required eight hours of annual re-training required of commercial passenger drivers. Mandatory safety meetings are held monthly.
Vehicle Maintenance
SMOOTH employs a single part-time mechanic for the routine maintenance activity – 45-day interval A and B inspections – on SMOOTH’s fleet of vehicles. Heavy repair work is performed by outside vendors, with warranty work performed by authorized shops. All vehicles are fueled by the drivers at the City of Santa Maria City Yard under a Memorandum of Understanding between the City and
O’Melia Consulting in association with Kelly Hines Consulting

SMOOTH TDA Triennial Performance Audit Page 31
SMOOTH. SMOOTH reports that this agreement is saving them approximately $0.70 per gallon over purchasing fuel in the open market.
SMOOTH has a fleet of 16 cutaway vehicles all of which are wheelchair lift equipped. The oldest vehicle was acquired in 2000 and the newest (12 in total) during the first year of the audit period (FY04). The most recent vehicle purchase consisted of 12 diesel vehicles. SMOOTH later learned that it was subject to CARB regulations for the general public Senior Dial-a-Ride service, and was required to retrofit two vehicles for unleaded fuel operation. During the audit period, 11 of the 16 vehicles were required for peak service. In FY07, two additional vehicles were assigned to the new R&D Routes, leaving three spare vehicles (19% spare ratio).
SMOOTH prepared a fleet replacement plan in FY06 to facilitate the planning of a new operations and maintenance facility. The next scheduled vehicle purchase is slated for FY08 (one vehicle) with two vehicles in FY09. Federal 5310 grant funding, with a 20% local match, will be used to purchase the new vehicles. Beginning in FY06, SMOOTH began setting aside funding in the amount of $10,000 per year to fund vehicle acquisition.
Construction of the new operations facility began in June 2007. The new facility, funded through retained earnings, will accommodate parking for 25 vehicles and will have two bus bays.
Budget and Planning
SMOOTH’s annual budget process generally begins at the time when it receives the estimated TDA apportionments from SBCAG. Over the audit period, 26% to 31% of CTSA revenues were from TDA with the remainder made up of payments for services provided to partner agencies, donations, miscellaneous grants, and a small amount of fare revenue from the Senior Dial-a-Ride service. SMOOTH does not receive Measure D funds.
SMOOTH’s last service plan was developed in 1999 when it was designated as the North County CTSA. This CTSA Action Plan identified 13 objectives, which SMOOTH has reviewed and updated annually with its Board. SMOOTH services were also part of the North
O’Melia Consulting in association with Kelly Hines Consulting

SMOOTH TDA Triennial Performance Audit Page 32
County Santa Barbara Transit Plan completed in December 2006. No short term recommendations specific to SMOOTH service were identified but the study discussed the value of implementing a vanpool program for farm workers in the North County region, reinforcing an Unmet Transit Needs finding. Under an agreement with the County of Santa Barbara, SMOOTH is implementing a farm worker vanpool program this fiscal year (i.e., FY08).
Given the significant organizational and operational changes that characterized this audit period, and those likely to have an impact during the next audit period including the farm worker vanpool program, potential loss of Measure D transit funding in the region, and growth in the senior population in the North County just to name a few, SMOOTH should develop a multi-year service plan to make sure it is positioned to meet the transportation needs of the socially-disadvantaged population in the Santa Maria region as well as the customers it serves through its contract operations. Included in this review should be a performance assessment of SMOOTH’s historical and target performance with respect to regional standards identified in the North County Santa Barbara Transit Plan as shown in Exhibit 14.
Exhibit 14 – SMOOTH 2006 Performance & Regional Standards Operating Cost per Passenger
Operating Cost per Service Hour
Passengers per Hour
Farebox Recovery Ratio
Standard <$14.00 $50 3 10%SMOOTH $16.01 $73.69 4.6 75.1%Standard as indicated in the North County Santa Barbara Transit Plan (10/19/2006), except Farebox Recovery which is TDA requirement.
SMOOTH’s Executive Director, as a result of this performance audit process, is carefully monitoring performance with respect to these indicators and is sensitive to the need to ensure that performance standards are met in spite of changes, both expected and unexpected, to SMOOTH’s operating and funding environments.
O’Melia Consulting in association with Kelly Hines Consulting

SMOOTH TDA Triennial Performance Audit Page 33
IV. RECOMMENDATIONS
Three recommendations are offered for consideration by SMOOTH. This includes one recommendation related to compliance, and two aimed at improving effectiveness and efficiency of operations.
1. SMOOTH should revise its data collection process to correctly calculate required TDA data elements, and include such information in an annual State Controller’s Report. This includes submission of the missing FY06 State Controller Report.
• Findings – During the audit period, SMOOTH improved its data
collection processes with respect to providing revenue rather than total miles and hours of service for the Senior Dial-a-Ride, Wisdom Center, and R&D Routes during the audit period. However, SMOOTH continues to incorrectly count revenue versus total hours for those services which it considers to be “portal to portal” or revenue-generating for SMOOTH under its agreements with the participating agencies. Additionally, SMOOTH is not subtracting paid time off from total pay hours when calculating FTEs. Finally, SMOOTH has never submitted a State Controller’s report per the requirements of TDA (PUC Section 99243).
• Suggested Actions – The following corrective actions will bring SMOOTH into compliance with TDA data definition requirements:
a) SMOOTH should count revenue hours and miles from the first passenger pick up (or scheduled pick up location) to the last passenger drop off (or scheduled last stop), excluding any driver breaks during that period. This is the approach currently applied to the three services identified above and should be applied to all services, even those for which SMOOTH is paid from the time the driver gets behind the wheel of a vehicle.
b) Exclude paid time off from the employee FTE calculation. The correct definition is paid work hours divided by 2,000.
O’Melia Consulting in association with Kelly Hines Consulting

SMOOTH TDA Triennial Performance Audit Page 34
c) These required elements should be reported annually to the State Controller by the deadline set annually by the State Controller. Data may be submitted in hard copy or electronically. More information can be found at http://www.sco.ca.gov/ard/local/locrep/transit/forms/index.shtml. SMOOTH should immediately prepare and submit the FY06 State Controller Report to avoid funds being withheld due to delinquent reports.
• Expected Results – Implementation of this recommendation will bring SMOOTH into compliance with State Controller Reporting (PUC 99243) and TDA data definition (PUC 99247) requirements.
2. SMOOTH should conduct a customer satisfaction survey and incorporate findings into a CTSA Operations Plan (see Recommendation three).
• Findings – SMOOTH provides a number of different services with
different operational characteristics and customer needs. Following the significant agency re-structuring and staff turnover during the audit period, SMOOTH is now in a position to begin assessing the impacts of the agency’s changes on the quality of the service provided to its customers (i.e., SMOOTH riders and the agencies with which SMOOTH partners to provide service).
• Suggested Actions – It is recommended that SMOOTH undertake a customer satisfaction survey consisting of two primary elements:
1) An on-board self-administered customer satisfaction survey
2) A self-administered partner/stakeholder survey
For an initial effort, the recommendation is made to utilize only self-administered tools to keep the costs of implementing this recommendation at a minimum while SMOOTH continues to bring CTSA costs per hour and per passenger within regional standards of performance. The customer satisfaction assessment process could later be expanded as resources allow and/or significant areas of improvement are identified through the self-administered process.
O’Melia Consulting in association with Kelly Hines Consulting

SMOOTH TDA Triennial Performance Audit Page 35
• Expected Results – Implementation of this recommendation will allow SMOOTH to assess the impacts of its re-organization on the quality of service provided to its customers. Results from this process should be incorporated into an updated CTSA Operations Plan and corrective actions identified moving forward that will help to position SMOOTH in meeting the social service transportation needs of the North County region.
3. SMOOTH should develop a CTSA Operations Plan for the FY08 through FY11 period.
• Findings – SMOOTH has experienced significant organizational
and operational changes over the last three years resulting largely from the loss of the SMAT operations contract. The next audit period will also be one of significant change as the social service transportation needs of SMOOTH’s service area change, SMOOTH takes on the operation of new and expanded services, and the potential loss of Measure D in FY10.
• Suggested Actions – It is recommended that SMOOTH develop an Operational Plan for CTSA activities and services (similar to a transit operator Short Range Transit Plan) for the next four year period to assess SMOOTH’s operational and financial abilities to meet the social service transportation needs in its service area. Specific elements to consider in the plan include:
a) Impact of the successful re-negotiation of the Guadalupe Transit contract, especially the expected growth of the ADA paratransit element of the contract; and, the impact should the contract not be extended after the conclusion of the three-year period of performance on June 30, 2009.
b) Opportunities to coordinate efforts in the provision of paratransit services in the Santa Maria area between SMOOTH, Guadalupe Transit, and SMAT.
c) Continued operation or discontinuation of the Los Alamos Shuttle in light of the 10% farebox recovery requirement of this County-funded service.
O’Melia Consulting in association with Kelly Hines Consulting

SMOOTH TDA Triennial Performance Audit Page 36
d) Impact of a potential loss of Measure D revenues to the provision of specialized transit services in the Santa Maria region. While SMOOTH does not receive funds directly, it is likely to be impacted by the loss of these funds for specialized transportation services and may place added pressure to improve coordination of such service in the region (see item c).
e) Growth in the senior population that will most directly impact SMOOTH’s Senior Dial-a-Ride program.
f) Need for or ability of additional charitable contributions to provide greater financial resources with which to meet growth in need for specialized services.
g) Fleet composition and quantity in light of projected service demand.
h) Incorporate results of the customer satisfaction survey recommended as part of this audit.
i) Estimated assessment of performance with respect TDA performance indicators to identify areas of possible non or partial compliance for the next audit period.
j) Assessment of performance against regional performance standards in the North County Santa Barbara Transit Plan.
k) Development of additional performance measures to assess the level and value of SMOOTH CTSA activities that don’t result in hours of transit service and passengers carried including the Mobility Training program and trip planning services.
• Expected Results – Completion of an Operations Plan will allow
SMOOTH to identify in advance internal and external circumstances that are likely to have an impact on SMOOTH financial and operational performance during the next audit period and beyond.
O’Melia Consulting in association with Kelly Hines Consulting

SMOOTH TDA Triennial Performance Audit Page 37
O’Melia Consulting in association with Kelly Hines Consulting
4. SMOOTH should include findings of compliance as required by CAC 6667 as part of annual financial and compliance audit required by PUC Section 99245.
• Findings – Agencies receiving TDA funds are required by PUC 99245 to submit an annual fiscal audit to the State Controller within 180-days after the end of the year. SMOOTH is in compliance with this requirement under PUC Section 99245.2, which allows for an expanded annual fiscal audit for those agencies that receive funds from other sources. In conducting the compliance audit for an operator or transit service claimant, the independent auditor shall perform at least the tasks outlined in CAC 6667. Specific findings relative to these tasks, and documentation supporting compliance findings have not been clearly identified in recent audits.
• Suggested Actions – SMOOTH should include compliance audit tasks per CAC 6667 in the scope of work for annual financial and compliance audits. Including specific statements and the calculations to verify some of the more detailed financial requirements would go a long way in streamlining the amount of work required by transit operator staff preparing claims and SBCAG staff reviewing claims prior to funding approval. Feedback on compliance issues would be annually rather than waiting for triennial performance audits.
In addition, SMOOTH should ensure that financial auditors present information in a format consistent with State Controller Financial Transaction Reporting, as required by PUC 99243. Referring to financial information using the Uniform System of Accounts would facilitate consistent application of required compliance calculations and for ease in preparing the State Controller Report. Particularly important is the separation of operating and capital revenues and costs for fare ratio, expenditure limitation, and STA qualifying criteria calculations.
• Expected Results – Improved compliance with State regulatory requirements is expected to result from this recommendation. A second benefit is that transit operator and SBCAG staff will spend less time determining compliance.

SANTA YNEZ VALLEY TRANSIT (SYVT) TDA TRIENNIAL PERFORMANCE
AUDIT FOR FY 2004-2006 Fiscal Years Ending June 30th
Prepared by
In Association With
OCTOBER 20, 2007

Santa Ynez Valley Transit TDA Triennial Performance Audit Page i
TABLE OF CONTENTS
EXECUTIVE SUMMARY.................................................................... 1
Purpose of Audit.........................................................................................1
Findings......................................................................................................1
Recommendations .....................................................................................3
I. INTRODUCTION....................................................................... 5
Performance Audit Objectives and Approach.............................................5
System Overview .......................................................................................7
II. COMPLIANCE REVIEW......................................................... 11
Regulatory Requirements.........................................................................11
Progress To Implement Prior Audit Recommendations ...........................14
Data Verification.......................................................................................17
TDA Performance Indicator Trends..........................................................23
III. FUNCTIONAL AREA PERFORMANCE RESULTS............... 29
Transportation Operations........................................................................29
Vehicle Maintenance................................................................................32
Administration & Planning ........................................................................33
IV. RECOMMENDATIONS........................................................... 36
O’Melia Consulting in association with Kelly Hines Consulting

Santa Ynez Valley Transit TDA Triennial Performance Audit Page ii
LIST OF EXHIBITS
Exhibit 1 – Performance Audit Sources ................................................................6
Exhibit 2 – Organization Chart ..............................................................................8
Exhibit 3 – Regulatory Compliance Matrix ..........................................................11
Exhibit 4 – Progress To Implement Prior Audit Recommendations.....................15
Exhibit 5 – Verified Data Elements for TDA Performance Indicators ..................18
Exhibit 6 – Financial Data Consistency Review ..................................................20
Exhibit 7 – Operational Data Consistency Review – Fixed-Route ......................21
Exhibit 8 – Operational Data Consistency Review – Demand Response ...........22
Exhibit 9 – TDA Performance Indicators – System-Wide....................................24
Exhibit 10 – TDA Performance Indicators – Fixed Route Mode..........................26
Exhibit 11 – TDA Performance Indicators – Demand Response Mode...............27
Exhibit 12 – SYVT 2006 Performance & Regional Standards.............................35
O’Melia Consulting in association with Kelly Hines Consulting

Santa Ynez Valley Transit TDA Triennial Performance Audit Page 1
EXECUTIVE SUMMARY
Purpose of Audit
As the RTPE for Santa Barbara County, the Santa Barbara County Association of Governments (SBCAG) is required by the Public Utilities Code (PUC) Sections 99246 and 99248 to contract for a third party performance audit of itself and each of the transit operators to which Transportation Development Act (TDA) funds are allocated. These audits are to be conducted in accordance with the California Department of Transportation, Performance Audit Guidebook for Transit Operators and Regional Transportation Entities. Performance audits are required to:
• Determine compliance with regulatory requirements
• Assess progress to implement prior performance audit recommendations
• Verify performance indicators and validate basic data used to calculate indicators
• Evaluate the effectiveness and efficiency of agency functions.
This performance audit is for Fiscal Years 2004, 2005 and 2006 -- the period of time beginning July 1, 2003 and ending June 30, 2006.
Findings
• Santa Ynez Valley Transit (SYVT) serves the communities of Solvang, Buellton, Santa Ynez and Los Olivos and includes both fixed route and demand response elements. The fixed route service consists of two routes – A and B – which follow the same route along the Buellton/Solvang portion of the service area but travel in opposite directions around the loop covering Los Olivos and Santa Ynez. The demand response service is an ADA complementary service for the disabled and seniors 60 years of age and older.
O’Melia Consulting in association with Kelly Hines Consulting

Santa Ynez Valley Transit TDA Triennial Performance Audit Page 2
• SYVT service is provided under a Memorandum of Understanding (MOU) between the City of Solvang, the City of Buellton, and the County of Santa Barbara. Under the MOU, administration of the service is provided by the City of Solvang with overall policy direction provided by a three-member Board made up of one representative from each jurisdiction. Formal meetings of the policy board are on an as-needed basis to address specific projects or programs such as the bus stop improvement program now underway for the system. Informal communications (e.g., phone-calls, business lunches) between the jurisdictions are more common and have been sufficient in keeping the City of Buellton and the County apprised of system performance and operational issues.
• The basis for cost-sharing among the three jurisdictions is share of passenger boardings by jurisdiction. All three jurisdictions expressed satisfaction with this arrangement, indicating that an occasional review of system ridership is sufficient to verify cost shares among the jurisdictions. The SYVT contract operator tracks and reports ridership by jurisdiction every month.
• The City of Solvang successfully re-bid its service contract twice during the audit period – the first contractor, MV Transportation, began operation in September, 2003 and the second and current, AmericanStar Transportation, began operation in July 2006.
• Continuing a finding from the previous audit, the City of Solvang continues to experience problems with administration and oversight of the transit system, reflected largely in the data reporting inconsistencies noted as part of this audit. Fortunately, the shifting responsibilities of City staff have not negatively impacted the system’s performance, which maintains a high farebox recovery ratio and receives very few complaints.
• The City of Solvang is compliant with all PUC requirements, except for growth in the cost per hour in FY04 and FY05 exceeding growth in CPI. The City of Solvang may not use STA funding for operating purposes if the cost per hour exceeds the CPI and fails to meet PUC Section 99314.6 requirements. Following two years of higher than expected growth in cost per hour, SYVT experienced a decline in cost per hour in FY06, bringing it more in line with historical
O’Melia Consulting in association with Kelly Hines Consulting

Santa Ynez Valley Transit TDA Triennial Performance Audit Page 3
performance. Given the problems with data collection and reporting by the previous contractor during the FY01-FY03 audit period, it is suspected that vehicle service hours reported during the prior audit period were over-stated resulting in a lower reported cost per hour in FY03, the baseline year against which performance during this audit period is compared.
• The City of Solvang has taken preliminary action to address prior performance audit recommendations related to system administration, oversight, and data reporting. While some action has been taken, issues raised in the prior audit have not been fully addressed and additional actions are recommended in this performance audit.
• With the exception of employee full-time equivalents and separation of costs by mode, SYVT data collection on the part of the contract operator and City staff is compliant with TDA requirements. However, the reporting of such data to external oversight agencies including the State Controller and SBCAG could be improved.
• During the audit review period, ridership increased 2.8%. The farebox recovery ratio improved from 10.8% in FY03 to 12.7% in FY06. Cost per hour and cost per passenger trends are positive in that costs increased at a rate below that of inflation. Passenger productivity improved as well. Overall, performance trends are positive. Service quality factors such as miles between roadcalls, miles between accident, and customer complaints also show positive results.
• An SYVT SRTP was last prepared in 2003 and the system may be due for a new plan. Since 2003, SYVT has had two new contractors, changes in City staff, completion of the North Santa Barbara County Transit Plan in October 2003, and identification of Unmet Needs between the Solvang/Buellton and Lompoc areas. An updated operating plan may be warranted.
Recommendations
Two recommendations are offered for consideration by SYVT. Both recommendations are offered with the intention of helping the City of
O’Melia Consulting in association with Kelly Hines Consulting

Santa Ynez Valley Transit TDA Triennial Performance Audit Page 4
Solvang improve its transit system administration, oversight, and reporting functions.
1. The City of Solvang should carefully monitor and report transit system financial data and employee full-time equivalents (FTEs) in reports to oversight agencies, including reporting information by mode and requesting the financial auditors for FY 2007 to review FY 2006 farebox and operating costs.
2. The City of Solvang should clearly define the unique responsibilities of each staff member involved in the oversight and administration of the transit service.
O’Melia Consulting in association with Kelly Hines Consulting

Santa Ynez Valley Transit TDA Triennial Performance Audit Page 5
I. INTRODUCTION
Performance Audit Objectives and Approach
As the Regional Transportation Planning Agency (RTPA) for Santa Barbara County, the Santa Barbara County Association of Governments (SBCAG) is required by the Public Utilities Code (PUC) Sections 99246 and 99248 to contract for a third party performance audit of itself and each of the transit operators to which Transportation Development Act (TDA) funds are allocated. These audits are to be conducted in accordance with the California Department of Transportation, Performance Audit Guidebook for Transit Operators and Regional Transportation Entities. Performance audits are required to:
• Determine compliance with regulatory requirements
• Assess progress to implement prior performance audit recommendations
• Verify performance indicators and validate basic data used to calculate indicators
• Evaluate the effectiveness and efficiency of agency functions.
This performance audit is for Fiscal Years 2004, 2005 and 2006 -- the period of time beginning July 1, 2003 and ending June 30, 2006.
While the performance audit is being conducted in response to State requirements, such audits can and should be constructive and useful to governing boards, SBCAG and transit operator management.
It is the Auditor’s responsibility to provide objective and balanced reporting of results. This is important because very few agencies are all good or all bad. It is the auditor's responsibility to conduct thorough and accurate analyses and objectively report performance findings. This includes good, moderate and poor performance, as well as the factors contributing to performance results. Significant accomplishments and positive performance trends are discussed as well as opportunities for improvement.
O’Melia Consulting in association with Kelly Hines Consulting

Santa Ynez Valley Transit TDA Triennial Performance Audit Page 6
The methodology for this audit included interviews with key staff and management involved in the provision of transit services, a site visit for review of operations and data collection practices, review of operational and financial data, and review of relevant documents. Highlights of this review are presented below in Exhibit 1.
Exhibit 1 – Performance Audit Sources
Interviews – Name and Title
Bradley Vidro, City Manager, City of Solvang Dana Waite, Finance Director, City of Solvang
Jonathan Dotson, Project Manager, AmericanStar Transportation Matt Dobberteen, Senior Planner, Santa Barbara County Public Works Department
Steve Thompson, City Manager, City of Buellton
Site Visit(s)
City of Solvang, May 9, 2007 AmericanStar Transportation, May 9, 2007
City of Solvang, July 13, 2007
Background Materials Reviewed
Comprehensive Annual Financial Reports, Fiscal Years 2004-2006 Annual Report of Financial Transactions of Transit Operations -- State Controllers
Annual Reports, Fiscal Years 2004-2006 TDA Triennial Performance Audit Report For Fiscal Years Ending June 30, 2003
Annual TDA and STA Claim Forms, Fiscal Years 2004-2006 City of Solvang Budget to Actual Reports, Fiscal Years 2004-2006 Contractor Monthly Management Reports, Fiscal Years 2004-2006
California Highway Patrol Pull-Notice and Terminal Inspection Certifications Purchased Transportation Service Agreement
Organizational Chart and Annual Budgets, Fiscal Years 2004-2006 Public Information – Website, Timetables & Schedules, Brochures
O’Melia Consulting in association with Kelly Hines Consulting

Santa Ynez Valley Transit TDA Triennial Performance Audit Page 7
System Overview Organization & Policy Decisions
Santa Ynez Valley Transit is provided through the City of Solvang’s Public Works Department, which contracts with a private transit carrier, AmericanStar Transportation, for service provision. The City of Solvang administers the contract with AmericanStar on behalf of the City of Buellton and the County of Santa Barbara, as documented in the Memorandum of Understanding (MOU) between the three jurisdictions.
Policy direction is provided by a three member governing board made up of a representative of each jurisdiction in the MOU. Each jurisdiction’s share of system costs is determined by ridership originating in each jurisdiction – Buellton, the County, and Solvang. The City of Solvang administers the service, which includes procuring contract operator services, approving and paying contractor invoices, filing claim forms and preparing external reports (e.g., State Controller).
The City of Buellton and the County have assumed a hands-off approach in the oversight of the SYVT service, content to leave system administration and management to the City of Solvang. Complaints received by member jurisdictions, of which there are very few, serves as an informal measure of system performance. The governing board does not have a regularly scheduled meeting time, instead meeting as needed to address policies or programs such as the bus stop improvement program now underway. Both the City of Buellton and the County indicate that they are kept sufficiently apprised of system performance and operational issues and are satisfied with Solvang’s administration of the system. Costs are shared based on the percentage of boardings within each jurisdiction, which is tracked and reported on monthly by the contract operator.
Management & Staffing
The contractor’s Project Manager reports directly to the City of Solvang’s Public Works Director with secondary reporting to the City’s Finance Director.
O’Melia Consulting in association with Kelly Hines Consulting

Santa Ynez Valley Transit TDA Triennial Performance Audit Page 8
O’Melia Consulting in association with Kelly Hines Consulting
Exhibit 2 – Organization Chart City Manager
AmericanStarTransportation
Finance Director
Public Works Director
Primary ReportingSecondary Reporting
City Manager
AmericanStarTransportation
Finance Director
Public Works Director
City Manager
AmericanStarTransportation
Finance Director
Public Works Director
Primary ReportingSecondary Reporting
This represents a recent change for the City of Solvang as the Public Works Director is new to the City and only recently took on the responsibility for oversight of transit operations. Prior to this organizational structure, the City Manager was responsible for transit service oversight. The City’s Finance Director continues to oversee financial reporting for the transit service and, together with the City Manager, provides approval of contractor invoices.
In September 2003, a new service contractor, MV Transportation, was selected and provided service throughout the audit period before AmericanStar Transportation took over on July 1, 2006.
The City of Solvang also contracts with a private public transit consulting firm for marketing and outreach activities, as well as planning and operational assistance on an as-needed basis.
Fixed Route Bus Service Characteristics
SYVT serves an area of 13 square miles with a population of approximately 25,000. The fixed route portion of the service is comprised of two routes with 80-minute headways (40-minute headways where the two routes overlap in Buellton and Solvang). Together, the two routes have 16 stops, nine of which are shared by the two routes in the Buellton and Solvang areas.
• Route A begins in Buellton at 7:00 am and follows the counter-clockwise loop through Santa Ynez and Los Olivos, ending service at 6:55 pm in Buellton.
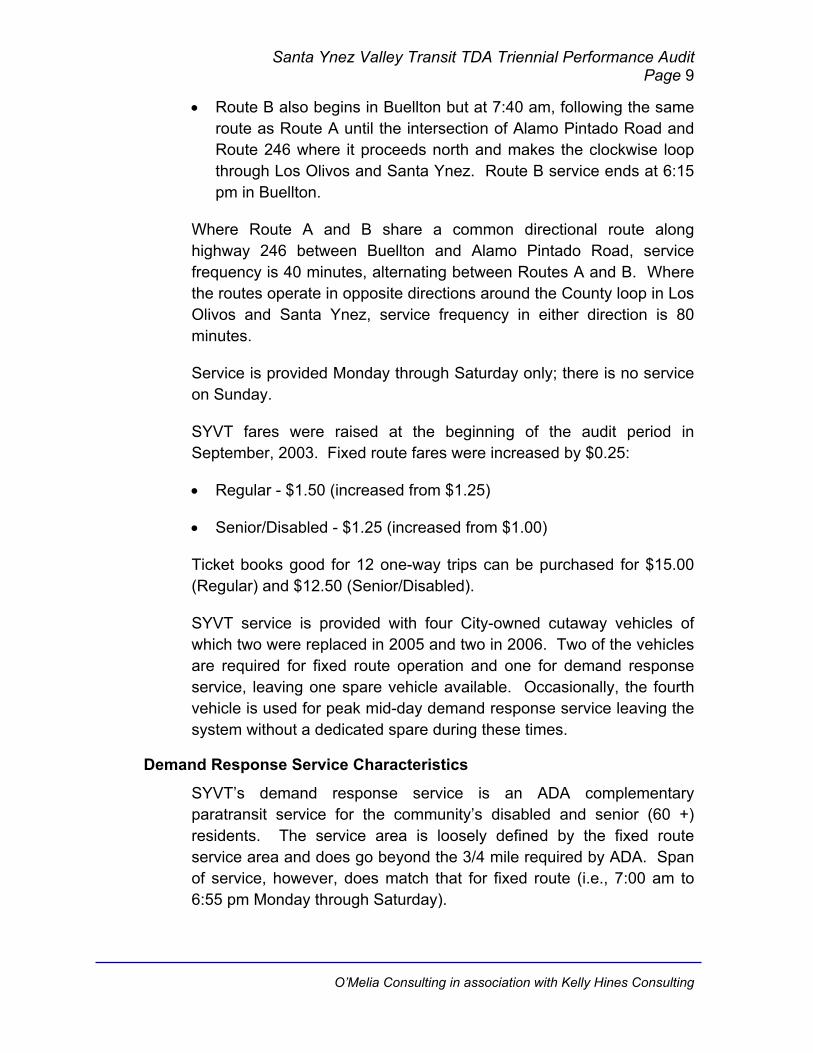
Santa Ynez Valley Transit TDA Triennial Performance Audit Page 9
• Route B also begins in Buellton but at 7:40 am, following the same route as Route A until the intersection of Alamo Pintado Road and Route 246 where it proceeds north and makes the clockwise loop through Los Olivos and Santa Ynez. Route B service ends at 6:15 pm in Buellton.
Where Route A and B share a common directional route along highway 246 between Buellton and Alamo Pintado Road, service frequency is 40 minutes, alternating between Routes A and B. Where the routes operate in opposite directions around the County loop in Los Olivos and Santa Ynez, service frequency in either direction is 80 minutes.
Service is provided Monday through Saturday only; there is no service on Sunday.
SYVT fares were raised at the beginning of the audit period in September, 2003. Fixed route fares were increased by $0.25:
• Regular - $1.50 (increased from $1.25)
• Senior/Disabled - $1.25 (increased from $1.00)
Ticket books good for 12 one-way trips can be purchased for $15.00 (Regular) and $12.50 (Senior/Disabled).
SYVT service is provided with four City-owned cutaway vehicles of which two were replaced in 2005 and two in 2006. Two of the vehicles are required for fixed route operation and one for demand response service, leaving one spare vehicle available. Occasionally, the fourth vehicle is used for peak mid-day demand response service leaving the system without a dedicated spare during these times.
Demand Response Service Characteristics
SYVT’s demand response service is an ADA complementary paratransit service for the community’s disabled and senior (60 +) residents. The service area is loosely defined by the fixed route service area and does go beyond the 3/4 mile required by ADA. Span of service, however, does match that for fixed route (i.e., 7:00 am to 6:55 pm Monday through Saturday).
O’Melia Consulting in association with Kelly Hines Consulting

Santa Ynez Valley Transit TDA Triennial Performance Audit Page 10
The demand response fare was also increased in 2003, from $1.50 to $2.25. Twelve trip booklets can be purchased for $22.50.
The demand response service utilizes one of SYVT’s four cutaway vehicles. Throughout most of the day only one vehicle is required, leaving one spare vehicle for both demand response and fixed route. Growth in demand for demand response service has required the single spare vehicle to be used occasionally for peak trips between 11:00 am and 1:00 pm.
Achievements and Challenges During the Audit Review Period
During the performance audit review period (i.e., July 1, 2003 and June 30, 2006), SYVT has successfully implemented a number of changes with a positive impact on performance. SYVT has also been faced with a number of challenges. These are highlighted below.
• SYVT successfully introduced two new contract operators over the audit period – one on September 1, 2003 (MV Transportation replacing Parking Company of America), and the second on July 1, 2006 (AmericanStar Transportation replacing MV Transportation). Data reporting improved greatly following the first new contractor in 2003 and has continued over the last year with AmericanStar. It does appear as if the City incurred higher costs with the introduction of MV Transportation but the poor data from the prior contractor makes it difficult to draw absolute conclusions. Cost per hour did decline during the final year of the audit period – the last year of MV Transportation’s contract.
• Ridership increased by nearly 10% in the final year of the audit period – up to 35,600 annual passengers.
• Despite improved contractor reporting of operational data, financial data reporting demonstrated some significant discrepancies over the audit period. This appears to be a by-product of shifting responsibilities among City staff for system administration as the City continued to experience turnover in staff positions with transit oversight responsibilities.
O’Melia Consulting in association with Kelly Hines Consulting
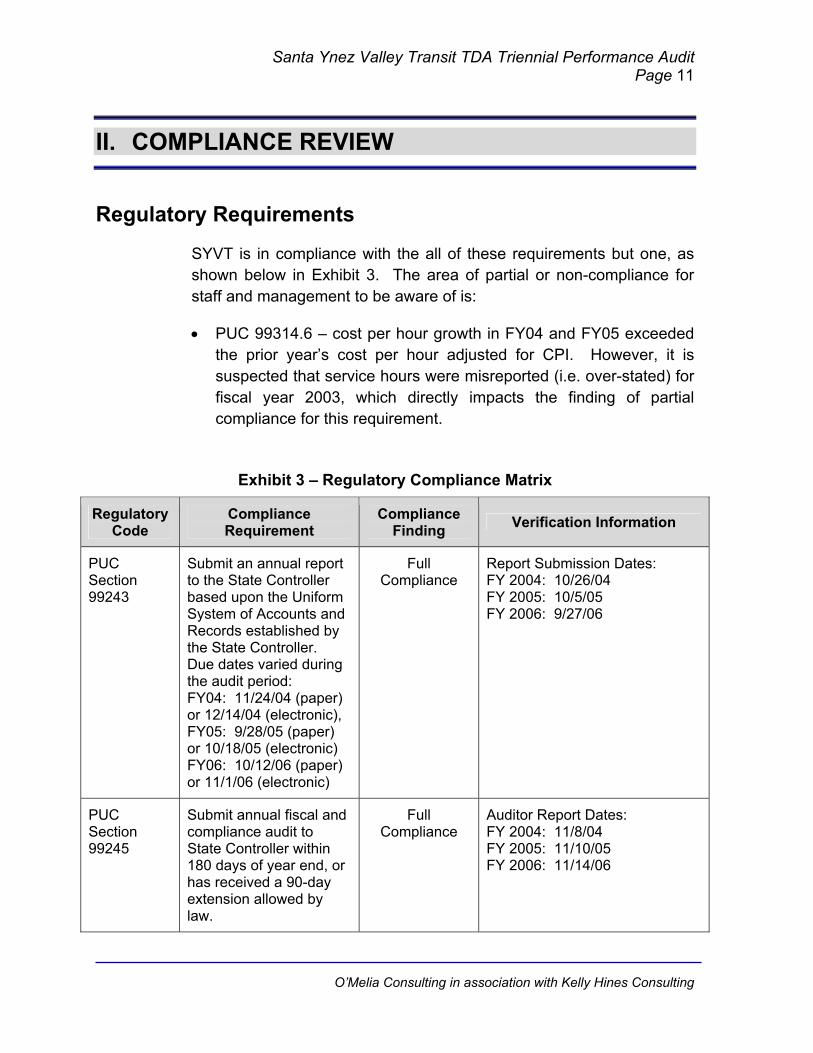
Santa Ynez Valley Transit TDA Triennial Performance Audit Page 11
II. COMPLIANCE REVIEW
Regulatory Requirements
SYVT is in compliance with the all of these requirements but one, as shown below in Exhibit 3. The area of partial or non-compliance for staff and management to be aware of is:
• PUC 99314.6 – cost per hour growth in FY04 and FY05 exceeded the prior year’s cost per hour adjusted for CPI. However, it is suspected that service hours were misreported (i.e. over-stated) for fiscal year 2003, which directly impacts the finding of partial compliance for this requirement.
Exhibit 3 – Regulatory Compliance Matrix
Regulatory Code
Compliance Requirement
Compliance Finding Verification Information
PUC Section 99243
Submit an annual report to the State Controller based upon the Uniform System of Accounts and Records established by the State Controller. Due dates varied during the audit period: FY04: 11/24/04 (paper) or 12/14/04 (electronic), FY05: 9/28/05 (paper) or 10/18/05 (electronic) FY06: 10/12/06 (paper) or 11/1/06 (electronic)
Full Compliance
Report Submission Dates: FY 2004: 10/26/04 FY 2005: 10/5/05 FY 2006: 9/27/06
PUC Section 99245
Submit annual fiscal and compliance audit to State Controller within 180 days of year end, or has received a 90-day extension allowed by law.
Full Compliance
Auditor Report Dates: FY 2004: 11/8/04 FY 2005: 11/10/05 FY 2006: 11/14/06
O’Melia Consulting in association with Kelly Hines Consulting

Santa Ynez Valley Transit TDA Triennial Performance Audit Page 12
Regulatory Code
Compliance Requirement
Compliance Finding Verification Information
PUC Section 99251
Submit CHP certification of compliance with Pull Notice within 13 months period prior to TDA claim
Full Compliance
CHP Certification Dates: FY 2004 Claim: 2/20/03 FY 2005 Claim: 2/23/04 FY 2006 Claim: 3/15/05
PUC Section 99261
Submit TDA Claim in compliance with rules and regulations adopted by RTPE
Full Compliance
TDA Claims were submitted to and funds approved by SBCAG in all three years.
PUC Section 99264
The operator does not routinely staff public transportation vehicles designed to be operated by one person with two or more persons
Full Compliance
Review of staffing assignments indicates that one person is responsible for vehicle operations.
PUC Section 99266
Operating budget has not increased by more than 15% over preceding year unless reasonable justification for the change has been provided
Full Compliance
% Change Per State Controller Report FY 2003 to 2004: 20.6% FY 2004 to 2005: 12.8% FY 2005 to 2006: 3.7% Data calculated as FY Budget as % increase over prior FY actual operating cost. FY04 budget did increase by more than 15% to account for costs of new contract provider starting in September, 2003.
PUC Sections 99268.2-5 & .12
Operator has maintained a ratio of revenues to operating costs equal to 20% for urban areas and 10% for rural areas and specialized services or 15% in areas with a population less than 500,000 if determined by RTPE
Full Compliance
Farebox Recovery Ratio Per Financial Audits: FY 2004: 11.5%, 14.9% with local subsidies FY 2005: 9%, 12.2% with local subsidies FY 2006: 9%, 14.3% with local subsidies. See TDA Performance Indicator Trends for revised estimates of SYVT farebox recovery ratio.
O’Melia Consulting in association with Kelly Hines Consulting

Santa Ynez Valley Transit TDA Triennial Performance Audit Page 13
Regulatory Code
Compliance Requirement
Compliance Finding Verification Information
PUC Section 99268
Operator TDA funding is no more than 50% of operating, maintenance, capital, and debt service requirements after federal grants and STA revenues are deducted
Not applicable as SYVT met
farebox recovery
requirement as noted above.
TDA Funds As % of Total Annual Costs (less Federal Grants & STA Revenues) Per Financial Audit: FY 2004: N/A FY 2005: N/A FY 2006: N/A
PUC Section 99271
The retirement system is fully funded, or the Operator is implementing a plan that will fully fund the retirement system within 40 years.
Full Compliance
The Public Employees Retirement System (PERS) covers City of Solvang staff.
PUC Section 99314.5
If the Operator receives STA funds, the Operator is not precluded by contract from employing part-time drivers or from contracting with common carriers
Full Compliance
The City of Solvang contracts with a common carrier for the provision of transit service. The contractor also employees part-time staff.
PUC Section 99314.6
If the Operator receives STA funds for operating purposes: (1) the Operator’s total operating cost per revenue hour does not exceed the prior year’s cost per revenue hour adjusted for inflation using the CPI; or (2) the Operator’s average total operating cost per revenue hour in the latest three years does not exceed the sum of the average of the three years preceding the latest year, adjusted for inflation using the CPI.
Partial Compliance –
FY06 is compliant,
FY05 and FY04 are not.
However, data for FY03 and
earlier may be skewed due to
incorrectly reporting total vehicle hours
as vehicle service hours or
not properly counting
vehicle service hours for demand response service.
Based on State Controller’s Reports, Option (1): FY06: Cost per hour fell 17.9% over FY05 cost per hour. - Compliant FY05: Cost per hour increased 11.4% over FY04 compared to CPI growth of 4.2% - Non-Compliant FY04: Cost per hour increased 18.9% compared to CPI growth of 2.5% - Non-Compliant Option (2): FY05: FY03-FY05 average cost per hour compared to FY02-FY04 inflation adjusted cost per hour: $42.57 versus $39.25 – Non-Compliant FY04: FY02-FY04 average cost per hour compared to FY01-FY03 inflation adjusted cost per hour: $37.42 versus $34.07 – Non-Compliant
O’Melia Consulting in association with Kelly Hines Consulting

Santa Ynez Valley Transit TDA Triennial Performance Audit Page 14
Regulatory Code
Compliance Requirement
Compliance Finding Verification Information
CAC Section 6754 (a) (3)
Available Federal funds are used prior to claiming STA funds
Full Compliance
Federal grant funds claimed per Financial Audit: FY 2004: $77,186 FY 2005: $0 FY 2006: $53,538
During the Exit Interview for this performance audit, areas of partial and non-compliance have been reviewed with management and staff.
Progress To Implement Prior Audit Recommendations
The prior TDA Performance Audit, completed in June 2004, made three recommendations for improved compliance and performance. SYVT progress to implement prior audit recommendations includes partial implementation of two recommendations, and no progress on the third recommendation though the third recommendation, as written, is unclear to City staff. Progress against the perceived intent of the third recommendation is assessed below. Key questions included in this analysis of progress to implement prior audit recommendations are:
• What action(s) have been taken to implement the recommendation? Has performance improved as a result of actions taken?
• Is the issue to be addressed by the prior performance audit recommendation still valid today? Why or why not?
• If there has been little or no progress, are future actions planned? Was a different approach selected and if so, what is the status of this activity?
Exhibit 4 summarizes progress relative to prior performance audit recommendations. Findings of “Implemented, Partially Implemented, or Not Implemented” are made for each recommendation.
O’Melia Consulting in association with Kelly Hines Consulting

Santa Ynez Valley Transit TDA Triennial Performance Audit Page 15
Exhibit 4 – Progress To Implement Prior Audit Recommendations
Prior Audit Recommendations
Prior Audit Findings Leading to
Recommendation Compliance
Finding Implementing Actions &
Results
1. Clearly define roles and responsibilities for administering Santa Ynez Valley Transit.
Two key staff positions were vacant during the last audit period. Positions were filled as of the first year of this audit period and the auditor recommended that responsibilities of each of these individuals be clearly identified to ensure that both day-to-day and long term planning and service evaluation tasks are addressed.
Partially Implemented
The second of the two staff vacancies identified during the last audit period – Public Works Director – was re-filled in the Spring of 2007 (just after this audit period) with the former Public Works Director becoming City Manager. City staff responsibilities for contract oversight and administration continue to be juggled between the Director of Finance and the Public Works Director, and no documentation of defined responsibilities for each position has been produced. The City has continued to rely on its contract operator for certain administrative tasks (i.e. data reporting in external reports and attendance at regional technical committee meetings). Additionally, the lack of defined responsibilities has led to significant errors in financial data reporting during the audit period and is a cause for concern. Fortunately, the current contractor is running a smooth and effective operation and there are no significant operational concerns. This recommendation is carried forward as recommendation of this audit period.
O’Melia Consulting in association with Kelly Hines Consulting

Santa Ynez Valley Transit TDA Triennial Performance Audit Page 16
Prior Audit Recommendations
Prior Audit Findings Leading to
Recommendation Compliance
Finding Implementing Actions &
Results
2. Continue on current course of improved record keeping and monitor performance trends separately for each service.
The contract operator during the last audit period kept poor and incomplete records.
Partially Implemented
Since the last audit period, SYVT service has been provided by two separate contract operators both of who kept better records of system data and performance, including separation of data by mode. However, there is no indication that City staff responsible for administering the service is routinely assessing contractor-reported data for system performance and are, in fact, combining data for the two modes for external data reporting. The contractor processes are in place to support the City in fully implementing this recommendation during the next audit period.
3. The City and the contractor should examine the current mechanism used for cost allocation between the fixed route and demand response services to ensure that the proportions accurately reflect the costs of each mode.
This recommendation was carried over from prior audits by the FY01-FY03 auditor. The auditor indicated that the operating cost reported to the State Controller during the last audit period was still determined based on the modal passenger split rather than the actual cost.
Deferred to this audit.
As operating cost data has never been segregated by mode in the State Controller’s Reports, the recommendation was not clear to City staff. The City, however, does receive costs by mode from the contractor. Data should be segregated by mode in the State Controller’s report and non-contractor operating costs such as City overhead should be allocated to each mode on the basis of operating costs (i.e., service hours as the cost per hour charged by the contractor is the same for each mode).
O’Melia Consulting in association with Kelly Hines Consulting

Santa Ynez Valley Transit TDA Triennial Performance Audit Page 17
Data Verification
Included in the review of transit operators is the regulatory requirement (i.e., PUC Section 99247) that performance audits include a verification of five data items including:
• Operating Cost. The total cost of running a transit operation, exclusive of capital expenditures, depreciation, direct costs of providing charter service and vehicle lease costs.
• Total Passengers. The total number of unlinked trips; all passenger boardings whether revenue producing or not.
• Total Vehicle Service Hours. The total annual number of hours that vehicles are in revenue service. Excluded is travel to and from storage facilities and other deadhead travel. Also referred to as Revenue Hours.
• Total Vehicle Service Miles. The total annual number of miles that vehicles are in revenue service. Miles traveled to and from storage facilities and other deadhead travel are excluded. Also referred to as Revenue Miles.
• Employee Equivalents. The total actual regular and overtime employee pay hours divided by 2,000 hours. Contract employees are included, but not volunteers. Also referred to as FTEs.
SYVT is in compliance with three of five data definitions and methods of data collection as summarized in Exhibit 5. A finding of partial compliance is made for operating costs as the data is not reported separately by mode as required by TDA. A finding of non-compliance is made for employee equivalents as the data is not reported per the TDA definition of total employee pay hours divided by 2,000 but instead as an employee headcount. Additionally, employee equivalent data is not reported separately by mode.
O’Melia Consulting in association with Kelly Hines Consulting

Santa Ynez Valley Transit TDA Triennial Performance Audit Page 18
Exhibit 5 – Verified Data Elements for TDA Performance Indicators
Data Items & Mode
Fiscal Year 2004
Fiscal Year 2005
Fiscal Year 2006
Operating Costs (Demand Response)
Could not be verified as contractor during this period was replaced.
Partial Compliance: Contractor reports costs on an hourly basis and segregates by mode. City separately tracks depreciation as required, but does not allocate non-contractor operating costs to each mode and reports system-wide costs.
Partial Compliance: Contractor reports costs on an hourly basis and segregates by mode. City separately tracks depreciation as required, but does not allocate non-contractor operating costs to each mode and reports system-wide costs.
Total Passengers (Demand Response)
Could not be verified as contractor during this period was replaced.
Full Compliance: Contractor reports ridership separately by each mode, counting all passenger boardings.
Full Compliance: Contractor reports ridership separately by each mode, counting all passenger boardings.
Total Vehicle Service Hours (Demand Response)
Could not be verified as contractor during this period was replaced.
Full Compliance: Contractor reports service hours separately by each mode, subtracting out deadhead.
Full Compliance: Contractor reports service hours separately by each mode, subtracting out deadhead.
Total Vehicle Service Miles (Demand Response)
Could not be verified as contractor during this period was replaced.
Full Compliance: Contractor reports service miles separately by each mode, subtracting out deadhead.
Full Compliance: Contractor reports service miles separately by each mode, subtracting out deadhead.
Employee Equivalents (Demand Response)
Non-compliant, contractor does not provide employee pay hours and City reports number of employees.
Non-compliant, contractor does not provide employee pay hours and City reports number of employees.
Non-compliant, contractor does not provide employee pay hours and City reports number of employees.
O’Melia Consulting in association with Kelly Hines Consulting

Santa Ynez Valley Transit TDA Triennial Performance Audit Page 19
Data Items & Mode
Fiscal Year 2004
Fiscal Year 2005
Fiscal Year 2006
Operating Costs (Fixed Route)
Could not be verified as contractor during this period was replaced.
Partial Compliance: Contractor reports costs on an hourly basis and segregates by mode. City separately tracks depreciation as required, but does not allocate non-contractor operating costs to each mode and reports system-wide costs.
Partial Compliance: Contractor reports costs on an hourly basis and segregates by mode. City separately tracks depreciation as required, but does not allocate non-contractor operating costs to each mode and reports system-wide costs.
Total Passengers (Fixed Route)
Could not be verified as contractor during this period was replaced.
Full Compliance: Contractor reports ridership separately by each mode, counting all passenger boardings.
Full Compliance: Contractor reports ridership separately by each mode, counting all passenger boardings.
Total Vehicle Service Hours (Fixed Route)
Could not be verified as contractor during this period was replaced.
Full Compliance: Contractor reports service hours separately by each mode, subtracting out deadhead.
Full Compliance: Contractor reports service hours separately by each mode, subtracting out deadhead.
Total Vehicle Service Miles (Fixed Route)
Could not be verified as contractor during this period was replaced.
Full Compliance: Contractor reports service miles separately by each mode, subtracting out deadhead.
Full Compliance: Contractor reports service miles separately by each mode, subtracting out deadhead.
Employee Equivalents (Fixed Route)
Non-compliant, contractor does not provide employee pay hours and City reports number of employees.
Non-compliant, contractor does not provide employee pay hours and City reports number of employees.
Non-compliant, contractor does not provide employee pay hours and City reports number of employees.
With the exception of employee equivalents and operating statistics by mode, SYVT is in compliance with data collection requirements. However, the reporting of verified data elements could be improved as discrepancies were found in reported financial information (operating
O’Melia Consulting in association with Kelly Hines Consulting

Santa Ynez Valley Transit TDA Triennial Performance Audit Page 20
costs and farebox revenues), and financial data was not reported separately by mode.
Data Consistency
Exhibit 6 compares financial data as reported in a number of separate documents. As the City of Solvang does not report financial information separately for the two modes of service, data shown is for the total system.
Exhibit 6 – Financial Data Consistency Review
FY 2004 FY 2005 FY 2006Financial Audit 414,024$ 466,505$ 418,410$ State Controller's Report 414,022$ 466,505$ 427,419$ Contractor Monthly Mgmt. Report N/A 50,888$ 55,187$ Financial Audit 47,815$ 41,872$ 37,775$ State Controller's Report 47,815$ 41,872$ 37,775$ Financial Audit 13,976$ 15,263$ 21,922$ City Budget to Actual Reports 13,976$ 15,263$ 21,921$
Local Subsidies & Auxiliary Revenues
Passenger Revenues
TDA Statistic Audit Review PeriodSource
Operating Costs
SYVT maintains a separate operational unit for SYVT – Department 5000 – Transit – for tracking SYVT expenses and revenues. The City correctly tracks depreciation expense separately and the numbers shown in Exhibit 6 are net of depreciation expense. About 2/3 of SYVT’s operating costs are attributable to contract operations which bills the City hourly for hours of service provided. Additional cost elements include City overhead, vehicle repair costs, bus stop maintenance, and fuel.
Operating costs were reported consistently in FY04 and FY05 but show a $9,000 discrepancy in FY06. Beginning in FY05, passenger revenues reported in the State Controller’s Report and in the Financial Audit were lower than that shown as collected in the Contractor Monthly Management Reports. In FY05, this difference was approximately $9,000 and may be the source of the $9,000 difference between the State Controller’s Report and Financial Audit in FY06 (i.e., City recorded $9,000 in fare revenue retained for FY05 as operating expense in FY06). However, the difference in reported fare revenues grew to $17,000 in FY06, while operating costs fell by $40,000 in FY06. It appears as though contractor operating costs, as reported on monthly invoices to the City, were under-stated by at least the $17,000 in fare revenue retained by the contractor and netted out of contractor operating costs to determine payment to the contractor.
O’Melia Consulting in association with Kelly Hines Consulting
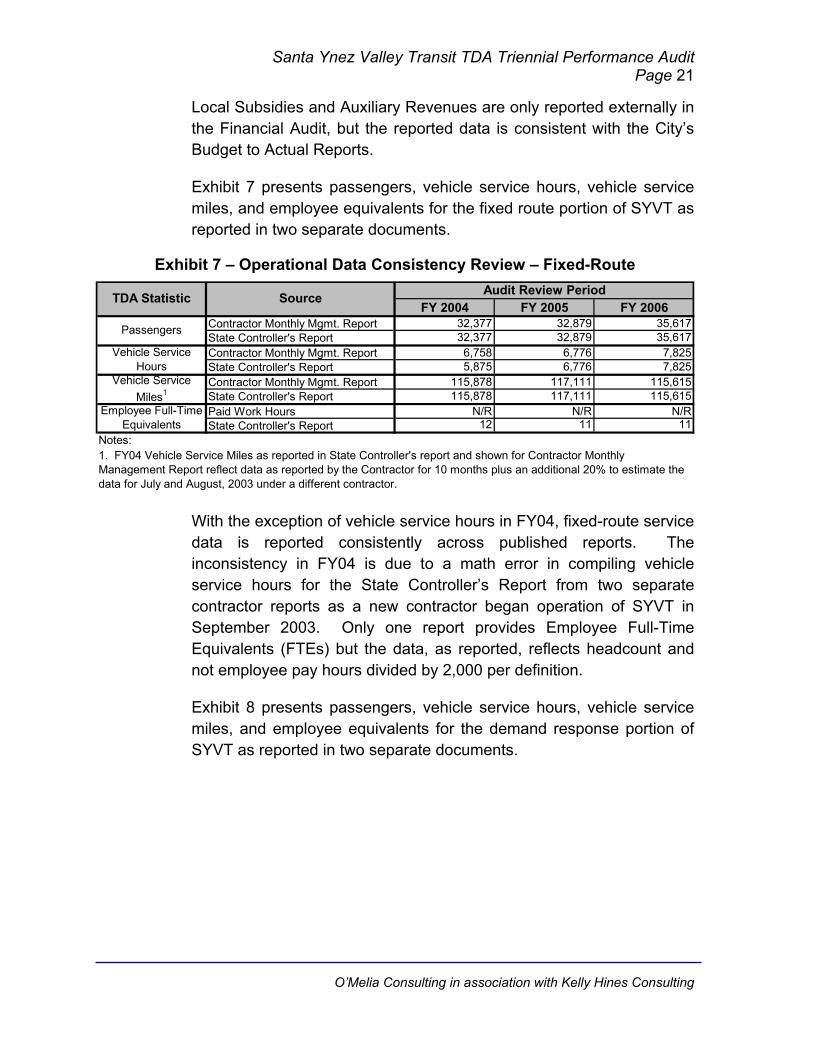
Santa Ynez Valley Transit TDA Triennial Performance Audit Page 21
Local Subsidies and Auxiliary Revenues are only reported externally in the Financial Audit, but the reported data is consistent with the City’s Budget to Actual Reports.
Exhibit 7 presents passengers, vehicle service hours, vehicle service miles, and employee equivalents for the fixed route portion of SYVT as reported in two separate documents.
Exhibit 7 – Operational Data Consistency Review – Fixed-Route
FY 2004 FY 2005 FY 2006Contractor Monthly Mgmt. Report 32,377 32,879 35,617State Controller's Report 32,377 32,879 35,617Contractor Monthly Mgmt. Report 6,758 6,776 7,825State Controller's Report 5,875 6,776 7,825Contractor Monthly Mgmt. Report 115,878 117,111 115,615State Controller's Report 115,878 117,111 115,615Paid Work Hours N/R N/R N/RState Controller's Report 12 11 11
Notes:1. FY04 Vehicle Service Miles as reported in State Controller's report and shown for Contractor Monthly Management Report reflect data as reported by the Contractor for 10 months plus an additional 20% to estimate the data for July and August, 2003 under a different contractor.
TDA Statistic Source Audit Review Period
Vehicle Service Hours
Vehicle Service Miles1
Employee Full-Time Equivalents
Passengers
With the exception of vehicle service hours in FY04, fixed-route service data is reported consistently across published reports. The inconsistency in FY04 is due to a math error in compiling vehicle service hours for the State Controller’s Report from two separate contractor reports as a new contractor began operation of SYVT in September 2003. Only one report provides Employee Full-Time Equivalents (FTEs) but the data, as reported, reflects headcount and not employee pay hours divided by 2,000 per definition.
Exhibit 8 presents passengers, vehicle service hours, vehicle service miles, and employee equivalents for the demand response portion of SYVT as reported in two separate documents.
O’Melia Consulting in association with Kelly Hines Consulting

Santa Ynez Valley Transit TDA Triennial Performance Audit Page 22
Exhibit 8 – Operational Data Consistency Review – Demand Response
FY 2004 FY 2005 FY 2006Other Source 4,689 4,956 4,975State Controller's Report 4,689 4,956 4,975Other Source 2,821 2,912 3,201State Controller's Report 2,606 2,912 3,201Other Source 28,320 29,334 23,957State Controller's Report 28,320 29,334 23,957Paid Work Hours N/R N/R N/RState Controller's Report 12 11 11
Notes:
Vehicle Service Miles1
Employee Full-Time Equivalents
1. FY04 Vehicle Service Miles as reported in State Controller's report and shown for Contractor Monthly Management Report reflect data as reported by the Contractor for 10 months plus an additional 20% to estimate the data for July and August, 2003 under a different contractor.
TDA Statistic Source Audit Review Period
Passengers
Vehicle Service Hours
Like fixed route data, demand response data is reported consistently across published reports with the exception of vehicle service hours in FY04. Reported FTEs reflect a headcount, rather than calculated FTEs as required by TDA.
The process for compiling and/or calculating the four service data items is as follows:
• Passengers – 100% headcount of passenger boardings.
• Vehicle Service Hours – data based on scheduled service, with deadhead subtracted out based on a one-week analysis period of actual deadhead time. The same approach is used for fixed route and demand response service. The contractor reports that there is little fluctuation in demand response ridership as most customers use standing reservations. Missed trips are subtracted from the schedule-based totals.
• Vehicle Service Miles – same as vehicle service hours.
• Employee Full-Time Equivalents – data reported in the State Controller’s report reflects an employee headcount and not employee pay hours divided by 2,000 as required by definition. The contractor does not provide the City with employee pay hours. The City should require the Contractor to report these hours and then include any City staff hours charged directly to Transit (Department 5000) but not time for staff that are included in the Transit allocation of City overhead. Total employee pay hours should then be divided by 2,000 to arrive at FTEs.
O’Melia Consulting in association with Kelly Hines Consulting

Santa Ynez Valley Transit TDA Triennial Performance Audit Page 23
TDA Performance Indicator Trends
California Public Utilities Code Section 99246 (d) states that performance audits of transit operators shall include a verification of performance indicators defined in the Public Utilities Code Section 99247. These performance indicators include:
• Operating Cost Per Vehicle Service Hour • Operating Cost Per Passenger • Passengers Per Vehicle Service Hour • Passengers Per Vehicle Service Mile • Vehicle Service Hours Per Employee.
Trends for these five TDA performance indicators are presented below by total system and by mode (i.e., fixed route and demand response). Performance indictor trends involving costs are also compared to the Consumer Price Index -- Urban Wage Earners and Clerical Workers for the Los Angeles-Riverside-Orange County area.
Additionally, SYVT’s revised farebox recovery performance, system-wide and by mode, are documented on the following pages, correcting, to the extent possible, for data reporting errors over the audit period as noted in the Regulatory Requirements and Data Verification sections of this chapter.
O’Melia Consulting in association with Kelly Hines Consulting

Santa Ynez Valley Transit TDA Triennial Performance Audit Page 24
TDA Performance Indicator Trends – System-wide
Exhibit 9 presents TDA performance indicators for SYVT’s total system.
Exhibit 9 – TDA Performance Indicators – System-Wide
FY 2004 FY 2005 FY 2006Operating Costs $ 390,194 $ 414,024 $ 466,505 $ 435,822 11.7%Passengers 39,478 37,066 37,835 40,592 2.8%Vehicle Service Hours 10,864 9,579 9,688 11,026 1.5%Vehicle Service Miles 160,310 144,198 146,445 139,572 -12.9%Employee Full-Time Equivalents 10.0 12.0 11.0 11.0 10.0%Farebox Revenues $ 42,143 $ 47,815 $ 50,888 $ 55,187 31.0%Local Subsidies & Auxiliary Revenues $ 17,208 $ 13,976 $ 15,263 $ 21,922 27.4%Operating Cost Per Vehicle Service Hour $ 35.92 $ 43.22 $ 48.15 $ 39.53 10.1%Operating Cost Per Passenger $ 9.88 $ 11.17 $ 12.33 $ 10.74 8.6%Passengers Per Vehicle Service Hour 3.6 3.9 3.9 3.7 1.3%Passengers Per Vehicle Service Mile 0.25 0.26 0.26 0.29 18.1%Vehicle Service Hours Per Employee FTE 1,086 798 881 1,002 -7.7%Farebox Recovery Ratio 10.8% 11.5% 10.9% 12.7% 17.2%Farebox Recovery Ratio with Local Subsidies 15.2% 14.9% 14.2% 17.7% 16.3%Percent Change in the CPI - 2.5% 4.2% 4.8% 11.9%Notes:
Verified TDA Statistics & Performance Indicators
Base Year FY 2003
Audit Review Period Percent Change FY 2003 to FY 2006
FY05 and FY06 service data from State Controller's Reports. FY04 Vehicle Service Hours from Contractor Monthly Management Reports, all other FY04 data from State Controller's reports. FY03 data from previous audit which cites State Controller as the source. However, FY03 vehicle service miles as shown in the previous audit and shown here could not be verified in the 2003 State Controller's report.
Financial data from City of Solvang Public Transit Fund Annual Financial Statements except 1) FY06 operating cost which is based on Financial Statement plus Farebox Revenues under-reported in the Financial Audit by $17,412 as compared to Contractor Monthly Management Reports, 2) FY06 farebox revenues which are from Contractor Monthly Management Reports, and 3) FY05 farebox revenues which are from Contractor Monthly Management Reports.
• Operating Cost Per Vehicle Service Hour is a measure of cost
efficiency. During the audit review period, cost per hour grew less than inflation as vehicle service hours grew by 1.5%. However, as stated previously, it is suspected that vehicle service hours reported in FY03 reflect, instead, total vehicle hours. This would lead to an under-statement of cost per hour in FY03 and an over-statement of the growth in costs over the audit period.
• Operating Cost Per Passenger is a measure of cost effectiveness. During the audit period, cost per passenger grew just 8.6% compared to growth in CPI of 11.9%. Modest growth in ridership combined with inflation-only growth in costs led to positive cost effectiveness performance.
• Operating Cost Per Vehicle Service Hour is a measure of cost efficiency. During the audit review period, cost per hour also grew less than inflation as vehicle service hours grew by 1.5%. However, as stated previously, it is suspected that vehicle service hours reported in FY03 reflect, instead, total vehicle hours. This
O’Melia Consulting in association with Kelly Hines Consulting

Santa Ynez Valley Transit TDA Triennial Performance Audit Page 25
would lead to an under-statement of cost per hour in FY03 and an over-statement of the growth in costs over the audit period.
• Passengers Per Vehicle Service Hour is a measure of service productivity. During the audit review period, passengers per hour remained relatively unchanged as passenger and vehicle service hours both experienced modest growth.
• Passengers Per Vehicle Service Mile also measures service productivity. During the audit review period, passengers per mile grew by 18 percent as vehicle service miles fell by nearly 13 percent. Like service hours, however, it is suspected that reported FY03 service miles reflect total miles.
• Vehicle Service Hours Per Employee measures labor productivity. During the audit review period, labor productivity fell by nearly 8% but the measure is not indicative of actual performance as FTEs were not reported correctly. As the service is provided under contract, significant variation in this statistic from year to year would not be expected.
SYVT not only met its required farebox recovery ratio of 10% but saw an increase of more than 17% over the audit period. SYVT’s farebox recovery grew from 10.8% in FY03 to 12.7% in FY06. Considering other local funding sources (i.e., interest income and Measure D revenues), SYVT’s farebox recovery was 17.7% in FY06.
TDA Performance Indicator Trends – Fixed Route Service Mode
Exhibit 10 presents TDA performance indicators for SYVT’s fixed route service.
O’Melia Consulting in association with Kelly Hines Consulting

Santa Ynez Valley Transit TDA Triennial Performance Audit Page 26
Exhibit 10 – TDA Performance Indicators – Fixed Route Mode
FY 2004 FY 2005 FY 2006Operating Costs1 $ 241,896 $ 292,088 $ 326,284 $ 309,297 27.9%Passengers2 33,061 32,377 32,879 35,617 7.7%Vehicle Service Hours2 6,735 6,758 6,776 7,825 16.2%Vehicle Service Miles3 128,826 115,878 117,111 115,615 -10.3%Employee Full-Time Equivalents - - - - #DIV/0!Farebox Revenues4 $ 36,044 $ 40,895 $ 42,968 $ 46,754 29.7%Local Subsidies & Auxiliary Revenues5 $ 6,127 $ 4,775 $ 5,374 $ 10,340 68.8%Operating Cost Per Vehicle Service Hour $ 35.92 $ 43.22 $ 48.15 $ 39.53 10.1%Operating Cost Per Passenger $ 7.32 $ 9.02 $ 9.92 $ 8.68 18.7%Passengers Per Vehicle Service Hour 4.9 4.8 4.9 4.6 -7.3%Passengers Per Vehicle Service Mile 0.26 0.28 0.28 0.31 20.0%Vehicle Service Hours Per Employee FTE #DIV/0! #DIV/0! #DIV/0! #DIV/0! #DIV/0!Farebox Recovery Ratio 14.9% 16.0% 13.2% 15.1% 1.4%Farebox Recovery Ratio with Local Subsidies & Auxiliary Revenues 17.4% 15.6% 14.8% 18.5% 5.9%
Percent Change in the CPI - 2.5% 4.2% 4.8% 11.9%Notes:1. Total system operating cost allocated to mode on the basis of vehicle service hours.
3. FY03 Total System Vehicle Service Miles allocated to mode on FY04 modal split.
2. Passengers and Vehicle service hours from State Controller's reports, except FY04 vehicle service hours which is from Contractor Monthly Management Report.
Verified TDA Statistics & Performance Indicators
Base Year FY 2003
Audit Review Period Percent Change FY 2003 to FY 2006
5. Local Subsidies and Auxiliary Revenues for the total system allocated to mode on the basis of operating costs, except for Measure B revenues which are allocated 100% to demand response service.
4. Farebox revenues based on Contractor Monthly Management Report. July, 2003 data not available so remaining revenue (total system less reported modal revenue) allocated to each mode on the basis of 11 months contractor reported modal revenue for FY04. FY03 fare revenue estimated based on FY04 modal split of farebox revenues.
• Operating Cost Per Vehicle Service Hour is a measure of cost efficiency. During the audit review period, cost per hour grew just 10.1% compared to CPI growth of 11.9%. A new contractor began operation in September, 2003 accounting for some of the growth in operating cost from FY03 to FY04.
• Operating Cost Per Passenger is a measure of cost effectiveness. During the audit period, cost per passenger demonstrated declining performance as cost per passenger grew 18.7% compared to CPI growth of 11.9%. However, performance was improving towards the end of the audit period as FY06 cost per passenger was $8.68 compared to $9.02 in FY04 and $9.92 in FY05
• Passengers Per Vehicle Service Hour is a measure of service productivity. During the audit review period, passengers per hour fell by 7% as service hours grew at a rate more than twice that of passengers.
• Passengers Per Vehicle Service Mile also measures service productivity. During the audit review period, passengers per mile
O’Melia Consulting in association with Kelly Hines Consulting

Santa Ynez Valley Transit TDA Triennial Performance Audit Page 27
were up 20% over the audit period as vehicle service miles fell by more than 10%.
• Vehicle Service Hours Per Employee was not measured for fixed route service as employees were reported only for the entire system.
The fixed route farebox recovery ratio grew by 1.4% over the audit period to just over 15% in FY06. With local subsidies and auxiliary revenues, the farebox recovery ratio increased to 18.5%.
TDA Performance Indicator Trends – Demand Response Service Mode
Exhibit 11 presents TDA performance indicators for SYVT’s demand response service.
Exhibit 11 – TDA Performance Indicators – Demand Response Mode
FY 2004 FY 2005 FY 2006Operating Costs1 $ 148,298 $ 121,936 $ 140,221 $ 126,525 -14.7%Passengers2 6,417 4,689 4,956 4,975 -22.5%Vehicle Service Hours2 4,129 2,821 2,912 3,201 -22.5%Vehicle Service Miles3 31,484 28,320 29,334 23,957 -23.9%Employee Full-Time Equivalents - - - - #DIV/0!Farebox Revenues4 $ 6,099 $ 6,920 $ 7,920 $ 8,433 38.3%Local Subsidies & Auxiliary Revenues (including Measure B Demand Response Revenues)4 $ 11,081 $ 9,201 $ 9,889 $ 11,582 4.5%
Operating Cost Per Vehicle Service Hour $ 35.92 $ 43.22 $ 48.15 $ 39.53 10.1%Operating Cost Per Passenger $ 23.11 $ 26.00 $ 28.29 $ 25.43 10.0%Passengers Per Vehicle Service Hour 1.6 1.7 1.7 1.6 0.0%Passengers Per Vehicle Service Mile 0.20 0.17 0.17 0.21 1.9%Vehicle Service Hours Per Employee FTE #DIV/0! #DIV/0! #DIV/0! #DIV/0! #DIV/0!Farebox Recovery Ratio 4.1% 5.7% 5.6% 6.7% 62.1%Farebox Recovery Ratio with Local Subsidies & Auxiliary Revenues 11.6% 13.2% 12.7% 15.8% 36.6%
Percent Change in the CPI - 2.5% 4.2% 4.8% 11.9%Notes:1. Total system operating cost allocated to mode on the basis of vehicle service hours.
3. FY03 Total System Vehicle Service Miles allocated to mode on FY04 modal split.
Verified TDA Statistics & Performance Indicators
Base Year FY 2003
Audit Review Period Percent Change FY 2003 to FY 2006
4. Farebox revenues based on Contractor Monthly Management Report. July, 2003 data not available so remaining revenue (total system less reported modal revenue) allocated to each mode on the basis of 11 months contractor reported modal revenue for FY04. FY03 fare revenue estimated based on FY04 modal split of farebox revenues.5. Local Subsidies and Auxiliary Revenues for the total system allocated to mode on the basis of operating costs, except for Measure B revenues which are allocated 100% to demand response service.
2. Passengers and Vehicle service hours from State Controller's reports, except FY04 vehicle service hours which is from Contractor Monthly Management Report.
• Operating Cost Per Vehicle Service Hour is a measure of cost efficiency. During the audit review period, cost per hour grew by 10.1% as both operating costs and vehicle service hours fell between FY03 and FY06. As service hours in FY03 appear to be over-stated, performance between FY04 and FY06 shows a decline in cost per hour indicating improved cost efficiency.
O’Melia Consulting in association with Kelly Hines Consulting

Santa Ynez Valley Transit TDA Triennial Performance Audit Page 28
• Operating Cost Per Passenger is a measure of cost effectiveness. During the audit period, cost per passenger grew by 10% compared to growth in CPI of 11.9%. At $25.43, the cost per passenger on the demand response system is nearly three times that of the fixed-route system, reflecting the low service productivity of the demand response service.
• Passengers Per Vehicle Service Hour is a measure of service productivity. During the audit review period, passengers per hour remained relatively unchanged at 1.6.
• Passengers Per Vehicle Service Mile also measures service productivity. During the audit review period, passengers per mile also remained largely unchanged
• Vehicle Service Hours Per Employee was not measured for fixed route service as employees were reported only for the entire system.
The demand response farebox recovery ratio grew by more than 60% over the audit period to 6.7% in FY06. With local subsidies and auxiliary revenues, demand response farebox recovery was 15.8% in FY06.
O’Melia Consulting in association with Kelly Hines Consulting

Santa Ynez Valley Transit TDA Triennial Performance Audit Page 29
III. FUNCTIONAL AREA PERFORMANCE RESULTS
A high level review of functional area performance was conducted for select functions including:
• Transportation Operations • Vehicle Maintenance • Administration, Planning, and Budget
Information used in this section was obtained through document reviews, management interviews, and reports such as the State Controller Report and Financial Audits.
Transportation Operations Staffing
AmericanStar Transportation provides SYVT transit services using a crew of ten employees:
• Eight drivers, two of which are full-time and 1 which also serves as the dispatcher/fare revenue handler
• One Project Manager which is shared with the City of Lompoc – 20% of this person’s time is spent at the SYVT site
• One Road Supervisor/Trainer who spends about 2½ days per week providing field supervision and over-seeing work of the dispatcher/driver
• AmericanStar management personnel occasionally conduct surprise audits of fare handling activities.
AmericanStar reports very low turnover of staff, and retained most of the staff from the prior contract operator, MV Transportation. Since AmericanStar took over the contract on July 1, 2006, only one new driver has been hired.
O’Melia Consulting in association with Kelly Hines Consulting

Santa Ynez Valley Transit TDA Triennial Performance Audit Page 30
Driver Training
Driver qualifications, standards, and training requirements are documented in the contractor’s Scope of Services and include the following elements:
• Drivers must be employees of the contractor
• Drivers must possess a valid Class A or B license, Transit Certificate, passenger endorsement, and air brake endorsement
• Not more than two moving violations in five years and no DWI/DUI convictions in last seven years
• No felony conviction history
• Must Pass Federal Drug and Alcohol test
• New driver training that exceeds State requirements – 80 hours training (32 behind the wheel) and must include eight hours of system orientation. Additional topics include disability awareness, sexual harassment, passenger control/difficult passenger, and defensive driving.
As allowed under the contract, AmericanStar has implemented a modified training program for new drivers with recent transit experience, which includes 40 hours of classroom training and 20 hours of system orientation training.
ADA Eligibility
AmericanStar administers the ADA eligibility process persons with disabilities, as well as seniors, age 60 or older. Applicants are required to submit proof of age or healthcare documentation along with the application. Approval or denial is granted within 21 days. If denied, an appeal may be filed within 60 days. Approvals may be granted on a temporary or permanent basis. However, even permanent approvals require re-approval after three years.
Trip reservations are to be made 24 hours ahead of the requested pick-up time but same day requests will be honored if they can be met. AmericanStar reports that there are many periods of down-time during the day, making same day service requests easy to meet. The low
O’Melia Consulting in association with Kelly Hines Consulting

Santa Ynez Valley Transit TDA Triennial Performance Audit Page 31
productivity of the demand response service, 1.6 passengers per hour in FY06, is reflective of the rural nature (i.e., low population densitry) of the service area. SYVT’s demand response service policies and scheduling practices do not appear to be negatively impacting system productivity. Per ADA guidelines, demand response service hours must match those of the fixed route system. SYVT complies with this requirement but simply doesn’t have the demand to warrant 12 hours (7 am to 7 pm) of demand response service Monday through Saturday. Over the period July 2006 through March 2007, AmericanStar billed the City of Solvang for just nine hours of service per day for seven of the nine months, and never more than 11 per day in any month (when supplemental peak service from 11 am to 1 pm was provided). Additionally, the service is not restricted to just ADA-certified riders but is available to seniors 60 years of age and older as well. Should SYVT experience growth in the need for supplemental (i.e., 2nd demand response vehicle) peak period service, scheduling practices may need to be examined to determine if spreading the peak demand over less productive times of the day can be implemented within ADA guidelines which would not only improve system productivity overall but maintain an available spare vehicle during all service hours.
SYVT does have a no-show policy, but no-shows have not been a problem with only 7 no-shows during the final two years of the audit period. A no-show is defined as: 1) failure to cancel a trip; 2) more than five minutes late at the designated pick-up location; or 3) cancellation of a ride less than two hours before scheduled pick-up. Excessive no-shows (more than three in four months) result in a seven-day expulsion from the system or a monetary fine equal to the cost of four one-way trips. Five no-shows result in a 14-day suspension from the service.
Service Quality
During the final two years of the audit period, SYVT received 11 complaints, which translates to one complaint per 7,088 boardings. This exceeds the standard identified in the North County Santa Barbara Transit Plan of one complaint per 1,000 boardings by more than seven times. Complaints were up in February of this year following the schedule changes implemented in January with 11 complaints received.
O’Melia Consulting in association with Kelly Hines Consulting

Santa Ynez Valley Transit TDA Triennial Performance Audit Page 32
On the fixed route side, the contractor reported only one missed trip and two late trips for FY05 and FY06. SYVT also experienced only one accident during the final two years of the audit period. The number of late trips for demand response service increased from 15 in FY05 to 43 in FY06, but there were no missed trips reported in either year.
Vehicle Maintenance
The fixed cost per hour charged by the contractor is inclusive of transit operations cost as well as preventative maintenance for the four vehicles in the fleet. Additional maintenance work (e.g., repairs) is the responsibility of the contractor but charges are billed separately to the City as part of the monthly invoice. AmericanStar follows manufacturer guidelines for preventative maintenance cycles of every 3,000 miles ± 10%. Transmission work is performed every 30,000 miles; differential and power steering work every 50,000 miles. The four SYVT vehicles are cycled through both fixed route and demand response service to balance miles on each vehicle.
A total of nine roadcalls were experienced during FY05 and FY06, resulting in one roadcall per every 32,000 vehicle service miles. This performance is better than the recommended standard of one roadcall per every 10,000 revenue miles in the North County Santa Barbara Transit Plan, reflecting the young age of the SYVT fleet as all vehicles were replaced during the audit period – two in 2005 and two in 2006.
AmericanStar uses its own maintenance foreman to provide maintenance and repair services to the maximum extent possible. When this individual is unable to make the trip into Solvang, AmericanStar uses Frazier’s – a local maintenance shop – for such work. AmericanStar does not have a contract with Frazier’s and shops for the best price in purchasing maintenance services. Vehicles are washed once every two weeks (more often during inclement weather) at an auto detailing facility in Santa Ynez. The vehicles cannot be washed within City limits as there is an ordinance against water run-off.
As indicated previously, the SYVT fleet is made up of four cutaway vehicles which are used jointly by the fixed route and demand response services. Two vehicles are required for daily fixed route operation and one is required for demand response service, leaving
O’Melia Consulting in association with Kelly Hines Consulting

Santa Ynez Valley Transit TDA Triennial Performance Audit Page 33
one spare vehicle. Occasionally, the spare vehicle is utilized for peak period (mid-day) demand response service around which scheduled maintenance is performed. However, should an unforeseen event occur during peak demand response service, SYVT would be without a dedicated spare vehicle. Other City fleet vehicles are potentially available as a backup transit vehicle should the need arise. Another option the City should consider is having a standing agreement with a local car rental company for a van rental should a backup vehicle be required.
Administration & Planning Contract Administration
As previously indicated, AmericanStar’s Project Manager reports directly to the City’s Public Works Director with additional oversight and reporting assistance provided by the City Manager and Finance Director. Invoice review and approval resides with the Public Works Director. Both the contractor and City staff report open and candid communications and there have been no significant operational issues over the audit period. The City is relying on the contract Project Manager for certain administrative activities – data reporting and regional planning activities specifically – that typically would be the responsibility of City staff. With a new Public Works Director, some activities are transitioning back to the City and the process continues to improve. Additionally, the City’s contract with Moore and Associates (see below) includes provisions for assistance with contract administration including:
• Service performance monitoring
• Contract procurement
• Contract oversight
• Compliance monitoring.
There are no performance incentives or penalties in the contract. While there does not appear to be any cause for concern under the current contract, the City’s experience with prior contractors suggests that incorporating these elements into future contracts may be warranted.
O’Melia Consulting in association with Kelly Hines Consulting

Santa Ynez Valley Transit TDA Triennial Performance Audit Page 34
Planning
The City has contracted with Moore and Associates for marketing and service planning activities including service development and planning, coordination with regional partners, stops/zones, financial planning, and grants assistance. Service changes currently under consideration include extending service hours in order to meet early morning Valley Express run to Santa Barbara per the recommendation in the North County Santa Barbara Transit Plan. As indicated previously, oversight of the system is largely the purview of the City of Solvang which has contracted with Moore and Associates to assist with certain activities including system planning. Involvement by Solvang’s partner jurisdictions is limited as both jurisdictions are pleased with Solvang’s administration of the system and responsiveness of the City as well as both contractors – AmericanStar and Moore and Associates – to system inquiries, suggestions for improvement, and responsiveness to complaints.
The service was most recently changed in January of 2007, with new schedules shortening the headways of each route from 90 to 80 minutes. Ridership was up during the second half of FY07 compared to the same period in FY06, but it is not clear that this is a direct result of the route changes as ridership was higher in the first half of FY07 (pre-service change) as well.
A Short Range Regional Transit Plan was last completed in 2003. The bi-directional routing of SYVT’s fixed route services was implemented in September 2003 based on a recommendation from the SRTP. Development of a new SRTP may be warranted given the number of changes that have occurred since the last plan was completed including:
• Two new contract operators have run the service
• Service changes including bi-directional routing and revised schedules
• Change in City staff overseeing the service
• Reduction in the active vehicle fleet from five to four vehicles, and accommodations for maintaining an available spare vehicle
O’Melia Consulting in association with Kelly Hines Consulting

Santa Ynez Valley Transit TDA Triennial Performance Audit Page 35
• Completion of the North County Santa Barbara Transit Plan
• Finding of an Unmet Need between Buellton/Solvang and Lompoc, and
• Failure to pass the first attempt at renewing Measure D.
A new SRTP would provide the City and its partners with an opportunity to take a fresh look at the service in the context of these greater changes and the potential impacts on SYVT. The SRTP could include elements such as those identified in Exhibit 12, assessing SYVT performance against regional standards identified in the North County Santa Barbara Transit Plan.
Exhibit 12 – SYVT 2006 Performance & Regional Standards Operating Cost per Passenger
Operating Cost per Service Hour
Passengers per Hour
Farebox Recovery Ratio
Standard <$5.00 $50 15 10%SYVT Fixed Route $8.68 $39.53 4.6 15.1%Standard <$14.00 $50 3 10%SYVT DAR $25.43 $39.53 1.6 12.5%*
* Includes Measure B Demand Response Revenues.
Standard as indicated in the North Santa Barbara County Transit Plan (10/19/2006), except Farebox Recovery which is TDA requirement.
SYVT is performing well against regional efficiency standards with respect to cost per hour and farebox recovery ratio. Even cost per passenger and passengers per hour, though lower than regional standards, are acceptable given SYVT’s rural service area that doesn’t have the population density to achieve standards more suited to an urban environment. Additional opportunities to improve system productivity, particularly that of the demand response service, would be a valuable component of a new SRTP and could include lowering the age at which seniors are eligible to use the demand response service and, examining the mix and span of service between fixed route and demand response services during the service day to possibly include general public dial-a-ride or deviated fixed route services.
O’Melia Consulting in association with Kelly Hines Consulting

Santa Ynez Valley Transit TDA Triennial Performance Audit Page 36
IV. RECOMMENDATIONS
Two recommendations are offered for consideration by SYVT. Both recommendations are intended to bring SYVT into compliance with TDA requirements, with the second also intending to position SYVT to better monitor system efficiency and effectiveness.
1. The City of Solvang should carefully monitor and report transit system financial data and employee full-time equivalents (FTEs) in reports to oversight agencies, including reporting information by mode and requesting the financial auditors for FY 2007 to review FY 2006 farebox and operating costs.
• Findings: Significant discrepancies were found in reported operating costs and farebox revenues for FY05 and FY06 as compared to information as reported by the contract operator in the Monthly Management Reports provided as part of each invoice to the City. It appears as if City staff made errors in book-keeping that resulted in: 1) under-reported operating costs as they were recorded net of fare revenues retained by the operator; and 2) under-reported fare revenues that were not recognized as revenues, instead netted out from contractor operating costs.
Additionally, the City of Solvang is not separately reporting fixed-route and ADA paratransit financial and system information as required by the State Controller in the annual State Controller’s Report.
Finally, FTEs as reported in the State Controller report reflect actual employee headcount of both contractor and City staff instead of employee pay hours divided by 2,000 per the definition of a full-time equivalent.
• Suggested Actions. It is recommended that City staff take the following actions to implement this recommendation:
O’Melia Consulting in association with Kelly Hines Consulting
Santa Ynez Valley Transit TDA Triennial Performance Audit Page 37
a) Train City staff as to the correct booking of reported operating costs and retained fare revenues on monthly invoices from the contractor.
b) Request its FY06 Public Transit Fund Financial Statement be corrected for the under-reporting of operating costs and farebox revenues.
c) Report financial and operating data separately for the fixed-route and ADA paratransit modes in the annual State Controller’s Report. Data is segregated by mode in the Monthly Management Report from the Contractor. Where other system revenues (e.g., TDA, STA funds) or costs (e.g., City overhead) cannot be segregated by mode, allocation of these costs and revenues can easily be done on the basis of contractor modal operating costs (i.e., service hours) as the City pays the same cost per hour for both modes of service.
d) Request AmericanStar to report employee pay hours as part of its monthly invoice to the City and include these hours as part of the FTE calculation.
e) Identify pay hours of City staff that charge directly to the Transit Fund (i.e., Transit Department) and include these hours as part of the FTE calculation. Hours associated with general City overhead charged to the Transit Department need not be included in the FTE calculation.
• Expected Results. Implementation of this recommendation will bring the City of Solvang into compliance with TDA data definition (PUC 99247) and fiscal (PUC 99268) requirements.
2. The City of Solvang should clearly define the unique responsibilities of each staff member involved in the oversight and administration of the transit service.
• Findings: The City has called upon its contract operator for regulatory reporting requirements such as the rural NTD reporting implemented for FY06 and has asked its contractor to attend SBCAG Technical Advisory Committee meetings on its behalf. As a contract operator, AmericanStar should not be the primary point
O’Melia Consulting in association with Kelly Hines Consulting

Santa Ynez Valley Transit TDA Triennial Performance Audit Page 38
of contact for NTD reporting nor should it be representing the City’s interests on issues such as Unmeet Needs.
Additionally, financial data reporting errors as noted in the findings for the first recommendation would be less likely to happen with systematic processes for review and approval of contractor invoices and preparation of annual reports to oversight agencies.
• Suggested Actions. It is recommended that the City identify the staff member responsible for the following activities related to the administration and oversight of SYVT:
a) Acceptance, review, and approval of Contractor monthly invoices. It is recommended that a single person routinely receive, review for consistency and provide first approval for payment of all contractor invoices. This process should include, at a minimum, correct allocation of costs and revenues to City expense and revenue accounts per recommendation 1(a) above; review of reported hours of service and consistency with number of service days in the month; review of reported fare revenues retained to include consistency with prior month trends and expected fare revenue per passenger accounting for difference between regular and discount fares. At this time, service quality as reflected in customer complaints and roadcall/maintenance information does not appear to be a concern. However, this information should be routinely reviewed as part of the monthly invoice approval process.
b) Monthly segregation of modal operating costs and service statistics. Per recommendation 1(c) above, information should be reported separately for each mode in the annual State Controller’s report. This responsibility would likely fall to the individual responsible for the first review and approval of contractor invoices. The information should be tabulated and recorded monthly and provided at the end of the year to the individual responsible for the preparation of external reports to oversight agencies (see item d below).
c) Primary participation in regional planning activities including attendance at regional Technical Advisory Committee meetings and participation in the Unmet Needs process.
O’Melia Consulting in association with Kelly Hines Consulting

Santa Ynez Valley Transit TDA Triennial Performance Audit Page 39
O’Melia Consulting in association with Kelly Hines Consulting
d) Preparation of external reports to oversight agencies including the State Controller, FTA 5311 reporting, and SBCAG TDA claims as well as review of annual financial statements. This responsibility could be split between two individuals, if necessary, to address the financial versus operational data elements of each report. It is recommended, however, that a single person be responsible for the final review of each report before submittal to ensure completeness, accuracy, and consistency with other reports.
• Expected Results. Implementation of this recommendation will bring SYVT into compliance with TDA reporting requirements, support the accurate and timely submission of reports, and better position the City to meet its transit administration and oversight responsibilities if and when staffing changes occur in the future.