TCS 2008 Annual Report - AnnualReports.com
94
-
Upload
khangminh22 -
Category
Documents
-
view
2 -
download
0
Transcript of TCS 2008 Annual Report - AnnualReports.com

20
08
AN
NU
AL
RE
PO
RT
T
EL
EC
OM
MU
NIC
AT
ION
SY
ST
EM
S, IN
C.
About the Company
TeleCommunication Systems, Inc. (TCS) engineers and delivers highly reliable wireless communications technology.
Investments since 1987 in wireless technology R&D and customer relationships have led to growing software-
based text messaging and location-based service businesses (including public safety applications) with leading
wireless, VoIP, and telematics customers, and rapidly growing satcom and IT solutions business with U.S. govern-
ment agencies. The company has about 600 employees (based primarily in Annapolis and metro D.C., Seattle,
Oakland, and Tampa), and a portfolio of more than 65 patents and more than 200 applications pending.
Commercial / Carriers
• Licensed software for text messaging and location-based services technology for wireless carriers and Voice over
Internet Protocol (VoIP) service providers. World leadership in technology for capturing and using the “X/Y” coordinates
that defi ne the precise location of a wireless device user.
• In-network systems, including the Company’s Xypoint® Location Platform, Wireless Intelligent Gateway™ for
network data traffi c management, Short Message Service Center (SMSC), wireless portal (e.g., www.vtext.com), and
the Xypoint® Mapping Server for geospatial information.
• Hosted applications in TL 9000-certifi ed facilities, including E9-1-1 call routing and related services, along with reference
network services for assisted GPS, in Seattle, Phoenix and Mumbai.
• Handset-based and vehicle applications for navigation, traffi c, and points of interest via downloadable wireless and
telematics technology.
• Customers include Verizon Wireless, AT&T Mobility, Tata Teleservices, Hutchison Whampoa’s 3 networks, T-Mobile,
Vonage, and Denso.
Government / Satcom
• SwiftLink® deployable, secure satellite-based wireless communication systems, and related terrestrial
systems, fi eld support and maintenance.
• Services including secure teleport facilities, communications engineering, program management, continuity of
operations planning, telecom expense management and help desk outsourcing.
• One of six prime vendors for the U.S. Army’s fi ve-year, Indefi nite Delivery, Indefi nite Quantity (IDIQ), $5 billion
World-Wide Satellite Systems (WWSS) contract vehicle through 2011.
• Customers include the U.S. Departments of Defense, State, and Homeland Security.
millionsRevenue
CAGR = Compound Annual Growth Rate
Government
Commercial
23% CAGR
$97 $102$125
$144
$220
2004 2005 2006 200820070
50
100
150
200
EBITDA
$.19
$.44$.38
$.79
$.17
$.62
$.13
2004 2005 2006 2007 2008
per diluted share
0
0.10
0.20
0.30
0.40
0.50
0.60
0.70
EBITDA – Earnings Before Interest, Taxes, Depreciation and Amortization
See reconciliation to GAAP on the inside back cover
2008 includes $0.17 per share from patent sale in Q2
2004 2005 2006 2007 2008
-0.30
-0.60
0
0.30
0.60
0.90
1.20
per diluted shareNet Income
-$.11$.05 -$.02
$1.23
$.71
$.17
$.35
-$.48
2008 includes no tax expense, $0.71 tax benefit
and $0.17 Q2 patent sale
CERTIFIEDISO 9001:2000
CERTIFIEDTL 9000
Carrier Service Bureau Operations Carrier and Government Operations
2401 Elliott Avenue
Seattle, WA 98121
206.792.2000
300 Lakeside Drive
Oakland, CA 94612
510.763.3300
206 Kelsey Lane
Tampa, FL 33619
813.831.6353
Headquarters275 West Street
Annapolis, MD 21401
410.263.7616
1.888.728.TSYS (8797)
www.telecomsys.com
TeleCommunication Systems Ltd.338 Euston Road
London NW1 3BT
+44 (0) 7544 8606
Commercial Sales SupportAlliance Digital Group
Beijing, China
Forward Deployed Depot CentersBaghdad & Tikrit,
Iraq
Hosted Applications Facility
Mumbai,
India
Swiftlink® Sales & Service CenterBahrain
Software Development CenterDelhi,
India
Teleports
Manassas, VA
Fuchsstadt, GE
Bedford, UK
Chalfont Grove, UK

Commercial / Carrier Segment
Text messaging technology. According to a study released in
December 2008, the typical U.S. wireless consumer sends and
receives more Short Message Service (SMS) text messages than
mobile voice calls – and the typical U.S. teen mobile subscriber now
sends or receives six times more text messages than phone calls.
TCS earns revenue from licensing and maintaining the carrier net-
work software which enables text messaging. Our experience in
2008 portends signifi cant sales of incremental licensed SMS capacity,
and growing maintenance and professional service revenues, for at
least several years to come.
Wireless location-based service (LBS) technology and electronic
map data. TCS continues to provide about half the wireless E9-1-1
call routing service in the U.S. to more than 35 carriers using our core
LBS expertise, and we’re investing to effi ciently serve next genera-
tion carrier architectures – wireless and wireline. Our customers also
include voice over IP and telematics companies. Telematics is in-vehicle
information technology which integrates location data, enabled
by wireless communication, and involves companies like OnStar and
Denso. The TCS Master Street Address Guide validation service
has won awards, including a 2008 Product of the Year Award from
Technology Marketing Corporation.
Proliferation of the devices for widespread use of premium location-
based services continued in 2008, and the accompanying graph
indicates analyst expectations for shipments of GPS-enabled hand-
sets around the world.
During 2008 we added a net of six carrier customers using our
Xypoint Location Platform, including both in-network deployments
and hosted location business. With our partner, Qualcomm, we are
proceeding to provide hosted location infrastructure and application
technology to Tata TeleServices, a 25-million subscriber carrier in India,
and we are in discussions with other operators in India. We have also
entered into an agreement with Beijing’s Alliance Digital Group, an
advisor for cross-border selling into the China market. ADG has a suc-
cessful track record with other telecommunications vendors.
We have launched our navigation and maps applications at Centennial
Puerto Rico – another TCS LBS “full meal deal,” including the hosted
XLP location platform and applications. This is an example of the
appeal to carriers of TCS’s integrated location solution, which enables a
faster time to revenue.
In the telematics market, we have expanded the range and scope
of our electronic map and points-of-interest based deliverables, and
are working closely with a growing base of customers and partners.
Government / Satcom Segment
Systems. During 2008 we announced the largest new contract win in
TCS history – an award under the Army’s World-Wide Satellite Systems
(WWSS) contract called SNAP (Secure and Nonsecure IP router Access
Points). This program has a potential value to TCS of $246 million for
about 1,500 SNAP systems over three years. In conjunction with these
shipments, TCS employees and contractors also provide fi eld support
staff for training, installation, and logistical support services. We have
orders and production in motion to carry us well into 2009.
Another WWSS program, Wireless Point-to-Point Link (WPPL) for the
U.S. Marine Corps, contributed $22 million of 2008 revenue. We carry a
healthy backlog of WPPL orders and unfunded options that are likely to
be exercised in 2009.
New product offerings include a high data-speed, man-packable, dual
Ku band and X band VSAT terminal, which we have branded “Stingray,”
with the smallest form factor designed by TCS to date. The entire kit
can fi t into the overhead bin of a commercial airline or in a backpack.
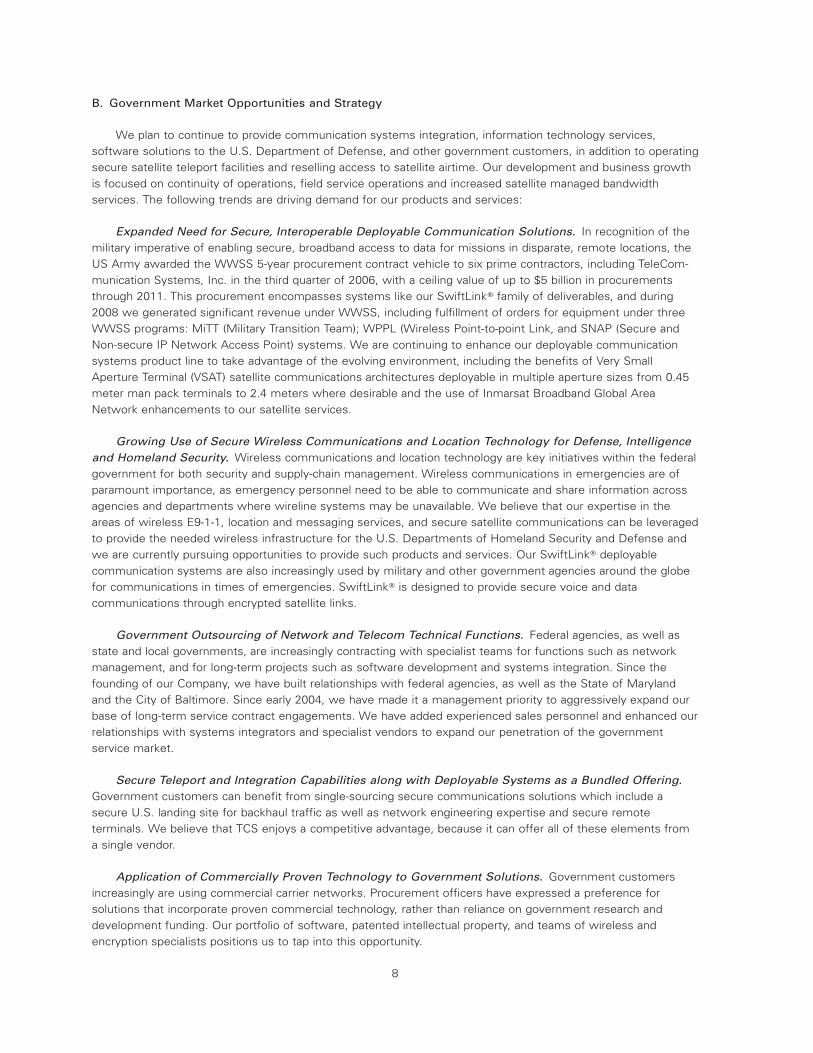
To accommodate our rapid growth in 2008, we expanded our integra-
tion facility in Tampa to about 46,000 square feet. We have been able
to recruit experienced management, engineering talent, and production
labor to keep pace with deliveries, and investments in supply chain man-
agement personnel and tools have enabled us to handle our growth.
Services. New services accounts in 2008 include the U.S. Army
Materiel Command HQ; the U.S. Army Offi ce for Continuity of
Operations planning; and the Department of Homeland Security CIO.
And we now provide managed satcom bandwidth services for criti-
cal U.S. diplomatic missions, expanded services to new locations in
Fort Hood and Fort Huachuca, as well as in Iraq and Afghanistan.
These contracts are in addition to longstanding major service relation-
ships with Defense Telecom Services, the Directorates of Information
Management, and the City of Baltimore. Investments in teleport infra-
structure should contribute to signifi cant continued growth in 2009.
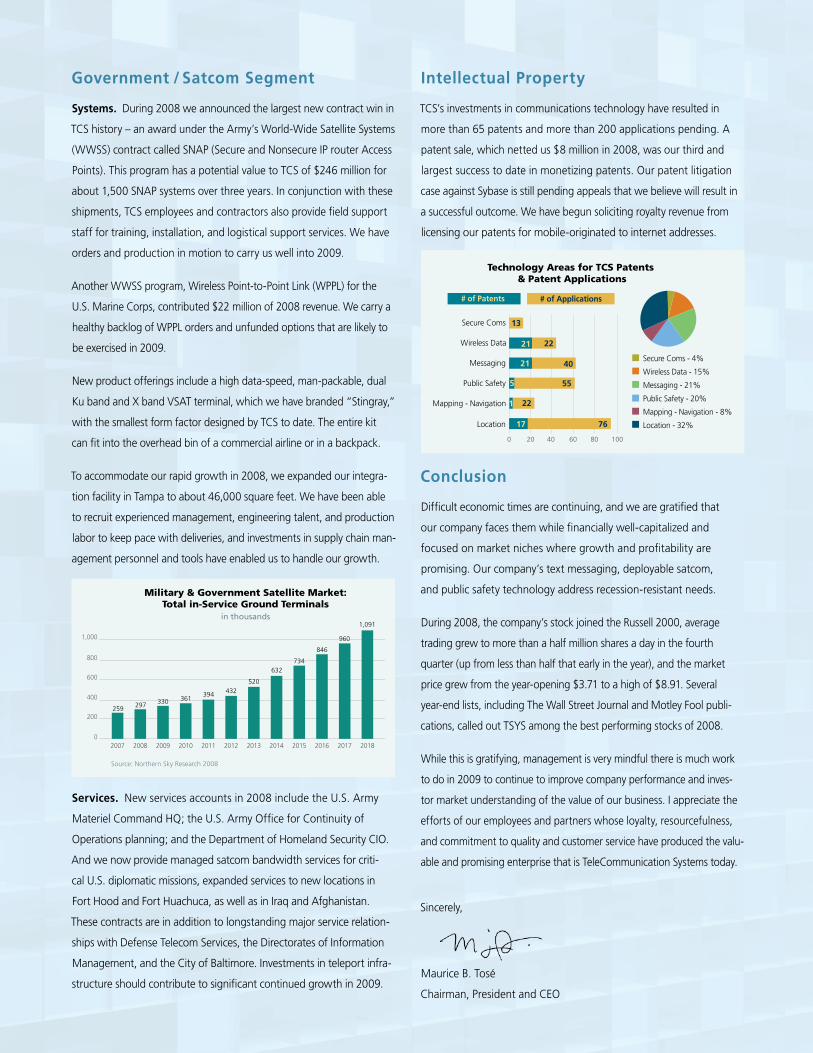
Intellectual Property
TCS’s investments in communications technology have resulted in
more than 65 patents and more than 200 applications pending. A
patent sale, which netted us $8 million in 2008, was our third and
largest success to date in monetizing patents. Our patent litigation
case against Sybase is still pending appeals that we believe will result in
a successful outcome. We have begun soliciting royalty revenue from
licensing our patents for mobile-originated to internet addresses.
Conclusion
Diffi cult economic times are continuing, and we are gratifi ed that
our company faces them while fi nancially well-capitalized and
focused on market niches where growth and profi tability are
promising. Our company’s text messaging, deployable satcom,
and public safety technology address recession-resistant needs.
During 2008, the company’s stock joined the Russell 2000, average
trading grew to more than a half million shares a day in the fourth
quarter (up from less than half that early in the year), and the market
price grew from the year-opening $3.71 to a high of $8.91. Several
year-end lists, including The Wall Street Journal and Motley Fool publi-
cations, called out TSYS among the best performing stocks of 2008.
While this is gratifying, management is very mindful there is much work
to do in 2009 to continue to improve company performance and inves-
tor market understanding of the value of our business. I appreciate the
efforts of our employees and partners whose loyalty, resourcefulness,
and commitment to quality and customer service have produced the valu-
able and promising enterprise that is TeleCommunication Systems today.
Sincerely,
Maurice B. Tosé
Chairman, President and CEO
Caution Concerning Forward-Looking Statements
This document includes certain “forward-looking statements” within the meaning of the Private Securities Litigation Reform Act of 1995. For example, the statements that (i) the com-
pany holds the promise of continued profitable growth; (ii) significant sales of incremental licensed SMS capacity, maintenance and professional service revenues are expected for several
years to come; (iii) we have invested to efficiently serve next generation carrier architectures; (iv) we anticipate selling into the China market; (v) we are expanding telematics opportuni-
ties with a growing base of customers and partners; (vi) certain government systems deals have potential for higher revenue and that a healthy backlog of orders and unfunded options
are likely to be exercised in 2009; (vii) investments in teleport infrastructure should contribute to significant growth in 2009; (viii) we believe our patent enforcement efforts will result in
a successful outcome; (ix) we are focused on market niches where growth and profitability are promising; and (x) that our products and services serve recession-resistant needs are some
of the forward-looking statements in this document. These statements involve risks and uncertainties, and actual results may differ materially. Factors that could cause or contribute to
such differences include, but are not limited to, those discussed elsewhere in the Company’s filings with the Securities and Exchange Commission. Readers are cautioned not to place
undue reliance on the forward-looking statements, which speak only as of the date of this Annual Report. The Company undertakes no obligation to publicly release any revisions to
the forward-looking statements or reflect events or circumstances after the date of this document.
Reconciliation of EBITDA to Net Income/(Loss)
EBITDA is not a financial measure calculated and presented in accordance with U.S. generally accepted accounting principles (GAAP) and should not be considered as an alter-
native to net income, operating income, or any other financial measures so calculated and presented, nor as an alternative to cash flow from operating activities as a measure
of our liquidity. We present EBITDA because we believe it to be an important supplemental measure of our performance that is commonly used by securities analysts, inves-
tors, and other interested parties in the evaluation of companies in our industry. Management also uses this information internally for forecasting and budgeting. It may not
be indicative of the historical operating results of TCS nor is it intended to be predictive of potential future results.
($ in millions) 2004 2005 2006 2007 2008
Net income/(loss) on a GAAP basis $ (18.5) $ (11.5) $ (21.7) $ (1.3) $ 57.6
Depreciation and amortization 7.9 9.6 9.3 7.7 8.1
Non-cash stock-based compensation 1.2 0.7 3.1 4.3 3.8
Financing and other expenses (incl. debt conversion expense in 2004) 11.1 1.3 3.2 4.6 0.9
Discontinued operations 2.6 7.2 23.7 0.3 -
Benefit for income taxes - - - - (33.3)
Gain on sale of patent - - - - (8.1)
EBITDA from continuing operations $ 4.3 $ 7.3 $ 17.6 $ 15.6 $ 29.0
Copyright
Copyright © 2009 TeleCommunication Systems, Inc. (TCS). All rights reserved. Enabling Convergent Technologies®, SwiftLink®, Xypoint®, LivewirE911™, RAVE911™, and Wireless
Intelligent Gateway™ are trademarks of TCS. All other trademarks are the property of their respective companies. Information subject to change without notice. | NasdaqGM: TSYS
DE
SIG
N:
BA
RK
ER
DE
SIG
N,
INC
.
Maurice B. ToséChairman, President and CEO
Corporate InformationDear Fellow Shareholders:
Our company’s record 2008 fi nancial performance refl ects returns on investments in technology
and business relationships that we made with a long-term view. In our 22nd year, the TCS team
of communications and IT professionals has evolved to focus on monetizing text messaging,
location-based wireless technology (including public safety applications), and secure satellite-
based communications technology. Demand for our deliverables grew substantially in 2008,
and our company responded effectively across the board. We enter 2009 as a larger-scale
enterprise, with the promise of continued profi table growth around all three core competencies.
# of Patents # of Applications
Technology Areas for TCS Patents & Patent Applications
Secure Coms
Wireless Data
Messaging
Public Safety
Mapping - Navigation
Location
Secure Coms - 4%
Wireless Data - 15%
Messaging - 21%
Public Safety - 20%
Mapping - Navigation - 8%
Location - 32%
100806040200
13
22
40
55
76
22
21
21
17
5
1
in thousands
Source: Northern Sky Research 2008
Military & Government Satellite Market:Total in-Service Ground Terminals
20182007 2008 2009 2010 2011 2012 2013 2014 2015 2016 2017
1,091
960
846
734632
520
432394361330297259
0
200
400
600
800
1,000
0
$10
$20
$30
$40
$50
TCS
Mes
sagi
ng R
even
ue (M
illio
ns)
U.S
. SM
S Pe
r Ye
ar (B
illio
ns)
0
500
1,000
1,500
2,000
2,500
2004 2005 2006 2007 2008 2009 2010 2011
TCS Messaging Revenue
TCS SMS / Year (Company Est.)
US SMS / Year (Frost & Sullivan)
actual forecast
TCS - Text Messaging Leader
TCS earns revenue from SMS via perpetual, capacity-based software licenses to carriers, along with customization services and software maintenance.
Source: ABI Research, 7-08
700
600
500
400
300
200
100
Global Outlook for Location-Based Services (LBS)GPS Enabled Handset Shipments, World Market 2005-2013
Africa ME
Eastern Europe
Western Europe
South America
North America
Asia Pacific
2005 2006 2007 2008 2009 2010 2011 2012 2013
Maurice B. ToséChairman of the Board President and Chief Executive Officer TeleCommunication Systems, Inc.
James M. BethmannManaging DirectorThe Caldwell Partners InternationalToronto, Ontario, Canada
Thomas M. Brandt, Jr. Senior Vice President and Chief Financial OfficerTeleCommunication Systems, Inc.
Clyde A. HeintzelmanExecutive Chairman Diet BrownSeattle, Washington
Lt. Gen. Jan C. Huly (USMC, Ret.)Annandale, Virginia
Richard A. KozakChief Executive Officer R&D2, LLCAnnapolis, Maryland
Weldon H. LathamSenior Partner Davis Wright Tremaine LLPWashington, D.C.
Byron F. MarchantPresident and Chief Executive OfficerThe U.S. Naval Academy Alumni Association and FoundationAnnapolis, Maryland
Richard A. YoungExecutive Vice President and Chief Operating OfficerTeleCommunication Systems, Inc.
Board of Directors
Senior Corporate Executives
Maurice B. ToséChairman of the BoardPresident and Chief Executive Officer
Richard A. YoungExecutive Vice President and Chief Operating Officer
Thomas M. Brandt, Jr.Senior Vice President and Chief Financial Officer
Drew A. MorinSenior Vice President and Chief Technology Officer
Timothy J. LorelloSenior Vice President Commercial Sales and Chief Marketing Officer
Dan A. AllenSenior Vice PresidentService Bureau Operations
Michael D. Bristol, Sr.Senior Vice PresidentGovernment Solutions Group
Stockholder Information
Stock ListingTeleCommunication Systems, Inc. Class A common stock is traded on the NASDAQ Global Market under the symbol TSYS.
Transfer Agent and RegistrarAmerican Stock Transfer and Trust CompanyNew York, New York
Form 10-K Additional copies of this annual report on Form 10-K, as filed with the Securities and Exchange Commission, are available without charge upon request from the company. Copies also are available for download via the investor section at www.telecomsys.com.
Annual MeetingThe annual meeting of shareholders will be held at 10:00 a.m. on June 11, 2009 at: The Westin Annapolis 100 Westgate Circle Annapolis, Maryland.
Commercial / Carrier Segment
Text messaging technology. According to a study released in
December 2008, the typical U.S. wireless consumer sends and
receives more Short Message Service (SMS) text messages than
mobile voice calls – and the typical U.S. teen mobile subscriber now
sends or receives six times more text messages than phone calls.
TCS earns revenue from licensing and maintaining the carrier net-
work software which enables text messaging. Our experience in
2008 portends signifi cant sales of incremental licensed SMS capacity,
and growing maintenance and professional service revenues, for at
least several years to come.
Wireless location-based service (LBS) technology and electronic
map data. TCS continues to provide about half the wireless E9-1-1
call routing service in the U.S. to more than 35 carriers using our core
LBS expertise, and we’re investing to effi ciently serve next genera-
tion carrier architectures – wireless and wireline. Our customers also
include voice over IP and telematics companies. Telematics is in-vehicle
information technology which integrates location data, enabled
by wireless communication, and involves companies like OnStar and
Denso. The TCS Master Street Address Guide validation service
has won awards, including a 2008 Product of the Year Award from
Technology Marketing Corporation.
Proliferation of the devices for widespread use of premium location-
based services continued in 2008, and the accompanying graph
indicates analyst expectations for shipments of GPS-enabled hand-
sets around the world.
During 2008 we added a net of six carrier customers using our
Xypoint Location Platform, including both in-network deployments
and hosted location business. With our partner, Qualcomm, we are
proceeding to provide hosted location infrastructure and application
technology to Tata TeleServices, a 25-million subscriber carrier in India,
and we are in discussions with other operators in India. We have also
entered into an agreement with Beijing’s Alliance Digital Group, an
advisor for cross-border selling into the China market. ADG has a suc-
cessful track record with other telecommunications vendors.
We have launched our navigation and maps applications at Centennial
Puerto Rico – another TCS LBS “full meal deal,” including the hosted
XLP location platform and applications. This is an example of the
appeal to carriers of TCS’s integrated location solution, which enables a
faster time to revenue.
In the telematics market, we have expanded the range and scope
of our electronic map and points-of-interest based deliverables, and
are working closely with a growing base of customers and partners.
Government / Satcom Segment
Systems. During 2008 we announced the largest new contract win in
TCS history – an award under the Army’s World-Wide Satellite Systems
(WWSS) contract called SNAP (Secure and Nonsecure IP router Access
Points). This program has a potential value to TCS of $246 million for
about 1,500 SNAP systems over three years. In conjunction with these
shipments, TCS employees and contractors also provide fi eld support
staff for training, installation, and logistical support services. We have
orders and production in motion to carry us well into 2009.
Another WWSS program, Wireless Point-to-Point Link (WPPL) for the
U.S. Marine Corps, contributed $22 million of 2008 revenue. We carry a
healthy backlog of WPPL orders and unfunded options that are likely to
be exercised in 2009.
New product offerings include a high data-speed, man-packable, dual
Ku band and X band VSAT terminal, which we have branded “Stingray,”
with the smallest form factor designed by TCS to date. The entire kit
can fi t into the overhead bin of a commercial airline or in a backpack.
To accommodate our rapid growth in 2008, we expanded our integra-
tion facility in Tampa to about 46,000 square feet. We have been able
to recruit experienced management, engineering talent, and production
labor to keep pace with deliveries, and investments in supply chain man-
agement personnel and tools have enabled us to handle our growth.
Services. New services accounts in 2008 include the U.S. Army
Materiel Command HQ; the U.S. Army Offi ce for Continuity of
Operations planning; and the Department of Homeland Security CIO.
And we now provide managed satcom bandwidth services for criti-
cal U.S. diplomatic missions, expanded services to new locations in
Fort Hood and Fort Huachuca, as well as in Iraq and Afghanistan.
These contracts are in addition to longstanding major service relation-
ships with Defense Telecom Services, the Directorates of Information
Management, and the City of Baltimore. Investments in teleport infra-
structure should contribute to signifi cant continued growth in 2009.
Intellectual Property
TCS’s investments in communications technology have resulted in
more than 65 patents and more than 200 applications pending. A
patent sale, which netted us $8 million in 2008, was our third and
largest success to date in monetizing patents. Our patent litigation
case against Sybase is still pending appeals that we believe will result in
a successful outcome. We have begun soliciting royalty revenue from
licensing our patents for mobile-originated to internet addresses.
Conclusion
Diffi cult economic times are continuing, and we are gratifi ed that
our company faces them while fi nancially well-capitalized and
focused on market niches where growth and profi tability are
promising. Our company’s text messaging, deployable satcom,
and public safety technology address recession-resistant needs.
During 2008, the company’s stock joined the Russell 2000, average
trading grew to more than a half million shares a day in the fourth
quarter (up from less than half that early in the year), and the market
price grew from the year-opening $3.71 to a high of $8.91. Several
year-end lists, including The Wall Street Journal and Motley Fool publi-
cations, called out TSYS among the best performing stocks of 2008.
While this is gratifying, management is very mindful there is much work
to do in 2009 to continue to improve company performance and inves-
tor market understanding of the value of our business. I appreciate the
efforts of our employees and partners whose loyalty, resourcefulness,
and commitment to quality and customer service have produced the valu-
able and promising enterprise that is TeleCommunication Systems today.
Sincerely,
Maurice B. Tosé
Chairman, President and CEO
Caution Concerning Forward-Looking Statements
This document includes certain “forward-looking statements” within the meaning of the Private Securities Litigation Reform Act of 1995. For example, the statements that (i) the com-
pany holds the promise of continued profitable growth; (ii) significant sales of incremental licensed SMS capacity, maintenance and professional service revenues are expected for several
years to come; (iii) we have invested to efficiently serve next generation carrier architectures; (iv) we anticipate selling into the China market; (v) we are expanding telematics opportuni-
ties with a growing base of customers and partners; (vi) certain government systems deals have potential for higher revenue and that a healthy backlog of orders and unfunded options
are likely to be exercised in 2009; (vii) investments in teleport infrastructure should contribute to significant growth in 2009; (viii) we believe our patent enforcement efforts will result in
a successful outcome; (ix) we are focused on market niches where growth and profitability are promising; and (x) that our products and services serve recession-resistant needs are some
of the forward-looking statements in this document. These statements involve risks and uncertainties, and actual results may differ materially. Factors that could cause or contribute to
such differences include, but are not limited to, those discussed elsewhere in the Company’s filings with the Securities and Exchange Commission. Readers are cautioned not to place
undue reliance on the forward-looking statements, which speak only as of the date of this Annual Report. The Company undertakes no obligation to publicly release any revisions to
the forward-looking statements or reflect events or circumstances after the date of this document.
Reconciliation of EBITDA to Net Income/(Loss)
EBITDA is not a financial measure calculated and presented in accordance with U.S. generally accepted accounting principles (GAAP) and should not be considered as an alter-
native to net income, operating income, or any other financial measures so calculated and presented, nor as an alternative to cash flow from operating activities as a measure
of our liquidity. We present EBITDA because we believe it to be an important supplemental measure of our performance that is commonly used by securities analysts, inves-
tors, and other interested parties in the evaluation of companies in our industry. Management also uses this information internally for forecasting and budgeting. It may not
be indicative of the historical operating results of TCS nor is it intended to be predictive of potential future results.
($ in millions) 2004 2005 2006 2007 2008
Net income/(loss) on a GAAP basis $ (18.5) $ (11.5) $ (21.7) $ (1.3) $ 57.6
Depreciation and amortization 7.9 9.6 9.3 7.7 8.1
Non-cash stock-based compensation 1.2 0.7 3.1 4.3 3.8
Financing and other expenses (incl. debt conversion expense in 2004) 11.1 1.3 3.2 4.6 0.9
Discontinued operations 2.6 7.2 23.7 0.3 -
Benefit for income taxes - - - - (33.3)
Gain on sale of patent - - - - (8.1)
EBITDA from continuing operations $ 4.3 $ 7.3 $ 17.6 $ 15.6 $ 29.0
Copyright
Copyright © 2009 TeleCommunication Systems, Inc. (TCS). All rights reserved. Enabling Convergent Technologies®, SwiftLink®, Xypoint®, LivewirE911™, RAVE911™, and Wireless
Intelligent Gateway™ are trademarks of TCS. All other trademarks are the property of their respective companies. Information subject to change without notice. | NasdaqGM: TSYS
DE
SIG
N:
BA
RK
ER
DE
SIG
N,
INC
.
Maurice B. ToséChairman, President and CEO
Corporate InformationDear Fellow Shareholders:
Our company’s record 2008 fi nancial performance refl ects returns on investments in technology
and business relationships that we made with a long-term view. In our 22nd year, the TCS team
of communications and IT professionals has evolved to focus on monetizing text messaging,
location-based wireless technology (including public safety applications), and secure satellite-
based communications technology. Demand for our deliverables grew substantially in 2008,
and our company responded effectively across the board. We enter 2009 as a larger-scale
enterprise, with the promise of continued profi table growth around all three core competencies.
# of Patents # of Applications
Technology Areas for TCS Patents & Patent Applications
Secure Coms
Wireless Data
Messaging
Public Safety
Mapping - Navigation
Location
Secure Coms - 4%
Wireless Data - 15%
Messaging - 21%
Public Safety - 20%
Mapping - Navigation - 8%
Location - 32%
100806040200
13
22
40
55
76
22
21
21
17
5
1
in thousands
Source: Northern Sky Research 2008
Military & Government Satellite Market:Total in-Service Ground Terminals
20182007 2008 2009 2010 2011 2012 2013 2014 2015 2016 2017
1,091
960
846
734632
520
432394361330297259
0
200
400
600
800
1,000
0
$10
$20
$30
$40
$50
TCS
Mes
sagi
ng R
even
ue (M
illio
ns)
U.S
. SM
S Pe
r Ye
ar (B
illio
ns)
0
500
1,000
1,500
2,000
2,500
2004 2005 2006 2007 2008 2009 2010 2011
TCS Messaging Revenue
TCS SMS / Year (Company Est.)
US SMS / Year (Frost & Sullivan)
actual forecast
TCS - Text Messaging Leader
TCS earns revenue from SMS via perpetual, capacity-based software licenses to carriers, along with customization services and software maintenance.
Source: ABI Research, 7-08
700
600
500
400
300
200
100
Global Outlook for Location-Based Services (LBS)GPS Enabled Handset Shipments, World Market 2005-2013
Africa ME
Eastern Europe
Western Europe
South America
North America
Asia Pacific
2005 2006 2007 2008 2009 2010 2011 2012 2013
Maurice B. ToséChairman of the Board President and Chief Executive Officer TeleCommunication Systems, Inc.
James M. BethmannManaging DirectorThe Caldwell Partners InternationalToronto, Ontario, Canada
Thomas M. Brandt, Jr. Senior Vice President and Chief Financial OfficerTeleCommunication Systems, Inc.
Clyde A. HeintzelmanExecutive Chairman Diet BrownSeattle, Washington
Lt. Gen. Jan C. Huly (USMC, Ret.)Annandale, Virginia
Richard A. KozakChief Executive Officer R&D2, LLCAnnapolis, Maryland
Weldon H. LathamSenior Partner Davis Wright Tremaine LLPWashington, D.C.
Byron F. MarchantPresident and Chief Executive OfficerThe U.S. Naval Academy Alumni Association and FoundationAnnapolis, Maryland
Richard A. YoungExecutive Vice President and Chief Operating OfficerTeleCommunication Systems, Inc.
Board of Directors
Senior Corporate Executives
Maurice B. ToséChairman of the BoardPresident and Chief Executive Officer
Richard A. YoungExecutive Vice President and Chief Operating Officer
Thomas M. Brandt, Jr.Senior Vice President and Chief Financial Officer
Drew A. MorinSenior Vice President and Chief Technology Officer
Timothy J. LorelloSenior Vice President Commercial Sales and Chief Marketing Officer
Dan A. AllenSenior Vice PresidentService Bureau Operations
Michael D. Bristol, Sr.Senior Vice PresidentGovernment Solutions Group
Stockholder Information
Stock ListingTeleCommunication Systems, Inc. Class A common stock is traded on the NASDAQ Global Market under the symbol TSYS.
Transfer Agent and RegistrarAmerican Stock Transfer and Trust CompanyNew York, New York
Form 10-K Additional copies of this annual report on Form 10-K, as filed with the Securities and Exchange Commission, are available without charge upon request from the company. Copies also are available for download via the investor section at www.telecomsys.com.
Annual MeetingThe annual meeting of shareholders will be held at 10:00 a.m. on June 11, 2009 at: The Westin Annapolis 100 Westgate Circle Annapolis, Maryland.

SECURITIES AND EXCHANGE COMMISSIONWASHINGTON, D.C. 20549
FORM 10-K(Mark One)
¥ ANNUAL REPORT PURSUANT TO SECTION 13 OR 15(d) OFTHE SECURITIES EXCHANGE ACT OF 1934
For the year ended December 31, 2008
ORn TRANSITION REPORT PURSUANT TO SECTION 13 OR 15(d) OF
THE SECURITIES EXCHANGE ACT OF 1934Commission File No. 0-30821
TELECOMMUNICATION SYSTEMS, INC.(Exact name of registrant as specified in its charter)
Maryland 52-1526369(State or Other Jurisdiction of Incorporation or Organization) (I.R.S. Employer Identification No.)
275 West Street, Annapolis, MD 21401(Address of principal executive offices) (Zip Code)
(410) 263-7616Registrant’s telephone number, including area code)
Securities registered pursuant to Section 12(b) of the Act: None.
Securities registered pursuant to Section 12(g) of the Act: Class A Common Stock, Par Value $0.01 per share
Indicate by check mark if the registrant is a well-known seasoned issuer, as defined in Rule 405 of the SecuritiesAct: Yes n No ¥
Indicate by check mark if the registrant is not required to file reports pursuant to Section 13 or Section 15(d) of theAct: Yes n No ¥
Indicate by check mark whether the registrant (1) has filed all reports required to be filed by Section 13 or 15(d) of theSecurities Exchange Act of 1934 during the preceding 12 months (or for such shorter period that the registrant was required to filesuch reports) and (2) has been subject to such filing requirements for the past 90 days: Yes ¥ No n
Indicate by check mark if disclosure of delinquent filers pursuant to Item 405 of Regulation S-K is not contained herein, andwill not be contained, to the best of registrant’s knowledge, in definitive proxy or information statements incorporated by referencein Part III of this Form 10-K or any amendment to this Form 10-K. n
Indicate by check mark whether the registrant is a large accelerated filer, an accelerated filer, or a non-accelerated filer.
Large accelerated filer n Accelerated filer ¥ Non-accelerated filer n Smaller reporting company n
Indicate by check mark whether the registrant is a shell company (as defined in rule 12b-2 of the Act): Yes n No ¥
As of June 30, 2008, the aggregate market value of the Class A Common Stock held by non-affiliates, as reported on theNASDAQ Global Market, was approximately $157,546,510.*
As of January 31, 2009 there were 38,559,279 shares of Class A Common Stock and 6,876,334 shares of Class B CommonStock outstanding.
DOCUMENTS INCORPORATED BY REFERENCE
Document Part of 10-K into which incorporatedPortions of the registrant’s Proxy Statement for the
Annual Meeting of Stockholders to be held June 11, 2009Part III
* Excludes 1,478,026 shares of Class A Common Stock and 7,226,334 shares of Class B Common Stock deemed to be held by stockholderswhose ownership exceeds ten percent of the shares outstanding at June 30, 2008. Exclusion of shares held by any person should not beconstrued to indicate that such person possesses the power, direct or indirect, to direct or cause the direction of the management or policies ofthe registrant, or that such person is controlled by or under common control with the registrant.

TABLE OF CONTENTS
Page Number
Part IItem 1 Business . . . . . . . . . . . . . . . . . . . . . . . . . . . . . . . . . . . . . . . . . . . . . . . . . . . . . . . . 2Item 1A Risk Factors . . . . . . . . . . . . . . . . . . . . . . . . . . . . . . . . . . . . . . . . . . . . . . . . . . . . . . 12Item 1B Unresolved Staff Comments . . . . . . . . . . . . . . . . . . . . . . . . . . . . . . . . . . . . . . . . . . 27Item 2 Properties. . . . . . . . . . . . . . . . . . . . . . . . . . . . . . . . . . . . . . . . . . . . . . . . . . . . . . . . 27Item 3 Legal Proceedings . . . . . . . . . . . . . . . . . . . . . . . . . . . . . . . . . . . . . . . . . . . . . . . . . . 28Item 4 Submission of Matters to a Vote of Security Holders . . . . . . . . . . . . . . . . . . . . . . . . . 29Part IIItem 5 Market for Registrant’s Common Equity, Related Stockholder Matters and Issuer
Purchases of Equity Securities . . . . . . . . . . . . . . . . . . . . . . . . . . . . . . . . . . . . . . . . . 29Item 6 Selected Financial Data . . . . . . . . . . . . . . . . . . . . . . . . . . . . . . . . . . . . . . . . . . . . . . 32Item 7 Management’s Discussion and Analysis of Financial Condition and Results of
Operations . . . . . . . . . . . . . . . . . . . . . . . . . . . . . . . . . . . . . . . . . . . . . . . . . . . . . . . 33Item 7A Qualitative and Quantitative Disclosure About Market Risk . . . . . . . . . . . . . . . . . . . . . 47Item 8 Financial Statements and Supplementary Data . . . . . . . . . . . . . . . . . . . . . . . . . . . . . 48Item 9 Changes In and Disagreements With Accountants on Accounting and Financial
Disclosure . . . . . . . . . . . . . . . . . . . . . . . . . . . . . . . . . . . . . . . . . . . . . . . . . . . . . . . 48Item 9A Controls and Procedures . . . . . . . . . . . . . . . . . . . . . . . . . . . . . . . . . . . . . . . . . . . . . 48Part IIIItem 10 Directors, Executive Officers and Corporate Governance . . . . . . . . . . . . . . . . . . . . . . 51Item 11 Executive Compensation . . . . . . . . . . . . . . . . . . . . . . . . . . . . . . . . . . . . . . . . . . . . 51Item 12 Security Ownership of Certain Beneficial Owners and Management . . . . . . . . . . . . . . 51Item 13 Certain Relationships and Related Transactions and Director Independence . . . . . . . . . 51Item 14 Principal Accountant Fees and Services . . . . . . . . . . . . . . . . . . . . . . . . . . . . . . . . . . 51Part IVItem 15 Exhibits, Financial Statement Schedules . . . . . . . . . . . . . . . . . . . . . . . . . . . . . . . . . . 52Index to Consolidated Financial Statements . . . . . . . . . . . . . . . . . . . . . . . . . . . . . . . . . . . . . . . F-1Signatures . . . . . . . . . . . . . . . . . . . . . . . . . . . . . . . . . . . . . . . . . . . . . . . . . . . . . . . . . . . . . . . 53Exhibit Index . . . . . . . . . . . . . . . . . . . . . . . . . . . . . . . . . . . . . . . . . . . . . . . . . . . . . . . . . . . . . 54
i

Cautionary Note Concerning Factors That May Affect Future Results
This document contains forward-looking statements within the meaning of Section 27A of the Securities Actof 1933, as amended (the “Securities Act”), and Section 21E of the Securities Exchange Act of 1934, asamended (the “Exchange Act”). Forward-looking statements are statements other than historical information orstatements of current condition. We generally identify forward-looking statements by the use of terms such as“believe”, “intend”, “expect”, “may”, “should”, “plan”, “project”, “contemplate”, “anticipate”, or other similarstatements. Examples of forward looking statements in this Annual Report on Form 10-K include, but are notlimited to statements that
(i) we are well positioned to address the evolving integration needs of our clients through our expertise inmessaging and location determination;
(ii) we are developing relationships with communication infrastructure providers and we intend to expandour domestic and international carrier base;
(iii) we plan to continue to develop and sell software and engineered systems which we will deliver throughdeployment in customer networks or through hosted and subscription business models and we believe that oursoftware is positioned for early adoption by carriers;
(iv) wireless growth is expected to continue to increase in all regions around the world for the foreseeablefuture;
(v) both the number of users and messages per individual are projected to increase significantly;
(vi) we will continue to develop network software for wireless carriers that operate on all major types ofnetworks;
(vii) we will continue to leverage our knowledge of complex call control technology to unlock valuableinformation and expand the range of capabilities that the technology can accomplish for our customers;
(viii) we will continue to invest in our underlying technology and to capitalize on our expertise to meet thegrowing demand for sophisticated wireless applications;
(ix) we intend to continue to selectively consider acquisitions of companies and technologies in order toincrease the scale and scope of our operations, market presence, products, services and customer base;
(x) the Broadband Global Area Network upgrade of the Inmarsat satellite constellation expands ouropportunity for SwiftLink sales volume;
(xi) we believe our expertise in the area of wireless E9-1-1, location and messaging services, and securesatellite communications can be leveraged into providing products and services to the Federal agencies;
(xii) we are continuing to enhance our deployable communication systems product line to take advantage ofthe evolving environment of satellite communications;
(xiii) we believe that our company enjoys a competitive advantage because of its secure teleport andintegration capabilities along with deployable systems as a bundled offering;
(xiv) federal agencies, as well as state and local governments, are increasingly contracting with specialistteams for functions such as network management, and for long-term projects such as software developmentand systems integration;
(xv) we expect to continue generate significant portions of our total revenue from our largest customers;
(xvi) we expect to realize $116.0 million of backlog within the next twelve months;
(xvii) the bases on which we expect to continue to compete;
(xviii) we expect to require increasing levels of support from subcontractors and vendors and expand ourwork under contract vehicles;
1

(xix) we believe we have sufficient capital resources to meet our anticipated cash operating expenses,working capital and capital expenditure and debt services needs for the next twelve months;
(xx) that we believe our capitalized research and development expense will be recoverable from futuregross profits generated by the related products;
(xxi) we believe our intellectual property assets are valuable and that we may realize revenue from patentinfringement claims;
(xxii) we believe we should not incur an material liabilities from customer indemnification requests;
(xxiii) the WWSS procurement vehicle is expected to contribute to significant sales growth and that weexpect to fulfill the potential values under WWSS orders;
(xxiv) expectations about the amount of future non-cash stock compensation;
(xxv) our assumptions and expectations related to income taxes and deferred tax assets;
(xxvi) we do not expect that the adoption of new accounting standards to have a material impact on thecompany’s financial statements, and
(xxvii) statements about financial covenants related to our loan agreements.
Other such statements include without limitation risks and uncertainties relating to our financial results andour ability to (i) continue to rely on our customers and other third parties to provide additional products andservices that create a demand for our products and services, (ii) conduct our business in foreign countries,(iii) adapt and integrate new technologies into our products, (iv) develop software without any errors or defects,(v) protect our intellectual property rights, (vi) implement our business strategy, (vii) realize backlog, (viii) competewith small business competitors, (ix) effectively manage our counter party risks, and (x) achieve continuedrevenue growth in the foreseeable future in certain of our business lines. This list should not be consideredexhaustive.
These forward-looking statements relate to our plans, objectives and expectations for future operations. Webase these statements on our beliefs as well as assumptions made using information currently available to us. Inlight of the risks and uncertainties inherent in all projected operational matters, the inclusion of forward-lookingstatements in this document should not be regarded as a representation by us or any other person that ourobjectives or plans will be achieved or that any of our operating expectations will be realized. Revenues, resultsof operations, and other matters are difficult to forecast and could differ materially from those projected in theforward-looking statements contained in this Annual Report on Form 10-K as a result of factors discussed in“Management’s Discussion and Analysis of Financial Conditions and Results of Operations”, the mattersdiscussed in “Risk Factors Affecting Our Business and Future Results”, which are included in Item 1A, andthose factors discussed elsewhere in this Annual Report on Form 10-K including, changes in economicconditions, technology and the market in general, and our ability to adapt our products and services to thesechanges. We undertake no obligation to release publicly the results of any future revisions we make to forward-looking statements to reflect events or circumstances after the date hereof or to reflect the occurrence ofunanticipated events. We caution you not to put undue reliance on these forward-looking statements.
Item 1. Business
Overview
TeleCommunication Systems, Inc. develops and applies highly reliable wireless data communicationstechnology, with emphasis on text messaging, location-based services including enhanced 9-1-1 (E9-1-1) forwireless carriers and Voice over Internet Protocol (VoIP) service providers, and secure satellite-based communi-cation solutions for government customers.
We are a Maryland corporation founded in 1987 with headquarters at 275 West Street, Annapolis, Maryland21401. Our Web address is www.telecomsys.com. The information contained on our Web site does notconstitute part of this Annual Report on Form 10-K. All of our filings with the Securities and ExchangeCommission are available through a link on our website. The terms “TCS”, “we”, “us” and “our” as used in this
2

Annual Report on Form 10-K refer to TeleCommunication Systems, Inc. and its subsidiaries as a combined entity,except where it is made clear that such terms mean only TeleCommunication Systems, Inc.
Our business is conducted through two operating segments, Commercial (46% of 2008 revenue) andGovernment (54% of 2008 revenue). See discussion of segment reporting in Note 20 to the audited ConsolidatedFinancial Statements presented elsewhere in this Annual Report on Form 10-K for additional segmentinformation.
Commercial Segment: Our carrier services and systems products enable wireless carriers to deliver shorttext messages, location information, internet content, and other enhanced communication services to and fromwireless phones. We provide E9-1-1 services, commercial location-based services, and inter-carrier text messagedistribution services on a hosted, or service bureau basis, that is, customers use our software functionalitythrough connections to and from our network operations centers, paying us monthly fees based on the numberof subscribers, cell sites, call center circuits, or message volume. We provide hosted services under contractswith wireless carrier networks, as well as VoIP service providers. We earn subscriber revenue through wirelessapplications including our navigation and traffic application which are available via many wireless carriers. Weearn carrier software-based revenue through the sale of licenses, deployment and customization fees andmaintenance fees. Pricing is generally based on the volume of capacity purchased from us by the carrier. As ofDecember 31, 2008, we had deployed 108 of our software systems in wireless carrier networks around theworld, including those of Verizon Wireless, Telefonica and its affiliate Vivo, and Hutchison Whampoa’s “3” brandthird generation networks.
Government Segment: Since our founding in 1987 we have provided communication systems integration,information technology services, and software solutions to the U.S. Department of Defense and othergovernment customers. We also own and operate secure satellite teleport facilities, and resell access to satelliteairtime (known as space segment.) We design, furnish, install and operate wireless and data networkcommunication systems, including our SwiftLink» deployable communication systems which incorporate highspeed, satellite, and internet protocol technology. More than 1,500 of our SwiftLink» deployable communicationsystems are in use for security, defense, and law enforcement around the world. In 2006, we were named oneof six prime contractors on the US Army’s Worldwide Satellite Systems (“WWSS”) contract vehicle, with aceiling value of up to $5 billion in procurements through 2011.
We currently have more than 65 patents, primarily for wireless messaging and location technology, andmore than 210 patent applications pending. During 2008, we sold one of our patents to TIP Communication LLCnetting $8.1 million, as part of settling a patent infringement suit again Research in Motion Limited. We employapproximately 600 people.
SwiftLink», Xypoint», and Enabling Convergent Technologies», are trademarks or service marks of TeleCom-munication Systems, Inc. or our subsidiaries. This Annual Report on Form 10-K also contains trademarks, tradenames and services marks of other companies that are the property of their respective owners.
I. Commercial Segment:
We provide software, related systems, hosted services, maintenance and related services to wirelesscarriers, Voice Over IP service providers, and users of electronic map and related location-based technology,based on our portfolio of patented intellectual property.
A. Commercial Product and Service Offerings
1. Commercial services. We own and lease network operation centers that host software for whichcustomers make recurring monthly usage payments. Our hosted offerings include wireless and Voice over IP E9-1-1, and commercial location-based applications. Through wireless carriers, we sell subscriptions to servicesusing our client software applications such as navigation, traffic, and points of interest, sometimes in
3

collaboration with owners of brand names such as Rand McNally». Our primary commercial product offeringsinclude:
a. Hosted Location-Based Services, including E9-1-1. Our E9-1-1 service bureau works with wirelesscarriers and local emergency services in compliance with the Federal Communication Commission require-ments. When a wireless subscriber covered by this service makes a 9-1-1 call from his or her wirelessphone, the software (1) identifies the call as an emergency call, (2) accesses the handset’s locationinformation from the wireless network, (3) routes the call to the appropriate public safety jurisdiction,(4) translates the information into a dispatcher-friendly format, and (5) transmits the data to the localemergency service call center. Our E9-1-1 service operates on a platform at our network operations centerin Seattle, Washington with data center redundancy in Phoenix, Arizona. As of December 31, 2008, we areunder contract to provide E9-1-1 services to more than 40 customers including wireless carriers Verizon andAT&T Wireless, and Voice over IP service providers including Vonage and Level 3.
b. Customer subscriptions to application-based services such as Navigation, Traffic and Points-of-Interest. TCS’ strategy is to provide wireless subscriber applications that use location-based technology,which subscribers may select and pay recurring monthly fees. TCS has launched its real-time trafficapplication downloadable mobile applications that deliver easy access to maps, directions and directorylistings for the entire United States, and its navigation applications on multiple networks. Variations of allapplications are sold under the Rand McNally» brand as well as carrier or other brands.
c. Software and system maintenance. For our installed base of systems in use by customers (seesystem descriptions below), we provide ongoing operational support, including administration of systemcomponents, system optimization and configuration management. Maintenance services include trackingcustomer support issues, trouble shooting, and developing and installing maintenance releases. We typicallyprovide maintenance services for an annual fee paid in advance, which is priced based on the cumulativelicense fees we have billed for the systems being supported.
d. Professional services involving electronic map technology. We provide custom software devel-opment and professional services to customers engaged in telematics (the use of Global Positioning Systemtechnology integrated with computers and mobile communications technology in automotive navigationsystems). Customers include DENSO Corporation of Japan, and services include points-of-interest applica-tions, and compilation and maintenance of geographic information databases used in vehicle navigationsystems for products including Toyota, Lexus, Land Rover and Hyundai brands.
2. Commercial Licensed Software-based Systems: We design and develop software products forwireless carrier and enterprise networks that enable the delivery of secure and personalized content, services,and transactions to wireless devices. We design our software using industry standards for easy implementation,customization, and interoperability with other network components. Most of our commercial software isdesigned and delivered together with third-party software and related hardware, which is integrated into newand existing networks by our engineers. Our primary commercial software-based system offerings include:
a. Xypoint» Location Platform (XLP) and Applications for Location-based Services: Our Xypoint»Location Platform system interacts with wireless network to extract location information (the “X/Y”coordinates) of a user’s device. In order to determine a user’s location with sufficient precision for U.S. publicsafety compliance and for commercial location-based applications, our technology interacts with networksthat have incorporated Assisted GPS systems that use Global Positioning System (GPS) chips in userhandsets; it can also work with network triangulation software which some carriers have added to celltowers and switches in the network. We have been a leader in developing the location platform standardcalled Secure User Plane for Location (SUPL) and have incorporated the technology in our product. Ourplatform also provides privacy controls so that the wireless device user controls access to the user’s locationinformation. The “X/Y” information extracted from networks by our XLP is used by application softwareincluding E9-1-1, driving navigation directions, identification of points of interest locations near the end user(such as gas stations, restaurants, or hotels), and locating other network subscribers near the user’s currentposition.
4

b. Short Message Service Center and Wireless Intelligent Gateway. Our Short Message ServiceCenter software enables users to send and receive text or data messages to and from wireless devices.The Wireless Intelligent Gateway is a portal for two-way data communication between users of wirelessnetworks and the Internet. The Gateway allows users to customize the services they receive on wirelessdevices by setting up a user profile through a single Internet-based procedure. Wireless carriers can accessthese user profiles and usage data to gain a better understanding of customer behavior. The WirelessIntelligent Gateway allows additional wireless applications to be added as desired, as well as personalization,instant messaging and spam-blocking capabilities that can be independently customized by the end-user. Itcan interoperate with our location-based service platform and applications.
B. Commercial Market Opportunities and Strategy
We plan to continue to develop and sell software and engineered systems which we will deliver throughdeployment in customer networks or through hosted and subscription business models. Our developmentinvestment is focused on the delivery of Internet content, proprietary third-party content, short messages,location information, corporate network data and other enhanced data-communication services to and fromwireless devices. The following trends are driving demand for our products and services:
Growth in Wireless and Voice over Internet Protocol (VoIP) Subscribers. The use of wirelesscommunications has increased significantly in recent years, driven by expanded wireless network coverage,upgraded high-speed digital wireless networks, more affordable wireless communications service plans, andhigher quality and less expensive wireless devices. VoIP service offers cost advantages over traditionalwireline service. Wireless growth is expected to continue to increase in all regions around the world for theforeseeable future. Driving this growth is the replacement of landline connections with wireless connections.Some households are now using cellular phones exclusively. This is especially true for young adults, but alsotrue in developing countries where wireless may often be the only means of communications.
The FCC’s E9-1-1 Mandates. We are one of the two leading providers of E9-1-1 service to wirelessand VoIP service providers in the U.S. The ability to call for help or communicate with family members inneed is the reason many people cite for having a wireless phone. A key to enhancing personal safetythrough a cell phone is the availability of E9-1-1 wireless capabilities. In 1996, the Federal CommunicationsCommission (FCC) mandated the adoption of E9-1-1 technology by wireless carriers. In June 2005, the FCCordered providers of interconnected VoIP service to provide E9-1-1 services to all of their customers as astandard feature of the service, rather than as an optional enhancement. The FCC requires wireless carriersto issue quarterly reports as to their progress and compliance with FCC-mandated deployment schedules.
Cellular Network Improvements to Third Generation Capabilities. Mobile operators are deployinghigh-speed data networks based on third generation technologies that, in many cases, equal or surpass datarates that are typically available for residential wireline users. The deployments of these high-speed wirelessdata networks have made it possible for individuals and enterprises to “wireless-enable” many services thatpreviously required a wireline connection, such as connecting to the Internet and accessing corporate dataoutside the office. Our location-based technology and applications incorporating map graphics takeadvantage of these network enhancements.
Improving Wireless Device Functionality. Manufacturers continue to increase the functionality ofmobile devices including phones and personal digital assistants through higher resolution, color screens, andincreased computing capability for sophisticated applications. These devices enable the user to takeadvantage of the high-speed data networks for Internet and data usage. Broad adoption of location-basedservices (LBS) has required, among other things, handsets incorporating components for interoperation withGlobal Positioning System satellites and with LBS network components that we have developed andprovide. A growing number of handheld wireless device models contain Global Positioning System (GPS)chipsets which interoperate with our network platforms and applications.
Growing Use of Commercial Location-Based Wireless Services (LBS). A driver of wireless commu-nication subscriber revenue growth is the delivery of timely, highly specialized, interactive and location-specific information. Technology incorporated in a growing number of networks and handsets now enables
5

determination of the handset’s location with sufficient precision to allow useful applications beyond publicsafety’s E9-1-1. Wireless users benefit from the ability to receive highly customized location-specificinformation in response to their queries or via targeted opt-in content delivered to the wireless device.Enterprises benefit from wireless location technology by utilizing routing and tracking applications for theirmobile field forces. Our software provides wireless location solutions to mobile operators today through ourXypoint» Location Platform (XLP.) This technology is being used, via interconnection with XLP systemshosted in our network operations, by MetroPCS and Ntelos in the U.S., Bell Mobility in the U.S. and Canada,Centennial Puerto Rico in Puerto Rico, and Iusacell in Mexico. Our XLP in-network system customersinclude Alltel (now part of Verizon Wireless), Hutchison Whampoa’s “3“TM networks, and Telefonica’s Vivonetwork in Brazil. We are deploying hosting infrastructure in Mumbai, India to serve Tata Teleservices andother carriers in India with location data and downloadable navigation application software.
Growing Use of Short Messaging and Internet Applications. The number of short messagingservices (SMS) users and messages per individual are projected to continue to increase significantly. Mobileoperators in the United States are experiencing rapid SMS traffic growth, according to statistics from mobileoperators. The Internet and internal corporate data networks, or intranets, have emerged as globalcommunications channels that allow users to share information and conduct business transactions electron-ically. We provide solutions for mobile operators to receive and route e-mail and SMS messages through ourShort Message Service Center and Wireless Intelligent Gateway systems.
The key elements of our commercial strategy are to:
• Focus our Software and Integration Resources on Evolving Carrier Network Capabilities. Mobileoperators and the federal government increasingly seek integrated solutions that can harness bothmessaging capabilities of networks and location information of end-users. We are well positioned toaddress the evolving integration needs of our commercial and government clients through our demon-strated expertise in both messaging and location determination. Mobile operators have made large capitalexpenditure investments in infrastructure for wireless data and location determination technologies. Whileoriginally envisioned as separate technologies, messaging and location determination technologies can beintegrated to provide value-added services and applications for the operators’ end-users.
• Expand Our Sales and Marketing Relationships. We are developing relationships with communicationinfrastructure providers in order to expand our sales channels for our carrier software products andservices. We have historically leveraged our strategic relationships with original equipment manufacturersto market our Commercial Segment products to wireless carriers worldwide. We have long standingrelationships with Qualcomm Incorporated and its subsidiary SnapTrack Inc., including the BREW LocateSignature Solution. We are adding partnerships for our location technologies, including a marketing alliancein China established in January 2009.
• Grow Our Wireless Carrier and Voice Over IP Customer Base. We now serve or are under contractwith more than 40 wireless carrier networks and VoIP service providers in 16 countries. We intend toexpand our domestic and international carrier base by capitalizing on our relationships with originalequipment manufacturers and establish new distribution partnerships and by expanding our own sales andmarketing initiatives. We will continue to develop network software for wireless carriers that operate onall major types of networks.
• Leverage Our Expertise in Accessing Information Stored Inside Wireless Networks. We will continueto leverage our knowledge of complex call control technology, including Signaling System 7 and InternetProtocol standards, to unlock valuable information such as user location, device on/off status, and billingand transaction records that reside inside wireless networks and are difficult to retrieve and utilize. Usingthis information, we intend to expand the range of capabilities that wireless data technology canaccomplish for our customers.
• Develop and Enhance Our Technology. We will continue to invest in our underlying technology and tocapitalize on our expertise to meet the growing demand for sophisticated wireless applications. As ofJanuary 1, 2009, our staff included approximately 300 personnel with technical expertise in wirelessnetwork, client software development, hosted wireless operations, satellite-based communication
6

technology and integrated network solutions. We also have research and development relationships withwireless handset manufacturers, wireless carriers, and content and electronic commerce providers. OurXypoint» platform architecture efficiently integrates our presence, location, call control and messagingtechnology, resulting in reduced costs, increased reliability, more efficient deployments, compatibility withour existing products and a migration path to third-generation services.
• Pursue Select Acquisitions. We intend to continue to selectively consider acquisitions of companies andtechnologies in order to increase the scale and scope of our operations, market presence, products,services and customer base.
II. Government Segment:
We provide secure, deployable communication systems, and engineering and technical services, withemphasis on satellite-based communication technology, to agencies of the U.S. Departments of Defense (DoD),State, Justice, Homeland Security, as well as the City of Baltimore and other government customers.
A. Government Products and Services
1. Government Services. We enter into fee-for-service contracts under which revenue is generated basedon contract labor billing rates or based on fixed fees for deliverables. These services, typically under multi-yearcontracts or contract vehicles, include:
a. Network Operation and Telecom Expense Management Support. We design, install, and operatedata networks that integrate computing and communications, including systems that provide communica-tions via both satellite and terrestrial links. We can provide complete network installation services fromcabling infrastructure to complex communications system components. We also provide ongoing networkoperation and management support services including telecom expense management under multi-yearcontracts with government customers.
b. Secure Satellite Teleport Data Landing and Transmission Services. We own and operate a high-speed satellite communications teleports in Manassas, Virginia that are connected to the public switchedtelephone network. These facilities provide transport services for Internet Protocol (IP)-based media contentconsisting of Voice over IP (VoIP), Internet, video, and messaging data using Very Small Aperture Terminal(VSAT) satellite technology as part of our communication solutions for our customers. We purchase spacesegment and resell it to customers using our facilities.
c. Maintenance Services. We offer basic and extended maintenance services related to our SwiftLink»products and customized deployable communication systems.
2. Government Systems. We have designed and developed our SwiftLink» product line a series ofruggedized, wireless and satellite-based secure communication systems, which can be rapidly deployed inremote areas where other means of reliable communications may not be available. SwiftLink» products providesecure voice, video and data communications for multiple personnel. All of our SwiftLink» systems can bedeployed by a single person in less than ten minutes, creating critical communication channels from any locationaround the world. Uses include critical communications for DoD warfighters and command headquarters,emergency response, news reporting, public safety, drilling and mining operations, field surveys and otheractivities that require remote capabilities for video and data transmission. Integration work which typicallyaccompanies customer purchases of our secure deployable systems is reported together with the system salesrevenue. The Broadband Global Area Network upgrade of the Inmarsat satellite constellation, which enableslower cost internet protocol traffic with broader band capability, expands our opportunity for SwiftLink» sales.More importantly, our deployable VSAT multi-band terminals provide access to a wide array of commercial andmilitary satellites that make broadband capabilities available on a global basis. In addition, our deployablebroadband wireless systems provide additional extensions of secure wireless communications services for up to30 miles from a Switlink» point of presence.
7
B. Government Market Opportunities and Strategy
We plan to continue to provide communication systems integration, information technology services,software solutions to the U.S. Department of Defense, and other government customers, in addition to operatingsecure satellite teleport facilities and reselling access to satellite airtime. Our development and business growthis focused on continuity of operations, field service operations and increased satellite managed bandwidthservices. The following trends are driving demand for our products and services:
Expanded Need for Secure, Interoperable Deployable Communication Solutions. In recognition of themilitary imperative of enabling secure, broadband access to data for missions in disparate, remote locations, theUS Army awarded the WWSS 5-year procurement contract vehicle to six prime contractors, including TeleCom-munication Systems, Inc. in the third quarter of 2006, with a ceiling value of up to $5 billion in procurementsthrough 2011. This procurement encompasses systems like our SwiftLink» family of deliverables, and during2008 we generated significant revenue under WWSS, including fulfillment of orders for equipment under threeWWSS programs: MiTT (Military Transition Team); WPPL (Wireless Point-to-point Link, and SNAP (Secure andNon-secure IP Network Access Point) systems. We are continuing to enhance our deployable communicationsystems product line to take advantage of the evolving environment, including the benefits of Very SmallAperture Terminal (VSAT) satellite communications architectures deployable in multiple aperture sizes from 0.45meter man pack terminals to 2.4 meters where desirable and the use of Inmarsat Broadband Global AreaNetwork enhancements to our satellite services.
Growing Use of Secure Wireless Communications and Location Technology for Defense, Intelligenceand Homeland Security. Wireless communications and location technology are key initiatives within the federalgovernment for both security and supply-chain management. Wireless communications in emergencies are ofparamount importance, as emergency personnel need to be able to communicate and share information acrossagencies and departments where wireline systems may be unavailable. We believe that our expertise in theareas of wireless E9-1-1, location and messaging services, and secure satellite communications can be leveragedto provide the needed wireless infrastructure for the U.S. Departments of Homeland Security and Defense andwe are currently pursuing opportunities to provide such products and services. Our SwiftLink» deployablecommunication systems are also increasingly used by military and other government agencies around the globefor communications in times of emergencies. SwiftLink» is designed to provide secure voice and datacommunications through encrypted satellite links.
Government Outsourcing of Network and Telecom Technical Functions. Federal agencies, as well asstate and local governments, are increasingly contracting with specialist teams for functions such as networkmanagement, and for long-term projects such as software development and systems integration. Since thefounding of our Company, we have built relationships with federal agencies, as well as the State of Marylandand the City of Baltimore. Since early 2004, we have made it a management priority to aggressively expand ourbase of long-term service contract engagements. We have added experienced sales personnel and enhanced ourrelationships with systems integrators and specialist vendors to expand our penetration of the governmentservice market.
Secure Teleport and Integration Capabilities along with Deployable Systems as a Bundled Offering.Government customers can benefit from single-sourcing secure communications solutions which include asecure U.S. landing site for backhaul traffic as well as network engineering expertise and secure remoteterminals. We believe that TCS enjoys a competitive advantage, because it can offer all of these elements froma single vendor.
Application of Commercially Proven Technology to Government Solutions. Government customersincreasingly are using commercial carrier networks. Procurement officers have expressed a preference forsolutions that incorporate proven commercial technology, rather than reliance on government research anddevelopment funding. Our portfolio of software, patented intellectual property, and teams of wireless andencryption specialists positions us to tap into this opportunity.
8
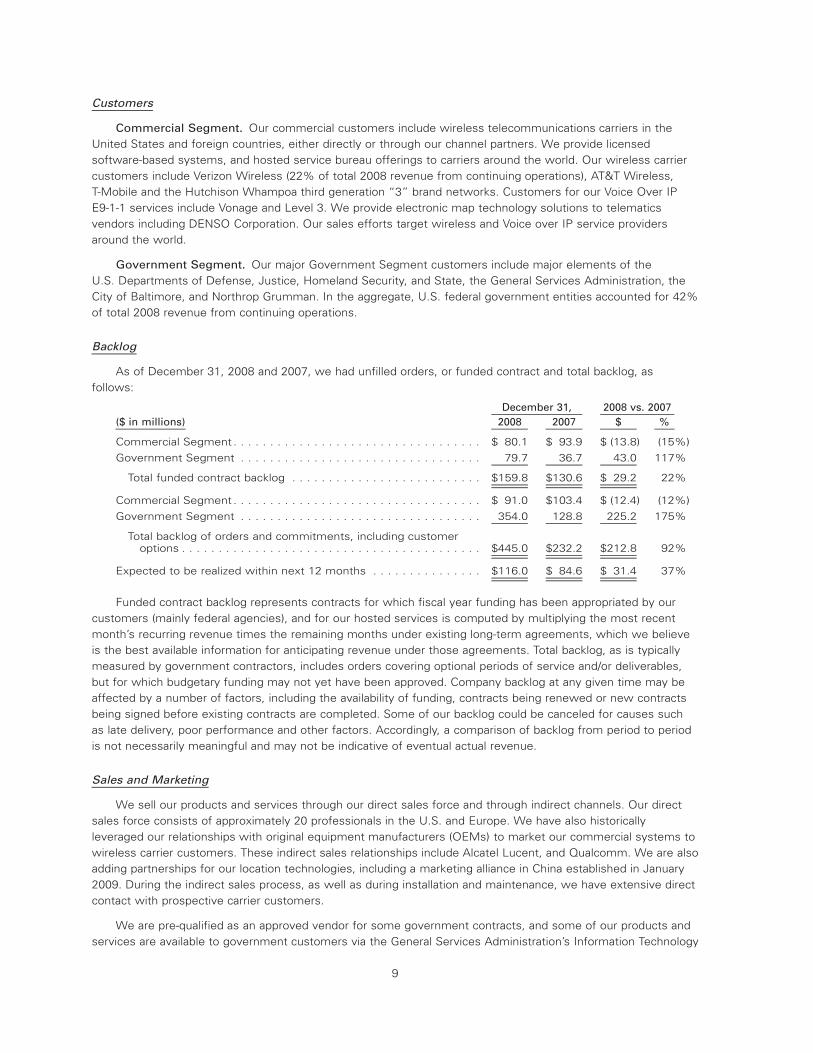
Customers
Commercial Segment. Our commercial customers include wireless telecommunications carriers in theUnited States and foreign countries, either directly or through our channel partners. We provide licensedsoftware-based systems, and hosted service bureau offerings to carriers around the world. Our wireless carriercustomers include Verizon Wireless (22% of total 2008 revenue from continuing operations), AT&T Wireless,T-Mobile and the Hutchison Whampoa third generation “3” brand networks. Customers for our Voice Over IPE9-1-1 services include Vonage and Level 3. We provide electronic map technology solutions to telematicsvendors including DENSO Corporation. Our sales efforts target wireless and Voice over IP service providersaround the world.
Government Segment. Our major Government Segment customers include major elements of theU.S. Departments of Defense, Justice, Homeland Security, and State, the General Services Administration, theCity of Baltimore, and Northrop Grumman. In the aggregate, U.S. federal government entities accounted for 42%of total 2008 revenue from continuing operations.
Backlog
As of December 31, 2008 and 2007, we had unfilled orders, or funded contract and total backlog, asfollows:
($ in millions) 2008 2007 $ %December 31, 2008 vs. 2007
Commercial Segment . . . . . . . . . . . . . . . . . . . . . . . . . . . . . . . . . . $ 80.1 $ 93.9 $ (13.8) (15%)Government Segment . . . . . . . . . . . . . . . . . . . . . . . . . . . . . . . . . 79.7 36.7 43.0 117%
Total funded contract backlog . . . . . . . . . . . . . . . . . . . . . . . . . . $159.8 $130.6 $ 29.2 22%
Commercial Segment . . . . . . . . . . . . . . . . . . . . . . . . . . . . . . . . . . $ 91.0 $103.4 $ (12.4) (12%)Government Segment . . . . . . . . . . . . . . . . . . . . . . . . . . . . . . . . . 354.0 128.8 225.2 175%
Total backlog of orders and commitments, including customeroptions . . . . . . . . . . . . . . . . . . . . . . . . . . . . . . . . . . . . . . . . . $445.0 $232.2 $212.8 92%
Expected to be realized within next 12 months . . . . . . . . . . . . . . . $116.0 $ 84.6 $ 31.4 37%
Funded contract backlog represents contracts for which fiscal year funding has been appropriated by ourcustomers (mainly federal agencies), and for our hosted services is computed by multiplying the most recentmonth’s recurring revenue times the remaining months under existing long-term agreements, which we believeis the best available information for anticipating revenue under those agreements. Total backlog, as is typicallymeasured by government contractors, includes orders covering optional periods of service and/or deliverables,but for which budgetary funding may not yet have been approved. Company backlog at any given time may beaffected by a number of factors, including the availability of funding, contracts being renewed or new contractsbeing signed before existing contracts are completed. Some of our backlog could be canceled for causes suchas late delivery, poor performance and other factors. Accordingly, a comparison of backlog from period to periodis not necessarily meaningful and may not be indicative of eventual actual revenue.
Sales and Marketing
We sell our products and services through our direct sales force and through indirect channels. Our directsales force consists of approximately 20 professionals in the U.S. and Europe. We have also historicallyleveraged our relationships with original equipment manufacturers (OEMs) to market our commercial systems towireless carrier customers. These indirect sales relationships include Alcatel Lucent, and Qualcomm. We are alsoadding partnerships for our location technologies, including a marketing alliance in China established in January2009. During the indirect sales process, as well as during installation and maintenance, we have extensive directcontact with prospective carrier customers.
We are pre-qualified as an approved vendor for some government contracts, and some of our products andservices are available to government customers via the General Services Administration’s Information Technology
9

Schedule 70, and the Worldwide Satellite Services (WWSS) and the Space and Naval Warfare Foreign MilitarySales (SPAWAR FMS) contract vehicles. We collaborate in sales efforts under various arrangements withintegrators. Our marketing efforts also include advertising, public relations, speaking engagements and attendingand sponsoring industry conferences.
Competition
The markets for our products and services are competitive. The adoption of industry standards may make iteasier for new market entrants to compete with us. We expect that we will continue to compete primarily onthe basis of the functionality, breadth, time to market, ease of integration, price, and quality of our products andservices, as well as our market experience and reputation. The market and competitive conditions are continuallydeveloping. Our software products compete with many similar products provided by other companies. It isdifficult to present a meaningful comparison between our competitors and us because there is a large variationin revenue generated by different customers, different products and services, as well as the differentcombinations of products and services offered by our competitors. We cannot, therefore, quantify our relativecompetitive position.
Our current and potential competitors include:
• Commercial Segment. Intrado Inc. division of West Corporation; Motorola Inc.; Siemens AG; EricssonLM Telephone Co.; Openwave Systems Inc.; Acision; Comverse Technology Inc.
• Government Segment. Computer Sciences Corporation; ViaSat Inc.; General Dynamics corp.; DataPathInc.; CACI International Inc.; Globecomm Systems, Inc.; Comtech Telecommunications, Corp.
Many of our existing and potential competitors have substantially greater financial, technical, marketing anddistribution resources than we do. Many of these companies have greater name recognition and moreestablished relationships with their target customers. Furthermore, these competitors may be able to adoptmore aggressive pricing policies and offer customers more attractive terms than we can. With time and capital,it would be possible for our competitors to replicate our products and services.
We partner with vendors of precise location technology. Certain of our partners may attempt to competewith our operating platform by developing their own transmission platform or by purchasing another mobilelocation platform. The markets for commercial location and other mobile wireless applications for carriers andenterprises are relatively new and continually developing. The convergence of wireless technologies and theInternet is creating many initiatives to bring data and transaction capabilities to wireless devices. There is a widearray of potential competitors in this market, including providers of competing location management platforms,competing e-mail products, competing enterprise mobility platforms and other competing applications forwireless devices.
Research and Development
Our success depends on a number of factors, which include, among other items, our ability to identify andrespond to emerging technological trends in our target markets, to develop and maintain competitive products,to enhance our existing products by adding features and functionality that differentiate the products from thoseof our competitors, and to bring products to market on a timely basis and at competitive prices. As of January 1,2009, our overall staff included approximately 300 professionals with technical expertise in wireless network,client software development and satellite-based communication technology. Since 1996, we have madesubstantial investments in wireless technology research and development, most of which has been devoted tothe development of carrier and enterprise network software products and services. We are primarily focusingour current research and development investments in cellular location-based and electronic map technology,including E9-1-1 technology. We actively support existing telecommunications standards and promote newtelecommunications standards in order to expand the market for wireless data. We actively participate inwireless standards-setting organizations including the Open Mobile Alliance, and we are represented on theBoard of Directors for the E9-1-1 Institute. In 1996, we co-founded the Intelligent Network Forum, anorganization dedicated to expanding the role of intelligent networks in telecommunications. As part of ourstrategy to expand the role of short messaging, we co-founded the Short Message Peer-to-Peer Forum in 1999.
10

For the years ended December 31, 2008, 2007, and 2006, our research and development expense in continuingoperations was $16.2 million, $13.1 million, and $12.6 million, respectively.
Certain of our government customers contract with us from time to time to conduct research ontelecommunications software, equipment and systems.
Intellectual Property Rights
We rely on a combination of patent, copyright, trademark, service mark, and trade secret laws andrestrictions to establish and protect certain proprietary rights in our products and services.
We currently hold more than 65 issued patents relating to wireless text messaging, inter-carrier messaging,number portability, GPS ephemeris data, emergency public safety data routing and electronic commerce. Wehave filed more than 210 additional patent applications for certain apparatus and processes we believe we haveinvented to enable key features of the location services, wireless text alerts, Short Message Service Center,mobile-originated data and E9-1-1 network software. There is no assurance that these patent applications willresult in a patent being issued by the U.S. Patent and Trademark Office or other patent offices, nor is there anyguarantee that any issued patent will be valid and enforceable. Additionally, foreign patent rights may or may notbe available or pursued in any technology area for which U.S. patent applications have been filed.
We developed our Short Message Service Center software in 1996 under our development agreement withAlcatel Lucent. Under the development agreement, we share certain ownership rights in this software applicationwith Alcatel Lucent. The scope of each party’s ownership interest is subject to each party’s various underlyingownership rights in intellectual property and also to confidential information contributed to the applications, andis subject to challenge by either party.
As a member of various industry standard-setting forums, we have agreed to license certain of ourintellectual property to other members on fair and reasonable terms to the extent that the license is required todevelop non-infringing products under the specifications promulgated by those forums.
Employees
As of December 31, 2008, we had 585 employees, of which 573 were full-time and 12 were part-time. Webelieve relations with our employees are good. None of our employees is represented by a union.
Geographical Information
During 2008, 2007, and 2006, total revenue generated from products and services of our continuingoperations in the U.S. were $211.5 million, $138.6 million, and $117.6 million, respectively, and total revenuegenerated from products and services outside of the U.S. were $8.6 million, $5.6 million, and $7.3 million,respectively. As of December 31, 2008, 2007, and 2006, essentially all of the long-lived assets of our continuingoperations were located in the U.S.
During 2007 and 2006, total revenue generated from products and services of our discontinued Enterprisedivision in the U.S. were $5.6 million and $22.1 million, respectively. All discontinued operations were divested in2007.
We are subject to risks related to offering our products and services in foreign countries. See theinformation under the heading “Risk Factors — Because our product offerings are sold internationally, we aresubject to risks of conducting business in foreign countries” included in Item 1A.
11

Item 1A. Risk Factors
You should consider carefully each of the following risks and all of the other information in this Annual Report onForm 10-K and the documents incorporated by reference herein. If any of the following risks and uncertaintiesdevelops into actual events, our business, financial condition or results of operations could be materiallyadversely affected.
Risks Related to Our Business
If wireless carriers do not continue to provide additional products and services to their subscribers,our business could be harmed.
If wireless carriers limit their product and service offerings or do not purchase additional products containingour applications, our business will be harmed. Wireless carriers face implementation and support challenges inintroducing Internet-based services via wireless devices, which may slow the rate of adoption or implementationof our products and services. Historically, wireless carriers have been relatively slow to implement complex newservices such as Internet-based services. Our future success depends upon a continued increase in the use ofwireless devices to access the Internet and upon the continued development of wireless devices as a mediumfor the delivery of network-based content and services. We have no control over the pace at which wirelesscarriers implement these new services. The failure of wireless carriers to introduce and support services utilizingour products in a timely and effective manner could reduce sales of our products and services and have amaterial adverse effect on our business, financial position, results of operations or cash flows.
We may fail to support our anticipated growth in operations which could reduce demand for our ser-vices and materially adversely affect our revenue.
Our business strategy is based on the assumption that the market demand, the number of customers, theamount of information they want to receive and the number of products and services we offer will all increase.We must continue to develop and expand our systems and operations to accommodate this growth. Theexpansion and adaptation of our systems operations requires substantial financial, operational and managementresources. Deployment of our Government systems has increased substantially and while we have increased ourproduction capabilities to satisfy the increased demand, our ability to meet production schedules for increasingdemand could adversely impact our product quality and reliability. Any failure on our part to develop and maintainour wireless data services and government system production lines as we experience rapid growth couldsignificantly reduce demand for our services and materially adversely affect our revenue. Also, if we incorrectlypredict the market areas that will grow significantly, we could expend significant resources that could have beenexpended on other areas that do show significant growth.
A significant portion of our contracts with the U.S. government are on a fixed price basis which couldnegatively impact the Company profitability.
A material portion of the Company’s annual revenues are derived from fixed-price contracts. Due to theirnature, fixed-price contracts inherently have more risk than flexibly priced contracts. Our operating margin isadversely affected when contract costs that cannot be billed to customers are incurred. While management usesits best judgment to estimate costs associated with fixed-price contracts, future events could result in eitherupward or downward adjustments to those estimates which could negatively impact our profitability. Theincrease in contract costs can occur if estimates to complete increase or if initial estimates used for calculatingthe contract cost were incorrect. The cost estimation process requires significant judgment and expertise.Reasons for cost growth may include unavailability and productivity of labor, the nature and complexity of thework to be performed, the effect of change orders, the availability of materials, interruptions in our supply chain,the effect of any delays in performance, availability and timing of funding from the customer, natural disasters,and the inability to recover any claims included in the estimates to complete. A significant change in costestimates on one or more programs could have a material effect on the company’s consolidated financial positionor results of operations.
12

We are subject to procurement and other related laws and regulation which carry significant penaltiesfor non-compliance.
As a supplier to the U.S. government, we must comply with numerous regulations, including thosegoverning security and contracting practices. In addition, prime contracts with various agencies of the U.S. gov-ernment and subcontracts with other prime contractors are subject to numerous laws and regulations.
Failure to comply with these procurement regulations and practices could result in fines being imposedagainst us or our suspension for a period of time from eligibility for bidding on, or for award of, new governmentcontracts. If we are disqualified as a supplier to government agencies, we would lose most, if not all, of ourU.S. government customers and revenues from sales of our products would decline significantly. Among thepotential causes for disqualification are violations of various statutes, including those related to procurementintegrity, export control, U.S. government security regulations, employment practices, protection of the environ-ment, accuracy of records in the recording of costs, and foreign corruption. The government could investigateand make inquiries of our business practices and conduct audits of contract performance and cost accounting.Based on the results of such audits, the U.S. government could adjust our contract-related costs and fees.Depending on the results of these audits and investigations, the government could make claims against us, andif it were to prevail, certain incurred costs would not be recoverable by us.
Current levels of market volatility are unprecedented and adverse capital and credit market conditionsmay negatively impact us.
The capital and credit markets have continued to experience extreme volatility and disruption. Historically,we have occasionally accessed these markets to support certain business activities. In the future, we may notbe able to obtain capital market financing or credit availability on similar terms, or at all, which could have amaterial adverse effect on our business, financial position, results of operations or cash flows.
Changes in the U.S. and global market conditions that are beyond our control may have a materialadverse effect on us.
The U.S. and global economies are currently experiencing a period of substantial economic uncertainty withwide-ranging effects, including the current disruption in global financial markets. Possible effects of theseeconomic events include those relating to U.S. government defense spending, business disruptions caused bysuppliers or subcontractors, impairment of goodwill and other long-lived assets and reduced access to capitaland credit markets. Although governments worldwide, including the U.S. government, have initiated sweepingeconomic plans, we are unable to predict the impact, severity, and duration of these economic events, whichcould have a material effect on our business, financial position, results of operations or cash flows.
We could incur substantial costs from product liability claims relating to our software.
Our agreements with customers may require us to indemnify customers for our own acts of negligence andnon-performance. Product liability and other forms of insurance are expensive and may not be available in thefuture. We cannot be sure that we will be able to maintain or obtain insurance coverage at acceptable costs or insufficient amounts or that our insurer will not disclaim coverage as to a future claim. A product liability or similarclaim may have a material adverse effect on our business, financial position, results of operations or cash flows.
Our operating results could be adversely affected by any interruption of our data delivery services,system failure or production interruptions.
Our E9-1-1, hosted location-based services and satellite teleport services operations depend on our ability tomaintain our computer and telecommunications equipment and systems in effective working order, and toprotect our systems against damage from fire, natural disaster, power loss, telecommunications failure,sabotage, unauthorized access to our system or similar events. Although all of our mission-critical systems andequipment are designed with built-in redundancy and security, any unanticipated interruption or delay in ouroperations or breach of security could have a material adverse effect on our business, financial condition andresults of operations.
13

Furthermore, any addition or expansion of our facilities to increase capacity could increase our exposure tonatural or other disasters. Our property and business interruption insurance may not be adequate to compensateus for any losses that may occur in the event of a system failure or a breach of security. Furthermore, insurancemay not be available to us at all or, if available, may not be available to us on commercially reasonable terms.
Because we rely on a few key customers, our revenue may decline if we fail to retain thosecustomers.
The largest customers for our product and service offerings in terms of revenue generated have been theU.S. government, Verizon Wireless, AT&T Wireless, and Hutchison 3G. For the years ended December 31, 2008and 2007, each of Verizon Wireless and the U.S. government accounted for 10% or more of our total revenue.For the year ended December 31, 2006 each of Verizon Wireless, AT&T Wireless (formerly known as CingularWireless), and the U.S. government accounted for 10% or more of our total revenue. We expect to generate asignificant portion of our total revenue from these customers for the foreseeable future. For the year endedDecember 31, 2008, the largest customers for our Commercial Segment was Verizon Wireless and the largestcustomers for our Government Segment were various U.S. Government agencies.
Our growth depends on maintaining relationships with our major customers and on developing othercustomers and distribution channels. The loss of any of the customers discussed in this paragraph would have amaterial adverse impact on our business, financial position, results of operations or cash flows.
We derive a significant portion of our revenue from sales to various agencies of the U.S. Governmentwhich has special rights unlike other customers and exposes us to additional risks that could have amaterial adverse effect on us.
Sales to various agencies of the U.S. Government accounted for approximately 42% of our total revenue forthe fiscal year ended December 31, 2008, all of which was attributable to our Government Segment. A majorityof our backlog as of December 31, 2008 consisted of orders from the U.S. Government. Our ability to earnrevenue from sales to the U.S. Government can be affected by numerous factors outside of our controlincluding:
• The U.S. Government may terminate the contracts it has with us. All of the contracts we have with theU.S. Government are, by their terms, subject to termination by the U.S. Government either for itsconvenience or in the event of a default by us. In the event of termination of a contract by theU.S. Government, we may have little or no recourse.
• Our contracts with the U.S. Government may be terminated due to Congress failing to appropriate funds.Our U.S. Government contracts are conditioned upon the continuing availability of Congressional appropri-ations. Congress usually appropriates funds for a given program on a fiscal-year basis even thoughcontract performance may take more than one year.
• The U.S. Government may audit and review our costs and performance on their contracts, as well as ouraccounting and general practices. The costs and prices under these contracts may be subject toadjustment based upon the results of any audits. Future audits that result in the increase in our costs mayadversely affect our business, financial position, results of operations or cash flows
Any failure by Congress to appropriate funds to any program that we participate in could materially delay orterminate the program and could have a material adverse effect on our business, financial position, results ofoperations or cash flows.
Because we rely on key partners to expand our marketing and sales efforts, if we fail to maintain orexpand our relationships with strategic partners and indirect distribution channels our license reve-nues could decline.
We have announced strategic partnerships with Motorola and Alcatel-Lucent, and are working on additionalpartnerships to provide supplemental channels for the marketing and sale of our software applications globally.Our growth depends on maintaining relationships with these partners and on developing other distribution
14

channels. The loss of any of these partners would have a material adverse impact on our business, financialposition, results of operations or cash flows.
Because our business may not generate sufficient cash to fund our operations, we may not be able tocontinue to grow our business if we are unable to obtain additional capital when needed.
We believe that our cash and cash equivalents, and our bank line of credit, coupled with the fundsanticipated to be generated from operations will be sufficient to finance our operations for at least the nexttwelve months. However, unanticipated events could cause us to fall short of our capital requirements. Inaddition, such unanticipated events could cause us to violate our bank line of credit covenants causing the bankto foreclose on the line and/or opportunities may make it necessary for us to return to the public markets, orestablish new credit facilities or raise capital in private transactions in order to meet our capital requirements. Wecannot assure you that we will be able to raise additional capital in the future on terms acceptable to us, or at all.
Our line of credit and term loan agreement contains covenants requiring us to maintain a minimum adjustedquick ratio and a minimum liquidity ratio; as well as other restrictive covenants including, among others,restrictions on our ability to merge, acquire assets above prescribed thresholds, undertake actions outside theordinary course of our business (including the incurrence of indebtedness), guarantee debt, distribute dividends,and repurchase our stock, and minimum tangible net worth. The agreement also contains a subjective covenantthat requires (i) no material adverse change in the business, operations, or financial condition of our Companyoccur, or (ii) no material impairment of the prospect of repayment of any portion of the bank credit agreement; or(iii) no material impairment of value or priority of the lenders security interests in the collateral of the bank creditagreement. If our performance does not result in compliance with any of the restrictive covenants, or if our lineof credit agreement lender seeks to exercise its rights under the subjective acceleration clause referred toabove, we would seek to further modify our financing arrangements, but there can be no assurance that ourdebt holders would not exercise their rights and remedies under their agreements with us, including declaring alloutstanding debt due and payable.
We are exposed to counterparty credit risk and there can be no assurances that we will manage ormitigate this risk effectively.
We are exposed to many different industries, counterparties, and partnership agreements, and regularlyinteract with counterparties in various industries.
The insolvency or other inability of a significant counterparty or partner, including a counterparty to thesignificant counterparty, to perform its obligations under an agreement or transaction, including, withoutlimitation, as a result of the rejection of an agreement or transaction by a counterparty in bankruptcyproceedings, could have a material adverse effect on our business, financial position, results of operations orcash flows.
Our short-term investments are subject to market fluctuations which may affect our liquidity.
Although we have not experienced any losses on our cash, cash equivalents, and short-term investments,declines in the market values of these investments in the future could have an adverse impact on our financialcondition and operating results. Historically, we have invested in AAA rated money market funds meeting certaincriteria. These investments are subject to general credit, liquidity, market, and interest rate risks, which may bedirectly or indirectly impacted by the U.S. sub-prime mortgage defaults that have affected various sectors of thefinancial markets causing credit and liquidity issues. If an issuer defaults on its obligations, or its credit ratingsare negatively affected by liquidity, losses or other factors, the value of our cash equivalents and short-terminvestments could decline and could have a material adverse effect on our business, financial position, results ofoperations or cash flows.
15

Our stock price, like that of many technology companies, has been and may continue to be volatile.
We expect that the market price of our Class A common stock will continue to be volatile. We are involvedin a highly visible, rapidly changing industry and stock prices in our industry and similar industries have risen andfallen in response to a variety of factors, including:
• announcements of new wireless data communications technologies and new providers of wireless datacommunications;
• announcements of the issuance of new patents;
• acquisitions of, or strategic alliances among, providers of wireless data communications;
• changes in recommendations by securities analysts regarding the results or prospects of providers ofwireless data communications;
• changes in investor perceptions of the acceptance or profitability of wireless data communications; and
• other global economic uncertainties.
Variations in quarterly operating results due to factors such as changes in demand for our productsand changes in our mix of revenues and costs may cause our Class A common stock price to decline.
Our quarterly revenue and operating results are difficult to predict and are likely to fluctuate from quarter-to-quarter. For example, 2008 revenues of our Government Segment were significantly higher in the second half ofthe year than in the first half. In 2007, revenues were slightly higher in the second half of the year than in thefirst, whereas in 2006 revenues from our Government Segment were higher in the first half of the year than inthe second half. In addition, we generally derive a significant portion of wireless carrier license revenue in ourCommercial Segment from initial license fees. The initial license fees that we receive in a particular quarter mayvary significantly. As these projects begin and end, quarterly results may vary. We therefore believe that quarter-to-quarter comparisons of our operating results may not be a good indication of our future performance, and youshould not rely on them to predict our future performance or the future performance of our Class A commonstock. Our quarterly revenues, expenses and operating results could vary significantly from quarter-to-quarter. Ifour operating results in future quarters fall below the expectations of market analysts and investors, the marketprice of our stock may fall.
Additional factors that have either caused our results to fluctuate in the past or that are likely to do so in thefuture include:
• changes in our relationships with wireless carriers, the U.S. Government or other customers;
• timing of introduction of new products and services;
• changes in pricing policies and product offerings by us or our competitors;
• changes in projected profitability of acquired assets that would require the write down of the value of thegoodwill reflected on our balance sheet.
• costs associated with advertising, marketing and promotional efforts to acquire new customers;
• capital expenditures and other costs and expenses related to improving our business, expandingoperations and adapting to new technologies and changes in consumer preferences; and
• our lengthy and unpredictable sales cycle.
Growing market acceptance of “open source” software could have a negative impact on us.
Growing market acceptance of open source software has presented both benefits and challenges to thecommercial software industry in recent years. “Open source” software is made widely available by its authorsand is licensed “as is” for a nominal fee or, in some cases, at no charge. For example, Linux is a free Unix-typeoperating system, and the source code for Linux is freely available.
16

We have incorporated some types of open source software into our products, allowing us to enhancecertain solutions without incurring substantial additional research and development costs. Thus far, we haveencountered no unanticipated material problems arising from our use of open source software. However, as theuse of open source software becomes more widespread, certain open source technology could becomecompetitive with our proprietary technology, which could cause sales of our products to decline or force us toreduce the fees we charge for our products, which could have a material adverse effect on our business,financial position, results of operations or cash flows.
Because our product offerings are sold internationally, we are subject to risks of conducting businessin foreign countries.
Wireless carriers in Europe, Asia, Australia, Africa and Central and South America have purchased ourproducts. We believe our revenue will be increasingly dependent on business in foreign countries, and we willbe subject to the social, political and economic risks of conducting business in foreign countries, including:
• inability to adapt our products and services to local business practices, customs and mobile userpreferences;
• costs of adapting our product and service offerings for foreign markets;
• inability to locate qualified local employees, partners and suppliers;
• reduced protection of intellectual property rights;
• the potential burdens of complying with a variety of U.S. and foreign laws, trade standards and regulatoryrequirements, including tax laws, the regulation of wireless communications and the Internet anduncertainty regarding liability for information retrieved and replicated in foreign countries;
• general geopolitical risks, such as political and economic instability and changes in diplomatic and traderelations; and
• unpredictable fluctuations in currency exchange rates.
Any of the foregoing risks could have a material adverse effect on our business, financial position, results ofoperations or cash flows by diverting time and money toward addressing them or by reducing or eliminatingsales in such foreign countries.
Because several of our competitors have significantly greater resources than we do, we could losecustomers and market share.
Our business is highly competitive. Several of our potential competitors are substantially larger than we areand have greater financial, technical and marketing resources than we do. In particular, larger competitors havecertain advantages over us which could cause us to lose customers and impede our ability to attract newcustomers, including: larger bases of financial, technical, marketing, personnel and other resources; moreestablished relationships with wireless carriers; more funds to deploy products and services; and the ability tolower prices of competitive products and services because they are selling larger volumes.
The widespread adoption of open industry standards such as the Secure User Plane for Location (SUPL)specifications may make it easier for new market entrants and existing competitors to introduce products thatcompete with our software products. Because our Commercial Segment is part of an emerging market, wecannot identify or predict which new competitors may enter the mobile location services industry in the future.With time and capital, it would be possible for competitors to replicate any of our products and service offeringsor develop alternative products. Additionally, the wireless communications industry continues to experiencesignificant consolidation which may make it more difficult for smaller companies like us to compete. Ourcompetitors include application developers, telecommunications equipment vendors, location determinationtechnology vendors and information technology consultants, and may include traditional Internet portals andInternet infrastructure software companies. We expect that we will compete primarily on the basis of price, timeto market, functionality, quality and breadth of product and service offerings.
17

These competitors could include wireless network carriers, mobile and/or wireless software companies,wireless data services providers and secure portable communication and wireless systems integrators anddatabase vendors. As discussed above, many of our potential competitors have significantly greater resourcesthan we do. Furthermore, competitors may develop a different approach to marketing the services we provide inwhich subscribers may not be required to pay for the information provided by our services. Competition couldreduce our market share or force us to lower prices to unprofitable levels.
Because we are not a small business under government size standards, we could lose business tosmall-business set-aside competitors.
Federal and state procurement laws require that certain purchases be set-aside for small businesscompetitors, effectively giving a preference to those small businesses even if we have better products andbetter prices. We have outgrown the size standards set for the many of the categories used to purchaseproducts of the nature that we sell. If a particular procurement is set-aside for only small business participants,we may lose customers and revenues and may not be able to replace those sales with purchases from othercustomers.
While we characterize a significant portion of our revenue as being “recurring” there is no guaranteethat we will actually achieve this revenue.
A significant portion of our revenue is generated from long-term customer contracts that pay certain fees ona month-to-month basis. While we currently believe that these revenue streams will continue, renegotiation ofthe contract terms, early termination or non-renewal of material contracts could cause our recurring revenues tobe lower than expected and any growth depends on maintaining relationships with these important customersand on developing other customers and distribution channels.
We cannot guarantee that our estimated contract backlog will result in actual revenue.
As of December 31, 2008, our estimated contract backlog totaled approximately $445.0 million, of whichapproximately $159.8 million was funded. There can be no assurance that our backlog will result in actualrevenue in any particular period, or at all, or that any contract included in backlog will be profitable. There is ahigher degree of risk in this regard with respect to unfunded backlog. The actual receipt and timing of anyrevenue is subject to various contingencies, many of which are beyond our control. The actual receipt of revenueon contracts included in backlog may never occur or may change because a program schedule could change, theprogram could be canceled, a contract could be reduced, modified or terminated early, or an option that we hadassumed would be exercised not being exercised. Further, while many of our federal government contractsrequire performance over a period of years, Congress often appropriates funds for these contracts for only oneyear at a time. Consequently, our contracts typically are only partially funded at any point during their term, andall or some of the work intended to be performed under the contracts will remain unfunded pending subsequentCongressional appropriations and the obligation of additional funds to the contract by the procuring agency.Approximately 80% of our backlog consisted of orders from the Government Segment. Our estimates are basedon our experience under such contracts and similar contracts. However, there can be no assurances that all, orany, of such estimated contract value will be recognized as revenue.
The loss of key personnel or any inability to attract and retain additional personnel could harm ourbusiness.
Our future success will depend in large part on our ability to hire and retain a sufficient number of qualifiedpersonnel, particularly in sales and marketing and research and development. If we are unable to do so, ourbusiness could be harmed. Our future success also depends upon the continued service of our executiveofficers and other key sales, engineering and technical staff. The loss of the services of our executive officersand other key personnel could harm our operations. We maintain key person life insurance on certain of ourexecutive officers. We would be harmed if one or more of our officers or key employees decided to join acompetitor or if we failed to attract qualified personnel. Our ability to attract qualified personnel may be adverselyaffected by a decline in the price of our Class A common stock. In the event of a decline in the price of our
18

Class A common stock, the retention value of stock options will decline and our employees may choose not toremain with us, which could have a material adverse effect on our business, financial position, results ofoperations or cash flows.
If our subcontractors and vendors fail to perform their contractual obligations, our performance andreputation as a prime contractor and our ability to obtain future business could suffer.
As a prime contractor, we often rely significantly upon other companies as subcontractors to perform workwe are obligated to perform for our clients and vendors to deliver critical components. As we secure more workunder our contract vehicles such as the WWSS agreement, we expect to require an increasing level of supportfrom subcontractors and vendors that provide complementary and supplementary products and services to ourofferings. Depending on labor market conditions, we may not be able to identify, hire and retain sufficientnumbers of qualified employees to perform the task orders we expect to win. In such cases, we will need torely on subcontracts with unrelated companies. Moreover, even in favorable labor market conditions, weanticipate entering into more subcontracts in the future as we expand our work under our contract vehicles. Weare responsible for the work performed by our subcontractors, even though in some cases we have limitedinvolvement in that work. If one or more of our subcontractors fail to satisfactorily perform the agreed-uponservices on a timely basis or violate federal government contracting policies, laws or regulations, our ability toperform our obligations as a prime contractor or meet our clients’ expectations may be compromised. In extremecases, performance or other deficiencies on the part of our subcontractors could result in a client terminating ourcontract for default. A termination for default could expose us to liability, including liability for the agency’s costsof re-procurement, could damage our reputation and could hurt our ability to compete for future contracts.
Our accounting policies and methods are fundamental to how we record and report our financialposition and results of operations, and they require management to make estimates, judgments andassumptions about matters that are inherently uncertain.
Our accounting policies and methods are fundamental to how we record and report our financial positionand results of operations. We have identified several accounting policies as being critical to the presentation ofour financial position and results of operations because they require management to make particularly subjectiveor complex judgments about matters that are inherently uncertain and because of the likelihood that materiallydifferent amounts would be recorded under different conditions or using different assumptions. For example, theCompany accounts for income taxes in accordance with SFAS No. 109, Accounting for Income Taxes(“SFAS 109”). Under SFAS 109, deferred tax assets and liabilities are computed based on the differencebetween the financial statement and income tax basis of assets and liabilities using the enacted marginal taxrate. SFAS 109 requires that the net deferred tax asset be reduced by a valuation allowance if, based on theweight of available evidence, it is more likely than not that some portion of all of the net deferred tax asset willnot be realized. This process requires the Company’s management to make assessments regarding the timingand probability of the ultimate tax impact. Actual income taxes could vary from these estimates due to futurechanges in income tax law, significant changes in the jurisdictions in which the Company operates, our inabilityto generate sufficient future taxable income or unpredicted results from the final determination of each year’sliability by taxing authorities. These changes could have a significant impact on the Company’s our business,financial position, results of operations or cash flows.
Industry Risks
Because the wireless data industry is a rapidly evolving market, our product and service offeringscould become obsolete unless we respond effectively and on a timely basis to rapid technologicalchanges.
The successful execution of our business strategy is contingent upon wireless network operators launchingand maintaining mobile location services, our ability to create new network software products and adapt ourexisting network software products to rapidly changing technologies, industry standards and customer needs. Asa result of the complexities inherent in our product offerings, new technologies may require long developmentand testing periods. Additionally, new products may not achieve market acceptance or our competitors could
19

develop alternative technologies that gain broader market acceptance than our products. If we are unable todevelop and introduce technologically advanced products that respond to evolving industry standards andcustomer needs, or if we are unable to complete the development and introduction of these products on atimely and cost effective basis, it could have a material adverse effect on our business, financial position, resultsof operations or cash flows.
New laws and regulations that impact our industry could increase costs or reduce opportunities to earnrevenue. The wireless carriers that use our product and service offerings are subject to regulation by domestic,and in some cases, foreign, governmental and other agencies. Regulations that affect them could increase ourcosts or reduce our ability to sell our products and services. In addition, there are an increasing number of lawsand regulations pertaining to wireless telephones and the Internet under consideration in the United States andelsewhere.
The applicability to the Internet of existing laws governing issues such as intellectual property ownershipand infringement, copyright, trademark, trade secret, taxation, obscenity, libel, employment and personal privacyis uncertain and developing. Any new legislation or regulation, or the application or interpretation of existing laws,may have a material adverse effect on our business, results of operations and financial condition. Additionally,modifications to our business plans or operations to comply with changing regulations or certain actions taken byregulatory authorities might increase our costs of providing our product and service offerings and could have amaterial adverse effect on our business, financial position, results of operations or cash flows.
Concerns about personal privacy and commercial solicitation may limit the growth of mobile locationservices and reduce demand for our products and services.
In order for mobile location products and services to function properly, wireless carriers must locate theirsubscribers and store information on each subscriber’s location. Although data regarding the location of thewireless user resides only on the wireless carrier’s systems, users may not feel comfortable with the idea thatthe wireless carrier knows and can track their location. Carriers will need to obtain subscribers’ permission togather and use the subscribers’ personal information, or they may not be able to provide customized mobilelocation services which those subscribers might otherwise desire. If subscribers view mobile location services asan annoyance or a threat to their privacy, that could reduce demand for our products and services and have amaterial adverse effect on our business, financial position, results of operations or cash flows.
Because many providers are not in compliance with current regulatory mandates and because ourindustry is undergoing rapid technological and regulatory change, our future performance isuncertain.
The Federal Communication Commission, or FCC, has mandated that certain location information beprovided to operators when they receive an E9-1-1 call. Phase I of the FCC’s 9-1-1 mandate required providers tobe able to locate wireless E9-1-1 callers within their originating cell sector site and report their callback numberby April 1998. Phase II of the FCC mandate required providers to be able to pinpoint the location of all E9-1-1callers within 125 meters in 67% of all cases by October 1, 2001. Although both the Phase I and Phase IIdeadlines have passed, many providers are not currently in compliance with either phase of the FCC’s mandate.Even so, we believe that many public safety jurisdictions are continuing to deploy Phase I technology and whenavailable, we believe they will deploy Phase II technology.
Carriers’ obligations to provide Phase I and Phase II services are subject to request by public safetyorganizations. Due to complex regulatory, funding and political issues many public safety organizations have notyet requested this service. As a result, wireless carriers and wireless users may never exhibit sufficient demandfor our mobile location services. Technical failures, time delays or the significant costs associated with developingor installing improved location technology could slow down or stop the deployment of our mobile locationproducts. If deployment of improved location technology is delayed, stopped or never occurs, market acceptanceof our products and services may be adversely affected.
In addition, we will rely on third-party providers to manufacture and deploy devices that determine theprecise geographic location of wireless users to comply with Phase II of the FCC mandate. The extent and
20

timing of the deployment of our products and services is dependent both on public safety requests for suchservice and wireless carrier’s ability to certify the accuracy of and deploy the precise location technology.Because we will rely on third-party location technology instead of developing the technology ourselves, we havelittle or no influence over its improvement. If the technology never becomes precise enough to satisfy wirelessusers’ needs or the FCC’s requirements, we may not be able to increase or sustain demand for our products andservices, if at all.
Our E9-1-1 business is dependent on state and local governments and the regulatory environment forVoice over Internet Protocol (VoIP) services is developing.
Under the FCC’s mandate, wireless carriers are required to provide E9-1-1 services only if state and localgovernments request the service. As part of a state or local government’s decision to request E9-1-1, they havethe authority to develop cost recovery mechanisms. However, cost recovery is no longer a condition to wirelesscarriers’ obligation to deploy the service. If state and local governments do not widely request that E9-1-1services be provided or we become subject to significant pressures from wireless carriers with respect to pricingof E9-1-1 services, our E9-1-1 business would be significantly harmed and future growth of our business wouldbe significantly reduced.
The FCC has determined that VoIP services are not subject to the same regulatory scheme as traditionalwireline and wireless telephone services. If the regulatory environment for VoIP services evolves in a mannerother than the way we anticipate, our E9-1-1 business would be significantly harmed and future growth of ourbusiness would be significantly reduced. For example, many states provide statutory and regulatory immunityfrom liability for wireless and wireline E9-1-1 service providers but provide no express immunities for VoIP E9-1-1service providers. Additionally, the regulatory scheme for wireless and wireline service providers require thosecarriers to allow service providers such as us to have access to certain databases that make the delivery of anE9-1-1 call possible. No such requirements exist for VoIP service providers so carriers could prevent us fromcontinuing to provide VoIP E9-1-1 service by denying us access to the required databases.
Because the industries which we serve are currently in a cycle of consolidation, the number of cus-tomers may be reduced which could result in a loss of revenue for our business.
The telecommunications industry generally is currently undergoing a consolidation phase. Many of ourcustomers, specifically wireless carrier customers of our Commercial Segment, have or may become the targetof acquisitions. If the number of our customers is significantly reduced as a result of this consolidation trend, orif the resulting companies do not utilize our product offerings, our business, financial position, results ofoperations or cash flows could be materially adversely affected.
Technology Risks
Because our software may contain defects or errors, and our hardware products may incorporatedefective components, our sales could decrease if these defects or errors adversely affect our reputa-tion or delays shipments of our products.
The software products that we develop are complex and must meet the stringent technical requirements ofour customers. Our hardware products are equally complex and integrate a wide variety of components fromdifferent vendors. We must quickly develop new products and product enhancements to keep pace with therapidly changing software and telecommunications markets in which we operate. Products as complex as oursare likely to contain undetected errors or defects, especially when first introduced or when new versions arereleased. Our products may not be error or defect free after delivery to customers, which could damage ourreputation, cause revenue losses, result in the rejection of our products or services, divert developmentresources and increase service and warranty costs, each of which could have a serious harmful effect on ourbusiness, financial position, results of operations or cash flows.
21

If we are unable to integrate our products with wireless service providers’ systems we may lose salesto competitors.
Our products operate with wireless carriers’ systems, various wireless devices and, in the case of our E9-1-1 offering, with mobile telephone switches and VoIP service provider systems. If we are unable to continue todesign our software to operate with these systems and devices, we may lose sales to competitors. Mobiletelephone switches and wireless devices can be manufactured according to many different standards and mayhave different variations within each standard. Combining our products with each type of switch, device or VoIPsystem requires a specialized interface and extensive testing. If as a result of technology enhancements orupgrades to carrier and VoIP provider systems our products can no longer operate with such systems, we mayno longer be able to sell our products. Further, even if we successfully redesign our products to operate withthese systems, we may not gain market acceptance before our competitors.
Failure to meet our contractual obligations could adversely affect our profitability and futureprospects.
We design, develop and manufacture technologically advanced and innovative products and services appliedby our customers in a variety of environments. Problems and delays in development or delivery as a result ofissues with respect to design, technology, licensing and patent rights, labor, learning curve assumptions, ormaterials and components could prevent us from achieving contractual obligations. In addition, our productscannot be tested and proven in all situations and are otherwise subject to unforeseen problems. Examples ofunforeseen problems which could negatively affect revenue and profitability include problems with quality,delivery of subcontractor components or services, and unplanned degradation of product performance.
Because our systems may be vulnerable to systems failures and security risks, we may incur signifi-cant costs to protect against the threat of these problems.
We provide for the delivery of information and content to and from wireless devices in a prompt and timelymanner. Any systems failure that causes a disruption in our ability to facilitate the transmission of information tothese wireless devices could result in delays in end users receiving this information and cause us to losecustomers. Our systems could experience such failures as a result of unauthorized access by hackers, computerviruses, hardware or software failures, power or telecommunications failures and other accidental or intentionalactions which could disrupt our systems. We may incur significant costs to prevent such systems disruptions.
Increasingly our products will be used to create or transmit secure information and data to and from wirelessdevices. For example, our software can be used to create private address lists and to provide the preciselocation of an individual. To protect private information like this from security breaches, we may incur significantcosts. If a third party were able to misappropriate our proprietary information or disrupt our operations, we couldbe subject to claims, litigation or other potential liabilities that could materially adversely impact our business.Further, if an individual is unable to use our service to receive the precise location in a health or life-and-deathsituation, or if our service provides the wrong information, we could be subject to claims, litigation or otherpotential liabilities that could materially adversely impact our business.
The wireless data services provided by our Commercial Segment are dependent on real-time, continuousfeeds from map and traffic data vendors and others. The ability of our subscribers to receive critical location andbusiness information requires timely and uninterrupted connections with our wireless network carriers. Anydisruption from our satellite feeds or backup landline feeds could result in delays in our subscribers’ ability toreceive information. We cannot be sure that our systems will operate appropriately if we experience hardware orsoftware failure, intentional disruptions of service by third parties, an act of God or an act of war. A failure in oursystems could cause delays in transmitting data, and as a result we may lose customers or face litigation thatcould involve material costs and distract management from operating our business.
22

If mobile equipment manufacturers do not overcome capacity, technology and equipment limitations,we may not be able to sell our products and services.
The wireless technology currently in use by most wireless carriers has limited bandwidth, which restrictsnetwork capacity to deliver bandwidth-intensive applications like data services to a large number of users.Because of capacity limitations, wireless users may not be able to connect to their network when they wish to,and the connection is likely to be slow, especially when receiving data transmissions. Data services also may bemore expensive than users are willing to pay. To overcome these obstacles, wireless equipment manufacturerswill need to develop new technology, standards, equipment and devices that are capable of providing higherbandwidth services at lower cost. We cannot be sure that manufacturers will be able to develop technology andequipment that reliably delivers large quantities of data at a reasonable price. If more capacity is not added, asufficient market for our products and services is not likely to develop or be sustained and sales of our productsand services would decline resulting in a material adverse effect on our business, financial position, results ofoperations or cash flows.
Because the market for most mobile content delivery and mobile location products is new, our futuresuccess is uncertain.
The market for mobile content delivery and mobile location products and services is new and its potential isuncertain. In order to be successful, we need wireless network operators to launch and maintain mobile locationservices utilizing our products, and need corporate enterprises and individuals to purchase and use our mobilecontent delivery and mobile location products and services. We cannot be sure that wireless carriers orenterprises will accept our products or that a sufficient number of wireless users will ultimately utilize ourproducts.
If wireless handsets pose health and safety risks, we may be subject to new regulations and demandfor our products and services may decrease.
Media reports have suggested that certain radio frequency emissions from wireless handsets may be linkedto various health concerns, including cancer, and may interfere with various electronic medical devices, includinghearing aids and pacemakers. Concerns over radio frequency emissions may have the effect of discouraging theuse of wireless handsets, which would decrease demand for our services. In recent years, the FCC and foreignregulatory agencies have updated the guidelines and methods they use for evaluating radio frequency emissionsfrom radio equipment, including wireless handsets. In addition, interest groups have requested that the FCCinvestigate claims that wireless technologies pose health concerns and cause interference with airbags, hearingaids and other medical devices. There also are some safety risks associated with the use of wireless handsetswhile driving. Concerns over these safety risks and the effect of any legislation that may be adopted in responseto these risks could limit our ability to market and sell our products and services.
If we are unable to protect our intellectual property rights or are sued by third parties for infringingupon intellectual property rights, we may incur substantial costs.
Our success and competitive position depends in large part upon our ability to develop and maintain theproprietary aspects of our technology. We rely on a combination of patent, copyright, trademark, service mark,trade secret laws, confidentiality provisions and various other contractual provisions to protect our proprietaryrights, but these legal means provide only limited protection. Although a number of patents have been issued tous and we have obtained a number of other patents as a result of our acquisitions, we cannot assure you thatour issued patents will be upheld if challenged by another party. Additionally, with respect to any patentapplications which we have filed, we cannot assure you that any patents will issue as a result of theseapplications. If we fail to protect our intellectual property, we may not receive any return on the resourcesexpended to create the intellectual property or generate any competitive advantage based on it, and we may beexposed to expensive litigation or risk jeopardizing our competitive position. Similarly, third parties could claimthat our future products or services infringe upon their intellectual property rights. Claims like these could requireus to enter into costly royalty arrangements or cause us to lose the right to use critical technology.
23

Our ability to protect our intellectual property rights is also subject to the terms of any future governmentcontracts. We cannot assure you that the federal government will not demand greater intellectual property rightsor restrict our ability to disseminate intellectual property. We are also a member of standards-settingorganizations and have agreed to license some of our intellectual property to other members on fair andreasonable terms to the extent that the license is required to develop non-infringing products.
Pursuing infringers of our patents and other intellectual property rights can be costly.
Pursuing infringers of our proprietary rights could result in significant litigation costs, and any failure topursue infringers could result in our competitors utilizing our technology and offering similar products, potentiallyresulting in loss of a competitive advantage and decreased revenues. Despite our efforts to protect ourproprietary rights, existing patent, copyright, trademark and trade secret laws afford only limited protection. Inaddition, the laws of some foreign countries do not protect our proprietary rights to the same extent as do thelaws of the United States. Protecting our know-how is difficult especially after our employees or those of ourthird party contract service providers end their employment or engagement. Attempts may be made to copy orreverse-engineer aspects of our products or to obtain and use information that we regard as proprietary.Accordingly, we may not be able to prevent the misappropriation of our technology or prevent others fromdeveloping similar technology. Furthermore, policing the unauthorized use of our products is difficult andexpensive. Litigation may be necessary in the future to enforce our intellectual property rights or to determinethe validity and scope of the proprietary rights of others. The costs and diversion of resources could significantlyharm our business. If we fail to protect our intellectual property, we may not receive any return on the resourcesexpended to create the intellectual property or generate any competitive advantage based on it.
Third parties may claim we are infringing their intellectual property rights and we could be preventedfrom selling our products, or suffer significant litigation expense, even if these claims have no merit.
Our competitive position is driven in part by our intellectual property and other proprietary rights. Thirdparties, however, may claim that we, our products, operations or any products or technology we obtain fromother parties are infringing their intellectual property rights, and we may be unaware of intellectual propertyrights of others that may cover some of our assets, technology and products. From time to time we receiveletters from third parties that allege we are infringing their intellectual property and asking us to license suchintellectual property. We review the merits of each such letter, none of which has resulted in litigation as of thedate of this report. However, any litigation regarding patents, trademarks, copyrights or intellectual propertyrights, even those without merit, could be costly and time consuming, and divert our management and keypersonnel from operating our business. The complexity of the technology involved and inherent uncertainty andcost of intellectual property litigation increases our risks. If any third party has a meritorious or successful claimthat we are infringing its intellectual property rights, we may be forced to change our products or enter intolicensing arrangements with third parties, which may be costly or impractical. This also may require us to stopselling our products as currently engineered, which could harm our competitive position. We also may be subjectto significant damages or injunctions that prevent the further development and sale of certain of our products orservices and may result in a material loss of revenue.
The security measures we have implemented to secure information we collect and store may bebreached, which could cause us to breach agreements with our partners and expose us to potentialinvestigation and penalties by authorities and potential claims by persons whose information wasdisclosed.
We take reasonable steps to protect the security, integrity and confidentiality of the information we collectand store but there is no guarantee that inadvertent or unauthorized disclosure will not occur or that third partieswill not gain unauthorized access despite our efforts. If such unauthorized disclosure or access does occur, wemay be required to notify persons whose information was disclosed or accessed under existing and proposedlaws. We also may be subject to claims of breach of contract for such disclosure, investigation and penalties byregulatory authorities and potential claims by persons whose information was disclosed.
24
Risks Related to Acquisitions
Our past and future acquisitions of companies or technologies could prove difficult to integrate, dis-rupt our business, dilute stockholder value or adversely affect operating results or the market price ofour Class A common stock.
We have in the past acquired a number of businesses and technologies, and we may in the future acquireor make investments in other companies, services and technologies. Any acquisitions, strategic alliances orinvestments we may pursue in the future will have a continuing, significant impact on our business, financialcondition and operating results. The value of the companies or assets that we acquire or invest in may be lessthan the amount we paid if there is a decline of their position in the respective markets they serve or a declinein general of the markets they serve. If we fail to properly evaluate and execute acquisitions and investments,our business and prospects may be seriously harmed. To successfully complete an acquisition, we must:
• properly evaluate the technology;
• accurately forecast the financial impact of the transaction, including accounting charges and transactionexpenses;
• integrate and retain personnel;
• retain and cross-sell to acquired customers;
• combine potentially different corporate cultures; and
• effectively integrate products and services, and research and development, sales and marketing andsupport operations.
If we fail to do any of these, we may suffer losses, our management may be distracted from day-to-dayoperations and the market price of our Class A common stock may be materially adversely affected. In addition,if we consummate future acquisitions using our equity securities or convertible debt, existing stockholders maybe diluted which could have a material adverse effect on the market price of our Class A common stock.
The companies and business units we have acquired or invested in or may acquire or invest in are subjectto each of the business risks we describe in this section, and if they incur any of these risks the businesses maynot be as valuable as the amount we paid. Further, we cannot guarantee that we will realize the benefits orstrategic objectives we are seeking to obtain by acquiring or investing in these companies.
Risks Related to Our Capital Structure and Common Stock
A majority of our Class A common stock is beneficially owned by a small number of holders, andthose holders could thereby transfer control of us to a third party without anyone else’s approval orprevent a third party from acquiring us.
We have two classes of common stock: Class A common stock and Class B common stock. Holders ofClass A common stock generally have the same rights as holders of Class B common stock, except that holdersof Class A common stock have one vote per share while holders of Class B common stock have three votes pershare. As of January 31, 2009, Maurice B. Tosé, our President, Chief Executive Officer and Chairman of theBoard, beneficially owned 6,876,334 shares of our Class B common stock and 1,848,548 shares of our Class Acommon stock. Therefore, in the aggregate, Mr. Tosé beneficially owned shares representing approximately38.01% of our total voting power, assuming no conversion or exercise of issued and outstanding convertible orexchangeable securities held by our other shareholders. Accordingly, on this basis, Mr. Tosé can exert significantinfluence over us through his ability to determine the outcome of elections of directors, amend our charter andby-laws and take other actions requiring stockholder action, including mergers, going private transactions andother extraordinary transactions. Mr. Tosé could, without seeking anyone else’s approval, transfer voting controlof us to a third party. Such a transfer could have a material adverse effect on our stock price, and our business,operating results and financial condition. Mr. Tosé is also able to prevent a change of control regardless ofwhether holders of Class A common stock might benefit financially from such a transaction.
25
Our governing corporate documents contain certain anti-takeover provisions that could prevent achange of control that may be favorable to shareholders.
We are a Maryland corporation. Anti-takeover provisions of Maryland law and provisions contained in ourcharter and by-laws could make it more difficult for a third party to acquire control of us, even if a change incontrol would be beneficial to shareholders. These provisions include the following:
• authorization of the board of directors to issue “blank check” preferred stock;
• prohibition of cumulative voting in the election of directors;
• our classified board of directors;
• limitation of the persons who may call special meetings of stockholders;
• prohibition on stockholders acting without a meeting other than through unanimous written consent;
• supermajority voting requirement on various charter and by-law provisions; and
• establishment of advance notice requirements for nominations for election to the board of directors or forproposing matters that can be acted on by stockholders at stockholder meetings.
These provisions could delay, deter or prevent a potential acquirer from attempting to obtain control of us,depriving shareholders of an opportunity to receive a premium for Class A common stock. These provisionscould therefore materially adversely affect the market price of our Class A common stock.
Because this report contains forward-looking statements, it may not prove to be accurate.
This report, including the documents we incorporate by reference, contains forward-looking statements andinformation relating to our Company. These statements are based upon our current expectations andassumptions that are subject to a number of risks and uncertainties that would cause actual results to differmaterially from those anticipated. We generally identify forward-looking statements using words like “believe,”“intend,” “expect,” “may,” “should,” “plan,” “project,” “contemplate,” “anticipate,” or other similar state-ments. We base these statements on our beliefs as well as assumptions we made using information currentlyavailable to us. We do not undertake to update our forward-looking statements or risk factors to reflect futureevents or circumstances.
Statements in this report that are forward-looking include, but are not limited to, the following statementsthat
(i) we are well positioned to address the evolving integration needs of our clients through our expertise inmessaging and location determination;
(ii) we are developing relationships with communication infrastructure providers and we intend to expandour domestic and international carrier base;
(iii) we plan to continue to develop and sell software and engineered systems which we will deliver throughdeployment in customer networks or through hosted and subscription business models and we believe that oursoftware is positioned for early adoption by carriers;
(iv) wireless growth is expected to continue to increase in all regions around the world for the foreseeablefuture;
(v) both the number of users and messages per individual are projected to increase significantly;
(vi) we will continue to develop network software for wireless carriers that operate on all major types ofnetworks;
(vii) we will continue to leverage our knowledge of complex call control technology to unlock valuableinformation and expand the range of capabilities that the technology can accomplish for our customers;
(viii) we will continue to invest in our underlying technology and to capitalize on our expertise to meet thegrowing demand for sophisticated wireless applications;
26

(ix) we intend to continue to selectively consider acquisitions of companies and technologies in order toincrease the scale and scope of our operations, market presence, products, services and customer base;
(x) the Broadband Global Area Network upgrade of the Inmarsat satellite constellation expands ouropportunity for SwiftLink sales volume;
(xi) we believe our expertise in the area of wireless E9-1-1, location and messaging services, and securesatellite communications can be leveraged into providing products and services to the Federal agencies;
(xii) we are continuing to enhance our deployable communication systems product line to take advantage ofthe evolving environment of satellite communications;
(xiii) we believe that our company enjoys a competitive advantage because of its secure teleport andintegration capabilities along with deployable systems as a bundled offering;
(xiv) federal agencies, as well as state and local governments, are increasingly contracting with specialistteams for functions such as network management, and for long-term projects such as software developmentand systems integration;
(xv) we expect to continue generate significant portions of our total revenue from our largest customers;
(xvi) we expect to realize $116.0 million of backlog within the next twelve months;
(xvii) the bases on which we expect to continue to compete;
(xviii) we expect to require increasing levels of support from subcontractors and vendors and expand ourwork under contract vehicles;
(xix) we believe we have sufficient capital resources to meet our anticipated cash operating expenses,working capital and capital expenditure and debt services needs for the next twelve months;
(xx) that we believe our capitalized research and development expense will be recoverable from futuregross profits generated by the related products;
(xxi) we believe our intellectual property assets are valuable and that we may realize revenue from patentinfringement claims;
(xxii) we believe we should not incur an material liabilities from customer indemnification requests;
(xxiii) the WWSS procurement vehicle is expected to contribute to significant sales growth and that weexpect to fulfill the potential values under WWSS orders;
(xxiv) expectations about the amount of future non-cash stock compensation;
(xxv) our assumptions and expectations related to income taxes and deferred tax assets;
(xxvi) we do not expect that the adoption of new accounting standards to have a material impact on thecompany’s financial statements, and
(xxvii) statements about financial covenants related to our loan agreements.
This list should not be considered exhaustive.
Item 1B. Unresolved Staff Comments
None.
Item 2. Properties
Our principal executive office is located in Annapolis, Maryland in a 29,000 square foot facility under a leaseexpiring in March 2011. We have a second 17,000 square foot facility in Annapolis, Maryland under a leaseexpiring in April 2013. The Annapolis facilities are utilized for the executive and administrative offices, as well asportions of our Commercial and Government Segments. Other leased facilities include a 49,900 square footfacility in Seattle, Washington under a lease expiring in September 2010, an 11,000 square foot facility in
27

Oakland, California under a lease expiring August 2012. During 2008, we vacated a former site and moved ourTampa, Florida operations to 45,600 flex-space facility under a lease expiring in December 2014. We also lease ahosting facility in Phoenix, Arizona under a lease that expires in February 2010, which is utilized by ourCommercial Segment.
In addition to the leased office space, we own a 7-acre teleport facility in Manassas, Virginia for teleportservices for our Government Segment customers.
Item 3. Legal Proceedings
In November 2001, a shareholder class action lawsuit was filed against us, certain of our current officersand a director, and several investment banks that were the underwriters of our initial public offering (the“Underwriters”): Highstein v. TeleCommunication Systems, Inc., et al., United States District Court for theSouthern District of New York, Civil Action No. 01-CV-9500. The plaintiffs seek an unspecified amount ofdamages. The lawsuit purports to be a class action suit filed on behalf of purchasers of our Class A CommonStock during the period August 8, 2000 through December 6, 2000. The plaintiffs allege that the Underwritersagreed to allocate our Class A Common Stock offered for sale in our initial public offering to certain purchasersin exchange for excessive and undisclosed commissions and agreements by those purchasers to make additionalpurchases of our Class A Common Stock in the aftermarket at pre-determined prices. The plaintiffs allege that allof the defendants violated Sections 11, 12 and 15 of the Securities Act, and that the underwriters violatedSection 10(b) of the Exchange Act, and Rule 10b-5 promulgated thereunder. The claims against us of violation ofRule 10b-5 have been dismissed with the plaintiffs having the right to re-plead. On February 15, 2005, theDistrict Court issued an Order preliminarily approving a settlement agreement among class plaintiffs, all issuerdefendants and their insurers, provided that the parties agree to a modification narrowing the scope of the barorder set forth in the settlement agreement. The parties agreed to a modification narrowing the scope of the barorder, and on August 31, 2005, the court issued an order preliminarily approving the settlement. On December 5,2006, the United States Court of Appeals for the Second Circuit overturned the District Court’s certification ofthe class of plaintiffs who are pursuing the claims that would be settled in the settlement against the underwriterdefendants. Plaintiffs filed a Petition for Rehearing and Rehearing En Banc with the Second Circuit on January 5,2007 in response to the Second Circuit’s decision. On April 6, 2007, the Second Circuit denied plaintiffs’rehearing petition, but clarified that the plaintiffs may seek to certify a more limited class in the District Court.On June 25, 2007, the District Court signed an Order terminating the settlement. On November 13, 2007, theissuer defendants in certain designated “focus cases” filed a motion to dismiss the second consolidatedamended class action complaints that were filed in those cases. On March 26, 2008, the District Court issued anOpinion and Order denying, in large part, the motions to dismiss the amended complaints in the “focus cases.”We intend to continue to defend the lawsuit until the matter is resolved. We have purchased Directors andOfficers insurance policy which we believe should cover any potential liability that may result from these claims,but can provide no assurance that any or all of the costs of the litigation will ultimately be covered by theinsurance. No reserve has been created for this matter. More than 300 other companies have been named innearly identical lawsuits that have been filed by some of the same law firms that represent the plaintiffs in thelawsuit against us.
On July 12, 2006, we filed suit in the United States District Court for the Eastern District of Virginia againstMobile 365 (now Sybase 365, a subsidiary of Sybase Inc.) and WiderThan Americas for patent infringementrelated to U.S. patent No. 6,985,748, Inter-Carrier Short Messaging Service Providing Phone Number OnlyExperience (“the ’748 patent”), issued to the Company. We resolved the matter with regard to WiderThanAmericas, and, during the second quarter of 2007, we received a favorable jury decision that Sybase 365infringed the claims of our patent. The jury awarded us a one-time monetary payment in excess of $10 millionfor past damages and a 12% royalty. The jury also found Sybase 365’s infringement willful and upheld the validityof the patent. After the jury verdict, both parties filed post-trial motions. The court denied Sybase 365’s post-trialmotion for a new trial or a judgment in its favor, granted our motion for a permanent injunction prohibiting anyfurther infringement by Sybase 365, but stayed the injunction pending the outcome of any appeal that may befiled, reduced the jury verdict damages award by $2.2 million and vacated the jury finding of willful infringement.We expect that Sybase 365 will appeal from the final judgment of the district court to U.S. Court of Appeals forthe Federal Circuit. In the first quarter of 2008, Sybase 365 filed a request for reexamination of the ’748 patent
28

claiming that the patent is invalid. In the second quarter of 2008, the United States Patent and Trademark Officegranted the request and began the requested reexamination of the ’748 patent. There can be no assurances towhat extent the matter will continue to be successful, if at all. Additionally, we could become subject tocounterclaims or further challenges to the validity of the ’748 patent. To date, the Company has not received orrecorded any amounts related to this jury award.
Other than the items discussed immediately above, we are not currently subject to any other material legalproceedings. However, we may from time to time become a party to various legal proceedings arising in theordinary course of our business.
Item 4. Submission of Matters to a Vote of Security Holders
None.
Part II
Item 5. Market for Registrant’s Common Equity, Related Stockholder Matters and Issuer Purchases ofEquity Securities
Our Class A Common Stock has been traded on the NASDAQ Global Market under the symbol “TSYS”since our initial public offering on August 8, 2000. The following table sets forth, for the periods indicated, thehigh and low closing prices for our Class A Common Stock as reported on the NASDAQ Global Market:
High Low
2009First Quarter 2009 (through February 20, 2009) . . . . . . . . . . . . . . . . . . . . . . . . . . . . . . $9.93 $7.012008
First Quarter 2008 . . . . . . . . . . . . . . . . . . . . . . . . . . . . . . . . . . . . . . . . . . . . . . . . . . $3.98 $2.71Second Quarter 2008 . . . . . . . . . . . . . . . . . . . . . . . . . . . . . . . . . . . . . . . . . . . . . . . . $5.47 $3.06Third Quarter 2008 . . . . . . . . . . . . . . . . . . . . . . . . . . . . . . . . . . . . . . . . . . . . . . . . . . $8.75 $4.19Fourth Quarter 2008 . . . . . . . . . . . . . . . . . . . . . . . . . . . . . . . . . . . . . . . . . . . . . . . . . $8.91 $4.582007
First Quarter 2007 . . . . . . . . . . . . . . . . . . . . . . . . . . . . . . . . . . . . . . . . . . . . . . . . . . $3.92 $2.99Second Quarter 2007 . . . . . . . . . . . . . . . . . . . . . . . . . . . . . . . . . . . . . . . . . . . . . . . . $5.75 $3.86Third Quarter 2007 . . . . . . . . . . . . . . . . . . . . . . . . . . . . . . . . . . . . . . . . . . . . . . . . . . $5.21 $3.45Fourth Quarter 2007 . . . . . . . . . . . . . . . . . . . . . . . . . . . . . . . . . . . . . . . . . . . . . . . . . $4.55 $3.02
As of February 20, 2009, there were approximately 263 holders of record of our Class A Common Stock,and there were 8 holders of record of our Class B Common Stock.
Dividend Policy
We have never declared or paid cash dividends on our common stock. We currently intend to retain anyfuture earnings to fund the development, growth and operation of our business. Additionally, under the terms ofour loan arrangements, our lender’s prior written consent is required to pay cash dividends on our commonstock. We do not currently anticipate paying any cash dividends on our common stock in the foreseeable future.
Change in Securities and Use of Proceeds
In March 2006, we issued (i) $10 million of secured notes due March 10, 2009, which bore cash interest atthe rate of 14% per annum, and (ii) warrants to purchase an aggregate of 1.75 million shares of our Class ACommon Stock at an exercise price of $2.40 per share. We received net cash proceeds of approximately$9.3 million from this transaction, which were used for general corporate purposes. In December 2008, theholders of 1.1 million warrants issued in 2006 exercised those warrants and 1.1 million shares were issued. Theremaining 0.7 million warrants remain outstanding and expire March 2011.
29

The consummation of the note purchase agreement and the issuance of notes and warrants thereunderwere conducted as a private placement made to accredited investors in a transaction exempt from theregistration requirements of the Securities Act.
With the exception of the notes and warrants issued in March 2006, all of the other securities issued by usin connection with these transactions have been registered under the Securities Act.
Issuer Purchases of Equity Securities
None.
30

Stock Performance Graph
The following graph compares the cumulative total shareholder return on the Company’s Class A CommonStock with the cumulative total return of the Nasdaq Global Market U.S. Index and a mobile data index preparedby the Company of the following relevant publicly traded companies in the commercial and government sectorsin which we operate: Openwave Systems, Inc.; Comtech Telecommunications Corp.; Sybase, Inc.; ComverseTechnology Inc.; Globecomm Systems Inc.; NCI Inc.; NeuStar, Inc.; Syniverse Holdings, Inc.; and ViaSat Inc. (the“New Peer Group”)
The composition of the Mobile Data Index has been changed from last year (the “Old Peer Group”) asfollows: Comtech Telecommunications Corp. was added to the remaining companies to comprise the “New PeerGroup” because its mobile communications systems and satellite services business lines are comparable to ourGovernment Segment business.
The information provided is from January 1, 2002 through December 31, 2008.
This performance graph shall not be deemed “filed” for purposes of Section 18 of the Exchange Act, orincorporated by reference into any filing of the Company under the Securities Act or the Exchange Act, exceptas shall be expressly set forth by specific reference in such filing. The stock price performance shown on thegraph below is not necessarily indicative of future price performance.
Comparison of 5 Year Cumulative Total ReturnAssumes Initial Investment of $100
December 2008
0.00
50.00
100.00
150.00
200.00
2003 2004 2005 2006 2007 2008
TELECOMMUN SYS NASDAQ Composite - Total Returns New Peer Group Old Peer Group
31

Item 6. Selected Financial Data
The table that follows presents portions of our consolidated financial statements. You should read thefollowing selected financial data together with our audited Consolidated Financial Statements and related notesand with “Management’s Discussion and Analysis of Financial Condition and Results of Operations” and themore complete financial information included elsewhere in this Form 10-K. We have derived the statement ofoperations data for the years ended December 31, 2008, 2007, and 2006 and the balance sheet data as ofDecember 31, 2008 and 2007 from our consolidated financial statements which have been audited by Ernst &Young LLP, independent registered public accounting firm, and which are included in Item 15 of this Form 10-K.We have derived the statement of operations data for the years ended December 31, 2005 and 2004 and thebalance sheet data as of December 31, 2006, 2005, and 2004, from our audited financial statements which arenot included in this Form 10-K. The historical results presented below are not necessarily indicative of the resultsto be expected for any future fiscal year. See “Management’s Discussion and Analysis of Financial Condition andResults of Operations.” As a result of implementation of SFAS 123(R) in 2006, our non-cash stock compensationexpense has been allocated to direct cost of revenue, research and development expense, sales and marketingexpense, and general and administrative expense in our continuing operations as well as discontinuedoperations.
2008 2007 2006 2005 2004Year Ended December 31,
(in millions, except share and per share data)
Statement of Operations Data:Revenue Services . . . . . . . . . . . . . . . . . . . . . . . . . . . $ 101.4 $ 88.1 $ 88.4 $ 75.0 $ 60.2Systems . . . . . . . . . . . . . . . . . . . . . . . . . . . . . . . . . . 118.8 56.1 36.6 27.2 36.7
Total revenue . . . . . . . . . . . . . . . . . . . . . . . . . . . . . 220.2 144.2 124.9 102.2 96.9Direct cost of services revenue . . . . . . . . . . . . . . . . . 61.6 52.2 52.5 39.2 30.9Direct cost of systems revenue . . . . . . . . . . . . . . . . . 77.3 37.9 17.9 17.7 21.2
Total direct cost of revenue . . . . . . . . . . . . . . . . . . . 138.9 90.1 70.4 56.9 52.1Services gross profit . . . . . . . . . . . . . . . . . . . . . . . . . 39.8 35.9 35.8 35.8 29.3Systems gross profit . . . . . . . . . . . . . . . . . . . . . . . . . 41.5 18.2 18.7 9.5 15.5
Total gross profit . . . . . . . . . . . . . . . . . . . . . . . . . . 81.3 54.1 54.5 45.2 44.8Research and development expense . . . . . . . . . . . . . . 16.2 13.1 12.6 13.9 18.1Sales and marketing expense . . . . . . . . . . . . . . . . . . . 13.7 11.9 11.7 10.5 9.0General and administrative expense . . . . . . . . . . . . . . 28.2 19.3 17.0 15.0 15.0Depreciation and amortization of property and
equipment . . . . . . . . . . . . . . . . . . . . . . . . . . . . . . . 5.9 6.2 8.0 8.6 7.4Amortization of goodwill and other intangible assets . . 0.1 0.1 0.1 0.1 —
Total operating costs and expenses . . . . . . . . . . . . . 64.2 50.6 49.3 48.2 49.6Gain on sale of patent . . . . . . . . . . . . . . . . . . . . . . . . 8.1 — — — —Income/(loss) from operations . . . . . . . . . . . . . . . . . . 25.2 3.5 5.2 (3.0) (4.8)Interest expense . . . . . . . . . . . . . . . . . . . . . . . . . . . . (0.9) (1.8) (1.8) (0.7) (3.2)Amortization of debt discount and debt issuance
expenses, including $2,458 write-off in 2007 . . . . . . (0.2) (3.2) (1.4) (0.5) —Debt conversion expense . . . . . . . . . . . . . . . . . . . . . . . — — — — (7.9)Other (expense)/income, net . . . . . . . . . . . . . . . . . . . . . 0.2 0.5 — (0.1) —Income/(loss) from continuing operations before income
taxes . . . . . . . . . . . . . . . . . . . . . . . . . . . . . . . . . . . . 24.3 (1.0) 2.0 (4.3) (15.9)Benefit from income taxes . . . . . . . . . . . . . . . . . . . . . . 33.3 — — — —Income/(loss) from continuing operations . . . . . . . . . . . . 57.6 (0.3) (23.7) (7.2) (2.6)Loss from discontinued operations. . . . . . . . . . . . . . . . . — (0.3) (23.7) (7.2) (2.6)Net income/(loss) . . . . . . . . . . . . . . . . . . . . . . . . . . . . . $ 57.6 $ (1.3) $ (21.7) $ (11.5) $ (18.5)
Income/(loss) from continuing operations per share . . . . . $ 1.34 $ (0.02) $ 0.05 $ (0.11) $ (0.48)Loss from discontinued operations per share . . . . . . . . . — (0.01) (0.60) (0.19) (0.08)Net income/(loss) per share — basic. . . . . . . . . . . . . . . . $ 1.34 $ (0.03) $ (0.55) $ (0.30) $ (0.56)
Income/(loss) from continuing operations per share . . . . . $ 1.23 $ (0.02) $ 0.05 $ (0.11) $ (0.48)Loss from discontinued operations per share . . . . . . . . . — (0.01) (0.59) (0.19) (0.08)Net income/(loss) per share — diluted . . . . . . . . . . . . . . $ 1.23 $ (0.03) $ (0.54) $ (0.30) $ (0.56)
Basic shares used in computation (in thousands). . . . . . . 43,063 41,453 39,430 38,823 33,381Diluted shares used in computation (in thousands) . . . . . 46,644 41,453 40,166 38,823 33,381
32

2008 2007 2006 2005 2004As of December 31,
(in millions)
Balance Sheet Data:
Cash and cash equivalents . . . . . . . . . . . . . . . . . . . . . . . . . . . . . . $ 39.0 $16.0 $10.4 $ 9.3 $ 18.3Working capital . . . . . . . . . . . . . . . . . . . . . . . . . . . . . . . . . . . . . . 79.1 35.0 25.4 27.5 20.2Total assets . . . . . . . . . . . . . . . . . . . . . . . . . . . . . . . . . . . . . . . . 182.0 82.1 83.6 90.6 102.4Capital leases and long-term debt (including current portion) . . . . . . 11.8 16.1 17.6 16.5 18.4Total liabilities . . . . . . . . . . . . . . . . . . . . . . . . . . . . . . . . . . . . . . . 67.7 38.2 48.6 41.5 42.9Total stockholders’ equity . . . . . . . . . . . . . . . . . . . . . . . . . . . . . . 114.3 44.0 35.1 49.1 59.5
Item 7. Management’s Discussion and Analysis of Financial Condition and Results of Operations
Critical Accounting Policies and Estimates
Management’s Discussion and Analysis of Financial Condition and Results of Operations addresses ourconsolidated financial statements, which have been prepared in accordance with U.S. generally acceptedaccounting principles. The preparation of these financial statements requires management to make estimatesand assumptions that affect the reported amounts of assets and liabilities at the date of the financial statementsand the reported amounts of revenues and expenses during the reporting period. On an on-going basis,management evaluates its estimates and judgments. Management bases its estimates and judgments onhistorical experience and on various other factors that are believed to be reasonable under the circumstances,the results of which form the basis for making judgments about the carrying value of assets and liabilities thatare not readily apparent from other sources. Actual results may differ from these estimates under differentassumptions or conditions. We have identified our most critical accounting policies and estimates to be thoserelated to the following:
Revenue Recognition. The Company records revenue from multiple element arrangements under theguidance governed by AcSEC Statement of Position (SOP) No. 97-2 “Software Revenue Recognition”, asmodified by SOP No. 98-9 “Software Revenue Recognition, With Respect to Certain Transactions”, SEC StaffAccounting Bulletin SAB no. 104 “Revenue Recognition in Statements” and EITF Issue Number 00-21 “RevenueArrangements with Multiple Deliveries.” At the time of entering into each customer agreement or arrangement,each element is identified and the revenue, cost of revenue, and gross profit for each deliverable is recorded andpresented separately as either systems or services. The sale of products and product related solutions tocustomers are classified as systems revenue within the Company’s Statement of Operations. This typically is anintegrated solution that may include licenses, hardware and labor to deliver the product and/or solution per thecustomer’s specifications. Services revenue include the elements of the contract typically related to maintenanceor other recurring services performed over an extended period. Each of these captions represents more than10 percent of the Company’s total revenue. There is no other category of revenue described in Rule 5-03 ofRegulation S-X in which the Company is currently engaged, so that further sub captions are not necessary at thistime. The Company considered Rule 5-03 of Regulation S-X as it relates to the labor portion of the systemsrevenue. The Company will continue to periodically assess the materiality of the labor portion of systemsrevenue and classify the amount as services if significant.
Under the provisions of SOP 97-2, if significant customization is not required, the Company recognizesrevenue for all delivered elements of a software sale at the point when all four criteria of revenue recognition aremet and, the Company has vendor-specific objective evidence (VSOE) of fair value for all identified undeliveredelements. We sell communications systems incorporating our licensed software for enhanced services, includingtext messaging and location-based services to wireless carriers. These systems are designed to incorporate ourlicensed software. Systems revenues typically contain multiple elements, which may include the product license,installation, integration, and hardware. The total arrangement fee is allocated among each element based onvendor-specific objective evidence of the fair value of each of the elements. Fair value is generally determinedbased on the price charged when the element is sold separately. In the absence of evidence of fair value of adelivered element, revenue is allocated first to the undelivered elements based on fair value and the residualrevenue to the delivered elements. The software licenses are generally perpetual licenses for a specified volume
33
of usage, along with the purchase of annual maintenance at a specified rate. We recognize license fee revenuewhen each of the following has occurred: (1) evidence of an arrangement is in place; (2) we have delivered thesoftware; (3) the fee is fixed or determinable; and (4) collection of the fee is probable. Software projects thatrequire significant customization are accounted for under the percentage-of-completion method. We measureprogress to completion using costs incurred compared to estimated total costs or labor costs incurred comparedto estimated total labor costs for contracts that have a significant component of third-party materials costs. Werecognize estimated losses under long-term contracts in their entirety upon discovery. If we did not accuratelyestimate total costs to complete a contract or do not manage our contracts within the planned budget, thenfuture margins may be negatively affected or losses on existing contracts may need to be recognized. Softwarelicense fees billed and not recognized as revenue are included in deferred revenue.
The Company recognizes contract revenue as billable costs are incurred and for fixed-price product deliverycontracts using the percentage-of-completion method or proportional performance method, measured by eithertotal labor costs or total costs incurred compared to total estimated labor costs or total costs to be incurred inaccordance with Statement of Position 81-1. We recognize estimated losses on contracts in their entirety upondiscovery. If we did not accurately estimate total labor costs or total costs to complete a contract or do notmanage our contracts within the planned budget, then our future margins may be negatively affected or losseson existing contracts may need to be recognized.
Acquired Intangible Assets. The acquired intangible assets are amortized over their useful lives ofbetween five and nineteen years, based on the greater of the straight-line method or the revenue curve method.We evaluate acquired intangible assets when events or changes in circumstances indicate that the carryingvalues of such assets might not be recoverable. Our review of factors present and the resulting appropriatecarrying value of our acquired intangible assets are subject to judgments and estimates by management. Futureevents such as a significant underperformance relative to historical or projected future operating results,significant changes in the manner of our use of the acquired assets, and significant negative industry oreconomic trends could cause us to conclude that impairment indicators exist and that our acquired intangibleassets might be impaired. There have been no changes in the valuation of the Company’s acquired intangibleassets for the current period. The expense recognized in 2008, 2007, and 2006 relates to the intangible assetsacquired with the 2004 acquisition of assets from Kivera Inc., including customer lists, customer contracts,trademarks, and patents.
Impairment of Goodwill. The Company performs an annual analysis of our goodwill for impairment inaccordance with SFAS 142, “Goodwill and other Intangible Assets”. The analysis of goodwill includes, amongother factors, estimating future cash flows to be received from the assets. At December 31, 2008, goodwill was$1.8 million and we determined that the fair value of our goodwill exceeded the carrying value. Materialdifferences in our assumptions and valuations in the future could result in a future impairment loss.
Stock Compensation Expense. Effective January 1, 2006, we adopted the fair value recognition provisionsof SFAS 123(R), using the modified prospective transition method. Under the fair value recognition provisions ofSFAS 123(R), we estimate the fair value of our employee stock awards at the date of grant using the Black-Scholes option pricing model, which requires the use of certain subjective assumptions. The most significant ofthese assumptions are our estimates of expected volatility of the market price of our stock and the expectedterm of the stock award. We have determined that historical volatility is the best predictor of expected volatilityand the expected term of our awards was determined taking into consideration the vesting period of the award,the contractual term and our historical experience of employee stock option exercise behavior. We review ourvaluation assumptions at each grant date and, as a result, we could change our assumptions used to valueemployee stock-based awards granted in future periods. In addition, we are required to estimate the expectedforfeiture rate and only recognize expense for those awards expected to vest. If our actual forfeiture rate werematerially different from our estimate, the stock-based compensation expense would be different from what wehave recorded in the current period. SFAS 123(R) requires that employee stock-based compensation costs berecognized over the vesting period of the award and we have elected the straight-line method as the basis forrecording our expense.
Income Taxes. Income taxes are accounted for under the provisions of SFAS 109, “Accounting for IncomeTaxes”. We use the asset and liability method of accounting for deferred income taxes. We assess the likelihood
34

that our deferred tax assets will be recovered from future taxable income. Significant management judgment isrequired in determining any valuation allowance recorded against the net deferred tax assets. Our evaluation ofthe realizability of our deferred tax assets is inherently subjective and is based on our analysis and weighting ofvarious positive and negative evidence available to us. This evaluation includes estimates and assumptions abouta number of market, execution and economic variables. It is possible that actual results may differ fromassumptions and require adjustments to allowances. On January 1, 2007, the Company adopted the FASBissued Interpretation No. 48, “Accounting for Uncertainty in Income Taxes” (FIN 48) which prescribes a minimumrecognition threshold and measurement attribute for the financial statement recognition and measurement of atax position. FIN 48 also provides guidance on derecognition, measurement, classification, interest and penalties,accounting interim periods, disclosure and transition. If a tax position does not meet the more-likely-than-notinitial recognition threshold, no benefit is recorded in the financial statements.
Overview and Recent Developments
We operate two business segments: (i) our Commercial Segment, which consists principally of enhancedcommunication services to and from wireless phones, location application software, our E9-1-1 application andother hosted services for wireless carriers and Voice Over IP service providers, and (ii) our GovernmentSegment, which includes the design, development and deployment of information processing and communica-tion systems, mainly satellite-based, and related services to government agencies.
This Management’s Discussion and Analysis of Financial Condition and Results of Operations providesinformation that our management believes to be necessary to achieve a clear understanding of our financialstatements and results of operations.
Our management monitors and analyzes a number of performance indicators in order to manage ourbusiness and evaluate our financial and operating performance. Those indicators include:
• Revenue and gross profit. We derive revenue from the sales of systems and services including recurringmonthly service and subscriber fees, maintenance fees, software licenses and related service fees for thedesign, development, and deployment of software and communication systems, and products andservices derived from the delivery of information processing and communication systems to governmentalagencies.
• Gross profit represents revenue minus direct cost of revenue, including certain non-cash costs. The majoritems comprising our cost of revenue are compensation and benefits, third-party hardware and software,amortization of software development costs, non-cash stock-based compensation, and overheadexpenses. The costs of hardware and third-party software are primarily associated with the delivery ofsystems, and fluctuate from period to period as a result of the relative volume, mix of projects, level ofservice support required and the complexity of customized products and services delivered. Amortizationof software development costs, including acquired technology, is associated with the recognition ofsystems revenue from our Commercial Segment.
• Operating expenses. Our operating expenses are primarily compensation and benefits, professional fees,facility costs, marketing and sales-related expenses, and travel costs as well as certain non-cash expensessuch as non-cash stock compensation expense, depreciation and amortization of property and equipment,and amortization of acquired intangible assets.
• Liquidity and cash flows. The primary driver of our cash flows is the results of our operations. Importantother sources of our liquidity are our leases secured for the purchase of equipment and potentialborrowings under our credit lines.
• Balance sheet. We view cash, working capital, and accounts receivable balances and days revenuesoutstanding as important indicators of our financial health.
35

Results of Operations
Revenue and Cost of Revenue
The following discussion addresses the revenue and cost of revenue for the two segments of our business.For information regarding the results of the Enterprise assets, see Discontinued Operations — Enterprise assetsbelow.
Commercial Segment:
($ in millions) 2008 2007 $ % 2006 $ %
2008 vs.2007
2007 vs.2006
Services revenue . . . . . . . . . . . . . . . . . . . . . . . . . . $ 64.4 $58.8 $ 5.6 10% $59.7 $(0.9) (2%)
Systems revenue . . . . . . . . . . . . . . . . . . . . . . . . . . 37.4 16.5 20.9 127% 17.2 (0.7) (4%)
Total Commercial Segment revenue . . . . . . . . . . 101.8 75.3 26.5 35% 77.0 (1.7) (2%)
Direct cost of services . . . . . . . . . . . . . . . . . . . . . . 32.4 29.4 3.0 10% 31.4 (2.0) (6%)
Direct cost of systems . . . . . . . . . . . . . . . . . . . . . . 8.9 5.0 3.9 78% 5.2 (0.2) (4%)
Total Commercial Segment cost of revenue . . . . . 41.3 34.4 6.9 20% 36.6 (2.2) (6%)
Services gross profit . . . . . . . . . . . . . . . . . . . . . . . . 32.0 29.4 2.6 9% 28.3 1.1 4%
Systems gross profit . . . . . . . . . . . . . . . . . . . . . . . . 28.5 11.5 17.0 148% 12.0 (0.5) (4%)
Total Commercial Segment gross profit (1) . . . . . . $ 60.5 $40.9 $19.6 48% $40.3 $ 0.6 1%
Segment gross profit as a percent of revenue . . . . . 59% 54% 52%
(1) See discussion of segment reporting in Note 20 to the audited Consolidated Financial Statements presented else-where in this Annual Report on Form 10-K.
Commercial Services Revenue and Cost of Revenue:
Our hosted offerings include our E9-1-1 service for wireless and Voice over Internet Protocol (VoIP) E9-1-1service providers, hosted Position Determining Entity (PDE) service, and hosted Location Based Service (LBS)applications. Revenue from these offerings primarily consists of monthly recurring service fees and is recognizedin the month earned. E9-1-1, PDE, VoIP and hosted LBS service fees are priced based on units served during theperiod, such as the number of customer cell sites served, the number of connections to Public ServiceAnswering Points (PSAPs), or the number of customer subscribers served. Subscriber service revenue isgenerated by client software applications for wireless subscribers such as Rand McNally» Traffic. Maintenancefees on our systems and software licenses are collected in advance and recognized ratably over the maintenanceperiod. Unrecognized maintenance fees are included in deferred revenue. Custom software development,implementation and maintenance services may be provided under time and materials or fixed-fee contracts.
Our commercial services revenue increased $5.6 million or 10% in 2008 from 2007 due to growth in hostedservice customer volume and new hosted service customers and increased maintenance fees due to highercumulative system license sales. The 2% decrease in 2007 from 2006 was due to decreases in average feesreceived per unit under pricing arrangements with some wireless E9-1-1 customers, and the loss of a mid-tiercarrier customer in the third quarter of 2006 offset by increased maintenance revenue on our installed softwarebase.
The direct cost of our services revenue consists primarily of compensation and benefits, network access,data feed and circuit costs, and equipment and software maintenance. The direct cost of maintenance revenueconsists primarily of compensation and benefits expense. For the year ended December 31, 2008, the directcost of service revenue increased 10% over the same period in 2007 in direct relation to increase in revenues.For the year ended December 31, 2007, the direct cost of services revenue decreased 6% compared to 2006.During 2007, we incurred less labor and direct costs related to custom development efforts and deployment
36

requirements of VoIP E9-1-1 infrastructure than in 2006. While we increased the number of cell sites, subscribersand public safety answering points (PSAPs) served, our overall circuit and data access costs were relativelyconsistent year to year. For 2008, the cost of circuit and other data access costs accounted for approximately13% of total direct costs of commercial service revenues. The cost of circuit and other data access costsaccounted for approximately 15% and 11% of the total direct costs of our commercial service revenues for 2007and 2006 respectively.
Commercial services gross profit for the year ended December 31, 2008 was 9% higher than in 2007 onhigher revenue with a comparable percentage increase in labor, fringe and contractor costs. Commercial servicesgross profit in 2007 was 4% higher than in 2006 based on improved operating efficiencies.
Commercial Systems Revenue and Cost of Revenue
We sell communications systems incorporating our licensed software for enhanced services, including textmessaging and location-based services to wireless carriers. These systems are designed to incorporate ourlicensed software. We design our software to ensure that it is compliant with all applicable standards. Licensingfees for our carrier software are generally a function of its volume of usage in our customers’ networks. As acarrier’s subscriber base or usage increases, the carrier must purchase additional capacity under its licenseagreement and we receive additional revenue. We may also realize license revenue as a result of infringementclaims that we make in enforcing our patents. In 2006, we reached a settlement on a patent infringement caseand won a jury award of more than $10 million in another infringement case; no revenue has been recognized onthe second case pending post trial motions, appeals, and potential settlement.
Commercial systems revenue in 2008 was 127% higher than in 2007 due to higher sales of licenses for textmessaging capacity and customer hardware upgrades. Commercial systems revenue in 2007 was 4% lower thanin 2006 due mainly to lower sales of text messaging licenses.
The direct cost of commercial systems consists primarily of compensation, benefits, purchased equipment,third-party software, travel expenses, and consulting fees as well as the amortization of both acquired andcapitalized software development costs for all reported periods. The direct cost of the license component ofsystems is normally very low, and the gross profit very high since the software development efforts wereexpensed in prior periods. The direct cost of systems includes amortization of software development costs of$2.1 million, $1.5 million, and $1.3 million, respectively, in 2008, 2007, and 2006.
Our commercial systems gross profit was $28.5 million in 2008, a 148% or $17.0 million increase from2007. Commercial systems gross profit was $11.5 million in 2007, or a 4% decrease from 2006. Systems grossmargins are higher in periods when systems revenue includes a higher proportion of software licenses relative tothird party system components and integration labor, as was the case in 2008 and 2006.
37

Government Segment:
($ in millions) 2008 2007 $ % 2006 $ %
2008 vs. 2007 2007 vs. 2006
Services revenue . . . . . . . . . . . . . . . . . . . . . . $ 36.9 $29.3 $ 7.6 26% $28.6 $ 0.7 2%
Systems revenue . . . . . . . . . . . . . . . . . . . . . . 81.4 39.6 41.8 106% 19.3 20.3 105%
Total Government Segment revenue. . . . . . . . 118.3 68.9 49.4 72% 48.0 20.9 44%
Direct cost of services . . . . . . . . . . . . . . . . . . 29.2 22.8 6.4 28% 21.1 1.7 8%
Direct cost of systems . . . . . . . . . . . . . . . . . . 68.3 32.9 35.4 108% 12.7 20.2 159%
Total Government Segment cost of revenue . . 97.5 55.7 41.8 75% 33.8 21.9 65%
Services gross profit . . . . . . . . . . . . . . . . . . . . 7.7 6.5 1.2 18% 7.5 (1.0) (13%)
Systems gross profit . . . . . . . . . . . . . . . . . . . . 13.1 6.7 6.4 96% 6.7 — NM
Total Government Segment gross profit (1) . . . $ 20.8 $13.2 $ 7.6 58% $14.2 $ (1.0) 7%
Segment gross profit as a percent of revenue . . . 18% 19% 30%
(1) See discussion of segment reporting in Note 20 to the audited Consolidated Financial Statements presented else-where in this Annual Report on Form 10-K. (NM = Not meaningful)
For 2008, Government Segment revenue increased 72% reflecting increases in both services and systemsrevenue. Government Segment revenue in 2007 and 2006 increased 44% and 32%, respectively, reflectingincreases in both services and systems revenue. During the third quarter of 2006, we were one of six vendorsselected by the U.S. Army to provide secure satellite services and systems under a five year contract vehicle,with a possible maximum value of up to $5 billion for the six vendors. The WWSS contract vehicle is expectedto continue to contribute significant government systems sales growth through 2011. The Company’sGovernment Segment has been awarded participation as a prime or sub-contractor to provide similar satellite-based technology under several other contract vehicles. For the year ended December 31, 2008, the Companywas awarded 6 new delivery orders and received incremental funding against two delivery orders initially issuedin 2008 under the WWSS vehicle with a total contract value of $84.5 million, of which $61.6 million was fulfilled,resulting in 2008 revenue. The total potential value of all WWSS awards received to date is $366.7 million ofwhich $124 million has been funded which we currently expect to fulfill over the next three years.
Government Services Revenue and Cost of Revenue:
Government services revenue increased to $36.9 million in 2008 from $29.3 million in 2007 and $28.6 millionin 2006. These increases were generated by new and expanded-scope contracts resulting from increased salesemphasis on communications and information technology service work, increased revenue generated fromsatellite airtime services using our teleport facilities, and maintenance and field support associated with oursystems sales. Continuing growth is expected from higher usage of our teleport -related services and continuingincremental additions of technical outsource service personnel. System maintenance fees are collected inadvance and recognized ratably over the maintenance periods.
Direct cost of government service revenue consists of compensation, benefits and travel incurred indelivering these services, as well as satellite space segment purchased for resale to government customers.These costs increased as a result of the increased volume of service in all three years.
Our gross profit from government services increased to $7.7 million in 2008 from $6.5 million in 2007 and$7.5 million in 2006. The growth in 2008 was realized from professional services, teleport usage, andmaintenance on the installed base of systems. The decline in gross profit in 2007 was due to the lower averagemargins as a result of tighter average pricing in 2007 due to competition for the contracts as they were renewedor newly won. Gross profit as a percentage of revenue decreased in all three years as a result of lower averagepricing on our mix of government customer contracts.
38

Government Systems Revenue and Cost of Revenue:
We generate government systems revenue from the design, development, assembly and deployment ofinformation processing and communication systems, primarily deployable satellite-based communication sys-tems, and integration of those systems into our customer networks. These are largely variations on ourSwiftLink» product line, which are lightweight, secure, deployable communication systems, sold to units of theU.S. Departments of State, Justice and Defense, and other government agencies. Government systems salesmore than doubled to $81.4 million in 2008 from $39.6 million in 2007, which was more than double the$19.3 million in 2006. The increases over the last three years in systems revenues were primarily due toincreases in sales volume from the fulfillment of task orders under the WWSS 5-year contract vehicle, for whichTCS was one of six awardees in September 2006. In July 2008, TCS was named the sole awardee of a deliveryorder contract with a potential value of $246 million over the next several years, under the WWSS procurementvehicle.
The cost of our government systems revenue consists of purchased system components, compensation,benefits, travel, and the costs related to third-party contractors that we engage. These costs have increased overthe three years presented as a direct result of the increase in volume. These equipment and third-party costs arevariable for our various types of products, and margins may fluctuate between periods based on pricing andproduct mix.
Our government systems gross profit in 2008 increased 96% over 2007 primarily due to higher salesvolume under the WWSS procurement vehicle. Government systems gross profit was the same at $6.7 millionin 2007 and 2006. In 2007, the effect of lower margins was offset by an increase over 2006 volume.
Operating Expenses:
Research and Development Expense:
($ in millions) 2008 2007 $ % 2006 $ %
2008 vs.2007
2007 vs.2006
Research and development expense . . . . . . . . . . . . . . $16.2 $13.1 $3.1 24% $12.6 $0.5 4%
Percent of revenue . . . . . . . . . . . . . . . . . . . . . . . . . . 7% 9% 10%
Our research and development expense consists of compensation, benefits, and a proportionate share offacilities and corporate overhead. The costs of developing software products are expensed prior to establishingtechnological feasibility. Technological feasibility is established for our software products when a detailedprogram design is completed. We incur research and development costs to enhance existing packaged softwareproducts as well as to create new software products including software hosted in our network operations center.These costs primarily include compensation and benefits as well as costs associated with using third-partylaboratory and testing resources. We expense such costs as they are incurred unless technological feasibility hasbeen reached and we believe that the capitalized costs will be recoverable.
The expenses we incur relate to software applications which are being marketed to new and existingcustomers on a global basis. Throughout 2008, 2007, and 2006, research and development was primarilyfocused on cellular and hosted location-based applications, including Voice over IP E9-1-1, enhancements to ourhosted location-based service platform, and wireless location-based service applications. Management continuallyassesses our spending on research and development to ensure resources are focused on products that areexpected to achieve the highest level of success. In 2008, 2007, and 2006, we capitalized $0.5 million,$1.5 million, and $1.8 million, respectively, of software development costs for certain software projects inaccordance with the above policy. The capitalized costs relate to our wireless location-based software. Thesecosts will be amortized on a product-by-product basis using the straight-line method over the products’ estimateduseful life, not longer than three years. Amortization is also computed using the ratio that current revenue for theproduct bears to the total of current and anticipated future revenue for that product (the revenue curve method).If this revenue curve method results in amortization greater than the amount computed using the straight-linemethod, amortization is recorded at that greater amount. Amortization of software development costs is
39

recorded as a direct cost of revenue. We believe that these capitalized costs will be recoverable from future
gross profits generated by these products.
Research and development expense increased 24% in 2008 from 2007, primarily since software developers
spent less time on work that was subject to capitalized expenditure accounting (discussed above), increased
Company personnel assigned to software development work, and higher variable compensation in 2008.
Research and development expense increased 4% in 2007 from 2006. This increase is mainly due to more
Company personnel assigned to software development work during 2007 than in 2006.
Our research and development expenditures have yielded more than 65 patents, primarily for wireless
messaging and location technology, and more than 210 pending patent applications. We believe that the
intellectual property represented by these patents is a valuable asset that will contribute positively to our results
of operations in 2009 and beyond.
Sales and Marketing Expense:
($ in millions) 2008 2007 $ % 2006 $ %
2008 vs.2007
2007 vs.2006
Sales and marketing expense . . . . . . . . . . . . . . . . . . . $13.7 $11.9 $1.8 15% $11.7 $0.2 2%
Percent of revenue . . . . . . . . . . . . . . . . . . . . . . . . . . 6% 8% 9%
Our sales and marketing expense includes compensation and benefits, trade show expenses, travel costs,
advertising and public relations costs as well as a proportionate share of facility-related costs which are expensed
as incurred. Our marketing efforts also include speaking engagements, and attending and sponsoring industry
conferences. We sell our software products and services through our direct sales force and through indirect
channels. We have also historically leveraged our relationships with original equipment manufacturers to market
our software products to wireless carrier customers. We sell our products and services to agencies and
departments of the U.S. government primarily through direct sales professionals. Sales and marketing costs
increased 15% and 2% in 2008 and 2007, respectively, primarily as a result of adding additional Government
Segment sales personnel, increased public relations fees, and an increase of approximately $0.9 million in
variable compensation charges. The increase in 2007 was partially offset by reductions in senior sales and
marketing executive staff costs.
General and Administrative Expense:
($ in millions) 2008 2007 $ % 2006 $ %
2008 vs.2007
2007 vs.2006
General and administrative expense . . . . . . . . . . . . . . $28.2 $19.3 $8.9 46% $17.0 $2.3 14%
Percent of revenue . . . . . . . . . . . . . . . . . . . . . . . . . . 13% 13% 14%
General and administrative expense consists primarily of costs associated with management, finance,
human resources and internal information systems. These costs include compensation, benefits, professional
fees, travel, and a proportionate share of rent, utilities and other facilities costs which are expensed as incurred.
The increase in 2008 included a charge for vacating a leased facility in Tampa, Florida, earlier than its December
2009 expiration, and variable compensation of $8 million related to record revenue, operating profit, and net
income for the year in accordance with formulas established for key employees at the beginning of the year. The
14% increase in 2007 over 2006 was primarily attributable to higher legal and advisory fees associated with
intellectual property related activity.
40

Depreciation and Amortization of Property and Equipment:
($ in millions) 2008 2007 $ % 2006 $ %
2008 vs.2007
2007 vs.2006
Depreciation and amortization of property andequipment . . . . . . . . . . . . . . . . . . . . . . . . . . . . $ 5.9 $ 6.2 $(0.3) (5%) $ 8.0 $(1.8) (23%)
Average gross cost of property and equipment . . . . $50.4 $50.3 $ 0.1 NM $52.0 $(1.7) (3%)
Depreciation and amortization of property and equipment represents the period costs associated with ourinvestment in information technology and telecommunications equipment, software, furniture and fixtures, andleasehold improvements. We compute depreciation and amortization using the straight-line method over theestimated useful lives of the assets. The estimated useful life of an asset generally ranges from five years forfurniture, fixtures, and leasehold improvements to three to four years for most other types of assets includingcomputers, software, telephone equipment and vehicles. In 2008 and 2007, our depreciable asset base hasdecreased as a result of assets purchased in previous years becoming fully depreciated.
Amortization of Acquired Intangible Assets:
($ in millions) 2008 2007 $ % 2006 $ %
2008 vs.2007
2007 vs.2006
Amortization of acquired intangible assets . . . . . . . . . . . $0.1 $0.1 $— NM $0.1 $— NM
The acquired intangible assets associated with the Kivera Acquisition are being amortized over their usefullives of between five and nineteen years. The expense recognized in 2008, 2007, and 2006 relates to theintangible assets acquired in this acquisition, including customer lists, customer contracts, trademarks, andpatents.
Interest Expense:
($ in millions) 2008 2007 $ % 2006 $ %
2008 vs.2007
2007 vs.2006
Interest expense incurred on notes payable andunder our bank revolving credit agreement . . . . . . $ 0.7 $ 1.6 $(0.9) (56%) $ 1.5 $ 0.1 7%
Interest expense incurred on capital leaseobligations . . . . . . . . . . . . . . . . . . . . . . . . . . . . . 0.3 0.2 0.1 50% 0.3 (0.1) (33%)
Amortization of deferred financing fees . . . . . . . . . . 0.2 0.3 (0.1) (33%) 0.4 (0.1) (25%)
Amortization of debt discount . . . . . . . . . . . . . . . . . — 0.5 (0.5) (100%) 1.0 (0.5) (50%)
Write-off of unamortized debt discount and debtissuance expenses . . . . . . . . . . . . . . . . . . . . . . . — 2.4 (2.4) (100%) — 2.4 100%
Less: capitalized interest . . . . . . . . . . . . . . . . . . . . (0.1) (0.1) — NM (0.1) — NM
Total Interest and Financing Expense . . . . . . . . . . $ 1.1 $ 4.9 $(3.8) (78%) $ 3.1 $ 1.8 58%
Interest expense is incurred under notes payable, an equipment loan, a line of credit, and capital leaseobligations. Interest on notes, is primarily at stated interest rates of between 0.25% above prime rate and10.35% and line of credit borrowing is at the bank’s prime rate, which was 3.25% as of December 31, 2008.
On June 25, 2007, we refinanced $10 million secured notes with a new five year term loan payable to ourprincipal bank. The borrowing rate under the new term loan is the prime rate plus 0.25% per annum (3.5% atDecember 31, 2008) and the loan is repayable in equal monthly installments of $0.2 million plus interest. Thefunds were used primarily to retire the March 2006 secured notes. This refinancing resulted in the $2.4 millionwrite-off of unamortized debt discount and debt issuance expenses in the second quarter of 2007. In March2006, we issued $10 million of secured notes, with cash interest at the rate of 14% per annum, along with
41

warrants to purchase an aggregate of 1.75 million shares of our Class A Common Stock at an exercise price of$2.40 per share (2006 Warrants).
In December 2006, we borrowed $5 million from Tatonka Capital under a 3 year note secured by theaccounts receivable of one customer. Effective March 28, 2008, we paid this debt in full and modified the termsof the note to a line of credit. Under the line of credit agreement, the maximum indebtedness of the line is equalto the current maximum debt of $3.2 million ($1.7 million at December 31, 2008) less $0.2 million per month forthe number of full months that have expired since the effective date. The maturity date of the line of credit isDecember 28, 2009. The borrowing rate is the London InterBank Offered Rate (LIBOR) plus 500 basis points.The Company has not borrowed against this Tatonka line.
Our bank line of credit expires in June 2010, and our maximum line of credit is $22 million. Borrowings atany time are limited to an amount based principally on accounts receivable levels as defined in the amended lineof credit agreement. Our potential borrowing under the amended line of credit agreement is also reduced by theamount of letters of credit outstanding which totaled about $2.3 million at December 31, 2008. There were noborrowings under our bank line of credit during 2008.
Cash interest expense on notes payable was lower for the year ended December 31, 2008 due to thelower-cost refinancing in 2007 of higher priced March 2006 debt, and lower average bank borrowings. Intereston capital lease financing was about the same in both periods. Cash interest expense on notes payable wasslightly higher for the year ended December 31, 2007 than in 2006 mainly due to the effect of the higher pricedMarch 2006 debt while it was outstanding. The interest incurred on the March 2006 notes, partially offset byreduced average principal balances on our revolving credit and other notes payable, caused our total interestexpense to be higher in 2006.
Deferred financing fees relate to the up-front expenditures at the time of contracting for notes payable andour revolving line of credit facility, which are being amortized over the term of the note or the life of the facility.The higher 2007 and 2006 amortization reflects fees to borrow the 2006 Notes.
The amortization of debt discount in 2007 and 2006 relates to the 2006 Warrants as well as adjustment tothe terms of warrants issued in connection with 2004 financings. The value of the 2006 Warrants was estimatedto be $2.9 million, determined using the Black-Scholes option-pricing model, which was recorded as a debtdiscount and additional paid-in capital in 2004. The value of the adjustments to the 2004 Warrants was estimatedto be $0.6 million using the Black-Scholes option-pricing model, which was recorded as a debt discount andadditional paid-in capital in the first quarter of 2006. The total debt discount at issuance was being amortized tointerest expense over the three year life of the 2006 Notes, yielding an effective interest rate of 15.2%. The2006 Notes were written off with the 2007 refinancing.
Our capital lease obligations include interest at various amounts depending on the lease arrangement. Ourinterest under capital leases fluctuates depending on the amount of capital lease obligations in each year, andthe interest under those leases, has remained relatively constant since 2006. The interest cost of capital leasefinancings was about the same in the years ending December 31, 2008, 2007, and 2006.
Our interest and financing expense decreased in 2008 over 2007 primarily as a result of retiring our March2006 and December 2006 borrowings. Interest and financing expense increased in 2007 over 2006 due mainly tothe write-off of the amortization of debt discount and financing fees associated with the refinancing of our March2006 debt.
Other Income, Net:
($ in millions) 2008 2007 $ % 2006 $ %
2008 vs.2007
2007 vs.2006
Foreign currency translation/ transaction (loss)/gain . . . $0.1 $(0.1) $ 0.2 200% $(0.1) $ — NM
Miscellaneous other (expense)/ income . . . . . . . . . . . 0.1 0.6 (0.5) (83%) 0.1 0.5 500%
Total other income, net. . . . . . . . . . . . . . . . . . . . . . . $0.2 $ 0.5 (0.3) (60%) $ — 0.5 100%
42

For the year ended December 31, 2008, Other income, net consisted primarily of $0.7 interest incomeearned on investment accounts, and $0.1 million net gain on foreign currency translation/transaction, which isdependent on fluctuations in currency exchange rates. We record the effects of foreign currency translation onour cash, receivables and deferred revenues that are stated in currencies other than our functional currency. TheCompany also recorded a 2008 loss of $0.8 million from the decline in the fair market value of certain securitiesconsidered to be other than temporary. The other components of other income, net, were about the same as inperiods.
Income Taxes:
The Company accounts for income taxes in accordance with SFAS No. 109, Accounting for Income Taxes(“SFAS 109”). Under SFAS 109, deferred tax assets and liabilities are computed based on the differencebetween the financial statement and income tax basis of assets and liabilities using the enacted marginal taxrate. Upon the adoption of FIN 48 on January 1, 2007, the estimated value of the Company’s uncertain taxpositions was a liability of $2.7 million resulting from unrecognized net tax benefits which did not include interestand penalties. The Company recorded the estimated value of its uncertain tax position by reducing the value ofcertain tax attributes. The Company would classify any interest and penalties accrued on any unrecognized taxbenefits as a component of the provision for income taxes. There were no interest or penalties recognized in theconsolidated statement of income for year ended December 31, 2008 and the consolidated balance sheet atDecember 31, 2008. The Company does not currently anticipate that the total amounts of unrecognized taxbenefits will significantly increase within the next 12 months. The Company files income tax returns in U.S. andstate jurisdictions. As of December 31, 2008, open tax years in the federal and some state jurisdictions dateback to 1999, due to the taxing authorities’ ability to adjust operating loss carry forwards.
SFAS 109 requires that the net deferred tax asset be reduced by a valuation allowance if, based on theweight of available evidence, it is more likely than not that some portion of all of the net deferred tax asset willnot be realized.
This process requires the Company’s management to make assessments regarding the timing andprobability of the ultimate tax impact. The Company records valuation allowances on deferred tax assets ifdetermined it is more likely than not that the asset will not be realized. Additionally, the Company establishesreserves for uncertain tax positions based upon our judgment regarding potential future challenges to thosepositions. Actual income taxes could vary from these estimates due to future changes in income tax law,significant changes in the jurisdictions in which the Company operates, our inability to generate sufficient futuretaxable income or unpredicted results from the final determination of each year’s liability by taxing authorities.These changes could have a significant impact on the Company’s financial position.
Deferred tax assets consist primarily of net operating loss and tax credit carryforwards as well as deductibletemporary differences. Prior to 2008, the Company provided a full tax valuation allowance for federal and statedeferred tax assets based on management’s evaluation that the Company’s ability to realize such assets did notmeet the criteria of “more likely than not”. The Company has continuously evaluated additional facts represent-ing positive and negative evidence in the determination of its ability to realize the deferred tax assets. In the yearended December 31, 2008, management has determined, as the result of cumulative income and anticipatedfuture taxable income, that it is now more likely than not that these deferred tax assets will be realized in thefuture. Accordingly, the Company determined that it is appropriate to reverse the deferred tax asset valuation.This has resulted in a benefit to deferred tax expense of $33.3 million for the year 2008.
Discontinued Operations:
In 2007, the Company sold its Enterprise division operations, which had previously been included in ourCommercial Segment. Accordingly, the assets, liabilities, and results of operations for the Enterprise assets havebeen classified as discontinued operations for all periods presented in the Consolidated Financial Statementsincluded elsewhere in this Annual Report on Form 10-K in accordance with Statement of Financial AccountingStandards No. 144, Accounting for the Impairment or Disposal of Long-Lived Assets (Statement No. 144).
43

Effective January 1, 2007, the Company sold two of its three Enterprise units to strategic buyers forcommon stock in the acquiring publicly traded companies valued at approximately $1 million and earn-outarrangements. As at December 31, 2008, we wrote down the investments by $0.8 million. The Company doesnot expect to receive material payments from the earn-out arrangement. During May 2007, the last Enterpriseunit was sold for $4 million in cash of which $0.2 million was in escrow and was released in June 2008, a$1 million 18-month note which was paid in full in November 2008, and $0.2 million in equity interest.
The following table presents income statement data for the Enterprise division, currently reported asdiscontinued operations. The 2005 results were previously reported as part of the results of our CommercialSegment.
($ in millions) 2008 2007 $ % 2006 $ %
2008 vs.2007
2007 vs.2006
Total revenue . . . . . . . . . . . . . . . . . . . . . . . . . . . . $— $ 5.6 $(5.6) 100% $ 26.0 $(20.4) (78%)
Total gross profit . . . . . . . . . . . . . . . . . . . . . . . . . — 0.8 $(0.8) 100% 4.5 $ (3.7) (82%)
Loss from discontinued operations, including 2006impairment charges of $15.5 million . . . . . . . . . . $— $(0.3) $ 0.3 100% $(23.7) $ 23.4 99%
Net Income/(loss):
($ in millions) 2008 2007 $ % 2006 $ %
2008 vs.2007
2007 vs.2006
Net income/(loss) from continuing operations. . . $57.6 $(1.0) $58.6 5,860% $ 2.0 $ (3.0) (150%)
Loss from discontinued operations . . . . . . . . . . — (0.3) 0.3 100% (23.7) 23.4 99%
Net income/(loss) . . . . . . . . . . . . . . . . . . . . . . $57.6 $(1.3) $58.9 4,531% $(21.7) $20.4 94%
Net income/(loss) changes for each year are as a result of the discussions above.
44

Liquidity and Capital Resources
The following table summarizes our comparative statements of cash flow:
($ in millions) 2008 2007 2006
Net cash and cash equivalents provided by (used in):
Net income/(loss) . . . . . . . . . . . . . . . . . . . . . . . . . . . . . . . . . . . . . . . . . . . . . $ 57.6 $ (1.3) $(21.7)
Less: loss from discontinued operations . . . . . . . . . . . . . . . . . . . . . . . . . . . . . — (0.3) (23.7)
Income/(loss) from continuing operations. . . . . . . . . . . . . . . . . . . . . . . . . . . . . 57.6 (1.0) 2.0
Non-cash charges . . . . . . . . . . . . . . . . . . . . . . . . . . . . . . . . . . . . . . . . . . . . . 12.8 15.5 13.9
Benefit from income taxes . . . . . . . . . . . . . . . . . . . . . . . . . . . . . . . . . . . . . . (34.0) — —
Net changes in working capital . . . . . . . . . . . . . . . . . . . . . . . . . . . . . . . . . . . . (10.4) (5.4) (2.9)
Operating activities of continuing operations . . . . . . . . . . . . . . . . . . . . . . . . . 26.0 9.1 13.0
Operating activities of discontinued operations . . . . . . . . . . . . . . . . . . . . . . . — (3.6) (8.0)
Net operating activities . . . . . . . . . . . . . . . . . . . . . . . . . . . . . . . . . . . . . . . 26.0 5.5 5.0
Investing activities for continuing operations:
Purchases of property and equipment . . . . . . . . . . . . . . . . . . . . . . . . . . . . . . . (3.7) (2.6) (2.8)
Capitalized software development costs . . . . . . . . . . . . . . . . . . . . . . . . . . . . . (0.5) (1.5) (1.8)
Investing activities for continuing operations . . . . . . . . . . . . . . . . . . . . . . . . . (4.2) (4.1) (4.6)
Investing activities for discontinued operations . . . . . . . . . . . . . . . . . . . . . . . — 4.0 (1.4)
Net investing activities . . . . . . . . . . . . . . . . . . . . . . . . . . . . . . . . . . . . . . . . (4.2) (0.1) (6.0)
Financing activities:
Payments on debt and leases . . . . . . . . . . . . . . . . . . . . . . . . . . . . . . . . . . . . (7.7) (16.0) (13.6)
Proceeds from/(finance fees related to) issuance of stock and debentures, net . . — — (1.5)
Proceeds from borrowings. . . . . . . . . . . . . . . . . . . . . . . . . . . . . . . . . . . . . . . — 10.0 16.0
Proceeds from exercise of warrants . . . . . . . . . . . . . . . . . . . . . . . . . . . . . . . . 2.5 2.2 —
Proceeds from employee option exercises . . . . . . . . . . . . . . . . . . . . . . . . . . . 6.4 4.0 0.7
Net financing activities from continuing operations . . . . . . . . . . . . . . . . . . . . 1.2 0.2 1.6
Effect of exchange rates from discontinued operations . . . . . . . . . . . . . . . . . . . . — — 0.3
Change in cash and cash equivalents from continuing operations . . . . . . . . . . . . . 23.0 5.2 10.1
Change in cash and cash equivalents from discontinued operations . . . . . . . . . . . . — 0.4 (9.1)
Net change in cash and cash equivalents . . . . . . . . . . . . . . . . . . . . . . . . . . . . . . $ 23.0 $ 5.6 $ 1.0
Days revenue outstanding in accounts receivable including unbilled receivables . . . 95 87 82
Capital resources: We have funded our operations, acquisitions, and capital expenditures primarily usingcash generated by our operations, as well as the net proceeds from capital including:
• June 2007 bank term loan borrowing of $10 million to refinance March 2006 secured notes, at a lowercoupon rate.
• March 2006 issuance of secured notes and warrants (described below) which generated net cashproceeds of approximately $9.3 million.
• Capital leases to fund fixed asset purchases.
Sources and uses of cash: The Company’s cash and cash equivalents balance was approximately $39.0 mil-lion at December 31, 2008, a $23.0 million increase from $16.0 million at December 31, 2007.
Operations: Cash generated by continuing operations increased to $26.0 million in 2008 from $9.1 million in2007 due mainly to higher earnings. The cash generated by continuing operations in 2007 decreased $9.1 million
45

from $13.0 million in 2006 in due mainly to fluctuations in working capital. Discontinued operations used$3.6 million and $8.0 million in 2007 and 2006, respectively. The operations and cash flows of the discontinuedoperations have been eliminated and the Company has had no significant involvement in the operations sincethe disposal transaction.
Investing activities: Fixed asset additions in 2008, 2007, and 2006 were $3.7, $2.6, and $2.8 million,respectively. Investments made in the development of carrier software for resale which had reached the stageof development calling for capitalization decreased by approximately $1 million in 2008 to about $0.5 million, asmore developer labor cost was expensed as research and development. The amounts capitalized in 2007 and2006 were approximately $2.0 million each year. Discontinued operations generated $4 million from the sale ofassets in 2007 and $1 million from collection of a note in 2008. Investments were made during 2006 indiscontinued operations primarily for enhancements to the core software for resale by the mobile assetmanagement unit.
Financing activities: We have a $22 million revolving credit line with our principal bank through June 2010with borrowing was available at the bank’s prime rate, which was 3.25% per annum at December 31, 2008.Borrowings at any time are limited based mainly on accounts receivable levels as defined in the line of creditagreement. Availability under the line of credit available is also reduced by the amount of letters of creditoutstanding, which was $2.3 million at December 31, 2008. As of December 31, 2008, we had no borrowingsoutstanding under our bank line of credit and had approximately $19.3 million of unused borrowing availabilityunder the line.
On December 28, 2006, we issued a $5 million note for a term of three years, secured by accountsreceivable of one customer to Tatonka Capital. Effective March 28, 2008, we paid the term loan in full, andmodified the terms of the note to a line of credit. Under the line of credit agreement, the maximumindebtedness of the line is equal to $1.7 million at December 31, 2008 less $0.2 million per month throughDecember 28, 2009. The borrowing rate is London InterBank Offered Rate (LIBOR) plus 500 basis points. As ofDecember 31, 2008, we had no borrowings outstanding and $1.7 million in unused borrowing availability underthe line.
In June 2007, we refinanced $10 million of our March 2006 secured notes with a with a five year notepayable to our principal bank. The borrowing rate under the new note was the bank’s prime rate plus 0.25% perannum, (3.5% at December 31, 2008) and the note is repayable in equal monthly installments of $0.2 millionplus interest.
In March 2006, we issued (i) $10 million of secured notes due March 10, 2009, with cash interest at 14%per annum, and (ii) warrants to purchase an aggregate of 1.75 million shares of our Class A Common Stock at anexercise price of $2.40 per share. Also, some warrants that we had previously issued in 2004 containedprovisions which required an adjustment in both the warrant price and the number of warrants outstanding as aconsequence of the issuance of 2006 Warrants. The resulting carrying value of the debt at issuance was$6.5 million, net of the original discount of $3.5 million which was amortized to interest expense over its three-year term using the effective interest method, yielding an effective interest rate of 15.2%. The remainingunamortized debt discount and deferred debt issuance expenses of $2.4 million were written off in the secondquarter of 2007 as a result of early retirement of the March 2006 note. In December 2008, the holders of thesewarrants exercised their warrants and 1.1 million shares were issued for proceeds of $2.5 million. The remaining0.7 million warrants remain outstanding and expire March 2011.
Our line of credit and term loan agreement contains covenants requiring us to maintain a minimum adjustedquick ratio and a minimum liquidity ratio; as well as other restrictive covenants including, among others,restrictions on our ability to merge, acquire assets above prescribed thresholds, undertake actions outside theordinary course of our business (including the incurrence of indebtedness), guarantee debt, distribute dividends,and repurchase our stock, and minimum tangible net worth. The bank credit agreement also contains asubjective covenant that requires (i) no material adverse change in the business, operations, or financial conditionof the Company to occur, or (ii) no material impairment of the prospect of repayment of any portion of theborrowings under the agreement; or (iii) no material impairment of value or priority of the lenders securityinterests in the collateral of the agreement. If our performance does not result in compliance with any of our
46

restrictive covenants, we would seek to further modify our financing arrangements, but there can be noassurance that the bank would not exercise its rights and remedies under its agreement with us, includingdeclaring all outstanding debt due and payable. As of December 31, 2008, we were in compliance with thecovenants related to our line of credit and term loan agreement and we believe that the Company will continueto comply with these covenants.
We believe that we have sufficient capital resources with cash generated from operations as well as cashon hand to meet our anticipated cash operating expenses, working capital, and capital expenditure and debtservice needs for the next twelve months. We have borrowing capacity available to us in the form of capitalleases as well as a line of credit arrangement with our principal bank which expires in June 2010. We may alsoconsider raising capital in the public markets as a means to meet our capital needs and to invest in our business.Although we may need to return to the capital markets, establish new credit facilities or raise capital in privatetransactions in order to meet our capital requirements, we can offer no assurances that we will be able toaccess these potential sources of funds on terms acceptable to us or at all.
Off-Balance Sheet Arrangements
We had standby letters of credit totaling approximately $2.3 million at year-end 2008 and $2.9 million atyear-end 2007 in support of processing credit card payments from our customers, as collateral with a vendor,and security for office space.
Contractual Commitments
As of December 31, 2008, our most significant commitments (including interest) consisted of long-termdebt, obligations under capital leases and non-cancelable operating leases. We lease certain furniture andcomputer equipment under capital leases. We lease office space and equipment under non-cancelable operatingleases. As of December 31, 2008 our commitments consisted of the following:
($ in millions) 2009 2010-2011 2012-2013 Beyond Total
Notes payable . . . . . . . . . . . . . . . . . . . . . . . . . . . . . . . . . . . . . $2.5 $ 4.6 $1.2 $ — $ 8.3
Capital lease obligations . . . . . . . . . . . . . . . . . . . . . . . . . . . . . . 2.1 2.4 0.6 — 5.1
Operating leases, primarily for office space . . . . . . . . . . . . . . . . . 3.4 4.3 1.3 0.6 9.6
Total contractual commitments. . . . . . . . . . . . . . . . . . . . . . . . $8.0 $11.3 $3.1 $0.6 $23.0
Related Party Transactions
In February 2003, we entered into an agreement with Annapolis Partners LLC to explore the opportunity ofrelocating our Annapolis offices to a planned new real estate development. Our President and Chief ExecutiveOfficer own a controlling voting and economic interest in Annapolis Partners LLC and he also serves as amember. The financial and many other terms of the agreement have not yet been established. The lease issubject to several contingencies and rights of termination. For example, the agreement can be terminated at thesole discretion of our Board of Directors if the terms and conditions of the development are unacceptable to us,including without limitation the circumstances that market conditions make the agreement not favorable to us orthe overall cost is not in the best interest to us or our shareholders, or any legal or regulatory restrictions apply.Our Board of Directors will evaluate this opportunity along with alternatives that are or may become available inthe relevant time periods and there is no assurance that we will enter into a definitive lease at this newdevelopment site.
Item 7A. Qualitative and Quantitative Disclosures about Market Risk
Interest Rate Risk
We have limited exposure to financial market risks, including changes in interest rates. As discussed aboveunder “Item 7. Management’s Discussion and Analysis of Financial Condition and Results of Operations —Liquidity and Capital Resources,” we have a $22 million line of credit. A hypothetical 100 basis point adverse
47

movement (increase) in the prime rate would have increased our interest expense for the year endedDecember 31, 2008 by approximately $0.1 million, resulting in no significant impact on our consolidated financialposition, results of operations or cash flows.
At December 31, 2008, we had cash and cash equivalents of $39.0 million. Cash and cash equivalentsconsisted of demand deposits and money market accounts that are interest rate sensitive. However, theseinvestments have short maturities mitigating their sensitivity to interest rates. A hypothetical 100 basis pointadverse movement (decrease) in interest rates would have increased our net loss for 2008 by approximately$0.1 million, resulting in no significant impact on our consolidated financial position, results of operations or cashflows. Substantially all of the Company’s cash equivalents at December 31, 2008 are money market fundinvestments which are backstopped as to principal under a federal guarantee program in effect through April2009.
Foreign Currency Risk
For the year ended December 31, 2008, we generated $8.6 million of revenue outside the U.S. A majority ofour transactions generated outside the U.S. are denominated in U.S. dollars and a change in exchange rateswould not have a material impact on our Consolidated Financial Statements. As of December 31, 2008, we didnot have any billed or unbilled accounts receivable that would expose us to foreign currency exchange risk.During 2008, our average receivables and deferred revenue subject to foreign currency exchange risk were$0.1 million and $0.7 million, respectively. We recorded transaction income of approximately $0.1 million onforeign currency denominated receivables and deferred revenue for the year ended December 31, 2008.
Item 8. Financial Statements and Supplementary Data
The financial statements listed in Item 15 are included in this Annual Report on Form 10-K beginning onpage F-1.
Item 9. Changes In and Disagreements With Accountants on Accounting and Financial Disclosure
None.
Item 9A. Controls and Procedures
Evaluation of Disclosure Controls and Procedures
As of the end of the period covered by this Annual Report on Form 10-K, we carried out an evaluation,under the supervision and with the participation of our management, including our Chief Executive Officer andChief Financial Officer, of the effectiveness of the design and operation of our disclosure controls andprocedures. There are inherent limitations to the effectiveness of any system of disclosure controls andprocedures, including the possibility of human error and the circumvention or overriding of the controls andprocedures. Accordingly, even effective disclosure controls and procedures can only provide reasonableassurance of achieving their control objectives.
Based upon that evaluation, our Chief Executive Officer and Chief Financial Officer concluded that ourdisclosure controls and procedures (as defined in Rule 13a-15(e) or 15d-15(e) of the Exchange Act) wereeffective to provide reasonable assurance that information we are required to disclose in reports we file orsubmit under the Exchange Act is recorded, processed, summarized and reported within the time periodsspecified in the applicable rules and forms, and that it is accumulated and communicated to our management,including our Chief Executive Officer and Chief Financial Officer, as appropriate, to allow timely decisionsregarding required disclosure.
Management’s Report on Internal Control over Financial Reporting
Our management is responsible for establishing and maintaining adequate internal control over financialreporting, as defined in Exchange Act Rule 13a-15(f). Management, including our Chief Executive Officer andChief Financial Officer, conducted an evaluation of the effectiveness of our internal control over financial
48

reporting based on the framework in Internal Control - Integrated Framework issued by the Committee ofSponsoring Organizations of the Treadway Commission. Based on this evaluation, management concluded thatour internal control over financial reporting was effective as of December 31, 2008. Management reviewed theresults of their assessment with our Audit Committee. The effectiveness of our internal control over financialreporting as of December 31, 2008 has been audited by Ernst & Young LLP, an independent registered publicaccounting firm, as stated in their report which is included in Item 9A of this Annual Report on Form 10-K.
Changes in Internal Control over Financial Reporting
There were no changes in the Company’s internal controls over financial reporting during the quarter endedDecember 31, 2008, that are materially affected, or are reasonably likely to materially affect, the Company’sinternal control over financial reporting.
49

Report of Independent Registered Public Accounting Firm
The Board of Directors and StockholdersTeleCommunication Systems, Inc.
We have audited TeleCommunication Systems, Inc.’s internal control over financial reporting as of Decem-ber 31, 2008, based on criteria established in Internal Control — Integrated Framework issued by the Committeeof Sponsoring Organizations of the Treadway Commission (the COSO criteria). TeleCommunication Systems,Inc.’s management is responsible for maintaining effective internal control over financial reporting, and for itsassessment of the effectiveness of internal control over financial reporting included in the accompanyingManagement’s Report on Internal Control over Financial Reporting. Our responsibility is to express an opinion onthe Company’s internal control over financial reporting based on our audit.
We conducted our audit in accordance with the standards of the Public Company Accounting OversightBoard (United States). Those standards require that we plan and perform the audit to obtain reasonableassurance about whether effective internal control over financial reporting was maintained in all materialrespects. Our audit included obtaining an understanding of internal control over financial reporting, assessing therisk that a material weakness exists, testing and evaluating the design and operating effectiveness of internalcontrol based on the assessed risk, and performing such other procedures as we considered necessary in thecircumstances. We believe that our audit provides a reasonable basis for our opinion.
A company’s internal control over financial reporting is a process designed to provide reasonable assuranceregarding the reliability of financial reporting and the preparation of financial statements for external purposes inaccordance with generally accepted accounting principles. A company’s internal control over financial reportingincludes those policies and procedures that (1) pertain to the maintenance of records that, in reasonable detail,accurately and fairly reflect the transactions and dispositions of the assets of the company; (2) providereasonable assurance that transactions are recorded as necessary to permit preparation of financial statementsin accordance with generally accepted accounting principles, and that receipts and expenditures of the companyare being made only in accordance with authorizations of management and directors of the company; and(3) provide reasonable assurance regarding prevention or timely detection of unauthorized acquisition, use ordisposition of the company’s assets that could have a material effect on the financial statements.
Because of its inherent limitations, internal control over financial reporting may not prevent or detectmisstatements. Also, projections of any evaluation of effectiveness to future periods are subject to the risk thatcontrols may become inadequate because of changes in conditions, or that the degree of compliance with thepolicies or procedures may deteriorate.
In our opinion, TeleCommunication Systems, Inc. maintained, in all material respects, effective internalcontrol over financial reporting as of December 31, 2008, based on the COSO criteria.
We also have audited, in accordance with the standards of the Public Company Accounting Oversight Board(United States), the consolidated balance sheets of TeleCommunication Systems, Inc. and subsidiaries as ofDecember 31, 2008 and 2007, and the related consolidated statements of operations, stockholders’ equity, andcash flows for each of the three years in the period ended December 31, 2008 of TeleCommunication Systems,Inc. and subsidiaries and our report dated March 2, 2009 expressed an unqualified opinion thereon.
/s/ Ernst & Young LLP
Baltimore, MarylandMarch 2, 2009
50

Part III
Item 10. Directors , Executive Officers, and Corporate Governance
The information required by this Item 10 is incorporated herein by reference from the information captioned“Board of Directors” and “Security Ownership of Certain Beneficial Owners and Management” to be included inthe Company’s definitive proxy statement to be filed in connection with the 2009 Annual Meeting ofStockholders, to be held on June 11, 2009 (the “Proxy Statement”). The Company’s Code of Ethics andWhistleblower Procedures may be found at http://www1.telecomsys.com/investor — info/corp —governance.cfm.
Item 11. Executive Compensation
The information required by this Item 11 is incorporated herein by reference from the information captioned“Board of Directors” and “Executive Compensation” to be included in the Proxy Statement.
Item 12. Security Ownership of Certain Beneficial Owners and Management
The information required by this Item 12 is incorporated herein by reference from the information captioned“Security Ownership of Certain Beneficial Owners and Management” to be included in the Proxy Statement.
Item 13. Certain Relationships and Related Transactions and Director Independence
The information required by this Item 13 is incorporated herein by reference from the information captioned“Certain Relationships and Related Transactions” and “General Information Concerning the Board of Directors”to be included in the Proxy Statement.
Item 14. Principal Accountant Fees and Services
The information required by this Item 14 is incorporated herein by reference from the information captioned“Principal Accountant Fees and Services” to be included in the Proxy Statement.
51

Part IV
Item 15. Exhibits, Financial Statement Schedules
(a)(1) Financial Statements
The financial statements listed in Item 15 are included in this Annual Report on Form 10-K beginning onpage F-1.
(a)(2) Financial Statement Schedules
The financial statement schedule required by Item 15 is included in Exhibit 12 to this Annual Report onForm 10-K.
Exhibits
The exhibits are listed in the Exhibit Index immediately preceding the exhibits.
52

Index to Consolidated Financial Statements
Report of Independent Registered Public Accounting Firm. . . . . . . . . . . . . . . . . . . . . . . . . . . . . . . . . . . . . F-2Consolidated Balance Sheets as of December 31, 2008 and 2007 . . . . . . . . . . . . . . . . . . . . . . . . . . . . . . . F-3Consolidated Statements of Operations for each of the three years in the period ended December 31,
2008 . . . . . . . . . . . . . . . . . . . . . . . . . . . . . . . . . . . . . . . . . . . . . . . . . . . . . . . . . . . . . . . . . . . . . . . . . F-4Consolidated Statements of Stockholders’ Equity for each of the three years in the period ended
December 31, 2008 . . . . . . . . . . . . . . . . . . . . . . . . . . . . . . . . . . . . . . . . . . . . . . . . . . . . . . . . . . . . . . F-5Consolidated Statements of Cash Flows for each of the three years in the period ended December 31,
2008 . . . . . . . . . . . . . . . . . . . . . . . . . . . . . . . . . . . . . . . . . . . . . . . . . . . . . . . . . . . . . . . . . . . . . . . . . F-7Notes to Consolidated Financial Statements . . . . . . . . . . . . . . . . . . . . . . . . . . . . . . . . . . . . . . . . . . . . . . . F-8
F-1

Report of Independent Registered Public Accounting Firm
The Board of Directors and StockholdersTeleCommunication Systems, Inc.
We have audited the accompanying consolidated balance sheets of TeleCommunication Systems, Inc. andsubsidiaries as of December 31, 2008 and 2007, and the related consolidated statements of operations,stockholders’ equity, and cash flows for each of the three years in the period ended December 31, 2008. Ouraudit also included the financial statement schedule listed in the Index at Item 15. These financial statements arethe responsibility of the Company’s management. Our responsibility is to express an opinion on these financialstatements based on our audits.
We conducted our audits in accordance with the standards of the Public Company Accounting OversightBoard (United States). Those standards require that we plan and perform the audit to obtain reasonableassurance about whether the financial statements are free of material misstatement. An audit includesexamining, on a test basis, evidence supporting the amounts and disclosures in the financial statements. Anaudit also includes assessing the accounting principles used and significant estimates made by management, aswell as evaluating the overall financial statement presentation. We believe that our audits provide a reasonablebasis for our opinion.
In our opinion, the financial statements referred to above present fairly, in all material respects, theconsolidated financial position of TeleCommunication Systems, Inc. and subsidiaries at December 31, 2008 and2007, and the consolidated results of their operations and their cash flows for each of the three years in theperiod ended December 31, 2008, in conformity with U.S. generally accepted accounting principles. Also, in ouropinion, the related financial statement schedule, when considered in relation to the basic financial statementstaken as a whole, presents fairly in all material respects the information set forth therein.
We also have audited, in accordance with the standards of the Public Company Accounting Oversight Board(United States), TeleCommunication Systems, Inc.’s internal control over financial reporting as of December 31,2008, based on criteria established in Internal Control-Integrated Framework issued by the Committee ofSponsoring Organizations of the Treadway Commission and our report dated March 2, 2009 expressed anunqualified opinion thereon.
/s/ Ernst & Young LLP
Baltimore, MarylandMarch 2, 2009
F-2

TeleCommunication Systems, Inc.
Consolidated Balance Sheets(amounts in thousands, except share data)
December 31,2008
December 31,2007
AssetsCurrent assets:
Cash and cash equivalents . . . . . . . . . . . . . . . . . . . . . . . . . . . . . . . . . . . . . $ 38,977 $ 15,955Accounts receivable, net of allowance of $285 in 2008 and $266 in 2007. . . . 61,827 20,424Unbilled receivables . . . . . . . . . . . . . . . . . . . . . . . . . . . . . . . . . . . . . . . . . . 21,797 15,229Inventory . . . . . . . . . . . . . . . . . . . . . . . . . . . . . . . . . . . . . . . . . . . . . . . . . 2,715 5,373Deferred income taxes. . . . . . . . . . . . . . . . . . . . . . . . . . . . . . . . . . . . . . . . 9,736 —Other current assets . . . . . . . . . . . . . . . . . . . . . . . . . . . . . . . . . . . . . . . . . 3,869 5,561
Total current assets . . . . . . . . . . . . . . . . . . . . . . . . . . . . . . . . . . . . . . . 138,921 62,542Property and equipment, net of accumulated depreciation and amortization of
$41,268 in 2008 and $35,969 in 2007 . . . . . . . . . . . . . . . . . . . . . . . . . . . . . 12,391 11,209Software development costs, net of accumulated amortization of $6,873 in
2008 and $4,783 in 2007 . . . . . . . . . . . . . . . . . . . . . . . . . . . . . . . . . . . . . . 2,773 4,406Acquired intangible assets, net of accumulated amortization of $656 in 2008
and $509 in 2007. . . . . . . . . . . . . . . . . . . . . . . . . . . . . . . . . . . . . . . . . . . . 562 709Goodwill. . . . . . . . . . . . . . . . . . . . . . . . . . . . . . . . . . . . . . . . . . . . . . . . . . . . 1,813 1,813Deferred income taxes . . . . . . . . . . . . . . . . . . . . . . . . . . . . . . . . . . . . . . . . . 24,309 —Other assets . . . . . . . . . . . . . . . . . . . . . . . . . . . . . . . . . . . . . . . . . . . . . . . . 1,190 1,445
Total assets . . . . . . . . . . . . . . . . . . . . . . . . . . . . . . . . . . . . . . . . . . . . $ 181,959 $ 82,124
Liabilities and stockholders’ equity
Current liabilities:Accounts payable and accrued expenses. . . . . . . . . . . . . . . . . . . . . . . . . . . $ 34,345 $ 12,459Accrued payroll and related liabilities . . . . . . . . . . . . . . . . . . . . . . . . . . . . . . 17,243 4,915Deferred revenue . . . . . . . . . . . . . . . . . . . . . . . . . . . . . . . . . . . . . . . . . . . 4,349 4,685Current portion of capital lease obligations and notes payable . . . . . . . . . . . . 3,837 5,444
Total current liabilities . . . . . . . . . . . . . . . . . . . . . . . . . . . . . . . . . . . . . 59,774 27,503Capital lease obligations and notes payable, less current portion. . . . . . . . . . . . 7,913 10,657Stockholders’ equity:
Class A Common Stock; $0.01 par value:Authorized shares — 225,000,000; issued and outstanding shares of
38,527,234 in 2008 and 34,970,394 in 2007 . . . . . . . . . . . . . . . . . . . . . 385 349Class B Common Stock; $0.01 par value:
Authorized shares — 75,000,000; issued and outstanding shares of6,876,334 in 2008 and 7,301,334 in 2007 . . . . . . . . . . . . . . . . . . . . . . . 69 74
Additional paid-in capital . . . . . . . . . . . . . . . . . . . . . . . . . . . . . . . . . . . . . . . 240,559 227,987Accumulated other comprehensive income/(loss) . . . . . . . . . . . . . . . . . . . . . 12 (125)Accumulated deficit . . . . . . . . . . . . . . . . . . . . . . . . . . . . . . . . . . . . . . . . . . (126,753) (184,321)
Total stockholders’ equity . . . . . . . . . . . . . . . . . . . . . . . . . . . . . . . . . . 114,272 43,964
Total liabilities and stockholders’ equity . . . . . . . . . . . . . . . . . . . . . . . . . $ 181,959 $ 82,124
See accompanying Notes to Consolidated Financial Statements.
F-3

TeleCommunication Systems, Inc.
Consolidated Statements of Operations(amounts in thousands, except per share data)
2008 2007 2006Year Ended December 31,
RevenueServices . . . . . . . . . . . . . . . . . . . . . . . . . . . . . . . . . . . . . . . . . . . . . . . . $101,359 $ 88,062 $ 88,380Systems . . . . . . . . . . . . . . . . . . . . . . . . . . . . . . . . . . . . . . . . . . . . . . . . 118,783 56,106 36,556
Total revenue. . . . . . . . . . . . . . . . . . . . . . . . . . . . . . . . . . . . . . . . . . . 220,142 144,168 124,936
Direct costs of revenue
Direct cost of services . . . . . . . . . . . . . . . . . . . . . . . . . . . . . . . . . . . . . . 61,594 52,161 52,540Direct cost of systems, including amortization of software development
costs of $2,090, $1,522 and $1,273, respectively . . . . . . . . . . . . . . . . . 77,291 37,906 17,883
Total direct cost of revenue . . . . . . . . . . . . . . . . . . . . . . . . . . . . . . . 138,885 90,067 70,423
Services gross profit . . . . . . . . . . . . . . . . . . . . . . . . . . . . . . . . . . . . . . . . . 39,765 35,901 35,840Systems gross profit. . . . . . . . . . . . . . . . . . . . . . . . . . . . . . . . . . . . . . . . . 41,492 18,200 18,673
Total gross profit . . . . . . . . . . . . . . . . . . . . . . . . . . . . . . . . . . . . . . . 81,257 54,101 54,513
Operating costs and expenses
Research and development expense. . . . . . . . . . . . . . . . . . . . . . . . . . . . 16,161 13,072 12,586Sales and marketing expense. . . . . . . . . . . . . . . . . . . . . . . . . . . . . . . . . 13,715 11,917 11,713General and administrative expense . . . . . . . . . . . . . . . . . . . . . . . . . . . . 28,238 19,334 16,959Depreciation and amortization of property and equipment. . . . . . . . . . . . . 5,865 6,200 7,956Amortization of acquired intangible assets . . . . . . . . . . . . . . . . . . . . . . . . 147 148 147
Total operating costs and expenses . . . . . . . . . . . . . . . . . . . . . . . . . 64,126 50,671 49,360Gain on sale of patent . . . . . . . . . . . . . . . . . . . . . . . . . . . . . . . . . . . . . . 8,060 — —
Operating income/(loss) . . . . . . . . . . . . . . . . . . . . . . . . . . . . . . . . . . . . . 25,191 3,430 5,153Interest expense . . . . . . . . . . . . . . . . . . . . . . . . . . . . . . . . . . . . . . . . . . . (922) (1,776) (1,751)Amortization of debt discount and debt issuance expenses, including write-
off of $2,458 in 2007 . . . . . . . . . . . . . . . . . . . . . . . . . . . . . . . . . . . . . . . (180) (3,176) (1,447)Other income, net . . . . . . . . . . . . . . . . . . . . . . . . . . . . . . . . . . . . . . . . . . 222 508 22
Income/(loss) from continuing operations before income taxes . . . . . . . 24,311 (1,014) 1,976Benefit from income taxes . . . . . . . . . . . . . . . . . . . . . . . . . . . . . . . . . . . . 33,257 — —
Income/(loss) from continuing operations. . . . . . . . . . . . . . . . . . . . . . . . 57,568 (1,014) 1,976Loss from discontinued operations. . . . . . . . . . . . . . . . . . . . . . . . . . . . . . . — (275) (23,671)
Net income/(loss) . . . . . . . . . . . . . . . . . . . . . . . . . . . . . . . . . . . . . . . . . . $ 57,568 $ (1,289) $ (21,695)
Income/(loss) per share — basic:Income/(loss) per share from continuing operations. . . . . . . . . . . . . . . . . . . $ 1.34 $ (0.02) $ 0.05Loss per share from discontinued operations . . . . . . . . . . . . . . . . . . . . . . . — (0.01) (0.60)
Net income/(loss) per share — basic . . . . . . . . . . . . . . . . . . . . . . . . . . . . $ 1.34 $ (0.03) $ (0.55)
Income/(loss) per share — diluted:Income/(loss) per share from continuing operations. . . . . . . . . . . . . . . . . . . $ 1.23 $ (0.02) $ 0.05Loss per share from discontinued operations . . . . . . . . . . . . . . . . . . . . . . . — (0.01) (0.59)
Net income/(loss) per share-diluted . . . . . . . . . . . . . . . . . . . . . . . . . . . . $ 1.23 $ (0.03) $ (0.54)
Weighted average shares outstanding-basic . . . . . . . . . . . . . . . . . . . . . . . . 43,063 41,453 39,430Weighted average shares outstanding-diluted . . . . . . . . . . . . . . . . . . . . . . . 46,644 41,453 40,166
See accompanying Notes to Consolidated Financial Statements.
F-4

TeleCommunication Systems, Inc.
Consolidated Statements of Stockholders’ Equity(amounts in thousands, except share data)
Class ACommon
Stock
Class BCommon
StockDeferred
Compensation
AdditionalPaid-InCapital
AccumulatedOther
ComprehensiveIncome (Loss)
AccumulatedDeficit Total
Balance at January 1, 2006 . . . . . . . . $314 $80 $(231) $210,275 $ (40) $(161,336) $ 49,062
Elimination of deferred compensationupon adoption of SFAS No. 123(R) . . — — 231 (231) — — —
Options exercised for the purchase of209,632 shares of Class A CommonStock . . . . . . . . . . . . . . . . . . . . . . 2 — — 343 — — 345
Issuance of 212,194 shares of Class ACommon Stock under EmployeeStock Purchase Plan . . . . . . . . . . . . 2 — — 388 — — 390
Issuance of warrants to purchase1,750,000 shares of Class ACommon Stock . . . . . . . . . . . . . . . — — — 3,455 — — 3,455
Surrender of 67,827 restricted sharesof Class A Common Stock aspayment for payroll taxwithholdings . . . . . . . . . . . . . . . . . (1) — — (187) — — (188)
Conversion of 510,291 shares ofClass B Common Stock to Class ACommon Stock . . . . . . . . . . . . . . . 5 (5) — — — — —
Stock compensation expense forissuance of Class A Common Stockoptions for continuing operations . . . — — — 2,872 — — 2,872
Stock compensation expense forissuance of Class A Common Stockoptions for discontinued operations . . — — — 504 — — 504
Vesting of employee stock options . . . . — — — 244 — — 244Valuation adjustment to stock options
issued to non-employees forservice . . . . . . . . . . . . . . . . . . . . . — — — 76 — — 76
Foreign currency translationadjustment . . . . . . . . . . . . . . . . . . — — — — 40 — 40
Net loss for 2006 . . . . . . . . . . . . . . . — — — — — (21,695) (21,695)Balance at December 31, 2006 . . . . . $322 $76 $ — $217,739 $ — $(183,032) $ 35,105Options exercised for the purchase of
1,347,301 shares of Class ACommon Stock . . . . . . . . . . . . . . . 14 — — 3,461 — — 3,475
Issuance of 173,833 shares of Class ACommon Stock under EmployeeStock Purchase Plan . . . . . . . . . . . . 2 — — 541 — — 543
Exercise of warrants to purchase886,787 shares of Class A CommonStock . . . . . . . . . . . . . . . . . . . . . . 9 — — 2,208 — — 2,217
Surrender of 19,358 restricted sharesof Class A Common Stock aspayment for payroll taxwithholdings . . . . . . . . . . . . . . . . . — — — (57) — — (57)
Conversion of 224,338 shares ofClass B Common Stock to Class ACommon Stock . . . . . . . . . . . . . . . 2 (2) — — — — —
Stock compensation expense forissuance of Class A Common Stockoptions for continuing operations . . . — — — 3,963 — — 3,963
Stock compensation expense forissuance of Class A Common Stockoptions for discontinued operations . . — — — 132 — — 132
Unrealized loss on securities andother . . . . . . . . . . . . . . . . . . . . . . — — — — (125) — (125)
Net loss for 2007 . . . . . . . . . . . . . . . — — — — — (1,289) (1,289)Balance at December 31, 2007 . . . . . $349 $74 $ — $227,987 $(125) $(184,321) $ 43,964
F-5

Class ACommon
Stock
Class BCommon
StockDeferred
Compensation
AdditionalPaid-InCapital
AccumulatedOther
ComprehensiveIncome (Loss)
AccumulatedDeficit Total
Options exercised for the purchase of1,927,284 shares of Class ACommon Stock . . . . . . . . . . . . . . . 19 — — 5,853 — — 5,872
Issuance of 134,000 shares of Class ACommon Stock under EmployeeStock Purchase Plan . . . . . . . . . . . . 1 — — 451 — — 452
Exercise of warrants to purchase1,050,000 shares of Class ACommon Stock . . . . . . . . . . . . . . . 11 — — 2,510 — — 2,521
Conversion of 425,000 shares ofClass B Common Stock to Class ACommon Stock . . . . . . . . . . . . . . . 5 (5) — — — — —
Stock compensation expense forissuance of Class A Common Stockoptions . . . . . . . . . . . . . . . . . . . . . — — — 3,758 — — 3,758
Unrealized loss on securities andother . . . . . . . . . . . . . . . . . . . . . . — — — — 137 — 137
Net income for 2008 . . . . . . . . . . . . . — — — — — 57,568 57,568Balance at December 31, 2008 . . . . . $385 $69 $ — $240,559 $ 12 $(126,753) $114,272
See accompanying Notes to Consolidated Financial Statements.
F-6
TeleCommunication Systems, Inc.
Consolidated Statements of Stockholders’ Equity — (Continued)(amounts in thousands, except share data)
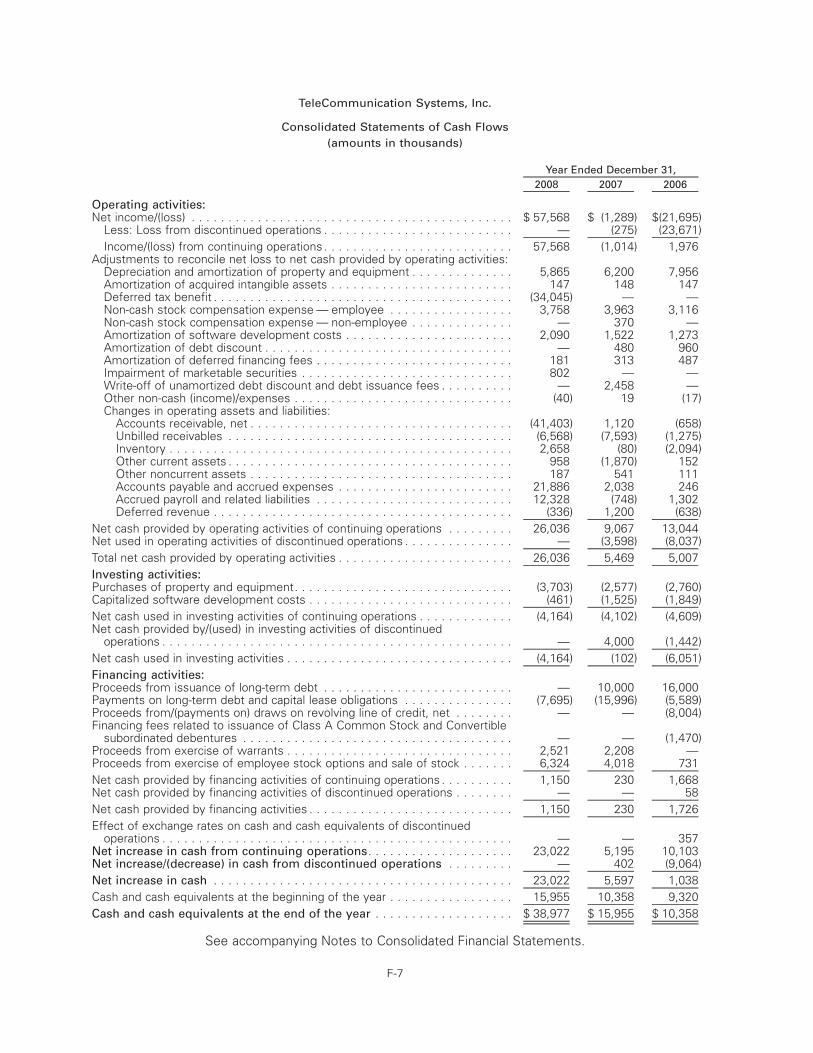
TeleCommunication Systems, Inc.
Consolidated Statements of Cash Flows(amounts in thousands)
2008 2007 2006Year Ended December 31,
Operating activities:Net income/(loss) . . . . . . . . . . . . . . . . . . . . . . . . . . . . . . . . . . . . . . . . . . . . $ 57,568 $ (1,289) $(21,695)
Less: Loss from discontinued operations . . . . . . . . . . . . . . . . . . . . . . . . . . — (275) (23,671)Income/(loss) from continuing operations . . . . . . . . . . . . . . . . . . . . . . . . . . 57,568 (1,014) 1,976
Adjustments to reconcile net loss to net cash provided by operating activities:Depreciation and amortization of property and equipment . . . . . . . . . . . . . . 5,865 6,200 7,956Amortization of acquired intangible assets . . . . . . . . . . . . . . . . . . . . . . . . . 147 148 147Deferred tax benefit . . . . . . . . . . . . . . . . . . . . . . . . . . . . . . . . . . . . . . . . . (34,045) — —Non-cash stock compensation expense — employee . . . . . . . . . . . . . . . . . 3,758 3,963 3,116Non-cash stock compensation expense — non-employee . . . . . . . . . . . . . . — 370 —Amortization of software development costs . . . . . . . . . . . . . . . . . . . . . . . 2,090 1,522 1,273Amortization of debt discount . . . . . . . . . . . . . . . . . . . . . . . . . . . . . . . . . . — 480 960Amortization of deferred financing fees . . . . . . . . . . . . . . . . . . . . . . . . . . . 181 313 487Impairment of marketable securities . . . . . . . . . . . . . . . . . . . . . . . . . . . . . 802 — —Write-off of unamortized debt discount and debt issuance fees . . . . . . . . . . — 2,458 —Other non-cash (income)/expenses . . . . . . . . . . . . . . . . . . . . . . . . . . . . . . (40) 19 (17)Changes in operating assets and liabilities:
Accounts receivable, net . . . . . . . . . . . . . . . . . . . . . . . . . . . . . . . . . . . . (41,403) 1,120 (658)Unbilled receivables . . . . . . . . . . . . . . . . . . . . . . . . . . . . . . . . . . . . . . . (6,568) (7,593) (1,275)Inventory . . . . . . . . . . . . . . . . . . . . . . . . . . . . . . . . . . . . . . . . . . . . . . . 2,658 (80) (2,094)Other current assets . . . . . . . . . . . . . . . . . . . . . . . . . . . . . . . . . . . . . . . 958 (1,870) 152Other noncurrent assets . . . . . . . . . . . . . . . . . . . . . . . . . . . . . . . . . . . . 187 541 111Accounts payable and accrued expenses . . . . . . . . . . . . . . . . . . . . . . . . 21,886 2,038 246Accrued payroll and related liabilities . . . . . . . . . . . . . . . . . . . . . . . . . . . 12,328 (748) 1,302Deferred revenue . . . . . . . . . . . . . . . . . . . . . . . . . . . . . . . . . . . . . . . . . (336) 1,200 (638)
Net cash provided by operating activities of continuing operations . . . . . . . . . 26,036 9,067 13,044Net used in operating activities of discontinued operations . . . . . . . . . . . . . . . — (3,598) (8,037)Total net cash provided by operating activities . . . . . . . . . . . . . . . . . . . . . . . . 26,036 5,469 5,007Investing activities:Purchases of property and equipment. . . . . . . . . . . . . . . . . . . . . . . . . . . . . . (3,703) (2,577) (2,760)Capitalized software development costs . . . . . . . . . . . . . . . . . . . . . . . . . . . . (461) (1,525) (1,849)Net cash used in investing activities of continuing operations . . . . . . . . . . . . . (4,164) (4,102) (4,609)Net cash provided by/(used) in investing activities of discontinued
operations . . . . . . . . . . . . . . . . . . . . . . . . . . . . . . . . . . . . . . . . . . . . . . . . — 4,000 (1,442)Net cash used in investing activities . . . . . . . . . . . . . . . . . . . . . . . . . . . . . . . (4,164) (102) (6,051)Financing activities:Proceeds from issuance of long-term debt . . . . . . . . . . . . . . . . . . . . . . . . . . — 10,000 16,000Payments on long-term debt and capital lease obligations . . . . . . . . . . . . . . . (7,695) (15,996) (5,589)Proceeds from/(payments on) draws on revolving line of credit, net . . . . . . . . — — (8,004)Financing fees related to issuance of Class A Common Stock and Convertible
subordinated debentures . . . . . . . . . . . . . . . . . . . . . . . . . . . . . . . . . . . . . — — (1,470)Proceeds from exercise of warrants . . . . . . . . . . . . . . . . . . . . . . . . . . . . . . . 2,521 2,208 —Proceeds from exercise of employee stock options and sale of stock . . . . . . . 6,324 4,018 731Net cash provided by financing activities of continuing operations . . . . . . . . . . 1,150 230 1,668Net cash provided by financing activities of discontinued operations . . . . . . . . — — 58Net cash provided by financing activities . . . . . . . . . . . . . . . . . . . . . . . . . . . . 1,150 230 1,726Effect of exchange rates on cash and cash equivalents of discontinued
operations . . . . . . . . . . . . . . . . . . . . . . . . . . . . . . . . . . . . . . . . . . . . . . . . — — 357Net increase in cash from continuing operations. . . . . . . . . . . . . . . . . . . . 23,022 5,195 10,103Net increase/(decrease) in cash from discontinued operations . . . . . . . . . — 402 (9,064)Net increase in cash . . . . . . . . . . . . . . . . . . . . . . . . . . . . . . . . . . . . . . . . . 23,022 5,597 1,038Cash and cash equivalents at the beginning of the year . . . . . . . . . . . . . . . . . 15,955 10,358 9,320Cash and cash equivalents at the end of the year . . . . . . . . . . . . . . . . . . . $ 38,977 $ 15,955 $ 10,358
See accompanying Notes to Consolidated Financial Statements.
F-7

TeleCommunication Systems, Inc.
Notes to Consolidated Financial Statements(amounts in thousands, except share and per share data)
1. Significant Accounting Policies
Description of Business
TeleCommunication Systems, Inc. develops and applies highly reliable wireless data communicationstechnology. We manage our business in two segments, Commercial and Government:
Commercial Segment. Our carrier software system products enable wireless carriers to deliverpremium services including short text messages, location information, internet content, and otherenhanced communication services to and from wireless phones. We provide enhanced 9-1-1 (E9-1-1)services, commercial location-based services, and inter-carrier text message distribution services on ahosted, or service bureau basis. As of December 31, 2008, we provide hosted services under contractswith more than 40 wireless carrier networks and Voice-over-Internet-Protocol (VoIP) service providers.We also earn subscriber revenue through wireless applications including our Rand McNally» Trafficapplication which is available via all major US wireless carriers. We earn carrier software-based systemsrevenue through the sale of licenses, deployment and customization fees and maintenance fees. Pricingis generally based on the volume of capacity purchased from us by the carrier. We also provide carriertechnology on a hosted, i.e., service bureau basis; that is, customers use our software functionalitythrough connections to and from our network operations centers, paying us monthly based on thenumber of subscribers, cell sites, or call center circuits, or message volume.
Government Segment. We provide communication systems integration, information technology ser-vices, and software solutions to the U.S. Department of Defense and other government customers. Wedesign, assemble, sell and maintain satellite-based network communication systems, including ourSwiftLink» deployable communication systems which incorporate high speed, encrypted, InternetProtocol technology. We also own and operate secure satellite teleport facilities, and resell access tosatellite airtime (known as space segment).
Use of Estimates. The preparation of financial statements in conformity with accounting principles generallyaccepted in the U.S. requires management to make estimates and assumptions that affect the reported amountsand related disclosures. Actual results could differ from those estimates.
Principles of Consolidation. The accompanying financial statements include the accounts of our whollyowned subsidiaries. All intercompany balances and transactions have been eliminated in consolidation.
Cash and Cash Equivalents. Cash and cash equivalents include cash and highly liquid investments with amaturity of three months or less when purchased. Cash equivalents are reported at fair value, whichapproximates cost.
Allowances for Doubtful Accounts Receivable. Substantially all of our accounts receivable are tradereceivables generated in the ordinary course of our business. We use estimates to determine the amount of theallowance for doubtful accounts necessary to reduce accounts receivable to their expected net realizable value.We estimate the amount of the required allowance by reviewing the status of significant past-due receivablesand by establishing provisions for estimated losses by analyzing current and historical bad debt trends. Changesto our allowance for doubtful accounts are recorded as a component of general and administrative expenses inour accompanying Consolidated Statements of Operations. Our credit and collection policies and the financialstrength of our customers are critical to us in maintaining a relatively small amount of write-offs of receivables.We generally do not require collateral from or enter netting agreements with our customers. Receivables thatare ultimately deemed uncollectible are charged-off as a reduction of receivables and the allowance for doubtfulaccounts.
F-8

Inventory. We maintain inventory of component parts and finished product for our Government deployablecommunications systems. Inventory is stated at the lower of cost or market. Cost is based on the weightedaverage method. The cost basis for finished units includes manufacturing cost.
Investments in Marketable Securities and Note Receivable. The Company received a $1,000 note andsome marketable securities as partial consideration from three small divestitures during 2007. The marketablesecurities, now valued at $78, are included in other current assets and are classified as available-for-sale inaccordance with the provision of SFAS No. 115, Accounting for Certain Investments in Debt and EquitySecurities. These securities are carried at fair market value based on quoted market price. For the year endedDecember 31, 2007, the Company reported $152 net unrealized losses in stockholders’ equity as a componentof accumulated other comprehensive income. During 2008, the Company has determined that the losses in fairmarket value of marketable securities held were other-than-temporary and wrote down the value of thesesecurities by approximately $802, which the write-down is included in Other income, net. Gains or losses onsecurities sold will be based on the specific identification method. The note receivable was reported in othercurrent assets for 2007 and was collected in full in November of 2008, including interest at 8.25%.
Property and Equipment. Property and equipment is stated at cost less accumulated depreciation.Depreciation is computed using the straight-line method based on the estimated useful lives of equipment,generally five years for furniture and fixtures and three to four years for computer equipment, software andvehicles. Our depreciable asset base includes equipment in our network operations centers related to our hostedservice offerings, development costs for computer software for internal use, and company-wide computerhardware. Amortization of leasehold improvements is provided using the straight-line method over the lesser ofthe useful life of the asset or the remaining term of the lease. Assets held under capital leases are stated at thelesser of the present value of future minimum lease payments or the fair value of the property at the inceptionof the lease. The assets recorded under capital leases are amortized over the lesser of the lease term or theestimated useful life of the assets in a manner consistent with our depreciation policy for owned assets.
Goodwill. Goodwill represents the excess of cost over the fair value of assets of acquired businesses.Goodwill acquired in a purchase business combination is not amortized, but instead is evaluated annually forimpairment using a discounted cash flow model in accordance with the provisions of Statement of FinancialAccounting Standards No. 142, Goodwill and Other Intangible Assets.
Software Development Costs. We capitalize software development costs after we establish technologicalfeasibility, and amortize those costs over the estimated useful lives of the software beginning on the date whenthe software is available for general release. Acquired technology, representing the estimated value of theproprietary technology acquired, has also been recorded as capitalized software development costs.
Costs we incurred are capitalized when technological feasibility has been established. For new products,technological feasibility is established when an operative version of the computer software product is completedin the same software language as the product to be ultimately marketed, performs all the major functionsplanned for the product, and has successfully completed initial customer testing. Technological feasibility forenhancements to an existing product is established when a detail program design is completed. Costs that arecapitalized include direct labor, related overhead and other direct costs. These costs are amortized on aproduct-by-product basis using the straight-line method over the product’s estimated useful life, which has notbeen greater than three years. Amortization is also computed using the ratio that current revenue for the productbears to the total of current and anticipated future revenue for that product (the revenue curve method). If thisrevenue curve method results in amortization greater than the amount computed using the straight-line method,amortization is recorded at that greater amount. Our policies to determine when to capitalize softwaredevelopment costs and how much to amortize in a given period require us to make subjective estimates andjudgments. If our software products do not achieve the level of market acceptance that we expect and ourfuture revenue estimates for these products change, the amount of amortization that we record may increase
F-9
TeleCommunication Systems, Inc.
Notes to Consolidated Financial Statements — (Continued)(amounts in thousands, except share and per share data)
compared to prior periods. The amortization of capitalized software development costs has been recorded as acost of revenue.
Acquired technology is amortized over the product’s estimated useful life based on the purchase priceallocation and valuation procedures performed at the time of the acquisition. Amortization is calculated using theratio of the estimated future cash flows generated in each period to the estimated total cash flows to becontributed from each product or the straight-line method, whichever is greater.
For 2008, 2007, and 2006 we capitalized $461, $1,525, and 1,849, respectively, of software developmentcosts of continuing operations for certain software projects after the point of technological feasibility had beenreached but before the products were available for general release. Accordingly, these costs have beencapitalized and are being amortized over their estimated useful lives beginning when the products are availablefor general release. The capitalized costs relate to our location-based software.
We believe that these capitalized costs will be recoverable from future gross profits generated by theseproducts.
The Company capitalizes all costs related to software developed or obtained for internal use whenmanagement commits to funding the project and the project completes the preliminary project stage. Capitaliza-tion of such costs ceases when the project is substantially complete and ready for its intended use.
Acquired Intangible Assets. Acquired intangible assets have useful lives of 5 to 19 years. We areamortizing these assets using the greater of the straight-line method or the revenue curve method.
Impairment of Long-Lived Assets. Long-lived assets, including intangible assets, are reviewed for impair-ment whenever events or changes in circumstances indicate that the carrying amount of an asset or group ofassets may not be fully recoverable.
If an impairment indicator is present, we evaluate recoverability by a comparison of the carrying amount ofthe assets to future undiscounted net cash flows that we expect to generate from these assets. If the assetsare impaired, we recognize an impairment charge equal to the amount by which the carrying amount exceedsthe fair value of the assets. Assets to be disposed of are reported at the lower of carrying values or fair values,less estimated costs of disposal.
Other Comprehensive Income/Loss. Comprehensive income/loss includes changes in the equity of abusiness during a period from transactions and other events and circumstances from non-owner sources. Othercomprehensive income/loss refers to revenue, expenses, gains and losses that under U.S. generally acceptedaccounting principles are included in comprehensive income, but excluded from net income. For operationsoutside the U.S. that prepare financial statements in currencies other than the U.S. dollar, results of operationsand cash flows are translated at average exchange rates during the period, and assets and liabilities aretranslated at end-of-period exchange rates. Translation adjustments for our European subsidiary are included as acomponent of accumulated other comprehensive loss in stockholders’ equity. Also included are any unrealizedgains or losses on marketable securities that are classified as available-for-sale. Total comprehensive income/(loss) for each of the three years ended December 31, 2008, 2007, and 2006, was not materially different thanconsolidated net income/(loss).
Revenue Recognition. Revenue is generated from our two segments as described below.
Services Revenue. Revenue from hosted services consists of monthly recurring service fees and isrecognized in the month earned. Revenue from subscriber service fees is recognized in the period earned.Maintenance fees are collected in advance and recognized ratably over the maintenance period, which is typicallyannual. Any unearned revenue, including unrecognized maintenance fees, is included in deferred revenue.
F-10
TeleCommunication Systems, Inc.
Notes to Consolidated Financial Statements — (Continued)(amounts in thousands, except share and per share data)

We also recognize services revenue from the design, development and deployment of informationprocessing and communication systems primarily for government enterprises. These services are provided undertime and materials contracts, cost plus fee contracts, or fixed price contracts. Revenue is recognized under timeand materials contracts and cost plus fee contracts as billable costs are incurred. Fixed-price service contractsare accounted for using the proportional performance method. These contracts generally allow for monthly billingor billing upon achieving certain specified milestones. Any estimated losses on contracts are recognized in theirentirety at the date that they become evident.
Systems Revenue. We design, develop, and deploy communications systems. These systems may includepackaged software licenses. Systems typically contain multiple elements, which may include the product license,installation, integration, and hardware. The total arrangement fee is allocated among each element based onvendor-specific objective evidence of the fair value of each of the elements. Fair value is generally determinedbased on the price charged when the element is sold separately. In the absence of evidence of fair value of adelivered element, revenue is allocated first to the undelivered elements based on fair value and the residualrevenue to the delivered elements. The software licenses are generally perpetual licenses for a specified numberof users that allow for the purchase of annual maintenance at a specified rate. All fees are recognized as revenuein accordance with Statement of Position 97-2, Software Revenue Recognition (SOP 97-2) when four criteria aremet. These four criteria are (i) evidence of an arrangement (ii) delivery has occurred, (iii) the fee is fixed ordeterminable and (iv) the fee is probable of collection. Software license fees billed and not recognized as revenueare included in deferred revenue. Systems containing software licenses include a 90-day warranty for defects.We have not incurred significant warranty costs on any software product to date, and no costs are currentlyaccrued upon recording the related revenue.
Systems revenue is also derived from fees for the development, implementation and maintenance ofcustom applications. Fees from the development and implementation of custom applications are generallyperformed under time and materials and fixed fee contracts. Revenue is recognized under time and materialscontracts and cost plus fee contracts as billable costs are incurred. Fixed-price product delivery contracts areaccounted for using the percentage-of-completion or proportional performance method, measured either by totalcosts incurred as a percentage of total estimated costs at the completion of the contract, or direct labor costsincurred compared to estimated total direct labor costs for projects for which third-party hardware represents asignificant portion of the total estimated costs. These contracts generally allow for monthly billing or billing uponachieving certain specified milestones. Any estimated losses under long-term contracts are recognized in theirentirety at the date that they become evident. Revenue from hardware sales to our monthly subscribercustomers is recognized as systems revenue.
Under our contracts with the U.S. government for both systems and services, contract costs, including theallocated indirect expenses, are subject to audit and adjustment by the Defense Contract Audit Agency. Werecord revenue under these contracts at estimated net realizable amounts.
Our accounting for revenues from systems and services contracts not accounted for under SOP 97-2 or theproportional performance of percentage of completion methods, follows the guidance of Emerging Issues TaskForce 00-21 “Revenue Arrangements with Multiple Deliverables” (EITF 00-21) for determining of the number ofunits of accounting and the allocation of the total fair value among the multiple elements.
Deferral of Costs Incurred. We defer direct costs incurred in certain situations as dictated by authoritativeaccounting literature. In addition, if the revenue for a delivered item is not recognized because it is not separablefrom the arrangement, then we defer incremental costs related to that delivered but unrecognized element.Deferred costs are included in other current assets on the balance sheet.
Advertising Costs. Advertising costs are expensed as incurred. Advertising expense totaled $1, $34, and$29, for the years ended December 31, 2008, 2007, and 2006, respectively.
F-11
TeleCommunication Systems, Inc.
Notes to Consolidated Financial Statements — (Continued)(amounts in thousands, except share and per share data)

Capitalized Interest. Total interest incurred was $1,120, $5,026, and $3,253 for the years ended Decem-ber 31, 2008, 2007, and 2006, respectively. Approximately $18, $74, and $55 of total interest incurred wascapitalized as a component of software development costs during the year ended December 31, 2008, 2007,and 2006 respectively.
Stock-Based Compensation. We have two stock-based employee compensation plans, which aredescribed more fully in Note 17.
Beginning January 1, 2006, the Financial Accounting Standards Board (FASB) Statement No. 123(R)(“Statement No. 123(R)”) requires us to report all share based payments to employees, including grants ofemployee stock options in the income statement based on their fair value. We adopted Statement No. 123(R)effective January 1, 2006 using the modified prospective method.
Research and Development Expense. We incur research and development costs which are primarilycomprised of compensation and travel expenses related to our engineers engaged in the development andenhancement of new and existing software products. All costs are expensed as incurred prior to reachingtechnological feasibility.
Income Taxes. Income tax amounts and balances are accounted for using the asset and liability method ofaccounting for income taxes as prescribed by SFAS 109. Under this method, deferred income tax assets andliabilities are measured using the enacted tax rates and laws that will be in effect when the differences areexpected to reverse.
In June 2006, the FASB issued Interpretation No. 48, “Accounting for Uncertainty in Income Taxes”(FIN 48) which prescribes a minimum recognition threshold and measurement attribute for the financialstatement recognition and measurement of a tax position. FIN 48 also provides guidance on derecognition,measurement, classification, interest and penalties, accounting interim periods, disclosure and transition. If a taxposition does not meet the more-likely-than-not initial recognition threshold, no benefit is recorded in the financialstatements. Upon the adoption of FIN 48 on January 1, 2007, the estimated value of the Company’s uncertaintax positions was a liability of $2.7 million resulting from unrecognized net tax benefits which did not includeinterest and penalties. The Company recorded the estimated value of its uncertain tax position by reducing thevalue of certain tax attributes. The Company would classify any interest and penalties accrued on anyunrecognized tax benefits as a component of the provision for income taxes. There were no interest or penaltiesrecognized in the consolidated statement of income for year ended December 31, 2008 and 2007 or theconsolidated balance sheet at December 31, 2008 and 2007. The Company files income tax returns in U.S. andstate jurisdictions. As of December 31, 2008, open tax years in the federal and some state jurisdictions dateback to 1999, due to the taxing authorities’ ability to adjust operating loss carry forwards.
Fair Value of Financial Instruments. The Company’s major categories of financial assets and liabilitiessubject to fair value measurements include cash and cash equivalents and marketable securities that are held asavailable for sale. Both categories use observable inputs only and are measured using a market approach basedon quoted prices, see Note 14.
Recent Accounting Pronouncements.
In September 2006, the FASB issued SFAS 157, “Fair Value Measurements,” which defines fair value,establishes a framework for measuring fair value and expands disclosures about fair value measurements.SFAS 157 was effective for fiscal years beginning after November 15, 2007. In February 2008, the FASB decidedto issue a final Staff Position to allow a one-year deferral of adoption of SFAS 157 for non-financial assets andnon-financial liabilities that are recognized or disclosed at fair value in the financial statements on a non-recurringbasis. The FASB also decided to amend SFAS 157 to exclude FASB Statement No. 13 and its related interpretiveaccounting pronouncements that address leasing transactions. The adoption of SFAS 157 for financial assets and
F-12
TeleCommunication Systems, Inc.
Notes to Consolidated Financial Statements — (Continued)(amounts in thousands, except share and per share data)

liabilities in the first quarter of 2008 did not have an effect on the Company’s results of operations and financialposition. The Company is evaluating the impact of the non-financial asset and liability provisions of this standardand does not expect the adoption of those provisions to have a material impact on its financial statements. InOctober 2008, the FASB issued SFAS 157-3, “Determining The Fair Market Value of a Financial Asset When theMarket for That Asset is not Active” (“SFAS 157-3), which clarifies the application of SFAS 157 in a market thatis not active and provides an example to illustrate in determining fair market value in that market. The Companyis evaluating the impact of SFAS 157-3 provisions of this standard and does not expect the adoption of thoseprovisions to have a material impact on its financial statements.
In February 2007, the FASB issued SFAS 159, “Fair Value Option for Financial Assets and Liabilities.”SFAS 159 allows companies to elect to measure certain assets and liabilities at fair value and is effective forfiscal years beginning after November 15, 2007. The Company did not elect the fair value measurement ofSFAS 159.
In December 2007, the FASB issued SFAS 141(R), “Business Combinations.” This standard establishesprinciples and requirements for how an acquirer recognizes and measures in its financial statements theidentifiable assets acquired, the liabilities assumed, any noncontrolling interest in the acquired and the goodwillacquired. This statement also establishes disclosure requirements which will enable users to evaluate the natureand financial effects of the business combination. SFAS 141(R) is effective for us for acquisitions made afterDecember 31, 2008. The Company is evaluating the impact of this standard. The adoption of SFAS 141(R) mayhave a material impact on the Company’s financial statements for acquisitions post-adoption.
In December 2007, the FASB issued SFAS 160, “Noncontrolling Interests in Consolidated FinancialStatements, an amendment of ARB No. 51” (SFAS 160). SFAS 160 amends ARB No. 51 to establish accountingand reporting standards for the noncontrolling interest in a subsidiary and for the deconsolidation of a subsidiary.It also amends certain of ARB No. 51’s consolidation procedures for consistency with the requirements ofSFAS 141(R). This statement is effective for fiscal years, and interim periods within those fiscal years, beginningon or after December 15, 2008. The statement shall be applied prospectively as of the beginning of the fiscalyear in which the statement is initially adopted. The adoption of SFAS 160 will not have a material impact on theCompany’s financial statements.
In March 2008, the FASB issued SFAS 161, “Disclosures about Derivative Instruments and HedgingActivities, an amendment of FASB Statement 133” (SFAS 161). SFAS 161 amends and expands the disclosurerequirements of SFAS 133 with the intent to provide users of financial statements with an enhancedunderstanding of: (i) How and why an entity uses derivative instruments; (ii) How derivative instruments andrelated hedged items are accounted for under SFAS 133 and its related interpretations and (iii) How derivativeinstruments and related hedged items affect an entity’s financial position, financial performance and cash flows.This statement is effective for financial statements issued for fiscal years and interim periods beginning afterNovember 15, 2008, with early application encouraged. The Company does not expect the adoption of SFAS 161to have a material impact on its financial statements.
In May 2008, the FASB issued SFAS 162, “The Hierarchy of Generally Accepted Accounting Principles”(SFAS 162). SFAS 162 is intended to improve financial reporting by identifying a consistent framework, orhierarchy, for selecting the principles used in the preparation of financial statements of nongovernmental entitiesthat are presented in conformity with GAAP. This statement shall be effective 60 days following the Securitiesand Exchange Commission’s approval of the Public Company Accounting Oversight Board Auditing amendmentsto AU Section 411, “The Meaning of Present Fairly in Conformity with Generally Accepted AccountingPrinciples”. The Company is evaluating the impact of this standard and does not expect the adoption of SFAS 162to have a material impact on the Company’s financial statements.
F-13
TeleCommunication Systems, Inc.
Notes to Consolidated Financial Statements — (Continued)(amounts in thousands, except share and per share data)

2. Enterprise Assets-Discontinued Operations
In 2007, the Company sold its Enterprise division operations, which had previously been included in itsCommercial Segment. The operations and cash flows of the business have been eliminated from those ofcontinuing operations and the Company has no significant involvement in the operations since the disposaltransactions. Accordingly, the assets, liabilities, and results of operations for the Enterprise assets have beenclassified as discontinued operations for all periods presented in the Consolidated Financial Statements inaccordance with Statement of Financial Accounting Standards No. 144, Accounting for the Impairment orDisposal of Long-Lived Assets (Statement No. 144). Impairment charges of $15,500 to adjust the estimatedcarrying value of Enterprise long-lived assets and goodwill were recorded during 2006 based on informationobtained during the process of offering the operating assets for sale and the declines in the Subscriberbusinesses being sold.
Effective January 1, 2007, the Company sold two of its three Enterprise units to strategic buyers forcommon stock in the acquiring publicly traded companies valued at approximately $1,000 and earn-outarrangements. During the year ended December 31, 2008, we wrote down the public securities to $78. TheCompany does not expect to receive material payments from the earn-out arrangement. During May 2007, thelast Enterprise unit was sold for $4,000 in cash (of which $200 was released from escrow in June 2008), a$1,000 18-month note which was paid in full in November 2008, and $250 in equity interest.
3. Income/(loss) Per Common Share
Basic income/(loss) per common share is based upon the average number of shares of common stockoutstanding during the period. Stock options to purchase approximately 2.6 million, 2.5 million and 6.5 millionshares were excluded from the computation of diluted net income per share because their inclusion would havebeen anti-dilutive for the years ended 2008, 2007, and 2006, respectively. Because we incurred a loss fromcontinuing operations in 2007 potentially dilutive securities were excluded from the computation because theresult would be anti-dilutive. These potentially dilutive securities consist of stock options, restricted stock, andwarrants as discussed in Notes 1 and 17.
F-14
TeleCommunication Systems, Inc.
Notes to Consolidated Financial Statements — (Continued)(amounts in thousands, except share and per share data)

The following table summarizes the computations of basic and diluted earnings per share for the yearsended December 31:
2008 2007 2006
Income/(loss) from continuing operations . . . . . . . . . . . . . . . . . . . $57,568 $ (1,014) $ 1,976Loss from discontinued operations . . . . . . . . . . . . . . . . . . . . . . . . — (275) (23,671)
Net loss . . . . . . . . . . . . . . . . . . . . . . . . . . . . . . . . . . . . . . . . . . $57,568 $ (1,289) $(21,695)
Denominator for basic earnings per share — weighted-averagecommon shares outstanding. . . . . . . . . . . . . . . . . . . . . . . . . . . 43,063 41,453 39,430
Net effect of dilutive stock options based on treasury stockmethod . . . . . . . . . . . . . . . . . . . . . . . . . . . . . . . . . . . . . . . . . 3,195 — 632
Net effect of dilutive warrants based on treasury stock method . . . . 386 — 104
Denominator for diluted earnings per share — weighted-averagecommon shares outstanding and assumed conversions . . . . . . . . 46,664 41,543 40,166
Income/(loss) per share — basic:Income/(loss) per share from continuing operations . . . . . . . . . . . . $ 1.34 $ (0.02) $ 0.05Loss per share from discontinued operations . . . . . . . . . . . . . . . . . — (0.01) (0.60)
Net income/(loss) per share — basic . . . . . . . . . . . . . . . . . . . . . . . $ 1.34 $ (0.03) $ (0.55)
Income/(loss) per share — diluted:Income/(loss) per share from continuing operations . . . . . . . . . . . . $ 1.23 $ (0.02) $ 0.05Loss per share from discontinued operations . . . . . . . . . . . . . . . . . — (0.01) (0.59)
Net income/(loss) per share-diluted. . . . . . . . . . . . . . . . . . . . . . . . $ 1.23 $ (0.03) $ (0.54)
4. Supplemental Disclosure of Cash Flow Information
Property and equipment acquired under capital leases totaled $3,343, $1,979, and $1,725 during the yearsended December 31, 2008, 2007, and 2006, respectively.
As partial consideration for our 2007 divestitures, we received publicly trade common stock in two of theacquiring companies valued at approximately $1,000 at the time of January 2007 closing on the transactions.During 2008, the Company returned a portion of the common stock of one of the acquiring companies insettlement of a divestiture post closing adjustment claim. We recorded a $140 expense as part of thissettlement.
Interest paid totaled $922, $1,002, and $607 during the years ended December 31, 2008, 2007, and 2006,respectively.
Alternative minimum income taxes and estimated state income taxes paid totaled $559 during 2008. Noincome taxes were paid for 2007 and 2006.
5. Unbilled Receivables
Unbilled receivables consist of the excess of revenue earned in accordance with generally acceptedaccounting principles over the amounts billable at contract milestones. Substantially all unbilled receivables areexpected to be billed and collected within twelve months.
F-15
TeleCommunication Systems, Inc.
Notes to Consolidated Financial Statements — (Continued)(amounts in thousands, except share and per share data)

6. Inventory
Inventory consisted of the following at December 31:
2008 2007
Component parts . . . . . . . . . . . . . . . . . . . . . . . . . . . . . . . . . . . . . . . . . . . . . . $1,763 $2,670Finished goods . . . . . . . . . . . . . . . . . . . . . . . . . . . . . . . . . . . . . . . . . . . . . . . . 952 2,703
Total inventory at year end . . . . . . . . . . . . . . . . . . . . . . . . . . . . . . . . . . . . . . $2,715 $5,373
7. Property and Equipment
Property and equipment consisted of the following at December 31:
2008 2007
Computer equipment . . . . . . . . . . . . . . . . . . . . . . . . . . . . . . . . . . . . . . . . . $ 28,456 $ 24,393Computer software . . . . . . . . . . . . . . . . . . . . . . . . . . . . . . . . . . . . . . . . . . 18,408 16,360Furniture and fixtures . . . . . . . . . . . . . . . . . . . . . . . . . . . . . . . . . . . . . . . . . 2,520 2,558Leasehold improvements . . . . . . . . . . . . . . . . . . . . . . . . . . . . . . . . . . . . . . 3,168 2,760Land . . . . . . . . . . . . . . . . . . . . . . . . . . . . . . . . . . . . . . . . . . . . . . . . . . . . 1,000 1,000Vehicles . . . . . . . . . . . . . . . . . . . . . . . . . . . . . . . . . . . . . . . . . . . . . . . . . . 107 107
Total property and equipment at cost at year end . . . . . . . . . . . . . . . . . . . . 53,659 47,178Less: accumulated depreciation and amortization . . . . . . . . . . . . . . . . . . . . . (41,268) (35,969)
Net property and equipment at year end . . . . . . . . . . . . . . . . . . . . . . . . . . $ 12,391 $ 11,209
8. Acquired Intangible Assets and Capitalized Software Development Costs
Our acquired intangible assets and capitalized software development costs consisted of the following:
GrossCarryingAmount
AccumulatedAmortization Net
GrossCarryingAmount
AccumulatedAmortization Net
December 31,2008
December 31,2007
Acquired intangible assets:Customer Lists . . . . . . . . . $ 606 $ 521 $ 85 $ 606 $ 405 $ 201Trademarks & Patents . . . . 612 135 477 612 104 508
Software development costs,including acquiredtechnology . . . . . . . . . . . . 9,646 6,873 2,773 9,189 4,783 4,406
Total . . . . . . . . . . . . . . . $10,864 $7,529 $3,335 $10,407 $5,292 $5,115
Estimated future amortization expense:Year ending December 31, 2009 . . . . . . . . . . . . . . . . . . . . . . . . . . . . . . . . . . . . . . . . . $1,845Year ending December 31, 2010 . . . . . . . . . . . . . . . . . . . . . . . . . . . . . . . . . . . . . . . . . $ 786Year ending December 31, 2011 . . . . . . . . . . . . . . . . . . . . . . . . . . . . . . . . . . . . . . . . . $ 227Year ending December 31, 2012 . . . . . . . . . . . . . . . . . . . . . . . . . . . . . . . . . . . . . . . . . $ 80Year ending December 31, 2013 . . . . . . . . . . . . . . . . . . . . . . . . . . . . . . . . . . . . . . . . . $ 80Thereafter . . . . . . . . . . . . . . . . . . . . . . . . . . . . . . . . . . . . . . . . . . . . . . . . . . . . . . . . . $ 317
$3,335
F-16
TeleCommunication Systems, Inc.
Notes to Consolidated Financial Statements — (Continued)(amounts in thousands, except share and per share data)

We routinely update our estimates of the recoverability of the software products that have been capitalized.Management uses these estimates as the basis for evaluating the carrying values and remaining useful lives ofthe respective assets.
9. Accounts Payable and Accrued Expenses
Our accounts payable and accrued expenses consisted of the following at December 31:
2008 2007
Accounts payable . . . . . . . . . . . . . . . . . . . . . . . . . . . . . . . . . . . . . . . . . . . . $21,223 $ 5,848Accrued expenses . . . . . . . . . . . . . . . . . . . . . . . . . . . . . . . . . . . . . . . . . . . . 13,122 6,611
Total accounts payable and accrued expenses at year end. . . . . . . . . . . . . . . $34,345 $12,459
Accrued expenses consist primarily of costs incurred for which we have not yet been invoiced, accruedsales taxes, and amounts due to our E9-1-1 customers that we have billed and collected from regulatingagencies on their behalf under cost recovery arrangements.
10. Line of Credit
We have maintained a line of credit arrangement with our principal bank since 2003. In June 2007, weamended the agreement to extend our line of credit and decrease the cost of borrowing. Under the amendedagreement, the availability of the line was extended to June 2010, and the borrowing rate decreased from primeplus 1.25% to the bank’s prime rate which was 3.25% per annum at December 31, 2008. Our maximumborrowing availability remained the same at $22,000. Borrowings at any time are limited to an amount basedprincipally on accounts receivable levels and a working capital ratio, each as defined in the amended line of creditagreement. The line of credit available is also reduced by the amounts of letters of credit outstanding whichtotaled $2,280 at December 31, 2008. As of December 31, 2008 and 2007 we had no borrowings outstandingunder the line of credit and we had approximately $19,300 and $11,000, respectively, of unused borrowingavailability under this line.
Our amended line of credit and term loan agreement contains covenants requiring us to maintain a minimumadjusted quick ratio and a minimum liquidity ratio as well as other restrictive covenants including, among others,restrictions on our ability to merge, acquire assets above prescribed thresholds, undertake actions outside theordinary course of our business (including the incurrence of indebtedness), guarantee debt, distribute dividends,and repurchase our stock, and maintenance of a minimum tangible net worth. The agreement also contains asubjective covenant that requires (i) no material adverse change in the business, operations, or financial conditionof the Company occur, or (ii) no material impairment of the prospect of repayment of any portion of theborrowings under the agreement; or (iii) no material impairment of value or priority of the lenders securityinterests in the collateral of the bank credit agreement. As of December 31, 2008, we were in compliance withthe covenants related to our line of credit and we believe that the Company will continue to comply with itsrestrictive covenants. If our performance does not result in compliance with any of these restrictive covenants,we would seek to further modify our financing arrangements, but there can be no assurance that the bank wouldnot exercise its rights and remedies under its agreement with us, including declaring all outstanding debt dueand payable.
In December 2006, we borrowed $5,000 under 3-year notes secured by accounts receivable of onecustomer. Effective March 28, 2008, we prepaid this debt in full and modified the terms of the note to a line ofcredit. Under the line of credit agreement, the maximum indebtedness of the line is equal to $1,700 atDecember 31, 2008 less $150 per until the maturity date of December 28, 2009. The borrowing rate is theLondon InterBank Offered Rate (LIBOR) plus 500 basis points. As of December 31, 2008, the Company has notborrowed against this line.
F-17
TeleCommunication Systems, Inc.
Notes to Consolidated Financial Statements — (Continued)(amounts in thousands, except share and per share data)

11. Long-Term Debt
Long-term debt consisted of the following at December 31:
2008 2007
Note payable dated June 2007 due July 1, 2012 and bearing interest at primerate plus 0.25% per annum, See further description . . . . . . . . . . . . . . . . . . . $ 7,167 $ 9,167
Note payable dated December 28, 2006, paid in full March 28, 2008 andmodified to a line of credit (see Note 10 for further description) . . . . . . . . . . . — 3,501
Other, paid in full January 2008 . . . . . . . . . . . . . . . . . . . . . . . . . . . . . . . . . . . — 1
Total long term debt . . . . . . . . . . . . . . . . . . . . . . . . . . . . . . . . . . . . . . . . . 7,167 12,669Less: current portion . . . . . . . . . . . . . . . . . . . . . . . . . . . . . . . . . . . . . . . . . . (2,000) (3,661)
Non current portion of long term debt . . . . . . . . . . . . . . . . . . . . . . . . . . . . . $ 5,167 $ 9,008
Aggregate maturities of long-term debt at December 31, 2008 are as follows:
2009 . . . . . . . . . . . . . . . . . . . . . . . . . . . . . . . . . . . . . . . . . . . . . . . . . . . . . . . . . . . . . . $2,0002010 . . . . . . . . . . . . . . . . . . . . . . . . . . . . . . . . . . . . . . . . . . . . . . . . . . . . . . . . . . . . . . 2,0002011 . . . . . . . . . . . . . . . . . . . . . . . . . . . . . . . . . . . . . . . . . . . . . . . . . . . . . . . . . . . . . . 2,0002012 . . . . . . . . . . . . . . . . . . . . . . . . . . . . . . . . . . . . . . . . . . . . . . . . . . . . . . . . . . . . . . 1,167
Total . . . . . . . . . . . . . . . . . . . . . . . . . . . . . . . . . . . . . . . . . . . . . . . . . . . . . . . . . . . . . $7,167
On June 25, 2007, we refinanced $10,000 of March 2006 secured notes with a five year bank term loan.The borrowing rate under the new term loan was the prime rate plus 0.25% per annum (3.5% at December 31,2008) and payments are due in equal monthly installments of $167 plus interest. In March 2006, we issued(i) $10,000 of secured notes due March 10, 2009, with cash interest at 14% per annum, and (ii) warrants topurchase an aggregate of 1.75 million shares of our Class A Common Stock at an exercise price of $2.40 pershare. In December 2008, the holders of 1.1 million of the warrants exercised those warrants and 1.1 millionshares were issued. The remaining 0.7 million warrants remain outstanding and expire March 2011. The resultingcarrying value of the debt at issuance was $6,500, net of the original discount of $3,500 which was beingamortized to interest expense over its three-year term using the effective interest method, yielding an effectiveinterest rate of 15.2%. The remaining unamortized debt discount and issuance expenses of $2,458 million werewritten off in the second quarter of 2007 as a result of early retirement of the March 2006 note.
12. Capital Leases
We lease certain equipment under capital leases. Property and equipment included the following amountsfor capital leases at December 31:
2008 2007
Computer equipment. . . . . . . . . . . . . . . . . . . . . . . . . . . . . . . . . . . . . . . . . . . $ 5,340 $ 5,685Computer software . . . . . . . . . . . . . . . . . . . . . . . . . . . . . . . . . . . . . . . . . . . . 1,654 1,474Furniture and fixtures . . . . . . . . . . . . . . . . . . . . . . . . . . . . . . . . . . . . . . . . . . 18 237Leasehold improvements . . . . . . . . . . . . . . . . . . . . . . . . . . . . . . . . . . . . . . . . 25 6
Total equipment under capital lease at cost . . . . . . . . . . . . . . . . . . . . . . . . . . 7,037 7,402Less: accumulated amortization . . . . . . . . . . . . . . . . . . . . . . . . . . . . . . . . . . . (2,090) (3,824)
Net property and equipment under capital leases. . . . . . . . . . . . . . . . . . . . . . $ 4,947 $ 3,578
Capital leases are collateralized by the leased assets. Our capital leases generally contain provisions wherebywe can purchase the equipment at the end of the lease for a one dollar buyout or the current fair market value
F-18
TeleCommunication Systems, Inc.
Notes to Consolidated Financial Statements — (Continued)(amounts in thousands, except share and per share data)

capped at 18.5% of the original purchase price. Amortization of leased assets is included in depreciation andamortization expense.
Future minimum payments under capital lease obligations consisted of the following at December 31, 2008:
2009 . . . . . . . . . . . . . . . . . . . . . . . . . . . . . . . . . . . . . . . . . . . . . . . . . . . . . . . . . . . $2,1012010 . . . . . . . . . . . . . . . . . . . . . . . . . . . . . . . . . . . . . . . . . . . . . . . . . . . . . . . . . . . 1,3632011 . . . . . . . . . . . . . . . . . . . . . . . . . . . . . . . . . . . . . . . . . . . . . . . . . . . . . . . . . . . 1,0692012 . . . . . . . . . . . . . . . . . . . . . . . . . . . . . . . . . . . . . . . . . . . . . . . . . . . . . . . . . . . 567
Total minimum lease payments. . . . . . . . . . . . . . . . . . . . . . . . . . . . . . . . . . . . . . . 5,100Less: amounts representing interest . . . . . . . . . . . . . . . . . . . . . . . . . . . . . . . . . . . . (517)
Present value of net minimum lease payments (including current portion of$1,837) . . . . . . . . . . . . . . . . . . . . . . . . . . . . . . . . . . . . . . . . . . . . . . . . . . . . . . $4,583
13. Common Stock
Our Class A common stockholders are entitled to one vote for each share of stock held for all matterssubmitted to a vote of stockholders. Our Class B stockholders are entitled to three votes for each share owned.
14. Fair Value of Financial Instruments
In the first quarter of 2008, we adopted SFAS 157 “Fair Value Measurements” for financial assets andliabilities. This standard defines fair value, provides guidance for measuring fair value, and requires certaindisclosures. This standard does not require any new fair value measurements, but rather applies to all otheraccounting pronouncements that require or permit fair value measurements. This standard does not applymeasurements related to share-based payments, nor does it apply to measurements related to inventory.
SFAS 157 discusses valuation techniques, such as the market approach (comparable market prices), theincome approach (present value of future income or cash flows), and the cost approach (cost to replace theservice capacity of an asset or replacement cost). The statement utilizes a fair value hierarchy that prioritizes theinputs to valuation techniques used to measure fair value into three broad levels. The following is a briefdescription of those three levels:
Level 1: Observable inputs such as quoted prices (unadjusted) in active markets for identical assets orliabilities.
Level 2: Inputs other than quoted prices that are observable for the asset or liability, either directly orindirectly. These include quoted prices for similar assets or liabilities in active markets and quoted pricesfor identical or similar assets or liabilities in markets that are not active.
Level 3: Observable inputs that reflect the reporting entity’s own assumptions.
Our population of financial assets and liabilities subject to fair value measurements and the necessarydisclosures are as follow:
Fair Value as of12/31/2008
Total Level 1 Level 2 Level 3
Fair Value Measurements at12/31/2008
Using Fair Value Hierarchy
AssetsCash and cash equivalents . . . . . . . . . . . . . . . . $38,977 $38,977 $ — $ —
Marketable securities available for sale . . . . . . . . 78 78 — —
$39,055 $39,055 $ — $ —
F-19
TeleCommunication Systems, Inc.
Notes to Consolidated Financial Statements — (Continued)(amounts in thousands, except share and per share data)

The fair values of marketable securities are based on quoted market prices from various stock exchanges.
15. Income Taxes
The Company accounts for income taxes under SFAS 109 using the asset and liability approach toaccounting for income taxes. Deferred tax assets and liabilities are determined based upon differences betweenfinancial reporting and tax bases of assets and liabilities and are measured using the enacted tax rates and lawsthat will be in effect when the differences are expected to reverse. Net deferred tax assets are recorded when itis more likely than not that the tax benefits will be realized.
The provision for income taxes consisted of the following at December 31:
2008
Current:Federal. . . . . . . . . . . . . . . . . . . . . . . . . . . . . . . . . . . . . . . . . . . . . . . . . . . . . . . . . . $ 636State . . . . . . . . . . . . . . . . . . . . . . . . . . . . . . . . . . . . . . . . . . . . . . . . . . . . . . . . . . . 152
Total current . . . . . . . . . . . . . . . . . . . . . . . . . . . . . . . . . . . . . . . . . . . . . . . . . . . . 788Deferred:
Federal. . . . . . . . . . . . . . . . . . . . . . . . . . . . . . . . . . . . . . . . . . . . . . . . . . . . . . . . . . (29,938)State . . . . . . . . . . . . . . . . . . . . . . . . . . . . . . . . . . . . . . . . . . . . . . . . . . . . . . . . . . . (4,107)
Total deferred . . . . . . . . . . . . . . . . . . . . . . . . . . . . . . . . . . . . . . . . . . . . . . . . . . . (34,045)
Total benefit for income taxes from continuing operations . . . . . . . . . . . . . . . . . . . . . $(33,257)
In previous years, the Company recorded a full valuation allowance against its deferred tax assets due touncertainty surrounding the realization of the benefits of such assets; therefore, there was no tax provision in2007 or 2006. For 2008, based on historical taxable income from continuing operations and projections for futuretaxable income, the Company determined that it is more likely than not that its deferred tax assets are expectedto be realized, and reversed the valuation allowance. The reversal of the valuation allowance and otheradjustments to the deferred tax assets resulted in the recognition of income tax benefits of $33,257 in 2008.The $33,257 benefit is comprised of a federal benefit of $29,302 and a state net benefit of $3,955.
F-20
TeleCommunication Systems, Inc.
Notes to Consolidated Financial Statements — (Continued)(amounts in thousands, except share and per share data)

Significant components of our deferred tax assets and liabilities at December 31 were:
2008 2007
Deferred tax assets:Net operating loss carryforwards . . . . . . . . . . . . . . . . . . . . . . . . . . . . . . . . $26,746 $ 38,198Research and development tax credit . . . . . . . . . . . . . . . . . . . . . . . . . . . . 294 15Stock compensation expense . . . . . . . . . . . . . . . . . . . . . . . . . . . . . . . . . . 1,513 1,635Depreciation and amortization . . . . . . . . . . . . . . . . . . . . . . . . . . . . . . . . . . 4,079 4,578Reserves and accrued expenses . . . . . . . . . . . . . . . . . . . . . . . . . . . . . . . . 1,432 958Alternative minimum tax credit . . . . . . . . . . . . . . . . . . . . . . . . . . . . . . . . . 636 —Deferred revenue . . . . . . . . . . . . . . . . . . . . . . . . . . . . . . . . . . . . . . . . . . 108 813Other . . . . . . . . . . . . . . . . . . . . . . . . . . . . . . . . . . . . . . . . . . . . . . . . . . . 373 62
Total deferred tax assets . . . . . . . . . . . . . . . . . . . . . . . . . . . . . . . . . . 35,181 46,259
Deferred tax liabilities:Capitalized software development costs . . . . . . . . . . . . . . . . . . . . . . . . . . (1,132) (1,202)Other . . . . . . . . . . . . . . . . . . . . . . . . . . . . . . . . . . . . . . . . . . . . . . . . . . . (4) (4)
Total deferred tax liabilities . . . . . . . . . . . . . . . . . . . . . . . . . . . . . . . . . (1,136) (1,206)
Net deferred tax asset . . . . . . . . . . . . . . . . . . . . . . . . . . . . . . . . . . . . . . . . 34,045 45,053Valuation allowance for net deferred tax asset . . . . . . . . . . . . . . . . . . . . . . . . — (45,053)
Net deferred tax asset recognized in the consolidated balance sheets . . . . . . . $34,045 $ —
At December 31, 2008, we had U.S. federal net operating loss carryforwards for income tax purposes ofapproximately $81,643, which includes approximately $24,177 of remaining acquired net operating losses fromthe acquisition of Xypoint in 2001, and $9,361 from the excess tax benefits related to stock-based compensationdeductions which will increase additional paid in capital once the benefit is realized, through a reduction ofincome taxes payable. The net operating loss carryforwards acquired in connection with the purchase of Xypointin 2001 will begin to expire in 2018. The remaining net operating loss carryforwards will expire from 2019through 2027.
The timing and manner in which we may utilize the net operating loss carryforwards and tax credits in futuretax years will be limited by the amounts and timing of future taxable income and by the application of theownership change rules under Section 382 of the Internal Revenue Code. Utilization of the Xypoint net operatinglosses are limited as a result of ownership changes occurring in 1997 and 2001. Additionally, the Companydetermined that they had an ownership change in December 2001, which imposes an annual limitation of thenet operating losses created in 1999 to 2001. As of December 31, 2007, the Company reduced its deferred taxassets related to the portion of the research and development tax credits acquired from Xypoint that are limitedunder Section 382, which cannot be used before they expire.
The remaining U.S. federal net operating loss carryforwards may become subject to limitations under theInternal Revenue Code as well. We have state net operating loss carryforwards available which expire through2027, utilization of which will be limited in a manner similar to the federal net operating loss carryforwards. AtDecember 31, 2008, the Company had federal alternative minimum tax credit carry forwards of approximately$636, which are available to offset future regular federal taxes. Research and development credits ofapproximately $294 will begin to expire in 2011.
F-21
TeleCommunication Systems, Inc.
Notes to Consolidated Financial Statements — (Continued)(amounts in thousands, except share and per share data)

The reconciliation of the reported income tax benefit to the amount that would result by applying theU.S. federal statutory rate of 34% to loss from continuing operations for the year ended December 31 is asfollows:
2008 2007 2006
Income tax (benefit) at statutory rate . . . . . . . . . . . . . . . . . . . . . . . . $ 8,266 $ (364) $ 653Change in valuation allowances . . . . . . . . . . . . . . . . . . . . . . . . . . . (45,053) (887) (2,241)Write-down of tax attributes . . . . . . . . . . . . . . . . . . . . . . . . . . . . . . 874 1,894 —Non deductible items . . . . . . . . . . . . . . . . . . . . . . . . . . . . . . . . . . 1,612 255 55Non deductible stock compensation expense . . . . . . . . . . . . . . . . . . 473 (705) 689Research and development tax credit . . . . . . . . . . . . . . . . . . . . . . . (230) (130) (43)Change in state apportionment tax rates on deferred
assets/liabilities . . . . . . . . . . . . . . . . . . . . . . . . . . . . . . . . . . . . . (53) (41) 807State tax (benefit) . . . . . . . . . . . . . . . . . . . . . . . . . . . . . . . . . . . . . 1,066 (8) 52Other . . . . . . . . . . . . . . . . . . . . . . . . . . . . . . . . . . . . . . . . . . . . . (212) (14) 28
Total . . . . . . . . . . . . . . . . . . . . . . . . . . . . . . . . . . . . . . . . . . . . . $(33,257) $ — $ —
Upon the adoption of FIN 48, the estimated value of the Company’s uncertain tax positions was a liability of$2,736 resulting from unrecognized net tax benefits which did not include interest and penalties. It is reasonablypossible theses unrecognized deferred tax benefits will be recognized in the next twelve months through the taxprovision. The Company does not currently anticipate that the total amounts of unrecognized tax benefits willsignificantly increase within the next 12 months. The Company recorded the estimated value of its uncertain taxpositions by reducing the value of certain tax attributes.
The following table summarizes the activity related to the Company’s unrecognized tax benefits (excludinginterest, penalties and related tax carry forwards):
Total
Balance at December 31, 2006Gross increases related to prior year tax positions . . . . . . . . . . . . . . . . . . . . . . . . . . . . . $ —Gross decreases related to prior year tax positions. . . . . . . . . . . . . . . . . . . . . . . . . . . . . —Gross increases related to current year tax positions . . . . . . . . . . . . . . . . . . . . . . . . . . . 2,736Settlements/lapse in statute of limitation . . . . . . . . . . . . . . . . . . . . . . . . . . . . . . . . . . . —
Balance at December 31, 2007 . . . . . . . . . . . . . . . . . . . . . . . . . . . . . . . . . . . . . . . . . . . . $2,736Gross increases related to prior year tax positions . . . . . . . . . . . . . . . . . . . . . . . . . . . . . —Gross decreases related to prior year tax positions. . . . . . . . . . . . . . . . . . . . . . . . . . . . . —Gross increases related to current year tax positions . . . . . . . . . . . . . . . . . . . . . . . . . . . —Settlements/lapse in statute of limitation . . . . . . . . . . . . . . . . . . . . . . . . . . . . . . . . . . . —
Balance at December 31, 2008 . . . . . . . . . . . . . . . . . . . . . . . . . . . . . . . . . . . . . . . . . . . . $2,736
If the Company’s positions are sustained by the taxing authority in favor of the Company, approximately,$2,736 (excluding interest and penalties) of uncertain tax position liabilities would favorably impact theCompany’s effective tax rate.
Upon the adoption of FIN 48, the Company’s policy is to classify any interest and penalties accrued on anyunrecognized tax benefits as a component of the provision for income taxes. There were no interest or penaltiesrecognized in the consolidated statement of income for year ended December 31, 2008 and the consolidatedbalance sheet at December 31, 2008. The Company files income tax returns in U.S. and state jurisdictions. As ofDecember 31, 2008, open tax years in the federal and some state jurisdictions date back to 1999, due to thetaxing authorities’ ability to adjust operating loss carry forwards.
F-22
TeleCommunication Systems, Inc.
Notes to Consolidated Financial Statements — (Continued)(amounts in thousands, except share and per share data)

16. Employee Benefit Plan
The Company maintains a 401(k) plan covering defined employees who meet established eligibilityrequirements. Under the provisions of the plan, the Company may contribute a discretionary match. The planmay also contribute a non-elective contribution determined by the Company. For 2008, the Company matched35% of employee deferrals. The Company contribution was $798, $575, and $218 for the years endedDecember 31, 2008, 2007, and 2006 respectively.
17. Stock-based Compensation Plans
We maintain two stock-based compensation plans: a stock incentive plan, and an employee stock purchaseplan.
Stock Incentive Plan. We maintain a stock incentive plan that is administered by our CompensationCommittee of our Board of Directors. Options granted under the plan vest over periods ranging from one to fiveyears and expire 10 years from the date of grant. Under the principal share-based compensation plans, theCompany may grant certain employees, directors and consultants options to purchase common stock, stockappreciation rights and restricted stock units. Options are rights to purchase common stock of the Company atthe fair market value on the date of the grant. Stock appreciation rights are equity settled share-basedcompensation arrangements whereby the number of shares that will ultimately be issued is based upon theappreciation of the Company’s common stock and the number of awards granted to an individual. Restrictedstock units are equity settled share-based compensation arrangements of a number of share of the Company’scommon stock. Restricted stock unit holders do not have voting rights until the restrictions lapse.
Beginning January 1, 2006, the Company adopted SFAS 123(R) using the modified prospective method.Consistent with the requirements of SFAS 123(R), we recognized compensation expense net of estimatedforfeitures over the requisite service period, which is generally the vesting period of 5 years. The Companyestimates the fair value of each stock option award on the date of grant using the Black-Scholes option-pricingmodel. Expected volatilities are based on historical volatility of the Company’s stock. The Company estimatesforfeitures based on historical experience and the expected term of the options granted are derived fromhistorical data on employee exercises. The risk free interest rate is based on the U.S. Treasury yield curve ineffect at the time of the grant. The Company has not paid and does not anticipate paying dividends in the nearfuture.
F-23
TeleCommunication Systems, Inc.
Notes to Consolidated Financial Statements — (Continued)(amounts in thousands, except share and per share data)

A summary of our stock option activity and related information consisted of the following for the yearsended December 31 (all share amounts in thousands):
Number ofOptions
WeightedAverageExercise
PriceNumber of
Options
WeightedAverageExercise
PriceNumber of
Options
WeightedAverageExercise
Price
2008 2007 2006
Outstanding, beginning of year . . . . . . . . . . 11,144 $3.69 11,622 $3.62 9,793 $3.86
Granted . . . . . . . . . . . . . . . . . . . . . . . . . . 3,056 3.57 2,537 3.69 2,908 2.42
Exercised . . . . . . . . . . . . . . . . . . . . . . . . . (1,927) 3.04 (1,347) 2.58 (199) 1.75
Forfeited . . . . . . . . . . . . . . . . . . . . . . . . . (597) 3.58 (1,668) 4.07 (880) 3.26
Outstanding, end of year . . . . . . . . . . . . . . 11,676 $3.77 11,144 $3.69 11,622 $3.62
Exercisable, at end of year . . . . . . . . . . . . . 6,308 $4.12 6,515 $4.14 6,823 $4.33
Vested and expected to vest, at end ofyear . . . . . . . . . . . . . . . . . . . . . . . . . . . 9,992 $3.84 7,510 $3.69 8,179 $3.62
Estimated weighted-average grant- date fairvalue of options granted during the year . . $ 2.07 $ 3.69 $ 2.42
Weighted-average remaining contractual lifeof options outstanding at end of year . . . . 6.5 years 6.6 years 7.0 years
Number ofOptions
WeightedAverage
Fair ValueNumber of
Options
WeightedAverage
Fair ValueNumber of
Options
WeightedAverage
Fair Value
Non-vested, beginning of year . . . . . . . . . . . . 4,692 $2.29 4,799 $2.05 3,972 $2.33
Forfeited . . . . . . . . . . . . . . . . . . . . . . . . . . (525) $2.16 (1,088) $2.37 (731) $2.03
Vested . . . . . . . . . . . . . . . . . . . . . . . . . . . . 1,792 $2.21 1,579 $2.13 1,350 $2.41
Exercisable, at year end . . . . . . . . . . . . . . . . 6,308 $3.56 6,515 $3.73 6,823 $4.01
Non-vested, at end of year . . . . . . . . . . . . . . 5,368 $2.21 4,692 $2.29 4,799 $2.05
Exercise prices for options outstanding at December 31, 2008 ranged from $0.29 to $26.05 as follows (allshare amounts in thousands):
Exercise PricesOptions
Outstanding
Weighted-AverageExercise Prices
of OptionsOutstanding
Weighted-AverageRemaining
Contractual Lifeof Options
Outstanding (years)Options
Exercisable
Weighted-AverageExercise Prices
of OptionsExercisable
$0.29— $2.61 . . . . . . . 2,917 $ 2.40 6.56 1,963 $ 2.40
$2.61— $5.21 . . . . . . . 6,515 $ 3.34 6.99 2,365 $ 3.30
$5.21— $7.82 . . . . . . . 2,214 $ 6.74 5.19 1,950 $ 6.74
$7.82 — $26.05 . . . . . . 30 $11.07 4.01 30 $11.07
Total end of year . . . . . 11,676 6,308
F-24
TeleCommunication Systems, Inc.
Notes to Consolidated Financial Statements — (Continued)(amounts in thousands, except share and per share data)

As of December 31, 2008, the aggregate intrinsic value of options exercisable was $56,348. As ofDecember 31, 2008, we estimate that we will recognize $3,385 in expense for outstanding, unvested optionsover their weighted average remaining vesting period of 3.9 years.
In calculating the fair value of our stock options using Black-Scholes for the years ended December 31,2008, 2007, and 2006, respectively, our assumptions were as follows:
2008 2007 2006
For The Years EndedDecember 31,
Expected life (in years) . . . . . . . . . . . . . . . . . . . . . . . . . . 5.5 5.5 5.5
Risk-free interest rate(%) . . . . . . . . . . . . . . . . . . . . . . . . 2.65%-3.33% 4.24%-4.90% 4.56%
Volatility(%) . . . . . . . . . . . . . . . . . . . . . . . . . . . . . . . . . 60%-67% 68.1%-83% 78%
Dividend yield(%) . . . . . . . . . . . . . . . . . . . . . . . . . . . . . 0% 0% 0%
For the years ended December 31, 2008, 2007, and 2006, the Company granted a total of 20,556, 89,600,and 22,025 of restricted shares of Class A Common Stock to directors and certain key executives. Therestrictions expired at the end of one year for directors and expire in annual increments over three years forexecutives conditional on continued employment. The fair value of the restricted stock on the date of issuance isrecognized as non-cash stock compensation expense over the period over which the restrictions expire. Werecognized $105, $328, and $244 of non-cash stock compensation expense related to these grants for the yearsended December 31, 2008, 2007, and 2006, respectively. We expect to record future stock compensationexpense of $50 as a result of these restricted stock grants that will be recognized over the remaining vestingperiods.
Employee Stock Purchase Plan. We have an employee stock purchase plan (the Plan) that gives allemployees an opportunity to purchase shares of our Class A Common Stock. The Plan allows for the purchaseof 1,384,932 shares of our Class A Common Stock at a discount of 15% of the fair market value. The discountof 15% is calculated based on the average daily share price on either the first or the last day of each quarterlyenrollment period, whichever date is more favorable to the employee. Option periods are three months induration. As of December 31, 2008, 1,092,821 shares of Class A Common Stock have been issued under thePlan. Compensation expense relating to the Employee Stock Purchase Plan is not material.
As of December 31, 2008, our total shares of Class A Common Stock reserved for future issuance iscomprised of:
(in thousands)
Stock incentive plan . . . . . . . . . . . . . . . . . . . . . . . . . . . . . . . . . . . . . . . . . . . . . . 4,524
Warrants (see Note 11) . . . . . . . . . . . . . . . . . . . . . . . . . . . . . . . . . . . . . . . . . . . . 700
Employee stock purchase plan . . . . . . . . . . . . . . . . . . . . . . . . . . . . . . . . . . . . . . . 292
Total shares restricted for future use . . . . . . . . . . . . . . . . . . . . . . . . . . . . . . . . . 5,516
As of December 31, 2008, the composition of non-cash stock compensation expense was as follows:
2008 2007 2006
Direct costs of revenue . . . . . . . . . . . . . . . . . . . . . . . . . . . . . . . . . . . $2,494 $2,080 $1,509
Research and development expense. . . . . . . . . . . . . . . . . . . . . . . . . . 822 867 558
Sales and marketing expense. . . . . . . . . . . . . . . . . . . . . . . . . . . . . . . 272 628 326
General and administrative expense. . . . . . . . . . . . . . . . . . . . . . . . . 170 758 723
Total non-cash stock compensation expense . . . . . . . . . . . . . . . . . $3,758 $4,333 $3,116
F-25
TeleCommunication Systems, Inc.
Notes to Consolidated Financial Statements — (Continued)(amounts in thousands, except share and per share data)

18. Operating Leases
We lease certain office space and equipment under non-cancelable operating leases that expire on variousdates through 2015. Future minimum payments under non-cancelable operating leases with initial terms of oneyear or more consisted of the following at December 31, 2008:
2009 . . . . . . . . . . . . . . . . . . . . . . . . . . . . . . . . . . . . . . . . . . . . . . . . . . . . . . . . . . . . . . $3,423
2010-2011 . . . . . . . . . . . . . . . . . . . . . . . . . . . . . . . . . . . . . . . . . . . . . . . . . . . . . . . . . . 4,295
2012-2013 . . . . . . . . . . . . . . . . . . . . . . . . . . . . . . . . . . . . . . . . . . . . . . . . . . . . . . . . . . 1,260
Beyond . . . . . . . . . . . . . . . . . . . . . . . . . . . . . . . . . . . . . . . . . . . . . . . . . . . . . . . . . . . . 575
$9,553
Our leases include our offices in Annapolis, Maryland under a lease expiring in March 2011, a second facilityin Annapolis under a lease expiring in April 2013, a facility in Seattle, Washington under a lease expiring inSeptember 2010, a facility in Oakland, California under a lease expiring August 2012, and we relocated ourproduction facility in Tampa, Florida under a lease expiring in December 2014. The Annapolis facilities are utilizedfor executive and administrative offices, as well as portions of our Commercial and Government Segments. TheSeattle and Oakland facilities are utilized by our Commercial Segment and the Tampa facility is utilized by ourGovernment Segment. Future payments on all of our leases are estimated based on future payments includingthe minimum future rent escalations, if any, stipulated in the respective agreements.
Rent expense for continuing operations was $4,079, $3,823, and $3,603 for the years ended December 31,2008, 2007, and 2006, respectively.
19. Concentrations of Credit Risk and Major Customers
Financial instruments that potentially subject us to significant concentrations of credit risk consist primarilyof accounts receivable and unbilled receivables. Those customers that comprised 10% or more of our revenues,accounts receivable, and unbilled receivables from continuing operations are summarized in the following tables.
Customer Segment 2008 2007 2006
% of Total RevenuesFor the Year Ended
December 31,
U.S. Government . . . . . . . . . . . . . . . . . . . . . . . . . . . . . . . . Government 42% 37% 25%
Customer A . . . . . . . . . . . . . . . . . . . . . . . . . . . . . . . . . . . . Commercial 22% 20% 20%
CustomerAccounts
ReceivableUnbilled
ReceivablesAccounts
ReceivableUnbilled
Receivables
As of December 31, 2008 As of December 31, 2007
U.S. Government . . . . . . . . . . . . . . . . . . . 54% 73% 40% 66%
Customer A . . . . . . . . . . . . . . . . . . . . . . . 22% �10% �10% �10%
Customer B . . . . . . . . . . . . . . . . . . . . . . . �10% 10% 11% �10%
As of December 31, 2008, our total exposure to credit risk was $69,532 based on the amount due to us bythe above customers. As of December 31, 2007, our exposure to such risks was $23,689. We did notexperience significant losses from amounts due to us by any customers for the year ended December 31, 2007.
20. Business and Geographic Segment Information
Our two reporting segments are the Commercial Segment and the Government Segment.
F-26
TeleCommunication Systems, Inc.
Notes to Consolidated Financial Statements — (Continued)(amounts in thousands, except share and per share data)

Our Commercial Segment products and services enable wireless carriers to deliver short text messages,location information, internet content, and other enhanced communication services to and from wireless phones.Our Commercial Segment also provides E9-1-1 services, commercial location-based services, inter-carrier textmessage distribution services, and carrier technology on a hosted, or service bureau, basis. We also earnsubscriber revenue through wireless applications including our Rand McNally» Traffic application.
Our Government Segment designs, assembles, sells and maintains data network communication systems,including our SwiftLink» deployable communication systems. We also own and operate secure satellite teleportfacilities, resell access to satellite airtime (known as space segment), and provide communication systemsintegration, information technology services, and software systems and services to the U.S. Department ofDefense and other government customers.
Management evaluates segment performance based on gross profit. We do not maintain informationregarding segment assets. Accordingly, asset information by reportable segment is not presented.
For the years ended December 31, 2008, 2007, and 2006, respectively, our revenues include approximately$8,598, $5,551, and $7,349 of revenues generated from customers outside of the United States.
The following table sets forth results for our reportable segments as of December 31, 2008. All revenuesreported below are from external customers. A reconciliation of segment gross profit to net loss for therespective periods is also included below:
Comm. Gvmt Total Comm. Gvmt Total Comm. Gvmt Total2008 2007 2006
Year Ended December 31,
Revenue
Services . . . . . . . . . . . . . $ 64,441 $ 36,918 $101,359 $58,793 $29,269 $ 88,062 $59,741 $28,639 $ 88,380
Systems . . . . . . . . . . . . . 37,429 81,354 118,783 16,521 39,585 56,106 17,219 19,337 36,556
Total revenue. . . . . . . . . 101,870 118,272 220,142 75,314 68,854 144,168 76,960 47,976 124,936
Direct costs of revenue
Direct cost of services . . . . 32,402 29,192 61,594 29,346 22,815 52,161 31,409 21,131 52,540
Direct cost of systems . . . . 8,993 68,298 77,291 5,024 32,882 37,906 5,211 12,672 17,883
Total Direct Costs . . . . . . 41,395 97,490 138,885 34,370 55,697 90,067 36,620 33,803 70,423
Gross profit
Services gross profit . . . . . 32,039 7,726 39,765 29,447 6,454 35,901 28,332 7,508 35,840
Systems gross profit . . . . . 28,436 13,056 41,492 11,497 6,703 18,200 12,008 6,665 18,673
Total Gross Profit . . . . . . $ 60,475 $ 20,782 $ 81,257 $40,944 $13,157 $ 54,101 $40,340 $14,173 $ 54,513
F-27
TeleCommunication Systems, Inc.
Notes to Consolidated Financial Statements — (Continued)(amounts in thousands, except share and per share data)

2008 2007 2006
Total segment gross profit . . . . . . . . . . . . . . . . . . . . . . . . . . . . . . . . . . . . . . . . $ 81,257 $ 54,101 $ 54,513
Research and development expense . . . . . . . . . . . . . . . . . . . . . . . . . . . . . . . . . (16,161) (13,072) (12,586)
Sales and marketing expense. . . . . . . . . . . . . . . . . . . . . . . . . . . . . . . . . . . . . . (13,715) (11,917) (11,713)
General and administrative expense . . . . . . . . . . . . . . . . . . . . . . . . . . . . . . . . . (28,238) (19,334) (16,959)
Depreciation and amortization of property and equipment . . . . . . . . . . . . . . . . . . (5,865) (6,200) (7,956)
Amortization of acquired intangible assets . . . . . . . . . . . . . . . . . . . . . . . . . . . . . (147) (148) (147)
Interest expense . . . . . . . . . . . . . . . . . . . . . . . . . . . . . . . . . . . . . . . . . . . . . . (922) (1,776) (1,751)
Amortization of debt discount and debt issuance expenses, including $2,458 write-off in June 2007 . . . . . . . . . . . . . . . . . . . . . . . . . . . . . . . . . . . . . . . . . . . . . (180) (3,176) (1,447)
Gain on sale of patent . . . . . . . . . . . . . . . . . . . . . . . . . . . . . . . . . . . . . . . . . . . 8,060 — —
Benefit for income taxes . . . . . . . . . . . . . . . . . . . . . . . . . . . . . . . . . . . . . . . . . 33,257 — —
Other income, net . . . . . . . . . . . . . . . . . . . . . . . . . . . . . . . . . . . . . . . . . . . . . 222 508 22
Income/(loss) from continuing operations . . . . . . . . . . . . . . . . . . . . . . . . . . . . . 57,568 (1,014) 1,976
Loss from discontinued operations. . . . . . . . . . . . . . . . . . . . . . . . . . . . . . . . . . . . — (275) (23,671)
Net income/(loss) . . . . . . . . . . . . . . . . . . . . . . . . . . . . . . . . . . . . . . . . . . . . . . . $ 57,568 $ (1,289) $(21,695)
21. Quarterly Financial Information (Unaudited)
The following is a summary of the quarterly results of operations for the years ended December 31, 2008and 2007. The quarterly information has not been audited, but in our opinion, includes all normal recurringadjustments, which are, in the opinion of the Management, necessary for fair statement of the results of theinterim periods.
March 31 June 30 September 30 December 31(unaudited)
Three Months Ended2008
Revenue . . . . . . . . . . . . . . . . . . . . . . . . . . . . . . $40,413 $43,911 $56,531 $79,287
Gross profit . . . . . . . . . . . . . . . . . . . . . . . . . . . . $19,564 $19,212 $17,457 $25,024
Income from continuing operations . . . . . . . . . . . $ 4,618 $11,965 $ 2,757 $38,228
Loss from discontinued operations . . . . . . . . . . . . — — — —
Net income . . . . . . . . . . . . . . . . . . . . . . . . . . . . $ 4,618 $11,965 $ 2,757 $38,228
Earnings per share — basic from continuingoperations . . . . . . . . . . . . . . . . . . . . . . . . . . . $ 0.11 $ 0.28 $ 0.06 $ 0.87
Loss per share — basic from discontinuedoperations . . . . . . . . . . . . . . . . . . . . . . . . . . . $ — $ — $ — $ —
Net income per share — basic . . . . . . . . . . . . . . . $ 0.11 $ 0.28 $ 0.06 $ 0.87
Earnings per share — diluted from continuingoperations . . . . . . . . . . . . . . . . . . . . . . . . . . . $ 0.11 $ 0.26 $ 0.06 $ 0.78
Loss per share — diluted from discontinuedoperations . . . . . . . . . . . . . . . . . . . . . . . . . . . $ — $ — $ — $ —
Net income per share — diluted . . . . . . . . . . . . . . $ 0.11 $ 0.26 $ 0.06 $ 0.78
F-28
TeleCommunication Systems, Inc.
Notes to Consolidated Financial Statements — (Continued)(amounts in thousands, except share and per share data)

March 31 June 30 September 30 December 31(unaudited)
Three Months Ended2007
Revenue . . . . . . . . . . . . . . . . . . . . . . . . . . . . . . $34,119 $35,336 $37,635 $37,078
Gross profit . . . . . . . . . . . . . . . . . . . . . . . . . . . . $14,295 $10,681 $14,138 $14,987
Income/(loss) from continuing operations . . . . . . . $ 767 $ (5,993) $ 1,716 $ 2,498Income/(loss) from discontinued operations . . . . . . (124) (145) 54 (61)
Net income/(loss) . . . . . . . . . . . . . . . . . . . . . . . . $ 643 $ (6,138) $ 1,770 $ 2,437
Earnings/(loss) per share — basic from continuingoperations . . . . . . . . . . . . . . . . . . . . . . . . . . . $ 0.02 $ (0.15) $ 0.04 $ 0.06
Loss per share — basic from discontinuedoperations . . . . . . . . . . . . . . . . . . . . . . . . . . . $ (0.00) $ (0.00) $ 0.00 $ (0.00)
Net income/(loss) per share — basic . . . . . . . . . . . $ 0.02 $ (0.15) $ 0.04 $ 0.06
Earnings/(loss) per share — diluted from continuingoperations . . . . . . . . . . . . . . . . . . . . . . . . . . . $ 0.02 $ (0.15) $ 0.04 $ 0.06
Net income/(loss) per share — diluted fromdiscontinued operations . . . . . . . . . . . . . . . . . . $ (0.00) $ (0.00) $ 0.00 $ (0.00)
Net income/(loss) per share — diluted. . . . . . . . . . $ 0.02 $ (0.15) $ 0.04 $ 0.06
22. Commitments and Contingencies
The Company has been notified that some customers may seek indemnification under its contractualarrangements with those customers for costs associated with defending lawsuits alleging infringement of certainpatents through the use of our products and services in combination with the use of products and services ofmultiple other vendors. The Company will continue to negotiate with these customers in good faith because theCompany believes its technology does not infringe on the cited patents and due to specific clauses within thecustomer contractual arrangements that may or may not give rise to an indemnification obligation. Although theCompany cannot currently predict the outcome of these matters, we do not expect the resolutions will have amaterial effect on our consolidated results of operations, financial position or cash flows.
In November 2001, a shareholder class action lawsuit was filed against us, certain of our current officersand a director, and several investment banks that were the underwriters of our initial public offering (the“Underwriters”): Highstein v. TeleCommunication Systems, Inc., et al., United States District Court for theSouthern District of New York, Civil Action No. 01-CV-9500. The plaintiffs seek an unspecified amount ofdamages. The lawsuit purports to be a class action suit filed on behalf of purchasers of our Class A CommonStock during the period August 8, 2000 through December 6, 2000. The plaintiffs allege that the Underwritersagreed to allocate our Class A Common Stock offered for sale in our initial public offering to certain purchasersin exchange for excessive and undisclosed commissions and agreements by those purchasers to make additionalpurchases of our Class A Common Stock in the aftermarket at pre-determined prices. The plaintiffs allege that allof the defendants violated Sections 11, 12 and 15 of the Securities Act, and that the underwriters violatedSection 10(b) of the Exchange Act, and Rule 10b-5 promulgated thereunder. The claims against us of violation ofRule 10b-5 have been dismissed with the plaintiffs having the right to re-plead. On February 15, 2005, theDistrict Court issued an Order preliminarily approving a settlement agreement among class plaintiffs, all issuerdefendants and their insurers, provided that the parties agree to a modification narrowing the scope of the barorder set forth in the settlement agreement. The parties agreed to a modification narrowing the scope of the barorder, and on August 31, 2005, the court issued an order preliminarily approving the settlement. On December 5,2006, the United States Court of Appeals for the Second Circuit overturned the District Court’s certification of
F-29
TeleCommunication Systems, Inc.
Notes to Consolidated Financial Statements — (Continued)(amounts in thousands, except share and per share data)
the class of plaintiffs who are pursuing the claims that would be settled in the settlement against the underwriterdefendants. Plaintiffs filed a Petition for Rehearing and Rehearing En Banc with the Second Circuit on January 5,2007 in response to the Second Circuit’s decision. On April 6, 2007, the Second Circuit denied plaintiffs’rehearing petition, but clarified that the plaintiffs may seek to certify a more limited class in the District Court.On June 25, 2007, the District Court signed an Order terminating the settlement. On November 13, 2007, theissuer defendants in certain designated “focus cases” filed a motion to dismiss the second consolidatedamended class action complaints that were filed in those cases. On March 26, 2008, the District Court issued anOpinion and Order denying, in large part, the motions to dismiss the amended complaints in the “focus cases.”We intend to continue to defend the lawsuit until the matter is resolved. We have purchased Directors andOfficers insurance policy which we believe should cover any potential liability that may result from these claims,but can provide no assurance that any or all of the costs of the litigation will ultimately be covered by theinsurance. No reserve has been created for this matter. More than 300 other companies have been named innearly identical lawsuits that have been filed by some of the same law firms that represent the plaintiffs in thelawsuit against us.
On July 12, 2006, we filed suit in the United States District Court for the Eastern District of Virginia againstMobile 365 (now Sybase 365, a subsidiary of Sybase Inc.) and WiderThan Americas for patent infringementrelated to U.S. patent No. 6,985,748, Inter-Carrier Short Messaging Service Providing Phone Number OnlyExperience (“the ’748 patent”), issued to the Company. We resolved the matter with regard to WiderThanAmericas, and, during the second quarter of 2007, we received a favorable jury decision that Sybase 365infringed the claims of our patent. The jury awarded us a one-time monetary payment in excess of $10 millionfor past damages and a 12% royalty. The jury also found Sybase 365’s infringement willful and upheld the validityof the patent. After the jury verdict, both parties filed post-trial motions. The court denied Sybase 365’s post-trialmotion for a new trial or a judgment in its favor, granted our motion for a permanent injunction prohibiting anyfurther infringement by Sybase 365, but stayed the injunction pending the outcome of any appeal that may befiled, reduced the jury verdict damages award by $2.2 million and vacated the jury finding of willful infringement.We expect that Sybase 365 will appeal from the final judgment of the district court to U.S. Court of Appeals forthe Federal Circuit. In the first quarter of 2008, Sybase 365 filed a request for reexamination of the ’748 patentclaiming that the patent is invalid. In the second quarter of 2008, the United States Patent and Trademark Officegranted the request and began the requested reexamination of the ’748 patent. There can be no assurances towhat extent the matter will continue to be successful, if at all. Additionally, we could become subject tocounterclaims or further challenges to the validity of the ’748 patent. To date, the Company has not received orrecorded any amounts related to this jury award.
Other than the items discussed immediately above, we are not currently subject to any other material legalproceedings. However, we may from time to time become a party to various legal proceedings arising in theordinary course of our business.
23. Related Party Transactions
In February 2003, we entered into an agreement with Annapolis Partners LLC to explore the opportunity ofrelocating our Annapolis offices to a planned new real estate development. Our President and Chief ExecutiveOfficer owns a controlling voting and economic interest in Annapolis Partners LLC and he also serves as amember. The financial and many other terms of the agreement have not yet been established. The lease issubject to several contingencies and rights of termination. For example, the agreement can be terminated at thesole discretion of our Board of Directors if the terms and conditions of the development are unacceptable to us,including without limitation the circumstances that market conditions make the agreement not favorable to us orthe overall cost is not in the best interest to us or our shareholders, or any legal or regulatory restrictions apply.Our Board of Directors will evaluate this opportunity along with alternatives that are or may become available inthe relevant time periods and there is no assurance that we will enter into a definitive agreement at this newdevelopment site.
F-30
TeleCommunication Systems, Inc.
Notes to Consolidated Financial Statements — (Continued)(amounts in thousands, except share and per share data)

SIGNATURES
Pursuant to the requirements of Section 13 or 15(d) of the Securities Exchange Act of 1934, the registranthas duly caused this report to be signed on its behalf by the undersigned, thereunto duly authorized.TeleCommunication Systems, Inc.
By: /s/ MAURICE B. TOSÉ
Maurice B. ToséChief Executive Officer, President and
Chairman of the Board
Pursuant to the requirements of the Securities Exchange Act of 1934, this report has been signed below bythe following persons on behalf of the registrant and in the capacities and on the dates indicated. Theundersigned hereby constitute and appoint Maurice B. Tosé, Thomas M. Brandt, Jr. and Bruce A. White, andeach of them, their true and lawful agents and attorneys-in-fact with full power and authority in said agents andattorneys-in-fact, and in any one or more of them, to sign for the undersigned and in their respective names asdirectors and officers of TeleCommunication Systems, any amendment or supplement hereto. The undersignedhereby confirm all acts taken by such agents and attorneys-in-fact, and any one or more of them, as hereinauthorized
Name Title Date
/s/ MAURICE B. TOSÉ
Maurice B. Tosé
Chief Executive Officer, President andChairman of the Board (Principal ExecutiveOfficer)
March 3, 2009
/s/ THOMAS M. BRANDT, JR.
Thomas M. Brandt, Jr.
Chief Financial Officer and Senior VicePresident (Principal Financial Officer) andDirector
March 3, 2009
/s/ JAMES M. BETHMANN
James M. Bethmann
Director March 3, 2009
/s/ CLYDE A. HEINTZELMAN
Clyde A. Heintzelman
Director March 3, 2009
/s/ JAN C. HULY
Jan C. Huly
Director March 3, 2009
/s/ RICHARD A. KOZAK
Richard A. Kozak
Director March 3, 2009
Weldon H. Latham
Director March 3, 2009
/s/ BYRON F. MARCHANT
Byron F. Marchant
Director March 3, 2009
/s/ RICHARD A. YOUNG
Richard A. Young
Executive Vice President, Chief OperatingOfficer and Director
March 3, 2009
53

EXHIBIT INDEX
ExhibitNumbers Description
4.1 Amended and Restated Articles of Incorporation. (Incorporated by reference to the company’s QuarterlyReport on Form 10-Q for the quarter ended June 30, 2004)
4.2 Second Amended and Restated Bylaws. (Incorporated by reference to the Company’s Quarterly Report onForm 10-Q for the quarter ended June 30, 2004)
4.3 Form of Class A Common Stock certificate. (Incorporated by reference to the Company’s RegistrationStatement on Form S-1 (No. 333-35522))
4.5 Warrants to Purchase Common Stock issued pursuant to the Securities Purchase Agreement for each ofthe investors party to the Securities Purchase Agreement dated January 13, 2004. (Incorporated byreference to the Company’s Current Report on Form 8-K filed on January 23, 2004)
4.6 Note Purchase Agreement dated March 13, 2006 by and among the Company and the Purchasers namedtherein (Incorporated by reference to the Company’s Annual Report on Form 10-K, as amended, for the yearended December 31, 2005)
4.7 Warrants to Purchase Common Stock issued pursuant to the Note Purchase Agreement dated March 13,2006 to each of the Purchasers named therein (Incorporated by reference to the Company’s Annual Reporton Form 10-K, as amended, for the year ended December 31, 2005)
4.8 Notes issued pursuant to the Note Purchase Agreement dated March 13, 2006 to each of the Purchasersnamed therein (Incorporated by reference to the Company’s Annual Report on Form 10-K, as amended, forthe year ended December 31, 2005)
4.9 Registration Rights Agreement dated March 13, 2006 by and among the Company and the Investors namedtherein (Incorporated by reference to the Company’s Annual Report on Form 10-K, as amended, for the yearended December 31, 2005)
4.10 Intellectual Property Security Agreement dated March 13, 2006 by and among the Company, BonanzaMaster Fund Ltd., as Agent, and the Secured Parties named therein (Incorporated by reference to theCompany’s Annual Report on Form 10-K, as amended, for the year ended December 31, 2005)
4.11 Subordination Agreement dated March 13, 2006 by and among the Company, Silicon Valley Bank, and thePurchasers named therein (Incorporated by reference to the Company’s Annual Report on Form 10-K, asamended, for the year ended December 31, 2005)
10.1 West Garrett Office Building Full service Lease Agreement dated October 1, 1997 by and between theCompany and West Garrett Joint Venture. (Incorporated by reference to the Company’s RegistrationStatement on Form S-1 (No. 333-35522))
10.2† Form of Indemnification Agreement. (Incorporated by reference to the Company’s Registration Statementon Form S-1 (No. 333-35522))
10.3† Fourth Amended and Restated 1997 Stock Incentive Plan. (Incorporated by reference to Appendix A to theCompany’s definitive proxy statement for its 2004 Annual Meeting of stockholders as filed with the SEC onJune 17, 2004 (No. 000-30821))
10.4† First Amended and Restated Employee Stock Purchase Plan. (Incorporated by reference to the Company’sRegistration Statement on Form S-8 (No. 333-136072))
10.5† Optionee Agreement dated October 1, 1997 by and between the Company and Richard A. Young.(Incorporated by reference to the Company’s Registration Statement on Form S-1 (No. 333-35522))
10.6† Optionee Agreement dated July 29, 1998 by and between the Company and Richard A. Young.(Incorporated by reference to the Company’s Registration Statement on Form S-1 (No. 333-35522))
10.7† Optionee Agreement dated October 1, 1997 by and between the Company and Thomas M. Brandt, Jr.(Incorporated by reference to the Company’s Registration Statement on Form S-1 (No. 333-35522))
10.8† Optionee Agreement dated July 29, 1998 by and between the Company and Thomas M. Brandt, Jr.(Incorporated by reference to the Company’s Registration Statement on Form S-1 (No. 333-35522))
10.9† Optionee Agreement dated April 1, 1999 by and between the Company and Thomas M. Brandt, Jr.(Incorporated by reference to the Company’s Registration Statement on Form S-1 (No. 333-35522))
10.10† 401(k) and Profit Sharing Plan of the Company dated January 1, 1999. (Incorporated by reference to theCompany’s Registration Statement on Form S-4 (No. 333-51656))
54

ExhibitNumbers Description
10.11† Employment Agreement dated February 1, 2001 by and between the Company and Richard A. Young.(Incorporated by reference to the Company’s Quarterly Report on Form 10-Q for the quarter endedSeptember 30, 2001)
10.12† Employment Agreement dated February 1, 2001 by and between the Company and Thomas M. Brandt.(Incorporated by reference to the Company’s Quarterly Report on Form 10-Q for the quarter endedSeptember 30, 2001)
10.13† Employment Agreement dated February 1, 2001 by and between the Company and Drew A. Morin.(Incorporated by reference to the Company’s Quarterly Report on Form 10-Q for the quarter endedSeptember 30, 2001)
10.14† Employment Agreement dated February 1, 2001 by and between the Company and Timothy J. Lorello.(Incorporated by reference to the Company’s Quarterly Report on Form 10-Q for the quarter endedSeptember 30, 2001)
10.15‡ Services Integration Agreement dated January 31, 2002 by and between the Company and Hutchison 3G.(Incorporated by reference to the Company’s Annual Report on Form 10-K for the year ended December 31,2001)
10.16 Deed of Lease by and between Annapolis Partner, LLC and the Company. (Incorporated by reference to theCompany’s Annual Report on Form 10-K for the year ended December 31, 2002)
10.17† Restricted stock award certificate to Mr. Thomas M. Brandt, Jr. (Incorporated by reference to theCompany’s Quarterly Report on Form 10-Q for the quarter ended September 30, 2003)
10.18† Restricted stock award certificate to Mr. Thomas M. Brandt, Jr. (Incorporated by reference to theCompany’s Quarterly Report on Form 10-Q for the quarter ended September 30, 2003)
10.19† Restricted stock award certificate to Mr. Clyde A. Heintzelman. (Incorporated by reference to theCompany’s Quarterly Report on Form 10-Q for the quarter ended September 30, 2003)
10.20† Restricted stock award certificate to Mr. Richard A. Kozak. (Incorporated by reference to the Company’sQuarterly Report on Form 10-Q for the quarter ended September 30, 2003)
10.21† Restricted stock award certificate to Mr. Weldon H. Latham. (Incorporated by reference to the Company’sQuarterly Report on Form 10-Q for the quarter ended September 30, 2003)
10.22† Restricted stock award certificate to Mr. Timothy J. Lorello. (Incorporated by reference to the Company’sQuarterly Report on Form 10-Q for the quarter ended September 30, 2003)
10.23† Restricted stock award certificate to Mr. Timothy J. Lorello. (Incorporated by reference to the Company’sQuarterly Report on Form 10-Q for the quarter ended September 30, 2003)
10.24† Restricted stock award certificate to Mr. Bryon F. Marchant. (Incorporated by reference to the Company’sQuarterly Report on Form 10-Q for the quarter ended September 30, 2003)
10.25† Restricted stock award certificate to Mr. Drew A. Morin. (Incorporated by reference to the Company’sQuarterly Report on Form 10-Q for the quarter ended September 30, 2003)
10.26† Restricted stock award certificate to Mr. Drew A. Morin. (Incorporated by reference to the Company’sQuarterly Report on Form 10-Q for the quarter ended September 30, 2003)
10.27† Restricted stock award certificate to Mr. Maurice B. Tosé. (Incorporated by reference to the Company’sQuarterly Report on Form 10-Q for the quarter ended September 30, 2003)
10.28† Restricted stock award certificate to Mr. Maurice B. Tosé. (Incorporated by reference to the Company’sQuarterly Report on Form 10-Q for the quarter ended September 30, 2003)
10.29† Restricted stock award certificate to Mr. Kevin M. Webb. (Incorporated by reference to the Company’sQuarterly Report on Form 10-Q for the quarter ended September 30, 2003)
10.30† Restricted stock award certificate to Mr. Kevin M. Webb. (Incorporated by reference to the Company’sQuarterly Report on Form 10-Q for the quarter ended September 30, 2003)
10.31† Restricted stock award certificate to Mr. Richard A. Young. (Incorporated by reference to the Company’sQuarterly Report on Form 10-Q for the quarter ended September 30, 2003)
10.32† Restricted stock award certificate to Mr. Richard A. Young. (Incorporated by reference to the Company’sQuarterly Report on Form 10-Q for the quarter ended September 30, 2003)
55

ExhibitNumbers Description
10.33 Registration Rights Agreement dated as of December 18, 2003 by and among the Company and theinvestors party to the 2003 SPA. (Incorporated by reference to Exhibit 10 to the Company’s Current Reporton Form 8-K dated December 18, 2003)
10.34 Trademark License Agreement by and among Aether, TSYS and the Company dated as of January 13, 2004.(Incorporated by reference to the Company’s Current Report on Form 8-K filed on January 23, 2004)
10.35 Registration Rights Agreement by and between the Company and Aether dated as of January 13, 2004.(Incorporated by reference to the Company’s Current Report on Form 8-K filed on January 23, 2004)
10.36 Amended and Restated Loan and Security Agreement by and between the Company and Silicon ValleyBank. (Incorporated by reference to the Company’s Quarterly Report on Form 10-Q for the quarter endedSeptember 30, 2004)
10.37† Restricted stock award certificate to Mr. Clyde A. Heintzelman (Incorporated by reference to the Company’sAnnual Report on Form 10-K, as amended, for the year ended December 31, 2005)
10.38† Restricted stock award certificate to Mr. Richard A. Kozak (Incorporated by reference to the Company’sAnnual Report on Form 10-K, as amended, for the year ended December 31, 2005)
10.39† Restricted stock award certificate to Mr. Weldon F. Latham (Incorporated by reference to the Company’sAnnual Report on Form 10-K, as amended, for the year ended December 31, 2005)
10.40† Restricted stock award certificate to Mr. Byron F. Marchant (Incorporated by reference to the Company’sAnnual Report on Form 10-K, as amended, for the year ended December 31, 2005)
10.46 Second Amended and Restated Loan and Security Agreement by and between the Company and SiliconValley Bank (Incorporated by reference to the Company’s Quarterly Report on Form 10-Q for the quarterended September 30, 2005)
10.47† Form of Incentive Stock Option Agreement
10.48† Form of Non-Qualified Stock Option Agreement
10.49† Form of Restricted Stock Grant Agreement
12.1 Supplemental Financial Statement Schedule II
21.1 Subsidiaries of the Registrant
23.1 Consent of Ernst & Young LLP
23.2 Consent of James Cowper
31.1 Certification of CEO required by the Securities and Exchange Commission Rule 13a-14(a) or 15d-14(a)
31.2 Certification of CEO required by the Securities and Exchange Commission Rule 13a-14(a) or 15d-14(a)
32.1 Certification pursuant to 18 U.S.C. Section 1350, as adopted pursuant to Section 906 of the Sarbanes-OxleyAct of 2002
32.2 Certification pursuant to 18 U.S.C. Section 1350, as adopted pursuant to Section 906 of the Sarbanes-OxleyAct of 2002
99.01 Report of Independent Auditors- James Cowper
† Management contract, compensatory plans or arrangement required to be filed as an exhibit pursuant to Item 15(a)(3)of Form 10-K.
‡ Confidential treatment has been for certain portions of this Exhibit pursuant to Rule 24b-2 of the Securities ExchangeAct of 1934, as amended, which portions have been omitted and filed separately with the Securities and ExchangeCommission.
56

Commercial / Carrier Segment
Text messaging technology. According to a study released in
December 2008, the typical U.S. wireless consumer sends and
receives more Short Message Service (SMS) text messages than
mobile voice calls – and the typical U.S. teen mobile subscriber now
sends or receives six times more text messages than phone calls.
TCS earns revenue from licensing and maintaining the carrier net-
work software which enables text messaging. Our experience in
2008 portends signifi cant sales of incremental licensed SMS capacity,
and growing maintenance and professional service revenues, for at
least several years to come.
Wireless location-based service (LBS) technology and electronic
map data. TCS continues to provide about half the wireless E9-1-1
call routing service in the U.S. to more than 35 carriers using our core
LBS expertise, and we’re investing to effi ciently serve next genera-
tion carrier architectures – wireless and wireline. Our customers also
include voice over IP and telematics companies. Telematics is in-vehicle
information technology which integrates location data, enabled
by wireless communication, and involves companies like OnStar and
Denso. The TCS Master Street Address Guide validation service
has won awards, including a 2008 Product of the Year Award from
Technology Marketing Corporation.
Proliferation of the devices for widespread use of premium location-
based services continued in 2008, and the accompanying graph
indicates analyst expectations for shipments of GPS-enabled hand-
sets around the world.
During 2008 we added a net of six carrier customers using our
Xypoint Location Platform, including both in-network deployments
and hosted location business. With our partner, Qualcomm, we are
proceeding to provide hosted location infrastructure and application
technology to Tata TeleServices, a 25-million subscriber carrier in India,
and we are in discussions with other operators in India. We have also
entered into an agreement with Beijing’s Alliance Digital Group, an
advisor for cross-border selling into the China market. ADG has a suc-
cessful track record with other telecommunications vendors.
We have launched our navigation and maps applications at Centennial
Puerto Rico – another TCS LBS “full meal deal,” including the hosted
XLP location platform and applications. This is an example of the
appeal to carriers of TCS’s integrated location solution, which enables a
faster time to revenue.
In the telematics market, we have expanded the range and scope
of our electronic map and points-of-interest based deliverables, and
are working closely with a growing base of customers and partners.
Government / Satcom Segment
Systems. During 2008 we announced the largest new contract win in
TCS history – an award under the Army’s World-Wide Satellite Systems
(WWSS) contract called SNAP (Secure and Nonsecure IP router Access
Points). This program has a potential value to TCS of $246 million for
about 1,500 SNAP systems over three years. In conjunction with these
shipments, TCS employees and contractors also provide fi eld support
staff for training, installation, and logistical support services. We have
orders and production in motion to carry us well into 2009.
Another WWSS program, Wireless Point-to-Point Link (WPPL) for the
U.S. Marine Corps, contributed $22 million of 2008 revenue. We carry a
healthy backlog of WPPL orders and unfunded options that are likely to
be exercised in 2009.
New product offerings include a high data-speed, man-packable, dual
Ku band and X band VSAT terminal, which we have branded “Stingray,”
with the smallest form factor designed by TCS to date. The entire kit
can fi t into the overhead bin of a commercial airline or in a backpack.
To accommodate our rapid growth in 2008, we expanded our integra-
tion facility in Tampa to about 46,000 square feet. We have been able
to recruit experienced management, engineering talent, and production
labor to keep pace with deliveries, and investments in supply chain man-
agement personnel and tools have enabled us to handle our growth.
Services. New services accounts in 2008 include the U.S. Army
Materiel Command HQ; the U.S. Army Offi ce for Continuity of
Operations planning; and the Department of Homeland Security CIO.
And we now provide managed satcom bandwidth services for criti-
cal U.S. diplomatic missions, expanded services to new locations in
Fort Hood and Fort Huachuca, as well as in Iraq and Afghanistan.
These contracts are in addition to longstanding major service relation-
ships with Defense Telecom Services, the Directorates of Information
Management, and the City of Baltimore. Investments in teleport infra-
structure should contribute to signifi cant continued growth in 2009.
Intellectual Property
TCS’s investments in communications technology have resulted in
more than 65 patents and more than 200 applications pending. A
patent sale, which netted us $8 million in 2008, was our third and
largest success to date in monetizing patents. Our patent litigation
case against Sybase is still pending appeals that we believe will result in
a successful outcome. We have begun soliciting royalty revenue from
licensing our patents for mobile-originated to internet addresses.
Conclusion
Diffi cult economic times are continuing, and we are gratifi ed that
our company faces them while fi nancially well-capitalized and
focused on market niches where growth and profi tability are
promising. Our company’s text messaging, deployable satcom,
and public safety technology address recession-resistant needs.
During 2008, the company’s stock joined the Russell 2000, average
trading grew to more than a half million shares a day in the fourth
quarter (up from less than half that early in the year), and the market
price grew from the year-opening $3.71 to a high of $8.91. Several
year-end lists, including The Wall Street Journal and Motley Fool publi-
cations, called out TSYS among the best performing stocks of 2008.
While this is gratifying, management is very mindful there is much work
to do in 2009 to continue to improve company performance and inves-
tor market understanding of the value of our business. I appreciate the
efforts of our employees and partners whose loyalty, resourcefulness,
and commitment to quality and customer service have produced the valu-
able and promising enterprise that is TeleCommunication Systems today.
Sincerely,
Maurice B. Tosé
Chairman, President and CEO
Caution Concerning Forward-Looking Statements
This document includes certain “forward-looking statements” within the meaning of the Private Securities Litigation Reform Act of 1995. For example, the statements that (i) the com-
pany holds the promise of continued profitable growth; (ii) significant sales of incremental licensed SMS capacity, maintenance and professional service revenues are expected for several
years to come; (iii) we have invested to efficiently serve next generation carrier architectures; (iv) we anticipate selling into the China market; (v) we are expanding telematics opportuni-
ties with a growing base of customers and partners; (vi) certain government systems deals have potential for higher revenue and that a healthy backlog of orders and unfunded options
are likely to be exercised in 2009; (vii) investments in teleport infrastructure should contribute to significant growth in 2009; (viii) we believe our patent enforcement efforts will result in
a successful outcome; (ix) we are focused on market niches where growth and profitability are promising; and (x) that our products and services serve recession-resistant needs are some
of the forward-looking statements in this document. These statements involve risks and uncertainties, and actual results may differ materially. Factors that could cause or contribute to
such differences include, but are not limited to, those discussed elsewhere in the Company’s filings with the Securities and Exchange Commission. Readers are cautioned not to place
undue reliance on the forward-looking statements, which speak only as of the date of this Annual Report. The Company undertakes no obligation to publicly release any revisions to
the forward-looking statements or reflect events or circumstances after the date of this document.
Reconciliation of EBITDA to Net Income/(Loss)
EBITDA is not a financial measure calculated and presented in accordance with U.S. generally accepted accounting principles (GAAP) and should not be considered as an alter-
native to net income, operating income, or any other financial measures so calculated and presented, nor as an alternative to cash flow from operating activities as a measure
of our liquidity. We present EBITDA because we believe it to be an important supplemental measure of our performance that is commonly used by securities analysts, inves-
tors, and other interested parties in the evaluation of companies in our industry. Management also uses this information internally for forecasting and budgeting. It may not
be indicative of the historical operating results of TCS nor is it intended to be predictive of potential future results.
($ in millions) 2004 2005 2006 2007 2008
Net income/(loss) on a GAAP basis $ (18.5) $ (11.5) $ (21.7) $ (1.3) $ 57.6
Depreciation and amortization 7.9 9.6 9.3 7.7 8.1
Non-cash stock-based compensation 1.2 0.7 3.1 4.3 3.8
Financing and other expenses (incl. debt conversion expense in 2004) 11.1 1.3 3.2 4.6 0.9
Discontinued operations 2.6 7.2 23.7 0.3 -
Benefit for income taxes - - - - (33.3)
Gain on sale of patent - - - - (8.1)
EBITDA from continuing operations $ 4.3 $ 7.3 $ 17.6 $ 15.6 $ 29.0
Copyright
Copyright © 2009 TeleCommunication Systems, Inc. (TCS). All rights reserved. Enabling Convergent Technologies®, SwiftLink®, Xypoint®, LivewirE911™, RAVE911™, and Wireless
Intelligent Gateway™ are trademarks of TCS. All other trademarks are the property of their respective companies. Information subject to change without notice. | NasdaqGM: TSYS
DE
SIG
N:
BA
RK
ER
DE
SIG
N,
INC
.
Maurice B. ToséChairman, President and CEO
Corporate InformationDear Fellow Shareholders:
Our company’s record 2008 fi nancial performance refl ects returns on investments in technology
and business relationships that we made with a long-term view. In our 22nd year, the TCS team
of communications and IT professionals has evolved to focus on monetizing text messaging,
location-based wireless technology (including public safety applications), and secure satellite-
based communications technology. Demand for our deliverables grew substantially in 2008,
and our company responded effectively across the board. We enter 2009 as a larger-scale
enterprise, with the promise of continued profi table growth around all three core competencies.
# of Patents # of Applications
Technology Areas for TCS Patents & Patent Applications
Secure Coms
Wireless Data
Messaging
Public Safety
Mapping - Navigation
Location
Secure Coms - 4%
Wireless Data - 15%
Messaging - 21%
Public Safety - 20%
Mapping - Navigation - 8%
Location - 32%
100806040200
13
22
40
55
76
22
21
21
17
5
1
in thousands
Source: Northern Sky Research 2008
Military & Government Satellite Market:Total in-Service Ground Terminals
20182007 2008 2009 2010 2011 2012 2013 2014 2015 2016 2017
1,091
960
846
734632
520
432394361330297259
0
200
400
600
800
1,000
0
$10
$20
$30
$40
$50
TCS
Mes
sagi
ng R
even
ue (M
illio
ns)
U.S
. SM
S Pe
r Ye
ar (B
illio
ns)
0
500
1,000
1,500
2,000
2,500
2004 2005 2006 2007 2008 2009 2010 2011
TCS Messaging Revenue
TCS SMS / Year (Company Est.)
US SMS / Year (Frost & Sullivan)
actual forecast
TCS - Text Messaging Leader
TCS earns revenue from SMS via perpetual, capacity-based software licenses to carriers, along with customization services and software maintenance.
Source: ABI Research, 7-08
700
600
500
400
300
200
100
Global Outlook for Location-Based Services (LBS)GPS Enabled Handset Shipments, World Market 2005-2013
Africa ME
Eastern Europe
Western Europe
South America
North America
Asia Pacific
2005 2006 2007 2008 2009 2010 2011 2012 2013
Maurice B. ToséChairman of the Board President and Chief Executive Officer TeleCommunication Systems, Inc.
James M. BethmannManaging DirectorThe Caldwell Partners InternationalToronto, Ontario, Canada
Thomas M. Brandt, Jr. Senior Vice President and Chief Financial OfficerTeleCommunication Systems, Inc.
Clyde A. HeintzelmanExecutive Chairman Diet BrownSeattle, Washington
Lt. Gen. Jan C. Huly (USMC, Ret.)Annandale, Virginia
Richard A. KozakChief Executive Officer R&D2, LLCAnnapolis, Maryland
Weldon H. LathamSenior Partner Davis Wright Tremaine LLPWashington, D.C.
Byron F. MarchantPresident and Chief Executive OfficerThe U.S. Naval Academy Alumni Association and FoundationAnnapolis, Maryland
Richard A. YoungExecutive Vice President and Chief Operating OfficerTeleCommunication Systems, Inc.
Board of Directors
Senior Corporate Executives
Maurice B. ToséChairman of the BoardPresident and Chief Executive Officer
Richard A. YoungExecutive Vice President and Chief Operating Officer
Thomas M. Brandt, Jr.Senior Vice President and Chief Financial Officer
Drew A. MorinSenior Vice President and Chief Technology Officer
Timothy J. LorelloSenior Vice President Commercial Sales and Chief Marketing Officer
Dan A. AllenSenior Vice PresidentService Bureau Operations
Michael D. Bristol, Sr.Senior Vice PresidentGovernment Solutions Group
Stockholder Information
Stock ListingTeleCommunication Systems, Inc. Class A common stock is traded on the NASDAQ Global Market under the symbol TSYS.
Transfer Agent and RegistrarAmerican Stock Transfer and Trust CompanyNew York, New York
Form 10-K Additional copies of this annual report on Form 10-K, as filed with the Securities and Exchange Commission, are available without charge upon request from the company. Copies also are available for download via the investor section at www.telecomsys.com.
Annual MeetingThe annual meeting of shareholders will be held at 10:00 a.m. on June 11, 2009 at: The Westin Annapolis 100 Westgate Circle Annapolis, Maryland.

20
08
AN
NU
AL
RE
PO
RT
T
EL
EC
OM
MU
NIC
AT
ION
SY
ST
EM
S, IN
C.
About the Company
TeleCommunication Systems, Inc. (TCS) engineers and delivers highly reliable wireless communications technology.
Investments since 1987 in wireless technology R&D and customer relationships have led to growing software-
based text messaging and location-based service businesses (including public safety applications) with leading
wireless, VoIP, and telematics customers, and rapidly growing satcom and IT solutions business with U.S. govern-
ment agencies. The company has about 600 employees (based primarily in Annapolis and metro D.C., Seattle,
Oakland, and Tampa), and a portfolio of more than 65 patents and more than 200 applications pending.
Commercial / Carriers
• Licensed software for text messaging and location-based services technology for wireless carriers and Voice over
Internet Protocol (VoIP) service providers. World leadership in technology for capturing and using the “X/Y” coordinates
that defi ne the precise location of a wireless device user.
• In-network systems, including the Company’s Xypoint® Location Platform, Wireless Intelligent Gateway™ for
network data traffi c management, Short Message Service Center (SMSC), wireless portal (e.g., www.vtext.com), and
the Xypoint® Mapping Server for geospatial information.
• Hosted applications in TL 9000-certifi ed facilities, including E9-1-1 call routing and related services, along with reference
network services for assisted GPS, in Seattle, Phoenix and Mumbai.
• Handset-based and vehicle applications for navigation, traffi c, and points of interest via downloadable wireless and
telematics technology.
• Customers include Verizon Wireless, AT&T Mobility, Tata Teleservices, Hutchison Whampoa’s 3 networks, T-Mobile,
Vonage, and Denso.
Government / Satcom
• SwiftLink® deployable, secure satellite-based wireless communication systems, and related terrestrial
systems, fi eld support and maintenance.
• Services including secure teleport facilities, communications engineering, program management, continuity of
operations planning, telecom expense management and help desk outsourcing.
• One of six prime vendors for the U.S. Army’s fi ve-year, Indefi nite Delivery, Indefi nite Quantity (IDIQ), $5 billion
World-Wide Satellite Systems (WWSS) contract vehicle through 2011.
• Customers include the U.S. Departments of Defense, State, and Homeland Security.
millionsRevenue
CAGR = Compound Annual Growth Rate
Government
Commercial
23% CAGR
$97 $102$125
$144
$220
2004 2005 2006 200820070
50
100
150
200
EBITDA
$.19
$.44$.38
$.79
$.17
$.62
$.13
2004 2005 2006 2007 2008
per diluted share
0
0.10
0.20
0.30
0.40
0.50
0.60
0.70
EBITDA – Earnings Before Interest, Taxes, Depreciation and Amortization
See reconciliation to GAAP on the inside back cover
2008 includes $0.17 per share from patent sale in Q2
2004 2005 2006 2007 2008
-0.30
-0.60
0
0.30
0.60
0.90
1.20
per diluted shareNet Income
-$.11$.05 -$.02
$1.23
$.71
$.17
$.35
-$.48
2008 includes no tax expense, $0.71 tax benefit
and $0.17 Q2 patent sale
CERTIFIEDISO 9001:2000
CERTIFIEDTL 9000
Carrier Service Bureau Operations Carrier and Government Operations
2401 Elliott Avenue
Seattle, WA 98121
206.792.2000
300 Lakeside Drive
Oakland, CA 94612
510.763.3300
206 Kelsey Lane
Tampa, FL 33619
813.831.6353
Headquarters275 West Street
Annapolis, MD 21401
410.263.7616
1.888.728.TSYS (8797)
www.telecomsys.com
TeleCommunication Systems Ltd.338 Euston Road
London NW1 3BT
+44 (0) 7544 8606
Commercial Sales SupportAlliance Digital Group
Beijing, China
Forward Deployed Depot CentersBaghdad & Tikrit,
Iraq
Hosted Applications Facility
Mumbai,
India
Swiftlink® Sales & Service CenterBahrain
Software Development CenterDelhi,
India
Teleports
Manassas, VA
Fuchsstadt, GE
Bedford, UK
Chalfont Grove, UK