Bayer Annual Report 2008 - AnnualReports.com
262
» Key Data » Credo » Chairman’s Letter ........................................................................... 4 » Board of Management ...................................................................... 8 » Report of the Supervisory Board....................................................... 10 INVESTOR INFORMATION » Bayer Stock and Bonds................................................................... 14 BAYER MAGAZINE » A Changing World ......................................................................... 22 » The Bayer Climate Program............................................................. 28 » Research – the Key to the Future ...................................................... 29 » Research for a Healthier Future ........................................................ 30 » Richer Harvests and Secure Food Supplies ......................................... 36 » The Stuff the Future is Made of ....................................................... 42 » Highlights 2008 ........................................................................... 48 » GROUP MANAGEMENT REPORT ........................................ 50 » CONSOLIDATED FINANCIAL STATEMENTS OF THE BAYER GROUP ...................................................... 133 FURTHER INFORMATION » Governance Bodies ...................................................................... 247 » Organization Chart ....................................................................... 249 » Group Leadership Circle ............................................................... 250 » Glossary ................................................................................... 252 » Index ....................................................................................... 256 » Global Commitment to Sustainability .............................................. 258 » The Bayer Group » At Home Throughout The World » Five-Year Financial Summary » Financial Calendar, Masthead, Disclaimer COVER PICTURE Bayer chemists Dr. Susanne Roehrig and Dr. Alexander Straub examine the molecular contours of rivaroxaban – the active ingredient of the new anticoagulant Xarelto ® – using a computer simulation. One of Bayer‘s aims in developing this innovative drug is to minimize the risk of thrombosis following orthopedic surgery. Read more in the magazine section on page 32. For direct access to a chapter, simply click on its name. ANNUAL REPORT 2008
-
Upload
khangminh22 -
Category
Documents
-
view
0 -
download
0
Transcript of Bayer Annual Report 2008 - AnnualReports.com

» Key Data» Credo» Chairman’s Letter . . . . . . . . . . . . . . . . . . . . . . . . . . . . . . . . . . . . . . . . . . . . . . . . . . . . . . . . . . . . . . . . . . . . . . . . . . . 4» Board of Management . . . . . . . . . . . . . . . . . . . . . . . . . . . . . . . . . . . . . . . . . . . . . . . . . . . . . . . . . . . . . . . . . . . . . . 8» Report of the Supervisory Board. . . . . . . . . . . . . . . . . . . . . . . . . . . . . . . . . . . . . . . . . . . . . . . . . . . . . . . 10
INVESTOR INFORMATION» Bayer Stock and Bonds . . . . . . . . . . . . . . . . . . . . . . . . . . . . . . . . . . . . . . . . . . . . . . . . . . . . . . . . . . . . . . . . . . . 14
BAYER MAGAZINE
» A Changing World . . . . . . . . . . . . . . . . . . . . . . . . . . . . . . . . . . . . . . . . . . . . . . . . . . . . . . . . . . . . . . . . . . . . . . . . . 22» The Bayer Climate Program . . . . . . . . . . . . . . . . . . . . . . . . . . . . . . . . . . . . . . . . . . . . . . . . . . . . . . . . . . . . . 28» Research – the Key to the Future . . . . . . . . . . . . . . . . . . . . . . . . . . . . . . . . . . . . . . . . . . . . . . . . . . . . . . 29» Research for a Healthier Future . . . . . . . . . . . . . . . . . . . . . . . . . . . . . . . . . . . . . . . . . . . . . . . . . . . . . . . . 30» Richer Harvests and Secure Food Supplies . . . . . . . . . . . . . . . . . . . . . . . . . . . . . . . . . . . . . . . . . 36» The Stuff the Future is Made of . . . . . . . . . . . . . . . . . . . . . . . . . . . . . . . . . . . . . . . . . . . . . . . . . . . . . . . 42» Highlights 2008 . . . . . . . . . . . . . . . . . . . . . . . . . . . . . . . . . . . . . . . . . . . . . . . . . . . . . . . . . . . . . . . . . . . . . . . . . . . 48
» GROUP MANAGEMENT REPORT . . . . . . . . . . . . . . . . . . . . . . . . . . . . . . . . . . . . . . . . 50
» CONSOLIDATED FINANCIAL STATEMENTS OF THE BAYER GROUP . . . . . . . . . . . . . . . . . . . . . . . . . . . . . . . . . . . . . . . . . . . . . . . . . . . . . . 133
FURTHER INFORMATION» Governance Bodies . . . . . . . . . . . . . . . . . . . . . . . . . . . . . . . . . . . . . . . . . . . . . . . . . . . . . . . . . . . . . . . . . . . . . . 247» Organization Chart . . . . . . . . . . . . . . . . . . . . . . . . . . . . . . . . . . . . . . . . . . . . . . . . . . . . . . . . . . . . . . . . . . . . . . . 249» Group Leadership Circle . . . . . . . . . . . . . . . . . . . . . . . . . . . . . . . . . . . . . . . . . . . . . . . . . . . . . . . . . . . . . . . 250» Glossary . . . . . . . . . . . . . . . . . . . . . . . . . . . . . . . . . . . . . . . . . . . . . . . . . . . . . . . . . . . . . . . . . . . . . . . . . . . . . . . . . . . 252» Index . . . . . . . . . . . . . . . . . . . . . . . . . . . . . . . . . . . . . . . . . . . . . . . . . . . . . . . . . . . . . . . . . . . . . . . . . . . . . . . . . . . . . . . 256» Global Commitment to Sustainability . . . . . . . . . . . . . . . . . . . . . . . . . . . . . . . . . . . . . . . . . . . . . . 258
» The Bayer Group» At Home Throughout The World» Five-Year Financial Summary» Financial Calendar, Masthead, Disclaimer
COVER PICTURE
Bayer chemists Dr. Susanne Roehrig and Dr. Alexander Straub examine the molecular contours of rivaroxaban – the active ingredient of the new anticoagulant Xarelto® – using a computer simulation. One of Bayer‘s aims in developing this innovative drug is to minimize the risk of thrombosis following orthopedic surgery. Read more in the magazine section on page 32.
For direct access to a chapter, simply click on its name.
A N N U A L R E P O R T
2008
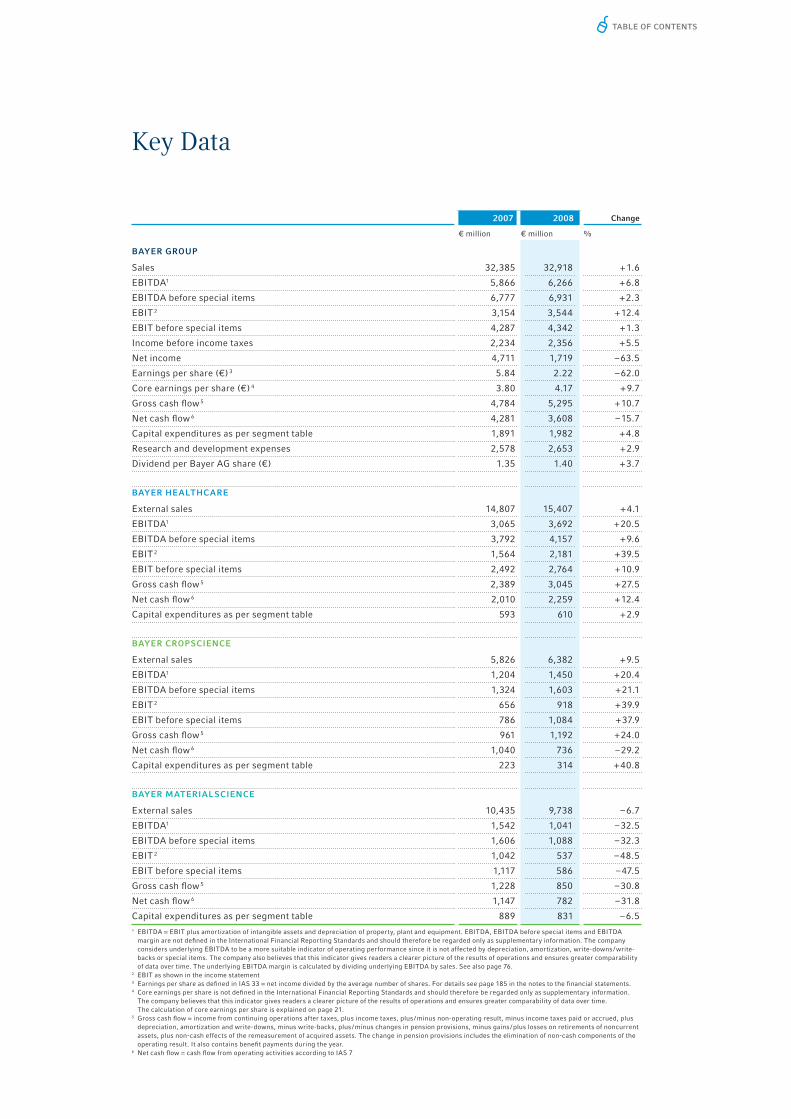
TABLE OF CONTENTS
Key Data
2007 2008 Change
€ million € million %
BAYER GROUP
Sales 32,385 32,918 + 1.6
EBITDA1 5,866 6,266 + 6.8
EBITDA before special items 6,777 6,931 + 2.3
EBIT 2 3,154 3,544 + 12.4
EBIT before special items 4,287 4,342 + 1.3
Income before income taxes 2,234 2,356 + 5.5
Net income 4,711 1,719 – 63.5
Earnings per share (€) 3 5.84 2.22 – 62.0
Core earnings per share (€) 4 3.80 4.17 + 9.7
Gross cash fl ow 5 4,784 5,295 + 10.7
Net cash fl ow 6 4,281 3,608 – 15.7
Capital expenditures as per segment table 1,891 1,982 + 4.8
Research and development expenses 2,578 2,653 + 2.9
Dividend per Bayer AG share (€) 1.35 1.40 + 3.7
BAYER HEALTHCARE
External sales 14,807 15,407 + 4.1
EBITDA1 3,065 3,692 + 20.5
EBITDA before special items 3,792 4,157 + 9.6
EBIT 2 1,564 2,181 + 39.5
EBIT before special items 2,492 2,764 + 10.9
Gross cash fl ow 5 2,389 3,045 + 27.5
Net cash fl ow 6 2,010 2,259 + 12.4
Capital expenditures as per segment table 593 610 + 2.9
BAYER CROPSCIENCE
External sales 5,826 6,382 + 9.5
EBITDA1 1,204 1,450 + 20.4
EBITDA before special items 1,324 1,603 + 21.1
EBIT 2 656 918 + 39.9
EBIT before special items 786 1,084 + 37.9
Gross cash fl ow 5 961 1,192 + 24.0
Net cash fl ow 6 1,040 736 – 29.2
Capital expenditures as per segment table 223 314 + 40.8
BAYER MATERIALSCIENCE
External sales 10,435 9,738 – 6.7
EBITDA1 1,542 1,041 – 32.5
EBITDA before special items 1,606 1,088 – 32.3
EBIT 2 1,042 537 – 48.5
EBIT before special items 1,117 586 – 47.5
Gross cash fl ow 5 1,228 850 – 30.8
Net cash fl ow 6 1,147 782 – 31.8
Capital expenditures as per segment table 889 831 – 6.51 EBITDA = EBIT plus amortization of intangible assets and depreciation of property, plant and equipment. EBITDA, EBITDA before special items and EBITDA
margin are not defi ned in the International Financial Reporting Standards and should therefore be regarded only as supplementary information. The company considers underlying EBITDA to be a more suitable indicator of operating performance since it is not affected by depreciation, amortization, write-downs / write-backs or special items. The company also believes that this indicator gives readers a clearer picture of the results of operations and ensures greater comparability of data over time. The underlying EBITDA margin is calculated by dividing underlying EBITDA by sales. See also page 76.
2 EBIT as shown in the income statement3 Earnings per share as defi ned in IAS 33 = net income divided by the average number of shares. For details see page 185 in the notes to the fi nancial statements. 4 Core earnings per share is not defi ned in the International Financial Reporting Standards and should therefore be regarded only as supplementary information.
The company believes that this indicator gives readers a clearer picture of the results of operations and ensures greater comparability of data over time. The calculation of core earnings per share is explained on page 21.
5 Gross cash fl ow = income from continuing operations after taxes, plus income taxes, plus / minus non-operating result, minus income taxes paid or accrued, plus depreciation, amortization and write-downs, minus write-backs, plus / minus changes in pension provisions, minus gains / plus losses on retirements of noncurrent assets, plus non-cash effects of the remeasurement of acquired assets. The change in pension provisions includes the elimination of non-cash components of the operating result. It also contains benefi t payments during the year.
6 Net cash fl ow = cash fl ow from operating activities according to IAS 7

TABLE OF CONTENTS
Bayer: Science For A Better Life
Bayer is a global enterprise with core
competencies in the fi elds of health care,
nutrition and high-tech materials.
As an inventor company, we set trends
in research-intensive areas. Our products
and services are designed to benefi t
people and improve their quality of life.
At the same time we want to create
value through innovation, growth and
high earning power.
We are committed to the principles of
sustainable development and to our
social and ethical responsibilities as a
corporate citizen.

4 / / BAYER ANNUAL REPORT 2008 TABLE OF CONTENTS
We look back on an eventful year. The fourth quarter, particularly, was marked by the
unexpectedly severe fi nancial and economic crisis. While the economy remains sur-
rounded by considerable uncertainty, we are looking to the future with relative confi -
dence. Our Group strategy is tried and tested, and our commitment to research and
development stands undiminished even in diffi cult times. A further budget increase, to
€2.9 billion, will make this year’s r&d spending the highest in our history and lay the
foundations for future growth.
We believe Bayer is well equipped, we trust in its strengths, and we stand for sustainable
success. Our performance last year bolsters that confi dence. Operationally, 2008 was
Bayer’s most successful year ever. We again improved our key data compared to the prior
year and achieved our published earnings targets:
We stand for sustainable success

CHAIRMAN’S LETTER 5TABLE OF CONTENTS
Sales rose to €32.9 billion, up by a currency- and portfolio-adjusted 4.4 percent.
ebitda before special items increased by 2.3 percent to €6.9 billion, with the margin
edging up to 21.1 percent from 20.9 percent in 2007.
At Bayer HealthCare, the ebitda margin before special items moved ahead to 27 per-
cent.
Bayer CropScience achieved an underlying ebitda margin of 25 percent, reaching its
2009 target a year earlier than originally planned.
Bayer MaterialScience – despite a substantial drop in business toward the end of the
year – posted a cash fl ow return on investment (cfroi) of 10.1 percent, clearly exceed-
ing the internal hurdle.
With a cfroi of 13 percent for the Bayer Group, the highest in our history, we created
appreciable value for you, our stockholders.
These achievements were made possible by an outstanding level of commitment on the
part of our employees, whom I would like to thank on behalf of the entire Board of
Management. And I can assure you that we are taking the overall economic situation and
the related concerns of our workforce very seriously. Of course, Bayer too must take
appropriate steps in response to the crisis. Yet now more than ever, positive signals are
needed to encourage and motivate our people.
It goes without saying that you, our stockholders, should also benefi t from the solid per-
formance of our business. The Board of Management and the Supervisory Board are
therefore proposing to raise the dividend by 3.7 percent from the previous year, to €1.40.
Bayer stock was unable to escape the general market trend, which was determined by the
changing economic situation. Yet its 32 percent decline on the year was signifi cantly
smaller than that of the dax (minus 40 percent) or the euro stoxx 50 (minus 42 percent).
We achieved a great deal in 2008. It was a strong year for Bayer HealthCare, with all
divisions performing very well and posting above-market rates of growth. The integra-
tion of Schering, Berlin, Germany, was successfully completed. And we strengthened key
areas of the business with further acquisitions and inlicensed products.
A highlight of 2008 is featured on the cover of this Annual Report: the fi rst marketing
approvals for our new anticoagulant Xarelto. We believe this innovative drug could
achieve peak annual sales of more than €2 billion.
Bayer CropScience turned in the best performance in the history of our crop protection
business, benefi ting from the positive conditions on agricultural markets around the
world. Given the favorable market environment and the high demand for innovative solu-
tions, we now expect that our €2 billion sales target for new active ingredients from the
launch program initiated in 2000 will be reached by the end of this year. That would be
two years earlier than originally planned.
•
•
•
•
•

6 / / BAYER ANNUAL REPORT 2008 TABLE OF CONTENTS
As a result we have already set ourselves a new goal. Between 2008 and 2012 we plan
to launch new active substances with peak sales potential totaling over €1 billion.
This underscores the success of our alignment toward the research and development of
new crop protection solutions and emphasizes our innovation leadership in this area.
Bayer MaterialScience experienced a much weaker year, with declines in sales and earn-
ings. Business in the fourth quarter, particularly, was tangibly harmed by the effects of
the global fi nancial and economic crisis. But we responded prudently to the diffi cult mar-
ket conditions at an early stage, reinforcing the foundations for our long-term success.
We signifi cantly strengthened our presence in the expanding Chinese market with the
inauguration of the world’s largest mdi production facility in Shanghai. At the same time
this entire production complex sets standards for energy-effi cient and environmentally
compatible production. Bayer MaterialScience will have invested a total of €2.1 billion in
Shanghai by the end of 2012.
The strategic alignment of the Bayer Group allows us to look forward to 2009 with rela-
tive confi dence despite the current fi nancial and economic crisis. The fact that the less
cyclical life-science businesses – HealthCare and CropScience – account for more than
70 percent of our sales is paying off. For these two subgroups we expect a gratifying
trend in 2009, and aim to improve the ebitda margin before special items toward
28 percent at HealthCare and maintain the margin for CropScience at the high level of
about 25 percent. The business situation at MaterialScience runs counter to this. We an-
ticipate an extremely diffi cult year for this subgroup, with a severe drop in sales and
earnings. In this negative scenario for MaterialScience, we are nevertheless confi dent of
limiting the decline in Group ebitda before special items to about 5 percent. Should
there be a tangible recovery in our MaterialScience business in the short term, Group
ebitda before special items could match the very high level of 2008 or even post a slight
increase.
We are convinced that Bayer can emerge from the fi nancial and economic crisis even
stronger than before. Sustainable success requires responsible interaction with all
stakeholders, sound business models and investment in the future. And sustainable suc-
cess is Bayer’s utmost priority. We are aiming for sustainability in everything we do.
In these turbulent times we could, of course, help to improve earnings in the short term
by cutting back on research, for example. But that would not be a sustainable strategy. It
would simply be short-sighted. Our investment in research and development is intended
to drive our growth and produce groundbreaking innovations. That is how we safeguard
growth – and with it jobs and prosperity. Success tomorrow demands investment today.
The time to compete for tomorrow’s best products and technologies is now.
But we must not lose sight of the long-term challenges either. By these I mean the major
issues such as demographic change, global food supplies, energy conservation and

CHAIRMAN’S LETTER 7TABLE OF CONTENTS
climate protection. Bayer’s climate program is already making very encouraging head-
way. We have good answers that address long-term challenges and at the same time take
advantage of related business opportunities for our enterprise.
There are also other fi elds in which politicians, industry leaders and society as a
whole need to think – and act – in terms of sustainability. Safeguarding the future also
involves investing more heavily in education, for example. That is a crucial task to
which we should all pay special attention. And for that reason Bayer has for many years
trained more young people than it will need to employ at its own facilities. We also
support numerous school projects aimed at improving science teaching through the
Bayer Science & Education Foundation.
We have seen success in recent years. I and my colleagues on the Board of Management
would like to thank you, our stockholders, for your renewed trust in 2008. We will do all
we can to ensure that we continue along our successful path.
Sincerely,
WERNER WENNINGChairman of the Board of Management of Bayer AG

8 / / BAYER ANNUAL REPORT 2008 TABLE OF CONTENTS
Board of Management
WERNER WENNINGChairman
DR. WOLFGANG PLISCHKEInnovation · Technology · Environment · Asia / Pacific region
Werner Wenning has been Chairman of the
Bayer AG Board of Management since April 2002.
Born in 1946, Wenning joined the company in
1966 as a commercial trainee. He held a number of
positions with Bayer in Germany and abroad, serv-
ing as managing director of Bayer subsidiaries in
Peru and Spain and later as Head of the Corporate
Planning and Controlling Division. Wenning was
fi rst appointed to the Bayer AG Board of Manage-
ment as Chief Financial Offi cer in February 1997.
Werner Wenning is married with two daughters.
Born in 1951, Wolfgang Plischke studied biology at
Hohenheim University, Germany. Having gained his
Ph.D., Plischke began his career with Bayer in 1980,
joining the subsidiary Miles. After holding a number
of positions in Germany and abroad, he became Head
of the Pharmaceuticals Business Group in North Amer-
ica in 2000, and two years later took charge of the
Pharmaceuticals Business Group of Bayer AG. Plischke
was appointed to the Bayer AG Board of Management
in March 2006. Since December 2007, he has been
Chairman of the German Association of Research-
Based Pharmaceutical Companies.
Wolfgang Plischke is married with two sons.
An avid soccer fan, Werner Wenning watches Bayer 04 Leverkusen in action as often as he can.
Wolfgang Plischke enjoys endurance sports such as jogging and cycling.

BOARD OF MANAGEMENT 9TABLE OF CONTENTS
KLAUS KÜHNFinance · Europe region
DR. RICHARD POTTStrategy · Human Resources · Labor Director · Americas, Africa and Middle East regions
Born in 1952, Klaus Kühn studied mathematics
and physics at the Technical University of Berlin,
Germany, gaining a mathematics degree in 1978.
He also studied in the United States, where
he obtained a Master of Business Administration.
Kühn joined Bayer AG in 1998 as Head of the
Finance Section, and shortly afterwards was made
Head of the Group Finance Division. He was
appointed to the Bayer AG Board of Management
in May 2002.
Klaus Kühn is married with two daughters.
Born in 1953, Richard Pott studied physics at the
University of Cologne, Germany, where he obtained
his Ph.D. In 1984 Pott joined the company’s Central
Research Division. After holding various positions
in the Corporate Staff Division he became Head of
the former Specialty Products Business Group in
1999. He was appointed to the Bayer AG Board of
Management in May 2002.
Richard Pott is married with three children.
Klaus Kühn is an enthusiastic amateur musician. On his piano at home, he mostly plays
pieces by Classical and Romantic composers.
Richard Pott loves the countryside and enjoys driving tractors.

10 / / BAYER ANNUAL REPORT 2008 TABLE OF CONTENTS
During 2008 the Supervisory Board monitored the conduct of the company’s business
and acted in an advisory capacity. We performed these functions on the basis of detailed
written and oral reports received from the Board of Management. In addition, the Chair-
man of the Supervisory Board and the Chairman of the Board of Management main-
tained a constant exchange of information and ideas. In this way the Supervisory Board
was kept continuously informed about the company’s intended business strategy, corpo-
rate planning (including fi nancial, investment and human resources planning), earnings
performance, the state of the business and the situation in the company and the Group
as a whole.
The documents relating to Board of Management decisions or actions which – by law or
under the articles of incorporation or the rules of procedure – required the approval of
the Supervisory Board were inspected by the Supervisory Board at its plenary meetings,
sometimes after preparatory work by the committees. In certain cases the Supervisory
Board gave its approval on the basis of documents circulated to its members. The Super-
visory Board was involved in decisions of material importance to the company. We dis-
cussed at length the business trends described in the reports from the Board of Manage-
ment and the prospects for the development of the Bayer Group as a whole, the individual
organizational units and the principal affi liated companies in Germany and abroad. Four
plenary meetings of the Supervisory Board were held during 2008. In addition, a deci-
sion concerning the Possis Medical Inc. acquisition project was made after the relevant
documents had been circulated to the members. No member of the Supervisory Board
attended fewer than half of its meetings. All members of the Board of Management regu-
larly attended the meetings of the Supervisory Board.
PRINCIPAL TOPICS DISCUSSED BY THE SUPERVISORY BOARD
At the focus of the Supervisory Board’s deliberations were questions relating to the
strategies and business activities of the Group as a whole and of the subgroups. Other
selected topics were dealt with at each of the meetings. At the meeting held in February,
the Supervisory Board devoted special attention to the Bayer Group’s risk management
system and a sale-and-leaseback transaction entered into for fi nancing purposes. At the
focus of the September meeting were activities at the Berlin site, research in the fi elds
of women’s healthcare and diagnostic imaging, and the acquisition of Direvo Biotech AG,
which has since been completed. At the meeting in December 2008, the Board of Manage-
ment presented its operational, fi nancial and balance sheet planning for the years 2009
Report of the Supervisory Board

11TABLE OF CONTENTS
through 2011, which was the subject of detailed discussion, and delib erated on the new
version of the German Corporate Governance Code and the issuance of a new
Declaration of Conformity with the Code. The regular effi ciency audit of the Supervisory
Board’s work was also initiated in December 2008.
COMMITTEES OF THE SUPERVISORY BOARD
The Supervisory Board has a Presidial Committee, an Audit Committee, a Human
Resources Committee and a Nominations Committee*.
WORK OF THE COMMITTEES
The Presidial Committee of the Supervisory Board was not required to convene in 2008
in its capacity as the Mediation Committee under Section 27 Paragraph 3 of the German
Codetermination Act, nor did it need to resolve on any other matters.
The Audit Committee met four times during the year, addressing in particular the
company’s and the Group’s fi nancial reporting, the Group’s risk management system, the
internal control system and compliance issues. The Audit Committee also set the budget
for the services of the external auditor and discussed with the auditor the main areas of
the audit for the 2008 fi scal year. The auditor was present at all the meetings of the Audit
Committee, reporting in detail on the audit work and the audit reviews of the interim
fi nancial statements.
* The description of the responsibilities and membership of the committees, which forms part of the Report of the Supervisory Board, can be found in the Corporate Governance Report on page 107 of this Annual Report and therefore is not reproduced here.
REPORT OF THE SUPERVISORY BOARD

12 / / BAYER ANNUAL REPORT 2008 TABLE OF CONTENTS
The principal topics addressed at the meetings of the Audit Committee were, at the
February meeting, the internal control system and the consequences of deregistering
with the u.s. Securities and Exchange Commission; at the April meeting, the manage-
ment of pension risk at Bayer; at the July meeting, the reports received on the status of
the tax audits; and at the October meeting, the effects of the fi nancial crisis on Bayer
and the implications of the imminent entry into force of the Accounting Law Moderni-
zation Act in Germany for the fi nancial reporting of the company and the Group.
The Human Resources Committee convened on two occasions, dealing mainly with
matters relating to the remuneration of the Board of Management and the pensions of
former members of the Board of Management. At its meeting in December the Commit-
tee deliberated on the division of responsibilities between the Human Resources Com-
mittee and the full Supervisory Board provided for in the June 2008 revised version of
the German Corporate Governance Code and the Code’s new recommendations on
limiting the severance payment to a member of the Board of Management in the event of
premature contract termination. At this meeting the Human Resources Committee also
discussed the reappointment of Dr. Plischke to the Bayer AG Board of Management and
the renewal of his service contract.
On one occasion in 2008, in accordance with its responsibilities, the Nominations Com-
mittee discussed possible candidates for future election to the Bayer AG Supervisory
Board as representatives of the stockholders.
The meetings and decisions of the committees were prepared on the basis of reports
and other information provided by the Board of Management. Members of the Board of
Management regularly attended the committee meetings. Reports on the committee
meetings were presented at the plenary meetings of the Supervisory Board.
CORPORATE GOVERNANCE
The Supervisory Board dealt with the ongoing development of corporate governance at
Bayer, taking into account the amendments made to the German Corporate Governance
Code in June 2008. In December 2008 the Board of Management and the Supervisory
Board issued a new Declaration of Conformity, which is also reproduced in the Corpo-
rate Governance Report on page 105 of this Annual Report.
FINANCIAL STATEMENTS AND AUDITS
The fi nancial statements and management report of Bayer AG were drawn up according
to the requirements of the German Commercial Code and Stock Corporations Act, while
the consolidated fi nancial statements and management report of the Bayer Group were
prepared according to the principles of the International Financial Reporting Standards
(ifrs). The fi nancial statements of Bayer AG, the consolidated fi nancial statements of the
Bayer Group, the management report of Bayer AG and the management report of the
Bayer Group have been examined by the auditor, PricewaterhouseCoopers Aktiengesell-

13TABLE OF CONTENTS
schaft, Wirtschafts prüfungsgesellschaft, Essen. The conduct of the audit is explained in
the auditor’s report. The auditor fi nds that Bayer has complied with the requirements of
the German Commercial Code and the International Financial Reporting Standards, re-
spectively, and issues an unqualifi ed opinion on the fi nancial statements of Bayer AG and
the consolidated fi nancial statements of the Bayer Group. The fi nancial statements and
management report of Bayer AG, the consolidated fi nancial statements and management
report of the Bayer Group, and the audit reports were submitted to all members of the
Supervisory Board. They were discussed in detail by the Audit Committee and at a ple-
nary meeting of the Supervisory Board. The auditor submitted a report on both occa-
sions and was present during the discussions.
We examined the fi nancial statements and management report of Bayer AG, the proposal
for distribution of the profi t, and the consolidated fi nancial statements and management
report of the Bayer Group. We found no objections, thus we concur with the result of the
audit. We have approved the fi nancial statements of Bayer AG and the consolidated fi nan-
cial statements of the Bayer Group prepared by the Board of Management. The fi nancial
statements of Bayer AG are thus confi rmed. We are in agreement with the management
reports of Bayer AG and the Bayer Group and, in particular, with the assessment of the
future development of the enterprise. We also concur with the dividend policy and the de-
cisions concerning earnings retention by the company. We assent to the proposal for dis-
tribution of the profi t, which provides for payment of a dividend of €1.40 per share.
The Supervisory Board would like to thank the Board of Management and all employees
for their dedication and hard work in 2008.
Leverkusen, February 2009
For the Supervisory Board
DR. MANFRED SCHNEIDER
Chairman
REPORT OF THE SUPERVISORY BOARD

14 / / BAYER ANNUAL REPORT 2008
Performance of Bayer Stock in 2008
110
100
90
80
70
60
50
Jan Feb Mar Apr May June July Aug Sept Oct Nov Dec
(indexed; 100 = closing price on December 31, 2007)
Bayer -31.9% DAX -40.4% DJ EURO STOXX 50SM -42.3%
Investor Information
TABLE OF CONTENTS

15INVESTOR INFORMATION
Although Bayer stock was unable to escape last year’s global market turmoil, its performance placed it in the top third of the stocks in the German dax index. The price fell by nearly 32 per-cent on the year, compared with a 40 percent drop in the dax. The Board of Management and the Supervisory Board propose that the dividend be raised by 4 percent to €1.40 per share.
TABLE OF CONTENTS

16 / / BAYER ANNUAL REPORT 2008
Diffi cult year on the stock market
WEAKEST YEAR FOR GERMAN STOCKS SINCE 2002
Last year saw the second-worst performance by the dax since its introduction on July 1, 1988. The index closed 2008 at 4,810 points, down 40 percent from the end of the previous year. Only in 2002 did it sustain a heavier loss of 44 percent.
The downward movement was triggered by the subprime mortgage crisis in the United States, which began in summer 2007. The resulting crisis on the fi nancial markets eventually spread to the real economy, leading to the current global economic downturn. Nearly all dax companies saw double-digit falls in their share prices.
The performance of stock markets in other European countries, North America and Asia was equally disappointing, with the euro stoxx 50sm ending the year down roughly 42 percent, the s&p 500 in the u.s. falling by some 38 percent, and Japan’s Nikkei index losing 42 percent.
BAYER STOCK MOVED LOWER
Caught up in the global market turbulence, Bayer stock lost 33.6 percent on the year. Including the dividend of €1.35 per share paid in May 2008, its performance amounted to minus 31.9 per-cent. Despite the drop in the share price, Bayer ranked among the top third of dax 30 stocks in performance terms.
The price initially fell by some 25 percent at the start of the year to €47 at the beginning of March. This was followed by a rally that lasted until mid-September and restored the price to about €57. The collapse of the investment bank Lehman Brothers in mid-September was just one of the factors causing share prices around the world to plummet in the fourth quarter. Amid very high trading volumes, especially in October (11.5 million shares per day), Bayer stock fell to a year low of €36.83 on November 21, 2008.
SUCCESSFUL FINANCING DESPITE THE DIFFICULT MARKET CONDITIONS
The subprime mortgage crisis in the u.s. had already put pressure on credit markets in thesecond half of 2007. Uncertainty among credit investors continued in 2008, leading to a surge in the risk premiums for credit default swaps (cds) (see cds graph on page 17).
The market price of these tradable insurance contracts, which are used to hedge against default of a borrower, depends on the underlying credit risk and thus helps to determine the credit margin when raising debt.
Despite the diffi cult environment, Bayer concluded two opportunistic fi nancing agreements on comparatively attractive terms in the second half of the year. Apart from small private place-ments totaling Yen 25 billion (approximately €198 million) in Japan, special mention should be made of a €450 million seven-year credit fi nancing agreement with the European Investment Bank and a €200 million private placement. A list of the bonds issued by Bayer can be found in Note 27 to the consolidated fi nancial statements.
INTERNET
For more information about Bayer on the capital market, go to www.investor.bayer.com
TABLE OF CONTENTS
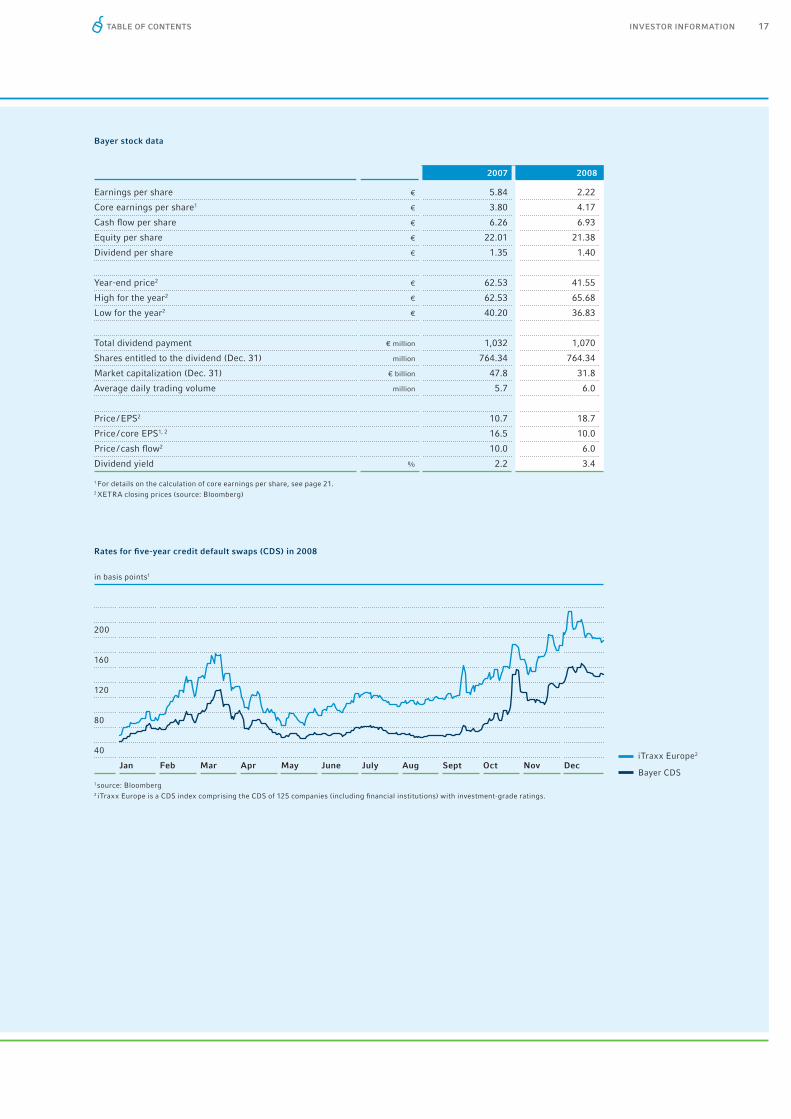
17INVESTOR INFORMATION
iTraxx Europe2
Bayer CDS
Rates for fi ve-year credit default swaps (CDS) in 2008
200
160
120
80
40
Jan Feb Mar Apr May June July Aug Sept Oct Nov Dec
1 source: Bloomberg2 iTraxx Europe is a CDS index comprising the CDS of 125 companies (including fi nancial institutions) with investment-grade ratings.
in basis points1
1 For details on the calculation of core earnings per share, see page 21.2 XETRA closing prices (source: Bloomberg)
TABLE OF CONTENTS
2007 2008
Earnings per share € 5.84 2.22
Core earnings per share1 € 3.80 4.17
Cash fl ow per share € 6.26 6.93
Equity per share € 22.01 21.38
Dividend per share € 1.35 1.40
Year-end price2 € 62.53 41.55
High for the year2 € 62.53 65.68
Low for the year2 € 40.20 36.83
Total dividend payment € million 1,032 1,070
Shares entitled to the dividend (Dec. 31) million 764.34 764.34
Market capitalization (Dec. 31) € billion 47.8 31.8
Average daily trading volume million 5.7 6.0
Price / EPS2 10.7 18.7
Price / core EPS1, 2 16.5 10.0
Price / cash fl ow2 10.0 6.0
Dividend yield % 2.2 3.4
Bayer stock data

18 / / BAYER ANNUAL REPORT 2008
HIGHER LONG-TERM YIELD THAN THE DAX AVERAGE
A long-term investor who purchased Bayer shares for €10,000 fi ve years ago on January 1, 2004 and reinvested all dividends would have seen the value of the position grow to €21,442 as of December 31, 2008, giving an average annual return of 16.5 percent.
BAYER STOCK INCLUDED IN THE STOXX 50 INDEX
Since September 22, 2008, Bayer stock has been included in the Dow Jones stoxx 50, a Europe-an blue chip index comprising the top 50 stocks from 17 western European countries. It also con-tinues to be listed in the euro stoxx 50sm index of the 50 top shares in the euro currency zone.
MSCI INDEX FAMILY RECLASSIFIES BAYER TO HEALTHCARE SECTOR
The index provider msci reclassifi ed Bayer stock from the “Materials” sector, category “Diversi-fi ed Chemicals,” to the “Health Care” sector, category “Pharmaceuticals,” effective July 1, 2008, refl ecting our new focus on the HealthCare business.
BAYER STOCK DELISTED IN JAPAN
Bayer AG withdrew from the Tokyo Stock Exchange in early December 2008 because the lowtrading volume made its listing there superfl uous. Bayer shares had been listed in Japan since 1988.
HIGH TURNOUT AT THE ANNUAL STOCKHOLDERS’ MEETING
In 2008, the number of stockholders represented at the Annual Stockholders’ Meeting increased for the fourth consecutive year, with 62 percent of the voting capital represented at the meeting held on April 25, 2008.
DIVIDEND RAISED TO €1.40 PER SHARE
The Board of Management and Supervisory Board will propose to the Annual Stockholders’ Meeting that the dividend be raised by €0.05 to €1.40 per share. This results in a payout ratio of approximately 34 percent calculated on core earnings per share (see page 21), which is within the target corridor of 30 to 40 percent.
The dividend yield calculated on the share price of €41.55 at year end 2008 amounts to 3.4 per-cent and the total dividend payment to €1,070 million.
TABLE OF CONTENTS
Performance p.a. 1 year 2008 3 years 2006 – 2008 5 years 2004 – 2008
% % %
Bayer – 31.9 + 8.1 + 16.5
DAX – 40.4 – 3.8 + 3.9
DJ EURO STOXX 50SM – 42.4 – 9.3 + 0.3
Comparison of average annual performance in % (dividends reinvested)

19INVESTOR INFORMATION
Total dividend payment
1999 2000 2001 2002 2003 2004 2005 2006 2007 2008
€ million € million € million € million € million € million € million € million € million € million
1,000
900
800
700
600
500
400
300
200
100
0
949 1,022 657 657 365 402 694 764 1,032 1,070
TABLE OF CONTENTS
Dividends per share
1999 2000 2001 2002 2003 2004 2005 2006 2007 2008
€ € € € € € € € € €
1.5
1.0
0.5
0.0
1.30 1.40
0.90 0.90
0.50 0.55
0.95 1.00
1.35 1.40

20 / / BAYER ANNUAL REPORT 2008
BROADER STOCKHOLDER STRUCTURE
The latest survey of domestic and foreign stockholders, which covered 85 percent of Bayer stock (approximately 650.8 million shares out of the 764.3 million total), revealed a slight increase in the proportion of foreign institutional investors compared with the previous year. Of the shares identifi ed, 80 percent are owned by institutions outside Germany, with 43 percent held by u.s.-based institutions, 20 percent by those in Germany and 13 percent by institutions headquartered in the u.k. The high proportion of foreign investors refl ects the importance of Bayer stock on the international fi nancial markets.
BAYER STOCK A SUSTAINABLE INVESTMENT
In 2008 Bayer was again included in leading sustainability indices. Our stock has been listed right from the beginning in both the Dow Jones Sustainability Index World and the ftse4Good Index series. Bayer also featured once more in the Carbon Disclosure Leadership Index and has thus been honored for its activities in the area of climate protection.
At conferences and one-on-one discussions we stepped up our dialogue with investors who are guided largely by sustainability criteria when making their investment decisions.
CONTINUING HIGH LEVEL OF INVESTOR RELATIONS ACTIVITIES
A broad range of investor relations activities again took place in 2008. The Board of Management and Investor Relations department held over 400 one-on-one meetings in some 25 fi nancial cen-ters to provide information on current events in the Bayer Group.
The focus of attention was on progress with the pharmaceutical research pipeline, and especial-ly the anti-thrombosis drug Xarelto®. Experts explained the main research fi ndings at confer-ence calls, which were streamed in parallel on the Internet. Other key topics were the sustained boom in the agricultural sector and the demand situation for polymers.
AWARDS FOR INVESTOR RELATIONS ACTIVITIES
Bayer’s capital market communications again received several awards in 2008.
For example, Bayer garnered fi rst place in a buy-side survey conducted by the Institutional In-vestor Research Group as the company with the best ir work in the European chemicals sector. More than 600 buy-side analysts and portfolio managers in Europe and the u.s. took part in this survey.
The German business journal Capital presents the Capital Investor Relations Award annually in conjunction with the Society of Investment Professionals in Germany (dvfa). For this purpose fi nancial communications are rated by target-group focus, transparency, and continuity of reporting. In 2008 Bayer came third in the euro stoxx 50sm category.
The French fi nancial journal La Vie Financière also honored the excellent service provided by Bayer’s fi nancial communications. Bayer was awarded the “Fils d’or 2008” as the best non-French company in the fts Eurofi rst 80 share index in the category “Prix du Meilleur Service Actionnaire.”
For the fourth time, Bayer’s investor relations website took fi rst place in the overall ranking issued by the leading international consultancy mz Consult. The factors appealing to the jury included the breadth of the Internet offering, the use of modern technologies such as rss (Rich Site Summary) feeds, podcasts and mobile services, and the high update frequency.
TABLE OF CONTENTS

21INVESTOR INFORMATION
CALCULATION OF CORE EARNINGS PER SHARE
Earnings per share according to ifrs are affected by the purchase price allocation for Schering, Berlin, Germany, and other special factors. To enhance comparability, we also determine core net income from continuing operations after elimination of the amorti zation of intangible assets, asset write-downs (including any impairment losses), special items in ebitda including the relat-ed tax effects, and one-time tax income or expense.
The calculation of earnings per share in accordance with the International Financial Reporting Standards (ifrs) is explained in the notes to the fi nancial statements on page 185. Adjusted core net income, core earnings per share and core ebit are not defi ned in the ifrs. Therefore they should be regarded as supplementary information rather than stand-alone indicators.
Calculation of core EBIT and core earnings per share 2007 2008
€ million € million
EBIT as per income statement 3,154 3,544
Amortization and write-downs of intangible assets 1,463 1,550
Write-downs of property, plant and equipment 118 88
Special items (other than write-downs) 911 665
Core EBIT 5,646 5,847
Non-operating result (as per income statement) (920) (1,188)
Income taxes (as per income statement) 72 (636)
One-time tax income* (870) –
Tax adjustment (887) (691)
Income after taxes attributable to non-controlling interest(as per income statement) (5) (5)
Core net income from continuing operations 3,036 3,327
Financing expenses for the mandatory convertible bond, net of tax effects 98 112
Adjusted core net income 3,134 3,439
Shares Shares
Weighted average number of issued ordinary shares 764,341,920 764,342,029
Potential shares to be issued upon conversion of the mandatory convertible bond 59,565,383 59,893,122
Adjusted weighted average total number of issued and potential ordinary shares 823,907,303 824,235,151
Core earnings per share from continuing operations (€) 3.80 4.17
* arising from the corporate tax reform in Germany in 2007
TABLE OF CONTENTS

22 / / BAYER ANNUAL REPORT 2008 TABLE OF CONTENTS
GLOBAL POPULATION (IN BILLIONS) 9.2Source: UN, World Population Prospects: The 2006 Revision.
6.15.3
1990 2000 2020 2050
7.7

MAGAZINE 23TABLE OF CONTENTS
A Changing World
Today’s global trends present major challenges. More than ever
before, humankind needs to provide conclusive answers to complex
questions. Bayer is playing an important part in this through its
research and development activities.

24 / / BAYER ANNUAL REPORT 2008 TABLE OF CONTENTS
Climate change raises the likelihood of extreme weather conditions such as heatwaves, torrential rain and tropical storms. The potential consequences include increasing desertifi cation, as in the Sahel (left), or fl oods such as occur frequently in Bangladesh.
ENERGY EFFICIENCY AS A BENCHMARK
Global solutions, like global problems, are closely interlinked. Climate change can only be tackled using the most advanced energy-saving technologies combined with sustain-able energy generation. The International Energy Agency (iea) in its “Energy Outlook 2008” calls for an “energy revolution.” On the other hand, some improvements in effi ciency have already been achieved. For example, modern automotive engineering and its use of lightweight plastic parts has brought about substantial reductions in energy consumption. And the development of alternative fuels made from renewable raw materials is well under way.
Improvements in the energy effi ciency of buildings are equally impressive. Materials re-search has brought forth insulating materials for building “passive houses” that require almost no heating. Innovative insulation tech-niques are already being used for existing buildings to cut their heating requirements, and the associated carbon dioxide emissions, by up to 50 percent. And intelligent, electronic control can signifi cantly cut the energy con-sumption of virtually all electrical appliances and avoid electricity wastage.
Climate change can only be tackled using the most advanced energy-saving technol-ogies combined with sustainable energy generation.
Climate change involves extremes such as fl ooding, heat-waves and periods of drought. Demographic change is resulting from rapid popu -
lation growth in developing countries and aging societies in most industrial nations. Each global trend is accompanied by the same basic question: How can we slow the pace of climate change and limit its impact on human-kind and the ecosystem to a tolerable level? How can we generate energy sustainably on a large scale? How can we provide enough food for the expanding global population? And how can we ensure that everyone receives good medical care?
MAGAZINE 25TABLE OF CONTENTS
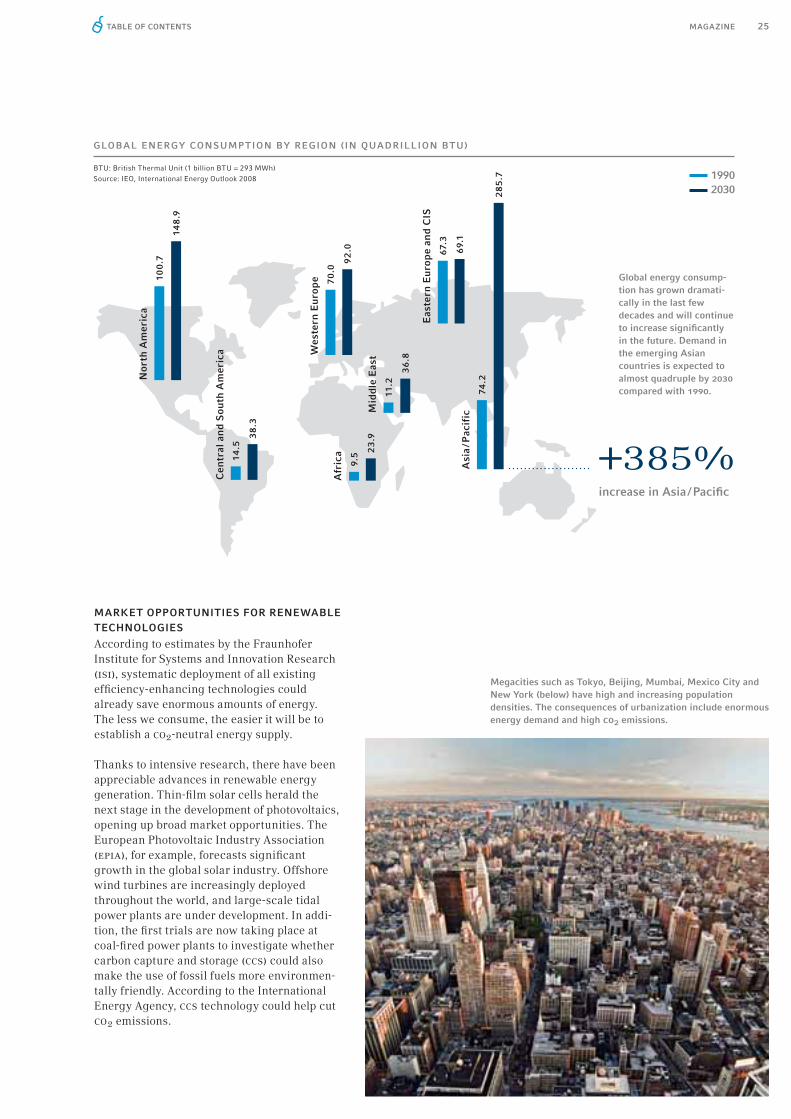
Megacities such as Tokyo, Beijing, Mumbai, Mexico City and New York (below) have high and increasing population densities. The consequences of urbanization include enormous energy demand and high co2 emissions.
MARKET OPPORTUNITIES FOR RENEWABLE TECHNOLOGIES
According to estimates by the Fraunhofer Institute for Systems and Innovation Research (isi), systematic deployment of all existing effi ciency-enhancing technologies could already save enormous amounts of energy. The less we consume, the easier it will be to establish a co2-neutral energy supply.
Thanks to intensive research, there have been appreciable advances in renewable energy generation. Thin-fi lm solar cells herald the next stage in the development of photovoltaics, opening up broad market opportunities. The European Photovoltaic Industry Association (epia), for example, forecasts signifi cant growth in the global solar industry. Offshore wind turbines are increasingly deployed throughout the world, and large-scale tidal power plants are under development. In addi-tion, the fi rst trials are now taking place at coal-fi red power plants to investigate whether carbon capture and storage (ccs) could also make the use of fossil fuels more environmen-tally friendly. According to the International Energy Agency, ccs technology could help cut co2 emissions.
GLOBAL ENERGY CONSUMPTION BY REGION (IN QUADRILLION BTU)
+385%increase in Asia / Pacifi c
Global energy consump-tion has grown dramati-cally in the last few decades and will continue to increase signifi cantly in the future. Demand in the emerging Asian countries is expected to almost quadruple by 2030 compared with 1990.
1990 2030
Nor
th A
mer
ica
10
0.7
148
.9
Wes
tern
Eur
ope 70
.0
92
.0
Mid
dle
Eas
t
11.2
36
.8
Eas
tern
Eur
ope
and
CIS
67.
3
69.
1A
sia
/ Pac
ific
74.2
28
5.7
Afr
ica
9.5 2
3.9
Cen
tral
an
d S
outh
Am
eric
a
14.5
38
.3
BTU: British Thermal Unit (1 billion BTU = 293 MWh) Source: IEO, International Energy Outlook 2008

26 / / BAYER ANNUAL REPORT 2008 TABLE OF CONTENTS
FOOD FOR MORE AND MORE PEOPLE
Sustainable energy is only one of the key re-quirements for the future. Combating hunger is arguably even more urgent. These two issues are interrelated, because global warming could result in more and more frequent crop failures. This is a major threat in view of global popula-tion growth. The steady increase in the earth’s population, which already exceeds 6.7 billion, makes ensuring adequate food supplies a major challenge. The Food and Agriculture Organiza-tion of the United Nations (fao) has calculated that global agricultural production would have to double over the next 50 years in order to feed the population of over nine billion that
Rice is an important staple food for many millions of people. The picture shows rice cultivation in the Chinese province of Zhejiang and the hard work it involves.
our planet will have by then. This is another area in which science is pointing the way forward. Current crop yields could be increased by up to 70 percent by giving crop plants optimum protection against pests, disease and weeds. Innovative products and integrated solutions for protecting crops could leverage this considerable potential. Novel crop breed-ing techniques, such as hybridization or the molecular breeding of high-yield seeds, could also play a key role in improving food supplies. Carefully harnessing plant biotechnology options in order to breed stress-tolerant crop plants, for example, offers major further poten-tial for increasing yields.
+70%higher crop yields can be achieved with innovative crop protection products

MAGAZINE 27TABLE OF CONTENTS
People’s average life expectancy continues to rise and is dependent on many factors, including hygiene, nutrition, medical care and gender. Western industrial nations in particular are increasingly being confronted by demographic change: the birth rate is falling, while people are living longer and longer.
INVESTING IN HEALTH
A changing world needs more than clean ener-gy and improved food supplies. Health care is of growing importance, particularly in aging societies. Great advances have been made in drug research and development in recent decades, the fi eld of cancer treatment being one example. The aim of research-driven pharmaceutical manufacturers is for increas-ing numbers of people to gain access to innovative drugs.
Substantial investment is necessary to successfully combat dangerous diseases and epidemics. The targeted use of biotechnology in particular can bring major benefi ts in this area. Responsible drug development involves a willingness to make medical advances accessible to people in poor regions of the world as well. This requires collaboration between companies, government agencies and community organizations. Public-private partnerships can use their combined exper-tise to provide health care where people urgently need it and would not get it without
outside help. The same also applies to preventive health education. For example, the provision of expert advice on family planning to specifi c target groups has also proven an effective way to diminish the spread of sexually transmitted diseases.
Health care is of growing importance, particularly in aging societies.
Source: UN, World Population Prospects: The 2006 Revision
LIFE EXPECTANCY IN YEARS
Developed countries Less developed countries
1950 2000 2050
6676 82
74
64
41

28 / / BAYER ANNUAL REPORT 2008 TABLE OF CONTENTS
The Bayer Climate Program
Bayer is already acknowledged as an international leader in its sector with respect to its achievements in climate pro-tection. Its activities in this area are combined in a Group-wide climate program in which Bayer is investing €1 billion in the period through 2010 alone.
STRESS-TOLERANT PLANTS
Climate change is leading to worsen-ing growing conditions in agriculture. Heat, drought, cold and soil salinity place food crops under extreme stress. Bayer is working to boost the stress tolerance of rice, corn and other cereals and thereby safeguard crop yields even under extreme conditions.
SUSTAINABLE AGRICULTURE
A growing global population needs more and more food. The effi ciency of agricultural production must therefore be sustainably increased. Thanks to its state-of-the-art crop protection prod-ucts and new solutions in the fi eld of plant breeding and biotechnology, Bayer is helping to achieve sustainable increases in yields all over the world.
ZERO-EMISSIONS ARCHITECTURE
Almost 20 percent of all greenhouse gas emissions worldwide are the result of energy consumption in buildings – which could be halved through the systematic use of high-effi ciency insulating mate rials. Bayer is looking to design energy-optimized, zero-emissions struc-tures throughout the world accord-ing to its “EcoCommercial Building” concept using innovative materials.
CLIMATE-FRIENDLY PRODUCTION
Chemical processes require energy and raw materials. With the “Bayer Climate Check,” the Group is analyzing its production facilities across the globe. Processes are not only reviewed with respect to factors such as raw materials, logistics and energy supply, but are also assessed in terms of their impact on the climate. The aim is to minimize emissions of climate-relevant gases.
The goal is to achieve economic growth in harmony with ecology and social responsibility.
FURTHER INFORMATION
Further information can be found in the brochure “The Bayer Climate Program,” which is available in English, German and Spanish. It may be ordered free of charge by calling +49 214 30 57546 or emailing [email protected] and is available for download at www.climate.bayer.com
SUSTAINABILITY AS A MODEL
A whole range of factors is causing the world to change. Research combined with sustain-able development is the key to shaping this change positively. The goal is to achieve eco-nomic growth in harmony with ecology and social responsibility. This perspective specifi -cally affects a number of areas, including a company’s strategic alignment, its product portfolio and its social commitment. And a company that lives and breathes the principle of sustainability as integral to its mission also inspires the top performers of the future. After all, for increasing numbers of talented young people, corporate governance based on ethical values is a key criterion when choosing a job.
By focusing on sustainability goals, innovative companies can deploy technological solutions to overcome the great challenges of the future. That means using the resources provided to them by research and development. And this is exactly what Bayer is doing in health care, nutrition and high-tech materials, true to the company’s mission statement and its slogan “Science For A Better Life.”

MAGAZINE 29TABLE OF CONTENTS
Research – the Key to the Future
“Simplifying contraception”DR. MAUREEN CRONINHead of Global Medical Affairs, Women’s Healthcare, Bayer HealthCare
Access to safe and effective contraception has revolutionized women’s lives throughout the world. Abortion rates in eastern Europe, which were among the world’s highest, have quickly dropped by half thanks to the increasing use of modern contraception methods. As pioneers in hormone research and gynecology, we are committed to simplifying contraception for women by offering them more options, making prod-ucts easier to use and providing education.
“Improving yields”DR. ULRIKE WACHENDORFF-NEUMANNHead of Profiling, Fungicides, Bayer CropScience
Growing enough food for an increasing global population on a con-stant area of arable land is the key challenge facing the agricultural industry. That’s why we are developing new crop protection products that not only safeguard current crop yields but sustainably increase them. Cutting-edge technology platforms enable us to identify poten-tial active ingredients and optimize them. Our research also focuses on substances that boost crops’ tolerance toward climatic stress factors such as heat and drought. In addition, we are raising the yield and quality of canola, rice, vegetables and cotton with our innovative seeds.
“Shaping the future”ECKARD FOLTINHead of Creative Center, Bayer MaterialScience
Our team of market scouts and innovation managers uses forecasts of customer needs to determine what kinds of materials we need to develop and supply in the future. One of many examples is that higher life expectancy increases the demand for service robots in the home. This is an area in which Bayer can play a key role with functionalized high-tech polymers. We are charting the “robotics” vision of the future as a global team, enabling us to take cultural factors into account as well.
Bayer scientists are developing innovative answers to future challenges all over the world. The Group’s budget for research and development in 2008 was €2.8 billion. Three of the 11,800 people employed in research and development at Bayer give a brief insight into their work:

30 / / BAYER ANNUAL REPORT 2008 TABLE OF CONTENTS
Bayer HealthCare
A thrombosis usually develops near a valve in the veins of the calf muscles, causing vein obstruction symptoms as the blood clot enlarges.
1. Healthy vein
2. Vein blocked by a thrombus
Bayer HealthCare employees Anthonie Lensing (right) and Dr. Tiemo-Jörg Bandel evaluate a computer simulation of leg veins.
1. 2.

MAGAZINE 31TABLE OF CONTENTS
Every year, doctors diagnose millions of new cases of cancer, heart
attack, stroke and dementia. The mission of Bayer HealthCare is
to discover innovative diagnostic approaches and therapies so that
diseases can be better identifi ed, treated and cured in the future.
Research for a Healthier Future

32 / / BAYER ANNUAL REPORT 2008 TABLE OF CONTENTS
Going with the fl ow
The number alone is shocking. Some 540,000 people die in Europe each year as the result of a thrombosis. That is more than the number of deaths attributable to breast can-cer, prostate cancer, Aids and road traffi c accidents combined. Bayer’s innovative anti-coagulant drug Xarelto® helps to prevent thrombosis after orthopedic surgery. The superior effi cacy of its active ingredient,
rivaroxaban, compared with the current therapeutic standard has been demonstrated in studies. And it has a comparable safety profi le. Xarelto® has been approved in the European Union for the prevention of venous thromboembolism in adults following elec-tive hip or knee replacement surgery. It has also been registered in over ten other countries, and further applications are cur-rently being reviewed by regulatory authori-ties worldwide, including the u.s. Food and Drug Administration.
PULMONARY EMBOLISM
If a thrombus enters the pulmo-nary artery and becomes lodged in one of the blood vessels in the lung, the blood supply to the lung may be restricted and its function thus impaired, putting the patient’s life at risk. Pulmo-nary embolism is the third most common cause of death in Germany.
A thrombus origi-nating in a leg vein may travel through the heart into the lung.
XARELTO®
This drug is currently the most thoroughly investigated anticoagulant in clinical development. Over 60,000 patients are to be enrolled in the study program.
Red and white blood cells (erythrocytes and leukocytes) can move freely through the body if the veins are healthy.

MAGAZINE 33TABLE OF CONTENTS
ACTIVE INGREDIENT INHIBITS KEY ENZYME
The success of Xarelto® is due in large part to the work carried out by biologist Dr. Elisabeth Perzborn, chemists Dr. Alexander Straub and Dr. Susanne Roehrig, and an interdisciplinary team of chemists, pharmacokinetics experts, toxicologists, physicians and technicians. The scientists at Bayer HealthCare’s research center in Wuppertal discovered the mecha-nism by which rivaroxaban can prevent throm-bosis: the active substance inhibits Factor Xa, an enzyme that plays a key role in the blood coagulation cascade.
Blood coagulation normally serves a protective purpose. Without it, people would bleed to death from the slightest injury. Essential to this complex process is the conversion of pro-thrombin to thrombin – and this is triggered by Factor Xa. The wound is ultimately sealed by a network of insoluble fi brin strands in which red and white blood cells as well as blood platelets are embedded.
If the blood, and with it the coagulation enzymes that occur naturally in the body, fl ows through the veins more slowly than usu-al, the formation of these fi brin strands may become life-threatening. Sometimes these en-zymes become active without any external stimulus, triggering a chemical chain reaction that may be fatal.
The strands of fi brin link to form a gel-like network that traps blood cells and platelets. This results in a blood clot, or thrombus.
If it becomes detached and enters the blood-stream, a life-threatening pulmonary or other embolism can develop.
STUDIES INVOLVING OVER 60,000 PATIENTS
Patients who need surgery to replace a knee or hip joint have a high risk of developing thrombosis. During surgery, the major leg veins that return the blood to the heart may be damaged. Another factor is that pa-tients’ mobility after the operation is restrict-ed. Doctors often administer heparins to prevent thrombosis, but the disadvantage of these drugs is that they have to be injected. Vitamin k antagonists, another class of pre-ventive drugs, are complicated to administer. “They are diffi cult to dose,” explains Perz-born. “And the patient’s coagulation status has to be monitored regularly because they interact with other drugs.” Perzborn, known affectionately by her staff as “Mother Xarelto,” has been a research scientist at Bayer for 30 years. She continues to be a valuable source of information when it comes to preclinical aspects of the new anti-coagulant. The effi cacy of rivaroxaban in further indications is currently being investi-gated in a study program focusing on the prophy laxis and therapy of acute and chronic coagulation disorders. The indications in-clude the long-term treatment of venous thromboembolism and stroke prophylaxis in patients with atrial fi brillation. It is intended to enroll over 60,000 patients in these studies.
In the United States alone, some 700,000 artifi cial hip or knee joints are implanted every year. These are routine procedures for the surgeons.
“Our active substance rivaroxaban
has the potential to set a new
therapeutic standard in the global
anticoagulant market.”
DR. ELISABETH PERZBORNHead of Laboratory
Bayer HealthCare
THE SUCCESSFUL
MOLECULE
It took 700 syntheses and countless test series to optimize the structure of the active substance rivaroxaban. The illustra-tion above shows the volume contour of the rivaroxaban molecule.

34 / / BAYER ANNUAL REPORT 2008 TABLE OF CONTENTS
Liver tumors can be visualized clearly by magnetic resonance imaging (mri). Imaging is facilitated by Primovist®, a contrast agent from Bayer HealthCare. Hepatocellular carcinoma accounts for about 90 percent of primary malignant tumors of the liver.
A pioneer in the battle against cancer
More than 600,000 new cases of liver cancer are diagnosed worldwide every year, and this number is increasing. Around 90 percent of malignant primary tumors – cancers that develop in the liver itself – are hepatocellular carcinomas. Like many other types of cancer, malignant liver tumors develop when mutated cells go on dividing. This happens, for example, if an indi-vidual’s genetic material is defective, causing a healthy cell to reproduce uncontrollably. When Bayer HealthCare’s scientists were de-veloping the cancer therapy Nexavar® (active ingredient: sorafenib), they focused on the central points in the cell, where signaling pathways that mediate cell division and growth meet, as a site of action for the new drug.
TARGETED ACTION
Nexavar® blocks a special signaling pathway that is estimated to be hyperactive in around 30 percent of all tumors. At the same time, the innovative mechanism of action inhibits the formation of the new blood vessels that are vital for the survival of a malignant tumor.
“Nexavar is the only systemic therapy proven to be effective and well tolerated in the treat-ment of liver cancer in a variety of patient populations,” says Dr. Dimitris Voliotis from Clinical Development at Bayer HealthCare. Since liver cancer is the third most common cause of death from cancer worldwide, “there is a signifi cant need for new treatment options that can be used at all stages of the disease to delay its progress and extend life.”
Nexavar® has already been approved in more than 60 countries for the therapy of liver can-cer and in over 70 countries to treat advanced renal cell carcinoma (kidney cancer).
GOOD PROSPECTS FOR THE FUTURE
Ongoing clinical studies on the effi cacy of Nexavar® show that it also has therapeutic potential in other types of tumor. Government institutions, oncology groups, individual scientists and, of course, Bayer and its u.s. development partner Onyx Pharmaceuticals are all investigating Nexavar® in various types of cancer as a single-agent therapy and in combination with other drugs. These include non-small-cell lung cancer, breast cancer and metastatic melanoma.
NEXAVAR®
The active substance sorafenib has already been approved in more than 60 countries for the therapy of liver cancer and in over 70 countries to treat kidney cancer.

MAGAZINE 35TABLE OF CONTENTS
Lost identity
It’s an insidious disease. A person can’t remember words, loses keys over and over again, or forgets the date. Alzheimer’s dis-ease is a condition that gradually develops over a period of years, because for a long time the brain is able to compensate relative-ly well for the loss of nerve cells. Then sud-denly the patient loses his or her bearings and becomes disoriented even in a familiar environment. Alzheimer’s means forgetting what you once knew. And the end is always catastrophic. This disease ultimately de-stroys the individual.
DETECTING THE SIGNS EARLY
The World Health Organization (who) current-ly puts the number of people with Alzheimer’s at more than 18 million and estimates that it will exceed 34 million by 2025. There is cur-rently no cure for the disease, although there are drugs that relieve the symptoms. If the de-generation of the brain cells is to be countered, the process needs to be identifi ed at an early stage, before the fi rst symptoms develop. But this is exactly what is proving so diffi -cult. “So far an autopsy is the only way to reach a fi rm diagnosis,” explains Dr. Ludger Dinkelborg, Head of Diagnostic Imaging Research at Bayer HealthCare. Dinkelborg intends to do something about this. He and his team are looking for ways to detect signs of the disease earlier on, preferably before the fi rst symptoms emerge, and thus provide support for doctors and patients in their decisions regarding treatment. The fi rst results of these endeavors are prom-ising. bay 94-9172 is the code for a molecule to which a radioactive fl uorine-18 atom has
been attached. The labeled substance, known as a tracer, attaches to the protein plaques in the brain that typically occur in Alzheimer’s patients and can then be visualized using a technique called positron emission tomo-graphy (pet).
TRACER IN CLINICAL TRIALS
The tracer has a special property that allows it to bind to the plaques. It is so small that it has no diffi culty crossing the blood-brain barrier. This physiological barrier between the central nervous system and the blood-stream normally protects the brain against disease pathogens or toxins circulating in the blood. Apart from being so small, the tracer has other advantages: only a tiny quantity needs to be injected into the patient, and the radioactive tag decays after as little as 20 hours. The tracer is currently in Phase ii clinical development.
Alzheimer‘s disease is a neuro-degenerative disorder, the most common form of which occurs predominantly in people over 65. Its causes are still not fully understood.
Positron emission tomography (pet) of the brain of an Alzheimer’s patient. Amyloid plaques, which develop at an early stage in the disease, are shown in yellow. Right: pet image of a healthy brain.
ALZHEIMER‘S DISEASE
In the early stage, a person’s short-term memory starts to deteriorate as the cells in the hippocampus are destroyed. The brain tissue shrinks dramatically as the disease progresses. In addition, the ventricles are greatly enlarged. The patient’s power of judg-ment disappears as the disease spreads beyond the cortex of the brain, leading to emotional outbursts and speech impair-ment.

36 / / BAYER ANNUAL REPORT 2008 TABLE OF CONTENTS
Bayer CropScience
Farmer Neels Neethling (left) and his employee Tol Kaptein inspect the quality of the wheat growing on his 4,500 hectares of land at Malmesbury, South Africa.
AVAILABLE ARABLE LAND PER CAPITA
-70%
1950 2050

MAGAZINE 37TABLE OF CONTENTS
Richer Harvests and Secure Food SuppliesClimate change, worsening growing conditions and an expanding global population:
three factors that are diminishing the global supply of wheat, rice and corn. Researchers at
Bayer CropScience are developing innovative crop protection solutions and biotechnological
methods that are helping to safeguard harvests and boost crop yields worldwide.

38 / / BAYER ANNUAL REPORT 2008 TABLE OF CONTENTS
The world’s population is growing rapidly – and needs enough to eat. It is estimated that eight billion people will inhabit our planet by 2025. Fig-
ures produced by the World Bank already put the number of people facing starvation at around 850 million, and that number is grow-ing. Yet global food stocks have already dropped to their lowest level in 30 years. At the same time there is little scope for increasing the amount of land under cultivation. On the contrary, according to a u.n. forecast there will be around one third less arable land avail-able per capita of the population in 2050 than in 2000.
Climate change is exacerbating the situation. Meteorologists are recording more and more frequent extreme weather events such as drought or delayed precipitation. In South America, torrential rain has devastated large areas. Southeast Africa, Indonesia and Austra-lia have experienced prolonged droughts. And Florida has been hit by frost. Extreme weather fl uctuations can make farming a highly unpre-dictable business and greatly reduce the size of the harvest.
THE SECOND GREEN REVOLUTION
However, the main factors responsible for per-sistently poor growing conditions, and hence much smaller harvests, are lack of water, in-creasingly saline soil, and intense heat and cold. Corn, rice and wheat, for example, can no longer cope with such extreme environmental factors – and this has dire consequences. Even if their fi elds are optimally managed, farmers regularly lose between 30 and 70 percent of their crops. It is clear that the agricultural industry must overcome major challenges if it is to safeguard the world’s food supply in the future. “We need higher yields per unit of land and yields that are more resilient to climatic factors, particularly drought,” says Professor Stefan Tangermann, who for many years headed the Trade and Agriculture Directorate at the Organization for Economic Cooperation and Development (oecd). In the 1960s, the global community launched a number of programs, known jointly as the “Green Revolution,” designed to combat poverty in developing countries and meet the demand for food by introducing modern agricultural technology and high-quality seed. This kind of effort now needs to be repeated.
Research to secure the food supply: Bayer CropScience employees Tinnakorn Srivichai (left) and Noppol Sritharathikul evaluate the data recorded by the weather station at the new rice development center in Suphanburi, Thailand.

MAGAZINE 39TABLE OF CONTENTS
“What we need is a second Green Revolution. We must refocus on agricultural research, with particular emphasis on increasing har-vests and yields,” stresses Professor Friedrich Berschauer, Chairman of the Board of Man-agement of Bayer CropScience AG. Bayer CropScience intends to contribute to this ef-fort, and between 2008 and 2012 will be in-vesting a total of €3.4 billion in the discovery of innovative crop protection products and new solutions in the areas of seeds and plant biotechnology.
STRESS-TOLERANT PLANTS
We could go a long way toward reaching the United Nations’ goal of halving hunger in the world by 2015 if optimum use were made of all existing technology options. Bayer Crop-Science believes that farmers throughout the world could increase their yields by up to 70 percent just by using innovative crop protection products. And the Council for Bio-technology estimates that green genetic engi-neering could increase yield potential world-wide by some 25 percent. In this context researchers at Bayer CropScience are devel-oping ways of protecting crops more effec-tively against stress caused by factors such as climate and environment. For example, they are employing genetic engineering tech-
niques to equip rice plants with traits that will enable them to cope better with several stress factors. In some cases our scientists are introducing useful genes into the plants to make them more resistant to the extreme stress caused by drought or humidity. In other cases they are silencing individual genes that would otherwise trigger excessive stress reactions and reduce yields. “This enables plants to deliver high, stable yields over the long term in spite of fl uctuating environmen-tal conditions,” explains Dr. Michael Metzlaff from the Innovation Center for Plant Molecu-lar Biology operated by Bayer CropScience in Ghent, Belgium.
In Canada, genetic engineering has already helped to boost the oil yield of canola by up to 30 percent compared with conventional vari-eties. It is clear that modern breeding tech-niques and plant biotechnology can make a major contribution to feeding the world, but this presupposes greater acceptance of this technology so that it can be used on a large scale worldwide. “The food crisis has rekindled awareness of the need to secure the food sup-ply. This is encouraging a change in attitude and will lead to a calmer approach to green genetic engineering,” concludes agricultural expert Tangermann.
“Biotechnology enables plants to deliver high, stable yields over the long term in spite of fl uctuating environmental condi-tions.”
DR. MICHAEL METZLAFF
Research Liaison Manager Bayer CropScience
Bayer scientist Michael Metzlaff inspects canola crops in which stress tolerance has been enhanced by silencing specific genes.
€3.4 billionBayer CropScience will invest €3.4 billion through 2012 to research and develop innovative crop protection products and plant biotechnology solutions.

40 / / BAYER ANNUAL REPORT 2008 TABLE OF CONTENTS
INNOVATIVE PRODUCTS
Apart from biotechnology, however, conven-tional crop protection products can also help to boost harvests. One of the company’s most recent innovations is Movento® for the control of aphids and white fl ies. Its active ingredient, spirotetramat, displays exceptional mobility within the plant (see illustration on page 41), and when properly used it spares bees and other important benefi cials.
Another example is trifl oxystrobin, a com-pound that farmers all over the world have been using for years to protect their cereal, vegetable and fruit crops against harmful fungal diseases. But that is not all this fungi-cide can do: it also increases the resistance of plants to stress. “Field trials have shown that crops on which the active ingredient has been used produce higher yields than those treated with conventional fungicides,” ex-plains Dr. Dirk Ebbinghaus, a crop protection scientist at Bayer CropScience. Plants treated with trifl oxystrobin also grow considerably better than untreated plants when water is in short supply.
The latest research shows that certain active ingredients make rice plants more resistant to fl uctuations in the salt content of water.
Yet there is another problem that agriculture will have to solve in the future. It, too, results from the shortage of arable land and the in-crease in the global population. In the future there will be increasing competition between plants grown for food and those destined for producing energy.
Bayer’s scientists are examining ways to raise crop yields with the aid of new biotechnological processes. For example, they are looking at how to boost plants’ tolerance of stress factors or enhance their photosynthetic performance.
“The food crisis has rekindled aware-ness of the need to secure the food supply. This is encouraging a change in attitude and will lead to a calmer approach to green genetic engineering.”
PROFESSOR STEFAN TANGERMANN Former Head of the Trade and Agriculture Directorate of the oecd
PLANT BIOTECHNOLOGY AT BAYER
+25%growth thanks to plant biotechnology

MAGAZINE 41TABLE OF CONTENTS
PhloemXylem
Flussrichtung im Transportkanal:
Bayer CropScience’s posi-tion is that meeting the de-mand for food takes priority over the use of crops for energy. There may, however, be ways of defusing this confl ict by growing plants on what are known as marginal soils. Jatropha, for example, is an inedible plant that grows in barren soils. It has an oil content of more than 30 percent that can be used to produce biodiesel. Bayer CropScience is working with partners to investigate specif-ic crop protection solutions for Jatropha with the aim of fi nding out more about the econom-ic potential of this plant.
If efforts to safeguard and increase crop yields on existing arable land succeed, this could also help to solve the problem of human food and animal feed crops competing for acreages. This problem is occurring particu-larly in emerging nations such as China and India, where people are eating more meat as prosperity increases, thereby driving the demand for animal feed.
Bayer CropScience is well placed to meet the agricultural challenges posed by climate change and an expanding world population.
Yet these global tasks also re-
quire a deliberate emphasis on global
investment in technolo-gy, innovation and agricul-
tural infrastructure. “We need intensive agricultural research if we are
to meet the challenge of producing enough food, and we must also ensure that optimum use is made of our agricultural resources,” emphasizes Berschauer. This is the only way to feed the rapidly growing number of people who will be sharing our planet in the coming decades.
The active ingredient tri-fl oxystrobin protects cereal, vegetable and fruit crops (such as orange trees) against fungal diseases and also increases the plants’ resistance to stress factors such as lack of water.
ALL-ROUND PROTECTION
The crop protection product Movento® is distributed throughout the plant via its two transport systems, the xylem and the phloem. Unlike most other insecticides, it is thus delivered to places where pests are diffi cult to reach, such as inside young shoots or in the plant’s root system. When an aphid bites into the nutrient channel it ingests the insecticide.
Xylem Phloem
Direction of fl ow in the transport channel:
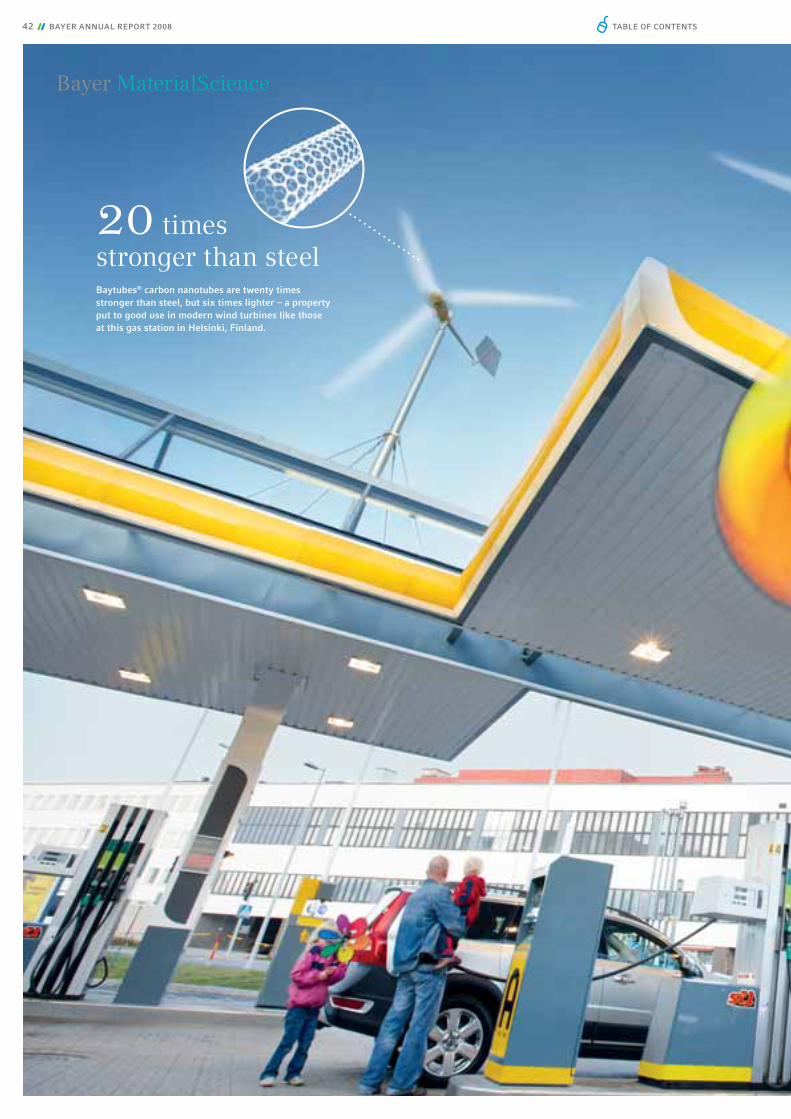
42 / / BAYER ANNUAL REPORT 2008 TABLE OF CONTENTS
20 timesstronger than steel Baytubes® carbon nanotubes are twenty times stronger than steel, but six times lighter – a property put to good use in modern wind turbines like those at this gas station in Helsinki, Finland.
Bayer MaterialScience

MAGAZINE 43TABLE OF CONTENTS
The Stuff the Future is Made ofLife depends on energy, and global demand for electricity, light and heat is
growing at an astounding rate. To achieve a balance between energy consumption
and climate protection from both an environmental and an economic perspective,
researchers at Bayer MaterialScience are developing innovative materials for
use in applications like zero-emission buildings, lighter cars and effi cient wind
turbines.

44 / / BAYER ANNUAL REPORT 2008 TABLE OF CONTENTS
The wind is increasingly being har-nessed as a source of power, with coastal and mountainous areas now home to a growing number of rotors
that convert airfl ows into electrical energy. Wind turbines are experiencing a boom that is expected to continue, with experts predicting that wind turbines with a total power of some 718,000 megawatts will be installed across the world by 2017. These turbines are urgently needed because, although energy from fossil sources continues to power the global econo-my, oil shortages and the need to protect the climate necessitate a rapid change of thinking. The link between energy consumption and economic growth must be broken and co2 emissions cut. These are the fi ndings of the International Energy Agency (iea) in its report “Energy Technology Perspectives 2008,” which forecasts that global gdp will quadruple by 2050, possibly even increasing tenfold in emerging markets such as China and India. But current co2 emissions from energy con-sumption are already threatening the earth’s climate, the agency warns.
High-tech “windmills” are gaining importance in the bid to meet at least part of tomorrow’s energy needs from sustainable sources. But making turbine blades longer will soon take conventional materials to the limits of their load-bearing capacity. Baytubes® carbon nano-tubes are therefore viewed as a beacon of hope for the future of wind power. These tiny cylin-ders just a few nanometers across achieve a material strength twenty times that of steel, yet the blade is only one-sixth as heavy as a steel blade of the same size. What’s more, they
WIND TURBINES
Baytubes® make rotor blades much lighter and stronger so that they can withstand extreme loads.
LITHIUM-ION BATTERIES
Baytubes® conduct heat better than diamonds, en-suring a continuous fl ow of electricity in rechargeable batteries and thereby boost-ing their performance and service life.
PLASTIC AUTOFENDERS
Carbon nanotubes enable automakers to coat exterior plastic components electro-statically without fi rst ap-plying a conductive primer.
CARBON NANOTUBES – DESIGN AND FUNCTION
The future of materials science is closely bound up with nanotechnology. Bayer MaterialScience is exploiting the potential of Baytubes® carbon nano-tubes. Baytubes® form the basis for materials that combine strength with low weight, imparting properties such as conductivity and increased tough-ness. Their benefi ts are already being felt in a wide range of products.
Right: a 3d model of the hexagonal structure of carbon nanotubes.
CARBON NANOTUBES –
INNOVATIVE APPLICATIONS

MAGAZINE 45TABLE OF CONTENTS
can turn even small wind power plants into cost-effective energy
producers. Ultra-lightweight plastic rotor blades made with Baytubes®
recently went into service in the wind tur-bines of Finnish company Eagle Windpower.
The turbines have an output of up to 20 kilo-watts. “Drawing on our expertise in polymer engineering, we can help our customers inte-grate Baytubes into various plastics,” explains Martin Schmid, responsible for developing the global Baytubes® business at Bayer Material-Science. Thanks to the high strength of the tubes, the two-and-a-half-meter-long blades of the Finnish turbines are so light and slen-der that they generate energy effi ciently even at low wind speeds, making them suitable for residential properties as well.
LITHIUM-ION BATTERIES WITH NANO MATERIALS
Carbon nanotubes have enormous market potential, which experts estimate at several thousand metric tons a year over the next few years. This is because, apart from their very high strength, they have other outstanding properties that boost effi ciency. They conduct heat better than diamonds and as well as copper. That’s why carbon nanotubes also of-fer great potential for lithium-ion batteries. Baytubes® ensure an unimpeded fl ow of elec-trons within the batteries, thereby boosting their performance and prolonging their ser-vice life. The automotive industry could even use nanotubes to save on costly production steps. For example, a plastic fender made
INTERNET
For more information on the production of Bayer’s carbon nanotubes and their applications, go to www.baytubes.com
electrically conductive by incorporating Baytubes® can be coated by the eco-friendly electrostatic process, saving a considerable quantity of solvent, coating materials and energy.
LIGHTWEIGHT PLASTICS SAVE FUEL
Automotive engineers exploit material innova-tions from Bayer MaterialScience to make vehicles lighter – for example by using Makro-lon® plastic for windows. Glazing made from Bayer’s polycarbonate weighs up to 50 percent less than glass. Industry experts forecast that over the next few years automotive designers will include signifi cantly more transparent areas in vehicles. The trend towards large, lightweight panoramic roofs is particularly evident, the latest example being Hyundai’s “i-mode” car. A total of eleven lightweight glazing panels made from Makrolon® fl ood the interior of this concept car with light, while at the same time helping to cut fuel consump-tion.
Bayer MaterialScience has also developed nu-merous weight-saving solutions for cars using polyurethanes – including strong and rigid trunk fl oors, spare-wheel covers and sunroof sections. The Volkswagen Tiguan features a number of lightweight components made from Bayer plastics, which are up to 80 percent light-er than their sheet metal counterparts, thus signifi cantly cutting fuel consumption and co2 emissions.
“Baytubes offer tremendous opportunities for innovation. We will continue to drive research in this fi eld and open up new areas of application.”MARTIN SCHMIDGeneral Manager Carbon Nanotubes Bayer MaterialScience

46 / / BAYER ANNUAL REPORT 2008 TABLE OF CONTENTS
In Dubai there is an increasing focus on climate protection and building insulation. Bayer’s polyurethane insulating materials are ideal for either keeping the heat out or protect-ing against the cold.
DESIGNING BUILDINGS TO SUIT THE CLIMATE
The construction sector needs innovative material concepts for the future. According to fi gures published by the United Nations Inter-governmental Panel on Climate Change, energy consumption in buildings is responsi-ble for almost 20 percent of global greenhouse gas emissions. Now, specialists from Bayer Material Science are proving that climate-friendly construction is possible with the fi rst project to be launched as part of the “EcoCom-mercial Building” initiative. The project is an offi ce complex currently being built for Bayer near New Delhi, India. Scheduled for comple-tion by the end of 2009, it will consume 70 per-cent less electricity than other local commer-cial buildings. The engineers are adapting the building to the extreme heat and humidity of the subtropics. The result will be zero emis-sions, thanks to insulation with high-quality Bayer materials combined with the EcoCom-mercial Building’s own ability to harness solar energy. The building will meet its entire energy needs itself, thus lowering emissions by at least the amount generated by its operation.
Polyurethane insulating materials are ideal both for keeping the heat out in countries like India and for protecting against the cold. This enables the new Bayer climate concept for buildings to be deployed throughout the world. “We bring the best materials, systems and technologies together to design buildings that are adapted to local climatic conditions,” says Rüdiger Utsch, in charge of the project at Bayer MaterialScience. At the Madinat Jumei-rah resort in Dubai, for example, 7,000 square meters of fl oor space have been insulated with Bayer polyurethane.
CO2 – THE RAW MATERIAL FOR NEW PRODUCTS
Researchers from Bayer MaterialScience are actively helping to reducing carbon dioxide (co2) emissions. In fact, they hope this green-house gas can soon be used as a raw material: “We want to use co2 as a feedstock for polyure-thane production,” says Dr. Christoph Gürtler from Bayer MaterialScience. To this end, Bayer has joined forces with rwth Aachen University to set up the “cat Catalytic Center.” Researchers there initially intend to develop new catalysts to convert co2 into a valuable starting material for new products. If this is successful, it may soon be possible to bind the gas in polyurethane, thus removing it from the atmosphere.
-70% power consumption
The fi rst “EcoCommercial Building” is under construc-tion near New Delhi. It can meet its entire energy needs itself – electricity, heating, hot water and refrigeration.

MAGAZINE 47TABLE OF CONTENTS
VEGETABLE OILS FOR “GREEN” PLASTICS
Natural materials such as industrial sugar and vegetable oils have been used for some time in the production of polyols, which, along with isocyanates, are basic components of polyurethanes. Bayer MaterialScience has now developed polyols that contain up to 70 percent (by weight) renewable raw materi-als, such as canola or soybean oil, and therefore help to reduce emissions. In some cases, these “green” polyurethane foams have even better material properties than conventionally manufactured products. The vegetable oils enhance compatibility with the pentane blowing agent used for foaming these plastics, which provide effi cient insula-tion in buildings, refrigerating appliances and pipelines, and are used to produce car seats, fl ooring, shoe soles and high-quality mattresses.
The conventional method of producing poly-urethane raw materials requires large quanti-ties of chlorine, and chlorine production is en-ergy-intensive. But together with its partners, Bayer has developed a process that consumes some 30 percent less energy and thus reduces co2 emissions from power plants. Known as oxygen-depolarized cathode technology, it uses oxygen in the electrolysis of hydrochloric acid. The process has already received the Environmental Award of the Federation of German Industries. In 2009, Bayer is looking to use this technology to cut co2 emissions by 100,000 metric tons in China alone.
GLOBAL CLIMATE CHECK OF PRODUCTION FACILITIES
The company also is employing the “Bayer Climate Check” to analyze processes at its facilities throughout the world with the aim of making them more effi cient. Some 100 production plants are being examined by this method, which was developed by Bayer Tech-nology Services, to gauge their climate com-patibility. Bayer is looking at the “climate footprint” – the impact that raw materials, logistics and energy use have on the climate. The Bayer Climate Check thus adds a new di-mension to the basis for decisions on process design, for the fi rst time ensuring that envi-ronmental aspects are taken into account along with profi tability criteria. The Group’s emissions of direct and indirect greenhouse gases are expected to be reduced by between fi ve and ten percent as a result. “The Bayer Climate Check will help us to identify new potential for cutting emissions, harness that potential and ultimately achieve our ambi-tious emission targets,” says Dr. Wolfgang Plischke, the member of the Bayer AG Board of Management responsible for innovation, technology and the environment.
The less unused energy escapes in the future, the smaller will be the climate burden affect-ing future generations. High-tech materials and process know-how from Bayer Material-Science are crucially important in this re-spect, as materials play a key role in saving energy and thus reducing greenhouse gases such as carbon dioxide.
Plant assistant Jörg Bäther checks the oxygen inlet pipe of the plant at Bayer’s Brunsbüttel site that uses the oxygen depolarized cathode tech-nology.

48 / / BAYER ANNUAL REPORT 2008 TABLE OF CONTENTS
JANUARY
Innovative active substance offers protection from fungal diseases
Fluopicolide, an inno-vative fungicidal active ingredient from Bayer CropScience, receives regulatory approval in Japan and the United States. It can now be used in Japan for the control of late blight (Phy-tophthora infestans) in potatoes. In the United States, fluopic-olide is used to protect vegetables, grapes, turf and ornamentals from disease.
MARCH Donation for hemophilia patients
On the occasion of World Hemophilia Day on April 17, Bayer HealthCare donates €250,000 to the World Federation of Hemo-philia (wfh) along with more than 950,000 international units of the recombi-nant coagulation factor Kogenate® FS. This further donation means Bayer has contributed more than €1 million to the wfh in recent years to support treatment and training programs. Approximately 400,000 people around the world have hemophilia a.
APRIL
High-yielding ricevariety for India
Bayer CropScience launches Arize® Dhani – the world’s first hy-brid rice variety resis-tant to bacterial leaf blight – in India. The new variety increases yields by between 20 and 30 percent com-pared with conven-tional varieties and at the same time offers broad protection against this devastat-ing disease, which is caused by the bacteria Xanthomonas oryzae oryzae. In India, bacte-rial leaf blight can de-stroy up to 60 percent of the rice crop.Photo: Bayer employee Frank Adam removes seeds from a rice plant.
MAY
Bayer receives Environmental Award from the Federation of German Industries
Bayer is presented with the 2008 Environmental Award in the category “Envi-ronmentally Friendly Technologies” by the Federation of German Industries (bdi) for its new chlorine produc-tion process, which reduces power con-sumption and co2 emissions by 30 per-cent. The new process is based on oxygen-depolarized cathode technology. Chlorine is a basic chemical used in the manufac-ture of high-tech materials such as poly-urethanes.Photo: BMS employees Andreas Bulan (left) and Blas Riquelme-Moreno next to anoxygen-depolarizedcathode.
JUNE
Highlights 2008
FEBRUARY
Catalysis center to raise productionefficiency
In February 2008 a new catalysis center opens in Aachen, Ger-many. Bayer Material-Science, Bayer Tech-nology Services and rwth Aachen Univer-sity sign a cooperation agreement for aresearch facility in which Bayer will invest more than €7 million. The planned research projects will focus partly on making sus-tainable chemical pro-duction more efficient, one of the aims being to find alternative raw materials for plastics.Photo: Dr. Angelina Prokofiewa and Dr. Guilia Erre (from left) at the Aachen catalysis center.
Leukemia drug: European registration expanded
The European Com mission grants marketing authori za-tion to MabCampath® for the treatment of patients with b-cell chronic lymphocytic leukemia (b-cll) for whom fludarabine combination chemo-therapy is not appro-priate. MabCampath® works in an entirely different way than chemo therapy, and is the first and only mono clonal antibody approved in Europe for the treatment of b-cll, the leading form of adult leukemia in the Western hemi-sphere.

49TABLE OF CONTENTS
World-scale production facilities in Shanghai
Bayer MaterialScience commissions its new 350,000 tons-per-year diphenylmethane diisocyanate (mdi) pro-duction complex in Shanghai, the largest mdi facility of its kind in the world. mdi is needed for the manu-facture of rigid poly-urethane foams. The company also breaks ground at the site for a 250,000 tons-per-year toluene diisocyanate (tdi) plant, due on stream in 2010. tdi is the primary raw material used in the production of flexible polyurethane foams.
OCTOBER
Industrial-scale production of biopharmaceuticals
A facility is to be developed in Owens-boro, Kentucky, United States, for the indus-trial-scale production of proteins in tobacco plants. Plant-made pharmaceuticals (pmp) and other high-value products will be manu-factured there on the basis of Bayer’s magnICON® tech-nology.Photo: Dr. Stefan Herz of Bayer subsidiary Icon Genetics homo-genizes tobacco plants.
SEPTEMBER
Expanding innovation
At a press forum entitled “Bayer’s Per-spective on Innovation 2008,” Management Board Chairman Werner Wenning announces a further increase in the Bayer Group’s research and development activi-ties. The demand for food and health care, in particular, continues to grow. Bayer is responding with the development of new crop protection products, ten of which it is planned to bring to market in the period from 2008 through 2012. The company’s pharmaceutical pipeline is also well stocked, with 50 projects currently in Phases i to iii of clinical testing.
DECEMBERJoining forces to fight cancer
The German Cancer Research Center and Bayer Schering Pharma form a strate-gic research alliance scheduled to run for an initial period of two years. The collabora-tion is aimed at enabling more rapid exploitation of re-search findings for the development of new cancer drugs and en-hancing the evaluation of innovative thera-peutic approaches for tumor diseases. To this end, the partners will each invest €1.75 mil-lion in joint cancer research through 2010.Photo: Prof. Dr. Otmar D. Wiestler (dkfz) and Dr. Wolfgang Plischke (from left) sign the collaboration agreement.
NOVEMBER
JULY
New insecticide approved in North America
The new insecticide Movento® from Bayer CropScience is granted regulatory approval in the United States and Canada, two strategically important markets. The innovative feature of Movento® is that it works by moving up and down through the entire plant system. Thanks to this two-way transport, the product also prevents insect eggs and larvae from growing in the shoots, leaves and roots.
Bayer MaterialScience at the Olympics
Numerous buildings at the Olympic Games in Beijing incorporate materials from Bayer MaterialScience. The roof of the stadium in Shenyang, for example, is made of Makrolon®, its wing-shaped design sym-bolizing elegance and lightness. Makrolon® sheets in the Tianjin Olympic stadium form a transparent inner ring measuring ap-proximately 13,000 square meters that covers part of the stands. Another ex-ample is the use of the aliphatic polyure-thane crosslinking agent Desmodur® n in the topcoat for the steel struts of the “Bird’s Nest” national stadium (photo).
AUGUST
HIGHLIGHTS 2008
50 / / BAYER ANNUAL REPORT 2008
Management Report
» Overview of Sales, Earnings and Financial Position. . . . . . . . . . . . . . . . . . . . . . . . . . . . . . . . . . . . . . . . . . . . 51
» Operating Environment . . . . . . . . . . . . . . . . . . . . . . . . . . . . . . . . . . . . . . . . 56
» Performance by Subgroup and Segment . . . . . . . . . . . . . . . . . . . . . . . . . . . . . . . . . . . . . . . . . 58
» Bayer HealthCare . . . . . . . . . . . . . . . . . . . . . . . . . . . . . . . . . . . . . . . . . . . . . . 59
» Bayer CropScience. . . . . . . . . . . . . . . . . . . . . . . . . . . . . . . . . . . . . . . . . . . . 65
» Bayer MaterialScience . . . . . . . . . . . . . . . . . . . . . . . . . . . . . . . . . . . . . . 70
» Performance by Region . . . . . . . . . . . . . . . . . . . . . . . . . . . . . . . . . . . . . . . . . 74
» Earnings Performance . . . . . . . . . . . . . . . . . . . . . . . . . . . . . . . . . . . . . . . . . 74
» Calculation of ebit(da) Before Special Items . . . . . . . . . . . . . . . . . . . . . . . . . . . . . . . . . . . . . . . . . . . . . 76
» Value Management . . . . . . . . . . . . . . . . . . . . . . . . . . . . . . . . . . . . . . . . . . . . . . . . 77
» Liquidity and Capital Resources . . . . . . . . . . . . . . . . . . . . . . . . . . . . 78
» Asset and Capital Structure . . . . . . . . . . . . . . . . . . . . . . . . . . . . . . . . . . . 81
» Information Required Under Takeover Law . . . . . . . . . . . 83
» Proposal for Distribution of the Profi t . . . . . . . . . . . . . . . . . . . . 85
» Procurement, Production and Distribution . . . . . . . . . . . . 86
» Research and Development . . . . . . . . . . . . . . . . . . . . . . . . . . . . . . . . . . . 88
» Employees . . . . . . . . . . . . . . . . . . . . . . . . . . . . . . . . . . . . . . . . . . . . . . . . . . . . . . . . . . . . . 97
» Sustainable Development . . . . . . . . . . . . . . . . . . . . . . . . . . . . . . . . . . . . 100
» Corporate Social Responsibility . . . . . . . . . . . . . . . . . . . . . . . . . . . 103
» Corporate Governance Report . . . . . . . . . . . . . . . . . . . . . . . . . . . . . 105
» Compensation Report . . . . . . . . . . . . . . . . . . . . . . . . . . . . . . . . . . . . . . . . . . 111
» Subsequent Events . . . . . . . . . . . . . . . . . . . . . . . . . . . . . . . . . . . . . . . . . . . . . . 115
» Future Perspectives . . . . . . . . . . . . . . . . . . . . . . . . . . . . . . . . . . . . . . . . . . . . . 116
» Economic Outlook and Market Opportunities . . . . . . . . . . . . . . . . . . . . . . . . . . . . . . . . . . . . . 116
» Anticipated Development Opportunities . . . . . . . . . 117
» Risk Report . . . . . . . . . . . . . . . . . . . . . . . . . . . . . . . . . . . . . . . . . . . . . . . . . . . . . 117
» Business Strategy . . . . . . . . . . . . . . . . . . . . . . . . . . . . . . . . . . . . . . . . . . . 125
» Financial Strategy . . . . . . . . . . . . . . . . . . . . . . . . . . . . . . . . . . . . . . . . . . . 129
» Sales and Earnings Forecast . . . . . . . . . . . . . . . . . . . . . . . . . . . 130
For direct access to a chapter, simply click on its name.
TABLE OF CONTENTS

MANAGEMENT REPORT
Group strategy holds up well in a diffi cult environment
Bayer achieves 2008 earnings targets
• Sales advance by 1.6% to €32.9 billion
• ebitda before special items up 2.3% to €6.9 billion
• ebit before special items up 1.3% to €4.3 billion
• Net income of €1.7 billion
• Dividend to be raised to €1.40
• Outlook for 2009:
Earnings growth at HealthCare and CropScience;
substantial decline at MaterialScience
Signifi cant reduction in fi nancial debt
51TABLE OF CONTENTS MANAGEMENT REPORT

52 / / BAYER ANNUAL REPORT 2008
Overview of Sales, Earnings and Financial Position
FULL YEAR 2008
In 2008 Bayer had a successful year overall in an increasingly diffi cult economic environment. The Group’s key operational performance data showed a slight further improvement from the previous year, and earnings targets were achieved. We benefi ted from the Group’s focus on the HealthCare and CropScience businesses, which are less dependent on global economic develop-ment.
Sales of the Bayer Group came in at €32,918 million, up 1.6% from the prior-year fi gure of €32,385 million. Adjusted for currency and portfolio effects, business expanded by 4.4%, slight-ly less than we had forecasted. HealthCare posted a 6.9% increase on a currency- and portfolio-adjusted basis. CropScience sales climbed by 13.9%. MaterialScience experienced a consider-able drop in business in the fourth quarter as a result of the fi nancial and economic crisis, causing full-year sales to drop by 4.6%. Group ebitda before special items rose by 2.3% to a record €6,931 million (2007: €6,777 mil-lion). With an improvement in the ebitda margin before special items to 21.1%, we met our profi tability target for fi scal 2008.
ebitda before special items of the HealthCare subgroup advanced by 9.6% to €4,157 million (2007: €3,792 million), yielding an ebitda margin before special items of 27.0%. Contributing to this increase were the gratifying business performance and the synergies realized from the inte-gration of the former business of Schering AG, Berlin, Germany. Earnings of CropScience rose by 21.1% to €1,603 million (2007: €1,324 million), and the ebitda margin before special items came in at 25.1%. This increase resulted from signifi cantly larger volumes, selling price increases and cost savings. MaterialScience reported ebitda before special items of €1,088 million, down by a substantial 32.3% from the prior-year fi gure of €1,606 million. The decline was due to lower volumes, mainly because of the overall slump in the economy in the fourth quarter. Earnings were also hampered by a high average level of petrochemical raw material and energy costs for the year.
ebit before special items of the Bayer Group amounted to €4,342 million, up 1.3% from the prior-year fi gure of €4,287 million. ebit in 2008 was diminished by net special charges of €798 million, against €1,133 million in the previous year. Of the 2008 fi gure, HealthCare accounted for €583 million, CropScience for €166 million and MaterialScience for €49 million. Special charges of €365 million (2007: €683 million) related to the acquisition and integration of Schering AG, €215 million (2007: €172 million) to restructuring at CropScience and Material-Science, €106 million (2007: €139 million) to litigation and €98 million (2007: €166 million) to impairments. ebit of the Bayer Group rose by 12.4% to €3,544 million (2007: €3,154 million).
After a non-operating result of minus €1,188 million (2007: minus €920 million), income before income taxes came in at €2,356 million (2007: €2,234 million). The main components of the non-operating result were €702 million (2007: €701 million) in net interest expense, €300 million (2007: €246 million) in interest cost for pension and other provisions and a €79 million exchange loss (2007: €88 million exchange gain). The shift in the balance of exchange gains and losses was partly due to the increased cost of exchange hedging in emerging countries arising from the
TABLE OF CONTENTS MANAGEMENT REPORT
Change in Sales 2007 2008
% %
Volume + 5.6 + 2.8
Price + 0.5 + 1.6
Currency – 3.6 – 3.4
Portfolio + 9.3 + 0.6

MANAGEMENT REPORT
Overview of Sales, Earnings and Financial Position
53
Bayer Group Quarterly Sales
Q1
Q2
Q3
Q4
20072008
20072008
20072008
20072008
1,3011,325
1,1991,202
1,1901,227
1,1251,043
€ millionDomestic
7,0347,211
7,0187,309
6,6036,721
6,9156,880
€ millionForeign
8,3358,536
8,2178,511
7,7937,948
8,0407,923
Total
Quarterly Sales by Subgroup
Q1
Q2
Q3
Q4
20072008
20072008
20072008
20072008
3,6103,731
3,7173,734
3,6803,802
3,8004,140
€ millionBayer HealthCare
2,6082,512
2,6232,622
2,6252,549
2,5792,055
€ millionBayer MaterialScience
1,7861,978
1,5621,804
1,1571,248
1,3211,352
€ millionBayer CropScience
Bayer Group Quarterly EBITDA Before Special Items
Q1
Q2
Q3
Q4
20072008
20072008
20072008
20072008
1,9902,185
1,8061,896
1,5591,493
1,4221,357
€ million
Quarterly EBITDA Before Special Items by Subgroup
Q1
Q2
Q3
Q4
20072008
20072008
20072008
20072008
9481,050
969994
9531,018
9221,095
€ millionBayer HealthCare
409407
409372
421255
36754
€ millionBayer MaterialScience
584713
396501
167207
177182
€ millionBayer CropScience
TABLE OF CONTENTS MANAGEMENT REPORT

54 / / BAYER ANNUAL REPORT 2008
expansion of our business there, while in the previous year we had benefi ted from exchange gains on fi nancial transactions.
In 2008 we recorded tax expense of €636 million, compared to net tax income of €72 million in the prior year. The latter amount included a one-time, non-cash positive tax effect of €912 mil-lion arising in connection with the 2007 corporate tax reform in Germany.
Income from continuing operations after taxes receded to €1,720 million (2007: €2,306 million). After-tax income in the previous year also included €2,410 million from discontinued operations, chiefl y consisting of gains from the divestitures of the diagnostics business, H.C. Starck and Wolff Walsrode.
After non-controlling interest, net income of the Bayer Group came in at €1,719 million (2007: €4,711 million). Earnings per share amounted to €2.22 (2007: €5.84). Core earnings per share improved to €4.17 (2007: €3.80). The calculation of core earnings per share is explained under “Investor Information,” page 21.
Gross cash fl ow increased by 10.7% from the previous year to €5,295 million (2007: €4,784 mil-lion), due to the gratifying business trend at HealthCare and CropScience. Net cash fl ow declined by 15.7% to €3,608 million (2007: €4,281 million), mainly due to a signifi cant increase in cash tied up in working capital. Contributing to this increase was a higher level of receivables and inventories at HealthCare and CropScience, which was partly the result of business growth.
Net debt of the Bayer Group as of December 31, 2008 amounted to €14.2 billion (2007: €12.2 bil-lion). Components of this increase included the increase in cash tied up in working capital, €0.9 billion in acquisition-related disbursements and a €0.6 billion effect from fl uctuations in major currencies against the euro. The €0.7 billion for payments to minority stockholders of Bayer Schering Pharma AG, Berlin, Germany, did not affect net debt, as the amount held in escrow accounts for this purpose was not deducted when net debt was calculated in the past.
The net pension liability rose by €1.0 billion compared with December 31, 2007, to €6.0 billion, due to sharp falls in share prices that diminished the value of stocks held by pension funds, par-ticularly in the United States. The return on plan assets was a negative 6.5% overall.
Gross Cash Flow
Q1
Q2
Q3
Q4
20072008
20072008
20072008
20072008
1,4111,651
1,1871,322
1,1651,171
1,0211,151
Net Cash Flow
Q1
Q2
Q3
Q4
20072008
20072008
20072008
20072008
375528
816889
1,6231,234
1,467957
€ million € million
TABLE OF CONTENTS MANAGEMENT REPORT

MANAGEMENT REPORT
Overview of Sales, Earnings and Financial Position
55
FOURTH QUARTER OF 2008
Sales of the Bayer Group in the fourth quarter of 2008 declined by 1.5% to €7,923 million (q4 2007: €8,040 million) due to a substantial decline in business at MaterialScience. Adjusted for currency and portfolio effects, business was down by 4.0%. While HealthCare and Crop-Science grew sales by 6.2% and 1.7%, respectively, on a currency- and portfolio-adjusted basis, MaterialScience saw sales decline by an adjusted 24.2%.
Fourth-quarter ebitda before special items came in at €1,357 million, down 4.6% from the prior-year fi gure of €1,422 million. HealthCare saw earnings advance by 18.8% to €1,095 million (q4 2007: €922 million), while underlying ebitda of CropScience improved by 2.8% to €182 mil-lion (q4 2007: €177 million). ebitda before special items of MaterialScience amounted to only €54 million (q4 2007: €367 million), due mainly to the steep decline in volumes. Underlying ebit of the Bayer Group fell by 8.8% in the fourth quarter, to €706 million. There were special charges of €294 million (q4 2007: €389 million). Of this fi gure, HealthCare accounted for €197 million (q4 2007: €311 million), CropScience for €62 million (q4 2007: €36 million) and MaterialScience for €35 million (q4 2007: €42 million). ebit for the fourth quarter thus came in at €412 million (q4 2007: €385 million).
After a non-operating result of minus €375 million (q4 2007: minus €179 million), income before income taxes for the fourth quarter came in at €37 million (q4 2007: €206 million). The non-operating result contained net interest expense of €167 million (q4 2007: €160 million). After one-time tax effects, we had tax income of €65 million (q4 2007: €149 million tax expense). Income from continuing operations after taxes came to €102 million (q4 2007: €57 million).
After non-controlling interest, Group net income in the fourth quarter came to €106 million (q4 2007: €67 million). Earnings per share amounted to €0.16 (q4 2007: €0.11). Core earnings per share were €0.71 (q4 2007: €0.71).
Gross cash fl ow moved ahead by 12.7% year on year in the fourth quarter of 2008, to €1,151 million. Net cash fl ow declined by 34.8% to €957 million (q4 2007: €1,467 million) due to a signifi cant increase in cash tied up in working capital.
Key Data by Subgroup and Segment, 4th Quarter
SalesEBIT
before special items*EBITDA
before special items*EBITDA margin
before special items*
4th Quarter
2007
4th Quarter
2008
4th Quarter
2007
4th Quarter
2008
4th Quarter
2007
4th Quarter
2008
4th Quarter
2007
4th Quarter
2008
€ million € million € million € million € million € million % %
HealthCare 3,800 4,140 584 759 922 1,095 24.3 26.4
Pharmaceuticals 2,619 2,868 367 508 670 804 25.6 28.0
Consumer Health 1,181 1,272 217 251 252 291 21.3 22.9
CropScience 1,321 1,352 43 53 177 182 13.4 13.5
Crop Protection 1,100 1,124 33 52 147 158 13.4 14.1
Environmental Science, BioScience 221 228 10 1 30 24 13.6 10.5
MaterialScience 2,579 2,055 241 (86) 367 54 14.2 2.6
Systems 1,801 1,506 240 (17) 325 82 18.0 5.4
Materials 778 549 1 (69) 42 (28) 5.4 (5.1)
Reconciliation 340 376 (94) (20) (44) 26 (12.9) 6.9
ContinuingOperations 8,040 7,923 774 706 1,422 1,357 17.7 17.1
* for defi nition see chapter “Calculation of EBIT(DA) Before Special Items,” page 76
TABLE OF CONTENTS MANAGEMENT REPORT

56 / / BAYER ANNUAL REPORT 2008
Operating Environment
GLOBAL ECONOMY
The global economy weakened increasingly during 2008. Major factors contributing to the decline were the sharp increases in commodity prices in the fi rst half of the year and the severe real-estate crisis in the United States. Market prices for the petrochemical raw materials relevant to our business reached an all-time high in the summer but showed a distinct turnaround in the second half.
The global fi nancial crisis worsened as the year went on, accelerating the global economic down-trend. The economy of the Unites States remained reasonably robust in the fi rst half thanks to monetary counter measures adopted in the form of sharp cuts in interest rates. After that, howev-er, the u.s. economy weakened considerably. In Europe, too, the downturn intensifi ed as the year went on, plunging some countries into recession. Yet in many emerging markets, particularly the so-called bric countries (Brazil, Russia, India and China), growth initially continued almost un-abated thanks to robust domestic demand. There too, however, economic growth slowed increas-ingly toward year end.
HEALTHCARE
In 2008 the market for prescription medicines posted stable growth in the mid-single digits. The importance of specialty pharmaceuticals continued to increase and, as in previous years, there were further regional shifts. Pharmaceutical markets continued to expand in the emerging countries, where health services are becoming more broadly available and the demand for the treatment of chronic diseases is growing. By contrast, there were signs of slower market expan-sion in the United States and the major European countries. This was due partly to the fact that leading drugs in major therapeutic areas such as cardiovascular care have come off patent, with generic products increasingly capturing market share as a result. In addition, growth in western Europe in particular was hampered by health policy factors that drove more rigorous cost con-tainment and limited access to certain types of treatment.
The global consumer care market again experienced solid growth, to which all regions contributed. Market expansion was above the average in Latin America, eastern Europe and the Asia / Pacifi c region except for Japan. The animal health environment was again favorable, with fi rm growth in most areas following a record year in 2007. In the majority of the industrialized countries the companion animal market made a strong contribution to the positive market devel-opment.
CROPSCIENCE
The global seed and crop protection market benefi ted in 2008 from very favorable conditions on the world agricultural markets. Market prices for the principal plant-based raw materials reached an all-time high in the fi rst half of the year, boosting crop production and the related demand for crop protection products worldwide. The higher prices for agricultural inputs in general enabled prices to be raised for crop protection products as well. Climatic conditions in the most important growing regions were also favorable. In this environment, the crop protec-tion market registered double-digit growth rates in all the major regions. This performance was particularly positive in Latin America, where growth was driven primarily by higher farm incomes in Brazil. Crop production and the related demand for crop protection products also intensifi ed in eastern Europe, especially in Russia and Ukraine. The suspension of mandatory fallowing practices in the European Union benefi ted the cereals sector in particular. In North America, crop protection products were used increasingly to improve yields. The market situation in the Asia / Pacifi c region varied from one country to another. While the agricultural economy in Australia benefi ted from considerably higher precipitation and the Chinese and Indian markets also developed favorably, Japan continued to show a slight downward trend.
TABLE OF CONTENTS MANAGEMENT REPORT
Pharmaceutical marketStable growth in the
mid-single digits
Very favorable conditions on the world
agricultural markets
MANAGEMENT REPORT
Operating Environment
57
MATERIALSCIENCE
The business environment for the automotive industry deteriorated sharply in 2008, especially in the second half of the year. Experts believe the entire industry is facing its most diffi cult period in decades. Global manufacturers saw sales drop more sharply each month. Most manu-facturers responded to this very diffi cult situation with temporary shutdowns or worktime reduc-tions or by shedding contract workers. This directly impacted the automotive supply industry and the car retail trade in the fourth quarter.
The real-estate and fi nancial crisis also had a signifi cant effect on the construction industry, where global investment was slightly down compared with 2007. This was due to the dramatic decline in the United States and to distinctly negative developments in major western European countries (Spain, United Kingdom, Italy). These factors were partially offset by what was still a robust situation in eastern Europe, the Middle East and Asia / Pacifi c.
In contrast to many other sectors, the electronics industry maintained growth in the mid-single digits in 2008, again driven by Asia and eastern Europe. Highly developed technologies (such as renewable energies) and strong exports to eastern Europe and China led to moderate growth in the western European electronics industry, while the sector’s performance in North America was impaired by the economic crisis.
The furniture industry had to contend with increasingly diffi cult business conditions worldwide. The uncertainty created by the real-estate and fi nancial crisis also made consumers somewhat reticent about buying furniture. This trend particularly affected manufacturers in North America, although companies in western Europe and Asia also had to contend with a drop in demand.
TABLE OF CONTENTS MANAGEMENT REPORT
Difficult business environment for MaterialScience

58 / / BAYER ANNUAL REPORT 2008
Performance by Subgroup and Segment
CORPORATE STRUCTURE
Bayer AG, headquartered in Leverkusen, Germany, is the strategic management holding compa-ny for the Bayer Group. Business activities are conducted by the HealthCare, CropScience and MaterialScience subgroups, supported by the service companies Bayer Business Services, Bayer Technology Services and Currenta. There have been no material changes to the Bayer Group’s structure since the 2007 Annual Report.
With the entry of the squeeze-out of the remaining minority stockholders of Bayer Schering Pharma AG in the commercial register on September 25, 2008, Bayer Schering Pharma AG be-came a wholly owned subsidiary of Bayer AG.
The names “Bayer Schering Pharma” or “Schering” as used in this report always refer to Bayer Schering Pharma AG, Berlin, Germany, or its predecessor, Schering AG, Berlin, Germany, re-spectively. The reference to Bayer Schering Pharma AG or Schering AG also includes business conducted by affi liated entities in countries outside Germany. Bayer Schering Pharma AG and Schering-Plough Corporation, New Jersey, United States, are unaffi liated companies that have been totally independent of each other for many years.
The commentaries in this report relate exclusively to continuing operations, except where spe-cifi c reference is made to discontinued operations or to a total value (total).
Sales by Segment, 2008 (2007 in parentheses)
46.8% (45.7%)HealthCarePharmaceuticals 32.5% (31.7%)Consumer Health 14.3% (14.0%)19.4% (18.0%)
CropScienceCrop Protection 16.2% (14.8%)Environmental Science, BioScience 3.2% (3.2%)
Reconciliation 4.2% (4.1%)29.6% (32.2%)MaterialScienceSystems 21.7% (22.8%)Materials 7.9% (9.4%)
TABLE OF CONTENTS MANAGEMENT REPORT
Key Data by Subgroup and Segment
SalesEBIT
before special items*EBITDA
before special items*EBITDA margin
before special items*
2007 2008 2007 2008 2007 2008 2007 2008
€ million € million € million € million € million € million % %
HealthCare 14,807 15,407 2,492 2,764 3,792 4,157 25.6 27.0
Pharmaceuticals 10,267 10,704 1,641 1,835 2,807 3,080 27.3 28.8
Consumer Health 4,540 4,703 851 929 985 1,077 21.7 22.9
CropScience 5,826 6,382 786 1,084 1,324 1,603 22.7 25.1
Crop Protection 4,781 5,339 632 962 1,093 1,397 22.9 26.2
Environmental Science, BioScience 1,045 1,043 154 122 231 206 22.1 19.8
MaterialScience 10,435 9,738 1,117 586 1,606 1,088 15.4 11.2
Systems 7,394 7,130 1,017 670 1,333 1,012 18.0 14.2
Materials 3,041 2,608 100 (84) 273 76 9.0 2.9
Reconciliation 1,317 1,391 (108) (92) 55 83 4.2 6.0
Continuingoperations 32,385 32,918 4,287 4,342 6,777 6,931 20.9 21.1
* for defi nition see “Calculation of EBIT(DA) Before Special Items,” page 76

MANAGEMENT REPORT
Bayer HealthCare
59TABLE OF CONTENTS MANAGEMENT REPORT
Bayer HealthCare
Above: illustration of blood cells.
Key Data – HealthCare 2007 2008 Change
€ million € million %
Sales 14,807 15,407 + 4.1
Pharmaceuticals 10,267 10,704 + 4.3
Consumer Health 4,540 4,703 + 3.6
Sales by Region
Europe 6,184 6,379 + 3.2
North America 4,439 4,512 + 1.6
Asia / Pacifi c 2,023 2,278 + 12.6
Latin America / Africa / Middle East 2,161 2,238 + 3.6
EBITDA* 3,065 3,692 + 20.5
Special items (727) (465)
EBITDA before special items * 3,792 4,157 + 9.6
EBITDA margin before special items 25.6% 27.0%
EBIT * 1,564 2,181 + 39.5
Special items (928) (583)
EBIT before special items * 2,492 2,764 + 10.9
Gross cash fl ow ** 2,389 3,045 + 27.5
Net cash fl ow ** 2,010 2,259 + 12.4
* for defi nition see “Calculation of EBIT(DA) Before Special Items,” page 76** for defi nition see “Liquidity and Capital Resources,” page 78

60 / / BAYER ANNUAL REPORT 2008
Bayer HealthCare Sales of the HealthCare subgroup rose by 4.1% in 2008 to €15,407 million (2007: €14,807 mil-lion). Adjusted for currency and portfolio effects, business expanded by 6.9%. Sales growth was driven by positive business trends in both the Pharmaceuticals and the Consumer Health segments.
ebitda before special items of HealthCare rose by 9.6% in 2008 to €4,157 million (2007: €3,792 million). The ebitda margin before special items came in at 27.0%, meeting the target set for the year. This increase was attributable to the pleasing business trend and the syner-gies realized from the Schering integration. Earnings growth was held back by negative currency effects and appreciably higher marketing expenses for the expansion of our activities in emerging markets and the introduction of new products. ebit before special items came to €2,764 million, up 10.9% from the prior-year level of €2,492 million. The net special charges of €583 million (2007: €928 million) resulted mainly from expenses relating to the acquisition and integration of Schering AG, Berlin, Germany, litigations and asset write-downs. ebit jumped by 39.5% to €2,181 million (2007: €1,564 million).
PHARMACEUTICALS
TABLE OF CONTENTS MANAGEMENT REPORT
Key Data – Pharmaceuticals 2007 2008 Change
€ million € million %
Sales 10,267 10,704 + 4.3
Primary Care 3,055 3,113 + 1.9
Women’s Healthcare 2,630 2,873 + 9.2
Diagnostic Imaging (including Medrad) 1,298 1,323 + 1.9
Specialized Therapeutics 1,253 1,364 + 8.9
Hematology / Cardiology 1,033 896 – 13.3
Oncology 754 885 + 17.4
Dermatology (Intendis) 244 250 + 2.5
Sales by Region
Europe 4,367 4,403 + 0.8
North America 2,862 2,966 + 3.6
Asia / Pacifi c 1,659 1,867 + 12.5
Latin America /Africa / Middle East 1,379 1,468 + 6.5
EBITDA* 2,108 2,657 + 26.0
Special items (699) (423)
EBITDA before special items * 2,807 3,080 + 9.7
EBITDA margin before special items 27.3 % 28.8 %
EBIT * 741 1,294 + 74.6
Special items (900) (541)
EBIT before special items * 1,641 1,835 + 11.8
Gross cash fl ow ** 1,685 2,220 + 31.8
Net cash fl ow ** 1,451 1,627 + 12.1
* for defi nition see “Calculation of EBIT(DA) Before Special Items,” page 76** for defi nition see “Liquidity and Capital Resources,” page 78

MANAGEMENT REPORT
Bayer HealthCare
61
Sales of our Pharmaceuticals segment increased by 4.3% in 2008 to €10,704 million (2007: €10,267 million). Adjusted for currency and portfolio effects, sales rose by 7.1%.
Sales of the Primary Care business unit expanded by 1.9% to €3,113 million (2007: €3,055 mil-lion). On a currency-adjusted (Fx adj.) basis, business was up by 4.2%, thanks largely to increas-es for Aspirin Cardio® (Fx adj. +19.6%), Avalox® / Avelox® (Fx adj. +7.8%) and Levitra® (Fx adj. +7.0%). The cholesterol-lowering drug Zetia® (Fx adj. +147%), launched on the Japanese market in summer 2007, also contributed to the upward trend. Sales of Cipro® / Ciprobay® fell signifi cant-ly in Europe due to generic competition but rose in the United States following the signing of a two-year contract with the u.s. government.
The Women’s Healthcare business unit saw sales increase by a substantial 9.2% to €2,873 mil-lion (2007: €2,630 million). On a currency-adjusted basis, business expanded by 13.6%. Sales of the intra-uterine system Mirena® developed very well (Fx adj. +35.5%), due particularly to higher unit sales in the United States. While business with the older oral contraceptive product Diane® continued to decline (Fx adj. -3.6%), sales of our yaz® / Yasmin® / Yasminelle® line of oral contraceptives registered another strong increase (Fx adj. +22.2%). Sales of the yaz® product family as a whole gained at about the same rate in the United States too, despite the launch of a generic competitor for Yasmin®. The market introduction of yaz® in Europe began in September 2008.
Sales of our Diagnostic Imaging business unit moved ahead by 1.9% in 2008 to €1,323 million (2007: €1,298 million). The 2008 fi gure includes the sales of u.s.-based thrombectomy systems supplier Possis Medical, Inc., acquired in April. Adjusted for currency and portfolio changes, sales rose by 1.7%. Our medical appliances business (Medrad) continued its positive prior-year performance, with sales advancing by a currency- and portfolio-adjusted 7.5%. Sales of Magnevist® declined (Fx adj. -17.4%), due partly to a shift toward Gadovist® in Europe. Business with Ultravist® (Fx adj. +16.5%) developed very well, especially in China and France. Sales of Iopamiron® were hampered by a government-imposed price reduction in Japan.
TABLE OF CONTENTS MANAGEMENT REPORT
Currency-adjusted
changeBest-Selling Pharmaceutical Products 2007 2008 Change
€ million € million % %
YAZ® / Yasmin® / Yasminelle® (Women’s Healthcare) 1,042 1,222 + 17.3 + 22.2
Betaferon® / Betaseron® (Specialized Therapeutics) 1,028 1,144 + 11.3 + 15.0
Kogenate® (Hematology / Cardiology) 818 848 + 3.7 + 7.3
Adalat® (Primary Care) 614 626 + 2.0 + 3.9
Avalox® / Avelox® (Primary Care) 445 462 + 3.8 + 7.8
Nexavar® (Oncology) 270 462 + 71.1 + 75.7
Mirena® (Women’s Healthcare) 361 462 + 28.0 + 35.5
Levitra® (Primary Care) 332 341 + 2.7 + 7.0
Cipro® / Ciprobay® (Primary Care) 383 338 – 11.7 – 8.9
Glucobay® (Primary Care) 298 304 + 2.0 + 1.8
Aspirin Cardio® (Primary Care) 229 270 + 17.9 + 19.6
Ultravist® (Diagnostic Imaging) 235 261 + 11.1 + 16.5
Magnevist® (Diagnostic Imaging) 301 241 – 19.9 – 17.4
Iopamiron® (Diagnostic Imaging) 211 199 – 5.7 – 10.1
Diane® (Women’s Healthcare) 175 164 – 6.3 – 3.6
Total 6,742 7,344 + 8.9 + 12.4
Proportion of Pharmaceuticals sales 66 % 69 %

62 / / BAYER ANNUAL REPORT 2008
The Specialized Therapeutics business unit grew sales by a substantial 8.9% to €1,364 million (2007: €1,253 million). Adjusted for shifts in exchange rates, business expanded by 12.2%. This gratifying performance was due especially to the successful marketing for our multiple sclerosis drug Betaferon® / Betaseron® (Fx adj. +15.0%).
In the Hematology / Cardiology business unit, sales fell by 13.3% to €896 million (2007: €1,033 million), or by 9.6% when adjusted for currency and portfolio effects. This decline was attributable to the worldwide suspension of marketing for Trasylol® in November 2007, sales of this product in 2007 having amounted to €103 million. Business with our blood coagulation factor Kogenate® showed pleasing growth (Fx adj. +7.3%). At the end of 2008 we already com-menced marketing activities for our new anti-thrombosis drug Xarelto® in 19 countries.
Our Oncology business unit saw sales grow by a substantial 17.4% to €885 million (2007: €754 million). After adjusting for currency changes, business expanded by 20.9%. This positive performance was attributable to the signifi cant gains made by Nexavar® (Fx adj. +75.7%), which more than offset slight declines for other products. We received new or extended marketing authorizations for the cancer drug Nexavar® in numerous countries during 2007 and 2008.
Sales of our Dermatology business (Intendis) advanced by 2.5% in 2008 to €250 million (2007: €244 million). The currency-adjusted increase came to 4.7%.
ebitda before special items of the Pharmaceuticals segment rose by 9.7% in 2008 to €3,080 mil-lion (2007: €2,807 million). This increase was due especially to the realization of planned synergies from the integration of Schering, Berlin, Germany, as well as to the gratifying busi-ness trend. The considerable business growth more than offset higher marketing costs, which were incurred mainly in connection with the expansion of our Primary Care business in China and the launch of yaz®, Xarelto® and Nexavar®. ebit before special items advanced by 11.8% to €1,835 million (2007: €1,641 million). Of the net special charges of €541 million, expenses relat-ed to the acquisition and integration of Schering accounted for €365 million. In addition, we discontinued marketing of the former Schering product Vasovist® and terminated clinical devel-opment for Spheramine®. We also incurred special charges in connection with the suspension of marketing for Trasylol®. ebit climbed by a substantial €553 million to €1,294 million (2007: €741 million).
TABLE OF CONTENTS MANAGEMENT REPORT

MANAGEMENT REPORT
Bayer HealthCare
63
CONSUMER HEALTH
Our Consumer Health segment improved sales by 3.6% to €4,703 million (2007: €4,540 million). After adjusting for currency and portfolio effects, the increase came to 6.3%, with all divisions contributing similarly to growth.
TABLE OF CONTENTS MANAGEMENT REPORT
Key Data – Consumer Health 2007 2008 Change
€ million € million %
Sales 4,540 4,703 + 3.6
Consumer Care 2,634 2,770 + 5.2
Diabetes Care 950 970 + 2.1
Animal Health 956 963 + 0.7
Sales by Region
Europe 1,817 1,976 + 8.8
North America 1,577 1,546 – 2.0
Asia / Pacifi c 364 411 + 12.9
Latin America / Africa / Middle East 782 770 – 1.5
EBITDA* 957 1,035 + 8.2
Special items (28) (42)
EBITDA before special items * 985 1,077 + 9.3
EBITDA margin before special items 21.7% 22.9%
EBIT * 823 887 + 7.8
Special items (28) (42)
EBIT before special items * 851 929 + 9.2
Gross cash fl ow ** 704 825 + 17.2
Net cash fl ow ** 559 632 + 13.1
* for defi nition see “Calculation of EBIT(DA) Before Special Items,” page 76** for defi nition see “Liquidity and Capital Resources,” page 78
Currency-adjusted
changeBest-Selling Consumer Health Products 2007 2008 Change
€ million € million % %
Contour® * (Diabetes Care) 488 554 + 13.5 + 18.4
Aspirin® ** (Consumer Care) 460 449 – 2.4 + 1.2
Advantage® product line (Animal Health) 314 329 + 4.8 + 11.1
Aleve® / naproxen (Consumer Care) 239 220 – 7.9 – 1.4
Canesten® (Consumer Care) 182 200 + 9.9 + 16.1
Bepanthen® / Bepanthol® (Consumer Care) 145 173 + 19.3 + 20.7
Baytril® (Animal Health) 156 152 – 2.6 + 1.6
Breeze® * (Diabetes Care) 152 145 – 4.6 – 0.5
Supradyn® (Consumer Care) 134 140 + 4.5 + 6.8
One-A-Day® (Consumer Care) 130 138 + 6.2 + 13.8
Total 2,400 2,500 + 4.2 + 9.0
Proportion of Consumer Health sales 53% 53%
* previously included with the Ascensia® product family** total Aspirin® sales = €719 million (2007: €689 million), including Aspirin Cardio®, which is refl ected in sales of the Pharmaceuticals segment

64 / / BAYER ANNUAL REPORT 2008
In the Consumer Care Division, sales advanced by 5.2% to €2,770 million (2007: €2,634 mil-lion). The increase came in part from the calcium supplement Citracal® acquired in October 2007, the Sagmel business in eastern Europe acquired in June 2008 and, since September 2008, the Topsun acquisition in China. Sales rose by 6.2% on a currency- and portfolio-adjusted basis. Bepanthen® / Bepanthol® (Fx adj. +20.7%), Canesten® (Fx adj. +16.1%) and One-A-Day® (Fx adj. +13.8%) developed particularly well.
Sales of our Diabetes Care Division rose by 2.1% to €970 million (2007: €950 million). After adjusting for shifts in exchange rates, the increase came to 6.4%. The blood glucose monitoring systems of our Contour® product line performed very well in the market, with sales up by a cur-rency-adjusted 18.4%. This growth was partly due to substitution of the older Elite® systems, sales of which declined by a currency-adjusted 26.5%. Also contributing to the positive business performance of Diabetes Care was our Contour® TS product line, launched in the second half of 2007, which generated sales of €25 million in 2008 (2007: €4 million).
Animal Health recorded sales of €963 million (2007: €956 million). On a currency-adjusted basis, business expanded by 6.4%. Our Advantage® product line for fl ea and tick control per-formed particularly well (Fx adj. +11.1%). We also benefi ted from higher sales of our Drontal® line of dewormers (Fx adj. +5.5%).
ebitda before special items of our Consumer Health segment improved by 9.3% to €1,077 mil-lion (2007: €985 million) due chiefl y to the favorable business development in all divisions. ebit before special items moved ahead €78 million to €929 million (2007: €851 million). After special charges of €42 million related to litigations, ebit advanced by 7.8% to €887 million (2007: €823 million).
TABLE OF CONTENTS MANAGEMENT REPORT
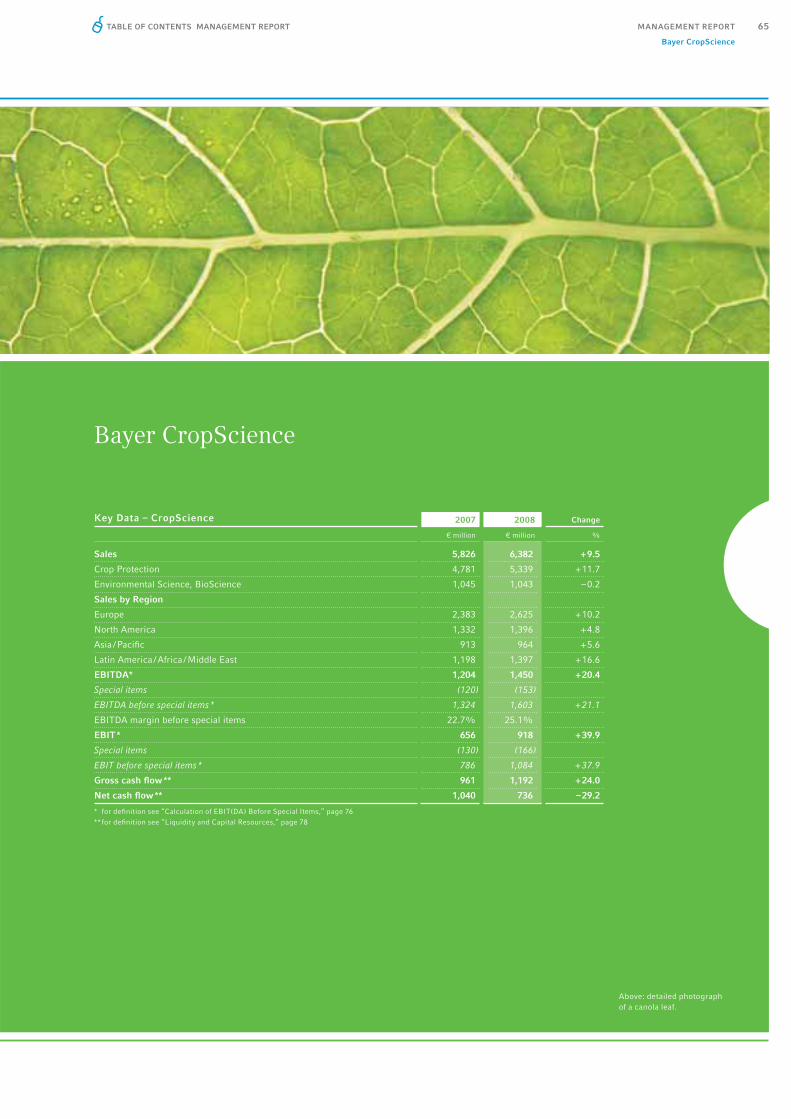
MANAGEMENT REPORT
Bayer CropScience
65TABLE OF CONTENTS MANAGEMENT REPORT
Bayer CropScience
Above: detailed photograph of a canola leaf.
Key Data – CropScience 2007 2008 Change
€ million € million %
Sales 5,826 6,382 + 9.5
Crop Protection 4,781 5,339 + 11.7
Environmental Science, BioScience 1,045 1,043 – 0.2
Sales by Region
Europe 2,383 2,625 + 10.2
North America 1,332 1,396 + 4.8
Asia / Pacifi c 913 964 + 5.6
Latin America / Africa / Middle East 1,198 1,397 + 16.6
EBITDA* 1,204 1,450 + 20.4
Special items (120) (153)
EBITDA before special items * 1,324 1,603 + 21.1
EBITDA margin before special items 22.7% 25.1%
EBIT * 656 918 + 39.9
Special items (130) (166)
EBIT before special items * 786 1,084 + 37.9
Gross cash fl ow ** 961 1,192 + 24.0
Net cash fl ow ** 1,040 736 – 29.2
* for defi nition see “Calculation of EBIT(DA) Before Special Items,” page 76** for defi nition see “Liquidity and Capital Resources,” page 78

66 / / BAYER ANNUAL REPORT 2008
Bayer CropScience Sales of CropScience rose by a substantial 9.5% in 2008 to a record €6,382 million (2007: €5,826 million). Adjusted for currency and portfolio effects, business expanded by 13.9%. Conditions on the world’s agricultural markets as a whole were highly favorable. Against the background of a steadily expanding global population with increasing nutritional requirements, combined with low inventories worldwide and heightened demand for plants as alternative ener-gy sources, very high prices for major agricultural products – particularly in the fi rst half of the year – led to higher investment by farmers in high-quality seed and innovative crop protection products. We not only increased volumes signifi cantly but also succeeded in raising prices, espe-cially in the Crop Protection business.
ebitda before special items advanced by 21.1% to €1,603 million (2007: €1,324 million). With an ebitda margin before special items of 25.1%, we achieved our 2009 target a year early. The signifi cant improvement in profi tability was the result of the gratifying business trend. Earnings were held back by negative currency effects. ebit before special items climbed by 37.9% to €1,084 million (2007: €786 million). Special charges of €166 million were taken in connection with the cost structure program initiated in 2006. ebit jumped by 39.9% to €918 million (2007: €656 million).
Net cash fl ow fell by 29.2% to €736 million, mainly because of a much greater inventory build-up than in the previous year in anticipation of high sales levels in the coming spring season, cou-pled with an increase in receivables due to the strong sales performance.
TABLE OF CONTENTS MANAGEMENT REPORT
Currency-adjusted
changeBest-Selling Bayer CropScience Products* 2007 2008 Change
€ million € million % %
Confi dor® / Gaucho ® /Admire® / Merit®
(Insecticides / Seed Treatment / Environmental Science) 556 599 + 7.7 + 13.0
Flint® / Stratego® / Sphere® / Nativo ® (Fungicides) 243 365 + 50.2 + 58.0
Proline® / Input® / Prosaro® (Fungicides) 175 246 + 40.6 + 46.8
Atlantis® (Herbicides) 207 244 + 17.9 + 21.1
Folicur® / Raxil® (Fungicides / Seed Treatment) 235 242 + 3.0 + 6.7
Basta® / Liberty® / Rely® (Herbicides) 241 235 – 2.5 + 1.9
Poncho® (Seed Treatment) 237 223 – 5.9 + 0.5
Puma® (Herbicides) 187 203 + 8.6 + 13.5
Decis® / K-Othrine® (Insecticides / Environmental Science) 178 175 – 1.7 + 3.5
Fandango® (Fungicides) 80 132 + 65.0 + 68.2
Total 2,339 2,664 + 13.9 + 19.1
Proportion of Bayer CropScience sales 40% 42%
* Figures are based on active ingredient class. For the sake of clarity, only the principal brands and business units are listed.
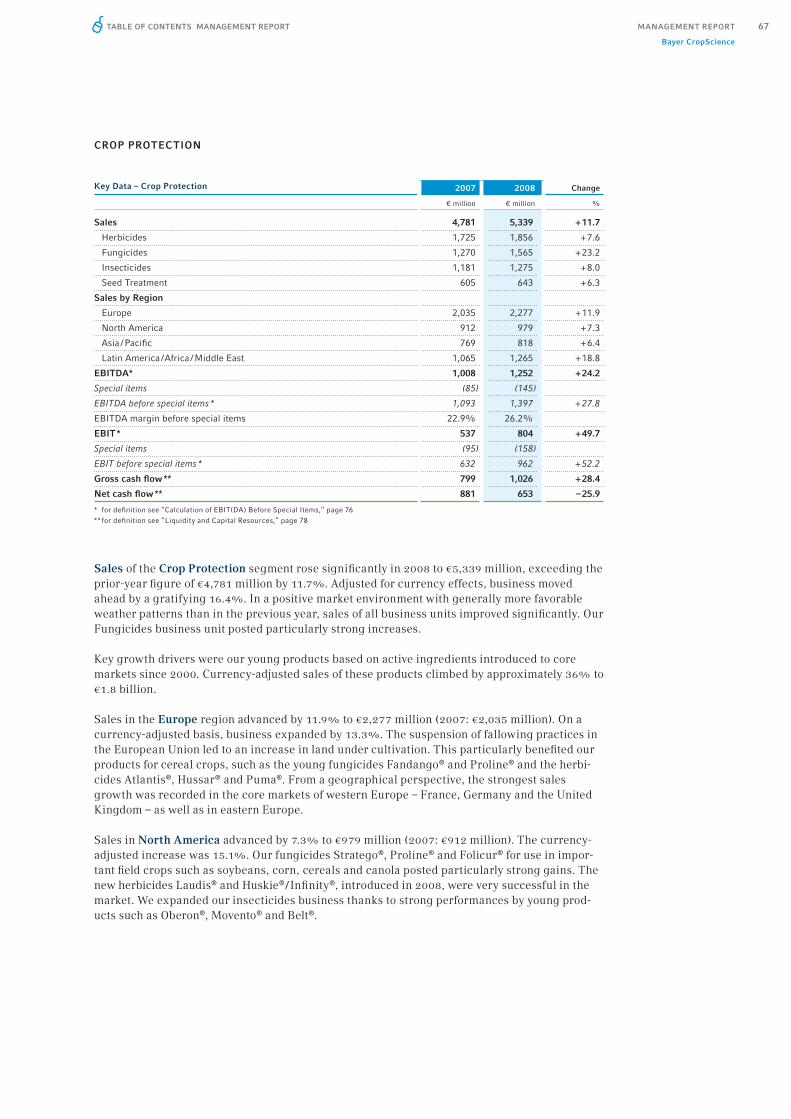
MANAGEMENT REPORT
Bayer CropScience
67
CROP PROTECTION
Sales of the Crop Protection segment rose signifi cantly in 2008 to €5,339 million, exceeding the prior-year fi gure of €4,781 million by 11.7%. Adjusted for currency effects, business moved ahead by a gratifying 16.4%. In a positive market environment with generally more favorable weather patterns than in the previous year, sales of all business units improved signifi cantly. Our Fungicides business unit posted particularly strong increases.
Key growth drivers were our young products based on active ingredients introduced to core markets since 2000. Currency-adjusted sales of these products climbed by approximately 36% to €1.8 billion.
Sales in the Europe region advanced by 11.9% to €2,277 million (2007: €2,035 million). On a currency-adjusted basis, business expanded by 13.3%. The suspension of fallowing practices in the European Union led to an increase in land under cultivation. This particularly benefi ted our products for cereal crops, such as the young fungicides Fandango® and Proline® and the herbi-cides Atlantis®, Hussar® and Puma®. From a geographical perspective, the strongest sales growth was recorded in the core markets of western Europe – France, Germany and the United Kingdom – as well as in eastern Europe.
Sales in North America advanced by 7.3% to €979 million (2007: €912 million). The currency-adjusted increase was 15.1%. Our fungicides Stratego®, Proline® and Folicur® for use in impor-tant fi eld crops such as soybeans, corn, cereals and canola posted particularly strong gains. The new herbicides Laudis® and Huskie® / Infi nity®, introduced in 2008, were very successful in the market. We expanded our insecticides business thanks to strong performances by young prod-ucts such as Oberon®, Movento® and Belt®.
TABLE OF CONTENTS MANAGEMENT REPORT
Key Data – Crop Protection 2007 2008 Change
€ million € million %
Sales 4,781 5,339 + 11.7
Herbicides 1,725 1,856 + 7.6
Fungicides 1,270 1,565 + 23.2
Insecticides 1,181 1,275 + 8.0
Seed Treatment 605 643 + 6.3
Sales by Region
Europe 2,035 2,277 + 11.9
North America 912 979 + 7.3
Asia / Pacifi c 769 818 + 6.4
Latin America / Africa / Middle East 1,065 1,265 + 18.8
EBITDA* 1,008 1,252 + 24.2
Special items (85) (145)
EBITDA before special items * 1,093 1,397 + 27.8
EBITDA margin before special items 22.9% 26.2%
EBIT * 537 804 + 49.7
Special items (95) (158)
EBIT before special items * 632 962 + 52.2
Gross cash fl ow ** 799 1,026 + 28.4
Net cash fl ow ** 881 653 – 25.9
* for defi nition see “Calculation of EBIT(DA) Before Special Items,” page 76** for defi nition see “Liquidity and Capital Resources,” page 78

68 / / BAYER ANNUAL REPORT 2008
In the Asia / Pacifi c region, sales of the Crop Protection business unit grew by 6.4% to €818 mil-lion (2007: €769 million). On a currency-adjusted basis, the increase amounted to 12.2%. Our insecticides and fungicides developed particularly well. Our business made good headway in India, Southeast Asia and China. In Australia, the recovery of the agricultural industry following two years of extreme drought led to a tangible recovery in business with fungicides, herbicides and seed treatment products.
Sales in the Latin America / Africa / Middle East region rose by 18.8% to €1,265 million (2007: €1,065 million). Business was up by a substantial 26.3% after adjusting for shifts in exchange rates. Sales declined in Africa and the Middle East but advanced signifi cantly in Latin America. Supported by the outstanding performance in Brazil, where Crop Protection sales climbed by a currency-adjusted 47.0%, we registered double-digit growth rates in all business units. Our young products based on new active ingredients and innovative mixtures, such as Nativo®, Sphere®, Soberan®, Connect® and CropStar®, played a key role in this growth.
ebitda before special items advanced by 27.8% to €1,397 million (2007: €1,093 million). This pleasing earnings improvement came mainly from higher volumes and also from selling-price in-creases and higher margin contributions by our new products. The impact of higher raw material and energy prices was more than offset by savings from the cost structure program initiated in 2006. However, adverse currency effects and higher marketing expenses to support the business expansion had a negative impact. ebit before special items advanced by 52.2% to €962 million (2007: €632 million). Special charges for our cost structure program amounted to €158 million. ebit improved by €267 million, or 49.7%, to €804 million (2007: €537 million).
TABLE OF CONTENTS MANAGEMENT REPORT
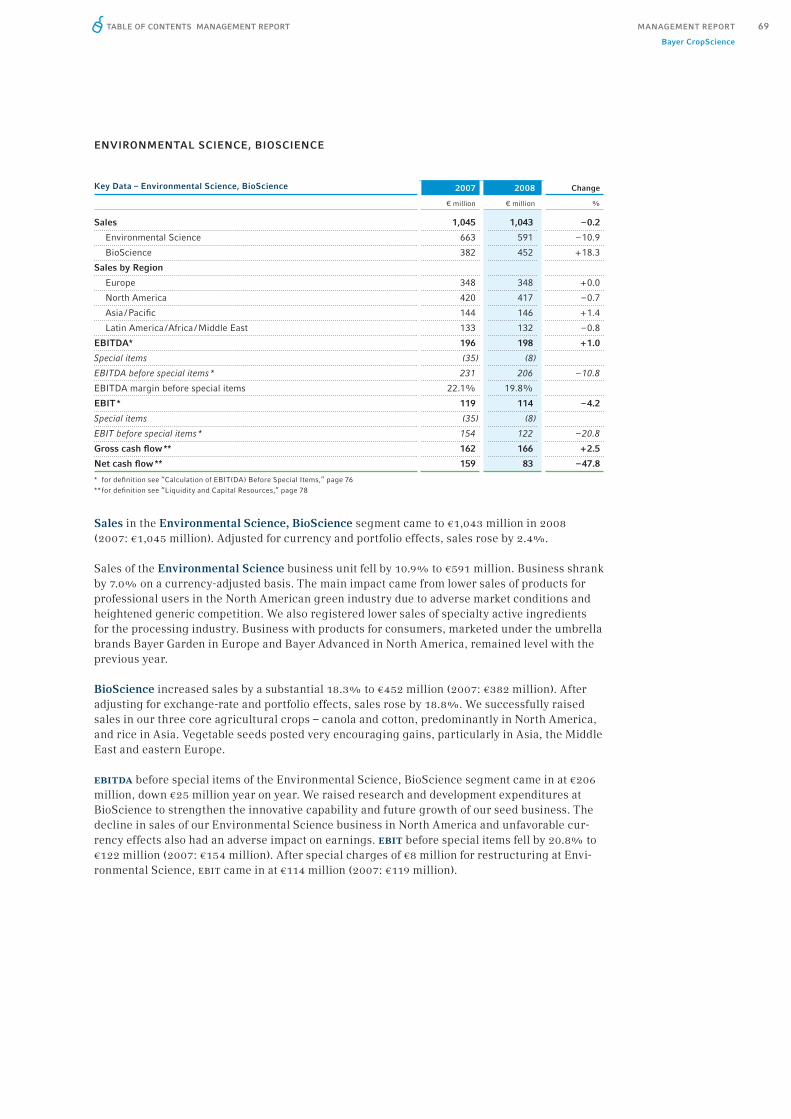
MANAGEMENT REPORT
Bayer CropScience
69
ENVIRONMENTAL SCIENCE, BIOSCIENCE
Sales in the Environmental Science, BioScience segment came to €1,043 million in 2008 (2007: €1,045 million). Adjusted for currency and portfolio effects, sales rose by 2.4%.
Sales of the Environmental Science business unit fell by 10.9% to €591 million. Business shrank by 7.0% on a currency-adjusted basis. The main impact came from lower sales of products for professional users in the North American green industry due to adverse market conditions and heightened generic competition. We also registered lower sales of specialty active ingredients for the processing industry. Business with products for consumers, marketed under the umbrella brands Bayer Garden in Europe and Bayer Advanced in North America, remained level with the previous year.
BioScience increased sales by a substantial 18.3% to €452 million (2007: €382 million). After adjusting for exchange-rate and portfolio effects, sales rose by 18.8%. We successfully raised sales in our three core agricultural crops – canola and cotton, predominantly in North America, and rice in Asia. Vegetable seeds posted very encouraging gains, particularly in Asia, the Middle East and eastern Europe.
ebitda before special items of the Environmental Science, BioScience segment came in at €206 million, down €25 million year on year. We raised research and development expenditures at BioScience to strengthen the innovative capability and future growth of our seed business. The decline in sales of our Environmental Science business in North America and unfavorable cur-rency effects also had an adverse impact on earnings. ebit before special items fell by 20.8% to €122 million (2007: €154 million). After special charges of €8 million for restructuring at Envi-ronmental Science, ebit came in at €114 million (2007: €119 million).
TABLE OF CONTENTS MANAGEMENT REPORT
Key Data – Environmental Science, BioScience 2007 2008 Change
€ million € million %
Sales 1,045 1,043 – 0.2
Environmental Science 663 591 – 10.9
BioScience 382 452 + 18.3
Sales by Region
Europe 348 348 + 0.0
North America 420 417 – 0.7
Asia / Pacifi c 144 146 + 1.4
Latin America / Africa / Middle East 133 132 – 0.8
EBITDA* 196 198 + 1.0
Special items (35) (8)
EBITDA before special items * 231 206 – 10.8
EBITDA margin before special items 22.1% 19.8%
EBIT * 119 114 – 4.2
Special items (35) (8)
EBIT before special items * 154 122 – 20.8
Gross cash fl ow ** 162 166 + 2.5
Net cash fl ow ** 159 83 – 47.8
* for defi nition see “Calculation of EBIT(DA) Before Special Items,” page 76** for defi nition see “Liquidity and Capital Resources,” page 78

70 / / BAYER ANNUAL REPORT 2008 TABLE OF CONTENTS MANAGEMENT REPORT
Umsatz, Ertrags und Finanzlage im Überblick
GESAMTJAHR 2008
Das Gesamtjahr 2008 verlief für Bayer in einem zunehmend schwierigeren wirtschaftlichen Um-feld erfolgreich. Wir konnten unsere Konzernkennzahlen im operativen Geschäft im Vergleich zum Vorjahr nochmals leicht steigern und unsere Ergebnisziele erreichen. Dabei profi tierten wir von der Ausrichtung des Konzerns auf die weniger von der weltwirtschaftlichen Entwicklung ab-hängigen Life-Science-Bereiche HealthCare und CropScience. Der Konzernumsatz lag mit 32.918 mio € um 1,6 % über dem Vorjahreswert von 32.385 mio €. Bereinigt um Währungs- und Portfolioeffekte verzeichneten wir ein Umsatzplus von 4,4 %. Dieses lag leicht unter unserer Prognose. HealthCare wuchs währungs- und portfoliobereinigt um 6,9 %. CropScience erzielte ein Wachstum von 13,9 %. MaterialScience musste im Zuge der Finanz- und Wirtschaftskrise deutliche Umsatzrückgänge im 4. Quartal hinnehmen, sodass der Umsatz im Gesamtjahr um 4,6 % sank.
Above: thermoplastic polyurethane fi lm
Bayer MaterialScience
Key Data – MaterialScience 2007 2008 Change
€ million € million %
Sales 10,435 9,738 – 6.7
Systems 7,394 7,130 – 3.6
Materials 3,041 2,608 – 14.2
Sales by Region
Europe 4,585 4,267 – 6.9
North America 2,376 2,108 – 11.3
Asia / Pacifi c 2,229 2,098 – 5.9
Latin America / Africa / Middle East 1,245 1,265 + 1.6
EBITDA* 1,542 1,041 – 32.5
Special items (64) (47)
EBITDA before special items * 1,606 1,088 – 32.3
EBITDA margin before special items 15.4% 11.2%
EBIT * 1,042 537 – 48.5
Special items (75) (49)
EBIT before special items * 1,117 586 – 47.5
Gross cash fl ow ** 1,228 850 – 30.8
Net cash fl ow ** 1,147 782 – 31.8
* for defi nition see “Calculation of EBIT(DA) Before Special Items,” page 76** for defi nition see “Liquidity and Capital Resources,” page 78

MANAGEMENT REPORT
Bayer MaterialScience
71
Bayer MaterialScience Sales of the MaterialScience subgroup came in at €9,738 million in 2008, down 6.7% from the prior-year fi gure of €10,435 million. After adjusting for currency and portfolio effects, sales fell by 4.6%. Selling price increases were more than offset by a drop in volumes, particularly in the fourth quarter. The global fi nancial and economic crisis impacted MaterialScience in nearly all product groups and regions.
ebitda before special items fell by 32.3% from the year before, to €1,088 million (2007: €1,606 million). Earnings were hampered by a €0.5 billion increase in purchase prices for petrochemical raw materials and energies. In addition, volumes and capacity utilization dropped signifi cantly in the wake of the economic slump, especially in the fourth quarter. The relative easing of prices on the raw material markets of importance to MaterialScience did not yet signifi cantly improve earnings in the fourth quarter. Selling price increases, the savings from our restructuring program and further countermeasures adopted only partially offset the negative volume and raw material cost effects over the year as a whole. Accordingly, ebit be-fore special items dropped by 47.5% to €586 million (2007: €1,117 million). We took special charges of €49 million (2007: €75 million) in connection with the restructuring program initiat-ed in 2007. ebit fell by 48.5% to €537 million (2007: €1,042 million).
SYSTEMS
Sales of our Systems segment in 2008 amounted to €7,130 million, down 3.6% from the previ-ous year. We acquired a number of systems houses to strategically reinforce our polyurethanes business. After adjusting for currency and portfolio effects, business shrank by 2.7%. For the year as a whole, we came close to offsetting the signifi cant decline in volumes by raising our prices. In the fourth quarter the segment could not escape the effects of a steep drop in global demand in the wake of the fi nancial and economic crisis.
TABLE OF CONTENTS MANAGEMENT REPORT
Key Data – Systems 2007 2008 Change
€ million € million %
Sales 7,394 7,130 – 3.6
Polyurethanes 5,224 4,894 – 6.3
Coatings, Adhesives, Specialties 1,598 1,586 – 0.8
Industrial Operations 423 489 + 15.6
Other 149 161 + 8.1
Sales by Region
Europe 3,446 3,269 – 5.1
North America 1,802 1,635 – 9.3
Asia / Pacifi c 1,192 1,229 + 3.1
Latin America / Africa / Middle East 954 997 + 4.5
EBITDA* 1,269 980 – 22.8
Special items (64) (32)
EBITDA before special items * 1,333 1,012 – 24.1
EBITDA margin before special items 18.0% 14.2%
EBIT * 942 636 – 32.5
Special items (75) (34)
EBIT before special items * 1,017 670 – 34.1
Gross cash fl ow ** 991 779 – 21.4
Net cash fl ow ** 964 557 – 42.2
* for defi nition see “Calculation of EBIT(DA) Before Special Items,” page 76** for defi nition see “Liquidity and Capital Resources,” page 78

72 / / BAYER ANNUAL REPORT 2008
Sales in our Polyurethanes business unit receded by 6.3% to €4,894 million (2007: €5,224 mil-lion). On a currency- and portfolio-adjusted basis, sales decreased by 4.3%. Business with diphe-nylmethane diisocyanate (mdi) was slightly down on an adjusted basis. Sales expanded in the Asia / Pacifi c region but moved back in the North America and Latin America regions. By contrast, sales of toluene diisocyanate (tdi) moved ahead, with all regions except Europe contributing to growth. Sales of polyethers (pet) declined sharply despite selling price increases. With the excep-tion of Latin America, we registered a drop in sales in all regions.
Sales of our Coatings, Adhesives, Specialties business unit were almost level with the prior year at €1,586 million (-0.8%). On a currency- and portfolio-adjusted basis, sales decreased by 4.0%. Business expanded in Asia / Pacifi c and Latin America, while sales in Europe and North America declined.
The Industrial Operations business unit saw a gratifying 15.6% rise in sales in 2008, to €489 million. The currency-adjusted increase was 17.7%. This was mostly attributable to price increases achieved for sodium hydroxide solution in both Germany and the United States and also to slightly higher volumes.
The Systems segment generated ebitda before special items of €1,012 million, down 24.1% year on year. The selling price increases we implemented and the savings from our restructuring program did not fully compensate for the combined effect of the sharply higher average raw material and energy costs for the year and the drop in volumes. Earnings were also held back, particularly in the fourth quarter, by a demand-related drop in plant utilization rates and by start-up costs for our new mdi plant in Shanghai, China. ebit before special items decreased by 34.1% to €670 million (2007: €1,017 million). Our restructuring program led to special charges of €34 million (2007: €75 million) for the full year. ebit moved back by 32.5% to €636 million.
TABLE OF CONTENTS MANAGEMENT REPORT

MANAGEMENT REPORT
Bayer MaterialScience
73
MATERIALS
Sales of the Materials segment receded by 14.2% to €2,608 million (2007: €3,041 million). On a currency- and portfolio-adjusted basis, the decline amounted to 9.5%.
Sales of the Polycarbonates business unit fell by 15.6% to €2,372 million. After adjusting for currency and portfolio effects, sales dropped by 10.1%. This resulted primarily from the effects of the fi nancial and economic crisis, which led to lower volumes in the fourth quarter of 2008 in nearly all regions and product groups. Only in the polycarbonate sheet business did we post a slight increase in volumes.
Sales of the Thermoplastic Polyurethanes business unit rose by 2.6% to €236 million. Adjusted for currency and portfolio effects, however, business declined by 2.4%. Price increases, which were implemented in all regions, only partially offset the drop in sales resulting from lower volumes.
ebitda before special items of the Materials segment fell steeply to €76 million (-72.2%). This fall in earnings was mainly caused by sharp increases in average raw material and energy costs for the year combined with a demand-related drop in volumes, particularly in the fourth quarter, and lower capacity utilization as a result of the fi nancial and economic crisis. Earnings were enhanced by the savings achieved from the cost structure program initiated in 2007. ebit before special items for the Materials segment came in at minus €84 million (2007: €100 million). Special charges for restructuring in 2008 amounted to €15 million. ebit amounted to minus €99 million (2007: €100 million). Against this background we reduced working capital, improv-ing net cash fl ow in the Materials segment by 23.0% to €225 million.
TABLE OF CONTENTS MANAGEMENT REPORT
Key Data – Materials 2007 2008 Change
€ million € million %
Sales 3,041 2,608 – 14.2
Polycarbonates 2,811 2,372 – 15.6
Thermoplastic Polyurethanes 230 236 + 2.6
Sales by Region
Europe 1,139 998 – 12.4
North America 574 473 – 17.6
Asia / Pacifi c 1,037 869 – 16.2
Latin America / Africa / Middle East 291 268 – 7.9
EBITDA* 273 61 – 77.7
Special items 0 (15)
EBITDA before special items * 273 76 – 72.2
EBITDA margin before special items 9.0% 2.9%
EBIT * 100 (99) •
Special items 0 (15)
EBIT before special items * 100 (84) •
Gross cash fl ow ** 237 71 – 70.0
Net cash fl ow ** 183 225 + 23.0
* for defi nition see “Calculation of EBIT(DA) Before Special Items,” page 76** for defi nition see “Liquidity and Capital Resources,” page 78

74 / / BAYER ANNUAL REPORT 2008 TABLE OF CONTENTS MANAGEMENT REPORT
Performance by Region
Earnings Performance
Sales of the Bayer Group increased by 1.6%, or €533 million, from the previous year to €32,918 million. Adjusted for currency and portfolio effects, sales rose by 4.4%.
The cost of goods sold remained approximately level year on year at €16,456 million (+0.6%). The ratio of the cost of goods sold to total sales was 50.0% (2007: 50.5%). Selling expenses rose by 4.2% from the previous year, to €8,105 million, and were thus equivalent to 24.6% of sales (2007: 24.0%). This increase was due particularly to the introduction of new pharmaceutical products and the expansion of our sales organization in the bric countries. Our research and development expenses also increased by 2.9% to €2,653 million. The ratio of r&d expenses to sales was 8.1% (2007: 8.0%). However, we reduced general administration expenses by 6.9% to €1,649 million (2007: €1,772 million), thanks mainly to synergies from the integration of Schering AG, Berlin, Germany, and the restructuring program at MaterialScience. The negative balance of other operating income and expenses, at €511 million, resulted mainly from costs related to the integration of Schering AG, restructuring, litigations and valuation write-downs.
Sales by Region and Segment (by Market)
Europe North America
2007 2008 2007 2008
€ million € million % yoy% yoy
Fx adj. € million € million % yoy% yoy
Fx adj.
HealthCare 6,184 6,379 + 3.2 + 4.3 4,439 4,512 + 1.6 + 8.8
Pharmaceuticals 4,367 4,403 + 0.8 + 1.7 2,862 2,966 + 3.6 + 10.8
Consumer Health 1,817 1,976 + 8.8 + 10.5 1,577 1,546 – 2.0 + 5.1
CropScience 2,383 2,625 + 10.2 + 11.6 1,332 1,396 + 4.8 + 12.1
Crop Protection 2,035 2,277 + 11.9 + 13.3 912 979 + 7.3 + 15.1
Environmental Science,BioScience 348 348 + 0.0 + 1.2 420 417 – 0.7 + 5.7
MaterialScience 4,585 4,267 – 6.9 – 6.9 2,376 2,108 – 11.3 – 4.8
Systems 3,446 3,269 – 5.1 – 5.1 1,802 1,635 – 9.3 – 2.7
Materials 1,139 998 – 12.4 – 12.4 574 473 – 17.6 – 11.7
Continuing operations(incl. reconciliation) 14,353 14,549 + 1.4 + 2.1 8,161 8,026 – 1.7 + 5.3
yoy = year-on-year; Fx adj. = currency-adjusted
Bayer Group Summary Income Statements 2007 2008 Change
€ million € million %
Sales 32,385 32,918 + 1.6
Cost of goods sold (16,352) (16,456) + 0.6
Selling expenses (7,782) (8,105) + 4.2
Research and development expenses (2,578) (2,653) + 2.9
General administration expenses (1,772) (1,649) – 6.9
Other operating income and expenses – net (747) (511) – 31.6
EBIT (operating result) 3,154 3,544 + 12.4
Non-operating result (920) (1,188) – 29.1
Income before income taxes 2,234 2,356 + 5.5
Income taxes 72 (636) •
Income after taxes from discontinued operations 2,410 4 – 99.8
Income after taxes 4,716 1,724 – 63.4
of which attributable to non-controlling interest 5 5 + 0.0
of which attributable to Bayer AG stockholders (net income) 4,711 1,719 – 63.5
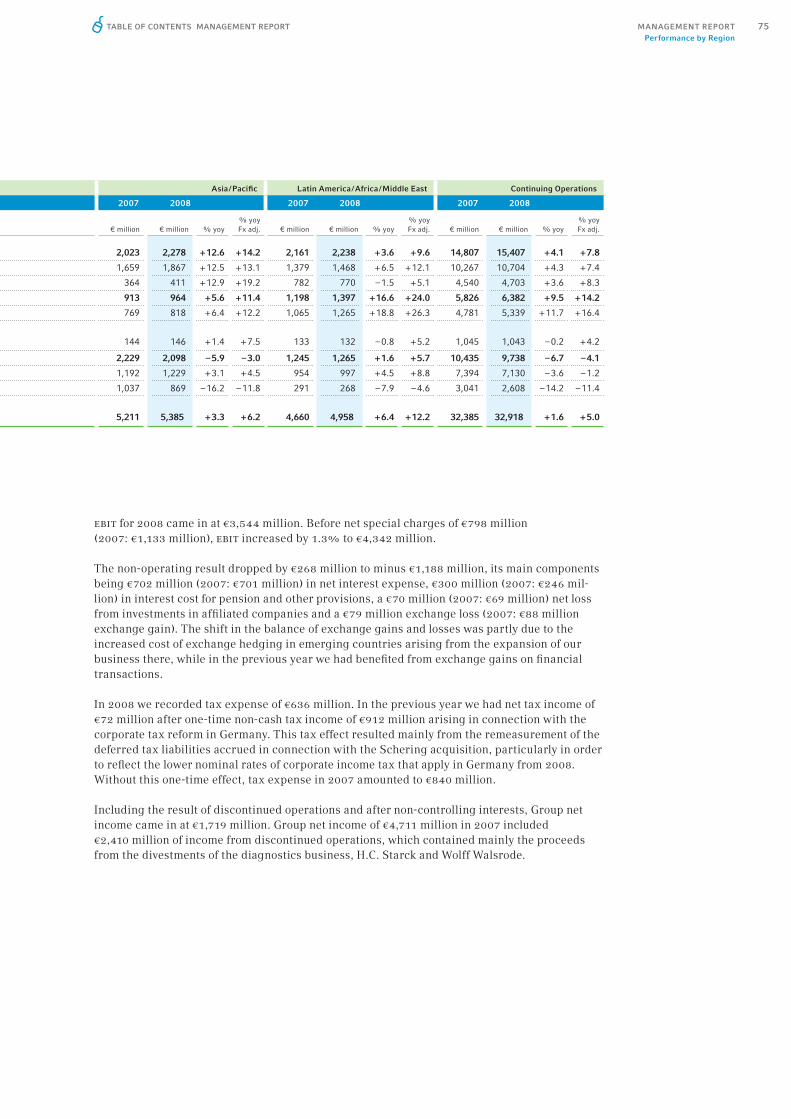
TABLE OF CONTENTS MANAGEMENT REPORT MANAGEMENT REPORTPerformance by Region
75
ebit for 2008 came in at €3,544 million. Before net special charges of €798 million (2007: €1,133 million), ebit increased by 1.3% to €4,342 million.
The non-operating result dropped by €268 million to minus €1,188 million, its main components being €702 million (2007: €701 million) in net interest expense, €300 million (2007: €246 mil-lion) in interest cost for pension and other provisions, a €70 million (2007: €69 million) net loss from investments in affi liated companies and a €79 million exchange loss (2007: €88 million exchange gain). The shift in the balance of exchange gains and losses was partly due to the increased cost of exchange hedging in emerging countries arising from the expansion of our business there, while in the previous year we had benefi ted from exchange gains on fi nancial transactions.
In 2008 we recorded tax expense of €636 million. In the previous year we had net tax income of €72 million after one-time non-cash tax income of €912 million arising in connection with the corporate tax reform in Germany. This tax effect resulted mainly from the remeasurement of the deferred tax liabilities accrued in connection with the Schering acquisition, particularly in order to refl ect the lower nominal rates of corporate income tax that apply in Germany from 2008. Without this one-time effect, tax expense in 2007 amounted to €840 million.
Including the result of discontinued operations and after non-controlling interests, Group net income came in at €1,719 million. Group net income of €4,711 million in 2007 included €2,410 million of income from discontinued operations, which contained mainly the proceeds from the divestments of the diagnostics business, H.C. Starck and Wolff Walsrode.
Asia / Pacifi c Latin America / Africa / Middle East Continuing Operations
2007 2008 2007 2008 2007 2008
€ million € million % yoy% yoy
Fx adj. € million € million % yoy% yoy
Fx adj. € million € million % yoy% yoy
Fx adj.
2,023 2,278 + 12.6 + 14.2 2,161 2,238 + 3.6 + 9.6 14,807 15,407 + 4.1 + 7.8
1,659 1,867 + 12.5 + 13.1 1,379 1,468 + 6.5 + 12.1 10,267 10,704 + 4.3 + 7.4
364 411 + 12.9 + 19.2 782 770 – 1.5 + 5.1 4,540 4,703 + 3.6 + 8.3
913 964 + 5.6 + 11.4 1,198 1,397 + 16.6 + 24.0 5,826 6,382 + 9.5 + 14.2
769 818 + 6.4 + 12.2 1,065 1,265 + 18.8 + 26.3 4,781 5,339 + 11.7 + 16.4
144 146 + 1.4 + 7.5 133 132 – 0.8 + 5.2 1,045 1,043 – 0.2 + 4.2
2,229 2,098 – 5.9 – 3.0 1,245 1,265 + 1.6 + 5.7 10,435 9,738 – 6.7 – 4.1
1,192 1,229 + 3.1 + 4.5 954 997 + 4.5 + 8.8 7,394 7,130 – 3.6 – 1.2
1,037 869 – 16.2 – 11.8 291 268 – 7.9 – 4.6 3,041 2,608 – 14.2 – 11.4
5,211 5,385 + 3.3 + 6.2 4,660 4,958 + 6.4 + 12.2 32,385 32,918 + 1.6 + 5.0

76 / / BAYER ANNUAL REPORT 2008 TABLE OF CONTENTS MANAGEMENT REPORT
Calculation of EBIT(DA) Before Special Items Key performance indicators for the Bayer Group are ebit before special items, ebitda before spe-cial items and the ebitda margin before special items. These indicators are reported in order to allow a more accurate assessment of business operations. The special items – one-time effects that are non-recurring or do not regularly recur or attain similar magnitudes – are detailed in the following table. “ebitda,” “ebitda before special items” and “ebit before special items” are not defi ned in the International Financial Reporting Standards and should therefore be regarded only as supplementary information. The company considers ebitda before special items to be a more suitable indicator of operating performance since it is not affected by depreciation, amorti-zation, write-downs / write-backs or special items. The company also believes that this indicator gives readers a clearer picture of the results of operations and ensures greater comparability of data over time. The ebitda margin before special items, which is the ratio of ebitda before spe-cial items to sales, serves as a relative indicator for the internal and external comparison of opera-tional earning power.
Depreciation and amortization in 2008 was virtually level with the previous year at €2,722 mil-lion (+0.4%), comprising €1,550 million in amortization and write-downs of intangible assets and €1,172 million in depreciation and write-downs of property, plant and equipment. Of the included write-downs, €133 million constituted special items.
Reconciliation of Special Items EBIT *
2007EBIT * 2008
EBITDA**2007
EBITDA**2008
€ million € million € million € million
After special items 3,154 3,544 5,866 6,266
HealthCare 928 583 727 465
Schering PPA effects *** 177 208 216 208
Schering integration costs 506 157 418 111
Write-downs 166 98 14 26
Litigations 106 106 106 106
Other (27) 14 (27) 14
CropScience 130 166 120 153
Restructuring 97 166 87 153
Litigations 33 0 33 0
MaterialScience 75 49 64 47
Restructuring 75 49 64 47
Reconciliation 0 0 0 0
Total special items 1,133 798 911 665
Before special items 4,287 4,342 6,777 6,931
2007 fi gures restated * EBIT as shown in the income statement** EBITDA: EBIT plus amortization of intangible assets and depreciation of property, plant and equipment. The underlying EBITDA margin
is calculated by dividing underlying EBITDA by sales.*** The purchase price paid for Schering AG, Germany, was allocated among the acquired assets and assumed liabilities in accordance with the
International Financial Reporting Standards (IFRS). To ensure comparability with future earnings data, the expected long-term effects of the step-up are refl ected in EBIT and EBITDA before special items, whereas temporary, non-cash effects of the purchase price allocation are eliminated and deducted when calculating EBIT before special items.

TABLE OF CONTENTS MANAGEMENT REPORT MANAGEMENT REPORTValue Management
77
Value ManagementCASH VALUE ADDED-BASED SYSTEM
One of the prime objectives of the Bayer Group is to sustainably increase enterprise value. In 1994 we became one of the fi rst German companies to embark on the development of a value management system, which we introduced throughout the Group in 1997. The system is used for the planning, controlling and monitoring of our businesses. Our primary value-based indicator is the cash value added (cva), which shows the degree to which the cash fl ows needed to cover the costs of equity and debt and of reproducing depletable assets have been generated. If the cva is positive, the company or business entity concerned has created additional value. If it is negative, the anticipated capital and asset reproduction costs have not been earned. Gross cash fl ow and cva are profi tability indicators for a single reporting period. For a year-on-year comparison we therefore use the delta cva, which is the difference between the cvas of two consecutive periods. A positive delta cva shows that value creation has improved from one period to the next.
CALCULATING THE COST OF CAPITAL
Bayer calculates the cost of capital according to the debt / equity ratio by the weighted average cost of capital (wacc) formula. The cost of equity capital is the return expected by stockholders, computed from capital market information. The cost of debt used in calculating wacc is based on the terms for a ten-year corporate bond issue.
To take into account the different risk and return profi les of our principal businesses, we calcu-late individual capital cost factors after income taxes for each of our subgroups. In 2008 this was 8.0% (2007: 8.0%) for HealthCare, 7.5% (2007: 7.0%) for CropScience and 7.0% (2007: 6.5%) for MaterialScience. The minimum return required for the Group was 7.5% (2007: 7.5%).
GROSS CASH FLOW, CASH FLOW RETURN ON INVESTMENT AND CASH VALUE ADDED AS PERFORMANCE YARDSTICKS
The gross cash fl ow as published in our cash fl ow statement is the measure of our internal fi nancing capability. Bayer has chosen this parameter because it is relatively free of accounting infl uences and thus a more meaningful performance indicator.
The profi tability of the Group and of its individual business entities is measured by the cash fl ow return on investment (cfroi). This is the ratio of the gross cash fl ow to the capital invested, which is derived from the balance sheet and basically comprises the property, plant and equip-ment and intangible assets required for operations – stated at cost of acquisition or construction – plus working capital, less interest-free liabilities (such as current provisions). To allow for fl uctuations, the cfroi is computed on the basis of the average capital invested for the respective year.
Taking into account the costs of capital and of reproducing depletable assets, we determine the gross cash fl ow hurdle. If the gross cash fl ow hurdle is equaled or exceeded, the required return on equity and debt plus the cost of asset reproduction has been earned. The cfroi hurdle for 2008 was 10.1% (2007: 10.2%), while the corresponding gross cash fl ow hurdle was €4,049 mil-lion (2007: €4,035 million).
Actual gross cash fl ow came in at €5,295 million, exceeding the hurdle by a substantial 30.8%. Thus in 2008 we earned our entire capital and asset reproduction costs, and the positive cva of €1,246 million shows that Bayer created additional value. Given the previous year’s cva of €749 million, the Bayer Group therefore recorded a delta cva of €497 million, showing that the rate of value creation increased. The cfroi for 2008 reached a record 13.0% (2007: 12.2%).
Positive CVA=
additional valuecreated
Weighted average cost of capital for the
Bayer Group
7.5%

78 / / BAYER ANNUAL REPORT 2008 TABLE OF CONTENTS MANAGEMENT REPORT
All three subgroups exceeded their target returns including asset reproduction. The cfroi for HealthCare was 13.6% (2007: 11.1%), for CropScience 14.1% (2007: 11.3%) and for MaterialScience 10.1% (2007: 15.9%).
Liquidity and Capital Resources
OPERATING CASH FLOW
Gross cash fl ow in 2008 rose by 10.7%, from €4,784 million in the prior year to €5,295 million. There was a signifi cant improvement in gross cash fl ow at HealthCare and CropScience due to the gratifying business performance in those subgroups, more than offsetting the decline at MaterialScience. Net cash fl ow declined to €3,608 million (2007: €4,281 million), mainly due to a signifi cant increase in cash tied up in working capital. Contributing particularly to this increase was a higher level of receivables and inventories at HealthCare and CropScience due to business growth. We also recorded high cash disbursements in connection with the utilization of provi-sions.
Value Management Indicators by Subgroup
HealthCare CropScience MaterialScience Bayer Group
2007 2008 2007 2008 2007 2008 2007 2008
€ million € million € million € million € million € million € million € million
Gross cash fl ow hurdle 2,394 2,387 939 906 624 696 4,035 4,049
Gross cash fl ow* 2,389 3,045 961 1,192 1,228 850 4,784 5,295
Cash value added (CVA) (5) 658 22 286 604 154 749 1,246
CFROI hurdle 11.0% 10.9% 10.8% 10.8% 8.3% 8.7% 10.2% 10.1%
Cash fl ow return on investment (CFROI) 11.1% 13.6% 11.3% 14.1% 15.9% 10.1% 12.2% 13.0%
Average capital invested 21,608 22,380 8,500 8,471 7,722 8,442 39,203 40,862
* for defi nition see “Liquidity and Capital Resources”
Bayer Group Summary Cash Flow Statements 2007 2008
€ million € million
Gross cash fl ow* 4,784 5,295
Changes in working capital / other non-cash items (503) (1,687)
Net cash provided by (used in) operating activities (net cash fl ow), continuing operations 4,281 3,608
Net cash provided by (used in) operating activities (net cash fl ow), discontinued operations 2 -
Net cash provided by (used in) operating activities (net cash fl ow) (total) 4,283 3,608
Net cash provided by (used in) investing activities (total) 3,186 (3,089)
Net cash provided by (used in) fi nancing activities (total) (7,730) (873)
Change in cash and cash equivalents due to business activities (total) (261) (354)
Cash and cash equivalents at beginning of period 2,915 2,531
Change due to exchange rate movements and to changes in scope of consolidation (123) (83)
Cash and cash equivalents at end of period 2,531 2,094
* Gross cash fl ow = income from continuing operations after taxes, plus income taxes, plus / minus non-operating result, minus income taxes paid or accrued, plus depreciation, amortization and write-downs, minus write-backs, plus / minus changes in pension provisions, minus gains / plus losses on retirements of noncurrent assets, plus non-cash effects of the remeasurement of acquired assets. The change in pension provisions includes the elimination of non-cash components of the operating result. It also contains benefi t payments during the year.

TABLE OF CONTENTS MANAGEMENT REPORT MANAGEMENT REPORTLiquidity and
Capital Resources
79
INVESTING CASH FLOW
There was a net cash outfl ow of €3,089 million for investing activities in 2008. This total con-tained disbursements of €1,617 million for acquisitions, including €227 million in connection with the acquisition of u.s.-based Possis Medical, Inc., €265 million associated with the purchase of the eastern European otc business of Sagmel, Inc., €109 million for the acquisition of the otc business of the Chinese Topsun group and €185 million to acquire Direvo Biotech AG, Germany. Disbursements of €695 million were also made for the acquisition of the remaining interest in Bayer Schering Pharma AG, Berlin, Germany. With the entry of the squeeze-out in the commercial register, the remaining minority stockholders received cash compensation of €98.98 per share for their stock. The funds held in escrow accounts for this purpose were paid out to the stockholders at the beginning of October 2008. In the previous year there was a cash infl ow of €3,186 million, mainly comprising the net proceeds from the divestitures of the diagnostics business, H.C. Starck and Wolff Walsrode.
Cash outfl ows for property, plant and equipment and intangible assets in 2008 totaled €1,759 million (2007: €1,860 million). This fi gure included the expenditures for the expansion of our polymers production facilities in Shanghai, China, and the acquisition of the hematology portfolio of Maxygen, Inc. Infl ows comprised €553 million in “interest and dividends received” and €167 million in proceeds from the sale of property, plant, equipment and other assets.
Selected capital expenditures for property, plant and equipment made by the Bayer Group in the last two years are described in the following table:
Segment Description
Capital expenditures 2008
Pharmaceuticals Optimization of steroid production in Bergkamen, Germany
New packaging lines in Weimar and Berlin, Germany, and Gaillard, France
Expansion of the production site in Beijing, China
Capacity expansion in Jakarta, Indonesia
Crop Protection Capacity expansion for herbicidal active ingredients in Frankfurt and Knapsack, Germany
Consolidation of formulating activities in Kansas City, Missouri, U.S.A.
Expansion of formulating capacity for non-herbicides in Belford Roxo, Brazil
New insecticide formulation plant in Hangzhou, China
Modifi cation of a herbicide production facility in Ankleshwar, India
BioScience Construction of greenhouse, breeding and laboratory facilities for canola seedin Saskatoon, Canada
Systems Construction of a world-scale integrated production facility for MDI in Shanghai, China
Polyether capacity increases in Dormagen, Germany, and Santa Clara, Mexico
Construction of a pilot plant for carbon nanotubes in Leverkusen, Germany
Construction of a polyurethane systems house in Noida, India
Materials Construction of the MacroColor Center in Noida, India
Modifi cation of a facility for the manufacture of high-purity polycarbonate in Antwerp, Belgium

80 / / BAYER ANNUAL REPORT 2008 TABLE OF CONTENTS MANAGEMENT REPORT
FINANCING CASH FLOW
Net cash outfl ow for fi nancing activities in 2008 amounted to €873 million. The outfl ow in the prior year came to €7,730 million. This fi gure included €5.6 billion for net loan repayments, which in turn included the scheduled redemption of our 2002 / 2007 Eurobond in April 2007 (€2.1 billion). We made net borrowings of €1,525 million in 2008. Interest payments dropped by 5.4% year on year to €1,272 million. The Bayer AG dividend and dividend payments to non-controlling stockholders of consolidated companies, along with payments of withholding tax, totaled €1,126 million (2007: €773 million).
LIQUID ASSETS AND NET DEBT
Segment Description
Capital expenditures 2007
Pharmaceuticals Consolidation of biotech production facilities in Seattle, Washington, U.S.A.
Integration of biotech production facilities in Emeryville, California, U.S.A.
Consolidation of R&D activities in Germany and the U.S. due to the integration of Bayer Schering Pharma
Expansion of production facility for contrast media application systems in Warrendale, Pennsylvania, U.S.A.
Crop Protection Capacity expansion at the active ingredient and formulating facilities in Hangzhou, China
Formulation site consolidation project, U.S.A.
Modifi cation of existing facilities for the production of intermediates and new active ingredients for insecticides in Dormagen, Germany
Site consolidation projects in Thane, India, and Wolfenbüttel, Germany
Reconstruction of an active ingredient unit in Belford Roxo, Brazil
BioScience New greenhouse for vegetable seeds in ’s-Gravenzande, Netherlands
Systems Construction of a world-scale MDI production facility in Shanghai, China
Construction of a plant for polyurethane dispersions in Shanghai, China
Construction of a world-scale facility for polymer polyols in Antwerp, Belgium
Materials Expansion of the polycarbonate facility in Map Ta Phut, Thailand
Expansion of the polycarbonate facility in Shanghai, China
Construction of a new logistics center for polycarbonate compounds in Krefeld-Uerdingen, Germany
Net Debt Dec. 31,2007
Dec. 31,2008
€ million € million
Bonds and notes 10,411 10,729
of which hybrid bond 1,237 1,245
of which mandatory convertible bond 2,285 2,296
Liabilities to banks 3,032 4,438
Liabilities under fi nance leases 358 535
Liabilities from derivatives 235 612
Other fi nancial liabilities 162 333
Positive fair values of hedges of recorded transactions (230) (454)
Financial debt 13,968 16,193
Cash and cash equivalents* (1,776) (2,037)
Current fi nancial assets (8) (4)
Net debt from continuing operations 12,184 14,152
Net debt from discontinued operations 0 0
Net debt (total) 12,184 14,152
* In view of the restriction on its use, the €57 million liquidity in escrow accounts as of December 31, 2008 (December 31, 2007: €755 million)was not deducted when calculating net debt. December 31, 2008: €2,037 million = €2,094 million – €57 million.
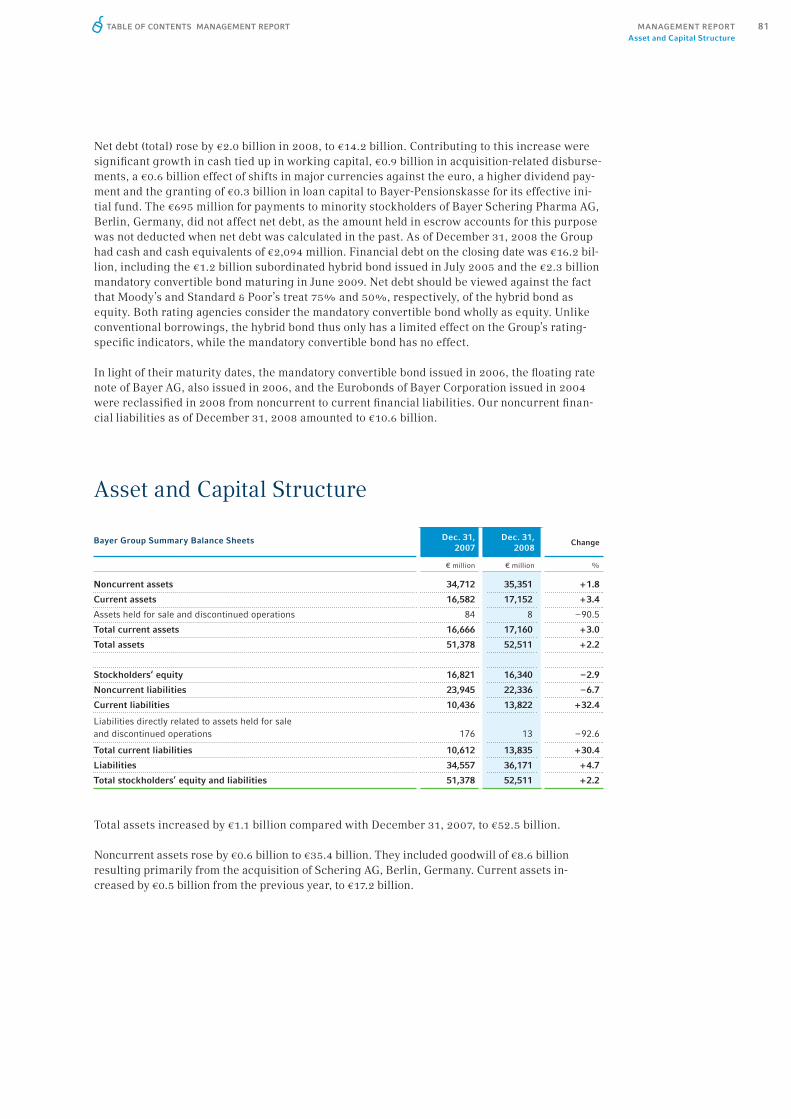
81TABLE OF CONTENTS MANAGEMENT REPORT MANAGEMENT REPORTAsset and Capital Structure
Net debt (total) rose by €2.0 billion in 2008, to €14.2 billion. Contributing to this increase were signifi cant growth in cash tied up in working capital, €0.9 billion in acquisition-related disburse-ments, a €0.6 billion effect of shifts in major currencies against the euro, a higher dividend pay-ment and the granting of €0.3 billion in loan capital to Bayer-Pensionskasse for its effective ini-tial fund. The €695 million for payments to minority stockholders of Bayer Schering Pharma AG, Berlin, Germany, did not affect net debt, as the amount held in escrow accounts for this purpose was not deducted when net debt was calculated in the past. As of December 31, 2008 the Group had cash and cash equivalents of €2,094 million. Financial debt on the closing date was €16.2 bil-lion, including the €1.2 billion subordinated hybrid bond issued in July 2005 and the €2.3 billion mandatory convertible bond maturing in June 2009. Net debt should be viewed against the fact that Moody’s and Standard & Poor’s treat 75% and 50%, respectively, of the hybrid bond as equity. Both rating agencies consider the mandatory convertible bond wholly as equity. Unlike conventional borrowings, the hybrid bond thus only has a limited effect on the Group’s rating-specifi c indicators, while the mandatory convertible bond has no effect.
In light of their maturity dates, the mandatory convertible bond issued in 2006, the fl oating rate note of Bayer AG, also issued in 2006, and the Eurobonds of Bayer Corporation issued in 2004 were reclassifi ed in 2008 from noncurrent to current fi nancial liabilities. Our noncurrent fi nan-cial liabilities as of December 31, 2008 amounted to €10.6 billion.
Asset and Capital Structure
Total assets increased by €1.1 billion compared with December 31, 2007, to €52.5 billion.
Noncurrent assets rose by €0.6 billion to €35.4 billion. They included goodwill of €8.6 billion resulting primarily from the acquisition of Schering AG, Berlin, Germany. Current assets in-creased by €0.5 billion from the previous year, to €17.2 billion.
Bayer Group Summary Balance Sheets Dec. 31,2007
Dec. 31,2008
Change
€ million € million %
Noncurrent assets 34,712 35,351 + 1.8
Current assets 16,582 17,152 + 3.4
Assets held for sale and discontinued operations 84 8 – 90.5
Total current assets 16,666 17,160 + 3.0
Total assets 51,378 52,511 + 2.2
Stockholders‘ equity 16,821 16,340 – 2.9
Noncurrent liabilities 23,945 22,336 – 6.7
Current liabilities 10,436 13,822 + 32.4
Liabilities directly related to assets held for sale and discontinued operations 176 13 – 92.6
Total current liabilities 10,612 13,835 + 30.4
Liabilities 34,557 36,171 + 4.7
Total stockholders’ equity and liabilities 51,378 52,511 + 2.2

82 / / BAYER ANNUAL REPORT 2008 TABLE OF CONTENTS MANAGEMENT REPORT
Stockholders’ equity fell by €0.5 billion to €16.3 billion. A positive effect came particularly from the Group net income of €1.7 billion. Stockholders’ equity was diminished mainly by the divi-dend payment of €1.0 billion made in 2008, an €0.7 billion increase in pension obligations that did not affect earnings, and negative currency effects of €0.4 billion. Our equity ratio (equity coverage of total assets) was 31.1% as of December 31, 2008 (2007: 32.7%).
Liabilities increased by €1.6 billion compared with December 31, 2007, to €36.2 billion. Current and noncurrent fi nancial liabilities rose by €2.4 billion to €16.9 billion.
NET PENSION LIABILITY
The net pension liability increased by €1.0 billion compared with December 31, 2007, to €6.0 bil-lion, mainly because the fair value of plan assets was lower than in the previous year.
Balance Sheet and Financial Ratios 2007 2008
Cost of sales ratio (%)Cost of goods sold
50.5 50.0 Sales
R&D expense ratio (%)Research and development expenses
8.0 8.1 Sales
Inventory turnoverCost of goods sold
2.6 2.5Inventories
Receivables turnoverSales
5.6 5.5Trade accounts receivable
EBIT margin before special items (%)EBIT before special items
13.2 13.2Sales
EBITDA margin before special items (%)EBITDA before special items
20.9 21.1Sales
Asset intensity (%)
Property, plant and equipment + intangible assets
61.6 61.1Total assets (continuing operations)1
D&A / capex ratio (%)Depreciation and amortization3
128.3 129.7Capital expenditures3
Liability structure2 (%)
Current liabilities 30.7 38.2
Liabilities
Gearing
Net debt + pension provisions 1.1 1.3
Stockholders’ equity
Free operating cash fl ow (€ million)
Net cash fl ow less cash outfl ows for
additions to property, plant, equipment
and intangible assets
2,423 1,849
Equity ratio2 (%)
Stockholders’ equity32.7 31.1
Total assets
Return on stockholders’ equity2 (%) Income after taxes
31.8 10.4Average stockholders‘ equity
Return on assets (%)Income before taxes and interest expense
6.9 7.0Average total assets for the year
based on segment table
1 total assets (continuing operations) = noncurrent and current assets minus the balance sheet item “assets held for sale and discontinued operations”
2 Ratio refers to the total of continuing and discontinued operations.3 property, plant and equipment + intangible assets
Net Pension LiabilityDec. 31,
2007Dec. 31,
2008
€ million € million
Provisions for pensions and other post-employment benefi ts 5,501 6,347
Prepaid benefi t assets (533) (351)
Net pension liability 4,968 5,996

83TABLE OF CONTENTS MANAGEMENT REPORT MANAGEMENT REPORTInformation Required Under Takeover Law
Information Required Under Takeover LawREPORT PURSUANT TO SECTION 315, PARAGRAPH 4 OF THE GERMAN COMMERCIAL CODE IN CONJUNCTION WITH SECTION 120, PARAGRAPH 3, SENTENCE 2 OF THE GERMAN STOCK CORPORATION ACT
The capital stock of Bayer AG amounted as of December 31, 2008 to €1,956,718,656 (2007: €1,956,715,315.20), divided into 764,343,225 (2007: 764,341,920) no-par bearer shares. Each share confers one voting right.
We received no notifi cations in 2008 or 2007 of direct or indirect holdings of shares in Bayer AG that exceed 10% of the capital stock. The Capital Research and Management Company, u.s.a., notifi ed us that the proportion of voting rights it holds in our company exceeded the 10% thresh-old on November 8, 2006, and that since that date it has held 10.0852% of the voting rights.
Pursuant to Section 84, Paragraph 1 of the German Stock Corporation Act (AktG), the members of the Board of Management are appointed and dismissed by the Supervisory Board. Since Bayer AG falls within the scope of the German Codetermination Act, the appointment or dismissal of members of the Board of Management requires a majority of two thirds of the votes of the mem-bers of the Supervisory Board on the fi rst ballot. If no such majority is achieved, the appointment may be approved pursuant to Section 31, Paragraph 3 of the Codetermination Act on a second ballot by a simple majority of the votes of the members of the Supervisory Board. If the required majority is still not achieved, a third ballot is held. Here again, a simple majority of the votes suffi ces, but in this ballot the Chairman of the Supervisory Board has two votes pursuant to Section 31, Paragraph 4 of the Codetermination Act.
Under Section 6, Paragraph 1 of the Articles of Incorporation of Bayer AG, the Board of Manage-ment must comprise at least two members. The Supervisory Board may appoint one member to be Chairman of the Board of Management pursuant to Section 84, Paragraph 2 of the German Stock Corporation Act or Section 6, Paragraph 1 of the Articles of Incorporation.
Under Section 179, Paragraph 1 of the German Stock Corporation Act, amendments to the Arti-cles of Incorporation require a resolution of the Stockholders’ Meeting. Pursuant to Section 179, Paragraph 2 of the German Stock Corporation Act, this resolution must be passed by a majority of three quarters of the voting capital represented at the meeting, unless the Articles of Incorpo-ration provide for a different majority. However, where an amendment relates to a change in the object of the company, the Articles of Incorporation may only specify a larger majority. Section 17, Paragraph 2 of the Articles of Incorporation of Bayer AG utilizes the scope for deviation pur-suant to Section 179, Paragraph 2 of the German Stock Corporation Act and provides that resolu-tions may be passed by a simple majority of the votes or, where a capital majority is required, by a simple majority of the capital.
Provisions of the Articles of Incorporation concerning Authorized Capital i and Authorized Capi-tal ii are entered in the commercial register of Bayer AG. With the approval of the Supervisory Board and until April 27, 2011, the Board of Management may use the Authorized Capital i to in-crease the capital stock by up to a total of €465 million. The issue of new shares may take place in exchange for cash and / or contributions in kind, but capital increases in exchange for contri-butions in kind may not exceed a total of €370 million. If the Authorized Capital i is used to issue shares in return for cash contributions, stockholders must be granted subscription rights. With the approval of the Supervisory Board and until April 26, 2012, the Board of Management is also authorized to increase the capital by up to €195 million in one or more installments by issuing shares out of the Authorized Capital ii in exchange for cash contributions. The stockholders must be granted subscription rights. However, the Board of Management is authorized, with the approval of the Supervisory Board, to exclude subscription rights for stockholders provided the capital increase out of the Authorized Capital ii does not exceed 10% of the capital stock exist-ing at the time this authorization becomes effective or the time this authorization is exercised.

84 / / BAYER ANNUAL REPORT 2008 TABLE OF CONTENTS MANAGEMENT REPORT
Conditional capital of €186.88 million, corresponding to 73 million shares, exists to service the conversion rights under a mandatory convertible bond issued by Bayer Capital Corporation B.V., Netherlands, on April 6, 2006 and maturing on June 1, 2009. The Annual Stockholders’ Meeting on April 25, 2008 adopted two resolutions creating conditional capital of €195,584,000 each in connection with two authorizations for the issuance of bonds with warrants or convertible bonds, profi t-sharing rights or profi t participation bonds (collectively referred to as “bonds”) with a total face value of €6 billion. The Board of Management may, with the consent of the Supervisory Board, exclude the subscription rights that in principle are granted to stockholders for such bonds provided, among other things, that the proportionate amount of the shares covered by such subscription rights does not exceed 10% of the capital stock. Any other shares issued without granting subscription rights to the stockholders in direct or analogous applica-tion of Section 186, Paragraph 3, Sentence 4 of the Stock Corporation Act shall be credited against this 10% limit. Further, the Annual Stockholders’ Meeting on April 25, 2008 authorized the Board of Management to purchase and sell company shares representing up to 10% of the capital stock. This authorization expires on October 24, 2009.
A material agreement entered into by Bayer AG that is subject to the condition precedent of a change of control pertains to the €7 billion syndicated loan granted to Bayer AG on March 23, 2006. This agreement contains provisions entitling the banks participating in the syndication to terminate the agreement in the event of a change of control and demand repayment of any out-standing sums. The loan was valued at €1.25 billion as of December 31, 2008, unchanged from the previous year. There is also an undrawn €3.5 billion syndicated credit facility, arranged by Bayer AG and its u.s. subsidiary Bayer Corporation on March 31, 2005, that is available until 2012. The participating banks are entitled to terminate the credit facility in the event of a change in control at Bayer and demand repayment of any loans that may have been granted under this facility up to that time.
Similarly, the aforementioned €2.3 billion mandatory convertible bond issued by Bayer Capital Corporation B.V., Netherlands, on April 6, 2006, which is secured by a subordinated guarantee from Bayer AG, also contains a change of control clause. Under Section 6.5 of the conditions of issue, in the event of a takeover offer pursuant to Section 29, Paragraph 1 of the German Securi-ties Acquisition and Takeover Act (WpÜG) or a mandatory offer, pursuant to Section 35, Para-graph 1 of that Act, bondholders shall be entitled to exercise their conversion rights. If they do so, they will receive Bayer AG shares in accordance with the applicable conversion ratio.
Finally, the terms of the €4.3 billion (as of December 31, 2008) in notes issued by Bayer in the years 2006 to 2008 under its multicurrency European Medium Term Note program also contain a change-of-control clause. Holders of these notes have the right to demand the redemption of their notes by Bayer AG in the event of a change of control if Bayer AG’s credit rating is down-graded within 120 days after such change of control becomes effective.
In the event of a takeover offer for Bayer AG, the following agreements exist for members of the Board of Management whose service contracts were concluded prior to the entry into force of the amendments to the German Corporate Governance Code in June 2008:
The severance indemnity clause for the members of the Group Management Board described in the Compensation Report is currently supplemented by a change-of-control clause which, like the severance indemnity clause, only takes effect if a change of control results in the termination of a Group Management Board member’s service contract and his leaving the Bayer Group prior to his 60th birthday. The potential benefi ts are the same as under the severance indemnity clause.
This clause is now obsolescent and of only limited signifi cance. The Supervisory Board has decided to follow the recommendation of the German Corporate Governance Code, as amended in June 2008, and limit severance payments under new service contracts. In the case of the only Board of Management member to have his contract renewed since then, it was contractually agreed during the second half of 2008 that payment claims can only arise in the event of prema-ture contract termination by the company without cause and that their amount is limited. Such

85TABLE OF CONTENTS MANAGEMENT REPORT MANAGEMENT REPORTProposal for Distribution
of the Profi t
payments, including ancillary benefi ts, are limited to the value of two years’ compensation (severance payment cap) and may not compensate more than the remaining term of the contract. The severance payment cap is to be calculated on the basis of the total compensation (fi xed sala-ry plus target value of the short-term incentive) for the previous year and, if appropriate, also the expected total compensation for the current year. Payments in the event of premature contract termination due to a change of control may not exceed 150% of the severance payment cap.
Proposal for Distribution of the Profi tUnder German law, the dividend payment is based on the balance sheet profi t of the parent company Bayer AG, which amounted to €1,070 million in 2008.
We will propose to the Annual Stockholders’ Meeting on May 12, 2009 that the balance sheet profi t be used to pay a dividend of €1.40 (2007: €1.35) per share (764,343,225 shares) on the capital stock of €1,957 million entitled to the dividend for 2008.
Proposed dividend for 2008
€1.40Bayer AG Summary Income Statements according to the German Commercial Code 2007 2008
€ million € million
Income from investments in affi liated companies – net 3,030 2,711
Interest expense – net (744) (948)
Other non-operating income (expense) – net 18 (228)
Other operating income 260 209
General administration expenses (197) (194)
Other operating expenses (242) (266)
Income before income taxes 2,125 1,284
Income taxes (197) (123)
Net income 1,928 1,161
Allocation to retained earnings (896) (91)
Balance sheet profi t 1,032 1,070

86 / / BAYER ANNUAL REPORT 2008 TABLE OF CONTENTS MANAGEMENT REPORT
Procurement, Production and DistributionOur activities in the areas of procurement, production and distribution are organized on a de-centralized basis in view of our diversifi ed business portfolio.
Bayer HealthCare
The Pharmaceuticals segment generally procures the starting materials for manufacturing the active ingredients of its ethical pharmaceuticals from external suppliers. To prevent supply bottlenecks and to mitigate major price fl uctuations, these starting materials and intermediates we do not produce ourselves are generally purchased under global contracts or from several internally approved suppliers.
The active ingredients of our ethical pharmaceuticals currently are manufactured mainly at our sites in Wuppertal and Bergkamen, Germany, and Berkeley and Emeryville, California. The manufacturing and packaging of pharmaceutical products based on these active ingredients takes place at locations around the world including Berlin, Leverkusen and Weimar, Germany; Berkeley and Emeryville, California; Garbagnate, Italy; São Paulo, Brazil; Madrid, Spain; Beijing, China; and Turku, Finland.
Our pharmaceutical products are primarily distributed through wholesalers, pharmacies and hospitals. Co-promotion and co-marketing agreements serve to optimize our distribution network. In June 2007, for example, we began co-marketing the Schering-Plough product Zetia® in Japan under a strategic alliance with Schering-Plough. (Please note that Schering-Plough Corporation, New Jersey, and the company acquired by Bayer in June 2006, i.e. Bayer Schering Pharma AG (formerly named Schering AG), Berlin, Germany, are unaffi liated companies that have been totally independent of each other for many years.) In the United States, Schering-Plough also distributes Primary Care products from Bayer and co-markets our erectile dysfunc-tion drug Levitra® with GlaxoSmithKline. The agreement with Johnson & Johnson subsidiary Ortho-McNeil on the further development and marketing of the anticoagulant Xarelto® ensures optimum progress in this area, conferring regional marketing rights that enable both partners to share in the product’s expected success.
In our Consumer Health segment the focus is on products marketed directly to consumers. Consumer Care procures certain high-volume raw materials such as acetylsalicylic acid and clotrimazole from within the HealthCare subgroup. The principal raw materials we purchase from third parties are naproxen, citric acid, ascorbic acid and other vitamins, and paracetamol. To minimize business risks, we diversify our raw material procurement sources worldwide and conclude long-term supply agreements. Among the division’s largest production sites are the facilities in Myerstown, Pennsylvania, United States; Gaillard, France; and Bitterfeld and Grenzach, Germany. While the division’s sales and distribution channels outside Europe are typically supermarket chains, drugstores and other large retailers, pharmacies are the usual distribution channel in Europe.
Some four fi fths of the products of the Diabetes Care Division are procured from original equipment manufacturers (oems). Material prices and availability are contractually agreed in most cases and therefore are not subject to major fl uctuations. We hold strategic reserves of certain direct materials or fi nished products in order to be able to supply our customers consistently and reliably. Our largest production site is located in Mishawaka, Indiana, United States. We generally market our Diabetes Care products to consumers outside Europe through pharmacies, drugstores, mass merchants, hospitals and wholesalers. In Europe, they are sold mainly through pharmacies.
Optimized distribution through
partnerships

87TABLE OF CONTENTS MANAGEMENT REPORT MANAGEMENT REPORTProcurement, Production
and Distribution
The Animal Health Division procures the pharmaceutical active ingredients for its veterinary medicines both from within the Bayer Group and from external suppliers throughout the world. Our animal health products are manufactured mainly at the sites in Kiel, Germany, and Shawnee, Kansas, United States, and marketed worldwide. Depending on local regulatory frameworks, animal health products may be available to end users with a prescription issued by a veterinarian or over the counter from retail stores, drugstores and pharmacies.
Bayer CropScience
CropScience procures most of its raw materials for the manufacture of crop protection products externally in various parts of the world. The cost of some raw materials depends on fl uctuating crude oil and energy prices and freight charges.
Our business is subject to the growing seasons for the relevant crops and the respective distribution cycles.
CropScience operates some 40 production facilities of its own around the world. Among the largest are the plants in Dormagen and Frankfurt am Main, Germany; Institute, West Virginia and Kansas City, Missouri, United States; and Vapi, India. In addition to the central locations for the manufacture of our active ingredients, a network of decentralized formulation and fi lling sites enables us to respond rapidly to local market needs.
Our crop protection products are marketed either via wholesalers or directly through retailers by means of a two- or three-step distribution system, depending on local market conditions.
The products of the Environmental Science unit for non-agricultural uses are marketed through various distribution channels. Our green industry, pest control and vector control products are sold directly to professional users, while home and garden products are marketed to consumers through specialist retailers.
BioScience produces its commercial seeds in numerous breeding stations around the world. The products are made available to growers, breeders, specialist dealers and processing industries. Traits developed using plant biotechnology are either incorporated into our own seed varieties or licensed to other seed companies for use in their products. In some cases, traits are also provid-ed to other companies for research purposes.
Bayer MaterialScience
The primary raw materials for our products are petrochemical feedstocks, which we generally purchase under long-term agreements. This safeguards the supply of raw materials on competi-tive terms.
MaterialScience manufactures polyurethanes, polycarbonates, coating and adhesive raw materials and certain basic chemicals in close proximity to its customers at 30 locations around the world. Our largest production facilities for the European market are located in Dormagen, Krefeld-Uerdingen and Brunsbüttel, Germany; Antwerp, Belgium; and Tarragona, Spain. The major production site for the u.s. market is at Baytown, Texas, while customers in the Asia / Pacifi c region are supplied chiefl y from Map Ta Phut, Thailand and Shanghai, China. Our focus is on world-scale facilities.
40 CropScience production sites
worldwide
World-scale production facilities at
MaterialScience

88 / / BAYER ANNUAL REPORT 2008 TABLE OF CONTENTS MANAGEMENT REPORT
Our polyurethane raw materials, such as diphenylmethane diisocyanate (mdi), toluene diiso-cyanate (tdi) and polyether (pet), and the polyurethane systems based on them that are offered in the market are used, for example, in the production of mattresses, refrigerator insulations, automotive bumpers and shoe soles. The Coatings, Adhesives, Specialties business unit manu-factures raw materials for coatings used in the automobile and commercial vehicle industries, and for adhesives used in footwear. Examples of applications for our polycarbonates, which we market under the Makrolon®, Bayblend®, Makroblend® and other trademarks, include car head-lamps, stadium roofs, housings for electrical appliances, and water bottles for water dispensers.
Depending on their fi elds of application, these products are used mainly in the automotive, con-struction, electronics, information technology, furniture, timber, chemical, sports equipment, leisure goods, textile, medical technology and manufacturing industries.
Our plastics materials are marketed primarily through regional distribution channels or directly to customers. We also work together with trading houses and local distributors who are respon-sible for business with small customers. Major customers with global operations are serviced di-rectly by our key account managers.
Research and DevelopmentOur mission statement “Science For A Better Life” underscores Bayer’s belief that innovation will play a major part in resolving the challenges facing society and will therefore remain a key growth driver for our research-based enterprise. Bayer has the necessary resources in place to realize further growth opportunities for the future through research and development activities. In 2008 a total of €2,653 million was invested in research and development, compared with €2,578 million in the previous year. It is particularly important for us to develop new products that strengthen our core businesses. To enable us to meet our growth targets, we strive to con-tinuously expand our product portfolio and optimize our production processes. Our research activities are closely aligned to the requirements of our markets. Our own research and develop-ment activities are supplemented by an international network of collaborations with leading uni-versities, public-sector research institutes and partner companies. Through this pooling of ex-pertise, we aim to rapidly translate new ideas into successful products. Our activities are also supported by the systematic advancement of talented scientists and experts in our research and development units.
€2.7 billionfor research
and development
Research and Development Expenses by Subgroup (2007 in parentheses)
Reconciliation 2% (1%)
66% (66%)HealthCare
24% (25%)CropScience
8% (8%)MaterialScience
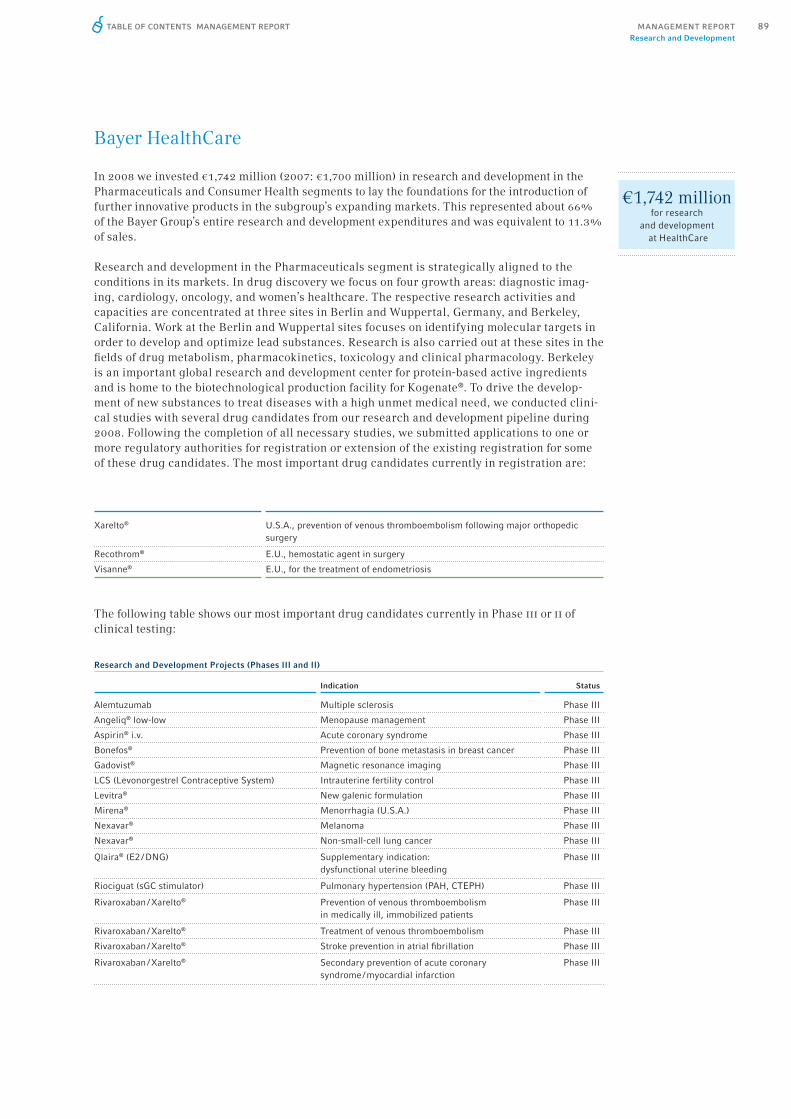
89TABLE OF CONTENTS MANAGEMENT REPORT MANAGEMENT REPORTResearch and Development
Bayer HealthCare
In 2008 we invested €1,742 million (2007: €1,700 million) in research and development in the Pharmaceuticals and Consumer Health segments to lay the foundations for the introduction of further innovative products in the subgroup’s expanding markets. This represented about 66% of the Bayer Group’s entire research and development expenditures and was equivalent to 11.3% of sales.
Research and development in the Pharmaceuticals segment is strategically aligned to the conditions in its markets. In drug discovery we focus on four growth areas: diagnostic imag-ing, cardiology, oncology, and women’s healthcare. The respective research activities and capacities are concentrated at three sites in Berlin and Wuppertal, Germany, and Berkeley, California. Work at the Berlin and Wuppertal sites focuses on identifying molecular targets in order to develop and optimize lead substances. Research is also carried out at these sites in the fi elds of drug metabolism, pharmacokinetics, toxicology and clinical pharmacology. Berkeley is an important global research and development center for protein-based active ingredients and is home to the biotechnological production facility for Kogenate®. To drive the develop-ment of new substances to treat diseases with a high unmet medical need, we conducted clini-cal studies with several drug candidates from our research and development pipeline during 2008. Following the completion of all necessary studies, we submitted applications to one or more regulatory authorities for registration or extension of the existing registration for some of these drug candidates. The most important drug candidates currently in registration are:
The following table shows our most important drug candidates currently in Phase iii or ii of clinical testing:
Research and Development Projects (Phases III and II)
Indication Status
Alemtuzumab Multiple sclerosis Phase III
Angeliq® low-low Menopause management Phase III
Aspirin® i.v. Acute coronary syndrome Phase III
Bonefos® Prevention of bone metastasis in breast cancer Phase III
Gadovist® Magnetic resonance imaging Phase III
LCS (Levonorgestrel Contraceptive System) Intrauterine fertility control Phase III
Levitra® New galenic formulation Phase III
Mirena® Menorrhagia (U.S.A.) Phase III
Nexavar® Melanoma Phase III
Nexavar® Non-small-cell lung cancer Phase III
Qlaira® (E2 / DNG) Supplementary indication: dysfunctional uterine bleeding
Phase III
Riociguat (sGC stimulator) Pulmonary hypertension (PAH, CTEPH) Phase III
Rivaroxaban / Xarelto® Prevention of venous thromboembolismin medically ill, immobilized patients
Phase III
Rivaroxaban / Xarelto® Treatment of venous thromboembolism Phase III
Rivaroxaban / Xarelto® Stroke prevention in atrial fi brillation Phase III
Rivaroxaban / Xarelto® Secondary prevention of acute coronary syndrome / myocardial infarction
Phase III
€1,742 millionfor research
and development at HealthCare
Xarelto® U.S.A., prevention of venous thromboembolism following major orthopedic surgery
Recothrom® E.U., hemostatic agent in surgery
Visanne® E.U., for the treatment of endometriosis
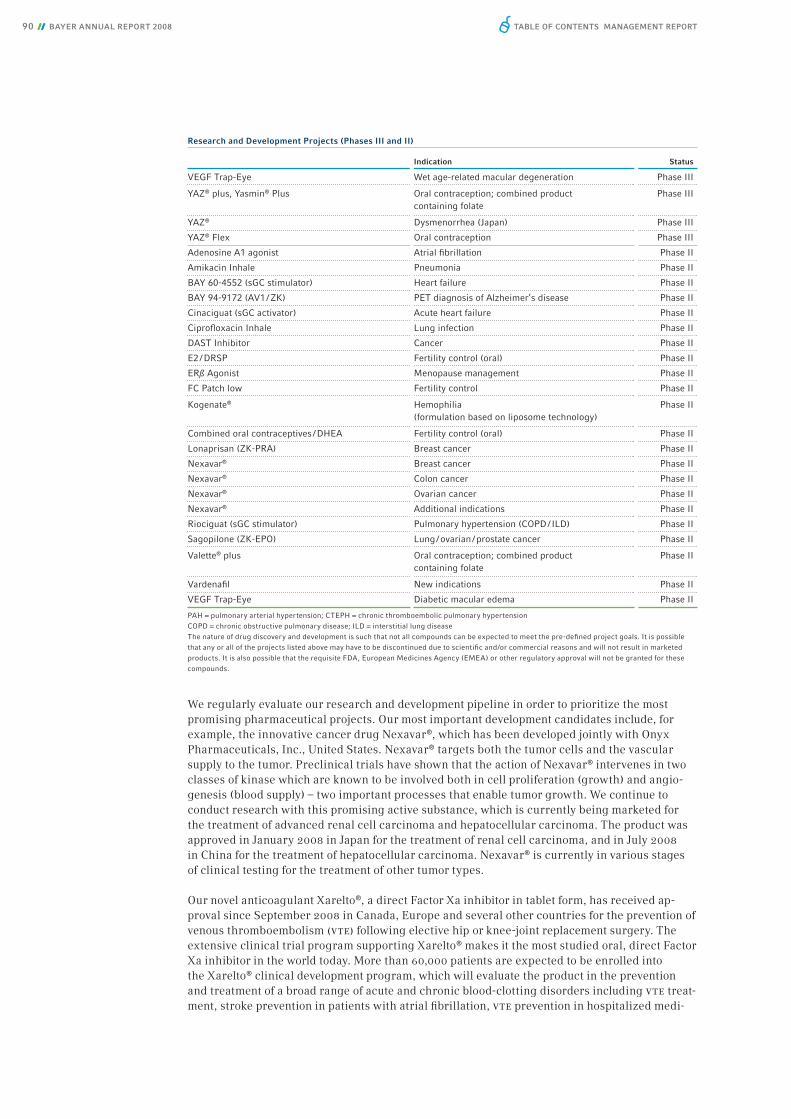
90 / / BAYER ANNUAL REPORT 2008 TABLE OF CONTENTS MANAGEMENT REPORT
We regularly evaluate our research and development pipeline in order to prioritize the most promising pharmaceutical projects. Our most important development candidates include, for example, the innovative cancer drug Nexavar®, which has been developed jointly with Onyx Pharmaceuticals, Inc., United States. Nexavar® targets both the tumor cells and the vascular supply to the tumor. Preclinical trials have shown that the action of Nexavar® intervenes in two classes of kinase which are known to be involved both in cell proliferation (growth) and angio-genesis (blood supply) – two important processes that enable tumor growth. We continue to conduct research with this promising active substance, which is currently being marketed for the treatment of advanced renal cell carcinoma and hepatocellular carcinoma. The product was approved in January 2008 in Japan for the treatment of renal cell carcinoma, and in July 2008 in China for the treatment of hepatocellular carcinoma. Nexavar® is currently in various stages of clinical testing for the treatment of other tumor types.
Our novel anticoagulant Xarelto®, a direct Factor Xa inhibitor in tablet form, has received ap-proval since September 2008 in Canada, Europe and several other countries for the prevention of venous thromboembolism (vte) following elective hip or knee-joint replacement surgery. The extensive clinical trial program supporting Xarelto® makes it the most studied oral, direct Factor Xa inhibitor in the world today. More than 60,000 patients are expected to be enrolled into the Xarelto® clinical development program, which will evaluate the product in the prevention and treatment of a broad range of acute and chronic blood-clotting disorders including vte treat-ment, stroke prevention in patients with atrial fi brillation, vte prevention in hospitalized medi-
Research and Development Projects (Phases III and II)
Indication Status
VEGF Trap-Eye Wet age-related macular degeneration Phase III
YAZ® plus, Yasmin® Plus Oral contraception; combined product containing folate
Phase III
YAZ® Dysmenorrhea (Japan) Phase III
YAZ® Flex Oral contraception Phase III
Adenosine A1 agonist Atrial fi brillation Phase II
Amikacin Inhale Pneumonia Phase II
BAY 60-4552 (sGC stimulator)
BAY 94-9172 (AV1 / ZK)
Heart failure
PET diagnosis of Alzheimer‘s disease
Phase II
Phase II
Cinaciguat (sGC activator) Acute heart failure Phase II
Ciprofl oxacin Inhale Lung infection Phase II
DAST Inhibitor Cancer Phase II
E2 / DRSP Fertility control (oral) Phase II
ERß Agonist Menopause management Phase II
FC Patch low Fertility control Phase II
Kogenate® Hemophilia (formulation based on liposome technology)
Phase II
Combined oral contraceptives / DHEA Fertility control (oral) Phase II
Lonaprisan (ZK-PRA) Breast cancer Phase II
Nexavar® Breast cancer Phase II
Nexavar® Colon cancer Phase II
Nexavar® Ovarian cancer Phase II
Nexavar® Additional indications Phase II
Riociguat (sGC stimulator) Pulmonary hypertension (COPD / ILD) Phase II
Sagopilone (ZK-EPO) Lung / ovarian / prostate cancer Phase II
Valette® plus Oral contraception; combined product containing folate
Phase II
Vardenafi l New indications Phase II
VEGF Trap-Eye Diabetic macular edema Phase II
PAH = pulmonary arterial hypertension; CTEPH = chronic thromboembolic pulmonary hypertensionCOPD = chronic obstructive pulmonary disease; ILD = interstitial lung disease The nature of drug discovery and development is such that not all compounds can be expected to meet the pre-defi ned project goals. It is possible that any or all of the projects listed above may have to be discontinued due to scientifi c and/or commercial reasons and will not result in marketed products. It is also possible that the requisite FDA, European Medicines Agency (EMEA) or other regulatory approval will not be granted for these compounds.
91TABLE OF CONTENTS MANAGEMENT REPORT MANAGEMENT REPORTResearch and Development
cally ill patients, and secondary prevention of acute coronary syndrome (heart attack). The Phase iii study on secondary prevention of acute coronary syndrome was initiated in December 2008.
Featuring an innovative, patent-protected 24 /4 day dosage regimen, our low-dose oral contra-ceptive yaz® from the drospirenone product family can be used in three distinct indications: contraception, treatment of moderate acne, and treatment of the emotional and physical symp-toms associated with pmdd (premenstrual dysphoric disorder). The product is already registered in all three indications in the United States, important markets of the Asia / Pacifi c region and in Latin America. In September 2008, yaz® was launched for the oral contraception indication in Europe.
Our activities in the fi eld of biological products are focused on strengthening and expanding our recombinant Factor viii product Kogenate®. A key project here is the development of a new presentation of Kogenate® based on a patent-pending pegylated liposome technology.
Based on positive Phase ii trial outcomes with riociguat, the fi rst member of a new class of vaso-dilating agents known as soluble guanylate cyclase (sgc) stimulators, we moved into Phase iii trials with this substance in December 2008. Administered in tablet form, riociguat is currently being investigated as a new approach for the treatment of various forms of pulmonary hyperten-sion.
The portfolio of products emerging from our own research and development is supplemented by products inlicensed on a national, regional or global level. The humanized monoclonal antibody alemtuzumab successfully completed Phase ii clinical trials and is now being tested in two global Phase iii studies for the treatment of multiple sclerosis (ms). This novel approach to the treatment of the autoimmune disease ms is being developed in collaboration with Genzyme Corporation.
The Phase iii study in age-related macular degeneration (wet amd) for our vegf Trap-Eye project that we are pursuing in collaboration with Regeneron Pharmaceuticals Inc. has started. Our de-velopment partner additionally initiated a Phase ii study in patients with diabetic macular edema in December 2008. vegf (vascular endothelial growth factor) is a natural growth factor that stimulates the formation of new blood vessels (angiogenesis) and is formed naturally during the growth of tissues and organs. vegf Trap-Eye blocks this growth factor specifi cally and very effectively. Inhibition of vegf prevents the abnormal formation of new blood vessels and the leakage of fl uid, which is very important in treating patients with wet amd. The medication is administered topically into the eye. Once the product has been granted regulatory approval, Bayer will market it outside the United States. Regeneron maintains exclusive commercialization rights to vegf Trap-Eye in the u.s.
We have also acquired the commercialization rights for recombinant human thrombin (rhThrombin) outside the United States from u.s.-based ZymoGenetics, Inc. This product re-ceived fda approval for the u.s. market in January 2008. The two companies will co-promote the product in the United States for an initial period of three years under the name Recothrom® for the control of bleeding during surgery. In August 2008 Bayer submitted a marketing authoriza-tion application for rhThrombin in Europe.
In 2007 we entered into a partnership with u.s.-based Nektar Therapeutics, Inc. to develop and commercialize an inhaled formulation of the antibiotic amikacin. This innovative treatment for pneumonia in intubated and mechanically ventilated patients is based on a novel inhalation technology. This project is currently in Phase ii clinical testing and shows promising results.
To further strengthen our activities in the area of biopharmaceutical active ingredients, we acquired the protein engineering specialist Direvo Biotech AG, Germany. In addition, July 2008 saw the acquisition of the hemophilia portfolio of Maxygen, Inc., United States, along with a license to use that company’s novel biotechnology research platform known as Molecular Breed-ing. With this acquisition we are seeking to build on our strong market position in hemophilia care.

92 / / BAYER ANNUAL REPORT 2008 TABLE OF CONTENTS MANAGEMENT REPORT
We also invest in continuous life-cycle management to identify possible additional indications and improved delivery forms for products already on the market.
In our Consumer Health segment, research and development activities of the Consumer Care Division at our product development centers in Morristown, New Jersey, United States, and Gaillard, France, focus on identifying, developing and commercializing non-prescription (over-the-counter = otc) products. These efforts are centered on support for both existing and new brands through the implementation of product-specifi c, clinical and regulatory development strategies that enable the successful exploitation of new technologies, the expansion of indica-tions for existing products or the reclassifi cation of current prescription medicines as otc prod-ucts. We introduced a variety of new product line extensions to several markets in 2008.
In the Diabetes Care Division, headquartered in Tarrytown, New York, we focus our research and development activities on strengthening core product lines and continuing our expansion into attractive segments of the diabetes market. The results of our internal development work and our collaborations enable us to offer user-friendly monitoring systems to meet the individual needs of people with diabetes, as demonstrated for example by the wireless combination of our new Contour® Link system and the Medtronic® insulin pump.
The Animal Health Division focuses its research and development activities in Monheim, Germany, on antiinfectives and parasiticides as well as active ingredients for the treatment of non-infectious disorders such as chronic kidney and cardiovascular diseases and cancer, particularly in companion animals. With the launch of Renalzin®, an innovative dietary supple-ment for cats suffering from chronic renal failure, we laid the foundation for expanding our portfolio of kidney disease treatments.
Bayer CropScience
In 2008, €649 million (2007: €637 million) in research and development expenditures, or about 24% of the Bayer Group total, were made in the CropScience subgroup. This is equivalent to 10.2% of sales. CropScience maintains a global network of research and development facilities. Our biggest r&d sites for crop protection products are located in Monheim and Frankfurt am Main, Germany, and Lyon, France. The major research centers of the BioScience unit are located in Ghent, Belgium, and Haelen, Netherlands.
While research is concentrated at a small number of sites, our development activities take place both there and at fi eld testing stations across the globe to enable future products to be tested un-der the relevant regional climatic conditions. Breeding activities for our seed business are also carried out at various decentralized locations to take account of specifi c local requirements.
In the Crop Protection unit we identify and develop innovative, safe and sustainable insecticide, fungicide and herbicide products for farmers and carry out research projects across all indica-tions in new areas of future importance, such as plant health or stress tolerance. In addition to conventional chemistry, biology and biochemistry, modern technologies such as genomics, high-throughput screening, bioinformatics and combinatorial chemistry play an important role in the identifi cation of new lead structures. Collaborations with external parties supplement our own activities.
€649 millionfor research
and developmentat CropScience
93TABLE OF CONTENTS MANAGEMENT REPORT MANAGEMENT REPORTResearch and Development
We actively seek to extend the spectrum of use for our substances by developing seed treatment solutions, new mixtures or innovative formulations of products that are already on the market so that they can be applied in additional crops or are easier to use.
In 2008 we introduced two new active ingredients to the market: Spirotetramat (major brand: Movento®), Bayer CropScience’s third ketoenol compound, is a highly effective systemic insecti-cide that offers protection against a broad spectrum of sucking insects. Spirotetramat protects pome and stone fruit, citrus fruit, grapes, nuts, vegetables and potatoes against pests such as aphids, cicadas, grape lice, mealybugs, whitefl ies and cottony-cushion scales.
Pyrasulfotole (major brand: Huskie®), a member of the benzoylpyrazoles class, is a new cereal herbicide offering farmers reliable control of a large number of broadleaved weeds. Thanks to its novel mechanism of action in cereal crops, this product can play an effective part in resistance management programs.
The active ingredient pipeline in Crop Protection currently contains 18 developmental projects that the company hopes to bring to market maturity between 2009 and 2017, along with a further 50 projects in early-stage research.
In 2008 we already received the fi rst marketing approvals for a new herbicide and an innovative safener substance that we plan to commercialize as of 2009. Safeners are special substances added to herbicides to protect crops from potentially damaging effects of the active ingredient. We aim to introduce three promising new fungicides to the market in 2010 subject to their successful registration:
Thiencarbazone-methyl (major brands: Adengo®, Corvus®) is a new sulfonyl amino carbonyl triazolinone (sact) compound to control weeds in corn and cereal crops. This substance ideally complements our active ingredient isoxafl utole, which is already on the market. The combined modes of action of these two ingredients, in conjunction with our new safener cyprosulfamide, ensure particularly good plant tolerance.
CropScience anticipates a total peak sales potential in excess of €1 billion for the nine new active ingredients it plans to introduce to the market between 2008 and 2012.
The compounds developed by Crop Protection are also tested and evaluated by our Environ-mental Science unit for possible non-agricultural uses. In addition, we carry out tests with active ingredients from other companies and may purchase such ingredients if results are positive. Current development projects include passive treatments such as gels and baits to combat insect pests, biological solutions for pest control and insecticides for material treatment in a vector-con-trol context. Also at the focus of our development activities are new products for weed control and active ingredient mixtures to control fungal diseases on turf and ornamental plants.
Well-stockedresearch pipeline
New active incredient IndicationPlanned
launch
Thiencarbazone-methyl Herbicide 2009
Cyprosulfamide Herbicide / safener 2009
Fluopyram Fungicide 2010
Bixafen Fungicide 2010
Isotianil Fungicide 2010

94 / / BAYER ANNUAL REPORT 2008 TABLE OF CONTENTS MANAGEMENT REPORT
In 2008, Environmental Science introduced numerous new products featuring simple, user-friendly handling for professional users and consumers. In Europe, for example, we launched Kid Way® and Pistol®, two new herbicides for professional users that are intended to replace older products in our portfolio. In the United States we launched Temprid®, a new product for profes-sional users featuring an active-ingredient combination to control ants and other pests, particu-larly outdoors.
We strengthened our Bayer Advanced portfolio for u.s. consumers with new products, including an insecticide that also acts as a disinfectant. In Europe we launched a number of additions to the Bayer Garden range for consumers, including several new products based on the young active ingredient thiacloprid.
Several product introductions are planned for 2009. They include the u.s. launch of Kontos® , a new pest control product for the greenhouse and nursery markets, based on the active ingredient spirotetramat, to protect ornamental plants.
Research in our BioScience unit is concerned with optimizing the properties of plants. We are developing new varieties of our core crops – cotton, canola and rice – and new vegetable seeds.
Our research and development activities are focused on the agronomic properties of these core crops. For example, our scientists are working to develop crop plants that are more resistant to stress factors such as extreme temperatures and drought conditions. We also aim to increase the plants’ yield potential and quality, as by improving the profi le of canola oil or enhancing the properties of cotton fi bers. Other projects are directed toward broadening the spectrum of herbi-cide tolerance through additional mechanisms of action and improving plants’ resistance to in-sect attack and diseases.
The technologies we use comprise both modern breeding methods and processes based on plant biotechnology. Our research and development pipeline currently contains more than 40 promis-ing lead projects and is supplemented by research and license agreements.
The growth in BioScience sales in 2008 was supported by new product introductions. We launched several new canola varieties – including InVigor® Health, a canola line developed for the specialty canola oil market in North America. The year also saw the market introduction of Arize® Dhani rice seed. This high-yield variety is resistant to bacterial leaf blight, a disease much feared by rice growers. We also successfully introduced numerous new vegetable varieties and several new cotton lines.
In 2009 we plan to launch several innovative seed varieties, including cotton featuring our own glyphosate herbicide-tolerance trait. In conjunction with leading seed producers, we also intend to introduce our LibertyLink® herbicide tolerance technology in soybean seeds for the u.s. market.
To further strengthen the innovative capability of CropScience, we plan to gradually increase research and development spending to reach some €750 million annually by 2015. We intend to step up our research effort, particularly in the seed and plant biotechnology areas, where expen-ditures are planned to increase to more than €200 million over the same period.
95TABLE OF CONTENTS MANAGEMENT REPORT MANAGEMENT REPORTResearch and Development
Bayer MaterialScience
In 2008, MaterialScience spent €221 million (2007: €209 million) on research and development (not including joint development activities with customers) to further expand its leading posi-tion in the market and in process technology as a global supplier of high-quality customized materials and system solutions. MaterialScience thus accounted for 8% of the Bayer Group’s total research and development expenses. The subgroup’s expenses in this fi eld amounted to 2.3% of sales. In the MaterialScience business units – Polyurethanes; Polycarbonates; Thermo-plastic Polyurethanes; and Coatings, Adhesives, Specialties – the latest technologies and pro-duction processes are used to develop new products and applications in close cooperation with our customers and other external partners.
Product development work in the Polyurethanes business unit is focused on expanding appli-cations for materials and optimizing the properties of our polyurethane systems. In the construction industry, for example, our polyurethanes serve as the basis for highly effi cient insulating materials and thus make an active contribution to climate protection. Roughly 70 times as much energy can be saved during the product life cycle of rigid polyurethane foam as is required for its manufacture. The use of renewable raw materials also plays an important part in our research and development activities. For example, we have developed polyols con-taining up to 70% by weight of renewable raw materials for use in mattresses, car seats and refrigerator insulation. One new application is a polyurethane foam system used to lay railroad ballast beds. The use of this innovative technology, which is currently being tested under regular rail traffi c conditions, can result in a lower maintenance requirement for the railroad bed and also considerably reduce train noise levels.
Investment in process development is currently focused on new and improved raw materials and the optimization of manufacturing processes for polyether polyols and aromatic isocyanates. Our 250,000 tons-per-year tdi facility in Shanghai, China, due on stream in 2010, will employ the gas-phase phosgenation process, which uses up to 60% less energy than would a conventional world-scale facility of the same size. This innovative process also reduces carbon dioxide emissions by 60,000 tons per year. We have also developed highly effi cient processes for mdi that are already being used at our 350,000 tons-per-year plant at Shanghai. This is the world’s largest single-line mdi facility.
The Coatings, Adhesives, Specialties business unit focuses its research and development activi-ties on developing polyurethane raw materials for the formulation of high performance coatings, adhesives and sealants, such as aliphatic and aromatic polyisocyanates and resin components. Important areas of research are raw materials for waterborne and uv-curing systems that help to conserve resources by obviating the need for organic solvents and reducing drying times for coatings. We are also working to open up more new applications in the areas of cosmetics and medical technology. The new strategic business unit Functional Films was created based on the high level of expertise harbored by the Coatings, Adhesives, Specialties business unit in the fi eld of innovative surfaces. This unit’s activities include three-dimensionally formable electrolumi-nescent fi lms (Lyttron©), lcd diffuser fi lms for fl at screens, formable coated fi lms for electronic and automotive applications and soft-touch Makrofol® fi lms used in automotive interior compo-nents and cellphone housings. We are also collaborating with u.s.-based InPhase Technologies to develop holographic data-storage media with a capacity of 300 gigabytes per fi rst-generation disc. And with an annual capacity of 60 tons, we have quickly established ourselves as one of the world’s leading industrial-scale suppliers of carbon nanotubes (Baytubes®).
€221 millionfor research
and developmentat MaterialScience

96 / / BAYER ANNUAL REPORT 2008 TABLE OF CONTENTS MANAGEMENT REPORT
Our aim in the Polycarbonates business unit is to develop new applications for our products and steadily improve manufacturing processes. We direct our efforts toward fi nding innovative solu-tions that align with global societal trends in areas such as climate protection, mobility and liv-ing standards against a background of steady population growth. Examples include lightweight plastics components for automotive construction, novel approaches in the fi eld of led light man-agement technologies and stronger yet lighter materials for the passenger transportation and other sectors. Product development focuses on new polymer alloys (pc blends and compounds), modifi ed base materials for polycarbonate sheets and various coating technologies for modifying polycarbonate surfaces. An example is the polycarbonate-based glazing and roof panels intro-duced globally in collaboration with leading automakers in the fi rst quarter of 2008 under the “BayVision” competence brand. This pooling of material, application, processing and service ex-pertise is central to integrating development activities in areas that are important for growing the business.
Research and development work in the Thermoplastic Polyurethanes business unit is concerned mainly with high-performance thermoplastic polyurethane resin granules and fi lm products, such as solar-module fi lms with very high transparency and uv stability.
The New Business section of MaterialScience constantly tracks and evaluates new technological and market trends, channeling the most promising ideas into research and development projects in order to create profi table business opportunities for the future or expand existing technology platforms. Early 2008 saw the inauguration of the Center for Catalysis Research (cat) at rwth Aachen University, Aachen, Germany, as part of a new technology initiative. The center will de-velop novel catalytic processes for MaterialScience.
Bayer Technology Services
All Bayer subgroups work closely with Bayer Technology Services worldwide on technology solu-tions, particularly in the fi elds of process technology, plant engineering, automation and product development. For example, this service company cooperates with MaterialScience in the devel-opment of new production processes that make effi cient use of energy and raw materials, thereby helping the subgroup to maintain and expand its technological and cost leadership. Centralized development work on technologies relevant to more than one subgroup, such as nanotechnology and biotechnology, along with mathematical simulation and data mining expertise, helps Health-Care and CropScience to shorten development times for new products. International sourcing of know-how plays a key strategic role in this respect. It involves country-specifi c expertise in the implementation of capital expenditure projects, global access to innovations and public funding, and the recruiting of top international personnel.
Bayer Innovation
Bayer Innovation investigates and evaluates innovative areas related to the subgroups’ current core activities and develops them into viable new businesses for the Bayer Group.
An example is the manufacture of plant-made pharmaceuticals (pmp). In 2008 a pilot facility was inaugurated to produce clinical trial samples of a vaccine for the therapy of non-Hodgkin’s lym-phoma. Bayer Innovation also has activities in the fi eld of medical technology, with novel con-cepts under development including dressings made from biodegradable silica gel fi bers for the treatment of chronic wounds. The full potential of these technologies is being evaluated in close cooperation with the Bayer subgroups and external partners.
97TABLE OF CONTENTS MANAGEMENT REPORT MANAGEMENT REPORTEmployees
Triple-i: Inspiration, Ideas, Innovation
The innovation campaign entitled “Triple-i: Inspiration, Ideas, Innovation” is motivating Bayer employees worldwide to submit ideas for possible new products and thereby help to strengthen the company’s innovative capability. More than 7,000 suggestions were submitted by February 2009, and many of them have been or continue to be evaluated by our subgroups. Some ideas have already been successfully commercialized, such as the use of polycarbonate in special boatbuilding applications.
EmployeesOn December 31, 2008, the Bayer Group had 108,600 employees worldwide, compared with 106,200 at the end of 2007. The net increase of 2,400 was mainly the result of our acquisitions and the expansion of our organization in the bric countries (Brazil, Russia, India and China) and other growth markets. These factors were partly offset by decreases in headcount such as that resulting from the integration of Schering, Berlin, Germany. In Germany we had 37,400 employ-ees, who made up 34.4% of the Group workforce.
On the reporting date we employed 53,100 people at HealthCare (2007: 51,500). Included here for the fi rst time are 300 employees who joined the subgroup following the acquisition of Possis Medical, Inc. in the United States, 600 employees of the acquired company Topsun in the Asia / Pacifi c region, and the 600 employees of Sagmel in Europe. CropScience had 18,300 employees as of December 31, 2008 (2007: 17,800) and MaterialScience 15,100 (2007: 15,400). In addition, 22,100 (2007: 21,500) Bayer Group employees work for the service companies or the holding company. Personnel expenses declined in 2008 by 1.1% to €7,491 million (2007: €7,571 million).
Employee Data Dec. 31,2007
Dec. 31,2008
FTE FTE
Employees by region
Europe 56,200 55,500
North America 16,800 17,000
Asia / Pacifi c 18,900 20,800
Latin America / Africa / Middle East 14,300 15,300
Employees by corporate function
Production 48,800 49,100
Marketing 36,900 38,000
Research and development 11,600 12,300
General administration 8,900 9,200
Total 106,200 108,600
of which trainees 2,700 2,900
Training costs in percent of personnel expenses 2.0 2.7
Percentage of women in Bayer Group senior management 4.3 4.7
Number of nationalities in Bayer Group senior management 16 23
The total number of employees with permanent or temporary contracts is reported in full-time equivalents, with part-time employees included in proportion to their contractual working hours. We believe this presentation improves the comparability of personnel expenses and employee numbers.

98 / / BAYER ANNUAL REPORT 2008 TABLE OF CONTENTS MANAGEMENT REPORT
The Bayer Group’s economic success is crucially dependent on a high level of commitment by all employees. It is therefore important to enhance employee skills and performance through con-tinuing education, global personnel development programs and a healthy work environment. Flexible worktime models enable our employees to better harmonize professional and personal interests. We have also initiated actions and projects in many countries to counter the effects of demographic change at an early stage and fi nd tailored solutions for our company.
Our human resources policy is based on the conviction that commercial success and social re-sponsibility are mutually dependent. That’s why we offer our employees not only diverse career challenges and development opportunities, competitive performance-based compensation and numerous additional benefi ts, but also a high level of social security. All of our employees world-wide either have statutory health insurance or can obtain it through the company. 80% of our workforce also has access to corporate pension insurance. The working conditions for nearly 60% of our global workforce are set forth in collective or company agreements. For many years we have safeguarded jobs in Germany through a series of agreements with the employee repre-sentatives that rule out dismissals for operational reasons. The current agreement runs until the end of 2009.
EMPLOYEE PARTICIPATION
The participation of our employees in the company’s success has traditionally been a key element of our human resources policy. €475 million is earmarked for short-term incentive (sti) awards for 2008 that are to be paid out to our employees in 2009 under our Group-wide sti program. The Group Management Board decided last year to fundamentally reorganize the globally uni-form sti system for managerial employees. The aim of the changes, which will take effect for the 2009 fi scal year, is to make the sti system even more transparent for its approximately 18,000 participants and provide greater rewards for personal performance than in the past.
In 2008 we continued the international introduction of the redesigned “BayShare” stock pro-gram launched in 2007, thus stepping up our commitment to this area of compensation policy. The program, already in force in Portugal, Spain, Italy and the Netherlands, was also introduced in Finland and Belgium, enabling employees in these countries to acquire Bayer shares at a dis-counted price. In addition, we offer local programs in many other countries so that employees there may acquire Bayer shares on special terms in order to benefi t further from the company’s success. Since 2005 we have offered senior and middle managers throughout the Group uniform, widely acclaimed stock-based compensation programs known as Aspire i and ii (see note [26.6] to the consolidated fi nancial statements).
VOCATIONAL TRAINING AND PROGRAMS FOR YOUNG EMPLOYEES
The vocational training of young people is not only part of our social responsibility as a major employer, it is also a sustainable investment in the company’s future. Thus in 2008 we again con-tinued our intensive global effort to train or recruit future specialists and managerial employees. In countries with dual training programs we offer places on such programs. At our German sites alone, more than 900 young people embarked on our vocational training programs in 2008 to prepare for a career. In Mexico more than 80 youngsters entered our dual training programs, in Argentina about 30 and in China more than 20.
In November 2008, Bayer celebrated the 20th anniversary of its program to assist and train disad-vantaged youngsters, once again receiving praise for this contribution from numerous represen-tatives of politics and industry. Last year, this groundbreaking initiative implemented at fi ve sites in Germany prepared 149 young people with educational defi cits for a formal vocational training program.
As an inventor company, we rely to a great extent on the ideas and potential of managerial staff with an academic background. In Germany, for example, this again prompted us to hire some 300 university graduates in various disciplines during 2008. The number of employees with various academic qualifi cations joining the company during the same period was over 1,000 in the United States, more than 800 in China, some 400 in Brazil, about 300 in Mexico and nearly 100 in Japan.
Employee participation
€475 million

99TABLE OF CONTENTS MANAGEMENT REPORT MANAGEMENT REPORTEmployees
REALIGNING THE HUMAN RESOURCES FUNCTION
Since 2006 Bayer has been realigning its human resources function by way of the Group-wide “Transforming Human Resources” project. The goal is to increase the contribution of the human resources function to the success of the business and enhance the quality and effi ciency of global human resources processes through an innovative operating model. We recorded major progress in this respect during 2008, with the continuing introduction of the new hr operating model in fi ve South American countries, the United Kingdom and at fi ve German affi liates. In January 2009, Bayer Schering Pharma AG also aligned its human resources activities to the new structures. This marks the conclusion of the project in Germany. By 2008, fi ve central human resources processes had already been successfully implemented within the new structures and according to uniform rules and processes in more than 70 countries and over 160 Group compa-nies.

100 / / BAYER ANNUAL REPORT 2008
Sustainable DevelopmentSustainable development is a key component of the Bayer Mission Statement and of our Values and Leadership Principles. Our commitment in this area is clearly defi ned in our Sustainable Development Policy and established within the Group by means of our corporate directives and policy statements. Various voluntary commitments, such as our signing of the Responsible Care Global Charter and our membership of the United Nations Global Compact, underscore our atti-tude to sustainability. Our existing committees for sustainable development and for health, safety and environmental issues continued their work in the reporting period. In 2008 we adopted an extended strategy for sustainability in procurement that we are implementing on a step-by-step basis starting in 2009. In 2008 we continued to implement both the Group-wide position on human rights developed in the prior year and the Bayer Climate Program, which is based on our new policy on climate change.
Both our corporate growth and our sustainability efforts are driven by our innovative capability. Bayer seeks innovative answers to global challenges such as climate change and the need to improve health care and food supplies. We are also addressing the challenges presented by the new agricultural economy. Here our aim is to help safeguard harvests and raise crop yields by deploying the latest crop protection methods and new solutions in the areas of plant biotechnolo-gy and breeding. Biotechnology and nanotechnology hold tremendous potential for signifi cant new products and applications for health care, nutrition and environmental protection. Bayer has evolved corporate positions on the responsible use of these technologies of the future.
Innovation, product stewardship, excellence in corporate management, social responsibility and responsibility for the environment are the fi elds of activity covered in our Sustainable Develop-ment Program 2006+ (“Our goals for 2010”). This program – a yardstick for our sustainability performance management – incorporates the goals of all the subgroups and service companies. The respective management and executive boards are responsible for successfully implementing these goals.
Bayer has voluntarily pledged to observe the Greenhouse Gas (ghg) Protocol in its emissions reporting. Our direct greenhouse gas emissions declined in 2008, largely due to process tech-nology improvements in connection with our climate program. Both direct and indirect emis-sions fell as a result of a lower total production volume at MaterialScience.
The fi gure originally stated in the 2007 Annual Report for direct greenhouse gas emissions in 2007 has been adjusted from 3.9 to 4.4 million metric tons of co2 equivalents because a nitric acid facility was newly included in the Bayer Group emissions statistics to comply with the guidelines of the ghg Protocol. This plant is operated by a third party but owned by Material Science. The fact that MaterialScience exerted operational infl uence at the facility by investing in emissions reduction measures, thereby modifying the process, obligates Bayer under the ghg Protocol to include this plant in its greenhouse gas emissions statistics.
Nearly all other key performance indicators held steady or further improved in 2008. The indus-trial injury rate fell once again, as did emissions of phosphorus, nitrogen and organic carbon. Use of resources remained constant, with energy use even declining. There was a considerable increase in reportable environmental incidents in 2008. Of particular importance to us is not just the absolute number – which remained relatively steady compared to the fi ve-year average – but also the various reasons for, and effects of, the individual incidents. We are therefore analyzing and evaluating each incident in order to take the necessary action. There was an increase in the emission of volatile organic compounds due to a rise in production at one of our sites in Asia.
TABLE OF CONTENTS MANAGEMENT REPORT

MANAGEMENT REPORTSustainable Development
101
The key performance indicators for the “Employees and Society” area can be found in the pre-ceding “Employees” chapter (see page 97). Our Sustainable Development Report, which is issued annually, is based largely on Version g3 of the Global Reporting Initiative (gri) for sustainability reporting. The 2007 report covers all required indicators in full (Level a+, gri-checked). Bayer’s Sustainable Development Report for 2008 is scheduled to appear at the end of May 2009.
Evaluating both benefi ts and possible risks is a key element in Bayer’s product development. We examine all Bayer products in applications known to us and monitor them with regard to possi-ble health, safety, environment or quality risks, taking into account the entire value chain. In 2008 we updated both our directive on economical warehousing and the related instruction manual.
We are committed to product stewardship and also support the objectives of the e.u. chemicals policy (reach), which are to ensure the safety of everyone who comes into contact with chemical products throughout their life cycles and to further improve consumer safety and environmental protection. To ensure the implementation of this policy throughout the Bayer Group, the Board of Management issued an internal directive in 2007 entitled “reach Implementation.” The fi rst step in implementing the reach regulation – the pre-registration of all substances we manufacture in the e.u. or import from elsewhere – was successfully completed in 2008.
We also endorse the goals of the action plans of the e.u. and who Europe for improving health and the environment, which focus particularly on children’s health. It is essential here to look at all factors infl uencing children’s health and focus on relevant health problems. Decision-making must continue to be based on the scientifi c assessment of risk, which is increasingly based on human biomonitoring. We support scientifi cally sound human biomonitoring programs and have established a Group-wide position on this topic.
It is important to us that we participate in shaping external conditions. Bayer is keenly involved in the discussion surrounding environmental and consumer protection strategies and regula-tions at both the national and international levels.
TABLE OF CONTENTS MANAGEMENT REPORT
Key Performance Indicators
Category Key Performance IndicatorKey-Performance-Indikatoren 2007 2008
Health and Safety Industrial injuries to Bayer employees resulting
in at least one day’s absence
(number of injuries per million hours worked)
2.4 2.2
Reportable industrial injuries to Bayer employees (number of injuries per million hours worked)
3.7 3.6
Major environmental incidents 3 7
Transportation incidents 10 10
Emissions Direct greenhouse gas emissions(CO2 equivalents in million metric tons)*
4.4 4.0
Indirect greenhouse gas emissions(CO2 equivalents in million metric tons)*
3.7 3.5
Volatile organic compounds(thousand metric tons / year)
2.9 3.2
Total phosphorus in waste water(thousand metric tons / year)
1.0 0.8
Total nitrogen in waste water(thousand metric tons / year)
0.7 0.7
Total organic carbon(thousand metric tons / year)
1.8 1.6
Waste Hazardous waste generated (million metric tons / year) 0.3 0.4
Hazardous waste landfi lled (million metric tons / year) 0.1 0.1
Use of resources Water use (million m3 / day) 1.2 1.2
Energy use (petajoules [1015 joules]) / year) 91.7 88.5
2007 fi gures restated* as per Greenhouse Gas Protocol

102 / / BAYER ANNUAL REPORT 2008
WORKING FOR CLIMATE PROTECTION
Bayer is permanently committed to addressing the major global challenge presented by climate change. In 2007 we launched the integrated Group-wide Bayer Climate Program, based on our new policy on climate change.
Bayer has set itself ambitious emission targets for the period from 2005 through 2020. The MaterialScience subgroup aims to lower its global specifi c greenhouse gas emissions per ton of products sold by 25%. CropScience plans to reduce absolute emissions worldwide by 15% and HealthCare by 5%. We currently expect that the Group’s emissions will remain at the present level through 2020 despite increased production.
Initiated by the Group Management Board, the program comprises a package of measures to be implemented over a period of several years. Bayer has launched and is pressing ahead with groundbreaking projects such as the global “EcoCommercial Building” concept for zero-emis-sions offi ce and industrial buildings, the development of stress-tolerant plants and the “Bayer Climate Check” for production processes.
Supporting initiatives play a signifi cant role – including a new car policy, increased use of new telecommunications technologies, and the Bayer Climate Fellows program for dedicated school students.
Details on the Bayer Climate Program can be found in our brochures “Climate Change – We help with solutions” and “The Bayer Climate Program.”
Bayer participates in the international dialogue through its membership of the business leader-ship initiative “3c: Combat Climate Change” and the Climate Change Dialogue of the World Economic Forum in Davos, Switzerland. The company has also joined the voluntary “Caring for Climate” initiative for u.n. Global Compact participants.
SUSTAINABLE INVESTMENT
For many years Bayer stock has been included in numerous indices and investment funds that fo-cus on companies with sustainable and responsible corporate policies.
Bayer has appeared continuously in the Dow Jones Sustainability Index World (djsi World) since it was established in 1999. Our stock is also listed continuously in the benchmark series of the ftse4Good indices, which has been published annually by the Financial Times and the London Stock Exchange since 2001. In 2007, we were additionally included in the newly established ftse4Good Environmental Leaders Europe 40 Index, which lists European companies with optimal environmental management. The analysts of the Storebrand Principle Fund rated Bayer among the top companies in its peer group in their most recent evaluation in 2007, awarding it the ranking “Best in Class – Environmental and Social Performance.” In addition, our shares have been listed in the French “Advanced Sustainable Performance Indices” (aspi) Eurozone Index since 2001. In 2008 the Carbon Disclosure Project (cdp), an investors’ organization, again listed Bayer in the Carbon Disclosure Leadership Index – the fi rst global climate protection index – as one of the world’s leading companies in the area of climate protection. Bayer is the only European chemical and pharmaceutical company to have been listed in this index four times in succession.
For more detailed information on sustainability, please refer to our Sustainable Development Report.
TABLE OF CONTENTS MANAGEMENT REPORT
INTERNET
For more information on the Bayer Climate Program, go towww.climate.bayer.com
INTERNET
For more information on sustainability, go to www.sustainability2007.bayer.com
103MANAGEMENT REPORTCorporate Social
Responsibility
Corporate Social Responsibility The principle of corporate social responsibility (csr) is fi rmly embedded in Bayer’s philosophy and strategy as a business enterprise. The company considers itself part of society and therefore obligated to behave as a responsible corporate citizen. Bayer’s csr commitment is exemplifi ed by numerous projects that the company organizes or supports in many parts of the world, some of which have been running for years. In 2008 the Bayer Group provided funding of nearly €50 mil-lion for these activities, focusing on the areas of education and research, environment and nature, health and social needs, and sports and culture. We continuously adapt the scope of our projects and / or extend them to additional countries.
EDUCATION AND RESEARCH
Bayer traditionally places great importance on support for education and research, which are es-sential to the future viability of society. A company such as ours depends on recruiting people with a very high level of scientifi c skills.
In 2008 the Bayer Science & Education Foundation provided fi nancial support for outstanding scientists, high-achieving university students and dedicated school students. It also sponsored innovative teaching programs in schools. The €50,000 Otto Bayer Award for 2008 went to Professor Thomas Carell of the Institute for Chemistry and Pharmacy at Ludwig Maximilian Uni-versity in Munich, Germany, for his work in the fi eld of dna repair. As part of the Bayer Climate Program, the foundation presented the Bayer Climate Award, also in the amount of €50,000, for the fi rst time in 2008. The honor went to Emeritus Professor Eberhard Jochem of the Fraunhofer Institute for Systems and Innovation Research in Karlsruhe for his groundbreaking contributions to the improvement of energy effi ciency, which is essential for reducing greenhouse gas emissions. The Bayer Climate Award is one of the fi rst international prizes to be awarded by a company for fundamental research in climate science.
Bayer provided nearly €140,000 to sponsor 23 gifted and ambitious students in the fi elds of natu-ral sciences and medicine. The foundation also provided roughly €500,000 in funding for 47 school programs in communities near our sites to help improve the conditions in which science is taught. Again in the context of the Bayer Climate Program, the foundation in 2008 awarded its fi rst scholarships for school students participating in international sustainability seminars. Den-mark joined the list of countries participating in Bayer’s educational program “Making Science Make Sense,” which means schoolchildren in 11 countries are now benefi ting from the commit-ment of Bayer employees who visit schools to demonstrate the fascination and benefi ts of science with the aid of hands-on experiments.
ENVIRONMENT AND NATURE
Protecting the environment and nature has long been of major importance to Bayer. As a company with international production operations, Bayer believes the judicious use of natural resources is a major part of its social responsibility along with environmental protection and nature conservation.
In 2008 Bayer and the United Nations Environment Programme (unep) again organized around a dozen environmental projects for young people and children within the scope of their global environmental education partnership. The centerpiece of these joint activities was an auction in New York City featuring selected pictures on the subject of climate change that were entered for the International Children’s Painting Competition organized each year by the two partners. More than 15,000 children from 90 countries took part in the 2008 competition. The proceeds from the sale of the paintings were donated to a newly established aid fund administered by unicef for children in a position of need following climate-related disasters. Bayer also assisted unep in organizing the international children’s environmental conference and regional youth environ-mental conferences.
TABLE OF CONTENTS MANAGEMENT REPORT

104 / / BAYER ANNUAL REPORT 2008
The Young Environmental Envoy program launched by Bayer in Thailand in 1998 last year cele-brated the 10th anniversary of its founding. This time young environmental activists from a total of 18 countries in Asia, Latin America, eastern Europe and Africa participated in the week-long study trip to Germany. Nearly 1,000 young photographers from Poland, Hungary, the Czech Re-public and Slovakia participated in the 2008 “Ecology in Focus” competition, which centered on the issue of how to tackle climate change.
HEALTH AND SOCIAL NEEDS
Bayer demonstrates an active commitment to improving social conditions and health services in many regions of the world with the dual aim of promoting social stability in the communities near its sites and helping to solve global health challenges.
As part of this commitment, the Bayer Cares Foundation supported 21 charitable projects in the environs of our sites with total funding of nearly €90,000. In this way the foundation rewarded employee and citizen volunteerism as a central feature of an active community.
The second permanent area of activity for the Bayer Cares Foundation is providing rapid emer-gency aid in situations such as natural disasters and assisting with sustainable reconstruction projects. For example, Bayer provided immediate relief to earthquake victims in Sichuan, China, in the form of medicines, equipment and fi nancial aid to which our employees also contributed. The foundation also supported long-term reconstruction efforts, resulting in total assistance from Bayer worth more than €2.2 million. The Bayer Cares Foundation, in cooperation with the Red Cross, provided 20 modern container classrooms, 50 homes and a mobile clinic, using Bayer’s technical expertise, for a college complex with more than 7,000 students in the particularly hard-hit city of Dujiangyan.
In the area of health care, Bayer launched a new collaboration with the u.s. Agency for Interna-tional Development (usaid). The company will provide usaid with up to 110 million cycles of oral contraceptives annually for family planning programs in developing countries throughout the world at signifi cantly reduced prices. These efforts will give more than eight million women each year access to modern, reliable hormonal contraception.
CULTURE AND SPORTS
Bayer has served as a patron of the arts for more than a century. The extensive program of events organized by Bayer’s Cultural Affairs Department and our support for a range of clubs and societies make a signifi cant contribution to cultural life and enhance the attractiveness of our corporate locations.
Bayer has also sponsored sports for over 100 years. Here we focus particularly on the promotion of sports for the disabled as well, mainly through our support for club activities. Among the highlights of 2008 were the 13th Paralympics in Beijing, China, at which the 13 participating disabled athletes from Bayer took home eight medals.
As well as sponsoring disabled athletes as part of our csr activities, we again supported top-class sports in 2008, with a total of 21 Bayer club members taking part in the 29th Olympic Sum-mer Games in Beijing. As at the Paralympics, the Olympic competitors from tsv Bayer 04 Leverkusen made up the world’s largest club contingent.
TABLE OF CONTENTS MANAGEMENT REPORT
INTERNET
For more information on Bayer’s social commitment, go towww.csr.bayer.com
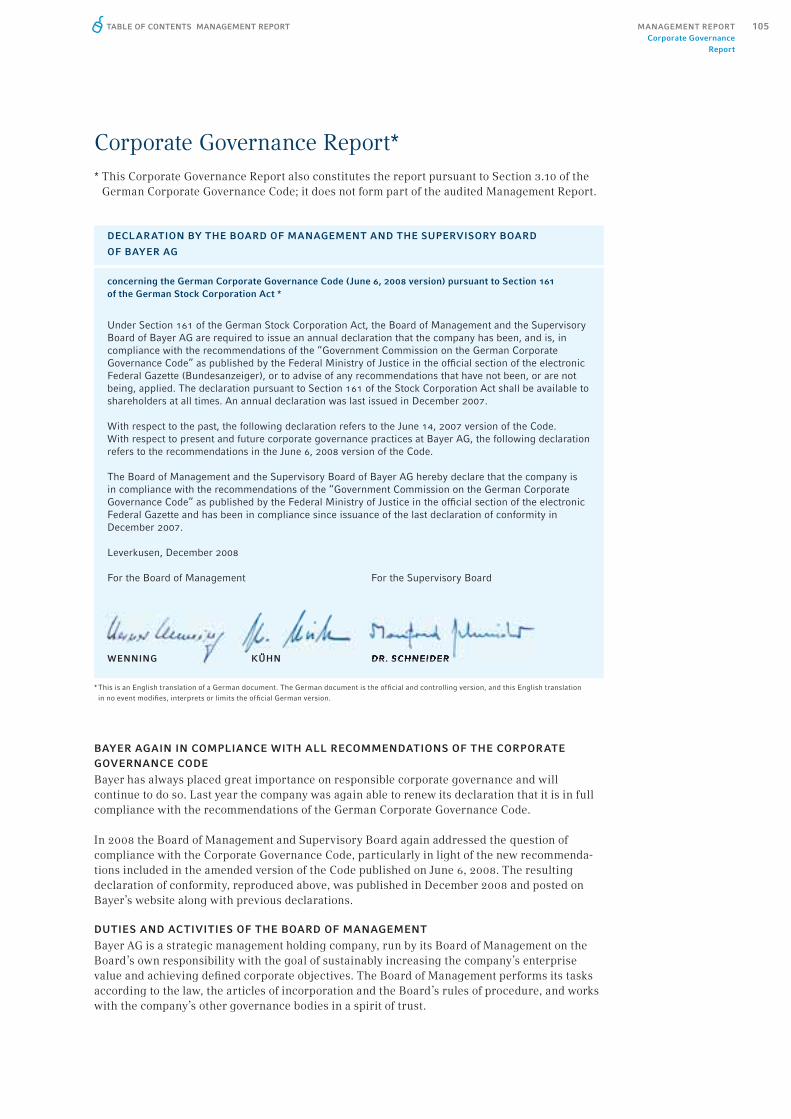
105MANAGEMENT REPORTCorporate Governance
Report
Corporate Governance Report** This Corporate Governance Report also constitutes the report pursuant to Section 3.10 of the
German Corporate Governance Code; it does not form part of the audited Management Report.
DECLARATION BY THE BOARD OF MANAGEMENT AND THE SUPERVISORY BOARD
OF BAYER AG
concerning the German Corporate Governance Code (June 6, 2008 version) pursuant to Section 161 of the German Stock Corporation Act *
Under Section 161 of the German Stock Corporation Act, the Board of Management and the Supervisory Board of Bayer AG are required to issue an annual declaration that the company has been, and is, in compliance with the recommendations of the “Government Commission on the German Corporate Governance Code” as published by the Federal Ministry of Justice in the offi cial section of the electronic Federal Gazette (Bundesanzeiger), or to advise of any recommendations that have not been, or are not being, applied. The declaration pursuant to Section 161 of the Stock Corporation Act shall be available to shareholders at all times. An annual declaration was last issued in December 2007.
With respect to the past, the following declaration refers to the June 14, 2007 version of the Code. With respect to present and future corporate governance practices at Bayer AG, the following declaration refers to the recommendations in the June 6, 2008 version of the Code.
The Board of Management and the Supervisory Board of Bayer AG hereby declare that the company is in compliance with the recommendations of the “Government Commission on the German Corporate Governance Code” as published by the Federal Ministry of Justice in the offi cial section of the electronic Federal Gazette and has been in compliance since issuance of the last declaration of conformity in December 2007.
Leverkusen, December 2008
For the Board of Management For the Supervisory Board
WENNING KÜHN DR. SCHNEIDER
* This is an English translation of a German document. The German document is the offi cial and controlling version, and this English translation in no event modifi es, interprets or limits the offi cial German version.
BAYER AGAIN IN COMPLIANCE WITH ALL RECOMMENDATIONS OF THE CORPORATE GOVERNANCE CODE
Bayer has always placed great importance on responsible corporate governance and will continue to do so. Last year the company was again able to renew its declaration that it is in full compliance with the recommendations of the German Corporate Governance Code.
In 2008 the Board of Management and Supervisory Board again addressed the question of compliance with the Corporate Governance Code, particularly in light of the new recommenda-tions included in the amended version of the Code published on June 6, 2008. The resulting declaration of conformity, reproduced above, was published in December 2008 and posted on Bayer’s website along with previous declarations.
DUTIES AND ACTIVITIES OF THE BOARD OF MANAGEMENT
Bayer AG is a strategic management holding company, run by its Board of Management on the Board’s own responsibility with the goal of sustainably increasing the company’s enterprise value and achieving defi ned corporate objectives. The Board of Management performs its tasks according to the law, the articles of incorporation and the Board’s rules of procedure, and works with the company’s other governance bodies in a spirit of trust.
TABLE OF CONTENTS MANAGEMENT REPORT
106 / / BAYER ANNUAL REPORT 2008
The Board of Management defi nes the long-term goals and the strategies for the Group, its sub-groups and its service companies, and sets forth the principles and directives for the resulting corporate policies. It coordinates and monitors the most important activities, defi nes the portfolio, develops and deploys managerial staff, allocates resources and decides on the Group’s fi nancial steering and reporting.
The members of the Board of Management bear joint responsibility for running the business as a whole. However, the individual members manage the areas assigned to them on their own responsibility within the framework of the decisions made by the entire Board. The allocation of duties among the four members of the Board of Management is defi ned in a written schedule.
The entire Board of Management makes decisions on all matters of fundamental importance and in cases where a decision of the entire Board is prescribed by law or otherwise mandatory. The rules of procedure of the Board of Management contain a list of topics that must be dealt with and resolved by the entire Board.
Meetings of the Board of Management are held regularly. They are convened by the Chairman of the Board of Management. Any member of the Board of Management may also demand that a meeting be held. The Board of Management makes decisions by a simple majority of the votes cast, except where unanimity is required by law. In the event of a tie vote, the Chairman has the deciding vote.
According to the Board of Management’s rules of procedure and schedule of duties, the Chair-man bears particular responsibility for leading and coordinating the Board’s work. He repre-sents the company and the Group in dealings with third parties and the workforce on matters relating to more than one part of the company or the Group. He also bears special responsibility for certain departments of the Corporate Center and their fi elds of activity.
The schedule of duties also assigns particular areas of specialist responsibility to the other three members of the Board of Management, who are respectively responsible for Strategy and Human Resources; Finance; and Innovation, Technology and Environment. Each of these members also represents certain geographical regions.
No committees of the Board of Management have been set up in view of the small number of members and the role of Bayer AG as a strategic management holding company.
SUPERVISORY BOARD: OVERSIGHT AND CONTROL FUNCTIONS
The role of the 20-member Supervisory Board is to oversee and advise the Board of Manage-ment. Under the German Codetermination Act, half the members of the Supervisory Board are elected by the stockholders, and half by the company’s employees. The Supervisory Board is directly involved in decisions on matters of fundamental importance to the company, regularly conferring with the Board of Management on the company’s strategic alignment and the imple-mentation status of the business strategy.
The Chairman of the Supervisory Board coordinates its work and presides over the meetings. Through regular discussions with the Board of Management, the Supervisory Board is kept constantly informed of business policy, corporate planning and strategy. The Supervisory Board approves the annual budget and fi nancial framework. It also approves the fi nancial statements of Bayer AG and the consolidated fi nancial statements of the Bayer Group, taking into account the reports by the auditor.
TABLE OF CONTENTS MANAGEMENT REPORT

107MANAGEMENT REPORTCorporate Governance
Report
COMMITTEES OF THE SUPERVISORY BOARD
The Supervisory Board currently has the following committees:
Presidial Committee: This comprises two stockholder representatives and two employee repre-sentatives. The Presidial Committee serves primarily as the mediation committee pursuant to the German Codetermination Act. It has the task of submitting proposals to the Supervisory Board on the appointment of members of the Board of Management if the necessary two-thirds majority is not achieved in the fi rst vote at a plenary meeting. Certain decision-making powers relating to capital measures have also been delegated to this committee.
Audit Committee: The Audit Committee, comprising three stockholder representatives and three employee representatives, meets regularly four times a year. Its tasks include examining the company’s fi nancial reporting along with the fi nancial statements of Bayer AG, the consoli-dated fi nancial statements of the Bayer Group and the management reports of Bayer AG and the Bayer Group, all of which are prepared by the Board of Management. It also examines the pro-posal for distribution of the balance sheet profi t of Bayer AG and the interim fi nancial statements and management reports of the Bayer Group. On the basis of the auditor’s report on the audit of the fi nancial statements of Bayer AG, the consolidated fi nancial statements of the Bayer Group and the management reports of Bayer AG and the Bayer Group, the Audit Committee develops proposals concerning the approval of the statements by the full Supervisory Board. The Audit Committee is also responsible for the company’s relationship with the external auditor. The Audit Committee prepares the awarding of the audit contract to the audit fi rm appointed by the Annual Stockholders’ Meeting, suggests areas of focus for the audit and determines the auditor’s remuneration. It also monitors the independence, qualifi cations, rotation and effi ciency of the auditor.
In addition, the Audit Committee oversees the company’s internal control system along with the procedures used to identify, track and manage risk. It also bears responsibility for corporate compliance issues and discusses developments in this area at each of its meetings. The internal Corporate Auditing department reports regularly to the Audit Committee.
Human Resources Committee: On this committee, too, there is parity of representation between stockholders and employees. It consists of the Chairman of the Supervisory Board, one other stockholder representative and two employee representatives. The Human Resources Committee prepares the personnel decisions of the full Supervisory Board, which resolves on appointments or dismissals of members of the Board of Management. The Human Resources Committee re-solves on behalf of the Supervisory Board on the service contracts of the members of the Board of Management. However, in accordance with a recommendation of the Corporate Governance Code issued in 2008, the compensation system for the Board of Management and the principal provisions of their contracts are the responsibility of the full Supervisory Board. The Human Re-sources Committee also discusses the long-term succession planning for the Board of Manage-ment.
Nominations Committee: This committee carries out preparatory work when an election of stockholder representatives to the Supervisory Board is to be held. It suggests suitable candi-dates for the Supervisory Board to propose to the Annual Stockholders’ Meeting for election. The Nominations Committee comprises the Chairman of the Supervisory Board and the other stock-holder representative on the Presidial Committee.
Detailed information on the work of the Supervisory Board and its committees is provided in the Report of the Supervisory Board on page 10ff. of this Annual Report.
INFORMATION ON THE REMUNERATION OF THE BOARD OF MANAGEMENT AND THE SUPERVISORY BOARD (COMPENSATION REPORT)
To avoid dual presentation of the data, this Corporate Governance Report explicitly adopts, and makes reference to, the information given in the Compensation Report on page 111ff. This also applies to the description of the stock-based compensation for the Board of Management (see page 111ff.) and employees (see Note [26.6] to the consolidated fi nancial statements).
TABLE OF CONTENTS MANAGEMENT REPORT

108 / / BAYER ANNUAL REPORT 2008
PERSONAL LIABILITY IN PLACE OF A DEDUCTIBLE
The company meets the recommendation in the German Corporate Governance Code regarding deductibles for any Directors’ & Offi cers’ (d&o) liability insurance by obtaining personal declara-tions from each member of the Board of Management and Supervisory Board to the effect that, should they cause damage to the company or third parties through gross negligence (as defi ned by German law) in the performance of their duties, they undertake to pay for such damage up to the equivalent of half their total annual remuneration for the year in which such damage occurs. The members of the Supervisory Board undertake to pay for such damage, if caused by them, up to the equivalent of the variable portion of their respective annual remuneration as Supervisory Board members for the relevant year. There is no insurance coverage for intentional breach of duty.
DISCLOSURE OF SECURITIES TRANSACTIONS BY MEMBERS OF THE SUPERVISORY BOARD AND BOARD OF MANAGEMENT
To comply with Section 15 a of the German Securities Trading Act, members of the Board of Management and Supervisory Board and their close relatives are required to disclose all trans-actions involving the purchase or sale of Bayer stock where such transactions total €5,000 or more in a calendar year. Bayer publishes details of such transactions immediately on its website and also notifi es the German Financial Supervisory Authority accordingly. This information is provided to the company register for archiving.
The following transactions were reported to Bayer AG in 2008:
Information fi led with the company by members of the Board of Management and Supervisory Board shows that, on the closing date for the fi nancial statements, their total holdings of Bayer AG stock or related fi nancial instruments were equivalent to less than 1% of the issued stock.
SYSTEMATIC MONITORING OF ALL BUSINESS ACTIVITIES
Bayer has a control system in place enabling it to identify any business or fi nancial risks at an early stage and take appropriate action to manage them. This control system is designed to en-sure timely and accurate accounting for all business processes and the constant availability of reliable data on the company’s fi nancial position.
When acquisitions are made, we aim to bring the acquired units’ internal control systems into line with those of the Bayer Group as quickly as possible.
However, the control and risk management system cannot provide absolute protection against losses arising from business risks or fraudulent actions.
CORPORATE COMPLIANCE
Our corporate activity is governed by national and local laws and statutes that place a range of obligations on the Bayer Group and its employees throughout the world. Bayer manages its busi-ness responsibly in compliance with the statutory and regulatory requirements of the countries in which it operates.
TABLE OF CONTENTS MANAGEMENT REPORT
Willy Beumann, Supervisory Board
Date / PlaceSecurity / Right ISIN Transaction
Price / Currency Quantity
Total transaction volume
May 13, 2008 / Xetra Shares DE0005752000 Purchase €55.72 261 €14,542.92
Dec. 22, 2008 / Over-the-counter Shares DE0005752000 Purchase €39.20 68 €2,665.60

109MANAGEMENT REPORTCorporate Governance
Report
The Board of Management has also issued internal directives to achieve this goal. These are summarized in the Corporate Compliance Policy – the revised version of the former Corporate Compliance Program – which contains binding rules for fair competition, integrity in business dealings and adherence to the principle of sustainable development.
To avoid confl icts of interest, every employee is required to separate corporate and private interests. The Corporate Compliance Policy also lays down clear rules for the establishment of fair and respectful working conditions and the responsible handling of insider information.
Compliance Committees have been established for Bayer AG, the HealthCare, CropScience and MaterialScience subgroups and the service companies Bayer Business Services, Bayer Technolo-gy Services and Currenta.
The role of these committees is to initiate systematic, business-specifi c training programs and oversee their implementation in line with the Corporate Compliance Policy. They are also responsible for investigating any suspected violations of the Corporate Compliance Policy and, if necessary, taking remedial action. All Compliance Committees report at least once a year to a coordination committee chaired by the Chief Financial Offi cer. The Group Compliance Offi cer and the Head of Corporate Auditing regularly report to the Audit Committee of the Supervisory Board on any compliance violations.
All Bayer employees are required to immediately report any violations of the Corporate Compli-ance Policy. Special telephone hotlines have been set up in all countries to allow this to be done anonymously. By far the majority of these hotlines connect callers to specialist law fi rms re-tained by us.
Starting in the fall of 2008, the revised Corporate Compliance Policy was introduced worldwide using the slogan “Compliance w.i.n.s.” (Worldwide Integrity is Necessary for Success).
A global communications campaign was launched to illustrate how compliance contributes to long-term success for the company as a whole and for each employee. The message to employees is: “Compliance makes everyone a winner.”
COMMON VALUES AND LEADERSHIP PRINCIPLES
To supplement the Corporate Compliance Policy, Bayer has drawn up a Group mission statement setting out the principles underlying Bayer’s corporate strategy. It outlines our corporate philosophy and the framework for our business activity to stockholders, customers, employees and the general public. Common values and leadership principles are considered essential for all employees in their daily work. The values include a will to succeed; a passion for our stakehold-ers; integrity, openness and honesty; respect for people and nature; and the sustainability of our actions. The assessment of managers’ performance on the basis of defi ned leadership principles helps to ensure adherence to these values throughout the enterprise.
TABLE OF CONTENTS MANAGEMENT REPORT

110 / / BAYER ANNUAL REPORT 2008
DETAILED REPORTING
To maximize transparency, we provide regular and timely information on the company’s position and signifi cant changes in business activities for stockholders, fi nancial analysts, stockholders’ associations, the media and the general public. Bayer complies with the recommendations of the Corporate Governance Code by publishing reports on business trends, fi nancial position, results of operations and related risks four times a year.
In line with statutory requirements, the members of the company’s Board of Management provide an assurance that, to the best of their knowledge, the annual fi nancial statements and management report of Bayer AG and the consolidated fi nancial statements and management report of the Bayer Group provide a true and fair view.
The annual fi nancial statements of Bayer AG and the consolidated fi nancial statements of the Bayer Group are published within 90 days following the end of each fi scal year. During the fi scal year, stockholders and other interested parties are kept informed about the company’s perfor-mance through the half-year fi nancial report and additional interim reports as of the end of the fi rst and third quarters. The half-year fi nancial report is voluntarily subjected to an audit review by the auditor, whose appointment by the Annual Stockholders’ Meeting also relates specifi cally to this audit review.
Bayer also provides information at news conferences and analysts’ meetings. In addition, the company uses the Internet as a platform for timely disclosure of information, including details of the dates of major publications and events, such as the annual and interim reports or the Annual Stockholders’ Meeting.
In line with the principle of fair disclosure, we provide the same information to all stockholders and other principal target groups. All signifi cant new facts are disclosed immediately to the general public. Stockholders also have immediate access to the information that Bayer publishes locally in compliance with the stock market regulations of various countries.
In addition to our regular reporting, we issue ad-hoc statements on developments that otherwise might not become publicly known but have the potential to materially affect the price of Bayer stock.
TABLE OF CONTENTS MANAGEMENT REPORT

111MANAGEMENT REPORTCompensation Report
Compensation ReportCOMPENSATION OF THE BOARD OF MANAGEMENT
The compensation of the Board of Management basically comprises four components: a fi xed annual salary, a short-term incentive award on a yearly basis in relation to a target amount, a long-term incentive award for a three-year period in relation to a target amount, and a company pension plan conferring pension entitlements that increase with years of service. Remuneration in kind and other benefi ts are also provided, such as the use of a company car for private purposes or reimbursement of the cost of health screening examinations.
The fi xed salary consists of two parts: a base salary and a fi xed supplement.
The short-term incentive award for 2008 is calculated partly according to the Group’s ebitda margin before special items, and partly according to the weighted average target attainment of the HealthCare, CropScience and MaterialScience subgroups. The latter is based mainly on the subgroups’ target attainment measured by ebitda before special items as well as on a qualitative appraisal in relation to the market and competitors. The short-term incentive award for 2007 also contained a one-time special individual performance bonus granted in connection with the structural changes in the Bayer Group.
The directly effected remuneration (non-performance-related remuneration and short-term incentive) of members of the Board of Management in 2008 amounted to €8,813 thousand (2007: €8,883 thousand), comprising €2,105 thousand (2007: €1,986 thousand) in base salaries, €1,042 thousand (2007: €983 thousand) in fi xed supplements and €5,498 thousand (2007: €5,769 thousand) in short-term incentive awards to be paid out in 2009 as well as €168 thousand (2007: €145 thousand) in remuneration in kind and other benefi ts. Remuneration in kind mainly consists of values assigned to remuneration in kind and other benefi ts in accordance with German taxation guidelines.
The members of the Board of Management participate in the long-term stock-based compensa-tion program Aspire i (annual tranches 2005 through 2008). Under this program, awards are paid out provided that the performance of Bayer stock (both in absolute terms and relative to the euro stoxx 50sm benchmark index) meets defi ned criteria over a three-year period. Fur-ther details of this program are provided in Note [26.6] to the consolidated fi nancial statements. The fair value of the stock-based compensation newly granted in 2008 as of its grant date is in-cluded in the calculation of total remuneration (see table below), although the award entitlement was only partially earned as of the balance sheet date.
TABLE OF CONTENTS MANAGEMENT REPORT

112 / / BAYER ANNUAL REPORT 2008
The following table shows the remuneration components of the individual members of the Board of Management in 2008.
The award entitlements earned in 2008 – both from the 2008 tranche and from previous years’ tranches on which the entitlements were only partially earned – are shown separately in the following table along with the changes in the value of entitlements from previous years’ tranches based on the performance of Bayer stock in 2008. The fair value of the award entitlement already earned in 2008 from the 2008 tranche is included under “Stock-based compensation entitle-ments earned in the respective year.” Since certain components of the award entitlements are included in both tables, the fi gures in the following and the preceding table should not be added together.
The current members of the Board of Management are generally entitled to receive a pension from the age of 60 in an annual amount equal to at least 30% of the last yearly fi xed salary. No such pensions are currently being paid. This percentage increases depending on years of service as a Board of Management member and, according to the inception of the respective service contract, is capped between 60 and 80%. We refer to the maximum such percentage a member of the Board of Management can reach as his fi nal target pension level. Pension provisions for the current members of the Board of Management amounted to €28,726 thousand (2007: €25,810 thousand).
TABLE OF CONTENTS MANAGEMENT REPORT
Werner Wenning
Klaus Kühn
Wolfgang Plischke
Richard Pott Total
€ thousand € thousand € thousand € thousand € thousand
Base salary 2008 794 437 437 437 2,105
2007 749 413 412 412 1,986
Fixed supplement 2008 344 336 181 181 1,042
2007 325 316 171 171 983
Remuneration in kind and other benefi ts 2008 61 36 38 33 168
2007 51 36 25 33 145
Non-performance-related remuneration 2008 1,199 809 656 651 3,315
2007 1,125 765 608 616 3,114
Short-term incentive 2008 2,105 1,305 1,044 1,044 5,498
2007 2,169 1,380 1,110 1,110 5,769
Directly effected remuneration 2008 3,304 2,114 1,700 1,695 8,813
2007 3,294 2,145 1,718 1,726 8,883
Fair value of newly granted stock-based compensation as of grant date
2008 352 240 191 191 974
2007 299 203 162 162 826
Aggregate benefi ts (according to the German Commercial Code)
2008 3,656 2,354 1,891 1,886 9,787
2007 3,593 2,348 1,880 1,888 9,709
Werner Wenning
Klaus Kühn
Wolfgang Plischke
Richard Pott Total
€ thousand € thousand € thousand € thousand € thousand
Long-term incentive (stock-based compensation entitlements earned in the respective year)
2008 569 364 267 309 1,509
2007 1,150 699 359 631 2,839
Change in value of existing entitlements 2008 (195) (135) (97) (106) (533)
2007 890 510 101 492 1,993

113MANAGEMENT REPORTCompensation Report
The current service cost for the pension entitlements of the members of the Board of Manage-ment was as follows:
The aggregate remuneration of the Board of Management according to ifrs does not include the fair value of newly granted stock-based compensation, but rather the stock-based compensation entitlements earned in the year under report plus the change in the value of stock-based compen-sation entitlements from previous years that have not yet been paid out. The current service cost for pension entitlements must also be added.
The components of the Board of Management’s remuneration are summarized in the following table:
For active Board of Management members whose service contracts were concluded prior to the entry into force of the amendments to the German Corporate Governance Code in June 2008, a general severance indemnity clause applies if the service contract is terminated at the company’s instigation prior to a member’s 60th birthday. The basic principles according to this clause are as follows:
If a member of the Board of Management is not offered a new service contract upon expiration of his existing service contract because he is not reappointed to the Board of Management, or if the member is removed from the Board of Management prematurely during the term of his contract in the absence of grounds for termination without notice, he will receive a monthly bridging allowance amounting to 80% of his last monthly fi xed salary for a maximum period of 60 months from the date of expiration of his service contract less the period for which he was released from his duties on full pay or otherwise compensated. (If he were removed during the term of his contract, he would also receive the payment due for the rest of the term, though this would be reduced to the amount of his annual fi xed salary plus the target amount for the short-term incentive payment for at least twelve months). His earnings from any new employment else-where would be offset against the bridging allowance. In the case of premature termination at the instigation of the company, further years of service might be credited under certain circum-stances for the purpose of computing his Board of Management pension entitlement, though not beyond his 60th birthday.
TABLE OF CONTENTS MANAGEMENT REPORT
Werner Wenning
Klaus Kühn
Wolfgang Plischke
Richard Pott Total
€ thousand € thousand € thousand € thousand € thousand
Current service cost for
pension entitlements earned
in the respective year
2008 - 505 182 197 884
2007 - 588 187 224 999
2007 2008
€ thousand € thousand
Directly effected remuneration 8,883 8,813
Long-term incentive (stock-based compensation entitlements earned in the respective year) 2,839 1,509
Change in value of existing entitlements 1,993 (533)
Current service cost for pension entitlements earned in the respective year 999 884
Aggregate benefi ts (according to IFRS) 14,714 10,673
114 / / BAYER ANNUAL REPORT 2008
This clause is now obsolescent and of only limited signifi cance. The Supervisory Board has de-cided to follow the recommendation of the German Corporate Governance Code, as amended in June 2008, and limit severance payments under new service contracts. In the case of the only Board of Management member to have his contract renewed since then, it was contractually agreed during the second half of 2008 that payment claims can only arise in the event of prema-ture contract termination by the company without cause and that their amount is limited. Such payments, including ancillary benefi ts, are limited to the value of two years’ compensation (severance payment cap) and may not compensate more than the remaining term of the contract. The severance payment cap is to be calculated on the basis of the total compensation (fi xed salary plus target value of the short-term incentive) for the previous year and, if appropriate, also the expected total compensation for the current year.
Special supplementary arrangements apply in the event of a change of control, see “Information Required Under Takeover Law,” page 83ff.
There were no loans to members of the Board of Management outstanding as of December 31, 2008, nor any repayments of such loans during the year.
We currently pay former and retired members of the Board of Management a monthly pension equal to 80% of the last monthly base salary received while in service. The pensions paid to former members of the Board of Management or their widows are reassessed annually as of January 1, 2009 and adjusted taking into account the development of consumer prices. These benefi ts are in addition to any amounts they receive under previous employee pension arrange-ments. Pension payments to retired members of the Board of Management and their surviving dependents totaled €11,697 thousand (2007: €10,997 thousand). Pension provisions for former members of the Board of Management and their surviving dependents amounted to €107,863 thousand (2007: €115,104 thousand).
COMPENSATION OF THE SUPERVISORY BOARD
The compensation of the Supervisory Board is determined according to the relevant provisions of the Articles of Incorporation, which provisions were approved by the Annual Stockholders’ Meeting on April 29, 2005. This provides that, in addition to reimbursement of their expenses, each member of the Supervisory Board receives fi xed annual remuneration of €60,000 and a variable annual remuneration component. The variable remuneration component is based on corporate performance in terms of the gross cash fl ow reported in the consolidated fi nancial statements of the Bayer Group for the respective fi scal year. The members of the Supervisory Board receive €2,000 for every €50 million or part thereof by which the gross cash fl ow exceeds €3.1 billion, but the variable component for each member may not exceed €30,000.
In accordance with the provisions of the German Corporate Governance Code, additional remu-neration is paid to the Chairman and Vice Chairman of the Supervisory Board and for chairing and membership of committees. The Chairman of the Supervisory Board receives three times the basic remuneration, while the Vice Chairman receives one-and-a-half times the basic remuneration. Members of the Supervisory Board who are also members of a committee receive an additional one quarter of the amount, with those chairing a committee receiving a further quarter. However, no member of the Supervisory Board may receive total remuneration exceed-ing three times the basic remuneration. It has been agreed that no additional remuneration shall be paid for membership of the Nominations Committee. If changes are made to the Supervisory Board and its committees during the fi scal year, members receive remuneration on a pro-rated basis. No member of the Supervisory Board received compensation or any other benefi ts for per-sonally performed services such as consultancy or agency services. The company has purchased insurance for the members of the Supervisory Board to cover their personal liability arising from their service on the Supervisory Board.
TABLE OF CONTENTS MANAGEMENT REPORT

115MANAGEMENT REPORTSubsequent Events
In addition to their remuneration as members of the Supervisory Board, those employee repre-sentatives who are employees of Bayer Group companies receive compensation unrelated to their service on the Supervisory Board. The total amount of such compensation was €591 thousand (2007: €687 thousand).
There were no loans to members of the Supervisory Board outstanding as of December 31, 2008, nor any repayments of such loans during the year.
Subsequent Events At MaterialScience in Germany we have initiated a reduction in the working hours of payscale employees for a limited period, accompanied by a corresponding salary reduction, along with equivalent pay-related measures for managerial staff. We have taken this action in response to the drop in orders and the resulting decline in capacity utilization. Measures such as tempo-rarily shutting down certain plants and cutting back production at others, bringing forward planned maintenance work and making greater use of fl extime arrangements were already adopted at an early stage. Comparable measures are being implemented at our sites in other countries in line with local collective agreements and statutory regulations.
TABLE OF CONTENTS MANAGEMENT REPORT
Remuneration of the Members of the Supervisory Board
of Bayer AG in 2008Fixed
RemunerationVariable
Remuneration Total
€ thousand € thousand € thousand
Dr. Paul Achleitner 75 38 113
Willy Beumann 60 30 90
Dr. Clemens Börsig 60 30 90
Karl-Josef Ellrich 75 38 113
Dr.-Ing. Thomas Fischer 75 38 113
Peter Hausmann 75 38 113
Prof. Dr.-Ing. e.h. Hans-Olaf Henkel 75 38 113
Reiner Hoffmann 60 30 90
Dr. rer. pol. Klaus Kleinfeld 60 30 90
André Krejcik 60 30 90
Petra Kronen 75 38 113
Dr. rer. nat. Helmut Panke 60 30 90
Hubertus Schmoldt 75 38 113
Dr. Manfred Schneider (Chairman) 180 90 270
Dr.-Ing. Ekkehard D. Schulz 60 30 90
Dr. Klaus Sturany 90 45 135
Dipl.-Ing. Dr.-Ing. e.h. Jürgen Weber 75 38 113
Thomas de Win 120 60 180
Prof. Dr. Dr. h.c. Ernst-Ludwig Winnacker 60 30 90
Oliver Zühlke 60 30 90

116 / / BAYER ANNUAL REPORT 2008
Future Perspectives
Economic Outlook and Market Opportunities
The prospects for global economic development in 2009 are very uncertain. Business confi dence indicators have fallen worldwide, in some cases reaching all-time lows. In view of the many negative factors, we expect the global economy to remain fragile for some time. The sharp down-turn in the United States and western Europe is likely to have a substantial impact. While growth is expected to continue in the emerging markets, it will be distinctly weaker than in previous years. It is currently impossible to predict what effects the extensive government measures aimed at stabilizing the fi nancial markets and bolstering the business environment will have on the global economy. We anticipate a signifi cant weakening of global economic growth in 2009, with only very slow expansion at best.
In 2009 we expect the pharmaceutical market to grow more slowly than in 2008 by a low single-digit percentage. This enlargement will probably be driven increasingly by countries such as China, Brazil, Mexico, South Korea, India, Turkey and Russia. By contrast, we predict restrained growth in the traditional markets – the United States and the major European countries – due to the expiration of patents for leading products, the drop in new product launches and increasing cost pressure exerted by health institutions. The diffi cult overall economic environment will probably have a negative impact on the pharmaceutical market as well, particularly in countries where patients bear a large proportion of the costs.
We expect the global consumer care market to go on expanding, albeit at a slower pace in 2009 than in 2008. The animal health market as a whole is likely to show moderate growth in 2009.
In 2009 we expect a continued positive trend for the global seed and crop protection market, although growth rates are likely to be lower than in 2008. Although prices for the most important agricultural commodities have fallen again in recent months, they remain well above the level of two years ago. Demand for plant-based food and feed products on the world markets should remain at a comparatively high level, while inventories are forecasted to remain correspondingly low. We therefore expect an ongoing increase in production for important crops such as cereals, corn, canola, soybeans and rice, which in turn would preserve the favorable business environ-ment for seeds and crop protection products. Although the agricultural industry is generally quite robust in the face of cyclical fl uctuations, the ongoing fi nancial crisis poses a certain risk for the crop protection market in countries where agricultural production is fi nanced by the banking sector.
Automakers have signifi cantly lowered their production forecasts for 2009 after a slump in sales. For the fi rst time the decline is likely also to affect the Asia / Pacifi c and eastern Europe regions, which have registered solid growth in recent years. We anticipate stagnation in eastern Europe and a slight decline in the Far East attributable largely to the Japanese market. The global crisis is expected to impact mainly the export-driven auto markets such as Germany, Japan and South Korea. Governments are enacting stimulus packages – including some to promote new car regis-trations – to set off a recovery in demand. Nonetheless, there are concerns about bankruptcies among car dealerships and automotive industry suppliers worldwide. A recovery is not expected until 2010 at the earliest.
TABLE OF CONTENTS MANAGEMENT REPORT

117MANAGEMENT REPORTFuture Perspectives
For the construction industry, we do not foresee a signifi cant recovery from the effects of the global fi nancial and economic crisis during 2009. Investment in residential construction in the United States is expected to be at a low level. Incipient weakness in the remainder of the con-struction industry means building investment as a whole is unlikely to recover before 2010. In western Europe, too, we believe the current economic situation will continue to have negative repercussions in 2009, causing a signifi cant drop in investment in the construction industry. In regions that so far have experienced strong growth rates – such as eastern Europe, the Middle East and Asia / Pacifi c – we anticipate much lower growth than originally forecast. On a global level, these assumptions signify slightly negative growth in 2009.
A slight decrease in global growth is predicted for the electrical and electronics sector in 2009, though the extent of the decline will depend on the further effects of the economic crisis. There are generally major regional and sub-regional differences. The demand for electronics and infor-mation technology in the emerging countries continues unabated. However, further adverse effects of the economic crisis could have negative implications for individual sectors within the electrical and electronics industry, putting manufacturers in diffi cult positions. Competition remains strong throughout the world, with prices greatly under pressure.
Sales forecasts for the furniture industry in 2009 are very much determined by the effects and the intensity of the global economic crisis. In the United States especially, it is presumed that demand will drop steeply against a background of considerably dampened consumer confi dence. The global economic downswing could also impact furniture producers in Europe (Italy, Germany, Poland) and Asia (China, Vietnam, Malaysia), where lower exports probably will not be compensated by higher domestic demand. A signifi cant recovery in the global furniture market is not anticipated until 2010 at the earliest.
Anticipated Development Opportunities
As an international enterprise, Bayer is subject to a wide variety of developments in the various national and international markets in which it operates in its three areas of business. The following forecasts are based on the business performance described in this report, taking into account the potential risks and opportunities.
We aim to take maximum advantage of the opportunities that present themselves in our various fi elds of activity. We continuously evaluate potential additional opportunities in all areas. Through our research and development activities in particular, we constantly strive to discover new products and improve existing ones. Various risks described in our Risk Report – particu-larly fi nancial risks – are counterbalanced by corresponding opportunities that could result from positive trends. In addition, our initiated cost and structural measures are aimed at further im-proving our earnings performance. We also attempt to realize business opportunities through suitable portfolio measures.
Risk Report
RISK MANAGEMENT
Business operations necessarily involve opportunities and risks. Effective risk management is therefore a key factor in sustainably safeguarding a company’s value.
The management of opportunities and risks at Bayer is an integral part of the Group-wide corpo-rate governance system, not the task of one particular organizational unit. Key elements of the risk management system are the planning and controlling process, Group regulations and the reporting system. In regular conferences the company’s results and its potential opportunities and risks are discussed, and targets and necessary actions are agreed upon. The principles of the Bayer Group’s risk management system are set forth in a Group directive.
TABLE OF CONTENTS MANAGEMENT REPORT

118 / / BAYER ANNUAL REPORT 2008
The subgroups, service companies and the units of the holding company have nominated per-sons responsible for risk management at the upper managerial level and risk management coor-dinators to ensure that an effective system for early identifi cation of risks is implemented and maintained.
Corporate Auditing is responsible for coordinating the identifi cation and documentation of risk areas throughout the Group, enhancing the risk management system and monitoring its effec-tiveness at regular intervals. In addition, during the year-end audit the external auditor issues an opinion on the risk management system and informs the Group Management Board and the Su-pervisory Board of the outcomes of these evaluations. These outcomes are taken into account in the continuing enhancement of our risk management system.
RISK EXPOSURE
As a global company with a diverse business portfolio, the Bayer Group is exposed to numerous risks. We have purchased insurance coverage – where it is available on economically acceptable terms – in order to minimize related fi nancial impacts. The level of this coverage is continuously re-examined.
Signifi cant risks for the Bayer Group are outlined in the following sections. The order in which the risks are listed is not intended to imply any assessment as to the likelihood of their material-ization or the extent of any resulting damages.
LEGAL RISKS
We are exposed to numerous legal risks from legal disputes or proceedings to which we are cur-rently a party or which could arise in the future, particularly in the areas of product liability, competition and antitrust law, patent disputes, tax assessments and environmental matters. The outcome of any current or future proceedings cannot be predicted with certainty. It is therefore possible that legal or regulatory judgments could give rise to expenses that are not covered, or not fully covered, by insurers’ compensation payments and could signifi cantly affect our reve-nues and earnings.
Legal proceedings currently considered to involve material risks are described in Note [32] to the consolidated fi nancial statements.
OVERALL BUSINESS RISKS
Pharmaceutical product prices are subject to regulatory controls in many markets. Some govern-ments intervene directly in setting prices. In addition, in some markets major purchasers of pharmaceutical products have the economic power to exert substantial pressure on prices. Price controls, as well as price pressure from generic manufacturers as a result of government reim-bursement systems favoring less expensive generic pharmaceuticals over brand-name products, diminish earnings from our pharmaceutical products and could potentially render the market in-troduction of a new product unprofi table. We expect the current extent of regulatory controls and market pressures on pricing to persist or increase.
Regulatory changes are continuously monitored, especially in our key markets. If necessary, we adjust our business plans according to the signifi cance of governmental intervention.
Some of our products, particularly medicines, are marketed by third parties. The success of such products therefore depends on the quality of these partners’ marketing and sales efforts.
Sales of the Bayer Group are subject to seasonal fl uctuations. This applies particularly in the CropScience business, which is affected by factors such as weather conditions. The performance of our MaterialScience subgroup is affected by cyclicality in customer industries. A downturn in the business cycle, characterized by weak demand – especially from key customers – and overca-pacities, may lead to price pressure and more intense competition. Expectations of growth, espe-cially in Asian economies, encourage producers to increase their production capacities. Future growth in demand may not be suffi cient to absorb those capacity additions without signifi cant downward pressure on prices.
TABLE OF CONTENTS MANAGEMENT REPORT
119MANAGEMENT REPORTFuture Perspectives
The early identifi cation of trends in the economic or regulatory environment and active portfolio management are important elements of our business management. Our analyses of the global economy and forecasts of medium-term economic development are documented in detail on a quarterly basis and used to support operational business planning. For a summary forecast, see “Future Perspectives – Economic Outlook and Market Opportunities” on page 116f.
Where it appears strategically advantageous we may acquire a company or part of a company and combine it with our existing business. The amount of goodwill and other intangible assets refl ected in the consolidated balance sheet of the Bayer Group has increased signifi cantly in re-cent years. Failure to successfully integrate a newly acquired business or unexpectedly high in-tegration costs could jeopardize the achievement of quantitative or qualitative targets, such as synergies, and adversely impact earnings.
The integration processes associated with our acquisitions are steered by integration teams. Ap-propriate resources are provided to support the integration processes.
PRODUCT DEVELOPMENT RISKS
The Bayer Group’s competitive position, sales and earnings depend signifi cantly on the develop-ment of commercially viable new products and production technologies. We therefore devote substantial resources to research and development. Because of the lengthy development process-es, technological challenges, regulatory requirements and intense competition, we cannot as-sure that all of the products we will develop in the future or are currently developing will actual-ly reach the market and achieve commercial success as scheduled or at all.
Furthermore, adverse effects of our products that may be discovered after regulatory approval or registration despite thorough prior testing may lead to a partial or complete withdrawal from the market, due either to regulatory actions or our voluntary decision to stop marketing a product. Also litigations and associated claims for damages due to negative effects of our products may materially diminish our net income.
To ensure an effective and effi cient use of resources, the Bayer Group has implemented an orga-nizational structure and process organization comprising functional departments, working groups and reporting systems to monitor internal research and development projects.
REGULATORY RISKS
Our life science businesses, in particular, are subject to strict regulatory regimes relating to the testing, manufacturing and marketing of many of our products. In some countries regulatory controls have become increasingly demanding. We expect this trend to continue, particularly in the United States and the European Union. Increasing regulatory requirements, such as those governing clinical or (eco-)toxicological studies, may increase product development costs and / or delay product (re-)registration.
To counter risks arising from legal or other requirements, we make our decisions and engineer our business processes on the basis of comprehensive legal advice provided both by our own experts and by acknowledged external specialists. Projects have been initiated to coordinate the implementation of new regulatory controls and mitigate any negative implications for the busi-ness.
TABLE OF CONTENTS MANAGEMENT REPORT

120 / / BAYER ANNUAL REPORT 2008
PATENT RISKS
A large proportion of our products, mainly in our life sciences businesses, is protected by patents. We are currently involved in lawsuits to enforce patent rights in our products. Generic manufacturers and others attempt to contest patents prior to their expiration. When a patent defense is unsuccessful, or if one of our patents expires, our prices are likely to come under pressure because of increased competition from generic products entering the market. Details of related litigation are provided as part of the description of legal risks in Note [32] to the consoli-dated fi nancial statements.
In some areas of activity we may also be required to defend ourselves against charges that products infringe patent or proprietary rights of third parties. This could impede or even halt the development or manufacturing of certain products or require us to pay monetary damages or royalties to third parties.
Our life science businesses, in particular, have a comprehensive product life cycle management in place. In addition, our legal department, in conjunction with the relevant functional depart-ments, regularly reviews the patent situation. Potential infringements of our patents by other companies are carefully monitored so that legal action can be taken if necessary.
PRODUCTION, PROCUREMENT MARKET AND ENVIRONMENTAL RISKS
Production capacities at some of our manufacturing facilities could be adversely affected by, for instance, technical failures, natural disasters, regulatory rulings or disruptions to supplies of key raw materials or intermediates, as in the case of dependence on a single source for critical materials. This applies particularly to our biotech products because of the highly complex manu-facturing process. If in such cases we are unable to meet demand by shifting suffi cient produc-tion to other plants or drawing on our inventories, we may suffer declines in sales revenues.
The supply of strategically important raw materials is ensured on the basis of long-term con-tracts with multiple suppliers wherever possible. Furthermore, all stages of our production processes and our material inputs are continuously monitored by the respective expert function within the company.
Moreover, the manufacturing of chemical products is subject to risks associated with the production, fi lling, storage and transportation of raw materials, products and wastes. These risks may result in personal injury, property damage, environmental contamination or business interruptions and liability for compensation payments.
Furthermore, the possibility of accidental cross-contamination among our crop protection products or the presence of unintended trace amounts of genetically modifi ed organisms in agri-cultural products and / or foodstuffs cannot be completely excluded.
We address product and environmental risks by way of suitable quality assurance measures. An integrated quality, health, environmental and safety management system ensures process stability. In addition, we are committed to the international Responsible Care initiative of the chemical industry, have initiated a special Bayer Climate Program and report regularly on our own safety and environmental management system.
TABLE OF CONTENTS MANAGEMENT REPORT

121MANAGEMENT REPORTFuture Perspectives
IT RISKS
Business and production processes and the internal and external communications of the Bayer Group are increasingly dependent on information technology systems. Major disruptions or failure of global or regional business systems may result in loss of data and / or impairment of business and production processes.
The foundations for a continuous and sustainable it risk management system have been laid by establishing a comprehensive organization, enacting rules and regulations that defi ne the relevant roles and responsibilities, and implementing a periodic reporting system. Technical pre-cautions such as data recovery and continuity plans have been established together with our internal it service provider to address this risk.
RISK TO PENSION OBLIGATIONS FROM CAPITAL MARKET DEVELOPMENTS
The Bayer Group has obligations to current and former employees related to pensions and other post-employment benefi ts. Changes in relevant valuation parameters such as interest rates, mortality and rates of increases in compensation may raise the present value of our pension obli-gations. This may lead to increased pension costs or diminish stockholders’ equity due to actuarial losses being recognized directly in equity. A large proportion of our pension and other post-employment benefi t obligations is covered by plan assets including fi xed-income securities, shares, real estate and other investments. Declining or even negative returns on these invest-ments may negatively impact the future fair value of plan assets. This again may diminish equity, and / or it may necessitate additional contributions by the company. Further details are given in Note [25] to the consolidated fi nancial statements.
We address the risk of market-related fl uctuations in the fair value of our plan assets through prudent strategic investment, and we constantly monitor investment risks in regard to our global pension obligations.
FINANCIAL RISKSMANAGEMENT OF FINANCIAL AND COMMODITY PRICE RISKS
As a global enterprise, Bayer is exposed in the normal course of business to credit risk, liquidity risk and various market risks that could materially affect its net assets, fi nancial position and results of operations.
It is company policy to use derivatives to minimize or eliminate the risks associated with operat-ing activities and the resulting fi nancing requirements. Derivatives are used almost exclusively to hedge realized or forecasted transactions. The use of derivatives is subject to strict internal controls based on centrally defi ned mechanisms and uniform guidelines. The derivatives used are mainly over-the-counter instruments, particularly forward exchange contracts, foreign cur-rency options, interest-rate swaps, cross-currency interest-rate swaps, commodity swaps and commodity option contracts concluded with banks. We set counterparty limits for such banks depending on their creditworthiness.
The various risks associated with fi nancial instruments are outlined below together with the relevant risk management systems.
TABLE OF CONTENTS MANAGEMENT REPORT
122 / / BAYER ANNUAL REPORT 2008
CREDIT RISKS
Credit risk arises from the possibility of the value of receivables or other fi nancial assets being impaired because counterparties cannot meet their payment or other performance obligations. Since the Bayer Group does not conclude master netting arrangements with its customers, the total amounts recognized in assets plus the total potential contribution to the effective initial fund of Bayer-Pensionskasse represent the maximum exposure to credit risks. Thanks to com-prehensive credit management, the Bayer Group so far has not registered an increase in defaults on trade receivables despite the current situation on the capital markets.
To effectively manage the credit risks from trade receivables, Bayer has put in place a standard-ized risk management system, which is the subject of a Group directive. Regular creditworthi-ness analysis takes place in relation to exposures; these receivables are partly secured. Credit limits are set for all customers. All credit limits for debtors where total exposure is €10 million or more are evaluated by operational credit management and submitted to the Group’s Central Financial Risk Committee.
To minimize credit risks, fi nancial instrument transactions are only conducted with banks and other partners of fi rst-class credit standing in line with predefi ned exposure limits. All risk limits are based on methodical models and are continuously monitored.
Country risks relating to trade receivables and intra-Group loans are continuously monitored, systematically evaluated and centrally managed.
LIQUIDITY RISKS
Liquidity risk, i.e. the risk of not being able to fulfi ll current or future payment obligations because insuffi cient cash is available, is centrally managed in the Bayer Group. Suffi cient liquid assets are held to meet all of the Group’s payment obligations when they fall due, thereby ensur-ing solvency at all times. Payment obligations result both from operating cash fl ows and from changes in current fi nancial liabilities and are included in liquidity planning. In addition, a re-serve is maintained for unbudgeted shortfalls in cash receipts or unexpected disbursements. For this purpose, budget deviation analyses are performed on the basis of historical time series, adjusted for variations in business structure. The liquidity reserve is then determined which, with a defi ned probability, will cover a negative deviation from budgeted cash fl ows. The size of this reserve is regularly reviewed and adjusted as necessary to current conditions. Liquid assets are kept mainly in the form of overnight and term deposits. Credit facilities also exist with banks. These include, in particular, a €3.5 billion syndicated credit facility, which is undrawn.
We intend to service the bonds maturing in 2009 out of liquidity and free operating cash fl ow. The maturation of the mandatory convertible bond in June 2009 will not result in a cash outfl ow because the bond will be converted into equity.
TABLE OF CONTENTS MANAGEMENT REPORT

123MANAGEMENT REPORTFuture Perspectives
MARKET RISKS
Market risks relate to the possibility that the fair value or future cash fl ows of a fi nancial instru-ment could fl uctuate due to variations in market prices. Market risks include currency risk, inter-est-rate risk and other price risks, especially commodity price risk.
Sensitivity analysis is a widely used risk measurement tool that allows our management to make judgments regarding the potential loss in future earnings, fair values or cash fl ows of market-risk-sensitive instruments resulting from one or more selected hypothetical changes in interest rates, foreign currency exchange rates, commodity prices or other relevant market rates or prices over a selected period of time. We use sensitivity analysis because it provides reasonable risk estimates using straightforward assumptions (for example, an increase in interest rates). The risk estimates we provide below assume:
a simultaneous, parallel foreign exchange rates shift in which the euro depreciates against all currencies by 10%; a simultaneous, parallel commodity price increase of 20% in all relevant commodities with respect to which we hold derivatives; anda parallel shift of 100 basis points in the interest rate yield curves of all currencies.
We use market information and additional analytics to manage our risk exposure and mitigate the limitations of our sensitivity analysis. We have found sensitivity analysis to be a useful tool in achieving some of our specifi c risk management objectives. Sensitivity analysis offers an easy-to-understand risk exposure estimate that allows an approximation of the effect changing market conditions could have on our business. Additionally, it allows our management to take the necessary steps to address such risks.
We continually refi ne our risk measurement and reporting procedures. This includes periodical-ly re-examining the underlying assumptions and parameters utilized.
The sensitivity analyses included in the following sections of this Risk Report present the hypo-thetical loss in cash fl ows of fi nancial instruments and derivatives that we held as of December 31, 2008 and December 31, 2007. The range of sensitivities that we chose for these analyses re-fl ects our view of changes in foreign exchange rates, commodity prices and interest rates that are reasonably possible over a one-year period.
CURRENCY RISKS
Since the Bayer Group conducts a signifi cant portion of its operations outside the euro currency zone, fl uctuations in currency exchange rates can materially affect earnings. Currency risks from fi nancial instruments exists with respect to receivables, payables, cash and cash equiva-lents that are not denominated in a company’s functional currency. In the Bayer Group these risks are particularly signifi cant for the U.S. dollar, the Japanese yen and the Canadian dollar.
Currency risks are identifi ed, analyzed and managed centrally and systematically. The scope of hedging is evaluated regularly and defi ned in a corporate directive. Recorded foreign currency operating items, receivables and payables are normally fully hedged.
•
•
•
TABLE OF CONTENTS MANAGEMENT REPORT

124 / / BAYER ANNUAL REPORT 2008
The anticipated foreign currency exposure from forecasted transactions in the next 24 months is hedged on a basis agreed between the Group Management Board, the central fi nance depart-ment and the operating units. A signifi cant proportion of contractual and foreseeable currency risks is hedged, mainly through forward exchange contracts and currency options.
Our Board of Management has provided clear guidance on how to limit and monitor cash fl ow risks that result from this approach.
We applied a hypothetical adverse scenario in which all currencies simultaneously appreciate by 10% against the euro compared with their year-end exchange rates. Under this scenario the estimated hypothetical loss of cash fl ows from derivatives and non-derivatives as of December 31, 2008 would be €293 million (2007: €119 million). Of this €293 million, €236 million is related to the u.s. dollar, €36 million to the Japanese yen and €21 million to other currencies. Of the €293 million estimated hypothetical loss of cash fl ow, €296 million results from derivatives used to hedge anticipated exposure from planned sales denominated in foreign currencies. Such transactions qualify for hedge accounting, and the respective changes in value are recognized in other comprehensive income. The impact of exchange-rate fl uctuations on our anticipated sales in foreign currencies is not included in this calculation. The offsetting position of €3 mil-lion is primarily attributable to unhedged currency derivatives embedded in supply contracts.
INTEREST-RATE RISKS
The Bayer Group’s interest-rate risks arises primarily from fi nancial assets and liabilities with maturities exceeding one year. In the case of fi xed-rate fi nancial instruments, such as fi xed-rate bonds, the risk of fl uctuations in capital-market interest rates results in a fair-value risk because the fair values fl uctuate as a function of interest rates. In the case of fl oating-rate instruments, a cash fl ow risk exists because interest payments could increase in the future.
Interest-rate risks is analyzed centrally in the Bayer Group and managed by the central fi nance department. This is done in line with the duration set by the Board of Management, which implicitly also includes the ratio of fi xed-rate to fl oating-rate debt. The duration is subject to regular review. Derivatives – mainly interest-rate swaps, cross-currency interest-rate swaps and interest options – are employed to preserve the target structure of the portfolio.
Financial debt including derivatives amounted to €16,647 million as of December 31, 2008 (De-cember 31, 2007: €14,198 million). The sensitivity analysis was performed on the basis of our fl oating-rate debt position at year end 2008, taking into account the interest rates relevant to our liabilities in all principal currencies. A hypothetical increase of 100 basis points, or 1% per annum, in these interest rates (assuming constant currency exchange rates) as of January 1, 2008 would have raised our interest expense for the year ended December 31, 2008 by €75 mil-lion (2007 based on liabilities at year end 2007: €65 million).
OTHER PRICE RISKS (ESPECIALLY COMMODITY PRICE RISKS)
The Bayer Group requires signifi cant quantities of petrochemical feedstocks and energy for its various production processes. The prices of these inputs may fl uctuate considerably depending on market conditions. As in the past, there will be times when it is not possible for us to pass on increased raw material costs to customers through price adjustments. This applies particularly to our MaterialScience business.
We have addressed this risk by concluding long-term contracts with multiple suppliers. In addi-tion, derivatives are employed where possible to hedge against commodity price risks by smoothing variations in income-statement items due to changes in commodity prices – and the resulting changes in stockholders’ equity – over the long term. The procurement departments of the subgroups are responsible for managing these price risks on the basis of internal directives and centrally determined limits, which are subject to constant review.
TABLE OF CONTENTS MANAGEMENT REPORT

125MANAGEMENT REPORTFuture Perspectives
Commodity swaps and commodity options, in particular, are employed to hedge changes in the prices of utilities, especially gas, and of crude oil, naphtha and benzene feedstocks. These instruments are also used in the case of long-term, fi xed-price supply contracts.
We applied a hypothetical adverse scenario in which all commodity and energy prices simulta-neously decrease by 20%. Under this scenario the estimated hypothetical loss of cash fl ows from derivatives as of December 31, 2008 would be €30 million (2007: €34 million). Of this €30 mil-lion, €1 million would be directly disclosed in the income statement and €29 million would be recognized as a value adjustment in other comprehensive income according to hedge accounting rules. In considering sensitivities for commodity futures and commodity option contracts, we have made a small allowance for the fact that forward rates are less volatile than spot rates. The stated long-term contract volumes are therefore based on somewhat smaller price changes. The derivatives used by the Bayer Group to mitigate the risk of changes in exchange rates, interest rates and commodity prices are described in Note [30.3] to the consolidated fi nancial statements.
ASSESSMENT OF THE OVERALL RISK SITUATION
Compared with the previous year, the overall risk situation did not change signifi cantly in the reporting period. The overall risk assessment is based on a consolidated view of all signifi cant individual risks. At present, no potential risks have been identifi ed that either individually or in combination could endanger the continued existence of the Bayer Group.
Business Strategy
The Bayer Group is focusing on the fast-growing, innovation-driven health care, nutrition and high-tech materials businesses in line with its mission statement: “Bayer: Science For A Better Life.” By strategically aligning ourselves to these attractive markets and concentrating on our core competencies, we are able to invest more intensively in growth areas and innovative tech-nologies. We aim to achieve leadership roles and expand our already strong market positions. We will also press ahead with cost-containment and effi ciency-improvement efforts in order to further increase the company’s value over the long term.
BAYER HEALTHCARE
HealthCare’s goal remains to grow with or above the market in both segments. We aim to further strengthen this subgroup and expand it into a world-leading diversifi ed health care enterprise. For example, we plan to keep the business share outside of Pharmaceuticals at a minimum 30% for the long term, sharpen the focus on specialty pharmaceuticals, further increase the produc-tivity of research and development and place even greater importance on the emerging markets.
As of January 1, 2009, the larger of our HealthCare segments, Pharmaceuticals, comprises four business units: General Medicine, Specialty Medicine, Women’s Healthcare and Diagnostic Imaging. We intend to maintain a distinct focus on indications with major potential for the im-provement of diagnosis and therapy.
Our General Medicine business unit focuses on products that are normally prescribed by general practitioners. We are well represented in this market with our established brands Avalox® / Avelox®, Levitra®, Adalat®, Glucobay® and Cipro® / Ciprobay®. In the United States, these products are marketed through the existing alliance with Schering-Plough. (Please note that Schering-Plough Corporation, New Jersey, and the company acquired by Bayer in June 2006, i. e. Bayer Schering Pharma AG (formerly named Schering AG), Berlin, Germany, are unaffi liated companies that have been entirely independent of each other for many years.) The Specialty Medicine unit possesses a promising portfolio in the areas of hematology, oncology and neurolo-gy, with products including Kogenate®, Nexavar® and Betaferon® / Betaseron®.
No risks that couldendanger the
company’s existence
TABLE OF CONTENTS MANAGEMENT REPORT

126 / / BAYER ANNUAL REPORT 2008
The Women’s Healthcare and Diagnostic Imaging units offer market-leading products such as yaz® / Yasmin® and Magnevist®.
Research and development (r&d) is an important growth driver for our Pharmaceuticals seg-ment, which accounts for the greater part of r&d spending in the HealthCare subgroup. Life cycle management, inlicensing, alliances and collaborations are important elements in our strat-egy. Such business development activities supplement our own research efforts and are designed to strengthen our portfolio, which focuses on diseases with a high unmet medical need. Exam-ples include the recombinant Factor viia protein maxy-vii acquired from Maxygen, Inc., and the preclinical oncology program acquired from Nycomed GmbH.
Our Consumer Health segment comprises the Consumer Care, Medical Care and Animal Health divisions. The goal of our Consumer Care Division is to build a leading position in the global over-the-counter (otc) medicines market. The strategy of Consumer Care is aimed at fully lever-aging the growth potential of proven brands such as Aspirin®, Aleve®, Canesten®, Bepanthen®, One-A-Day®, Rennie® and Alka-Seltzer®. We are pursuing a clear course of expansion in fast-growing regions such as central and eastern Europe and Asia / Pacifi c, and we aim to further de-velop our business in new growth segments. Recent examples of these growth initiatives include the acquisition of the otc business of Sagmel, Inc. in eastern Europe and the otc cough and cold business of Chinese company Topsun Science and Technology Qidong Gaitianli Pharmaceutical Co., Ltd. We acquired these businesses in order to position ourselves successfully against com-petitors in the Commonwealth of Independent States (cis) and China, respectively. We intend to continue exploiting external growth opportunities through strategically relevant acquisitions and in-licensing. Effective January 1, 2009, the Intendis dermatological business, formerly part of the Pharmaceuticals Division, is managed and reported within the Consumer Care Division.
Effective January 1, 2009, Bayer HealthCare’s Diabetes Care Division and our Medrad medical devices business were combined in the Medical Care Division. Medical Care’s goal is to strengthen its competitive position in the areas of blood glucose measurement, diabetes manage-ment and contrast injection systems used to diagnose cardiovascular and other diseases. To this end, we are expanding our product range by developing new measurement systems and test strips to facilitate even more user-friendly monitoring devices for people suffering from diabetes. At Medrad we are also continuing to develop a new generation of injection platforms for use in the diagnosis of cardiovascular diseases and in computed tomography and magnetic resonance imaging (mri). We also intend to develop new it platforms for mri. Apart from these development activities, we aim to expand our portfolio by investing in additional business areas, the acquisi-tions of iSense Corporation and Possis Medical, Inc. being the most recent examples of such projects. iSense is a u.s.-based company developing a minimally invasive continuous system for monitoring glucose in intercellular tissue. Possis Medical is a leading provider of mechanical thrombectomy devices used to treat narrowed or blocked arteries and veins. We intend to continuously improve our products, contain costs and use our resources more effi ciently. Our strategy also includes supplementing our own strengths with strategic partnerships in specifi c fi elds of expertise.
In the Animal Health Division, we aim to achieve global leadership positions in the livestock and companion animal markets and to become a preferred supplier and partner. Our strategy is directed toward achieving organic growth by focusing on countries and markets with long-term market sales potential and successfully managing the life cycles of existing core brands. In addi-tion, we are pursuing external growth opportunities through acquisitions and in-licensing.
TABLE OF CONTENTS MANAGEMENT REPORT
127MANAGEMENT REPORTFuture Perspectives
BAYER CROPSCIENCE
Bayer CropScience is aligning its corporate planning to the long-term trends in agricultural mar-kets. As a leading innovation-driven enterprise, comprising the Crop Protection, Environmental Science and BioScience business units, its aim is to provide products and integrated solutions that contribute to the production of high-quality agricultural raw materials. Against the back-ground of limited arable land and a steadily increasing world population that places growing de-mands on the quality of food and clothing and consumes more energy, it is essential to safeguard and further increase agricultural yields. We manage our business responsibly in keeping with our commitment to sustainable development and our goal of profi table long-term growth.
Innovation forms the basis for CropScience to create value in the future. The development of new active ingredients and formulations along with high-quality seed enables us to replace older products and technologies with innovative products that have an improved performance spec-trum, offer better environmental compatibility and user safety, and increase value-added for our customers. These new products also help us to boost sales and are an important prerequisite for meeting our profi tability targets. Our strict cost management is making a further contribution. The initiative to optimize cost structures and raise effi ciency that we launched in August 2006 should be largely completed by the end of 2009. By 2010 it should lead to annual savings of about €300 million compared with the start date of the initiative.
In Crop Protection, the largest business unit, CropScience intends to defend and further expand its leading market positions in the areas of insecticides, fungicides, herbicides and seed treatments, building on its broad regional presence and innovative, highly effective products.
We endeavor to achieve this strategic goal by steadily enhancing our product mix. This not only means regularly launching new active ingredients and products from our research and develop-ment pipeline and successfully managing product life cycles, but also carrying out research in new growth areas. Examples include projects aimed at making plants healthier and increasing yields by improving nutrient uptake and stress tolerance.
As part of our efforts to offer our customers comprehensive solutions, we develop integrated con-cepts for specifi c crops in the various regions. These efforts involve both the Crop Protection and BioScience business units.
The Environmental Science business unit makes use of the development and production capaci-ties of Crop Protection and its innovative active ingredients. In terms of sales, it is among the world’s leading suppliers of products for non-agricultural applications. Our strategy is to further expand this position by developing and marketing high-quality products for consumers and professional users. The focus here is on the development of innovative products and solutions that are individually tailored to customer needs, easy to use, safe to handle and satisfy society’s increasing demands with regard to health, hygiene, growing and greening. The environmental compatibility and sustainability of such products are also important criteria.
Our BioScience business unit comprises the research, development and commercialization of seeds and solutions based on plant biotechnology and modern breeding methods. BioScience subsidiary Nunhems is a leading developer and supplier of high-quality vegetable seeds. Our activities for the agriculture market focus on three core crops – cotton, canola and rice. We market the technologies we develop not only in our own seed products, but also – with the help of our partners – for other crops such as corn and soybeans. CropScience intends to expand its activities in seeds and plant biotechnology with the aim of raising BioScience sales to approximately €1 billion by 2015.
TABLE OF CONTENTS MANAGEMENT REPORT

128 / / BAYER ANNUAL REPORT 2008
BAYER MATERIALSCIENCE
The strategy of MaterialScience is based on safeguarding its existing competitive position in its traditional markets and achieving profi table growth in emerging markets such as China and In-dia, central and eastern Europe and Brazil. We aim to maintain our profi table position in the iso-cyanates market and attain earnings leadership in polycarbonates. We are therefore endeavoring to steadily raise the effi ciency of production and administration processes and strengthen down-stream business activities such as BaySystems® in the Polyurethanes business unit and com-pounding in the Polycarbonates business unit. By 2012 MaterialScience plans to further increase the proportion of differentiated business in relation to sales of its high-volume products such as tdi or polycarbonate resins. We also intend to drive forward our newly formed Functional Films and Carbon Nanotubes businesses and create effi cient resources and competencies in the emerging markets. Investments in additional production capacities will be reviewed in light of the current fi nancial and economic crisis.
Our goal in the Polyurethanes business unit is to expand our global market leadership in isocya-nates and at the same time achieve cost leadership in all areas. Our 250,000 tons per year tdi plant in Shanghai, China, is due on stream in 2010, supporting our growth in Asia. We also in-tend to consolidate the production of isocyanates in Europe and increase our output depending on market development. Our polyether polyols will primarily support the isocyanates business to complement the solutions we offer to customers. In the BaySystems® business we aim to achieve profi table growth and further expand our global market share. We will therefore proceed with our successful systems house strategy.
The Coatings, Adhesives, Specialties business unit is seeking to defend and selectively expand its position in the market for basic and modifi ed isocyanates. With this goal in mind, we plan to meet growing demand in the growth regions by increasing production capacities and expanding our technical centers. We aim to achieve higher profi tability in our resins activities by narrowing the focus of our portfolio toward modern solutions such as waterborne and uv-curing systems. In addition, lean distribution structures at Viverso, based in Bitterfeld, Germany, are contributing to increased profi tability in this business unit.
The polycarbonate industry faces increasing commoditization. We are addressing this trend with a differentiated strategy. On the one hand, we aim to achieve cost leadership by operating world-scale facilities. On the other, we intend to increasingly offer customized solutions and compounded products, selectively investing at existing and new sites. We are working to im-prove the profi tability of our semi-fi nished products, such as those for polycarbonate sheet, by optimizing our product portfolio. We also plan to enhance the overall performance of the Polycarbonates business unit by increasing the effi ciency of distribution in standard segments, focusing our research activities and optimizing our cost structures.
We have combined our activities in the area of innovative surfaces and carrier materials in the new “Functional Films and Specialties” unit. This area includes applications in cosmetics, medical technology, carbon nanotubes for improving the properties of plastics and metals, and the activities of the Functional Films unit, which include three-dimensionally formable elec-troluminescent fi lms, lcd diffuser fi lms for fl at screens, formable coated fi lms for electronic and automotive applications and Makrofol® soft-touch fi lms used in automotive interior components and cellphone housings. We intend to strengthen and expand these activities by combining them and exploiting the resulting synergies.
As part of a strategic realignment of the Thermoplastic Polyurethanes (tpu) business unit, the tpu granules activities will be integrated into the Polyurethanes business unit and the tpu fi lms activities into the Functional Films business of the Coatings, Adhesives, Specialties business unit. We believe we can raise effi ciency in the manufacture and marketing of tpu granules by linking these activities into the global systems house network. We expect the integration of tpu fi lms into the Functional Films business to strengthen our technological and applications capa-bilities and boost market prospects. The integration is to be completed by April 1, 2009.
TABLE OF CONTENTS MANAGEMENT REPORT

129MANAGEMENT REPORTFuture Perspectives
The service functions Procurement and Trading, Technology Services, Health Safety Environ-ment & Quality, Corporate Energy Policy & Reporting, along with site management at the multi-business-unit sites in Baytown and Shanghai, are combined within the Industrial Operations unit. In addition, the Basic Chemicals unit ensures the supply of chlorine, sodium hydroxide solution, hydrogen, carbon monoxide and nitric acid at the German plants on the Lower Rhine and at the multi-business-unit sites.
The New Business unit identifi es and evaluates market and technology trends for all MaterialScience business units, translating business ideas into specifi c projects for the develop-ment of new products and applications beyond the company’s existing core business.
Financial Strategy
The fi nancial management of the Bayer Group is conducted by the strategic management holding company Bayer AG. Capital is a global resource, generally procured centrally and distributed within the Group. The foremost objectives of our fi nancial management are to help bring about a sustained increase in corporate value and ensure the Group’s liquidity and creditworthiness. This involves reducing the cost of capital, improving the fi nancing cash fl ow, optimizing the cap-ital structure and effectively managing risk. The management of currency, interest rate, raw material price and default risks helps to reduce the volatility of our earnings.
The rating agencies contracted assess Bayer as follows:
These credit ratings refl ect the company’s high solvency and ensure access to a broad investor base for fi nancing purposes. Particularly in these days of turbulent credit markets, our strategy remains geared toward achieving a rating in the single-a category in order to maintain our fi nan-cial fl exibility. We therefore plan to use part of our operating cash fl ows to reduce net debt.
We pursue a prudent debt management strategy aimed at ensuring fl exibility, drawing on a bal-anced fi nancing portfolio. Chief among these resources are a multi-currency European Medium Term Note program, a syndicated acquisition fi nancing, a syndicated credit facility, bilateral loan agreements and a global commercial paper program.
TABLE OF CONTENTS MANAGEMENT REPORT
Long-term rating Outlook Short-term rating
Standard & Poor’s A- stable A-2
Moody’s A3 stable P-2
130 / / BAYER ANNUAL REPORT 2008 TABLE OF CONTENTS MANAGEMENT REPORT
We use fi nancial derivatives to hedge against risks arising from business operations or fi nancial transactions, but do not employ contracts in the absence of an underlying transaction. It is our policy to diminish the default risk by selecting trading partners with a high credit standing. We closely monitor the execution of all transactions, which are conducted according to Group-wide guidelines.
Further details of our risk management objectives and the ways in which we account for all the major types of hedged transactions – along with price, credit and liquidity risks as they relate to the use of fi nancial instruments – are given in the Risk Report, page 117 ff.
Sales and Earnings Forecast
BAYER GROUP
The strategic alignment of the Bayer Group allows us to look forward to 2009 with relative confi dence despite the current fi nancial and economic crisis. The fact that the less cyclical life-science businesses account for more than 70% of our sales is paying off.
For the markets relevant to our HealthCare business we predict largely steady growth of between 3% and 5%. For the CropScience markets we are assuming moderate growth of 2% to 3%. In the main sectors of importance for our MaterialScience business, however, we anticipate a very diffi cult year marked by a great deal of uncertainty. We have budgeted for an exchange rate of us$ 1.35 to the euro.
For HealthCare and CropScience we expect a gratifying trend in 2009, with growth in sales and ebitda before special items. At MaterialScience the start to the year has been even weaker than expected, and we therefore anticipate an extremely diffi cult year for this subgroup, with a severe drop in sales and earnings. In this negative scenario for MaterialScience we are nevertheless confi dent of limiting the decline in Group ebitda before special items to about 5%. Group sales would probably then be in the region of €32 billion.
Should there be a tangible recovery in our MaterialScience business in the short term, Group ebitda before special items could match the very high level of 2008 or even post a slight in-crease.
We have budgeted for special charges in the region of €250 million related to our ongoing re-structuring programs.
Our capital expenditure budget for 2009 is €1.5 billion. We expect to record some €2.8 billion in depreciation and amortization, including €1.3 billion in depreciation of property, plant and equipment. Research and development expenses are planned to rise to about €2.9 billion.
We expect to reduce net debt toward €10 billion in 2009, helped by the conversion of the manda-tory convertible bond into equity upon maturation in June 2009 and an improvement in net cash fl ow. This forecast does not take into account any possible portfolio changes.
We are not currently issuing any sales or earnings guidance beyond 2009 in view of the consid-erable uncertainty as to the future development of the global economy.

MANAGEMENT REPORTFuture Perspectives
131TABLE OF CONTENTS MANAGEMENT REPORT
BAYER HEALTHCARE
In 2009 HealthCare plans to achieve currency-adjusted growth rates ahead of the market aver-age in all divisions. We aim to further improve the ebitda margin before special items toward 28%.
BAYER CROPSCIENCE
CropScience plans to continue expanding sales in a generally favorable market environment. We aim to maintain the ebitda margin before special items at the high level of about 25%.
BAYER MATERIALSCIENCE
The MaterialScience business is greatly impeded by the global recession. We expect sales and ebitda before special items to show a further decline in the fi rst quarter of 2009 compared with the fourth quarter of 2008, which included a comparatively steady October. For the full year we predict a severe drop in sales and ebitda before special items.

TABLE OF CONTENTS

CONSOLIDATED FINANCIALSTATEMENTS
133
Consolidated Financial Statements
» Bayer Group ConsolidatedStatements of Income . . . . . . . . . . . . . . . . . . . . . . . . . . . . . . . . . . 134
» Bayer Group Consolidated
Balance Sheets . . . . . . . . . . . . . . . . . . . . . . . . . . . . . . . . . . . . . . . . . . . . . 135
» Bayer Group ConsolidatedStatements of Cash Flows . . . . . . . . . . . . . . . . . . . . . . . . . 136
» Bayer Group Consolidated Statements of Recognized Income and Expense . . . . . . . . . . . . . . . . . . . . . . . . . . . . . . . . . . . 137
Notes to the Consolidated FinancialStatements of the Bayer Group
1. Key data by segment and region . . . . . . . . . . . . . . . . . . . 138
2. General information . . . . . . . . . . . . . . . . . . . . . . . . . . . . . . . . . . . . . . . 140
3. Effects of new accounting pronouncements . . . . . . . . . . . . . . . . . . . . . . . . . . . . . . . . . . . . . . . . . . . . 141
4. Basic principles, methods and critical accounting policies . . . . . . . . . . . . . . . . . . . . . . . . . . . . 144
5. Segment reporting . . . . . . . . . . . . . . . . . . . . . . . . . . . . . . . . . . . . . . . . 159
6. Scope of consolidation; subsidiaries and affi liates . . . . . . . . . . . . . . . . . . . . . . . . . . . . . . . . . . . . . . . . . . . . . . . . . . 161
6.1 Changes in the scope of consolidation . . . . . . . . . . 162
6.2 Business combinations and other acquisitions . . . . . . . . . . . . . . . . . . . . . . . . . . . . . . . . . . . . . . . . . . 174
6.3 Divestitures and discontinued operations . . . . . 177
NOTES TO THE STATEMENTS OF INCOME
7. Net sales . . . . . . . . . . . . . . . . . . . . . . . . . . . . . . . . . . . . . . . . . . . . . . . . . . . . . . . 178
8. Selling expenses . . . . . . . . . . . . . . . . . . . . . . . . . . . . . . . . . . . . . . . . . . . 179
9. Research and development expenses . . . . . . . . . . . . 179 10. Other operating income . . . . . . . . . . . . . . . . . . . . . . . . . . . . . . . . . 179
11. Other operating expenses. . . . . . . . . . . . . . . . . . . . . . . . . . . . . . 179
12. Personnel expenses / employees . . . . . . . . . . . . . . . . . . . . 180
13. Non-operating result . . . . . . . . . . . . . . . . . . . . . . . . . . . . . . . . . . . . . 180
13.1 Income (loss) from investments in affi liated companies . . . . . . . . . . . . . . . . . . . . . . . . . . . . . . . . . . . 181
13.2 Interest expense . . . . . . . . . . . . . . . . . . . . . . . . . . . . . . . . . . . . . . . . . . . . 181
13.3 Other non-operating income and expense . . . . . 182
14. Income taxes . . . . . . . . . . . . . . . . . . . . . . . . . . . . . . . . . . . . . . . . . . . . . . . . . 182
15. Income / losses attributable to non-controlling interest . . . . . . . . . . . . . . . . . . . . . . . . . . . . . . . . 185
16. Earnings per share from continuing and discontinued operations. . . . . . . . . . . . . . . . . . . . . . . . . . 185
NOTES TO THE BALANCE SHEETS
17. Goodwill and other intangible assets . . . . . . . . . . . . . . . . . . . . . . . . . . 186
18. Property, plant and equipment . . . . . . . . . . . . . . . . . . . . . . . . . . . . . . . . . . . 192
19. Investments in associates . . . . . . . . . . . . . . . . . . . . . . . . . . . . . . . . . . . . . . . . . . . 194
20. Other fi nancial assets . . . . . . . . . . . . . . . . . . . . . . . . . . . . . . . . . . . . . . . . . . . . . . . . . 196
21. Inventories . . . . . . . . . . . . . . . . . . . . . . . . . . . . . . . . . . . . . . . . . . . . . . . . . . . . . . . . . . . . . . . . . 197
22. Trade accounts receivable . . . . . . . . . . . . . . . . . . . . . . . . . . . . . . . . . . . . . . . . . . 197
23. Other receivables . . . . . . . . . . . . . . . . . . . . . . . . . . . . . . . . . . . . . . . . . . . . . . . . . . . . . . . 198
24. Stockholders’ equity . . . . . . . . . . . . . . . . . . . . . . . . . . . . . . . . . . . . . . . . . . . . . . . . . . . 198
25. Provisions for pensions and other post-employment benefi ts . . . . . . . . . . . . . . . . . . . . . . . . . . . . . . . . . . . . . . . . . 203
26. Other provisions . . . . . . . . . . . . . . . . . . . . . . . . . . . . . . . . . . . . . . . . . . . . . . . . . . . . . . . . 212
26.1 Taxes . . . . . . . . . . . . . . . . . . . . . . . . . . . . . . . . . . . . . . . . . . . . . . . . . . . . . . . . . . . . . . . . . . . . . . . . . . 212
26.2 Environmental protection . . . . . . . . . . . . . . . . . . . . . . . . . . . . . . . . . . . . . . . . . . . 212
26.3 Restructuring . . . . . . . . . . . . . . . . . . . . . . . . . . . . . . . . . . . . . . . . . . . . . . . . . . . . . . . . . . . . . 213
26.4 Trade-related commitments. . . . . . . . . . . . . . . . . . . . . . . . . . . . . . . . . . . . . . . . 214
26.5 Litigations . . . . . . . . . . . . . . . . . . . . . . . . . . . . . . . . . . . . . . . . . . . . . . . . . . . . . . . . . . . . . . . . . . 214
26.6 Personnel commitments . . . . . . . . . . . . . . . . . . . . . . . . . . . . . . . . . . . . . . . . . . . . . 214
26.7 Miscellaneous . . . . . . . . . . . . . . . . . . . . . . . . . . . . . . . . . . . . . . . . . . . . . . . . . . . . . . . . . . . . 217
27. Financial liabilities . . . . . . . . . . . . . . . . . . . . . . . . . . . . . . . . . . . . . . . . . . . . . . . . . . . . . . 217
28. Trade accounts payable . . . . . . . . . . . . . . . . . . . . . . . . . . . . . . . . . . . . . . . . . . . . . 220
29. Other liabilities . . . . . . . . . . . . . . . . . . . . . . . . . . . . . . . . . . . . . . . . . . . . . . . . . . . . . . . . . . 221
30. Financial instruments . . . . . . . . . . . . . . . . . . . . . . . . . . . . . . . . . . . . . . . . . . . . . . . . 222
30.1 Information on fi nancial instruments by category . . . . . . . . . . . . . . . . . . . . . . . . . . . . . . . . . . . . . . . . . . . . . . . . . . . . . . . . . . . . . . . . 223
30.2 Maturity analysis . . . . . . . . . . . . . . . . . . . . . . . . . . . . . . . . . . . . . . . . . . . . . . . . . . . . . . 225
30.3 Accounting for derivatives . . . . . . . . . . . . . . . . . . . . . . . . . . . . . . . . . . . . . . . . . 228
31. Commitments and contingencies . . . . . . . . . . . . . . . . . . . . . . . . . . . . . . 230
32. Legal risks . . . . . . . . . . . . . . . . . . . . . . . . . . . . . . . . . . . . . . . . . . . . . . . . . . . . . . . . . . . . . . . . . 231
NOTES TO THE STATEMENTS OF CASH FLOWS
33. Net cash provided by (used in) operating activities . . . 238
34. Net cash provided by (used in) investing activities . . . . 239
35. Net cash provided by (used in) fi nancing activities . . . . 239
36. Cash and cash equivalents . . . . . . . . . . . . . . . . . . . . . . . . . . . . . . . . . . . . . . . . . 240
OTHER INFORMATION
37. Audit fees . . . . . . . . . . . . . . . . . . . . . . . . . . . . . . . . . . . . . . . . . . . . . . . . . . . . . . . . . . . . . . . . . . 240
38. Related parties . . . . . . . . . . . . . . . . . . . . . . . . . . . . . . . . . . . . . . . . . . . . . . . . . . . . . . . . . . 240
39. Total remuneration of the Board of Management and the Supervisory Board and loans . . . . . . . . . . . . . . . . . . . . . . . . . . . . . . . . . . . . . . 241
Statement by the Board ofManagement on Financial Reporting . . . . . . . . . . . . . . . . . . 244
Responsibility Statement . . . . . . . . . . . . . . . . . . . . . . . . . . . . . . . . . . . . . . . . . . 244
Auditor’s Report . . . . . . . . . . . . . . . . . . . . . . . . . . . . . . . . . . . . . . . . . . . . . . . . . . . . . . . . . . 245
For direct access to a chapter, simply click on its name.
TABLE OF CONTENTS

134 / / BAYER ANNUAL REPORT 2008
Note 2007 2008
€ million € million
Net sales [7] 32,385 32,918
Cost of goods sold (16,352) (16,456)
Gross profi t 16,033 16,462
Selling expenses [8] (7,782) (8,105)
Research and development expenses [9] (2,578) (2,653)
General administration expenses (1,772) (1,649)
Other operating income [10] 822 907
Other operating expenses [11] (1,569) (1,418)
Operating result [EBIT] 3,154 3,544
Equity-method loss [13.1] (45) (62)
Non-operating income 834 589
Non-operating expenses (1,709) (1,715)
Non-operating result [13] (920) (1,188)
Income before income taxes 2,234 2,356
Income taxes [14] 72 (636)
Income from continuing operations after taxes 2,306 1,720
Income from discontinued operations after taxes [6.3] 2,410 4
Income after taxes 4,716 1,724
of which attributable to non-controlling interest [15] 5 5
of which attributable to Bayer AG stockholders (net income) 4,711 1,719
Earnings per share (€)
From continuing operations [16]
Basic* 2.91 2.22
Diluted* 2.91 2.22
From discontinued operations [16]
Basic* 2.93 -
Diluted* 2.93 -
From continuing and discontinued operations [16]
Basic* 5.84 2.22
Diluted* 5.84 2.22
*The ordinary shares to be issued upon conversion of the mandatory convertible bond are treated as already issued shares.
TABLE OF CONTENTS CONSOLIDATED FINANCIAL STATEMENTS
Bayer Group Consolidated Statements of Income
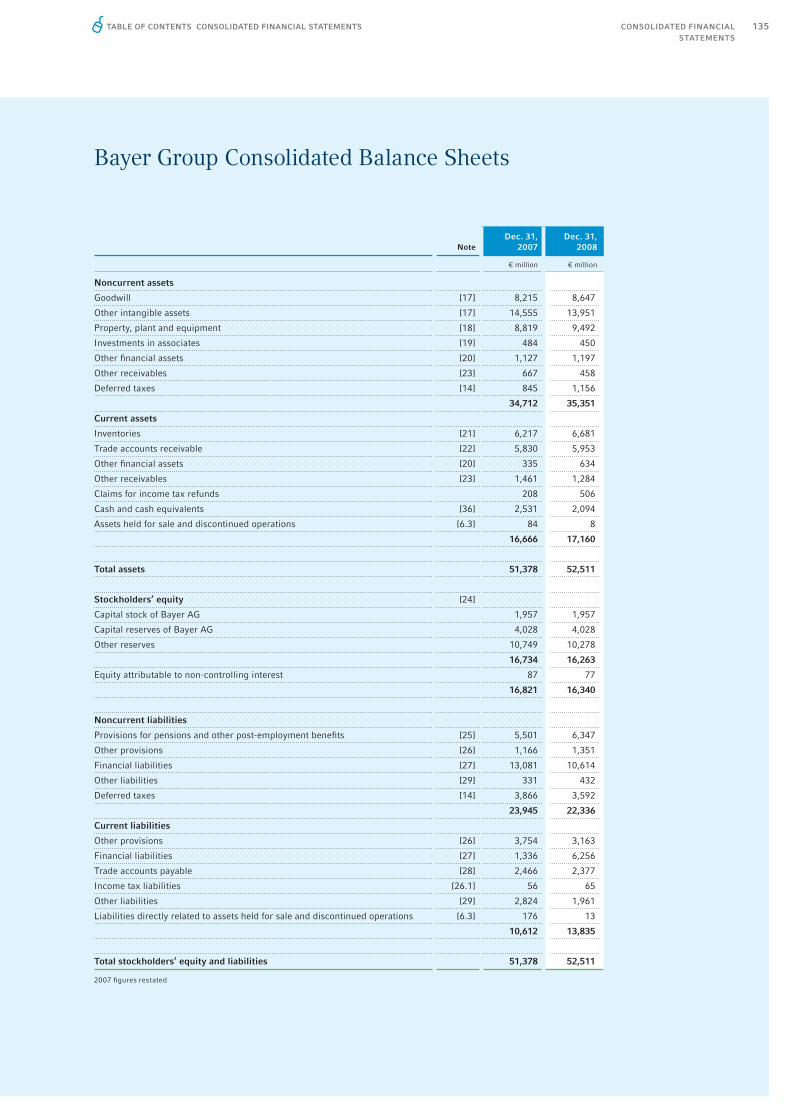
135CONSOLIDATED FINANCIALSTATEMENTS
TABLE OF CONTENTS CONSOLIDATED FINANCIAL STATEMENTS
Bayer Group Consolidated Balance Sheets
NoteDec. 31,
2007Dec. 31,
2008
€ million € million
Noncurrent assets
Goodwill [17] 8,215 8,647
Other intangible assets [17] 14,555 13,951
Property, plant and equipment [18] 8,819 9,492
Investments in associates [19] 484 450
Other fi nancial assets [20] 1,127 1,197
Other receivables [23] 667 458
Deferred taxes [14] 845 1,156
34,712 35,351
Current assets
Inventories [21] 6,217 6,681
Trade accounts receivable [22] 5,830 5,953
Other fi nancial assets [20] 335 634
Other receivables [23] 1,461 1,284
Claims for income tax refunds 208 506
Cash and cash equivalents [36] 2,531 2,094
Assets held for sale and discontinued operations [6.3] 84 8
16,666 17,160
Total assets 51,378 52,511
Stockholders‘ equity [24]
Capital stock of Bayer AG 1,957 1,957
Capital reserves of Bayer AG 4,028 4,028
Other reserves 10,749 10,278
16,734 16,263
Equity attributable to non-controlling interest 87 77
16,821 16,340
Noncurrent liabilities
Provisions for pensions and other post-employment benefi ts [25] 5,501 6,347
Other provisions [26] 1,166 1,351
Financial liabilities [27] 13,081 10,614
Other liabilities [29] 331 432
Deferred taxes [14] 3,866 3,592
23,945 22,336
Current liabilities
Other provisions [26] 3,754 3,163
Financial liabilities [27] 1,336 6,256
Trade accounts payable [28] 2,466 2,377
Income tax liabilities [26.1] 56 65
Other liabilities [29] 2,824 1,961
Liabilities directly related to assets held for sale and discontinued operations [6.3] 176 13
10,612 13,835
Total stockholders‘ equity and liabilities 51,378 52,511
2007 fi gures restated

136 / / BAYER ANNUAL REPORT 2008
Bayer Group Consolidated Statementsof Cash Flows
Note 2007 2008
€ million € million
Income from continuing operations after taxes 2,306 1,720
Income taxes (72) 636
Non-operating result 920 1,188
Income taxes paid or accrued (915) (812)
Depreciation and amortization 2,712 2,722
Change in pension provisions (369) (292)
(Gains) losses on retirements of noncurrent assets (13) (75)
Non-cash effects of the remeasurement of acquired assets (inventory work-down) 215 208
Gross cash fl ow 4,784 5,295
Decrease (increase) in inventories (347) (692)
Decrease (increase) in trade accounts receivable (183) (134)
(Decrease) increase in trade accounts payable 189 (36)
Changes in other working capital, other non-cash items (162) (825)
Net cash provided by (used in) operating activities (net cash fl ow), continuing operations [33] 4,281 3,608
Net cash provided by (used in) operating activities (net cash fl ow), discontinued operations
[6.3] 2 -
Net cash provided by (used in) operating activities (net cash fl ow) (total) 4,283 3,608
Cash outfl ows for additions to property, plant, equipment and intangible assets (1,860) (1,759)
Cash infl ows from sales of property, plant, equipment and other assets 165 167
Cash infl ows from (outfl ows for) divestitures 4,648 (41)
Cash infl ows from (outfl ows for) noncurrent fi nancial assets 70 (390)
Cash outfl ows for acquisitions less acquired cash (491) (1,617)
Interest and dividends received 636 553
Cash infl ows from (outfl ows for) current fi nancial assets 18 (2)
Net cash provided by (used in) investing activities (total) [34] 3,186 (3,089)
Capital contributions - -
Dividend payments and withholding tax on dividends (773) (1,126)
Issuances of debt 2,155 2,277
Retirements of debt (7,768) (752)
Interest paid (1,344) (1,272)
Net cash provided by (used in) fi nancing activities (total) [35] (7,730) (873)
Change in cash and cash equivalents due to business activities (total) (261) (354)
Cash and cash equivalents at beginning of year 2,915 2,531
Change in cash and cash equivalents due to changes in scope of consolidation (4) 3
Change in cash and cash equivalents due to exchange rate movements (119) (86)
Cash and cash equivalents at end of year [36] 2,531 2,094
TABLE OF CONTENTS CONSOLIDATED FINANCIAL STATEMENTS
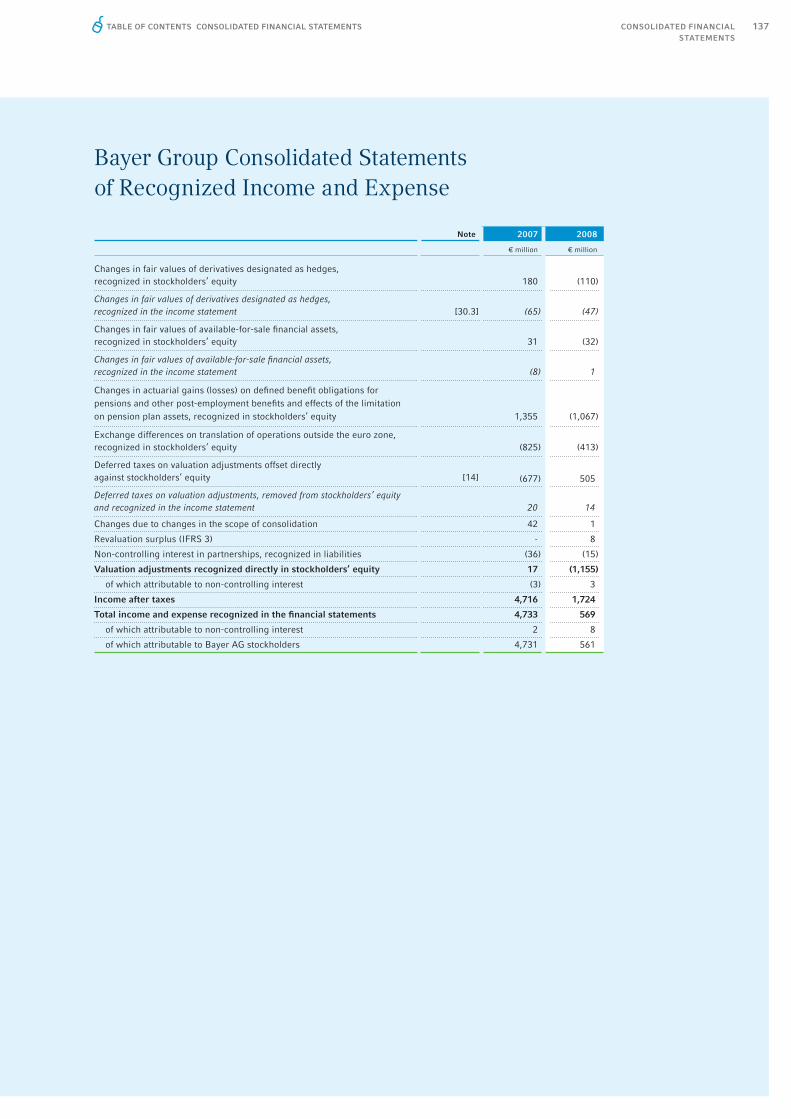
137
Bayer Group Consolidated Statementsof Recognized Income and Expense
Note 2007 2008
€ million € million
Changes in fair values of derivatives designated as hedges, recognized in stockholders’ equity 180 (110)
Changes in fair values of derivatives designated as hedges, recognized in the income statement [30.3] (65) (47)
Changes in fair values of available-for-sale fi nancial assets, recognized in stockholders’ equity 31 (32)
Changes in fair values of available-for-sale fi nancial assets, recognized in the income statement (8) 1
Changes in actuarial gains (losses) on defi ned benefi t obligations for pensions and other post-employment benefi ts and effects of the limitation on pension plan assets, recognized in stockholders’ equity 1,355 (1,067)
Exchange differences on translation of operations outside the euro zone, recognized in stockholders’ equity (825) (413)
Deferred taxes on valuation adjustments offset directly against stockholders’ equity [14] (677) 505
Deferred taxes on valuation adjustments, removed from stockholders’ equity and recognized in the income statement 20 14
Changes due to changes in the scope of consolidation 42 1
Revaluation surplus (IFRS 3) - 8
Non-controlling interest in partnerships, recognized in liabilities (36) (15)
Valuation adjustments recognized directly in stockholders’ equity 17 (1,155)
of which attributable to non-controlling interest (3) 3
Income after taxes 4,716 1,724
Total income and expense recognized in the fi nancial statements 4,733 569
of which attributable to non-controlling interest 2 8
of which attributable to Bayer AG stockholders 4,731 561
CONSOLIDATED FINANCIALSTATEMENTS
TABLE OF CONTENTS CONSOLIDATED FINANCIAL STATEMENTS

138 / / BAYER ANNUAL REPORT 2008
Notes to the Consolidated Financial Statements of the Bayer Group
1. Key data by segment and region
HealthCare
Pharmaceuticals Consumer Health
Segments 2007 2008 2007 2008
€ million € million € million € million
Net sales (external) 10,267 10,704 4,540 4,703
Change + 37.3% + 4.3% + 6.9% + 3.6%
Currency-adjusted change + 41.1% + 7.4% + 11.5% + 8.3%
Intersegment sales 97 75 11 6
Net sales 10,364 10,779 4,551 4,709
Other operating income 322 219 49 39
Operating result [EBIT] 741 1,294 823 887
Gross cash fl ow 1,685 2,220 704 825
Capital invested 17,885 18,977 3,601 4,296
CFROI 9.3% 12.0% 19.9% 20.9%
Net cash fl ow 1,451 1,627 559 632
Equity-method income (loss) - - - -
Equity-method investments - - - -
Assets 23,119 23,694 4,102 4,829
Capital expenditures 359 451 234 159
Depreciation, amortization and write-downs 1,367 1,363 134 148
of which write-downs 242 121 - -
Liabilities 2,823 4,012 1,128 1,289
Research and development expenses 1,518 1,540 182 202
Number of employees (as of Dec. 31) 39,300 39,200 12,200 13,900
Europe North America
Regions 2007 2008 2007 2008
€ million € million € million € million
Net sales (external) – by market 14,353 14,549 8,161 8,026
Change + 13.4% + 1.4% + 4.9% – 1.7%
Currency-adjusted change + 13.5% + 2.1% + 13.6% + 5.3%
Net sales (external) – by point of origin 15,575 15,845 8,197 7,985
Change + 13.7% + 1.7% + 5.4% – 2.6%
Currency-adjusted change + 13.8% + 2.4% + 14.4% + 4.4%
Interregional sales 5,472 5,902 2,138 1,923
Other operating income 508 920 138 116
Operating result [EBIT] 1,947 2,230 798 914
Assets 34,002 33,180 9,066 9,637
Capital expenditures 709 945 489 385
Depreciation, amortization and write-downs 1,957 1,995 467 403
Liabilities 22,246 22,640 4,274 4,945
Research and development expenses 1,836 2,014 581 459
Number of employees (as of Dec. 31) 56,200 55,500 16,800 17,000
TABLE OF CONTENTS CONSOLIDATED FINANCIAL STATEMENTS
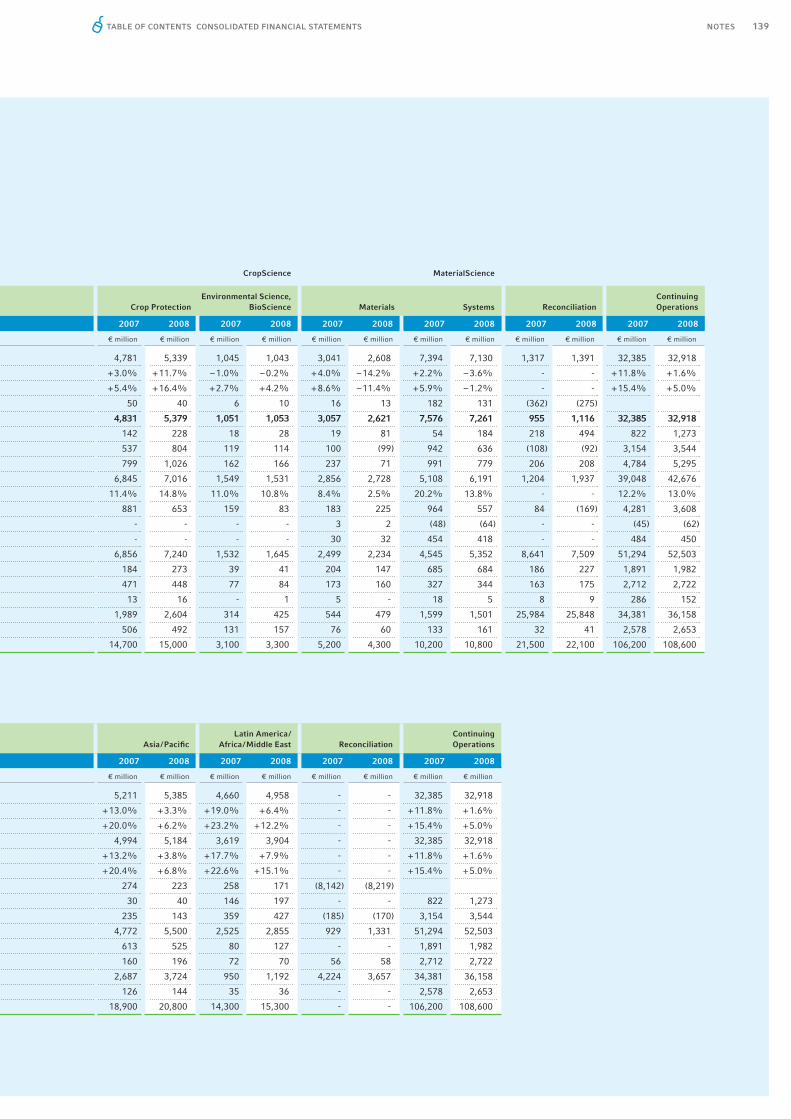
139NOTES
CropScience MaterialScience
Crop ProtectionEnvironmental Science,
BioScience Materials Systems ReconciliationContinuing Operations
2007 2008 2007 2008 2007 2008 2007 2008 2007 2008 2007 2008
€ million € million € million € million € million € million € million € million € million € million € million € million
4,781 5,339 1,045 1,043 3,041 2,608 7,394 7,130 1,317 1,391 32,385 32,918
+ 3.0% + 11.7% – 1.0% – 0.2% + 4.0% – 14.2% + 2.2% – 3.6% - - + 11.8% + 1.6%
+ 5.4% + 16.4% + 2.7% + 4.2% + 8.6% – 11.4% + 5.9% – 1.2% - - + 15.4% + 5.0%
50 40 6 10 16 13 182 131 (362) (275)
4,831 5,379 1,051 1,053 3,057 2,621 7,576 7,261 955 1,116 32,385 32,918
142 228 18 28 19 81 54 184 218 494 822 1,273
537 804 119 114 100 (99) 942 636 (108) (92) 3,154 3,544
799 1,026 162 166 237 71 991 779 206 208 4,784 5,295
6,845 7,016 1,549 1,531 2,856 2,728 5,108 6,191 1,204 1,937 39,048 42,676
11.4% 14.8% 11.0% 10.8% 8.4% 2.5% 20.2% 13.8% - - 12.2% 13.0%
881 653 159 83 183 225 964 557 84 (169) 4,281 3,608
- - - - 3 2 (48) (64) - - (45) (62)
- - - - 30 32 454 418 - - 484 450
6,856 7,240 1,532 1,645 2,499 2,234 4,545 5,352 8,641 7,509 51,294 52,503
184 273 39 41 204 147 685 684 186 227 1,891 1,982
471 448 77 84 173 160 327 344 163 175 2,712 2,722
13 16 - 1 5 - 18 5 8 9 286 152
1,989 2,604 314 425 544 479 1,599 1,501 25,984 25,848 34,381 36,158
506 492 131 157 76 60 133 161 32 41 2,578 2,653
14,700 15,000 3,100 3,300 5,200 4,300 10,200 10,800 21,500 22,100 106,200 108,600
Asia / Pacifi cLatin America /
Africa / Middle East ReconciliationContinuing Operations
2007 2008 2007 2008 2007 2008 2007 2008
€ million € million € million € million € million € million € million € million
5,211 5,385 4,660 4,958 - - 32,385 32,918
+ 13.0% + 3.3% + 19.0% + 6.4% - - + 11.8% + 1.6%
+ 20.0% + 6.2% + 23.2% + 12.2% - - + 15.4% + 5.0%
4,994 5,184 3,619 3,904 - - 32,385 32,918
+ 13.2% + 3.8% + 17.7% + 7.9% - - + 11.8% + 1.6%
+ 20.4% + 6.8% + 22.6% + 15.1% - - + 15.4% + 5.0%
274 223 258 171 (8,142) (8,219)
30 40 146 197 - - 822 1,273
235 143 359 427 (185) (170) 3,154 3,544
4,772 5,500 2,525 2,855 929 1,331 51,294 52,503
613 525 80 127 - - 1,891 1,982
160 196 72 70 56 58 2,712 2,722
2,687 3,724 950 1,192 4,224 3,657 34,381 36,158
126 144 35 36 - - 2,578 2,653
18,900 20,800 14,300 15,300 - - 106,200 108,600
TABLE OF CONTENTS CONSOLIDATED FINANCIAL STATEMENTS

140 / / BAYER ANNUAL REPORT 2008 TABLE OF CONTENTS CONSOLIDATED FINANCIAL STATEMENTS
2. General information
The consolidated fi nancial statements of the Bayer Group as of December 31, 2008 have been prepared – pursuant to Article 315a of the German Commercial Code – according to the Interna-tional Financial Reporting Standards (ifrs) of the International Accounting Standards Board (iasb), London, and the interpretations of the International Financial Reporting Interpretations Committee (ifric), which are endorsed by the European Union, in effect at the closing date.
Bayer Aktiengesellschaft (Bayer AG) is a global enterprise based in Germany. Its material busi-ness activities in the fi elds of health care, nutrition and high-tech materials take place in the Bayer HealthCare, Bayer CropScience and Bayer MaterialScience subgroups, respectively. The activities of the various segments are outlined in Note [5].
A Declaration of Conformity with the German Corporate Governance Code has been issued pur-suant to Section 161 of the German Stock Corporation Act and made available to stockholders.
The Board of Management of Bayer AG prepared the consolidated fi nancial statements of the Bayer Group on February 17 and 24, 2009. The Audit Committee of the Supervisory Board of Bayer AG discussed the consolidated fi nancial statements of the Bayer Group at its meeting on February 26, 2009 and the Supervisory Board approved them at its meeting on February 27, 2009.
The consolidated fi nancial statements of the Bayer Group are drawn up in euros. Amounts are stated in millions of euros (€ million) except where otherwise indicated. The fi nancial state-ments of the individual consolidated companies are prepared as of the closing date for the Group statements.
In the income statement, balance sheet, cash fl ow statement and statement of recognized income and expense, certain items are combined for the sake of clarity. These are explained in the Notes. The income statement is prepared using the cost-of-sales method. Assets and liabilities are classifi ed by maturity. They are regarded as current if they mature within one year or within the normal business cycle of the company or the Group, or are held for sale. The normal busi-ness cycle is defi ned for this purpose as beginning with the procurement of the resources neces-sary for the production process and ending with the receipt of cash or cash equivalents as con-sideration for the sale of the goods or services produced in that process. Trade accounts receiv -able and payable, claims for tax refunds, tax liabilities and inventories are always presented as current items, deferred tax assets and liabilities and pension provisions as noncurrent items.
In compliance with ifrs 5 (Non-current Assets Held for Sale and Discontinued Operations), a distinction is made between continuing operations and discontinued operations or assets held for sale. The discontinued operations are recognized as separate line items in the income state-ment, balance sheet and cash fl ow statement. Depreciation of noncurrent assets allocable to dis-continued operations and of assets held for sale ceased when the respective divestiture was an-nounced. All data in these Notes refer to continuing operations, except where otherwise indi-cated. Discontinued operations are described in Note [6.3].
Changes in recognition and valuation principles are explained in the Notes. The retrospective application of new or revised standards requires – except as otherwise provided in the respec-tive standard – that earnings for the preceding year and the opening balance sheet for the re-porting year be restated as if the new recognition and valuation principles had been applied in the past.

141NOTESTABLE OF CONTENTS CONSOLIDATED FINANCIAL STATEMENTS
3. Effects of new accounting pronouncements
Accounting standards applied for the fi rst time in 2008In 2008, the following accounting standards and interpretations were applied for the fi rst time. None of the new standards had a material impact on the presentation of the Group’s fi nancial position or results of operations, or on earnings per share.
In October and November 2008 the iasb published amendments to ias 39 (Financial Instru-ments: Recognition and Measurement) and ifrs 7 (Financial Instruments: Disclosures). The pur-pose of these amendments is to permit companies to reclassify certain fi nancial assets that are held for trading from the “fair value through profi t or loss” category to a different category in exceptional circumstances, and also to allow available-for-sale fi nancial assets to be reclassifi ed to loans and receivables if they meet the applicable recognition criteria. The Bayer Group did not reclassify any assets as a result of these amendments in 2008.
ifric 11 (ifrs 2 – Group and Treasury Share Transactions), endorsed by the European Union in June 2007, states that share-based payment for goods or services received (as from employees) must be accounted for as equity-settled regardless of whether the enterprise acquires the nec-essary equity instruments voluntarily or is forced to do so. ifric 11 also specifi es the account-ing treatment of the issuance of equity instruments in the parent company to employees of a subsidiary.
ifric 12 (Service Concession Arrangements), published in November 2006, addresses the recog-nition of service agreements between public-sector entities and private companies for the opera-tion of public infrastructure such as swimming pools, freeways, electric and water utilities by private licensees.
In July 2007, the ifric issued ifric 14 (ias 19 – The Limit on a Defi ned Benefi t Asset, Minimum Funding Requirements and their Interaction) dealing with accounting for plan assets that ex-ceed pension obligations. This interpretation provides details of how to determine the economic benefi t of such assets to the enterprise. It also sets out specifi c rules on accounting for plan as-sets in light of statutory minimum funding requirements.
Published accounting standards that have not yet been appliedIn November 2006, the iasb published ifrs 8 (Operating Segments), which will replace ias 14 (Segment Reporting), the existing standard in this fi eld. Under ifrs 8, segment reporting must be based on the information used internally by management to identify operating segments and to evaluate their performance. ifrs 8 is to be applied for the fi rst time for annual periods begin-ning on or after January 1, 2009. The application of ifrs 8 will not have a material impact on the presentation of our segment reporting.
In March 2007, the iasb issued amendments to ias 23 (Borrowing Costs) requiring the capital-ization of interest on borrowings made to acquire, construct or produce a qualifying asset. The amendments are to be applied for annual periods beginning on or after January 1, 2009. Since the option to capitalize interest on borrowed capital that is directly attributable to qualifying as-sets was already utilized in the past, the amendments will have no impact on the consolidated fi nancial statements of the Bayer Group.

142 / / BAYER ANNUAL REPORT 2008 TABLE OF CONTENTS CONSOLIDATED FINANCIAL STATEMENTS
In September 2007, the iasb issued amendments to ias 1 (Presentation of Financial Statements). Apart from proposing the renaming of certain sections of the fi nancial statements, these amend-ments mandate that in certain circumstances an opening balance sheet for the previous fi nan-cial year be published along with a separate presentation of changes in equity arising from transactions with owners and with non-owners, and that the income tax effects of such transac-tions also be disclosed separately by component in the statement of recognized income and ex-pense. The amendments are to be applied for the fi rst time for annual periods beginning on or after January 1, 2009. They will not have a material impact on the presentation of the Group’s fi nancial position or results of operations.
In January 2008 the iasb published amendments to ifrs 2 (Share-based Payment) to clarify the defi nition of vesting conditions (exercisability) and cancellation of share-based payment. The revised standard is to be applied for the fi rst time for annual periods beginning on or after Janu-ary 1, 2009. The change will not have a material impact on the presentation of the Group’s fi nancial position or results of operations.
In January 2008, the iasb published the revised standards ifrs 3 (Business Combinations) and ias 27 (Consolidated and Separate Financial Statements). Signifi cant changes required by ifrs 3 (revised 2008) include:
In future, a non-controlling interest may be measured either at fair value (i.e. including good-will) or at the proportionate share of the identifi able net assets of the entity in which the non-controlling interest is held. In the case of a step acquisition, the acquirer must remeasure its previously held interest at fair value on the date on which it gains control of the acquiree and recognize the resulting gain or loss in income. The difference between the (remeasured) carrying amount of the in-terest in the subsidiary and the acquirer’s remeasured proportionate share of the net assets of the subsidiary must be recognized as goodwill. Liabilities recognized as of the acquisition date for the purpose of future purchase price ad-justments in light of future events can no longer be offset against goodwill in subsequent periods. Ancillary acquisition costs must be recognized in income.
The principal changes required by ias 27 (revised 2008) are:
A reduction in the equity interest held in a subsidiary that does not result in a loss of control by the parent is now to be accounted for as an equity transaction. If a reduction in the equity interest held in a subsidiary involves a loss of control, the assets and liabilities of the subsidiary must be derecognized in their entirety. The remaining inter-est in the company is to be recognized at fair value. The difference between the remaining carrying amounts and the fair values must be recognized in income. Non-controlling interests that become negative due to incurred losses must be recognized at their net negative amounts.
ifrs 3 (revised 2008) and ias 27 (revised 2008) are applicable prospectively for annual periods beginning on or after July 1, 2009. Earlier application is permitted provided that both revised standards are applied simultaneously. The impact on the presentation of the Group’s fi nancial position and results of operations will depend on the scale of future business combinations or divestments. The revised standards have not yet been endorsed by the European Union.
In February 2008, the iasb issued amendments to ias 32 (Financial Instruments: Presentation) and ias 1 (Presentation of Financial Statements). These refer particularly to the distinction be-tween equity and debt in accounting for company capital to which cancellation rights are at-tached (puttable fi nancial instruments). Puttable fi nancial instruments previously had to be
•
•
•
•
•
•
•

143NOTESTABLE OF CONTENTS CONSOLIDATED FINANCIAL STATEMENTS
classifi ed as a liability, whereas in the future such cancellable instruments are to be classifi ed as equity in certain circumstances. The amendments are to be applied for the fi rst time for an-nual periods beginning on or after January 1, 2009. Their application will not have a material impact on the presentation of the Group’s fi nancial position or results of operations.
In May 2008 the iasb published amendments – mainly of a terminological or editorial nature – to a number of International Financial Reporting Standards as part of its “Annual Improve-ments” project. The amendments are to be applied for the fi rst time for annual periods begin-ning on or after January 1, 2009. They are not expected to have a material impact on the presentation of the Group’s fi nancial position or results of operations.
In July 2008 the iasb published amendments to ias 39 (Financial Instruments: Recognition and Measurement) to clarify the circumstances in which a hedged risk or portion of cash fl ows is eli-gible for hedge accounting. It deals with one-sided risk hedging using options and with infl ation hedging. The amendments are to be applied for the fi rst time for annual periods beginning on or after July 1, 2009. They have not yet been endorsed by the European Union.
In June 2007 the ifric issued ifric 13 (Customer Loyalty Programmes), which addresses both revenue and expense recognition relating to “award credits” that are provided to customers as purchase incentives and can be exchanged for free or discounted goods or services in the fu-ture. This interpretation is to be applied for annual periods beginning on or after July 1, 2008. The application of ifric 13 to customer loyalty programs is not expected to have a material im-pact since the Bayer Group makes little use of such programs.
In July 2008 the ifric adopted ifric 15 (Agreements for the Construction of Real Estate), which addresses revenue recognition for real estate sold before completion. The interpretation defi nes the criteria for deciding whether ias 11 (Construction Contracts) or ias 18 (Revenue) is appli-cable. It is applicable for annual periods beginning on or after January 1, 2009. It has not yet been endorsed by the European Union. ifric 15 will not have a material impact on the presen-tation of the Group’s fi nancial position or results of operations.
In July 2008 ifric 16 (Hedges of a Net Investment in a Foreign Operation) was issued. It defi nes the risk to which hedge accounting may be applied in this context and which entity or entities within a group may hold the respective hedging instrument. This interpretation is to be applied for annual periods beginning on or after October 1, 2008. It has not yet been endorsed by the European Union. ifric 16 is not expected to have a material impact on the presentation of the Group’s fi nancial position or results of operations as the Group so far has not hedged net invest-ments in foreign operations.
In November 2008 ifric 17 (Distributions of Non-cash Assets to Owners) was published. This in-terpretation defi nes when an obligation to distribute a non-cash dividend is to be recognized, that it must be measured at fair value, and that the difference between the dividend paid and the carrying amount of the net assets distributed must be recognized in profi t or loss at the distribu-tion date. This interpretation, which is to be applied prospectively for annual periods beginning on or after July 1, 2009, has not yet been endorsed by the European Union. It is not expected to have a material impact on the presentation of the Group’s future fi nancial position or results of operations.

144 / / BAYER ANNUAL REPORT 2008 TABLE OF CONTENTS CONSOLIDATED FINANCIAL STATEMENTS
In January 2009 the ifric issued ifric 18 (Transfers of Assets from Customers). This interpreta-tion relates to agreements in which an entity receives from a customer an item of property, plant and equipment – or cash earmarked exclusively for its acquisition or construction – that the enti-ty must then use either to connect the customer to a network or to provide the customer with on-going access to a supply of goods or services. The interpretation specifi es the circumstances and timing of asset recognition by the receiving entity and how the asset is to be measured. It also clarifi es how to determine the receiving entity’s obligation to render one or more separately identifi able services in exchange for the transferred asset and sets forth the conditions for reve-nue recognition. ifric 18 is to be applied prospectively to transfers of assets from customers on or after July 1, 2009. Earlier application is permitted on certain conditions. It has not yet been endorsed by the European Union. The Bayer Group is currently evaluating the impact that the application of the interpretation may have on the presentation of the Group’s fi nancial position or results of operations.
4. Basic principles, methods and critical accounting policies
The fi nancial statements of the consolidated companies are prepared according to uniform ac-counting and valuation principles.
The consolidated fi nancial statements of the Group are based on the principle of the historical cost of acquisition, construction or production, with the exception of the items refl ected at fair value, such as available-for-sale fi nancial assets and derivatives.
The preparation of the fi nancial statements for the Bayer Group requires the use of estimates and assumptions that affect the classifi cation and measurement of assets, liabilities, income, ex-penses and contingent liabilities. Estimates and assumptions mainly relate to the useful life of noncurrent assets, the discounted cash fl ows used for impairment testing or purchase price allo-cations, and the recognition of provisions, including those for litigation-related expenses, pen-sions and other benefi ts, taxes, environmental compliance and remediation costs, sales allow-ances, product liability and guarantees. Essential estimates and assumptions that may affect reporting in the various item categories of the fi nancial statements are described in the follow-ing sections of this Note. Estimates are based on historical experience and other assumptions that are considered reasonable under given circumstances. They are continually reviewed but may vary from the actual values.
ConsolidationProfi ts and losses, sales revenues, and income and expenses arising from transactions among the consolidated companies, along with receivables and payables existing between them, are eliminated. Deferred income tax effects are refl ected in consolidation.
Joint ventures are included by proportionate consolidation according to the same principles.
Capital consolidation is performed according to ias 27 (Consolidated and Separate Financial Statements) by offsetting the carrying amounts of subsidiaries in the balance sheet against their underlying equity. Equity of subsidiaries is valued at the respective acquisition dates, recogniz-ing identifi able assets and liabilities (including contingent liabilities) at their fair values along with attributable deferred tax assets and liabilities. Any remaining difference to the purchase price is recognized as goodwill.

145NOTESTABLE OF CONTENTS CONSOLIDATED FINANCIAL STATEMENTS
The cost of acquisition of a company included at equity in the consolidated fi nancial statements is adjusted annually by a percentage of any change in its stockholders’ equity corresponding to Bayer’s percentage interest in the company. Differences arising upon fi rst-time inclusion at equi-ty are accounted for according to full-consolidation principles. Bayer’s share of changes in these companies’ stockholders’ equities that are recognized in their income statements – including write-downs of goodwill – are recognized in the non-operating result. Intercompany profi ts and losses for these companies were not material in either 2008 or 2007.
Foreign currency translationIn the fi nancial statements of the individual consolidated companies, all receivables and pay-ables in currencies other than the respective functional currency are translated at closing rates, irrespective of whether they are exchange-hedged. Exchange rate differences from valuation of balances in foreign currencies are recognized in income. Derivatives are stated at fair value. The majority of consolidated companies autonomously carry out their activities fi nancially, economi-cally and organizationally and their functional currencies are therefore the respective local cur-rencies.
The assets and liabilities of foreign companies at the start and end of the year are translated into euros at closing rates. All changes occurring during the year and all income and expense items and cash fl ows are translated into euros at average rates for the year. Components of stockhold-ers’ equity are translated at the historical exchange rates prevailing at the respective dates of their fi rst-time recognition in Group equity.
The differences between the resulting amounts and those obtained by translating at closing rates are refl ected in other comprehensive income and stated separately in the tables in the Notes under “Exchange differences on translation of operations outside the euro zone” or “Ex-change differences.” When a company is deconsolidated, exchange differences recognized in stockholders’ equity are removed from equity and recognized in the income statement.
The exchange rates for major currencies against the euro varied as follows:
Net sales and other operating incomeRevenues from the sale of products and the rendering of services are recognized when the sig-nifi cant risks and rewards of ownership of the goods have been transferred to the customer, the company retains neither continuing managerial involvement to the degree usually associated with ownership nor effective control over the goods sold, the amount of revenue and costs in-curred or to be incurred can be measured reliably, and it is suffi ciently probable that the eco-nomic benefi ts associated with the transaction will fl ow to the company.
Closing rate Average rate
2007 2008 2007 2008
ARS Argentina 4.64 4.80 4.27 4.64
BRL Brazil 2.61 3.25 2.67 2.67
CAD Canada 1.44 1.70 1.47 1.56
CHF Switzerland 1.65 1.49 1.64 1.59
CNY China 10.75 9.50 10.42 10.23
GBP U.K. 0.73 0.95 0.68 0.80
JPY Japan 164.93 126.14 161.23 152.37
MXN Mexico 16.08 19.23 14.97 16.31
USD United States 1.47 1.39 1.37 1.47

146 / / BAYER ANNUAL REPORT 2008 TABLE OF CONTENTS CONSOLIDATED FINANCIAL STATEMENTS
Sales are stated net of sales taxes, other taxes and sales deductions at the fair value of the con-sideration received or to be received. Sales deductions are estimated amounts for rebates, cash discounts and product returns. They are deducted at the time the sales are recognized, and ap-propriate provisions are recorded. Sales deductions are estimated primarily on the basis of his-torical experience, specifi c contractual terms and future expectations of sales development in each strategic business entity. It is unlikely that estimation parameters other than these could affect sales deductions in a way that would be material to the Bayer Group’s business operations. Adjustments to provisions for rebates, cash discounts or returns for sales made in prior periods were of secondary importance for income before income taxes in the years under report.
Provisions for rebates in 2008 amounted to 1.4% of total net sales, as in the previous year. In ad-dition to rebates, Group companies offer cash discounts for prompt payment in some countries. Provisions for cash discounts as of December 31, 2008 and December 31, 2007 were less than 0.1% of total net sales for the respective year.
Sales are reduced for expected returns of defective goods or in respect of contractual arrange-ments to return saleable products on the date of sale or at the time when the amount of future returns can be reasonably estimated. Provisions for product returns as of December 31, 2008 were 0.2% of total net sales for the year (December 31, 2007: 0.3%). If future product returns cannot be reasonably estimated and are signifi cant to the sale transaction, the revenues and the related cost of sales are deferred until an estimate may reasonably be made or when the right to return the goods has expired.
Some of the Bayer Group’s revenues are generated on the basis of licensing agreements under which third parties are granted rights to its products and technologies. Payments relating to the sale or outlicensing of technologies or technological expertise – once the respective agreements have become effective – are recognized in income if all rights relating to the technologies and all obligations resulting from them have been relinquished under the contract terms and Bayer has no continuing obligation to perform under the agreement. However, if rights to the technolo-gies continue to exist or obligations resulting from them have yet to be fulfi lled, the payments received are recorded accordingly. Upfront payments and similar non-refundable payments re-ceived under these agreements are recorded as other liabilities and recognized in income over the estimated performance period stipulated in the agreement.
License or research and development collaboration agreements may consist of multiple elements and provide for varying consideration terms, such as upfront payments and milestone or similar payments. They therefore have to be assessed to determine whether separate delivery of the in-dividual elements of such arrangements requires more than one unit of account. The delivered elements are separated if they have value to the customer on a stand-alone basis, there is objec-tive and reliable evidence of the fair value of the undelivered element(s) and the arrangement in-cludes a general right of return relative to the delivered element(s) and delivery or performance of the as yet undelivered element(s) is probable and substantially within the control of the com-pany. If all three criteria are fulfi lled, the appropriate revenue recognition rule is then applied to each separate accounting unit.
Research and development expensesA substantial proportion of the Bayer Group’s fi nancial resources is invested in research and de-velopment. In addition to in-house research and development activities, especially in the health care business, various research and development collaborations and alliances are maintained with third parties involving the provision of funding and / or payments for the achievement of performance milestones.

147NOTESTABLE OF CONTENTS CONSOLIDATED FINANCIAL STATEMENTS
For accounting purposes, research expenses are defi ned as costs incurred for current or plan-ned investigations undertaken with the prospect of gaining new scientifi c or technical knowl-edge and understanding. Development expenses are defi ned as costs incurred for the applica-tion of research fi ndings or specialist knowledge to production, production methods, services or goods prior to the commencement of commercial production or use.
According to ias 38 (Intangible Assets), research costs cannot be capitalized; development costs must be capitalized if, and only if, specifi c, narrowly defi ned conditions are fulfi lled. Develop-ment costs must be capitalized if it is suffi ciently certain that the future economic benefi ts to the company will also cover the respective development costs. Since development projects are often subject to regulatory approval procedures and other uncertainties, the conditions for the capital-ization of costs incurred before receipt of approvals are not normally satisfi ed.
The following costs in particular, by their very nature, constitute research and development ex-penses: the appropriate allocations of direct personnel and material costs and related overheads for application technology, engineering and other departments; costs for experimental and pilot facilities; costs for services purchased in connection with research and development activities; costs for clinical research; costs for the utilization of third parties’ patents for research and de-velopment purposes; other taxes related to research facilities; and fees for the fi ling and regis-tration of internally generated patents that are not capitalized.
Under ias 38 (Intangible Assets), milestone payments must initially be capitalized to the extent that they are related to the acquisition of the related technology rights, even if uncertainties exist as to whether the research and development will ultimately be successful in producing a saleable product. Where research and development collaborations are embedded in contracts for a strategic alliance, it is necessary to assess whether milestone or advance payments constitute funding of research and development work or consideration for the acquisition of assets. Factors considered in reaching this determination are the reason for the payment (for example, whether it is related to a regulatory approval, the attainment of a sales target or outsourced research and development activities), and the ratio of the fair value of the planned research and development activities to the total amount of the payment.
Goodwill and other intangible assetsIntangible assets are recognized at the cost of acquisition or generation. Those with a determin-able useful life are amortized accordingly over a period of up to 30 years, except where their ac-tual depletion demands a different amortization pattern. Determination of the expected useful lives of such assets and of amortization patterns is based on estimates of the period for which they will generate cash fl ows and the distribution of those cash fl ows over time.
Write-downs are made for impairment losses. Corresponding write-backs are made where the reasons for previous write-downs of intangible assets other than goodwill no longer apply, pro-vided that the write-backs do not cause the carrying amount to exceed the amortized cost of acquisition.
Goodwill and other assets with an indefi nite life are subject to annual impairment tests, which are explained under “Procedure used in global impairment testing and its impact.”

148 / / BAYER ANNUAL REPORT 2008 TABLE OF CONTENTS CONSOLIDATED FINANCIAL STATEMENTS
Property, plant and equipmentProperty, plant and equipment is carried at the cost of acquisition or construction depreciated over its estimated useful life. A write-down (impairment loss) is recognized in addition if an as-set’s value falls below the depreciated cost of acquisition or construction.
The cost of acquisition comprises the acquisition price plus ancillary and subsequent acquisi-tion costs, less any reduction received on the acquisition price. The cost of self-constructed prop-erty, plant and equipment comprises the direct cost of materials, direct manufacturing expenses and appropriate allocations of material and manufacturing overheads. Where an obligation ex-ists to dismantle or remove an asset or restore a site to its former condition at the end of its use-ful life, the present value of the related future payments is capitalized along with the cost of ac-quisition or construction upon completion and a corresponding liability is recognized.
If the construction phase of property, plant or equipment extends over a long period, the interest incurred on borrowed capital up to the date of completion is capitalized as part of the cost of ac-quisition or construction in accordance with ias 23 (Borrowing Costs).
Expenses for the repair of property, plant and equipment, such as ongoing maintenance costs, are normally recognized in income. The cost of acquisition or construction is capitalized if a re-pair (such as a complete overhaul of technical equipment) will result in future economic benefi ts.
Property, plant and equipment is depreciated by the straight-line method, except where depreci-ation based on actual depletion is more appropriate.
The following depreciation periods, based on the estimated useful lives of the respective assets, are applied throughout the Group:
Declines in value that go beyond regular depreciation and are expected to be permanent are ac-counted for by write-downs. Corresponding write-backs are made where the reasons for previ-ous write-downs no longer apply, provided that the write-backs do not cause the carrying amount to exceed the cost of acquisition less accumulated depreciation.
When assets are sold, closed down or scrapped, the difference between the net proceeds and the carrying amount of the assets is recognized as a gain or loss in other operating income or ex-penses, respectively.
Buildings 20 to 50 years
Outdoor infrastructure 10 to 20 years
Storage tanks and pipelines 10 to 20 years
Plant installations 6 to 20 years
Machinery and equipment 6 to 12 years
Furniture and fi xtures 4 to 10 years
Vehicles 4 to 8 years
Computer equipment 3 to 5 years
Laboratory and research facilities 3 to 5 years

149NOTESTABLE OF CONTENTS CONSOLIDATED FINANCIAL STATEMENTS
LeasingA lease is an agreement whereby the lessor assigns to the lessee the right to use an asset for an agreed period of time in return for a payment or series of payments. Leases are classifi ed as ei-ther fi nance or operating leases. Leasing transactions that transfer substantially all the risks and rewards incidental to ownership of the leased asset to the lessee are classifi ed as fi nance leases. All other leasing agreements are classifi ed as operating leases.
Where the Bayer Group is the lessee in a fi nance lease, the leased asset is capitalized at the low-er of the fair value or present value of the minimum lease payments at the beginning of the lease term and simultaneously recognized under fi nancial liabilities. The minimum lease payments essentially comprise fi nancing costs and the principal portion of the remaining obligation. The leased asset is depreciated by the straight-line method. If subsequent transfer of title to the leased asset is uncertain, it is depreciated over the shorter of its estimated useful life or the lease term. The lease payments to be made are divided into the principal portion and the interest ex-pense using the effective-interest method.
Where the Bayer Group is the lessor in a fi nance lease, the net investment in the lease is refl ect-ed in sales and a leasing receivable is recognized. The lease payments received are divided into the principal portion and the interest income using the effective-interest method.
Where the Bayer Group is the lessee in an operating lease, the lease payments are expensed. Where it is the lessor, the lease payments received are recognized in income. The leased asset remains on the balance sheet of the lessor.
Financial AssetsFinancial assets comprise loans and receivables, acquired equity and debt instruments, cash and cash equivalents, and derivatives with positive fair values.
They are recognized and measured in accordance with ias 39 (Financial Instruments: Recogni-tion and Measurement). Accordingly, fi nancial assets are recognized in the consolidated fi nan-cial statements if the Bayer Group has a contractual right to receive cash or other fi nancial as-sets from another entity. Regular way purchases and sales of fi nancial assets are generally posted on the settlement date. Financial assets are initially recognized at fair value plus trans-action costs. The transaction costs incurred for the purchase of fi nancial assets held at fair value through profi t or loss are expensed immediately. Interest-free or low-interest receivables are initially refl ected at the present value of the expected future cash fl ows. For purposes of subse-quent measurement, fi nancial assets are allocated to the following categories according to ias 39, with different measurement rules applying to each category:
Financial assets held at fair value through profi t or loss comprise those fi nancial assets that are held for trading. This category also comprises receivables from forward commodity contracts and receivables from other derivatives, which are included in other fi nancial assets, except where hedge accounting is used. Changes in the fair value of fi nancial assets in this category are recognized in the income statement when the increase or decrease in value occurs.

150 / / BAYER ANNUAL REPORT 2008 TABLE OF CONTENTS CONSOLIDATED FINANCIAL STATEMENTS
Loans and receivables are non-derivative fi nancial assets that are not quoted in an active market. They are carried at amortized cost. This category comprises trade accounts receivable, the fi nan-cial receivables and loans included in other fi nancial assets, the additional fi nancial receivables and loans refl ected in other receivables, and cash and cash equivalents. Interest income from items assigned to this category is determined using the effective interest method, insofar as such items are not classifi ed as current receivables and the effect of discounting interest is not material.
Held-to-maturity fi nancial assets are non-derivative fi nancial assets, with fi xed or determinable payments, that are to be held to maturity. They are accounted for at amortized cost by the effec-tive-interest method. Held-to-maturity fi nancial investments are recognized in other fi nancial assets.
Available-for-sale fi nancial assets are those non-derivative fi nancial assets that are not assigned to any of the above categories. They mainly include equity instruments, such as shares, and debt instruments not to be held to maturity, which are included in other fi nancial assets. Changes in the fair value of available-for-sale fi nancial assets are recognized in stockholders’ equity. Im-pairments are not recognized in income until the assets are sold, except where the fair value is substantially below the amortized cost and / or remains below the amortized cost for a prolonged period. Where possible, a fair value for equity and debt securities is derived from market data. Financial assets for which no market price is available and whose fair value cannot be reliably estimated are carried at cost less impairment charges.
If there are substantial, objective indications that loans and receivables, held-to-maturity fi nan-cial assets or available-for-sale fi nancial assets are impaired, their carrying amount is compared to the present value of the expected future cash fl ows, discounted by the current market rate of return on a comparable fi nancial asset. If an impairment is confi rmed, they are written down by the difference between the two amounts. Indications of impairment include the fact that a com-pany has been making an operating loss for several years, a reduction in market value, a signifi -cant deterioration in credit standing, a material breach of contract, a high probability of insol-vency or other fi nancial restructuring of the debtor, or the disappearance of an active market for the asset.
Corresponding write-backs are made where the reasons for previous write-downs no longer ap-ply, provided that the write-backs do not cause the carrying amount to exceed the amortized cost. No write-backs are made for available-for-sale equity instruments.
Financial assets are derecognized when contractual rights to receive cash fl ows from the fi nan-cial assets expire or the fi nancial assets are transferred together with all material risks and benefi ts.
DerivativesThe Bayer Group uses derivatives to mitigate the risk of changes in exchange rates, interest rates and commodity prices. Many transactions constitute economic hedges but do not qualify for hedge accounting under ias 39 (Financial Instruments: Recognition and Measurement).

151NOTESTABLE OF CONTENTS CONSOLIDATED FINANCIAL STATEMENTS
Contracts concluded in order to receive or deliver non-fi nancial goods for the company’s own purposes are accounted for not as derivatives but as pending transactions. Where embedded de-rivatives are identifi ed that are required to be separated from the pending transactions, they are accounted for separately. To take advantage of market opportunities or cover possible peak de-mand, non-material transactions may be entered into under which the possibility of immediate resale cannot be excluded. Such transactions are allocated to separate portfolios upon acquisi-tion and accounted for as derivatives according to ias 39. Changes in the fair values of these de-rivatives are recognized directly in the income statement.
Changes in the values of forward exchange contracts and currency options are refl ected in ex-change gains and losses, while changes in the values of interest-rate swaps and interest-rate op-tions are recognized in interest income and expense. Changes in the fair values of commodity futures and commodity options and those arising from the hedging of forecasted transactions in foreign currencies are recognized in other operating income and expenses at the date of realiza-tion.
The fair values of derivatives are measured by the usual methods in light of the market data available at the measurement date. Currency and commodity contracts are measured individual-ly at their forward rates or forward prices on the balance sheet date. These depend on spot rates or prices including time spreads. The fair values of interest-rate hedging instruments are deter-mined by discounting future cash fl ows over the remaining terms of the instruments at market rates of interest. The present value of each interest-rate, currency or cross-currency interest-rate swap transaction is measured individually as of the balance sheet date. Interest income is recog-nized in the income statement at the date of payment or, in case of accrual, at the balance sheet date. Certain long-term commodity contracts to which fair values cannot be assigned are mea-sured with the aid of valuation models based on internal fundamental data.
Changes in the fair values of derivatives designated as fair value hedges and the adjustments in the carrying amounts of the underlying transactions are recognized in the income statement.Changes in the fair values of the effective portion of derivatives designated as cash fl ow hedges are initially recognized not in the income statement, but in stockholders’ equity under other com-prehensive income. They are released to the income statement when the underlying transaction is realized. If a derivative is sold or ceases to qualify for hedge accounting, the amount refl ected in other comprehensive income continues to be recognized in this item until the forecasted transac-tion is realized. If the forecasted transaction is no longer probable, the amount previously recog-nized in other comprehensive income is released to the income statement.
The income and expense refl ected in the non-operating result pertaining to the derivatives and the underlying transactions are shown separately. Income and expense are not offset.
InventoriesIn accordance with ias 2 (Inventories), inventories encompass assets held for sale in the ordi-nary course of business (fi nished goods and goods purchased for resale), in the process of pro-duction for such sale (work in process) or in the form of materials or supplies to be consumed in the production process or in the rendering of services (raw materials and supplies). Inventories are recognized at the lower of acquisition or production cost – calculated by the weighted-aver-age method – and net realizable value which is the realizable sale proceeds under normal busi-ness conditions less estimated cost to complete and selling expenses.

152 / / BAYER ANNUAL REPORT 2008 TABLE OF CONTENTS CONSOLIDATED FINANCIAL STATEMENTS
TaxesIncome taxes comprise the taxes levied on taxable income in the individual countries and the changes in deferred tax assets and liabilities. The income taxes recognized are refl ected at the amounts likely to be payable under the statutory regulations in force, or already enacted in rela-tion to future periods, as of the closing date.
The remaining taxes, such as property, electricity and other energy taxes, are included in the functional cost items.
In compliance with ias 12 (Income Taxes), deferred taxes are calculated for temporary differ-ences between the carrying amounts of assets and liabilities in the ifrs balance sheet and the balance sheet drawn up for tax purposes, for consolidation measures, and for tax loss carryfor-wards likely to be realizable.
Deferred tax assets relating to deductible temporary differences, tax credits and tax loss carry-forwards are recognized where it is suffi ciently probable that taxable income will be available in the future to enable the tax loss carryforwards to be utilized. Deferred tax liabilities are recog-nized on temporary differences taxable in the future. Deferred taxes are calculated at the rates which – on the basis of the statutory regulations in force, or already enacted in relation to future periods, as of the closing date – are expected to apply in the individual countries at the time of realization. Deferred tax assets and deferred tax liabilities are offset if they relate to income taxes levied by the same taxation authority.
Where gains or losses are recognized directly in stockholders’ equity, this also applies to the re-lated deferred tax assets or liabilities.
The probability that deferred tax assets resulting from temporary differences or loss carryfor-wards can be utilized in the future is the subject of forecasts by the individual consolidated companies regarding their future earnings situation and other parameters.
Deferred tax liabilities recognized on planned dividend payments by subsidiaries depend on the anticipated earnings situation of the subsidiaries concerned and on further assumptions regard-ing their future fi nancing structure, for example. Such deferred taxes are subject to regular re-view with respect to the underlying assumptions. Changes in the assumptions or in circum-stances may necessitate adjustments, possibly resulting in allocations to deferred taxes or reversals thereof.
Stockholders‘ equityUnder the German Stock Corporations Act, the distributable dividend is based on the balance sheet profi t recognized in the annual fi nancial statements of Bayer AG, which are prepared in accordance with the German Commercial Code.
The proposed dividend is subject to approval by the company’s stockholders at the Annual Stockholders Meeting and has not been recognized as a liability in the consolidated fi nancial statements of the Bayer Group.
Provisions for pensions and other post-employment benefi tsGroup companies provide retirement benefi ts for most of their employees, either directly or by contributing to privately or publicly administered funds. The way these benefi ts are provided varies according to the legal, fi scal and economic conditions of each country, the benefi ts gener-ally being based on the employees’ remuneration and years of service. The obligations relate both to existing retirees’ pensions and to pension entitlements of future retirees.

153NOTESTABLE OF CONTENTS CONSOLIDATED FINANCIAL STATEMENTS
Group companies provide retirement benefi ts under defi ned contribution and / or defi ned benefi t plans. In the case of defi ned contribution plans, the company pays contributions to publicly or privately administered pension schemes on a mandatory, contractual or voluntary basis. Once the contributions have been paid, the company has no further payment obligations. The regular contributions constitute expenses for the year in which they are due and as such are included in the functional cost items, and thus in the operating result (ebit). All other retirement benefi t systems are defi ned benefi t plans, which may be either unfunded, i. e. fi nanced by provisions, or funded, i. e. fi nanced through pension funds.
All income and expenses relating to defi ned benefi t plans other than from interest cost and the expected return on plan assets are recognized in the operating result (ebit). Interest cost and the expected return on plan assets are refl ected in the non-operating result under other non-op-erating income and expense. Actuarial gains and losses from defi ned benefi t plans and deduc-tions in connection with asset limitation are reported net of taxes in the statement of recognized income and expense, without affecting the income statement, as well as being recognized in full in the respective provision. Early retirement and certain other benefi ts to retirees are also in-cluded in the provisions for pensions, since these obligations are similar in character to pension obligations.
The present value of provisions for defi ned benefi t plans is calculated in accordance with ias 19 (Employee Benefi ts) by the projected unit credit method. The future benefi t obligations are val-ued by actuarial methods. This involves assumptions regarding life expectancy, staff fl uctua-tion, and other parameters that depend partly on the economic situation in the respective coun-try. The other main factors on which these calculations are based are assumptions regarding discount rate, expected return on plan assets, the rate of future compensation increases and variations in health care costs. Statistical information such as attrition and mortality rates is also used in estimating the expenses and liabilities under the plans. The effects of changes in important parameters are explained in Note [25].
The expenses for the benefi ts expected to be payable after retirement are spread over each em-ployee’s entire period of employment, also allowing for future changes in remuneration.
The fair value of plan assets is deducted from the present value of the defi ned benefi t obligation for pensions and other post-employment benefi ts. The obligations and plan assets are valued at regular intervals of not more than three years. For all major plans, comprehensive actuarial val-uations are performed annually as of December 31. The difference between the defi ned benefi t obligation – after deducting the fair value of plan assets – and the net liability recognized in the balance sheet is attributable to unrecognized past service cost. Plan assets in excess of the bene-fi t obligation are refl ected in other receivables, subject to the asset limitation specifi ed in ias 19 (Employee Benefi ts).
The expected future cash outfl ows are discounted in order to recognize obligations for pensions and other post-employment benefi ts at their present value as of the reporting date. The discount rates used are calculated from the yields of high-quality corporate bond portfolios in specifi c currencies with cash fl ows approximately equivalent to the expected disbursements from the pension plans. The uniform discount rate that is used to discount pension and post-employment benefi t obligations as part of the actuarial valuation is thus based on the yields, at the balance sheet date, of a portfolio of aa-rated corporate bonds whose weighted residual maturities approx-imately correspond to the duration necessary to cover the entire benefi t obligation. If aa-rated corporate bonds of equal duration are not available, a discount rate equivalent to the effective interest rate for government bonds or interest-rate swaps at the balance sheet date is used in-stead but was increased by about 0.5 to 1.0 percentage points in previous years since corporate bonds generally provide higher yields by virtue of their risk structure. In light of current devel-opments on the fi nancial markets and the associated higher yields on corporate bonds and lower yields on government bonds, a spread premium of 2.0 to 2.5 percentage points has been taken into account.
154 / / BAYER ANNUAL REPORT 2008 TABLE OF CONTENTS CONSOLIDATED FINANCIAL STATEMENTS
The expected long-term return on plan assets, determined on the basis of published and internal capital market reports and forecasts for each asset class, is applied to the fair value of plan as-sets at each year end.
Because of changing market and economic conditions, the expenses and the obligations actually arising under the plans in the future may differ materially from the estimates made on the basis of these actuarial assumptions. The plan assets are mainly comprised of equity and fi xed-income instruments. Therefore, declining returns on equity markets and markets for fi xed-income in-struments could necessitate additional contributions to the plans in order to cover future pen-sion obligations. Higher or lower rates of employee fl uctuation or longer or shorter life of partici-pants may also affect the amount of pension income or expense recorded in the future.
Other provisionsOther provisions are recognized for present legal and constructive obligations arising from past events that will probably give rise to a future outfl ow of resources, provided that a reliable esti-mate can be made of the amount of the obligations.
Other provisions are measured in accordance with ias 37 (Provisions, Contingent Liabilities and Contingent Assets) or, where applicable, ias 19 (Employee Benefi ts). Where the cash outfl ow to settle an obligation is expected to occur after one year, the provision is recognized at the pres-ent value of the expected cash outfl ow. Claims for reimbursements from third parties are capi-talized separately if their realization is virtually certain.
If the projected obligation declines as a result of a change in the estimate, the provision is re-versed by the corresponding amount and the resulting income recognized in the operating ex-pense item(s) in which the original charge was recognized.
To enhance the information content of the estimates, certain provisions that could have a materi-al effect on the fi nancial position or results of operations of the Group are selected and tested for their sensitivity to changes in the underlying parameters. To refl ect uncertainty about the likeli-hood of the assumed events actually occurring, the impact of a 5% change in the probability of occurrence is examined in each case. This analysis has not shown other provisions to be materi-ally sensitive.
Uncertainties exist with respect to the interpretation of complex tax regulations and the amount and timing of future taxable income. Given the wide range of international business relation-ships and the long-term nature and complexity of existing contractual agreements, differences arising between the actual results and the assumptions made, or future changes to such assump-tions, could necessitate adjustments to tax income and expense in future periods. The Group es-tablishes provisions for taxes, based on reasonable estimates, for liabilities to the tax authori-ties of the respective countries that are uncertain as to their amount and the probability of their occurrence. The amount of such provisions is based on various factors, such as experience with previous tax audits and differing legal interpretations by the taxable entity and the responsible tax authority.

155NOTESTABLE OF CONTENTS CONSOLIDATED FINANCIAL STATEMENTS
Provisions for environmental protection are recorded if future cash outfl ows are likely to be nec-essary to ensure compliance with environmental regulations or to carry out remediation work, such costs can be reliably estimated and no future benefi ts are expected from such measures.
Estimating the future costs of environmental protection and remediation involves many uncertain-ties, particularly with regard to the status of laws, regulations and the information available about conditions in the various countries and at the individual sites. Signifi cant factors in estimating the costs include previous experiences in similar cases, the conclusions in expert opinions obtained regarding the Group’s environmental programs, current costs and new developments affecting costs, management’s interpretation of current environmental laws and regulations, the number and fi nancial position of third parties that may become obligated to participate in any remediation costs on the basis of joint liability, and the remediation methods which are likely to be deployed. Changes in these assumptions could impact future reported results.
Taking into consideration experience gained to date regarding environmental matters of a simi-lar nature, provisions are believed to be adequate based upon currently available information. There were no signifi cant changes in assumptions or estimates that would have impacted the in-come statement in prior years. However, given the inherent diffi culties in estimating liabilities in the businesses in which the Group operates, especially those for which the risk of environmental damage is relatively greater (CropScience and MaterialScience), it remains possible that materi-al additional costs will be incurred beyond the amounts accrued. It may transpire during reme-diation work that additional expenditures are necessary over an extended period of time that ex-ceed existing provisions and cannot be reasonably estimated. Management nevertheless believes that such additional amounts, if any, would not have a material adverse effect on the Group’s fi nancial position or results of operations.
Provisions for restructuring only cover expenses that arise directly from restructuring mea-sures, are necessary for restructuring and are not related to future business operations, such as costs for real estate no longer utilized or severance payments to employees.
Restructuring measures may include the sale or termination of business units, site closures, re-location of business activities, changes in management structure or a fundamental reorganiza-tion of departments or business units.
The respective provisions are established when a detailed restructuring plan has been drawn up, resolved upon by the responsible decision-making level of management and communicated to the employees or their representatives. Provisions for restructuring are established at the present value of future disbursements.
Trade-related provisions are recorded mainly for the granting of rebates or discounts, the ac-ceptance of product returns, or obligations in respect of services already received but not yet invoiced.
As a global company with a diverse business portfolio, the Bayer Group is exposed to numerous legal risks, particularly in the areas of product liability, competition and antitrust law, patent disputes, tax assessments and environmental matters. Provisions for litigations are recorded in the balance sheet in respect of pending or future litigation, subject to a case-by-case examina-tion. Such legal proceedings are evaluated on the basis of the available information, including

156 / / BAYER ANNUAL REPORT 2008 TABLE OF CONTENTS CONSOLIDATED FINANCIAL STATEMENTS
that from legal counsel acting for the Group, to assess potential outcomes. Where it is more like-ly than not that a present obligation arising out of legal proceedings will result in an outfl ow of resources, a provision is recorded in the amount of the present value of the expected cash out-fl ows if these are considered to be reliably measurable. These provisions cover the estimated payments to plaintiffs, court fees, attorney costs and the cost of potential settlements. The evalu-ation is based on the current status of litigation as of each reporting date and includes an assess-ment of whether the criteria for recording a provision are met and, if so, the amount of the provi-sion to be recorded.
Litigations and other judicial proceedings generally raise complex issues and are subject to many uncertainties and complexities including, but not limited to, the facts and circumstances of each particular case, issues regarding the jurisdiction in which each suit is brought and dif-ferences in applicable law. The outcome of currently pending and future proceedings therefore cannot be predicted. Upon resolution of any pending legal matter, the Bayer Group may be forced to incur charges in excess of presently established provisions and related insurance cov-erage. If courts fi nd against Bayer in patent suits and this results in other manufacturers being permitted to market products developed by the Bayer Group or its legal predecessors, this could adversely impact the Group’s fi nancial position or results of operations.
Personnel-related provisions are mainly those recorded for annual bonus payments, variable one-time payments, individual performance awards, long-service awards, surpluses on long-term accounts and other personnel costs. Obligations under stock-based compensation programs that provide for awards payable in cash are also included here.
Financial liabilitiesFinancial liabilities comprise primary fi nancial liabilities and negative fair values of derivatives.
Primary fi nancial liabilities are recognized in the balance sheet if the Bayer Group has a con-tractual obligation to transfer cash or other fi nancial assets to another party. Such liabilities are initially recognized at the fair value of the consideration received or the value of payments re-ceived less any transaction costs. In subsequent periods, primary fi nancial liabilities are mea-sured at amortized cost using the effective-interest method.
Financial liabilities are derecognized when the contractual obligation is discharged or can-celled, or has expired.
Under ias 32 (Financial Instruments: Presentation), fi nancial instruments are only classifi ed as equity if no contractual obligation exists to repay the capital or deliver other fi nancial assets to the issuer. Where stockholders of Bayer AG or non-controlling interest are contractually entitled to terminate their participation and at the same time claim repayment of their capital contribu-tion, such capital is recognized as a liability in the Group statements even if it is classifi ed as eq-uity in the respective jurisdiction. The redeemable capital of a non-controlling stockholder is recognized at the amount of such stockholder’s pro-rated share of the subsidiary’s net assets.
Other receivables and liabilitiesAccrued items, advance payments and other non-fi nancial assets and liabilities are carried at amortized cost. They are amortized to income by the straight-line method or according to per-formance of the underlying transaction.
157NOTESTABLE OF CONTENTS CONSOLIDATED FINANCIAL STATEMENTS
In accordance with ias 20 (Accounting for Government Grants and Disclosure of Government As-sistance), grants and subsidies from third parties that serve to promote investment are refl ected in the balance sheet under other liabilities and amortized to income over the useful lives of the respective assets.
Noncurrent assets held for sale and discontinued operations, and liabilities directly related theretoAssets held for sale comprise noncurrent assets and disposal groups (net of any related liabili-ties), the carrying amounts of which will be realized primarily by way of a highly probable di-vestment transaction within the next twelve months or an already executed divestment transac-tion, and not through continued use. Such assets are recognized at the lower of the carrying amount and the fair value less costs to sell.
Acquisition accountingAcquired businesses are accounted for using the purchase method, which requires that the assets acquired and liabilities assumed be recorded at their respective fair values on the date Bayer gains control.
The application of the purchase method requires certain estimates and assumptions especially concerning the determination of the fair values of the acquired intangible assets and property, plant and equipment as well as the liabilities assumed at the date of the acquisition. Moreover, the useful lives of the acquired intangible assets, property, plant and equipment have to be de-termined.
Measurement is based to a large extent on anticipated cash fl ows. If actual cash fl ows vary from those used in calculating fair values, this may materially affect the Group’s future results of op-erations. In particular, the estimation of discounted cash fl ows from intangible assets under de-velopment and developed technologies is based on assumptions concerning, for example:
the outcomes of research and development activities regarding compound effi cacy, results of clinical trials etc.,the probability of obtaining regulatory approval in individual countries,long-term sales trends, possible selling price erosion due to generic competition in the market following patent expirations,the behavior of competitors (launch of competing products, marketing initiatives etc.).
For signifi cant acquisitions, the purchase price allocation is carried out with assistance from in-dependent third-party valuation specialists. The valuations are based on information available at the acquisition date.
The effect of the revaluation of assets relating to acquisitions made in stages is recognized in equity in compliance with ifrs 3 (Business Combinations). If an enterprise is acquired in several stages, all assets and liabilities of the company have to be completely revalued on the date on which the acquiring company gains control and recognized at fair value. If the new fair value of the assets already held by the acquiring company exceeds their carrying amount, the carrying amount must be increased accordingly. This adjustment is recognized in a separate equity item (revaluation surplus) and thus has no effect on net income.
•
•••
•

158 / / BAYER ANNUAL REPORT 2008 TABLE OF CONTENTS CONSOLIDATED FINANCIAL STATEMENTS
Procedure used in global impairment testing and its impactIn accordance with ifrs 3 (Business Combinations), in conjunction with the related revised ver-sions of ias 36 (Impairment of Assets) and ias 38 (Intangible Assets), goodwill and other intan-gible assets with indefi nite useful lives are tested regularly for impairment.
Where goodwill or other indefi nite-lived intangible assets are allocated to a cash-generating unit, they must be tested for impairment annually, or more frequently if events or changes in cir-cumstances indicate a possible impairment. This involves comparing the carrying amount of each cash-generating unit to the recoverable amount, which is the higher of the cash-generating unit’s fair value less costs to sell or its value in use. In the Bayer Group, the strategic business entities – the fi nancial reporting levels below the segments – are defi ned as the cash-generating units.
Where the carrying amount of a cash-generating unit exceeds the recoverable amount, an im-pairment loss is recognized for the difference. First, the goodwill of the relevant strategic busi-ness entity is written down accordingly. Any remaining impairment loss is allocated among the other assets of the strategic business entity in proportion to their carrying amounts. This value adjustment is recognized in the income statement under other operating expenses.
The recoverable amount is determined from the present value of future cash fl ows, based on continuing use of the asset by the strategic business entity and its retirement at the end of its useful life. Forecasts of future cash fl ows for the purpose of determining the recoverable amount are based on the current planning of the Bayer Group, generally for a planning horizon of three to fi ve years, which involves assumptions, especially regarding future selling prices, sales volumes and costs. Cash fl ows beyond this planning period are extrapolated using individual growth rates derived from the respective market information. The assumed growth rates, de-pending on the businesses valued, are 0% to 2.0% (2007: 0% to 4.0%) for HealthCare, 1.7% to 6.4% (2007: 1.4% to 5.7%) for CropScience, and 0% to 1.0%, as in the previous year, for MaterialScience.
Bayer calculates the cost of capital on the basis of the debt / equity ratio. The underlying capital structure of each subgroup is determined by benchmarking against comparable companies in the same industry sector. The cost of equity corresponds to the return expected by stockholders, while the cost of debt is based on the conditions on which the company can obtain long-term fi -nancing. Both components are derived from capital market information.
To allow for the different risk and return profi les of the Bayer Group’s principal businesses, the after-tax cost of capital is calculated separately for each subgroup. The discount rates used are 7.6% (2007: 8.1%) for HealthCare, 7.9% (2007: 8.1%) for CropScience and 7.0% (2007: 7.6%) for MaterialScience. The equivalent pre-tax interest rates are 7.9% (2007: 8.3%) for HealthCare, 8.3% (2007: 8.5%) for CropScience and 7.6% (2007: 8.0%) for MaterialScience. These rates are based on assumptions and estimates relating to business-specifi c costs of capital, which in turn depend on country risks, credit risks, and additional risks resulting from the volatility of certain businesses. The risk adjustment for each subgroup is determined by benchmarking against com-parable companies in the same industry sector.

159NOTESTABLE OF CONTENTS CONSOLIDATED FINANCIAL STATEMENTS
Sensitivity analysis is based on a 10% decline in future cash fl ows and a 10% increase in the weighted average cost of capital because changes up to this magnitude are reasonably possible. Based on the Group’s experience, greater changes than this are unlikely. If the actual present value of future cash fl ows were 10% lower than the anticipated present value, the carrying amount of goodwill in the Systems segment would have to be impaired by €78 million. If the weighted average cost of capital used for the impairment test were increased by 10%, assets of the Systems segment would have to be impaired by €81 million. In 2008 as in 2007, however, no impairment losses were recorded on the basis of the global annual impairment tests. Although the estimates of the useful lives of certain assets, assumptions concerning the macro-economic environment and developments in the industries in which the Bayer Group operates and estimates of the discounted future cash fl ows are believed to be appropriate, changes in as-sumptions or circumstances could require changes in the analysis. This could lead to additional impairment charges in the future or – except in the case of goodwill – to valuation write-backs should the expected trends reverse.
5. Segment reporting
In accordance with ias 14 (Segment Reporting), separate breakdowns of certain data reported in the consolidated fi nancial statements are given by business segment and geographical region. The segments and regions are the same as those used for internal reporting.
As of December 31, 2008 the Bayer Group comprised three subgroups with operations subdivid-ed into strategic business entities known as divisions (HealthCare) or business units (Crop-Science and MaterialScience). Their activities are aggregated into the six reporting segments listed below according to economic characteristics, products, production processes, customer relationships and methods of distribution.
The segments’ activities are as follows:
Subgroup / Segment Activities
HealthCare
Pharmaceuticals Development, production and marketing of prescription pharmaceuticals, such as for the treatment of hypertension, cardiovascular diseases, infectious diseases, cancer and multiple sclerosis, and for contraception.
Consumer Health Development, production and marketing of over-the-counter medications, dia-gnostic products, nutritional supplements for humans and animals, veterinary medicines and animal grooming products.
CropScience
Crop Protection Development, production and marketing of a comprehensive portfolio of fungicides, herbicides, insecticides and seed treatment products to meet a wide range of regional requirements.
Environmental Science, BioScience Development, production and marketing of a wide range of products for the green industry, garden care, non-agricultural pest and weed control, plant biotechnology and conventional seeds.
MaterialScience
Materials Development, production and marketing of high-quality plastics granules, sheet
and fi lm.
Systems Development, production and marketing of polyurethanes for a wide variety of applications and of coating and adhesive raw materials; production and marketing of inorganic basic chemicals.

160 / / BAYER ANNUAL REPORT 2008 TABLE OF CONTENTS CONSOLIDATED FINANCIAL STATEMENTS
The segment table presents continuing operations only. Details of the discontinued operations are given in Note [6.3].
The reconciliation eliminates intersegment and interregional sales and refl ects income, expens-es, assets and liabilities not allocable to segments. These include in particular the Corporate Center and the service companies.
The segment data are calculated as follows:
The intersegment sales refl ect intragroup transactions effected at transfer prices fi xed on an arm’s-length basis. The gross cash fl ow comprises income from continuing operations after taxes, plus income taxes, plus / minus non-operating result, minus income taxes paid or accrued, plus deprecia-tion, amortization and write-downs, minus write-backs, plus / minus changes in pension pro-visions, minus gains / plus losses on retirements of noncurrent assets, plus non-cash effects of the remeasurement of acquired assets. The change in pension provisions includes the elimi-nation of non-cash components of the operating result (ebit). It also contains benefi t pay-ments during the year. The net cash fl ow is the cash fl ow from operating activities as defi ned in ias 7 (Cash Flow Statements). The capital invested comprises all assets serving the respective segment that are required to yield a return on their cost of acquisition. Noncurrent assets are included at cost of acquisi-tion or construction throughout their useful lives because the calculation of cash fl ow return on investment (cfroi) requires that depreciation and amortization be excluded. Interest-free liabilities are deducted. The capital invested is stated as of December 31 of the respective year. The cfroi is the ratio of the gross cash fl ow to the average capital invested for the year and is thus a measure of the return on capital employed. The equity items refl ect the earnings and carrying amounts of companies recognized at equi-ty (associates). They are allocated to the segments. Since fi nancial management of Group companies is carried out centrally by Bayer AG, fi nan-cial liabilities are not allocated directly to the respective segments. Consequently, the liabili-ties shown for the individual segments do not include fi nancial liabilities. The number of employees is reported as full-time equivalents, with part-time employees in-cluded in proportion to their contractual working hours.
The table shows the regional breakdown of intangible assets and property, plant and equipment:
•
•
•
•
•
•
•
•
2007 2008
€ million € million
Germany 17,504 16,896
United States 4,916 5,466
Finland 2,040 1,903
China 1,269 1,902
France 1,296 1,243
Switzerland 1,130 917
Other 3,434 3,763
Total 31,589 32,090

161NOTESTABLE OF CONTENTS CONSOLIDATED FINANCIAL STATEMENTS
6. Scope of consolidation; subsidiaries and affi liates
The consolidated fi nancial statements include all subsidiaries, joint ventures and associates. Subsidiaries are those companies in which Bayer AG directly or indirectly has a majority of the voting rights or from which it is able to derive the greater part of the economic benefi t and bears the greater part of the risk by virtue of its power to govern corporate fi nancial and operating policies, generally through an ownership interest of more than 50%. Inclusion of such compa-nies’ accounts in the consolidated fi nancial statements begins when Bayer AG starts to exercise control over the company and ceases when it is no longer able to do so.
Joint ventures are companies over which the Bayer Group exercises joint control with a third party. A company is generally deemed a joint venture if voting rights are divided equally be-tween two stockholders or the company is established on the basis of a joint venture agreement.
Associates over which Bayer AG exerts signifi cant infl uence, generally through an ownership in-terest between 20% and 50%, are accounted for by the equity method.
Subsidiaries that do not have a material impact on the Group’s fi nancial position or results of operations, either individually or in aggregate, are recognized at amortized cost in the consoli-dated fi nancial statements.

162 / / BAYER ANNUAL REPORT 2008
6.1 Changes in the scope of consolidation
The decrease in the number of fully consolidated companies in 2008 is primarily due to mergers between Group companies in the course of the integration of the Schering group.
The four joint ventures included by proportionate consolidation in compliance with ias 31 (Inter-ests in Joint Ventures) affected the Group balance sheet and income statement as follows:
Also included in the consolidated fi nancial statements are fi ve associates – the same number as in the previous year – which are accounted for by the equity method. Details of their impact on the income statement and balance sheet are shown in Note [19].
A total of 91 subsidiaries and 24 associates or joint ventures that in aggregate are immaterial to the Bayer Group’s fi nancial position and results of operations are not consolidated but recog-nized at amortized cost. The subsidiaries account for less than 0.1% of Group sales, less than 0.5% of stockholders’ equity and less than 0.3% of total assets.
TABLE OF CONTENTS CONSOLIDATED FINANCIAL STATEMENTS
Germany Other countries Total
Bayer AG and consolidated companies
December 31, 2007 60 266 326
Changes in the scope of consolidation 2 7 9
Additions 3 3 6
Retirements (2) (23) (25)
December 31, 2008 63 253 316
Joint ventures
December 31, 2007 1 4 5
Changes in the scope of consolidation - - -
Additions - 1 1
Retirements (1) (1) (2)
December 31, 2008 - 4 4
2008 2008
€ million € million
Current assets 28 Income 66
Noncurrent assets 77 Expenses (50)
Current liabilities (18)
Noncurrent liabilities (14)
Net assets 73 Income after taxes 16

163NOTES
The companies fully consolidated in the fi nancial statements of the Bayer Group are listed in the following table:
TABLE OF CONTENTS CONSOLIDATED FINANCIAL STATEMENTS
Name of fully consolidated company Place of business Bayer’s interest
%
EuropeA / O Bayer Moscow, Russia 100
Bayer (Schweiz) AG Zurich, Switzerland 100
Bayer 04 Immobilien GmbH Leverkusen, Germany 100
Bayer 04 Leverkusen Fußball GmbH Leverkusen, Germany 100
Bayer 04 Marketing GmbH Leverkusen, Germany 100
Bayer 04 Mobilien GmbH Leverkusen, Germany 100
Bayer A / S Lyngby, Denmark 100
Bayer AB Stockholm, Sweden 100
Bayer AEH Ltd. Cambridge, U. K. 100
Bayer AGCO Ltd. Cambridge, U. K. 100
Bayer Agriculture Ltd. Cambridge, U. K. 100
Bayer Animal Health GmbH Leverkusen, Germany 100
Bayer Antwerpen N.V. Antwerp, Belgium 100
Bayer AS Oslo, Norway 100
Bayer Austria Gesellschaft m. b. H. Vienna, Austria 100
Bayer B.V. Mijdrecht, Netherlands 100
Bayer Beteiligungsverwaltung Goslar GmbH Leverkusen, Germany 100
Bayer Beteiligungsverwaltungsgesellschaft mbH Leverkusen, Germany 100
Bayer Biologicals S. r. l. Milan, Italy 100
Bayer BioScience GmbH Potsdam, Germany 100
Bayer BioScience N.V. Ghent, Belgium 100
Bayer Bitterfeld GmbH Bitterfeld, Germany 100
Bayer Bulgaria EOOD Sofi a, Bulgaria 100
Bayer Business Services GmbH Leverkusen, Germany 100
Bayer Capital Corporation B.V. Mijdrecht, Netherlands 100
Bayer Chemicals AG Leverkusen, Germany 100
Bayer Consumer Care AG Basel, Switzerland 100
Bayer CropScience (Portugal)-Produtos para a Agricultura Lda. Carnaxide, Portugal 100
Bayer CropScience AG Monheim, Germany 100
Bayer CropScience B.V. Mijdrecht, Netherlands 100
Bayer CropScience Beteiligungsgesellschaft mbH Frankfurt, Germany 100
Bayer CropScience Germany GmbH Langenfeld, Germany 100
Bayer CropScience France S. A. S. Lyon, France 100
Bayer CropScience Holding S. A. Lyon, France 100
Bayer CropScience Holdings Ltd. Cambridge, U. K. 100
Bayer CropScience Ltd. Cambridge, U. K. 100
Bayer CropScience Nufarm Ltd. Cambridge, U. K. 75
Bayer CropScience Nufarm S. A. Lyon, France 100
Bayer CropScience S. A. Lyon, France 100
Bayer CropScience S. A.-N.V. Brussels, Belgium 100
Bayer CropScience S.L. Valencia, Spain 100
Bayer CropScience S. r. l. Milan, Italy 100
Bayer CropScience Vermögensverwaltungsgesellschaft mbH Leverkusen, Germany 100
Bayer d. o. o. Belgrade, Serbia 100
Bayer d. o. o. Ljubljana, Slovenia 100
Bayer d. o. o. Zagreb, Croatia 100
Bayer Diagnostics Manufacturing Ltd. Bridgend, U. K. 100
Bayer Direct Services GmbH Leverkusen, Germany 100
Bayer Environmental Science S. A. S. Lyon, France 100

164 / / BAYER ANNUAL REPORT 2008 TABLE OF CONTENTS CONSOLIDATED FINANCIAL STATEMENTS
Name of fully consolidated company Place of business Bayer’s interest
%
Bayer Gastronomie GmbH Leverkusen, Germany 100
Bayer Gesellschaft für Beteiligungen mbH Leverkusen, Germany 100
Bayer HealthCare AG Leverkusen, Germany 100
Bayer Hellas AG Athens, Greece 100
Bayer Hispania S. L. Sant Joan Despi, Spain 100
Bayer Hungaria Kft. Budapest, Hungary 100
Bayer Immobilier S. A. S. Puteaux, France 100
Bayer Innovation GmbH Düsseldorf, Germany 100
Bayer International S. A. Fribourg, Switzerland 100
Bayer Ltd. Dublin, Ireland 100
Bayer Ltd. Kiev, Ukraine 100
Bayer MaterialScience AG Leverkusen, Germany 100
Bayer MaterialScience Customer Services GmbH Leverkusen, Germany 100
Bayer MaterialScience S. r. l. Milan, Italy 100
Bayer Oy Espoo, Finland 100
Bayer Polimeros S. L. Sant Joan Despi, Spain 100
Bayer Polyols S. N. C. Puteaux, France 100
Bayer Polyurethanes B.V. Mijdrecht, Netherlands 100
Bayer Portugal S. A. Lisbon, Portugal 100
Bayer Public Limited Company Newbury, U.K. 100
Bayer Real Estate GmbH Leverkusen, Germany 100
Bayer S. A.-N.V. Brussels, Belgium 100
Bayer S. A. S. Puteaux, France 100
Bayer S. p. A. Milan, Italy 100
Bayer s. r. o. Prague, Czech Republic 100
Bayer Santé Familiale S. A. S. Gaillard, France 100
Bayer Santé S. A. S. Puteaux, France 100
Bayer Schering Pharma AG Berlin, Germany 100
Bayer Schering Pharma Oy Turku, Finland 100
Bayer Sheet Europe GmbH Darmstadt, Germany 100
Bayer Sheet Europe N.V. Tielt, Belgium 100
Bayer Sheet Europe S. p. A. Milan, Italy 90
Bayer Sp. Z. o. o. Warsaw, Poland 100
Bayer spol. s. r. o. Bratislava, Slovakia 100
Bayer Technology Services GmbH Leverkusen, Germany 100
Bayer Vital GmbH Leverkusen, Germany 100
Bayfi n GmbH Leverkusen, Germany 100
BaySystems a.s. Prague, Czech Republic 100
BaySystems B.V. Foxhol, Netherlands 100
BaySystems Büfa Polyurethane GmbH & Co. KG Oldenburg, Germany 100
BaySystems Italia S. p. A. Mussolente, Italy 100
BaySystems Northern Europe A / S Otterup, Denmark 100
Berlimed S.A. Madrid, Spain 51
Berlis AG Zurich, Switzerland 100
BerliServe Professional Services GmbH Berlin, Germany 100
Biogenetic Technologies B.V. Rotterdam, Netherlands 100
Chemie-Beteiligungsaktiengesellschaft Glarus, Switzerland 100
Chemion Logistik GmbH Leverkusen, Germany 100
Currenta GmbH & Co. OHG Leverkusen, Germany 60
Direvo Biotech AG Cologne, Germany 100
Drugofa GmbH Cologne, Germany 100
Dynevo GmbH Leverkusen, Germany 100
Epurex Films GmbH & Co. KG Bomlitz, Germany 100
Erste K-W-A Beteiligungsgesellschaft mbH Leverkusen, Germany 100
Euroservices Bayer GmbH Leverkusen, Germany 100
Euroservices Bayer S. L. Sant Joan Despi, Spain 100

165NOTESTABLE OF CONTENTS CONSOLIDATED FINANCIAL STATEMENTS
Name of fully consolidated company Place of business Bayer’s interest
%
Generics Holding GmbH Leverkusen, Germany 100
GP Grenzach Produktions GmbH Grenzach, Germany 100
Hild Samen GmbH Marbach am Neckar, Germany 100
Icon Genetics GmbH Munich, Germany 100
Intendis Austria Handels GesmbH Vienna, Austria 100
Intendis Dermatologie GmbH Berlin, Germany 100
Intendis Farma S. A. Madrid, Spain 100
Intendis GmbH Berlin, Germany 100
Intendis Manufacturing S. p. A. Milan, Italy 100
Intendis Polska Sp. Zo. o. Warsaw, Poland 100
Intendis Portugal Sociedade Unipessoal Lda. Mem Martins, Portugal 100
Intendis S. p. A. Milan, Italy 100
Jenapharm GmbH & Co. KG Jena, Germany 100
Justesa Imagen S. A. Madrid, Spain 51
Kosinus Grundstücks-Verwaltungs-Gesellschaft mbH & Gamma OHG Berlin, Germany 100
KVP Pharma+Veterinär-Produkte GmbH Kiel, Germany 100
Lyttron Technology GmbH Leverkusen, Germany 100
Marotrast GmbH Jena, Germany 100
Mediwest Norway AS Oslo, Norway 100
Medrad Belgium BVBA Antwerp, Belgium 100
Medrad Denmark ApS Glostrup, Denmark 100
Medrad Europe B.V. Maastricht, Netherlands 100
Medrad France S. A. R. L. Rungis Cedex, France 100
Medrad Italia S. r. l. Cava Manara, Italy 100
Medrad Medizinische Systeme GmbH Volkach, Germany 100
Medrad Sweden AB Västra Frölunda, Sweden 100
Medrad UK Ltd. Ely, U. K. 100
Menadier Heilmittel GmbH Berlin, Germany 100
Nunhems B.V. Nunhem, Netherlands 100
Nunhems France S. A. R. L. Soucelles, France 100
Nunhems Hungary Kft. Szolnok, Hungary 100
Nunhems Italy S. r. l. St. Agata Bolognes, Italy 100
Nunhems Netherlands B.V. Nunhem, Netherlands 100
Nunhems Poland Sp. Zo. o. Poznan, Poland 100
Nunhems Spain S. A. Valencia, Spain 100
Pallas Versicherung AG Leverkusen, Germany 100
pbi Home & Garden Ltd. Cambridge, U.K. 100
Pharma Verlagsbuchhandlung GmbH Berlin, Germany 100
Plant Genetics System International N.V. The Hague, Netherlands 100
Quimica Farmacéutica Bayer S. L. Sant Joan Despi, Spain 100
SC Bayer S. r. l. Bucharest, Romania 100
Schering AG Berlin, Germany 100
Schering Agrochemicals Holdings Ltd. Burgess Hill, U.K. 100
Schering Espana S. A. Madrid, Spain 99.9
Schering GmbH und Co. Produktions KG Weimar, Germany 100
Schering Health Care Ltd. Burgess Hill, U.K. 100
Schering Holdings Ltd. Burgess Hill, U.K. 100
Schering Industrial Products Ltd. Burgess Hill, U.K. 100
Schering International Holding GmbH Berlin, Germany 100
Schering Kahlbaum GmbH Berlin, Germany 100
Schering ZAO Moscow, Russia 100
Sportrechte Vermarktungs- und Verwertungs-GmbH& Co. oHG Leverkusen, Germany 100
Tectrion GmbH Leverkusen, Germany 100
Too Bayer KAZ Astana, Kazakhstan 100

166 / / BAYER ANNUAL REPORT 2008 TABLE OF CONTENTS CONSOLIDATED FINANCIAL STATEMENTS
Name of fully consolidated company Place of business Bayer’s interest
%
TravelBoard GmbH Leverkusen, Germany 100
UAB Bayer Vilnius, Lithuania 100
Viverso GmbH Bitterfeld, Germany 100
Zweite K-W-A Beteiligungsgesellschaft mbH Leverkusen, Germany 100
North AmericaBayer Business and Technology Services LLC Pittsburgh, U. S. A. 100
Bayer Canadian Holdings Inc. Toronto, Canada 100
Bayer Corporation Pittsburgh, U. S. A. 100
Bayer Cotton Seed International Inc. Research Triangle Park, U. S. A. 51
Bayer CropScience Holding Inc. Research Triangle Park, U. S. A. 100
Bayer CropScience Holdings Inc. Calgary, Canada 100
Bayer CropScience Inc. Calgary, Canada 100
Bayer CropScience Inc. Research Triangle Park, U. S. A. 100
Bayer CropScience LLC Research Triangle Park, U. S. A. 100
Bayer CropScience LP Research Triangle Park, U. S. A. 100
Bayer HealthCare LLC Tarrytown, U. S. A. 100
Bayer HealthCare Pharmaceuticals Inc. Pine Brook, U. S. A. 100
Bayer HealthCare Pharmaceuticals LLC Seattle, U. S. A. 100
Bayer Inc. Toronto, Canada 100
Bayer MaterialScience LLC Pittsburgh, U. S. A. 100
Bayer Pharma Chemicals Inc. Pine Brook, U. S. A. 100
Bayer Puerto Rico Inc. Guaynabo, Puerto Rico 100
Baypo I LLC New Martinsville, U. S. A. 100
Baypo II LLC New Martinsville, U. S. A. 100
Baypo LP New Martinsville, U. S. A. 100
BHCP Holdings LLC Wilmington, U. S. A. 100
Bippo Corporation New Martinsville, U. S. A. 100
Collateral Therapeutics Inc. San Diego, U. S. A. 100
Cooper Land Company of New Jersey Inc. Tarrytown, U. S. A. 100
Deerfi eld Urethane Inc. South Deerfi eld, U. S. A. 100
Guidance Interactive Healthcare Inc. Tarrytown, U. S. A. 100
Intendis Inc. Pine Brook, U. S. A. 100
iSense Corporation Wilsonville, U. S. A. 100
iSense Development Corporation Wilsonville, U. S. A. 100
iSense Hospital Care LLC Wilsonville, U. S. A. 100
Medrad Inc. Indianola, U. S. A. 100
Medrad Saxonburg Inc. Saxonburg, U. S. A. 100
MTFP Inc. Wilmington, U. S. A. 100
NippoNex Inc. Springfi eld, U. S. A. 100
NOR-AM Agro LLC Pine Brook, U. S. A. 100
NOR-AM Land Company Pine Brook, U. S. A. 100
Nunhems USA Inc. Morgan Hill, U. S. A. 100
Pallas North America Insurance Company Inc. Burlington, U. S. A. 100
SB Capital Corporation Pine Brook, U. S. A. 100
Schering Berlin Inc. Pine Brook, U. S. A. 100
Schering Berlin Venture Corporation Pine Brook, U. S. A. 100
SCIC Holdings LLC Burlington, U. S. A. 100
Sheffi eld Plastics Inc. Sheffi eld, U. S. A. 100
Stoneville Pedigreed Seed Company Saint Louis, U. S. A. 100
STWB Inc. Pittsburgh, U. S. A. 100
Asia / Pacifi c
Bayer (Beijing) Sheet Co. Ltd. Beijing, China 100
Bayer (China) Ltd. Beijing, China 100
Bayer (Malaysia) Sdn. Bhd. Petaling Jaya, Malaysia 100

167NOTESTABLE OF CONTENTS CONSOLIDATED FINANCIAL STATEMENTS
Name of fully consolidated company Place of business Bayer’s interest
%
Bayer (Sichuan) Animal Health Co. Ltd. Chengdu, China 70
Bayer (South East Asia) Pte. Ltd. Singapore, Singapore 100
Bayer Australia Ltd. Pymble, Australia 100
Bayer BioScience Pvt. Ltd. Hyderabad, India 100
Bayer Co. (Malaysia) Sdn. Bhd. Petaling Jaya, Malaysia 100
Bayer Coatings Systems Shanghai Co. Ltd. Shanghai, China 100
Bayer CropScience (China) Co. Ltd. Hangzhou, China 100
Bayer CropScience (Pvt) Ltd. Karachi, Pakistan 100
Bayer CropScience Holdings Pty Ltd. East Hawthorn, Australia 100
Bayer CropScience Inc. Laguna, Philippines 100
Bayer CropScience K. K. Tokyo, Japan 100
Bayer CropScience Ltd. Mumbai, India 71.1
Bayer CropScience Ltd. Seoul, South Korea 100
Bayer CropScience Pty Ltd. East Hawthorn, Australia 100
Bayer CropScience Taiwan Ltd. Taipei, Taiwan 100
Bayer Far East Service Co. Ltd. Hong Kong, Hong Kong 100
Bayer Healthcare Co. Ltd. Beijing, China 100
Bayer HealthCare Ltd. Hong Kong, Hong Kong 100
Bayer Holding Ltd. Tokyo, Japan 100
Bayer Jinling Polyurethane Co. Ltd. Nanjing, China 55
Bayer Korea Ltd. Seoul, South Korea 100
Bayer MaterialScience Ltd. Hong Kong, Hong Kong 100
Bayer MaterialScience Ltd. Tokyo, Japan 100
Bayer MaterialScience Pvt. Ltd. Mumbai, India 100
Bayer MaterialScience Trading (Shanghai) Co. Ltd. Shanghai, China 100
Bayer New Zealand Ltd. Auckland, New Zealand 100
Bayer Pakistan (Pvt) Ltd. Karachi, Pakistan 100
Bayer Pharmaceuticals Pvt. Ltd. Mumbai, India 100
Bayer Philippines Inc. Makati City, Philippines 100
Bayer Polychem (India) Ltd. Thane, India 100
Bayer Polymers Shanghai Co. Ltd. Shanghai, China 90
Bayer Polyurethanes (Shanghai) Co. Ltd. Shanghai, China 100
Bayer Polyurethanes Taiwan Ltd. Taipeh, Taiwan 94.9
Bayer Sheet Korea Ltd. Kimhae City, South Korea 100
Bayer Taiwan Company Ltd. Taipeh, Taiwan 100
Bayer Technology and Engineering (Shanghai) Co. Ltd. Shanghai, China 100
Bayer Thai Company Ltd. Bangkok, Thailand 100
Bayer TPU (Shenzhen) Co. Ltd. Shenzhen, China 100
Bayer Uretech Ltd. Yu Pu Village, Taiwan 100
Bayer Vietnam Ltd. Bien Hoa City (Amata), Vietnam 100
Bayer Yakuhin Ltd. Osaka, Japan 100
Bilag Industries Pvt. Ltd. Andheri, India 100
Guangzhou Bayer MaterialScience Co. Ltd. Guangzhou, China 100
Imaxeon Pty. Ltd. Rydalmere, Australia 100
Intendis K.K. Osaka, Japan 100
Laserlite Australia Pty. Ltd. Pymble, Australia 100
Medipharm (Pvt) Ltd. Lahore, Pakistan 100
Medrad Asia Pte. Ltd. Singapore, Singapore 100
Nihon Medrad K.K. Osaka, Japan 100
Nunhems Beijing Seed Co. Ltd. Beijing, China 95
Nunhems India Pvt. Ltd. Haryana, India 100
PT. Bayer Indonesia Jakarta, Indonesia 99.8
PT. Bayer MaterialScience Indonesia Jakarta, Indonesia 99.9
Sumika Bayer Urethane Co. Ltd. Amagasaki, Japan 60
U I M Agrochemicals (Aust) Pty Ltd. East Hawthorn, Australia 100

168 / / BAYER ANNUAL REPORT 2008 TABLE OF CONTENTS CONSOLIDATED FINANCIAL STATEMENTS
Name of fully consolidated company Place of business Bayer’s interest
%
Latin America / Africa / Middle EastAgrEvo South Africa (Pty) Ltd. Isando, South Africa 100
Bayer (Pty) Ltd. Isando, South Africa 100
Bayer Boliviana Ltda. Santa Cruz De La Sierra, Bolivia 100
Bayer Central America S.A. San Jose, Costa Rica 100
Bayer Cropscience S.A. Bogota, Colombia 100
Bayer de Mexico S.A. de C.V. Mexico City, Mexico 100
Bayer East Africa Ltd. Nairobi, Kenya 55
Bayer Israel Ltd. Hod Hasharon, Israel 100
Bayer S. A. Asuncion, Paraguay 100
Bayer S. A. Bogotá, Colombia 100
Bayer S. A. Buenos Aires, Argentina 100
Bayer S. A. Caracas, Venezuela 100
Bayer S. A. Casablanca, Morocco 100
Bayer S. A. Colón, Panama 100
Bayer S. A. Guatemala City, Guatemala 100
Bayer S. A. Lima, Peru 89.3
Bayer S. A. Managua, Nicaragua 100
Bayer S. A. Montevideo, Uruguay 100
Bayer S. A. Quito, Ecuador 100
Bayer S. A. San Jose, Costa Rica 100
Bayer S. A. San Salvador, El Salvador 100
Bayer S. A. Santiago de Chile, Chile 100
Bayer S. A. Santo Domingo, Dom. Republic 100
Bayer S. A. São Paulo, Brazil 100
Bayer S. A. de C.V. Tegucigalpa, Honduras 100
Bayer Türk Kimya Sanayi Limited Sirketi Istanbul, Turkey 100
BaySystems Pearl FZCO Dubai, United Arab Emirates 51
Corporación Bonima S.A. de C.V. Ilopango, El Salvador 99.8
Cropsa Ltda. Bogota, Colombia 100
Cropsa S. A. C. Lima, Peru 100
Intendis do Brasil Farmaceutica Ltda. Itapevi, Brazil 100
Intendis Ilac Ticaret Limited Sirketi Istanbul, Turkey 100
Intendis Mexicana S. A. de C.V. Mexico City, Mexico 100
Justesa Imagem do Brasil S. A. Rio de Janeiro, Brazil 100
Justesa Imagen Argentina S. A. Buenos Aires, Argentina 100
Justesa Imagen Mexicana S. A. de C.V. Mexico City, Mexico 100
Mediterranean Seeds Ltd. Einat, Israel 100
Medrad America Latina Ltda. São Paulo, Brazil 100
Medrad Mexicana S. de R.L. de CV Mexico City, Mexico 100
Nunhems Chile S. A. Santiago de Chile, Chile 100
Nunhems do Brasil Comercio de Sementes Ltda. Campinas, Brazil 100
Nunhems Mexico S. A. de C.V. Queretaro, Mexico 99
Nunhems Tohumculuk Limited Sirketi Antalya, Turkey 100
Proquina Productos Quimicos Naturales S. A. de C.V. Orizaba, Mexico 100
Schering (Pty) Ltd. Midrand, South Africa 100
Schering do Brasil Quimica e Farmaceutica Ltda. São Paulo, Brazil 100

169NOTES
The following four joint ventures are included in the fi nancial statements of the Bayer Group by proportionate consolidation:
The following associates are accounted for in the consolidated fi nancial statements by the equity method:
The following subsidiaries are refl ected in the consolidated fi nancial statements at amortized cost due to immateriality:
TABLE OF CONTENTS CONSOLIDATED FINANCIAL STATEMENTS
Name of joint venture Place of business Bayer’s interest
%
Baulé S. A. S. Romans-sur-Isere, France 50
Bayer IMSA, S. A. de C. V. Leon, Mexico 50
BayOne Urethane Systems LLC Saint Louis, U.S.A. 50
Indurisk Rückversicherung AG Luxembourg, Luxembourg 50
Name of associate Place of business Bayer’s interest
%
DIC Bayer Polymer Ltd. Tokyo, Japan 50
Lyondell Bayer Manufacturing Maasvlakte VOF Rotterdam, Netherlands 50
Palthough Industries (1998) Ltd. Kibbutz Ramat Yochanan, Israel 25
PO JV LP Wilmington, U. S. A. 41.3
Polygal Plastics Industries Ltd. Kibbutz Ramat Hashofer, Israel 25.8
Name of subsidiary Place of business Bayer’s interest
%
Europe1. BCrSV GmbH Leverkusen, Germany 100
2. BHCV GmbH Leverkusen, Germany 100
Agreva GmbH Frankfurt, Germany 100
AgrEvo Verwaltungsgesellschaft mbH Frankfurt, Germany 100
Ausbildungsinitiative Rheinland GmbH Leverkusen, Germany 100
Bayer 04 Leverkusen Sportförderung gGmbH Leverkusen, Germany 100
Bayer Bel IOOO Minsk, Belarus 100
Bayer d. o. o. Sarajevo Sarajevo, Bosnia-Herzegovina 100
Bayer Healthcare S. r. l. Milan, Italy 100
Bayer Innovation Ventures GmbH Düsseldorf, Germany 100
Bayer International Services GmbH Leverkusen, Germany 100
Bayer OÜ Tallinn, Estonia 100
Bayer Schering Pharma Medical S. L. Sant Joan Despi, Spain 100
Bayer UK Ltd. Newbury, U. K. 100
Bayer Unterstützungskasse GmbH Leverkusen, Germany 100
Bayer Verwaltungsgesellschaft für Anlagevermögen mbH Leverkusen, Germany 100
Bayer-Handelsgesellschaft mbH Leverkusen, Germany 100
Bayer-Kaufhaus GmbH Leverkusen, Germany 100
Bayhealth Comercializacao de Produtos Farmaceuticos Unipessoal Lda. Lisbon, Portugal 100
Bayhealth S. L. Sant Joan Despi, Spain 100
BayInvest GmbH Leverkusen, Germany 100
BaySystems Büfa Polyurethane Verwaltungs GmbH Oldenburg, Germany 100
BCS Romania S. r. l. Bucharest, Romania 100

170 / / BAYER ANNUAL REPORT 2008 TABLE OF CONTENTS CONSOLIDATED FINANCIAL STATEMENTS
Name of subsidiary Place of business Bayer’s interest
%
Berlex Especialidades Farmaceuticas Lda. Carnaxide, Portugal 100
Berlifarma Lda. Carnaxide, Portugal 100
Berlimed-Especialidades Farmaceuticas Lda. Carnaxide, Portugal 100
Berlipharm B. V. Weesp, Netherlands 100
Centrofarma-Industria e Comercio de Prod. Farmaceuticos Lda. Coimbra, Portugal 100
CIS (U. K.) Ltd. Burgess Hill, U. K. 100
Currenta Geschäftsführungs-GmbH Leverkusen, Germany 100
Ehrfeld Mikrotechnik BTS GmbH Wendelsheim, Germany 100
Epurex Films Geschäftsführungs-GmbH Walsrode, Germany 100
Farbenfabriken Bayer GmbH Leverkusen, Germany 100
Fünfte Bayer VV GmbH Leverkusen, Germany 100
Genus Grundstücks- und Vermietungsgesellschaft mbH & Co. KG Düsseldorf, Germany 100
HTV Gesellschaft für Hochtemperaturverbrennung mbH Bergkamen, Germany 100
Job@ctive GmbH Leverkusen, Germany 100
Kosinus Grundstücks-Verwaltungs-Gesellschaft mbH Berlin, Germany 100
Lusal Producao Quimico Farmaceutica Luso-Alema Lda. Carnaxide, Portugal 100
Lusalfarma-Especialidades Farmaceuticas Lda. Carnaxide, Portugal 100
Rhone Poulenc Plant S. A. Brussels, Belgium 100
Schering Industrial Products Holdings Burgess Hill, U. K. 100
Schering Romania S. r. l. Bucharest, Romania 100
Schering Verwaltungsgesellschaft mbH Weimar, Germany 100
Sechste Bayer VV GmbH Leverkusen, Germany 100
SIA Bayer Riga, Latvia 100
ZAO Rhone-Poulenc AO Moscow, Russia 100
North AmericaBayOne Canada Inc. Niagara Falls, Canada 100
Berlex Canada Inc. Pointe-Claire, Canada 100
Boston Poly Company Wilsonville, U. S. A. 100
Delinting and Seed Treating Company Maricopa, U. S. A. 100
Icon Genetics Inc. Montmouth Junction, U. S. A. 100
The SDI Divestiture Corporation Cincinnati, U. S. A. 100
Viterion TeleHealthcare LLC Tarrytown, U. S. A. 100
Asia / PacificAgrEvo (Thailand) Ltd. Bangkok, Thailand 100
Bayer CropScience (OHQ) (Malaysia) Sdn Bhd Kuala Lumpur, Malaysia 100
Bayer CropScience (Thailand) Company Ltd. Bangkok, Thailand 99.9
Bayer CropScience Ltd. Dhaka, Bangladesh 60
Bayer CropScience Seeds Pty Ltd. Toowoomba, Australia 100
Bayer Environmental Health Singapore (Pvt) Ltd. Singapore, Singapore 100
BCS (Pvt) Ltd. Karachi, Pakistan 100
Chemdyes Pakistan (Pvt) Ltd. Karachi, Pakistan 100
C-Qentec Diagnostics Pty. Ltd. Epping, Australia 100
Medrad Medical Equipment Trading Company Beijing, China 100
Myanmar Aventis CropScience Ltd. Yangon, Myanmar 100
Schering (Hong Kong) Ltd. Hong Kong, Hong Kong 100
Schering (Malaysia) Sdn Bhd Kuala Lumpur, Malaysia 100
Schering (Singapore) (Pvt) Ltd. Singapore, Singapore 100
Schering Asia / Pacifi c (Pvt) Ltd. Singapore, Singapore 100
Schering China Ltd. Hong Kong, Hong Kong 100
Schering Pty. Ltd. Alexandria, Australia 100

171NOTES
The following associates and joint ventures are accounted for at amortized cost in light of their secondary importance:
TABLE OF CONTENTS CONSOLIDATED FINANCIAL STATEMENTS
Name of associate or joint venture Place of business Bayer’s interest
%
EuropeAxxam S. r. l. Milan, Italy 24.5
BaySecur GmbH Leverkusen, Germany 49
BaySports-Travel GmbH Leverkusen, Germany 50
BBB Management GmbH Campus Berlin-Buch Berlin, Germany 20
Byometric Systems AG Ainring, Germany 26
Disalfarm S. A. Barcelona, Spain 33.3
EMP-Estrusione Materiali Plastici S. A. Stabio, Switzerland 42.1
Faserwerke Hüls GmbH Marl, Germany 50
Gigas Grundstücks-Vermietungsgesellschaft mbH Düsseldorf, Germany 20
Pyco S. A. Mont de Marsan, France 47
Sauerstoff- und Stickstoffrohrleitungsgesellschaft mbH Krefeld, Germany 50
Societe Immobiliere de Gaillard d‘Economie Mixte (SIGEM) Gaillard, France 48
Solavista GmbH & Co. KG Potsdam, Germany 50
Solavista Verwaltungs GmbH Potsdam, Germany 50
SuNyx GmbH Düsseldorf, Germany 41.8
North AmericaBurrill Nutraceuticals Capital Fund LP Wilmington, U. S. A. 33
Chromatin Inc. Chicago, U. S. A. 26.3
Name of subsidiary Place of business Bayer’s interest
%
Latin America / Africa / Middle EastAgrEvo Middle East (Cyprus) Ltd. Limassol, Cyprus 100
Aventis CropScience Malawi Ltd. Blantyre, Malawi 100
Bayer Algerie S. P. A. Algiers, Algeria 100
Bayer CropScience Zimbabwe (Pvt) Ltd. Harare, Zimbabwe 99.9
Bayer Distribuidora de Produtos Quimicos e Farmaceuticos Ltda. São Paulo, Brazil 100
Bayer Iranchemie AG Teheran, Iran 100
Bayer Middle East FZE Dubai, United Arab Emirates 100
Bayer Namibia Pty. Ltd. Windhoek, Namibia 100
Bayer Schering Pharma Moçambique Lda. Maputo, Mozambique 100
Bayer Zimbabwe (Pvt) Ltd. Harare, Zimbabwe 100
Centro Estrategico Canada Latinoamerica S. A. de C. V. Mexico City, Mexico 100
Comercial Interamericana S. A. Guatemala City, Guatemala 100
Farmaco Ltda. São Paulo, Brazil 100
Indhorm Sociedad Anonima, Industrial, Comercial y Financiera Buenos Aires, Argentina 99.5
Junta Comercializadora de Productos de Latinoamerica S. A. de C. V. Mexico City, Mexico 100
Kyrgyz Agra Investment Company Ltd. Nicosia, Cyprus 57.1
Laboratorio Berlimed S. A. Santiago de Chile, Chile 100
Miles S. A. Guatemala Branch Guatemala City, Guatemala 100
Quimicas Unidas S. A. Havana, Cuba 100
Schering Peruana S. A. Lima, Peru 100

172 / / BAYER ANNUAL REPORT 2008
The Bayer Group holds between 5% and 20% of the voting rights of the following “large compa-nies” as defi ned in Section 267, paragraphs 2 and 3 of the German Commercial Code:
The following domestic subsidiaries availed themselves in 2008 of certain exemptions granted under Section 264, paragraph 3 and Section 264 b of the German Commercial Code regarding the preparation, auditing and publication of fi nancial statements:
TABLE OF CONTENTS CONSOLIDATED FINANCIAL STATEMENTS
Company Name Place of business Bayer‘s interest
%
Baywoge GmbH Leverkusen, Germany 5.1
CuraGen Corporation New Haven, U. S. A. 5.6
Hokkai Sankyo Co. Ltd. Tokyo, Japan 19.8
OncoGenex Pharmaceuticals Inc. Bothell, U. S. A. 10.6
Salzgewinnungsgesellschaft Westfalen mbH & Co. KG Ahaus, Germany 10
Name of exempt subsidiary Place of business Bayer‘s interest
in %
Bayer 04 Immobilien GmbH Leverkusen, Germany 100
Bayer 04 Leverkusen Fußball GmbH Leverkusen, Germany 100
Bayer 04 Marketing GmbH Leverkusen, Germany 100
Bayer 04 Mobilien GmbH Leverkusen, Germany 100
Bayer Animal Health GmbH Leverkusen, Germany 100
Bayer Beteiligungsverwaltungsgesellschaft mbH Leverkusen, Germany 100
Bayer Bitterfeld GmbH Bitterfeld, Germany 100
Bayer BioScience GmbH Potsdam, Germany 100
Bayer Business Services GmbH Leverkusen, Germany 100
Bayer Chemicals AG Leverkusen, Germany 100
Bayer CropScience AG Monheim, Germany 100
Bayer Direct Services GmbH Leverkusen, Germany 100
Bayer Gastronomie GmbH Leverkusen, Germany 100
Bayer Gesellschaft für Beteiligungen mbH Leverkusen, Germany 100
Bayer HealthCare AG Leverkusen, Germany 100
Bayer Innovation GmbH Düsseldorf, Germany 100
Bayer MaterialScience AG Leverkusen, Germany 100
Bayer MaterialScience Customer Services GmbH Leverkusen, Germany 100
Bayer Real Estate GmbH Leverkusen, Germany 100
Bayer Schering Pharma AG Berlin, Germany 100
Bayer Technology Services GmbH Leverkusen, Germany 100
Bayer Vital GmbH Leverkusen, Germany 100
Bayfi n GmbH Leverkusen, Germany 100
Name of associate or joint venture Place of business Bayer’s interest
%
Schein Pharmaceutical Canada Inc. Ontario, Canada 50
Asia / PacificBayer DAS (Pvt) Ltd. Karachi, Pakistan 50
Cotton Growers Services Pty. Ltd. Wee Waa, Australia 50
Teijin-Bayer Polytec Ltd. Tokyo, Japan 50
Latin America / Africa / Middle EastAlimtec S. A. Santiago, Chile 40
Coopers Environmental Health Pty Ltd. Pomona Gardens, South Africa 26
Wenkem SA (Pty) Ltd. Midrand, South Africa 24.9

173NOTESTABLE OF CONTENTS CONSOLIDATED FINANCIAL STATEMENTS
Name of exempt subsidiary Place of business Bayer‘s interest
in %
BaySystems Büfa Polyurethane GmbH & Co. KG Oldenburg, Germany 100
BerliServe Professional Services GmbH Berlin, Germany 100
Chemion Logistik GmbH Leverkusen, Germany 100
Currenta GmbH & Co. OHG Leverkusen, Germany 60
Direvo Biotech AG Cologne, Germany 100
Drugofa GmbH Cologne, Germany 100
Dynevo GmbH Leverkusen, Germany 100
Epurex Films GmbH & Co. KG Bomlitz, Germany 100
Erste K-W-A Beteiligungsgesellschaft mbH Leverkusen, Germany 100
Euroservices Bayer GmbH Leverkusen, Germany 100
Generics Holding GmbH Leverkusen, Germany 100
GP Grenzach Produktions GmbH Grenzach, Germany 100
Icon Genetics GmbH Munich, Germany 100
Intendis GmbH Berlin, Germany 100
Intendis Dermatologie GmbH Berlin, Germany 100
Jenapharm GmbH & Co. KG Jena, Germany 100
Kosinus Grundstücks-Verwaltungs-Gesellschaft mbH & Gamma OHG Berlin, Germany 100
KVP Pharma+Veterinär-Produkte GmbH Kiel, Germany 100
Lyttron Technology GmbH Leverkusen, Germany 100
Marotrast GmbH Jena, Germany 100
Menadier Heilmittel GmbH Berlin, Germany 100
Pharma Verlagsbuchhandlung GmbH Berlin, Germany 100
Schering AG Berlin, Germany 100
Schering GmbH und Co. Produktions KG Weimar, Germany 100
Schering International Holding GmbH Berlin, Germany 100
Schering Kahlbaum GmbH Berlin, Germany 100
Sportrechte Vermarktungs- und Verwertungs-GmbH & Co. oHG Leverkusen, Germany 100
Tectrion GmbH Leverkusen, Germany 100
TravelBoard GmbH Leverkusen, Germany 100
Viverso GmbH Bitterfeld, Germany 100
Zweite K-W-A Beteiligungsgesellschaft mbH Leverkusen, Germany 100

174 / / BAYER ANNUAL REPORT 2008
6.2 Business combinations and other acquisitions
Acquisitions were accounted for by the purchase method in accordance with ifrs 3 (Business Combinations), the results of the acquired businesses therefore being included in the consoli -da ted fi nancial statements as from the respective dates of acquisition. The purchase prices of acqui-sitions of companies domiciled outside the euro zone were translated at the exchange rates in effect at the respective dates of acquisition.
Acquisition costs in 2008 amounted to €932 million (2007: €482 million). The purchase prices of the acquired companies or businesses were settled mainly in cash. Goodwill arising on these acquisitions totaled €380 million (2007: €210 million) and related principally to the following transactions:
Bayer subsidiary Medrad Inc. acquired the remaining shares of Possis Medical Inc. through its subsidiary Phoenix Acquisition Corp. in March 2008 for €227 million. By virtue of the merger of Phoenix Acquisition Corp. with Possis Medical Inc., the latter became a wholly owned subsidiary of Medrad. The main components of the difference between the value of the acquired net assets and the purchase price are €99 million pertaining to patented technologies, trademarks and re-search and development projects, €40 million in deferred taxes and €125 million of goodwill.
The acquisition of the over-the-counter (otc) medicines business of u.s.-based Sagmel Inc. for €265 million was completed at the beginning of June 2008. The otc business of Sagmel Inc. is now integrated into the operations of Bayer HealthCare in Russia, Ukraine, Kazakhstan, the Bal-tic states and several countries of the Caucasus and Central Asia regions. The main components of the difference between the value of the acquired net assets and the purchase price are €161 million pertaining to trademarks and €70 million of goodwill.
In July 2008 the over-the-counter (otc) cough and cold medicines business of the Chinese com-pany Topsun Science and Technology Qidong Gaitianli Pharmaceutical Co. Ltd. was acquired for €109 million. The main components of the difference between the value of the acquired net assets and the purchase price are €50 million pertaining to trademarks and €48 million of goodwill.
The protein engineering specialist Direvo Biotech AG, Cologne, Germany, was acquired at the end of September 2008 for €185 million. The main components of the difference between the val-ue of the acquired net assets and the purchase price are €150 million pertaining to patented re-search and development technologies, €45 million in deferred taxes and €106 million of goodwill.
The acquired businesses named above contributed €109 million to Bayer Group sales in 2008. These portfolio changes had an effect on the operating result (ebit) for 2008 of -€14 million, whereas a total after-tax result of -€27 million was recorded for the acquired businesses since the respective dates of their fi rst-time consolidation. This includes the fi nancing costs incurred since the dates of acquisition.
If these acquisitions had already been made as of January 1, 2008, the Bayer Group would have had sales of €32,978 million in 2008. Income after taxes would have amounted to €1,690 million, taking into account the effects of the revaluation of acquired net assets and hypothetical fi nanc-ing costs for the full year. Earnings per share from continuing and discontinued operations would not have been materially affected.
With the entry of the squeeze-out of the remaining minority stockholders of Bayer Schering Pharma AG in the commercial register on September 25, 2008, all the shares of the minority stockholders of Bayer Schering Pharma AG were transferred by operation of law to Bayer Scher-ing GmbH, a wholly owned subsidiary of Bayer AG. The remaining minority stockholders re-ceived cash compensation of €98.98 per share pursuant to the resolution of the stockholders’ meeting of Bayer Schering Pharma AG held on January 17, 2007. The required sum of €695 mil-lion, which had been held in escrow accounts for this purpose, was paid out to the stockholders at the beginning of October 2008.
TABLE OF CONTENTS CONSOLIDATED FINANCIAL STATEMENTS

175NOTES
The effects of these and other, smaller acquisitions on the Group’s assets and liabilities as of the respective acquisition dates are shown in the table. Net of acquired cash and cash equivalents, they resulted in the following cash outfl ow:
The fair-value adjustment refl ects the differences between the balance-sheet values of the assets and liabilities prior to their acquisition and the fair values in the acquirer’s balance sheet at the acquisition date.
The goodwill arising after the purchase price allocation on the above acquisitions made in 2008 is due to a number of factors, including acquired distribution networks and marketing syner-gies. The goodwill arising on the acquisition of Direvo Biotech AG is largely attributable to the expected high earnings potential of the products it is intended to develop using the protein engi-neering platform that forms part of the acquisition.
In May 2007 Bayer CropScience signed an agreement to acquire the u.s. cotton seed producer Stoneville Pedigreed Seed Company from Monsanto. This company was included in full effective June 1, 2007 in the consolidated fi nancial statements of the Bayer Group. The purchase price in-cluding ancillary acquisition costs was €232 million. The goodwill remaining after the purchase price allocation was mainly attributable to technology and distribution synergies. The acquisi-tion strengthened the position of Bayer’s BioScience business unit in the u.s. cotton seed mar-ket.
TABLE OF CONTENTS CONSOLIDATED FINANCIAL STATEMENTS
Pre-acquisition carrying amount
Fair-value adjustment
Fair value at the acquisition
date
€ million € million € million
Acquired assets and assumed liabilities
Goodwill - 380 380
Patents - 222 222
Trademarks - 232 232
R&D projects - 67 67
Other intangible assets - 60 60
Property, plant and equipment 25 - 25
Other noncurrent assets 23 - 23
Inventories 31 7 38
Other current assets 56 (2) 54
Cash and cash equivalents 10 - 10
Provisions for pensions and other post-employment benefi ts (1) - (1)
Other provisions (10) - (10)
Financial liabilities (12) - (12)
Other liabilities (57) 1 (56)
Deferred taxes 15 (115) (100)
Net assets 80 852 932
Non-controlling interest - - -
Purchase prices 932
of which ancillary acquisition costs 6
Acquired cash and cash equivalents 10
Compensation of non-controlling interest 695
Net cash outfl ow for the acquisitions 1,617

176 / / BAYER ANNUAL REPORT 2008
In July 2007 Bayer MaterialScience completed the acquisition of the Ure-Tech Group of Taiwan, the largest producer of thermoplastic polyurethanes (tpu) in the Asia / Pacifi c region, for €63 million.
In September 2007 Bayer HealthCare completed the acquisition of a biologics production facility in Emeryville, California, from Novartis. Bayer HealthCare is continuing the production of Betaferon® / Betaseron® in Emeryville and has taken over the entire manufacturing and process technology and the facility’s employees. Novartis received about €137 million for the acquisition of the production facility, including the Biologics License Application (bla), the transfer of the related equipment and inventories, and the leasing of certain buildings.
The effects of these and other, smaller acquisitions made in 2007 on the Group’s assets and lia-bilities in that year as of the respective acquisition dates are shown in the table. Net of acquired cash and cash equivalents, they resulted in the following cash outfl ow:
TABLE OF CONTENTS CONSOLIDATED FINANCIAL STATEMENTS
Pre-acquisition carrying amount
Fair-valueadjustment
Fair value atthe acquisition
date
€ million € million € million
Acquired assets and assumed liabilities
Goodwill 6 204 210
Other rights 77 52 129
Production rights - 24 24
Other intangible assets 13 13 26
Property, plant and equipment 51 18 69
Other noncurrent assets 5 - 5
Inventories 83 (14) 69
Other current assets 32 (1) 31
Cash and cash equivalents 1 - 1
Provisions for pensions and other post-employment benefi ts - (4) (4)
Other provisions - (17) (17)
Financial liabilities - (6) (6)
Other liabilities (31) (7) (38)
Deferred taxes - (1) (1)
Net assets 237 261 498
Non-controlling interest - - (16)
Purchase prices 482
of which ancillary acquisition costs 4
Acquired cash and cash equivalents 1
Net cash outfl ow for the acquisitions 481

177NOTES
6.3 Divestitures and discontinued operations
Divestitures and the sale of discontinued operations led to the following cash fl ows in 2008:
The diagnostics activities, along with H. C. Starck and Wolff Walsrode, were recognized as dis-continued operations in 2007. Tax payments made in connection with the divestiture of the diag-nostics business and a subsequent purchase price payment are therefore recognized in discon-tinued operations in 2008 as well. The information on discontinued operations, which is pro-vided from the standpoint of the Bayer Group, is to be regarded as part of the reporting for the entire Bayer Group by analogy with our segment reporting and is not intended to portray either the discontinued operations or the remaining operations of Bayer as separate entities. The pre-sentation is thus in line with the principles for reporting discontinued operations.
A breakdown of the results of discontinued operations is given below:
TABLE OF CONTENTS CONSOLIDATED FINANCIAL STATEMENTS
2008
€ million
Divestiture proceeds 39
Prepayments and outstanding payments -
Divestiture costs -
Divested cash and fi nancial loans -
Tax payments (79)
Other cash fl ows (1)
Net cash outfl ow from the divestitures (41)
Diagnostics H.C. Starck Wolff Walsrode Total
2007 2008 2007 2008 2007 2008 2007 2008
€ million € million € million € million € million € million € million € million
Net sales - - 74 - 172 - 246 -
Cost of goods sold - - (51) - (109) - (160) -
Selling expenses (1) - (4) - (22) - (27) -
Research and development expenses - - (2) - (4) - (6) -
General administration expenses (1) - (2) - (9) - (12) -
Other operating income (expenses) - net 2,821 6 90 - 246 - 3,157 6
Operating result (EBIT) 2,819 6 105 - 274 - 3,198 6
Non-operating result - - (1) - (3) - (4) -
Income before income taxes 2,819 6 104 - 271 - 3,194 6
Income taxes (766) (2) (5) - (13) - (784) (2)
Income after taxes 2,053 4 99 - 258 - 2,410 4
of which:
Current income (loss) (before taxes) (16) - 11 - 26 - 21 -
Income taxes 4 - (3) - (7) - (6) -
Current income (loss) (after taxes) (12) - 8 - 19 - 15 -
Income from divestitures (before taxes) 2,835 6 93 - 245 - 3,173 6
Income taxes (770) (2) (2) - (6) - (778) (2)
Income from divestitures (after taxes) 2,065 4 91 - 239 - 2,395 4

178 / / BAYER ANNUAL REPORT 2008
The separate asset and liability line items in the balance sheet refl ect the following amounts per-taining to the discontinued operations as of December 31 of the respective year:
Discontinued operations affected the Group cash fl ow statements as follows:
NOTES TO THE STATEMENTS OF INCOME
7. Net sales
Net sales are derived primarily from product deliveries. Total reported net sales increased by €533 million or 1.6% from 2007 to €32,918 million. While volumes increased by €898 million, or 2.8%, adverse shifts in exchange rates trimmed sales by €1,086 million, or 3.4%. Changes in selling prices contributed €534 million, or 1.6%, to the growth in business. Portfolio changes boosted sales by €187 million, or 0.6%.
Portfolio changes led to the following changes in sales compared with the previous year:
Breakdowns of net sales by segment and by region are given in the table in Note [1].
TABLE OF CONTENTS CONSOLIDATED FINANCIAL STATEMENTS
2008
€ million
Acquisitions
Sagmel Inc. (OTC business) 54
Possis Medical Inc. 41
BaySystems B.V. 30
Others 141
266
Divestitures
Hennecke GmbH (61)
Others (18)
(79)
Net effect of portfolio changes 187
Diagnostics H.C. Starck Wolff Walsrode Total
2007 2008 2007 2008 2007 2008 2007 2008
€ million € million € million € million € million € million € million € million
Net cash provided by (used in) operating activities (34) - 23 - 13 - 2 -
Net cash provided by (used in) investing activities 3,292 (52) 927 - 429 8 4,648 (44)
Net cash provided by (used in) fi nancing activities (3,258) 52 (950) - (442) (8) (4,650) 44
Change in cash and cash equivalents - - - - - - - -
Diagnostics H.C. Starck Wolff Walsrode Total
2007 2008 2007 2008 2007 2008 2007 2008
€ million € million € million € million € million € million € million € million
Current assets 76 3 - - 8 - 84 3
Assets held for sale and discontinued operations 76 3 - - 8 - 84 3
Other current provisions 129 13 - - - - 129 13
Other current liabilities 47 - - - - - 47 -
Liabilities directly related to assets held for sale and discontinued operations 176 13 - - - - 176 13
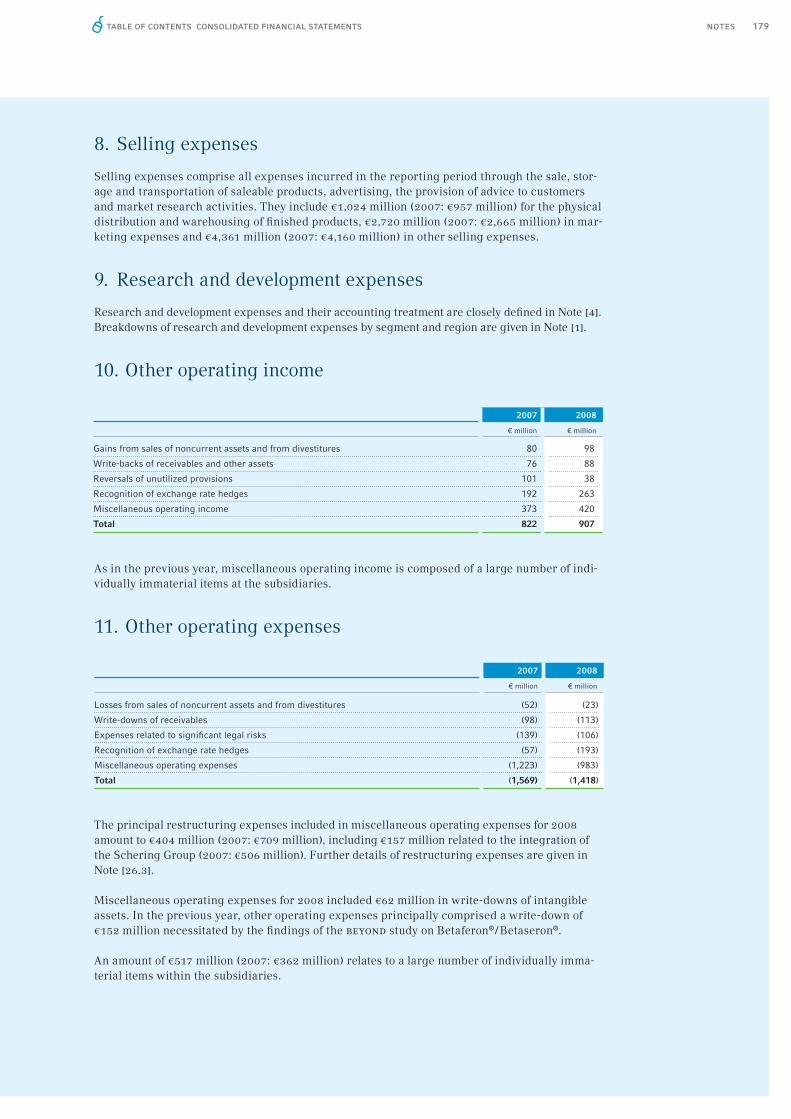
179NOTES
8. Selling expenses
Selling expenses comprise all expenses incurred in the reporting period through the sale, stor-age and transportation of saleable products, advertising, the provision of advice to customers and market research activities. They include €1,024 million (2007: €957 million) for the physical distribution and warehousing of fi nished products, €2,720 million (2007: €2,665 million) in mar-keting expenses and €4,361 million (2007: €4,160 million) in other selling expenses.
9. Research and development expenses
Research and development expenses and their accounting treatment are closely defi ned in Note [4]. Breakdowns of research and development expenses by segment and region are given in Note [1].
10. Other operating income
As in the previous year, miscellaneous operating income is composed of a large number of indi-vidually immaterial items at the subsidiaries.
11. Other operating expenses
The principal restructuring expenses included in miscellaneous operating expenses for 2008 amount to €404 million (2007: €709 million), including €157 million related to the integration of the Schering Group (2007: €506 million). Further details of restructuring expenses are given in Note [26.3].
Miscellaneous operating expenses for 2008 included €62 million in write-downs of intangible assets. In the previous year, other operating expenses principally comprised a write-down of €152 million necessitated by the fi ndings of the beyond study on Betaferon® / Betaseron®.
An amount of €517 million (2007: €362 million) relates to a large number of individually imma-terial items within the subsidiaries.
TABLE OF CONTENTS CONSOLIDATED FINANCIAL STATEMENTS
2007 2008
€ million € million
Gains from sales of noncurrent assets and from divestitures 80 98
Write-backs of receivables and other assets 76 88
Reversals of unutilized provisions 101 38
Recognition of exchange rate hedges 192 263
Miscellaneous operating income 373 420
Total 822 907
2007 2008
€ million € million
Losses from sales of noncurrent assets and from divestitures (52) (23)
Write-downs of receivables (98) (113)
Expenses related to signifi cant legal risks (139) (106)
Recognition of exchange rate hedges (57) (193)
Miscellaneous operating expenses (1,223) (983)
Total (1,569) (1,418)

180 / / BAYER ANNUAL REPORT 2008
12. Personnel expenses / employees
Personnel expenses declined by €80 million to €7,491 million in 2008 (2007: €7,571 million). Changes in exchange rates diminished personnel expenses by €175 million.
The personnel expenses shown here do not contain the interest portion of the allocation to per-sonnel-related provisions, which is included in the non-operating result as other non-operating expense. These personnel-related provisions are mainly for employee pensions (see Note [13.3]).
The average number of employees classifi ed by corporate functions is shown in the table below.
The employees of joint ventures are included in the above fi gures in proportion to Bayer’s inter-ests in the respective companies. The total number of people employed by joint ventures in 2008 was 60 (2007: 66).
The average number of employees is stated in full-time equivalents, with part-time employees included on a pro-rata basis in line with their contractual working hours.
13. Non-operating result
The non-operating result for 2008 was minus €1,188 million (2007: minus €920 million), com-prising an equity-method loss of €62 million (2007: €45 million), non-operating expenses of €1,715 million (2007: €1,709 million) and non-operating income of €589 million (2007: €834 mil-lion). Details on the individual categories of the non-operating result are provided below.
TABLE OF CONTENTS CONSOLIDATED FINANCIAL STATEMENTS
2007 2008
€ million € million
Wages and salaries 5,960 5,978
Social expenses and expenses for pensions and other benefi ts 1,611 1,513
of which for defi ned-contribution pension plans 410 431
of which for defi ned-benefi t pension plans 294 195
Total 7,571 7,491
2007 2008
Production 48,250 48,384
Marketing 35,849 38,006
Research and development 11,732 11,914
General administration 9,791 8,995
Total 105,622 107,299
of which trainees 2,631 2,623

181NOTES
13.1 Income (loss) from investments in affi liated companies
This comprised the following:
The income from investments in affi liated companies mainly comprised an equity-method loss of €64 million (2007: €48 million) from two production joint ventures with Lyondell.
Further details of the companies included at equity in the consolidated fi nancial statements are given in Note [19].
13.2 Interest expense
This comprised the following:
This item includes interest expense of €31 million (2007: €32 million) relating to non-fi nancial liabilities and interest income of €13 million (2007: €1 million) from non-fi nancial assets.
The portion of net income or loss attributable to non-controlling interest to which the company has a repayment obligation out of total assets is refl ected in net interest expense. In this context pro-rated income of €18 million was recognized in interest expense for the year under report (2007: €2 million).
TABLE OF CONTENTS CONSOLIDATED FINANCIAL STATEMENTS
2007 2008
€ million € million
Net loss from investments in associates (equity-method loss) (45) (62)
Expenses
Write-downs of investments in affi liated companies (27) (13)
Losses from the sale of investments in affi liated companies - (7)
Income
Dividends from affi liated companies and income from profi t and loss transfer agreements (net) - -
Gains from the sale of investments in affi liated companies 3 12
Total (69) (70)
2007 2008
€ million € million
Expenses
Interest and similar expenses (1,320) (948)
Interest expenses for derivatives (held for trading) (107) (295)
Income
Other interest and similar income 612 171
Interest income from derivatives (held for trading) 114 370
Total (701) (702)

182 / / BAYER ANNUAL REPORT 2008
13.3 Other non-operating income and expense
Other non-operating income and expense comprised the following:
The interest portion of noncurrent interest-bearing provisions mainly relates to pension provi-sions.
14. Income taxes
The breakdown of income taxes by region and origin is as follows:
In 2007 the Bayer Group recognized deferred tax income of €921 million due to changes in tax rates, including one-time deferred tax income of €912 million arising in connection with the cor-porate tax reform in Germany. The latter amount resulted mainly from the remeasurement of the deferred tax liabilities accrued in connection with the Schering acquisition, particularly in order to refl ect the lower nominal rates of corporate income tax applicable in Germany from 2008.
TABLE OF CONTENTS CONSOLIDATED FINANCIAL STATEMENTS
2007 2008
€ million € million
Expenses
Interest portion of interest-bearing provisions (246) (300)
Exchange loss - (79)
Miscellaneous non-operating expenses (9) (73)
Income
Exchange gain 88 -
Miscellaneous non-operating income 17 36
Total (150) (416)
2007 2008
€ million € million
Income taxes paid or accrued
Germany (185) (161)
other countries (730) (651)
(915) (812)
Deferred taxes
from temporary differences 1,469 323
from interest carryforwards - 11
from tax loss carryforwards (517) (168)
from tax credits 35 10
987 176
Total 72 (636)

183NOTES
The deferred tax assets and liabilities are allocable to the various balance sheet items as follows:
The recognition in stockholders’ equity of actuarial gains and losses relating to defi ned benefi t pension plans and similar commitments resulted in a €460 million increase (2007: €611 million decrease) in stockholders’ equity due to the related deferred taxes. Similarly, changes in fair values of available-for-sale fi nancial assets and derivatives designated as hedges resulted in the recognition in stockholders’ equity of deferred tax assets of €45 million (2007: deferred tax lia-bilities of €66 million).
Utilization of tax loss carryforwards from previous years diminished the amount of income tax-es paid or accrued in 2008 by €287 million (2007: €353 million).
Tax credits and tax loss carryfowards expire as follows:
Deferred tax assets of €11 million were recognized for interest expense of €36 million that is not currently tax-deductible in Germany, in the expectation that the interest carryforward can be utilized in the future.
TABLE OF CONTENTS CONSOLIDATED FINANCIAL STATEMENTS
Dec. 31, 2007 Dec. 31, 2008
Deferred tax
assets
Deferred tax
liabilities
Deferred tax
assets
Deferred tax
liabilities
€ million € million € million € million
Intangible assets 464 3,946 470 3,766
Property, plant and equipment 59 696 67 632
Financial assets 45 293 78 228
Inventories 392 247 324 85
Receivables 52 459 64 511
Other assets 5 26 150 74
Provisions for pensions and other post-employment benefi ts 797 523 1,170 462
Other provisions 674 404 301 318
Liabilities 487 66 524 44
Interest carryforwards - - 11 -
Tax loss carryforwards 589 - 429 -
Tax credits 75 - 96 -
3,639 6,660 3,684 6,120
of which noncurrent 2,092 5,707 2,644 5,354
Set-off (2,794) (2,794) (2,528) (2,528)
Total 845 3,866 1,156 3,592
Tax credits Tax loss carryforwards
Dec. 31, 2007 Dec. 31, 2008 Dec. 31, 2007 Dec. 31, 2008
€ million € million € million € million
One year - - 4 58
Two years - - 42 10
Three years - - 33 58
Four years - - 32 51
Five years - 1 83 113
Thereafter 75 95 2,096 1,566
Total 75 96 2,290 1,856

184 / / BAYER ANNUAL REPORT 2008
Of the total tax loss carryforwards of €1,856 million in 2008 (2007: €2,290 million), an amount of €1,455 million (2007: €1,896 million) can probably be utilized within a reasonable period. Deferred tax assets of €429 million (2007: €589 million) were recognized for these tax loss car-ryforwards, including €15 million (2007: €14 million) that could not be recognized in income.
The utilization of €401 million (2007: €394 million) of loss carryforwards is subject to legal or economic restrictions. Consequently, no deferred tax assets were recognized for these amounts. However, if the utilizability of the loss carryforwards had been probable, theoretical deferred tax assets of €113 million (2007: €113 million) would have had to be recognized.
Tax credits of €96 million (2007: €75 million) were recognized as deferred tax assets, including €3 million (2007: €0 million) that could not be recognized in income.
Deferred taxes were not recognized for temporary differences of €6,651 million (2007: €3,830 mil lion) relating to earnings of subsidiaries, either because these profi ts are not subject to taxation or because they are to be reinvested for an indefi nite period. If deferred taxes were recognized for these temporary differences, the liability would be based on the respective withholding tax rates only, taking into account the local and German tax rates on corporate divi-dends where applicable. Deferred tax liabilities are recognized for €19 million (2007: €73 mil-lion) in planned dividend payments by subsidiaries.
The reported tax expense of €636 million for 2008 (2007: tax income of €72 million) differs by €62 million (2007: €867 million) from the expected tax expense of €698 million (2007: €795 mil-lion) that would result from applying an anticipated weighted average tax rate to the pre-tax in-come of the Group. This average rate is derived from the theoretical tax rates of individual Group companies and was 29.6% in 2008 (2007: 35.6%). The effective tax rate was 27.0% (2007: minus 3.2%).
The reconciliation of theoretical to reported income tax expense (income) for the Group is as follows:
TABLE OF CONTENTS CONSOLIDATED FINANCIAL STATEMENTS
2007 2008
€ million % € million %
Theoretical income tax expense (income) 795 100 698 100
Reduction in taxes due to tax-free income
Tax-free income from affi liated companies and divestiture proceeds (2) - (10) (1)
Other (47) (6) (51) (7)
First-time recognition of previously unrecognized deferred tax assets
on loss carryforwards (1) - (50) (7)
Use of tax loss carryforwards without prior recognition
of deferred tax assets - - (11) (2)
Increase in taxes due to non tax-deductible expenses
Write-downs of investments 2 - 29 4
Expenses related to litigations 10 1 18 2
Other 85 11 107 15
Tax income and expenses relating to other periods 4 1 (42) (6)
Tax effects of changes in tax rates (921) (116) 7 1
Other tax effects 3 - (59) (8)
Actual income tax expense (income) (72) (9) 636 91

185NOTES
15. Income/losses attributable to non-controlling interest
Income attributable to non-controlling interest amounted to €12 million (2007: €16 million), while losses attributable to non-controlling interest amounted to €7 million (2007: €11 million).
16. Earnings per share from continuing and discontinued operations
Earnings per share are determined according to ias 33 (Earnings per Share) by dividing net in-come by the weighted average number of shares. The number of ordinary shares to be taken into account for this purpose is increased by the potential shares that would be issued upon exercise of the rights under the mandatory convertible bond issued in April 2006. The fi nancing expens-es for the mandatory convertible bond are added back to net income. In computing earnings per share, the ordinary shares to be issued upon exercise of the conversion rights from this bond is-sue are counted along with the already issued shares, so basic and diluted earnings per share are identical. Further details of the convertible bond can be found in Note [27].
TABLE OF CONTENTS CONSOLIDATED FINANCIAL STATEMENTS
2007 2008
€ million € million
Income after taxes 4,716 1,724
of which attributable to non-controlling interest 5 5
of which attributable to Bayer AG stockholders (net income) 4,711 1,719
Income from discontinued operations after taxes 2,410 4
Financing expenses for the mandatory convertible bond, net of tax effects 98 112
Adjusted net income from continuing operations 2,399 1,827
Adjusted net income from continuing and discontinued operations 4,809 1,831
Weighted average number of issued ordinary shares 764,341,920 764,342,029
Potential shares to be issued upon conversion of the mandatory convertible bond 59,565,383 59,893,122
Adjusted weighted average total number of issued and potential ordinary shares 823,907,303 824,235,151
Basic earnings per share € €
from continuing operations 2.91 2.22
from discontinued operations 2.93 -
from continuing and discontinued operations 5.84 2.22
Diluted earnings per share € €
from continuing operations 2.91 2.22
from discontinued operations 2.93 -
from continuing and discontinued operations 5.84 2.22
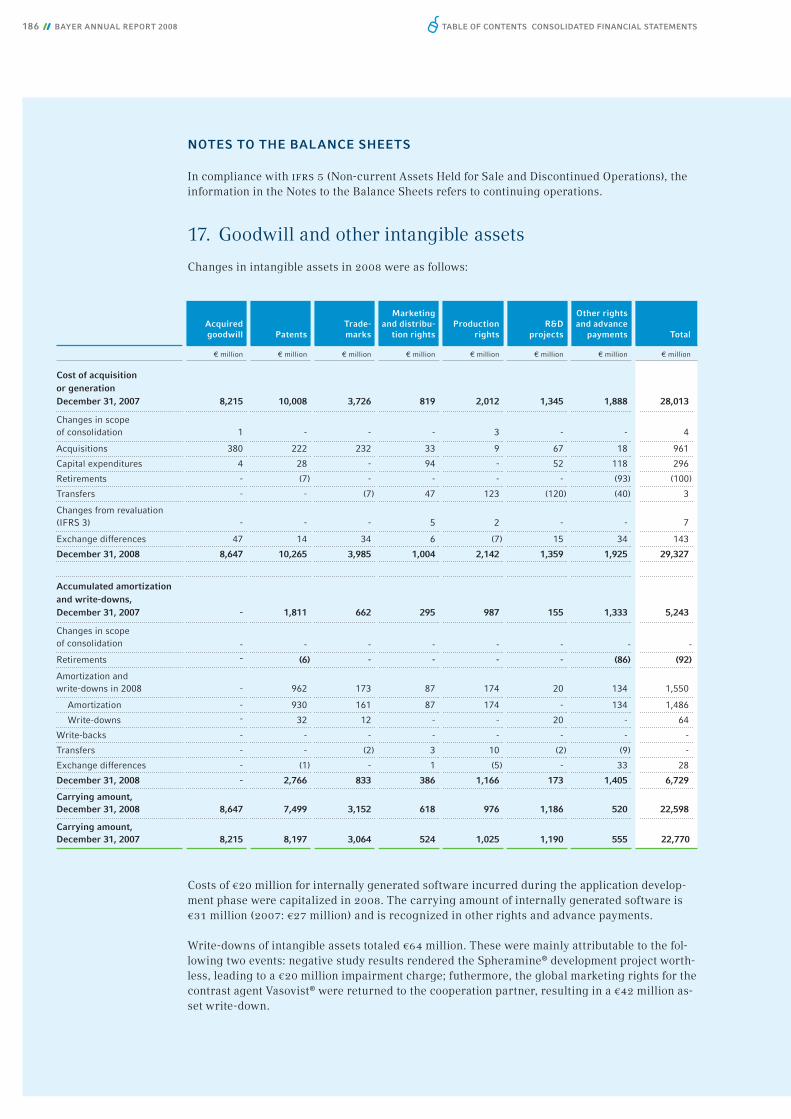
186 / / BAYER ANNUAL REPORT 2008
NOTES TO THE BALANCE SHEETS
In compliance with ifrs 5 (Non-current Assets Held for Sale and Discontinued Operations), the information in the Notes to the Balance Sheets refers to continuing operations.
17. Goodwill and other intangible assets
Changes in intangible assets in 2008 were as follows:
Costs of €20 million for internally generated software incurred during the application develop-ment phase were capitalized in 2008. The carrying amount of internally generated software is €31 million (2007: €27 million) and is recognized in other rights and advance payments.
Write-downs of intangible assets totaled €64 million. These were mainly attributable to the fol-lowing two events: negative study results rendered the Spheramine® development project worth-less, leading to a €20 million impairment charge; futhermore, the global marketing rights for the contrast agent Vasovist® were returned to the cooperation partner, resulting in a €42 million as-set write-down.
TABLE OF CONTENTS CONSOLIDATED FINANCIAL STATEMENTS
Acquired goodwill Patents
Trade-marks
Marketing and distribu-
tion rightsProduction
rightsR&D
projects
Other rights and advance
payments Total
€ million € million € million € million € million € million € million € million
Cost of acquisitionor generationDecember 31, 2007 8,215
10,008
3,726
819
2,012
1,345
1,888
28,013
Changes in scope of consolidation 1 - - - 3 - - 4
Acquisitions 380 222 232 33 9 67 18 961
Capital expenditures 4 28 - 94 - 52 118 296
Retirements - (7) - - - - (93) (100)
Transfers - - (7) 47 123 (120) (40) 3
Changes from revaluation (IFRS 3) - - - 5 2 - - 7
Exchange differences 47 14 34 6 (7) 15 34 143
December 31, 2008 8,647 10,265 3,985 1,004 2,142 1,359 1,925 29,327
Accumulated amortizationand write-downs, December 31, 2007 - 1,811 662 295 987 155 1,333 5,243
Changes in scope of consolidation - - - - - - - -
Retirements - (6) - - - - (86) (92)
Amortization and write-downs in 2008 - 962 173 87 174 20 134 1,550
Amortization - 930 161 87 174 - 134 1,486
Write-downs - 32 12 - - 20 - 64
Write-backs - - - - - - - -
Transfers - - (2) 3 10 (2) (9) -
Exchange differences - (1) - 1 (5) - 33 28
December 31, 2008 - 2,766 833 386 1,166 173 1,405 6,729
Carrying amount, December 31, 2008 8,647 7,499 3,152 618 976 1,186 520 22,598
Carrying amount, December 31, 2007 8,215 8,197 3,064 524 1,025 1,190 555 22,770
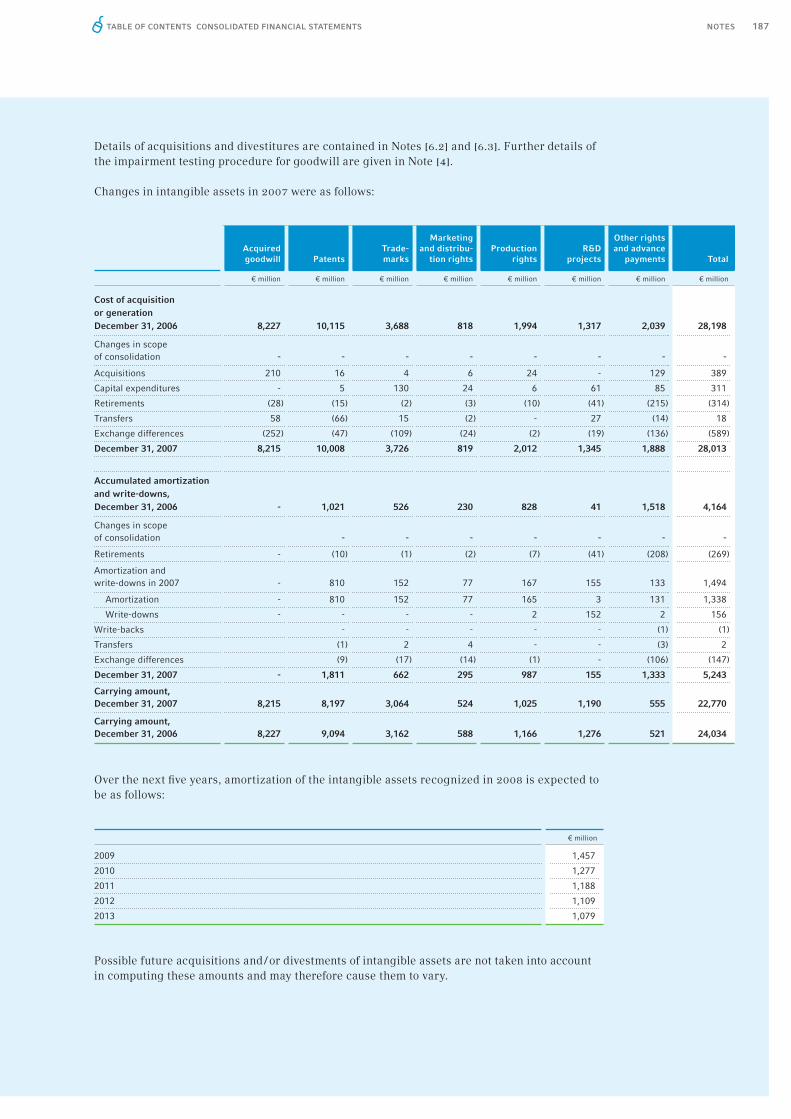
187NOTES
Details of acquisitions and divestitures are contained in Notes [6.2] and [6.3]. Further details of the impairment testing procedure for goodwill are given in Note [4].
Changes in intangible assets in 2007 were as follows:
Over the next fi ve years, amortization of the intangible assets recognized in 2008 is expected to be as follows:
Possible future acquisitions and / or divestments of intangible assets are not taken into account in computing these amounts and may therefore cause them to vary.
TABLE OF CONTENTS CONSOLIDATED FINANCIAL STATEMENTS
€ million
2009 1,457
2010 1,277
2011 1,188
2012 1,109
2013 1,079
Acquired goodwill Patents
Trade-marks
Marketing and distribu-
tion rightsProduction
rightsR&D
projects
Other rights and advance
payments Total
€ million € million € million € million € million € million € million € million
Cost of acquisitionor generationDecember 31, 2006
8,227
10,115 3,688 818 1,994 1,317 2,039 28,198
Changes in scope of consolidation - - - - - - - -
Acquisitions 210 16 4 6 24 - 129 389
Capital expenditures - 5 130 24 6 61 85 311
Retirements (28) (15) (2) (3) (10) (41) (215) (314)
Transfers 58 (66) 15 (2) - 27 (14) 18
Exchange differences (252) (47) (109) (24) (2) (19) (136) (589)
December 31, 2007 8,215 10,008 3,726 819 2,012 1,345 1,888 28,013
Accumulated amortization
and write-downs, December 31, 2006 - 1,021 526 230 828 41 1,518 4,164
Changes in scope of consolidation - - - - - - -
Retirements - (10) (1) (2) (7) (41) (208) (269)
Amortization and write-downs in 2007 - 810 152 77 167 155 133 1,494
Amortization - 810 152 77 165 3 131 1,338
Write-downs - - - - 2 152 2 156
Write-backs - - - - - (1) (1)
Transfers (1) 2 4 - - (3) 2
Exchange differences (9) (17) (14) (1) - (106) (147)
December 31, 2007 - 1,811 662 295 987 155 1,333 5,243
Carrying amount, December 31, 2007 8,215 8,197 3,064 524 1,025 1,190 555 22,770
Carrying amount, December 31, 2006 8,227 9,094 3,162 588 1,166 1,276 521 24,034

188 / / BAYER ANNUAL REPORT 2008
The residual carrying amounts of goodwill for our operating subgroups and reporting segments are as follows:
TABLE OF CONTENTS CONSOLIDATED FINANCIAL STATEMENTS
Pharma-ceuticals
Consumer Health HealthCare
Crop Protection
Environ-mental
Science / BioScience
Crop-Science
€ million € million € million € million € million € million
Carrying amounts, January 1, 2007 5,727 863 6,590 1,136 389 1,525
Changes in scope of consolidation - - - - - -
Acquisitions 8 4 12 4 152 156
Capital expenditures - - - - - -
Retirements - - - (9) (19) (28)
Amortization and write-downs in 2007 - - - - - -
Transfers 58 - 58 - - -
Exchange differences (154) (42) (196) (17) (36) (53)
Carrying amounts, December 31, 2007 5,639 825 6,464 1,114 486 1,600
Changes in scope of consolidation 1 - 1 - - -
Acquisitions 232 128 360 - - -
Capital expenditures 1 - 1 - - -
Retirements - - - - - -
Amortization and write-downs in 2008 - - - - - -
Transfers - - - 3 (3) -
Exchange differences 63 (13) 50 (29) 23 (6)
Carrying amounts, December 31, 2008 5,936 940 6,876 1,088 506 1,594
Materials SystemsMaterial-
ScienceRecon-
ciliationBayer Group
€ million € million € million € million € million
Carrying amounts, January 1, 2007 91 21 112 - 8,227
Changes in scope of consolidation - - - - -
Acquisitions 33 9 42 - 210
Capital expenditures - - - - -
Retirements - - - - (28)
Amortization and write-downs in 2007 - - - - -
Transfers - - - - 58
Exchange differences (2) (1) (3) - (252)
Carrying amounts, December 31, 2007 122 29 151 - 8,215
Changes in scope of consolidation - - - - 1
Acquisitions - 20 20 - 380
Capital expenditures 3 - 3 - 4
Retirements - - - - -
Amortization and write-downs in 2008 - - - - -
Transfers - - - - -
Exchange differences 2 1 3 - 47
Carrying amounts, December 31, 2008 127 50 177 - 8,647

189NOTES
Goodwill and other intangible assets with an indefi nite useful life that are of material signifi -cance for the Bayer Group are allocated to the following strategic business entities or cash-gen-erating units:
Since it is uncertain whether acquired research and development projects or capitalized mile-stone payments will eventually result in the production of saleable products, the period over which the corresponding asset is expected to generate an economic benefi t for the company cannot be determined. Development projects in the amount of €1,186 million were capitalized as of the end of 2008.
The Bayer Cross, which was reacquired for the North America region in 1994, having been awarded to the United States and Canada under the reparations agreements at the end of the First World War, is recognized as an intangible asset with an indefi nite useful life. The company names “Schering” and “Medrad,” which passed to Bayer with the acquisition of Schering AG, Berlin, Germany, in 2006, also have an indefi nite useful life. The period for which the Bayer Group will derive an economic benefi t from these names cannot be determined as it intends to make continued use of them. The Bayer Cross is capitalized at €107 million, while the “Scher-ing” and “Medrad” names are carried at €405 million and €293 million respectively.
PatentsWe seek to protect our products with patents in major markets. Depending on the jurisdiction, patent protection may be available for:
individual active ingredients,specifi c compounds, formulations and combinations containing active ingredients,manufacturing processes,working methods,equipment,intermediates useful in the manufacture of products,genomic research andnew uses for existing active ingredients or products.
The protection that a patent provides varies from country to country, depending on the type of claim granted, the scope of the claim’s coverage and the legal remedies available for enforce-ment.
The advance of genomic research has increased our patent fi lings for biological products. We typically seek protection upon determining a gene’s function.
We currently hold thousands of patents, and have applications pending for a signifi cant number of new patents. Although the patents on Avalox® / Avelox®, Betaferon® / Betaseron®, Kogenate®, Levitra®, Magnevist®, Mirena®, Nexavar®, Ultravist®, Xarelto®, yaz®, Yasmin® and Yasminelle® are particularly important to our business, we believe that no single patent (or group of related patents) is material to our business as a whole.
••••••••
TABLE OF CONTENTS CONSOLIDATED FINANCIAL STATEMENTS
Reporting segment Cash-generating unit GoodwillIntangible assets
with indefi nite useful life
€ million € million
Pharmaceuticals Women’s Healthcare 2,821 644
Pharmaceuticals Diagnostic Imaging 1,192 643
Pharmaceuticals Specialized Therapeutics 1,196 214
Pharmaceuticals Oncology 459 221
Consumer Health Consumer Care 915 22

190 / / BAYER ANNUAL REPORT 2008
Term and expiration of patentsPatents are valid for varying periods, depending on the laws of the jurisdiction granting the pat-ent. In some jurisdictions, patent protection begins from the date a patent application was fi led; in others, it begins on the date the patent is granted.
The European Union member countries as well as the United States, Japan and certain other countries extend patent terms or issue supplementary protection certifi cates to compensate for patent term loss due to regulatory review and for the substantial investments in product re-search and development. Our policy is to obtain these extensions wherever possible.
Patent protection in our major markets for some of our key products is scheduled to expire in the near term. Although the expiration of a patent for an active ingredient often results in the loss of market exclusivity, we may continue to reap protection provided by:
patents on processes and intermediates used in manufacturing an active ingredient,patents relating to specifi c uses for an active ingredient,patents relating to novel compositions and formulations, and in certain markets (including the United States), market exclusivity under laws other than patent laws.
The following table sets forth the expiration dates in our major markets of the most important patents covering Avalox® / Avelox®, Betaferon® / Betaseron®, Kogenate®, Levitra®, Magnevist®, Mi-rena®, Nexavar®, Ultravist®, Xarelto®, yaz®, Yasmin® and Yasminelle®.
••••
TABLE OF CONTENTS CONSOLIDATED FINANCIAL STATEMENTS
Market
Germany France U.K. Italy Spain Japan U.S.A. Canada
Products
Avalox® /Avelox®
Active ingredient 2014 2014 2014 2014 2014 2014 2014 2015
Active ingredient monohydrate 2016 2016 2016 2016 2016 2016 2016 2016
Tablets 2019 2019 2019 2019 2019 2019 2019 2019
Betaferon® / Betaseron® active ingredient 2008 2008 2008 2008 - 2008 - 2016
Kogenate®
Active ingredient 2009 - 2009 - - - 2014 2019
Formulation 2017 2017 2017 2017 2017 2017 2017 2017
Levitra® active ingredient 2018 2018 2018 2018 2018 2020 2018 2018
Magnevist®
Active ingredient - - - - - - 2011 -
Formulation - - - - - - 2009 2010
Process - - - - - - 2013 -
Mirena®
Applicator 2015 2015 2015 2015 2015 - 2015 2015
Process 2013 2013 2013 2013 2013 2013 2013 2013
Nexavar® active ingredient 2020a 2021 2021 2021 2021 2020a 2022 2020
Ultravist® active ingredient - - - 2009 - - - -
Xarelto® active ingredient 2020 2020 2020 2020 2020 2020 2021 2020
Yasmin®
Formulation 2020 2020 2020 2020 2020 2020b 2020c 2020
Production process 2025 2025 2025 2025 2025 2026b 2025 2026b
Yasminelle®
Formulation 2020 2020 2020 2020 2020 2020b 2020c 2020
Production process 2025 2025 2025 2025 2025 2026b 2025 2026b
YAZ®
Formulation 2020 2020 2020 2020 2020 2020b 2020c 2020
Dosage regimen 2014 2014 2014 2014 2014 2014b 2014 2014b
Production process 2025 2025 2025 2025 2025 2026b 2025 2026b
a An application has been submitted to extend patent protection through 2021.b Patent pending.c Patent invalidated, appeal by Bayer against this ruling is pending. See Note [32].

191NOTES
Information on specifi c patent disputes is given in Note [32].
TrademarksWe seek to obtain extensive trademark protection for our products in all jurisdictions in which they are marketed or are to be marketed in the near future. As well as product names, we also register particularly distinctive slogans, logos, graphic elements and designs as global trade-marks.
Wherever possible, trademarks are registered through supranational trademark protection sys-tems, for example as European Community Trademarks or international trademarks, and addi-tionally with the national trademark registration offi ces. The protection actually provided by a trademark may vary considerably from one country to another depending on the distinctiveness of the trademark.
Our trademarks include:
Bayer HealthCare: Adalat®, Aleve®, Alka-Seltzer®, Aspirin®, Avalox® / Avelox®, Bepanthen®, Betaferon® / Betaseron®, Canesten®, Ciprobay® / Cipro®, Contour®, Kogenate®, Levitra®, Magne-vist®, Nexavar®, Rennie®, Xarelto® and Yasmin®.
Bayer CropScience: Basta® / Liberty®, Confi dor® / Gaucho® / Admire® / Merit®, Flint®, Folicur® and Puma®.
Bayer MaterialScience: Bayblend®, BaySystems®, Desmodur®, Desmopan®, Desmophen®, Makro-lon® and Vulkollan®.
We currently have many thousands of registered and pending trademarks. Trademarks are par-ticularly important for those products that are not protected by patents and are exposed to strong competitive pressure from generics. However, with the exception of the company name “Bayer” and the “Bayer Cross” logo, we do not believe that any single trademark is crucial to our business as a whole.
TABLE OF CONTENTS CONSOLIDATED FINANCIAL STATEMENTS

192 / / BAYER ANNUAL REPORT 2008
18. Property, plant and equipment
Changes in property, plant and equipment in 2008 were as follows:
Write-downs of property, plant and equipment totaled €88 million, including €61 million related to the subgroups’ restructuring programs. A further material write-down consists of a €10 mil-lion impairment of property, plant and equipment that was utilized for the production of Trasylol®.
Further capital expenditures were made for the expansion of the production facilities in Shang-hai, China. The total capital expenditures of €1,686 million include approximately €400 million for this major project alone.
In 2008, borrowing costs of €29 million (2007: €9 million) were capitalized as components of the cost of acquisition and construction of qualifying assets, applying an average fi nancing cost fac-tor of 6.2% (2007: 5%).
TABLE OF CONTENTS CONSOLIDATED FINANCIAL STATEMENTS
Land and buildings
Plant installations
and machinery
Furniture, fi xtures and
other equipment
Construction in progress
and advance payments Total
€ million € million € million € million € million
Cost of acquisition or constructionDecember 31, 2007 6,999 12,448
1,599 1,362
22,408
Changes in scope of consolidation 45 3 (2) 1 47
Acquisitions 12 8 3 2 25
Capital expenditures 231 554 136 765 1,686
Retirements (169) (267) (137) (33) (606)
Transfers 252 637 (59) (841) (11)
Changes from revaluation (IFRS 3) - - 1 - 1
Exchange differences 101 229 (7) 54 377
December 31, 2008 7,471 13,612 1,534 1,310 23,927
Accumulated depreciation and write-downs, December 31, 2007 3,577 8,914 1,069 29 13,589
Changes in scope of consolidation 30 - 1 1 32
Retirements (120) (249) (122) (17) (508)
Depreciation and write-downs in 2008 278 732 157 5 1,172
Depreciation 226 705 153 - 1,084
Write-downs 52 27 4 5 88
Write-backs - - - - -
Transfers 4 23 (31) - (4)
Exchange differences 40 118 (5) 1 154
December 31, 2008 3,809 9,538 1,069 19 14,435
Carrying amounts, December 31, 2008 3,662 4,074 465 1,291 9,492
Carrying amounts, December 31, 2007 3,422 3,534 530 1,333 8,819

193NOTES
Capitalized property, plant and equipment includes assets with a total net value of €454 million (2007: €237 million) held under fi nance leases. The cost of acquisition and contruction of these assets as of the balance sheet date totaled €989 million (2007: €719 million). They comprise plant installations and machinery with a carrying amount of €266 million, buildings with a car-rying amount of €103 million and other assets with a carrying amount of €85 million. For infor-mation on the liabilities arising from fi nance leases see Note [27].
Also included are assets with a carrying amount of €15 million (2007: €51 million) leased to oth-er parties under operating leases as defi ned in ias 17 (Leases). The cost of acquisition of assets classifi ed as operating leases is €33 million (2007: €70 million); their depreciation in 2008 amounted to €4 million (2007: €4 million).
In 2008 rental payments of €291 million (2007: €204 million) were made for assets leased under operating leases as defi ned in ias 17 (Leases).
Changes in property, plant and equipment in 2007 were as follows:
TABLE OF CONTENTS CONSOLIDATED FINANCIAL STATEMENTS
Land and buildings
Plant installations
and machinery
Furniture, fi xtures and
other equipment
Construction in progress
and advance payments Total
€ million € million € million € million € million
Cost of acquisition
or constructionDecember 31, 2006 7,267 12,514 1,566
971 22,318
Changes in scope of consolidation 2 10 1 4 17
Acquisitions 28 36 - 5 69
Capital expenditures 117 273 144 1,046 1,580
Retirements (413) (290) (167) (23) (893)
Transfers 189 277 93 (577) (18)
Exchange differences (191) (372) (38) (64) (665)
December 31, 2007 6,999 12,448 1,599 1,362 22,408
Accumulated depreciation and write-downs, December 31, 2006 3,670 8,703 1,049 29 13,451
Changes in scope of consolidation (2) 3 - - 1
Retirements (356) (274) (142) (2) (774)
Depreciation and write-downs in 2007 370 711 184 5 1,270
Depreciation 278 681 181 - 1,140
Write-downs 92 30 3 5 130
Write-backs (3) (8) (1) - (12)
Transfers (28) 26 - - (2)
Exchange differences (74) (247) (21) (3) (345)
December 31, 2007 3,577 8,914 1,069 29 13,589
Carrying amounts, December 31, 2007 3,422 3,534 530 1,333 8,819
Carrying amounts, December 31, 2006 3,597 3,811 517 942 8,867

194 / / BAYER ANNUAL REPORT 2008
The following tables provide an overview of the main sites operated by each subgroup:
19. Investments in associates
Changes in the carrying amounts of the Group’s interests in associates included at equity were as follows:
TABLE OF CONTENTS CONSOLIDATED FINANCIAL STATEMENTS
Location Principal use
Bayer HealthCare
Leverkusen, Germany Headquarters, administration, formulation and packaging of pharmaceutical products
Bergkamen, Germany Active ingredient production
Berkeley, U. S. A Production, formulation and packaging of recombinant Factor VIII
Wuppertal, Germany Production of active ingredients for pharmaceutical products, research and development
Berlin, Germany Production and packaging of contrast media, packaging of solids, research and development, administration
Emeryville, U. S. A Production and formulation of Betaferon® / Betaseron®
Myerstown, U. S. A Formulation and packaging of Consumer Care products
Mishawaka, U. S. A Production of instruments and test strips (Diabetes Care Division)
Bitterfeld, Germany Formulation and packaging of Consumer Care products
Turku, Finland Production of gynecological and andrological products, solids (oncology), research and development
Bayer CropScience
Monheim, Germany Headquarters, administration, research and development for fungicidesand insecticides
Dormagen, Germany Development of new production processes and manufacture of products for Crop Protection and Environmental Science
Frankfurt, Germany Research and development for herbicides, manufacture of productsfor Crop Protection and Environmental Science
Haelen, Netherlands Research, development and production of vegetable seeds
Kansas City, U. S. A Manufacture of products for Crop Protection and Environmental Science
Vapi, India Development of new production processes and manufacture of products for Crop Protection and Environmental Science
Bayer MaterialScience
Leverkusen, Germany Headquarters, administration
Krefeld, Germany Production of polycarbonates, diphenylmethane diisocyanate, chlorine,sodium hydroxide solution, hydrochloric acid and hydrogen
Baytown, U. S. A. Production of base and modifi ed isocyanates, polycarbonates, diphenylmethane diisocyanate, toluene diisocyanate, chlorine, sodium hydroxide solution, hydrochloric acid and hydrogen
Dormagen, Germany Production of modifi ed isocyanates, coating resins, polycarbonate fi lm,toluene diisocyanate, polyether, thermoplastic polyurethanes, chlorine,sodium hydroxide solution, hydrochloric acid and hydrogen
Antwerp, Belgium Production of polycarbonates, aniline, nitrobenzene and polyether
Brunsbüttel, Germany Production of diphenylmethane diisocyanate, toluene diisocyanate, chlorine, hydrochloric acid and hydrogen
Shanghai, China Production of base and modifi ed isocyanates, polycarbonates, diphenylmethane diisocyanate, toluene diisocyanate (under construction)
2007 2008
€ million € million
Carrying amounts, January 1 532 484
Acquisitions - -
Other additions 28 14
Divestitures - -
Miscellaneous retirements - (15)
Equity-method loss after taxes (45) (47)
Exchange differences (31) 14
Carrying amounts, December 31 484 450

195NOTES
For strategic reasons, the Bayer MaterialScience subgroup holds interests in companies that are included at equity in the consolidated fi nancial statements of the Bayer Group.
In 2000, Bayer acquired the polyols business and parts of the propylene oxide (po) production operations of Lyondell Chemicals. The strategic objective is to ensure access to patented tech-nologies and safeguard the long-term supply of po, a starting product for polyurethane, at rea-sonable prices. As part of this strategy, two joint ventures have been established to produce po (po jv Delaware u.s.a., Bayer’s interest 41%, and Lyondell Bayer Manufacturing Maasvlakte vof, Netherlands, Bayer’s interest 50%). The production facilities of both companies are operated by Lyondell. Bayer benefi ts from fi xed long-term supply quotas / volumes of po based on fi xed price components.
The following tables present a summary of the aggregated income statement and balance sheet data for the associates included at equity in the consolidated fi nancial statements of the Bayer Group.
The item “other” mainly comprises differences arising from adjustments of data to Bayer’s uni-form accounting policies, purchase price allocations and their amortization in income, and im-pairment losses.
TABLE OF CONTENTS CONSOLIDATED FINANCIAL STATEMENTS
Aggregated income statement data of associates included at equity 2007 2008
€ million € million
Sales 1,072 919
Gross profi t (18) (25)
Net loss (92) (95)
Share of pre-tax loss (45) (47)
Other - -
Pre-tax loss from interests in associates included at equity (45) (47)
Pre-tax loss upon derecognition of other interests - (15)
Pre-tax loss from interests in associates included at equity (equity-method loss) (45) (62)
Aggregated balance sheet data of associates included at equityDec. 31,
2007Dec. 31,
2008
€ million € million
Noncurrent assets 962 944
Current assets 260 238
Noncurrent liabilities 11 13
Current liabilities 191 178
Stockholders’ equity 1,020 991
Share of stockholders’ equity 463 430
Other 21 20
Carrying amount of associates included at equity 484 450

196 / / BAYER ANNUAL REPORT 2008
20. Other fi nancial assets
Other fi nancial assets are as follows:
The increase in loans is principally due to the granting of loan capital of €310 million to Bayer-Pensionskasse VVaG (Bayer-Pensionskasse) for its effective initial fund.
In 2008, impairment losses of €1 million (2007: €9 million) were recognized on loans and receiv-ables and an impairment charge of €14 million (2007: €27 million) was recognized on available-for-sale fi nancial assets. No unimpaired other fi nancial assets were overdue on the closing date.
Available-for-sale fi nancial assets include equity instruments in the amount of €84 million (2007: €86 million) whose fair value could not be determined from a stock exchange or other market price or by discounting reliably determined future cash fl ows. These equity instruments are recognized at amortized cost.
Further information on the accounting for receivables from derivatives is given in Note [30].
Receivables under lease agreements relate to fi nance leases where Bayer is the lessor and the lessee is the economic owner of the leased assets. These receivables comprise expected lease payments of €32 million (2007: €32 million), including an interest component of €5 million (2007: €6 million). €2 million of the expected lease payments is due within one year (2007: €2 million), €28 million is due in the following four years (2007: €7 million) and €2 million is due after fi ve years (2007: €23 million).
TABLE OF CONTENTS CONSOLIDATED FINANCIAL STATEMENTS
Dec. 31, 2007 Dec. 31, 2008
TotalOf which
current TotalOf which
current
€ million € million € million € million
Loans and receivables 347 126 633 142
Available-for-sale fi nancial assets 325 7 288 4
of which debt instruments 59 5 62 3
of which equity instruments 266 2 226 1
Held-to-maturity fi nancial investments 179 9 167 57
Receivables from forward commodity contracts 246 38 81 57
Receivables from other derivatives 339 154 635 373
Receivables under lease agreements 26 1 27 1
Total 1,462 335 1,831 634

197NOTES
21. Inventories
Inventories comprised:
The changes in the inventory reserve, which are refl ected in the cost of goods sold, were as follows:
22. Trade accounts receivable
Trade accounts receivable less write-downs amounted to €5,953 million on the reporting date (2007: €5,830 million), including €5,936 million (2007: €5,775 million) maturing within one year and €17 million (2007: €55 million) maturing after one year. Write-downs in 2008 amounted to €256 million (2007: €295 million).
The following unimpaired trade accounts receivable were overdue on the reporting date:
Trade accounts receivable not yet due as of the reporting date are deemed to be collectible on the basis of established credit management processes such as regular analyses of the creditwor-thiness of our customers and selective use of credit insurance.
TABLE OF CONTENTS CONSOLIDATED FINANCIAL STATEMENTS
Dec. 31, 2007
Dec. 31, 2008
€ million € million
Raw materials and supplies 1,012 1,253
Work in process, fi nished goods and goods purchased for resale 5,197 5,409
Advance payments 8 19
Total 6,217 6,681
Of which neither impaired nor
overdue at the balance sheet date Of which not impaired but overdue at the balance sheet date
Carrying amount
up to 3 months* 3 –6 months 6 – 12 months
more than 12 months
€ million € million € million € million € million € million
December 31, 2008 5,953 4,699 739 156 142 100
December 31, 2007 5,830 4,493 638 119 84 103
* The fi gures in the column “up to three months” also include receivables due immediately.
2007 2008
€ million € million
January 1 (311) (318)
Changes in scope of consolidation (3) -
Additions expensed (149) (236)
Deductions due to reversal or utilization 130 186
Exchange differences 15 -
December 31 (318) (368)

198 / / BAYER ANNUAL REPORT 2008
23. Other receivables
Other receivables, after write-downs of €9 million (2007: €13 million), are comprised as follows:
Interest receivables consist mainly of interest earned or accrued that is not due to be received until after the balance sheet date.
Miscellaneous receivables include €174 million (2007: €169 million) in accrued income, of which €156 million (2007: €149 million) represents current receivables.
The following unimpaired other receivables were overdue on the reporting date:
24. Stockholders’ equity
The foremost objectives of our fi nancial management are to help bring about a sustained in-crease in the value of the Bayer Group for the benefi t of all stakeholders, and ensure the Group’s creditworthiness and liquidity. The pursuit of these goals means reducing our cost of capital, optimizing our capital structure, improving our fi nancing cash fl ow and effectively managing risk.
The rating agencies commissioned by Bayer assess the fi nancial risks of the Bayer Group as follows:
TABLE OF CONTENTS CONSOLIDATED FINANCIAL STATEMENTS
Dec. 31, 2007 Dec. 31, 2008
TotalOf which
current TotalOf which
current
€ million € million € million € million
Benefi t plan assets in excess of obligations 533 - 351 -
Payroll receivables 32 32 41 41
Other tax receivables 326 322 403 399
Interest receivables 164 163 5 4
Miscellaneous receivables 1,073 944 942 840
Total 2,128 1,461 1,742 1,284
Of which neither impaired nor
overdue at the balance sheet date Of which not impaired but overdue at the balance sheet date
Carrying amount
up to 3 months* 3 –6 months 6 – 12 months
more than 12 months
€ million € million € million € million € million € million
December 31, 2008 1,742 520 126 13 13 35
December 31, 2007 2,128 611 74 15 17 22
* The fi gures in the column “up to three months” also include receivables due immediately.
Long-term rating Outlook Short-term rating
Standard & Poor’s A- stable A-2
Moody’s A 3 stable P-2
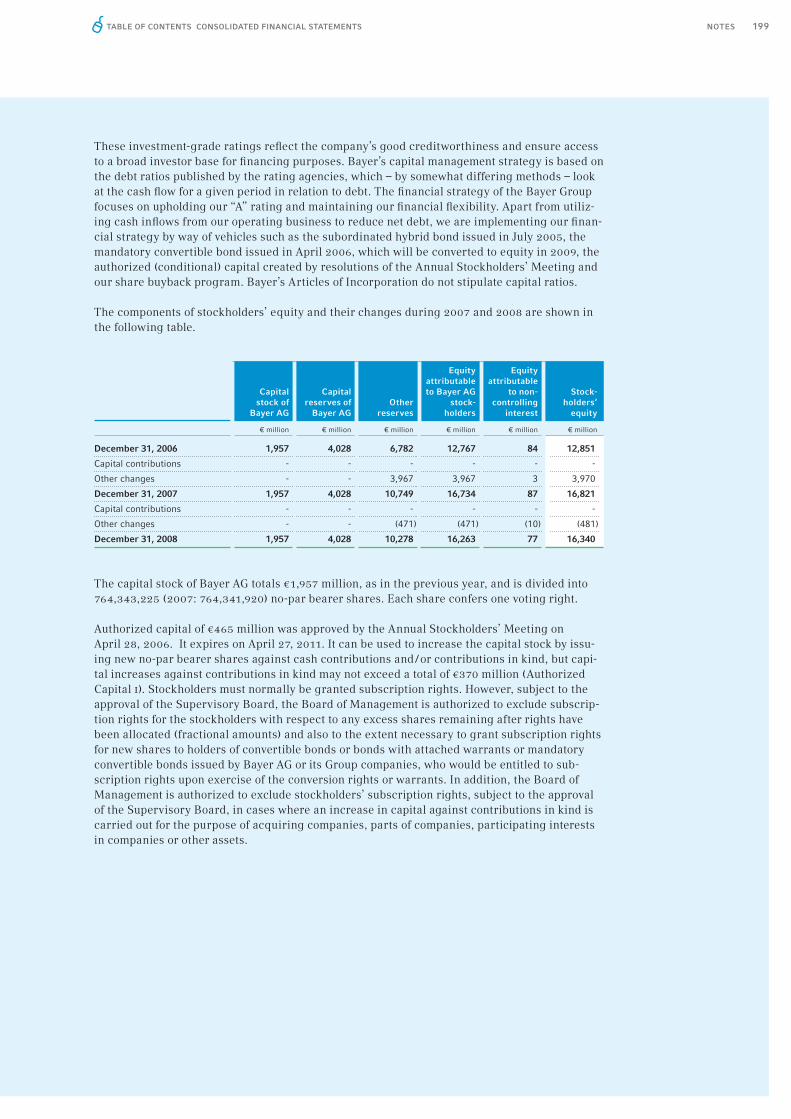
199NOTES
These investment-grade ratings refl ect the company’s good creditworthiness and ensure access to a broad investor base for fi nancing purposes. Bayer’s capital management strategy is based on the debt ratios published by the rating agencies, which – by somewhat differing methods – look at the cash fl ow for a given period in relation to debt. The fi nancial strategy of the Bayer Group focuses on upholding our “A” rating and maintaining our fi nancial fl exibility. Apart from utiliz-ing cash infl ows from our operating business to reduce net debt, we are implementing our fi nan-cial strategy by way of vehicles such as the subordinated hybrid bond issued in July 2005, the mandatory convertible bond issued in April 2006, which will be converted to equity in 2009, the authorized (conditional) capital created by resolutions of the Annual Stockholders’ Meeting and our share buyback program. Bayer’s Articles of Incorporation do not stipulate capital ratios.
The components of stockholders’ equity and their changes during 2007 and 2008 are shown in the following table.
The capital stock of Bayer AG totals €1,957 million, as in the previous year, and is divided into 764,343,225 (2007: 764,341,920) no-par bearer shares. Each share confers one voting right.
Authorized capital of €465 million was approved by the Annual Stockholders’ Meeting on April 28, 2006. It expires on April 27, 2011. It can be used to increase the capital stock by issu-ing new no-par bearer shares against cash contributions and / or contributions in kind, but capi-tal increases against contributions in kind may not exceed a total of €370 million (Authorized Capital i). Stockholders must normally be granted subscription rights. However, subject to the approval of the Supervisory Board, the Board of Management is authorized to exclude subscrip-tion rights for the stockholders with respect to any excess shares remaining after rights have been allocated (fractional amounts) and also to the extent necessary to grant subscription rights for new shares to holders of convertible bonds or bonds with attached warrants or mandatory convertible bonds issued by Bayer AG or its Group companies, who would be entitled to sub-scription rights upon exercise of the conversion rights or warrants. In addition, the Board of Management is authorized to exclude stockholders’ subscription rights, subject to the approval of the Supervisory Board, in cases where an increase in capital against contributions in kind is carried out for the purpose of acquiring companies, parts of companies, participating interests in companies or other assets.
TABLE OF CONTENTS CONSOLIDATED FINANCIAL STATEMENTS
Capital stock of
Bayer AG
Capitalreserves of
Bayer AGOther
reserves
Equity attributable to Bayer AG
stock-holders
Equity attributable
to non-controlling
interest
Stock-holders‘
equity
€ million € million € million € million € million € million
December 31, 2006 1,957 4,028 6,782 12,767 84 12,851
Capital contributions - - - - - -
Other changes - - 3,967 3,967 3 3,970
December 31, 2007 1,957 4,028 10,749 16,734 87 16,821
Capital contributions - - - - - -
Other changes - - (471) (471) (10) (481)
December 31, 2008 1,957 4,028 10,278 16,263 77 16,340

200 / / BAYER ANNUAL REPORT 2008
Further authorized capital was approved by the Annual Stockholders’ Meeting on April 27, 2007. The Board of Management is authorized until April 26, 2012 to increase the capital stock, sub-ject to the approval of the Supervisory Board, by up to a total of €195 million in one or more in-stallments by issuing new no-par bearer shares against cash contributions (Authorized Capital ii). Under the resolution adopted by the Annual Stockholders’ Meeting, stockholders must nor-mally be granted subscription rights. However, the Board of Management is authorized to ex-clude subscription rights for stockholders with respect to one or more capital increases out of the Authorized Capital ii, subject to the approval of the Supervisory Board, provided that such capital increase does not exceed 10% of the capital stock existing at the time this authorization becomes effective or the time this authorization is exercised, for purposes of issuing new shares against cash contributions at a price that is not signifi cantly below the market price of shares in the company that are already listed on the stock exchange at the time the issue price is fi nally determined. Shares acquired on the basis of an authorization of the Stockholders’ Meeting and sold pursuant to Section 71, Paragraph 1, No. 8, Sentence 5 of the German Stock Corporation Act in conjunction with Section 186, Paragraph 3, Sentence 4 of that Act during the term of this authorization shall count toward the above 10% limit. Shares issued or to be issued to service bonds with conversion rights, attached warrants or mandatory conversion rights shall also count toward this limit where such bonds were issued during the term of this authorization and stock-holders’ subscription rights were excluded by application of Section 186, Paragraph 3, Sentence 4 of the German Stock Corporation Act.
Conditional capital of €186.88 million, corresponding to 72,998,695 shares, exists to service the conversion rights contained in a mandatory convertible bond issued by Bayer Capital Corpora-tion b.v., Netherlands, on April 6, 2006. Based on the conversion prices valid as of December 31, 2008, the number of issued shares would increase in 2009 by at least 60,040,823 and at most 70,238,509 as a result of the conversion of the mandatory convertible bond issued in 2006. The conditional capital declined by €3,341 in 2008 due to conversion of part of the mandatory con-vertible bond.
The Annual Stockholders’ Meeting on April 25, 2008 approved the creation of Conditional Capi-tal 2008 I and Conditional Capital 2008 ii and authorized a conditional increase in the capital stock in each case of €195.58 million through the issue of 76,400,000 shares. This conditional capital increase may be used to grant shares to the holders of bonds with warrants or convert-ible bonds, profi t-sharing rights or profi t participation bonds (or combinations of these instru-ments) with option or conversion rights or obligations, issued on or before April 24, 2013 in accordance with the authorizations granted by the Annual Stockholders’ Meeting of April 25, 2008 by Bayer AG or a Group company in which Bayer AG has a direct or indirect interest of at least 90%. The authorization to issue such instruments is limited to a total nominal value of €6 billion. In principle, stockholders have a statutory right to be granted subscription rights to such instruments. However, the Board of Management is authorized to exclude subscription rights, subject to the approval of the Supervisory Board, if the instruments are issued at a price that is not signifi cantly below the market price. The limit of 10% of the capital stock set analo-gously with Section 186 Paragraph 3 Sentence 4 of the German Stock Corporation Act for the exclusion of stockholders’ subscription rights may not be exceeded. Both shares and other such instruments shall count towards this limit if they were issued under exclusion of subscription rights in direct or analogous application of Section 186, Paragraph 3, Sentence 4 of the German Stock Corporation Act.
The individual components of other reserves and their changes during 2007 and 2008 are shown in the following table.
TABLE OF CONTENTS CONSOLIDATED FINANCIAL STATEMENTS

201NOTESTABLE OF CONTENTS CONSOLIDATED FINANCIAL STATEMENTS
Retained earningsAccumulated other
comprehensive income
Revaluation surplus
Other retained earnings Net income
Exchange differences
Fair-value measure-
ment of securities
Cash fl ow hedges
Other reserves
€ million € million € million € million € million € million € million
December 31, 2006 58 6,536 1,683 (1,495) 18 (18) 6,782
Changes in stockholders’ equity not recognized in net income
Changes in fair value of securities and cash fl ow hedges 31 157 188
Changes in actuarial gains / losses
on defi ned benefi t obligations for pensions
and other post-employment benefi ts 1,406 1,406
Exchange differences on translation of operations outside the euro zone (822) (822)
Deferred taxes on valuation adjustments offset directly against stockholders’ equity (627) (11) (41) (679)
Other changes in stockholders’ equity (4) 4 -
Transfer of changes recognized in income (6) (67) (73)
54 7,319 1,683 (2,317) 32 31 6,802
Dividend payments (764) (764)
Allocations to retained earnings 919 (919) -
919 (1,683) (764)
Changes in stockholders’ equity recognized in net income
Net income 2007 4,711 4,711
4,711 4,711
December 31, 2007 54 8,238 4,711 (2,317) 32 31 10,749
Changes in stockholders’ equity not recognized in net income
Changes in fair value of securities and cash fl ow hedges (32) (110) (142)
Changes in actuarial gains/losses on defi ned benefi t obligations for pensions
and other post-employment benefi ts (1,085) (1,085)
Exchange differences on translation of operations outside the euro zone (416) (416)
Deferred taxes on valuation adjustments offset directly against stockholders’ equity 459 9 40 508
Other changes in stockholders’ equity 4 4 8
Transfer of changes recognized in income 1 (32) (31)
58 7,616 4,711 (2,733) 10 (71) 9,591
Dividend payments (1,032) (1,032)
Allocations to retained earnings 3,679 (3,679) -
3,679 (4,711) (1,032)
Changes in stockholders’ equity recognized in net income
Net income 2008 1,719 1,719
1,719 1,719
December 31, 2008 58 11,295 1,719 (2,733) 10 (71) 10,278

202 / / BAYER ANNUAL REPORT 2008
The revaluation surplus of €58 million reported under stockholders’ equity is due to the acquisi-tion in 2005 of the remaining 50% interest in an otc joint venture with Roche in the United States that was established in 1996 and the acquisition of the remaining 50% interest in Bay-Systems, Oldenburg, Germany, in 2008. In addition, an amount of €4 million (2007: €4 million) that constitutes scheduled amortization / depreciation of the respective assets and is recognized in income was transferred in 2008 from the revaluation surplus to retained earnings.
The retained earnings contain prior years’ undistributed income of consolidated companies.
Retained earnings also include all actuarial gains and losses related to defi ned benefi t pension plans that are not recognized in income. Changes in fair values of cash fl ow hedges and avail-able-for-sale fi nancial assets are recognized in other comprehensive income.
The dividend paid for the 2007 fi scal year was €1.35 per share, compared with €1.00 for 2006. The proposed dividend for fi scal year 2008 is €1.40 per share, which would result in a total divi-dend payment of €1.070 million.
The components of non-controlling interest in Group equity and their changes during 2008 and 2007 are shown in the following table.
Non-controlling interest mainly comprise the equity of Sumika Bayer Urethane Co. Ltd., Japan; Bayer CropScience Ltd., India; Berlimed, s.a., Spain; BaySystems Pearl, Dubai; Bayer CropScience Nufarm Ltd., United Kingdom; Justesa Imagen, s.a., Spain; Bayer East Africa Ltd., Kenya, and Bayer Jinling Polyurethane Company Ltd., China.
TABLE OF CONTENTS CONSOLIDATED FINANCIAL STATEMENTS
Equity attributable to non-controlling interest
2007 2008
€ million € million
January 1 84 87
Changes in stockholders’ equity not recognized in net income
Changes in fair value of securities and cash fl ow hedges - -
Changes in actuarial gains / losses on defi ned benefi t obligations for pensions and other post-employment benefi ts - -
Exchange differences on translation of operations outside the euro zone (3) 3
Deferred taxes on valuation adjustments offset directly against stockholders’ equity - -
Other changes in stockholders’ equity 12 (9)
Dividend payments (11) (9)
Changes in stockholders’ equity recognized in net income 5 5
December 31 87 77

203NOTES
25. Provisions for pensions and other post-employment benefi ts
The provisions for pensions and other post-employment benefi ts in Germany and other countries as of the reporting date are as shown in the following table:
The expenses for defi ned benefi t pension plans and other post-employment benefi t obligations for the continuing and discontinued operations are comprised as follows:
TABLE OF CONTENTS CONSOLIDATED FINANCIAL STATEMENTS
PensionsOther post-employment
benefi t obligations Total
Dec 31, 2007
Dec 31, 2008
Dec 31, 2007
Dec 31, 2008
Dec 31, 2007
Dec 31, 2008
€ million € million € million € million € million € million
Germany 4,538 4,557 141 109 4,679 4,666
Other countries 438 1,197 384 484 822 1,681
Total 4,976 5,754 525 593 5,501 6,347
Expenses for defi ned benefi t
pension plansGermany Other countries Total
2007 2008 2007 2008 2007 2008
€ million € million € million € million € million € million
Current service cost 186 134 66 48 252 182
Past service cost 40 (9) 3 (2) 43 (11)
Interest cost 523 567 234 232 757 799
Expected return on plan assets (315) (307) (272) (267) (587) (574)
Plan curtailments - - (27) (3) (27) (3)
Plan settlements - - 4 1 4 1
Total 434 385 8 9 442 394
Expenses for other post-employment
benefi t obligationsGermany Other countries Total
2007 2008 2007 2008 2007 2008
€ million € million € million € million € million € million
Current service cost 10 9 27 17 37 26
Past service cost - - (1) - (1) -
Interest cost 6 6 50 47 56 53
Expected return on plan assets - - (28) (28) (28) (28)
Plan curtailments - - (14) - (14) -
Plan settlements - - - - - -
Total 16 15 34 36 50 51
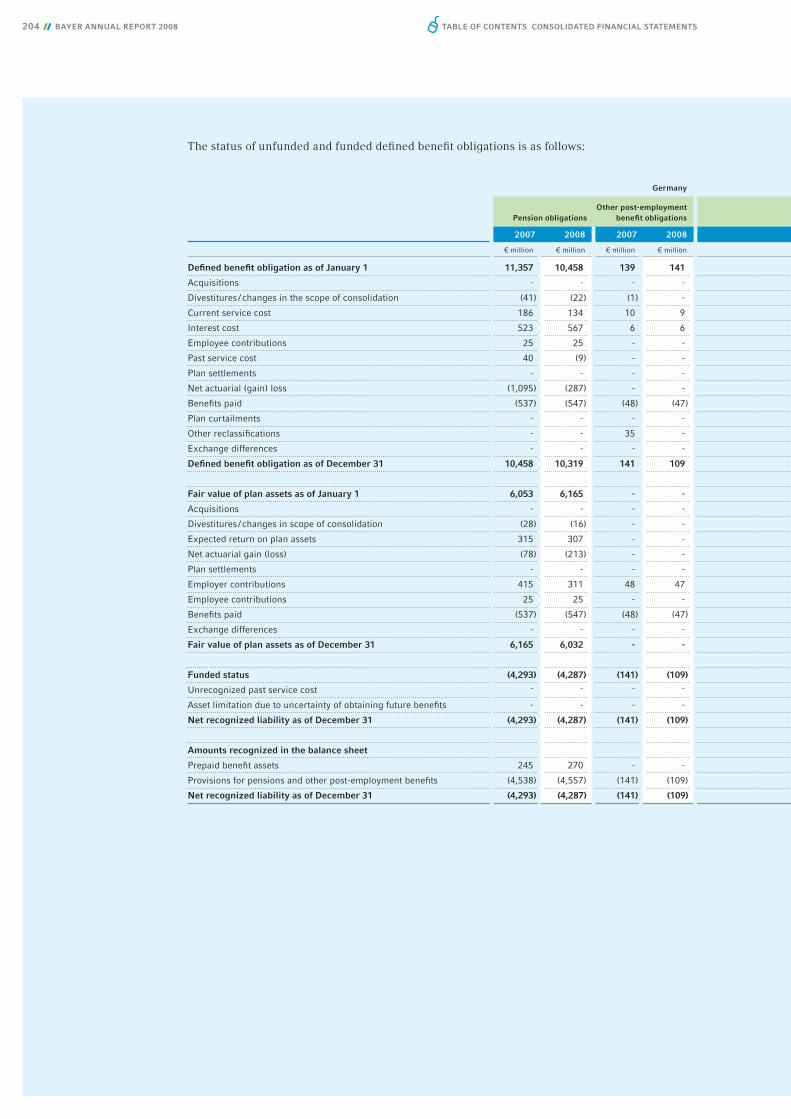
204 / / BAYER ANNUAL REPORT 2008
The status of unfunded and funded defi ned benefi t obligations is as follows:
TABLE OF CONTENTS CONSOLIDATED FINANCIAL STATEMENTS
Germany
Pension obligationsOther post-employment
benefi t obligations
2007 2008 2007 2008
€ million € million € million € million
Defi ned benefi t obligation as of January 1 11,357 10,458 139 141
Acquisitions - - - -
Divestitures / changes in the scope of consolidation (41) (22) (1) -
Current service cost 186 134 10 9
Interest cost 523 567 6 6
Employee contributions 25 25 - -
Past service cost 40 (9) - -
Plan settlements - - - -
Net actuarial (gain) loss (1,095) (287) - -
Benefi ts paid (537) (547) (48) (47)
Plan curtailments - - - -
Other reclassifi cations - - 35 -
Exchange differences - - - -
Defi ned benefi t obligation as of December 31 10,458 10,319 141 109
Fair value of plan assets as of January 1 6,053 6,165 - -
Acquisitions - - - -
Divestitures / changes in scope of consolidation (28) (16) - -
Expected return on plan assets 315 307 - -
Net actuarial gain (loss) (78) (213) - -
Plan settlements - - - -
Employer contributions 415 311 48 47
Employee contributions 25 25 - -
Benefi ts paid (537) (547) (48) (47)
Exchange differences - - - -
Fair value of plan assets as of December 31 6,165 6,032 - -
Funded status (4,293) (4,287) (141) (109)
Unrecognized past service cost - - - -
Asset limitation due to uncertainty of obtaining future benefi ts - - - -
Net recognized liability as of December 31 (4,293) (4,287) (141) (109)
Amounts recognized in the balance sheet
Prepaid benefi t assets 245 270 - -
Provisions for pensions and other post-employment benefi ts (4,538) (4,557) (141) (109)
Net recognized liability as of December 31 (4,293) (4,287) (141) (109)

205NOTESTABLE OF CONTENTS CONSOLIDATED FINANCIAL STATEMENTS
Other countries Total
Pension obligationsOther post-employment
benefi t obligations Pension obligationsOther post-employment
benefi t obligations
2007 2008 2007 2008 2007 2008 2007 2008
€ million € million € million € million € million € million € million € million
4,348 3,705 864 718 15,705 14,163 1,003 859
- 5 - - - 5 - -
- 1 - - (41) (21) (1) -
66 48 27 17 252 182 37 26
234 232 50 47 757 799 56 53
1 3 - - 26 28 - -
- (2) - - 40 (11) - -
(74) 22 - - (74) 22 - -
(270) 138 (97) (26) (1,365) (149) (97) (26)
(264) (216) (40) (34) (801) (763) (88) (81)
(27) (3) (14) - (27) (3) (14) -
- 11 - (11) - 11 35 (11)
(309) (192) (72) 19 (309) (192) (72) 19
3,705 3,752 718 730 14,163 14,071 859 839
3,804 3,568 357 339 9,857 9,733 357 339
- 5 - - - 5 - -
- - - - (28) (16) - -
272 267 28 28 587 574 28 28
(9) (893) (1) (137) (87) (1,106) (1) (137)
(71) 21 - - (71) 21 - -
139 100 33 35 554 411 81 82
1 3 - - 26 28 - -
(264) (216) (40) (34) (801) (763) (88) (81)
(304) (204) (38) 20 (304) (204) (38) 20
3,568 2,651 339 251 9,733 8,683 339 251
(137) (1,101) (379) (479) (4,430) (5,388) (520) (588) 4 3 (5) (5) 4 3 (5) (5)
(17) (18) - - (17) (18) - -
(150) (1,116) (384) (484) (4,443) (5,403) (525) (593)
288 81 - - 533 351 - -
(438) (1,197) (384) (484) (4,976) (5,754) (525) (593)
(150) (1,116) (384) (484) (4,443) (5,403) (525) (593)

206 / / BAYER ANNUAL REPORT 2008
Of the defi ned benefi t obligation for pensions, €4,799 million (2007: €4,762 million) relates to unfunded benefi t obligations while €9,272 million (2007: €9,401 million) relates to funded bene-fi t obligations. Of the defi ned benefi t obligation for other post-employment benefi ts, €185 million (2007: €235 million) relates to unfunded benefi t obligations while €654 million (2007: €624 mil-lion) relates to funded benefi t obligations.
Of the funded pension plans, total overfunding of individual plans amounts to €366 million (2007: €546 million) while underfunding amounts to €955 million (2007: €214 million). Similar-ly, other funded post-employment benefi t obligations of individual funds are underfunded by €404 million (2007: €285 million). Other unfunded post-employment benefi t obligations relate mainly to early retirement benefi ts in Germany.
The Bayer Group has set up funded pension plans for its employees in many countries. Since the legal and tax requirements and economic conditions may vary considerably between countries, assets are managed according to country-specifi c principles.
Bayer-Pensionskasse VVaG (Bayer-Pensionskasse) in Germany is by far the most signifi cant of the pension funds. This legally independent fund is a private insurance company and is there-fore subject to the German Law on the Supervision of Private Insurance Companies. Bayer guar-antees the commitments of Bayer-Pensionskasse under German law on secondary liability. Bayer- Pensionskasse is classifi ed as a defi ned benefi t plan for ifrs purposes. The fair value of the plan assets includes real estate leased by Bayer which is recognized at a fair value of €74 million (2007: €51 million).
The investment policy of Bayer-Pensionskasse is geared to compliance with regulatory provi-sions and to the risk structure resulting from its obligations. In light of capital market move-ments, Bayer-Pensionskasse has therefore developed a strategic target investment portfolio aligned to its risk structure. Its investment strategy focuses principally on stringent manage-ment of downside risks rather than on maximizing absolute returns. It is anticipated that this in-vestment policy can generate a return that enables it to meet its long-term commitments.
A large proportion of the benefi t obligations of Bayer Schering Pharma AG, Berlin, Germany, which was acquired in 2006, is covered by Schering Altersversorgung Treuhand Verein. Here too, the investment strategy is geared to the structure of the corresponding obligations. It per-mits the use of derivatives; nearly all currency risks are fully hedged. With the aid of a risk man-agement system, stress scenarios are simulated and other risk analyses are undertaken (e. g. val-ue at risk).
For plan assets in other countries as well, the key investment strategy criteria are the structure of the benefi t obligations and the risk profi le. Other determinants are risk diversifi cation, portfo-lio effi ciency and a country-specifi c and global balance of opportunity and risk capable of ensur-ing the payment of all future benefi ts.
TABLE OF CONTENTS CONSOLIDATED FINANCIAL STATEMENTS

207NOTES
The weighted parameters used to value the plan assets to cover pensions and other post-employ-ment benefi t obligations were allocated as follows at year-end:
At the closing dates, plan assets included roughly the same weightings of Bayer shares as the major stock indices. The other plan assets principally comprise mortgage loans granted, other receivables, fi xed-term deposits and cash and cash equivalents.
The major pension funds in the United States and the United Kingdom posted a negative perfor-mance in fi scal 2008 because stocks make up a higher proportion of their investments. Bayer-Pensionskasse, however, which is Bayer’s most signifi cant German pension plan, reported a pos-itive return on assets in 2008.
The following weighted parameters were used to value the pension obligations as of Decem-ber 31 and the expense of pensions and other post-employment benefi ts in the respective year:
TABLE OF CONTENTS CONSOLIDATED FINANCIAL STATEMENTS
Plan assets to cover pension obligations
as of December 31Germany Other countries
2007 2008 2007 2008
% % % %
Equity securities 26.01 17.68 45.72 37.94
Debt securities 47.16 60.73 44.61 50.17
Real estate and special real estate funds 8.66 8.83 3.12 1.80
Other 18.17 12.76 6.55 10.09
Total 100.00 100.00 100.00 100.00
Plan assets to cover other post-employment benefi t obligations
as of December 31Germany Other countries
2007 2008 2007 2008
% % % %
Equity securities - - 51.73 39.38
Debt securities - - 41.04 44.53
Real estate and special real estate funds - - - -
Other - - 7.23 16.09
Total - - 100.00 100.00
Parameters for pension and other post-employment benefi t obligations
Germany Other countries Total
2007 2008 2007 2008 2007 2008
% % % % % %
Pension obligations
Discount rate 5.50 6.00 6.45 6.30 5.75 6.10
Projected future remuneration increases 2.85 3.00 4.65 4.00 3.10 3.25
Projected future benefi t increases 1.75 2.00 3.25 2.95 1.95 2.25
Other post-employment benefi t obligations
Discount rate 5.10 6.40 6.85 6.45 6.55 6.45

208 / / BAYER ANNUAL REPORT 2008
Altering individual parameters by 0.5 percentage points while leaving the other parameters un-changed would impact pension and other post-employment benefi t obligations as of year end 2008 as follows:
Altering individual parameters by 0.5 percentage points while leaving the other parameters un-changed would impact pension expense in 2009 as follows:
TABLE OF CONTENTS CONSOLIDATED FINANCIAL STATEMENTS
Parameters for benefi t expenseGermany Other countries Total
2007 2008 2007 2008 2007 2008
% % % % % %
Pension benefi t obligations
Discount rate 4.60 5.50 5.65 6.45 4.90 5.75
Projected future remuneration increases 2.60 2.85 4.10 4.65 2.85 3.10
Projected future benefi t increases 1.50 1.75 2.45 3.25 1.60 1.95
Expected return on plan assets 5.25 4.75 7.85 7.45 6.20 5.55
Other post-employment benefi t obligations
Discount rate 4.30 5.10 6.25 6.85 6.00 6.55
Expected return on plan assets - - 8.25 8.25 8.25 8.25
Germany Other countries Total
0.5 per-centage
point increase
0.5 per-centage
point decrease
0.5 per-centage
point increase
0.5 per-centage
point decrease
0.5 per-centage
point increase
0.5 per-centage
point decrease
€ million € million € million € million € million € million
Pension benefi t obligations
Change in discount rate (623) 697 (217) 240 (840) 937
Change in projected future remuneration increases 65 (58) 27 (25) 92 (83)
Change in projected future benefi t increases 445 (413) 37 (15) 482 (428)
Other post-employment benefi t obligations
Change in discount rate (1) 1 (38) 42 (39) 43
Germany Other countries Total
0.5 per-centage
point increase
0.5 per-centage
point decrease
0.5 per-centage
point increase
0.5 per-centage
point decrease
0.5 per-centage
point increase
0.5 per-centage
point decrease
€ million € million € million € million € million € million
Pension benefi t obligations
Change in discount rate (5) 5 (3) 3 (8) 8
Change in projected future remuneration increases 8 (7) 3 (3) 11 (10)
Change in projected future benefi t increases 33 (31) 2 (1) 35 (32)
Change in expected return on plan assets (30) 30 (13) 13 (43) 43
Other post-employment benefi t obligations
Change in discount rate - - (1) 1 (1) 1
Change in expected return on plan assets - - (1) 1 (1) 1
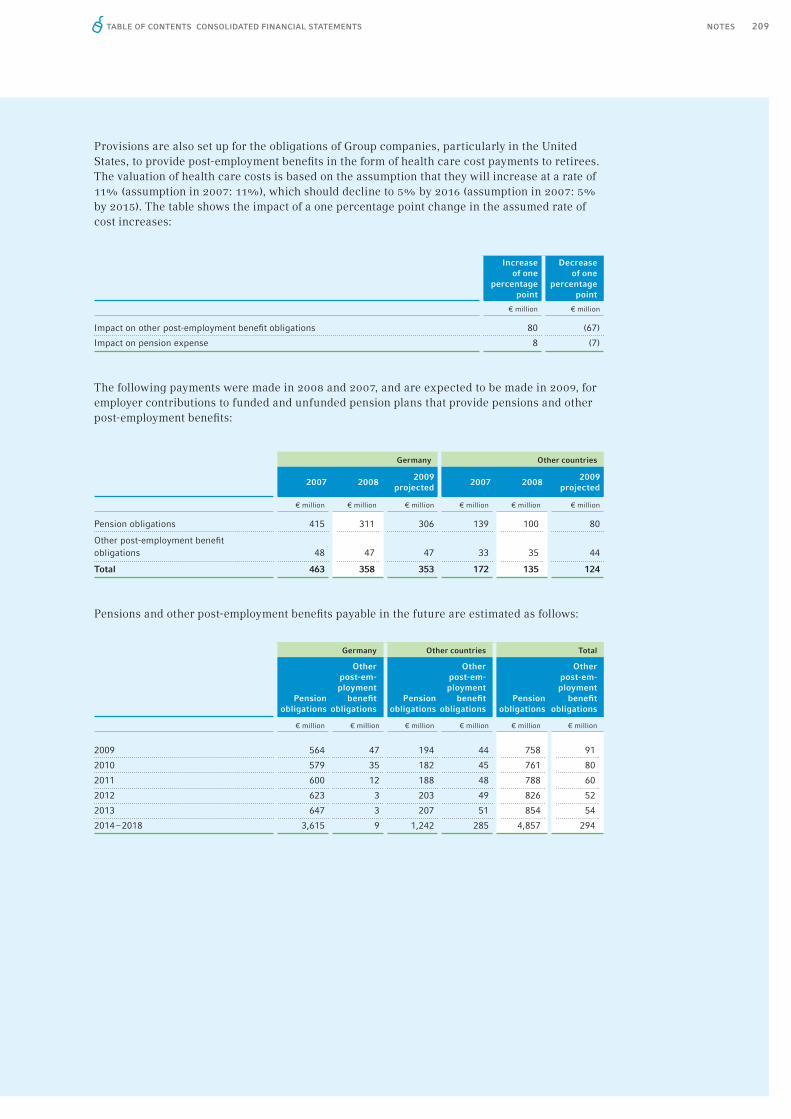
209NOTES
Provisions are also set up for the obligations of Group companies, particularly in the United States, to provide post-employment benefi ts in the form of health care cost payments to retirees. The valuation of health care costs is based on the assumption that they will increase at a rate of 11% (assumption in 2007: 11%), which should decline to 5% by 2016 (assumption in 2007: 5% by 2015). The table shows the impact of a one percentage point change in the assumed rate of cost increases:
The following payments were made in 2008 and 2007, and are expected to be made in 2009, for employer contributions to funded and unfunded pension plans that provide pensions and other post-employment benefi ts:
Pensions and other post-employment benefi ts payable in the future are estimated as follows:
TABLE OF CONTENTS CONSOLIDATED FINANCIAL STATEMENTS
Increase of one
percentage point
Decrease of one
percentage point
€ million € million
Impact on other post-employment benefi t obligations 80 (67)
Impact on pension expense 8 (7)
Germany Other countries
2007 20082009
projected2007 2008
2009 projected
€ million € million € million € million € million € million
Pension obligations 415 311 306 139 100 80
Other post-employment benefi t obligations 48 47 47 33 35 44
Total 463 358 353 172 135 124
Germany Other countries Total
Pension obligations
Other post-em-ployment
benefi t obligations
Pension obligations
Other post-em-ployment
benefi t obligations
Pension obligations
Other post-em-ployment
benefi t obligations
€ million € million € million € million € million € million
2009 564 47 194 44 758 91
2010 579 35 182 45 761 80
2011 600 12 188 48 788 60
2012 623 3 203 49 826 52
2013 647 3 207 51 854 54
2014 – 2018 3,615 9 1,242 285 4,857 294

210 / / BAYER ANNUAL REPORT 2008
The actuarial gains and losses related to defi ned benefi t obligations and plan assets, recognized in a separate statement of recognized income and expense outside of profi t or loss, are as follows:
In Germany, no unrealized gains / losses exist in relation to other post-employment benefi t obligations.
TABLE OF CONTENTS CONSOLIDATED FINANCIAL STATEMENTS
Pension obligations Germany
Pension obligations Other countries
2004 2005 2006 2007 2008 2004 2005 2006 2007 2008
€ million € million € million € million € million € million € million € million € million € million
Defi ned benefi t obligation 8,866 10,256 11,357 10,458 10,319 3,807 4,269 4,348 3,705 3,752
Fair value of plan assets 4,373 4,599 6,053 6,165 6,032 2,841 3,485 3,804 3,568 2,651
Funded status (4,493) (5,657) (5,304) (4,293) (4,287) (966) (784) (544) (137) (1,101)
Accumulated actuarial gains (losses) relating to benefi t obligation as of
January 1 (1,119) (1,682) (2,842) (2,293) (1,197) (304) (421) (692) (657) (403)
Changes due to divestitures and changes in scope of consolidation - - 1 1 - - - - - -
Newly arisen during the year due to changes in actuarial parameters (575) (1,122) 441 1,097 450 (161) (265) 46 299 40
Newly arisen during the year due to experience adjustments 12 (38) 46 (2) (163) 19 3 (45) (29) (178)
Allocations to discontinued operations - - 61 - - - - 34 - -
Exchange differences - - - - - 25 (9) - (16) 28
December 31 (1,682) (2,842) (2,293) (1,197) (910) (421) (692) (657) (403) (513)
Accumulated actuarial gains (losses) relating to plan assets as of
January 1 (735) (786) (693) (846) (920) (315) (204) (125) 15 7
Changes due to divestitures and changes in the scope of consolidation - - - 4 - - - - - -
Newly arisen during the year (51) 93 (154) (78) (213) 100 84 159 (9) (893)
Allocations to discontinued operations - - 1 - - - - (19) - -
Exchange differences - - - - - 11 (5) - 1 -
December 31 (786) (693) (846) (920) (1,133) (204) (125) 15 7 (886)

211NOTESTABLE OF CONTENTS CONSOLIDATED FINANCIAL STATEMENTS
Other post-employment benefi t obligations Other countries
Pension obligations Total
Other post-employment benefi t obligations Total
2004 2005 2006 2007 2008 2004 2005 2006 2007 2008 2004 2005 2006 2007 2008
€ million € million € million € million € million € million € million € million € million € million € million € million € million € million € million
724 878 864 718 730 12,673 14,525 15,705 14,163 14,071 908 1,036 1,003 859 839
286 359 357 339 251 7,214 8,084 9,857 9,733 8,683 286 359 357 339 251
(438) (519) (507) (379) (479) (5,459) (6,441) (5,848) (4,430) (5,388) (622) (677) (646) (520) (588)
(222) (259) (259) (311) (221) (1,423) (2,103) (3,534) (2,950) (1,600) (222) (259) (259) (311) (221)
- - - - - - - 1 1 - - - - - -
(38) (31) (71) 33 (10) (736) (1,387) 487 1,396 490 (38) (31) (71) 33 (10)
(17) 31 17 64 36 31 (35) 1 (31) (341) (17) 31 17 64 36
- - - - - - - 95 - - - - - - -
18 - 2 (7) - 25 (9) - (16) 28 18 - 2 (7) -
(259) (259) (311) (221) (195) (2,103) (3,534) (2,950) (1,600) (1,423) (259) (259) (311) (221) (195)
(49) (36) (41) (24) (25) (1,050) (990) (818) (831) (913) (49) (36) (41) (24) (25)
- - - - - - - - 4 - - - - - -
11 (5) 17 (1) (137) 49 177 5 (87) (1,106) 11 (5) 17 (1) (137)
- - - - - - - (18) - - - - - - -
2 - - - - 11 (5) - 1 - 2 - - - -
(36) (41) (24) (25) (162) (990) (818) (831) (913) (2,019) (36) (41) (24) (25) (162)
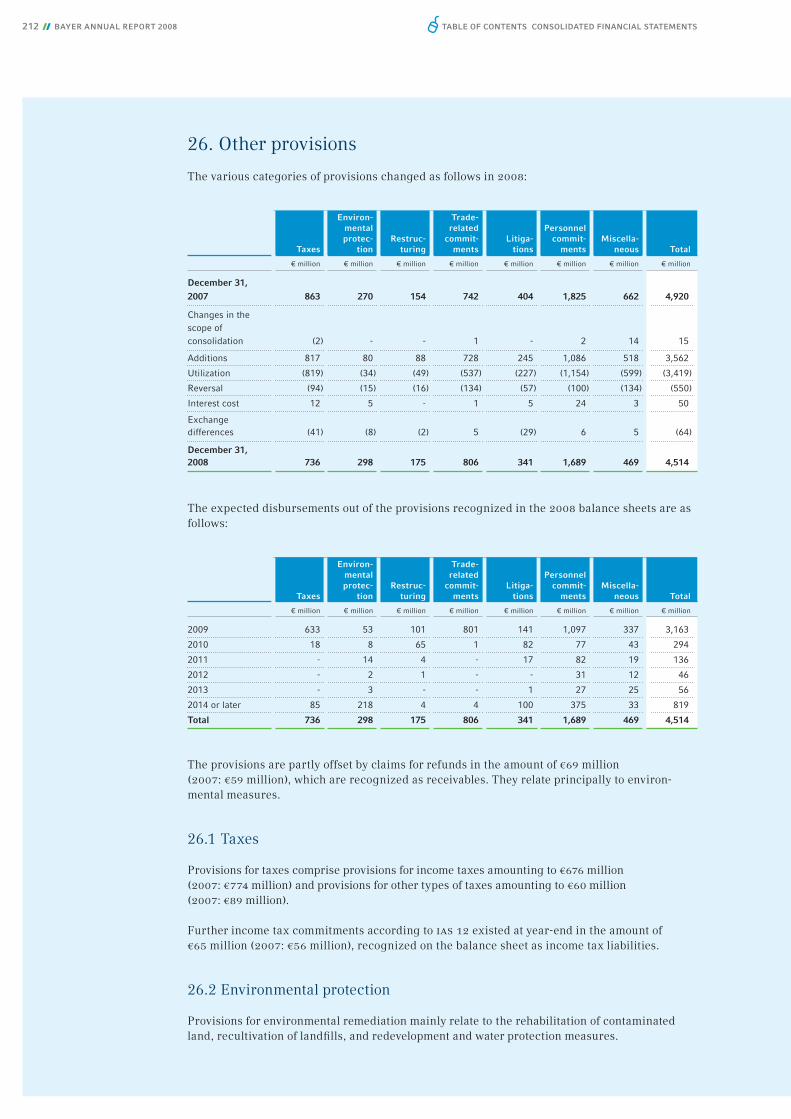
212 / / BAYER ANNUAL REPORT 2008
26. Other provisions
The various categories of provisions changed as follows in 2008:
The expected disbursements out of the provisions recognized in the 2008 balance sheets are as follows:
The provisions are partly offset by claims for refunds in the amount of €69 million (2007: €59 million), which are recognized as receivables. They relate principally to environ-mental measures.
26.1 Taxes
Provisions for taxes comprise provisions for income taxes amounting to €676 million (2007: €774 million) and provisions for other types of taxes amounting to €60 million (2007: €89 million).
Further income tax commitments according to ias 12 existed at year-end in the amount of €65 million (2007: €56 million), recognized on the balance sheet as income tax liabilities.
26.2 Environmental protection
Provisions for environmental remediation mainly relate to the rehabilitation of contaminated land, recultivation of landfi lls, and redevelopment and water protection measures.
TABLE OF CONTENTS CONSOLIDATED FINANCIAL STATEMENTS
Taxes
Environ-mental protec-
tionRestruc-
turing
Trade-related
commit-ments
Litiga-tions
Personnelcommit-
mentsMiscella-
neous Total
€ million € million € million € million € million € million € million € million
2009 633 53 101 801 141 1,097 337 3,163
2010 18 8 65 1 82 77 43 294
2011 - 14 4 - 17 82 19 136
2012 - 2 1 - - 31 12 46
2013 - 3 - - 1 27 25 56
2014 or later 85 218 4 4 100 375 33 819
Total 736 298 175 806 341 1,689 469 4,514
Taxes
Environ-mentalprotec-
tionRestruc-
turing
Trade-related
commit-ments
Litiga-tions
Personnel commit-
mentsMiscella-
neous Total
€ million € million € million € million € million € million € million € million
December 31, 2007 863 270 154 742 404 1,825 662 4,920
Changes in the scope of consolidation (2) - - 1 - 2 14 15
Additions 817 80 88 728 245 1,086 518 3,562
Utilization (819) (34) (49) (537) (227) (1,154) (599) (3,419)
Reversal (94) (15) (16) (134) (57) (100) (134) (550)
Interest cost 12 5 - 1 5 24 3 50
Exchange differences (41) (8) (2) 5 (29) 6 5 (64)
December 31, 2008 736 298 175 806 341 1,689 469 4,514

213NOTES
26.3 Restructuring
Provisions for restructuring included €139 million for severance payments and €36 million for other expenses, which mainly comprised demolition and other costs related to the closure of production facilities.
The principal restructuring charges in 2008 related to four major projects.
The “Transforming Human Resources” (thr) project initiated in 2005 is designed to harmonize the human resources function worldwide by introducing an innovative operating model. The new structures provide better, and at the same time more effi cient, support for employees and thus make a greater contribution to the company’s performance. The new operating model and the related organizational units have been gradually introduced at 162 Bayer Group companies worldwide starting in October 2006. According to current planning, the project will be complet-ed during 2010. Total restructuring expenses related to the thr project in 2008 came to €32 mil-lion, including €1 million in severance payments and €31 million in other restructuring expens-es. Provisions for restructuring amounted to €1 million on December 31, 2008.
The “river” restructuring project initiated by the Bayer MaterialScience subgroup in fall 2007 to optimize cost structures and achieve a lasting improvement in effi ciency was continued as planned in 2008. The central focus was on North America and Europe. In North America, in ad-dition to many individual projects, effi ciency was improved signifi cantly at the facilities in Pitts-burgh, Pennsylvania, and in the administrative functions. The reduction of capacity for methyl-enediphenyl diisocyanate at the facility in New Martinsville, West Virginia, proceeded on schedule. In Germany, the optimization mainly affected administrative functions at the Leverku-sen site. Total restructuring expenses for this project amounted to €49 million in 2008, compris-ing €21 million in severance payments, €2 million in write-downs and €26 million in other re-structuring expenses. Restructuring provisions amounted to €30 million as of December 31, 2008.
The implementation of the “new” restructuring program, instigated in August 2006 to ensure a sustained improvement in the effi ciency of the Bayer CropScience subgroup, continued as plann ed in 2008. This resulted in restructuring expenses of €166 million in 2008, including €51 million for personnel-related measures, €13 million for write-downs and €102 for other restructuring expenses. The restructuring provisions amounted to €73 million as of December 31, 2008.
Important measures were implemented in the United States, France and Germany. These includ-ed, in particular, the concentration of u.s. production capacity at the facilities in Kansas City, Missouri, and Institute, West Virginia. In addition, consolidation of the global research activities continued, leading to restructuring expenses in France. In Germany, restructuring as part of the “new” project mainly comprised the divestment of the formulating and packaging facility and the logistics center in Wolfenbüttel.
In 2008 the Bayer Schering Pharma Division continued the restructuring program introduced following the acquisition of Schering AG, Berlin, Germany, in 2006. The aim is to consolidate Bayer’s pharmaceutical activities in parallel with the integration progress and ensure uniform management of the business in the interests of the Bayer Group as a whole. Restructuring provi-sions of €54 million were recognized as of December 31, 2008 for these and other measures.
TABLE OF CONTENTS CONSOLIDATED FINANCIAL STATEMENTS

214 / / BAYER ANNUAL REPORT 2008
The integration of local subsidiaries of Bayer Schering Pharma AG into existing Bayer subsidiar-ies was very largely completed. Sales forces and marketing functions at the Bayer and former Schering companies were merged, facilities were amalgamated and it systems harmonized. The consolidation of the global research and development activities at the Berlin and Wuppertal sites in Germany and at Berkeley, California, United States, continued.
Total expenses for the integration of Schering amounted to €157 million in 2008, including €53 million in severance payments, €46 million in accelerated depreciation and write-downs and €58 million in other restructuring expenses.
26.4 Trade-related commitments
Provisions for trade-related commitments comprise provisions for rebates, discounts and other price adjustments, provisions for product returns, outstanding invoices, pending losses and onerous contracts.
26.5 Litigations
The legal risks currently considered to be material are described in Note [32].
26.6 Personnel commitments
Provisions for personnel commitments mainly include those for variable and individual one-time payments, credit balances on long-term accounts, service awards and other personnel costs. Also refl ected here are the obligations under the stock-based compensation programs.
Stock-based compensation in the Bayer Group is granted primarily under standard programs and also on an individual agreement basis. Individual agreements enable the company to link re-muneration components to the stock price or future stock price movements. Awards under such agreements may be contingent upon the attainment of agreed targets, or may be based solely on the length of service. Standard programs exist for different groups of employees. The program offered to members of the Board of Management and other senior executives from 2001 through 2004 was essentially a stock option program with variable stock-based awards. This program provides for cash payments. Middle management was offered a stock incentive program, while other groups of employees were offered a stock participation program. A stock-based compensa-tion program for top and middle management known as “Aspire” was introduced in 2005. It comprises two variants, which are described on the following pages. For other managers and non-managerial employees, an annual stock participation program has been offered since 2005 (“abp 2008” in the year under report), under which Bayer subsidizes employee purchases of shares in the company.
As with other remuneration systems involving cash settlement, awards to be made under the stock-based programs are covered by provisions in the amount of the fair value of the obliga-tions existing as of the date of the fi nancial statements vis-à-vis the respective employee group. Adjustments to provisions relating to all existing stock-based compensation programs are recognized in the income statement.
TABLE OF CONTENTS CONSOLIDATED FINANCIAL STATEMENTS

215NOTES
The table below shows the change in provisions for the various programs:
Provisions of €10 million existed at the end of 2008 (2007: €11 million) for obligations entered into under individual stock-based compensation agreements. The obligations were measured in the same way as those incurred under the standard programs.
The fair value of obligations under the standard stock-based compensation programs and indi-vidual agreements has been calculated using the Monte Carlo simulation method based on the following key parameters:
The expected exercise period is three to fi ve years.
Long-term incentive program for members of the Board of Management and other senior executives (Aspire i)To participate in Aspire i, members of the Board of Management and other senior executives are required to purchase a certain number of Bayer shares that is predetermined according to spe-cifi c guidelines and to retain them for the full term of the program. A percentage of the execu-tive’s annual base salary – based on his / her position – is defi ned as a target for variable pay-ments (Aspire target opportunity). Depending on the performance of Bayer stock, both in absolute terms and relative to the Dow Jones euro stoxx 50sm benchmark index over a three-year performance period, participants are granted an award of up to 200% of their individual Aspire target opportunity at the end of the program.
Long-term incentive program for middle management (Aspire ii)Other senior managers are offered Aspire ii, a variant of Aspire i that does not require a person-al investment in Bayer shares. In this case the amount of the award is based entirely on the ab-solute performance of Bayer stock. The maximum award is 150% of each manager’s Aspire tar-get opportunity.
Stock Participation Program (2008) for other managers and non-managerial employeesUnder this program, Bayer offered employees the opportunity to purchase shares at a discount of 15% on the lowest stock price on August 11, 2008. Employees could invest a maximum of €10,000 in discounted shares, depending on their base salary and salary grade. The shares purchased un-der the 2008 Stock Participation Program may not be sold prior to December 31, 2009. In 2008, employees subscribed for a total of 632,117 Bayer shares under the Stock Participation Program.
TABLE OF CONTENTS CONSOLIDATED FINANCIAL STATEMENTS
2007 2008
Dividend yield 1.91% 3.80%
Risk-free interest rate 4.06% 1.93%
Volatility of Bayer stock 22.19% 31.56%
Volatility of the EURO STOXX 50SM 13.83% 25.72%
Correlation between Bayer stock price and the EURO STOXX 50SM 0.54 0.68
Stock Option
Program
Stock Incentive Program
Stock Participa-
tion Program Aspire I Aspire II Total
€ million € million € million € million € million € million
December 31, 2007 11 4 17 58 60 150
Allocations 2 - 1 12 3 18
Utilization (8) (1) (6) (27) (29) (71)
Reversal (3) (1) (3) (3) (2) (12)
Exchange differences - - - 1 1 2
December 31, 2008 2 2 9 41 33 87
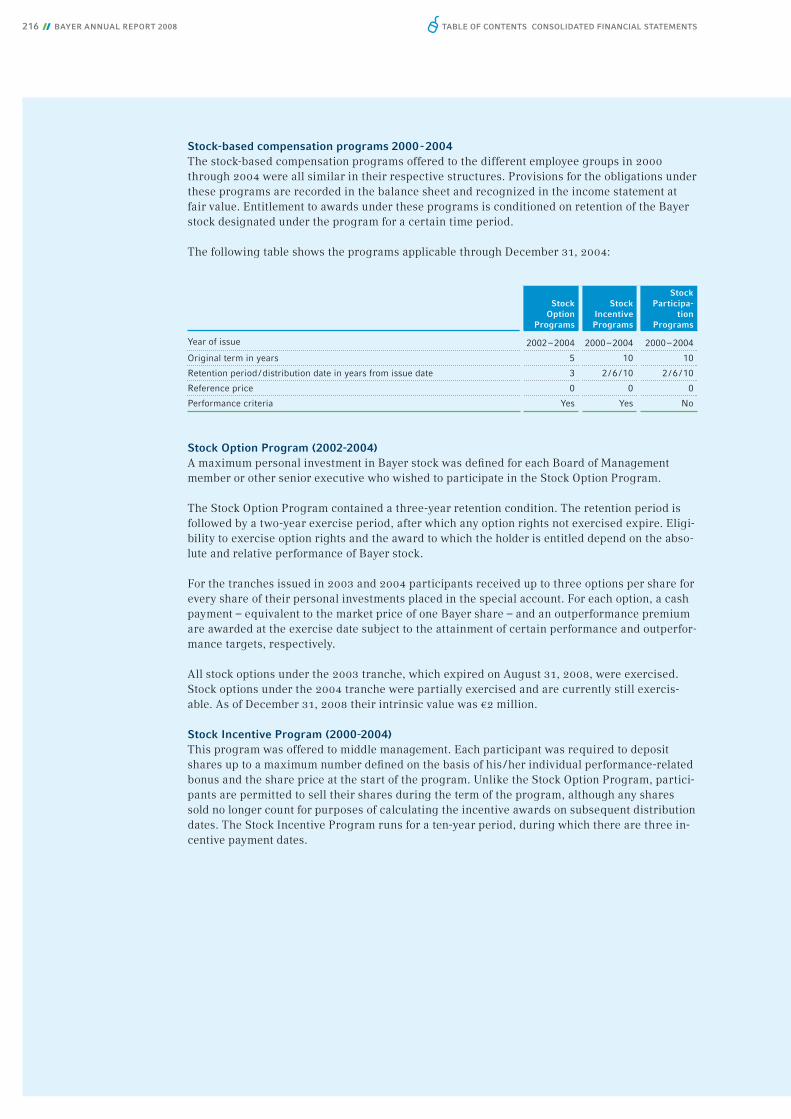
216 / / BAYER ANNUAL REPORT 2008
Stock-based compensation programs 2000 - 2004The stock-based compensation programs offered to the different employee groups in 2000 through 2004 were all similar in their respective structures. Provisions for the obligations under these programs are recorded in the balance sheet and recognized in the income statement at fair value. Entitlement to awards under these programs is conditioned on retention of the Bayer stock designated under the program for a certain time period.
The following table shows the programs applicable through December 31, 2004:
Stock Option Program (2002-2004)A maximum personal investment in Bayer stock was defi ned for each Board of Management member or other senior executive who wished to participate in the Stock Option Program.
The Stock Option Program contained a three-year retention condition. The retention period is followed by a two-year exercise period, after which any option rights not exercised expire. Eligi-bility to exercise option rights and the award to which the holder is entitled depend on the abso-lute and relative performance of Bayer stock.
For the tranches issued in 2003 and 2004 participants received up to three options per share for every share of their personal investments placed in the special account. For each option, a cash payment – equivalent to the market price of one Bayer share – and an outperformance premium are awarded at the exercise date subject to the attainment of certain performance and outperfor-mance targets, respectively.
All stock options under the 2003 tranche, which expired on August 31, 2008, were exercised. Stock options under the 2004 tranche were partially exercised and are currently still exercis-able. As of December 31, 2008 their intrinsic value was €2 million.
Stock Incentive Program (2000-2004)This program was offered to middle management. Each participant was required to deposit shares up to a maximum number defi ned on the basis of his / her individual performance-related bonus and the share price at the start of the program. Unlike the Stock Option Program, partici-pants are permitted to sell their shares during the term of the program, although any shares sold no longer count for purposes of calculating the incentive awards on subsequent distribution dates. The Stock Incentive Program runs for a ten-year period, during which there are three in-centive payment dates.
TABLE OF CONTENTS CONSOLIDATED FINANCIAL STATEMENTS
Stock Option
Programs
Stock Incentive Programs
Stock Participa-
tion Programs
Year of issue 2002 – 2004 2000 – 2004 2000 – 2004
Original term in years 5 10 10
Retention period / distribution date in years from issue date 3 2 / 6 / 10 2 / 6 / 10
Reference price 0 0 0
Performance criteria Yes Yes No
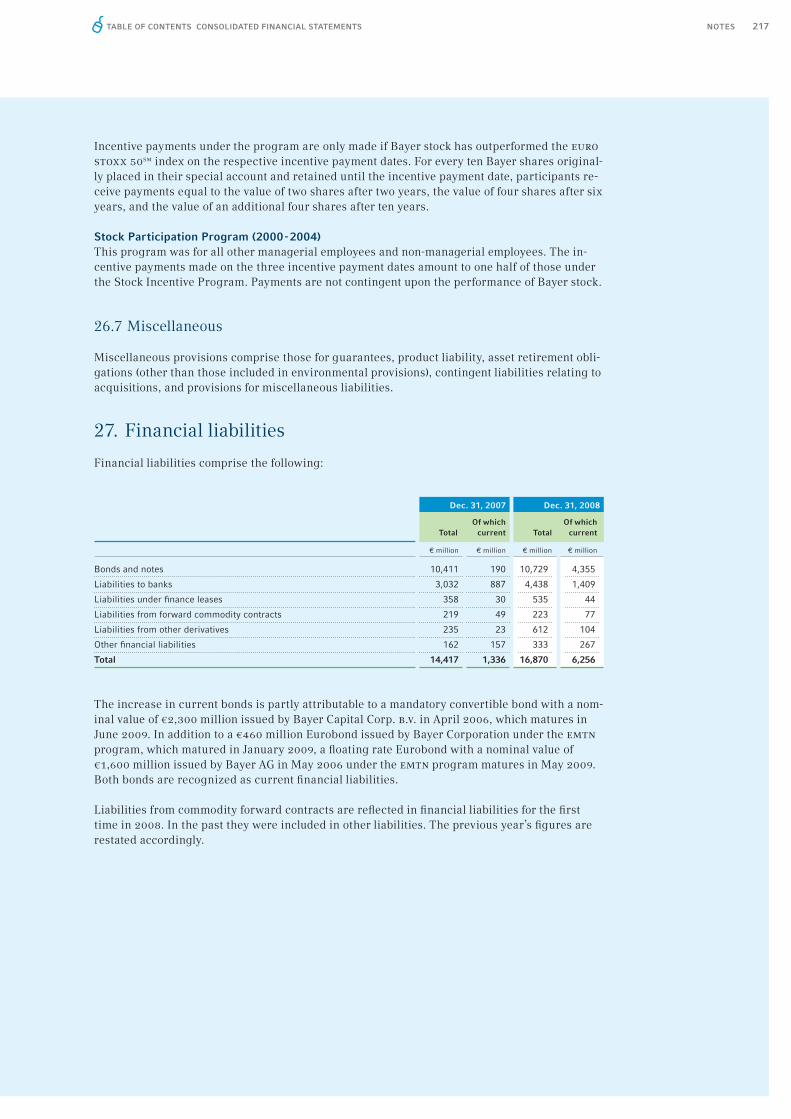
217NOTES
Incentive payments under the program are only made if Bayer stock has outperformed the euro stoxx 50sm index on the respective incentive payment dates. For every ten Bayer shares original-ly placed in their special account and retained until the incentive payment date, participants re-ceive payments equal to the value of two shares after two years, the value of four shares after six years, and the value of an additional four shares after ten years.
Stock Participation Program (2000 - 2004)This program was for all other managerial employees and non-managerial employees. The in-centive payments made on the three incentive payment dates amount to one half of those under the Stock Incentive Program. Payments are not contingent upon the performance of Bayer stock.
26.7 Miscellaneous
Miscellaneous provisions comprise those for guarantees, product liability, asset retirement obli-gations (other than those included in environmental provisions), contingent liabilities relating to acquisitions, and provisions for miscellaneous liabilities.
27. Financial liabilities
Financial liabilities comprise the following:
The increase in current bonds is partly attributable to a mandatory convertible bond with a nom-inal value of €2,300 million issued by Bayer Capital Corp. b.v. in April 2006, which matures in June 2009. In addition to a €460 million Eurobond issued by Bayer Corporation under the emtn program, which matured in January 2009, a fl oating rate Eurobond with a nominal value of €1,600 million issued by Bayer AG in May 2006 under the emtn program matures in May 2009. Both bonds are recognized as current fi nancial liabilities.
Liabilities from commodity forward contracts are refl ected in fi nancial liabilities for the fi rst time in 2008. In the past they were included in other liabilities. The previous year’s fi gures are restated accordingly.
TABLE OF CONTENTS CONSOLIDATED FINANCIAL STATEMENTS
Dec. 31, 2007 Dec. 31, 2008
TotalOf which
current TotalOf which
current
€ million € million € million € million
Bonds and notes 10,411 190 10,729 4,355
Liabilities to banks 3,032 887 4,438 1,409
Liabilities under fi nance leases 358 30 535 44
Liabilities from forward commodity contracts 219 49 223 77
Liabilities from other derivatives 235 23 612 104
Other fi nancial liabilities 162 157 333 267
Total 14,417 1,336 16,870 6,256

218 / / BAYER ANNUAL REPORT 2008
The maturities of fi nancial liabilities were as follows:
Bayer sold a registered usufructuary right to real estate with a residual carrying amount of €164 million to a leasing company and leased it back immediately under an agreement that in-cludes a right of repurchase upon expiration of the lease. This transaction, which is accounted for as a secured loan, does not restrict the operational use of the real estate. The Bayer Group’s other fi nancial liabilities are mostly unsecured and – with the exception of the subordinated mandatory convertible bond with a nominal value of €2,300 million and a subordinated hybrid bond with a nominal value of €1,300 million – are of equal priority.
Further information on the accounting for liabilities from derivatives is given in Note [30].
The Bayer Group has issued the following bonds and notes:
TABLE OF CONTENTS CONSOLIDATED FINANCIAL STATEMENTS
Effective interest rate
Stated rate Nominal volume
Dec. 31, 2007
Dec. 31, 2008
€ million € million
Bayer AG
6.075% 6.000% Eurobonds 2002 / 2012 EUR 2,000 million 1,971 2,025
5.155% 5.000% Hybrid bonds 2005 / 2105 (2015) EUR 1,300 million 1,237 1,245
Floating Floating Eurobonds 2006 / 2009 EUR 1,600 million 1,598 1,599
4.621% 4.500% Eurobonds 2006 / 2013 EUR 1,000 million 994 995
5.774% 5.625% Eurobonds 2006 / 2018 GBP 250 million 337 259
5.541% 5.625% Eurobonds 2006 / 2018 (increase) GBP 100 million 137 106
Floating Floating Eurobonds 2007 / 2010 EUR 300 million 300 300
4.464% 4.375% Eurobonds 2007 / 2011 EUR 200 million 199 200
4.038% 4.000% Eurobonds (private placement) 2008 / 2011 EUR 200 million - 200
3.502% 3.490% Eurobonds (private placement) 2004 / 2008 EUR 20 million 20 -
Bayer Capital Corp. B.V.
7.117% 6.625% Mandatory convertible bonds 2006 / 2009 EUR 2,300 million 2,285 2,296
Bayer Corporation
7.180% 7.125% Notes 1995 / 2015 US$ 200 million 135 162
6.670% 6.650% Notes 1998 / 2028 US$ 350 million 236 249
6.210% 6.200% Notes 1998 / 2008 US$ 250 million 170 -
4.043% 3.750% Eurobonds 2004 / 2009 EUR 460 million 459 460
Bayer Holding Ltd.
1.654% 1.585% Eurobonds 2007 / 2010 JPY 10 billion 61 79
2.006% 1.955% Eurobonds 2007 / 2012 JPY 15 billion 91 119
Floating Floating Eurobonds 2007 / 2012 JPY 30 billion 181 237
Floating Floating Eurobonds 2008 / 2013 JPY 10 billion - 79
3.654% 3.575% Eurobonds 2008 / 2018 JPY 15 billion - 119
Total 10,411 10,729
Maturity Dec. 31, 2007
Maturity Dec. 31, 2008
€ million € million
Up to 2008 1,336 Up to 2009 6,256
Up to 2009 4,742 Up to 2010 771
Up to 2010 518 Up to 2011 1,967
Up to 2011 1,566 Up to 2012 2,740
Up to 2012 2,455 Up to 2013 1,465
Up to 2013 or later 3,800 Up to 2014 or later 3,671
Total 14,417 Total 16,870

219NOTES
In December 2008 Bayer AG issued a bond with a nominal value of €200 million under the multi-currency European Medium Term Note (emtn) program. It has a coupon of 4% and matures on January 27, 2011.
In June 2008 Bayer Holding Ltd. issued a fl oating-rate bond with a nominal value of jpy 10 bil-lion under the emtn program. The bond matures in fi ve years and has a variable coupon com-prising the three-month jpy Libor plus 56 basis points. In December Bayer Holding Ltd. also is-sued a bond with a nominal value of jpy 15 billion under this program. This bond has a coupon of 3.575% and matures on December 19, 2018.
In June 2007 Bayer Holding Ltd. launched bond issues under the emtn program. These com-prised a three-year bond with a nominal value of jpy 10 billion and a coupon of 1.585%, a fi ve-year bond with a nominal value of jpy 15 billion and a coupon of 1.955%, and a fl oating-rate note with a nominal value of jpy 30 billion. The latter has a maturity of fi ve years and a coupon com-prising the three-month jpy Libor plus 26 basis points.
In April 2007, Bayer AG issued a fl oating rate bond with a maturity of three years and a nominal value of €300 million under the emtn program. The coupon is the three-month euribor rate plus 10 basis points. At the same time, a four-year bond with a nominal value of €200 million and a coupon of 4.375% was issued.
In May 2006 Bayer AG launched three further bond issues under its multi-currency emtn pro-gram as part of the fi nancing of the Schering acquisition. The fi rst of these was a three-year fl oating rate note in a nominal amount of €1,600 million which bears interest at 22.5 basis points above the 3-month euribor rate. The second issue, which has a nominal value of €1,000 million, has a coupon of 4.5% and a maturity of seven years. A third bond, denominated in sterling (gbp), was also issued with a nominal value of gbp 250 million. A second tranche of gbp 100 million was issued in the same year. This bond has a coupon of 5.625% and matures in 2018. The entire issue has been swapped into euros.
In April 2006, Bayer Capital Corp. b.v. issued a subordinated mandatory convertible bond with a nominal value of €2,300 million as part of the fi nancing of the acquisition of Schering AG, Ber-lin, Germany. This issue carries a 6.625% coupon and matures on June 1, 2009. Unless the issue has been converted, repurchased or canceled before the expiration date of June 1, 2009, all out-standing bonds will be converted into the corresponding number of Bayer AG shares at the man-datory conversion ratio on the maturity date. If the mandatory conversion ratio is within the band set for the fl uctuation of the stock price, the number of shares per bond will be issued on the basis of this mandatory conversion ratio. If the share price exceeds or falls below the band, the bond will be converted into a fi xed number of shares. Investors may convert the bond into shares before the maturity date as provided in the issue conditions. This bond is treated entirely as equity by Moody’s and Standard & Poor’s and therefore improves the Bayer Group’s rating-specifi c debt indicators.
In July 2005, Bayer AG issued a 100-year subordinated hybrid bond with a volume of €1,300 mil-lion. This issue matures in 2105 and has a fi xed coupon of 5% in the fi rst ten years. Thereafter, interest is calculated quarterly at a fl oating rate (three-month euribor plus 280 basis points). After the fi rst ten years, Bayer AG has a quarterly option to redeem the bonds at nominal value. The coupon is payable in arrears. This bond is treated as 75% equity by Moody’s and as 50% equity by Standard & Poor’s and therefore improves the Bayer Group’s rating-specifi c debt indi-cators.
In January 2004 Bayer Corporation issued a fi ve-year bond with a nominal value of €460 million and a coupon of 3.75% under the emtn program. In February 1998 Bayer issued notes with a to-tal nominal value of us$600 million for eligible institutional investors. This comprised two sepa-rate issues. The fi rst issue, with a nominal value of us$350 million, has a maturity of 30 years and a coupon of 6.65% with half-yearly interest payments. The second issue, with a nominal
TABLE OF CONTENTS CONSOLIDATED FINANCIAL STATEMENTS

220 / / BAYER ANNUAL REPORT 2008
value of us$ 250 million, had combined call and put options, giving the lead manager the right to repurchase the notes, and the investors the right to cash them, after ten years. As contractually agreed with the lead manager in September 2007, it exercised its right to repurchase the notes from the investors in February 2008 and sold them back to Bayer Corporation.
The long-term liabilities to banks principally comprise a syndicated loan raised in 2006 of now €1.25 billion, in connection with the acquisition of Schering AG, Berlin, Germany. This credit fa-cility is provided by a syndicate of eleven banks and bears a variable interest rate (euribor plus a margin, which has been fi xed at 20 basis points since July 2007). This credit facility has a fi xed term until March 2011 but can be repaid in full or in part at any time on Bayer’s request.
Bayer AG guarantees all the bonds issued by its subsidiaries.
As of December 31, 2008 the Group had credit facilities at its disposal totaling €9.9 billion (2007: €7.9 billion), of which €4.4 billion (2007: €3.0 billion) was used and €5.5 billion (2007: €4.9 billion) was unused and thus available for borrowing on an unsecured basis.
Lease payments totaling €707 million (2007: €458 million), including €172 million (2007: €100 million) in interest, are to be made to the respective lessors in future years.
Leasing liabilities mature as follows:
28. Trade accounts payable
Trade accounts are payable mainly to third parties. Trade accounts payable as of December 31, 2008 include €2,376 million (2007: €2,455 million) due within one year and €1 million (2007: €11 million) due after one year.
TABLE OF CONTENTS CONSOLIDATED FINANCIAL STATEMENTS
Dec. 31, 2007 Dec. 31, 2008
Maturity
Lease pay-
ments
Interest compo-
nent
Liabilities under
fi nance leases Maturity
Lease pay-
ments
Interest compo-
nent
Liabilities under
fi nance leases
€ million € million € million € million € million € million
2008 47 17 30 2009 70 26 44
2009 48 17 31 2010 60 25 35
2010 37 15 22 2011 59 23 36
2011 33 14 19 2012 51 22 29
2012 32 13 19 2013 207 18 189
2013 or later 261 24 237 2014 or later 260 58 202
Total 458 100 358 Total 707 172 535

221NOTES
29. Other liabilities
Other liabilities comprised:
Liabilities for social expenses include, in particular, social insurance contributions that had not been paid by the closing date.
Based on the takeover offer made in connection with the domination agreement with Bayer Scher-ing Pharma AG, a total obligation of €721 million existed in 2007 toward the remaining minority stockholders to purchase their shares. This was refl ected in other current liabilities and not in equity attributable to non-controlling interest. This obligation comprised a guaranteed dividend for the minority stockholders of Bayer Schering Pharma AG and an appropriate cash compensation payment to be made in exchange for their shares. Following the entry of the squeeze-out in the Commercial Register on September 25, 2008, a cash compensation payment was made to the mi-nority stockholders of Bayer Schering Pharma AG. The sum of €695 million held in escrow ac-counts for this purpose was disbursed to the stockholders in October 2008.
Liabilities to non-controlling interest also include an amount of €101 million (2007: €73 million) representing the third-party share of the capital of Currenta GmbH & Co. OHG.
Miscellaneous liabilities include €376 million (2007: €399 million) in accrued expenses, of which €200 million (2007: €248 million) are to be regarded as current. The accrued expenses include €49 million (2007: €44 million) in grants and subsidies received from governments. The amount reversed and recognized in income was €13 million (2007: €7 million). The miscella-neous liabilities also include a large number of individually immaterial amounts pertaining to subsidiaries such as guarantees, commissions to customers and reimbursements of expenses.
TABLE OF CONTENTS CONSOLIDATED FINANCIAL STATEMENTS
Dec. 31, 2007 Dec. 31, 2008
TotalOf which
current TotalOf which
current
€ million € million € million € million
Accrued interest on liabilities 451 439 321 304
Payroll liabilities 172 126 171 138
Liabilities for social expenses 159 150 143 133
Other tax liabilities 275 265 276 275
Advance payments received 40 40 87 87
Liabilities to non-controlling interest 794 721 101 -
Miscellaneous liabilities 1,264 1,083 1,294 1,024
Total 3,155 2,824 2,393 1,961

222 / / BAYER ANNUAL REPORT 2008
30. Financial instruments
The system used by the Bayer Group to manage credit risk, liquidity risk and the various types of market risks (interest-rate risk, currency risk and other price risks), together with its objectives, methods and procedures, is outlined in the Risk Report, which forms part of the Management Report.
TABLE OF CONTENTS CONSOLIDATED FINANCIAL STATEMENTS
Dec. 31, 2007
Carried at amortized cost
Carried at fair value
Non-fi nancial assets /liabilities
Carrying amount
Dec. 31, 2007Fair value
(for information)Carrying
amountCarrying
amountCarrying amount on balance sheet
€ million € million € million € million € million
Trade accounts receivable 5,830 5,830
Loans and receivables 5,830 5,825 5,830
Other fi nancial assets 638 824 1,462
Loans and receivables 373 370 373
Available-for-sale fi nancial assets 86 239 325
Held-to-maturity fi nancial investments 179 177 179
Derivatives that qualify for hedge accounting 134 134
Derivatives that do not qualify for hedge accounting 451 451
Other receivables 1,085 1,043 2,128
Loans and receivables 1,085 1,084 1,085
Non-fi nancial assets 1,043 1,043
Cash and cash equivalents 2,531 2,531
Loans and receivables 2,531 2,531 2,531
Total fi nancial assets 10,084 824
of which loans and receivables 9,819 9,819
Financial liabilities 13,963 454 14,417
Carried at amortized cost 13,963 15,312 13,963
Derivatives that qualify for hedge accounting 99 99
Derivatives that do not qualify for hedge accounting 355 355
Trade accounts payable 2,466 2,466
Carried at amortized cost 2,466 2,465 2,466
Other liabilities 2,229 38 888 3,155
Carried at amortized cost 2,229 2,228 2,229
Derivatives that qualify for hedge accounting 7 7
Derivatives that do not qualify for hedge accounting 31 31
Non-fi nancial liabilities 888 888
Total fi nancial liabilities 18,658 492
of which carried at amortized cost 18,658 18,658
of which derivatives that qualify for hedge accounting 106 106
of which derivatives that do not qualify for hedge accounting 386 386

223NOTES
30.1 Information on fi nancial instruments by category
The following table shows the carrying amounts and fair values of fi nancial assets and liabilities by category of fi nancial instrument and a reconciliation to the corresponding line item in the bal-ance sheet. Since the line items “Other receivables” and “Other liabilities” contain both fi nancial instruments and non-fi nancial assets and liabilities (such as other tax receivables or advance payments for services to be received in the future), the reconciliation is shown in the column headed “Non-fi nancial assets / liabilities.”
TABLE OF CONTENTS CONSOLIDATED FINANCIAL STATEMENTS
Dec. 31, 2008
Carried at amortized cost
Carried at fair value
Non-fi nancial assets /liabilities
Carrying amount
Dec. 31, 2008Fair value
(for information)Carrying
amountCarrying
amountCarrying amount on balance sheet
€ million € million € million € million € million
5,953 5,953
5,953 5,953 5,953
911 920 1,831
660 682 660
84 204 288
167 168 167
248 248
468 468
676 1,066 1,742
676 671 676
1,066 1,066
2,094 2,094
2,094 2,094 2,094
9,634 920
9,383 9,383
16,035 835 16,870
16,035 16,706 16,035
308 308
527 527
2,377 2,377
2,377 2,377 2,377
1,357 100 936 2,393
1,357 1,356 1,357
87 87
13 13
936 936
19,769 935
19,769 19,769
395 395
540 540

224 / / BAYER ANNUAL REPORT 2008
Loans and receivables and liabilities carried at amortized cost also include receivables and lia-bilities under fi nance leases where Bayer is the lessor or lessee and which therefore have to be measured in accordance with ias 17.
The fair value stated for receivables, loans, held-to-maturity fi nancial investments and primary liabilities is the present value of the respective future cash fl ows. This is determined by dis-counting the cash fl ows at a closing-date interest rate that takes into account the term of the as-sets or liabilities and the creditworthiness of the counterparty. If a market price is available, however, this is deemed to be the fair value.
Because of the short maturities of most trade accounts receivable and payable, other receivables and liabilities, and cash and cash equivalents, their carrying amounts at the balance sheet date do not differ signifi cantly from the fair values.
Income, expense, gains and losses on fi nancial instruments can be assigned to the following categories:
TABLE OF CONTENTS CONSOLIDATED FINANCIAL STATEMENTS
2008
Loans and receivables
Held-to-maturity
investments
Available-for-sale fi nancial
assets
Held for trading
(derivatives only)
Liabilities carried at amortized
cost Total
€ million € million € million € million € million € million
Interest income 123 10 1 370 24 528
Interest expense - - - (295) (917) (1,212)
Income from affi liated companies - - - - - -
Changes in fair value - - - 12 - 12
Impairment charges (114) (27) (14) - - (155)
Income from write-backs 92 - - - - 92
Gains / losses from retirements - - (7) - - (7)
Other non-operating income and expense 17 - - - (22) (5)
Net result 118 (17) (20) 87 (915) (747)

225NOTES
The column headed “Held for trading” consists almost entirely of interest income and expenses relating to interest-rate and cross-currency interest-rate hedges that do not qualify for hedge ac-counting. Further information is provided in Note [13.2].
30.2 Maturity analysis
As of the reporting date, the liquidity risk to which the Bayer Group was exposed from its fi nan-cial instruments comprises obligations relating to future interest and repayment installments for fi nancial liabilities and the liquidity risk arising from derivatives, as shown in the table in Note [30.3].
The carrying amount of bonds includes €2,296 million (2007: €2,285 million) for the mandatory convertible bond. The future interest payments on this bond are stated. There will be no repay-ments because the bond will be converted into equity.
As of the reporting date, there was an unpaid portion of the effective initial fund of Bayer-Pen-sionskasse amounting to €490 million, which may result in further payments by Bayer AG in sub-sequent years.
TABLE OF CONTENTS CONSOLIDATED FINANCIAL STATEMENTS
2007
Loans and receivables
Held-to-maturity
investments
Available-for-sale fi nancial
assets
Held for trading
(derivatives only)
Liabilities carried at amortized
cost Total
€ million € million € million € million € million € million
Interest income 243 9 9 114 350 725
Interest expense - - - (107) (1,288) (1,395)
Income from affi liated companies - - - - - -
Changes in fair value - - - 1 - 1
Impairment charges (107) - (27) - - (134)
Income from write-backs 83 - - - - 83
Gains / losses from retirements - - 1 - - 1
Other non-operating income and expense 12 - (1) - 1 12
Net result 231 9 (18) 8 (937) (707)
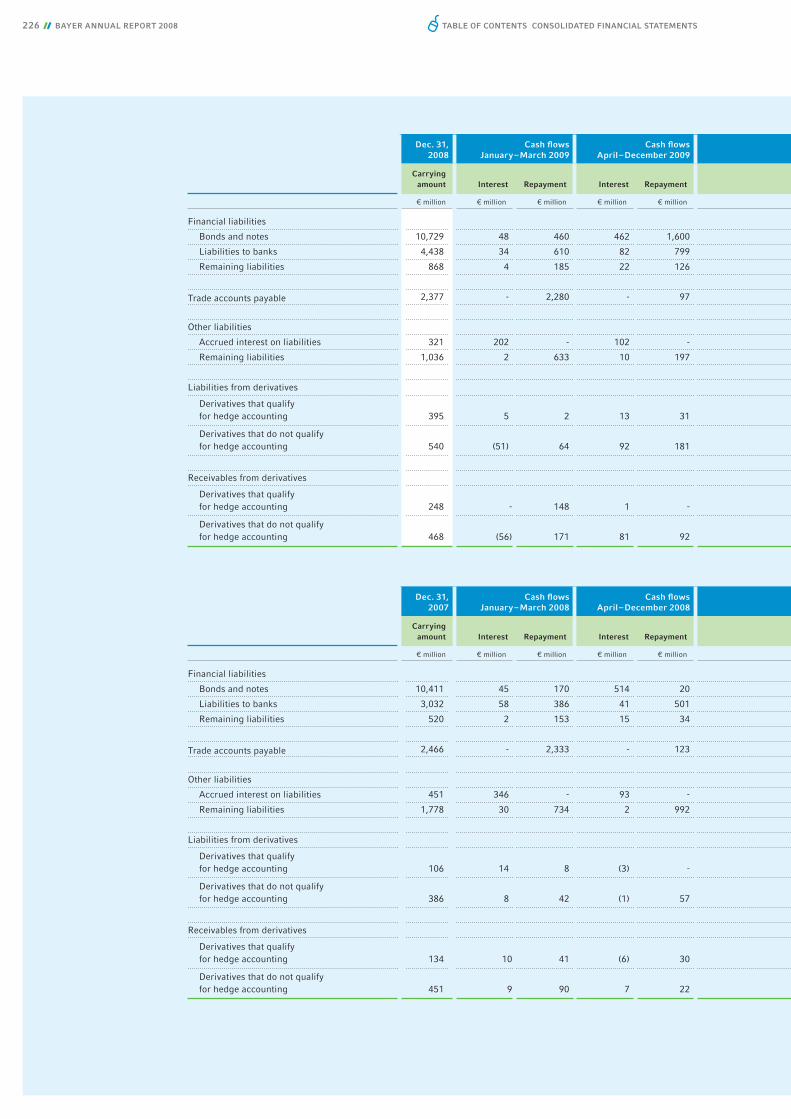
226 / / BAYER ANNUAL REPORT 2008 TABLE OF CONTENTS CONSOLIDATED FINANCIAL STATEMENTS
Dec. 31,2008
Cash fl ows January – March 2009
Cash fl ows April – December 2009
Carrying amount Interest Repayment Interest Repayment
€ million € million € million € million € million
Financial liabilities
Bonds and notes 10,729 48 460 462 1,600
Liabilities to banks 4,438 34 610 82 799
Remaining liabilities 868 4 185 22 126
Trade accounts payable 2,377 - 2,280 - 97
Other liabilities
Accrued interest on liabilities 321 202 - 102 -
Remaining liabilities 1,036 2 633 10 197
Liabilities from derivatives
Derivatives that qualify for hedge accounting 395 5 2 13 31
Derivatives that do not qualify for hedge accounting 540 (51) 64 92 181
Receivables from derivatives
Derivatives that qualify for hedge accounting 248 - 148 1 -
Derivatives that do not qualify for hedge accounting 468 (56) 171 81 92
Dec. 31,2007
Cash fl ows January – March 2008
Cash fl ows April – December 2008
Carrying amount Interest Repayment Interest Repayment
€ million € million € million € million € million
Financial liabilities
Bonds and notes 10,411 45 170 514 20
Liabilities to banks 3,032 58 386 41 501
Remaining liabilities 520 2 153 15 34
Trade accounts payable 2,466 - 2,333 - 123
Other liabilities
Accrued interest on liabilities 451 346 - 93 -
Remaining liabilities 1,778 30 734 2 992
Liabilities from derivatives
Derivatives that qualify for hedge accounting 106 14 8 (3) -
Derivatives that do not qualify for hedge accounting 386 8 42 (1) 57
Receivables from derivatives
Derivatives that qualify for hedge accounting 134 10 41 (6) 30
Derivatives that do not qualify for hedge accounting 451 9 90 7 22
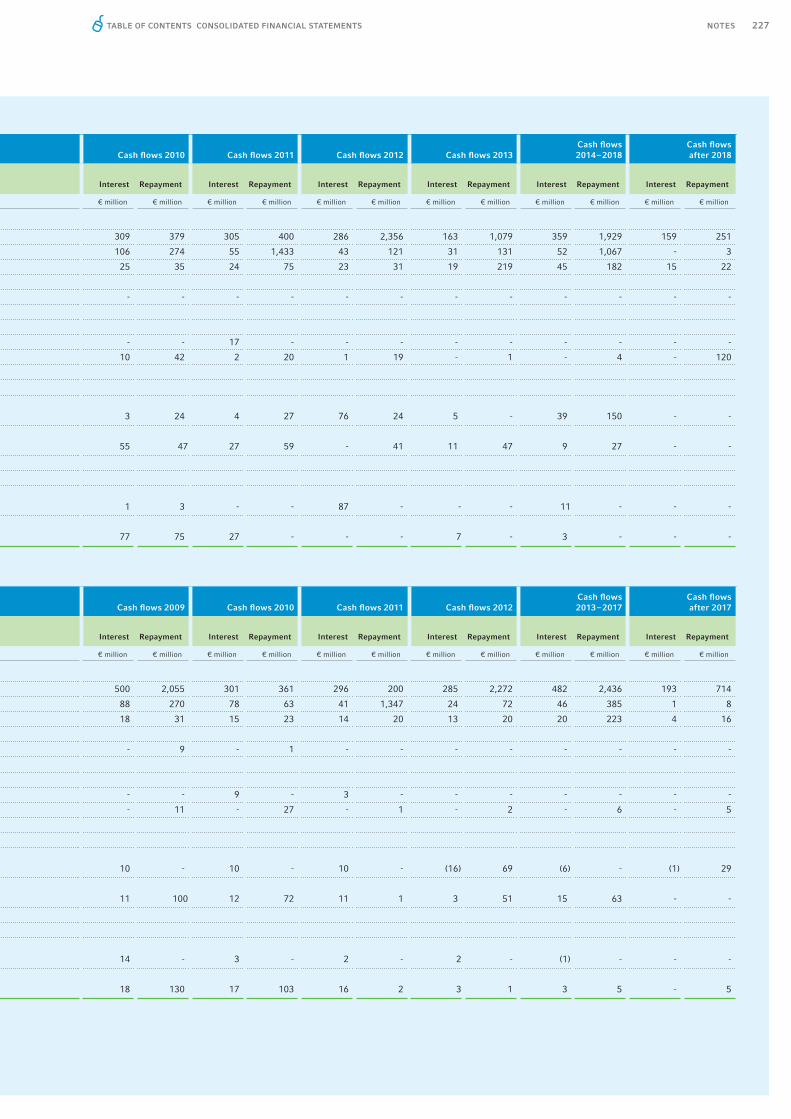
227NOTESTABLE OF CONTENTS CONSOLIDATED FINANCIAL STATEMENTS
Cash fl ows 2010 Cash fl ows 2011 Cash fl ows 2012 Cash fl ows 2013Cash fl ows2014 – 2018
Cash fl ows after 2018
Interest Repayment Interest Repayment Interest Repayment Interest Repayment Interest Repayment Interest Repayment
€ million € million € million € million € million € million € million € million € million € million € million € million
309 379 305 400 286 2,356 163 1,079 359 1,929 159 251
106 274 55 1,433 43 121 31 131 52 1,067 - 3
25 35 24 75 23 31 19 219 45 182 15 22
- - - - - - - - - - - -
- - 17 - - - - - - - - -
10 42 2 20 1 19 - 1 - 4 - 120
3 24 4 27 76 24 5 - 39 150 - -
55 47 27 59 - 41 11 47 9 27 - -
1 3 - - 87 - - - 11 - - -
77 75 27 - - - 7 - 3 - - -
Cash fl ows 2009 Cash fl ows 2010 Cash fl ows 2011 Cash fl ows 2012Cash fl ows 2013 – 2017
Cash fl ows after 2017
Interest Repayment Interest Repayment Interest Repayment Interest Repayment Interest Repayment Interest Repayment
€ million € million € million € million € million € million € million € million € million € million € million € million
500 2,055 301 361 296 200 285 2,272 482 2,436 193 714
88 270 78 63 41 1,347 24 72 46 385 1 8
18 31 15 23 14 20 13 20 20 223 4 16
- 9 - 1 - - - - - - - -
- - 9 - 3 - - - - - - -
- 11 - 27 - 1 - 2 - 6 - 5
10 - 10 - 10 - (16) 69 (6) - (1) 29
11 100 12 72 11 1 3 51 15 63 - -
14 - 3 - 2 - 2 - (1) - - -
18 130 17 103 16 2 3 1 3 5 - 5
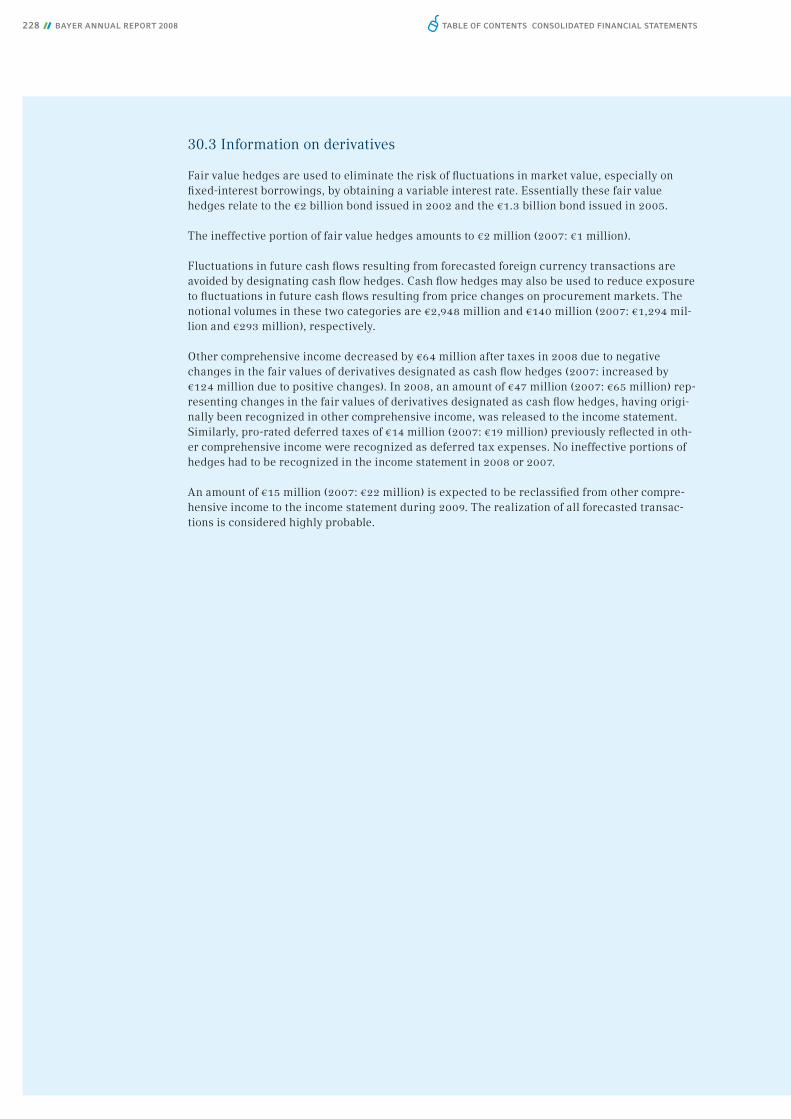
228 / / BAYER ANNUAL REPORT 2008
30.3 Information on derivatives
Fair value hedges are used to eliminate the risk of fl uctuations in market value, especially on fi xed-interest borrowings, by obtaining a variable interest rate. Essentially these fair value hedges relate to the €2 billion bond issued in 2002 and the €1.3 billion bond issued in 2005.
The ineffective portion of fair value hedges amounts to €2 million (2007: €1 million).
Fluctuations in future cash fl ows resulting from forecasted foreign currency transactions are avoided by designating cash fl ow hedges. Cash fl ow hedges may also be used to reduce exposure to fl uctuations in future cash fl ows resulting from price changes on procurement markets. The notional volumes in these two categories are €2,948 million and €140 million (2007: €1,294 mil-lion and €293 million), respectively.
Other comprehensive income decreased by €64 million after taxes in 2008 due to negative changes in the fair values of derivatives designated as cash fl ow hedges (2007: increased by €124 million due to positive changes). In 2008, an amount of €47 million (2007: €65 million) rep-resenting changes in the fair values of derivatives designated as cash fl ow hedges, having origi-nally been recognized in other comprehensive income, was released to the income statement. Similarly, pro-rated deferred taxes of €14 million (2007: €19 million) previously refl ected in oth-er comprehensive income were recognized as deferred tax expenses. No ineffective portions of hedges had to be recognized in the income statement in 2008 or 2007.
An amount of €15 million (2007: €22 million) is expected to be reclassifi ed from other compre-hensive income to the income statement during 2009. The realization of all forecasted transac-tions is considered highly probable.
TABLE OF CONTENTS CONSOLIDATED FINANCIAL STATEMENTS
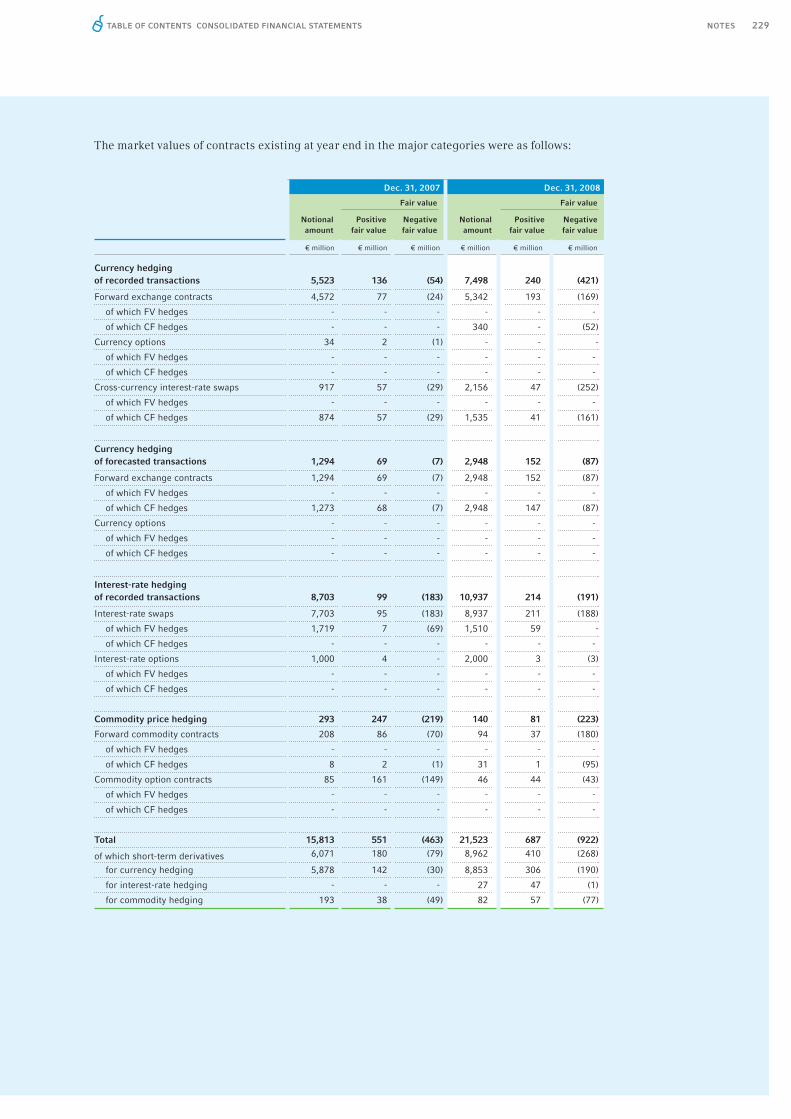
229NOTES
The market values of contracts existing at year end in the major categories were as follows:
TABLE OF CONTENTS CONSOLIDATED FINANCIAL STATEMENTS
Dec. 31, 2007 Dec. 31, 2008
Fair value Fair value
Notional amount
Positive fair value
Negative fair value
Notional amount
Positive fair value
Negative fair value
€ million € million € million € million € million € million
Currency hedging of recorded transactions 5,523 136 (54) 7,498 240 (421)
Forward exchange contracts 4,572 77 (24) 5,342 193 (169)
of which FV hedges - - - - - -
of which CF hedges - - - 340 - (52)
Currency options 34 2 (1) - - -
of which FV hedges - - - - - -
of which CF hedges - - - - - -
Cross-currency interest-rate swaps 917 57 (29) 2,156 47 (252)
of which FV hedges - - - - - -
of which CF hedges 874 57 (29) 1,535 41 (161)
Currency hedging of forecasted transactions 1,294 69 (7) 2,948 152 (87)
Forward exchange contracts 1,294 69 (7) 2,948 152 (87)
of which FV hedges - - - - - -
of which CF hedges 1,273 68 (7) 2,948 147 (87)
Currency options - - - - - -
of which FV hedges - - - - - -
of which CF hedges - - - - - -
Interest-rate hedging of recorded transactions 8,703 99 (183) 10,937 214 (191)
Interest-rate swaps 7,703 95 (183) 8,937 211 (188)
of which FV hedges 1,719 7 (69) 1,510 59 -
of which CF hedges - - - - - -
Interest-rate options 1,000 4 - 2,000 3 (3)
of which FV hedges - - - - - -
of which CF hedges - - - - - -
Commodity price hedging 293 247 (219) 140 81 (223)
Forward commodity contracts 208 86 (70) 94 37 (180)
of which FV hedges - - - - - -
of which CF hedges 8 2 (1) 31 1 (95)
Commodity option contracts 85 161 (149) 46 44 (43)
of which FV hedges - - - - - -
of which CF hedges - - - - - -
Total 15,813 551 (463) 21,523 687 (922)
of which short-term derivatives 6,071 180 (79) 8,962 410 (268)
for currency hedging 5,878 142 (30) 8,853 306 (190)
for interest-rate hedging - - - 27 47 (1)
for commodity hedging 193 38 (49) 82 57 (77)
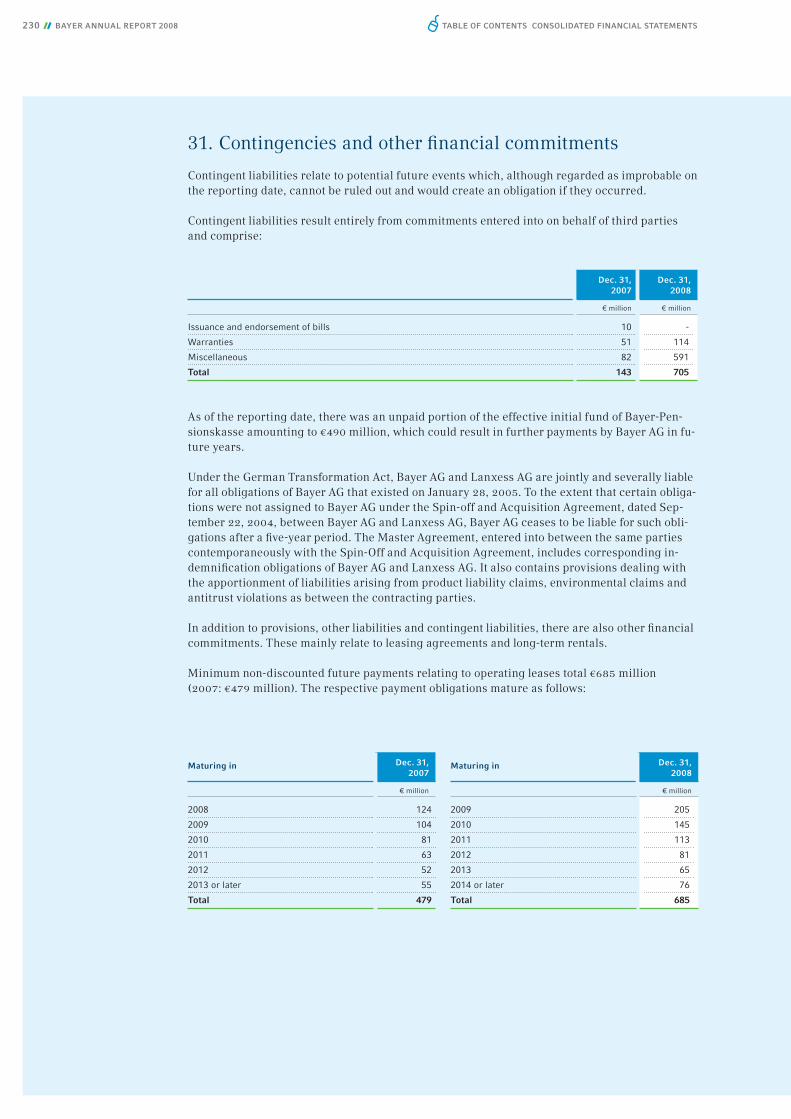
230 / / BAYER ANNUAL REPORT 2008
31. Contingencies and other fi nancial commitments
Contingent liabilities relate to potential future events which, although regarded as improbable on the reporting date, cannot be ruled out and would create an obligation if they occurred.
Contingent liabilities result entirely from commitments entered into on behalf of third parties and comprise:
As of the reporting date, there was an unpaid portion of the effective initial fund of Bayer-Pen-sionskasse amounting to €490 million, which could result in further payments by Bayer AG in fu-ture years.
Under the German Transformation Act, Bayer AG and Lanxess AG are jointly and severally liable for all obligations of Bayer AG that existed on January 28, 2005. To the extent that certain obliga-tions were not assigned to Bayer AG under the Spin-off and Acquisition Agreement, dated Sep-tember 22, 2004, between Bayer AG and Lanxess AG, Bayer AG ceases to be liable for such obli-gations after a fi ve-year period. The Master Agreement, entered into between the same parties contemporaneously with the Spin-Off and Acquisition Agreement, includes corresponding in-demnifi cation obligations of Bayer AG and Lanxess AG. It also contains provisions dealing with the apportionment of liabilities arising from product liability claims, environmental claims and antitrust violations as between the contracting parties.
In addition to provisions, other liabilities and contingent liabilities, there are also other fi nancial commitments. These mainly relate to leasing agreements and long-term rentals.
Minimum non-discounted future payments relating to operating leases total €685 million (2007: €479 million). The respective payment obligations mature as follows:
TABLE OF CONTENTS CONSOLIDATED FINANCIAL STATEMENTS
Dec. 31,2007
Dec. 31,2008
€ million € million
Issuance and endorsement of bills 10 -
Warranties 51 114
Miscellaneous 82 591
Total 143 705
Maturing in Dec. 31,2007
Maturing in Dec. 31,2008
€ million € million
2008 124 2009 205
2009 104 2010 145
2010 81 2011 113
2011 63 2012 81
2012 52 2013 65
2013 or later 55 2014 or later 76
Total 479 Total 685

231NOTES
Financial commitments resulting from orders already placed under purchase agreements related to planned or ongoing capital expenditure projects total €300 million (2007: €256 million).
In addition, the Group has entered into research agreements with a number of third parties un-der which Bayer has agreed to fund various research projects or has assumed other commit-ments based on the achievement of certain milestones or other specifi c conditions. The total amount of such funding and other commitments is €915 million (2007: €932 million). At Decem-ber 31, 2008, the remaining payments expected to be made to these parties, assuming the mile-stones or other conditions are met, were as follows:
32. Legal risks
As a global company with a diverse business portfolio, the Bayer Group is exposed to numerous legal risks, particularly in the areas of product liability, competition and antitrust law, patent dis-putes, tax assessments, and environmental matters. The outcome of any current or future pro-ceedings cannot be predicted with certainty. It is therefore possible that legal or regulatory judg-ments could give rise to expenses that are not covered, or not fully covered, by insurers’ compensation payments and could signifi cantly affect our revenues and earnings.
Legal proceedings currently considered to involve material risks are outlined below. The legal proceedings referred to do not necessarily represent an exhaustive list.
Bayer HealthCare
Product-related litigationLipobay / Baycol: As of February 2, 2009, approximately 236 Lipobay / Baycol cases, 200 of them in the United States, remain pending against Bayer worldwide, claiming economic loss, medical monitoring, and personal injury. We are currently aware of fewer than fi ve pending cases in the United States that in our opinion meet our criteria for potential settlement.
The class-action lawsuit which had been fi led by shareholders in connection with Lipobay / Baycol has been resolved for a payment by Bayer of a total of us$ 18.5 million.
Magnevist®: As of February 2, 2009, Bayer has been served in a total of 241 lawsuits in the Unit-ed States involving the gadolinium-based contrast agent Magnevist®. Three other manufacturers of gadolinium-based contrast agents in the United States also have been named party to the same or similar lawsuits. Additional cases are anticipated.
TABLE OF CONTENTS CONSOLIDATED FINANCIAL STATEMENTS
Maturing inDec. 31,
2007 Maturing inDec. 31,
2008
€ million € million
2008 159 2009 127
2009 181 2010 93
2010 59 2011 110
2011 83 2012 133
2012 69 2013 71
2013 or later 381 2014 or later 381
Total 932 Total 915

232 / / BAYER ANNUAL REPORT 2008
In the lawsuits, plaintiffs allege that patients developed nephrogenic systemic fi brosis (nsf) as a result of the use of Magnevist® during medical imaging procedures. nsf is a rare, severe condi-tion that can be debilitating and in some cases fatal. Plaintiffs seek compensatory and punitive damages under theories of strict liability and negligence and / or breach of warranty, claiming that the product is defective and unreasonably dangerous, that Bayer knew or should have known of the risks associated with Magnevist®, and has failed to disclose or adequately warn its users.
All cases pending in federal courts have been consolidated in a multidistrict litigation (mdl) pro-ceeding for common pre-trial management. Bayer believes that it has meritorious defenses and intends to defend itself vigorously. Based on the information currently available, Bayer has taken accounting measures for anticipated defense costs.
Trasylol® (aprotinin) is a drug approved for use in managing bleeding in patients undergoing coronary artery bypass graft surgery. As of February 2, 2009, there were 470 lawsuits pending in the United States served upon Bayer on behalf of persons alleging personal injuries, including renal failure and death, and economic loss from the use of Trasylol®. Bayer also has been served with a class action in Canada. Plaintiffs in both the u.s. and Canadian cases seek compensatory and punitive damages, claiming that Bayer knew or should have known of these risks and is lia-ble for having failed to disclose or adequately warn users of Trasylol®. All cases pending in u.s. federal courts have been consolidated in a multidistrict litigation (mdl) proceeding for common pre-trial management. Additional cases are anticipated.
In 2006 and 2007 observational studies reported on a possible correlation between the adminis-tration of Trasylol® and severe renal dysfunction, myocardial infarction, stroke and an increase in mortality. In November 2007, Bayer temporarily suspended worldwide marketing of Trasylol® after preliminary results from an independent clinical study in Canada raised concerns about a possible increased risk of mortality in patients who had received Trasylol®. The marketing sus-pension will remain in effect until the fi nal results from the Canadian study have been analyzed and the benefi t-risk assessment for Trasylol® can be re-evaluated together with the health au-thorities. In some countries, including the United States, Trasylol® continues to be available to certain surgical patients with an established medical need. We are closely cooperating with health authorities to resolve the questions that have arisen.
Bayer believes it has meritorious defenses and intends to defend itself vigorously. Based on the information currently available, Bayer has taken accounting measures for anticipated defense costs.
hiv / hcv: Numerous actions are pending against Bayer in the United States and other countries seeking damages for plaintiffs resident outside of the United States who claim to have become infected with hiv or hcv (hepatitis c virus) through use of blood plasma products sold by Bayer. Additional actions are pending by u.s. residents who claim to have been infected with hcv. Bayer believes it has meritorious defenses.
Competition law proceedingsDiabetes Care investigation: The United States Department of Justice had conducted an investi-gation into Bayer HealthCare’s Diabetes Care Division regarding the manner in which Bayer pro-vided business development funds from 1998 to 2003 to certain customers who marketed and sold Bayer blood glucose meters and test strips to patients. In November 2008, Bayer agreed to a settlement with the u.s. Department of Justice in order to avoid the time, uncertainty and ex-pense of litigation. Without acknowledging liability, Bayer agreed to pay us$ 97.5 million to the u.s. government, and to enter into a Corporate Integrity Agreement with the Offi ce of Inspector General for the Department of Health and Human Services.
TABLE OF CONTENTS CONSOLIDATED FINANCIAL STATEMENTS

233NOTES
Cipro®: 39 putative class action lawsuits and one individual lawsuit against Bayer involving the medication Cipro® have been pending in the United States since 2000. The plaintiffs are suing Bayer and other companies also named as defendants, alleging that a settlement to end patent litigation reached in 1997 between Bayer and Barr Laboratories, Inc. violated antitrust regula-tions. The plaintiffs claim the alleged violation prevented the marketing of generic ciprofl oxacin as of 1997. In particular, they are seeking triple damages under u.s. law. After the settlement with Barr the patent was the subject of a successful re-examination by the u.s. Patent and Trade-mark Offi ce and of successful defenses in u.s. federal courts. It has since expired.
All the actions pending in federal courts were consolidated in federal district court in New York in a multidistrict litigation (mdl) proceeding. In October 2008, the Court of Appeals for the Fed-eral Circuit in Washington d.c. affi rmed the 2005 ruling of the United States District Court in New York dismissing all lawsuits fi led in federal court. The recent appellate decision affi rmed the dismissal of various lawsuits brought by indirect purchaser plaintiffs in federal courts. Another appeal remains pending concerning the claims brought by direct purchasers of Cipro®. These claims also were dismissed by the federal district court, but the appellate court in New York has jurisdiction for the appeal of these lawsuits. Further cases are pending before various state courts. Bayer believes that it has meritorious defenses and intends to defend itself vigorously.
Patent disputesYasmin®: In April 2005, Bayer fi led suit against Barr Pharmaceuticals Inc. and Barr Laboratories Inc. in u.s. federal court alleging patent infringement by Barr for the intended generic version of Bayer’s Yasmin® oral contraceptive product in the United States. In June 2005, Barr fi led its counterclaim seeking to invalidate Bayer’s patent. In March 2008, the u.s. federal court invali-dated Bayer’s ’531 patent for Yasmin®. Bayer has appealed this ruling.
In June 2008, Bayer and Barr Laboratories Inc. signed a supply and licensing agreement for Yas-min® covering the United States. Bayer supplies Barr with a generic version of Yasmin® which Barr markets solely in the United States. Barr pays Bayer a fi xed percentage of the revenues from the product sold by Barr. Bayer continues to pursue its appeal of the court decision that invali-dated Bayer’s u.s. patent ’531 for Yasmin®. If Bayer prevails in its appeal, Bayer will receive a larger share of Barr’s revenues from sales of its generic version of Yasmin® in the United States.
In March 2008 Bayer received two notices of an Abbreviated New Drug Application with a Para-graph iv certifi cation (an “anda iv”) pursuant to which Watson Laboratories Inc. and Sandoz Inc. each seek approval to market a generic version of Bayer’s oral contraceptive Yasmin® in the Unit-ed States. Bayer has fi led suit against Watson and Sandoz in u.s. federal court alleging patent in-fringement by Watson and Sandoz for the intended generic version of Yasmin®. In reply, Sandoz has fi led its answer and counterclaim alleging, among other things, the invalidity of various Bay-er patents and that the agreement reached with Barr is anticompetitive and violates the Sherman Act antitrust law.
yaz®: In January 2007, Bayer received notice from Barr Laboratories Inc. that it has fi led an anda paragraph iv application with the u.s. fda seeking approval of a generic version of Bayer’s yaz® oral contraceptive. In October 2007 Bayer also received notice from Watson Laboratories Inc. that it has fi led an anda iv with the u.s. fda seeking approval of a generic version of yaz®. In June / July 2008 Bayer further received notice from Sandoz Inc. that it has fi led an anda iv with the u.s. fda seeking approval of a generic version of yaz®. All three applications claim that Bay-er’s patents are invalid and / or that the respective generic product does not infringe them. Bayer has fi led patent infringement suits against Watson and Sandoz claiming that certain of Bayer’s patents have been infringed. Originally, Bayer included the ’531 patent in its fi rst suit against Watson. After the court decision in the suit against Barr regarding Yasmin®, Bayer had to ex-clude the ’531 patent from the suit against Watson. If Bayer prevails in its appeal against the
TABLE OF CONTENTS CONSOLIDATED FINANCIAL STATEMENTS

234 / / BAYER ANNUAL REPORT 2008
court decision regarding Yasmin®, Bayer will evaluate its options to use the ’531 patent. Howev-er, regardless of these patent disputes, Bayer retains data exclusivity for yaz® as an oral contra-ceptive in the u.s. until March 16, 2009. No generic manufacturer can lawfully market a generic version of yaz® for an oral contraceptive indication in the United States until after March 16, 2009.
In June 2008, Bayer and Barr agreed that Bayer will grant Barr a license to market a generic ver-sion of yaz® in the United States starting July 2011. Bayer will supply Barr with the product for this purpose. Should Bayer lose patent lawsuits in the United States against other companies concerning yaz®, at that time Bayer will begin supplying the product to Barr and Barr will begin marketing generic yaz® in the United States. Barr will pay Bayer a fi xed percentage of the reve-nues from the product sold by Barr.
Blood glucose monitoring devices: In 2005, Abbott Laboratories commenced a lawsuit in the United States against Bayer and another party alleging infringement of two of Abbott’s patents relating to blood glucose monitoring devices. The devices concerned are sold by Bayer as part of its Ascensia® Contour® system and its dex® and Autodisc® system. The Ascensia® Contour® sys-tem is supplied to Bayer by a Japanese manufacturer, who originally designed the product and is contractually obligated to indemnify Bayer. Abbott added a separate claim of infringement against the devices sold by Bayer as part of its dex® and Autodisc® system. Bayer is not entitled to indemnifi cation on this separate claim. In 2008 the court granted summary judgment in favor of Bayer with regard to one of the two patents and held the patent claims at issue invalid. After a trial on the issue of invalidity, the court also held the second patent invalid. Abbott has appealed both decisions.
In 2007, Roche Diagnostics Operations and Corange International commenced a lawsuit in the United States against Bayer and several other parties alleging infringement of two of Roche’s patents relating to blood glucose monitoring devices. Two of the accused devices are sold by Bay-er as part of its Breeze® 2 and Contour® systems. Bayer believes that these patents are covered by an existing license agreement between the parties, and the litigation has been dismissed in favor of an arbitration under this earlier license agreement. The arbitration proceeding is currently pending. Roche has added to the arbitration four additional patents which Roche alleges the Bay-er Contour® systems infringe.
Kogenate®: In 2008, Novartis Vaccines and Diagnostics Inc. and Novo Nordisc a / s commenced a patent infringement suit in the United States alleging that Bayer’s manufacturing and marketing of the recombinant Factor viii product Kogenate® infringe a substance patent granted in 2006. The suit primarily seeks damages. Bayer does not believe that it has infringed any valid patent.
Bayer believes it has meritorious defenses in these patent disputes and intends to defend itself vigorously.
Further legal proceedings Wholesale prices in the u.s.: Bayer and a number of pharmaceutical companies in the United States are defendants in pending lawsuits in which plaintiffs, including states, are alleging ma-nipulation in the reporting of wholesale prices and / or best prices for their prescription pharma-ceutical products. The plaintiffs seek damages, including disgorgement of profi ts and punitive damages. Bayer believes it has meritorious defenses and intends to defend itself vigorously.
Bayer Schering Pharma AG former shareholder litigation: In September 2008, the squeeze-out of the former minority shareholders of Bayer Schering Pharma AG became effective. As usual in such cases, several shareholders have initiated special court proceedings to review the adequacy of the compensation payments made by Bayer for the transfer of the shares in the squeeze-out. The adequacy of the compensation and the guaranteed dividend paid by Bayer in connection with the Bayer Schering Pharma AG profi t and loss transfer agreement made in 2006 is also be-ing reviewed by the courts. (Please note that Bayer Schering Pharma AG and Schering-Plough Corporation, New Jersey, are unaffi liated companies that have been independent of each other for many years. The names “Bayer Schering Pharma” or “Schering” as used in this Annual Re-
TABLE OF CONTENTS CONSOLIDATED FINANCIAL STATEMENTS

235NOTES
port always refer to Bayer Schering Pharma AG, Berlin, Germany, or its predecessor, Schering AG, Berlin, Germany, respectively).
Bayer CropScience
Proceedings involving genetically modifi ed rice: Since August 2006, Bayer CropScience has been party to multiple lawsuits, including putative class actions, fi led in u.s. federal and state courts by rice farmers and resellers. Plaintiffs allege that they have suffered economic losses af-ter traces of genetically modifi ed rice were identifi ed in samples of conventional long-grain rice grown in the u.s. This is alleged to have led to various commercial damages, including a decline in the commodity price for long-grain rice, costs associated with restrictions on imports and ex-ports, and costs to secure alternative supplies. All the actions pending in federal court were con-solidated in December 2006 in federal district court in Missouri in a multidistrict litigation (mdl) proceeding. In 2008, this court denied plaintiffs’ request to certify a class action. Plaintiffs’ sub-sequent request for interim appeal was denied by the appellate court.
In development of the genetically modifi ed rice, fi eld testing was conducted in cooperation with third parties, including a breeding research institute in the u.s. The genetically modifi ed rice was never commercialized.
The usda and the fda have stated that the genetically modifi ed rice does not present a health risk and is safe for use in food and feed and for the environment. Additionally, in October 2007, the usda released its report concerning its investigation into how the genetically modifi ed rice en-tered the commercial rice supply. The usda was unable to determine a cause and indicated it would not pursue any enforcement actions against Bayer CropScience or any other party.
Bayer believes it has meritorious defenses in these actions and intends to continue to defend it-self vigorously. Bayer has taken accounting measures for anticipated defense costs based on the information currently available.
Limagrain: In France, Limagrain had fi led suit against Bayer for indemnity against liabilities to third parties arising from an alleged breach of a 1986 contract. In March 2008 the Commercial Court in Paris as the court of fi rst instance dismissed all claims of Limagrain. Limagrain did not appeal and the court decision has become fi nal.
Asbestos: A further risk may arise from asbestos litigation in the United States. In many cases, the plaintiffs allege that Bayer and co-defendants employed third parties on their sites in past decades without providing them with suffi cient warnings or protection against the known dan-gers of asbestos. Additionally, a Bayer affi liate in the United States is the legal successor to com-panies that sold asbestos products until 1976. Union Carbide has agreed to indemnify Bayer for this liability. Bayer believes it has meritorious defenses and intends to defend itself vigorously.
Premise®: Bayer, among others, had been named as a defendant in a putative nationwide class action fi led in federal court in North Carolina, United States, which alleges violations of antitrust laws in the marketing of a certain pest control product (Premise®). In 2007, the court granted summary judgment in favor of the defendants and plaintiffs have appealed. Bayer believes it has meritorious defenses and intends to continue to defend itself vigorously.
TABLE OF CONTENTS CONSOLIDATED FINANCIAL STATEMENTS

236 / / BAYER ANNUAL REPORT 2008
Bayer MaterialScience
Antitrust proceedings in connection with polymersAll proceedings by authorities reported in the past relating to rubber, polyester polyols, poly-ether polyols, urethanes, urethane chemicals and other primary products for urethane end prod-ucts in which fi nes were expected have since been terminated.
In addition, subject to few exceptions, all civil law suits for damages relating to proceedings by authorities in North America have been settled. Bayer no longer considers the remaining risks to be material.
In Europe, the European Commission imposed fi nes upon Bayer or granted Bayer full amnesty in antitrust investigations concerning the products rubber chemicals, butadiene rubber, emulsion styrene butadiene rubber, polychloroprene rubber and nitrile butadiene rubber. However, civil law lawsuits for damages have been fi led. In February 2008, a group of plaintiffs who are pri-marily producers of tires brought an action for damages before the High Court of Justice in the United Kingdom against Bayer and other producers of butadiene rubber and emulsion styrene butadiene rubber based on alleged violations of antitrust law. In June 2008, Bayer fi led its de-fense with the High Court. Due to a parallel proceeding initiated before a court in Milan, to which Bayer joined as intervenient, the question arises as to which jurisdiction is competent to judge the case. In August 2008, The Goodyear Tire & Rubber Company fi led an amended com-plaint in a u.s. federal court alleging that Bayer and other producers of butadiene rubber and sty-rene butadiene rubber violated antitrust law. The complaint seeks, among other things, treble damages. In September 2008, Bayer fi led a motion asking the court to dismiss Goodyear’s com-plaint for failure to state a cause of action. A class action alleging antitrust violations in connec-tion with rubber products was fi led in Australia in 2008. While the Australian action was struck out in October 2008, the plaintiffs fi led an amended claim in November 2008. This proceeding is still at a very early stage.
Bayer is defending itself in the European, u.s. and Australian litigation. The fi nancial risk from these proceedings cannot currently be quantifi ed. Therefore, Bayer is unable to take any ac-counting measures in this regard.
It remains possible that further civil antitrust lawsuits for damages may be fi led concerning these products.
Proceedings involving propylene oxideIn 2006, a u.s. arbitration panel issued a fi nal award in favor of Lyondell Chemical Co. in respect of a dispute with Bayer over interpretation of their Joint Venture Agreement for the manufacture of propylene oxide. Subsequently, Bayer sought to vacate the fi nal award and fi led additional claims against Lyondell.
In December 2008, Bayer and Lyondell concluded a settlement agreement which disposed of all previous claims among the parties.
TABLE OF CONTENTS CONSOLIDATED FINANCIAL STATEMENTS

237NOTES
Personal injury litigationmdi: In the United States, Bayer, together with other manufacturers, resellers and applicators, is a defendant in multiple cases, including a putative class action, that seek damages for personal injuries allegedly resulting from exposure to diphenylmethane diisocyanate (mdi) based prod-ucts used in coal mines. In one case the plaintiffs allege that they were also exposed to tdi and hdi based products. Bayer believes it has meritorious defenses and intends to defend itself vigor-ously.
Baytown: In 2006, a high pressure rupture of a holding tank interrupted operation of the toluene diisocyanate ii unit at the Baytown, Texas facility. After the rupture, 61 contractor employees fi led a lawsuit against Bayer in Texas state court seeking damages for personal injuries. The claims of 57 of the plaintiffs have been settled. Bayer believes the legal risks remaining are no longer material.
Liability considerations following the Lanxess spin-offThe liability situation following the spin-off of the Lanxess subgroup is governed by both statuto-ry and contractual provisions. Under the German Transformation Act, all entities that are parties to a spin-off are jointly and severally liable for obligations of the transferor entity that are estab-lished prior to the spin-off date. Bayer AG and Lanxess AG are thus jointly and severally liable for a time period of fi ve years for all obligations of Bayer AG that existed on January 28, 2005.
TABLE OF CONTENTS CONSOLIDATED FINANCIAL STATEMENTS

238 / / BAYER ANNUAL REPORT 2008
NOTES TO THE STATEMENTS OF CASH FLOWS
The cash fl ow statement shows how the liquidity of the Bayer Group was affected by the infl ow and outfl ow of cash and cash equivalents during the year. The effects of changes in the scope of consolidation are stated separately. Cash fl ows are classifi ed by operating, investing and fi nanc-ing activities in accordance with ias 7 (Cash Flow Statements). The cash and cash equivalents shown in the cash fl ow statement comprise cash, checks and balances with banks and public-sector entities. Also included are fi nancial instruments with an original maturity of up to three months.
The amounts reported by consolidated companies outside the euro zone are translated at aver-age exchange rates for the year, with the exception of cash and cash equivalents, which are translated at closing rates as in the balance sheet. The effect of changes in exchange rates on cash and cash equivalents is shown separately.
Cash and cash equivalents contain both the proceeds from divestitures of discontinued opera-tions and the cash infl ows from these operations prior to the divestitures. In principle, therefore, the statement of cash fl ows must account for all cash infl ows and outfl ows from continuing and discontinued operations. However, ifrs 5 (Non-current Assets Held for Sale and Discontinued Operations) specifi es that cash fl ows from operating, investing and fi nancing activities be classi-fi ed by continuing and discontinued operations. The discontinued operations’ shares of the cash fl ows from operating, investing and fi nancing activities are stated separately in Note [6.3].
In both the balance sheet and the income statement, however, the amounts corresponding to the components of the net operating cash fl ow are shown for continuing operations only. This is the case, for example, with the amounts of inventories, receivables and payables recognized in the balance sheet that determine the changes in working capital shown in the cash fl ow statement. The income from continuing operations after taxes that is recognized in the income statement forms the starting point for the cash fl ow statement. To ensure that the operating activities are consistently presented in the cash fl ow statement, income statement and balance sheet, the net operating cash fl ow from continuing operations is stated fi rst on the face of the cash fl ow state-ment. The total net operating cash fl ow from discontinued operations is shown in the next line, by analogy with the presentation of the income statement. The cash fl ows from continuing and discontinued operations are added together to give the net operating cash fl ow (total) for the en-tire business.
33. Net cash provided by (used in) operating activities
The gross cash fl ow for 2008 of €5,295 million (2007: €4,784 million) is the cash surplus from operating activities before any changes in working capital. The cash fl ows by segment are shown in the table in Note [1].
The net operating cash fl ow from continuing operations of €3,608 million (2007: €4,281 million) takes into account the changes in working capital and other non cash-relevant transactions. The €2 million net cash fl ow from discontinued operations in 2007 comprised operating cash fl ows from the H. C. Starck and Wolff Walsrode business units and the diagnostics business. The total net cash fl ow for 2008 was €3,608 million (2007: €4,283 million).
The line “Non-cash effects of the remeasurement of acquired assets (inventory work-down)” has been inserted in the cash fl ow statement in order to eliminate the effects of the Schering pur-chase price allocation from gross cash fl ow. Thus, the non-cash effect of the work-down of the step-up from the remeasurement of Schering inventories to fair value as of June 23, 2006, the date of acquisition, on the gross cash fl ow is reversed. In 2008, €208 million (2007: €215 million) was transferred to this line from “Decrease / Increase in inventories.”
TABLE OF CONTENTS CONSOLIDATED FINANCIAL STATEMENTS

239NOTES
Income-tax-related cash fl ows of €1,073 million are refl ected in the net cash fl ow for 2008 (2007: €1,151 million). The changes in income tax liabilities, income tax provisions and claims for reimbursement of income taxes are shown in the line “Changes in other working capital, other non-cash items.”
34. Net cash provided by (used in) investing activities
Net cash outfl ow for investing activities in 2008 amounted to €3,089 million (2007: €3,186 million net infl ow).
Cash outfl ows for additions to property, plant and equipment and intangible assets in 2008 came to €1,759 million (2007: €1,860 million). Disbursements for property, plant and equipment and intangible assets included those for the expansion of the production site for polymer products in Shanghai, China, and the acquisition of the hematology portfolio of Maxygen Inc. Receipts from the sale of property, plant and equipment and other assets amounted to €167 million (2007: €165 million).
The net cash outfl ow relating to divestitures amounting to €41 million in 2008 principally in-cludes tax payments in connection with the divestment of the diagnostics business and a subse-quent purchase price payment from the sale of Wolff Walsrode.
In addition, acquisitions resulted in cash outfl ows of €1,617 million (2007: €491 million). The main acquisitions were those of Possis Medical Inc., United States, the eastern European otc business of Sagmel Inc., the otc business of the Topsun group, China, and of Direvo Biotech AG, Germany. Cash outfl ows for acquisitions also included €695 million related to the acquisition of the remaining shares of Bayer Schering Pharma AG. Following registration of the squeeze-out, the remaining minority stockholders received a cash compensation payment of €98.98 per share. Further details of acquisitions and divestitures are given in Notes [6.2] and [6.3], respectively.
Cash outfl ows for noncurrent fi nancial assets amounted to €390 million (2007: infl ow of €70 mil-lion).
35. Net cash provided by (used in) fi nancing activities
In fi scal 2008 there was a net cash outfl ow of €873 million (2007: €7,730 million) for fi nancing activities. Net borrowings amounted to €1,525 million.
Cash outfl ows for dividend payments amounted to €1,126 million (2007: €773 million), including €84 million in withholding tax on intragroup dividends. Interest expense decreased to €1,272 million (2007: €1,344 million).
TABLE OF CONTENTS CONSOLIDATED FINANCIAL STATEMENTS

240 / / BAYER ANNUAL REPORT 2008
36. Cash and cash equivalents
Cash and cash equivalents comprise cash, checks and balances with banks and public-sector en-tities. In accordance with ias 7 (Cash Flow Statements) this item also includes securities with original maturities of up to three months, refl ecting their high liquidity. Cash and cash equiva-lents amounted to €2,094 million as of December 31, 2008 (2007: €2,531 million). Cash of €57 million (2007: €755 million) has been deposited in escrow accounts for payments relating to civil law settlements in antitrust proceedings.
OTHER INFORMATION
37. Audit fees
The following fees for the services of the auditor of the consolidated fi nancial statements, PricewaterhouseCoopers Aktiengesellschaft Wirtschaftsprüfungsgesellschaft, Essen, Germany, were recognized as expenses:
The fees for the auditing of fi nancial statements mainly comprise those for the audits of the con-solidated fi nancial statements of the Bayer Group and the fi nancial statements of Bayer AG and its German subsidiaries. Fees for audit-related services and other audit work primarily relate to audit work in connection with acquisitions and divestitures, audits of the internal control system including project audits in connection with the implementation of new it systems, and auditor reviews of interim fi nancial statements.
38. Related parties
Related parties as defi ned in ias 24 (Related Party Disclosures) are those legal entities and natural persons that are able to exert infl uence on Bayer AG and its subsidiaries or over which Bayer AG or its subsidiaries exercise control or have a signifi cant infl uence. They include, in particular, non-consolidated subsidiaries, joint ventures, associates and post-employment benefi t plans, and also the corporate offi cers of Bayer AG whose remuneration is reported in Note [39].
Transactions with non-consolidated subsidiaries, joint ventures, associates and post-employment benefi t plans are carried out on an arm’s-length basis.
TABLE OF CONTENTS CONSOLIDATED FINANCIAL STATEMENTS
2007 2008
€ million € million
Financial statements auditing 9 6
Audit-related services and other audit work 2 2
Tax consultancy - -
Other services rendered to Bayer AG or subsidiaries - -
Total 11 8

241NOTES
The following table shows the volume of transactions with related parties that are included in the consolidated fi nancial statements of the Bayer Group at equity or amortized cost and with post-employment benefi t plans:
Bayer AG has undertaken to provide profi t-sharing capital in the form of an interest-bearing loan totaling €150 million for the Bayer-Pensionskasse. The entire amount was drawn as of Decem-ber 31, 2007 and 2008. In addition, loan capital of €310 million was provided in 2008 to Bayer-Pensionskasse for its effective initial fund.
No write-downs were made in either 2008 or 2007 on receivables from related parties.
39. Total remuneration of the Board of Management and the Supervisory Board and loans
The remuneration of the Supervisory Board amounted to €2,295 thousand (2007: €2,347 thou-sand), including €765 thousand (2007: €782 thousand) in variable components.
The following table shows the remuneration components of the individual members of the Board of Management in 2008.
TABLE OF CONTENTS CONSOLIDATED FINANCIAL STATEMENTS
Werner Wenning
Klaus Kühn
Wolfgang Plischke
Richard Pott Total
€ thousand € thousand € thousand € thousand € thousand
Base salary 2008 794 437 437 437 2,105
2007 749 413 412 412 1,986
Fixed supplement 2008 344 336 181 181 1,042
2007 325 316 171 171 983
Remuneration in kind and other benefi ts 2008 61 36 38 33 168
2007 51 36 25 33 145
Non-performance-related remuneration 2008 1,199 809 656 651 3,315
2007 1,125 765 608 616 3,114
Short-term incentive 2008 2,105 1,305 1,044 1,044 5,498
2007 2,169 1,380 1,110 1,110 5,769
Directly effected remuneration 2008 3,304 2,114 1,700 1,695 8,813
2007 3,294 2,145 1,718 1,726 8,883
Fair value of newly granted stock-based compensation as of grant date
2008 352 240 191 191 974
2007 299 203 162 162 826
Aggregate benefi ts (according to theGerman Commercial Code)
2008 3,656 2,354 1,891 1,886 9,787
2007 3,593 2,348 1,880 1,888 9,709
Income Receivables Liabilities
2007 2008 2007 2008 2007 2008
€ million € million € million € million € million € million
Non-consolidated subsidiaries 12 14 10 10 (53) (67)
Joint ventures 54 37 10 3 (2) -
Associates 123 22 37 15 (58) (18)
Post-employment benefi t plans - - 150 460 - -

242 / / BAYER ANNUAL REPORT 2008
The award entitlements earned in 2008 – both from the 2008 tranche and from previous years’ tranches on which the entitlements were only partially earned – are shown separately in the following table along with the changes in the value of entitlements from previous years’ tranches based on the performance of Bayer stock in 2008. The fair value of the award entitlement already earned in 2008 from the 2008 tranche is included under “Stock-based compensation entitle-ments earned in the respective year.” Since certain components of the award entitlements are included in both tables, the fi gures in the following and the preceding table should not be added together.
The current service cost for the pension entitlements of the members of the Board of Manage-ment was as follows:
The aggregate remuneration of the Board of Management according to ifrs does not include the fair value of newly granted stock-based compensation, but rather the stock-based compensation entitlements earned in the year under report plus the change in the value of stock-based compen-sation entitlements from previous years that have not yet been paid out. The current service cost for pension entitlements must also be added.
The following table summarizes the various components of the compensation of the Board of Management.
TABLE OF CONTENTS CONSOLIDATED FINANCIAL STATEMENTS
Werner Wenning
Klaus Kühn
Wolfgang Plischke
Richard Pott Total
€ thousand € thousand € thousand € thousand € thousand
Current service cost for
pension entitlements earned
in the respective year
2008 - 505 182 197 884
2007 - 588 187 224 999
2007 2008
€ thousand € thousand
Directly effected remuneration 8,883 8,813
Long-term incentive (stock-based compensation entitlements earned in the
respective year)
2,839 1,509
Change in value of existing entitlements 1,993 (533)
Current service cost for pension entitlements earned in the respective year 999 884
Aggregate benefi ts (according to IFRS) 14,714 10,673
Werner Wenning
Klaus Kühn
Wolfgang Plischke
Richard Pott Total
€ thousand € thousand € thousand € thousand € thousand
Long-term incentive (stock-based compensation entitlements
earned in the respective year)
2008 569 364 267 309 1,509
2007 1,150 699 359 631 2,839
Change in value of existing entitlements 2008 (195) (135) (97) (106) (533)
2007 890 510 101 492 1,993
243NOTES
Further details are provided in the Compensation Report, which forms part of the Management Report.
The pensions paid to retired members of the Board of Management and their surviving depen-dents amounted to €11,697 thousand (2007: €10,997 thousand). Pension provisions for members of the Board of Management amount to €107,863 thousand (2007: €115,104 thousand).
There were no loans to members of the Board of Management or the Supervisory Board out-standing as of December 31, 2008, nor any repayments of such loans during the year.
Leverkusen, February 17 / 24, 2009Bayer Aktiengesellschaft
Board of Management
TABLE OF CONTENTS CONSOLIDATED FINANCIAL STATEMENTS

244 / / BAYER ANNUAL REPORT 2008
Management’s Statement of Responsibility for Financial Reporting
The consolidated fi nancial statements of the Bayer Group have been prepared by the manage-ment, which is responsible for the substance and objectivity of the information contained there-in. The same applies to the management report, which is consistent with the fi nancial state-ments.
Our fi nancial reporting takes place according to the rules issued by the International Accounting Standards Board, London.
Effective internal monitoring procedures instituted by Group management at the consolidated companies along with appropriate staff training ensure the propriety of our reporting and its compliance with legal provisions. Integrity and social responsibility form the basis of our corpo-rate principles and of their application in areas such as environmental protection, quality, prod-uct safety, plant safety and adherence to local laws and regulations. The worldwide implementa-tion of these principles and the reliability and effectiveness of the monitoring procedures are continuously verifi ed by our Corporate Auditing Department.
The Board of Management conducts the business of the Group in the interests of the stockhold-ers and in awareness of its responsibilities toward employees, communities and the environment in all the countries in which we operate. Our declared aim is to deploy the resources entrusted to us in order to increase the value of the Bayer Group as a whole.
In accordance with the resolution of the Annual Stockholders’ Meeting, the Supervisory Board appointed PricewaterhouseCoopers Aktiengesellschaft Wirtschaftsprüfungsgesellschaft as the independent auditor of the consolidated fi nancial statements and of the statements’ compliance with the International Financial Reporting Standards. The scope of the auditor’s report, which appears on the following page, also includes Bayer’s risk management system, audited in light of the German Law on Corporate Supervision and Transparency. The consolidated fi nancial state-ments, the management report and the auditor’s report were discussed in detail, in the presence of the auditor, by the Audit Committee of the Supervisory Board and at a plenary meeting of the Supervisory Board. The Supervisory Board reports on this separately in the Report of the Super-visory Board in the Bayer Annual Report 2008.
The Board of Management
TABLE OF CONTENTS CONSOLIDATED FINANCIAL STATEMENTS
RESPONSIBILITY STATEMENT
To the best of our knowledge, and in accordance with the applicable reporting principles for fi nancial reporting, the consolidated fi nancial statements give a true and fair view of the assets, liabilities, fi nancial position and profi t or loss of the Group, and the management report of the Group includes a fair review of the development and performance of the business and the position of the Group, together with a de-scription of the principal opportunities and risks associated with the expected development of the Group.
Leverkusen, February 24, 2009Bayer Aktiengesellschaft
The Board of Management
WERNER WENNING KLAUS KÜHN DR. WOLFGANG PLISCHKE DR. RICHARD POTT

245NOTES
Auditor’s Report
We have audited the consolidated fi nancial statements prepared by Bayer Aktiengesellschaft, Leverkusen, comprising the income statement, the balance sheet, cash fl ow statement, statement of recognized income and expenses and the notes to the consolidated fi nancial statements, to-gether with the group management report for the business year from January 1, 2008 to Decem-ber 31, 2008. The preparation of the consolidated fi nancial statements and the group manage-ment report in accordance with the ifrs, as adopted by the e.u., and the additional requirements of German commercial law pursuant to § (Article) 315a Abs. (paragraph) 1 hgb (“Handelsgesetz-buch”: German Commercial Code) are the responsibility of the parent Company’s Board of Man-agement. Our responsibility is to express an opinion on the consolidated fi nancial statements and on the group management report based on our audit.
We conducted our audit of the consolidated fi nancial statements in accordance with § 317 hgb and German generally accepted standards for the audit of fi nancial statements promulgated by the Institut der Wirtschaftsprüfer (Institute of Public Auditors in Germany) (idw) and additional-ly observed the International Standards on Auditing (isa). Those standards require that we plan and perform the audit such that misstatements materially affecting the presentation of the net assets, fi nancial position and results of operations in the consolidated fi nancial statements in ac-cordance with the applicable fi nancial reporting framework and in the group management report are detected with reasonable assurance. Knowledge of the business activities and the economic and legal environment of the Group and expectations as to possible misstatements are taken into account in the determination of audit procedures. The effectiveness of the accounting-related in-ternal control system and the evidence supporting the disclosures in the consolidated fi nancial statements and the group management report are examined primarily on a test basis within the framework of the audit. The audit includes assessing the annual fi nancial statements of those en-tities included in consolidation, the determination of the entities to be included in consolidation, the accounting and consolidation principles used and signifi cant estimates made by the Compa-ny’s Board of Management, as well as evaluating the overall presentation of the consolidated fi nancial statements and the group management report. We believe that our audit provides a rea-sonable basis for our opinion.
Our audit has not led to any reservations.
In our opinion based on the fi ndings of our audit the consolidated fi nancial statements comply with the ifrs as adopted by the e.u., the additional requirements of German commercial law pur-suant to § 315a Abs. 1 hgb and give a true and fair view of the net assets, fi nancial position and results of operations of the Group in accordance with these requirements. The group manage-ment report is consistent with the consolidated fi nancial statements and as a whole provides a suitable view of the Group’s position and suitably presents the opportunities and risks of future development.
Essen, February 27, 2009
PricewaterhouseCoopersAktiengesellschaftWirtschaftsprüfungsgesellschaft
(ARMIN SLOTTA) (VOLKER LINKE)
Wirtschaftsprüfer Wirtschaftsprüfer
TABLE OF CONTENTS CONSOLIDATED FINANCIAL STATEMENTS

246 / / BAYER ANNUAL REPORT 2008 TABLE OF CONTENTS
Further Information
Governance Bodies 247Organization Chart 249Group Leadership Circle 250Glossary 252Index 256Global Commitment to Sustainability 258

247FURTHER INFORMATION
TABLE OF CONTENTS
Governance BodiesHERMANN JOSEF STRENGERHonorary Chairman of the Supervisory Board of Bayer AG, Leverkusen
Supervisory BoardMembers of the Supervisory Board held offi ces as members of the supervisory board or a comparable supervising body of the corporation listed (as at December 31, 2008 or the date on which they ceased to be members of the Supervisory Board of Bayer AG):
DR. MANFRED SCHNEIDER Chairman of the Supervisory Boardof Bayer AG, Leverkusen(born December 21, 1938)
Daimler AG
Linde AG (Chairman)
Metro AG (until April 3, 2008)
RWE AG
TUI AG
THOMAS DE WINVice Chairman of the Supervisory Board of Bayer AG, LeverkusenChairman of the Bayer Central Works Council(born November 21, 1958)
Bayer MaterialScience AG
DR. PAUL ACHLEITNERMember of the Board of Management of Allianz SE, Munich(born September 28, 1956)
Allianz Deutschland AG
Allianz Elementar Lebensversicherungs-AG (Chairman) (until February 7, 2008)
Allianz Elementar Versicherungs-AG (Chairman) (until February 7, 2008)
Allianz Global Investors AG
Allianz Investment Bank (Vice Chairman) (until February 7, 2008)
Allianz Lebensversicherungs-AG (until May 7, 2008)
Henkel AG & Co. KGaA (Shareholders’ Committee)
RWE AG
WILLY BEUMANNChairman of the Works Council of the Wuppertal site of Bayer AG(born April 12, 1956)
Bayer HealthCare AG (Vice Chairman) (until December 30, 2008)
DR. CLEMENS BÖRSIGChairman of the Supervisory Board of Deutsche Bank AG, Frankfurt am Main(born July 27, 1948)
Daimler AG
Deutsche Bank AG (Chairman)
Deutsche Lufthansa AG(until April 29, 2008)
Linde AG
KARL-JOSEF ELLRICHChairman of the Dormagen Works Council of Bayer AGChairman of the Bayer Group Works Council(born October 5, 1949)
Bayer CropScience AG (Vice Chairman)
DR.-ING. THOMAS FISCHERChairman of the Group Managerial Employees’ Committee of Bayer AG(born August 27, 1955)
Bayer MaterialScience AG
PETER HAUSMANNNorth Rhine District Secretary of the German Mining, Chemical and Energy Industrial Union, Düsseldorf(born February 13, 1954)
Evonik Services GmbH
PROF. DR.-ING. E.H. HANS-OLAF HENKELHonorary Professor at the University of Mannheim, Berlin(born March 14, 1940)
Continental AG
Daimler Luft- und Raumfahrt Holding AG
EPG AG
Ringier AG
SMS GmbH
REINER HOFFMANNDeputy General Secretary of the European Trade Union Confederation (etuc), Brussels(born May 30, 1955)
SASOL Germany GmbH
DR. RER. POL. KLAUS KLEINFELDChief Executive Offi cer of ALCOA Inc.,New York, usa(born November 6, 1957)
ANDRÉ KREJCIKMember of the Works Council of Bayer Schering Pharma AG(born February 17, 1969)
PETRA KRONENChairwoman of the Uerdingen Works Council of Bayer AG(born August 22, 1964)
Bayer MaterialScience AG
DR. RER. NAT. HELMUT PANKEMember of various supervisory boards, Munich(born August 31, 1946)
Microsoft Corporation
UBS AG
HUBERTUS SCHMOLDTChairman of the German Mining, Chemical and Energy Industrial Union, Hannover(born January 14, 1945)
Deutsche BP AG (Vice Chairman)
DOW Olefi nverbund GmbH (Vice Chairman)
E.ON AG (Vice Chairman)
RAG AG (Vice Chairman)
DR.-ING. EKKEHARD D. SCHULZChairman of the Executive Board of ThyssenKrupp AG, Duisburg/Essen(born July 24, 1941)
AXA Konzern AG
MAN AG (Vice Chairman)
RWE AG
ThyssenKrupp Services AG (Chairman)
ThyssenKrupp Steel AG (Chairman)
ThyssenKrupp Technologies AG(Chairman)

248 / / BAYER ANNUAL REPORT 2008 TABLE OF CONTENTS
DR. KLAUS STURANYMember of various supervisory boards, Dortmund(born October 23, 1946)
Commerzbank AG (until May 15, 2008)
Hannover Rückversicherung AG
Heidelberger Druckmaschinen AG
Österreichische Industrieholding AG
DIPL.-ING. DR.-ING. E.H. JÜRGEN WEBERChairman of the Supervisory Board of Deutsche Lufthansa AG, Cologne(born October 17, 1941)
Allianz Lebensversicherungs-AG
Deutsche Bank AG (until May 29, 2008)
Deutsche Lufthansa AG (Chairman)
Deutsche Post AG (Chairman) (until December 31, 2008)
Loyalty Partner Holding GmbH (Chairman)
Tetra Laval Group
Voith AG
Willy Bogner GmbH & Co. KGaA
PROF. DR. DR. H.C. ERNST-LUDWIG WINNACKERSecretary General of the EuropeanResearch Council, Brussels(born July 26, 1941)
Medigene AG (Chairman)
Wacker Chemie AG
OLIVER ZÜHLKEVice Chairman of the Works Council of Bayer AG(born December 11, 1968)
Bayer HealthCare AG (until December 30, 2008)
Standing Committee of the Supervisory Board of Bayer AG (as at Dec. 31, 2008)
PRESIDIAL COMMITTEE / MEDIATION
COMMITTEE Schneider (Chairman), Achleitner, Schmoldt, de Win
AUDIT COMMITTEE Sturany (Chairman), Fischer, Hausmann, Henkel, Schneider, de Win
HUMAN RESOURCES COMMITTEE Schneider (Chairman), Ellrich, Kronen, Weber
NOMINATIONS COMMITTEE Schneider (Chairman), Achleitner
Board of ManagementMembers of the Board of Management held offi ces as members of the supervisory board or a comparable supervising body of the corporations listed (as at December 31, 2008):
WERNER WENNINGChairman of the Board of Management(born October 21, 1946)
Bayer Schering Pharma AG (Chairman)
Deutsche Bank AG (effective May 29, 2008)
E.ON AG (effective April 30, 2008)
Evonik Industries AG (until September 16, 2008)
Henkel AG & Co. KGaA Supervisory Board (until April 14, 2008)Shareholders’ Committee (effective April 14, 2008)
KLAUS KÜHN(born February 11, 1952)
Bayer Business Services GmbH (Chairman)
Bayer CropScience AG (Chairman)
Bayer Schering Pharma AG
Symrise AG (until December 31, 2008)
DR. WOLFGANG PLISCHKE(born September 15, 1951)
ARK Therapeutics, Non-Executive Director
Bayer Innovation GmbH, Shareholders’ Committee (Chairman)
Bayer MaterialScience AG (Chairman)
Bayer Technology Services GmbH (Chairman)
DR. RICHARD POTTLabor Director(born May 11, 1953)
Bayer Chemicals AG (Chairman)
Bayer HealthCare AG (Chairman)
Bayer Innovation GmbH, Share-holders’ Committee
Currenta Geschäftsführungs-GmbH (Chairman)

249FURTHER INFORMATION
TABLE OF CONTENTS
Bayer CropScience
F. Berschauer (photo)ChairmanR. Scheitza *Portfolio ManagementA. KlausenerResearchF. J. PlackeDevelopmentW. WelterIndustrial Operations& QHSED. SuwelackBusiness Planning& AdministrationB. NaafCrop ProtectionAsia / Pacifi cJ. du PuyCrop ProtectionEurope & TAMECISW. BucknerCrop ProtectionNorth AmericaM. ReichardtCrop ProtectionLatin AmericaP. HoussetEnvironmental ScienceJ. SchneiderBioScience
Organization Chartas of February 1, 2009
BAYER AG (HOLDING COMPANY)
Group Management Board
Werner WenningChairman
Richard Pott *Strategy & Human Resources
Klaus KühnFinance
Wolfgang PlischkeInnovation, Technology & Environment
Corporate Center
Corporate Offi ce J. KrellCommunications M. SchadeInvestor Relations A. RosarCorporate Auditing R. Meyer
Corporate Human Resources & Organization J. PetersFinance J. DietschCorporate Development M. Mangold
Law & Patents, Insurance R. HartwigEnvironment & Sustainability W. Große EntrupGroup Accounting & Controlling U. HauckRegional Coordination I. Paterson
BUSINESS AREAS SERVICE AREAS
* Labor Director
Bayer HealthCare
A. J. Higgins (photo)ChairmanL. van der BroekAnimal HealthG. BalkemaConsumer CareS. E. PetersonMedical CareA. FibigBayer Schering Pharma (BSP)G. RiemannBSP Business UnitsU. KöstlinBSP RegionsA. BuschBSP Global Drug DiscoveryK. MalikBSP Global DevelopmentW. Baumann *Central Administration &OrganizationH. KlusikProduct Supply
Bayer MaterialScience
P. Thomas (photo)ChairmanA. Steiger-Bagel AdministrationT. Van Osselaer *Industrial OperationsG. HilkenPolycarbonatesP. VanackerPolyurethanesJ. WolffCoatings, Adhesives,SealantsT. BielfeldtThermoplasticPolyurethanes
Bayer Business Services
Executive BoardD. Hartert (photo)Chairman
N. Fieseler *
Bayer Technology Services
A. Noack (photo)Managing Director
Currenta
Executive BoardK. Schäfer (photo)Chairman
J. Waldi *

250 / / BAYER ANNUAL REPORT 2008
Group Leadership Circleas of February 1, 2009
The Group Leadership Circle consists of managers in the holdingcompany, subgroups and service companies whose functions areparticularly important for the Bayer Group as a whole.
A Abreu, ClaudioAchenbaum, JonAllen, ChristopherAmling, AndreasAngerbauer, RolfApel, DanielApplegate, JacquelineArnold, MarkusAsadullah, KhusruAsboth, ChristianAtzor, Michael
B Babe, GregoryBachlechner, GuenterBackhaus, DirkBaldus, BertholdBalkema, GaryBaltzer, MarkusBaumann, WernerBechem, MartinBeck, Carlos-AlbertoBecker, LudgerBehrens, JensBeier, AndreasBenecke, LarsBernhardt, MichaelBerschauer, FriedrichBertram, FrankBey, AlexanderBielfeldt, TimBier, Bernd-PeterBieringer, ThomasBinda, Maria-LuisaBishop, HansBlake, PhilipBohne, GerhardBomann, WernerBostian, ArlinBrocks, DietrichBroué, JeanBrüll, LudgerBruhn, BurghardtBuckner, WilliamBuehner, KlausBurck, AlexanderBusch, Andreas
C Cardinal von Widdern, LutzCetnarowski, WesChenet, ThierryCherny, MargaretChiassarini, MauroChisholm, Ian
Chrise, JamesCondon, LiamCoppens, ErnstCremers, Hans JosefCrosby, AdrianCunitz, Olaf
D Dannapel, BrunoDawkins, MartinDe Cleyn, ReneDe Jonge, MaartenDe Prins, WernerDe Ruwe, KurtDeall, MichaelDecker-Conradi, JörgDeege, RolfDeLong, JamesDevoy, MichaelDietrich, FrankDietsch, JohannesDini, AlainDinter, HaraldDöllinger, LotharDoerholt, Hermann-JosefDollinger, MarkusDorison, DominiqueDu Puy, JacquesDumont, ChristopheDumont, Philippe
E Echterhoff, RalfEhemann-Schneider, ChristelEiki, NorikazuEilers, PeterEldem, CenkEngels, Hans-WilhelmEvans, Christopher
F Fairhurst, Margaret MaryFenu, GiovanniFey, ClausFibig, AndreasFieseler, NorbertFirl, Rolf-ReinerFischer, Meredith
Flechtner, HelmutFont, Jean-ChristopheFranzen, ReinhardFraser, ShonaFreytag, MichaelFriel, JohnFritz, ReinhardFunk, Rolf
G Garnier, FranckGasche, Hans-ErichGause, FriedrichGellert, MartinGerlach, MartinGerlich, StephanGeyer, EdgarGilbert, MichaelGraney, RobertGray, JohnGross, DietmarGroße Entrup, WolfgangGruber, FriedrichGrunert, FrankGünther, AndreasGuth, Sebastian
H Habenicht, Ursula-FriederikeHakert, HubertusHansen, RalfHartert, DanielHartmann, JensHartwig, RolandHauck, UlrichHaug, MatthiasHaug, MichaelHaumesser, WinfriedHausner, Hans-DieterHayes, TimothyHeiden, Paul-GerdHeider, WilfriedHeidrich, JoergHeld, ChristianHiggins, ArthurHilken, GünterHinderer, JürgenHöhl, Hans-WalterHoever, Franz-PeterHotop, ReinerHousset, PascalHouston, JohnHumby, StephenHummel, Donald
I Inamdar, KumarInkmann-Koch, Anette
J Jahn, AlexanderJelich, KlausJesse, Ralf RüdigerJonsson, HaakanJuhnke, Andreas
K Kastner, Thomas KarlKatz, NancyKaushik, Vidya SagarKlausener, AlexanderKlebert, UlrichKlusik, HartmutKnapp, FrankKneen, GeoffreyKnights, IanKnors, ArminKöhler, GregorKöhler, JürgenKönig, MichaelKöplin, WilfriedKoersvelt, AdriKöstlin, UlrichKolpon, JayKopp, WilfriedKrause, RainerKrauskopf, BirgitKrell, JörgKremer, MathiasKreuzburg, ChristaKrüger, Bernd-WielandKrüger, GerdKühling, SteffenKumpf, Robert-JosephKurzawa, SteffenKuschnerus, Norbert
L Läpple, HorstfriedLafeuille, MarcLee, ChrisLeidemann, BurkhardLeidinger, WalterLeroux, Bernard
TABLE OF CONTENTS
251FURTHER INFORMATION
Leucker, HermannLiedtke, HaraldLöwer, HartmutLohkamp, GudrunLondershausen, MichaelLouvel, ErikLowinski, Jean-LucLukas, FrankLykos, George
M MacCleary, GeraldMackintosh, BruceMaier, HansMain, AlanMalik, KemalMangold, MatthiasMarchand, GerhartMarchand, TobiasMarchant, GavinMathews, MichaelMaul, JürgenMcCahon, PeterMcCullough, DennisMetzner, BerndMeuten, Hans-PeterMeyer, RainerMichaelis, JohannesMiebach, WolfgangMilon, Jean-PhilippeMirgel, VolkerMöller, JörgMoritz, MatthiasMoscho, AlexanderMothes, HelmutMüller, MichaelMüller, PeterMurek, Udo
N Naaf, BerndNagy, PaulNehoda-Hahn, VeraNellshen, StefanNestler, AndrewNoack, Achim
O Oehlschläger, GabrieleOehlschläger, WilhelmOelrich, StefanOhle, Jörg
Ohst, HolgerOrme, AndrewOstertag, UlrichOtt, JürgenOttow, EckhardOwlia, Azita
P Parotelli, RobertoPascoletti, Karl-HeinzPaterson, IanPegg, Clive JohnPercy, AdrianPerne, RainerPeters, Jan H.Peterson-Buengeler, SandraPickel, MarkusPilgram, FrankPlacke, Franz-JosefPortoff, MichaelPrenzel, JürgenPreuß, Rainer
R Raab, JürgenRahenbrock, UdoRaps, MichaelRaubach, Hans-JoachimReichardt, MarcReiff, FelixRenneke, Franz-JosefRenner, OliverRettig, RainerRichartz, AndreRiemann, GunnarRittgen, FrankRosar, AlexanderRosenberg, DirkRothe, Hans-JoachimRotondo, JohnRyan, Mark
S Saez, AntonioSalge, AndreasSchade, MichaelSchäfer, Klaus
Scheeren, JosephScheitza, RüdigerSchenk, WolfgangSchepers, WalterScherf, WillyScheuermann, Hans-JörgSchill, Hans-JosefSchlegel, GünterSchlieper, HennerSchmeer, HubertSchmeer, NorbertSchmelzer, PeterSchmidt, JoachimSchmieder, WilfriedSchmitz, Jörg-RainerSchmuck, RichardSchneider, JoachimSchneider, MartinSchneider, ReinerSchneider, StephanSchöneseiffen, JosefSchorr, RainerSchramm, HelmutSchubmehl, JohannesSchulz, Michael AndreasSchwartz, MichaelSchwarz, RainerSchweinfurth, HermannSeaton, R. ChristopherSick-Sonntag, RalfSimons, GerhardSmits, PhilipSoerensen, Michael HellemannSoland, KurtSommer, KlausSpagnol, TracySpinks, IanStadterman, RichardSteenblock, RolandStegmüller, RolandSteiger-Bagel, AxelSteilemann, MarkusSteiling, LotharStein, UlrichSteinhilber, BerndStruck, WernerStübler, HermannSturm, KlausSuwelack, Dirk T Terhorst, FrankThomaier, JörgThomas, PatrickTrebels, WolfgangTurck, Roland
V Van der Broek, LykeleVan der Loo, TheodorusVan der Merwe, Richard-EwaldVan der Stouwe, ClausVan Laak, KaiVan Lengerich, HartmutVan Lookeren Campagne, Mi-chielVan Meirvenne, DirkVan Nooy, MichaelVan Osselaer, TonyVanacker, PeterVantellino, GiampieroVehreschild, ManfredVon Franck, ErnstVon Keutz, EckhardVon Pescatore, DominikusVon Podewils, Hans-ChristophVorreuther, Reinhart
W Waite, StephenWalker, DavidWalker, PhilippeWarmbier, PeterWarner, BartonWeber, BennoWeber, ThomasWeeks, JoshuaWeissmueller, JoachimWelter, WolfgangWestcott, RichardWild, HannoWilson, KirkWingen, Franz-JosefWitasek, FrankWolff, JoachimWollweber, DetlefWozniewski, ThomasWright, Paul
Y Yim, Marcus
Z Zervoudis, DemetriosZijp, Douwe
TABLE OF CONTENTS

252 / / BAYER ANNUAL REPORT 2008 TABLE OF CONTENTS
Glossary
A
Adalat® Drug product for the treatment of hypertension; active ingredient: nifedipine
Adengo® Herbicide; active ingredients: thiencarbazone-methyl, isoxafl utole; main application: corn
Admire® Insecticide; active ingredient: imidacloprid; main applications: vegetables, rice, fruit, potatoes
Advantage® Flea control prod-uct for dogs and cats; active in-gredient: imidacloprid
Alemtuzumab Humanized monoclonal antibody, currently being tested in the indication multiple sclerosis (ms)
Aleve® Analgesic; active ingre-dient: naproxen
Alka-Seltzer® Drug product that binds excess gastric acid and reduces pain and fever
Amikacin Antibiotic for inhala-tion treatment of pneumonia caused by gram-negative bacte-ria; active ingredient: amikacin sulfate
Arize® Seed for hybrid rice
Aspirin® World- famous analge-sic; active ingredient: acetylsali-cylic acid
Aspirin® Cardio Drug product for protection against heart attack; active ingredient: acetyl-salicylic acid
Asset-backed securities (abs) abs are (debt) securities collate-ralized by a pool of receivables
Atlantis® Herbicide; active ingredients: mesosulfuron and others; main applications: wheat, triticale, rye
Avalox® / Avelox® Drug product for the treatment of respiratory tract infections; active ingredi-ent: moxifl oxacin
B
Basta® Herbicide; active ingre-dient: glufosinate-ammonium; main applications: plantation crops, potatoes and vegetables
Bayblend® Brand name for polymer blends based on poly-carbonate and acrylonitrile-butadiene-styrene
BaySystems® Global umbrella brand for the polyurethane sys-tems business
Baytril® Drug for the treatment of severe veterinary infectious diseases; active ingredient: en-rofl oxacin
Baytubes® Brand name for multi-wall carbon nanotubes
BayVision® Competence brand for automotive glazing
Belt® Insecticide; active ingre-dient: fl ubendiamide; main applications: vegetables, cotton, rice, grapes, apples
Bepanthen® Range of skin care and wound-healing products; active ingredient: dexpanthenol
Bepanthol® Range of care prod-ucts to treat dry, irritated skin; active ingredient: panthenol
Betaferon® / Betaseron® Drug product for the treatment of multiple sclerosis; active ingre-dient: interferon beta-1b
Breeze® Blood glucose mea-surement device for people with diabetes for simple, safe and rapid use at home or while traveling
C
Campath® / MabCampath® Humanized monoclonal anti-body for the treatment of patients with chronic lympho-cytic leukemia
Canesten® Antifungal drug for infections of the skin; active ingredient: clotrimazole or bifonazole
Capital invested (ci) Capital invested comprises the assets on which the company must obtain a return by generating an appropriate cash infl ow; in some cases the cost of ultimate-ly reproducing the assets must be earned in addition.
Cash fl ow return on invest-ment (CFROI) The cash fl ow return on investment is the ratio of the gross cash fl ow earned in a period to the capital invested. It is thus a measure of profi t-ability in that period.
Cash value added (cva) This is the difference between the gross cash fl ow and gross cash fl ow hurdle. It is therefore the portion of the gross cash fl ow that exceeds the return and reproduction requirements. If cva is positive, the company has created value.
Cipro® / Ciprobay® Drug product for the treatment of in-fectious diseases; active ingre-dient: ciprofl oxacin
Citracal® Dietary supplement
Confi dor® Insecticide; active ingredient: imidacloprid; main applications: vegetables, rice, fruit, potatoes
Connect® Insecticide; active ingredients: imidacloprid, beta-cyfl uthrin; main applications: soybeans, corn, cotton
Contour® Blood glucose mea-surement device for people with diabetes for simple, safe and rapid use at home or while traveling
Core earnings per share (core eps) Core earnings per share comprises adjusted core net in-come divided by the weighted average number of issued ordi-nary shares (taking into account the potential number of shares resulting from the conversion of the mandatory convertible bond). The adjusted core net income is computed from ebit plus amortization of intangible assets and write-downs of prop-erty, plant and equipment, plus / minus special items, plus / minus non-operating re-sult, plus / minus income taxes, plus / minus tax adjustments, minus income after taxes attrib-utable to non-controlling inter-ests, plus fi nancing costs relat-ing to the mandatory bond after tax effects. Core earnings per share is not an indicator defi ned in the International Financial Reporting Standards and should therefore be regarded as sup-plementary information only. The company believes that this indicator gives readers a clearer picture of the results of opera-tions and ensures greater com-parability of data over time.
Corporate compliance Corpo-rate compliance comprises the observance of statutory and company regulations on lawful and responsible conduct by the company, its employees and its management and supervisory bodies.
Corporate governance Corpo-rate governance comprises the long-term management and oversight of the company in accordance with the principles of responsibility and transpar-

FURTHER INFORMATION
TABLE OF CONTENTS
ency. The German Corporate Governance Code sets out basic principles for the management and oversight of publicly listed companies.
Corvus® Herbicide; active ingredients: thiencarbazone-methyl, isoxaflutole; main ap-plications: corn, cereals
Credit default swaps (cds) Credit default swaps are fi nan-cial instruments that permit the trading of credit risks. They are essentially tradable insurance contracts used to hedge against the default of a borrower or similar credit instruments.
CropStar® Insecticide; active ingredients: imidacloprid and thiodicarb; main application: seed treatment in corn
D
Decis® Insecticide; active ingredient: deltamethrin; main applications: cotton, vegetables, cereals
Delta cash value addedDelta cva is an indicator of the change in the cash value added between two periods. A positive delta cva shows that a unit has created more value or destroyed less value compared with the reference period.
Desmodur® Brand name for various isocyanates
Desmopan® Brand name for thermoplastic polyurethanes
Desmophen® Brand name for various polyesters and polyols used in the formulation of poly-urethanes
Diane® Acne therapy with ad-ditional contraceptive action; active ingredients: cyproteron-acetate and ethinyl estradiol
Drontal® product line Dewormers for dogs and cats; active ingredients: combina-tions of praziquantel, pyrantel and febantel
E
Earnings before interest and taxes (ebit) ebit comprises the operating profi t of a company before deduction of the non-operating result and taxes. In Bayer’s Annual Report ebit is the operating result shown in the income statement.
Earnings before interest, taxes, depreciation and amor-tization (ebitda) ebit plus amortization of intangible assets and depreciation of prop-erty, plant and equipment. ebitda, underlying ebitda and the underlying ebitda margin are not defi ned in the Interna-tional Financial Reporting Stan-dards. The company considers ebitda before special items to be a more suitable indicator of operating performance since it is not affected by depreciation, amortization, write-downs / write-backs or special items. The company also believes that this indicator gives readers a clearer picture of the results of operations and ensures greater comparability of data over time.
(Underlying) ebitda margin The (underlying) ebitda margin is calculated by dividing ebitda (before special items) by sales
emtn and multi-currency emtn program The Euro Medium Term Note (emtn) pro-gram is a documentation plat-form that enables Bayer to raise capital by quickly issuing debt on the European capital market. Securities issued under this program may be listed in Lux-embourg or unlisted. Their ma-turities, currencies and condi-tions may vary considerably.
Earnings per share (eps) eps is calculated by dividing Group net income by the weighted average number of shares as defi ned in ias 33.
F
Fandango® Fungicide; active ingredients: fl uoxastrobin and prothioconazole; main appli-cation: cereals
Flint® Fungicide; active ingredi-ent: trifl oxystrobin; main appli-cations: cereals, soybeans, fruit
Folicur® Fungicide; active ingre-dient: tebuconazole; main appli-cations: cereals, soybeans, cano-la, peanuts
G
Gadovist® Contrast agent for mri of the central nervous sys-tem that enables the number and location of lesions to be displayed in patients with brain metastases or multiple sclerosis (ms); active ingredient: gadobu-trol
Gaucho® Insecticide; active in-gredient: imidacloprid; main applications: seed treatment for sugar beet, corn, cereals, cotton, canola
Global commercial paper pro-gram Commercial paper is a short-term unsecured debt in-strument normally issued at a discount and redeemed at nominal value. It is a fl exible way of obtaining short-term funding on the capital markets. Bayer’s commercial paper pro-gram allows the company to issue commercial paper on both the u.s. market and the Euro-pean market.
Glucobay® Drug product for the treatment of diabetes; active ingredient: acarbose
Gross cash fl ow The gross cash fl ow comprises income from continuing operations after taxes, plus income taxes, plus / minus non-operating result, minus income taxes paid or accrued, plus depreciation, amortization and write-downs, minus write-backs, plus / minus-changes in pension provisions, minus gains / plus losses on retirements of noncurrent
assets, plus non-cash effects of the remeasurement of acquired assets. The change in pension provisions includes the elimina-tion of non-cash components of the operating result (ebit). It also contains benefi t payments during the year.
Gross cash fl ow hurdle The gcf hurdle is the cash amount that must be generated in light of the respective asset situation in order to satisfy investors’ re-turn and reproduction require-ments.
H
hdi Hexamethylene diisocya-nate, a raw material for polyure-thane coatings
Huskie® Herbicide; active ingredients: pyrasulfotole; main application: cereals
Hussar® Herbicide; active ingredient: iodosulfuron; main application: cereals
Hybrid bond A hybrid bond is an equity mezzanine corporate bond, usually with either no or very long maturity. Due to its subordination, issuer bank-ruptcy can lead to a complete fi nancial loss.
I
Infi nity® Herbicide; active ingredient: pyrasulfotole; main application: cereals
Input® Fungicide; active in-gredients: prothioconazole, spiroxamine; main application: cereals
InVigor® Seed for summer canola
Iopamiron® Non-ionic intra-vascular contrast agent for all common X-ray analyses
253

254 / / BAYER ANNUAL REPORT 2008 TABLE OF CONTENTS
K
Key performance indicators (kpi) Central indicators used to evaluate the attainment of targets in the company.
Kid Way® Herbicide; active ingredients: difl ufenican, glyphosate, oxadiazon; main application: landscaping
Kontos® Insecticide; active ingredient: spirotetramat; main application: cultivation of ornamental plants by breeders and garden centers
K-Othrine® Insecticide; active ingredient: deltamethrin; main applications: insects that trans-mit malaria, sleeping sickness and Chagas’ disease
Kogenate® Drug product for the treatment of hemophilia; active ingredient: recombinant Factor viii
L
Laudis® Herbicide; active ingredient: tembotrione; main application: corn
Levitra® Drug product for the treatment of erectile dysfunc-tion; active ingredient: vardena-fi l
Liberty® Herbicide; active ingredient: glufosinate-ammo-nium; main applications: corn, canola, cotton, soybeans, rice in conjunction with herbicide-tolerant technology
Life sciences Field of activities comprising particularly health care and nutrition; at Bayer this refers to the activities of the Bayer HealthCare and Bayer CropScience subgroups.
Lyttron® Subsidiary of Bayer MaterialScience that develops, produces and markets electrolu-minescent polycarbonate fi lms
M
Magnevist® Contrast agent for diagnosis in the central nervous system and body; active ingre-dient: dimeglumine gadopen-tetate
Makroblend® Brand name for polymer blends made from polycarbonate and polybutylene terephthalate or polyethylene terephthalate
Makrofol® Brand name for fi lms made from Makrolon®
Makrolon® Brand name for polycarbonate
mdi Diphenylmethane diisocya-nate, an important raw material for polyurethane rigid foam used in thermal insulation
Merit® Insecticide; active in-gredient: imidacloprid; main applications: broad-spectrum insecticide for non-agricultural grass lawns
Mirena® Intrauterine contra-ceptive; active ingredient: levo-norgestrel
Movento® Insecticide; active ingredient: spirotetramat; main applications: vegetables, fruit, grapes, cotton and soybeans
N
Nativo® Fungicide; active in-gredients: trifl oxystrobin, tebu-conazole; main applications: soybeans, corn, rice, cereals
Net cash fl ow The net cash fl ow is the cash fl ow from oper-ating activities as defi ned in ias 7.
Nexavar® Drug product to treat kidney and liver cancer; active ingredient: sorafenib
O
Oberon® Insecticide; active in-gredient: spiromesifen; main applications: fruit, vegetables, cotton
One-A-Day® Multivitamin product
Over the counter (otc) The trading of securities outside of an organized exchange. otc transactions are still subject to the statutory provisions on se-curities trading. In the Health-Care business, otc refers to non-prescription medication.
P
pet Abbreviation for polyether, one of the two main compo-nents used in the production of polyurethane along with isocya-nates
Pistol® Herbicide; active ingre-dients: difl ufenican, glyphosate; main application: landscaping
Poncho® Insecticide; active i ngredient: clothianidine; main applications: seed treatment for corn, canola, sugar beet, cereals
ppa Purchase price allocation
Premise® Insecticide; active ingredient: imidacloprid; main application: termite control
Price / cash fl ow ratio The price/cash fl ow ratio is the ratio of the share price to gross cash fl ow per share. It shows how long it would take for the com-pany’s cash fl ow to cover the share price.
Price / eps This is the ratio of the current share price to earnings per share. A high price / eps ratio indicates that the market assigns a high value to the stock in the expectation of future earnings growth.
Proline® Fungicide; active in-gredient: prothioconazole; main applications: cereals, canola
Prosaro® Fungicide; active ingredients: prothioconazole, tebuconazole; main applica-tions: cereals, canola
Puma® Herbicide; active ingredient: fenoxaprop-P-ethyl; main applications: cereals, rice, soybeans, canola
R
Raxil® Fungicide; active ingre-dient: tebuconazole; main ap-plications: seed treatment for wheat and barley
Recothrom™ A recombinant form of human thrombin ap-plied topically to stop bleeding during surgery; active ingredi-ent: recombinant human throm-bin
Rely® Herbicide; active ingredi-ent: glufosinate ammonium; main applications: canola, soy-beans, corn, cotton, fruit, nuts
Renalzin® Dietary supplement to support kidney function in cats with chronic kidney failure; active ingredients: Lantharenol® (lanthanum carbonate octahy-drate), kaolin, vitamin e
Rennie® Medicine to treat heartburn and acid-related stomach disorders; active ingre-dients: calcium carbonate and magnesium carbonate
Riociguat Drug product from a new class of vasodilative sub-stances; stimulates the enzyme soluble guanylate cyclase and is currently being tested in a Phase iii program to determine its effi cacy and safety in the treatment of chronic thrombo-embolic pulmonary hyperten-sion and pulmonary arterial hypertension; active ingredient: soluble guanylate cyclase stim-ulator

FURTHER INFORMATION
TABLE OF CONTENTS
S
Soberan® Herbicide; active ingredient: tembotrione; main application: corn
Sphere® Fungicide; active ingredients: trifl oxystrobin and cyproconazole; main applica-tions: soybeans, cereals, sugar beet, coffee
Squeeze-out Transfer of the shares held by minority stock-holders in a stock corporation to the majority stockholder in return for a compensation payment. In Germany, a major-ity stockholder with an interest of 95 percent can request a squeeze-out.
Stratego® Fungicide; active ingredients: trifl oxystrobin, propiconazole; main applica-tions: soybeans, cereals, rice, corn
Supradyn® Vitamin and mineral supplement with trace elements
Syndicated credit facility Credit line agreed with a group of banks. Generally used for extensive fi nancing require-ments, such as when making an acquisition, to increase the available liquidity reserves or as security for the issuance of debt instruments. The credit facility can be utilized and repaid fl ex-ibly, either in full or in portions, during its term.
T
tdi Toluene diisocyanate, an important raw material for poly-urethane fl exible foam used in upholstery, mattresses and car seats
Temprid® Insecticide; active ingredients: imidacloprid, beta-cyfl uthrin; main application: ant and pest control in non-agricul-tural settings
U
Ultravist® Contrast agent for X-ray examinations including computed tomography; active ingredient: iopromide
V
vegf Trap-Eye vegf (vascular endothelial growth factor) is a natural growth factor that is also involved in the pathologi-cal formation of new blood vessels in the eyes, which leads to wet age-related macular degeneration (amd). vegf Trap-Eye specifi cally inhibits this process and other growth factors and is currently under-going Phase iii clinical testing.
Visanne® Drug product for the treatment of endometriosis; active ingredient: dienogest
Vulkollan® Brand name for a high-performance polyurethane elastomer
W
Weighted average cost of capital (wacc) The weighted average cost of capital (wacc) represents the return required by investors on the capital invested in the company. It is computed as a weighted average of the cost of equity and debt. The cost of equity correlates with the return expectations of stockholders while the cost of debt comprises the conditions obtained by the company for its long-term fi nancing.
World-scale production facility Extremely large production plant whose capacity allows the realization of substantial econo-mies of scale.
X
Xarelto® Direct Factor Xa in-hibitor in tablet form. The active ingredient rivaroxaban is used to prevent and treat thrombosis in a wide range of indications and is registered in the Euro-pean Union and other regions as Xarelto® for the prophylaxis of venous thromboembolism (vte) in adults following elective hip and knee joint replacement surgery.
Y
yaz® / Yasmin® / Yasminelle® Oral contracaptives; active in-gredients: ethinyl estradiol and drospirenone
Z
Zetia® Cholesterol-lowering drug from Schering-Plough marketed jointly in Japan with Bayer; active ingredient: ezetimib
Zevalin® An yttrium-90 labeled monoclonal antibody for treatment of non-Hodgkin’s lymphoma; active ingredient: ibritumomab tiuxetan
255
INTERNET
For explanations of further specialist terminology, go to:www.investor.bayer.com > stock> glossary

256 / / BAYER ANNUAL REPORT 2008
Index
A
Accounting standards 144
Acquisition accounting 157
Acquisitions 79, 157
Annual Stockholders’ Meeting Back fl ap
Asset structure 81
Associates 194
Audit Committee 11, 107
Audit fees 11, 240
Auditor 11, 240
Auditor’s report 245
B
Balance sheet 135, 186
Bayer Business Services Inside front fl ap, 58
Bayer CropScience Inside front fl ap, 36, 56, 65, 87, 92, 127, 131, 194, 235
Bayer HealthCare Inside front fl ap, 30, 56, 59, 86, 89, 125, 131, 194, 231
Bayer Innovation GmbH 96
Bayer MaterialScience Inside front fl ap, 42, 57, 70, 87, 95, 128, 131, 194, 236
Bayer stock14, 17, 21
Bayer stock data 17
Bayer stock programs 98, 215
Bayer Technology Services Inside front fl ap, 58, 96
Board of Management8, 105, 111, 241
Bonds80, 218
Business strategy125
C
Capital expenditures78, 186
Capital structure81
Cash fl ow54, 55, 77, 136, 138, 139, 238
Changes in stockholders’equity 82, 201
Climate protection 100, 102
Commodity price risks 121, 124
Companies consolidated 161, 163
Compliance Committee 109
Consolidated fi nancial statements 12, 132
Consolidated statements of cash fl ows 78, 136, 238
Consolidation 144
Contact Inside back fl ap
Contingencies 230
Corporate citizen 103
Corporate Compliance Program 109
Corporate governance 11, 12, 105
Corporate Governance Code 11, 113
Corporate social responsibility 103
Corporate structure 249
Critical accounting policies 144
Currency risk 123
Currenta Inside front fl ap, 58
D
Derivatives150, 228
Discontinued operations 58, 177
Distribution 86, 179
Divestitures 177
Dividend 17, 85
E
Earnings performance 52, 74
Earnings per share 17, 21, 185
Economic outlook 116
Employees 97, 180
Environmental protection 103, 155, 212
Exchange rate risk 123, 222
Exchange rates145
F
Fair value 229
Financial calendar Back fl ap
Financial instruments 121, 222
Financial liabilities 156, 217
Financial position 52, 78
Financial risks 121
Financial strategy 129
Five-year fi nancial summaryInside back fl ap
Future perspectives 130
G
Glossary 252
Goodwill 147, 186
Governance bodies 250
Gross cash fl ow54, 55, 77, 136 ,138, 139, 238
Group Leadership Circle 250
Group structure Inside front fl ap, 58
H
Hedge accounting 121, 124, 125, 144, 222
Highlights 20
Human Resources Committee 12, 107
TABLE OF CONTENTS

FURTHER INFORMATION
257
I
Impairment21, 158
Impairment testing 158
Income attributable to non-controlling interest 185
Income from investments in affi liated companies 181
Income statements 134, 178
Income taxes75, 182
Indices 102, 258
Innovation and growthFront fl ap
Intangible assets 147, 160, 186
Interest expense181
Interest-rate risk 124
Inventories151, 197
Investor relations 20
K
Key data by segment and region 74, 138
Key data by subgroup Inside front fl ap, 53, 55, 58
Key performance indicators 100, 101
L
Leasing149
Legal risks 118, 231
M
Management report 50
Mission statement88, 100, 125
N
Net cash fl ow 54, 55, 78, 136, 138, 139, 238
Net debt 54, 80
Net income Inside front fl ap, 54, 55
Nominations Committee 107
Non-operating result 55, 180
Notes to the consolidated fi nancial statements 138
O
Operating environment56
Opportunities
116, 117
P
Pensions 152, 203
Performance by subgroup 58
Personnel expenses 97, 180
Presidial Committee 11, 107
Procurement 86
Procurement market risk 120
Production 86
Property, plant and equipment 148, 160, 192
Proposal for distribution of the profi t85
Provisions154, 212
Provisions for pensions and other post-employment benefi ts82, 152, 203
R
R&D expenses 88, 146, 179
Recognition and valuation principles 140, 144
Regions 74
Remuneration of the Board of Management 107, 111
Remuneration of the Supervisory Board107, 114
Research and development 88
Responsible Care 258
Restructuring charges155, 213
Risk management 11, 117
Risk report117
S
Salaries (see Remuneration)
Sales 52, 53, 145, 178
Scope of consolidation 161
Segment reporting 159
Segments 55, 58, 159
Statement by the Board of Management on fi nancial reporting 244
Statement of recognized income and expense137
Stockholders’ equity 152, 198
Strategy 125
Subsequent events 115
Supervisory Board 10, 106, 114, 241, 247
Sustainability 100, 258
Sustainable development 258
Sustainable investment 102
T
Taxes 152, 212
Trade accounts payable 220
Trade accounts receivable 197
U
UNEP 258
V
Value management 77
TABLE OF CONTENTS

TABLE OF CONTENTS258 / / BAYER ANNUAL REPORT 2008
Global Commitment to Sustainability
Social responsibility and sustainability are integral to Bayer’s corporate policy. This com-mitment is also evidenced by the company’s participation in numerous initiatives and projects around the world. Logos relating to a selection of these activities appear in the left margin in the order in which the respective activities are described below.
Bayer has long practiced the concept of Responsible Care and was one of the fi rst companies to sign the new Responsible Care Global Charter in 2006. A member of the World Business Council for Sustainable Development since 1997, Bayer is also among the founding members of German industry’s sustainable development forum “econsense.”
Bayer is represented in major sustainability indices and investment funds that focus on com-panies pursuing responsible and sustainable corporate strategies. For example, Bayer is listed in the Dow Jones Sustainability Index World, the ftse4Good index series, the Store-brand Principal Funds and the Advanced Sustainable Performance Indices (aspi) Eurozone. Our sustainability reporting is based on the guidelines of the Global Reporting Initiative, which Bayer supports as an organizational stakeholder.
The company places maximum importance on climate protection. For example, in 2008 Bayer was again included in the Climate Disclosure Leadership Index published by the Carbon Disclosure Project, run on behalf of institutional investors and other organizations. Bayer is also one of the 17 founding members of the climate protection initiative “3c: Combat Climate Change.”
Bayer is a founding member of the Global Compact initiative of the United Nations, actively promoting its principles through numerous projects. In Brazil, for example, Bayer supports the Abrinq Foundation in its efforts to combat child labor and cooperates with the non-gov-ernmental organization Agência Mandalla in the fi ght against hunger and poverty. Bayer’s partnership with the United Nations Environment Programme (unep) has set new standards in public-private partnerships. One of the joint activities is the “Bayer Young Environmental Envoy” program, which has now been extended to 18 countries on four continents.
Bayer set up the Global Exploration Fund together with National Geographic, the world’s largest non-profi t scientifi c organization. Further progress was made in 2008 with nine research projects aimed at safeguarding global drinking water supplies.
For years, Bayer has also been an active member of the Global Business Coalition on hiv/aids, Tuberculosis and Malaria, which is committed to the fi ght against these three epidemic diseases. For example, the company is cooperating with the Global Alliance for tb Drug Development, a u.s. non-profi t organization, to develop a new tuberculosis drug that could reduce treatment times.

TABLE OF CONTENTS
The Bayer Group
Bayer HealthCare
Bayer HealthCare is among the world’s foremost innovators in the fi eld of pharmaceutical and medical products. This subgroup’s mission is to research, develop, manufacture and market innovative products that improve the health of people and animals throughout the world. Read more starting on page 59.
Bayer CropScience
Bayer CropScience, with its highly effective products, pioneering innovations and keen customer focus, holds global leadership positions in crop protection and non-agricultural pest control. The company also has major activities in seeds and crop plants with genetically optimized properties. Read more starting on page 65.
Bayer MaterialScience
Bayer MaterialScience is a renowned supplier of high-performance materials such as polycarbonates and polyurethanes, and innovative system solutions such as coatings, for a wide range of everyday uses. Products holding leading positions on the world market account for a large proportion of its sales. Read more starting on page 70.
Bayer Business Services is the Bayer Group’s international competence center for it-based services. The focus of this company’s offering is on integrated services in the core areas of it infrastructure and applications, procurement and logistics, human resources and management services, and fi nance and accounting.
Bayer Technology Services, the global technological backbone and a major innovation driver of the Bayer Group, is engaged in process development and in process and plant engineering, construction and optimization.
Currenta offers services for the chemical industry including utility supply, waste management, infrastructure, safety, security, analytics and vocational training.
SERVICE COMPANIES
Bayer
Bayer AG defi nes common values, goals and strategies for the entire Group. The subgroups and service companies operate independently, led by the management holding company. The Corporate Center supports the Bayer AG Board of Management in its task of strategic leadership.

TABLE OF CONTENTS
NORTH AMERICA
In North America (United States and Canada), Bayer is represented by a total of 46 consolidated subsidiaries in all strategic business areas. In 2008 Bayer’s 17,000 em-ployees in this region generated sales of €8 billion, which was 24.4% of the Group total.
At Home Throughout The World
EUROPE
In 2008 Bayer achieved sales of €14.5 billion on the European market, which accounted for 44.2% of the Group total. A comprehensive distribution network, numerous major production facilities and 55,500 employees (of whom 37,400 are based in Germany) give the company a strong presence in this region.
LATIN AMERICA / AFRICA / MIDDLE EAST
Bayer has been represented in Latin America for more than 110 years. In 2008 the company’s 15,300 employees in the Latin America / Africa / Middle East region generated €5 billion in sales – 15% of the Group total.
ASIA / PACIFIC
With its tremendous growth potential, this economic region is one of the most important markets of the future. In 2008 Bayer generated €5.4 billion in sales here – 16.4% of the Group total – with 20,800 employees.

TABLE OF CONTENTS
Five-Year Financial Summary
Bayer Group 2004 2005 2006 2007 2008
€ million € million € million € million € million
Sales 23,278 24,701 28,956 32,385 32,918
Sales outside Germany 86.9% 84.4% 84.4% 85.1% 85.4%
EBIT* 1,875 2,514 2,762 3,154 3,544
Income before income taxes 1,222 1,912 1,980 2,234 2,356
Income after taxes 682 1,595 1,695 4,716 1,724
Noncurrent assets 16,859 20,130 35,897 34,712 35,351
of which goodwill and otherintangible assets 5,952 7,688 24,034 22,770 22,598
of which property, plant and equipment 7,662 8,321 8,867 8,819 9,492
Current assets 15,972 16,592 17,069 16,582 17,152
Inventories 4,738 5,504 6,153 6,217 6,681
Receivables and other current assets 7,664 7,798 8,001 7,834 8,377
Cash and cash equivalents 3,570 3,290 2,915 2,531 2,094
Financial liabilities 9,191 8,952 19,801 14,417 16,870
Noncurrent 7,025 7,185 14,723 13,081 10,614
Current 2,166 1,767 5,078 1,336 6,256
Interest expense – net (229) (338) (728) (701) (702)
Return on stockholders’ equity 6.1% 14.4% 14.1% 31.8% 10.4%
Gross cash fl ow** 2,885 3,114 3,913 4,784 5,295
Capital expenditures (total) 1,275 1,400 1,939 1,905 1,982
Depreciation and amortization 1,933 1,758 2,086 2,478 2,570
Personnel expenses (including pension expenses) 6,026 5,318 6,630 7,571 7,491
Number of employees*** (Dec. 31) 91,700 82,600 106,000 106,200 108,600
Research and development expenses 1,927 1,729 2,297 2,578 2,653
Stockholders‘ equity including non-controlling interest (total) 10,943 11,157 12,851 16,821 16,340
Capital stock 1,870 1,870 1,957 1,957 1,957
Reserves 8,227 9,287 10,894 14,864 14,383
Net income 685 1,597 1,683 4,711 1,719
Non-controlling interest 111 80 84 87 77
Liabilities (total) 26,645 25,565 43,040 34,557 36,171
Total assets 37,588 36,722 55,891 51,378 52,511
Equity ratio 29.1% 30.4% 23.0% 32.7% 31.1%BAYER AG
Net income 274 613 1,250 1,928 1,161
Allocation to (from) retained earnings (128) (81) 486 896 91
Total dividend payment 402 694 764 1,032 1,070
Dividend per share (€) 0.55 0.95 1.00 1.35 1.40
fi gures for 2004-2006 as reported, 2007 fi gures restated** EBIT as shown in the income statement** for defi nition see chapter “Liquidity and Capital Resources” on page 78*** 2004: headcount; 2005 – 2008: full-time equivalents

TABLE OF CONTENTS
Forward-Looking StatementsThis Annual Report contains forward-looking statements based on current assumptions and forecasts made by Bayer Group or subgroup management. Various known and unknown risks, uncertainties and other factors could lead to material differences between the actual assets, fi nancial position, earnings, development or performance of the company and the estimates given here. These factors include those discussed in Bayer’s public reports, which are available on the Bayer website at www.bayer.com. The company assumes no liability whatsoever to update these forward-looking statements or to conform them to future events or developments.
Important Information The names “Bayer Schering Pharma” or “Schering” as used in this publication always refer to Bayer Schering Pharma AG, Berlin, Germany, or its predecessor, Schering AG, Berlin, Germany, respectively.
MASTHEAD
PublisherBayer AG, 51368 Leverkusen, Germany
EditorIwan Zinn, phone +49 214 30 58992email: [email protected]
English editionCurrenta GmbH & Co. OHGLanguage Service
Investor RelationsPeter Dahlhoff, phone +49 214 30 33022email: [email protected]
Date of publicationTuesday, March 3, 2009
Bayer on the Internetwww.bayer.com
issn 0343 / 1975
This Annual Report was produced by a climate-neutral process. The total CO2 emissions of 180 tons resulting from its production and distribution were offset by investment in climate protection projects from the “myclimate International Portfolio.” These high-quality Gold Standard climate protection measures help to reduce global greenhouse gas emissions and are inspected by an auditing agency recognized by the United Nations.
Financial Calendar
2008 Annual Report march 3, 2009
q1 2009 Interim Report april 29, 2009
Annual Stockholders’ Meeting 2009 may 12, 2009
Payment of Dividend may 13, 2009
q2 2009 Interim Report july 29, 2009
q3 2009 Interim Report october 27, 2009
Annual Stockholders’ Meeting 2010 april 30, 2010
Payment of Dividend may 3, 2010