Tazania Basic Economic Report - World Bank Documents
198
Report No. 1616-TA Tazania BasicEconomic Report LE COPY Annex V-Industry: Perspective and Strategic Choices December 1977 Eastern A.nca Country Prograrrs I FOR OFfICIAL USE ONLY Document of the Worid Bank This document has a restricted distnbut-on andmaybe used by rec!pients orlv in the pe-forrnance of their offic!ai dut:es Itscontents -nay not otherfwise be disclosed without vVofd BanK authonzatkno Public Disclosure Authorized Public Disclosure Authorized Public Disclosure Authorized Public Disclosure Authorized Public Disclosure Authorized Public Disclosure Authorized Public Disclosure Authorized Public Disclosure Authorized
-
Upload
khangminh22 -
Category
Documents
-
view
3 -
download
0
Transcript of Tazania Basic Economic Report - World Bank Documents

Report No. 1616-TA
Tazania Basic Economic Report LE COPYAnnex V-Industry: Perspective and Strategic Choices
December 1977
Eastern A.nca Country Prograrrs I
FOR OFfICIAL USE ONLY
Document of the Worid Bank
This document has a restricted distnbut-on and may be used by rec!pientsorlv in the pe-forrnance of their offic!ai dut:es Its contents -nay nototherfwise be disclosed without vVofd BanK authonzatkno
Pub
lic D
iscl
osur
e A
utho
rized
Pub
lic D
iscl
osur
e A
utho
rized
Pub
lic D
iscl
osur
e A
utho
rized
Pub
lic D
iscl
osur
e A
utho
rized
Pub
lic D
iscl
osur
e A
utho
rized
Pub
lic D
iscl
osur
e A
utho
rized
Pub
lic D
iscl
osur
e A
utho
rized
Pub
lic D
iscl
osur
e A
utho
rized
CVM.ECY EQUIVALENTS I1
SDR. 1. 00 Tarnzania Shilling (T.Sh.) 9.66US$ 1.00 - Tanzania Shilling (T.Sh.) 8.30T:Sh. 1.00 :US$0.12
TANZANIA FTSCAL TEAB..
July lst -June 30th
I/1 in 0ctober- 1975 the- Talnzanian Shilling was pegged to thevalue of the Special Drawing Rights (SDR) of the InternationalMonetary Fund. The US Dollar/Tanzania Shilling exchange rateis therefore subject to change.
FOR OFFICIAL USE ONLY
TANZANIA - BASIC ECONOMIC REPORT
ANNEX V
INDUSTRY: PERSPECTIVE A-YD STRATEGIC CHOICES
Prepared by
Mr. Gene Tidrick
The full report consists of the following separately boundvolumes:
Main ReportAnnex I - Domestic Finance and Resource UseAnnex II - Fiscal Implications of Universal Primary
Education and Universal Rural Water SupplyAnnex III - Labor Market Allocation and Income
DistributionAnnex IV - Income Distribution and Growth: A Simulation
ModelAnnex V - Industry: Perspective and Strategic CnoicasAnnex VI - Key Issues in Agriculture and Rural DevelopmentAnnex VII - Appropriaze Technology in Tanzanian
Agriculture: Some Empirical and PolicyConsiderations
This document ha!b Artntrycteddistribufion and riay :eoused by recipients oniy 1%1 I P f omace of their oinciai duties. itscontents iuy not othtrwi.e be dlbciosed without World BLnk -uthorization .
(i)
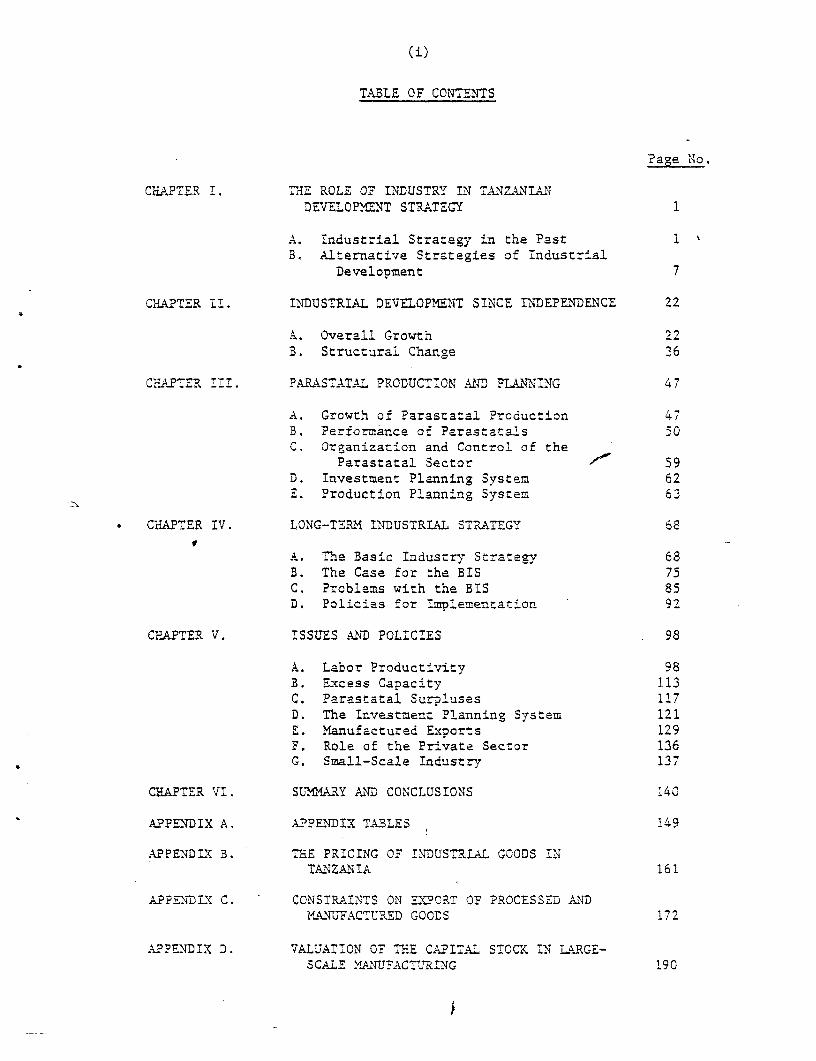
TABLE OF CONTENTS
2a.,e No,
CHAPTER I. THE ROLE OF INDUSTRY IN TANZANIANDEVELOPMEENT STRATEGY 1
A. Industrial Strategy in the Past 1B. Alternative Strategies of Industrial
Development 7
CHAPTER II. INDUSTRIAL DEVELOPEtENT SINCE INDEPENDENCE 22
A. Overall Growth 22B. Structural Change 36
CHAPTER III. PARAST'ATAL PRODUCTION AND PLA2NNING 47
A. Growth of Parastatal Production 47B. Performance of Parastatals 5OC. Organization and Control of the
Parastatal Sector 59D. Investment Planning System 62E. Production Planning System 63
CHAPTER IV. LONG-TEPM INDUSTRIAL STRATEGY 68
A. The Basic Industry Strategy 68B. The Case Lor the BIS 75C. Problems with the BIS 85D. Policies for Implementation 92
CHAPTER V. ISSUES AND POLICIES 98
A. Labor Productivity 98B. Excess Capacity 113C. Parastatal Surpluses 117D. The Investment Planning System 121E. Manufactured Exports 129F. Role of the Private Sector 136G. Small-Scale Industry 137
CHAPTER VI. SUMMARY AND CONCLUSIONS 140
APPENDIX A. APPENDIX TABLES 149
APPENDIX B. THE PRICING OF INDUSTRIAL GOODS INTANZANIA 161
APPENDIX C. CONSTRAINTS ON EXPORT OF PROCESSED ANDMANUFACTURED GOODS 172
APPENDIX D. VALUATION OF THE CAPITAL STOCK IN LiLRGE-SCALE MAINUFACTURING i90
( ii.)
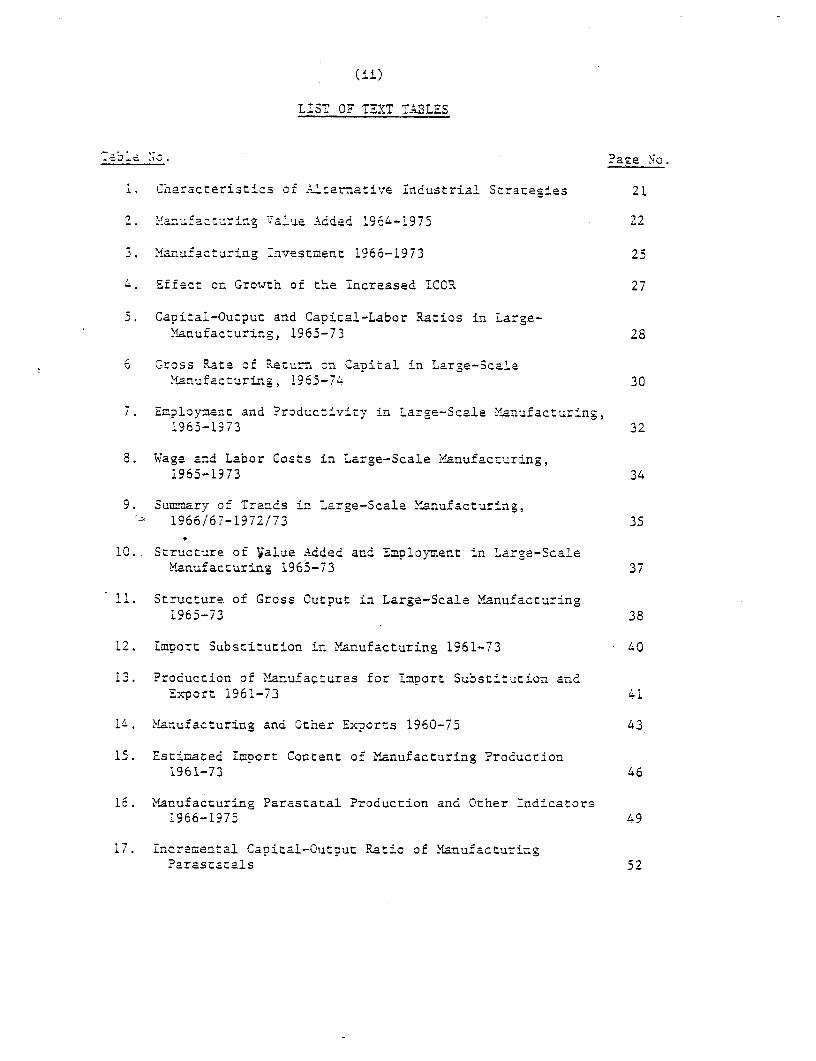
LIST OF TEXT T-ULES
-_'a c. -?aze Mc.
1 Characterist4cs of :ernative Industrial Strategies 21
2. 'Ma-.fa turi-.g V~a ue cAdded 1964-1975 22
3. Manufacturing investment 1966-1973 25
4. Ef`ect on Growth of the Ircreased ICOR 27
3. CaDital-Output and Capital-Labor Ratios in Large-Manufacturing, 1963-73 28
6 C-ross Rate of Returm on CaDital in Large-ScalaYanufacturing, 196i-74 30
7. Employment and Productivity in Large-Scale Manufacturing,1963-1973 32
8. Wage and Labor Costs in Large-Scale Manufacturing,1965-1973 34
9. Summary of Trends in Large-Scale Manufacturing,1966/67-1972/73 35
10. Structure of Value Added and Employment in Large-ScaleManufacturing 1965-73 37
11. Structure of Gross Output in Large-Scale Manufacturing1965-73 38
12. tmmort Substitution in Manufacturing 1961-73 40
13. Production of Manufacturas for Import Substitution andExport 1961-73 41
14. Manufacturing and Other Exports 1960-75 43
15. Estimated Import Content of Manufacturing Production1961-73 46
16. Manufacturing Parastatal Production and Other Indicators1966-1975 49
17. Incremental Capital-Output Ratio of ManufacturingParastatals 52
(ii i)
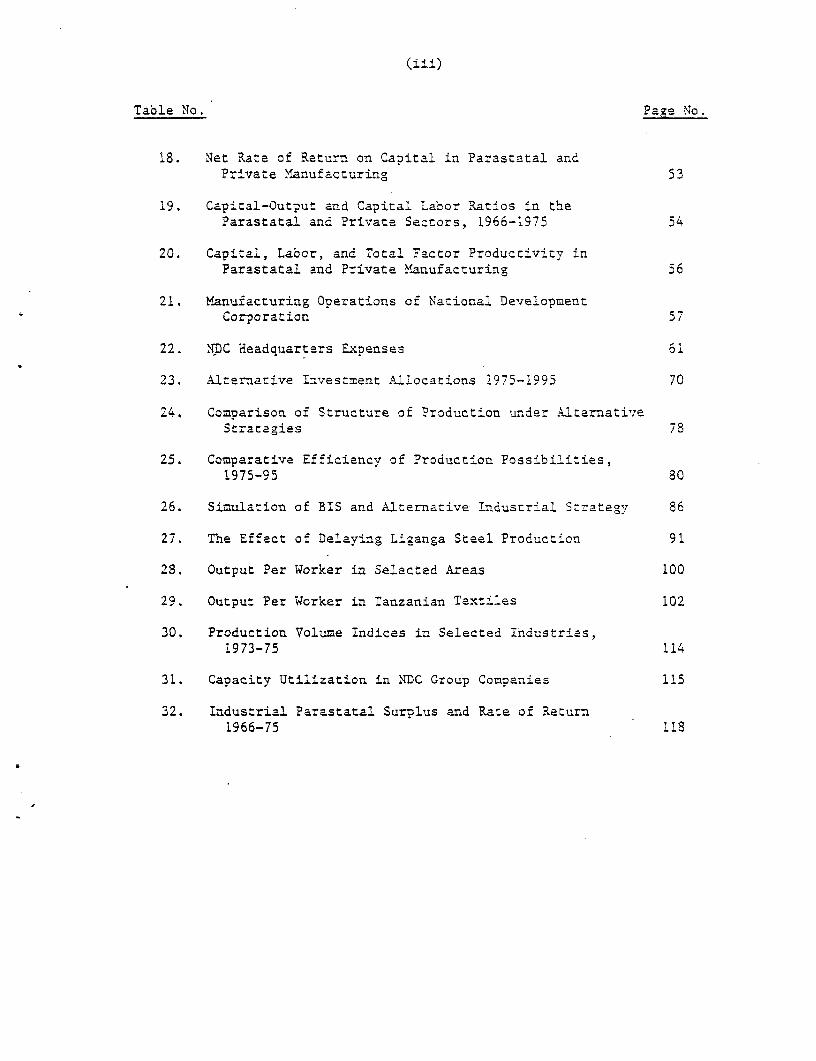
Table No. Page No.
18. Net Rate of Return on Capital in Parastatal andPrivate Mbanufacturing 53
19. Capital-Output and Capital Labor Ratios in theParastatal and Private Sectors, 1966-1975 54
20. Capital, Labor, and Total Factor Productivity inParastatal and Private Manufacturing 56
21. iManufacturing Operations of National DevelopmentCorporation 57
22. MC Headquarters Expenses 61
23. Alternative Investment Allocations 1975-1995 70
24. Comparison of Structure of Production under AlternativeStrategies 78
25. Comparative Efficiency of Production Possibilities,1975-95 80
26. Simulation of BIS and Alternative Industrial Strate-y 86
27. The Effect of Delaying Liganga Steel Production 91
28. Output Per Worker in Selected A-reas 100
29. Output Per Worker in Tanzanian Textiles 102
30. Production Volume Indices in Selected Industrias,1973-75 114
31. Capacity Utilization in 'DC Group Companies 115
32. Industrial Parastatal Surplus and Rate of Return1966-75 118
(iv)
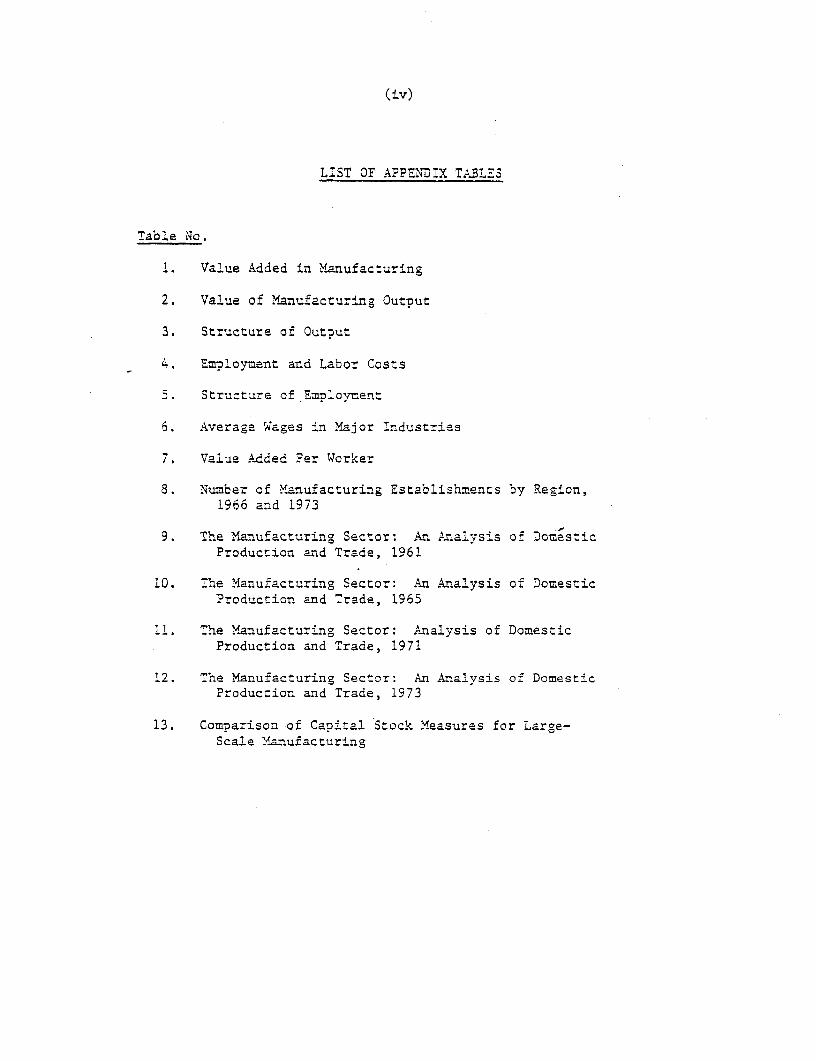
LIST OF APPENDIX TABLiES
Table No.
1. Value Added in Manufacturing
2. Value of Manufacturing Output
3. Structure of Output
4. Employment and Labor Costs
5. Structure of Employment
6. Average Wages in Major Industries
7. Value Added Per 'Worker
8. Number of Manufacturing Establishments by Region,1966 ard 1973
9. The MaLnufacturing Sector: An Analysis of DomesticProduction and Trade, 1961
10. The Manufacturing Sector: An Analysis of DomesticProduction and Trade, 1965
11. The Manufacturing Sector: Analysis of DomesticProduction and Trade, 1971
12. The Manufacturing Sector: An Analysis of DomesticProduction and Trade, 1973
13. Comparison of Capital Stock Measures for Large-Scale Manufacturing
CHAPTER I. RE ROLE OF INDUSTRY IN TANZAINIANDEVELOPF_UT STRITEGY
A. Industrial Strategy in the Past
Strategy After Independence
1.1 At the time of indenendence in late 1961, Tanzania had only arudimentary industrial structure. The largest single manufacturing sub-sector was cotton ginning. There was no factory production of textiles,shoes, cement, or cigarettes. Beer and sugar were produced but did notmeet domestic demand. The only export industries were canned meat andwattle extract. There were numerous small establishments producingclothing, bread, bricks, footwear, and the like, mostly owned by Asians.Total manufacturing employment was about 20,000 out of a total populationof around 10 million and manufacturing and handicrafts contributed lessthan 5% of GDP.
1.2 The newly-independent Government inherited an industrialstrategy based upon reports by Arthur D. Little and the World Bank. 1/This strategy was to encourage private investors (mostly foreign) toproduce a few simple goods for the domestic market. Processing of localraw materials for export was seen as a longer-term possibility, but forthe moment the most promising prospect was to substitute domestic produc-tion for the import of cotton textiles, cigarettes, shoes, beer, sugar,cement, and tires. The World Bank's sober assessment was that thisprogram of import substitution, while large in relation to existingcapacity, would add only 3% to existing GDP.
1.3 The First Five-Year Plan (22X2)2/ published in 1964, proposeda more ambitious program of industrial development without changing thebroad outline of the inherited strategy. The analysis underlying theFFYP strategy was that industrialization was limited by two factors: theavailability of capital and the extent of the market. The capitalconstraint could only be overcome by reliance on private, including foreign
1/ Arthur D. Little, Inc., Tanganyika Industrial Develovment (Dar esSalaam: 1961); IBRD, Economic Development of Tanganyika (Baltimore:John Hopkins Press, 1961). See also Government of Tanganyika,DeveloDment Plan for Tanganyika, 1961-1962, 1963-1964 (Dar es Salaam,Government Prircer, 1961)
2/ The United Republic of Tanganyika and Zanzibar, Tanganyika Five-YearPlan for Economic and Social Development 1st July, 1964 - 30th June1969 (Dar es Salaam: Government Printer, 1964)
- 2 -
investment. .hree-cuarters of total industrial invest-ent during theFir-st Plarn oeriod was to come from the private sector. The Governmentwas preparad to participate in financing through its Tanganyika evelop-menc Corporation, but the ain policy instr=ments to achieve ind.ustrialinvestment targets were to be accelerated deoreciation allowances, tariffprotection, and guarantees for the repatriation of capital.
1.4 Thne market constraint was to be loosened bv a charge ir therules of the East African Common Market. The Common Market with Ugandaand Kenya had been in force since 1927 and was widely regarded as anobstacle to Tanzanian industrial development. Kenya, with a largerexisting industrial base, attracted a disproportionate share of industrialinvestment. Under the relativ-ely unrestricted customs union which existedat the time of indenendence, Tanzania not only had little hope of attract-ting industries which would produce for the entire Common Market, but alsohad difficulty in setting up industries to substitute for imports ofKenyan manufactures. President Nyerere had attempted to achieve Politicalfederaticn which would have preserved a full customs union, but when thatfailed Tanzania sought greater scope to pursue an independent industrialpolicy. The result of these efforts was the Kampala Agreement of 1964which modified the rules of the Common Market and widened the potentialmarket for Tanzanian industry in two ways. First, it permitted Tanzaniato impose restrictions on some partner state imports, thereby givingprotection to local import substitution irdustries. Second, it set up alicensing procedure which reserved to each of the partner states theproduction of several industries which depended on the entire regiornalmarket. Tanzania was allocated aluminum rolling, tires, and radioassembly. Although Kenya never ratified the Kampala Agreement and laterset up some of these same industries, production was started in Tanzaniain the expectation cf obtaining the entire Common Market.l/
1.5 The First Five-Year Plan did move beyond the Three Year Planin some ways. It proposed a wider range of import substitute investmentsfor the domestic market, including rolled steel, oil refining, andfertilizer. it also proposed that processing of sisal and cashews forexport be initiated on a modest scale. Finally, it extended the conceptof import substitution to embrace the entire East African Common Market.Nevertheless, industrial strategy remained broadly consistent from thetime of independence until the Arusha Declaration. rne aim was toincrease the rate of economic growth by exploiting some obvious opportu-nities for industrial investment. The fact that most of these opportunitieswere for the import substitution of simple consumer goods or buildingmaterials was inC4dental; no signiflcance was attached to the nature of
1/ J.F. Rweyemamu, Underdevelooment and Industrialization in Tanzanria(Nairobi: Oxford University Press, 1973), p. 119. Chapters 2 and 4of this book give a detailed analysis and c-iti'ue of Tanzanianindustrial strategy through 1971.
-3-
either the product or of the market. There did not even appear to be anyparticular significance attached to industrialization as such; manufactu-ring output was valued largely for its potential contribution to GDPrather than for its linkage effects, external economies, or role instructural transformation. The early industrial strategy also paid littleattention to three other aspects of industrial structure: pattern ofownership, choice of technique, and comparative advantage. The Tanzanianleadership would probably have preferred public, or at least local,ownership of industry, but this was not viewed as a serious possibilitygiven the capital and managerial requirements of the industrial program.There is little evidence that much thought was given to the choice oftechnique; increased employment was a professed aim of industrializationbut there seems to have been little consideration of the possibility ofsystematically promoting labor-intensive techniques or sectors, nor tothe likely effect on employment growth of promotional policies such asaccelerated depreciation allowances. Comparative advantage and productioncost considerations were also neglected. Tariffs were usually establishedthrough negotiations with investors and tariff levels varied amongstindustries. If the level of protection proved to be too low, the tariffmight be raised again as happened in the case of radio assembly. Nominalrates of protection for new industries usually ranged between 33% and50%, but effective rates of protection ranged from negative to over 500%.1/
Post-Arusha Industrial Strategy
1.6 The Arusha Declaration charted a completely new course forTanzania based upon socialism and self-reliance. It reversed a basicprinciple of previous industrial strategy; dependence on foreign invest-ment as the major instrument of industrial development. Henceforth, mostmajor industries would be publicly owned and most new investment could bemade by the public sector. Foreign investment could no longer be theprincipal agent of industrial development, first, because the requisiteamounts of foreign capital were not forthcoming and, second, becausedependence on foreign investment would not be consistent with politicalindependence, self-reliance, or socialism. As the Declaration put it,"Th.e policy of inviting a chain of capitalists to come and establishindustries in our country might succeed in giving us all the industrieswe need, but it would also succeed in preventing the establishment ofsocialism unless we believe that without first building capitalism, wecannot build socialism".2/
1/ See Rweyemamu, pp. 130-137, and D. Kessel, "Effec-ive Protection inTanzania", East African Economic Review, (June, 1968).
2/ Julius K. Nyerere, "The Arusha Declaration," reprinted in UJamaa -
Essays on Socialism (New Y7ork: Oxford UnTriversity t ress, 1968),p.26.
-4-
1.7 A second consequence of the policy changes following the ArushaDeclaration was increased attention to employment creation in industry.One concern which led up to the Declaration was the rapid growth of wages,particularly in large-scale industry. This was believed to be respcnsiblefor growing inequality between urban' workers and peasants and for thestagnation of overall employment growth. A new incomes policy based uponan ILO report was introduced to reverse these trends.l/ The wage guide-lines establi shed by the new incomes policy set an upper limit of 5% forannual wage increases.
1.8 The Arusha Declaration also attempted to define the role ofindustry within the overall strategy of economic and social development.A major theme of the document was that too much emphasis had been put onindustry in the past. Tanzaria could no:t establish very much industrybecause it had neither the =oney nor the expertise to do so, and depend-ence on foreigners was no.t acceptable because it jeopardized self-relianceand socialism. More fundamentally, reliance on industrialization as theprimary agent of development was to confuse means and ends. Industry,like money, was a consequence rather than a cause of development."Industries will come and money will come but their foundation is the?eople and hard work, especially in AGRIC'ULTURE. This is the meaning ofself-reliance." 1/
1.9 This stress on agriculture and rural development and thedisparagement of the importance of industry created in some minds anexpectation that Tanzanials industrial program would be'drastically cutback. It is doubtful if that was ever the intention. The intention wasto exhort people to greater effort - to persuade them that developmentdid not mean having what developed countries have (a l'ot of money andmodern industries) but that it meant acquiring the skills and attitudeswhich would enable Tanzanians to be as productive as people in developedcountries. Development was seen as the development of people, not asincome growth or structural change. But since the development of peopleis not primarily a matter of investment, this did not mean that investmentin industry would be greatly changed. The Arusha Declaration made noconnection between the structure of production and its underlying conceptof development. It therefore had almost no implications for the structure
1/ International Labour Organization, Report to the Government of theUnited Republic of Tanzania on Wages, Incomes and Prices Policy,Government Paper No. 3, (Dar es Salaam: Government Printer, 1967).This is frequently called the Turner Report after its authorProfessor H.A. Turner. The Government's response was contained inUnited Republic of Tanzania, Wages, Incomes Rural Development,Investment and Price Policy, Government Paper No. 4, (Dar es Salaam:Government Printer, 1967).
2/ Nyerere, "The Azrusha Declaration", p. 33 .Iiphasis in. the original.
of production and investment, though it did of course imply a betterdistribution of income between urban and rural areas. In the absence ofany link between the production structure and development, as implici lydefined in the Arusha Declaration, investment in industry was to continuemuch as before, except that now it would be undertaken by public enter-prise.
1.10 This interpretation of the strategic implications for industryof the Arusha Declaration is supported by subsequent development plans.The Second Five-Year Plan (SFYP),1/ published two years after the ArushaDeclaration, set a target rate of growth for manufacturing of 13.0%,exactly double the target rate of 6.5% for total GDP. This differedlittle from the First FY? (which had also declared agriculture to be thefoundation of development) with a planned rate of industrial developmentof 14.8% and a target rate for total GDP of 6.7%. President Nyerereendorsed the new industrial growth targets in a speech introducing theSecond FE?.
1.11 In addition to being ambiguous on the size of industrial program,the Arusha Declaration gave no positive guidance on the content. Thisuncertainty about the appropriate content of industrial investment, andthe basic continuity with previous industrial strategy, are reflected inPresident Nyerere's sul-Azry of industrialization plans for the SecondFive-Year Plan period.
"We shall continue to expand simple manufacturing, the process-ing of primary commodities, and the provision of basic constr-uction materials; but we have now reached the stage where wemust think seriously about the next and more difficult phase ofindustrialization. For it is comparatively easy to produceyour own textiles, cement, and similar goods; beginning toproduce your own capital goods, and goods which are used onlyin the production of other things, is a more complex operatior.and demands a more sophisticated degree of economic planning.Yet such a move is essential for long-term growth; an importanttask which will be undertaken early in the Second Plan periodis the preparation of a long-term in.dustrialization ?lan, takinginto account the possibilities of the East African CommonMarket and of exports. The aim is that we should be ready toembark on this kind of work at the very beginning of the ThirdPlan.
Let me just add one further point. Although mass productionis the best and cheapest way of meeting the needs of our people
1/ United Renublic of Tanzania, Tanzania Second Five-Year Plan forEconomic and Social Develosment 1st July, 1969 - 30th june. 1974(Dar es Salaam: Government Printer, 1969).
-6-
for certain types of goods, there are many others where the needscan be best met by labour intensive, small-scale industriesand craft workshops. Obvious examples of this are furniture,which can be made locally from local materials without theproblem of transportation over long distances; ready-madeclothes, and local food preservation. It is vital that weshould increase our efforts in this matter, for such activitieshave the further advantage that they require very littlecapital investment, and they can be carried on in the villagesand small towns of our country, thus improving the quality andvariety of life in the rural areas."I/
!.12 The industry chapter of the Plan extended the range of possibi-lities. In addition to producing simple import substitution goods,intermediate and capital goods (later), manufactures for exports,manufactures for the East African market, and simple manufactures fromsmall-scale industries, the Plan provided that industry was to bedecentralized, labor-intensive techniques were to be encouraged, socialcost-benefit analysis was to be used to evaluate all industrial investmentsconsistently, and cost reduction was to be enforced through reducingtariffs over time. A case could be made for each of these proposals onits own, but taken as a group, they did not add up to a coherent industrialstrategy. The industrial section of the Plan as it finally emerged waslittle more than a list of 385 projects of which 70% were expected to becompleted.
1.13 The Arusha Declaration changed the ownership pattern of industryand, through the new incomes policy, sought to increase the rate ofemployment growth and to improve the distribution of income between urbanand rural areas. Fowever, it did not appreciably affect industrialstrategy in any other way. There was increasing concern about whatindustrial products should be produced, the market orientation of industry,the cost of production, and linkages with other sectors, but no guidingdoctrine emerged nor was there any visibly coherent pattern of policywith respect to these aspects of industrial strategy. The definition ofa long-term industrial strategy was left as an exercise to prepare for theThird Five-Year Plan.
1/ United Republic of Tanzania, Tanzania Second Five-Year Plan, Vol. 1,p. xiii.
B. Alternative Strategies of SocialistIndustrial Development
1.14 After the Arusha Declaration there was general agreement thatTanzania must pursue a socialist industrial strategy. Hiowever, apartfrom the implication that the role of the private sector would be limiced,there was little agreement about what constituted a truly socialiststrategy. While not everyone concerned with Tanzania industrial policy had afully-articulated strategy, most subscribed, either implicitly or explicitly, toone of four main models of socialist industrial development: a maximumgrowth strategy, a processing strategy, a basic industry strategy, or asmall-scale industry strategy. As presented below, the distinctionsbetween these alternative models are heightened and individual variationsare minimized in order to keep the discussion within manageable bounds.While no single individual might agree with every aspect of the idealtypes which are presented, the mcdels do give a fair summary of therange of conflicting views of the role of industry in socialist develop-ment.1/
Maximum Growth Strategy
1.15 Perhaps the dominant model of industrial development duringthe late 1960's and early 1970's was the maximum growth strategy. Inthis strategy industrialization is seen as the main engine of growth cfthe economy. Industry is valued for its contribution to GDP andindustrial projects are selected on the basis of their rate of return.No importance is attached to what, how or for what market a product isproduced; it matters only whether a product is in demand and can be.produced at a cost which gives an acceptable rate of return. In practice,cost considerations tend to favor light industrial products for importsubstitution or the processing of local raw materials for export, andthe use of relatively labor-intensive techniques of production, but thisis an incidental result of the search for projects which would maximizethe growth of GDP.
1.16 There are two main streams of thought within the group ofmaximum growth strategists. The first, and most influential, is the"state capitalist" school. This was best exemplified in the late 1960'sby the National Development Corporation which became the princiDalindustrial development institution after the Arusha Declaration. TheNDC model of development depended on the establishment of independent,state-owned firms (parastatals) which would act as profit maximizers.
1/ Much of the discussion in this section is based upon an unpublishedpaper by M. Roemer, "Models of Socialist Industrial Development",(Dar es Salaam: mimeo, September, 1972).
NDC's role was to identify the most profitable investment opportunities(with some allowances made for employment and foreign exchange benefits)and then to set up a subsidiary company to produce the goods. Thesubsidiary parastatal was then supposed to operate much like a capitalistfirm, seeking out the most profitable product lines and searching forways to reduce costs of productior.. The parastatal sector did not havethe resources to produce all the manufactured goods possible, of course,so a sizeable amount of residual manufacturing would be left to theprivate sector. Cooperatives would be encouraged to compete with theprivate sector wherever possible and the parastatal sector would graduallyexpand its share of manufacturing production.
1.17 Since the Arusha Declaration did nct have a clearly statedindustrial strategy, the state capitalist version of the maximum growthstrategy became the actual Tanzanian strategy by default. However, thestrategy has not worked in practice quite as intended. AJthough parastatalproduction has expanded rapidly and with little regard to the type ofproduct vroduced, the technique of production, cr to market orientation,the parastatal sector has not been as cost-conscious as the ideal set bythe maximum growth model. Ideally, a parastatal considering productionof a new product would ask, "Can it be produced efficiently?" Tanzanianparastatals have tended to ask only, "Can it be Droduced?" In bothinvestment and production decisions the parastatal sector has not respondedwell to market signals which indicate that costs are too high., Whenmarket signals have impinged upon parastatal thinking - for example, whenlosses are being made - the response has frequently been to try to removethe market cnnstraint by securing a higher product price or by convertingloans to ecuity, rather than to try to reduce costs. In spite of thislapse, the ideal of the state capitalism model remains for independentstate enterorises to maxi'mize profits (and reduce costs) subject to theconstraints of existing market prices.
1.18 The second variant of the maxiJum growth strategy is the"market socialism" model. This has been advocated largely by professionaleconomists (frequently foreign) and is based on the well-known Lange-Lerner model.I/ Yugoslavia is probably the closest working model ofmarket socialism, thiough the Yugoslav economy differs significantly fromthe Lange-Lerner ideal. The market socialism model pays more attentionto the policy framework within which parastatals operate than does thestate capitalism model. Independent state-owned firms (worker-managedfirms in Yugoslavia) would still seek to maxi.mize profits, but decisionswould be based uvon social costs and benefits rather than commercial costsand benefits as in the state capitalism model. Investment decisions, forexample, would be based upon social cost-benefit analysis using shadow
I/ 0. Lange, On the Economic Theory of Socialism, (Minneapol4s: Univer-sity of Minnesota Press, 1938); and A.P. Lerner, The Economics ofControl,(New York: Macmillan, 1944).
- 9 -
prices or, better yet, market prices would be brought into line withshadow prices. Since the social cost (shadow price) of foreign exchangeand capital is higher than the market price and the social cost of labor(shadow wage) lower than the market wage in Tanzania, a market socialismstrategy would tend to favor labor-intensive production techniques andprojects bringing quick foreign exchange returns even more than the statecapitalism model. As in the state capitalism variant, however, thestructure of production which results is due to the attention paid tocomparative advantage and the cost of production rather than to any dogmathat labor-intensive, export-oriented industries are always better.
1.19 A maximum growth strategy of either the state capitalist ormarket socialist variety has several drawbacks. First, it may be diffi-cult to reconcile maximum growth with certain socialist objectives suchas minimizing the use of material incentives or increasing worker parti-cipation.l/ The difficulties encountered by some parastatals in ea-rningthe profits expected of them is partly due to an incentive structurewhich inadequately focuses the attention of planners, managers, and workerson efficiency and profit maximization. The problem of devising anincentive structure which adequately reconciles growth-efficiency withequity-participation objectives is discussed in more detail in a latezsection.
1.20 A second drawback is that the strategy may not be effective inmeeting its own major goal of maximum growth in the long run. Commercialcost-benefit analysis, orn which the state capitalism strategy is based,does not adequately take account of linkages or training effects whichcreate external economies for other industries. Social cost-benefitanalysis, on which the market socialism strategy is based, takes accountof these benefits in principle, but in practice frequently ignores thedifferential training effects of alternative projects because they aredifficult to quantify. This means that the maximum growth strategy mayignore infant industries with high long-term growth potential. In thelong run, the non-quantifiable benefits of certain industries may outweighthe gains of maximizing short-term comparative advantage.
1.21 A third criticism of the maximum growth strategy is that it basesdecisions on distorted market prices. On the production side, alternativeproduction structures will generate different sets of future pricestructures (in spite of international trade) owing to linkages amongindustries and to differential productivity growth from learning by doing.On the consumption side, relative prices and profitability reflect thepresent inegalitarian income distribution. The state capitalism model
1/ For a discussion of the way in which worker-managed firms may bebiased against growth see J. Meade, "The Theory of Labour-ManagedFirms and Profit-Sharing," Economic Journal, Vol. 82, No. 325supplement (March, 1972), pp. 402-428.
- 10 -
bases ali production and investmenr decisions on these distorted prices,n or bcialysm a-1 distortions could be corrected by the use
c: ie-; orzl'care- s-acow p but as a oract-ical matter, manz of thediscoroSrzls rwoull Se Le _ .Z-ected because of the scarcityr of o'u-li_iedproject analysts and the zressures to make timely investment decisions.
I1. 22J A^. final criticism of the maximum growth strategy is tnat it ismarginal_st. The method of analysis is based on small (marginal) ch:angesand therefore is frequently biased against major structural change. Itis not just that the strategy may reject a particular structural changebecause its cost in terms of foregone growth would be high. It is alsothat the maximum growth strategy may not even envision possible structuralchange which would be perfectly consistent with high growth. This iscue to the short-cern rocus and deceatralized decision-making characteristicof the planning mechanism under thle strategy. Most projects are proposedby parastatals which tend to propose only marginal changes ±n the existingeconomic structure; rroects are appraised as they are generated and areapproved or rewecr_ed according to whether they meet some acceptable=inimum rate of return and fit within the short-term budget. Withoutsome more purposeful vision, a maximum growth strategy is unlikely torestructure the economy in a major way.
Processing Strate2y
1.23 A second strategy frequently proposed in the post-Arusha periodis a processing strategy. Emphasis is placed on processing major rawmaterials - cotto.., cashews, sisal, h'des and skins - before exportingthem. To a lesser extent, the strategy also stresses substituting processeddomestic materials for manufactures produced from imported raw materials:for example, using tile rather cor-rugated iron sheet roofing, bricks ratherthan cement, cotton textiles rather than blended fabrics, and leatherrather than rubber or plastic shoes and sandals. In 1974 the Governmentendorsed an investmenc program heavily inf-luenced by the processing strategy.(Ironically, this occurred just as the Planning Commission was pre?aringa report to,recommend a long-term industrial strategy based on the basicindustry strategy which is largely incompatible with a processing strategy).The Economic Committee of the Cabinet (ECC) approved sectoral investmentplans which provided for processing of all hides and skins into leather,processing of about half the cashew crop, processing of three-fourths or-ore of sisal production, and a tripling of cotton textile production, allby 1980. At the same time, official statements called for sharply increa-sed brick production to substitute for imports of cement and for processingof 60% of the cotton crop, which implied arn even larger expansion oftextile production than approved by the ECC.
1.24 Although the ECC approval was only an endorsement in principleand hence subject to later reversal or modification, it showed the appealto Tanzanians of a processing strategy of industrial develooment. Externalfinancing of a substantial portion of the cashew and leather processingproposals by the World Bank and others suggested that a processing strategyapoealed to ex-ternal donors as well. In the case of outside agencies,the appeal probably stemmed from a oresunvticn that Tanzania has a
- 11 -
comparative advantage in processing. For Tanzanian planners, the appeal ismore complex. Some support a processing strategy because they also believethat Tanzania's comparative advantage, and best growth prospects, lie inincreased processing for export. For others, a processing strategy is aconvenient tool for identifying the next step in industrializaticn; it peformsthe same identification function as the imoort substitution strategy and isbased on a similar premise that any investment is desirable so long as itproduces incremental value added. For yet others, processing for export isthe most obvious way to earn much-needed foreign exchange. Finally, theprocessing strategy also appeals to a large number of people because it wouldbreak the colonial tra2:a pattern of exporting raw materials and therebvreduce dependency, improve the terms or trade, and end the exploitationincnerent in producing raw materials for otners to manufacture.
1.25 The main criticism of the processing strategy is that it maynot perform any of the roles expected of it. The presumption that Tanzaniahas a comparative advantage in processing for export is brought intoquestion by industry studies prepared for the long-term industrial strategyexercise in preparation for the Third Five-Year Plar../ Cashew processingin Tanzania has never been profitable at commercial prices; despite somenatural transport protection, neither hand nor machine urocessing inTanzania has been competitive with Indian hand processing. It was onlymarginally efficient at shadow prices in 1973; since that time capitalcosts of machine srocessing have tripled, wages have risen by about 60%,and the processing margin (the difference between the value of a ton ofraw nuts and the value of a raw nut ton-equivalent of kernels) has decreasedby 5%.2/. It is also questionable whether Tanzania has a comparative advantage
1/ The studies were done during 1973-74 by a group of foreign economistsLrom the Harvard Institute for International Development in collabora-tion with Tanzanian colleagues in the former Ministry of EconomicAffairs and Development Planning (Devplan). A si=ary is given inM. Roemer, G. Tidrick, and D. Williams, "The Range of Strategic Choicein Tanzanian Industry," Journal of Develoment Economics 3(1976),pp. 257-275.
2/ Based on the 1973 and 1975 export statistics and assuming a 22.5%outturn of kernels per ton of raw nuts, the margin between a raw nutton-equivalent of kernels and a ton of raw nuts fell from Shs 699 in1973 to Shs 665 in 1975. Fortunately for the rate of return onprocessing (though not for the economy as a whole), the processingmargin increased in 1976 to Shs 1586 according to preliminary estimates,This may reflect one of three things: a lag in the response of raw nutprices to increased kernel prices, the skillful exercise of bargainingpower by the Indian state trading company which purchases all ofTanzania's raw nuts, or an increase in the cost of hand processing inIndia. If it is the last, then Tanzania's comparative advantage haschazged. If it is the second reason, there may be a case forinvestment in the industry on strategic grounds.
- 12 -
in processing h4ider into finished leather; the capital and labor cost inshadow prices of leather production in 1973 was calculated to be 20%above value added at world orices.l/ Ir textiles Tanzania would havegreat difficulty in exporting profitably at current productivity levels.Even if productivity improved, it is hard to imagine Tanzania competingin the world market for standardized products such as crey cloth vithAsian economies having one-third the Tanzanian wage level. However, -heremight be scope for exporting fine-count yarns based on the local hign-quality cotton, or of exporting finished textiles to nearby markets.Finally, Tanzania does have a clear-cut cost advantage over Europeancompetitors ir. the production of sisal twine, but the future of theindustry itself is in question.
1.26 The foreign exchange benefits of a -rocessing strategy mayalso be d±sa-pointing. Processing should always increase net foreignexchange earnings, even after deducting the cost of additional importsused in processing. The key questicn, however, is whether Processingwould increase net foreign exchange earnin gs more -.ar. would an alter-native use of the same domestic resources. The background _ndustrystudies for the long-term industrial strategy showed that many processingindustries had relatively high domestic resource costs Der unit of foreignexchange earned. At the extreme, mechanical processing of cashews in1973 had a domestic resource cost of Shs 1,74 for each shilling of netforeign exchange earnings. This was weil above the shadow exchangerate of 1.30 and implies that there were other i-ndustries where the samedomestic resources would have saved or earned more foreign excliange.
1.27 Finally, it is questionable whether processing raw materialsbefore exporting them actually reduces dependency or imprcves terms oftrade prospects. In the case of sisal, for example, where technologicalchange threatens a drastic reduction in the demand for sisal twine,investment in t-wine production may make Tanzania even more dependent onexternal events than when exoorting raw sisal. Although it is possiblethat processing most of its sisal into twine will enable Tanzania to obtaina sufficiently large share of the world market to stabilize the price oftwine, and thus help preserve demand for it, it is equally possible thatdemand for twine will decline anywav. With heavy investment in process-ing Tanzania would have much more at risk. The terms of trade argumentfor a processing strategy is similarly questionable. Processing might
1/ On this measure of efficiency, the production of leather for expor:ranked fourth from the bottom in a comparison of 38 industrialproduction possibilities in 1973. See Roemer, et a', ̀The Range ofStrategic Choice", pp 262-3.
- 13 -
help iron out fluctuations in export prices in some case, but in thehighly competitive industries which Tanzania has proposed entering it ishard to imagine that the prospective price trends would be mcre favorablefor processed products than raw materials.l/
1.28 None of the above criticism is meant to imply that Tanzaniahas ncthing to gain from processing any product for exrort. It would besurprising if na good possibilities existed. However, it is essentialto go beyond identification to analysis of prospects on a case by casebasis. A large margin in price between finished good and raw materialdoes not establish a case for processing. In spite of its limitations,cost-benefit analysis is a necessary step in appraising whether benefitsare commensurate with costs.
3asic Industry Strategy v
1.29 The most fully articulated, and recently the most influential,model of socialist industzial development for Tanzania is the basicindustry strategy. There are two main sources for this strategy:J.F. Rweyemamu, whose aim is to remedy the deficiencies of the ArushaDeclaration with respect to industrial strategy, and C.Y. Thomas, whodeveloped a theory of transformation based largely on Tanzanian experience.2/No attem=t is made in this summAry to give a full exposition of eithersource or to distinguish differences between the two. Although manv ofthe sVecific features of the basic industry strategy as applied to Tanzaniaare new, the model is similar to the Mahalanobis model of developmenrt forIndia and to the strategy of industrialization pursued by the SovietUnion since the late 1920's. 3/
1.30 The goal of the basic industry strategy is to restructureproduction and eliminate dependence on outside forces; industry is seenas the principal agent of structural transformation and self-reliance.The colonial pattern of trade fostered dependence; it resulted in aneconomic struacture in which Tanzania produced what it didn't consume andconsumed what it did not produce. The structure brought about by amaximum growth or a processing stratagy is little better according tobasic industry proponents; a decade after the Arusha Declaration Tanzania's
1/ To take extreme examples, for the past two years the price of sisaltwine has frecuently been below the price of an ecuivalent amount orfiber; and in 1974 and 1975 the price for raw hides and skins exceededthat of wet blue leather. On the latter see Indecentre, "Leather andLeather Goods Industries" (Dar es Salaam: mimeo, April, 1976).
2/ Rweyemamu, Underdeveloament and Industrialization in Tanzaria; andC.Y. Thomas, Dependence and Transformation: The Economics of theTransition to Socialism, (New York: Monthly Review Press, 1974).
3/ The term "basic industry strategy" focuses attention on the structureof production, but the strategy is also concerned with the structureof consumption. In this sense the strategy is closer to the basicneeds approach recently emphasized by the ILO and others.
- 14 -
e 0no''c tsruc-ure still lar"l7 reflects the inherited colonial trade---::r-. a-.¢ ;:ne economy is sill dependent on the world cazitalist systemn_ 'bo.h markets and sup>'-_sof basic consumer and nroducer goods. The
_a -dustr st.ateg~ rcuit transform tihe structure of the economy bybringing prcduction and consur.tion into line. A recur'ring theme in thisstrate2v is the use of "domestic resources for domestic needs". The basicneeds of food, shelter, cloth4ng, health services, transportation, andco a oil goods would all be procduced using domestic resources as 'ar aspossibl a.
1.31 There are major features which distinguish the basic industrys^rategy from other industrial strategies advocated in. Tanzania. First,t'ne strategy emplhasizes the producticn of producer goods. Wherever7possible, of course, producer gocas must use domestic resources, but,he major producer goods with high potential linkages in a modern eccnomy(sceel and other metals, chemicals, glass, rubber, etc.) should beproduced using imported raw materials if necessary. Capital gocdsindustries are oarticularly important because they have high linkagesand externalities, permit the adaptation of production techniques to localconditions, and produce higher growth in the long run. The emphasis ison the production of goods with high linkages; the basic industry strategyuses an input-output matrix of a developed industrial economy to identifypriority investments in the way an import substitution strategy uses_moort dem.and statistics or a processing strategy uses export statistics.
1.32 A second distinguishing feacure of the basic industry strategyis its limitation of consumer preferences in the interest of- restructuringoroduction and using domestic resources. The basic minimal needs of allconsumers, rather than market demand, determine production prioritiesfor consumer goods. A skewed income distribution should not be allowed,o distort production priorities, nor should irrational preference forgoods based on imported raw materials determine production when goodsusing local raw materials can be produced to meet the same aeeds of..utrition, shelter, clothing, etc.
1.33 A third feature of this strategy is i'ts goal of reducing thesnare O-f inte .ational trade in production - the willingness to foregoshort-term gains o' specialization in the interest of reducing dependence.The aim is not complete autarky. It is recognized that Tanzania will bedependent on trade for a long time to come and that this trade willlargely reflect the existing economic structure. In the long run, tradewill be needed to secure advanced technology, some raw materials, andother goods which could be produced only at prohibitive cost. Trade willalso Drov±de a useful vent for surplus production of basic industriesestablished or a larger scale than the domestic market can initiallyabsorb. The direction of policy is clear, however. The strategy has animport-substitution bias for both agriculture and industry. Backward-linkage import substitution, in particular, is strongly preferred overprocessing for export.
- 15 -
1.34 The final distinguishing characteristic of the basic industrystracegy is that costs and comparative advantage do not guide investmentor production decisions. Market prices (including world trade prices)are not regarded as a mean±ngful measure of song-run opportunity costs.Very high comnarative costs of production may impose some constraints;for example, the need to achieve minimum economies of scale may delayproduction. However, it is argued chat the importance of scale economiesis exaggerated and that medium-sized ecoromies l Tke anzania can takeadvantage of recent techinological advances such as relatively small-scalesteel mills which Droduce at competitive prices. But even if rates ofreturn are relatively low, the strategy would still direct investmenttoward industries defined as basic. This might conflict with short-termgrowth, but in the long run it is argued that there is no conflict;only a structure in which production and consumption are congruent canproduce a high and sustainable growth rate in the long run.
1.35 Since the basic industry strategy has influenced plans for thelon'g term industrial strategy, a detailed examination of its strengthsand weakn,esses will be deferred unt-il a later section on cucure strategy.In summary the main drawbacks of the basic industry strategy are that:it has very high requirements for some of the scarcest resources - capital.foreign exchange, and planniLng capacity; cost coasiderations are moreimportant than the strategy acknowledges; and the supposed benefits ofwme basic industries may be illusory.
Smnall-Scale Industry Strategy
1.36 A fourth distinctive strategy sometimes advocated for Tanzaniais a rural-based, small-scale industry strategy. Its advocates maintainthat such a strategy is the most consistent vith socialism, particularlyTanzania's distinctive ujamaa policy, for several reasons. First, itextends the principle of self-reliance to the local level. Each communitywould produce many of its own consumption goods and tools, with productionbased as much as possible on local raw materials. The strategy would alsohelp national self-reliance by reducing the need f4or imports of rawmaterials and advanced equipment. Second, a small-scale industry strategywould promote worker participation in a way which couldn't be done withlarge-scale industry. 'Workers would be using a technology they couldunderstand and would be producing on a scale which lends itself to workermanagement. Third, the strategy promotes equality by bringing industryto the countryside. This helps eliminate the biggest source of inequalitv- the urban-rural gap - and reduces the incentive to migrate to urbanareas. Finally, because it encourages the use of simpler .and more labor-intensive technology, the small-scale industry strategy helps develop theskills of a much larger number of workers. The employment effect of thestrategy thus permits more widespread participation in the direct benefitsof industrialization than other strategies. These direct benefits tosocialist development should not obscure the fact that industry as a wholewould be de-emphasized under the rural based, small-scale industry strategy.Fewer resources would be devoted to industry than under alternativestrategies and industry would not be expected to be the or4mary egent of
- 16 -
development. The main role of industry under the small-scale strategyis as an adjunct to u,amaa. Indus:rv would lend support to agriculturaldevelopment and the la-rgely social and oolitical aims of ujamaa.
1.37 The emphasis of the strate-gy is or. small-scale productioncsing mostly local resources. As =any industrial activities as possiblewould be left to the individual village or to groups of villages workingtogether. Village production would typically incluce mtany consumer goods,building materials, and farm implements. There would still be trade bothbetween villages and with national markets and suppliers, but the emphasiswould be on productionr for local consumption. In this respect, the small-scale strategy is a village-level version of the basic industry strategy.In order to make small-scale oroduction possible, it might be necessaryto override consumer preferences for standardized mass-produced products.The strate-y also implies that cost considerations will be subordinatedwhen these conflict with the goals of small-scale production.
1.38 The most ardent advocates of a rural-based, small-scale industrystrategy are usually foreigners who see this as the logical consequenceof President Nverere's emphasis on rural development and ujamaa socialism.l/In its pure form, where small-scale industry is virtually the only industryand manufacturing is relegated to a very subordinate role, there is noworking model of a small-scale industry strategy. However, a variant ofthe model which is sometimes oroposed is based on Chinese industrialstrategy. In this variant, each village or district would be expectedto be self-sufficient in the production of a large number of simpleconsumer goods, building materials, and farm implements using small-scalemethods of production, but there would -still be national or regionalproduction of heavy industrial products and some consumer goods. Industrywould still play a leading role in development under this variant, butsmall-scale production would be strongly promoted because of its inherentvirtues and in order to save capital and foreign exchange for investmentin essential large-scale industry.
1.39 Most Tanzanian leaders have at some time or oth-er give general-expressions of support for-small-scale industry. Even. the Working ?art7,n Long-Term Industrial Stategy endorsed a program similar to theChinese variant of the small-scale industry: the large-scale zationalsector would be oriented toward basic industry, but small-scale productionwould be encouraged over a substantial range of industries. However,there has been less evidence of meaningful support for a small-scaleindustry strategy in most Government policy actions. The major parastatals
1/ It is doubtful whether President Nyerere himself holds this view.Based on statements such as that quoted earlier from nis introductionto the Second Five Year Plar it would acsear that- hie would not favorliniting industrial develoo-ent tc small-scale village industry, noreven to giving preferenc_ to 'high-cost, small-scale industry.
- 17 -
(with Governmrent approval) have consistent-ly pre-empted opportuni-ties forsmall-scale oroduction by building large factories for mass production ofgoods in which there are small-scale alternatives. Moreover, the Govern-ment has beer. unwilling to override consumer preferences for goodsproduced in large-scale factories,
1.40 This ambi,valence toward sm-all-scale industry reflects, in Dart,the 1i=itacions of th,e strategy itself. lny strategy relying heavily onsmall-scale industry faces formidable obstacles. The first obstacle isthat the scope for small-scale production at a cost approaching that ofmass production may be very limited. The most obvious candidates fo-small-scale ptoductior are: garments, soap, canned food, simple tools,hand-made bricks and tiles, sugar, shoes, and milled grain. Beyond this,few suggestions have been advanced. It is sometimes suggested t;hatChina could provide technical assistance to establish a much broaderrange of small-scale industries. It is crue that the typical Chinesecountry or district produces 'ertilizer, cement, machinery, iron andsteel and energy, but these are not really on a scale suitable for aTanzanian district. The average C'hinese country or district is aboutthe size of tne average Tanzanian region.i/
1.41 The second obstacle to a strategy emphasizin, small-scaleproduction is that consumers have an aversion to many of the possibilitieswhich have been identified because of the cost or quality of the products.Leather sandals, for example, genera2ly cost more than factory-producedrubber or plastic sandals. Small-scale production therefore may conflictwith the goal of providing low-cost footwear to the mass of the population.There is a similar conflict between tiles and galvanized iron roofing;because tiles require much more timber to support them they are sometimesmore expensive roofing material than factory-produced galvanized ironsheets. Ever. bricks may be more expensive than cement in areas wherefirewcod is scarce. Consumers also frequently prefer goods produced ona large scale even if they cost more. For example, one significantpossibility for village industry is the use of hammer mills to grindmaize. However, consumers almost universally prefer the higher-cost, butfiner (and nutritionally inferior), product of large-scale roller mills.There is no evidence tha. the Tanzanian Government is w;illing to overrideconsumer preferences 4n suICa cases in the interest of smal--;^aleproduction.2/
1/ For a brief descriotio. of Chinese industrial policy see D.3. Keesing,"Eccnomic Lessons from China," Journal of Development Economics2(1975) prp 1-32.
2/ However, consumer preferences have been overridden for ot.er reasons.See page 75.
- 18 -
1.42 A final difficulty is that it requires a great deal of planningto integrate small-scale with large-scale production in a socialist economy.Although small -scale oroduction conserves scarce high-level managementresources at the production level, it requires a lot of higah-level r.anpowerat the coordination level. At the very least it is necessary to coordinateplans sufficiently to prevent the ore-em=tion of small-scale opportunities.A serious effort to promote village industry in several sectors wouldrequire the acquisition and dissemination of information on small-scaleproduction techniques, physical controls or market intervention in orderto protect small-scale industry from competition from large-scale productionor imports, and detailed plans for tne integration of small-scale productionof components with large-scale assembly.
Comparison of Strategies
1.43 The four major strategies of industrial development proposedfor Tanzania differ in several ways. The major difference, from whichmany other differences stem, is the conception of industry's role insocialist economic development. For advocates of the maximum growthstrategy, the role of industry is to promote economic developmentthrough rapid growth cf output, foreigr. exchange earnings (or savings),and employment. The focus is on economic development rather than socialism,though the strategy is not necessarily incompatible with socialism;-ndustrial organization, pricing, and incomes policy can help ensureconsistency betweenA Tanzania's broad socialist goals and the efficiencyrequirements of the strategy. The role of industry in both the basicand the small-scale industry strategies is determined by a vision of anideal socialist society. Advocates of the basic industry strategyenvision the possibility of a future Tanzanian economy which is self-reliant and indenendent of the world canitalist system; a particularform of industrial development is required to restructure the economy tomeet this aim. Advocates of the small-scale industry strategy see afuture economy in which small communities work together cooperativelyto produce most of their basic needs; small-scale industry can play animportant auxiliary role in the development of the village socialisteconomv. Supporters of the processing strategy have differing views onthe role of industry, ranging from the promotion of growth to thereduction of dependence. It is doubtful whether a strategy based largelyon processing for export would be effective in promoting either of thesegoals, however.
1.44 A second difference among the strategies is the factors consideredto be most important in choosing what to produce and how to produce it.This follows directly from the different conceptions of the role ofindustry. The maximum growth strategy attaches primary importance to thecost of production because low production costs are the key to profit-ability and economic growth. The basic industry strategy stresses thenature of the product because the productio-n of certain cozmodities isnecessary to achieve desired structural change. The small-scale industrystrategy places most importance on the process of production becausesmall-scale production is essential for worker control and rural self-reliance and equity. Finally, the processing strategy regards the sourceof raw material as the most important ractor in choosing what to produce
-19-
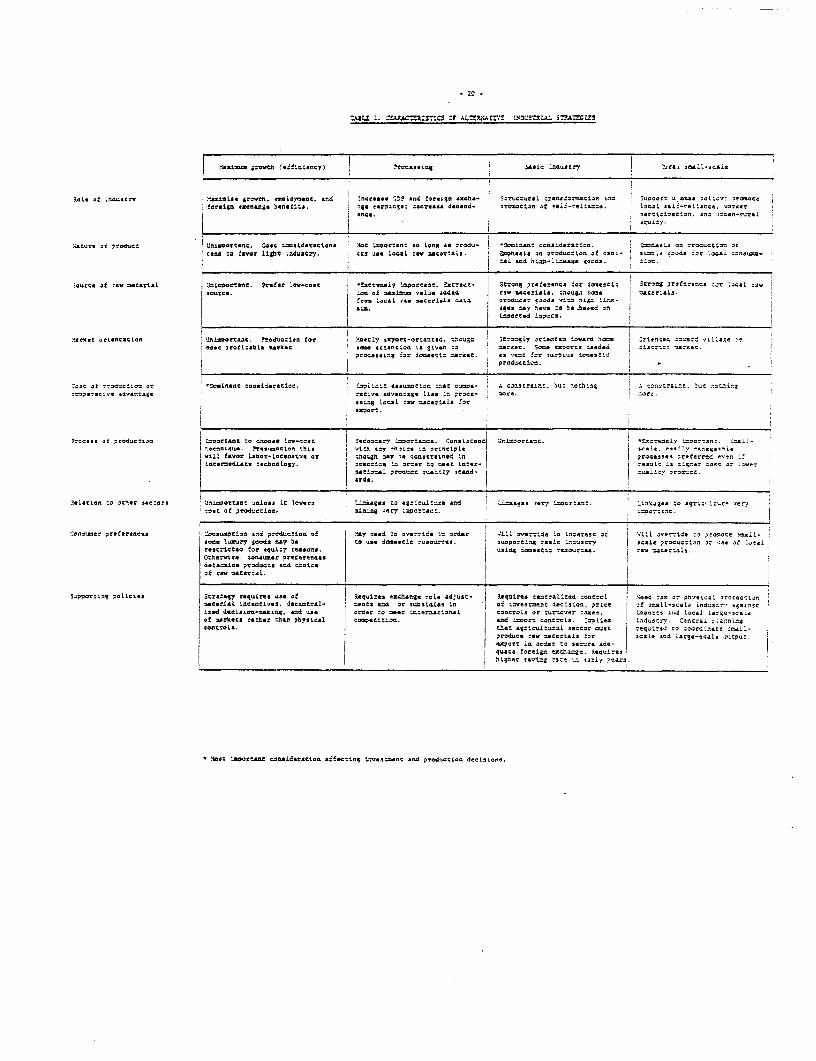
because extraction of maximum value added is perceived as the best way tomaximize growth, prevent exploitation by foreigners, and reduce deoendenceon external markets. Table 1 summarizes additional differences amongststrategies. The summary table highlights differences among "pure" strategies;innumerable variations and differences in emphasis are possible.
1.45 In spite of the conflicting premises upon which the alternativestrategies are based, there is a substantial overlap in the outcomes ofthe different strategies. It is probably fair to say that 80% of theadvocates of contending stragegies would agree on 80% of the products,processes of production, and supporting policies over the next 20 years.There is a large core of products which would be produced under anystrategy (with the partial exception of the pure small-scale industrystrategy): sugar, other processed foods, cotton textiles, beer, tobacco,clothing, wood products, pulp and paper, printing and publishing, PVCplastics, plastic products, fertilizer, paints, glass, cement, metalfabrication, and assembly of trucks and buses. The essential differencesamong the strategies with regard to what is produced are two: timing andemphasis. The shorter the planning horizon the greater are the differencesin investment choices. Over a twenty-year planning horizon, for example,the processing, maximum growth, and basic industry strategies would allinclude additional investment in sugar, cotton textiles, and iron andsteel. However, the processing strategy would sequence investments asfollows: sugar and textiles (including production for export) followedby iron and steel; the basic industry strategy would reverse the sequenceby building a smaller-scale (and higher-cost) steel mill immediately;and the maximum growth strategy would delay investment in iron and steelfor several years until a larger-scale and lower cost plant could beconstructed. Both the maximum growth and basic industry strategieswould probably restrict production of sugar and textiles to the domesticmarket, though for different reasons. At the margin each of the strategieswould emphasize different industries, but there would still be a largenumber of industries and production processes common to all strategies.It was because of this substantial overlap that agreement on a long termindustrial strategy was possible in spite of apparently irreconcilabledifferences in the premises on which the conflicting strategies werebased. A detailed examination of the proposed long-term strategy isundertaken in a later section.
-iJ2 1. 'AAC-Z2tI1C J AL-3J;ArI' 2 lp.IA1. SA r!c;s
| .tLoa grswch (sfialcecy) a rcssLo 34aac inustoy '.r.1 saui l-cala
.L. Pi L.ndustr.C ....... .owt.h ouoLapsP *nd d? rse 0th.- -5rs Lccu ro far-tian and S!oonetr: oss :oL:c7; -e-C! forign xaegse;. oa-sefte. | earning; d..:.... tdalnd- ' arneatlon of caij-es.oc. local eeit-rnllanne Macca
uc-?5 of 7rdunc! 'niacetnt. Coat cracsidsr.iono I .St I.ocrtnt so Lang aX a rodu- 3-ir.nc c nsidasz:ila. pfehash an orodutcian or-and .O !Svor light lzduacry. uces ot l'ocl rav ac*rilis. &IphasiL on .rad'c:lan of :o.L- -sLI. ;a..da far Las ranos
j I :aL sad~~~~co hian-lza.ga goon.. tIn
z-urc a raw mcartel Jnaoortsce. frfl r low-cas !.n ty Ilpertanc. Ucract- Strng p?refrersca for ISaustic Screng preference for L cal Iawsaute.. :neof at n L-, addscd re c na rici _ J :h or. erai..
ala. L;c- L: v Y;wrt L =e L | ages =xy have o be t ..sed an
Ysnasc ari-nattSton | Crolaparca . Prduction tan Meetcly exyrpor-erlan:ca Ohuh ongf ;rvLy ortatccnd togard Marcc j naactd :004,5 otUago Mrjase prafLtablo nekac i ottanntica L. S- .:. .c... San -len: :s adad 1iuc:- rte:
{ | ~~~~~~~~PronaesLc% far docastlc :mrktht ' s rent far surplus :ausstt
.one ad rroda: o, or LcJ. %si ad.r.ln ImaidcLt *.nton:; -0-: uoaec- A b.nonatr: Mu: natas i S: t _c a:: ::Lrgc= rsv advantage [ j rle±ve advontcgs lisa In .. a.a- acts. Pr.re.!
j ^sal3ing al ra v tr±orala for!
_ .- _ fa
prone. a prO. antcoa I rcpr-:ant to alOe.. Ins-cast i Ocendsry Iinas:nnta. CaIaLu..nt Untncarsn cinaroOclY zccrcan: Sr i.-r eoneique. Presainottor :inta c7tch ay onates to principle arjnie.k eastLy eranaeacia
I v.11 favor i oar.Ltoansh or Ihno gn 3. se anacrtaled LIn praos.. urederrod -e.n fincarin.dLazt :.nhosLsgy. Practice In ardr to neat lnter- j r.auL S hIgher :c.. ar Lacer
patealn L renue qatitcystand. 3 | qu.i0y srsdsac.ards. [ tj
felotIao ta cher nr:a -agro sunles iC Lpre -.aaes Ia sgres l.tars and .LL=k.gaa racy inpat:aoc. Iinsaa :a agr:aalr.re .eryn ost a produetie. l 0407 -orcc. !Lar:atI
Cans--er prefer.e.e. !acaUnetcis and praductian of SAY ... t to aorrita in u:der Will override in ... erest o S dtil override :0 -rtee naIL-ce. iSurY SOods at7 a ca u-. do-iscn rsaurnet. esiporciog ba.ia '-n-usry -a.ia oroductIon Mr M -of Lcul
rlocrtetsd for equiTy reasons, oscag iceactiz rcaaurtoa rig nartaicOrthes . .. .o s-r presr suce dts=teea produt *. end h;I'f rest nataniaUL.' °
Saapponr:ig colicies Str.--:e rquir.. of legumeahang. -. La dfast- Rsquirt. calrid croa . r. a...
macctal ltc.uetl . taneetr. i- ents .td or s-idLes i j of Inveatneet icIsioa, price of rnll-saclo ied:srr'a- str-cIo d dsiai -ain. nd us order :eatc iaternantass.e anetrais or :.rnavcr caars pcrco and lan -argn-aeaoaf nras.ca rather tahe physical I Po.pecita. and aotr: :a-tri. L.:o IatAatr. Cun.r.. - ain.n..
c -.ris. cst: ag:Iasalturil "ctr oCust -equ-ret ta acuriino:t Snail-prods tav materIal, far scalaend Larg.-.eais outec.BtPcrt in ord.r no s-cure cd-4rotto forecgn 'ccran as .- legue
higt o-ing Ite Aoo ta*-1 7nde.
oMost tnprtast w"nid.acti.a.efetn to-ecan and produ-tiondoiias
- 21 -
CHAPTER II. INDUSTRIAL DEVELOPMENT SINCE INDEPENDENCE
A. Overall Growth
The Data Base
2.1 This section attempts to describe what has happened to aggregatemanufacturing output during the period from the mid-60's through 1975,and to analyze why the sector has performed as it has. It is possible toobtain a fairly good picture of what has happened to manufacturingoutput over the period, but statistics for the sector are no: sufficientlycomprehensive, accurate, or comparable.to establish with certainty whyoutput has grown as it has. National accounts statistics give estimatesof total manufacturing and handicrafts value added in both current andconstant prices for 1964-75.1/The same source provides estimates of invest-ment by sector in current prices for 1966-73 and total investment incurrent and constant prices for 1964-75. The annual SurveV Of TndustrialProduction provides estimates of gross output, value added, and severalother variables (not including investment) in current prices for thelarge-scale manufacturing sector (firms employing ten or more workers)for the period 1965-73. However, coverage and the response rate of thissurvey vary slightly from year to year and some of the individual firmreturns are unreliable. In spite of these data limitations some ir.er-ences have been drawn about the performance of the manufacturing sector,but these should be regarded as a set of hypotheses rather than establishedfact. In later sections scattered evidence on the performance of indivi-dual firms or sub-sectors will be presented in an attempt to clarifyfurther what has been happening in the manufacturing sector.
1/ The implicit GDP deflator for industry has some limitations. In someindustries, employment is used as a proxy for quantity of output andthe quantity indices fail to take account of backward or forwardintegration in some industries. This tends to understate the growthof real output and overstate price increases. An opposite biasprobably occurs as a result of the inclusion of new industries sincethe base year of 1966; these new industries are likely to have a higherratio of value added in domestic prices to value added in world pricesthus overstating the real growth of output in world prices resultingfrom the addition of new industries. In spite of these limitations andbecause of offsetting biases the implicit GDP deflator for industryseems to be a reasonably reliable index. A comparison with other priceindices over the period 1966 -75 shows that the implicit GDP deflatorfor industry is very much in line with comparable indices. The 1975indices (1966 = 100) for several price measures are as follows: implicitGDP deflator for industry 194.1; implicit total GDP deflator 175.8;implicit equipment price index 202.5; World Bank international inflationindex (SITC sections 5-8 of industrialized countries exports in U.S,dollars) IU.t.
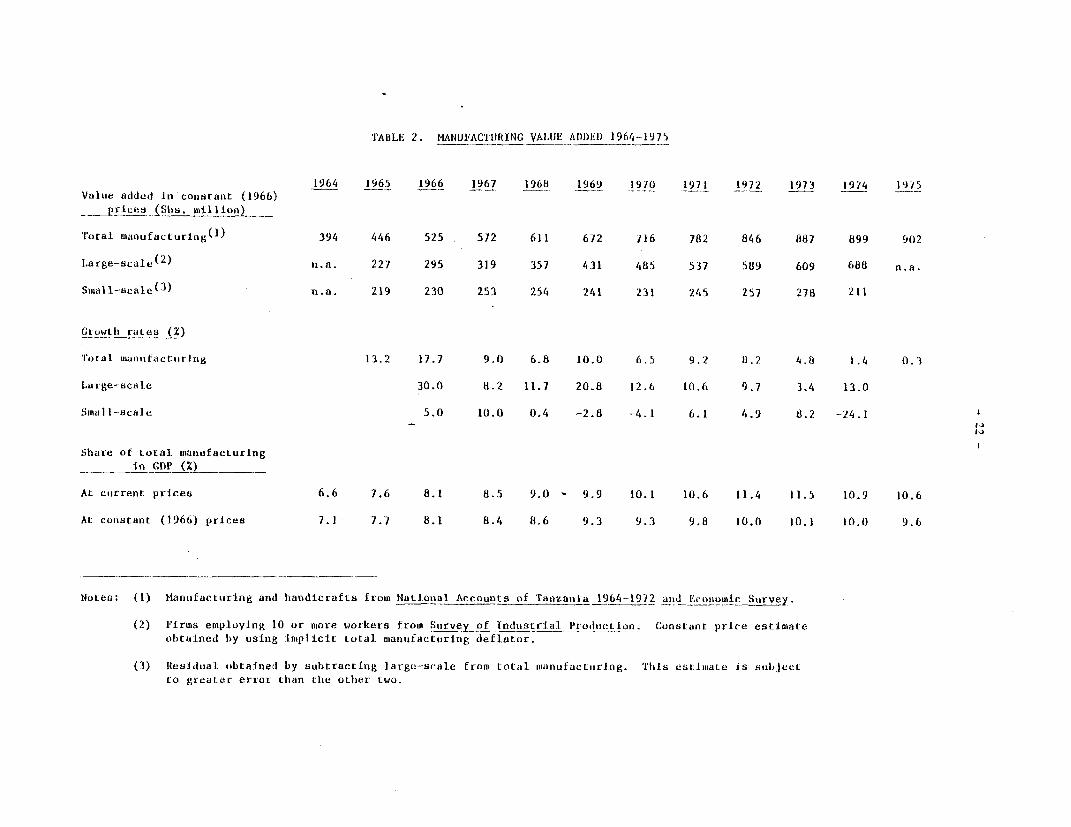
TABLE 2. MANUFACT1RING VALUE ADDED 1964-1975
1964 1965 1966 1967 1968 1969 1970 1971 1972 1973 1974 1975
Value added in constant (1966)pricea S. million)_
i'otal inanufacturing(l) 394 446 525 572 611 672 716 782 846 887 899 902
Large-scale(2) n.a. 227 295 319 357 431 485 537 589 609 688 n.a.
Small-scale(3) - .a. 219 230 253 254 241 231 245 257 278 211
Growth rates (2)
'I'otal manuftacturlig 13.2 17.7 9.0 6.8 10.0 6.5 9.2 8.2 4.8 1.4 0. 3
Lavge-scale 30.0 8.2 11.7 20.8 12.6 10.6 9.7 3.4 13.0
Small-scale 5.0 10.0 0.4 -2.8 -4.1 6.1 4.9 8.2 -24.1
Share of total manufacturing_ in GDP (2)
At current prices 6.6 7.6 8.1 8.5 9.0 - 9.9 10.1 10.6 11.4 11.5 10.9 10.6
At constanL (1966) prices 7.1 7.7 8.1 8.4 8.6 9.3 9.3 9.8 10.0 10.1 10.0 9.6
Notes: (1) Mantifacturing and handicrafts from National Accounts of Tanizania 1964-1972 a_d Econonmtx_c Survey.
(2) Firms employing 10 or miore workers from Survey_of Indtistrial Production. Constant price estimate
obtained by using impi icit total maniufacttiring deflator.
(3) Residual obtained by subtracting large-scale from total maniufactuiring. Tils estimiate is subject
to greater error than the otiher two.
- 23 -
Output
2.2 Manufacturing output has more than doubled since the early post-independence period, the average annual ra-e of real growth in manufactu-ring 1964-75 was 7.8% compared to an average growth ra.e of 4.o% of totalGDP. Growth was even more vigorous prior to the economic crisis of 1974-75;-rom. 1964-73 the annual aterage rate cf growh of manufacturing was 9.4%compared to an average growth of 5.1% for the entire economy. The shareof manufacturing in total output increased from 6.6% in 1964 to 11.5% in1973, buc has slipped back. to 10.6% in 1975 as a result of the stagnationcf industr4al output during 1974 and 1975.1/
2.3 Large-scala manufacturing has expanded particularly fast -- by13.1% per year from 1965-73 compared to 9.0% for total manufacturing.Small-scale manufacturing and handicrafts appear to have grown more slowly(3.0% average annual growth 1965-73), but this is an estimate subject toa higher degree of error._/_
1/ Thais is the share of manufacturing in current 4rices. As Table 2 shosmanufacturing as a percentage of total GDP in cornstant prices increasedby less - from 7.1% in 1964 to 10.1% in 1973. This means that Oar. ofthe increased share of manufacturing output in current prices was dueto an increase in the relative price of manufactured coods. This mayreflect either an increased level of protection for the manufacturingsector during the period or a change in relative world prices, probablyboth.
2/ According to the Ministry of Industries there has been a decli'ne irn theresponse rate of small-scale industries to surveys in recent years withthe result chat small-scale production may be underestimated. TheSmall-Scale Industry Development Organization (SIDO) is conducting aninventory of all small-scale firms and believes there may be around4,000 firms operating in 1977. Assuming that there were 4,000 small-scale firms in 1973, that each firm employed 10 workers, and that valueadded per worker was Shs. 14,400 (the equivalent of VA per worker inlarge-scale enterprises), then value added in current prices from thesmall-scale sector in 1973 would have been Shs. 576 million. This is38% higher than the actual estimate derived from official statistics.However the assumptions used to estimate the higher figure are undoubtedlybiased upward so that it is not clear that the official statisticsunderestimate small-scale industrial production much, i' at all, urtil1974.
-4- t; -
2.4 Although t'ne a-rae a aca 3: g 0ro7th has been high, t-e rate o'growth has been sloSng r -'s ese-4' 4 > mar;ted ln 197' and 1975when manufacturing output irtla'7 san-ted. Capacity continued toexpand in 1974 and 1975. but ,-_.. :an u-nceruzi ized capacitv emerged.This was largely due ro s^_ no- I - c ..S rc:cer thnan to a decline indemand. There was e:xcess _c._c r fz'-us-il goods but productionwas not forthcoming for a s: e, asonsh: s:r:ages of lccally-oroduced raw materials o';_g t_h :r ig- and azriculcurai oroductlonproblems; di'ficulties in obra-'ni *-:-:ate _ :nol es of ut l-ities,particularly water and elae'ri nd; dashOr tage o f spare parts, rawmaterials and transport, owing in part to th severe import restrictionsintroduced to deal with the foreign Zx<change cris:s.
2.5 Of more concern th.an _he recent stagnation is the apparentdecline in growth of industrial utou. t orno to 1974. Table 2 shows chatthe annual rate of growth in larrge-scale anu-rac:uring declined each yearfrom 1969-73. Splitting the 8-vear -er-' 1965-73 -r half, the averageannual growth rate of large-scai manu:acturi-n was 9.0Y from 1965through 1969, but only 9.0% f'rom the end off 1969 through 1973. To someextent this may reFlect the ver-- lcw oase __m wnhich growth started in1965. However, it is worrving that the growth race had declined to only3.4% bv 1973. Analvsis of investmen-t and eno1m,iaent trends revealsthat the slowing rate of growth of ranufacturnig outout bet77een 1969 and1973 reflects something m.ore than an enl2ared 'ndustrial base.
Investment
2.6 Table 3 shows investment (fixed cacital for-ation) inmanufacturing from 1966-1973. The absolute amount of investment inmanufacturing in real terms increased sharply in 1970 and 1971 and thendeclined again in 1972 and 1973; avera,e inr.estment in real terms inmanufacturing rose from Shs 173 m4illiorn in 18-69 to Shs 297 millionin 1970-71, before falling back to Shs 32 -million in 1972-73. Sectoralinvestment Figures are not available for 1,974 an.d 1975, though we cnonwthat substantial parastatal investment in manufacturing continued tobe made while total invescment in t'ae economy increased sl4ghtly overthe 1973 level. Manufacturing investment as a share of total investmentbegan to decline a year before the decline in the absolute amount;manufacturing's share peaked at 1.4% in 1970, decliring to 11.7% in1973.
2.7 The decline in manufacturing investment is onl- a small ?art ofthe reason for the decline in the growth rate of manuracturing output,however. In the first place, the h iav investment of 1970 and 1971should have yielded increased out-ut ir. .971-1973, the very years thatthe growth rate was decli--nin. ianufactur lng vestmeac -s a pcrcentage
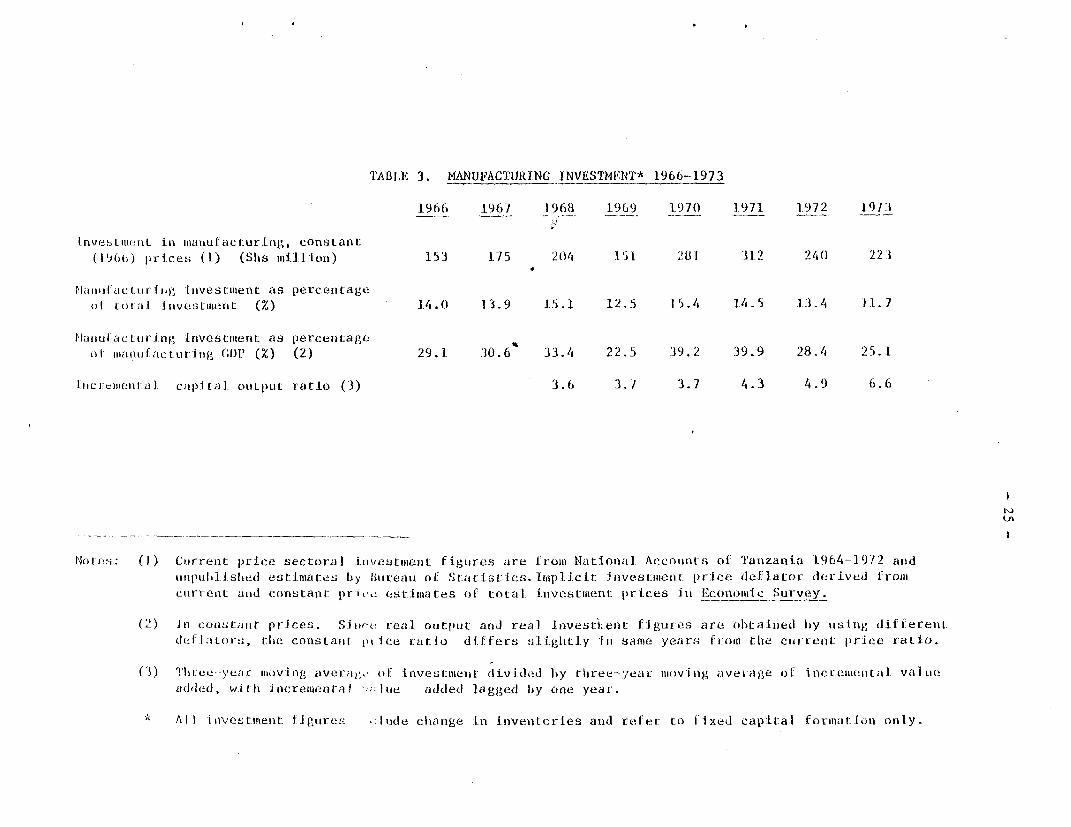
TABlE 3. MANUFACTURING TNVESTMENT* 1966-1973
1966 1967 1-9668 1969' 197( 1971 1.972 19 73.
lnvesLmtnt in mantiufacturing, constant(I.9)(1) prices (1) (Slun mIlli.on1) 153 175 204 151 281 112 240 2 23
Mamifiiac hrio)- investment as percentageOf tLotl ilvestment (%) 14.0 13.9 15.1 12.5 15.4 I/ .5 13.4 11.7
Hamn-ufactmri ng investment as percentageof manufacturing (;CP (%) (2) 29.1 30.6 33.4 22.5 39.2 39.9 28.4 25.1
IncremljentaJ. capi tal outputit ratio (3) 3.6 3.7 3.7 4.3 4.9 6.6
Notes: (I) Culrrent price sectoral im)\'estment figures are Ifronm National Accounts of Tanzania 1964-1972 and
uinpublJ1ished estfliiates by llureati of SltcistcLcs. impli.cit lnvesutllent price (leflator (lerived frolil
current antd constant -rir estilmates of total iLnvestment prices ill Economic Survey.
(2) In coOstauIt: prices. Siw (t real output and real investit-ent figures are obttained by using dif ferenii
de f .Itorts, tlhe constant olice ratio difffers slightliLy In sanme years from the cutrrent price rati.o.
(3 ) Three-year moving averal (if investtineLn divided by thiree-year mioving average of increlmkental valune
aidded, wit:h incrementa I u I tie added lagiged by o)ne year.
' Al I investimient figures .:lude change in invenitci-ies and refer to Ifixed capital formatiJon only.
- 26 -
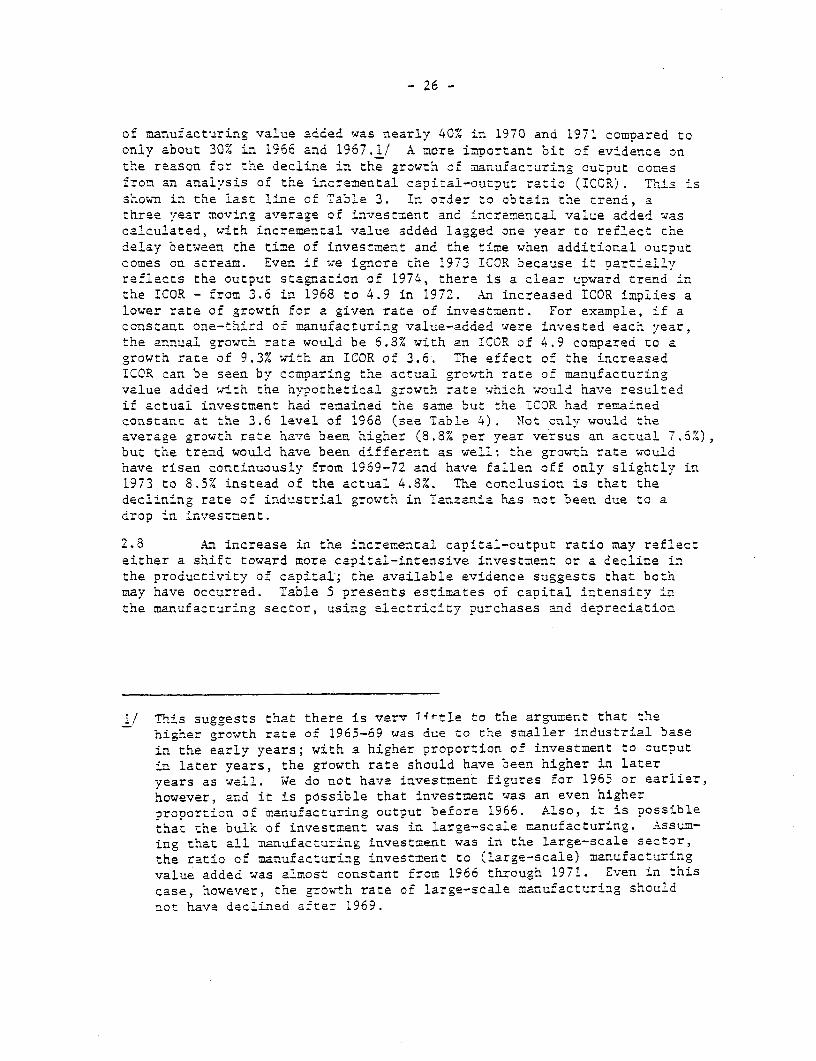
of manufacturi.ng value added was nearly 40% in 1970 and 1971 comnared toonly about 30% in 1966 and 1967.1/ A more important bit of evidence onthe reason for the decline in the growth. of manufacturing output comes-rom an anal-vss of the incremental cait-al-outvut ratio (ICOR). This isshown in the last line of Table 3. Lr order to obtain tie trend, athree vear moving averaze of investment and incremental value added wascalculated, with incremental value added lagged one year to reflect thedelay between the time of investment and the time when additional outoutcomes on stream. Even if we ignore the 1973 ICOR because it oartiallyreflects the output stagnation of 1974, there is a clear upward trend inthe ICOR - from 3.6 in 1968 to 4.9 in 1972. An increased ICOR implies alower rate of growth for a given rate of investment. For example, if aconstant one-third of manufacturing value-added were invested each year,the annual growth race would be 6.8% with an ICOR of 4.9 compared to agrowth rate of 9.3% with an ICOR of 3.6. The effect of the increasedICOR can be seen by comparing the actual growth rate of manufacturingvalue added with the hypochetical growth rate which would have resultedif actual investment had remained the same but the 1COR had remainedconstant at the 3.6 level of 1968 (see Table 4). Not only would theaverage growth rate have been higher (8.8% per year versus an accual 7.6%),but the trend would have been different as well: the growth rate wouldhave risen continuously from 1969-72 and have fallen off only slightly in1973 to 8.5% instead of the actual 4.8%. The conclusion is that thedeclining rate of industrial growth in Tanzania has not been due to adrop in investment.
2.8 An increase in the incremental capital-output ratio may reflecteither a shift toward more capital-intensive investment or a decline inthe productivity of capital-; the available evidence suggests that bothmay have occurred. Table 5 presents estimates of capital intensity inthe manufacturing sector, using electricity purchases and depreciation
1/ This suggests that there is verv l41tle to the argument that thehigher growth rate of 1965-69 was due to the smaller industrial basein the early years; with a higher proportion of investment to outputin later years, the growth rate should have been higher in lateryears as well. We do not have in.vestment figures for 1965 or earlier,
however, and it is possible that investment was an even higherproportion of manufacturing output before 1966. Also, it is possibleth.at the bulk of investment was in large-scale manufacturing. Assum-ing that all manufacturing investment was in the large-scale sector,the ratio of manufacturing investment to (large-scale) manufacturingvalue added was almost constant from 1966 through 1971. Even in thiscase, however, the growth rate of large-scale manufacturing shouldnot have declined after 1969.
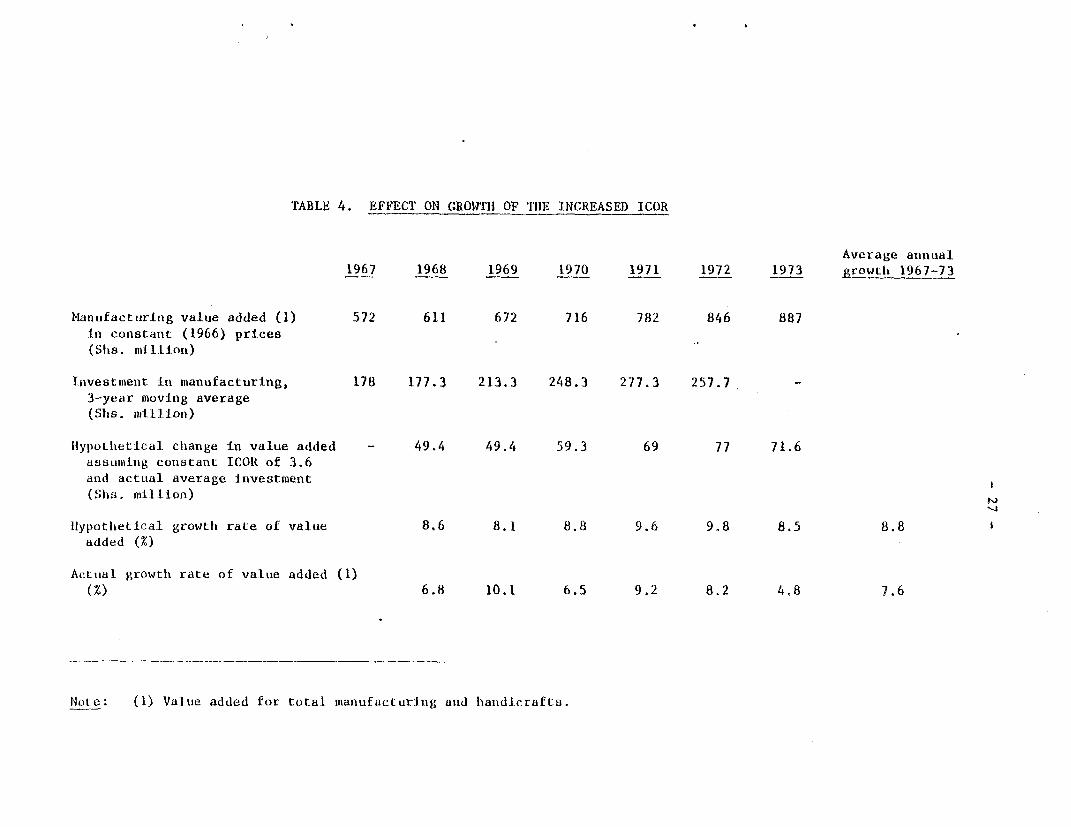
TABLE 4. EFFECT ON GROWTII OF 'IIIE INCREASED ICOR
Average annual1967 1968 1969 1970 1971 1972 1973 growth 1967-73
Manufacturilng value added (1) 572 611 672 716 782 846 887
in constant (1966) prices(Shis. million)
Investment in manufacturing, 178 177.3 213.3 248.3 277.3 257.7 -
3-year moving average(Sha. million)
hlypothietical change in value added - 49.4 49.4 59.3 69 77 71.6assumiiilng constant ICOR of 3.6and actual average investment(Shis. million)
Hypothetical growth rate of value 8.6 8.1 8.8 9.6 9.8 8.5 8.8
added (%)
Actual growth rate of value added (1)(%.) 6.8 10.1 6.5 9.2 8.2 4.8 7.6
Note: (1) Value added for total manufacturing and hanidicrafts.
TABLE 5. CAPITAL-OUTPUT AND CAPITAL-LABOR RATIOS IN LARGE-SCALE MANUFACTURING 1965-73
1966 1967 1968 1969 1970 1971 1972 1973 1974
Electricity purclhases as proxyfor capital:
Capital-output (1) .156 .181 .173 .218 .232 .231 .246 .255 .255
Capital-labor (2) 1.52 1.85 1.62 2.16 2.32 2.32 2.33 2.50 2.49
Depreciation in constant (1966)prices as proxy for capital:
Capital-output (3) 1.57 1.76 1.60 2.03 1.97 1.83 2.06 2.42 2.31
Capital-labor (4) 15.3 18.0 15.0 20.4 20.1 18.7 20.5 23.6 22.5
Source: Survey of Industrial Productioni \
Notes: (1) kwh per shilling value added In constant (1966) prices(2) Thiousand kwlh per worker(3) Caletulation of depreciation in constant pri.ces explained in Table 6(4) Thousand shillings per worker
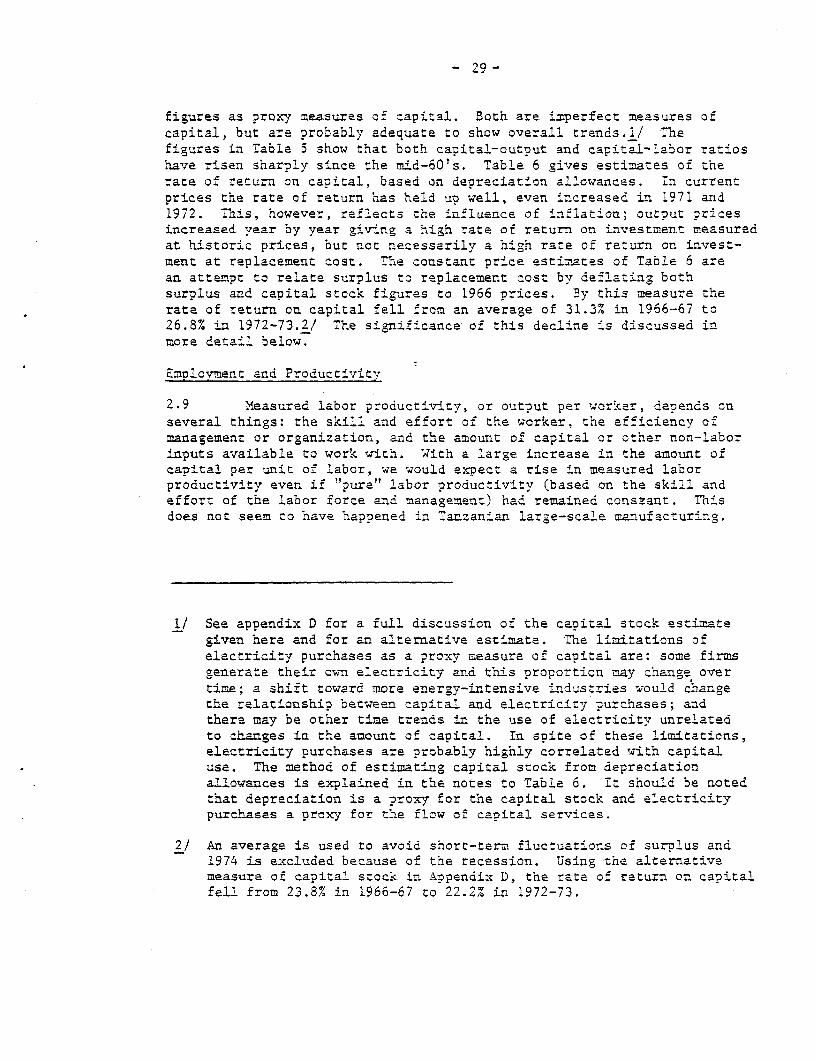
- 29 -
figures as proxy measures of capital. Both are imperfect measures ofcapital, but are probably adequate to show overall trends.l/ Thefigures in Table S show that both capital-output and capital-labor ratioshave risen sharply since the mid-60's. Table 6 gives estimates of tnerate of return on capital, based on depreciation allowances. In currentprices the rate of return has held up well, even increased in 1971 and1972. Tais, however, reflects the influence of inflation; output pricesincreased year by year giving a high rate of return on investment measuredat historic prices, but not necessarily a high rate of return on invest-ment at replacement cost. The constant price estimates of Table 6 arean attempt to relate surplus to replacement cost by deflating bothsurplus and capital stock figures to 1966 prices. By this measure therate of return on capital fell from an average of 31.3% in 1966-67 to26.8% in 1972-73.2/ The significance of this decline is discussed inmore detail below.
EmploymerXe and Productivity
2.9 Measured labor productivity, or output per work.er, depends onseveral things: the skill and effort of the worker, the efficiency ofmanagement or organization, and the amount of capital or other non-laborinputs available to work with. With a large increase in the amount ofcapital per unit of labor, we would expect a rise in measured laborproductivity even if "pure" labor productivity (based on the skill andeffort of the labor force and management) had remained constant. Thisdoes not seem to have happened in Tanzanian large-scale manufacturing.
1/ See appendix D for a full discussion of the capital stock estimategiven here and for an alternative estimate. The limitations ofelectricity purchases as a proxy measure of capital are: some firmsgenerate their own electricity and this proporticn may change overtime; a shift toward more energy-intensive industries would changethe relationship between capital and electricity purchases; andthere may be other time trends in the use of electricity unrelatedto changes in the amount of capital. In spite of these limitations,electricity purchases are probably highly correlated with capitaluse. The method of estimating capital stock from depreciationallowances is explained in the notes to Table 6. It should be notedthat depreciation is a proxy for the capital stock and electricitypurchases a proxy for the flow oL capital services.
2/ An average is used to avoid short-term fluctuations of surplus and1974 is excluded because of the recession. Using the alternativemeasure of capital stock in Appendix D, the rate of return on capitalfell from 23.8% in 1966-67 to 22.2% in 1972-73.
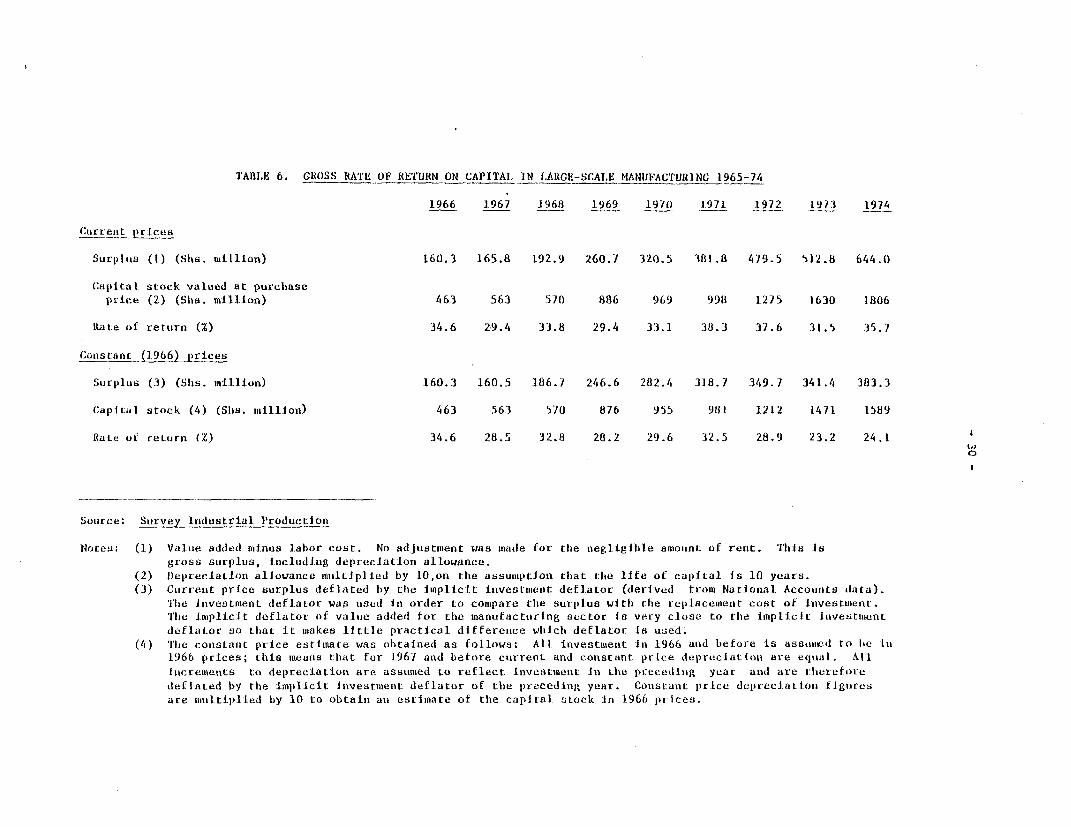
TABLE 6. GROSS RATE OF RETURN ON CAPITAI. IN LARGE-SCALE KANUFACTURlNC 1965-74
1966 1967 1.968 1969 1970 1971 1972 1973 1974
Curir nt pricesa
SurplIts (1) (Sits. million) 160.3 165.8 192.9 260.7 320.5 381.8 479.5 512.8 644.0
Capital stock valued at purchaseprice (2) (Shs. million) 463 563 570 886 969 998 1275 1630 1806
ltate of return (Z) 34.6 29.4 33.8 29.4 33.1 38.3 37.6 31.5 35.7
Constant (1966 rices
Surplus (3) (Shs. million) 160.3 160.5 186.7 246.6 282.4 318.7 349.7 341.4 383.3
CapiLtal stock (4) (Slhs. million) 463 563 570 876 955 981 1212 1471 1589
Uate or return (Z) 34.6 28.5 32.8 28.2 29.6 32.5 28.9 23.2 24.1 a0
Soberce: Survey industrial lProductioni
Notes: (1) Value added minitis labor cost. No adjustment was made for the negligible amiiouint of rent. 'lis isgross surplus, including depreciation allowance.
(2) Depreciation allowance multiplied by 10,on the assumiiption that the life of capital is 10 years.(3) Current price surplus deflated by the implicit investment deflator (derived from National Accounits *lata).
lhe investment deflator was tised in order to compare the surplus with the replacement cost of investmiient.lhe imiplicit deflator of value added for the mtanufacttiring sector is very close to the implicit Investment
deflator so that it makes little practical difference whichi deflator is used.(4) 'Ihe constant price estimate was obtained as follows: All investimient in 1966 and betore is assummcd to lie In
1966 prices; this meanls thdt for 1967 and before current and conistant price depreciation are ejlual. Alllincremiients to depreciation are assumiedt to reflect investmenit in the precedilng year andi are thereforedeflated by the implicit investment deflator of the preceding year. Constanit price depreciation figulresare miiultiplied by 10 to obtain ani estimate of the capital stock in 1966 prices.
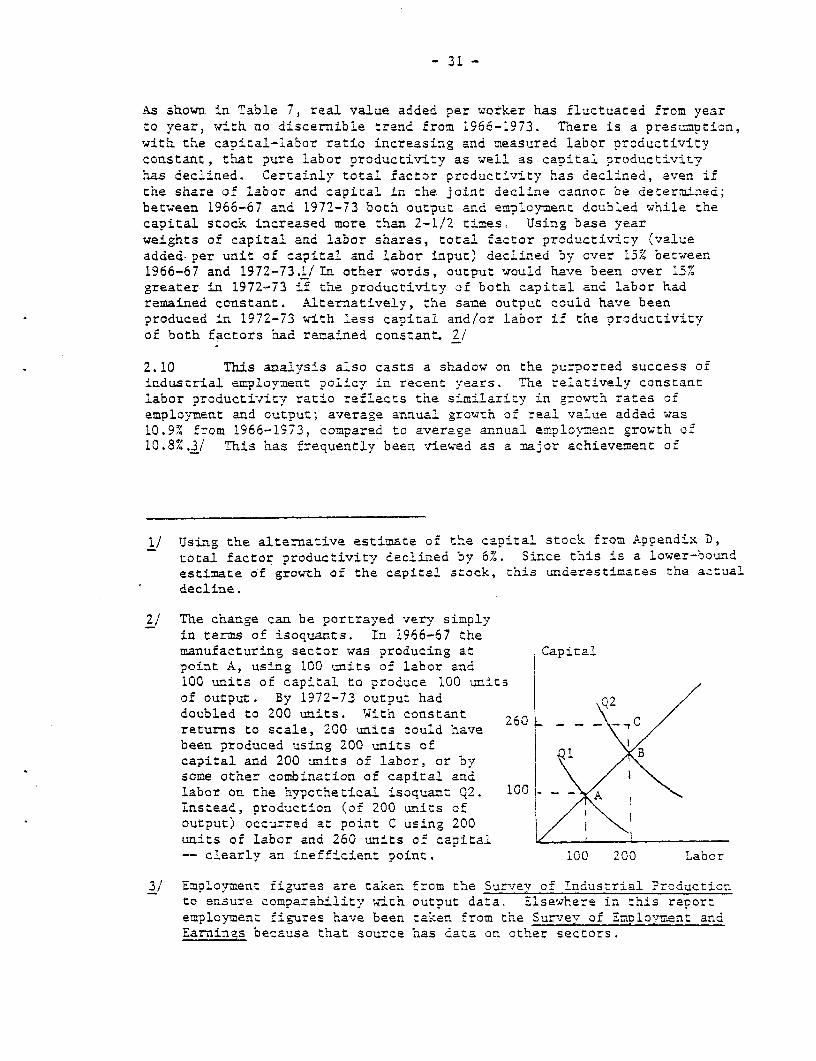
- 31 -
As shown in Table 7, real value added per worker has fluctuated from yearto year, with no discernible trend from 1966-1973. There is a presumpticn,withl the capital-labor ratio increasing and measured labor oroductivityconstant, that pure labor productivity as well as capital productivityhas declined. Certainly total factor productivity has declined, even ifthe share of labor and capital in the joint decline cannot be determined;between 1966-67 and 1972-73 both output and emnloyment doubled while thecapital stock increased more than 2-1/2 times. Using base yearweights of capital and labor shares, total factor productivity (valueadded per unit of capital and labor input) declinred by over 15% between1966-67 and 1972-73.1/ Tn other words, output would have been over 15%greater in 1972-73 if the productivity of both capital and labor hadremained constant. Alternatively, the same output could have beenproduced in 1972-73 with less capital and/or labor if the productivityof both factors had remained constant. 2/
2.10 This analysis also casts a shadow on the purported success ofindustrial employment policy in recent years. The relatively constantlabor productivity ratio reflects the similarity in growth rates ofemployment and output; average annual growth of real value added was10.9% from 1966-1973, compared to average annual employment growth of10.8%.3/ This has frequently been viewed as a major achievement of
1/ Using the alternative estimate of the capital stockL from Appendix D,total factor productivity declined by 6%. Since this is a lower-boundestimate of growth of the capital stock, this underestimates the actualdecline.
2/ The change can be portrayed very simplyin terms of isocuants. In 1966-67 themanufacturing sector was producing at Capitalpoint A, using 100 units of labor and100 units of capital to produce 100 unitsof output. By 1972-73 output had Q2doubled to 200 units. With constant 260 Creturns to scale, 200 units could have 2 - - Cbeen produced using 200 units ofcapital and 200 units of labor, or by 1some other combination of capital andlabor on the hypcthetical isoquant Q2. 100 - , AInstead, production (of 200 units ofoutput) occurred at point C using 200units of labor and 260 units of capital-- clearly arn inefficient point. 100 200 Labor
3/ Employment figures are taken from the Survey of Industrial Productionto ensure comcarability with output data. Elsewhere in this reportemployment figures have been taken from the Survey of Empoyment andEarninzs because that source has data an other sectors.
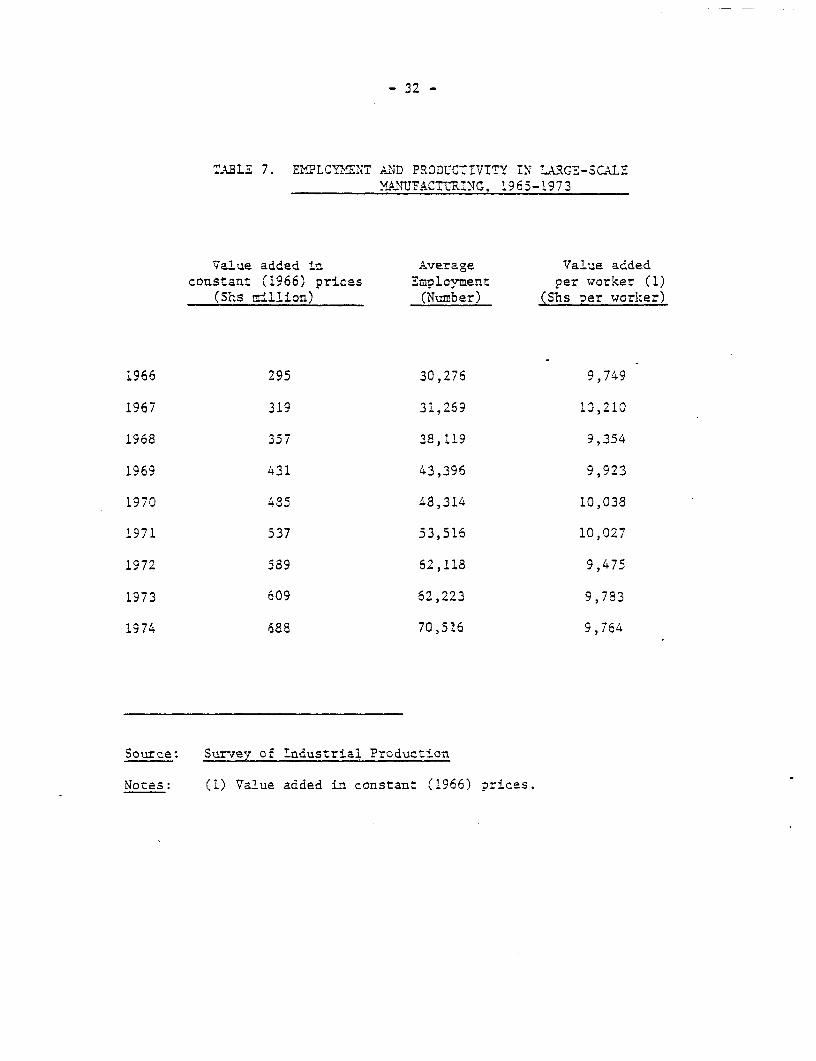
- 32 -
TABLE 7. EMPLOYMENT AND PRODUCTIVITY IN LARGE-SCALEY-1-UFACT'URING, 196;-1973
Value added in A;verage Value addedconstant (1966) prices Employment per worker (1)
(Shs mill±on) (Number) (Shs per woriker)
1966 295 30,276 9,749
1967 319 31,269 1.0,210
1968 357 38,119 9,354
1969 431 43,396 9,923
197-0 485 48,314 10,038
1971 537 33,516 10,027
1972 i89 62,118 9,475
1973 609 62,223 9,783
1974 688 70,516 9,764
Source: Sur-7ey of Industrial Production
Notes: (1) Value added in constant (1966) prices.
- 33 -
industrial policy in recent years. However, increased em0loymen.t is onlydesirable so long as the extra workers produce additional outpur orsubstitute for other inputs. As noted above, this did not happen. Outputincreased at the same rate as emplovment, but the size of the capi'calstock iacreased even more. Given the increase in investment, eitheroutput shculd have increased more or employment should have increasedless and the extra workers used to produce output elsewhere in the economy.Or, since the decline in relative wages should have encouraged the substi-tution of labor for capital, output and employment grovth might haveremained the same with considerably less investment in the manufacturingsector.
Wages and Labor Costs
2.11 Table 8 shows the effect of incomespolicy on labor costs inmanufacturing. The real average cost per worker (real product wage)declined for several years after the introduction of an incomes policyin 1967. The real product wage rose again in 1973 following the largewage increase of mid-1972. The declining cost of labor seems not tohave discouraged investment in more capital-intensive techniques andsectors, but neither does it seem to have encouraged the substitution ofcapital for labor. It seems rather to have enabled firms to expand bothemployment and investment more rapidly than Justified by the incrementaloutput obtained. The declining real product wage in fact masks theextent of the fall in the real rate of return on capital. From the datain Table 6, it was shown that the rate of return on capitel at replace-ment cost fell from 31.3% in 1966-67 to 25.8% in 1972-73. "However, thereal product wage fell from Shs 4679 to Shs 4068 in the same period. Ifthe real product wage had remained constant, the rate of return on Icapital would have been only 23.0%. 1/
Overview of Aggregate Performance
2.12 Table 9 summarizes the main aggregate trends in large-scalemanufacturing from 1966-67 to 1972-73. From this table and the previousdiscussion, the following picture emerges.
2.13 Aggregate manufacturing production grew rapidly between the mid-60's and the onset of the economic crisis in 1974. However, the rate ofgrowth slackened after 1970 largely due to an increase in the incrementalcapital-output ratio. An increasing ICOR combined with constant outputper worker implies that the joint productivity of capital and labor wasfalling. Although the nominal rate of return on capital held up, the realrate of return on assets valued at replacement cost fell. Firms appearto have been generally unresponsive to market trends. Capital goodsprices remained constant in terms of final product prices, but real productvages fell; nevertheless, this fall in the relative price of labor did notencourage more labor-intensive investments, nor did firms dismiss workersin spite of increased cavital-intensity of production. From availableevidence it appears that the productevity of capital fell during theperiod because of poor project selection and increasing productionproblems while pure labor productivity declined due to overmanning.
Ll Using the alternative estimate of caoital stock from. Appendix D, thehypothetical rate of return fell from 23.8% in 1966-67 co 19.37% in1972-73.
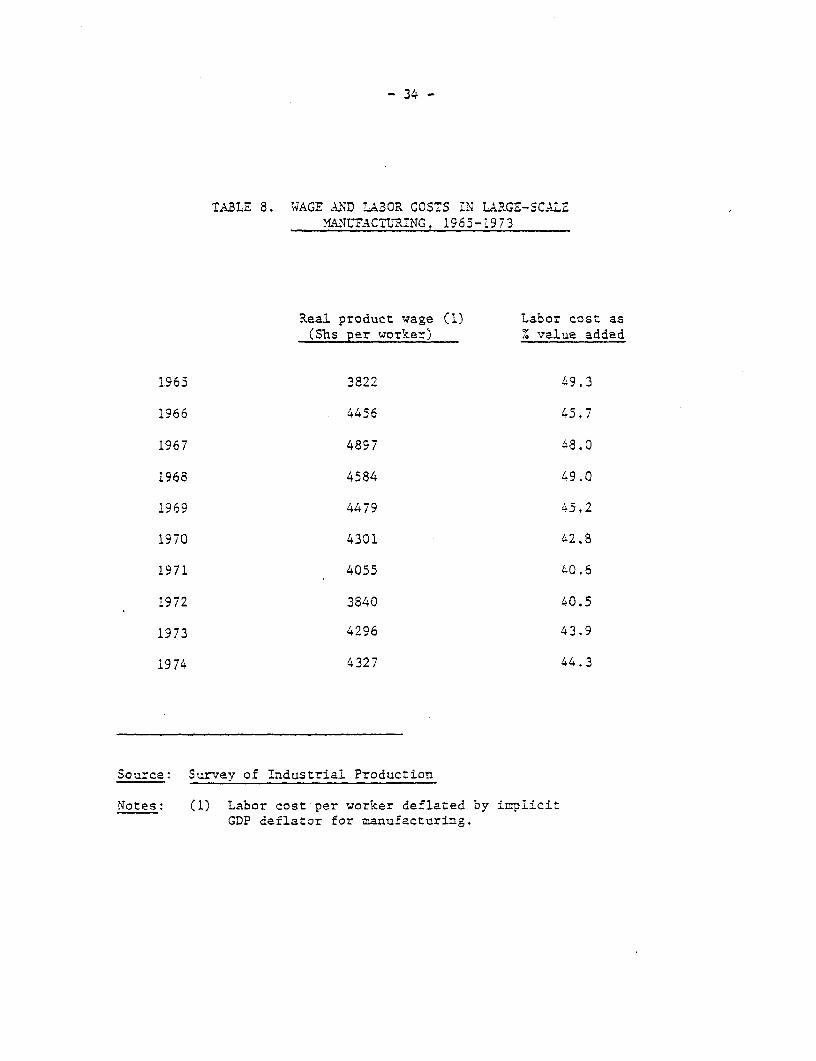
- 34 -
TABLE 8. 'wAGE AND LA3OR COSTS IN LARGE-SCALEMANUFACTURING, 1963-1973
Real product wage (1) Labor cost as(Shs Der worker) % value added
1965 3822 49.3
1966 4456 45,7
1967 4897 48.0
1968 4584 49.0
1969 4479 45,2
1970 4301 42.8
1971 4055 40.6
1972 3840 40.5
1973 4296 43.9
1974 4327 44.3
Source: Survey of Industrial Production
Notes: (1) Labor cost per worker deflated by implicitGDP deflator for manufacturing.
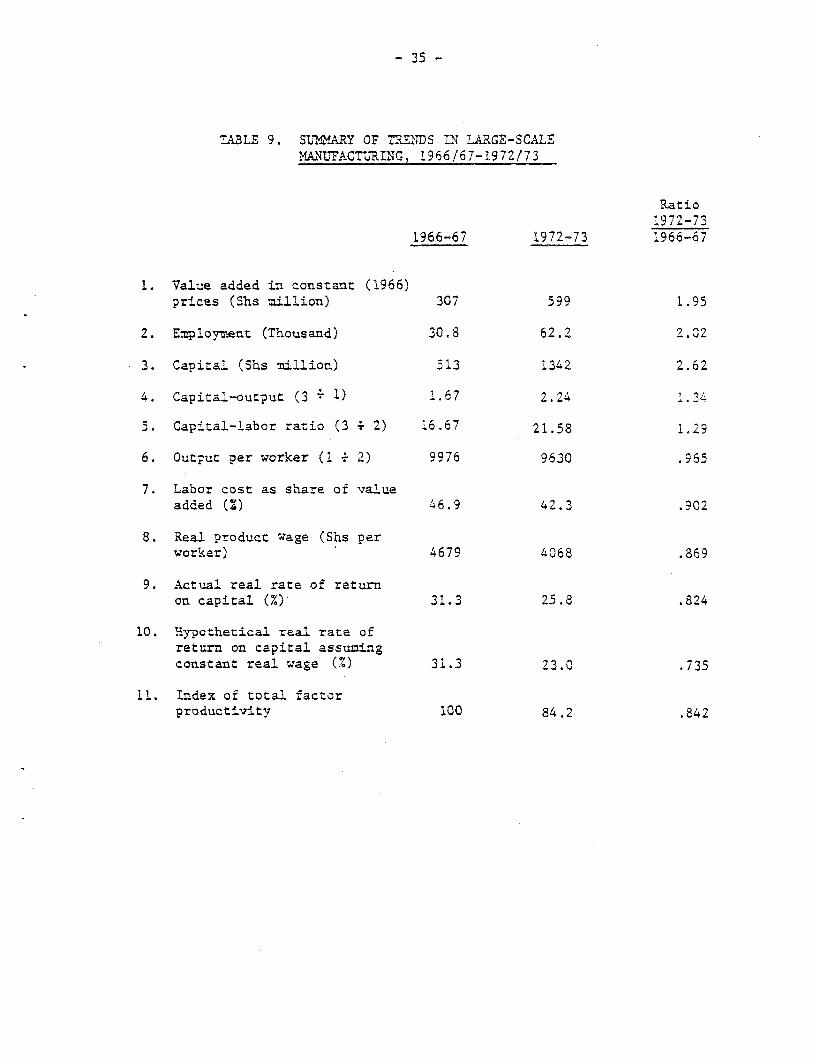
- 35 -
TABLE 9. SUMMARY OF TRENDS IN LARGE-SCALEMANUFACTTRING, 1966/67-1972/73
Ratio1972-73
1966-67 1972-73 1966-67
1. Value added in constant (1966)prices (Shs million) 307 599 1.95
2. Employment (Thousand) 30.8 62.2 2.02
3. Capital (Shs million) 513 1342 2.62
4. Capital-output (3 1) 1.67 2.24 1.3L
5. Capital-labor ratio (3 . 2) 16.67 21.58 1.29
6. Output per worker (1 . 2) 9976 9630 .965
7. Labor cost as share of valueadded (2) 46.9 42.3 .902
8. Real product wage (Shs perworker) 4679 4068 .869
9. Actual real rate of returnon capital (%)' 31.3 25.8 .824
10. Hypothetical real rate ofreturn on capital assumingconstant real wage (%) 31.3 23.0 .735
11. Index of total factorproductivity 100 84.2 .842
_ 36 _
B. Structural C:-.ange
Value Added, E=loyment, and Gross Outrut
2.14 Table 10 shows the change in the structure of industrial valueadded and employment between 1965 and l973. In 1973 nearly 60% of valueadded and nearly 70% of employment in large-scale nanufacturing originatedin the ccnsumer gcods sector. Even more striking, the share of consumergoods industries increased slightly during the period 196i-73; 59.7% ofthe increase in value added and 69.7% of the increase in employment camefrom consumer goods industries. In addition, some of the irndustriesclassified as Intermediate goods, capital goods, and other manufacturmingwould also be counted as consumer goods industries if a finer industrialbreakdown were a-ailable; for example, foot-wear, furniture, soap, radios,and cosmetics are all counted as non-cons-uer goods because of the levelof aggregation of available data.
2.15 The slight increase in the overall share of consumer goodsproduction masks some important changes in the relative contribution ofparticular industri es. The contribution of food and food productsdeclined from 36.4% of value added in 1965 to 22.8% in 1973, while non-food consumer goods nearly doubled as a proportion of total va.ue added(from 19.9% in 196.5 to 36.1% in 1973). Textile and clothing productionaccounted for much of the latter increase. In fact, textile and clothingproduction accounted for 25.4% of the total increase in large-scaie valueadded and 40.2% of i:ncreased employment from 1965-1973. By 1973, textilesand clothing was the largest single sub-sector with over 21% of totalvalue added and 30% of total employment. The only other sub-sectors toincrease their share of value added significantly were tobacco processing(from 1.1% in 1965 to 7.3% in 1973) and basic industrial chemicals, non-edible oils, and oetroleum products (from 2.2% to 6.3% in 1973). Ineach case, the increase was attributable to a single large investment:a cigarette factory and a petroleum refinery, respectively.
2.16 A different pattern emerges from the trends of gross output;consumer goods production declined from 71.+Lxo of total gross output irn1965 to 57.2% in 1973. The share of producer goods in total grossoutput rose from about one-fourth in 1965 to over 40% in 1973. (Table11 gives the figures). This is a reversal of the trends in value addedcited previously in which the share of consumer goods production actuallyincreased slightly between 1965 and 1973. The reversal is due to changesin the proportior of value added in gross output. The consumer goodsindustries in 1965 were predominantly low value added industries (theratio of value added to outnut was cnly 16%) but the share of valueadded increased markedly (to 30.9% in 1973) largely due to the changein textiles and clothing away from low value added ginning toward highvalue added spinning and weaving. In the producer goods sector theratio of value added to gross output was initially high (346% in 1965for intermediate and capital goods taken together) but fell (to 28.9%
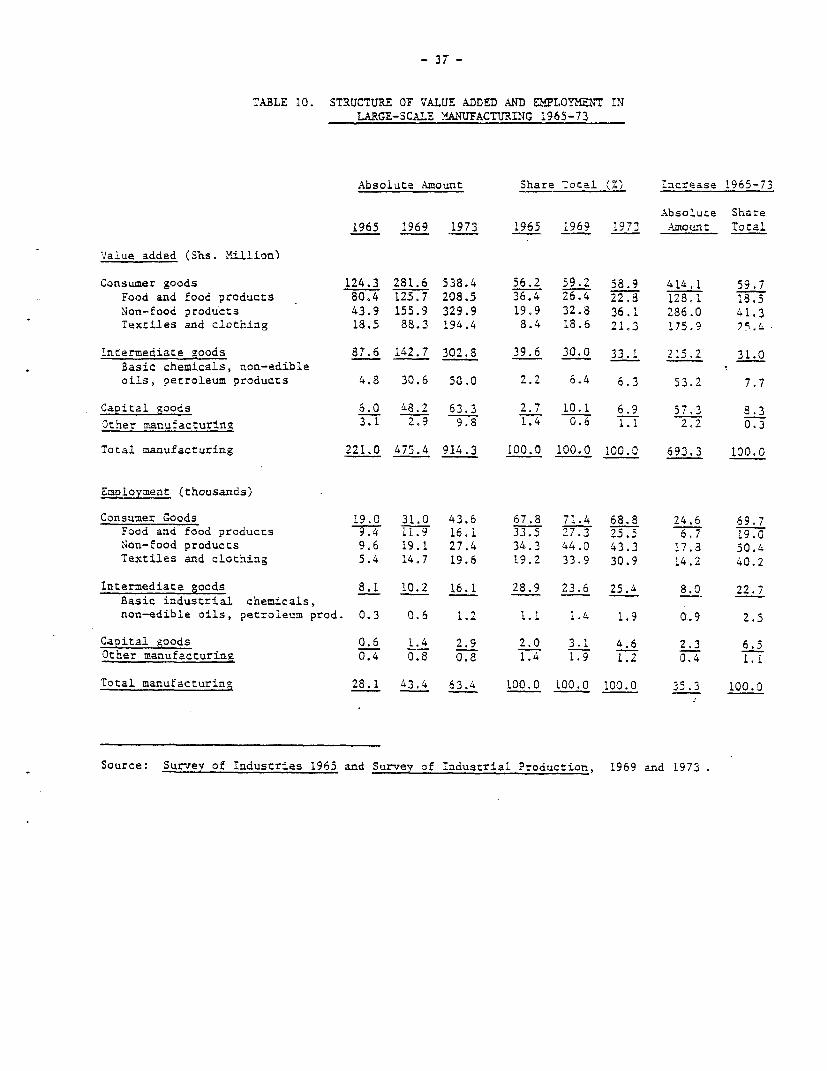
- 37 -
TABLE 10. STRUCTURE OF VALUE ADDED AND EMLOYMENT rNLARGE-SCALE Y_A.NUFACTURING 1965-73
Absolute Amount Share Total (x) Increase 1965-73
Absolute Share
1965 1969 1973 1965 1969 1973 Amount Total
Value added (Shs. Yillion)
Consumer goods 124.3 281.6 538.4 56.2 59.2 58.9 414,1 59.7Food and food products 80.4 125.7 208.5 36.4 26.4 22.8 128.1 18.5
Non-food products 43.9 155.9 329.9 19.9 32.8 36.1 286.0 41.3Textiles and clothing 18.5 88.3 194.4 8.4 18.6 21.3 175.9 2 &
Intermediate goods 87,6 142.7 302.8 39.6 30.0 33.1 215.2 31.0
Basic chemicals, non-edibleoils, petroleum products 4.8 30.6 53.0 2.2 6.4 6.3 53.2 7.7
Capital goods 6.0 48.2 63.3 2.7 10.1 6.9 57.3 8.3
Other manufacturing 3.1 2.9 9.8 1.4 0.6 1.1 2.2 0.3
Total manufacturing 221.0 475.4 914.3 100.0 100.0 100.0 693.3 100.0
Emoloyment (thousands)
Consumer Goods 19.0 31.0 43.6 67.8 71.4 68.8 24.6 69.7Food and food products 9.4 11.9 16.1 33.5 27.3 25.5 6.7 19.0Non-food products 9.6 19.1 27.4 34.3 44.0 43.3 17.3 50.4Textiles and clothing 5.4 14.7 19.6 19.2 33.9 30.9 14.2 40.2
Intermediate goods 8.1 10.2 16.1 28.9 23.6 25.4 8.0 22.7Basic industrial chemicals,non-edible oils, petroleum prod. 0.3 0.6 1.2 1.1 1.4 1.9 0,9 2.5
Ca2ital goods 0.6 1.4 2.9 2.0 3.1 4.6 2.3 6.5Other manufacturing 0.4 0.8 0.8 1.4 1.9 1.2 0,4 1.1
Total manufacturing 28.1 43.4 63.4 100.0 i0O.O 100.0 35.3 100.0
Source: Survey of Industries 1965 and Survey of industrial Production, 1969 and 1973
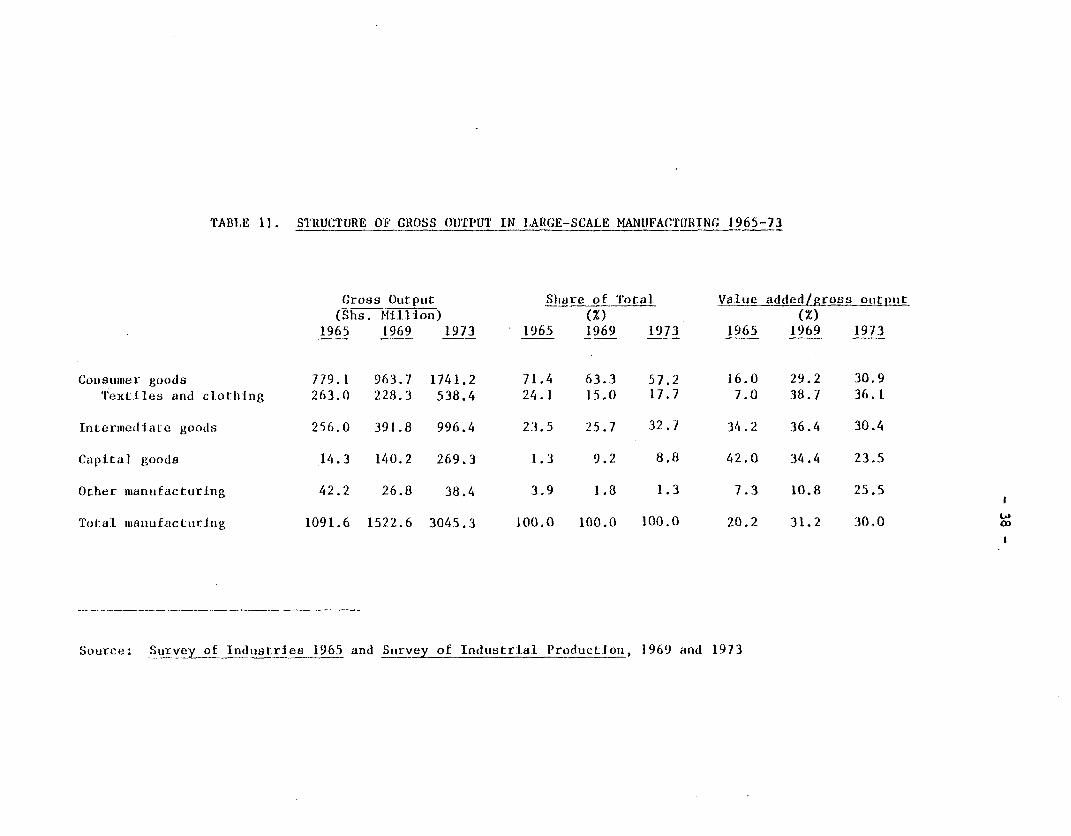
TABLE 11. STRUCTURE OF CROSS OUTPUT IN LARGE-SCALE MANUFACTIJRING 1965-73
Gross Output Slhare of Total Valte added/gross otutpt(Shs. Million) (%) (%)
1965 1969 1973 1965 1969 1973 1965 1969 1973
Consumer goods 779.1 963.7 1741.2 71.4 63.3 57.2 16.0 29.2 30.9Textiles and clotlhing 263.0 228.3 538.4 24.1 15.0 17.7 7.0 38.7 36.1
Intermediate goods 256.0 391.8 996.4 23.5 25.7 32.7 34.2 36.4 30.4
Capital goods 14.3 140.2 269.3 1.3 9.2 8.8 42.0 34.4 23.5
Other manufacturing 42.2 26.8 38.4 3,9 1.8 1.3 7.3 10.8 25.5
Total manufacturing 1091.6 1522.6 3045.3 100.0 100.0 100.0 20.2 31.2 30.0
Source: Surve of Industries 1965 and Strvey of Industrial Production, 1969 and 1973
- 39 -
in 1973) due to the growth of relatively lower value added producer goodsindustries. The overall ratio of value added to gross output rose fromabout one-fifth in 1965 to just under one-third in 1969 and appears tohave stabilized since then. This relatively low share of value addedreflects the continued predominance of industries involved in simpleprocessing of raw or semi-finished materials.
Imnort Substitution and Exoort Production
2.17 The main thrust of industrialization since independence has beentoward production for import substitution. As shown in Table 12, nearlyaalf of the total supply of manufactured goods is produced domestically,up from one-third in 1961.1/ The share of local production increased inspite of an increase in the share of imports of producer goods, whichinclude a much higher proportion of non-competitive imports.
2.13 Import substitution has gone furthest in consumer gcods; by1971 Tanzania supplied 71% of the total supply of manufactured consumergoods. However, the relative rate of increase was greater in the product-ion of manufactured producer goods. Domestic production of intermediatemanufactured goods rose from 31% of total supply in 1965 to 35% in 1973,while capital goods production (mostly vehicle repair and assembly) rosefrom 14% of total supply in 1965 to 21% in 1973.
2.19 The emphasis given to import substitution is also rellected inthe declining share of manufacturing production for exports. Table 13shows that 22.5% of manufacturing gross output was exported in 1961,17.7% in 1965, and only 13.1% in 1972. The output mix betwee.n exports andproduction for the domestic market is complicated by the pecul aritiesof the petroleum products market. The trade in manufactured petroleumproducts is largely a market-balancing operation, with Tanzania exportingproducts to Zambia and other countries and importing the same productsfrom Kenya for the northern part of the country. Trade fluctuates,however, as neignboring countries have set up their own refineries.Table 13 therefore also shows manufacturing production trends excludingthe petroleum and chemical products sectors. With petroleum productsexcluded, the trends in production are even more marked: the share ofexports has fallen steadily from 22% to 10% of manufacturing production,while the share of production of producer goods for the domestic markethas doubled and the share of domestic market consumer goods productionhas fallen slightly. (It is worth noting again, however, that the shareof consumer goods in value added terms has risen, in contrast to theshare of consumer goods in gross output.)
1/ In Appendix A tables total supply is given inclusive of taxes; thisfacilitates comparison with GDP at market prices and permitsalternative assumptions about the relationship between domesticand world prices. In the tables and text in this section, outputis measured net of all duties and taxes. Domestic productionrefers to large-scale manufacturing only.
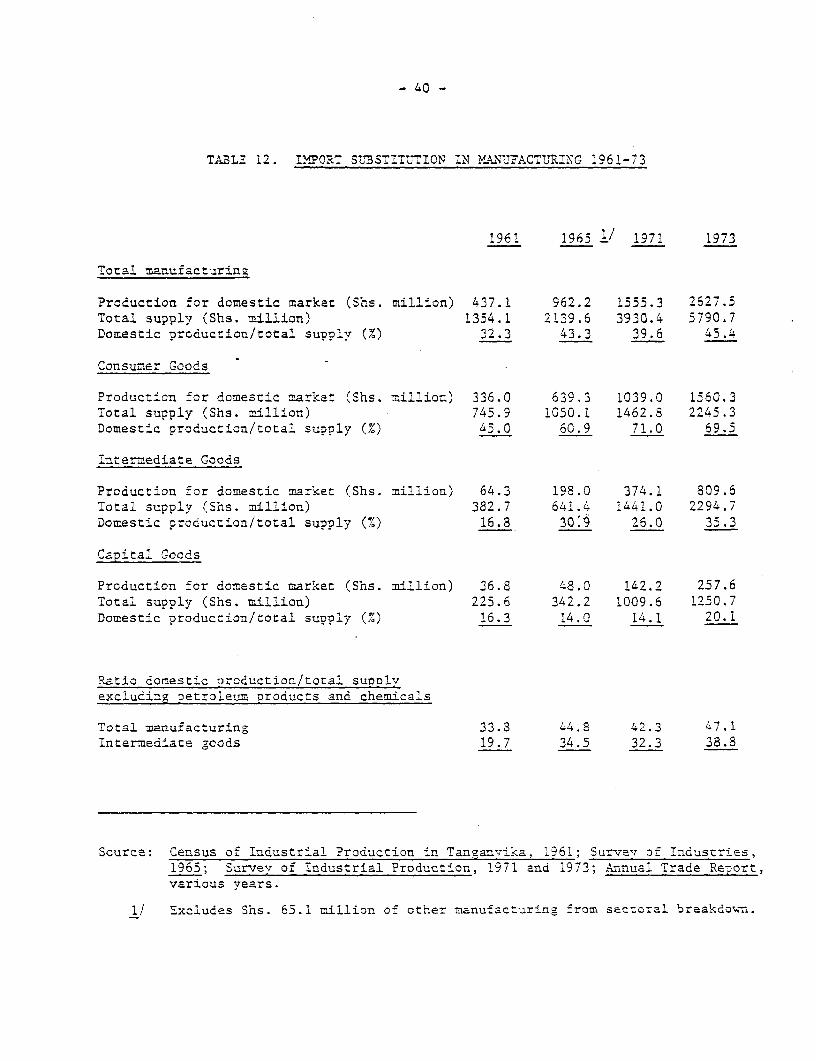
- 40 -
TABLE 12. 2IPORT Sn3STITIMON IN MY.AUFACTUTRING 1961-73
1961 1965 1' 1971 1973
Total manufacturinz
Production for domestic market (Shs. million) 437.1 962.2 1555.3 2627.5Total supply (Shs. million) 1354.1 2139.6 3930.4 5790.7Domestic prc<iuction/total supply (%) 32.3 43.3 39.6 45,hL
Consumer Goods
Production for domestic marlket (Shs. million) 336.0 639.3 1039.0 1560.3Total supply (Shs. million) 745.9 1050.1 1462.8 2245.3Domestic production/total supply (%) 45.0 60.9 71.0 69.5
Intermediate Goods
Production for domestic market (Shs. million) 64.3 198.0 374.1 809.6Total supply (Shs. million) 382.7 641.4 1441.0 2294,7Domestic production/total supply (7) 16.8 30'. 26.0 35.3
Capital Goods
Production for domestic market (Shs. millilon) 36.8 48.0 142.2 257.6Total supply (Shs. million) 225.6 342.2 1009.6 1250.7Domestic production/total supply (7.) 16.3 14.0 14.1 20.1
Ratio domestic oroduction/total supplvyexcluding petroleum Droducts and chemicals
Total manufacturing 33.8 44.8 42.3 47.1intermediate goods 19.7 34.5 32.3 38.8
Source: Census of Industrial Production in Tanganvika, 1961; Survey of Industries,1965; Survey7 of Industrial Production, 1971 and 1973; Annual Trade Re?ort,various years.
1/ Excludes Shs. 65.1 million of other manufacturing from sectoral breakdown.
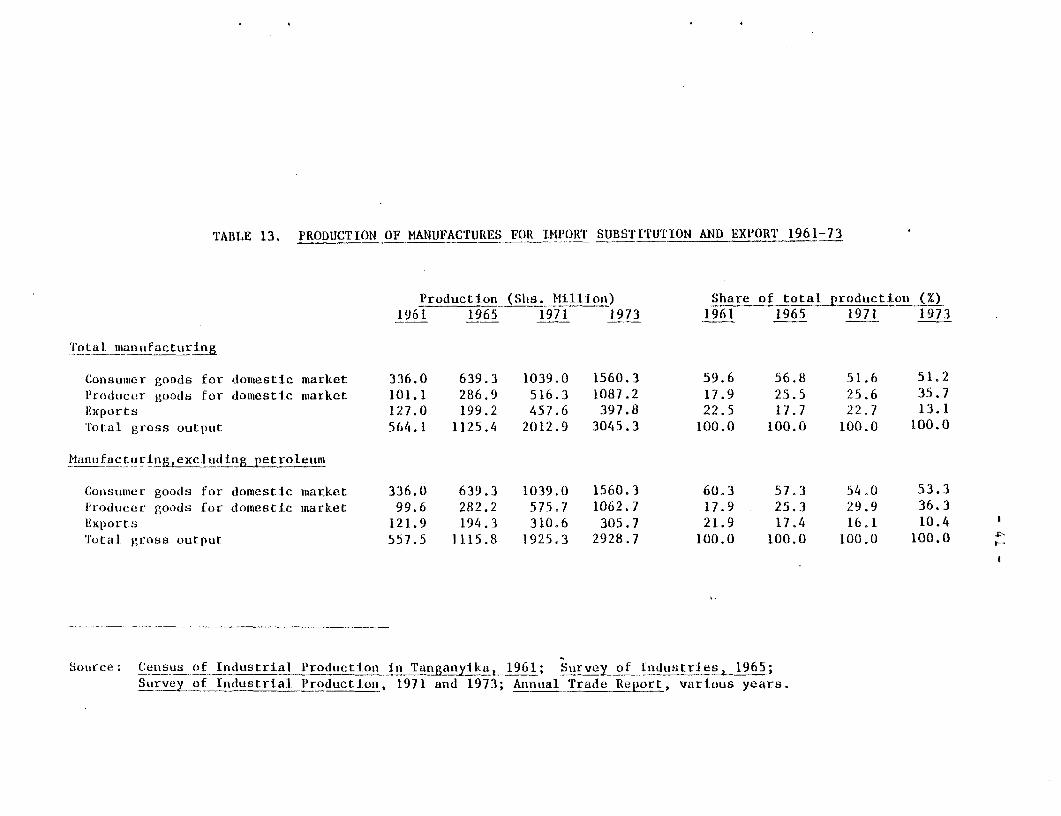
TABLE 13. PRODUCTION OF MANUFACTURES FOR IMPORT SUBSTITUTION AND EXPORT 1961-73
Production (Shs. Million) Share of total productioll (%)1961 1965 1971 1973 1961 1965 1971 1973
'Tlotal manufacturing
Consumer goods for domtiestic market 336.0 639.3 1039.0 1560.3 59.6 56.8 51.6 51.2Producer goods for domiestic market 101.1 286.9 516.3 1087.2 17.9 25.5 25.6 35.7lxports 127.0 199.2 457.6 397,8 22.5 17.7 22.7 13.1
''otal gross outpttt 564.1 1125.4 2012.9 3045.3 100.0 100.0 100.0 100.0
Hanu facturin, excludinag petroleum
Consumiier goods for domestic market 336.0 639.3 1039.0 1560.3 60.3 57.3 54.0 53.3
Producer goods for dlomestic imarket 99.6 282.2 575.7 1062.7 17.9 25.3 29.9 36.3
Exports 121.9 194.3 310.6 305.7 21.9 17.4 16.1 10.4Total gross output 557.5 1115.8 1925.3 2928.7 100.0 100.0 100.0 100.0
Source; Census of InduLstrial Production in Tanganyika, 1961; Survey of Industries 1965;Survey of Industrial Production, 1971 and 1973; Annual Trade Report, various years.
- 42 -
2.20 Table 14 gives more detailed statistics on manufactured exports.l/These show that manufactured exports have lagged not only with respect tomanufacturing production, but also in relation to tctal exports and GDP.In fact, the real value of manufactured exports (excluding petroleumproducts) appears to have declined by about 20% between 1969 and 1975.2/
2.21 There are three main reasons for the decline in :anufacturedexports.3/ First, the potential of the East African CoMunity marketnas declined. This reflects both the political difficulties of theCommunity and the normal product cycle of EAC trade in which individualproducts are first produced in one country, then exported to the partnerstates, and finally import-substituted in one or both the partner states.Second, manufactured exDorts have declined because of lagging productionof many agricultural raw materials. This has happened in the case ofpyrethrum, for example. A third reason for the decline in manufacturedexports is the rapid growth of domestic demand for a number of exportablemanufactures which are based largely on domestic demand as weell asdomestic raw materials. These include meat, wood, and vegetable andanimal oil products. WThether demand grew too fast or supply too slowlyis perhaps debatable, but it is certain that exports of these productsdeclined in large part because domestic demand grew more rapidly thandomestic supply. In the case of animal and vegetable oil productsTanzania switched over from being a net exporter to a net importer in the
l/ The figures in Table 14 are from Appendix C. Coverage and totalsfor manufacturing differ slightly from other tables in this section.
2/ No price or volume indices for manufactured exports are available.If the implicit GDP deflator for manufacturing is used to deflatethe current price value of manufactured exports, volume fell by17.3% between 1969 and 1975. Using a price index of manufacturedgoods of OECD countries as a deflator, the volume of exports isestimated to have fallen by 24.4% between 1969 and 1975.
3/ In addition to these three proximate causes of the decline inmanufactured exports there are of course other issues regardingpricing and exchange rate policy, incomes and labor managementpolicy, and the allocation of investment, which are consideredelsewhere in th.s report.
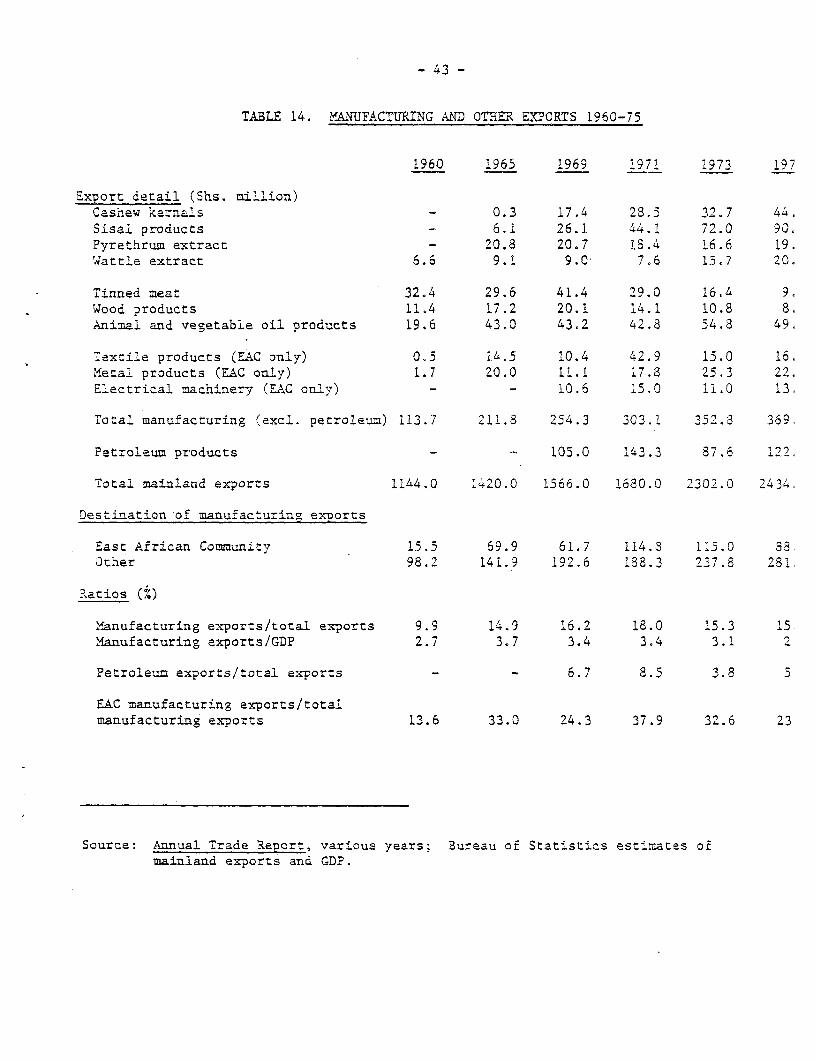
- 43 -
TABLE 14. MANUFACTURING AND OTHER EXPORTS 1960-75
1960 1965 1969 1971 1973 197
Export detail (Shs. million)Cashew kernals - 0.3 17.4 28.5 32.7 44.Sisal products 6.1 26.1 44.1 72.0 90.Pyrethrum extract - 20.8 20.7 18.4 16.6 19.Wattle extract 6.6 9.1 9.0 7.6 1.7 20.
Tinned meat 32.4 29.6 41.4 29.0 16.4 9.Wood products 11.4 17.2 20.1 14.1 10.8 8.Animal and vegetable oil products 19.6 43.0 43.2 42.8 54.3 49.
Textile products (ZAC only) 0.5 14.5 10.4 42.9 15.0 16.Metal products (ZAC only) 1.7 20.0 11.1 17.8 25.3 22.Electrical machinery (EAC only) - - 10.6 15.0 11.0 13.
Tatal manufacturing (excl. petroleum) 113.7 211.8 254.3 303.1 352.3 369.
Petroleum products - 105.0 143.3 87.6 122.
Total mainland exports 1144.0 1420.0 1566.0 1680.0 2302.0 2434.
Destination of manufacturing exvorts
East African Community 15.5 69.9 61.7 114.3 115.0 88Other 98.2 141.9 192.6 188.3 237.8 281.
Ratios (%)
Manufacturing exports/total exports 9.9 14.9 16.2 18.0 15.3Manufacturing exports/GDP 2.7 3.7 3.4 3.4 3.1 2
Petroleum exports/total exports - - 6.7 8.5 3.8 5
EAC manufacturing exports/totalmanufacturing exports 13.6 33.0 24.3 37.9 32.6 23
Source: Annual Trade Revort, various Years; Bureau of Statistics estimates ofmainland exports and GDP.
- 44 -
early 1970's, From a policy standpoint, these do=estically-based exports(i.e. both supply and demand are mostly dcmestically-based) are especiallyinteresting because they offer the greatest scope for quick increases inexports.l/ The Governme-nt has recognized th4s potential in some instancesin recent months; domestic ccnsumption of both sugar and textiles has beencut back in order to expand exports of these manufactures.
2.22 The only rapidly-growing manufacturing exports in recent yearswera cashew kernels and sisal products. Althougha these industries processdomestic raw materials, they differ from domestically-based industries asdefined above in that there is almost no domestic consumption of theirproducts. This means that they are far more dependent on external marketsthan domestically-based manufactures. In recent years the structure ofmanufactured exports has shifted toward industries which produce strictly'or export. Between. 1965 and 1975 the share of the four major externally-based manufactured exports (cashew kernels, s' sal products, and pyrethrumand wattle extracts) has increased -from 17.1% to 47.3% of total manufac-tured exports.
i/ The price elasticity of export supply of such products is typicallyvery high even if domestic elasticities are low. This can beillustrated by a simple numerical example. Suppose that initiallyproduction of meat = 100, domestic consumption = 80, and exports= 20. Assume, too, that the elasticity of supply is only 0.2 andthe elasticity of demand is only -0.5. Under these assumptions a10% price increase w-ill lead to an increase in production of 2%(2 units) and a decrease in demand of 5% (4 units) yielding anincrease in export supply of 6 units or 30%. Tn other words, theelasticity of supply of exports is 3.0 - far higher than the domesticelasticities of supply and demand. In general, the export supplyelasticity is:
,MLAS = SELAS + DELAS (HS)XS
where XELAS = elasticity of supply of exportsSELAS = elasticity of supply of productionDELAS = absolute value of elasticity of domestic demandHS = share of home consumption in total productionXS = share of ex=orts in total oroduction
Al1 foreign elasticities are assumed infinite.
- 45 -
2.23 A final noteworthy trend in the structure of manufacturing isthe ircreasing import-intensity of production. Import coefficients for11 manufacturing sub-sectors from the 1969 input-output table have beenused to show the effect of the changing structure of manufacturingproduction on current imports. The results are presented in Table 15.The estimates make no allowance for changes in i=port content within asub-sector, nor do they show imports of capital equipment required formanufacturing production. Nevertheless, they probably give a reasonablyaccurate account of changes in the intermediate import content ofmanufacturing production. The estimates show that the import content,while still fairly low, has risen from 11.5% in 1965 to 14.6% in 1973.
Summary of Structural Change
2.24 The main changes in the structure of production can be quicklys-mmarized. Tanzanian manufacturing is still dominated by production ofconsumer goods for the domestic market. In terms of value added andemployment, the share of consumer goods actually increased slightlybetween 1963 and 1973. This is largely due to the rapid growt1h of thetextile and clothing industry which in 1973 accounted for 17% of g-rossoutput, 22% of value added, and 30% of employment in large-scalemanufacturing. Most of the increase in industrial production has beendirected toward the domestic market in substitution for imports.Manufactured exports have declined in both relative and absolute termsin recent years and an increasing share of manufactured exports arefrom industries totally dependent on external markets. At the same time,however, the import content of manufacturing production has increasedsteadily.
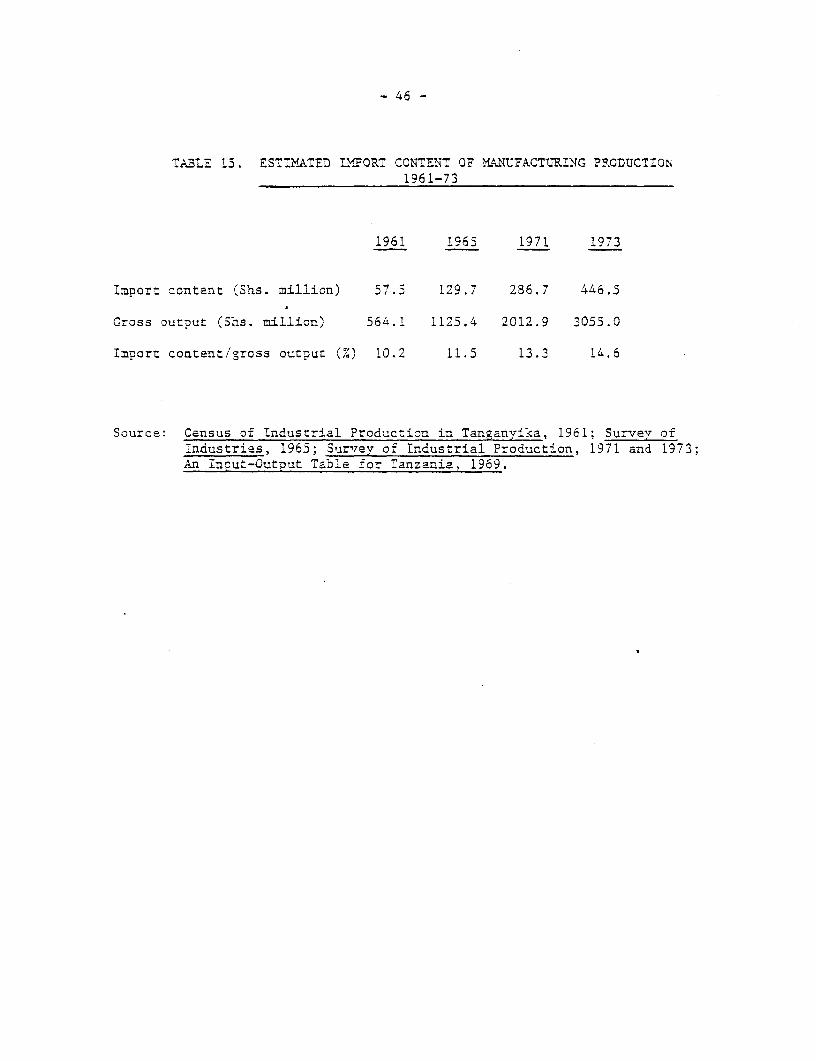
- 46 -
T.kBLE 1S. ESTINATED LNeORT CONTENT OF YA.NUJFACTURING PRODUCTION1961-73
1961 1965 1971 1973
Import content (Shs. million) 57.5 129.7 286.7 4A6.5
Gross output (Shs. million) 564.1 1125.4 2012.9 3055.0
Import content/gross output (%) 10.2 11.5 13.3 14.6
Source: Census of Industrial Production in Tanganvika, 1961; Survey ofIndustries, 1965; Survey of Industrial Production, 1971 and 1973;An inout-Output Table for Tanzania, 1969.
- 47 -
CHAPTZR III. PARASTATAL PRODUCTION AND ?LA.1NING
A. Growth of Parastatal Production
3.1 The Arusha Declaration of 1967 proclaimed "the way to buildand maintain socialism is to ensure that the major means of productionare under the control and ownership of the Peasants and Workers them-selves through their Government and their Cooceratives." In the manu-facturing sector the Declaration went on to define the major means ofproduction to include: "the steel, machine-tool, arms, motor-car, cement,and fertilizer factories; the tedt:Ile industry; and any other big industryupon which a large section of the population depend for their living, orwhich provides essential components for other indust7ies." Within a weekafter the Arusha Declaration the Government nationalized several foodprocessing firms 1/ and announced its intention to acquire a ccntrollingshare of firms producing beer, cigarettes, shoes, metal boxes, pyrethrumextract, and cement. In a subsequent clarifying statement, the Presidentstated that the Government would not seek to acquire a controlling interestin any other existing firm, that private investment would be welcome inany new or existing industry not listed as reserved to public ownership,and that minority private participation might be permitted in several ofthe listed industries.
3.2 The policy of public ow-nership in manufacturing was not anentirely new departure. Even prior to independence, the Governmentowned 50% of Williamson Diamonds, 51% of Tanganyika Packers, and 81%of Nyanza Salt Mines, as well as controlling several public serviceindustries. The National Development Corporation (NDC) had also set upsome publicly owned manufacturing enterprises in 1966. Nor did theArusha Declaration herald a radical change in industrial management. TheGovernment made clear its intention to continue operating the new publicenterprises along commercial lines and to maintain existing managementfor some time to come. In the case of new firms, the Government acknow-ledged that it would have to hire outside management in most instances.As of the mid-1970's,about two-thirds of manufacturing parastatals werestill managed by expatriate management agents. In many cases managementis supplied by the minority shareholder.
1/ Outside of manufacturing, banks, insurance compan±es, and external andwholesale trade were also nationalized, with full compensation in allcases.
- 48 -
3.3 The para-tatal 1/ sector qu±ckly assumed importance in industry:value added of zaras:atals inc:eased from 8.9% of large-scale manufactur-ing value added in 1966 to 25.8% in 1967. Between 1966 and 1973, parastatalsaccounted for 75'.8%° of the increase in value added of large-scale manufactur-ing fir=s. Part of this increase was due to takeover of existing privatefi==s, of course, but most was due to new parastatal enterprises.
3.4 Table 16 slmmarizes the growth of manufacturing parastatals.In 1966 there were 13 parastatals directly involved in manufacturingproduction; by 1975 there were 47 employing over 35,000 people and witha value added of some Shs 695 million. In 1966 manufactUring parastatalsaccounted for 13%of fixed capital foration in manufacturing industry; by1973 they accounted for 46%. (The public sector as a whole has greatlyincreased its share in fixed capital foration, accounting for 40% in1966, rising to an average of 72%' during 1971-73 at the height of theconstruction of the Tazara project, and falling to about 60% in 1975.) Inemployment, manufacturing parastatals accounted for 8% of employment inmanufacturing industry in 1966, 46% in 1971 and nearly 50% by 1974.'te number of emplovees rose over fifteen times from 2,330 in 1966to 35,278 in 1975, or an annual growth rate of 35%. The wage bill rosefrom Shs 11.8 million in 1966 to Shs 318.7 million in 1975, or 10% of themanufacturing industry wage bill in 1966, to 55% in 1974. The manufacturingparastatals accounted for only 9% of value added in manufacturing industryin 1966 but 45% wn 1974. Sales income generated by the manufacturingparastatal.s grew at an annual rate of 40%, from Shs 131.9 mill4on in i966co Shs 2563 million ir, 1975.
3.5 Despite the rapid expansion of parastatal producticr. the privatesector in manufacturing remains surprisingly large. In 1974, privateproduction accounted for over half of large-scale production and nearlytwo-thirds of total manufacturing and handicraft production, includingsmall-scale. This may slightly understate the role of parastatals inmanufacturing because of the way parastatals are allocated to sectors inthe parastatals accounts, but the general conclusion would not be changed:the private sector in manufacturing remains large. Nevertheless, the relativeimportance of the private sector will no doubt continue to diminish and mostincrementalproduction will come from parastatal production.
1/ Parastatals are defired as "cc=mercial enter?r4ses :mned bv the Governmentor with majority Goverrment participation and ran on commercial principlesand whose accounts are not directly integrated into the Gover-=ent budget."
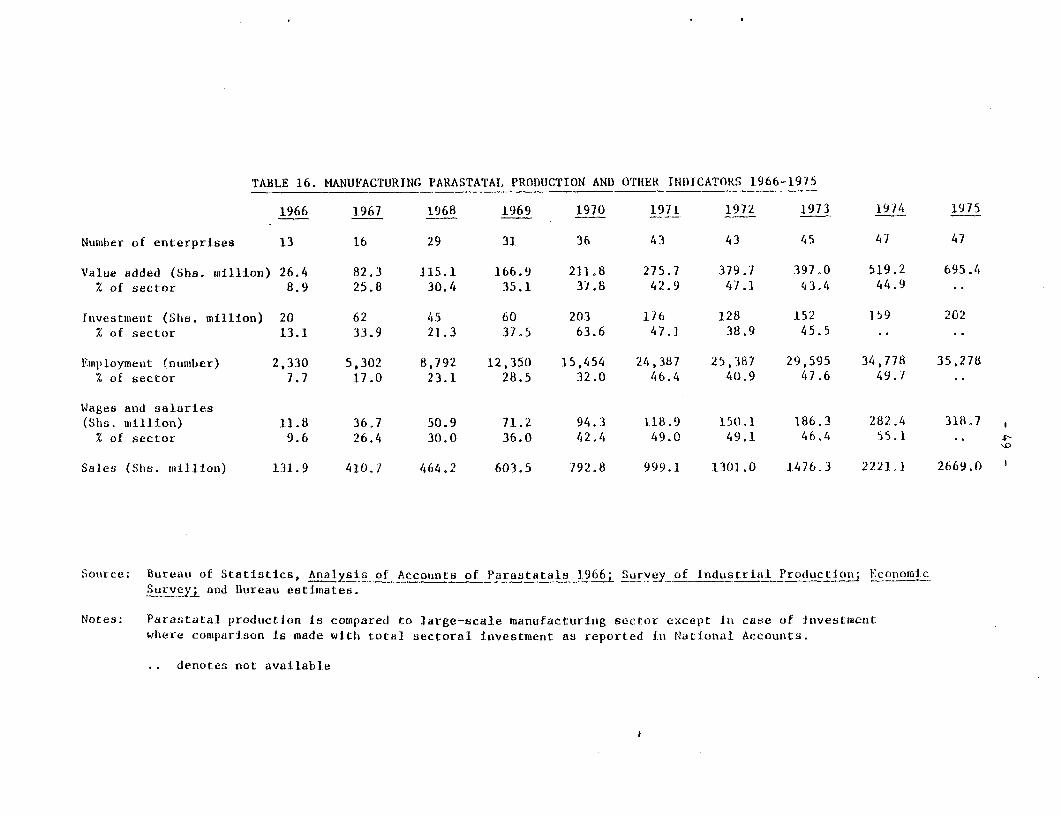
TABLE 16. HANUFACTURING PARASTATAI. PRODUCTION AND OTHER INDICATORS 1966-1975
1966 1967 1968 1969 1970 1971 1972 1973 1974 1975
Nunuber of enterprises 13 16 29 31 36 43 43 45 47 47
Value added (Sha. Million) 26.4 82.3 115.1 166.9 211.8 275.7 379.7 397.0 519.2 695.4% of sector 8.9 25.8 30.4 35.1 37.8 42.9 47.1 43.4 44.9
Investimienit (Shs. million) 20 62 45 60 203 176 128 152 159 202% of sector 13.1 33.9 21.3 37.5 63.6 47.1. 38.9 45.5
Employment (number) 2,330 5,302 8,792 12,350 15,454 24,387 25,387 29,595 34,778 35,278Z of sector 7.7 17.0 23.1 28.5 32.0 46.4 40.9 47.6 49.7
Wages and salaries(Shs. million) 11.8 36.7 50.9 71.2 94.3 118.9 150.1 186.3 282.4 318.7% of sector 9.6 26.4 30.0 36.0 42.4 49.0 49.1 46.4 55.1 ..
Sales (Sh1s. mil:lion) 131.9 410.7 464.2 603.5 792.8 999.1 1301.0 1476.3 2221.1 2669.0
Source; Bureau of Statistics, Analysis ofAccounts of Parastatals 1966; Survey of Industrial Productioni EconomicSurveyl and Bureau estimates.
Notes: Parastatal production is compared to large-scale manufacturinig sector except in case of Investmiientwhere comparison is made wlth total sectoral investment as reported in National Accounts.
denotes not available
- 50 -
B. Performance of Parastatals
3.6 The analysis of past industrial dev7elooment in Chapter ITconcluded that the performance of the large-scale manufacturing sector hadbeen disappointing in recent years. This conclusion was based on severalobservations:
(a) The rate of industrial growth had been declining ±nrecent years despite a high level of investment. Thiswas reflected in a rising incremental capital-outputratio.
(b) The real rate of return on capital had fallen.
(c) Labor productivity had remained approximately constantdespite increased amounts of capital per worker. Thissuggests that pure labor productLvity had declined dueto overmanning.
(d) Total factor productivity declined by over 15% between1966-67 and 1972-73.
3.7 Using data from the Analysis of Parastata- Accounts it is possi-ble to analyze these trends more closely and to compare the performanceof the parastatal and private sectors. The data are subject to all of thelimitations outlined earlier and more.l/ Nevertheless, it is possible todraw some tentative conclusions on the comparative performance of theparastatal and private sectors.
3.8 The surm-ary, conclusion is two-fold; first, there is not muchdifference in overall efficiency between the parastatal and privatesectors; but, second the trend of parastatal performance has been someu2atworse than that of the private sector. In 1966-67 the parastatal sectorconsisted largely of recently nationalized large and profitable firms.
1/ Parastatal figures taken from the Analysis of Parastatal Accounts1966-75 are subtracted from total figures taken from the Survey ofIndustrial Production to obtain estimates of private sector production,employment, etc. The estimates for the private sector are subject toa higher degree of error because they are derived as a residual fromtwo separate data sources. P.cblems of anpropriate deflators are alsomagnified in analyzing additional sectors. Finally, the compositionof the parastatal and private sectors is subject to greater variationthan aggregate production owing to nationalizations which change thecategorization of firms from one year to the next.
-51 -
These firms and, therefore, the parastatal sector as a whole, wererelatively more efficient than the remaining private sector firms. Asthe parastatal sector has expanded, however, overall parastatal efficiencyhas declined to a level comparable to that of the private sector as awhole.
3.9 Tables 17 - 20 map out the comparative trends in the parastataland private manufacturing sectors in considerable detail. Table 17 showsthat the trend of a rising ICOR for total manufacturing is mirrored inthe parastatal sector; after an initial fall, the ICOR for parastatalmanufacturing rose steadily from 1970-73.1/ This increase in capitalper unit of output is reflected in a falling real rate of return oncapital. Table 18 shows that the average net rate of return on capitalin the parastatal sector fel by 35% from 19606-67 to 1972-73. In theprivate sector, however, the real rate of return fell by 8% during thesame period. By the end of the period the net rate of return in theparastatal sector had fallen slightly below that in the private sector,even though the parastatal rate of return tended to be above the privaterate in the early years after the Arusha Declaration,
3.10 Table 19 gives the most detailed comparison of parastacal andprivate manufacturing production. The most striking comparisons are:
(a) Parastatal output quintupled between 1966-67 and l972-7 -while private manufacturing output increased by only 30%(see the last column of Table 19).
(b) This five-fold increase in parastatal output was accompaniedby a more than seven-fold iacrease in both capital and laborinputs. This means that output per unit of both capital andlabor fell in the parastatal sector. In the private sector,the capital stock also increased faster than output, butlabor productivity rose slightly as capital was substitutedfor labor.
(c) The trends in Table 19 support the earlier conclusion thatpure labor productivity must have declined due to overmanning.Moreover, it appears that the parastatal sector has been theprincipal source of this decline in labor productivity. Inspite of a constant capital-labor ratio, output per worker in
1/ The ICORs in Table 3 and Table 17 are not directly comparable becausethose in Table 3 are based in gross investment figures, while those inTable 17 are based on net asset figures derived from depreciationallowances. Gross investment figures for the parastatal sector areavailable, but not very helpful because much parastatal growth is theresult of nationalization rather than new investment.
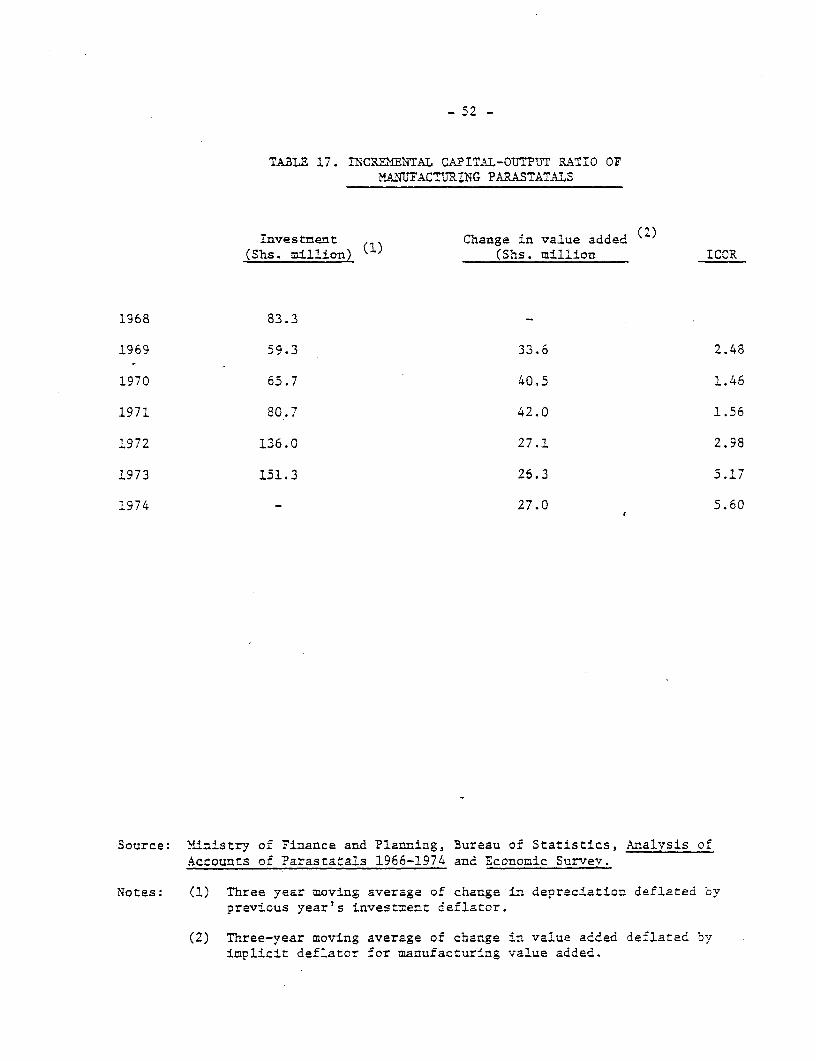
_ 52 -
TABLE 17. INCIREMNTAL CAPITAL-OUTPUT RATIO OFMANUFACTURING PARASTATALS
Investment Change in value added (2)(Shs. million) (Shs. million ICOR
1968 83.3
1969 59.3 33.6 2.48
1970 65.7 40.5 1.46
1971 80.7 42.0 1.56
1972 136.0 27.1 2.98
1973 151.3 26.3 5.17
1974 - 27.0 5.60
Source: Ministry of Finance and Planning, Bureau of Statistics, Analysis ofAccounts of Parastatals 1966-1974 and Economic Survev.
Notes: (1) Three year moving average of change in depreclation deflated byprevious year's investment deflator.
(2) Three-year moving average of change in value added deflated byimplicit deflator for manufacturing value added.
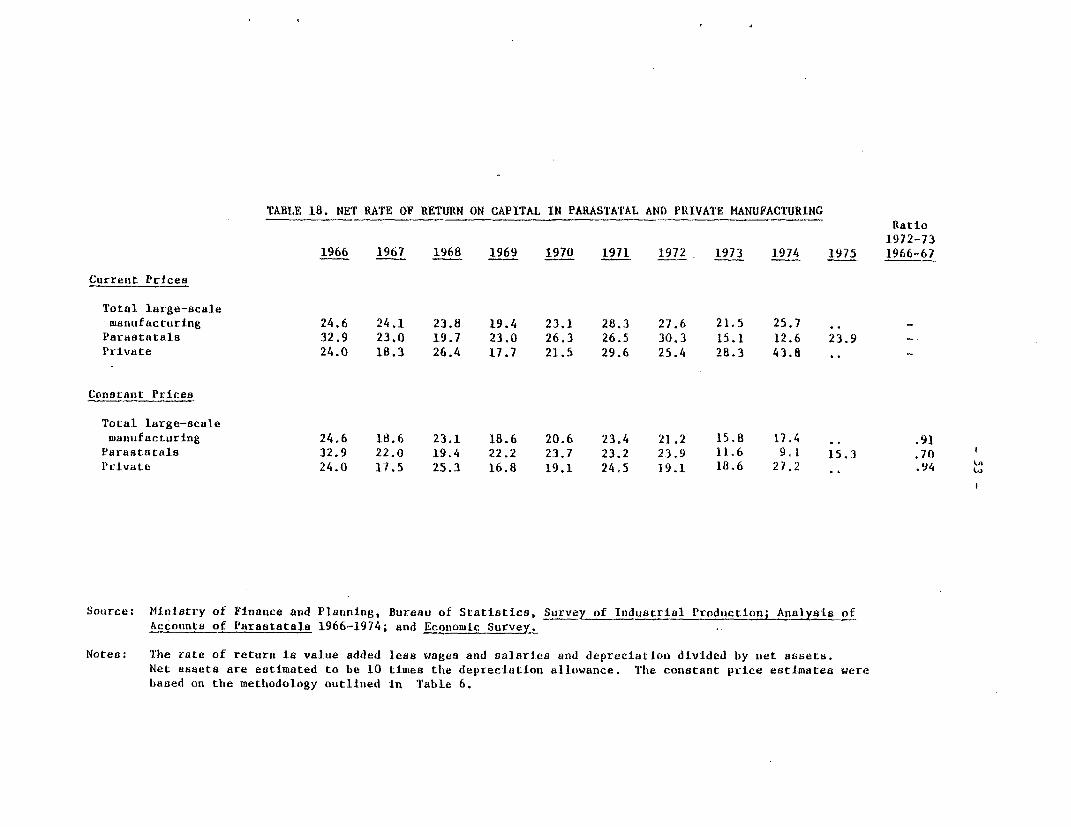
TABLE 18. NET RATE OF RETURN ON CAPITAL IN PARASTATAL AND PRIVATE HANUFACTURINGRatio1972-73
1966 1967 1968 1969 1970 1971 1972 1973 1974 1975 1966-61
Current Prices
Total large-scalemanufacturing 24.6 24.1 23.8 19.4 23.1 28.3 27.6 21.5 25.7
Pardatatals 32.9 23.0 19.7 23.0 26.3 26.5 30.3 15.1 12.6 23.9
Private 24.0 18.3 26.4 17.7 21.5 29.6 25.4 28.3 43.8
Constant Prices
Total large-scalemanufacturing 24.6 18.6 23.1 18.6 20.6 23.4 21.2 15.8 17.4 ,, .91
Parastatals 32.9 22.0 19.4 22.2 23.7 23.2 23.9 11.6 9.1 15.3 .70 1
Private 24.0 17.5 25.3 16.8 19.1 24.5 19.1 18.6 27.2 .94
Source: Ministry of Finance and Planning, Bureau of Statistics, Survey of Industrial Production; Analysis of
Accounts of Parastatals 1966-1974; and Econiomic Survey.
Notes: The rate of return is value added less wages and salaries and depreciatlon divided by net assets.
Net asseta are estimated to be 10 times thie depreciation allowance. The constant price estimates were
based on the methodology outlined in Table 6.
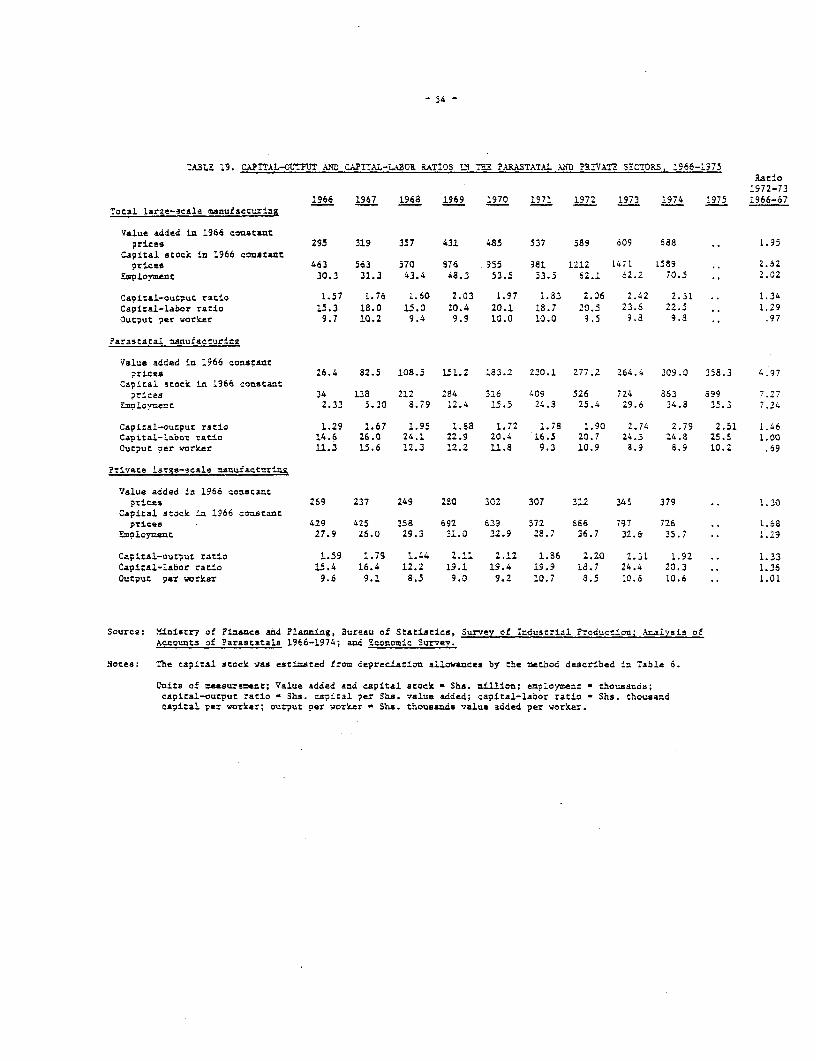
- 54 -
TABLE 19. CAL!2A*-OUTrJT AND WITAL-l-ZOR .RAkIOS "1 TF2 ?ARASTATAL .AIMD RIVA!Z SECTORS, :966-1975Ratio1972-73
1966 1967 1968 1969 1970 1971 1972 1973 1974 1975 1966-67Total large-ecale manufacturlin
Value added in 1966 constantprices 295 319 357 431 485 537 589 609 688 .. 1.95
Capital scock in 1966 constantprices 463 563 570 S76 955 981 1212 1471 1589 2.62
Employment 30.3 31.3 43.4 48.3 53.5 53.5 62.1 62.2 70.5 .. 2.02
Capital-outpuc ratio 1.57 1.76 1.60 2.03 1.97 1.83 2.06 2.42 2.31 .. 1.34Capital-labor ratio 15.3 18.0 15.0 20.4 20.1 18.7 20.5 23.6 22.5 .. 1.29Output per worker 9.7 10.Z 9.4 9.9 10.0 10.0 9.5 9.8 9.3 .. .97
Parastatal manufacturiz2
Value added in 1966 constantprices 26.4 82.5 108.5 151.2 183.2 230.1 277.2 264.4 3C9.J 358.3 4.97
Capital stock in 1966 constantprices 34 138 212 234 316 409 526 724 863 899 7.27
Z=ployment 2.33 5.30 8.79 12.4 15.5 24.3 25.4 29.6 34.8 35.3 7.24
Capital-output ratio 1.29 1.67 1.95 1.88 1.72 1.78 1.90 2.74 2.79 2.51 1.46Capital-labor ratlo 14.6 Z6.0 24.1 22.9 ZO.4 16.5 20.7 24.5 24.8 25.5 1.00Oucput per worker 11.3 15.6 12.3 12.2 1l.8 9.3 10.9 8.9 8.9 10.2 .69
3zivate 1arge-scale =znufacturinm
Value added in 1966 constantprices 269 237 249 280 302 307 312 345 379 .. 1._0
Capital stock in 1966 constantprices 429 425 358 692 639 572 686 797 726 .. 1.68
Employment 27.9 Z6.0 29.3 31.0 32.9 28.7 36.7 32.S 35.7 .. 1.29
Capital-output ratio 1.59 1.79 1.44 2.11 2.12 1.86 2.20 2.3i 1.92 .. 1.33Capital-labor ratio 15.4 16.4 12.2 19.1 19.4 19.9 18.7 24.4 20.3 .. 1.36Output per worker 9.6 9.1 8.5 9.0 9.2 'A0.7 S.5 10.6 10.6 .. 1.01
Source: "iniscry of Finance and Plannlng, Bureau of Statiatics, Survey of Industrial ?-oduction; Analysis ofAccouats of .arastatals 1966-1974; and Economic Survey.
Notes: The capital stock vas estimated from depreciation allowances by the ethod described in 7able 6.
Tuits of measuremant; Value added and capital acock - Sha. million; employment - thousanda;capital-autput ratio - Sha. capital per Sha. value added; capital-labor ratio - Shs. thousandcapital per worker; output per worker - Shs. thousands value added per worker.
- 55 -
the parastatal sector fell bv 31% frcm 19606-67 to1972-73.
3.11 Table 20 provides surary measures of both the comparative levelsand trends of parastatal and pr4vate sector ezflcien.cy. Tn 1972-73 the twoseczc *:s were at comparable levels of efficienc-: the rate fr returr on capitalwas slightly higher in the private sector, wnhile output per worker was slightlylower than in the parastatal sector. 1,/ !owever, the trends are much moredisparate: total factor productivity ir the parastaca- sactor dezlined by 30%wi-hile .otal factor productivity in the private sector declined by 12%.
3.12 It must be stressed again that the conclusions drawn about compara-tive ;erformance are tentative and subject to scme cualifications. First, thed&ta ;re not entirely reliable. This is especially true of the capital stockfigures. Second, there is substantial variation in ratios from year to yearso that even a t-wo-year average as used above may distort the comparisons.In 1975, for example, parastatal performance improved slightly over 1972-73according to the indicators being used. Both the rate of return on capitaland labor productivity rose someewhat. Total factor productiv4ty was still13% below the 1966-67 average, so that the most hcef;ul' conclusicn one coulddraw would be that 1975 may mark the beginning of a reversal in the trend ofdeclining factor productivity in the parastatal sector.
3.13 Analysis of the accounts of the National Development Corporation,the largest manufacturing holding company, yields some insights into perfor-mance of the parastatal sector. NDC was in charge of all manufacturingparastatals for several years after the Arusha Declaration but in recentyears new holding companies have been established for several manufacturingparastatals. Table 21, therefore, gives an incomplete but still suggestivepicture of what has been happening in the parastacal sector.
3.14 As Table 21 shows, total vNDC profit on manufacturing activities hastended to rise over the period 1968-1974. These are current price figures,but constant price estimates would no doubt show a similar, though lessmarked, trend. The rate of profit was negative in 1968, 3.9% in 1969, androse to 21.3% in 1974. The aggregate profit rate dissembles the most re-markable feature of hNfC operations, however: the structure of profits. Aslate as 1973, 95% of N3C manufacturing profits came from a small group ofcompanies nationalized at the time of the Arusha Declaration. Thesecompanies had net assets totalling only 21.3% of total NDC manufacturingassets. The remaining non-Arusha companies - which were mostly started by NDC,
1/ This refers to the grcss rate of return, that is the capital surplusincluding depreciation divided by net assets, but the same statementwould be true of the net rate of return. The gross rate of return isused in Table 20 because that is the relevant concept for computinrgtotal factor productivitv.
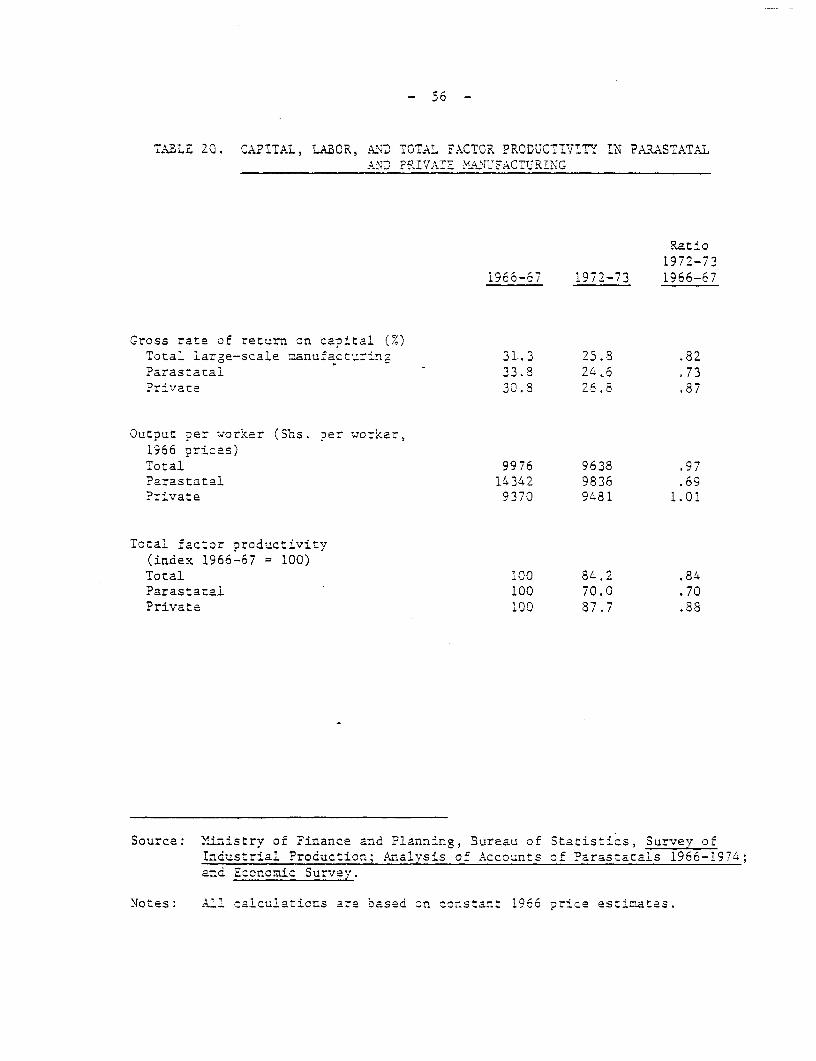
- ;6 -
TABLE 20. CAPITAL, LABOR, END TO7AL FACTOR PRODUCTIVTY TN PARASTATALAND ?fJIVA_: A.>NUFACTURTNG
Rat Io1972-73
1966-67 1972-73 1966-67
Gross rate of return on capital (%)Total large-scale manuSact-=ri.ng 31.3 23.8 .82Parastatal - 33.8 24^6 .73Private 30.8 26.8 .87
Output Der worker (Shs. per w-orker,1966 prices)Total 9976 9638 .97?arastatal 14342 9836 .69Private 9370 9481 1.01
Total factor productivity(index 1966-67 = 100)Total 100 84.2 .84Parastatal' 100 70.0 .70Private 100 87.7 .88
Source: 24inistrv of Finance and Planning, Bureau of Stacistics, Survey ofIndustrial Production; Analysis of Accounts of Parastatals 1966-1974;and Economic Surve=.
Notes: ALl- calculations are oased on constant 1966 orice estimates.
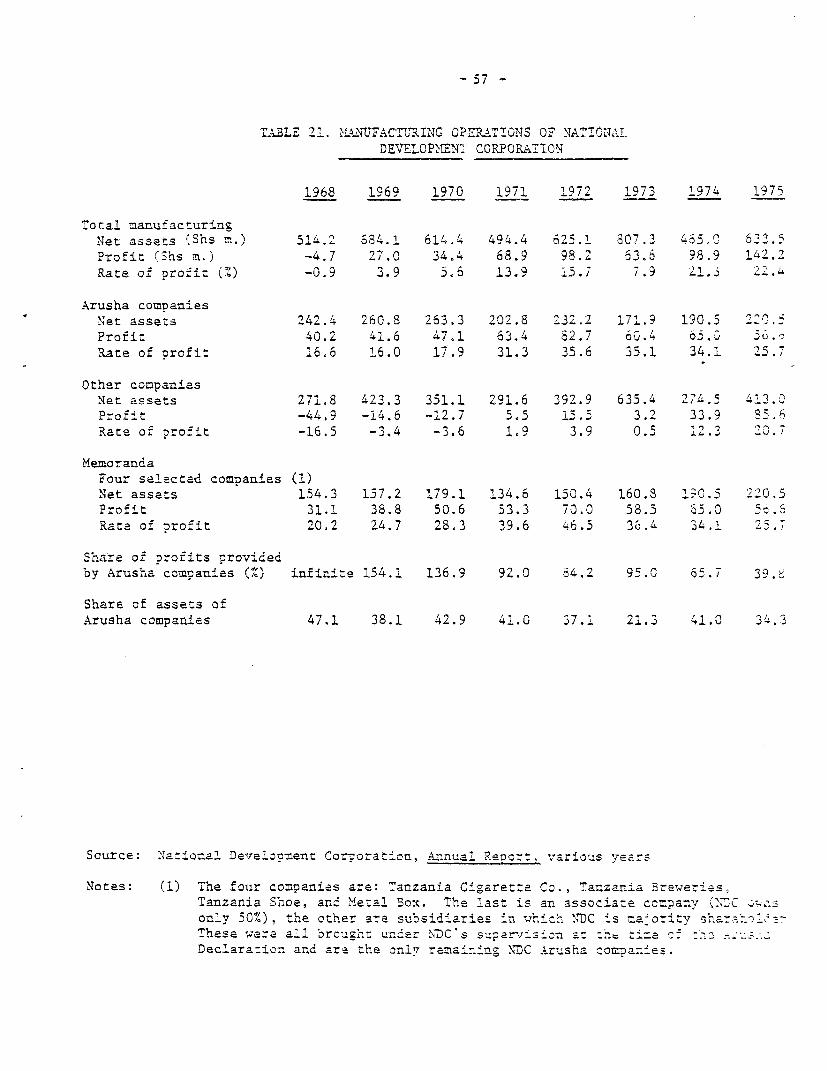
- 57 -
TABLE 21. 'MANUF.ACTIJRING OPERATTONS OF NATIO-LkTDEVELOPMENT CORPORAT-TION
1968 1969 1970 1971 1972 1973 1974 1975
Total manufacturingNet assets (Sns mr.) 514.2 5034.1 614.4 494.4 625.1 807.3 455.0 5.33.7Profit (Shs m.) -4.7 27.C 34.4 68.9 98.2 53.6 98.9 142.2Rate of profit (0) -0.9 3.9 5.6 13.9 15.7 7.9 Zl. .
Arusha companiesNet assets 242.4 260.8 263.3 202.8 232.2 171.3 190.5 220 .Profi; 40.2 41.6 47.1 63.4 o2.7 6O.4 0,.0 ;.
Rate of profit 16.6 16.0 17.9 31.3 35.6 35.1 34.1 25.7
Other companiesNet assets 271.8 423.3 351.1 291.6 392.9 635.4 274.5 413.0Profit -44.9 -14.6 -12.7 5.5 15.5 3.2 33.9 35.6Rate of profit -16.5 -3.4 -3.6 1.9 3.9 0.5 12.3 20.7
MemorandaFour selected comDanies (1)Net assets 154.3 157.2 179.1 134.6 150.4 1060.3 10. 220.5Profit 31.1 38.8 50.6 53.3 70.0 58.5 35.0 .Rate of profit 20.2 24.7 28.3 39.6 46.5 36.4 34.1 25
Share of profits providedby Arusha companies (%) infinite 154.1 136.9 92.0 84.2 95.0 6,.7 39.
Share of assets ofArusha companies 47.1 38.1 42.9 41.0 37.1 21.3 41.0 34.3
Source: National Develonment Corsoration, .Annual Revor`, various years
Notes: (1) The four companies are: Tanzania Cigarette Co., Tanzania Breweries,Tanzaria Shoe, and Metal Box. The last is an associate company ('C .only 50%), th.e other are subsidiaries in 'u.'hch NfC is maJority sha.-:-,.-
These wera all brcug:et urder N'C's supevision a:rn t_ec-
Declaration and are the only rezaining MXZ Arusha COmaCieS.
- 58 -
but in a few cases are later acquisitions of private fi-rs - had a rate ofprofit of only 0.5% in 1973 compared to 35.1% for the Arusha companies.
3.15 Table 21 helos clarify why the general level of efficiency i'nthe parastatal sector has declined. NDC took over some of the largestand cost profitable comDanies in Tanzania after the Arusha Declaration.Initiallty, therefore, both the rate of r-tur on capital and labor pro-ductivity were higher in the parastatal sector. These already functioningArusha companies helped finance new manufacturing parastatals. Tne newNDC investments were far less productive than either the Arusha companiesor the private sector; as the share of new manufacturing parastatals grewlarger total factor productivity in the parastatal secto- declined. Onaverage the parastatal and vrivate sectors appear to have been about equallyproductive in the most recent period for which data are available. However,this ccmparative equality in efficiency is a bit misleading. The parastatalsector is composed of a number of established manufacturing firs which aremore productive than the private sector and of a nm'ber of new firms whichare far less productive than the private sector. This does not necessarilymean that the parastatal sector will continue to decline in efficiency, forthere are some signs that the rate of return on new parastatal manufacturinginvestments is increasing. In 1974, NDC's non-Arusha manufacturing companiesregistered a profit rate of 12.3% and in 1975 this rose to 20.7%'. This isconsistent with the accountsof a number of individual firms (some of whichhave now been taken away from NDC) which show rising profits after a periodof losses in their first few years of operations.l/ The important questionfor future growth is whether this increased profitability reflects increasedefficiency in the use of resources or whether it is due to supply shortagesand the operation of the price control system which tends to ratify in-efficiency. The little evidence there is suggests that both forces have beenat work to raise the rate of return. This question will be addressed againlater in the section on productivity.
1/ Zxamples are Friendship and M-atex textile mills, Kibo Paper Industries,Tegry Plastics, UTungo Farm Implements, Steel Rolling LMills, and (perhaps)Tanzania Fertilizer Co.
- 539 -
C. Organization and Control of the Parastatal Sector
3.16 Each operating parastatal in the manufacturing sector is em-bedded in a seven-layer control system. 1/ A manager is responsiblefor day-to-day operational decis4ons in the producing parastatal; eachoperating parastatal has a board of directors to advise management ormajor decisions and to represent equity-holders (including Government);holding corporations (which are also parastatals) hold equity in operat-ing parastatals, provide various specialized services for their subsi-diaries, and promote development of the sub-sector for which they areresponsible; holding corporations also have boards of directors withsimilar functiors to those of their subsidiaries, each holding corporationis responsible to a parent mirnistry such as the Ministry of Industries;the Ministry of Finance and Planning controls the selection and financingof projects and has the authority to interrene directly in parastataloperaticns; and finally, the Cabinet and Parliament exercise ultimateauthority over parastatals with the Economic Committee of the Cabinetreviewing long-Cerm sectoral development plans.
3.17 The control system has gotten even more complex as parastatalactivities have expanded. Initially, !0C was the only holding corporationand it supervised parastatals in several sectors. Gradually, other hold-ing corporations, usually organized along the same lines as NDC, werecreated. At present there are more than ten holding corporations concernedwith manufacturing parastatals and these in turn are controlled by fourseparate parent ministries. In the case of sisal spinning, operatingparastatals have both a holding corporation and a Sisal Authority betweenthem and the parent Ministry of Agriculture.
3.18 The elaborate organizational structure af the parastatal sectorhas created major problems. First, it has made coordination of industrialplanning difficult. A notable example was the instance in which ̀ DC plannedto use the same stand of timber for a paper mill which TW'ICO had plannedto use for a saw mill. Fortunately the conflict was discovered in time,but it illustrates the difficulties of ccordinaticn between different hold-ing corporations and separate ministries.
3.19 A second problem is that the functions of different levels ofthe control structure are vague and overlapping. Holding corporations, forexample, have Financial Departments and Operations Departments whose functions
1/ The discussion of parastatal control draws heavily on unopublishedpapers by D. Williams, especially "Government Control of Parastatalsin the Industrial Sector" (Dar es Salaam, 1375). A. more detailedsurvey of the organization of the industrial sector is given in IBRD,Tanzania Tndustrial and Mining Sector Survey, (Washington, March 31,1975), and will not be repeated here.
- 60 -
are not clearly separated ftom those of their subsidiaries. Perhaps themost frequent complaint of opera:ig I ar.zstatals is that their 'holdingcor=oration charge fes 'or Hol-: so vices. Eolding corporations alsofrequently seek to lnre fo-ei;n f_nance for their projects in a waywhich frustrates Treasury s enforts to rat-onalize aid from differentdonors and across sectors. Ths 'ralp ncitg unc:ions of different levelsof the control hierarchy t.ake it diffic 'O assign responsibility forfailure. The combinee erfect ^t- ' ficul-''ties of both horizontal andvertical coordination is to increase the bureaucratic nature of decisions.This, of course, is the very ?roblem that holdi'ng corporations and para-statals in general were designed to avoid.
3.20 A third result of the proliferation of holding companies and
their duplication of the funccicns of orerating parastatals and minist-iesis that administrative costs 'aave 2ncreased tremendously. Table 22 showsthat headquarters expenses of NZC rose from one-fourth of total incomein 1968 to over 80% in 1974. As a oronortio.- of total NDC funds employed,headquarters expenses rcse from 3,_° in 1968 to .6% in 1974. It isprobably safe to infer that the he-adquartersexpenses of the many holdirgcorporations set up to tak-e over par- of NTC's operations have alsoexpanded more quickly thian total assets or income.l/
3.21 In addition to the formal h_erarchy o,f aut.hority, manufacturingparastatals are subject to a large num-e- of controls over almost everyaspect of their investment and oroducti-on decisions. All parastatal invest-meet plans must be approlred in t;he annual Development Budget; even the useof a parastatal's ow-n profits is restricted by a provision which givesTreasury the right to distributc parascaral dividends. Most industrialloans must be approved by the Tanzania Investment Bank (TIB) and the onlysource of working cap'tal is the National Bank of Commerce. Any use offoreign aid funds is, of course, controlled by Treasury. Imports of capitaland most other goods are controlled by import li_censes issued by the Bankof Tanzania in consultation with Treasur7: most 'vorts must also bepurchased through a designated parastatai wnhch holds a confinement. Outputprices are controlled by the Price Co=ission; foreign exchange transactionsare controlled by the Bank of Tanzania; management agreements are controlledby an Inter-Ministerial Committee and require approval by the EconomicCommittee of the Cabinet; work permits ard visas for non-nationals arecontrolled through the Ministtry of Labour and the Treasury; labor agreementsmust be approved by the Permanent Labour Tribunal; wage scales are set bythe Standing Committee or, Parastatal Organization; industrial exportpermits require approval by th-e Ministry of Trade and the Bank of Tanzania;and tariff rebates are administered by the Ministry of Trade. It is clear
l/ In 1975, for ths fi-st ti-me sr.ce 1966, there was a decline in theratio of NNDC's headquarters exr=sas tc total funds employed, andthe ratio is exnected to show fu-ther declire in 1976. Someattention is cb'vicusly being -vei cto tzh problam of h4gh overheadcosts.
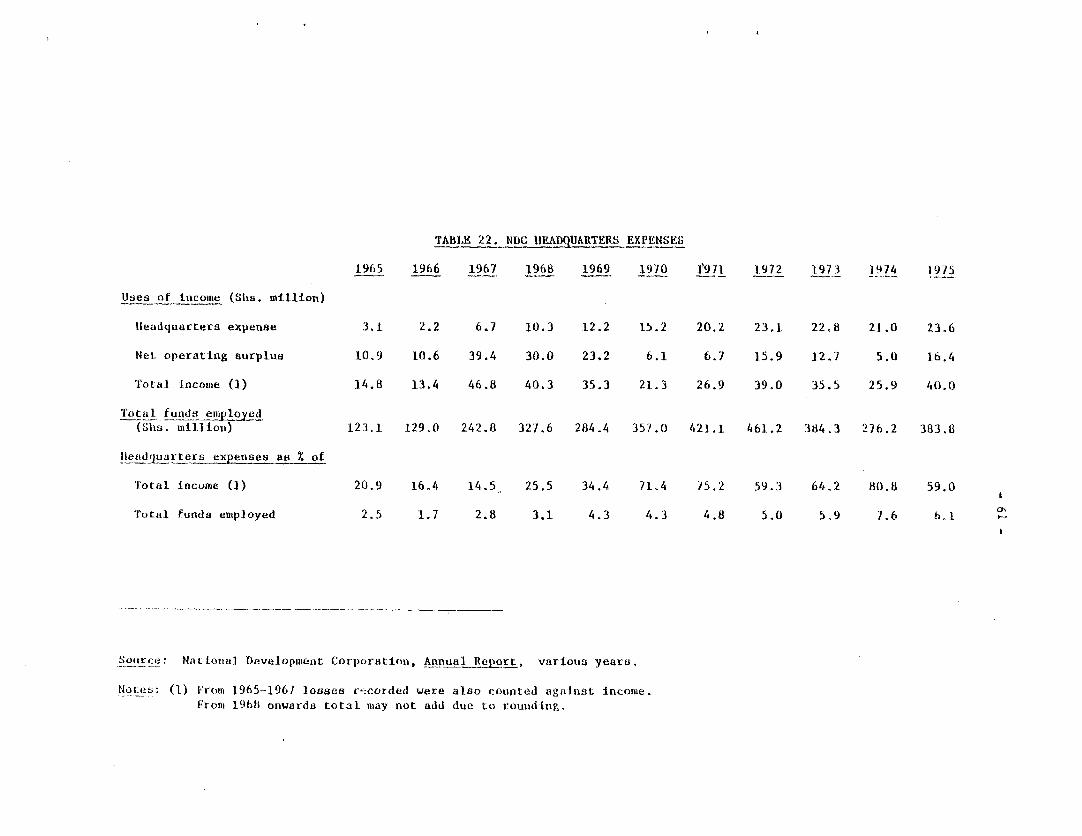
TABI.E 22. NDC IEADQUARTERS EXPENSES
1965 1966 1967 1968 1969 1970 l'971 1972 197?3 1974 1975
Uses of incolue (Shs. million)
Headquarters expense 3.1 2.2 6.7 10.3 12.2 15.2 20.2 23.1 22.8 21.0 23.6
Net operating surplus 10.9 10.6 39.4 30.0 23,2 6.1 6.7 15.9 12.7 5.0 16.4
l'otal income (1) 14.8 13.4 46.8 40.3 35.3 21.3 26.9 39.0 35.5 25.9 40.0
Total funds employed(Shis. mlli]ono) 123.1 129.0 242.8 327.6 284.4 357.0 421.1 461.2 384.3 276.2 383.8
lleaduaYrters expenses as X of
Total incomie (1) 20.9 16.4 14.5 25.5 34,4 71.4 75,2 59.3 64.2 80.8 59.0
Total funds employed 2.5 1.7 2.8 3.1 4.3 4.3 4.8 5.0 5.9 7.6 6.1
Source: National Development Corporation, Annual Re ort, various years.
Notes: (1) From 1965-1967 losses re-corded were also counted against incomiie.
IFroms 1968 onwards total nmay not add due to rounding.
- 62 -
that if the parastatal sector is not working efficiently it is not due toa lack of instruments of control. A brief description of the investmentplanning, production control, and labor relaticns systems will set thestage for a later analysis of why the system does not work as efficientlyas it should.
D. Investment Planning System
3.22 It is instructive to compare the Tanzanian planning system withthe operatior. of ideal type unplanned capitalist and planned sbocilistmodels. In the ideal version of an unplanned capitalist model individualfirms decide their own investment pians in accordance with the profit-ability of a project. If a shortage of a ccmmodity exists, the pricewill rise and capitalist firms will expand production to take advantageof the exceptional profits to be made. The investment is financed byusing the firm's own funds or by borrowing from banks or through capitalmarkets at the market rate of interest. Firms purchase their caoitalequipment from the cheapest possible source in the local or foreignmarket. Profits in the capitalist system may be taxed by the state, butotherwise a firm is free to use the profits as it likes -- for new invest-ment or d-vidends. The state may influence investment decisions indirectlyby raising tariffs to make certain goods more profitable or by suchmeasures as depreciation allowances, but the amount and allocation ofiavestment amongst sectors is determined solely by individual firms ;naccordance with market conditions.
3.23 In an ideal version of the planned socialist model, by contrast,central planners decide what investment is to be made by which firms inaccordance with long and short-term plans which have physical productiontargets. Investment funds are provided by state-controlled banks orthrough a central budgetary fund. The source of equipment is specified inthe annual production plan: typically a firm producing machinery is detailedto supply eouipment needed for new investment, or permission is given toimport from a specified source. Just because a firm makes an accountingprofit does not mean that it can use the funds for unapproved investment;the central planners may use these financial surplus of one firm to financeinvestment elsewhere.
3.24 Superficially, Tanzanian parastatal investment planning apoearsto follow the ideal type socialist model. There is a Five-Year Plan whichallocates 4-vestment among sectors and gives guidance on priorities withinsectors. There is also an Annual Plan which specifies the projects andamount of investment each ministry and parastatal will make in the comingyear. The sources of finance are also specified: a parastatal is authorizedto use its ovn runds, to borrow from TIB, to use froreign aid funds, or -sallocated funds from the Development Budget.
- 63 -
3.2, In practice, however, actual investments tn the manufacturingsector iiave borne little resemblanca to the i-ive-7tear PlZns. During theFirsL Five-Year Plan period this was per.aps inevitable since the industrialsector was controlled by private (frequently foreign) firms which were freeto dis. gard the largely indicative plan projactions. The Second Five-YearPlan a"so gave little direction to investment during the period, despitethe predominance of parastatal incremental cutout. rhe detailed controlof .nvet:tment decisions has tended to break down for several reasons.(1) Tht Annual Plans took little notice of the Five-Yea.z Plans. ThelonL-te l plans were vague and frequently unrealistic -- for the most par:jus-t: a st of possible projects, unguided by any strategic priority, andchz'act ;ized by overcommitment. Confrcnted with a list of many vaguepos. ibi ities -- far more than could reasonably be implemented -- almostanyihin' that was propsed (whether on the list or not) was greeted withentl isi. sm. (2) The planning system lacks proper indicators or enforce-ment ,eehanisms. In the capitalist system a manager proposes investmentswhich are expected to be profitable and i' they are not, the manager's jobor salary suffers accordingly. In a socialist system, producing firmsdeveelop investment proposals which are designed to implement detailedphysical production targets; if a firm proposed a totally extraneous inves;-ment, the persons responsible would suffer some penalties. In theTanzanian planning system, projects are supposed to be analyzed forprofitability and are supposed to conform to the guidelines laid dcwnin the Five-Year Plan, but in practice project appraisal frequentlv doesnot get done and there are no sanctions for proposing unprofitableinvestments on projects which fail either by commission or omissionto conform the Plan guidelines. Planning, therefore, becomes simplyan annual budgetary exercise not greatly different from traditionalministerial budgetary allocations and with little relation co long-termdevelopment plans. (3) A third factor complicating investment planningis the need to match project proposals with the availability of foreignaid, which is frequently tied. Combined with an increasingly tightforeign exchange position and increased reliance on external aid, thishas significantly influenced investment allocations in ways which willbe discussed in detail in a later sqction. (4) Finally, underlying allof the above problems, is the fundamental shortage of high-level trainedmanpower required to operate a sophisticated planning system. Trainedplanners and high level administrative or managerial personnel areamongst the scarcest resources in Tanzania. Yet effective operationof the investment planning system requires intensive use of this scarcefactor.
E. Production Planning System
3.26 Tanzania's methods of controlling the production decisions ofindustrial parastatals combines features of both the capitalist andsocialist models. Four aspects of production control are especiallyworthy of note.
Pr: -e Control.
2.27 .eav a ' ma..r '--!:-- ,.-._ -- '' :--: iz--es (both oarastatal andpt-.t.vate) are cnntrclled b. F or all practical pur-pe,ses. prices are sat on. a coFt -i .-, 4s. -eausa of the importanceof this system fcr efficie ,. 9 tm,.n from the 13BRD Industrialand Mining Sector Suv.ey7) iVes a I - d escri)t ion of the system.l/Here it is s-u'ficient to c e'. - c cuences of the pricecontrol s-ystem. First, trIe ra5" _'-:s or'-e r^oduction ofL Tanzanianindustrial zocds some:im-s duff .i icantly from world prices.This means that dcmestic 4 r- ̂es ft '1 "cation of the comparativeefficiency of different indstr' t ahat profits and lossesmay give little indicat-on _f -l :_ni_ Go., :here is little incen-tive for firms to impcrove af-iC 'S are usually set togive a fixed margin over ope::n; CJS_S,
Purchase of Innuts
3.28 Most industrial inurs aust -pu-rchased from a designatedparastatal or crop authorit- at _tr_o _ r:cas. Many imports areconfined to a particular parasta_al so that: nhe firm using these inputscannot Durchase them directly fr-om overl--aa-s (um-rl ess it happens to hold theconfinement). Impo-rts are liccsnsad for si-m-onth periods, usually on thebasis of historical usage anr appi at-r.s. Tn recent years allocationsof foreign exchange for industrinl -nou1 have - llen short of applica-tions due to the balance of Da9:=nts cr-lis, If a product is availablefrom a domestic firm it usually %cza' or7ted at all, thus givingabsolute protection to comestt4 priCQS. The ner result of the complicatedcontrol system and the general short age forei gmn exchange has been tocreate underutilized industrial capacit 1de .o shortages of raw materialsand spare parts. Spare Darts eave n-uz cn Open General License (whichpermits firms to import toc_:Y) ixY rI-_ io crt4cism from manufactur-ing parastatals, but some fi=s st'Il -ai-tain that they cannot obtain thespare parts theY need. Prices of imported inputs are usually kept at thec.i.f. plus tariff price which, in mcs. cases. is below the price whichfirms would be willing to pa-y . The a -r _ffot-rture, as in m-ost countries,has ze-o or low -rate on capi_ta gcc-s and 4ny inputs, but higher rates onconsumer goods and dcmesticall p-cd p -:droducar goods.
Management Selection
3.29 Responsibilityz for --,o_r.n r.aanagers or manufacturing parastatalsis not clearly defirled. The aolding corpurati,o and the parastatal's board
1/ See also Robert Rice, Tri F rit_ Czn::ol Iystetn: Theor7y andPractice" (Dar es Salaza: -'-E coomi -'C cEesuraau, 1975)
- 55 -
of direccors \ouId normally ue Jnvov;- :.L the decision but they areconstrained by :n-., centralized allocatic of his&-leval Tanzani-an mani-power i-n the case of locaL managers. In he more typical case of hiringforeign managers. management agreements i; st be approved by an Inter-Miir-s terial C OuMit * ee .
3.30 The high propQrticn o; teo_ managers (abnout two-thirds) irManufacturi n arastacals poses so=e difficulz issues or ccntrol. Fre-quenclv, .ae managers are 6upplied .,y minoricy snar,nc1ers -ho alsotypically supply machinery, raw materials, and/or marketing outlets.This means that the foreign managers may be more interested in maintain-ing supp'l ccnr-Pctions wit-h the foreign parents than in ma:cimizing localprofits thzc h cost reductions; muc1 or the Mi_or-Lty shareholder 'sprofit may came from supplying inputs or marketing rather than on itsshare of the parastatal's operating profit. The possibiliyc of harmfultransfer pricin.g is enhanced by the cose-plus system of price control.This does not necessarily mean that most foreigr. manage s are subvertingTanzanian's interests, but it does mean that Tanzania must pay specialattentiorn to its pr4cing and cther control mechanisms to ensure that theydon't provide an incentive for such subversion.
Labor relations
3.31 Two important policy guidelines have influenced labor relation'sin Tanza-.ia in the post-Arusha period. Tle first or these is the inco-a_spolicy adopted in 1967 and the secord is the Tanu Guidelines or "NMorgozo"document of 1971.'/
3.32 In 1967 incomes policy was Cne of the key pclicy measures adontedat the tme of the Arusha Declaraticn, It c ae irn response to a wideni?nrural-urban income gap and to stagnation in the growth of wage emplo:rment.2/The major provisions of the wages policy were: (1) a wage guidelinelmiting average wage increases to 5% per year; (2) wages of lower paidworkers could be raised by more than 5% subject to the overall wage guide-line; and (3) exceptiors to the 5% guidelines wculd be permit_ed in caseswhere 4ustified by prcducti-,ity increases . This bonus soheme was to beadministzred Uy Lhe z Labour Tribual ,allpolicy was to decrease tila rate of growth Q_` avd waces:E fWom 1,i -'9
L/ An English version of the TANU Guidelines may be found in Te AfricanRevi '_ ,,, VC 1'_, ' i_b- - _ ll49 11972). See Cha?r.er I for referGoce.sfor the icomes policy.
2/ Though as Ri',7eyem.mu pointed out, the stagmatforn. c overall wage ez : y-ment was i-argely due to a decline in sisal eaployment rather than - s growth of urban emplovment. See J. F. Rwevema-Iu, "Some Aspects or `hcTurne-r Report," Economic Research Bu-reau, (Dar es Salaan: Ecoacmi.;Researcz Bur_z_, >&C-).
- 66 -
Few productivi:t agreements twere formulated or approved by the PLT somost workers received wage increases of 5% or less.l/ In 1972, however,the Goverr=ent raised the minimum wage by Over 40% , The incomes policywas not formally revoked, but its provisions largely ceased to apply asa result of that increase. Irn 1974 another 40% increase in the minimumwage was granted. The Government, realizing the need for a new incomespolicy which would be relevant under inflationary conditions, again askedfor Professor Turner ard the 7LO to provide assistance. The new TurnerReport has not been made public but some of the crucial issues of futureincomes policy will be discussed in a later section.
3.33 The 1°67 incomes policy had two important effects on industrialdevelopment. First, the wage restraint established by the policy nodoubt played an important part in the rapid growth of manufacturingemployment during the period. H,owever, the emphasis given to equityin the policy also seems to have adversely affected efficiency: producti-vity related wage schemes have been discouraged and Part of the employmentincrease seems to be due to overmanning and lower total factor productivity.
3.34 The Mwongozo statement of 1971 stressed the desirability ofpopular participation in decision making:
"TWe have inherited in the Government, industries ardother institutions the habit in which one man givesthe orders and the rest just obey them. If you do rotinvolve people in work plans, the result is to make themfeel a national institution is not theirs, and conse-quently workers adopt the habits of hired employees.The party has a duty to emphasize its leadership on thisissue, ... The duty of our party is not to urge thepeople to implement plans which have been decided uponby a few experts and leaders. The duty of our party isto ensure that the leaders and experts implement theplans that have been agreed upon by the people them-selves."2/
The response to Hwongozo was imed4ate; there were several strikes andworkers completely took over production in a few instances. Some of thesetakeovers were allowed to stand but after some time the Government tookfirm action to halt the trend. Although institutional arrangements have
l/ This refers to wage scale increases. See Annex III for an analysis ofthe problem of wage drift.
_/ TANU Guidelines, paragraphs 13 and 28.
- 67 -
not been made, Tanzania is still committed to worker participation inmanagement and the Mwongozo statement still exerts considerable influenceon labor relations.
3.35 The effect of the emphasis on equity and worker participationis reflected in several aspects of the labor relations system. First,although management has considerable discretion in hiring productionworkers, procedures for dismissal are very cumbersome. Recently theclimate of opinion has been changLng and some workers have been dismissed"in the national interest," but prior to 1976 both legal procedures andpolitical attitudes made it practically impossible to dismiss workersfor anything other than gross breaches of discipline. Second, productivityrelated pay schemes are extremely rare. Most workers are paid on straighttine rates even in industries such as shoes which in most countries havesome form of payment by results schemes. Third, in the few instanceswhere bonuses have been approved by the PLT, bonus payments have beenmade in equal amounts for all workers. Small group or individual bonuspayments are discouraged and there is no separate bonus system formanagers.
* 68 -
cMUT-.` IV. LONNG-TEPU INDUSTRIAL STR4TGY
A. The Basic Industry Strategy
4.1 In a lengthy planning exercise preceding the drafting of theThird Five Year Plan, the Governaent considered several possible long-cerm industrial stateegies,l/ The strategy adopted by the Governmentincorporated elements of several of the strategies outlined earlier inthis annex, but the main rationale, product compcsition, and policyrecoimendations were drawn from the basic industry strategy. To emphasizethis link, the Government aas called its chosen strategy the basic inddustrystrategy (henceforth referred to as BIS).
4.2 The high-level Working Party res-oonsible for recommending a long-term industrial strategy gave the following rationale for proposingadoption of a BIS. First, the Working Party identified seven naticnalgoals which would be affected by the choice of industrial strategy:industrial growth, structural change, employment generation, increasedequity of personal income distribution, increased equity of regionaldevelopment, worker participation and self-reliance. Second, the WorkingParty reasoned that the main objectives to which industry could contributewere structural change and self-reliance. -This did aot necessarily implythat overall development strategy should subordinate other goals -,o thequest for structural change and self-reliance, but it did Amply that thesewould be the main considerations influencing industrial strategy. Theargument was based on the assignment of a particular policy instrument(investment allocation to industry) to a particular policy objective(structural change) on the grounds that the link between instrument andobjective was particularly strong in this case. The major burden ofachieving other objectives would be left to other policy instruments andother sectoral development strategies. Finally, it followed that sincestructural change was the main objective to be served in the choice ofindustrial strategy, the strategy chosen was the one which. produced thegreatest structural change - the BIS.
4.3 Although the objectives of structural change and self-reliancedominated the selection of industries to be developed over a t-wenty-yearperiod, other goals were not entirely neglected. The new industrialstrategy also incorporates some ideas from the advocates of the small-scale industry, maximum growth, and processing strategies described inan earlier section. There are several features of the new strategywhich should be highlighted.
1/ A brief descripticn of the planning methodology and a co=narison o-two of the strategies is published in Roemer, et al, "The Range ofStrategic Choice".
- 69 -
Investment Priorities
4.4 A pure basic industry strategy would give top priority toindustries supplying minimum mass needs of food, shelter,health,education, and transport, and to producer goods which enter into theproduction of a wide range of industrial products. Emphasis would begiven to products using local resources (needs would thus be defined bvcentral planners rather than effective market demand) and to productionfor the local market. The BIS adopted by the Government is also foundedon the premise that the economy must be restructured to reduce relativedependence on international trade, but the selection of industries to beincluded, especially in the near future, was modified in several ways.
4.5 In the first place, plans for several new investments werealready far advanced. Even though some of these ne-w investments would nothave had high priority under the 3IS, they were taken as commitmentswhich it would be too awkward or costly to change. The decision tocarry out existing comitments means that the new investment prioritiesof the 3IS will only gradually begin to shape the structure of industry.
4.6 it is worth noting at this point that the differences in outcomeof alternative industrial strategies is not nearly so great as thedifferences in the premises on which alternative strategies are based.To illustrate, the alcernative investment allocations over a twenty-yearperiod for-a pure basic industry strategy and a maximum growth strategyare shown in Table 23. These are based on the original alternativesconsidered by the Working Party on Long-Term Industrial Strategy. On.eof the most striking th.ngA about the comparison is the degree of overlapof actual investments over a twenty-year period. The contrasts wouldhave been somewhat greater if shorter time periods had been chosen,because the two alternative strategies also sequenced some investmentsdifferently, but over a twenty year period 70% of the investments under-taken would have been the same under these two contrasting strategies.The major difference between the two was that the basic industry strategywould invest nearly a quarter of total resources in iron and steel whilethe maximum growth strategy would have invested the same resources inprocessing for export (sisal, cashews and textiles).l/ With the decision
1/ The difference in food processing investment reflected assumeddifferences in capital intensity of technique rather than any majordifference of product. The alternatives shown were based on informa-tion available in 1973. They do not reflect changes in the relativeprice of capital goods, new investment possibilities which may ariseas a result of the discovery of natural gas, or new commitments madesince 1973 (including the decision to develop the Chunya iron oredeposit).
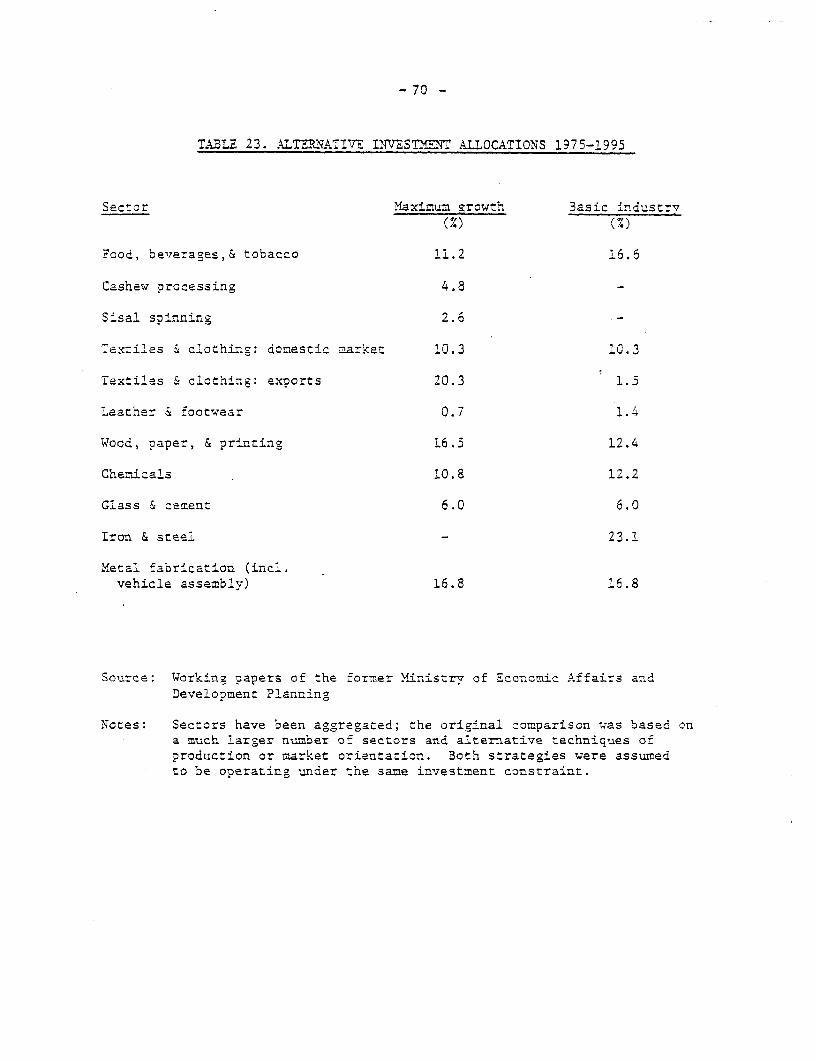
- 70 -
TA3LE 23. AMLTMNATIVE IYVESIT-=T ALLOCATIONS 1975-1995
Sector Maximum erowth 3asic industrv
(%) (X)
Food, beverages,& tobacco 11.2 16.6
Cashew processing 4.8
Sisal spinning 2.6
Textiles & clorhing: domestic market 10.3 10.3
Textiles & clothing: exports 20.3 1.5
Leather & footwear 0.7 1.4
Wood, paper, & printing 16.5 12.4
Chemicals 10.8 12.2
Glass & cement 6.0 6.0
Iron & steel - 23.1
Metal fabrication (incl.vehicle assembly) 16.8 16.8
Source: Working papers of the former Ministry of Economic Affairs andDevelopment Planning
Notes: Sectors have been aggregated; the original comparison was based ona much larger number of sectors and alternative techniques ofproduction or market orientation. Both strategies were assumedto be operating under the same investment constraint.
- 71 -
to modify the long-term industrial strategy for existing commitments,the contrasts between any possible alternative strategies was evenfurther narrowed; existing commitments include both additional cashewprocessing and 9nvest-ment in an iron and steel complex, for example.
4.7 A second way in which investment oriorities have beer modifiedis to permit sc=e further expansion of export processing industry. Thisis deemed necessar,r by advocates of a basic industry strategy in orderto avcid disruption of the economy: "Obviously this strategy (the 31S)is not being proposed on a tabula rasa. While such activities as cashewdprocessing and diamond cutting do not fit the essential aims of thestrategy, they are an imoortant element of the present economic structure.It may be necessary, especially in this difficult period of foreignexchange constraint, to continue and even expand some of these activitieswhich will not, in the long run, be given an important place in theindustrial structure".1/ At the same time, the concession on the possibi-lity of further expansion of some export processing industries reflectsa conflict which in fact has not vet been clearly resolved. The ultimateintent of the major advocates of the BIS is to restrict further investmentin processing for export. In their view processing for export is littlebetter than exporting raw materials because it still leaves the economydependent on extarnal markets and diverts scarce investment resourcesaway from industries which would generate a more fundamental structuralchange. However, several influential policy makers have defined theaims of the BIS as processing local raw materials for the domestic marketand for export. Ambiguity over the role of industries which process forexport is likely to continue for some ti me.
Efficiency Criteria
4.8 Another way in which the adopted strategy has been influencedby the advocates of other strategies - in this case the maximum growthstrategy - is through the introduction of some efficiency criteria intoBIS. This is proposed to be done in two ways. First, the choice oftechnique within sectors is supposed to be made with a view to achievinggoals other than structural change and self-reliance which are takencare of by the choice of activities. Techniques are to be chosen which wouldincrease industrial growth, employment generation, and the regionaldisversion of industry.2/ This implies that social cost-benefit analysis
1/ J.F. Rweyemamu, "The Formulation of an Industrial Strategy forTanzania," (Dar es Salaam, mimeo, 1976).
2/ The hierarchy of assigned instruments and objectives is as follows:(1) allocation of investment among sectors will be guided primarilyby goals of self-reliance and structural change. (2) Technicues ofproduction within sectors will be chosen to encourage industrialgrowth, employment generation, and regional balance. (3) Generalmacroeconomic policies and the organization of industry will be theinstruments used to influence income distribution and worker part-ci-pation.
- 72 -
will be used to dc r-mine the appropriate choice of technique withinsectors. This conclusion, however, must be modified to take account ofthe guideline an small-scale industry and other aspects of the choiceof technique, both of which are discussed below.
4.9 The second modificaticn of the BIS to take account of efficiencyconsideracions is a guideline which places efficiency limits on investTmentand production in different sectors. Non-basic industries will be judgedin large part on their ability to earn a high rate of return a capital orto earn or save foreign exchange at a low domestic resource cost. Basisindustries will be subject to lower target rates of return or targetdomestic resource costs, but will still be expected to attain a minimumtarget. The guideline is also ex?licit on the relationship betwen costsof production and the use of local raw materials; local raw materials willnormally be given preference, but this preference will be limited to aspecified percentage above the cost of imported raw materials.
4.10 E'ffciency or cost of Draduction is certainly not the maindeterminant of investment or production decisions under the proposed BIS,but efficiency does enter as a constraint upon decision making. TheTanzanian BIS thus reverses conventional grow-th-oriented strategies; theychoose products, market orientation, and source of raw materials on thebasis of efficiency, with choice constrained by employment, dependence,and other considerations. The Tanzanian strategy chooses products,market orientation, and source of raw material on the basis of theirrole in restructuring the economy and reducing dependency subject toefficiency constraints.
Small-Scale Industry
4.11 An important feature of the BIS is the emphasis to be placedon small-scale industry. This reflects the influence of the advocatesof a rural-oriented small-scale industry strategy. Although details ofthe reconciliation between the basic industry and small-scale concertshave not been worked out, it appears that the conception is not unlikethat of the Chinese industrial strategy. The Tanzanian formulation, toquote a proposal of the W4orking Party or Long-Term Industrial stratecy,is that "Part of the market and the resources available far industrialinvestment should be reserved for small-scale techniques in thoseindustries in which small-scale techniques can compete reasonably wellin price and quality with large-scale techniques".1/ It is evident fromthis proposal that although small-scale industry may require someprotection, the intention is to limit both the degree of cost protectionand the extent to which consumer preferences will be ignored.
1/ United Republic of Tarzania, "Report of WorlLing Party No. 7 on Long-Term Industrial Strategy," (Dar es Salaam: mimec, 1974)
- 73 -
4.12 The hinistry of Industries has elaborated the proposed role ofsmall-scale activities in the future industrial structure_.! Industrywould be organized on three levels. National industries would includemost large-scale activities producirg for the national or export market.These would be concentrated in a few industrial centers, though attermtswould be made to i=prove the regional distribution of industries throughnew investments. The second level woould be district irdustries. Thesewould include small- and medium-scale firms producirng items such as shirts,soap, soft drinks, shoes, and nails. District Develooment Corporation(DDC's) would be responsible for setting up such small-scale industriesin their districts. Although these firms would be publicly-owned, theywould sometimes be set up in cooneracion w-ith local private businesspartners.2/ Some questions about the role of district-level industrieshave been left unanswered: e.g. would DDC firms be encouraged to engagein "socialist competition" with similar firms in neighboring districts?The main thrust of the proposal is clear,however. Prcduction of a numberof simple consumer goods would *se decentralized in order to save ontransportation costs and to exvand industrial activities in small towns.Moreover, responsibility for a number of small-scale industries wouldalso be decentralized, with DDC's rather than varascatals responsible forproduction. The third level of industries would be village industries.The main emphasis at this level would be on the production of simplegoods for village (including neighboring village) consumption and ofhandicrafts (such as carvings)which might have a wider market. SIDO wouldhave responsibility for assisting villages to establish viable enterprises.
I/ United Republic of Tanzania, "Speech by the Honorable C,D. Msuya, M.P.,Minister for Industries, Introducing the Estimates af Ecenditure for1976/77 to the National Assembly," (Dar as Salaam: Mi.nistry ofIndustries, 1976).
2/ The Minister made a potentially important statement in tkis speech(p. 12) on the role of Asian and Arab non-citizens living in smalltowns:
"While at the national level Tanzania goes outside searching fortechnical skills for our industries, it is important for theregions and districts to find ways of utilizing the skills ofsome of the people living among us, particularly in towns, andwho equally enjoy our public facilities. These people whohave decided to make Tanzania their home and have the reiuisiteskills, have an obligation to cooperate with district organsin the establishment of certain industries either as employeesor as business partners. Since their skills are a nationalasset, it is our responsibility, as leaders, to define howbest we can utilize these skills for the benefit of the nationwithinr the framework of our national policies. "
- 74 -
Cho-ce o: Technicue
t. .3 As noted earlier, ef-iciency Wi11be a or-me conrsideration int.^e choice or tecnnique athin a sector. T-he a-m is to do something morethan si=mly maximize stacic e.ficiency, however. RWeyeeamu has posed-ve cuestions rwhrcn shculd be asked of any prorosed techr.`ue oforoduction:
"First does the technology to be introduced stimulate new skills,new capabilities, new organization? In other words does ftcontribute to institutional building? Secondly does it leadtcward technological autonomy or a perpetuation of dependency,especia'ly on mcther companies in foreign countries. Thirdly,does it contribute toward technological integ-ration? Fourthly,is it compatible with reasonable resource :.anagemrent a: nat_onallevel? Fifthlv does it help to tie togeth,er universit-is andresearch instit-tes with producing enterprisas?"1/
4.14 The abstract ideal is to choose tecmnicues whic'h not only areefficient in static terms, but which are also consistent with Tanzania'sexisting skill level and which have potential for generating furthertechnological change and institutional development. The practical impli-cations are that Tanzania should,if possible, avoid: turrkey projectswhich will be dependent on expatriate management for the foreseeablefuture, techniques which can only be obtained under strict controls fromlarge multinational firms, and techniques (suclh as hand processing ofcashewnluts) which have little potential for technologi cal change ordevelopment of generalized skills.
Coansumer Preferences and Local Resources
4.15 Freque-ntly there is a conflict between usn..g local resources andsatisf7ying consumer preferences. Amongst other instances, this occurs withgarments made from local cotton versus those made from imported synthetics,shoes made from local leather or imported plastic, and clay roofing tilesversus oalv;zed iron sneecs. z'any or tnese coincide with conflictsbetween consumer preferences and the use of small-scale production methods,discussed ir the analysis of the small-scale industry strategy.
4.16 The Working Party on Long-Term lndustrial Strategy tried to giviesome guidance on this issue in the following proposal: "Prefererce shouldbe given to the production of products using local resources. Productswhich fulfill similar needs but which are produced from imported materialsshould ustially be made available, but at a price which reflects theirhngher social costs of production. 'When the prcduct using imported materialsis a close substitute in price and quality for a locally-based product,as in the case of garments, the i mport-based product should only be madeavailable in very limited suovly and at a high price premium. "2/
1/ Rweyemamu, "The Formulation of an Industrial Strategy for Tanzanira,"p. 14
2/ "Report of Working Party No, 7".
- 75 -
4.17 This proposal points to a willingness to rely on marketinstruments and a reluctance to override consumer wants. At the sametime, it is evident from recent policies that basing production onneeds (as determined by central planners or political leaders) rather thanwants (as determined by market demand) is no longer unthinkable. Theclearest instance of this is the recent decision to limit the number ofdesigns of vitange (the printed cotton cloth popular wit1h Tanzanianwomen) to four per mill per year. This move seems to nave been inspiredby distributional considerations - a judgment that some urban women, whowere buying every new design produced, were consuming r^ar in excess oftheir needs as well as hampering the distribution of vitenge to ruralareas where basic needs were not being met. An interesting test ofwhether a needs or a wants production criterion will predominate mayemerge in the case of a proposed textile mill tc produce blended fabrics.The present intention is to produce a conventional 35% cotton (usinglocal yarn) and 65% (imported) pclyester blended fabric. At currentrelative prices this appears sensible on every count: it maximizes netforeign exchange earnings because pol-yester is cheaper than cotton (bothbeing tradeable goods), it satisfies consumer preferences, and it doesnot increase dependence since the weaving equipment can be converted toproduce a different blend or an all cotton fabric if relative pricesshould change. The test will come if relative prices do change: wouldthe mill be shifted to production of all-cotton or a higher-cotton blend?A similar test of the relative importance accorded to consumer preferencesand small-scale production will arise if the small-scale open-pansulphitation sugar refining process proves to be reasonably low-cost.Consumers will no doubt prefer the whiter, more highly-refined productof large-scale sugar mills.
B. The Case for the BIS
4.18 There is a tendency for economists trained in the western, neo-classical tradition to dismiss the basic industry strategy as warmed-overStalinism misapplied to a small, open economy. The strategy seemssyptomatic of much of what conventional wisdom has found wrong withindustrial policy in a large part of the developing world in recent years;particularly in its emphasis on import substitution and its anti-exportbias. This impression of the BIS is unduly alarmist. There are, ofcourse, numerous problems and potential pitfalls with the strategy andthese will be discussed in the next section. However, there is also acase for the strategy. Itany of the argu=ents below are conducted withinthe neo-classical paradigm and have not been raised by the advocatesof a basic industry strategy. Conversely, some of the criticisms raisedin the next section are made from the point of view of the strategy'sown expressed aims.
- 76 -
Goals of the StrateOy
L.19 The starting point .for any evaluation of. the BI3 must be theobjectives it is intended to serve. Much of the critfcism of the strategy_s based on the implicit assumption that it must be ludged solelv in termsof its affect uoan efficiency and growth But Tanzanian policy maketsgive high weight to the goal of structural change and the BLS is seen asthe major instrument for achieving this. It is true that most advocatesof a basic industry strategy believe that in the long run growth andstructural change are complementary, but for the foreseeable futureTanzania seems willing to give up a substantial amount of growth in orderto restructure the economy and lessen dependence on other countries.Structural change is not just instrumental to growth in the Tanza-.nianview,but an end in itself. Tt is therefore beside the point to cr-t4cizethe BI3 for failing to maximize growth. Criticism must be based on anexplicit argument that the goal of structural change is wrong (a delicateissue for an outsider), that the strategy is not effective or is lnconsis-tent in achieving ics declared goals, or that the opportunity cost interms of subsidiary goals (including growth) is greater than Tanzaniansrealize.
4.20 What is meant by structural change is not always well-defined,but it usually implies changing the economic structure to be more likethat of an advanced industrial economy, and specifically, to bringproduction and consumption more closely into line. A frequent lament ofsupporters of the BIS is that, "We consume what we do not prodluce andproduce what we do not consume." Of course, this is precisely theadvantage of international trade - to raise total income by permittinga country to consume what it does nct produce by producing what it doesnot consume. However, trade in most developed countries does not lead tonearly the same disproportion bet-ween production ansd consumptlon as thatof Tanzania. Most developed countries consume a large proportion ofexportables and produce a large proportion of their importables; frequentlya country both imports and exports a similar range of goods.l/ Most
1/ It does not follow that developed countries necessarily started cutwith congruent production and consumption structures. Such aninference might be an example of the post hoc ergo proDter hocfallacy. This is too large an issue to analyze here. Besides, theessential argument is that Tanzania values the decreased dependenceof such a trade structure for its own sake.
- 77 -
im=ortant, a developed country could usually adapt its production to achange in the international market. It is this flexibility, th4s capacityto chanae the production structure and the implied reduction in. de?endence,which the BIS hopes to achieve..L/ Processing a raw material such as sisalfor export might give higher value added, but it is an unacceptable basisfor industrizlization according to BIS advocates because it leaves theindustrial structure too dependent.
4.21 The impcrtanct point is not the justification for the gcal butthat structural change is the goal and the BIS seems generally well-designed to achieve it. Table 24 sumnArizes the structure of prcductionwhich a pure basic industry strategy and a pure maximum growth strategywould achieve by 1995. Once again the comparison is based on the originalalternatives considered by the Working Party on Long-Term IndustrialStrategy and would have to be modified for new commitments made since1973, changes in the relative cost of capital, and new possibilities forinvestment based on natural gas, but it does serve to show that there aresubstantial potential differences in structural change under alcernativestrategies.
Comvarative Advantace
4.22 A second argument in favor of the BIS is that most of theimport substitution industries selected under its criteria for investmentpriorities appear to be relatively efficient. 7i is frequently assumedthat Tanzanian comparative advantage must be based upon processing forexport. This unexamined assumption is just as likely to lead to themisallocations of planning by slogan as some of the cruder formulae ofthe BIS. On a priori grounds it is difficult to see why Tanzania shouldhave a comparative advantage in labor-intensive manufactured exports.The cost of unskilled labor in Tanzania (and many other African countries)is two or three times that cf unskilled labor in parts of Asia. Nor isthis due simply to the distortions of high minimum wage rates or an over-valued exchange rate; it is due rather to the relative abundance of landwhich raises the marginal product of labor in agriculture relative toparts of Asia and sets a higher floor under the supply price of labor tothe urban sector. In addition, the efficiency of unskilled labor tendsto be lower in Tanzania than in much of low-wage Asia owing to a lessertradition of viliage nandcrafts, a relatively l-ess sophisticated agricul-tural technology which might provide training in the use and repair ofsimple-tools, and lower motivation to accept the unaccustomed disciplineof industrial life because of more attractive income earning opportunitiesin agriculture.
1/ The argument can be cast in terms of the production possibilities andindifference curves of trade analysis. The aim is not to get ontothe highest possible indifference curve by moving alorg the productionpossibilities curve in response to international trading opportunities,nor is the aim even to push out che production possibilities curve atthe highest possible rate. The aim is rather to reducE the curvatureof the production possibilities curve so that movements along thecurve in response to price changes will be easier.
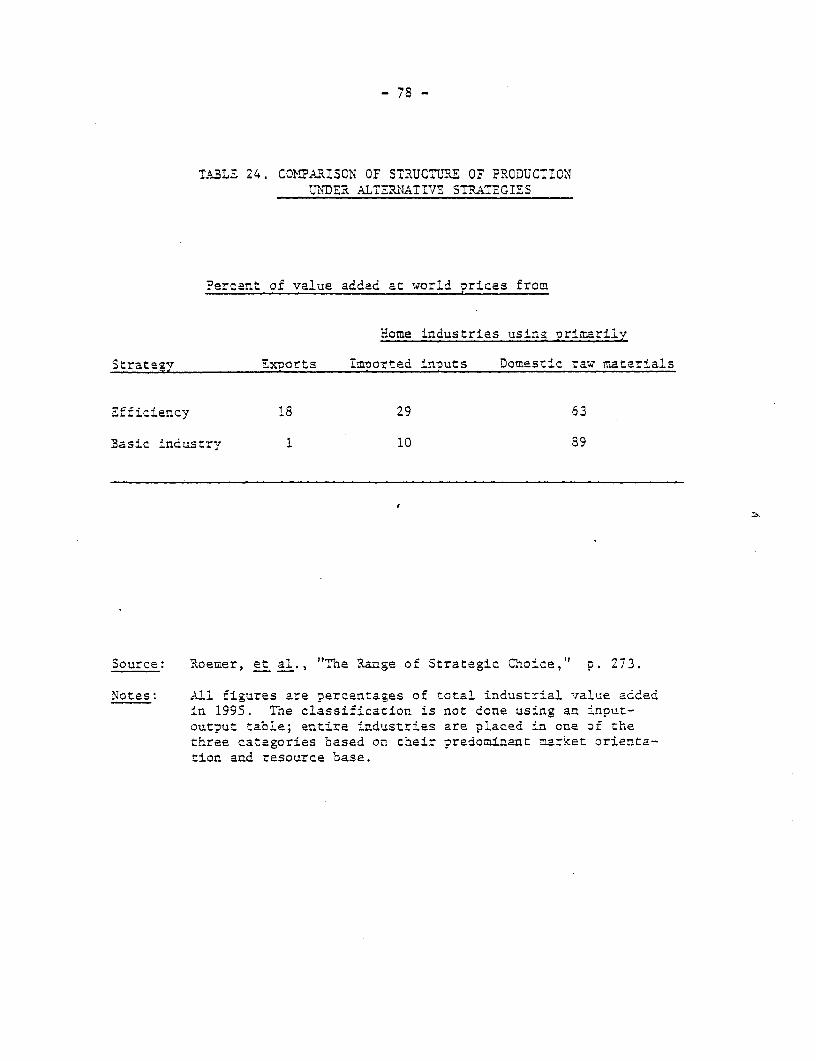
- 78 -
TABLE 24. COMPARTSON OF STRUCMME OF PRODUCTIONUNDER ALMTMPNATIVE STIATEG-:S
?ercent of value added at world prices from
Xome industries using primarily
Strategy Extorts Imnorted innuts Domestic raw materials
Efficiency 18 29 63
Basic industry 1 10 89
Source: Roemer, et al., "The Range of Strategic Choice," p. 273.
Notes: All figures are Dercentages of total industrial value addedin 1995. The classification is not done using an input-output table; entire industries are placed in one of thethree categories based on their predominant market orienta-tion and resource base.
- 79 -
4.23 This supposition regarding comparative advantage was largelyconfirmed by the industry studies prepared as background for the WorkingParty on Long-Term Industrial Strategy. Iable 25 provides a comparisonof efficiency in several industries. The only export industry whichshowed a major cost advantage over znost i=port-substitution possibilitieswas sisal orocessing, an industrv ir which the main comnecitors were in.urope, Tatin .America, and -he rest of Africa. Both textile exports andnrccessed cashews appeared only marginally efficient at shadow prices;wood oroducts for exrort would probablv be an efficient industry based onboth labor-inten.sity and transport cost savings, but the potential costsand markets are not well known. Leather tanning for e:port was inefficientat shadow prices. On the other hand, most imoort-substitution industries,including several backward-linkage industries, were found to be potentiallyefficient. This is accounted for by four main factors: (1) the naturalprotection afforded by transportation costs tips the balance in favor ofimport subst.itution, (2) minimum economies of scale for a large number ofintermediate industries would be achieved within a 20-year period if theeconomy were to grow at the pre-1974 historical average, (3) some other-w=ise ineff_cient industries can be started using the by-products ofexisting indulstries, and (4) there are still a number of efficient,"easy" import-substitution possibilities in Tanzania, particularly withthe growth of the domestic market over a twenty-year period.
4,.4 The argument must not be carried too far. It is not meant toimly that there are no efficient manufacturing ex-port possibilities, noris it meant to imply that the investment criteria of the BIS wouldinadvertantly maximize allocative efficiency. The argument is simplythat the costs in growth and efficiency of the BIS are not as high asmight be thought by some critics. As noted earlier, 70% of industrialinvestments under a pure basic industry strategy would be identical withthose of a maximum growth strategy. And, apart from the two extremes ofsisal processing and steel production (two very large exceptions, ofcourse), export processing industries in general offer fewer opportunitiesfor growth-producing investment thar. backward-linkage import-substitutionindustries. 1/
1/ This result should not be too surprising. Some of the leading criticsof the conventional import-substitution strategy of development haveconcluded that there has been too little backward-linkage importsubstitution in some of the countries pursuing this strategy, SeeJ.B. Sheahan, "Imports, Investment and Growth: Colombia Experiencesince 1950," in G.F. Papanek (ed), Development Policy - Theory andPractice, (Cambridge: Harvard University Press, 1968); and G.C.Winston, "Consumer Goods or Capital Goods - Supply Consistency inDevelopment Planning," Pakistan Development Revi.ew, Autumn, 1967. Oneof the reasons for this is that the differentiated structure ofprotection in most developing countries is biased niot only againstexports but also against backward-lirkage import substitution; seeH.J. Brnton, "The Import-Substitution Strategy of Economic Develop-Ment: A Survey, "Pakistan Develcrmen: Review, Suer, 1970, andJ.H. Power, "Import Substitution as an Industrialization Strategy,"Philionine Economic journal, Second semester, 1966.
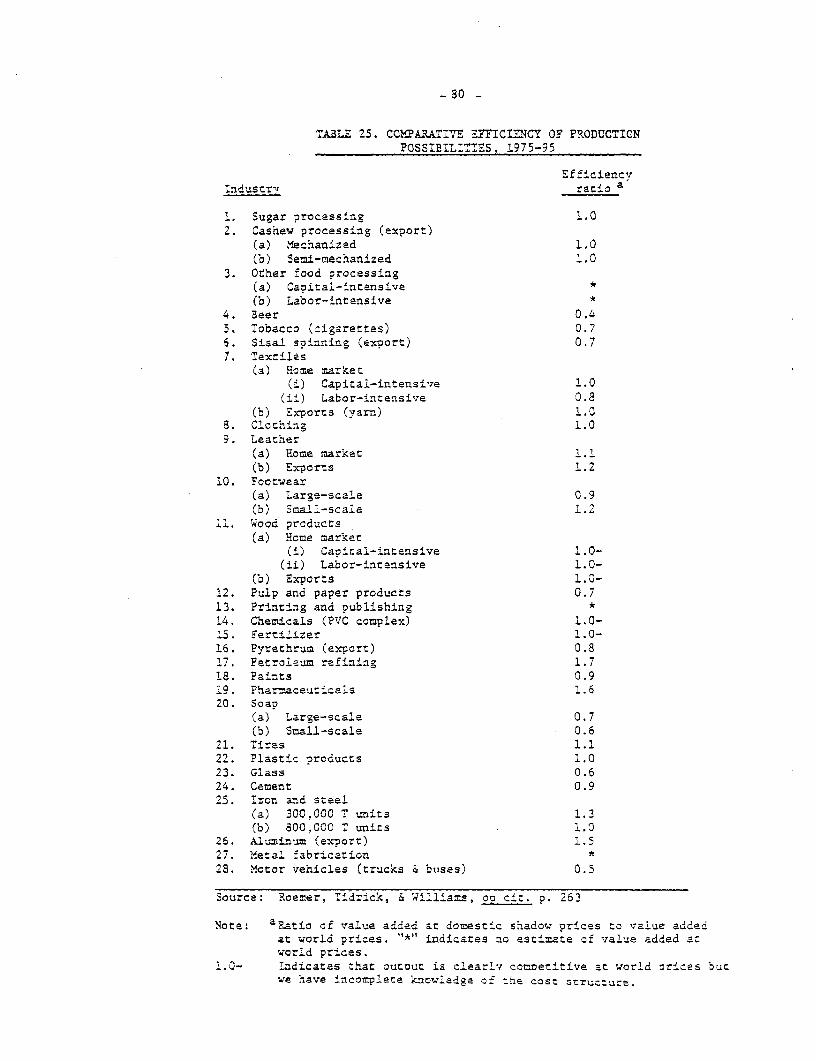
o80 -
TABLE 25. CObPAPRATIVE EFICIESCY OF PRODUCT,ONPOSSIBILITTES, 1975-95
EfficiencyIndustrT ratio a
1. Sugar processing 1.02. Cashew processing (export)
(a) Mechanized 1.0(b) Semi-mechanized 1.0
3. Other food processing(a) Capital-intensive *(b) Labor-intensive *
4. Beer 0.45. Tobacco (cigarettes) 0.76. Sisal spinning (export) 0.77. Textilts
(a) Home market(i) Capital-intensive 1.0
(ii) Labor-intensive 0.8(b) Exports (yarn) 1.0
8. Clothing 1.09. Leather
(a) Home market 1.1(b) Exports 1.2
10. Footwear(a) Large-scale 0.9(b) Small-scale 1.2
11. Wood products(a) Home market
(i) Caoical-iacensive 1.0-(ii) Labor-intensive 1.0-
(b) Exoorts 1.0-12. Pulp and paper products 0.713. Printing and publishing *14. Chemicals (PVC complex) 1.0-15. Fertilizer 1.0-16. Pyrethrum (export) 0.817. Petroleum refining 1.718. Paints 0.919. Pharmaceuticals L.620. Scag
(a) Large-scale 0.7(b) Small-scale 0.6
21. Tires 1.122. Plastic products 1.023. Glass 0.624. Cement 0.925. Iron and steel
(a) 300,000 T units 1.3(b) 800,000 T units 1.0
26. Aluminum (export) 1.527. Metal fabrication *28. Motor vehicles (trucks & buses) 0.5
Source: Roemer, Tidrick, & Williams, oo cit. ?. 263
Note: aRatic of value added at domestic shadow prices to value addedat world prices. "*" indicates no estimate of value added atworld prices.
1.0- Iudicates that output is clearly comoetitive at world orices bucwe have incomplete lknowledge of the cost structure.
- 81 -
EmD lo tent
4.25 The 31S does nct create as much industrial e=lpo'jent over a20-year period as a more growth-oriented strategy would do. In thecomparison of pure strategies prepared for the Workin. Party on Long-TermIdst-ri Strateg, a 'as4C idsrS -y sCr :eas . -
industrial employment to 229 ,CQ0 in 1995 (from about 50,000 in; 1975)compared to 317,000 for a growzh-oriien:ed strategy. 1t In terms ofpercentage increase the difference is significant. Howe'ter, it helos toput this in uerspectjve by noting that under a oure basic i_naustry straregypro-ected employment in manufacturing would be about 2.1% , of the laborforce in 1995 compared to 2.9% for a growth-orientad strate-y. in brief,no industrial strategy will aave a sig-nificant i=pacc on em=iomentoppor-un_ties in the economy as a whole for manJy years Cecause -^ taeexisting small base of industrial emDloument. Moreover, it is questiorable
whether the expansion of industrial emplo,ment is an inorta-nt object-v2of Tanzanian policy; in a relatively land-surplus eccnomy employnmentexpansion is not an especially urgent need. Finally, However, taking aneven longer perspective of, sav, 50 years, it is possible that a secuence
of a BIS strate7,v for 25 vears foillowed by a -ro--th str-a-egv for 25 vears
would have larger employment effects than the reverse se;:ence. Th--e
reason for this is that the 3IS should create a greatser capacty to adapctechnology to local factor availabilities, thus Dercrn- tizg an accelerated
-rowth of emplovment in tne iacer period.
Foreign Exchange Gap
4.26 The maikr short-run constraint to gro=tn for many developing
countries is the foreigrn exchange gap. This gap is bindiLng because in
the short run increased dcmestic savings canrot readily be trans'ated
into additioral foreign exz,ange earnings.2/ Some critics h-ave iden t iiedthe conventional import substitution strategy of de:veloment as one of
the major causes of the foreign exchange gap. 3/ TIe strategy's bias
against exports and in favor of domestic production of consumer goods
typically creates a structure in which exports are predominan.tly prim-a-y
products not consumed iL .ne aomestic market and imports are mostly
inter.ediate and capital gocds which go to =antaaz o0 e.gand a
1/ Roemer,et al,"The Range of Strategic Choice," Tables 2 and 4.
2/ H. Chenery and A. Strour, 'Forei-gn Assistance ann ncCnCoLiz "e'eon-
ment," American Economic Review, Vol. LVI, No. 4 (Sentember 1966)
pp. 679-732.
3/ HI.J. Bruton, "The Twc-G-ap Approach to Aitd anrd ;e%e c-_:: Cc=elt,Am,erican Economic Rview, Vol. LTX, No. 3 (ur '9 3) . '39--
- 82 -
marn facturi=n sectcr producing mostly consumer goods. In such a structureexports cannot be expanded in the short run arnd any reduction in importswill cut either currer.t or future production because both are imnort-cetrendent. In short, increased savings cannot be converted into increasecavaiLability of foreign exchange.
t.27 Te usual prescripticr. or structural change in a foraizne%cnan-e constraieed ecoromy is to e:qand manufacturing exports. InTanzania this would probably be takken to mean an excpansion of activitieswhich increase the degree of processing of raw materials before export.This expands foreign exchange earnings, but at the end of the expansionshort-term flexibility is no greater than before. The reason is thatthere is still no scope for increasing exports CuicUly by reducingdomestic consurmcton. HAowever, if consumer goods i=port-substitut_ionindustries can be converted into export industYies, than not or.ly is thelevel of net :oreign exchange earnings increased but the short-termpotential for further expansion by reducing domestic consumption is alsoincreased. Of course, with perfect foresight planners would always choosethe activity which gives the greatest net foreign exchange earning orsavirn for a given expenditure of domestic resources. The argument herais that, in a world of fluctuations and uncertainty, there is specialvalue in having an exPort st-ucture n-r. which exports are an extension ofthe domestic mar'-et. It goes without saying that this advantage mustalways be balanced agailast t1he cost of .oregone export opportunities witha lower domestic resource cost of foreign exchange.
4.23 Ar alternative way of alleviating the foreign exchangeconstraint is to expand back-ward-linkage imvport substitution. Thins alsoincreases net foreign exchange availability and has two additionaladvantages as well. First, it extends the range of products which arelargely dependent on the domestic market and which therefore are potentialexports which can be increased quickly through reductions in domesticdemand. Second, because the economic structure would be more diversified,and because it is easier to expand an existing industry than start a newone, production could be ad,usted more cuickly in response to changinginterna:icnal conditions.
4.29 The increase in short-term foreign exchange flexibility providedby the BIS is a particular examDle of the potential benefits (otherthings being equal) of aligning the structures of production and consumptionmore closely. If production and consumption are closely balanced then theshort-term supply and demand elasticities are much higher. A good exampleof the flexibility which this gives is the recent experience with sugar;by reducing domestic consumption of sugar Tanzania was able to move fromsugar imports of Shs 83.5 million in 1974 to exports of Shs 52.8 milliorLn 1975 - a tur-aaround of Shs 136.3 million in one year.
4.30 Of course, other things may not be ecual. The greater flexibi-lity of the MIS structure may be purchased at a higher domestic resourcecost oer unit of foreign exchange earned or saved. 'n that case tnerewill be a trade-off between increased flexibility and increased income.
- 83 -
The previously cited efficiency ratios suggest taat the domestic resourcecost of backward liakage import suhstitution is generally not higher thanthat of most exportables. However, it is essential to look at the trade-off in each sub-sector; no general prescription is a substitute for goodproject analysis giving some indication of the trade-offs involved in aparticular project.
4.31 Two conclusions can be drawn from this discussion. First, thepreference of the BIS for a domestic market based industry over an industr-ywhich produces exclusively for export may be rational withii. the frame.workof both the efficiency paradigm and the dependenct- paradig=. Secorc, alogical corollary of the BIS which its supportars have nrct identified is5that it makes sense to develop at least a minimal export capacity for awide range of industries. Without some prior attention tc price, cuali;y,and market channels it will not be possible to take advantage cf the shorn-berm export potential given by closer alignment of the production andconsumption structure.1/
Skill Develooment
4.32 A final strength of the 3IS is the prominence it gi-'es codevelopment of the metals angineering sector. The advocates of a basicindustry strategy have advanced several reasons for the importance ofdeveloping metals engineering:
(a) The enginecring industry is the most basic industry ofall because it provides the reproducible capital used inall other industries; it has more linkages than any othersector.
(b) Without an engineering industry it is impossible to emergefrom a state of technological dependence.
(c) Development of metal-using industries is essential toprovide a market for another basic industry, steel.
(d) The engineering industry provides the capacity fortechnological innovation, thereby facilitating producti-vity growth and the adaptation of technology to Tanzanianconditions and factor availabilities.
1/ It must be stressed that ualess there is some follow-through to tryto extend the range of manufactured exports, the BIS will fail tcyield the advantage outlined here. For an analysis of tae problemsresulting from anti-export biased policies see I. Little,T. Scitovsky,and M. Scott, Indust7y and Trade in Some Developing Countries,(Londor.: Oxford University Press for O.E.C.D., 1970)
- 84 -
4.33 The first three of these arguments can hardly be evaluated froman efficiency perspective; for example, providing a market for steel isonly important if steel is viewed as inherently important (or if develop-ment of both industries together would be efficient). However, the lastargument is couched in efficiency terms and is potent'ally very important.There are t-wo separate issues raised in item (d). One is that developmentof an engineering industry twill permit adaptation of technology to localfactor availabilities. This would be important even if there were alarge international market in inter7ediate capital goods (amongst develop-ing countries, for example). In developed countries, the engineeringindustry in typically very decentralized. A textile factory, for example,may be set up using machinery supplied from a large specialized manufacturer.Ordinarily, however, small engineering firms arise rnearby to service themachinery and then frequently expand into the manufacture of spare parts,one-of f construction jobs, and finally, modifications of the machinery.Even if an apprDpriate technology is available off-the-shelf, there areeconomies to having a local engirneering firm available to service themachinery and construct one-off piaces of equipment with high transportcosts. There appropriate technolcgy cannot be purchased internationallyor is available only second-hand, a local engineering capacity may be theonly way to assure the availability of techniques of production suitableto the country's factor endowment.
4.34 Unfortunately, development of a metals engineerin.g industryis very difficult, especially in a country at an early stage Ofindustrialization. This raises a second issue. implicit in point (d):the need for special encouragement in order to develop ;he engineeringsector. The metals engineering industry is the training ground forsome of the most important, and most generalized, industrial skills.Precisely because these skills are rare the sector will be relativJelyhigh cost in the beginning. On static efficiency grounds the sector willlook like a poor candidate for investment. But the rate of increase inskill through learning by doing is potentially great. The benefits ofthis productivity growth and skill development may not be captured by asingle firm or a single project, however, because skilled workers mayleave. In short, the sector exhibits all the conditions US2' ally associa-ted with the infant industry argument for protection of manufacturing.The case for special attention to the metals engineering industry beingmade here is simply the infant industry argument applied to a sub-sector.Thus, even though the case for special attention to the metal engineeringis generally made on different grounds by basic industry theorists,there is a presumption that it should have high priority on conventionaldevelopment theory grounds as -well.
- 85 -
C. Problems with the BIS
4.35 Some of t;e shortcomings of the BIS have been alluded to before.Most of the criticisms or questions below are based on an evaluation ofthe 3IS on its own terms, i.e. taking the objectives of structurai Qca-neand self-reliance as dominant.
Capital and Foreign Exchange Requirements
4.36 Many of the priority investment allocations of the 3IS arerelatively capital intensive and have a long gestation period. The short--erm costs in terms of foregone growth may therefore be especially high,particularly if agricultural exports do not increase to improve foreignexchange availability. This raises the question of whether it mighat bepossible to achieve even more structural change in -the long run byconcentrating on investments with quick growth and foreign exchangereturns now. In effect, the cuestior. is whether more structural changemight be achieved by postponing implementation of some parts of the 3I5unt-l a more favorable time. This is analogous to the debate o-rer whetherincomes of the poor will be raised more by concentrating on growth ordirect attempts at income redistribution. In a sense the question hasbeen answered by the decision to go ahead with a number of previouscommitments and with the explanation that "It may be necessary, especiallyin this difficult period of foreign exchange constraint, to continue andeven expand some of those industries which will not, ;n the long run begiven an important place in the industrial structure. "1/
4.37 The dilemma may still exist in the longer term. To see theproblem more clearly, it is useful at this stage to present the resultsof a simulation of alternative industrial strategies using the model inAnnex IV. The model simulates the feedback effects of large capitalrequirements: in the baserun the higher ICOR's of the BIS lower growthbut also reduce total capital funds available in the next period so thatthe effect on growth is even greater. (The feedback effect is leveredin the model because investment in manufacturing is a residual after allother sectoral requirements are met). Table 27 summarizes the projectedresults of the BIS and an alternative stratcgy giving -ore emphasis tolight, export-oriented industry.2/ The growth and foreign exchangce
I/ Rweyemamu, "The Formulation of an Industrial Stracegy fcr Tanzania",
2/ For a com-oarison of investment allocations under the two strateg2iessee Annex IV, Tables IX-9 and X.3, and accompanying discussion.
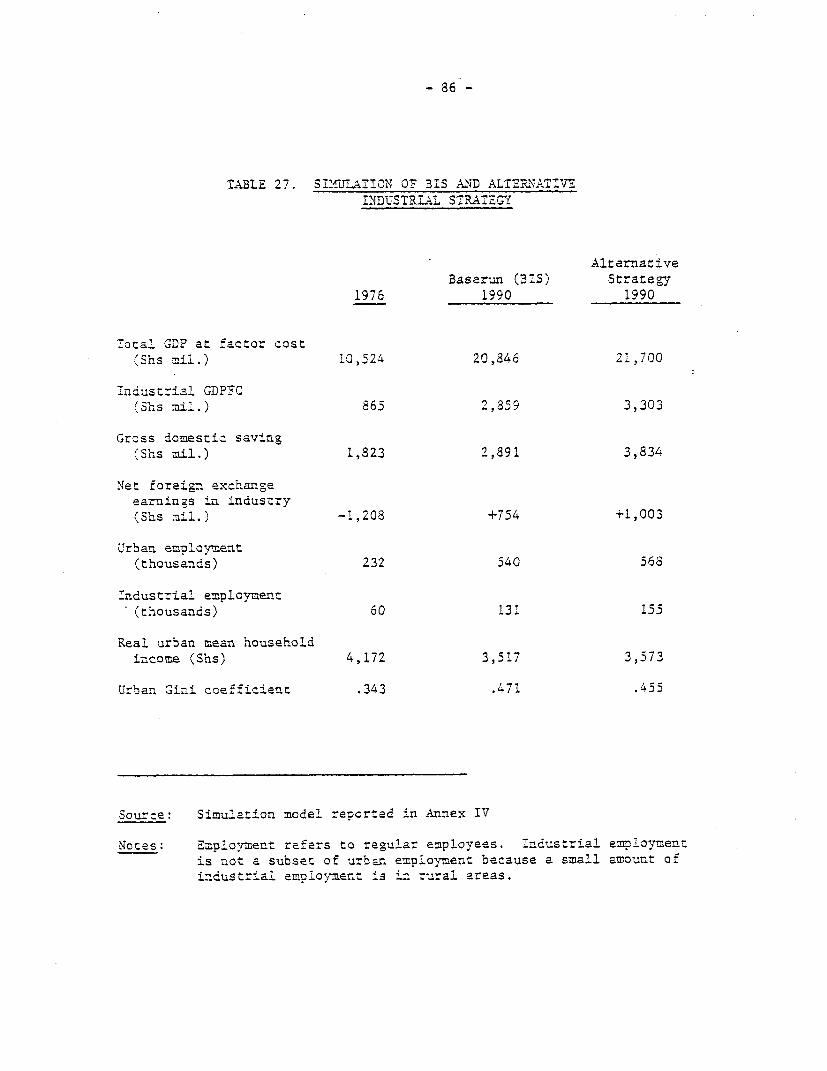
- 86 -
TABLE 27. SIIULATION OF BIS AND ALTZMNATIVEINDUSTRIAL STRATEGY
AlternativeBaserun (BIS) Strategy
1976 1990 1990
Total GDP at factor cost(Shs mil.) 10,524 20,846 21,700
Industrial GDPyC(Shs mil.) 865 2,859 3,303
Gross domestic saving(S'ns tmil.) 1,823 2,891 3,834
Net foreign exchangeearnings in industry(Shs Mil.) -1,208 +754 +1,003
Urban e=alcyment(thousands) 232 540 568
Industrial employment(thousands) 60 131 155
Real urban mean householdincome (Shs) 4,172 3,517 3,573
Urban Gini coefficient .343 .471 .455
Source: Simulation model reported in Annex IV
Notes: Employment refers to regular employees. Industriai employmentis not a subset of urban employment because a small amount ofindustrial employment is :n rural areas.
- 87 -
effects of the two industrial strategies differ little. before 1980 becauseinvestment during this oeriod is already set. After 1980, however, thehigher capital requirements of the BIS begin to depress growth. Thnen allof the feedback effects are taken into account industrial value added is13.4% less in 1990 under the BIS than under the alternative strategy.Perhaps more surprising, other sectors are also adversely affected by theslower industrial growth so that total GDP at factor cost is 3.9% less in1990 under the BIS.1/ If the model were continued longer the effects ongrowth would be even greater for total savings are strongly affected bythe choice of industrial strategy. By 1990 total gross domestic savingswould be 32.6% higher under the alternative strategy than under the BIS.The feedback effects of foreign exchange growth are not examined in themodel, but the direct effects are. Again, net foreign exchange earningsin 1990 in the industrial sector would be Shs 250 million less Cin 1969prices) under the BIS than under the alternative strategy. Incomedistribution and employment growth are also less Lavorable under the BIS.
4.38 Structural change is not explicitly shown in toe simulation andin any case it would be difficult to make meaningful projections for amuch longer period. But if it were possible to make longer projections,the model would probably show that the strategy mix or sequencing o'investment which produced the most structural change would differdepending an the date which is the reference point. The sequence ofinvestments would probably differ depending upon whether the aim was toget as much structural change as possible by 1985 or by the year 2000.
Im=lication for Structure of Exvorts and Agriculture
4.39 Most Tanzanians would also like to change the structure ofagricultural production (to reduce the share of exported crops) and ofexports (to reduce the share of unprocessed primary products). The costsof undertaking these structural changes along with structural change inindustry would be prohibitively high, however. In order to earn theforeign exchange needed to meet minimum growth targets and to providesufficient foreign exchange and capital to undertake long-gestation basicindustry projects, it may even be necessary to expand primary productexports in the short ter=. Structural change in industry may thereforerequire worsening of the structure of agriculture and exports trom aTanzanian point of view; the proportion and absolute value of primaryexports may have to increase. This is more than just a paradox. It alsopresents a problem for advocates of the BIS. For many Tanzanians the mostvisible sign of underdevelopment is the high proportion of exports ofprimary products and it is not clear that they accept that greaterstructural change in industry may imply less change in the structure ofexports. This is one of the reasons why the BIS has been defined bysome officials to include processing raw materials for export; theseofficials would probably not support the 31S if it became apparent thatthere are trade-offs between changing the structure of industrialproduction and changing the structure of primary exports.
1/ Industrial sector value added is Shs 444 million less (in 1969 prices)under the BIS, but total value added is Shs 854 million less.
- 88 -
The Role of Steel
4.40 One of the distinctive features of the 3IS is the e=hasisgiven to the production of steel. A decision has already been made toproduce steel from low-grade iron ore deposits at Chunya with Chlineseassistance. There have also been continuing consultations with Euroveanconsultants and aid agencies concerning the possible production of steelfrom the high grade, but problematic. iron ore deposits at Liganga. At themoment, there is virtual certainty that there will be steel productionbased on Chunya in the early 1980's, but the amount of production is notknown as studies are still being conducted. The Government seems alsoto be seriously considering early production from the Liganga deposits.
4.41 The decision to produce steel at such an early date, andparticularly the apparent intention of starting production at both Chunyaand Liganga in the next Plan period, raises serious questions aboutsequencing, markets, and costs.
4.42 The 4mportance of the sequence and timing cf investments hasbeen stressed in much of the background work and theoretical dIscussicnof the basic industry strategy. The i=lications for the steel industryare generally agreed:
"rThe imortance of the rapid development of engin.eerin =aand metal transforming industries must be further emphasizedin the light of the proposed development of Tanzanials naturalresources. The eventual production of semi-finished steel fromTanzanian deposits of iron-ore and coal is a prime example ofthe type of industrial development at which the industrialstrategy is aimed. It will be essential, however, if all theaims of the strategy are to be met, to provide an efficienthome-market base for the industry. In order to do this steel-using industries such as engineering, metal transforming andconstruction must be developed to the fullest extent possiblebefore steel production co=ences."1/
The issue is whether the user industries will, in fact, be developedahead of steel production. Production of steel may come on stream earlierthan originally planned in the BIS and, if Liganga is developed early,in much greater volume than could be absorbed by the domestic market.With forced development of the metal engineering industry it has been
1/ J.F. Rweyemamu, Introduction to Draft Report of Metals TIdust=yDevelopment Task Force, (Dar es Salaam: mimeo, 1976).
- 89 -
estimated 1/ that demand for liquid steel in Tanzania would be about145,000 tons in 1980 and less than 240,000 tons in 1985. This assumesgrowth in the metal-using sector of 10% per year which looks like a veryoptimistic estimate in view of the Plan postponement and recent crisis.If both Chunya and Liganga came on stream by 1985 domestic productionof steel would probably be from 370,000 to 540,000 tons of liquid steel,2/far in excess of the domestic market. Rapid development of both sourcesof steel would contradict the strategy's own guidelines on sequencing.
4.43 The reason for the stress on development of the metalsengineering industry first is simple: "Development of the metals andengineering industry is not dependent on the local production of steel;but a local steel industry will be a precarious one without the develop-ment of user industries in Tanzania."3/ Steel is not a product whichwould normally be considered high on the list of export prospects;ex-orts would have to be mostly in the form of billets rather thanfinished steel, the international market is unstable, and Tanzanianproduction costs would be high. To build steel-making capacity inadvance of steel-using capacity would be to exchange dependence onimports of steel for dependence on exports. Since steel billets arehighly standardized and the industry is very comoetitive, the exchangeis unlikely to be beneficial to Tanzania.4/
4.44 The most important question about steel proudction is its cost.There are large economies of scale in steel production: for thetechnology needed to produce steel using Liganga ore, a plant with acapacity of 300,000 tons is estimated to have total production costsper ton 22.5% higher than a plant producing 500,000 tons, while a 150,000
1/ In the background industry study for the Working Party on Long-TermIndustrial Strategy: D. Williams, "Development of the Iron and SteelIndustry in Tanzania, 1975-1995," (Dar es Salaam: mimeo, 1973). Inits earlier survey of the Lidustrial sector using the methodologyof this study the Bank came up with similar short-range projections.
2/ A plant producing 270,000 tons of steel (300,000 tons of iron) wouldbe necessary to achieve minimum economies of scale. No one yetknows the proposed scale of production at Chunya but it can hardlybe less than 100,000 tons.
3/ Williams, "Development of the Iron and Steel Industry".
4/ The Tanga rolling mill did have trouble getting supplies of billetsat one time, but this was because the mill was set up to use a veryunusual size billet.
- 90 -
ton plant would have unit costs which are 55% higher than a 500,000 tonplant.l/ A 500,000 ton plant was estimated in 1973 to be marginallyefficient at shadow prices.2/ But production from a 500,000 ton plantcoming on top of Ch=nya production could not be absorbed by the domesticmarket until about 1995. The case which basic industry theorists makefor steel is that it has very high linkages. This is true, but if ahigh linkage industry 4S also a high-cost industry, then linkages maybecome blockages. High-cost intermediate inputs raise the wholestructure of industrial costs and thus have high opportunity costs interms of growth. If the high cost of steel is passed on to metal--usingindustries, the growth of these industries will be slowed; yet it istne metal-using industries, not steel production, which yield largepotential external economies in the form of skill development, capacityto adapt cechnology, and productivity growth. If the cost of steel issubsidized, on the other hand, this reduces the investment surplus andthe rate of growth. A high proportion of the growth-reducing effectof the BIS in the simulation model stems from the assumtion thatLiganga steel production will be started early. If additional steelproduction were dropped from the BIS until after 1990 but all otherfeatures of the strategy remained the same, total GDP would be 2.4%higher and total savings 13.7% hdgher in 1990.3/ Table 27 shows thecomnarative effects.
4.45 A detailed feasibility study may show that steel productionfrom Liganga ore is less costly than shown by the preliminary studyprepared for the Workirng Party on Long-Term Industrial Strategy.However, policy makers should be prepared to specify what cost they arewilling to bear in order to expand this one industry at an early date.At the moment it appears that the production of steel is an end initself for many people, with little justification in terms of theprofessed aims of the BIS.
1/ CaDacity refers to iron production; liquid steel capacity would beabout 10% less. Thomas, Dependence and Transformation, rests alarge part of his case for steel production on the argument that100,000 ton plants compete effectively in the United States. Tneseare highly specialized producers,however. A 100,000 ton plant inTanzania would either have to export specialized products, orproduce a w-ider range of products at much higher unit cost.
2/ Williams, "Development of the Iron and Steel Industry".
3/ This means that over half of the growth-depressing effects of theBIS in the simulation model result from early development ofLiganga steel.
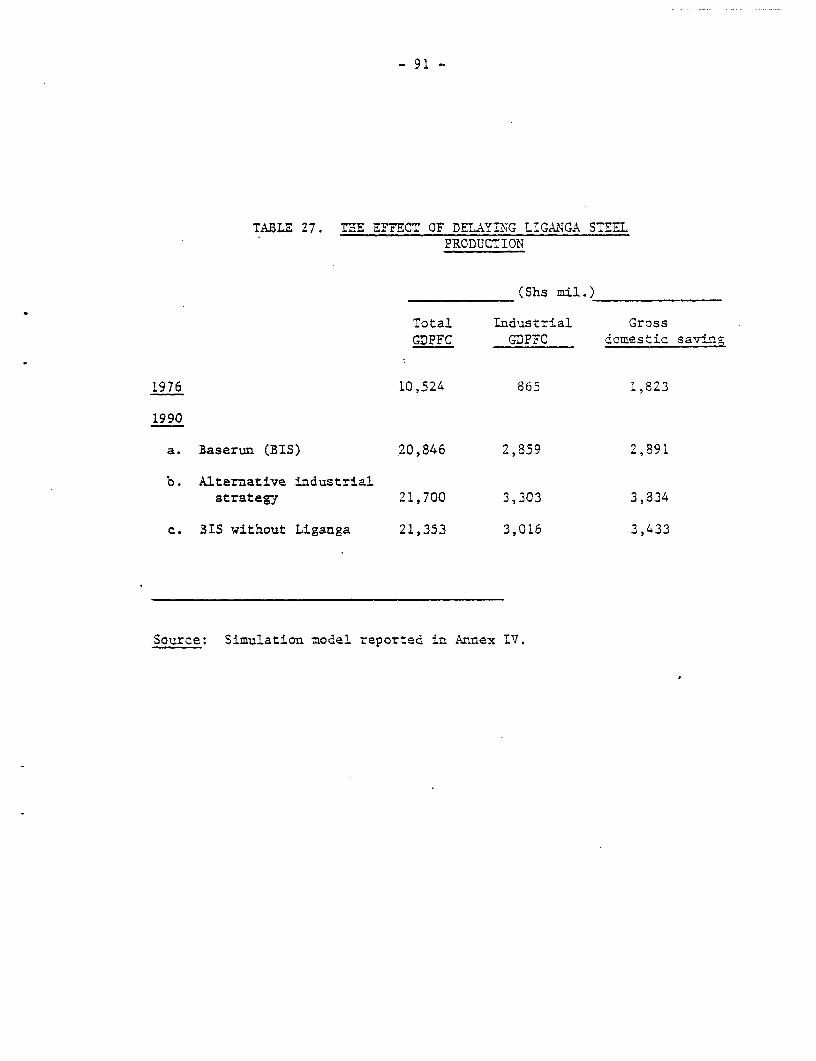
TABLE 27. THE EFE CT OF DELAYING LIGANGA STEMLPRODUCTION
(Shs mi4l.)
Total Industrial GrossGDPFC GDPFC domestic saving
1976 10,524 865 1,823
1990
a. Baserun (BIS) 20,846 2,859 2,891
b. Alternative industrialstrategy 21,700 3,303 3,834
c. BIS without Liganga 21,353 3,016 3,433
Source: Simulation model reported in Annex IV.
- 92 -
Planning Requireme_ s
4.46 Perhaps the most serious question concer=ing the viability ofthe B3S is the capacity of the planning system to implement it. Theweaknesses of the planning system will be discussed in detail in alater section. It is sufficient at this point to note that failuresof the planning system may be held responsible for much of the disappoint-ing performance of the industrial sector in recent years. Because ofthe linkages among industries, the BIS will make very high demands onplanning capacity which is perhaps the scarcest resource in the economy.Considerable centralized cont-ol must be exercised to ensure thatinvestments are sequenced properly to take advantage of linkages and toensure that small-scale production possibilities are not pre-empted.Yet there is some question whether tight centralized control overinvestment decisions is consistent with improving parastatal efficiencyor with development of the metals industry, which is inherently adecentralized industry.
D. Policies for Imolementation
4.47 A final evaluation of the BIS must depend on the relativeimportance assigned to structural change versus growth or efficiency.The preoccupation of many of the advocates of a pure basic industrystrategy with structural change someti'mes conveys the impression thatthey think efficiency doesn't matter. Equally the preoccupation ofsome critics with growth conveys the impression that they believe thatonly efficiency matters. The BIS adopted in principle by Tanzaniatakes an intermediate position: efficiency matters, but it is not theonly thing that matters. Given the importance attached to structuralchange by Tanzanian policy makers, the BIS appears reasonably well-conceived; little structural change could be expected unless there weresome purposeful vision of the ultimate structure desired, Tanzania'scomparative advantages is not skewed toward processing for export,backward-linkage import substitution should increase the short-termflexibility of the economy, and the central role assigned to the metalsengineering industry appears defensible on grounds of both growth andstructural change. On the other hand there are some features of thestrategy which call into question both its ability to meet minimumgrowth targets and its consistency with its own objectives. The mainconcerns are that attempts to restructure the economy too quickly mayultimately frustrate both growth and structural chance, that expansionof the steel industry, in particular, will contribute little to theultimate objectives of the BIS, and that the planning capacity of thecountry may be overburdened by the strategy.
- 93 -
4.48 The objective of structural change constrained bv efficiencywill remain mere semantics, however, unless a number of policy changesare made to implement the strategy. Some of these policy changes wouldbe required whatever the intended industrial strategy; others must bemodified to meet the objectives of the BIS. The more general policyissues will be examined in the next section, but some of the mainpolicy implications which are peculiar to the BIS can be outlined brieflyhere.
4.49 The objective of the BIS is to maximize structural changesubject to some efficiency constraints. This poses some unusualimplementation problems. The central dilemma which this poses is thatthe requirements of structural change imply that investment decisionsshould be guided by a central plan, but Tanzania does not really havethe administrative capacity to oDerate a centrally-planned economy.Moreover, as we shall discuss at some length in the next section,parastatal inefficiency and low labor productivity have been seriousproblems. Solution of these, which is essential in order to mobilizeresources to undertake the BIS, may require some decentralization ofdecision-making: to speed up implementation of projects, to permit aflexible response to new information or changed conditions, and perhapsto provide the necessary incentives for parastatals to improve efficiency.There is no easy solution to this dilemma, but two general points areevident. (1) Because of the limited administrative capacity, pricingpolicy and other market instruments must be used as much as possibleto control economic behavior. Even when administrative controls areused as well, it is essential that market incentives pull in the samedirection and not give an incentive to break administrative rules.(2) It is equally clear that the objectives of the BIS will requiresignificant departures from neoclassical pricing policy prescriptions.
4.50 One implication of the BIS is that there will be differentstandards of efficiency for some products and processes, and differentstandards for the same product depending on its source of raw materialor market orientation. Thus there will be different target rates ofreturn on capital (or different target rates of domestic resource costof foreign exchange, depending on the efficiency criterion used) forbasic industries and for other industries. Even basic industries willbe subject to some minimum efficiency limit, however. Cost-benefitanalysis, suitably modified for the different objectives of the BIS,should therefore be an important part of imolementation of the strategy.1/Regardless of whether investment decisions are decentralized or not, itwill be essential to ensure that different standards are applied todifferent sectors and that minimum standards are set for each sector.
1/ A detailed industrial project analysis manual was prepared as afollow-up to the Long-Term Industrial Strategy planning exercise.See M. Roemer, Industrial Project Aooraisal Manual for Tanzania,(Cambridge, Massachusetts: mimeo, 1975).
- 94 -
'.51 The whole structure of protection and tariffs will also requirerethinking if the BIS is to be effectively implemented. Once again, theaim is not to rule out direct controls, but to use pricing policy toreinforce and to minimize the need for direct controls. It is especiallyimportant to have price si4g.als pointing in the right directior. f thereis to be some decentralization of investment decisions and if the -roblemof productivicy growth is to be addressed effectirely. The presentstructure of protection does not serve the needs of :he BIS. The tariffstructure is similar to that of most countries pursuing a conventionalindustrial strategy which aims to substitute for imports of consumergoods; there is a nominal tariff on most consumer goods of 25% - 50%while most intermediate and capital goods are imported duty-free. Thisgives high and widely effective rates of protection to consumer goodsproduction and discriminates against backward-linkage import substitutionand the use of domestic raw materials.l! The free i=oortation of capitalgoods discourases their domestic production.2/ The free importation o-intermediate goods such as petroleum discourages the use of domesticenergy sources such as coal, natural gas, and hydro power. Completebars on imports of goods which compete with domestic production have=urther complicated incentives: these have given an incentive fcc backward-linkage import substitution in some cases, but the general effect hasbeen to widen disparities in the effective rate of protection, to makeit more difficult to know how much protection is being given to differentindustries, and to eliminate any irncentive to reduce operating costs.Finally, of course, the present system is biased against exports. Thisis not necessarily a disadvantage from the point of view of the BIS,except that the present anti-export bias is undoubtedly greater and morehaphazard than it should be from any point of vies.
1/ For an estimate of the effective rates of protection in Tanzanianindustry in the late 1960's see Kessel, "Effective Protection inTanzania."
2/ A frequently cited reason for allowing duty free importation ofcapital is that it "encourages investment". For most less developedcountries, including Tanzania, this is a mistaken notion. In theeconomy as a whole there is excess demand for investment goods. Theconstraint on investment is the total supply of investment goodswhich is determined by the domestic capacity to produce plus theforeign exchange available to import capital goods. Thus, loweringthe tariff on capital goods may actually decrease investment for theecono=y as a whole, even though any firm lucky enough to be allowedto import equipment may feel that the lower tariff rate encouragesinvestment. The argument that a low tariff rate encourages invest-ment is based on the fallacy of coMposition, that what is true fora part (of the economy) must be true for the whole. In addition toits effect on the aggregate level of investment, of course, a tariffon capital goods may also have an impact on the choice of techniqueof production.
- 95 -
4.52 The usual policy prescription given by critics of the conven-tional import substitution strategy is a uniform tariff and exportsubsidy for all industrial products. In effect this amounts to a dualexchange rate for industry and agriculture.l/
4.53 This system would not be completely consistent with the goalsof the BIS. Implementation of the BIS requires a structure which:
(1) Gives more protection to industry than to agriculture.
(2) Gives more protection to production for the domesticmarket than for exports.
(3) Gives an incentive to use domestic raw materials.
(4) Gives additional protection to some basic industriesover and above that given by rules 2 and 3 (e.g. themetals engineering industry).
These requirements could only be fully met by a complicated system ofsubsidies on value added, with differential rates of subsidy for exportsand production for the domestic market. This must be rejected as toocomplicated and too costly in terms of administrative resources andrecurrent budget expenditure.
4.54 It is possible to devise a system which achieves most of theobjectives of the BIS without undue strain on administrative resources.The suggestions outlined below would not eliminate all distortions andadditiocal modifications may be desirable. However, each additionalcomplication is likely to require additional administrative resourcesand risks slowing development by delaying decisions.
4.55 One long-term policy change which is important in establishingan effective implementation system is to eliminate direct controls onimports as far as possible. This would be the most effective way toreduce administrative costs and to prove an effective incentive for costreduction. This of course implies that the balance oL' payments gap willgradually be reduced through some combination of fiscal, exchange rate, andinvestment policies to a level at which tariffs and subsidies will besufficient to maintain balance of payments equilibrium. Although thismust be regarded as a medium-term objective, it would still be advantageousto restructure the tariff system now in order to improve the signals given
1/ Sometimes the prescription is for no discrimination between industryand agriculture, i.e. for free trade, but usually some allowance ismade for infant industry protection.
- 96 -
b'- the pricing system. The following three changes would help achieve mostof the obiectives outlined above; (1) a uniform tariff on all imports;(') an additional direct subsidy on value added for especially crucialProcucts in the metals engineering sector; and (3) an export subsidy forlndustrial products based on total domestic costs of production, exclusiveof raw macerial costs but inclusive of value added.
4.56 The uniform tariff on imports would eliminate the presentdiscrimination against backward-linkage import substitution. An extrasubsid-; for key products in metals engineering would be justifiedbecause of the high priority given to this sector on both structural andinfant industry grounds. A subsidy would be difficult to administer,but perhaps not unduly so for this one sector and possibly one or twoother projects. The alternative of higher tariff protection for engineer-ing products would introduce widespread distortions and would restrictthe rate of growth of demand. The most difficult oroblem is how toestablish an appropriate export subsidy system. The aim of an exportsubsidy is to offset, at least partially, the bias against exports ofproducts which use domestically manufactured intermediate goods asinputs. A subsidy based on domestic costs, including value added butexcluding raw materials, is suggested as a reasonably cheap andadministratively simple way to offset part of this bias against exportsfrom industries using domestically-manufactured inputs. The only wayto offset the bias fully is to set the subsidy rate equal to the rate ofthe uniform tari'f. However, that would give equal encouragement toproduction for export and for the domestic market. That leaves twochoices: (1) the subsidy and tariff rate could be equalized, withpreference being given to production for the domestic market throughinvestment policy, or (2) a continuing bias against exports of some kindsof manufactured products could be accepted as an inevitable cost offavoring production for the domestic market.I/
I/ One unavoidable consequence of this system, or of any dual exchangerate system which gives tariff protection to industry over agriculture,is that the effective rate of protection for an industry using localexportable raw materials (such as a cotton textile industry) will behigher than the ERP for an industry using locally manufactured inputs(such as a bicycle industry which purchases local components. Tnisoccurs because the local exportable raw material must be co=petitiveat world prices while the cost of the locally manufactured input canbe higher than world prices by the amount of the protective tariff.The ER? for industries processing local raw materials also variesinversely with the proportion of value added; thus spinning wouldhave a higher ERP than an integrated text-ile mill. This is probablya relativelv minor disadvantage for Tanzania because investment andpricing policy can be used to counteract the few cases ir which -twould ari'se. The unified tariff rate would, on the other hand,
- 97 -
4.57 The details of tariff and pricing policy can be worked outlater. The essential points are that the BIS could be imolemented moreeasily if (1) costs and profit margins are controlled through some formof price competition, (2) the import tariff rate is unified to eliminatethe bias against backward-linkage import substitution and (3) some formof export subsidy is introduced.
4.58 One final requirement for successful implementation of theBIS is a decision on how much efficiency and growth Tanzania is willingto give up in order to restructure the economy. One crucial dimensionof this question is the time horizon over which structural change is tobe achieved. The future reference date will make a lot of differenceto the sequencing of investment and to the opportunity cost of structuralchange. It will also be necessary to decide what the target rates ofreturn for different kinds of investment are, and how preference is tobe given to industry over agriculture, to production for the domesticmarket over exports, to small-scale industry over large-scale industry,and to key industries such as metals engineering over other industries.Without such quantitative targets, the BIS may fail to achieve itsstated purpose and degenerate into planning by slogan.
equalize the ERP of all other industries producing for the domesticmarket, which is a significant benefit. As regards export industries,the proposed subsidy at a rate equal to the tariff rate would equalizethe ERP for all industries using domestic inputs. The reason forproposing an export subsidy on domestic costs, exclusive of raw materialsbut including value added is that this formulation eliminates the biastoward processing exportable raw materials for export. A subsidy onoutput preserves the bias and a subsidy on value added leaves widevariations in the ER? for export. If the subsidy rate is less than thetariff rate, the structure of protection is still biased in favor ofindustries which process exportable raw materials, but the proposedformulation reduces the variation in ERP more than a subsidy on outputor value added. Nevertheless, any subsidy rate much lower than thetariff rate will tend to leave industries which use domesticallymanufactured inputs with a negative ERP for exports. Because of this,it would seem that implementation of the BIS might best be served by asubsidy rate equal to the tariff rate. The "'distortion" (in terms ofthe goals of the BIS) which this introduces could be offset throughinvestment policy.
- 98 -
CLP2TER V. ISSUES AND POLICIES
A. Labor Productivity
5.1 The problem of low and, in some cases, declining labcrproductivity has been recognized and debated in Tanzania for severalyears. In recent months the Government has expressed concern over lowproductivity in the parastatal sector and has begun to experiment withways to increase i_.
The Evidence
5.2 There are three main sources of data on the level and trendof industrial labor productivity: aggregate seccoral data, time seriesdata from individual firms or homogeneous sub-sectors,and anecdotalevidence based on case studies, interviews and other scattered sources.
5.3 The most reliable source of data on aggregate industrial laborproductivity is the annual Survey of Industrial Production.1/ Thisglves both employment and production data for firms employing 10 ormore workers. Labor productivity in this large-scale sector was presentedeariler in Table 7. Productivity has fluctuated from year to year
I/ In theory the most comprehensive source of em=lovment data is theannual Survey of Employment and Earnings. This is supposed to coverall firms employing five or more workers, compared to the Survey ofIndustrial Production which covers firms with ten or more em=loyees.If we were to assume that almost all industrial production comes fromthese firms, or that firms of fewer than five empioyees produce aconstant proportion of manufacturing output, the trend of industrialproductivity could be estimated by dividing real GDP in the manufac-turing sector (taken from the national accounts) by emnloyment.This calculation shows that real output per worker declined fromShs 16,107 in 1966 to Shs 13,848 in 1974, or by 1.9% per year.Unfortunately, however, the data cannot be used in this way. Ifoutput from firms of fewer than five employees is not a constantproportion of GDP then the above calculation will be biased.Specifically, if small-scale output grew more slowly than totaloutput, as it almost certainly did from 1966-1974, then the calculatedtrend will be biased dowrward. Moreover, total manufacturing employ-ment from the Survey of Employment and Earnings is usually less thanthe total given in the Survev of Industrial Production, even t1houghthe former's coverage is supposedly greater. We conclude that datafrom the Survey of Employment and Earnings cannot be used to estimateindustrial nroductivity trends, although the source is much morereliable for other sectors.
_ 99 -
throughout the period 1965-74 with no real discernible trend eitherfor che period as a whole or for sub-periods. rZhile real output perworker has remained constant, however, the amount of capital per workerrose steadily, nearly doubling in the decade 196;-74. (See Table 5).Thus no comfort can be derived from the constant level of real outputper worker; with increasing capital per worker, real output per workershould have risen.
5.4 A comparison of labor productivity in the private and parasta-tal sectors is instructive. The figures presented earlier in Table 19show that the general trend of productivity has been upward in theprivate sector and downward in the parastatal sector. The comparativetrends in recent years are particularly noteworthy. Between 1970 and1974 parastatal labor productivity declined bY 24.6% while the amountof capital per worker increased by 21.6%. In the private sector, laborproductivity rose by more (15.2%) than the amount of capital per worlker(4.6%)increase). Parastatal productivity was higher than private sectorproductivity before 1970, probably because the parastatals had takenover the most productive private firms, but since 1970 productivity inthe oarastatal sector has dropped below that in the private sector inspite of a higher capital-labor ratio in the parastatal sector. Inbrief, it appears from these aggregate figures that there has been aproblem of declining labor productivity, but it seems to be confinedlargely to the parastatal sector.
5.5 Aggregate productivity trends can be misleading becausechanges in the output mix could cause aggregate output per worker todecline even though productivity within each industry was constant oreven rising. The available evidence suggests that this is not thereason, or at least not the main reason, for constant aggregate andfalling parastatal productivity. Analysis of trends at the threedigit industrial level using the tables in Apnendix A shows thatproductivity has fallen in some sub-sectors and risen in others and thatthere has been no general tendency for labor-intensive sub-sectors (thosewith below-average productivity) to grow more rapidly.
5.6 More importantly, the limited data available for firmsproducing a fairly homogeneous product shows that physical output perworker has fallen in some cases. Table 28 gives time series data onproductivity in several firms.l/ In the textile sector productivityfell by over 25% between 1970 and 1976. Productivity in the cementplant fell by about 15% between 1971 and 1975; as a result of
1/ One discouraging symptom of the productivity problem is that, inspite of all the publicity the problem has been given, most of theparastatal holding companies had considerable difficulty in supply-ing employment or productivity figures for their subsidiary firms.
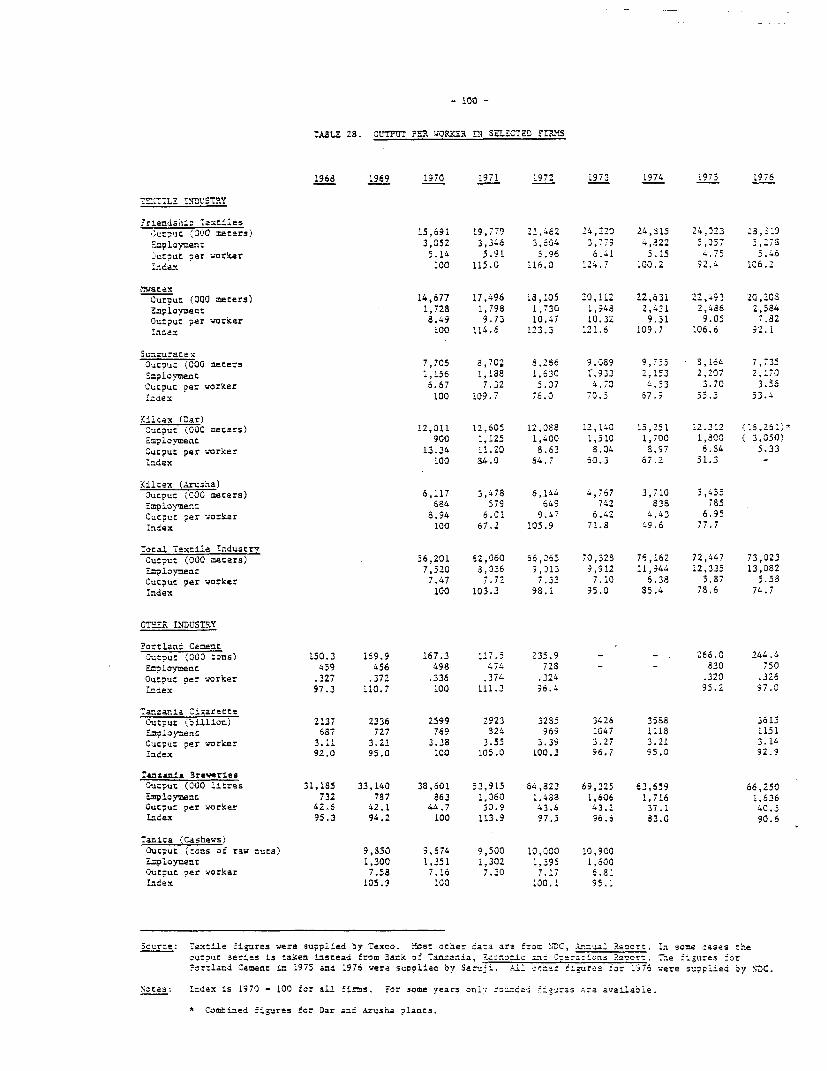
7ABLZ 28. OUT?= PFr ',;0R8R ?l SZL_CIED FI,"XS
1968 1969 1970 1971 1972 1973 1974 1975 1976
7riendsai.4o Taxt32.es 979Za~1 420'3urp7u 'Oj(040 te:rs) 15,691 ;9. 9 '1,462 24,205 24,023 3,- 9E=plomen: 3,052 3,346 3,o04 3,'.9 4,a22 5,057 ;,2.S2Uczut ner worker 5.14 5.91 5.96 6.41 5.15 4..7 5.66
100 li15.0 16.0 124.7 100.2 92.4 106.2
M-atexCut-cut (0CO aecers) 14,677 17,496 IS,205 20,11- 22,631 22,493 20,2065mpioyeot 1,728 1,798 1,730 1,948 2,431 2,486 2,584Orutpuc per worker 8.49 9.73 10.47 10.37 9.31 9.05 7.82Index 100 114.6 123.3 121.6 109.7 106.6 92.1
Suzzu-azaxSutDut (000 meters 7,705 8,702 S,266 9,089 9,755 3,164 7,735
1=.ioyment 1,156 1,138 ',630 *,933 2,153 2,207 2,170Curpuc per worker 6.67 7.32 5.07 4,70 4.53 3.70 3.56.zaex 100 109.7 76.0 70.5 57.9 55.5 53.4
Kilcex (Oar)Output (000 meters) 12,011 12,605 12,388 22,140 .5,251 12.312 (26,261)*imployment 900 1,125 1,400 1,510 1,700 1,800 ( 3,050)Oucput per *worker 13.34 11.20 8.63 8.04 S.97 6.84 5.33index 100 84.0 64.7 60.3 67.2 51.3 -
Kiltex (A&rusha)Outpur (COO meters) 6,117 3,478 6,144 4,767 3,710 5,455Emp o1tment 684 579 649 742 838 785Oucput per worver 8.94 6.01 9.47 6.42 4.43 6.95index 100 67.2 105.9 71.8 49.6 77.7
lotal Zextile IndustrrOut?ut (000 necers) 56,201 62,060 56,065 70,328 76,162 72,447 73,023*-Ploymert 7,520 8,036 9,013 9,912 11,944 12,335 13,082Output per worker 7.47 7.72 7.33 7.10 6.38 53,87 5.58Index 100 103.3 98.1 95.0 35.4 78.6 74.7
G0T--'R IyDUSTRY
?ortland Caeent3utDut (C00 tons) 150.3 169.9 167.3 117.5 235.9 - - 266.0 244.4EIoloyment 459 456 498 474 728 --30 750Out?ur cer worker .327 .372 .336 374 .324 .320 .326..noex 97.3 110.7 100 111.3 96.4 95.2 97.0
Tanzania ClzaretteOutput ('billion) 2137 2336 2599 2923 32S5 3426 3588 3615Z2noloymenr 687 727 769 824 969 1047 1118 1151Output ?er worker 3.11 3.21 3.38 3.55 3.39 3.27 3.21 3.14Index 92.0 95.0 100 105.0 100.3 96.7 95.0 92.9
Tanz&ania 3rever'esOutput (000 licres 31,185 33,140 38,601 53,915 64,823 69,325 63,659 66,250Eployment 732 787 863 1,060 1.483 1,606 1,716 1,636Output per worker 42.6 42.1 44.7 50.9 43.6 43.2 37.1 40.5In-dex 95.3 94.2 100 i13.9 97.5 96.6 83.0 90.6
lanica (Cashews)Output (tons of raw ruts) 9,850 9,674 9,500 10,000 10,9C0Zployenrt 1,300 1,351 1,302 1,395 1,600Output per worker 7.58 7.16 7.30 7.17 6.81Irdex 105.9 '00 i00.1 95.2
Source. Tax:Lle fi-gures were Supplied by Texco. !osr oe:er data ara from !.C, A snrl Rocrt. In some cases t:e.outut serIes is taken instead from 3ank oa arnzania, _;z ic aa: 3oera:1 ns R.a^r:. The .'_gures -or7or:land Cement in 1975 and 1976 were supplied by SaAug-. : a: .':gures .or .976 were suppi ed Sy '70C.
N:otes: Index is 1970 - 100 for al' firms. For some years onl;: :o=dae: --as .are ava-ailad1e.
* Combined figures for Dar and Arusha plants.
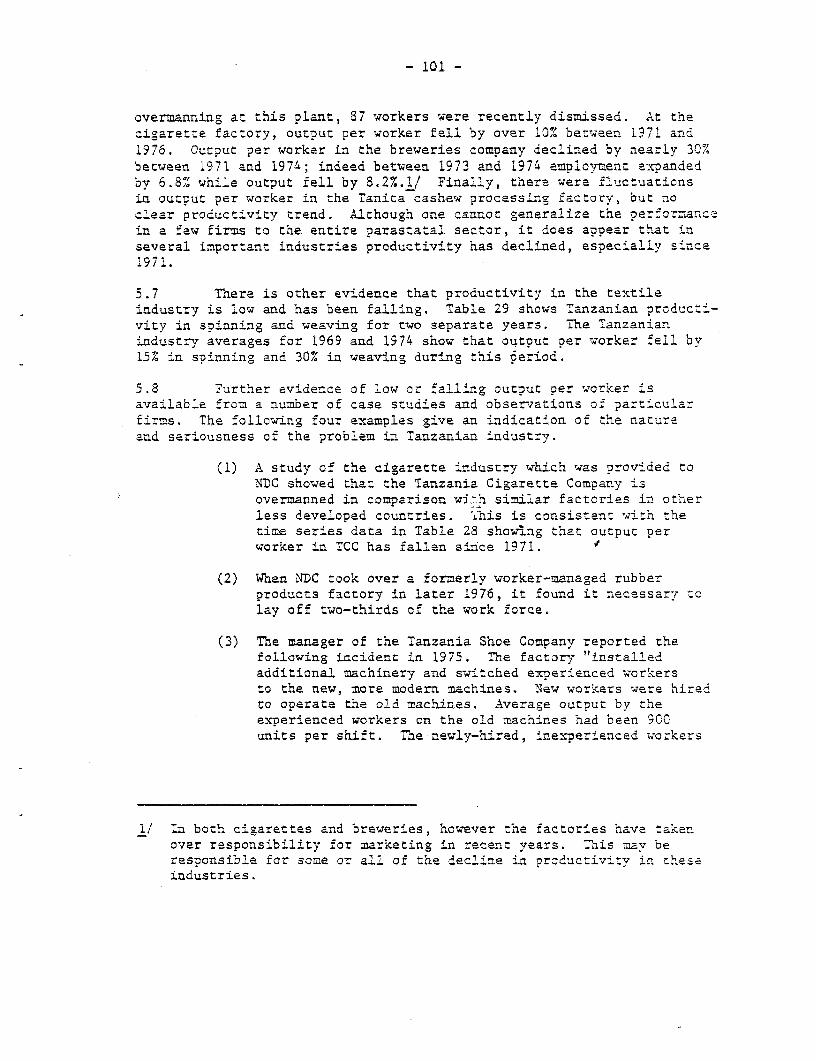
- 101 -
overmanning at this plant, 87 workers were recently dismissed. At thecigarette factory, output per worker fell by over 10% between 1971 and1976. Output per worker in the breweries company declined by nearly 30%between 1971 and 1974; indeed between 1973 and 1974 employment expandedby 6.8% while output fell by 8.2%.1/ Finally, there were 'luctuationsin output per worker in the Tanita cashew processing factory, but acclear productivity trend. Although one cannot generalize the perfornancain a few firms to the entire parastatal sector, it does appear that inseveral important industries productivity has declined, especially since1971.
5.7 There is other evidence that productivity in the textileindustry is low and has been falling. Table 29 shows Tanzanian producti-vity in spinning and weaving for two separate years. The Tanzanianindustry averages for 1969 and 1974 show that output per worker fell bv15% in spinning and 30% in weaving during this period.
5.8 Further evidence of low or falling output per worker isavailable from a number of case studies and observations of particularfirms. The following four examples give an indication of the natureand seriousness of the problem in Tanzanian industry.
(1) A study of the cigarette industry which was provided toNDC showed that the Tanzania Cigarette Company isovermanned in comparison wi-,h similar factories in otherless developed countries. Tihis is consistent with thetime series data in Table 28 showing that output perworker in TCC has fallen since 1971.
(2) When NDC took over a formerly worker-managed rubberproducts factory in later 1976, it found it necessar7 tolay off two-thirds of the work force.
(3) The manager of the Tanzania Shoe Company reported thefollowing incident in 1975. The factory "installedadditional machinery and switched experienced wor'kersto the new, more modern machines. New workers were hiredto operate the old machines. Average output by theexperienced workers on the old machines had been 900units per shift. The newly-hired, inexperienced workers
1/ In both cigarettes and breweries, however the factories have :akernover responsibility for marketing in recent years. This mav berespcnsible for some or all of the decline in productivity in thesaindustries.
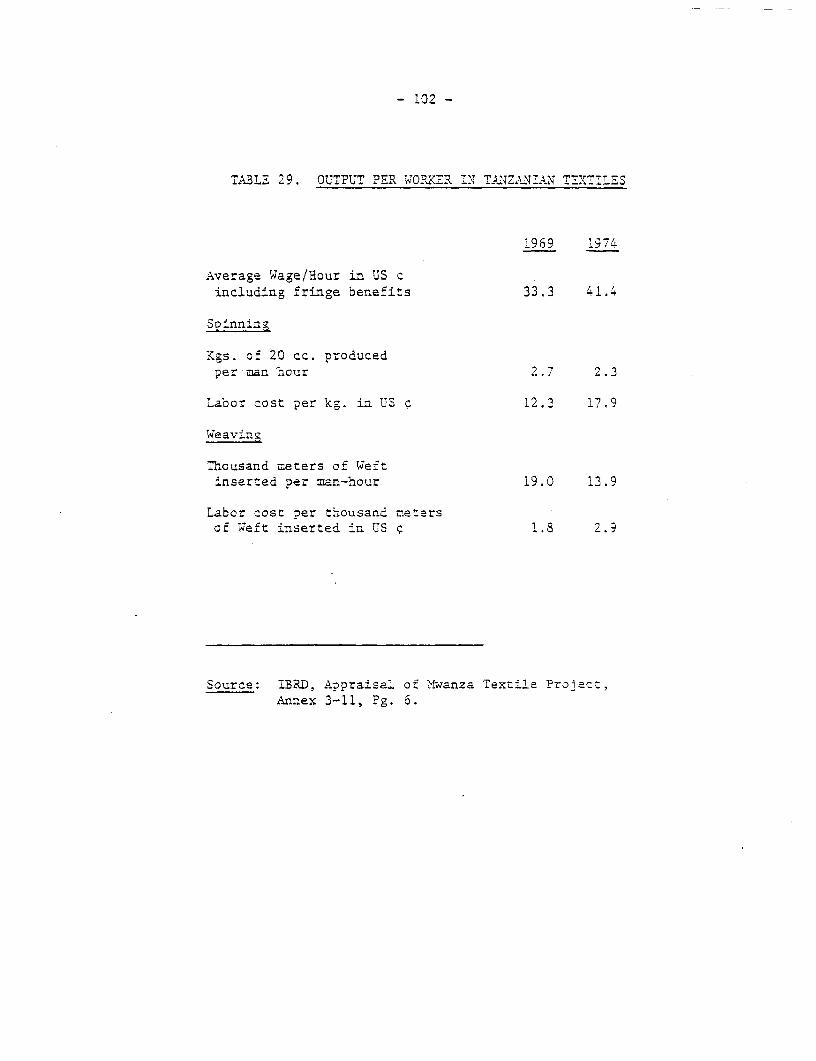
- 102 -
TA3LE 29. OUTPUT PER WORKER 7N TANZAN7AlN TFXT 7S
1969 1974'
Average Wage/liour in US ciacluding fringe benefits 33.3 41.'
Soninnin
Kgs. of 20 cc. producedper man hour 2.7 2.3
L,abor cost per kg. in US c 12.3 17.9
=weavin
Thousand meters of Weftinserted per man-hour 19.0 13.9
Labor cost Der thousand metersof Weft inserted in US ¢ 1.8 2.9
Source: IBRD, Anpraisal of Mwanza Textile Prolect,Annex 3-li, Pg. 6.
- 103 -
averaged 1300 units of output per shift on the samemachines. However, when the three-month probationaryperiod was up, average output per shift dropped to about1100 units."I/
(4) The throughput of cattle at the Tanganyika Packers plantfell from 201,724 head in 1974 to 138,370 head in 1975.At the same time employment in the plant increasedslightly (to 1,196). The Marketing Development Bureauof the Ministry of Agriculture estimated that only 750workers would be required for the reduced throughput. Bymid-1976 the annual rate of throughput had dropped to70,000 head owing to renovations in the plant, but employ-ment, if anything, increased slightly. Even after therenovation is completed, throughput wi'Ll be no more than165,000 head and would require a labor force of 980 atmost.2/
5.9 These examples are not meant to suggest that there is overman-aing in every parastatal. There are certainly parastatals which areefficiently run and which have increased output per worker in recentyears. Nevertheless these examples do show that even some of the mostefficient parastatals (such as TCC) have below-average productivity byinternational standards, and that in some firms low and declining laborproductivity is a very serious problem.
Reasons for the Decline
5.10 A number of factors have contributed to the productivityproblem in Tanzania.
5.11 First, poor project planning and prolonged learning problemsof new industries have lowered aggregate labor productivity. A Treasurystudy of t-wenty-four persistent loss-making parastatals showed that lowlabor productivity was a common problem.3/ In our earlier analysis of
1/ G. Tidrick, "'Labour Productivity in Tanzanian Industry," (Dar esSalaam: mimeo, 1975).
2/ The above description is based on an IBRD Review Mission Report ofthe Second Livestock Development Project.
31 The parastatals as a group had accumulated losses at the end of 1974equivalent to 91% of their combined equity. Not all of the parasta-tals studied were in the industrial sector, but neither did the studyinclude all parastatals which had made losses, only those wwhich hadconsistently done so.
- 104 -
NDC operations, it was noted that until quite recently new NDC investments,as a group, had a very low rate of return. In at least some instancesthe increased profitability has been caused or accompanied by an increasein labor productivitv; this reportedly was the case with the Tanga SteelRolling MIills, for example.
12. A second factor contributing to disappointing productivityperformance has been underutilized capacity in industry. Temporarystoppages due to an interruption in material or utility supplies reduceannual output, but are less likely to be accompanied by a correspondingfall in employment; output per worker an an annual basis therefore falls.In addition the labor force has frequently been kept at full strengthduring even quite prolonged periods of low capacitv utilization, as inthe Tanganyika Packers case cited above. Excess capacity has alwaysexisted in some agricultural processing industries and since 1973 itappears to have emerged as a major problem throughout the industrialsector. It is doubtful, however, whether low and falling productivityhas been primarily caused by excess capacity. Data from both theaggregate and individual firm level show that productivity fell beforeunderutilized capacity emerged. Falling productivity has been associatedwith increased output as often as with 'alling output.l/
5.13 The third and most important reason for Tanzania s productivityproblem is the incentive system. Of course it is also true that thequaity of the labor force, worker motivation, and the attitudes andcompetence of management all affect labor productivity.2/ But a resortto these explanatiqns fails to account for the fall in parastatal laborproductivity in recent years, or for the differential trends in producti-vity in the parastatal and private sectors. There is no reason tosuppose that the quality of the labor force aas fallen in recent yearsor that the private sector attracts more qualified workers (or, if itdoes, that this is unrelated to incentives). Worker motivation andmanagerial failures have certainly been responsible for much of the lowand falling productivity, but these are clearly affected by incentivesand can only be understood within the framework of incentives and 1aborrelations in which workers operate.
I/ Even when employment is reduced so that output per worker remainsconstant, underutilized capacity will cause the capital-labor ratioto increase where capital is measured by the capital stock.
2/ For a detailed examination of the way these factors affect producti-vity in Tanzania, see G. Tidrick, "Labour Producitivity in TanzanianIndustry". Most of the following discussion and exa=ples are based onthis source.
- 105 -
5.14 The key to an understanding of the producti.vity problem inTanzania is that nowhere in the entire system of parastatal productionand control is there a strong incentive to improve labor productivity.The description of this system which follows is somewhat overdrawn, andfortunately is beginning to change, but in broad outline it is accurate.
5.15 For the workers themselves there is neither a positive incentiveto increase productivity nor a negative sanction for a worker whoseoutput is below average. The wage payment system is based largely ontime rates and tae only productivity-based bonus system is managed bythe Permanent Labour Tribunal and is applicable in equal measure to everyworker in the firm. Neither individual nor small group bonuses areencouraged. The prevailing ethos is generally hostile to individualincentives.l/ Disincentives for poor performance are also largely absent.Procedures for dismissal of an inefficient worker are cumbersome and theConciliation Board can (and sometimes does) order a worker reinstatedwho has been dismissed on such grounds. This applies in the privateas well as the parastatal sector, though small-scale firms can generallvdismiss workers more easily. Temporary workers or workers who have beenemployed for less than three months can be dismissed easily. In orderto avoid such tenure problems, firm (including parastatals) haveincreasingly resorted to keeping full-time workers on a "casua.'L basis.
5.16 Parastatal managers also have little incentive to increaselabor productivity or otherwise reduce costs. Management salaries arenot based on profits, costs, or any other such measure. (This is trueonly in the parastatal sector, of course). Equally important, promotionor demotion are seldom dependent on such indicators of performance.Except in cases of gross inefficiency a manager is seldom taken to taskfor high costs, but a labor dispute can be quite damaging to a manager'scareer, whether he is Tanzanian or expatriate. Generally speaking theparastatal control system in which a manager works focuises on production,not on production costs. This is evident from the fact that holdingcompanies frecuently do not even know what labor productivity orproduction costs are in their subsidiaries, or how current productivitycompares to the firm's own past or to productivity in other countries.
1/ The following case is a rather extreme example of this hostility.A multi-national firm operating in Tanzania found that productivitywas suffering because many workers were arriving late to work. TheDisciplinary Code provides for a fine (after one wrritten warning,a reprimand, and a severe reprimand), on the fourth occasion oflateness and dismissal for subsequent breacaes, but the TanzanianPersonnel Officer advised against this. Instead the firm offered abonus to any worker who arrived on time each day during the month.The Workers' Council rejected the proposal because it would beunfair to workers who were late to work through no fault of theirown.
- 106 -
5.17 Finally there are no real macroeconomic incentives tc increaseprodc --ivity, especially i. the parastatal sector. Firms are frequentlvinsulated frcm internacional price competition by trade restrictions and::om domestic competition by shortages and the price control system whichgenerally sets prices high encugh to cover the most inefficient producer.With differential taxes and subsidies cn inputs and cost-plus pricing oLoutDut, Drofitabilitv 's a ocor indicator of comparative efficiency.Since cost increases are typically passed on through higher output prices,profits also give no indication of how efficiency is changing over time.Most important, the system gives little incentive to reduce coststhrough increased labor productivity. It is probably misleading, however,to sav that the cost-plus pricing system causes firms to maximize costs.The problem in the present system of parastatal control is that firmshave little incentive to maximize anything. /
Policy Pronosals
5.18 The Government has become increasingly aware o. the productivitvproblem and has begurn to try in recent months to raise parastatalproductivity: redundant workers have been dismissed in a few cases, thetextile industry and others have introduced limited payment by resultwage schemes, and the Price Commission has started to look more closelyat costs before approving price increases. A much more comprehensiveand sustained attack on the problem is needed, however, and there is adanger that essential changes in the broad macroeconomic framework wilbe overlooked.
5.19 Pressure for cost control and productivity increases need to beapplied at every point throughout the system of production.2/ This iswhy the macroeconomic framework is as important to improvement in.productivity as decisions taken on the factory floor. In the discussionof policy implications of the BIS it was argued that Tanzania should tryto set up a system of price incentives which reinforce, and to someextent replace, administrative controls. The main advantage offeredby a system of indirect controls through price incentives is conservationof the very short supply of efficient administrators with high levelsof technical expertise. This ideal toward which Tanzania should bemoving in the course of the next few years is one in which price competi-tion from imports sets an upper limit on the degree of ineffici'encywhich can be tolerated in any industry. Parastatals and other firms
1/ A partial exception is that parastatal producers and holding companiesdo occasionally behsee as if thei-r coals is to maximize production.However, eveen with respect to production, most behavior seems to beitsatisficing" rather than maximizing, and attention is seldom givento the cost of production. This will be elaborated in the discussionof the planning system.
2/ Many loss-making firms do not even know their costs of production.Existing mechanisms could be used to improve this situation. As astarting point, iiMited liability companies organized under theCompanies Ordinance Act could be required to become public companieswhich are required to file profit and loss accounts.
- 107 -
would be expected to compete within a system of revised protectivetariffs and subsidies such as that outlined previously, Such a systemwould not preclude the possibility of using direct ccntrols or otherincentives as well, but it would greatly reduce the administrativeburden. More importantly, it would help identify where there areproblems of inefficiency and could be used as an incentive to improveproductivity.
5.20 This ideal system could not be introduced in a short periodbecause the balance of payments position precludes it. However, thereare a number of things which can be done now which would help movetoward the ideal and which would improve productivity in their ownright. These include changes in the pricing system, parastatal control,mnmagerial incentives, and worker incentives and labor relations.
(.a) Pricing system
5.21 The present price cortrol system is undermined bv severalforces. First, there is not an adequate basis for determiningwhat the "right" price should be. Even if domestic producerswere expected to produce at the world price plus tariff level,the present system of tariffs (and the hidden subsidies giventhrough controlled prices of domestic inputs) would lead towidely different levels of efficiency amongst industries. Withthe present system of import controls, the permissable varia-tions in efficiency (compared to efficiency in other countries)are even wider, and frequently are not even known. Second, onthe basis of this inadequate knowledge the Price Commissiontries to control the prices of hundreds of items. It isimpossible to analyze what the price should be for so manydifferent products. Third, the Price Commission can onlyeffectively control the price of an item within a very narrowrange.l/ Regardless of the cost of production or of the priceof a competing import, if demand exceeds supply at the fixedprice then secondary (black) markets will emerge in which aquite different effective price is set. Attempts to controlprices in a period of persistent scarcity will thus not onlybe thwarted but will also have corrosive social effects assmuggling, corruption and black markets develop.
5.22 Several things could be done about this. First, reformof the tariff structure in line with the principles of theBIS would give a reference point for what prices should be ifTanzanian producers were efficient. Second, the number ofitems subAect to price control could be reduced. If decontrol
1/ See Rice, "The Tanzanian Price Control System" for an elaboration ofthis point.
- 108 -
is expecced to give excessive windfall profits because of supplyinelasticity, it could be accompanied by a temporary turnovertax. Tne tax could be reduced when the orice could be effecti-vely controlled through domestic or international pricecompetitior.. The aim -s to control prices more effectively byattempting to control fewer prices. Since one of the mair.reasons for reforming price control is to encourage increasedproduction, most remaining controls could focus on a few kaventerprises rather than or. a wide range of croducts. Third,where controls re=air. the controlled price should be set inrelation to the ideal price (the cif price plus revised tariffof comparable imports). If a firm cannot meet the ideal pricedue to inefficiency, it should at least be set as a target tobe achieved -within a reasonable amount of time. Final y, ircases where the ideal, or comparable cif price plss tarff, isnot known, an attempt can be aade to increase productivity bydistinguishing between controllable and uncontrollable costs.This concept is already being applied in some sectors bylimiting allowable increases for overhead costs. It could beextended in the following way: permit price increases foruncontrollable costs such as fuel and raw materials, but notfor controllable costs such as labor; labor costs (adjustedfor legislated changes in wage rates) would be expected todecrease by some target rate (say, 3%'.). T,his, of coursewould give an incentive to improve productivity. If the cifplus tariff price of a comparable good is known, this conceptcould be applied even more effectively: a firm whose costswere 30% above the ideal price,for example,might be forced toreduce its output price by 10% per year until the target pricewas met.
(b) Parastatal control
5.23 If the price control system were reformed, then profits(or at least changes in profits) could begin to be used asindicators of efficiency. However, a parastatal is morelikely to apply for some sort of price relief in order to avoidlosses than to look for ways to reduce costs. Under thepresent system this attempt is frequently successful; reliefis granted through an increase in output price, a subsidizedinput price, or by conversion of a loan to equity. On the otherhand, a parastatal which successfully raises profits by reducingcosts may see the profits disappear through a reduction in itscontrolled output price or through pa3rment of extra dividendsto the Treasurv or the parent holding company. The parastatalhas only limited control over the use of its profits, whetherfor increased investment or for increased worker benefits.
5.24 There are some very obvious ways ir which. the parastatalcontrol system could be improved. First, the loss-avoidancemotivation can be converted into a force for increasedproductivity by reform of the price control system along the
- 109 -
lines suggested above. Subsidies (for cashew processing, forexample) could be eliminated. Price increases would only begranted for increases in uncontrollable costs. Firms whichcould not produce at a profit umder the reformed tariff andsubsidy system could be put on notice that they must reducecosts in order to avoid losses. Second, parastatals couldbe required to earn a minimum rate of return on all theircapital (fixed and working capital, loans and equity). Atpresent equity is frequently treated by parastatals as a freesource of finance. There might still be occasions in whicha shift in the debt-equity ratio would be justified in order toallow for differences in the earnings profile, but parastatalswould no longer be permitted to earn "profits" by simplyconverting loans to equity. Over the life of a project, afirm would be expected to earn a minimum rate of return onequity as well as debt. Some mechanisms for achieving thiswill be discussed irn the section on the planning system.Third, it may be desirable to give parastatals or theirholding companies more control over the use of their profits.Holding companies in particular appear to be strongly motivatedto increase control over their investible surplus in order toinvest as they please without interference from the Treasury.This motivation could also be channeled into pressure forincreased production. However, increased parastatal controlover surpluses may conflict with the need for central controlin order to ensure that investment conforms to the prioritiesset by the BIS. Discussion of how a balance may be achievedis also deferred until later. Finally, holding companies couldmake an immediate contribution to increased productivity bysimply finding out what the productivity problems of theirsubsidiaries are. The model for this is NDCts current"improvement program". NDC has engaged consultants to studya number of problems in its subsidiary companies, includingcapacity utilization, inventory control, and input pricingcontrol. These studies may well produce recommendation forimproving labor productivity, but it would be helpful ifstudies focused specifically on labor productivity could bestarted by NDC and other holding companies.
(c) Managerial incentives
5.25 At present a parastatal manager's performance is ratedsatisfactory if he avoids losses, produces enough to satisfythe local market, and avoids labor disputes. The risk oftrying to cut costs (or expand into export markets) frequentlyoutweighsthe potential advantages. A manager seldom gainspersonally from cutting costs and he risks losing his jobif workers object strongly to efforts to raise productivity.One frequently recommended way to encourage managers to paymore attention to costs is by linking their salaries toimprovements in efficiency. If the pricing system -were
- 110 -
reformed so that profits reflected efficiency, this link couldbe achieved by basing managerial salaries in part on profits.As an intermediate step, part of a manager's salary coulddepend on the extent to which he achieves productivity or costtargets which are derived from studies ot labor productivity.
5.26 A.lthough managerial salaries usually are linked to profitsor the achievement of specif ic targets in many economic system,including many socialist economies, it may not be necessary todo this in Tanzania. The main problem in Tanzania is that theenvironment with-in which a manager works is one of unconcernwith, and sometimes hostility to, productivity improvements.A major step in inducing managers to be concerned withproductivity would be for holding companies arnd ministries tobecome concerned and to commun4cate this concern. If producti-vity were simply measured, and if promotions, demotions, andextensions of cantracts were made to depend on improvements rnproductivity, it might make a big difference. To be reallyeffective, this would have tobe backed up with other changes.Managers would have to be assured of support at other levels- both from workers and from the Gover.nment - in efforts toimprove productivity. Material incentives to managers mayeventually also prove necessary to stimulate productivity growth,bout in the present environment productivity-based materi2aincentives might be ineffecti-:e on their own. The immediaterequirement is for ministries and parastatals to communicatetheir concerns to managers over low producti-uity, to providesome assistance in evaluating productivity if needed, and toprovide support for efforts to improve productivity.l/
(d) Worker incentives and labor relations
5.27 There are three main changes in labor relations and workerincentives which might increase labor productivity. First,extended use of payment by results (PBR) -wage schemes couldhave an important effect on worker motivation. Internationalexperience has shown. PBR to be one of the most effective waysto increase labor productivity. 2/ Most industrial economies,including socialist economies, rely heavily on PBR to maintainand improve productivity. PBR schemes are not a panacea,however. There are many jobs which must continue to be basedon time rates. Even when output per worker can be measuredeasily, the use of a partial indicator such as quantity
1/ The motivation of parastatal managers in Tanzania would be a veryuseful research topic. It will not be possible to devise appropriatenconti7s iintil more is known abourt -hat ranagers respo.nd to.
2/ For a brief summary of experience in several countries see H. Leibenstein," 1Ailocative Efficienc7 vs. 'x-Efficiency'," American _conomic Review,Vol. LVI, No. 3 (June 1966), pp. 392-415.
- Ill -
may lead to distortions (such as a deterioration in quality);thus a scheme designed to raise productivity may have to bemodified as other problems arise. If a PBR scheme isintroduced without reference to existing levels of producti-vity, workers in inefficient firms would be rewarded for theirpast inefficiency while already efficient workers would not beable to increase their incomes. For this reason, it isessential that any PBR scheme be based on a study of thepresent level of efficiency in comparison to similar firms inTanzania and other countries. Despite these and other problems,however, there is little doubt that careful extention of PBRcould improve output per worker. Moreover, the equity argumentfor PBR in Tanzania appears very strong. In a country wherethe vast majority of workers are peasants whose income dependsoverwhelmingly on luck and their own efforts, it does notappear inequitable to ask industrial workers (who have a higherstandard of living than most peasants) to be paid in part onthe basis of their results.
5.28 A second change which could help raise productivity wouldbe to make it easier to apply sanctions for poor performance.One such measure would be to set minimum standards of perfor-mance in any job based on PBR. The textile industry hasreportedly done this; workers who consistently fail to meetminimum output targets are moved to less demanding jobs whichare based on time rates. A more important measure would be tofacilitate dismissal of redundant or inefficient workers. Thiscould be combined with more generous termination payments andworkers made redundant because of excess capacity could begiven preference for other industrial jobs. If managers are tobe held accountable for the productivity of their enterprises,it may be necessary to give them increased authority to dismissinefficient workers. One way of doing this would be to permita manager to dismiss any worker he felt was inefficient, uponpayment of statutory compensation and with no possibility ofreinstatement unless the Conciliation Board judged the dismissalto be based on discrimination for extraneous reasons. Ifgiving increased authority to managers is unacceptable, it isstill essential that some improved mechanism for dismissinginefficient workers be instituted. An industrial systemunfortunately cannot be run on civil service rules. Thepresent lack of sanctions for inefficiency is costly, underminesthe morale of other workers, and is unfair to the large numberof unemployed who would be willing to work efficiently.
5.29 One final measure which might be contemplated is toincrease workers' participation in decision-making. This isan im=ortant goal. in its own right, of course. It may also bea way of enlisting worker support for other measures toincrease productivity. Some form of workers' participationmight even be used as an alternative to such measures as PBR
- 1!2 -
scaemes or increased ma-agerial authori-ty. There is also nozra=cn wh- _anzania could not i-mert in a limited way witha variety of models in diffarenz 'actories, with increasedmanagerial authority in cne ractory and increased workers'
Sa c' pat 'cr in c'.Gther.
5.30 Tnere are manv differen: levels of 7rkers' participation.A very elementary stage -s one in which w7orkers are elected tothe Board of Directors wh.ile a fTha' stage is full workermanagement in which workers select the factory manager, run theBoard of Directors and make major decisions or. investment. Anintermediate stage Which is perha-s more anprosriate forTanzania's level of develoDment and the problem of productivity,is one in which worlkers have a 'arge say in shop floor manage-ment: small groups of workers might select their own foreman,participate in organizing the work flow and assigning tasks,and decide How to allocate a wage fund (which might be based ongroup output) for their small group. Some variant of thismight provide a useful mcdel for e:cperfmentation in increasedworkers' participation. The experimental nature of thisproposal should be emphasized. Workers participation caneasily be turned into a device for protecting unproductiveworkers. The number of such experiments should be limitedand they should be subject to review based on their resultsin actually increasing output per -worker.
5.31 Some of the proposals outll.ed above must be regardea aspart of a system; they could only be implemented if otherparts of the system were also in place. Judging parastatalperformance on the basis of present profits would be foolish,for example, unless the structure of protection and the wholeprice control system were changed. Until these reforms canbe enacted, it would be better in most cases to focus oncruder productivity measures to Judge parastatal performance.his is not to say that nothing can be done until everythingis done, however. Many of the proposed measures do stard ontheir own and could be enacted inr isolation. Moreover, thereare many things which could be done now to improve laborproduction: the Price Commission can reduce the number of itemsit controls, it can try to find out comparable world pricesfor major products, and it can begin to distinguish betweencrntrollable and uncontrollable costs; the system of protectioncould be reformed in order to give a clearer indication ofappropriate relative prices to the Price Comiission and toinvesting parastatals and to lay the groundwork for the longer-term process of import liberalization; holding companies couldengage consultants to study how to improve productivity intheir subsidiaries; managers could be notified that they areexpected to improve productivi.y and t.at approved measures*will De given ministerial support; and the (formal and informal)rules governing dismissal of redunant and ine f-icient workerscould be relaxed.
- 113 -
B. Excess Capacitv
5.32 Underutilized capacity has long been a problem in agriculturalprocessing industries. A study by the Marketing Development Bureau in1971 found the following rates of capacity utilization in grain milling:wheat, 89%; maize, 56%; rice, 42Z; and animal feeds, 34%.1/ Foodcanning factories under the National Milling Corporation have experiencedsimilar difficulties. The tomato canning factory in Dodoma, for example,operated at 8% of capacity during the height of the 1970 season.2/ TheNMC food canning factory in Dar es Salaam has also never come close tofull utilization. Other processing parastatals have experienced difficul-ties as well. Mtibwa sugar mill has had a long history of underutilizedcapacity, while only one of the four factories of the Tanzania TeaAuthority operated at close to full capacity in 1974/75; the respectiverates of capacity utilization (and associated profit or loss per kilo)were: 93% (Shs .76 profit), 77% (Shs .27 loss), 60% (Shs .81 loss), and42% (Shs 1.64 loss).3!
5.33 Underutilized capacity in agricultural processing industries i5mostly due to a shortage of raw materials. This reflects both poorproject planning (capacity has frequently been built far ahead of anyrealistic projection of supply) and unforeseen difficulties in theproduction of raw materials. The pervasive tendency of agriculturalprocessing parastatals to create excess capacity is a prime example ofthe need for reform of the investment planning system.
5.34 Excess capacity has emerged as a more general problem in theindustrial sector since 1973. Table 30 shows production indices in 20industries for 1973-75; in 12 of these 20 industries production in 1974or 1975 (or both) was at least 10% below peak production in the precedingyear. Table 31 shows capacity utilization in 13 NDC Group Companies fLorwhich data are available. Only two companies (Tanzania Cigarette andSteel Rolling Mills) were operating above 80% capacity utilization, amdone of these (Steel Rolling Mills) bases its rated capacity or. only aone-shift basis.4/
1/ P.M. Newhouse, A Review of the Production and Marketing Agreementsfor Maize, Paddy and Wheat with Particular Reference to the MillingSector, (Dar es Salaam: Marketing Development Bureau, 1972).
2/ F. Kanga "Agro-Processing Parastatals in Tanzania," (IBRD, mimeo,1976).
3/ Industrial Studies and Development Centre, "Horticultural ProductsProcessing - Present and Future," (Dar es Salaam: mimeo, 1971).
4/ Ten of the thirteen companies listed in Table 31 are reported to haveimproved their capacity utilization in 1976.
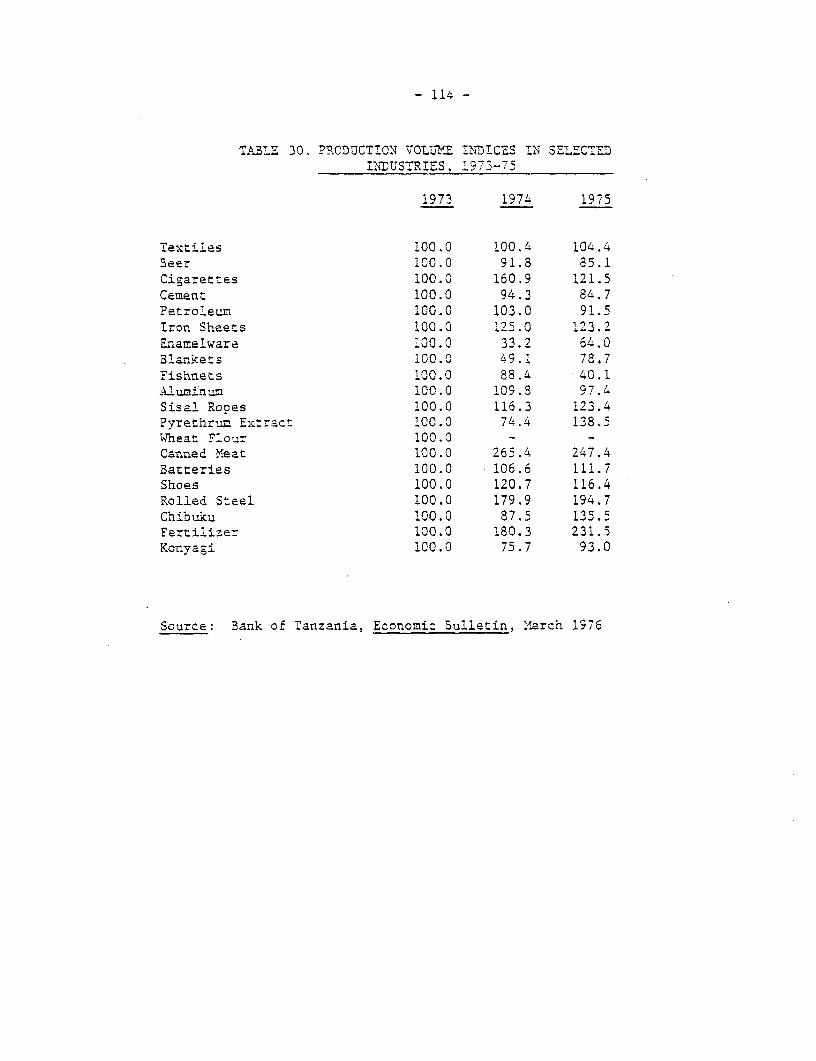
- 114 -
TA317 30. PRODUCTICN VOLUME IDICES IN SELrCTZDNDUSZ'RIES, 1973-75
1973 1974 1975
Iextiles 100.0 100.4 104.43eer 100.0 91.8 85.1Cigarettes 100.0 160.9 121.5Cement 100.0 94.3 84.7Petroleum 100.0 103.0 91.5Iron Sheets 100.0 125.0 123.2Enamelware 100.0 33.2 64.0Blankets 100.0 49.1 78.7Fishnets 100.0 88.4 40.1Aluminum 100.0 109.8 97.4Sisal Ropes 100.0 116.3 123.4Pyrethrum Ex.ract 100.0 74.4 138.5Wheat Flour 100.0 - -
Canned Meat 100.0 265.4 247.4Batteries 100.0 106.6 111.7Shoes 100.0 120.7 116.4Rolled Steel 100.0 179.9 194.7Chibuku 100.0 87.5 135.5Fertilizer 100.0 180.3 231.5Konyagi 100.0 75.7 93.0
Source: Bank of Tanzania, Economic Bulletin, March 1976
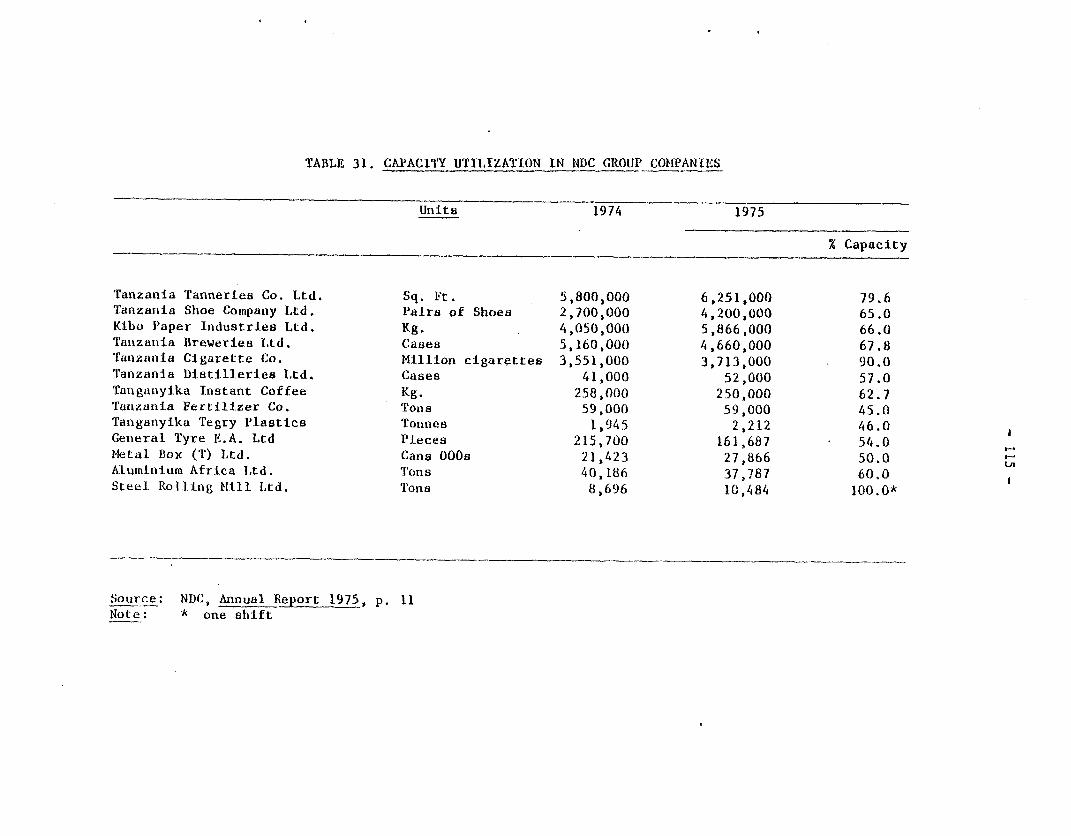
TABLE 31. CAPACITY UTILIZATION IN NDC GROUP COtIPANIES
Units 1974 1975
% Capacity
Tanzania Tanneries Co. Ltd. Sq. Ft. 5,800,000 6,251,000 79.6
Tanzania Shioe Company Ltd. Pairs of Shoes 2,700,000 4,200,000 65.0
Kibo Paper Industries Ltd. Kg. 4,050,000 5,866,000 66.0
Tanzania Breweries Ltd. Cases 5,160,000 4,660,000 67.8
Tanzania Cigarette Co. Million cigarettes 3,551,000 3,713,000 90.0
Tanzania Distilleries Ltd. Cases 41,000 52,000 57.0
Tanganyika Instant Coffee Kg. 258,000 250,000 62.7
Tanzania Fertilizer Co. Tons 59,000 59,000 45.0
Tanganyika Tegry Plastics Tonnes 1,945 2,212 46.0
General Tyre E.A. Ltd Pieces 215,700 161,687 54.0
Metal Box (T) Ltd. Cans 000 21,423 27,866 50,0
Alumiinium Africa Ltd. Tons 40,186 37,787 60.0
Steel. Rolling Mill Ltd. Tons 8,696 10,484 100.0*
Source: NDC, Annual Report 1975, p. 11
Note: * one shift
- 116 -
5.35 The most recent fall in capacity utilization was due to severalfactors: shortages of water and electr1cit7 suoplies, inability toobtain adequate spare parts and raw materials, inadequate m2aintenanceand repair facilities, and t;he multiplier effects of production shortfallsin one industry spreadirng to other industries which rely on its products.Shortages of water and electricity sunnlies have lar--ely beer. overcome,at least in Dar es Salaam, as a result of the comcletion of new waterand power projects. Shortages of spare parts and imported raw materia4sshould also beign to ease now that the most severe foreign exchangedifficulties have been weathered. The Bank of Tanzania has recently,relaxed import restrictions by placing most spare parts on Open GeneralLicense. However, the Bank of Tanzania has underestimated the problemscaused by its foreign exchange licEnsing procedures in the past and itcannrot be assumed that foreign exchange-related problems have beencompletely solved. Raw materials are currently licensed for a six monthsperiod based on applications submitted three months in advance. Thisprocedure creates a lot of problems: :irms cannot always antici:ate theirneeds so far in advance; firms tend to overstock in order to hedge againstfuture restrictions; and firms frequently overstate their needs inanticipation of a cut in their requested allocation. The net results ofthis system are that, even when total foreign exchange supplies areadequate, there is a tendency toward overstocking (and thus an increasein the demand for. working capital) and secondly, the distribution offoreign exchange is deficient so that some firms have very largeinventories while others must shut down for lack of materials. Assumingthat the foreign exc1hange position will continue to be tight for sametime, there are two things which might be done to improve the allocationof foreign exchange for raw materials. First, the control procedurescould be modified by shortening the licensing period or by permittingsupplementary requests from a substantial reserve of foreign exchangewhich would be withheld for this purpose. A second means of improvingthe import control system is to use supplementary tariff or otherpricing measures to help reduce excess demand for foreign exchange. Afirst step in this direction would be to reform the tariff structure asadvocated earlier so that all materials, spare parts,and capital goodsare subject to a uniform tariff. This could also be supplemented by asurcharge on imports or by an import deposit scheme during periods oLextreme foreign exchange shortage. Finally, licenses to import rawmaterials using the reserve fund mentioned above might be auctionedoff in order to ensure that the fund is used for high priority imports,
5.36 The inadequacy of repair and maintenance facilities is a longer-term problem. NDC's studies of underutilized capacity have shown "histo be a major reason for excess capacity in the firms studied thus far.The long-term solution to this problem lies in development of the metalsengineering industry. It is important to note that the imrort controlmeasures suggested above are consistent with long-term developmentpolicy for the engineering industry. Placi'ng a tariff ̂ n snare partswill not only help ration demand for imports in the short run, but alsowill provide some protection for the domestic engineeri.g industry. Othermeasures will be required to develop the industry, however, and some ofthese could conflict with short-term requirements for imports of spareparts u-nless great care is taken.
- 117 -
C. Parastatal Surpluses
The Nature of the Problem
5.37 With the decline in national savings following the 1974economic crisis, parastatal surpluses have become the focus of muchconcern. As shown in Annex I, parastatal savings was about the onlycomponent of national savings which appears to have held up during thecrisis and may be the major source of incremental savings in the future.By 1975, the gross surplus of industrial parastatals alone accounted fornearly one quarter of total national savings.l/ Thus, the performanceof industrial parastatals will have important implications for resourcemobilization in the economy as a whole in addition to the implicationsfor resource mobilization and growth in the industrial sector itself.
5.38 Although industrial parastatal surpluses have increased inrelative importance, this largely reflects the decline in savings inmost other parts of the economy rather than good performance byindustrial parastatals. Table 32 shows that between 1972 and 1974 thegross surplus of industrial parastatals stayed about constant innominal terms and declined in real terms. The real surplus increasedin 1975 but the total growth of industrial sector parastatal surplusesbetween 1972 and 1975 lagged behind the growth of real value added.The lag in surplus generation was reflected in a falling rate of returnon capital. Table 32 shows that the real gross rate of return on capitalfell sharply after 1972.
5.39 The lag in parastatal savings and the falling rate of returnare closely linked to the decline in labor productivity. Other factorsno doubt aggravated the savings problem, of course. The rapid increasein wages and other costs may have eroded profits, for example; this wasprobably one reason for the drop in the ratio of gross surplus to valueadded shown in Table 32. In addition, the emergence of excess capacityalso has probably tended to reduce surpluses. However, the underlyingreason for the decline in parastatal surpluses seems to be the same asfor the decline in parastatal labor productivity: there is insufficientconcern with costs and there is little pressure anywhere in the systemto promote such concern.
1/ Where gross national savings are taken to exclude net foreigntransfers. See Annex I for a discussion of the problems of definitionof national savings in Tanzania.
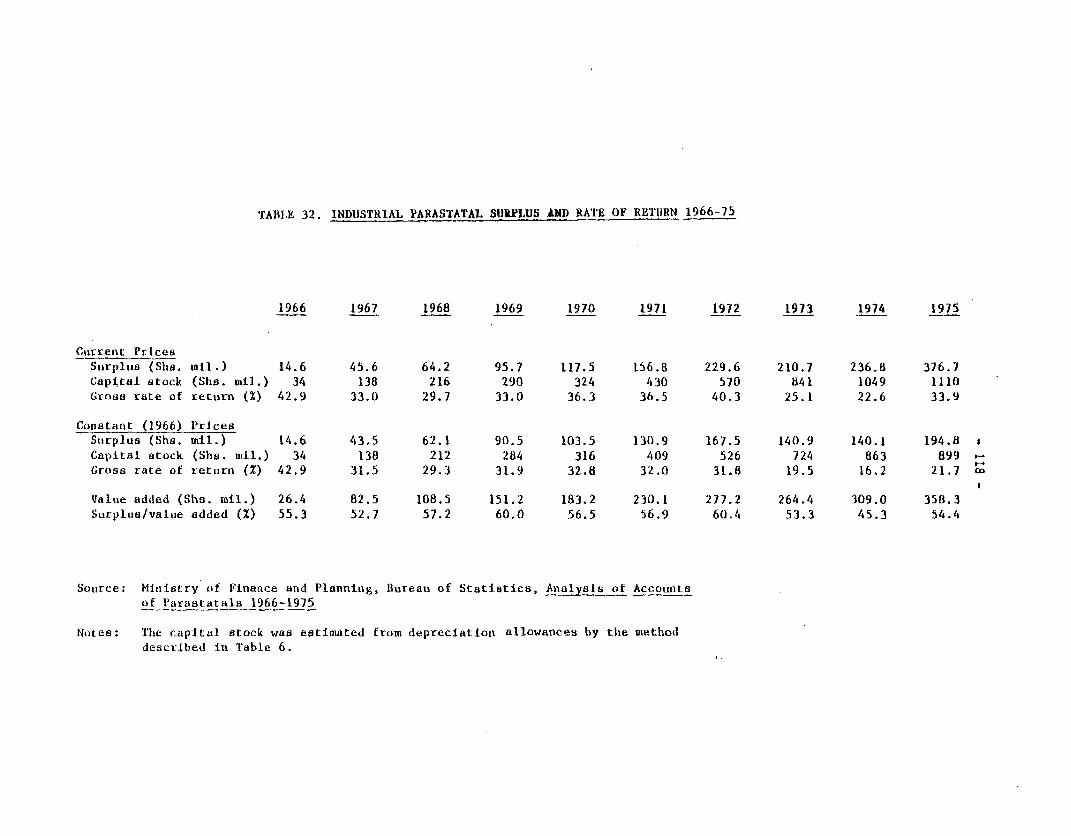
TABLE 32. INDUSTRIAL PARASTATAL SURPLUS AND RATE OF RETtURN 1966-75
1966 1967 1968 1969 1970 1971 1972 1973 1974 1975
Current PricesSurplus (Slis. mtl.) 14.6 45.6 64.2 95.7 117.5 156.8 229.6 210.7 236.8 376.7Capital stock (She. mil.) 34 138 216 290 324 430 570 841 1049 1110Gross rate of return (%) 42.9 33.0 29.7 33.0 36.3 36.5 40.3 25.1 22.6 33.9
Constant 1966) PricesSurplus (Shs. mil.) 14.6 43.5 62.1 90.5 103.5 130.9 167.5 140.9 140.1 194.8Capital stock (Shs. mill.) 34 138 212 284 316 409 526 724 863 899Gross rate of returni (X) 42.9 31.5 29.3 31.9 32.8 32.0 31.8 19.5 16.2 21.7 X
Value added (Shs. mil.) 26.4 82.5 108.5 151.2 183.2 230.1 277.2 264.4 309.0 358.3Surplus/value added (%) 55.3 52.7 57.2 60.0 56.5 56.9 60.4 53.3 45.3 54.4
Source: Ministry of Finance and Planning, Bureau of Statistics, Analysis of Accountsof Parastatals 1966-1975
Notes: T'Ike capital stock was estimated from depreciation allowances by the methoddescribed In Table 6.
- 119 -
5.40 The absence of pressure for cost reduction has affected notonly labor productivity, but other costs as well.This is typified by theproblems of controlling overhead costs in both operating parastatalsand holding companies. NDC headquarters expenses, for example, increasedfrom 2.8% of total fumds employed in 1967 to 7.6% in 1974.1/ In 1973headquarters expenses were equivalent to 36% of the profits of all NDCmanufacturing parastatals. Scattered evidence from other sourcessuggests that high overhead expense is a fairly general oroblem. TheHead Office of the Tanzania Tea Authority employed 111 people in 1975excluding marketing staff. The Uganda Tea Growers Association in 1969employed only 24 people to perform the same functions and to handle thesame volume of tea as TTA in 1975.2/ The Tanganyika Packets meat packingplant, previously cited as an example of a parastatal which was grosslyovermanned, provides the most flagrant example of failure to controloverhead expenses. The cost of maintaining the factory canteen morethan tripled between 1973 and 1974, doubled again in 1975, and increasedby another 10% (at an annual rate) in the first half of 1976. Throughputof livestock (and possibly employment) did increase substantially (about75%) between 1973 and 1974 but it returned to nearly the 1973 level in1975 and fell again in 1976. In 1973 canteen costs were only 19% ofelectricity costs for the factory; by 1976 canteen costs were 125% ofelectricity costs.3/ These may be extreme examples, but they illustratethe tendency for overhead expenditures to consume investible surpluses.Fortunately there is increasing recognition of this problem and bothNDC and TTA, along with some other parastatals, have reportedly reducedoverhead expenditures recently.
Policies to Increase Surpluses
5.41 Parastatal surpluses can be increased either by raising pricesor by cutting costs. Generating surpluses by raising prices has twodrawbacks. First, there is a tendency for costs to rise along with theincrease in output price, thereby eroding the surplus. Secondly, evenif costs can be held down, an increase in price merely acts as a taxwhich raises saviags by reducing the real incomes of consumers. Cuttingcosts is a better way to increase surpluses because the savings achievedin this way frees resources which can be used to increase output elsewherein the economy. Thus the effect on growth is much greater if surplusgeneration is based on cost reduction rather than price increases. Inpractice it may be necessary to raise prices as well, but the main thrustof policies to increase parastatal savings must be aimed at cost reduction.Moreover, when prices are raised, this must be done in such a way asto minimize any incentive to let costs rise as well.
I/ See Table 22.
2/ F. Kanga, "Agro-Processing Parastatals".
3/ Figures taken from an IBRD review Mission Report of the SecondLivestock Development Project.
- 120 -
3.4-2 Most of the measures proposed earl_er for raising labor producti-vi-y and for rational4z ng the tariff and pricing s.ructure are consistentw th increasing overall savings in the economy. Rowever, some precautionsare necessary to ensure that productivity increases do increase overalls_2Vinls. For example, while PBR szhemes may increase productivity, theymight not generate increased parastatal surpluses if all of the benefitsof increased productivity are paid out in increased wages. Similarly, ifp-ice controls are used to pass all cost reductions on to consumers, thencost reductions may not increase savings.
5.43 Viewing parastatal surplus generation from the broader perspect-ive of resource mobilization and investment allocation in. the economyas a whole, three general principles shouid guide the formulation of:o-licies to increase narastatal surpluses. First, as noted above, emphasisshould be placed upon poLicies which generate surpluses through costreductions rather than through price increases. Second, it is essentialto protect parastatal surpluses from beina absorbed entirely into generalrevenue where they tend to disappear into Government consumption. Third,it is essential to make sure that industrial parastacal investmentsconform to the criteria set by the BIS.
3.44 The policies proposed for increasing labor productivity willhelp achieve the first objective. Two policies proposed in Annex 1 wouldhelp achieve the second aim and would complement some of the roliciesto raise productivity. The first policy proposed in Annex I is toincrease turnover taxes as a means of putting cost pressure on firms whilenot Dassing along all cost savings to consumers. This could be especiallyuseful in cases where a new pricing policy resulted in lower output prices forfirms producing consumer goods;I/ an increase in sales tax might be desirable
to prevent all of the cost reduction from disappearing into increasedprivate consumptiorn. If turtover taxes were earmarked for relending byT13, the savings would also be protected from Government consumptionand from the too closely defined purposes of most existing productiondevelopment funds. The second propcsal in Annex I was for an increasein interest rates as a way of transferrinq surpluses to financialinstitutions. Again this is designed to put added pressure on firms toreduce costs-and to give increased control of surpluses to institutionswith a broad view of investment priorities. To the extent that LIB andother financi2al istitutions are concerned to implement the BIS, theseproposals would also be consistent with the third objective set outabove. An increase in interest rates would have one drawback which mustbe offset: firms might be even more concerned to secure equity firancing.One way to counter this tendency would be to place more stress on gocdproject analysis which judges investment proposals by their prospectiverate of return on total investment. This also im=lies that minimum
1/ Or in cases where prices are decontrolled ard there are potentialwindfall profits. See Section A.
- 121 -
target rates of return for different industrial sectors will be appliedto all new investment proposals and that projects are judged on theirprospects for attaining a minimum rate of return on all capital underthe prices set under a reformed tariff and pricing system. Ultimately,however, the Government must simply resist the demands for increasedequity financing because from the point of view of national savings andgrowth there is no distinction between debt and equity financing. In thelast resort, projects which cannot earn the minimum target rate of returr.must be rejected and existing firms which cannot earn a surplus underthe reformed pricing system within a reasonable time must be closed downso that their resources can be put to more productive use.
5.45 One final policy change which might help achieve all threeobjectives would be to permit TIB to offer high interest bonds toparastatals. This would help create a parastatal capital market byproviding surplus-producing parastatals with an attractive alternativeto reinvestment in their own enterprises. It would reinforce theprinciple that a firm's own equity funds have a high opportunity cost,it would help mobilize surpluses for more general investment purposes,and it would help protect surpluses from being absorbed into generalTreasury revenues.
D. The Investment Planning System
Tlne Present System: Unplanned Socialism
5.46 An earlier section has described the general system of invest-ment planning in Tanzania. There is ample evidence that the system hasnot worked well; there has been neither adequate structural change inthe industrial system nor adequate rates of return on most recentparastatal investments. This section will attempt to identify some ofthe reasons for these shortcomings and to suggest ways in which theplanning system might be reformed to achieve the structural aims of theBIS along with more efficient use of resources and a higher rate ofreturn on investment.
(a) The budget process
5.47 Theoretically, all parastatal investments must be approvedby the Treasury and ultimately by the National Assembly in theannual budgeting exercise. Funds are allocated to each approvedproject from Government equity, TIB loans, and foreign aid.Even the use of a parastatal's own retained profits must beapproved in the Annual Plan. 'With this degree of control, theGovernment should be able to direct investment to any sectorit wishes and at least be able to ensure that funds are notused to create excess capacity in one sector while potentiallyprofitable projects go unimplemented.
- 122 -
5.48 The main shortcominJ Of the Annual ?la-. as t;e princioalinstrument of Gvcverme:-t control over invest-ent is that it '-aoperated as a conventional budgeting exercise, differing li.tlefrom the recurrant budcet vrocess.1/ The orincizal f-uresof this Crocess include the folloTwing:
(1) .he focus of budget sessicns is nearl always on :hea2.Iocat:on of the Government s own scarce furns frznthe Development Budget. This means that if aparastatal has other sources of finance lined up(its own funds, a promise of a TIB loan, prospectiveforeign assistance, or even a supplier's credit) theproject proposal is alm.ost never questioned - evenwher. ;Ife proposed investment is of low strategicpriority and/or has a low prospective rate of return.The main auestion asked of any project is "Eow muchmoney do you want from us?" and only rarely "Is thisa good project?".
(2) Budget sessions also t`ypically focus only on thecoming year with little attention given to futurefinancial implications or to the viability of theproject. It is quite common to approve a smallamount for a large number of projects, thus delayingimnlementation of all projects, implicitly comittingmost of next year's budget to ongoing projects, andcreatirg strorg pressures to enlarge the overallDevelopment Budget through deficit spending. Thistendency to underfinance most projects is also partial>7responsible for parastatal efforts to convert debtfinancing to equity; many parastatals are forced toborrow far too high a proportion of their resourcesin the early years of implementation, thus creatinga severe cash flow problem.
(3) Priority is given to "commitments" in the allocationof funds. The definition of a commitment is ratherflexible but is usually taken to include any ongoingproject, any project for which a promise of foreignassistance has been obtained, and any project approved
l/ "At present ..... planning is not institutionalised - only the budget isinstitutionalised."; E.B. Waide, "Planning ard Annual Planning asan Administrative Process," i-n A.E. Rweyemamu and 3.U. Mwansasu (eds.)Planning in Tanzania, (Dar es Salaam: East African Literature Bureau,1974), p.56.
- 123 -
by the Economic Committee of the Cabinet. Thisfrequently aggravates the problem of urderfinancingbecause in most years "commitments" exceed availableresources; rather than drop some commitments so thatothers can be implemented, a little money is givento all such projects.
(4) All of these problems are compounded by a lack ofprior communication amongst the Treasury, parastatals,and parent ministries. In some years the Treasuryhas not given parent ministries or their parastatalseven a rough guideline concerning their likely budgetallocation even though overall guidelines are set bythe Treasury (formerly by Devplan) before the budgetsessions begin. In one such case a large parastatalholding company asked for Shs 200 million to startseveral projects which had already been approved bythe Economic Commitee of the Cabinet. ine parastatalassumed that it would be forced to drop a projector cut back or rephase another, but it was astonishedto learn that its tentative allocation was onlyShs 20 million - one-tenth of what it asked for. Theupshot of the confused negotiations which followedwas that the parastatal was given Shs 30 million tomake a small start cn most of its proposed projects;this included Shs 10 million for a project whosetotal cost would be Shs 300 million.
(b) Foreign aid allocation
5.49 The defects of the budget process are magnified by thedifficulties of foreign aid coordination. In theory all aidflows are centralized through the Treasury; donors give themoney to Treasury which allocates it to mutually approvedprojects. In practice, however, parastatals frequently dealdirectly with donors to initiate project'proposals. The principalresult of this is loss of effective central control over projectselection. The Treasury is reluctant to turn down an offer ofaid for a particular project - even if it is a bad project - forfear of offending the donor. Donors are reluctant to turn downa request for a particular project - even if it is a dubiousproject cooked up by a national equipment supplier and aTanzanian parastatal - for fear of offending the Government.Parastatals, on the other hand, have every incentive to try tointerest donors directly in their projects because of the waythe budget system works. Parastatals find it extremely diffi-cult to secure finance if they ask for a large Governmentequity contribution, but they find approval almost automaticif they can show they have a commitment from a foreign donor.It is this interaction of foreign aid management and the budgetsystem which is responsible for many of the worst industrialplanning decisions in recent years.
- 124 -
5.50 Foreign aid affects investment plann_ng in other ways aswell. First, tying makes it difficult to match Tanzania planswith donor canabilities. There are numerous instances in whichaid has distorted investment priorities or the choice oftechnique. Second, the preference of both donors and parasta-tal recipients for turnkey industrial projects limits the kindsof projects which are considered and their long-term trainingeffects. Third,the concern with limited absorptive capacityand the urge to trarsfer more resources in the short run bothdivert aid to sectors which already have a proven absorptivecapacity. This is unfortunate because structural change willprobably require technical assistance in helping build upabsorptive capacity in different sectors. Excessive concernwith short-term- absorptive capacity merely tends to perpetuatethe notion that any project which can absorb aid must bte a goodone because all aid resources are incremental. This is a veryshort-sighted view given Tanzania's long-term objective ofstructural change.
5.51 Because of the importance of aid to the Development Budgetand because of the limitations of the formal budget procedures,the little central planning which effectively exists inTanzania is mostly done in the External Finance Division ofTreasury. However, the complexity of coordinating aid fromso mn2y donors, each with its ow-n complex administrativerequirements, leaves time for little more than matchingpossible sources of finance with possible projects. The sheeradministrative ourden of aid coordination makes it difficultfor the Government to coordinate its own planning in order toget a grip on the kinds of investment wihich are taking place.
(c) Parastatal in'vestment olanning
5.52 The main motivation of parastatals in the present policyenvironment is to ecpand production. Neither the budgetprocess nor the production planning system puts much emphasison efficiency or costs so parastatals geferally feel free topursule their goal unimpeded by the need to earn a high rateof return.l/ They are impeded, however, by the need to obtainfinance. Although parastatals have little form-al control overtheir own surniuses, in practice they tend to be able to usetheir retained earnings for expansion. Parastatals can
1/ TIB does use project analysis to evaluace l^an applications so thismay thwart bad investments in some cases.
- 125 -
therefore usually bypass Treasury control over their investmentplans if they can use their cwn retained earnings and/orinterest a foreign donor in a project.l/ The desire toexpand production rapidly also encourages holding corporationsto seek large-scale turnkey projects because these conserveheadquarters managerial resources and bring the greatest growthof oroduction in the shortest time.
(d) Results of the system
5.53 The present system of investment decision-making in theparastatal sector is essentially one of the unrplanned socialism.The choice of projects and of techniques of production is theoutcome of a bureaucratic process.2/ The results usually bearonly a coincidental relation to any formal development planor to the proclaimed goals of industrial development. Distortedfactor and product prices have little effect on investmentdecisions in this system because profit maximization is not amotivating factor. The causation is typically reversed; productand factor prices tend to be shaped by investment decisionsthrough cost-plus pricing and manipulation of the financialstructure to avoid accounting losses. The choice of projectsand techniques of production is determined by such factors asthe source of finance. No single factor can be blamed for theoutcome; it is the result of a complex interaction of theTanzanian budgeting process, the process of foreign aid commit-ment and coordination, and the methods and motivations ofparastatal investment planning.
i.54 One interesting question is whether the bureaucratic processof investment choice is systematically biased in the kinds ofprojects selected. Does it favor capital-intensive or labor-intensive techniques, small-scale or large-scale methods,import-substitution or export production? The only clear-cutbias of the system in the past seems to have been in favor oflarge-scale production. A5s nated above, parastatals tend toravor large-scale factories because large projects minimizetheir o man.a^gria-l inputs and generally lead to faster growth
1/ This leads to such as anomalies as the decision by NDC to try tostart a PVC plastic plant under the control of Aluminium Africabecause this firm has a surplus for investment. The conglomeratecorporate st-ucture is less likely to provoke Treasury oppositionthan the tra;-sfor of funds to another parastatal.
2/ For an analysis of this process see D. Williams, The Choice of
Technol'ogy and National Planning: The Case of Tanzania, D3A thesis,Harvard Business School, September, 1976.
- 126 -
of production. There are very few industries in which small-scale productian appears to be a viable alternative and inalmost; all of these oarastatals have recently implemented orare planning ex?ansion of large-scale facilities. This hashappened in garments, oil milling, grain milling, bakeries,and sugar. Even in those cases where SIDO hopes to promotesmall-scale production, it has been difficult to restrainthe major oarastatals from pre-em=ting the entire dcmesticmarket for many years to come. This is not to say that small-scale production would be preferable in every instance, buttoo often the present planning system never seriously considersthe alterrnative.
5.55 There is quite a bit of evidence to show that choice oftechnique has not been biased in either a capital-intensiveor labor-intensive direction.l/ In the textile industryz, forexample, there is a wide range of techniques of production.At nearly opposite poles are the Friendship Textile Millusing fairly labor-intensive technology from China and the.Mwanza Textile Mill using more capital-intensive technologyfrom Western Europe. The two investments were both made inthe late 1960's by NDC, both have been expanded recently, anduz.til very recently future expansion plans corzemplated newinvestments of both Friendship and Mwanza-ty-pe mills. A similarrange ot factor intensities have been incorporated if recentinvestments in sugar and tanneries, while sisal spinning nas t
expanded using both new and second-hand machinery. In all ofthese cases, the- choice of techniques appears to have beeninfluenced by largely extraneous bureaucratic decisions whichdetermined the source of finance, which in turn determined thechoice of technique. The lack of factor-intensity bias in thechoice of techmique cannot be regarded as an advantage, however.Part of the problem with the present planning system is thateven when there is a basis for comparing different techniquesof productior. in the same industry, as in textiles, theopportunity to plan expansion of the industry on the basis ofthe low-cost technicue is nat grasped. In textiles, theChinese technology appears to be relatively low-cost in bothmarket and shadow prices, but the possibility of expansionbased on this technology was foregone by the decision to askfor Chinese assistance in steel production. This does notnecessarily mean that this decision was misguided, but it ischaracteristic of the Tanzanian planning system that thepossible opportunity cost to the textile industry was notconsidered in making the decision.
I/ bid
- 127 -
5.56 Frequent institutional change is testimony to thestrength of the bureaucratic process of decision-making. Thetypical response to any perceived fault in the present systemis to reorganize a ministry or create a new parastatal as abureaucratic counterweight to the established forces which areproducing the faulty decisions. Proper organization is ofcourse essential, but excessive institutional change mayexacerbate the problems arising from a shortage of high-levelmanpower. There is also a danger that people will assume thatonce an institution has been created to deal with a problemit is as good as solved. The need for appropriate organizationshould not overshadow the need for policy -- a consistentcourse of action for attaining stated objectives.
Some Suggested Reforms
5.57 The main issue in reforming the investment planning system isthe extent to which decision-making should - or can - be centralized ordecentralized. Who shall control investment decisions, parastatals orcentral planners? The dilemma is that there is an apparent need to giveparastatals more control over their surpluses in order to motivate themto produce surpluses, but at the same time there is a need for centralcontrol over investment decisions in order to achieve the structuralobjectives of the BIS. There is no s-.2 ple solution to this dilemma.Whatever is done, some conflict will remain between the requirements forimproved efficiency, increased surpluses, and more vigorous growth onthe one had and the requirements for better coordination to achievestructural change on the other. In spite of this inherent tension,however, there are numerous ways in which the present investment planningsystem could be improved. Some of these would increase parastatalcontrol while others are aimed at improving central coordination. Themost important measures are those which reduce the conflict betweenparastatals and central planners so that the energies of both are harnessedto pull in the same direction.
5.58 Many of the reforms proposed earlier in this Annex would helpreduce the conflict between parastatals and central planners. Two ofthese are especially important: reform of the tariff and pricing systemand restructuring of the incentive system to focus attention on costsand productivity. Taken together, these t-wo sets of reforms wouldencourage parastatals to invest in industries which are consistent -withthe long term industrial strategy and discourage investments which havelittle prospect of earning a surplus. In this way central planners, whoestablish the pricing and incentive frameworks, would gain greaterindirect control, at least,over parastatal investment decisions. At thesame time, because of the new motivation that the system would imoseon parastatals, more control over individual investment decisions could- indeed, might have to be in order for the motivational change to occur -devolved to parastatals. Parastatals would have a responsibility toearrn a profit on all their operations within the pricing and financial
- 128 -
frAmework established by central planners, But parastatals could alsobe given more control over the use of their retained earnings. Thevwould still pay cornorate taxes, interest on debt, and dividends or,TIB, holding company, or Treasury equity,1/ but would have cor;.ol ofremaining profits.
5.59 There are also certain changes in the budget process and inaid coordination which might improve investment planning. Some o.these changes have already been initiated by the Government.
5.60 First, holding companies should prepare medium-term perspectiveplans, such as the Three-Year Plans of NDC, which would be reviewed bythe parent ministry and the Treasury.2/ This would give an earlyopportunity for objection to projects which were in conflict with thelong-term perspective plan based on the 3IS and for spotting inconsisten-cies with the plans of other parastatals. It would also give centralplanners a charce to propose projects which are important to implementa-tion of the BIS but which have not been included in the parastatalperspective plans.
5.61 Second, two questions should be paramount in evaluating allprojects proposed for implementation in the Annual Plan exercise: (l)How does the proposed project fit in with the BIS and the lang-terMindicative plan? and (2) Does the project meet the minimum targetefficiency measure for its sector? The first question is desigr.ed tospot such contradictions as a proposal to build a particular chemicalfactory in 1980 when the long-term indicative plan suggests that alarger-scale plant in 1985 mi8ht be more appropriate. This doesn't meanthat the indicative plan should be followed slavishly; technologicalchange or the availability of an unforeseen raw material may justifvthe change in plans. But reference to the indicative plan, which wasframed in much longer-term perspectiLve, may help avoid inconsistencies,bad phasing, and sub-optimal investments.
I/ One way of emphasizing that equity is not costless while at the sametime giving more incentive to parastatals would be to provide equityin the form of preferred stock but to eliminate Treasury's right tocontrol dividends. Thus a firm mig-nt have a target rate of returnof 15% on capital, pay 12% on its debt financing and, say 8% onpreferred shares of stock held by Treasury, the parent holdingcompany, or TIB. The firm, however, would have control over remain-ing post-tax profits. This should increase attention to costs ofproduction in operation and to rate of return in investment planning.The Treasury could always capture excess profits through turnovertaxes of course.
2/ This is similar to Waide's proposal for a two or three-year roilingplan, the principal aim of which is to start effective planningearly in the project cycle before projects build u? too much momentumto be stopped or altered. See Waide, "'lanning and Annual Planning".
129 -
5.62 Third, Treasury should take the lead in securing foreignfinance for projects. The emphasis should be on obtaining the recuisiteforeign assistance for the Tanzanian plan rather than accepting whateverhappens to be offered. Donor capabilities and preferences will alwayscomplicate planning, but most donors would probably respond well to aTanzanian initiative for better coordination of aid with Tanzania's long-term industrial strategy. The Treasury has recently attempted to getmore control by asking some donors to concentrate their aid in a fewwell-defined sectors. The purpose is to improve aid coordination andto involve donors more closely in project preparation. If handledproperly, this could help improve long-term absorptive capacity anddirect aid into sectors of high priority for the BIS. It is essential,however, that the planning function not be simply abdicated to donorsand parastatals. Both should be aware of the need to prepare projectsin accordance with the guidelines set out in the previous two paragraphs.
5.63 Fourth, approved projects should be costed for the liFe of theproject. Ongoing projects should also have an automatic first claim onresources. This orocedure should establish better cost control, speedimplementation, and permit more realistic projections of the availablefuture finance for new projects. By focusing largely on new projectsit should also be possible to pay much closer attention to how theproposals fit in with the long-term indicative plan and to theirprospective rate of return. The recurrent cost implications of proposedprojects should also be estimated to permit better recurrent cost control.
5.64 Fifth, greater care should be taken to avoid overcommitmentand consequent underfinancing of projects. This is simply a matter ofbetter budget and macroeconomic management.
5.65 Very little formal institutional change has been oroposed. Thebiggest improvement to the present planning system is likely to come fromchanges in the pricing and incentive framework within which parastatalsoperate. Changes in project selection criteria and in some of themethods of budgeting and aid coordination should also help improveinvestment planning. Taken together, these proposals should help attainthe objectives of the BIS.
E. Manufactured Exports
5.66 The stagnation of exports is one of Tanzania's most seriouseconomic problems. Manufactured export performance has, if anything,been even worse than export performance generally. The proportion ofmnufactured exports (excluding petroleum products) has declined from18.0% in 1971 to 15.2% in 1975 and over the slightly longer period
- 130 -
1969-1475, the volume of manufactures exports declined about 20%.1I/ Insoite of the emphasis which the BIS gives to productior. for the domesticmarket, the performance of manufactured exports will be an im=ortantissue for the next several years. The size of the trade gap, theoutlook for some traditional agricultural exports, the decline of diamondexports, and the slow gestation period of many import-substitutionprojects all point to the conclusion that manufactured exnorts mustincrease in the near future if Tanzania is to achieve substantial economicgrowth in the medium term. nless manufactured eaxports can be increased,there is little prospect of generating enough foreign exchange, growth,and savings to implement the BIS in the longer term.2/
Reasons for Poor Exnort Performance
5.67 Several factors have hampered the growth of manufacturedexports in recent years.
(a) Most major industrial investmentshave been for imnortsubstitution Droduction.
(b) Low labor productivity and relatively high wages have madea number of products uncompetitive.
(c) An overvalued exchange rate has put exports at a compeci-tive disadvantage.
(d) The structure of protection and pricing policy havediscriminated against exports. Exports are discouragednot only by high costs for inputs, especially locallymanufactured inputs, but also by the relatively favorableprice for output sold in the domestic market.
(e) Increased domestic consumption has reduced the exportablesurplus of a number of goods.
(f) Agriculcural supply problems have reduced the exports ofseveral processed exports.
(g) A number of administrative restrictions and cumbersomebureaucratic procedures have hampered exports.
1/ See Table 14 and the discussion preceding this table.
2/ In additior. a long-term objective of the BIS is to increase theflexibility of the industrial production structure. Tnhis includesdeveloping a capacity to respond to a foreign exchange crisis byincreasing manufactured exports. Develooment of this reserveexport capacity implies some attention to costs, quality, andmarkets from the beginning.
- 131 -
5.68 These bureaucratic constraints are discussed a: some length inAppendix C, but they are worth summarizing here because of theirimportance. One major constraint faced by potential exporters is the
import licensing system. Failure to obtain essential raw materials hasrestricted production for export in a number of industries. Suchfailures are especially important because this represents a net foreignexchange loss to the economy; the foreign exchange earned by exportproduction would always exceed che cost of imported inputs. Theconstraint is not only that exporters are not given adequate foreignexchange, but also that the procedures for application are so complicatedand time-consuming that potential exporters are deterred from applying.A related problem faced by many exporting firms is the import confinementsystem. The Agricultural Industrial Supply Company (AISCO) has exclusiveimporting rights for several essential industrial materials. Producersmust purchase through AISCO rather than purchase directly from foreignsuppliers. Producers complain of delays, high mark-ups, and frequentmistakes in orders for specialized requirements.
5.69 A third constraint on export expansion has been the unwillingnessof the Government to contemplate entering into medium or long-term supplycontracts with foreign importers. This has been a deterrent to theexpansion of exports in several agra-processing industries. Long-termmarketing agreements can of course be detrimental to Tanzanian interestsunder some conditions, but in many cases they are the only way Tanzaniacan gain a foothold for exports of new products.
5.70 A fourth administrative constraint on export expansion is theBank of Tanzania's procedures for vetting export prices. This procedureis intended to prevent capital flight through underinvoicing. However,its application has been so stringent that export orders have been lostdue to delays or refusals in approval of negotiated prices. Sometimesthis reflects a lack of understanding of what the appropriate exportprice should be. Parastatal textile producers, for example, claim tohave been prevented from exporting cloth because the export price wasbelow the protected domestic price.
5.71 Other procedures of the Bank of Tanzania have also deterredexport growth: the credit terms permitted are frequently uncompetitivewith other producers and travel allowances for business purposes havebeen too restrictive in some instances. Finally, export documentationprocedures have also hampered the growth of exports. In this case, theprincipal agencies responsible are the Ministry of Trade and the EastAfrican Customs Department. Delays in obtaining an Export Permit havecaused loss of export sales and the typical three to five week wait forcustoms inspection reduces Tanzanian competitiveness.
- 132 -
?olicies to Promote Exports
5.72 Tanzania does, of course, have policies intended to promotemanu:actured exports. The most important policy instrument has beeninvestment policy. Increased emopiasis has been given recently toinvesting in production for export, particularly in processing domesticraw materials for export. A second important policy has been therestriction of domestic demand For such products as sugar and textilesin order to free production for export. Third, there is an import dutydrawback scheme under which exporters may apply for remission of dutiespaid on imported inputs used in production for export. Finally, acommittee including representatives of the Bank of Tanzania and theMinistry of Trade, sets export targets for some manufacturers.
5.73 'Jnfortunately these policies are insufficient or simpLy don'twork. Some investments 'for export have been proposed in which not evencne most rudimentary market analysis, prize projections, or productioncost comparisons have been made; this was oarticularly true of theambitious expansion programs which were approved for sugar and textilesby the Economic Committee of the Cabinet in late 1974. There have alsobeen more carefully prepared investments in export industries, but evenwell-designed investment proposals are only the first step in successfulexport policy. The policy of restraining dcmestic demand has been oneOf the most successful measures tor increasing manufactured e.xports.Extension of this policy may represent the best hope for increasingex?orts in the next five years. The last two policy measures - dutydrawbacks and export targeting - have had virtuall-y no discernibleeffect on exports. M2any firms have never even heard of the duty drawbackscheme. For those who do apply, refunds take up to two years and aresometimes denied. As for export targets, many exporters are againunaware of their existence; the targets which are set frequentlyrepresent the companies' own estimates of what they can easily export;and there are no rewards for meeting targets nor penalties for failureto do so.
5.74 Some policy changes which should improve manufactured exportperformance are set out beilow. The main purpose of these proposals isto remove existing constraints on increased exports of manufactures.It is not a list of all the positive steps whichi must be tak-en, butrather a framework within which more conventional export-promotionactivities and detailed planning of production and marketing for exportmight occur.
(a) Investment policy
5.75 For the next rfew years more emphasis may need to be placedupon investing in export-oriented industries than would have tobe done if the BLS were being launched urder more favorablemacroeconomic conditions. The premium on earn-ng and savingforeign exchange can perhaps best be reflected by usi-ng a high
- 133 -
shadow rate of foreign exchange in all industrial projectanalyses.l/ Emphasis should be given to projects (whetherimport-substicuting or export-oriented) which promiserelatively quick net foreign exchange returns, This should notbe used as a license to implement any and every export projectproposed, however. There are still many export projects whichearn little foreign exchange at a very high domestic resourcecost; many integrated agro-industrial projects can still beexpected to run into implementation problems, based on pastexperience; attention to details of marketing and cost andquality competitiveness must be assured; and the longer-termemphasis on backward-linkage import substitution remainsvalid, given the importance attached to structural change.Nevertheless, in the immediate future, investments in exportproduct:or will have to be regarded more favorably than theymight otherwise have been.
(b) Pricing, tariffs, and subsidies
5.76 The system of import tariffs and e:sort subsidiesrecommended earlier was proposed as a consistent pricingframework for implementation of the BIS. These proposalscould also have an immediate beneficial effect on exports. Themain elements of the proposed restructuring were: (1) a uniformtariff on all imported inputs; (2) all exportable domesticraw material inputs should be priced at export parity; and(3) all manufactured exports would be eligible for a subsidybased on domestic costs, excluding domestic raw materials butincludina value added. Such a system would help eliminateconflicts between pricing signals and administrative controls,thereby conserving scarce administrative resources. It wouldalso eliminate the present system's bias against using certaindomestic raw materials and the production of intermediate andcapital goods manufactures. And, most importantly for thepresent discussion, such a system would confer two advantages:it would help identify industries which earn or save foreignexchange efficiently and it would reduce the bias of thepresent system against certain manufactured exports. If therate of subsidy is equalized with the tariff rate, the systemwould be easier to administer and would be less biased againstindustries which use domestically manufactured inputs. Theimportant thing Is not the precise details of this proposal,
1/ The World Bank currently uses a shadow rate of Shs 12 per U.S. dollarfor evaluating the social costs and benefits of projects in Tanzania.This is about a 44% premium on the official rate.
- 134 -
but the orinciple of oroviding some price incernives fcrmanutacturad exmor:s to cfrset the costs 4-mrosed b7 the oresen:Oricia.n svstem.1/ Ic is essential co note, however, that theeffects af exporc subsidies can be very complex; if' he :ari-:and domestic pricing structure are n-ot reformed a the sams time.an. en:irely different ki_nd of export subsidv min'ght be cal'ledfor.
(c) lxchange rate adjustment
5.77 A gradual adjustment of the exchange rate would alsobenefit exoorts. It would give a direct incentive to exnortersby raisinc their shilling output price w7ithout affect-ing mostinput prices; it would helo restrain consumption of exoortableproducts, assuming the exchange rate changes are reflected inconsumer prices; it would reduce the incentive for capitalflight through underinvoicing and smuggling because the ga?betweer. the official and the black market rate would benarrowed; and it would relieve the pressure for administrativedevices and reduce the subsidies needed to make exportscomvetitive. A series of small exchange rate adjustments wouldbe preferable to a large devaluation because the macroeconomiceffects would be less disruptive. Combined with other policiesto make oarastatals more cost conscious, there is no reasonwhy some exchange rate adjustment should interfere with effortsto raise labor productivity. In the longer term it is almostcertain that some exchange rate adjustment will be requiredin order to provide adequate agricultural producer price
1/ An exoort subsidy on domestic costs as defined in this oroncsal wouldnot offset the effect of a tariff on imported inputs; an exnortindustry using imported inouts would have a lower effective rate ofprotection than an industry using locally manufactured inputs withthe same domestic price. The intent was to conform with the BISguideline assigring very low priority to industries processingimported raw materials for export. If Tanzanian policy-makers feelthat the foreign exchange situation is too grave even to discriminaceagainst this kind of -anufactured export (petroleum and aluminumproducts are the -ain exa-les of such exoorts) then it would bebetter to base the export subsidy on total costs (except local rawmaterial costs), rather than to exemot or refund duties on importedraw materials. The reasons for this preference are: it is lessbiased against the use of competing domestic raw materials andproducts, it makes it easier to identify the extent of protectionbeing given to the subsidized industry, and it reduces variationsirn the ER? across industries.
- 135 -
incentives; although tariffs, subsidies, and controls may serveto replace exchange rate adjustments in the industrial sectorthey clearly cannot do so in agriculture.l/
(d) Restraint on domestic consumDtion
5.78 Tanzanian policy makers have already recogrnized the largeand quick foreign exchange gains to be derived from reducingconsumption of products in which production and consumptionare finely balanced. As noted earlier, a reduction in sugarconsumption of about one-fourth improved the trade balance onsugar by Shs 136.3 million in one year. This was equivalentto about 5%' of total exports. Over the longer term, simplyslowing the growth of consumption of several products couldhave a substantial effect on export earnings. The potentialgains are especially large in the case of sugar, textiles,cooking oil, tea, and tobacco amongst manufactured products,while there are a number of agricultural exports which wouldalso be affected by slowing the rate of private consumption.
(e) Administrative measures
5.79 Most of the bureaucratic constraints on exports stem froma fear of the adverse consequences Qf uncontrolled exports, afear of capital flight and of depriving the domestic marketof essential commodities. These fears have some basis but theyneed to be balanced by an appreciation of the desperate needfor more foreign exchange. The cost of increasing exports maywell include some widening of the opportunities for capitalflight, but this may equally be a price worth paying in orderto secure additional foreign exchange. Ultimately it is aquestion of balance; at the moment it appears that the balanceof controls is so weighted against abuse of exports that itis increasingly difficult to export at all. Most of theadministrative changes required to expedite exports are implicitin the criticisms of bureaucratic procedures outlined earlier.
1/ In addition, the lower the exchange rate, the more the burden ofbalance of payments adjustment will be thrown onto the industrialsector and the higher the level of subsidies and tariffs required.This implies a very high differential effective rate of protectiorbetween industry and agriculture and a much higher domestic resourcecost of foreign exchange than if there were some excahange rateadjustment.
- 136 -
F. Role of the Private Sector
5.80 Although this report has concluded that the performance of theparastatal sector has beer. 3enerally weaker than th.at of the privatesector, this is not meant to suggest that Tanzania should revert toreliance upon the private sector in manufacturinag. The problems ofmanufacturing parastatals have little to do with oublic Ownership; theyare the result of particular shortcomings in the systems of incentives,pricing, and parastatal control. The problems stem, in brief, fromtrying to run parastatals as an extension of the civil service insteadof as commercial enter-rises. If the policy framework is changed, thereshould be a big improvement in parastacal labor productivity, savings,e:iports, and general efficiency.
3.81 For the foreseeable future, however, the orivate sector willhave an important role to play. The Government does not have theresources -- neither financial nor technical, managerial, and businessskills -- to extend its control over the full range of manufacturingactivity in the near future. The corollary of this is that some of theresources (both financial and human) which do exist in the privatesector could not be tapped for use by the public sector; some of theprivate savings which currently go into self-financed investment wouldbe lost as would some of the skills, particularly of the still sizeableAsian business community. These considerations are particularly relevantto the small-scale industrial sector, which includes the bulk of thevital engineering industry.
5.82 This does not mean that the private sector need be all-owed toexpand unimpeded nor that certain activities should be reserved forprivate firms. It is assumed that the Government will cortinue theprocess of gradual takeover of large-scale private manufacturing firms.It is also assumed that cooperatives, District Developmert Corporations,and even parastatals will extend their activities into small-scaleoperation or sectors which are presently the preserve of the privatesector. It is important, however, that these activities not be confinedto cooperatives and the public sector. One of the most inoortantfunctions the private sector can perform is to provide competition forsmall-scale public or cooperative enterprises. Confinement of certainactivities to cooperatives or the public sector in Tanzania has frequentlybeen justified on the grounds that this eliminates exploitation byprivate firms. Yet it is not uncommon for prices to rise and the qualityof goods or services to deteriorate following the elimination of privatefirms. It is hard to understand in what way private firms have beenexloitative in such circumstances. There is certainly a case for theuse of public or cooperative competition to prevent exploitation byprivate firms. There may also be an infant industry justification forinitial subsidies or orotection for cocoerative or public enter-riseswhile they learn the essential skills for competing effectively. Butconfinement to public or cooperative enterorises could be very ccstly.
- 137 -
5.83 The most important recuirement for making better use of theprivate sector is to define its role more precisely. In some industries(such as sawmilling) uncertainty about their future role and of theinvestment plans of parastatals has caused some private firms to lettheir capital equipment deteriorate. The Arusha Declaration attemptedto define the role of the private sector, but the guidelines set out inthat document need to be updated. Some of the industries which were tobe left open to the private sector have since been nationalized, whileother iadustries reserved to the public sector should perhaps bereconsidered or their definition clarified.l/ It is less important whatthe limits placed upon private firms are than that the limits be statedwith clarity. Clarification of the permissable activities and of sizeor other limitations on private firms would help eliminate some of theuncertainty which many private firms now feel.2/ In addition privatefirms need to be given some indication of proposed parastatal activity.3/With these uncertainties removed private savings and investment shouldboth increase.
G. Small-Scale Industry
5.84 One of the stated objectives of the BIS is to foster thedevelopment of small-scale industry. There are both structural andinstitutional or policy obstacles to implementing this objective. Themajor structural difficulties have been touched upon previously: therereally are not that many products for which small-scale productionmethods are competitive in price, and consumers frequently have a strongpreference for mass-produced products. The focus of this section willbe upon the institutional and policy obstacles to development of small-scale industry.
5.85 The main institution concerned with the development of small-scale industry is SIDO. Although SIDO has some important functions toperform, there is a danger that its existence will deter parastatalsfrom treating small-scale industry as an integral part of industrialdevelopment. With a separate organi%ntion to "take care'' of small-scaleproduction, producing parastatals too often regard small-scale productionas none of their concern. As a result they frequently invest in large-
l/ Any small engineering shop for example could make simple "machinetools". The Arusha Declaration reserves machine tools to the publicsector, but it is doubtful if the intention was to preclude privatefirms from producing simple metal products.
2/ A speech by the President in late 1977 has helped to start thisprocess of clarification.
3/ The model for such consultation might be the Engineering IndustryAssociation proposed by the Metals Industry Development Task Force.
- 138 -
scale produc:icn units even. when small-scale alternatives are available..or its oart, SIDO has no authority to invest in producticn and isJvirtual> limited te pronoting che cause cf small-scale industry byadvice and oersuasicn.
,-36 There are numerous ex:amples of the failure of the system toConsider small-scale methods. In one case, Texco proposed to build atarge-scaie garment Lactory. Since garments is one of the few induscriesin which small-scale production is already well-established and whichcould reasonably be expected :o be highly ccmpetitive with large-scaleproduction, the proposal was :urned dow-n and Texco was asked to submita new proposal based upon small-scale production. Texco never submitteda new proposal but it was subsequently given per=ission to build a large-scale garment factorv in Dar es Salaam. In another instance, the SuzarDevelopment Cor-oration rejected all suggestions that it e-cplore thepossibility of a small-scale alternative method of production (the openspan sulphitation process used in India) on the grounds that SIDO shoulddo this. The rationale for going ahead with the large-scale garmentractory was the availability of foreign finance which could otherwisenot be easily used. In the case of sugar, SIDO is experimenting with thealternative method of production, but meanwhile SIDECO is going aheadwith large-scale production plans which may pre-empt che possibility ofsmall-scale production of sugar for many years to come. These and similarinstances su-gest that little progress can be expected in promotingsmall-scale industry without significant changes in present policy.
3.37 There are several problems which need to be overcome anddecisions which need to be made if small-scale industry is to occupyanvthing other than a token place in the future industrial structure.
5.83 The predominant problem is to prevent parastatals from pre-e=pting the market for small-scale products. This is largely a questionof political will. Technical solutions cannot solve the problem if theimplicit political Judgment is that small-scale industry doesn't reallymatter. At the moment the Ministry of Finance and Planning has thepower in theory to stop pre-emptive large-scale investments, but inpractice the attempts to use this power have failed. If the intentreally is to prevent pre-emption in selected industries, however, thanpolicy instruments such as taxes (or outright bans) on large-scaleproduction in certain industries, or requirements for sub-contracting ofcomponents to small-scale firms in other industries, may be usefl .1/
5.89 A second urgent need in promoting small-scale industry is toestablish what small-scale production opport'unities are available. SIDOhas a potentially useful program of pilot plant production which itsaimed at discovering by production trials just what are the costs,technical problems, and product characteristics of several small-scale
1/ Large-scale production of furniture, for example, could be banned andproduction of som components for the new bicycle factory could bereserved for small-scale industry.
- 139 -
production methods not currently in use in Tanzania. When these productiontrials have been run there w-ill be a more informed basis for decidinghow much, if any, of the market might be served by small-scale productionof particular products. SIDO's plan is to disseminate information onproduction methods which have beer. proved to cooperatives and DistrictDevelopment Corporations which might want to undertake co=ercialproduction. In some cases it might also be useful for parastatals toinvest in trial small-scale production methods in order to get a workingknowledge of their potential suitability.
5.90 A third requirement for implementing a small-scale industryprogram is to decide on a case by case basis how much weight to give toconsumer preferences when these conflict with using small-scale productionmethods. Once again this is a political decision, but it is better toraise the issue ox a possible conflict explicitly than to have the issuedecided by default. The evidence so far is that consumer preferenceswill always win out, but the decision might be different if politicalleaders are aware of the possible conflict. Again technical policyinstruments can be used to implement a political decision. It might bedecided for example to make both roller mill (large-scale) and hammer mill(small-scale) ground maize available, but to give preference to small-scale production by putting a tax on roller mill production.
5.91 A final important issue is the role of the private sector insmall-scale industry. As noted in the previous section, private firmsare particularly strong in the small-scale sector and will probablycontinue to be for some time since it would be very costly to socializesmall-scale industry completely in the near future. This raises a wholeset of questions. Is the objective to favor all small-scale industry,or just public and cooperative small-scale industry? What if theeffective choice is between small-scale private and large-scale publicproduction? Where much of production is necessarily small-scale, as inthe engineering industry, what will be the role of the private sector?
5.92 Only when such basic obstacles have been overcome and questionsanswered, can planners get down to detailed work on developing small-scale industry.1/
1/ See G.F. Mbowe, rfDevelopment of Small Scale Industries in Tanzania,"J(Dar es Salaam: mimeo 1977). The paper has useful suggestions forfinancing small-scale industry and on the possible range of products.Further study of small-scale industry will be taken up in futureBank sector work.
- 140 -
CHAPTER VI. SLM-LARY AND CONCLUSIONS
6.1 The performance of the industrial sector in the past 15 yearshas been mixed. Starting from a very low base at the time of indenendence,industrial growth has been quite vigor^us. In the period 1964-73 realindustrial output grew at 9.4% per year. However, in recent years someserious shortcomings in the performance o. the manufacturing sector havebecome apparent.
(1) The rate of growth has slowed down. From 1973-75industrial output virtually stagnated, but even before1973 growth had begun to slow down.
(2) The slowdown in growth coincided with an increase in theamount of investment. The incremental capital-outputratio (ICOR) increased from 3.6 in 1968 to 4.9 in 1972.
(3) Real output per worker was constant from 1966-67 to 1972-73in spite of the fact that capital per worker irncreased by29% during the same period. This implies that pure laborproductivity was falling.
(4) The real value of manufactured exports (excluding petroleumproducts) fell by about 20% between 1969 and 1975.
(5) Little change in the structure of production has occurred.Although the share of producer goods has increased whenmeasured in terms of gross output, this has been achievedby the expansion of low value added industries. The shareof consumer goods industries in total value added increasedfrom 56% in 1965 to i9% in 1973.
6.2 'Many of these shortcomings stem from deficiencies in theperformance of the fast-growing parastatal sector. Total factor producti-vity fell by 30% in the parastatal sector between L966-67 and 1972-73.Real output per worker in manufacturing parastatals fell by 31% duringthis period while the rate of return on capital fell by 27%. In large-scale private manufacturing the rate of return on capital also fell(by about 13%) but this was partially offset by a 1% increase in laborproductivity. Total factor product-ivity in the private sector fell by 12%.
6.3 The poor performance of the parastatal sector seems to havebeen largely due to the low rate of return on new parastatal investments.As late as 1973, 95% of 'MC's profits from manufacturing operations wasaccounted for by four large companies taken over at the time of theArusha Declaration. In addition, there was some decline in laborproductivity in the Arusha companies. One hopeful sign is that the post-Arusha companies have gradually Increased their profitability, though itremains to be seen whether this reflects a genuine increase in efficiencyor is simply due to output price increases.
- 141 -
6.4 Tanzania has adopted a new long-term industrial strategy calledthe Basic Industry Strategy (BIS). This is the outcome of a long debatein which a number of strategies were advocated. One school of thoughthad long held that Tanzania should try to maximize growth by investingin any reasonably efficient industrial apportunity which presented itself.By default this tended to be the actual strategy during most of the pcst-independence era. Unfortunately defects in both the planning and thepricing systems limited the growth effects of this growth and efficiency-oriented strategy. Investments were usually approved on the basis of anaffirmative answer to the question "Can it be produced?" rather than themore appropriate question "Can it be produced efficiently?"
o.5 Another industrial strategy often proposed for Tanzaniaemphasized small-scale, village-based industries to complement ujamaa.AlIchou-h small-scale industry has frequently found favor in officialpronouncements, implementation has been stymied by several obstacles:the limited number of small-scale production possibilities, consumerresistance, and pre-emption of the market by large-scale parastatalproduction. More recently strong support has developed for a processingstrategy. rnis strategy emphasizes processing local raw materials forboth the domestic market and for export in order to increase the shareof local value added and to reduce dependence on primary exports. Froman efficiency standpoint this strategy is deficient because it considersonly benefits, not costs, while from the structural point of view increasedprocessing for export might increase rather than decrease Tanzaniandependency.
6.6 The officially-approved BIS is based on the premise that themain role of industry is to produce structural change and increase self-reliance. Emphasis is to be placed on "basic" industries, which arethose which provide the basic needs of the population as well as inter-mediate goods industries which have high linkages with other industries.The aim is to use domestic resources for domestic needs as far as possible.In its pure form the strategy is characterized by (1) an emphasis uponthe production of producer goods; (2) limitation of consumer choice inaccordance with the desire to use domestic raw materials and to avoidproduction of luxury goods; (3) emphasis upon production for the domesti.cmarket; and (4) a relative lack of concern with comparative costs.
6.7 The new long-term industrial strategy, the BIS, emphasizesbasic industries, but with some modifications to accommodate existinginvestment commitments and the main concerns of other strategies. Anumber of investments in processing for export are scheduled in the nextfew years, both because these had already been planned and because ofthe current foreign exchange shortage. Small-scale production is to bestrongly encouraged. Finally, investment in basic industries is to beconstrained by efficiency considerations. A minimun target rate of returnwill be required f.r all investments and attention will be paid to thesequencing of investments in order to reap external economies and raisethe rate of return.
- 142 -
6.8 To many outside observors, Tanzania seems poised to duplicatethe errors of a number of Asian and Latin American countries if i4attempts to implement the BIS. The argument is that :anzania must orientindustrial production toward external markets in order to achieve rap_dgrowth, to provide adequate foreign exchange for essential im=orts. andto generate increased employment opportunities for a rapidly growinglabor force. TIe fears that the BIS will be a dead-end trap seemexaggerated for several reasons.
(1) Studies of industrial investment possibilities for a twenty-year period show that Tanzania tends to have a comparativeadvantage in import-substitution industries (inc7udingbackward-linkage IS industries) rather than in exportproduction. Even under a pure basic industry strategy 70%of total investment would also have been included in agrowth or efficiency-oriented investment program. Withmodifications for existing commitments the overlap isprobably more like 80%. Given the high wage level stemmingfrom a relatively high land-labor ratio and the low skilllevel of the labor force, it should not be surprising thatthe comparative cost of production in many labor-intensive,export-oriented manufacturing processes is high.
(2) While an alternative strategy would provide more employmentthan the BIS, the difference would not be great: 2.9% ofthe labor force would be employed in industry by 1995compared to 2.1% under the BIS. No industrial strategycould have a significant impact on employment opportunitiesin the economy as a whole for many years.
(3) Backward-linkage import-substitution as well as export-promotion can prevent the emergence of a foreign-exchangeconstraint. Moreover, if import-substitution industriesare relatively efficient and have developed at leastminimal export penetration, the economy will have greatershort-term flexibility and be better able to convertdomestic savings into foreign exchange than with a structureof specialized, export-oriented industries.
(4) The metals engineering industry, which has a central rolein the BIS, is especially important for skill developmentard the development of a capacity to adapt technology tolocal conditions. Although this industry might not aualifyfor investment on static efficiency grounds, it would doso on the basis of its infant industry potential.
6.9 Any evaluation of the 3IS must also take note of its (andTanzania's) goals. The BIS is intended to promote structural change andself-reliance and in this it should be effective. Without some vision ofpurposeful change, it may be impossible to restructure the economy. itis therefore irrelevant to criticize the 315 for failin.g to maximizeshort-term growth. Tanzanian nolicy-makers do care about growth, but they
- 143 -
are willing to forego some increases in income in order to obtain thebenefits of greater structural change and reduced dependence.
6.10 In spite of these considerations in its favor, however, theBIS does have some shortcomings and potential dangers, even in terms ofstructural change and self-reliance.
(1) The capital and foreign-exchange requirements of the BISare very high in the early years and this is costly interms of foregone growth. By 1990 industrial producticnwould be 13.4% less and total GDP 3.9% less under the BIS thanunder an alternative strategy. More importantly forsubsequent growth, gross domestic savings would be one-third higher under an alternative strategy by 1990. Alonger time horizon for achieving structural change wouldreduce the foregone growth costs of the BIS. If thesecosts are not to be excessive (by Tanzania's own standards),it is essential to define the time horizon more closely andto take seriously the strategy's own guidelines for minimumtarget rates of return and for sequencing investment.
(2) One particular investment which must be looked at closelyis production of steel from Liganga in the near future.The adverse growth and savings effects of the BIS couldbe cut in half if Liganga steel production were delayeduntil the domestic market could absorb the production ofboth the Chunya plant and a large plant at Liganga whichwould achieve greater economies of scale. Early productionof steel at Liganga would also contradict the strategy'sown guidelines on sequencing.
(3) Because of the capital and foreign exchange requirementsfor overall growth, structural change in industry willcompete with structural change of agriculture and ofexports. By foregoing some manufactured exports theeconomy will remain more dependent on primary exports.
(4) Perhaps the most important drawback of the BIS is the demandsit places upon planning capacity - one of the scarcestresources in the economy. Considerable centralized controlwill be necessary to ensure that investments accord withthe priorities of structural change, that investments aresequenced to take advantage of linkages, and that small-scale production possibilities are not pre-empted. Yettight centralized control over investment decisions may beinconsistent with improving parastatal efficiency or withdevelopment of the metals industry, which is inherently adecentralized industry.
- 144 -
6.11 There are a number of problems and issues in the industrialsector which would require attention whatever the lcng-ter: industrialstrategy.
6.12 The most important of these is declining labcr productivi:'?,particularly in the parastatal sector. Falling productivity has beencaused by: poor project planning and prolonged learning problems in newparastatal investments; reductions ir. cavacity Uti'ization; inadequateincentives, both positive and negative, for workers and managers; andinadequate macroeconomic incentives to increase productivity. The cost-plus price control system is a particularly deficient mechanism forfocusing atzent±on on cost reduction.
6.13 Excess capacity is another problem which has emerged in severalindustries since 1973. There has always been a tendency to overbuildcapacity in relation to supply in some processi-g industries, but recentlythe problem has become more widespread. Since 1973 the -roblem that hasemerged is due to inadequate supplies cf water and electricity, a shortageof imported raw materials and spare parts, and inadecuate maintenance andrepair facilities.
6.14 Parastatal surpluses, while holding up better than most othercompcnents of national savings, have lagged in relation to the growth ofoutput. Tnis lag in surplus generation is reflected in a falling realrate of return an capital in industrial parastatals. The underlyingreason for this decline is related to the decline in parastatal laborproductivity: there is insufficient concern with costs and little pressurefor cost-reduction anywhere in the system. Surpluses have also beenreduced by growing overhead costs in holding companies. NDC headcuartersexpenses, for example, increased from 2.8% of total funds employed in1967 to 7.6% in 1974, though the trend appears to have been reversedsince 1974.
6.15 A fourth problem is that the investment planning system hasworked very badly. It has achieved neither structural change nor adequaterates of return or. most recert parastatal investments. Amongst the manydeficiencies of the planning system are included: a focus on tne annualbudget as the major instrument of control and, within that context,excessive concern with the source of finance, inadequate attention tofuture cost implications of current decisions, and a strong tendencytoward overcommitment with consequent underfinancing of all projects;inadequate coordination of foreign assistance; and the tendency ofparastatals to evade both central planning controls and profitabilitycriteria in their investment plans.
6.16 Another important issue is the role of the private sector, whic-astill accounts for half of large-scale manufactured output. the publicsector will no doubt continue to grow in relative term-s but the Governmentdoes not have the firancial, technical, nor managerial resources to extendits control over all manufacturing in the near future. A maicr challengefor Government volicy is to find some means o. mobilizing the skills and
- 145 -
savings of the private sector for the development of such importantindustries as engineering. One way in which this can be done is to updatethe Arusha Declaration definition of the role of private industry in orderto eliminate uncertainty. Another useful function the privat2 sectorcould perform is to provide competition for small-scale public orcooperative enterprises.
6.17 A final issue is the role of small-scale industry. Althoughthe promotion of small-scale industry is frequently proclaimed as anobjective, this commitment is not always evident in practical policies orinvestment decisions. If small-scale industry is to play a significantpart in industrialization it will be necessary to prevent parastatalsfrom pre-empting the market, to establish what small-scale productionopportunities are available, to decide how much weight is to be given toconsumer preferences for large-scale products, and to define the institu-tional relationships in the small-scale sector.
6.18 In order to implement the BIS and to improve the performanceof existing industrial enterprises a number of policy reforms should beconsidered. A major dilemm in policy formulation is that the require-ments of structural change imply that investment decisions should beguided by a central plan, but that the administrative capacity toimplement a centrally-planned economy is one of Tanzania's scarcestresources. Moreover, while implementation of the BIS requires somecentralized control over investment, solution of many of the productionproblems of existing enterprises may require some decentralization ofdecision-making. Although there is no way to resolve the conflictcompletely, a big step in this direction would be to set up a system ofprice incentives which reinforce, and to some extent replace, administra-tive controls. The main advantage of a system of indirect controlsthrough price incentives would be the conservation of the very shortsupply of efficient administrators with high levels of technical expertise.At the very least the aim should be to set up a pricing sytem which pullsin the same direction as administrative controls.
6.19 Fortunately, most of the recommended changes in the pricingsystem would both help improve existing parastatal performance and helpimplement the BIS. In broadest outline it is proposed that the pricingsystem be revised to: (1) place a uniform tariff on all imports; (2) givean additional subsidy on value added for especially crucial products inthe metals engineering sector; and (3) give some form of export subsidyfor industrial products. Such a reform would help implement the BIS byreducing the bias against backward-linkage import-substitution and bygiving special encouragement to the metals engineering industry. It wouldalso help reduce (but not eliminate) the bias of the present pricingsystem against industrial e-ports. One ultimate aim of the reform is toset an upper limit on the degree of inefficiency which can be toleratedin any industry through competition with imports. Tnis ideal could notbe achieved for a few years because of the balance of payments situation,but idmediate reform of the tariff-subsidy system would help provideguidance for investment decisions and for price controls. The particularsof the proposed pricing system differ substantially from the neo-classical
- 146 -
nieal because of the structural aims of the BIS, but the effect onproductive efficiency ar.d resource allocation should benefit both growthand structural change.
6.20 Implementation of these changes in the pricing system would not-have much effect or price control in the short run. However, there area number of changes in the industrial price control system which could beimrlemented immedlately and which would improve incentives to increaseproductivity:
(1) Reduce the number of price-controlled items. This couldbe combined with increased turnover taxes to preventwindfall profits and to put pressure on fi'rms to reducecosts.
(2) Wherever possible, set prices in relatisn to ideal prices(c.i.f. plus tariff under the ref=rmed tariff system) orestablish a schedule for gradual m.ovement toward the idealprice.
(3) Where the ideal price is not known, extend the presentsystem of distinguishing between controllable anduncontrollable costs by building in a target for iincreasedlabor productivity.
6.21 Charges in the system of labor relations and of incentives forworkers and managers could also help increase productivity.
(1) Managerial promotions, demotion, and contract extensionscould be made to depend more on performance in improvingproductivity and reducing costs.
(2) Payment by results wage payment s-ystems should beintroduced in some industries. These should be introducedcarefully because not all industries or tasks are suitedto PBR and because PBR schemes frequently have unintendedside effects.
(3) Facilitati;ng the dismissal of workers for poor performancemay be as important as rewarding good performance inincreasing productivity.
(4) Increased workers' participation mizht in some instancesbe an alternative means of increasing productivity.Because of the potential for achieving exactly the oppositeeffect, however, such initiatives should be selective andexperimental.
6.22 Increased capacity utilization is dependent in large part onimproving the avai1abi1ity and allocation of foreign exchange. The moveto place spare parts on Open General License and the proposed reductionin the practice of confinement should help considerably. The supply of
- 147 -
imported raw materials could also be improved by:
(1) Reducing the 6-month licencing period or permittingsupplementary requests from a reserve fund.
(Z) Using supplementary tariffs or other pricing measures coreduce low-priority demand.
6.23 Policies to increase manufactured exports Include the following:
(1) Putting more emphasis on investment in projects whichpromise relatively quick net foreign exchange returns.This applies to import-substitution as well as export-oriented projects, of course.
(2) Gradually adjusting the exchange rate through a series of
small devaluations. This would benefit agricultural as wellas industrial exports and reduce the subsidies needed tomake manufactured exports competitive
(3) Restraining domestic consumption of those products ofwhich a large proportion of total production is domesticallyconsumed.
(4) Relaxing some of the administrative measures which hamperexports.
6.24 There are several changes which might improve parastatalperformance.
(1) The elimination of all parastatal subsidies, includingsubsidized inputs, would help identify industries whichare relatively inefficient and would encourage inefficientfirms to reduce costs.
(2) All parastatals should be expected to earn a minimumtarget rate of return on both new and existing investments.This minimum may differ by industry according to thepriority accorded the industry by the 3IS, but a targetshould be set for all industries. Without target ratesof return, the danger is that projects will not be subjectedto cost-benefit analysis at all.
(3) Parastatal holding companies could undertake studies,modeled on NDC's improvement program, to determine theproblems of raising productivity in specific firms.
(4) .-A increase in interest rates would put added pressure on
firms to reduce costs and would help transfer surplusesto the financial parastatals.
- 148 -
(5) Additional steDs in creating a parastatal capital marketshould be considered. One such measure would be theissuance of high-interest bonds by TIB for parastatalinvestment.
(6) This needs to be coupled with measures to make parastatalsrealize that equity funds are not costless. One possibleway of doing this would be for Treasury's equity partici-pation to be in the form of preferred stock.
(7) Finally, parastatals should be given more control overtheir retained earnings. This could be a major motivationalfactor to increase surpluses. Taken in conjunction withother proposed changes, this change would imply that itwould be harder for a parastatal to earn surpluses overand above its taxes, interest payments, and dividends butit would have more control over the earnings it did retain.There may be continuing tension between this provision andcentralized investment criteria, but the seriousness ofthe productivity problem suggests that the present balanceshould be shifted toward decentralization.
6.25 The last major area of reform is the investment p1anning system.The following general changes would improve the planning process.
(1) In order to provide more coordination at the crucial earlystage of project identification and preparation, all hold-ing companies should prepare medium-term perspective planswhich would be reviewed by the parent ministry and theTreasury.
(2) The Annual Plan exercise should focus on the economicdesirability of projects (their rate of return andconsistency with the long-term industrial strategy) ratherthan simply on the source of finance.
(3) Treasury should take the lead in securing assistance forprojects. The emphasis should be an obtaining the requisiteforeign assistance for the Tanzanian plan rather thanaccepting whatever happens to be offered.
(4) Approved projects should be costed for the life of theproject. Both recurrent and future capital costs shouldbe projected. Priority should be given to cngoing projectsin the Annual Plan in order to avoid overco=itment and-nderfinancing.
6.26 The above proposals are meant to be suggestions for a generalapproach to solving the problems of the industrial sector rather than adetailed plan of action. However, policy reforms along the linessuggested would go a long way toward improving parastatal performanceand establishing a sound framework for implementation of the 3IS.
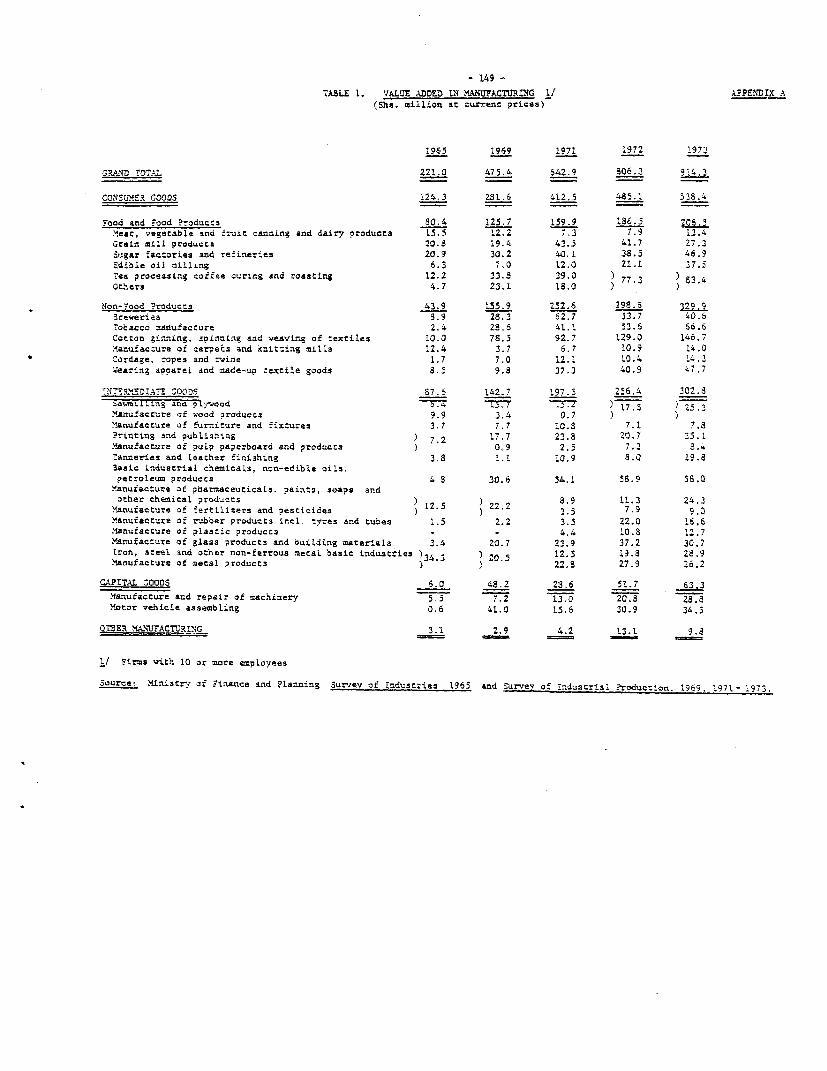
- 149 -
-.A8LE 1. VALUE .0ODED IN M4ANIUVACeJRLG 1/ AP?En-DX A(Shs. million at current prices)
1965 1969 1971 1972 1973
GRAND -TOTA.L 221.0 475.4 642.9 S06.3 i24
CONSUM.ER G00OS 124.3 281.6 412.5 485.1 538.r
Food and Food ?roduccs 80.4 125.7 159.9 186.5 208 5Meat, vegecable and .ruic canning and dairy products 15.5 12.2 7.3 7.9 13.4Grain mill produccs 20.8 19.4 43.3 41.7 27.2
Sugar 'actories and refineries 20.9 30.2 40.1 38.5 46.93dible oil milling 6.3 7.0 12.0 Z1.1 j7.5
Tea processing coffee curing and roasting 12.2 233.8 29.0 77) 8334Others 4.7 23.1 18.0
Non-Food ?roduccs 43.9 155.9 252.6 298.6 329.93rewerias S.9 28.3 62.7 53.7 40.6Tocacco manufacture 2.4 28.6 4l.1 33.6 66.6
Cotton ginning, spinniig aad -weaving of textiles 10.0 78S5 92.7 129.0 146.7Manufaccure of carsec3 and kuittirg mills 12.4 3.7 6.7 10.9 14.0Cordage, ropes and twine 1.7 7.0 12.1 10.4 !4.2Vearing acoarel and made-up textile goods 8.5 9.8 37.3 40.9 47.7
l Ctr_DrATE_ SOODS 87.6 142.7 197.5 256.4 302.8
iavm1.11ing ana p9ywood o.0 ='7 F )17 5 ) 25.2
Manufact-,re of wood aroducts 9.9 3.4 0.7Manufacture of furniture and fixtures 3.7 7.7 10.8 7.1 7.8
?rinting and publishing ) 7.2 17.7 23.8 20.7 25.1Manufacture of pulp paperboard and products ) 0.9 2.5 7.3 8.4
Tanneries and leacher fini3hing 3.8 1.1 10.9 8.0 19.A3asic industrial chemicals, non-edible oils,petrolet= products 4 8 30.6 54.1 58.9 58.0Manufacture of pharmaceuticais. paints, soaos andother chemical products 12 5 22 2 8.9 11.3 24.3
Manufacture of fertilizers and pesticides ) ) 3.5 7 9 9.0
Manufaccure of rubber products ncl. tyres and tubes 1.5 2.2 3.5 22.0 16.6Manufacture of plastic products - - 4.4 10.8 12.7Manufacture of glass products and buiLding materials 3.4 20.7 23.9 37.2 30.7
Iron, steel and other non-ferrous metal basic industties )34.3 20.5 12.5 19.8 28.9Manufacture of metal products ) ) 22.8 27.9 26.2
CAKITAL :Qoos 6.0 48.2 23.6 51.7 63.3
Manufacture ard repair of machinery 5.5 7.2 13.0 20.8 28.8Motor vehicle assembling 0.6 41.0 13.6 30.9 34.5
OU.ER YPANUFACTURING 3.1 2.9 4.2 13.1 9.8
1/ Firmas with 10 or more employees
Sourcet Ministry of Finance and ?lanning Survey of Industries t965 and Survey of Industrtal Produccion. 1969, '971- 1973.
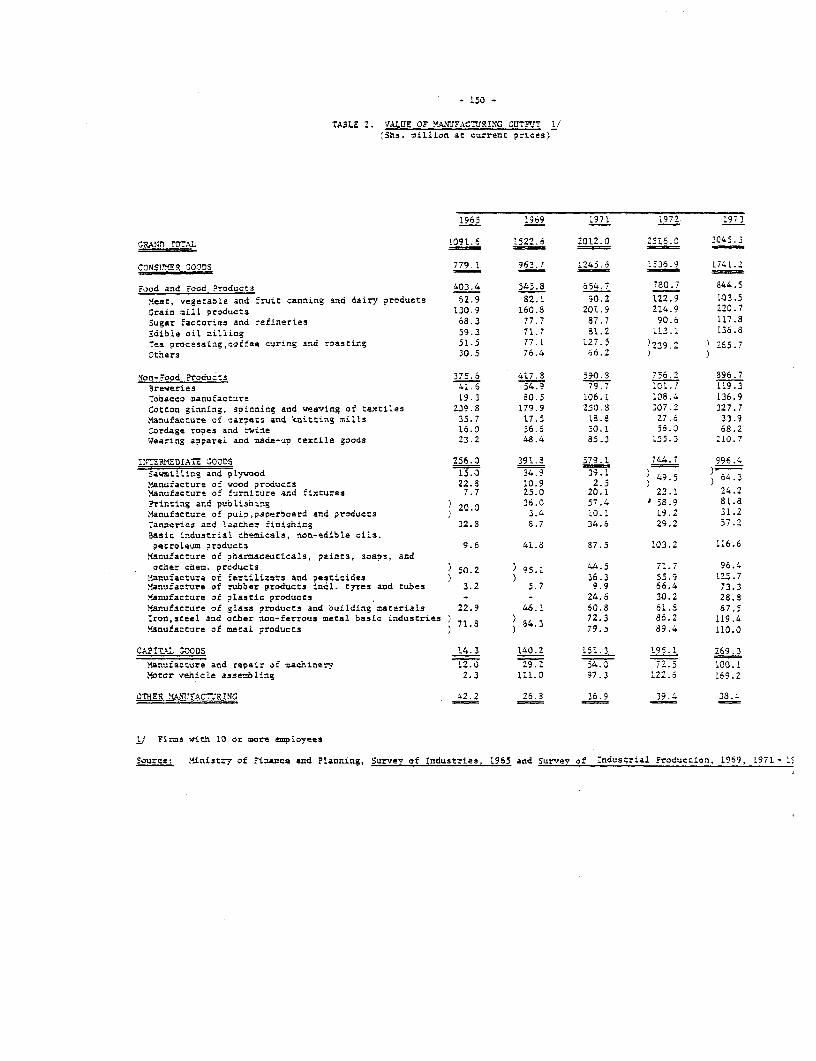
- 150 -
TABLE 2. VALUE OF MA 3MFACTURING OUTPUT I /(Sha. million at current prices)
1965 1969 1971 ;972 1973
5RAND ToTAL 1091.6 1522.6 '012.0 2516.0 3045.3
CDNS0M5 R OOODS 779 1 963.7 1245.6 1536.9 1741.J.2
Food and Food products 403.4 545.a 654.7 780.7 844.5
Meat, vegecable and fruit canning and dairy products 62.9 82.1 90.2 122.9 103.5
Grain mill products 130.9 160.8 201.9 214.9 220.7
Sugar factories and refineries 68.3 77.7 87.7 90.6 117.8Edible oil milling 59.3 71.7 81.2 113.1 136.STea processing,coffee curing and roastirg 51.5 77.1 127.5 )239.2 ) 65.7Others 30.5 76.4 66.2
Mon--ood Products 375.6 417.S 590.3 756.2 896.7Breweries S1.6 54.9 79.7 101.7 119.3Tobacco manufacture 19.3 80.5 106.1 ;08.4 !36.9
Cotton ginning. spinning and weaving of textiles 239.8 179.9 250.8 307.2 327.7Manufacture oi carpets and knitting mills 35.7 17.5 18.8 27.6 33.9Cordage ropes and :vine 16.0 36.6 50.1 56.0 68.2Vearing apparel and made-up textile goods 23.2 48.4 85.3 155.3 10.7
111774 EDIATE 3OODS 256.0 391.3 579.1 744.7 996.4Sawmilling and plywood 15.0 34.9 39.1 )
Manufacture o_ wood products 22.8 10.9 2.5 ) 4 64.3Manufacture of rurniture and fixcures 7.7 25.0 20.1 22.1 4.2?rinting and publishing 20.0 36.0 57.4 ' 58.9 81.8Manufacture of pulp,paperboard and products ) 3.4 10.1 19.2 31.2Tanneries and laather finishing 32.8 8.7 34.6 29.2 57.25asic industrial chemicals, non-edible oils.petroleum product3 9.6 41.8 87.5 103.2 116.6
Manufacture of pharmaceuticals, paints, soaps, andocher cbe=. prcducts ) 50.2 95.1 71.7 96.4
Manufacture of fertilizers and pesticides ) ) 36.3 55.9 125.7Manufacrure of rubber products inel. tyres and Cubes 3.2 5.7 9.9 66.4 73.3YMAnufacture of plastic products - - 24.6 30.2 28.8
Manufacture of glass products and building materials 22.9 46.1 60.8 61.3 67.5Iron,sceel and ocher non-ferrous metal basic industries 7I.8 84 3 72.3 86.2 119.4Manufacture of macal products ) ) 79.z 89.4 110.0
CAPiT.A2 OODS 14.3 140.2 151.3 195.1 269.3
Yanufacture and repair of machinery 12.0 29.2 54.0 72.5 100.1Motor vehicle assembling 2.3 111.0 97.3 122.6 169.2
OTHER MANUFACt"R1NG 42.2 26.3 36.9 39.S 38.1
LJ Firms with 10 or more employees
Sourtes Ministry of Finance and Planning, Survev of Industries. 1965 and Survev of Industrial 5roduction, 1969, L971-
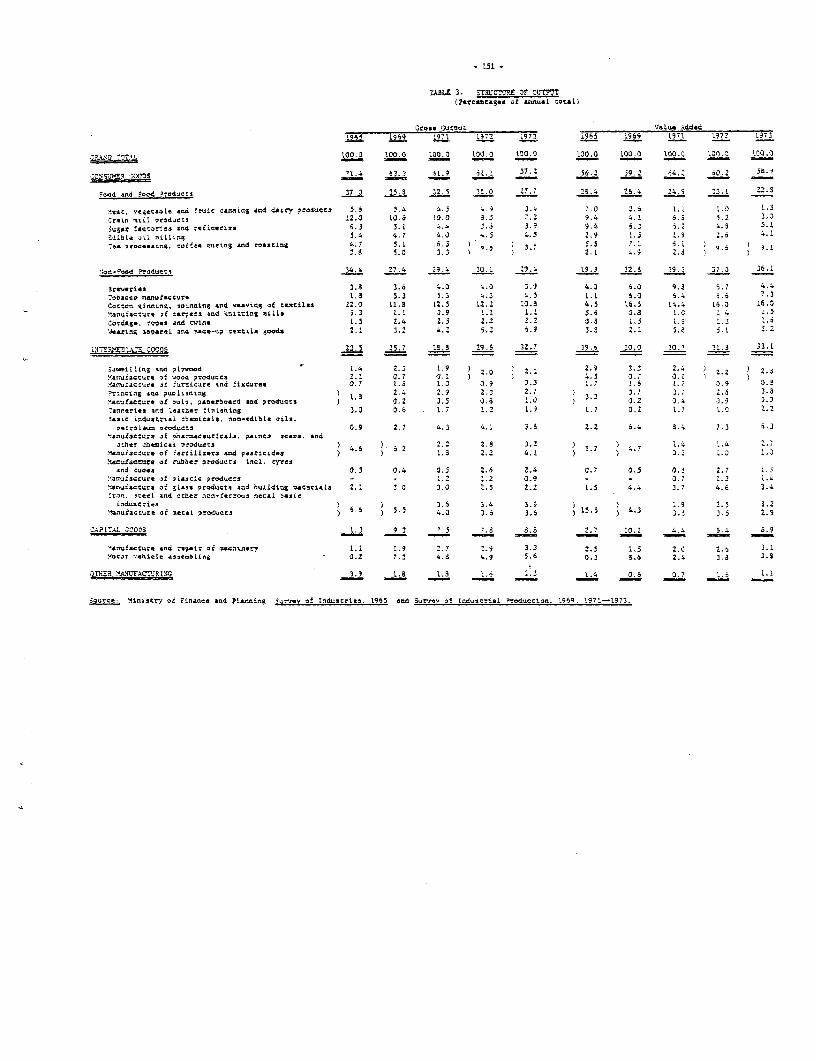
OAhLZ 2. Srnucv- OF sOU=oJT
Von$ u cue 7aIo.t Added!.9651 1969 19711 1970 ~ 970 91963 19-66 9171 1972 1907
~~~45 7'~~~~~~~~~~~~~94 ~~~~~~100.0 100.0 100.0 100.0 1100 0 100 0 100.0 100.0 0 Z 1 00.0
'~~~~sts~~~~~~o boos it ~~~~~~~~~~14 53 0 il 9 i. 57.2 3 j9 2 A4. 2 0. 2 6.
load sad Food fiodoots 07-0 35-5 22 5 01 0 2 6 64 4.0 - 3
,tsbL sod 0t.4Lc cart0in dOd daLry r ,?4uQx 5.6 41 -3 9 0, 0 L .0
1r.in ,ti1l prdocz 12.0 10.5 1.0.0 .0 7.21 94 6.0 3.2 3.0io4mv faotor-bos And t1~ .6.0 0.1 41.4 0.6 3.9 9.4 6.0 i.2 4. 5.4fOitbl. .U oi115g 5.4 4. 7 4.0 4.0 -.3 2.9 1,L.9 2.i 4. 1'oc P ........ S. ooff.. t.ri05 and raa.ris 4. 7 5.1 6.35. 71 6. 1
2.6 3.0 0.0 Z. . .1 4,.9 0.
101-Food ?,r.d.ccl 3~~~~~~4.4 27.4 29.4 20. 29.- 19.9 02.3 09., 37.0 06.1
3re~erie 3~ .8 0.6 4.0 4.0 0.9 4.0 9.0 9.0 9.7 41.47obsCC. m~fcr 1.5 5.3 5.3 4.0 4.5 1.1 6.0 4.41 t6 7.0QCZO: 5ioig.sLoolog "od ~.vo f texiles 22.0 11.5 12.5 12.2 10.5 4.5 16.3 L4.4 14.0 1
MOOOZOOOrO .~~~f 0*07*00 aod 4o10:lng oiII ~~~3.0 L-1 3.9 1.1 1.1 3.6 O.s 1.0 1.4 1.
Cordage, roots and tw1oe 1.5 2.4 2.0 0.2 2.2 0.3 1.0 1.9 1. .4QA:%og aeoeoel and aded-o ;az:11. 4oed; 2 1 .2 4. 2 5.2 6.9 30 2.1 0.5 3 1 0.
LXTE5R~tt.kn 2005 22_ 35 25.7 05 5 09. 32.7 59- 200 0 00 01 4 0.
-ii1o .od 915I od 1.4 2 0 1.9 2. . 2.9 3.0 2-2 7 .M'ao ACtC.o. of -1oo pr.4ootS 2.1 0.7 0.1 11 4.5 0,7 0.1 Y-racr-I ef i.rncure sod fx,rs0. 1 5 1.0 0.9 I.0 1,7 1,5 1. 7 0 -9 0.5?rincing 406 ,ooLijl5iag 1. 2 .. 2.9 2. 0 2.7 1 7 0 7 2.o 0.3
M.ao,da0lure of ,olo, 7*04090.06 sod odssso. 7 0~~ ~ ~~~.21 0. Q.9 1. .0 02 '0,4 0.9 0.97ao-ri.e aod 1...oh*r ft.t.hing 0.0 2.4 1.7, 1.2 .91.7 0.2 1.1 1.0 Z.2SasLc Lrin.s0tr.1 che-ic.ls. ooo-.dlblt oils.
-C::olos pcodwc--o 0.9 2.7 4.3 -.1 3.5 2.0 6.4 3.4 7.0 5.3Y=MaflfctO: of ,.aroc1 p-sots so.-. cod
Other Chei. v .o u c. 6 .2 0.2 2.9 0,0 7 .4 L. 41..9Sofa.:r* of eortillz*eo ado ercie 1.5 2.2 Z., I 0.0 1.0 1.01oanuiaccrso of rubber produces Intl. eo'res
.sd Co6.s 0.0 0.4 0.0 2.6 2.4 0.7 0.3 0.3 2.7 1.7,a.1m0turt or Plastic prod,.oO - L .2 0.9 -- 0.7 t.0 1.4Xsroofaccurv of glass products aaod 6w.ilizg o.Oeri.13 2,1 2.0 3.0 2.5 2.0 1.3 4.4 . 7 4.6 0.4t.ro. s.tee sad sOber -w-Cnusoca bas-
iadusnzies 73.6 0.4 3.9 L .9 2.3 0.2MIanuiactur:e of oct.1 produ.c. 7 . 5.5 4.0 3.9 3. 311. 4.03 0.0 0.0 0.9
147A7.41. 17055 103 92 7.5 78 9.3 7 10.1 4 ~ ., o.9
manutaiwcCuc and rs1a1r of os.sisary 1.1 1.9 2.7 0.9 3.0 2.5 I's 2.0 2. 3 .iXaC-O~4i1 *.seobLig 0.2 7.3 4. 5 *9 5,6 5.0 5.6 Z.4 0~ 6 .9
0Th~~~~0 M7.N0?AC~~~~~~~~~7!2R150 ~~~~~3.9 1. 5 1.9 1 6 1.0 1.4 0 9 0.7 1.
Osource, Slinistny of Finance end ?Iansoiog Survey of Ondastri.s. 1965 and Sorvo of :ndusat-i1 -rod,occion, '969. 197t-1970.
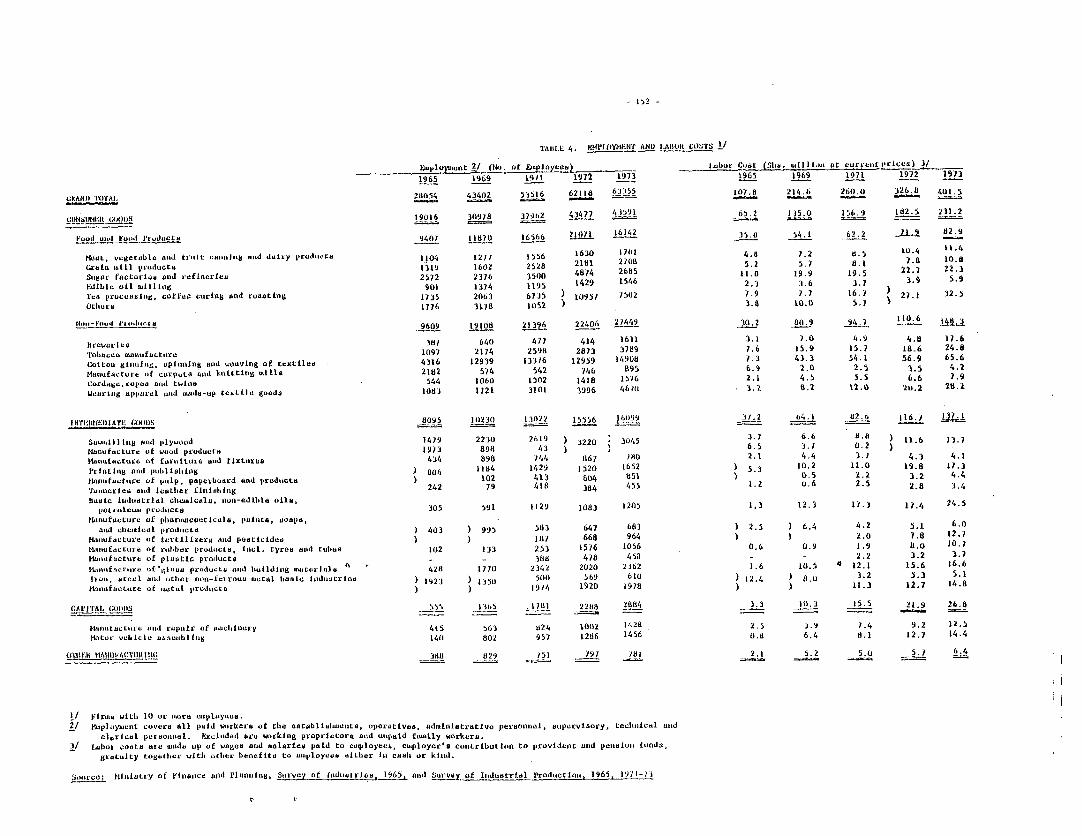
TAIILI 4. I01V1.ifENTI ~AND Llut0551
k)..P oyent 21 (N.. of *ipoea I.aobr cost (Shao lilai.nat currLnf Ptl.600) 311965 1969 0191 1912 1913 1965 196 1971 19 7 2 191 3
GRIAND TOTIAL. 28054 43402 33516 62118 6A.!Ž5 1 07. 214 .6 260. ~0 326.8 401. 5
CO)INSUME GODS I 19016 30918 37)62 inu 4 59 65. 2 11J5.0 156. 9 182. 5 2 31. 2
F~ood and 1k,od I1ruducta 9407 1 1870 16 566 Z11a~l 16142 jso 54..i 62. 2 .J.- 29
WU~L. vegeatable and trait .cafugn ankd datry poducts 1104 12/1 s556 1630 1/0 1 4.8 7.2 8.5 10.4 1'.4Grain oLlI pitdoCta 1311 1602 2528 2181 2708 5.2 5.7 8.1 7.8 10. 8
Sua actol.a*lu efnele 2572 2376 3500 4874 2685s 11.8 19.9 19.5 22.1 22.3lOlIle oiMMI 901 1314 1195 1429 1546 2.3 3.6 3.1 3*'9 5.9Tea proceatiag,6 coffe(1 cur101(t ant roasting 1135 2063 6135 10957 7502 7.9 7.1 *6.7 27.1 32.5
Othuore 1116 3118 1052 3.8 10.0 5.7
Noo-VO.d P-I-Ld ~ ~~~~~9609 19108 2*396 22406 274 ____0994714f brew.ries 38/ 640 477 414 1631 3.1 1 .0f 4 .9 4.8 11.6Trobacco MallofactotoL 1097 2174 2598 2873 3789 7.6 15.9 15.1 18.6 24.8GotLoIl gialifik 6, tpiPtnlig and woavlng of t.xtilea 4316 12939 13316 12959 14908 1.3 43.3 54.1 56.9 65.6Maonufacture of carpto a nd knittingu mitlls 2182 514 542 146 B95 6. 9 2.0 2.5 3.5 4.2Cordag..ropeg. and twioa 544 1060 1302 1418 1516 2.1 4.5 5.5 6.6 1.9Wearing apparel miid nuode-up teLtila Fooda 1083 1121 3101 3996 4610 3.2 8.2 12.b 20.2 28.2
I NTt0(NiIIIAI6 WOO(lS 8(0195 *0230 13022 15556 j6 991 3L/.2 642.lt G 16. fiLSawailIlluf "ad, plywood 14/9 2230 26*9 ) 3220 *30465 316688 )11.6 13.1tianfact.re ot wood poducts 1973 698 43 ) 6.5 3.1 0.2
Hanutucture of fornittore and flxluorLe 434 898 144 867 702.1 4.4 3.1 4.3 4.1VrIunt1ns auid p'nblla*h.g . 5 06 1184 1429 1520 1652 5310.2 11.0 19.8 17.3Mianufactture of pulp, paperboard aul products 102 413 604 1151 ) .5 2.2 3.2 4.4TaunLerlna aind leatLler f1nahtiniii 242 79 418 384 .5 5 1.2 0.6 2.5 2.8 3.4DBoelt iuduatrial cheao.acals, noan-edIhll olla,
jerlorproducts 305 591 1129 1083 1205 1,3 12.3 11.3 17.4 24,5muloufactuce Of IihanaWcautica a, *patinta, oaufiil,aind ch*i,r1atI product 5403 5 5 583 647 683 52.5 56.4 4.2 5.1 6.0Mio,ufacture of tertiziera antd peoelcideai I 5 18 668 964 2.0 7.8 82.1lionaufaclure of rublior praducLo, tcii. t-yree and tubesa 102 133 253 1516 1056 0.6 0.9 1.9 8.0 10.1
H*a,ufucture of pIloatic. prodlucts - 5118I 418 4.51 - - 2.2 3.2 3.7lidaufAII.,re oeaaprodolauL and building miaterilel 428 1770 2342 2020 2162 1.6 10.5 12,1 15.6 16.6Iron. ateel miid oLther u.n-ferrous metal baaic toduatricau5*2 15 500 569 610 12.4 58.0 3.2 5.3 5.1Hati.nfnnCLUC Of roetal. p~rOdooCtf 1 974 1920 1978 5)11.3 12.7 1.
CAPI*'A*. GOODS1 55 136S .1/8* 22188 2884 __.3 *11. 3 15.5 21.9 26.8
la%niitactiif aud repair of mach*nLnry 415 5(3 (124 10(12 *428 2.5 3 .9 1.4 9.2 12.5Motor vehicle ausee.b* fng 140 802 957 1286 1456 0.8 6.4 8.1 12.7 14.4
81 829) 15* 9 1 2.1 5.2 5.0 5.7 6.4__8 - --2 an -
I/ Prlrn wiith 1(3 or: mour, emp1loyees.3! *teMploymment: covers all paild woirkeras of thie eatablia*eeouta, oprertiveae adoministrative peraoinnel, eupervisory, Leclimmical and
cl.rical pmersonn.el. Excluded are womrking propritLorel atnd uttpaid family workers.1/1Ahor coatea are wid. uip of wages and salariem paid to eamployeea, eumployer's conitributton to providenit anid peaulon funds,
gratuity tog8 et*mr wiLhm Oth,er benefits to Lcaploycca either- Ini caa*, or kind.
Source: liJlniatrY Of Iac id1lni8 uvof det a9 asnd Survn of Induatrial Paroductlo. 16, 9-7
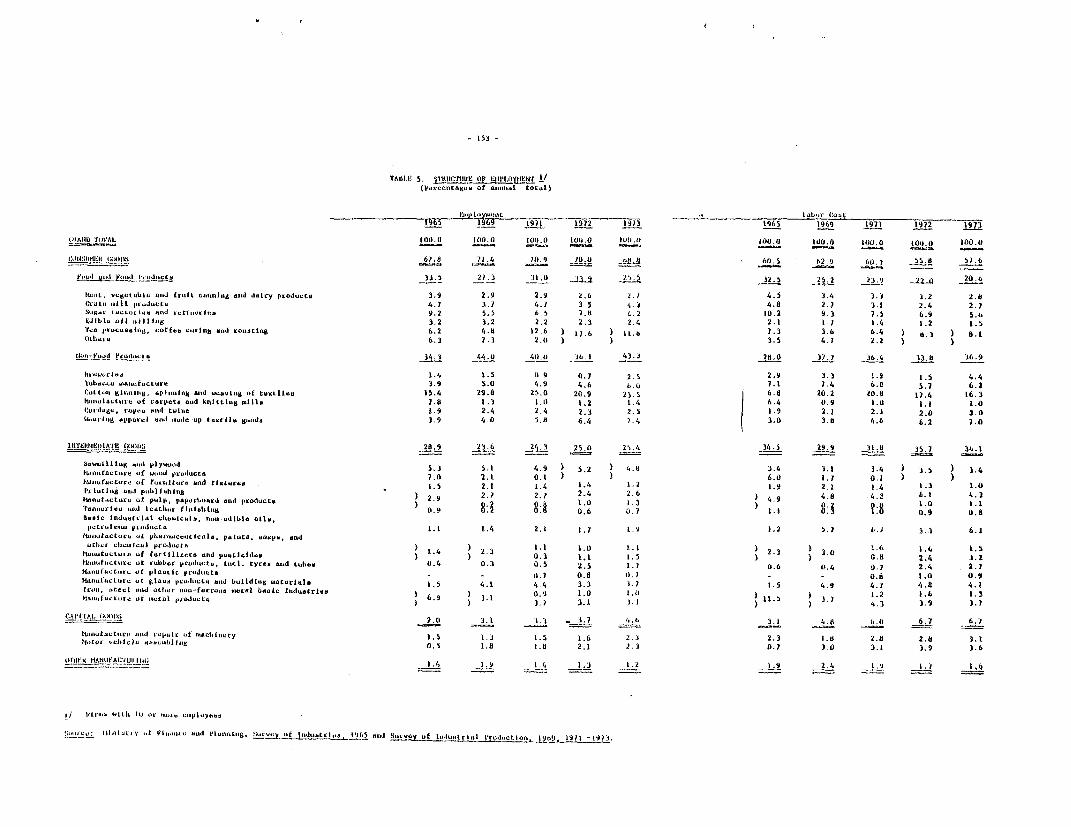
TABLE1 S. ';T111GVUIp4 01' aIpLOytjNElT(rcltgnof amnnil total)
1965 1969 1911 1912 1913 1965 1969 1971 19'12 1973
A 11141 tOO 0 ~~~~~~ ~~~~~~~~~~~~~~~~ ~~~~~~~100.0 I0 1 (JO,. 11(. 1'1W 100.0 I 0. .. o 100. 0 10(. 0.11
_________ 2~~~~~~~~~~~~~~~~~~~~~~~~67 1.3 31 9 ).0 kt ' a j-t
)os~I ut fo2± hod"'ita 33.5 -1J 21.5 32.5 2-5. -133. 2..i 20 .6
Kbat. no1toAnd froji; Cnningl and .iairy IpwOdonts 3.9 2.9 2,9 2.6 7. / 4.5 3.4 3. J 3.2 2.11
Ora In III p6roduct. 4. 7 3.7 4.7 3 5 4.3 4.81 2.1 3.1 2.4 2.7S1,.8oL ..4., a an ,ft ... (Ia 9.2 5.5 6.5 7.8 4.1 10.2 9.3 7.5 6.9 5.6
ldlbln 0(1 'oififug 3.2 3.2 2.2 2.3 2.4 2.1 I.7 1.4 1.2 1.5
T.O prronna1n.W .otkee rorln 8 #d VOntLIg fi.2 4.11 12.6 1) .6 ) 1.11 1.3 3.6 6.4 ) 13 B.
OLI'eIra 6.3 7.3 2.0 3.5 4.1 2.2
tki.o-F od Pro.d-t. 34 31 44.11 411.1 36.1 43321.0 37. 36.4 3.118 36.9
llrnm.orlna ~~~~ ~~~~~~~~ ~~~~ ~~~~~~~ ~ ~~~ ~ ~~1.4 4.5 1.-9 012.5 2.9 3.3 1.9 1.5 4.4
U1lati ...aamntfacLu.r 3.9 5.0 4.9 4.6 II.0 1.1 7.4 6.0 5.1 6.2
C.Lt.1s, 61.100.1, apit fln and .na.nln1 of ta11t110 15.4 29.11 25.0 20.9 23.5 6.81 20.2 10.11 1.4 16.3
H.Aoi4atur. of roaL'nt anid kAIttln11 Mills 1.11 1.3 1.0 1.2 1.44 6.4 0.9 1.0 1.1 1.0
cordo11n. rop1.la 0117 jul00 1.9 2.4 2.4 2,3 2.5 . 2,1 2.1 2.0 2.0
(6.04101 aIp.l.aro aO. ol-ni,u t.attle 11 noda 3.9 4.01 5.11 6.4 5.4 3. 113. 4.6 6.2 7.0
1llE1It1111ff 4~I K(11017 11.9 2.6 243 25.0 25.4 _4._I 29.9 11- 35.1 34.1
SalhllMIng and i.lywod 5.3 5.1 4.9 5.2 1 4.1 3.4 3.1 3.4 1 5 3.4
lo1nufuctura of Wnod products 1.0 2.1 0.1 5 6.0 1.7 0.1hmwfoactorn of forniturn and ft.jr.na 1.5 2.1 1.4 1.4 1.2 1.9 2.) j.4 1.3 1.11
kwiiit-t.ro f pulp, paporb.4rd altd pro4u.to ) 2A 2.? 2.7 2.4 2.6 4.9 .4.2 6.1 4,3l~~r lot In11 am.d ,,ol,1 lab 1011 5 2.9 2.7 2.? 1.0 1.3 5.11 1.1~~~~~~~~~~~~~~10 1. 4.
ano.A'w torn ofA 1'lllp, fi.i.roaht nds ).o 0.9 8 0.6 0.1 OA.1: 0.9 0.11
Ioni Indat al LA.nalel4, 2n-.1IlIa 1la 1,2 5.1 6.Y 3.3 6.1
Inr.It- n prdc..ta 1.4 2.4 2.1 1.7 1.9. I'
tv.u,a.latnra of fert:1lloora almd P4caid.1n 1. 23 . 1.1 1.5 5 50.1 2.4 3.Z
ttuhitnoturn 01 rObbOr Vrodoern.. LnIC. tyren And tuba, 0.4 0.3 0.5 Z.5 1.t 01.6 0.4 0.7 2.4 2.7
tlanalacutuo of plna.cl prdut 0.1 0.11 1.1 - - 0.11 1.00.Ianu.fact.rn of fil... pcoI..eva and l.olldfitS .4carI1a. I.5 4.1 4.4 3,3 1.? 1.5 4.9 4.7 4.11 4.)Iroon. atnol ad acha, noA-f.rrooa lacc.1 baujo tviduatitrja .1 . 0.9 1.0 1. 1531I2 1.6 1.3
maiwf-C.L. of .. LAI pr.j-ti, 6.9 3.1 3 11.5 3.1 ~~~~~~~~~~~~~~~~~~~~~~4:33.9 3.1
Knt-Aboatl,t and1 V.11.01 at -0,ftmlry 1.5 1.3 . 1.6 2.3 2.3 L.1 2.11 2.11 3.1Ntt.,r "Lthioln aa-elblon 1 1
0.5 1.1 I.'s 2.1 2.3 0.7 3.0 3.1 3.9 3.6
1101411 IIANIIEAI..111111W ~~~~ ~~~~ ~~~~ ~~~ ~ ~~~~~~~~1.4 1 .9 1.4 1.3 .7.92.4 1, . 1.11
II 1.14,- WILl. III or thr- wrlona
4., 11101042~~~~, I'(onAnd llam.onwa 2000 olnmarn.I'65An,, Sorui,, ofSlor 11. noIo 11019
II it
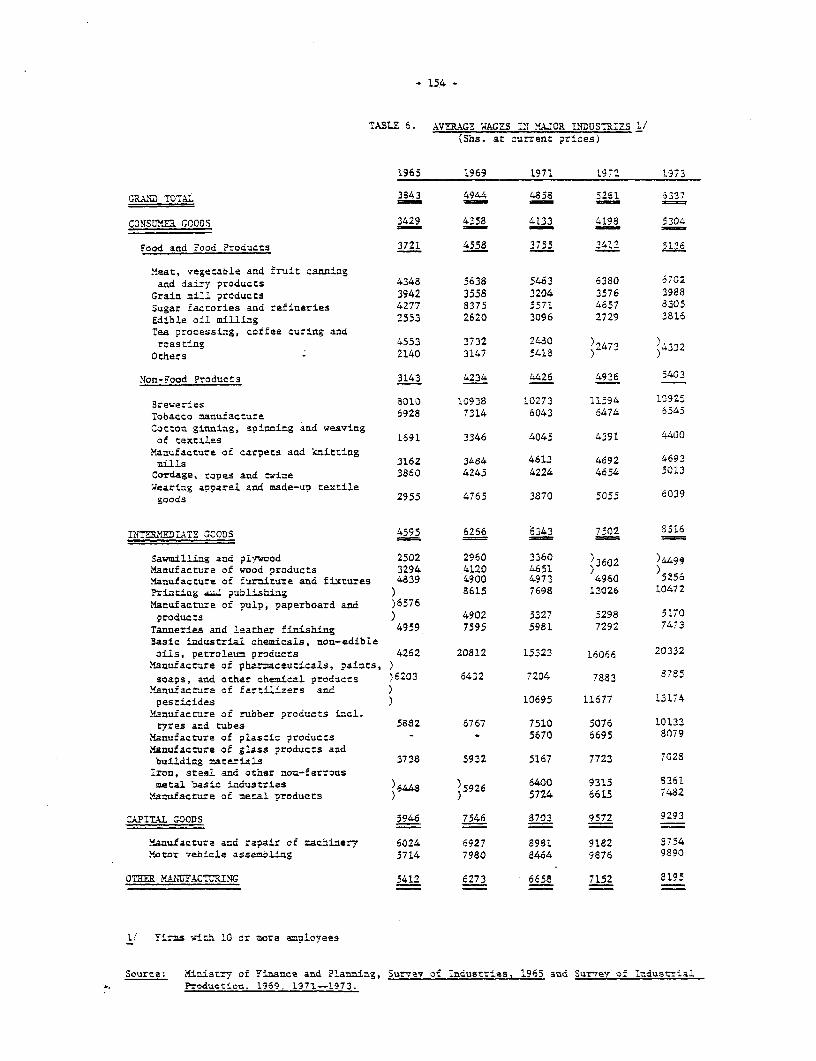
- 154 -
TABLZ 6. AVAGS 'AGES I-N M-kOR I.-UST2J I253(Sbs. at current prices)
1965 1969 1971 1972 1973
GP.AD ,'ToA 3843 4944 4858 5261 6337
CONSUEr- SOCDS 3429 4358 4133 a198 5304
Food and -ood 'roducts 3721 4553 3755 3412 5136
Meat, vegetable and fruit canningand dai:7 products 4348 5638 5463 6380 6702
Grain mill products 3942 3558 3204 3576 3988Sugar factories and refineries 4277 8375 j571 4657 8305Edible oil ailling 2553 2620 3096 2729 3816Tea processing, coffee curing and
roasting 4553 3732 2480 )2473 " 32Others - 2140 3147 5418 2 '432
Non-Food Products 3143 4234 4426 4L936 5403
Brewer4es 8010 10938 10273 11594 10925Tobacco man,ufacture 6928 7314 6043 6474 6545Cotton ginning, spinning and weavingof textiles 1691 3346 4045 4391 4400
Manufacture of carpets and 'knittingmills 3162 3&84 4613 4692 4693
Cordage, ropes and twine 3860 4245 4224 4654 5013W4earing apparel and made-up textile
goods 2955 4765 3870 505j 6039
INTMLYMLaTE GOODS 4595 6266 6343 7502 8516
Sawmil ing and plywcod 2502 2960 3360 )3602 )499Manufacture of wood products 3294 4120 4651 ) )Manufacture of furniture and fixtures 4839 4900 4973 4960 5256Pinr ing A" publihi3 g ) 8615 7698 13026 10472tanufacture of pulp, paperboard and )6576products ) 4902 5327 5298 5170Tanneries and leather finishing 4959 7595 5981 7292 7473Basic industrial chemicals, non-edibleoils, petroleum products 4262 20812 15323 16066 20332Manufacture of pharmaceuticals, paints, )soaps, and other chemical products )6203 6432 7204 7883 S7S5
Manufacture of fertilizers and )pesticides ) 10695 11677 13174
Manufacture of rubber products 1=1.tyres and tubes 5882 6767 7510 5076 10123
Manufacture of plastic products - - 3670 6695 8079Kanufacture of glass products andbuilding materials 3738 5932 5167 7723 7028
Iron, steel and other non-ferrousmetal basic industries )6448 )5926 6400 9315 8361
Yanufacture of mecal products ) ) 5724 6615 7482
CAPITAL GOODS 5966 7546 8703 9572 9293
.Manufactture and repair of machiner7 6024 6927 8981 9182 S754Motor vehicle assembling 5714 7980 8464 9876 9890
Oi MANGF7ACRING 5412 6273 6658 7152 8195
3/ Firms with 10 or more employees
Source: MInistrsy of Finance and Planning, Surtey of Industries, 1965 and Suriey of l.dustr'a1
-. ~~Production. 1969. 197l-1973.
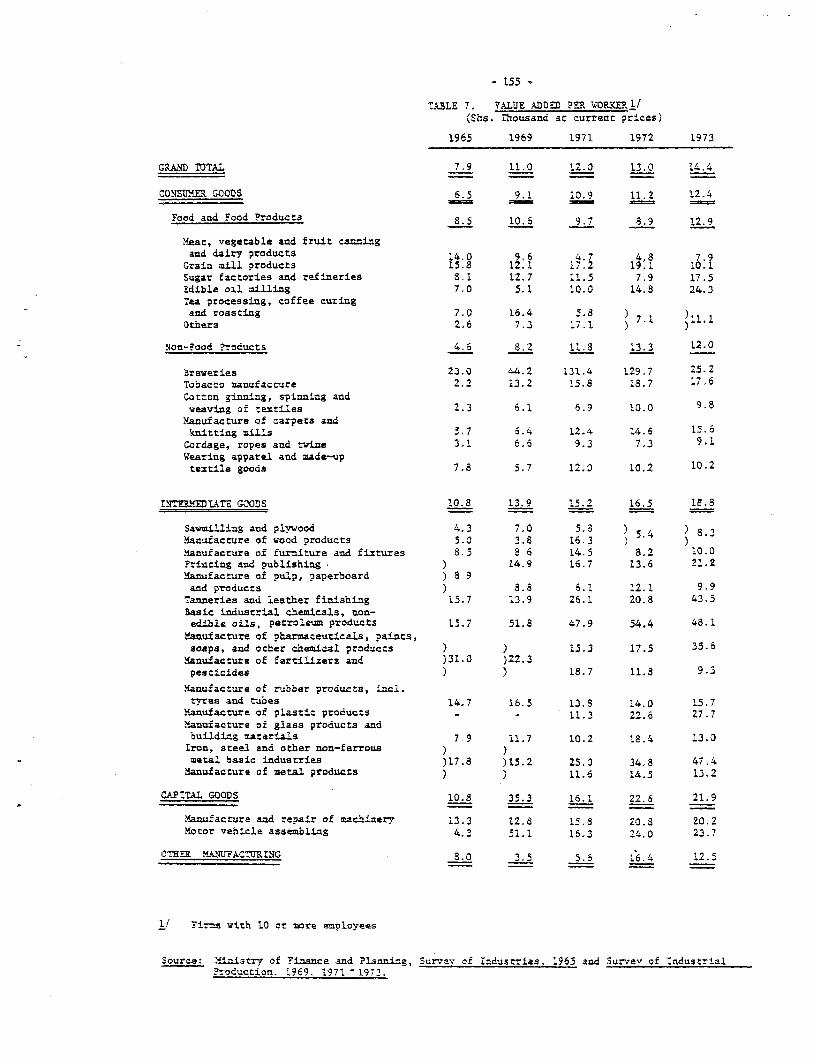
TABLE 7. VALUE ADDED ?EX WORYJI1/(Shs. Thousand at current prices)
1965 1969 1971 1972 1973
GRAND TOTAL 7.9 11.0 12.0 13.0 14.4
CONSUER GOODS 6.5 9.1 10.9 11.2 12.4
Food and Food Products 8.5 10.6 9.7 8.9 12.9
Meat, vegetable and fruit canningand dairy products 14.0 9.6 4.7 4.8 7.9
Graia mill products 15.8 12.1 17.Z 19.1 10.1Sugar factories and refineries 8.1 12.7 11.5 7.9 17.5Edible oil milling 7.0 5.1 10.0 14.8 24.3Tea processing, coffee curingand roasting 7.0 16.4 5.8 ) 7.1 111
Others 2.6 7.3 17.1
Non-Food ?roducts 4.6 8.2 l1.8 13.3 12.0
3reweries 23.0 44.2 131.4 129.7 25.2Tobacco manufacture 2.2 13.2 15.8 18.7 17.6Cotton ginning, spinning andweaving of textiles 2.3 6.1 6.9 10.0 9.8
Manufacture of carpets andknitting mills 5.7 6.4 12.4 14.6 15.6
Cordage, ropes and twine 3.1 6.6 9.3 7.3 9.1Wearing apparel and made-uptextile goods 7.8 5.7 12.0 10.2 10.2
NTE2MMIATE GOODS 10.8 13.9 15.2 16.5 15s.8
Sawmi2.ing and plywood 4.3 7.0 5.3 ) 5 4 ) 8.3'fanufacture of wood products 5. 3.8 16.3 Manufacture of furnjture and fixtures 8.5 8 6 14.5 8.2 10.0Printing and publishing ) 14.9 16.7 13.6 21.2Manufacture of pulp, paperboard ) 8 9and products ) 8.8 6.1 12.1 9.9
Tanneries and leather finishing 15.7 13.9 26.1 20.8 43.5Basic industrial chemicals, non-edible oils, petroleum products 15.7 51.8 47.9 54.4 48.1
Manufacture of pb.Armaceuticals, paints,soaps, and other chemical products ) ) 15.3 17.5 35.6
Manufacture of fertilizers aud )31.0 )22.3pesticides ) ) 18.7 11.8 9.3
Manufacture of rubber products, nci.ty-res and tubes 14.7 16.5 13.8 14.0 15.7
Nanufacture of plastic products - - 11.3 22.6 27.7MLanufacture of glass products andbuilding materials 7 9 11.7 10.2 18.4 13.0
Iron, steel and other non-ferrous )metal basic industries )17.8 )15.2 25.0 34.8 47.4
Manufacture of metal products ) ) 11.6 14.5 13.2
CAPITAL GOODS 10.8 35.3 16.1 22.5 21.9
Hav-facture and repair of machinery 13.3 12.8 15.8 20.8 20.2Motor vehicle assembling 4.3 51.1 16.3 24.0 23.7
.OTER KANUFACTURING 8.0 3.5 5.6 16.4 12.5
'/ Firms with 10 or more employees
Source: Ministry of Finance and Planning, Survav of Industries, 1965 and Survev of industrialProduction. 1969. 1971 1973.
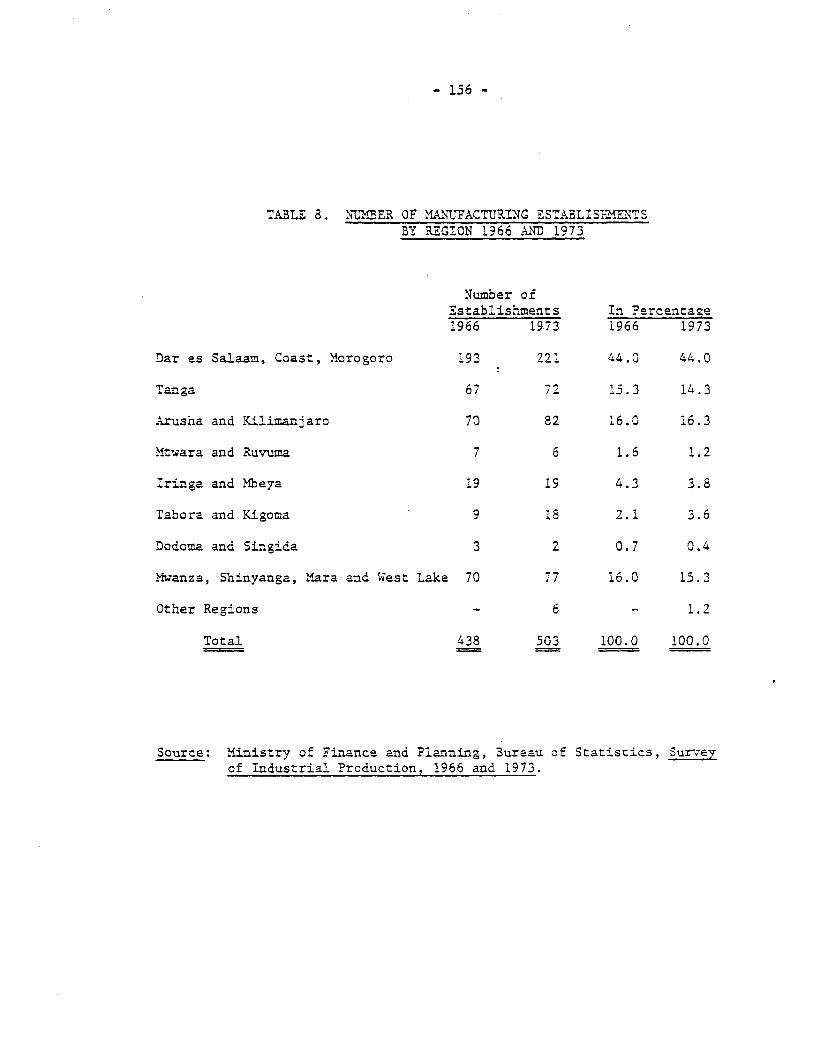
- 156 -
TABLE 8. NNU2ER OF HANMUACTURING ESTABLISEM.ENTSBY REGION 1966 AND 1973
Number ofEstablishments In Percentage1966 1973 1966 1973
Dar es Salaam, Coast, 2iorogoro 193 221 44.0 44.0
Tanga 67 72 15.3 14.3
Arusha and -Kilizanjaro 70 82 16.0 16.3
Mtwara and Ruvuma 7 6 1.6 1.2
Iringa and Mbeya 19 19 4.3 3.8
Tabora and Kigoma 9 18 2.1 3.6
Dodoma and Singida 3 2 0.7 0.4
Mwanza, Shinyanga, Mara and West Lake 70 77 16.0 15.3
Other Regions - 6 - 1.2
Total 438 503 100.0 100.0
Source: Ministry of Finance and Planning, Bureau of Statistics, Surveyof Industrial Production, 1966 and 1973.
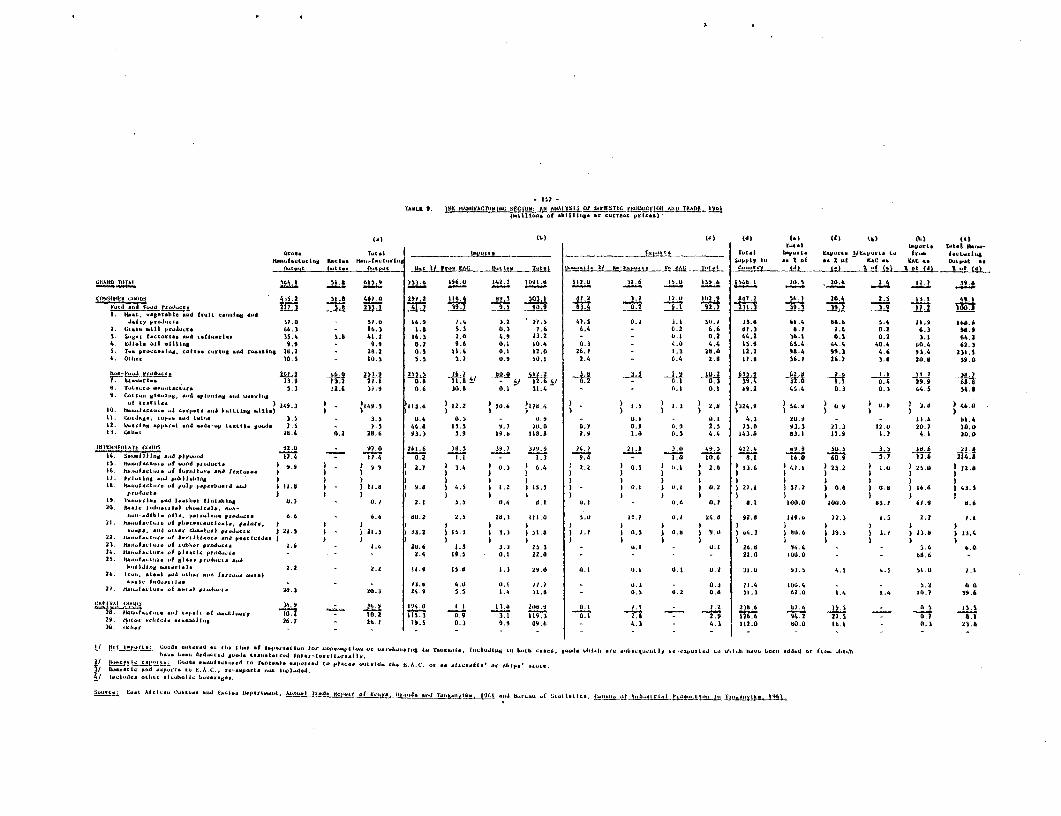
TAOLK t. 21K RAL)L41S (y im*tcsULC PRODUCTION "D TRADE 12,11It. t
W (b) id) (a)
T-k ju--T.t.1 bp., t. E.P.a. ljL.P-t. t.
.9 R. It .9 VAC .. EAC wtp.k A.
11 I�AC T-& It 4� -f iti-
GIIAND MAL 114.1 "A 611.9 4!U 116.0 141.1 1091 11 I'll, "I I I'll, 11, 11-1 31-11
CONSIMALN GWDS 415.2 291.2 IW4 _89,5 .1 2 11-11 67. 16.1 20.4 - I, I
VM M .. d MU 4=7 =1 -j-09 -67:1 =0 2 t t". -2-Oi MIT - lool
16.1 7 4 3 2 27 5 4) 1 0.2 J.k so.) 11.6 &k.4 64.6 5 4 Ii.9 168,6d:,'Illy P;'d;:.4L1. 11 11 � "I %6 1 16 6 Al 2 6 3 II a .3 5:5 0: 0 6.
3, S.,- t! .... I.. -d 3$'4 1 6 41.2 16- 2 0 4 9 2 0:1 0-2 i6,14- L'tibl. .11 .1M.1 9.9 9.1 9.6 01 10.4 4.1 4.0 4.4 Is.11 LSA 44:1. 40.4 60A W 3
S. T. . 0..... a.ji. -ft.. - 4.,j -4 .... tills 29�2 28.2 0.5 11.4 OJ 12.0 26.1 1.1 26.6 12.2 Oa.4 99.1 416 9JA 231.1
C 10 5 10.s S.5 1.1 019 10.1 2.4 OA 2.6 17.0 $6.1 16.) 3.0 20.6 $916
62.# __I-t 1Q iy 6 A) k2 a 1.1 0,4
13.0 21A 0- I ":a- I - 1 194 ".96. T.4.- 5.1 al,fi ))A I. ;.I 31A 6. �I 60.1 45.4 B.) 013 44.5 54.6-4 PI 1,Ix d
10.3 )�149.j '113.6 t2.2 50.6 ))119.4 1.5 1.1 2.d ))324.9 S4.1 0, V U-P 3-41 46.410. p.t. -4 M.)) ), -
3 5 4 0.5 - 9 d'i 0,1 4.3 "I., - -is 9 25
"p' I'S 411 -1 I 11 11 5.0 I3-4. I:I 01 1.9 - 9.1-I 12.0ti. 0, 1I. 1 28.4 0.2 .6 �t3 .9 9 a 2.11 11. 0.5 4.4 14310 8311 11.9 1.? N 20.0
INUMFOIAM WHIS 92.0 92.0 261.6 M5 14.1 .9.9 50.� .614, �.;Zt) I hIs .,A p3y-.4 -9 A17.7 1.4 0.2 1- 1 - 1.1 9.4 - 1.0 10.6 8.1 25.0
9.9 A.? 3.4 0.) 6.4 2.2 0.5 1 UA 2.0 13.6 4111 .2 la.f 1. "I .. j fj ......
POP p.p-b-4 .,w 11.8 9's 4.1 1.2 15.5 I ii.tJ t,.,
P JIS, 1- ...... 0.1 a-I 5.1 0.4 it. t 0.1 0.6 0.1 6.1 100.0 too.0 45.7 Wil a. 620. 1
b,b 6.6 da.z ?.S 21J. 3 M A 1.0 19.1 0.1 14.6 9?.s 141J�6 1vt 1.5 2.1 1.121. J I
IV .,1114 13.Z I55.J I]A �I.a 1.1 I 0.5 3 0.6 V.0 64,3 fla�6 Is, S 1.1 21.0 J3.4-P
,4. 1.6 20.6 4.3 3.3 15.3 0.1 all 26.6 14.4 5.6 6.0P-4.". - 2.4 11.1 0.1 22.0 22.0 A W, a ba.6 -
to 2,2 2.2 91.9 15.0 1.3 MO Q. I OA OA 0.2 31.0 %J.s 4.5 4.S 51.0 Ij...... .... I
MO 4.0 O.i )1.) 0.3 - 0.3 IJA 100A 5.2 Lk, 0-f 20.3 20�1 24.1 5.5 1.4 U.0 (.5 0.2 0.6 51.1 62.0 t.4 k.4 10.7 11). fi
CAPIIAI C-DS 36. 91 1-4 1 194 1 1 1 11-11 -1 I - 1.Z I'd 6),b 11 I 0 1 Is.$
10.2 M .) 0�9 3.1 119.1 0.1 2.9 2.9 126.6 14.2 V's B.) a.,29� II-- 26.7 26�1 ".S 0.3 W6 - 4.1 4.1 112.0 80.0 16.4 0.3 21.6Id. 'Uh.,
i- a t., b.C1 I ...... I..d. WIWI Ill. ... tiy Ad.1, D- U.- d4.4 ft- 14,10I4.C.l-d .. 4. t.-.t 1frj.11y,
...... -d " T-1-1- -I.N. W3/ A C., t-1.4.4.
b .........
L- Atli-, Wit- -4 Ulj.. �p.ll-t,
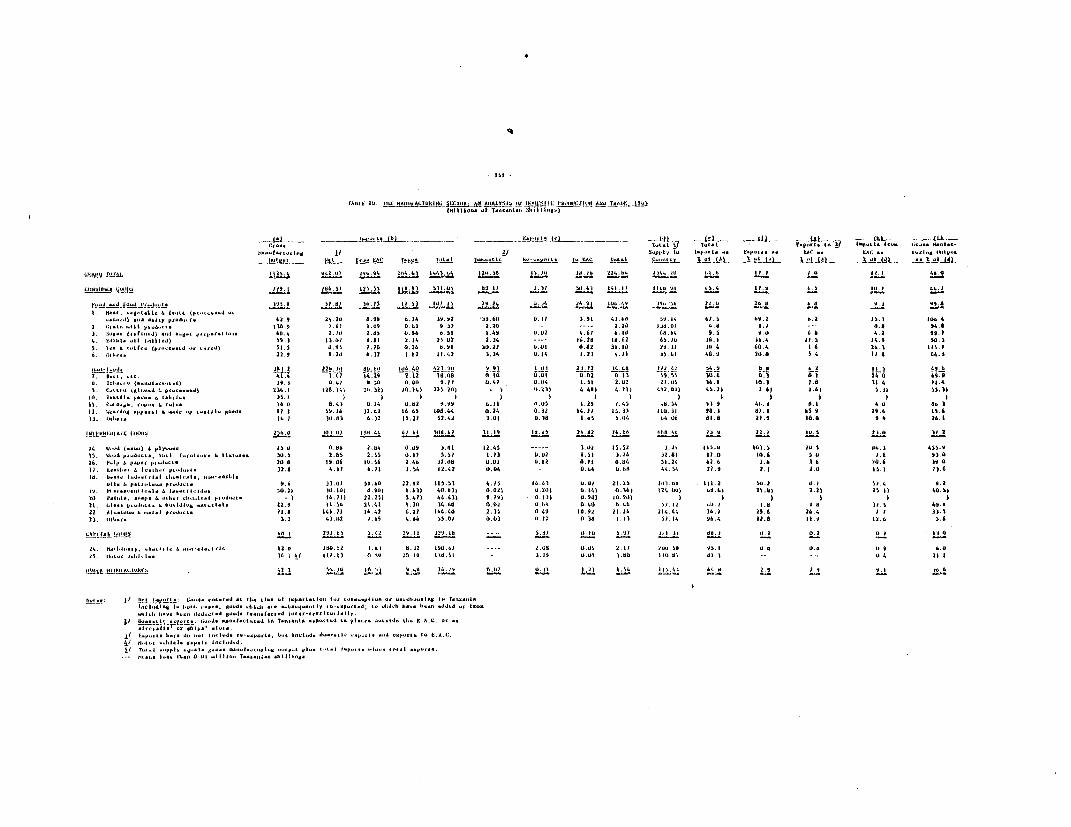
rAb 9I. DL±mTL6L KNI KE!" AM AN!1 A A i.pyll-I !," MO WI4411
(M II .. -
E-~.444~51 a4-Pht4445.-J. 542 454- 444O w54 5 j ifjjIt 194 54 44 42 44.41 6 44.4 I'll. 444 4,46I £4.4 I2 £4 4.
c4444.4.444444:4444442 ~~~~~ ~ ~~~~~~~224 4 24264 U2155 1,44 544 49511 4.44 146 £41I 44 44. 547 52.41 £4. 61 444.4 166A
-it Ila.9~~~~~~54 !."L a £25 £244 4444 2--4 25 42644. 2.4422 44.6244 1.4 £4461 444.44 .4.s 42...4 68.4 24. 44 244 5 a6 65 54 12 49 6442 44 .44 44.64 5444 4.5 6 ,0a4.2 2. 9.3£44
4. 62464. 24£ 44444444) Ws. 41 42 5.44 2A£4 25 £12 2.14 --- 6.24 44.64 65.42 is2. 5£.5 2254 4 54.56 .42 44.....44. .4.14 5i.s 44.55 2.24 0.26 4.5£ 240.221.2 0,0 .42 1 hIl 24 5£ 244 4 64-4 t.6 22. 5 411.14. 4444444* ~~~~~ ~~~~~ ~ ~~~~~~22.9 4 444 6.22 1.65 41.42 3.35 4.15 £.23 4.44 35.64 444.5 la£ 4 2.4 II4 65.3
4. .4.4. 4..4..£44 444.4 4.44 14.52 4.42 W.U 4.44o 0.444 4.3£ 2.22 S4.45 16. .1 £4. 2. 3£.5 41.95. 6.44444,44 2444.4444.4 6 £444.~~~4.4.o45 256.5 42.414 2 45 4.4 255 2445 9-1 5 425 .444.0 15 2.024 452.5 56.24 go.) £4 1.54 3.34444.21444142 444144*6444£444441 ~~~~~~~216.1 if.4 ~ 5 3) o.4) 42 50 42j 2. 4,) 49.9 4.1 4.6 4.6 3A S £
44. I 442 4444. 4.4 0 44 4.44 5.49 6.44 4,4 .54 4.41 44.4 54 5 56.4 4. .4 44.3£2. 2.4£44441464.4-244144 444£. £.2 55.46 34.53 £6.63 44.4 .24, 4.34 £4.44 45.1p£44.4L5.3 443 45 24. 45.43 0244. 4- 52.43 6.)2 £5.22 52.42 3.0£ 4.34£ 1.65 5.444 64.44, b£.4 24.9 £44. 5 4 14.1
146444.644t ,444414 245 L,54 44 44! 4£ 5444.64 51.14 £4.45 24 42 46.46 14fl 44 I3 4J 24.4 £2 5- I4 34.4 1
44. 14W,",~44 £4444444 14. 44.2 4.44 0445 2.4£ 12.55 --- 3.41 £5.52 2.34 £41.4 £22J.5 24.5 44.,3 4555.41. 46.44 P..24.s,4.4 144444, £4..4... 34. 3.41 15. 6£) 5.4 14344 1.5£ 3.26 5242 £4.42 44.4 5.4 . 93.416. £Ni4l 6~ 44-P.4 4-4.4.44 2449.46 £2.56 2.46 32 444 4.4£ 5. .1 1£ .4 142 6. .6 3 6 226 542. 62-4.. 6 1-1-4 6444444 12.a 5.14 6.I4 1.54 £4.42 4.04 - 41.64 0.644 44.14 24.5 2.1 24 £5.4 49.
444~~644.444.444444 44444444.44.4. 5~~ ~~.44 24.64 3.644 22.42 15.1£ C.I5 44.45 44.44 24.25 444.4£ £4.2 52.2 4 4 54.4 4 I£5. 454l644.644441444.44 4 £4444464464.42. 542.24 32~~~~).44) d.424 4.434 44.634 4.624 U2.22 i.t444 4.it,4 42 4.4425 64.65 34.44 2.33 11.15 54.54P24.44 .**4:24,64~42 4624 6.244 22.254 5.444 44.454 9.495 2.434 42.944 44.3444 I I 24. 44 . .. 4444444.4.4444.44444 44. 4 4 1 24.42 4.4 44.'a (4.52 2.64 4.442 4246 44 £4 644.4 Lif I 4 II.$ 54.122.2 444... A 642.44-.44-4 21.4 £41.24 £6.43 6.42 £66.44 2.35 24 4 41.22 21.446 244.44 16.4 44.6 26 4 I I 53.525. 444., .2 43445 I.49 4.46 W154 4.63 2.42 434 4.41 51.4 26.4 £5.9 £1.5 44.6 1.4
4.A4~~~~4£464,44.4l41 44.~~~~~~~~~~4 2_549 6) 2.4 2 94 44.4 -- 5.24 4411 I4 554 -"I,4 244. 444 42 £24. 4.44.4.442.441.4444. 64.44.44£4444444£2.4 £44212 .44 .52 54.44 ...- .64 45 £4 4444144 5.14.4s44 2 4.
4444446 444.1,..4 .424 ... 44. P.".4-4 I W. 44-6444444444 444.444444;4444..'a 444444444242.4. 41
w.4444 4. I II'.4 444,444444441144441 44.-I444244
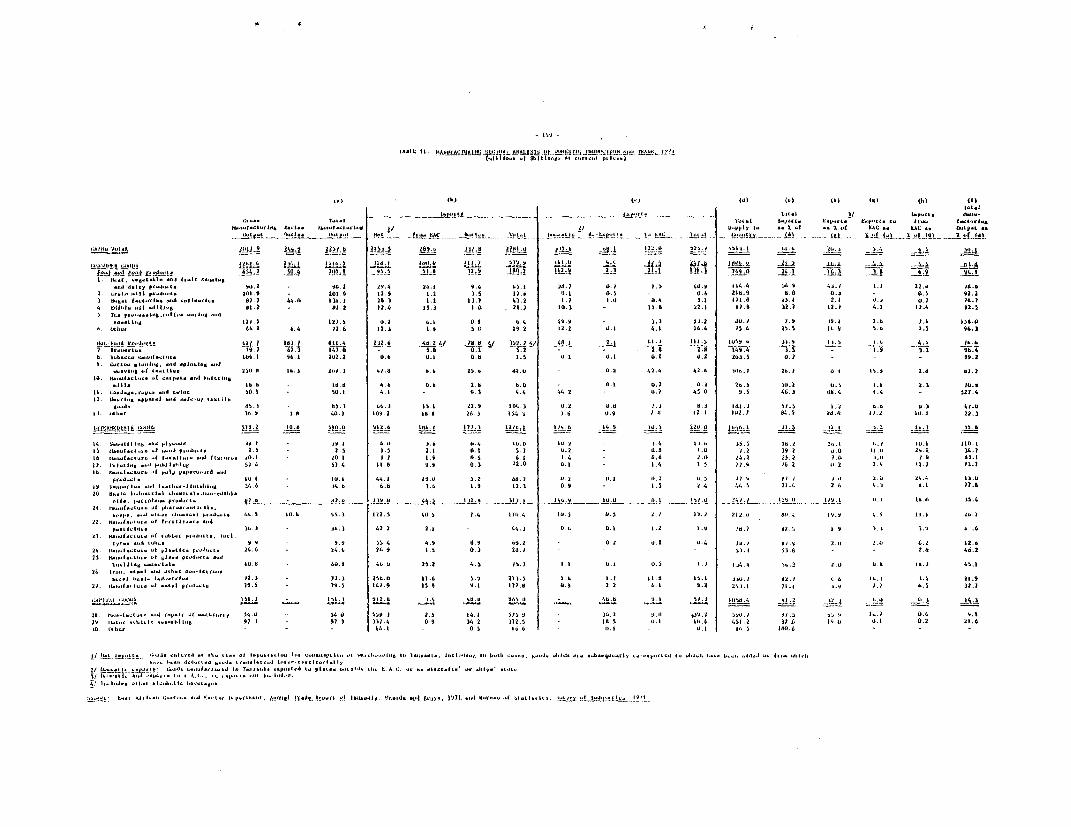
V.'" L II mm-ffAUAftUE I L'i JIL-VIM!�o1ft-Iq OLAAM- 121 LI4 pd-.)
(b)
'C Ot LL _ __ _L _ __- '-VL - -, --f- LAC AC
15-b _tfo; O 1!II 1. I .1 ..L, TL! t. 1�9-1 P §
- Ji A -1.1 -n LA
fe�!J- AM B"ii !12-.l 1.) 1-A !16A P19.0 24,1 I MI -1-8 -6.9
la. 1 VIA 24. I 9.6 IS. i is. I 0). I 40,V I 14.4 S. % 4 J. I 1. 1 22.. M.0
I t-k 2411 .0 - 201 A 12.9 t.2 1.5 W6 O.j 0.5 0.6 21,9 8.41 0. - 03 0. a3 S-- "t d, a,I 1 44.0 1 ik. I 26. I I 3, ) 4). 2 1 1 1 .1) U-4 "I "I Z' .1 - 0. I .1 16.
4 tAll'i. .11 ::111"S' t't .2 2 12 .4 I�a 24. I1.5 AA d, 112. 4 .1 ION 2 -0.2 6.I 0, i 6.4 49 i 5.1.2 go. 9 W 2'.
66, 2 6.4 12, 6 12. 1 I'O 5.0 t9.2 k 2, 2 0.1 4. t 16.4 J5.4 b. S 6. U 5,6 2.5 96. 1A.-l!V -La-$V hX -.2V 2L8 A -- LJ 11.4
2-1-11
7 fil. 1 147 � (J - !1.11 0.1 5.2
-1-8 -179-4 -3.3 1.9 3.3 9b.4,
20LI 0.6 0.1 018 1.5 0 1 0. I 81 0.2 203.5 1). I 99.24W: W ZIJ'. 1 41.: 4.66 Z5. U4.0 1.1 12,4 41 -1 I 11, I0. 2. 0.0 0.2 0. J U. S jo.1 0. NA 2.1 10.9
-d "i". 50. 1 4 .1 3 4.4 44. 2 - 0.7 4S 0 9. S 46. 1 66.4 1 .4 - 127.465.1 85, 3 66. 3 isli 22.1 104. J U-2 0. 4 1. J J 141.3 sl.:i I.t h.. U. 1 0.4
12, -Lif�1 J. 1.11- 36. 1 4 0 40 1 M � 2 Id.6 26. 3 I 1 6 0.9 1 12. J 1,12. p 84. i 1J.11 A9.2 10.3 22. 1
i U-6 I i �11 I 111'.Y�- 1 J) --i-A LIA -ii-a�4. I I I 1- .114 II I.-O W, I
4.6 0.4 W.0 io 2 j.4 I-. �S. � 2.. 2 2-1 10.1 I to. L
-. 4 2. S I.S J.5 2 0. 1 5.7 O�2 0.6 1.0 I . .1 19. 2 o.0 " ' 2�.l 14. 76�5 1).4 a. 6 t . �4.2 25.2 1. t, I .4.1 1.9 11-10. 1 25) 4
210.1 44 - I 19.0 3. 2 Ld. J 0. 4 0.1 0.2 44.; 14.0
14 II 0. 9 1 .5 2.4 ".S 2) A 2, 6 4. J b.1 11.8
I...1 is. 4'A' S I It. b W 1 122. S 40.1 1.4 1 11, 4 0.1 )I. I 21 2. )9.9 4.9 "A 13b. J M I 3 42 2 2.1 44. A 0.6 0. i I .2 1.1 id. I bi I 1 1.9 J-15S 4 4.� d.9 6�. z -0. 0.2 0.4
6 2 12164.5 0.3 28. I
3. 6 6.2W11,11.1. i.l. 60. 8 5 41,0 25L2 4. 1 1 �. I 1.1 0. 1 0.5 a I 14.4 �-a 2.0 U.b 1 4S.1
t
HI.Y 4. 6 W J Ii.92). 19. 5 )9. 5 141.9 15 9. L 112.6 0.% 2 2 6.1 9A 24J. I I 6.$ 12Al-L LIIAN f�'
"I I "I 1 112 8 I., 4U 0 91, 0 11"A 9 1 51" 'Ili:P.(, t
5 30.2 �.o 'J'A.2 590. J 91.:I 55.!, 0.4id 451.2 at 4 0.2V.2 D16-I 05 16 0 .5 140.6
O'W' I-. U---,
j/ 1. kA.C.,
C.., All il- C.--. -J I-1 &L.�J.. 4"'g, J�'Ajql, ".�Ak ,A Uu,,- 127L -4 t I- .
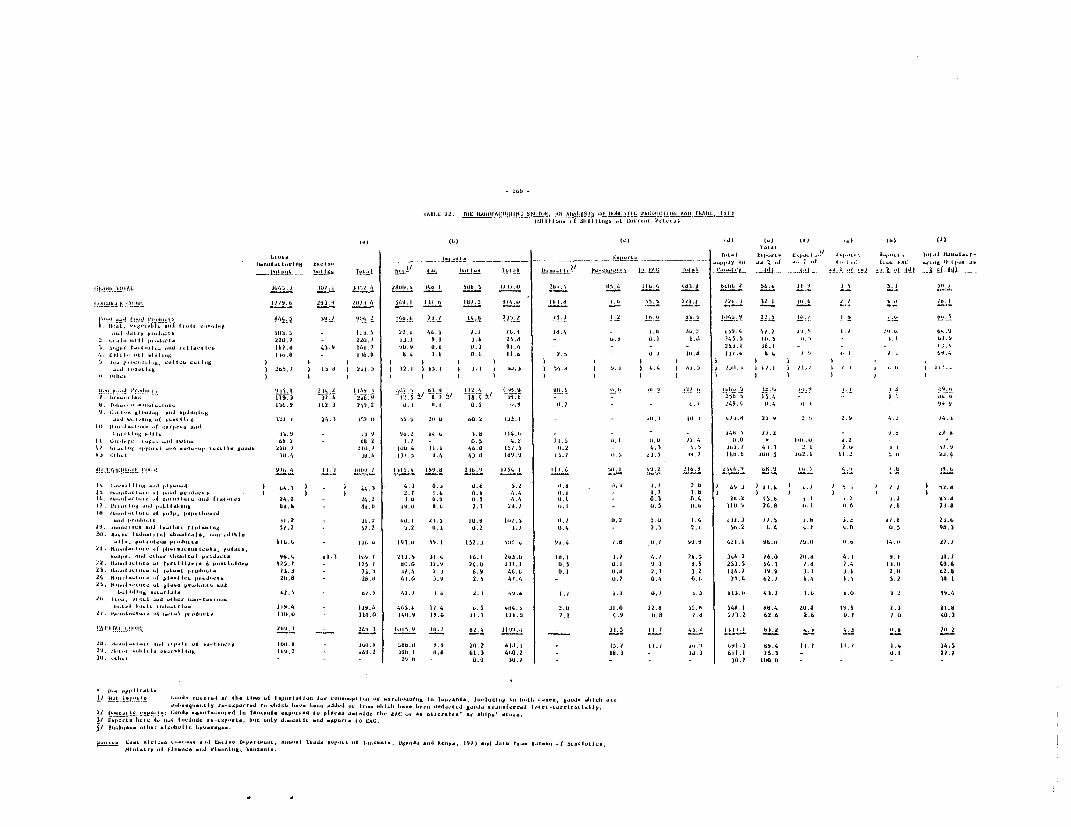
.1 11 2~~~~~~~~~~~44)40 1 I 44161. 4 4I
Ill,. A t i A_____Žoe P ±st L..4.11 :sA 4 t& oP(It A siO'.4.2.4), 4/lIt). 0045)~~~~~~~~~~~~~19. /4.1 1)52 i4 22) a4 I 54).9 1)10 2440. 19.4 00 t).,2 50' 4 9,/1.
* '0) 04,4 0...,.) 44o).,..)4 044~~~~~~~~13.9 49.2 904.2 /I.. 21) 4. 209.2 2.9 .242 4.90. 14.9 249 4) n '0I.Oo'a4, '.'o")"44o aol 44..fr o/o..l..o
4.0 244.2 459.4 4I5 11 5. .0. 1,2.9 44W5I 4 4 11' 2'. 049.9"'.4 "'a4.o v'"1.".
4
44)4~~~~~~~~~~~1. 9 - /i. 2. 140. .4. 124.4 40.4 - 1~2. .a..4.~~~U 44 9.'.4..o4 - 220.0 - 2244.) 43.4 0.4 0.6 09.0 - ".9 0.4 4..! 21.9.9 441.5 I.. - 4.1 04.9 I 00 12- a.
9 Ic.. /*''0~~~~./... ,,~~~ .044 4.00~~~~0 4041 .I 4 4 4 4 45 1. 1 I 4 19a 4 . 4. 112,
i,40, A 41 A 04. 24 1 41 1 4 4 4 I 44 4
0' 0.'.,I.. 41 9I 4.' 4 0 4 49. -:' - - -. 290.9 45.4 - 1 0 4,,0..'o..,..,4.,..~~~~~~~~~~~~,, 430.9 4404 249~~~~~~ai.21 0.4 0. 0.5I 0.9 0. 0. 1 / 246. 04 I. 6 40
'a) o'=4 44,-a 1~~~~~~~~~S?2)4 4. 450 9.2 2.2 0.0 '0.2 2.I 4 - - 4.4 40.4 4).2 LA474.0 1402.29 . 94.43IL.,,,, too) 140 .14 '.,44'oIa .4.4.49.. 5. 12A 4. 4 A4 . 0 I s' .9 4 1 I s61 614.4 2.
00)444.9, ,./44o 31~~~~~~~~~~~~~~964. -l1 15 I9 9oS. 32 44.0. 1.0 4).u00 - -26 - 440.92 1. 20.2 - 4 4 9 22 i 04 4',4..o .4044/' 0/.6.2 - 25 00.2 I -2. 0.5 43.2 11.4 44.41 0. 10.4 (4.0 54 0 4/,)' 4.2J.1 442 /,.)09..4..4....'I).446o4 42 33 J 240. .1)/4 J 40.09 461.5 0.2I .1 4.93 3.2 /11.)1 44.3 243 2) .41 92.92 01.420.4 - 10 411 / . 2.4 50 409. 94 0.5 21.9 9. 460 4,.1~ 401.4 04.2 5 . 2.id4.4
____________________ 19I.4 14.4 I 'no.) H42'.4 499,0 0a/.0 4254 4 141.6 9/4.4 49.2 240.9 2540.4 00.9 0.., ',.. '.0 49."~~~~~~~~~~~~~~~~II.. 43.1 . 6 .0 I3,,.
44 0..o/44I4//0'...44
.Iyao...4 ~~~~~~~~ ~~I Jo.y - 4 I6s4. 41 0, 1v.6 i 9. /4.0 - .2.18J 4.) 2.0 55 4 4 1 tu.o 44,L.d is9/ I 22 I 5.0j"- 10.61 I I 24.4 9 (1.0 0.41 47.4 2.1 -. 4.18 4.0 21 1 2 12. 216 2 4I 0
.4'..) 4',02.'..4, 34.) - o4.2 04~~~~~~~~~~~~~~~~~~~~~~u.) 209 0.92 402.5 0 .2 , 4. 4.4 4L12. 214. ia.0I .4. 4/44 244,49. 4'.,'...,04a a'.4 4=a44.ao 4 4
"4
"4
'.o ~ ~ ~ ~ 191.2 Its4.2 19.21 0. 01.9 -40.0 laI 2.1 . 90. 4S.4 4. 400 ..444, ...- 4o..4..u. ~~~~ 446.0 - ho 4 491.442' 50. 4 .92. 024I . 0.1 S)I24. 90.4) 2.0. 402.
24. l01o..O~~~~~~~I,l, ool pOahooc..ttooI.4, 4104,400, ~ ~ ~ ~ ~ ~ ~ ~ ~ ~ ~ ~ ~ '.t.
041,,.04,a.a4.44 )4.4905 46.4 44.1 09) 2,9 1. 404 21oI) 2 42 2.9460 60 2.0.4941422. 0..o.,4a..4o.4o4 4o -l'44 ., .4...P.,00= 425.- - 2.1 000 1.0 2. 400090491 . 0. 412. . 904.21. oo.. MI4'44 .4 ooo4
rd.o-1.- 11 44 21 69 4.00400211. 4. 9-1. . .46.24..... .)oo,,- .4
04 lo-- '. 20.0- I.- 20.0 44.0 K.9, 2. 9i 40 J .. -t.-440 90 0244444521.
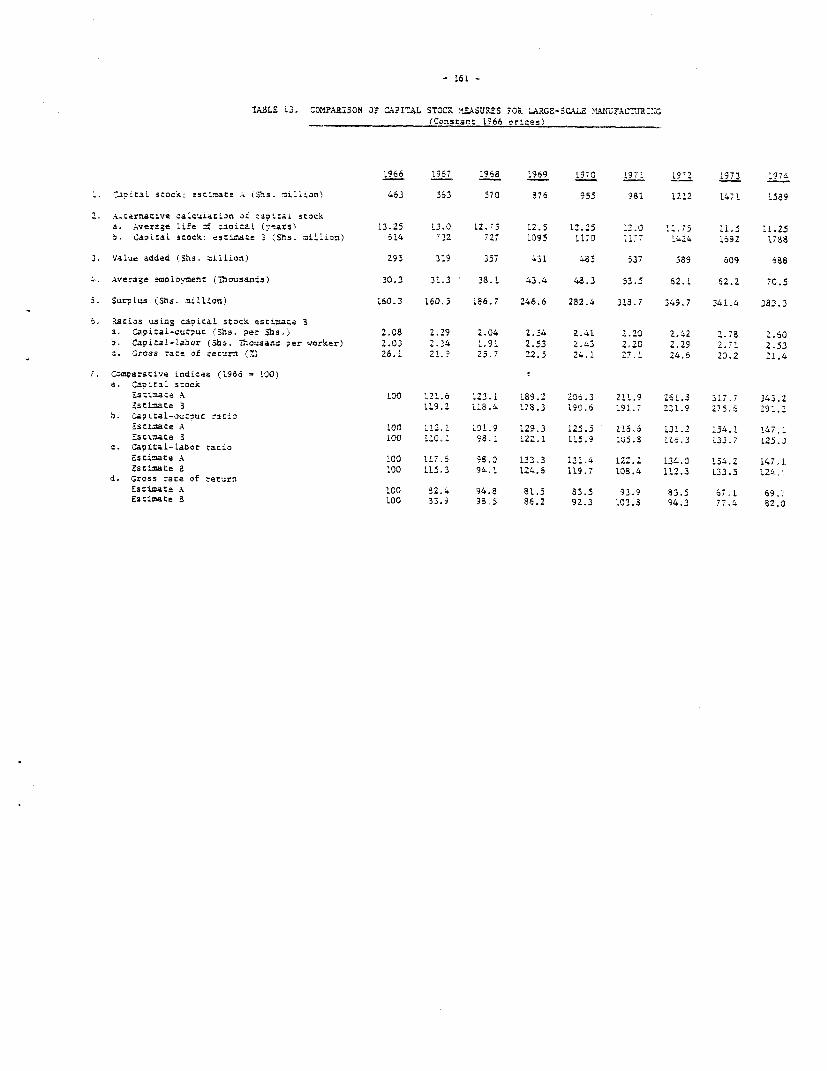
- !.61 -
TABLE 13. COMPARISON OF CA2TAL STOCK: Yt.ASURES TOa LARCE-SCALZ MU!'CFACTJRI'.G(Constant 1966 or±ces)
1966 1967 L968 L969 L970 !97L i9-2 1973 '974
'. icaL S aCsc: ssC1saCe Ak (S.s. 'mil ion) 463 563 570 876 955 98i 1212 1471 1.89
2. Alcarnative calc-4iac4on of czpitai stock
a. Average Life 4 caoical (vears\ 13.25 !3.0 12.75 12.5 L2.25 12.0 11.75 L1.5 LL.25
b. Ca"ital stock: esae are 3 (Shs. milLior) 5L4 732 727 1095 L170 i1,7 1424 1692, 17S8
3. Value added (Shs. zillion) 295 319 357 431 485 537 589 609 688
4. Average empLovenc (Thousands) 30.3 31.3 38.1 43.4 48.3 53.5 62.1 62.2 70.5
S. SurpLus (Shs. milljon) 160.3 160.; 186.7 246.6 282.4 315.7 349.7 341.4 383.3
6. Ratios uaing capital 5sock estimate 3a. CavicaL-outpiu (Shs. per Shs,) 2.08 2.29 2.04 2.54 2.41 2.20 2.42 2.78 2.60
b, Caaical-labor (Sha. Thousand per m rker) 2.03 2.34 1.91 2.53 2.'3 2.20 2.29 2.71 2.53
Gross race of recur:1 (2) 28.1 21.9 25.7 22.5 24.1 27.1 24.6 20.2 2!,4
7. Comparative indiees (1966 - LOO)a. Cacktal stock
Esaimate A 100 121.6 123.1 L89.2 206.3 211.9 261.3 317.7 343.2
Estimate 3 119.2 li8.4 178.3 190.6 191.7 231.9 25.5 291.2
b Capital-ouc)uc ratio
Tatiei-ce A 100 1l2.1 i3l.9 129.3 125.5 ll6.6 131.2 134.1 147.1_scimate d 100 1LO.1 98.1 122.1 115.9 L05.3 L16.3 L33.7 L25.0
c. oapital--abor ratioEasimate A L00 117.5 98.0 133.3 131.4 12Z.2 134.0 154.2 147.1
ati:zate 7 100 115.3 94.1 124.6 119.7 108.4 112.3 L33.5 124,d. Gross race of return
Estimate A ICO 82.4 94.8 81.5 85.5 93.9 83.5 67.1 69.7,Eatimate 3 100 33.9 98.5 86.2 92.3 103.3 94.3 77.4 82.0
1. This Atrrend i discusses t_he , rc- mecha.nism as applied tomanufactu-red oo-s t-,- sc-_e ser-ces T-t is n.ot i-tendec to criticizeor comnr nc-sve -7^-:m .anzani^ 's 5 svstam, but merely todescribe so-e aspects of it and wvIher- az-o: a id-ti:a potenti alloopholes and ae^paree incons'istencia-e in tlhe relevant legislation.The effect cf J-- iZ._: S:tonM -n th z_ emzr- of idi.-idual firmsand on the ind-ustr-ial s-cftcr as a Wn- Gi s '' S 'ssed in tne mairreport. Com=rshensie :ri c -r nt--ol i. iaza-.4e s ofs very recentdate and 7cst ei v stll -' t, ̂ ;S exeriner,ta± sriase. The
difficult-'3- -_-7T.-__A_ J<- -B-n - u-z * rnnrehensi-ve
prices are 'UnerouS C many carn be o-e---m thro u~h iroved adminis-tLration.
7. The 'as-s foor p-icinz ecisions the Cover=ent is theRegulatios of ?r-f '.t (1,973)) , 47eve-z there s - r-sence betweenthe prcvis__ .::s __ Q t _ _ _ _, . _ . _ Se _q_._tlY, thereappear o G-e 54vol iz t1- r'nino 1 anecuslv and a
lack of un-_form o z_-_sr Thar _eu 3 _ . syed stem combiningsomewhat haphazardly, elemenCs of a mazret a.nd a centrally plannedeconomy and reflecting Tanzania's as yet incomplete transition from theformer ecc=cno'c sT-stam to the latter. Section TI ouzlines the provisionsof the Act. Sczn _cz- ou_s:sSs --s imolemen"._ation and attempts toaralyze so _f the _con c Am:c l.z: tht 4riv e f_om it. Section
IV discusl ss -'' - --' -a r _r s ana
T,Cv:S:CNS t, _ _ P?ICEES ACT (19 7 3)
The NatioLnal ?ric_ . ssio
3. The Naticnal P-rice Co=issi-- (Nr) was formed in September 1973by an Act c- Par liaza a= consists of ?rice Co issioner wno isappointec oby t=e z--''-.^ CL nzi^- and wo is the ha-irm"an. and ChiefEx ecuti4-v O :e _ C : Co:ss-'n, n -d'iio3 the Cc=ission consists
1/ Ex:raC:ed ---- 3, T<-o- e-'-'^tni-al rn Mning Sector Surey,Vol. 3, '---:- ,' ? ;5
-163-
of five (minimum) to seven (maximum) other membe-rs who are appointed bythe Minister of Ccmerce and Industry.
4. Each Regional and District Development Director is an AssistantPrice Commissioner for his region or district. However, the Minister mayappoint a public officer other than the RDD or the DDD to be the AssistantPrice Commissioner, after consultation with the Regional or the DistrictDevelopment Committtee.
The Function of the Price Commission
5. The function of the NPC is to determine price structure on anational basis and to provide for their variation when necessary. Theseprices are expected to be "compatible with, and to conform to, the prin-ciples of socialism."
6. According to the Act, the NPC has the pcwer to:
(a) fix the maximum prices for the sale of any goods at alllevels, i.e., at the manufacturer and/or importer level,the wholesaler and/or sub-wholesaler level, and at theretail level. However, the NPC will not exercise thispower where other public bodies have been given theauthority to set the prices of particular goods or ser-vices.
i (b) fix the maximum service charge made for any service;
(c) fix the maximum hire charge that may be made for the hireof any goods;
(d) fix the maximum commission that may be charged forthe sale, purchase or hire of any goods or services;
(e) fix the maximum price of any used goods;
(f) fix the maximum amount, including interest, that may becharged for any goods sold on credit; and
(g) prescribe the type of packing, weight, size quality andthe processing of any domestically manufactured goods.
The Determination of Prices
7. The NPC or the Assistant Price Comissioner may set different pricestructures for goods and services in different areas. Generally the NPCsets prices applicable at the national level while the EDD's and DDD'sacting as Assistant Price Commissioners fig prices in their own areaswhere this has not been done by the NPC.
- 164 -
8. The NPC must consider t.he following in determining the pricestructure:
(a) the commodities and services must be essential to thecomunity;
Cb) frequent variations in price should be avoided;
(c) the competitive position of domestic products in thedomestic and foreign markets must be preserved and/orpromoted;
(d) the income of peasants and workers must not be adverselyaffected by unnecessary or unjustified price increases;
(e) fair relacionships must be maintained among the incomesof the different sectors of the community;
(f) the continued ability of the Government to financedevelopment programs and recurrent expenditure must beensured;
(g) the domestic industries must be able to maintain theirefficiency and expand;
(h) circumstances must be provided for a healthy and orderlydevelorment of. trade and commerce in rural and urbar.areas; and
(i) guidelines regarding margins must be issued.
9. In setting the mxi-m price at the various levels in the distribu-tion process, the NPC must take into account the following cost components:
(a) The ex-factory orice for domestically manufactured goods:the direct costs of production, general overhead expenses,normal wear and tear of capital assets, cost of holdingstocks of goods and materials, a margin in relation tothe turnover and capital employed, excise duty, sales tax,and other similar taxes and duties payable by or collectedfrom the manufacturer.
(b) The im-norter's selling price: the c.i.f. costs of the goods,the landling, handling and clearing charges, custom dutiesand other similar taxes payable by the importers, inventory,carrying and storage costs and a margin in relation to theturnover and capital employed.
(c) The wholesaler's and sub-,wholesaler's price: the manufacturer's,importer's or wholesaler's maxi=um price, transport costs to
- 165 -
the point where the price applies, inventory, carryand storage costs, and a margin in relation to theturnover and capital employed.
(d) The retail price of goods: the manufacturer's, importer'swholesaler's and sub-wholesaler's maximum price, costof transport to the point at which retail price applies,inventory, carrying and storage costs and a margin inrelation to the turnover and capital employed.
(e) The retail price of services: the cost of material used(if any), the direct costs of providing the service, amargin in relation to the turnover and capital employed.
(f) The price of agricultural commodities and Droducts: theproduction costs (including the labor of the peasantsengaged in production), transport expenses, any statutorylevy or fee payable, the storage costs, marketing costsand processing costs (if any).
The NPC must try to secure a rational structure of ex-factory andprocessed product prices.
10. hence the price to be set by the NPC appears to be based on allactual expenses incurred by the seller including an undefined provisionfor depreciation, overhead expenses, indirect taxes, transport andstorage costs as well as a "margin in relation to turnover and capitalemployed" to be determined by the NPC on a case by case basis.
The Review of Prices
11. The NPC regularly reviews the price structure. For domesticallyproduced goods, this review is not more than once a year. For importedgoods, the price revision is quarterly. The N?C may specify periods inany calendar year during which applications for review will be considered.If the application is not made within that specified period, the NPC mayrefuse to entertain the application. In special circumstances the NPCmay decide to review prices more frequently. If the Minister deems it inthe national interest that the price of any goods be controlled, decontrolledor that the controlled price be reviewed, he may direct the NPC to do so.
12. The NPC has the power to receive and review applications for thedeterminaticn or the variation of maximum prices at any level (i.e., manu-facturer, wholesaler, sub-wholesaler and retailer). It may also receiveapplications regarding prices from any user, consuer or public authority.
13. The Assistant Price Commissioner behaves in an identical mannerto the NPC (as stated in paragraph 5) but his actions are restricted tothose parts of the region where the prices fixed bv the NPC do not apply.
- 166 -
iowever, the price structure determined by the Assistant PriceCo=.issioner is subject to review by the NPC at any time.
The Publication of Prices
14. The NPC publishes controlled prices in the Gazette to informthe public. All traders or those supplying price-controlled goods and/or services must display these-prices in a prominent manner, Everytrader, manufacturer, producer, comission agent, clearing and forward-ing agent is expected to keep books and accounts, issue invoices andkeen duplicate copies of the same.
The Powers of Enforcement
15. The Price Cormmsslcner may require any person involved in anybusiness, to provide within a svecified time, any information that hemay consider necessary, notwithstanding any law to the contrary.
16. The Price Commissioner, any Assistant Price Commissioner, anyPrice Inspector or any police officer of or above the rank of AssistantInspector or any person authorized (in writing) by one of the above hasthe right to enter and inspect any business premises, examine and makecopies of or seize any relevant books, documents or accounts.
17. The NPC, with the consent of the Minister, may take any measuresthat it considers necessary for the proper enforcement of the provisionsof the Act.
18. No decision of the NPC, the Price Commissioner or the AssistantPrice Commissioner, made in accordance with the Act of 1973 is subject toreview by any court on any grounds.
19. Any person who is guilty of not complying with any of thearticles of the Act is subject to a maximum fine of TSh 50,000/ - and/orimprisonrment for a maximum of five years.
III. =MLMMNATION OF THE REGULATIONS OF PRICES ACT (1973)
The National Price C0mmission
20. A reading of the previous section gives an indication of theseveral "grey" areas of the Act which are open to interpretation. TheAct confers very wide powers on the NPC, which include the power tointerpret the various "grey" areas. Several articles appear to becontradictory and others do not coincide wi-th their actual implementation.
- 167 -
21. The total number of basic types of commodities listed in theList of Price Controlled Items (March 1974) is 1,064. Six hundred andtwo of these are domestically produced and 462 imported. Each commodityis divided into several items by means of product differentiation. Con-sequently the total number of items that are in fact price controlledexceeds 3,000. Moreover, the list is not complete as it does notinclude any of the agricultural producer prices which are also controlledby the Government. NPC is not involved in controlling these producerprices. The number of goods and services subject to Government pricecontrol is growing rapidly. The NPC has a staff of approximately 18.The task of monitoring the prices of over 1,000 types of commodities by18 people appears to be virtually impossible.
The Pricing of Goods and Services
22. Although the NPC has the power to fix the (maximum) price oflianyly goods or services (para. 6), another Article of the Act (para. 8(a))suggests that it should in fact limit its activities to goods andservices that are "essential" to the community, Since there is no clear-cut definition of what constitutes an "essential" good (or service), thedividing line between "essential" and "other" goods is inevitably ratherarbitrary. It is not clear for instance, why a portable tape recordershould be considered essential. The same question could be asked regard-ing other domestically manufactured goods (e.g., beer and konyagi) andfor some imported goods (e.g., Gouda cheese, Martell cognac and tapecasettes).l/ A more discerning distinction would go a long way toalleviate the load of an already overburdened (NPC) staff,
23. In the List of Price Controlled Items (March 1974), prices ofsome products are set only for Dar es Salaam. Examples of such productsare metal products, fruit juices and chemicals. It is not clear what theprices of such products are in other parts of the country, how they aredetermined and who determines them.
24. One of the functions of the NBC, the setting of the price ofservices, has not yet been accomplished. The problems of classificationand differentiation of various services have not yet been surmounted. Inaddition, some service fees do not fa}l into the domain of the NPC.Examples are insurance premiums, interest rates on loans and fees forprofessional services, e.g., doctors and lawyers.
1/ It should be noted that in October 1974 the Government impcsed acomplete import ban on these and certain other luxury consumeritems.
- 168 -
The Justification for P-Ice Controls
25. Part of the justification for price controls is that the incomeof peasants and workers must not be adversely affected (para. 8(d)O. Oneof the main objectives of the system of price control as conceived inTanzania is to protect the consumer against excessive mark-ups. Toincrease the surpluses at the 'irm level for the financing of expansionis at best a secondary objective. Many importers and domestic manufactur-ers are State-owned or State-controlled. However, most of the retailtrade is in private hands. Hence the perceived need by the NPC tocontrol the prices of even those products that are produced or importedby a parastatal organization but retailed by private traders.
26. There is an obvious conflict bet4-een the Gover=nment's desi-e tokeep the prices low to the consumer and the need to build up savings(equity) for the financing of expansion. There is the additisnalcomplication that in a situation of rapid cost inflation some prices aretemporarily fixed below the firm's break-even price. This becomesparticularly relevant in a situation of rapidly rising production costsand infrequent revision of the selling price by the NPC (cf. para 31)Historical evidence in Tanzania seems to suggest that no parastatal firmis allowed to go into liquidation but is instead assisted from Governmentrevenues or through other means. Therefore, the peasant and the workerare in fact paying the actual costs of production through the various formsof taxation. Hence not only is the consumer paying for the product, butthe worker wno does not consume that particular product is neverthelessindirectly paying for it, in effect subsidizing the worker *who does consumethat product.
27. In addition, there are "second level" effects. Governmentrevenues that have been spent to keep the firm(s) afloat, could have beenput to better use in, say, irrigation or education projects. Hence theopportunity cost to the society of ill-conceived price control is muchhigher than is imediately apparent. Finally, since incentives for.efficiency (cost-minimization) are weak or non-existent, inflationarypressures are built into the system, which in the long run will tend toreduce the re3 income of peasants and workers. Hence four conclusionseserge:
(a) the consumer does in fact pay for the expansion of thefirm, even though it is done indirectly;
(b) instead of only the user of the product paying for it,the non-user is also made to pay;
(c) the fact that Government revenues are diverted away frompuolic projects to support inefficient firms contributesfurther to a loss in income of the workers; and
- 169 -
(d) the built-in inflation will erode the real income ofthese workers in the long run.
The above four points clearly illustrate the possible conflicts betweenthe various objectives of price control as enumerated in paragraph 8.
A Cost-Plus Pricing Scheme
28. The Act provides for the setting of a sellIng price based onactual cost plus "a margin in relation to turnover and capital employed"(para. 9). In practice it appears that the margin is normally set inrelation to actual costs. These margins average around 10% of totalcost and rarely exceed 20%. In each case the manufacturer's margin isa fixed percentage of the cost of production. The ex-factory price is
tnen obtained by su-ing this margin and the total cost of production.There seems to be some diver-ence between the Articies o: the Act andits implementation.
Uniform Pricing
29. Implicit in the Act is the suggestion that the ex-factory priceof a particular commodity produced by several different firms must be thesame. This is, in general, true.l/ The ex-factory price is then basedon the cost of the least efficient (highest cost) firm. Hence, ineffi-ciency is not penalized. In addition, a firm that suffers a loss is moreor less assured a (direct or indirect) subsidy from the Government. Itis not clear how this system could oreserve or promote the competitivenature of industry which is one of the objectives of the Act (cf. para 8(c)
The Setting of Margins
30. The Act does not state how frequently guidelines regarding marginsmust be issued (para. 8(i)). Nor does it state how these margins are deter-mined. They are determined on a case-by-case basis.
1/ Textiles were an exception until April 1974. The ex-factory pricesvaried depending on the production costs of each factory, but retailprices did not. Hence Natex, the State owrned trading company fortextiles operates an internal price equaiizaticn fund to harmonize theretail prices of the same goods produced by different manufacturers.Since April 1974 ex-factory prices are uniform (for the same fabric)and are linked to the production costs of the least ef-icient producer.
- 170 -
The Ex_ansion of Firms
31. Because of cost inflation and the emphas±s of the price controlsystem on conster protection against excessive mark-ups, many fi=sfind it difficult to generate funds for expansion financing. Some firmsare still operating on last year's prices even though their input prices,in particular thcse of raw materials, have steeply inc-reased. Tanzania'ssystem of price control and price review is clearly not designed forperiods of rapid cost inflation as has been experienced in recent years.Frequent price reviews for all commodities would be physically impossibleto handle by the small staff available. Combined with the lack of in-centive for cost-minimization explained above, it is not clear how domesticindustries are expected to maintain their efficiency and expand under thepresent system as stated in the Act (para. Sg)).
The Under-Utilized Capacity of Firms
32. In setting maximum prices, the NPC must take into account variouscosts including production costs (para. 9). No mention is made of the levelof output at which these costs are to be evaluated. If under-utilizedcapacity exists, say due to shortage of raw materials, the average totalcost and hence the maximum price set, is likely to be higher than necessary.Hence it becomes imperative for the Government to ensure maximum utiliza-tion of capacity. This may be done through various ways such as minimiz-ing the delays in obtaining import licenses, allowing adequate foreignexchange (subject to its availability, of course) and ensuring adequatewater and power supply..
33. Since the NSPC sets the price on the basis of current costs,firms in the stages of under-utilized capacity will have high average totalcosts. Once the price has been fixed at that level, it can stay "lockedin" at that high level as the plant moves toward fuller utilization ofcapacity. The manufacturer is apparently under no obligation to reducehis selling price or to apply for a downward revision of his maximum pricein the event of cost reductions due to increased capacity utilization orfor any other reason (see para. 34).
The Review of Prices
34. The manufacturer does not have to apply for a price review everyyear. Consequently 1f the price of inputs decline, it is to the manufactur-er's advantage not to request a price review. Technically, according tothe provision of the Act, the manufacturer need merely not apply for areview during the period specified and NPC may refuse to entertain theapplication at any other date. The NPC does, however, have the power toreview any price at its own discretion at any time. But it would be anextremely difficult task to monitor all input prices and identify themanufacturers who have benefited. Hence the price review mechanism appearsto be asymecric. There will always be pressures on NPC to review prices
- 171 -
more frequently in the event of rising input prices and rising costsand probably no such pressures at all when the opposite happens.
Enforement and Vercfvcation Powers of the NPC
35. In the event a person is found guilty of not complying withthe Articles of the Act, the NBC may impose a fine and if convictedin a Court of Law an offender may also be jailed,
36. Despite the powers of cost investigation, there does notappear to be an effective verification system apart from obtaining thenecessary documents regarding costs. Because of staff constraints theNPC has in most cases little choice but to accept the word of the manu-facturer. With regard to the enforcement of price controls at theretail level the picture is very mixed. Generally enforcement isbest in areas where the political party is strong.
The Pricing of Imworts and the Board of Internal Trade
37. Forty percent of total imports into Tanzania are imported bythe central companies, which were established in 1973 to take over theimporting function of the now defiunct State Trading Corporation (STC).STC's domestic -Wholesaling and distribution functions were taken overby 18 (now 20) Regional Trading Companies. The activities of these 26parastatal trading companies are coordinated and supervised by a newlycreated semi-independent regulatory agency, the Board of Internal TradeThe six central companies are:
(a) The General Foods Company
(b) The Sousehold Supply Company
(c) The Domestic Appliances and Bicycle Company
(d) The Building Eardware and Electric Supply Company
(e) The National Pharmaceutical Company
(f) The Agricultural and Industrial Supplies Company.
38. They are referred to as the National Specialized Companies becuasethey deal with special technical items for industrial use. Scme of theseimported Ctechnical and non-technicall) Jtems are price controlled by theNPC (para. 8(b)). For the non-controlled items, the companies presumablyprice the items to maximize profits subject to the constraint that t1heirprice cAnnot, of course, exceed the price of the article manufactureddomestically. If the NPC deems it in the national interest to controlthe price of a particular import, the relevant central companies may stopimporting that item and import a very close substitute until that is also

- 172 -
price controlled. Because of product differentiation and the avail-ability of substitutes in foreign markets, the B.I.T. companies cancircumvent certain NPC pricing decisions.
U ~ ~ ~ ~ ~ ~
- 173 - A.PPENDIX C
CONSTRAINTS ON E.UORT OF PROCESSED AND MANTAFACTUTRED GOODS 1/
1. OL the constraints on manufactured exports detailed belowsuppLy and productivity problems are clearly the most significant andintractable. Significant policy action including new export incentiveinitiatives would be necessary to address these problems. Lesssignificant constraints concern procedural and administrative matters.The mission was pleased to note moves within Government to initiateaction to alleviate some of these latter problems. It is entirelypossible that some manufactured exports would be boosted substantiallyby removal of less fundamental constraints.
Marketing
2. Marketing is frequently mentioned as the problem for manydeveloping countries attempting to break into markets for manufacturedexports. The mission found this to be the case among many officialsand operators in Tanzania. But marketing is not in fact a major hindranceto expansion of exports, if by this term it is implied that Tanzaniaproduces or has the imediate potential to produce large quantities ofgoods for export, meeting all international requirements and that itsimply lacks buyer awareness or established channels of sale to theprincipal foreign markets. Lack of market intelligence may be a problemfor a few smaller exporters but the larger companies in Tanzania can andsome do hire selling agents abroad. The real constraints are intrinsicto the structure and operations of the industries themselves and will bedetailed in ensuing sections.
3. Market intelligence obtained by official trade promotionauthorities is inadequate. The mission found dissatisfaction was wides-pread with the efforts of Tanzanian trade attaches at some of thecountry's embassies abroad. The trade attaches are civil servants andnot trained and experienced marketing officers. A few examples willemphasize this point. NDC, the major Government manufacturing holdingcompany, expressed dissatisfaction wich the lack of response by tradeattaches in providing market intelligence and fast communication linkswith foreign buyers. It should, however, be noted in this context thatNDC does not encourage its operating companies to export and the overseasmarketing efforts by the NDC firms examined by the mission were largelvnon-existent. A firm engaging in production of metal goods complainedthat reliance on trade attaches to negotiate foreign sales was anunrewarding experience. For example, a sale of Sh 300,000 to a nearby
1/ This Appendix is extracted from a report prepared by John P. Sargent
- 174 -
African country had been lost simply because the trade attache prolongedthe negotiations excessively and the buyer became impatient, seekinganother supplier who could quickly cement a sale and supply the goods..n the food industries, inadequate information is often supplied to localproducers as to precise product specifications required by foreignbuyers, e.g. a fish products exporter received cables from the tradeattache in a Scandanaviar. country announcing a requested large order forprawns, but insufficient information was supplied as to the type andsize of prawn required. By the time necessary supplementary informationis obtained, sales are frequently lost.
4. An associated problem in foodstuff export industries is lack oflocal knowledge concerning up to date health and quality requirements forfood import items into different areas of the world. This has createdmarket acceptance difficulties in export of various crustacean productsand in exDort of meat products. With the loss of European markets forits processed beef, partly due to inadequate health standards, someelements of the livestock and meat industry in Tanzania appear to feelpenetration of Middle Eastern markets is feasible since health andquality requirements are allegedly below those of Europe. However, itshould be realized that these countries can now import and are doing soin increasing volume, meat from sources such as Australia and New Zealandwhich is price competitive and meets the highest health and qualitystandards. The demonstration effect on zMiddle Eastern consumers willtherefore make it extremely difficult for the Tanzanian product topenetrate.
5. Consideration should be given to employment at Embassies inmajor trading nations of professionally trained and experiencedmarketing experts to seek out and coordinate the marketing servicesrequired by Tanzanian industries. Since the needs of different industriesare so diverse, Embassy personnel would act in consultation with Tanzanianindustry management to secure services of professional marketing firmswhich are abundantly available in Europe and U.S.A. At the Tanzanian end,some receival mechanism is necessary. Either one body could be responsiblefor local dissemination of market intelligence or the representativesabroad could forward intelligence directly to management in each industry.On the grounds of minimizing bureaucratic impediments and fostering moredirect participation in marketing and competition among industrialcompanies, the mission strongly favors direct transmission of marketinformation to management.
6. The textile industry is a good example of the possibilities ofuse of agents. Though Tanzania can perhaps never hope to secure largemarkets for its cloth in Europe, no permanent foothold at all will begained unless reforms are introduced in present marketing methods.Tanzitex, the industry's marketing company, has no offices abroad andemploys no agents, relying on random trips by its marketing executivesfor contact with European buyers. In this highly fashion consious andseasonal demand oriented industry, Tanzania needs agents who cananticiDate demand, quickly transmit detailed requirements to the operatingcompanies and have adequate storage available in Europe for efficient
- 175 -
distribution. A number of alternative marketing arrangements arepossible. The textile industry, through Tanzitex, could directly employits own specialized textile agents in Europe or rely on marketing staffat the Embassies to seek out appropriate firms to represent the industry.
7. As a general policy recommendation the mission feels theGovernment should allow marketing responsibilities in manufacturing industryto rest with the operating companies. Provided with the necessary marketintelligence, operating managers are mostly easily able to respond quicklyto overseas market demands. Centralized marketing organizations tormarufacturing industries could lead to unnecessary overheads and defectivetransmission of market intelligence due to lack of knowledge of peculia-rities of the market and inadequate appreciation of production conditions.Holding parastatal companies should not take on marketing functions. Thisrecommendation is not intended to be dogmatic. There will-remain instanceswhere the structure of an industry is such that foreign marketing, eventhrough marketing attaches at Embassies on to specialist agents, is beyondthe capacity of each of the individual production units comprising theindustry. Timber is a good example. Wich many producing units, sawmillsand small factories, many of which do not operate as modern tightly runbusinesses, the presence of a single marketing company (i.e. TanzaniaTimber Export Company) is at least temporarily desirable. Staffed byexpatriates with direct industry experience the company can deal withforeign buyers or agents abroad. However, as the industry beccmes moremodern and the more efficient operators expand, some companies cancommence direct marketing activities.
Supply Problems
8. Much more significant than marketing as a constraint onexpansion of manufactured exports are inadequacy, uncertainty and irregu-larity of supply and inconsistent quality of local materials and processedoutput. The mission accumulated considerable evidence on these failings.
9. The timber industry, with high export potential, is perhapsworst affected by supply and quality problems. The most basic weaknessis the lack of information on the timber resource base of Tanzania,divided among the various species. The Forestry Division has littleinformation on the aggregate magnitude of forest resources or on specificspecies availability. It is impossible to estimate the sustainableofftake of a variety unless the resource base is first known. Even ifresource availability were known there are considerable uncertainties inthe supply of logs to sawmills - trucks are in short supply and arepoorly maintained and railways are badly situated for supplying sawmillsand for freighting sawn timber to ports (except for the Sao Hill operations).Further, most of the mills are old and equipment is very inefficient,unable often to produce sawn timber of uniform dimensions. Qualitycontrol is poor or non-existent and binding of sawn timber for export ispoorly performed. The result is that supply of sawr timber is irregularin quantity available and uncertain in quality standards. Export ordersoften cannot be met on time and/or quantities required cannot be
- 176 -
obtained.!/ Forei6 buyers have therefore been reluctant to continueto place business with the Tanzanian timber export authorities. Thereasons are not simnly irregular supplies, poor management and productioni'nefficiencies. Private sawmill otmers, fearing possible expropriation,have been allowing capital to deteriorate. Practical capacity utiliza-ticn has declined alarmingly. One sawmiller had orders of 70,000 to80,000 cubic feet per month in the first half of 1976 but met only 20%of this demand. Given that this situacion is not unusual in Tanzania,buyers quickly commence to look elsewhere.2/ Plywood produced inTanzania is of poor quality and supplies are uncertain. The factory atMoshi is poorly managed and operated and export sales are sporadic withmany promising export contracts going begging - e.g. an order 60,000sheets from Kenya -was recently received but no more than 3,000 sheets!month were forthcoming. An opportunity exists in the South for anexport oriented new plvwood mill near Mtambara where plentiful suppliesof timber suitable for plywood are located. Similarly,the fibreboardolant at Arusha faces substantial mana-er4al and production difficultiesand its ex-factory costs are significantly above current export prices.A ready market exists in Africa if a cost-efficient product of adequatequality could be manufactured. The conclusion must be that, althoughsubstantial exort markets await exploitation by the Tanzania timberindustry, lack of adequate supplies, capital and experienced processingpersonnel and managers may doom the industry to slow growth or stagnation.
10. Another example of supply problems hindering potential exportsis in the livestock and meat industries. 'while the export prospects ofcanned beef remain bleak, there are some possibilities for export ofcattle livestock co the Middle East, if health certificate difficultiescan be overcome. Further, there is large demand for small animalcarcasses in Middle Eastern countries, particularly Iran. However,Tanzania does not have an accurate estimate of the size of the nationalherd of cattle, sheep and goats. Sheep and goats and to a lesser extentcattle are the preserve of small herders who do not engage in regularculling for sale to agents wich access to export markets. Predictionscannot confidently be made of annual availability of cattle and smallanimals of adequate quality for export. Therefore Tanzania cannot enterinto the type of extended contracts being sought by Middle Eastern buyers.
1/ Based on information from Tanzania Timber Export Company.
2/ Price realization may have been a const-:nt on supply before TanzaniaTimber Export Company took over marketing in December 1975. Eistoric-ally, 7WICO did not secure the high.est feasible prices abroad but in1974 average value per unit volume exported ,umped 50% to Sh 15S0/cubic meter and by another third to Sh 2030 in 1975. Prices havecontinued co rise under the new mar,keters, so supplier incentive isimproving.
- 177 -
In any case, the TPL factory and others have no adecuate slaughtainglines for processing small animals. But if regular supply of adequatequality animals could be guaranteed, processing facilities could be aneconomic investment, either in Dar es Salaam or Ywanza. Good suppliesof sheep and goats are apparently available in the Mwanza area and airfreight exports of small animal livestock have already occurred. Thebenefits of avoiding the weight loss involved in shipping livestock toDar es Salaam is a significant factor.
11. The metal products factory in Tanzania reported that itsprincipal constraint in production was periodically inadequate supply ofmetal sheeting from the aluminium factory. The explanation of thealuminium supplier was basically one of production bottlenecks due toinadequate machinery and at times insufficient supplies of raw materials.Import licensing restrictions were the immediate constraint. In thetextile industry, consistent supply of high quality goods has been one ofthe factors hindering exports to other African countries. The principalcauses of irregular quality have been poor management, inadequatelytrained operators and, in some cases, inappropriate machinery.l/ Afinal example concerns the export of wattle extract which is used intanning of hides and skins into leather. The extract company complainedrecently that it was receiving inadequate supplies of wattle bark (fromwhich the extract is obtained) from peasants. The company had expectedto produce 2,500 tons of wattle extract in 1976 but by half year, only740 tons were achieved. It was not clear why peasants were failing toprovide adequate supplies, but presumably the price being offered bythe extract company was a factor. At present, almost 95% of the extractis exported to socialist countries and the rest used in local tanneries.As the new Tanzanian tanneries come on line there should be greaterdemand for the tannin locally and establishment of wattle farms, nowuneconomic, could become a partial solution to the supply problems,along with higher returns to peasant collectors of the wattle bark.
12. Even if inputs are readily available, not all manufacturers arefree to directly purchase materials and parts as need arises. Many mustmake their purchases through the Agricultural Industrial Supply Company(AISCO), a parastatal with exclusive importing rights over a broad rangeof agricultural and industrial inputs. Several manufacturers, bothparastatal and private, complained that the company represented asubstantial supply constraint. The pyrethrum extract company, forexample, has to import solvents, anti-oxidents, special kerosene, packingmaterials and steel drums. Management has found the Supply Company causesconsiderable delays in meeting orders and does not always seem tocomprehend the exact specifications of the materials required, quantities
1/ Based on information from IBRD Report, "Appraisal of Mwanza TextileProject', 743-TA, May 1975 and mission discussions with GherziCompany textile consultants to Tanzanian Government.
178 -
needed and scheduling of delivery. As a result, inappropriate materialsare sometimes delivered and deliveries are often late, the outcomebeing disruption of the operations of the pyre:hrum factory. If manage-ment attempts to deal directly with suppliers and bypass AISCO, the Bankof Tanzania detects the transaction and demands a detailed explanation.The .etal Products Company had similar complaints about AISCO but inaddition claimed it suffered direct financial penalties through enforceduse of AISCO. For example, alumirnium buckets, one of the company's majorlines, require steel handles and AISCO which imports ard sells thehandles to Metal Products charges 30% to 40% above the internationalprice. In addition, the specifications and quality of the goods frequentlydiffer from those requested, since AISCO has no expertise in the industryand delays in meeting input orders are often excessive. Once again,costly bottlenecks and decreased operating capacity are the result. Theprivate manage=ent of this firm feels it is essential to the futurefinancial success of the company that it be permitted to deal directlywith its foreign suppliers. Delays in input supplies have contrIbutedan element of uncertainty into undertaking of export orders which demandprompt and reliable deliveries.
Costs and Productivit7
13. Productivity in manufacturing industry in Tanzania is generallywell below standards of developed countries and even falls short ofproductivity levels attained in most developing countries. The reasons forunderlying low productIvity are analyzed in the main body of this Annex.The consequences for exports of manufactured goods are clear - Tanzaniais not competitive in international markets in many of the commoditylines in wnich it is producing domestically and seeking foreign markets.The textile industry is a good example. With high quality cotton, dutyfree access to European markets, central locations vis-a-vis surroundingeast African markets and some textile mills provided on concessionalterms by foreign aid donors, Tanzania could expect to be a reasonablyefficient producer of textiles. This is not the case. Labor costs perunit of output should be much below European and American costs sinceaverage wages in Tanzania are comparatively very low, but laborproductivity is so poor that labor costs per unit of cutput almost reachthose of the USA. The factory price of Thanga and Kitenge, the princioalAfrican print lines of Tanzania, are 20% over the c.i.f. prices ofcompeting Japanese prints. This is even after taking into account the40% cotton subsidy received by Tanzanian mills, which translates into a10% to 15% subsidy on f.o.b. export prices. A-n additional symptom islow engineering/technical efficiency, averagirg 60%7 (ranging from 40%to 70%) compared, for example, with around 85% for the M-alavi textilemill.l/ A major reason for low productivity in the textile industry
1/ Based on information from IBRD Reporzs - Mwanza Project and Industrialand Mining Sector Survey, 647-TA, March 1975, Annex IV, and Missiondiscussions with Gherzi Company.
- 179 -
is overstaffing. Comparison with mills in other countries with similarcapacity machinery and factory through-put revealed excess staffing ofup to 75%.
14. Tanzania is a relatively efficient producer of some primary,unprocessed commodities, but when further processing is attempted,competitiveness falls away rapidly. In cofZee production, for example,Tanzania successfully exports good quality coffee world wide. But itsinstant coffee processing industry is grossly inefficient, operating atless than half capacity and exporting only when it can obtain coffee beansat subsidized prices. There is a market for processed coffee in Africaand large orders have been received, for example, from Mozambique. In1975 alone, 80 potential export orders were received. But the Tanzanianfactory cannot even meet variable costs and and was unable to respondto this foreign demand. The managing agents, Nestles, are unable tosolve the problems of low productivity and inconsistent quali:y and naveresorted to proposing that Tanzania import cheaper, lower quality beansfor processing for the African markets and concentrate all sales ofquality Tanzanian beans on higher value world markets. A similar situationhas existed in the leather industry, where in 1974 and 1975 the price perunit volume of export for raw hides and skins exceeded the foreign exchangereturn on wet blue leather, resulting in a net loss of foreign exchangeon export of semi-processed leather. This was reflected in the first 9months of 1975, by the failure of Tanzania Tanneries Ltd. to coverproduction costs which included purchase of Tanzanian raw hides and skinsat international prices.l/
15. Other examples of Tanzanian uncompetitiveness include thefollowing. A private mahufacturer of fishnets (partly for export) foundthat productivity was 30% below that of its principal overseas competi-tors and on a specific machine tested for Tanzanian productivity, outputwas only 56% of the level attained by Japanese operatives. Managementfelt the main problems were lack of skills, work ethic and financialmotivation. Several firms also cited Government-sponsored absences fromwork as significant contributory factors. Workers were regularly absentfor militia training, political education, sports and cultural meetingsand activities. Not only was this a direct financial burden but itrequired management to double-staff, in many instances, to prevent produc-tion bottlenecks. "Standby" workers were employed for only a few hourseach day. The manager of a company in the aluminium industry claimedloss of 30% to 35% of total work hours from such absenteeism and consequentoverstaffing of 25%. High wage costs, particularly among lower echelonworkers, were also a burden on this company and many others approachedby the mission. The aluminium company felt its labor costs per ton ofoutput were high compared to India, Taiwan and Japan due to wage ratesas well as poor productivity.
1/ Information from Indecenter report, "Leather and Leather GoodsIndustries", April, 1976.
- 130 -
Exnorts Varsus Dorctic Sales
16. While it is evidenc that many barriers co increasing manufacturedexports are beyond the control of industry itself, it is nevertheless truethat for many Tanzani2An producers, sales in highly protected iocal marketsare preferable to exposure to the spotlight of international competition.High and sometimes prohibitive import duties and quantitative restrictions,rationalized and to some degree justified by foreign exchange scarcity,have severely restricted competitive imports. At the same time, rapidgrowth of Tanzanian purchasing power has boosted domestic demand and helpedto establish sellers' markets for a range of products. This has oftenenabled local suppliers to enhance turnover by expanding output at theexpense of quality of product and standard of service, including choiceopen to consumers.
17. The evidence accumulated by the mission suggests that in arange of activities exDort sales would be loss-making or only marginallyprofitable.1/ 'Wnen obstacles and hin4drances to engaging in expor.s arecoupled with t1he often large and unsatisfied local demand, domestic salesare preferred. In some developing countries export sales are such poorprofit performers that profit maximization dictates domestic salesorientation. This is not generally the case in Tanzania. Price control,on the evidence, apDears to control profits to post-tax levels of nomore than 6% to 12% on sales. This observation becomes relevant toexport policy if restraint on domestic demand is seen as a means ofraising export earnings. It is sometimes argued that by placing a strongDrice control squeeze on domestic sales, exports are encouraged, Whilein the case of Tanzania, such a policy in isolation might simply bankruptcompanies, something obviously has to be done in a number of instances whereexport potential exists to restrain local demand. Appropriate policy forTanzania might be some combination of positive export incentives andconstraints removal, along with discretionary and conscious policyrestraints on domestic sales. Quantitative restriction on local demandnecessarily have to be linked to freeing domestic prices to rationlimited sunoli es. Another policy instrument useful in this instancewould be indirect tax rates which could be progressively raised untillocal demand declined sufficiently to generate sizeable surpluses forexport. Such a policy would incidentally assist attainment of the macrogoal of raising domestic savings, be it through higher Government orprivate savings.
1/ The argu7ment is sometimes made that since exports are not nowprofitable encouragement of high domestic sales profits cculd actas a subsidy to export expansion. However, such a domestic policywould, in isolation, simply encourage more local saies, doing nothingfor exports.
- 181 -
18. Following is some of the evidence obtained by the missicn ondomestic markets pre-empting exports. In the timber industry, Tanzanianwood is of such a high quality that virtually any local sales of well-processed wood pre-empts exports. In particular, the hardwood sawntimber and the pine sawn timber presently processed and mostly soldlocally by the new Norwegian-managed mill at Sao Hill could export allits output and force the local market to absorb a lesser quality product,which it could easily do. Similarly, Tanzania's parquetry flooring, ispresently being sold in domestic markets, at prices below its internationalvalue, at the expense of export markets. While export opportunities formeat and livestock are limited, there is nevertheless a feeling inTanzanian Government circles that domestic meat prices are too low. Salesof sheep and goats on the hoof or perhaps chilled carcasses are a possi-bility but the major source of supply, from the traditional sector, isalmost totally committed to local demand. Sheep offtake for domesticconsumption has been forecast by the Bank to grow by 50% over 197/2 to 1980to 733,000 head. Similarly, beef offtake in 1980, put at 1-1/2 millionhead would exceed 1972 domestic consumption supply by 50%. If throughprice adjustments or some other rationing mechanism, this projecteddomestia demand could be curtailed somewhat an export surplus mightresult. Another highly exportable product, domestic consumption of whichis expected to increase significantly over a similar period (by 25%), iscassava starch and derivatives. Similarly, the soap making factory LakeSoap Industries forgoes potential export markets in surrounding countriessince { current prices it is unable at full capacity to meet localdemand.
19. The textile industry offers another example of excess domesticdemand under prevailing market conditions. Tanzanian producers are highlyinefficient by international standards (see preceding subsection) and by1976 imports had virtually been banned. Thus, with production capacityof 70 to 80 million square meters per annum, domestic demand estimatesof as high as 150 million square meters were mentioned to the mission byIndustry officials. The local sales tax on textiles is already substan-tial at 60%, making Tanzanian retail prices the highest of countries inthe region. But excess demand is such that domestic consumption willabsorb whatever the local industry can produce. The industry is attempt-ing to export at the expense of increasing local shortages but unfortuna-tely high production costs and low quality output also limit exportpotential. In one of the promising new potential export industries,processed oil seeds, local market sales again threaten foreign exchangeearnings. The planned new capacity of 21,000 tons of edible oils andfats will not accommodate the shortfall in domestic consumption atcurrent prices. 2Marketed production of oilseeds has been decliningrecently due partly to increased local consumption of groundnuts and poorcotton crops. This has affected availability for export of both oilseedsand processed oil. While marketed production of oilseeds had declinedfrom 30,000 tons in 1971/72 to 12,000 tons in 1975/76 local demand foredible oil has been rapidly increasing and is estimated to reach 44,000tons by 1980. An export surplus can therefore be created only by largenew plantings and good cottonseed production combined with steeply
- ,,, -, -
increased onrice for local ConsutitO to ka-eo 1'0 deZand be.ow th'efor-caszt ig're. S7 : ll n -i o-i'eS_ re already quite h_n _.h . a_ a-xortpotentia'l exists. 7he Cruo m.sr' - in 'rIstn: Oucouc
c apacitv .s c -ta severe, z:a.' a :._ .nsu..-o cosugar has been subscanraln;y _ .- o - _.- countri s. 'P ocs,demanad was showm resoonsi-_, :a .}-' .. - es cutconsumption by abcu: 320. Hard p - ci-. *z:2 7n ' s ell r a- .
the future to create a worthwh;ile eNxo r: Luriu.! . ::-a ha rk-eting Develop-ment Bureau estimates that if g-rowth or d1mestic demand is controliedand expected production growth eventuates, exports could reach 40,000to 50,000 tons by 1980.
Bureaucratic Constraints
Imnor: Licensinz
20. Goods imported are -ii4,ded i-s:o those urder Ozen Gearal License(OGL) and specific license. The OGC allows the i=norter to br_ng in itemswithout having on each occasion to go through the formal licensingprocedure. M- official OGL notice is published specifying (a) items whichmay be imported freely without a license (b) items which may be importedonly by specified institutions (with or without a s7iecific License).Goods in category (a) are imports which it is considered cannot berestricted because of physical difficulty in controlling legal entry,essentiality, as in cases such as medical supplies; or because certainitems such as petroleum are vital to the continued operation of theeconomy.l/ The Ministry of Finance and Planning and the Bank of Tanzaniadetermine the division of the Fcreign Exchange Plan allowance between OGLand specific licenses. The Adviiscry Committee on Imzorts then furtherdecides on the allocation to each of the broad categories of importeditems, basing its decisions on historical trends (in practice last year'sallocation) shown in the East African Customs annual trade repcrts andbudget plans of major state Importers. A general but important element inthe decision process is to give consideration to "the growth of the economywith special reference to the gr3wth of local import substitution indust-ries .. " .llotment of foreign exchange is made first for developmentgoods and specified essential consumer goods. Non-essential consumer
1/ The latter category of CGL items also now includes all spare partsfor industrv. This is significant for exoorters since delay inreplacement of machinery and equipment parts has in the past been aserious bottleneck. Liberalization of the scone of the OGL to allspare parts is a recent itntiative and at the time of the mission,many exportirg industrialists still complained of productiondisruptions due to delays in obtainina licenses for soares. -The newsystem obviously needs more publict-y by the institutions concernedwith promocing exports.
- 183 -
goods are allotted the residual foreign exchange. There are two licensingperiods in each fiscal year with licenses issued for six monthly periods.The exclusive importing rights granted to AISCO on a wide range of itemswhich are integral inputs to much of agriculture and industry representsa significant exception to the overall policy, with detrimental efficiencyimplications already noted.
21. In terms of sectoral priorities,the Bank of Tanzania claims thefollowing order of oriority has been established: (a) industries (b) statetrading institutions (confinces, i.e. goods imports are confined to thesesix institutions) and (c) established trading importers with significantprior participation in the import market. Licenses are issued largely onthe basis of past performance of the applicant and present stocks.
22. The "flavor" of the import licensing system therefore emergesas one in which all requests for imports, whether for final consumption
4W or for inputs to be incorporated into goods for export, are consideredunder the guidelines specified above, constrained by the overridingceiling of the Foreign Exchange Plan. There is no automatic preferentialconsideratior given to exporters. The application form is the same foreveryone and information on estimated foreign exchange value added, if any,as a result of using imported inputs is not requested by the authorities.The Bank of Tanzania (BOT), while recognizing that no automatic systemapplies to exporters, claims that on a case by case basis the importlicensing committee gives priority to exporters. In addition, when anexport industry formally puts its case to the authorities potential netforeign exchange earnings are sometimes calculated and taken intoconsideration. This bureaucratic, case by case, ?rocedure appears to bean unwieldy and inflexible method of addressing the vital import require-ments of exporters. The Export Department of BOT further claimed thatpreference was given to imported raw materials to be utilized inmanufact.uring, with special emphasis on the needs of exporters. However,not only is the supposed preference again administered on a tortuous caseby case basis, but the facts do not support the claim. Over the periodJanuary to June 1975, requests for import of industrial raw materialsand inputs totalled Sh 1.3 billion, while allocations were only Sa 0.77billion. The situation over the same period for 1976 was similar withrequests for Sh 1.07 billion and licenses for Sh 0.76 billion. Requestswere lower, perhaps partly in recognition of the futility o' applyingfor maximur expected requirements of raw materials. The large declinein applications for raw materials licenses in the latter half oL 1976compared to 1975 and the slight fall in licenses granted contrasts withan increase in total import license applications and a rise in totallicenses approved of about 6%. The evidence from the industry side isthat import licenses granted for raw materials are inadequate to meetpotential export orders. Failure of the licensing authorities to allowimport of the amounts of raw materials requested, which are often basedon the requirements of actual or expected export orders, results in-forfeiture of export contracts. There further follows loss of confidenceby the exporter and potential customers concerning the prospects for.uture sales. The aluminium industry, for example, cited as a majorconstraint on exports the difficult, protracted and usually unsuccessful
- 184 -
process or ac:empting to secure foreign exchange for purchase of essentialraw materials. An additional oroblem is of course that for manufacturerswho have the choice of local or foreign sales, a reduced import iicensefor raw materials will result in further concentration on selling in themore oroficable and less complicated domestic market.
253. The Tanzanian import licensing authorities claim ad hoc attemccsare made to revol-,ve imuort licenses to active ex:orters. Mut the 7m:ss-:.nwas unable to establish existence among exporters cuestioned, any stro.gawareness of this policy. An additional problem faced by many exportersis posed by the fairly rigid 6 monthly allocation of import licenses. Ifan unexpected large export order is received during ore of these periodsand immediate ordering of essential imported inputs is necessary, thereis no fast and automatic method of securing the requisite foreign aXc?g-.BOT apparently does maintZin a reserve fund which is supposed to caterfor such contingencies, but applications again must be considered by theimport licensing authorities on a case by case basis. The mission :our.clittle or no appreciation among industrialists of the existence of this
Long Term Contracts
24. Tanzanian authorities have in the -cast exhibited extreme suspDi-cion of entering into medium or long term contracts with large foreignimporters. The consequence has been loss of e-.xport sales and a growingreluctance by overseas companies evern to enter into negotiations withTanzan.ian suppliers. The mission found -evidence of continuation of thissuspicion, but also some signs of a less rigid approach. Tanzanianofficials attempt to Justily past policy on the grounds that (a) longterm contracts, often at inflexible prices, may in the future depriveTanzanians of the full foreign exchange value of their output and (b) thereis a risk of dishonoring contracts if production fails to reach expecta-tions. There is already evidence in a World Bank study of agro-processingparastatals in Tanzania that holding parastatals prefer not to enter intolong term cortracts. As a consequence no producer/client relationshiois established, at possible cost of price and market continuity. Theexport sector mission found that suspicion of long term arrangements ha¢been inhibiting the conclusion of a contract for large e-port sales :flime juice to the British firm L. Rose, which dominates the world limejuice market. Rose wished to enter into a contract at the current worldprice, but the Tanzanians, believing the long term market to be veryfavorable, were holding out for a substantially highier guaranteed price,There seemed to be insufti ient appreciation of the fact that, as thevirtual monopsonist purchasing from a number of developing countries allseeking to boost nroduction, Rose was and would rem-in in the morepowerful bargaining situation. The other exanmi es concerned potentialMiddle Eastern markets. Saudi Arabia had expressed interest in buildinga citrus fruic packin.g factory in northern Tanzania but had required taall production be com=itted on a long term basis to the Saudi market.The Tanzanian Government had apparently been so wary or such an arragne-ment that the proposal may nave been dropped. Simi larly, u wa4t "-acex,ressed interest in a cat-le fattening project on the basis of total
- 185 -
commitment of exoorts to the Kuwait market. Tanzanian officials hadproved more flexible in this case on production commitment but had takena hard line on price. Negotiations had become deadlocked on the questionof guaranteed price and the project's .uture was clouded.
Administrative Activities of Bank of Tanzania
25. Procedures of the Bank of Tanzania were a frequent source ofcomplaint by exporters. The series of complaints regist2red with themission can be categorized as concerning export price, credit terms andpromotional travel.
26. BOT is felt to interfere excessively in the matter of exportprices. Some degree of surveillance and vetting is obviously necessaryto minimize underinvoicing of exports, but the evidence is that BOT hasbeer. over-zealous. Exporters both in the private and parastatal sectorscomplained that when price negotiations with foreign importers werecomnleted, the Tanzanian party had to seek approval from BOT, which initself caused delay and uncertainty wher the exporter was abroad andattempting to persuade souhisticated foreign businessmen to sign hiscontract over those simultaneously being offered by other countries. But.urther, BOT sometimes refuses to accept the negotiated price and ordersthe exporter to renegotiate. Sales are immediately lost and hopes offuture negotiations with the same parties are forfeited. The ExchangeControl Department of BOT, which is responsible for price surveillance,has no particular expertise in assessing the reasonableness or otherwiseof prices negotiated for a wide range of industrial prices, for many ofwhich there are no clearly established international prices. Theparastatal operated textile industry was especially critical of theinterference of BOT in its attempts to export cloth. In particular, theindustry pointed to the inappropriate methods used to assess acceptabilityof negotiated prices. It was claimed that BOT compared the agreedinternational price submitted by the industry with Tanzanian productioncosts and local market prices for similar products. Since Tanzania isa relatively high cost producer, it can only attempt to break intoforeign markets by initial break-even or below cost pricing. Further,domestic prices are artificially high, due to shortages accentuated bya ban on imports. If the assessment of BOT is based on this type ofanalysis, it is obviously spurious. BOT officials, while not denyingthese allegations, claimed the Ministry of Trade also had the authorityto block export sales but the mission received ro reports of suchinterference from industrialists. Senior Trade Ministry officials didnot include intervention in export price agreements as one of theMinistry's functions.
27. In the past, when Tanzania's exports of manufactured goods werequantitatively negligible, payment by overseas importers of the foreignexchange necessary to purchase traditional unprocessed e-ports o-Tanzania was usually prompt and credit terms of no more than 60 days werenecessary. Payment had in fact at one time been allowed up to 180 daysafter shipment but there had been so little use of this facility thatBOT had reduced the credit period to 60 days. In general, then, until
- 186 -
recent years, Tanzanian exporters have managed to adhere to BOT'sregulations on repatriation of export proceeds. Hdowever,as manufacturedexports have become quantitatively more significant and their expansionbecomes more essential to the stability of Tanzania's future tradebalance, the 60 day credit terms have become less accepcable. Thegeneral prac:ice of most LDC's now is to offer 180 day credit formanufactured exportsi/ and to be competitive in this regard, Tanzaniamust otter comparable terms. To some imparting countries, a longforeign exchange credit arrangement is as i-portant as a !avorable pricecontract. Several Tanzanian exporters complained of the strictures whichthe short cerm credit rules placed on their export promotion efforts.For example overseas buyers of finished leather and leather productsrequire and receivre credit terms of at least 90 days and often longer.BOT is aware that manufacturing exporters may need to offer credit termsexceeding 60 days and are considering an across the board extensior ofcredit terms for Foreign sales of manufactured goods. It presentlyexamines pleas bv exporters for longer credit terms on a case bv casebasis. Tnduscr-v finds this sytem unworkable since uncertainty and delay,while 30T considers each case, can result in loss of potential exportcontracts.
23. A related though more minor problem is the unnecessarilybureaucratic and close restraint placed by 30T on market-seeking tripsabroad by exporters. Once again, uncertainty on both buying and sellingsides cf trading situaticns is heightened and potential export salesare Lost. At oresent B0T' acting as the arbiter in this matter, appearsto feel that personal visits by expbrt executives to promote or cementforeign sales are often unnecessary and a waste of foreign currency.Its attitude appears based largely on suspicion of the motives of4industrialists. But while not all proposed marketing trips are genuineor would result in izoediate additional sales, excessive suspicion seemsto act as a constraint on legitimate export activities. Arguments whichBOT puts to businessmen. when refusing travel requests include thecontention that promotioonal work can be performed adeouately by Tanzaniantrade attaches abroad or that written contacts are sufficient. Both ofthese methods are demonstrably inadequate. Trade attaches are neitherskilled nor numerous enough to perform the work of specialized industrialexecutives. Attempts to carry orn over a period of time complex foreigntrade negotiations and sales solely by written communication are doomedto failure. Examples of excessive restriction on such travel are notdifficult to accumulate. The Tanganyika M4eerschaum Corporationadmittedly is sufFering from serious production and managerial problems.Nevertheless it has been constrained, as a totally export orientedindustry, by the continuing refusal of BOT to permit foreign visitswhich may assist management in idertifying its current marketing problems.The Tanzania Textile Trading Company, seeking to promote sales of textiles
1/ Nigeria and Ghana are African countries which offer 180 day terms.
- 187 -
in surrounding countries, experienced similar difficulties. Inparticular, although the Government is supposed to be giving maximumsupport to boosting trade with Mozatmbique, textile export executiveswere provided with insufficient foreign exchange to travel to townsoutside MaDuto, where the principal people concerned with Mozambique'stextile trade are located. Finally, a manager in the aluminium industry,discovering that a rise in aluminium prices had created good marketopportunities in the Middle East, sought to travel to Saudi Arabia toquickly cement contracts. However, this executive had the additionalproblem of having to make application through the holding company, NDC,which created delay additional to that entailed in the applicationpassing through the State House and then undergoing detailed scrutinyby BOT. Consequent lags of several weeks must be expected, with nocertainty that the marketing trip will be finally approved.
Procedural Constraints
29. Purely procedural strictures on export of manufactured goodsare perhaps not much worse in Tanzania than a number of other developingcountries. But procedures to be completed prior to goods physicallyleaving Tanzania are nevertheless excessively complex and time consumingfor industrialists and should be simplified. For exporters who mustimport materials to be incorporated in their production, the policyconsiderations canvassed earlier are a constraint in the sense ofuncertainty about obtaining a license. But there has been the additionalprocedural burden of applying for a license through BOT. Exportingmanufacturers claimed to have to specify in great detail the items tobe imported. This reflects a desire to maintain close control over theitems allowed to be imported. The procedure involves at least threeseparate visits to BOT for those companies fortunate enough to haveready physical access to BOT in Dar es Salaam. The first visit is tolodge (and informally advocate acceptance of) the imoort license, second,to obtain the necessary documents for inspection of the goods by theGeneral Superintendence Company or similar body at point of origin andsend a copy to the foreign ex?orter for completion after inspection.Finally SOT must be provided with evidence that the Tanzanian importer'sbank (i.e. National Bank of Commerce) has issued a Letter of Credit andBOT further confirms this approval wzith the National Bank of Commerce.Most companies found that these procedures took at least 6 weeks, BOTinformed the mission that importing of materials was being simplifiedthrough issue, at the half yearly intervals, of block licenses which nolonger required detailed specification of items. However, there is little,if any, awareness of this new policy among industrialists, which raisesquestions as to implementation of "block" licensing.
30. Once goods are manufactured and export sales are arranged theprocedures for exporting must then be addressed. Firstly, the exporter'sbank, NBC must receive, process and notify apDroval to BCT of the foreignexchange payment documents of the overseas importer, usually a LOC issuedon the importer's bank. Several exporters reported excessive delays inthis prccedure, caused by the unfamiliarity of NBC with the differenttypes of LOC now being issued with increasing frequency to Tanzanian
- 188 -
exporters by non-3ri,ish Co=tonwealth banking systems. A Certificateof Origin must then be obtained for each export shipment. This is arequirement not of the Tanzanian authorities but is associated with thei-porting countries under the Generalized System of Preferences. TheCertificate must attest that the goods are Tanzanian in origin or atleast 30% of the value of the goods must have been added in Tanzania.A timing problem is created in some cases since the signature of aparticular Trade Ministry officer is re.uired to validate the Certificate.Failure to delegate authority to ancther officer during absence from theoffice somecimes cause considerable delays in obtaining this stamp ofapproval.
31. The most significant and ootentially bothersome procedure forexporters is to obtain an Export Permit from the Ministry of Trade.These permits are not issued as a matter of course. Detailed informacionmust be provided to che Ministry as to the physical characteristics ofthe goods being exported and the foreign exchange value of the goods.The formal purpose of these requirements is to ensure that by export,manufacturers are not depriving Tanzanians of needed goods and ensurethat capital flight is not occurring through underinvoicing. Someexporters reported inordirate delays in secu-ring the Permit. Once again,a single officer of the Trade Ministry has responsibility for finalapproval of Export Permits ard particularly in his absence long delaysoccur. Loss of export contracts has at times resulted from justifiableimpatience on the part of foreign buyers. An extreme example of thepossible outcome of such a procedure, provided to the mission, concernedexport of cashew-nuts. The exporter had negotiated a price and contractand a ship was in port with space available to load the shipment waitingon the docks. However, in the absence of Lhe officer responsible forapproving the Export Permit, alternative approval procedures _ould notbe implemented expeditiously and the ship departed. The buyer subsequentlycancelled the contract because of failure to meet the snecified deliverydate and a Sh 3 million order was lost. The mission was informed that,although an extreme example, this was by rno means ar. isolated incident.A further problem, encountered by a private exporting company, entailedattempts to direct export sales to parastatal enterprises. Governmentauthorities had requested the company to withdraw an application for anExport Permit to leave the way open for a parastatal organization,theoretically capable of producing the required goods. Only afterconsiderable argument was the Government convinced of the parastatalcompany's inability to meet the product specifications or deadlines ofthe foreign buyer. The Export Permit in this instance acted as aninstrument of interference with the normal commercial paractices ofcompetition for export contracts.
32. The chronologically final procedural hurdle to be overcome byexporters is customs clearance. Goods transported to the docks forshipment are opened and inspected by officers of the East African CustomsDepartment. The principal justification for this procedure is preventionof illegal export of goods by persons ;who may be planning to leaveTanzania. The potential time involved in delaying shipment of exports

- 189 -
and the incentive which this procedure creates for corruption should betraded off against the supposed benefits of infringement, detection anddeterrence. Industrialists assert that the time involved in completingthe required customs inspection is at least 3 weeks and on average, 5weeks.
- 190 -
APPENI) X D
VALUATION OF TrE CE2IT.AL STOCK IN '-RGZ-5CALH. - , L_RE-CL
MA.W YUFAC TRING
1. There are no official estimates of the capital stock in large-scale manufacturing in Tanzania. In the text of this annex an estimateof the value of the capital stock in 1966 prices was derived as follows.The capital stock in 1966 was assumed to be 10 times the depreciationallowance 'or that year. In all subsequent years the net increment todepreciation was deflated by the 4mplicit investmen: deflator for thepreceding year and the quotient was added to the preceding year'sdepreciation to obtain an estimate of real depreciation. Real depreciationwas then multiplied by 10 to obtain an estimate of the value of the capitalstock in 1966 orices. Note 4 to Table 6 further exp2lains the procedureand the resulting capital stoclk estimates are given irn Table 6.
2. A key assumption irn the procedure outlined above is that theaverage life of capital remains constant at 10 years. In comments on anearlier draft of this Report, the Ministry of Industries presentedfigures showing that the weighted average depreciation rate for large-scale manufacturing firms had increased from 7.4% in 1965 to 8.75% in1973. The average is based on the officially permissable rate of deprecia-tion for particular types of assets. The increased rate of depreciationimplies that the average life of the capital stock had declined from13.5 years in 1965 to 11.4 years in 1973.
3. These weighted depreciation rates can be used to calculate analternative measure of the value of the capital stock. This is done inTable 13 where it is assumed that the average life of capital declinedsteadily by 0.5 year per year after 1965. The average life of capitalis multiplied by real depreciation each year to obtain an estimate ofthe capital stock for that year valued at constant 1966 prices.
Neither of these methods of estimation is entirely satisfactory.Tne use of weighted depreciation rates to estimate the capital stock hastwo,limitations. First, the change in the average life of the capitalstock is exaggerated by inflation. This occurs because the averagedepreciation rate is calculated as a percentage of net assets valued atpurchase price, thus giving greater weight to more recent investmentsthan would be given if there had been no inflation. This means that thedotwward trend in the average life of capital is greater by this measure 5
than it would be if all investments could be properly valued in constantprices. A second difficulty is that the value of net assets understatesthe true value of the capital stock if the capital stock 4is growing inreal terms. Tne faster the capital stock grows the greater the gapbetween the value of the capital stock and the value of net assets. Thiseffect occurs regardless of whether there is any inflation. Both of thesefactors give a dow-ward bias to the estimated rate of growth of the capitalstock using the weighted depreciation method. The estimates using this
- 191 -
methodology, then, can be regarded as a lower 1tmit (and definite under-estimate) of the race of growth of the capital stock in the period underconsideration.
5. The other method of estimation -- using an assumed constantlife of capital of 10 years -- also has limitations. The most obviouslimitation is that it takes no account of the decline in the average lifeof capital. Although the decline in the average life of capital is lessthan estimated by weighted depreciation method, there can be no doubt thatsome decline occurred unless the two years for which data were given arevery unrepresentative. The assumption of a constant life of capitalimparcs an upward bias to the rate of growth of the capital stock.Offsetting this to some extent is an opposite bias: the value of netassets understates the true value of the capital stock for this estimatingprocedure as well as for the alternative procedure. This does not meanthat the two biases exactly cancel out. It is likely that the assumedconstant-life method of estimation exaggerates the rate of growth of thecapital stock to some extent. However, it is probably closer to the truerate of growth than the weighted depreciation method.1/ Rather thanattempting a degree of accuracy which would be wholly spurious, thesimpler method of assumed constant life of capital is used in the maintext of the Annex and in the tables, but footnotes or references toTable 13 are occasionally given.
6. Both >thods of estimation show similar trends, although thienumbers and the steepiess of the trends vary according to ;which measureof the capital stock is used.2/ Most importantly, both measures showthat capital intensity grew ana the gross rate of return on capital fellduring the period 1966-67 to 1972-73.
1/ It is also worth noting that a third proxy measure of the capitalstock, purchases of electricity, grew at almost exactly the samerate as the estimate based on unweighted depreciation. See ChapterII, Table 5.
2/ The estimates of the absolute value of the capital stock differsubstantially more than the differences in the trends, but that isof no consequence. Our interest is only in the trends.