Taxation and Fiscal Reform in Ghana
21
Copyright ã UNU/WIDER 2001 1 World Institute for Development Economics Research of the United Nations University (UNU/WIDER), Katajanokanlaituri 6 B, FIN-00160 Helsinki, Finland; [email protected] 2 University of Nottingham, UK; [email protected] This study has been prepared within the UNU/WIDER project on New Fiscal Policies for Growth and Poverty Reduction which is directed by Tony Addison. UNU/WIDER gratefully acknowledges the financial contribution to the project by the Government of Italy (Directorate General for Development Cooperation). Discussion Paper No. 2001/97 Taxation and Fiscal Reform in Ghana Tony Addison 1 and Robert Osei 2 September 2001 Abstract To finance basic pro-poor services, the Government of Ghana must mobilize more public revenue. But tax reform has been highly controversial in Ghana. An attempt to introduce VAT in 1995 failed after widespread protests. Although a second attempt to introduce VAT in 1998 succeeded, strong resistance to tax reform remains, and the total tax base remains narrow and over-dependent on petroleum taxes. This paper argues that slow progress in public expenditure reform, in particular in raising spending on basic services, has impeded the public's willingness to pay taxes, since many people see little benefit. This is especially the case in the poorer regions, which in addition have borne the brunt of the rising petroleum tax. The paper concludes that much more attention must be given to the political economy of fiscal policy in Ghana, if lasting improvements to the fiscal system are to be achieved. Keywords: fiscal policy, taxation, Ghana, sub-Saharan Africa JEL classification: O23, O55, H20
-
Upload
independent -
Category
Documents
-
view
1 -
download
0
Transcript of Taxation and Fiscal Reform in Ghana
Copyright� UNU/WIDER 20011 World Institute for Development Economics Research of the United Nations University(UNU/WIDER), Katajanokanlaituri 6 B, FIN-00160 Helsinki, Finland; [email protected] University of Nottingham, UK; [email protected]
This study has been prepared within the UNU/WIDER project on New Fiscal Policies for Growth andPoverty Reduction which is directed by Tony Addison.
UNU/WIDER gratefully acknowledges the financial contribution to the project by the Government ofItaly (Directorate General for Development Cooperation).
Discussion Paper No. 2001/97
Taxation and Fiscal Reformin Ghana
Tony Addison1 and Robert Osei2
September 2001
Abstract
To finance basic pro-poor services, the Government of Ghana must mobilize morepublic revenue. But tax reform has been highly controversial in Ghana. An attempt tointroduce VAT in 1995 failed after widespread protests. Although a second attempt tointroduce VAT in 1998 succeeded, strong resistance to tax reform remains, and the totaltax base remains narrow and over-dependent on petroleum taxes. This paper argues thatslow progress in public expenditure reform, in particular in raising spending on basicservices, has impeded the public's willingness to pay taxes, since many people see littlebenefit. This is especially the case in the poorer regions, which in addition have bornethe brunt of the rising petroleum tax. The paper concludes that much more attentionmust be given to the political economy of fiscal policy in Ghana, if lastingimprovements to the fiscal system are to be achieved.
Keywords: fiscal policy, taxation, Ghana, sub-Saharan Africa
JEL classification: O23, O55, H20
UNU World Institute for Development Economics Research (UNU/WIDER)was established by the United Nations University as its first research andtraining centre and started work in Helsinki, Finland in 1985. The purpose ofthe Institute is to undertake applied research and policy analysis on structuralchanges affecting the developing and transitional economies, to provide aforum for the advocacy of policies leading to robust, equitable andenvironmentally sustainable growth, and to promote capacity strengtheningand training in the field of economic and social policy making. Its work iscarried out by staff researchers and visiting scholars in Helsinki and throughnetworks of collaborating scholars and institutions around the world.
UNU World Institute for Development Economics Research (UNU/WIDER)Katajanokanlaituri 6 B, 00160 Helsinki, Finland
Camera-ready typescript prepared by Adam Swallow at UNU/WIDERPrinted at UNU/WIDER, Helsinki
The views expressed in this publication are those of the author(s). Publication does not implyendorsement by the Institute or the United Nations University, nor by the programme/project sponsors, ofany of the views expressed.
ISSN 1609-5774ISBN 92-9190-016-8 (printed publication)ISBN 92-9190-017-6 (internet publication)
Acknowledgements
Paper presented at a UNU/WIDER project meeting on 'New Fiscal Policies for Growthand Poverty Reduction', Helsinki, 17-18 November 2000. This project focuses on publicexpenditure management, taxation, and the macro-economic effects of fiscal policy inmainly (but not exclusively) low-income countries. Further details of the project can beobtained from WIDER's web site (www.wider.unu.edu) or from the project director,Tony Addison ([email protected]).
We thank participants at the project meeting for their comments. This paper representswork in progress. Further comments are welcome.
1
Introduction
The design and implementation of public-expenditure management and taxationsystems is one of the most important tasks facing low-income countries. This isespecially the case in sub-Saharan Africa, where weaknesses in fiscal policy havecontributed to slow growth and limited human development. Yet improvements inpublic expenditure management and taxation remain fraught with difficulty, not leastbecause of their political dimensions (Addison 2000). Within the low-income group,Ghana presents a particularly interesting case; over two decades of economic stagnationand decline began to be reversed with the start of economic reform in 1983 and theadoption of the Economic Recovery Programme.
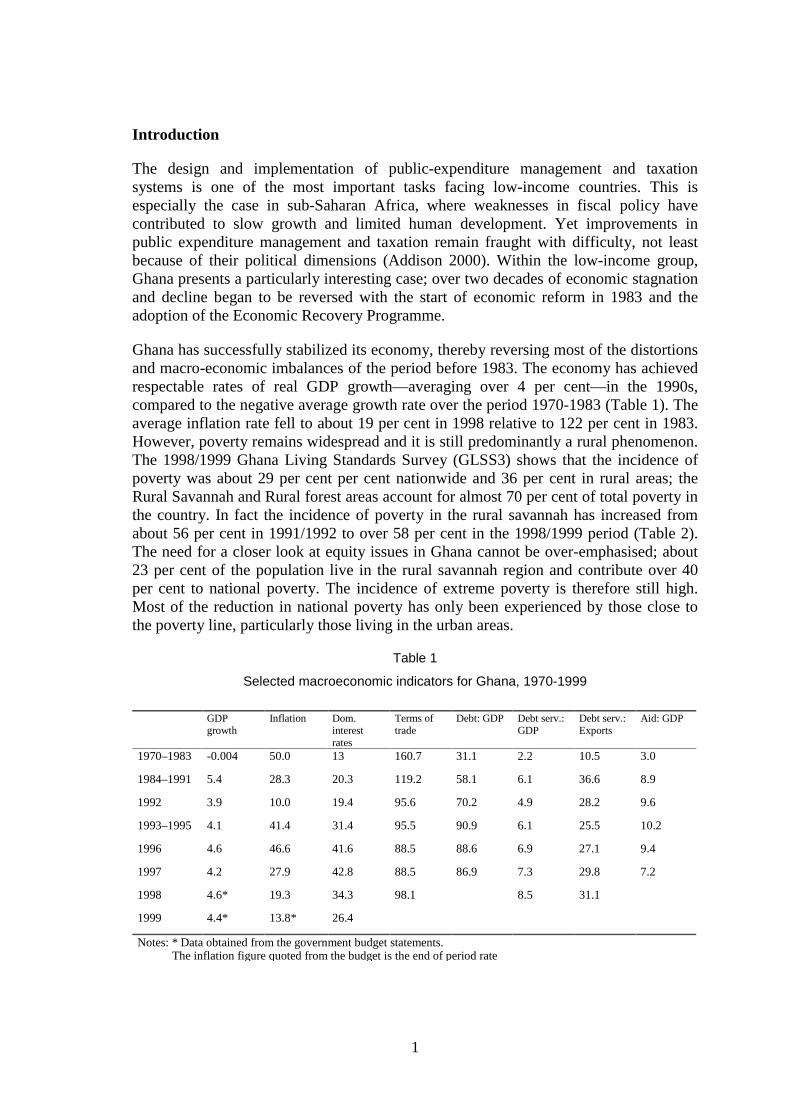
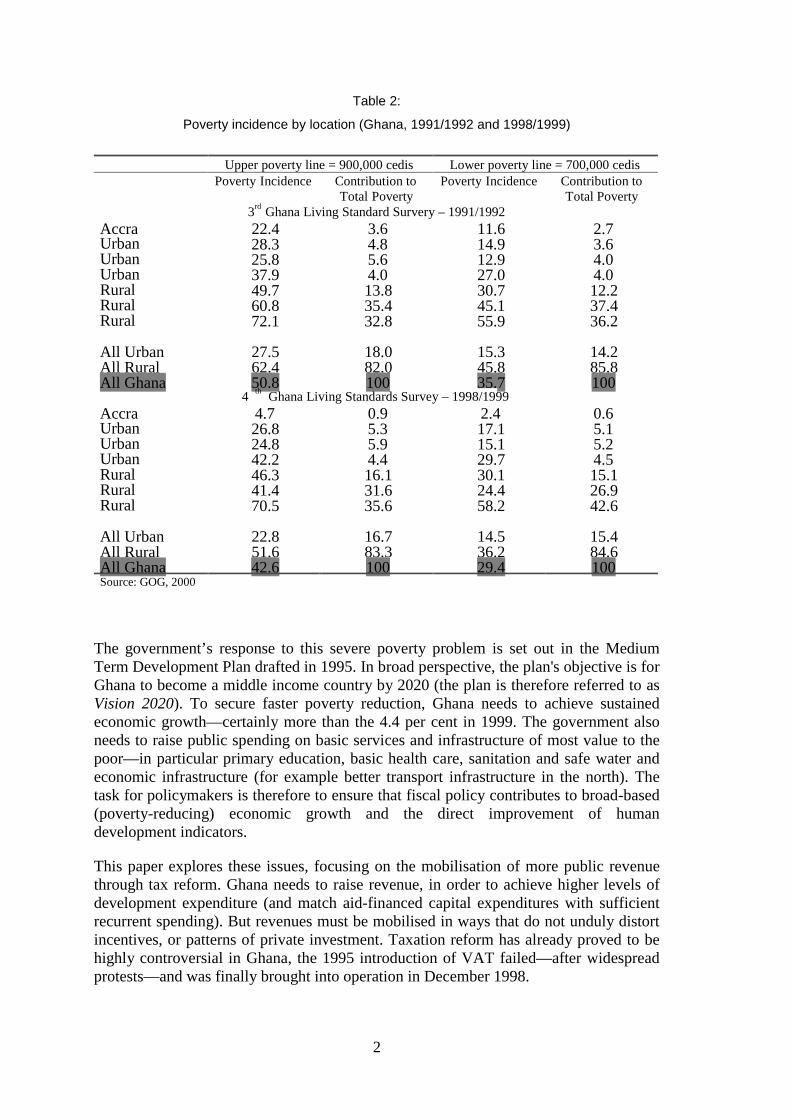
Ghana has successfully stabilized its economy, thereby reversing most of the distortionsand macro-economic imbalances of the period before 1983. The economy has achievedrespectable rates of real GDP growth—averaging over 4 per cent—in the 1990s,compared to the negative average growth rate over the period 1970-1983 (Table 1). Theaverage inflation rate fell to about 19 per cent in 1998 relative to 122 per cent in 1983.However, poverty remains widespread and it is still predominantly a rural phenomenon.The 1998/1999 Ghana Living Standards Survey (GLSS3) shows that the incidence ofpoverty was about 29 per cent per cent nationwide and 36 per cent in rural areas; theRural Savannah and Rural forest areas account for almost 70 per cent of total poverty inthe country. In fact the incidence of poverty in the rural savannah has increased fromabout 56 per cent in 1991/1992 to over 58 per cent in the 1998/1999 period (Table 2).The need for a closer look at equity issues in Ghana cannot be over-emphasised; about23 per cent of the population live in the rural savannah region and contribute over 40per cent to national poverty. The incidence of extreme poverty is therefore still high.Most of the reduction in national poverty has only been experienced by those close tothe poverty line, particularly those living in the urban areas.
Table 1
Selected macroeconomic indicators for Ghana, 1970-1999
GDPgrowth
Inflation Dom.interestrates
Terms oftrade
Debt: GDP Debt serv.:GDP
Debt serv.:Exports
Aid: GDP
1970–1983 -0.004 50.0 13 160.7 31.1 2.2 10.5 3.0
1984–1991 5.4 28.3 20.3 119.2 58.1 6.1 36.6 8.9
1992 3.9 10.0 19.4 95.6 70.2 4.9 28.2 9.6
1993–1995 4.1 41.4 31.4 95.5 90.9 6.1 25.5 10.2
1996 4.6 46.6 41.6 88.5 88.6 6.9 27.1 9.4
1997 4.2 27.9 42.8 88.5 86.9 7.3 29.8 7.2
1998 4.6* 19.3 34.3 98.1 8.5 31.1
1999 4.4* 13.8* 26.4
Notes: * Data obtained from the government budget statements.The inflation figurequoted from the budget is the end ofperiod rate
2
Table 2:
Poverty incidence by location (Ghana, 1991/1992 and 1998/1999)
Upper poverty line = 900,000 cedis Lower poverty line = 700,000 cedisPoverty Incidence Contribution to
Total PovertyPoverty Incidence Contribution to
Total Poverty3rd Ghana Living Standard Survery – 1991/1992
Accra 22.4 3.6 11.6 2.7Urban 28.3 4.8 14.9 3.6Urban 25.8 5.6 12.9 4.0Urban 37.9 4.0 27.0 4.0Rural 49.7 13.8 30.7 12.2Rural 60.8 35.4 45.1 37.4Rural 72.1 32.8 55.9 36.2
All Urban 27.5 18.0 15.3 14.2All Rural 62.4 82.0 45.8 85.8All Ghana 50.8 100 35.7 100
4 th Ghana Living Standards Survey – 1998/1999Accra 4.7 0.9 2.4 0.6Urban 26.8 5.3 17.1 5.1Urban 24.8 5.9 15.1 5.2Urban 42.2 4.4 29.7 4.5Rural 46.3 16.1 30.1 15.1Rural 41.4 31.6 24.4 26.9Rural 70.5 35.6 58.2 42.6
All Urban 22.8 16.7 14.5 15.4All Rural 51.6 83.3 36.2 84.6All Ghana 42.6 100 29.4 100Source: GOG, 2000
The government’s response to this severe poverty problem is set out in the MediumTerm Development Plan drafted in 1995. In broad perspective, the plan's objective is forGhana to become a middle income country by 2020 (the plan is therefore referred to asVision 2020). To secure faster poverty reduction, Ghana needs to achieve sustainedeconomic growth—certainly more than the 4.4 per cent in 1999. The government alsoneeds to raise public spending on basic services and infrastructure of most value to thepoor—in particular primary education, basic health care, sanitation and safe water andeconomic infrastructure (for example better transport infrastructure in the north). Thetask for policymakers is therefore to ensure that fiscal policy contributes to broad-based(poverty-reducing) economic growth and the direct improvement of humandevelopment indicators.
This paper explores these issues, focusing on the mobilisation of more public revenuethrough tax reform. Ghana needs to raise revenue, in order to achieve higher levels ofdevelopment expenditure (and match aid-financed capital expenditures with sufficientrecurrent spending). But revenues must be mobilised in ways that do not unduly distortincentives, or patterns of private investment. Taxation reform has already proved to behighly controversial in Ghana, the 1995 introduction of VAT failed—after widespreadprotests—and was finally brought into operation in December 1998.
3
In section 1 we look at the trends and structure of public expenditures and revenues aswell as the implications of trends in the fiscal deficit for the macroeconomy. Section 2outlines the political economy of taxation in Ghana paying particular attention to taxreforms after 1983. We also discuss the incidence of petroleum taxes and its implicationfor poverty reduction in the poorer regions of Ghana. We conclude the paper byemphasising the importance of revenue mobilization to Ghana. However, we cautionthat until government expenditure policies become more credible there is a need to givemore consideration to equity issues in taxation in Ghana
1 The fiscal position in Ghana
1.1 Public spending: trends and structure
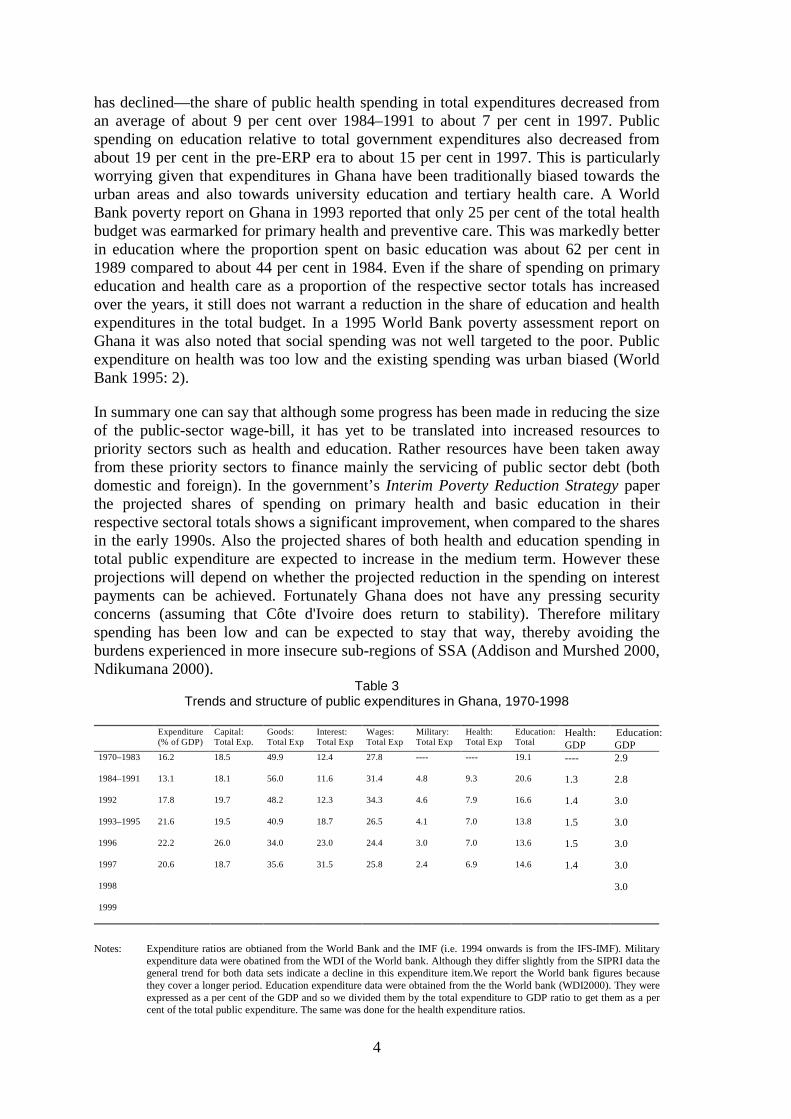
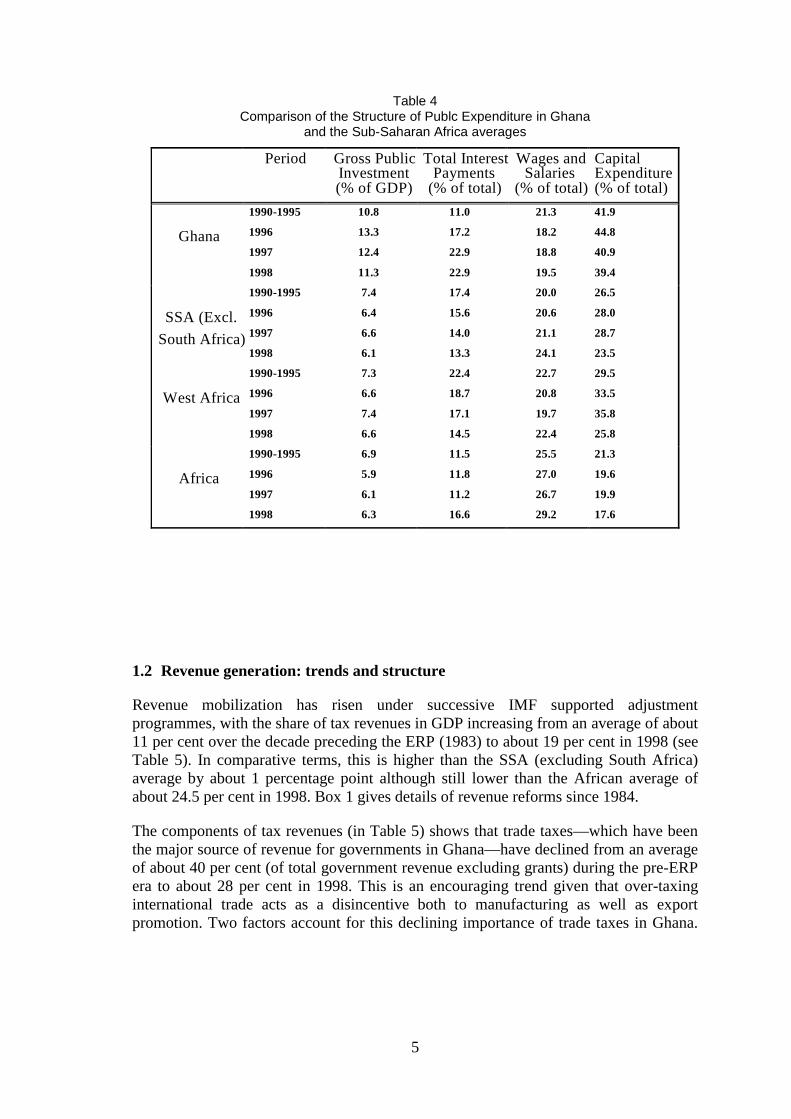
Table 3 shows the structure and trend of recent public spending. Ghana has managed torestore spending in real terms, although little progress has been made in shiftingspending to development and/or pro-poor priorities. Government expenditures ratios(expressed as a per cent of GDP) increased over the post–ERP period; the mostsignificant jump being in 1992 (the year Ghana returned to constitutional rule) when theexpenditure/GDP ratio increased by over 4 percentage points. Comparatively, the shareof public expenditures in GDP was over 4 percentage points higher than the Sub-Saharan average of about 23.2. Moreover, while the average for the sub region seems tohave declined in the 1990s, the same cannot be said for Ghana (Table 4).
A look at the components of public expenditure shows that the public wage billaccounts for the lion's share: it averaged over 27 per cent of the total in the pre-ERPperiod, reaching about 34 per cent in 1992 (Table 3).1 Although the share of wages intotal expenditures has declined in more recent years, it is still higher than the pre-reformaverage. Interest payments have also become an important component of publicspending especially during the 1990s, increasing from about 12 per cent of totalexpenditure in the late 1980s to about 32 per cent in 1997. This is a significant portionof government expenditures, and needs to be given serious attention if faster progress isto be made in reducing poverty. Two reasons account for this increase in interestpayments. First, high domestic interest rates which have averaged over 30 per cent inthe 1990s, significantly more than the early 1980s average of about 13 per cent. Second,Ghana’s external debt ratio of about 87 per cent of GDP in 1997 is almost 3 times theaverage for the pre-reform period (Table 1). This has resulted in the debt-servicing ratioincreasing from an average of about 11 per cent of GDP over 1970-1983 to about 31 percent of GDP in 1998.
Despite the duration of economic reform, the pattern of public expenditures in Ghanastill does not appear to be ‘pro-poor’—or at least it is no more pro-poor than it was inthe pre-ERP era. Although there have been slight increases in both health and educationexpenditures (as a per cent of GDP) their importance relative to other expenditure items
1 As Amoako Tuffouret al. (1996: 7) point out, this is probably an under-estimate since governmenttransfers to subvented institutions include personnel related expenditures excluded from thegovernment wage bill. We expect that this ‘additional public wage bill’ will have decreased in morerecent years with the increased momentum of the divestiture program.
4
has declined—the share of public health spending in total expenditures decreased froman average of about 9 per cent over 1984–1991 to about 7 per cent in 1997. Publicspending on education relative to total government expenditures also decreased fromabout 19 per cent in the pre-ERP era to about 15 per cent in 1997. This is particularlyworrying given that expenditures in Ghana have been traditionally biased towards theurban areas and also towards university education and tertiary health care. A WorldBank poverty report on Ghana in 1993 reported that only 25 per cent of the total healthbudget was earmarked for primary health and preventive care. This was markedly betterin education where the proportion spent on basic education was about 62 per cent in1989 compared to about 44 per cent in 1984. Even if the share of spending on primaryeducation and health care as a proportion of the respective sector totals has increasedover the years, it still does not warrant a reduction in the share of education and healthexpenditures in the total budget. In a 1995 World Bank poverty assessment report onGhana it was also noted that social spending was not well targeted to the poor. Publicexpenditure on health was too low and the existing spending was urban biased (WorldBank 1995: 2).
In summary one can say that although some progress has been made in reducing the sizeof the public-sector wage-bill, it has yet to be translated into increased resources topriority sectors such as health and education. Rather resources have been taken awayfrom these priority sectors to finance mainly the servicing of public sector debt (bothdomestic and foreign). In the government’sInterim Poverty Reduction Strategypaperthe projected shares of spending on primary health and basic education in theirrespective sectoral totals shows a significant improvement, when compared to the sharesin the early 1990s. Also the projected shares of both health and education spending intotal public expenditure are expected to increase in the medium term. However theseprojections will depend on whether the projected reduction in the spending on interestpayments can be achieved. Fortunately Ghana does not have any pressing securityconcerns (assuming that Côte d'Ivoire does return to stability). Therefore militaryspending has been low and can be expected to stay that way, thereby avoiding theburdens experienced in more insecure sub-regions of SSA (Addison and Murshed 2000,Ndikumana 2000).
Table 3Trends and structure of public expenditures in Ghana, 1970-1998
Expenditure(% of GDP)
Capital:Total Exp.
Goods:Total Exp
Interest:Total Exp
Wages:Total Exp
Military:Total Exp
Health:Total Exp
Education:Total
Health:GDP
Education:GDP
1970–1983 16.2 18.5 49.9 12.4 27.8 ---- ---- 19.1 ---- 2.9
1984–1991 13.1 18.1 56.0 11.6 31.4 4.8 9.3 20.6 1.3 2.8
1992 17.8 19.7 48.2 12.3 34.3 4.6 7.9 16.6 1.4 3.0
1993–1995 21.6 19.5 40.9 18.7 26.5 4.1 7.0 13.8 1.5 3.0
1996 22.2 26.0 34.0 23.0 24.4 3.0 7.0 13.6 1.5 3.0
1997 20.6 18.7 35.6 31.5 25.8 2.4 6.9 14.6 1.4 3.0
1998 3.0
1999
Notes: Expenditure ratios are obtianed from the World Bank and the IMF (i.e. 1994 onwards is from the IFS-IMF). Militaryexpenditure data were obatined from the WDI of the World bank. Although they differ slightly from the SIPRI data thegeneral trend for both data sets indicate a decline in this expenditure item.We report the World bank figures becausethey cover a longer period. Education expenditure data were obtained from the the World bank (WDI2000). They wereexpressed as a per cent of the GDP and so we divided them by the total expenditure to GDP ratio to get them as a percent of the total public expenditure. The same was done for the health expenditure ratios.
5
Table 4Comparison of the Structure of Publc Expenditure in Ghana
and the Sub-Saharan Africa averages
Period Gross PublicInvestment(% of GDP)
Total InterestPayments
(% of total)
Wages andSalaries
(% of total)
CapitalExpenditure(% of total)
Ghana
1990-1995
1996
1997
1998
10.8
13.3
12.4
11.3
11.0
17.2
22.9
22.9
21.3
18.2
18.8
19.5
41.9
44.8
40.9
39.4
SSA (Excl.
South Africa)
1990-1995
1996
1997
1998
7.4
6.4
6.6
6.1
17.4
15.6
14.0
13.3
20.0
20.6
21.1
24.1
26.5
28.0
28.7
23.5
West Africa
1990-1995
1996
1997
1998
7.3
6.6
7.4
6.6
22.4
18.7
17.1
14.5
22.7
20.8
19.7
22.4
29.5
33.5
35.8
25.8
Africa
1990-1995
1996
1997
1998
6.9
5.9
6.1
6.3
11.5
11.8
11.2
16.6
25.5
27.0
26.7
29.2
21.3
19.6
19.9
17.6
1.2 Revenue generation: trends and structure
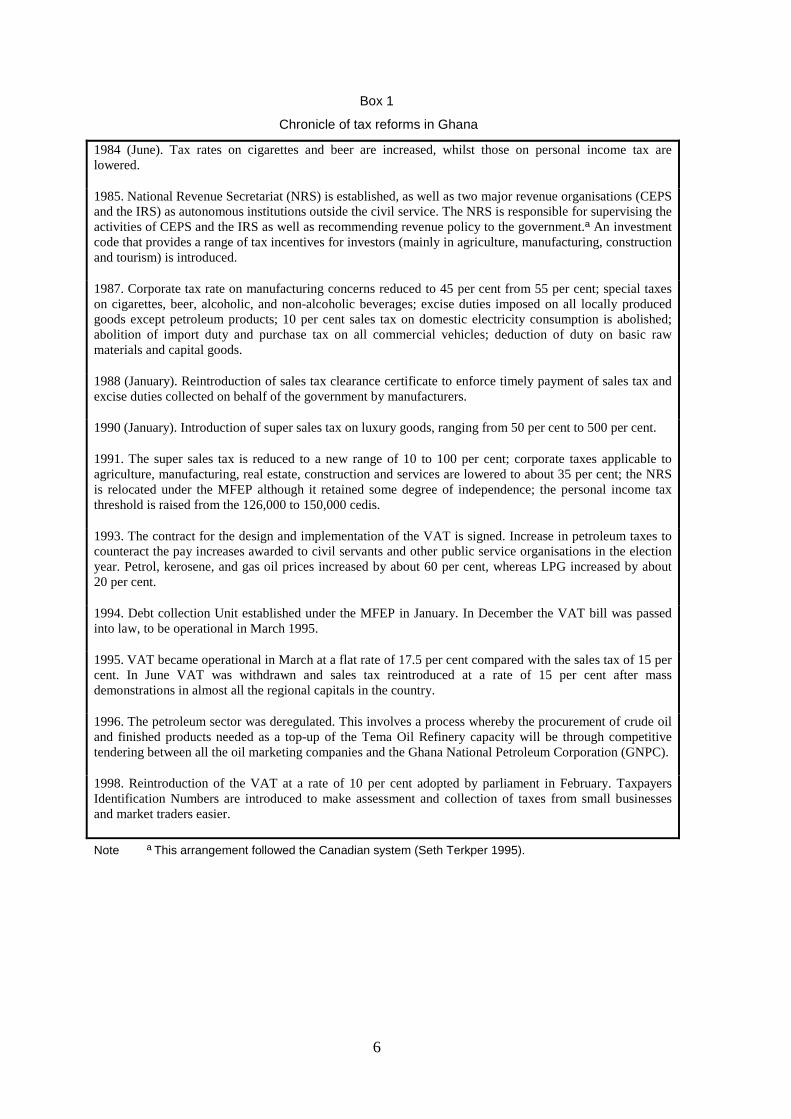
Revenue mobilization has risen under successive IMF supported adjustmentprogrammes, with the share of tax revenues in GDP increasing from an average of about11 per cent over the decade preceding the ERP (1983) to about 19 per cent in 1998 (seeTable 5). In comparative terms, this is higher than the SSA (excluding South Africa)average by about 1 percentage point although still lower than the African average ofabout 24.5 per cent in 1998. Box 1 gives details of revenue reforms since 1984.
The components of tax revenues (in Table 5) shows that trade taxes—which have beenthe major source of revenue for governments in Ghana—have declined from an averageof about 40 per cent (of total government revenue excluding grants) during the pre-ERPera to about 28 per cent in 1998. This is an encouraging trend given that over-taxinginternational trade acts as a disincentive both to manufacturing as well as exportpromotion. Two factors account for this declining importance of trade taxes in Ghana.
6
Box 1
Chronicle of tax reforms in Ghana
1984 (June). Tax rates on cigarettes and beer are increased, whilst those on personal income tax arelowered.
1985. National Revenue Secretariat (NRS) is established, as well as two major revenue organisations (CEPSand the IRS) as autonomous institutions outside the civil service. The NRS is responsible for supervising theactivities of CEPS and the IRS as well as recommending revenue policy to the government.a An investmentcode that provides a range of tax incentives for investors (mainly in agriculture, manufacturing, constructionand tourism) is introduced.
1987. Corporate tax rate on manufacturing concerns reduced to 45 per cent from 55 per cent; special taxeson cigarettes, beer, alcoholic, and non-alcoholic beverages; excise duties imposed on all locally producedgoods except petroleum products; 10 per cent sales tax on domestic electricity consumption is abolished;abolition of import duty and purchase tax on all commercial vehicles; deduction of duty on basic rawmaterials and capital goods.
1988 (January). Reintroduction of sales tax clearance certificate to enforce timely payment of sales tax andexcise duties collected on behalf of the government by manufacturers.
1990 (January). Introduction of super sales tax on luxury goods, ranging from 50 per cent to 500 per cent.
1991. The super sales tax is reduced to a new range of 10 to 100 per cent; corporate taxes applicable toagriculture, manufacturing, real estate, construction and services are lowered to about 35 per cent; the NRSis relocated under the MFEP although it retained some degree of independence; the personal income taxthreshold is raised from the 126,000 to 150,000 cedis.
1993. The contract for the design and implementation of the VAT is signed. Increase in petroleum taxes tocounteract the pay increases awarded to civil servants and other public service organisations in the electionyear. Petrol, kerosene, and gas oil prices increased by about 60 per cent, whereas LPG increased by about20 per cent.
1994. Debt collection Unit established under the MFEP in January. In December the VAT bill was passedinto law, to be operational in March 1995.
1995. VAT became operational in March at a flat rate of 17.5 per cent compared with the sales tax of 15 percent. In June VAT was withdrawn and sales tax reintroduced at a rate of 15 per cent after massdemonstrations in almost all the regional capitals in the country.
1996. The petroleum sector was deregulated. This involves a process whereby the procurement of crude oiland finished products needed as a top-up of the Tema Oil Refinery capacity will be through competitivetendering between all the oil marketing companies and the Ghana National Petroleum Corporation (GNPC).
1998. Reintroduction of the VAT at a rate of 10 per cent adopted by parliament in February. TaxpayersIdentification Numbers are introduced to make assessment and collection of taxes from small businessesand market traders easier.
Note a This arrangement followed the Canadian system (Seth Terkper 1995).
7
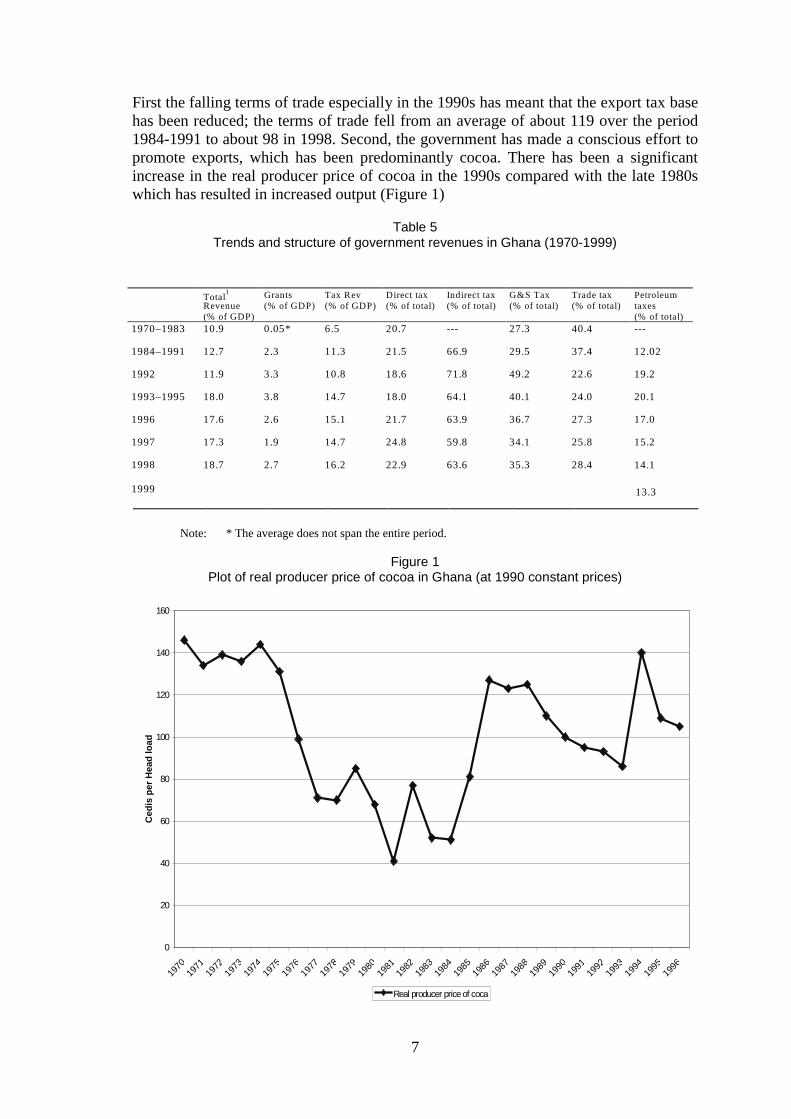
First the falling terms of trade especially in the 1990s has meant that the export tax basehas been reduced; the terms of trade fell from an average of about 119 over the period1984-1991 to about 98 in 1998. Second, the government has made a conscious effort topromote exports, which has been predominantly cocoa. There has been a significantincrease in the real producer price of cocoa in the 1990s compared with the late 1980swhich has resulted in increased output (Figure 1)
Table 5Trends and structure of government revenues in Ghana (1970-1999)
Total1
Revenue(% of GDP)
Grants(% of GDP)
Tax Rev(% of GDP)
Direct tax(% of total)
Indirect tax(% of total)
G&S Tax(% of total)
Trade tax(% of total)
Petroleumtaxes(% of total)
1970–1983 10.9 0.05* 6.5 20.7 --- 27.3 40.4 ---
1984–1991 12.7 2.3 11.3 21.5 66.9 29.5 37.4 12.02
1992 11.9 3.3 10.8 18.6 71.8 49.2 22.6 19.2
1993–1995 18.0 3.8 14.7 18.0 64.1 40.1 24.0 20.1
1996 17.6 2.6 15.1 21.7 63.9 36.7 27.3 17.0
1997 17.3 1.9 14.7 24.8 59.8 34.1 25.8 15.2
1998
1999
18.7 2.7 16.2 22.9 63.6 35.3 28.4 14.1
13.3
Note: * The average does not span the entire period.
Figure 1Plot of real producer price of cocoa in Ghana (at 1990 constant prices)
0
20
40
60
80
100
120
140
160
19701971
19721973
19741975
19761977
19781979
19801981
19821983
19841985
19861987
19881989
19901991
19921993
19941995
1996
Ced
ispe
rH
ead
load
Real producer price of coca
8
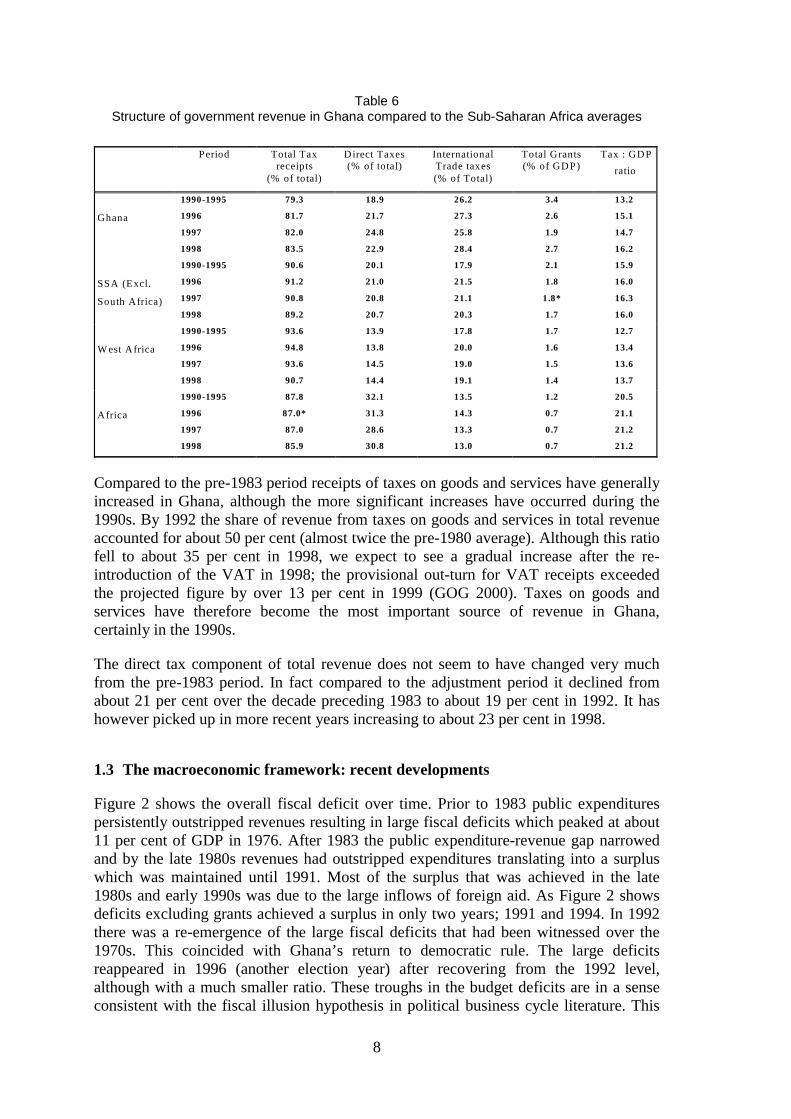
Table 6Structure of government revenue in Ghana compared to the Sub-Saharan Africa averages
Period Total Taxreceipts
(% of total)
D irect Taxes(% of total)
InternationalTrade taxes(% of Total)
Total Grants(% of GDP)
Tax : GDP
ratio
Ghana
1990-1995
1996
1997
1998
79.3
81.7
82.0
83.5
18.9
21.7
24.8
22.9
26.2
27.3
25.8
28.4
3.4
2.6
1.9
2.7
13.2
15.1
14.7
16.2
SSA (Excl.
South Africa)
1990-1995
1996
1997
1998
90.6
91.2
90.8
89.2
20.1
21.0
20.8
20.7
17.9
21.5
21.1
20.3
2.1
1.8
1.8*
1.7
15.9
16.0
16.3
16.0
W est Africa
1990-1995
1996
1997
1998
93.6
94.8
93.6
90.7
13.9
13.8
14.5
14.4
17.8
20.0
19.0
19.1
1.7
1.6
1.5
1.4
12.7
13.4
13.6
13.7
Africa
1990-1995
1996
1997
1998
87.8
87.0*
87.0
85.9
32.1
31.3
28.6
30.8
13.5
14.3
13.3
13.0
1.2
0.7
0.7
0.7
20.5
21.1
21.2
21.2
Compared to the pre-1983 period receipts of taxes on goods and services have generallyincreased in Ghana, although the more significant increases have occurred during the1990s. By 1992 the share of revenue from taxes on goods and services in total revenueaccounted for about 50 per cent (almost twice the pre-1980 average). Although this ratiofell to about 35 per cent in 1998, we expect to see a gradual increase after the re-introduction of the VAT in 1998; the provisional out-turn for VAT receipts exceededthe projected figure by over 13 per cent in 1999 (GOG 2000). Taxes on goods andservices have therefore become the most important source of revenue in Ghana,certainly in the 1990s.
The direct tax component of total revenue does not seem to have changed very muchfrom the pre-1983 period. In fact compared to the adjustment period it declined fromabout 21 per cent over the decade preceding 1983 to about 19 per cent in 1992. It hashowever picked up in more recent years increasing to about 23 per cent in 1998.
1.3 The macroeconomic framework: recent developments
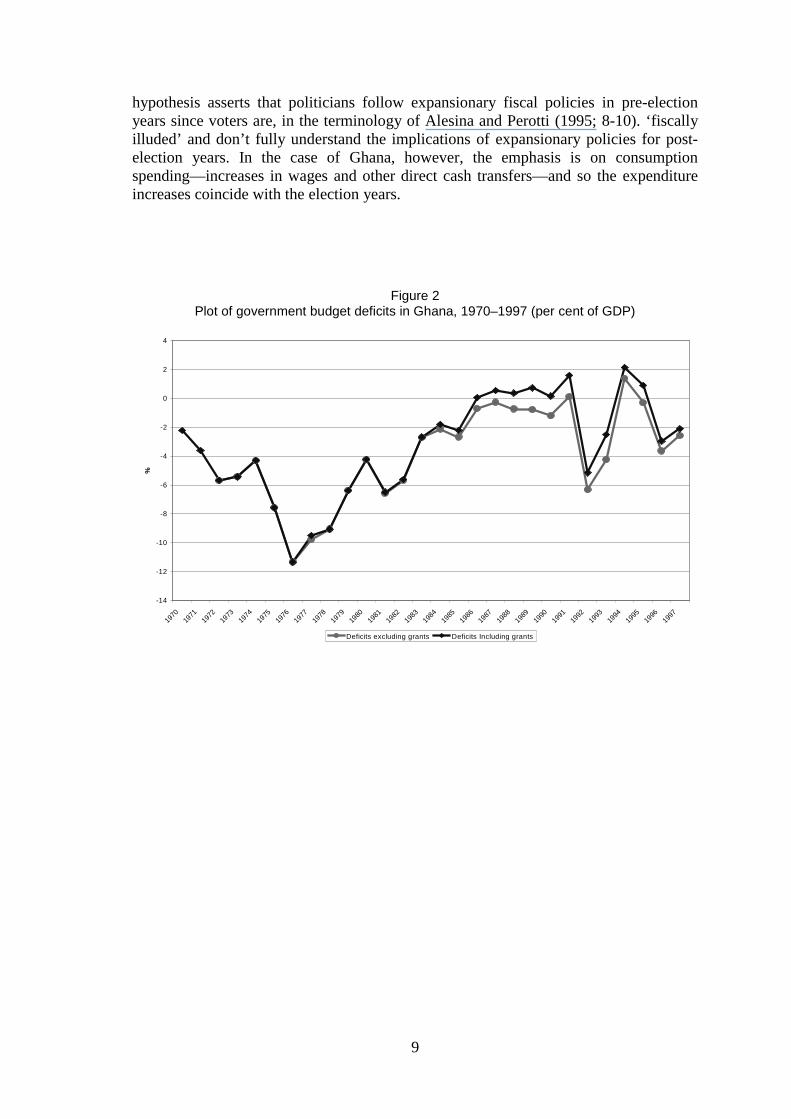
Figure 2 shows the overall fiscal deficit over time. Prior to 1983 public expenditurespersistently outstripped revenues resulting in large fiscal deficits which peaked at about11 per cent of GDP in 1976. After 1983 the public expenditure-revenue gap narrowedand by the late 1980s revenues had outstripped expenditures translating into a surpluswhich was maintained until 1991. Most of the surplus that was achieved in the late1980s and early 1990s was due to the large inflows of foreign aid. As Figure 2 showsdeficits excluding grants achieved a surplus in only two years; 1991 and 1994. In 1992there was a re-emergence of the large fiscal deficits that had been witnessed over the1970s. This coincided with Ghana’s return to democratic rule. The large deficitsreappeared in 1996 (another election year) after recovering from the 1992 level,although with a much smaller ratio. These troughs in the budget deficits are in a senseconsistent with the fiscal illusion hypothesis in political business cycle literature. This
9
hypothesis asserts that politicians follow expansionary fiscal policies in pre-electionyears since voters are, in the terminology of Alesina and Perotti (1995; 8-10). ‘fiscallyilluded’ and don’t fully understand the implications of expansionary policies for post-election years. In the case of Ghana, however, the emphasis is on consumptionspending—increases in wages and other direct cash transfers—and so the expenditureincreases coincide with the election years.
Figure 2Plot of government budget deficits in Ghana, 1970–1997 (per cent of GDP)
-14
-12
-10
-8
-6
-4
-2
0
2
4
19701971
19721973
19741975
19761977
19781979
19801981
19821983
19841985
19861987
19881989
19901991
19921993
19941995
19961997
%
Deficits excluding grants Deficits Including grants
10
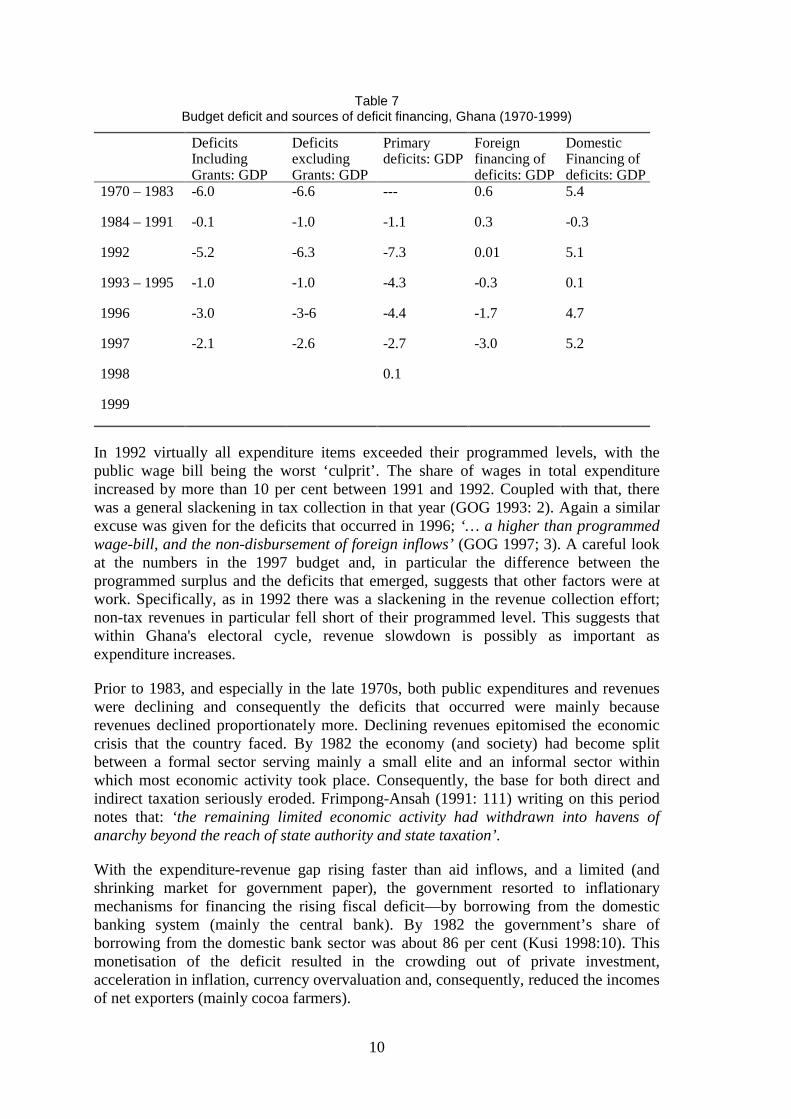
Table 7Budget deficit and sources of deficit financing, Ghana (1970-1999)
DeficitsIncludingGrants: GDP
DeficitsexcludingGrants: GDP
Primarydeficits: GDP
Foreignfinancing ofdeficits: GDP
DomesticFinancing ofdeficits: GDP
1970 – 1983 -6.0 -6.6 --- 0.6 5.4
1984 – 1991 -0.1 -1.0 -1.1 0.3 -0.3
1992 -5.2 -6.3 -7.3 0.01 5.1
1993 – 1995 -1.0 -1.0 -4.3 -0.3 0.1
1996 -3.0 -3-6 -4.4 -1.7 4.7
1997 -2.1 -2.6 -2.7 -3.0 5.2
1998 0.1
1999
In 1992 virtually all expenditure items exceeded their programmed levels, with thepublic wage bill being the worst ‘culprit’. The share of wages in total expenditureincreased by more than 10 per cent between 1991 and 1992. Coupled with that, therewas a general slackening in tax collection in that year (GOG 1993: 2). Again a similarexcuse was given for the deficits that occurred in 1996;‘… a higher than programmedwage-bill, and the non-disbursement of foreign inflows’(GOG 1997; 3). A careful lookat the numbers in the 1997 budget and, in particular the difference between theprogrammed surplus and the deficits that emerged, suggests that other factors were atwork. Specifically, as in 1992 there was a slackening in the revenue collection effort;non-tax revenues in particular fell short of their programmed level. This suggests thatwithin Ghana's electoral cycle, revenue slowdown is possibly as important asexpenditure increases.
Prior to 1983, and especially in the late 1970s, both public expenditures and revenueswere declining and consequently the deficits that occurred were mainly becauserevenues declined proportionately more. Declining revenues epitomised the economiccrisis that the country faced. By 1982 the economy (and society) had become splitbetween a formal sector serving mainly a small elite and an informal sector withinwhich most economic activity took place. Consequently, the base for both direct andindirect taxation seriously eroded. Frimpong-Ansah (1991: 111) writing on this periodnotes that:‘the remaining limited economic activity had withdrawn into havens ofanarchy beyond the reach of state authority and state taxation’.
With the expenditure-revenue gap rising faster than aid inflows, and a limited (andshrinking market for government paper), the government resorted to inflationarymechanisms for financing the rising fiscal deficit—by borrowing from the domesticbanking system (mainly the central bank). By 1982 the government’s share ofborrowing from the domestic bank sector was about 86 per cent (Kusi 1998:10). Thismonetisation of the deficit resulted in the crowding out of private investment,acceleration in inflation, currency overvaluation and, consequently, reduced the incomesof net exporters (mainly cocoa farmers).
11
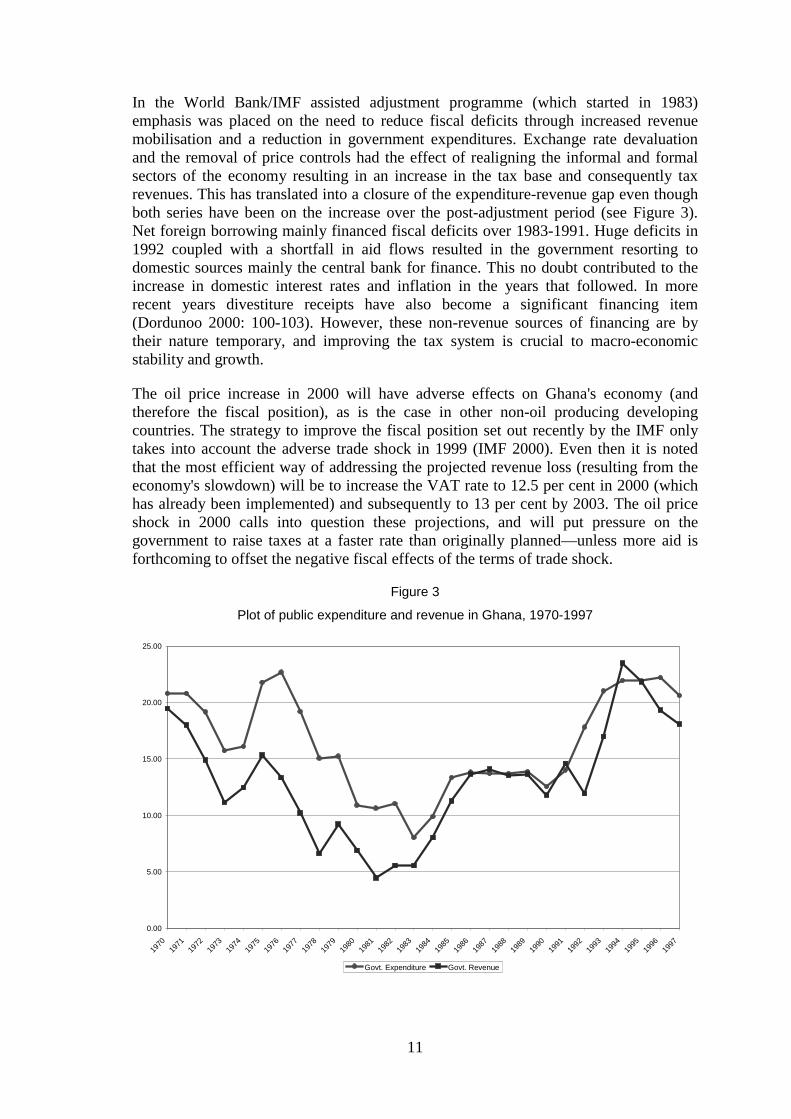
In the World Bank/IMF assisted adjustment programme (which started in 1983)emphasis was placed on the need to reduce fiscal deficits through increased revenuemobilisation and a reduction in government expenditures. Exchange rate devaluationand the removal of price controls had the effect of realigning the informal and formalsectors of the economy resulting in an increase in the tax base and consequently taxrevenues. This has translated into a closure of the expenditure-revenue gap even thoughboth series have been on the increase over the post-adjustment period (see Figure 3).Net foreign borrowing mainly financed fiscal deficits over 1983-1991. Huge deficits in1992 coupled with a shortfall in aid flows resulted in the government resorting todomestic sources mainly the central bank for finance. This no doubt contributed to theincrease in domestic interest rates and inflation in the years that followed. In morerecent years divestiture receipts have also become a significant financing item(Dordunoo 2000: 100-103). However, these non-revenue sources of financing are bytheir nature temporary, and improving the tax system is crucial to macro-economicstability and growth.
The oil price increase in 2000 will have adverse effects on Ghana's economy (andtherefore the fiscal position), as is the case in other non-oil producing developingcountries. The strategy to improve the fiscal position set out recently by the IMF onlytakes into account the adverse trade shock in 1999 (IMF 2000). Even then it is notedthat the most efficient way of addressing the projected revenue loss (resulting from theeconomy's slowdown) will be to increase the VAT rate to 12.5 per cent in 2000 (whichhas already been implemented) and subsequently to 13 per cent by 2003. The oil priceshock in 2000 calls into question these projections, and will put pressure on thegovernment to raise taxes at a faster rate than originally planned—unless more aid isforthcoming to offset the negative fiscal effects of the terms of trade shock.
Figure 3
Plot of public expenditure and revenue in Ghana, 1970-1997
0.00
5.00
10.00
15.00
20.00
25.00
19701971
19721973
19741975
19761977
19781979
19801981
19821983
19841985
19861987
19881989
19901991
19921993
19941995
19961997
Govt. Expenditure Govt. Revenue
12
The government has consistently failed to meet its fiscal targets in recent years, and thiscalls into question the realism of the projections inVision 2020; considerable catch up isneeded to remain on target to meet them. First, as previously noted, the divestiturereceipts are short-term inflows for the government and are therefore expected todwindle in the not too distant future. Second, foreign aid flows—which had been one ofthe principal means for financing the fiscal deficit over most of the adjustment/postadjustment period—have seen a decline in recent years. The aid/GDP ratio in 1997 wasabout 7.2 per cent compared with an average of about 8.9 per cent over 1984–1991(Table 7). The tax effort must be improved if a return to monetisation of the fiscaldeficit and the accompanying inflation are to be avoided. Certainly the introduction ofthe VAT is a welcome step in this direction, although one that was not politically easyto take.
2 The political economy of taxation in Ghana
2.1 The choice of taxation instruments
The dependence on trade taxes has been reduced and this has been compensated for byan expansion of indirect taxes and non-tax revenues. Tax reforms over the post 1983period have mainly been geared towards achieving two goals. The first stage reformsaimed to restore the tax base and strengthen production incentives that had been erodedby persistent over-valuation and the divergence between prices in the official andparallel markets. Accordingly, the foreign-exchange market was liberalized and controlson prices of goods and services were removed. The investment code (passed underPNDC law 116) in 1985 as well as the new minerals law in 1986 provided a wide rangeof incentives for investors in priority sectors of the economy. These incentives includedcompany tax allowances, for example 40 to100 per cent of the cost of capital investmentcould be set against tax (Kusi 1998).
Second-stage tax reforms sought to improve the efficiency of tax administration and totackle issues of equity within the system. In line with these objectives the nationalrevenue secretariat (NRS) was formed in 1986 with ministerial status and charged withthe duty of overseeing the Custom, Excise and Preventive service (CEPS) and theInternal Revenue Service (IRS) and also advising government on revenue measures.2
The formation of the NRS coincided with measures to make the operations of the IRSand CEPS independent of the civil service structure. However, in 1991 the NRS wasrelocated under the Ministry of Finance and Economic Planning but was still allowedsome measure of autonomy (Terkper 1995: 5-7).
In line with steps to improve the administration of indirect taxes, the governmentabolished excise duties on all products except petroleum beverages and tobacco in 1987,and instead increased the sales tax rate from 10 to 25 per cent by 1988. This rate has,however, been systematically reduced in recent years and was 15 per cent by 1998.
2 Both CEPS and the IRS were previously under the Ministry of Finance and Economic Planning.
13
The most radical tax reform in Ghana have been the introduction of the VAT. The VATwas adopted for several reasons. First, it brings Ghana into line with the ECOWASprotocol that makes it mandatory for members to adopt the VAT system by the end of1999 (Osei 2000: 258). Second, this system of taxation was thought to be moreefficient, less burdensome in terms of its incidence, and its overall impact moreequitable than the sales tax (GOG 1994: 32). Despite these advantages, the first attemptat introducing the VAT in 1995 failed due to widespread public opposition. In part, thiswas because of the haphazard manner in which it was implemented reflectinginadequate investment in institutional capacity. Moreover, little attempt was made toeducate businessmen or the public more generally about the rationale for the tax (Osei2000). It was reintroduced in December 1998 and is now operational in Ghana.
Petroleum taxes are very controversial and are one of the tax instruments most hotlydebated in Ghana today. Two reasons account for this. First there has been a persistentincrease in the prices of petroleum products over this period, and this has mostly beenassociated with increases in the petroleum tax. Second, the average Ghanaian doesn'thave much interest in changes in the fiscal deficit, but they do clearly understand theeffects of petroleum tax increases on their cost of living.
Persistent increases in the prices of petroleum products have given rise to speculativeactivity, especially among retailers who have periodically made large windfall gains.The government, in order to get its share of the windfall gains, converted any such gainsthat resulted from a rise in the world price of oil into a specific excise duty on petroleumproducts (Kusi 1998). Petroleum price increases have also been used to discourage itssmuggling to neighbouring countries (GOG 1991: 20). In 1996, attempts to reducespeculation related to petroleum products led to the deregulation of the petroleumsector. This involved a competitive tendering process between the oil marketingcompanies as well as the Ghana National Petroleum Company (GNPC) which waspreviously the only importer of crude oil into the country. The tender process thendetermined the costs (cif) of crude oil, which constitutes about 90 per cent of the cost inthe refinery activity as a whole (GOG 1996: 28-30). In 1998 taxes on petroleumproducts were re-structured so that they consisted of two components; anad valoremcomponent to the ex-refinery price (applicable to all products) and a specific rateapplicable to road transport fuels (mainly gasoline).
Direct taxes have also seen some reforms over the post 1983 period. To reduce evasion,the basis for assessing corporate taxes was changed in the 1980s from profits to income.Corporate tax rates have also been unified and reduced for all sectors; these rates fell toabout 35 per cent by 1993 compared to 55 per cent in 1986 (Kusi 1998). The tax freebracket for personal income tax has been persistently increased whilst marginal rateshave been lowered so as to reduce the average effective rates. Moreover, to reduce taxevasion by individuals shifting incomes between corporate profits and personal taxes,the marginal tax rates of the top brackets on the personal income scale have been madeequal to corporate tax rates.
2.2 Taxation and its incidence
Should the taxation instrument be directed to the objective of poverty reduction? Thestandard argument is that taxation should be directed to raising revenue in the leastdistorting way possible, and that objectives of equity (poverty reduction and, perhaps
14
additionally, the reduction of inequality) should be addressed by other means (forexample pro-poor public spending and targeted safety nets). But is this argumentcompletely applicable to Ghana, or do there exist some second-best arguments formodifying the structure of taxation in order to address equity concerns?
The current IMF view on the distributional effects of adjustment programmes is thatexpanding the tax base for property and income taxes will have positive distributionaleffects (i.e. they are broadly pro-poor) whereas indirect taxes, particularly on goods andservices, tend to have adverse distributional effects (Tanzi 1997). Ghana’s tax reformshave not necessarily followed this pattern. The base for property and income tax hasincreased. However, for indirect taxes both the base and the rate have been increased.
As we noted earlier, petroleum taxes have become particularly important in the categoryof indirect taxes since they provide a convenient way of raising revenue (Younger 1996:234). For instance in 1993 the ex-pump prices of petroleum products increased by about60 per cent.3 The reason for the increase as quoted in the budget was as follows:
government revenue will have to be increased in order to pay the presentwage-bill, and the only immediate way for this to be done is to increasethe prices of petroleum products. (GOG 1993:8)
Younger (1996) analyses the incidence of taxes in Ghana using household data andfinds petroleum taxes to be progressive but taxes on alcoholic beverages and tobaccoproducts regressive. He consequently argues that complaints about gasoline priceincreases falling disproportionately on the poor are unfounded (Younger 1996: 251).4 Iftax incidence analysis alone is used to make inferences about welfare then the policyrecommendation implied by Younger’s conclusion will be valid. However, taxincidence analysis of this kind only looks at the first-order impact and this may not beappropriate in welfare analysis. Indirect taxes may have spillover effects that may not becaptured by incidence analysis alone. We attempt, in a veryad hocway, to trace someof these spillover effects of a petroleum price rise.
Say we divide households in Ghana into five groups: public servants,5 transport owners,traders, cocoa farmers and other food crop and livestock farmers. The last groupproduce for domestic consumption and basically represents the poorest households inGhana. With a rise in price of petroleum products all the households are affected by theresulting increase in the cost of transportation and its consequent inflationary effects. Ofcourse this will also vary both within- and between-groups; for instance within thegroup labelled public servants, the petroleum tax is likely to be regressive when just theconsumption of transport services is considered.6 Our main interest here is to do with
3 The only exception was the price of liquefied petroleum gas (LPG) which increased by 20 per cent.Even then, the average for all petroleum products was over 50 per cent; Calculations are based on the1993 budget statement.
4 This analysis is based on consumption of gasoline and transport services.
5 This can be defined to include those with white- and blue-collar jobs.
6 Some of those in the upper echelon of this group either get free fuel or get petrol and car maintenanceallowance from their employers, usually the government.
15
what happens to those in the last group (food crop and livestock farmers) relative to theother groups when petroleum prices increase.
Most of the farmers that fall in this category don’t sell their produce in the majormarkets where they are most likely to benefit from price increases. Most of theirproduce is sold to market traders (i.e. the ‘middlemen’) who have some power overfarmgate prices since the supply of these goods is highly inelastic. It is not uncommonfor the middlemen to pay lower prices to the farmers, citing increases in transport costsas an excuse. The implication of this will be that whereas all households are likely to beaffected by the increased transport costs and inflation, the rural poor in Ghana are inaddition likely to experience a decline in nominal income. For these households thisdecline could be substantial and can consequently lead to increased poverty within thatgroup. Tax incidence analysis will not capture these adverse spillover effects on thefood crop and livestock farmers.
The conclusion of the above analysis—that such a broad based tax may have adversedistributional effects—is consistent with Colatei and Round (2000) who find, using aSAM-based CGE model, that structural adjustment may not be benefiting all segmentsof Ghanaian society. More specifically, they find that poverty in the savannah farmhouseholds (the poorest group in Ghana) cannot be totally eradicated using transfersfinanced from an indirect tax imposed on the other households.7 It must be emphasisedthat in the CGE analysis although all the resources generated from indirect taxation aretransferred to the targeted households, poverty is still not eradicated within that group.
Given the trends and structure of public expenditures in Ghana (which as we saw havebeen disappointing from a poverty reduction perspective), these regular increases inpetroleum taxes do not seem to have been returned to the poor in the form of betterpublic spending. Certainly the argument that the non-poor in society consume moreenergy products—and therefore a ‘first-order incidence analysis’ of an increase inpetroleum taxes will be progressive—cannot be discarded. However the indirect effectsof these taxes on the poor could be substantial and may actually worsen the distributionof income. Therefore further increases in petroleum taxes will be justified only if theextra resources generated are channelled towards specific pro-poor programmes.
3 Conclusions
This paper has explored some of the hard choices that Ghana's policy makers face ifthey are to generate sufficient revenues to achieve public spending targets, includingthose for pro-poor spending. We also discussed progress to date in public expendituremanagement. The following observations were made: First, by and large, publicexpenditures in Ghana over the last decade have not been any more pro-poor than theywere in the 1970s—despite all the rhetoric. The planned expenditure policies in Ghana’sVision 2020seek to reverse this trend. However, this can only be achieved if the publicdebt problem is brought under control and the share of interest payments in totalexpenditure is reduced, and more revenue is mobilized.
7 The authors calculate the amount of transfers necessary for eradication of poverty for the differentgroups of households.
16
Second, the structure of taxation in Ghana is moving away from heavy reliance on tradetaxes to indirect taxes on goods and services. This is a step in the right direction asdependence on these taxes has been found to increase the degree of instability ingovernment tax revenues (Bleaneyet al. 2000).
Third, the trend in the fiscal deficit in Ghana over the 1990s is starting to follow anelectoral cycle. Admittedly, this observation is based on a small sample (only twoelections to date). Nevertheless it is almost certain that Ghana, like many developed anddeveloping countries that have competitive multi-party elections, will exhibit anelectoral cycle in its fiscal variables (including a slackening in the tax collection effortin addition to the expansion of public expenditures in election years). The first electionwas certainly accompanied by a serious deterioration in fiscal control, the second lessso. We can hypothesise that in new democracies where democratization is sustained, theamplitude of the electoral cycle in fiscal variables will decline over time as institutionsthat act as agents of restraint are developed, and as politicians begin to see that it is intheir long-term political interest to avoid excessive manipulation of expenditures ortaxation for party-political purposes.
In summary, this paper has shown that Ghana must raise revenues if it is to achieve thesustained high growth that is necessary for poverty reduction. However revenuegeneration considerations should take issues of equity into account. This is particularlyso given that expenditure patterns do not appear to have been geared towards tacklingpoverty reduction. It is heartening to note that the interim poverty reduction strategy ofthe government in theVision 2020document (endorsed by both the IMF and the WorldBank), emphasises the need to deepen access to basic social services and infrastructureavailable to the poor, but it is clearly proving very difficult for the government todeliver on these promises (a situation aggravated by the recent and adverse terms oftrade shock).
To end, we make a couple of concluding points. First, given the importance of the roadtransport sector to the Ghanaian economy, it is possible that increases in petroleumtaxes may hurt the poor, more than a first-order incidence analysis suggests. In order toachieve the pro-poor growth envisaged in theVision 2020, there is a need to raiserevenues to finance projected expenditures. Expenditure policies have, however, notbeen particularly credible in Ghana especially in the 1990s, because of both internal andexternal shocks. Therefore, further increases in petroleum taxes may only be justified ifthe generated revenue is earmarked as additional spending on specific pro-poorprogrammes over and above the already projected spending. In other words, policymakers should give more consideration to equity issues in taxation if the objective ofbroad-based growth is to be realised.
Second, investment in democratic institutions is important to tax reform, since taxpayers will be unwilling to comply with tax law unless there is some mechanism forensuring that their money is used legitimately. Historically, effective tax systems haveresulted from the exchange of resources for institutions: governments have only beenable to sustain their tax effort if they provide effective institutions (such as law andorder), including limitations on their own powers (Mahon 2000). Ghana has advancedwith regard to both democratisation and the construction of appropriate fiscalinstitutions, which are now more transparent. Nevertheless, much more needs to bedone, including the possibility of giving the legislature more power. This may beinconsistent with findings in the political business cycle literature, where countries with
17
‘hierarchical’ budgetary procedures are noted to achieve more fiscal discipline.However, for a country such as Ghana—in which democracy is still an infant—it maybe better to give the legislature more powers to act as a check on the executive untilsuch time as the budget process becomes truly transparent.
References
Adam, C.S. and S.A. O'Connell (1999). ‘Aid, taxation and development in Sub-SaharanAfrica’. Economics and Politics, 11 (3): 225-253
Addison, T. (2000). The Political Economy of Fiscal Policy in Low-Income Countries.Paper prepared for the UNU/WIDER project meeting on ‘New Fiscal Policies forGrowth and Poverty Reduction’, Helsinki, 17-18 November 2000. Helsinki:UNU/WIDER.
Addison, T. and S.M. Murshed (2000). Fiscal Policy in Conflict and Reconstruction,Paper presented at the UNU/WIDER project meeting on ‘Why Some CountriesAvoid Conflict While Others Fail’, Helsinki 20-21 October 2000. Helsinki:UNU/WIDER.
Alesina, A and R. Perotti (1995).The Political Economy of Budget Deficits, IMF StaffPapers, Vol. 42, Number 1, pp. 1-31
Amoako-Tuffour, J. (1999). ‘Ghana government fiscal deficits: how small or howlarge?’Journal of African Economies, Vol. 8, pp. 1-30.
Amoako-Tuffour, J., J.S.D.Brean and C. Youngblood (1996).Public Finances in Ghana(1983-1995): Trends and Issues,Centre for economic Policy Analysis (CEPA)Research/Working Paper, August 1996.
Aryeetey, E., Harrigan, J. and Nissanke, M. (2000).Economic Reforms in Ghana: TheMiracle and the Mirage. Oxford: James Curry.
Bleaney, M., N. Gemmil and D. Greenaway, (2000). ‘Tax revenue instability in Sub-Saharan Africa: causes and consequences’, in Bevanet al. (eds),Trade and FiscalAdjustments in Africa.London: Macmillan.
Bolnick, B. and J. Haughton (1998).Tax Policy in Sub-Saharan Africa: Examining theRole of Excise Taxation. African Economic Policy, Discussion Paper Number 2.
Colatei, D., and J.I. Round (2000).Poverty and Policy: Experiments with a SAM-basedCGE Model for Ghana. Paper presented at the XIII International Conference onInput-Output Techniques, 21–25 August, Macerato, Italy
Cowen, M. Laakso, L. Virtanen, S. and Yrjolä, R. (2000).Testing for Political BusinessCycles in Africa.Processed, University of Helsinki, Department of Political Science.
Dordunoo, C.K., (2000). ‘Fiscal trends: 1970-1995’, in Aryeetey, E., J. Harrigan, andM. Nissanke (eds),Economic Reforms in Ghana: The Reality and Mirage, pp. 88-144. London: James Curry
Frimpong-Ansah, J.H., (1991).The Vampire State in Africa: The Political Economy ofDecline in Ghana.Trenton: African World Press.
18
Government of Ghana (1991).The Budget Statement and Economic policy of theGovernment of Ghana for the Financial year 1991. Accra: Ghana PublishingCorporation.
Government of Ghana (1993).The Budget Statement and Economic policy of theGovernment of Ghana for the Financial year 1993. Accra: Ghana PublishingCorporation.
Government of Ghana (1994).The Budget Statement and Economic policy of theGovernment of Ghana for the Financial year 1994.Accra: Ghana PublishingCorporation.
Government of Ghana (1995).The Budget Statement and Economic policy of theGovernment of Ghana for the Financial year 1995.Accra: Ghana PublishingCorporation.
Government of Ghana (1996).The Budget Statement and Economic policy of theGovernment of Ghana for the Financial year 1996.Accra: Ghana PublishingCorporation.
Government of Ghana (1997).The Budget Statement and Economic policy of theGovernment of Ghana for the Financial year 1997.Accra: Ghana PublishingCorporation.
Government of Ghana (1998).The Budget Statement and Economic policy of theGovernment of Ghana for the Financial year 1998.Accra: Ghana PublishingCorporation.
Government of Ghana (1999).The Budget Statement and Economic policy of theGovernment of Ghana for the Financial year 1999.Accra: Ghana PublishingCorporation.
Government of Ghana (2000a).The Budget Statement and Economic policy of theGovernment of Ghana for the Financial year 2000.Accra: Ghana PublishingCorporation.
Government of Ghana (2000b).Interim Poverty Reduction Strategy Paper: 2000-2002.Ministry of Finance and Economic Planning, June.
IMF (2000).Ghana: Selected Issues. Staff Country Report, Number 2.
Kusi, N.K. (1998).Tax Reform and Revenue Productivity in Ghana.AERC ResearchPaper, No. 74, March Edition.
Mahon, J.E. (2000).Globalization and the Exchange of Institutions for Resources.Processed, Department of Political Science, Williams College. Paper presented at the18th World Congress of the International Political Science Association, Quebec,August 1-16 (www.williams.edu/PoliSci/mahon/index.www.html).
Ndikumana, L. (2000).Fiscal Policy, Conflict and Reconstruction in Burundi andRwanda. Paper prepared for the UNU/WIDER project on ‘New Fiscal Policies forGrowth and Poverty Reduction’, published as WIDER Discussion Paper 2001/62,Helsinki: UNU/WIDER.
Osei, P (2000). ‘Political liberalisation and the implementation of value added tax inGhana’.The Journal of Modern African Studies, Vol. 28, Number 2, pp. 255-278.
19
Tanzi, V., (1997).Asia and the IMF: The changing Role of Fiscal Policy in Fund PolicyAdvice. IMF Seminar Paper, September.
Terkper, S.E. (1995).Ghana Tax Administration Reforms (1985-1993), HarvardInstitute for International Development, Development Discussion Papers.
World Bank (1993). 2000 and Beyond: Setting the Stage for Accelerated Growth andPoverty Reduction. World Bank Poverty Assessment Summaries.
World Bank (1995).2000 and Beyond: Setting the Stage for Accelerated Growth andPoverty Reduction.World Bank Poverty Assessment Summaries.
Younger, S. (1996). ‘Estimating tax incidence in Ghana using household data’, in D.E.Sahn (ed.),Economic Reform and the Poor: 231-253. Oxford: Clarendon Press.