Tax rates and tax evasion: An empirical analysis of the long-run aspects in Italy
23
Electronic copy available at: http://ssrn.com/abstract=1417449 Working Papers N°1 - Gennaio 2009 Ministry of Economy and Finance Department of the Treasury Tax rates and Tax evasion: an Empirical Analysis of the Structural Aspects and Long-Run Characteristics in Italy di Bruno Chiarini, Elisabetta Marzano and Friedrich Schneider ISSN 1972-411X
-
Upload
unipartenop -
Category
Documents
-
view
0 -
download
0
Transcript of Tax rates and tax evasion: An empirical analysis of the long-run aspects in Italy
Electronic copy available at: http://ssrn.com/abstract=1417449
Working Papers N°1 - Gennaio 2009
Ministry of Economy and Finance
Department of the Treasury
Tax rates and Tax evasion: an Empirical Analysis of the Structural Aspects and
Long-Run Characteristics in Italy di Bruno Chiarini, Elisabetta Marzano and Friedrich Schneider
ISSN 1972-411X
Electronic copy available at: http://ssrn.com/abstract=1417449
Working Papers
The working paper series is aimed at promoting circulation and dissemination of working papers produced in the Department of the Treasury (DT) of the Italian Ministry of Economy and Finance (MEF) or presented by external economists on the occasion of seminars organised by MEF on topics of institutional interest of DT, with the aim of stimulating comments and suggestions. The views expressed in the working papers are those of the authors and do not necessarily reflect those of MEF and DT.
Copyright: © 2009, Bruno Chiarini, Elisabetta Marzano and Friedrich Schneider. The document can be downloaded from the Website www.dt.tesoro.it and freely used, providing that its source and authors are quoted.
Editorial Board: Lorenzo Codogno, Mauro Marè, Libero Monteforte, Francesco Nucci
Organisational coordination: Marina Sabatini

3
Tax rates and Tax evasion: an Empirical Analysis of the Structural Aspects and Long-Run
Characteristics in Italy 1
Bruno Chiarini (*), Elisabetta Marzano (**) and Friedrich Schneider (***)
Abstract
By using official time series of the Italian evaded VAT base (Ministry of Finance) for the period 1980-2004 we investigate empirically the long-run characteristics of tax evasion and the relationship with the tax burden. We focus on three important issues not analyzed so far. First, using different measures of aggregate economic activity as reference variables in estimating the average tax burden, we investigate the size and dynamics of the over-burden traceable back to tax evasion. Second, exploiting cointegration techniques, we quantify the elasticity between tax evasion and the average tax rate in Italy. We then comment on the complex dynamic interaction between tax burden and tax evasion, to ascertain whether in the Italian experience there is evidence for any “vicious circle” between them.
JEL Classification: H30; H26; O17; C32. Keywords: tax evasion, VAT evasion, effective tax rate, apparent tax rate, VECM.
(*) Corresponding Author: Prof. Dr. Bruno Chiarini, Dipartimento di Studi Economici, Università "Parthenope", Via Medina, 40, 80133 Napoli, Italy, [email protected]. (**) Dr. Elisabetta Marzano, Dipartimento di Studi Economici, Università "Parthenope", Via Medina, 40, 80133 Napoli, Italy, [email protected] (***)Prof. Dr. Dr.h.c.mult. Friedrich Schneider, Johannes Kepler University of Linz, Department of Economics Altenbergerstrasse 69, A-4040 Linz-Auhof, AUSTRIA, E-mail: [email protected] 1 We are indebted to Douglas Hibbs, Eelke de Jong, Stefano Pisani, Mauro Marè, Roberto Golinelli and Roberta Zizza for their helpful comments. We thank participants at the 2008 Annual Meeting of the European Public Choice Society. Bruno Chiarini and Elisabetta Marzano gratefully acknowledge the funding from PRIN 2006, “Implicazioni macroeconomiche e di politica economica dell’economia sommersa e dell’evasione fiscale”. Elisabetta Marzano also thanks the Regione Campania for funding under Progetto 10 Idee, LR 13/2004. Most of this material has been discussed within the Study Centre of the Revenues Agency.
4
Contents
1 INTRODUCTION .............................................................................................................. 5
2 ITALIAN TAX EVASION AND THE TAX BURDEN ........................................................ 6
2.1 TIME SERIES DATA: TAX EVASION ...................................................................................... 6 2.2 TIME SERIES DATA: THE TAX BURDEN ................................................................................ 8
3 QUANTIFICATION OF THE TAX BURDEN EFFECT ON TAX EVASION ................... 10
3.1 THE STATISTICAL MODEL ............................................................................................... 11 3.2 TO WHAT EXTENT IS THE TAX BURDEN A DETERMINANT OF TAX EVASION? .......................... 12
3.2.1 long-run equilibrium and error correction adjustment .............................................. 12 -“Long-run elasticities” ................................................................................................................. 12 -Adjustment coefficients and dynamics ....................................................................................... 13 3.2.2 Impulse response analysis .................................................................................. 13 -The evader equilibrium: an assessment .................................................................................... 15 3.2.3 Variance decomposition analysis ....................................................................................... 16
4 CONCLUDING REMARKS ............................................................................................ 16
REFERENCES ............................................................................................................................ 18
APPENDIX .................................................................................................................................. 22
FIGURES
Fig. 1 VAT undeclared tax base (solid line) and long-run trend (dashed line) ........................ 8 Fig. 2 Figure 2: Average Tax Rates in Italy ............................................................................. 9 Fig. 3 Impulse response (Cholesky one standard innovation) .............................................. 14 Table 1 Variance decomposition .......................................................................................... 16 Table 2 Stationarity test ADF: Unreported VAT base, Tax Rates and Tax gap. .................. 22
5
1 INTRODUCTION
The tax burden is viewed, in both empirical and theoretical studies, as the main determinant of tax evasion and the shadow economy. “Cheating the government” is a thriving practice in most countries, and in particular in Italy where latest official estimates indicate a figure of about 200 billion euro for the value added generated by the underground economy (ISTAT, 2006).
Although the determinants of tax evasion have been extensively examined elsewhere2, the lack of reliable time series has prevented the characteristics of this phenomenon being investigated over a long period.
In this paper, by exploiting a new yearly time series estimate of the non-reported Value Added Tax base (Marigliani and Pisani, 2007), we get round this shortcoming. This estimate is extremely important, not only because it provides a long enough time series of tax evasion, but also because it allows the size of the underground production to be estimated. Actually, evading VAT means under-reporting production, labour activities and revenues. Hence, the time series of the concealed VAT Base, covering the period 1980-2004, can be used as a proxy for the size of “unreported production”. 3
Looking at the available evidence for Italy, we focus on three key issues, hitherto not analyzed. First, using univariate analysis, we investigate the size and dynamics of two tax rates: the average “apparent” tax rate, where tax revenues are compared with the total GDP (reported and concealed), and the “effective” tax rate, where tax receipts are compared with the GDP net of evaded VAT base. The difference between the two tax rates is a rough measure of the over-burden gap for compliant taxpayers, providing interesting insights to understand the impact of tax evasion in terms of effective fiscal pressure. Second, we investigate the long-run characteristics of tax evasion in Italy, and, using multivariate cointegration models, we check for the existence of a long-run equilibrium relationship between the official average tax burden and the estimated tax evasion. This allows us to get a measure of the long run elasticity of tax evasion to official tax rates and vice versa 4 . Third, taking into account the equilibrium relationship, we quantify the sign and intensity of the complex dynamic interaction between taxation and tax non-compliance. This allows us to ascertain whether in the Italian experience there is evidence for any vicious circle between tax rates and tax evasion.
The paper is organized as follows. Section 2 shows magnitudes and long-run features of
2 For instance, see the Economic Journal Symposium on The Hidden Economy (1999) and Cowell (1990a; 1990b) for a survey of the models. Many of these models are based on the tax-evader-as-gambler model first analyzed by Allingham and Sandmo (1972). However, in order to overcome some of the shortcomings of this approach, another stream of literature focuses on different determinants, for instance institutional or governance quality, as well as social norms (Torgler and Schneider, 2006; 2007) or law abidance (Orviska and Hudson, 2003; Orviska et al., 2006). For a study of the phenomenon in Italy, see, amongst others, Alesina and Marè (2005), Bordignon and Zanardi (1997), Cannari and D’Alessio (2007), the papers in Guerra and Zanardi (2007), the ISAE Report (2006) and the papers on the Italian Revenues Agency web site: http://www1.agenziaentrate.it/ufficiostudi/. 3 We are aware that part of VAT evasion is generated by VAT “carousel frauds”, which do not necessarily imply other forms of tax evasion, and, in particular, the under-reporting of production. In this sense, our proxy for unreported production might be, to some extent, over-estimated. 4 Of course in discussing our results we should keep in mind that we are dealing with: a) estimates of unobservable data; b) aggregate realizations rather than observable or theoretical behaviours. Spanos (1999), Lutkepohl and Kratzig (2004), amongst others, stress these aspects with relation to time series.
6
the time series for tax evasion and tax rates. The univariate statistical characteristics of the series are discussed, with particular attention to the gap between the two tax rates, stressing their implications for the analysis of the fiscal overburden. Section 3 reports on the stationary relationship between the “hidden” variable and the average tax rate. The long-run parameters are discussed, stressing the implications for the dynamic adjustment to the long-run equilibrium. The section ends with the impulse response and variance decomposition analysis of the system. Section 4 concludes the article.
2 ITALIAN TAX EVASION AND THE TAX BURDEN
Several estimates of the underground economy have been carried out in Italy5. They should only be taken as indicative, stressing the importance the irregular economy may assume. The elusive nature of the phenomenon and the use of very different estimation methods have provided striking variability in assessments of hidden activities 6 . The National Institute of Statistics (ISTAT, 2005), consistently with international standards and, in particular, with the 1993 System of National Accounts, estimated and regularly updated a time series of the size of the underground economy from 1992 until 2003, showing an increasing trend during the period considered, rising from 15.8% of the total GDP in 1992 to 16.7% in 2003. Italian National Accounts, and, in particular GDP and Employment statistics, address the issue of exhaustiveness, measuring productive activities that are non-observed because they are part of the underground economy. The compilation method for covering underground activities relies on a complex procedure, whose main steps can be summarized as follows: i) the correction for underreporting by small and medium sized firms; ii) the use of labour input method (pioneered by ISTAT during the 1980s); iii) the cross check of the supply and demand aggregates by branch of economic activity.
Several authors have attempted conservative estimates of tax evasion based on these official estimates for the underground economy, showing that the phenomenon accounts for about 8-10 percent of GDP.7
2.1 Time series data: tax evasion
Data on tax evasion in Italy are currently provided by the Revenue Agency of the Ministry of Finance, which has recently estimated a yearly time series of the non-reported Value Added Tax base. This issue is crucial, since according to the data constructors, Marigliani and Pisani (2007), evading VAT means under-reporting production, labour activities and revenues. Hence, this time series estimate for the period 1980-2003 can be used as a proxy for the size of underground production. The approach for assessing declared and undeclared VAT taxable amounts, as well as the corresponding income, is based on a comparison of actual values, derived mainly from VAT returns, and theoretical ones, derived from National Account
5 See Bovi (1999), Zizza (2002), Dell’Anno (2003), and Dell’Anno and Schneider (2003). 6 For instance, Chiarini and Marzano (2004); Busato, Chiarini and Di Maro (2005). 7 See for instance, Busato, Chiarini and Rey (2005).
7
macroeconomic data. The latter aggregates are estimated selecting the national account expenditure categories that comprehensively cover VAT liabilities: i) household spending and non-profit institutions serving household final consumption expenditure; ii) central government current and capital expenditure; iii) exempt sector intermediate consumption; iv) other expenditure which incurs non-refundable VAT. For each of the listed items the most appropriate data source is chosen in order to respect VAT rules.
The size of the unreported VAT base is shown in Figure 1, both in absolute terms and as a share of the total tax base. In addition, together with the estimated series we also display their long-run trends, using filter methodology suggested by Hodrick and Prescott (1997).
The size of the evaded VAT Base ranges between 170 to 240 billion euros (real value), whereas VAT evasion in percentage terms ranges from a peak of 37% in the late 1980s to a minimum of 27% ten years later. The two series display considerable volatility, particularly during the second decade of the observed sample. The first half of the 1990s was characterized by considerable political instability and a fragmented approach to the fiscal policy, whereas during the period 1996-2000 a more stable political framework allowed the start of a process structurally reforming tax collection (Giannini, Guerra 2000). 8 The two downward peaks observed in 1994 and 1999 are both the turning points of an economic recession.9 They are also affected by a process of institutional reform. In particular, during the period 1991-93, some minor reforms were introduced, namely the minimum tax and “congruity” coefficients. It is also remarkable that the upward peak registered in VAT evasion in 1996 occurred after the tax amnesty (concordato fiscale) granted in 1994, whose receipts were mainly collected in 1995. The sharp reduction in VAT evasion observed during 1996-99 can be explained by structural innovations, such as the tax on line system (fisco telematico) and the new tax returns filing system (Unico form) introduced in 1998, together with Sector Studies (Studi di Settore), procedures midway between audit selection mechanisms and methods of presumptive (normal) taxation (see Santoro 2007b). These two interventions, together with a reorganization process of the fiscal authority started in 1997, contributed to improve the efficiency of tax administration, indirectly increasing the effectiveness of auditing. The new upward pattern registered in the last years of the sample can be explained by a learning process, with tax evaders being “more skilled” with respect to the new tax collection procedures, and perhaps also by an indirect effect due to the amnesties granted in 2002. What is more interesting is the different long-run pattern of the two series. Although the graph displayed in Figure 1 show an increasing trend for the unreported VAT base measured in millions of euro, equally clearly it appears that the share of VAT non-compliance decreases, with a drop in the two decades of approximately five percentage points.
As to the univariate properties of these two series, in the appendix it is demonstrated that they are both integrated of order 1, i.e. tax evasion is a random walk, though with a deterministic trend. 10
8 More insights about the reform may be found in the special issue of Politica Economica (2002). 9 The GDP cycle is calculated using the Hodrick Prescott filter. When considering the log of the GDP at constant prices the bottom of the cycle is 1993 (-1.8%), while 1994 is the downward peak of the GDP cycle at current prices (-2.7%). 10 It is essential to identify the non-stationary nature of our series in order to avoid problems of spurious regressions when interested in calculating the elasticity of tax evasion to fiscal pressure.

8
Fig. 1 VAT undeclared tax base (solid line) and long-run trend (dashed line)
Evaded VAT as a share of total VAT base Evaded VAT base in millions of euro
Given the nature of the concealed VAT base, which can be considered as a measure of the underground production, we are able to provide an estimate of the regular production. Actually, Italian national accounts accomplish the requirement of exhaustiveness, as stated by OECD and Eurostat, including the value added generated in the underground economy. Therefore, subtracting estimated VAT evasion from the official GDP (national accounts), we get the regular production. This way of dealing with the aggregate market GDP may be considered to be rather crude. However, the literature provides empirical measures of the hidden economy that vary enormously in terms of methodology employed, reliability of the data and magnitudes estimated. Here we try to overcome many of these weaknesses using the official data available, and, without “heroic assumptions” 11, we explicitly relate the share of national production or income deliberately concealed from observation to the VAT revenues not reported to the tax authorities (i.e. produced in underground activities). These two measures may have much in common, since VAT tax evasion may be considered an important device that helps to conceal the tax base of other taxes and hence shadow activities. This is a necessary step for our analysis. Indeed, Italian national accounts provide an exhaustive estimate of GDP, but only since 1992 have they also distinguished the share to attribute to missing economic activities12.
2.2 Time series data: the tax burden
The tax burden is one of the most commonly cited determinants of tax evasion and, in general, of the underground economy13. The overall tax burden is a key feature for working and producing in the hidden sector and for concealing income and wealth. To assess an empirical relationship with the hidden phenomenon under investigation, we first analyse the univariate characteristics of the series. This is done by constructing two average aggregate tax rates,
11 See, for instance, the Economic Journal symposium on the Hidden Economy and Schneider and Enste (2002). 12 Marigliani and Pisani (2007) compare their estimate of tax evasion (here exploited) with the Istat estimate of the underground economy for the available common years, i.e. 1992-2004, founding no large differences. 13 See, amongst others, Tanzi (1982), Feige (1989), Thomas (1992), Lippert and Walzer (1997), Schneider and Enste (2002).
26
28
30
32
34
36
38
1980 1985 1990 1995 2000
%
% of totaltrend
160000
170000
180000
190000
200000
210000
220000
230000
240000
250000
1980 1985 1990 1995 2000
Millions eurotrend

9
defined, respectively, as the ratio of total tax revenues to total GDP and to a proxy for the regular GDP. The latter is produced by subtracting from the time series of GDP the size of the evaded VAT base, as discussed in the previous subsection. We label these tax rates, respectively, as the “apparent” tax rate and effective tax rate.
Although we cannot deliver a statistical analysis based on a unique source for the output components, it may be very helpful to indicate some core problems in discussing the dynamics of tax evasion. Moreover, it is useful to recall that the Ministry of Finance’s estimates originate from national accounts.
The apparent and effective tax rates, along with their respective Hodrick-Prescott trends (H-P the smoothed line) are depicted in the left-hand panel of Figure 2, whereas the right-hand panel displays the difference between the two tax rates14.
Fig. 2 Figure 1: Average Tax Rates in Italy
Apparent and Effective Tax Rates The overburden for compliant tax payers
The apparent tax rate is the one usually considered when examining average fiscal pressure. However, this measure is downward biased in countries with a considerable underground economy: by definition, the effective tax rate is always higher than the apparent one. If we adopt a simplifying assumption, that is, some taxpayers do not comply with their tax duties whereas others cannot escape their tax liabilities, then the difference between the two tax rates can be considered an overburden for compliant tax payers caused by tax evaders15.
Obviously, in the absence of evasion, all the citizens would contribute to finance the public sector, lowering the average fiscal burden.
Three important characteristics of Figure 2 should be stressed. First, a steep increasing
14 We are aware of the problems using this filter. However, the analysis is only indicative and using others filters does not change the results depicted in this paper. Moreover, following Ravn and Uhlig (2001) we have also tried using different smoothing parameters without achieving different results. 15 However, a different point of view would suggest that each tax payer acts as a moonlighter, deciding how much to comply/declare according to the utility maximization process. In this case the higher tax rate depicted in Figure 2 would represent the statutory tax rate, whereas the share of tax revenues to total GDP is the smoothed tax rate resulting from optimal evasion choice.
30
35
40
45
50
55
1980 1985 1990 1995 2000
effective tax rate
apparent tax rate
8
8.5
9
9.5
10
10.5
11
11.5
12
1980 1985 1990 1995 2000 2005
tax
rate
s ga
p
trend
10
trend may be observed both tax rates during the period 1980-1997, followed, in more recent years, by a slightly declining pattern, more accentuated for the effective tax rate. Second, the peaks in the path of the two tax rates show the increases in tax revenues due to fiscal amnesties granted in 1982 and 1991, whereas the amnesties granted in 1994 and 2002 are not clearly discernible. The sharp rise in the tax rates, especially the effective one, observed in 1997 and, to a lesser extent, in 1993, is mainly due to extraordinary revenues, respectively connected to the so-called tax for Europe (1997) and to asset and buildings taxation (1993). These remarks, together with the persistence of the overburden gap, confirm that amnesties have, at best, a short-run effect, but cannot be used as policy instruments for reducing work and income “under the ground”.16
Finally, the considerably magnitude of the apparent fiscal pressure, rising from 31 to 43% during the period examined, is appreciably lower than the effective one, with a gap oscillating around 11 percentage points, clearly indicating the huge burden that taxpayers have undergone due to the existence of underground activity and tax evasion. This over-burden gap seems to be invariant over the decades, generations and governments. To better appreciate this issue, in the right-hand panel of Figure 2 the gap between the two tax rates is displayed. The overburden gap presents marked oscillations during the observed sample, though in recent years there is evidence of lower volatility. However, it is remarkable that the H-P trend of this overburden gap has a clear inverted U shape, accounting for higher compliance.
Further investigation of the time pattern of the latter time series reveals that, in contrast to the tax rate levels, which are both I(1), the overburden gap is a stationary process, though with a deterministic trend (see the appendix for details on the ADF tests). Moreover, the gap between the apparent and effective tax rate seems to display a normal distribution over the observed sample.17 It is widely acknowledged that the comparison between stationary and stochastic processes has important economic implications. A stationary time series evolves around a constant mean, or, in the presence of a deterministic trend, around some specified and predictable function of time. Conversely, a series with a stochastic trend has no clear long-run pattern, since its longer term movement is affected by stochastic disturbances, which have an enduring effect on the future path of the series. In our context, the exclusion of a random walk implies that the estimated series of the overburden is not permanently shifted by any institutional change, such as tax reform and/or laws to combat tax evasion.
3 QUANTIFICATION OF THE TAX BURDEN EFFECT ON TAX EVASION
The evidence available for Italy tells a story of increasing fiscal pressure, though with a declining pattern in recent years, and high volatility of tax evasion.
What is remarkable in this time-varying framework is the stable gap between the apparent and the effective tax rates, suggesting that tax payers suffer a stable over-burden of fiscal
16 See the paper of Bernasconi and Lapecorella (2007). 17 The augmented Dickey-Fuller test rejects the null of a unit root at 7% level of significance, allowing for an exogenous constant and a deterministic trend and one lag. Since the two tax rates are both I(1) processes, the stationarity of the tax gap implies that the equation. Teff – Tappar = constant+ trend can be considered a cointegrating vector.
11
pressure because of tax evasion. Moreover, the absence of a stochastic trend also signals that a long-run strategy might exist, linking tax evasion to fiscal pressure, and the intensity of this interaction is certainly worth quantifying.
A second economic issue not fully clear from the univariate evidence is the perverse interaction between tax evasion and tax rates, through tax base erosion.18 This worrying issue is considerably more marked in a situation of high public debt and deficit spending, such as it was in pre-EMU Italy. However, at a first glance, the stability of the overburden gap may be considered a signal of the absence of such a vicious circle.
However, to further investigate the interaction between tax evasion and the tax rate, it is important to find empirical support for the two claims above. To this end we will refer to the average tax rate, since this measure is the one usually considered in fiscal policy analysis.19
3.1 The Statistical Model
Although we are dealing with two non-stationary variables, the tax rate and tax evasion, and possibly one cointegrating relationship, we use the Johansen technique to estimate and test the time series models. Our estimation procedure is the following: after setting the appropriate lag-length of the VAR model, we determine whether the system is conditioned on some dummy variables for controlling structural breaks. Then we test for the existence of a cointegration vector, and finally for weak exogeneity of the tax variable. All the variables (except the time trends) are in log.
Estimated equations are derived by a two-variable system with one cointegrating equation and a lag structure including two lags in the VAR model. Consider the following VAR model, written in the usual notation:20
1
11
p
t i t tti
y y y Bzt ε−
−−=
Δ = Π + ΓΔ + +∑ (1)
where
;1 1
p pA I Ai i j
i j iΠ= − Γ =−∑ ∑
= = + In our case, y is a vector containing two I(1) non-stationary variables, z is a vector of
deterministic variables and tε is a vector of innovation. It is well known that if the coefficient of
the matrix Π has a reduced rank (r<k=2 the number of cointegrating relations in our case)
there exist two 2*1 matrices α and β such that 'αβΠ = where β is a cointegrating vector. In the VAR specified in equation (1), we use as a normalized variable the unreported VAT
18 This is related to the Laffer Curve as modified by Gutmann (1981) to account for shadow economy activities. 19 The econometric analysis is carried out only for the apparent tax rate (the tax burden is compared with the total GDP), since when controlling for the effective tax rate the estimated residuals display too large a correlation with the size of tax evasion, weakening the interpretation of the statistical model. 20 See, for instance, Johansen (1995).
12
base as a percentage of total VAT base ( )TVATEVAT /
.
3.2 To what extent is the tax burden a determinant of tax evasion?
We have seen that our series are characterized, other than stochastic trends, by non-zero means and deterministic trends. Similarly, the stationary relations may call for intercepts and trends. For the VAT evasion model we cannot rule out the following assumption (the level data and the cointegrating equation have linear trends): 21
1 1 0 1 0( ) : ( ' ) ( )t t tH r y Bz y tα β μ μ α γ− −Π + = + + + ⊥ (2)
3.2.1 long-run equilibrium and error correction adjustment
A major feature of the data set is a break occurring in 1994 and 1999, i.e. the two minima peaks in tax evasion already commented upon in section 2.1.22 Conditioning the model on two dummy variables for taking such a break into account, and estimating the stationary model using total GDP as scale variable for the tax burden (the apparent tax rate τ ), produces the following cointegrating relation and loading factors (estimated standard errors in parentheses):
)12.0()19.0()004.0()28.0(
22.0;86.058.1011.055.0 =−=−−= ταατ ET
E tVATVAT
(3)
The cointegrating vector and the variable residuals seem statistically satisfactory. Trace and Maximum Eigenvalue tests indicate one stationary relation at the 0.07 and 0.03 level respectively, when including two dummies for the years 1994 and 1999.23 The VEC residual serial correlation LM test shows that the Null of no serial correlation up to lag 3 is not rejected. The negative sign of the trend variable, required by the stationary relation, is consistent with the hypothesis of a gradual reduction in tax evasion. 24
-“Long-run elasticities”
The model displays a long-run elasticity of tax evasion to the apparent tax rate below unity (0.55) but a very high speed of adjustment when a disturbance in the equilibrium relation occurs. On inverting the cointegrating relationship (3), we find that the long-run tax rate elasticity to a change in tax evasion is 1.8. Below we show that this estimate may be misleading. In fact, these “elasticities” are only indicative. Stationary relationships must be interpreted cautiously because their coefficients cannot be interpreted as elasticities as in the usual sense, when all
21 As in Johansen (1995), α ⊥ is orthogonal to α and serves to define and distinguish the (unrelated) constants from the cointegration space and the constants from the data. 22 Introducing dummies eliminates outliers and induces residuals to be normal, providing more Gaussian-like residuals. 23 The critical values provided by Johansen and Osterwarld-Lenum are known to be only indicative in such a situation (small sample, dummy variables and trends). We also perform unit root tests on the cointegrating residuals. 24 Cointegrating tests indicates the existence of one stationary equation. With regard to the VEC residual tests: the LM-stat does not reject the Null of serial correlation (lag 1, 1.15 prob. 0.88; lag 2, 2.97 prob. 0.56, lag 3 3.81 prob 0.43) and the Jarque-Bera statistic does not reject the Null of multivariate normal residuals (2.16 , prob. 0.70).
13
the other dynamic relations between the variables which are specified in the VAR model are ignored. The analysis requires that short-term dynamics and intertemporal adjustment processes generated by equilibrium errors are taken into account.25 Impulse response analysis, taking into account the full system may provide a more reliable conclusion.
-Adjustment coefficients and dynamics
Thus the reactions of tax evasion to the tax rate cannot be motivated without considering the adjustment to disequilibrium which takes place through the error correction coefficient. Note that αE is -0.86. Since the lower limit of the loading factor is -1, the estimated αE implies that there is almost no distinction between the short run and long run: the evaders always seek to be in equilibrium. In our case, they are ready to keep in perfect step to eradicate the past disequilibrium: about 86% of the disequilibrium is removed in one period.
This is a major aspect of the model and of the Italian tax rate-tax evasion relationship, which deserves emphasis. Consider the tax evasion adjustment coefficient when the cointegrating
vector is normalized on tax evasion )/( TE VATVAT , as it is in equation (3). Consider the lagged equilibrium as specified in the cointegrating vector (2). Suppose that the perspective of time is t. Thus if the ECM component in (2) is different from zero, as for instance in (3.1), this means that the economy was not in equilibrium at time (t-1). Hence tax evasion and/or the tax rate have to change:
t
VATVAT
ttT
E 011.055.058.1 11
−+−>⎟⎟⎠
⎞⎜⎜⎝
⎛−
−
τ (3.1)
The disequilibrium (3.1) implies that to keep on target, tax evasion must be reduced and/or the apparent fiscal pressure must be increased. The estimated equation (3) shows a positive but small ECM adjustment coefficient for the tax rate. Therefore, the tax burden increases, albeit slowly. On the contrary, the tax evasion adjustment coefficient is negative and very large, indicating that under the disequilibrium depicted in (3.1), tax evasion almost immediately decreases to restore the equilibrium. A result perfectly consistent with the zig-zag behaviour around the tax evasion trend depicted in Figure 1. Of course, the opposite picture is obtained with a disequilibrium characterized by a tax rate higher than VAT evasion in equation (3.1).
The slow adjustment of the tax rate and the very quick reaction of tax evasion to long-run disequilibrium support the idea that the evaders operate in a context which allows them to fix a tax evasion target, feeling almost free to react to any changes in the tax burden.26
3.2.2 Impulse response analysis
Impulse response analysis amounts to dynamic simulation of the whole system (long-run
25 Lutkepohl (1991; 1994), among others, emphasizes this issue. 26 This aspect is not investigated in this paper and it has much to do with the audit selection mechanisms purported to detect firms which are most likely to evade, i.e. Studi di Settore (see Convenevole et al 2007). This instrument is far from reflecting the theory of optimal auditing for several reasons. In particular Studi di Settore (roughly, “business sector analysis”)are focused on reported turnover rather than on reported profits (turnover minus costs), but the real problem is that firm representatives are deeply involved in all the phases of construction of the Studi di Settore. As stressed by many (see, for instance, Santoro 2007 a, b), this presumed level reflects a political compromise between the government (or the Tax Agency) and these unions. Thus, the level of deterrence of the Studi di Settore is directly related to this political compromise rather than the probability of being audited.
14
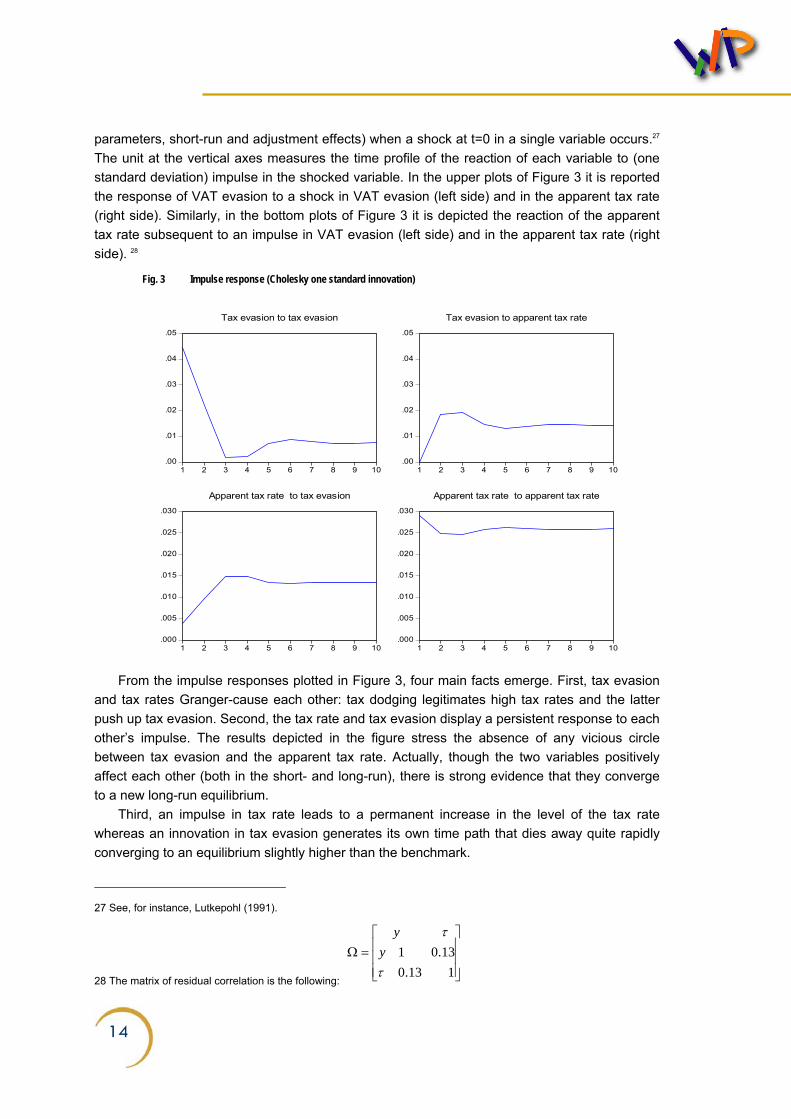
parameters, short-run and adjustment effects) when a shock at t=0 in a single variable occurs.27 The unit at the vertical axes measures the time profile of the reaction of each variable to (one standard deviation) impulse in the shocked variable. In the upper plots of Figure 3 it is reported the response of VAT evasion to a shock in VAT evasion (left side) and in the apparent tax rate (right side). Similarly, in the bottom plots of Figure 3 it is depicted the reaction of the apparent tax rate subsequent to an impulse in VAT evasion (left side) and in the apparent tax rate (right side). 28
Fig. 3 Impulse response (Cholesky one standard innovation)
.00
.01
.02
.03
.04
.05
1 2 3 4 5 6 7 8 9 10
Tax evasion to tax evasion
.00
.01
.02
.03
.04
.05
1 2 3 4 5 6 7 8 9 10
Tax evasion to apparent tax rate
.000
.005
.010
.015
.020
.025
.030
1 2 3 4 5 6 7 8 9 10
Apparent tax rate to tax evasion
.000
.005
.010
.015
.020
.025
.030
1 2 3 4 5 6 7 8 9 10
Apparent tax rate to apparent tax rate
From the impulse responses plotted in Figure 3, four main facts emerge. First, tax evasion and tax rates Granger-cause each other: tax dodging legitimates high tax rates and the latter push up tax evasion. Second, the tax rate and tax evasion display a persistent response to each other’s impulse. The results depicted in the figure stress the absence of any vicious circle between tax evasion and the apparent tax rate. Actually, though the two variables positively affect each other (both in the short- and long-run), there is strong evidence that they converge to a new long-run equilibrium.
Third, an impulse in tax rate leads to a permanent increase in the level of the tax rate whereas an innovation in tax evasion generates its own time path that dies away quite rapidly converging to an equilibrium slightly higher than the benchmark.
27 See, for instance, Lutkepohl (1991).
28 The matrix of residual correlation is the following: ⎥⎥⎥
⎦
⎤
⎢⎢⎢
⎣
⎡=Ω
113.013.01
τ
τy
y
15
Overall, the strong equilibrium properties of the statistical model support what we saw about the overburden gap depicted in Figure 2, which was described as a stationary process (around a declining trend).
Finally, as described above, IR analysis provides more reliable estimates of the cross elasticities compared to the coefficients of the estimated stationary long-run relation (3). The
responses of )/( TE VATVAT to one-time percentage impulses in the tax rate is zero on impact and about 0.65% in the second and third year, whereas the lasting effect is 0.48% . The response of tax rate τ to a one-off percentage impulse in tax evasion is 0.09 on impact, but it rises to 0.2% in the second year and 0.34% in the third and fourth years. After ten periods it is still close to 0.3%.29 These results also emphasize the potential error of uncritical long-run tax rate-tax evasion elasticities provided by simple static (stationary) regressions.
-The evader equilibrium: an assessment
The tax evader equilibrium characterizes the long-run relationship between tax evasion and the tax rate, and is defined by our VAR-ECM model. Whenever the tax rate increases (for instance, for financing new public spending), those who evade taxes wish to nullify this disequilibrium (avoiding the tax increase), and the adjustment coefficient in equation (3) indicates how quickly this disequilibrium will be removed. Thus, the equilibrium is quickly restored (the adjustment coefficient is almost 0.9), as is the gap between the apparent and effective tax rates. Actually, a simple definition of our variables used in the construction of Figure 2 shows the relationships identified and quantified by the statistical model. The apparent tax rate τ is defined as the ratio between total revenues REV and total GDP, whereas the total
revenues/Regular GDP ratio defines the effective tax rate τ)
:
;T T EVAsion R
REV REV REVY Y VAT Yτ τ= = =−
)
Whenever τ increases, impulse response analysis clarifies that VAT evasion, in order to keep the evasion target, reacts positively and quickly to restore the equilibrium. Implicitly, this
produces a higher effective tax rate, τ)
. Tax dodging reflects a behaviour aiming at a sort of “apparent tax cut”: given the long-run
relationship linking tax evasion and fiscal pressure, the size of evasion is adapted in order to pursue the target, entailing a change in the effective tax rate.
Notice that both the tax rate and tax evasion are driven by the long-run elasticities to converge to a higher equilibrium. This means that both the effective and apparent tax rate change over time but the gap still remains constant.
The evidence we are discussing refers to macroeconomic aggregates, which are undoubtedly the result of individual actions. The micro-founded rationale of this macroeconomic evidence is related to the individual decision process and especially to risk aversion considerations.
29 These elasticities are computed from the numerical impulse responses depicted in the plots and the estimate standard error of the VECM regression. Lutkepohl (1991) discusses the caveats of impulse response analyses.
16
3.2.3 Variance decomposition analysis
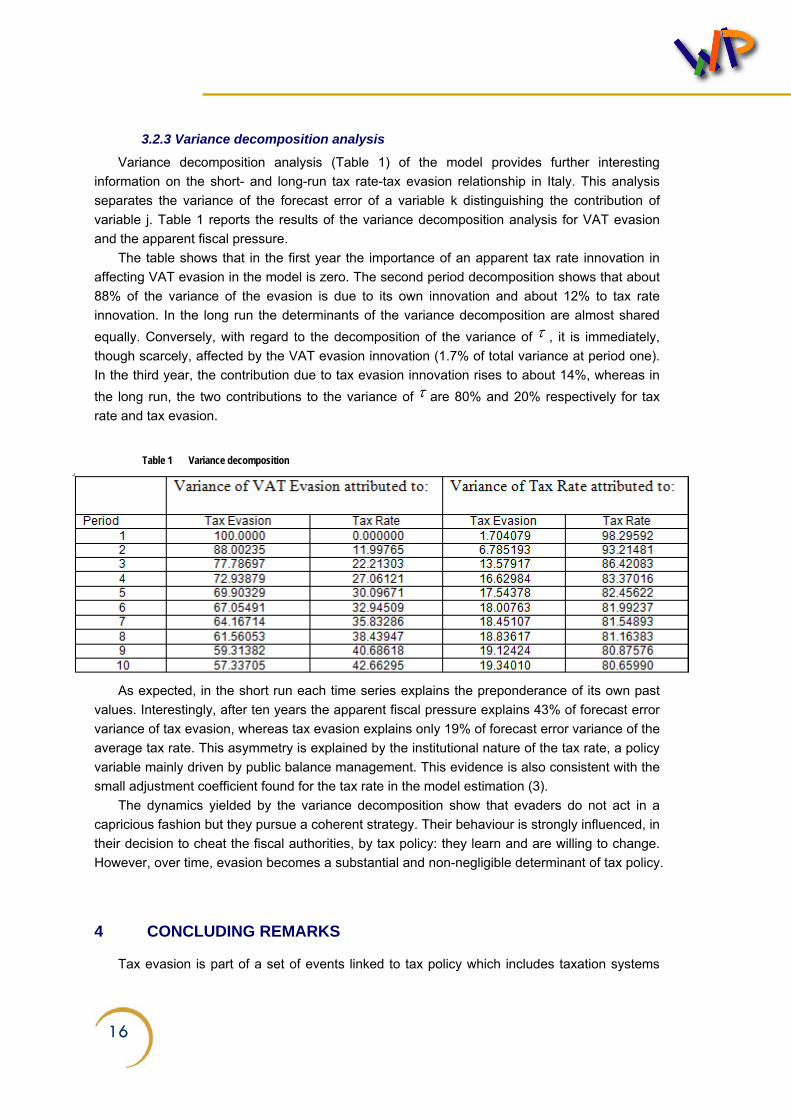
Variance decomposition analysis (Table 1) of the model provides further interesting information on the short- and long-run tax rate-tax evasion relationship in Italy. This analysis separates the variance of the forecast error of a variable k distinguishing the contribution of variable j. Table 1 reports the results of the variance decomposition analysis for VAT evasion and the apparent fiscal pressure.
The table shows that in the first year the importance of an apparent tax rate innovation in affecting VAT evasion in the model is zero. The second period decomposition shows that about 88% of the variance of the evasion is due to its own innovation and about 12% to tax rate innovation. In the long run the determinants of the variance decomposition are almost shared equally. Conversely, with regard to the decomposition of the variance of τ , it is immediately, though scarcely, affected by the VAT evasion innovation (1.7% of total variance at period one). In the third year, the contribution due to tax evasion innovation rises to about 14%, whereas in the long run, the two contributions to the variance of τ are 80% and 20% respectively for tax rate and tax evasion.
Table 1 Variance decomposition
As expected, in the short run each time series explains the preponderance of its own past
values. Interestingly, after ten years the apparent fiscal pressure explains 43% of forecast error variance of tax evasion, whereas tax evasion explains only 19% of forecast error variance of the average tax rate. This asymmetry is explained by the institutional nature of the tax rate, a policy variable mainly driven by public balance management. This evidence is also consistent with the small adjustment coefficient found for the tax rate in the model estimation (3).
The dynamics yielded by the variance decomposition show that evaders do not act in a capricious fashion but they pursue a coherent strategy. Their behaviour is strongly influenced, in their decision to cheat the fiscal authorities, by tax policy: they learn and are willing to change. However, over time, evasion becomes a substantial and non-negligible determinant of tax policy.
4 CONCLUDING REMARKS
Tax evasion is part of a set of events linked to tax policy which includes taxation systems
17
complexity, enforcement and attitudes to the state. Underreporting income, overstating deductions, failing to pay obligations are the main sources of a phenomenon called “tax cheating”. The failure to pay what the tax law requires in Italy is such a figure that the budget imbalance over the last twenty years would have been considerably cut.30
In this paper we use official time series of the Italian Revenues Agency on the evaded VAT base, to assess some statistical characteristics of tax evasion in Italy. We think that combined with detailed evidence (official audit, private enquiry, and indirect inference) and analytical frameworks, empirical aggregate analysis and its implications can be useful as a guide to policy. The main results of our analysis can be listed as follows.
First, distinguishing the apparent tax burden (revenue-GDP ratio) from the effective tax burden (revenues-net GDP ratio) we find that the two tax rates show, during the period examined, a permanent gap, with the effective tax rate permanently higher than the apparent tax rate. The statistical properties of this gap clarify that it fluctuates around a fixed value of about 11%, with only short-term effects from exogenous disturbances. This might suggest that tax payers adopt a strategy of tax evasion aiming to maintain this equilibrium gap, whose size might be related to risk aversion issues, a strategy supported by our estimated model elasticities and dynamic coefficients.
Second, the estimated model provides quantitative results about the cross-elasticity between tax evasion and average fiscal pressure. In equilibrium, a percentage increase in tax evasion brings the apparent tax rate up by 0.3% whereas the latter raises the long-run tax evasion by 0.48 percentage points: each variable, dangerously, Granger-causes the other. Moreover, the estimated long-run parameters imply a quick adjustment to equilibrium. This again suggests the existence of a long-run strategy by tax payers. Whenever a new reform or a tool comes into the system and generates disequilibrium, this is rapidly learned by the evaders and removed. This result confirms that there is an underlying process (behaviour) explaining tax evasion in Italy, which is invariant through decades, generations and governments.
Finally, despite the fact that tax evasion lies at the core of the Italian economy, there is no evidence of any vicious circle with fiscal pressure, since the dynamic interaction between these two variables always converges to a stable equilibrium. Both the variables are driven by a unique stochastic trend, and average fiscal pressure emerges as the long-run trend driving tax evasion.
30 See the conservative estimate of Alesina and Marè (1995).
18
REFERENCES
Alesina A. and Marè M. (2005), Evasione e debito, in Monorchio A. (ed.) La Finanza Pubblica Italiana dopo la Svolta del 1992, Il Mulino Bologna.
Allingham M. and Sandmo A. (1972), Income tax evasion: a theoretical analysis, Journal of
Public Economics, 1, 323-338. Bernardi L. (2000), La Finanza Pubblica Italiana. Rapporto 2000. Il Mulino Bologna. Bernasconi M. and Lapecorella F. (2007), I condoni nel sistema tributario italiano, in Guerra
M.C. and Zanardi A. (eds), La Finanza Pubblica Italiana. Rapporto 2006. Il Mulino Bologna. Bordignon M. and Zanardi A. (1997), Tax evasion in Italy, Giornale degli Economisti e
Annali di Economia, 56, 169-210. Bovi M., (1999), Un miglioramento del metodo di Tanzi per la stima dell’economia
sommersa in Italia, ISTAT, Quaderni di Ricerca 2, 5-51. Busato, F. and Chiarini B. (2004), Market and underground activities in a two sector
dynamic equilibrium model, Economic Theory, 23, pp. 831-861. Busato, F., B. Chiarini and Guido M. Rey (2005) Equilibrium implications of fiscal policy with
tax evasion, University of Aarhus, DK, Working Paper. Busato, F., B. Chiarini and V. Di Maro (2005) Using theory for measurement. An analysis of
behavior of undeground economy, University of Aarhus Working paper. Cannari L. and D’Alessio G. (2007), Le opinioni degli Italiani sull’evasione fiscale, Banca
d’Italia, Temi di Discussione no. 618. Chiarini B. and Marzano E. (2004) Dimensione e dinamica dell’economia sommersa: un
approfondimento del Currency Demand Approach. Politica Economica 3, 303-334. Convenevole R., Farina A., Perinetti A.R. and Pisani S. (2007), Gli effetti dell’applicazione
degli studi di settore in termini di ampliamento delle basi imponibili, Ministero dell’Economia e delle Finanze, Documenti di Lavoro dell’Ufficio Studi, 2007/1.
Cowell F. (1990a), Cheating the Government, MIT Press: Cambridge Mass. Cowell F. (1990b), Tax sheltering and the cost of evasion, Oxford Economic Papers, 42,
19
231-243. Dell’Anno, R., (2003), Estimating the Shadow Economy in Italy: a Structural Equation
Approach, University of Aarhus, Department of Economics, DK. Working paper 2003-7 Dell’Anno, R. and F. Schneider (2003), The Shadow Economy of Italy and other OECD
Countries: What do we know?, Journal of Public Finance and Public Choice (PFPC) / Economia delle scelte pubbliche, XXI, Nos. 2-3, 2003, pp. 97-120.
Feige E.L. (1989)(ed.), The Underground Economies. Tax Evasion and Informal Distortion.
Cambridge, Cambridge University Press. Giannini S. and Guerra M.C. (2000), Dove eravamo e dove siamo: il sistema tributario dal
1990 al 2000, in Bernardi L. (eds), La Finanza Pubblica Italiana. Rapporto 2000. Il Mulino Bologna.
Guerra M.C. and Zanardi A. (2007), La Finanza Pubblica Italiana. Rapporto 2006, Il Mulino:
Bologna. Gutmann P. (1981), Implications of subterranean economy, in R.X. Bove and R. D.
Klingenstein, eds, Wertheim’s underground economy conference, Wertheim, Inc., 31-58. Hodrick R., Prescott E. (1997), Post-war US business cycles: An empirical investigation, in
Journal of Money, Credit and Banking, 29, 1-16. ISAE (2006), Rapporto, October, Rome. ISTAT (2005), La misura dell’economia sommersa secondo le statistiche ufficiali, Statistiche
in Breve, 22 September 2005, Rome. ISTAT (2006), La misura dell’economia sommersa secondo le statistiche ufficiali, Statistiche
in Breve, 14 December 2006, Rome. Johansen S. (1995), Likelihood-based Inference in Cointegrated Vector Autoregressive
Models, Oxford, Oxford University Press. Lippert O. and Walzer M. (1997)(eds), The Underground Economy: Global Evidences of its
Size and Impact. Vancouver, The Fraser Institute. Lutkepohl H. (1991), Introduction to Multiple Time Series Analysis, Springer-Verlag: Berlin. Lutkepohl H. (1994), Interpretation of cointegration relations, Econometric Reviews, 13,
391-394.
20
Lutkepohl H. and Kratzig M. (2004), Applied Time Series Econometrics, Cambridge, Cambridge University Press.
Marigliani M., Pisani S. (2007), Le basi imponibili IVA. Aspetti generali e principali risultati
per il periodo 1980-2004, Documenti di lavoro dell’Ufficio Studi Agenzia delle Entrate, n.7. OECD (2002), Measuring the Non-Observed Economy. A Handbook, www.oecd.org. Orviska, M. and J. Hudson (2003) Tax evasion, civic duty and the law abiding citizen,
European Journal of Political Economy, Vol. 19, 83-102. Orviska, M., A. Caplanova, J. Medved and J. Hudson (2006) A cross-section approach to
measuring the shadow economy, Journal of Policy Modeling, 28, 713-724. Politica Economica (2002), Il disegno di legge delega per la riforma fiscale. Quali Problemi?
Quali Prospettive?, Politica Economica, no.3, December 2002. Ravn M.O. and Uhlig H. (2001), On adjusting the H-P filter for frequency of observations,
CESifo Working Paper No 479. Rey G.M. (2007), Il frutto illegittimo dell’economia Italiana, forthcoming, QA Schneider, F. and Enste D.H. (2002). The Shadow Economy. An International Survey.
Cambridge University Press, Cambridge. Santoro A. (2007a), Evasione e studi di settore. Quali risultati? Quali prospettive?, in Guerra
M.C. and Zanardi A. (eds), La Finanza Pubblica Italiana. Rapporto 2006. Il Mulino Bologna. Santoro A. (2007b), Taxpayers’ choices under Studi di settore: what do we know and how
we can interpret it?, mimeo University of Milan, Bicocca. Spanos A. (1999), Probability Theory and Statistical Inference, Cambridge University Press;
Cambridge. Tanzi V. (1982), The Underground Economy in the United States and Abroad, Lexington:
D.C. Heath. Thomas J.J. (1992), Informal Economy Activity, LSE Handbooks in Economics. London:
Harvester Wheatsheaf. Torgler, B and F. Schneider (2006) What Shapes Attitudes Toward Paying Taxes?
Evidence from Multicultural European Countries, IZA DP No. 2117. Torgler, B and F. Schneider (2007) The Impact of Tax Morale and Institutional Quality on

21
the Shadow Economy, IZA DP No. 2541. Zizza R. (2002) Metodologie di stima dell’economia sommersa: un’applicazione al caso
italiano. Banca d’Italia, Temi di Discussione 4.
22
APPENDIX
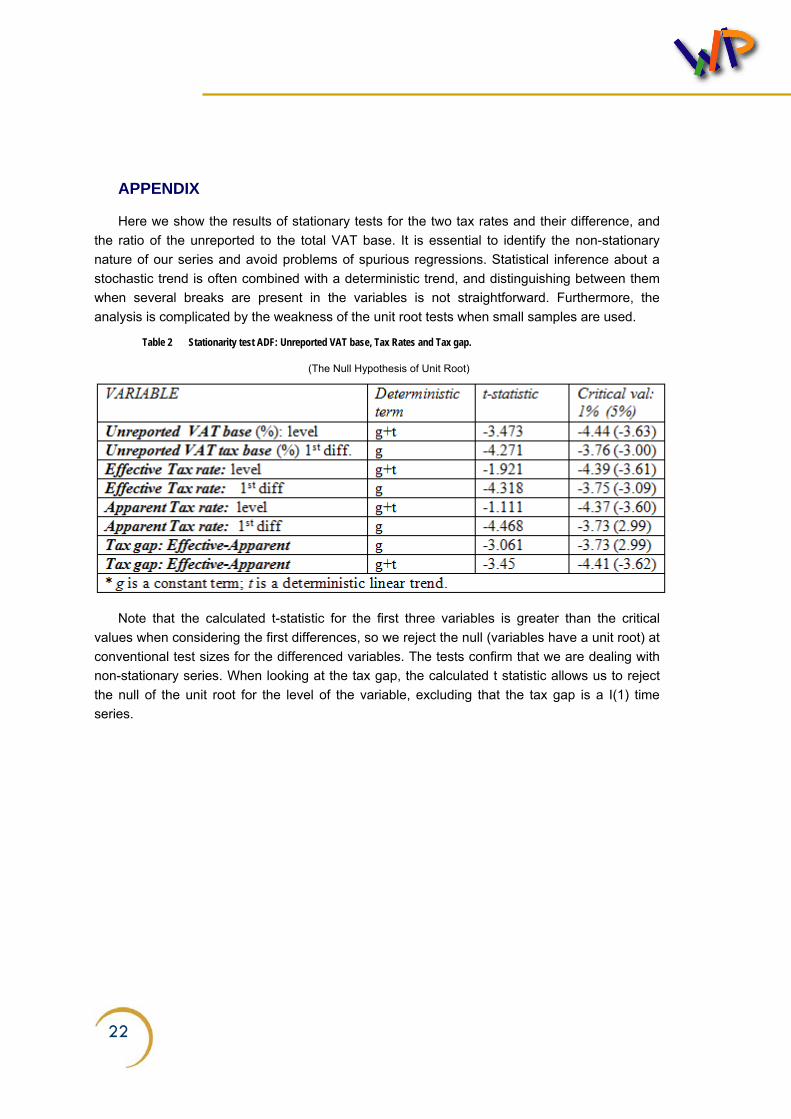
Here we show the results of stationary tests for the two tax rates and their difference, and the ratio of the unreported to the total VAT base. It is essential to identify the non-stationary nature of our series and avoid problems of spurious regressions. Statistical inference about a stochastic trend is often combined with a deterministic trend, and distinguishing between them when several breaks are present in the variables is not straightforward. Furthermore, the analysis is complicated by the weakness of the unit root tests when small samples are used.
Table 2 Stationarity test ADF: Unreported VAT base, Tax Rates and Tax gap.
(The Null Hypothesis of Unit Root)
Note that the calculated t-statistic for the first three variables is greater than the critical
values when considering the first differences, so we reject the null (variables have a unit root) at conventional test sizes for the differenced variables. The tests confirm that we are dealing with non-stationary series. When looking at the tax gap, the calculated t statistic allows us to reject the null of the unit root for the level of the variable, excluding that the tax gap is a I(1) time series.
Ministry of Economy and Finance
Department of Treasury
Directorate I: Economic and Financial Analysis
Address: Via XX Settembre, 97 00187 - Rome Websites: www.mef.gov.it www.dt.tesoro.it e-mail: [email protected] Telephone: +39 06 47614202 +39 06 47614197 Fax: +39 06 47821886