Small is Beautiful, we make it big and more beautiful. - xampp ...
Upload
khangminh22Category
view
0download
0
3
73rd Annual Report (Integrated) 2017-18

2,398 2,016 81,090
Total employees Total R&D spend
Tata Motors Limited (in J Crores) Jaguar Land Rover (in £ Millions)
FY18 highlights
31,121 EBITDA2 (in J Crores)
42,672Total CAPEX (in J Crores)
2,94,243 Revenue1 (in J Crores)
12,21,124 50+ 2 9
Total vehicles sold Products launched
Tata Motors Limited Jaguar Land Rover
Commercial Vehicles3 Passenger Vehicles4 Vehicles
1 Net of excise duty2 Reported EBITDA is defined to include the product development expenses charged to Profit and Loss (P&L), revaluation of current assets and liabilities and realised
foreign exchange (forex) and commodity hedges, but excludes the revaluation of foreign currency, Mark to Market (MTM) on forex and commodity hedges, other
income, as well as exceptional items.3 With more than 200 variants4 With six variants
Mobility is transitioning to a new era marked by remarkable technological innovation. The global automobile industry is being shaped by this transition and is further affected by urbanisation, population growth and climate change. As the Commercial Vehicles (CV) segment is experiencing improved active emissions control and an expanded product portfolio, the Passenger Vehicles (PV) space is readying its format to embrace higher degrees of automation, while moving on to non-conventional sources of energy. The connected and autonomous vehicle technologies are poised to help make driving safer and cleaner in future across the world.
Building on an enabling ecosystem of sustainable technology, the zero-emission electric variant of vehicles is defining the automotive landscape of the world. The trend is likely to continue going forward.
At the Tata Motors Group, we stay ahead of the future. With our continued investments in hybrid and Battery Electric Vehicle (BEV) technologies, we are actively working on innovation by bringing ingenuity into the areas of vehicle engineering and development. Our keen eye for digitisation, connectivity, automation and advanced regulations compliance is helping us deliver exciting innovations to our customers worldwide.
In preparation for the future, we are also transforming our organisation from within, by building in operational efficiency using modular architecture, managing costs and embedding the culture of innovation.
We believe that tomorrow belongs to those who prepare for it today. As responsible automakers, we are committed to transforming the future of mobility and more.
FUTURE READY

Contents
About this Report Tata Motors Limited (TML) has adopted the Integrated Reporting framework prescribed by the International Integrated Reporting Council (IIRC). This is the second year of our journey on Integrated Reporting. Through this Report, we aspire to provide to our stakeholders an all-inclusive depiction of the organisation’s value creation using both financial and non-financial resources. The Report provides insights into our key strategies, operating environment, the operating risks and opportunities, governance structure and the Company’s approach towards long-term sustainability.
Responsibility statementIn order to optimise governance oversight, risk management and controls, the contents of this Report have been reviewed by the Members of the Executive Committee of TML.
Reporting principleThe financial and statutory data presented in this Report is in line with the requirements of the Companies Act, 2013 (and the rules made thereunder), Indian Accounting Standards, the Securities and Exchange Board of India (Listing Obligations and Disclosure Requirements) Regulations, 2015 and the Secretarial Standards issued by the Institute of Company Secretaries of India. The non-financial section of the Report is guided by the framework of the IIRC.
Our approach to reporting
Integrated Report
2 About Tata Motors4 Our global footprint6 Our diverse product suite10 Product launches in FY1813 Our future-ready portfolio14 Our achievements during FY18 16 Key performance indicators18 Chairman’s message20 Leadership messages22 Our business model24 Our external environment26 Our strategic framework32 Risks and opportunities38 The ‘Turnaround’ story42 Keeping the momentum with Turnaround 2.046 Transforming today for tomorrow50 Long-term value creation51 Our way forward52 Governance framework56 Our people practices60 For a sustainable future65 Corporate information
Statutory reports
66 Board’s Report108 Management discussion and
analysis150 Corporate governance173 Business Responsibility Report
Financial statements
Standalone
186 Independent Auditor’s Report192 Balance Sheet193 Statement of Profit and Loss194 Cash Flow Statement195 Statement of Changes in Equity197 Notes to Accounts
Consolidated
255 Independent Auditor’s Report
260 Balance Sheet261 Statement of Profit and Loss262 Cash Flow Statement264 Statement of Changes in Equity266 Notes to Accounts
346 Summarised Statements 348 Financial Statistics350 Subsidiary Companies Financial
Highlights 2017-18
354 Notice
Materiality and scope of the Integrated ReportThis Report includes information that is material to our stakeholders and it presents an overview of our businesses and associated activities that help in short-, medium- and long-term value creation. We have also presented information around our strategic approach towards the material issues.
We have presented the information on the Tata Motors Group in a fair and balanced manner.
Assurance statementAssurance on financial statements has been provided by independent auditors BSR & Co. and non-financial statements by TUV India Private Limited. The assurance report issued by TUV India Private Limited is available on our website www.tatamotors.com
→18Chairman’s message
→46Transforming today for tomorrow
→60For a sustainable future
Forward-looking statements
Certain statements in this Report regarding our business operations may constitute forward-looking statements. These include all statements other than statements of historical fact, including those regarding the financial position, business strategy, management plans and objectives for future operations. Forward-looking statements can be identified by words such as ‘believes’, ‘estimates’, ‘anticipates’, ‘expects’, ‘intends’, ‘may’, ‘will’, ‘plans’, ‘outlook’ and other words of similar meaning in connection with a discussion of future operating or financial performance. Forward-looking statements are necessarily dependent on assumptions, data or methods that may be incorrect or imprecise and that may be incapable of being realised, and as such, are not intended to be a guarantee of future results, but constitute our current expectations based on reasonable assumptions. Actual results could differ materially from those projected in any forward-looking statements due to various events, risks, uncertainties and other factors. We neither assume any obligation nor intend to update or revise any forward-looking statements, whether as a result of new information, future events or otherwise.
The ‘Turnaround’ story →38

2
About Tata Motors Group
Vision
As a high-performance organisation, we are, by FY19:
• Among the top three in global CV and domestic PV• Achieving sustainable financial performance• Delivering exciting innovations
Mission
We innovate mobility solutions with passion to enhance quality of life
Values
Integrity Teamwork Accountability Customer Focus Excellence Speed
Tata Motors Group (Tata Motors) is a $45 Billion organisation and a part of the $100 Billion Tata group. It is a leading global automobile manufacturing company. Its diverse portfolio includes an extensive range of cars, sports utility vehicles, trucks, buses and defence vehicles. Tata Motors is India’s largest and the only Original Equipment Manufacturer (OEM) offering an extensive range of integrated, smart and e-mobility solutions. We have operations in the UK, South Korea, Thailand, South Africa, Indonesia, Austria and Slovakia through a strong global network of 97 subsidiaries and nine associate companies, four Joint Ventures (JVs) and two joint operations, including Jaguar Land Rover (JLR) in the UK and Tata Daewoo in South Korea.
Our brandsEach Tata Motors brand, though unique in its own right, speaks in a common voice. The Tata Motors brands are an expression of the Tata Motors Group’s promise to connect aspirations, bringing people’s dreams to life through path-breaking product development and engineering capabilities.
Tata Motors Limited (TML) is India’s market leader in CV and among the top four in the PV market.
Our brand promise
In FY18, ‘Connecting Aspirations’ was chosen to define Tata Motors’ promise as a brand that understands its customers and imagines mobility in all its forms. The expression captures the personality of Tata Motors as an intelligent, perceptive and innovative brand, delivering mobility solutions that are designed to meet the aspirations of people across the world.
TATA MOTORS GROUP
TATA BRANDS
TATA MOTORS LTD.
TMF HOLDINGS LTD.
TATA DAEWOO COMMERCIAL VEHICLES CO. LTD.
JAGUAR AND LAND ROVER
JAGUAR LAND ROVER AUTOMOTIVE PLC

373rd Annual Report 2017-18 (Integrated)
INTEGRATED REPORT 1-65 FINANCIAL STATEMENTS 185-353STATUTORY REPORTS 66-184
Jaguar Land Rover (JLR), is Britain’s largest automobile company engaged in designing, manufacturing and selling some of the world’s best-known premium cars. The two iconic brands of JLR are Jaguar, which includes a portfolio of luxury sedans, sports cars and luxury performance Sport-Utility Vehicles (SUVs), and Land Rover, with a range of premium all-terrain vehicles. JLR has made its mark in the Chinese automotive market with Chery Jaguar Land Rover Automotive Co. Ltd. (CJLR), a 50:50 JV between Chery Automobile and JLR.
Mission
We are entering the largest, fastest industrial revolution ever, driven by decarbonisation, air quality, digitisation, connectivity, automation and technology. Against this backdrop, we see endless exciting opportunities to create a world in which we will live safer, better, more connected and mobile lives.
PIONEERING, INTEGRITY, EXCELLENCE, UNITY, RESPONSIBILITY
Our most valuable asset is our people; nothing is more important than their safety and wellbeing
MORE GREAT PRODUCTS
FASTER
ENGAGED PASSIONATE
PEOPLE
TRANSFORMED COST
STRUCTURE
BUSINESS EXCELLENCE
GLOBAL GROWTH
CUSTOMER FIRST
EXPERIENCES CUSTOMERS
LOVE, FOR LIFE
ENVIRONMENTAL INNOVATION
ONE COMPANY PURPOSE
TWO GLOBAL ICONIC BRANDS
THREE PASSIONS
FOUR
FOUNDATIONS
FIVE CORE
VALUES
Tata Daewoo Commercial Vehicle Company (TDCV) is South Korea’s second largest manufacturer of medium- and heavy-duty trucks. Formerly a part of the Daewoo Group, the Company was acquired by Tata Motors in March 2004. TDCV is enhancing its reach across overseas markets with exports to ~60 countries.
TMF Holdings Limited (TMFHL) is a Core Investment Company (CIC), which ensures funding of equity or debt requirement of all subsidiary companies, including Tata Motors Finance Limited (TMFL) and Tata Motors Finance Solutions Limited (TMFSL). The objective of TMFL is to become a preferred finance provider for the customers of Tata Motors’ dealers.

4
Our global footprint
Tata Motors
1 JLR, Halewood, UK
2 JLR, Solihull, UK
3 JLR, Castle Bromwich, UK
4 JLR, Warwick Manufacturing Group, UK
5 JLR, Itatiaia, Rio de Janeiro, Brazil
6 JLR, Graz, Austria (Contract manufacturing; operational 2018)
7 JLR, Changshu, China
8 JLR, Nitra, Slovakia
9 JLR Pune, Maharashtra
Jaguar Land Rover
Our state-of-the-art manufacturing facilities
1 TML, Jamshedpur, Jharkhand
2 TML, Pantnagar, Uttarakhand
3 TML, Dharwad, Karnataka
4 TML, Pune, Maharashtra
5 TML, Ahmedabad, Gujarat
6 TML, Lucknow, Uttar Pradesh
7 Tata Marcopolo, Dharwad, Karnataka
89
5
7
8
1
1
3
2
1
4
5
6
7
65
Tata Daewoo
1 TDVC, Gunsan, South Korea
67
TML and JLR have manufacturing locations across the world. These manufacturing operations are supported by a vast network of design and innovation centres spanning four continents. These state-of-the-art facilities have helped both TML and JLR grow their commercial presence in diverse geographies and for different product segments.
Map not to scale
9

573rd Annual Report 2017-18 (Integrated)
INTEGRATED REPORT 1-65 FINANCIAL STATEMENTS 185-353STATUTORY REPORTS 66-184
Our centres for innovation and design
1 Whitley, Global Headquarters, Engineering & Design, UK
2 Coventry, Special Vehicle Operations Technical Centre, UK
3 Gaydon, UK National Sales Centre, Design and Engineering Centre and Test Centre UK
4 Warwick Manufacturing Group Advanced Research Centre, UK and Tata Motors European Technical Centre (TMETC)
5 Jamshedpur, India
6 Pune, India
7 Gunsan, South Korea
8 Portland, US
9 Trilix, Italy
Total Tata Motors Group sales in FY18
1 After inter-segment elimination2 After intra-segment elimination
*These revenues are gross of excise duty
Revenues – Automotive operations (J in Crores)
Tata and other brand vehicles JLR
Total2
66,620.38 226,964.86
293,453.33
Segment-wise revenues(J in Crores)
Automotive operations Others
Total1
293,453.33 3,252.36
295,409.34
43,39459,593
49,68146,393
44,9
92
51,356
Geography-wise Revenues* FY18
(J in Crores) 20.2%
16.8%
14.7% 17.4%
15.2%
15.7%
ChinaUK
US
Rest of Europe Rest of
the world
India
Our dealer/retailer networks (As on March 31, 2018)
TML JLR
746PV sales touchpoints
576PV service touchpoints
19,972CV retailers
1,571Retailers/dealers
Tata and other brands
TML
219,274PVs
456,552CVs
*Including CJLR
JLR
614,309Total Retail Sales
108,759
129,319
133,592
150,
116
92,523
JLRGeography-
wise Retail (%)
21.75%
24.44%
15.06%
21.05%
17.70%
Europe
China*
Overseas
North America
UK

6
Our diverse product suiteTata Motors Limited
HAT
CHB
ACK
SS
EDA
NS
SU
Vs
NEXON SUMO GOLD
TIAGO BOLT
HEXA SAFARI STORME
Passenger Vehicles (PV)
TIGOR ZEST
GENX NANO

773rd Annual Report 2017-18 (Integrated)
INTEGRATED REPORT 1-65 FINANCIAL STATEMENTS 185-353STATUTORY REPORTS 66-184
SM
ALL
CO
MM
ERCI
AL
VEH
ICLE
S
(SCV
) & P
ICK-
UP
S (P
U)
PAS
SEN
GER
TR
AN
SP
OR
TATI
ON
INTE
RM
EDIA
TE A
ND
LIG
HT
CO
MM
ERCI
AL
VEH
ICLE
S (I
LCV
)M
EDIU
M A
ND
HEA
VY
CO
MM
ERCI
AL
VEH
ICLE
S (M
HCV
)
CARGO RANGE
CONSTRUCK RANGE
ACE RANGE YODHA RANGEXL RANGE
Commercial Vehicles (CV)
COACHES URBAN BUSES CONTRACT CARRIAGES VANS
ULTRA RANGE SFC & LP RANGE

8
Our diverse product suite
Jaguar
E-PACE
I-PACE
XF
F-TYPE
F-PACE
XE
XF SPORTBRAKE XJ

973rd Annual Report 2017-18 (Integrated)
INTEGRATED REPORT 1-65 FINANCIAL STATEMENTS 185-353STATUTORY REPORTS 66-184
Land Rover
RANGE ROVER RR SPORT
VELAR EVOQUE
DISCOVERY DISCOVERY SPORT

10
Product launches in FY18
TIAGO XTA (AMT)
TIAGO WIZZ
TATA NEXON
HEXA DOWNTOWN, URBAN EDITION TIGOR AMT VARIANTS
TIGOR EV
Tata Motors Limited

1173rd Annual Report 2017-18 (Integrated)
INTEGRATED REPORT 1-65 FINANCIAL STATEMENTS 185-353STATUTORY REPORTS 66-184
ACE MEGA XL MAGIC EXPRESS SIGNA 4923.S
ULTRA AMT BUS
TIGOR XM VARIANT

12
Jaguar and Land Rover
Product launches in FY18
JAGUAR XEL JAGUAR XF SPORTBRAKE JAGUAR E-PACE
JAGUAR F-PACE SVR
RANGE ROVER AND RANGE ROVER SPORT
LAND ROVER REBORN
RANGE ROVER SV COUPÉ
JLR’s long-wheelbase XE model produced exclusively in China
Limited edition, hand-built
An addition to the PACE family with a five-star Euro NCAP rating, underlining the compact SUV’s safety credentials
JAGUAR E-TYPE REBORN
Jaguar celebrates 50 years of the iconic E-Type
Offering from JLR Classic
JAGUAR I-PACE
The world’s first fully electric premium SUV
With a plug-in hybrid powertrain option, this model offers customers 31 miles of electric-only range and a fuel economy of up to 91.1 mpg
Joins the award-winning XF saloon in its tenth year of production
Jaguar’s ultimate performance SUV, also considered as one of the safest

1373rd Annual Report 2017-18 (Integrated)
INTEGRATED REPORT 1-65 FINANCIAL STATEMENTS 185-353STATUTORY REPORTS 66-184
Our future-ready portfolio
Tata Motors is prepared for the future with its promising portfolio, addressing various product and technology drivers. These drivers range from changing standards on emissions – Bharat Stage VI (BS VI) – safety norms, fuel economy, rated loads, megatrends such as the Autonomous, Connected, Electric, Shared (ACES) phenomenon and strategic product offerings.
TML’s upcoming offerings
The key leading-edge powertrain technologies that TML is prepared with include:
• New-gen family of powertrains with best-in-class fuel efficiency, performance, durability and reliability. The powertrains have multi-fuel capability, including CNG/LPG, ethanol, bio-diesel and bio-CNG
• Advanced powertrains (xEVs) for Tigor EV and Diesel Hybrid Bus, India’s first fuel cell bus
• Selective Catalytic Reduction (SCR) system for its Medium to Heavy Commercial Vehicles (MHCV), helping adhere to BS IV standards, while investing in BS VI powertrains
• Range of manual and automatic transmissions for a wide gamut of applications, including reliable, rugged and efficient drivelines
TML’s range of Electric Vehicles (EVs) include IRIS EV, Magic EV, 12 m Urban Electric Bus, Tiago EV, Tigor EV and RaceMo EV, along with the EVision Concept Electric Vehicle showcased at the Geneva International Motor Show in March 2018.
JLR’s future product line-up
Jaguar’s Portfolio
The XJ, Jaguar’s flagship luxury saloon car, offers unprecedented power and performance in the form of the 186 mph XJR575. Further demonstrating a long-term commitment to the Chinese market, the all-new XEL saloon – with an additional 100mm added to the wheelbase – is the second Jaguar product engineered exclusively for China, following the larger XFL, and is the fourth JLR model to be manufactured in China. The XEL delivers even greater interior comfort for rear-seat passengers.
• I-PACE, the all-Electric Vehicle from Jaguar, set a precedent in the industry. Two electric motors deliver 400 PS, all-wheel drive traction and 0-60 mph in just 4.5 seconds. The 90kWh lithium-ion battery gives a range of up to 480 km (Worldwide Harmonised Light Vehicle Test Procedure (WLTP) cycle), while the 100kW DC charging can deliver 80% charge (from 0%) in just 40 minutes.
Land Rover’s product suite
• Range Rover and Range Rover Sport both offer customers 31 miles of electric-only range and fuel economy of up to 91.1 mpg through Land Rover’s plug-in hybrid powertrain option. This exceptional, new hybrid powertrain, a Range Rover Sport P400e, became the first SUV to ascend the famously challenging 45°, 999-step staircase to Heaven’s Gate rock arch in China.
• Range Rover Velar was launched in 2017 and was recognised as the World Design of the Year. It is a midsized luxury SUV known for its safety, design and technology. Velar received the five-star Euro NCAP rating and the independent safety body noted its outstanding performance in the severe side barrier and side pole crash tests.
• A Land Rover Discovery towed a 110-tonne road train along a 16 km test route in the heat and dust of Australia’s Northern Territory, proving its versatility and position as the world’s best family SUV in the most extreme conditions. The compact SUVs, Land Rover Discovery Sport and Range Rover Evoque, offer greater performance with the Ingenium petrol engines.
1373rd Annual Report 2017-18 (Integrated)

14
April
Our achievements during FY18
→ TML handed over the first 117 of the 500 new next-generation low-floor urban city buses to Ivory Coast.
→ TAL Manufacturing Solutions, a subsidiary of TML, launched the TAL BRABO robot in two variants; the TAL BRABO is a ‘Made in India’ solution.
→ TML announced its readiness in implementing the Selective Catalytic Reduction (SCR) and Exhaust Gas Recirculation (EGR) technologies for BS IV-compliant engines in its range of CV.
→ Two ground-breaking JLR vehicles – the Range Rover Velar and the Jaguar I-PACE Concept – debuted in China at the Shanghai Motor Show.
Jaguar F-PACE received the prestigious World Car of the Year and World Car Design of the Year titles at the 2017 World Car Awards.
MayTML won the HR Innovation of the Year award for outstanding contribution to skill development at the Asia Pacific Excellence Awards.
June → TML commenced trials of its Tata Ultra
ELECTRIC 9m bus in Chandigarh.
→ JLR announced the ‘Lighting up Lives’ collaboration with sustainability experts ClimateCare to bring safe and clean light to 1.2 Million people in East Africa, replacing the hazardous kerosene fuel.
→ InMotion, JLR’s mobility services business, announced a £25 Million investment in Lyft, the fastest-growing ride-share company in the US.
JLR engineer Dr. Amy Rimmer won
Autocar magazine’s Rising Star award
for British women in the car industry.
July
→ TATA TIAGO, the first TML car to embody the Company’s impACT design philosophy, crossed the 1 Lakh bookings milestone in the Indian market.
→ TML showcased the country’s first bio-CNG bus at the bio-energy programme, Urja Utsav.
→ TML partnered with the Pilipinas Taj Autogroup Inc. as the official distributor of Tata Motors CV in the Philippines.
→ JLR confirmed the newest member of its Jaguar PACE family, the E-PACE, which will be manufactured on two continents to satisfy expected customer demand for the compact SUV.
→ JLR opened its Chinese engine plant as part of its ¥10.9 Billion JV with Chery Automobile Ltd.
August → TML adopted a new corporate brand identity
‘Connecting Aspirations’.
September → JLR announced plans to collaborate with robotics
researchers at Harvard University as part of an effort to develop next-generation technologies to create super-human strength in the factory of future.
→ JLR revealed the first voice-activated Artificial Intelligence (AI) based connected steering wheel of the future – Sayer – at London. This is a step towards the FUTURE-TYPE Concept, JLR’s advanced research project for on-demand cars in 2040 and beyond.

1573rd Annual Report 2017-18 (Integrated)
INTEGRATED REPORT 1-65 FINANCIAL STATEMENTS 185-353STATUTORY REPORTS 66-184
October
→ TML showcased the new safety technology, Electronic Stability Control (ESCsmart™), for the range of PRIMA and SIGNA trucks at an event in Chennai.
→ TML’s Grahak Seva Mahotsav, or National Customer Care Day, witnessed over 16,000 customers visiting daily. TML initiated the Grahak Samvaad campaign to educate more than 8,000 customers in ten days.
November → TML signed a Memorandum of
Understanding (MoU) with Energy Efficiencies Services Limited (EESL) to achieve energy and resource conservation, by implementing various energy efficiency initiatives across the Company’s manufacturing facilities in India.
→ JLR participated in the UK’s first road tests for autonomous and connected vehicles, making intelligent vehicles a reality.
JLR Classic enjoyed a double victory at the 2017 Octane Awards held in London.
The ‘Legends Continued’ Jaguar XKSS variation was crowned 2017 Car of the Year and JLR Classic received the Manufacturer Heritage Collection of the Year title.
TML Nexon received the prestigious Best Design Award of this Year by Autoportal.
December February
March
→ TML rolled out the first batch of the Tigor EV from its Sanand facility in Gujarat.
→ Tata Ace crossed the important milestone of 20 Lakh vehicle sales on road.
→ In JLR’s largest ever volunteering activity, more than 150 employees participated in the Company’s first ‘Mapathon’ event, plotting roads, rivers and buildings across a sprawling area in the Kurigram district of Bangladesh using satellite imagery.
TML conferred with the prestigious National Energy Conservation Award for its Jamshedpur plant, by the Government of India.
TML Starbus Hybrid received Special Recognition at the Apollo CV Awards 2018. January
→ TML launched the branded Tata Motors Genuine Oil exclusively for Tata Motors CV range in the Indian market.
→ JLR confirmed its plans to open a software engineering centre and create 150 jobs in Shannon, Republic of Ireland, in 2018.
JLR was named the largest automotive vehicle and engine manufacturer in the UK in 2017.
→ As part of a unique initiative to promote ‘Skill India Mission’, Tata Motors and Automotive Skills Development Council (ASDC) certified the first batch of trainees under their collaborative skills development and certification programme.
→ The indigenously-developed Tata Starbus Hybrid Electric Bus with full low-floor configuration was formally handed over to Mumbai Metropolitan Region Development Authority (MMRDA) at the launch ceremony in Mumbai.
→ JLR and Waymo announced a long-term strategic partnership for developing the world’s first premium self-driving EV for Waymo’s driverless transportation service.

16
Key performance indicators
Financial KPIs (Consolidated)
Total incomeNet profit (after minority interest)(` in Crores) (` in Crores)
2017-18
2016-17
2015-16
296,298
275,247
278,546
2017-18
2016-17
2015-16
9,091
7,557
11,678
Operating profits (` in Crores)
2017-18
2016-17
2015-16
36,873
36,912
41,776
Earnings per share(after minority interest)
Basic
(`)
2017-18
2016-17
2015-16
26.46
21.94
34.25

1773rd Annual Report 2017-18 (Integrated)
INTEGRATED REPORT 1-65 FINANCIAL STATEMENTS 185-353STATUTORY REPORTS 66-184
Total debt Net debt equity ratio(` in Crores)
2017-18
2016-17
2015-16
88,950
78,604
69,360
2017-18
2016-17
2015-16
0.42
1.35
0.88
Net cash from operations (` in Crores)
2017-18
2016-17
2015-16
23,857
30,199
37,900

18
Chairman’s Message
The commitment to growth, disciplined capital allocation and shareholder returns are shared goals for Jaguar Land Rover and Tata Motors.
Natarajan ChandrasekaranNon-Executive Chairman
Chairman’s message
Dear Shareholders,
It is my privilege to write to you and present the Annual Report for 2017-18 as the Chairman of the Board at Tata Motors and its British subsidiary Jaguar Land Rover. This year, we mark the 150th year of the foundation of the Tata Group and Tata Motors has been an integral part of the Tata Group’s journey of industrializing India.
Tata Motors and Jaguar Land Rover are both iconic companies and brands. We are together, preparing ourselves to leverage growth potential of the Indian economy, while facing the headwinds of uncertainty due to market cyclicality, Brexit and the decline in diesel demand.
The global automobile industry is undergoing a structural shift due to technology led business and market
disruption, evolving consumer preferences, market cyclicality, regulatory overhauls and geopolitical uncertainty. The ACES (Autonomous, Connected, Electric, Shared) phenomenon is likely to transform mobility and influence consumer preferences going forward. Some of the key operating markets for the group are faced with diverse market dynamics requiring specific interventions to ensure sustainable profitable growth. North America is nearing the peak of the demand cycle and growth is likely to remain muted in the near term. While regulatory restrictions on diesel, market cyclicality, Brexit and taxation in UK pose specific challenges in Europe and UK, the key Asian markets of China and India offer high growth opportunities led

1973rd Annual Report 2017-18 (Integrated)
INTEGRATED REPORT 1-65 FINANCIAL STATEMENTS 185-353STATUTORY REPORTS 66-184
by GDP growth, strong domestic consumption and favourable demographic support.
India’s automotive industry is the fourth-largest in the world (by production), and the annual production in FY 2017-18 grew sharply at 14.8% yoy. This sector is well positioned for growth, given low rates of auto penetration, rising incomes and increasing affordability. In addition, we expect to see government policy supporting auto growth through lower excise duties and the National Electric Mobility Mission Plan 2020. Altogether, by 2026 India is expected to be the third largest automotive market in the world. The Indian auto industry is not without its challenges, including adapting to a structural shift towards electric vehicles (EVs), shared mobility options with ride-sharing permeating the urban landscape, a pan-India shift to Bharat Stage-VI emission by 2020 and enhanced safety norms. As such, we will have to be more agile than ever and work towards being future-ready.
I am encouraged to note that Jaguar Land Rover continues to set new standards for engineering excellence with the introduction of new automotive technologies and advanced design. This is reflected by the multiple awards for its various models. Jaguar Land Rover continues its investment for growth, launched exciting new products and landmark partnerships during the year. The company also announced its electrification roadmap to address diesel challenges. The company will focus on optimization, drive operating leverage and manage capital spends prudently to offset the impact of headwinds facing the business.
Tata Motors delivered a strong performance this year. Within the commercial vehicles segment, key gaps were identified and addressed through modular product designs. In the passenger car segment, your company focused on improving customer experience and providing “best in class” features, which is driving changes in the brand perception. The company will continue to focus on product development, network expansion and cost reduction.
The commitment to growth, disciplined capital allocation and shareholder returns are shared goals for Jaguar Land Rover and Tata Motors. I am confident that both shall continue to work towards delivering Competitive, Consistent and Cash Accretive Growth in the coming years.
I would like to thank our employees as well as our extended partners, including dealers, suppliers and other stakeholders for their hard work and commitment in this critical but exciting phase of your company.
Finally, I thank you for your continued trust, confidence and support.
Best Regards, N Chandrasekaran Mumbai, May 23, 2018
We will have to be more agile than ever and work towards being future-ready.

20
Guenter ButschekCEO and Managing Director, Tata Motors
Dear Shareholders,
I am excited to present the annual performance report of Tata Motors standalone business for FY18 on a much more positive note than a year ago.
For the year gone by, I would regard the BSIV transition as the most difficult part of our journey, eventually dampening the first quarter results. This coupled with the carry forward impact of weak financials from FY17 was enough to bring a sense of urgency within the organisation, building up to the launch of ‘Business Turnaround’ in June 2017. The aggressive ‘Turnaround’ plan was approved by the Board in June 2017 and the organisation shifted gears with an immediate effect.
The next nine months of FY18 saw the organisation demonstrating a single-minded focus on execution of three objectives - sales enhancement, rigorous cost reduction and supply debottlenecking.
Back-to-back product launches, intensified stakeholder engagement, production ramp-up, effectiveness of product line function enabling higher empowerment and accountability within business units all paved the way for a comprehensive implementation of the ‘Turnaround’ plan.
ImpACT projects, our strategic priorities, which were seeded in FY17 as part of the ‘transformation journey’ bore fruit, contributing to 50% of the total cost reduction achieved
in FY18, in addition to structurally improving the fundamental process backbone for long-term sustainability of the performance improvement. The new taxation regime of Goods and Services Tax (GST) was well-managed within the timelines and was capitalised as a value creation opportunity rather than a mere compliance milestone.
Overall, the ‘Turnaround’ led to outstanding results with the business reporting higher volume growth, stronger improvement in underlying profitability, and positive free cash flow. The market share in CV increased by 70 bps to 45.1%, and by 60 bps to 5.7% in PV. Our standalone net revenues increased by 31.6% to H58,457 Crore for the 12 months to March 31, 2018 and our standalone profit before exceptional items and tax for the year came at H20 Crore, compared with a loss of H2,015 Crore in the previous year.
Further, this was the year that gave wings to our aspirations in the EV space, well demonstrated by some of the industry-first achievements - winning prestigious order of Tigor EV from EESL and garnering majority share in the e-bus contracts, winning 6 out of 10 cities.
We fully recognise that this is just the beginning and to deliver competitive, consistent, cash-accretive growth, the ‘Turnaround’ approach must continue. In FY19, we have announced the launch of ‘Turnaround 2.0’ with three clear objectives viz. ‘win decisively’ in CV, ‘win sustainably’ in PV and embed a culture of ‘Turnaround’ deep into the organisation.
I am confident that as a team we will draw strength from our strong performance in FY18, and commit ourselves to deliver ‘Turnaround 2.0’ to further improve our performance in FY19.
I would like to take this opportunity to thank all of you for your confidence in our abilities. With your continued support, I am optimistic of a brighter future for Tata Motors, reclaiming its pride of place in the coming years.
Best Regards,
Guenter Butschek Mumbai, May 23, 2018
TML CEO and Managing Director’s message
We fully recognise that this is just the beginning and to deliver competitive, consistent, cash-accretive growth, the ‘Turnaround’ approach must continue.

2173rd Annual Report 2017-18 (Integrated)
INTEGRATED REPORT 1-65 FINANCIAL STATEMENTS 185-353STATUTORY REPORTS 66-184
Professor Dr. Ralf D. Speth (KBE, FREng) CEO, Jaguar Land Rover
Dear Shareholders,
This year JLR celebrates 10 years of Tata ownership. Since 2008, we have grown into a global player in the premium market. We are proud to be Britain’s largest automotive manufacturer, respected for our outstanding award-winning products.
JLR delivered a solid business and financial performance in FY18. We increased sales volumes, grew revenue to £25.8 Billion and sustained profitability.
Our global retail sales rose 1.7% to 614,309. Growing demand in China and the US offset weaker conditions in the UK and mainland Europe.
Our Products Today, JLR offers the most luxurious and most sustainable product portfolio in our history.
Jaguar expanded its portfolio to include the E-PACE, a new compact SUV. We introduced the Chinese market XEL, the beautiful XF Sportbrake and the F-Pace SVR, Jaguar’s ultimate performance SUV.
The launch of the Jaguar I-PACE, the world’s first fully electric premium SUV, is a technological game-changer.
Land Rover attracted new customers with the new Discovery and revealed the 18 Model Year Range Rover and Range Rover Sport, both with plug-in hybrid versions. The limited edition Range Rover SV Coupe takes our flagship brand to new heights.
Among the 200 awards won this year, the newly introduced Velar, the fourth Range Rover model, was named ‘World Car Design of the Year’.
Our TechnologiesIt is through innovation that JLR will become a true technology-driven company.
Our future modular architecture will bring flexibility and greater economies of scale, offering our customers a full choice of electrified vehicle options, as well as clean petrol and diesel. From 2020, all new Jaguar and Land Rover vehicles will be electrified.
We are working tirelessly to improve the efficiencies of our engine technologies, while simultaneously moving to ‘ACE’ (Autonomous, Connected, Electrified technologies).
Our PeopleAt JLR, our primary asset is our people. We are committed to attracting and retaining the best people and our 43,000-strong workforce has continued to grow, with recruitment starting for our new plant in Nitra, Slovakia.
Our External EnvironmentAs a company operating globally, we favour a policy and trading environment that protects tariff-free, fair and frictionless trade.
While we respect the democratic decision of the UK people, JLR is seeking clarification and certainty on the terms of Britain’s withdrawal from the European Union. It is of paramount importance that as many benefits as possible are preserved.
Demand has been undermined in Europe by consumer uncertainty over diesel, particularly in the UK where diesel cars face unfair tax treatment.
Our FutureA world of sustainable mobility will offer significant economic, social and health benefits: zero emissions vehicles, zero congestion and zero accidents.
We are committed to recycling and zero emissions at every stage. All of our cars offer greater connectivity than ever before, and we are already testing fully autonomous vehicles on UK roads.
We will continue to invest in new products, technology and capacity to drive long-term profitable growth.
As we embark on the next phase of our strategy, let me reaffirm our pledge: that we will continue to produce and deliver vehicles that create experiences customers will love, for life.
Best Regards,
Professor Dr. Ralf D. Speth Mumbai, May 23, 2018
JLR CEO’s message
JLR delivered a solid business and financial performance in FY18. We increased sales volumes, grew revenue to £25.8 Billions and sustained profitability.

22
Key inputsCapitals engaged
Our business model
Financial Capital
The funds and monetary resources needed to establish and operate the business. The business raises funds through a mix of debt and equity and optimises its debt based on market conditions.
Capital expenditure (Consolidated)
K42,672 Crores
Research and Development (R&D)
R&D investment
People strength (Consolidated)
81,090 Employees
Employee cost (Consolidated)
K30,300 Crores
Natural resources used
Manufactured Capital
The production facilities and equipment for designing, prototyping and manufacturing vehicles.
Intellectual Capital
Research and Development (R&D), innovation, design and engineering, which form the basis of our product development efforts.
Human Capital
The collective skills, experience and expertise of our people, which drive our production process.
Social & Relationship Capital
Stable and sustainable relationships with value-chain partners and customers are indispensable for business continuity. Our relations with communities ensure our social licence to operate.
Natural Capital
The automotive business is dependent on multiple natural resource based raw materials. At the same time, there are several impacts of the business activities on nature.
Manufacturing assetsKey manufacturing units
*except the facility in Slovakia, which will be functional from December 2018
6 TML
Consumption of raw materials
K1,73,371 Crores 8* JLR
K2,398 Crores TML
K21.44 Crores TML CSR spend
£2,016 Millions JLR
2 JLR Innovation Hubs in Europe and the US
£10.5 Millions JLR
4.91 GJ TML
2.11 MWh JLR
3 TML India (Pune), the UK and South Korea
R&D centres
Community investments
Energy consumption per vehicle
Our partners
Growth drivers
• Strong industry know-how• State-of-the-art
manufacturing sites• Consistent innovation
• Talent development and retention• Disciplined capital allocation• Robust risk management • Strong supplier and customer relationships
4,931Sales and service touchpoints for PV and CV businesses of TML
1,571 Strong dealer network of JLR

2373rd Annual Report 2017-18 (Integrated)
Outcomes Impact on stakeholders
Output
Business value chain
Designing new products and solutions Judicious investment in technology and R&D, together with an understanding of market trends and customer needs. S1 and S4
Strategic focus areas linked to our business processes
Shareholders With profitable growth and financial returns, we strive to deliver sustainable returns for our shareholders. More on Page 16
Customers It is our endeavour to achieve market leadership by delivering products that meet the evolving needs of customers on safety, inside-car environment, eco-friendliness and future technologies. More on Page 50
Employees We strive to attract, develop, retain and reward talent and build a diverse workforce to draw requisite skills to drive our future strategy needs. More on Page 56
Suppliers and dealers We engage closely with our value-chain partners to develop their skills and mutually benefit by creating efficient processes and consolidating our supply chains. More on Page 50
Communities We engage with the communities we operate in and enhance their quality of lives through technology-enabled interventions in the domains of health, education and livelihood development, among others. More on Page 60
Winning new businesses Offering value through strong engineering capability, global footprint and innovative solutions. S2, S3 and S4
Sourcing materials and products Moving towards consolidation of supply chain for efficiency and reducing the time for design-to-delivery. S3 and S5
Efficient manufacturing Efficient and cost-effective processes that make higher levels of capacity utilisation possible. S5
Delivering high-quality products Meeting customers’ needs and earning trust. S1 and S4
Commitment towards sustainability Intensifying our focus on developing alternative fuel engine technologies for a cleaner and greener environment. S1 and S5
New technologies developed
LTIFR
TML ranked second in J D Power 2017 India Customer Service Index (CSI) Study
JLR Retailers invested £ 3 Billions in Arch sites, a customer experience game changer
Reduction in specific water consumption
Reduction in specific GHG emissions (%)
CSR beneficiaries
Diversity
Patents granted Designs registered
TML – India’s first bio-methane engine for buses
JLR – CloudCar and Connected Car technology
TML – 3% women workforce
JLR – 24 % increase in the proportion of women in workforce since 2014
66,620 TML
Vehicles sold (Consolidated)
12,21,124
80TML
0.08TML
15.91%TML (y-o-y)
4%TML (y-o-y)
39%JLR (since 2007)
46%JLR (since 2007)
6,44,000TML
1.2 MillionJLR
23TML
2,26,965 JLR
Revenue (in H Crores)
Vehicles Manufactured
PVs, CVs, SUVs, EVs More on Page 6-12
>
>1
2
3
4
5
6
S1 Focus on new product developmentS2 Expanding international businessS3 Mitigating cyclicality
S4 Customer focusS5 Organisational efficiency and cost management
More on Page 26
>
EBIT (in H Crores)
11,846Growth in PBT
20%PBT (in H Crores)
11,155
(Consolidated)

24
Varying demandSeveral markets around the world have been posting record levels of vehicle demand in the last few years, in the aftermath of recovery from the global recession. But this demand varies from region to region. Demand in the US has plateaued; the European market is on tenterhooks as there still is a lack of clarity on the impact of Brexit, added with diesel uncertainty, UK taxation and market cyclicality. On the back of a strong GDP growth and a strong demographic support, along with consistent consumer demand, the Chinese automotive market is growing.
During 2017-18, the new car market in the UK declined -5.1%, with registrations by business, private and fleet buyers all being down by -29.8%, -7.1% and -2.1%, respectively. Society of Motor Manufacturers and Traders (SMMT)
The volume of car sales in the US fell 1.8% for the first time in eight years in 2017.money.cnn.com/2018/01/03/news/companies/auto-sales-fall
In 2017, China’s Light Vehicle (LV) market rose by 2.3% or 0.63 Million vehicles to a record 27.6 Million unit. Although positive, this was the slowest growth in over a decade. automotiveworld.com/news-releases/chinas-new-vehicle-market-prospects-2022-automotive-world-report/
The Government of India’s support for infrastructure growth and a y-o-y increase in India’s industrial production at 4.4% (in March 2018) are all supporting the strong demand.https://dea.gov.in/sites/default/files/MER-April%202018.pdf
What does it mean for Tata Motors? A robust global strategy is in place to navigate through the challenging operating context.
New technologies and return on investments from ITGlobally, automobile manufacturers are making huge investments in R&D for innovation such as autonomous driving and electrification that represent a huge opportunity to change a hyper-competitive playing field. However, the global automotive industry is moving towards ACES vehicles and this technology shift requires huge investments from development to testing. The outcomes of these investments remain largely undetermined. As a result, today’s business models would have to change to capture a reasonable return on investments in new technologies.
An important factor that will determine the success of these innovations will be their affordability.
In 2017, the automotive industry’s R&D expenditures are estimated to amount to ~$98.2 Billion. https://www.statista.com/statistics/566098/research-development-spending-automotive-industry-worldwide/
What does it mean for Tata Motors? Stepping up our investments in research and innovation will offer a number of opportunities for our businesses. At the same time, we will have to be conscious of maintaining our cost leadership in the market.
Changing emission normsEmission norms are growing stricter, with pollution control being the need of the hour. Further, those such as BS VI are on the anvil earlier than expected. This changing regulatory landscape is adding pressure on automobile manufacturers to rethink the way forward to be able to produce upgraded, rules-compliant vehicles.
The Government of India has decided to switch over directly from BS IV (equivalent to EU 4) to BS IV (equivalent to EU 6) auto fuel by April 1, 2020.
China requires all LVs to adhere to tougher new China VIa emission standards by the middle of 2020 and China VIb emission standards by 2023.
What does it mean for Tata Motors? Tata Motors has been gearing up for the change though the right technology adoption, manufacturing innovations, testing and validation process improvements. Overall, it is fully prepared for a seamless transition to the new regime.
Brexit Significant uncertainty exists in the business world, with respect to how the relationship between the UK and the European Union (EU) will unfold. As a result, substantial doubt prevails over the political and economic future of the UK and the legal structure applicable to companies that have a business presence in the country. The ongoing transitional period ends on March 29, 2019.
What does it mean for Tata Motors?
Pending the determination of the terms of the future relationship between the UK and the EU, uncertainty over the former’s right to access the single EU market, EU’s customs area and global trade deals may have an impact on our European business.
Our external environmentWith the kind of presence Tata Motors has across multiple geographies, it has to be cognisant of the global as well as regional trends.
2573rd Annual Report 2017-18 (Integrated)
INTEGRATED REPORT 1-65 FINANCIAL STATEMENTS 185-353STATUTORY REPORTS 66-184
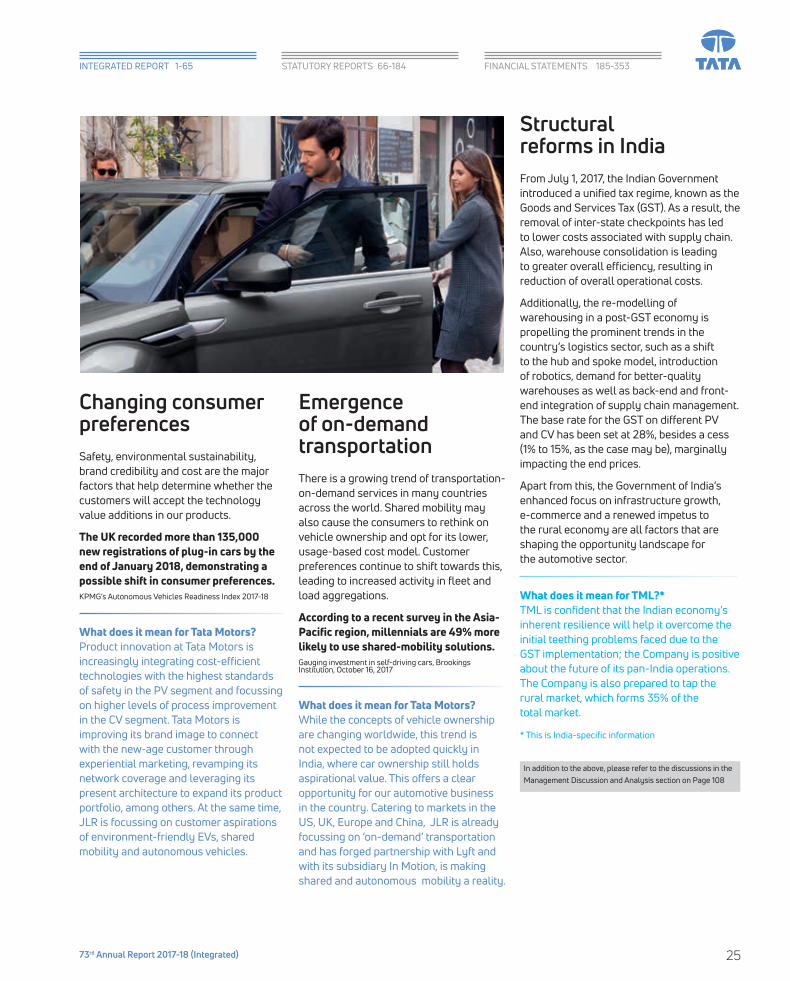
Changing consumer preferences Safety, environmental sustainability, brand credibility and cost are the major factors that help determine whether the customers will accept the technology value additions in our products.
The UK recorded more than 135,000 new registrations of plug-in cars by the end of January 2018, demonstrating a possible shift in consumer preferences. KPMG’s Autonomous Vehicles Readiness Index 2017-18
What does it mean for Tata Motors? Product innovation at Tata Motors is increasingly integrating cost-efficient technologies with the highest standards of safety in the PV segment and focussing on higher levels of process improvement in the CV segment. Tata Motors is improving its brand image to connect with the new-age customer through experiential marketing, revamping its network coverage and leveraging its present architecture to expand its product portfolio, among others. At the same time, JLR is focussing on customer aspirations of environment-friendly EVs, shared mobility and autonomous vehicles.
Emergence of on-demand transportation There is a growing trend of transportation-on-demand services in many countries across the world. Shared mobility may also cause the consumers to rethink on vehicle ownership and opt for its lower, usage-based cost model. Customer preferences continue to shift towards this, leading to increased activity in fleet and load aggregations.
According to a recent survey in the Asia-Pacific region, millennials are 49% more likely to use shared-mobility solutions. Gauging investment in self-driving cars, Brookings Institution, October 16, 2017
What does it mean for Tata Motors? While the concepts of vehicle ownership are changing worldwide, this trend is not expected to be adopted quickly in India, where car ownership still holds aspirational value. This offers a clear opportunity for our automotive business in the country. Catering to markets in the US, UK, Europe and China, JLR is already focussing on ‘on-demand’ transportation and has forged partnership with Lyft and with its subsidiary In Motion, is making shared and autonomous mobility a reality.
Structural reforms in India From July 1, 2017, the Indian Government introduced a unified tax regime, known as the Goods and Services Tax (GST). As a result, the removal of inter-state checkpoints has led to lower costs associated with supply chain. Also, warehouse consolidation is leading to greater overall efficiency, resulting in reduction of overall operational costs.
Additionally, the re-modelling of warehousing in a post-GST economy is propelling the prominent trends in the country’s logistics sector, such as a shift to the hub and spoke model, introduction of robotics, demand for better-quality warehouses as well as back-end and front-end integration of supply chain management. The base rate for the GST on different PV and CV has been set at 28%, besides a cess (1% to 15%, as the case may be), marginally impacting the end prices.
Apart from this, the Government of India’s enhanced focus on infrastructure growth, e-commerce and a renewed impetus to the rural economy are all factors that are shaping the opportunity landscape for the automotive sector.
What does it mean for TML?*
TML is confident that the Indian economy’s inherent resilience will help it overcome the initial teething problems faced due to the GST implementation; the Company is positive about the future of its pan-India operations. The Company is also prepared to tap the rural market, which forms 35% of the total market.
* This is India-specific information
In addition to the above, please refer to the discussions in the Management Discussion and Analysis section on Page 108

26
Our strategic framework
Our objectiveTML
To develop a range of exciting and contemporary products and services across the PV and CV segments to match and surpass customer expectations
JLR
• Producing and delivering vehicles that create experiences, which customers love, for life
• Embracing technologies on ACES while delivering products of the highest quality
• Delivering a fully emissions-compliant portfolio
• Moving towards Modular Longitudinal Architecture (MLA) - scalable architecture that is agnostic to propulsion system and will optimise commonality and reduce complexity, while managing costs
Key initiatives and actionsTML
The Company launched a number of models during FY18:
• Launched the next-generation Compact Utility Vehicle (CUV) – Nexon
• Rolled out the first batch of Tigor EV as part of the prestigious EV car tender floated by EESL
• Enhanced customer experience with exciting design and features (including Automated Manual Transmission [AMT] and smart connectivity)
• Introduced a number of new CV models, including the new XL range of small commercial cargo vehicles and a number of new products on the Prima and Signa ranges
• Unveiled a number of new products during the Auto Expo 2018, including the new-generation Tata H5X and 45X concepts, Intra compact truck, Ultra T7 light truck and the SIGNA 4323, India’s first six-axle rigid truck
Focus on new product development
JLR
• Awarded the World Car Design of the Year award at the 2018 World Car Awards for Range Rover Velar, a luxury performance SUV
• Launched E-PACE, Jaguar’s first compact SUV, which has a five-star Euro NCAP rating, confirming it to be among the safest vehicles in the market
• Introduced I-PACE, the first fully electric premium SUV in the world in early 2018, giving JLR a true competitive advantage and helping the Company attain a leadership position among EVs
• Launched plug-in hybrid variants of Rang Rovers and Range Rover Sports, offering customers 31 miles of electric-only range and combined fuel economy and CO2 emissions of up to 91.1 mpg and as low as 72g/km
• Continued investment in new models that cater to the technology needs of ACES and helps the Company remain competitive in the marketplace — its new factory in Slovakia is slated to commence production by the end of 2018
Looking aheadTML
• TML is leveraging modular approach state-of-the-art architectures both in CV and PV, while developing a number of new products and
variants to enhance the range of choices for its expanding customer base.
• The Company is introducing contemporary and value-added features and technologies to increase the product appeal, safety and passenger comfort.
• TML is actively working on alternate propulsion systems, including zero-emission technology, especially in EVs for certain applications.
JLR
• Jaguar has started the migration to be a leader in electrification. At the same time, Land Rover has a strong line-up of SUVs, including the new Defender, which is currently under development. JLR also has a line-up of special vehicles created in Special Vehicles Operations (SVO). The Company aims to grow and expand up to 16 nameplates between FY22 to FY24.
• JLR is on track for complying with European fleet average tailpipe CO2 emissions by 2020–supported by the Plug-in Hybrid Electric Vehicle (PHEV) powertrains in its Range Rover and Range Rover Sport SUVs, the fully electric Jaguar I-PACE and other future PHEV/BEVs.
• From 2020, all JLR vehicles will offer an electric option. These vehicles will be Mid Hybrids and/or PHEVs or BEVs.
• JLR announced its partnership with Waymo for development of autonomous cars and for delivering 20,000 Jaguar I-Pace models under this arrangement.
Key capitals deployed
Strategy 1S1

2773rd Annual Report 2017-18 (Integrated)
INTEGRATED REPORT 1-65 FINANCIAL STATEMENTS 185-353STATUTORY REPORTS 66-184
Our objectiveThe focus of this strategy is to identify new international markets based on the demographical and socio-economical features of specific regions, which include the aspects of:
• Regulatory landscape
• Geopolitical landscape
• Competitive landscape
Expanding international business Key capitals deployed
Key initiatives and actionsTML
• Shipments to ASEAN doubled in FY18 as compared to last year, making it the fastest growing region.
• In FY18, the Company successfully bagged several prestigious orders, including 250 units Xenon pickups, 200 units of LPTA 715 from the Myanmar armed forces, 540 units of buses from ILOC, Senegal, 209 units of Winger (135 units) and Xenon (75 units) from GVK EMRI Sri Lanka and 100 buses from FTC Mozambique.
• Some of the key events in FY18 were the launch of Prima in the Philippines, Signa in Sri Lanka, Yodha in Nepal, Ultra buses in Tanzania, Ultra range in South Africa and unveiling of Ultra in Thailand and Indonesia.
• Shipment of 9166 units of ILCV in FY18 is also the highest ever shipment for the segment in a year.
JLR
• Through the China JV, the Company capitalised on the high demand in China. Outside of the UK, JLR has a global plant network, with a contract manufacturing facility at Austria and a plant at China. It has established local assembly operations at India and Brazil.
• JLR has attained a balanced sales profile across North America, China, Europe, the UK and overseas during FY18.
• JLR has a global network of 23 National Sales Companies, which cover 92% of the worldwide volume. With a common identity across the retailer network for enhanced customer experiences (ARCH), JLR’s retailers are investing around:
• £3 Billion currently
• Plan to increase the investment to £9 Billion by FY23
Looking aheadTML
The Company will enhance volumes from non-SAARC markets driven by growth in ASEAN, Africa and the Middle East.
• To expand global market footprint further, TML will focus on four key areas of developing suitable products, driving optimal sourcing and manufacturing, enhancing overall customer experience and further establishing the TML brand across geographies.
• The Company’s KD assembly facilities are spread across eight countries and it aims to grow this to other strategic markets, taking KD contribution to almost 20% of total exports in FY21 compared to 8% in FY18.
JLR
• JLR’s manufacturing footprint is expanding, with the Slovakia plant on track for start of production by the end of 2018. The Company’s approach is to support key markets while accessing a lower cost base.
• JLR is also working on further expansion of its manufacturing footprint in China through its JV.
• JLR continues to expand in new markets.
Strategy 2S2

28
Our strategic framework
Mitigating cyclicalityOur objective• To mitigate the impact of cyclicality in the automobile industry, the Tata
Motors Group plans to continually strengthen operations while gaining market share across different product lines and offering a wide range of products in diverse geographies.
• The Company also plans to strengthen other business operations such as financing of vehicles and spare part sales, service and maintenance contracts, among others.
Key initiatives and actionsTML
• TML has invested in building adequate capacities across locations, ensuring smooth production ramp-up for all new models and creating flexibility across manufacturing plants.
• The Company has been actively looking for opportunities to optimise its operations, with specific focus on improving the supply chain efficiency, significant cost reduction and sales enhancement initiatives.
• The Company is also actively pursuing increased penetration of services, such as penetration of annual maintenance contracts and fleet management services by leveraging its competencies and the use of technology.
• Initiatives such as sale of certified pre-owned CV and greater push on spare parts and aftersales have also been actioned.
• Expanding the addressable market in PV, with products targeting multiple growth segments, is one of the key focus areas.
JLR
• JLR is expanding its international footprint and maintains a balanced retail sales profile across key sales regions.
• In addition, the Company is bringing in substantial changes to the market (e.g. automation and electrification) with new product launches, which enables it to focus on industry-defining products ahead of its competition.
Key capitals deployed
Looking aheadTML
TML is working towards:• Increasing the sales of Tata OK refurbished vehicles• Growing business in the field of fully-built vehicles, such as trailers and tippers• Continued focus on cost management and production throughput to maximise
the overall efficiencies• Actively pursuing opportunities in EVs and mobility services as future growth
areas for the business
JLR
• To safeguard against the effects of a cyclical business, JLR is focussing on more realistic planning of volumes in recognition of the present market realities. It is focussed on driving cost efficiency and operating leverage across the business. The Company is also making prudent investment plans to meet the affordability criteria while remaining at the forefront of technologies. Jaguar and Land Rover are both now stronger and more vibrant brands than ever before, supporting the ambition for further global growth.
Strategy 3S3
2973rd Annual Report 2017-18 (Integrated)
INTEGRATED REPORT 1-65 FINANCIAL STATEMENTS 185-353STATUTORY REPORTS 66-184
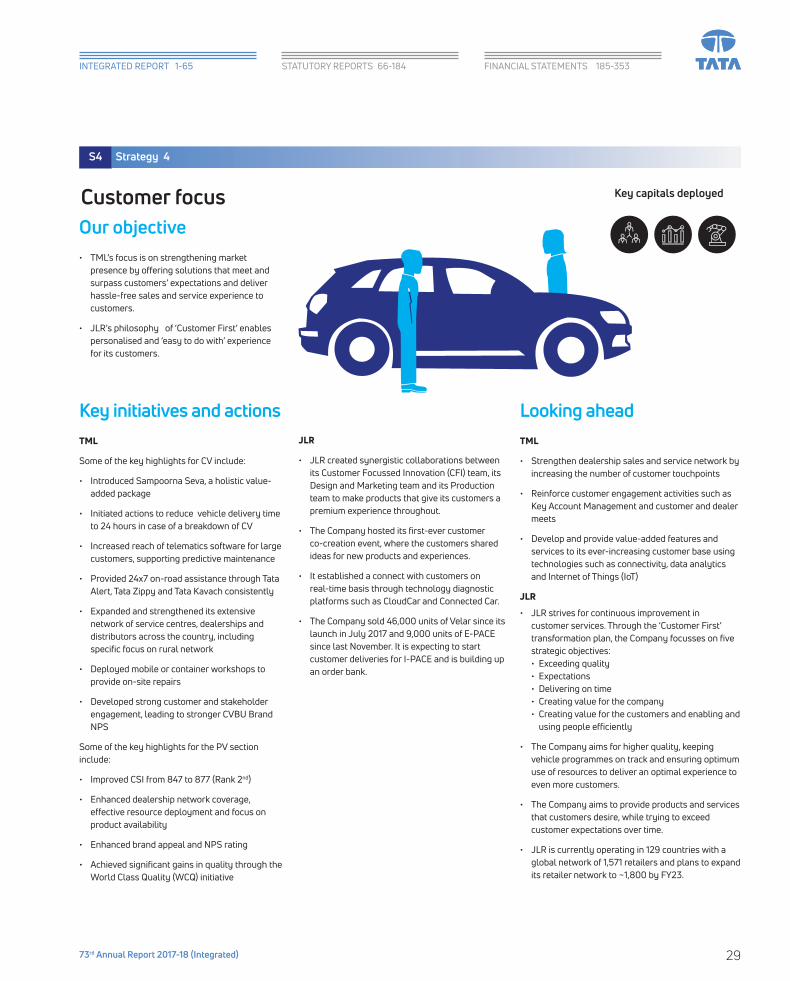
Key initiatives and actionsTML
Some of the key highlights for CV include:
• Introduced Sampoorna Seva, a holistic value-added package
• Initiated actions to reduce vehicle delivery time to 24 hours in case of a breakdown of CV
• Increased reach of telematics software for large customers, supporting predictive maintenance
• Provided 24x7 on-road assistance through Tata Alert, Tata Zippy and Tata Kavach consistently
• Expanded and strengthened its extensive network of service centres, dealerships and distributors across the country, including specific focus on rural network
• Deployed mobile or container workshops to provide on-site repairs
• Developed strong customer and stakeholder engagement, leading to stronger CVBU Brand NPS
Some of the key highlights for the PV section include:
• Improved CSI from 847 to 877 (Rank 2nd)
• Enhanced dealership network coverage, effective resource deployment and focus on product availability
• Enhanced brand appeal and NPS rating
• Achieved significant gains in quality through the World Class Quality (WCQ) initiative
JLR
• JLR created synergistic collaborations between its Customer Focussed Innovation (CFI) team, its Design and Marketing team and its Production team to make products that give its customers a premium experience throughout.
• The Company hosted its first-ever customer co-creation event, where the customers shared ideas for new products and experiences.
• It established a connect with customers on real-time basis through technology diagnostic platforms such as CloudCar and Connected Car.
• The Company sold 46,000 units of Velar since its launch in July 2017 and 9,000 units of E-PACE since last November. It is expecting to start customer deliveries for I-PACE and is building up an order bank.
Looking aheadTML
• Strengthen dealership sales and service network by increasing the number of customer touchpoints
• Reinforce customer engagement activities such as Key Account Management and customer and dealer meets
• Develop and provide value-added features and services to its ever-increasing customer base using technologies such as connectivity, data analytics and Internet of Things (IoT)
JLR
• JLR strives for continuous improvement in customer services. Through the ‘Customer First’ transformation plan, the Company focusses on five strategic objectives: • Exceeding quality• Expectations• Delivering on time• Creating value for the company • Creating value for the customers and enabling and
using people efficiently
• The Company aims for higher quality, keeping vehicle programmes on track and ensuring optimum use of resources to deliver an optimal experience to even more customers.
• The Company aims to provide products and services that customers desire, while trying to exceed customer expectations over time.
• JLR is currently operating in 129 countries with a global network of 1,571 retailers and plans to expand its retailer network to ~1,800 by FY23.
Customer focus Key capitals deployed
Our objective• TML’s focus is on strengthening market
presence by offering solutions that meet and surpass customers’ expectations and deliver hassle-free sales and service experience to customers.
• JLR’s philosophy of ‘Customer First’ enables personalised and ‘easy to do with’ experience for its customers.
Strategy 4S4

30
Organisational efficiency and cost management
• To critically review and right-size the cost structure to deliver best-in-class products at competitive prices and maximise the returns on a continual basis
Key Capitals Deployed
Our objective
Key initiatives and actionsTML
TML undertook multiple initiatives in FY18 to bring about higher efficiencies within the organisation.
Some of the key activities undertaken were:
• Intense cost reduction exercise across the product range through the Value Analysis Value Engineering (VAVE) approach
• Extensive benchmarking exercise with systematic deployment of initiatives such as the ‘should-cost’ approach
• Alternate sourcing, and commercial negotiation
• Critical review of internal resources, including the roll out of operational efficiency initiatives, productivity improvement initiatives and fixed-cost reduction measures
• Establishing a clear decision-making matrix and accountability within business units
JLR
JLR introduced certain initiatives to reduce product and business complexity (e.g. Modular Longitudinal Architecture (MLA)) to benefit from economies of scale and has established robust project management processes to ensure the set targets are met. Some of the initiatives are:
• JLR is investing in new state-of-the-art facilities designed for efficiency and quality with reduced development cycle times.
• It plans to leverage new product architecture commonality and scale efficiencies through Design for Assembly and Design for Logistics.
• It is growing its facility utilisation and energy efficiency with technology application and best practice maintenance systems.
• JLR is also enhancing its logistics infrastructure and systems for inbound supply chains and is developing outbound logistics using autonomous vehicle capabilities. The Company is sourcing globally to drive cost savings and improve flexibility and logistics e.g. in China, Hungary and Slovakia.
Looking aheadTML
• TML will continue to focus on identifying areas of resource optimisation and reducing input costs.
• Initiatives such as margin improvement projects and cost reduction actions across locations and functions are continuing in FY19 to strengthen overall financials.
JLR
• JLR’s Slovakia plant provides an opportunity to the Company for a relatively lower cost manufacturing location compared to the UK. It offers the opportunity for lower labour cost in the manufacturing facility and also better access to supply base. Global sourcing and supply base will drive cost savings and improve flexibility and logistics.
• JLR has been making tough and prudent choices on its investment plan to meet affordability criteria while remaining competitive and innovative.
Our strategic framework
Strategy 5 S5


32
Risks and opportunities
Rapid technology change
Evolving customer demands
There is a paradigm shift in the automobile marketplace with rapid advances being made in new technologies such as electrification and autonomous cars, among others.
The fast pace of technological development together with scarcity of specialist resources could result in a significant change in the automotive industry and increase the risk of delivering superior products demanded by current and future customers.
Recently, several geographies, such as Norway, Germany, the UK, France, the Netherlands, India and China, announced their intentions to eliminate the sale of conventionally fuelled vehicles in their markets in the coming decades.
Customer preferences, especially in mature markets, are trending towards smaller and more fuel-efficient cars and environment-friendly vehicles. In many markets, these preferences are driven by customers’ environmental concerns or increases in fuel prices.
JLR operates in the premium car segment. Any downturn or reduction in the demand for cars in these limited segments could have a more pronounced effect on its performance and earnings. JLR is working towards meeting the changing customer preferences.
Risk Risk
We continue to invest substantially in R&D and also continue our strategic focus on key technology areas, including autonomy, connectivity and electrification, with the aim of launching our products ahead of our competition.
We are working towards developing high-performance EVs, investing in development programmes to reduce fuel consumption by using lightweight materials, reducing parasitic losses through the driveline and improving aerodynamics.
Technology has been a major enabling factor for transformation, whether in terms of added features to products ensuring better ride quality, safety and performance or manufacturing efficiency. TML continues to invest in technology solutions as substantial changes to the market in terms of automation of factory lines and move from manual to electric. This enables us to focus on launching industry-defining products ahead of our competition as well as strengthening partnerships with global technological organisations and leading academic research teams.
Through innovation and technological advancement, our product portfolio and services can be developed according to the changing consumer demands.
Mitigation
Opportunities
Opportunities
TML and JLR are developing new models of vehicles in various segments with different capabilities.
TML developed and launched India’s first bio-methane engine for buses; Tata Nexon, an award-winning compact SUV and the XL range of small commercial cargo vehicles in India on the ACE platform.
JLR launched the I-PACE, a fully electric premium sedan, successfully electrified the Range Rover and the Range Rove Sport models and introduced the premium SUV Range Rover Velar.
Mitigation
HM

3373rd Annual Report 2017-18 (Integrated)
INTEGRATED REPORT 1-65 FINANCIAL STATEMENTS 185-353STATUTORY REPORTS 66-184
Diesel uncertainty
Competitive business efficiency
Adverse public perception of diesel-powered vehicles mainly driven by the media and government policy has precipitated a fall in diesel sales, primarily in the UK and Europe. It has also created uncertainty for customers, which could further impact future sales.
In addition to the financial impact of falling sales, a significantly lower diesel sales mix would create a challenge in achieving CO2 compliance and cause major disruption to our supply base.
The Company initiated programmes to optimise operating efficiency. However, there is a risk that these programmes may not deliver projected efficiencies and anticipated benefits may not accrue as expected.
If the Company is unable to deliver the desired benefits from these programmes, its business results may be adversely impacted and its ability to compete successfully, over the longer term, could be affected.
Risk Risk
We are committed to the introduction and expansion of our electrified fleet across the product portfolio and the continued refinement of our internal combustion engines and production flexibility in our Engine Manufacturing Centre.
The Company launched certain initiatives to reduce product and business complexity and to benefit from economies of scale. A robust project management process is in place to ensure set targets are met.
TML initiated various ImpACT (Improvement by Action) projects based on Balanced Score Card (BSC) objectives and business challenges. The ImpACT projects constituted systemic projects addressing key backbone processes, capacity building through long-term enabling projects and high-impact projects addressing its market position and profitability aspirations.
This will enable us to grow our presence in the EV and Hybrid spaces, thereby resulting in recovering our investments made in full battery-operated EVs such as the I-Pace, PHEVs in Range Rover and Range Rover Sport and also in refinement of the internal combustion engines.
We develop real-time analytical data tools to aid in business decision - making and to realise greater degrees of efficiency. Furthermore, its expansion plans present opportunities to invest in world-class facilities and enhanced capabilities.
MitigationMitigation
OpportunitiesOpportunities
M M Probability
Financial
Manufactured
Intellectual
Human
Social & Relationship
Natural
Capitals impacted
H
M
High
Medium

34
Risk Risk Risk
Environmental regulations and compliances
Information and cyber security
Both TML and JLR operate in an environment of rapidly changing regulatory landscape, particularly environmental issues relating to emissions and fuel economy. These would have an impact on their products as well as their manufacturing facilities.
TML must migrate to BS VI emission norms in India from April 1, 2020. In fact, Delhi has already started receiving BS VI-compliant fuel with effect from April 1, 2018. This entails challenges in the adaptation of technologies and innovations relating to manufacturing, testing and validation to the new standards.
New and emerging technologies bring unprecedented threats to internet-connected devices, including vehicles. Recent global hacking incidents impacting the geo-political environment indicate an increase in the motivation to instigate cyber attacks.
The loss of sensitive and personal data or a breach in any safeguards aimed at protecting this information could lead to significant legal action combined with the imposition of regulation and associated fines.
TML successfully worked towards its goal of manufacturing cleaner and more efficient vehicles using advanced technologies. TML showcased its all-new electric EVision car at the Geneva International Motor Show in March 2018. The EVision uses the OMEGA architecture and was developed in collaboration with JLR.
Both TML and JLR strive to implement consistent security policies and procedures while educating staff, vendors and suppliers to embed best practices. The Companies do this by implementing internal tools to detect and mitigate the current and emerging cyber security threats.
The development of battery electric products (starting with the I-PACE and EVision in 2018) and the introduction of plug-in hybrid technologies such as Range Rover and Range Rover Sport PHEV help achieve compliance, aligning our products with consumer demands. TML developed India’s first bio-methane engine for buses in the current year.
We strive to maintain a strong IT-controlled environment. By monitoring and responding to emerging cyber threats, we embed deeper, more intelligent controls over time.
Exchange rate fluctuations
Approximately 80% of JLR’s revenue is derived from international sales (e.g. the US and China) and we source a significant proportion of our components from the eurozone, while JLR’s reporting currency is Pounds Sterling.
Currency transaction risk is managed with financial derivatives in line with the hedging policy approved by the JLR plc Board. Also, we aim to align our sourcing base with our global sales profile. Recently, we have executed cross-currency interest rate swaps to hedge our exposure to a proportion of our US Dollar debt.
We continue to investigate further opportunities to develop our international manufacturing footprint, which may result in greater natural hedging of ourcurrency exposures by aligning the currency profile of cost with sales. Going forward, we plan to execute further derivatives in order to hedge significant proportionsof our debt denominated in foreign currency.
Mitigation Mitigation Mitigation
Opportunities Opportunities Opportunities
M M
Risks and opportunities
H

3573rd Annual Report 2017-18 (Integrated)
INTEGRATED REPORT 1-65 FINANCIAL STATEMENTS 185-353STATUTORY REPORTS 66-184
Risk Risk
Opportunities Opportunities
H H
Volatile global economic and geo-political environment
Product liability, warranties and recalls
The Indian automotive industry could be affected materially by the general economic conditions in India and around the world. The automotive industry, in general, is cyclical and economic slowdowns in the recent past have affected the manufacturing sector in India, including the automotive and allied industries.
Our expanding global presence increases our exposure to changes in the global economic and geopolitical environments as well as to other external factors (i.e. Brexit, political instability, wars, terrorism and natural disasters) that may impact our business.
Both TML and JLR are subjected to risks and costs associated with product liability, warranties and recalls in connection with performance, compliance or safety-related issues affecting their products.
Moreover, in the Indian context, the additional factor to consider is the Motor Vehicles (Amendment) Bill, 2017, which is currently being debated in the Rajya Sabha. This draft Bill addresses vehicle recalls, road safety, traffic management and accident insurance, among other matters, and imposes civil and criminal liability on manufacturers selling vehicles in contravention of the standards specified in the Bill or required by the Government to recall their vehicles.
TML’s CV business is already present in seven clusters, including Latin America, North & West America, Africa, Association of Southeast Asian Nations (ASEAN), South Asian Association for Regional Cooperation (SAARC), the Middle East and Commonwealth of Independent States (CIS). The Company is further expanding its international footprint through initiatives such as the launch of CV in new markets such as the Philippines, growth of CV sales in markets such as Nepal and launch of the Slovakia manufacturing plant. It maintains a balanced retail sales profile across key sales regions.
Also, Tata Motors closely monitors global geo-political and macroeconomic developments. JLR is continuing expansion in new geographies like Slovakia and is trying to maintain a balanced retail sales profile across key regions.
Both TML and JLR regularly monitor the service data of their vehicles to proactively manage recalls and minimise warranty claims. The Companies also issue technical updates to their dealer networks to manage identified faults and defects.
Global economic growth in developed and emerging markets represents opportunities to extend sales, both in new and existing geographical markets as well as segments.
Enhanced vehicle connectivity and digital capability provide opportunities for us to identify and remedy potential faults more efficiently.
TML is aligned to the vision of the Government of India.
Mitigation
Mitigation

36
The Tata Motors Group is all set to embrace the futureOur strategy sets the course of our actions for today and tomorrow. Our concerted efforts have led to:
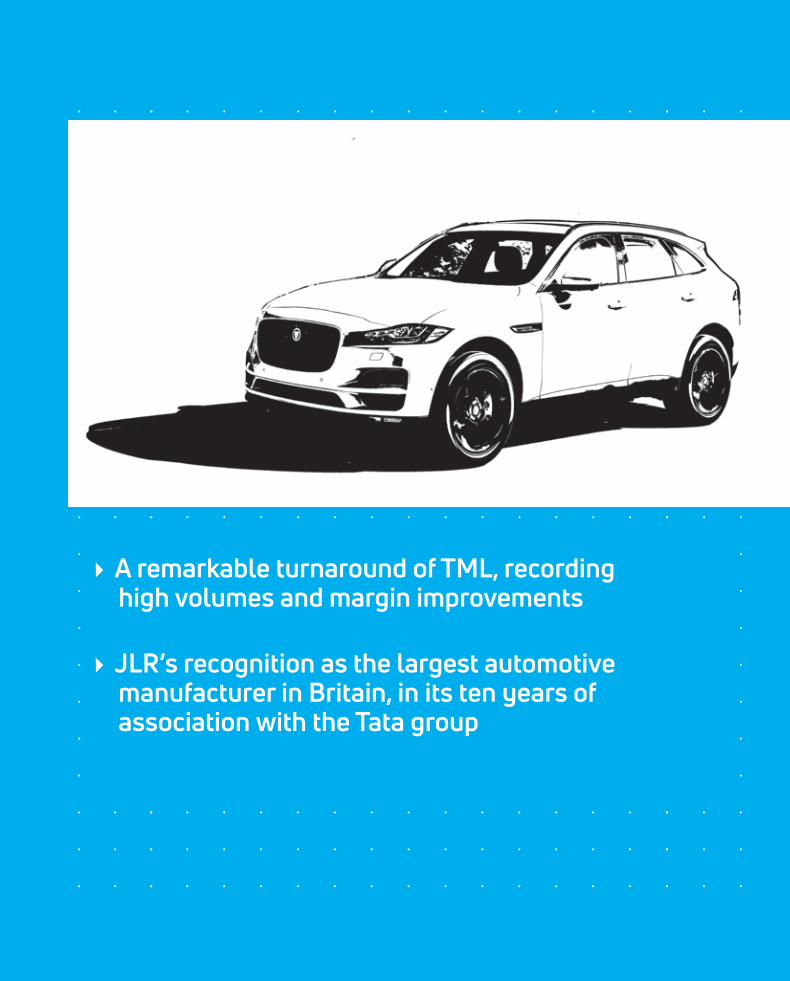
3773rd Annual Report 2017-18 (Integrated)
A remarkable turnaround of TML, recording high volumes and margin improvements
JLR’s recognition as the largest automotive manufacturer in Britain, in its ten years of association with the Tata group

38
The ‘Turnaround’ storyTata Motors Limited (TML)In 2016, TML had stepped into its transformation journey, which was aimed at countering some of the biggest internal and external challenges that the Company was facing then. Very few product introductions, weak market activation compounded with increasing pressure on margins and a complex organisation structure were a few of them. TML’s challenges were accentuated by the developments in the external environment such as structural reforms in the economy and introduction of new emission standards.
Our business sought a ‘Turnaround’ to overcome these challenges and to prepare for the future.
The ‘Turnaround’ story translated into success, with TML delivering profitable growth even in challenging conditions.

73rd Annual Report 2017-18 (Integrated) 39
The ‘Turnaround’ story
Progressing on a clear roadmapThe roadmap for ‘Turnaround’ has been contoured with our strategic interventions for both our CV and PV businesses.
Execution areas
Sales enhancement
For each of the execution areas, there were a series of interventions undertaken with measurable impacts.
Leveraging production and supply-chain efficiencies
Cost reduction and bottom-line improvement

40
Customer centricity• Initiatives to improve ‘first time right’ and zero-defect stations
were launched to focus on reducing rejection, rework, warranty and inventory cost and vendor recoveries.
• Better planning and execution resulted in improvement of the Sales and Operations (S&OP) metrics such as forecast accuracy, adherence to production plan, finished goods cover days, reduction in unplanned shipments and others across both the PV and CV businesses.
• Word-of-mouth communication was strengthened by onboarding Tata ‘Advocates’ through a structured approach, including both offline and online engagement with advocates.
Intense top-line focus• CV turnaround comprised initiatives focussed at gaining market
share.
• 18 work streams/levers deployed that covered TML policy changes, as well as dealer operational efficiency improvements
• Mini-projects were rolled out in commercial, aftermarket and operations areas
Building a strategic supplier base• TML conducted deep-dive workshops to develop a plan
for a robust and strategic supplier base, along with rigorous and exhaustive supplier assessments. This enabled cost savings with optimised manufacturing operations.
Impacts
During FY18, TML achieved ~30% reduction in supplier base through rationalisation of low APV and poor performing suppliers.
Sales enhancement
Impacts
Impacts
67%
40%
~15%
43% 24%
~10% ~30%
30–45%
22% NPS has improved
Conversions from enquiry to retail, showing an improvement over FY17 and hitting the industry benchmark rate twice in the year
Increase in profitable dealers compared to FY17
Growth in retail sales due to ‘Tata Guru Mechanics’, an innovative scheme in pilot markets
Rural market penetration in pilot markets due to the ‘Tata Gramin Mitras’ programme
Increase in Dealer Satisfaction Score
Increase in Kaizen Pilot for warehouse throughput
Quarter-wise conversion y-o-y
Brand Consideration Score (BCS) has improved over FY17 baseline
Leveraging production and supply-chain efficiencies

4173rd Annual Report 2017-18 (Integrated)
INTEGRATED REPORT 1-65 FINANCIAL STATEMENTS 185-353STATUTORY REPORTS 66-184
Organisational restructuring• Rationalising and reducing 13 managerial layers within the
organisational structure considerably to five layers improved direction and decision making through streamlining of processes, de-centralisation and delayering.
• Implementation of a BSC and alignment of KPIs with target outcomes and success factor helped in creating controls.
• Compensation Benchmarking Study, Rewards Strategy and Benefits Strategy have been revamped.
• Empowerment of management and employees to take decisions percolated to lower levels.
Impacts
Leaner manpower and processes due to the said initiatives enabled TML to be better prepared and move quickly to respond to market dynamics and threats.
Align cost management• Running Mega Competitive Teardown and VAVE idea
generation workshops to reduce costs for both CV and PV.
• Benchmark comparison to focus on high-potential areas, commercial negotiations, ‘should cost model’ and e-auctions.
• Restructuring of post-sales discount, realisation of value chain opportunities in supply chain and optimisation in Regional Sales Office (RSO) costs.
Structural improvements• TML’s modular Bill of Materials (BOM) capability was
horizontally deployed across CV and other PV platforms.
• TML created and tested the BOM Architecture, its system and process readiness through POC on control set of Vehicle Configurations (VCs) and went on to implement it successfully on all VCs of the Alpha (X4) Platform.
Impacts
Cost savings were driven with the model migration to lower cost locations, selective outsourcing and optimisation of manufacturing operations (shift patterns, production scheduling and others) under the long-term convergence plan towards the desired manufacturing footprint.
Cost reduction and bottom-line improvement
45.1%CV market share compared to 44.4% in FY17
CV PV
3-5% (Post Product Development Cost Policy changes) between FY19 and FY21
5-7% Over the long-term
5.7%PV market share compared to 5.1% in FY17
Highest volume in 5 years
Highest volume in 6 years
The ‘Turnaround’ initiative led to strong overall performance with visible impacts in terms of improvements in the CV and PV market shares.
With this performance, TML is on its way to achieve its medium-to-long term EBIT targets of :

42
Keeping the momentum with Turnaround 2.0It’s time to deliver againBuilding on the success of the first ‘Turnaround’ story, which focussed on execution, Turnaround 2.0 aims to embed the turnaround thinking deep into the organisation. With TML’s concrete learnings from its CV turnaround story, the Company is laying the future roadmap for its PV business and is assured of its success in this space as well. The objective is to enable the PV business to fund itself for the future and also help in taking it much beyond the aspirations of being the No. 3 player in the domestic market by FY19 as stated in the current vision of the Company, along with continuing focus on the CV business.

Turnaround 2.0 objectives
‘Winning Decisively’ in the CV business
‘Winning Sustainably’ in the PV business
Embedding turnaround into our way of life/culture
73rd Annual Report 2017-18 (Integrated) 43
The basic building blocks of Turnaround 2.0 are its objectives, ‘Winning Decisively’ in the CV business, ‘Winning Sustainably’ in the PV business and embedding turnaround into our way of life/culture.

44
Strengthening product planning to address white spacesTML has introduced more than 50 products with more than 200+ variants, including Ultra 1518, SIGNA 3718, Ace Gold and Starbus Hybrid. Additionally, TML is adopting the BS IV technology to strengthen its product range.
Leading in technology and powertrain solutions TML aims to use emission control technologies across the CV range that aid in superior performance, reliability, commercial affordability, environmental sustainability and future readiness of its vehicles. Use of the SCR technology will enable TML to meet the increasingly stringent emission norms.
Building modularity and architecture approach in product development Creating an effect across the entire value chain, this will give TML the chance to reduce the number of suppliers and also connect with more capable suppliers by leveraging its installed capacity in return of a higher output.
Enhancing customer engagement, along with product and service offerings While focussing on key customers, TML is concentrating on improved live deal visibility. A significant aspect is constant engagement with different stakeholders, including dealers and financiers, among others. With concerted efforts towards each of these strategic intervention areas, the production capacity is significantly ramping up and the Company is well prepared for FY19.
‘Winning Decisively’ in the CV business

4573rd Annual Report 2017-18 (Integrated)
INTEGRATED REPORT 1-65 FINANCIAL STATEMENTS 185-353STATUTORY REPORTS 66-184
As a major ‘turnaround’ initiative, TML is trying to embed a culture of ownership and collaboration among employees. By introducing Employee Stock Ownership Plans (ESOPs) the Company is trying to align rewards with performance. This, in turn, will bring about a competitive, consistent and cash-accretive growth in the long term.
Sales enhancementTML is focussing on bringing in different vehicle models – from small hatchbacks to SUVs – in order to cover different customer segments, while enhancing network coverage with an improved dealer network, reinforced channel engagement and channel capability and intensified marketing strategy.
Stepping up capacity utilisationThe Company is setting targets for all products and plant locations to meet the enhanced requirement of capacity utilisation.
Architecture approach for new launchesTML is prepared to launch two new platforms – Optimal Modular Efficient Global Advanced (OMEGA-ARC) and Agile Light Flexible Advanced (ALFA-ARC) – by 2019. The two innovative architectures were unveiled at the Auto Expo (India) 2018. The ALFA-ARC will bring about high commonality across architecture for both hatchbacks and sedans. The OMEGA-ARC is a proven architecture for Land Rover and is suited for products ranging from long SUVs to full-size sedans.
Structural cost reductionThe Company is bringing about many structural changes to optimise operations for faster decision making and overall execution of the annual production plans. There is also an enhanced focus on embedding new capabilities through analysis based on idea generation and data-driven negotiations, which will facilitate innovative ways of efficiency enhancement and cost reduction.
Affordable and efficient capexThe Company is working towards an affordable and efficient capex to ensure return on research investments and reduced time to market.
Improvement by Actions (ImpACT) InitiativesTo further step up the pace of Turnaround 2.0, almost more than 20 prioritised high-impact initiatives are planned. The ImpACT initiatives are shaped by bringing into consideration factors such as strategic objectives of the business division, future trends and opportunities, key business challenges and overall business excellence.
‘Winning Sustainably’ in the PV business
Embedding turnaround into our way of life/culture K1,900 Crores
savings through ‘ImpACT’ initiatives during FY18

46
Transforming today for tomorrow
JLR aims to ‘Win Distinctively’by leveraging its uniquenessDifferentiated premium brands JLR will continue to develop two of the most-loved, well-differentiated premium brands – Jaguar and Land Rover.
Scale and agility JLR will build agility by expanding its manufacturing capabilities across geographies, building scale and using modular architecture, coupled with digital technologies.
World-class design and engineering JLR’s focus on innovation and engineering, coupled with its design pedigree, will continue to provide its products with a distinct edge.
Passionate and talented team JLR will continue nurturing its vast talent pool, enhancing their engineering and scientific acumen.
Supportive and empowering ownership JLR’s proud association with the Tata group will continue empowering it for future growth.
Jaguar Land Rover (JLR)

73rd Annual Report 2017-18 (Integrated) 47
With the global trends of urbanisation, changing lifestyles and the new face of luxury emphasising on experiences, wellness and sustainability, JLR is focussing on the new-age technologies of ACES, without compromising its core business attribute of premium mobility.
The Company’s enhanced focus is on developing products that are based on safer, smarter and cleaner technology. The strategic interventions are also aligned towards meeting this requirement.
JLR’s new partnership with Waymo, formerly the Google self-driving car project, will be critical to the Company’s future plans. It is working together with Waymo to design and engineer the self-driving Jaguar I-PACE vehicles. This long-term strategic collaboration will further JLR’s goal to make cars safer, save valuable time for people and improve mobility for everyone.
JLR’s initiatives span across the ACES paradigm and the concept of modular architecture.
Connected possibilities
Autonomous innovation
Electrification advances
Shared future
Delivering a cleaner future
Future-focus areas

48
Autonomous innovation
Connected possibilities
Electrification advances
Autonomous vehicles will change our customers’ experiences for the better, saving them time, increasing safety and offering unparalleled convenience. Driver-less vehicles open up Jaguar and Land Rover models to customers who may have struggled previously to drive, offering transportation to the young, the elderly, the disabled or those nervous behind the wheel.
As the UK’s leading auto manufacturer, JLR is part of the ‘UK Autodrive project’, which is testing autonomous and connected technologies in real-world scenarios. JLR’s collaborations, such as with Baidu in China, take advantage of autonomous technologies that open the door to Autonomous Mobility on Demand (AMoD), giving customers access to a fleet of autonomous vehicles at the touch of a button. JLR is investing in AMoD technologies now with its partnerships with Lyft and Waymo.
In 2018, JLR launched the I-PACE, the first fully electric premium SUV in the world. This model provides the Company a competitive advantage and gives it a leading position in the premium fleet, where the electric powertrain is emerging as a prerequisite.
Built from the ground up by JLR, the new Jaguar I-PACE is a pure BEV. Thrilling to look at and drive, Jaguar I-PACE is the ultimate all-electric performance SUV.
The world is growing increasingly interconnected with the advent of IoT.
The car is no exception to this revolution and the pace of adoption of connected mobility has accelerated in recent years. The automotive industry has also seen entrants from new competitors, such as Google and Apple, as customers want seamless integration of their devices even when they are on the move. JLR’s vehicles are already internet-enabled and connected, allowing ease of use and increased security. The Company is also investing in customer relationship management systems for tailoring interactions with customers appropriately, for predictive maintenance, remote diagnostics and for reducing the inconvenience to them in the event of a breakdown.
JLR’s agreement with Qualcomm Technologies allows the Company to prepare for 5G internet, giving ultra-fast connectivity and over-the-air download capabilities, allowing customers to update any software without visiting a retailer.

4973rd Annual Report 2017-18 (Integrated)
INTEGRATED REPORT 1-65 FINANCIAL STATEMENTS 185-353STATUTORY REPORTS 66-184
Shared future
Delivering a cleaner future
JLR is embracing the shared mobility trend, which is becoming commonplace in different cities of the world.
As customers are looking for new ways to access vehicles beyond the traditional ownership models, the Company is exploring possibilities of premium mobility that will offer them the choice and flexibility to match their lifestyles. The Company has invested $25 Million in Lyft and is partnering with Waymo and Baidu for venturing into the ride-hailing sector.
The on-demand mobility company, Sheprd, which operates in Boston, US, and provides on-demand school buses with approved drivers to families, is using a fleet of Land Rover Discoveries.
Currently, JLR operates on multiple architectures. However, with investments in Modular Longitudinal Architecture (MLA), the Company will provide customers an opportunity to choose the powertrain systems that optimise commonality, reduce complexity and increase efficiency.
By 2025, JLR’s current vehicles and all future nameplates will be engineered on a flexible, modular architecture.
While MLA is an important part of the Company’s future roadmap, JLR is focussing on the transformation of its cost structure by applying an objective and data-driven approach to identifying, analysing and solving cross-functional problems.
Our today…
614,309Retail sales
3.8%EBIT reported
16% Revenue invested in new models, technology and capacity
….is leading the way for our futureTo attain the medium-to-long term EBIT targets of:
JLR is focussing on the following profit improvement drivers:• Growing premium segments• Introducing new and exciting products• Improving operating leverage• Driving cost efficiencies• Building a modular architecture strategy• Concentrating on ACES
4-7%(Post Product Development Cost Policy changes) between FY19 and FY21
7-9%Over the long-term

50
A key aspect of our preparedness for future
TML PVCustomer centricity is one of the top priorities for TML. To improve customer satisfaction, concerted efforts were made to enhance entire customer life-cycle experiences. To address the perceived weak brand sentiment and low enquiries from customers, TML launched various initiatives such as deploying ‘Tata Advocates’, rolling out a standard operating procedure called ‘Mantra’, building capabilities through large-scale trainings to the sales staff and deploying an online client engagement platform.
TML CV
To improve customer and dealer confidence, TML increased engagement with them. It developed ‘Sampoorna Seva’, which is a comprehensive service package that provides complete solution for the upkeep of vehicles. TML has witnessed the benefits of these initiatives whereby the NPS and the customer and dealer scores have improved compared to earlier years in both the CV and PV segments.
TML is moving into massive customisation to provide ‘Vehicle of Choice’ to its customers. The Modularisation and Super APP Framework, which has been developed in-house, enables TML to capture the customers requirements and configure accordingly for both the CV and PV segments.
We continuously engage with our supply chain partners to improve efficiency and address various bottlenecks that may impede our production targets. Our focus this year was to increase the ratio of subsystem-and aggregator-level suppliers within our supplier base while reducing the total number of suppliers. We conduct regular site assessments and quality checks for each of our suppliers and prescribe our policies on sustainability.
Customers
Sustainable supply chain
TML’s initiatives for strengthening customer connect and providing enhanced value to them is covered in ‘S5: Customer Focus’ in the section ‘Strategic Priorities’.
JLR
Excellent customer service doesn’t just mean satisfying customers; it means listening and responding to them for continuous improvements. That is why JLR used over 250,000 verbatim comments from customers, distilling their thoughts down into five Customer-First principles: Easy to Do Business With, Dependable, Personalised, Make Me Feel Special and Transparent.
These principles focus JLR’s attention on everything they do, from each screw they turn to each mile they drive, keeping customers at the forefront of their minds.
This is why JLR recruits only the best talent, who understand the importance of customer care and can convey these principles throughout the business, continuing to create experiences customers love for life.
Long-term value creation

5173rd Annual Report 2017-18 (Integrated)
INTEGRATED REPORT 1-65 FINANCIAL STATEMENTS 185-353STATUTORY REPORTS 66-184
Our way forwardTo keep pace with the rapidly changing automobile industry and to prepare for what lies ahead, we expect that the investment needs will remain high, especially on account of ACES, BS VI and new products.
While there are already 1,800+ touchpoints for CV as of today, TML aims to attain a target of 1,200 outlets for PV by 2020. The Company is also considering the possibility of introducing digital and virtual showrooms to make customer experience a more fruitful one.
With 12 nameplates in FY18, JLR projects its growth to 16 by FY24.
TML – On the path to connecting aspirations At the core of TML’s brand remains its driving ambition, ‘Connecting Aspirations’.
TML aims to develop innovative products to excite customers. It understands the need for a connected ecosystem that it is developing for customers to integrate into their digital lives. Today’s customers want their future vehicles to be more than just about four wheels that transport them from one point to another. With this aspiration in mind, TML plans to manufacture connected vehicles, which will provide access to a whole new world of experiences through a range of predictive and personalised services.
TML is also well-positioned to play its part in India’s ambitious road to progress. The Government of India is geared to take the nation to the next level by building smart cities. TML is committed to give this aspiration the necessary impetus with its diverse set of products that will drive connectivity in the smart-city ecosystem. Being the only auto major with an end-to-end product portfolio from public transport to personal cars, from providing last-mile connectivity solutions to Bus Rapid Transit System (BRTS), from emergency response vehicles to commercial utility vehicles, from green mobility to smart and secure mobility solutions and vehicles designed to simply amplify the thrill of the drive, the Company shares a responsibility to seamlessly connect the smart cities.
JLR – ‘ACE’ing the future Internationally, there is a shift from the internal combustion engine environment to one with autonomous, connected and electrified vehicles. In keeping with this change, JLR has set plans in motion towards giving customers the choice of deciding the degree of electrification in their vehicles from 2020. The customers will be able to choose from mild hybrids, plug-in hybrids and also BEVs. At present, the Company already has a plug-in hybrid option in the refreshed Range Rover and Range Rover Sport models.
While the strategy for electrified vehicles has been defined, there are challenges on the way. There are geopolitical issues, especially in Europe and the UK, and higher taxes on diesel, that may throw a spanner in the works. However, JLR is quite optimistic that with its premium, advanced vehicles, it can continue its profitable sustainable growth.
Further, the import duty in China has gone down by 10%, from 25% to 15%. JLR is hopeful that its consumers in China will benefit from the lower prices and the Company sees this as a big step towards the development of free trade and commerce.
5173rd Annual Report 2017-18 (Integrated)
Our EBIT target milestonesBetween FY19 and FY21 (Post Product Development Cost Policy changes) Long term
TML 3-5% 5-7%
JLR 4-7% 7-9%

52
Ratan TataChairman Emeritus
Natarajan ChandrasekaranNon-Executive Director and Chairman
2 6*
Mr. Chandrasekaran is the Chairman of the Board of Tata Sons, the holding company of the Tata group. He also chairs the Boards of the major operating group companies and is an active member of India’s bilateral business forums. He serves as a Director on the Board of Reserve Bank of India (RBI). He has served 30+ years with the Tata Consulting Services rising through the ranks to become its CEO and Managing Director, the leading global IT solutions and consulting firm.
He is a post-graduate in Computer Applications from Regional Engineering College, Tamil Nadu, and is the recipient of several awards from various industry bodies.
Mr. Tata was the Chairman of Tata Sons from 1991 till his retirement in December 2012. He also chaired the Boards of major operating Tata Companies and the Tata Trusts. Under his stewardship, various group restructuring initiatives were undertaken to leverage global opportunities for the Tata Group which was in the business from salt to software, growing Group revenues and profitability by over 40 times.
He was on the Company’s Board for 32+ years from 1981 till his retirement, including as Chairman during the last 24 years. During this exciting phase, the Company transitioned from a domestic truck company to a global automobile company traversing milestones such as, the launch of the wholly indigenous Indica, the peoples, car – Tata Nano, the very successful series of small vehicles – Tata Ace, acquisition of the iconic Jaguar Land Rover, Daewoo Commercial Vehicles and joint ventures with Fiat and Marcopolo. In recognition of his visionary leadership, strategic direction and stewardship and with a view to continue receiving his guidance, counsel and advice, the Board had in December 2012 conferred to Mr. Tata the title of Chairman Emeritus.
He is the Chairman of the Tata Trusts which are amongst India’s oldest, non-sectarian philanthropic organisations that work in several areas of community development. He is the Chairman of The Council of Management of Tata Institute of Fundamental Research and trustee of Cornell University and the University of Southern California.
Nasser MunjeeNon-Executive, Independent Director
1* 2 6
Mr. Munjee is on the Board of various multinational companies and trusts. He was a Technical Advisor on the World Bank’s Public-Private Partnership Infrastructure and Advisory Fund, and is the Chairman of Development Credit Bank (DCB). He has served with HDFC Bank for 20+ years, across various positions, including as Executive Director. He was the Managing Director of Infrastructure Development Finance Co. Ltd. (IDFC).
He holds graduate and post-graduate degrees from the London School of Economics.
Board of DirectorsGovernance framework
Om Prakash BhattNon-Executive, Independent Director
1 2* 4*
Mr. Bhatt is on the Boards of several multinational companies. He was the Chairman of the State Bank Group. Under his leadership, State Bank of India (SBI) rose on the global list rankings of Fortune 500. Besides chairing the Indian Banks’ Association, he has also served as the Indian diplomat on the India-US CEO Forum, Indo-French CEO Forum and Indo-Russia CEO Forum.
He was the National Science Talent Search Scholar in Physics at DAV College, Dehradun, and holds a post-graduate degree in English Literature from Meerut University.
Hanne SorensenNon-Executive, Independent Director
3 5*
Ms. Sorensen, a Danish national, is on the Boards of various international companies. Previously, she was engaged in various roles within the A.P. Moller – Maersk A/S Group in Denmark between 1994 and 2016, including as the CEO of Damco, the CEO of Maersk Tankers, and the Senior Vice-President and Chief Commercial Officer of Maersk Line.
She is a post-graduate in Economics and Management from the University of Aarhus.

5373rd Annual Report 2017-18 (Integrated)
INTEGRATED REPORT 1-65 FINANCIAL STATEMENTS 185-353STATUTORY REPORTS 66-184
Committees
* Chairperson of the committee
1 Audit
2 Nomination & Remuneration
3 Stakeholders’ Relationship
4 Corporate Social Responsibility
5 Risk Management
6 Executive Committee of the Board
7 Safety, Health and Sustainability
Vinesh Kumar JairathNon-Executive, Independent Director
1 7
Mr. Jairath is on the Board of various Indian companies. He has served in numerous important positions with the Government of India and the State Government of Maharashtra. He has 25+ years’ experience in public administration, rural development, poverty alleviation, infrastructure, finance, industry, urban development, environmental management and the private sector as part of the Indian Administrative Service.
He is a post-graduate in Economics from the University of Manchester.
Satish BorwankarExecutive Director and COO
4 5 6 7
Mr. Borwankar started his career with Tata Motors in 1974 as a Graduate Engineer Trainee and has served in various operating functions like manufacturing, quality, vendor development and strategic sourcing, rising through the ranks to become its Executive Director and Chief Operating Officer.
He is a graduate in Mechanical Engineering from Indian Institute of Technology (IIT), Kanpur.
Guenter ButschekCEO and Managing Director
3 4 5 6 7
Mr. Butschek has 25+ years’ global experience in international automotive management, across multiple functions such as production, industrialisation and procurement. Besides Daimler AG, he has worked in the Airbus group as its Chief Operating Officer (COO) and a member of the Group Executive Committee.
He is a graduate in Business Administration and Economics with a Diploma from the University of Cooperative Education, Stuttgart.
Falguni NayarNon-Executive, Independent Director
1 3* 4
Ms. Nayar is, at present, the founder and CEO of a promising e-commerce start-up, Nykaa.com and is also on the Board of few multinational companies. She has spent 19+ years with Kotak Mahindra Bank, with the last 6 years as Managing Director and CEO of Kotak Investment Bank.
She is a Commerce graduate from University of Mumbai and is a post graduate from Indian Institute of Management (IIM)-Ahmedabad.
Ralf SpethNon-Executive Director
Professor Dr. Ralf D. Speth (KBE, FREng) is on the Board of Jaguar Land Rover Automobile PLC, UK, and is its Chief Executive Officer (CEO). He has worked with BMW for 20 years and Ford Motor Company’s Premier Automotive Group, where he was the Director of Production, Quality and Product Planning.
He holds a Doctorate in Mechanical Engineering and Business Administration from Warwick University and an engineering degree from Rosenheim University, Germany.

54
The criteria for the performance evaluation of our Board of Directors includes aspects such as our Board of Directors’ composition and structure, and the effectiveness of our Board of Directors’ processes, information flow and functioning. The criteria for the performance evaluation of the individual Directors includes aspects such as the Director’s contribution to our Board of Directors and Committee meetings, including preparation on the issues to be discussed, meaningful and constructive contribution and input during meetings. In addition, the Chairperson is evaluated on the key aspects of his role.
Board’s key areas of focus
• Direct, supervise and control the performance of the Company
• Provide leadership and guidance to the Company’s management
• Review the Company’s strategic and business plan
• Monitor the responsibilities delegated to the Board Committees, to ensure proper and effective governance and control of the Company’s activities
• Establish a framework for the risks to be assessed and managed
Board effectiveness evaluation
Governance framework
1 Audit
Review of:• Quarterly/annual financial statements • Adequacy of internal control systems• Review of internal audit reports • Auditors’ independents, RPT and utilisation
of issue proceeds
7 Safety, Health and Sustainability
Oversee implementation of:• Safety, health and environmental matters• Broad guidelines/policies
6 Executive Committee of the Board
Review of:• Capital and revenue budget and long-term
business strategies and plans and• The organisational structure, borrowing and
investment transactions • Legal cases, acquisitions, divestments, etc.
Committees of the Board and their responsibilitiesThe Board of Directors carry out annual evaluation of its performance and the performance of its committees as well as individual Directors. This involves input from all the Directors. A separate meeting of Independent Directors is held to review the performance of Non-Independent Directors, the performance of our Board of Directors and the performance of the Chairperson of TML. The Independent Directors consider the views of Executive Directors and Non-Executive Directors.
6
7
5
Governance
4
3
2
1
2 Nomination & Remuneration
Provide various recommendations to the Board, including:• Set up and composition of the Board and its
Committees• Appointment/reappointment of Directors
and review and refresh of the Committees• Remuneration of Directors and Senior
Management
3 Stakeholders’ Relationship
Review of:• Statutory compliances relating to security
holders and dividend payments• Performance of Registrar and Transfer agents• Grievance mechanism
4 Corporate Social Responsibility
Formulate and recommend to the Board:• Corporate Social Responsibility (CSR) policy• Expenditure to be incurred• Monitor progress of projects
5 Risk Management
Assist the Board in:• Overseeing the risk management process,
controls, risk tolerance, capital liquidity and funding
• Review of Company’s risk governance structure

5573rd Annual Report 2017-18 (Integrated)
INTEGRATED REPORT 1-65 FINANCIAL STATEMENTS 185-353STATUTORY REPORTS 66-184
Governance framework for TML and JLR
Tata Motors Shareholding Pattern
Governance is ensured by the Board and the Committees – comprising two Executive, two Non-Executive and five Independent members who are empowered to take the right decisions for the Company. The Board also brings in diverse and wide experiences to the table in the areas of automobile engineering, business and economics; banking and finance, and legal affairs, coupled with a global outlook. More than half of the members have spent over four years on the Board.
Although there are two different Boards for TML and JLR, there are four common Board members, including the Chairman. One of eight board meetings is held in the UK.
Mr Guenter Butschek
Mr Vinesh K Jairath
Ms Falguni S Nayar
Mr O P Bhatt
Ms Hanne Sorensen
Mr Satish Borwankar
Mr N Chandrasekaran
Mr Nasser Munjee
Dr Ralf Speth
Mr P B Balaji *
Mr Andrew M Robb
Tata Motors Limited Jaguar Land Rover Automotive PLC
* Group CFO and Director in Jaguar Land Rover Board
Ownership Voting rights
*DIM: Domestic Institutions & Mutual Funds
10.6%
14.9
%
Promoters
AD
R
Others
35.8%
18.0%
20.5%
20.7%24.5%
12.9
%
11.2%
30.9%
DIM*
FII
Total number of shareholders
10,13,524

56
Our people practices
Our people are pivotal to all the initiatives that drive us to realising our future vision. With a dedicated focus on cost efficiency, at Tata Motors, we are providing our employees the right opportunities to increase productivity, improve processes, develop future leaders and turn a higher profit. We are also driving an organisation-wide culture of innovation.
A high-quality talent pipeline enables the organisation to bring operational excellence across the board.
TML partners with premier technology institutions to develop technical talent at multiple levels in the organisation. ‘T-talk’ is an initiative in which TML employees interact with the student community about the industry and areas of learning. TML’s employer brand-building programme, titled Mind Rover, engages with students through a case study competition that invites solutions to challenging real-world problems that the Company currently faces or has faced in the past. TML also invites eminent faculty members from various institutes to participate in its research programmes. TML’s ‘Talent on Demand’ initiative is a pull-based strategy where employees, particularly from the departments with high attrition, are trained to build talent pipelines on demand.
JLR is driven by passionate people who design, develop and manufacture cars that their customers love. The Company’s long-term success relies on attracting and nurturing the next generation of bright minds. To inspire and attract a diverse range of talent, JLR is investing in innovative recruitment strategies.
The Company found 15 new engineers through Tech Quest, an online game that tests abilities through puzzles and coding challenges. 5% of JLR’s September 2017 apprentices were recruited through its Gorillaz programme. This was an app-based code-breaking challenge with the best-performing candidates fast tracked through the recruitment process.
Strengthening the talent pipeline
Total TML and JLR employees
81,090Employees

5773rd Annual Report 2017-18 (Integrated)
INTEGRATED REPORT 1-65 FINANCIAL STATEMENTS 185-353STATUTORY REPORTS 66-184
At Tata Motors, we constantly engage our employees on a multitude of programmes for improving their work efficiency and build on their collective skills and intelligence.
JLR is a lead partner in the £150 Million National Automotive Innovation Centre (NAIC) venture, which will open at the University of Warwick towards the end of 2018. A state-of-the-art research and collaboration hub for emerging automotive technologies, the NAIC will develop the talent and skills needed for the future of the UK automotive industry.
TML initiated the Organisation Effectiveness (OE) project to create a leaner organisation and enhance process efficiencies. Town Halls are conducted every quarter by the Executive Committee (ExCom) at different locations to update the Company on business and OE exercise. After each Town Hall, group discussions are held between the ExCom and employees. TML instituted a robust performance management methodology i.e. Balanced Scorecard to measure both organisational and employee performance. This has enabled it to positively impact the overall employee lifecycle, including assessment, compensation and rewards management. Additionally, TML re-engineered its processes to further sharpen its operational efficiencies. This initiative has yielded multiple benefits, which include organisational agility, process orientation, standardised decision making and streamlined governance.
52%Of permanent unionised workforce with which the management engages frequently
Accelerating changes with engagement
TML is one of the first Tata group companies to launch a long-term ESOP. The underlying intent of launching the ESOP was:
→ To drive ongoing commitment towards the Turnaround 2.0 strategy and to ensure that TML achieves consistent, competitive and cash-accretive growth over the medium-to-long
→ To channelise management focus on sales enhancement, rigorous cost reduction, supply de bottlenecking and timely product launches, which will lead to market share enhancement and bottom-line growth
→ To ring fence the TML leadership team, it motivates and selects high-potential employees, ensuring to create an ownership mindset that is aligned to the interests of shareholders
Incentive plans

58
TML built capacities across management tiers through different modules as well as learning academies that offer training programmes on knowledge and capability enhancement, management development and fundamental skills development. With digital and online skills assessment, the Company identifies the learning priorities of each individual employee, with customised exercises and course content. By enhancing the skills of its employees on future technologies, TML is ensuring a smoother organisation-wide transition towards adoption of newer technologies and development of new products.
At JLR, efforts are made to continuously improve the working conditions and promote safe working practices to ensure the safety and wellbeing of its employees and the wider communities the Company engages with. Workplace safety is an intrinsic part of working at JLR. It is key to ensuring the on-going success of the business and to support JLR’s journey to zero harm.
Upskilling to drive product leadership
JLR is in a unique position to answer the industry’s insatiable call for a wide range of skills. The Company is investing more than £100 Million per year in the Jaguar Land Rover Academy, offering lifelong learning for employees. Around a quarter of employees are actively working towards a formal academic or professional qualification at all levels, from apprenticeship to doctorate. They have also upskilled 7,000 engineers with Master’s level education since 2010.
Total training (in person-hours)
5,87,137TML
For TML, workforce safety is of top priority and the Company undertakes multiple initiatives across different levels of the organisation to implement a culture of wellbeing.
Initiatives such as safety drills and trainings, contractor safety management prior to awarding contracts, audits and rewards and recognitions on safety ensure better work efficiency, increased value and better service delivery to clients. For TML’s white-collared employees, the Company engages in continuous communication and awareness drill on lifestyle/wellness and health promotional activities. TML has also broadened its scope of safety awareness, building campaigns (such as road safety week and national safety month, among others) for engaging its channel partners and supplier fraternity as well.
1,565Female employees trained in safety
Providing a safe work environment
TML’s safety performance
TML’s Lost Time Injury Frequency rate (LTIFR) has improved from 0.17 to 0.08 – an overall reduction of 52.9% compared to its FY17 safety performance.

5973rd Annual Report 2017-18 (Integrated)
INTEGRATED REPORT 1-65 FINANCIAL STATEMENTS 185-353STATUTORY REPORTS 66-184
TML believes that with diversity and inclusion on the shop floor, it can leverage the multiplicity of skillsets needed in all its operations. The Company has established policies and integrated capacity-building systems for providing a supportive work environment, especially for its female employees as well as employees from different backgrounds and ethnicities. The Company recruits trainees from villages and small towns, especially from economically disadvantaged regions. Its ‘GearUp’ initiative for mid-level women managers is designed to provide management development inputs focussed on leadership skills enhancement. TML has in place a programme for the employment of returning mothers. Its comprehensive Human Resource (HR) policy framework, including maternity leave, sabbatical and half-day-half-pay policy and flexible timings, helps employees establish a work-life balance.
JLR encourages its women employees across the organisation in different types of roles and responsibilities. The Company is changing the convention and reaching out to millions of young women to attract them to a career in engineering and design. Some of the programmes for the female employees at JLR include Top Flight and Leadership Summit programmes to prepare the brightest and best female employees for the highest leadership roles, in addition to providing flexible working hours, on-site childcare and a 52-week, fully paid maternity leave.
There has been a 24% increase in the proportion of women in the Company’s workforce since 2014 and a 21% increase in the proportion of women in its management grades in the same period. In 2017, JLR recruited more women than men (55% female) for its Advanced Apprentice programme. Women also comprised 29% of the total hires joining the graduation programme, in the year.
3%
100%
4.5%
of TML workforce is women
Assembly line manufactured by women in Pune and JSR
Mean pay gapThe mean pay gap tells us the difference in the average hourly pay rate for men and women.
A diverse workforce

60
For a sustainable future
For Tata Motors, sustainable value creation is based on long-term relationships, which we nurture with all our partners across the value chain, including suppliers, vendors and dealers. Some of the key enablers for the Company to be ‘fit for future’ include a harmonious co-existence with the communities where we operate, a consistent performance in introducing environment-friendly technologies and empowering our people while preparing them for future.
Total CSR spend
K21.44 CroresTML
£10.5 MillionsJLR
Contributing to sustainable community development
Our CSR interventions are designed on the basis of local requirements and specific conditions. We believe in creating shared value with the communities we operate in and invest in long-term relationships with our large vendor/dealer base. Our community development related activities focus on some of the following key areas.
TML
For years, health has remained a frontrunner of all the programmes that TML has initiated for the society. The Company has set up a community hospital in Jamshedpur, India and also commenced several community programmes to address the issues of leprosy, malnutrition and others.
Through ‘Aarogya’, the health initiative under its CSR programme, TML operates mobile health clinics for remote tribal community outreach, offering last-mile aid in Pune. Aarogya also focusses on maternal and child health, with a holistic and balanced approach towards preventive healthcare and curative healthcare interventions. The Company has tied up with nutrition rehabilitation centres across India to raise awareness on the health of children, pregnant women and lactating mothers.
JLR
Since it was established jointly by JLR and the China Soong Ching Ling Foundation (CSCLF) in May 2014, the Jaguar Land Rover China Children and Youth Dream Fund has invested RMB 50 Million (over £5.4 Million) in projects to improve the health and wellbeing of young people in China.
As of 2018, 254,000 children and young people have benefitted from Dream Fund programmes. One Dream Fund initiative, the Journey for Vision project, has already provided vital eye care to over 160,000 children across remote areas of China.
Contribution made
K2.90 CroresImpact created
376,310 lives touched
89%of the malnourished children in the target group are now in the `healthy’ zone
Health

6173rd Annual Report 2017-18 (Integrated)
INTEGRATED REPORT 1-65 FINANCIAL STATEMENTS 185-353STATUTORY REPORTS 66-184
TML
TML believes education is the cornerstone of one’s cognitive, psychological and intellectual faculties. Vidyadhanam, TML’s CSR programme for education, provides support to young learners by ensuring holistic development in education infrastructure and services. The programme focusses on the academic, physical and social development of students, in conjunction with value education. It facilitates their mentoring by professionals who are experts in their subjects of interest. The key projects under Vidyadhanam are:
• Scholarships
• Financial aid to students of IITs and government engineering colleges
• Coaching classes
• Special coaching for IIT-JEE and other competitive exams
• School infrastructure improvement
• Co-curricular activities
JLR
The ‘Inspiring Tomorrow’s Engineers’ programme conducted by JLR saw participation of over 350,000 school children during 2017. The programme provided interactive learning and team challenges and facilitated educational visits for encouraging active and ongoing interest in engineering.
By 2020, the programme aims at engaging two Million young people, nurturing talent for the business and the wider automotive industry.
In addition, around 5,000 employees donated 100,000 hours annually to support JLR’s STEM education programmes in schools.
Contribution made
K10.43 Crores
Education
Students benefited
The school drop-out rate, in target group, decreased from
40% two years ago to 0%.
The number of students passing the school curriculum
improved from 65% to 96%.
Impact created
101,420

62
TML
Aadhar, TML’s community development programme, aims to serve the socio-economically disadvantaged Scheduled Caste (SC) and Scheduled Tribe (ST) communities.
Community development
K 1 CroreOn Aadhar
9,706Employee volunteers
45,000Volunteering hours
Contribution made
Impact created
18% hires from specific communities
93,715 people skilled
JLR
To make a positive global social impact, JLR has established a network of interlinked projects around the world. In the last five years, JLR has delivered 40 global social impact projects, fulfilling the commitment to combine the talent of its people with technology to make a unique contribution.
Every JLR employee is empowered to take two days per year to volunteer their time and skills to work on a project that will have a social impact.
During FY18, JLR’s employees committed over 70,000 hours through the Volunteer Changemakers programme.
During FY18, JLR has supported over 1.2 Million people through various community development projects, volunteering hours and gifts in kind, totalling £10.5 Million.
Seva, TML’s volunteering programme, provides employees and their families with varied opportunities to meaningfully volunteer their time for social causes. TML employees also offer pro bono services based on their competencies to NGOs.

6373rd Annual Report 2017-18 (Integrated)
INTEGRATED REPORT 1-65 FINANCIAL STATEMENTS 185-353STATUTORY REPORTS 66-184
TML
Without formal skills, the employability of a person gets affected. To address this issue, TML has partnered with numerous skill development centres across India. TML’s skill development programme, Kaushalya, seeks to empower unemployed youth by providing vocational training in automotive and other industrial trades. Additionally, TML also facilitates the following:
• Train youth in vocational skills for employment areas such as electrician, nursing assistant and so on
• Engage in capacity building of community-based groups, including women and farmers, in agriculture and allied industries
TML
Given that environment is a global concern, any effort at preserving local ecosystems would benefit local communities and the society at large.Through Vasundhara, TML’s environment-related programme, the Company contributes to enhance environmental sustainability and aspires to promote environmental consciousness among communities. The initiative facilitates and encourages the protection, conservation, judicious use and augmentation of natural resources.
Employability and skills training Environment conservation
K 1.38 Crores 56,161Lives touched
1,03,746 Saplings plantedContribution made
K 4.52 Crores
Contribution made
Impact created
98,661Lives touched
Impact created
JLR
Jaguar Land Rover is the biggest provider of automotive apprenticeships in the UK.
Over the last six years, the Company has invested £186.5 Million in young people through their apprenticeship programme, with more apprenticeships than all the other UK automotive manufacturers put together.
JLR
JLR proactively balances the risks and opportunities associated with biodiversity, protected species and habitats, both within its sites and across the wider landscape. At its Fen End Special Vehicle Operations facility in the Weat Midlands, UK, there has been significant ecology mitigation of ponds and badger tunnels. The bunds at the location reused the excavated soil from building excavation and 35% of the materials used for construction were from recognised highly responsible manufacturers (BES 6001 Very Good, Forestry Stewardship Council (FSC)).
Some of the key aspects of this ecological restoration project were:
• 90% of construction waste was diverted from landfill.
• 78,000 m3 of soil was re-used during the construction of the new vehicle operations building and the associated landscaping.
• A net gain in biodiversity was delivered through: − Creation of 8.5 hectares of new high-value habitat features; − Planting over 38,000 trees; and − Improvement of 8 hectares of existing habitat, including Runway
Woodland (a community woodland that was planted onsite next to the entrance by local residents and a local school prior to our ownership of the site).
TML has received the Golden Peacock award for its training initiatives.

64
TML
TML initiated the Amrutdhara programme for providing safe drinking water across India. While addressing the concerns relating to safe drinking water, the programme also helps in improving health and fostering a climate of gender and social equality.
TML
TML aspires to become water-neutral and water-positive (particularly in green water), having introduced rainwater harvesting and storage, water pooling and water recycling, among others, in its operations. The Company is also one of the signatories to RE100, a global collaboration that is working towards converting to 100% renewable electricity by 2030.
4,08,221 tCO2eGreenhouse Gas (GHG) emissions from manufacturing operations in FY18
5,362.482 MTHazardous waste generation in FY18
JLR
JLR intends to be a zero-waste company and is committed to reduce its dependence on plastic globally. The need to reduce tailpipe CO2 and NOx emissions, while minimising the carbon footprint of its business, remains another key objective. Additionally, the Company has transitioned to cleaner, sustainable sources of energy.
REALITY Recycled Aluminium through Innovative Technology, a £2 Million research project in partnership with Innovate UK, demonstrates JLR’s commitment to the practical application of sustainability. The learnings from REALITY will help JLR understand how it can use post-consumer aluminium in its vehicles, giving a high-value second life to a valuable natural resource.
Impact created
• JLR has reduced CO2 from global vehicle manufacturing operations
by 46% per vehicle compared to 2007.
• 37% reduction in JLR’s European fleet average tailpipe CO2 emissions has been achieved in 10 years
• The average energy required to build a Jagaur or Land Rover vehicle
is now 43% lower compared to 2007, down from 3.69 MWh per car to 2.11 MWh
Nurturing a safe environmentWe recognise that our manufacturing operations largely depend on natural resources, including water, energy and sand, among others. Moreover, our operations have a significant effect on the environment through emissions, effluents and solid waste.
At Tata Motors, we are trying to map, measure and manage our dependencies and impacts on the natural capital through numerous initiatives. We are managing our resource utilisation by optimising usage and minimising waste and at the same time, approaching ‘design thinking’ with ways to leverage ‘circular economy’.
K 0.59 CroresContribution made Impact created
• 25 litres of water made available per person per day
• 1,01,454 beneficiaries
• More than 40% beneficiaries belong to the SC/ST category
Providing safe drinking water

65
FINANCIAL STATEMENTS 185-353STATUTORY REPORTS 66-184INTEGRATED REPORT 1-65
73rd Annual Report 2017-18 (Integrated)
Chairman Emeritus Mr Ratan N Tata
Board of Directors Mr N Chandrasekaran Non-Executive Director and Chairman
Mr Nasser Munjee Non-Executive, Independent Director
Mr Vinesh Kumar Jairath Non-Executive, Independent Director
Dr Ralf Speth Non-Executive Director
Ms Falguni Nayar Non-Executive, Independent Director
Mr Om Prakash Bhatt Non-Executive, Independent Director
Ms Hanne Sorensen Non-Executive, Independent Director
Mr Guenter Butschek CEO and Managing Director
Mr Satish Borwankar Executive Director and Chief Operating Officer
Registered Office Bombay House, 24, Homi Mody StreetMumbai 400 001 Tel: +91 22 6665 8282 Fax: +91 22 6665 7799 Email: [email protected] Website: www.tatamotors.com
Corporate Identity Number L28920MH1945PLC004520
Executive Committee Mr Guenter Butschek CEO and Managing Director
Mr Satish Borwankar Executive Director and Chief Operating Officer
Mr P B Balaji Group Chief Financial Officer
Mr Girish Wagh President - Commercial Vehicles Business Unit
Mr Mayank Pareek President - Passenger Vehicles Business Unit
Mr Rajendra Petkar Chief Technology Officer
Mr Gajendra Chandel Chief Human Resource Officer
Mr Shailesh Chandra President - Electric Mobility Business & Corporate Strategy
Mr Thomas Flack Chief Purchasing Officer
Company Secretary Mr H K Sethna
Auditors BSR & Co. LLP (Registration No. 101248W/W–100022)
Share Registrars TSR Darashaw Limited 6-10, Haji Moosa Patrawala Industrial Estate, 20, Dr E Moses Road, Mahalaxmi, Mumbai 400 011 Tel: +91 22 6656 8484 Fax: +91 22 6656 8494 Email: [email protected] Website: www.tsrdarashaw.com
BankersAllahabad Bank
Andhra Bank
Bank of America
Bank of Baroda
Bank of India
Bank of Maharashtra
Central Bank of India
Citibank NA
Corporation Bank
Deutsche Bank
Federal Bank
HDFC Bank
Hongkong and Shanghai Banking Corporation
ICICI Bank
IDBI Bank
Indian Bank
Kotak Mahindra Bank
Karur Vysya Bank
Punjab National Bank
Standard Chartered Bank
State Bank of India
Union Bank of India
United Bank of India
WORKSJamshedpur Pune Lucknow Pantnagar Sanand Dharwad
Corporate information

66
BOARD’S REPORTTO THE MEMBERS OF TATA MOTORS LIMITED
The Directors present their Seventy Third Annual Report along with the Audited Statement of Accounts for Fiscal 2018.
FINANCIAL PERFORMANCE SUMMARY (` in crores)
Tata Motors(Standalone)*
Tata Motors Group (Consolidated)
Fiscal 2018 Fiscal 2017 Fiscal 2018 Fiscal 2017FINANCIAL RESULTSRevenue from operations 59,624.69 49,054.49 2,95,409.34 2,74,492.12Total expenditure 55,824.11 47,242.28 2,58,536.37 2,37,579.76Operating profit 3,800.58 1,812.21 36,872.97 36,912.36Other Income 1,557.60 981.06 888.89 754.54Profit before interest, foreign exchange, depreciation, amortization, exceptional item and tax
5,358.18 2,793.27 37,761.86 37,666.90
Finance cost 1,744.43 1,569.01 4,681.79 4,238.01Profit before depreciation, amortization, exceptional item, foreign exchange and tax
3,613.75 1,224.26 33,080.07 33,428.89
Depreciation, amortization and product development/ engineering expenses 3,576.87 3,491.60 25,085.46 21,318.56Foreign exchange (gain)/loss (net) 17.14 (252.78) (1,185.28) 3,910.10Profit/(loss) before exceptional items and tax 19.74 (2,014.56) 9,179.89 8,200.23Exceptional Items - (gain) / loss (net) 966.66 338.71 (1,975.14) (1,114.56)Profit/(loss) before tax (946.92) (2,353.27) 11,155.03 9,314.79Tax expenses (net) 87.93 76.33 4,341.93 3,251.23Profit/(loss) after tax (1,034.85) (2,429.60) 6,813.10 6,063.56Share of profit of joint venture and associates (net) - - 2,278.26 1,493.00Profit/(loss) for the year (1,034.85) (2,429.60) 9,091.36 7,556.56Other comprehensive income/(loss) 43.22 94.21 29,562.51 (27,494.57)Total Other comprehensive income/(loss) for the year (991.63) (2,335.39) 38,653.87 (19,938.01)Attributable to: Shareholders of the Company - - 38,524.52 (20,005.94) Non-controlling interest - - 129.35 67.93* These include the Company’s proportionate share of income and expenditure in its two joint operations, namely, Tata Cummins Pvt. Ltd. and Fiat India
Automobiles Pvt. Ltd. Effective April 30, 2018, the Company completed the merger of TML Drivelines Ltd. Fiscal 2017 has been restated for accounting the said merger. The appointed date of merger was April 1, 2017.
DIVIDENDIn view of the losses for Fiscal 2018, no dividend is permitted to be paid to the Members as per the provisions of the Companies Act, 2013 (‘the Act’) and the Rules framed thereunder.
TRANSFER TO RESERVES Due to losses in Fiscal 2018, resulting in debit balance in retained earnings, no amount has been transferred to the Debenture Redemption Reserve.
OPERATING RESULTS AND PROFITSThe year 2017 for India was marked by a number of key structural initiatives to build strength across macro-economic parameters for sustainable growth in the future. The growth in the first half of the year suffered, despite global tailwinds. However, the weakness seen at the beginning of 2017 seems to have bottomed out with
the onset of 2018. Currently, the Indian economy seems to be on the path to recovery from the effects of demonetization, transition into BS-IV emission norms and the introduction of the Goods and Service Tax, with indicators of industrial production, stock market index, auto sales and exports having shown some uptick.
The year 2017 saw global economy accelerating although UK economy evidently slowed down, while the US economy continued to grow at a modest pace. The Chinese economy continued to grow strong, however, the Euro zone and Japan showed signs of acceleration like many of the major emerging economies such as Turkey and Russia. The US economy grew at 2.7% in 2017, supported by broad-based strength in domestic demand, especially investment. The Eurozone grew at a faster rate then in a decade, in 2017 by 2.4%, highest since 2007, reflecting the strong consumption, investment, and exports. The UK by contrast, was growing by 1.8% in 2017, down from 2016’s 1.9% rate and the weakest expansion since

6773rd Annual Report 2017-18
INTEGRATED REPORT 1-65 STATUTORY REPORTS 66-184 FINANCIAL STATEMENTS 185-353
2012, mainly reflecting the impact of higher inflation in the wake of the 2016 Brexit vote and weaker investment from companies due to uncertainty of future trade arrangements. China registering growth of 6.9% in 2017 and had remained solid this year. Activity continued to shift to consumption, while investment growth rates remain well below those in recent years. Industrial production has stabilized following significant cuts in overcapacity sectors implemented over the past 2 years.
During 2017, prices of base metal also strengthened, with the strong growth in infrastructure sector in major countries around the globe. Crude prices remained range bound in major part of 2017 although it started to give a signal of upward breakout towards fourth quarter of Fiscal 2018. Brent crude started sharp rally in the middle of 2017 around US$44/bbl and has rallied all the way to US$79/bbl. The tensions in the Middle East and West Asia would only add to the increase in oil prices. The US shale output was also expected to grow just by 1.1 million bpd and the year 2018 could be the year of oil deficit to the tune of 7.5 lacs bpd.
The Tata Motors Group registered a growth of 7.6% in income from operations to `2,95,409 crores in Fiscal 2018 as compared to `2,74,492 crores in Fiscal 2017. This was due to growth in the business in India, higher wholesale volumes in Jaguar and Land Rover offset by negative translation impact from Great Britain Pound (‘GB£’) to Indian Rupee (‘`’) of `3,192 crores. The consolidated EBITDA margins for Fiscal 2018 stood at 10.6%. EBIT was lower due to non-recurrence of Tianjin recoveries offset by favourable foreign currency revaluation and pension credit at Jaguar Land Rover. Consequently, Profit Before Tax and Profit After Tax [post share of profit of joint ventures and associates (net)] were `11,155 crores and `9,091 crores, respectively.
Tata Motors Limited recorded revenue from operations (including joint operations) of `59,625 crores in Fiscal 2018, 21.6% higher from `49,054 crores in Fiscal 2017. Growth in demand of Medium and Heavy Commercial Vehicle (M&HCV) and Light Commercial Vehicle (LCV), new product offerings in passenger cars and Utility Vehicles (UV), resulted in increase in EBITDA margins to 5.8% in Fiscal 2018 as against 3.4% in Fiscal 2017. Loss Before and After Tax (including joint operations) for Fiscal 2018 were at `947 crores and `1,035 crores, respectively as compared to Loss Before and After Tax (including joint operations) of `2,353 crores and `2,430 crores, respectively for Fiscal 2017. There will be significant disruptions in the Auto Industry necessitating a review of the Company’s tangible and intangible assets to ensure “Fit for Future”. Accordingly, an exceptional provision for impairment of `963 crores has been taken in Fiscal 2018.
Jaguar Land Rover (‘JLR’) (as per IFRS) recorded a 5.9% higher revenue of GB£25.8 billion in Fiscal 2018 compared to GB£24.3 billion in Fiscal 2017 driven by higher sales volumes and favourable mix.
Consolidated EBITDA for Fiscal 2018 was GB£3.3 billion, marginally higher as compared to EBITDA of GB£3.0 billion for Fiscal 2017, as the higher revenue was offset by higher marketing expense, higher incentives and certain engineering charges. EBIT was GB£974 million in Fiscal 2018 compared to GB£1.5 billion in Fiscal 2017, due to higher depreciation and amortisation related to new product
launches which was partially offset by higher profits from our China Joint Venture.
Profit Before Tax (‘PBT’) in Fiscal 2018 was GB£1.5 billion marginally lower than PBT GB£1.6 billion in Fiscal 2017, due to lower EBIT and the non-recurrence of Tianjin recoveries from Fiscal 2017 offset by more favourable foreign currency revaluation of debt and hedges as well as the GB£437 million pension credit realised in first quarter of Fiscal 2018.
GB£437 million pension realised in first quarter of Fiscal 2018 was partially offset by engineering charges (‘Fit for Future‘) in fourth quarter of Fiscal 2018.
TMF Holdings Limited (‘TMFHL’) (earlier known as Tata Motors Finance Limited) (consolidated) (as per Indian GAAP) the Company’s captive financing subsidiary, reported revenues of `2,876 crores (Fiscal 2017: `2,721 crores) and Profit After Tax of `217 crores in Fiscal 2018 as compared to Loss After Tax of `1,182 crores in Fiscal 2017.
Tata Daewoo Commercial Vehicle Company Limited (‘TDCV’), (as per Korean GAAP) South Korea registered revenues of KRW 868.26 billion, a drop of 15.8% in Fiscal 2018 over the Fiscal 2017 mainly due to lower domestic sales. The Profit After Tax was KRW 33.66 billion compared to KRW 50.25 billion of Fiscal 2017. Lower profitability was mainly due to the impact of lower domestic sales which was partially set-off by material cost reduction.
VEHICLE SALES AND MARKET SHARES The Tata Motors Group sales for the year stood at 12,21,124 vehicles, up by 11.9% as compared to Fiscal 2017. Global sales of all Commercial Vehicles (CV) were 4,56,552 vehicles, while sales of Passenger Vehicles (PV) were at 7,64,572 vehicles.
TATA MOTORS
Tata Motors recorded sales of 584,564 vehicles, a growth of 21.9% over Fiscal 2017, higher than the Indian Auto Industry grew by 10%. The Company’s market share increased to 14.1% in Fiscal 2018 from 12.7% in Fiscal 2017. The Company’s exports on standalone basis were lower by 18.4% to 52,404 vehicles in Fiscal 2018 as compared to 64,221 vehicles in Fiscal 2017.
Commercial Vehicles
The CV market after a turbulent start in the year 2017, as a result of announcement of BS-III to BS-IV changeover and concerns over Goods and Services Tax (GST), recovered strongly representing a growth of 21.7% in Fiscal 2018. The Company sold 399,821 vehicles within the domestic market, representing a growth of 23.3% over Fiscal 2017. The market share of CVBU for Fiscal 2018 was 45.1%. All segments with the exception of buses showed strong growth in Fiscal 2018.
Some of the highlights for the year were:
• M&HCV volumes grew by 15.5% in Fiscal 2018. Several new products were launched across the SIGNA, PRIMA and conventional platforms – SIGNA 4923.S with Bell Crank suspension, SIGNA 3718, SIGNA 3718.TK, Prima 2530.K Scoop,

68
Prima Lx 3125.K 23cm, LPK 2523 ULTIMAAX, LPK 2518 7 Cum RMC Bogie.
• ILCV volumes registered a strong 35.6% growth in Fiscal 2018. The introduction of the ULTRA 1518 marked the Company’s entry in the 15T segment previously dominated by competition. New products such as LPT 407/38, ILCV Tippers and ILCV CNG products have helped grow volumes significantly.
• SCV Volumes grew by 37.3%. The XL series of SCVs, consisting of the Zip XL, Mega XL and Ace XL models, was launched with a 15% longer load body delivering improved Total Cost of Ownership (‘TCO’) to our customers.
• Volumes in the CV passenger segment marginally increased by 0.2% from Fiscal 2017. The Magic Express passenger SCV was launched in second quarter of Fiscal 2018 and was well received, helping this segment gain 9% market share in the year. The Net Promoter Score (‘NPS’) stood at positive (+57) for Fiscal 2018.
• Reiterating its commitment to greener fuel options, the Company won orders for electric buses in 6 out of the 9 cities for which tenders were released across the Country, garnering around 60% share. The Company also supplied the country’s first diesel hybrid buses for the city of Mumbai with 25 units being flagged off by the Chief Minister of Maharashtra in March 2018.
• The Company became the first Original Equipment Manufacturer (OEM) in India to deploy Advanced Driver Assistance Systems (ADAS) systems in its PRIMA and SIGNA range. This package included Electronic Stability Control (ESC), Automatic Traction Control (ATC), Hill Start Aid (HSA), a Collision Mitigation System (CMS) and a Lane Departure Warning System (LDWS).
• The Company significantly improved the ability to provide customers with end to end support and comfort through enhancing the value added services under a common brand of “Sampoorna Seva”. The key elements include 6 Year 6 lakh km warranty on the entire range of M&HCVs, Tata Alert breakdown assistance service available across 3 million kilometers of Indian roads and Tata Delight Loyalty Program.
• Tie up with Indian Oil to launch Tata Motors Genuine Oil (TMGO), a single brand of affordable lubricating oils that is guaranteed by the Company for use across the range of CVs.
• Sales Kraft – Value Selling and Negotiation training module was developed along with Mercuri Goldman to improve the negotiation skills of the frontline sales team, aimed to improve net sales realization. Over the course of 3 phases, the entire M&HCV sales team has been trained. In the next phase of the program, this module is being extended to the dealer sales teams.
• The Company participated in the SIAM Auto Expo 2018 where 15 vehicles and 1 new engine from the CV portfolio were showcased. Some of the key products displayed were:
– The SIGNA 4323 – India’s first 6-axle rigid truck with a 30-ton payload, the highest in the market and 4.5 tons higher than the nearest competitor.
– The special PRIMA 4930.S technology demonstrator which displayed some of our latest advanced safety features like LDWS, Advanced Emergency Braking System (AEBS), HSA and rear view cameras
– The ULTRA T.7, an elegant 4.2 ton payload LCV with a 1.9-meter wide cabin for easier maneuverability on the narrow roads of urban and rural India.
The Tata INTRA compact truck which is set to re-define the SCV segment in the country
– The MAGNA Bus – the first bus body code compliant two-axle OEM coach with world-class design and engineering inputs from our partner Marcopolo, Brazil.
– The Turbotronn Engine Family - a brand new next generation state-of-the-art diesel engine family that offers best in class fuel economy, excellent performance, better reliability, and durability as well as lower TCO to our customers.
– A range of Electric commercial vehicles including the Starbus Electric, Magic EV and Iris EV.
• CV won numerous awards for its various innovative products and initiatives, some of which are mentioned below:
– At the prestigious Apollo CV Awards, CVBU won:
- Small People Mover of the Year for the Tata Magic Express
- M&HCV People Mover of the Year for the Tata Magna Bus
- HCV Tractor Cargo Carrier of the Year for the Tata SIGNA 4923.S
- Special Recognition award for the Tata Starbus Hybrid
– Brand Equity YouTube Leader board – No 1. In Top 10 ads on YouTube in India that resonate most with the audience - February 2018.
– World Digital Marketing Congress (WDMC) - Best Digital Integrated marketing campaign for Tata Ace - Keep Loading campaign. Global Digital marketing awards. This is one of the first industry awards in the year.
– Abby’s – Best use of Digital media – Bronze Award for Best use of Digital display advertising
– Digital Industry Awards 2017 - Best Use of Social Media in a Digital Campaign for Tata T1 Prima Truck Racing Championship 2017 for the year’s Digital Industry Awards
– Use Dipper At Night Campaign – an innovative campaign to bring awareness amongst the truck driver community of safe practices continues to be extremely well received and acknowledged winning the Silver WARC Prize for Asian Strategy and award for the Best Channel Thinking.
– Tata Yodha – This media campaign won the Bronze award at the prestigious Effies in India.
• In order to promote various applications on the Company’s products a series of campaigns were organized on Pan India:

6973rd Annual Report 2017-18
INTEGRATED REPORT 1-65 STATUTORY REPORTS 66-184 FINANCIAL STATEMENTS 185-353
– M&HCV Truck World - Organized 6 Truck World Exhibitions with a full range of over 35 different models displayed. The events were also used to highlight new product launches. This has been backed up with 10,000+ market activations including 3100+ customer meets and 1600+ Fuel Trials.
– ILCV Expos – 53 ILCV Expos, showcasing the complete ILCV range of the Company, were conducted across 17 states with 18,500 customers in attendance.
– XL Series Launch Activities – 44 large and 114 small format XL Range launch events were conducted across 19 states, attended by over 28,000 potential customers.
– UP Yoddha Kabaddi Team – Tied up with the Pro Kabaddi League team UP Yoddha to promote the Tata Yodha range of pickups. This association was amplified though a concentrated promotion campaign including digital and Below The Line (‘BTL’) activities.
– HAMARE BUS KI BAT HAI - a unique outreach program for school staff, to upgrade their soft skills touched more than 1500 schools in Fiscal 2018 alone. This meant touching more than 46,000 school staff in 800+ locations.
– Bandhan Key Customer Meets – 7 large format key customer meets were organized in strategic markets across the country, with seniors CVBU leadership in attendance.
– During Fiscal 2018, the Lucknow and Pantnagar plants were certified for Word Class Quality (WCQ) Level 3. The Incident Per Thousand Vehicles (‘IPTV’) has decreased significantly over the last 3 years.
Passenger Vehicles
The domestic PV industry grew by 7.3% during Fiscal 2018, registering a volume of 3.25 million vehicles. The growth in industry was mainly driven by growth in overall economy of India coupled with easing financing cost. This growth was driven by top 4 manufacturers only.
The Company’s PV business registered a growth of 19.0% with total volumes of 184,743 vehicles. The market share of the Company for Fiscal 2018 was 5.7%. The Company sold 134,860 cars with a marginal de-growth of 1.2%, and 49,883 Utility Vehicle (UV) with a growth of 165.6% as compared with Fiscal 2017. The growth in UV segment was driven by strong demand for Nexon and Hexa. The sharp increase in sales was achieved despite a sharp decline in the Fleet Segment, in which the Company has been traditionally a big player. Focus on individual customers helped in increasing share of individual customers to over 85%. In the field of customer service, the Company ranked second in J D Power Customer Satisfaction Index Survey, which is a significant improvement over last few years. Dealer Network upgradation and working capital availability were prevailing constrains in PV sales and the Company has been working with TMF Holdings Limited, its financing arm and other banks to plug these gaps.
During Fiscal 2018, the Company launched two new products namely Nexon and Tigor. Apart from these two main launches Tiago Wizz, Tiago AMT, Tigor AMT, Hexa Downtown and Zest limited editions were launched. All the newly launched cars experienced strong demand and wide acceptance from the market. After almost 6 years, one of the Company’s products, namely, Tiago figured among top 10 brands in car industry becoming the second highest selling model in compact car segment. Apart from these regular models, the Company made significant progress in electrical vehicles. The Company won the tender for supply of 10,000 electric cars to Energy Efficiency Services Limited (‘EESL’).
The PV business has seen a sharp transformation in NPS from a negative score (-13) in Fiscal 2015 to positive score (14) in Fiscal 2018, significantly improving brand perception and pricing power of the PVs.
During Fiscal 2018, the Pune and Sanand PV plants were certified for WCQ Level 3 while UV plant certified for WCQ Level 2. The warranty IPTV is at all time lowest level. Both these parameters are indicators of continued focus on quality improvement.
Exports
The Company exported 52,404 vehicles (Fiscal 2017: 64,221 vehicles) comprising 50,106 units of CV and 2,298 units of PV during Fiscal 2018.
Export of CV dropped by 16.7% in Fiscal 2018 with 50,106 units exported compared to 60,184 units in Fiscal 2017. The prime reason for the drop in numbers was the drop in Total Industry Volumn (TIV) in two of our key markets, Nepal (by 34% due to duty changes) and Sri Lanka (by 39% due to liquidity crisis). Export shipments to Bangladesh achieved record shipments and retails. Market Share in all SAARC markets either improved or have been strong. Political distresses in the Middle East, Kenya and South Africa and economic slowdown and currency devaluations in various markets in Africa affected volumes in these regions in Fiscal 2018. The shipments to ASEAN doubled in Fiscal 2018 as compared to Fiscal 2017, making it our fastest growing region.
In Fiscal 2018, the Company successfully bagged several prestigious orders, including 250 units of Xenon pickups, 200 units of LPTA 715 from the Myanmar Armed forces [making Myanmar Armed Forces the biggest customer of Xenon globally (1950 units)], 540 units of buses from ILOC, Senegal, 209 units from GVK EMRI Sri Lanka. Some of the key events in Fiscal 2018 were the launch of Prima in Philippines, Signa in Sri Lanka, Yodha in Nepal, Ultra buses in Tanzania, Ultra range in South Africa and unveiling of Ultra in Thailand and Indonesia. The complete CR range of ILCV was launched in Nepal.
Export of PV stood at 2,298 units compared to 4,037 units in the Fiscal 2017. Two large markets remain non-operational, mainly Sri Lanka due to high import duties, tight retail financing and South Africa due to the closure of the distribution channel.
During Fiscal 2018, launch of new models in Nepal and

70
Bangladesh helped the Company to accrue 44% of its PV export volumes from launches. The Company successfully launched the Hexa, Tigor and Nexon in Nepal, where the Tigor and Nexon were both ‘Number One’ sedan and CUV respectively. The Tata Motors’ brand ranked ‘Number Three’ in the PV segment in Nepal, despite being present only in a limited number of high volume segments. In Bangladesh the Tiago AMT was ranked as ‘Number One’ hatchback.
JAGUAR LAND ROVER
Jaguar Land Rover (JLR) achieved record retail sales of 614,309 in Fiscal 2018, marginally higher by 1.7% compared to Fiscal 2017, primarily driven by the introduction of the Range Rover Velar, Jaguar E-PACE, the all new Land Rover Discovery coupled with solid demand for the long-wheel base Jaguar XFL in China and the award-winning Jaguar F-PACE. Year-on-year the higher retail sales volumes by 19.9% in China, 4.7% in North America and 3.4% in overseas markets were offset by lower sales in the UK by 12.8% and in Europe by 5.3% primarily driven by ongoing uncertainty surrounding diesel.
The total wholesale volumes (excluding sales from the China Joint Venture) were 545,298 in Fiscal 2018, up 2.0% compared to the 534,746 units in Fiscal 2017. The growth in wholesales primarily reflected the introduction of new models offset by lower wholesales of older models, notably the Jaguar XE and XF, Land Rover Discovery Sport, Range Rover Evoque and other models (including Range Rover and Range Rover Sport on account of the model year changeover).
Some of the key highlights of Fiscal 2018:
• All new Land Rover Discovery launched in the US and China in May 2017
• The new Jaguar XF Sportbrake unveiled in June 2017 with sales following shortly
• The Range Rover Velar commenced retail sales in July 2017 (Winner of World Car Design of the Year)
• Jaguar’s new compact performance SUV, the E-PACE, commenced sales from November 2017
• Refreshed Range Rover and Range Rover Sport models (including plug in hybrids) were launched at the end of calendar 2017
• Production of the new long wheel base Jaguar XEL commenced at our China Joint Venture and went on sale in December 2017
• JLR announced that all models would offer an electrified option from 2020
• The Range Rover Velar, Jaguar F-PACE and E-PACE were all awarded a 5 star Euro NCAP rating in Fiscal 2018
• JLR’s first battery electric vehicle, the Jaguar I-PACE was launched in March 2018
• Production of JLR’s 4 cylinder 2 litre ingenium petrol engine commenced production at our China joint venture in July 2017 for locally manufactured JLR vehicles in China
• Construction of the manufacturing plant in the city of Nitra in Slovakia advanced during Fiscal 2018 and the all new Discovery will be the first vehicle to be produced at the new plant from the end of calendar year 2018
• InMotion Ventures announced $25m investment in rideshare company LYFT in June 2017
• JLR is taking part in the UK’s first road tests for autonomous vehicles
• Long term strategic partnership with Waymo announced in March to develop a self-driving I-PACE for Waymo’s driverless transportation service, with 20,000 units joining Waymo’s fleet over 2020 and 2021
• JLR confirmed plans to open a software engineering centre and create 150 jobs in Shannon, Republic of Ireland, in 2018
TATA DAEWOO COMMERCIAL VEHICLES COMPANY LIMITED
Tata Daewoo Commercial Vehicles Company Limited (TDCV) during Fiscal 2018 sold 8,870 commercial vehicles, lower by 14.0% over Fiscal 2017, mainly due to decrease in domestic sales. TDCV sold 6,859 commercial vehicles in the domestic market lower by 22.0% as compared to sales in Fiscal 2017, primarily due to lower industry volumes and aggressive discounting and marketing strategies of importers considering their higher ordering level. The market share for both HCV and MCV segments put together was 26.5% as compared to 29.6% in Fiscal 2017. The export market scenario continued to remain challenging in Fiscal 2018 with factors like local currency depreciation against the US Dollar, continuing statutory regulations to reduce imports, the slowdown in Chinese economy impacting commodity exporting countries and increased dealer inventory. However, TDCV could increase its export sales to 2,011 commercial vehicles, 32.1% higher compared to 1,522 commercial vehicles in Fiscal 2017.
TATA MOTORS (THAILAND) LIMITED
Tata Motors (Thailand) Limited (TMTL) domestic retail sales in Fiscal 2018 was 958 units as compared to 1,094 units in Fiscal 2017. Offtake was 682 units in Fiscal 2018, as compared to 1,332 units in Fiscal 2017. The Thai Automobile Industry has witnessed a growth of 13.6% in Fiscal 2018 compared to flat growth last year, the addressable segment of TMTL declined by 3% compared to 14% growth last year. Fiscal 2018 saw the launch of Ultra Truck models. Super Ace was well received in the market resulting in market share improvement to 8.9% compared to 4.6% in Fiscal 2017. During the year, TMTL received its first order from Royal Thai Army to supply 1.25 ton Tata Trucks.
TATA MOTORS (SA) (PTY) LIMITED
Tata Motors (SA) (Pty) Ltd (TMSA) sold 773 chassis in the South African market in Fiscal 2018 compared to 697 chassis in Fiscal 2017 and exported 42 chassis in Fiscal 2018 compared to 6 chassis to Mozambique during Fiscal 2017. TMSA commenced manufacturing of the –Ultra 814 and is in the process of assembling new range of TDCV models in South Africa in Fiscal 2019.
TMF HOLDINGS LIMITED
TMF Holdings Limited (TMFHL) – a wholly owned subsidiary of the Company, is the vehicle financing arm under the brand

7173rd Annual Report 2017-18
INTEGRATED REPORT 1-65 STATUTORY REPORTS 66-184 FINANCIAL STATEMENTS 185-353
“TMF Holdings Limited”. TMFHL’s total disbursements (including refinance) increased by 65.7% at `15,406 crores in Fiscal 2018 as compared to `9,298 crores in Fiscal 2017. TMFHL financed a total 1,75,128 vehicles reflecting an increase of 47.3% over 1,18,883 vehicles financed in Fiscal 2017. Disbursements for CV increased by 60.6% and were at `11,448 crores (115,689 units) as compared to `7,127 crores (77,898 units) of Fiscal 2017 mainly due to higher disbursements in the M&HCV segment. Disbursements of PV increased by 14.3% to `2,345 crores (42,619 units) from a level of `1,542 crores (34,126 units). Disbursements achieved under refinance through Tata Motors Finance Services Limited (TMFSL), a 100% Subsidiary of TMFHL were at `1,614 crores (16,820 vehicles) as compared to `628 crores (6,859 vehicles) during Fiscal 2017.
TMFHL has increased its reach by opening limited services branches (called Spoke and Collections branches) exclusively in Tier 2 and 3 towns, which has helped in reducing the turnaround time to improve customer satisfaction. TMFHL had 267 branches at the end of Fiscal 2018. The book size of TMFHL’s corporate lending business, which includes providing finance to the Company’s dealers and vendors, increased by 179.6% from `1,150 crores in Fiscal 2017 to `3,215 crores in Fiscal 2018.
The gross NPA has decresed from 17.9% to 4% from Fiscal 2017 to Fiscal 2018, showing the improvement in credit quality of its portfolio.
MATERIAL CHANGES & COMMITMENT AFFECTING THE FINANCIAL POSITION There are no material changes affecting the financial position of the Company subsequent to the close of the Fiscal 2018 till the date of this report.
SIGNIFICANT & MATERIAL ORDERS PASSED BY THE REGULATORS OR COURTS OR TRIBUNALSThere are no significant material orders passed by the Regulators or Courts or Tribunal, which would impact the going concern status of the Company and its future operation. However, Members attention is drawn to the Statement on Contingent Liabilities and Commitments in the Notes forming part of the Financial Statement.
RISK MANAGEMENTThe Risk Management Committee (RMC) is entrusted with responsibility to assist the Board in (a) overseeing the Company’s risk management process and controls, risk tolerance and capital liquidity and funding (b) setting strategic plans and objectives for risk management and review of risk assessment of the Company ( c ) review the Company’s risk appetite and strategy relating to key risks, including credit risk, liquidity and funding risk, market risk, product risk and reputational risk, as well as the guidelines, policies and processes for monitoring and mitigating such risks.
The Committee operates as per its Charter approved by the Board and within the broad guidelines laid down in it. The Company has a Risk Management Policy in accordance with the provisions of the Act and SEBI (Listing Obligations and Disclosure Requirements) Regulation, 2015 (“SEBI Listing Regulations”). It establishes various levels of accountability and overview within the Company, while vesting identified managers with responsibility for each significant risk.
The Board takes responsibility for the overall process of risk management in the organisation. Through Enterprise Risk Management Programme, business units and corporate functions address opportunities and the attendant risks with an institutionalized approach aligned to the Company’s objectives. This is facilitated by internal audit. The business risk is managed through cross functional involvement and communication across businesses. The results of the risk assessment are thoroughly discussed with the Senior Management before being presented to RMC.
INTERNAL FINANCIAL CONTROLS WITH REFERENCE TO THE FINANCIAL STATEMENTDetails of internal financial control and its adequacy are included in the Management Discussion and Analysis Report, which forms part of this Report.
HUMAN RESOURCESThe Tata Motors Group employed 81,090 permanent employees as of Fiscal 2018 (Fiscal 2017: 79,558 employees). The Company employed 24,989 permanent employees as of Fiscal 2018 (Fiscal 2017: 26,035 employees). The Tata Motors Group has generally enjoyed cordial relations with its employees and workers.
The Company has labour unions for operative / worker grade employees at all the plants across India, except the Dharwad Plant. The Company has generally enjoyed cordial relations with its employees and unions at its factories and offices and have received union support in the Company’s implementation of reforms that impact safety, quality, cost and productivity improvements across all locations. Employee wages are being paid in accordance with wage agreements that have varying terms (typically three to four years) at different locations.
With an objective of improving Organization Effectiveness, the Company undertook a structure change exercise with key guiding principles of Empowerment to the Business Units with clear accountability for business results, strong functional leadership and oversight for an effective maker-checker concept, improved and speedier decision making, agility and quick responsiveness to market, and strong cross functional alignment to drive quick issue resolution. The exercise has delayered the organization to 5 managerial levels below ExCom, making the organization lean and agile while rationalizing the span of control for key roles, increasing customer facing roles and providing scope for merit and vacancy based career development. The new organization structure went live on April 01, 2017.
As part of the structure change, a new product line organization has been created with complete P&L responsibility. Transactional roles have been identified across functions for transition to shared services, and therefore focus on core activities. Volumetric study has been performed to identify optimum manpower at each level, bringing the organizational spread closer to global standards. This, combined with the Job Evaluation exercise and Management Audit helped in establishing clear job description for each role and identifying the right talent for the roles.
Placement of Individuals in these roles done through external assessment (for mid and senior level roles) and internal assessments (for junior level roles) were conducted by ExCom and respective Senior Leadership teams. Individuals, based on their performance

72
and the experience they bring to the role, have been given bands within the levels. This will help us provide an opportunity to employees to progress from one band to another within the same level, thus managing career aspiration of individuals in the long run, in line with the promotion and progression policy.
Management is keen on ensuring smooth implementation of the new vision, mission and structure. Multiple FGDs were conducted during Fiscal 2018 with different cross section of employees and few course corrections, like providing level wise designation, concept of personal levels, protection of benefits, etc. was undertaken based on feedback received from employees.
Tata Motors Limited Employees Stock Option Scheme 2018 (“TML ESOP Scheme 2018” / “the Scheme”)
The Board of Directors, on the recommendation of the Nomination and Remuneration Committee and pursuant to the provisions of the Act and the Securities and Exchange Board of India (Share Based Employee Benefits) Regulations, 2014, had at its meeting held on May 23, 2018, proposed adoption of Tata Motors Limited Employees Stock Option Scheme 2018 (“TML ESOP Scheme 2018” / “the Scheme”), in order to ring fence and incentivize key talent, approximately aggregating to 200 employees, forming 2% of the white collar population, for driving the long term objectives of the Company and ensuring that employee payoffs match the long gestation period of certain key initiatives and at the same time fostering ownership behavior and collaboration amongst employees.
Members’ approval to the Scheme is sought, by way of Special Resolution, at Item No. 7 of the Notice. The salient features of the Scheme are as provided in the explanatory statement of the Notice.
Safety & Health – Performance & Initiatives
The Company is committed to provide a safe and healthy working environment for its employees and associates. It was ensured that none of our employees or workers are subjected to high incident or high risk disease related to their individual occupation. A company-wide occupational health and safety policy exist in order to ensure increased vigilance and awareness on health and safety. It was recognised that to achieve the target in safety it was crucial to internalize safety and engage with our employees.
The Indian operations achieved improved performance with Total Recordable Case Frequency Rate (TRCFR) being 1.14 against the target of 1.47 for the Fiscal 2018, the overall Safety Performance improved but recorded one fatality during Fiscal 2018.
The manufacturing plants across the Country are certified to ISO 14001 - Environment Management Systems and OHSAS 18001 – Occupational Health & Safety Management System. The CV manufacturing plants of the Company across India are certified to ISO 50001 - Energy Management System. The Company has undertaken several initiatives for resource conservation such as re-cycling of treated effluents back to process, energy, material recovery and co-processing from hazardous wastes through cradle to grave waste management principles and rainwater harvesting. Manufacturing plants generate in-house renewable power besides sourcing off-site green power. All the Company’s sites are certified for GreenCo, except for the Sanand plant which is participating for GreenCo in June 2018.
The Company places equal emphasis on safety processes, behavioral safety and strives to create a positive safety culture towards achieving the ultimate goal of ‘Zero Injury’. Safety is a primary focus area in daily management and safety parameters are part of the scorecard for Senior Leaders. Sessions on Road Safety were conducted at all offices across India engaging 1,000+ employees along with mentoring of Flexi Work Force under “MY BUDDY” program by Permanent Blue Collar Work force / Group leaders.
In line with Safety and Health Policy, to enhance safety standards of its business partners, the Company engaged it’s upstream and downstream supply chain in the safety journey. The objective of such engagement is to raise the safety standards at Supplier and Dealer workshops. In addition to existing 16 safety standards, new standards / guidelines like Cell Phone Policy, CCTV Policy, Lone Working Standard, Industrial Hygiene Standard, Engineering Standards, Vehicle Usage & Replacement Guidelines were developed and rolled out to raise the level of safety.
The Company continued Campaign ‘i-drive safe’ – an initiative on building a safe driving culture amongst its employee and associates and have trained them in Defensive Driving. ‘My Road My Discipline’ Road Safety Week campaign during April 23 to 29 included Road Safety Celebrations conducted in all location including all Plants, Offices, Dealerships, Warehouses and Vendors.
‘senSHEtize’- A Company’s initiative on Women’s Safety Awareness: more than 1800 women employees underwent training focused on Women’s Safety and Self-defense in 60 session across offices & plants.
Jagruti – Safety Awareness Building Campaign for Workshop Managers is a year-long campaign focused on building awareness on safety and understanding of the Company’s expectations on Dealers Workshop Safety. Jagruti Safety Awareness campaign was done for channel partners PV and CV dealers covering Pan-India level.
In health area, as per the age band, specific health check-up of employees was organized and conducted. Health & well-being of aging workforce remained a prime concern and various health awareness programs and exhibitions across all locations were organized.
Jamshedpur, Lucknow and Pantnagar plants were certified for Food Safety Management System ISO 22000:2005. Remaining plants i.e. Dharwad and Sanand plants will be undergoing certification process in Fiscal 2019.
The Company continued to drive a number of initiatives to reduce its environmental footprint in Fiscal 2018. Our GreenHouse Gas (GHG) mitigation approach included driving energy conservation in manufacturing operations and generation / procurement of renewable energy. The Company consumed 99 million units of renewable electricity in its operations, which was 21% of total power consumed. This is 19% higher than renewable power consumed in Fiscal 2017. On Company’s efforts to achieve ‘Zero Waste to Landfill’, the hazardous waste disposed to Common Facilities (for landfill / incineration) was lower by 18% over Fiscal 2017. The Company’s approach to lowering the water consumption included driving water conservation in manufacturing operations, re-cycling treated effluent for re-use in process and harvesting

7373rd Annual Report 2017-18
INTEGRATED REPORT 1-65 STATUTORY REPORTS 66-184 FINANCIAL STATEMENTS 185-353
seasonal rainwater. The Company’s performance on effluent re-cycling improved by 15% over Fiscal 2017.
On Sustainability, supply chain sustainability was one of the major initiatives undertaken during Fiscal 2018. Over 50 suppliers have been trained and provided handholding to improve sustainability performance and assessed towards sustainability expectations.
Circular economy, natural capital evaluation of key dependencies, design for environment, biodiversity assessment, life cycle assessment of products, climate adaptation study were some of the other initiatives the Company has taken in sustaining its business and planet.
JLR continues to drive health and safety through Destination Zero – A Journey to Zero Harm. The Company’s commitment is reflected in JLR commitment with the key statement being “Our most valuable asset is our people, nothing is more important than their safety and wellbeing. Our co-workers and families rely on this commitment. There can be no compromise”. The concept of ‘Humanising’ safety metrics and ensuring transparent reporting enables the journey to zero harm to continue to be highly visible. To support the wider ambition of zero harm as well as focusing on incidents, JLR also continued to mature the approach to wellbeing activities with a focus on mental health and the launch of the ‘let’s have the conversation’ programme, designed to support open discussions on matters of mental health. The development of focused plans has ensured that each functional area, aligned at Board level, has a specific ‘Destination Zero’ Harm Plan. These have assisted each functional area to tailor their own plan of activities to lead improved safety and wellbeing within their own area of responsibility.
Performance on Loss Time Injuries (LTI) continued to show improving trend consistent with overall business improvement. A notable improvement was seen in manufacturing locations with around 47% improvement against last Fiscal performance. Many of the sites continued to celebrate sustained zero lose time injuries. The improved performance on safety was resultant of various initiatives taken throughout the year, such as improving quality of safety observations, effective implementation of existing safety management programs, robust safety training and defensive driving etc.
The business has gone through OHSAS 18001 - surveillance visits in Fiscal 2018, within all the UK locations and maintained its accreditation to this standard through a series of external assessments. Plans for migration to the new International Standard ISO 45001 was underway.
TMSA sustained good performance, leadership commitment and employee engagement in areas of Safety and Health during Fiscal 2018. TDCV Korea and TMTL Thailand continued leadership commitment and engagement with focus in areas of safety communication, risk assessment, improving capabilities of employees for emergency situations.
Prevention of Sexual Harassment
The Company has zero tolerance for sexual harassment at workplace and has adopted a Policy on Prevention, Prohibition and Redressal of sexual harassment at workplace in line with the provisions of the Sexual Harassment of Women at Workplace (Prevention, Prohibition and Redressal) Act, 2013 and the
Rules thereunder for prevention and redressal of complaints of sexual harassment at workplace. The Company is committed to providing equal opportunities without regard to their race, caste, sex, religion, colour, nationality, disability, etc. All women associates (permanent, temporary, contractual and trainees) as well as any women visiting the Company’s office premises or women service providers are covered under this Policy. All employees are treated with dignity with a view to maintain a work environment free of sexual harassment whether physical, verbal or psychological.
During Fiscal 2018, the Company had received 13 complaints on sexual harassments, 12 of which have been substantiated and appropriate actions were taken. The remaining 1 complaint was received during mid March and is being investigated. The Company organized 148 workshops or awareness program against sexual harassment. There were no complaints pending for more than 90 days during the year.
Similar initiatives on Prevention of Sexual Harassment are in place across the Tata Motors Group of companies.
BUSINESS RESPONSIBILITY REPORT Pursuant to Regulation 34(2)(f) of the SEBI Listing Regulations, the Business Responsibility Report (BRR) initiatives taken from an environmental, social and governance perspective, in the prescribed format is available as a separate section of the Annual Report and also hosted on the Company’s website www.tatamotors.com
FINANCE During the year, the free cash flows for Tata Motors Group were negative `11,183 crores, post spend on capex, design and development of (`35,039 crores). Tata Motors Group’s borrowing as at March 31, 2018 stood at `88,951 crores (as at March 31, 2017: `78,604 crores). Cash and bank balances and investments in mutual funds stood at `48,974 crores (as at March 31, 2017: `51,119 crores). The consolidated net automotive debt to equity ratio stood at 0.15 as at March 31, 2018, as compared to 0.13 as at March 31, 2017.
Free cash flows were `1,339 crores for standalone operations of the Company. Spend on capex, design and development were `2,794 crores (net). The borrowings of the Company as on March 31, 2018 stood at `18,464 crores (as at March 31, 2017: `19,357 crores). Cash and bank balances including mutual funds stood at 2,312 crores (as at March 31, 2017: 2,764 crores). During Fiscal 2018, the Company issued rated, listed, unsecured NCDs of `1,500 crores.
At JLR, post spend on capex, design and development of GB£4,186 million (`35,776 crores), the free cash flows were negative GB£1,045 million (`8,931 crores) for Fiscal 2018. The borrowings of the JLR as on March 31, 2018, stood at GB£3,731 (`34,238 crore) [as at March 31, 2017: GB£3,581 million (`28,977 crores)]. Cash and financial deposits stood at GB£4,657million (`42,977 crores) [as at March 31, 2017: GB£5,487 million (`44,400 crores)]. Additionally, JLR has undrawn committed long term bank lines of GB£1,935 million (JLR data as per IFRS).
During Fiscal 2018, JLR issued US$500 million senior notes due in 2027 at a coupon of 4.50% per annum. The proceeds were for general corporate purposes, including support for JLR’s ongoing growth and capital spending requirements.

74
During Fiscal 2018, TMFHL and its subsidiaries, Tata Motors Finance Limited and TMFSL, raised `3,231 crores by issuing NCDs. Bank borrowings through secured and unsecured term loans continued to be a major source of funds for long-term borrowing and raised `2,330 crores during Fiscal 2018. In Fiscal 2018, TMFHL Group short-term debt (net) increased by `5,008 crores and long-term debt (net) increased by `7 crores.
Tata Motors Group has undertaken and will continue to implement suitable steps for raising long term resources to match fund requirements and to optimise its loan maturity profile.
During Fiscal 2018, the Company’s rating for foreign currency borrowings was retained to “Ba1”/Stable by Moody’s and to “BB+”/ Stable by Standard & Poor’s. For borrowings in the local currency, the ratings was retained by CRISIL at “AA/ Positive” and by ICRA at “AA/Positive”. The Non-Convertible debentures and long term bank facilities i.e. (Buyers Credit and Revolving Credit Facility) rating by CARE was retained at “AA+/Stable”. During the year, JLR’s rating was retained by Moody’s at “Ba1” with a change in outlook to Stable and was retained by Standard & Poor’s at “BB+/Stable”. For TMFHL, CRISIL has maintained its rating on long-term debt instruments and bank facilities to CRISIL “AA/ A1+/Positive” and ICRA has maintained its rating at “AA/Positive”
DEPOSITS The Company has not accepted any public deposits during Fiscal 2018. There were no over dues on account of principal or interest on public deposits other than the unclaimed deposits as at the end of Fiscal 2018.
EXTRACT OF ANNUAL REPORTAs provided under Section 92(3) of the Act, the details forming part of the extract of the Annual Return in Form MGT 9 is annexed as Annexure - 1.
INFORMATION TECHNOLOGY AND DIGITAL PRODUCT DEVELOPMENT INITIATIVESa. Information Technology Initiatives
The Company has been a pioneer in adopting Information Technologies (IT) to enable the processes and create efficiencies in its systems. It has been working towards implementing the components of its IT roadmap to create a digital ready platform for transformation. It leverages its strong partnerships with product and services companies to harness the potential of IT for ensuring execution of business initiatives towards a competitive advantage.
The major highlights of IT at the Company are:
• Executed IT Cost Optimization across strategic out sourcing programs.
• Implemented GST framework and IT enablement to support business transactions.
• Enabled World Class Quality initiative of the Company through extending the implementation of Manufacturing Execution System.
• Digital initiatives like e-guru mobile app for dealers’ sales force has helped create customer awareness about our products
• Focus on Supplier Relationship Transformation (SRT) through implementation of Supplier systems and inauguration of SRT training centre
• Continued greater collaboration with subsidiaries leveraging IT leadership
• Strengthening information security through multiple initiatives such as Network Access Control and preparation for ISO27000 framework
• IT team has led the Tata Group CIO Forum enabling synergies across Tata companies in the areas of Digital, Information Security and procurement
In the Company, IT was all about digital. Right from conception of programs such as high fidelity technology backends to connected vehicle roadmaps, the span of technology has never been this vast. All of it was geared towards constant evolution in the mobility (commute) space and providing the best in class technology experience to our end customers. Programs to enhance the sales executive interactions with customers, capturing just in time information from the ground, driving analytics decision making with cloud services and preparing for the next generation of customer relationship have been top focus areas.
Providing customized technology experience in the full lifecycle of a product, at all stakeholder touchpoints, is a niche which technology is aiming to achieve going forward. Digital platforms and services married to unique business use cases was the way forward. The technology team was in continuous research process of evaluating the best use of state of the art technologies for the benefit of our customers and providing a delight to all stakeholders.
With the readiness of our systems on the digital front, the Company is well equiped in its exciting phase of transformation journey by using cutting edge technology to provide customer centric products and services.
b. Digital Product Development Systems Initiatives
Significant improvements in key processes for product design and manufacturing planning domain had been accomplished through modification of existing processes and identifying few manual processes and converting them in digital engineering domain for better agility.
Achievements through various initiatives are listed below:
• 35 new knowledge based engineering applications were designed and implemented across various product design and safety domains. They were integrated with various tools such as to predict problematic reflections for driver and analyze different parameters for driver comfort, defining datum strategy ensuring first time right panel datum information for tooling and dimensional variation analysis.
• 100+ new productivity tools were developed and implemented across various product design and

7573rd Annual Report 2017-18
INTEGRATED REPORT 1-65 STATUTORY REPORTS 66-184 FINANCIAL STATEMENTS 185-353
validation domains. These tools helped large number of designers to increase their productivity significantly through identified levers such as quality checks for design, drawing automation and process automation. CAE tools for load body analysis, NVH assembly model creation, BIW static stiffness, structural connectivity, frequency response and harmonic fatigue, spot-weld failure prediction, axle bracket weld, etc, are few such examples. During concept evaluation phase of the product, advanced concept evaluation tool had been introduced and by this, various design concepts, including sections, shapes and load paths had been optimized.
• Digital process of Requirements Management Design Verification and Validation was implemented for various product development functions, to keep check on product validation status. This process ensures conformance of vehicle performance targets.
• Tool for design of Mastics and Sealants is developed and deployed for Body Engineering. It’s inbuilt feature of linking vehicle body panels with sealants helps designer to quickly regenerate Mastics & Sealants for iterative design modifications. Application standardizes design methodology across vehicle platforms and provides more accurate weight and cost management of sealants at vehicle level.
• High Performance Computing (HPC) solution throughput of CAE simulation using General Purpose Graphics Processing Unit (GPGPU) computation technology has resulted in significant improvement for non-linear implicit simulations.
• Smart review tools were deployed delivering insights into engineering changes of vehicle data at each design release milestones, enabling project teams to review changes. In this, integrated approach of 3D Visualization, issue management and change comparison was helpful in accurate design reviews, identifying critical areas to focus and facilitated accurate decision making.
• 20 business processes were digitized by converting either paper based or email based processes into standardized online applications using homegrown pFirst platform.
• Implementation of MOST time analysis based tool at all locations for MOP (Measure of Performance) improvement by identifying VA (Value Added), ENVA (Essential Non-value Added), NVA (Non-value Added) activities and Lean Analytics.
• For all new vehicle programs, simulation and validation of critical manufacturing processes were carried out for detection of a potential problem in the early stage.
• Quality Application tools for mobility devices for monitoring real time part Design and Commercial
information of BOTS & CHAT software engines. (Productivity Improvement)
Subsidiaries
Jaguar Land Rover (JLR):
JLR continue to develop the use of the latest Product Lifecycle Management (PLM) technologies to ensure JLR remains at the cutting edge of engineering and drive efficiencies into the process. The application of leading visualisation and systems engineering technologies enable full engagement in the product creation process, all with the aim of producing cars and SUVs that the customers will love for life.
Tata Daewoo Commercial Vehicles (TDCV):
TDCV continued the focus on quality and agility in its digital product creation processes. PLM software system was upgraded to a higher version giving enhanced features. The PLM processes were also improved, considering various business requirements and scenarios.
Tata Technologies Limited (TTL):
Tata Technologies Limited (TTL) has invested in state-of-the-art software and hardware technologies in alignment with business goals and customer needs, with the prime focus on delivering world class business solutions to the stakeholders. These investments have stemmed from the pressing need of the hour to keep the organization abreast with the latest technologies by enhancing and upgrading the digital eco-system.
TTL continued to augment and enhance the Virtual Desktop Infrastructure setup for engineering users to improve network and information security. It has also deployed Unified Communication Technology as part of enhanced collaboration platform. The deployment of Hyper Converged Infrastructure has resulted in better performance and high availability computing for enterprise applications hosted on hybrid cloud. As part of O2C (Opportunity to Cash) – a transformational program to standardize, streamline and improve the core processes and systems, TTL has invested on Salesforce for Sales Excellence, IPMS for Delivery Excellence and SAP Concur to refine travel and expense management. Upgrade to SAP HANA has resulted in better performance of SAP platform.
TTL has defined an Information Security roadmap to address latest threats and risks. Deployment of NexGen antivirus, virtual patching for servers, certifying a delivery centre for ISO 27001:2013 and monthly governance for critical accounts are some of the initiatives taken up last year. The end goal was to have an integrated security enterprise architecture which can cut down on complexity and, of course, increase security effectiveness.
Tata Motors European Technical Centre (TMETC):
TMETC continued the use of best in class hardware and software systems to enhance quality and agility in its product conceptualization, design and virtual validation domain.

76
TECHNOLOGY AND ENVIRONMENT FRIENDLY INITIATIVESThe Company continued to develop alternate technologies for sustainable mobility. The fleet of diesel series hybrid buses for Mumbai were delivered for operation. Six fuel cell buses were built, tested and one bus building was processed for demonstration and four fuel cell buses were under testing. Electric buses were tested under several prototypes of 9m and 12m developed by the Company, which would be ideal for passenger to commute in ecologically sensitive areas and urban centre. In addition, a fleet of small commercial electric vehicles were being built for last-mile passenger transport. The Company was working on several electrification, hybridization and alternate fuel technologies, which would be launched once the market is ready for them, in addition to developing technologies that improve the footprint of conventional powertrains. Some of the key initiatives in this direction are mentioned below :
• Development of LNG engines for city buses and medium duty trucks.
• Development of engine as well as engine calibrations for various bio-fuel blends.
• Development of semi-synthetic engine oil, which has increased oil drain intervals and improved fuel economy by 1-3%.
• Reduction of real drive emissions and CO2 emission by incorporating 48 V Boost Recuperation System (BRS) in LCVs.
CONSOLIDATED FINANCIAL STATEMENTS The Company announces its consolidated financial statement on a quarterly basis. As required under the SEBI Listing Regulations, consolidated financial statements of the Company and its subsidiaries, prepared in accordance with IndAS 110 issued by the Institute of Chartered Accountants of India, form part of the Annual Report and are reflected in the consolidated financial statements of the Company. Pursuant to Section 129(3) of the Act, a statement containing the salient features of the financial statements of the subsidiary companies is attached to the Financial Statements in Form AOC-1. Pursuant to the provisions of Section 136 of the Act, the Company will make available the said financial statements of the subsidiary companies upon the request by any member of the Company or its subsidiary companies. These financial statements of the Company and the subsidiary companies will also be kept open for inspection by any member at the Registered Office of the Company and could be available on the website of the Company.
SUBSIDIARY, JOINT ARRANGEMENTS AND ASSOCIATE COMPANIES The Company has 96 subsidiaries (14 direct and 82 indirect) as at March 31, 2018, as disclosed in the accounts.
The Scheme of Amalgamation between one of the direct subsidiaries viz TML Drivelines Limited with the Company was approved by the Hon’ble National Company Law Tribunal and a certified true copy was received on April 26, 2018 and the
said scheme was operative from April 30, 2018. The financial statements of this subsidiary was merged with the standalone financial statements of the Company from the Appointed Date with effect from April 1, 2017.
During Fiscal 2018, the following changes have taken place in subsidiary / associates / joint venture companies:
Subsidiary companies formed/acquired:
• Jaguar Land Rover Ireland (Services) Limited was incorporated with effect from July 28, 2017.
• Jaguar Land Rover Taiwan Company Limited was incorporated with effect from November 17, 2017.
• Servicios GDV Mexico S.A. de C.V. was incorporated on October 2, 2017.
• GDV Imports Mexico SAPI de C.V. was acquired on October 2, 2017.
• Tata Technologies Europe Limited incorporated 100% stake in Escenda Engineering AB with effect from May 1, 2017.
Companies ceasing to be subsidiary companies / ceased operations:
• Cambric UK Limited dissolved with effect from May 23, 2017.
• Midwest Managed Services Inc. merged into Tata Technologies Inc with effect from February 28, 2018.
• TML Drivelines Limited merged with the Company and the Scheme of Merger and Arrangement was operative from April 30, 2018.
Name changes
• Tata Motors Finance Limited was renamed TMF Holdings Limited with effect from June 17, 2017.
• Sheba Properties Limited was renamed Tata Motors Finance Limited with effect from June 30, 2017.
• Servicios GDV Mexico S.A. de C.V. was renamed Jaguar Land Rover Servicios México, S.A. de C.V. with effect from December 11, 2017.
• GDV Imports Mexico SAPI de C.V. was renamed Jaguar Land Rover México, S.A.P.I. de C.V. with effect from December 11, 2017.
• Cambric Manufacturing Technologies (Shanghai) Co. Limited was renamed Tata Manufacturing Technologies (Shanghai) Co. Limited with effect from April 1, 2017.
Re-structuring
Shareholding in Tata Motors (Thailand) Limited increased from 95.28% to 95.49% with effect from June 6, 2017. Shareholding in Spark44 (JV) Limited increased from 50% to 50.50% with effect from August 31, 2017, making it and its 14 downstream companies indirect subsidiaries of the Company. Besides the above, JLR continued to integrate / restructure legal entities for manufacturing and for exporting globally as combined brand legal entities. Other than the above, there has been no material change in the nature of the business of the subsidiary companies.

7773rd Annual Report 2017-18
INTEGRATED REPORT 1-65 STATUTORY REPORTS 66-184 FINANCIAL STATEMENTS 185-353
Associate Companies
As at March 31, 2018, the Company has 9 associate companies, 4 joint ventures and 2 joint operations.
The Company has adopted a Policy for determining Material Subsidiaries in line with Regulation 16 of the SEBI Listing Regulations. The Policy, as approved by the Board, is uploaded on the Company’s website (URL: http://investors.tatamotors.com/pdf/material.pdf).
CONSERVATION OF ENERGY, TECHNOLOGY ABSORPTION & FOREIGN EXCHANGE EARNING AND OUTGOING The information on conservation of energy, technology absorption and foreign exchange earnings and outgo stipulated under Section 134(3)(m) of the Act, read along with Rule 8 of the Companies (Accounts) Rules, 2014, is annexed as Annexure - 2.
DIRECTORS Appointment / Re-appointment
The Company has on the recommendation of NRC and in accordance with provisions of the Act and SEBI Listing Regulations, appointed Ms Hanne Sorensen (DIN: 08035439) as Additional and Independent Director on the Board for a tenure of 5 years with effect from January 03, 2018, subject to approval of Members at the Annual General Meeting (AGM). She shall hold office as Additional Director upto the date of the forthcoming AGM and is eligible for appointment as a Director.
As reported in the previous year, Mr Om Prakash Bhatt (DIN: 00548091) was appointed as Additional and Independent Director on the Board for a tenure of 5 years with effect from May 9, 2017, pursuant to Section 161 of the Act, read along with Rules framed thereunder, the Members had vide Ordinary Resolution approved at the AGM held on August 22, 2017, the appointment of Mr Bhatt as an Independent Director.
In accordance with provisions of the Act and the Articles of Association of the Company, Mr Guenter Butschek, Chief Executive Officer and Managing Director (DIN: 07427375) is liable to retire by rotation and is eligible for re-appointment.
The disclosures required pursuant to Regulation 36 of the SEBI Listing Regulations, Clause 1.2.5 of the Secretarial Standard are given in the Notice of AGM, forming part of the Annual Report and Schedule V of the SEBI Listing Regulations are given in the Corporate Governance Report, forming part of the Annual Report. Attention of the Members is also invited to the relevant items in the Notice of the AGM.
Cessation
Mr Ravindra Pisharody (DIN: 01875848) vide letter dated June 5, 2017, tendered his resignation as Executive Director (Commercial Vehicles) of the Company, but continued to serve his term of office for another 6 months in lieu of his contractual severance notice period, ensuring seamless transition in the business operations of the Company. Mr Pisharody concluded his contractual severance notice period on September 30, 2017.
Dr Raghunath Mashelkar, Independent Director (DIN: 00074119), on attaining the age of 75 years retired on December 31, 2017, in accordance with Governance Guidelines on Board Effectiveness.
The Board of Directors places on record their appreciation for contributions made by Mr Pisharody and Dr Mashelkar during their tenure.
Independent Directors
All Independent Directors of the Company have given declarations under Section 149(7) of the Act, that they meet the criteria of independence as laid down under Section 149(6) of the Act and Regulation 16 of the SEBI Listing Regulations.
Key Managerial Personnel
The Key Managerial Personnel (KMPs) of the Company during Fiscal 2018 are:
• Mr Guenter Butschek, Chief Executive Officer and Managing Director
• Mr Satish Borwankar, Executive Director and Chief Operating Officer
• Mr Pathamadai Balachandran Balaji, Group Chief Financial Officer (with effect from November 14, 2017)
• Mr Hoshang Sethna, Company Secretary
• Mr. Ravindra Pisharody, Executive Director – Commercial Vehicles (upto September 30, 2017)
• Mr C Ramakrishnan, Group Chief Financial Officer (upto September 30, 2017)
During the year, Mr C Ramakrishnan concluded his tenure as a Group Chief Financial Officer and KMP with effect from September 30, 2017 and the Board of Directors, pursuant to the said cessation, approved appointment of Mr P.B. Balaji as Group Chief Financial Officer and KMP of the Company with effect from November 14, 2017.
CORPORATE GOVERNANCEAt the Company, we ensure that we evolve and follow the corporate governance guidelines and best practices sincerely, to boost long-term shareholder value and to respect minority rights. The Company considers it an inherent responsibility to disclose timely and accurate information regarding its operations and performance, as well as the leadership and governance of the Company.
A separate section on Corporate Governance and the certificate from the Practicing Company Secretary confirming compliance of Corporate Governance norms as stipulated in Regulation 34 read along with Schedule V of the SEBI Listing Regulations, giving information pertaining to the Board, number of Board meetings held, Committee of the Board and other details of relevance forms part of this Report.
Governance Guidelines
During the year under review, the Company adhered to the Governance Guidelines on Board Effectiveness. The Governance

78
Guidelines cover aspects related to composition and role of the Board, Chairman and Directors, Board diversity, definition of independence, Director term, retirement age and Committees of the Board. It also covers aspects relating to nomination, appointment, induction and development of Directors, Director Remuneration, Subsidiary oversight, Code of Conduct, Board Effectiveness Review and Mandates of Board Committees.
Selection and procedure for nomination and appointment of Directors
The NRC is responsible for developing competency requirements for the Board based on the industry and strategy of the Company. The Board composition analysis reflects in-depth understanding of the Company, including its strategies, environment, operations, financial condition and compliance requirements.
The NRC conducts a gap analysis to refresh the Board on a periodic basis, including each time a Director’s appointment or re-appointment is required. The Committee is also responsible for reviewing and vetting the CVs of potential candidates vis-à-vis the required competencies, undertake a reference and due diligence and meeting potential candidates, prior to making recommendations of their nomination to the Board. At the time of appointment, specific requirements for the position, including expert knowledge expected, is communicated to the appointee.
Criteria for Determining Qualifications, Positive Attributes and Independence of a Director
The NRC has formulated the criteria for determining qualifications, positive attributes and independence of directors in terms of provisions of Section 178 (3) of the Act and Regulation 19 read along with Schedule II of SEBI Listing Regulations, which is annexed as Annexure - 3.
REMUNERATION POLICYThe Company has in place a Remuneration Policy for the Directors, Key Managerial Personnel and other employees, pursuant to the provisions of the Act and Regulation 19 of SEBI Listing Regulations, the same is annexed as Annexure - 4.
BOARD EVALUATIONThe annual evaluation process of the Board of Directors (“Board”), Committees and individual Directors was carried out in the manner prescribed in the provisions of the Act, Guidance Note on Board Evaluation issued by Securities and Exchange Board of India on January 5, 2017 and as per the Corporate Governance requirements prescribed by SEBI Listing Regulations.
The performance of the Board, Committees and individual Directors was evaluated by the Board seeking inputs from all the Directors. The performance of the Committees was evaluated by the Board seeking inputs from the Committee Members. The NRC reviewed the performance of the individual Directors, a separate meeting of Independent Directors was also held to review the performance of Non-Independent Directors; performance of the Board as a whole and performance of the Chairperson of the Company, taking into account the views of Managing Director / Executive Directors and Non-Executive Directors. This was followed by a Board meeting that discussed
the performance of the Board, its Committees and individual Directors.
The criteria for performance evaluation of the Board included aspects like Board composition and structure; effectiveness of Board processes, information and functioning, etc. The criteria for performance evaluation of Committees of the Board included aspects like composition and structure of the Committees, functioning of Committee meetings, contribution to decision of the Board, etc. The criteria for performance evaluation of the individual Directors included aspects on contribution to the Board and Committee meetings like preparedness on the issues to be discussed, meaningful and constructive contribution and inputs in meetings, integrity etc. In addition, the Chairman was also evaluated on the key aspects of his role.
Significant findings of the Fiscal 2018 Board effectiveness evaluation included providing regular updates to the Board on projects undertaken to support cost and productivity improvements along with a monthly information report thereon, inclusion of educative topics in the agenda on technology, governance, regulations which could impact business and continuing efforts to balance the Board agenda with focus on budgets, strategic issues. Critical suggestions to improve the Company’s business included, augmenting the succession pipeline, harmonizing interactions and integrating synergies that could be derived between the Company and JLR Group. The Board also monitors action taken on the findings and suggestions made in the process of the Board evaluation.
Familiarisation programme for Independent Directors
The details of the Familiarisation Programme for Independent Directors with the Company in respect of their roles, rights, responsibilities in the Company, nature of the industry in which Company operates, business model of the Company and related matters are put up on the website of the Company at (URL: http://investors.tatamotors.com/pdf/familiarisation-programme-independent-directors.pdf).
VIGIL MECHANISM The Company has adopted a Whistle Blower Policy establishing vigil mechanism, to provide a formal mechanism to the Directors and employees to report their concerns about unethical behaviour, actual or suspected fraud or violation of the Company’s Code of Conduct or ethics policy. The Policy provides for adequate safeguards against victimization of employees who avail of the mechanism and also provides for direct access to the Chairman of the Audit Committee. It is affirmed that no personnel of the Company has been denied access to the Audit Committee. The policy of vigil mechanism is available on the Company’s website at (URL: http://investors.tatamotors.com/pdf/whistle-blower-policy.pdf).
PARTICULARS OF EMPLOYEES Disclosure pertaining to remuneration and other details as required under Section 197(12) of the Act read with rule 5(1) of the Companies (Appointment and Remuneration of Managerial Personnel) Rules, 2014 is annexed to the Report as Annexure - 5.
The statement containing particulars of top 10 employees and the employees drawing remuneration in excess of limits prescribed under Section 197 (12) of the Act read with Rule 5(2)

7973rd Annual Report 2017-18
INTEGRATED REPORT 1-65 STATUTORY REPORTS 66-184 FINANCIAL STATEMENTS 185-353
and (3) of the Companies (Appointment and Remuneration of Managerial Personnel) Rules, 2014 is provided in the Annexure forming part of the Report. In terms of proviso to Section 136(1) of the Act, the Report and Accounts are being sent to the shareholders excluding the aforesaid Annexure. The said statement is also open for inspection at the Registered Office of the Company. Any member interested in obtaining a copy of the same may write to the Company Secretary.
CORPORATE SOCIAL RESPONSIBILITY The brief outline of the Corporate Social Responsibility (CSR) Policy of the Company and the initiatives undertaken by the Company on CSR activities during the year are set out in Annexure - 6 of this Report in the format prescribed in the Companies (CSR Policy) Rules, 2014. The Policy is available on Company’s website at (URL: http://investors.tatamotors.com/pdf/csr-policy.pdf).
PARTICULARS OF CONTRACTS OR ARRANGEMENTS WITH RELATED PARTIESAll contracts/ arrangements/ transactions entered by the Company during the year with related parties were on an arm’s length basis, in the ordinary course of business and were in compliance with the applicable provisions of the Act and SEBI Listing Regulations. The prior approval of the Audit Committee was sought for all related party transactions. The Company has adopted a policy on Related Party Transactions which even provides for the parameters to grant omnibus approval(s) by the Audit Committee and is available on the website at (URL: http://investors.tatamotors.com/pdf/rpt-policy.pdf).
A statement on related party transactions specifying the details of the transactions, pursuant to each omnibus approval granted, have been placed on a quarterly basis for review by the Audit Committee.
During the Fiscal 2018, there were no related party transactions of the Company with its Directors and Key Managerial Personnel or their relatives, its holding, subsidiary or associate companies as prescribed under Section 188 of the Act and SEBI Listing Regulations and therefore, the Company is not required to report in the prescribed Form AOC-2 and does not form part of the Report.
PARTICULARS OF LOANS, GUARANTEES OR INVESTMENTS The details of Loans, Guarantees or Investments made during Fiscal 2018 are given below:
(` in crores)Name of Companies Nature of
TransactionsLoans Investment
TMF Holdings Limited Investment in shares
- 300.00
Tata Steel Limited Investment in shares
- 41.63
JT Special Vehicle Private Limited
Investment in shares
- 2.50
Note:
During Fiscal 2018, the Company has not given guarantee to any of its subsidiaries, joint ventures and associates companies.
AUDIT Statutory Audit
In the 72nd Annual General Meeting (AGM) held on August 22, 2017 M/s B S R & Co. LLP, Chartered Accountants (B S R LLP) (ICAI Firm No. 101248W/W–100022) was appointed as Statutory Auditors of the Company for a tenure of 5 years subject to ratification of their appointment at every subsequent AGM. The Ministry of Corporate Affairs has vide notification dated May 7, 2018 obliterated the requirement of seeking Member’s ratification at every AGM on appointment of Statutory Auditor during their tenure of 5 years. B S R LLP have under Section 139(1) of the Act and the Rules framed thereunder furnished a certificate of their eligibility.
The report of the Statutory Auditor forming part of the Annual Report, does not contain any qualification, reservation, adverse remark or disclaimer. The observations made in the Auditor’s Report are self-explanatory and therefore do not call for any further comments.
Cost Audit
As per Section 148 of the Act, the Company is required to have the audit of its cost records conducted by a Cost Accountant. The Board of Directors of the Company has on the recommendation of the Audit Committee, approved the appointment of M/s Mani & Co., a firm of Cost Accountants in Practice (Registration No.000004) as the Cost Auditors of the Company to conduct cost audits pertaining to relevant products prescribed under the Companies (Cost Records and Audit) Rules, 2014 for the year ending March 31, 2019. The Board of Director on recommendation of the Audit Committee approved remuneration of 5 lakhs plus applicable taxes and out of pocket expenses, subject to ratification of their remuneration by the Members at the forthcoming AGM.
M/s Mani & Co. have, under Section 139(1) of the Act and the Rules framed thereunder furnished a certificate of their eligibility and consent for appointment.
M/s Mani & Co., have vast experience in the field of cost audit and have conducted the audit of the cost records of the Company for the past several years.
Secretarial Audit
Pursuant to the provisions of Section 204 of the Act and the Companies (Appointment and Remuneration of Managerial Personnel) Rules, 2014, the Board of Director appointed M/s Parikh & Associates, a firm of Company Secretaries in Practice to conduct the Secretarial Audit of the Company for year ended March 31, 2018. The Report of the Secretarial Audit is annexed herewith as Annexure- 7.
The Secretarial Audit Report does not contain any qualification, reservations, adverse remarks and disclaimer.
The Securities and Exchange Board of India (SEBI) have vide Order dated March 6, 2018 issued directions for the Company to conduct an internal inquiry within 3 months into the leakage of information relating to its financial results for the quarter ended December 2015, take appropriate actions against those responsible and to submit its report witin 7 days thereafter. The Company has appointed an expert to conduct an independent investigation to submit its report to the Audit Committee of the Company which will be submitted to

80
SEBI in a timely manner.
The Company has paid a penalty of `5.60 lakhs each levied by the BSE Limited and the National Stock Exchange of India Limited in respect of delay in filing of listing application for 266 Ordinary Share and 80 ‘A’ Ordinary Shares allotted out of shares held in abeyance on settlement of an inter-se dispute amongst the shareholders. This penalty has been paid ‘under protest’ subsequent to various representation made by the Company.
SECRETARIAL STANDARDS The Institute of Company Secretaries of India had revised the Secretarial Standards on Meetings of the Board of Directors (SS-1) and Secretarial Standards on General Meetings (SS-2) with effect from October 1, 2017. The Company has devised proper systems to ensure compliance with its provisions and is in compliance with the same.
DIVIDEND DISTRIBUTION POLICYPursuant to SEBI’s notification dated July 8, 2016, the Board of Directors of the Company have formulated a Dividend Distribution Policy (“the policy”). The detailed policy is annexed to this Report as Annexure-8 and is also available on our website (URL: http://investors.tatamotors.com/pdf/dividend-distribution-policy.pdf )
DIRECTORS’ RESPONSIBILITY STATEMENTBased on the framework of internal financial controls and compliance systems established and maintained by the Company, work performed by the internal, statutory, cost, external agencies and secretarial auditors, including audit of internal financial controls over financial reporting by the statutory auditors and the reviews performed by Management and the relevant Board Committees, including the Audit Committee, the Board is of the opinion that the Company’s internal financial controls were adequate and effective during Fiscal 2018.
Accordingly, pursuant to sub-section 3(c) ans 5 Section 134 of the Act, the Board of Directors, to the best of their knowledge and ability, confirm:
(a) that in the preparation of the annual accounts, the applicable accounting standards have been followed and that there are no material departures;
(b) that we have selected such accounting policies and have applied them consistently and made judgments and estimates that are reasonable and prudent, so as to give a true and fair view of the state of affairs of the Company at the end of the financial year and of the loss of the Company for that period;
( c ) that proper and sufficient care for the maintenance of adequate accounting records in accordance with the provisions of the Act, for safeguarding the assets of the Company and for preventing and detecting fraud and other irregularities;
(d) that the annual accounts have been prepared on a going concern basis;
(e) that proper internal financial controls were laid down and that such internal financial controls are adequate and were operating effectively*; and
(f) that proper systems to ensure compliance with the provisions of all applicable laws and such systems are adequate and operating effectively.
*please refer to the Section “Internal Control Systems and their Adequacy in the Management Discussion and Analysis”.
ACKNOWLEDGEMENTSThe Directors wish to convey their appreciation to all of the Company’s employees for their enormous personal efforts as well as their collective contribution to the Company’s performance. The Directors would also like to thank the employee unions, shareholders, customers, dealers, suppliers, bankers, Government and all other business associates for their continuous support to the Company and their confidence in its management.
On behalf of the Board of Directors
N CHANDRASEKARANChairman
(DIN: 00121863)Mumbai, May 23, 2018

8173rd Annual Report 2017-18
INTEGRATED REPORT 1-65 STATUTORY REPORTS 66-184 FINANCIAL STATEMENTS 185-353
ANNEXURE – 1Form No. MGT – 9
Extract of Annual Returnas on the financial year ended on 31st March, 2018
[Pursuant to Section 92(3) of the Companies Act, 2013 and rule 12(1) of the Companies (Management and Administration) Rules, 2014]
I. REGISTRATION AND OTHER DETAILS:
i) CIN:- L28920MH1945PLC004520 vii) Name, Address and contract details of Registrar and Transfer Agent, if any:-
TSR Darashaw Limited 6-10 Haji Moosa Patrawala Industrial Estate, Near Famous Studio, 20, E Moses Road, Mahalaxmi (W), Mumbai 400 001 Tel: 022-6656 8484; Fax: 022-66568494 Email: [email protected];
Website: www.tsrdarashaw.com For Rights Issue 2015: Link InTime India Private Limited No.C-13, Pannalal Silk Mill Compound, Lal Bahadur Sharstri Road, Bhanpud (W), Mumbai 400 078 Email: [email protected];
Website: www.linkintime.com
ii) Registration Date:- 1st September, 1945
iii) Name of the Company:- Tata Motors Limited
iv) Category / Sub-Category of the Company: Public Company / Limited by shares
v) Address of the Registered office and contact details:- Address: Bombay House, 24 Homi Mody Street, Mumbai 400 001 Tel: 022-6665 8282 Fax: 022-6665 7799 Email: [email protected] Website: www.tatamotors.com
vi) Whether listed company:- Yes
II. PRINCIPAL BUSINESS ACTIVITIES OF THE COMPANY:
All the business activities contributing 10% or more of the total turnover of the company shall be stated:-
Sr. No
Name and Description of main product/services NIC Code of the Product / service
% to total turnover of the company
1 Manufacturing of Motor Vehicles 2910 92.09%
III. PARTICULARS OF HOLDING SUBSIDIARIES AND ASSOCIATE CO (INCLUDING JOINT VENTURE)
Sl. No.
Name of Subsidiary CIN of subsidiary company Percentage of shares held by holding
company
Subsidiary / Associate /
Joint Venture
Section Address
1 Concorde Motors (India) Limited U24110MH1972PLC015561 100 Subsidiary 2(87) 3rd Floor, Nanavati Mahalaya, 18 Homi Mody Street, Hutatma Chowk, Mumbai 400 001
2 TAL Manufacturing Solutions Limited U29100PN2000PLC130290 100 Subsidiary 2(87) PDO Building, Tata Motors Campus, Chinchwad, Pune - 411033
3 Tata Motors European Technical Centre PLC 05551225 100 Subsidiary 2(87) 18, Grosvenor Place, London, SW1X7HS
4 Tata Motors Insurance Broking and Advisory Services Limited
U50300MH1997PLC149349 100 Subsidiary 2(87) 3rd Floor, Nanavati Mahalaya, 18 Homi Mody Street, Hutatma Chowk, Mumbai 400 001
5 TML Holdings Pte Ltd 200802595C 100 Subsidiary 2(87) 9 Battery Road, #15-01, Straits Trading Building, Singapore 049910
6 TML Distribution Company Limited U63000MH2008PLC180593 100 Subsidiary 2(87) 3rd Floor, Nanavati Mahalaya, 18 Homi Mody Street, Hutatma Chowk, Mumbai 400 001
7 Tata Hispano Motors Carrocera S.A. A50089119 100 Subsidiary 2(87) Carretera de Castellon, Km.230,5 (poligono Empresarium) Zaragoza, Spain
8 Tata Hispano Motors Carrocerries Maghreb SA
1004723 100 Subsidiary 2(87) Zone Industrial - Berrechid, Rue Al Adrisa, Berrechid -26100, Morocco
9 TMF Holdings Limited (name changed from Tata Motors Finance Limited w.e.f. June 17, 2017)
U65923MH2006PLC162503 100 Subsidiary 2(87) 10th floor, 106 A and B, Maker Chambers III, Nariman Point, Mumbai 400 021
10 TML Drivelines Limited (Mergered with the Company w.e.f. April 30, 2018)
U34100MH2000PLC124874 100 Subsidiary 2(87) C/o Tata Motors Limited, 3rd Floor, Nanavati Mahalaya, 18 Homi Mody Street, Hutatma Chowk, Mumbai – 400001
11 Trilix S.r.l 1044707 80 Subsidiary 2(87) Via Teano 3, 10042 Nichelino, Torino, Italy

82
Sl. No.
Name of Subsidiary CIN of subsidiary company Percentage of shares held by holding
company
Subsidiary / Associate /
Joint Venture
Section Address
12 Tata Precision Industries Pte Ltd 197100574C 78.39 Subsidiary 2(87) 1 Robinson Road, #19-01, AIA Towers, Singapore 048 542
13 Tata Technologies Limited U72200PN1994PLC013313 72.29 Subsidiary 2(87) Plot No. 25, Pune Infotechpark, MIDC Taluka - Mulshi Hinjawadi, Pune - 27
14 Tata Marcopolo Motors Limited U34101MH2006PLC164771 51 Subsidiary 2(87) Bombay House, 24, Homi Mody street, Mumbai-400001
15 Tata Daewoo Commercial Vehicle Company Limited
401-81-22865 100 Subsidiary 2(87) 172 Dongjangsan-ro, Gunsan-si, Joellabuk-do, 54006, Korea
16 Tata Motors (Thailand) Ltd 0105550023406 95.28 Subsidiary 2(87) 199 Column Tower 20th Floor, Ratchadapisek Road, Klongtoey, Bangkok 10110 Thailand
17 Tata Motors (SA)(Proprietary) Ltd 2007/034689/07 60 Subsidiary 2(87) 39 Ferguson Road, Illova 2196
18 PT Tata Motors Indonesia Tax Reg no. 03.188.148.5-013.000 100 Subsidiary 2(87) Pondok Indah Office Tower 3 Suite 801-A, Jl Sultan Iskandar Muda Kav V-TA Pondok Pinang Kebayoran Lama, Jakarta 12130 the Republic of Indonesia
19 Jaguar Land Rover Automotive Plc 6477691 100 Subsidiary 2(87) Abbey Road, Whitley, Coventry, CV3 4LF - England UK
20 TMNL Motor Services Nigeria Limited 1284940 100 Subsidiary 2(87) C/o Tata Africa Services (Nigeria) Limited, Plot C89, Amuwo Odofin Industrial Layout, Lagos, Nigeria
21 Tata Technologies Pte Limited 198100504W 72.29 Subsidiary 2(87) 8 Shenton Way, #19-05 AXA Tower, Singapore 068811
22 Tata Motors Finance Solutions Limited U65910MH1992PLC187184 100 Subsidiary 2(87) C/o Tata Motors Finance Ltd., 10th floor, 106 A & B, Maker Chambers III, Nariman Point, Mumbai 400 021
23 Tata Motors Finance Limited (name changed from Sheba Properties Limited w.e.f June 30, 2017)
U45200MH1989PLC050444 100 Subsidiary 2(87) C/o Tata Motors Finance Limited, 10th F 106 A & B, Makers Chambers III, Nariman Point Mumbai 400 021
24 Tata Daewoo Commercial Vehicle Sales and Distribution Company Limited
104-86-27436 100 Subsidiary 2(87) 4th floor, 272 Yeongdeung-ro, Yeongdeungpo-gu, Seoul 150 033, Korea
25 PT Tata Motors Distribusi Indonesia Tax Reg no. 03.286.323.5-013.000 100 Subsidiary 2(87) Pondok Indah Office Tower 3, Floor 8, Suite 801-B, Jl. Sultan Iskandar Muda Kav. V-TA, Pondok Pinang, Kebayoran Lama, Jakarta Selatan 12310, the Republic of Indonesia
26 Jaguar Land Rover Holdings Limited 4019301 100 Subsidiary 2(87) Abbey Road, Whitley, Coventry, CV3 4LF, England, UK
27 Tata Technologies (Thailand) Limited 10554812171 72.29 Subsidiary 2(87) 889 Thai CC Tower, Room 108-9, 10th Floor, South Sathorn Road, Kwhaeng Yannawa, Khet Sathorn, Bangkok Metropolis 10120
28 Tata Manufacturing Technologies (Shanghai) Co. Ltd
310000400732137 72.29 Subsidiary 2(87) 11F,Aurora plaza,99 Fucheng Rd,Room 1131, Shangai 200120, China
29 INCAT International Plc 02377350 72.29 Subsidiary 2(87) 2 Temple Back East, Temple Quay, Bristol BS1 6EG
30 Jaguar Land Rover Limited 1672070 100 Subsidiary 2(87) Abbey Road, Whitley, Coventry, CV3 4LF - England UK
31 Jaguar Land Rover (China) Investment Company Limited
310115400245293 100 Subsidiary 2(87) Room 713, 7F No. 6 Jirong Road (Area C1, Plot 001), Shanghai, China Free Trade Zone
32 Limited Liability Company “Jaguar Land Rover” (Russia)
1085047006549 100 Subsidiary 2(87) 28B, Building 2, Mezhdunarodnoe Shosse 141411, Moscow, Russian Federation
33 INCAT GmbH HRB 18622 72.29 Subsidiary 2(87) Breitwiesenstrasse 19, 70565 Stuttgart, Germany
34 Tata Technologies Europe Limited 02016440 72.29 Subsidiary 2(87) 2 Temple Back East, Temple Quay, Bristol BS1 6EG
35 JLR Nominee Company Limited 1672065 100 Subsidiary 2(87) Abbey Road, Whitley, Coventry, CV3 4LF - England UK
36 Jaguar Cars South Africa (Pty) Limited 2000/026853/07 100 Subsidiary 2(87) Simon Vermooten Road, Silverton, Pretoria 0184, South Africa
37 The Jaguar Collection Limited 2018432 100 Subsidiary 2(87) Abbey Road, Whitley, Coventry, CV3 4LF - England UK
38 Jaguar Cars Limited 1672067 100 Subsidiary 2(87) Abbey Road, Whitley, Coventry, CV3 4LF - England UK
39 Land Rover Exports Limited 1596703 100 Subsidiary 2(87) Abbey Road, Whitley, Coventry, CV3 4LF - England UK
40 Land Rover Ireland Limited 318198 100 Subsidiary 2(87) C/o LK Shields Solicitors, 39/40 Upper Mount Street Dublin 2, Ireland
41 The Diamler Motor Company Limited 112569 100 Subsidiary 2(87) Abbey Road, Whitley, Coventry, CV3 4LF - England UK
42 Diamler Transport Vehicles Limited 322903 100 Subsidiary 2(87) Abbey Road, Whitley, Coventry, CV3 4LF - England UK
43 S.S Cars Limited 333482 100 Subsidiary 2(87) Abbey Road, Whitley, Coventry, CV3 4LF - England UK
44 The Lanchester Motor Company Limited 551579 100 Subsidiary 2(87) Abbey Road, Whitley, Coventry, CV3 4LF - England UK
45 Jaguar Land Rover Pension Trustees Limited 4102133 100 Subsidiary 2(87) Abbey Road, Whitley, Coventry, CV3 4LF - England UK
46 Spark 44 (JV) Limited 07535151 50.5 Subsidiary 2(87) Abbey Road, Whitley, Coventry, CV3 4LF - England UK
47 Jaguar Land Rover Austria GmbH FN84604v 100 Subsidiary 2(87) Fuerbergstrasse 51, Salzburg, A5020, Austria

8373rd Annual Report 2017-18
INTEGRATED REPORT 1-65 STATUTORY REPORTS 66-184 FINANCIAL STATEMENTS 185-353
Sl. No.
Name of Subsidiary CIN of subsidiary company Percentage of shares held by holding
company
Subsidiary / Associate /
Joint Venture
Section Address
48 Jaguar Land Rover Japan Limited 0104-01-075166 100 Subsidiary 2(87) 3-13 Toranomon 4-chome, Minato-ku, Tokyo, Japan45
49 Jaguar Land Rover Deutschland GmbH HRB2408 100 Subsidiary 2(87) Am Kronberger Hang 2a, 65824 Schwalbach/Ts, Germany
50 Jaguar Land Rover North America LLC 2075961 100 Subsidiary 2(87) 555 MacArthur Blvd., Mahwah, New Jersey 07430, USA
51 Jaguar Land Rover Nederland BV 23074977 100 Subsidiary 2(87) PO Box 40, 4153 ZG Bessd Stationsweg 8, Netherlands
52 Jaguar Land Rover Portugal - Veiculose Pecas, Lda
504998803 100 Subsidiary 2(87) Edificio Escritorios do Tejo, Rua do Polo Sul, Lote 1.10.1.1 – 3. B-3, Parish of Santa Maria dos Olivais, Municipality of Lisboa, Portugal
53 Jaguar Land Rover Australia Pty Ltd 4352238 100 Subsidiary 2(87) 65 Epping Road, North Ryde, New South Wales, 2113, Australia
54 Jaguar Land Rover Italia SpA 6070621005 100 Subsidiary 2(87) Via Alessandro Marchetti, 105 - 00148, Roma, Italy
55 Jaguar Land Rover Korea Company Limited 110111-3977373 100 Subsidiary 2(87) 25F West Mirae Asset Center 1, Building, 67 Suha-dong, Jung-gu, Seoul 100-210, Korea
56 Jaguar Land Rover Canada ULC 2013828088 100 Subsidiary 2(87) 75 Courtneypark Drive West, Unit 3, Mississauga, ON L5W 0E3, Canada
57 Jaguar Land Rover France, SAS 509016804 100 Subsidiary 2(87) 34 Rue de la Croix de Fer 78105 Saint Germain en Laye Cedex, France
58 Jaguar Land Rover India Limited U34200MH2012FLC237194 100 Subsidiary 2(87) Nanavati Mahalaya, 18 Homi Mody Street, Hutatma Chowk, Mumbai 400 001
59 Jaguar e Land Rover Brasil Industria e Comercio de Veiculos LTDA
35.222.373.953 100 Subsidiary 2(87) Avenida Ibirapuera 2.332, Torre I -10º andar- Moema 04028-002, São Paulo-SP-Brazil
60 Jaguar Land Rover (South Africa) Holdings Limited
7760130 100 Subsidiary 2(87) Abbey Road, Whitley, Coventry, CV3 4LF - England UK
61 Jaguar Land Rover Espana SL B-82526757 100 Subsidiary 2(87) Torre Picasso, Plaza Pablo Ruiz Picasso, 1 – Planta 42, 23020 Madrid, SPAIN
62 Jaguar Land Rover Belux N.V. 0456.612.553 100 Subsidiary 2(87) Generaal Lemanstraat 47, 2018 Antwerpen, Belgium
63 Jaguar Land Rover Slovakia s.r.o 48302392 99.99 Subsidiary 2(87) Vysoka 2B, 811 06, Bratislava, Slovakia
64 Jaguar Land Rover Singapore Pte Ltd 201541482M 100 Subsidiary 2(87) Level 30, Singapore Land Rover, Raffles Place, 048623, Singapore
65 Jaguar Racing Limited 9983877 100 Subsidiary 2(87) Abbey Road, Whitley, Coventry, CV3 4LF - England UK
66 InMotion Ventures Limited 10070632 100 Subsidiary 2(87) Abbey Road, Whitley, Coventry, CV3 4LF - England UK
67 Jaguar Land Rover Colombia S.A.S Tax Id no. 901.000.833-7 100 Subsidiary 2(87) CL 677735 OFE 1204 BOGOTAN CUDNDINAMARKA 13192900
68 Jaguar Land Rover Ireland (Services) Limited 608696 100 Subsidiary 2(87) C/o LK Sheilds Solicitors 39/40 Upper Mount Street Dublin 2 Ireland
69 Jaguar Land Rover Taiwan Company Limited 55768890 100 Subsidiary 2(87) 12F, No. 40, Sec.1, Chengde Road, Datong Dist., Taipei City 103, Taiwan (R.O.C)
70 Jaguar Land Rover Servicios Mexcio S.A. de C.V.
SGM101223SU6 100 Subsidiary 2(87) Javier Barros, Sierra, 540 Piso 7 703 Santa Fe Alvaro Obregon Distrito Federal 01210
71 Jaguar Land Rover Mexico S.A.P.I de CV JLR080418T9A 100 Subsidiary 2(87) Javier Barros, Sierra, 540 Piso 7 703 Santa Fe Alvaro Obregon Distrito Federal 01211
72 Shanghai Jaguar Land Rover Automotive Services Company Limited
310115400006268 100 Subsidiary 2(87) Room E16, Floor 2, 477, Fute West 1st Road, Shanghai Free Trade Zone, PRC
73 Tata Technologies Inc 476-730+C9 72.35 Subsidiary 2(87) 41050, W Eleven Mile Road, Novi, Michigan 48375, USA
74 Escenda Engineering AB 556798-1286 72.29 Subsidiary 2(87) C/o S Wedin, Helenedalsvagen 14, 431 36 Molndal
75 Spark 44 (Pty) Ltd (Sydney, Australia) 56602084346 50.5 Subsidiary 2(87) Level 5, 65 Berry Street, North Sydney , NSW 2060
76 Spark 44 GmbH (Frankfurt, Germany) HRB90999 50.5 Subsidiary 2(87) Querstr. 7, 60322 Frankfurt am Main
77 Spark 44 LLC (LA & NYC, USA) 27-4287883 50.5 Subsidiary 2(87) 5870 W. Jefferson Blvd, Studio H,Los Angeles, CA 90016, USA
78 Spark 44 Limited (Shanghai, China) 91310000088514160B 50.5 Subsidiary 2(87) Units 6401,6402,6501,6502, No.436 Ju Men Road, Huangpu District, Shanghai 200023, China
79 Spark 44 DMCC (Dubai, UAE) DMCC34726 50.5 Subsidiary 2(87) Unit No: 1401 & 1404, Swiss Tower, Plot No: JLT-PH2-Y3A Jumeirah Lakes Towers, Dubai, UAE
80 Spark 44 Demand Creation Partners Private Limited (Mumbai, India)
U74999MH2015FTC269125 50.5 Subsidiary 2(87) Block A, Level 1, Shiv Sagar Estate, Dr. Annie Besent Road, Worli,Mumbai – 400018

84
Sl. No.
Name of Subsidiary CIN of subsidiary company Percentage of shares held by holding
company
Subsidiary / Associate /
Joint Venture
Section Address
81 Spark 44 Limited (London & Birmingham, UK) 7535381 50.5 Subsidiary 2(87) White Collar Factory, 1 Old Street Yard, London, England, EC1Y 8AF
82 Spark 44 Pte Ltd (Singapore) 201523182E 50.5 Subsidiary 2(87) 138 Market Street #36-01/02 CapitaGreen, Singapore 048946
83 Spark 44 Communications SL (Madrid, Spain) ESB8730486 50.5 Subsidiary 2(87) Prim 19, 4th floor, 28004 Madrid
84 Spark 44 S.r.l (Rome, Italy) 11353340018 50.5 Subsidiary 2(87) via Marcella, 4/6- 00153 Rome
85 Spark 44 Seoul Limited (Korea) 110114-0162252 50.5 Subsidiary 2(87) F12, 11 Cheonggyecheon-ro, Jongno-gu, Seoul - 03187, Korea
86 Spark 44 Japan K.K. (Tokyo, Japan) 5011101074299 50.5 Subsidiary 2(87) 2-23-1-806, Akasaka, Minato-ku, Tokyo, 153-0042
87 Spark 44 Canada Inc (Toronto) 2467809 50.5 Subsidiary 2(87) 1059 Spadina Road, Toronto, ON M5N 2M7, Canada
88 Spark 44 Pty. Limtied (South Africa) 2015/300314/07 50.5 Subsidiary 2(87) 21 Forssman Close, Barbeque Downs, Kyalami
89 Tata Technologies de Mexico, S.A. de C.V. New Tax Regn No: TTM-990127-V84-
72.35 Subsidiary 2(87) Blvd. Independencia #1600 Ote., Local C-46 C.P. 27100 Torreon, Coahuila, Mexico
90 Cambric GmbH HRB 14269 72.35 Subsidiary 2(87) Service Kontor, Universitat Geb A1 1, D-66123 Saarbrucken, Stuhlsatzenhausweg 69, Raum 130, 66123 Saarbrücken
91 Cambric Limited 57500 72.32 Subsidiary 2(87) H & J Corporate Services, Ltd., Ocean Centre, Montagu Foreshore, East Bay Street, P.O. Box SS-19084, Nassau, Bahamas
92 Jaguar Land Rover (South Africa) (Pty) Limited
2001/027269/07 100 Subsidiary 2(87) Simon Vermooten Road, Silverton, Pretoria 0184, South Africa
93 InMotion Ventures 1 Limited 10442527 100 Subsidiary 2(87) Abbey Road, Whitley, Coventry, CV3 4LF - England UK
94 InMotion Ventures 2 Limited 10444740 100 Subsidiary 2(87) Abbey Road, Whitley, Coventry, CV3 4LF - England UK
95 InMotion Ventures 3 Limited 10445040 100 Subsidiary 2(87) Abbey Road, Whitley, Coventry, CV3 4LF - England UK
96 Tata Technologies SRL Romania B1766921 72.32 Subsidiary 2(87) Brasov Office: Str Branduselor, No 84 Brasov, 500397, Romania; Craiova Office: Str Iaon Maiorescu, No 10 Etaj 4 cam 405 Craiova, 200760, Romania; Iasi Office: 23, Calea Chisinau Street, First Floor, Tester Building, 700265 Iasi, Romania
97 Automobile Corporation of Goa Limited L35911GA1980PLC000400 47.19 Associate 2(6) Plant I, Honda Sattari, Goa 403530
98 Nita Company Limited NA 40.00 Associate 2(6) 1703, Sky Bhaban, 195, Motljheel C/A, Dhaka - 1000, Bangladesh
99 Tata Hitachi Construction Machinery Company Private Limited
U85110KA1998PTC024588 39.99 Associate 2(6) Jubilee Building, 45, Museum Road, Bangalore, Karnataka - 560025
100 Tata Precision Industries (India) Limited U29120MP1995PLC009773 39.19 Associate 2(6) Industrial Area No. 2, A B Road, Dewas, Madhya Pradesh - 455001
101 Tata AutoComp Systems Limited U34100PN1995PLC158999 26.00 Associate 2(6) TACO House, Plot No- 20/B FPN085, V.G. Damle Path Off Law College Road, Erandwane Pune 411004
102 Jaguar Cars Finance Limited 1731924 49.90 Associate 2(6) Bishopsgate, London EC2M 3UR
103 Cloud Car Inc 5052102 26.30 Associate 2(6) 2771, Centervilla Road, Suite-400, Wilmington, Country of New Castle, Delaware, 19808, USA
104 Synaptiv Limited 10592914 33.33 Associate 2(6) Kirakland Avenue, Ilford, Essex, England, IG50th
105 DriveClubService Pte Ltd 201707581H 25.07 Associate 2(6) 22 Sin Ming Lane, #06-76, Midview City, Singapore 573969
106 Tata Cummins Private Limited U34101JH1993PTC005546 50.00 Joint Operations
2(6) Telco Township, Jamshedpur 831004
107 Fiat India Automobiles Private Limited U28900PN1997PTC130940 50.00 Joint Operations
2(6) Plot No B-19, M. I. D. C. Ranjangaon Industrial Area, Ranjangaon, Taluka Shirur, Pune 412210
108 Chery Jaguar Land Rover Automotive Company Limited
91320581717885280B 50.00 Joint Venture 2(6) No. 1, Lu Hu Road, Changshu Economic and Technical Development Zone, Suzhou City, Jiangsu Provice, China
109 Chery Jaguar Land Rover Auto Sales Company Limited
7535151 50.00 Joint Venure 2(6) 6F, Binjiang International Plaza, No.88, Tonggang Road, Changshu Economic and Technical Development Zone, Suzhou City, Jiangsu Provice, China
110 JT Special Vehicles Private Limited U34102TZ2016PTC027770 50.00 Joint Venture 2(6) Post Box No. 1840, No. 2, Ondipudur Road Singanallur, Coimbatore 641005
111 Tata HAL Technologies Limited U93000KA2008PLC046588 36.16 Joint Venture 2(6) Unit 901-902, A Block, 8th Floor Laurel Building, Bagmane Tech Park, CV Raman Nagar, Bangalore 560093

8573rd Annual Report 2017-18
INTEGRATED REPORT 1-65 STATUTORY REPORTS 66-184 FINANCIAL STATEMENTS 185-353
IV) Shareholding Pattern (Equity Share Capital Breakup as percentage of Total Equity) i) Category-wise Share HoldingCategory of Shareholers No.of Shares held at the beginning of the year .i.e
01.04.2017No.of Shares held at the end of the year .i.e 31.03.2018 % Change
during the yearDemat Physical Total % of Total
SharesDemat Physical Total % of Total
Shares(A) Promoters(a) Individuals / Hindu Undivided Family 0 0 0 0.00 0 0 0 0.00 0.00(b) Central Government / State Governments(s) 0 0 0 0.00 0 0 0 0.00 0.00(c) Bodies Corporate 1,001,370,950 0 1,001,370,950 29.49 1,050,644,727 0 1,050,644,727 30.94 1.45(d) Financial Institutions / Banks 0 0 0 0.00 0 0 0 0.00 0.00(e) Any Other (Trust) 1,774,880 0 1,774,880 0.05 106,720 0 106,720 0.00 -0.05
Sub-Total (A) (1) 1,003,145,830 0 1,003,145,830 29.54 1,050,751,447 0 1,050,751,447 30.94 1.40(2) Foreign 0.00 0.00(a) Individuals (Non-Resident Individuals / Foreign
Individuals)0 0 0 0.00 0 0 0 0.00 0.00
(b) Bodies Corporate 0 0 0 0.00 0 0 0 0.00 0.00(c) Institutions 0 0 0 0.00 0 0 0 0.00 0.00(d) Qualified Foreign Investor 0 0 0 0.00 0 0 0 0.00 0.00(e) Any Other (specify) 0 0 0 0.00 0 0 0 0.00 0.00
Sub-Total (A) (2)Total Shareholding of Promoter and Promoter Group (A) 1,003,145,830 0 1,003,145,830 29.54 1,050,751,447 0 1,050,751,447 30.94 1.40(B) Public Shareholding(1) Institutions(a) Mutual Funds / UTI 279,632,280 88,730 279,721,010 8.24 379,105,423 72,340 379,177,763 11.17 2.93(b) Financial Institutions / Banks 3,483,760 291,650 3,775,410 0.11 10,338,275 248,930 10,587,205 0.31 0.20(c) Cental Government / State Governments(s) 5,181,711 2,013,905 7,195,616 0.21 6,742,762 2,013,905 8,756,667 0.26 0.05(d) Venture Capital Funds 0 0 0 0.00 0 0 0 0.00 0.00(e) Alternate Investment Funds 0 0 0 0.00 3,772,751 0 3,772,751 0.11 0.11(f) Insurance Companies 310,951,228 1,550 310,952,778 9.16 293,235,196 800 293,235,996 8.64 -0.52(g) Foreign Institutional Investors 118,366,247 43,375 118,409,622 3.49 3,344,136 23,940 3,368,076 0.10 -3.39(h) Foreign Venture Capital Investors 0 0 0 0.00 0 0 0 0.00 0.00(i) Qualified Foreign Investor 0 0 0 0.00 0 0 0 0.00 0.00(j) Any Other (specify)
(j-i) Foreign Portfolio Investors (Corporate) 833,787,950 0 833,787,950 24.55 820,646,479 0 820,646,479 24.17 -0.39 (j-ii) Foreign Bodies - DR 6,231,611 0 6,231,611 0.18 6,215,251 0 6,215,251 0.18 -0.00(j-iii) Foreign Nationals - DR 286,876 0 286,876 0.01 286,661 0 286,661 0.01 -0.00(j-iv) Foreign Institutional Investors - DR 321,226 0 321,226 0.01 73,015 0 73,015 0.00 -0.01(j-v) LLP -DR 750 0 750 0.00 750 0 750 0.00 -0.00Sub-Total (B) (1) 1,558,243,639 2,439,210 1,560,682,849 45.96 1,523,760,699 2,359,915 1,526,120,614 44.94 -1.02
(2) Non-Institutions(a) Bodies Corporate 17,710,637 537,735 18,248,372 0.54 37,417,129 477,150 37,894,279 1.12 0.58(b) Individuals - 0.00 0.00i Individual shareholders holding nominal
share capital upto Rs. 1 lakh 184,406,963 24,606,744 209,013,707 6.15 244,339,196 20,151,115 264,490,311 7.79 1.63
ii Individual shareholders holding nominal share capital in excess of Rs. 1 lakh
24,996,328 450,240 25,446,568 0.75 17,382,047 410,975 17,793,022 0.52 -0.23
(c) Qualified Foreign Investor 0 0 0 0.00 0 0 0 0.00 0.00(d) Any Other
(d-i) NBFCs registered with RBI 0 0 0 0.00 126,674 0 126,674 0.00 0.00(d-ii) Non Resident Indians 11,546,286 2,670,770 14,217,056 0.42 17,339,947 2,378,480 19,718,427 0.58 0.16(d-iii) Clearing Member 16,248,035 0 16,248,035 0.48 12,524,514 0 12,524,514 0.37 -0.11(d-iv) Trust 18,186,295 1,750 18,188,045 0.54 25,693,501 1,750 25,695,251 0.76 0.22(d-v) OCBs/Foreign Cos 0 490 490 0.00 152,061 0 152,061 0.00 0.00d-vi) Foreign Corporate Bodies (including FDI) 163,487 0 163,487 0.00 0 0 0 0.00 -0.00(d-vii) IEPF Suspense A/C 0 0 0 0.00 3,559,715 0 3,559,715 0.10 0.10Sub-total (B) (2) 273,258,031 28,267,729 301,525,760 8.88 358,534,784 23,419,470 381,954,254 11.25 2.37Total Public Shareholding (B) = (B)(1)+(B)(2) 1,831,501,670 30,706,939 1,862,208,609 54.84 1,882,295,483 25,779,385 1,908,074,868 56.19 1.35TOTAL (A)+(B) 2,834,647,500 30,706,939 2,865,354,439 84.38 2,933,046,930 25,779,385 2,958,826,315 87.13 2.75( C) Shares held by Custodians and against which Depository Receipts have been issued(1) Promoter and Promoter Group(2) Public 530,475,530 20,750 530,496,280 15.62 437,004,000 20,750 437,024,750 12.87 -2.75
GRAND TOTAL (A)+(B)+( C ) 3,365,123,030 30,727,689 3,395,850,719 100.00 3,370,050,930 25,800,135 3,395,851,065 100.00 0.00

86
ii) Share Holding of Promoters (including Promoter Group)
Sr. No
Shareholder’s Name Shareholding at the beginning of the year 01.04.2017
Shareholding at the end of the year 31.03.2018
% change in shareholding
during the yearNo.of Shares % of total
Shares of the company
% of Shares Pledged/
encumbered to total shares
No.of Shares % of total Shares of the
company
% of Shares Pledged/
encumbered to total shares
1 Tata Sons Limited - Promotor 828,970,378 24.41 1.73 961,381,852 28.31 1.73 3.90
2 Tata Industries Limited 72,203,630 2.13 0.00 72,203,630 2.13 0.00 -0.00
3 Tata Investment Corporation Ltd 10,600,000 0.31 0.00 11,000,000 0.32 0.00 0.01
4 Ewart Investments Limited 3,525,187 0.10 0.00 3,525,187 0.10 0.00 -0.00
5 Tata Chemicals Limited 1,966,294 0.06 0.00 1,966,294 0.06 0.00 -0.00
6 Af-Taab Investment Company Ltd 408,181 0.01 0.00 408,181 0.01 0.00 -0.00
7 Tata Steel Limited 83,637,697 2.46 0.00 100,000 0.00 0.00 -2.46
8 Simto Investment Company Ltd 59,583 0.00 0.00 59,583 0.00 0.00 -0.00
9 J R D Tata Trust 105,280 0.00 0.00 105,280 0.00 0.00 -0.00
10 Lady Tata Memorial Trust 1,440 0.00 0.00 1,440 0.00 0.00 -0.00
11 Sir Ratan Tata Trust 859,200 0.03 0.00 0 0.00 0.00 -0.03
12 Sir Dorabji Tata Trust 808,960 0.02 0.00 0 0.00 0.00 -0.02
1,003,145,830 29.54 1.73 1,050,751,447 30.94 1.73 1.40
Note: Entities listed from Sr. No. 2 to 12 above form part of the Promoter Group
iii) Change in Promoter’s Shareholding (please specify,if there is no change)
Sr. No
Name of the ShareHolder Shareholding at the beginning of the year as on 01.04.2017
Date Reason Increase/Decrease in Shareholding
Cumulative Shareholding during the year
No. of Shares % of total shares of the
company
No. of Shares % of total shares of the
company
No. of Shares % of total shares of the
company
1 Tata Sons Limited 828,970,378 24.41 828,970,378 24.41
30.06.2017 Purchase of Shares 83,537,697 2.46 912,508,075 26.87
22.09.2017 Purchase of Shares 47,205,617 1.39 959,713,692 28.26
23.03.2018 Purchase of Shares 1,668,160 0.05 961,381,852 28.31
31.03.2018 At the end of the year - - 961,381,852 28.31
2 Tata Investment Corporation Ltd 10,600,000 0.33 - - 10,600,000 0.33
23.09.2016 Purchase of Shares 400,000 0.01 11,000,000 0.32
31.03.2018 At the end of the year - - 11,000,000 0.32
3 Tata Steel Limited 83,637,697 2.46 83,637,697 2.46
23.06.2017 Sale of Shares -3,990,222 -0.12 79,647,475 2.35
23.06.2017 Sale of Shares -79,547,475 -2.34 100,000 0.00
31.03.2018 At the end of the year - - 100,000 0.00
4 Sir Ratan Tata Trust 859,200 0.03 859,200 0.03
16.03.2018 Sale of Shares -859,200 -0.03 0 0.00
31.03.2018 At the end of the year - - 0 0.00
5 Sir Dorabji Tata Trust 808,960 0.02 808,960 0.02
16.03.2018 Sale of Shares -808,960 -0.02 0 0.00
31.03.2018 At the end of the year - - 0 0.00
Note: i) Except for the above there is no change in the holding of Tata Industries Ltd, Ewart Investment Ltd, Tata Chemicals Ltd, Af-taab Investment Co Ltd, Simto Investment Co Ltd, JRD Tata Trust and Lady Tata Memorial Trust during this Fiscal 2018
ii) Entities listed from 2 to 5 above form part of the Promoter Group

8773rd Annual Report 2017-18
INTEGRATED REPORT 1-65 STATUTORY REPORTS 66-184 FINANCIAL STATEMENTS 185-353
iv) Shareholding Pattern of Top 10 Shareholders (Other than Director,Promoters and Holders of GDRS and ADRs):
Sr No
Name of the ShareHolder Shareholding at the beginning of the year as on 01.04.2017
Shareholding at the end of the year as on 31.03.2018
No of Shares % of total Shares of the Company
No of Shares % of total Shares of the Company
1 Life Insurance Corporation Of India 149,423,428 4.40 149,295,627 4.40
2 Government Of Singapore 67,367,492 1.98 84,997,140 2.50
3 ICICI Prudential Value Discovery Fund 39,088,564 1.15 73,921,224 2.18
4 Franklin Templeton Mutual Fund A/C Franklin India Prima Plus 42,938,549 1.26 59,959,475 1.77
5 ICICI Prudential Life Insurance Company Ltd 46,398,243 1.37 52,206,965 1.54
6 HDFC Trustee Company Limited-Hdfc Prudence Fund 62,847,816 1.85 49,926,659 1.47
7 Reliance Capital Trustee Co. Ltd A/C Reliance equity Opportunities Fund# 9,353,053 0.28 48,603,527 1.43
8 Franklin Templeton Investment Funds 39,647,214 1.17 42,930,633 1.26
9 SBI-Etf Nifty 50 37,847,939 1.11 34,094,397 1.00
10 UTI Nifty Index Fund# 12,578,096 0.37 32,146,194 0.95
11 Abu Dhabi Investment Authority* 50,686,594 1.49 22,273,860 0.66
12 Stichting Depositary Apg Emerging Markets Equity PooL* 26,522,500 0.78 21,309,717 0.63* ceased to be in the list of Top 10 as on 31.03.2018. The same is reflected above since the shareholder was one of the Top 10 shareholders as on 01.04.2017
# Not in the list of Top 10 shareholders as on 01.04.2017. The same is reflected above since the it is in the Top 10 shareholder as on 31.03.2018.
Shareholding of Top 10 is consolidated based on Permanent Account Number of the shareholder. The date wise increase or decrease in shareholding of the Top 10 shareholders giving break-up of Ordinary and ‘A’ Ordinary shares bought and sold is available on the website of the Company www.tatamotors.com
v) Shareholding of Directors and Key Managerial Personnel :
Sr. No
Name of the ShareHolder Shareholding at the beginning of the year as on
01.04.2017
Date Reason Increase/Decrease in Shareholding
Cumulative Shareholding during the year
No. of Shares
% of total shares of the
company
No. of Shares
% of total shares of the
company
No. of Shares†
% of total shares of the
company
1 Mr. Satish Borwankar, Executive Director & COO 500 0.00 500 0.00
- No Change - - 500 0.00
31.03.2018 At the end of the year - - 500 0.00
2 Mr. C Ramakrishnan, CFO @ 8,312 0.00 5,274(AOS) 3,038
0.00
- No Change - - 5,274(AOS) 3,038
0.00
30.09.2017 As at Sept 30, 2017 - - 5,274(AOS) 3,038
0.00
3 Mr. P B Balaji, CFO ++ (w.e.f. November 14, 2017)
0 0.00 - - 20,000 0.00
- No Change - - 20,000 0.00
31.03.2018 At the end of the year - - 20,000 0.00
4 Mr. Hoshang Keki Sethna (Company Secretary) 3,766 0.00 2,953(AOS) 813
0.00
- No change - - 2,953(AOS) 813
0.00
31.03.2018 At the end of the year - - 2,953(AOS) 813
0.00
Other than the above, none of the Directors and KMPs hold any shares.
Note: @ Ceased to be the Group Chief Financial Officer with effect from September 30, 2017
++ Appointed as Group Chief Financial Officer with effect from November 14, 2017
† Ordinary shares unless explictly stated as AOS for ‘A’ Ordinary Shares.

88
V INDEBTEDNESS
Indebtedness of the Company including interest outstanding /accrued but not due for payment
(` in crores)
Secured loan excluding deposits
Unscured Loan
Deposits Total Indebetness
Indebtedness at the beginning of the financial year
i) Principal Amount 2,403.71 15,957.68 - 18,361.39
ii) Interest due but not paid -
iii) Interest accrued but not due 48.81 397.29 - 446.10
Total (i+ii+iii) 2,452.52 16,354.97 - 18,807.49
Change in Indebtedness during the financial year
• Addition 6,746.69 10,583.21 - 17,989.65
• Reduction (6,896.79) (11,300.76) - (19,073.74)
Net Change (150.10) (717.55) - (1,084.09)
Indebtedness at the end of the financial year
i) Principal Amount 2,253.61 15,240.13 - 17,493.74
ii) Interest due but not paid -
iii) Interest accrued but not due 51.96 442.67 - 494.63
Total (i+ii+iii) 2,305.57 15,682.80 - 17,988.37
VI. REMUNERATION OF DIRECTORS AND KEY MANAGERIAL PERSONNEL
A. Remuneration to Managing Directors, Whole-time Directors and/or Manager
Sr. No
Particulars of Remuneration Name of MD/WTD/Manager Amount in (`)$
Mr Guenter Butschek#
Mr Ravindra Pisharody*
Mr Satish Borwankar
1 Gross Salary
a) Salary as per provisions contained in Section 17(1) of the Income tax Act, 1961
192,212,608 17,190,250 20,180,370 229,583,228
b) Value of perquisites u/s 17(2) Income-tax Act, 1961
8,903,948 3,516,258 1,320,194 13,740,400
c) Profits in lieu of salary under - - - 0
2 Stock Options - - - 0
3 Sweat Equity - - - 0
4 Commission - - - 0
a) as % of profit - - - 0
b) others, specify - - - 0
5 Other, please specify (LTA exemption) - (20,250) - (20,250)
Total (A) 201,116,556 20,686,258 21,500,564 243,303,378
Ceiling as per Schedule V of the Act - 25,530,690 51,061,380 -* Ceased to be a Director w.e.f. September 30, 2017# Being a managerial person functioning in a professional capacity as per circular of the Ministry of Corporate Affiairs dated 12-9-2016, the ceiling under Schedule V is not applicable to him.$ The above remuneration is as per Income Tax Act, 1961 and excludes contribution by the Company to Provident Fund, provisions for special retirement benefits etc. Further these amounts are paid to Managing Director and Whole Time Directors during the year.

8973rd Annual Report 2017-18
INTEGRATED REPORT 1-65 STATUTORY REPORTS 66-184 FINANCIAL STATEMENTS 185-353
VI. B. Remuneration to other directors
Sr. No
Particulars of Remuneration
Name of Directors Total amount in
(`)1 Independent Directors R Mashelkar# N Munjee V K Jairath F Nayar O P Bhatt* H Sorenson^a) Fee for attending board/
committee meetings860,000 1,400,000 1,220,000 1,040,000 720,000 300,000 5,540,000
b) Commission - - - - - - 0c) Others, please specify - - - - - - 0Total (1) 860,000 1,400,000 1,220,000 1,040,000 720,000 300,000 5,540,000
2 Other Non-Executive Directors N Chandrasekaran R Spetha) Fee for attending board/
committee meetings780,000 - 780,000
b) Commission - - 0c) Others, please specify - - 0Total (2) 780,000 - 780,000Total B = (1+2) 6,320,000Total Managerial Remuneration NilOverall Ceiling as per the Act Not applicable as only sitting fees paid
# Dr Mashelkar retired on December 31, 2017
* Mr O P Bhatt was appointed as Additional and Independent Director on May 9, 2017
^ Ms Hanne Sorensen was appointed as Additional and Independent Director on January 3, 2018
The figures are rounded to nearest thousand.
VI. C. Remuenration to Key Managerial Personnel Other than MD / Manager / WTD
Sr. No
Particulars of Remuneration Key Managerial Personnel Amount in (`)$
C Ramakrishnan^ Group Chief
Financial Officer
P B Balaji# Group Chief
Financial Officer
Hoshang Sethna Company Secretary
1 Gross Salarya) Salary as per provisions contained in Section 17(1) of the
Income tax Act, 196141,568,000 66,663,520 11,478,457 119,709,977
b) Value of perquisites u/s 17(2) Income-tax Act, 1961 890,997 9,900 854,330 1,755,227c) Profits in lieu of salary under - - - 0
2 Stock Options - - - 03 Sweat Equity - - - 04 Commission - - - 0
a) as % of profit - - - 0b) others, specify - - - 0
5 Other, please specify - - - 0Total 42,458,997 66,673,420 12,332,787 121,465,204
^ Ceased to be Group Chief Financial Officer on September 30, 2017
# Appointed as Group Chief Financial Officer on November 14, 2017$ The above remuneration is as per Income Tax Act, 1961 and excludes contribution by the Company to Provident Fund.
VII. PENALTIES/PUNISHMENT/COMPOUNDING OF OFFENCES:
There were no penalties/punishment/compounding of offences for the breach of any sections of Companies Act against the Company or its Directors or other officers in default, if any, during the year.
On behalf of the Board of Directors
N CHANDRASEKARANChairman
DIN - 00121863
Mumbai, May 23, 2018

90
A. CONSERVATION OF ENERGY
The Company has always been conscious of the need for energy conservation. In Fiscal 2018, the Company has signed a Memorandum of Understanding (MoU) with Energy Efficiency Services Limited (EESL), Ministry of Power, Government of India to achieve energy saving and resource conservation by implementing various energy efficiency initiatives across the Company’s manufacturing facilities in India. Phase I of the project is being rolled-out at the Pantnagar, Lucknow and Pune plants and will be extended later to other plants. Key Highlights of the MoU include - diagnostic studies and pilot projects, implementation of energy efficiency projects through innovative financial models and capacity building & training.
The Energy Conservation (ENCON) projects have been implemented at all plants and offices of the Company in a planned and budgeted manner. Some of the major ENCON Projects in Fiscal 2018 include:
(i) The steps taken or impact on conservation of energy:
Pune plant optimized power consumption in ventilation systems at engine shop, installed energy efficient LED lighting systems, converted washing machines from electrical to natural gas heating, provided interlocks and auto switch-off timers in engine shop, installed Intelligent Flow Control in compressor for paint shop operations and integrated painting operations into a single paint shop.
Jamshedpur Plant optimized engine test bed utilization and installed energy efficient LED lighting.
Sanand Plant optimized use of Air Supply Plant (ASP), washing process in head & block at engine shop, replaced Nd-YAG laser with fiber laser, and provided interlocks and auto switch-off timers for energy intensive machines and equipment.
Lucknow Plant implemented empty skid storage facility in paint shop and installed energy efficient LED lighting.
Pantnagar Plant contributed by reduction in no-load losses in transformers and installed energy efficient LED lighting.
These efforts have resulted into energy savings of 86,086 GJ (power + fuel), avoided 18,378 tCO2e and cost savings of `1,746 lakhs in Fiscal 2018.
(ii) The steps taken by the Company for utilizing alternate sources of energy:
The Company has set up in-house Renewable Energy generation capacity (solar and wind) which includes:
– 21.95 MW Captive Wind Power project at Supa and Satara in Maharashtra;
– 2 MW Roof-top Solar PV installation at Sanand Works;
– 2.1 MW Roof-top Solar PV installation at Pune Works and
ANNEXURE - 2
Particulars of Conservation of energy, Technology absorption and Foreign Exchange Earnings and Outgo[Pursuant to Section 134 (3) (m) of the Act read with Rule 8 of the Companies (Accounts) Rules, 2014]
work is ongoing for additional 2 MW installation;
– 2 MW Solar PV installation at Lucknow Works;
– 18.5 kWp Solar PV installation at Pantnagar Works; and
– 7.2 kW hybrid-wind and solar installation at Dharwad Works.
the Company sources off-site wind power at its Pune, Sanand and Dharwad Works through Power Purchase Agreements (PPA) with Third Party Wind Power Generators and will continue to source renewable power from the grid in line with regulatory policies / frameworks and tariffs in the States of operations.
the Company generated / sourced 99 million kWh of renewable electricity for its manufacturing operations, which contributed to financial saving of ` 666.3 lakhs and avoided 64,657 tCO2e.
in addition, past wind power arrears of 20 million kWH (Fiscal 2015 & Fiscal 2017) were realized in Fiscal 2018, which is an additional avoidance of 16,837 tCO2e.
auction of 13,332 Renewable Energy Certificates (RECs) resulted in revenue of `121 lakhs to the Company.
(iii) The capital investment on energy conservation equipments:
In Fiscal 2018, the Company has invested `428 lakhs in various energy conservation projects.
Awards / Recognition received during the year is as below,
the Company’s Jamshedpur Plant won First Prize in the Automobile (Manufacturing) Sector at the National Energy Conservation Awards-2017 by Bureau of Energy Efficiency (BEE), Ministry of Power, Government of India. The Award was received from Shri Ram Nath Kovind, Hon’ble President of India on December 14, 2017 - National Energy Conservation Day, at Vigyan Bhawan, New Delhi.
the Company’s CVBU Pune awarded “Certificate of Merit” at the National Energy Conservation Awards-2017, in Automobile (Manufacturing) Sector by Bureau of Energy Efficiency (BEE), Ministry of Power, Government of India.
the Company’s CVBU PUNE won the “Golden Peacock Award for Energy Efficiency-2017”. The award was received on July 7, 2017 at the 19th World Congress on Environment Management, at Hyderabad.
the Company’s CVBU Pune won the “CII-National Award for Excellence in Energy Management -2017” and declared as “Excellent Energy Efficient Unit”
the Company’s CVBU Pune, was re-certified ‘GOLD’ under CII’s GreenCo Rating system in 2017. CV Pune received the original ‘GOLD’ rating initially in 2014.

9173rd Annual Report 2017-18
INTEGRATED REPORT 1-65 STATUTORY REPORTS 66-184 FINANCIAL STATEMENTS 185-353
B. TECHNOLOGY ABSORPTION, ADAPTATION AND INNOVATION
(i) Efforts made towards technology absorption, adaptation and innovation
The Company used a three-horizon strategy for managing its engineering and technology initiatives. The first-horizon involved products that the Company is working on currently, to bring to the market. The second-horizon involves researching known technologies that the Company may not be entirely familiar with at present, but are needed for our future products. And the third-horizon is for ‘blue sky’ research projects and there are a number of projects aimed at fostering a culture of innovation in the Company.
The Company has its sights set on delivering well engineered, safe, technology laden cars to the market continuously. The Company’s future technology pipeline focuses on four key pillars namely smart autonomous & connected vehicle, clean vehicle, capable vehicle and desirable vehicle. The Company has set up lean and agile innovation hubs to kindle innovation, by focusing on testing of solutions and go-to-market strategies. The setting up of the first of these centers is already underway in Silicon Valley (US) and the UK.
Key areas of technology engagement in line with global and Indian trends:
• Advanced HMI technologies for improved user experience
• Advanced occupant safety and driving convenience adapted to Indian driving conditions
• Advanced connectivity architecture to support future mobility driven features
• Advanced vehicle with improved efficiency through light-weighting of body and chassis structures and use of higher efficiency aggregates
The Company believes in bringing academia and the industry together for advancements in automotive research. Recent research with various leading technical institutes include:
• Development of full vehicle multi-body dynamic model for simulation of PAT targets for engine mounting system
• Brake disc temperature rise simulation for multi-stop applications
• Tire component target cascading simulation for vehicle ride and handling (ongoing) (Customer Delight)
• Engine vibration frequency calculation and simulation in ADAMS for improved NVH
• A new approach for powertrain multi-attribute target development & balancing for vehicle integration
• To develop a mathematical model of powertrain for the passenger vehicle with Front Wheel Drive(FWD) to address torsional vibrations
The main endeavor of the Company has been to continuously scan for innovative projects in the third and second horizon to
integrate the promising ones to the main stream projects in the first horizon.
The forward-looking technology programs that the Company is concentrating on are:
• Soot emission reduction of 55% from light commercial vehicle engine by combustion optimization through simulation program executed with IIT Bombay.
• Participation in a consortium led by a US research firm, for thermal efficiency improvement of diesel engines.
(ii) Benefits derived as a result of the above efforts
The Company continued to strengthen its capabilities across technology by careful selection of advanced engineering and future technology portfolio, with intent to capitalize and bookshelf the developed technology into the future products for making them more exciting and more attractive to the end customers. The Company wishes to mitigate all future risks related to technology by timely having appropriate emerging technology on emissions, FE enhancement, powertrain, safety, connectivity, infotainment, telematics, green initiatives etc., to meet and exceed all future emissions and vehicular safety norms.
The Company continued efforts have translated into successful product launches and concept unveils. Fiscal 2018 marked the launch of Tata Nexon and the first batch of Tigor Electric Vehicles to state-run Energy Efficiency Services Limited was delivered. The Company future vehicle concepts for the H5X,the 45X and the EVision at the Geneva International Motor Show were lauded by automotive critics. The Company harnessed the talent in India’s reputed academic institutions to realize state of the art and emerging concepts for current and future vehicles.
(iii) a) Major technology absorption undertaken during the last year includes:
Sr. No.
Technology For Status
1 E-Viscous fan for cooling systems on medium duty vehicles
Implemented
2 Development of connected car Technol-ogy and Cyber Security
Proof of Concept Ready
3 Development of Advanced Driver Assis-tance with 360 degree surround sense, surround view and parking assist
Validation in progress
4 Moflex MMS Structural Technology Proof of Concept Ready
5 Development of domain controllers for cockpit electronics
Development in Progress
6 Development of low cost Electronic Parking Brake
Proof of Concept Ready
7 Light Weighting of BIW and Chassis Structures
Development in Progress
8 Development of efficient HVAC system with Coandavents and Electronically variable displacement compressor
Development in Progress

92
Sr. No.
Technology For Status
9 Fuel cell vehicle based on small com-mercial vehicle
Development in progress
10 Hydrogen recirculation blower system for Fuel cell system
Under implemen-tation
11 Battery management system for EV bus/car and car hybrids
Development in progress
12 Brake blending systems for improving regenerative brake energy capture in electric and hybrid vehicles
Development in progress
13 In-house patented hybrid powertrain development
Development in progress
14 Exhaust energy recovery through Va-pour-ejector refrigeration systems
Development in progress
15 Electric Trolley Bus system Development in progress
16 Ultra capacitor based energy storage system for hybrid vehicles
Development in progress
17 Development of induction motor with copper rotor
Development in progress
18 Development of DC-DC converter for fuel cell vehicles
Development in progress
19 Traction motor control algorithm devel-opment for xEVs
Development in progress
20 In-house development of battery packs for electric and hybrid vehicles
Development in progress
21 Development of Fuel Cell/Battery EV controller for fuel cell / Battery Electric vehicles
Development in progress
22 Design and development of Automotive fuel cell Stack
Development in progress
23 Design and development of Traction motor controller hardware
Development in progress
24 Design and development of DC-DC converters and On-board chargers
Development in progress
25 Design and development of Induction Traction motors based
Development in progress
26 Light-weight material for Acoustic Insu-lation of Trimmed Body of Tiago
Implemented
27 In house development and demonstra-tion of parallel PHEV technology
Development in progress
28 Development of Advanced Driver Assis-tance Safety Systems LDWS, AEBS
Testing in Progress
(iii) b) Major Technology Imports includes (preceding 3 financial years):
Sr. No.
Technology for Year of Import
Status
1 A door seal pressure measurement rig
2014-15 Commissioned and being used for new passenger vehicles
Sr. No.
Technology for Year of Import
Status
2 Synthetic road shells on a chassis dynamometer
2015-16 Implemented
3 A Noise Test Cell for engine and drivelines
2015-16 Implemented
4 Combustion analyser and knock sensors
2015-16 Implemented
5 Miniature shakers [from USA]—needed for Accurate Transfer Path Analysis of vibrations of engine To vehicle-body
2016-17 Implemented
6 Master air flow calibration rig 2016-17 Implemented7 Climatic chamber with gasoline
emission facility2016-17 Implemented
8 Upgrade of test facilities for BS-6 compliance including particle number counter, ammonia analyzer, urea measurement system
2017-18 Implemented
9 Diesel Particulate Filter oven and weighing balance
2017-18 Implemented
10 A single channel Digital Signal Processer from M/s Silentium, Israel as a low cost Active Noise cancellation
2017-18 Implemented
(iv) RESEARCH AND DEVELOPMENT
Particulars (` in crores)Expenditure incurred on research and development:
2017-18 2016-17
(a) Revenue Expenditure - charged to Profit & Loss Statement
923.10 508.26
(b) Revenue Expenditure – capitalized
1,362.51 1,526.34
( c ) Capital Expenditure 111.91 65.59Total 2,397.52 2,100.19Income from Operations 57,258.60 48,273.97R&D cost as a % to Revenue from Operations
4.2% 4.4%
Specific areas in which R & D carried out by the Company
The Company commitment to our customers ensures that our products remains fresh, exciting and class leading. The main focus on specific areas of R&D and engineering are to strengthen its HorizonNext philosophy, likewise, the PV R&D portfolio is aligned towards developing technologies, core competence and skill sets in specific domains to secure impactful and timely delivery of envisaged future products with leading product attributes. In CV R&D portfolio the main focus areas are total cost ownership, pursue market leadership in application specific fuel efficiency and deliver high performance and reliable products. Focus areas of the Company R&D evolves around R&D infrastructure development and being timely future ready for emission and vehicular safety norms.

9373rd Annual Report 2017-18
INTEGRATED REPORT 1-65 STATUTORY REPORTS 66-184 FINANCIAL STATEMENTS 185-353
The Company commitment to its customers ensures that its products remain fresh, exciting and class leading. The next generation ConnectNext platform, adapted the Android automotive operating systems to bring consumer world into the car infotainment system. In line with connected mobility and smart city initiatives, the Company was working with on connected infrastructure with Microsoft and mobility provider offering affordable telematics solutions to target vehicle segment. The Company strengthened its commitment on occupant safety by investing in Advanced Driver Assistance Systems (ADAS). Visual and audible alerts were provided to the drivers to warn them of an imminent hazard and so on. Intelligent start stop systems, intelligent alternator controllers and low-drag outsider rear view mirrors are few of the areas under focus. The Company has been constantly striving to increase the efficiency of its products, in a bid to create a sustainable future.
Some of the forward-looking R&D programs that the Company is concentrating on are:
• Robust control system for hybrid and electric buses and electric cars
• Electrification of vehicle accessories for electric buses
• Development of indigenous Li-Ion battery packs for hybrid and electric buses and electric cars
• Enhancing the effectiveness of regenerative braking by optimally blending it with conventional brake systems
• Indigenous development of fuel cell systems and accessories
• Development of high efficiency motors and inverters
• Development of electric thermostat control on M&HCV trucks which improve fuel economy by optimizing fan duty and controlling coolant temperature
Benefits derived as a result of the above R&D
In PV, the Company continued efforts have translated into successful product launches and concept unveils. Recently launched Tata Nexon, was critically acclaimed and went on to win multiple awards, notable among which was winning the prestigious Autocar “Best Design and Styling Award 2018” and “Best Value for Money Car of the Year 2018” and the NDTV Car & bike “Subcompact SUV of the year 2018”, “Design of the year 2018”. The Nexon offers cutting edge features such as an automated manual transmission (AMT), a freestanding infotainment display, keyless entry/ignition, intelligent start/stop systems, intelligent alternator controller’s application integration in upcoming premium hatch and a wearable key, a market first. The Company launched special edition of the lifestyle SUV Hexa, which was displayed with power-packed and adrenalin filled driving experience. Promotion of green and sustainable transport solution, the Company recently launched Tiago EV & Tigor EV to begun it’s journey in boosting e-mobility and offering full range of electrical vehicle. The Company showcased
two new innovative products - H5X concept for 5 seater luxury USV which set to re-define the SUV benchmarks in the country & another one ‘45X concept’, the premium hatchback.
In CV developments include, new Tata INTRA - the stylish, feature loaded, compact truck that is set to re-define the SCV segment in the country was unveiled. Demonstrating it’s capability in promoting smart and safe public transportation, the Company displayed the 12-m Electric Bus and passenger carriers- the Magic EV and the Iris EV in Auto Expo 2018. SIGNA 4323 – Highest tonnage rigid trucks with 6-axle and 30-ton payload, the Prima 3718 with advanced rubber Suspension system and the Prima 4930.S with latest, advanced safety and driving features.
In addition to the dynamic showcase of products, the Company displayed its New Generation Diesel Turbotron Engines of 3L and 5L capacities for its commercial vehicle applications. These state-of-the-art engines offer best-in-class fuel economy, excellent performance (flat torque curve & high low-end torque), lower TCO, better reliability and durability.
During Fiscal 2018, the Company filed 50 Patent Applications and 25 Design applications. In respect of applications filed in earlier years, 80 Patents were granted and 23 Designs were registered. Both filing and grant details include national and international jurisdictions.
Future Plan of Action
The Company planned to continue it’s endeavor in the research and development space to develop vehicles with reduced cost, time to market and shorter product life cycles. One of the main future initiatives in this direction would be a platform approach of creating bills of material and bills of process that have a high degree of commonality to reduce complexity and enhance ability to the scale. Also, the Company aims for timely and successful conclusion of technology projects so as to begin their induction into mainstream products, which will lead to a promising future.
Some exciting new innovative projects have been kicked off in the areas of Digital Assistance, Augmented Reality, IoT based solutions, Innovative In-Cab experience, Safety and even Dealership experience.
The Company would continue to invest in in-house R&D as well as collaborative projects which will enhance the competitiveness of the Company’s future products. The Company would also start active research in upcoming areas of automotive technology like autonomous driving, connected cars, and others.
The Company plans to focus in the following areas to meet future product portfolio needs.
• Customer facing and monetizable connected solutions
• Redefining cockpit experience with reconfigurable HMI content
• Vehicle efficiency improvements
• Driving convenience and occupant safety

94
C. FOREIGN EXCHANGE EARNINGS & OUTGO
Activities relating to exports
The Company exported during the year 52,404 vehicles consisting of 50,106 units of Commercial Vehicles and 2,298 units of Passenger Vehicles.
Export initiatives such as goods, products and services exported include:
Commercial Vehicles
• The Company participated in key motor shows and conclaves around the world such as the Futuroad Expo, Bangkok Motor Show, Dhaka Automotive Show, Thailand Defence Expo.
• Tata Prima successfully launched in Philippines, Signa launched in Sri Lanka and Yodha in Nepal. Launched the Ultra buses in Tanzania, Ultra range in South Africa, Ultra was unveiled in Thailand and Indonesia as well. CR range launched in ILCV in Nepal.
• CVIB conducted ‘Global Service Campaign’ in more than 40 countries from 21st to 23rd November, 2017 as a part of the enhancing the Customer Connect. The service campaign saw more than 31,000 vehicles serviced in 3 days.
• Bagged the order for 250 units Xenon pickups and 200 units of LPTA 715 from the Myanmar Armed forces; and 209 units of Winger (135 units) and Xenon (75 units) to GVK Sri Lanka
• Supplied 99 school buses to STS in UAE and 100 buses to FTC Mozambique.
• Bagged order for 540 units of buses from ILOC, Senegal
• The 4th edition of the Company One World - International CV Distributor meet was held in Jaipur from 25th to 27th February, 2018. This year’s event saw attendance by the Company Senior Management and over 250 guests from across 26 countries.
Passenger Vehicles
• In Nepal, the Tata Motors’ brand elevated to position ‘Three’ after competing with 26 Passenger Vehicle brands, augmenting market share from 10.2% to 12.18% during Fiscal 2018 due to highest market share in the Utility Vehicles segment at 59%, Sedan segment at 32% coupled with surged sales and deliveries.
• 246 Sumo Ambulances were supplied including supply of 60 ambulances to Embassy of India and 20 ambulances to Government of Nepal. The Company thus contributed towards the well-being of the society by enabling assessibility of ambulances services to a wider section of the community.
• In Bangladesh, the Company secured ‘Market Leader Position’ in cars segment. The vehicle deliveries increased by 43% in Fiscal 2018 than over Fiscal 2017. The Tiago was successfully launched in January 2018.
• The Company participated in the prestigious Geneva Motor Show in Switzerland for the 21st successive year where the Tata eVision electric sedan concept was displayed for the first time in an international arena. The Company also participated in Nepal Automobile Dealers’ Association (NADA) Auto Show and the Dhaka Automobile show.
• The Company initiated the 1st Annual Kathmandu Walkathon the promote awareness of a healthy lifestyle and witnessed attendance by nearly 700 enthusiastic participants.
Development of export markets
The new markets in ASEAN are the Company’s focus region for future growth – Indonesia, Philippines, Vietnam and Malaysia are steadily picking up as the Tata Motors’ brand is becoming more visible in these markets. Our shipments to ASEAN doubled in Fiscal 2018 as compared to the Fiscal 2017, making it the fastest growing region. Vehicle assembly, in Vietnam saw steady growth of numbers in Fiscal 2018.
The Company has been expanding its relevance in the markets it is present in, with the introduction of new products such as Tata Prima, Ultra trucks and buses in the key markets to further grow volumes.
In Nepal, the Company bagged prestigious orders of 60 Sumo Ambulances from the Embassy of India, 20 Ambulances from Ministry of Health, 24 units of Tiago and Sumo by Supreme Court of Nepal, 26 units from the Rastriya Banijya Bank and 4 Safari Stormes to the Embassy of Switzerland at Kathmandu. The Company delivered 138 units of Indigo CS to various Taxi fleets including Uber at Dhaka, Bangladesh and 15 Storme were supplied to the fleet of the Narcotics Control Bureau in the Seychelles.
Export Plans
The Company plans to focus on growing the export business aggressively in identified geographies by offering customer centric products and strong after sales support.
Foreign Earning Exchange and Outgoings in Fiscal 2018
(` in crores)
Earning in foreign currency 5,422.47Expenditure in foreign currency (including dividend remittance)
3,079.76
On behalf of the Board of Directors
N CHANDRASEKARANChairman
(DIN: 00121863)Mumbai, May 23, 2018

9573rd Annual Report 2017-18
INTEGRATED REPORT 1-65 STATUTORY REPORTS 66-184 FINANCIAL STATEMENTS 185-353
Definition of Independence
• A director will be considered as an “Independent Director” if the person meets with the criteria for ‘Independent Director’ as laid down in the Act and Regulation 16 of the Securities and Exchange Board of India (Listing Obligations and Disclosure Requirements) Regulations, 2015 (“SEBI Listing Regulations”).
• The definition of Independence as provided in the Act and Regulation 16 of SEBI Listing Regulations is as follows:
“An independent director in relation to a company, means a director other than a managing director or a whole-time director or a nominee director, —
(a) who, in the opinion of the Board, is a person of integrity and possesses relevant expertise and experience;
(b) (i) who is or was not a promoter of the company or its holding, subsidiary or associate company;
(ii) who is not related to promoters or directors in the company, its holding, subsidiary or associate company;
( c ) who has or had no pecuniary relationship with the company, its holding, subsidiary or associate company, or their promoters, or directors, during the two immediately preceding financial years or during the current financial year;
(d) none of whose relatives has or had pecuniary relationship or transaction with the company, its holding, subsidiary or associate company, or their promoters, or directors, amounting to two per cent or more of its gross turnover or total income or fifty lakh rupees or such higher amount as may be prescribed, whichever is lower, during the two immediately preceding financial years or during the current financial year;
(e) who, neither himself nor any of his relatives—
(i) holds or has held the position of a key managerial personnel or is or has been employee of the company or its holding, subsidiary or associate company in any of the three financial years immediately preceding the financial year in which he is proposed to be appointed;
(ii) is or has been an employee or proprietor or a partner, in any of the three financial years immediately preceding the financial year in which he is proposed to be appointed, of—
(a) a firm of auditors or company secretaries in practice or cost auditors of the company or its holding, subsidiary or associate company; or
(b) any legal or a consulting firm that has or had any transaction with the company, its holding, subsidiary or associate company amounting to ten per cent or more of the gross turnover of such firm;
ANNEXURE - 3
Criteria for Determining Qualifications, Positive Attributes and Independence of a Director [Pursuant to Section 178 (3) of the Companies Act, 2013 and Regulation 16 read along with Schedule II of the SEBI Listing Regulations]
(iii) holds together with his relatives two per cent or more of the total voting power of the company; or
(iv) is a Chief Executive or director, by whatever name called, of any non-profit organisation that receives twenty-five percent or more of its receipts from the company, any of its promoters, directors or its holding, subsidiary or associate company or that holds two per cent. or more of the total voting power of the company;
(v) is a material supplier, service provider or customer or a lessor or lessee of the company;
(vi) who is not less than 21 years of age.
• Current and ex-employees of a Tata company may be considered as independent only if he/ she has or had no pecuniary relationship with any Tata company (due to employment/ receipt of monthly pension by way of Special Retirement Benefits/ holding consultant or advisor positions) during the two immediately preceding financial years or during the current financial year.
2. Qualifications of Directors
• Boards will ensure that a transparent board nomination process is in place that encourages diversity of thought, experience, knowledge, perspective, age and gender.
• It is expected that boards have an appropriate blend of functional and industry expertise.
• While recommending appointment of a director, it is expected that the Nomination and Remuneration Committee (“NRC”) consider the manner in which the function and domain expertise of the individual contributes to the overall skill-domain mix of the Board.
• Independent Directors (“ID”) ideally should be thought/ practice leaders in their respective functions/ domains.
3. Positive attributes of Directors
Directors are expected to comply with duties as provided in the Act. For reference, the duties of the Directors as provided by the Act are as follows:
1) “Act in accordance with the articles of the company.
2) Act in good faith in order to promote the objects of the company for the benefit of its members as a whole, and in the best interests of the company, its employees, the shareholders, the community and for the protection of environment.
3) Exercise duties with due and reasonable care, skill and diligence and exercise independent judgment.
4) Not be involved in a situation in which he may have a direct or indirect interest that conflicts, or possibly may conflict, with the interest of the company.

96
5) Not achieve or attempt to achieve any undue gain or advantage either to himself or to his relatives, partners, or associates.
6) Not assign his office.”
Additionally, the Directors on the Board of a Tata Company are also expected to demonstrate high standards of ethical behaviour, strong interpersonal and communication skills and soundness of judgment.
IDs are also expected to abide by the ‘Code for Independent Directors’ as outlined in Schedule IV to section 149(8) of the Act. The Code specifies the guidelines of professional conduct, role and function and duties of Independent Directors. The guidelines of professional conduct specified in the Code are as follows:
“An independent director shall:
1) uphold ethical standards of integrity and probity;
2) act objectively and constructively while exercising his duties;
3) exercise his responsibilities in a bona fide manner in the interest of the company;
4) devote sufficient time and attention to his professional obligations for informed and balanced decision making;
5) not allow any extraneous considerations that will vitiate his exercise of objective independent judgment in the paramount interest of the company as a whole, while concurring in or dissenting from the collective judgment of the Board in its decision making;
6) not abuse his position to the detriment of the company or its shareholders or for the purpose of gaining direct or indirect personal advantage or advantage for any associated person;
7) refrain from any action that would lead to loss of his independence;
8) where circumstances arise which make an independent director lose his independence, the independent director must immediately inform the Board accordingly;
9) assist the company in implementing the best corporate governance practices.”
On behalf of the Board of Directors
N CHANDRASEKARANChairman
(DIN: 00121863)Mumbai, May 23, 2018

9773rd Annual Report 2017-18
INTEGRATED REPORT 1-65 STATUTORY REPORTS 66-184 FINANCIAL STATEMENTS 185-353
The philosophy for remuneration of directors, Key Managerial Personnel (“KMP”) and all other employees of Tata Motors Limited (“the Company”) is based on the commitment of fostering a culture of Leadership with Trust. The remuneration policy is aligned to this philosophy.
This remuneration policy has been prepared pursuant to the provisions of Section 178(3) of the Companies Act, 2013 (“Act”) and Regulation 19 read with Part D of Schedule II of the Securities and Exchange Board of India (Listing Obligations and Disclosure Requirements) Regulations, 2015 (Listing Regulations). In case of any inconsistency between the provisions of law and this remuneration policy, the provisions of the law shall prevail and the Company shall abide by the applicable law. While formulating this policy, the Nomination and Remuneration Committee (“NRC”) has considered the factors laid down under Section 178(4) of the Act, which are as under:
“(a) the level and composition of remuneration is reasonable and sufficient to attract, retain and motivate directors of the quality required to run the company successfully;
(b) relationship of remuneration to performance is clear and meets appropriate performance benchmarks; and
( c ) remuneration to directors, key managerial personnel and senior management involves a balance between fixed and incentive pay reflecting short and long-term performance objectives appropriate to the working of the company and its goals”
Key principles governing this remuneration policy are as follows:
– Remuneration for independent directors and non-independent non- executive directors
• Independent directors (“ID”) and non-independent non-executive directors (“NED”) may be paid sitting fees (for attending the meetings of the Board and of committees of which they may be members) and commission within regulatory limits.
• Within the parameters prescribed by law, the payment of sitting fees and commission will be recommended by the NRC and approved by the Board.
• Overall remuneration (sitting fees and commission) should be reasonable and sufficient to attract, retain and motivate directors aligned to the requirements of the Company (taking into consideration the challenges faced by the Company and its future growth imperatives).
• Overall remuneration should be reflective of size of the Company, complexity of the sector/industry/Company’s operations and the Company’s capacity to pay the remuneration.
• Overall remuneration practices should be consistent with recognized best practices.
• Quantum of sitting fees may be subject to review on a periodic basis, as required.
• The aggregate commission payable to all the NEDs and IDs will be recommended by the NRC to the Board based on Company performance, profits, return to investors, shareholder value creation and any other significant qualitative parameters as may be decided by the Board.
• The NRC will recommend to the Board the quantum of commission for each director based upon the outcome of the evaluation process which is driven by various factors including attendance and time spent in the Board and committee meetings, individual contributions at the meetings and contributions made by directors other than in meetings.
• In addition to the sitting fees and commission, the Company may pay to any director such fair and reasonable expenditure, as may have been incurred by the director while performing his/her role as a director of the Company. This could include reasonable expenditure incurred by the director for attending Board/Board committee meetings, general meetings, court convened meetings, meetings with shareholders/creditors/management, site visits, induction and training (organized by the Company for directors) and in obtaining professional advice from independent advisors in the furtherance of his/her duties as a director.
– Remuneration for managing director (“MD”)/executive directors (“ED”)/KMP/ rest of the employees1
The extent of overall remuneration should be suffcient to attract and retain talented and qualified individuals suitable for every role. Hence remuneration should be
• Market competitive (market for every role is defined as companies from which the Company attracts talent or companies to which the Company loses talent)
• Driven by the role played by the individual,
• Reflective of size of the Company, complexity of the sector/industry/Company’s operations and the Company’s capacity to pay,
• Consistent with recognized best practices and
• Aligned to any regulatory requirements.
1 Excludes employees covered by any long term settlements or specific term contracts. The remuneration for these employees would be driven by the respective long term settlements or contracts.
ANNEXURE - 4
Remuneration policy for Directors, Key Managerial Personnel and other employees [Pursuant to Section 178(3) of the Companies Act,2013 and Regulation 19 read along with Schedule II of the SEBI Listing Regulations]

98
• In terms of remuneration mix or composition,
- The remuneration mix for the MD/EDs is as per the contract approved by the shareholders. In case of any change, the same would require the approval of the shareholders.
- Basic/ fixed salary is provided to all employees to ensure that there is a steady income in line with their skills and experience.
- In addition to the basic/ fixed salary, the Company provides employees with certain perquisites, allowances and benefits to enable a certain level of lifestyle and to offer scope for savings and tax optimization, where possible. The Company also provides all employees with a social security net (subject to limits) by covering medical expenses and hospitalization through re-imbursements or insurance cover and accidental death and dismemberment through personal accident insurance.
- The Company provides retirement benefits as applicable.
- In addition to the basic/ fixed salary, benefits, perquisites and allowances as provided above, the Company provides MD/EDs such remuneration by way of commission, calculated with reference to the net profits of the Company in a particular financial year, as may be determined by the Board, subject to the overall ceilings stipulated in Section 197 of the Act. The specific amount payable to the MD/EDs would be based on performance as evaluated by the Board or the NRC and approved by the Board.
- In addition to the basic/ fixed salary, benefits, perquisites and allowances as provided above, the Company provides MD/EDs such remuneration by way of an annual incentive remuneration/ performance linked bonus subject to the
achievement of certain performance criteria and such other parameters as may be considered appropriate from time to time by the Board. An indicative list of factors that may be considered for determination of the extent of this component are:
- Company performance on certain defined qualitative and quantitative parameters as may be decided by the Board from time to time, Industry benchmarks of remuneration,
- Performance of the individual.
- The Company provides the rest of the employees a performance linked bonus. The performance linked bonus would be driven by the outcome of the performance appraisal process and the performance of the Company.
– Remuneration payable to Director for services rendered in other capacity
The remuneration payable to the Directors shall be inclusive of any remuneration payable for services rendered by such director in any other capacity, unless:
a) The services rendered are of a professional nature; and
b) The NRC is of the opinion that the director possesses requisite qualification for the practice of the profession.
– Policy implementation
The NRC is responsible for recommending the remuneration policy to the Board. The Board is responsible for approving and overseeing implementation of the remuneration policy.
On behalf of the Board of Directors
N CHANDRASEKARANChairman
(DIN: 00121863)Mumbai, May 23, 2018
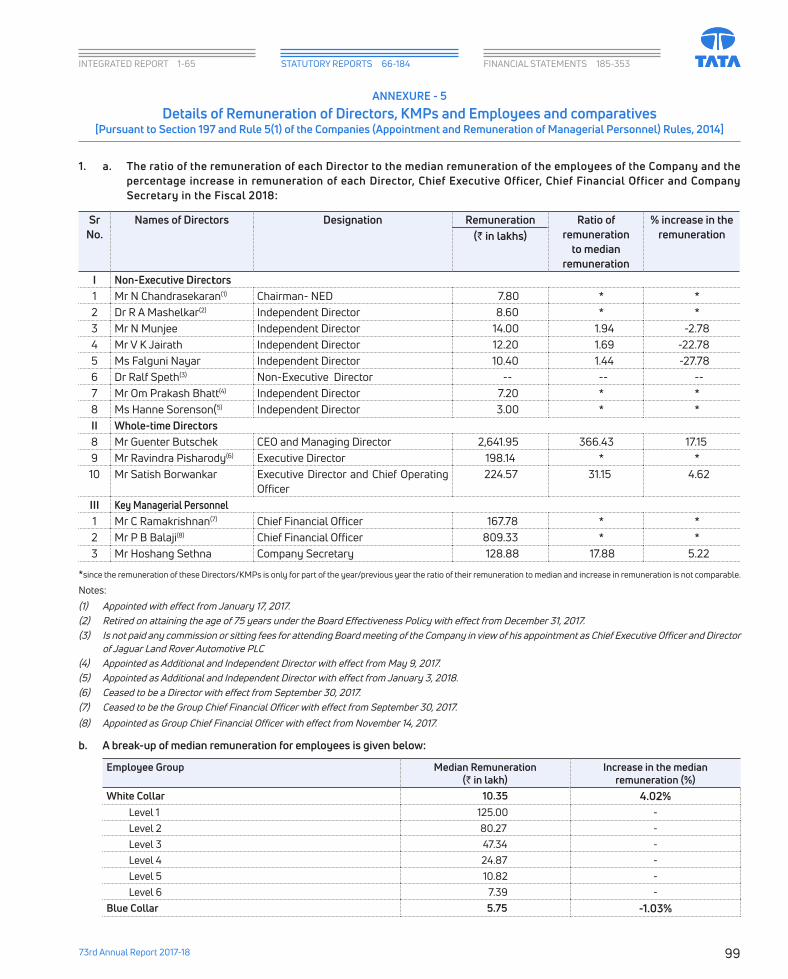
9973rd Annual Report 2017-18
INTEGRATED REPORT 1-65 STATUTORY REPORTS 66-184 FINANCIAL STATEMENTS 185-353
ANNEXURE - 5
Details of Remuneration of Directors, KMPs and Employees and comparatives [Pursuant to Section 197 and Rule 5(1) of the Companies (Appointment and Remuneration of Managerial Personnel) Rules, 2014]
1. a. The ratio of the remuneration of each Director to the median remuneration of the employees of the Company and the percentage increase in remuneration of each Director, Chief Executive Officer, Chief Financial Officer and Company Secretary in the Fiscal 2018:
SrNo.
Names of Directors Designation Remuneration Ratio of remuneration
to median remuneration
% increase in the remuneration(` in lakhs)
I Non-Executive Directors1 Mr N Chandrasekaran(1) Chairman- NED 7.80 * *2 Dr R A Mashelkar(2) Independent Director 8.60 * *3 Mr N Munjee Independent Director 14.00 1.94 -2.784 Mr V K Jairath Independent Director 12.20 1.69 -22.785 Ms Falguni Nayar Independent Director 10.40 1.44 -27.786 Dr Ralf Speth(3) Non-Executive Director -- -- --7 Mr Om Prakash Bhatt(4) Independent Director 7.20 * *8 Ms Hanne Sorenson(5) Independent Director 3.00 * *II Whole-time Directors8 Mr Guenter Butschek CEO and Managing Director 2,641.95 366.43 17.159 Mr Ravindra Pisharody(6) Executive Director 198.14 * *10 Mr Satish Borwankar Executive Director and Chief Operating
Officer224.57 31.15 4.62
III Key Managerial Personnel1 Mr C Ramakrishnan(7) Chief Financial Officer 167.78 * *2 Mr P B Balaji(8) Chief Financial Officer 809.33 * *3 Mr Hoshang Sethna Company Secretary 128.88 17.88 5.22
*since the remuneration of these Directors/KMPs is only for part of the year/previous year the ratio of their remuneration to median and increase in remuneration is not comparable.
Notes:
(1) Appointed with effect from January 17, 2017.(2) Retired on attaining the age of 75 years under the Board Effectiveness Policy with effect from December 31, 2017.(3) Is not paid any commission or sitting fees for attending Board meeting of the Company in view of his appointment as Chief Executive Officer and Director
of Jaguar Land Rover Automotive PLC(4) Appointed as Additional and Independent Director with effect from May 9, 2017.(5) Appointed as Additional and Independent Director with effect from January 3, 2018.(6) Ceased to be a Director with effect from September 30, 2017.(7) Ceased to be the Group Chief Financial Officer with effect from September 30, 2017.
(8) Appointed as Group Chief Financial Officer with effect from November 14, 2017.
b. A break-up of median remuneration for employees is given below:
Employee Group Median Remuneration (` in lakh)
Increase in the median remuneration (%)
White Collar 10.35 4.02%Level 1 125.00 -Level 2 80.27 -Level 3 47.34 -Level 4 24.87 -Level 5 10.82 -Level 6 7.39 -
Blue Collar 5.75 -1.03%

100
Note – Effective April 01, 2017 white collar employees have moved into levels. Hence, percentage increase in the median remuneration of white collar employees is not comparable.
The Median Remuneration of employees for the Fiscal 2018 is `7.21 lakhs
2. The number of permanent employees on the rolls of Company as at March 31, 2018: 24,989
3. Average percentile increase already made in the salaries of employees other than the managerial personnel in the last financial year and its comparison with the percentile increase in the managerial remuneration and justification thereof and point out if there are any exceptional circumstances for increase in the managerial remuneration:
Employee group Average percentage increase / (decrease) in salaries for Fiscal 2018 (in %)
All permanent (Blue Collar and White Collar permanent) 3.04%White Collar 5.71%Blue collar 3.94%Executive Directors/Managerial RemunerationMr Guenter Butschek 17.15%Mr Satish Borwankar 4.62%
Note: Salaries for blue collar includes only TFP (as they are not given any performance linked bonus but have plant-wise wage revision at a set frequency).
The annual variable/performance pay and the salary increment of managers is linked to the Company’s performance in general and their individual performance for the relevant year is measured against major performance areas which are closely aligned to Company’s objectives.
4. Affirmation that the remuneration is as per the remuneration policy of the Company:
The remuneration for MD/ED/KMP/rest of the employees is as per the remuneration policy of the Company
On behalf of the Board of Directors
N CHANDRASEKARANChairman
(DIN: 00121863)Mumbai, 23, 2018

10173rd Annual Report 2017-18
INTEGRATED REPORT 1-65 STATUTORY REPORTS 66-184 FINANCIAL STATEMENTS 185-353
1. A brief outline of the Company’s CSR policy, including an overview of projects or programmes proposed to be undertaking and a reference to the web-link to the CSR Policy and projects or programmes:
I. Overview:
(i) Outline of CSR Policy - As an integral part of the Company’s commitment to good corporate citizenship, the Company believes in actively assisting in improvement of the quality of life of people in communities, giving preference to local areas around the Company’s business operations. Towards achieving long-term stakeholder value creation, the Company shall always continue to respect the interests of and be responsive towards its key stakeholders - the communities, especially those from socially and economically backward groups, the underprivileged and marginalized; focused on inter alia the Scheduled Castes and Scheduled Tribes, and the society at large. In order to leverage the demographic dividend of its country, Company’s CSR efforts shall focus on Health, Education, Environment and Employability interventions for relevant target groups, ensuring diversity and giving preference to needy and deserving communities inhabiting urban India. CSR at the Company shall be underpinned by ‘More from Less for More People’ philosophy which implies striving to achieve greater impacts, outcomes and outputs of its CSR projects and programmes by judicious investment and utilization of financial and human resources, engaging in like-minded stakeholder partnerships for higher outreach benefitting more lives.
Weblink for Tata Motors India CSR Policy: http://investor.tatamotors.com/pdf/csr-policy.pdf
(ii) CSR Projects: 1. Aarogya (Health): Addressing child malnutrition; health awareness for females; preventive and curative health services, drinking water projects; 2. Vidyadhanam (Education): Scholarships; Special coaching classes for secondary school students; IIT-JEE and competitive exams coaching, school infrastructure improvement; co-curricular activities; financial aid to engineering students; 3. Kaushalya (Employability): Divers training – novice and refresher; ITI partnership and allied-auto trades; Motor Mechanic Vehicle (MMV); training in retail, hospitality, white goods repair, agriculture and allied trades; 4. Vasundhara (Environment): Tree plantation, environmental awareness for school students.
2. Composition of CSR Committee: The CSR Committee of the Board of Tata Motors comprises (i) Om Prakash Bhatt, Non-Executive, Independent Director [Chairman of the Committee]; (ii) Ms Falguni S. Nayar, Non-Executive, Independent Director; (iii) Mr Guenter Butschek, CEO & Managing Director, (iv) Mr Satish B. Borwankar, Executive Director and Chief Operating Officer.
3. Average Net Profit of the Company for last three financial years:
Loss ` 2,336.56 crores
4. *Prescribed CSR Expenditure (two per cent. Of the amount as in item 3 above):
Not applicable in view of the loss.
5. *Details of CSR Spend during the financial year:
21.44 crores was spent towards various schemes of CSR as prescribed under Section 135 of the Act. The prescribed CSR expenditure required to be spend in Fiscal 2018 as per the Act was Nil, in view of net profit of the Company being negative under Section 198 of the Act.
(a) Total amount to be spent for the financial year: Not applicable
(b) Amount unspent, if any: Not applicable
( c ) Manner in which the amount spent during the financial year: Refer Table in Annexure-A
6. In case the company has failed to spend the two per cent of the average net profit of the last three financial years or any part thereof, the company shall provide the reasons for not spending the amount: Not Applicable
7. Responsibility Statement of CSR Committee of Board: The CSR Committee of the Company’s Board states that the implementation and monitoring of CSR Policy, is in compliance with CSR objectives and Policy of the Company. The Company had engaged M/s KPMG India (Registered) for assurance on CSR spend by the Company under Section 135 of the Act, Schedule VII.
sd/-
Guenter Butschek CEO & Managing Director(DIN 07427375)
sd/-
Om Prakash Bhatt, Non-Executive, Independent Director (Chairman CSR Committee)(DIN 00548091)
Mumbai, May 23, 2018
ANNEXURE - 6
Annual Report on CSR Activities[Pursuant to Section 135 of the Companies Act, 2013 and the Companies (Corporate Social Responsibility Policy) Rules, 2014]

102
Annexure A
Sr. No.#
CSR project / activity identified
Sector in which the Project is
covered
Projects / Programmes 1. Local area / others 2.Specify the state and district where projects
or programs were undertaken
Amount outlay
(budget) project /
programs wise
Amount spent on the project / programme subheads
Cumulative spend upto
the reporting period
Amount spent: Direct/through implementing
agency*Direct Overhead*
(` in crores) 1 Skill
Development and vocational skills in Automotive and Non-Automotive Sector
Employability Enhancing Skill Development
2. Karnataka- Dharwad Maharashtra- Mumbai, Palghar, Thane, Pune Gujarat- Ahmedabad Jharkhand- East Singhbhum Uttar Pradesh- Bara Banki and Lucknow Uttarakhand- Udham Singh Nagar
5.41 4.28 0.24 4.52 Direct = 0.32 Implementation Agency = 4.20
2 Promoting primary and secondary education in Rural and Socially/ Economically Backward communities
Promoting Education
2. Karnataka- Bangalore and Dharwad Maharashtra- Mumbai, Thane, Navi Mumbai, Pune Gujarat- Ahmedabad Jharkhand- East Singhbhum Uttar Pradesh- Bara Banki and LucknowUttarakhand- Udham Singh Nagar
11.89 9.92 0.51 10.43 Direct = 0.10 Implementation Agency = 10.27
3 Preventive and curative health services in Communities
Eradicating Hunger, Promoting preventive healthcare, Malnutrition, Promoting Preventive healthcare and sanitation and safe drinking water
2. Maharashtra- Mumbai, Palghar, PuneGujarat- Ahmedabad Jharkhand- East Singhbhum Uttar Pradesh- Bara Banki and LucknowUttarakhand- Udham Singh Nagar
3.64 2.72 0.18 2.90 Direct = 0.07 Implementation Agency = 2.83
4 Ensuring environmental sustainability through awareness and protection of natural habitats
Ensuring environmental sustainability
2. Maharashtra- Mumbai, Palghar, PuneGujarat- Ahmedabad Jharkhand- East Singhbhum Uttar Pradesh- Bara Banki and LucknowUttarakhand- Udham Singh Nagar
1.71 1.30 0.08 1.38 Direct = 0.00 Implementation Agency = 1.38
5 Rural Development
Rural development projects
2. Maharashtra- Mumbai, Palghar, 1.00 1.00 0.00 1.00 Direct = 0.00 I m p l e m e n t a t i o n Agency = 1.00
6 Drinking water project under SMDF
Safe drinking water
2. Maharashtra- Mumbai, Palghar, PuneGujarat- AhmedabadJharkhand- East Singhbhum Uttar Pradesh- Bara Banki and LucknowUttarakhand- Udham Singh Nagar
0.00 0.60 0.00 0.60
7 Administrative Overheads And Capacity Building Cost 0.70 0.60 0.01 0.61 Total 24.35 20.42 1.02 21.44
#1 : Employability: Institute of Driving Training & Research, Ahmedabad Dist Cooperative Milk Producers Union Ltd, Ambika Motor Driving School, Center for Youth Development & Activities, Centre for Civil Society, CII, College of Engg Pune, Gram Vikas Kendra, Hubert Ebner (I) Pvt Ltd., Laurus Edutech life Skills Pvt Ltd., MITCON Foundation, Paryawaran Evam Jan Kalyan Samiti, Prasad Chikitsa, Pratham Education Foundation, Prolife, Ramkrishna Mission Sakwar, Sambhav Foundation, Shiksha Prasar Kendra, Samaj Vikas Kendra, Sanand Education Trust, Shashwat, Skill For Progress, Suvidha, Vedanta Foundation, Vikas Samities, Vruksha
#2 : Education: Action Aid, Agastya International Foundation, Avanti Fellows, Govt. Block Resource Centre Education Dept. SSA, Cathedral Church Sanand, Center for Youth Development & Activities, Children’s Movement for Civic Awareness, College of Engineering Pune, Foundation for Academic Excellence, GANATAR, Global Education Trust, Gram Vikas Kendra, IIT Bombay Alumni Association, Manav Seva Education Trust, Moinee Foundation, Paryawaran Evam Jan Kalyan Samiti, Samaj Vikas Kendra, Samata Shikshan Sanstha, Sambhav Foundation, Sanand Lions Foundation Trust, Sarvodhaya Mahasangh, Seva Sahyog Foundation, Shanti Seva Nidhi Trust, Shiksha Prasar Kendra, Shri Shakti Kelavni Uttejak Trust, Society for Human Environmental Development, Suprabhat Mahila Mandal, Swami Vivekananda Youth Movement, Swaroopwardhinee, Tata Institute of Social Sciences, Tata Motors Gruhini Social Welfare Society, The Jai Narayan Charitable Trust, Urmee Charitable Trust, Vidya Poshak, Vikas Samities
#3 : Health: Action Aid, Chetna, Family Planning Association of India, Jan Parivar Kalyan Sansthan, Manav Seva Education Trust, Namaste Life, Nav Jagrat Manav Samaj, Parivar Kalyan Sansthan, Paryawaran Evam Jan Kalyan Samiti, Prasad Chikitsa, Seth G S Medical College and KEM Hospital, SDM college of Medical Science, Sneh Foundation, Snehdeep Jankalyan Foundation, Sumant Moolgaokar Development Foundation, Sterling Hospital, Swadhar, Vikas Samities
#4 : Environment: Bansilal Ramntath Agarwal Charitable Trust, Bombay Natural History Society, College of Social Work Nirmala Niketan Institute, Ganatar, Gram Vikas Kendra, Green Thumb, Manav Seva Education Trust, Paryawaran Evam Jan Kalyan Samiti, Samaj Vikas Kendra, Sarvodhaya Maha Sangh, Terre Policy Center, Tree Public Foundation, Vikas Samities, Wildlife Research and Conservation Society
sd/-
Guenter Butschek CEO & Managing Director(DIN 07427375)
sd/-Om Prakash Bhatt, Non-Executive, Independent Director (DIN 00548091)(Chairman CSR Committee)
Mumbai, May 23, 2018

10373rd Annual Report 2017-18
INTEGRATED REPORT 1-65 STATUTORY REPORTS 66-184 FINANCIAL STATEMENTS 185-353
ANNEXURE - 7
Secretarial Audit Report for the Financial Year ended 31st March, 2018 [Pursuant to section 204 (1) of the Companies Act, 2013 and Rule No. 9 of the Companies
(Appointment and Remuneration of Managerial Personnel) Rules, 2014]
To,The Members,Tata Motors Limited
We have conducted the secretarial audit of the compliance of applicable statutory provisions and the adherence to good corporate practices by Tata MotorsLimited (hereinafter called the Company). Secretarial Audit was conducted in a manner that provided us a reasonable basis for evaluating the corporate conducts/statutory compliances and expressing our opinion thereon.
Based on our verification of the Company’s books, papers, minute books, forms and returns filed and other records maintained by the Company, the information provided by the Company, its officers, agents and authorised representatives during the conduct of secretarial audit, the explanations and clarifications given to us and the representations made by the Management, we hereby report that in our opinion, the Company has, during the audit period covering the financial year ended on 31st March, 2018, generally complied with the statutory provisions listed hereunder and also that the Company has proper Board processes and compliance mechanism in place to the extent, in the manner and subject to the reporting made hereinafter:
We have examined the books, papers, minute books, forms and returns filed and other records made available to us and maintained by the Company for the financial year ended on 31st March, 2018 according to the provisions of:
(i) The Companies Act, 2013 (the Act) and the rules made thereunder;
(ii) The Securities Contract (Regulation) Act, 1956 (‘SCRA’) and the rules made thereunder;
(iii) The Depositories Act, 1996 and the Regulations and Bye-laws framed thereunder;
(iv) Foreign Exchange Management Act, 1999 and the rules and regulations made thereunder to the extent of Foreign Direct Investment, Overseas Direct Investment and External Commercial Borrowings;
(v) The following Regulations and Guidelines prescribed under the Securities and Exchange Board of India Act, 1992 (‘SEBI Act’)
(a) The Securities and Exchange Board of India (Substantial Acquisition of Shares and Takeovers) Regulations, 2011;
(b) The Securities and Exchange Board of India (Prohibition of Insider Trading) Regulations, 2015;
( c ) The Securities and Exchange Board of India (Issue of Capital and Disclosure Requirements) Regulations, 2009 and amendments from time to time;
(d) The Securities and Exchange Board of India (Share Based
Employee Benefits) Regulations, 2014;(Not applicable to the Company during the audit period)
(e) The Securities and Exchange Board of India (Issue and Listing of Debt Securities) Regulations, 2008;
(f) The Securities and Exchange Board of India (Registrars to an Issue and Share Transfer Agents) Regulations, 1993 regarding the Companies Act and dealing with client; (Not applicable to the Company during the audit period)
(g) The Securities and Exchange Board of India (Delisting of Equity Shares) Regulations, 2009; (Not applicable to the Company during the audit period) and
(h) The Securities and Exchange Board of India (Buyback of Securities) Regulations, 1998; (Not applicable to the Company during the audit period)
(vi) Other laws applicable specifically to the Company namely:
1. The Motor Vehicle Act, 1988 and the Rules made thereunder.
We have also examined compliance with the applicable clauses of the following:
(i) Secretarial Standards issued by The Institute of Company Secretaries of India with respect to board and general meetings.
(ii) The Listing Agreements entered into by the Company with BSE Limited and National Stock Exchange of India Limited read with the Securities and Exchange Board of India (Listing Obligations and Disclosure Requirements) Regulations, 2015.
During the period under review, the Company has complied with the provisions of the Act, Rules, Regulations, Guidelines, standards etc. mentioned above.
The Securities and Exchange Board of India have vide Order dated March 6, 2018 issued directions for the Company to conduct an internal inquiry within 3 months into the leakage of information relating to its financial results for the quarter ended December 2015, take appropriate actions against those responsible and to submit its report within 7 days thereafter.
The Company has paid a penalty of Rs. 5.60 lakhs each levied by the BSE Limited and National Stock Exchange of India Limited in respect of delay in filing of listing application for 266 Ordinary Share and 80 ‘A’ Ordinary Shares allotted out of shares held in abeyance on settlement of an interse dispute amongst the shareholders.
We further report that:
The Board of Directors of the Company is duly constituted with proper balance of Executive Directors, Non-Executive Directors and Independent Directors subject to what is stated above. The changes in the composition of the Board of Directors that took place

104
during the period under review were carried out in compliance with the provisions of the Act.
Adequate notice was given to all directors to schedule the Board Meetings, agenda and detailed notes on agenda were sent at least seven days in advance for meetings other than those held at shorter notice for which necessary consents have been sought at the meeting, and a system exists for seeking and obtaining further information and clarifications on the agenda items before the meeting and for meaningful participation at the meeting.
Majority decision is carried through while the dissenting members’ views are captured and recorded as part of the Minutes of the Meetings.
We further report that there are adequate systems and processes in the Company commensurate with the size and operations of the Company to monitor and ensure compliance with applicable laws, rules, regulations and guidelines.
We further report that during the audit period the Company had following events which had bearing on the Company’s affairs in pursuance of the above referred laws, rules, regulations, guidelines, standards etc.
a. The Company held NCLT convened meeting of the Shareholders on November 15, 2017 for merger of TML Drivelines Limited, its wholly-owned subsidiary with the Company.
b. The decision of the Supreme Court vide order dated 29-03-2017 which was to ban sale of BS3 vehicles with effect from April 1, 2017 impacted the automobile industry including the Company, mainly in the context of the BS3 inventory lying unsold as on that date.
c. Issue of 266 Ordinary shares and 80 ‘A’ Ordinary shares earlier kept in abeyance.
d. The Company redeemed unsecured Non-Convertible Debentures aggregating Rs. 250 crores during the year has complied with the applicable laws.
e. The Company made Private placement of Non-Convertible Debentures aggregating Rs. 1500 crores and complied with the applicable provisions of laws.
For Parikh & AssociatesCompany Secretaries
P. N. ParikhPartnerFCS No: 327 CP No: 1228
Place: MumbaiDate : May 23, 2018
This Report is to be read with our letter of even date which is annexed as Annexure A and
Forms an integral part of this report.
‘Annexure A’
To,The Members,Tata Motors Limited
Our report of even date is to be read along with this letter.
1. Maintenance of secretarial record is the responsibility of the management of the Company. Our responsibility is to express an opinion on these secretarial records based on our audit.
2. We have followed the audit practices and process as were appropriate to obtain reasonable assurance about the correctness of the contents of the secretarial records. The verification was done on test basis to ensure that correct facts are reflected in secretarial records. We believe that the process and practices, we followed provide a reasonable basis for our opinion.
3. We have not verified the correctness and appropriateness of financial records and Books of Accounts of the Company.
4. Where ever required, we have obtained the Management Representation about the Compliance of laws, rules and regulations and happening of events etc.
5. The Compliance of the provisions of Corporate and other applicable laws, rules, regulations, standards is the responsibility of management. Our examination was limited to the verification of procedure on test basis.
6. The Secretarial Audit report is neither an assurance as to the future viability of the Company nor of the efficacy or effectiveness with which the management has conducted the
affairs of the Company.
For Parikh & AssociatesCompany Secretaries
P. N. ParikhPartnerFCS No: 327 CP No: 1228
Place: MumbaiDate : May 23, 2018

10573rd Annual Report 2017-18
INTEGRATED REPORT 1-65 STATUTORY REPORTS 66-184 FINANCIAL STATEMENTS 185-353
1. Preamble
The Securities Exchange Board of India (SEBI) vide its notification dated July 08, 2016 has amended the SEBI (Listing Obligations and Disclosure Requirements) Regulations, 2015 (“SEBI LODR”), by inserting Regulation 43A, making it mandatory for the top 500 listed Companies based on the market capitalization (calculated as on March 31 of every financial year) to formulate a Dividend Distribution Policy, which will be disclosed in their annual report and on their website.
Tata Motors Limited being one of the top 500 listed companies as per the criteria mentioned above, has framed a Dividend Distribution Policy (“Policy”). This policy has been adopted by the Board of Directors of the Company at its meeting held on May 23, 2017, being the effective date of this Policy.
2. Scope and Objective
This Policy seeks to lay down a broad framework for the distribution of dividend by the Company whilst appropriately balancing the need of the Company to retain resources for the Company’s growth & sustainability. Through this policy, the Company also endeavors to maintain fairness and consistency while considering distributing dividend to the shareholders.
The Policy sets out the circumstances and different factors for consideration by the Board at the time of taking a decision on distribution or retention of profits, in the interest of providing transparency to the shareholders.
The Policy is not an alternative to the decision of the Board for recommending dividend, which is made every year after taking into consideration all the relevant circumstances enumerated hereunder or other factors as may be considered relevant by the Board.
The Policy is being recommended for adoption by the Board of Directors of all the Companies in the Tata Motors Group ie. by all its subsidiaries and to the extent possible, the joint ventures after discussions with its partners
3. Statutory Requirements
This policy on dividend distribution shall be in accordance with the provisions of the Companies Act, 2013, read with applicable rules framed thereunder, as may be in force for the time being (“Act”), SEBI ( Listing Obligations and Disclosure Requirements) Regulations, 2015, (“SEBI LODR”), such other applicable provisions of law.
4. Definitions
i. “Act” shall mean the Companies Act, 2013 including the Companies (Declaration and Payment of Dividend) Rules, 2014, as amended from time to time.
ANNEXURE - 8
Dividend Distribution Policy [Pursuant to Regulation 43A of SEBI (Listing Obligations and Disclosure Requirements) Regulations, 2015]
ii. “Applicable Laws” shall mean the Companies Act, 2013 and Rules made thereunder, the Securities and Exchange Board of India (Listing Obligations and Disclosure Requirements) Regulations, 2015 together with the circulars issued thereunder; as amended from time to time and such other act, rules or regulations which deals with the distribution of dividend.
iii. “Board” or “Board of Directors” shall mean Board of Directors of the Company.
iv. “Company” shall mean “Tata Motors Limited” or “TML”.
v. “Dividend” includes any interim dividend as defined under the Companies Act, 2013.
vi. “Free Reserves” shall means such reserves which, as per the latest audited balance sheet of a Company, are available for distribution as dividend:
Provided that -
i. any amount representing unrealized gains, notional gains or revaluation of assets, whether shown as reserves or otherwise, or
ii. any change in carrying amount of an asset or of a liability recognized in equity, including surplus in profit and loss account on measurement of the asset or the liability at fair value,
shall not be treated as free reserves.”
vii. “SEBI LODR” shall mean Securities and Exchange Board of India (Listing Obligations and Disclosure Requirements) Regulations, 2015 together with the circulars issued thereunder; as amended from time to time.
viii. “Policy” or “this Policy” shall mean the Dividend Distribution Policy.
5. Statutory Provisions Relating to Distribution Of Dividend
In accordance with the provisions of the Act, dividend shall be declared or paid only:
A. Out of distributable profits of current year or previous financial years:
i. Current financial year’s profit after tax of standalone financial statement as per applicable Accounting Standards:
(a) after providing for depreciation in accordance with Applicable laws and regulations; and
(b) after transferring to reserves such amount as may be prescribed or as may be otherwise considered appropriate by the Board at its discretion; OR

106
ii. Profits for any previous financial year(s):
(a) after providing for depreciation in accordance with Applicable Laws and regulations; and
(b) remaining undistributed; OR
iii. A combination of (i) & (ii) above;
B. Out of free reserves – in the event of inadequacy/absence of profits
In the event of inadequacy or absence of profits in any year, Company may declare dividend out of free reserves, subject to fulfilment of conditions specified under the Act, as amended from time to time.
C. Company may, in certain cases, declare dividend using a combination of A and B above.
6. Parameters to be considered while Recommending/Declaring Dividend
The Board while determining quantum of the dividend payout to the shareholders, will consider following internal and external factors:
Internal Factors:
• Profits earned and available for distribution during the financial year
• Accumulated reserves, including retained earnings
• Mandatory transfer of Profits earned to specific reserves, such as Debenture Redemption Reserve, etc.
• Past dividend trends – rate of dividend, EPS and payout ratio, etc.
• Earning Stability
• Future Capital Expenditure requirement of the Company
• Growth plans, both organic and inorganic
• Capital restructuring, Debt reduction, Capitalisation of shares
• Crystallization of contingent liabilities of the Company
• Profit earned under the Consolidated Financial Statement
• Cash Flows
• Current and projected Cash Balance and Company’s working capital requirements.
• Covenants in loan agreements, Debt servicing obligations and Debt maturity profile.
External Factors:
• Economic environment, both domestic and global.
• Unfavorable market conditions
• Changes in Government policies and regulatory provisions
• Cost of raising funds from alternate sources
• Inflation rates
• Sense of shareholders’ expectations
• Cost of external financing
7. Circumstances under which the shareholders of the Company may or may not expect Dividend
The decision regarding dividend payout is a crucial decision as it determines the amount of profit to be distributed among shareholders and amount of profit to be retained in business. Hence, the shareholders of the Company may expect dividend only if the Company is having surplus funds after providing for all the expenses, depreciation, etc., and after complying with the statutory requirements under the Applicable Laws.
The shareholders of the Company may not expect dividend in the following circumstances, subject to the discretion of the Board of Directors:
• the Company has inadequacy of profits or incurs losses for the Financial Year;
• the Company undertakes /proposes to undertake a significant expansion project requiring higher allocation of capital;
• the Company undertakes /proposes to undertake any acquisitions or joint arrangements requiring significant allocation of capital.
• the Company has significantly higher working capital requirement affecting free cash flow.
• the Company proposes to utilize surplus cash for buy- back of securities;
• the Company is prohibited to recommend/declare dividend by any regulatory body.
The Board may also not recommend a dividend on considering any compelling factors/parameters mentioned in point 6 above.
8. Quantum, Manner and Timelines for Dividend Payout
Quantum:
The dividend history of the Company over the past 10 years is as follows:
FY08-09
FY09-10
FY10-11
FY11-12
FY12-13
FY13-14
FY14-15
FY 15-16
FY16-17
FY 17-18
Dividend paid per share on Ordinary shares 6 15 20* 4 2 2 - .20 - -
Dividend payout (as a % to Standalone PAT) 35 44 81* 118 240 199 - 31 - -
Dividend Payout (as % to Consolidated PAT) -15 39 16* 11 8 5 - 1 - -
* subdivision of shares on September 13, 2011 (record date) from face value of `10/- each to face value of `2/- each.
The ‘A’ Ordinary Shares issued in 2008 are paid a higher dividend of 5% i.e `0.10 per share of `2/- each as per the terms of Issue.

10773rd Annual Report 2017-18
INTEGRATED REPORT 1-65 STATUTORY REPORTS 66-184 FINANCIAL STATEMENTS 185-353
Considering the aforementioned dividend payment track record of the Company, the Company shall endeavor to maintain a total dividend pay-out ratio in the range of 25% to 40% of the annual standalone profits after tax (PAT) of the Company. Under the applicable provisions of the Act, the Company’s ability to declare and pay dividends is based on the standalone Financial Statements only. In future should the regulations be amended permitting the Company to pay dividend based on its Consolidated Profits, the Board would consider such a payout ratio on its Consolidated Profits. Till such time, the Company will endeavor to have a policy on dividend distribution with a similar payout ratio across its subsidiaries and to the extent possible, in its joint ventures after discussions with its partners.
Manner and timelines:
The Company may declare dividends for a year, usually payable for a financial year at the time when the Board considers and recommends the Annual Financial Statements, which is called final dividend. The Board of Directors shall have the power to recommend final dividend to the shareholders for their approval in the Annual General Meeting of the Company.
The Board of Directors shall also have the absolute power to declare interim dividend during the financial year, between two Annual General Meetings as and when they consider it fit.
9. Specific Clause with regard to Dividend on Shares with Differential Voting Rights
The payment of dividend shall be based on the respective rights attached to each class of shares as per their terms of issue.
The Company has two classes of shares- the Ordinary shares and ‘A’ Ordinary shares. The holders of “A” Ordinary shares shall as per the terms of its issue be entitled to receive
dividend for each financial year at five percentage points more than the aggregate rate of dividend on Ordinary shares for that financial year.
10 Policy Review and Amendments
The Policy will be reviewed periodically by the Board. Any changes in the policy will be communicated to the shareholders, alongwith the rationale for carrying out said changes in timely manner.
11. Disclosures
The Policy shall be disclosed in the Annual report and on the website of the Company i.e. at http://investor.tatamotors.com/pdf/dividend-distribution-policy.pdf.
12. Disclaimer
a. The Policy does not constitute a commitment regarding the future dividends of the Company, but only represents a general guidance regarding dividend policy. The statement of the Policy does not in any way restrict the right of the Board to use its discretion in the recommendation of the Dividend to be distributed in the year and the Board reserves the right to depart from the policy as and when circumstances so warrant.
b. Given the aforementioned uncertainties, prospective or present investors are cautioned not to place undue reliance on any of the forward- looking statements in the Policy.
On behalf of the Board of Directors
N CHANDRASEKARANChairman
(DIN: 00121863)Mumbai, May 23, 2018

108
MANAGEMENT DISCUSSION AND ANALYSIS
ECONOMY OVERVIEW
INDIA
The year 2017, for India was marked by a number of key structural initiatives to build strength across macro-economic parameters for sustainable growth in the future. The growth in the first half of the year suffered despite global tailwinds. However, the weakness seen at the beginning of 2017, seems to have bottomed out as 2018 set in. Currently, the economy seems to be on the path to recovery, with indicators of industrial production, stock market index, auto sales and exports having shown some uptick. India has recovered from the effects of demonetization and the introduction of the Goods and Service Tax.
As per the advance estimates, in Fiscal 2018, India’s GDP increased to 6.7% as compared to an increase of 7.1% in Fiscal 2017. India’s GDP growth bottomed out in the middle of 2017 after slowing for five consecutive quarters, and has since improved significantly, with momentum carrying over into 2018 on the back of a recovery in investment. Although investment growth was still moderately lower in 2017 than in 2016, high-frequency indicators suggest that it accelerated into 2018. The temporary disruptions caused by the implementation of the Goods and Services Tax dissipated by mid-2017, and manufacturing output and industrial production have continued to firm since then.
Currently, India is the world’s seventh-largest economy at USD 2.2 trillion, sitting between France and Italy. India has emerged as the fastest growing major economy in the world as per the Central Statistics Organization and International Monetary Fund (IMF) and it is expected to be one of the top three economic powers of the world over the next 10-15 years, backed by strong democracy and partnerships.
WORLD
2017 is the year which saw global economy accelerating although UK economy is evidently slowing, while the US economy continues to grow at a modest pace. The Chinese economy continues to grow strong. However, the Euro zone and Japan shows sign of acceleration, as do many of the major emerging economies such as Turkey and Russia. The US economy grew at 2.7% in Fiscal 2018, supported by broad-based strength in domestic demand, especially investment. The economy may be near its productive potential, as both capacity utilisation and the employment rate are moving toward peaks attained prior to the financial crisis.
During 2017, prices of base metal also strengthened, with the strong growth in infrastructure sector in major countries around the globe. Crude prices remained range bound in major part of 2017 although it started to give a signal of upward breakout towards fourth quarter of Fiscal 2018. Brent crude started sharp rally in the middle of 2017 around $44/bbl and has rallied all the way to $79/bbl. The tensions in the Middle East and West Asia will only add to the increase in oil prices.
The Eurozone grew at its faster rate in a decade in 2017, by 2% highest since 2007, reflecting the strong consumption, investment, and exports. Amid continued monetary policy stimulus, growth is projected to be 2.1% in 2018. The Eurozone is in the midst of a broad cyclical expansion, after years of economic stagnation and rolling crisis, fueled by recovery confidence and monetary stimulus from the European Central Bank. The UK by contrast, has grown by 1.8% in 2017, down from 2016’s 1.9% rate and the weakest expansion since 2012, mainly reflecting the impact of higher inflation in the wake of the 2016 Brexit vote and weaker investment from Companies due to uncertainty of future trade arrangements. The United Kingdom is expected to grow at 1.4% in 2018. The economies in Spain, Italy and France has shown better prospects with GDP rate. Germany accounted for 28% of the Euro area economy with steady growth of 2% GDP.
China registering growth of 6.9% in 2017 and had remained solid this year. Activity continues to shift to consumption, while investment growth rates remain well below those in recent years. Industrial production has stabilized following significant cuts in overcapacity sectors implemented over the past two years. However, according to International Monetary Fund (IMF), China’s debt has ballooned to 234% of the total output. Supported by deepening macro-economic stability and gradual monetary loosening, Russia’s economy continued its recovery in 2017, mainly driven by non-tradable sectors. Growth momentum towards the end of 2017 slowed down but picked up in Fiscal 2018. Russia’s growth prospect remain modest.
Growth in Japan reached 1.7% in 2017, underpinned by supportive financial conditions and strong exports, but contracted at the beginning of this year. Nonetheless, unemployment is falling to levels not seen since the 1990s. South Africa had GDP increase. This is mainly due to change in the political leadership, which has demonstrated strong commitment to strengthening institutional integrity-especially state owned enterprises- reaching out both to business and labor, and pronouncing the intention to build a new social compact in the country.
(Source : Global Economic Prospects, Wold Bank)
Business Summary
The Company primarily operates in the automotive segment which include all activities relating to the development, design, manufacture, assembly and sale of vehicles including vehicle financing, as well as sale of related parts and accessories. Through Jaguar Land Rover business, the Company operates in the premium car market segment wholesaling vehicles in developed markets such as the United Kingdom, the United States, Europe and China as well as several emerging markets such as Russia, Brazil and South Africa amongst others. The Company expects to focus on profitable growth opportunities in its global automotive business through new products and market expansion. Within automotive operations, the Company continues to focus on integration and synergy through sharing of resources, platforms, facilities for product development and manufacturing, sourcing strategy and mutual sharing of best practices.

10973rd Annual Report 2017-18
INTEGRATED REPORT 1-65 STATUTORY REPORTS 66-184 FINANCIAL STATEMENTS 185-353
The Company’s business segments are (i) automotive operations and (ii) all other operations. The Company provide financing for vehicles sold by dealers in India. The vehicle financing is intended to encourage sales of vehicles by providing financing to the dealers’ customers and as such is an integral part of the Company’s automotive business. The Company’s automotive operations are further subdivided into Tata and other brand vehicles (including vehicle financing) and Jaguar Land Rover. Tata and other brand vehicles consist of vehicles manufactured under Tata, Daewoo and Fiat brands, and exclude vehicles manufactured under Jaguar Land Rover brands.
The Company’s other operations business segment mainly includes information technology services, and machine tools and factory automation services.
The Company has decided to sell stake of the various non-core investments to ensure that it wins decisively in the future. Slump sale of value added Segment of Defence vehicles business and specialized Defence projects (excluding FICV) to Tata Advanced Systems Limited (TASL). Sale of Aerospace business unit of TAL Manufacturing Solutions Ltd (TAL) via 100% Share sale to TASL. The Company has also classified its investment in Tata Technologies Ltd, Tata Hitachi Construction Machinery Company Private Ltd, Tata Steel Ltd and Tata Chemicals as held for sale / current investments.
Automotive Operations
Automotive operations is the Company’s most significant segment, which include:
o activities relating to the development, design, manufacture, assembly and sale of vehicles as well as related spare parts and accessories;
o distribution and service of vehicles; and
o financing of the Company’s vehicles in certain markets.
The Company’s consolidated total sales (including international business sales and Jaguar Land Rover sales, excluding Chery Jaguar Land Rover) for Fiscal 2018 and 2017 are set forth in the table below:
Fiscal 2018 Fiscal 2017
Units % Units %
Passenger cars 3,19,492 26.2% 3,10,171 28.4%
Utility vehicles 4,45,080 36.4% 3,85,480 35.3%
Light Commercial Vehicles 2,85,857 23.4% 2,16,222 19.8%
Medium and Heavy Commercial Vehicles 1,70,695 14.0% 1,79,875 16.5%
Total 12,21,124 100.0% 10,91,748 100.0%
The automotive operations segment is further divided into (i) Tata and other brand vehicles (including vehicle financing) and (ii) Jaguar Land Rover.
Tata and other brand vehicles (including vehicle financing)
India is the primary market for Tata and other brand vehicles (including vehicle financing). During Fiscal 2018, there was a robust and steady pace of economic growth in the geographic markets in which the Tata and other brand vehicles segment has operations.
Fiscal 2018 was a milestone year for the Indian automotive industry, as it overtook Germany to become the 4th largest global automotive market. The sales volume built upon last year’s momentum to register a double-digit growth - first time since Fiscal 2012 - helped by improvement in the rural economy and partly due to demonetization-influenced low base in the second half of Fiscal 2017.
The following table sets forth the Company consolidated total sales of Tata and other brand vehicles:
Fiscal 2018 Fiscal 2017
Units % Units %
Passenger cars 1,69,008 25.0% 1,40,887 25.3%
Utility vehicles 50,266 7.4% 20,018 3.6%
Light Commercial Vehicles
2,85,857 42.3% 2,16,222 38.8%
Medium and Heavy Commer-cial Vehicles
1,70,695 25.3% 1,79,875 32.3%
Total 6,75,826 100.0% 5,57,002 100.0%
The Company’s overall sales of Tata and other brand vehicles increased by 21.3% to 6,75,826 units in Fiscal 2018 from 5,57,002 units in Fiscal 2017, and the revenue (before inter-segment elimination) increased by 18.0% to ` 66,620.38 crores during Fiscal 2018, compared to `56,448.48 crores in Fiscal 2017.
Vehicle Sales in India
Automobile sales across categories domestically rose by 10.1% in Fiscal 2018. Sale of passenger vehicles grew by 7.3% in Fiscal 2018, as compared to Fiscal 2017, being increase in all categories- passenger cars and UV’s.
The following table sets forth the Company‘s (on standalone basis) sales, industry sales and relative market share in vehicle sales in India. Passenger vehicles includes passenger cars and utility vehicles. Commercial vehicles include Medium & Heavy Commercial Vehicles, Light Commercial Vehicles, Intermediate & Small commercial vehicles & Pickups and CV Passenger vehicles.

110
Industry Sales Company Sales Market ShareFiscal 2018 Fiscal 2017 Growth Fiscal 2018 Fiscal 2017 Growth Fiscal 2018 Fiscal 2017
Units % Units % %Commercial Vehicles1 8,87,316 7,29,360 21.7% 3,99,821 3,24,175 23.3% 45.1% 44.4%
Passenger Vehicles2 32,55,010 30,32,910 7.3% 1,84,743 1,55,260 19.0% 5.7% 5.1%
Total 41,42,326 37,62,270 10.1% 5,84,564 4,79,435 21.9% 14.1% 12.7%Source:
Society of Indian Automobile Manufacturers report and Company Analysis1 Commercial vehicles include V2 van sales.2 Passenger vehicles does not include Jaguar Land Rover-branded cars.
Passenger Vehicles in India
Sales in the passenger vehicles industry in India increased by 7.3% in Fiscal 2018. Utility Vehicles sales witnessed significant growth during Fiscal 2018 due to continued consumption demand and strong rural growth.
Reflecting the growth in the Indian passenger vehicle sector, the Company’s passenger vehicle sales in India increased by 19.0% to 184,743 units in Fiscal 2018 from 155,260 units in Fiscal 2017, due to new product offerings by the Company viz. Nexon, Tigor, Hexa, Tiago etc.
Industry Sales Company Sales Market ShareFiscal 2018 Fiscal 2017 Growth Fiscal 2018 Fiscal 2017 Growth Fiscal 2018 Fiscal 2017
Units % Units % % %Passenger Cars 21,73,380 2,104,976 3.2% 1,34,860 1,36,479 (1.2%) 6.2% 6.5%UV & Vans1 10,81,630 9,27,934 16.6% 49,883 18,781 165.6% 4.6% 2.0%Total2 32,55,010 30,32,910 7.3% 1,84,743 1,55,260 19.0% 5.7% 5.1%Source:
Society of Indian Automobile Manufacturers report and Company Analysis1 Excludes V2 van sales.2 Total industry numbers includes sale in other segments.
The Company’s passenger vehicles category consists of: (i) passenger cars and (ii) utility vehicles. The Company sold 134,860 units in the passenger car category in Fiscal 2018, representing a marginal decrease of 1.2% compared to 136,479 units in Fiscal 2017. However, in the utility vehicles category, the Company sold 49,883 units in Fiscal 2018, representing an increase of 165.6% from 18,781 units in Fiscal 2017. During Fiscal 2018, the Company launched, Nexon, a compact SUV and sold 27,111 units. The Tata Tiago, Hexa and Tata Tigor were launched in Fiscal 2017. All these new product launches has helped Company increasing its market share and volumes in passenger vehicles category. Dealer network upgradation and working capital availability were prevailing constrains in passenger vehicle sales and the Company has been working with THF Holding Limited, its financing arm and other banks to plug these gaps.
Commercial Vehicles in India
The following table sets forth the Company’s commercial vehicle sales, industry sales and relative market share in commercial vehicle sales in India.
Industry Sales Company Sales Market Share
Fiscal 2018 Fiscal 2017 Growth Fiscal 2018 Fiscal 2017 Growth Fiscal 2018 Fiscal 2017
Units % Units % % %M&HCV 247,659 211,198 17.3% 134,455 116,403 15.5% 54.3% 55.1%ILCV1 103,131 80,625 27.9% 46,343 34,166 35.6% 44.9% 42.4%SCV & Pickups 421,084 324,090 29.9% 166,746 121,411 37.3% 39.6% 37.5%CV Passenger 115,442 113,447 1.8% 52,277 52,195 0.2% 45.3% 46.0%Total 887,316 729,360 21.7% 399,821 324,175 23.3% 45.1% 44.4%Source:
Society of Indian Automobile Manufacturers report and Company Analysis1 LCVs include V2 van sales

11173rd Annual Report 2017-18
INTEGRATED REPORT 1-65 STATUTORY REPORTS 66-184 FINANCIAL STATEMENTS 185-353
Industry sales of commercial vehicles increased by 21.7% to 887,316 units in Fiscal 2018 from 729,360 units in Fiscal 2017. Industry sales in the medium and heavy commercial vehicle segment has grown by 17.3% at 247,659 units in Fiscal 2018, as compared to 211,198 in Fiscal 2017. The M&HCV industry has shown signs of recovery since July 2017. The implementation of GST, restrictions on overloading and infrastructure growth supported by the Government has boosted the demand. Industry sales of ILCV reported an increase of 27.9% to 103,131 units in Fiscal 2018, from 80,625 units in Fiscal 2017. Industry sales of SCV & Pickups reported an increase of 29.9% to 421,084 units in Fiscal 2018, from 324,090 units in Fiscal 2017. The ILCV & SCV industry growth is mainly due to high investments in e-commerce segments which is driving demand for last mile transportation requirements, growth in replacement demand, improved financing and recovery in rural demand. Industry sales of CV Passenger reported a marginal increase of 1.8% to 115,442 units in Fiscal 2018, from 113,447 units in Fiscal 2017 due to muted demand from STUs.
The sales of the Company’s commercial vehicles in India outperformed the industry with a growth rate of 23.3% to 399,821 units in Fiscal 2018 from 324,175 units in Fiscal 2017. The Company’s sales in the M&HCV category increased by 15.5% to 134,455 units in Fiscal 2018, as compared to sales of 116,403 units in Fiscal 2017. The Company’s sales in the ILCV segment increased by 35.6% to 46,343 units in Fiscal 2018, from 34,166 units in Fiscal 2017. The sales in SCV & Pickups segment increased by 37.3% to 166,746 units in Fiscal 2018 from 121,411 units in Fiscal 2017. However, the CV Passenger segment remained flat with a growth of 0.2% to 52,277 units in Fiscal 2018 from 52,195 units in Fiscal 2017. There has been positive customer response to the superior range of BS4 vehicles complemented by the success of the Company’s innovative SCR technology led to this growth. The new products introduced like the Ultra range trucks, ACE XL range have seen very strong response.
Tata and other brand vehicles — International Markets
The Company’s exports (on standalone basis) de-grew by 18.4% to 52,404 units in Fiscal 2018 as compared to 64,221 units in Fiscal 2017. The reduction was on account of contraction in TIV (Total Industry Volume) in few key markets. The increase of exports to Nepal provided an opportunity for the Company. The launch of new models in the Middle East and Africa region, along with the opening of new markets in these regions, contributed to an increase in international sales volumes. The Company’s top five (quantity terms) export destinations for vehicles manufactured in India - Bangladesh, Nepal, Sri Lanka, South Africa and Indonesia accounted for approximately 81% of the exports of commercial vehicles and passenger vehicles.
In Fiscal 2018, Tata Daewoo Commercial Vehicle Co. Ltd or TDCV’s overall vehicles sales were 8,870 units compared to 10,317 units in fiscal 2017, a drop of 14.0%. The domestic sales in South Korea at 6,859 units in Fiscal 2018, reduced by 22.0% as compared to 8,795 units of Fiscal 2017, primarily due to lower industry volumes and aggressive discounting and marketing strategies of importers considering their higher ordering level. The combined market share was 26.5% as compared to 29.6% in Fiscal 2017. The export market scenario continued to remain challenging in Fiscal 2018 with factors like local currency depreciation against the US Dollar,
continuing statutory regulations to reduce imports, the slowdown in Chinese economy impacting commodity exporting countries and increased dealer inventory. However, TDCV could increase its export sales to 2,011 units, 32.1% higher compared to 1,522 units in Fiscal 2017 primarily due to better sales in key markets such as Algeria & Vietnam through new distributors and higher focus on KD shipments to counter CBU import regulations.
Tata and other brand vehicles — Sales, Distribution and Support
The Company’s sales and distribution network in India as at March 2018 comprised approximately 4,931 contact points for sales and service for its passenger and commercial vehicle business. The Company’s subsidiary, TML Distribution Company Limited, or TDCL, acts as a dedicated distribution and logistics management Company to support the sales and distribution operations of its vehicles in India and has set up stocking points at some of Company’s plants and at different places throughout India. The Company believes this has improved the efficiency of its selling and distribution operations and processes. The Company uses a network of service centers on highways and a toll-free customer assistance center to provide 24-hour roadside assistance, including replacement of parts, to vehicle owners.
TDCL helps the Company improve its planning, inventory management, transport management and timing of delivery. The Company has customer relations management system, or CRM, at all of its dealerships and offices across the country, which supports users both at its Company and among its distributors in India and abroad. The Company believes that the reach of its sales, service and maintenance network provides it with a significant advantage over its competitors.
The Company markets its commercial and passenger vehicles in several countries in Africa, the Middle East, South East Asia, South Asia, Australia, Latin America, Russia and the Commonwealth of Independent States countries. The Company has a network of distributors in all such countries, where it exports its vehicles. Such distributors have created a network of dealers and branch offices and facilities for sales and after-sales servicing of the Company’s products in their respective markets. The Company has also stationed overseas resident sales and service representatives in various countries to oversee its operations in the respective territories.
TML has a 100% subsidiary TMF Holdings Ltd which in turn has two operating Companies Tata Motors Finance Ltd and Tata Motors Finance Solutions Ltd. Through Tata Motors Finance Ltd, it provides financing services to purchasers of its vehicles through independent dealers, who act as the Company’s agents for financing transactions, and through the Company’s branch network. Tata Motors Finance Solutions Ltd provides funding in the Used Vehicle Finance space and is also in the Business of extending loans to TML Dealers and Vendors. Revenue from the Company’s vehicle financing operations (on consolidated basis as per Ind AS) increased by 8.4% to `2,632.18 crores in Fiscal 2018 as compared to `2,429.23 crores in Fiscal 2017, which was mainly driven by growth in the commercial vehicle segment.
TMFL disbursed `15,406 crores and `9,298 crores in vehicle financing during Fiscal 2018 and 2017, respectively. During Fiscal 2018 and 2017, approximately 25% and 22%, respectively, of the Company’s vehicle unit sales in India were made by the dealers

112
through financing arrangements where the Company’s captive vehicle financing divisions provided the support. As at March 31, 2018 and 2017, the Company’s customer finance receivable portfolio comprised 488,456 and 552,991 contracts, respectively. The Company follow specified internal procedures, including quantitative guidelines, for selection of its finance customers and assist in managing default and repayment risk in the Company’s portfolio. The Company originate all of the contracts through its authorized dealers and direct marketing agents with whom the Company have agreements. All the Company’s marketing, sales and collection activities are undertaken through dealers or by TMFL. Total vehicle finance receivables outstanding as at March 31, 2018 and 2017 amounted to `23,881.18 crores and `17,563.25 crores, respectively.
Tata and other brand vehicles — Spare Parts and After-sales Activity
The Company’s consolidated spare parts and after-sales activity revenue was `4,993.28 crores in Fiscal 2018, compared to `4,895.75 crores in Fiscal 2017. The Company’s spare parts and after-sales activity experienced limited growth due to weak sales of both commercial vehicles and passenger vehicles in recent years.
Tata and other brand vehicles — Competition
The Company faces competition from various domestic and foreign automotive manufacturers in the Indian automotive market. Improving infrastructure and robust growth prospects compared to other mature markets has attracted a number of international companies to India that have either formed joint ventures with local partners or have established independently owned operations in India. Global competitors bring with them decades of international experience, global scale, advanced technology and significant financial resources, and, as a result, competition is likely to further intensify in the future. The Company has designed its products to suit the requirements of the Indian market based on specific customer needs such as safety, driving comfort, fuel-efficiency and durability. The Company believes that its vehicles are suited to the general conditions of Indian roads and the local climate. Its vehicles have also been designed to comply with applicable environmental regulations currently in effect. The Company also offers a wide range of optional configurations to meet the specific needs of its customers and intends to develop and is developing products to strengthen its product portfolio in order to meet the increasing customer expectations of owning world-class products.
Tata and other brand vehicles — Seasonality
Demand for the Company’s vehicles in the Indian market is subject to seasonal variations. Demand for the Company’s vehicles generally peaks between January and March, although there is a decrease in demand in February just before release of the Indian fiscal budget. Demand is usually lean from April to July and picks up again in the festival season from September onwards, with a decline in December due to year-end.
Jaguar Land Rover (JLR)
Total wholesales of Jaguar Land Rover vehicles (excluding Chery Jaguar Land Rover) with a breakdown between Jaguar and Land Rover brand vehicles, in Fiscal 2018 and 2017 are set forth in the table below:
Fiscal 2018 Fiscal 2017
Units % Units %
Jaguar 1,50,484 27.6% 1,69,284 31.7%
Land Rover 3,94,814 72.4% 3,65,462 68.3%
Total 5,45,298 100.0% 5,34,746 100.0%
In Fiscal 2018, Jaguar Land Rover wholesale volumes were 545,298 units, up 2.0% compared to Fiscal 2017. Lower sales of more established models partially offset the rise in sales driven by the introduction of new models. Wholesale volumes were up in China (11.0%), Overseas markets (13.0%) and in North America (3.4%) but down in the United Kingdom (1.1%) and in Europe (7.2%), reflecting continuing uncertainty over diesel.
Jaguar wholesale volumes were 150,484 units, down 11.1% compared to Fiscal 2017, reflecting the introduction of E-PACE offset by lower sales of XE, F-PACE, XF and all other models of Jaguar.
Land Rover wholesale volumes were 394,814 units, up 8.0% compared to the prior year led by the introduction of the Range Rover Velar and the all new Land Rover Discovery, partially offset by lower sales of Evoque and Discovery Sport. Sales of Range Rover and Range Rover Sport were also lower year on year on account of the model year change over, including the launch of our first Plug in Hybrid models, during the third and fourth quarter.
The wholesale volumes of Chery Jaguar Land Rover (China Joint venture) were 88,212 units from 66,060 units, reflecting a growth of 33.5% in Fiscal 2018 compared to 2017. This is mainly due to introduction of the long wheel base Jaguar XEL during Fiscal 2018 as well as the sales ramp up of the long wheel base Jaguar XFL at China joint venture.
Jaguar Land Rover’s performance in key geographical markets on a retail basis
Retail volumes (including retail sales from the China Joint Venture) in Fiscal 2018 increased by 1.7% to 614,309 units from 604,009 units in Fiscal 2017 led by the introduction of the Range Rover Velar, the all new Land Rover Discovery and the Jaguar E-PACE as well as continued demand for F-PACE and the long wheel base XFL from China Joint Venture. This increase was partially offset by lower sales of XE (long wheel base XEL launched in December 2017 with sales still ramping up), XJ, Discovery Sport and Evoque. Retail sales of Range Rover and Range Rover Sport were also lower year on year on account of the model year change over during the third and fourth quarter.
TML has a 100% subsidiary TMF Holdings Ltd which in turn has 2 operating Companies Tata Motors Finance Ltd and Tata Motors Finance Solutions Ltd. Through Tata Motors Finance Ltd, it provides financing services to purchasers of its vehicles through independent dealers, who act as the Company’s agents for financ-ing transactions, and through the Company’s branch network. Tata Motors Finance Solutions Ltd provides funding in the Used Vehicle Finance space and is also in the Business of extending loans to TML Dealers and Vendors.

11373rd Annual Report 2017-18
INTEGRATED REPORT 1-65 STATUTORY REPORTS 66-184 FINANCIAL STATEMENTS 185-353
United Kingdom
Industry vehicle sales fell 11.0% in Fiscal 2018 in the United Kingdom due to the weaker automotive cycle, Brexit and the continuing uncertainty around diesel (diesel sales down 26.2% year on year). Jaguar Land Rover retail volumes decreased by 12.8% to 108,759 units in Fiscal 2018 from 124,755 units in Fiscal 2017, which was broadly inline with the decline in industry volumes. The introduction of Velar and E-PACE as well as continuing demand for F-PACE in the United Kingdom were not enough to offset lower sales of more established models, including the model year changeover impacting sales of Range Rover and Range Rover Sport, and the lower demand for diesel powered vehicles.
North America
Economic performance in North America was generally favourable in Fiscal 2018 with solid GDP growth and strong labour market conditions. Industry sales in North America were down slightly (1.1%) in Fiscal 2018 whilst Jaguar Land Rover retails increased by 4.7% year on year to 129,319 units from 123,527 units in Fiscal 2017. Jaguar retail sales were down 1.7% in North America as continued demand for F-PACE and the introduction of E-PACE were offset by lower sales of XE and other models. Land Rover retailed 88,464units in Fiscal 2018, up 8.0%, from 81,949 units last year led by the introduction of Velar and the all new Discovery partially offset by lower sales of Evoque, Discovery Sport and Range Rover Sport, primarily reflecting the model year changeover.
Europe
Economic performance in Europe has been improving during Fiscal 2018 with consistent GDP growth of around 2.5%. Industry volumes in Europe were up 3.4% but Jaguar Land Rover retail sales in Europe were down 5.3% to 133,592 in Fiscal 2018 from 141,043 last year, primarily driven by uncertainty over diesel. Jaguar volumes decreased by 10.1% to 36,248 units in Fiscal 2018 compared to 40,332 units in Fiscal 2017 as the introduction of E-PACE was more than offset by lower sales of XE, XF and F-PACE. Land Rover retails were 97,344 units in Fiscal 2018, down 3.3% compared to the 100,711 units in Fiscal 2017 as the introduction of Velar and the all new Discovery solid sales were offset by lower sales of other models, including lower sales of Range Rover and Range Rover Sport which were impacted by the model year change over in the third and fourth quarter.
China
Passenger car sales in China increased by 1.3% in Fiscal 2018 supported by GDP growth of around 6.8%, broadly in-line with the government’s target. Jaguar Land Rover retail volumes (including sales from the China Joint Venture) increased by 19.9% to 150,116 units in Fiscal 2018 from 125,207 units in Fiscal 2017. Jaguar retail sales in Fiscal 2018 were 44,705 units, up 52.3% compared to the 29,351 units in Fiscal 2017 primarily reflecting the introduction of the long wheel base XFL from China joint venture and continued demand for F-PACE. Furthermore sales of the long wheelbase Jaguar XEL from China joint venture started in December 2017 and are still ramping up. Land Rover retail sales were 105,411 units in
Fiscal 2018, up 10.0% compared to the 95,856 units sold in Fiscal 2017 led by the introduction of Velar and continued demand for the Discovery Sport and Evoque from China Joint Venture. Retail sales of Discovery were somewhat lower year on year due to the launch phasing of the all new Discovery in China during Fiscal 2018.
Other Overseas markets
Jaguar Land Rover’s retail volumes in the other overseas markets increased by 3.4% to 92,523 units in Fiscal 2018 compared to 89,477 units in the prior year. Jaguar retail volumes were 20,674 units, down 7.9% compared to the 22,455 units last year the introduction of E-PACE and solid demand for F-PACE was more than offset by lower sales of XE, XF and XJ. Land Rover retail volumes were 71,849 units, down 7.2% compared to the 67,022 units in Fiscal 2017 led by the introduction of Velar and the all new Discovery, partially offset by lower sales of Range Rover and Range Rover Sport, which were impacted by the model year changeover in quarters three and four.
Jaguar Land Rover’s Sales & Distribution
As at March 31, 2018, Jaguar Land Rover distribute its vehicles in 120 markets for Jaguar and 129 markets for Land Rover globally. Sales locations for vehicles are operated as independent franchises. Jaguar Land Rover are represented in its key markets through its National Sales Companies (“NSC’s”) as well as thirdparty importers. Jaguar and Land Rover have regional offices in certain select countries that manage customer relationships and vehicle supplies and provide marketing and sales support to their regional importer markets. The remaining importer markets are managed from the United Kingdom.
Jaguar Land Rover products are sold through a variety of sales channels: through its dealerships for retail sales; for sale to fleet customers, including daily rental car companies; commercial fleet customers; leasing companies; and governments. Jaguar Land Rover do not depend on a single customer or small group of customers to the extent that the loss of such a customer or group of customers would have a material adverse effect on its business.
As at March 31, 2018, Jaguar Land Rover global sales and distribution network comprised 22 NSCs, 79 importers, 2 export partners and 1,571 franchise sales dealers, of which 1,226 are joint Jaguar and Land Rover dealers.
Jaguar Land Rover — Competition
Jaguar Land Rover operates in a globally competitive environment and faces competition from established premium and other vehicle manufacturers who aspire to move into the premium performance car and premium SUV markets, some of which are much larger than they are. Jaguar vehicles compete primarily against other European brands such as Audi, Porsche, BMW and Mercedes Benz. Land Rover and Range Rover vehicles compete largely against SUVs from companies such as Audi, BMW, Infiniti, Lexus, Mercedes Benz, Porsche, Volvo and Volkswagen.
Jaguar Land Rover — Seasonality
Jaguar Land Rover volumes are impacted by the biannual change in age-related registration plates of vehicles in the United Kingdom, where new age-related plate registrations take effect in March and

114
September. This has an impact on the resale value of the vehicles because sales are clustered around the time of the year when the vehicle registration number change occurs. Seasonality in most other markets is driven by introduction of new model year vehicles and derivatives. Furthermore, Western European markets tend to be impacted by summer and winter holidays, and the Chinese market tends to be affected by the Lunar New Year holiday in either January or February, the PRC National Day holiday and the Golden Week holiday in October. The resulting sales profile influences operating results on a quartertoquarter basis.
Other Operations Overview
The Company’s other operations business segment mainly includes information technology services, machine tools and factory automation services. The Company’s revenue from other operations before inter-segment eliminations was `3,252.36 crores in Fiscal 2018, an increase of 2.1% from `3,184.06 crores in Fiscal 2017. Revenues from other operations represented 1.1% and 1.2% of total revenues, before inter-segment eliminations, in Fiscal 2018 and 2017.
OPPORTUNITIES:
In the Budget 2018, Government of India has plans to complete 9,000 km of national highways by Fiscal 2019 and 35,000 km under the Bharatmala project at 5.35 lac crore. With the allocation of funds to improve national highways; people will see value in personal transportation and increase in sentiments towards purchasing new vehicles. Even the commercial vehicle industry will benefit from this increased connectivity.
The Automotive Mission Plan 2016-26 aims at 13% share of automotive industry in GDP, along with implementation of BS6 vehicles effective April 1, 2020 and increase in Value added services. National Electric Mobility Mission, aims at providing 7 million electric cars 2020, along with concession in manufacturing of selected parts for electric cars. Use of Block chain in Supply chain; augmented reality in designing and manufacturing; 3D printing and Four-cylinder supercar. At a global level, increasing levels of environmental regulations adds up the complexity quotient in design, marked by diverging behavior.
Jaguar Land Rover intends to grow its business by diversifying its product range to compete in new segments, for example the Range Rover Velar (on sale since July 2017), the Jaguar E-PACE (on sale since November 2017) and Jaguar Land Rover’s first battery electric vehicle, the I-PACE (now available to order with deliveries commencing this summer) ensures that Jaguar Land Rover competes in new premium segments with class-leading products that further supports their growth plans.
FINANCIAL PERFORMANCE ON A CONSOLIDATED BASIS
The financial information discussed in this section is derived from the Company’s Audited Consolidated Financial Statements.
Overview
The Company income from operations including finance revenues increased by 7.6% to `295,409.34 crores in Fiscal 2018 from `274,492.12 crores in Fiscal 2017. The increase is attributable to
better sales volumes of the Company’s India business and Jaguar Land Rover, offset by `3,192 crores due to unfavorable currency translation from GB£ to INR. Overall, earnings before other income, interest and tax, were `11,787.51 crores in Fiscal 2018 compared to `15,593.80 crores in Fiscal 2017, a decrease of 24.4%. The decrease in net income was primarily driven by higher depreciation and amortization, fixed marketing expenses/selling costs at Jaguar Land Rover business. The Company’s net income (attributable to shareholders of the Company) was `8,988.91 crores in Fiscal 2018 as compared to `7,454.36 crores in Fiscal 2017.
The Company has pursued a strategy of increasing exports of Tata and other brand vehicles to new and existing markets. However, in Fiscal 2018, the revenue of the Company’s subsidiary in South Korea, TDCV, has been lower due to lower industry volumes and aggressive marketing strategy from the competitors. Similarly for TTL, its specialized subsidiary engaged in engineering, design and information technology services, had reported lower revenue and profits due to adverse movement in exchange rates of major currencies as average rate of US$/INR declined by 3.9% in Fiscal 2018 compared to Fiscal 2017, while average rate of GBP/INR declined by 2.5% during the above period. TTL also suffered decline in revenue in Europe and North America mainly due to completion of vehicle programs with its key clients and delayed start of new programs due to client plan changes. The decline in Europe and North America were partially offset by growth in revenue in Asia Pacific region. Improved market sentiment in certain countries to which the Company exports and the strong sales performance of Jaguar Land Rover has enabled the Company to increase its sales in these international markets in Fiscal 2018. However, due to unfavorable currency translation from GB£ to INR and also growth in revenue in India in Fiscal 2018, the proportion of the Company’s net sales earned from markets outside of India decreased to 79.8% in Fiscal 2018 from 82.5% in Fiscal 2017. The following table sets forth the Company’s revenues from its key geographical markets and the percentage of total revenues that each key geographical market contributes for the periods indicated:
Revenue Fiscal 2018 Fiscal 2017
(` in crores) % (` in crores) %
India 59,593.18 20.2% 47,101.21 17.2%
China 43,394.13 14.7% 41,369.40 15.1%
UK 51,356.29 17.4% 50,588.18 18.4%
United States 44,991.88 15.2% 42,935.31 15.6%
Rest of Europe* 46,393.27 15.7% 47,122.48 17.2%
Rest of World* 49,680.59 16.8% 45,375.54 16.5%
Total 295,409.34 274,492.12
* The Rest of Europe market is geographic Europe, excluding the United Kingdom
and Russia. The rest of The World market is any region not included above.
The Company’s operations is divided into automotive operations and other operations as described further below. The table below sets forth the breakdown in revenues between the Company automotive operations and other operations in Fiscal 2018 and 2017 and the percentage change from period to period.

11573rd Annual Report 2017-18
INTEGRATED REPORT 1-65 STATUTORY REPORTS 66-184 FINANCIAL STATEMENTS 185-353
Fiscal 2018 Fiscal 2017 Change
(` in crores) %
Automotive operations 293,453.33 272,692.41 7.6%
Others 3,252.36 3,184.06 2.1%
Inter-segment elimination (1,296.35) (1,384.35) (6.4)%
Total 295,409.34 274,492.12 7.6%
Automotive operations
Automotive operations is the Company’s most significant segment, accounting for 99.3% of the Company’s total revenues in Fiscal 2018 and Fiscal 2017. In Fiscal 2018, revenue from automotive operations before inter-segment eliminations was `293,453.33 crores as compared to `272,692.41 crores in Fiscal 2017, an increase of 7.6%.
The following table sets forth selected data regarding the Company’s automotive operations for the periods indicated, and the percentage change from period to period (before inter-segment eliminations).
Fiscal 2018 Fiscal 2017 Change %
Total revenue (` in crores) 293,453.33 272,692.41 7.6%
Earning before other income, interest and tax (` in crores) 11,512.38 15,324.12 (24.9)%
Earning before other income, interest and tax (% to total revenue) 3.9% 5.6%
The Company’s automotive operations segment is further divided into Tata and other brand vehicles (including vehicle financing) and Jaguar Land Rover. In Fiscal 2018, Jaguar Land Rover contributed 77.3% of the Company’s total automotive revenue compared to 79.4% in Fiscal 2017 and the remaining 22.7% was contributed by Tata and other brand vehicles in Fiscal 2018 compared to 20.6% in Fiscal 2017.
The Company’s revenue from Tata and other brand vehicles (including vehicle financing) and Jaguar Land Rover in Fiscals 2018 and 2017 and the percentage change from period to period (before intra-segment eliminations) is set forth in the table below.
Fiscal 2018 Fiscal 2017 Change
(` in crores) %
Tata and other brand vehicles 66,620.38 56,448.78 18.0%
Jaguar Land Rover 226,964.86 216,388.82 4.9%
Intra-segment elimination (131.91) (145.19) (9.1)%
Total 293,453.33 272,692.41 7.6%
Earning before other income, interest and tax
Fiscal 2018 Fiscal 2017 Change
(` in crores) %
Tata and other brand vehicles
2,103.58 207.05 916%
Jaguar Land Rover 9,408.80 15,117.05 (37.8)%
Total 11,512.38 15,324.11 (24.9)%
Earning before other income, interest and tax (% to total revenue)
Fiscal 2018 Fiscal 2017 Change
%
Tata and other brand vehicles
3.2% 0.4% 2.8%
Jaguar Land Rover 4.1% 7.0% (2.9)%
Total 3.9% 5.6% (1.7)%
Other operations
The following table sets forth selected data regarding the Company’s other operations for the periods indicated and the percentage change from period to period (before inter-segment eliminations).
Fiscal 2018 Fiscal 2017 Change (%)
Total revenue (` in crores) 3,252.36 3,184.06 2.1%
Earning before other income, interest and tax (` in crores) 422.32 471.90 (10.5%)
Earning before other income, interest and tax (% to total revenue) 13.0% 14.8%
The other operations business segment includes information technology, machine tools and factory automation solutions. The reduction in Earning before other income, interest and tax is mainly due to Tata Technologies Ltd.
Results of Operations
Revenue from operations of the Company for Fiscal 2018, stood at ` 295, 409.34 crores, as compared to ` 274,492.12 crores, increased by 7.6%. Total number of vehicles sold were 12,21,124 units in Fiscal 2018 as compared to 10,91,748 units in Fiscal 2017, a growth of 11.9%. Revenue from operations (net of excise duty) stood at ` 294, 242.57 crores as compared to ` 269,849.66 crores, increase of 9.0%.
The following table sets forth selected items from the Company’s consolidated statements of income for the periods indicated and shows these items as a percentage of total revenues:

116
Fiscal 2018 Fiscal 2017(%) (%)
Revenue from operations (net of excise duty) 100.0 100.0Expenditure:Cost of material consumed (including change in stock) 63.2 61.5Excise Duty (refer below explanation)
(0.1) 0.1
Employee Cost 10.3 10.5Product development/Engineering 1.2 1.3Other expenses (net) 20.5 20.5Amount Capitalized (6.3) (6.3)Total Expenditure 88.7 87.6Profit before interest, tax, depreciation and amortisation
11.3 12.4
Other Income 0.3 0.3Profit before Exceptional Items, Depreciation and Amortization, Interest, Foreign exchange and Tax 11.6 12.7Depreciation and Amortization 7.3 6.6Finance costs 1.6 1.6Foreign exchange loss (net) (0.4) 1.4Exceptional Item (gain)/loss (net) (0.7) (0.4)Profit before Tax 3.8 3.5Tax expense 1.5 1.2Profit after Tax 2.3 2.2Share of profits/(loss) of equity accounted investees (net)
0.8 0.6
Minority Interest 0.0 0.0Profit for the year 3.1 2.8
Cost of materials consumed (including change in stock)
Fiscal 2018 Fiscal 2017
(` in crores)
Consumption of raw materials and components
173,371.19 160,147.12
Basis adjustment on hedge accounted derivatives
(1,378.60) (777.57)
Purchase of product for sale 15,903.99 13,924.53
Change in inventories of finished goods, Work-in-progress and products for sale
(2,046.58) (7,399.92)
Total 185,850.00 165,894.16
Cost of material consumed increased to 63.2% of total revenue (excluding income from vehicle financing) in Fiscal 2018 from 61.5% in Fiscal 2017. For Tata Motors Standalone (including Joint Operations), costs of materials consumed was 73.0% of net revenue in Fiscal 2018 of total revenue as compared to 70.5% in Fiscal 2017, representing an increase of 250 bps, which was mainly
attributable to a change in product mix. For Jaguar Land Rover, costs of materials consumed was 65.9% of total revenue in Fiscal 2018 compared to 66.3% in Fiscal 2017, representing a decrease of 40 bps, mainly driven by product mix.
Excise duty for the Fiscal 2018 represents the reversal of excise duty on closing inventories as at July 1, 2017. Consequent to the introduction of Goods and Service Tax (GST) with effect from July 1, 2017, Central Excise, Value Added Tax (VAT) etc have been replaced by GST. Excise duty for Fiscal 2018 was `790.16 crores as compared to `4,799.61 crores in Fiscal 2017. Of this recovery from sales was `1,166.77 crores for Fiscal 2018 as compared to `4,642.46 crores for Fiscal 2017. The same has been netted off in the discussion under this section against Revenue from operations to be comparable.
Employee Costs were `30,300.09 crores in Fiscal 2018 as compared to `28,332.89 crores in Fiscal 2017, an increase of 6.9%. There was favourable translation impact of GB£ to INR of Jaguar Land Rover operation of `462.49 crores. At Jaguar Land Rover the increase in employee cost is by 9.3% to GB£ 2,726 million (`23,392.69 crores) in Fiscal 2018 as compared to GBP 2,495 million (`21,829.15 crores) in Fiscal 2017, primarily reflects the increase in the employee head count all across functions and impact of consolidating Spark 44 since August 31, 2017. For Tata Motors Standalone (including joint operations), the employee cost increased by 5.4% to `3,966.73 crores as compared to 3,764.35 crores in Fiscal 2017, mainly due to annual increments, higher performance payment accruals and wage revisions. Employee costs at TDCV were `828.65 crores in Fiscal 2018, as compared to 775.83 crores in Fiscal 2017, an increase of 6.8%, due to annual increments.
Other Expenses includes all works operations, indirect manufacturing expenses, freight cost, fixed marketing costs and other administrative costs. These expenses have increased to `60,184.21 crores in Fiscal 2018 from `55,430.06 crores in Fiscal 2017. The breakdown is provided below:
Fiscal 2018 Fiscal 2017 Change(` in crores)
Processing charges
1,339.08 1,172.03 167.05
Consumption of stores and spare parts
2,210.56 2,419.11 (208.55)
Freight, transportation, port charges, etc.
10,742.12 9,754.71 987.41
Power and fuel 1,308.08 1,159.82 148.26Warranty and product liability expenses
7,700.07 8,106.37 (406.30)
Publicity 8,968.59 8,698.68 269.91Information technology/computer expenses
2,143.18 2,202.51 (59.33)
Allowance for finance, trade and other receivables
57.87 104.78 (46.91)

11773rd Annual Report 2017-18
INTEGRATED REPORT 1-65 STATUTORY REPORTS 66-184 FINANCIAL STATEMENTS 185-353
Fiscal 2018 Fiscal 2017 Change(` in crores)
Engineering expenses
5,278.84 4,273.72 1,005.12
MTM (gain)/loss on commodity derivatives
214.63 918.40 (703.77)
Works operation and other expenses
20,221.19 16,619.93 3,601.26
Other Expenses 60,184.21 55,430.06 4,754.15
The changes are mainly driven by volumes and the size of operations.
i. Processing charges were mainly incurred by Tata and other brand vehicles (including vehicle financing) which, due to higher volumes, led to higher expenditures.
ii. Freight, transportation, port charges etc. have increased, for Jaguar Land Rover, predominantly due to increased sales in certain geographies and for India business due to increased volumes. As a percentage to total revenue, Freight, transportation and port charges etc. were flat at 3.6% in Fiscal 2018.
iii. Publicity expenses increased by 3.1% mainly due to increase in JLR and represented 3.0% of total revenues in Fiscal 2018 and 3.2% in Fiscal 2017. In addition to routine product and brand campaigns, the Company incurred expenses relating to new product introduction campaigns for the I-Pace, E-Pace, Velar and the all new Jaguar XF, the Nexon at Tata Motors. Further, during the year the amount was spent on certain Auto / Motor shows, viz. Delhi Auto expo, Geneva Motor show etc.
iv. Warranty and product liability expenses represented 2.6% and 2.9% of the Company’s revenues in Fiscal 2018 and 2017, respectively. The warranty expenses at Jaguar Land Rover represented 2.6% of the revenue as compared to 2.9% last year, whereas Tata Motors India operations these represent 1.3% and 1% of revenue for Fiscal 2018 and 2017, respectively.
v. Works operation and other expenses have increased to 6.9% of net revenue in Fiscal 2018 from 6.4% in Fiscal 2017.
vi. Engineering expenses at Jaguar Land Rover have increased, reflecting its increased investment in the development of new vehicles. A significant portion of these costs are capitalized and shown under the line item “Amount capitalized”.
vii. The provision of various debtors, vehicle loans and advances (net), has decreased to `57.87 crores in Fiscal 2018 as compared to `104.78 crores in Fiscal 2017, mainly reflect provisions for finance receivables, where the collections have improved in Fiscal 2018. Further there is reversal of certain provisions in Trade receivables due to favourable litigation awards.
Amount capitalized represents expenditure transferred to capital and other accounts allocated out of employee cost and other expenses, incurred in connection with product development
projects and other capital items. The expenditure transferred to capital and other accounts has increased by 10.1% to `18,588.09 crores in Fiscal 2018 from `16,876.96 crores in Fiscal 2017, mainly due to various product development projects undertaken by the Company for the introduction of new products and the development of engine and products variants.
Other Income increased by 17.8% to `888.89 crores in Fiscal 2018 from `754.54 crores in Fiscal 2017. Interest income increased to `711.81 crores in Fiscal 2018, compared to `562.21 crores in Fiscal 2017, whereas profit on sale of investment decreased to `129.26 crores in Fiscal 2018, compared to `176.14 crores in Fiscal 2017, primarily on the sale of mutual funds, at Tata and other brand vehicles (including vehicle financing).
Profit before Interest, Depreciation, Foreign Exchange (gain)/loss, Exceptional Items and Tax is `37,761.86 crores in Fiscal 2018, representing 12.8% of revenue in Fiscal 2018 compared to `37,666.90 crores in Fiscal 2017.
Depreciation and Amortization: During Fiscal 2018, expenditures increased by 20.4% to `21,553.59 crores from `17,904.99 crores in Fiscal 2017. The depreciation has increased by 20.2% to `10,874.34 crores as compared to `9,048.63 crores in Fiscal 2017 and is due to new product launches both at Jaguar Land Rover and Tata and other brand vehicles (including vehicle financing). The amortization expenses have also increased by 20.6% to `10,679.25 crores in Fiscal 2018 from `8,856.37 crores in Fiscal 2017, and are attributable to new products introduced during the year.
Expenditure on product development / engineering expenses charged off increased by 3.5% to `3,531.87 crores in Fiscal 2018 from `3,413.57 crores in Fiscal 2017.
Finance Cost increased by 10.5% to `4,681.79 crores in Fiscal 2018 from `4,238.01 crores in Fiscal 2017. The increase was mainly due to increased borrowing & interest rates.
Foreign exchange gain of `1,185.28 crores in Fiscal 2018 as compared to a loss of `3,910.10 crores in Fiscal 2017. The gain was mainly due to appreciation of GBP as compared to USD.
Exceptional items (gain)/loss
Fiscal 2018 Fiscal 2017 Change
(` in crores)
Employee separation cost 3.68 67.61 (63.93)
Defined benefit pension plan amendment (3,609.01) - (3,609.01)
Provision for impairment of intangible under development and capital work in progress 1,641.38 - 1,641.38
Provision for BSIII vehicles - 147.93 (147.93)
Others (11.19) (1,330.10) 1,318.91
Total (1,975.14) (1,114.56) (860.58)

118
• The credit of 3,609.01 crores (GB£ 437 million) during the Fiscal 2018, relates to the amendment of the Defined Benefit scheme of Jaguar Land Rover Automotive Plc.
• There has been significant disruptions in the Auto industry necessitating a review of the Company’s product development cost capitalization policy. The new capitalization gateway introduced the factor “affordability” of investments w.e.f April 1, 2018. Thus the Company reviewed its tangible and intangible assets to ensure “fit for future” and taken a charge of `1,641.38 crores in Fiscal 2018.
Earnings Before Interest Tax (EBIT) increased to `13,478 crores in Fiscal 2018, compared to 11,846 crores in Fiscal 2017. EBIT is defined to include the revaluation of current assets and liabilities and realized foreign exchange and commodity hedges as well as profits from equity accounted investees but excludes the revaluation of foreign currency debt, mark to market (MTM) on foreign exchange and commodity hedges, other income and exceptional items.
Consolidated Profit Before Tax (PBT) increased to `11,155.03 crores in Fiscal 2018, compared to `9,314.79 crores in Fiscal 2017. The increase in PBT is primarily driven by improvement in the Tata Motors Ltd Standalone business in India, mainly favourable model mix and better management of other operating costs. The increase in PBT was also due to exceptional gain of `3,609.01 crores of pension cost. However, the profitability at Jaguar Land Rover operations were lower due to product mix, higher manufacturing expenses and other operating costs including higher marketing expenses, higher depreciation and amortization expenses related to significant capital expenditure incurred in prior periods. In Fiscal 2017 there were exceptional credit of 1,330.10 crores, which relates to receipt of insurance proceeds, recovery of import duties and taxes for the explosion at the port of Tianjin (China) in August 2015. Further, there was a decrease due to translation impact from GB£ to INR of `273 crores.
Tax Expense represents a net charge of `4,341.93 crores in Fiscal 2018, as compared to `3,251.23 crores in Fiscal 2017. The effective tax rate in Fiscal 2018 was 32.3% as compared to 30.0% in Fiscal 2017 (PBT includes share of profit of Joint Venture and associates). For Tata Motors Ltd and certain subsidiaries, the Company has not recognized deferred tax assets due to uncertainty of future taxable profits. In Fiscal 2018, there was a reduction in the US Federal rate from 35% to 21% and in the UK Corporation tax from 19% to 17% resulting in a deferred tax charge.
Consolidated Profit after tax increased by 20.6% to `8,988.91 crores in Fiscal 2018 from `7,454.36 crores in Fiscal 2017, after considering the profit from associate companies and shares of minority investees. The increase was mainly attributable to improvement in Company’s standalone business and credit of pension plan amendment, China Joint Venture performance offset by provision for impairment of certain assets and JLR performance.
Consolidated Balance Sheet(` in crores)
As at March 31, Change Translation of JLR
Net Change
2018 2017ASSETS(a) Property, plant and equipment and intangible
assets 161,331 128,970 32,361 16,486 15,875(b) Goodwill 116 673 (557) 1 (558)(c ) Investment in equity accounted investees 5,385 4,606 779 554 225(d) Financial assets 104,184 89,380 14,804 8,188 6,616(e) Deferred tax assets (net) 4,159 4,457 (298) 477 (775)(f) Current tax assets (net) 1,109 1,196 (87) 11 (98)(g) Other assets 10,344 9,387 957 811 146(h) Inventories 42,138 35,085 7,053 4,245 2,808(i) Assets classified as held-for-sale 2,585 - 2,585 - 2,585
TOTAL ASSETS 331,351 273,754 57,597 30,773 26,824LIABILITIES(a) Financial liabilities 188,941 174,066 14,875 14,544 331(b) Provisions 18,902 14,812 4,090 2,057 2,033(c ) Deferred tax liabilities (net) 6,126 1,174 4,952 664 4,288(d) Other liabilities 18,800 23,794 (4,994) 2,010 (7,004)(d) Current tax liabilities (net) 1,559 1,393 166 182 (16)(e) Liabilities directly associated with Assets
held-for-sale 1,070 - 1,070 - 1,070TOTAL LIABILITIES 235,398 215,239 20,159 19,457 702

11973rd Annual Report 2017-18
INTEGRATED REPORT 1-65 STATUTORY REPORTS 66-184 FINANCIAL STATEMENTS 185-353
Property, plant and equipment and other intangible assets
As at March 31, Change
2018 2017
(` in crores)
Property, plant and equipment (including capital work-in-progress) 90,010.78 69,781.39 20,229.39
Other intangible assets (including assets under development) 71,320.13 59,188.21 12,131.92
Total 1,61,330.91 1,28,969.60 32,361.31
There is increase (net of depreciation and amortization) in the intangible and tangible assets in Fiscal 2018, due to favourable currency translation impact from GB£ to INR of `16,486 crores. Further, the increase is driven by Jaguar Land Rover Slovakia plant and tooling and facilities for new products like E-Pace, Velar, I-Pace, XF. At Tata Motors Ltd, the additions were mainly in tooling’s, and product development cost for new products.
Investments in equity accounted investees were `5,385.24 crores as at March 31, 2018, as compared to `4,606.01 crores as at March 31, 2017. The increase was mainly due to profits at the Company’s Joint Venture at China of GB£252 million (`2,138.92 crores).
Financial Assets (Current + Non-current)
Investments (Current + Non-current) were `15,427.51 crores as at March 31, 2018, as compared to `15,731.91 crores as at March 31, 2017. The details are as follows:
As at March 31,Change
2018 2017
(` in crores)
Mutual Funds 14,360.47 15,065.84 (705.37)
Quoted Equity shares 339.92 260.29 79.63
Unquoted Equity shares 609.08 369.98 239.10
Others 118.04 35.80 82.24
Total 15,427.51 15,731.91 (304.40)
The decrease in mutual fund investments was mainly at Tata Motors Limited.
Finance receivables (current + non-current) were `23,881.18 crores as at March 31, 2018, as compared to `17,563.25 crores as at March 31, 2017, an increase of 36%, primarily due to increased vehicle financing business. The Gross finance receivables were `25,070.75 crores as at March 31, 2018, as compared to `21,160.76 crores as at March 31, 2017.
Loans and Advances
As at March 31, Change2018 2017(` in crores)
Non-current loans and advances 495.41 753.66 (258.25)Current loans and advances 2,279.66 710.45 1,569.21Total 2,775.07 1,464.11 1,310.96
Loans and advances include advance and other recoveries from suppliers, contractors amounting to ` 2,260.50 crores and ` 684.35 crores in Fiscal 2018 and 2017 respectively.
Other Financial Assets
As at March 31, Change
2018 2017
(` in crores)
Other financial assets - non current 4,563.87 2,911.12 1,652.75
Other financial assets – current 3,029.12 1,555.94 1,473.18
Total 7,592.99 4,467.06 3,125.93
These included 5,323.03 crores of derivative financial instruments, mainly attributable to Jaguar Land Rover as at March 31, 2018 compared to `4,285.52 crores as at March 31, 2017, reflecting notional asset due to the valuation of derivative contracts.
Deferred tax assets / liability: Deferred tax assets represent timing differences for which there will be future current tax benefits due to unabsorbed tax losses and expenses allowable on a payment basis in future years. Deferred tax liabilities represent timing differences where current benefit in tax will be offset by a debit in the statement of profit and loss.
As at March 31,Change
2018 2017
(` in crores)
Deferred tax assets 4,158.70 4,457.34 (298.64)
Deferred tax liability 6,125.80 1,174.00 4,951.80
A deferred tax liability (net) of `1,038.47 crores was recorded in the income statement and `4,394.71 crores in other comprehensive income, which mainly includes post-retirement benefits and cash flow hedges in Fiscal 2018. The major movement is due to deferred tax liability in respect of gains on derivatives and post-retirement benefits.
Inventories as at March 31, 2018, were `42,137.63 crores as compared to `35,085.31 crores as at March 31, 2017, an increase of

120
20%. Inventory at Tata and other brand vehicles (including vehicle financing) was `7,318.87 crores as at March 31, 2018 as compared to `6,923.42 crores as at March 31, 2017. Inventory at Jaguar Land Rover was `34,805.01 crores as at March 31, 2018, an increase of 24%, as compared to `28,079.40 crores as at March 31, 2017. In terms of number of days of sales, finished goods represented 42 inventory days in Fiscal 2018 as compared to 38 days in Fiscal 2017. The increase is mainly due to inventory held for new models (E-Pace, I-Pace and Velar) at Jaguar Land Rover.
Trade Receivables (net of allowance for doubtful debts) were `19,893.30 crores as at March 31, 2018, representing an increase of 41.3% compared to `14,075.55 crores as at March 31, 2017. Trade Receivables have increased at Tata and other brand vehicles (including vehicle financing) to 5,492.78 crores as at March 31, 2018 as compared to `3,471.93 crores as at March 31, 2017. The increase was mainly due to higher sales at year end. Trade receivables at Jaguar Land Rover was `14,374.03 crores as at March 31, 2018, as compared to `10,006.21 crores as at March 31, 2017, due to introduction of new models. The allowances for doubtful debts were `1,261.67 crores as at March 31, 2018 compared to `1,377.44 crores as at March 31, 2017.
Cash and cash equivalents were `14,716.75 crores, as at March 31, 2018, compared to `13,986.76 crores as at March 31, 2017. The Company holds cash and bank balances in Indian rupees, GB£, Chinese Renminbi, etc.
Other bank balances were `19,897.15 crores, as at March 31, 2018, compared to `22,091.12 crores as at March 31, 2017. These include bank deposits maturing within one year of `19,361.58 crores as at March 31, 2018, compared to `21,852.76 crores as at March 31, 2017.
Current tax assets (net) (current + non-current) were `1,108.81 crores, as at March 31, 2018, compared to `1,195.67 crores as at March 31, 2017.
Other assets
As at March 31, Change
2018 2017
(` in crores)
Other assets - non current 2,681.25 2,847.36 (166.11)
Other assets – current 7,662.37 6,539.99 1,122.38
Total 10,343.62 9,387.35 956.27
These mainly includes prepaid expenses, including rentals on operating lease of `2,584.66 crores as at March 31, 2018, as compared to `2,063.55 crores as at March 31, 2017. Taxes recoverable, statutory deposits and dues from government were `6,724.43 crores as at March 31, 2018, as compared to `6,030.06 crores as at March 31, 2017.
Shareholders’ fund was `95,427.91 crores and `58,061.89 crores as at March 31, 2018 and 2017, respectively, an increase of 64.4%.
Reserves increased by 65.1% from `57,382.67 crores as at March 31, 2017 to `94,748.69 crores as at March 31, 2018. Though, the profit for Fiscal 2018 was `8,988.91 crores, increase in Reserves of `37,366.02 crores was primarily attributable to following reasons:
• Credits for remeasurement of employee benefit plans was `3,909.10 in Fiscal 2018.
• Translation gain of `9,921.36 crores recognized in Translation Reserve on consolidation of subsidiaries further contributed to an increase in Reserves and Surplus.
• Further increase in Hedging Reserves by `14,285.59 crores, primarily due to mark-to-market gains on forwards and options in Jaguar Land Rover, primarily due to the Strengthening in the US$-GB£ forward rates.
Borrowings
As at March 31, Change2018 2017
(` in crores)Long term borrowings 61,199.50 60,629.18 570.32Short term borrowings 16,794.85 13,859.94 2,934.91Current maturities of long term borrowings 10,956.12 4,114.86 6,841.26Total 88,950.47 78,603.98 10,346.49
• Current maturities of long-term borrowings represent the amount of loan repayable within one year.
• During Fiscal 2018,
o the Company raised `1,500 crores through unsecured non-convertible debentures with a tenor ranging from 3 years to 5 years.
o Jaguar Land Rover Automotive plc, issued USD 500 million (`3,156.93 crores) Senior Notes maturing in October 2027 at a coupon of 4.5%.
o TML Holdings Pte. Singapore, a wholly owned subsidiary of Tata Motors Ltd, had refinanced its existing syndicate loan of USD 850 million with a new syndicated loan facility of GBP 640 million.
Other financial liabilities
As at March 31,Change
2018 2017
Other financial liabilities - non current 2,739.14 11,409.58 (8,670.44)
Other financial liabilities – current 31,267.49 25,634.83 5,632.66
Total 34,006.63 37,044.41 (3,037.78)

12173rd Annual Report 2017-18
INTEGRATED REPORT 1-65 STATUTORY REPORTS 66-184 FINANCIAL STATEMENTS 185-353
These included 8,657.86 crores of derivative financial instruments, mainly attributable to Jaguar Land Rover as at March 31, 2018 compared to `25,517.52 crores as at March 31, 2017, reflecting favourable foreign exchange movement between USD and GBP. However, current maturities of long-term borrowings were `10,956.12 crores as at March 31, 2018, as compared to `4,114.86 crores as at March 31, 2017.
Trade payables were `72,038.41 crores as at March 31, 2018, as compared to `57,698.33 crores as at March 31, 2017.
Acceptances were `4,901.42 crores as at March 31, 2018, as compared to `4,834.24 crores as at March 31, 2017.
Provisions (current and non-current) were made towards warranty and employee benefit schemes. Short-term provisions are those, which are expected to be settled during next financial year. The details are as follows:
As at March 31, Change
2018 2017
(` in crores)
Long term provisions - non-current 10,948.44 9,004.46 1,943.98
Short term provisions – current 7,953.50 5,807.76 2,145.74
Total 18,901.94 14,812.22 4,089.72
i. Provision for warranty increased to `15,935.10 crores as at March 31, 2018, as compared to `12,031.33 crores as at March 31, 2017, an increase of `3,903.77 crores.
ii. The provision for employee benefits obligations increased to `844.64 crores as at March 31, 2018, as compared to `801.90 crores as at March 31, 2017.
iii. Provision for legal and product liability increased to `1,319.87 crores as at March 31, 2018, as compared to `1,266.00 crores as at March 31, 2017.
Other liabilities
As at March 31,Change
2018 2017
(` in crores)
Other liabilities - non current 11,165.19 17,392.56
(6,227.37)
Other liabilities – current 7,634.55 6,401.84
1,232.71
Total 18,799.74 23,794.40 (4,994.66)
These mainly includes liabilities towards employee benefits obligations of `4,100.76 crores as at March 31, 2018, as compared to `11,984.03 crores as at March 31, 2017, decrease mainly at Jaguar Land Rover. Deferred revenue were `9,413.29 crores as
at March 31, 2018, as compared to `6,926.35 crores as at March 31, 2017. Statutory dues (VAT, Excise, Service Tax, Octroi etc.) were `3,176.86 crores as at March 31, 2018, as compared to `2,658.93 crores as at March 31, 2017.
Consolidated Cash Flow
The following table sets forth selected items from consolidated cash flow statement:
Fiscal 2018 Fiscal 2017 Change
(` in crores)
Cash from operating activity 23,857.42 30,199.25 (6,341.83)
Profit for the year 9,091.36 7,556.56Adjustments for cash flow from operations 24,220.92 21,283.55Changes in working capital (6,433.70) 3,254.24Direct taxes paid (3,021.16) (1,895.10)Cash from investing activity (26,201.61)
(38,079.88) 11,878.27
Payment for property, plant and equipment and other intangible assets (net) (35,048.62) (30,413.49)Net investments, short term deposit, margin money and loans given 6,359.13 (8,924.27)Dividend and interest received 2,487.88 1,257.88Net Cash from / (used in) Financing Activities 2,011.71 6,205.30 (4,153.59)Proceeds from issue of shares - 4.55Dividend Paid (including paid to minority shareholders) (55.97) (121.22)Interest paid (5,410.64) (5,336.34)Net Borrowings (net of issue expenses) 7,478.32 11,658.31Net increase / (decrease) in cash and cash equivalent (332.48) (1,675.28) 1,342.80

122
Fiscal 2018 Fiscal 2017 Change
(` in crores)Cash and cash equivalent, beginning of the year 13,986.76 17,153.61Effect of exchange fluctuation on cash flows 1,306.41 (1,491.52)Classified as held for sale (243.94) -Cash and cash equivalent, end of the year 14,716.75 13,986.76
a) Cash generated from operations before working capital changes was `33,312.28 crores in Fiscal 2018, as compared to `28,840.11 crores in the previous year, representing an increase in cash from generated from consolidated operations. After considering the impact of working capital changes including the net movement of vehicle financing portfolio, the net cash generated from operations was `23,857.42 crores in Fiscal 2018, as compared to 30,199.25 crores in the previous year. The increase in trade receivables, finance receivables, inventories and other assets amounting to `17,440.36 crores mainly due to increase in sales was offset by increase in trade and other payables and provisions amounting to `11,006.66 crores.
b) The net cash outflow from investing activity decreased to `26,201.61 crores in Fiscal 2018 from `38,079.88 crores in Fiscal 2017.
• Capital expenditure (net) was at `35,048.62 crores in Fiscal 2018, compared to `30,413.49 crores, related mainly to capacity/ expansion of facilities, quality and reliability projects and product development projects.
• Net investments, short-term deposits, margin money and loans given was an inflow of `6,359.13 crores in Fiscal 2018 as compared to outflow of 8,924.27 crores in Fiscal 2017, mainly at Jaguar Land Rover.
c) The net change in financing activity was an inflow of `2,011.71 crores in Fiscal 2018 as compared to `6,205.30 crores in Fiscal 2017.
• In Fiscal 2018, `4,559.81 crores were raised from long-term borrowings (net) as compared to `9,172.39 crores (net) in Fiscal 2017 as described in further detail below
• Net increase in short-term borrowings of `2,960.35 crores in Fiscal 2018 as compared to `2,485.30 crores in Fiscal 2017, mainly at Tata and other brand vehicles (including vehicle financing).
d) Free cash flows of (a non-GAAP measure, measured at cash flow from operating activities, less payment for property, plant and equipment and intangible assets) were negative of `7,322 crores due to lower growth and higher investments in Jaguar Land Rover.
As at March 31, 2018, the Company’s borrowings (including short-term debt) were `88,950.47 crores, compared to `78,603.98 crores as at March 31, 2017.
Principal Sources of Funding Liquidity
The Company finances its capital expenditures and research and development investments through cash generated from operations, cash and cash equivalents, debt and equity funding. The Company also raises funds through sale of investments, including divestment in stakes of subsidiaries on a selective basis.
The Company’s cash and bank balances on a consolidated basis were `34,613.91 crores as at March 31, 2018, as compared to `36,077.88 crores as at March 31, 2017. These enable the Company to cater to business needs in the event of changes in market conditions.
The Company’s capital expenditures were `42,672.28 crores and `31,750.74 crores for Fiscal 2018 and 2017, respectively, and it currently plans to invest approximately `461 billion in Fiscal 2019 in new products and technologies. The Company intends to continue to invest in new products and technologies to meet consumer and regulatory requirements. These investments are intended to enable the Company to pursue further growth opportunities and improve the Company’s competitive positioning. In December 2015, Jaguar Land Rover announced the initial investment of GB£1 billion to build a manufacturing facility in Slovakia with annual capacity of 150,000 units and production scheduled to begin in 2018 (construction of the plant commenced in September 2016) and in November 2016 confirmed that the all new Land Rover Discovery would be the first model manufactured at the plant. In November 2015, Jaguar Land Rover announced additional investment of GB£450 million to double capacity at the engine manufacturing facility in Wolverhampton and production of the 2.0l Ingenium petrol engine recently began. The manufacturing partnership with Magna Steyr, an operating unit of Magna International Inc, to build vehicles in Graz, Austria was announced in July 2015. Jaguar E Pace was the first vehicle to be produced as a part of Jaguar Land Rover’s contract manufacturing agreement with Magna Steyr, Austria in late 2017 and it will be joined by Jaguar I Pace from 2018. The Company expects to meet most of its investments out of operating cash flows and cash liquidity available. In order to meet the remaining funding requirements, the Company may be required to raise funds through additional loans and by accessing capital markets from time to time, as deemed necessary.
With the ongoing need for investments in products and technologies, the Company on a standalone basis (Including joint operations) was free cash flow (a non-GAAP measure, measured at cash flow from operating activities, less payment for property, plant and equipment and intangible assets) positive in Fiscal 2018, of `1,310.99 crores.
The following table provides information for the credit rating of Tata Motors Limited for short-term borrowing and long-term borrowing from the following rating agencies as at March 31, 2018:

12373rd Annual Report 2017-18
INTEGRATED REPORT 1-65 STATUTORY REPORTS 66-184 FINANCIAL STATEMENTS 185-353
Credit Analysis and Research Ltd Ratings, or CARE, Information and Credit Rating Agency of India Ltd, or ICRA, Credit Rating Information Services of India Limited, or CRISIL Ltd, Standard & Poor’s Ratings Group, or S&P, and Moody’s Investor Services, or Moody’s. A credit rating is not a recommendation to buy, sell or hold securities. A credit rating may be subject to withdrawal or revision at any time. Each rating should be evaluated separately of any other rating:
CARE ICRA CRISIL S&P Moody’sLong-term borrowings AA+ AA AA BB+ Ba1Short-term borrowings A1+ A1+ A1+ — —
The Company believes that it has sufficient liquidity available to meet its planned capital requirements. However, the Company’s sources of funding could be materially and adversely affected by an economic slowdown, as was witnessed in Fiscal 2009, or other macroeconomic factors in India and abroad, such as in the United Kingdom, the United States, Europe, Russia and China, all of which are beyond the Company’s control. A decrease in the demand for the Company’s vehicles could affect its ability to obtain funds from external sources on acceptable terms or in a timely manner.
The Company’s cash is located at various subsidiaries within the Tata Motors Group. There may be legal, contractual or economic restrictions on the ability of subsidiaries to transfer funds to the Company in the form of cash dividends, loans, or advances. Brazil, Russia, South Africa and other jurisdictions have regulatory restrictions, disincentives or costs on pooling or transferring of cash. However, such restrictions have not had and are not estimated to have a significant impact on the Company’s ability to meet its cash obligations.
In order to refinance the Company’s borrowings and for supporting long-term fund needs, the Company continued to raise funds in Fiscal 2017 and 2018, through issue of various debt securities described below.
During Fiscal 2017, the Company raised `2,700 crores through unsecured NCDs with a tenor ranging from 2 years to 5 years. The proceeds have been used for refinancing and supporting the funding requirements of the Company.
In January 2017, Jaguar Land Rover Automotive plc issued EUR 650 million senior notes due 2024 at a coupon of 2.200% per annum and GBP 300 million senior notes due 2021 at a coupon of 2.750% per annum. The proceeds were for general corporate purposes, including support for Jaguar Land Rover’s ongoing growth and capital spending requirements.
In March 2017 Jaguar Land Rover Automotive plc completed consent transactions to align the terms of its US$ 500 million 5.625% senior notes due 2023, its US$ 700 million 4.125% senior notes due 2018 and its GB£ 400 million 5.000% senior notes due 2022 to bonds it issued after January 2014.
During Fiscal 2017, Tata Motors Limited issued rated, listed, unsecured NCDs of `2,700 crores. The proceeds have been utilized for general corporate purpose. Tata Motors Limited prepaid `300 crores of its Unsecured 8.60% NCD due 2018 in February 2017.
During Fiscal 2017, Tata Motors Finance Limited through its subsidiary Sheba Properties Ltd., issued 22,500,000 privately
placed, cumulative non-participating compulsory convertible preference shares of `100 each convertible after seven years, which qualifies as tier 1 capital. In Fiscal 2017, Tata Motors Finance Limited, and its subsidiaries, Sheba Properties Ltd and Tata Motors Finance Solutions Ltd, issued NCDs and raised `316 crores. Bank borrowings through secured and unsecured term loans continued to remain as the major source of funds for long-term borrowing, and during, Fiscal 2017 `2,625 crores were raised.
In October 2017, Jaguar Land Rover Automotive plc issued US$500 million senior notes due 2027 at a coupon of 4.50% per annum. The proceeds were for general corporate purposes, including support for Jaguar Land Rover’s ongoing growth and capital spending requirements.
During Fiscal 2018, Tata Motors Limited issued rated, listed, unsecured NCDs of `1,500 crores. The proceeds have been utilized for general corporate purpose.
In Fiscal 2018, TMF Holdings Ltd (TMFHL), and its subsidiaries, TMFL & TMFSL, issued NCDs and raised `3,231 crores. Bank borrowings through secured and unsecured term loans continued to remain as the major source of funds for long-term borrowing, and during, Fiscal 2018 `2,330 crores was raised. Overall during Fiscal 2018 for the TMFL group, the short-term debt (net) increased by `50,079 million and long-term debt (net) increased by `72 million.
During Fiscal 2016, TML Holdings Pte. Ltd., a subsidiary of the Company, has
• refinanced an existing unsecured multi-currency loan of US$600 million (US$250 million and SG$62.8 million maturing in November 2017 and US$210 million and SG$114 million maturing in November 2019) with a new unsecured loan of US$600 million (US$300 million maturing in October 2020 and US$300 million maturing in October 2022); and
• refinanced the existing SG$350 million 4.25% Senior notes due in May 2018 with a new syndicated loan of US$250 million maturing in March 2020.
During Fiscal 2018, TML Holdings Pte Ltd, has refinanced an existing unsecured loan of US$ 600 million (US$ 300 million maturing in October 2020 and US$ 300 million maturing in October 2022) and a syndicated loan of US$ 250 million maturing in March 2020 with a new unsecured loan of GB£ 640 million (GB£ 190 million maturing in July 2020, GB£ 225 million in July 2022 and GB£ 225 million in July 2023).
The Tata Motors Group funds its short-term working capital requirements with cash generated from operations, overdraft facilities with banks, short-and medium-term borrowings from lending institutions, banks and commercial paper. The maturities of these short-and medium-term borrowings and debentures are generally matched to particular cash flow requirements. The working capital limits are `14,000 crores from various banks in India as at March 31, 2018. The working capital limits are secured by hypothecation of certain existing current assets of the Company. The working capital limits are renewed annually.

124
Jaguar Land Rover Automotive plc currently has a GB£1.94 billion revolving credit facility with a syndicate of 31 banks, maturing in 2022. The revolving credit facility remained undrawn as at March 31, 2018.
Tata Motors Limited currently has `500 crores revolving credit facility which remained undrawn as at March 31, 2018.
Short-term borrowings as ast March 31, 2018 and 2017 is `16,794.85 crores and `13,859.94 crores respectively.
Some of the Company’s financing agreements and debt arrangements set limits on and/or require prior lender consent for, among other things, undertaking new projects, issuing new securities, changes in management, mergers, sales of undertakings and investment in subsidiaries. In addition, certain negative covenants may limit the Company’s ability to borrow additional funds or to incur additional liens, and/or provide for increased costs in case of breach. Certain of the Company’s financing arrangements also include financial covenants to maintain certain debt- to-equity ratios, debt-to-earnings ratios, liquidity ratios, capital expenditure ratios and debt coverage ratios.
The Company monitors compliance with its financial covenants on an ongoing basis. The Company also reviews its refinancing strategy and continues to plan for deployment of long-term funds to address any potential non-compliance.
As at March 31, 2018, GB£542 million of cash was held by Jaguar Land Rover subsidiaries outside of the UK. The cash in some of these jurisdictions is subject to certain restrictions on cash pooling, intercompany loan arrangements or interim dividends. However, annual dividends are generally permitted and JLR do not believe that these restrictions have, or are expected to have, any impact on Jaguar Land Rover’s ability to meet it’s cash obligations.
Certain debt issued by Jaguar Land Rover is subject to customary covenants and events of default, which include, among other things, restrictions or limitations on the amount of cash, which may be transferred outside the Jaguar Land Rover group of companies in the form of dividends, loans or investments to the Company and its subsidiaries. These are referred to as restricted payments in the relevant Jaguar Land Rover financing documentation. In general, the amount of cash which may be transferred as restricted payments from the Jaguar Land Rover group to the Company and its subsidiaries is limited to 50% of its cumulative consolidated net income (as defined in the relevant financing documentation) from January 2011. As at March 31, 2018, the estimated amount that is available for dividend payments, other distributions and restricted payments was approximately GB£ 4,941 million.
FINANCIAL PERFORMANCE ON A STANDALONE BASIS
The financial information discussed in this section is derived from the Company’s Audited Standalone Financial Statements. These include the Company’s proportionate share of income and expenditure in its two Joint Operations, namely Tata Cummins Pvt Ltd and Fiat India Automobiles Pvt Ltd.
Effective April 30, 2018, the Company completed the merger of TML Drivelines Ltd (appointed date April 01, 2017) pursuant to scheme of arrangement of merger. Comparative numbers have been restated for the accounting impact of the merger.
Fiscal 2018 Fiscal 2017
(%) (%)Revenue from operations (net of excise duty) 100 100Expenditure:Cost of material consumed (including change in stock) 73.0 70.5Excise Duty (0.6) 0.3Employee cost 6.8 8.5Product development /Engineering 0.8 1.0Other expenses (net) 15.8 18.8Amount capitalised (1.5) (2.1)Profit before interest, tax, depreciation and amortisation 5.7 3.1Other income 2.7 2.2Profit before exceptional items, depreciation and amortisation, foreign exchange (gain)/loss interest and tax 8.4 5.3Depreciation and amortisation (including product development / engineering expenses written off) 5.3 6.8Finance costs 3.0 3.5Foreign exchange (gain)/loss - (0.6)Exceptional items – loss 1.7 0.8Profit before tax (1.6) (5.3)Tax expenses 0.2 0.2Profit after tax (1.8) (5.5)
Fiscal 2018 has been a good year, followed a period of high demand in the automotive sector in India.
Revenue from operations of the Company for Fiscal 2018, stood at `59,624.69 crores as compared to `49,054.49 crores, increased by 21.5%. Total number of vehicles sold were 636,968 units in Fiscal 2018, as compared to 543,656 units in Fiscal 2017, a growth of 17.2%. Revenue from operations (net of excise duty) stood at `58,456.55 crores as compared to `44,430.95 crores, increase of 31.6%.
Cost of materials consumed (including change in stock)
Fiscal 2018 Fiscal 2017
(` in crores)
Consumption of raw materials and components
37,080.45 27,651.65
Purchase of product for sale 4,762.41 3,945.97
Change in inventories of finished goods, Work-in-progress and products for sale
842.05 (252.14)
Total 42,684.91 31,345.48
Cost of material consumed increased to 73.0% of total revenue from 70.5% in Fiscal 2017, representing an increase of 250 bps, mainly due to product mix.

12573rd Annual Report 2017-18
INTEGRATED REPORT 1-65 STATUTORY REPORTS 66-184 FINANCIAL STATEMENTS 185-353
Excise duty for the Fiscal 2018 represents the reversal of excise duty on closing inventories as at July 1, 2017. Consequent to the introduction of Goods and Service Tax (GST) with effect from July 1, 2017, Central Excise, Value Added Tax (VAT) etc. have been replaced by GST. Excise duty for Fiscal 2018 was `793.28 crores in Fiscal 2018 as compared to `4,738.15 crores in Fiscal 2017. Of this recovery from sales was `1,168.14 crores for Fiscal 2018 as compared to `4,623.54 crores for Fiscal 2017. The same has been netted off against Revenue from operations to be comparable for discussion of performance.
Employee Costs were 3,966.73 crores in Fiscal 2018 as compared to `3,764.35 crores in Fiscal 2017, an increase by 5.4%, mainly due to higher volumes, annual increments, higher performance payment provisions for Fiscal 2018 and wage revisions at some plant locations.
Other Expenses includes all works operations, indirect manufacturing expenses, freight cost, fixed marketing costs and other administrative costs. These expenses have increased by 10.8%to `9,234.27 crores in Fiscal 2018 from `8,335.90 crores in Fiscal 2017. The breakdown is provided below:
Fiscal 2018 Fiscal 2017 Change(` in crores)
Processing charges 1,240.88 1,004.45 236.43Consumption of stores & spare parts 639.35 653.61 (14.26)Freight, transportation, port charges, etc. 1,703.15 1,536.77 166.38Power and fuel 545.12 483.48 61.64Warranty expenses 766.18 493.33 272.85Information technology/computer expenses 711.95 762.39 (50.44)Publicity 720.18 848.36 (128.18)Allowances made/(reversed) for trade and other receivables (109.19) 133.72 (242.91)Assets scrapped/written off 995.47 141.45 854.02Works operation and other expenses 2,021.18 2,278.34 (257.16)Other Expenses 9,234.27 8,335.90 898.37
The changes are mainly driven by volumes and the size of operations.
i. Freight, transportation, port charges etc., as a percentage to total revenue, were 2.9% in Fiscal 2018, as compared to 3.1% in Fiscal 2017.
ii. Publicity expenses represented 1.2% of total revenues in Fiscal 2018 and 1.7% in Fiscal 2017. In addition to routine product and
brand campaigns, the Company incurred expenses relating to new product introduction campaigns for the Nexon etc. Further, expenses were incurred for the Auto Expo and Geneva Motor Show.
iii. Warranty expenses represented 1.3% and 1%, of the Company’s revenues in Fiscal 2018 and 2017, respectively. The increase was due to volumes of M&HCV. Further, the Company has increased product warranty period for certain vehicles from four years to six years.
iv. Information technology/computer expenses represented 1.2% and 1.6% of the Company’s revenues in Fiscal 2018 and 2017, respectively.
v. Assets written off of `995.47 crores in Fiscal 2018 represents 1.7% of the Company’s revenues.
vi There was reversal in allowances for trade and other receivables of `109.19 crores in Fiscal 2018, due to favorable litigation orders.
vii. Works operation and other expenses have decreased to 3.4% of net revenue in Fiscal 2018 from 4.9% in Fiscal 2017. Decrease is due to charge off of certain projects discontinued. The Company has run certain ImpACT projects thereby reducing its fixed costs.
Amount capitalized represents expenditure transferred to capital and other accounts allocated out of employee cost and other expenses, incurred in connection with product development projects and other capital items. The expenditure transferred to capital and other accounts has decreased by 9.2% to `855.08 crores in Fiscal 2018 from `941.60 crores in Fiscal 2017, mainly due to various product development projects undertaken by the Company for the introduction of new products and the development of engine and products variants.
Other Income increased by 58.8% to 1,557.60 crores in Fiscal 2018 from `981.06 crores in Fiscal 2017. This includes interest income of `397.71 crores in Fiscal 2018, compared to `187.90 crores in Fiscal 2017. Dividend income increased to `1,054.69 crores in Fiscal 2018 from `672.65 crores in Fiscal 2017, whereas profit on sale of investment decreased marginally to `103.17 crores in Fiscal 2018, compared to `116.76 crores in Fiscal 2017, primarily profit on sale of mutual funds.
Profit before exceptional items, depreciation and amortization, interest, foreign exchange (gain)/loss and tax is 5,358.18 crores in Fiscal 2018, representing 9.0% of revenue, compared to `2,793.27 crores in Fiscal 2017.
Depreciation and amortization: During Fiscal 2018, expenditures increased by 2.1% to 3,101.89 crores from 3,037.12 crores in Fiscal 2017. The depreciation has increased by 1.8% to `1,973.94 crores as compared to `1,939.77 in Fiscal 2017 is due to new product launches. The amortization expenses have increased by 2.8% to `1,127.95 crores in Fiscal 2018 from `1,097.35 crores in Fiscal 2017, and are attributable to new products introduced during the year.
Expenditure on product development / engineering expenses written off increased by 4.5% to `474.98 crores in Fiscal 2018 from `454.48 crores in Fiscal 2017.
Finance Cost has increased by 11.2% to `1,744.43 crores in Fiscal 2018 from `1,569.01 crores in Fiscal 2017. The increase is attributable to higher interest rates and borrowings.

126
Foreign exchange loss of `17.14 crores in Fiscal 2018 as compared to gain of `252.78 crores in Fiscal 2017. The loss was due to depreciation on INR as compared to USD.
Exceptional items
Fiscal 2018 Fiscal 2017 Change(` in crores)
Employee separation cost 3.68 67.61 (63.93)Provision for impairment of investment in a subsidiary - 123.17 (123.17)Impairment of capitalized fixed assets 962.98 - 962.98Provision for BSIII vehicles - 147.93 (147.93)Total 966.66 338.71 627.95
i. Employee separation cost: The Company has given early retirement to various employees resulting in an expense both in Fiscal 2018 and 2017.
ii. In order to make the Company fit for future certain product development programs were reviewed and accordingly an impairment charge of `962.98 crores were taken during Fiscal 2018.
iii. `147.93 crores for Fiscal 2017, relates to provision for inventory of BS III vehicles as at March 31, 2017.
Loss before tax was `946.92 crores in Fiscal 2018, compared to `2,353.27 crores in Fiscal 2017. Though the Company performed well in terms of sales and revenue and reducing the costs, the losses were due to certain one-time charges to make the Company “fit for future”.
Tax Expense represents a net charge of `87.93 crores in Fiscal 2018, as compared to `76.33 crores in Fiscal 2017.
Loss after tax was `1,034.85 crores in Fiscal 2018 as compared to `2,429.60 crores in Fiscal 2017.
Standalone Balance Sheet
Property, plant and equipment and Other Intangible assets.
As at March 31, Change2018 2017
(` in crores)Property, plant and equipment (including capital work - in- progress)
19,563.97 19,799.73 (235.76)
Other intangible assets (including assets under development)
7,137.29 8,145.09 (1,007.80)
Total 26,701.26 27,944.82 (1,243.56)
There is decrease (net of depreciation and amortization) in the intangible and tangible assets in Fiscal 2018. The decrease is mainly due to higher depreciation and amortization and certain write offs / provision for impairment during the year.
Investments in subsidiaries, joint ventures and associates were `14,632.51 crores as at March 31, 2018, as compared to `14,330.02 crores as at March 31, 2017. During Fiscal 2018, the Company made additional investments of `300 crores in Tata Motors Finance Holdings Ltd.
Investments (Current + Non-current) were `2,131.06 crores as at March 31, 2018, as compared to `2,965.79 crores as at March 31, 2017. The details are as follows:
As at March 31, Change2018 2017
(` in crores)Mutual Funds 1,517.03 2,437.42 (920.39)Quoted Equity shares 303.84 218.18 85.66Unquoted Equity shares 310.19 310.19 -Total 2,131.06 2,965.79 (834.73)
There was decrease in mutual fund investments in Fiscal 2018. Increase in quoted equity shares were due to increase in market value as at March 31, 2018, and also due to investments in the Rights issue of Tata Steel Ltd.
Loans and Advances (Current + Non-current)
As at March 31,Change
2018 2017(` in crores)
Non-Current loans and advances 143.96 391.46 (247.50)Current loans and advances 140.27 215.96 (75.69)Total 284.23 607.42 (323.19)
Loans and advances include advance to suppliers, contractors etc. Advance and other receivables increased to `68.03 crores as at March 31, 2018, as compared to `82.59 crores as at March 31, 2017, offset by reduction in inter-corporate deposits by `60 crores.
Other Financial Assets (Current + Non-current)
As at March 31, Change
2018 2017
(` in crores)
Other financial assets - non current 793.40 196.32 597.08
Other financial assets – current 646.31 141.54 504.77
Total 1,439.71 337.86 1,101.85

12773rd Annual Report 2017-18
INTEGRATED REPORT 1-65 STATUTORY REPORTS 66-184 FINANCIAL STATEMENTS 185-353
The above includes `878.54 crores on account of accrual of Government grants receivable. Further, it also consists of `242.34 crores of derivative financial instruments, as at March 31, 2018 compared to `291.10 crores as at March 31, 2017, reflecting notional liability due to the valuation of derivative contracts.
Inventories as at March 31, 2018, were `5,670.13 crores as compared to `5,553.01 crores as at March 31, 2017, an increase of 2.1%. In terms of number of days of sales, finished goods represented 13 inventory days in Fiscal 2018 as compared to 23 days in Fiscal 2017.
Trade Receivables (net of allowance for doubtful debts) were `3,479.81 crores as at March 31, 2018, representing an increase of 63.5% compared to `2,128.00 crores as at March 31, 2017. The allowances for doubtful debts were `543.50 crores as at March 31, 2018 compared to `693.17 crores as at March 31, 2017. The increase in Trade receivable is due to year end billings both at Tata Motors Ltd and Fiat India Automobiles Private Ltd.
Cash and cash equivalents were `546.82 crores, as at March 31, 2018, compared to `228.94 crores as at March 31, 2017. The increase was mainly attributable to balances with banks and cheques on hand, offset by deposit with banks.
Other bank balances were `248.60 crores, as at March 31, 2018, compared to `97.67 crores as at March 31, 2017. These include earmarked balances with banks of `248.53 crores as at March 31, 2018, compared to `86.60 crores as at March 31, 2017.
Current tax assets (net) (current + non-current) were `769.63 crores, as at March 31, 2018, compared to `902.16 crores as at March 31, 2017.
Other assets (Current + Non-current)
As at March 31, Change2018 2017
(` in crores)Other assets - non current 1,546.39 1,858.45 (312.06)Other assets – current 1,439.73 1,825.05 (385.32)Total 2,986.12 3,683.50 (697.38)
These mainly includes prepaid expenses, including rentals on operating lease of `221.74 crores as at March 31, 2018, as compared to `234.02 crores as at March 31, 2017. Taxes recoverable, statutory deposits and dues from government were `1.978.74 crores as at March 31, 2018, as compared to `2,444.36 crores as at March 31, 2017. Capital advances were `285.54 crores as at March 31, 2018, as compared to `561.01 crores as at March 31, 2017. Recoverable form insurance companies were `212.96 crores as at March 31, 2018 as compared to `170.84 crores as at March 31, 2017.
Shareholders’ fund was `20,170.98 crores and `21,162.61 crores as at March 31, 2018 and 2017, respectively, a decrease of 4.7%.
Reserves decreased by 4.8% from `20,483.39 crores as at March 31, 2017 to `19,491.76 crores as at March 31, 2018, mainly due to losses for Fiscal 2018.
Borrowings
As at March 31, Change
2018 2017
(` in crores)
Long term borrowings 13,155.91 13,686.09 (530.18)
Short term borrowings 3,099.87 5,158.52 (2,058.65)
Current maturities of long term borrowings 2,208.06 512.37 1,695.69
Total 18,463.84 19,356.98 (893.14)
Current maturities of long-term borrowings represent the amount of loan repayable within one year.
Other financial liabilities
As at March 31, Change
2018 2017
(` in crores)
Other financial liabilities - non current 211.28 1,130.23 (918.95)
Other financial liabilities – current 4,091.16 2,485.94 1,605.22
Total 4,302.44 3,616.17 686.27
These included `977.26 crores of financial guarantee contracts as at March 31, 2018 compared to `2,045.08 crores as at March 31, 2017. The reduction is due to payments of `905 crores and reduction in provision by `163 crores in Fiscal 2018. Current maturities of long-term borrowings were `2,208.06 crores as at March 31, 2018 as compared to `512.37 crores as at March 31, 2017. Further, interest accrued but not due on borrowings were `500.06 crores as at March 31, 2018 as compared to `449.73 crores as at March 31, 2017.
Trade payables were `9,411.05 crores as at March 31, 2018, as compared to `7,082.95 crores as at March 31, 2017, mainly due to creditors for goods supplied and services received, liabilities for variable marketing expenses, wage revisions etc.
Acceptances were `4,814.58 crores as at March 31, 2018, as compared to `4,379.29 crores as at March 31, 2017.

128
Provisions (current and non-current) were made towards warranty and employee benefit schemes. Short-term provisions are those, which are expected to be settled during next financial year. The details are as follows:
As at March 31, Change2018 2017
(` in crores)Long term provisions (Non-current) 1,009.48 892.18 117.30Short term provisions (Current) 862.92 477.17 385.75Total 1,872.40 1,369.35 503.05
i. Provision for warranty increased to `1,103.47 crores as at March 31, 2018, as compared to `666.82 crores as at March 31, 2017, an increase of `436.65 crores, mainly due to increase in volumes, higher warranty cost for BS IV models and also increase of warranty period for certain vehicle models.
ii. The provision for employee benefits obligations were flat at `655.05 crores as at March 31, 2018, as compared to `652.14 crores as at March 31, 2017.
Other liabilities
As at March 31,2018 2017 Change
(` in crores)Other liabilities - non current 291.09 321.24 (30.15)Other liabilities – current 1,917.60 1,870.80 46.80Total 2,208.69 2,192.04 16.65
These mainly includes liability for advance received from customers of `896.35 crores as at March 31, 2018, as compared to `850.40 crores as at March 31, 2017. Deferred revenue were `441.32 crores as at March 31, 2018, as compared to `428.05 crores as at March 31, 2017. Statutory dues (GST, VAT, Excise, Service Tax, Octroi etc.) were `781.12 crores as at March 31, 2018, as compared to `803.11 crores as at March 31, 2017.
Deferred tax liability represent timing differences where current benefit in tax will be offset by a debit in the statement of profit and loss. The amount increased to `154.61 crores as at March 31, 2018, as compared to `147.58 crores as at March 31, 2017.
Standalone Cash Flow
Fiscal 2018 Fiscal 2017 Change
(` in crores )
Net cash from operating activities 4,133.94 1,453.45 2,680.49Profit/(Loss) for the year (1,034.85) (2,429.60)
Fiscal 2018 Fiscal 2017 Change
(` in crores )
Adjustments for cash flow from operations 5,125.70 4,091.24
Changes in working capital 51.50 (93.09)
Direct taxes paid (8.41) (115.10)
Net cash used in investing activities (710.27) (2,859.00) 2,148.73
Payment for property, plant and equipment and other intangible assets (net) (2,794.80) (3,496.49)
Net investments, short term deposit, margin money and loans given 630.50 (294.03)
Dividend and interest received 1,454.03 931.52
Net Cash from/(used in) financing activities (3,105.63) 1,208.80 (4,314.43)
Proceeds from issue of shares - 4.55
Dividend Paid (including paid to minority shareholders (2.75) (73.00)
Interest paid (2,098.44) (1,936.45)
Net Borrowings (net of issue expenses) (1,004.44) 3,213.70
Net increase / (decrease) in cash and cash equivalent 318.04 (196.75) 514.79
Cash and cash equivalent, beginning of the year 228.94 427.07
Effect of exchange fluctuation on cash flows (0.16) (1.38)
Cash and cash equivalent, end of the year 546.82 228.94
a) Increase in net cash from operations reflects better performance in Fiscal 2018. The cash from operations before working capital changes was `4,090.85 crores in Fiscal 2018 compared to `1,661.64 crores in Fiscal 2017. There was

12973rd Annual Report 2017-18
INTEGRATED REPORT 1-65 STATUTORY REPORTS 66-184 FINANCIAL STATEMENTS 185-353
marginal net inflow of `51.50 crores in Fiscal 2018 towards working capital changes.
b) The net cash used in investing activities was `710.27 crores in Fiscal 2018 compared to `2,859.00 crores in Fiscal 2017, mainly attributable to:
• Decrease in Investments in mutual funds in Fiscal 2018 was `1,025.59 crores as compared to increase in investments by `537.40 crores in Fiscal 2017.
• The cash used for payments for fixed assets was `2,794.80 crores (net) in Fiscal 2018 compared to `3,496.49 crores in Fiscal 2017.
• Outflow by way of investments in subsidiary companies resulting of `300 crores in Fiscal 2018 as compared to `139.08 crores.
• Inflow due to dividends and interest in Fiscal 2018 was `1,454.03 crores as compared to `931.52 crores in Fiscal 2017.
• There was an outflow (net) of `110.96 crores in Fiscal 2018 compared to an inflow of `229.28 crores for Fiscal 2017 towards Fixed / restricted deposits.
c) The net change in financing activity was an outflow of `3,105.63 in Fiscal 2018 against inflow of `1,208.80 crores in Fiscal 2017. The outflow is attributable to:
• Long-term borrowings (net) – inflow of `1,034.70 crores in Fiscal 2018 as compared to `1,474.30 crores.
• Short-term borrowings (net) – outflow of 2,039.14 crores in Fiscal 2018 as compared to inflow of `1,739.40 crores.
• In Fiscal 2017, the Company paid dividend of `73.00 crores.
• In Fiscal 2018, interest payment was `2,098.44 crores as compared to `1,936.45 crores in Fiscal 2017.
d) There has been positive Free cash flows of `1,339 crores in Fiscal 2018 due to improved performance.
FINANCIAL PERFORMANCE OF JAGUAR LAND ROVER (AS PER IFRS)
The financial statements of Jaguar Land Rover are prepared in accordance with International Financial Reporting Standards (IFRS) applicable in the United Kingdom. This information is given to enable the readers to understand the performance of Jaguar Land Rover on a consolidated basis for the Jaguar Land Rover group.
Revenues for Jaguar Land Rover for Fiscal 2018 were GB£25,786 million, an increase of 5.9% compared to the GB£24,339 million in Fiscal 2017, driven primarily by increased wholesale volumes and favourable mix, reflecting the introduction of the Range Rover Velar.
Material and other cost of sales in Fiscal 2018 were of GB£16,328 million, up 8.3% compared to the GB£15,071 million in Fiscal 2017 (and increased as a proportion of revenue to 63.3% in Fiscal 2018
compared to 61.9% in Fiscal 2017) primarily driven by the increase in sales volumes and a generally stronger Euro vs the Pound Sterling.
Employee costs increased by 9.3% to GB£2,722 million in Fiscal 2018 compared to GB£2,490 million in Fiscal 2017, primarily reflecting increase in employees to support increased product development activities and increased production related to the launch of new models and increasing sales.
Other expenses (net of income) increased by 8.6% to GB£5,426 million in Fiscal 2018 compared to GB£4,997 million in Fiscal 2017 primarily reflecting an increase in fixed marketing costs, primarily related to the launch of new models, and higher engineering, related to increased R&D activities, and an increase in freight costs related to the increase in volumes.
Product development costs capitalized increased by 12.9% to GB£1,610 million in Fiscal 2018 compared to GB£1,426 million in Fiscal 2017 primarily related to the development of future models, technologies and production facilities.
EBITDA was GB£3,271 million (10.9% margin) in Fiscal 2018, up 10.7% compared to the EBITDA of GB£2,955 million (12.1% margin) in Fiscal 2017 due to the factors described above.
EBIT was GB£974 million (3.8% margin) in Fiscal 2018, down 32.6% compared to the EBIT of GB£1,445 million (6.0% margin) in Fiscal 2017 due to the lower EBITDA as well as an increase in depreciation and amortization, partially offset by higher profits from the company’s China joint venture.
Profit before tax (“PBT”) decreased by 4.6% to GB£1,536 million in Fiscal 2018 compared to GB£1,610 million in Fiscal 2017, reflecting the lower EBIT and favourable revaluation of unrealized foreign currency debt and hedges in Fiscal 2018 compared to unfavourable revaluation of foreign currency debt and the non-recurrence of favourable revaluation of unrealized commodity hedges in the prior year, partially offset by higher net finance expense. The exceptional items primarily include the pension credit of £437 million in Fiscal 2018 compared to the non-recurrence of £151 million of Tianjin recoveries in Fiscal 2017.
Profit after tax (“PAT”) decreased by 10.9% to GB£1,133 million in Fiscal 2018 compared to GB£1,272 million in Fiscal 2017. The effective tax rate of 26.2% in Fiscal 2018 compared to the 21.0% in Fiscal 2017 primarily reflects a £54 million charge for the impact of the change in the US Federal rate from 35% to 21% on deferred tax assets.
Net cash generated from operating activities was GB£2,958 million in Fiscal 2018 compared to GB£3,160 million in Fiscal 2017, primarily reflecting lower profits in Fiscal 2018 compared the prior year and working capital inflows of £81 million compared to £467 million in Fiscal 2017, and Dividends received from the China joint venture of £206 million up from the GB£68 million dividend received in Fiscal 2017, however GB£312 million was paid in tax this fiscal year compared to £199 million in the prior year.
After GB£3,780 million of investment spending (excluding £406 million of expensed R&D), £125 million of net interest expense and £98 million of other outflows, free cash flow was negative

130
GB£1,045 million. Increases in debt of GB£370 million primarily reflects the US$500 million bond issued in October 2017 GB£150 million of dividends were paid to parent Company and £5 million of other distributions to non-controlling interests were paid during the year. As a result Jaguar Land Rover had a total cash balance of GB£4,657 million (comprising GB£2,626 million of cash and cash equivalents and GB£2,031 million of financial deposits) at March 31, 2018 compared to GB£5,487 million of total cash at March 31, 2017 (comprising GB£2,878 million of cash and cash equivalents and GB£2,609 million of financial deposits). With total cash of GB£4,657 million and an undrawn revolving credit facility of GB£1,935 million (amended and extended in July 2017) maturing in July 2022, total liquidity available to Jaguar Land Rover was GB£6,592 million at March 31, 2018, compared to GB£7,357 million at March 31, 2017.
FINANCIAL PERFORMANCE OF TATA MOTORS FINANCE LTD (AS PER INDIAN GAAP)
Consolidated revenue for TMF Holdings during Fiscal 2018 increased 5.7% to `2,875.53 crores, compared to `2,720.51 crores in Fiscal 2017. The Profit before tax was `290.28 crores in Fiscal 2018, compared to a loss before tax of `698.56 crores in Fiscal 2017. The Profit after tax was `217.41 crores in Fiscal 2018, as compared to a Loss of `1,182.29 crores in previous year. The GNPA reduced by 1,390 bps to 4% (measured on 90 days basis). NNPA at 3%.
FINANCIAL PERFORMANCE OF TATA DAEWOO COMMERCIAL VEHICLES (AS PER KOREAN GAAP)
During Fiscal 2018, TDCV, registered revenues of KRW 868.26 billion (`5,035 crores), a drop of 15.8% over the previous year revenues of KRW 1,031.77 billion (`5,986 crores), mainly due to lower domestic sales. The Profit After Tax was KRW 33.66 billion (`203 crores) compared to KRW 50.25 billion (`290 crores) of Fiscal 2017. Lower profitability was mainly due to the impact of lower sales which was partially set off by material cost reduction
FINANCIAL PERFORMANCE OF TATA TECHNOLOGIES LTD
The consolidated revenue of TTL in Fiscal 2018 decreased by 3.9% to `2,691.48 crores, compared to `2,801.95 crores in Fiscal 2017. The profit before tax decreased by 25.7% to `336.43 crores in Fiscal 2018, compared to `452.77 crores in Fiscal 2017. The profit after tax decreased by 30.5% to `245.71 crores in Fiscal 2018, as compared to `353.59 crores in Fiscal 2017. The Company suffered decline in revenue in Europe and North America primarily due to completion of vehicle programs and delay in the start of new programs due to client product plan changes, budgetary approval delays and softness in staffing deployments. This was partially offset by 6.8% growth in Asia Pacific regions. There has been increase in purchase of traded products, employee costs and other expenses partially offset by outsourcing and consultancy charges, leading to a decrease in profits.
INTERNAL CONTROL SYSTEMS AND THEIR ADEQUACY
The Company has an adequate system of internal controls in place. It has documented policies and procedures covering all financial and operating functions. These controls have been designed to
provide a reasonable assurance with regard to maintaining of proper accounting controls for ensuring reliability of financial reporting, monitoring of operations, and protecting assets from unauthorized use or losses, compliances with regulations. The Company has continued its efforts to align all its processes and controls with global best practices.
Some significant features of the internal control of systems are:
• The Audit Committee of the Board of Directors, comprising of independent directors and functional since August 1988, regularly reviews the audit plans, significant audit findings, adequacy of internal controls, compliance with accounting standards as well as reasons for changes in accounting policies and practices, if any;
• Documentation of major business processes and testing thereof including financial closing, computer controls and entity level controls, as part of compliance programme towards Sarbanes-Oxley Act, as required by the listing requirements at New York Stock Exchange;
• An ongoing programme, for the reinforcement of the Tata Code of Conduct is prevalent across the organization. The Code covers integrity of financial reporting, ethical conduct, regulatory compliance, conflicts of interest’s review and reporting of concerns.
• State-of-the-art Enterprise Resource Planning, supplier relations management and customer relations management connect the Company’s different locations, dealers and vendors for efficient and seamless information exchange. The Company also maintains a comprehensive information security policy and undertakes continuous upgrades to its IT systems;
• Detailed business plans for each segment, investment strategies, year-on-year reviews, annual financial and operating plans and monthly monitoring are part of the established practices for all operating and service functions;
• A well-established, independent, multi-disciplinary Internal Audit team operates in line with governance best practices and based on its Internal Audit Charter. It reviews and discusses, with the management and reports directly to Audit Committee about compliance with internal controls.
The Board takes responsibility for the overall process of risk management throughout the organization. Through an Enterprise Risk Management programme, the Company’s business units and corporate functions address risks through an institutionalized approach aligned to the Company’s objectives. This is facilitated by internal audit. The Business risk is managed through cross-functional involvement and communication across businesses. The results of the risk assessment are presented to the senior management. The Risk Management Committee reviews business risk areas covering operational, financial, strategic and regulatory risks.
During Fiscal 2018, the Company conducted an assessment of the effectiveness of the Internal Control over Financial Reporting and has determined that the Company’s Internal Control over

13173rd Annual Report 2017-18
INTEGRATED REPORT 1-65 STATUTORY REPORTS 66-184 FINANCIAL STATEMENTS 185-353
Financial Reporting for Tata Motors Limited, its subsidiary companies, its joint operation companies, its associates and joint ventures, which are companies incorporated in India as at March 31, 2018, is effective.
The Company identified certain control weaknesses in its subsidiary Jaguar Land Rover during Fiscal 2018. The management has performed additional procedures and confirmed that there are no material misstatements in the financial statement. However, the Company’s annual report in Form 20-F to be submitted to Securities Exchange Commission, USA is being finalized and hence the final assessment and reporting of Internal Controls over Financial Reporting, for the Company’s subsidiaries incorporated outside India is pending.
HUMAN RESOURCES / INDUSTRIAL RELATIONS
The Company considers its human capital a critical factor to its success. Under the aegis of Tata Sons and the Tata Sons promoted entities, the Company has drawn up a comprehensive human resource strategy, which addresses key aspects of human resource development such as:
• The code of conduct and fair business practices;
• A fair and objective performance management system linked to the performance of the businesses which identifies and differentiates employees by performance level;
• Creation of a common pool of talented managers across Tata Sons and the Tata Sons promoted entities with a view to increasing their mobility through job rotation among the entities;
• Evolution of performance based compensation packages to attract and retain talent within Tata Sons and the Tata Sons promoted entities; and
• Development and delivery of comprehensive training programs to impact and improve industry- and/or function-specific skills as well as managerial competence.
• In line with the Company human resource strategy, it has implemented various initiatives in order to build better organizational capabilities that the Company believe will enable it to sustain competitiveness in the global marketplace. The Company’s focus is to attract talent, retain the better and advance the best. Some of the initiatives to meet this objective include:
• Development of an agile organization through process modification, delayering and structure alignment and increase in customer facing roles;
• Changed organization structure has empowered teams, across each product lines, which will manage the product lifecycle and be accountable for the Profit and Loss;
• Extensive process mapping exercises to benchmark and align the human resource processes with global best practices;
• Outsource transactional activities to an in house back office (Global Delivery Center), thereby reducing cost and time of transaction;
• Talent management process redesigned with a stronger emphasis on identifying future leaders;
• Build strategic partnerships with educational institutions of repute to foster academia based research and provide avenues for employees to further their educational studies;
• Enhance company’s image and desirability amongst the target engineering and management schools, to enable it to attract the best;
• Functional academies setup for functional skills development;
• Skill development of all Blue collared workforce to enable them to effectively meet the productivity and quality deliverables.
• Training youth under Government of India’s National Employment Enhancement Mission in our skill development centers in all the plants. These trainees are given Automotive Skill Development Council certification, helping them get gainful employment in the industry. Engaging trainees benefit the company to meet the cyclicity of demand as well.
The Company employed approximately 81,090 and 80,389 permanent employees as at March 31, 2018 and 2017, respectively. The average number of flexible (temporary, trainee and contractual) employees for Fiscal 2018, was approximately 38,017 (including joint operations) compared to 38,120 in Fiscal 2017.
The following table set forth a breakdown of persons employed by the Company’s business segments and by geographic location as at March 31, 2018 and 2017.
As at March 31,
2018 2017
Segment No. of Employees
Automotive 72,683 72,259
Other 8,407 8,130
Total 81,090 80,389
Location No. of Employees
India 41,295 42,992
Abroad 39,795 37,397
Total 81,090 80,389
Training and Development: The Company has committed to the development of its employees to strengthen their functional, managerial and leadership capabilities. The Company has a focused approach with the objective of addressing all capability gaps and preparing its employees to adopt to fast changing external environment in order to meet its strategic objectives.
To achieve this, the Company has established the Tata Motors Academy, which addresses development needs of various segments of its workforce through a structured approach. The Tata Motors Academy focuses on three functional pillars – customer excellence, product leadership, and operational excellence – and one pillar on management education, all of which are aligned with the Company-level strategic objectives. The emphasis of functional academies is to strengthen knowledge, skills and expertise with an

132
in depth approach, within respective function, and the emphasis of management education is developing general management and leadership skills. Tata Motors Academy also provides executive education opportunities in the areas of B.Tech, M.Tech, Executive MBA.
As an integral part of the Tata Motors Academy, the Company’s Learning Advisory Council, which includes senior leaders from different parts of organization, aims to align its learning and development efforts, more closely with its business needs and priorities. The Learning Advisory Council is responsible for providing guidance and strategic direction to the Academies to design, implement and review the learning agenda.
The Company is now migrating from a trade-based training approach to a process-based training approach, which emphasizes team members’ knowledge as related to their actual work, in addition to the general trade-based skills, which are learned at training institutes. These skills are very specific and not currently taught at the training institutes. To accomplish this, the Company is implementing a fundamental skills training initiative throughout organization. Its objective is to address key employee performance issues, such as inconsistent quality, poor craftsmanship, high frequencies of repair reworking and low productivity levels through training of front-line team members.
Union Wage Settlements: The Company has labour unions for operative grade employees at all its plant across India, except Dharwad plant. The Company has generally enjoyed cordial relations with its employees at its factories and offices and have received union support in the implementation of reforms that impact safety, quality, cost erosion and productivity improvements across all locations.
Employee wages are paid in accordance with wage agreements that have varying terms (typically three to five years) at different locations. The expiration dates of the wage agreements with respect to various locations/subsidiaries are as follows:
Location/subsidiaries Wage Agreement valid until
Pune commercial vehicles August 31, 2018
Pune passenger vehicles March 31, 2019
Jamshedpur March 31, 2019
Mumbai December 31, 2018
Lucknow March 31, 2020
Pantnagar March 31, 2019
Sanand September 30, 2020
Jaguar Land Rover – UK Plants November 30, 2018
The Company’s wage agreements link an employee’s compensation to certain performance criteria that are based on various factors such as quality, productivity, operating profit and an individual’s performance and attendance. The Company has generally received union support in its implementation of reforms that impact quality, cost erosion and productivity improvements across all locations. In addition to this the Company have signed settlement with a variable as part of wage cost and stagger payment instead of one time pay to be bring more cost effectiveness on account of fixed pay.
JAGUAR LAND ROVER
Jaguar Land Rover has always focused on the safety, security, wellbeing and development of the people. The Company nurture and retain talent through the Jaguar Land Rover Academy, an environment offering accredited learning for the employees at every stage of their career. Actively shaping education and contributing to the skills development available to our communities is part of our long-term recruitment strategy. So too is continuing our successful apprentice and graduate programme, working closely with academic partners such as the Warwick Manufacturing Group. The Company has been investing £100 million per year in the Jaguar Land Rover Academy for lifelong learning of employees. Around a quarter of the employees are actively working towards a formal academic or professional qualification at all levels from apprenticeship to doctorate. The Company has also up-skilled 7,000 engineers with Master-level education since our Academy technical accreditation scheme began in 2010.
Closing the gender gap and a digital call for the worlds brightest and best
Jaguar Land Rover has focused on attracting women into engineering and advanced manufacturing through programmes such as our Young Women in the Know initiative for female students aged 15 to 18. With fewer women than men in senior roles and a majority of men in production operations in factories, the gender gap can be hard to close. Traditionally, a lower number of women coming into the industry and flourishing within it has made this even harder. However, the Company is committed both to equality and encouraging a diverse workforce, and things are changing for the better. There has been a 21% increase in proportion of women in our management grades since 2014. In 2017, Jaguar Land Rover recruited more women than men (55% female) onto their Advanced Apprentice Programme. The Company has also developed new ways to seek out tomorrow’s innovators, partnering with virtual band Gorillaz to find the next generation of software engineering brilliance, through code-breaking puzzles that test curiosity, persistence, lateral thinking and problem-solving. Those who have cracked them were interviewed by Jaguar Land Rover and the best were hired.
Human Rights
The Human Rights Policy sets out the commitment to respect and comply will all relevant laws, rules and regulations in the territories in which Jaguar Land Rover operates. These include provisions addressing slavery, human trafficking, forced labour, child labour and upholding each employee’s right to freedom of association. The Company has refreshed the assessment of slavery and human trafficking risk risks and continue to deem the risk to be low.
OUTLOOK
The Indian automotive sector has the potential to generate upto US$300 billion in annual revenue by 2026, create 65 million additional jobs and contribute over 13% to India’s GDP. Increased urbanization is firmly placed in the centre of this progress. As per World Bank study, by 2031, some 600 million people are expected to live in India’s cities. Therefore, automakers are slated to be one

13373rd Annual Report 2017-18
INTEGRATED REPORT 1-65 STATUTORY REPORTS 66-184 FINANCIAL STATEMENTS 185-353
of the greatest contributors to this futuristic plan of 100 smart cities by 2020. The Company has recently supplied Hybrid electric buses, which runs both on diesel and electric, and is economically viable, safe and environment-friendly.
A revival of the economy post-demonetization and implementation of GST are putting the country back on track. The Company is looking to be the major beneficiary for the increased infrastructure spending on roads, airports and expected high GDP. In Passenger vehicle, there has been a shift in the trend of buying from small passenger vehicles towards Utility Vehicles (UV). This shift will lead to more profitable growth for the Automobile sector. The passenger vehicle sector is expected to grow at 8%-10% in Fiscal 2019.
The Commercial Vehicles segment is expected to grow at low double digits. The continued government spending on infrastructure, robust rural economy and strong private consumption will be supporting the growth in this segment. Pre-buying is expected before implementation of BS VI in Fiscal 2020. The privatization of select State Transport undertakings bodes well for the bus segment. This can result in both the volumes and profitability.
There is an increasing buzz for e-mobility by 2030. The Company acknowledges the importance to environment risk and is prepared for the electric vehicles which is visible from the recent orders received from EESL and Government of Maharashtra. The
Company has already started delivery of the vehicles to EESL. In addition to Electric vehicles, the Company is preparing itself to be efficient in not only BSVI emission norms, but also plans to take a holistic approach towards environment regulations and stay ahead in Industry.
The global premium auto industry is expected to grow at a CAGR of 2.6% between Fiscal 2018-24. Continued investment, by Jaguar Land Rover, in new products and technologies as well as expanding its production capacity in appropriate strategic locations, while balancing production with sales, is key for the success of the Company.
CAUTIONARY STATEMENT
Statements in the Management Discussion and Analysis describing the Company’s objective, projections, estimates and expectations may be “forward-looking statements” within the meaning of applicable securities laws and regulations. Actual results could differ materially from those expressed or implied. Important factors that could make a difference to the Company operations include, among others, economic conditions affecting demand/supply and price conditions in the domestic and overseas markets in which the Company operates, changes in government regulations, tax laws and other statutes and incidental factors.

134
Risks associated with the Company’s Business and the Automotive Industry.
Deterioration in global economic conditions could have a material adverse impact on the Company sales and results of operations.
The Indian automotive industry could be affected materially by the general economic conditions in India and around the world. The automotive industry, in general, is cyclical, and economic slowdowns in the recent past have affected the manufacturing sector in India, including the automotive and related industries. Further deterioration in key economic metrics, such as the growth rate, interest rates and inflation, as well as reduced availability of financing for vehicles at competitive rates, environment policies, tax policies, increase in freight rates and fuel prices could materially and adversely affect the Company’s automotive sales and results of operations.
In addition, investors’ reactions to economic developments or a loss of investor confidence in the financial systems of other countries may cause volatility in Indian financial markets and indirectly, in the Indian economy in general. Any worldwide financial instability, including increased protectionist measures and withdrawal from trade pacts by countries in which the Company operate, could also have a negative impact on the Indian economy, including the movement of exchange rates and interest rates in India. In the event global economic recovery is slower than expected, or if there is any significant financial disruption, this could have a material adverse effect on the Company’s cost of funding, portfolio of financing loans, business, prospects, results of operations, financial condition and the trading price of the Company’s Shares and ADSs.
Jaguar Land Rover business has significant operations in the United Kingdom, North America, continental Europe and China as well as sales operations in other overseas markets across the globe. Conditions in automotive markets were generally more challenging in Fiscal 2018 with industry volumes down significantly year-on-year in the UK (11.0%), primarily because of a sharp decline in diesel-based vehicle sales (26.2%), down slightly in the US (1.1%), but up modestly in China (1.3%) and in Europe (3.8%). Although conditions remained challenging in emerging markets such as Brazil, Russia and South Africa, stabilizing economic growth improved automotive industry sales during Fiscal 2018. Jaguar Land Rover’s growth plans may not quite materialize as expected which could have a significant adverse impact on the Company’s financial performance. If automotive demand softens because of lower or negative economic growth in key markets or due to other factors, Jaguar Land Rover’s operations and financial condition could be materially and adversely affected as a result. Deterioration in key economic factors, such as GDP growth rates, interest rates and inflation, as well as the reduced availability of financing for vehicles at competitive rates in countries where Jaguar Land Rover has sales operations may result in a decrease in demand for automobiles. A decrease in demand would, in turn, cause automobile prices and manufacturing capacity utilization
rates to fall. Such circumstances have in the past materially affected, and could in the future, materially affect, the Company’s business, results of operations and financial condition.
The United Kingdom’s contemplated exit from the European Union may adversely impact Jaguar Land Rover business, results of operations and financial condition.
In a non-binding referendum on the United Kingdom’s membership in the European Union in June 2016, a majority of the electorate voted for the United Kingdom’s withdrawal from the European Union. Pursuant to its invocation of Article 50 of the Lisbon Treaty, the United Kingdom is currently negotiating its exit from the European Union. Substantial uncertainty remains regarding the outcome of the negotiations, United Kingdom’s future relationship with the European Union, the economic and political future of the United Kingdom, the legal structure applicable to companies doing business in the United Kingdom as well as the scope and duration of a transitionary period, if any, following the expiration of the Article 50 period on December 2020. This uncertainty, along with any real or perceived impact of Brexit, could have a material adverse effect on the Company’s business, results of operations and financial condition.
Depending on the outcome of the negotiations, the United Kingdom could lose its present rights or terms of access to the single EU market and EU customs area and to the global trade deals negotiated by the European Union on behalf of its members. New or modified trading arrangements between the United Kingdom and other countries may have a material adverse effect on Jaguar Land Rover’s business. A decline in trade could also affect the attractiveness of the United Kingdom as a global investment center and, as a result, could have a detrimental impact on the level of investment in UK companies, including the Company’s Jaguar Land Rover business. Customer behaviour may change as a result of global economic uncertainty, which may cause Jaguar Land Rover’s customers to re-evaluate when and to the extent they are willing to spend on its products and services. The uncertainty concerning the terms of Brexit could also have a negative impact on the growth of the UK economy and cause greater volatility in the British pound against foreign currencies in which Jaguar Land Rover conducts business, particularly the U.S. dollar, the euro and the Chinese yuan.
There also exists significant uncertainty with respect to the laws and regulations that will apply as the United Kingdom determines which European Union-derived laws to replace or replicate. This uncertainty may adversely affect business activity and economic conditions in the United Kingdom and the Eurozone. In particular, changes in taxes, tariffs and other fiscal policies could have a significant impact on Jaguar Land Rover business; 22% of its retail sales volume in Fiscal 2018 was to customers based in the European Union (excluding the United Kingdom) and a substantial portion of its suppliers are situated there. The economic outlook could be further adversely affected by the risk of a greater push for independence by Scotland or Northern Ireland or the risk that the
Risk Factors

13573rd Annual Report 2017-18
INTEGRATED REPORT 1-65 STATUTORY REPORTS 66-184 FINANCIAL STATEMENTS 185-353
euro as the single currency of the European Union could cease to exist. Changes to UK border and immigration policy could likewise occur as result of Brexit, affecting the Company’s business’s ability to recruit and retain employees from outside the United Kingdom. Any of the foregoing factors and other factors relating to Brexit that Jaguar Land Rover cannot predict may have a material adverse effect on Jaguar Land Rover’s business, results of operations and financial condition.
Intensifying competition could materially and adversely affect the Company’s sales, financial condition and results of operations.
The global automotive industry is highly competitive and competition is likely to further intensify in light of continuing globalization and consolidation. Competition is especially likely to increase in the premium automotive categories as each market participant intensifies the Company’s efforts to retain its position in established markets while also expanding in emerging markets, such as China, India, Russia, Brazil and parts of Asia. Factors affecting competition include product quality and features, innovation and the development time for introduction of new products, cost control, pricing, reliability, safety, fuel economy, environmental impact and perception thereof, customer service and financing terms. Some of the Company’s competitors based in the European Union may gain a competitive advantage that would enable them to benefit from their access to the European Union single market post-Brexit. There can be no assurance that the Company will be able to compete successfully in the global automotive industry in the future.
The Company also face strong competition in the Indian market from domestic, as well as foreign automobile manufacturers. Improving infrastructure and growth prospects, compared to those of other mature markets, has attracted a number of international companies to India either through joint ventures with local partners or through independently owned operations in India. International competitors bring with them decades of international experience, global scale, advanced technology and significant financial resources. Consequently, domestic competition is likely to further intensify in the future. There can be no assurance that the Company will be able to implement its future strategies in a way that will mitigate the effects of increased competition on the Indian automotive industry.
Designing, manufacturing and selling vehicles is capital intensive and requires substantial investments in manufacturing, machinery, research and development, product design, engineering, technology and marketing in order to meet both consumer preferences and regulatory requirements. If the Company’s competitors consolidate or enter into other strategic agreements such as alliances, they may be able to take better advantage of economies of scale. The Company believe that competitors may be able to benefit from the cost savings offered by consolidation or alliances, which could adversely affect the Company’s competitiveness with respect to those competitors. Competitors could use consolidation or alliances as a means of enhancing their competitiveness (including through the acquisition of technology), which could also materially adversely affect the Company’s business. Further, the Company’s growth strategy relies on the expansion of its operations in less
mature markets abroad, where it may face significant competition and higher than expected costs to enter and establish itself.
The electric vehicle market may not evolve as anticipated.
The Company intends to develop electric vehicles as more car manufacturers consider various opportunities to expand their electric vehicle product range and stringent emissions norms make it push OEMs increasingly in the direction of adopting zero emission technology. However, sales of electric vehicles are hard to predict as consumer demand may fail to shift in favour of electric vehicles and this market segment may remain small relative to the overall market for years to come. Consumers may remain reluctant to adopt electric vehicles due to the lack of fully developed charging infrastructure or long charging times. If it takes longer for the long-term value proposition of electric vehicles to fully materialize, this could have a material adverse effect on the Company’s financial condition or results of operations.
If the Company is unable to effectively implement or manage its growth strategy, its operating results and financial condition could be materially and adversely affected.
As part of the Company’s growth strategy, it may open new manufacturing, research or engineering facilities, expand existing facilities, add additional product lines or expand its businesses into new geographical markets. There is a range of risks inherent in such a strategy that could adversely affect the Company’s ability to achieve these objectives, including, but not limited to, the following: the potential disruption of the Company’s business; the uncertainty that new product lines will generate anticipated sales; the uncertainty that it may not be able to meet or anticipate consumer demand; the uncertainty that a new business will achieve anticipated operating results; the diversion of resources and management’s time;the Company’s cost reduction efforts, which may not be successful; the difficulty of managing the operations of a larger company; and the difficulty of competing for growth opportunities with companies having greater financial resources than the Company have.
More specifically, the Company’s international businesses faces a range of risks and challenges, including, but not limited to, the following: language barriers, cultural differences, difficulties in staffing and managing overseas operations, inherent difficulties and delays in contract enforcement and the collection of receivables under the legal systems of foreign countries, the risk of non-tariff barriers, regulatory and legal requirements affecting the Company’s ability to enter new markets through joint ventures with local entities, difficulties in obtaining regulatory approvals, environmental permits and other similar types of governmental consents, difficulties in negotiating effective contracts, obtaining the necessary facility sites or marketing outlets or securing essential local financing, liquidity, trade financing or cash management facilities, export and import restrictions, multiple tax regimes (including regulations relating to transfer pricing and withholding and other taxes on remittances and other payments from subsidiaries), foreign investment restrictions, foreign exchange controls and restrictions on repatriation of funds, other restrictions on foreign trade or investment sanctions, and the burdens of complying with a wide variety of foreign laws and

136
regulations. Furthermore, as part of the Company’s global activities, it may engage with third-party dealers and distributors, which it does not control but which, nevertheless, take actions that could have a material adverse impact on its reputation and business; the Company cannot assure you that it will not be held responsible for any activities undertaken by such dealers and distributors. If the Company is unable to manage risks related to its expansion and growth in other parts of the world and therefore fail to establish a strong presence in those higher growth markets, its business, results of operations and financial condition could be adversely affected or its investments could be lost.
Furthermore, the Company is subject to risks associated with growing its business through mergers and acquisitions. The Company believes that its acquisitions provides it opportunities to grow significantly in the global automobile markets by offering premium brands and products. The Company’s acquisitions have provided it with access to technology and additional capabilities while also offering potential synergies. However, the scale, scope and nature of the integration required in connection with its acquisitions present significant challenges, and the Company may be unable to integrate the relevant subsidiaries, divisions and facilities effectively within its expected schedule. An acquisition may not meet the Company’s expectations and the realization of the anticipated benefits may be blocked, delayed or reduced as a result of numerous factors, some of which are outside its control.
For example, the Company acquired the Jaguar Land Rover business from Ford in June 2008, and since then Jaguar Land Rover has become a significant part of its business, accounting for approximately 77% of its total revenues in Fiscal 2018. As a result of the acquisition, the Company is responsible for, among other things, the obligations and liabilities associated with the legacy business of Jaguar Land Rover. There can be no assurances that any legacy issues at Jaguar Land Rover or any other acquisition we have undertaken in the past or will undertake in the future would not have a material adverse effect on the Company’s business, financial condition and results of operations, as well as its reputation and prospects.
The Company will continue to evaluate growth opportunities through suitable mergers and acquisitions in the future. Growth through mergers and acquisitions involves business risks, including unforeseen contingent risks or latent business liabilities that may only become apparent after the merger or acquisition is completed. The key success factors are seamless integration, effective management of the merged and/or acquired entity, retention of key personnel, cash flow generation from synergies in engineering and sourcing, joint sales and marketing efforts, and management of a larger business. If any of these factors fails to materialize or if the Company is unable to manage any of the associated risks successfully, its business, financial condition and results of operations could be materially and adversely affected.
The Company’s future success depends on the Company’s ability to satisfy changing customer demands by offering innovative products in a timely manner and maintaining such products’ competitiveness and quality.
Customer preferences, especially in many of the more mature markets, have trended towards smaller and more fuel-efficient and environmentally friendly vehicles. Climate change concerns, increases in fuel prices, certain government regulations (such as CO2 emissions limits and higher taxes on SUVs) and the promotion of new technologies encourages customers to look beyond standard purchasing factors (such as price, design, performance, brand image and features) to differentiation of the technology used in the vehicle or the manufacturer or provider of this technology. Such consumer preferences could materially affect the Company’s ability to sell premium passenger cars and large or medium-sized all-terrain vehicles at current or targeted volume levels, and could have a material adverse effect on the Company’s general business activity, net assets, financial position and results of operations.
The Company’s operations may be significantly impacted if it fail to develop, or experience delays in developing, fuel-efficient vehicles that reflect changing customer preferences and meet the specific requirements of government regulations. The Company’s competitors may gain significant advantages if they are able to offer products satisfying customer needs earlier than we are able to, which could adversely impact its sales, results of operations and financial condition. Delays or cost overruns in implementing new product launches, expansion plans or capacity enhancements could also materially and adversely impact its financial condition and results of operations.
As a result of the public discourse on climate change and volatile fuel prices, the Company faces more stringent government regulations, imposition of speed limits and higher taxes on sports utility vehicles or premium automobiles. The Company endeavours to take account these factors, and it is focused on researching, developing and producing new drive technologies, such as hybrid engines and electric cars. The Company also investing in development programs to reduce fuel consumption through the use of lightweight materials, reducing parasitic losses through the driveline and improving aerodynamics. Coupled with consumer preferences, a failure to achieve its planned objectives or delays in developing fuel efficient products could have a material adverse effect on its general business activity, net assets, financial position and results of operations. In addition, deterioration in the quality of the Company’s vehicles could force it to incur substantial costs and damage its reputation. There is a risk that competitors or joint ventures set up by competitors will develop better solutions and will be able to manufacture the resulting products more rapidly, in larger quantities, with a higher quality and/or at a lower cost. It is possible that the Company could then be compelled to make new investments in researching and developing other technologies to maintain its existing market share or to win back the market share lost to competitors. Finally, the Company’s manufacturing operations and sales may be subject to potential physical impacts of climate change, including changes in weather patterns and an increased potential for extreme weather events, which could affect the manufacture and distribution of its products and the cost and availability of raw materials and components.
Private and commercial users of transportation increasingly use modes of transportation other than the automobile, The reasons for this include the rising costs related to automotive transport

13773rd Annual Report 2017-18
INTEGRATED REPORT 1-65 STATUTORY REPORTS 66-184 FINANCIAL STATEMENTS 185-353
of people and goods, increasing traffic density in major cities and environmental awareness. In addition, the increased use of car sharing concepts and other innovative mobility initiatives facilitates access to other methods of transport, thereby reducing dependency on private automobiles. Furthermore, non-traditional market participants may cut dependency on the private automobile altogether. A shift in consumer preferences away from private automobiles would have a material adverse effect on the Company’s general business activity and on its sales, prospects, financial condition and results of operations.
To stimulate demand, competitors in the automotive industry have offered customers and dealers price reductions on vehicles and services, which has led to increased price pressures and sharpened competition within the industry. As a provider of numerous high-volume models, the Company’s profitability and cash flows are significantly affected by the risk of rising competitive price pressures. Special sales incentives and increased price pressures in the new car business also influence price levels in the used car market, with a negative effect on vehicle resale values. This could have a negative impact on the profitability of the used car business in the Company’s dealer organization.
There can be no assurance that the Company’s new models will meet its sales expectations, in which case it may be unable to realize the intended economic benefits of its investments, which would in turn materially affect the Company’s business, results of operations and financial condition. In addition, there is a risk that its quality standards can be maintained only by incurring substantial costs for monitoring and quality assurance. For the Company’s customers, one of the determining factors in purchasing its vehicles is the high quality of the products. A decrease in the quality of the Company’s vehicles (or if the public were to have the impression that such a decrease in quality had occurred) could damage its image and reputation as a premium automobile manufacturer and in turn materially affect the Company’s business, results of operations and financial condition.
In addition, product development cycles can be lengthy, and there is no assurance that new designs will lead to revenues from vehicle sales, or that the Company will be able to accurately forecast demand for its vehicles, potentially leading to inefficient use of its production capacity. Additionally, the Company’s high proportion of fixed costs, due to its significant investment in property, plant and equipment, further exacerbates the risks associated with incorrectly assessing demand for the Company’s vehicles.
The Company are more vulnerable to reduced demand for premium performance cars and all-terrain vehicles than automobile manufacturers with a more diversified product range.
The Company’s Jaguar Land Rover operates in the premium performance car and all-terrain vehicle segments, which are very specific segments of the premium passenger car market, and it has a more limited range of models than some of the Company’s competitors. Accordingly, its performance is linked to market conditions and consumer demand in those market segments in which it operates. Furthermore, some other premium performance vehicle manufacturers operate in a relatively broader spectrum of market segments, which makes them comparatively less
vulnerable to reduced demand for any specific segment. Any downturn or reduction in the demand for premium passenger cars and all-terrain vehicles, or any reduced demand for Jaguar Land Rover’s most popular models in the geographic markets in which it operates, could have a more pronounced effect on its performance and earnings.
The Company is subject to risks associated with product liability, warranty and recall.
The Company is subject to risks and costs associated with product liability, warranties and recalls in connection with performance, compliance or safety-related issues affecting the Company’s products which may, in turn, cause its customers to question the safety or reliability of the Company’s vehicles and thus result in a materially adverse effect on the Company’s business, impacting its reputation, results from operations and financial condition. Such events could also require us to expend considerable resources to remediate, and the Company may also be subject to class actions or other large-scale product liability or other lawsuits in various jurisdictions where the Company conduct business. In May 2016, an industry-wide passenger airbag safety recall was announced in the United States by the National Highway Traffic System Administration or NHTSA, in respect of airbags from Takata Corporation or Takata, a supplier of airbags. Certain front-passenger airbags supplied by Takata were installed in vehicles sold by Jaguar Land Rover. The Company considered the cost associated with the recall and recognized a provision of GBP 67.4 million for the estimated cost of repairs in the Company’s income statement for Fiscal 2016. As at March 31, 2018 the provision was GB£ 61 million. We expect to utilize such provision over the next one to four years.
Furthermore, the Company may also be subject to class actions or other large-scale product liability or other lawsuits in various jurisdictions in which the Company has a significant presence. The use of shared components in vehicle production increases this risk because individual components are deployed in a number of different models across the Company’s brands. Any costs incurred or lost sales caused by product liability, warranties and recalls could materially adversely affect the Company’s business.
The Company is exposed to the risks of new drive and other technologies being developed and the resulting effects on the automobile market.
Over the past few years, the global market for automobiles, particularly in established markets, has been characterized by increasing demand for more environmentally friendly vehicles and technologies. This is related, in particular, to the public debate on global warming and climate protection. Jaguar Land Rover endeavours to take account of climate protection and the ever more-stringent laws and regulations that have been and are likely to be adopted. Jaguar Land Rover is focusing on researching, developing and producing new drive technologies, such as hybrid engines and electric cars. Jaguar Land Rover is also investing in development programmes to reduce fuel consumption through the use of lightweight materials, reducing parasitic losses through the driveline and improvements in aerodynamics. Recently, several jurisdictions, such as Norway, Germany, the United Kingdom, France, the Netherlands, India and China, have announced the

138
intention to eliminate the sale of conventionally fueled vehicles in their markets in the coming decades.
Diesel technologies have also become the focus of legislators in the United States and European Union as a result of emissions levels. This has led various carmakers to announce programs to retrofit diesel vehicles with software that will allow them to reduce emissions which may require us to undertake increased R&D spending. There is a risk that these R&D activities, including retrofit software upgrades, will not achieve their planned objectives or that competitors or joint ventures set up by competitors will develop better solutions and will be able to manufacture the resulting products more rapidly, in larger quantities, with a higher quality and/or at a lower cost. This could lead to increased demand for the products of such competitors and result in a loss of market share for the Company. There is also a risk that the money invested in researching and developing new technologies, including autonomous, connected and electrification technologies, or money invested in mobility solutions to overcome and address future travel and transport challenges, will, to a considerable extent, have been spent in vain, because the technologies developed or the products derived therefrom are unsuccessful in the market or because competitors have developed better or less expensive products. It is possible that Jaguar Land Rover could then be compelled to make new investments in researching and developing other technologies to maintain its existing market share or to win back the market share lost to competitors.
In addition, climate change concerns and the promotion of new technologies encourages customers to look beyond standard factors (such as price, design, performance, brand image or comfort/features) to differentiation of the technology used in the vehicle or the manufacturer or provider of this technology. This could lead to shifts in demand and the value-added parameters in the automotive industry at the expense of the Company’s products.
The Company’s competitors may be able to benefit from the cost savings offered by industry consolidation or alliances.
As part of the Company’s growth strategy, it may open new manufacturing, research or engineering facilities, expand existing facilities, add additional product lines or expand the Company’s businesses into new geographical markets. There is a range of risks inherent in such a strategy that could adversely affect the Company’s ability to achieve these objectives, including, but not limited to, the following: the potential disruption of the Company’s business; the uncertainty that new product lines will generate anticipated sales; the uncertainty that it may not be able to meet or anticipate consumer demand; the uncertainty that a new business will achieve anticipated operating results; the diversion of resources and management’s time; the Company’s cost reduction efforts, which may not be successful; the difficulty of managing the operations of a larger company; and the difficulty of competing for growth opportunities with companies having greater financial resources than the Company have.
More specifically, the Company’s international businesses face a range of risks and challenges, including, but not limited to, the following: language barriers, cultural differences, difficulties in staffing and managing overseas operations, inherent difficulties
and delays in contract enforcement and the collection of receivables under the legal systems of foreign countries, the risk of non-tariff barriers, regulatory and legal requirements affecting the Company’s ability to enter new markets through joint ventures with local entities, difficulties in obtaining regulatory approvals, environmental permits and other similar types of governmental consents, difficulties in negotiating effective contracts, obtaining the necessary facility sites or marketing outlets or securing essential local financing, liquidity, trade financing or cash management facilities, export and import restrictions, multiple tax regimes (including regulations relating to transfer pricing and withholding and other taxes on remittances and other payments from subsidiaries), foreign investment restrictions, foreign exchange controls and restrictions on repatriation of funds, other restrictions on foreign trade or investment sanctions, and the burdens of complying with a wide variety of foreign laws and regulations. Furthermore, as part of the Company’s global activities, it may engage with third-party dealers and distributors, which it do not control but which, nevertheless, take actions that could have a material adverse impact on the Company’s reputation and business; the Company cannot assure that it will not be held responsible for any activities undertaken by such dealers and distributors. If the Company is unable to manage risks related to its expansion and growth in other parts of the world and therefore fail to establish a strong presence in those higher growth markets, the Company’s business, results of operations and financial condition could be adversely affected or its investments could be lost.
Furthermore, the Company is subject to risks associated with growing its business through mergers and acquisitions. The Company believe that its acquisitions provide opportunities to grow significantly in the global automobile markets by offering premium brands and products. The Company’s acquisitions have provided it with access to technology and additional capabilities while also offering potential synergies. However, the scale, scope and nature of the integration required in connection with the Company’s acquisitions present significant challenges, and it may be unable to integrate the relevant subsidiaries, divisions and facilities effectively within the Company’s expected schedule. An acquisition may not meet the Company’s expectations and the realization of the anticipated benefits may be blocked, delayed or reduced as a result of numerous factors, some of which are outside the Company’s control.
Any disruption in the supply of automobile components could have a material adverse impact on the Company’s results of operations
Adverse economic conditions, a decline in automobile demand and lack of access to sufficient financing arrangements, among others, could have a negative financial impact on the Company’s suppliers, thereby impairing timely availability of components to us or causing increase in the costs of components. In addition, if one or more of the other global automotive manufacturers were to become insolvent, this would have an adverse effect on the Company’s supply chains and may have a material adverse effect on the Company’s results of operations.

13973rd Annual Report 2017-18
INTEGRATED REPORT 1-65 STATUTORY REPORTS 66-184 FINANCIAL STATEMENTS 185-353
The Company has also entered into supply agreements with Ford and certain other third parties for critical components and remain reliant upon Ford and the Ford-PSA joint venture for a portion of its engines. However, following the launch of the Engine Manufacturing Centre (EMC) in Wolverhampton, the Company now also manufacture its own ‘‘in-house’’ engines. The Company may not be able to manufacture certain types of engines or find a suitable replacement supplier in a timely manner in the event of any disruption in the supply of engines, or parts of engines, and other hardware or services provided to us by Ford or the Ford-PSA joint venture and such disruption could have a material adverse impact on the Company’s operations, business and/or financial condition.
A change in requirements under long-term supply arrangements committing Jaguar Land Rover to purchase minimum or fixed quantities of certain parts, or to pay a minimum amount to the seller, could have a material adverse impact on the Company’s financial condition or results of operations. The Company have entered into a number of long-term supply contracts that require Jaguar Land Rover to purchase a fixed quantity of parts to be used in the production of Jaguar Land Rover vehicles (e.g., ‘‘take-or-pay’’ contracts). If the need for any of these parts were to lessen, Jaguar Land Rover could still be required to purchase a specified quantity of the part or pay a minimum amount to the seller pursuant to the take-or-pay contract, which could have a substantial adverse effect on the Company’s financial condition or results of operations.
Increases in input prices may have a material adverse effect on the Company’s results of operations.
In Fiscal 2018 and 2017, the consumption of raw materials, components and aggregates and purchase of products for sale (including changes in inventory) constituted approximately 63.2% and 61.5%, respectively, of the Company’s revenues. Prices of commodity items used in manufacturing automobiles, including steel, aluminum, copper, zinc, rubber, platinum, palladium and rhodium, have become increasingly volatile in recent years. Further price movements would closely depend on the evolving economic scenarios across the globe. Most of these inputs are priced in US dollars on international markets. While the Company continue to pursue cost reduction initiatives, an increase in price of input materials could severely impact the Company’s profitability to the extent such increase cannot be absorbed by the market through price increases and/or could have a negative impact on demand.
In addition, an increased price and supply risk could arise from the need for rare and frequently sought-after raw materials for which demand is high, such as rare earths, which are predominantly found in China. Rare earth metal prices and supply remain uncertain. In the past, China has limited the export of rare earths from time to time. Due to intense price competition and the Company’s high level of fixed costs, the Company may not be able to adequately address changes in commodity prices even if they are foreseeable. Increases in fuel costs also pose a significant challenge, especially in the commercial and premium vehicle categories where increased fuel prices have an impact on demand. If we are unable to find substitutes for supplies of raw materials or pass price increases on to customers, or to safeguard the supply of scarce raw materials, the Company’s vehicle production, business,
financial condition and results of operations could be materially and adversely affected. The Company is also exposed to supply chain risks relating to lithium-ion cells which are critical for its electric vehicle production. Any disruption in the supply of battery cells from such suppliers could disrupt production of its vehicles. The severity of this risk is likely to increase as the Company and other manufacturers increase electric vehicle production.
The Company presently manage the risks for some of these commodities through the use of fixed price supply contracts with tenors of up to 12 months and the use of financial derivatives pursuant to a defined hedging policy. The Company enters into a variety of foreign currency, interest rates and commodity forward contracts and options to manage the Company’s exposure to fluctuations in foreign exchange rates, interest rates and commodity price risk. These financial exposures are managed in accordance with its risk management policies and procedures. The Company uses foreign currency forward and option contracts to hedge risks associated with foreign currency fluctuations relating to highly probable forecast transactions. The Company also enters into interest rate swaps and interest rate currency swap agreements, mainly to manage exposure on its fixed rate or variable rate debt. The Company further uses interest rate derivatives or currency swaps to hedge exposure to exchange rate fluctuations on principal and interest payments for borrowings denominated in foreign currencies. Specific transactional risks include risks like liquidity and pricing risks, interest rate and exchange rate fluctuation risks, volatility risks, counterparty risks, settlement risks and gearing risks. However, the hedging transactions may not adequately protect us against these risks. In addition, if markets move adversely, the Company may incur financial losses on such hedging transactions, the financial condition and results of operations may be adversely impacted.
Any inability to implement the Company’s growth strategy by entering new markets may adversely affect its results of operations.
The Company’s growth strategy relies on the expansion of its operations in emerging markets such as ASEAN, SAARC and Latin American countries and North and West Africa and other parts of the world which feature higher growth potential than many of the more mature automotive markets in developed countries. The costs associated with entering and establishing the Company in new markets, and expanding such operations may, however, be higher than expected, it may face significant competition in those regions. In addition, the Company’s international business faces a range of risks and challenges, including language barriers, cultural differences, difficulties in staffing and managing overseas operations, inherent difficulties and delays in contract enforcement and the collection of receivables under the legal systems of foreign countries, the risk of non-tariff barriers, regulatory and legal requirements affecting the Company’s ability to enter new markets through joint ventures with local entities, difficulties in obtaining regulatory approvals, environmental permits and other similar types of governmental consents, difficulties in negotiating effective contracts, obtaining the necessary facility sites or marketing outlets or securing essential local financing, liquidity, trade financing or cash management facilities, export and

140
import restrictions, multiple tax regimes (including regulations relating to transfer pricing and withholding and other taxes on remittances and other payments from subsidiaries), foreign investment restrictions (including restrictions on incentives offered by foreign governments for investment in their jurisdictions), foreign exchange controls and restrictions on repatriation of funds, other restrictions on foreign trade or investment sanctions, and the burdens of complying with a wide variety of foreign laws and regulations. If the Company is unable to manage risks related to its expansion and growth in other parts of the world and therefore fail to establish a strong presence in those higher growth markets, its business, results of operations and financial condition could be adversely affected or the Company’s investments could be lost.
A significant reliance on key markets by both TML and Jaguar Land Rover increases the risk of negative impact of reduced customer demand in those countries.
TML and Jaguar Land Rover rely on the United Kingdom, Chinese, North American, continental European and Indian markets. Although demand remains relatively solid, a decline in demand for the Company’s vehicles in these major markets may in the future significantly impair its business, financial position and results of operations. Softening of the UK economy would be expected to impact the Company’s growth opportunities in that country, which is an important market for us. Any decline in demand for the Company’s vehicles in these major markets may in the future significantly impair its business, financial position and results of operations. Further, decreased demand for the Company’s and Jaguar Land Rover’s products may not be sufficiently mitigated by new product launches and expansion into growing markets, which could have a significant adverse impact on the Company’s financial performance. In addition, the Company’s strategy, which includes new product launches and expansion into growing markets may not be sufficient to mitigate a decrease in demand for its products in mature markets in the future, which could have a significant adverse impact on the Company’s financial performance.
The Company is exposed to liquidity risks.
The Company’s main sources of liquidity are cash generated from operations, existing notes, external debt in the form of factoring discount facilities and other revolving credit facilities. However, adverse changes in the global economic and financial environment may result in lower consumer demand for vehicles, and prevailing conditions in credit markets may adversely affect both consumer demand and the cost and availability of finance for the Company’s business and operations. If the global economy goes back into recession and consumer demand for the Company’s vehicles drops, as a result of higher oil prices, excessive public debt or for any other reasons, and the supply of external financing becomes limited, the Company may again face significant liquidity risks.
The Company is also subject to various types of restrictions or impediments on the ability of the companies in certain countries to transfer cash across the companies through loans or interim dividends. These restrictions or impediments are caused by
exchange controls, withholding taxes on dividends and distributions and other similar restrictions in the markets in which the Company operate. The cash in some of these jurisdictions is subject to certain restrictions on cash pooling, intercompany loan arrangements or interim dividends.
Exchange rate and interest rate fluctuations could materially and adversely affect the Company’s financial condition and results of operations.
The Company’s Jaguar Land Rover operations are also subject to fluctuations in exchange rates with reference to countries in which it operates. Jaguar Land Rover purchases capital equipment, raw materials and components from, manufacture vehicles in, and sell vehicles into, various countries, and therefore, the Company’s revenues and costs have significant exposure to the relative movements of the GBP, the U.S. dollar, the Euro, the Russian Ruble, the Chinese Renminbi, the Singapore dollar, the Japanese Yen, the Australian dollar, the South African rand, the Thai baht, the Korean won and the Indian rupee. The United Kingdom’s exit from the European Union could cause greater volatility in the pound sterling. This could directly impact Jaguar Land Rover’s sales volumes and financial results, as Jaguar Land Rover derives the majority of its revenues from overseas markets and sources significant levels of raw materials and components from Europe, which may result in a decrease in profits to the extent non-GBP costs are not fully mitigated by non-GBP sales. The GBP declined significantly relative to the Indian rupee and U.S. dollar in 2017. As published by Bloomberg L.P., the exchange rate as at June 23, 2016 expressed in Indian rupees per GBP1.00, was Rs.100.2 compared to Rs. 79.88 as at March 14, 2017 and the rate expressed in US$ per GBP1.00, was US$149 as at June 23, 2016 compared to US$1.20 as at January 16, 2017.
Moreover, the Company has outstanding foreign currency-denominated debt and are sensitive to fluctuations in foreign currency exchange rates. The Company has experienced and could in the future experience foreign exchange losses on obligations denominated in foreign currencies in respect of its borrowings and foreign currency assets and liabilities due to currency fluctuations.
The Company is exposed to changes in interest rates, as it has both interest-bearing assets (including cash balances) and interest-bearing liabilities, which bear interest at variable rates. Although the Company engages in managing its interest and foreign exchange exposure through use of financial hedging instruments, such as forward contracts, swap agreements and option contracts, higher interest rates and a weakening of the Indian rupee against major foreign currencies could significantly increase the Company’s cost of borrowing, which could have a material adverse effect on its financial condition, results of operations and liquidity.
Appropriate hedging lines for the type of risk exposures the Company are subject to may not be available at a reasonable cost, particularly during volatile rate movements, or at all. Moreover, there are risks associated with the use of such hedging instruments. While hedging instruments may mitigate the Company’s exposure to fluctuations in currency exchange rates to a certain extent, it potentially forego benefits that might result

14173rd Annual Report 2017-18
INTEGRATED REPORT 1-65 STATUTORY REPORTS 66-184 FINANCIAL STATEMENTS 185-353
from market fluctuations in currency exposures. These hedging transactions can also result in substantial losses. Such losses could occur under various circumstances, including, without limitation, any circumstances in which a counterparty does not perform its obligations under the applicable hedging arrangement (despite having International Swaps and Derivatives Association (ISDA) agreements in place with each of the Company’s hedging counterparties), there are currency fluctuations, the arrangement is imperfect or ineffective, or the Company’s internal hedging policies and procedures are not followed or do not work as planned. In addition, because the Company’s potential obligations under the financial hedging instruments are marked to market, the Company may experience quarterly and annual volatility in its operating results and cash flows attributable to its financial hedging activities.
A decline in retail customers’ purchasing power or consumer confidence or in corporate customers’ financial condition and willingness to invest could materially and adversely affect the Company’s business.
Demand for vehicles for personal use generally depends on consumers’ net purchasing power, their confidence in future economic developments and changes in fashion and trends, while demand for vehicles for commercial use by corporate customers (including fleet customers) primarily depends on the customers’ financial condition, their willingness to invest (motivated by expected future business prospects) and available financing. A decrease in potential customers’ disposable income or their financial flexibility or an increase in the cost of financing will generally have a negative impact on demand for the Company’s products.
A weak macroeconomic environment, combined with restrictive lending and a low level of consumer sentiment generally, may reduce consumers’ net purchasing power and lead existing and potential customers to refrain from purchasing a new vehicle, to defer a purchase further or to purchase a smaller model with less equipment at a lower price. A deteriorating macroeconomic environment may disproportionately reduce demand for luxury vehicles. It also leads to reluctance by corporate customers to invest in vehicles for commercial use and/or to lease vehicles, resulting in a postponement of fleet renewal contracts.
To stimulate demand, the automotive industry has offered customers and dealers price reductions on vehicles and services, which has led to increased price pressures and sharpened competition within the industry. As a provider of numerous high-volume models, the Company’s profitability and cash flows are significantly affected by the risk of rising competitive and price pressures.
Special sales incentives and increased price pressures in the new car business also influence price levels in the used car market, with a negative effect on vehicle resale values. This may have a negative impact on the profitability of the used car business in the Company’s dealer organization.
The Company is subject to risks associated with the automobile financing business.
The sale of the Company’s commercial and passenger vehicles is heavily dependent on funding availability for its customers. Rising delinquencies and early defaults have contributed to a reduction in automobile financing, which, in turn, has had an adverse effect on funding availability for potential customers. This reduction in available financing may continue in the future and have a material adverse effect on the Company’s business, financial condition and results of operations.
In India, default by the Company’s customers or inability to repay installments as due could materially and adversely affect its business, financial condition, results of operations and cash flows. In addition, any downgrade in the Company’s credit ratings may increase its borrowing costs and restrict its access to the debt markets. Over time, and particularly in the event of any credit rating downgrade, market volatility, market disruption, regulatory changes or otherwise, the Company may need to reduce the amount of financing receivables originated, which could severely disrupt the Company’s ability to support the sale of its vehicles.
Jaguar Land Rover has consumer finance arrangements in place with Lloyds Black Horse in the United Kingdom, FCA Bank S.p.A. in European markets and Chase Auto Finance in North America and has similar arrangements with local providers in a number of other key markets. Any reduction in the supply of available consumer financing for the purchase of new vehicles or an increase in the cost thereof would make it more difficult for some of its customers to purchase its vehicles, which could put Jaguar Land Rover under commercial pressure to offer new (or expand existing) retail or dealer incentives to maintain demand for its vehicles, thereby materially and adversely affecting the Company’s sales and results of operations. For example, during the global financial crisis, several providers of customer finance reduced their supply of consumer financing for the purchase of new vehicles. Additionally, base interest rates in developed economies are at historic lows. An increase in interest rates due to tightening monetary policy or for any other reason would result in increased costs for consumers.
Furthermore, Jaguar Land Rover offers residual value guarantees on the purchase of certain leases in some markets. The value of these guarantees is dependent on used car valuations in those markets at the end of the lease, which is subject to change. Consequently, the Company may be adversely affected by movements in used car valuations in these markets.
Underperformance of the Company’s distribution channels could have a material adverse effect on the Company’s sales and results of operations.
The Company relies on third parties for sourcing raw materials, parts and components used in the manufacture of its products. At the local level, the Company is exposed to reliance on smaller enterprises where the risk of insolvency is greater. Furthermore, for some parts and components, it is dependent on a single source. The Company’s ability to procure supplies in a cost-effective and timely manner or at all is subject to various factors, some of which are not within its control. For instance, the outcome of the

142
Brexit negotiations could lead to reduced access to the European Union single market and to the global trade deals negotiated by the European Union on behalf of its members, which could affect the imports of raw materials, parts and components and disrupt Jaguar Land Rover supplies. Furthermore, there is the risk that manufacturing capacity does not meet, or exceeds, sales demand thereby compromising business performance and without any near term remedy given the time frames and investments required for any change. While the Company manages its supply chain as part of its supplier management process, any significant problems with its supply chain or shortages of essential raw materials in the future could affect the Company’s results of operations in an adverse manner.
The Company’s products are sold and serviced through a network of authorized dealers and service centers across India and through a network of distributors and local dealers in international markets. The Company monitor the performance of its dealers and distributors and provide them with support to enable them to perform to its expectations. There can be no assurance, however, that the Company’s expectations will be met. Any underperformance by or a deterioration in the financial condition of the Company’s dealers or distributors could materially and adversely affect the Company’s sales and results of operations.
If dealers or importers encounter financial difficulties and the Company’s products and services cannot be sold or can be sold only in limited numbers, this would have a direct effect on the sales of such dealers and importers. Additionally, if the Company cannot replace the affected dealers or importers with other franchises, the financial difficulties experienced by such dealers or importers could have an indirect effect on the Company’s vehicle deliveries.
Consequently, the Company could be compelled to provide additional support for dealers and importers and, under certain circumstances, may even take over their obligations to customers, which would adversely affect the Company’s financial position and results of operations in the short term.
Deterioration in the performance of any of the Company’s subsidiaries, joint ventures and affiliates could materially and adversely affect the Company’s results of operations.
The Company have made and may continue to make capital commitments to the Company’s subsidiaries, joint ventures and affiliates, and if the business or operations of any of these subsidiaries, joint ventures and affiliates deteriorates, the value of the Company’s investments may decline substantially. Operating a business as a joint venture often requires additional organizational formalities and a requirement of information sharing. The Company is also subject to risks associated with joint ventures and affiliates wherein the Company retain only partial or joint control. Investments in projects over which the Company has partial or joint control are subject to the risk that the other shareholders of the joint venture, who may have different business or investment strategies than the Company does or with whom the Company may have a disagreement or dispute, may have the ability to block business, financial or management decisions, such as the decision
to distribute dividends or appoint members of management, which may be crucial to the success of the project or its investment in the project, or otherwise implement initiatives which may be contrary to its interests. Moreover, the Company’s partners may be unable, or unwilling, to fulfill their obligations, or the strategies of the Company’s joint ventures or affiliates may not be implemented successfully, any of which may significantly reduce the value of the Company’s investments or relationship with the co-owner may be deteriorated, and, which could, in turn, have a material adverse effect on the Company’s reputation, business, financial position or results of operations.
The Company may be adversely impacted by political instability, wars, terrorism, multinational conflicts, and countries resorting to protectionism, natural disasters, fuel shortages/prices, epidemics and labor strikes.
The Company’s products are exported to a number of geographical markets and it plans to further expand the international operations in the future. For example, the Company has manufacturing facilities and design and engineering centers in India, the United Kingdom, China, South Korea, Thailand, South Africa, Brazil and Indonesia. Consequently, the Company’s operations in markets abroad may be subject to political instability, wars, terrorism, regional or multinational conflicts, natural disasters and extreme weather, fuel shortages, epidemics and labour strikes. Any disruption of the operations of the Company’s manufacturing, design, engineering, sales, corporate and other facilities could materially and adversely affect its business, financial condition and results of operations. If any of these events were to occur, there can be no assurance that the Company would be able to shift its manufacturing, design, engineering, sales, corporate and other operations to alternate sites in a timely manner or at all. In addition, conducting business internationally, especially in emerging markets, exposes us to additional risks, including adverse changes in economic and government policies, unpredictable shifts in regulation, inconsistent application of existing laws, applicability of retrospective taxes, sanctions programs, unclear regulatory and taxation systems and divergent commercial and employment practices and procedures. Any deterioration in international relations, especially between India and its neighbouring countries, may result in investor concern regarding regional stability. Any significant or prolonged disruption or delay in the Company’s operations related to these risks could materially and adversely affect its business, financial condition and results of operations.
Terrorist attacks, civil disturbances, regional conflicts and other acts of violence, particularly in India, may disrupt or otherwise adversely affect the markets in which the Company operate, the Company’s business and the Company’s profitability. India has from time to time experienced social and civil unrest and hostilities and adverse social, economic or political events, including terrorist attacks and local civil disturbances, riots and armed conflict with neighboring countries. Events of this nature in the future could influence the Indian economy and could have a material adverse effect on the Company’s business, as well as the market for securities of Indian companies, including the Company’s Shares and ADSs. Such incidents could also create a greater perception

14373rd Annual Report 2017-18
INTEGRATED REPORT 1-65 STATUTORY REPORTS 66-184 FINANCIAL STATEMENTS 185-353
that investment in Indian companies involves a higher degree of risk and could have a material adverse effect on the Company’s business, results of operations and financial condition, and also the market price of the Company’s Shares and ADSs.
The Company is vulnerable to supply chain disruptions resulting from natural disasters or man-made accidents. For example, on August 12, 2015, there was an explosion in the city port of Tianjin, one of three major ports in China through which the Company import its vehicles. Approximately 5,800 of the Company’s vehicles were stored at various locations in Tianjin at the time of the explosion, and, as a result, the Company recognized an exceptional charge of GBP245 million in September 2015. Subsequently, GBP275 million of net insurance proceeds and other recoveries have been received till March 31, 2018, including GBP35 million related to other costs associated with Tianjin including lost and discounted vehicle revenue. A significant delay or sustained interruption in the supply of key inputs sourced from areas affected by disasters or accidents could materially and adversely affect the Company’s ability to maintain its current and expected levels of production, and therefore negatively affect its revenues and increase the Company’s operating expenses.
The Company is a global organization, and is therefore vulnerable to shifts in global trade and economic policies and outlook. Policies that result in countries withdrawing from trade pacts, increasing protectionism and undermining free trade could substantially affect the Company’s ability to operate as a global business. Additionally, negative sentiments towards foreign companies among the Company’s overseas customers and employees could adversely affect its sales as well as its ability to hire and retain talented people. A negative shift in either policies or sentiment with respect to global trade and foreign businesses could have a material adverse effect on the Company’s business, results of operations and financial condition.
The Company’s business is seasonal in nature and a substantial decrease in its sales during certain quarters could have a material adverse impact on the Company’s financial performance.
The sales volumes and prices for the Company’s vehicles are influenced by the cyclicality and seasonality of demand for these products. The automotive industry has been cyclical in the past, and the Company expect this cyclicality to continue.
In the Indian market, demand for the Company’s vehicles generally peaks between January and March, although there is a decrease in demand in February just before release of the Indian fiscal budget. Demand is usually lean from April to July and picks up again in the festival season from September onwards, with a decline in December due to year-end as customers defer purchases to the new year.
The Company’s Jaguar Land Rover business is impacted by the bi-annual registration of vehicles in the United Kingdom where the vehicle registration number changes every March and September, which leads to an increase in sales during these months, and, in turn, has an impact on the resale value of vehicles. This leads to
an increase in sales during the period when the aforementioned change occurs. Most other markets, such as the United States, are influenced by the introduction of new-model-year products, which typically occurs in the autumn of each year. Furthermore, in the United States, there is some seasonality in the purchasing pattern of vehicles in the northern states for Jaguar when there is a concentration of vehicle sales in the spring and summer months and for Land Rover, where the trend for purchasing 4x4 vehicles is concentrated in the autumn and winter months. Markets in China tend to experience higher demand for vehicles around the Lunar New Year holiday in either January or February, the Chinese National Day holiday and the Golden Week holiday in October. Furthermore, Western European markets tends to be softer during the summer and winter holidays. Jaguar Land Rover’s cash flows are impacted by the temporary shutdown of four of their manufacturing plants in the United Kingdom (including the Engine Manufacturing Centre at Wolverhampton) during the summer and winter holidays. Sales in the automotive industry have been cyclical in the past and we expect this cyclicality to continue.
Restrictive covenants in the Company’s financing agreements could limit the Company’s operations and financial flexibility and materially and adversely impact the Company’s financial condition, results of operations and prospects.
Some of the Company’s financing agreements and debt arrangements set limits on and/or require us to obtain lender consent before, among other things, pledging assets as security. In addition, certain financial covenants may limit the Company’s ability to borrow additional funds or to incur additional liens.
In the event the Company breach these covenants, the outstanding amounts due under such financing agreements could become due and payable immediately and/or result in increased costs. A default under one of these financing agreements may also result in cross-defaults under other financing agreements and result in the outstanding amounts under such other financing agreements becoming due and payable immediately. Defaults under one or more of the Company’s financing agreements could have a material adverse effect on its financial condition and results of operations.
The Company rely on licensing arrangements with Tata Sons Limited to use the “Tata” brand. Any improper use of the associated trademarks by the Company’s licensor or any other third parties could materially and adversely affect the Company’s business, financial condition and results of operations.
The Company’s rights to the Company’s trade names and trademarks are a crucial factor in marketing its products. Establishment of the “Tata” word mark and logo mark in and outside India is material to the Company’s operations. The Company has licensed the use of the “Tata” brand from its Promoter, Tata Sons Limited, or Tata Sons. If Tata Sons, or any of its subsidiaries or affiliated entities, or any third party uses the trade name “Tata” in ways that adversely affect such trade name or trademark, its reputation could suffer damage, which, in turn, could have a material adverse effect on the Company’s business, financial condition and results of operations.

144
Inability to protect or preserve the Company’s intellectual property could materially and adversely affect its business, financial condition and results of operations.
The Company own or otherwise have rights in respect of a number of patents relating to the products it manufacture. In connection with the design and engineering of new vehicles and the enhancement of existing models, the Company seek to regularly develop new intellectual property. The Company also use technical designs, which are the intellectual property of third parties with their consent. These patents and trademarks have been of value in the growth of the Company’s business and may continue to be of value in the future. Although the Company do not regard any of its businesses as being dependent upon any single patent or related group of patents, an inability to protect this intellectual property generally, or the illegal breach of some or a large group of the Company’s intellectual property rights, would have a materially adverse effect on its business, financial condition and results of operations. The Company may also be affected by restrictions on the use of intellectual property rights held by third parties and the Company may be held legally liable for the infringement of the intellectual property rights of others in the Company’s products.
Impairment of intangible assets may have a material adverse effect on the Company’s results of operations.
Designing, manufacturing and selling vehicles is capital intensive and requires substantial investments in intangible assets such as research and development, product design and engineering technology. The Company review the value of its intangible assets to assess on an annual basis whether the carrying amount matches the recoverable amount for the asset concerned based on underlying cash-generating units. The Company may have to take an impairment loss as at a current balance sheet date or future balance sheet date, if the carrying amount exceeds the recoverable amount, which could have a material adverse effect on the Company’s financial condition and the results of operations.
The Company may be adversely affected by labour unrest.
All of the Company’s permanent employees in India, other than officers and managers, and most of the Company’s permanent employees in South Korea and the United Kingdom, including certain officers and managers, in relation to the Company’s automotive business, are members of labour unions and are covered by the Company’s wage agreements, where applicable, with those labour unions.
In general, the Company consider its labour relations with all its employees to be good. However, in the future the Company may be subject to labour unrest, which may delay or disrupt its operations in the affected regions, including the acquisition of raw materials and parts, the manufacture, sales and distribution of products and the provision of services. If work stoppages or lock-outs at the Company’s facilities or at the facilities of its major vendors occur or continue for a long period of time, the Company’s business, financial condition and results of operations may be materially and adversely affected. During Fiscal 2018, the Company faced two standalone incidents of labour unrest in India, one at the Company’s Jamshedpur plant in
Jharkhand and the other at the Company’s Sanand plant in Gujarat. Although these particular issues were amicably resolved, there is no assurance that additional labour issues could not occur, or that any future labour issues will be amicably resolved.
The Company’s business and prospects could suffer if the Company lose one or more key personnel or if the Company is unable to attract and retain its employees.
The Company’s business and future growth depend largely on the skills of its workforce, including executives and officers, and automotive designers and engineers. The loss of the services of one or more of the Company’s personnel could impair its ability to implement the Company’s business strategy. In view of intense competition, any inability to continue to attract, retain and motivate its workforce could materially and adversely affect the Company’s business, financial condition, results of operations and prospects.
Future pension obligations may prove more costly than currently anticipated and the market value of assets in the Company’s pension plans could decline.
The Company provide post-retirement and pension benefits to its employees, including defined benefit plans. However, lower returns on pension fund assets, changes in market conditions, interest rates or inflation rates, and adverse changes in other critical actuarial assumptions, may impact its pension liabilities or assets and consequently increase funding requirements, which could materially decrease the Company’s net income and cash flows.
Jaguar Land Rover provides post-retirement and pension benefits to its employees, some of which are defined benefit plans. As part of Jaguar Land Rover’s Strategic Business Review process, it closed the Jaguar Land Rover defined benefit pension plan to new joiners as at April 19, 2010. All new Jaguar Land Rover employees from April 19, 2010 joined a new defined contribution pension plan. Under the arrangements with the trustees of the defined benefit pension schemes, an actuarial valuation of the assets and liabilities of the schemes is undertaken every three years following the most recent valuation, as at April 05, 2015. Jaguar Land Rover agreed to a schedule of contributions with the trustee of the schemes which, together with the expected investment performance of the assets of the schemes, is expected to eliminate the deficit by 2025. In line with the schedule of contributions, the current ongoing contribution rate to the defined benefits scheme is 31% of pensionable salaries in the UK. Deficit reduction payments also continue to be paid in line with this schedule of contributions. The funding deficit and on going contribution rates are expected to reduce following the completion of the 2018 statutory valuation during 2019. Following consultation with employees earlier in the year, on April 03, 2017, Jaguar Land Rover approved and communicated to its defined benefit schemes’ members that the defined benefit schemes’ rule were to be amended with effect from April 06, 2017. As a result, among other changes, future retirement benefits would be calculated each year and revalued until retirement in line with a prescribed rate rather than based upon a member’s final salary at retirement. As a result of the remeasurement of the schemes’ liabilities, a past service credit of £437 million has arisen and

14573rd Annual Report 2017-18
INTEGRATED REPORT 1-65 STATUTORY REPORTS 66-184 FINANCIAL STATEMENTS 185-353
was recognized in Fiscal 2018 with a corresponding decrease in the net shortfall of assets of the schemes versus the actuarially determined liabilities. The net shortfall fell to £438 million as at March 31, 2018 compared to £1,461 million as at March 31, 2017.
Lower return on pension fund assets, changes in market conditions, changes in interest rates, changes in inflation rates and adverse changes in other critical actuarial assumptions, may impact its pension liabilities or assets and consequently increase funding requirements, which will adversely affect the Company’s financial condition and results of operations.
The Company is exposed to operational risks, including cybersecurity risks in connection with the Company’s use of information technology.
Operational risk is the risk of loss resulting from inadequate or failed internal processes, people and systems or from external events. This includes, among other things, losses that are caused by a lack of controls within internal procedures, violation of internal policies by employees, disruption or malfunction of IT systems, computer networks and telecommunications systems, mechanical or equipment failures, human error, natural disasters, security breaches or malicious acts by third parties (including, for example, hackers). The Company is generally exposed to risks in the field of information technology, since unauthorized access to or misuse of data processed on the Company’s IT systems, human errors associated therewith or technological failures of any kind could disrupt the Company’s operations, including the manufacturing, design and engineering processes. In particular, as vehicles become more technologically advanced and connected to the internet, the Company’s vehicles may become more susceptible to unauthorized access to their systems. Like any other business with complex manufacturing, research, procurement, sales and marketing and financing operations, the Company is exposed to a variety of operational risks and, if the protection measures put in place prove insufficient, the Company’s results of operations and financial condition can be materially adversely affected. In addition, the Company would likely experience negative press and reputational impacts.
Some of the Company’s vehicles will make use of lithium-ion battery cells, which have been observed in some non-automotive applications to catch fire or vent smoke and flames, and such events have raised concerns, and future events may lead to additional concerns, about the batteries used in automotive applications.
The battery packs that the Company will use in its electric vehicles make use of lithium-ion cells. On rare occasions, lithium-ion cells can rapidly release the energy they contain by venting smoke and flames in a manner that can ignite nearby materials as well as other lithium-ion cells.
While the Company have designed the battery pack to passively contain any single cell’s release of energy without spreading to neighbouring cells, there can be no assurance that a field or testing failure of the Company’s vehicles will not occur, which could subject company to lawsuits, product recalls, or redesign efforts, all of which would be time consuming and expensive. Negative public perceptions regarding the suitability of lithium-ion cells for
automotive applications, or any future incident involving lithium-ion cells such as a vehicle fire, even if such incident does not involve the Company’s vehicles, could seriously harm its business.
In addition, the Company stores a significant number of lithium-ion cells at its manufacturing facilities. Any mishandling of battery cells may cause disruption to the operation of its facilities. While the Company has implemented safety procedures related to the handling of the cells, there can be no assurance that a safety issue or fire related to the cells would not disrupt the Company’s operations. Such damage or injury could lead to adverse publicity and potentially a safety recall. Moreover, any failure of a competitor’s electric vehicle may cause indirect adverse publicity for the company and the Company’s products. Such adverse publicity could harm the Company’s business, prospects, financial condition and operating results.
The Company may be materially and adversely affected by the divulgence of confidential information.
Although the Company has implemented policies and procedures to protect confidential information, such as key contractual provisions, future projects, and customer records, such information may be divulged, including as a result of hacking or other threats from cyberspace. If this occurs, the Company could be subject to claims by affected parties, negative publicity and loss of proprietary information, all of which could have an adverse and material impact on the Company’s reputation, business, financial condition, results of operations and cash flows.
The Company’s insurance coverage may not be adequate to protect against all potential losses to which it may be subject to, and this may have a material adverse effect on its business, financial condition and results of operations.
While the Company believe that the insurance coverage that it maintain is reasonably adequate to cover all normal risks associated with the operation of the Company’s business, there can be no assurance that the Company’s insurance coverage will be sufficient, that any claim under the Company’s insurance policies will be honoured fully or in a timely manner, or that the Company’s insurance premiums will not increase substantially. There can be no assurance that any claim under the Company’s insurance policies will be honoured fully or timely, its insurance coverage will be sufficient in any respect or the insurance premiums will not change substantially. Accordingly, to the extent that the Company suffer loss or damage that is not covered by insurance or that exceeds its insurance coverage, or are required to pay higher insurance premiums, the Company’s business, financial condition and results of operations could be materially and adversely affected.
The Company’s business could be negatively affected by the actions of activist shareholders.
Certain of the Company’s shareholders may from time to time advance shareholder proposals or otherwise attempt to effect changes at the Company, influence elections of directors or acquire control over its business. The Company’s success largely depends on the ability of its current management team to operate and manage

146
effectively. Campaigns by shareholders to effect changes at publicly listed companies are sometimes led by investors seeking to increase short-term shareholder value by advocating corporate actions such as financial restructuring, increased borrowing, special dividends, stock repurchases or even sales of assets or the entire company, or by voting against proposals put forward by the board of directors and management of the company. If faced with actions by activist shareholders, the Company may not be able to respond effectively to such actions, which could be disruptive to the Company’s business.
Political and Regulatory Risks
India’s obligations under the World Trade Organization Agreement could materially affect the Company’s business.
India’s obligations under its World Trade Organization agreement could reduce the present level of tariffs on imports of components and vehicles. Reductions of import tariffs could result in increased competition, which in turn could materially and adversely affect the Company’s sales, business, financial condition and results of operations.
New or changing laws, regulations and government policies regarding increased fuel economy, reduced greenhouse gas and other emissions, vehicle safety and taxes, tariffs or fiscal policies may have significant impact on the Company’s business.
As an automobile company, the Company is subject to extensive governmental regulations regarding vehicle emission levels, noise, safety and levels of pollutants generated by its production facilities. In particular, the United States and Europe have stringent regulations relating to vehicle emissions. The contemplated tightening of vehicle emissions regulations by the European Union will require significant costs for compliance. In China, further regulations are being introduced in the short to medium-term future relating to greenhouse gas emissions and other environmental concerns. While the Company is pursuing various technologies in order to meet the required standards in the various countries in which the Company sell its vehicles, these regulations are likely to become more stringent and the resulting higher compliance costs may be significant to the Company’s operations and may adversely impact its business, financial condition and results of operations. They may also limit the type of vehicles the Company sell and where it sell them, which could affect the Company’s revenues. Recently, several jurisdictions, such as Norway, Germany, the United Kingdom, France, the Netherlands, India and China, have announced the intention to eliminate the sale of conventionally fueled vehicles in their markets in the coming decades. Diesel technologies have also become the focus of legislators in the United States and European Union as a result of emissions levels. This has led various carmakers to announce programs to retrofit diesel vehicles with software that will allow them to reduce emissions. To maintain the Company’s competitiveness and compliance with applicable laws and regulations, the Company may be required to undertake increased R&D spending as well as other capital expenditures. There is a risk that these R&D activities, including retrofit software upgrades, will not achieve their planned objectives or that the Company’s competitors will develop better solutions and will be able to manufacture the resulting products more rapidly, in larger quantities, with a higher quality and/or at a lower cost. This could
lead to increased demand for the products of such competitors and result in a loss of market share for the Company . There is also a risk that investments in research and development of new technologies, including autonomous, connected and electrification technologies, and solutions to address future travel and transport challenges, may fail to generate sufficient returns because the technologies developed or the products derived therefrom are unsuccessful in the market and/or because the Company’s competitors have developed better and/or less expensive products.
In order to comply with current and future safety and environmental norms, the Company may have to incur additional capital expenditure and R&D expenditure to (i) operate and maintain the Company’s production facilities, (ii) install new emissions controls or reduction technologies, (iii) purchase or otherwise obtain allowances to emit greenhouse gases, (iv) administer and manage the Company’s greenhouse gas emissions program, and (v) invest in research and development to upgrade products and manufacturing facilities. If the Company is unable to develop commercially viable technologies or otherwise unable to attain compliance within the time frames set by the new standards, the Company could face significant civil penalties or be forced to restrict product offerings significantly. For example, in the United States, manufacturers are subject to substantial civil penalties if they fail to meet federal Corporate Average Fuel Economy, or CAFE, standards. These penalties are calculated at US$5.50 for each tenth of a mile below the required fuel efficiency level for each vehicle sold in a model year in the U.S. market. As with many European manufacturers, since 2010, Jaguar Land Rover has paid total penalties of US$46 million for its failure to meet CAFE standards. Jaguar Land Rover could incur a substantial increase in these penalties, as a result of announced increases in CAFE civil penalties to adjust for inflation. Moreover, safety and environmental standards may at times impose conflicting imperatives, which pose engineering challenges and would, among other things, increase the Company’s costs.
The Motor Vehicles (Amendment) Bill, 2017 was passed in the Lok Sabha on April 10, 2017, and is currently being debated in the Rajya Sabha. This Bill addresses vehicle recalls, road safety, traffic management and accident insurance, among other matters. In its current draft, the Bill imposes civil and criminal liability on manufacturers selling vehicles in contravention of the standards specified in the Bill, or required by the government to recall their vehicles. The Bill also proposes the creation of the National Road Safety Board to provide advice to the central and state governments on all aspects of road safety and traffic management.
Commencing July 1, 2017, the Indian tax regime underwent a systemic change. The Government of India, in conjunction with the state governments, implemented a comprehensive national goods and services tax, or GST regime to subsume large number of Central & State taxes into one unified tax structure. It is a dual GST with Centre & States simultaneously levying it on the common base. The tax is called Central GST (CGST), if levied by Centre; State/Union Territory GST (SGST/UTGST), in instances where the State or Union Territory levy the tax; and Integrated GST (IGST), in instances where the GST is levied on the inter-state supply of goods and services.
While both the Central and State Governments have publicly announced that all committed incentives will be protected following the implementation of the GST, given the limited availability of

14773rd Annual Report 2017-18
INTEGRATED REPORT 1-65 STATUTORY REPORTS 66-184 FINANCIAL STATEMENTS 185-353
information or alignment of Industrial Policy of various States to cover GST or to protect the quantum of incentive available to Industries in pre-GST regime, the company is unable to provide any assurance as to this or any other aspect of the tax regime, or guarantee that the implementation of GST will not materially or adversely affect the company’s business or financial condition.
Further, GST portal has not yet settled and Govt. has not yet started reconciliation of ITC availed in GST regime with the supply reported by the suppliers of TML and hence, possibility of mismatch in ITC and consequent financial/compliance risk on TML cannot be ruled out.
Imposition of any additional taxes and levies designed to limit the use of automobiles and changes in corporate and other taxation policies as well as changes in export and other incentives given by various governments or import or tariff policies, could adversely affect the demand for its vehicles and its results of operations. For instance, Brexit may result in material changes to the UK’s tax, tariff and fiscal policies. In addition, the United States presidential administration could seek to introduce changes to laws and policies governing international trade and impose additional tariffs and duties on foreign vehicle imports, as evidenced by the ongoing renegotiation of the North American Free Trade Act [and a contemplate rise in tariffs for automobiles imported into the U.S.], which could have a material adverse effect on the Company’s sales in the United States. Furthermore, in recent years, the Brazilian government has implemented increased import duty on foreign vehicles, along with related exemptions provided certain criteria are met. The Company continues its discussions with the Brazilian government to manage the impact on the Company’s business and are seeking to reduce the impact of increased tariffs. Finally, the European Commission opened an investigation into whether certain tax and other incentives granted by the government of Slovakia in connection with the construction of the Company’s Slovakian manufacturing facility complied with European Union rules on state aid. Such government actions may be unpredictable and beyond the Company’s control, and any adverse changes in government policy could have a material adverse effect on its business prospects, results of operations and financial condition.
Evaluating and estimating the Company’s provision and accruals for its taxes requires significant judgment. As the Company conduct its business, the final tax determination may be uncertain. The Company operate in multiple geographical markets and its operations in each market are susceptible to additional tax assessments and audits. The Company’s collaborations with business partners are similarly susceptible to such tax assessments.
Authorities may engage in additional reviews, inquiries and audits that disrupt the Company’s operations or challenge its conclusions regarding tax matters. Any resulting tax assessment may be accompanied by a penalty or additional fee for failing to make the initial payment. The Company’s tax rates may be affected by earnings estimation errors, losses in jurisdictions that do not grant a related tax benefit, changes in currency rates, acquisitions, investments, or changes in laws, regulations or practices. Additionally, government fiscal pressures may increase the likelihood of adverse or aggressive interpretations of tax laws or regulations or the imposition of arbitrary or onerous taxes, interest charges and penalties. Tax assessments may be levied even where
the Company consider its practices to be in compliance with tax laws and regulations. Should the Company challenge such taxes or believe them to be without merit, it may nonetheless be required to pay them. These amounts may be materially different from the Company’s expected tax assessments and could additionally result in expropriation of assets, attachment of additional securities, liens, imposition of royalties or new taxes and requirements for local ownership or beneficiation.
Regulations in the areas of investments, taxes and levies may also have an impact on Indian securities, including the Company’s Shares and ADSs.
In 2014, the antitrust regulator in China, the Bureau of Price Supervision and Anti-Monopoly of the National Development and Reform Commission (the ‘‘NDRC’’), launched an investigation into the pricing practices of more than 1,000 Chinese and international companies in the automotive industry, including Jaguar Land Rover and many of the Company’s competitors. The NDRC has reportedly imposed fines on certain of the Company’s international competitors as a result of anti-competitive practices pertaining to vehicle and spare-part pricing. In response to this investigation, the Company established a process to review the Company’s pricing in China and announced reductions in the manufacturer’s suggested retail price for the 5.0-liter V8 models, which include the Range Rover, Range Rover Sport and F-Type and the price of certain of the Company’s spare parts. Further imposition of price reductions and other actions taken in relation to the Company’s products may significantly reduce its revenues and profits generated by operations in China and have a material adverse effect on the Company’s financial condition and results of operations. As a result, the Company’s attempts to offset the potential decline in revenue and profits by increasing operational efficiencies and leveraging economies of scale (for example, through local production in China) may fail or not be as successful as expected. Furthermore, any regulatory action taken or penalties imposed by regulatory authorities may have significant adverse financial and reputational consequences on the Company’s business and have a material adverse effect on its results of operations and financial condition.
On March 29, 2017, the Supreme Court of India prohibited the sale and registration of Bharat Stage III vehicles from April 1, 2017. Bharat Stage emission standards are emission standards instituted by the Government of India to regulate the output of air pollutants from internal combustion engines and Spark-ignition engines equipment, including motor vehicles. These regulations are similar to European emission standards, and seeks to curb emission levels from motor vehicles. Bharat Stage III similar to European standards (Euro III) which was in place between 2000 and 2005 in most western nations. The Supreme Court’s judgment overturned a government regulation, and was unexpected. The Petroleum Ministry of India in consultation with Public Oil Marketing Companies brought forward the date of BS-VI grade auto fuels in NCT of Delhi with effect from April 1, 2018 instead of April 1, 2020. The Government has announced its intention to leapfrog to BS-VI from April 1, 2020. Any future potential or real unexpected change in law could have could have a material adverse effect on the company’s business prospects, results of operations and financial condition.

148
The Company may be affected by competition law in India and any adverse application or interpretation of the Competition Act could adversely affect the Company’s business.
The Indian Competition Act oversees practices having an appreciable adverse effect on competition, or AAEC, in a given relevant market in India. Under the Competition Act, any formal or informal arrangement, understanding or action in concert, which causes or is likely to cause an AAEC, is considered void and results in imposition of substantial penalties. Consequently, all agreements entered into by us could be within the purview of the Competition Act. Furthermore, any agreement among competitors which directly or indirectly involves determination of purchase or sale prices, limits or controls production, sharing the market by way of geographical area or number of subscribers in the relevant market or which directly or indirectly results in bid-rigging or collusive bidding is presumed to have an AAEC in the relevant market in India and is considered void. The Competition Act also prohibits abuse of a dominant position by any enterprise. The Company cannot predict with certainty the impact of the provisions of the Competition Act on the Company’s agreements at this stage.
On March 4, 2011, the Government of India issued and brought into force the combination regulation (merger control) provisions under the Competition Act with effect from June 1, 2011. These provisions require acquisitions of shares, voting rights, assets or control or mergers or amalgamations that cross the prescribed asset- and turnover-based thresholds to be mandatorily notified to and pre-approved by the Competition Commission of India, or CCI. Additionally, on May 11, 2011, the CCI issued the Competition Commission of India (Procedure for Transaction of Business Relating to Combinations) Regulations, 2011 (as amended), which sets out the mechanism for the implementation of the merger control regime in India.
Furthermore, the CCI has extraterritorial powers and can investigate any agreements, abusive conduct or combination occurring outside India if such agreement, conduct or combination has an AAEC in India. The CCI has initiated an inquiry against us and other car manufacturers, collectively referred to hereinafter as the OEMs, pursuant to an allegation that genuine spare parts of automobiles manufactured by the OEMs were not made freely available in the open market in India and, accordingly, anti-competitive practices were carried out by the OEMs.
If the Company are adversely affected, directly or indirectly, by the application or interpretation of any provision of the Competition Act, or any enforcement proceedings initiated by the CCI, or any adverse publicity that may be generated due to scrutiny or prosecution by the CCI or if any prohibition or substantial penalties are levied under the Competition Act, it could adversely affect the Company’s business, financial condition and results of operations.
Compliance with new or changing corporate governance and public disclosure requirements adds uncertainty to the Company’s compliance policies and increases the Company’s costs of compliance.
The Company is subject to a complex and continuously changing regime of laws, rules, regulations and standards relating to accounting, corporate governance and public disclosure, including the Sarbanes-Oxley Act of 2002 and U.S. Securities and Exchange
Commission, or SEC, regulations, Securities and Exchange Board of India, or SEBI, regulations, New York Stock Exchange, or NYSE, listing rules, and the Companies Act, as well as Indian stock market listing regulations. New or changed laws, rules, regulations and standards may lack specificity and are subject to varying interpretations. Under applicable Indian laws, for example, remuneration packages may, in certain circumstances, require shareholders’ approval. New guidance and revisions may be provided by regulatory and governing bodies, which could result in continuing uncertainty and higher costs of compliance. The Company is committed to maintaining high standards of corporate governance and public disclosure. However, the Company’s efforts to comply with evolving regulations have resulted in, and are likely to continue to result in, increased general and administrative expenses and a diversion of management resources and time.
The Companies Act has effected significant changes to the existing Indian company law framework, such as in the provisions related to the issue of capital, disclosures in offering documents, corporate governance norms, accounting policies and audit matters, related party transactions, class action suits against companies by shareholders or depositors, prohibitions on loans to directors and insider trading, including restrictions on derivative transactions concerning a company’s securities by directors and key managerial personnel. The Companies Act may subject the Company to higher compliance requirements, increase its compliance costs and divert management’s attention. The Company is also required to spend, in each financial year, at least 2% of the company’s average net profits during the three immediately preceding financial years, calculated for Tata Motors Limited on a standalone basis under Ind AS, toward corporate social responsibility activities. Furthermore, the Companies Act imposes greater monetary and other liability on the Company and its directors for any non-compliance. Due to limited relevant jurisprudence, in the event that the Company’s interpretation of the Companies Act differs from, or contradicts with, any judicial pronouncements or clarifications issued by the Government of India in the future, the Company may face regulatory actions or be required to undertake remedial steps. In addition, some of the provisions of the Companies Act overlap with other existing laws and regulations (such as corporate governance provisions and insider trading regulations issued by SEBI). SEBI promulgated the SEBI (Listing Obligations and Disclosure Requirements) Regulations, 2015, or the Listing Regulations, which are applicable to all Indian companies with listed securities or companies intending to list its securities on an Indian stock exchange, and the Listing Regulations became effective on December 1, 2015. Pursuant to the Listing Regulations, the Company is required to establish and maintain a vigilance mechanism for directors and employees to report their concerns about unethical behaviour, actual or suspected fraud or violation of the Company’s Code of Conduct or ethics policy under the Company’s whistleblower policy, to implement increased disclosure requirements for price sensitive information, to conduct elaborate directors familiarization programs and comprehensive disclosures thereof, in accordance with the Listing Regulations. The Company may face difficulties in complying with any such overlapping requirements. Furthermore, the Company cannot currently determine the impact of certain provisions of the Companies Act and the revised SEBI corporate governance norms. Any increase in the Company’s compliance

14973rd Annual Report 2017-18
INTEGRATED REPORT 1-65 STATUTORY REPORTS 66-184 FINANCIAL STATEMENTS 185-353
requirements or in the Company’s compliance costs may have a material and adverse effect on its business, financial condition and results of operations.
The Company is subject to risks associated with legal proceedings and governmental investigations, including potential adverse publicity as a result thereof.
The Company are and may be involved from time to time in civil, labour, administrative or tax proceedings arising in the ordinary course of business. It is not possible to predict the potential for, or the ultimate outcomes of, such proceedings, some of which may be unfavorable to the Company. In such cases, the Company may incur costs and any mitigating measures (including provisions taken on the Company’s balance sheet) adopted to protect against the impact of such costs may not be adequate or sufficient. In addition, adverse publicity surrounding legal proceedings, government investigations or allegations may also harm the Company’s reputation and brands.
In any of the geographical markets in which the Company operate, the Company could be subject to additional tax liabilities.
Evaluating and estimating the Company’s provision and accruals for its taxes requires significant judgement. As the Company conduct its business, the final tax determination may be uncertain. The Company operate in multiple geographical markets and its operations in each market are susceptible to additional tax assessments and audits. The Company’s collaborations with business partners are similarly susceptible to such tax assessments. Authorities may engage in additional reviews, inquiries and audits that disrupt the Company’s operations or challenge its conclusions regarding tax matters. Any resulting tax assessment may be accompanied by a penalty (including revocation of a benefit or exemption from tax) or additional fee for failing to make the initial payment.
The Company’s tax rates may be affected by earnings estimation errors, losses in jurisdictions that do not grant a related tax benefit, changes in currency rates, acquisitions, investments, or changes in laws, regulations, or practices. Additionally, government fiscal or political pressures may increase the likelihood of adverse or aggressive interpretations of tax laws or regulations or the imposition of arbitrary or onerous taxes, interest charges and penalties. Tax assessments may be levied even where the Company consider its practices to be in compliance with tax laws and regulations. Should the Company challenge such taxes or believe them to be without merit, it may nonetheless be required to pay them. These amounts may be materially different from the Company’s expected tax assessments and could additionally result in expropriation of assets, attachment of additional securities, liens, imposition of royalties or new taxes and requirements for local ownership or beneficiation.
The Company may have to comply with more stringent foreign investment regulations in India in the event of an increase in shareholding of non-residents or if the Company is considered as engaged in a sector in which foreign investment is restricted.
Indian companies, which are owned or controlled by non-resident persons, are subject to investment restrictions specified in the Consolidated FDI (Foreign Direct Investment) Policy. Under the Consolidated FDI Policy, an Indian company is considered to be “owned” by non-resident persons if more than 50% of its equity
interest is beneficially owned by non-resident persons. The non-resident equity shareholding in the Company may, in the near future, exceed 50%, thereby resulting in the Company being considered as being “owned” by non-resident entities under the Consolidated FDI Policy. In such an event, any investment by us in existing subsidiaries, associates or joint ventures and new subsidiaries, associates or joint ventures will be considered as indirect foreign investment and shall be subject to various requirements specified under the Consolidated FDI Policy, including sectoral limits, approval requirements and pricing guidelines, as may be applicable.
Furthermore, as part of the Company’s automotive business, its supply and have in the past supplied, vehicles to Indian military and paramilitary forces and in the course of such activities have obtained an industrial license from the Department of Industrial Policy. The Consolidated FDI policy applies different foreign investment restrictions to companies based upon the sector in which they operate. While the Company believe that it is an automobile company by virtue of the significance of the Company’s automobile operations, in the event that foreign investment regulations applicable to the defense sector (including under the Consolidated FDI Policy) are made applicable to us, the Company may face more stringent foreign investment restrictions and other compliance requirements compared to those applicable to us presently, which, in turn, could materially affect the Company’s business, financial condition and results of operations.
The Company require certain approvals or licenses in the ordinary course of business, and the failure to obtain or retain them in a timely manner, or at all, could materially and adversely affect the Company’s operations.
The Company require certain statutory and regulatory permits, licenses and approvals to carry out its business operations and applications for their renewal need to be made within certain time frames. For some of the approvals which may have expired, the Company have either made, or are in the process of making, an application for obtaining the approval or its renewal. While the Company have applied for renewal for such approvals, registrations and permits, it cannot assure you that the Company will receive them in a timely manner or at all. The Company can make no assurances that the approvals, licenses, registrations and permits issued to us would not be suspended or revoked in the event of non-compliance or alleged non-compliance with any terms or conditions thereof, or pursuant to any regulatory action. Furthermore, if the Company are unable to renew or obtain necessary permits, licenses and approvals on acceptable terms in a timely manner, or at all, the Company’s business, financial condition and results of operations could be materially and adversely affected.
Any downgrading of India’s debt rating by a domestic or international rating agency could negatively impact the Company’s business.
Any adverse revisions to India’s credit ratings for domestic and international debt by domestic or international rating agencies could adversely impact the Company’s ability to raise additional financing, as well as the interest rates and other commercial terms at which such additional financing is available. This could have a material adverse effect on the Company’s financial results, business prospects, ability to obtain financing for capital expenditures and the price of the Company’s Shares and ADSs.

150
Report on Corporate Governance
COMPANY’S PHILOSOPHY ON CORPORATE GOVERNANCE
As a Tata Company, the Company’s philosophy on Corporate Governance is founded upon a rich legacy of fair, ethical and transparent governance practices, many of which were in place even before they were mandated by adopting the highest standards of professionalism, honesty, integrity and ethical behavior. As a global organization, the Corporate Governance practices followed by the Company and its subsidiaries are compatible with international standards and best practices. Through the Governance mechanism in the Company, the Board along with its Committees undertakes its fiduciary responsibilities to all its stakeholders by ensuring transparency, fairplay and independence in its decision making.
The Corporate Governance mechanism is further strengthened with the adherence to the Tata Business Excellence Model as a means to drive excellence and the Balanced Scorecard methodology for tracking progress on long-term strategic objectives. The Tata Code of Conduct, which articulates the values, ethics and business principles, serves as a guide to the Company, its directors and employees and is supplemented with an appropriate mechanism to report any concerns pertaining to non-adherence to the said Code. The Company has adopted the Governance Guidelines on Board Effectiveness based on current and emerging best practices from both within and outside the Tata Group of companies. The Company is in full compliance with the requirements of Corporate Governance under the Securities and Exchange Board of India (Listing Obligations and Disclosure Requirements), Regulations, 2015 (“SEBI Listing Regulations”). The Company’s Depositary Programme is listed on the New York Stock Exchange and the Company also complies with US regulations as applicable to Foreign Private Issuers (non-US companies listed on a US Exchange) which cast upon the Board of Directors and the Audit Committee, onerous responsibilities to ensure higher standards of the Company’s operating efficiencies. Risk management and the internal control process are focus areas that continue to meet the progressive governance standards.
BOARD OF DIRECTORS
The Board of Directors is the apex body constituted by shareholders for overseeing the Company’s overall functioning. It provides strategic direction, leadership and guidance to the Company’s management as also monitors the performance of the Company with the objectives of creating long term value for the Company’s stakeholders. The Board currently comprises of 9 Directors, out of which 7 Directors (78%) are Non-Executive Directors, including 2 women directors. The Company has a Non-Executive Chairman and 5 Independent Directors, comprising more than half of the total strength of the Board. All the Independent Directors have confirmed that they meet
the ‘independence’ criteria as mentioned under Regulation 16(1)(b) of the SEBI Listing Regulations and Section 149(6) of the Companies Act, 2013 (“Act”) and the Rules framed thereunder.
All the Directors have made necessary disclosures regarding their directorships and other interests as required under Section 184 of the Act and on the Committee positions held by them in other companies. None of the Directors on the Company’s Board hold the office of Director in more than 20 companies, including not more than 10 public companies and none of the Directors of the Company are related to each other. In accordance with Regulation 26 of the SEBI Listing Regulations none of the Directors are members in more than 10 committees or act as chairperson of more than 5 committees [the committees being, Audit Committee and Stakeholders’ Relationship Committee] across all pulic limited companies in which he/she is a Director. All Non-Executive Non-Independent Directors, are liable to retire by rotation.
The required information, including information as enumerated in Regulation 17(7) read together with Part A of Schedule II of the SEBI Listing Regulations is made available to the Board of Directors, for discussions and consideration at Board Meetings. The Board reviews the declaration made by the CEO & Managing Director and the Group Chief Financial Officer (“CFO”) regarding compliance with all applicable laws on a quarterly basis, as also steps taken to remediate instances of non-compliance, if any.
Pursuant to Regulation 27(2) of the SEBI Listing Regulations, the Company also submits a quarterly compliance report on Corporate Governance to the Indian Stock Exchanges, including details on all material transactions with related parties, within 15 days from the close of every quarter. The CEO & Managing Director and the CFO have certified to the Board on inter alia, the accuracy of the financial statements and adequacy of internal controls for financial reporting, in accordance with Regulation 17(8) read together with Part B of Schedule II of the SEBI Listing Regulations, pertaining to CEO and CFO certification for the Financial Year ended March 31, 2018.
During the year under review, 9 Board Meetings were held on April 4, 2017, May 23, 2017, May 31, 2017, July 5, 2017, August 9, 2017, November 9, 2017, January 16, 2018, February 5, 2018 and March 22, 2018. All the agenda papers for the Board and Committee meetings are disseminated electronically on a real-time basis, by uploading them on a secured online application, specifically designed for this purpose, thereby eliminating circulation of printed agenda papers. The composition of the Board, attendance at Board Meetings held during the Financial Year under review and at the last Annual General Meeting, number of directorships (including Tata Motors), memberships/chairmanships of the Board and Committees of public companies and their shareholding as at March 31, 2018 in the Company are as follows:

15173rd Annual Report 2017-18
INTEGRATED REPORT 1-65 STATUTORY REPORTS 66-184 FINANCIAL STATEMENTS 185-353
Name of the Director
DirectorIdentification
Number
Director Category
No. of Board
Meetingsattended
in the year
Attendance %
Attendanceat the
last AGM
Directorships(1) Committee positions(2) Holding in shares and other
convertible instruments
Chairman Member Chairman Member
Mr Natarajan Chandrasekaran
00121863 Non-Executive, Chairman
9 100 Yes 7 - - - -
Dr R A Mashelkar(3)(4) 00074119 Non-Executive, Independent
6 100 Yes - 6 - 3 -
Mr Nasser Munjee 00010180 Non-Executive, Independent
9 100 Yes 2 6 5 1 -
Mr Vinesh Kumar Jairath 00391684 Non-Executive, Independent
9 100 Yes - 9 2 7 -
Ms Falguni Nayar 00003633 Non-Executive, Independent
7 78 Yes - 7 4 1 -
Mr Om Prakash Bhatt (5) 00548091 Non-Executive, Independent
8 100 Yes - 4 2 4 -
Ms Hanne Sorensen(6) 08035439 Non-Executive, Independent
3 100 N.A. - 1 - 1 -
Dr Ralf Speth 03318908 Non-Executive 8 89 Yes - 2 - - -
Mr Guenter Butschek 07427375 CEO and Managing Director
8 89 Yes - 3 - 1 -
Mr Ravindra Pisharody (7) 01875848 Executive Director (Commercial
Vehicles)
1 20 - - 5 - - -
Mr Satish Borwankar (8) 01793948 Executive Director & COO
8 89 Yes - 3 - 1 500 Ordinary Shares
(1) Excludes Directorships in private companies, foreign companies, Section 8 companies and alternate directorships.
(2) Includes only Audit and Stakeholders’ Relationship Committees.
(3) In accordance with the Company’s retirement age policy, retired on December 31, 2017, upon attaining the age of 75 years.
(4) Number of Directorships, Committee positions and shareholding details are as on the date of cessation as director.
(5) Appointed as an Independent Director of the Company with effect from May 9, 2017.
(6) Appointed as an Additional and Independent Director of the Company with effect from January 3, 2018.
(7) Tendered his resignation as Executive Director (Commercial Vehicles) vide letter dated June 5, 2017, but continued to serve his term of office upto September 30, 2017 to ensure seamless transition in business operations.
(8) Designated as Executive Director and Chief Operating Officer (COO) of the Company with effect from June 5, 2017.
The Company actively uses the facility of video conferencing, permitted under Section 173(2) of the Act read together with Rule 3 of the Companies (Meetings of Board and its Powers) Rules, 2014.
Independent Directors’ Meeting: As per Regulation 25(1) of the SEBI Listing Regulations, none of the Independent Directors serve as Independent Directors in more than 7 listed entities and in case they are whole-time directors in any listed entity, then they do not serve as Independent Directors in more than 3 listed entities. During the year, 1 Meeting of Independent Directors was held on March 22, 2018 the attendance whereat is as follows:
Composition Meetings attended
Attendance %
Dr R A Mashelkar (1) NA NAMr Nasser Munjee 1 100Mr Vinesh Kumar Jairath 1 100Ms Falguni Nayar 1 100Mr Om Prakash Bhatt (2) 1 100Ms Hanne Sorensen (3) 1 100
(1) In accordance with the Company’s retirement age policy, retired on December 31, 2017, upon attaining the age of 75 years.
(2) Appointed as an Independent Director of the Company with effect from May 9, 2017.
(3) Appointed as an Additional and Independent Director of the Company with effect from January 3, 2018.
An Independent Directors meeting in accordance with the provisions of Section 149(8) read with Schedule IV of the Act and Regulation 25(3) and 25(4) of the SEBI Listing Regulations was convened on March 22, 2018, to review the performance of Non-Independent Directors and the Board as a whole, the performance of the Chairman, taking into account the views of Executive and Non-Executive Directors. The quality, quality and timeliness of flow of information between the management and the Board is also assessed.
Board Effectiveness Evaluation: Pursuant to provisions of Regulation 17(10) of the SEBI Listing Regulations and the provisions of the Act, Board evaluation involving evaluation of the Board of Directors, its Committees and individual Directors,

152
including the role of the Board Chairman, was conducted during the year. For details pertaining to the same, kindly refer to the Board’s Report.
Board Diversity: To ensure that a transparent Board nomination process is in place that encourages diversity of thought, experience, knowledge, perspective, age and gender, the Board has adopted a Diversity Policy, formulated by the Nomination & Remuneration Committee (“NRC”), wherein it is expected that the Board has an appropriate blend of functional and industry expertise. Whilst recommending the appointment of a Director, the NRC considers the manner in which the function and domain expertise of the individual contributes to the overall skill-mix of the Board and is supported by the Group Human Resources in this regard.
Familiarisation Programme: Kindly refer to the Company’s website for details of the familiarisation programme for Independent Directors on their roles, rights, responsibilities in the Company,
nature of the industry in which the Company operates, business model of the Company and related matters.
THE COMMITTEES OF THE BOARD
The Board has constituted a set of Committees with specific terms of reference/scope, to focus effectively on the issues and ensure expedient resolution of diverse matters. The Committees operate as empowered agents of the Board as per their Charter/terms of reference. Targets set / actions directed by them, as agreed with the management are reviewed periodically and mid-course corrections are also carried out. The Board of Directors and the Committees also take decisions by circular resolutions which are noted at the next meeting. The minutes of the meetings of all Committees of the Board are placed before the Board for discussions/noting. An Organisation Chart depicting the relationship between the Board of Directors, the Committees and the senior management functions is illustrated below:
AUDIT COMMITTEE
The Audit Committee functions according to its Charter that defines its composition, authority, responsibility and reporting functions in accordance with Section 177 of the Act, Regulation 18(3) read with Part C of Schedule II of the SEBI Listing Regulations and US regulations applicable to the Company and is reviewed from time to time. Whilst, the full Charter is available on the Company’s website, given below is a gist of the responsibilities of the Audit Committee:
i. Reviewing with the management, quarterly/annual financial statements before submission to the Board, focusing primarily on:
- The Company’s financial reporting process and the disclosure of its financial information, including earnings, press release, to ensure that the financial statements are correct, sufficient and credible;
SHAREHOLDERS
BOARD OF DIRECTORS
CEO & MANAGING DIRECTOR (MD)
BUSINESS COMMITTEES EXECUTIVE COMMITTEE - ExCom (1) BOARD COMMITTEES (2)
CV & PV Business Unit Steering Committee (3) Chief Operating Officer Audit CommitteeCV & PV Product Review Committee Commercial Vehicles Executive Committee of the BoardInvestment Review Committee (3) Passenger Vehicles Nomination & Remuneration CommitteeRisk Oversight Committee Group Chief Financial Officer Stakeholders’ Relationship CommitteeSourcing Council (3) Chief Human Resource Officer Safety, Health & Sustainability CommitteeIT Governance Committee Chief Technology Officer Corporate Social Responsibility Committee
Chief Purchasing Officer Risk Management CommitteeE-Mobility Business & Corporate Strategy Special Need based CommitteesCorporate Communications (4)
OTHER DIRECT REPORTS TO MDChief Internal AuditorCompany SecretaryGovernment AffairsCorporate LegalChief Information Officer
(1) The CEO & MD chairs the ExCom(2) The Company Secretary acts as the Secretary for all Board constituted Committees(3) Business Committees are chaired by related ExCom member where indicated, otherwise by the CEO & MD(4) Associated member of the ExCom

15373rd Annual Report 2017-18
INTEGRATED REPORT 1-65 STATUTORY REPORTS 66-184 FINANCIAL STATEMENTS 185-353
- Reports on the Management Discussion and Analysis of financial condition, results of operations and the Directors’ Responsibility Statement;
- Major accounting entries involving estimates based on exercise of judgment by Management;
- Compliance with accounting standards and changes in accounting policies and practices as well as reasons thereof;
- Draft Audit Report, qualifications, if any and significant adjustments arising out of audit;
- Scrutinise inter corporate loans and investments;
- Disclosures made under the CEO and CFO certification; and
- Approval or any subsequent modification of transactions with related parties, including omnibus related party transactions.
ii. Reviewing with the management, external auditor and internal auditor, adequacy of internal control systems and recommending improvements to the management.
iii. Review Management letters/Letters of internal control weakness issued by the statutory auditors.
iv. Recommending the appointment/removal of the statutory auditor, cost auditor, fixing audit fees and approving non-audit/consulting services provided by the statutory auditors’ firms to the Company and its subsidiaries; evaluating auditors’ performance, qualifications, experience, independence and pending proceedings relating to professional misconduct, if any.
v. Reviewing the adequacy of internal audit function, including the structure of the internal audit department, staffing and seniority of the chief internal auditor, coverage and frequency of internal audit, appointment, removal, performance and terms of remuneration of the chief internal auditor.
vi. Discussing with the internal auditor and senior management, significant internal audit findings and follow-up thereon.
vii. Reviewing the findings of any internal investigation by the internal auditor into matters involving suspected fraud or irregularity or a failure of internal control systems of a material nature and report the matter to the Board.
viii. Discussing with the statutory auditor before the audit commences, the nature and scope of audit, as well as conduct post-audit discussions to ascertain any area of concern.
ix. Establish and review the functioning of the Vigil Mechanism under the Whistle-Blower Policy of the Company.
x. Reviewing the financial statements and investments made by subsidiary companies and subsidiary oversight, relating to areas such as adequacy of the internal audit structure and function of the subsidiaries, their status of audit plan and its execution, key internal audit observations, risk management and the control environment.
xi. Look into the reasons for any substantial defaults in payment to the depositors, debenture holders, shareholders (in case of non-payment of declared dividend) and creditors, if any.
xii. Reviewing the effectiveness of the system for monitoring compliance with laws and regulations.
xiii. Approving the appointment of CFO after assessing the qualification, experience and background etc. of the candidate.
xiv. Review the system of storage, retrieval, display or printout of books of accounts maintained in electronic mode during the required period under law.
xv. Approve all or any subsequent modification of transactions with related parties.
xvi. To approve policies in relation to the implementation of the Tata Code of Conduct for Prevention of Insider Trading and Code of Corporate Disclosure Practices (“Code”) and to supervise implementation of the Code.
xvii. To note and take on record the status reports, detailing the dealings by Designated Persons in Securities of the Company, as submitted by the Compliance Officer on a quarterly basis and to provide directions on any penal action to be initiated, in case of any violation of the Code, by any person.
During the year, the Committee inter alia reviewed key audit findings covering operational, financial and compliance areas. It also reviewed the internal control system in subsidiary companies. The Chairman of the Audit Committee briefs the Board on significant discussions at Audit Committee meetings.
The Committee comprises of 4 Independent Directors, all of whom are financially literate and have relevant finance and/or audit exposure. Mr Munjee is the Financial Expert. The quorum of the Committee is two members or one-third of its members, whichever is higher. The Chairman of the Audit Committee also attended the last Annual General Meeting of the Company. During the period under review, 8 Audit Committee meetings were held on April 18, 2017, May 22, 2017, July 4, 2017, August 7, 2017, September 18, 2017, November 7, 2017, a two-day meeting on January 11-12, 2018 and February 2, 2018. Each Audit Committee meeting which considers financial results is preceded by a meeting of the Audit Committee members and the Auditors.
The composition of the Audit Committee and attendance at its meetings is as follows:
Composition Meetings attended
Attendance %
Mr Nasser Munjee (Chairman) 8 100Dr R A Mashelkar (1) 5 83Mr Vinesh Kumar Jairath 8 100Ms Falguni Nayar 7 88Mr Om Prakash Bhatt (2) 0 0
(1) Consequent to his retirement as an Independent Director on December 31, 2017, he also ceased to be a Member of the Committee.
(2) Appointed as a Member with effect from January 16, 2018.

154
Ms Hanne Sorensen, Additional and Independent Director, also attends Audit Committee meetings as a special invitee with effect from January 16, 2018. The Committee meetings are held at the Company’s Corporate Headquarters or at its plant locations and are attended by the CEO & Managing Director, Executive Directors, CFO, Chief Internal Auditor, Statutory Auditors and Cost Auditors on a need based basis. The Business and Operation Heads are invited to the meetings, as and when required. The Chief Internal Auditor reports directly to the Audit Committee to ensure independence of the Internal Audit function.
The Committee relies on the expertise and knowledge of the management, the internal auditors and the Statutory Auditor, in carrying out its oversight responsibilities. It also uses external expertise, if required. The management is responsible for the preparation, presentation and integrity of the Company’s financial statements including consolidated statements, accounting and financial reporting principles. The management is also responsible for internal control over financial reporting and all procedures are designed to ensure compliance with accounting standards, applicable laws and regulations as well as for objectively reviewing and evaluating the adequacy, effectiveness and quality of the Company’s system of internal controls.
B S R & Co. LLP, Chartered Accountants (ICAI Firm Registration No.101248 W/W – 100022), the Company’s Statutory Auditor, is responsible for performing an independent audit of the Financial Statements and expressing an opinion on the conformity of those financial statements with accounting principles generally accepted in India.
The Audit Commiittee reviews on a quarterly basis the confirmation of the Independence made by the Auditors, as also approves of the fees paid to the Auditors by the Company, or any other company in the Tata Motors Group as per the Policy for Approval of Services to be rendered by the Auditors. The said Policy is also available on our website http://www.tatamotors.com/investors/pdf/auditfee-policy.pdf. The Company rotates its Audit Partners responsible for its audit every five years, apart from the requirement of the Act of rotating the Audit Firm every ten years, to ensure independence in the audit function.
NOMINATION AND REMUNERATION COMMITTEE
The Nomination and Remuneration Committee (NRC) of the Company functions according to its Charter, that defines its objective, composition, meeting requirements, authority and power, responsibilities, reporting and evaluation functions in accordance with Section 178 of the Act and the SEBI Listing Regulations. The broad terms of reference of the NRC are as follows:
- Recommend to the Board the set up and composition of the Board and its Committees including the “formulation of the criteria for determining qualifications, positive attributes and independence of a director”. The Committee periodically reviews the composition of the Board with the objective of achieving an optimum balance of size, skills, independence, knowledge, age, gender and experience.
- Devise a policy on Board diversity.
- Recommend to the Board the appointment or reappointment of Directors, including Independent directors, on the basis of the performance evaluation report of Independent Directors.
- Support the Board in matters related to set-up, review and refresh of the Committees.
- Recommend to the Board on voting on resolutions for appointment and remuneration of Directors on the Boards of its material subsidiary companies and provide guidelines for remuneration of Directors on material subsidiaries.
- Identify and recommend to the Board appointment of Key Managerial Personnel (“KMP” as defined by the Act) and executive team members of the Company (as defined by this Committee). The Committee shall consult the Audit Committee before recommending the appointment of the CFO.
- Carry out evaluation of every Director’s performance and support the Board, its Committees and individual Directors, including “formulation of criteria for evaluation of Independent Directors and the Board”.
- Oversee the performance review process for the KMP and the executive team of the Company with a view that there is an appropriate cascading of goals and targets across the Company and on an annual basis, recommend to the Board the remuneration payable to the Directors, KMP and executive team of the Company.
- Recommend the Remuneration Policy for Directors, KMP, executive team and other employees.
- Review matters related to voluntary retirement and early separation schemes for the Company.
- Oversee familiarization programmes for Directors.
- Oversee HR philosophy, HR and people strategy and efficacy of HR practices including those for leadership development, rewards and recognition, talent management and succession planning (specifically for the Board, KMP and executive team).
- Performing such other duties and responsibilities as may be consistent with the provisions of the Committee Charter.
The Committee presently comprises of 2 Independent Directors and 1 Non-Executive Director. During the year under review, three meetings of the Committee were held on May 23, 2017, January 16, 2018 and March 22, 2018. The decisions are taken by the Committee, at meetings or by passing circular resolutions. The composition of the NRC and attendance at its meetings is as follows:
Composition Meetings attended
Attendance %
Mr Om Prakash Bhatt (Chairman)(1)
3 100
Mr N Chandrasekaran 3 100Mr Nasser Munjee 3 100Dr R A Mashelkar(2) 1 100
(1) Inducted as a member on May 16, 2017 and appointed as the Committee Chairman with effect from January 16, 2018.
(2) Consequent to his retirement as an Independent Director on December 31, 2017, he also ceased to be the Chairman and Member of the Committee.

15573rd Annual Report 2017-18
INTEGRATED REPORT 1-65 STATUTORY REPORTS 66-184 FINANCIAL STATEMENTS 185-353
Remuneration Policy
The Company has in place a Remuneration Policy for Directors, KMP and other employees, in accordance with the provisions of the Act and the SEBI Listing Regulations. For details on Remuneration Policy for Directors, KMP and other employees, kindly refer to Annexure 4 to the Board’s Report.
Remuneration of Directors:
Non-Executive Directors
• A sitting fee of `60,000/- for attendance at each meeting of the Board, Audit Committee, Executive Committee of the Board, NRC and for Independent Directors Meeting; 20,000/- for attendance at each meeting of Stakeholders’ Relationship Committee; Safety, Health & Sustainability Committee, the Corporate Social Responsibility Committee, Risk Management Committee and other special need based committees, is paid to its Members (excluding Managing Director and Executive Directors) and also to Directors attending by invitation. The sitting fees paid/payable to the Non Whole-time Directors is excluded whilst calculating the limits of remuneration in accordance with Section 197 of the Act. The Company also reimburses out-of-pocket expenses to Directors attending meetings held at a city other than the one in which the Directors reside.
• The remuneration by way of commission to the Non-Executive Directors is decided by the Board of Directors and distributed to them based on their participation and contribution at the Board and certain Committee meetings as well as time spent on matters other than at meetings. The Members had, at the Annual General Meeting held on August 21, 2013, approved the payment of remuneration by way of commission to the Non Whole-time Directors of the Company, of a sum not exceeding 1% per annum of the net profits of the Company, calculated in accordance with the provisions of the Act for a period of 5 years commencing April 1, 2013, respectively.
No Commission was paid to any Non-Executive Director for FY 2017-18 in view of inadequacy of profits.
The performance evaluation criteria for Non-Executive Directors, including Independent Directors, is determined by the NRC. An indicative list of factors that were evaluated include participation and contribution by a director, commitment, effective deployment of knowledge and expertise, effective management of relationship with stakeholders, integrity and maintenance of confidentiality and independence of behaviour and judgement.
Given below are the Sitting Fees paid/ payable by the Company to Non-Executive Directors during FY 2017-18:
(` in lakhs)
Name Sitting Fees
Mr N Chandrasekaran 7.80
Dr R A Mashelkar(1) 8.60
Mr Nasser Munjee 14.00
(` in lakhs)
Name Sitting Fees
Mr Vinesh Kumar Jairath 12.20
Ms Falguni Nayar 10.40
Mr Om Prakash Bhatt(2) 7.20
Ms Hanne Sorensen(3) 3.00
Dr Ralf Speth(4) -
Total 63.20
(1) In accordance with the Company’s retirement age policy, retired on December 31, 2017, upon attaining the age of 75 years.
(2) Appointed as an Independent Director of the Company with effect from May 9, 2017.
(3) Appointed as an Additional and Independent Director of the Company with effect from January 3, 2018.
(4) Is not paid any commission or sitting fees for attending Board meetings of the Company in view of his appointment as Chief Executive Officer and Director of Jaguar Land Rover Automotive PLC.
Some of the aforementioned Directors are also on the Board of the Company’s subsidiaries and associates, in a non-executive capacity and are paid remuneration and sitting fees for participating in their meetings. Other than the above, the Non-Executive Directors have no pecuniary relationship or transactions with the Company, its subsidiaries and associates.
Managing and Executive Directors
The remuneration paid to the CEO & Managing Director and the Executive Directors is commensurate with industry standards and Board level positions held in similar sized companies, taking into consideration the individual responsibilities shouldered by them and is in consonance with the terms of appointment approved by the Members, at the time of their appointment.
The NRC, reviews and recommends to the Board the changes in the managerial remuneration, generally being increment in basic salary and commission/incentive remuneration of the Managing and Executive Directors on a yearly basis. This review is based on the Balanced Score Card that includes the performance of the Company and the individual director on certain defined qualitative and quantitative parameters such as volumes, EBITDA, market share, cashflows, cost reduction initiatives, safety, strategic initiatives and special projects as decided by the Board vis-a-vis targets set in the beginning of the year. This review also takes into consideration the benchmark study undertaken by reputed independent agencies on comparative industry remuneration practices.
The variable portion of the CEO & Managing Director’s remuneration comprises of incentive remuneration in the form of performance linked bonus and long-term incentive. The target performance linked bonus would be €550,000/- per annum upto a maximum of €825,000/- per annum. With the objective of achieving long-term value creation, through retention and continuity in leadership, a long term incentive plan is provided with a value intended target of €550,000/- per annum upto a maximum of €825,000/- per annum.

156
The variable portion of the Executive Directors remuneration comprises of a profit-linked commission and/or merit based incentive remuneration. The profit-linked commission is awarded at the discretion of the NRC and the Board of Directors, based on the net profits of the Company for that financial year, subject to the overall ceiling limits stipulated in Section 197 of the Act, but in any case not exceeding 400% of the basic salary. In case
(` in lakhs)
Particulars Mr Guenter Butschek Mr Ravindra Pisharody Mr Satish Borwankar
CEO & Managing Director Executive Director (Commercial Vehicles) (1)
Executive Director & COO
Basic Salary 250.80 48.97 60.72
Benefits, Perquisites & Allowance 1,294.39(2) 135.96(3) 87.46(4)
Incentive Remuneration 1,066.66(5) - 60.00(5)
Retirement Benefits 30.10 13.21 16.39
Total Remuneration 2,641.95 198.14 224.57
Note: No Commission was paid to the Whole-time Directors for FY 2017-18 in view of inadequacy of profits.(1) Resigned as Executive Director (Commercial Vehicles) with effect from September 30, 2017.(2) Includes reimbursement of pension benefits of `155.04 lakhs.(3) Includes Ex-gratia payment of `15 lakhs, gratuity of `30 lakhs and leave encashment of `42.60 lakhs.(4) Includes leave encashment of `2.53 lakhs.(5) Incentive remuneration would be payable as per agreement.
Terms of Appointment
CEO & Managing Director (MD) Executive Director(s)
Severance Notice Period and Fees
- The Contract with the CEO & MD may be terminated earlier, without any cause by either giving to the other party six months’ notice of such termination or the Company paying six months’ remuneration which shall be limited to provision of basic salary, benefits, perquisites and allowances (including Living Allowance) and any pro-rated incentive remuneration, in lieu of such notice. Additionally, in case of termination initiated by the Company before the end of the term for the reasons other than Tata Code of Conduct (“TCoC”), the CEO & MD shall be entitled to severance pay for a period of 12 months or balance term of the agreement whichever is less and which shall be limited to provision of basic salary, living allowance and any pro-rated incentive remuneration.
- This appointment may not be terminated by the Company without notice or payment in lieu of notice except for reasons of breach of TCoC. In case of breach of TCoC, the CEO & MD shall not be entitled to Severance.
- In the event the CEO & MD is not in a position to discharge his official duties due to any physical or mental incapacity, he shall be entitled to receive notice pay and the severance as mentioned above and this contract shall stand terminated.
- This appointment may be terminated by either party by giving to the other party six months’ notice of such termination or the Company paying six months’ remuneration in lieu of the Notice.
- The employment of the Executive Director, may be terminated by the Company without notice or payment in lieu of notice:
• if the Executive Director, is found guilty of any gross negligence, default or misconduct in connection with or affecting the business of the Company or any subsidiary or associated company to which he is required by the Agreement to render services; or
• in the event of any serious repeated or continuing breach (after prior warning) or non-observance by the Executive Director, of any of the stipulations contained in the Agreement to be executed between the Company and the Executive Director; or
• in the event the Board expresses its loss of confidence in the Executive Director.
- In the event the Executive Director is not in a position to discharge his official duties due to any physical or mental incapacity, the Board shall be entitled to terminate his contract on such terms, as the Board may consider appropriate in the given circumstances.
the Net Profits of the Company are inadequate for payment of profit-linked commission in any financial year, an incentive remuneration, not exceeding 200% of the basic salary, may be paid at the discretion of the Board.
Given below are details pertaining to certain terms of appointment and payment of Managerial Remuneration to the CEO & Managing Director and Executive Directors for FY 2017-18:

15773rd Annual Report 2017-18
INTEGRATED REPORT 1-65 STATUTORY REPORTS 66-184 FINANCIAL STATEMENTS 185-353
The Company has received approval from the shareholders and the Central Government for appointment and payment of remuneration to Mr Guenter Butschek, a foreign national, who is functioning in a professional capacity as its CEO and Managing Director for a period of 5 years from February 15, 2016 in accordance with Section 197 read together with Schedule V of the Act.
During the year under review, the Company did not have an Employee Stock Option Scheme for any of its employees or directors.
Retirement Policy for Directors
As per the retirement age policy adopted by the Company, the Managing and Executive Directors retire at the age of 65 years. The Executive Director, who have been retained on the Company’s Board beyond the age of 65 years as Non-Executive Directors for special reasons may continue as Directors at the discretion of the Board but in no case beyond the age of 70 years. The Company has also adopted a Policy for Managing and Executive Directors (except where he is an expat), which has also been approved by the Members of the Company, offering special retirement benefits, viz. pension, ex-gratia and medical. In addition to the above, the retiring Managing Director is entitled to residential accommodation or compensation in lieu of accommodation on retirement. The quantum and payment of the said benefits are subject to an eligibility criteria of the retiring director and is payable at the discretion of the Board in each individual case on the recommendation of the NRC. In line with the said Policy, payments are made to former Managing Directors / Whole-time Directors / their heirs, namely, the spouses of Late Mr J E Talaulicar and Late Mr V M Raval, Mr F J Da’Cunha, Mr Ravi Kant, Mr P M Telang and Mr R Pisharody.
Section 149 of the Act provides that an Independent Director shall hold office for a term of upto 5 consecutive years on the Board of a Company and would not be liable to retire by rotation. An Independent Director would be eligible to be re-appointed for another 5 years on passing of a Special Resolution by the Company. However, no Independent Director shall hold office for more than 2 consecutive terms, but would be eligible for appointment after the expiration of 3 years of ceasing to become an Independent Director. Provided that, during the said period of 3 years, he/she is not appointed in or associated with the Company in any other capacity, either directly or indirectly. The retirement age for Independent Directors is 75 years as per the Company’s Policy. Accordingly, all Independent Directors have a tenure of 5 years each or upon attaining the retirement age of 75 years, whichever is earlier, as approved by the Members at the Annual General Meeting held on July 31, 2014.
STAKEHOLDERS’ RELATIONSHIP COMMITTEE
The Stakeholders’ Relationship Committee functions in accordance with Section 178 of the Act and Regulation 20 read with Part D of Schedule II of the SEBI Listing Regulations. The Committee comprising of 2 Independent Directors and the CEO & Managing Director, is empowered to:
- Review statutory compliances relating to all security holders.
- Consider and resolve the grievances of security holders of the Company, including complaints related to transfer of securities, non-receipt of annual report/ declared dividends/ notices/ balance sheet.
- Oversee compliances in respect of dividend payments and transfer of unclaimed amounts and shares to and from the Investor Education and Protection Fund.
- Oversee and review all matters related to the transfer of securities of the Company.
- Approve issue of duplicate certificates of the Company.
- Review movements in shareholding and ownership structures of the Company.
- Ensure setting of proper controls and oversee performance of the Registrar and Share Transfer Agent.
- Recommend measures for overall improvement of the quality of investor services.
During the year under review, 1 Committee meeting was held on January 11, 2018. The composition of the Stakeholders’ Relationship Committee and attendance at its meeting is as follows:
Composition Meetings attended
Attendance %
Ms Falguni Nayar (Chairperson)(1)
1 100
Mr Vinesh Kumar Jairath(2) NA NA
Mr Guenter Butschek 1 100
Ms Hanne Sorensen(3) NA NA
(1) Appointed as the Chairperson of the Committee with effect from January 16, 2018.
(2) Resigned as a Member of the Committee with effect from July 18, 2017.
(3) Inducted as a Member of the Committee with effect from January 16, 2018.
Compliance Officer
Mr H K Sethna, Company Secretary, who is the Compliance Officer, can be contacted at: Tata Motors Limited, Bombay House, 24, Homi Mody Street, Mumbai - 400 001, India. Tel: 91 22 6665 8282, 91 22 6665 7824; Fax: 91 22 6665 7799; Email: [email protected]
Complaints or queries relating to the shares and/or debentures can be forwarded to the Company’s Registrar and Transfer Agents – M/s TSR Darashaw Limited at [email protected], whereas complaints or queries relating to the public fixed deposits can be forwarded to the Registrars to the Fixed Deposits Scheme – M/s TSR Darashaw Limited at [email protected].
Complaints or queries relating to the Rights Issue launched by the Company vide Letter of Offer dated March 30, 2015 of Ordinary and ‘A’ Ordinary Shares, can be forwarded to Link Intime India Private Limited, the Registrar to the Issue, for addressing any Issue related queries / complaints including those relating to the Applications Supported by Blocked Amount (ASBA) process.

158
Tel: (91 22) 4918 6000 / 9167779196 /97; Fax: (91 22) 4918 6060; Website: www.linkintime.co.in; Email: [email protected]; Contact Person: Mr Sachin Achar / Mr Sumeet Deshpande.
The status on the total number of investor complaints during FY 2017-18 is as follows:
Type Nos.Complaints regarding non-receipt of dividend, shares lodged for transfer
90
Complaints received from the shareholders through SEBI and other statutory bodies and resolved
29
Complaints redressed out of the above 115Pending complaints as on 31.03.2018 4*Other queries received from shareholders and replied
8,272
* SEBI complaints have been replied within 4 days, but the same has been reflected as unresolved as on 31.03.2018, as per the condition for complete resolution defined by SEBI.
All letters received from the investors are replied to and the response time for attending to investors’ correspondence during FY 2017-18 is shown in the following table:
Particulars Number %
Total number of correspondence received during FY 2017-18
8,391 100.00
Replied within 1 to 4 days of receipt
2,801 33.39
Replied within 5 to 7 days of receipt
2,434 29.00
Replied within 8 to 15 days of receipt
2,154 25.67
Replied after 15 days of receipt(1)
938 11.18
Received in last week of March 2018 have been replied in April 2018
64 0.76
(1) These correspondence pertained to court cases which involved retrieval of case files, cases involving retrieval of very old records, co-ordination with the Company/Advocates etc, partial documents awaited from the Investors, cases involving registration of legal documents, executed documents received for issue of duplicate certificates and transmission of shares without legal representation which involved checking of the documents, sending notices to Stock Exchange(s) and issue of duplicate certificates/transmission of shares after approval from the Company. However, all these cases have been attended to within the statutory limit of 30 days.
There were no pending share transfers pertaining to the Financial Year ended March 31, 2018. Out of the total number of complaints mentioned above, 29 complaints pertained to letters received through Statutory/Regulatory bodies and those related to the Court/Consumer forum matters, fraudulent encashment and non-receipt of dividend.
On recommendations of the Stakeholders’ Relationship Committee, the Company has taken various investor friendly initiatives like organising Shareholders’ visit to Company’s Works at Pune, sending reminders to investors who have not claimed their dues, sending nomination forms, etc.
THE EXECUTIVE COMMITTEE OF THE BOARD
The Committee reviews capital and revenue budgets, long-term business strategies and plans, the organizational structure of the Company, real estate and investment transactions, allotment of shares and/or debentures, borrowing and other routine matters. The Committee also discusses the matters pertaining to legal cases, acquisitions and divestment, new business forays and donations. During the year under review, 1 Committee meeting was held on September 12, 2017. The Executive Committee of Board presently comprises of 1 Independent Director, 1 Non-Executive Director and 2 Whole-time Directors. The composition of the Executive Committee of Board and attendance at its meetings is given hereunder:
Composition Meetings attended
Attendance %
Mr N Chandrasekaran (Chairman)
1 100
Mr Nasser Munjee 1 100
Mr Ravindra Pisharody(1) - -
Mr Satish Borwankar 1 100
Mr Guenter Butschek 1 100
(1) Consequent to his resignation as Executive Director (Commercial Vehicle) on September 30, 2017, he also ceased to be a Member of the Committee.
THE SAFETY, HEALTH AND SUSTAINABILITY (SHS) COMMITTEE
The Committee was renamed on August 9, 2017 from Safety, Health and Environment Committee with the objective of reviewing Safety, Health and Sustainability practices. The terms of reference of the Committee include the following:
- to take a holistic approach to safety, health and sustainability matters in decision making;
- to provide direction to Tata Motors Group in carrying out its safety, health and sustainability function;
- to frame broad guidelines/policies with regard to safety, health and sustainability;
- to oversee the implementation of these guidelines/policies; and
- to review the safety, health and sustainability policies, processes and systems periodically and recommend measures for improvement from time to time.
The Committee comprises of 1 Independent Director, 1 Executive Director and 1 Managing Director. During the year under review, 3 meetings of the Committee were held on May 22, 2017, July 4, 2017 and November 9, 2017. The composition of the SHS Committee and attendance at its meeting is given hereunder:

15973rd Annual Report 2017-18
INTEGRATED REPORT 1-65 STATUTORY REPORTS 66-184 FINANCIAL STATEMENTS 185-353
Composition Meetings attended
Attendance %
Dr R A Mashelkar (Chairman) (1) 3 100
Mr Vinesh Kumar Jairath 3 100
Mr Guenter Butschek 3 100
Mr Satish Borwankar 3 100
Mr Ravindra Pisharody(2) 1 50
(1) Consequent to his retirement as an Independent Director on December 31, 2017, he also ceased to be the Chairman and Member of the Committee.
(2) Consequent to his resignation as Executive Director (Commercial Vehicle) on September 30, 2017, he also ceased to be a Member of the Committee.
CORPORATE SOCIAL RESPONSIBILITY (CSR) COMMITTEE
The Committee is constituted by the Board in accordance with the Act to:
a. Formulate and recommend to the Board, a Corporate Social Responsibility Policy which shall indicate the activities to be undertaken by the Company as specified in Schedule VII of the Act;
b. Recommend the amount of expenditure to be incurred on the activities referred to in clause (a); and
c. Monitor the Corporate Social Responsibility Policy of the Company from time to time.
The CSR Policy is uploaded on the Company’s website as required under the provisions of Section 135 of the Act and Rule 9 of the Companies (Corporate Social Responsibility Policy) Rules, 2014.
The CSR Committee comprises of 2 Independent Directors, 1 Executive Director and 1 Managing Director. During the year under review, 3 meetings of the Committee were held on May 22, 2017, September 18, 2017 and January 12, 2018. The composition of the CSR Committee and attendance at its meetings is given hereunder:
Composition Meetings attended
Attendance %
Mr Om Prakash Bhatt (Chairman) (1)
NA NA
Dr R A Mashelkar (2) 2 100
Ms Falguni Nayar 2 67
Mr Satish Borwankar 3 100
Mr Guenter Butschek 3 100
(1) Appointed as the Chairman and Member of the Committee with effect from January 16, 2018.
(2) Consequent to his retirement as an Independent Director on December 31, 2017, he also ceased to be a Member and Chairman of the Committee.
RISK MANAGEMENT COMMITTEE (RMC)
The Committee is constituted and functions as per Regulation 21 of the SEBI Listing Regulations. The Committee comprises of 1 Independent Director, 1 Executive Director, 1 Managing Director and the CFO. The terms of reference enumerated in the Committee Charter are as follows:
- Principles and objectives inter alia include assisting the Board in overseeing the Company’s risk management process and controls, risk tolerance, capital liquidity and funding etc. and its periodic update to the Board.
- Committee shall act and have powers in accordance with the terms of reference specified in writing by the Board and shall be responsible for reviewing the Company’s risk governance structure, assessment, practice, guidelines etc.
- The Committee will report to the Board periodically on various matters and shall undergo an annual self-evaluation of its performance and report the results thereof to the Board.
During the year under review 4 meetings of the Committee were held on April 18, 2017, July 4, 2017, September 18, 2017 and January 11, 2018. The composition of the RMC and attendance at its meetings is given hereunder:
Composition Meetings attended
Attendance %
Ms Hanne Sorensen (Chairperson) (1)
NA NA
Mr Nasser Munjee (2) 4 100Dr R A Mashelkar (3) 2 67Mr Vinesh Kumar Jairath (4) 4 100Ms Falguni Nayar (4) 4 100Mr Guenter Butschek (5) NA NAMr Satish Borwankar (5) NA NAMr P B Balaji (5) NA NA
(1) Appointed as a Member on January 16, 2018 and as Chairperson with effect from March 22, 2018.
(2) Ceased to be the Chairman and Member of the Committee with effect from March 22, 2018.
(3) Consequent to his retirement as an Independent Director on December 31, 2017, he also ceased to be a Member of the Committee.
(4) Ceased to be Member of the Committee with effect from March 22, 2018.
(5) Inducted as Members with effect from March 22, 2018.
CODE OF CONDUCT
Whilst the Tata Code of Conduct is applicable to all Whole-time Directors and employees of the Company, the Board has also adopted a seperate Tata Code of Conduct for Non-Executive Directors and Independent Directors, respectively. Pursuant to Regulation 26(5) of the SEBI Listing Regulations, all members of senior management have confirmed that there are no material, financial and commercial transactions wherein they have a personal interest that may have a potential conflict with the interest of the Company at large. Pursuant to Regulation 26(3) of the SEBI Listing Regulations, all the Board members and senior management of the Company as on March 31,

160
2018 have affirmed compliance with their respective Codes of Conduct. A Declaration to this effect, duly signed by the CEO and Managing Director is annexed to this report. Furthermore, pursuant to the provisions of Regulations 8 and 9 under the
SEBI (Prohibition of Insider Trading) Regulations, 2015 the company has adopted and endeavors adherence to the Tata Code of Conduct for Prevention of Insider Trading and the Code of Corporate Disclosure Practices.
GENERAL BODY MEETINGSAnnual General Meeting (AGM)
Date of AGM Year Special Resolutions passed Venue and Time
August 22, 2017 2016-2017 • Re-appointment of Mr Satish Borwankar as Executive Director and Chief Operating Officer and payment of remuneration.
• Offer or invite for Subscription of Non-Convertible Debentures on private placement basis.
Birla Matushri Sabhagar,19, Sir Vithaldas
Thackersey Marg,Mumbai - 400020
3:00 p.m.
August 9, 2016 2015-2016 • Appointment of Mr Guenter Butschek as the Chief Executive Officer and Managing Director.
• Re-appointment of Mr Ravindra Pisharody – Executive Director (Commercial Vehicles) and payment of remuneration.
• Re-appointment of Mr Satish Borwankar – Executive Director (Quality) and payment of remuneration.
• Offer or invite for Subscription of Non-Convertible Debentures on private placement basis.
August 13, 2015 2014-2015 Offer or invite for Subscription of Non-Convertible Debentures on private placement basis.
There were no special resolutions proposed to be passed through Postal Ballot during the last year or at the forthcoming AGM.
Hon’ble National Company Law Tribunal Convened Equity Shareholders Meeting
Equity Shareholders Meeting was convened during the financial year, pursuant to the Order of the Hon’ble National Company Law Tribunal (NCLT), Mumbai Bench dated June 28, 2017, modified by Orders dated August 23, 2017 and September 15, 2017 (“Orders”) in the matter of the Scheme of Merger and Arrangement between TML Drivelines Limited and Tata Motors Limited and their respective Shareholders (“Scheme”). The details of this meeting are as given below:
Date of Meeting Resolution Outcome Venue & Time
November 15, 2017 To approve the Scheme of Merger and Arrangement between TML Drivelines Limited and Tata Motors Limited and their respective Shareholders under Sections 230 to 232 and other applicable provisions of the Act.
Resolution was passed by requisite majority of stakeholders, that is, majority in number of holders and three-fourths in value.
Walchand Hirachand Hall, 4th Floor, Indian Merchants’ Chamber, IMC Building, IMC Marg, Churchgate, Mumbai – 400020 at 3:00 p.m.
All resolutions moved at the last AGM and at the NCLT convened meeting, were passed by means of electronic and physical voting, by the requisite majority of members attending the meeting. The Minutes of the aforementioned General Meetings are available on the Company’s website.
There were no resolutions passed by Postal Ballot by the Company during the year under review.
MEANS OF COMMUNICATION The Quarterly, Half Yearly and Annual Results are regularly submitted to the Stock Exchanges in accordance with the SEBI Listing Regulations and are generally published in the Indian Express, Financial Express and the Loksatta (Marathi). The Company has emailed to the Members who had provided email addresses, the half yearly results of the Company. The information regarding the performance of the Company is shared with the shareholders vide the Annual Report. The official news releases, including on the quarterly and annual results and presentations made to institutional investors and analysts are also posted on the Company’s website (www.tatamotors.com) in the ‘Investors’ section.

16173rd Annual Report 2017-18
INTEGRATED REPORT 1-65 STATUTORY REPORTS 66-184 FINANCIAL STATEMENTS 185-353
The Annual Report, Quarterly Results, Shareholding Pattern, Press Releases, Intimation of Board Meetings and other relevant information of the Company are posted through BSE Listing Centre and NSE Electronic Application Processing System (NEAPS) portals for investor information.
Green Initiative:
In support of the “Green Initiative” undertaken by the Ministry of Corporate Affairs, the Company had during FY 2017-18 sent various communications by email to those shareholders whose email addresses were registered with the depositories or the Registrar and Transfer Agents.
All agenda papers for the Board and Committee meetings are disseminated electronically on a real-time basis, by uploading them on a secured online application specifically designed for this purpose.
In line with the SEBI Listing Regulations, the Company has emailed soft copies of its Annual Report to all those shareholders who have registered their email address for the said purpose. We would greatly appreciate and encourage more Members to register their email address with their Depository Participant or the Registrar and Transfer Agent of the Company, to receive soft copies of the Annual Report, Postal Ballot Notices and other information disseminated by the Company, on a real-time basis without any delay.
GENERAL INFORMATION FOR MEMBERS
The Corporate Identity Number (CIN) allotted to the Company by the Ministry of Corporate Affairs (MCA) is L28920MH1945PLC004520.
ANNUAL GENERAL MEETING
Date and Time Friday, August 3, 2018 at 3:00 p.m.
Venue Birla Matushri Sabhagar, 19, Sir Vithaldas Thackersey Marg, Mumbai 400020
FINANCIAL CALENDAR (TENTATIVE)
Financial Year ending March 31, 2018
Results for the Quarter ending
June 30, 2018 On or before August 14, 2018
September 30, 2018 On or before November 14, 2018
December 31, 2018 On or before February 14, 2019
March 31, 2019 On or before May 30, 2019
Date of Dividend payment No dividend is announced and recommended by the Board for FY 2017-18.
LISTINGS The Company’s shares are listed on the BSE Ltd. (BSE) and the National Stock Exchange of India Ltd. (NSE). The following are the details of the Company’s shares:
Type Ordinary Shares ‘A’ Ordinary Shares
ISIN INE155A01022 IN9155A01020
BSE – Stock Code 500570 570001
NSE – Stock Code TATAMOTORS TATAMTRDVR
BSE - Address Phiroze Jeejeebhoy Towers, Dalal Street, Mumbai 400 001; www.bseindia.com
NSE - Address “Exchange Plaza”, Bandra Kurla Complex, Bandra (E), Mumbai 400051; www.nseindia.com
The Company has paid Annual Listing fees for FY 2017-18 to all the Stock Exchanges (both domestic and international) where the Company’s securities are listed.
Attention is also drawn to foreign listing and listing of debt securities of the Company as mentioned under Outstanding Securities below.

162
MARKET INFORMATION Market price data - monthly high/low of the closing price and trading volumes on BSE/NSE depicting liquidity of the Company’s Ordinary Shares and ‘A’ Ordinary Shares on the said exchanges is given hereunder:-
Month Ordinary Shares ‘A’ Ordinary Shares
BSE NSE BSE NSE
High(`)
Low(`)
No. of Shares
High(`)
Low(`)
No. of Shares
High(`)
Low(`)
No. of Shares
High(`)
Low(`)
No. of Shares
Apr-17 475.05 440.40 9035809 474.90 440.60 105624063 289.35 270.60 1468847 290.30 270.45 28027749
May-17 481.45 419.75 14234698 481.50 419.60 152316124 287.85 259.30 9417946 287.90 258.95 62647044
Jun-17 478.55 432.50 93104805 478.48 432.55 113984752 291.10 263.30 3766918 290.85 263.30 37192849
Jul-17 464.60 427.65 10778762 464.60 426.90 105829696 275.80 260.55 1782932 276.50 260.50 25599145
Aug-17 446.90 373.35 15060796 446.90 373.60 153203697 262.45 219.45 3683342 262.60 218.75 41170126
Sep-17 423.90 375.05 59388584 423.65 375.00 172230315 240.65 209.55 4148001 241.40 210.15 82828802
Oct-17 436.55 415.25 7572208 437.05 415.50 115680473 245.95 230.55 2732475 246.10 230.35 40629154
Nov-17 461.55 404.65 16850022 462.90 404.15 247198902 259.25 232.30 5840651 259.65 231.45 54140365
Dec-17 431.20 396.80 12338945 431.85 397.05 135153789 244.80 224.95 2681504 244.10 224.90 35896187
Jan-18 438.85 396.20 11985096 439.30 395.85 170430901 256.55 224.35 4579860 256.65 224.55 62781952
Feb-18 396.05 358.55 13025465 395.80 358.50 181509302 221.80 202.45 5546661 222.05 201.95 51496981
Mar-18 370.85 327.45 12543946 370.75 326.85 161929567 207.85 183.90 2829028 207.45 183.30 41639881
The Performance of the Company’s Stock Price vis-à-vis Sensex, Auto Index and American Depository Receipts (ADR):
The monthly high and low of the Company’s ADRs is given below: (in US $)
Month High Low Month High Low
April 2017 36.78 34.10 October 2017 33.76 30.75
May 2017 37.33 32.59 November 2017 35.78 31.33
June 2017 37.15 33.49 December 2017 33.81 30.77
July 2017 36.12 33.16 January 2018 34.60 31.12
August 2017 34.87 29.14 February 2018 30.89 27.56
September 2017 32.93 29.35 March 2018 28.45 25.07
Each Depositary Receipt represents 5 underlying Ordinary Shares of face value of `2/- each.
April 17 May 17 June 17 July 17 Aug 17 Sept 17 Oct 17 Nov 17 Dec 17 Jan 18 Feb 18 Mar 18
600
500
400
300
200
100
0
$40
$35
$30
$25
$20
$15
$10
$5
$0
Tata
Mot
ors O
rdin
ary
& ‘A
’ Ord
inar
y Sh
ares
(`)
ADR
(US$
)
Ordinary Shares in BSE ‘A’ Ordinary Shares in BSE ADR PriceBSE Sensex Auto Index Ordinary Shares in BSE
April 17 May 17 June 17 July 17 Aug 17 Sept 17 Oct 17 Nov 17 Dec 17 Jan 18 Feb 18 Mar 18
40000
35000
30000
25000
20000
15000
10000
5000
0
600
500
400
300
200
100
0
BSE
SENS
EX &
AUT
O IN
DEX
Tata
Mot
ors O
rdin
ary
Shar
es (`
)

16373rd Annual Report 2017-18
INTEGRATED REPORT 1-65 STATUTORY REPORTS 66-184 FINANCIAL STATEMENTS 185-353
REGISTRAR AND TRANSFER AGENTS
For share related matters, Members are requested to correspond with the Company’s Registrar and Transfer Agents – M/s TSR Darashaw Limited quoting their Folio No./DP ID & Client ID at the following addresses:
1. For transfer lodgement, delivery and correspondence : TSR Darashaw Limited, Unit: Tata Motors Limited, 6-10, Haji Moosa Patrawala Industrial Estate, 20, Dr E Moses Road, (Near Famous Studios) Mahalaxmi, Mumbai – 400 011. Tel: 022-6656 8484; Fax: 022- 6656 8494;
e-mail : [email protected]; website:www.tsrdarashaw.com
2. For the convenience of investors based in the following cities, transfer documents and letters will also be accepted at the following branches/agencies of TSR Darashaw Limited:
(i) Bangalore: 503, Barton Centre, 5th Floor, 84, Mahatma Gandhi Road, Bangalore – 560 001.
Tel: 080 – 25320321, Fax: 080 – 25580019, e-mail: [email protected]
(ii) Jamshedpur: Bungalow No.1, “E” Road, Northern Town, Bistupur, Jamshedpur – 831 001.
Tel: 0657 – 2426616, Fax: 0657 – 2426937, email : [email protected]
(iii) Kolkata: Tata Centre, 1st Floor, 43, Jawaharlal Nehru Road, Kolkata – 700 071.
Tel: 033 – 22883087, Fax: 033 – 22883062, e-mail: [email protected]
(iv) New Delhi: Plot No.2/42, Sant Vihar, Ansari Road, Daryaganj, New Delhi – 110 002. Tel : 011 – 23271805, Fax : 011 – 23271802, e-mail : [email protected]
(v) Ahmedabad: Agent of TSRDL – Shah Consultancy Services Pvt. Limited: 3-Sumathinath Complex, Pritam Nagar Akhada Road, Ellisbridge, Ahmedabad -380 006.
Tel: 079-2657 6038, e-mail: [email protected]
For Fixed Deposits: the investors are requested to correspond with the Registrars to the Fixed Deposits Scheme – TSR Darashaw Limited at the same addresses as mentioned above or send an e-mail at [email protected]. Tel : 022-66568484
For Rights Issue related matters: The Company launched a Rights Issue vide Letter of offer dated March 30, 2015 and Members are requested to correspond with Link Intime India Private Limited, the Registrar to the Issue, for addressing any Issue related
matter, including all grievances relating to the ASBA process. Contact details: C101, 247 Park, L.B.S. Marg, Vikhroli (West), Mumbai 400 083; Tel: (91 22) 4918 6000 / 9167779196/97; Fax: (91 22) 4918 6060; Website: www.linkintime.co.in; Email: [email protected]; Contact Person: Mr Sachin Achar / Mr Sumeet Deshpande.
SHARE TRANSFER SYSTEM
Securities lodged for transfer at the Registrar’s address are normally processed within 15 days from the date of lodgment, if the documents are clear in all respects. All requests for dematerialization of securities are processed and the confirmation is given to the depositories within 15 days. The Executives of the Registrar are empowered to approve transfer of shares and debentures and other investor related matters. Grievances received from investors and other miscellaneous correspondence on change of address, mandates, etc. are processed by the Registrars within 15 days. The following compliances pertain to share transfers, grievances, etc.:
(1) Pursuant to Regulation 7(3) of the SEBI Listing Regulations, certificates are filed with the stock exchanges on half yearly basis by the Compliance Officer and the representative of the Registrar and Share Transfer Agent for maintenance of an appropriate share transfer facility.
(2) Pursuant to Regulation 13(2) of the SEBI Listing Regulations, a statement on the pending investor complaints is filed with the stock exchanges and placed before the Board of Directors on a quarterly basis.
(3) A Company Secretary-in-Practice carries out a Reconciliation of Share Capital Audit on a quarterly basis to reconcile the total admitted capital with depositories viz National Securities Depository Limited (NSDL) and Central Depository Services Limited (CDSL) and the total issued and listed capital. The audit confirms that the total issued/paid up capital is in agreement with the aggregate of the total number of shares in physical form and the total number of shares in dematerialized form (held with NSDL and CDSL).
(4) Pursuant to Regulation 61(4) read together with Regulation 40(9) of the SEBI Listing Regulations, a Certificate by the Company Secretary-in-Practice is filed with the stock exchanges within one month from the end of each half of the financial year, certifying that all certificates are issued within thirty days of the date of lodgement for transfer, sub-division, consolidation, renewal, exchange or endorsement of calls/ allotment monies

164
Transfer of unclaimed / unpaid amounts to the Investor Education and Protection Fund (IEPF):
(i) Pursuant to Sections 124 and 125 of the Act and the Investor Education and Protection Fund (Accounting, Audit, Transfer and Refund) Rules, 2016 (“IEPF Rules”), all unclaimed/unpaid dividend, application money, debenture interest and interest on deposits as well as principal amount of debentures and deposits, sale proceeds of fractional shares, redemption amount of preference shares, etc. pertaining to the Company remaining unpaid or unclaimed for a period of 7 years from the date they became due for payment, are liable to be transferred to the Investor Education and Protection Fund (IEPF) Authority, established by the Central Government.
Furthermore, the IEPF Rules mandate companies to transfer shares of shareholders whose dividends remain unpaid / unclaimed for a period of 7 consecutive years to the demat account of the IEPF Authority. The said requirement does not apply to shares in respect of which there is a specific order of the Court, Tribunal or Statutory Authority, restraining any transfer of the shares. The provisions relating to transfer of shares were made effective by the Ministry of Corporate Affairs, vide its Notification dated October 13, 2017 read with the Circular dated October 16, 2017, wherein it was provided that where the period of 7 consecutive years, as above, was completed or being completed during the period from September 7, 2016 to October 31, 2017, the due date of transfer for such shares was October 31, 2017.
In light of the aforesaid provisions, the Company has during the year, transferred the unclaimed dividends, outstanding for 7 consecutive years of the Company. Further, shares of the Company, in respect of which dividend has not been claimed for 7 consecutive years or more, have also been transferred to the demat account of the IEPF Authority. The details of the unclaimed dividends and shares transferred to IEPF during the year 2017-18 are as follows:
Financial Year
Amount of unclaimed dividend
transferred (`)
Number of shares transferred
Ordinary Shares
‘A’ Ordinary Shares
2008-09 88,64,667(transferred
during FY2016-17)
32,32,825 1,538
2009-10 2,03,23,084 3,23,527 1,825Total 2,91,87,751 35,56,352 3,363
The members who have a claim on the above dividends and shares may claim the same from the IEPF Authority by submitting an online application in the prescribed Form No.IEPF-5 available on the website www.iepf.gov.in and sending a physical copy of the same duly signed to the Company along with requisite documents enumerated in the Form No. IEPF-5. No claims shall lie against the Company in respect of the dividend/shares so transferred.
The Company strongly recommends shareholders to encash / claim their respective dividend within the period given below from the Company’s Registrar and Share Transfer Agents:
Financial Year Date of Declaration Last date for claiming dividend
Unclaimed Dividend (as on 31.03.2018) (`)
Ordinary Shares ‘A’ Ordinary Shares
2010-11 August 12, 2011 September 11, 2018 3,01,60,220.00 58,41,885.50
2011-12 August 10, 2012 September 9, 2019 2,97,40,764.00 7,01,149.20
2012-13 August 21, 2013 September 20, 2020 1,62,35,510.00 2,29,775.70
2013-14 July 31, 2014 August 30, 2021 1,62,37,490.00 1,90,638.00
2014-15 No dividend was declared
2015-16 August 9, 2016 September 8, 2023 27,54,452.00 96,200.40
2016-17 No dividend was declared
(ii) Whilst the Company’s Registrar has already written to the Members, Debenture holders and Depositors informing them about the due dates for transfer to IEPF for unclaimed dividends/interest payments, attention of the stakeholders is again drawn to this matter through the Annual Report. Notices in this regard are also published in the newspapers The data on unpaid / unclaimed dividend and other unclaimed monies is also available on the Company’s website at http://www.tatamotors.com/investor/iepf/. Investors of the Company who have not yet encashed their
unclaimed/unpaid amounts are requested to correspond with the Company’s Registrar and Transfer Agents, at the earliest.
Members may refer to the Refund Procedure for claiming the aforementioned amounts transferred to the IEPF Authority as detailed on http://iepf.gov.in/IEPFA/refund.html.
(iii) Upto March 31, 2018, the Company has transferred `25,21,06,874.34 to IEPF, including the following amounts during the year.

16573rd Annual Report 2017-18
INTEGRATED REPORT 1-65 STATUTORY REPORTS 66-184 FINANCIAL STATEMENTS 185-353
(in `)
Particulars FY 2017-18
Unpaid dividend amounts of the Company
2,03,23,084.00
Application moneys received for allotment of any securities and due for refund
-
Unpaid matured deposit with the Company
54,25,748.00
Unpaid matured debentures with the Company
-
DISTRIBUTION OF SHAREHOLDING AS AT MARCH 31, 2018Ordinary Shares
Range of Shares No. of Shares No. of shareholders
No. ofShares
Physical Form (%)
DematForm (%)
% of Capital
No. of Holders
Physical Form (%)
DematForm (%)
% of Capital
1 – 500 63,618,416 0.14 2.06 2.20 664,176 3.52 85.37 88.89
501 – 1,000 28,029,100 0.12 0.85 0.97 38,035 0.63 4.46 5.09
1,001 – 2,000 32,882,773 0.15 0.99 1.14 22,892 0.41 2.65 3.06
2,001 – 5,000 45,887,145 0.19 1.40 1.59 14,870 0.25 1.74 1.99
5,001 -10,000 28,821,303 0.09 0.91 1.00 4,148 0.05 0.51 0.56
Above 10,000 2,688,109,957 0.19 92.91 93.10 3,034 0.03 0.38 0.41
TOTAL 2,887,348,694 0.88 99.12 100.00 747,155 4.89 95.11 100.00
‘A’ Ordinary Shares
Range of Shares No. of Shares No. of shareholders
No. ofShares
Physical Form (%)
DematForm (%)
% of Capital
No. of Holders
Physical Form (%)
DematForm (%)
% of Capital
1 – 500 15,019,501 0.02 2.93 2.95 134,525 0.56 85.05 85.61
501 – 1,000 8,560,461 0.01 1.67 1.68 11,642 0.03 7.38 7.41
1,001 – 2,000 7,558,687 0.01 1.48 1.49 5,198 0.02 3.29 3.31
2,001 – 5,000 10,382,853 0.00 2.04 2.04 3,250 0.00 2.07 2.07
5,001 -10,000 8,357,889 0.00 1.64 1.64 1,168 0.00 0.74 0.74
Above 10,000 458,622,980 0.00 90.20 90.20 1,352 0.00 0.86 0.86
TOTAL 508,502,371 0.04 99.96 100.00 157,135 0.61 99.39 100.00
For details on the Shareholding Pattern and Top Ten Shareholders, kindly refer Form MGT-9 appended to the Directors’ Report of this Annual Report.
(in `)
Particulars FY 2017-18
Interest accrued on application money due for refund, unpaid matured deposits and debentures with the Company
15,34,828.00
Sale proceeds of fractional shares arising out of issuance of bonus shares, merger and amalgamation
-
Redemption amount of preference shares
-
Grants and donation -Others -TOTAL 2,72,83,660.00

166
DEMATERIALISATION OF SHARESThe electronic holding of the shares as on March 31, 2018 through NSDL and CDSL are as follows:
Particulars Ordinary Shares (%) ‘A’ Ordinary Shares (%)
2018 2017 2018 2017
NSDL 97.13 97.71 95.72 97.75
CDSL 1.99 1.23 4.24 2.21
TOTAL 99.12 98.94 99.96 99.96
OUTSTANDING SECURITIESOutstanding Depositary Receipts/Warrants or Convertible instruments, conversion / maturity date and likely impact on equity as on March 31, 2018 are as follows:
• Depositary Receipts: The Company has 8,74,04,950 ADRs listed on the New York Stock Exchange as on March 31, 2018. Each Depository Receipts represents 5 underlying Ordinary Shares of `2/- each.
Listing on Foreign Stock Exchange New York Stock Exchange (NYSE)
Security Type ADRs
ISIN US8765685024
Stock Code / Ticker TTM
Address NYSE, 20 Broad Street, New York, NY 10005
Overseas Depositary Domestic Custodian
Citibank N.A., 388 Greenwich Street, 14th Floor, New York, NY 10013
Citibank N.A., Trent House, 3rd Floor, G-60, Bandra Kurla Complex, Bandra (East), Mumbai 400 051
• Senior Unsecured Notes: In October 2014, the Company issued a dual tranche of Senior Unsecured Notes aggregating US$ 750 million, details of which are given hereunder:
Security Type ISIN Issue Size (US$ million)
Yield per annum (%)
Date of Maturity Listing
Senior Unsecured Notes XS1121907676 500 4.625% April 30, 2020 Singapore Stock ExchangeSenior Unsecured Notes XS1121908211 250 5.750% October 30, 2024
• There are no outstanding warrants or any other convertible instruments issued by the Company.
• The following Non-Convertible Debentures (NCD) are listed on NSE and BSE under the Wholesale Debt Market segment*:
Series No. Stock Exchange Listing
ISIN Principal Amount (` in crores)
Yield to Maturity (%)
Date of Maturity
E 22 NSE INE155A07219 200 9.95 March 2, 2020E22A NSE INE155A07227 500 10.25 `100 crores on April 30, 22 and
April 30, 2023; & `150 crores on April 30, 2024 and April 30, 2025.
E 23A NSE INE155A08043 150 9.90 May 7, 2020E 23B NSE INE155A08050 100 9.75 May 24, 2020E 23C NSE INE155A08068 150 9.70 June 18, 2020E 24B NSE INE155A08084 110 10.00 May 28, 2019E 24E NSE INE155A08118 200 9.69 March 29, 2019E26A NSE INE155A08183 190 10.30 November 30, 2018E26B NSE INE155A08191 300 9.81 August 20, 2024 E26C NSE INE155A08209 200 9.77 September 12, 2024E26D (Option - I) NSE INE155A08217 300 9.71 October 1, 2019E26D (Option - II) NSE INE155A08225 400 9.73 October 1, 2020E26E NSE & BSE INE155A08233 400 9.60 October 29, 2022E26F NSE & BSE INE155A08241 400 9.35 November 10, 2023

16773rd Annual Report 2017-18
INTEGRATED REPORT 1-65 STATUTORY REPORTS 66-184 FINANCIAL STATEMENTS 185-353
Series No. Stock Exchange Listing
ISIN Principal Amount (` in crores)
Yield to Maturity (%)
Date of Maturity
E26G NSE & BSE INE155A08258 300 9.02 December 10, 2021E27A NSE & BSE INE155A08274 300 8.25 January 28, 2019E27B NSE & BSE INE155A08282 300 8.40 May 26, 2021E27C NSE & BSE INE155A08290 400 8.13 July 18, 2018E27D NSE & BSE INE155A08308 400 8.00 August 1, 2019E27E NSE & BSE INE155A08316 300 7.50 October 20, 2021E27F NSE & BSE INE155A08324 500 7.71 March 3, 2022E27G NSE & BSE INE155A08332 500 7.84 September 27, 2021E27H NSE & BSE INE155A08340 500 7.50 June 22, 2022E27I (Tranche 1) NSE & BSE INE155A08357 500 7.28 July 29, 2020E27I (Tranche 2) NSE & BSE INE155A08365 500 7.40 June 29, 2021
*Detailed information on the above debentures is included in the ‘Notes to Accounts’.
Debenture Trustee: Vistra ITCL (India) Limited, situated at the IL&FS Financial Centre, 7th Floor, East Quadrant, Plot C- 22, G Block, Bandra Kurla Complex, Bandra (E), Mumbai 400051, are the debenture trustees
for all the aforementioned NCD’s issued by the Company. They may be contacted at Tel.: +91 22 2659 3333, Fax : + 91 22 2653 3297, Email id: [email protected].
PLANT LOCATIONS
Location Range of Products Produced Pimpri, Pune – 411 018;Chikhali, Pune – 410 501;Chinchwad, Pune – 411 033
Medium and Heavy Commercial Vehicles (M&HCVs), Light Commercial Vehicles (LCVs), Utility Vehicles (UVs) and Cars
Jamshedpur – 831 010 Intermediate Commercial Vehicles (ICVs) and M&HCVs Chinhat Industrial Area, Dewa Road,Chinhat, Lucknow – 226 019 ICVs, M&HCVs and LCVsPlot No. 1, Sector 11 and Plot No. 14, Sector 12, I.I.E., Pantnagar, District Udhamsingh Nagar, Uttarakhand – 263 145
Small Commercial Vehicles (SCVs)
Revenue Survey No. 1, Village Northkotpura, Taluka Sanand, Dist. Ahmedabad – 382 170
Cars
KIADB Block II, Belur Industrial Area, Mummigatti Post, Dharwad – 580 011
SCVs and LCVs
ADDRESS FOR CORRESPONDENCEFor Investor QueriesRetail / HNI InvestorsMr H K Sethna, Company SecretaryBombay House, 24, Homi Mody Street,Mumbai - 400 001, IndiaPhone : 91-22- 6665 7824 Fax: 91-22- 6665 7260E-Mail : [email protected]
Institutional InvestorsMr V B Somaiya, Head (Treasury & Investor Relations)3rd floor, Nanavati Mahalaya, 18, Homi Mody Street,Mumbai - 400 001, IndiaPhone : 91-22-66658282E-Mail : [email protected]
For Fixed Deposit, Rights Issue and other Share related queriesKindly refer details mentioned herein above under the head ‘Registrar and Transfer Agents’
SUBSIDIARY COMPANIES The Company does not have any material unlisted Indian subsidiary company and hence, it is not required to have an Independent Director of the Company on the Board of such subsidiary company. However, the following Independent Directors of the Company, are also present in an independent capacity, on the Board of the below mentioned subsidiary companies:
Common Independent Directors
Presence on the Board of Subsidiary Companies
Mr Nasser Munjee Jaguar Land Rover Automotive Plc and Tata Motors Finance Limited
Mr Vinesh Kumar Jairath
Concorde Motors (India) Limited, TML Distribution Company Limited and Tata Motors Finance Solutions Limited
Ms Falguni Nayar Tata Technologies Limited
The Company adopted a Policy for Determining Material Subsidiaries of the Company, pursuant to Regulation 16(1)( c ) of the SEBI Listing Regulations. This policy is available on the Company’s website at http://investors.tatamotors.com/pdf/material.pdf pursuant to Regulation 46(2) of the SEBI Listing Regulations.
The Audit Committee also has a 2-day meeting wherein the CEO and CFO of subsidiary companies make a presentation on significant issues in audit, internal control, risk management, etc. Significant issues pertaining to subsidiary companies are also discussed at Audit Committee meetings of the Company.
The minutes of the subsidiary companies are placed before the Board of Directors of the Company and the attention of the Directors is drawn to significant transactions and arrangements entered into by the subsidiary companies. The performance of its subsidiaries is also reviewed by the Board periodically.

168
DISCLOSURES i. Details of relevant related party transactions entered into
by the Company are included in the Board’s Report and in the Notes to Accounts. The Company has in place a Policy on Related Party Transactions setting out (a) the materiality thresholds for related parties and (b) the manner of dealing with transactions between the Company and related parties, including omnibus approvals by Audit Committee based on the provisions of the Act and Regulation 23 of the SEBI Listing Regulations. During the year, there were no materially significant transactions with related parties, as per the Policy adopted by the Company that have potential conflict with the interests of the Company at large. The Audit Committee takes into consideration the management representation and an independent audit consultant’s report, whilst scrutinising and approving all related party transactions, from the perspective of fulfilling the criteria of meeting arms’ length pricing and being transacted in the ordinary course of business. All transactions with related parties entered into by the Company were in the ordinary course of business on an arm’s length basis and were approved by the Audit Committee.
ii. The Company has complied with various rules and regulations prescribed Securities and Exchange Board of India or any other statutory authority relating to the capital markets during the last 3 years. No penalties or strictures have been imposed by them on the Company, except as mentioned below:
The Securities and Exchange Board of India vide Order dated March 6, 2018 had issued directions for the Company to conduct an internal inquiry within 3 months into the leakage of information relating to its financial results for the quarter ended December 2015 and to take appropriate actions against those responsible as well as to submit its report within 7 days thereafter. The Company is in the process of investigating the matter for submission of its report to the Audit Committee of the Company, which will be submitted to SEBI in a timely manner.
The Company has paid a penalty of `5.60 lakhs each, levied by BSE Limited and the National Stock Exchange of India Limited, in respect of delayed filing of the listing application for 266 Ordinary Shares and 80’A’ Ordinary Shares allotted, out of shares held in abeyance, on settlement of an inter-se dispute amongst the shareholders. This penalty has been paid ‘under protest’ subsequent to various representations made by the Company.
iii. In accordance with the provisions of the Act and Regulation 22 of the SEBI Listing Regulations, the Company has in place a Vigil Mechanism and a Whistle-Blower Policy duly approved by the Audit Committee which provides a formal mechanism for all Directors and employees of the Company to approach the Management of the Company (Audit Committee in case where the concern involves the
Senior Management) and make protective disclosures to the Management about unethical behaviour, actual or suspected fraud or violation of the Company’s Code of Conduct or Ethics policy. The disclosures reported are addressed in the manner and within the time frames prescribed in the Policy. The Company affirms that no director or employee of the Company has been denied access to the Audit Committee.
iv. The Company has complied with all the mandatory disclosure requirements of corporate governance as specified in Regulation 34(3) read with Part C of Schedule V of the SEBI Listing Regulations.
v. The Company also fulfilled the following non-mandatory requirements as specified in Part E of the Schedule II of the SEBI Listing Regulations:
• The Board: The Non-Executive Chairman maintains a separate office, for which the Company does not reimburse expenses.
• Shareholder Rights: Details are given under the heading “Means of Communications”.
• Modified opinion in Audit Report: During the year under review, there was no audit qualification in the Auditors’ Report on the Company’s financial statements. The Company continues to adopt best practices to ensure a regime of unqualified financial statements.
• Separate posts of Chairman and CEO: The post of the Non- Executive Chairman of the Board is separate from that of the Managing Director/CEO. In the Tata Motors Group, we have 2 CEO’s, namely the CEO & MD of Tata Motors, whose scope includes managing the Tata Motors Group excluding the Jaguar Land Rover (JLR) Group and the CEO and Director of JLR, whose scope covers managing JLR. The respective Boards has delegated the day-to-day running of the Group to the 2 CEO’s within certain limits, above which matters must be escalated to the Board for determination.
• Reporting of Internal Auditor: The Chief Internal Auditor reports to the Audit Committee of the Company, to ensure independence of the Internal Audit function.
vi. Commodity price risk or foreign exchange risk and hedging activities:
During the FY 2017-18, the Company had managed the foreign exchange and commodity price risk and hedged to the extent considered necessary. The Company enters into forward contracts for hedging foreign exchange and commodity exposures against exports and imports. The details of foreign currency and commodity exposures are disclosed in Note No.41(c )(i)(a) and 41( c )(iv) to the Standalone Financial Statements.

16973rd Annual Report 2017-18
INTEGRATED REPORT 1-65 STATUTORY REPORTS 66-184 FINANCIAL STATEMENTS 185-353
vii. Disclosures on compliance with corporate governance requirements specified in Regulations 17 to 27 have been included in the relevant sections of this report, a gist of which is given below:
Regulation No.
Particulars Compliance Status
(Yes/No/NA)
Compliance Observed
17 Board of Directors Yes · Composition· Meetings· Periodic review of compliance reports· Plans for orderly succession for appointments· Code of Conduct· Fees / compensation to Non-Executive Directors· Minimum information to be placed before the Board as per Part A of
Schedule II· Compliance Certificate as per Part B of Schedule II· Risk assessment and management· Performance evaluation of Independent Directors
18 Audit Committee Yes · Composition· Meetings· Powers of the Committee· Role of the Committee and review of information by the Committee
as per Part C of Schedule II19 Nomination and Remuneration
CommitteeYes · Composition
· Role of the Committee as per Part D of Schedule II20 Stakeholders Relationship
CommitteeYes · Composition
· Role of the Committee as per Part D of Schedule II21 Risk Management Committee Yes · Composition
· Role of the Committee22 Vigil Mechanism Yes · Review of Vigil Mechanism for Directors and employees
· Direct access to Chairperson of Audit Committee23 Related Party Transactions Yes · Policy on Materiality of Related Party transactions and dealing
with Related Party transactions· Prior approval including omnibus approval of Audit Committee· Review of Related Party transactions· No material Related Party transactions
24 Subsidiaries of the Company Yes · Appointment of Company’s Independent Director on the Board of material subsidiary
· Review of financial statements of subsidiary by the Audit Committee· Minutes of the Board of Directors of the subsidiaries are placed at
the meeting of the Board of Directors· Significant transactions and arrangements of subsidiary are placed
at the meeting of the Board of Directors25 Obligations with respect to
Independent DirectorsYes · Maximum directorships and tenure
· Meetings of Independent Directors and Board effectiveness evaluation· Cessation and appointment of Independent Directors· Familiarisation of Independent Directors
26 Obligations with respect to employees including Senior Management, Key Managerial Personnel, Directors and Promoters
Yes · Limit on Membership / Chairmanship in Committees and disclosures thereon
· Affirmation on compliance of Code of Conduct by Directors and Senior Management
· Disclosure of shareholding by non-executive Directors· Disclosures by Senior Management about potential conflicts of interest· No agreement with regard to compensation or profit sharing in
connection with dealings in securities of the Company by Key Managerial Personnel, Directors and Promoter

170
Regulation No.
Particulars Compliance Status
(Yes/No/NA)
Compliance Observed
27 Other Corporate Governance requirements
Yes · Compliance with discretionary requirements as per Part E of Schedule II· Filing of quarterly compliance report on Corporate Governance
with Stock Exchanges.
ix. Appropriate information has been placed on the Company’s website pursuant to clauses (b) to (i) of sub-regulation (2) of Regulation 46 of the SEBI Listing Regulations. Given below is the information on the Company’s website regarding key policies, codes and charters, adopted by the Company:
Name of Policy, Code or Charter Brief Description Web Link
Terms of Appointment of Independent Directors
Relevant extracts from the appointment letter issued to Independent Directors detailing the broad terms and conditions of their appointment.
http://investors.tatamotors.com/pdf/Terms-of-Appointment-ID.pdf
Board Committees The composition of various committees of the Board
http://www.tatamotors.com/about-us/leadership/
Tata Code of Conduct Represents the values and core principles that guide the conduct of every Tata business. The Code lays down the ethical standards that Tata colleagues need to observe in their professional lives.
a) For Whole-time Directors & Employees
http://corp-content.tatamotors.com.s3-ap-southeast-1.amazonaws.com/wp-content/uploads/2015/10/tata-code-of-conduct.pdf
b) For Non-Executive Directors and Independent Directors
http://investors.tatamotors.com/pdf/ned-id.pdf
Whistleblower Policy (Vigil Mechanism)
The Whistleblower policy has been formulated for Directors and employees of the Company to report concerns about unethical behavior, actual or suspected fraud or violation of the Tata Code of Conduct.
http://investors.tatamotors.com/pdf/whistle-blower-policy.pdf
Policy on Related Party Transactions
A policy on materiality of related party transactions and regulates all transactions between the Company and its related parties.
http://investors.tatamotors.com/pdf/rpt-policy.pdf
Policy for determining Material Subsidiaries
This policy determines material subsidiaries of the Company and disclosures thereof, as required under the SEBI Listing Regulations.
http://investors.tatamotors.com/pdf/material.pdf
Familiarisation Programme For all Directors through various programmes/ presentations.
http://investors.tatamotors.com/pdf/familiarisation-programme-independent-directors.pdf
Unpaid Dividend Account Details Statement of unclaimed and unpaid amounts to be transferred to the IEPF
https://www.tatamotors.com/investors/iepf/
Corporate Social Responsibility Policy
The policy outlines the Company’s strategy to bring about a positive impact on society through programmes focusing on Health, Education, Employability and Environment interventions for relevant target groups, ensuring diversity and giving preference to needy and deserving communities inhabiting urban India.
http://investors.tatamotors.com/pdf/csr-policy.pdf
viii. Disclosures on compliance with corporate governance requirements specified in Regulations 17 to 27 have been included in the relevant sections of his report. Appropriate information has been placed on the Company’s website pursuant to clauses (b) to (i) of sub-regulation (2) of Regulation 46 of the SEBI Listing Regulations.

17173rd Annual Report 2017-18
INTEGRATED REPORT 1-65 STATUTORY REPORTS 66-184 FINANCIAL STATEMENTS 185-353
Name of Policy, Code or Charter Brief Description Web Link
Audit Committee Charter Inter alia outlines the terms of reference, composition, quorum, meeting requirements, authority and responsibility of the Audit Committee of the Company.
http://investors.tatamotors.com/pdf/audit_committee_charter.pdf
Policy for Approval of Services to be rendered by the Auditors
For the Audit Committee to oversee the services rendered by the Auditors to the Tata Motors Group and the payment for the said services so as to ensure that the Auditors function in an independent manner.
http://www.tatamotors.com/investors/pdf/auditfee-policy.pdf
Policy on determination of Materiality for Disclosure of Event / Information
This policy applies to disclosures of material events affecting the Company and its subsidiaries. This policy is in addition to the Company’s corporate policy.
http://investors.tatamotors.com/pdf/material.pdf
Content Archiving Policy The policy provides guidelines for archiving of corporate records and documents as statutorily required by the Company.
http://investors.tatamotors.com/pdf/content-archiving-policy.pdf
Code of Corporate Disclosure Practices
This policy is aimed at providing timely, adequate, uniform and universal dissemination of information and disclosure of Unpublished Price Sensitive Information outside the Company in order to provide accurate and timely communication to our shareholders and the financial markets.
http://investors.tatamotors.com/pdf/CodeCorporateDisclosure.pdf
Dividend Distribution Policy This policy outlines the financial parameters and factors that are to be considered whilst declaring dividend.
http://investors.tatamotors.com/pdf/dividend-distribution-policy.pdf
On behalf of the Board of Directors
N CHANDRASEKARANChairman
Mumbai, May 23, 2018 (DIN: 00121863)

172
DECLARATION BY THE CEO UNDER REGULATION 26(3) OF THE SEBI (LISTING OBLIGATIONS AND DISCLOSURE REQUIREMENTS) REGULATIONS, 2015 REGARDING ADHERENCE TO THE CODE OF CONDUCT
Pursuant to Regulation 26(3) of the SEBI (Listing Obligations and Disclosure Requirements) Regulations, 2015, the Board Members and the Senior Management personnel of the Company have affirmed compliance to their respective Codes of Conduct, as applicable to them for the Financial Year ended March 31, 2018.
For Tata Motors Limited
Guenter ButschekCEO and Managing Director
(DIN: 07427375)
Mumbai, May 23, 2018
PRACTISING COMPANY SECRETARIES’ CERTIFICATE ON CORPORATE GOVERNANCE TO THE MEMBERS OF TATA MOTORS LIMITED
We have examined the compliance of the conditions of Corporate Governance by Tata Motors Limited (‘the Company’) for the year ended on March 31, 2018, as stipulated under Regulations 17 to 27, clauses (b) to (i) of sub-regulation (2) of Regulation 46 and para C, D & E of Schedule V of the Securities and Exchange Board of India (Listing Obligations and Disclosure Requirements) Regulations, 2015 (“SEBI Listing Regulations”).
The compliance of the conditions of Corporate Governance is the responsibility of the management. Our examination was limited to a review of procedures and implementation thereof, as adopted by the Company for ensuring compliance to the conditions of Corporate Governance. It is neither an audit nor an expression of opinion on the financial statements of the Company.
In our opinion and to the best of our information and according to the explanations given to us, and the representations made by the Directors and the management, we certify that the Company has complied with the conditions of Corporate Governance as stipulated in the SEBI Listing Regulations for the year ended on March 31, 2018.
We further state that such compliance is neither an assurance as to the future viability of the Company nor of the efficiency or effectiveness with which the management has conducted the affairs of the Company.
For Parikh & AssociatesPractising Company Secretaries
P. N. PARIKH FCS: 327 CP: 1228
Mumbai, May 23, 2018

17373rd Annual Report 2017-18
INTEGRATED REPORT 1-65 STATUTORY REPORTS 66-184 FINANCIAL STATEMENTS 185-353
IntroductionPart of the USD100 billion Tata Group founded by Jamsetji Tata in 1868, the Company is among the world’s leading manufacturers of automobiles. With consolidated revenues of `296,298.23 crores in Fiscal 2018, the Company continues to be India’s Largest Automobile Company. Sustainability and the spirit of ‘giving back to society’ is a core philosophy and good corporate citizenship is strongly embedded in our DNA. We are the first Indian company in engineering sector to be listed on the New York Stock Exchange. The Company is present across all segments of commercial vehicles and passenger vehicles with over 6,600 dealerships, sales, services and spare parts network touch points globally.
The Business Responsibility Report illustrate the Company efforts towards creating enduring value for all stakeholders in a responsible manner. This Report is aligned with National Voluntary Guidelines on Social, Environmental and Economic Responsibilities of Business (NVG-SEE) released by Ministry of Corporate Affairs and is in accordance with Regulation 34(2)(f) of the Securities and Exchange Board of India (Listing Obligations and Disclosure Requirements) Regulations 2015 (SEBI Listing Regulations). This report provides an overview of the activities carried out by the Company under each of the nine principles as outlined in NVG.
Section A: General Information about the Company
1. Corporate Identity Number (CIN) of the Company: L28920MH1945PLC004520
2. Name of the Company: Tata Motors Limited
3. Registered Address: Bombay House, 24, Homi Mody Street, Mumbai - 400001
4. Website: http://www.tatamotors.com
5. E-mail id: [email protected]
6. Financial Year reported: 2017-18
7. Sector(s) that the Company is engaged in (industrial activity code-wise)
NIC Code
Description
2910 Manufacture of motor vehicles2920 Manufacture of bodies (coachwork) for motor vehicles2930 Manufacture of parts and accessories for motor
vehicles4530 Sale of motor vehicle parts and accessories
8. List three key products/services that the Company manufactures/provides (as in balance sheet)
1. Passenger Cars
2. Commercial Vehicles
3. Vehicles Sales and Service
Please refer to our website www.tatamotors.com for complete list of our products.
9. Total number of locations where business activity is undertaken by the Company
i. Number of International Locations (Provide details of major 5): Through subsidiaries and associate companies, the Company operates in over 175 markets and has over 6600 sales and service touch points. The Company has manufacturing facilities in the UK, South Korea, Thailand, South Africa and Indonesia.
ii. Number of National Locations – The Company manufacturing base in India is spread across Jamshedpur (Jharkhand), Pune (Maharashtra), Lucknow (Uttar Pradesh), Pantnagar (Uttarakhand), Sanand (Gujarat) and Dharwad (Karnataka).
Please refer “Presence across markets” section of the Company’s Annual Report FY 2017-2018 for complete list of our global operations.
10. Markets served by the Company - Local/State/National/International
The Company vehicles and services cater to entire Indian market. The Company’s commercial and passenger vehicles are already being marketed in several countries in North America, Central and South America, Africa, Europe, Asia and Oceania.
Please refer “Presence across markets” section of the Company’s Annual Report FY 2017-18 for complete list of markets served
Section B: Financial Details of the Company
1. Paid up Capital (INR): `679.22 Crores
2. Total Turnover (INR): `57258.60 Crores (Standalone basis without joint operations)
3. Total Profit After Taxes (INR): Loss of `1266.19 crores (Standalone basis without joint operations)
4. Total Spending on Corporate Social Responsibility (CSR) as percentage of profit after tax (%): Total expenditure reported is `21.44 crores (Standalone basis without joint operations)
5. List of activities in which expenditure in 4 above has been incurred: -
The Company has been regularly conducting a community engagement strategy which revolves around four focus themes:
1. Arogya (Health): The focus is to work on addressing child malnutrition, health awareness for females. This initiative provides preventive & curative health services to community. In Fiscal 2018, 3,81,110 members benefited from our health initiatives.
2. Vidyadhanam (Education): This initiative aims to improve the quality of education in schools by offering scholarship to meritorious and needy secondary school students, organizing
Business Responsibility Report(PURSUANT TO REGULATION 34(2)(f) OF SEBI LISTING REGULATIONS)

174
special coaching classes to improve academic performance in Class X Board exam, supporting school infrastructure and organizing co-curricular activities for well-rounded personality development. In Fiscal 2018, 1,01,454 students have been benefitted through the education program.
3. Kaushalya (Employability): This program has been developed considering enhanced skill development among youth. It includes infusing marketable skills in school dropout youth in auto sector, non-auto trades, agriculture and allied activities. It also, strengthens the Industrial Training Institutes by offering domain expertise of automotive skills through knowledge partnership. In Fiscal 2018, the Company has trained 98,661 youth marketable vocational skills.
Through the AA policy initiatives, the Company has associated with 20 SC/ST entrepreneurs in the supply chain and extended business of 10.88 crore to them.
4. Vasundhara (Environment): The Company approach to improve environment included promotion of renewable energy, creation of carbon sinks through large scale sapling plantation, construction of water conservation structures and building awareness among the community members. More than 100000 saplings have been planted in our various programs under this initiative and 56,161 people participated in various environment awareness initiatives.
Please refer ‘Corporate Social Responsibility’ section of the Company’s Annual Report FY 2017-18 and Company’s Annual CSR Report 2017-18 for detailed community engagement strategy and key initiatives. The reports are available on our website www.tatamotors.com.
Section C: Other Details
1. Does the Company have any Subsidiary Company/ Companies?
The Company has 96 direct and indirect subsidiaries in India and abroad as year ended March 31, 2018.
2. Do the Subsidiary Company/Companies participate in the BR Initiatives of the parent company? If yes, then indicate the number of such subsidiary company(s)
The Company positively influences and encourages its subsidiaries to adopt Business Responsibility (BR) initiatives. All the Company’s subsidiaries are guided by Tata Code of Conduct (TCoC) to conduct their business in an ethical, transparent and accountable manner. It encompasses suppliers, customers and other stakeholders. It also addresses key BR issues like Quality and Customer value, Corruption and Bribery, Health and Safety, Environment, Human Rights and Employee well-being. Key subsidiaries like Jaguar Land Rover Automotive Plc. releases the Sustainability Report every year. The scope of this report is defined each year. For Fiscal 2018, the Company has extended its reporting boundary to include the performance of three subsidiary companies and one Joint Venture (JV) operating out of our premises.
3. Do any other entity/entities (e.g. suppliers, distributors etc.) that the Company does business with participate in the BR initiatives of the Company? If yes, then indicate the percentage of such entity/entities? [Less than 30%, 30-60%, More than 60%]
The Company’s suppliers, distributors are critical to our operations and supply chain sustainability issues can impact its operations. The Company engage with suppliers on BR initiatives through sustainable supply chain program. Suppliers Sustainability Initiative is used as a platform to raise awareness on health & safety, environmental and community initiatives of the Company. The vendors situated across all locations are actively participating in this initiative. The Company also emphasizes on skill development and upgradation of the dealer and channel partner resources. Currently less than 30% of value chain entities participate in the Company’s BR initiatives and there is a constant effort by the Company to extend these initiatives to larger value chain base.
Section D: BR Information
1. Details of Director/Directors responsible for BR
a) Details of the Director/Directors responsible for implementation of the BR policy/policies.
Sr. No.
Particulars Details
1. DIN Number (if applicable)
07427375
2. Name Mr. Guenter Butschek
3. Designation CEO and Managing Director
4 Telephone 022 6665 8282
5. E-mail id [email protected]
Sr. No.
Particulars Details
1. DIN Number (if applicable)
01793948
2. Name Mr. Satish B Borwankar
3. Designation COO & Executive Director
4 Telephone 020 6613 2257
5. E-mail id [email protected]
b) Details of the BR head
Sr. No.
Particulars Details
1. DIN Number (if applicable)
N.A
2. Name Mr. Arvind Bodhankar
3. Designation Head – Safety, Health, Environment and Sustainability
4 Telephone 022 6615 8538
5. E-mail id [email protected]

17573rd Annual Report 2017-18
INTEGRATED REPORT 1-65 STATUTORY REPORTS 66-184 FINANCIAL STATEMENTS 185-353
2. Principle-wise (as per NVGs) BR Policy/policies (Reply in Y/N)
The National Voluntary Guidelines on Social, Environmental and Economic Responsibilities of Business released by the Ministry of Corporate Affairs has adopted nine areas of Business Responsibility. These are as follows:
P1 – Businesses should conduct and govern themselves with Ethics, Transparency and Accountability.
P2 – Businesses should provide goods and services that are safe and contribute to sustainability throughout their life cycle.
P3 – Businesses should promote the well-being of all employees.
P4 – Businesses should respect the interests of, and be responsive towards all stakeholders, especially those who are disadvantaged, vulnerable and marginalized.
P5 – Businesses should respect and promote human rights.
P6 – Businesses should respect, protect, and make efforts to restore the environment.
P7 – Businesses, when engaged in influencing public and regulatory policy, should do so in a responsible manner.
P8 – Businesses should support inclusive growth and equitable development.
P9 – Businesses should engage with and provide value to their customers and consumers in a responsible manner.
S. No.
Questions P 1 P 2 P 3 P 4 P 5 P 6 P 7 P 8 P 9
1. Do you have policy/policies for? Y Y Y Y Y Y Y Y Y
2. Has the policy being formulated in consultation with the relevant stakeholders?
Y Y Y Y Y Y Y Y Y
3. Does the policy conform to any national /international standards? If yes, specify? (The policies conformance to the spirit of international standards like ISO 9000, ISO 14000, OHSAS 18000, SA 8000, UNGC guidelines and ILO principles and meet the regulatory requirements such as SEBI Listing Regulations, Sarbanes Oxley Act etc. The policies reflects Tata group’s commitment to improve the quality of life of the communities it serves and practice of returning to society what it earns )
Y Y Y Y Y Y Y Y Y
4. Has the policy being approved by the Board? Is yes, has it been signed by MD/owner/CEO/appropriate Board Director?*
Y Y Y Y Y Y Y Y Y
5. Does the company have a specified committee of the Board/ Director/Official to oversee the implementation of the policy?
Y Y Y Y Y Y Y Y Y
6. Has the policy been formally communicated to all relevant internal and external stakeholders?
The policies have been communicated to all internal stakeholders. TCoC and other policies are communicated to suppliers, vendors, dealers and channel partners based on their relevance.
7. Does the company have in-house structure to implement the policy/policies ?
The Company has established in-house structures to implement these policies.
8. Does the Company have a grievance redressal mechanism related to the policy/policies to address stakeholders’ grievances related to the policy/policies?
The whistle blower mechanism provides employees to report any concerns or grievances pertaining to any potential or actual violation of TCoC, which covers all aspects of BRR. An Investor grievance mechanism is in place to respond to investor grievances. The Customer Complaints Mechanism records the grievances of customers on product and service quality and other issues of interest to them. The supplier, vendor, dealer and channel partner forums and ongoing communication captures their concerns and grievances. The continual community engagement, needs assessments, impact assessments serve as means for communities to represent their concerns and grievances.

176
S. No.
Questions P 1 P 2 P 3 P 4 P 5 P 6 P 7 P 8 P 9
9. Has the company carried out independent audit/evaluation of the working of this policy by an internal or external agency?
The implementation of TCoC and other policies are reviewed through internal audit function/ethics counsellor. External assessment of Tata Business Excellence Model (TBEM) covers the review of implementation of all Company policies. The Quality, Safety & Health and Environmental policies are subject to internal and external audits as part of certification process.
* All the policies are signed by the Managing Director or an Executive Director. All the policies in Tata Motors are carved from its Guiding Principles and Core Values. These policies are mapped to each principle hereunder:
Principle Applicable Policies Link for policiesPrinciple 1: Businesses should conduct and govern themselves with Ethics, Transparency and Accountability
Whistle Blower Policy http://investors.tatamotors.com/pdf/whistle-blower-policy.pdf
Principle 2: Businesses should provide goods and services that are safe and contribute to sustainability throughout their life cycle.
Sustainability Policy https://www.tatamotors.com/about-us/corporate-governance/policies/sustainability-policy-pop/
Environment Policy https://www.tatamotors.com/about-us/corporate-governance/policies/environmental-policy-pop/
Quality Policy https://www.tatamotors.com/about-us/corporate-governance/policies/quality-policy-pop/
Principle 3: Businesses should promote the well-being of all employees.
Sustainability Policy https://www.tatamotors.com/about-us/corporate-governance/policies/sustainability-policy-pop/
Safety Policy https://www.tatamotors.com/about-us/corporate-governance/policies/safety-health-policy-pop/
Principle 4: Businesses should respect the interests of, and be responsive towards all stakeholders, especially those who are disadvantaged, vulnerable and marginalized.
CSR Policy http://investors.tatamotors.com/pdf/csr-policy.pdf
Tata Affirmative Action Policy http://tata.com/careers/articlesinside/Tata-Affirmative-Action-Programme
Sustainability Policy https://www.tatamotors.com/about-us/corporate-governance/policies/sustainability-policy-pop/
Principle 5: Businesses should respect and promote human rights.
Tata Code of Conduct http://corp-content.tatamotors.com.s3-ap-southeast-1.amazonaws.com/wp-content/uploads/2015/10/tata-code-of-conduct.pdf
Sustainability Policy https://www.tatamotors.com/about-us/corporate-governance/policies/sustainability-policy-pop/
Whistle Blower Policy http://investors.tatamotors.com/pdf/whistle-blower-policy.pdf
Principle 6: Businesses should respect, protect, and make efforts to restore the environment.
Environment Policy https://www.tatamotors.com/about-us/corporate-governance/policies/environmental-policy-pop/
Sustainability Policy https://www.tatamotors.com/about-us/corporate-governance/policies/sustainability-policy-pop/
Climate Change Policy http://investors.tatamotors.com/pdf/Climate-Policy-Eng.pdf

17773rd Annual Report 2017-18
INTEGRATED REPORT 1-65 STATUTORY REPORTS 66-184 FINANCIAL STATEMENTS 185-353
Principle Applicable Policies Link for policiesPrinciple 7: Businesses, when engaged in influencing public and regulatory policy, should do so in a responsible manner.
Tata Code of Conduct http://corp-content.tatamotors.com.s3-ap-southeast-1.amazonaws.com/wp-content/uploads/2015/10/tata-code-of-conduct.pdf
Principle 8: Businesses should support inclusive growth and equitable development.
Sustainability Policy https://www.tatamotors.com/about-us/corporate-governance/policies/sustainability-policy-pop/
CSR Policy http://investors.tatamotors.com/pdf/csr-policy.pdf
Principle 9: Businesses should engage with and provide value to their customers and consumers in a responsible manner.
Tata Code of Conduct http://corp-content.tatamotors.com.s3-ap-southeast-1.amazonaws.com/wp-content/uploads/2015/10/tata-code-of-conduct.pdf
Quality Policy https://www.tatamotors.com/about-us/corporate-governance/policies/quality-policy-pop/
3. Governance related to BR
• Indicate the frequency with which the Board of Directors, Committee of the Board or CEO to assess the BR performance of the Company. Within 3 months, 3-6 months, Annually, More than 1 year
Executive Committee (ExCom) reviews and assesses the various aspects of BR performance of the Company. The frequency of ExCom meetings for BR Review is 3-6 months.
Please refer “Corporate Governance” section of the Company’s Annual Report Fiscal Year 2017-18 for various Board Committees and their roles and responsibilities.
• Does the Company publish a BR or a Sustainability Report? What is the hyperlink for viewing this report? How frequently it is published?
The Company has been publishing Annual Sustainability Reports in accordance with globally recognized Global Reporting Initiative (GRI) Standards. These reports also serve as the Company’s Communication on Progress (COP) as part of United Nations Global Compact (UNGC) signatory reporting obligations and have been aligned with the National Voluntary Guidelines on Social, Environmental and Economic Responsibilities of Business, released by Ministry of Corporate Governance. The Company also published Annual CSR Report this year to highlight the community engagement strategy and performance. The Company’s CSR Report can be viewed at https://www.tatamotors.com/wp-content/uploads/2017/12/14090619/annualSustainabilityReport2016-17.pdf and the Sustainability report can be viewed at https://www.tatamotors.com/wp-content/uploads/2015/10/06100728/tml-sustainability-report-2016-17.pdf
Section E: Principle-wise performance
Principle 1: Ethics, Transparency and Accountability
1. Does the policy relating to ethics, bribery and corruption cover only the company? Yes/ No. Does it extend to the Group/Joint Ventures/ Suppliers/Contractors/ NGOs/Others?
The Company has adopted the TCoC to remain consistently vigilant and ensure ethical conduct of its operations. All internal and external stakeholders of the Tata Group are expected to work within boundaries of the TCoC. The Company ensures compliance of ethical standards by its vendors and contractors through appropriate clauses in its work contracts to which they are obligated. Generally, the contract includes clauses in relation to Human Rights Protection, Corruption practices and other things related to ethics. Training and awareness on TCoC is provided to all employees and relevant stakeholders are also made aware of the same from time to time.
The Company also has a whistle blower mechanism, which is being governed by the Whistle Blower Policy. Through this it has placed mechanisms for ensuring confidentiality and protecting the whistle blower from any harassment/ victimization. The policy covers instances pertaining to any unfair practice like retaliation, threat or intimidation of termination/suspension of service, disciplinary action, transfer, demotion, refusal of promotion, or the like including any direct or indirect use of authority to obstruct the Whistle Blower’s right to continue to perform his duties/functions including making further Protected Disclosure. The policy is directly monitored by the Chairman of the Audit Committee and the Group Ethics Officer.
Ethics Helpline:
The Company has an ethics helpline where employees can place anonymous complaints against ethics violations as per the policy of the Company. The ethics helpline can be reached in the following ways:
Ethics Hotline: 1800 1032931 / 022 2287 1839.
Oral reports will normally be documented by the Chief Ethics Counselor / Chairman of the Audit Committee by accessing the voice mail by a written transcription of the oral report.

178
Written application to Ethics and compliance:
All concerns can be reported to Chief Ethics Counselor / Chairman of the Audit Committee in Hindi, English or any regional language.
2. How many stakeholder complaints have been received in the past financial year and what percentage was satisfactorily resolved by the management? If so, provide details thereof, in about 50 words or so.
Stakeholders Complaint Received 57Stakeholders Complaint Resolved 51Percentage of Stakeholders Complaint Resolved 89
Includes TCoC concerns, investor complaints and customer complaints
The Company has setup an investor grievance mechanism to respond to investor grievances in a timely and appropriate manner. The investor grievances are also reviewed at the Board level by an Investors’ Grievance Committee and immediate action is taken to resolve the same. The TCoC concerns are resolved through internal review mechanism by Ethics Counselor and Senior Management. Both the Commercial Vehicles Business Unit and Passenger Vehicles Business Unit have established robust customer care systems which track customer complaints and responds to them in the minimum time possible.
Principle 2 Product Life Cycle Sustainability
1. List upto 3 of your products or services whose design has incorporated social or environmental concerns, risks and/or opportunities.
The Company is a leading automobile manufacturer of India and has played a significant role over the years in contributing to economic growth through its commercial vehicles and passenger cars which transport people, goods and help deliver services on time. The Company realizes its responsibility as a growth enabler and endeavors to create vehicles which will promote entrepreneurship. The Company is also cognizant of the environmental impacts caused during production and lifecycle of its products and continually strives to innovate to reduce such impacts. The Company has become the first Indian Manufacturer to commercially deploy Series Hybrid Technology in India, through the delivery of 25 ‘Tata Starbus Hybrid Electric Bus’ with Full Low Floor configuration, to the Mumbai Metropolitan Region Development Authority (MMRDA). The Company has also delivered the first set of Tigor Electric Vehicles (EVs) to state-run Energy Efficiency Services Limited (EESL) as part of their initiative to procure 10,000 electric vehicles. Below are few of the products which have been designed to address social or environmental concerns, risks and/or opportunities.
Product Social or Environmental benefitsBuses for Public Transport – Tata Starbus Hybrid Electric Bus Runs on dual power i.e diesel and electric and is hence, economically
viable, safe and environmentally friendly.Complies with all UBS-II (Urban Bus Specifications), AIS 052 (Automotive Industry Standards) and CMVR (Central Motor Vehicle Rules).Enhanced NVH (Noise, Vibration & Harshness) system.Chassis with new generation BS IV Engine.
Intermediate & Light Commercial Vehicles (ILCV) – Tata ULTRA Adhere to the latest BS IV emission standards.Tubeless radial tyres with low aspect ratio. Less rolling resistance - better fuel economy.Front and rear end suspension come with rubber bush - no hassles of greasing.Intelligent Power Steering - stability at high speed, low steering effort.Strongest chassis in its class with bolted design for increased modularity.
Passenger Cars – Tigor EV Full electric, zero emission vehicle.Equipped with a single speed, automatic transmission.The electric drive systems allows maximum efficiency and seamless acceleration.
2. For each such product, provide the following details in respect of resource use (energy, water, raw material etc.) per unit of product (optional):
(a) Reduction during sourcing/production/ distribution achieved since the previous year throughout the value chain?
In order to reduce the vehicular weight, the focus of the Company is on the new and improved technologies so
as to achieve higher fuel efficiency as well as it should reduce the environmental impact created by the vehicle, including its material sourcing, production, use and end-of-life stages. Also in order to reduce the fuel consumption, the Company focuses on researching, developing and producing new technologies, such as hybrid engines, electric cars, fuel-cell vehicles. Various development programs to reduce the consumption of fuel, like the use of lightweight materials, reducing parasitic losses

17973rd Annual Report 2017-18
INTEGRATED REPORT 1-65 STATUTORY REPORTS 66-184 FINANCIAL STATEMENTS 185-353
through the driveline and improvements in aerodynamics are also studied and implemented by the Company. At the sourcing stage, the Company work with its suppliers in order to reduce the environmental impacts like, by making use of returnable and recyclable packing solutions for majority of the components thereby managing the cost and the quality, as well as reducing the material use and avoiding waste generation. The Company was extensively working on green and light weighting technologies in products going beyond the basic Environmental regulatory compliance. The Company continuously strives to improve the sustainability performance of the product on Life Cycle basis.
(b) Reduction during usage by consumers (energy, water) has been achieved since the previous year?
The class leading fuel efficiencies of the Company’s vehicles enable the customers to achieve fuel savings which translate into cost savings as well. The REVOTRON engine epitomizes the FuelNext philosophy of the Company. It is developed using a range of eco-friendly and future oriented technologies. It also incorporates latest know-how like multi drive modes, allowing the best of economy and driving pleasure. The Company’s value proposition in the commercial vehicles is aimed to create vehicles with lowest overall cost of ownership. The Recon business, which reconditions aggregates, extends the life of the aggregates and eliminates the use of fresh resources that might have been consumed for new aggregates.
3. Does the company have procedures in place for sustainable sourcing (including transportation)? If yes, what percentage of your inputs was sourced sustainably?
The Company continually works with its vendors and suppliers to reduce the environmental impacts of sourcing. The Company has an Environment Procurement Policy and Sustainability Policy to engage with its value chain partners on environmental sustainability. The Company has launched a sustainable supply chain initiative in Fiscal 2017. Through this initiative the Company aims to firstly create awareness on the subject, ask for suppliers’ sustainability data and subsequently conduct a site assessment for data verification. In Phase I of this initiative, the Company has completed site assessment of 52 suppliers. Phase II of this initiative was completed in Fiscal 2018 where total of 66 suppliers were assessed at their sites. The Company plans to take this further to the dealers in the coming years. The Company noted a significant initiatives that have been taken to reduce the packaging impacts in the supply chain by using recycled / returnable packaging solutions for various components sourced. Transportation and logistics optimization is an ongoing activity to reduce the related environmental impacts. The Pantnagar and Sanand plants have created a vendor park model wherein the key vendors are situated surrounding the plant. This not only enables to optimize the production related costs but also significantly reduces the environmental impact of transportation of components.
4. Has the company taken any steps to procure goods and services from local & small producers, including communities surrounding their place of work? If yes, what steps have been taken to improve their capacity and capability of local and small vendors?
During Fiscal 2018, the Company has procured 57.88% of the materials (by value) from local sources, where local is defined as the State in which the manufacturing plant is established.
The Company takes significant initiatives in enhancing the capabilities of local and small vendors. Through the AA policy initiatives, in this Fiscal the Company has associated with 20 SC/ST entrepreneurs in the supply chain and extended business of `10.88 crore to them.
To ensure reliable and responsible suppliers for automotive production and service parts, the Company expects all its suppliers to adopt the ISO 9001/TS 16949 quality management system frameworks. The Company also encourage its dealers to adopt quality, environmental and safety management systems.
In addition, the Company has an Environment Procurement Policy and Sustainability Policy to engage with its value chain partners on environmental sustainability. The Company has launched a sustainable supply chain initiative in Fiscal 2017. Through this initiative the Company aims to firstly create awareness on the subject, ask for suppliers’ sustainability data and subsequently conduct a site assessment for data verification.
5. Does the company have a mechanism to recycle products and waste? If yes what is the percentage of recycling of products and waste (separately as <5%, 5-10%, >10%). Also, provide details thereof, in about 50 words or so.
The Company ongoing endeavor to have a mechanism to recycle its products and limit the waste arising out of production of vehicles. The Company has initiated well defined program ‘Prolife’. The objective is to reduce the waste and to minimize the need of raw materials to produce a brand new item. In Fiscal 2018, total of 26,993 components were reconditioned. The re-conditioned long blocks are also being exported to international markets. Hazardous waste is disposed as per regulatory requirements through the Common Hazardous Waste Treatment, Storage & Disposal Facilities (CHWTSDF), authorized re-cyclers and co-processing in cement plants.
Principle 3 Employee Wellbeing
1. Please indicate the Total number of employees.
52,979 as at 31st March, 2018 (Includes Permanent, Temporary, trainee and contractual employees).
2. Please indicate the Total number of employees hired on temporary/ contractual/ casual basis.
28,057 as at 31st March, 2018.
3. Please indicate the Number of permanent women employees.
689 as at 31st March, 2018.
4. Please indicate the Number of permanent employees with disabilities.
12 as at 31st March, 2018.

180
5. Do you have an employee association that is recognized by management?
The manufacturing plants at Jamshedpur, Pune, Lucknow, Pantnagar and Sanand have employee unions recognized by the management. The Company enters into long term wage settlements with these recognized unions.
6. What percentage of your permanent employees is members of this recognized employee association?
Around 94% of the operative employees at Jamshedpur, Pune, Lucknow, Pantnagar & Sanand plants are members of these employee unions. These employees represent around 52% of the total permanent employees at these five plants. The Company do not have an Employees Union at our Dharwad Plant presently.
7. Please indicate the Number of complaints relating to child labour, forced labour, involuntary labour, sexual harassment in the last financial year and pending, as on the end of the financial year.
S. No.
Category No of complaints filed during the financial year
No of complaints pending as on end of the financial year
1.Child labour/forced labour/involuntary labour
0 0
2. Sexual harassment 13 1
3. Discriminatory employment 0 0
8. What percentage of your under mentioned employees were given safety & skill up-gradation training in the last year?
• Permanent Employees
• Permanent Women Employees
• Casual/Temporary/Contractual Employees
• Employees with Disabilities
Safety is of paramount importance to the Company. All employees of the Company are provided with safety training as part of the induction programme. The safety induction programme is also a compulsory requirement for contract workforce before they are inducted into the system. The Company has a structured safety training agenda on an on-going basis to build a culture of safety across its workforce.
The Company believes in continual learning of its employees and has institutionalized a continual learning model for skill upgradation, especially at the shop-floor level. The learning and development needs of management cadre employees are met through the Company’s L&D structure which includes various training delivery mechanisms.
Principle 4: Stakeholder Engagement
1. Has the company mapped its internal and external stakeholders?
Yes. The Company has mapped its internal and external stakeholders. It uses both formal and informal mechanisms
to engage with various stakeholders to understand their concerns and expectations. Individual departments within the organization have roles and responsibilities identified and defined to engage with various stakeholders.
2. Out of the above, has the company identified the disadvantaged, vulnerable & marginalized stakeholders?
Yes. The Company’s AA policy is specially designed to address the socially disadvantaged sections of the society, Scheduled Castes and Tribes. Within the broader stakeholder group of communities, the Company works towards women empowerment and education of children. Every year, the Company participate in TAAP (Tata Affirmative Action Program) Assessment, developed on the lines of TBEM.
3. Are there any special initiatives taken by the company to engage with the disadvantaged, vulnerable and marginalized stakeholders. If so, provide details thereof, in about 50 words or so.
Our CSR programmes and projects are aimed at serving the needy, deserving, socio-economically backward and disadvantaged communities aimed at improving the quality of their lives. Under TAAP, the Company continues to serve the SC and ST communities in inter alia Education, Employability and Entrepreneurship.
Area Stakeholder (SC/ST community) Benefits
Education In Fiscal 2018, more than 20000 SC/ST students were benefited from the CSR Vidyadhanam programme. The projects include IIT-JEE & competitive exams coaching; co-curricular activities; financial aid program for Engineering Students at IIT Bombay; Scholarships for Secondary school students and Govt. Engineering College at Pune, School Infra Improvement and Special Coaching classes in Std. 8th, 9th and 10th.
Employability The programme has benefitted more than 7000 SC/ST youths across different locations in the country in Fiscal 2018. The skilling projects include: Novice drivers training, agriculture & allied training, ITI partnership & allied-auto trades; Motor Mechanic Vehicle (MMV) and training in marketable trades such as retail, tally, white goods repair, etc.
Health In Fiscal 2018, more than 2.5 Lakh community members benefited from our health initiatives including those who inhabit rural/tribal areas.

18173rd Annual Report 2017-18
INTEGRATED REPORT 1-65 STATUTORY REPORTS 66-184 FINANCIAL STATEMENTS 185-353
Principle 5: Human Rights
1. Does the policy of the company on human rights cover only the company or extend to the Group/Joint Ventures/Suppliers/Contractors/NGOs/Others?
The Company respects human rights and has established a Policy on Human Rights. The policy details the Company’s approach towards human rights and sets the Company’s expectations of its Channel Partners and Contractors to adhere to principles of human rights. The Company encourages its suppliers, vendors, contractors and other business partners associated with the Company to follow the principles laid out in the TCoC.
2. How many stakeholder complaints have been received in the past financial year and what percent was satisfactorily resolved by the management?
During Fiscal 2018, 57 concerns have been received towards actual or potential violation of TCoC, of which 51 of the complaints were satisfactorily resolved as at 31.03.2018.
Principle 6: Environmental
1. Does the policy related to Principle 6 cover only the company or extends to the Group/Joint Ventures/Suppliers/Contractors/NGOs/others.
Sustainability is built into the Company business processes through well-defined Sustainability Policy. This policy reaffirms value system committed to integrate environmental, social and ethical principles into our business and innovate sustainable mobility solutions with passion to enhance quality of life of communities.
The Company also has Environmental Procurement Policy which is applicable to all its vendors, contractors and service providers.
2. Does the company have strategies/initiatives to address global environmental issues such as climate change, global warming, etc.? Y/N. If yes, please give hyperlink for webpage etc.
Yes, the Company has Climate Change policy which guides the organizational efforts towards mitigating and adapting to climate change. The Company approach towards climate change mitigation and pursuing low carbon growth is three-fold – develop cleaner and more fuel efficient vehicles, reduce environmental impacts of manufacturing operations and build awareness among stakeholders. The Company also continually working on alternate fuel technologies like electric vehicles, hybrid vehicles and fuel cell technologies. The Company has delivered 25 ‘Tata Starbus Hybrid Electric Bus’ to Mumbai Metropolitan Region Development Authority (MMRDA) and has also delivered the first set of Tigor Electric Vehicles (EVs) to state-run Energy Efficiency Services Limited (EESL) as part of their initiative to procure 10,000 electric vehicles.
The Tata Group became part of the Prime Minister’s Low Carbon Committee and was a member in the Steering Committee of the ‘Caring for Climate’ initiative of the United
Nations Global Compact and United Nations Environment Programme. Ahead of the crucial global climate change talks that concluded in Paris, global corporate leaders signed an open letter on climate change.
3. Does the company identify and assess potential environmental risks? Y/N
Yes, the Company has a Sustainability Policy and Environmental Policy which guides the Company’s efforts to minimize its environmental impacts and continually improve the environmental performance across life cycle of the product. All manufacturing plants in India are certified to Environmental Management Systems (EMS) as per ISO 14001. As part of EMS implementation, potential environmental risks are identified and appropriate mitigation strategies are planned.
4. Does the company have any project related to Clean Development Mechanism? If so, provide details thereof, in about 50 words or so. Also, if yes, whether any environmental compliance report is filed?
None of our plants have undertaken Clean Development Mechanism projects during Fiscal 2018.
5. Has the company undertaken any other initiatives on - clean technology, energy efficiency, renewable energy, etc.? Y/N. If yes, please give hyperlink for web page etc.
In Fiscal 2018, the Company continued to work on improving energy efficiency, introduction of clean technology and increasing its renewable energy consumption in line with our aspiration to RE100 - which is a collaborative, global initiative of influential businesses aspiring to source 100% renewable electricity for operations.
(A) Renewable Energy
During Fiscal 2018, the Company has set up in-house Renewable Electricity (RE) generation capacity (solar and wind) which includes:
• 21.95 MW Captive Wind Power project at Supa and Satara in Maharashtra;
• 2 MW Roof-top Solar PV installation at Sanand Works;
• 2.1 MW Roof-top Solar PV installation at Pune Works and work is ongoing for additional 2MW installation;
• 2 MW Solar PV installation at Lucknow Works;
• 18.5 kWp Solar PV installation at Pantnagar Works; and
• 7.2 kW hybrid-wind and solar installation at Dharwad Works.
The Company sources off-site wind power at its Pune, Sanand and Dharwad Works through Power Purchase Agreements (PPA) with Third Party Wind Power Generators. It would continue to source renewable power from the grid in line with regulatory policies / frameworks and tariffs in the States where we operate.

182
In Fiscal 2018, the Company generated / sourced a total 99,382 MWh of RE for its manufacturing operations which contributed to financial saving of `666.3 Lakhs.
(B) Energy Efficiency / Clean Technology
The Company has signed a Memorandum of Understanding (MoU) with Energy Efficiency Services Limited (EESL), Ministry of Power, Government of India to achieve energy saving and resource conservation by implementing various energy efficiency initiatives across the Company’s manufacturing facilities in India. Phase I of the project is being rolled-out at our Pantnagar, Lucknow and Pune plants and will be extended later to other plants. Key highlights of the MoU include - Diagnostic Studies & Pilot Projects, Implementation of Energy Efficiency Projects through innovative financial models and Capacity Building & Training.
The Company has also implemented significant Energy Conservation projects across its manufacturing plants and offices in Fiscal 2018.
• Pune Plants optimized power consumption in ventilation systems at Engine Shop, installed energy efficient LED lighting systems, converted washing machines from electrical to natural gas heating, provided interlocks and auto switch-off timers in Engine Shop, installed Intelligent Flow Control in Compressor for Paint Shop operations and integrated painting operations into a single shop.
• Jamshedpur Plant optimized engine test bed utilization and installed energy efficient LED lighting.
• Sanand Plant optimized use of Air Supply Plants (ASP’s), washing process in Head & Block at Engine Shop, replaced Nd-YAG laser with fiber laser, and provided interlocks and auto switch-off timers for energy intensive machines and equipment.
• Lucknow Plant implemented empty skid storage facility in Paint Shop and installed energy efficient LED lighting.
• Pantnagar Plant contributed by reduction in no-load losses in transformers and installed energy efficient LED lighting.
Please refer Annexure 2 to Board’s Report of the Company Annual Report FY 2017-18, ‘Energy and Climate Change’ and ‘Environmental Stewardship of the Tata Motors Sustainability Report 2017-18 for details on the Company’s energy efficiency and cleaner production initiatives.
6. Are the Emissions/Waste generated by the company within the permissible limits given by CPCB/SPCB for the financial year being reported?
The Company is in compliance within the prescribed permissible limits as per CPCB/SPCB for air emissions, effluent quality and discharge, solid and hazardous waste
generation and disposal.
7. Number of show cause/ legal notices received from CPCB/SPCB which are pending (i.e. not resolved to satisfaction) as on end of Financial Year.
There is no show cause /legal notice from CPCB/SPCB pending resolution by the Company as on end of Fiscal 2018.
Principle 7 Policy Advocacy
1. Is your company a member of any trade and chamber or association? If Yes, Name only those major ones that your business deals with:
The Company is member of various trade and chamber associations.
1) The Company actively participate in all WP29 UNECE group activities.
2) The Company also participated in the following National Committees which are working on formulating policies and regulations for improvement of environment including GHG reduction throughout the country;
I. Standing Committee on Emissions (SCOE)
II. Sub-committee on Idle (CO & HC) emission norms of Union Ministry of Shipping, Road Transport and Highways of India, along with Automotive Research Association of India (ARAI).
III. Expert committee to define “Heavy Duty Vehicle Fuel Economy Norms for India’’ under Ministry of Shipping, Road Transport and Highways of Government of India (GoI) & Petroleum Conservation Research Association (PCRA).
IV. Expert Committee to define “Light & Medium Duty Vehicle Fuel Economy Norms for India’’ under Ministry of Road Transport & Highways of Government of India, Ministry of Petroleum & Natural Gas (MoPNG) & Petroleum Conservation Research Association (PCRA)
V. Expert committee on Fuel Economy and Labeling of Passenger Cars under Bureau of Energy Efficiency under Ministry of Power (GoI) & Ministry of Road Transport & Highways.
VI. Interministerial committee for upcoming emission norms (BSVI) including Real World Driving Emissions (RDE) & Portable Emission Measurement System (PEMS) for Motor Vehicles of Ministry of Shipping, Road Transport and Highways, Ministry of Heavy Industries, Ministry of Petroleum & Natural Gas (GoI).
VII. Working group on Quadricycle Emission Norms for India.
VIII. Ministry of New & Renewable Energy, GoI, is promoting and assisting technology development for GHG reduction by way of increased usage of Biodiesel. We are engaged in this initiative of GoI and currently running number of engine and vehicle programs to commercialize usage of Biodiesel as soon as the same is made available to the general public by oil marketing companies.

18373rd Annual Report 2017-18
INTEGRATED REPORT 1-65 STATUTORY REPORTS 66-184 FINANCIAL STATEMENTS 185-353
IX. Working Group on Energy for Sub-Group on DST’s XIIth plan on Technology Development Program (TDP).
X. National Electric Mobility Mission Plan - We have been actively participating in forming hybrid performance criteria along with SIAM-FTG group and helped government to launch FAME scheme. Now we are building two types of hybrid and electric vehicles under Technical Advisor Group under R&D scheme.
The Company participated in all the panel meetings pertaining to emissions, fuel economy, conventional & non-conventional fuels for rules and standards formulation.
2. Have you advocated/lobbied through above associations for the advancement or improvement of public good? Yes/No; if yes specify the broad areas (drop box: Governance and Administration, Economic Reforms, Inclusive Development Policies, Energy Security, Water, Food Security, Sustainable Business Principles, Others)
The Company, through various industry associations, participated in advocating matters advancement of the industry and public good. It supports various initiatives of the SIAM which include aspects of product safety, alternate fuel vehicles, environment, fuel policies, customer information and education, to name a few. The Company’s Sustainability policy and Affirmative Action policy is a progressive step towards inclusive development.
Principle 8 : Inclusive Growth
1. Does the company have specified programmes/initiatives/projects in pursuit of the policy related to Principle 8? If yes details thereof.
Inclusive growth is at the core of the Company’s community development strategy. Ankur, the Company’s community engagement strategy, is percolated to each manufacturing plant through a detailed community development plan. The plant specific
plan addresses the local needs and the corporate cell drives some company-wide strategic community development initiatives such as driver training. The initiatives primarily focus on Arogya (Health), Vidyadhanam (Education), Kaushalya (Employability) and Vasundhara (Environment). Seva, the employee volunteering initiative provides our employees with a platform to be a part of our community initiatives. Tata Motors along with its employees also supports Sumant Moolgaonkar Development Foundation (SMDF) towards implementing Amurtdhara, a National Drinking Water Project to provide safe drinking water to communities. Through adoption of Tata Group Affirmative Action (AA) Policy, the Company works toward inclusion of socially disadvantaged and marginalized sections of society (Scheduled Castes and Scheduled Tribes). The AA interventions focus on Education, Health, Employability and Entrepreneurship.
The Company has also worked extensively in areas of healthcare by establishing malnutrition treatment center (MTC) at its Jamshedpur location in collaboration with UNICEF & the National Rural Health Mission (NRHM) and in the area of agricultural development where it improved lives of around 500+ farmers constituting around 70% of ST farmers by implementing the Lift Agriculture (LI) project.
Please refer the Company’s ‘Annual CSR Report 2017-18’ and ‘Community Development’ section of Tata Motors Sustainability Report FY 2017-18 for detailed community engagement strategy and key initiatives.
2. Are the programmes/projects undertaken through in-house team/own foundation/external NGO/government structures/any other organization?
CSR Programmes and Projects are deployed by Company: directly; through its own company-promoted societies/NGOS; partnering with govt. and collaborating with reputed, external non-profit organizations under different models.
Area Partners Involved
Education Action Aid, Agastya International Foundation, Avanti Fellows, Block Resource Centre EDUCATION DEPT.(SSA), CATHEDRAL CHURCH SANAND, Center for Youth Development & Activities, Children’s Movement for Civic Awareness, College of Engineering Pune, GANATAR, Global Education Trust, Gram Vikas Kendra, IIT Bombay Alumni Association, Manav Seva Education Trust, Moinee Foundation, Nav Jagrat Manav Samaj, Paryawaran Evam Jan Kalyan Samiti, Rotary Club of Nigdi, Samaj Vikas Kendra, Samata Shikshan Sanstha, SANAND LIONS FOUNDATION TRUST, Seva Sahyog Foundation, Shanti Seva Nidhi Trust, Shiksha Prasar Kendra, SHRI SHAKTI KELAVNI UTTEJAK TRUST, Society for Human Environmental Development, Suprabhat Mahila Mandal, Swami Vivekananda Youth Movement, Swaroopwardhinee, Tata Institute of Social Sciences, Tata Motors Gruhini Social Welfare Society, The Jai Narayan Charitable Trust, Urmee Charitable Trust, Vidya Poshak, Vikas Samities
Employability Ahmedabad Dist. Cooperative Milk Producers Union Ltd, Ambika Motor Driving School, Centre for Civil Society, CII, Gram Vikas Kendra, LAURUS EDUTECH LIFE SKILLS PVT LTD, Manikbag Automobile Pvt Ltd, MITCON Foundation, Paryawaran Evam Jan Kalyan Samiti, Prasad Chikitsa, Pratham Education Foundation, Ramkrishna Mission Sakwar, Samaj Vikas Kendra, Sambhav Foundation, SANAND EDUCATION TRUST, Shashwat, Skill For Progress, SUVIDHA, Vedanta Foundation, Vigyan Ashram (IIE), Vikas Samities
Health Action Aid, CHETNA, Family Planning Association of India, Gram Vikas Kendra, Jan Parivar Kalyan Sansthan, Manav Seva Education Trust, NAMASTE LIFE, Nav Jagrat Manav Samaj, Parivar Kalyan Sansthan, Paryawaran Evam Jan Kalyan Samiti, Prasad Chikitsa, Seth G S Medical College and KEM Hospital, Sneh Foundation, Snehdeep Jankalyan Foundation, Sumant Moolgaonkar Development Foundation, Sterling Hospital, Swadhar, Vikas Samities
Environment Bansilal Ramntath Agarwal Charitable Trust, Bombay Natural History Society, COLLEGE OF SOCIAL WORK (NIRMALA NIKETAN INSTITUTE), GANATAR, Gram Vikas Kendra, Green Thumb, Manav Seva Education Trust, Paryawaran Evam Jan Kalyan Samiti, Samaj Vikas Kendra, Sarvodhaya Maha Sangh, Terre Policy Center, Tree Public Foundation, Vikas Samities, Wildlife Research and Conservation Society

184
Please refer the Company’s ‘Annual CSR Report 2017-18’ and ‘Community Development’ section of Tata Motors Sustainability Report 2017-18 for details on various community development programme partnerships.
3. Have you done any impact assessment of your initiative?
Yes. The Company has adopted ‘Tata CS Protocol’ to assess the impact of the various community interventions. Periodic impact assessments are conducted and the outcome forms a critical input to the community development plan preparation and implementation.
Please refer the Company’s ‘Annual CSR Report 2017-18’ and ‘Community Development’ section of Tata Motors Sustainability Report 2017-18 for details on community impacts created and assessed.
4. What is your company’s direct contribution to community development projects- Amount in INR and the details of the projects undertaken?
Total expenditure reported is ` 21.44 crores.
The details of projects:
1. Arogya (Health) build awareness on malnourishment and other health problems in the community, provides ferry mobile medical van to look into curative and preventive health care.
2. Vidyadhanam (Education) supporting for infrastructure, skills development, training and Institutionalized need based scholarships.
3. Kaushalya (Employability) Industrial Training to school dropout youth in auto sector, non-auto trades, agriculture and allied activities.
4. Vasundhara (Environment) large scale sapling plantation, construction of water conservation structures and building awareness about environment and renewable energy sources.
Please refer the Company’s ‘Annual CSR Report 2017-18’ and ‘Community Development’ section of Tata Motors Sustainability Report 2017-18 for details on various community development programmes undertaken.
5. Have you taken steps to ensure that this community development initiative is successfully adopted by the community? Please explain in 50 words, or so.
Yes. The Company adopts a collaborative and participatory approach with communities/beneficiaries in conceiving and deploying CSR projects. Partial beneficiary contribution is sought, wherever feasible, for project deployment / asset creation, maintenance for them to have greater ownership of the projects - which we believe is crucial for sustainability of our initiatives. Training and capacity building of communities and relevant stakeholders to successfully adopt & carry forward these initiatives is done from time to time.
Please refer the Company’s ‘Annual CSR Report 2017-18’ and ‘Community Development’ section of Tata Motors Sustainability Report 2017-18 for details on various community development programme implementation models.
Principle 9: Customer Value
1. What percentage of customer complaints/consumer cases are pending as on the end of financial year.
The Company provided its customers with the best in class after sales service. We hear our customers through various mediums such as 24X7 Call center toll free no, website, social media, Tata Motors Service Connect App.
The Company Service rests on three core ‘Service Promises’ – ‘Responsive’, ‘Reliable’ and ‘Best value’. A host of distinctive facilities and services are being offered to deliver each of these promises to customers in the Company’s nationwide service network.
Passenger Vehicle
Business Unit
Commercial Vehicle
Business Unit
Total
Percentage of Consumer Cases Pending as on 31st March 2018
0.45 0.20 0.21
2. Does the company display product information on the product label, over and above what is mandated as per local laws? Yes/No/N.A./ Remarks (additional information)
The Company displays all the requisite product information and safety guidance on the product label as required by the local laws. Over and above the mandatory requirements, the Company also subscribes to guidance by SIAM (Society of Indian Automobile Manufacturers) of various customer information requirements such as the Fuel Economy Customer Information. The vehicle manual is an important source of information for customers which contains product information, safety guidance, customer support details and tips on efficient use of the vehicle.
3. Is there any case filed by any stakeholder against the company regarding unfair trade practices, irresponsible advertising and/or anti-competitive behavior during the last five years and pending as on end of financial year. If so, provide details thereof, in about 50 words or so
There have been no cases relating to unfair trade practices, irresponsible advertising and/or anti-competitive behavior against The Company in the last five years.
4. Did your company carry out any consumer survey/ consumer satisfaction trends?
Regular customer satisfaction surveys are conducted to assess customer satisfaction levels and benchmark the Company’s performance with industry peers. Customer centricity is intrinsic to the Company culture – develop, deliver, delight. The Company continuously strive to provide best services to enhance its customer engagement. The customer service quality is met through integration of our Customer Relationship Management and Dealer Management System (CRM – DMS).
The Passenger Vehicle business uses globally renowned J.D.Power survey scores to assess overall customer satisfaction and benchmark with industry peers. The Commercial Vehicle business conduct customer satisfaction survey (eQ scores) through External Agency AC Nielsen every year. The eQ i.e. CEI scores conducted by AC Nielsen are in line with our internal satisfaction scores.

Financial statementsStandalone
186 Independent Auditors’ Report192 Balance Sheet193 Statement of Profit and Loss194 Cash Flow Statement195 Statement of Changes in Equity197 Notes to Accounts
Consolidated
255 Independent Auditors’ Report
260 Balance Sheet261 Statement of Profit and Loss262 Cash Flow Statement264 Statement of Changes in Equity266 Notes to Accounts
346 Summarised Statements348 Financial Statistics350 Subsidiary Companies Financial
Highlights 2017-18
354 Notice

186
To the Members of Tata Motors Limited
Report on the Audit of the Standalone Ind AS Financial Statements
We have audited the accompanying standalone Ind AS financial statements of Tata Motors Limited (“the Company”), which comprise the Balance Sheet as at 31 March 2018, the Statement of Profit and Loss, the Statement of Changes in Equity and the Statement of Cash Flows for the year then ended, and summary of the significant accounting policies and other explanatory information, and includes two joint operations consolidated on a proportionate basis.
Management's Responsibility for the Standalone Ind AS Financial Statements
The Company's Board of Directors is responsible for the matters stated in Section 134(5) of the Companies Act, 2013 (“the Act”) with respect to the preparation of these standalone Ind AS financial statements that give a true and fair view of the state of affairs, profit/loss and other comprehensive income, changes in equity and cash flows of the Company including its joint operations in accordance with the accounting principles generally accepted in India, including the Indian Accounting Standards (Ind AS) prescribed under section 133 of the Act.
The respective Board of Directors of the Company and its joint operations are responsible for maintenance of adequate accounting records in accordance with the provisions of the Act for safeguarding the assets of the Company and its joint operations and for preventing and detecting frauds and other irregularities; selection and application of appropriate accounting policies; making judgments and estimates that are reasonable and prudent; and design, implementation and maintenance of adequate internal financial controls that were operating effectively for ensuring the accuracy and completeness of the accounting records, relevant to the preparation and presentation of the standalone Ind AS financial statements that give a true and fair view and are free from material misstatement, whether due to fraud or error.
In preparing the financial statements, the respective Board of Directors of the Company and its joint operations are responsible for assessing the ability of the Company and its joint operations to continue as a going concern, disclosing, as applicable, matters related to going concern and using the going concern basis of accounting unless respective management either intends to liquidate the Company / joint operation or to cease operations, or has no realistic alternative but to do so.
Auditor's Responsibility
Our responsibility is to express an opinion on these standalone Ind AS financial statements based on our audit.
Independent Auditor’s Report
We have taken into account the provisions of the Act, the accounting and auditing standards and matters which are required to be included in the audit report under the provisions of the Act and the Rules made thereunder.
We conducted our audit of the standalone Ind AS financial statements in accordance with the Standards on Auditing specified under Section 143(10) of the Act. Those Standards require that we comply with ethical requirements and plan and perform the audit to obtain reasonable assurance about whether the standalone Ind AS financial statements are free from material misstatement.
An audit involves performing procedures to obtain audit evidence about the amounts and the disclosures in the standalone Ind AS financial statements. The procedures selected depend on the auditor's judgment, including the assessment of the risks of material misstatement of the standalone Ind AS financial statements, whether due to fraud or error. In making those risk assessments, the auditor considers internal financial control relevant to the Company's preparation of the standalone Ind AS financial statements that give a true and fair view in order to design audit procedures that are appropriate in the circumstances. An audit also includes evaluating the appropriateness of the accounting policies used and the reasonableness of the accounting estimates made by the Company's Directors, as well as evaluating the overall presentation of the standalone Ind AS financial statements.
We are also responsible to conclude on the appropriateness of management’s use of the going concern basis of accounting and, based on the audit evidence obtained, whether a material uncertainty exists related to events or conditions that may cast significant doubt on the entity’s ability to continue as a going concern. If we conclude that a material uncertainty exists, we are required to draw attention in the auditor’s report to the related disclosures in the financial statements or, if such disclosures are inadequate, to modify the opinion. Our conclusions are based on the audit evidence obtained up to the date of the auditor’s report. However, future events or conditions may cause an entity to cease to continue as a going concern.
We believe that the audit evidence we have obtained is sufficient and appropriate to provide a basis for our audit opinion on the standalone Ind AS financial statements.
Opinion
In our opinion and to the best of our information and according to the explanations given to us and based on the consideration of report of other auditor on separate financial statements of one joint operation, the aforesaid standalone Ind AS financial statements give the information required by the Act in the manner so required and give a true and fair view in conformity with the accounting principles generally accepted in India of the state of affairs of the Company as at 31 March 2018, its loss and other comprehensive income, changes in equity and its cash flows for the year ended on that date.

18773rd Annual Report 2017-18
INTEGRATED REPORT 1-65 STATUTORY REPORTS 66-184 FINANCIAL STATEMENTS 185-353
Other Matters
1. The comparative financial information of the Company for the year ended 31 March 2017 prepared in accordance with Ind AS, included in these standalone Ind AS financial statements have been audited by the predecessor auditor, which have been adjusted to give effect to the scheme of merger explained in Note 47 (iii) to the standalone Ind AS financial statements. The report of the predecessor auditor on the comparative financial information dated 23 May 2017 expressed an unmodified opinion.
2. We did not audit the financial statements of one joint operation included in the standalone Ind AS financial statements, whose financial statements reflect total assets of ` 6,940.15 crores and net assets of ` 3,375.06 crores as at 31 March 2018, total revenues of ` 6,994.76 crores and net cash outflows amounting to ` 115.57 crores for the year ended on that date, as considered on a proportionate basis in the standalone Ind AS financial statements. These financial statements have been audited by other auditor whose report has been furnished to us by the management and our report on the standalone Ind AS financial statements, in so far as it relates to the amounts and disclosures included in respect of this joint operation, is based solely on the report of the other auditor.
Our opinion is not modified in respect of these matters.
Report on Other Legal and Regulatory Requirements
1. As required by the Companies (Auditor's Report) Order, 2016 (“the Order”) issued by the Central Government in terms of Section 143(11) of the Act, we give in “Annexure A” a statement on the matters specified in paragraphs 3 and 4 of the Order for the Company (excluding its joint operations).
2. As required by Section 143(3) of the Act, based on our audit and on the consideration of report of the other auditor on separate financial statements of a joint operation we report, that:
a) We have sought and obtained all the information and explanations which to the best of our knowledge and belief were necessary for the purposes of our audit.
b) In our opinion, proper books of account as required by law have been kept by the Company and its joint operations so far as it appears from our examination of those books and the report of the other auditor.
c) The Balance Sheet, the Statement of Profit and Loss, the Cash Flow Statement and Statement of Changes in Equity dealt with by this Report are in agreement with the relevant books of account.
d) In our opinion, the aforesaid standalone Ind AS financial statements comply with the Indian Accounting Standards prescribed under section 133 of the Act.
e) On the basis of the written representations received from the directors as on 31 March 2018 taken on record by the Board of Directors and the report of the statutory auditors of the joint operations, none of the directors of the Company and its joint operations is disqualified as on 31 March 2018 from being appointed as a director in terms of Section 164(2) of the Act.
f) With respect to the adequacy of the internal financial controls with reference to financial statements of the Company and its joint operations which are companies incorporated in India and the operating effectiveness of such controls, refer to our separate Report in “Annexure B”.
g) With respect to the other matters to be included in the Auditor's Report in accordance with Rule 11 of the Companies (Audit and Auditors) Rules, 2014, in our opinion and to the best of our information and according to the explanations given to us:
i. The Company has disclosed the impact of pending litigations on its financial position in its standalone Ind AS financial statements; - Refer Note 38 to the standalone Ind AS financial statements.
ii. The Company has made provision, as required under the applicable law or accounting standards, for material foreseeable losses, if any, on long-term contracts including derivative contracts; - Refer Note 47 (v) to the standalone Ind AS financial statements.
iii. There has been no delay in transferring amounts, required to be transferred, to the Investor Education and Protection Fund by the Company.
iv. The disclosures in the financial statements regarding holdings as well as dealings in specified bank notes during the period from 8 November 2016 to 30 December 2016 have not been made since they do not pertain to the financial year ended 31 March 2018.
For B S R & Co. LLP Chartered Accountants Firm’s Registration No: 101248W/W-100022
Yezdi NagporewallaMumbai Partner23 May 2018 Membership No: 049265

188
Annexure A to the Independent Auditor’s Report – 31 March 2018
(Referred to in paragraph (1) under ‘Report on Other Legal and Regulatory Requirements’ section of our report of even date)
(i) (a) The Company has maintained proper records showing full particulars, including quantitative details and situation of fixed assets except for certain tools where the Company is in the process of updating the location.
(b) The Company has a regular program of physical verification of its fixed assets by which its fixed assets are verified in a phased manner over a period of three years. In our opinion, this periodicity of physical verification is reasonable having regard to the size of the Company and the nature of its fixed assets. However, fixed assets aggregating to a carrying value of 210.14 crores were not verified during the year though planned. As represented by the management, these will be verified during the financial year 2018-19. According to the information and explanations given to us, no material discrepancies were noticed on verification of the balance fixed assets.
( c ) According to the information and explanations given to us, the records examined by us and based on the examination of the registered sale deed /transfer deed /conveyance deed /court orders approving schemes of arrangements /amalgamations provided to us, we report that, the title deeds, comprising all the immovable properties of land and buildings which are freehold, are held in the name of the Company as at the Balance Sheet date except for certain title deeds for lands amounting to ` 525.80 crores which are yet to be transferred in the name of the Company. In respect of immovable properties that have been taken on lease and disclosed as property, plant and equipment in the standalone Ind AS financial statements, the lease agreements are in the name of the Company, where the Company is the lessee in the agreement.
(ii) The inventory including inventory lying with third parties, except goods-in-transit, has been physically verified by the management during the year. In our opinion, the frequency of such verification is reasonable and adequate in relation to the size of the Company and the nature of its business. The discrepancies noticed on verification between the physical stocks and the book records were not material and have been properly dealt with in the books of account.
(iii) According to information and explanations given to us, the Company has granted loans, secured or unsecured, to companies, firms or other parties covered in the Register maintained under Section 189 of the Companies Act, 2013, in respect of which:
(a) The terms and conditions of the grant of such loans are, in our opinion, prima facie, not prejudicial to the Company’s interest.
(b) The schedule of repayment of principal and payment of interest has been stipulated and repayments or receipts of principal amounts and interest have been regular as per stipulations.
( c ) There is no amount overdue for more than 90 days at the Balance Sheet date.
(iv) According to the information and explanations given to us, the Company has complied with provisions of section 185 and 186 of the Companies Act, 2013 in respect of grant of loans, making investments and providing guarantees and securities, as applicable.
(v) According to the information and explanations given to us, the Company has not accepted any deposits during the year. In respect of unclaimed deposits, the Company has complied with the provisions of section 73 to 76 of the Act and the rules framed thereunder.
(vi) We have broadly reviewed the books of account maintained by the Company pursuant to the rules prescribed by the Central Government for maintenance of cost records under section 148(1) of the Companies Act, 2013 in respect of manufacture of products and are of the opinion that prima facie, the prescribed accounts and records have been made and maintained. However, we have not made a detailed examination of the cost records.
(vii) (a) According to the information and explanations given to us and on the basis of our examination of the records of the Company, amounts deducted / accrued in the books of account in respect of undisputed statutory dues including Provident fund, Employees’ state insurance, Income tax, Sales tax, Service tax, Duty of customs, Duty of excise, Value added tax, Goods and services tax and other material statutory dues have generally been regularly deposited during the year by the Company with the appropriate authorities. We are informed by the Company that the Employee’s State Insurance Act, 1948 is applicable only to certain locations of the Company. With regard to the contribution under the Employee’s Deposit Linked Insurance Scheme, 1976 (the scheme), the Company has sought exemption from making contribution to the scheme since it has its own Life Cover Scheme. The Company has made application on March 28, 2017 seeking an extension of exemption from contribution to the Scheme for a period of 3 years which is awaited.
According to the information and explanations given to us, no undisputed amounts payable in respect of Provident fund, Employees’ state insurance, Income tax, Sales tax, Service tax, Duty of excise, Duty of customs, Value added tax, Goods and services tax and other material statutory dues were in arrears as at 31 March 2018, for a period of more than six months from the date they became payable.
(b) According to the information and explanations given to us, there are no dues of Income tax, Sales tax, Service tax, Value added tax, Goods and services tax, Duty of customs and Duty of excise which have not been deposited by the Company with appropriate authorities on account of any disputes except for the following:

18973rd Annual Report 2017-18
INTEGRATED REPORT 1-65 STATUTORY REPORTS 66-184 FINANCIAL STATEMENTS 185-353
Name of the statute
Nature of dues Amount (` in Crores)
Amount paid under protest (` in Crores)
Amount outstanding (` in Crores)
Period to which the amount relates
Forum where dispute is pending
Income Tax Act, 1961
Income tax 2.78 2.78 - 1982-83, 1991-92 and 1995-96 High Court162.51 162.51 - 1997-98 to 1999-2000, 2003-04
to 2011-12Income Tax Appellate Tribunal
330.65 111.78 218.87 2007-08, 2012-13 and 2013-14 Commissioner of Income Tax Appeals
Central Excise Act, 1944
Duty of excise 133.13 45.37 87.76 1991-92 to 1993-94, 1995-96 to 1999-2000, 2002-03, 2005-06 to 2010-11
High Court
1,384.72 22.06 1362.66 1989-90, 1990-91, 1992-93, 1994-95, 1996-97, 1997-98, 1999-2000 to 2016-17
The Customs, Excise and Service Tax Appellate Tribunal
32.10 1.91 30.19 1984-85, 1994-95, 1995-96, 1997-98, 2000-01, 2006-07 to 2016-17
Appellate Authority upto Commissioner’s level
Finance Act, 1994 Service tax 1,116.13 12.79 1,103.34 2003-04 to 2014-15 The Customs, Excise and Service Tax Appellate Tribunal
1.98 0.07 1.91 2011-12 Appellate Authority upto Commissioner’s level
Sales Tax Sales tax 13.18 - 13.18 1995-96 Supreme Court254.33 50.40 203.93 1984-85 to 1988-89, 1990-91,
2001-02 to 2005-06High Court
99.24 27.92 71.32 1983-84, 1986-87, 1989-90, 1991-92, 2000-01, 2004-05 to 2016-17
The Customs, Excise and Service Tax Appellate Tribunal
515.92 30.17 485.75 1979-80, 1986-87, 1988-89 to 2016-17
Appellate Authority upto Commissioner’s level
Customs Act, 1962 Duty of customs 3.90 3.90 - 2011-12 Supreme Court7.49 3.11 4.38 2008-09 The Customs, Excise and Service
Tax Appellate Tribunal
(viii) In our opinion and according to the information and explanations given to us, the Company has not defaulted in repayment of loans or borrowings to financial institutions, banks and government and dues to debenture holders.
(ix) In our opinion and according to the information and explanations given to us, the Company had not raised money by way of further public offer (including debt instruments) during the year and the term loans taken by the Company have been applied for the purpose for which they were raised.
(x) According to the information and explanations given to us, no fraud by the Company and no material fraud on the Company by its officers or employees has been noticed or reported during the course of our audit.
(xi) According to the information and explanations given to us and based on our examination of the records of the Company, the Company has paid / provided for managerial remuneration in accordance with the requisite approvals mandated by the provisions of Section 197 read with Schedule V of the Act for the year ended 31 March 2018.
(xii) In our opinion and according to the information and explanations given to us, the Company is not a Nidhi Company as per the Act. Accordingly, paragraph 3(xii) of the Order is not applicable to the Company.
(xiii) In our opinion and according to the information and explanations given to us, all transactions with related parties are in compliance with section 177 and 188 of the Act and the details, as required by the applicable accounting standards have been disclosed in the standalone Ind AS financial statements.
(xiv) According to the information and explanations given to us, the Company has not made any preferential allotment or
private placement of shares or fully or partially convertible debentures during the year. Accordingly, paragraph 3(xiv) of the Order is not applicable to the Company.
(xv) According to the information and explanations given to us, the Company has not entered into any non-cash transactions with directors or persons connected with them during the year. Accordingly, paragraph 3(xv) of the Order is not applicable to the Company.
(xvi) In our opinion and according to the information and explanations given to us, the Company is not required to register under section 45-IA of the Reserve Bank of India Act, 1934.
For B S R & Co. LLPChartered Accountants
Firm’s Registration No: 101248W/W-100022
Yezdi NagporewallaMumbai Partner23 May 2018 Membership No: 049265

190
(Referred to in paragraph 2(f) under ‘Report on Other Legal and Regulatory Requirements’ section of our report of even date)
Report on the Internal Financial Controls under Clause (i) of Sub-section 3 of Section 143 of the Companies Act, 2013 (“the Act”)
We have audited the internal financial controls with reference to financial statements of Tata Motors Limited (“the Company”) as of 31 March 2018 in conjunction with our audit of the standalone Ind AS financial statements of the Company for the year ended on that date which includes internal financial controls with reference to financial statements of the Company’s joint operations which are companies incorporated in India.
Management’s Responsibility for Internal Financial Controls
The respective Board of Directors of the Company and its joint operations incorporated in India are responsible for establishing and maintaining internal financial controls based on the internal financial controls with reference to financial statements criteria established by the respective companies considering the essential components of internal control stated in the Guidance Note on Audit of Internal Financial Controls over Financial Reporting (“the Guidance Note”) issued by the Institute of Chartered Accountants of India (“ICAI). These responsibilities include the design, implementation and maintenance of adequate internal financial controls that were operating effectively for ensuring the orderly and efficient conduct of its business, including adherence to company’s policies, the safeguarding of its assets, the prevention and detection of frauds and errors, the accuracy and completeness of the accounting records, and the timely preparation of reliable financial information, as required under the Act.
Auditor’s Responsibility
Our responsibility is to express an opinion on the internal financial controls with reference to financial statements of the Company based on our audit. We conducted our audit in accordance with the Guidance Note and the Standards on Auditing, issued by ICAI and deemed to be prescribed under section 143(10) of the Act, to the extent applicable to an audit of internal financial controls, both applicable to an audit of Internal Financial Controls and, both issued by the ICAI. Those Standards and the Guidance Note require that we comply with ethical requirements and plan and perform the audit to obtain reasonable assurance about whether adequate internal financial controls with reference to financial statements was established and maintained and if such controls operated effectively in all material respects.
Our audit involves performing procedures to obtain audit evidence about the adequacy of the internal financial controls system with
reference to financial statements and their operating effectiveness. Our audit of internal financial controls with reference to financial statements included obtaining an understanding of internal financial controls with reference to financial statements, assessing the risk that a material weakness exists, and testing and evaluating the design and operating effectiveness of internal control based on the assessed risk. The procedures selected depend on the auditor’s judgment, including the assessment of the risks of material misstatement of the financial statements, whether due to fraud or error.
We believe that the audit evidence we have obtained and the audit evidence obtained by the other auditor of a joint operation in terms of their report referred in the Other Matter paragraph below, is sufficient and appropriate to provide a basis for our audit opinion on the internal financial controls system with reference to financial statements of the Company.
Meaning of Internal Financial Controls with reference to financial statements
A company's internal financial controls with reference to financial statements is a process designed to provide reasonable assurance regarding the reliability of financial reporting and the preparation of financial statements for external purposes in accordance with generally accepted accounting principles. A company's internal financial controls with reference to financial statements includes those policies and procedures that (1) pertain to the maintenance of records that, in reasonable detail, accurately and fairly reflect the transactions and dispositions of the assets of the company; (2) provide reasonable assurance that transactions are recorded as necessary to permit preparation of financial statements in accordance with generally accepted accounting principles, and that receipts and expenditures of the company are being made only in accordance with authorisations of the management and directors of the company; and (3) provide reasonable assurance regarding prevention or timely detection of unauthorised acquisition, use, or disposition of the company's assets that could have a material effect on the financial statements.
Inherent Limitations of Internal Financial Controls with reference to financial statements
Because of the inherent limitations of internal financial controls with reference to financial statements, including the possibility of collusion or improper management override of controls, material misstatements due to error or fraud may occur and not be detected. Also, projections of any evaluation of the internal financial controls with reference to financial statements to future periods are subject to the risk that the internal financial controls with reference to financial statements may become inadequate because of changes in conditions, or that the degree of compliance with the policies or procedures may deteriorate.
Annexure B to the Independent Auditor’s Report – 31 March 2018

19173rd Annual Report 2017-18
INTEGRATED REPORT 1-65 STATUTORY REPORTS 66-184 FINANCIAL STATEMENTS 185-353
Opinion
In our opinion the Company and its joint operations which are incorporated in India, have, in all material respects, an adequate internal financial controls system with reference to financial statements and such internal financial controls with reference to financial statements were operating effectively as at 31 March 2018, based on the internal controls with reference to financial statements criteria established by the Company and its joint operations considering the essential components of internal control stated in the Guidance Note issued by the Institute of Chartered Accountants of India.
Other Matter
Our aforesaid report under Section 143(3)(i) of the Act on the adequacy and operating effectiveness of the internal financial controls with reference to financial statements in so far as it relates to one joint operation, which is a Company incorporated in India, is based solely on the corresponding report of the other auditor. Our opinion is not modified in respect of this matter.
For B S R & Co. LLP Chartered Accountants Firm’s Registration No: 101248W/W-100022
Yezdi NagporewallaMumbai Partner23 May 2018 Membership No: 049265

192
Balance Sheet
(` in crores)Notes As at
March 31, 2018As at
March 31, 2017I. ASSETS
(1) NON-CURRENT ASSETS(a) Property, plant and equipment 3 18,192.52 17,897.12 (b) Capital work-in-progress 1,371.45 1,902.61 ( c) Goodwill 99.09 99.09 (d) Other intangible assets 5 (a) 3,312.14 2,776.71 (e) Intangible assets under development 5 (b) 3,825.15 5,368.38 (f) Investments in subsidiaries, joint ventures and associates 6 13,950.60 14,330.02 (g) Financial assets (i) Investments 8 310.19 528.37 (ii) Loans and advances 10 143.96 391.46 (iii) Other financial assets 12 793.40 196.32 (h) Non-current tax assets (net) 695.75 772.67 (i) Other non-current assets 14 1,546.39 1,858.45
44,240.64 46,121.20 (2) CURRENT ASSETS
(a) Inventories 16 5,670.13 5,553.01 (b) Investments in subsidiaries and associate (held-for-sale) 7 681.91 - ( c) Financial assets (i) Investments 9 1,820.87 2,437.42 (ii) Trade receivables 17 3,479.81 2,128.00 (iii) Cash and cash equivalents 19 546.82 228.94 (iv) Bank balances other than (iii) above 20 248.60 97.67 (v) Loans and advances 11 140.27 215.96 (vi) Other financial assets 13 646.31 141.54 (d) Current tax assets (net) 73.88 129.49 (e) Assets classified as held-for-sale 47(iv) 223.33 - (f) Other current assets 15 1,439.73 1,825.05
14,971.66 12,757.08 TOTAL ASSETS 59,212.30 58,878.28
II. EQUITY AND LIABILITIESEQUITY (a) Equity share capital 21 679.22 679.22 (b) Other equity 19,491.76 20,483.39
20,170.98 21,162.61 LIABILITIES(1) NON-CURRENT LIABILITIES
(a) Financial liabilities (i) Borrowings 23 13,155.91 13,686.09 (ii) Other financial liabilities 25 211.28 1,130.23 (b) Provisions 27 1,009.48 892.18 ( c) Deferred tax liabilities (net) 154.61 147.58 (d) Other non-current liabilities 30 291.09 321.24
14,822.37 16,177.32 (2) CURRENT LIABILITIES
(a) Financial liabilities (i) Borrowings 24 3,099.87 5,158.52 (ii) Trade payables [includes dues of micro and small enterprises ` 141.59 crores
(as at March 31, 2017 ` 125.11 crores)] 9,411.05 7,082.95
(iii) Acceptances 4,814.58 4,379.29 (iv) Other financial liabilities 26 4,091.16 2,485.94 (b) Provisions 28 862.92 477.17 ( c) Current tax liabilities (net) 21.77 83.68 (d) Other current liabilities 31 1,917.60 1,870.80
24,218.95 21,538.35 TOTAL EQUITY AND LIABILITIES 59,212.30 58,878.28
See accompanying notes to financial statements
As per our report of even date attached For and on behalf of the Board
For B S R & Co. LLPChartered AccountantsFirm’s Registration No: 101248W/W-100022
YEZDI NAGPOREWALLAPartnerMembership No. 049265Mumbai, May 23, 2018
N CHANDRASEKARAN [DIN: 00121863]Chairman
N MUNJEE [DIN:00010180]
V K JAIRATH [DIN:00391684]
F S NAYAR [DIN:00003633]
O P BHATT [DIN:00548091]
R SPETH [DIN:03318908]
Directors
GUENTER BUTSCHEK [DIN: 07427375]CEO and Managing DirectorS B BORWANKAR [DIN: 01793948]ED and Chief Operating OfficerP B BALAJIGroup Chief Financial OfficerH K SETHNA [FCS: 3507]Company Secretary
Mumbai, May 23, 2018

19373rd Annual Report 2017-18
INTEGRATED REPORT 1-65 STATUTORY REPORTS 66-184 FINANCIAL STATEMENTS 185-353
Statement of Profit and Loss
(` in crores)
Notes Year ended March 31, 2018
Year ended March 31, 2017
I. Revenue from operations 32 59,624.69 49,054.49 II. Other Income 33 1,557.60 981.06 III. Total Income (I+II) 61,182.29 50,035.55 IV. Expenses
(a) Cost of materials consumed 37,080.45 27,651.65 (b) Purchases of products for sale 4,762.41 3,945.97 ( c) Changes in inventories of finished goods, work-in-progress and products for sale 842.05 (252.14)(d) Excise duty 32(2) 793.28 4,738.15 (e) Employee benefits expense 34 3,966.73 3,764.35 (f) Finance costs 35 1,744.43 1,569.01 (g) Foreign exchange (gain)/loss (net) 17.14 (252.78)(h) Depreciation and amortisation expense 3,101.89 3,037.12 (i) Product development/Engineering expenses 474.98 454.48 (j) Other expenses 36 9,234.27 8,335.90 (k) Amount capitalised (855.08) (941.60)Total Expenses (IV) 61,162.55 52,050.11
V. Profit/(loss) before exceptional items and tax (III-IV) 19.74 (2,014.56)VI. Exceptional items
(a) Provision for impairment of investment in a subsidiary - 123.17 (b) Employee separation cost 3.68 67.61 ( c) Provision for impairment of capital work-in-progress and intangibles under development 37(a) 962.98 - (d) Others 37(b) - 147.93
VII. Profit/(loss) before tax (V-VI) (946.92) (2,353.27)VIII. Tax expense/(credit) (net)
(a) Current tax 92.63 57.06 (b) Deferred tax (4.70) 19.27 Total tax expense/(credit) 87.93 76.33
IX. Profit/(loss) for the year from continuing operations (VII-VIII) (1,034.85) (2,429.60)X. Other comprehensive income/(loss):
(A) (i) Items that will not be reclassified to profit and loss: (a) Remeasurement gains and (losses) on defined benefit obligations (net) 18.24 8.24 (b) Equity instruments at fair value through other comprehensive income 44.04 73.84 (ii) Income tax (expense)/credit relating to items that will not be reclassified to profit or loss (6.27) (3.12)(B) (i) Items that will be reclassified to profit or loss - gains and (losses) in cash flow hedges (19.56) 23.32 (ii) Income tax (expense)/credit relating to items that will be reclassified to profit or loss 6.77 (8.07)Total other comprehensive income/(loss), net of taxes 43.22 94.21
XI. Total comprehensive income/(loss) for the year (IX+X) (991.63) (2,335.39)XII. Earnings per equity share (EPS) 39
(A) Ordinary shares (face value of ` 2 each) : (i) Basic ` (3.05) (7.15) (ii) Diluted ` (3.05) (7.15)(B) ‘A’ Ordinary shares (face value of ` 2 each) : (i) Basic ` (3.05) (7.15) (ii) Diluted ` (3.05) (7.15)
See accompanying notes to financial statements
As per our report of even date attached For and on behalf of the Board
For B S R & Co. LLPChartered AccountantsFirm’s Registration No: 101248W/W-100022
YEZDI NAGPOREWALLAPartnerMembership No. 049265Mumbai, May 23, 2018
N CHANDRASEKARAN [DIN: 00121863]Chairman
N MUNJEE [DIN:00010180]
V K JAIRATH [DIN:00391684]
F S NAYAR [DIN:00003633]
O P BHATT [DIN:00548091]
R SPETH [DIN:03318908]
Directors
GUENTER BUTSCHEK [DIN: 07427375]CEO and Managing DirectorS B BORWANKAR [DIN: 01793948]ED and Chief Operating OfficerP B BALAJIGroup Chief Financial OfficerH K SETHNA [FCS: 3507]Company Secretary
Mumbai, May 23, 2018

194
Cash Flow Statement
(` in crores)Year ended
March 31, 2018Year ended
March 31, 2017Cash flows from operating activities:Profit/(loss) after tax (1,034.85) (2,429.60)Adjustments for:Depreciation and amortisation expense 3,101.89 3,037.12 Allowances for trade and other receivables (109.19) 133.72 Inventory write down/(write back) 162.87 103.35 Provision for impairment of investment in a subsidiary - 123.17 Marked-to-market on investments measured at Fair value through profit or loss (2.03) (3.75)Provision for impairment of capital work-in-progress and intangibles under development 962.98 - Exceptional items - others - 147.93 Loss on sale of assets (net) (including assets scrapped / written off) 689.17 140.29 Profit on sale of investments at FVTPL (net) (103.17) (116.76)Gain on fair value of below market interest loans (6.02) (46.52)Tax expense / (credit) 87.93 76.33 Interest/dividend (net) 292.03 708.46 Foreign exchange (gain)/loss (net) 49.24 (212.10)
5,125.70 4,091.24Cash flows from operating activities before changes in following assets and liabilities 4,090.85 1,661.64Trade receivables (1,217.44) (199.07)Loans and advances and other financial assets (1,091.81) (107.37)Other current and non-current assets 429.86 (329.96)Inventories (277.80) (571.77)Trade payables and acceptances 2,763.65 2,313.77 Other current and non-current liabilities (138.51) 24.39 Other financial liabilities (957.23) (1,308.96)Provisions 540.78 85.88 Cash generated from operations 4,142.35 1,568.55 Income taxes credit/(paid) (net) (8.41) (115.10)Net cash from operating activities 4,133.94 1,453.45
Cash flows from investing activities:Payments for property, plant and equipments (1,378.58) (1,958.81)Payments for other intangible assets (1,444.37) (1,554.79)Proceeds from sale of property, plant and equipments 28.15 17.11 Investments in Mutual Fund (purchased)/sold (net) 1,025.59 (537.40)Investments in subsidiary companies (300.00) (139.08)Investments in joint ventures (2.50) (0.01)Loans to subsidiary companies - (0.07)Investment in other companies (41.63) - Repayment of loans to others - 0.75 (Increase)/Decrease in short term inter corporate deposit 60.00 20.00 Repayment of loans to joint operations - 132.50 Deposits with financial institution - (35.00)Deposits/restricted deposits with banks (768.67) (114.72)Realisation of deposits/restricted deposits with banks 657.71 379.00 Interest received 399.34 258.87 Dividend received 1,054.69 672.65 Net cash used in investing activities (710.27) (2,859.00)
Cash flows from financing activitiesProceeds from issue of shares held in abeyance 0.00* 4.55 Proceeds from long-term borrowings 1,621.80 4,070.52 Repayment of long-term borrowings (587.10) (2,596.22)Proceeds from short-term borrowings 3,644.70 6,616.67 Repayment of short-term borrowings (6,823.28) (3,298.44)Net change in other short-term borrowings (with maturity up to three months) 1,139.44 (1,578.83)Dividend paid (including dividend distribution tax) (2.75) (73.00)Interest paid [including discounting charges paid, ` 478.28 crores (March 31, 2017 ` 249.06 crores)] (2,098.44) (1,936.45)Net cash (used in) / from financing activities (3,105.63) 1,208.80 Net increase /(decrease) cash and cash equivalents 318.04 (196.75)Cash and cash equivalents as at April 1, (opening balance) 228.94 427.07 Exchange fluctuation on foreign currency bank balances (0.16) (1.38)Cash and cash equivalents as at March 31, (closing balance) 546.82 228.94 Non-cash transactions:Liability towards property, plant and equipment and other intangible assets purchased on credit/deferred credit 258.04 327.82 Increase / (decrease) in liabilities arising from financing activities on account of non-cash transactions :Exchange differences 25.66 (124.06)Amortisation / EIR adjustments of prepaid borrowings 13.73 13.90 * less than ` 50,000/-
As per our report of even date attached For and on behalf of the Board
For B S R & Co. LLPChartered AccountantsFirm’s Registration No: 101248W/W-100022
YEZDI NAGPOREWALLAPartnerMembership No. 049265Mumbai, May 23, 2018
N CHANDRASEKARAN [DIN: 00121863]Chairman
N MUNJEE [DIN:00010180]
V K JAIRATH [DIN:00391684]
F S NAYAR [DIN:00003633]
O P BHATT [DIN:00548091]
R SPETH [DIN:03318908]
Directors
GUENTER BUTSCHEK [DIN: 07427375]CEO and Managing DirectorS B BORWANKAR [DIN: 01793948]ED and Chief Operating OfficerP B BALAJIGroup Chief Financial OfficerH K SETHNA [FCS: 3507]Company Secretary
Mumbai, May 23, 2018

19573rd Annual Report 2017-18
INTEGRATED REPORT 1-65 STATUTORY REPORTS 66-184 FINANCIAL STATEMENTS 185-353
Sta
tem
ent o
f Cha
nges
in E
quity
fo
r the
yea
r end
ed M
arch
31,
2018
A.
Equi
ty S
hare
Cap
ital
(` in
cro
res)
Par
ticul
ars
Equ
ity S
hare
Cap
ital
Bal
ance
as
at A
pril
1, 20
17 6
79.2
2 P
roce
eds
from
issu
e of
sha
res
held
in a
beya
nce
0.0
0*B
alan
ce a
s at
Mar
ch 3
1, 20
18 6
79.2
2
*les
s th
an `
50,
000/
-
B.
Oth
er E
quity
(ref
er n
ote
22)
(` in
cro
res)
Par
ticul
ars
Sec
uriti
es
prem
ium
ac
coun
t
Capi
tal
rede
mpt
ion
rese
rve
Deb
entu
re
rede
mpt
ion
rese
rve
Capi
tal
Res
erve
(o
n m
erge
r)
Ret
aine
d ea
rnin
gsO
ther
com
pone
nts
of e
quity
Tota
l oth
er
equi
ty
Equi
ty in
stru
men
ts
thro
ugh
OCI
Hed
ging
re
serv
eCo
st o
f he
dgin
g re
serv
eB
alan
ce a
s at
Apr
il 1,
2017
19,2
13.9
3 2
.28
1,08
5.94
(3
45.3
0) 5
31.0
2 (2
7.12)
11.2
6 11
.38
20,
483.
39
Pro
fit/(
loss
) for
the
perio
d -
-
-
-
(1
,034
.85)
-
-
-
(1,0
34.8
5)O
ther
com
preh
ensi
ve in
com
e/(lo
ss) f
or th
e ye
ar -
-
-
-
11
.97
44.
04
(14.
40)
1.61
4
3.22
To
tal
com
preh
ensi
ve in
com
e/(lo
ss) f
or th
e ye
ar -
-
-
-
(1
,022
.88)
44.
04
(14.
40)
1.61
(9
91.6
3)P
roce
eds
from
issu
e of
sha
res
held
in a
beya
nce
0.0
0 *
-
-
-
-
-
-
-
0.0
0 *
Bal
ance
as
at M
arch
31,
2018
19,2
13.9
3 2
.28
1,
085.
94
(345
.30)
(491
.86)
16.9
2 (3
.14)
12.9
9 19
,491
.76
* le
ss th
an `
50,
000/
-
See
acco
mpa
nyin
g no
tes
to fi
nanc
ial s
tate
men
ts
As
per o
ur re
port
of e
ven
date
att
ache
dFo
r and
on
beha
lf of
the
Boa
rd
For B
S R
& C
o. L
LPCh
arte
red
Acco
unta
nts
Firm
’s R
egis
trat
ion
No:
1012
48W
/W-1
0002
2
YEZD
I NA
GP
OR
EWA
LLA
Part
ner
Mem
bers
hip
No.
049
265
Mum
bai,
May
23,
201
8
N C
HA
ND
RA
SEK
AR
AN
[DIN
: 001
2186
3]Ch
airm
anN
MU
NJE
E [D
IN:0
0010
180]
V K
JA
IRAT
H [D
IN:0
0391
684]
F S
NAY
AR
[DIN
:000
0363
3]
O P
BH
ATT
[DIN
:005
4809
1]
R S
PET
H [D
IN:0
3318
908]
Dire
ctor
s
GU
ENTE
R B
UTS
CHEK
[DIN
: 074
2737
5]CE
O a
nd M
anag
ing
Dire
ctor
S B
BO
RW
AN
KA
R [D
IN: 0
1793
948]
ED a
nd C
hief
Ope
ratin
g O
ffic
erP
B B
ALA
JIG
roup
Chi
ef F
inan
cial
Off
icer
H K
SET
HN
A [F
CS: 3
507]
Com
pany
Sec
reta
ryM
umba
i, M
ay 2
3, 2
018

196
Sta
tem
ent o
f Cha
nges
in E
quity
fo
r the
yea
r end
ed M
arch
31,
2017
A.
Equi
ty S
hare
Cap
ital
(` in
cro
res)
Par
ticul
ars
Equ
ity S
hare
Cap
ital
Bal
ance
as
at A
pril
1, 20
16 6
79.18
P
roce
eds
from
is
sue
of
shar
es
held
in
ab
eyan
ce
and
amou
nts
rece
ived
on
unpa
id c
alls
0.04
Bal
ance
as
at M
arch
31,
2017
679
.22
B.
Oth
er E
quity
(`
in c
rore
s)
Par
ticul
ars
Sec
uriti
es
prem
ium
ac
coun
t
Capi
tal
rede
mpt
ion
rese
rve
Deb
entu
re
rede
mpt
ion
rese
rve
Capi
tal
Res
erve
(o
n m
erge
r)
Ret
aine
d ea
rnin
gsO
ther
com
pone
nts
of e
quity
Tota
l oth
er
equi
tyEq
uity
inst
rum
ents
th
roug
h O
CIH
edgi
ng
rese
rve
Cost
of h
edgi
ng
rese
rve
Bal
ance
as
at A
pril
1, 20
16 19
,209
.42
2.28
1,04
2.15
-
2
,422
.65
(100
.96)
7.3
9 -
2
2,58
2.93
Ef
fect
of m
erge
r of T
ML
Driv
elin
es
(ref
er n
ote
47(ii
i)) -
-
-
(3
45.3
0) 6
49.6
4 -
-
-
3
04.3
4 B
alan
ce a
s at
Apr
il 1,
2016
19,2
09.4
2 2
.28
1,04
2.15
(3
45.3
0) 3
,072
.29
(100
.96)
7.3
9 -
2
2,8
87.
27
Pro
fit/(
loss
) for
the
year
-
-
-
-
(2,4
29.6
0) -
-
-
(2
,429
.60)
Oth
er c
ompr
ehen
sive
inco
me/
(loss
) fo
r the
yea
r -
-
-
-
5
.12
73.
84
3.8
7 11
.38
94.
21
Tota
l com
preh
ensi
ve in
com
e/(lo
ss)
for t
he y
ear
-
-
-
-
(2,4
24.4
8) 7
3.8
4 3
.87
11.3
8
(2,3
35.3
9)P
roce
eds
from
issu
e of
sha
res
held
in
abe
yanc
e 4
.51
-
-
-
-
-
-
-
4.5
1 Tr
ansf
er to
deb
entu
re re
dem
ptio
n re
serv
e -
-
4
3.79
-
(4
3.79
) -
-
-
-
D
ivid
end
(incl
udin
g di
vide
nd ta
x) -
-
-
-
(7
3.00
) -
-
-
(7
3.00
)B
alan
ce a
s at
Mar
ch 3
1, 20
17 19
,213
.93
2.2
8
1,08
5.94
(3
45.3
0) 5
31.0
2 (2
7.12
) 11
.26
11.3
8
20,
483.
39
See
acco
mpa
nyin
g no
tes
to fi
nanc
ial s
tate
men
ts
As
per o
ur re
port
of e
ven
date
att
ache
dFo
r and
on
beha
lf of
the
Boa
rd
For B
S R
& C
o. L
LPCh
arte
red
Acco
unta
nts
Firm
’s R
egis
trat
ion
No:
1012
48W
/W-1
0002
2
YEZD
I NA
GP
OR
EWA
LLA
Part
ner
Mem
bers
hip
No.
049
265
Mum
bai,
May
23,
201
8
N C
HA
ND
RA
SEK
AR
AN
[DIN
: 001
2186
3]Ch
airm
anN
MU
NJE
E [D
IN:0
0010
180]
V K
JA
IRAT
H [D
IN:0
0391
684]
F S
NAY
AR
[DIN
:000
0363
3]
O P
BH
ATT
[DIN
:005
4809
1]
R S
PET
H [D
IN:0
3318
908]
Dire
ctor
s
GU
ENTE
R B
UTS
CHEK
[DIN
: 074
2737
5]CE
O a
nd M
anag
ing
Dire
ctor
S B
BO
RW
AN
KA
R [D
IN: 0
1793
948]
ED a
nd C
hief
Ope
ratin
g O
ffic
erP
B B
ALA
JIG
roup
Chi
ef F
inan
cial
Off
icer
H K
SET
HN
A [F
CS: 3
507]
Com
pany
Sec
reta
ryM
umba
i, M
ay 2
3, 2
018

19773rd Annual Report 2017-18
INTEGRATED REPORT 1-65 STATUTORY REPORTS 66-184 FINANCIAL STATEMENTS 185-353
1. Background and operations
Tata Motors Limited referred to as (“the Company” or “Tata Motors”), designs, manufactures and sells a wide range of automotive vehicles. The Company also manufactures engines for industrial and marine applications.
The Company is a public limited Company incorporated and domiciled in India and has its registered office at Mumbai, India. As at March 31, 2018, Tata Sons Limited, together with its subsidiaries owns 36.46% of the Ordinary shares and 0.09% of ‘A’ Ordinary shares of the Company, and has the ability to significantly influence the Company’s operations.
These standalone financial statements were approved by the Board of Directors and authorised for issue on May 23, 2018.
2. Significant accounting policies
a. Basis of preparation
These financial statements have been prepared in accordance with Ind AS as notified under the Companies (Indian Accounting Standards) Rules, 2015 read with Section 133 of the Companies Act, 2013 (the “Act”). The financial statements have been prepared on historical cost basis except for certain financial instruments measured at fair value at the end of each reporting period as explained in the accounting policies below.
Joint operations
Certain of the Company’s activities, are conducted through joint operations, which are joint arrangements whereby the parties that have joint control of the arrangement have rights to the assets, and obligations for the liabilities, relating to the arrangement. As per Ind AS 111 - Joint arrangements, in its separate financial statements, the Company being a joint operator has recognised its share of the assets, liabilities, income and expenses of these joint operations incurred jointly with the other partners, along with its share of income from the sale of the output and any assets, liabilities and expenses that it has incurred in relation to the joint operation.
Although not required by Ind AS’s, the Company has provided in note 46 additional information of Tata Motors Limited on a standalone basis excluding its interest in its two Joint Operations viz. Tata Cummins Private Limited and Fiat India Automobiles Private Limited.
b. Use of estimates and judgments
The preparation of financial statements in conformity with Ind AS requires management to make judgments, estimates and assumptions, that affect the application
of accounting policies and the reported amounts of assets, liabilities and disclosures of contingent assets and liabilities at the date of these financial statements and the reported amounts of revenues and expenses for the years presented. Actual results may differ from these estimates.
Estimates and underlying assumptions are reviewed at each balance sheet date. Revisions to accounting estimates are recognised in the period in which the estimate is revised and future periods affected.
In particular, information about significant areas of estimation uncertainty and critical judgments in applying accounting policies that have the most significant effect on the amounts recognised in the financial statements are included in the following notes:
i) Note 3 and 5 - Property, plant and equipment and Intangible assets - useful life and impairment
ii) Note 29 - Recoverability/recognition of deferred tax assets
iii) Note 27 and 28 - Provision for product warranty
iv) Note 45 - Assets and obligations relating to employee benefits
c. Revenue recognition
Revenue is measured at fair value of consideration received or receivable.
Sale of products
The Company recognises revenues on the sale of products, net of discounts, sales incentives, customer bonuses and rebates granted, when products are delivered to dealers or when delivered to a carrier for export sales, which is when title and risks and rewards of ownership pass to the customer.
Revenues are recognised when collectability of the resulting receivable is reasonably assured.
d. Government grants and incentives
Government grants are recognised when there is reasonable assurance that the Company will comply with the relevant conditions and the grant will be received. These are recorded at fair value where applicable.
Government grants are recognised in the statement of profit and loss, either on a systematic basis when the Company recognises, as expenses, the related costs that the grants are intended to compensate or, immediately if the costs have already been incurred.
Notes Forming Part of Financial Statements

198
Government grants related to assets are shown as deferred revenue and amortised over the useful life of the asset. Government grants related to income are presented as an offset against the related expenditure, and government grants that are awarded as incentives with no ongoing performance obligations to the Company are recognised as income in the period in which the grant is received.
e. Cost recognition
Costs and expenses are recognised when incurred and are classified according to their nature.
Expenditure capitalised represents employee costs, stores and other manufacturing supplies, and other expenses incurred for construction including product development undertaken by the Company.
f. Provisions
A provision is recognised if, as a result of a past event, the Company has a present legal or constructive obligation that can be estimated reliably, and it is probable that an outflow of economic benefits will be required to settle the obligation. Provisions are determined by discounting the expected future cash flows at a pre-tax rate that reflects current market assessments of the time value of money and the risks specific to the liability.
Product warranty expenses
The estimated liability for product warranties are recorded when products are sold. These estimates are established using historical information on the nature, frequency and average cost of warranty claims and management estimates regarding possible future incidences based on actions on product failures. The timing of outflows will vary as and when warranty claim will arise, being typically up to six years.
The Company also has back-to-back contractual arrangement with its suppliers in the event that a vehicle fault is proven to be a supplier’s fault. Estimates are made of the expected reimbursement claim based upon historical levels of recoveries from suppliers, adjusted for inflation and applied to the population of vehicles under warranty as on Balance Sheet date.
Supplier reimbursements are recognised as separate asset.
g. Foreign currency
These financial statements are presented in Indian rupees, which is the functional currency of Tata Motors Limited.
Transactions in foreign currencies are recorded at the exchange rate prevailing on the date of transaction. Foreign currency denominated monetary assets and liabilities are re-measured into the functional currency at the exchange rate prevailing on the balance sheet date.
Exchange differences arising on settlement of transactions and translation of monetary items are recognised in the statement of Profit or Loss except to the extent, exchange differences which are regarded as an adjustment to interest costs on foreign currency borrowings, are capitalised as part of borrowing costs.
h. Income taxes
Income tax expense comprises current and deferred taxes. Income tax expense is recognised in the statement of Profit or Loss except when they relate to items that are recognised outside profit or loss (whether in other comprehensive income or directly in equity), in which case tax is also recognised outside profit or loss.
Current income taxes are determined based on respective taxable income of each taxable entity and tax rules applicable for respective tax jurisdictions.
Deferred tax assets and liabilities are recognised for the future tax consequences of temporary differences between the carrying values of assets and liabilities and their respective tax bases, and unutilised business loss and depreciation carry-forwards and tax credits. Such deferred tax assets and liabilities are computed separately for each taxable entity. Deferred tax assets are recognised to the extent that it is probable that future taxable income will be available against which the deductible temporary differences, unused tax losses, depreciation carry-forwards and unused tax credits could be utilised.
Deferred tax assets and liabilities are measured based on the tax rates that are expected to apply in the period when the asset is realised or the liability is settled, based on tax rates and tax laws that have been enacted or substantively enacted by the balance sheet date.
Current and deferred tax assets and liabilities are offset when there is a legally enforceable right to set off current tax assets against current tax liabilities and when they relate to income taxes levied by the same taxation authority and the Company intends to settle its current tax assets and liabilities on a net basis.
i. Cash & cash equivalents
Cash and cash equivalents are short-term (three months or less from the date of acquisition), highly liquid
Notes Forming Part of Financial Statements

19973rd Annual Report 2017-18
INTEGRATED REPORT 1-65 STATUTORY REPORTS 66-184 FINANCIAL STATEMENTS 185-353
investments that are readily convertible into cash and which are subject to an insignificant risk of changes in value.
j. Earnings per share
Basic earnings per share has been computed by dividing net income by the weighted average number of shares outstanding during the year. Partly paid up shares are included as fully paid equivalents according to the fraction paid up. Diluted earnings per share has been computed using the weighted average number of shares and dilutive potential shares, except where the result would be anti-dilutive.
k. Inventories
Inventories are valued at the lower of cost and net realisable value. Cost of raw materials, components and consumables are ascertained on a moving weighted average basis. Cost, including fixed and variable production overheads, are allocated to work-in-progress and finished goods determined on a full absorption cost basis. Net realisable value is the estimated selling price in the ordinary course of business less estimated cost of completion and selling expenses.
l. Property, plant and equipment
Property, plant and equipment are stated at cost of acquisition or construction less accumulated depreciation less accumulated impairment, if any.
Freehold land is measured at cost and is not depreciated. Cost includes purchase price, taxes and duties, labour cost and direct overheads for self-constructed assets and other direct costs incurred up to the date the asset is ready for its intended use.
Interest cost incurred for constructed assets is capitalised up to the date the asset is ready for its intended use, based on borrowings incurred specifically for financing the asset or the weighted average rate of all other borrowings, if no specific borrowings have been incurred for the asset.
Depreciation is provided on the Straight Line Method (SLM) over the estimated useful lives of the assets considering the nature, estimated usage, operating conditions, past history of replacement, anticipated technological changes, manufacturers warranties and maintenance support. Taking into account these factors, the Company has decided to retain the useful life hitherto adopted for various categories of property, plant and equipments, which are different from those
prescribed in Schedule II of the Act. Estimated useful lives of assets are as follows:
Type of asset Estimated useful life
• Buildings, Roads, Bridge and culverts 4 to 60 years
• Plant, machinery and equipment 8 to 20 years
• Computers and other IT assets 4 to 6 years
• Vehicles 4 to 10 years
• Furniture, fixtures and office appliances
5 to 15 years
The useful lives are reviewed at least at each year end. Changes in expected useful lives are treated as change in accounting estimates.
Assets held under finance leases are depreciated over their expected useful lives on the same basis as owned assets or, where shorter, the term of the relevant lease.
Depreciation is not recorded on capital work-in-progress until construction and installation are complete and the asset is ready for its intended use.
m. Other intangible assets
Intangible assets purchased are measured at cost less accumulated amortisation and accumulated impairment, if any.
Amortisation is provided on a straight-line basis over estimated useful lives of the intangible assets as per details below:
Type of asset Estimated amortisation
period
• Technological know-how 8 to 10 years
• Software 4 years
The amortisation period for intangible assets with finite useful lives are reviewed at least at each year-end. Changes in expected useful lives are treated as changes in accounting estimates.
Internally generated intangible assets
Research costs are charged to the statement of Profit or Loss in the year in which they are incurred.
Product development costs incurred on new vehicle platform, engines, transmission and new products are recognised as intangible assets, when feasibility has been established, the Company has committed technical, financial and other resources to complete the development and it is probable that asset will generate
Notes Forming Part of Financial Statements

200
future economic benefits.
The costs capitalised include the cost of materials, direct labour and directly attributable overhead expenditure incurred up to the date the asset is available for use.
Interest cost incurred is capitalised up to the date the asset is ready for its intended use, based on borrowings incurred specifically for financing the asset or the weighted average rate of all other borrowings if no specific borrowings have been incurred for the asset.
Product development costs are amortised over a period of 120 months for New Generation vehicles and powertrains on the basis of higher of the volumes between planned and actuals and on a straight line method over a period of 36 months for Vehicle Variants, Derivatives and other Regulatory Projects.
Capitalised development expenditure is measured at cost less accumulated amortisation and accumulated impairment, if any.
n. Goodwill
Cash generating units to which goodwill is allocated are tested for impairment annually at each balance sheet date, or more frequently when there is an indication that the unit may be impaired. If the recoverable amount of the cash generating unit is less than the carrying amount of the unit, the impairment loss is allocated first to reduce the carrying amount of any goodwill allocated to that unit and then to the other assets of the unit pro rata on the basis of carrying amount of each asset in the unit. Goodwill impairment loss recognised is not reversed in subsequent period.
o. Leases
At the inception of a lease, the lease arrangement is classified as either a finance lease or an operating lease, based on the substance of the lease arrangement.
Assets taken on finance lease
A finance lease is recognised as an asset and a liability at the commencement of the lease, at the lower of the fair value of the asset and the present value of the minimum lease payments. Initial direct costs, if any, are also capitalised and, subsequent to initial recognition, the asset is accounted for in accordance
with the accounting policy applicable to that asset. Minimum lease payments made under finance leases are apportioned between the finance expense and the reduction of the outstanding liability. The finance expense is allocated to each period during the lease term so as to produce a constant periodic rate of interest on the remaining balance of the liability.
Assets taken on operating lease
Leases other than finance leases are operating leases, and the leased assets are not recognised on the Company’s balance sheet. Payments made under operating leases are recognised in the statement of Profit or Loss on a straight-line basis over the term of the lease.
Assets given on finance lease
All assets given on finance lease are shown as receivables at an amount equal to net investment in the lease. Initial direct costs in respect of lease are expensed in the period in which such costs are incurred. Income from lease assets is accounted by applying the interest rate implicit in the lease to the net investment.
p. Impairment
At each balance sheet date, the Company assesses whether there is any indication that any property, plant and equipment and intangible assets with finite lives may be impaired. If any such impairment exists the recoverable amount of an asset is estimated to determine the extent of impairment, if any. Where it is not possible to estimate the recoverable amount of an individual asset, the Company estimates the recoverable amount of the cash-generating unit to which the asset belongs.
Intangible assets not yet available for use, are tested for impairment annually at each balance sheet date, or earlier, if there is an indication that the asset may be impaired.
Recoverable amount is the higher of fair value less costs to sell and value in use. In assessing value in use, the estimated future cash flows are discounted to their present value using a pre-tax discount rate that reflects current market assessments of the time value of money and the risks specific to the asset for which the estimates of future cash flows have not been adjusted.
If the recoverable amount of an asset (or cash-generating unit) is estimated to be less than its carrying amount, the carrying amount of the asset (or cash-generating unit) is reduced to its recoverable amount. An impairment loss is recognised immediately in the statement of Profit or Loss.
Notes Forming Part of Financial Statements
20173rd Annual Report 2017-18
INTEGRATED REPORT 1-65 STATUTORY REPORTS 66-184 FINANCIAL STATEMENTS 185-353
q. Employee benefits
i) Gratuity
Tata Motors Limited and its Joint operations have an obligation towards gratuity, a defined benefit retirement plan covering eligible employees. The plan provides for a lump-sum payment to vested employees at retirement, death while in employment or on termination of employment of an amount equivalent to 15 to 30 days salary payable for each completed year of service. Vesting occurs upon completion of five years of service. Tata Motors Limited make annual contributions to gratuity funds established as trusts. Tata Motors Limited account for the liability for gratuity benefits payable in the future based on an actuarial valuation.
ii) Superannuation
Tata Motors Limited have two superannuation plans, a defined benefit plan and a defined contribution plan. An eligible employee on April 1, 1996 could elect to be a member of either plan.
Employees who are members of the defined benefit superannuation plan are entitled to benefits depending on the years of service and salary drawn. The monthly pension benefits after retirement range from 0.75% to 2% of the annual basic salary for each year of service. Tata Motors Limited account for superannuation benefits payable in future under the plan based on an actuarial valuation.
With effect from April 1, 2003, this plan was amended and benefits earned by covered employees have been protected as at March 31, 2003. Employees covered by this plan are prospectively entitled to benefits computed on a basis that ensures that the annual cost of providing the pension benefits would not exceed 15% of salary.
During the year ended March 31, 2015, the employees covered by this plan were given a one-time option to exit from the plan prospectively. Furthermore, the employees who opted for exit were given one- time option to withdraw accumulated balances from the superannuation plan.
The Company maintains a separate irrevocable trust for employees covered and entitled to benefits. The Company contributes up to 15% or ` 1,50,000 whichever is lower of the eligible employee’s salary to the trust every year. The Company recognises such contribution as an expense when
incurred and has no further obligation beyond this contribution.
iii) Bhavishya Kalyan Yojana (BKY)
Bhavishya Kalyan Yojana is an unfunded defined benefit plan for employees of Tata Motors Limited. The benefits of the plan include pension in certain cases, payable up to the date of normal superannuation had the employee been in service, to an eligible employee at the time of death or permanent disablement, while in service, either as a result of an injury or as certified by the appropriate authority. The monthly payment to dependents of the deceased/disabled employee under the plan equals 50% of the salary drawn at the time of death or accident or a specified amount, whichever is greater. Tata Motors Limited account for the liability for BKY benefits payable in the future based on an actuarial valuation.
iv) Provident fund and family pension
In accordance with Indian law, eligible employees of Tata Motors Limited and its Joint operations are entitled to receive benefits in respect of provident fund, a defined contribution plan, in which both employees and the Company make monthly contributions at a specified percentage of the covered employees’ salary (currently 12% of employees’ salary). The contributions, as specified under the law, are made to the provident fund and pension fund set up as an irrevocable trust by Tata Motors Limited for its employees. The interest rate payable to the members of the trust shall not be lower than the statutory rate of interest declared by the Central Government under the Employees Provident Funds and Miscellaneous Provisions Act, 1952 and shortfall, if any, shall be made good by the Company. The liability in respect of the shortfall of interest earnings of the Fund is determined on the basis of an actuarial valuation. The liability toward interest is a defined benefit. There is no shortfall as at March 31, 2018.
v) Post-retirement medicare scheme
Under this unfunded scheme, employees of Tata Motors Limited receive medical benefits subject to certain limits on amounts of benefits, periods after retirement and types of benefits, depending on their grade and location at the time of retirement. Employees separated from the Company as part of an Early Separation Scheme, on medical grounds
Notes Forming Part of Financial Statements

202
or due to permanent disablement are also covered under the scheme. Tata Motors Limited account for the liability for post-retirement medical scheme based on an actuarial valuation.
vi) Compensated absences
The Company provides for the encashment of leave or leave with pay subject to certain rules. The employees are entitled to accumulate leave subject to certain limits, for future encashment. The liability is provided based on the number of days of unutilised leave at each balance sheet date on the basis of an independent actuarial valuation.
vii) Remeasurement gains and losses
Remeasurement comprising actuarial gains and losses, the effect of the asset ceiling and the return on assets (excluding interest) relating to retirement benefit plans, are recognised directly in other comprehensive income in the period in which they arise. Remeasurement recorded in other comprehensive income is not reclassified to statement of Profit or Loss.
Actuarial gains and losses relating to long-term employee benefits are recognised in the statement of Profit or Loss in the period in which they arise.
viii) Measurement date
The measurement date of retirement plans is March 31.
ix) The present value of the defined benefit liability and the related current service cost and past service cost are measured using projected unit credit method.
r. Dividends
Any dividend declared by Tata Motors Limited for any financial year is based on the profits available for distribution as reported in the standalone statutory financial statements of Tata Motors Limited (without joint operations) prepared in accordance with Generally Accepted Accounting Principles in India, or Ind AS. Indian law mandates that dividend be declared out of distributable profits, after setting off un-provided losses and depreciation of previous years. In case of inadequacy or absence of profits in a particular year, a Company may pay dividend out of accumulated profits of previous years transferred to retained earnings, however in the absence of accumulated profits, Company may declare
dividend out of free reserve subject to certain conditions. Accordingly, in certain years the net income reported in the financial statements may not be fully distributable. The amount available for distribution is ` Nil as at March 31, 2018 (` Nil as at March 31, 2017).
s. Segments
The Company is engaged mainly in the business of automobile products consisting of all types of commercial and passenger vehicles. These in the context of Ind AS 108 - operating segments reporting are considered to constitute one reportable segment.
t. Investments in subsidiaries, Joint Ventures and Associates
Investments in subsidiaries, Joint Ventures and Associates are measured at cost as per Ind AS 27 – Separate Financial Statements.
u. Financial instruments
i) Classification, initial recognition and measurement
A financial instrument is any contract that gives rise to a financial asset of one entity and a financial liability or equity instrument of another entity. Financial assets other than equity instruments are classified into categories: financial assets at fair value through profit or loss and at amortised cost. Financial assets that are equity instruments are classified as fair value through profit or loss or fair value through other comprehensive income. Financial liabilities are classified into financial liabilities at fair value through profit or loss and other financial liabilities.
Financial instruments are recognised on the balance sheet when the Company becomes a party to the contractual provisions of the instrument.
Initially, a financial instrument is recognised at its fair value. Transaction costs directly attributable to the acquisition or issue of financial instruments are recognised in determining the carrying amount, if it is not classified as at fair value through profit or loss. Subsequently, financial instruments are measured according to the category in which they are classified.
Financial assets at amortised cost: Financial assets having contractual terms that give rise on specified dates to cash flows that are solely payments of principal and interest on the principal outstanding and that are held within a business model whose objective is to hold such assets in order to collect such contractual cash flows are classified in this
Notes Forming Part of Financial Statements

20373rd Annual Report 2017-18
INTEGRATED REPORT 1-65 STATUTORY REPORTS 66-184 FINANCIAL STATEMENTS 185-353
category. Subsequently, these are measured at amortised cost using the effective interest method less any impairment losses.
Equity investments at fair value through other comprehensive income: These include financial assets that are equity instruments and are designated as such upon initial recognition irrevocably. Subsequently, these are measured at fair value and changes therein are recognised directly in other comprehensive income, net of applicable income taxes.
Dividends from these equity investments are recognised in the statement of Profit or Loss when the right to receive payment has been established.
When the equity investment is derecognised, the cumulative gain or loss in equity is transferred to retained earnings.
Financial assets at fair value through profit and loss: Financial assets are measured at fair value through profit or loss unless it is measured at amortised cost or at fair value through other comprehensive income on initial recognition. The transaction costs directly attributable to the acquisition of financial assets and liabilities at fair value through profit or loss are immediately recognised in profit and loss.
Equity instruments: An equity instrument is any contract that evidences residual interests in the assets of the Company after deducting all of its liabilities. Equity instruments issued by the Company are recorded at the proceeds received, net of direct issue costs.
Financial liabilities at fair value through profit or loss: Derivatives, including embedded derivatives separated from the host contract, unless they are designated as hedging instruments, for which hedge accounting is applied, are classified into this category. These are measured at fair value with changes in fair value recognised in the statement of Profit or Loss.
Financial guarantee contracts: These are initially measured at their fair values and, are subsequently measured at the higher of the amount of loss allowance determined or the amount initially recognised less, the cumulative amount of income recognised.
Other financial liabilities: These are measured at amortised cost using the effective interest method.
ii) Determination of fair value:
The fair value of a financial instrument on initial recognition is normally the transaction price (fair value of the consideration given or received). Subsequent to initial recognition, the Company determines the fair value of financial instruments that are quoted in active markets using the quoted bid prices (financial assets held) or quoted ask prices (financial liabilities held) and using valuation techniques for other instruments. Valuation techniques include discounted cash flow method and other valuation models.
iii) Derecognition of financial assets and financial liabilities:
The Company derecognises a financial asset only when the contractual rights to the cash flows from the asset expires or it transfers the financial asset and substantially all the risks and rewards of ownership of the asset to another entity. If the Company neither transfers nor retains substantially all the risks and rewards of ownership and continues to control the transferred asset, the Company recognises its retained interest in the asset and an associated liability for amounts it may have to pay. If the Company retains substantially all the risks and rewards of ownership of a transferred financial asset, the Company continues to recognise the financial asset and also recognises a collateralised borrowing for the proceeds received.
Financial liabilities are decrecognised when these are extinguished, that is when the obligation is discharged, cancelled or has expired.
iv) Impairment of financial assets:
The Company recognises a loss allowance for expected credit losses on a financial asset that is at amortised cost. Loss allowance in respect of financial assets is measured at an amount equal to life time expected credit losses and is calculated as the difference between their carrying amount and the present value of the expected future cash flows discounted at the original effective interest rate.
Notes Forming Part of Financial Statements

204
v. Hedge accounting
The Company uses foreign currency forward contracts to hedge its risks associated with foreign currency fluctuations relating to highly probable forecast transactions. The Company designates these forward contracts in a cash flow hedging relationship by applying the hedge accounting principles.
These forward contracts are stated at fair value at each reporting date. Changes in the fair value of these forward contracts that are designated and effective as hedges of future cash flows are recognised in other comprehensive income and the ineffective portion is recognised immediately in the statement of Profit or Loss. Amounts accumulated in equity are reclassified to the statement of Profit or Loss in the periods in which the forecasted transactions occur.
Forward premium in forward contract are not considered part of the hedge. These are treated as cost of hedge and the changes in fair value attributable to forward premium is recognised in the other comprehensive income along with the changes in fair value determined to be effective portion of the hedge.
Hedge accounting is discontinued when the hedging instrument expires or is sold, terminated, or exercised, or no longer qualifies for hedge accounting. For forecast transactions, any cumulative gain or loss on the hedging instrument recognised in equity is retained there until the forecast transaction occurs.
If the forecast transaction is no longer expected to occur, the net cumulative gain or loss recognised in equity is immediately transferred to the statement of Profit or Loss for the year.
w. Recent accounting pronouncements
Ind AS 115 - Revenue from Contracts with Customers
The standard outlines a single comprehensive model for entities to use in accounting for revenue arising from contracts with customers and supersedes most of the current revenue recognition guidance. The core principle of the new standard is for companies to recognise revenue to depict the transfer of goods or services to customers in amounts that reflect the consideration (that is, payment) to which the company expects to be entitled to exchange for those goods or services. The new standard also will result in enhanced disclosures about revenue, provide guidance for transactions that were not previously addressed
comprehensively (for example, service revenue and contract modifications) and improve guidance for multiple-element arrangements. Ind AS 115 is effective from April 1, 2018.
The Company will be adopting Ind AS 115 with a modified retrospective approach. The cumulative effect of initially applying this Standard will be recorded as an adjustment to the opening balance of retained earnings. The figures for the comparative periods will not be restated. The Company has assessed that the profit impact of Ind AS 115 adoption will not be significant to the financial statements.
Certain payouts made to dealers such as infrastructure support are to be treated as variable components of consideration and will therefore in accordance with Ind AS 115, be recognised as revenue deductions in future. These costs are presently reported as other expenses. These change in presentation in the income statement will result in decrease in both revenues and expenses.
Incentives received as Government Grants will be shown as other income which is currently presented under other operating revenues.
The introduction of the Standard will give rise to new financial statement categories in the statement of financial position, being “contract assets” and “contract liabilities.” These items can arise through advance payment received from customers or advance delivery of goods and services in excess of or ahead of billing at the contract level. In addition, disclosure requirements are extended.
Further, Ind AS 115, allows for transitional arrangements for modified and fulfilled contracts, and clarify the identification of performance obligations, principal-agent relationships, and licenses. The application of these amendments is also not expected to have any major impact on the Company’s profitability, liquidity and capital resources or financial position.
Ind AS 21 - The Effect of Changes in Foreign Exchange Rates
The amendment clarifies on the accounting of transaction that include the receipt or payment of advance consideration in a foreign currency. The appendix explains that the date of the transaction, for the purpose of determining rate, is the date of initial recognition of the non-monetary prepayment asset or deferred income liability. If there are multiple payments or receipts in advance, a date of transaction is established for each payment or receipt. The Company is evaluating the impact of this amendment on its financial statements.
Notes Forming Part of Financial Statements

20573rd Annual Report 2017-18
INTEGRATED REPORT 1-65 STATUTORY REPORTS 66-184 FINANCIAL STATEMENTS 185-353
Not
es F
orm
ing
Par
t of F
inan
cial
Sta
tem
ents
3.
Pro
pert
y, p
lant
and
equ
ipm
ent
(` in
cro
res)
Ow
ned
asse
tsG
iven
on
leas
eTa
ken
on le
ase
Land
Bui
ldin
gsP
lant
, m
achi
nery
an
d eq
uipm
ent
Furn
iture
an
d fix
ture
s
Vehi
cles
Com
pute
rs
& o
ther
IT
asse
ts
Pla
nt,
mac
hine
ry
and
equi
pmen
t
Bui
ldin
gsB
uild
ings
Pla
nt,
mac
hine
ry
and
equi
pmen
t
Com
pute
rs
& o
ther
IT
asse
ts
Furn
iture
an
d fix
ture
s
Tota
l
Cost
as
at A
pril
1, 20
174,
574.
93
3,3
84.4
3 2
4,76
7.37
2
43.7
4 18
6.75
6
39.6
5 3
8.68
4
.05
31.2
8 3
6.43
17
8.88
4
.31
34,
090.
50
Add
ition
s -
13
9.65
2
,191.5
0 14
.32
95.
91
39.
64
-
-
-
3.5
2 7
.28
-
2,4
91.8
2
Ass
ets
clas
sifie
d as
hel
d fo
r sal
e -
-
(2
.30)
-
-
-
-
-
-
-
-
-
(2.3
0)
Ass
ets
wri
tten
off
-
-
(536
.82)
-
-
-
-
-
-
-
-
-
(536
.82)
Dis
posa
l -
(0
.56)
(241
.10)
(12.
14)
(40.
31)
(18.
60)
(0.6
4) (0
.03)
-
-
-
-
(313
.38)
Cost
as
at M
arch
31,
2018
4,57
4.93
3
,523
.52
26,
178
.65
245
.92
242
.35
660
.69
38
.04
4.0
2 3
1.28
3
9.95
18
6.16
4
.31
35,7
29.8
2
Acc
umul
ated
dep
reci
atio
n as
at A
pril
1, 20
17 -
(9
96.5
5) (1
4,18
4.30
) (1
36.4
1) (1
23.7
2) (5
26.2
6) (2
0.58
) (0
.68)
(6.2
7) (3
4.60
) (1
63.3
6) (0
.65)
(16,
193.
38)
Dep
reci
atio
n fo
r the
yea
r -
(1
07.6
6) (1
,777
.03)
(13.
43)
(26.
93)
(34.
64)
(1.3
2) (0
.07)
(0.5
1) (0
.79)
(10.
70)
(0.8
6) (1
,973
.94)
Ass
ets
clas
sifie
d as
hel
d fo
r sal
e -
1.1
4 -
-
-
-
-
-
-
-
-
1.1
4
Ass
ets
wri
tten
off
-
-
389.
09 -
-
-
-
-
-
-
-
-
38
9.09
Dis
posa
l -
0
.25
180.
01
6.7
6 3
4.87
17
.62
0.2
8 -
-
-
-
-
23
9.79
Acc
umul
ated
dep
reci
atio
n as
at M
arch
31,
2018
-
(1,10
3.96
) (1
5,39
1.09
) (1
43.0
8) (1
15.7
8) (5
43.2
8) (2
1.62
) (0
.75)
(6.7
8) (3
5.39
) (1
74.0
6) (1
.51)
(17,
537.
30)
Net
car
ryin
g am
ount
as
at M
arch
31,
2018
4,57
4.93
2
,419
.56
10,7
87.
56
102.
84
126.
57
117.
41
16.4
2 3
.27
24.
50
4.5
6 12
.10
2.8
0 18
,192.
52
Cost
as
at A
pril
1, 20
164,
574.
93
3,2
47.3
9 2
2,33
1.38
229
.53
176.
75
628
.72
32.
88
4.0
5 3
1.28
116.
42
174.
26
-
31,
547.
59
Effe
ct o
f mer
ger o
f TM
L D
rivel
ines
-
46.
22
943
.76
6.4
9 1.
92
2.5
5 6
.37
-
-
-
-
-
1,00
7.31
Cost
as
at A
pril
1, 20
164,
574.
93
3,2
93.6
1 2
3,27
5.14
2
36.0
2 17
8.67
6
31.2
7 3
9.25
4
.05
31.2
8 11
6.42
17
4.26
-
3
2,55
4.90
Add
ition
s -
9
1.19
1,62
6.93
11
.49
24.
77
40.
65
0.0
4 -
-
-
4
.62
4.3
1 1,
804
.00
Dis
posa
l -
(0
.37)
(134
.70)
(3.7
7) (1
6.69
) (3
2.27
) (0
.61)
-
-
(79.
99)
-
-
(268
.40)
Cost
as
at M
arch
31,
2017
4,57
4.93
3
,384
.43
24,
767.
37
243
.74
186.
75
639
.65
38.
68
4.0
5 3
1.28
36.
43
178.
88
4.3
1 3
4,09
0.50
Acc
umul
ated
dep
reci
atio
n as
at A
pril
1, 20
16 -
(8
77.3
8) (1
2,07
2.58
) (1
20.9
1) (1
11.9
6) (5
21.5
9) (1
7.50
) (0
.59)
(5.7
6) (9
4.72
) (1
51.3
5) -
(1
3,97
4.34
)
Effe
ct o
f mer
ger o
f TM
L D
rivel
ines
(11.9
9) (5
08.4
1) (4
.40)
(0.7
0) (1
.88)
(1.16
) -
-
-
-
-
(5
28.5
4)
Acc
umul
ated
dep
reci
atio
n as
at A
pril
1, 20
16 -
(8
89.3
7) (1
2,58
0.99
) (1
25.3
1) (1
12.6
6) (5
23.4
7) (1
8.66
) (0
.59)
(5.7
6) (9
4.72
) (1
51.3
5) -
(14
,502
.88)
Dep
reci
atio
n fo
r the
yea
r -
(1
07.2
8) (1
,724
.37)
(12.
95)
(24.
84)
(35.
05)
(2.15
) (0
.09)
(0.5
1) (1
9.87
) (1
2.01
) (0
.65)
(1,9
39.7
7)
Dis
posa
l -
0
.10
121.0
6 1.
85
13.7
8 3
2.26
0
.23
-
-
79.
99
-
-
249
.27
Acc
umul
ated
dep
reci
atio
n as
at M
arch
31,
2017
-
(996
.55)
(14,
184.
30)
(136
.41)
(123
.72)
(526
.26)
(20.
58)
(0.6
8) (6
.27)
(34.
60)
(163
.36)
(0.6
5) (1
6,19
3.38
)
Net
car
ryin
g am
ount
as
at M
arch
31,
2017
4,57
4.93
2
,38
7.8
8
10,5
83.
07
107.
33
63.
03
113.
39
18.10
3
.37
25.
01
1.8
3 15
.52
3.6
6 17
,897
.12
Not
es:
a)
Bui
ldin
g in
clud
e `
8,6
31.0
0 (a
s at
Mar
ch 3
1, 20
17 `
8,6
31.0
0) b
eing
val
ue o
f inv
estm
ents
in s
hare
s of
Co-
oper
ativ
e H
ousi
ng S
ocie
ties.
b)
Land
incl
udes
` 5
25.8
0 cr
ores
for w
hich
tran
sfer
of t
itle
is p
endi
ng.

206
4. Leases
The Company has taken land, buildings, plant and equipment, computers and furniture and fixtures under operating and finance leases. The following is the summary of future minimum lease rental payments under non-cancellable operating leases and finance leases entered into by the Company:
(` in crores)
As at March 31, 2018 As at March 31, 2017
Operating Finance Operating Finance
Minimum Lease
Payments
Minimum Lease
Payments
Present value of minimum
lease payments
Minimum Lease
Payments
Minimum Lease
Payments
Present value of minimum
lease payments
Not later than one year 0.40 6.56 5.78 0.97 8.65 8.36
Later than one year but not later than five years 1.62 9.61 8.62 1.62 9.97 9.44
Later than five years 29.50 1.70 1.43 29.90 - -
Total minimum lease commitments 31.52 17.87 15.83 32.49 18.62 17.80
Less: future finance charges (2.04) (0.82)
Present value of minimum lease payments 15.83 17.80
Included in the financial statements as:
Other financial liabilities - current (refer 26) 5.78 8.36
Other financial liabilities - non-current (refer 25) 10.05 9.44
15.83 17.80
Total operating lease rent expenses were ` 77.45 crores and ` 28.79 crores for the years ended March 31, 2018 and 2017, respectively.
The Company has given plant and equipment under finance leses. The following is the summary of future minimum lease payments receivables for assets given on finance leases by the Company:
As at March 31, 2018 As at March 31, 2017
Minimum lease
payments receivables
Present value of minimum
lease payments
receivables
Minimum lease
payments receivables
Present value of minimum
lease payments
receivables
Not later than one year 33.95 12.04 - -
Later than one year but not later than five years 117.01 37.44 - -
Later than five years 78.74 80.00 - -
Total minimum lease payments receivables 229.70 129.48 - -
Less: unearned finance income (100.22) -
Present value of minimum lease payments receivables 129.48 -
Included in the financial statements as:
Other financial assets - current (refer 13) 12.04 -
Other financial assets - non-current (refer 12) 117.44 -
129.48 -
Notes Forming Part of Financial Statements

20773rd Annual Report 2017-18
INTEGRATED REPORT 1-65 STATUTORY REPORTS 66-184 FINANCIAL STATEMENTS 185-353
5. (a) Other Intangible assets(` in crores)
Technical know how
Computer Software
Product development
Total
Cost as at April 1, 2017 349.15 542.24 4,804.98 5,696.37
Additions 42.09 31.95 1,633.95 1,707.99
Fully amortised not in use - (1.27) - (1.27)
Assets classified as held for sale - - (66.29) (66.29)
Cost as at March 31, 2018 391.24 572.92 6,372.64 7,336.80
Accumulated amortisation as at April 1, 2017 (156.65) (492.10) (2,270.91) (2,919.66)
Amortisation for the year (39.12) (28.45) (1,060.38) (1,127.95)
Fully amortised not in use - 1.27 - 1.27
Assets classified as held for sale - - 21.68 21.68
Accumulated amortisation as at March 31, 2018 (195.77) (519.28) (3,309.61) (4,024.66)
Net carrying amount as at March 31, 2018 195.47 53.64 3,063.03 3,312.14
Cost as at April 1, 2016 348.91 513.06 6,796.77 7,658.74
Effect of merger of TML drivelines - 8.71 - 8.71
Cost as at April 1, 2016 348.91 521.77 6,796.77 7,667.45
Additions 0.24 20.47 445.97 466.68
Fully amortised not in use - - (2,437.76) (2,437.76)
Cost as at March 31, 2017 349.15 542.24 4,804.98 5,696.37
Accumulated amortisation as at April 1, 2016 (123.45) (459.13) (3,672.69) (4,255.27)
Effect of merger of TML drivelines - (4.96) - (4.96)
Accumulated amortisation as at April 1, 2016 (123.45) (464.09) (3,672.69) (4,260.23)
Amortisation for the year (33.20) (28.01) (1,035.98) (1,097.19)
Fully amortised not in use - - 2,437.76 2,437.76
Accumulated amortisation as at March 31, 2017 (156.65) (492.10) (2,270.91) (2,919.66)
Net carrying amount as at March 31, 2017 192.50 50.14 2,534.07 2,776.71
(b) Intangible assets under development
For the year ended March 31,
2018 2017
Balance at the beginning 5,368.38 4,133.93
Additions 1,634.69 1,813.10
Capitalised during the year (1,644.55) (447.91)
Assets classified as held for sale (177.56) -
Write off/provision for impairment (1,355.81) (130.74)
Balance at the end 3,825.15 5,368.38
Notes Forming Part of Financial Statements

208
6. Investments in subsidiaries, joint ventures and associates measured at cost - non-current
(` in crores)
Number Face value per unit
Description As at March 31, 2018
As at March 31, 2017
Equity shares
i) Subsidiaries
Unquoted
- - Tata Technologies Ltd [Note 7(1)] - 224.10
6,36,97,694 10 Concorde Motors (India) Ltd [Note 3] 109.63 109.63
- - TAL Manufacturing Solutions Ltd [Note 7(1)] - 200.00
- - Tata Motors Insurance Broking and Advisory Services Ltd [Note 71(1) and Note 7(2)] - 19.31
5,39,98,427 (GBP) 1 Tata Motors European Technical Centre PLC, (UK) [Note 2] 474.90 474.90
7,900 - Tata Technologies Inc, (USA) 0.63 0.63
1,40,47,35,056 10 Tata Motors Finance Ltd [85,714,285 shares acquired during the year] 2,800.00 2,500.00
8,67,00,000 10 Tata Marcopolo Motors Ltd 86.70 86.70
22,50,00,000 10 TML Distribution Company Ltd 225.00 225.00
2,51,16,59,418 (GBP) 1 TML Holdings Pte Ltd, (Singapore) 10,158.52 10,158.52
1,34,523 (EUR) 31.28 Tata Hispano Motors Carrocera S.A., (Spain) 17.97 17.97
1,220 (IDR) 8,855 PT Tata Motors Indonesia 0.01 0.01
2,02,000 (MAD) 1,000 Tata Hispano Motors Carroceries Maghreb S.A., (Morocco) 49.59 49.59
1,83,59,203 (SGD) 1 Tata Precision Industries Pte. Ltd, (Singapore) 40.53 40.53
Trilix Srl., Turin (Italy) [Note 4] 11.94 11.94
1,00,000 (NGN) 1 TMNL Motor Services Nigeria Ltd - # - #
13,975.42 14,118.83
Less: Provision for impairment of long-term investments (214.28) 13,761.14 (214.28) 13,904.55
ii) Associates
Quoted
29,82,214 10 Automobile Corporation of Goa Ltd 108.22 108.22
Unquoted
16,000 (TK) 1,000 NITA Co. Ltd (Bangladesh) 1.27 1.27
5,23,33,170 10 Tata AutoComp Systems Ltd 77.47 77.47
- - Tata Hitachi Construction Machinery Company Private Ltd (Note 7(1)) - 186.96 238.50 425.46
iii) Joint Ventures (JV)
Unquoted
25,00,000 10 JT Special Vehicle (P) Ltd (24,95,000 shares acquired during the year) 2.50 2.50 0.01 0.01
TOTAL 13,950.60 14,330.02
# less than ` 50,000/-
Notes:
(1) Market Value of quoted investments. 332.65 189.16
(2) The Company had given a letter of comfort to ANZ Bank, London for GBP 2 million (` 18.46 crores as at March 31, 2018) against loan extended by the bank to Tata Motors European Technical Centre PLC. UK (TMETC). Also the Company has given an undertaking to ANZ Bank, London to retain 51% ownership of TMETC at all times during the tenor of the loan.
(3) The Company has given a letter of comfort to Tata Capital Financial Services Ltd amounting to ` 15.00 crores against credit facility extended to Concorde Motors (India) Ltd (CMIL). The Company will not dilute its stake in CMIL below 100% during the tenor of the facility.
(4) Trilix Srl., Turin (Italy) is a limited liability Company.
Notes Forming Part of Financial Statements

20973rd Annual Report 2017-18
INTEGRATED REPORT 1-65 STATUTORY REPORTS 66-184 FINANCIAL STATEMENTS 185-353
7. Investments in subsidiaries and associate (held for sale) - carried at lower of cost or net-realisable value - current
Number Face value per unit
Description As at March 31, 2018
As at March 31, 2017
Equity shares
Subsidiaries
Unquoted
3,03,00,600 10 Tata Technologies Ltd (refer note 1 below) 224.10 -
11,50,00,000 10 TAL Manufacturing Solutions Ltd (refer note 1 below) 200.00 -
50,00,000 10 Tata Motors Insurance Broking and Advisory Services Ltd [refer note 1 & 2 below] (25,00,000 Bonus shares during the year) 19.31 -
Total 443.41 -
Associates
Unquoted
4,54,28,572 10 Tata Hitachi Construction Machinery Company Private Ltd (refer note 1 below) 238.50 -
Total 681.91 -
Note:
(1) The investment in the Company’s subsidiaries Tata Technologies Ltd, TAL Manufacturing Solutions Ltd and Tata Motors Insurance Broking and Advisory Services Ltd and associate Tata Hitachi Construction Machinery Company Private Ltd are classified as “Held for Sale” as they meet the criteria laid out under Ind AS 105.
(2) The Company has given a letter of comfort to HDFC bank amounting to ` 1 crore against Working Capital Facility to Tata Motors Insurance Broking and Advisory Services Ltd (TMIBASL). Also the Company has given an undertaking to HDFC bank that it will not dilute its stake below 51% in TMIBASL during the tenor of the loan.
Notes Forming Part of Financial Statements

210
8. Investments-non-current (` in crores)
Number Face value per unit
Description As at March 31, 2018
As at March 31, 2017
Investment in equity shares measured at fair value through other comprehensive income
Quoted
- - Tata Steel Ltd [Note 9 (a)] - 213.96
- - Tata Chemicals Ltd [Note 9 (a)] - - 4.22 218.18
Unquoted
50,000 1,000 Tata International Ltd 28.85 28.85
1,383 1,000 Tata Services Ltd 0.14 0.14
350 900 The Associated Building Company Ltd 0.01 0.01
1,03,10,242 100 Tata Industries Ltd 183.19 183.19
33,600 100 Kulkarni Engineering Associates Ltd - -
12,375 1,000 Tata Sons Ltd 68.75 68.75
2,25,00,001 10 Haldia Petrochemicals Ltd 22.50 22.50
2,40,000 10 Oriental Floratech (India) Pvt. Ltd - -
43,26,651 15 Tata Capital Ltd 6.70 6.70
50,000 10 NICCO Jubilee Park Ltd 0.05 310.19 0.05 310.19
TOTAL 310.19 528.37
Note:
a) Investment in equity shares measured at fair value through other comprehensive income also include: (Amount in `)
Number Face value per unit
Description As at March 31, 2018
As at March 31, 2017
- - Metal Scrap Trade Corporation Ltd - 25,000
50 5 Jamshedpur Co-operative Stores Ltd 250 250
16,56,517 (M$) 1 Tatab Industries Sdn. Bhd., (Malaysia) 1 1
4 25,000 ICICI Money Multiplier Bond 1 1
100 10 Optel Telecommunications 1,995 1,995
- - Punjab Chemicals - 1
b) (` in crores)
As at March 31, 2018
As at March 31, 2017
(1) Book Value of quoted investments - 218.18
(2) Book Value of unquoted investments 310.19 310.19
(3) Market Value of quoted investments - 218.18
Notes Forming Part of Financial Statements

21173rd Annual Report 2017-18
INTEGRATED REPORT 1-65 STATUTORY REPORTS 66-184 FINANCIAL STATEMENTS 185-353
9. Investments-current(` in crores)
Number Face value per unit
Description As at March 31, 2018
As at March 31, 2017
Investments in Mutual funds measured at Fair value through profit and loss
Unquoted
Mutual funds 1,517.03 2,437.42
Investment in equity shares measured at fair value through other comprehensive income
Quoted
51,41,696 10 Tata Steel Ltd (709,199 rights issue during the year) (note (a) below) 293.62 -
3,54,599 10 Tata Steel Ltd (Partly Paid) (354,599 rights issue during the year) (note (a) below) 5.46 -
70,249 10 Tata Chemicals Ltd (note (a) below) 4.76 303.84 - -
TOTAL 1,820.87 2,437.42
Note:
a) The Investment in Tata Steel Ltd and Tata Chemicals Ltd are classified as current investments.
b) Investment in equity shares measured at fair value through other comprehensive income also include:
(Amount in `)
Number Face value per unit
Description As at March 31, 2018
As at March 31, 2017
80,000 10 Metal Scrap Trade Corporation Ltd 25,000 -
200 10 Punjab Chemicals 1 -
c)
(` in crores)
As at March 31, 2018
As at March 31, 2017
(1) Book Value of quoted investments 303.84 -
(2) Market Value of quoted investments 303.84 -
(3) Book Value of unquoted investments 1,517.03 2,437.42
Notes Forming Part of Financial Statements

212
10. Loans and advances- non current(` in crores)
As at March 31, 2018
As at March 31, 2017
Unsecured :(a) Loans to employees 27.23 24.77 (b) Loan to subsidiaries
Considered good 12.04 12.04 Considered doubtful 585.75 585.75
597.79 597.79 Less : Allowances for doubtful loans (585.75) 12.04 (585.75) 12.04
( c) Dues from subsidiary companies, Considered doubtfulTata Hispano Motors Carrocera S.A. 53.74 53.74 Less : Allowances for doubtful dues (53.74) - (53.74) -
(d) Deposits 58.37 68.57 (e) Others
Considered good 46.32 286.08 Considered doubtful 7.30 16.41
53.62 302.49 Less : Allowances for doubtful loans and advances (7.30) 46.32 (16.41) 286.08 Total 143.96 391.46
11. Loans and advances- currentAs at
March 31, 2018As at
March 31, 2017Secured :
Finance receivables 15.79 16.19 (net of provision of ` 7.22 crores and ` 6.86 crores as at March 31, 2018 and 2017, respectively)
Unsecured :(a) Advances and other receivables 68.03 82.59
(net of provision of ` 123.15 crores and ` 87.04 crores as at March 31, 2018 and 2017, respectively)
(b) Inter corporate deposits - Considered good - 60.00 ( c) Dues from subsidiary companies (Note below) 17.23 22.79 (d) Loan to subsidiary company (Tata Motors European Technical
Centre Plc, UK) 39.22 34.39 TOTAL 140.27 215.96 Note:
As at March 31, 2018
As at March 31, 2017
Dues from subsidiary companies:(a) PT Tata Motors Indonesia 4.53 6.78 (b) Concorde Motors (India) Ltd 2.78 -( c) Tata Motors Insurance Broking and Advisory Services Ltd 0.05 0.07 (d) Tata Motors (SA) (Proprietary) Ltd 0.80 5.17 (e) Tata Motors Nigeria Ltd 0.20 0.20 (f) PT Tata Motors Distribusi Indonesia 2.36 2.11 (g) Jaguar Land Rover Ltd - 1.21 (h) Tata Daewoo Commercial Vehicle Co. Ltd - 0.24 (i) Tata Motors (Thailand) Ltd 6.51 6.12 (j) Tata Motors European Technical Centre PLC - 0.02 (k) Tata Motors Finance Ltd - 0.01 (l) TML Holdings Pte Ltd - 0.86
17.23 22.79
Notes Forming Part of Financial Statements

21373rd Annual Report 2017-18
INTEGRATED REPORT 1-65 STATUTORY REPORTS 66-184 FINANCIAL STATEMENTS 185-353
12. Other financial assets - non-current (` in crores)
As at March 31, 2018
As at March 31, 2017
(a) Derivative financial instruments 200.13 190.75 (b) Restricted deposits 3.98 3.94 ( c) Finance lease receivable 117.44 - (d) Government grants 467.14 - (e) Others 4.71 1.63
Total 793.40 196.32
13. Other financial assets - current
As at March 31, 2018
As at March 31, 2017
(a) Derivative financial instruments 42.21 100.35
(b) Interest accrued on loans and deposits 0.59 1.19
( c) Term / Fixed deposits other than banks - 40.00
(d) Finance lease receivable 12.04 -
(e) Interim dividend 42.37 -
(f) Government grants 411.40 -
(g) Others 137.70 -
Total 646.31 141.54
14. Other non-current assets
As at March 31, 2018
As at March 31, 2017
(a) Capital advances 285.54 561.01
(b) Taxes recoverable, statutory deposits and dues from government 931.39 998.39
( c) Prepaid lease rental on operating lease 127.74 128.86
(d) Recoverable from Insurance companies 185.99 150.00
(e) Others 15.73 20.19
Total 1,546.39 1,858.45
15. Other current assets
As at March 31, 2018
As at March 31, 2017
(a) Advance to suppliers and contractors 234.65 242.73
(b) Taxes recoverable, statutory deposits and dues from government 1,047.35 1,445.97
( c) Prepaid expenses 94.00 105.16
(d) Recoverable from Insurance companies 26.97 20.84
(e) Others 36.76 10.35
Total 1,439.73 1,825.05
Notes Forming Part of Financial Statements

214
16. Inventories (` in crores)
As at March 31, 2018
As at March 31, 2017
(a) Raw materials and components 2,216.20 1,510.40 (b) Work-in-progress 787.02 825.60 ( c) Finished goods 2,014.37 2,817.80 (d) Stores and spare parts 201.69 195.57 (e) Consumable tools 43.31 38.39 (f) Goods-in-transit - Raw materials and components 407.54 165.25
Total 5,670.13 5,553.01
During the year ended March 31, 2018 and 2017, the Company recorded inventory write-down expenses of ` 162.87 crores and ` 180.70 crores, respectively.
Cost of inventories (including cost of purchased products) recognised as expense during the year ended March 31, 2018 and 2017 amounted to ` 50,328.14 crores and ` 44,238.04 crores, respectively.
17. Trade receivables-unsecured
As at March 31, 2018
As at March 31, 2017
Considered good 3,479.81 2,128.00 Considered doubtful 543.50 693.17
4,023.31 2,821.17 Less : Allowances for doubtful debts (543.50) (693.17)Total 3,479.81 2,128.00
18. Allowance for trade receivables, loans and other receivables
For the year ended
March 31, 2018
For the year ended
March 31, 2017Balance at the beginning 1,447.55 1,432.44 Allowances made/(reversed) during the year (109.19) 133.72 Written off (15.85) (118.61)Balance at the end 1,322.51 1,447.55
19. Cash and cash equivalents
As at March 31, 2018
As at March 31, 2017
(a) Cash on hand 0.14 0.38 (b) Cheques on hand 242.77 0.79 ( c) Balances with banks (refer note below) 303.91 118.32 (d) Deposits with banks - 109.45
546.82 228.94 Note:Includes remittances in transit 145.17 60.91
Notes Forming Part of Financial Statements

21573rd Annual Report 2017-18
INTEGRATED REPORT 1-65 STATUTORY REPORTS 66-184 FINANCIAL STATEMENTS 185-353
20. Other bank balances (` in crores)
As at March 31, 2018
As at March 31, 2017
With upto 12 months maturity:(a) Earmarked balances with banks (refer note below) 248.53 86.60 (b) Bank deposits 0.07 11.07
Total 248.60 97.67
Note:
Earmarked balances with banks as at March 31, 2018 of ` 163.50 crores (as at March 31, 2017 ` 67.50 crores) is held as security in relation to repayment of borrowings.
21. Equity Share Capital
As at March 31, 2018
As at March 31, 2017
(a) Authorised:
(i) 400,00,00,000 Ordinary shares of ` 2 each 800.00 700.00
(as at March 31, 2017: 350,00,00,000 Ordinary shares of ` 2 each)
(ii) 100,00,00,000 ‘A’ Ordinary shares of ` 2 each 200.00 200.00
(as at March 31, 2017: 100 ,00,00,000 ‘A’ Ordinary shares of ` 2 each)
(iii) 30,00,00,000 Convertible Cumulative Preference shares of ` 100 each 3,000.00 3,000.00
(as at March 31, 2017: 30,00,00,000 shares of ` 100 each)
Total 4,000.00 3,900.00
(b) Issued [Note (h)]:
(i) 288,78,43,046 Ordinary shares of ` 2 each 577.57 577.57
(as at March 31, 2017: 288,78,43,046 Ordinary shares of ` 2 each)
(ii) 50,87,36,110 ‘A’ Ordinary shares of ` 2 each 101.75 101.75
(as at March 31, 2017: 50,87,36,110 ‘A’ Ordinary shares of ` 2 each)
Total 679.32 679.32
( c) Subscribed and called up:
(i) 288,73,48,694 Ordinary shares of ` 2 each 577.47 577.47
(as at March 31, 2017: 288,73,48,428 Ordinary shares of ` 2 each)
(ii) 50,85,02,371 ‘A’ Ordinary shares of ` 2 each 101.70 101.70
(as at March 31, 2017: 50,85,02,291 ‘A’ Ordinary shares of ` 2 each)
679.17 679.17
(d) Calls unpaid - Ordinary shares
310 Ordinary shares of ` 2 each (` 1 outstanding on each) and 260 Ordinary shares of ` 2 each (` 0.50 outstanding on each) (0.00) (0.00)
(as at March 31, 2017: 310 Ordinary shares of ` 2 each (` 1 outstanding on each) and 260 Ordinary shares of ` 2 each (` 0.50 outstanding on each)
(e) Paid-up (c+d): 679.17 679.17
(f) Forfeited - Ordinary shares 0.05 0.05
Total (e+f) 679.22 679.22
Notes Forming Part of Financial Statements

216
(g) The movement of number of shares and share capital
Year ended March 31, 2018
Year ended March 31, 2017
(No. of shares) (` in crores)
(No. of shares) (` in crores)
(i) Ordinary shares
Balance as at April 1 288,73,48,428 577.47 288,72,03,602 577.44
Add: Allotment of shares held in abeyance 266 0.00 * 1,44,826 0.03
Balance as at March 31 288,73,48,694 577.47 288,73,48,428 577.47
(ii) ‘A’ Ordinary shares
Balance as at April 1 50,85,02,291 101.70 50,84,76,704 101.70
Add: Allotment of shares held in abeyance 80 0.00 * 25,587 0.00
Balance as at March 31 50,85,02,371 101.70 50,85,02,291 101.70
* less than ` 50,000/-
(h) The entitlements to 494,352 Ordinary shares of ` 2 each (as at March 31, 2017 : 494,618 Ordinary shares of ` 2 each) and 233,739 ‘A’ Ordinary shares of ` 2 each (as at March 31, 2017: 233,819 ‘A’ Ordinary shares of ` 2 each) are subject matter of various suits filed in the courts / forums by third parties for which final order is awaited and hence kept in abeyance.
(i) Rights, preferences and restrictions attached to shares:
(i) Ordinary shares and ‘A’ Ordinary shares both of ` 2 each :
• The Company has two classes of shares – the Ordinary shares and the ‘A’ Ordinary shares both of ` 2 each (together referred to as shares). In respect of every Ordinary share (whether fully or partly paid), voting rights shall be in the same proportion as the capital paid up on such Ordinary share bears to the total paid up Ordinary share capital of the Company. In case of every ‘A’ Ordinary share, if any resolution is put to vote on a poll or by postal ballot at any general meeting of shareholders, the holder shall be entitled to one vote for every ten ‘A’ Ordinary shares held as per the terms of its issue and if a resolution is put to vote on a show of hands, the holder of ‘A’ Ordinary shares shall be entitled to the same number of votes as available to holders of Ordinary shares.
• The dividend proposed by the Board of Directors is subject to the approval of the shareholders in the ensuing Annual General Meeting. Further, the Board of Directors may also declare an interim dividend. The holders of ‘A’ Ordinary shares shall be entitled to receive dividend for each financial year at five percentage point more than the aggregate rate of dividend declared on Ordinary shares for that financial year.
• In the event of liquidation, the shareholders are eligible to receive the remaining assets of the Company after distribution of all preferential amounts, in proportion to their shareholdings.
(ii) American Depository Shares (ADSs) and Global Depository Shares (GDSs) :
• Each ADS and GDS underlying the ADR and GDR respectively represents five Ordinary shares of ` 2 each. A holder of ADS and GDS is not entitled to attend or vote at shareholders meetings. An ADS holder is entitled to issue voting instructions to the Depository with respect to the Ordinary shares represented by ADSs only in accordance with the provisions of the Company’s ADSs deposit agreement and Indian Law. The depository for the ADSs and GDSs shall exercise voting rights in respect of the deposited shares by issue of an appropriate proxy or power of attorney in terms of the respective deposit agreements.
• Shares issued upon conversion of ADSs and GDSs will rank pari passu with the existing Ordinary shares of ` 2 each in all respects including entitlement of the dividend declared.
Notes Forming Part of Financial Statements

21773rd Annual Report 2017-18
INTEGRATED REPORT 1-65 STATUTORY REPORTS 66-184 FINANCIAL STATEMENTS 185-353
(j) Number of shares held by each shareholder holding more than 5 percent of the issued share capital :
As at March 31, 2018 As at March 31, 2017
% of Issued Share Capital
No. of Shares % of Issued Share Capital
No. of Shares
(i) Ordinary shares :
(a) Tata Sons Ltd 32.72% 96,13,81,852 28.71% 82,89,70,378
(b) Life Insurance Corporation of India 5.08% 14,92,95,627 5.18% 14,94,23,428
( c) Citibank N.A. as Depository # 43,70,24,750 # 53,04,96,280
(ii) ‘A’ Ordinary shares :
(a) HDFC Trustee Company Ltd-HDFC Equity Fund * 34,40,000 8.19% 4,16,71,282
(b) Franklin Templeton Mutual Fund * 1,42,99,041 5.96% 3,03,29,225
( c) ICICI Prudential Balanced Advantage Fund 9.44% 4,79,98,379 - -
(d) Franklin India Smaller Companies Fund 8.74% 4,44,31,036 - -
(e) HDFC Large Cap Fund 5.15% 2,62,02,083 - -
(f) Government Of Singapore 6.78% 3,44,87,840 * 2,16,02,490
# held by Citibank, N.A. as depository for American Depository Receipts (ADRs) and Global Depository Receipts (GDRs)
* Less than 5%
(k) Information regarding issue of shares in the last five years
(a) The Company has not issued any shares without payment being received in cash.
(b) The Company has not issued any bonus shares.
( c) The Company has not undertaken any buy-back of shares.
22. A) Other components of equity
(a) The movement of Equity instruments through Other Comprehensive Income is as follows: (` in crores)
Year ended March 31, 2018
Year ended March 31, 2017
Balance at the beginning (27.12) (100.96)
Other comprehensive income for the year 44.04 73.84
Balance at the end 16.92 (27.12)
(b) The movement of Hedging reserve is as follows:
Balance at the beginning 11.26 7.39
Gain/(loss) recognised on cash flow hedges (4.80) 17.22
Income tax relating to gain/loss recognised on cash flow hedges 1.66 (5.97)
(Gain)/loss reclassified to profit or loss (17.22) (11.30)
Income tax relating to gain/loss reclassified to profit or loss 5.96 3.92
Balance at the end (3.14) 11.26
Notes Forming Part of Financial Statements

218
(` in crores)
( c) The movement of Cost of Hedging reserve is as follows:
Year ended March 31, 2018
Year ended March 31, 2017
Balance at the beginning 11.38 -
Gain/(loss) recognised on cash flow hedges 19.86 17.40
Income tax relating to gain/loss recognised on cash flow hedges (6.87) (6.02)
(Gain) / loss reclassified to profit or loss (17.40) -
Income Tax relating to (gain) / loss reclassified to profit or loss 6.02 -
Balance at the end 12.99 11.38
(d) Summary of Other components of equity:
Equity instruments through other comprehensive income 16.92 (27.12)
Hedging reserve (3.14) 11.26
Cost of hedging reserve 12.99 11.38
Total 26.77 (4.48)
(B) Notes to reserves
a) Capital redemption reserve
The Indian Companies Act, 2013 (the “Companies Act”) requires that where a company purchases its own shares out of free reserves or securities premium account, a sum equal to the nominal value of the shares so purchased shall be transferred to a capital redemption reserve account and details of such transfer shall be disclosed in the balance sheet. The capital redemption reserve account may be applied by the company, in paying up unissued shares of the company to be issued to shareholders of the company as fully paid bonus shares. Tata Motors Limited established this reserve pursuant to the redemption of preference shares issued in earlier years.
b) Debenture redemption reserve
The Companies Act requires that where a company issues debentures, it shall create a debenture redemption reserve out of profits of the company available for payment of dividend. The company is required to maintain a Debenture Redemption Reserve of 25% of the value of debentures issued, either by a public issue or on a private placement basis. The amounts credited to the debenture redemption reserve may not be utilised by the company except to redeem debentures.
c) Securities premium
The amount received in excess of face value of the equity shares is recognised in Securities Premium Account.
d) Retained earnings
Retained earnings are the profits that the Company has earned till date.
e) Dividends
For the year ended March 31, 2018 and 2017, considering the losses in the Tata Motors Limited (Standalone), no dividend is permitted to be paid to the Members, as per the Companies Act, 2013 and the Rules framed thereunder.
Notes Forming Part of Financial Statements

21973rd Annual Report 2017-18
INTEGRATED REPORT 1-65 STATUTORY REPORTS 66-184 FINANCIAL STATEMENTS 185-353
23. Long-term borrowings(` in crores)
As at March 31, 2018
As at March 31, 2017
Secured:(a) Privately placed Non-Convertible Debentures (refer note I (i) (a) and I (ii) (a)) 200.00 700.00 (b) Term loans: (i) from banks (refer note I (i) ( c)) 635.45 621.57 (ii) others (refer note I (i) ( b)) 144.75 130.16 ( c) Finance lease obligations 10.05 9.44
990.25 1,461.17 Unsecured:(a) Privately placed Non-Convertible Debentures (refer note I (ii) (b)) 6,307.37 5,898.57 (b) Term loan from banks Buyer’s line of credit (at floating interest rate) (refer note I (iv)) 1,000.00 1,500.00 ( c) Senior notes (refer note I (iii)) 4,858.29 4,826.35
12,165.66 12,224.92 Total 13,155.91 13,686.09
24. Short-term borrowings
As at March 31, 2018
As at March 31, 2017
Secured:Loans from banks (refer note II) 1,454.11 1,662.95
1,454.11 1,662.95 Unsecured:(a) Loans from banks 13.62 46.33 (b) Inter corporate deposits from subsidiaries and associates 203.75 177.00 ( c) Commercial paper 1,428.39 3,272.24
1,645.76 3,495.57 Total 3,099.87 5,158.52
I. Information regarding long-term borrowings
(i) Nature of security (on loans including interest accrued thereon) :
(a) Rated, Listed, Secured, 9.95% Coupon, Non-Convertible Debentures amounting to ` 200 crores included within Long-term borrowings in note 23 and 10.25% Coupon, Non-Convertible Debentures amounting to ` 500 crores included within Current maturities of Long-term borrowings in note 26 are secured by a pari passu charge by way of an English mortgage of the Company’s freehold land together with immovable properties, plant and machinery and other movable assets (excluding stock and book debts) situated at Sanand in the State of Gujarat.
(b) The term loan of ` 584.82 crores (recorded in books at ` 133.39 crores) is due for repayment from the quarter ending March 31, 2033 to quarter ending March 31, 2038, along with simple interest at the rate of 0.10% p.a. The loan is secured by a second and subservient charge (creation of charge is under process) over Company’s freehold land together with immovable properties, plant and machinery and other movable assets (excluding stock and book debts) situated at Sanand plant in the State of Gujarat.
The term loan of ` 35.92 crores (recorded in books at ` 11.36 crores) is due for repayment from the quarter ending June 30, 2030 to March 31, 2033, along with a simple interest of 0.01% p.a. The loan is secured by bank guarantee for the due performance of the conditions as per the terms of the agreement.
( c) Term loan of ` 635.45 is taken by joint operation Fiat India Automobiles Private Ltd which is due for repayment from December 2017 to May 2023. The loan is secured by first charge over fixed assets procured from its loan/jeep project.
Notes Forming Part of Financial Statements

220
ii) Schedule of repayment and redemption for Non-Convertible Debentures : (` in crores)
Non-Convertible Debentures (NCDs) Redeemable on Principal
(a) Secured :
10.25% Non-Convertible Debentures (2025) # April 30, 2025 150.00
10.25% Non-Convertible Debentures (2024) # April 30, 2024 150.00
10.25% Non-Convertible Debentures (2023) # April 30, 2023 100.00
10.25% Non-Convertible Debentures (2022) # April 30, 2022 100.00
9.95% Non-Convertible Debentures (2020) March 2, 2020 200.00
# The Company has exercised call option to redeem in full, at the end of 8th year from the date of allotment i.e. on April 30, 2018, hence classified as other financial liabilities-current.
(` in crores)
Non-Convertible Debentures (NCDs) Redeemable on Principal
(b) Unsecured :
9.77% Non-Convertible Debentures (2024) September 12, 2024 200.00
9.81% Non-Convertible Debentures (2024) August 20, 2024 300.00
9.35% Non-Convertible Debentures (2023) November 10, 2023 400.00
9.60% Non-Convertible Debentures (2022) October 29, 2022 400.00
7.71% Non-Convertible Debentures (2022) March 3, 2022 500.00
7.50% NCD due 2022(E27H Series) June 22, 2022 500.00
9.02% Non-Convertible Debentures (2021) December 10, 2021 300.00
7.50% Non-Convertible Debentures (2021) October 20, 2021 300.00
7.84% Non-Convertible Debentures (2021) September 27, 2021 500.00
8.40% Non-Convertible Debentures (2021) May 26, 2021 300.00
7.40% NCD due 2021(E27I Series Tranche 2) June 29, 2021 500.00
9.73% Non-Convertible Debentures (2020) October 1, 2020 400.00
9.70% Non-Convertible Debentures (2020) June 18, 2020 150.00
9.75% Non-Convertible Debentures (2020) May 24, 2020 100.00
9.90% Non-Convertible Debentures (2020) May 7, 2020 150.00
7.28% NCD due 2020(E27I Series Tranche 1) July 29, 2020 500.00
9.71% Non-Convertible Debentures (2019) October 1, 2019 300.00
8.00% Non-Convertible Debentures (2019) August 1, 2019 400.00
10.00% Non-Convertible Debentures (2019) May 28, 2019 110.00
9.69% Non-Convertible Debentures (2019) March 29, 2019 * 200.00
8.25% Non-Convertible Debentures (2019) January 28, 2019 * 300.00
10.30% Non-Convertible Debentures (2018) November 30, 2018 * 190.00
8.13% Non-Convertible Debentures (2018) July 18, 2018 * 400.00
Debt issue cost (2.63)
* Classified as other financial liabilities-current being maturity before March 31, 2019.
Notes Forming Part of Financial Statements

22173rd Annual Report 2017-18
INTEGRATED REPORT 1-65 STATUTORY REPORTS 66-184 FINANCIAL STATEMENTS 185-353
(iii) Schedule of repayment of Senior Notes:(` in crores)
Redeemable on Currency Amount (in million)
As at March 31, 2018
As at March 31, 2017
4.625% Senior Notes April 30, 2020 USD 500 3,238.86 3,230.54 5.750% Senior Notes October 30, 2024 USD 250 1,619.43 1,595.81
4,858.29 4,826.35 (iv) The Buyer’s line of credit from banks amounting to ` 1,500 crores is repayable within a maximum period of four years from
the drawdown dates. All the repayments are due from quarter ending September 30, 2018 to March 31, 2021. The Buyer’s line of credit of ` 500 crores classified under other financial liabilities-current being maturity before March 31, 2019.
II. Information regarding short-term borrowings Loans, cash credits, overdrafts and buyers line of credit from banks are secured by hypothecation of existing current assets of the
Company viz. stock of raw materials, stock in process, semi-finished goods, stores and spares not relating to plant and machinery (consumable stores and spares), bills receivable and book debts including receivable from hire purchase / leasing and all other moveable current assets except cash and bank balances, loans and advances of the Company both present and future.
III. Collateral Inventory, trade receivables, other financial assets, property, plant and equipment with a carrying amount of ` 4,415.30 crores
and ` 4,460.45 crores are pledged as collateral/security against the borrowings as at March 31, 2018 and 2017, respectively.
25. Other financial liabilities – non-current(` in crores)
As at March 31, 2018
As at March 31, 2017
(a) Derivative financial instruments - 0.55 (b) Liability for financial guarantee contracts - 995.08 ( c) Liability towards employee separation scheme 82.26 71.84 (d) Others 129.02 62.76
Total 211.28 1,130.23
26. Other financial liabilities – currentAs at
March 31, 2018As at
March 31, 2017(a) Current maturities of long-term borrowings (refer note below) 2,208.06 512.37 (b) Liability for financial guarantee contracts 977.26 1,050.00 ( c) Interest accrued but not due on borrowings 500.06 449.73 (d) Liability for capital expenditure 129.86 120.63 (e) Deposits and retention money 186.44 206.26 (f) Derivative financial instruments 1.29 9.38 (g) Deferred payment liability - 70.08 (h) Liability towards Investors Education and Protection Fund under Section 125 of the
Companies Act, 2013 not due(i) Unpaid dividends 10.73 13.48 (ii) Unpaid matured deposits and interest thereon 11.88 14.09 (iii) Unpaid debentures and interest thereon 0.18 0.18
(i) Others 65.40 39.74 Total 4,091.16 2,485.94 Details of Current maturities of long-term borrowings :
(i) Non Convertible Debentures (Unsecured) (refer note I (ii) (b)) 1,089.86 450.00 (ii) Non Convertible Debentures (Secured) (refer note I (ii) (a)) 500.00 - (iii) Finance lease obligations 5.78 8.36 (iv) Loans from Banks (refer note I (i) (d)) 112.42 34.94 (v) Buyer’s line of credit (Capex) (refer note I (i) (b)) 500.00 19.07
Total 2,208.06 512.37
Notes Forming Part of Financial Statements

222
27. Provisions-non current(` in crores)
As at March 31, 2018
As at March 31, 2017
(a) Employee benefits obligations 622.88 628.09 (b) Warranty 364.35 247.43 ( c) Annual maintenance contract (AMC) 9.26 16.66 (d) Others 12.99 -
Total 1,009.48 892.18
28. Provisions-current
As at March 31, 2018
As at March 31, 2017
(a) Employee benefits obligations 32.17 24.05 (b) Warranty 739.12 419.39 ( c) Annual maintenance contract (AMC) 46.20 33.73 (d) Others 45.43 -
862.92 477.17
NoteAMC and Warranty provision movement
Year ended March 31, 2018AMC Warranty
Balance at the beginning 50.39 666.82 Provision made during the year 15.74 907.39*Provision used during the year (10.67) (450.55)Impact of discounting - (20.19)Balance at the end 55.46 1,103.47 Current 46.20 739.12 Non-current 9.26 364.35
* Include estimated recovery from suppliers of ` 141.21 crores.
29. Income taxes The reconciliation of estimated income tax to income tax expense is as follows:
(` in crores)Year ended
March 31, 2018Year ended
March 31, 2017Profit/(loss) before tax (946.92) (2,353.27)Income tax expense at tax rates applicable to individual entities (327.71) (814.42)Additional deduction for patent, research and product development cost (198.58) (700.15)Items (net) not deductible for tax/not liable to tax :- foreign currency (gain)/loss relating to loans and deposits (net) 8.12 - - interest and other expenses relating to borrowings for investment 20.95 21.46 - Dividend from subsidiaries, joint operations, associates and investments measured at fair value through other comprehensive income
(77.04) (57.37)
- Provision for impairment of capital work in progress 34.61 - Undistributed earnings of joint operations 54.85 28.97 Deferred tax assets not recognised as realization is not probable 699.49 1,700.51 Utilization/credit of unrecognised tax losses, unabsorbed depreciation and other tax benefits (130.10) (62.57)Reversal of tax provision for previous years (2.45) (15.78)Others 5.79 (24.32)Income tax expense reported 87.93 76.33
Notes Forming Part of Financial Statements

22373rd Annual Report 2017-18
INTEGRATED REPORT 1-65 STATUTORY REPORTS 66-184 FINANCIAL STATEMENTS 185-353
Significant components of deferred tax assets and liabilities for the year ended March 31, 2018 are as follows:
Opening balance
Recognised in profit or
loss
MAT Credit utilised
Recognised in/reclassified
from OCI
Closing balance
Deferred tax assets:
Unabsorbed depreciation 2,546.16 (4.62) - - 2,541.54
Business loss carry forwards 1,578.01 (21.43) - - 1,556.58
Expenses deductible in future years:
- provisions, allowances for doubtful receivables and others 977.61 (367.45) - - 610.16
Compensated absences and retirement benefits 116.55 13.30 - (6.27) 123.58
Minimum alternate tax carry-forward 29.78 (15.21) (12.23) - 2.34
Intangible assets 6.57 - - 6.57
Derivative financial instruments - 7.87 - 6.77 14.64
Unrealised profit on inventory - 1.58 - - 1.58
Others 129.44 (56.76) - - 72.68
Total deferred tax assets 5,384.12 (442.72) (12.23) 0.50 4,929.67
Deferred tax liabilities:
Property, plant and equipment 2,676.75 (97.00) - - 2,579.75
Intangible assets 2,739.64 (375.54) - - 2,364.10
Undistributed earnings in joint operations 63.24 53.02* - - 116.26
Derivative financial instruments 22.61 (22.61) - - -
Others 29.46 (5.29) - - 24.17
Total deferred tax liabilities 5,531.70 (447.42) - - 5,084.28
Deferred tax liabilities (147.58) 4.70 (12.23) 0.50 (154.61)
* Net off ` 1.83 crores reversed on dividend distribution by joint operations.
As at March 31, 2018, unrecognised deferred tax assets amount to ` 2,102.72 crores and ` 5,511.61 crores which can be carried forward indefinitely and up to a specified period, respectively. These relate primarily to depreciation carry forwards, other deductible temporary differences and business losses. The deferred tax asset has not been recognised on the basis that its recovery is not probable in the foreseeable future.
Unrecognised deferred tax assets expire unutilised based on the year of origination as follows:(` in crores)
March 31,
2021 272.13
2022 26.13
2023 1,160.42
Thereafter 4.052.93
Notes Forming Part of Financial Statements

224
Significant components of deferred tax assets and liabilities for the year ended March 31, 2017 are as follows: (` in crores)
Opening balance
Effect of merger with
TML Drivelines
Recognised in profit or
loss
Recognised in/reclassified
from OCI
Closing balance
Deferred tax assets:Unabsorbed depreciation 1,984.14 - 562.02 - 2,546.16 Business loss carry forwards 1,531.47 - 46.54 - 1,578.01 Expenses deductible in future years: - provisions, allowances for doubtful receivables and others 1,440.93 - (463.32) - 977.61 Compensated absences and retirement benefits 111.36 3.98 4.33 (3.12) 116.55 Minimum alternate tax carry-forward 16.82 - 12.96 - 29.78 Intangible assets 7.47 - (0.90) - 6.57 Others 93.88 3.50 32.06 - 129.44 Total deferred tax assets 5,186.07 7.48 193.69 (3.12) 5,384.12 Deferred tax liabilities:Property, plant and equipment 2,663.29 49.17 (35.71) - 2,676.75 Intangible assets 2,519.18 4.04 216.42 - 2,739.64 Undistributed earnings in joint operations 36.88 - 26.36* - 63.24 Derivative financial instruments 3.91 - 10.63 8.07 22.61 Others 34.20 - (4.74) - 29.46 Total deferred tax liabilities 5,257.46 53.21 212.96 8.07 5,531.70 Deferred tax liabilities (71.39) (45.73) (19.27) (11.19) (147.58)
* Net off ` 1.83 crores reversed on dividend distribution by joint operation.
30. Other non-current liabilities
As at March 31, 2018
As at March 31, 2017
(a) Deferred revenue (refer note below) 253.09 270.40 (b) Employee Benefit Obligations - Funded 20.34 42.79 ( c) Others 17.66 8.05
291.09 321.24
31. Other current liabilities
As at March 31, 2018
As at March 31, 2017
(a) Advances received from customers 896.35 850.40 (b) Statutory dues (GST,VAT, Excise, Service Tax, Octroi etc) 781.12 803.11 ( c) Deferred revenue (refer note below) 188.23 157.65 (d) Others 51.90 59.64
1,917.60 1,870.80
Note:
Deferred revenue includes ` 187.67 crores as at March 31, 2018 ( ` 227.92 crores as at March 31, 2017) grants relating to property, plant and equipment related to duty saved on import of capital goods and spares under the Export Promotion Capital Goods (EPCG) scheme. Under such scheme, the Company is committed to export prescribed times of the duty saved on import of capital goods over a specified period of time. In case such commitments are not met, the Company would be required to pay the duty saved along with interest to the regulatory authorities.
Notes Forming Part of Financial Statements

22573rd Annual Report 2017-18
INTEGRATED REPORT 1-65 STATUTORY REPORTS 66-184 FINANCIAL STATEMENTS 185-353
Notes Forming Part of Financial Statements
32. Revenue From Operations(` in crores)
Year ended March 31, 2018
Year ended March 31, 2017
(a) Sale of products (including excise duty) (note 1 and 2 below) 57,868.04 47,709.39(b) Sale of services 365.17 367.44 ( c) Finance revenues 1.12 1.94 (d) Other operating revenues (note 3 below) 1,390.36 975.72
Total 59,624.69 49,054.49
Note:(1) Includes exchange gain/(loss) (net) on hedges reclassified from hedge reserve to
statement of profit or loss (0.93) (0.73)
(2) Consequent to the introduction of Goods and Service Tax (GST) with effect from July 1, 2017, Central Excise, Value Added Tax (VAT), etc have been replaced by GST. In accordance with Ind AS 18 on Revenue and Schedule III of the Companies Act, 2013, GST, GST Compensation Cess, etc. are not included in Revenue from Operations for applicable periods. In view of the aforesaid restructuring of indirect taxes, Sale of products for the year ended March 31, 2018 is not comparable with year ended March 31, 2017. Following additional information is being provided to facilitate such comparison:
Year ended March 31, 2018
Year ended March 31, 2017
(a) Sale of products 57,868.04 47,709.39(b) Excise duty (1,168.14) (4,623.54)( c) Sale of products (net of excise duty) (a-b) 56,699.90 43,085.85
(3) Other operating revenue includes export and other incentives from governments (referred to as ”incentives”) of ` 829.13 crores and ` 419.87 crores for the year ended March 31, 2018 and 2017, respectively.
33. Other income
Year ended March 31, 2018
Year ended March 31, 2017
(a) Interest income 397.71 187.90 (b) Dividend income (note 1 below) 1,054.69 672.65 ( c) Profit on sale of investments at FVTPL 103.17 116.76 (d) MTM – Investments measured at FVTPL 2.03 3.75
1,557.60 981.06 Note:(1) Includes :(a) Dividend from subsidiary companies and associates 999.25 669.48 (b) From investment measured at FVTOCI 14.49 4.45 ( c) Exchange gain / (loss) 40.95 (1.28)
34. Employee benefits expenseYear ended
March 31, 2018Year ended
March 31, 2017(a) Salaries, wages and bonus 3,311.57 3,179.05 (b) Contribution to provident fund and other funds 236.16 209.11 ( c) Staff welfare expenses 419.00 376.19
Total 3,966.73 3,764.35

226
Notes Forming Part of Financial Statements
35. Finance costs (` in crores)
Year ended March 31, 2018
Year ended March 31, 2017
(a) Interest 1,650.35 1,649.68 Add: Exchange fluctuation considered as interest cost 6.24 - Less: Interest capitalised* (396.11) (451.00)
1,260.48 1,198.68 (b) Discounting charges 483.95 370.33
Total 1,744.43 1,569.01
* The weighted average rate for capitalisation of interest relating to general borrowings was approximately 7.43 % and 7.63 % for the years ended March 31, 2018 and 2017, respectively.
36. Other expenses
Year ended March 31, 2018
Year ended March 31, 2017
(a) Processing charges 1,240.88 1,004.45 (b) Consumption of stores & spare parts 639.35 653.61 ( c) Power and fuel 545.12 483.48 (d) Freight, transportation, port charges etc. 1,703.15 1,536.77 (e) Publicity 720.18 848.36 (f) Warranty expenses 766.18 493.33 (g) Information technology/computer expenses 711.95 762.39 (h) Allowances made/(reversed) for trade and other receivables (109.19) 133.72 (i) Assets Scrapped/ Written Off 995.47 141.45(j) Works operation and other expenses (note below) 2,021.18 2,278.34
Total 9,234.27 8,335.90 Note:Works operation and other expenses include:
(a) Auditors’ Remuneration (excluding service tax): #
(i) Audit Fees 7.34 8.16 (ii) Audit Fees for financial statements as per IFRS (including SOX certification) 3.72 3.59 (iii) In other Capacities : Tax Audit / Transfer Pricing Audit 0.89 0.75 Taxation Matters 0.45 0.08 (iv) Other Services * 4.47 1.51 (v) Reimbursement of travelling and out-of-pocket expenses 0.86 0.88 * Includes payment to an affiliate firm of statutory auditors# The above amount includes ` 10.84 crores paid to predecessor Auditor, Deloitte Haskins and Sells LLP and its affiliates for the year ended March 31, 2018. 4.10 0.56
(b) Cost Auditors’ Remuneration (excluding service tax) :(i) Cost Audit Fees 0.20 0.20 (ii) Reimbursement of travelling and out-of-pocket expenses 0.01 -
( c) Works operation and other expenses for the year ended March 31, 2018 includes ` 21.44 crores (` 25.94 crores for the year ended March 31, 2017) spent by Tata Motors Ltd on standalone basis excluding interest in the joint operations, towards various schemes of Corporate Social Responsibility (CSR) as prescribed under Section 135 of the Companies Act, 2013. No amount has been spent on construction / acquisition of an asset of the Company. The prescribed CSR expenditure required to be spent in the year 2017-18 as per the Companies Act, 2013 is Nil, in view of average net profits of the Company being ` Nil (under section 198 of the Act) for last three financial years.

22773rd Annual Report 2017-18
INTEGRATED REPORT 1-65 STATUTORY REPORTS 66-184 FINANCIAL STATEMENTS 185-353
Notes Forming Part of Financial Statements
37. a) Exceptional debit of ` 962.98 crores is related to provision for impairment of certain capital work-in-progress and intangibles under development. The company reviewed product development programs and capital work-in-progrees and consequently provided for impairment during the year ended March 31, 2018.
b) Exceptional debit of ` 147.93 crores for the year ended March 31, 2017, relates to provision for inventory of BS III vehicles as at March 31, 2017. This does not include higher level of customer discounts and variable marketing expenses in March 2017, to support higher level of retail sales, which have been netted off against ‘Revenue from operations.
38. Commitments and contingencies
In the ordinary course of business, the Company faces claims and assertions by various parties. The Company assesses such claims and assertions and monitors the legal environment on an ongoing basis, with the assistance of external legal counsel, wherever necessary. The Company records a liability for any claims where a potential loss is probable and capable of being estimated and discloses such matters in its financial statements, if material. For potential losses that are considered possible, but not probable, the Company provides disclosure in the financial statements but does not record a liability in its accounts unless the loss becomes probable.
The following is a description of claims and assertions where a potential loss is possible, but not probable. The Company believes that none of the contingencies described below would have a material adverse effect on the Company’s financial condition, results of operations or cash flows.
Litigation
The Company is involved in legal proceedings, both as plaintiff and as defendant. There are claims which the Company does not believe to be of material nature, other than those described below.
Income Tax
The Company has ongoing disputes with income tax authorities relating to tax treatment of certain items. These mainly include disallowed expenses, the tax treatment of certain expenses claimed by the Company as deductions and the computation of, or eligibility of, the Company’s use of certain tax incentives or allowances.
Most of these disputes and/or disallowances, being repetitive in nature, have been raised by the income tax authorities consistently in most of the years.
The Company has a right of appeal to the Commissioner of Income Tax (Appeals), or CIT (A), the Dispute Resolution Panel, or DRP, and to the Income Tax Appellate Tribunal, or ITAT, against adverse decisions by the assessing officer, DRP or CIT (A), as applicable. The income tax authorities have similar rights of appeal to the ITAT against adverse decisions by the CIT (A) or DRP. The Company has a further right of appeal to the Bombay High Court or the Supreme Court against adverse decisions by the appellate authorities for matters involving substantial question of law. The income tax authorities have similar rights of appeal.
As at March 31, 2018, there are matters and/or disputes pending in appeal amounting to ` 60.89 crores (` 148.60 crores as at March 31, 2017).
Customs, Excise Duty and Service Tax
As at March 31, 2018, there are pending litigation for various matters relating to customs, excise duty and service taxes involving demands, including interest and penalties, of ` 1,491.36 crores (` 1,425.12 crores as at March 31, 2017). These demands challenged the basis of valuation of the Company’s products and denied the Company’s claims of Central Value Added Tax, or CENVAT credit on inputs. The details of the demands for more than ` 20 crores are as follows:
The Excise Authorities have raised a demand for ` 90.72 crores as at March 31, 2018 (` 90.72 crores as at March 31, 2017), on account of alleged undervaluation’s of ex-factory discounts given by Company on passenger vehicles through invoices. The matter is being contested by the Company before the Bombay High Court.
As at March 31, 2018, the Excise Authorities have raised a demand and penalty of ` 239.95 crores, (` 218.23 crores as at March 31, 2017), due to the classification of certain chassis (as dumpers instead of goods transport vehicles) which were sent to automotive body builders by the Company, which the Excise Authorities claim requires the payment of the National Calamity Contingent Duty, or

228
Notes Forming Part of Financial Statements
NCCD. The Company has obtained a technical expert certificate on the classification. The appeal is pending before the Custom Excise & Service Tax Appellate Tribunal.
The Excise Authorities had denied the Company’s claim of a CENVAT credit of ` 36.03 crores as at March 31, 2018 (` 24.96 crores as at March 31, 2017) claimed by the Company from financial year 1992 to 2013, on technical grounds. The matter is being contested by the Company before the appellate authorities.
As at March 31, 2018, the Excise Authorities had levied penalties and interest amounting to ` 679.88 crores (` 679.88 crores as at March 31, 2017) with respect to CENVAT credit claimed by the Company from March 2010 to November 2012, on inputs, stating that vehicles manufactured at Uttarakhand plant are “Exempted Products” and the Company may not claim a CENVAT credit on these vehicles. The Company has challenged this demand as NCCD and the automobile cess is assessed on those vehicles, which are “duties of excise”. Therefore, the Company asserts that these vehicles are not “Exempted Products”. The matter is being contested by the Company before the appellate authorities.
As at March 31, 2018, the Excise Authorities have raised a demand amounting to ` 29.54 crores (` 29.54 crores as at March 31, 2017) on pre-delivery inspection charges and free after-sales service charges incurred by dealers on Company’s products on the alleged grounds that the pre-delivery inspection charges and free after-sales services are provided by the dealer on behalf of the Company and should be included in excisable value of the vehicle. The case is pending before Tribunal.
As at March 31, 2018, the Exicse Authorities have confirmed demand & penalty totalling to ` 90.88 crores (` Nil as at March 31, 2017) towards vehicles allegedly sold below cost of production with an intention to penetrate the market. The matter is being contested by the Company before appellate authorities.
As at March 31, 2018, the Exicse Authorities have filed Appeal before appellate authority against the Order of adjudicating authority allowing Cenvat credit of service tax of ` 36.15 crores (` 36.15 crores as at March 31, 2017) availed on consulting engineers services.
Sales Tax
The total sales tax demands (including interest and penalty), that are being contested by the Company amount to ` 949.54 crores as at March 31, 2018 (` 965.80 crores as at March 31, 2017). The details of the demands for more than ` 20 crores are as follows:
The Sales Tax Authorities have raised demand of ` 269.38 crores as at March 31, 2018 (` 208.59 crores as at March 31, 2017) towards rejection of certain statutory forms for concessional lower/nil tax rate (Form F and Form C) on technical grounds such as late submission, single form issued against different months / quarters dispatches / sales, etc. and denial of exemption from tax in absence of proof of export for certain years. The Company has contended that the benefit cannot be denied on technicalities, which are being complied with. The matter is pending at various levels.
The Sales Tax Authorities have denied input tax credit and levied interest and penalty thereon due to varied reasons aggregating to ` 435.96 crores as at March 31, 2018 (` 305.46 crores as at March 31, 2017). The reasons for disallowing credit was mainly due to Taxes not paid by Vendors, incorrect method of calculation of set off as per the department, alleging suppression of sales as per the department etc. The matter is contested in appeal.
Sales tax demand aggregating 95.75 crores as at March 31, 2018 (` Nil as at March 31, 2017) has been raised by Sales Tax Authorities for non submission of Maharashtra Trial Balance. This is relating to VAT assessment for the financial year 2010 to 2013. The matter is contested in appeal.
The Sales Tax Authorities have raised demand for Entry Tax liability at various states amounting to ` 23.92 crores as at March 31, 2018 (` Nil as at March 31, 2017) . The company is contesting this issue.
Other Taxes and Dues
Other amounts for which the Company may contingently be liable aggregate to ` 205.19 crores as at March 31, 2018 (` 221.14 crores as at March 31, 2017). Following are the cases involving more than ` 20 crores:
The municipal authorities in certain states levy octroi duty (a local indirect tax) on goods brought inside the municipal limits at rates based on the classification of goods. Demands aggregating ` 61.65 crores as at March 31, 2018 (` 61.65 crores as at March 31, 2017) had been raised demanding higher octroi duties on account of classification disputes relating to components purchased for the manufacture of vehicles and retrospective increase in octroi rates relating to past periods. The dispute relating to classification is presently pending before the Bombay High Court and the other dispute is pending before the Supreme Court.

22973rd Annual Report 2017-18
INTEGRATED REPORT 1-65 STATUTORY REPORTS 66-184 FINANCIAL STATEMENTS 185-353
Notes Forming Part of Financial Statements
As at March 31, 2018, property tax amounting to ` 56.84 crores (` 53.70 crores as at March 31, 2017) has been demanded by the local municipal authorities in respect of vacant land of the Company in the plants in Pimpri, Chinchwad and Chikhali. The Company has filed Special Leave Petition (SLP) before the Supreme Court against an unfavorable decision of the Bombay High Court. The Supreme Court has disposed of the SLP and remanded the matter back to the local municipal corporation for fresh adjudication.
As at March 31, 2018, Sales tax / VAT amounting to ` 30.54 crores (` 29.95 crores as at March 31, 2017) has been demanded by local authorities on dealers in respect of spare parts used for carrying out warranty repairs. The dispute is pending before the Supreme Court.
Commitments
The Company has entered into various contracts with vendors and contractors for the acquisition of plant and machinery, equipment and various civil contracts of a capital nature amounting to ` 2,096.64 crores at March 31, 2018 (` 1,606.45 crores as at March 31, 2017), which are yet to be executed.
The Company has entered into various contracts with vendors and contractors for the acquisition of intangible assets of a capital nature amounting to ` 466.01 crores as at March 31, 2018, (` 420.06 crores as at March 31, 2017), which are yet to be executed.
39. Earnings per Share (“EPS”)(` in crores)
Year ended March 31, 2018
Year ended March 31, 2017
(a) Profit/(loss) after tax ` crores (1,034.85) (2,429.60)
(b) The weighted average number of Ordinary shares for Basic EPS Nos. 2,88,73,48,357 2,88,72,18,310
( c) The weighted average number of ‘A’ Ordinary shares for Basic EPS Nos. 50,85,02,336 50,84,83,714
(d) The nominal value per share (Ordinary and ‘A’ Ordinary) ` 2 2
(e) Share of profit / (loss) for Ordinary shares for Basic EPS ` crores (879.89) (2,065.78)
(f) Share of profit / (loss) for ‘A’ Ordinary shares for Basic EPS * ` crores (154.96) (363.82)
(g) Earnings per Ordinary share (Basic) ` (3.05) (7.15)
(h) Earnings per ‘A’ Ordinary share (Basic) ` (3.05) (7.15)
(i) Profit after tax for Diluted EPS ` crores # #
(j) The weighted average number of Ordinary shares for Basic EPS Nos. # #
(k) Add: Adjustment for Options relating to warrants and shares held in abeyance
Nos. # #
(l) The weighted average number of Ordinary shares for Diluted EPS Nos. # #
(m) The weighted average number of ‘A’ Ordinary shares for Basic EPS Nos. # #
(n) Add: Adjustment for ‘A’ Ordinary shares held in abeyance Nos. # #
(o) The weighted average number of ‘A’ Ordinary shares for Diluted EPS Nos. # #
(p) Share of profit for Ordinary shares for Diluted EPS ` crores # #
(q) Share of profit for ‘A’ Ordinary shares for Diluted EPS * ` crores # #
( c) Earnings per Ordinary share (Diluted) ` (3.05) (7.15)
(s) Earnings per ‘A’ Ordinary share (Diluted) ` (3.05) (7.15)
* ‘A’ Ordinary Shareholders are entitled to receive dividend @ 5% points more than the aggregate rate of dividend determined by the Company on Ordinary Shares for the financial year.
# Since there is a loss for year ended March 31, 2018 and 2017 potential equity shares are not considered as dilutive and hence Diluted EPS is same as Basic EPS.

230
Notes Forming Part of Financial Statements
40. Capital Management
The Company’s capital management is intended to create value for shareholders by facilitating the meeting of long-term and short-term goals of the Company.
The Company determines the amount of capital required on the basis of annual operating plans and long-term product and other strategic investment plans. The funding requirements are met through equity, non-convertible debentures, senior notes and other long-term/short-term borrowings. The Company’s policy is aimed at combination of short-term and long-term borrowings.
The Company monitors the capital structure on the basis of total debt to equity ratio and maturity profile of the overall debt portfolio of the Company.
Total borrowings includes all long and short-term borrowings as disclosed in notes 23, 24 and 26 (a) to the financial statements. Equity comprises all components excluding (profit)/loss on cash flow hedges.
The following table summarizes the capital of the Company:(` in crores)
Year ended March 31, 2018
Year ended March 31, 2017
Equity 20,161.13 21,139.97
Short-term borrowings and current maturities of long-term borrowings 5,307.93 5,670.89
Long-term borrowings 13,155.91 13,686.09
Total borrowings 18,463.84 19,356.98
Total capital (Debt + Equity) 38,624.97 40,496.95
Total equity as reported in balance sheet 20,170.98 21,162.61
Hedging reserve 3.14 (11.26)
Cost of Hedge reserve (12.99) (11.38)
Equity as reported above 20,161.13 21,139.97

23173rd Annual Report 2017-18
INTEGRATED REPORT 1-65 STATUTORY REPORTS 66-184 FINANCIAL STATEMENTS 185-353
Not
es F
orm
ing
Par
t of F
inan
cial
Sta
tem
ents
41.
Dis
clos
ures
on
finan
cial
inst
rum
ents
Th
is s
ectio
n gi
ves
an o
verv
iew
of t
he s
igni
fican
ce o
f fin
anci
al in
stru
men
ts fo
r the
Com
pany
and
pro
vide
s ad
ditio
nal i
nfor
mat
ion
on b
alan
ce s
heet
item
s th
at c
onta
in fi
nanc
ial
inst
rum
ents
.
Th
e de
tails
of s
igni
fican
t acc
ount
ing
polic
ies,
incl
udin
g th
e cr
iteria
for r
ecog
nitio
n, th
e ba
sis
of m
easu
rem
ent a
nd th
e ba
sis
on w
hich
inco
me
and
expe
nses
are
reco
gnis
ed,
in re
spec
t of e
ach
clas
s of
fina
ncia
l ass
et, f
inan
cial
liab
ility
and
equ
ity in
stru
men
t are
dis
clos
ed in
not
e 2
to th
e fin
anci
al s
tate
men
ts.
(a
) Fi
nanc
ial a
sset
s an
d lia
bilit
ies
The
follo
win
g ta
ble
pres
ents
the
carr
ying
am
ount
s an
d fa
ir va
lue
of e
ach
cate
gory
of f
inan
cial
ass
ets
and
liabi
litie
s as
at M
arch
31,
2018
.
(`
in c
rore
s)
Fina
ncia
l ass
ets
Cash
, and
oth
er
finan
cial
ass
ets
at a
mor
tised
cos
t
Inve
stm
ents
-
FVTO
CIIn
vest
men
ts -
FV
TPL
Der
ivat
ives
oth
er
than
in h
edgi
ng
rela
tions
hip
Der
ivat
ives
in
hed
ging
re
latio
nshi
p
Tota
l car
ryin
g va
lue
Tota
l fai
r val
ue
(a)
Inve
stm
ents
- n
on-c
urre
nt -
3
10.19
-
-
-
3
10.19
3
10.19
(b
) In
vest
men
ts -
cur
rent
-
303
.84
1,51
7.03
-
-
1,
820.
87
1,82
0.87
( c
) Tr
ade
rece
ivab
les
3,4
79.8
1 -
-
-
-
3
,479
.81
3,4
79.8
1 (d
) Ca
sh a
nd c
ash
equi
vale
nts
546
.82
-
-
-
-
546
.82
546
.82
(e)
Oth
er b
ank
bala
nces
248
.60
-
-
-
-
248
.60
248
.60
(f)
Loan
s an
d ad
vanc
es -
non
-cur
rent
143.
96
-
-
-
-
143.
96
143.
96
(g)
Loan
s an
d ad
vanc
es -
cur
rent
140.
27
-
-
-
-
140.
27
140.
27
(h)
Oth
er fi
nanc
ial a
sset
s -
non-
curr
ent
593
.27
-
-
200
.13
-
793
.40
793
.40
(i)
Oth
er fi
nanc
ial a
sset
s -
curr
ent
604
.10
-
-
26.
15
16.0
6 6
46.3
1 6
46.3
1
Tota
l 5
,756
.83
614
.03
1,51
7.03
2
26.2
8
16.0
6 8
,130.
23
8,13
0.23
Fina
ncia
l lia
bilit
ies
Der
ivat
ives
ot
her t
han
in h
edgi
ng
rela
tions
hip
Der
ivat
ives
in
hed
ging
re
latio
nshi
p
Oth
er fi
nanc
ial
liabi
litie
sTo
tal c
arry
ing
valu
eTo
tal f
air v
alue
(a)
Long
-ter
m b
orro
win
gs (i
nclu
ding
Cur
rent
mat
uriti
es o
f lon
g-te
rm
borr
owin
gs)
-
-
15,3
63.9
7 15
,363
.97
15,6
43.2
9 (b
) Sh
ort-
term
bor
row
ings
-
-
3,0
99.8
7 3
,099
.87
3,0
99.8
7 ( c
) Tr
ade
paya
bles
-
-
9,4
11.0
5 9
,411
.05
9,4
11.0
5 (d
) A
ccep
tanc
es -
-
4
,814
.58
4,8
14.5
8 4
,814
.58
(e)
Oth
er fi
nanc
ial l
iabi
litie
s -
non-
curr
ent
-
-
211
.28
211
.28
211
.28
(f)
Oth
er fi
nanc
ial l
iabi
litie
s -
curr
ent
0.3
0 0
.99
1,88
1.81
1,88
3.10
1,
883.
10
To
tal
0.3
0 0
.99
34,
782.
56
34,
783.
85
35,
063.
17

232
Not
es F
orm
ing
Par
t of F
inan
cial
Sta
tem
ents
Th
e fo
llow
ing
tabl
e pr
esen
ts th
e ca
rryi
ng a
mou
nts
and
fair
valu
e of
eac
h ca
tego
ry o
f fin
anci
al a
sset
s an
d lia
bilit
ies
as a
t Mar
ch 3
1, 20
17.
(` in
cro
res)
Fina
ncia
l ass
ets
Cash
, and
oth
er
finan
cial
ass
ets
at a
mor
tised
cos
t
Inve
stm
ents
-
FVTO
CIIn
vest
men
ts -
FV
TPL
Der
ivat
ives
oth
er
than
in h
edgi
ng
rela
tions
hip
Der
ivat
ives
in
hed
ging
re
latio
nshi
p
Tota
l car
ryin
g va
lue
Tota
l fai
r val
ue
(a)
Inve
stm
ents
- n
on-c
urre
nt -
5
28.3
7 -
-
-
5
28.3
7 5
28.3
7
(b)
Inve
stm
ents
- c
urre
nt -
-
2
,437
.42
-
-
2,4
37.4
2 2
,437
.42
( c)
Trad
e re
ceiv
able
s 2
,128.
00
-
-
-
-
2,12
8.00
2
,128.
00
(d)
Cash
and
cas
h eq
uiva
lent
s 2
28.9
4 -
-
-
-
2
28.9
4 2
28.9
4
(e)
Oth
er b
ank
bala
nces
97.
67
-
-
-
-
97.
67
97.
67
(f)
Loan
s an
d ad
vanc
es -
non
-cur
rent
391
.46
-
-
-
-
391
.46
391
.46
(g)
Loan
s an
d ad
vanc
es -
cur
rent
215
.96
-
-
-
-
215
.96
215
.96
(h)
Oth
er fi
nanc
ial a
sset
s -
non-
curr
ent
5.5
7 -
-
19
0.75
-
19
6.32
19
6.32
(i)
Oth
er fi
nanc
ial a
sset
s -
curr
ent
41.1
9 -
-
6
5.73
3
4.62
14
1.54
141.5
4
To
tal
3,10
8.7
9 5
28.3
7 2
,437
.42
256
.48
3
4.62
6
,365
.68
6
,365
.68
Fina
ncia
l lia
bilit
ies
Der
ivat
ives
ot
her t
han
in h
edgi
ng
rela
tions
hip
Der
ivat
ives
in
hed
ging
re
latio
nshi
p
Oth
er fi
nanc
ial
liabi
litie
sTo
tal c
arry
ing
valu
eTo
tal f
air v
alue
(a)
Long
-ter
m b
orro
win
gs (i
nclu
ding
Cur
rent
mat
uriti
es o
f lon
g-te
rm
borr
owin
gs)
-
-
14,19
8.46
14
,198.
46
14,7
00.9
7
(b)
Shor
t-te
rm b
orro
win
gs -
-
5
,158.
52
5,15
8.52
5
,158.
52
( c)
Trad
e pa
yabl
es -
-
7
,082
.95
7,0
82.9
5 7
,082
.95
(d)
Acc
epta
nces
-
-
4,3
79.2
9 4
,379
.29
4,3
79.2
9
(e)
Oth
er fi
nanc
ial l
iabi
litie
s -
non-
curr
ent
0.5
5 -
1,
129.
68
1,13
0.23
1,
130.
23
(f)
Oth
er fi
nanc
ial l
iabi
litie
s -
curr
ent
9.3
8 -
1,
964.
19
1,97
3.57
1,
973.
57
To
tal
9.9
3 -
3
3,91
3.09
3
3,92
3.02
3
4,42
5.53

23373rd Annual Report 2017-18
INTEGRATED REPORT 1-65 STATUTORY REPORTS 66-184 FINANCIAL STATEMENTS 185-353
Notes Forming Part of Financial Statements
The following table provides an analysis of financial instruments that are measured subsequent to initial recognition at fair value, grouped into Level 1 to Level 3, as described below.
Quoted prices in an active market (Level 1): This level of hierarchy includes financial assets that are measured by reference to quoted prices (unadjusted) in active markets for identical assets or liabilities. This category consists of quoted equity shares, quoted corporate debt instruments and mutual fund investments.
Valuation techniques with observable inputs (Level 2): This level of hierarchy includes financial assets and liabilities, measured using inputs other than quoted prices included within Level 1 that are observable for the asset or liability, either directly (i.e; as prices) or indirectly (i.e; derived from prices). This level of hierarchy include Company’s over-the-counter (OTC) derivative contracts.
Valuation techniques with significant unobservable inputs (Level 3): This level of hierarchy includes financial assets and liabilities measured using inputs that are not based on observable market data (unobservable inputs). Fair values are determined in whole or in part, using a valuation model based on assumptions that are neither supported by prices from observable current market transactions in the same instrument nor are they based on available market data.
There has been no transfers between level 1, level 2 and level 3 for the year ended March 31, 2018 and 2017.
Costs of certain unquoted equity instruments has been considered as an appropriate estimate of fair value because of a wide range of possible fair value measurements and cost represents the best estimate of fair value within that range. These investments in equity instruments are not held for trading. Instead, they are held for medium or long term strategic purpose. Upon the application of Ind AS 109, the Company has chosen to designate these investments in equity instruments at FVTOCI as the directors believes this provides a more meaningful presentation for medium or long term strategic investments, than reflecting changes in fair value immediately in profit or loss.
Derivatives are fair valued using market observable rates and published prices together with forecast cash flow information where applicable.
(` in crores)
As at March 31, 2018
Level 1 Level 2 Level 3 Total
Financial assets measured at fair value
(a) Investments 1,820.87 - 310.19 2,131.06
(b) Derivative assets - 242.34 - 242.34
Total 1,820.87 242.34 310.19 2,373.40
Financial liabilities measured at fair value
(a) Derivative liabilities - 1.29 - 1.29
Total - 1.29 - 1.29
As at March 31, 2017
Level 1 Level 2 Level 3 Total
Financial assets measured at fair value
(a) Investments 2,655.60 - 310.19 2,965.79
(b) Derivative assets - 291.10 - 291.10
Total 2,655.60 291.10 310.19 3,256.89
Financial liabilities measured at fair value
(a) Derivative liabilities - 9.93 - 9.93
Total - 9.93 - 9.93

234
Notes Forming Part of Financial Statements
The following table provides an analysis of fair value of financial instruments that are not measured at fair value on recurring basis, grouped into Level 1 to Level 3 categories:
(` in crores)
As at March 31, 2018
Level 1 Level 2 Level 3 Total
Financial assets not measured at fair value
(a) Investments - - - -
Total - - - -
Financial liabilities not measured at fair value
(a) Long-term borrowings (including Current maturities of long-term borrowings)
4,952.01 10,691.28 - 15,643.29
(b) Short-term borrowings - 3,099.87 - 3,099.87
Total 4,952.01 13,791.15 - 18,743.16
As at March 31, 2017
Level 1 Level 2 Level 3 Total
Financial assets not measured at fair value
(a) Investments - - - -
Total - - - -
Financial liabilities not measured at fair value
(a) Long-term borrowings (including Current maturities of long-term borrowings)
5,047.12 9,653.85 - 14,700.97
(b) Short-term borrowings - 5,158.52 - 5,158.52
Total 5,047.12 14,812.37 - 19,859.49
The short-term financial assets and liabilities are stated at amortised cost which is approximately equal to their fair value.
The fair value of borrowings which have a quoted market price in an active market is based on its market price and for other borrowings the fair value is estimated by discounting expected future cash flows, using a discount rate equivalent to the risk-free rate of return, adjusted for the credit spread considered by the lenders for instruments of similar maturity.
Management uses its best judgment in estimating the fair value of its financial instruments. However, there are inherent limitations in any estimation technique. Therefore, substantially for all financial instruments, the fair value estimates presented above are not necessarily indicative of all the amounts that the Company could have realised or paid in sale transactions as of respective dates. As such, the fair value of the financial instruments subsequent to the respective reporting dates may be different from the amounts reported at each year end.

23573rd Annual Report 2017-18
INTEGRATED REPORT 1-65 STATUTORY REPORTS 66-184 FINANCIAL STATEMENTS 185-353
Notes Forming Part of Financial Statements
Offsetting
Certain financial assets and financial liabilities are subject to offsetting where there is currently a legally enforceable right to set off recognised amounts and the Company intends to either settle on a net basis, or to realise the asset and settle the liability, simultaneously.
Certain derivative financial assets and financial liabilities are subject to master netting arrangements, whereby in the case of insolvency, derivative financial assets and financial liabilities will be settled on a net basis.
The following table discloses the amounts that have been offset, in arriving at the balance sheet presentation and the amounts that are available for offset only under certain conditions as at March 31, 2018:
(` in crores)
Gross amount
recognised
Gross amount recognised as set off in the
balance sheet
Net amount presented in the balance
sheet
Amounts subject to an enforceable master netting
arrangement
Net amount after
offsetting
Financial instruments
Cash collateral
Financial assets
(a) Derivative financial instruments 242.34 - 242.34 - - 242.34
(b) Trade receivables 3,670.42 (190.61) 3,479.81 - - 3,479.81
( c) Loans and advances-current 157.36 (17.09) 140.27 - - 140.27
Total 4,070.12 (207.70) 3,862.42 - - 3,862.42
Financial liabilities
(a) Derivative financial instruments 1.29 - 1.29 - - 1.29
(b) Trade payables 9,618.75 (207.70) 9,411.05 - - 9,411.05
Total 9,620.04 (207.70) 9,412.34 - - 9,412.34
The following table discloses the amounts that have been offset in arriving at the balance sheet presentation and the amounts that are available for offset only under certain conditions as at March 31, 2017:
Gross amount
recognised
Gross amount recognised as set off in the
balance sheet
Net amount presented in the balance
sheet
Amounts subject to an enforceable master netting
arrangement
Net amount after
offsetting
Financial instruments
Cash collateral
Financial assets
(a) Derivative financial instruments 291.10 - 291.10 (6.07) - 285.03
(b) Trade receivables 2,209.19 (81.19) 2,128.00 - - 2,128.00
( c) Loans and advances-current 256.68 (40.72) 215.96 - - 215.96
Total 2,756.97 (121.91) 2,635.06 (6.07) - 2,628.99
Financial liabilities
(a) Derivative financial instruments 9.93 - 9.93 (6.07) - 3.86
(b) Trade payables 7,204.86 (121.91) 7,082.95 - - 7,082.95
Total 7,214.79 (121.91) 7,092.88 (6.07) - 7,086.81

236
Notes Forming Part of Financial Statements
( c) Financial risk management
In the course of its business, the Company is exposed primarily to fluctuations in foreign currency exchange rates, interest rates, equity prices, liquidity and credit risk, which may adversely impact the fair value of its financial instruments.
The Company has a risk management policy which not only covers the foreign exchange risks but also other risks associated with the financial assets and liabilities such as interest rate risks and credit risks. The risk management policy is approved by the board of directors. The risk management framework aims to:
• Create a stable business planning environment by reducing the impact of currency and interest rate fluctuations on the Company’s business plan.
• Achieve greater predictability to earnings by determining the financial value of the expected earnings in advance.
(i) Market risk
Market risk is the risk of any loss in future earnings, in realizable fair values or in future cash flows that may result from a change in the price of a financial instrument. The value of a financial instrument may change as a result of changes in the interest rates, foreign currency exchange rates, equity price fluctuations, liquidity and other market changes. Future specific market movements cannot be normally predicted with reasonable accuracy.
(i) (a) Foreign currency exchange rate risk:
The fluctuation in foreign currency exchange rates may have potential impact on the income statement and equity, where any transaction references more than one currency or where assets/liabilities are denominated in a currency other than the functional currency.
Considering the countries and economic environment in which the Company operates, its operations are subject to risks arising from fluctuations in exchange rates in those countries. The risks primarily relate to fluctuations in U.S. dollar, Euro and Thai Baht against the respective functional currencies of the Company.
The Company, as per its risk management policy, uses foreign exchange and other derivative instruments primarily to hedge foreign exchange and interest rate exposure. Any weakening of the functional currency may impact the Company’s cost of exports and cost of borrowings and consequently may increase the cost of financing the Company’s capital expenditures.
The Company evaluates the impact of foreign exchange rate fluctuations by assessing its exposure to exchange rate risks. It hedges a part of these risks by using derivative financial instruments in accordance with its risk management policies.
The foreign exchange rate sensitivity is calculated for each currency by aggregation of the net foreign exchange rate exposure of a currency and a simultaneous parallel foreign exchange rates shift in the foreign exchange rates of each currency by 10%.
The exposure as indicated below is mitigated by some of the derivative contracts entered into by the Company as disclosed in (iv) derivative financial instruments and risk management below.
The following table sets forth information relating to foreign currency exposure (other than risk arising from derivatives disclosed at clause (iv) below) as of March 31, 2018:
(` in crores)
U.S. dollar Euro GBP THB Others 1 TotalFinancial assets 591.30 18.14 95.09 128.80 27.69 861.02 Financial liabilities 6,157.54 175.97 523.79 3.15 29.87 6,890.32
1 Others mainly include currencies such as the Russian rouble, Japanese yen, Swiss franc, Australian dollars, South African rand, Thai baht and Korean won.
10% appreciation/depreciation of the respective foreign currencies with respect to functional currency of the Company would result in decrease/increase in the Company’s net profit/(loss) before tax by approximately ` 86.10 crores and ` 689.03 crores for financial assets and financial liabilities respectively for the year ended March 31, 2018.

23773rd Annual Report 2017-18
INTEGRATED REPORT 1-65 STATUTORY REPORTS 66-184 FINANCIAL STATEMENTS 185-353
Notes Forming Part of Financial Statements
The following table sets forth information relating to foreign currency exposure (other than risk arising from derivatives disclosed at clause (iv) below) as of March 31, 2017:
(` in crores)
U.S. dollar Euro GBP THB Others 2 Total
Financial assets 395.23 11.03 34.53 95.25 16.22 552.26
Financial liabilities 5,974.81 150.24 374.84 8.17 26.17 6,534.23
2 Others mainly include currencies such as the Russian rouble, Japanese yen, Swiss franc, Australian dollars, South African rand, Thai baht and Korean won.
10% appreciation/depreciation of the respective foreign currencies with respect to functional currency of the Company would result in decrease/increase in the Company’s net profit/(loss) before tax by approximately 55.23 crores and ` 653.42 crores for financial assets and financial liabilities, respectively for the year ended March 31, 2017.
(Note: The impact is indicated on the profit/(loss) before tax basis.)
(i) (b) Interest rate risk
Interest rate risk is measured by using the cash flow sensitivity for changes in variable interest rates. Any movement in the reference rates could have an impact on the Company’s cash flows as well as costs.
The Company is subject to variable interest rates on some of its interest bearing liabilities. The Company’s interest rate exposure is mainly related to debt obligations. The Company also uses a mix of interest rate sensitive financial instruments to manage the liquidity and fund requirements for its day to day operations like short term loans.
As at March 31, 2018 and 2017, financial liability of ` 3,239.35 crores and ` 3,418.97 crores, respectively, was subject to variable interest rates. Increase/decrease of 100 basis points in interest rates at the balance sheet date would result in decrease/increase in profit/(loss) before tax of ` 32.39 crores and ` 34.19 crores for the year ended March 31, 2018 and 2017, respectively.
The model assumes that interest rate changes are instantaneous parallel shifts in the yield curve. Although some assets and liabilities may have similar maturities or periods to re-pricing, these may not react correspondingly to changes in market interest rates. Also, the interest rates on some types of assets and liabilities may fluctuate with changes in market interest rates, while interest rates on other types of assets may change with a lag.
The risk estimates provided assume a parallel shift of 100 basis points interest rate across all yield curves. This calculation also assumes that the change occurs at the balance sheet date and has been calculated based on risk exposures outstanding as at that date. The period end balances are not necessarily representative of the average debt outstanding during the period.
This analysis assumes that all other variables, in particular foreign currency rates, remain constant.
(Note: The impact is indicated on the profit/(loss) before tax basis).
(i) ( c) Equity Price risk
Equity Price Risk is related to the change in market reference price of the investments in equity securities.
The fair value of some of the Company’s investments measured at fair value through other comprehensive income exposes the Company to equity price risks. These investments are subject to changes in the market price of securities. The fair value of Company’s investment in quoted equity securities as of March 31, 2018 and 2017 was ` 303.84 crores and ` 218.18 crores, respectively. A 10% change in equity price as of March 31, 2018 and 2017 would result in an impact of ` 30.38 crores and ` 21.82 crores, respectively.
(Note: The impact is indicated on equity before consequential tax impact, if any).

238
Notes Forming Part of Financial Statements
(ii) Credit risk
Credit risk is the risk of financial loss arising from counterparty failure to repay or service debt according to the contractual terms or obligations. Credit risk encompasses both the direct risk of default and the risk of deterioration of creditworthiness as well as concentration risks.
Financial instruments that are subject to concentrations of credit risk, principally consist of investments classified as fair value through profit and loss, trade receivables, loans and advances and derivative financial instruments. None of the financial instruments of the Company result in material concentrations of credit risks.
Exposure to credit risk
The carrying amount of financial assets represents the maximum credit exposure. The maximum exposure to credit risk was ` 7,819.91 crores and ` 6,069.96 crores as at March 31, 2018 and 2017, respectively, being the total of the carrying amount of balances with banks, short term deposits with banks, trade receivables, finance receivables, margin money and other financial assets excluding equity investments.
Financial assets that are neither past due nor impaired
None of the Company’s cash equivalents, including time deposits with banks, are past due or impaired. Regarding trade receivables and other receivables, and other loans or receivables that are neither impaired nor past due, there were no indications as at March 31, 2018, that defaults in payment obligations will occur.
Credit quality of financial assets and impairment loss
The ageing of trade receivables as of balance sheet date is given below. The age analysis has been considered from the due date.
(` in crores)
As at March 31, 2018 As at March 31, 2017
Trade receivables Gross Allowance Net Gross Allowance Net
Period (in months)
(a) Not due 1,674.79 (8.10) 1,666.69 915.10 (9.59) 905.51
(b) Overdue up to 3 months 1,133.46 (33.60) 1,099.86 841.67 (15.83) 825.84
( c) Overdue 3-6 months 144.00 (12.50) 131.50 138.47 (11.36) 127.11
(d) Overdue more than 6 months 1,071.06 (489.30) 581.76 925.93 (656.39) 269.54 1
TOTAL 4,023.31 (543.50) 3,479.81 2,821.17 (693.17) 2,128.00
1 Trade receivables overdue more than six months include ` 462.22 crores as at March 31, 2018 (` 212.29 crores as at March 31, 2017) outstanding from state government organizations in India, which are considered recoverable.
Trade receivables consist of a large number of various types of customers, spread across geographical areas. Ongoing credit evaluation is performed on the financial condition of these trade receivables and where appropriate allowance for losses are provided. Further the Company, groups the trade receivables depending on type of customers and accordingly credit risk is determined.

23973rd Annual Report 2017-18
INTEGRATED REPORT 1-65 STATUTORY REPORTS 66-184 FINANCIAL STATEMENTS 185-353
Notes Forming Part of Financial Statements
(iii) Liquidity risk
Liquidity risk refers to the risk that the Company cannot meet its financial obligations. The objective of liquidity risk management is to maintain sufficient liquidity and ensure that funds are available for use as per requirements.
The Company has obtained fund and non-fund based working capital lines from various banks. Further, the Company has access to funds from debt markets through commercial paper programs, non-convertible debentures, senior notes and other debt instruments. The Company invests its surplus funds in bank fixed deposit and liquid and liquid plus schemes of mutual funds, which carry no/low mark to market risks. The Company has also invested 15% of the non-convertible debentures (taken/issued by the Company) falling due for repayment in the next 12 months in bank deposits, to meet the regulatory norms of liquidity requirements.
The Company also constantly monitors funding options available in the debt and capital markets with a view to maintaining financial flexibility.
The table below provides details regarding the contractual maturities of financial liabilities, including estimated interest payments as at March 31, 2018:
(` in crores)
Financial liabilities Carrying amount
Due in 1st Year
Due in 2nd Year
Due in 3rd to 5th Year
Due after 5th Year
Total contractual cash flows
(a) Trade payables 9,411.05 9,411.05 - - - 9,411.05
(b) Acceptances 4,814.58 4,814.58 - - - 4,814.58
( c) Borrowings and interest thereon 18,963.90 6,238.08 2,006.03 10,638.87 3,570.94 22,453.92
(d) Other financial liabilities 1,593.03 1,401.69 83.97 86.30 73.47 1,645.43
(e) Derivative liabilities 1.29 1.29 - - - 1.29
Total 34,783.85 21,866.69 2,090.00 10,725.17 3,644.41 38,326.27
The table below provides details regarding the contractual maturities of financial liabilities, including estimated interest payments as at March 31, 2017:
Financial liabilities Carrying amount
Due in 1st Year
Due in 2nd Year
Due in 3rd to 5th Year
Due after 5th Year
Total contractual cash flows
(a) Trade payables 7,082.95 7,082.95 - - - 7,082.95
(b) Acceptances 4,379.29 4,379.29 - - - 4,379.29
( c) Borrowings and interest thereon 19,806.71 7,056.76 2,662.85 10,158.67 5,003.70 24,881.98
(d) Other financial liabilities 2,644.14 1,493.66 1,019.23 56.56 73.13 2,642.58
(e) Derivative liabilities 9.93 9.38 - - 0.55 9.93
Total 33,923.02 20,022.04 3,682.08 10,215.23 5,077.38 38,996.73

240
Notes Forming Part of Financial Statements
(iv) Derivative financial instruments and risk management
The Company has entered into a variety of foreign currency, interest rates and commodity forward contracts and options to manage its exposure to fluctuations in foreign exchange rates, interest rates and commodity price risk. The counterparty is generally a bank. These financial exposures are managed in accordance with the Company’s risk management policies and procedures.
The Company also enters into interest rate swaps and interest rate currency swap agreements, mainly to manage exposure on its fixed rate or variable rate debt. The Company uses interest rate derivatives or currency swaps to hedge exposure to exchange rate fluctuations on principal and interest payments for borrowings denominated in foreign currencies.
Specific transactional risks include risks like liquidity and pricing risks, interest rate and exchange rate fluctuation risks, volatility risks, counterparty risks, settlement risks and gearing risks.
Fair value of derivative financial instruments are determined using valuation techniques based on information derived from observable market data.
The fair value of derivative financial instruments is as follows:
(` in crores)
As at March 31, 2018
As at March 31, 2017
(a) Foreign currency forward exchange contracts and options 245.74 276.81
(b) Commodity Derivatives (4.69) 4.37
Total 241.05 281.18
The gain/loss due to fluctuation in foreign currency exchange rates on derivative contracts, recognised in the income statement was ` 6.31 crores (loss) and ` 85.41 crores (loss) for the years ended March 31, 2018 and 2017, respectively.
The gain/(loss) on commodity derivative contracts, recognised in the income statement was ` 6.07 crores and ` 9.06 crores for the years ended March 31, 2018 and 2017, respectively.

24173rd Annual Report 2017-18
INTEGRATED REPORT 1-65 STATUTORY REPORTS 66-184 FINANCIAL STATEMENTS 185-353
Notes Forming Part of Financial Statements
42. Related-party transactions
The Company’s related parties principally consist of subsidiaries, joint operations, associates and their subsidiaries, Tata Sons Ltd, subsidiaries and joint ventures of Tata Sons Ltd. The Company routinely enters into transactions with these related parties in the ordinary course of business. The Company enters into transactions for sale and purchase of products and services with its related parties.
The following table summarizes related-party transactions and balances for the year ended / as at March 31, 2018: (` in crores)
Subsidiaries Joint Operations
Associates and its
subsidiaries
Tata Sons Ltd, its
subsidiaries and joint ventures
Total
Purchase of products 1,217.67 3,163.05 2,595.40 170.71 7,146.83
Sale of products 5,918.05 545.49 199.80 453.26 7,116.60
Services received 2,548.55 - 8.82 256.29 2,813.66
Services rendered 221.54 4.31 13.05 1.59 240.49
Bills discounted - - - 4,135.03 4,135.03
Purchase of property, plant and equipment 41.25 - 62.43 0.18 103.86
Purchase of investments - 2.50 - - 2.50
Interest (income)/expense, dividend (income)/paid, net (931.25) (4.56) (9.43) 3.93 (941.31)
Finance given (including loans and equity) - - - - -
Finance given, taken back (including loans and equity) 60.00 - - - 60.00
Finance taken (including loans and equity) 1,773.55 - 489.00 - 2,262.55
Finance taken, paid back (including loans and equity) 1,746.80 - 489.00 - 2,235.80
Assets / deposits given as security 2.35 - - - 2.35
Amounts receivable in respect of loans and interest thereon 637.37 - - - 637.37
Amounts payable in respect of loans and interest thereon 147.75 - 56.00 2.10 205.85
Trade and other receivables 564.28 - 61.18 61.59 687.05
Trade payables 1,592.08 184.81 149.57 67.43 1,993.89
Acceptances - - - 220.16 220.16
Assets / deposits given as security 2.54 - - 3.00 5.54
Deposit taken as security 3.31 - - - 3.31
Provision for amount receivable (including loans) 639.49 - - - 639.49
Note: With the introduction of GST from July 01, 2017, the related party transactions reported does not include indirect tax component. The previous period figures to that extent is not comparable.

242
The following table summarizes related-party transactions and balances for the year ended / as at March 31, 2017: (` in crores)
Subsidiaries Joint Operations
Associates and its
subsidiaries
Tata Sons Ltd, its
subsidiaries and joint ventures
Total
Purchase of products 1,036.85 2,275.75 2,056.84 65.46 5,434.90 Sale of products 4,541.55 323.72 248.20 452.62 5,566.09Services received 1,803.86 0.07 10.89 256.98 2,071.80Services rendered 216.14 16.11 13.03 4.64 249.92 Bills discounted - - - 3,202.77 3,202.77 Purchase of property, plant and equipment 49.06 - 13.79 0.02 62.87 Interest (income)/expense, dividend (income)/paid, net (648.91) (12.12) (11.07) 36.52 (635.58)Finance given (including loans and equity) 222.26 - - - 222.26Finance given, taken back (including loans and equity) 30.00 132.50 - - 162.50Finance taken (including loans and equity) 1,358.00 329.00 - - 1,687.00Finance taken, paid back (including loans and equity) 1,397.00 300.00 - - 1,697.00Deposits taken as security 3.31 - - - 3.31
Amounts receivable in respect of loans and interest thereon 692.48 - - 5.33 697.81 Amounts payable in respect of loans and interest thereon 121.00 - 56.00 0.64 177.64 Trade and other receivables 231.02 - 46.26 36.14 313.42 Trade payables 1,014.18 123.95 39.63 49.54 1,227.30Assets / deposits given as security 2,502.35 - - 3.00 2,505.35 Deposit taken as security 3.31 - - - 3.31 Provision for amount receivable (including loans) 639.49 - - - 639.49
Details of significant transactions are given below:Particulars Nature of relationship Year ended
March 31, 2018Year ended
March 31, 2017i) Bill discounted
Tata Capital Ltd Tata Sons Ltd, its subsidiaries and joint ventures 4,135.03 3,202.77
ii) Dividend Income TML Holding Pte Ltd Subsidiary 789.85 507.64
Compensation of key management personnel:Year ended
March 31, 2018Year ended March
31, 2017Short-term benefits 39.49 30.40 Post-employment benefits* 1.88 2.04
The compensation of CEO and Managing Director is ` 26.42 crores and ` 22.55 crores for the year ended March 31, 2018 and 2017 respectively.
* Excludes provision for encashable leave and gratuity for certain key management personnel as a separate actuarial valuation is not available.
Year ended March 31, 2018 Year ended March 31, 2017Other transactions with key management personnel:Dividend paid - - **
** less than ` 50,000/-
Refer note 44 for list of subsidiaries of the Company.
Refer note 45 for information on transactions with post-employment benefit plans.
Notes Forming Part of Financial Statements

24373rd Annual Report 2017-18
INTEGRATED REPORT 1-65 STATUTORY REPORTS 66-184 FINANCIAL STATEMENTS 185-353
Notes Forming Part of Financial Statements
43. Disclosures required by Schedule V of SEBI (Listing Obligations and Disclosure Requirements) Regulations, 2015 and Section 186 (4) of the Companies Act, 2013
(a) Amount of loans / advances in nature of loans outstanding from subsidiaries as at March 31, 2018, on a standalone basis. (` in crores)
Outstanding as at March
31, 2018/ March 31,
2017
Maximum amount
outstanding during the
year
Name of the Company
Tata Motors European Technical Centre Plc., UK 39.22 39.22
[Tata Motors European Technical Centre has utilised this loan for investment in National Automotive Innovation Centre set up jointly with University of Warwick and Jaguar Landrover Ltd and carried an interest rate of 12 months LIBOR + 3% prevailing rate (4.7076% p.a-5.6492% p.a] 34.39 40.56
Tata Hispano Motors Carrocera S.A. 539.40 539.40
(Tata Hispano Motors Carrocera S.A. has utilised this loan for meeting its capex requirement and general corporate purposes, which is fully provided). 539.40 539.40
Tata Hispano Motors Carroceries Maghreb SA 58.39 58.39
(Tata Hispano Motors Carroceries Maghreb SA has utilised this loan for general corporate purposes, which is partly provided). 58.39 58.39
Concorde Motors (India) Ltd - 50.00
(Inter Corporate Deposit utilised for working capital finance at the rate of interest of 9% p.a to 10.00% p.a. having Call / Put option). 50.00 50.00
Tata Marcopolo Motors Ltd - 10.00
(Inter Corporate Deposit utilised for working capital finance at the rate of interest of 9.00% p.a. to 10.00% p.a having Call / Put option). 10.00 25.00
(b) Details of Investments made are given in notes 6, 7, 8 and 9

244
Notes Forming Part of Financial Statements
44. Details of significant investments in subsidiaries, joint ventures and associates
% direct holding
Name of the Company Country of incorporation/
Place of business
As at March 31, 2018
As at March 31, 2017
Subsidiaries
TAL Manufacturing Solutions Ltd India 100.00 100.00
Concorde Motors (India) Ltd India 100.00 100.00
Tata Motors Insurance Broking & Advisory Services Ltd India 100.00 100.00
Tata Motors European Technical Centre Plc UK 100.00 100.00
Tata Technologies Ltd India 72.29 72.32
Tata Motors Finance Ltd India 100.00 100.00
Tata Marcopolo Motors Ltd India 51.00 51.00
TML Holdings Pte Ltd Singapore 100.00 100.00
TML Distribution Company Ltd India 100.00 100.00
Tata Hispano Motors Carrocera S.A Spain 100.00 100.00
Tata Hispano Motors Carroceries Maghreb S.A Morocco 100.00 100.00
Trilix S.r.l Italy 80.00 80.00
Tata Precision Industries Pte Ltd Singapore 78.39 78.39
Joint Ventures
JT Special Vehicle (P) Ltd India 50.00 50.00
Associates
Automobile Corporation of Goa Ltd India 46.44 46.44
Nita Co. Ltd Bangladesh 40.00 40.00
Tata AutoComp Systems Ltd India 26.00 26.00
Tata Hitachi Construction Machinery Company Private Ltd India 39.74 39.74

24573rd Annual Report 2017-18
INTEGRATED REPORT 1-65 STATUTORY REPORTS 66-184 FINANCIAL STATEMENTS 185-353
Notes Forming Part of Financial Statements
45. Employee benefits
Defined Benefit Plan
Pension and post retirement medical plans
The following table sets out the funded and unfunded status and the amounts recognised in the financial statements for the pension and the post retirement medical plans in respect of Tata Motors and joint operations:
(` in crores)
Pension Benefits Post retirement Medical BenefitsAs at March
31, 2018As at March
31, 2017As at March
31, 2018As at March
31, 2017Change in defined benefit obligations :Defined benefit obligation, beginning of the year 860.35 813.84 169.31 148.60 Current service cost 56.64 54.11 8.89 7.47 Interest cost 60.26 61.88 12.01 11.55 Remeasurements (gains) / lossesActuarial (gains) / losses arising from changes in demographic assumptions (11.28) - (11.17) - Actuarial (gains) / losses arising from changes in financial assumptions 25.21 12.58 (2.65) 20.24 Actuarial (gains) / losses arising from changes in experience adjustments 8.70 (6.89) (28.24) (10.31)Transfer in/(out) of liability 1.58 - - - Benefits paid from plan assets (105.49) (69.89) - - Benefits paid directly by employer (5.34) (5.28) (9.60) (8.24)Past service cost- plan amendments 7.55 - - - Defined benefit obligation, end of the year 898.18 860.35 138.55 169.31 Change in plan assets:Fair value of plan assets, beginning of the year 738.53 711.33 - - Interest income 55.42 54.59 - - Remeasurements gains / (losses) Return on plan assets, (excluding amount included in net Interest expense) (0.59) 23.81 - - Employer’s contributions 110.28 18.69 - - Transfer in/(out) of assets 1.58 - - - Benefits paid (105.49) (69.89) - - Fair value of plan assets, end of the year 799.73 738.53 - -
Pension Benefits Post retirement medical Benefits
As at March 31, 2018
As at March 31, 2017
As at March 31, 2018
As at March 31, 2017
Amount recognised in the balance sheet consists ofPresent value of defined benefit obligation 898.18 860.35 138.55 169.31 Fair value of plan assets 799.73 738.53 - - Net liability (98.45) (121.82) (138.55) (169.31)Amounts in the balance sheet:Non–current assets 0.82 4.26 - - Non–current liabilities (99.27) (126.08) (138.55) (169.31)Net liability (98.45) (121.82) (138.55) (169.31)

246
Notes Forming Part of Financial Statements
Total amount recognised in other comprehensive income consists of:(` in crores)
Pension Benefits Post retirement medical Benefits
As at March 31, 2018
As at March 31, 2017
As at March 31, 2018
As at March 31, 2017
Remeasurements (gains) / losses ( 4.99) (28.21) (40.20) 1.86
(4.99) (28.21) (40.20) 1.86
Information for funded plans with a defined benefit obligation in excess of plan assets:
Pension Benefits
As at March 31, 2018
As at March 31, 2017
Defined benefit obligation 44.71 704.77
Fair value of plan assets 41.99 678.02
Information for funded plans with a defined benefit obligation less than plan assets:
Pension Benefits
As at March 31, 2018
As at March 31, 2017
Defined benefit obligation 756.92 56.25
Fair value of plan assets 757.74 60.51
Information for unfunded plans:
Pension Benefits Post retirement medical Benefits
As at March 31, 2018
As at March 31, 2017
As at March 31, 2018
As at March 31, 2017
Defined benefit obligation 96.55 99.33 138.55 169.31
Net pension and post retirement medical cost consist of the following components:
Pension Benefits Post retirement medical Benefits
Year ended March 31, 2018
Year ended March 31, 2017
Year ended March 31, 2018
Year ended March 31, 2017
Service cost 56.64 54.11 8.89 7.47
Net interest cost / (income) 4.84 7.29 12.01 11.55
Past service cost- plan amendments 7.55 - - -
Net periodic cost 69.03 61.40 20.90 19.02

24773rd Annual Report 2017-18
INTEGRATED REPORT 1-65 STATUTORY REPORTS 66-184 FINANCIAL STATEMENTS 185-353
Notes Forming Part of Financial Statements
Other changes in plan assets and benefit obligation recognised in other comprehensive income.
Pension Benefits Post retirement medical Benefits
Year ended March 31,
2018
Year ended March 31,
2017
Year ended March 31,
2018
Year ended March 31,
2017
Remeasurements
Return on plan assets, (excluding amount included in net Interest expense) 0.59 (23.81) - -
Actuarial (gains) / losses arising from changes in demographic assumptions (11.28) - (11.17) -
Actuarial (gains) / losses arising from changes in financial assumptions 25.21 12.58 (2.65) 20.24
Actuarial (gains) / losses arising from changes in experience adjustments on plan liabilities 8.70 (6.89) (28.24) (10.31)
Total recognised in other comprehensive income 23.22 (18.12) (42.06) 9.93
Total recognised in statement of profit and loss and other comprehensive income 92.25 43.28 (21.16) 28.95
The assumptions used in accounting for the pension and post retirement medical plans are set out below:
Pension Benefits Post retirement medical Benefits
As at March 31, 2018
As at March 31, 2017
As at March 31, 2018
As at March 31, 2017
Discount rate 6.75%-7.70% 6.75%-7.50% 7.70% 7.30%
Rate of increase in compensation level of covered employees 6.00%-8.00% 5.00%-8.00% NA NA
Increase in health care cost NA NA 6.00% 6.00%
Plan Assets
The fair value of Company’s pension plan asset as of March 31, 2018 and 2017 by category are as follows:
Pension benefits
As at March 31, 2018
As at March 31, 2017
Asset category:
Cash and cash equivalents 6.5% 0.4%
Debt instruments (quoted) 65.2% 71.9%
Debt instruments (unquoted) 0.9% 5.4%
Equity instruments (quoted) 1.9% 1.5%
Deposits with Insurance companies 25.5% 20.8%
100.0% 100.0%
The Company’s policy is driven by considerations of maximizing returns while ensuring credit quality of the debt instruments. The asset allocation for plan assets is determined based on investment criteria prescribed under the Indian Income Tax Act, 1961, and is also subject to other exposure limitations. The Company evaluates the risks, transaction costs and liquidity for potential investments. To measure plan asset performance, the Company compares actual returns for each asset category with published bench marks.
The weighted average duration of the defined benefit obligation as at March 31, 2018 is 14.5 years ( March 31, 2017 : 15.7 years).

248
Notes Forming Part of Financial Statements
The Company expects to contribute ` 77.61 crores to the funded pension plans in FY 2018-19.
The table below outlines the effect on the service cost, the interest cost and the defined benefit obligation in the event of a decrease/increase of 1% in the assumed rate of discount rate, salary escalation and health care cost:
Assumption Change in assumption Impact on defined benefit obligation
Impact on service cost and interest cost
Discount rate Increase by 1% Decrease by ` 78.74 crores Decrease by ` 16.07 crores
Decrease by 1% Increase by ` 91.16 crores Increase by ` 17.42 crores
Salary escalation rate Increase by 1% Increase by ` 69.71 crores Increase by ` 15.91 crores
Decrease by 1% Decrease by ` 61.92 crores Decrease by ` 13.96 crores
Health care cost Increase by 1% Increase by ` 16.49 crores Increase by ` 3.78 crores
Decrease by 1% Decrease by ` 13.97 crores Decrease by ` 3.12 crores
The Company’s contribution to defined contribution plan aggregated to ` 182.20 crores and ` 163.30 crores for the years ended March 31, 2018 and 2017 respectively.

24973rd Annual Report 2017-18
INTEGRATED REPORT 1-65 STATUTORY REPORTS 66-184 FINANCIAL STATEMENTS 185-353
Notes Forming Part of Financial Statements
46 Additional information The financial statements include the Company’s proportionate share of assets, liabilities, income and expenditure in its two Joint
Operations, namely Tata Cummins Private Limited and Fiat India Automobile Private Limited. Below are supplementary details of Tata Motors Limited on standalone basis excluding interest in the aforesaid two Joint Operations:
A. Balance Sheet (` in crores)
As at March 31, 2018
As at March 31, 2017
I. ASSETS(1) NON-CURRENT ASSETS
(a) Property, plant and equipment 16,030.88 16,325.13 (b) Capital work-in-progress 1,337.89 1,490.50 ( c) Other intangible assets 3,198.53 2,723.94 (d) Intangible assets under development 3,811.03 5,330.49 (e) Investments in subsidiaries, joint arrangements and associates 15,607.64 15,987.06 (f) Financial assets
(i) Investments 310.19 528.37 (ii) Loans and advances 143.36 390.71 (iii) Other financial assets 784.46 190.54
(g) Non-current tax assets (net) 650.46 722.13 (h) Other non-current assets 1,419.52 1,536.27
43,293.96 45,225.14 (2) CURRENT ASSETS
(a) Inventories 4,925.47 5,185.58 (b) Investments in subsidiaries and associate (held-for-sale) 681.91 - ( c) Financial assets
(i) Investments 1,820.87 2,437.42 (ii) Trade receivables 2,960.93 1,922.88 (iii) Cash and cash equivalents 499.65 149.89 (iv) Bank balances other than (iii) above 180.38 86.67 (v) Loans and advances 136.37 215.64 (vi) Other financial assets 525.36 141.47
(d) Current tax assets (net) 73.88 129.49 (e) Assets classified as held-for-sale 223.33 - (f) Other current assets 1,172.45 1,413.45
13,200.60 11,682.49 TOTAL ASSETS 56,494.56 56,907.63
II. EQUITY AND LIABILITIESEQUITY (a) Equity share capital 679.22 679.22 (b) Other equity 19,004.01 20,228.02
19,683.23 20,907.24 LIABILITIES(1) NON-CURRENT LIABILITIES
(a) Financial liabilities(i) Borrowings 12,517.97 13,064.52 (ii) Other financial liabilities 211.28 1,129.68
(b) Provisions 983.55 864.33 ( c) Deferred tax liabilities (net) - 49.63 (d) Other non-current liabilities 97.90 86.61
13,810.70 15,194.77 (2) CURRENT LIABILITIES
(a) Financial liabilities(i) Borrowings 2,880.34 4,832.20 (ii) Trade payables 8,667.13 6,850.76 (iii) Acceptances 4,814.58 4,379.29 (iv) Other financial liabilities 3,936.77 2,386.11
(b) Provisions 852.93 444.43 ( c) Current tax liabilities (net) 14.76 70.06 (d) Other current liabilities 1,834.12 1,842.77
23,000.63 20,805.62 TOTAL EQUITY AND LIABILITIES 56,494.56 56,907.63

250
Notes Forming Part of Financial Statements
B. Statement of Profit and Loss (` in crores)
Particulars Year ended March 31,
2018
Year ended March 31,
2017I. Revenue from operations 57,258.60 48,273.97 II. Other Income 1,558.00 984.34 III. Total Income (I+II) 58,816.60 49,258.31 IV. Expenses
(a) Cost of materials consumed 35,011.52 27,387.84 (b) Purchases of products for sale 5,724.01 4,405.11 ( c) Changes in inventories of finished goods, work-in-progress and products for sale 845.67 (194.51)(d) Excise duty 733.95 4,508.46 (e) Employee benefits expense 3,767.86 3,607.16 (f) Finance costs 1,686.59 1,535.76 (g) Foreign exchange (gain)/loss (net) 10.99 (254.14)(h) Depreciation and amortisation expense 2,851.27 2,830.84 (i) Product development/Engineering expenses 474.55 453.33 (j) Other expenses 8,907.44 8,133.14 (k) Amount capitalised (855.08) (941.60)Total Expenses (IV) 59,158.77 51,471.39
V. Profit/(loss) before exceptional items and tax (III-IV) (342.17) (2,213.08)VI. Exceptional items
(a) Provision for impairment of investment in a subsidiary - 123.17 (b) Employee separation cost 3.68 67.61 ( c) Provision for impairment of capital-work-in progress and intangibles under development 962.98 - (d) Others - 147.93
VII. Profit/(loss) before tax (V-VI) (1,308.83) (2,551.79)VIII. Tax expense (net)
(a) Current tax 6.00 4.02 (b) Deferred tax (48.64) (8.58)Total tax expense (42.64) (4.56)
IX. Profit/(loss) for the year from continuing operations (VII-VIII) (1,266.19) (2,547.23)X. Other comprehensive income/(loss):
(A) (i) Items that will not be reclassified to profit and loss: (a) Remeasurement gains and (losses) on defined benefit obligations (net) 16.71 12.72 (b) Quoted equity instruments through other comprehensive income 44.04 73.84 (ii) Income tax relating to items that will not be reclassified to profit and loss (5.78) (4.40)(B) (i) Items that will be reclassified to profit and loss - gains and (losses) in cash flow
hedges (19.56) 23.32 (ii) Income tax relating to items that will be reclassified to profit and loss 6.77 (8.07)Total other comprehensive income/(loss), net of taxes 42.18 97.41
XI. Total comprehensive income/(loss) for the year (IX+X) (1,224.01) (2,449.82)XII. Earnings per equity share (EPS)
(a) Ordinary shares: (i) Basic ` (3.73) (7.50) (ii) Diluted ` (3.73) (7.50)(b) ‘A’ Ordinary shares: - (i) Basic ` (3.73) (7.50) (ii) Diluted ` (3.73) (7.50)

25173rd Annual Report 2017-18
INTEGRATED REPORT 1-65 STATUTORY REPORTS 66-184 FINANCIAL STATEMENTS 185-353
C.
Sta
tem
ent o
f Cha
nges
in E
quity
for t
he y
ear e
nded
Mar
ch 3
1, 20
18
i)
Equi
ty S
hare
Cap
ital
(` in
cro
res)
Par
ticul
ars
Equi
ty
Sha
re C
apita
l
Bal
ance
as
at A
pril
1, 20
17 6
79.2
2
Pro
ceed
s fr
om is
sue
of s
hare
s he
ld in
abe
yanc
e -
*
Bal
ance
as
at M
arch
31,
2018
679
.22
*les
s th
an `
50,
000/
-
ii)
O
ther
Equ
ity
Par
ticul
ars
Sec
uriti
es
prem
ium
ac
coun
t
Capi
tal
rede
mpt
ion
rese
rve
Deb
entu
re
rede
mpt
ion
rese
rve
Capi
tal
rese
rve
(on
mer
ger)
Ret
aine
d ea
rnin
gsO
ther
com
pone
nts
of e
quity
(OCI
)To
tal o
ther
eq
uity
Und
istr
ibut
able
(In
d A
S 10
1)D
istr
ibut
able
Equi
ty
inst
rum
ents
th
roug
h O
CI
Hed
ging
re
serv
eCo
st o
f he
dgin
g re
serv
e
Bal
ance
as
at A
pril
1, 20
17 19
,213
.93
2.2
8 1,
085.
94
(345
.30)
627
.03
(351
.38)
(27.1
2) 11
.26
11.3
8 2
0,22
8.0
2
Pro
fit/(
loss
) for
the
year
-
-
-
-
-
(1,2
66.19
) -
-
-
(1
,266
.19)
Oth
er c
ompr
ehen
sive
inco
me
/(lo
ss) f
or
the
year
-
-
-
-
-
10.9
3 4
4.04
(1
4.40
) 1.
61
42.
18
Tota
l com
preh
ensi
ve in
com
e/(lo
ss) f
or th
e ye
ar -
-
-
-
-
(1
,255
.26)
44.
04
(14.
40)
1.61
(1
,224
.01)
Pro
ceed
s fr
om is
sue
of s
hare
s he
ld in
ab
eyan
ce 0
.00*
-
-
-
-
-
-
-
-
-
Bal
ance
as
at M
arch
31,
2018
19,2
13.9
3 2
.28
1,
085.
94
(345
.30)
627
.03
(1,6
06.6
4) 16
.92
(3.14
) 12
.99
19,0
04.0
1
* le
ss th
an `
50,
000/
-
Not
es F
orm
ing
Par
t of F
inan
cial
Sta
tem
ents

252
D.
Sta
tem
ent o
f Cha
nges
in E
quity
for t
he p
erio
d en
ded
Mar
ch 3
1, 20
17
i)
Equi
ty S
hare
Cap
ital
(` in
cro
res)
Par
ticul
ars
Equi
ty
Sha
re C
apita
l
Bal
ance
as
at A
pril
1, 20
16 6
79.18
Pro
ceed
s fr
om is
sue
of s
hare
s he
ld in
abe
yanc
e an
d am
ount
s re
ceiv
ed o
n un
paid
cal
ls 0
.04
Bal
ance
as
at M
arch
31,
2017
679
.22
ii)
O
ther
Equ
ity
Par
ticul
ars
Sec
uriti
es
prem
ium
ac
coun
t
Capi
tal
rede
mpt
ion
rese
rve
Deb
entu
re
rede
mpt
ion
rese
rve
Capi
tal
rese
rve
(on
mer
ger)
Ret
aine
d ea
rnin
gsO
ther
com
pone
nts
of e
quity
(OCI
)To
tal o
ther
eq
uity
Und
istr
ibut
able
(In
d A
S 10
1)D
istr
ibut
able
Equi
ty
inst
rum
ents
th
roug
h O
CI
Hed
ging
re
serv
eCo
st o
f he
dgin
g re
serv
e
Bal
ance
as
at A
pril
1, 20
1619
209.
42 2
.28
1,04
2.15
-
7
09.3
6 1,
572.
34
(100
.96)
7.3
9 -
2
2,44
1.98
Effe
ct o
f mer
ger o
f TM
L D
rivel
ines
-
-
(3
45.3
0) (8
2.33
) 7
31.9
8 -
-
-
3
04.3
5
Bal
ance
as
at A
pril
1, 20
16 19
,209
.42
2.2
8 1,
042.
15
(345
.30)
627
.03
2,3
04.3
2 (1
00.9
6) 7
.39
-
22,
746.
33
Pro
fit/(
loss
) for
the
year
-
-
-
-
-
(2,5
47.2
3) -
-
-
(2
,547
.23)
Oth
er c
ompr
ehen
sive
inco
me
/(lo
ss) f
or
the
year
-
-
-
-
-
8.3
2 7
3.84
3
.87
11.3
8 9
7.41
Tota
l com
preh
ensi
ve in
com
e/(lo
ss) f
or th
e ye
ar -
-
-
-
-
(2
,538
.91)
73.
84
3.8
7 11
.38
(2
,449
.82)
Pro
ceed
s fr
om is
sue
of s
hare
s he
ld in
ab
eyan
ce
4.5
1 -
-
-
-
-
-
-
-
4
.51
Tran
sfer
to D
eben
ture
rede
mpt
ion
rese
rve
-
-
43.
79
-
-
(43.
79)
-
-
-
-
Div
iden
d (in
clud
ing
divi
dend
tax)
-
-
-
-
-
(73.
00)
-
-
-
(73.
00)
Bal
ance
as
at M
arch
31,
2017
19,2
13.9
3 2
.28
1,
085.
94
(345
.30)
627
.03
(351
.38)
(27.
12)
11.2
6 11
.38
2
0,22
8.0
2
Not
es F
orm
ing
Par
t of F
inan
cial
Sta
tem
ents

25373rd Annual Report 2017-18
INTEGRATED REPORT 1-65 STATUTORY REPORTS 66-184 FINANCIAL STATEMENTS 185-353
Notes Forming Part of Financial Statements47. Other notes:
i) Micro, Small and Medium Enterprises Development Act, 2006
The information as required to be disclosed under the Micro, Small and Medium Enterprises Development Act, 2006 has been determined to the extent such parties have been identified on the basis of information available with the Company. The amount of principal and interest outstanding during the year is given below :
(` in crores)
As at March 31, 2018
As at March 31, 2017
(a) Amounts outstanding but not due as at March 31, 141.59 125.11
(b) Amounts due but unpaid as at March 31, - Principal 0.69 -
( c) Amounts paid after appointed date during the year - Principal 95.50 88.32
(d) Amount of interest accrued and unpaid as at March 31, - Interest 2.55 1.72
(e) Amount of estimated interest due and payable for the period from April 1,2018 to actual date of payment or May 23, 2018 (whichever is earlier) - Interest 0.17 0.18
ii) Expenditure incurred on Research and Development by Tata Motors Limited on standalone basis excluding interest in the joint operations
(` in crores)
Particulars Year ended March 31, 2018
Year ended March 31, 2017
(a) Revenue expenditure charged to the statement of profit and loss (Product development / Engineering expenses, exceptional items and works, operations & other expenses)
923.10 508.26
(b) Revenue expenditure capitalised to intangibles under development during the year 1,362.51 1,526.34
( c) Capital expenditure in relation to tangible fixed assets 111.91 65.59
Total 2,397.52 2,100.19
iii) Effective April 30, 2018, the Company completed the merger of TML Drivelines Ltd (TML Drivelines) pursuant to a scheme of arrangement of merger. As TML Drivelines is a wholly owned subsidiary of the Company, the merger has been accounted in accordance with “Pooling of Interest Method” laid down by Appendix C of Indian Accounting Standard 103 (Ind AS 103): (Business combinations of entities under common control), notified under the Companies Act, 2013.
Accordingly, all assets, liabilities and reserves of TML Drivelines have been recorded in the books of account of the Company at their existing carrying amounts and in the same form. To the extent that there are inter-company loans, advances, deposits, balances or other obligations as between TML Drivelines and the Company, have been eliminated. The difference, between the investments held by the Company and all assets, liabilities and reserves of TML Drivelines, has been debited to capital reserve. Comparative accounting period presented in the financial statements of the Company has been restated for the accounting impact of the merger, as stated above, as if the merger had occurred from the beginning of the comparative period in the financial statements i.e. April 1, 2016.

254
Notes Forming Part of Financial Statements
As per our report of even date attached For and on behalf of the Board
For B S R & Co. LLPChartered AccountantsFirm’s Registration No: 101248W/W-100022
YEZDI NAGPOREWALLAPartnerMembership No. 049265Mumbai, May 23, 2018
N CHANDRASEKARAN [DIN: 00121863]Chairman
N MUNJEE [DIN:00010180]
V K JAIRATH [DIN:00391684]
F S NAYAR [DIN:00003633]
O P BHATT [DIN:00548091]
R SPETH [DIN:03318908]
Directors
GUENTER BUTSCHEK [DIN: 07427375]CEO and Managing DirectorS B BORWANKAR [DIN: 01793948]ED and Chief Operating OfficerP B BALAJIGroup Chief Financial OfficerH K SETHNA [FCS: 3507]Company Secretary
Mumbai, May 23, 2018
iv) The Company’s certain assets related to defence business are classified as ”Held for Sale’’ as they meet the criteria laid out under Ind AS 105.
v) The Company has a process whereby periodically all long term contracts (including derivative contracts) are assessed for material foreseeable losses. At the year end, the Company has reviewed and ensured that adequate provision as required under any law/accounting standards for material foreseeable losses on such long term contracts (including derivative contracts) has been made in the books of account.

To the Members ofTata Motors Limited
Report on the Audit of Consolidated Ind AS Financial Statements
We have audited the accompanying consolidated Ind AS financial statements of Tata Motors Limited (hereinafter referred to as “the Holding Company”) and its subsidiaries (the Holding Company and its subsidiaries together referred to as “the Group”), its joint operations, its associates and its jointly controlled entities, which comprise the Consolidated Balance Sheet as at 31 March 2018, the Consolidated Statement of Profit and Loss, Consolidated Statement of Changes in Equity and the Consolidated Cash Flow Statement, for the year then ended, including a summary of significant accounting policies and other explanatory information (hereinafter referred to as “the consolidated financial statements”).
Management's Responsibility for the Consolidated Ind AS Financial Statements
The Holding Company's Board of Directors is responsible for the preparation of these consolidated financial statements in terms of the requirements of the Companies Act, 2013 (hereinafter referred to as “the Act”) that give a true and fair view of the consolidated state of affairs, consolidated profit/ loss and other comprehensive income, consolidated statement of changes in equity and consolidated cash flows of the Group including its joint operations, associates and jointly controlled entities in accordance with the accounting principles generally accepted in India, including the Indian Accounting Standards (Ind AS) specified under section 133 of the Act. The respective Board of Directors of the companies included in the Group and of its joint operations, associates and jointly controlled entities are responsible for maintenance of adequate accounting records in accordance with the provisions of the Act for safeguarding the assets of the Group and its joint operations, associates and jointly controlled entities and for preventing and detecting frauds and other irregularities; the selection and application of appropriate accounting policies; making judgments and estimates that are reasonable and prudent; and the design, implementation and maintenance of adequate internal financial controls that were operating effectively for ensuring the accuracy and completeness of the accounting records, relevant to the preparation and presentation of the consolidated financial statements that give a true and fair view and are free from material misstatement, whether due to fraud or error, which have been used for the purpose of preparation of the consolidated financial statements by the Directors of the Holding Company, as aforesaid.
In preparing the consolidated financial statements, the respective Board of Directors of the companies included in the Group and of its joint operations, associates, jointly controlled entities are responsible for assessing the ability of the Group and of its joint operations, associates and jointly controlled entities to continue as
Independent Auditor’s Report
a going concern, disclosing, as applicable, matters related to going concern and using the going concern basis of accounting unless management either intends to liquidate the Group or to cease operations, or has no realistic alternative but to do so.
Auditor's Responsibility
Our responsibility is to express an opinion on these consolidated financial statements based on our audit. While conducting the audit, we have taken into account the provisions of the Act, the accounting and auditing standards and matters which are required to be included in the audit report under the provisions of the Act and the Rules made thereunder.
We conducted our audit in accordance with the Standards on Auditing specified under Section 143 (10) of the Act. Those Standards require that we comply with ethical requirements and plan and perform the audit to obtain reasonable assurance about whether the consolidated financial statements are free from material misstatement.
An audit involves performing procedures to obtain audit evidence about the amounts and the disclosures in the consolidated financial statements. The procedures selected depend on the auditor's judgment, including the assessment of the risks of material misstatement of the consolidated financial statements, whether due to fraud or error. In making those risk assessments, the auditor considers internal financial control relevant to the Holding Company's preparation of the consolidated financial statements that give a true and fair view in order to design audit procedures that are appropriate in the circumstances. An audit also includes evaluating the appropriateness of the accounting policies used and the reasonableness of the accounting estimates made, as well as evaluating the overall presentation of the consolidated financial statements.
We are also responsible to conclude on the appropriateness of management’s use of the going concern basis of accounting and, based on the audit evidence obtained, whether a material uncertainty exists related to events or conditions that may cast significant doubt on the ability of Group and of its joint operations, associates and jointly controlled entities to continue as a going concern. If we conclude that a material uncertainty exists, we are required to draw attention in the auditor’s report to the related disclosures in the consolidated financial statements or, if such disclosures are inadequate, to modify our opinion. Our conclusions are based on the audit evidence obtained up to the date of our auditor’s report. However, future events or conditions may cause Group and its joint operations, associates and jointly controlled entities to cease to continue as a going concern.
We believe that the audit evidence obtained by us and the audit evidence obtained by the other auditors in terms of their reports referred to in sub-paragraph 2 (a) of the Other Matters paragraph below, is sufficient and appropriate to provide a basis for our audit opinion on the consolidated financial statements.
25573rd Annual Report 2017-18
INTEGRATED REPORT 1-65 STATUTORY REPORTS 66-184 FINANCIAL STATEMENTS 185-353

Opinion
In our opinion and to the best of our information and according to the explanations given to us and based on the consideration of reports of other auditors on separate financial statements and on the other financial information of the subsidiaries, joint operations, associates and jointly controlled entities, the aforesaid consolidated financial statements give the information required by the Act in the manner so required and give a true and fair view in conformity with the accounting principles generally accepted in India, of the consolidated state of affairs of the Group, its joint operations, associates and jointly controlled entities as at 31 March 2018, and their consolidated profit and other comprehensive income, consolidated statement of changes in equity and consolidated cash flows for the year ended on that date.
Other Matters
1. The comparative financial information of the Group, its joint operations, associates and jointly controlled entities for the year ended 31 March 2017 prepared in accordance with Ind AS included in these consolidated financial statements have been audited by the predecessor auditor. The report of the predecessor auditor on the comparative financial information dated 23 May 2017 expressed an unmodified opinion.
2. (a) We did not audit the financial statements/ financial information of three subsidiaries, seventy-one step-down subsidiaries and one joint operation, whose financial statements/ financial information reflect total assets of ` 264,026.34 crores and net assets of ` 98,271.10 crores as at 31 March 2018, total revenues of ` 240,841.01 crores and net cash inflows amounting to ` 152.35 crores for the year ended on that date, as considered in the consolidated financial statements. The consolidated financial statements also include the Group's share of net profit of ` 2,266.54 crores for the year ended 31 March, 2018, as considered in the consolidated financial statements, in respect of five associates and three jointly controlled entities, whose financial statements / financial information have not been audited by us. These financial statements / financial information have been audited by other auditors whose reports have been furnished to us by the Management and our opinion on the consolidated financial statements, in so far as it relates to the amounts and disclosures included in respect of these subsidiaries, step-down subsidiaries, joint operation, associates and jointly controlled entities and our report in terms of sub-section (3) of Section 143 of the Act, insofar as it relates to the aforesaid subsidiaries, step-down subsidiaries, joint operation, associates and jointly controlled entities is based solely on the reports of the other auditors.
Of the three subsidiaries and seventy-one step-down subsidiaries listed above, the financial statements/ financial information of three subsidiaries and ten step-down subsidiaries which are located outside India have been prepared under the generally accepted accounting principles ('GAAPs') applicable in their respective countries
and which have been audited by the respective auditors under generally accepted auditing standards applicable in their respective countries. The Holding Company's management has converted these financial statements/ financial information from accounting principles generally accepted in their respective countries to Indian Accounting Standards (Ind AS) prescribed under Section 133 of the Companies Act, 2013. We have audited these conversion adjustments made by the Holding Company's management. Our opinion in so far as it relates to such subsidiaries and step-down subsidiaries located outside India is based on the reports of other auditors under the aforementioned GAAPs in the respective countries and the aforesaid conversion adjustments prepared by the Holding Company's management and audited by us.
(b) We did not audit the financial statements / financial information of four subsidiaries and eight step-down subsidiaries, whose financial statements / financial information reflect total assets of ` 18,454.64 crores and net assets of ` 9,714.24 crores as at 31 March 2018, total revenues of ` 1,305.67 crores and net cash inflows amounting to ` 568.39 crores for the year ended on that date, as considered in the consolidated financial statements. The consolidated financial statements also include the Group’s share of net profit of ` 2.67 crores for the year ended 31 March 2018, as considered in the consolidated financial statements, in respect of three associates and one jointly controlled entity whose financial statements / financial information have not been audited by us.
These financial statements / financial information are unaudited and have been furnished to us by the Management and our opinion on the consolidated financial statements, in so far as it relates to the amounts and disclosures included in respect of these subsidiaries, step-down subsidiaries, associates and jointly controlled entity, and our report in terms of sub-sections (3) of Section 143 of the Act in so far as it relates to the aforesaid subsidiaries, step-down subsidiaries, associates and jointly controlled entity, is based solely on such unaudited financial statements / financial information. In our opinion and according to the information and explanations given to us by the Management, these financial statements / financial information are not material to the Group.
Our opinion above on the consolidated financial statements, and our report on Other Legal and Regulatory Requirements below, is not modified in respect of the above matters with respect to our reliance on the work done and the reports of the other auditors and the financial statements / financial information certified by the Management.
Report on Other Legal and Regulatory Requirements
1. As required by Section 143(3) of the Act, based on our audit and on the consideration of report of the other auditors on separate financial statements and the other financial information of subsidiaries, step-down subsidiaries, joint operations, associates and jointly controlled entities, as noted in the ‘other matter’ paragraph, we report, to the extent applicable, that:
256

a) We have sought and obtained all the information and explanations which to the best of our knowledge and belief were necessary for the purposes of our audit of the aforesaid consolidated financial statements.
b) In our opinion, proper books of account as required by law relating to preparation of the aforesaid consolidated financial statements have been kept so far as it appears from our examination of those books and the reports of the other auditors.
c) The Consolidated Balance Sheet, the Consolidated Statement of Profit and Loss, the Consolidated Cash Flow Statement and Consolidated Statement of Changes in Equity dealt with by this Report are in agreement with the relevant books of account maintained for the purpose of preparation of the consolidated financial statements.
d) In our opinion, the aforesaid consolidated financial statements comply with the Indian Accounting Standards specified under section 133 of the Act.
e) On the basis of the written representations received from the directors of the Holding Company as on 31 March 2018 taken on record by the Board of Directors of the Holding Company and the reports of the statutory auditors of its subsidiary companies, joint operations, associates and jointly controlled entity incorporated in India, none of the directors of the Group companies, its joint operations, associates and jointly controlled entity incorporated in India is disqualified as on 31 March 2018 from being appointed as a director in terms of Section 164(2) of the Act.
f) With respect to the adequacy of the internal financial controls with reference to financial statements of the Holding Company, its subsidiary companies, joint operations, associates and jointly controlled entity incorporated in India and the operating effectiveness of such controls, refer to our separate Report in “Annexure A”.
g) With respect to the other matters to be included in the Auditor's Report in accordance with Rule 11 of the Companies (Audit and Auditor’s) Rules, 2014, in our opinion
and to the best of our information and according to the explanations given to us and based on the consideration of the report of the other auditors on separate financial statements as also the other financial information of the subsidiaries, joint operations, associates and jointly controlled entities, as noted in the ‘Other matter’ paragraph:
i. The consolidated financial statements disclose the impact of pending litigations on the consolidated financial position of the Group, its joint operations, associates and jointly controlled entities. Refer Note 37 to the consolidated financial statements.
ii. Provision has been made in the consolidated financial statements, as required under the applicable law or Ind AS, for material foreseeable losses, on long-term contracts including derivative contracts. Refer Note 45 (h) to the consolidated financial statements in respect of such items as it relates to the Group, its joint operations, associates and jointly controlled entities.
iii. There has been no delay in transferring amounts to the Investor Education and Protection Fund by the Holding Company and its subsidiary companies, joint operations, associates and jointly controlled entity incorporated in India during the year ended 31 March 2018.
iv. The disclosures in the consolidated financial statements regarding holdings as well as dealings in specified bank notes during the period from 8 November 2016 to 30 December 2016 have not been made since they do not pertain to the financial year ended 31 March 2018.
For B S R & Co. LLP Chartered Accountants Firm’s Registration No: 101248W/W-100022
Yezdi NagporewallaMumbai Partner23 May 2018 Membership No: 049265
25773rd Annual Report 2017-18
INTEGRATED REPORT 1-65 STATUTORY REPORTS 66-184 FINANCIAL STATEMENTS 185-353

(Referred to in paragraph (f) under ‘Report on Other Legal and Regulatory Requirements’ section of our report of even date)
Report on the Internal Financial Controls under Clause (i) of Sub-section 3 of Section 143 of the Companies Act, 2013 (“the Act”)
We have audited the internal financial controls with reference to financial statements of Tata Motors Limited (“the Company” or “the Holding Company”) and its subsidiary companies, its joint operations, its associates and its jointly controlled entity, which are companies incorporated in India, as at 31 March 2018 in conjunction with our audit of the consolidated Ind AS financial statements of the Holding Company for the year ended on that date.
Management’s Responsibility for Internal Financial Controls
The respective Board of Directors of the Holding Company and its subsidiary companies, its joint operations, its associates and jointly controlled entity, which are companies incorporated in India, are responsible for establishing and maintaining internal financial controls based on the internal financial controls with reference to financial statements criteria established by the respective company considering the essential components of internal control stated in the Guidance Note on Audit of Internal Financial Controls over Financial Reporting issued by the Institute of Chartered Accountants of India (“ICAI”). These responsibilities include the design, implementation and maintenance of adequate internal financial controls that were operating effectively for ensuring the orderly and efficient conduct of its business, including adherence to the respective company’s policies, the safeguarding of its assets, the prevention and detection of frauds and errors, the accuracy and completeness of the accounting records, and the timely preparation of reliable financial information, as required under the Act.
Auditor’s Responsibility
Our responsibility is to express an opinion on the Company's internal financial controls with reference to financial statements based on our audit. We conducted our audit in accordance with the Guidance Note on Audit of Internal Financial Controls Over Financial Reporting (the “Guidance Note”) and the Standards on Auditing, issued by ICAI and deemed to be prescribed under section 143(10) of the Act, to the extent applicable to an audit of internal financial controls, both issued by the ICAI. Those Standards and the Guidance Note require that we comply with ethical requirements and plan and perform the audit to obtain reasonable assurance about whether adequate internal financial controls with reference to financial statements was established and maintained and if such controls operated effectively in all material respects.
Our audit involves performing procedures to obtain audit evidence about the adequacy of the internal financial controls system with reference to financial statements and their operating effectiveness.
Annexure A to the Independent Auditor’s Report – 31 March 2018
Our audit of internal financial controls with reference to financial statements included obtaining an understanding of internal financial controls assessing the risk that a material weakness exists, and testing and evaluating the design and operating effectiveness of internal control based on the assessed risk. The procedures selected depend on the auditor’s judgment, including the assessment of the risks of material misstatement of the financial statements, whether due to fraud or error.
We believe that the audit evidence we have obtained and the audit evidence obtained by the other auditors in terms of their reports referred to in the Other Matter paragraph below, is sufficient and appropriate to provide a basis for our audit opinion on the Company's internal financial controls with reference to financial statements.
Meaning of Internal Financial Controls with reference to financial statementsA company's internal financial control with reference to financial statements is a process designed to provide reasonable assurance regarding the reliability of financial reporting and the preparation of financial statements for external purposes in accordance with generally accepted accounting principles. A company's internal financial control with reference to financial statements includes those policies and procedures that (1) pertain to the maintenance of records that, in reasonable detail, accurately and fairly reflect the transactions and dispositions of the assets of the Company; (2) provide reasonable assurance that transactions are recorded as necessary to permit preparation of financial statements in accordance with generally accepted accounting principles, and that receipts and expenditures of the Company are being made only in accordance with authorisations of management and directors of the Company; and (3) provide reasonable assurance regarding prevention or timely detection of unauthorised acquisition, use, or disposition of the Company's assets that could have a material effect on the financial statements.
Inherent Limitations of Internal Financial Controls with reference to financial statementsBecause of the inherent limitations of internal financial controls with reference to financial statements, including the possibility of collusion or improper management override of controls, material misstatements due to error or fraud may occur and not be detected. Also, projections of any evaluation of the internal financial controls with reference to financial statements to future periods are subject to the risk that the internal financial controls with reference to financial statements may become inadequate because of changes in conditions, or that the degree of compliance with the policies or procedures may deteriorate.
OpinionIn our opinion, the Holding Company, its subsidiary companies, joint operations, associates and jointly controlled entity, which are companies incorporated in India, have, in all material respects,
258

an adequate internal financial controls system with reference to financial statements and such internal financial controls with reference to financial statements were operating effectively as at 31 March 2018, based on the internal financial controls with reference to financial statements criteria established by the respective company considering the essential components of internal control stated in the Guidance Note on Audit of Internal Financial Controls Over Financial Reporting issued by the ICAI.
Other matter
Our aforesaid report under Section 143(3)(i) of the Act on the adequacy and operating effectiveness of the internal financial controls with reference to financial statements in so far as it relates to one joint operation, one associate and one jointly controlled
entity, which are companies incorporated in India, is based solely on the corresponding reports of the other auditors. Our opinion is not modified in respect of this matter.
For B S R & Co. LLP Chartered Accountants Firm’s Registration No: 101248W/W-100022
Yezdi NagporewallaMumbai Partner23 May 2018 Membership No: 049265
25973rd Annual Report 2017-18
INTEGRATED REPORT 1-65 STATUTORY REPORTS 66-184 FINANCIAL STATEMENTS 185-353

CONSOLIDATED BALANCE SHEET
(` in crores)Notes As at
March 31, 2018As at
March 31, 2017I. ASSETS
(1) NON-CURRENT ASSETS(a) Property, plant and equipment 3 73,867.84 59,594.56 (b) Capital work-in-progress 16,142.94 10,186.83 ( c) Goodwill 5 116.45 673.32 (d) Other intangible assets 6 (a) 47,429.57 35,676.20 (e) Intangible assets under development 6 (b) 23,890.56 23,512.01 (f) Investments in equity accounted investees 7 4,887.89 4,606.01 (g) Financial assets (i) Other Investments 8 763.76 690.76 (ii) Finance receivables 16 15,479.53 10,753.13 (iii) Loans and advances 10 495.41 753.66 (iv) Other financial assets 11 4,563.87 2,911.12 (h) Deferred tax assets (net) 20 4,158.70 4,457.34 (i) Non-current tax assets (net) 899.90 972.31 (i) Other non-current assets 18 2,681.25 2,847.36
195,377.67 157,634.61 (2) CURRENT ASSETS
(a) Inventories 12 42,137.63 35,085.31(b) Investments in equity accounted investees (held-for-sale) 7 ( c) 497.35 -( c) Financial assets (i) Other investments 9 14,663.75 15,041.15 (ii) Trade receivables 13 19,893.30 14,075.55 (iii) Cash and cash equivalents 14 14,716.75 13,986.76 (iv) Bank balances other than (iii) above 15 19,897.16 22,091.12 (v) Finance receivables 16 8,401.65 6,810.12 (vi) Loans and advances 10 2,279.66 710.45 (vii) Other financial assets 11 3,029.12 1,555.94 (d) Current tax assets (net) 208.91 223.36 (e) Assets classified as held-for-sale 45 ( c) 2,585.19 - (f) Other current assets 19 7,662.37 6,539.99
135,972.84 116,119.75TOTAL ASSETS 331,350.51 273,754.36
II. EQUITY AND LIABILITIES (1) EQUITY
(a) Equity share capital 21 679.22 679.22 (b) Other equity* 22 94,748.69 57,382.67 Equity attributable to owners of Tata Motors Limited 95,427.91 58,061.89 Non-controlling interests 525.06 453.17
95,952.97 58,515.06 LIABILITIES(2) NON-CURRENT LIABILITIES
(a) Financial liabilities (i) Borrowings 24 61,199.50 60,629.18 (ii) Other financial liabilities 26 2,739.14 11,409.58 (b) Provisions 28 10,948.44 9,004.46 ( c) Deferred tax liabilities (net) 20 6,125.80 1,174.00 (d) Other non-current liabilities 29 11,165.19 17,392.56
92,178.07 99,609.78 (3) CURRENT LIABILITIES
(a) Financial liabilities (i) Borrowings 25 16,794.85 13,859.94 (ii) Trade payables 72,038.41 57,698.33 (iii) Acceptances 4,901.42 4,834.24 (iv) Other financial liabilities 27 31,267.49 25,634.83 (b) Provisions 28 7,953.50 5,807.76 ( c) Current tax liabilities (net) 1,559.07 1,392.58 (d) Liabilities directly associated with Assets held-for-sale 45 ( c) 1,070.18 - (e) Other current liabilities 30 7,634.55 6,401.84
143,219.47 115,629.52 TOTAL EQUITY AND LIABILITIES 331,350.51 273,754.36
* Includes other comprehensive income relating to assets held for sale amounting to ` (6.64) crores as at March 31, 2018See accompanying notes to consolidated financial statements
As per our report of even date attached For and on behalf of the Board
For B S R & Co. LLPChartered AccountantsFirm’s Registration No: 101248W/W-100022
YEZDI NAGPOREWALLAPartnerMembership No. 049265
Mumbai, May 23, 2018
N CHANDRASEKARAN [DIN: 00121863] Chairman
N MUNJEE [DIN:00010180]
V K JAIRATH [DIN:00391684]
F S NAYAR [DIN:00003633]
O P BHATT [DIN:00548091]
R SPETH [DIN:03318908]
Directors
GUENTER BUTSCHEK [DIN: 07427375]CEO and Managing DirectorS B BORWANKAR [DIN: 01793948]ED and Chief Operating OfficerP B BALAJIGroup Chief Financial OfficerH K SETHNA [FCS: 3507]Company Secretary
Mumbai, May 23, 2018
260

CONSOLIDATED STATEMENT OF PROFIT AND LOSS
(` in crores)Notes Year ended
March 31, 2018Year ended
March 31, 2017
I. Revenue from operations 31 295,409.34 274,492.12II. Other income 32 888.89 754.54III. Total Income (I+II) 296,298.23 275,246.66IV. Expenses
(a) Cost of materials consumed (i) Cost of materials consumed 173,371.19 160,147.12 (ii) Basis adjustment on hedge accounted derivatives (1,378.60) (777.57)(b) Purchases of products for sale 15,903.99 13,924.53 ( c) Changes in inventories of finished goods, work-in-progress and products for sale (2,046.58) (7,399.92)(d) Excise duty 790.16 4,799.61 (e) Employee benefits expense 33 30,300.09 28,332.89 (f) Finance costs 34 4,681.79 4,238.01 (g) Foreign exchange (gain)/loss (net) (1,185.28) 3,910.10 (h) Depreciation and amortisation expense 21,553.59 17,904.99 (i) Product development/Engineering expenses 3,531.87 3,413.57 (j) Other expenses 35 60,184.21 55,430.06 (k) Amount capitalised (18,588.09) (16,876.96)Total Expenses (IV) 287,118.34 267,046.43
V. Profit/(loss) before exceptional items and tax (III-IV) 9,179.89 8,200.23VI. Exceptional items
(a) Defined benefit pension plan amendment past service credit 45(e) (3,609.01) - (b) Employee separation cost 3.68 67.61 ( c) Provision for impairment of capital work-in-progress and intangibles under development 45 (d) 1,641.38 - (d) Others 45 (f) & (g) (11.19) (1,182.17)
VII. Profit/(loss) before tax (V-VI) 11,155.03 9,314.79 VIII. Tax expense/(credit) (net) 20
(a) Current tax 3,303.46 3,137.66 (b) Deferred tax 1,038.47 113.57 Total tax expense/(credit) 4,341.93 3,251.23
IX. Profit for the year from continuing operations (VII-VIII) 6,813.10 6,063.56 X. Share of profit of joint ventures and associates (net) 7 2,278.26 1,493.00 XI. Profit for the year (IX+X) 9,091.36 7,556.56
Attributable to: (a) Shareholders of the Company 8,988.91 7,454.36 (b) Non-controlling interests 102.45 102.20
XII. Other comprehensive income/(loss):(A) (i) Items that will not be reclassified to profit or loss: (a) Remeasurement gains and (losses) on defined benefit obligations (net) 4,676.51 (7,823.75) (b) Quoted equity instruments at fair value through other comprehensive income 42.86 83.15 ( c) Share of other comprehensive income in equity accounted investees (net) (7.16) (6.08) (d) Gains and (losses) in cash flow hedges of forecast inventory purchases 1,227.74 2,026.77 (ii) Income tax (expense)/credit relating to items that will not be reclassified to profit or loss (991.02) 867.35 (B) (i) Items that will be reclassified to profit or loss: (a) Exchange differences in translating the financial statements of foreign operations 9,518.15 (9,678.58) (b) Gains and (losses) in cash flow hedges 18,069.71 (15,565.66) ( c) Share of other comprehensive income in equity accounted investees (net) 429.41 (304.70) (ii) Income tax (expense)/credit relating to items that will be reclassified to profit or loss (3,403.69) 2,906.93 Total other comprehensive income/(loss) for the period (net of tax) 29,562.51 (27,494.57)Attributable to: (a) Shareholders of the Company 29,535.61 (27,460.30) (b) Non-controlling interests 26.90 (34.27)
XIII. Total comprehensive income/(loss) for the period (net of tax) (XI+XII) 38,653.87 (19,938.01)Attributable to: (a) Shareholders of the Company 38,524.52 (20,005.94) (b) Non-controlling interests 129.35 67.93
XIV. Earnings per equity share (EPS) 43(A) Ordinary shares (face value of ` 2 each) : (i) Basic EPS ` 26.46 21.94 (ii) Diluted EPS ` 26.45 21.93 (B) ‘A’ Ordinary shares (face value of ` 2 each) : (i) Basic EPS ` 26.56 22.04 (ii) Diluted EPS ` 26.55 22.03
See accompanying notes to consolidated financial statements As per our report of even date attached For and on behalf of the Board
For B S R & Co. LLPChartered AccountantsFirm’s Registration No: 101248W/W-100022
YEZDI NAGPOREWALLAPartnerMembership No. 049265
Mumbai, May 23, 2018
N CHANDRASEKARAN [DIN: 00121863] Chairman
N MUNJEE [DIN:00010180]
V K JAIRATH [DIN:00391684]
F S NAYAR [DIN:00003633]
O P BHATT [DIN:00548091]
R SPETH [DIN:03318908]
Directors
GUENTER BUTSCHEK [DIN: 07427375]CEO and Managing DirectorS B BORWANKAR [DIN: 01793948]ED and Chief Operating OfficerP B BALAJIGroup Chief Financial OfficerH K SETHNA [FCS: 3507]Company Secretary
Mumbai, May 23, 2018
26173rd Annual Report 2017-18
INTEGRATED REPORT 1-65 STATUTORY REPORTS 66-184 FINANCIAL STATEMENTS 185-353

Consolidated Cash Flow Statement
(` in crores)
Year ended March 31, 2018
Year ended March 31, 2017
Cash flows from operating activities:Profit/(loss) after tax 9,091.36 7,556.56 Adjustments for:Depreciation and amortisation expense 21,553.59 17,904.99 Allowances/(reversal) for finance receivables 43.30 (28.15)Allowances/(reversal) for trade and other receivables 14.57 132.93Inventory write-down 607.42 295.59 Exceptional items-others (11.19) (1,182.17)Exceptional items- Defined benefit pension plan amendment (3,609.01) - Marked-to-market on investments measured at Fair value through profit or loss (32.05) (5.68)Loss on sale of assets (including provision for impairment, assets scrapped/written off) (net) 2,382.55 373.69Impairment of Goodwill - 14.25 Profit on sale of investments (net) (129.26) (176.14)Gain on fair value of below market interest loans (6.02) (46.52)Fair value gain on disposal of joint venture (19.06) - Share of profit of joint ventures and associates (net) (2,278.26) (1,493.00)Tax expense (net) 4,341.93 3,251.23 Interest / dividend (net) 3,954.21 3,665.29 Foreign exchange gain (net) (2,591.80) (1,422.76)Cash flows from operating activities before changes in following assets and liabilities 33,312.28 28,840.11Finance receivables (6,361.22) (1,783.64)Trade receivables (4,326.58) (2,368.66)Loans and advances and other financial assets (3,343.38) 379.93 Other current and non-current assets 151.25 (1,274.96)Inventories (3,560.43) (6,620.67)Trade payables and acceptances 7,320.34 9,300.56 Other current and non-current liabilities (4,756.95) 1,911.48 Other financial liabilities 1,541.98 744.28 Provisions 6,901.29 2,965.92 Cash generated from operations 26,878.58 32,094.35Income tax paid (net) (3,021.16) (1,895.10)Net cash from operating activities 23,857.42 30,199.25Cash flows from investing activities:Payments for property, plant and equipment (19,865.43) (16,071.78)Payments for other intangible assets (15,213.49) (14,395.10)Proceeds from sale of property, plant and equipment 30.30 53.39 Investments in Mutual Fund (purchased)/sold (net) 2,361.09 1,914.38 Loans to others - (9.78)Repayment of loan by other - 0.75 Repayment of loan by joint operation - 132.50 Excess of cash acquired on acquisition of subsidiary company 14.45 - Investment in equity accounted investees (4.21) (106.95)Investments - others (328.78) (6.36)Proceeds from sale of investments in other companies 19.43 50.61 Interest received 690.47 638.18 Dividend received 15.77 10.51 Dividend received from equity accounted investees 1,781.64 609.19 Decrease in short-term inter-corporate deposit - 30.00 Deposits with financial institution - (35.00)Deposits/restricted deposits with banks (48,260.05) (45,127.19)Realisation of deposits/restricted deposits with banks 52,557.20 34,232.77 Net cash used in investing activities (26,201.61) (38,079.88)
262

Year ended March 31, 2018
Year ended March 31, 2017
Cash flows from financing activities:Proceeds from issue of shares held in abeyance (net of issue expenses) 0.00* 4.55 Proceeds from long-term borrowings 15,145.21 18,384.52 Proceeds from issue of shares to minority shareholders - 0.62 Repayment of long-term borrowings (10,587.25) (9,212.13)Proceeds from short-term borrowings 15,008.73 15,005.26 Repayment of short-term borrowings (19,376.62) (11,753.71)Net change in other short-term borrowings (with maturity up to three months) 7,328.24 (766.25)Distribution to Minority (39.99) -Dividend paid (including dividend distribution tax) - (73.00)Dividend paid to non-controlling interests shareholders of subsidiaries (including dividend distribution tax)
(55.97) (48.22)
Interest paid [including discounting charges paid ` 918.90 crores (March 31, 2017 ` 666.40 crores)]
(5,410.64) (5,336.34)
Net cash from/(used in) financing activities 2,011.71 6,205.30 Net decrease in cash and cash equivalents (332.48) (1,675.33)Cash and cash equivalents as at April 1, (opening balance) 13,986.76 17,153.61 Classified as held for sale (243.94) - Effect of foreign exchange on cash and cash equivalents 1,306.41 (1,491.52)Cash and cash equivalents as at March 31, (closing balance) 14,716.75 13,986.76
Non-cash transactions:Liability towards property, plant and equipment and intangible assets purchased on credit/deferred credit
8,346.54 3,346.35
Increase/(decrease) in liabilities arising from financing activities on account of non-cash transactions:Exchange differences 2,768.03 (2,671.09) Classified as held for sale (142.55) - Amortisation of prepaid discounting charges 202.70 257.41
* less than ` 50,000/-
As per our report of even date attached For and on behalf of the Board
For B S R & Co. LLPChartered AccountantsFirm’s Registration No: 101248W/W-100022
YEZDI NAGPOREWALLAPartnerMembership No. 049265
Mumbai, May 23, 2018
N CHANDRASEKARAN [DIN: 00121863] Chairman
N MUNJEE [DIN:00010180]
V K JAIRATH [DIN:00391684]
F S NAYAR [DIN:00003633]
O P BHATT [DIN:00548091]
R SPETH [DIN:03318908]
Directors
GUENTER BUTSCHEK [DIN: 07427375]CEO and Managing DirectorS B BORWANKAR [DIN: 01793948]ED and Chief Operating OfficerP B BALAJIGroup Chief Financial OfficerH K SETHNA [FCS: 3507]Company Secretary
Mumbai, May 23, 2018
Consolidated Cash Flow Statement
(` in crores)
26373rd Annual Report 2017-18
INTEGRATED REPORT 1-65 STATUTORY REPORTS 66-184 FINANCIAL STATEMENTS 185-353

Cons
olid
ated
Sta
tem
ent o
f Cha
nges
in E
quity
fo
r the
yea
r end
ed M
arch
31,
2018
A.
Equi
ty S
hare
Cap
ital
(` in
cro
res)
Par
ticul
ars
Equ
ity S
hare
Cap
ital
Bal
ance
as
at A
pril
1, 20
17 6
79.2
2
Pro
ceed
s fr
om is
sue
of s
hare
s he
ld in
abe
yanc
e- *
Bal
ance
as
at M
arch
31,
2018
679
.22
*
less
than
` 5
0,00
0/-
B.
Oth
er E
quity
(`
in c
rore
s)
Parti
cula
rsSe
curit
ies
Prem
ium
Ac
coun
t
Capi
tal
rede
mpt
ion
rese
rve
Debe
ntur
e re
dem
ptio
n re
serv
e
Rese
rve f
or
rese
arch
an
d hum
an
reso
urce
de
velo
pmen
t
Spec
ial
rese
rve
Earn
ed
surp
lus
rese
rve
Capi
tal
Rese
rve
Reta
ined
ea
rnin
gsOt
her c
ompo
nent
s of e
quity
Attri
buta
ble
to O
wner
s of
Tata
Mot
ors
Limite
d
Non-
cont
rolli
ng
inte
rest
s
Tota
l oth
er
equi
tyEq
uity
in
stru
men
ts
thro
ugh
Othe
r Co
mpr
ehen
sive
Inco
me
Hedg
ing
Rese
rve
Cost
of
hedg
ing
rese
rve
Curre
ncy
trans
latio
n re
serv
e
Bala
nce a
s at A
pril 1
, 201
718
,891
.93
2.2
8 1,
085.
94
165.
78
292
.46
32.1
8 1,1
64.2
0 59
,053
.14
(19.
26)
(17,9
11.63
) (7
4.22
) (5
,300
.13)
57,3
82.6
7 4
53.17
5
7,835
.84
Prof
it fo
r the
per
iod -
- -
- -
- -
8,9
88.9
1 -
- -
- 8
,988
.91
102.
45
9,0
91.3
6 Ot
her c
ompr
ehen
sive i
ncom
e /(lo
ss)
for t
he y
ear
- -
- -
- -
- 3
,909
.10
42.
86
15,4
44.9
9 2
17.3
0 9
,921
.36
29,
535.
61
26.
90
29,
562.
51
Tota
l com
preh
ensiv
e inc
ome/
(loss
) fo
r the
yea
r -
- -
- -
- -
12,8
98.0
1 4
2.86
15
,444
.99
217
.30
9,9
21.3
6 3
8,52
4.52
12
9.35
3
8,65
3.87
Amou
nts r
ecog
nise
d in
inve
ntor
y -
- -
- -
- -
- -
(1,15
9.40
) 0
.90
- (1
,158.
50)
- (1
,158.
50)
Proc
eeds
from
issu
e of s
hare
s hel
d in
abey
ance
-*
- -
- -
- -
- -
- -
- -
-*
Min
ority
inte
rest
on
acqu
isitio
ns
durin
g th
e yea
r -
- -
- -
- -
- -
- -
- -
98.
62
98.
62
Dist
ribut
ion to
Min
ority
- -
- -
- -
- -
- -
- -
- (3
9.99
) (3
9.99
)M
inor
ity in
tere
st ch
ange
s dur
ing
the y
ear
- -
- -
- -
- -
- -
(60.1
2) (6
0.12
)
Real
ised
gain
on
inves
tmen
ts
held
at fa
ir va
lue t
hrou
gh O
ther
co
mpr
ehen
sive i
ncom
e
- -
- -
- -
- 0
.78
(0.78
) -
- -
- -
-
Divid
end
paid
(inclu
ding
divide
nd ta
x) -
- -
- -
- -
- -
- -
- -
(55.
97)
(55.
97)
Tran
sfer
(fro
m)/t
o re
tain
ed ea
rnin
gs-
- -
34.
96
86.
97
11.8
8 -
(133
.81)
- -
- -
- -
- Ba
lanc
e as a
t Mar
ch 3
1, 20
1818
,891
.93
2.2
8 1,
085.
94
200
.74
379
.43
44.
06
1,164
.20
71,8
18.12
2
2.82
(3
,626
.04)
143.
98
4,6
21.2
3 9
4,74
8.69
5
25.0
6 9
5,27
3.75
* le
ss th
an `
50,
000/
-
See
acco
mpa
nyin
g no
tes
to fi
nanc
ial s
tate
men
ts
As
per o
ur re
port
of e
ven
date
att
ache
dFo
r and
on
beha
lf of
the
Boa
rd
For B
S R
& C
o. L
LPCh
arte
red
Acco
unta
nts
Firm
’s R
egis
trat
ion
No:
1012
48W
/W-1
0002
2
YEZD
I NA
GP
OR
EWA
LLA
Part
ner
Mem
bers
hip
No.
049
265
Mum
bai,
May
23,
201
8
N C
HA
ND
RA
SEK
AR
AN
[DIN
: 001
2186
3]Ch
airm
anN
MU
NJE
E [D
IN:0
0010
180]
V K
JA
IRAT
H [D
IN:0
0391
684]
F S
NAY
AR
[DIN
:000
0363
3]
O P
BH
ATT
[DIN
:005
4809
1]
R S
PET
H [D
IN:0
3318
908]
Dire
ctor
s
GU
ENTE
R B
UTS
CHEK
[DIN
: 074
2737
5]CE
O a
nd M
anag
ing
Dire
ctor
S B
BO
RW
AN
KA
R [D
IN: 0
1793
948]
ED a
nd C
hief
Ope
ratin
g O
ffic
erP
B B
ALA
JIG
roup
Chi
ef F
inan
cial
Off
icer
H K
SET
HN
A [F
CS: 3
507]
Com
pany
Sec
reta
ry
Mum
bai,
May
23,
201
8
264

Cons
olid
ated
Sta
tem
ent o
f Cha
nges
in E
quity
fo
r the
yea
r end
ed M
arch
31,
2017
A.
Equi
ty S
hare
Cap
ital
(` in
cro
res)
Par
ticul
ars
Equ
ity S
hare
Cap
ital
Bal
ance
as
at A
pril
1, 20
16 6
79.18
Pro
ceed
s fr
om is
sue
of s
hare
s he
ld in
abe
yanc
e an
d am
ount
s re
ceiv
ed o
n un
paid
cal
ls 0
.04
Bal
ance
as
at M
arch
31,
2017
679
.22
B.
Oth
er E
quity
(`
in c
rore
s)
Parti
cula
rsSe
curit
ies
Prem
ium
Ac
coun
t
Capi
tal
rede
mpt
ion
rese
rve
Debe
ntur
e re
dem
ptio
n re
serv
e
Rese
rve f
or
rese
arch
an
d hum
an
reso
urce
de
velo
pmen
t
Spec
ial
rese
rve
Earn
ed
surp
lus
rese
rve
Capi
tal
Rese
rve
Reta
ined
ea
rnin
gsOt
her c
ompo
nent
s of e
quity
Attri
buta
ble
to O
wner
s of
Tata
Mot
ors
Limite
d
Non-
cont
rolli
ng
inte
rest
s
Tota
l oth
er
equi
tyEq
uity
in
stru
men
ts
thro
ugh
Othe
r Co
mpr
ehen
sive
Inco
me
Hedg
ing
Rese
rve
Cost
of
hedg
ing
rese
rve
Curre
ncy
trans
latio
n re
serv
e
Bala
nce a
s at A
pril 1
, 201
6 18
,887
.42
2.2
8 1,
042.1
5 16
5.78
2
92.4
6 2
4.00
1,164
.20
58,
292.
89
(102
.70)
(6,15
2.15)
4.70
4
,652
.20
78,2
73.2
3 4
32.8
4 78
,706.
07
Prof
it fo
r the
per
iod -
- -
- -
- -
7,45
4.36
-
- -
- 7,
454.
36
102.
20
7,55
6.56
Othe
r com
preh
ensiv
e inc
ome /
(loss
) for
th
e per
iod -
- -
- -
- -
(6,5
69.14
) 8
3.44
(1
0,94
3.35
) (7
8.92
) (9
,952
.33)
(27,4
60.3
0) (3
4.27
) (2
7,494
.57)
Tota
l com
preh
ensiv
e inc
ome/
(loss
) for
th
e yea
r -
- -
- -
- -
885
.22
83.
44
(10,
943.
35)
(78.
92)
(9,9
52.3
3) (2
0,00
5.94
) 6
7.93
(19,
938.
01)
Amou
nts r
ecog
nise
d in
inve
ntor
y -
- -
- -
- -
- -
(816
.13)
- -
(816
.13)
- (8
16.13
)
Divid
end
paid
(inclu
ding
divide
nd ta
x) -
- -
- -
- -
(73.0
0) -
- -
- (7
3.00)
(48.
22)
(121
.22)
Issue
of s
hare
s hel
d in
abey
ance
4.5
1 -
- -
- -
- -
- 4
.51
- 4
.51
Issue
of s
hare
s to
min
ority
shar
ehol
ders
- -
- -
- -
- -
- -
- -
- 0
.62
0.6
2
Tran
sfer
to d
eben
ture
rede
mpt
ion re
serv
e -
- 4
3.79
- -
- -
(43.7
9) -
Tran
sfer
(fro
m)/t
o re
tain
ed ea
rnin
gs -
- -
- -
8.18
(8
.18)
- -
- -
- -
-
Othe
rs -
- -
- -
- -
- -
- -
- -
-
Bala
nce a
s at M
arch
31,
2017
18,8
91.9
3 2
.28
1,08
5.94
16
5.78
2
92.4
6 3
2.18
1,16
4.20
5
9,05
3.14
(19.
26)
(17,9
11.63
) (7
4.22
) (5
,300
.13)
57,3
82.6
7 4
53.17
5
7,835
.84
* le
ss th
an `
50,
000/
-
See
acco
mpa
nyin
g no
tes
to fi
nanc
ial s
tate
men
ts
As
per o
ur re
port
of e
ven
date
att
ache
dFo
r and
on
beha
lf of
the
Boa
rd
For B
S R
& C
o. L
LPCh
arte
red
Acco
unta
nts
Firm
’s R
egis
trat
ion
No:
1012
48W
/W-1
0002
2
YEZD
I NA
GP
OR
EWA
LLA
Part
ner
Mem
bers
hip
No.
049
265
Mum
bai,
May
23,
201
8
N C
HA
ND
RA
SEK
AR
AN
[DIN
: 001
2186
3]Ch
airm
anN
MU
NJE
E [D
IN:0
0010
180]
V K
JA
IRAT
H [D
IN:0
0391
684]
F S
NAY
AR
[DIN
:000
0363
3]
O P
BH
ATT
[DIN
:005
4809
1]
R S
PET
H [D
IN:0
3318
908]
Dire
ctor
s
GU
ENTE
R B
UTS
CHEK
[DIN
: 074
2737
5]CE
O a
nd M
anag
ing
Dire
ctor
S B
BO
RW
AN
KA
R [D
IN: 0
1793
948]
ED a
nd C
hief
Ope
ratin
g O
ffic
erP
B B
ALA
JIG
roup
Chi
ef F
inan
cial
Off
icer
H K
SET
HN
A [F
CS: 3
507]
Com
pany
Sec
reta
ry
Mum
bai,
May
23,
201
8
26573rd Annual Report 2017-18
INTEGRATED REPORT 1-65 STATUTORY REPORTS 66-184 FINANCIAL STATEMENTS 185-353

NOTES FORMING PART OF CONSOLIDATED FINANCIAL STATEMENTS
1. Background and operations
Tata Motors Limited and its subsidiaries and joint operations, (collectively referred to as “the Company” or “Tata Motors”), designs, manufactures and sells a wide range of automotive vehicles. The Company provides financing for the vehicles sold by dealers of the Company in certain markets. The Company also manufactures engines for industrial and marine applications, aggregates such as axles and transmissions for commercial vehicles and factory automation equipment, and provides information technology services.
Tata Motors Limited is a public limited Company incorporated and domiciled in India and has its registered office in Mumbai, India. As at March 31, 2018, Tata Sons Limited together with its subsidiaries, owns 36.46% of the Ordinary shares and 0.09% of ‘A’ Ordinary shares of the Company, and has the ability to significantly influence the Company’s operation.
The Company’s operations include the Jaguar Land Rover business (referred to as JLR or Jaguar Land Rover).
The consolidated financial statements were approved by the Board of Directors and authorised for issue on May 23, 2018.
2. Significant accounting policies a. Statement of compliance
These financial statements have been prepared in accordance with Ind AS as notified under the Companies (Indian Accounting Standards) Rules, 2015 read with Section 133 of the Companies Act, 2013 (“the Act”).
b. Basis of preparation
The consolidated financial statements have been prepared on historical cost basis except for certain financial instruments measured at fair value at the end of each reporting period as explained in the accounting policies below.
c. Basis of consolidation
Subsidiaries
The consolidated financial statements include Tata Motors Limited and its subsidiaries. Subsidiaries are entities controlled by the Company. Control exists when the Company (a) has power over the investee, (b) it is exposed, or has rights, to variable returns from its involvement with the investee and (c ) has the ability to affect those returns through its power over the investee. The Company reassesses whether or not it controls an investee if facts and circumstances indicate that there are changes to one or more of the three elements listed above. In assessing control, potential voting rights that currently are exercisable are taken into account. The results of subsidiaries acquired or disposed off during the year are included in the consolidated financial statements from the effective date of acquisition and up to the effective date of disposal, as appropriate.
Inter-company transactions and balances including unrealised profits are eliminated in full on consolidation.
Non-controlling interests in the net assets (excluding goodwill) of consolidated subsidiaries are identified separately from the Company’s equity. The interest of non-controlling shareholders may be initially measured either at fair value or at the non-controlling interests’ proportionate share of the fair value of the acquiree’s identifiable net assets. The choice of measurement basis is made on an acquisition-by-acquisition basis. Subsequent to acquisition, the carrying amount of non-controlling interests is the amount of those interests at initial recognition plus the non-controlling interests’ share of subsequent changes in equity. Total comprehensive income is attributed to non-controlling interests even if it results in the non-controlling interest having a deficit balance.
Changes in the Company’s interests in subsidiaries that do not result in a loss of control are accounted for as equity transactions. The carrying amount of the Company’s interests and the non-controlling interests are adjusted to reflect the changes in their relative interests in the subsidiaries. Any difference between the amount by which the non-controlling interests are adjusted and the fair value of the consideration paid or received is recognised directly in equity and attributed to owners of the Company.
When the Company loses control of a subsidiary, the profit or loss on disposal is calculated as the difference between (i) the aggregate of the fair value of consideration received and the fair value of any retained interest and (ii) the previous carrying amount of the assets (including goodwill), and liabilities of the subsidiary and any non-controlling interests. Amounts previously recognised in other comprehensive income in relation to the subsidiary are accounted for (i.e., reclassified to profit or loss) in the same manner as would be required if the relevant assets or liabilities were disposed off. The fair value of any investment retained in the former subsidiary at the date when control is lost is regarded as the fair value on initial recognition for subsequent accounting under Ind-AS 109 Financial Instruments: Recognition and Measurement or, when applicable, the cost on initial recognition of an investment in an associate or jointly controlled entity.
Interests in joint arrangements
A joint arrangement is an arrangement of which two or more parties have joint control. Joint control is the contractually agreed sharing of control of an arrangement, which exists only when decisions about the relevant activities require the unanimous consent of the parties sharing control.
266

NOTES FORMING PART OF CONSOLIDATED FINANCIAL STATEMENTS
Joint operations
Certain of the Company’s activities, are conducted through joint operations, which are joint arrangements whereby the parties that have joint control of the arrangement have rights to the assets, and obligations for the liabilities, relating to the arrangement. The Company recognizes, in the consolidated financial statements, its share of the assets, liabilities, income and expenses of these joint operations incurred jointly with the other partners, along with its share of income from the sale of the output and any assets, liabilities and expenses that it has incurred in relation to the joint operation.
Joint ventures
A joint venture is a joint arrangement whereby the parties that have joint control of the arrangement have rights to the net assets of the arrangement. The results, assets and liabilities of a joint venture are incorporated in these financial statements using the equity method of accounting as described below.
Associates
Associates are those entities in which the Company has significant influence. Significant influence is the power to participate in the financial and operating policy decisions of the investee but not control or joint control those policies. Significant influence is presumed to exist when the Company holds between 20 and 50 percent of the voting power of another entity. The results, assets and liabilities of associates are incorporated in these financial statements using the equity method of accounting as described below.
Equity method of accounting (equity accounted investees)
An interest in an associate or joint venture is accounted for using the equity method from the date in which the investee becomes an associate or a joint venture and are recognised initially at cost. The Company’s investment includes goodwill identified on acquisition, net of any accumulated impairment losses. The consolidated financial statements include the Company’s share of profits or losses and equity movements of equity accounted investees, from the date that significant influence or joint control commences until the date that significant influence or joint control ceases. When the Company’s share of losses exceeds its interest in an equity accounted investee, the carrying amount of that interest (including any long-term investments in the nature of net investments) is reduced to nil and the recognition of further losses is discontinued except to the extent that the Company has an obligation or has made payments on behalf of the investee.
When the Company transacts with an associate or joint venture of the Company, unrealised profits and losses
are eliminated to the extent of the Company’s interest in its associate or joint venture.
d. Business combination
Acquisitions of subsidiaries and businesses are accounted for using the acquisition method. Acquisition related costs are recognised in profit or loss as incurred. The acquiree’s identifiable assets, liabilities and contingent liabilities that meet the conditions for recognition are recognised at their fair value at the acquisition date, except certain assets and liabilities required to be measured as per the applicable standard.
Purchase consideration in excess of the Company’s interest in the acquiree’s net fair value of identifiable assets, liabilities and contingent liabilities is recognised as goodwill. Excess of the Company’s interest in the net fair value of the acquiree’s identifiable assets, liabilities and contingent liabilities over the purchase consideration is recognised, after reassessment of fair value of net assets acquired, in the Capital Reserve.
e. Use of estimates and judgments
The preparation of financial statements in conformity with Ind AS requires management to make judgments, estimates and assumptions, that affect the application of accounting policies and the reported amounts of assets, liabilities, income, expenses and disclosures of contingent assets and liabilities at the date of these financial statements and the reported amounts of revenues and expenses for the years presented. Actual results may differ from these estimates.
Estimates and underlying assumptions are reviewed at each balance sheet date. Revisions to accounting estimates are recognised in the period in which the estimate is revised and future periods affected.
In particular, information about significant areas of estimation uncertainty and critical judgments in applying accounting policies that have the most significant effect on the amounts recognised in the financial statements are included in the following notes:
i) Note 3 and 6 - Property, plant and equipment and intangible assets – Useful lives and impairment
ii) Note 5 - Impairment of goodwill
iii) Note 6 - Impairment of indefinite life intangible assets
iv) Note 20 - Recoverability/recognition of deferred tax assets
v) Note 28 - Provision for product warranty
vi) Note 36 - Assets and obligations relating to employee benefits
vii) Note 16 - Allowances for credit losses for finance receivables
26773rd Annual Report 2017-18
INTEGRATED REPORT 1-65 STATUTORY REPORTS 66-184 FINANCIAL STATEMENTS 185-353

NOTES FORMING PART OF CONSOLIDATED FINANCIAL STATEMENTS
f. Revenue recognition
Revenue is measured at fair value of consideration received or receivable.
i) Sale of products
The Company recognises revenues on the sale of products, net of discounts, sales incentives, customer bonuses and rebates granted, when products are delivered to dealers or when delivered to a carrier for export sales, which is when title and risks and rewards of ownership pass to the customer.
Revenues are recognised when collectability of the resulting receivable is reasonably assured.
For sale with repurchase agreements, revenue is measured as the difference between the initial sale price and the agreed repurchase price. Such revenue is recognised on a straight line basis over the terms of the agreement.
ii) Finance revenues
Finance and service charges are accrued on the unpaid principal balance of finance receivables using the effective interest method.
g. Government grants and incentives
Government grants are recognised when there is reasonable assurance that the Company will comply with the relevant conditions and the grant will be received. These are recorded at fair value where applicable.
Government grants are recognised in the consolidated statement of profit and loss, either on a systematic basis when the Company recognizes, as expenses, the related costs that the grants are intended to compensate or, immediately if the costs have already been incurred.
Government grants related to assets are deferred and amortised over the useful life of the asset. Government grants related to income are presented as an offset against the related expenditure, and government grants that are awarded as incentives with no ongoing performance obligations to the Company are recognised as income in the period in which the grant is received.
h. Cost recognition
Costs and expenses are recognised when incurred and are classified according to their nature.
Expenditure capitalised represents employee costs, stores and other manufacturing supplies, and other expenses incurred for construction including product development undertaken by the Company.
i. Provisions
A provision is recognised if, as a result of a past event, the Company has a present legal or constructive obligation that can be estimated reliably, and it is probable that an outflow of economic benefits will be required to settle the obligation. Provisions are determined by discounting the
expected future cash flows at a pre-tax rate that reflects current market assessments of the time value of money and the risks specific to the liability.
i) Product warranty expenses
The estimated liability for product warranties are recorded when products are sold. These estimates are established using historical information on the nature, frequency and average cost of warranty claims and management estimates regarding possible future incidences based on actions on product failures. The timing of outflows will vary as and when warranty claim will arise, being typically up to six years.
The Company also has back-to-back contractual arrangement with its suppliers in the event that a vehicle fault is proven to be a supplier’s fault. Estimates are made of the expected reimbursement claim based upon historical levels of recoveries from supplier, adjusted for inflation and applied to the population of vehicles under warranty as on balance sheet date.
Supplier reimbursements are recognised as separate asset.
ii) Residual risk
In certain markets, the Company is responsible for the residual risk arising on vehicles sold by dealers under leasing arrangements. The provision is based on the latest available market expectations of future residual value trends. The timing of the outflows will be at the end of the lease arrangements – being typically up to three years.
iii) Legal and product liability
Legal and product liability provision is recorded in respect of compliance with regulations and known litigations which impact the Company. The product liability claim primarily relates to motor accident claims, consumer complaints, dealer terminations, personal injury claims and compliance with regulations.
iv) Environmental liability
Environmental liability relates to various environmental remediation cost such as asbestos removal and land clean up. The timing of when these costs will be incurred is not known with certainty.
j. Foreign currency
These consolidated financial statements are presented in Indian rupees, which is the functional currency of Tata Motors Limited.
Transactions in foreign currencies are recorded at the exchange rate prevailing on the date of transaction. Foreign currency denominated monetary assets and
268

NOTES FORMING PART OF CONSOLIDATED FINANCIAL STATEMENTS
liabilities are re-measured into the functional currency at the exchange rate prevailing on the balance sheet date. Exchange differences are recognised in the statement of profit and loss except to the extent, exchange differences which are regarded as an adjustment to interest costs on foreign currency borrowings, are capitalised as part of borrowing costs.
For the purpose of consolidation, the assets and liabilities of the Company’s foreign operations are translated to Indian rupees at the exchange rate prevailing on the balance sheet date, and the income and expenses at the average rate of exchange for the respective months. Exchange differences arising on such translation are recognised as currency translation reserve under equity.
Exchange differences arising from the translation of a foreign operation previously recognised in currency translation reserve in equity are not reclassified from equity to profit or loss until the disposal of the operation.
k. Income taxes
Income tax expense comprises current and deferred taxes. Income tax expense is recognised in the statement of profit and loss except when they relate to items that are recognised outside profit or loss (whether in other comprehensive income or directly in equity), in which case tax is also recognised outside profit or loss, or where they arise from the initial accounting for business combination. In the case of a business combination the tax effect is included in the accounting for the business combination.
Current income taxes are determined based on respective taxable income of each taxable entity and tax rules applicable for respective tax jurisdictions.
Deferred tax assets and liabilities are recognised for the future tax consequences of temporary differences between the carrying values of assets and liabilities and their respective tax bases, and unutilised business loss and depreciation carry-forwards and tax credits. Such deferred tax assets and liabilities are computed separately for each taxable entity and for each taxable jurisdiction. Deferred tax assets are recognised to the extent that it is probable that future taxable income will be available against which the deductible temporary differences, unused tax losses, depreciation carry-forwards and unused tax credits could be utilised.
Deferred tax assets and liabilities are measured based on the tax rates that are expected to apply in the period when the asset is realised or the liability is settled, based on tax rates and tax laws that have been enacted or substantively enacted by the balance sheet date.
Current and deferred tax assets and liabilities are offset when there is a legally enforceable right to set off current tax assets against current tax liabilities and when they relate to income taxes levied by the same taxation authority and the Company intends to settle its current tax assets and liabilities on a net basis.
l. Cash & cash equivalents
Cash and cash equivalents are short-term (three months or less from the date of acquisition), highly liquid investments that are readily convertible into cash and which are subject to an insignificant risk of changes in value.
m. Earnings per share
Basic earnings per share has been computed by dividing profit for the year by the weighted average number of shares outstanding during the year. Partly paid up shares are included as fully paid equivalents according to the fraction paid up. Diluted earnings per share has been computed using the weighted average number of shares and dilutive potential shares, except where the result would be anti-dilutive.
n. Inventories
Inventories (other than those recognised consequent to the sale of vehicles subject to repurchase arrangements) are valued at the lower of cost and net realisable value. Cost of raw materials, components and consumables are ascertained on a first in first out basis. Cost, including fixed and variable production overheads, are allocated to work-in-progress and finished goods determined on a full absorption cost basis. Net realisable value is the estimated selling price in the ordinary course of business less estimated cost of completion and selling expenses.
Inventories include vehicles sold subject to repurchase arrangements. These vehicles are carried at cost to the Company and are amortised in changes in inventories of finished goods to their residual values (i.e., estimated second hand sale value) over the term of the arrangement.
o. Property, plant and equipment
Property, plant and equipment are stated at cost of acquisition or construction less accumulated depreciation less accumulated impairment, if any.
Freehold land is measured at cost and is not depreciated.
Heritage assets, comprising antique vehicles purchased by the Company, are not depreciated as they are considered to have a residual value in excess of cost. Residual values are re-assessed on an annual basis.
Cost includes purchase price, taxes and duties, labour cost and direct overheads for self-constructed assets and other direct costs incurred up to the date the asset is ready for its intended use.
Interest cost incurred for constructed assets is capitalised up to the date the asset is ready for its intended use, based on borrowings incurred specifically for financing the asset or the weighted average rate of all other borrowings, if no
26973rd Annual Report 2017-18
INTEGRATED REPORT 1-65 STATUTORY REPORTS 66-184 FINANCIAL STATEMENTS 185-353

NOTES FORMING PART OF CONSOLIDATED FINANCIAL STATEMENTS
specific borrowings have been incurred for the asset.
Depreciation is provided on the Straight Line Method (SLM) over the estimated useful lives of the assets considering the nature, estimated usage, operating conditions, past history of replacement, anticipated technological changes, manufacturers warranties and maintenance support. Taking into account these factors, the Company and its domestic group companies have decided to retain the useful life hitherto adopted for various categories of property, plant and equipment, which are different from those prescribed in Schedule II of the Act.
Estimated useful lives of the assets are as follows:
Type of Asset Estimated useful life
Buildings, Roads, Bridge and culverts
4 to 60 years
Plant, machinery and equipment 3 to 30 years
Computers and other IT assets 3 to 6 years
Vehicles 3 to 11 years
Furniture, fixtures and office appliances
3 to 21 years
The useful lives and method of deprication is reviewed at least at each year-end. Changes in expected useful lives are treated as change in accounting estimates.
Assets held under finance leases are depreciated over their expected useful lives on the same basis as owned assets or, where shorter, the term of the relevant lease.
Depreciation is not recorded on capital work-in-progress until construction and installation are complete and the asset is ready for its intended use.
p. Other intangible assets
Intangible assets purchased, including those acquired in business combinations, are measured at cost or fair value as of the date of acquisition where applicable less accumulated amortisation and accumulated impairment, if any. Intangible assets with indefinite lives are reviewed annually to determine whether indefinite-life assessment continues to be supportable. If not, the change in the useful-life assessment from indefinite to finite is made on a prospective basis.
Estimated useful lives of assets are as follows:
Type of Asset Estimated useful life
Patents and technological know-how
2 to 12 years
Computer software 1 to 8 years
Customer related intangibles - dealer network
20 years
Intellectual property rights 3 to 10 years
The amortisation period for intangible assets with finite useful lives is reviewed at least at each year-end. Changes in expected useful lives are treated as changes in accounting estimates.
Internally generated intangible asset
Research costs are charged to the statement of profit and loss in the year in which they are incurred.
Product development costs incurred on new vehicle platform, engines, transmission and new products are recognised as intangible assets, when feasibility has been established, the Company has committed technical, financial and other resources to complete the development and it is probable that asset will generate probable future economic benefits.
The costs capitalised include the cost of materials, direct labour and directly attributable overhead expenditure incurred up to the date the asset is available for use.
Interest cost incurred is capitalised up to the date the asset is ready for its intended use, based on borrowings incurred specifically for financing the asset or the weighted average rate of all other borrowings if no specific borrowings have been incurred for the asset.
Product development cost is amortised over a period of 24 months to 120 months or on the basis of actual production or planned production volume over such period.
Product development expenditure is measured at cost less accumulated amortisation and accumulated impairment, if any.
q. Leases
At the inception of a lease, the lease arrangement is classified as either a finance lease or an operating lease, based on the substance of the lease arrangement.
Assets taken on finance lease
A finance lease is recognised as an asset and a liability at the commencement of the lease, at the lower of the fair value of the asset and the present value of the minimum lease payments. Initial direct costs, if any, are also capitalised and, subsequent to initial recognition, the asset is accounted for in accordance with the accounting policy applicable to that asset. Minimum lease payments made under finance leases are apportioned between the finance expense and the reduction of the outstanding liability. The finance expense is allocated to each period during the lease term so as to produce a constant periodic rate of interest on the remaining balance of the liability.
270

NOTES FORMING PART OF CONSOLIDATED FINANCIAL STATEMENTS
Assets taken on operating lease
Leases other than finance leases are operating leases, and the leased assets are not recognised on the Company’s balance sheet. Payments made under operating leases are recognised in the statement of profit and loss on a straight-line basis over the term of the lease.
r. Impairment
i) Goodwill
Cash generating units to which goodwill is allocated are tested for impairment annually at each balance sheet date, or more frequently when there is an indication that the unit may be impaired. If the recoverable amount of the cash generating unit is less than the carrying amount of the unit, the impairment loss is allocated first to reduce the carrying amount of any goodwill allocated to that unit and then to the other assets of the unit pro rata on the basis of carrying amount of each asset in the unit. Goodwill impairment loss recognised is not reversed in subsequent period.
ii) Property, plant and equipment and other intangible assets
At each balance sheet date, the Company assesses whether there is any indication that any property, plant and equipment and intangible assets with finite lives may be impaired. If any such impairment exists the recoverable amount of an asset is estimated to determine the extent of impairment, if any. Where it is not possible to estimate the recoverable amount of an individual asset, the Company estimates the recoverable amount of the cash-generating unit to which the asset belongs.
Intangible assets with indefinite useful lives and intangible assets not yet available for use, are tested for impairment annually at each balance sheet date, or earlier, if there is an indication that the asset may be impaired.
Recoverable amount is the higher of fair value less costs to sell and value in use. In assessing value in use, the estimated future cash flows are discounted to their present value using a pre-tax discount rate that reflects current market assessments of the time value of money and the risks specific to the asset for which the estimates of future cash flows have not been adjusted.
If the recoverable amount of an asset (or cash-generating unit) is estimated to be less than its carrying amount, the carrying amount of the asset (or cash-generating unit) is reduced to its recoverable amount. An impairment loss is recognised immediately in the statement of profit and loss.
s. Employee benefits
i) Pension plans
Jaguar Land Rover operate defined benefit pension plans for certain of its subsidiaries, which are contracted out of the second state pension scheme until April 5, 2016. The assets of the plan are held in separate trustee administered funds. The plans provide for monthly pension after retirement as per salary drawn and service period as set out in rules of each fund.
Contributions to the plans by the Jaguar Land Rover subsidiaries take into consideration the results of actuarial valuations. The plans with a surplus position at the year-end have been limited to the maximum economic benefit available from unconditional rights to refund from the scheme or reduction in future contributions. Where the subsidiary group is considered to have a contractual obligation to fund the pension plan above the accounting value of the liabilities, an onerous obligation is recognised.
A separate defined contribution plan is available to employees of Jaguar Land Rover. Costs in respect of this plan are charged to the statement of profit and loss as incurred.
ii) Gratuity
Tata Motors Limited and its subsidiaries and joint operations in India have an obligation towards gratuity, a defined benefit retirement plan covering eligible employees. The plan provides for a lump-sum payment to vested employees at retirement, death while in employment or on termination of employment of an amount equivalent to 15 to 30 days salary payable for each completed year of service. Vesting occurs upon completion of five years of service. Tata Motors Limited and such subsidiaries make annual contributions to gratuity funds established as trusts or insurance companies. Tata Motors Limited and its subsidiaries in India account for the liability for gratuity benefits payable in the future based on an actuarial valuation.
iii) Superannuation Tata Motors Limited and some of its subsidiaries
in India have two superannuation plans, a defined benefit plan and a defined contribution plan. An eligible employee as on April 1, 1996 could elect to be a member of either plan.
Employees who are members of the defined benefit superannuation plan are entitled to benefits depending on the years of service and salary drawn. The monthly pension benefits after retirement range from 0.75% to 2% of the annual basic salary for each year of service. Tata Motors Limited and such subsidiaries account for superannuation benefits
27173rd Annual Report 2017-18
INTEGRATED REPORT 1-65 STATUTORY REPORTS 66-184 FINANCIAL STATEMENTS 185-353

NOTES FORMING PART OF CONSOLIDATED FINANCIAL STATEMENTS
payable in future under the plan based on an actuarial valuation.
With effect from April 1, 2003, this plan was amended and benefits earned by covered employees have been protected as at March 31, 2003. Employees covered by this plan are prospectively entitled to benefits computed on a basis that ensures that the annual cost of providing the pension benefits would not exceed 15% of salary.
During the year ended March 31, 2015, the employees covered by this plan were given a one-time option to exit from the plan prospectively. Furthermore, the employees who opted for exit were given one- time option to withdraw accumulated balances from the superannuation plan.
Separate irrevocable trusts are maintained for employees covered and entitled to benefits. Tata Motors Limited and its subsidiaries contribute up to 15% or ` 150,000, whichever is lower, of the eligible employees’ salary to the trust every year. Such contributions are recognised as an expense when incurred. Tata Motors Limited and such subsidiaries have no further obligation beyond this contribution.
iv) Bhavishya Kalyan Yojana (BKY) Bhavishya Kalyan Yojana is an unfunded defined
benefit plan for employees of Tata Motors Limited and some of its subsidiaries. The benefits of the plan include pension in certain cases, payable up to the date of normal superannuation had the employee been in service, to an eligible employee at the time of death or permanent disablement, while in service, either as a result of an injury or as certified by the appropriate authority. The monthly payment to dependents of the deceased/disabled employee under the plan equals 50% of the salary drawn at the time of death or accident or a specified amount, whichever is greater. Tata Motors Limited and these subsidiaries account for the liability for BKY benefits payable in the future based on an actuarial valuation.
v) Provident fund and family pension In accordance with Indian law, eligible employees
of Tata Motors Limited and some of its subsidiaries and joint operations are entitled to receive benefits in respect of provident fund, a defined contribution plan, in which both employees and the Company make monthly contributions at a specified percentage of the covered employees’ salary (currently 12% of employees’ salary). The contributions, as specified under the law, are made to the provident fund and pension fund set up as an irrevocable trust by Tata Motors Limited and its subsidiaries or to respective Regional Provident Fund Commissioner and the Central Provident Fund under the State Pension scheme. The interest rate payable to the members of the trust shall not be lower than the statutory rate of interest declared by the Central Government under the Employees Provident Funds and Miscellaneous
Provisions Act,1952 and shortfall, if any, shall be made good by the Company. The embedded interest rate guarantee is considered to be defined benefit. The liability in respect of the short fall of interest earnings of the Fund is determined on the basis of an actuarial valuation. There is no shortfall as at March 31, 2018.
vi) Severance indemnity Tata Daewoo Commercial Vehicle Company Limited,
or TDCV, a subsidiary company incorporated in Korea; has an obligation towards severance indemnity, a defined benefit retirement plan, covering eligible employees. The plan provides for a lump sum payment to all employees with more than one year of employment equivalent to 30 days’ salary payable for each completed year of service.
vii) Post-retirement medicare scheme
Under this unfunded scheme, employees of Tata Motors Limited and some of its subsidiaries receive medical benefits subject to certain limits on amounts of benefits, periods after retirement and types of benefits, depending on their grade and location at the time of retirement. Employees separated from the Company as part of an Early Separation Scheme, on medical grounds or due to permanent disablement are also covered under the scheme. Tata Motors Limited and such subsidiaries account for the liability for post-retirement medical scheme based on an actuarial valuation.
viii) Compensated absences
Tata Motors Limited and some of its subsidiaries and joint operations provide for the encashment of leave or leave with pay subject to certain rules. The employees are entitled to accumulate leave subject to certain limits, for future encashment. The liability is provided based on the number of days of unutilised leave at each balance sheet date on the basis of an actuarial valuation.
ix) Remeasurement gains and losses
Remeasurement comprising actuarial gains and losses, the effect of the asset ceiling and the return on assets (excluding interest) relating to retirement benefit plans, are recognised directly in other comprehensive income in the period in which they arise. Remeasurement recorded in other comprehensive income is not reclassified to statement of profit and loss.
Actuarial gains and losses relating to long-term employee benefits are recognised in the statement of profit and loss in the period in which they arise.
x) Measurement date
The measurement date of retirement plans is March 31.
272

NOTES FORMING PART OF CONSOLIDATED FINANCIAL STATEMENTS
xi) The present value of the defined benefit liability and the related current service cost and past service cost are measured using projected unit credit method.
t. Dividends
Any dividend declared by Tata Motors Limited is based on the profits available for distribution as reported in the statutory financial statements of Tata Motors Limited (standalone) prepared in accordance with Generally Accepted Accounting Principles in India or Indian GAAP or Ind AS. Indian law permits the declaration and payment of dividend out of profits for the year or previous financial year(s) as stated in the statutory financial statements of Tata Motors Limited (Standalone) prepared in accordance with Generally Accepted Accounting Principles in India, or Ind AS after providing for depreciation in accordance with the provisions of Schedule II to the Companies Act. However, in the absence or inadequacy of the said profits, it may declare dividend out of free reserves, subject to certain conditions as prescribed under the Companies (Declaration and Payment of Dividend) Rules, 2014. Accordingly, in certain years the net income reported in these financial statements may not be fully distributable. The amount available for distribution is ` Nil as at March 31, 2018 (` Nil as at March 31, 2017).
u. Segments
The Company primarily operates in the automotive segment. The automotive segment comprises two reportable segments i.e. Tata and other brand vehicles, including financing thereof and Jaguar Land Rover. Other operating segments do not meet the quantitative thresholds for disclosure and have been aggregated.
v. Financial instruments
i) Classification, initial recognition and measurement
A financial instrument is any contract that gives rise to a financial asset of one entity and a financial liability or equity instrument of another entity. Financial assets other than equity instruments are classified into categories: financial assets at fair value through profit or loss and at amortised cost. Financial assets that are equity instruments are classified as fair value through profit or loss or fair value through other comprehensive income. Financial liabilities are classified into financial liabilities at fair value through profit or loss and other financial liabilities.
Financial instruments are recognised on the balance sheet when the Company becomes a party to the contractual provisions of the instrument.
Initially, a financial instrument is recognised at its fair value. Transaction costs directly attributable to the acquisition or issue of financial instruments are recognised in determining the carrying amount, if it is not classified as at fair value through profit or loss. Subsequently, financial instruments are measured according to the category in which they are classified.
Financial assets at amortised cost: Financial assets having contractual terms that give rise on specified dates to cash flows that are solely payments of principal and interest on the principal outstanding and that are held within a business model whose objective is to hold such assets in order to collect such contractual cash flows are classified in this category. Subsequently, these are measured at amortised cost using the effective interest method less any impairment losses.
Equity investments at fair value through other comprehensive income: These include financial assets that are equity instruments and are designated as such upon initial recognition irrevocably. Subsequently, these are measured at fair value and changes therein, are recognised directly in other comprehensive income, net of applicable deferred income taxes.
Dividends from these equity investments are recognised in the statement of profit and loss when the right to receive payment has been established.
When the equity investment is derecognised, the cumulative gain or loss in equity is transferred to retained earnings.
Financial assets at fair value through profit or loss: Financial assets are measured at fair value through profit or loss unless it is measured at amortised cost or at fair value through other comprehensive income on initial recognition. The transaction costs directly attributable to the acquisition of financial assets and liabilities at fair value through profit or loss are immediately recognised in profit or loss.
Derivatives, unless they are designated as hedging instruments, for which hedge accounting is applied, financial assets which have contractual cash flows which are not in the nature of solely principal and interest payments (like hybrid instruments having embedded derivatives) are classified into this category. These are measured at fair value with changes in fair value recognised in the statement of profit and loss.
Equity instruments: An equity instrument is any contract that evidences residual interests in the assets of the Company after deducting all of its liabilities. Equity instruments issued by the Company are recorded at the proceeds received, net of direct issue costs.
Financial liabilities at fair value through profit or loss
Derivatives, including embedded derivatives separated from the host contract, unless they are designated as hedging instruments, for which hedge accounting is applied, are classified into this category. These are measured at fair value with changes in fair value recognised in the statement of profit and loss.
27373rd Annual Report 2017-18
INTEGRATED REPORT 1-65 STATUTORY REPORTS 66-184 FINANCIAL STATEMENTS 185-353

Other financial liabilities: These are measured at amortised cost using the effective interest method.
ii) Determination of fair value:
The fair value of a financial instrument on initial recognition is normally the transaction price (fair value of the consideration given or received). Subsequent to initial recognition, the Company determines the fair value of financial instruments that are quoted in active markets using the quoted bid prices (financial assets held) or quoted ask prices (financial liabilities held) and using valuation techniques for other instruments. Valuation techniques include discounted cash flow method and other valuation models.
iii) Derecognition of financial assets and financial liabilities:
The Company derecognizes a financial asset only when the contractual rights to the cash flows from the asset expires or it transfers the financial asset and substantially all the risks and rewards of ownership of the asset to another entity. If the Company neither transfers nor retains substantially all the risks and rewards of ownership and continues to control the transferred asset, the Company recognizes its retained interest in the asset and an associated liability for amounts it may have to pay. If the Company retains substantially all the risks and rewards of ownership of a transferred financial asset, the Company continues to recognize the financial asset and also recognizes a collateralised borrowing for the proceeds received.
Financial liabilities are derecognised when these are extinguished, that is when the obligation is discharged, cancelled or has expired.
iv) Impairment of financial assets:
The Company recognizes a loss allowance for expected credit losses on a financial asset that is at amortised cost.
Loss allowance in respect of financial assets other than finance receivables is measured at an amount equal to life time expected credit losses and is calculated as the difference between their carrying amount and the present value of the expected future cash flows discounted at the original effective interest rate.
Loss allowance for finance receivables is measured at an amount equal to twelve month expected losses if credit risk on such assets has not increased significantly since initial recognition. An allowance equal to life time expected losses is provided if credit risk has increased significantly from the date of initial recognition. Credit risk is determined to have increased significantly when a finance receivable
contract becomes sixty/ninety days past due. Such impairment loss is recognised in the statement of profit and loss. If the amount of an impairment loss decreases in a subsequent period, and the decrease can be related objectively to an event occurring after the impairment was recognised, the previously recognised impairment loss is reversed. The reversal is recognised in the statement of profit and loss.
v. Hedge accounting
The Company uses foreign currency forward and option contracts to hedge its risks associated with foreign currency fluctuations relating to highly probable forecast transactions. The Company designates these forward and option contracts in a cash flow hedging relationship by applying the hedge accounting principles.
These forward and option contracts are stated at fair value at each reporting date. Changes in the fair value of these forward and option contracts that are designated and effective as hedges of future cash flows are recognised in other comprehensive income (net of tax) and the ineffective portion is recognised immediately in the consolidated statement of profit and loss. Amounts accumulated in equity are reclassified to the consolidated statement of profit and loss in the periods in which the forecasted transaction occurs.
For forwards and options, forward premium and the time value are not considered part of the hedge. These are treated as cost of hedge and the changes in fair value attributable to time value is recognised in the other comprehensive income along with the changes in fair value determined to be effective portion of the hedge.
Hedge accounting is discontinued when the hedging instrument expires or is sold, terminated, or exercised, or no longer qualifies for hedge accounting. For forecast transactions, any cumulative gain or loss on the hedging instrument recognised in equity is retained there until the forecast transaction occurs.
If the forecast transaction is no longer expected to occur, the net cumulative gain or loss recognised in equity is immediately transferred to the consolidated statement of profit and loss for the year.
w. Recent accounting pronouncement
Ind AS 115 – Revenue from Contracts with Customers
The standard outlines a single comprehensive model for entities to use in accounting for revenue arising from contracts with customers and supersede most current revenue recognition guidance, including industry-specific guidance. The core principle of the new standard is for companies to recognize revenue to depict the transfer of goods or services to customers in amounts that reflect the consideration
NOTES FORMING PART OF CONSOLIDATED FINANCIAL STATEMENTS
274

(that is, payment) to which the Company expects to be entitled to exchange for those goods or services. The new standard also will result in enhanced disclosures about revenue, provide guidance for transactions that were not previously addressed comprehensively (for example, service revenue and contract modifications) and improve guidance for multiple-element arrangements. Ind AS 115 is effective from April 1, 2018.
The Company will be adopting Ind AS 115 with a modified retrospective approach. The cumulative effect of initially applying this Standard will be recorded as an adjustment to the opening balance of retained earnings. The figures for the comparative periods will not be restated. The Company has assessed that the profit impact of Ind AS 115 adoption will not be significant to the Consolidated financial statements.
The Company has assessed that there will be change in the basis of measurement of revenue for certain contracts in which performance obligation is satisfied over a period of time and revenue is measured as a percentage to the work completed. For such contracts, revenue will be measured in accordance with Ind AS 115, when the Company has satisfied a performance obligation by transferring the promised good or service (i.e. an asset) to the customer i.e. when the customer obtains control of the asset and establishes an unconditional right to receive the consideration. There will be no significant impact to the opening retained earnings on account of this change in measurement.
The Company makes transport arrangements for delivering its vehicles to the dealers. The gross consideration received in respect of these arrangements are recognised and presented with revenue in the statement of profit and loss. The cost associated with these arrangements are presented within freight cost in the statement of profit and loss. In accordance with Ind AS 115, the Company has determined that it is an agent in providing these services, and therefore the gross consideration received, net off cost associated with respect to these arrangements will be presented within
revenue. Certain payouts made to dealers such as infrastructure support payments are to be treated as variable components of consideration and will therefore in accordance with Ind AS 115, be recognised as revenue deductions in future. These costs are presently reported as other expenses. These change in presentation in the income statement will result in decrease in both revenues and expenses.
The introduction of the Standard will give rise to new financial statement categories in the statement of financial position, being “contract assets” and “contract liabilities.” These items can arise through advance payment received from customers or advance delivery of goods and services in excess of or ahead of billing at the contract level. In addition, disclosure requirements are extended.
Incentives received from Government will be included under other income, which is currently presented under other operating income under revenue from operations.
Further, Ind AS 115, will allow for transitional arrangements for modified and fulfilled contracts, and clarify the identification of performance obligations, principal-agent relationships, and licenses. The application of these amendments is also not expected to have any major impact on the Group’s profitability, liquidity and capital resources or financial position.
Ind AS 21 - The Effect of Changes in Foreign Exchange Rates
The amendment effective April 1, 2018, clarifies on the accounting of transaction that include the receipt or payment of advance consideration in a foreign currency. The appendix explains that the date of the transaction, for the purpose of determining rate, is the date of initial recognition of the non-monetary prepayment asset or deferred income liability. If there are multiple payments or receipts in advance, a date of transaction is established for each payment or receipt. The Company is evaluating the impact of this amendment on its financial statements.
NOTES FORMING PART OF CONSOLIDATED FINANCIAL STATEMENTS
27573rd Annual Report 2017-18
INTEGRATED REPORT 1-65 STATUTORY REPORTS 66-184 FINANCIAL STATEMENTS 185-353

(x) The following subsidiary companies are considered in the consolidated financial statements:
Sr No.
Name of the Subsidiary company Country of incorporation
% of holding either directly or through subsidiaries
As at March 31, 2018
As at March 31, 2017
Direct Subsidiaries
1 TAL Manufacturing Solutions Limited India 100 100
2 Concorde Motors (India) Limited India 100 100
3 Tata Motors Insurance Broking & Advisory Services Limited India 100 100
4 Tata Motors European Technical Centre PLC UK 100 100
5 Tata Technologies Limited India 72.29 72.32
6 TMF Holdings Limited (formerly known as Tata Motors Finance Limited) India 100 100
7 Tata Marcopolo Motors Limited India 51 51
8 TML Holdings Pte. Limited Singapore 100 100
9 TML Distribution Company Limited India 100 100
10 Tata Hispano Motors Carrocera S.A. Spain 100 100
11 Tata Hispano Motors Carrocerries Maghreb SA Morocco 100 100
12 Trilix S.r.l Italy 80 80
13 Tata Precision Industries Pte. Limited Singapore 78.39 78.39
Indirect subsidiaries *
14 Tata Daewoo Commercial Vehicle Company Limited South Korea 100 100
15 Tata Daewoo Commercial Vehicle Sales and Distribution Company Limited
South Korea 100 100
16 Tata Motors (Thailand) Limited Thailand 95.49 95.28
17 Tata Motors (SA) (Proprietary) Limited South Africa 60 60
18 PT Tata Motors Indonesia Indonesia 100 100
19 Tata Technologies (Thailand) Limited Thailand 72.29 72.32
20 Tata Technologies Pte Limited Singapore 72.29 72.32
21 INCAT International Plc. UK 72.29 72.32
22 Tata Technologies Europe Limited UK 72.29 72.32
23 Escenda Engineering AB (Tata Technologies Europe Limited acquired 100% stake in the Company w.e.f. May 1, 2017)
UK 72.29 -
24 INCAT GmbH. Germany 72.29 72.32
25 Tata Technologies Inc. USA 72.35 72.37
26 Tata Technologies de Mexico, S.A. de C.V. Mexico 72.35 72.37
27 Cambric Limited USA 72.32 72.32
28 Cambric UK Limited (Dissolved w.e.f. May 23, 2017) UK 72.35 72.32
29 Cambric GmbH Germany 72.35 72.32
NOTES FORMING PART OF CONSOLIDATED FINANCIAL STATEMENTS
276

Sr No.
Name of the Subsidiary company Country of incorporation
% of holding either directly or through subsidiaries
As at March 31, 2018
As at March 31, 2017
30 Midwest Managed Services Inc.(Merged into Tata Technologies Inc. w.e.f. February 28, 2018)
USA - 72.32
31 Tata Technologies SRL Romania Romania 72.32 72.32
32 Tata Manufacturing Technologies (Shanghai) Limited China 72.29 72.32
33 Jaguar Land Rover Automotive Plc UK 100 100
34 Jaguar Land Rover Limited UK 100 100
35 Jaguar Land Rover Austria GmbH Austria 100 100
36 Jaguar Land Rover Belux NV Belgium 100 100
37 Jaguar Land Rover Japan Limited Japan 100 100
38 Jaguar Cars South Africa (Pty) Limited South Africa 100 100
39 JLR Nominee Company Limited UK 100 100
40 The Daimler Motor Company Limited UK 100 100
41 The Jaguar Collection Limited UK 100 100
42 Daimler Transport Vehicles Limited UK 100 100
43 S.S. Cars Limited UK 100 100
44 The Lanchester Motor Company Limited UK 100 100
45 Jaguar Land Rover Deutschland GmbH Germany 100 100
46 Jaguar Land Rover Holdings Limited UK 100 100
47 Jaguar Land Rover North America LLC USA 100 100
48 Land Rover Ireland Limited Ireland 100 100
49 Jaguar Land Rover Nederland BV Netherlands 100 100
50 Jaguar Land Rover Portugal - Veiculos e Pecas, Lda. Portugal 100 100
51 Jaguar Land Rover Australia Pty Limited Australia 100 100
52 Jaguar Land Rover Italia Spa Italy 100 100
53 Jaguar Land Rover Espana SL Spain 100 100
54 Jaguar Land Rover Korea Company Limited South Korea 100 100
55 Jaguar Land Rover (China) Investment Co. Limited China 100 100
56 Jaguar Land Rover Canada ULC Canada 100 100
57 Jaguar Land Rover France, SAS France 100 100
58 Jaguar Land Rover (South Africa) (pty) Limited South Africa 100 100
59 Jaguar e Land Rover Brasil industria e Comercio de Veiculos LTDA Brazil 100 100
60 Limited Liability Company "Jaguar Land Rover" (Russia) Russia 100 100
61 Jaguar Land Rover (South Africa) Holdings Limited UK 100 100
NOTES FORMING PART OF CONSOLIDATED FINANCIAL STATEMENTS
27773rd Annual Report 2017-18
INTEGRATED REPORT 1-65 STATUTORY REPORTS 66-184 FINANCIAL STATEMENTS 185-353
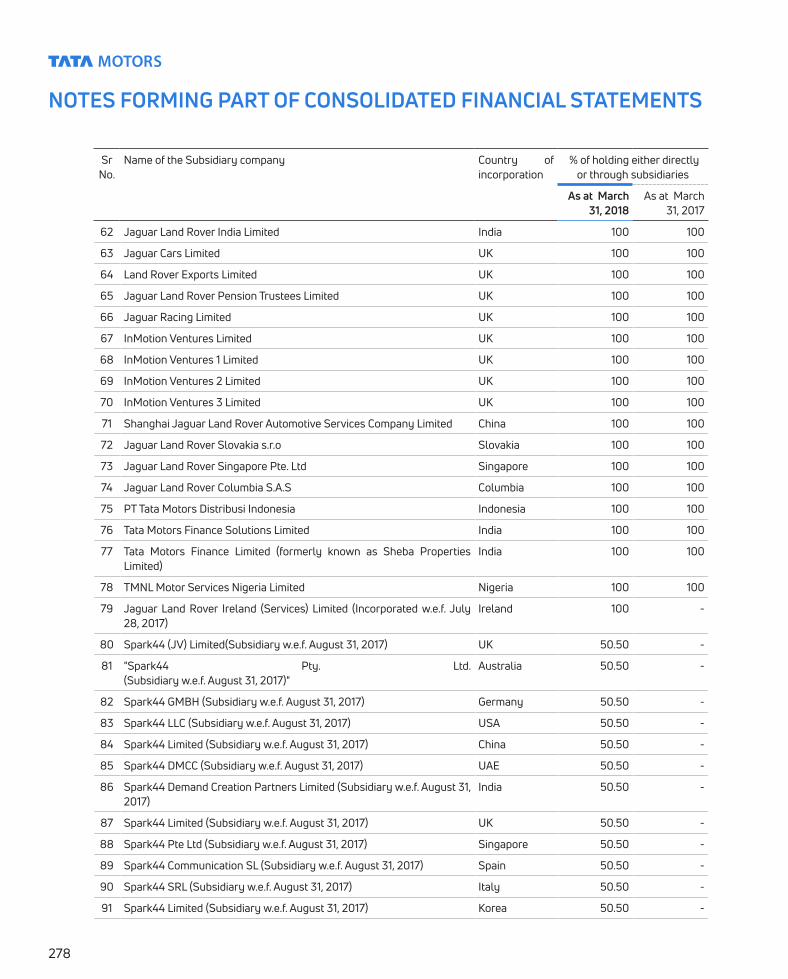
Sr No.
Name of the Subsidiary company Country of incorporation
% of holding either directly or through subsidiaries
As at March 31, 2018
As at March 31, 2017
62 Jaguar Land Rover India Limited India 100 100
63 Jaguar Cars Limited UK 100 100
64 Land Rover Exports Limited UK 100 100
65 Jaguar Land Rover Pension Trustees Limited UK 100 100
66 Jaguar Racing Limited UK 100 100
67 InMotion Ventures Limited UK 100 100
68 InMotion Ventures 1 Limited UK 100 100
69 InMotion Ventures 2 Limited UK 100 100
70 InMotion Ventures 3 Limited UK 100 100
71 Shanghai Jaguar Land Rover Automotive Services Company Limited China 100 100
72 Jaguar Land Rover Slovakia s.r.o Slovakia 100 100
73 Jaguar Land Rover Singapore Pte. Ltd Singapore 100 100
74 Jaguar Land Rover Columbia S.A.S Columbia 100 100
75 PT Tata Motors Distribusi Indonesia Indonesia 100 100
76 Tata Motors Finance Solutions Limited India 100 100
77 Tata Motors Finance Limited (formerly known as Sheba Properties Limited)
India 100 100
78 TMNL Motor Services Nigeria Limited Nigeria 100 100
79 Jaguar Land Rover Ireland (Services) Limited (Incorporated w.e.f. July 28, 2017)
Ireland 100 -
80 Spark44 (JV) Limited(Subsidiary w.e.f. August 31, 2017) UK 50.50 -
81 "Spark44 Pty. Ltd. (Subsidiary w.e.f. August 31, 2017)"
Australia 50.50 -
82 Spark44 GMBH (Subsidiary w.e.f. August 31, 2017) Germany 50.50 -
83 Spark44 LLC (Subsidiary w.e.f. August 31, 2017) USA 50.50 -
84 Spark44 Limited (Subsidiary w.e.f. August 31, 2017) China 50.50 -
85 Spark44 DMCC (Subsidiary w.e.f. August 31, 2017) UAE 50.50 -
86 Spark44 Demand Creation Partners Limited (Subsidiary w.e.f. August 31, 2017)
India 50.50 -
87 Spark44 Limited (Subsidiary w.e.f. August 31, 2017) UK 50.50 -
88 Spark44 Pte Ltd (Subsidiary w.e.f. August 31, 2017) Singapore 50.50 -
89 Spark44 Communication SL (Subsidiary w.e.f. August 31, 2017) Spain 50.50 -
90 Spark44 SRL (Subsidiary w.e.f. August 31, 2017) Italy 50.50 -
91 Spark44 Limited (Subsidiary w.e.f. August 31, 2017) Korea 50.50 -
NOTES FORMING PART OF CONSOLIDATED FINANCIAL STATEMENTS
278

Sr No.
Name of the Subsidiary company Country of incorporation
% of holding either directly or through subsidiaries
As at March 31, 2018
As at March 31, 2017
92 Spark44 Japan KK (Subsidiary w.e.f. August 31, 2017) Japan 50.50 -
93 Spark44 Canada Inc (Subsidiary w.e.f. August 31, 2017) Canada 50.50 -
94 Spark44 South Africa (Pty) Limited (Subsidiary w.e.f. August 31, 2017) South Africa 50.50 -
95 Jaguar Land Rover Taiwan Company Limited (Incorporated w.e.f.November 17, 2017)
Taiwan 100.00 -
96 Jaguar Land Rover Servicios Mexico,S.A. de C.V.(Incorporated w.e.f. October 2, 2017)
Mexico 100.00 -
97 Jaguar Land Rover Mexico,S.A.P.I. de C.V.(Incorporated w.e.f. October 2, 2017)
Mexico 100.00 -
* Effective holding % of the Company directly and through its subsidiaries.
(iv) The following Jointly controlled companies are considered in the consolidated financial statements:
Sr No.
Name of the jointly controlled company Country of incorporation
% of holding either directly or through subsidiaries
As at March 31, 2018
As at March 31, 2017
Joint operations 1 Fiat India Automobiles Private Limited India 50 502 Tata Cummins Private Limited India 50 50 Joint Ventures3 Tata HAL Technologies Limited ** India 36.16 36.16 4 Spark 44 (JV) Limited (Subsidiary w.e.f. August 31, 2017) UK - 50 5 Chery Jaguar Land Rover Automotive Company Limited China 50 50 6 JT Special Vehicles Pvt. Limited India 50 50
** Effective holding % of the Company as it is a Joint Venture of Tata Technologies Ltd
(v) The following associate companies are considered in the consolidated financial statements:
Sr No.
Name of the associate company Country of incorporation
% of holding either directly or through subsidiaries
As at March 31, 2018
As at March 31, 2017
1 Automobile Corporation of Goa Limited India 47.19 47.19 2 Nita Company Limited Bangladesh 40.00 40.00 3 Tata Hitachi Construction Machinery Company Private Limited India 39.99 39.99 4 Tata Precision Industries (India) Limited India 39.19 39.19 5 Tata AutoComp Systems Limited India 26.00 26.00 6 Jaguar Cars Finance Limited UK 49.90 49.90 7 Cloud Car Inc USA 26.30 42.60 8 Synaptiv Limited UK 33.33 33.33 9 DriveClubService Pte. Ltd. (Associate w.e.f. July 13, 2017) Singapore 25.07 -
NOTES FORMING PART OF CONSOLIDATED FINANCIAL STATEMENTS
27973rd Annual Report 2017-18
INTEGRATED REPORT 1-65 STATUTORY REPORTS 66-184 FINANCIAL STATEMENTS 185-353

3.
Pro
pert
y, p
lant
and
equ
ipm
ent
(` in
cro
res)
Owne
d ass
ets
Give
n on
leas
eTa
ken
on le
ase
Land
Build
ings
Plan
t and
eq
uipm
ent
Furn
iture
an
d fix
ture
s
Vehi
cles
Com
pute
rsHe
ritag
e As
sets
Land
Build
ings
Plan
t and
eq
uipm
ent
Vehi
cles
Build
ings
Plan
t and
eq
uipm
ent
Furn
iture
an
d fix
ture
s
Com
pute
rsTo
tal
Cost
as at
Apr
il 1, 2
017
6,76
1.98
12,0
14.3
079
,560
.141,2
18.13
290.
951,7
66.77
423.
3520
.1129
.46
8.95
8.14
149.
5741
6.15
4.31
178.
8710
2,85
1.18
Addi
tions
294.6
13,1
55.5
615
,698
.1814
6.43
109.
0226
3.54
-0.
72-
-25
.00
8.50
3.52
-7.2
819
,712.
36
Asse
t acq
uire
d in
Busin
ess C
ombi
natio
n-
2.06
0.22
42.73
-13
.12-
--
--
0.10
--
-58
.23
Asse
ts cl
assif
ied as
hel
d for
sale
-(2
7.11)
(366
.90)
(40.
73)
(3.8
8)(16
0.69
)-
--
--
(100.
20)
(0.6
3)-
-(7
00.14
)
Curre
ncy
trans
latio
n di
ffere
nces
282.0
01,3
55.9
18,
374.
9112
1.91
11.47
143.
8550
.00
2.41
3.98
--
2.68
39.6
7-
-10
,388
.79
Writ
e off
of as
sets
--
(536
.82)
--
-(11
0.06
)-
--
--
--
-(6
46.8
8)
Disp
osal
-(7.
78)
(2,6
62.47
)(6
3.18)
(54.
44)
(83.
44)
(8.6
1)-
(0.0
3)(3
.79)
(1.91
)(1.
56)
(299
.87)
--
(3,18
7.08)
Cost
as at
Mar
ch 3
1, 20
187,3
38.5
916
,492
.94
100,
067.2
61,4
25.2
935
3.12
1,943
.1535
4.68
23.2
433
.41
5.16
31.2
359
.09
158.
844.
3118
6.15
128,
476.
46
Accu
mul
ated
depr
eciat
ion
as at
Apr
il 1, 2
017
-2,
445.
4738
,476.
0760
0.90
179.
591,0
03.4
8-
-0.
733.0
83.6
635
.59
344.0
40.
6516
3.36
43,2
56.6
2
Depr
eciat
ion
for t
he pe
riod
-65
2.15
9,83
8.20
133.
5244
.68
176.
24-
-0.1
31.3
23.7
05.
607.2
40.
8610
.7010
,874
.34
Writ
eoff
of as
sets
--
(389
.08)
--
--
--
--
--
(389
.08)
Asse
ts cl
assif
ied as
hel
d for
sale
-(13
.07)
(115.
43)
(13.3
6)(2
.58)
(95.
56)
--
--
-(2
0.98
)(0
.60)
--
(261
.58)
Curre
ncy
trans
latio
n di
ffere
nces
-21
8.14
3,718
.80
54.3
86.1
951
.96
--
0.07
--
0.78
20.2
5-
-4,
070.
57
Disp
osal
-(2
.78)
(245
5.45
)(5
7.09)
(48.
05)
(77.4
3)-
--
(0.2
8)(1.
30)
-(2
99.8
7)-
-(2
,942
.25)
Accu
mul
ated
depr
eciat
ion
as at
Mar
ch
31, 2
018
-3,
299.
9149
,073
.1171
8.35
179.
831,0
58.6
9-
-0.
934.
126.
0620
.99
71.0
61.5
117
4.06
54,6
08.6
2
Net c
arry
ing a
mou
nt as
at
Mar
ch 3
1, 20
187,3
38.5
913
,193.
0350
,994
.1570
6.94
173.
2988
4.46
354.
6823
.24
32.4
81.0
425
.1738
.1087
.782.
8012
.09
73,8
67.8
4
Cost
as at
Apr
il 1, 2
016
7,161
.52
12,16
4.18
79,47
8.20
1,241
.33
279.
691,6
34.42
497.7
823
.1734
.55
21.9
3-
144.0
656
3.00
-17
4.25
103,
418.
08
Addit
ions
21.8
71,1
14.12
9,32
4.76
136.
7344
.7931
3.64
1.48
--
0.04
8.14
12.4
30.
994.
314.6
210
,987
.92
Curre
ncy
trans
latio
n dif
fere
nces
(421
.41)
(1,17
5.59
)(8
,824
.25)
(130.
46)
(11.5
0)(13
8.39
)(7
5.91
)(3
.06)
(5.0
9)-
-(6
.73)
(67.8
5)-
-(10
,860
.24)
Disp
osal
-(8
8.41
)(4
18.5
7)(2
9.47
)(2
2.03)
(42.
90)
--
-(13
.02)
-(0
.19)
(79.
99)
--
(694
.58)
Cost
as at
Mar
ch 3
1, 20
176,
761.9
812
,014
.30
79,5
60.14
1,218
.1329
0.95
1,766
.7742
3.35
20.11
29.4
68.
958.
1414
9.57
416.1
54.
3117
8.87
102,
851.1
8
Accu
mul
ated
dep
recia
tion
as at
Apr
il 1, 2
016
-2,1
70.8
634
,138.
3554
4.05
158.
5991
0.29
--
0.75
9.27
29.4
437
8.06
-15
1.35
38,4
91.0
1
Depr
eciat
ion fo
r the
yea
r-
507.7
08,
074.
5113
3.78
43.4
616
9.64
--
0.15
2.15
3.66
6.78
94.13
0.65
12.0
19,
048.
62
Writ
e off
of as
sets
--
102.0
4-
--
--
--
--
--
-10
2.04
Curre
ncy
trans
latio
n dif
fere
nces
-(18
3.91
)(3
,551
.59)
(50.
77)
(4.8
1)(4
1.24)
--
(0.17
)-
(0.4
4)(4
8.16
)-
-(3
,881
.09)
Disp
osal
-(4
9.18)
(287
.24)
(26.1
6)(17
.65)
(35.
21)
--
-(8
.34)
-(0
.19)
(79.
99)
--
(503
.96)
Accu
mul
ated
dep
recia
tion
as at
Mar
ch
31, 2
017
-2,
445.
4738
,476.
0760
0.90
179.
591,0
03.4
8-
-0.
733.0
83.6
635
.59
344.0
40.
6516
3.36
43,2
56.6
2
Net c
arry
ing a
mou
nt as
at
Mar
ch 3
1, 20
176,
761.9
89,
568.
8341
,084
.07
617.2
3111
.36
763.
2942
3.35
20.11
28.73
5.87
4.48
113.9
872
.113.
6615
.51
59,5
94.5
6
NO
TES
FO
RM
ING
PA
RT
OF
CON
SO
LID
ATED
FIN
AN
CIA
L ST
ATEM
ENTS
280

4. Leases The Company has taken land, buildings, plant and equipment, computers and furniture and fixtures under operating and finance
leases. The following is the summary of future minimum lease rental payments under non-cancellable operating leases and finance leases entered into by the Company:
(` in crores)
As at March 31, 2018 As at March 31, 2017Operating Finance Operating FinanceMinimum
Lease Payments
Minimum Lease
Payments
Present value of minimum
lease payments
Minimum Lease
Payments
Minimum Lease
Payments
Present value of minimum
lease payments
Not later than one year 880.80 25.39 22.23 659.77 25.82 22.12 Later than one year but not later than five years
2,152.78 28.25 22.19 1,787.14 41.71 33.81
Later than five years 2,334.29 38.06 24.56 1,464.55 37.22 20.23 Total minimum lease commitments
5,367.87 91.70 68.98 3,911.46 104.75 76.16
Less: future finance charges (22.72) (28.61)Present value of minimum lease payments
68.98 76.14
Included in the financial statements as:Other financial liabilities - current (refer note 27)
22.23 22.13
Long-term borrowings (refer note 24)
46.75 54.01
68.98 76.14
Total operating lease rent expenses were ` 1,022.39 crores and ` 822.48 crores for the years ended March 31, 2018 and 2017, respectively.
5. Goodwill
(` in crores)
As at March 31, 2018
As at March 31, 2017
Balance at the beginning 673.32 759.80Impairment - (14.25)Classified as held for sale (557.91) -Currency translation differences 1.04 (72.23)Balance at the end 116.45 673.32
As at March 31, 2018, goodwill of 116.45 crores relates to the automotive and related activity segment (Tata and other brand vehicles including financing thereof). As at March 31, 2017, goodwill of ` 115.41 crores and ` 557.91 crores relates to the automotive and related activity segment (Tata and other brand vehicles including financing thereof) and "others" segment, respectively.
As at March 31, 2018, goodwill of ` 99.09 crores has been allocated to a joint operation Fiat India Automobiles Pvt. Ltd., cash generating unit. The recoverable amount of the cash generating unit has been determined based on value in use. Value in use has been determined based on future cash flows, after considering current economic conditions and trends, estimated future operating results, growth rates and anticipated future economic conditions.
As at March 31, 2018, the estimated cash flows for a period of 5 years were developed using internal forecasts, and a pre-tax discount rate of 12.40%. The cash flows beyond 4 years have been extrapolated assuming 2% growth rates. The management believes that any reasonably possible change in the key assumptions would not cause the carrying amount to exceed the recoverable amount of the cash generating unit.
NOTES FORMING PART OF CONSOLIDATED FINANCIAL STATEMENTS
28173rd Annual Report 2017-18
INTEGRATED REPORT 1-65 STATUTORY REPORTS 66-184 FINANCIAL STATEMENTS 185-353

6.(a) Other intangible assets (` in crores)
Other intangible assets Software Patents and technological
know how
Customer related
Intellectual property
rights and other
intangibles
Indefinite life trade
marks and patents
Product development
Total
Cost as at April 1, 2017 5,212.84 1,313.68 516.61 194.99 5,003.50 47,746.09 59,987.71 Additions 847.20 42.75 22.31 61.53 - 16,464.77 17,438.56 Asset acquired in Business Combination
12.62 - - 33.59 - - 46.21
Assets classified as held for sale
(248.83) (1.68) (48.69) - - (299.20)
Currency translation differences
694.31 167.37 71.05 36.99 702.81 7,217.99 8,890.52
Write off assets - - - - - - - Fully amortised not in use (216.62) - - - - (1,231.04) (1,447.66)Cost as at March 31, 2018 6,301.52 1,522.12 561.28 327.10 5,706.31 70,197.81 84,616.14 Accumulated amortisation as at April 1, 2017
2,214.78 1,096.05 225.43 39.62 - 20,735.63 24,311.51
Amortisation for the period 997.26 135.07 26.09 53.67 - 9,467.16 10,679.25 Assest Held for Sale (170.05) (0.64) (10.96) - - - (181.65)Fully amortised not in use (216.62) - - - - (1,231.04) (1,447.66)Currency translation differences
297.30 153.38 32.56 4.83 - 3,224.34 3,712.41
Write off assets 112.71 - - - - - 112.71Accumulated amortisation as at March 31, 2018
3,235.38 1,383.86 273.12 98.12 - 32,196.09 37,186.57
Net carrying amount as at March 31, 2018
3,066.14 138.26 288.16 228.98 5,706.31 38,001.72 47,429.57
Cost as at April 1, 2016 5,966.68 1,525.56 605.00 82.08 5,902.17 50,681.24 64,762.73 Additions 797.70 1.79 - 129.43 - 7,943.73 8,872.65 Currency translation differences
(821.48) (213.67) (88.39) (13.14) (898.67) (7,231.70) (9,267.05)
Disposal - - - (3.38) - - (3.38)Fully amortised not in use (730.06) - - - - (3,647.18) (4,377.24)Cost as at March 31, 2017 5,212.84 1,313.68 516.61 194.99 5,003.50 47,746.09 59,987.71 Accumulated amortisation as at April 1, 2016
2,493.19 1,149.93 228.27 39.71 - 19,306.74 23,217.84
Amortisation for the year 756.87 131.20 28.97 1.06 - 7,938.27 8,856.37 Fully amortised not in use (730.06) - - - - (3,647.18) (4,377.24)Currency translation differences
(305.22) (183.14) (31.81) (1.15) - (2,862.20) (3,383.52)
Disposal - (1.94) - - - - (1.94)Accumulated amortisation as at March 31, 2017
2,214.78 1,096.05 225.43 39.62 - 20,735.63 24,311.51
Net carrying amount as at March 31, 2017
2,998.06 217.63 291.18 155.37 5,003.50 27,010.46 35,676.20
NOTES FORMING PART OF CONSOLIDATED FINANCIAL STATEMENTS
282

(b) Intangible assets under development
For the year ended March 31,
2018 2017
Balance at the beginning 23,512.01 19,367.97
Additions 16,877.22 15,125.50
Transferred to cost of other intangible assets (17,286.12) (7,986.70)
Transferred to held for sale (190.10) -
Write off / provision for impairment (1,596.26) (130.74)
Currency translation impact 2,573.81 (2,864.02)
Balance at the end 23,890.56 23,512.01
( c ) The useful life of trademarks and brands in respect of the acquired Jaguar Land Rover businesses have been determined to be indefinite as the Company expects to generate future economic benefits indefinitely from these assets.
The indefinite life intangible assets have been allocated to the Jaguar Land Rover businesses. The recoverable amount of the cash generating unit has been determined based on value in use. Value in use has been determined based on future cash flows after considering current economic conditions and trends, estimated future operating results, growth rates and anticipated future economic conditions.
The estimated cash flows for a period of five years were developed using internal forecast, and a pre-tax discount rate of 8.7%. The cash flows beyond five years have been extrapolated assuming 2.0% growth rate. The management believes that any reasonably possible change in the key assumptions would not cause the carrying amount to exceed the recoverable amount of the cash generating unit.
NOTES FORMING PART OF CONSOLIDATED FINANCIAL STATEMENTS
28373rd Annual Report 2017-18
INTEGRATED REPORT 1-65 STATUTORY REPORTS 66-184 FINANCIAL STATEMENTS 185-353

7. Investments in equity accounted investees:
(a) Associates:
The Company has no material associates as at March 31, 2018. The aggregate summarised financial information in respect of the Company's immaterial associates that are accounted for using the equity method is set forth below.
(` in crores)
As at March 31, 2018
As at March 31, 2017
Carrying amount of the Company’s interest in associates 933.34 872.63
As at March 31, 2018
As at March 31, 2017
Company’s share of profit/(loss) in associates* 118.30 110.93Company’s share of other comprehensive income in associates (1.90) (15.51)Company’s share of total comprehensive income in associates 116.40 95.42
(i) Fair value of investment in an equity accounted associate for which published price quotation is available, which is a level 1 input, was 338.04 crores and 192.22 crores as at March 31, 2018 and 2017, respectively. The carrying amount as at March 31, 2018 was ` 141.48 crores and ` 136.84 crores, as at March 31, 2017, respectively.
(ii) During the year ended March 31, 2018, the Group purchased 25.08% of the share capital of Driveclubservice Pte. Limited for `3.01 crores. In addition, the Group also purchased 1 per cent of the share capital of Driveclub Limited, the wholly owned subsidiary of Driveclubservice Pte. Limited. However, the Group has 25.83% of the voting rights, being the 1% of share capital held and the indirect shareholding held through Driveclubservice Pte. Limited. Both Driveclubservice Pte. Limited and Driveclub Limited are therefore accounted for as equity accounted investments as the Group has significant influence over the companies.
(b) Joint ventures:
(i) Details of the Company's material joint venture is as follows:
Name of joint venture Principal activity Principal place of the business
% holding as at March 31,2018 2017
Chery Jaguar Land Rover Automotive Co. Limited (Chery)
Manufacture and assembly of vehicles
China 50% 50%
Chery is a limited liability company, whose legal form confers separation between the parties to the joint arrangement. There is no contractual arrangement or any other facts and circumstances that indicate that the parties to the joint venture have rights to the assets and obligations for the liabilities of the joint arrangement. Accordingly, Chery is classified as a joint venture. The summarised financial information in respect of Chery that is accounted for using the equity method is set forth below.
(` in crores)As at
March 31, 2018As at
March 31, 2017Current assets 8,231.79 7,608.28Non-current assets 12,218.49 8,852.56Current liabilities (9,929.83) (7,565.07)Non-current liabilities (1,418.41) (1,424.97)The above amounts of assets and liabilities include the following:Cash and cash equivalents 4,046.68 5,025.85Current financial liabilities (excluding trade and other payables and provisions) (388.52) (1.70)Non-current financial liabilities (excluding trade and other payables and provisions) (1,399.96) (1,416.88)Share of net assets of material joint venture 4,551.02 3,735.40Other consolidation adjustments (101.62) (66.79)Carrying amount of the Company's interest in joint venture 4,449.40 3,668.61
NOTES FORMING PART OF CONSOLIDATED FINANCIAL STATEMENTS
284

Year ended March 31, 2018
Year ended March 31, 2017
Revenue 23,787.61 18,960.13
Net income/(loss) 4,338.13 2,732.06
Other comprehensive income 121.79 -
Total comprehensive income for the year 4,459.92 2,732.06
The above net income includes the following:
Depreciation and amortisation 1,194.78 920.11
Interest income (229.87) (99.32)
Interest expense (net) 60.90 70.66
Income tax expense/(credit) 1,163.05 901.44
Reconciliation of above summarised financial information to the carrying amount of the interest in the joint venture recognised in the consolidated financial statements:
As at March 31, 2018
As at March 31, 2017
Net assets of the joint venture 9,102.04 7,470.80
Proportion of the Company's interest in joint venture 4,551.02 3,735.40
Other consolidation adjustments (101.62) (66.79)
Carrying amount of the Company's interest in joint venture 4,449.40 3,668.61
During the year ended March 31, 2018, a dividend of GBP 206.46 Million(` 1,764.49 crores) was received by a subsidiary in UK from Chery Jaguar Land Rover Automotive Co. Ltd.(2017 : GBP 68 Million, ` 592.88 crores)
(ii) The aggregate summarised financial information in respect of the Company’s immaterial joint ventures that are accounted for using the equity method is set forth below.
As at March 31, 2018
As at March 31, 2017
Carrying amount of the Company's interest in joint ventures 2.50 64.77
During the year ended March 31, 2018, the Company acquired a further 10,000 ‘B’ shares in Spark 44 (JV) Ltd (Spark 44), increasing its share of the voting rights of Spark 44 from 50% to 50.5%. In addition, Spark 44’s Articles of Association together with the Shareholder Agreement were amended to give Jaguar Land Rover Limited control of Spark 44 as the majority shareholder.
Prior to this, Jaguar Land Rover Limited had joint control over Spark44 (JV) Limited and equity accounted for Spark44 (JV) Limited as a Joint Venture. Following the additional share purchase and change to Articles of Association and Shareholder Agreement Spark44 (JV) Limited has been consolidated as a subsidiary from August 31, 2017.
(` in crores)
As at March 31, 2018
As at March 31, 2017
Company’s share of profit/(loss) in immaterial joint ventures* 16.25 27.65
Company’s share of other comprehensive income in immaterial joint ventures - (13.03)
Company’s share of total comprehensive income in immaterial joint ventures 16.25 14.62
NOTES FORMING PART OF CONSOLIDATED FINANCIAL STATEMENTS
28573rd Annual Report 2017-18
INTEGRATED REPORT 1-65 STATUTORY REPORTS 66-184 FINANCIAL STATEMENTS 185-353

( c) Summary of carrying amount of the Company’s interest in equity accounted investees:
As at March 31, 2018
As at March 31, 2017
Carrying amount in immaterial associates 435.99 872.63
Carrying amount in immaterial associates (held for sale) 497.35 -
Carrying amount in material joint venture 4,449.40 3,668.61
Carrying amount in immaterial joint ventures 2.50 64.77
Total 5,385.24 4,606.01
Current (held for sale) 497.35 -
Non current 4,887.89 4,606.01
Total 5,385.24 4,606.01
(d) Summary of Company’s share of profit/(loss) in equity accounted investees:
Year ended March 31, 2018
Year ended March 31, 2017
Share of profit/(loss) in immaterial associates 118.30 110.93
Share of profit/(loss) in material joint venture 2,169.07 1,366.03
Share of profit/(loss) on other adjustments in material joint venture (25.36) (11.61)
Share of profit/(loss) in immaterial joint ventures 16.25 27.65
2,278.26 1,493.00
(e) Summary of Company’s share of other comprehensive income in equity accounted investees:
Year ended March 31, 2018
Year ended March 31, 2017
Share of other comprehensive income in immaterial associates (10.96) (4.00)
Currency translation differences-immaterial associates 9.06 (11.51)
Currency translation differences-material joint venture 420.35 (280.16)
Currency translation differences-immaterial joint ventures - (13.03)
418.45 (308.70)
* Company’s share of profit/(loss) of the equity accounted investees has been determined after giving effect for the subsequent amortisation/depreciation and other adjustments arising on account of fair value adjustments made to the identifiable net assets of the equity accounted investee as at the date of acquisition and other adjustment arising under the equity method of accounting.
NOTES FORMING PART OF CONSOLIDATED FINANCIAL STATEMENTS
286

8. Other Investments - non-current (` in crores)
As at March 31, 2018
As at March 31, 2017
(a) Investments - measured at Fair value through Other Comprehensive Income
Quoted:
Equity shares 36.64 260.29
Unquoted:
Equity shares 371.26 369.98
Total 407.90 630.27
(b) Investments - measured at Fair value through profit or loss
Quoted:
Mutual fund - 25.09
Unquoted:
(i) Non-cumulative redeemable preference shares 0.40 1.40
(ii) Cumulative redeemable preference shares 2.50 6.50
(iii) Equity shares 246.82 -
(iv) Convertible debentures 85.40 7.08
(v) Others 16.86 16.54
TOTAL 351.98 56.61
( c) Investments - measured at amortised cost
Unquoted:
Non-convertible debentures 3.88 3.88
Total 3.88 3.88
TOTAL (a+b+c) 763.76 690.76
Aggregate book value of quoted investments 36.64 285.38
Aggregate market value of quoted investments 36.64 285.38
Aggregate book value of unquoted investments 727.12 405.38
NOTES FORMING PART OF CONSOLIDATED FINANCIAL STATEMENTS
28773rd Annual Report 2017-18
INTEGRATED REPORT 1-65 STATUTORY REPORTS 66-184 FINANCIAL STATEMENTS 185-353

9. Other Investments - current (` in crores)
As at March 31, 2018
As at March 31, 2017
(a) Investments - measured at fair value through other comprehensive income Quoted: Equity Shares 303.28 -(b) Investments - measured at fair value through profit and loss Unquoted: (i) Mutual funds 1,601.00 3,040.54 (ii) Advance against investments - 0.40 Total 1,904.28 3,040.94 ( c ) Investments - measured at amortised cost Unquoted: Mutual funds 12,759.47 12,000.21 Total 12,759.47 12,000.21 TOTAL (a+b) 14,663.75 15,041.15
Aggregate book value of unquoted investments 14,360.47 15,041.15 Aggregate book value of quoted investments 303.28 -Aggregate market value of quoted investments 303.28 -
10. Loans and advancesAs at
March 31, 2018As at
March 31, 2017
Non-current
Secured, considered good:
(a) Loans to channel partners ( Net of provision ` 7.30 crores and ` 16.41 crores as at March 31, 2018 and 2017, respectively.)
237.03 195.61
Unsecured, considered good:
(a) Loans to employees 28.06 27.73
(b) Loans to others - 40.80
( c) Others (Net of provision ` 41.68 crores and ` Nil as at March 31, 2018 and 2017, respectively.)
230.32 489.52
Total 495.41 753.66
Current
Secured, considered good:
(a) Loans to channel partners 18.84 25.79
Unsecured, considered good:
(a) Advances to supplier, contractors etc. (Net of provision ` 165.10 crores and ` 119.57 crores as at March 31, 2018 and 2017, respectively)
2,260.50 684.35
(b) Inter corporate deposits 0.32 0.31
Total 2,279.66 710.45
NOTES FORMING PART OF CONSOLIDATED FINANCIAL STATEMENTS
288

11. Other financial assets (` in crores)
As at March 31, 2018
As at March 31, 2017
Non-current
(a) Derivative financial instruments 2,846.90 2,775.34
(b) Interest accrued on loans and deposits 2.60 2.40
( c) Restricted deposits 69.06 57.19
(d) Margin money / cash collateral with banks 104.80 74.56
(e) Government grant receivables 467.14 -
(f) Other deposits 1.18 1.63
(g) Others-supplier recovery 1,072.19 -
Total 4,563.87 2,911.12
Margin money with banks in restricted cash deposits consist of collateral provided for transfer of finance receivables. Restricted deposits as at March 31, 2018 and 2017 include ` 50.76 crores and ` 32.37 crores, respectively, held as a deposit in relation to ongoing legal cases.
Current
(a) Derivative financial instruments 2,476.13 1,510.18
(b) Interest accrued on loans and deposits 3.89 5.76
( c) Term /Fixed deposit other than Banks - 40.00
(d) Government grant receivable 411.39 -
(e) Others-supplier recovery 137.71 -
Total 3,029.12 1,555.94
12. Inventories
As at March 31, 2018
As at March 31, 2017
(a) Raw materials and components 3,019.28 2,159.53
(b) Work-in-progress 4,043.17 3,642.56
( c) Finished goods 33,875.53 28,235.17
(d) Stores and spare parts 208.72 216.12
(e) Consumable tools 375.56 297.66
(f) Goods-in-transit - Raw materials and components 615.37 534.27
Total 42,137.63 35,085.31
Note:
(i) Inventories of finished goods include 4,023.61 crores and 2,637.94 crores as at March 31, 2018 and 2017, respectively, relating to vehicles sold subject to repurchase arrangements.
(ii) Cost of inventories (including cost of purchased products) recognised as expense during the years ended March 31, 2018 and 2017 amounted to ` 2,17,338.62 crores and ` 2,03,087.37 crores, respectively.
(iii) During the years ended March 31, 2018 and 2017, the Company recorded inventory write-down expense of ` 607.42 crores and ` 372.51 crores, respectively.
(iv) Excludes ` 95.80 crores classified as held for sale as at March 31, 2018.
NOTES FORMING PART OF CONSOLIDATED FINANCIAL STATEMENTS
28973rd Annual Report 2017-18
INTEGRATED REPORT 1-65 STATUTORY REPORTS 66-184 FINANCIAL STATEMENTS 185-353

13. Trade receivables (Unsecured)*(` in crores)
As at March 31, 2018
As at March 31, 2017
Considered good 19,893.30 14,075.55
Considered doubtful 1,261.67 1,377.44
21,154.97 15,452.99
Less : Allowances for doubtful trade receivables (1,261.67) (1,377.44)
Total 19,893.30 14,075.55
* Excludes ` 524.58 crores classified as held for sale as at March 31, 2018.
14. Cash and cash equivalents
As at March 31, 2018
As at March 31, 2017
(a) Cash on hand 31.42 32.62
(b) Cheques on hand 399.44 111.31
( c) Balances with banks 8,907.19 8,462.76
(d) Deposit with banks 5,378.70 5,380.07
Total 14,716.75 13,986.76
15. Bank balances
As at March 31, 2018
As at March 31, 2017
With upto 12 months maturity:
(a) Earmarked balances with banks 493.87 238.36
(b) Margin money / cash collateral with banks 41.71 -
( c) Bank deposits 19,361.58 21,852.76
Total 19,897.16 22,091.12
Note:
Earmarked balances with bank include ` 248.60 crores and ` 186.14 crores as at March 31, 2018 and 2017, respectively held as security in relation to interest and repayment of bank borrowings. Out of these deposits, ` 85.09 crores and ` 118.64 crores as at March 31, 2018 and 2017, respectively are pledged till the maturity of the respective borrowing.
16. Finance receivables
As at March 31, 2018
As at March 31, 2017
Finance receivables 25,070.75 21,160.76
Less: allowance for credit losses (1,189.57) (3,597.51)
Total 23,881.18 17,563.25
Current portion 8,401.65 6,810.12
Non-current portion 15,479.53 10,753.13
Total 23,881.18 17,563.25
NOTES FORMING PART OF CONSOLIDATED FINANCIAL STATEMENTS
290

Changes in the allowance for credit losses in finance receivables are as follows:(` in crores)
Year ended March 31, 2018
Year ended March 31, 2017
Balance at the beginning 3,597.51 5,006.69
Allowances made/(reversed) during the year 43.30 (28.15)
Written off (2,451.24) (1,381.03)
Balance at the end 1,189.57 3,597.51
17. Allowance for trade and other receivables
Change in the allowances for trade and other receivables are as follows:
Year ended March 31, 2018
Year ended March 31, 2017
Balance at the beginning 1,517.03 1,483.71
Assets classified as held for sale (13.05) -
Allowances made/(reversed) during the year 14.57 132.93
Written off (45.49) (134.03)
Foreign exchange translation differences 4.56 34.42
Balance at the end 1,477.62 1,517.03
18. Other non-current assets*
As at March 31, 2018
As at March 31, 2017
a) Capital advances 284.53 562.52
b) Taxes recoverable, statutory deposits and dues from government 1,049.63 1,125.26
c) Prepaid rentals on operating leases 381.72 326.10
d) Prepaid expenses 762.59 631.24
e) Others 202.78 202.24
Total 2,681.25 2,847.36
* Excludes ` 83.56 crores classified as held for sale as at March 31, 2018.
19. Other current assets*
As at March 31, 2018
As at March 31, 2017
a) Advances and other receivables 364.02 402.94
b) GST/VAT, other Taxes recoverable, statutory deposits and dues from government (Net of provision ` 1.86 crores and ` 3.61 crores as at March 31, 2018 and 2017,
respectively.)
5,674.80 4,904.80
c) Prepaid expenses 1,440.35 1,106.21
e) Others 183.20 126.04
Total 7,662.37 6,539.99
* Excludes ` 33.75 crores classified as held for sale as at March 31, 2018.
NOTES FORMING PART OF CONSOLIDATED FINANCIAL STATEMENTS
29173rd Annual Report 2017-18
INTEGRATED REPORT 1-65 STATUTORY REPORTS 66-184 FINANCIAL STATEMENTS 185-353

20. Income taxes
The domestic and foreign components of profit/(loss) before income tax is as follows:(` in crores)
Year ended March 31, 2018
Year ended March 31, 2017
Profit/(loss) before income taxes
India (963.60) (2,657.73)
Other than India 12,118.63 11,972.52
Total 11,155.03 9,314.79
The domestic and foreign components of income tax expense is as follows:
Year ended March 31, 2018
Year ended March 31, 2017
Current taxes
India 242.00 184.55
Other than India 3,061.46 2,953.11
Deferred taxes
India 48.49 186.00
Other than India 989.98 (72.43)
Total income tax expense 4,341.93 3,251.23
The reconciliation of estimated income tax to income tax expense is as follows:
Year ended March 31, 2018
Year ended March 31, 2017
Pfofit /(Loss) before tax 11,155.03 9,314.79
Income tax expense at tax rates applicable to individual entities 2,248.91 1,621.79
Additional deduction for patent, research and product development cost (409.98) (745.58)
Items (net) not deductible for tax /not liable to tax :
- foreign currency (gain)/loss relating to loans and deposits (net) 133.62 (73.98)
- interest and other expenses relating to borrowings for investment 33.78 53.10
- Dividend from subsidiaries, joint operations, equity accounted investees and other investments
(5.01) 2.71
Profit on sale of business to a wholly owned subsidiary - 407.89
Undistributed earnings of subsidiaries, joint operations and equity accounted investees 917.01 389.17
Deferred tax assets not recognised because realization is not probable 990.23 2,243.94
Utilization/credit of unrecognised tax losses, unabsorbed depreciation and other tax benefits (358.33) (350.90)
Impact of change in statutory tax rates 539.26 (524.96)
Others 252.44 228.05
Income tax expense reported 4,341.93 3,251.23
The UK Finance Act 2016 was enacted during the year ended March 31, 2017 which included provisions for a reduction in the UK Corporation tax rate to 17% with effect from April 1, 2020. Accordingly, UK deferred tax has been provided at rates applicable when the temporary difference is expected to reverse.
Included within ‘Impact of change in statutory tax rates’ is a charge of ` 464.84 crores for the impact of the change in the US Federal rate from 35% to 21% on deferred tax assets for the year ended March 31, 2018.
NOTES FORMING PART OF CONSOLIDATED FINANCIAL STATEMENTS
292
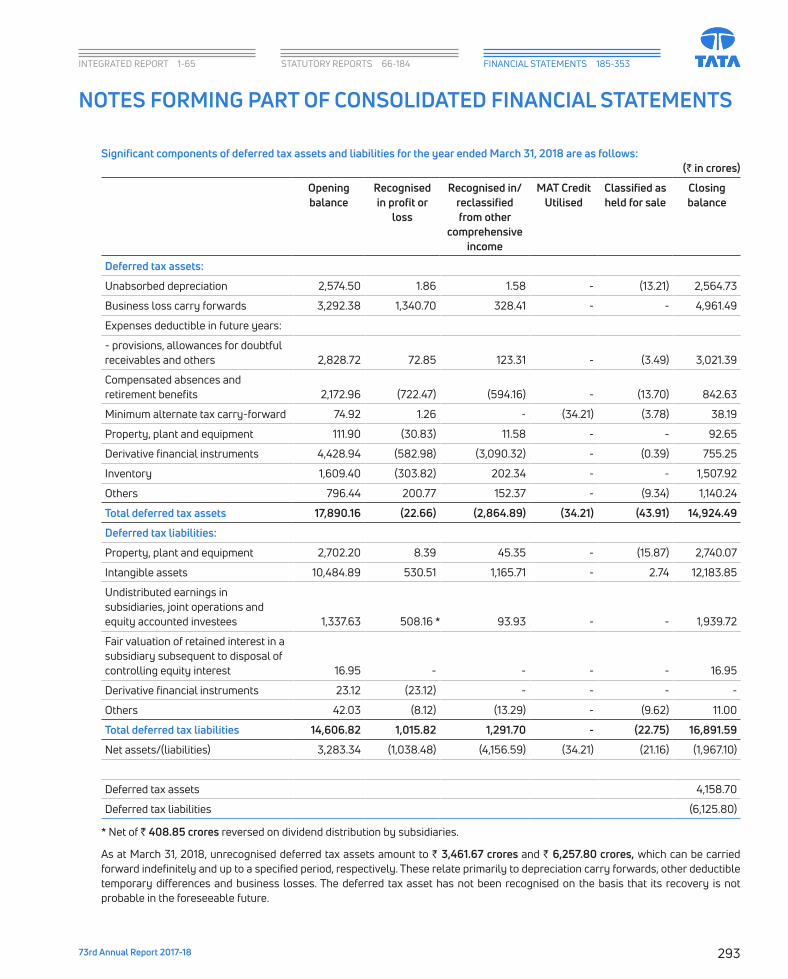
Significant components of deferred tax assets and liabilities for the year ended March 31, 2018 are as follows:(` in crores)
Opening balance
Recognised in profit or
loss
Recognised in/reclassified from other
comprehensive income
MAT Credit Utilised
Classified as held for sale
Closing balance
Deferred tax assets:
Unabsorbed depreciation 2,574.50 1.86 1.58 - (13.21) 2,564.73
Business loss carry forwards 3,292.38 1,340.70 328.41 - - 4,961.49
Expenses deductible in future years:
- provisions, allowances for doubtful receivables and others 2,828.72 72.85 123.31 - (3.49) 3,021.39
Compensated absences and retirement benefits 2,172.96 (722.47) (594.16) - (13.70) 842.63
Minimum alternate tax carry-forward 74.92 1.26 - (34.21) (3.78) 38.19
Property, plant and equipment 111.90 (30.83) 11.58 - - 92.65
Derivative financial instruments 4,428.94 (582.98) (3,090.32) - (0.39) 755.25
Inventory 1,609.40 (303.82) 202.34 - - 1,507.92
Others 796.44 200.77 152.37 - (9.34) 1,140.24
Total deferred tax assets 17,890.16 (22.66) (2,864.89) (34.21) (43.91) 14,924.49
Deferred tax liabilities:
Property, plant and equipment 2,702.20 8.39 45.35 - (15.87) 2,740.07
Intangible assets 10,484.89 530.51 1,165.71 - 2.74 12,183.85
Undistributed earnings in subsidiaries, joint operations and equity accounted investees 1,337.63 508.16 * 93.93 - - 1,939.72
Fair valuation of retained interest in a subsidiary subsequent to disposal of controlling equity interest 16.95 - - - - 16.95
Derivative financial instruments 23.12 (23.12) - - - -
Others 42.03 (8.12) (13.29) - (9.62) 11.00
Total deferred tax liabilities 14,606.82 1,015.82 1,291.70 - (22.75) 16,891.59
Net assets/(liabilities) 3,283.34 (1,038.48) (4,156.59) (34.21) (21.16) (1,967.10)
Deferred tax assets 4,158.70
Deferred tax liabilities (6,125.80)
* Net of ` 408.85 crores reversed on dividend distribution by subsidiaries.
As at March 31, 2018, unrecognised deferred tax assets amount to ` 3,461.67 crores and ` 6,257.80 crores, which can be carried forward indefinitely and up to a specified period, respectively. These relate primarily to depreciation carry forwards, other deductible temporary differences and business losses. The deferred tax asset has not been recognised on the basis that its recovery is not probable in the foreseeable future.
NOTES FORMING PART OF CONSOLIDATED FINANCIAL STATEMENTS
29373rd Annual Report 2017-18
INTEGRATED REPORT 1-65 STATUTORY REPORTS 66-184 FINANCIAL STATEMENTS 185-353

Unrecognised deferred tax assets expire unutilised based on the year of origination as follows:
March 31, (` in crores)2019 29.722020 54.352021 320.392022 90.582023 1,217.18Thereafter 4,545.58
The Company has not recognised deferred tax liability on undistributed profits of certain subsidiaries amounting to` 74,589.17 crores and 40,965.53 crores as at March 31, 2018 and 2017, respectively, because it is able to control the timing of the reversal of temporary differences associated with such undistributed profits and it is probable that such differences will not reverse in the foreseeable future.
Significant components of deferred tax assets and liabilities for the year ended March 31, 2017 are as follows:
Opening balance Recognised in profit or loss
Recognised in/reclassified from other
comprehensive income
Closing balance
Deferred tax assets:Unabsorbed depreciation 2,010.81 563.75 (0.06) 2,574.50 Business loss carry forwards 3,234.23 293.99 (235.84) 3,292.38 Expenses deductible in future years:- provisions, allowances for doubtful receivables and others
4,034.57 (1,063.87) (141.98) 2,828.72
Compensated absences and retirement benefits 1,186.90 (1.20) 987.26 2,172.96 Minimum alternate tax carry-forward 58.26 16.66 - 74.92 Property, plant and equipment 216.83 (72.74) (32.19) 111.90 Derivative financial instruments 2,296.64 (35.07) 2,167.37 4,428.94 Unrealised profit on inventory 1,223.34 534.47 (148.41) 1,609.40 Others 652.10 205.49 (61.15) 796.44 Total deferred tax assets 14,913.68 441.48 2,535.00 17,890.16 Deferred tax liabilities:Property, plant and equipment 2,743.13 (41.01) 0.08 2,702.20 Intangible assets 11,258.14 576.72 (1,349.97) 10,484.89 Undistributed earnings of subsidiaries joint operations and equity accounted investees
1,343.63 23.81* (29.81) 1,337.63
Fair valuation of retained interest in a subsidiary subsequent to disposal of controlling equity interest
16.95 - - 16.95
Derivative financial instruments 4.04 19.32 (0.24) 23.12 Others 65.54 (23.79) 0.28 42.03 Total deferred tax liabilities 15,431.43 555.05 (1,379.66) 14,606.82 Net assets/(liabilities) (517.75) (113.57) 3,914.66 3,283.34 Deferred tax assets 4,457.34 Deferred tax liabilities (1,174.00)
* Net of ` 365.36 crores reversed on dividend distributions by subsidiaries.
NOTES FORMING PART OF CONSOLIDATED FINANCIAL STATEMENTS
294

21. Equity Share Capital (` in crores)
As at March 31, 2018
As at March 31, 2017
(a) Authorised:(i) 400,00,00,000 Ordinary shares of ` 2 each 800.00 700.00
(as at March 31, 2017: 350,00,00,000 Ordinary shares of ` 2 each)(ii) 100,00,00,000 A’ Ordinary shares of ` 2 each 200.00 200.00
(as at March 31, 2017: 100,00,00,000 ‘A’ Ordinary shares of ` 2 each)(iii) 30,00,00,000 Convertible Cumulative Preference shares of ` 100 each 3,000.00 3,000.00
(as at March 31, 2017: 30,00,00,000 shares of ` 100 each)TOTAL 4,000.00 3,900.00
(b) Issued [Note (j)]:(i) 288,78,43,046 Ordinary shares of ` 2 each 577.57 577.57
(as at March 31, 2017: 288,78,43,046 Ordinary shares of ` 2 each)(ii) 50,87,36,110 ‘A’ Ordinary shares of ` 2 each 101.75 101.75
(as at March 31, 2017: 50,87,36,110 ‘A’ Ordinary shares of ` 2 each)Total 679.32 679.32
( c) Subscribed and called up:(i) 288,73,48,694 Ordinary shares of ` 2 each 577.47 577.47
(as at March 31, 2017: 288,73,48,428 Ordinary shares of ` 2 each)(ii) 50,85,02,371 ‘A’ Ordinary shares of ` 2 each 101.70 101.70
(as at March 31, 2017: 50,85,02,291 ‘A’ Ordinary shares of ` 2 each)(d) Calls unpaid - Ordinary shares (0.00)* (0.00)*
310 Ordinary shares of ` 2 each (` 1 outstanding on each) and 260 Ordinary shares of ` 2 each (` 0.50 outstanding on each)(as at March 31, 2017: 310 Ordinary shares of ` 2 each (` 1 outstanding on each) and 260 Ordinary shares of ` 2 each (` 0.50 outstanding on each) )
(e) Paid-up (c+d): 679.17 679.17 (f) Forfeited - Ordinary shares 0.05 0.05
Total (e + f) 679.22 679.22
(g) The movement of number of shares and share capital
(No. of shares) (` in crores) (No. of shares) (` in crores) Year ended March 31, 2018 Year ended March 31, 2017
(i) Ordinary sharesBalance as at April 1 2,887,348,428 577.47 2,887,203,602 577.44 Add: Allotment of shares held in abeyance 266 0.00* 144,826 0.03 Balance as at March 31 2,887,348,694 577.47 2,887,348,428 577.47
(ii) ‘A’ Ordinary sharesBalance as at April 1 508,502,291 101.70 508,476,704 101.70 Add: Allotment of shares held in abeyance 80 0.00* 25,587 0.00*Balance as at March 31 508,502,371 101.70 508,502,291 101.70
(h) The entitlements to 4,94,352 Ordinary shares of ` 2 each (as at March 31, 2017 : 4,94,618 Ordinary shares of ` 2 each) and 2,33,739 ‘A’ Ordinary shares of ` 2 each (as at March 31, 2017 : 2,33,819 ‘A’ Ordinary shares of ` 2 each) are subject matter of various suits filed in the courts / forums by third parties for which final order is awaited and hence kept in abeyance.
* less than ` 50,000/-
NOTES FORMING PART OF CONSOLIDATED FINANCIAL STATEMENTS
29573rd Annual Report 2017-18
INTEGRATED REPORT 1-65 STATUTORY REPORTS 66-184 FINANCIAL STATEMENTS 185-353

(i) Rights, preferences and restrictions attached to shares :
(i) Ordinary shares and ‘A’ Ordinary shares both of ` 2 each :
• The Company has two classes of shares – the Ordinary shares and the ‘A’ Ordinary shares both of ` 2 each (together referred to as shares). In respect of every Ordinary share (whether fully or partly paid), voting rights shall be in the same proportion as the capital paid up on such Ordinary share bears to the total paid up Ordinary share capital of the Company. In case of every ‘A’ Ordinary share, if any resolution is put to vote on a poll or by postal ballot at any general meeting of shareholders, the holder shall be entitled to one vote for every ten ‘A’ Ordinary shares held as per the terms of its issue and if a resolution is put to vote on a show of hands, the holder of ‘A’ Ordinary shares shall be entitled to the same number of votes as available to holders of Ordinary shares.
• The dividend proposed by the Board of Directors is subject to the approval of the shareholders in the ensuing Annual General Meeting. Further, the Board of Directors may also declare an interim dividend. The holders of ‘A’ Ordinary shares shall be entitled to receive dividend for each financial year at five percentage point more than the aggregate rate of dividend declared on Ordinary shares for that financial year.
• In the event of liquidation, the shareholders are eligible to receive the remaining assets of the Company after distribution of all preferential amounts, in proportion to their shareholdings.
(ii) American Depository Shares (ADSs) and Global Depository Shares (GDSs) :
• Each ADS and GDS underlying the ADR and GDR respectively represents five Ordinary shares of ` 2 each. A holder of ADS and GDS is not entitled to attend or vote at shareholders meetings. An ADS holder is entitled to issue voting instructions to the Depository with respect to the Ordinary shares represented by ADSs only in accordance with the provisions of the Company’s ADSs deposit agreement and Indian Law. The depository for the ADSs and GDSs shall exercise voting rights in respect of the deposited shares by issue of an appropriate proxy or power of attorney in terms of the respective deposit agreements.
• Shares issued upon conversion of ADSs and GDSs will rank pari passu with the existing Ordinary shares of ` 2 each in all respects including entitlement of the dividend declared.
(j) Number of shares held by each shareholder holding more than 5 percent of the issued share capital :
As at March 31, 2018 As at March 31, 2017
% Issued Share Capital
No. of Shares % Issued Share Capital
No. of Shares
(i) Ordinary shares :
(a) Tata Sons Limited 32.72% 96,13,81,852 28.71% 82,89,70,378
(b) Life Insurance Corporation of India 5.08% 14,92,95,627 5.18% 14,94,23,428
( c) Citibank N A as Depository # 43,70,24,750 # 53,04,96,280
(ii) ‘A’ Ordinary shares :
(a) HDFC Trustee Company Limited-HDFC Equity Fund
* 34,40,000 8.19% 4,16,71,282
(b) ICICI Prudential Balanced Advantage Fund 9.44% 4,79,98,379 - -
( c) Franklin India Smaller Companies Fund 8.74% 4,44,31,036 - -
(d) HDFC Large Cap Fund 5.15% 2,62,02,083 - -
(e) Government of Singapore 6.78% 3,44,87,840 * 21,602,490
(f) Franklin Templeton Mutual Fund * 1,42,99,041 5.96% 3,03,29,225
# held by Citibank, N.A. as depository for American Depository Receipts (ADRs) and Global Depository Receipts (GDRs)
* Less than 5%
(k) Information regarding issue of shares in the last five years
(a) The Company has not issued any shares without payment being received in cash.
(b) The Company has not issued any bonus shares.
( c) The Company has not undertaken any buy-back of shares.
NOTES FORMING PART OF CONSOLIDATED FINANCIAL STATEMENTS
296

22. Other components of equity
(a) The movement of Currency translation reserve is as follows:(` in crores)
Year ended March 31, 2018
Year ended March 31, 2017
Balance at the beginning (5,300.13) 4,652.20
Exchange differences arising on translating the net assets of foreign operations (net) 9,491.95 (9,647.63)
Net change in translation reserve - equity accounted investees (net) 429.41 (304.70)
Balance at the end 4,621.23 (5,300.13)
(b) The movement of Equity instruments held as fair value through other comprehensive income(FVTOCI) is as follows:
Year ended March 31, 2018
Year ended March 31, 2017
Balance at the beginning (19.26) (102.70)
Other comprehensive income/(loss) for the year 42.86 83.44
Fair value (gain)/loss reclassified to retained earnings on equity instruments held as FVTOCI (net)
(0.78) -
Balance at the end 22.82 (19.26)
( c) The movement of Hedging reserve is as follows:
Year ended March 31, 2018
Year ended March 31, 2017
Balance at the beginning (17,911.63) (6,152.15)
Gain/(loss) recognised on cash flow hedges 8,700.95 (23,738.38)
Income tax relating to gain/(loss) recognised on cash flow hedges (1,626.88) 4,558.18
(Gain)/loss reclassified to profit or loss 10,328.81 10,296.01
Income tax relating to gain/(loss) reclassified to profit or loss (1,957.86) (2,059.16)
Amounts removed from hedge reserve and recognised in inventory (1,431.40) (1,020.39)
Income tax related to amounts removed from hedge reserve and recognised in inventory
271.97 204.26
Balance at the end (3,626.04) (17,911.63)
(d) The movement of Cost of hedging reserve is as follows:
Year ended March 31, 2018
Year ended March 31, 2017
Balance at the beginning (74.22) 4.70
Gain/(loss) on cash flow hedges of inventory 186.13 (106.02)
Income tax relating to gain/(loss) recognised on cash flow hedges (35.47) -
Gain/(loss) recognised on cash flow hedges of forecast sales 81.56 9.50
Income tax relating to gain/loss recognised on cash flow hedges (14.95) 17.60
Amounts removed from hedge reserve and recognised in inventory 1.15 -
Income tax related to amounts removed from hedge reserve and recognised in inventory (0.22) -
Balance at the end 143.98 (74.22)
NOTES FORMING PART OF CONSOLIDATED FINANCIAL STATEMENTS
29773rd Annual Report 2017-18
INTEGRATED REPORT 1-65 STATUTORY REPORTS 66-184 FINANCIAL STATEMENTS 185-353

(e) Summary of Other components of equity:(` in crores)
Year ended March 31, 2018
Year ended March 31, 2017
Currency translation reserve 4,621.23 (5,300.13)
Equity instruments held as FVTOCI 22.82 (19.26)
Hedging reserve (3,626.04) (17,911.63)
Cost of hedging reserve 143.98 (74.22)
Total 1,161.99 (23,305.24)
23. Notes to reserves and dividends
(a) Securities premium
The amount received in excess of face value of the equity shares is recognised in Securities Premium Account.
(b) Retained earnings
Retained earnings are the profits that the Company has earned till date.
( c) Capital redemption reserve
The Indian Companies Act, 2013 (the “Companies Act”) requires that where a company purchases its own shares out of free reserves or securities premium account, a sum equal to the nominal value of the shares so purchased shall be transferred to capital redemption reserve account and details of such transfer shall be disclosed in the Balance Sheet. The capital redemption reserve account may be applied by the Company, in paying up unissued shares of the Company to be issued to shareholders of the Company as fully paid bonus shares. Tata Motors Limited established this reserve pursuant to the redemption of preference shares issued in earlier years.
(d) Debenture redemption reserve
The Companies Act requires that where a company issues debentures, it shall create a debenture redemption reserve out of profits of the Company available for payment of dividend. The company is required to maintain a Debenture Redemption Reserve of 25% of the value of debentures issued, either by a public issue or on a private placement basis. The amounts credited to the debenture redemption reserve may not be utilised by the Company except to redeem debentures.
(e) Reserve for research and human resource development
In terms of Article 9 of the Act on Special Taxation Restriction in Korea, Tata Daewoo Commercial Vehicle Company Limited (TDCV, a subsidiary of Tata Motors Limited) is entitled for deferment of tax in respect of expenditures incurred on product development cost subject to fulfillment of certain conditions, by way of deduction from the taxable income, provided that TDCV appropriates an equivalent amount from “Retained Earnings” to “Reserve for Research and Human Resource Development”.
The deferment is for a period of three years and from the fourth year onwards one-third of the reserve is offered to tax and an equal amount is then transferred from the reserve to “Retained earnings available for appropriation”.
(f) Special reserve
Special reserve represents the reserve created by two subsidiaries of Tata Motors Limited pursuant to the Reserve Bank of India Act, 1934 (the “RBI Act”) and related regulations applicable to those companies. Under the RBI Act, a non-banking finance company is required to transfer an amount not less than 20% of its net profit to a reserve fund before declaring any dividend. Appropriation from this reserve fund is permitted only for the purposes specified by the RBI.
(g) Earned surplus reserve
Under the Korean commercial code, TDCV is required to appropriate at least 10% of cash dividend declared each year to a legal reserve until such reserves equal to 50% of capital stock. This reserve may not be utilised for cash dividends, but may only be used to offset against future deficits, if any, or may be transferred to capital stock.
NOTES FORMING PART OF CONSOLIDATED FINANCIAL STATEMENTS
298

(h) Hedge Reserve
Effective portion of fair value gain/(loss) on all financial instrument designated in cash flow hedge relationship are accumulated in hedge reserve.
(i) Cost of hedge reserve
Fair value gain/(loss) attributable to cost of hedge on all financial instrument designated in cash flow hedge relationship are accumulated in cost of hedge reserve.
(j) Capital reserve
The capital reserve represents the excess of the Company‘s interest in the net fair value of the acquiree’s identifiable assets, liabilities and contingent liabilities over the purchase consideration.
(k) Dividends
The final dividend is recommended by the Board of Directors and is recorded in the books of account upon its approval by the shareholders. For the year ended March 31, 2018 and 2017, considering the losses in the Tata Motors Limited (standalone), No dividend is permitted to be paid to the members, as per the Companies Act, 2013 and the rules framed thereunder.
24. Long-term borrowings(` in crores)
As at March 31, 2018
As at March 31, 2017
Secured:
(a) Privately placed Non-Convertible Debentures 2,005.58 3,045.24
(b) Collateralised debt obligations 592.49 453.99
( c) Term loans:
(i) from banks 4,909.55 4,062.68
(ii) other parties 201.31 141.84
(d) Finance lease obligations 46.75 54.01
Unsecured:
(a) Privately placed Non-Convertible Debentures 8,694.50 8,668.80
(b) Term loans:
(i) from banks 8,753.12 9,475.88
(ii) other parties 55.67 54.12
( c) Senior notes 35,045.72 34,227.81
(d) Others 894.81 444.81
Total 61,199.50 60,629.18
NOTES FORMING PART OF CONSOLIDATED FINANCIAL STATEMENTS
29973rd Annual Report 2017-18
INTEGRATED REPORT 1-65 STATUTORY REPORTS 66-184 FINANCIAL STATEMENTS 185-353

25. Short-term borrowings(` in crores)
As at March 31, 2018
As at March 31, 2017
Secured:(a) Loans from banks 5,104.30 4,795.01 (b) Loans from other parties 171.11 79.77 Unsecured:(a) Loans from banks 851.89 733.58 (b) Loans from other parties - 15.91 ( c) Inter corporate deposits from associates 86.00 56.00 (d) Commercial paper 10,581.55 8,179.67 Total 16,794.85 13,859.94
Collaterals
Inventory, trade receivables, finance receivables, other financial assets, property, plant and equipment with a carrying amount of ` 18,196.91 crores and ` 17,105.18 crores are pledged as collateral/security against the borrowing as at March 31, 2018 and 2017, respectively.
Notes :
Nature of Security (on loans including interest accrued thereon) :
Long Term Borrowing
(A) Non convertible debentures
(i) Rated, Listed, Secured, 9.95% Coupon, Non-Convertible Debentures amounting to `200 crores included within Long-term borrowings in note 24 and 10.25% Coupon, Non-Convertible Debentures amounting to `500 crores included within Current maturities of long-term borrowings in note 27 are secured by a pari passu charge by way of an English mortgage of the Company’s freehold land together with immovable properties, plant and machinery and other movable assets (excluding stock and book debts) situated at Sanand in the State of Gujarat. 10.25% Coupon Non-Convertible Debentures amounting `500 crores has been classified as current liabilities, since the Company has exercised call option to redeem in full, at the end of 8th year from the date of allotment i.e. on April 30, 2018.
(ii) Privately placed non-convertible debentures amounting to `1,805.58 crores included within Long-term borrowings in note 24 and `2,024.28 crores included within Current maturities of long-term borrowings in note 27 are fully secured by :
(a) First pari passu charge on residential flat of Tata Motors Finance Limited (TMFL), formerly known as Sheba Properties Limited (SPL), an indirect subsidiary of the Company
(b) Pari - passu charge is created in favour of debenture trustee on : - All receivables of TMFL arising out of loan and lease transactions, - All book debts, trade advances forming part of movable property of SPL.
(c ) Any other security as identified by TMFL acceptable to the debenture trustee.
(B) Collateralised debt obligation
Collateralised debt obligation represent amount received against finance receivables securitised/assigned, which does not qualify for derecognition. The repayment are due from financial year ending March 31, 2019 to March 31, 2020.
( C) Long-term loan from banks/financial institutions and Government
(i) Term loans from banks amounting to `3,704.11 crores included within long-term borrowings and `184.82 crores included within current maturities of long-term borrowings are secured by a pari-passu charge in favour of the security trustee on all receivables of TMFL arising out of loan, lease, all other book debts; and such other current assets as may be identified by
NOTES FORMING PART OF CONSOLIDATED FINANCIAL STATEMENTS
300

TMFL from time to time and accepted by the relevant lender/security trustee.
(ii) Term loans from banks amounting to `570.00 crores included within long-term borrowings are secured by way of a charge created on all receivables of Tata Motors Finance Solutions Limited (TMFSL) arising out of loan, lease, trade advacnes and all other book debts; and such other current assets as may be identified by TMFSL from time to time and accepted by the relevant lender.
(iii) The term loan of `584.82 crores (recorded in books at `133.39 crores) is due for repayment from the quarter ending March 31, 2033 to quarter ending March 31, 2038, along with simple interest at the rate of 0.10% p.a. The loan is secured by a second and subservient charge (creation of charge is under process) over Company’s freehold land together with immovable properties, plant and machinery and other movable assets (excluding stock and book debts) situated at Sanand plant in the State of Gujarat.
(iv) The term loan of `53.90 crores (recorded in books at `18.87 crores) is due for repayment from the quarter ending June 30, 2030 to March 31, 2033, along with a simple interest of 0.01% p.a. The loan is secured by bank gurantee for the due performance of the conditions as per the terms of the agreement.
(v) Loans from Banks and External Commercial Borrowings (ECB) amounting to `635.45 crores included within long-term borrowings and `112.42 crores included within current maturity of long-term borrowings are secured by exclusive first charge on building and all movable fixed assets and also by hypothecation of existing current assets of the Company viz. stock of raw materials, stock in process, semi-finished goods, stores and spares not relating to plant and machinery (consumable stores and spares), bills receivable and book debts including receivable from hire purchase / leasing and all other movable current assets except cash and bank balances, loans and advances of the Company both present and future.
(vi) The term loan of `49.05 crores included within Long -term borrowings and `4.95 crores included within current maturity of long-term borrowing are secured by pari passu first charge on fixed assets of Tata Marcopolo Motors Limited.
(D) Short-term borrowings
Loans, cash credits, overdrafts and buyers line of credit from banks are secured by hypothecation of existing current assets of the Company viz. stock of raw materials, stock in process, semi-finished goods, stores and spares not relating to plant and machinery (consumable stores and spares), bills receivable and book debts including receivable from hire purchase / leasing and all other movable current assets except cash and bank balances, loans and advances of the Company both present and future.
Long-Term Borrowings: Terms
(A) Senior notes (Euro MTF listed debt)
The senior notes of Jaguar Land Rover Automotive Plc (JLR) are listed on the Euro MTF market, which is a listed market regulated by the Luxembourg Stock Exchange.
Details of the tranches of the senior notes outstanding at March 31, 2018 are as follows:(` in crores)
Particulars: Currency Amount (in million)
As at March 31, 2018
As at March 31, 2017
5.625% Senior Notes due 2023 USD 500 3,248.52 3,209.63 3.875% Senior Notes due 2023 GBP 400 3,666.48 3,210.84 5.000% Senior Notes due 2022 GBP 400 3,659.84 3,202.76 3.500% Senior Notes due 2020 USD 500 3,271.36 3,229.86 4.125% Senior Notes due 2018* USD 700 4,584.47 4,518.52 4.250% Senior Notes due 2019 USD 500 3,273.84 3,231.48 2.750% Senior Notes due 2021 GBP 300 2,750.46 2,406.52 2.200% Senior Notes due 2024 EUR 650 5,211.24 4,466.88 4.500% Senior Notes due 2027 USD 500 3,156.92 -
32,823.13 27,476.49 * Classified as other financial liabilities - current being maturity before March 31, 2019.
NOTES FORMING PART OF CONSOLIDATED FINANCIAL STATEMENTS
30173rd Annual Report 2017-18
INTEGRATED REPORT 1-65 STATUTORY REPORTS 66-184 FINANCIAL STATEMENTS 185-353

(B) Senior notes (SGX-ST listed debt)
The senior notes of Tata Motors Limited and TML Holdings Pte Ltd are listed on the SGX-ST market, which is a listed market regulated by the Singapore Stock Exchange.
Details of the tranches of the senior notes outstanding at March 31, 2018 are as follows:(` in crores)
Particulars: Currency Amount (in million)
As at March 31, 2018
As at March 31, 2017
5.750% Senior Notes due 2024 USD 250 1,619.43 1,595.815.750% Senior Notes due 2021 USD 300 1,948.77 1,924.98 4.625% Senior Notes due 2020 USD 500 3,238.86 3,230.53
6,807.06 6,751.32
(C ) Non convertible debentures amounting to `10,700.08 crores included within long-term borrowing and `4,110.71 crores included within current maturities of long term borrowings bear interest rate ranging from 7.28% to 11.50% and maturity ranging from April 2018 to September 2024.
(D) Loan from banks/ financial institutions consists of:
(i) Term loan amounting to 7,253.74 crores included within long-term borrowings and 1,423.25 crores included within current maturities of long term borrowings bearing floating interest rate based on marginal cost of funds lending rate (MCLR) of respective bank having maturity ranging from April, 2018 to March 2023.
(ii) External commercial borrowings in foreign currencies amounting to `629.86 crores included within long-term borrowing and `83.95 crores included within current maturities of long term borrowings bearing floating interest rate based on LIBOR maturing in May 2023.
(iii) Foreign currency term loan amounting to `5,828.12 crores included within long-term borrowing bearing floating interest rate that are linked to LIBOR with maturity ranging from July 2020 to July 2023.
Short Term Borrowings - Terms:
(i) Short-term loan from banks and other parties(financial institutions) consist of cash credit, overdrafts, short term loan, bill discounting amounting to `1,096.54 crores bearing fixed rate of interest ranging from 6.77% to 8.70% and `5,030.85 crores bear floating rate of interest based on MCLR of respective banks and other bench mark rates.
(ii) Commercial paper are unsecured short term papers, issued at discount bearing no coupon interest. The yield on commercial paper issued by the Company ranges from 6.08% to 8.15%.
26. Other financial liabilities – non-currentAs at
March 31, 2018As at
March 31, 2017a) Derivative financial instruments 2,450.20 11,259.57 b) Liability towards employee separation scheme 85.22 72.36 c) Others 203.72 77.65 Total 2,739.14 11,409.58
27. Other financial liabilities – current As at
March 31, 2018As at
March 31, 2017a) Current maturities of long-term borrowings 10,956.12 4,114.86 b) Interest accrued but not due on borrowings 1,095.72 943.24 c) Liability towards vehicles sold under repurchase arrangements 4,423.58 2,828.38 d) Liability for capital expenditure 8,219.45 3,120.40 e) Deposits and retention money 202.29 201.50 f) Derivative financial instruments 6,207.66 14,257.95 g) Deferred payment liability - 70.08 h) Liability towards Investors Education and Protection Fund under Section 125 of the Companies Act, 2013 (IEPF) not due 22.79 27.75 i) Others 139.88 70.67 Total 31,267.49 25,634.83
NOTES FORMING PART OF CONSOLIDATED FINANCIAL STATEMENTS
302

As at March 31, 2018
As at March 31, 2017
Notes:Current maturities of long term borrowings consist of :i) Privately placed Non-Convertible Debentures (Secured) 2,524.28 1,852.30 ii) Privately placed Non-Convertible Debentures (Unsecured) 1,586.43 950.00 iii) Collateralised debt obligation 728.09 573.39 iv) Finance lease obligation 22.23 22.13 v) Senior Notes 4,584.47 - vi) Term loans from banks and others 1,510.62 717.04Total 10,956.12 4,114.86
28. Provisions(` in crores)
As at March 31, 2018
As at March 31, 2017
Non-currenta) Employee benefits obligations 738.00 732.97 b) Product warranty 9,453.60 7,360.69 c) Legal and product liability 219.95 384.52 d) Provision for residual risk 254.76 219.07 e) Provision for environmental liability 150.05 178.00 f) Annual maintenance contract 9.26 16.66 g) Other provisions 122.82 112.55 Total 10,948.44 9,004.46 Currenta) Employee benefit obligations 106.64 68.93 b) Product warranty 6,481.50 4,670.64 c) Legal and product liability 1,099.92 881.49 d) Provision for residual risk 62.20 54.80 e) Provision for environmental liability 97.88 96.58 f) Annual maintenance contract 46.20 33.73 g) Other provisions 59.16 1.59 Total 7,953.50 5,807.76
Year ended March 31, 2018
Product warranty Legal and product Liability
Provision for residual risk
Provision for environmental
liabilityBalance at the beginning 12,031.33 1,266.00 273.87 274.58Provision made / (reversed) during the year * 8,533.88 209.13 44.10 (14.79)Provision used during the year (6,590.59) (316.65) (21.11) (45.64)Impact of discounting 152.14 - - -Impact of foreign exchange translation 1,813.03 161.39 20.10 33.78Provision for asset classified as held for sale (4.69) - - -Balance at the end 15,935.10 1,319.87 316.96 247.93Current 6,481.50 1,099.92 62.20 97.88Non-current 9,453.60 219.95 254.76 150.05
* Provision made during the year includes estimated recovery from supplies ` 1,042.93 crores.
NOTES FORMING PART OF CONSOLIDATED FINANCIAL STATEMENTS
30373rd Annual Report 2017-18
INTEGRATED REPORT 1-65 STATUTORY REPORTS 66-184 FINANCIAL STATEMENTS 185-353

29. Other non-current liabilities*(` in crores)
As at March 31, 2018
As at March 31, 2017
a) Deferred revenue 7,001.76 5,161.37
b) Employee benefits obligations 4,100.76 11,984.02
c) Others 62.67 247.17
Total 11,165.19 17,392.56
* Excludes ` 246.57 crores classified as held for sale as at March 31, 2018.
30. Other current liabilities*
As at March 31, 2018
As at March 31, 2017
a) Advances received from customers 1,431.25 1,711.15
b) Statutory dues (VAT, Excise, Service Tax, GST, Octroi etc) 3,176.86 2,658.93
c) Deferred revenue 2,411.53 1,764.98
d) Others 614.91 266.78
Total 7,634.55 6,401.84
Deferred revenue include:
(i) ` 187.67 crores as at March 31, 2018 and ` 227.92 crores as at March 31, 2017 grants relating to property, plant and equipment relate to duty saved on import of capital goods and spares under the EPCG scheme. Under such scheme, the Company is committed to export prescribed times of the duty saved on import of capital goods over a specified period of time. In case such commitments are not met, the Company would be required to pay the duty saved along with interest to the regulatory authorities.
(ii) ` 2,702.00 crores as at March 31, 2018 (` 2,047.24 crores as at March 31, 2017) relating to Research and Development Expenditure Credit (RDEC) on qualifying expenditure incurred since April 1, 2013.
* Excludes ` 174.89 crores classified as held for sale as at March 31, 2018.
31. Revenue from Operations
Year ended March 31,
2018
Year ended March 31,
2017
a) Sale of products (refer note 1 & 2 below) 283,748.32 265,436.34
b) Sale of services 3,033.90 2,432.51
c) Finance revenues 2,604.03 2,429.23
d) Other operating revenues (refer note 3 below) 6,023.09 4,194.04
Total 295,409.34 274,492.12
Note:(1) Includes exchange gain/(loss) (net) on hedges reclassified from hedge reserve to
statement of profit or loss (10,274.11) (9,928.70)
(2) Consequent to the introduction of Goods and Service Tax (GST) with effect from July 1, 2017, Central Excise, Value Added Tax (VAT), etc have been replaced by GST. In accordance with Ind AS 18 on Revenue and Schedule III of the Companies Act, 2013, GST, GST Compensation Cess, etc. are not included in sale of products for applicable periods. In view of the aforesaid restructuring
NOTES FORMING PART OF CONSOLIDATED FINANCIAL STATEMENTS
304

of indirect taxes, sale of products for the year ended March 31, 2018 are not comparable with the previous periods. Following additional information is being provided to facilitate such comparison:
(` in crores)
Year endedMarch 31, 2018
Year ended March 31, 2017
a) Sale of products 283,748.32 265,436.34
b) Excise duty (1,166.77) (4,642.46) c) Sale of products (net of excise duty) (a)- (b) 282,581.55 260,793.88
3) Other operating revenue include incentives form Governments of ` 1,555.58 crores and ` 1,485.63 crores for the year ended March 31, 2018 and 2017, respectively. This includes ` 387.67 crores and ` 561.04 crores, for the year ended March 31, 2018 and 2017, respectively, received by a foreign subsidiary as an indirect tax incentive that requires the subsidiary to meet certain criteria relating to vehicle efficiency and investment in engineering and research and development and ` 338.78 crores and ` 504.72 crores, for the year ended March 31, 2018 and 2017, respectively for Research and Development Expenditure Credit (RDEC) on qualifying expenditure.
32. Other income
Year ended March 31,
2018
Year ended March 31,
2017a) Interest income 711.81 562.21 b) Dividend income 15.77 10.51 c) Profit on sale of investments measured at FVTPL 129.26 176.14 d) MTM on investments measured at FVTPL 32.05 5.68 Total 888.89 754.54
33. Employee benefits expense
Year ended March 31,
2018
Year ended March 31,
2017a) Salaries, wages and bonus 23,686.45 22,409.51 b) Contribution to provident fund and other funds 3,218.30 2,826.23 c) Staff welfare expenses 3,395.34 3,097.15 Total 30,300.09 28,332.89
A subsidiary of the Company operates a Long Term Incentive Plan (LTIP) arrangement for certain employees. The scheme provides a cash payment to the employee based on a specific number of phantom shares at grant and the share price of Tata Motors Limited at the vesting date. The cash payment is dependent on the performance of the underlying shares of Tata Motors Limited over the 3 year vesting period and continued employment at the end of the vesting period. The fair value of the awards is calculated using a Black-Scholes model at the grant date. The fair value is updated at each reporting date as the awards are accounted for as cash-settled plan. The inputs into the model are based on the Tata Motors Limited historic data, the risk-free rate and the weighted average fair value of shares, in the scheme at the reporting date. During the year ended March 31, 2016, the subsidiary company issued its final LTIP based on the share price of Tata Motors Limited. The amount released in relation to the LTIP was ` 8.55 crores and `70.13 crores for the years ended March 31, 2018 and 2017, respectively. The Company considers these amounts as not material and accordingly has not provided further disclosures as required by Ind AS 102 “Share-based payment”.
During the year ended March 31, 2017, the subsidiary has launched a new long-term employment benefit scheme which provides a cash payment to certain employees based on subsidiary’s performance against long-term business metrics. This new LTIP scheme has been accounted for in accordance with Ind AS 19 “Employee benefits”.
NOTES FORMING PART OF CONSOLIDATED FINANCIAL STATEMENTS
30573rd Annual Report 2017-18
INTEGRATED REPORT 1-65 STATUTORY REPORTS 66-184 FINANCIAL STATEMENTS 185-353

34. Finance costs (` in crores)
Year ended March 31,
2018
Year ended March 31,
2017a) Interest 4,987.93 4,778.68 b) Less: Interest capitalised* (1,294.32) (1,294.10)c) Add: Exchange fluctuation considered as interest cost 6.19 -
3,699.80 3,484.58 d) Discounting charges 981.99 753.43 Total 4,681.79 4,238.01
* Represents borrowing costs capitalised during the year on qualifying assets (property plant and equipment and product development).
The weighted average rate for capitalisation of interest relating to general borrowings was approximately 4.26% and 4.40% for the years ended March 31, 2018 and 2017, respectively.
35. Other expensesYear ended
March 31, 2018
Year ended March 31,
2017(a) Processing charges 1,339.08 1,172.03 (b) Consumption of stores & spare parts 2,210.56 2,419.11 ( c) Power and fuel 1,308.08 1,159.82 (d) Information Technology (IT) related/Computer expenses 2,143.18 2,202.51 (e) Engineering expense 5,278.84 4,273.72 (f) MTM (gain)/loss on commodity derivatives 214.63 918.40 (g) Warranty and product liability expenses 7,700.07 8,106.37 (h) Freight, transportation, port charges etc. 10,742.12 9,754.71 (i) Publicity 8,968.59 8,698.68 (j) Allowances/(reversal) for trade and other receivables 14.57 132.93 (k) Allowances/(reversal) for finance receivables 43.30 (28.15)(l) Works operation and other expenses (note below) 20,221.19 16,619.93
Total 60,184.21 55,430.06
Note
Works operation and other expenses :
Year ended March 31,
2018
Year ended March 31,
2017(i) Auditors' remuneration
(i) Audit fees 55.59 59.28 (ii) Tax Audit fees 1.62 2.70 (iii) All other fees 4.72 4.07 Total 61.93 66.05
NOTES FORMING PART OF CONSOLIDATED FINANCIAL STATEMENTS
306

36. Employee benefits
Defined Benefit Plan
Pension and post retirement medical plans
The following table sets out the funded and unfunded status and the amounts recognised in the financial statements for the pension and the post retirement medical plans in respect of Tata Motors, its Indian subsidiaries and joint operations:
(` in crores)
Pension benefits Post retirement medical benefits
As at March 31, 2018
As at March 31, 2017
As at March 31, 2018
As at March 31, 2017
Change in defined benefit obligations :
Defined benefit obligation, beginning of the year 980.76 923.86 183.86 160.05
Current service cost 72.25 65.71 10.20 8.19
Interest cost 68.76 69.51 13.06 12.33
Remeasurements (gains) / losses
Actuarial (gains) / losses arising from changes in demographic assumptions
(16.03) (0.96) (11.40) 2.17
Actuarial (gains) / losses arising from changes in financial assumptions
22.88 16.01 (2.70) 21.82
Actuarial (gains) / losses arising from changes in experience adjustments
10.50 (6.50) (28.96) (10.46)
Benefits paid from plan assets (116.85) (77.89) - -
Benefits paid directly by employer (5.98) (8.98) (10.01) (10.24)
Past service cost - Plan amendment 8.50 - - -
Defined benefit obligation, end of the year 1,024.79 980.76 154.05 183.86
Change in plan assets:
Fair value of plan assets, beginning of the year 841.78 799.69 - -
Interest income 63.33 60.05 - -
Remeasurements gains / (losses)
Return on plan assets, (excluding amount included in net Interest cost) (2.69) 26.41 - -
Employer’s contributions 120.47 33.52 - -
Benefits paid (116.85) (77.89) - -
Fair value of plan assets, end of the year 906.04 841.78 - -
Amount recognised in the balance sheet consists of:
Present value of defined benefit obligation 1,024.79 980.76 154.05 183.86
Fair value of plan assets 906.04 841.78 - -
Net liability (118.75) (138.98) (154.05) (183.86)
Amounts in the balance sheet:
Non–current assets 1.57 6.55 - -
Non–current liabilities (106.98) (145.53) (142.01) (183.86)
Liabilities for asset classified as held for sale (13.34) - (12.04) -
Net liability (118.75) (138.98) (154.05) (183.86)
NOTES FORMING PART OF CONSOLIDATED FINANCIAL STATEMENTS
30773rd Annual Report 2017-18
INTEGRATED REPORT 1-65 STATUTORY REPORTS 66-184 FINANCIAL STATEMENTS 185-353

Total amount recognised in other comprehensive income consists of:
Pension benefits Post retirement medical benefitsAs at March
31, 2018As at March
31, 2017As at March
31, 2018 As at March
31, 2017
Remeasurements (gains) / losses (6.66) (26.70) (38.22) 4.84 (6.66) (26.70) (38.22) 4.84
Information for funded plans with a defined benefit obligation in excess of plan assets:
Pension benefitsAs at
March 31, 2018 As at
March 31, 2017
Defined benefit obligation 141.08 795.37 Fair value of plan assets 126.29 757.55
Information for funded plans with a defined benefit obligation less than plan assets:
Pension benefitsAs at
March 31, 2018 As at
March 31, 2017
Defined benefit obligation 778.18 77.69Fair value of plan assets 779.75 84.23
Information for unfunded plans:
Pension benefits Post retirement medical benefitsAs at
March 31, 2018 As at
March 31, 2017As at
March 31, 2018 As at
March 31, 2017
Defined benefit obligation 105.53 107.70 154.05 183.86
Net pension and post retirement medical cost consist of the following components:
Pension benefits Post retirement medical benefitsYear ended
March 31, 2018Year ended
March 31, 2017Year ended
March 31, 2018Year ended
March 31, 2017
Service cost 72.25 65.71 10.20 8.19 Net interest cost / (income) 5.43 9.46 13.06 12.33 Past service cost - Plan amendment 8.50 - - - Net periodic cost 86.18 75.17 23.26 20.52
Other changes in plan assets and benefit obligation recognised in other comprehensive income.
Pension benefits Post retirement medical benefitsYear ended
March 31, 2018Year ended
March 31, 2017Year ended
March 31, 2018Year ended
March 31, 2017
RemeasurementsReturn on plan assets, (excluding amount included in net Interest expense)
2.69 (26.41) - -
Actuarial (gains)/losses arising from changes in demographic assumptions (16.03) (0.96) (11.40) 2.17 Actuarial (gains)/losses arising from changes in financial assumptions 22.88 16.01 (2.70) 21.82 Actuarial (gains)/losses arising from changes in experience adjustments on plan liabilities
10.50 (6.50) (28.96) (10.46)
Total recognised in other comprehensive income 20.04 (17.86) (43.06) 13.53 Total recognised in statement of profit and loss and other comprehensive income
106.22 57.31 (19.80) 34.05
NOTES FORMING PART OF CONSOLIDATED FINANCIAL STATEMENTS
308

The assumptions used in accounting for the pension and post retirement medical plans are set out below:
Pension benefits Post retirement medical benefits
As at March 31, 2018
As atMarch 31, 2017
As at March 31, 2018
As atMarch 31, 2017
Discount rate 7.5% - 8.0% 6.75%-7.5% 8.0% 7.3%
Rate of increase in compensation
level of covered employees 5.0% - 12.0% 4.0% - 11.0% NA NA
Increase in health care cost NA NA 6.0% 6.0%
Plan Assets
The fair value of Company’s pension plan asset as of March 31, 2018 and 2017 by category are as follows:
Asset category: Pension benefits
As at March 31, 2018
As atMarch 31, 2017
Cash and cash equivalents 6.0% 1.0%
Debt instruments (quoted) 68.4% 72.0%
Debt instruments (unquoted) 0.3% 5.0%
Equity instruments (quoted) 1.7% 1.0%
Deposits with Insurance companies 23.6% 21.0%
100.0% 100.0%
The Company’s policy is driven by considerations of maximizing returns while ensuring credit quality of the debt instruments. The asset allocation for plan assets is determined based on investment criteria prescribed under the Indian Income Tax Act, 1961, and is also subject to other exposure limitations. The Company evaluates the risks, transaction costs and liquidity for potential investments. To measure plan asset performance, the Company compares actual returns for each asset category with published bench marks.
The weighted average duration of the defined benefit obligation as at March 31, 2018 is 14.51 years (2017 : 16.06 years)
The Company expects to contribute ` 85.63 crores to the funded pension plans in Fiscal 2019.
The table below outlines the effect on the service cost, the interest cost and the defined benefit obligation in the event of a decrease/increase of 1% in the assumed discount rate, salary escalation and health care cost:
Assumption Change in assumption Impact on defined benefit obligation
Impact on service cost and interest cost
Discount rate Increase by 1% Decrease by ` 91.80 crores Decrease by ` 21.11 crores
Decrease by 1% Increase by ` 106.73 crores Increase by ` 21.67 crores
Salary escalation rate Increase by 1% Increase by ` 81.51 crores Increase by ` 19.50 crores
Decrease by 1% Decrease by ` 72.24 crores Decrease by ` 18.62 crores
Health care cost Increase by 1% Increase by` 19.12 crores Increase by ` 4.57 crores
Decrease by 1% Decrease by ` 16.07 crores Decrease by ` 3.72 crores
NOTES FORMING PART OF CONSOLIDATED FINANCIAL STATEMENTS
30973rd Annual Report 2017-18
INTEGRATED REPORT 1-65 STATUTORY REPORTS 66-184 FINANCIAL STATEMENTS 185-353

Severance indemnity plan
Severance indemnity is a funded plan of Tata Daewoo Commercial Vehicles Limited (TDCV), a subsidiary of Tata Motors Limited.
The following table sets out, the amounts recognised in the financial statements for the severance indemnity plan. (` in crores)
As at March 31, 2018
As at March 31, 2017
Change in defined benefit obligation:
Defined benefit obligation, beginning of the year 348.26 333.92
Service cost 45.26 48.62
Interest cost 7.90 6.34
Remeasurements (gains) / losses
Actuarial (gains) / losses arising from changes in financial assumptions (0.14) (15.65)
Actuarial (gains) / losses arising from changes in experience adjustments on plan liabilities
14.70 (19.53)
Benefits paid from plan assets (7.08) (4.26)
Benefits paid directly by employer (3.49) (1.35)
Foreign currency translation 20.22 0.17
Defined benefit obligation, end of the year 425.63 348.26
Change in plan assets:
Fair value of plan assets, beginning of the year 324.53 261.76
Interest income 8.15 5.58
Remeasurements gain / (loss)
Return on plan assets, (excluding amount included in net Interest expense) (5.13) (2.54)
Employer’s contributions 65.64 64.64
Benefits paid (7.08) (4.68)
Foreign currency translation 19.25 (0.23)
Fair value of plan assets, end of the year 405.36 324.53
Amount recognised in the balance sheet consist of:
As at March 31, 2018
As at March 31, 2017
Present value of defined benefit obligation 425.63 348.26
Fair value of plan assets 405.36 324.53
Net liability (20.27) (23.73)
Amounts in the balance sheet:
Non- current liabilities (20.27) (23.73)
Total amount recognised in other comprehensive income for severance indemnity consists of:
As at March 31, 2018
As at March 31, 2017
Remeasurements (gains) / losses (77.12) (96.81)
(77.12) (96.81)
NOTES FORMING PART OF CONSOLIDATED FINANCIAL STATEMENTS
310

Net severance indemnity cost consist of the following components:(` in crores)
Year ended March 31, 2018
Year ended March 31, 2017
Service cost 45.26 48.62
Net interest cost (0.25) 0.76
Net periodic pension cost 45.01 49.38
Other changes in plan assets and benefit obligation recognised in other comprehensive income for severance indemnity plan:
Year ended March 31, 2018
Year ended March 31, 2017
Remeasurements (gains) / losses
Return on plan assets, (excluding amount included in net Interest expense) 5.13 2.54
Actuarial (gains) / losses arising from changes in financial assumptions (0.14) (15.65)
Actuarial (gains) / losses arising from changes in experience adjustments on plan liabilities 14.70 (19.53)
Total recognised in other comprehensive income 19.69 (32.64)
Total recognised in statement of profit and loss and other comprehensive income 64.70 16.74
The assumptions used in accounting for the Severance indemnity plan is set out below:
As at March 31, 2018
As at March 31, 2017
Discount rate 2.8% 2.3%
Rate of increase in compensation level of covered employees 3.5% 3.0%
The table below outlines the effect on the service cost, the interest cost and the defined benefit obligation in the event of a decrease/increase of 1% in the assumed rate of discount rate, salary escalation rate:
Assumption Change in assumption Impact on defined benefit obligation
Impact on service cost and interest cost
Discount rate Increase by 1% Decrease by ` 41.49 crores Decrease by ` 11.32 crores
Decrease by 1% Increase by ` 48.43 crores Increase by ` 12.43 crores
Salary escalation rate Increase by 1% Increase by ` 47.59 crores Increase by ` 13.26 crores
Decrease by 1% Decrease by ` 41.60 crores Decrease by ` 11.46 crores
Severance indemnity plans asset allocation by category is as follows:
As at March 31, 2018
As at March 31, 2017
Deposit with banks 100% 100%
The weighted average duration of the defined benefit obligation as at March 31, 2018 is 10.65 years (2017 : 10.85 years)
The Company expects to contribute ` 23.79 crores to the funded severance indemnity plans in Fiscal 2019.
NOTES FORMING PART OF CONSOLIDATED FINANCIAL STATEMENTS
31173rd Annual Report 2017-18
INTEGRATED REPORT 1-65 STATUTORY REPORTS 66-184 FINANCIAL STATEMENTS 185-353

Jaguar Land Rover Pension plan
Jaguar Land Rover Ltd UK, have pension arrangements providing qualifying employees with defined benefits related to pay and service as set out in the rules of each fund.
The UK defined benefit schemes are administered by a separate fund that is legally separated from the Company. The trustees of the pension schemes are required by law to act in the interest of the fund and of all relevant stakeholders in the scheme is responsible for the investment policy with regard to the assets of the schemes and all other governance matters. The board of trustees must be composed of representatives of the Company and plan participants in accordance with the plan’s regulations.
Through its defined benefit pension plans the Company is exposed to a number of risks, the most significant of which are detailed below :
Asset volatility
The plan liabilities are calculated using a discount rate set with references to corporate bond yields; if plan assets under perform compared to the corporate bonds discount rate, this will create or increase a deficit. The defined benefit plans hold a significant proportion of equity type assets, which are expected to outperform corporate bonds in the long-term while providing volatility and risk in the short-term.
As the plans mature, the Company intends to reduce the level of investment risk by investing more in assets that better match the liabilities.
However, the Company believes that due to the long-term nature of the plan liabilities and the strength of the supporting group, a level of continuing equity type investments is an appropriate element of the Company’s long term strategy to manage the plans efficiently.
Changes in bond yields
A decrease in corporate bond yields will increase plan liabilities, although this is expected to be partially offset by an increase in the value of the plans’ bond holdings and interest rate hedging instruments.
Inflation risk
Some of the Company’s pension obligations are linked to inflation, and higher inflation will lead to higher liabilities (although, in most cases, caps on the level of inflationary increases are in place to protect the plan against extreme inflation). The plans hold a significant proportion of assets in index linked gilts, together with other inflation hedging instruments and also assets which are more loosely correlated with inflation. However an increase in inflation will also increase the deficit to some degree.
Life expectancy
The majority of the plan’s obligations are to provide benefits for the life of the member, so increases in life expectancy will result in an increase in the plan’s liabilities. This is particularly significant in the UK defined benefit plans, where inflationary increases result in higher sensitivity to changes in life expectancy.
The following table sets out the disclosure pertaining to employee benefits of Jaguar Land Rover Limited (` in crores)
Pension benefitsAs at
March 31, 2018As at
March 31, 2017Change in defined benefit obligation:Defined benefit obligation, beginning of the year 80,667.69 73,179.07 Service cost 1,856.13 1,735.73 Interest cost 2,058.43 2,410.74 Remeasurements (gains) / losses
Actuarial (gains)/losses arising from changes in demographic assumptions (1,799.04) (666.24)Actuarial (gains)/losses arising from changes in financial assumptions (3,017.78) 20,469.33 Actuarial (gains)/losses arising from changes in experience adjustments on plan liabilities
(848.75) (1,867.22)
NOTES FORMING PART OF CONSOLIDATED FINANCIAL STATEMENTS
312

Pension benefitsAs at
March 31, 2018As at
March 31, 2017
Past service cost (3,609.01) -
Plan settlement (180.76) -
Benefits paid (8,444.13) (1,972.42)
Member contributions 32.48 17.53
Foreign currency translation 10,064.78 (12,638.83)
Defined benefit obligation, end of the year 76,780.04 80,667.69
Change in plan assets:
Fair value of plan assets, beginning of the year 68,845.49 67,803.30
Interest Income 1,866.13 2,261.71
Remeasurements gains / (losses)
Return on plan assets, (excluding amount included in net Interest expense) (997.46) 10,072.49
Employer’s contributions 2,455.42 1,989.95
Members contributions 32.48 17.53
Plan settlement (174.95) -
Benefits paid (8,444.13) (1,972.42)
Expenses paid (77.77) (78.90)
Foreign currency translation 9,232.68 (11,248.17)
Fair value of plan assets, end of the year 72,737.89 68,845.49
Amount recognised in the balance sheet consist of:
Pension benefits
As at March 31, 2018
As at March 31, 2017
Present value of defined benefit obligation 76,780.04 80,667.69
Fair value of plan assets 72,737.89 68,845.49
Net liability (4,042.15) (11,822.20)
Amount recognised in the balance sheet consist of:
Non- current assets - 3.81
Non -current liabilities (4,042.15) (11,826.01)
Net liability (4,042.15) (11,822.20)
Total amount recognised in other comprehensive income consist of :
Pension benefits
As at March 31, 2018
As at March 31, 2017
Remeasurements (gains) / losses (1,649.79) 3,018.32
(1,649.79) 3,018.32
NOTES FORMING PART OF CONSOLIDATED FINANCIAL STATEMENTS
31373rd Annual Report 2017-18
INTEGRATED REPORT 1-65 STATUTORY REPORTS 66-184 FINANCIAL STATEMENTS 185-353

Net pension and post retirement cost consist of the following components:(` in crores)
Pension benefitsYear ended
March 31, 2018Year ended
March 31, 2017Current service cost 1,856.13 1,735.73 Past service cost (3,609.01) - Administrative expenses 77.77 78.90 Plan settlement (5.81) - Net interest cost / (income) (Including onerous obligations) 192.30 149.03 Net periodic pension cost (1,488.62) 1,963.66
Amount recognised in other comprehensive income
Pension benefitsYear ended
March 31, 2018Year ended
March 31, 2017Actuarial (gains) / losses arising from changes in demographic assumptions (1,799.04) (666.24)Actuarial (gains) / losses arising from changes in financial assumptions (3,017.78) 20,469.33 Actuarial (gains) / losses arising from changes in experience adjustments on plan liabilities (848.75) (1,867.22)Return on plan assets, (excluding amount included in net Interest expense) 997.46 (10,072.49)Change in onerous obligation, excluding amounts included in interest expenses - (17.53)Total recognised in other comprehensive income (4,668.11) 7,845.85 Total recognised in statement of profit and loss and other comprehensive income (6,156.73) 9,809.51
The assumptions used in accounting for the pension plans are set out below:
Pension benefitsAs at
March 31, 2018As at
March 31, 2017Discount rate 2.7% 2.6%Expected rate of increase in compensation level of covered employees 2.3% 3.7%Inflation increase 3.1% 3.2%For the valuation as at March 31, 2018, the mortality assumptions used are the SAPS base table, in particular S2PxA tables and the Light table for members of the Jaguar Executive Pension Plan.
For the Jaguar Pension Plan, scaling factors of 113% to 119% have been used for male members and scaling factors of 102% to 114% have been used for female members.
For the Land Rover Pension Scheme, scaling factors of 108% to 113% have been used for male members and scaling factors of 102% to 111% have been used for female members.
For the Jaguar Executive Pension Plan, an average scaling factor of 95% has been used for male members and an average scaling factor of 85% has been used for female members.
For the valuation as at March 31, 2017, the mortality assumption used are the SAPS base table, in particular S2NxA tables and the light table for member of Jaguar Executive Pension Plan. A scaling factor of 120% for males and 110% for females has been used for Jaguar Pension Plan, 115% for males and 105% for females for Land Rover Pension scheme, and 95% for males and 85% for females for the Jaguar Executive Pension Plan.
There is an allowance for future improvements in line with the CMI (2017) projections and an allowance for long-term improvements of 1.25% per annum (2017, CMI (2014) projections with 1.25% per annum improvements).The assumed life expectations on retirement at age 65 are (years)Retiring today :Males 21.3 21.5 Females 23.4 24.5 Retiring in 20 years :Males 22.5 23.3 Females 25.1 26.3
NOTES FORMING PART OF CONSOLIDATED FINANCIAL STATEMENTS
314

Pension plans asset allocation by category is as follows: (` in crores)
As at March 31,
2018 2017
Quoted * Unquoted Total Quoted * Unquoted Total
Equity Instruments
Information Technology 1,218.16 - 1,218.16 1,149.04 - 1,149.04
Energy 516.79 - 516.79 493.60 - 493.60
Manufacturing 885.93 - 885.93 841.55 - 841.55
Financials 1,393.50 - 1,393.50 1,327.06 - 1,327.06
Others 3,848.27 - 3,848.27 3,649.43 - 3,649.43
7,862.65 - 7,862.65 7,460.68 - 7,460.68
Debt Instruments
Government 35,169.67 - 35,169.67 23,709.13 - 23,709.13
Corporate Bonds (Investment Grade) 184.57 16,943.46 17,128.03 161.84 16,758.23 16,920.07
Corporate Bonds (Non Investment Grade)
- 5,389.42 5,389.42 995.30 3,350.03 4,345.33
35,354.24 22,332.88 57,687.12 24,866.27 20,108.26 44,974.53
Property Funds
UK - 1,522.70 1,522.70 - 1,537.45 1,537.45
Other - 1,476.55 1,476.55 - 1,262.33 1,262.33
- 2,999.25 2,999.25 - 2,799.78 2,799.78
Cash and Cash equivalents 2,010.94 - 2,010.94 752.54 - 752.54
Other
Hedge Funds - 3,285.33 3,285.33 - 3,261.02 3,261.02
Private Markets 18.46 2,325.57 2,344.03 - 1,407.98 1,407.98
Alternatives 4,337.38 1,974.89 6,312.27 2,646.04 3,066.81 5,712.85
4,355.84 7,585.79 11,941.63 2,646.04 7,735.81 10,381.85
Derivatives
Foreign exchange contracts - 9.23 9.23 - 137.56 137.56
Interest Rate and inflation - 2,104.10 2,104.10 - 9,159.98 9,159.98
- 2,113.33 2,113.33 - 9,297.54 9,297.54
Collateralised debt obligations - (11,877.03) (11,877.03) - (6,821.43) (6,821.43)
Total 49,583.67 23,154.22 72,737.89 35,725.53 33,119.96 68,845.49
* determined on the basis of quoted prices for identical assets or liabilities in active markets.
The split of Level 1 assets is 71% (2017: 66%), Level 2 assets 20% (2017: 27%) and Level 3 assets 9% (2017: 7%). Private market holdings are classified as Level 3 instruments. Included in the value for Government bonds, Interest Rate and Inflation derivatives are Repo transactions, as noted above.
NOTES FORMING PART OF CONSOLIDATED FINANCIAL STATEMENTS
31573rd Annual Report 2017-18
INTEGRATED REPORT 1-65 STATUTORY REPORTS 66-184 FINANCIAL STATEMENTS 185-353

The sensitivity analysis below is based on a change in an assumption while holding all other assumptions constant. In practice, this is unlikely to occur, and changes in some of the assumptions may be correlated. When calculating the sensitivity of the defined benefit obligation to significant actuarial assumptions the same method (present value of the defined benefit obligation calculated with the projected unit credit method at the end of the reporting period) has been applied as when calculating the pension liability recognised within the consolidated balance sheet.
Assumption Change in assumption Impact on defined benefit obligation
Impact on service cost and interest cost
Discount rate Increase / decrease by 0.25% Decrease/increase by ` 4,074.37 crores
Decrease/increase by ` 74.75 crores
Inflation rate Increase / decrease by 0.25% Increase/decrease by ` 3,468.98 crores
Increase/decrease by ` 88.59 crores
Mortality rate Increase / decrease by 1 year Increase/decrease by ` 2,219.45 crores
Increase/decrease by ` 47.99 crores
Jaguar Land Rover contributes towards the UK defined benefit schemes. Following the April 5, 2015 valuations, it is intended to eliminate the pension scheme funding deficits over the 10 years following the valuation date. As at 31 March 2018, there is no additional liability; however, following the changes to the defined benefit schemes’ rules in April 2017, an additional obligation may arise in the future. The current agreed contribution rate for defined benefit accrual is 31% of pensionable salaries in the UK. Deficit contribution levels remain in line with the schedule of contributions agreed following the 2015 statutory valuation. Both the ongoing and deficit contribution rates these are expected to reduce following the completion of the 2018 statutory valuation during 2019.
The average duration of the benefit obligation at March 31, 2018 is 20.04 years (2017: 21.60 years).
With the new benefit structure effective April 6, 2017, the expected net periodic pension cost for the year ended March 31, 2019 is ` 2,120.39 crores. The Company expects to pay ` 2,371.71 crores to its defined benefit schemes in the year ended March 31, 2019.
Defined contribution plan
The Company’s contribution to defined contribution plans aggregated 899.59 crores, 754.95 crores for years ended March 31, 2018 and 2017, respectively.
37. Commitments and contingencies
In the ordinary course of business, the Company faces claims and assertions by various parties. The Company assesses such claims and assertions and monitors the legal environment on an ongoing basis, with the assistance of external legal counsel, wherever necessary. The Company records a liability for any claims where a potential loss is probable and capable of being estimated and discloses such matters in its financial statements, if material. For potential losses that are considered possible, but not probable, the Company provides disclosure in the financial statements but does not record a liability in its accounts unless the loss becomes probable.
The following is a description of claims and assertions where a potential loss is possible, but not probable. The Company believes that none of the contingencies described below would have a material adverse effect on the Company’s financial condition, results of operations or cash flows.
Litigation
The Company is involved in legal proceedings, both as plaintiff and as defendant. There are claims which the Company does not believe to be of material nature, other than those described below.
Income Tax
The Company has ongoing disputes with income tax authorities relating to tax treatment of certain items. These mainly include disallowed expenses, the tax treatment of certain expenses claimed by the Company as deductions and the computation of, or eligibility of, the Company’s use of certain tax incentives or allowances.
Most of these disputes and/or disallowances, being repetitive in nature, have been raised by the income tax authorities consistently in most of the years.
NOTES FORMING PART OF CONSOLIDATED FINANCIAL STATEMENTS
316

The Company has a right of appeal to the Commissioner of Income Tax (Appeals), or CIT (A), the Dispute Resolution Panel, or DRP, and to the Income Tax Appellate Tribunal, or ITAT, against adverse decisions by the assessing officer, DRP or CIT (A), as applicable. The income tax authorities have similar rights of appeal to the ITAT against adverse decisions by the CIT (A) or DRP. The Company has a further right of appeal to the Bombay High Court or the Supreme Court against adverse decisions by the appellate authorities for matters involving substantial question of law. The income tax authorities have similar rights of appeal.
As at March 31, 2018, there are matters and/or disputes pending in appeal amounting to ` 303.09 crores, which includes ` 2.18 crores in respect of equity accounted investees (` 158.61 crores, which includes ` 2.18 crores in respect of equity accounted investees as at March 31, 2017).
Customs, Excise Duty and Service Tax
As at March 31, 2018, there are pending litigations for various matters relating to customs, excise duty and service tax involving demands, including interest and penalties, of ` 1,671.71 crores, which includes ` 5.02 crores in respect of equity accounted investees (` 1,464.22 crores, which includes ` 5.99 crores in respect of equity accounted investees as at March 31, 2017). These demands challenged the basis of valuation of the Company’s products and denied the Company’s claims of Central Value Added Tax, or CENVAT, credit on inputs. The details of the demands for more than ` 20 crores are as follows:
The Excise Authorities have raised a demand for ` 90.72 crores as at March 31, 2018 (` 90.72 crores as at March 31, 2017), on account of alleged undervaluation’s of ex-factory discounts given by Company on passenger vehicles through invoices. The matter is being contested by the Company before the Bombay High Court.
As at March 31, 2018, the Excise Authorities have raised a demand and penalty of ` 239.95 crores (` 218.23 crores as at March 31, 2017), due to the classification of certain chassis (as dumpers instead of goods transport vehicles) which were sent to automotive body builders by the Company, which the Excise Authorities claim requires the payment of the National Calamity Contingent Duty, or NCCD. The Company has obtained a technical expert certificate on the classification. The appeal is pending before the Custom Excise & Service Tax Appellate Tribunal.
The Excise Authorities had denied the Company’s claim of a CENVAT credit of ` 36.03 crores as at March 31, 2018 (` 24.96 crores as at March 31, 2017) claimed by the Company from Fiscal 1992 to Fiscal 2013, on technical grounds. The matter is being contested by the Company before the appellate authorities.
As at March 31, 2018, the Excise Authorities had levied penalties and interest amounting to ` 679.88 crores (`679.88 crores as at March 31, 2017) with respect to CENVAT credit claimed by the Company from March 2010 to November 2012, on inputs, stating that vehicles manufactured at Uttarakhand plant are “Exempted Products” and the Company may not claim a CENVAT credit on these vehicles. The Company has challenged this demand as NCCD and the automobile cess is assessed on those vehicles, which are “duties of excise”. Therefore, the Company asserts that these vehicles are not “Exempted Products”. The matter is being contested by the Company before the appellate authorities.
As at March 31, 2018, the Service Tax Authorities have raised Service Tax demand of ` 54.85 crores, wherein department alleged that the fee charged for securitisation contract by one of our subsidiary, TMFL are not adequate. The matter is being contested by TMFL before the appellate authorities.
As at March 31, 2018, the Excise Authorities have raised a demand amounting to ` 29.54 crores (` 29.54 crores as at March 31, 2017) on pre-delivery inspection charges and free after-sales service charges incurred by dealers on Company’s products on the alleged grounds that the pre-delivery inspection charges and free after-sales services are provided by the dealer on behalf of the Company and should be included in excisable value of the vehicle. The case is pending before Tribunal.
As at March 31, 2018, the Exicse Authorities have confirmed demand & penalty totalling to ` 90.88 crores (` Nil crores as at March 31, 2017) towards vehicles allegedly sold below cost of production with an intention to penetrate the market. The matter is being contested by the Company before appellate Authorities.
As at March 31, 2018, the Exicse Authorities have filed Appeal before appellate authority against the Order of adjudicating authority allowing CENVAT credit of service tax of `36.15 crores (` 36.15 crores as at March 31, 2017) availed on consulting engineers services.
NOTES FORMING PART OF CONSOLIDATED FINANCIAL STATEMENTS
31773rd Annual Report 2017-18
INTEGRATED REPORT 1-65 STATUTORY REPORTS 66-184 FINANCIAL STATEMENTS 185-353

Sales Tax
The total sales tax demands (including interest and penalty), that are being contested by the Company amount to ` 1,096.18 crores, which includes ` 10.85 crores in respect of equity accounted investees as at March 31, 2018 (` 1,057.93 crores, which includes ` 11.54 crores in respect of equity accounted investees, as at March 31, 2017). The details of the demands for more than ` 20 crores are as follows:
The Sales Tax Authorities have raised demand of ` 269.38 crores (` 208.59 crores as at March 31, 2017) towards rejection of certain statutory forms for concessional lower/nil tax rate (Form F and Form C) on technical grounds such as late submission, single form issued against different months / quarters dispatches / sales, etc. and denial of exemption from tax in absence of proof of export for certain year The Company has contended that the benefit cannot be denied on technicalities, which are being complied with. The matter is pending at various levels.
The Sales Tax authorities have denied input tax credit and levied interest and penalty thereon due to varied reasons aggregating to ` 435.96 crores as at March 31, 2018 (` 305.46 crores as at March 31, 2017). The reasons for disallowing credit was mainly due to Taxes not paid by Vendors, incorrect method of calculation of set off as per the department, alleging suppression of sales as per the department etc. The matter is contested in appeal.
As at March 31, 2018, Sales Tax demand aggregating `95.75 crores has been raised by Sales Tax Authorities for non submission of Maharashtra Trial Balance. This is relating to VAT assessment for the financial year 2010-2013. The matter is contested in appeal.
As at March 31, 2018, the Sales Tax Authorities have raised demand for Entry Tax liability at various states amounting to ` 23.92 crores. The Company is contesting this issue.
Other Taxes and Dues
Other amounts for which the Company may contingently be liable aggregate to ` 367.02 crores, which includes ` 1.76 crores in respect of equity accounted investees as at March 31, 2018 (` 300.01 crores, which includes 1.76 crores in respect of equity accounted investees, as at March 31, 2017). Following are the cases involving more than ` 20 crores:
The municipal authorities in certain states levy octroi duty (a local indirect tax) on goods brought inside the municipal limits at rates based on the classification of goods. Demands aggregating ` 61.65 crores as at March 31, 2018 (` 61.65 crores as at March 31, 2017) had been raised demanding higher octroi duties on account of classification disputes relating to components purchased for the manufacture of vehicles and retrospective increase in octroi rates relating to past periods. The dispute relating to classification is presently pending before the Bombay High Court and the other dispute is pending before the Supreme Court.
As at March 31, 2018, property tax amounting to ` 56.84 crores (` 53.70 crores as at March 31, 2017) has been demanded by the local municipal authorities in respect of vacant land of the Company in the plants in Pimpri, Chinchwad and Chikhali. The Company has filed Special Leave Petition (SLP) before the Supreme Court against an unfavorable decision of the Bombay High Court. The Supreme Court has disposed of the SLP and remanded the matter back to the local municipal corporation for fresh adjudication.
As at March 31, 2018, Sales tax / VAT amounting to ` 30.54 crores (` 29.95 crores as at March 31, 2017) has been demanded by local authorities on dealers in respect of spare parts used for carrying out warranty repairs. The dispute is pending before the Supreme Court.
Other claims
There are other claims against the Company, the majority of which pertain to government body investigations with regards to regulatory compliances, motor accident claims, product liability claims and consumer complaints. Some of the cases also relate to the replacement of parts of vehicles and/or the compensation for deficiencies in the services by the Company or its dealers.
Commitments
The Company has entered into various contracts with vendors and contractors for the acquisition of plant and machinery, equipment and various civil contracts of a capital nature amounting to ` 10,018.66 crores, which includes ` 12.73 crores in respect of equity
NOTES FORMING PART OF CONSOLIDATED FINANCIAL STATEMENTS
318

accounted investees as at March 31, 2018 (` 19,610.93 crores, which includes ` 1,403.80 crores in respect of equity accounted investees, as at March 31, 2017), which are yet to be executed.
The Company has entered into various contracts with vendors and contractors for the acquisition of intangible assets of a capital nature amounting to ` 581.39 crores as at March 31, 2018, (` 640.21 crores as at March 31, 2017), which are yet to be executed.
Under the joint venture agreement with Chery Jaguar Land Rover Automotive Co. Limited, the Company is committed to contribute ` 3,622.12 crores as at March 31, 2018 (` 3,295.60 crores as at March 31, 2017) towards its share in the capital of the joint venture of which ` 2,975.31 crores (` 2,707.10 crores as at March 31, 2017) has been contributed as at March 31, 2018. As at March 31, 2018, the Company has an outstanding commitment of ` 646.81 crores (` 588.50 crores as at March 31, 2017).
The Company has contractual obligation towards Purchase Commitment for ` 13,222.63 crores (` 12,186.90 crores as at March 31, 2017).
38. Capital Management
The Company’s capital management is intended to create value for shareholders by facilitating the meeting of long-term and short-term goals of the Company.
The Company determines the amount of capital required on the basis of annual operating plans and long-term product and other strategic investment plans. The funding requirements are met through equity, convertible and non-convertible debt securities, senior notes and other long-term/short-term borrowings. The Company’s policy is aimed at combination of short-term and long-term borrowings.
The Company monitors the capital structure on the basis of total debt to equity ratio and maturity profile of the overall debt portfolio of the Company.
Total debt includes all long and short-term debts as disclosed in notes 24, 25 and 27 to the consolidated financial statements. Equity comprises all components excluding (profit)/loss on cash flow hedges and foreign currency translation reserve.
The following table summarizes the capital of the Company:(` in crores)
As at March 31, 2018
As at March 31, 2017
Equity* 94,794.02 81,808.56
Short-term borrowings and current portion of long-term debt 27,750.97 17,974.80
Long-term debt 61,199.50 60,629.18
Total debt 88,950.47 78,603.98
Total capital (Debt + Equity) 183,744.49 160,412.54
* Details of equity :
As at March 31, 2018
As at March 31, 2017
Total equity as reported in balance sheet 95,952.97 58,515.06
Currency translation reserve attributable to
- Shareholders of Tata Motors Limited (4,621.23) 5,300.13
- Non-controlling interests (19.78) 7.52
Hedging reserve 3,482.06 17,985.85
Equity as reported above 94,794.02 81,808.56
NOTES FORMING PART OF CONSOLIDATED FINANCIAL STATEMENTS
31973rd Annual Report 2017-18
INTEGRATED REPORT 1-65 STATUTORY REPORTS 66-184 FINANCIAL STATEMENTS 185-353

NO
TES
FO
RM
ING
PA
RT
OF
CON
SO
LID
ATED
FIN
AN
CIA
L ST
ATEM
ENTS
39. D
iscl
osur
e on
fina
ncia
l ins
trum
ents
Th
is s
ectio
n gi
ves
an o
verv
iew
of t
he s
igni
fican
ce o
f fin
anci
al in
stru
men
ts fo
r the
Com
pany
and
pro
vide
s ad
ditio
nal i
nfor
mat
ion
on b
alan
ce s
heet
item
s th
at c
onta
in fi
nanc
ial
inst
rum
ents
.
Th
e de
tails
of s
igni
fican
t acc
ount
ing
polic
ies,
incl
udin
g th
e cr
iteria
for r
ecog
nitio
n, th
e ba
sis
of m
easu
rem
ent a
nd th
e ba
sis
on w
hich
inco
me
and
expe
nses
are
reco
gnis
ed,
in re
spec
t of e
ach
clas
s of
fina
ncia
l ass
et, f
inan
cial
liab
ility
and
equ
ity in
stru
men
t are
dis
clos
ed in
not
e 2
to th
e co
nsol
idat
ed fi
nanc
ial s
tate
men
ts.
(a
) Fi
nanc
ial a
sset
s an
d lia
bilit
ies
The
follo
win
g ta
ble
pres
ents
the
carr
ying
am
ount
s an
d fa
ir va
lue
of e
ach
cate
gory
of f
inan
cial
ass
ets
and
liabi
litie
s as
at M
arch
31,
2018
.
Fina
ncia
l ass
ets
Cash
and
ot
her
finan
cial
as
sets
at
amor
tised
co
st
Inve
stm
ents
-
FVTO
CIIn
vest
men
ts -
FV
TPL
Inve
stm
ents
- A
mor
tised
co
st
Der
ivat
ives
ot
her t
han
in h
edgi
ng
rela
tions
hip
Der
ivat
ives
in
hed
ging
re
latio
nshi
p
Tota
l car
ryin
g va
lue
Tota
l fai
r va
lue
(a)
Oth
er in
vest
men
ts -
non
-cur
rent
-
407
.90
351
.98
3.8
8 -
-
7
63.7
6 7
63.7
6 (b
)In
vest
men
ts -
cur
rent
-
303
.28
1,60
1.00
12,7
59.4
7 -
-
14
,663
.75
14,6
63.7
5 ( c
)Tr
ade
rece
ivab
les
19,8
93.3
0 -
-
-
-
-
19
,893
.30
19,8
93.3
0 (d
)Ca
sh a
nd c
ash
equi
vale
nts
14,7
16.7
5 -
-
-
-
-
14
,716
.75
14,7
16.7
5 (e
)O
ther
ban
k ba
lanc
es 19
,897
.16
-
-
-
-
-
19,8
97.16
19
,897
.16
(f)Lo
ans
and
adva
nces
- n
on-
curr
ent
495
.41
-
-
-
-
-
495
.41
495
.41
(g)
Loan
s an
d ad
vanc
es -
cur
rent
2,2
79.6
6 -
-
-
-
-
2
,279
.66
2,2
79.6
6 (h
)Fi
nanc
e re
ceiv
able
- c
urre
nt 8
,401
.65
-
-
-
-
-
8,4
01.6
5 8
,401
.65
(i)Fi
nanc
e re
ceiv
able
- n
on-c
urre
nt 15
,479
.53
-
-
-
-
-
15,4
79.5
3 15
,421
.94
(j)O
ther
fina
ncia
l ass
ets
- no
n-cu
rren
t 1,
716.
97
-
-
-
489
.03
2,3
57.8
7 4
,563
.87
4,5
63.8
7
(k)
Oth
er fi
nanc
ial a
sset
s -
curr
ent
552.
99 -
-
-
87
8.80
1,59
7.33
30
29.12
3,02
9.12
Tota
l 8
3,43
3.42
7
11.18
1,
952.
98
12,7
63.3
5 1,
367.
83
3,9
55.2
0 10
4,18
3.96
10
4,12
6.37
Fina
ncia
l lia
bilit
ies
Der
ivat
ives
oth
er th
an
in h
edgi
ng re
latio
nshi
pD
eriv
ativ
es in
hed
ging
re
latio
nshi
pO
ther
fina
ncia
l lia
bilit
ies
Tota
l car
ryin
g va
lue
Tota
l fai
r val
ue
(a)
Long
-ter
m b
orro
win
gs (i
nclu
ding
cu
rren
t mat
uriti
es o
f lon
g-te
rm
borr
owin
gs) (
note
bel
ow)
-
-
72,
155.
62
72,
155.
62
72,8
71.8
2
(b)
Shor
t-te
rm b
orro
win
gs -
-
16
,794
.85
16,7
94.8
5 16
,794
.85
( c)
Trad
e pa
yabl
es -
-
7
2,03
8.41
7
2,03
8.4
1 7
2,03
8.4
1 (d
)A
ccep
tanc
es -
-
4
,901
.42
4,9
01.4
2 4
,901
.42
(e)
Oth
er fi
nanc
ial l
iabi
litie
s -
no
n-cu
rren
t 17
7.23
2
,272
.97
288
.94
2,7
39.14
2
,739
.14
(f)O
ther
fina
ncia
l lia
bilit
ies
- cu
rren
t 1,
329.
43
4,8
78.2
3 14
,103.
71
20,
311.
37
20,
311.
37
Tota
l 1,
506.
66
7,15
1.20
18
0,28
2.95
18
8,9
40.8
1 18
9,65
7.01
N
ote:
1
Incl
udes
USD
den
omin
ated
bon
ds d
esig
nate
d as
cas
h flo
w h
edge
s ag
ains
t for
ecas
ted
USD
reve
nue
amou
ntin
g to
` 1
1,166
.44
cror
es (U
SD 1,
700
mill
ion)
2
Incu
ldes
` 3
,156.
00 c
rore
s de
sign
ated
as
hedg
ed it
em in
fai
r va
lue
hedg
e re
latio
nshi
p. T
his
incl
udes
a l
oss
of `
92.
80
cro
res
on a
ccou
nt o
f fa
ir va
lue
chan
ges
attr
ibut
able
to th
e he
dged
intr
est r
ate
risk.
320

NO
TES
FO
RM
ING
PA
RT
OF
CON
SO
LID
ATED
FIN
AN
CIA
L ST
ATEM
ENTS
The
follo
win
g ta
ble
pres
ents
the
carr
ying
am
ount
s an
d fa
ir va
lue
of e
ach
cate
gory
of f
inan
cial
ass
ets
and
liabi
litie
s as
at M
arch
31,
2017
.
Fina
ncia
l ass
ets
Cash
and
ot
her
finan
cial
as
sets
at
amor
tised
co
st
Inve
stm
ents
-
FVTO
CIIn
vest
men
ts -
FV
TPL
Inve
stm
ents
- A
mor
tised
co
st
Der
ivat
ives
ot
her t
han
in h
edgi
ng
rela
tions
hip
Der
ivat
ives
in
hed
ging
re
latio
nshi
p
Tota
l car
ryin
g va
lue
Tota
l fai
r va
lue
(a)
Oth
er in
vest
men
ts -
non
-cur
rent
-
630
.27
56.
61
3.8
8 -
-
6
90.7
6 6
90.7
6 (b
)In
vest
men
ts -
cur
rent
-
-
3,0
40.9
4 12
,000
.21
-
-
15,0
41.15
15
,041
.15
( c)
Trad
e re
ceiv
able
s 14
,075
.55
-
-
-
-
-
14,0
75.5
5 14
,075
.55
(d)
Cash
and
cas
h eq
uiva
lent
s 13
,986
.76
-
-
-
-
-
13,9
86.
76
13,9
86.
76
(e)
Oth
er b
ank
bala
nces
22,
091.1
2 -
-
-
-
-
2
2,09
1.12
22,
091.1
2
(f)Lo
ans
and
adva
nces
- n
on-
curr
ent
753
.66
-
-
-
-
-
753
.66
753
.66
(g)
Loan
s an
d ad
vanc
es -
cur
rent
710
.45
-
-
-
-
-
710
.45
710
.45
(h)
Fina
nce
rece
ivab
le -
cur
rent
6,8
10.12
-
-
-
-
-
6
,810
.12
6,8
10.12
(i)
Fina
nce
rece
ivab
le -
non
-cur
rent
10,7
53.13
-
-
-
-
-
10
,753
.13
10,7
18.9
2 (j)
Oth
er fi
nanc
ial a
sset
s -
non-
curr
ent
135.
78
-
-
-
1,15
6.97
1,
618.
37
2,9
11.12
2
,911
.12
(k)
Oth
er fi
nanc
ial a
sset
s -
curr
ent
45.
76
-
-
-
424
.00
1,08
6.18
1,
555.
94
1,55
5.94
TO
TAL
69,
362.
33
630
.27
3,0
97.5
5 12
,004
.09
1,58
0.97
2
,704
.55
89,
379.
76
89,
345.
55
Fina
ncia
l lia
bilit
ies
Der
ivat
ives
oth
er th
an
in h
edgi
ng re
latio
nshi
pD
eriv
ativ
es in
hed
ging
re
latio
nshi
pO
ther
fina
ncia
l lia
bilit
ies
Tota
l car
ryin
g va
lue
Tota
l fai
r val
ue
(a)
Long
-ter
m b
orro
win
gs (i
nclu
ding
cu
rren
t mat
uriti
es o
f lon
g-te
rm
borr
owin
gs) (
note
bel
ow)
-
-
64,
744.
04
64,
744.
04
66,
339.
97
(b)
Shor
t-te
rm b
orro
win
gs -
-
13
,859
.94
13,8
59.9
4 13
,859
.94
( c)
Trad
e pa
yabl
es -
-
5
7,69
8.33
5
7,69
8.3
3 5
7,69
8.3
3 (d
)A
ccep
tanc
es -
-
4
,834
.24
4,8
34.2
4 4
,834
.24
(e)
Oth
er fi
nanc
ial l
iabi
litie
s -
non-
curr
ent
1,16
9.84
10
,089
.73
150.
01
11,4
09.5
8
11,4
09.5
8
(f)O
ther
fina
ncia
l lia
bilit
ies
- cu
rren
t 3
,541
.10
10,7
16.8
5 7
,262
.02
21,
519.
97
21,
519.
97
TOTA
L 4
,710
.94
20,
806
.58
14
8,5
48.5
8
174,
066.
10
175,
662.
03
Not
e:
Incl
udes
USD
den
omin
ated
bon
ds d
esig
nate
d as
cas
h flo
w h
edge
s ag
ains
t for
ecas
ted
USD
reve
nue
amou
ntin
g to
` 7
,78
2.0
0 cr
ores
(USD
1,20
0 m
illio
n)
32173rd Annual Report 2017-18
INTEGRATED REPORT 1-65 STATUTORY REPORTS 66-184 FINANCIAL STATEMENTS 185-353

The following table provides an analysis of financial instruments that are measured subsequent to initial recognition at fair value, grouped into Level 1 to Level 3, as described below.
Quoted prices in an active market (Level 1): This level of hierarchy includes financial assets that are measured by reference to quoted prices (unadjusted) in active markets for identical assets or liabilities. This category consists quoted equity shares, quoted corporate debt instruments and mutual fund investments.
Valuation techniques with observable inputs (Level 2): This level of hierarchy includes financial assets and liabilities, measured using inputs other than quoted prices included within Level 1 that are observable for the asset or liability, either directly (i.e; as prices) or indirectly (i.e; derived from prices). This level of hierarchy includes Company’s over-the-counter (OTC) derivative contracts.
Valuation techniques with significant unobservable inputs (Level 3): This level of hierarchy includes financial assets and liabilities measured using inputs that are not based on observable market data (unobservable inputs). Fair values are determined in whole or in part, using a valuation model based on assumptions that are neither supported by prices from observable current market transactions in the same instrument nor are they based on available market data. The main items in this category are investments in certain unquoted debentures and equity.
(` in crores)
As at March 31, 2018
Level 1 Level 2 Level 3 Total
Financial assets measured at fair value
(a) Investments 1 940.92 - 723.24 2,664.16
(b) Derivative assets - 5,323.03 - 5,323.03
Total 1 940.92 5,323.03 723.24 7,987.19
Financial liabilities measured at fair value
(a) Derivative laibilities - 8,657.86 - 8,657.86
Total - 8,657.86 - 8,657.86
As at March 31, 2017
Level 1 Level 2 Level 3 Total
Financial assets measured at fair value
(a) Investments 3,326.32 - 401.50 3,727.82
(b) Derivative assets - 4,285.52 - 4,285.52
TOTAL 3,326.32 4,285.52 401.50 8,013.34
Financial liabilities measured at fair value
(a) Derivative liabilities - 25,517.52 - 25,517.52
Total - 25,517.52 - 25,517.52
NOTES FORMING PART OF CONSOLIDATED FINANCIAL STATEMENTS
322

The following table provides an analysis of fair value of financial instruments that are not measured at fair value on recurring basis, grouped into Level 1 to Level 3 categories:
(` in crores)
As at March 31, 2018Level 1 Level 2 Level 3 Total
Financial assets not measured at fair value(a) Investments 12,759.47 - 3.88 12,763.35 (b) Finance receivables - - 23,823.59 23,823.59
Total 12,759.47 - 23,827.47 36,586.94 Financial liabilities measured at fair value(a) Long-term borrowings (including current
maturities of long term borrowing) 39,949.70 32,922.12 - 72,871.82(b) Short-term borrowings - 16,794.85 - 16,794.85
Total 39,949.70 49,716.97 - 89,666.67
As at March 31, 2017Level 1 Level 2 Level 3 Total
Financial assets not measured at fair value(a) Investments 12,000.21 - 3.88 12,004.09 (b) Finance receivables - - 17,529.04 17,529.04
Total 12,000.21 - 17,532.92 29,533.13 Financial liabilities measured at fair value(a) Long-term borrowings (including current
maturities of long term borrowing) 35,323.52 31,016.45 - 66,339.97
(b) Short-term borrowings - 13,859.94 - 13,859.94 ( c) Other financial liabilities - non-current - - - -
Total 35,323.52 44,876.39 - 80,199.91
The short-term financial assets and liabilities are stated at amortised cost which is approximately equal to their fair value.
Derivatives are fair valued using market observable rates and published prices together with forecast cash flow information where applicable.
The fair value of finance receivables has been estimated by discounting expected cash flows using rates at which loans of similar credit quality and maturity would be made and internal assumptions such as expected credit losses and estimated collateral value for repossessed vehicles as at March 31, 2018 and 2017. Since significant unobservable inputs are applied in measuring the fair value, finance receivables are classified in Level 3.
The fair value of borrowings which have a quoted market price in an active market is based on its market price and for other borrowings the fair value is estimated by discounting expected future cash flows, using a discount rate equivalent to the risk-free rate of return, adjusted for the credit spread considered by the lenders for instruments of similar maturity and credit quality.
Costs of certain unquoted equity instruments have been considered as an appropriate estimate of fair value because of a wide range of possible fair value measurements and Cost represents the best estimate of fair value within that range. These investments in equity instruments are not held for trading. Instead, they are held for medium or long-term strategic purpose. Upon the application of Ind AS 109, the Company has chosen to designate these investments in equity instruments as at FVTOCI as the management believe that this provides a more meaningful presentation for medium or long-term strategic investments, as opposed to reflecting changes in fair value immediately in profit or loss.
Management uses its best judgment in estimating the fair value of its financial instruments. However, there are inherent limitations in any estimation technique. Therefore, for substantially all financial instruments, the fair value estimates presented above are not necessarily indicative of all the amounts that the Company could have realised or paid in sale transactions as of respective dates. As such, the fair value of the financial instruments subsequent to the respective reporting dates may be different from the amounts reported at each year end.
NOTES FORMING PART OF CONSOLIDATED FINANCIAL STATEMENTS
32373rd Annual Report 2017-18
INTEGRATED REPORT 1-65 STATUTORY REPORTS 66-184 FINANCIAL STATEMENTS 185-353

Offsetting
Certain financial assets and financial liabilities are subject to offsetting where there is currently a legally enforceable right to set off recognised amounts and the Company intends to either settle on a net basis, or to realise the asset and settle the liability, simultaneously.
Certain derivative financial assets and financial liabilities are subject to master netting arrangements, whereby in the case of insolvency, derivative financial assets and financial liabilities with the same countries will be settled on a net basis.
The following table discloses the amounts that have been offset, in arriving at the balance sheet presentation and the amounts that are available for offset only under certain conditions as at March 31, 2018:
Gross amount
recognised
Gross amount
recognised as set off in the balance
sheet
Net amount presented in the balance
sheet
Amounts subject to an enforceable master netting
arrangement
Net amount after
offsettingFinancial
instrumentsCash
collateral
Financial assets(a) Derivative financial
instruments 5,323.03 - 5,323.03 (4,905.82) - 417.21
(b) Trade receivables 19,990.57 (97.27) 19,893.30 - - 19,893.30 ( c) Cash and cash
equivalents 16,384.33 (1,667.58) 14,716.75 - - 14,716.75
Total 41,697.93 (1,764.85) 39,933.08 (4,905.82) - 35,027.26 Financial liabilities(a) Derivative financial
instruments 8,657.86 - 8,657.86 (4,905.82) - 3,752.04
(b) Trade payable 72,135.68 (97.27) 72,038.41 - - 72,038.41 ( c) Loans from banks/
financial institutions (short-term & current maturities of long term debt
29,418.55 (1,667.58) 27,750.97 - - 27,750.97
Total 110,212.09 (1,764.85) 108,447.24 (4,905.82) - 103,541.42
The following table discloses the amounts that have been offset, in arriving at the balance sheet presentation and the amounts that are available for offset only under certain conditions as at March 31, 2017:
Gross amount
recognised
Gross amount
recognised as set off in the balance
sheet
Net amount presented in the balance
sheet
Amounts subject to an enforceable master netting
arrangement
Net amount after
offsettingFinancial
instrumentsCash
collateral
Financial assets(a) Derivative financial
instruments 4,285.52 - 4,285.52 (3,402.13) - 883.39
(b) Trade receivables 14,103.26 (27.71) 14,075.55 - - 14,075.55 ( c) Cash and cash
equivalents 14,237.61 (250.85) 13,986.76 - - 13,986.76
Total 32,626.39 (278.56) 32,347.83 (3,402.13) - 28,945.70 Financial liabilities(a) Derivative financial
instruments 25,517.52 - 25,517.52 (3,402.13) - 22,115.39
(b) Trade payable 57,726.04 (27.71) 57,698.33 - - 57,698.33 ( c) Loans from banks/
financial institutions (short-term & current maturities of long term debt)
18,225.65 (250.85) 17,974.80 - - 17,974.80
Total 101,469.21 (278.56) 101,190.65 (3,402.13) - 97,788.52
NOTES FORMING PART OF CONSOLIDATED FINANCIAL STATEMENTS
324

(b) Transfer of financial assets
The Company transfers finance receivables in securitisation transactions and direct assignments. In such transactions the Company surrenders control over the receivables, though it continues to act as an agent for the collection of receivables. Generally in such transactions, the Company also provides credit enhancements to the transferee.
Because of the existence of credit enhancements in such transactions, the Company continues to have the obligation to pay to the transferee, limited to the extent of credit enhancement provided, even if it does not collect the equivalent amounts from the original asset and hence continues to retain substantially all risks and rewards associated with the receivables, and as a result of which such transfer or assignment does not meet the derecognition criteria, resulting in the transfer not being recorded as sale. Consequently, the proceeds received from such transfers are recorded as collateralised debt obligations.
Further the Company transfers certain trade receivables under the debt factoring arrangements. These do not qualify for derecognition, if the recourse arrangement is in place. Consequently the proceeds received from such transfers with a recourse arrangements are recorded as loans from banks / financial institutions and classified under short-term borrowings.
The carrying amount of trade receivables and finance receivables along with the associated liabilities is as follows:
(` in crores)
As at March 31, 2018 As at March 31, 2017
Nature of Asset Carrying amount of asset sold
Carrying amount of associated
liabilities
Carrying amount of asset sold
Carrying amount of associated
liabilities
(a) Trade receivables 1,507.44 1,507.44 1,494.87 1,494.87
(b) Finance receivables 1,306.911 1,320.58 1,004.38 1,027.12
1 Net of provision of ` 22.62 crores, ` 29.00 crores as at March 31, 2018 and 2017, respectively.
( c) Cash flow hedges
As at March 31, 2018, the Company and its subsidiaries have a number of financial instruments in a hedging relationship. The Company and its subsidiaries use both foreign currency forward and option contracts, cross currency interest rate swaps and other currency options to hedge changes in future cash flows as a result of foreign currency and interest rate risk arising from sales and purchases and repayment of foreign currency bonds. The Company and its subsidiaries have also designated some of its U.S. dollar denominated bonds as hedging instruments in a cash flow hedging relationship to hedge the changes in future cash flows as a result of foreign currency risk arising from future anticipated sales.
The Company and its subsidiaries also have a number of foreign currency options and other currency options, which are entered into as an economic hedge of the financial risks of the Company. These contracts do not meet the hedge accounting criteria of Ind AS 109, hence the change in fair value of these derivatives are recognised in the statement of Profit and Loss.
Options are designated on spot discounted basis. The time value of options are identified as cost of hedge. Changes in the time value of options are recognised in Cost of Hedge reserve. Changes in the spot intrinsic value of options is recognised in Hedge reserve. Changes in fair value arising from own and counter-party credit risk in options and forward exchange contracts are considered ineffective in the hedge relationship and thus the change in fair value of forward exchange contracts attributable to changes in credit spread are recognised in the statement of profit and loss. Cross currency basis spread was historically included in the hedging relationship. Any ineffectiveness arising out of cross currency basis spread is recognised in the statement of profit and loss as it arises. Cross currency basis spread arising from forward exchange contracts entered after 1st January 2018 is identified as cost of hedge and accordingly changes in fair value attributable to this is recognised in cost of hedge reserve.
Changes in fair value of foreign currency derivative and bonds, to the extent determined to be an effective hedge, is recognised in other comprehensive income and the ineffective portion of the fair value change is recognised in statement of Profit and Loss. The fair value gain/losses recorded in Hedge reserve and Cost of Hedge reserve is recognised in the statement of profit and loss when the forecasted transactions occur. The accumulated gain/losses in hedge reserve and cost of hedge reserve are expected to be recognised in statement of profit or loss during the years ending March 31, 2019 to 2023.
NOTES FORMING PART OF CONSOLIDATED FINANCIAL STATEMENTS
32573rd Annual Report 2017-18
INTEGRATED REPORT 1-65 STATUTORY REPORTS 66-184 FINANCIAL STATEMENTS 185-353

(` in crores)
As at March 31,2018
As at March 31,2017
Fair value gain/(loss) of foreign currency derivative contracts entered for cash flow hedges of forecast sales recognised in hedging reserve
6,533.29 (24,547.60)
Fair value gain/(loss) of foreign currency derivative contracts entered for cash flow hedges of forecast inventory purchases recognised in hedging reserve
1,227.74 2,026.77
Fair value gain/(loss) of foreign currency bonds designated as cash flow hedges of forecast sales recognised in hedging reserve
1,243.52 (1,314.07)
Fair value gain/(loss) of cross currency interest rate swaps entered for cash flow hedges of repayment of foreign currency denominated borrowings recognised in hedging reserve
(35.91) -
Fair value gain/(loss) recognised in hedging reserve 8,968.64 (23,834.90)
Gain/(loss) reclassified from hedging reserve and recognised in ‘Revenue from Operation’ in the statement of profit and loss on occurrence of forecast sales
(10,274.11) (9,928.70)
Gain/(loss) reclassified out of hedging reserve and recorded in inventory in the Balance sheet on occurrence of forecast purchases
1,430.25 1,020.39
Gain/(loss) reclassified from hedging reserve and recognised in ‘Foreign exchange (gain)/loss (net)’ in the statement of profit and loss on account of forecast transactions no longer expected to occur
(54.70) (367.31)
Gain/(loss) reclassified from hedging reserve (8,898.56) (9,275.62)
Gain/(loss) on foreign currency derivatives not hedge accounted, recognised in ‘Foreign exchange (gain)/loss (net)’ in the statement of profit and loss
1,176.20 (2,041.94)
Fair value gain/(loss) recognised in ‘Foreign exchange (gain)/loss (net)’ in the statement of profit and loss on account of ineffectiveness arising from foreign currency basis spread on forward contracts designated in cash flow hedge relationship
381.64 (231.78)
(d) Financial risk management
In the course of its business, the Company is exposed primarily to fluctuations in foreign currency exchange rates, interest rates, equity prices, liquidity and credit risk, which may adversely impact the fair value of its financial instruments.
The Company has a risk management policy which not only covers the foreign exchange risks but also other risks associated with the financial assets and liabilities such as interest rate risks and credit risks. The risk management policy is approved by the board of directors. The risk management framework aims to:
• Create a stable business planning environment by reducing the impact of currency and interest rate fluctuations on the Company’s business plan.
• Achieve greater predictability to earnings by determining the financial value of the expected earnings in advance.
(i) Market risk
Market risk is the risk of any loss in future earnings, in realizable fair values or in future cash flows that may result from a change in the price of a financial instrument. The value of a financial instrument may change as a result of changes in the interest rates, foreign currency exchange rates, equity price fluctuations, liquidity and other market changes. Future specific market movements cannot be normally predicted with reasonable accuracy.
(a) Foreign currency exchange rate risk:
The fluctuation in foreign currency exchange rates may have potential impact on the income statement and equity, where any transaction references more than one currency or where assets/liabilities are denominated in a currency other than the functional currency of the respective consolidated entities.
Considering the countries and economic environment in which the Company operates, its operations are subject to risks arising from fluctuations in exchange rates in those countries. The risks primarily relate to fluctuations in U.S. dollar, Chinese renminbi, Japanese yen, Singapore dollar and Euro, against the respective functional currencies of Tata Motors Limited and its subsidiaries.
NOTES FORMING PART OF CONSOLIDATED FINANCIAL STATEMENTS
326

The Company, as per its risk management policy, uses foreign exchange and other derivative instruments primarily to hedge foreign exchange and interest rate exposure. Furthermore, any movement in the functional currencies of the various operations of the Company against major foreign currencies may impact the Company’s revenues from its international operations. Any weakening of the functional currency may impact the Company’s cost of imports and cost of borrowings and consequently may increase the cost of financing the Company’s capital expenditures.
The Company evaluates the impact of foreign exchange rate fluctuations by assessing its exposure to exchange rate risks. It hedges a part of these risks by using derivative financial instruments in accordance with its risk management policies.
The foreign exchange rate sensitivity is calculated for each currency by aggregation of the net foreign exchange rate exposure of a currency and a simultaneous parallel foreign exchange rates shift in the foreign exchange rates of each currency by 10%.
The following analysis is based on the gross exposure as of the relevant balance sheet dates, which could affect the income statement. There is no exposure to the income statement on account of translation of financial statements of consolidated foreign entities. Furthermore, the exposure as indicated below is mitigated by some of the derivative contracts entered into by the Company as disclosed at clause (iv) below.
The following table sets forth information relating to foreign currency exposure (other than risk arising from derivatives disclosed at clause (iv) below) as at March 31, 2018:
(` in crores)
U.S. dollar Euro Chinese Renminbi
GBP Japanese Yen
Others 1 Total
(a) Financial assets 13,531.07 12,817.17 4,997.72 1,511.50 475.02 4,165.24 37,497.72
(b) Financial liabilities 36,909.10 31,192.69 5,398.91 6,371.66 545.65 3,538.95 83,956.96
1 Others mainly include currencies such as the Russian rouble, Singapore dollars, Swiss franc, Australian dollars, South African rand, Thai baht and Korean won.
10% appreciation/depreciation of the respective foreign currencies with respect to functional currency of the Company would result in increase/decrease in the Company’s net income before tax by approximately ` 3,749.77 crores for financial assets and decrease/increase in Company’s net income before tax by approximately ` 8,395.70 crores for financial liabilities respectively for the year ended March 31, 2018.
The following table set forth information relating to foreign currency exposure (other than risk arising from derivatives disclosed at clause (iv) below) as at March 31, 2017:
U.S. dollar Euro Chinese Renminbi
Japanese Yen
Others 2 Total
(a) Financial assets 10,498.74 9,862.42 4,000.96 127.98 4,432.32 28,922.42
(b) Financial liabilities 37,547.87 21,301.83 3,399.19 538.22 2,939.25 65,726.36
(Note: The impact is indicated on the income/loss before tax basis).
(b) Interest rate risk
Interest rate risk is measured by using the cash flow sensitivity for changes in variable interest rates. Any movement in the reference rates could have an impact on the Company’s cash flows as well as costs.
The Company is subject to variable interest rates on some of its interest bearing liabilities. The Company’s interest rate exposure is mainly related to debt obligations. The Company also uses a mix of interest rate sensitive financial instruments to manage the liquidity and fund requirements for its day to day operations like short term non-convertible bonds and short term loans.
In its financing business, the Company enters into transactions with customers which primarily result in receivables at fixed rates. In order to manage this risk, the Company has a policy to match funding in terms of maturities and interest rates and also for certain part of the portfolio, the Company does not match funding with maturities, in order to take advantage of market opportunities.
NOTES FORMING PART OF CONSOLIDATED FINANCIAL STATEMENTS
32773rd Annual Report 2017-18
INTEGRATED REPORT 1-65 STATUTORY REPORTS 66-184 FINANCIAL STATEMENTS 185-353

The Company also enters into arrangements of securitization of receivables in order to reduce the impact of interest rate movements. Further, Company also enters into interest rate swap contracts with banks to manage its interest rate risk.
As at March 31, 2018 and 2017 financial liability of ` 21,018.28 crores and ` 18,928.36 crores, respectively, was subject to variable interest rates. Increase/decrease of 100 basis points in interest rates at the balance sheet date would result in an impact (decrease/increase in case of net income) of ` 210.18 crores and ` 189.28 crores on income for the year ended March 31, 2018 and 2017, respectively.
The model assumes that interest rate changes are instantaneous parallel shifts in the yield curve. Although some assets and liabilities may have similar maturities or periods to re-pricing, these may not react correspondingly to changes in market interest rates. Also, the interest rates on some types of assets and liabilities may fluctuate with changes in market interest rates, while interest rates on other types of assets may change with a lag.
The risk estimates provided assume a parallel shift of 100 basis points interest rate across all yield curves. This calculation also assumes that the change occurs at the balance sheet date and has been calculated based on risk exposures outstanding as at that date. The period end balances are not necessarily representative of the average debt outstanding during the period.
This analysis assumes that all other variables, in particular foreign currency rates, remain constant. (Note: The impact is indicated on the income/loss before tax basis). The Company uses cross currency interest rate swaps to hedge some of its exposure to interest rate arising from
variable rate foreign currency denominated debt. The Company and its subsidiaries also uses cross currency interest rate swaps to convert some of its foreign currency denominated fixed rate debt to floating rate debt.
( c) Equity Price risk
Equity Price Risk is related to the change in market reference price of the investments in equity securities.
The fair value of some of the Company’s investments in equity securities exposes the Company to equity price risks. In general, these securities are not held for trading purposes. These investments are subject to changes in the market price of securities. The fair value of some of the Companies investment in quoted equity securities as of March 31, 2018 and 2017, was ` 340.48 crores and ` 260.29 crores, respectively. A 10% change in equity prices of available-for-sale securities held as of March 31, 2018 and 2017, would result in an impact of ` 34.05 crores and ` 26.03 crores on equity, respectively.
(Note: The impact is indicated on equity before consequential tax impact, if any).
(ii) Credit risk
Credit risk is the risk of financial loss arising from counterparty failure to repay or service debt according to the contractual terms or obligations. Credit risk encompasses both the direct risk of default and the risk of deterioration of creditworthiness as well as concentration risks.
Financial instruments that are subject to concentrations of credit risk, principally consist of investments in debt instruments, trade receivables, finance receivables, loans and advances and derivative financial instruments. None of the financial instruments of the Company result in material concentrations of credit risks.
Exposure to credit risk
The carrying amount of financial assets represents the maximum credit exposure. The maximum exposure to credit risk was ` 1,03,506.52 crores as at March 31, 2018 and ` 88,716.87 crores as at March 31, 2017, being the total of the carrying amount of balances with banks, short term deposits with banks, trade receivables, finance receivables, margin money and other financial assets excluding equity investments.
Financial assets that are neither past due nor impaired
None of the Company’s cash equivalents, including time deposits with banks, are past due or impaired. Regarding trade receivables and other receivables, and other loans or receivables that are neither impaired nor past due, there were no indications as at March 31, 2018, that defaults in payment obligations will occur.
NOTES FORMING PART OF CONSOLIDATED FINANCIAL STATEMENTS
328

Credit quality of financial assets and impairment loss
The ageing of trade receivables and finance receivables as of balance sheet date is given below. The age analysis have been considered from the due date.
(` in crores)
Trade receivables As at March 31, 2018 As at March 31, 2017
Gross Allowance Net Gross Allowance Net
Period (in months)
(a) Not due 15,951.89 (21.56) 15,930.33 11,943.87 (90.99) 11,852.88
(b) Overdue up to 3 months 3,281.94 (37.15) 3,244.79 1,771.82 (31.98) 1,739.84
( c) Overdue 3-6 months 224.36 (35.48) 188.88 185.93 (25.49) 160.44
(d) Overdue more than 6 months 1,696.78 (1,167.48) 529.30 1 1,551.37 (1,228.98) 322.39
Total 21,154.97 (1,261.67) 19,893.30 15,452.99 (1,377.44) 14,075.55
Trade receivables consist of a large number of various types of customers, spread across geographical areas. Ongoing credit evaluation is performed on the financial condition of these trade receivables and where appropriate, allowance for losses are provided.
1 Trade receivables overdue more than six months include ` 462.22 crores as at March 31, 2018 (` 212.29 crores as at March 31, 2017, outstanding from state government organizations in India, which are considered recoverable.
The Company makes allowances for losses on its portfolio of finance receivable on the basis of expected future collection from receivables. The future collection are estimated on the basis of past collection trend which are adjusted for changes in current circumstances as well as expected changes in collection on account of future with respect to certain macro economic factor like GDP growth, fuel price and inflation.
Finance receivables 2 As at March 31, 2018 As at March 31, 2017
Gross Allowance Net Gross Allowance Net
Period (in months)
(a) Not due 3 23,914.24 (762.15) 23,152.09 18,004.78 (1,604.08) 16,400.70
(b) Overdue up to 3 months 452.63 (15.45) 437.18 298.24 (20.39) 277.85
( c) Overdue more than 3 months 703.88 (411.97) 291.91 2,857.74 (1,973.04) 884.70
Total 25,070.75 (1,189.57) 23,881.18 21,160.76 (3,597.51) 17,563.25
2 Finance receivables originated in India.
3 Allowance in the “Not due” category includes allowance against installments pertaining to impaired finance receivables which have not yet fallen due.
(iii) Liquidity risk
Liquidity risk refers to the risk that the Company cannot meet its financial obligations. The objective of liquidity risk management is to maintain sufficient liquidity and ensure that funds are available for use as per requirements.
The Company has obtained fund and non-fund based working capital lines from various banks. Furthermore, the Company has access to funds from debt markets through commercial paper programs, non-convertible debentures, fixed deposits from public, senior notes and other debt instruments. The Company invests its surplus funds in bank fixed deposit and liquid and liquid plus schemes of mutual funds, which carry no/low mark to market risks. The Company has also invested 15% of the public deposits/non-convertible debentures (taken by the Company) falling due for repayment in the next 12 months in bank deposits, to meet the regulatory norms of liquidity requirements.
NOTES FORMING PART OF CONSOLIDATED FINANCIAL STATEMENTS
32973rd Annual Report 2017-18
INTEGRATED REPORT 1-65 STATUTORY REPORTS 66-184 FINANCIAL STATEMENTS 185-353

The Company also constantly monitors funding options available in the debt and capital markets with a view to maintaining financial flexibility.
The table below provides details regarding the contractual maturities of financial liabilities, including estimated interest payments as at March 31, 2018:
(` in crores)
Financial liabilities Carrying amount
Due in 1st Year
Due in 2nd Year
Due in 3rd to 5th Year
Due after 5th Year
Total contractual cash flows
(a) Trade payables and accep-tances
76,939.83 76,939.83 - - - 76,939.83
(b) Borrowings and interest thereon
90,046.19 31,349.98 14,909.70 40,002.72 16,401.49 102,663.89
( c) Derivative liabilities 8,657.86 6,207.66 2,968.80 1,218.82 120.76 10,516.04
(d) Other financial liabilities 13,296.93 13,026.82 153.23 87.48 79.64 13,347.17
Total 188,940.81 127,524.29 18,031.73 41,309.02 16,601.89 203,466.93
Contractual maturities of borrowings includes cash flows relating to collateralised debt obligations. This represents the amount received against the transfer of finance receivables in securitisation transactions and/or direct assignments, which do not qualify for derecognition. The liability of the Company in such cases is limited to the extent of credit enhancements provided. The contractual maturities of such collateralised debt obligations are as follows:
Financial liabilities Carrying amount
Due in 1st Year
Due in 2nd Year
Due in 3rd to 5th Year
Due after 5th Year
Total contractual cash flows
Collateralised debt obligations 1,320.58 728.09 592.49 - - 1,320.58
The table below provides details regarding the contractual maturities of financial liabilities, including estimated interest payments as at March 31, 2017:
Financial liabilities Carrying amount
Due in 1st Year
Due in 2nd Year
Due in 3rd to 5th Year
Due after 5th Year
Total contractual cash flows
(a) Trade payables 57,698.33 57,698.33 - - - 57,698.33
(b) Acceptances 4,834.24 4,834.24 - - - 4,834.24
( c) Borrowings and interest thereon
79,547.22 21,733.53 13,055.95 39,614.01 19,358.94 93,762.43
(d) Derivative liabilities 25,517.52 15,791.87 10,470.86 6,052.83 1.15 32,316.71
(e) Other financial liabilities 6,468.79 6,318.78 30.53 69.78 78.89 6,497.98
Total 174,066.10 106,376.75 23,557.34 45,736.62 19,438.98 195,109.69
The contractual maturities of such collateralised debt obligations are as follows:
Financial liabilities Carrying amount
Due in 1st Year
Due in 2nd Year
Due in 3rd to 5th Year
Due after 5th Year
Total contractual cash flows
Collateralised debt obligations 1,027.38 629.67 367.07 110.82 - 1,107.56
NOTES FORMING PART OF CONSOLIDATED FINANCIAL STATEMENTS
330

(iv) Derivative financial instruments and risk management
The Company has entered into variety of foreign currency, interest rates and commodity forward contracts and options to manage its exposure to fluctuations in foreign exchange rates, interest rates and commodity price risk. The counter-party is generally a bank. These financial exposures are managed in accordance with the Company’s risk management policies and procedures.
The Company also enters into interest rate swaps and interest rate currency swap agreements, mainly to manage exposure on its fixed rate or variable rate debt. The Company uses interest rate derivatives or currency swaps to hedge exposure to exchange rate fluctuations on principal and interest payments for borrowings denominated in foreign currencies.
Specific transactional risks include risks like liquidity and pricing risks, interest rate and exchange rate fluctuation risks, volatility risks, counter-party risks, settlement risks and gearing risks.
Fair value of derivative financial instruments are determined using valuation techniques based on information derived from observable market data.
The fair value of derivative financial instruments is as follows:
(` in crores)
As at March 31, 2018
As at March 31, 2017
(a) Foreign currency forward exchange contracts and options (3,708.93) (21,685.18)
(b) Commodity Derivatives (0.24) 385.66
( c) Others including interest rate and currency swaps 374.34 67.52
Total (3,334.83) (21,232.00)
The gain/loss on commodity derivative contracts, recognised in the statement of Profit and Loss was ` 214.63 crores gain and ` 918.40 crores gain for the years ended March 31, 2018 and 2017, respectively.
Foreign exchange sensitivity in respect of company’s exposure to forward and option contract:
As at March 31, 2018
As at March 31, 2017
10% Depreciation of foreign currency:
Gain/(loss) in hedging reserve 4,532.90 12,194.42
Gain/(loss) in statement of Profit and loss 213.42 (90.35)
10% Appreciation of foreign currency:
Gain/(loss) in hedging reserve (5,335.38) (13,011.69)
Gain/(loss) in statement of Profit and loss (134.65) 816.50
In respect of the Company’s commodity derivative contracts, a 10% depreciation/appreciation of all commodity prices underlying such contracts, would have resulted in an approximate (loss)/gain of (` 461.42) crores/ ` 461.42 crores and (`461.24) / `461.24 crores in the statement of profit and loss for the years ended March 31, 2018 and 2017, respectively.
Exposure to gain/loss on derivative instruments offset to some extent the exposure to foreign currency risk, interest rate risk as disclosed above.
(Note: The impact is indicated on the income/loss before tax basis).
NOTES FORMING PART OF CONSOLIDATED FINANCIAL STATEMENTS
33173rd Annual Report 2017-18
INTEGRATED REPORT 1-65 STATUTORY REPORTS 66-184 FINANCIAL STATEMENTS 185-353

40. Disclosure of financial instruments designated as hedging instrument in cash flow hedge The details of cash flow hedges entered into by one of the Company’s subsidiaries to hedge the currency fluctuation of its functional
currency (GBP) against foreign currencies to hedge future cash flows arising from revenue and repayment of borrowing cost of materials is as follows:
Outstanding contracts Average strike rate Nominal amounts Fair value£ in million ` in crores
As at March 31, 2018
As at March 31, 2017
As at March 31, 2018
As at March 31, 2017
As at March 31, 2018
As at March 31, 2017
Fx ForwardsCash flow hedges - USDSell - USD/ Buy - GBP<1 year 0.659 0.667 1,724.9 2,767.7 (1,148.02) (4,228.80)Between 1-5 years 0.676 0.668 2,659.9 4,850.8 (581.39) (6,228.30)
Cash flow hedges - Chinese YuanSell - Chinese Yuan / Buy - GBP<1 year 0.102 0.100 2,974.0 3,435.7 (2,774.27) (3,874.38)Between 1-5 years 0.105 0.102 2,581.9 4,132.3 (767.81) (2,096.60)
Cash flow hedges -EuroBuy - Euro / Sell - GBP<1 year 0.817 0.795 1,602.1 1,574.1 1,200.62 977.50 Between 1-5 years 0.868 0.804 2,818.8 2,327.5 1,108.34 1,464.62
Cash flow hedges - Other<1 year - - 1,748.3 1,675.7 (567.55) (2,483.39)Between 1-5 years - - 1,559.7 1,829.5 370.98 (1,459.77)
Fx OptionsCash flow hedges - USDSell - USD/ Buy - GBP<1 year 0.743 0.760 48.3 11.4 25.84 - Between 1-5 years 0.706 0.728 258.4 127.4 113.51 5.66
Cash flow hedges - Chinese YuanSell - Chinese Yuan / Buy - GBP<1 year 0.103 0.105 10.3 10.5 - - Between 1-5 years - 0.103 - 10.3 - 1.62
Cash flow hedges -EuroBuy - Euro / Sell - GBP<1 year 0.963 0.956 534.3 186.5 (23.07) (28.32)Between 1-5 years 0.969 0.969 1,560.4 1,588.9 105.20 (158.60)
Cross currency interest rate swaps Buy - USD / Sell - GBPBetween 1-5 years 0.759 - 379.6 - (258.40) -
USD denominated Bonds 0.673 471.0 (4,614.23)< 1 year 0.736 735.8 (6,561.44)Between 1-5 years - 0.803 - 963.0 - (7,964.60)
NOTES FORMING PART OF CONSOLIDATED FINANCIAL STATEMENTS
332

41. Segment reporting
The Company primarily operates in the automotive segment. The automotive segment includes all activities relating to development, design, manufacture, assembly and sale of vehicles including financing thereof, as well as sale of related parts and accessories. The Company provides financing for vehicles sold by dealers in India. The vehicle financing is intended to drive sale of vehicles by providing financing to the dealers’ customers and as such is an integral part of automotive business. The financing activity is assessed as an integral part of the overall automotive business. The operating results of the financing activity does not include all of the interest or cost of funds employed for the purposes of financing, and therefore the operating results of this activity is not used to make decisions about resources to be allocated or to asses performance.
The Company’s products mainly include Tata and other brand vehicles and Jaguar and Land Rover vehicles.
As at March 31, 2018, the automotive segment is bifurcated into the following :
Tata and other brand vehicles, including financing thereof and Jaguar Land Rover.
The Company’s other segment comprises primarily activities relating to information technology or IT services, machine tools and factory automation solutions.
The segment information presented is in accordance with the accounting policies adopted for preparing the consolidated financial statements of the Company. Segment revenues, expenses and results include inter-segment transfers. Such transfers are undertaken either at competitive market prices charged to unaffiliated customers for similar goods or at contracted rates. These transfers are eliminated on consolidation.
(` in crores)
For the year ended /as at March 31, 2018Automotive and related activity
Tata and other brand vehicles
(including financing thereof) 1
Jaguar Land Rover
Intra-segment
eliminations
Total Others Inter-segment
eliminations
Total
Revenues:External revenue 66,469.13 226,964.86 - 293,433.99 1,975.35 - 295,409.34 Inter-segment/intra-segment revenue
151.25 - (131.91) 19.34 1,277.01 (1,296.35) -
Total revenues 66,620.38 226,964.86 (131.91) 293,453.33 3,252.36 (1,296.35) 295,409.34 Earnings before other income, finance cost, foreign exchange gain / (loss) (net), exceptional items and tax
2,103.58 9,408.80 - 11,512.38 422.32 (147.19) 11,787.51
Reconciliation to Profit before tax:Other income 888.89 Finance costs (4,681.79)Foreign exchange gain/(loss) (net)
1,185.28
Exceptional items 1,975.14 Profit before tax 11,155.03 Depreciation and amortisation expense
3,240.38 18,257.09 - 21,497.47 56.12 - 21,553.59
Capital expenditure 3,512.92 39,093.99 - 42,606.90 84.16 (18.78) 42,672.29Share of profit/(loss) of equity accounted investees (net)
30.18 2,138.92 - 2,169.10 109.16 - 2,278.26
NOTES FORMING PART OF CONSOLIDATED FINANCIAL STATEMENTS
33373rd Annual Report 2017-18
INTEGRATED REPORT 1-65 STATUTORY REPORTS 66-184 FINANCIAL STATEMENTS 185-353

For the year ended /as at March 31, 2018Automotive and related activity
Tata and other brand vehicles
(including financing thereof) 1
Jaguar Land Rover
Intra-segment
eliminations
Total Others Inter-segment
eliminations
Total
Segment assets 73,398.85 199,513.67 - 272,912.52 13.26 (886.02) 272,039.76
Assets classified as held for sale
223.33 - - 223.33 2,756.91 (395.05) 2,585.19
Investment in equity accounted investees
385.50 4,502.39 - 4,887.89 - - 4,887.89
Investment in equity accounted investees (held for sale)
- - - - 497.35 - 497.35
Reconciliation to total assets:
Other Investments 15,427.51
Current and non-current tax assets (net)
1,108.81
Deferred tax assets (net) 4,158.70
Other unallocated financial assets 2
30,645.30
Total assets 331,350.51
Segment liabilities 20,298.72 107,864.26 - 128,162.98 84.01 (315.22) 127,931.77
Liabilities classified as held-for-sale
- - - - 1,070.18 - 1,070.18
Reconciliation to total liabilities:
Borrowings 88,950.47
Current tax liabilities (net) 1,559.07
Deferred tax liabilities (net)
6,125.80
Other unallocated financial liabilities 3
9,760.25
Total liabilities 235,397.54
1 Tata and other brand vehicles include Tata Daewoo and Fiat brand vehicles.
2 Includes interest-bearing loans and deposits and accrued interest income.
3 Includes interest accrued and other interest bearing liabilities.
NOTES FORMING PART OF CONSOLIDATED FINANCIAL STATEMENTS
334

(` in crores)
For the year ended /as at March 31, 2017
Automotive and related activity
Tata and other brand vehicles
(including financing thereof) 1
Jaguar Land Rover
Intra-segment
eliminations
Total Others Inter-segment
eliminations
Total
Revenues:
External revenue 56,292.59 216,388.82 - 272,681.41 1,810.71 - 274,492.12
Inter-segment/intra-segment revenue
156.19 - (145.19) 11.00 1,373.35 (1,384.35) -
Total revenues 56,448.78 216,388.82 (145.19) 272,692.41 3,184.06 (1,384.35) 274,492.12
Earnings before other income, finance cost, foreign exchange gain / (loss) (net), exceptional items and tax
207.05 15,117.07 - 15,324.12 471.90 (202.22) 15,593.80
Reconciliation to Profit before tax:
Other income 754.54
Finance costs (4,238.01)
Foreign exchange gain/(loss) (net)
(3,910.10)
Exceptional items 1,114.56
Profit before tax 9,314.79
Depreciation and amortisation expense
3,157.71 14,650.51 - 17,808.22 96.77 - 17,904.99
Capital expenditure 4,018.58 27,783.03 - 31,801.61 124.12 (174.99) 31,750.74
Share of profit/(loss) of equity accounted investees (net)
25.21 1,384.37 - 1,409.58 83.42 - 1,493.00
Segment assets 64,890.05 154,654.50 - 219,544.55 2,205.13 (1,023.72) 220,725.96
Investment in equity accounted investees
377.31 3,835.72 - 4,213.03 392.98 - 4,606.01
Reconciliation to total assets:
Other investments 15,731.91
Current and non-current income tax assets
1,195.67
Deferred income taxes 4,457.34
Other unallocated financial assets 2
27,037.47
Total assets 273,754.36
NOTES FORMING PART OF CONSOLIDATED FINANCIAL STATEMENTS
33573rd Annual Report 2017-18
INTEGRATED REPORT 1-65 STATUTORY REPORTS 66-184 FINANCIAL STATEMENTS 185-353

For the year ended /as at March 31, 2017
Automotive and related activity
Tata and other brand vehicles
(including financing thereof) 1
Jaguar Land Rover
Intra-segment
eliminations
Total Others Inter-segment
eliminations
Total
Segment liabilities 17,548.81 89,478.99 - 107,027.80 747.75 (250.44) 107,525.11
Reconciliation to total liabilities:
Borrowings 78,603.98
Current income tax liabilities
1,392.58
Deferred income taxes 1,174.00
Other unallocated financial liabilities 3
26,543.63
Total liabilities 215,239.30
1 Tata and other brand vehicles include Tata Daewoo and Fiat brand vehicles.
2 Includes interest-bearing loans and deposits and accrued interest income.
3 Includes interest accrued and other interest bearing liabilities.
Entity-wide disclosures
Information concerning principal geographic areas is as follows:
Net sales to external customers by geographic area by location of customers:(` in crores)
Year ended March 31, 2018
Year ended March 31, 2017
(a) India 59,593.18 47,101.21
(b) United States of America 44,991.88 42,935.31
( c) United Kingdom 51,356.29 50,588.18
(d) Rest of Europe 46,393.27 47,122.48
(e) China 43,394.13 41,369.40
(f) Rest of the World 49,680.59 45,375.54
Total 295,409.34 274,492.12
Non-current assets (Property, plant and equipment, Intangible assets, other non-current assets and Goodwill) by geographic area:
As At March 31, 2018
As at March 31, 2017
(a) India 27,222.38 28,347.32
(b) United States of America 299.00 251.84
( c) United Kingdom 124,201.80 96,966.41
(d) Rest of Europe 7,242.06 1,306.66
(e) China 166.11 91.04
(f) Rest of the World 2,697.73 3,005.75
Total 161,829.08 129,969.02
NOTES FORMING PART OF CONSOLIDATED FINANCIAL STATEMENTS
336

Information about product revenues:(` in crores)
Year ended March 31, 2018
Year ended March 31, 2017
(a) Tata and Fiat vehicles 59,027.59 48,069.14
(b) Tata Daewoo commercial vehicles 4,828.79 5,793.30
( c) Finance revenues 2,604.03 2,429.23
(d) Jaguar Land Rover vehicles 226,964.86 216,388.82
(e) Others 1,984.07 1,811.63
TOTAL 295,409.34 274,492.12
42. Related-party transactions
The Company’s related parties principally consist of Tata Sons Limited, subsidiaries and joint arrangements of Tata Sons Limited, the Company’s associates and their subsidiaries, joint operations and joint ventures of the Company. The Company routinely enters into transactions with these related parties in the ordinary course of business. The Company enters into transactions for sale and purchase of products and services with its associates, joint operations and joint ventures. Transactions and balances with its own subsidiaries are eliminated on consolidation.
The following table summarizes related-party transactions and balances for the year ended/as at March 31, 2018:
Associates and its
subsidiaries
Joint ventures
Joint operations
Tata Sons Ltd, its
subsidiaries and joint ventures
Total
Purchase of products 2,605.70 - 3,163.10 171.30 5,940.10
Sale of products 201.60 6,008.21 545.49 709.10 7,464.40
Services received 8.90 550.09 0.16 1,735.30 2,294.45
Services rendered 19.00 1,207.72 4.34 24.10 1,255.16
Bills discounted - - - 4,135.03 4,135.03
Purchase of property, plant and equipment 62.40 - - 0.20 62.60
Purchase of Investments - 2.50 - - 2.50
Interest (income)/expense, dividend (income)/paid, (net)
(9.50) (1,764.49) (4.60) 26.30 (1,752.29)
Finance taken (including loans and equity) 489.00 - - - 489.00
Finance taken, paid back (including loans and equity)
489.00 - - - 489.00
Amounts receivable in respect of loans and interest thereon
- - - 4.00 4.00
Amounts payable in respect of loans and interest thereon
56.00 - - 4.80 60.80
Trade and other receivables 63.30 1,037.14 (0.07) 151.10 1,251.47
Trade payables 149.60 0.25 184.88 335.70 670.43
Acceptances - - - 220.16 220.16
Deposits given as security - - - 3.00 3.00
Note: With the introduction of GST from July 1, 2017, the related party transactions reported does not include indirect tax component. The previous period figures to that extent are not comparable.
NOTES FORMING PART OF CONSOLIDATED FINANCIAL STATEMENTS
33773rd Annual Report 2017-18
INTEGRATED REPORT 1-65 STATUTORY REPORTS 66-184 FINANCIAL STATEMENTS 185-353

The following table summarizes related-party transactions included in the consolidated financial statements for the year ended as at March 31, 2017:
(` in crores)
Associates and its
subsidiaries
Joint ventures
Joint operations
Tata Sons Ltd, its
subsidiaries and joint ventures
Total
Purchase of products 2,058.52 21.30 2,275.75 66.84 4,422.41 Sale of products 250.49 4,983.53 323.72 461.50 6,019.24 Services received 10.98 1,088.57 0.07 1,970.15 3,069.77 Services rendered 16.64 771.88 16.12 130.13 934.77 Bill discounted - - - 3,202.77 3,202.77 Purchase of property, plant and equipment 13.79 - - 0.11 13.90 Interest (income)/expense, dividend (income)/paid, (net)
(11.10) (594.36) (12.12) 64.26 (553.32)
Finance given (including loans and equity) - - - 30.30 30.30 Finance given, taken back (including loans and equity)
- - 132.50 60.30 192.80
Finance taken (including loans and equity) 329.00 - - 589.63 918.63 Finance taken, paid back (including loans and equity)
300.00 - - 626.95 926.95
Amounts receivable in respect of loans and interest thereon
- - - 9.33 9.33
Amounts payable in respect of loans and interest thereon
56.00 - - 105.55 161.55
Trade and other receivables 49.52 565.86 - 160.01 775.39 Trade payables 39.76 22.63 123.96 471.11 657.46 Conversion of optionally convertible preference shares into equity shares
160.00 - - - 160.00
Deposits given as security - - - 3.00 3.00
Details of significant transactions are given below:
Name of Related party Nature of relationship Year ended March 31, 2018
Year ended March 31, 2017
i) Services rendered Chery Jaguar Land Rover Automotive Company
LimitedJoint venture
1,207.72 1,087.57 ii) Bill discounted Tata Capital Tata Sons Ltd, its subsidiaries and
joint ventures 4,135.03 3,202.77
Compensation of key management personnel:
Year ended March 31, 2018
Year ended March 31, 2017
Short-term benefits 79.84 69.31
Post-employment benefits* 1.76 18.47
The compensation of CEO and Managing Director is ` 26.42 crores and ` 22.55 crores for the year ended March 31, 2018 and 2017, respectively.
NOTES FORMING PART OF CONSOLIDATED FINANCIAL STATEMENTS
338

The compensation of CEO at Jaguar Land Rover is ` 40.08 crores and ` 55.17 crores for the year ended March 31, 2018 and 2017, respectively.
* Excludes provision for encashable leave and gratuity for certain key management personnel as a separate actuarial valuation is not available.
Other transactions with key management personnel:
Year ended March 31, 2018
Year ended March 31, 2017
Sale of products - 0.81
Dividend paid - - **
** less than ` 50,000/-
Refer note 36 for information on transactions with post employment benefit plan.
43. Earnings per Share (“EPS”)(` in crores)
Year ended March 31, 2018
Year ended March 31, 2017
(a) Profit / (Loss) for the period ` crores 8,988.91 7,454.36
(b) The weighted average number of Ordinary shares for Basic EPS Nos. 2,887,348,357 2,887,218,310
( c) The weighted average number of 'A' Ordinary shares for Basic EPS Nos. 508,502,336 508,483,714
(d) The nominal value per share (Ordinary and 'A' Ordinary) ` 2.00 2.00
(e) Share of profit / (loss) for Ordinary shares for Basic EPS ` crores 7,638.57 6,333.80
(f) Share of profit / (loss) for 'A' Ordinary shares for Basic EPS* ` crores 1,350.34 1,120.56
(g) Earnings Per Ordinary share (Basic) ` 26.46 21.94
(h) Earnings Per 'A' Ordinary share (Basic) ` 26.56 22.04
(i) Profit after tax for Diluted EPS ` crores 8,988.91 7,454.36
(j) The weighted average number of Ordinary shares for Basic EPS Nos. 2,887,348,357 2,887,218,310
(k) Add: Adjustment for Options relating to warrants and shares held in abeyance
Nos. 494,469 599,766
(l) The weighted average number of Ordinary shares for Diluted EPS Nos. 2,887,842,826 2,887,818,076
(m) The weighted average number of 'A' Ordinary shares for Basic EPS Nos. 508,502,336 508,483,714
(n) Add: Adjustment for 'A' Ordinary shares held in abeyance Nos. 233,774 252,396
(o) The weighted average number of 'A' Ordinary shares for Diluted EPS Nos. 508,736,110 508,736,110
(p) Share of profit for Ordinary shares for Diluted EPS ` crores 7,638.23 6,333.52
(q) Share of profit for 'A' Ordinary shares for Diluted EPS* ` crores 1,350.68 1,120.84
( r) Earnings Per Ordinary share (Diluted) ` 26.45 21.93
(s) Earnings Per 'A' Ordinary share (Diluted) ` 26.55 22.03
* ‘A’ Ordinary shareholders are entitled to receive dividend at 5 percentage points more than the aggregate rate of dividend determined by the Company on Ordinary shares for the financial year.
NOTES FORMING PART OF CONSOLIDATED FINANCIAL STATEMENTS
33973rd Annual Report 2017-18
INTEGRATED REPORT 1-65 STATUTORY REPORTS 66-184 FINANCIAL STATEMENTS 185-353

44. Additional information as required under Schedule III to the Companies Act, 2013, of enterprises consolidated as subsidiary / Associates / Joint Ventures
Name of enterprises As % of consolidated
net assets
Net Assets (total assets
minus total liabilities)
As % of consolidated profit or loss
Share of profit or loss
As % of consolidated
OCI
Share of OCI
As % of comprehensive
income
Amount
Parent Tata Motors Ltd 20.63% 19,683.32 (14.09)% (1,266.19) 0.14% 42.18 (3.18)% (1,224.01)
Subsidiaries IndianTAL Manufacturing Solutions Ltd
0.10% 98.39 0.15% 13.39 0.00% (0.42) 0.03% 12.97
Concorde Motors (India) Ltd 0.01% 11.22 (1.45)% (130.24) 0.00% 0.07 (0.34)% (130.17)Tata Motors Finance Ltd 1.85% 1,764.43 1.50% 135.08 0.03% 9.83 0.38% 144.91 Tata Technologies Ltd 0.76% 721.25 1.97% 177.47 (0.01)% (1.51) 0.46% 175.96 Tata Motors Insurance Broking & Advisory Services Ltd
0.03% 27.48 0.16% 14.13 0.00% (0.43) 0.04% 13.70
TML Distribution Company Ltd 0.37% 354.44 0.56% 50.15 0.00% 0.23 0.13% 50.38 Tata Motors Finance Holdings Ltd
3.45% 3,292.77 (0.20)% (18.28) 0.00% (0.08) (0.05)% (18.36)
Tata Motors Financial Solutions Ltd
1.25% 1,196.34 17.19% 1,545.13 0.00% 0.68 4.01% 1,545.81
Tata Marcopolo Motors Ltd 0.13% 120.77 0.11% 9.68 0.00% 0.34 0.03% 10.02 Jaguar Land Rover India Limited 0.29% 274.42 (0.04)% (3.30) 0.00% (0.10) (0.01)% (3.40)
ForeignTata Daewoo Commercial Vehicle Co. Ltd
2.66% 2,539.86 2.26% 202.91 0.38% 111.88 0.82% 314.79
Tata Motors European Technical Centre Plc
0.35% 336.00 0.33% 29.88 0.00% - 0.08% 29.88
Tata Motors (SA) (Proprietary) Ltd
0.02% 15.19 0.02% 1.83 0.00% - 0.00% 1.83
Tata Motors (Thailand) Ltd (0.53)% (510.36) (1.48)% (132.77) 0.00% (0.09) (0.34)% (132.86)TML Holdings Pte Ltd, Singapore
9.99% 9,536.74 1.38% 123.78 (1.29)% (379.80) (0.66)% (256.02)
Tata Hispano Motors Carrocera S.A
(0.80)% (765.52) (0.10)% (9.09) 0.00% - (0.02)% (9.09)
Tata Hispano Motors Carroceries Maghreb
(0.03)% (29.27) (0.05)% (4.38) 0.00% - (0.01)% (4.38)
Trilix S.r.l 0.05% 48.78 (0.13)% (11.64) 0.00% - (0.03)% (11.64)Tata Precision Industries Pte Ltd 0.00% 0.86 0.00% (0.13) 0.00% - 0.00% (0.13)PT Tata Motors Indonesia 0.22% 210.10 (0.03)% (2.92) 0.00% 0.04 (0.01)% (2.88)INCAT International Plc. 0.05% 44.21 0.00% (0.26) 0.02% 5.45 0.01% 5.20 Tata Technologies Inc. (Including Midwest Managed Services Inc.which got merged into Tata Technologies Inc. w.e.f. Feb 28, 2018)
0.37% 353.74 0.05% 4.84 0.01% 1.84 0.02% 6.69
Tata Technologies de Mexico, S.A. de C.V.
0.01% 6.34 0.01% 0.53 0.00% 0.14 0.00% 0.67
Cambric Limited, Bahamas 0.02% 19.07 0.00% (0.22) 0.00% - 0.00% (0.22)Cambric UK Limited (Dissolved w.e.f. May 23, 2017)
0.00% - 0.00% - 0.00% 0.43 0.00% 0.43
Cambric GmbH (in process of liquidation)
0.00% 1.96 0.00% (0.31) 0.00% 0.30 0.00% (0.01)
Tata Technolgies SRL, Romania (erstwhile Cambric Consulting SRL was renamed w.e.f February 4, 2015)
0.03% 27.03 0.07% 6.55 0.01% 2.37 0.02% 8.93
Tata Manufacturing Technologies Consulting (Shanghai) Limited
0.04% 38.91 0.11% 10.24 0.01% 3.10 0.03% 13.33
Tata Technologies Europe Limited
0.75% 718.18 0.65% 58.63 0.33% 97.79 0.41% 156.42
Escenda Engineering AB (Tata Technologies Europe Limited acquired 100% stake in the Company w.e.f. May 1, 2017)
0.00% (0.17) (0.12)% (10.86) 0.00% (1.33) (0.03)% (12.19)
NOTES FORMING PART OF CONSOLIDATED FINANCIAL STATEMENTS
340

Name of enterprises As % of consolidated
net assets
Net Assets (total assets
minus total liabilities)
As % of consolidated profit or loss
Share of profit or loss
As % of consolidated
OCI
Share of OCI
As % of comprehensive
income
Amount
INCAT GmbH (in process of liquidation)
0.02% 18.12 0.01% 0.47 0.01% 2.55 0.01% 3.02
Tata Technologies (Thailand) Limited
0.01% 10.10 0.02% 2.07 0.00% 0.80 0.01% 2.87
Tata Technologies ESOP Trust 0.00% 2.68 0.00% 0.20 0.00% - 0.00% 0.20 Tata Technologies Europe Limited ESOP Trust
0.01% 10.93 0.01% 1.32 0.00% 0.02 0.00% 1.34
TATA Technologies Pte Ltd. 0.76% 726.17 (0.03)% (2.79) 0.01% 3.78 0.00% 0.99 Jaguar Land Rover Automotive plc
22.61% 21,572.85 47.66% 4,284.31 0.00% - 11.12% 4,284.31
Jaguar Land Rover Limited (previously Jaguar Cars Limited)
100.56% 95,959.27 60.71% 5,456.95 85.05% 25,121.23 79.37% 30,578.18
Jaguar Land Rover Holdings Limited(formally known as Land Rover)
43.44% 41,456.15 (0.64)% (57.76) 0.00% - (0.15)% (57.76)
JLR Nominee Company Limited (Formally known as Jaguar Land Rover Exports Limited, formerly Jaguar Cars Exports Limited)
0.00% - 0.00% - 0.00% - 0.00% -
Jaguar Land Rover (South Africa) Holdings Limited
1.35% 1,290.38 1.93% 173.52 0.00% - 0.45% 173.52
Jaguar Cars Limited 0.00% - 0.00% - 0.00% - 0.00% - Land Rover Exports Limited (Business transferred to Jaguar Land Rover Exports Ltd)
0.00% - 0.00% - 0.00% - 0.00% -
The Lanchester Motor Company Limited
0.00% - 0.00% - 0.00% - 0.00% -
The Daimler Motor Company Limited
0.01% 13.84 0.00% - 0.00% - 0.00% -
S S Cars Limited 0.00% - 0.00% - 0.00% - 0.00% - Daimler Transport Vehicles Limited
0.00% - 0.00% - 0.00% - 0.00% -
The Jaguar Collection Limited 0.00% - 0.00% - 0.00% - 0.00% - Jaguar Land Rover Pension Trustees Limited
0.00% - 0.00% - 0.00% - 0.00% -
Jaguar Cars (South Africa) (Pty) Ltd
0.00% - 0.00% - 0.00% - 0.00% -
Jaguar Land Rover Slovakia s.r.o.
2.82% 2,693.47 0.72% 64.86 0.31% 91.83 0.41% 156.69
Jaguar Racing Limited 0.01% 7.60 0.04% 3.61 0.00% - 0.01% 3.61 InMotion Ventures Limited (0.07)% (67.63) (0.12)% (10.64) 0.00% - (0.03)% (10.64)InMotion Ventures 1 Limited 0.00% - 0.00% - 0.00% - 0.00% - InMotion Ventures 2 Limited 0.00% - 0.00% - 0.00% - 0.00% - InMotion Ventures 3 Limited 0.00% - 0.00% - 0.00% - 0.00% - Land Rover Ireland (Services) Limited
0.00% 1.62 0.02% 1.51 (0.01)% (1.72) 0.00% (0.21)
Spark44 (JV) Ltd 0.27% 261.18 0.59% 52.80 0.05% 14.57 0.17% 67.37 Spark44 Limited (London & Birmingham)
0.00% - 0.00% - 0.00% - 0.00% -
Spark44 Pty Ltd (Sydney) 0.00% 2.71 0.02% 1.39 0.00% - 0.00% 1.39 Spark44 GmbH (Frankfurt) 0.02% 15.19 0.06% 5.27 0.00% - 0.01% 5.27 Spark44 GLLC (LA & NYC) 0.04% 36.07 0.07% 6.65 0.00% - 0.02% 6.65 Spark44 Limited (Shanghai) 0.02% 22.05 0.06% 5.72 0.00% - 0.01% 5.72 Spark44 Middle East DMCC (Dubai)
0.04% 35.96 0.24% 21.59 0.00% - 0.06% 21.59
Spark44 Demand Creation Partners Pte Ltd (Mumbai)
0.00% - 0.00% - 0.00% - 0.00% -
Spark44 Pte Ltd (Singapore) 0.00% 1.70 0.01% 1.18 0.00% - 0.00% 1.18 Spark44 Communicacions SL (Madrid)
0.00% 2.46 0.02% 1.70 0.00% - 0.00% 1.70
Spark44 SRL (Rome) 0.00% 0.15 0.00% 0.05 0.00% - 0.00% 0.05 Spark44 Limited (Seoul) 0.00% 4.37 0.02% 1.95 0.00% - 0.01% 1.95 Spark44 K.K. (Tokyo) 0.00% 3.30 0.02% 1.50 0.00% - 0.00% 1.50 Spark44 Canada Inc (Toronto) 0.03% 28.03 0.06% 5.19 0.00% - 0.01% 5.19 Spark44 South Africa (Pty) Limited
0.00% 1.18 0.00% 0.44 0.00% - 0.00% 0.44
NOTES FORMING PART OF CONSOLIDATED FINANCIAL STATEMENTS
34173rd Annual Report 2017-18
INTEGRATED REPORT 1-65 STATUTORY REPORTS 66-184 FINANCIAL STATEMENTS 185-353

Name of enterprises As % of consolidated
net assets
Net Assets (total assets
minus total liabilities)
As % of consolidated profit or loss
Share of profit or loss
As % of consolidated
OCI
Share of OCI
As % of comprehensive
income
Amount
Limited Liability Company Jaguar Land Rover (Russia)
0.85% 812.28 2.00% 179.67 0.00% - 0.47% 179.67
Jaguar Land Rover (China) Investment Co Ltd (previously Jaguar Land Rover Automotive Trading (Shanghai) Co. Ltd )
11.80% 11,263.51 47.39% 4,260.01 0.00% - 11.06% 4,260.01
Shanghai Jaguar Land Rover Automotive Service Co. Ltd
(0.01)% (11.84) (0.11)% (9.70) 0.00% - (0.03)% (9.70)
Jaguar Land Rover Colombia SAS
(0.01)% (6.07) (0.15)% (13.92) 0.00% - (0.04)% (13.92)
Jaguar Landrover Mexico S.A.P I de C.V
0.04% 36.91 0.03% 2.65 0.01% 2.70 0.01% 5.35
Jaguar Landrover Services Mexico S.A C.V
0.00% - 0.00% - 0.00% - 0.00% -
Jaguar Land Rover France SAS 0.04% 39.22 0.12% 10.76 0.00% - 0.03% 10.76 Jaguar Land Rover Portugal-Veiculos e Pecas, Lda.
0.09% 82.95 (0.03)% (2.62) 0.00% - (0.01)% (2.62)
Jaguar Land Rover Espana SL (merged company following the absorption of Jaguar Hispania, S.L.U by Land Rover Espana, S.L.U)
0.56% 534.71 0.35% 31.21 0.00% (0.56) 0.08% 30.65
Jaguar Land Rover Italia SpA 0.64% 609.21 0.85% 76.76 0.00% - 0.20% 76.76 Land Rover Ireland Limited - (no longer a trading NSC)
0.01% 12.51 (0.01)% (1.13) 0.00% - 0.00% (1.13)
Jaguar Land Rover Korea Co. Ltd.
0.13% 125.71 0.95% 84.99 0.00% - 0.22% 84.99
Jaguar Land Rover Deutschland GmbH
0.89% 849.14 1.48% 132.93 0.00% - 0.35% 132.93
Jaguar Land Rover Austria GmbH
0.12% 112.69 0.15% 13.73 0.00% - 0.04% 13.73
Jaguar Land Rover Australia Pty Limited
0.13% 122.88 0.37% 33.54 0.00% - 0.09% 33.54
Jaguar Land Rover North America, LLC.
1.69% 1,614.50 10.39% 933.77 0.03% 7.39 2.44% 941.16
Jaguar Land Rover Japan Limited
0.28% 269.22 0.25% 22.26 0.00% - 0.06% 22.26
Jaguar Land Rover Canada, ULC 0.03% 27.22 0.30% 27.02 0.00% - 0.07% 27.02 Jaguar e Land Rover Brasil Indústria e Comércio de Veículos LTDA
0.53% 510.11 (3.68)% (331.22) 0.00% - (0.86)% (331.22)
Jaguar Land Rover Belux N.V. (following the merger of Jaguar Belux and Land Rover Belux)
0.12% 118.84 0.26% 23.20 0.00% - 0.06% 23.20
Jaguar Land Rover Nederland BV
0.06% 58.49 0.10% 8.68 0.00% - 0.02% 8.68
Jaguar Land Rover (South Africa) (Pty) Limited
0.22% 213.52 0.94% 84.39 0.00% - 0.22% 84.39
Jaguar Land Rover Singapore Pte. Ltd
0.02% 15.59 0.04% 3.87 0.00% - 0.01% 3.87
Jaguar Land Rover Taiwan Company Pte. Ltd
0.01% 6.96 (0.02)% (1.58) 0.00% - 0.00% (1.58)
Tata Daewoo Commercial Vehicle Sales and Distribution Co. Ltd.
0.02% 19.79 (0.05)% (4.29) 0.00% 0.81 (0.01)% (3.48)
PT Tata Motors Distribusi Indonesia
0.02% 16.09 (0.37)% (33.30) 0.00% - (0.09)% (33.30)
TMNL Motor Services Nigeria Ltd (incorporated w.e.f September 2, 2015)
0.00% (0.10) 0.00% (0.03) 0.00% - 0.00% (0.03)
Minority Interests in all subsidiaries IndianConcorde Motors (India) Ltd 0.00% - 0.00% - 0.00% - 0.00% - Tata Marcopolo Motors Ltd (0.06)% (59.08) (0.05)% (4.74) 0.00% (0.17) (0.01)% (4.91)Tata Motors Finance Ltd 0.00% - 0.00% - 0.00% 0.00% - Tata Technologies Ltd (0.42)% (396.67) (0.96)% (86.31) (0.09)% (26.45) (0.29)% (112.76)
NOTES FORMING PART OF CONSOLIDATED FINANCIAL STATEMENTS
342

Name of enterprises As % of consolidated
net assets
Net Assets (total assets
minus total liabilities)
As % of consolidated profit or loss
Share of profit or loss
As % of consolidated
OCI
Share of OCI
As % of comprehensive
income
Amount
0.00% 0.00%Foreign 0.00% 0.00%Tata Motors (SA) (Proprietary) Ltd
(0.01)% (6.08) (0.01)% (0.73) 0.00% (0.79) 0.00% (1.52)
Tata Precision Industries Pte Ltd 0.00% (0.20) 0.00% 0.03 0.00% (0.01) 0.00% 0.02 Spark 44 Ltd (0.08)% (79.40) (0.21)% (19.02) 0.00% - (0.05)% (19.02)Tata Motors (Thailand) Limited 0.03% 27.75 0.07% 5.99 0.01% 2.19 0.02% 8.18 Trilix S.r.l (0.01)% (11.38) 0.03% 2.33 (0.01)% (1.67) 0.00% 0.66
Joint operationsIndianFiat India Automobiles Private Limited
1.77% 1,687.53 2.04% 183.60 0.00% 0.27 0.48% 183.87
Tata Cummins Private Ltd 0.48% 458.44 0.96% 86.63 0.00% 0.78 0.23% 87.41
Adjustments arising out of consolidation
(139.66)% (133,278.66) (109.08)% (9,805.48) 13.57% 4,006.70 (15.05)% (5,798.79)
Sub - total ( a ) 90,042.67 6,710.65 29,117.17 35,827.81
Joint ventures (as per proportionate consolidation / investment as per the equity methodIndianJT Special Vehicle (P) Ltd 0.00% 2.50 0.00% - 0.00% - 0.00% -
ForeignSpark 44 Ltd 0.00% - 0.00% - 0.00% - 0.00% - Chery Jaguar Land Rover Automotive Co Ltd
4.66% 4,451.33 24.05% 2,161.73 1.42% 420.35 6.70% 2,582.08
Sub - total ( b ) 4,453.83 2,161.73 420.35 2,582.08 Associates (Investment as per the equity method)IndianTata AutoComp Systems Ltd 0.22% 211.91 0.19% 17.12 0.01% 2.40 0.05% 19.52 Automobile Corporation of Goa Ltd
0.15% 141.19 0.10% 9.42 0.00% 0.25 0.03% 9.67
Tata Hitachi Construction Machinery Company Private Ltd
0.52% 497.35 1.21% 109.16 (0.02)% (4.55) 0.27% 104.61
ForeignNita Company Ltd 0.03% 29.54 0.04% 3.69 0.00% - 0.01% 3.69 Tata Precision Industries (India) Ltd
- - - - 0.00% - 0.00% -
Synaptiv Limited 0.00% 1.48 - - 0.00% - 0.00% - CloudCar Inc 0.05% 44.87 (0.25)% (22.86) 0.00% - (0.06)% (22.86)DriveClubService Pte. Ltd. 0.00% 1.85 0.00% - - - - -Jaguar Cars Finance Limited 0.00% 3.23 0.00% - 0.00% - 0.00% -
Sub - total ( c ) 931.41 116.53 (1.90) 114.63 Total ( b + c ) 5,385.24 100.00% 2,278.26 100.00% 418.45 100.00% 2,696.71 Total ( a + b ) 100.00% 95,427.91 100.00% 8,988.91 100.00% 29,535.61 100.00% 38,524.52
NOTES FORMING PART OF CONSOLIDATED FINANCIAL STATEMENTS
34373rd Annual Report 2017-18
INTEGRATED REPORT 1-65 STATUTORY REPORTS 66-184 FINANCIAL STATEMENTS 185-353

45. Other Notes (a) During the year ended March 31, 2014, legislation was enacted that allows United Kingdom (UK) companies to elect for the
Research and Development Expenditure Credit (RDEC) on qualifying expenditures incurred since April 1, 2013, instead of the existing super-deduction rules. As a result of this election by the Company’s subsidiary in the UK, ` 871.75 crores and ` 762.67 crores, for the year ended March 31, 2018 and 2017, respectively, the proportion relating to capitalised product development expenditure, have been off set against intangibles under development.
(b) The following subsidiaries have been considered on unaudited basis. Details for the same as per individual entity’s financials are as under :
Net Worth As at
March 31, 2018
Total Revenue for the year ended March 31, 2018
Net Increase / (Decrease) in Cash & Cash
equivalent during 2017-2018
Subsidiaries :
Trilix S.R.L 48.79 68.09 10.00
Tata Precision Industries Pte Ltd 0.87 - (0.03)
TML Holding Pte Ltd 9,536.74 - 538.63
TMNL Motor services Nigeria Limited (0.10) - 0.14
Concorde Motors (India) Ltd 11.21 1,183.83 10.73
Tata Technologies De Mexico, S.A. de C.V. 6.34 19.80 0.66
Incat International PLC 44.21 0.16 0.59
Incat Gmbh 18.12 0.30 0.27
Cambric Limited 19.07 1.78 0.07
Tata Technlogies SRL Romania 27.03 31.62 7.19
Cambric Gmbh 1.96 0.08 0.13
TOTAL 9,714.24 1,305.66 568.38
For the year ended / as at March 31, 2017 (311.26) 336.51 (46.11)
( c) The assets and liabilities of Tata Technologies Limited, TAL Manufacturing Solutions Limited, Company’s certain assets related to defence business and investment in Tata Hitachi Construction Machinery Company Private Limited (equity accounted investees) are classified as “Held for Sale” as they meet the criteria laid out under Ind AS 105.
(d) Exceptional debit of ` 1,641.38 crores, relates to provision for impairment of certain intangibles under development and capital work-in-progress. The Company reviewed product development programs in capital work-in-progress and consequently provided for impairment during the year ended March 31, 2018.
(e) The exceptional credit of ` 3,609.01 crores (GBP 437.40 million) for the year ended March 31, 2018, relates to the amendment of the Defined Benefit scheme of Jaguar Land Rover Automotive Plc. On April 3, 2017, Jaguar Land Rover Automotive Plc approved and communicated to its Defined Benefit scheme members that the Defined Benefit Scheme rules were to be amended with effect from April 6, 2017 so that amongst other changes, retirement benefit will be calculated on a career average basis rather than based upon a member’s final salary at retirement. These changes were effective from April 6, 2017 and as a result of the re-measurement of the scheme’s liabilities, the past service credit has been recognised in year ended March 31, 2018.
(f) Exceptional debit of ` 147.93 crores for the year ended March 31, 2017, relates to provision for inventory of BS III vehicles as at March 31, 2017. This does not include higher level of customer discounts and variable marketing expenses in March 2017, to support higher level of retail sales, which have been netted off against ‘Income from operations.
NOTES FORMING PART OF CONSOLIDATED FINANCIAL STATEMENTS
344

NOTES FORMING PART OF CONSOLIDATED FINANCIAL STATEMENTS
As per our report of even date attached For and on behalf of the Board
For B S R & Co. LLPChartered AccountantsFirm’s Registration No: 101248W/W-100022
YEZDI NAGPOREWALLAPartnerMembership No. 049265
Mumbai, May 23, 2018
N CHANDRASEKARAN [DIN: 00121863] Chairman
N MUNJEE [DIN:00010180]
V K JAIRATH [DIN:00391684]
F S NAYAR [DIN:00003633]
O P BHATT [DIN:00548091]
R SPETH [DIN:03318908]
Directors
GUENTER BUTSCHEK [DIN: 07427375]CEO and Managing DirectorS B BORWANKAR [DIN: 01793948]ED and Chief Operating OfficerP B BALAJIGroup Chief Financial OfficerH K SETHNA [FCS: 3507]Company Secretary
Mumbai, May 23, 2018
(g) The exceptional credit of ` 11.19 crores (GBP 1.4 million) and ` 1,330.10 crores (GBP 151 million) for the years ended March 31, 2018 and 2017, respectively, relates to the explosion at the port of Tianjin (China) in August 2015. This relates to the receipt of insurance proceeds, recovery of import duties and taxes and to an updated assessment of the condition of the remaining vehicles, which led to a reversal of the original provision recorded in the quarter ended September 30, 2015.
(h) The Company has a process whereby periodically all long term contracts (including derivative contracts) are assessed for material foreseeable losses. At the year end, the Company has reviewed and ensured that adequate provision are required under any law/accounting standards for material foreseeable losses on such long term contracts (including derivative contracts) has been made in the books of account.
34573rd Annual Report 2017-18
INTEGRATED REPORT 1-65 STATUTORY REPORTS 66-184 FINANCIAL STATEMENTS 185-353

Summarised statement of Assets and Liabilities(CONSOLIDATED) (` in crores)
As at March 31, 2018
As at March 31, 2017
WHAT THE COMPANY OWNED(1) Property, plant and equipment and Other intangible assets 161,330.91 128,969.60 (2) Goodwill 116.45 673.32 (3) Non-current Investments 5,651.65 5,296.77 (4) Non-current Finance receivables 15,479.53 10,753.13 (5) Non-current tax assets (net) 5,058.60 5,429.65 (6) Other non-current assets 7,740.53 6,512.14 (7) Current assets 135,972.84 116,119.75
TOTAL ASSETS 331,350.51 273,754.36
(` in crores)As at
March 31, 2018As at
March 31, 2017WHAT THE COMPANY OWED(1) Net worth
Equity share capital 679.22 679.22 Other equity 94,748.69 57,382.67
(2) Non-controlling interests 525.06 453.17 (3) Non-current borrowings 61,199.50 60,629.18 (4) Non-current provisions 10,948.44 9,004.46 (5) Deferred tax liabilities (net) 6,125.80 1,174.00 (6) Other non-current liabilities 13,904.33 28,802.14 (7) Current liabilities 143,219.47 115,629.52
TOTAL LIABILITIES 331,350.51 273,754.36
Summarised Statement of Profit and Loss(CONSOLIDATED) (` in crores)
2017-2018 2016-20171 INCOME
Income from operations 295,409.34 274,492.12 Other income 888.89 754.54 Total 296,298.23 275,246.66
2 EXPENDITURECost of materials consumed 171,992.59 159,369.55 Purchase of products for sale 15,903.99 13,924.53 Changes in inventories of finished goods, work-in-progress and products for sale (2,046.58) (7,399.92)Excise duty 790.16 4,799.61 Employee benefits expense 30,300.09 28,332.89 Finance costs 4,681.79 4,238.01 Foreign exchange (gain)/loss (net) (1,185.28) 3,910.10 Depreciation and amortisation expense 21,553.59 17,904.99 Product development/Engineering expenses 3,531.87 3,413.57 Other expenses 60,184.21 55,430.06 Amount capitalised (18,588.09) (16,876.96)Total Expenses 287,118.34 267,046.43 Profit/(loss) before exceptional items and tax 9,179.89 8,200.23 Defined benefit pension plan amendment past service credit (3,609.01) - Employee seperation cost 3.68 67.61 Provision for impairment of capital work in progress and intangibles under development 1,641.38 - Others (11.19) (1,182.17)
3 PROFIT BEFORE TAX FROM CONTINUING OPERATIONS 11,155.03 9,314.79 4 Tax expense(net) 4,341.93 3,251.23 5 PROFIT AFTER TAX FROM CONTINUING OPERATIONS (3-4) 6,813.10 6,063.56 6 Share of profit of joint ventures and associates (net) 2,278.26 1,493.00 7 PROFIT FOR THE YEAR 9,091.36 7,556.56 8 TOTAL OTHER COMPREHENSIVE INCOME/(LOSS) 29,562.51 (27,494.57)9 TOTAL COMPREHENSIVE INCOME/(LOSS) FOR THE YEAR 38,653.87 (19,938.01)
346

Summarised statement of Assets and Liabilities(STANDALONE) (` in crores)
As at March 31, 2018
As atMarch 31, 2017
WHAT THE COMPANY OWNED(1) Property, plant and equipment and Other intangible assets 26,701.26 27,944.82 (2) Goodwill 99.09 99.09 (3) Non-current Investments 14,260.79 14,858.39 (4) Non-current tax assets (net) 695.75 772.67 (5) Other non-current assets 2,483.75 2,446.23 (6) Current assets 14,971.66 12,757.08
TOTAL ASSETS 59,212.30 58,878.28
WHAT THE COMPANY OWED(1) Net worth
Equity share capital 679.22 679.22 Other equity 19,491.76 20,483.39
(2) Non-current borrowings 13,155.91 13,686.09 (3) Non-current provisions 1,009.48 892.18 (4) Deferred tax liabilities (net) 154.61 147.58 (5) Other non-current liabilities 502.37 1,451.47 (6) Current liabilities 24,218.95 21,538.35
TOTAL LIABILITIES 59,212.30 58,878.28
Summarised Statement of Profit and Loss (STANDALONE) (` in crores)
As at March 31, 2018
As atMarch 31, 2017
1 INCOME 2017-2018 2016-2017Income from operations 59,624.69 49,054.49 Other income 1,557.60 981.06 Total 61,182.29 50,035.55
2 EXPENDITURECost of materials consumed 37,080.45 27,651.65 Purchase of products for sale 4,762.41 3,945.97 Changes in inventories of finished goods, work-in-progress and products for sale 842.05 (252.14)Excise duty 793.28 4,738.15 Employee benefits expense 3,966.73 3,764.35 Finance costs 1,744.43 1,569.01 Foreign exchange (gain)/loss (net) 17.14 (252.78)Depreciation and amortisation expense 3,101.89 3,037.12 Product development/Engineering expenses 474.98 454.48 Other expenses 9,234.27 8,335.90 Amount capitalised (855.08) (941.60)Total Expenses 61,162.55 52,050.11 Profit/(loss) before exceptional items and tax 19.74 (2,014.56)Employee seperation cost 3.68 67.61 Provision for impairment of capital work-in-progress and intangibles under development 962.98 - Others - 271.10
3 PROFIT BEFORE TAX FROM CONTINUING OPERATIONS (946.92) (2,353.27)4 Tax expense(net) 87.93 76.33 5 PROFIT AFTER TAX FROM CONTINUING OPERATIONS (3-4) (1,034.85) (2,429.60)6 TOTAL OTHER COMPREHENSIVE INCOME/(LOSS) 43.22 94.21 7 TOTAL COMPREHENSIVE INCOME/(LOSS) FOR THE YEAR (991.63) (2,335.39)
34773rd Annual Report 2017-18
INTEGRATED REPORT 1-65 STATUTORY REPORTS 66-184 FINANCIAL STATEMENTS 185-353

FINANCIAL STATISTICS - CONSOLIDATEDYear CAPITAL ACCOUNTS (` in lakhs) REVENUE ACCOUNTS (` in lakhs) RATIOS
Capital Reserves and Surplus
Borrowings Gross Block Accumulated Depreciation
Net Block Turnover Depreciation Profit/ (Loss) Before Taxes
Taxes Profit/ (Loss) After
Taxes
Dividend including
tax
PAT to Sales
Earnings Per Share (Basic)* (`)
Dividend Per Share*# (`)
Net Worth Per Share* (`)
Ordinary Share
‘A’ Ordinary
Share
Ordinary Share
‘A’ Ordinary
Share
2001-02 31,982 183,617 282,031 634,984 252,475 382,509 932,220 39,222 (18,015) (6,740) (10,719) 45 -1.1% (3.95) - - - 66 @
2002-03 31,983 190,018 178,965 648,959 284,038 364,921 1,144,801 40,190 54,350 22,640 29,712 14,497 2.6% 9.29 - 4.00 - 66
2003-04 35,683 329,884 169,842 728,468 323,749 404,719 1,634,104 42,556 144,487 53,077 91,529 32,099 5.6% 27.88 - 8.00 - 104 @
2004-05 36,179 403,537 271,420 834,162 375,933 458,229 2,284,217 53,101 184,809 49,062 138,534 52,346 6.1% 38.50 - 12.50! - 121 @
2005-06 38,287 574,860 337,914 1,027,949 484,356 543,593 2,750,725 62,331 234,898 64,000 172,809 58,439 6.3% 45.86 - 13.00 - 160 @
2006-07 38,541 733,626 730,190 1,294,083 542,665 751,418 3,707,579 68,809 308,800 88,321 216,999 68,822 5.9% 56.43 - 15.00 - 200 @
2007-08 38,554 831,198 1,158,487 1,892,393 606,049 1,286,344 4,060,827 78,207 308,629 85,154 216,770 67,674 5.3% 56.24 - 15.00 - 225 @
2008-09 51,405 542,659 3,497,385 6,900,238 3,326,905 3,573,333 7,489,227 250,677 (212,925) 33,575 (250,525) 36,458 -3.3% (56.88) (56.88) 6.00 6.50 114 ++
2009-10 57,060 763,588 3,519,236 7,291,985 3,441,352 3,850,633 9,736,054 388,713 352,264 100,575 257,106 100,185 2.6% 48.64 49.14 15.00 15.50 144 ^
2010-11 63,771 1,853,376 3,281,055 8,291,975 3,969,870 4,322,105 12,684,370 465,551 1,043,717 121,638 927,362 148,130 7.3% 155.25 155.75 20.00 20.50 302 ^^
2011-12 63,475 3,206,375 4,714,896 10,572,497 4,951,247 5,621,250 17,133,935 562,538 1,353,387 (4,004) 1,351,650 148,862 7.9% 42.58** 42.68** 4.00** 4.10** 103 ^^
2012-13 63,807 3,699,923 5,371,571 12,158,556 5,172,265 6,986,291 19,451,406 760,128 1,364,733 377,666 989,261 75,614 5.1% 31.02 31.12 2.00 2.10 118 @
2013-14 64,378 6,495,967 6,064,228 16,619,078 6,881,538 9,737,540 23,745,502 1,107,816 1,886,897 476,479 1,399,102 69,008# 5.9% 43.51 43.61 2.00 2.10 204 @
2014-15 64,378 5,561,814 7,361,039 18,684,665 7,442,406 11,242,259 26,760,664 1,338,863 2,170,256 764,291 1,398,629 (3,319) 5.2% 43.44 43.54 - - 175
2015-16 67,918 8,010,349 7,046,849 21,639,756 8,754,689 12,885,067 28,107,844 1,701,418 1,398,087 287,260 1,102,375 11,052 3.9% 32.61 32.71 0.20 0.30 238 +++
2016-17 67,922 5,738,267 7,860,398 19,653,773 6,756,813 12,896,960 27,524,666 1,790,499 931,479 325,123 745,436 - 2.7% 21.94 22.04 - - 171 ^^^
2017-18 67,922 9,474,869 8,895,047 25,312,610 9,179,519 16,133,091 29,629,823 2,155,359 1,115,503 434,193 898,891 - 3.0% 26.46 26.56 - - 281
Notes
@ On increased capital base due to conversion of Bonds / Convertible Debentures / Warrants / FCCN into shares.
* To a face value of `10/- per share upto 2011-12.
# Includes Interim Dividend where applicable.
! Includes a special dividend of ` 2.50 per share for the Diamond Jubilee Year.
++ On increased capital base due to Rights issue and conversion of FCCN into shares.
^ On increased capital base due to GDS issue and conversion of FCCN into shares.
^^ On increased capital base due to QIP issue and conversion of FCCN into shares.
** Consequent to sub-division of shares, figures for previous ye ars are not comparable
## Includes reversal of dividend distribution tax of earlier year
+++ On increased capital base due to rights issue
^^^ The figures of FY 2016-17 onwards is as per Ind AS
348

FINANCIAL STATISTICS - STANDALONECAPITAL ACCOUNTS (` in lakhs) REVENUE ACCOUNTS (` in lakhs) RATIOS
Year Capital Reserves and
Surplus
Borrowings Gross Block
Depreciation Net Block Turnover Depreciation Profit/ (Loss) Before Taxes
Taxes Profit/ (Loss) After Taxes
Dividend including
tax
PAT to Sales
Earnings Per Share (Basic)* (`)
Dividend Per Share*# (`)
Net Worth Per Share*
(`)Ordinary Share
‘A’ Ordinary
Share
Ordinary Share
‘A’ Ordinary
Share1945-46 100 1 - 31 2 29 12 2 1 - 1 - 8.3% 0.07 - - - 10 1949-50 200 11 94 233 44 189 167 15 11 5 6 - 3.6% 0.03 - - - 10 1953-54 500 27 412 731 270 461 321 97 3 - 3 - 0.9% 0.11 - - - 11 1954-55 627 27 481 792 303 489 445 35 - - - - 0.0% 0.00 - - - 11 1955-56 658 120 812 1,010 407 603 1,198 105 125 32 93 59 7.8% 1.32 - 0.60 - 12 1956-57 700 149 1,382 1,352 474 878 2,145 70 116 27 89 44 4.1% 1.64 - 0.80 - 13 1957-58 700 117 1,551 1,675 668 1,007 2,694 129 99 6 93 52 3.5% 1.72 - 0.90 - 12 1958-59 1,000 206 1,245 2,050 780 1,270 2,645 113 155 13 142 56 5.4% 1.68 - 0.90 - 12 1959-60 1,000 282 1,014 2,201 940 1,261 2,825 161 222 93 129 108 4.6% 1.50 - 1.25 - 13 1960-61 1,000 367 1,263 2,593 1,118 1,475 3,735 180 313 122 191 126 5.1% 2.26 - 1.45 - 14 1961-62 1,000 432 1,471 2,954 1,336 1,618 4,164 220 378 188 190 124 4.6% 2.28 - 1.45 - 15 1962-63 1,000 450 1,758 3,281 1,550 1,731 4,364 223 327 185 142 124 3.3% 1.68 - 1.45 - 15 1963-64 1,198 630 2,470 3,920 1,802 2,118 5,151 260 404 200 204 144 4.0% 1.97 - 1.45 - 16 1964-65 1,297 787 3,275 4,789 2,144 2,645 6,613 345 479 208 271 157 4.1% 2.39 - 1.45 - 17 1965-66 1,640 995 3,541 5,432 2,540 2,892 7,938 398 477 189 288 191 3.6% 2.20 - 1.45 - 18 1966-67 1,845 1,027 4,299 6,841 3,039 3,802 9,065 505 620 192 428 235 4.7% 2.80 - 1.45+ - 17 1967-68 1,845 1,121 5,350 7,697 3,608 4,089 9,499 572 395 66 329 235 3.5% 2.10 - 1.45 - 18 1968-69 1,845 1,295 5,856 8,584 4,236 4,348 10,590 630 582 173 409 235 3.9% 2.66 - 1.45 - 19 1969-70 1,845 1,333 6,543 9,242 4,886 4,356 9,935 662 274 - 274 221 2.8% 1.72 - 1.35 - 19 1970-71 1,845 1,516 6,048 10,060 5,620 4,440 13,624 749 673 270 403 251 3.0% 2.49 - 1.45 - 20 1971-72 1,949 2,020 6,019 10,931 6,487 4,444 15,849 758 885 379 506 273 3.2% 3.04 - 1.50 - 23 1972-73 1,949 2,194 5,324 12,227 7,491 4,736 15,653 820 832 360 472 266 3.0% 2.87 - 1.50 - 24 1973-74 1,949 2,394 6,434 13,497 8,471 5,026 16,290 902 1,007 450 557 180 3.4% 3.43 - 0.93 - 26 1974-75 1,949 2,827 9,196 15,838 9,593 6,245 22,510 1,134 677 136 541 266 2.4% 3.32 - 1.50 - 28 1975-76 2,013 3,691 9,399 18,642 10,625 8,017 27,003 1,054 855 91 764 276 2.8% 4.60 - 1.50 - 33 1976-77 2,328 3,833 11,816 20,709 11,685 9,024 28,250 1,145 1,056 - 1,056 323 3.7% 5.38 - 1.50+ - 30 1977-78 2,118 4,721 11,986 22,430 12,723 9,707 28,105 1,101 1,044 - 1,044 313 3.7% 5.37 - 1.50 - 35 1978-79 3,151 5,106 11,033 24,900 13,895 11,005 37,486 1,200 1,514 - 1,514 467 4.0% 5.36 - 1.60+ - 27 1979-80 3,151 6,263 17,739 28,405 15,099 13,306 44,827 1,300 1,762 - 1,762 605 3.9% 5.96 - 2.00 - 31 1980-81 3,151 8,095 15,773 33,055 16,496 16,559 60,965 1,616 2,437 - 2,437 605 4.0% 8.27 - 2.00 - 38 1981-82 4,320 10,275 25,476 38,819 18,244 20,575 79,244 1,993 4,188 - 4,188 839 5.3% 10.18 - 2.00+ - 35 @
1982-83 4,226 12,458 23,361 43,191 20,219 22,972 86,522 2,187 3,481 460 3,021 827 3.5% 7.34 - 2.00 - 40 1983-84 5,421 14,103 25,473 46,838 23,078 23,760 85,624 2,923 2,163 235 1,928 923 2.3% 3.61 - 2.00 - 37 @
1984-85 5,442 15,188 30,226 52,819 26,826 25,993 93,353 3,895 2,703 390 2,313 1,241 2.5% 4.32 - 2.30 - 39 1985-86 5,452 16,551 44,651 61,943 29,030 32,913 102,597 3,399 1,832 215 1,617 1,243 1.6% 3.00 - 2.30 - 41 1986-87 5,452 15,886 53,476 68,352 30,914 37,438 119,689 2,157 293 - 293 552 0.2% 0.51 - 1.00 - 40 1987-88 6,431 17,491 44,406 75,712 34,620 41,092 140,255 3,822 3,205 510 2,695 1,356 1.9% 4.25 - 2.30 - 38 @
1988-89 10,501 30,740 32,396 83,455 38,460 44,995 167,642 4,315 8,513 1,510 7,003 2,444 4.2% 6.74 - 2.50 - 40 @
1989-90 10,444 37,870 48,883 91,488 43,070 48,418 196,910 4,891 14,829 4,575 10,254 3,126 5.2% 9.87 - 3.00 - 47 1990-91 10,387 47,921 48,323 100,894 48,219 52,675 259,599 5,426 23,455 9,250 14,205 4,154 5.5% 13.69 - 4.00 - 56 1991-92 11,765 61,863 105,168 123,100 54,609 68,491 317,965 6,475 20,884 7,800 13,084 4,389 4.1% 12.45 - 4.00 - 67 @
1992-93 12,510 64,207 144,145 153,612 61,710 91,902 309,156 7,456 3,030 26 3,004 3,642 1.0% 2.47 - 3.00 - 63 1993-94 12,867 70,745 141,320 177,824 70,285 107,539 374,786 9,410 10,195 20 10,175 5,020 2.7% 7.91 - 4.00 - 65 1994-95 13,694 128,338 115,569 217,084 81,595 135,489 568,312 11,967 45,141 13,246 31,895 8,068 5.6% 23.29 - 6.00 - 104 1995-96 24,182 217,400 128,097 294,239 96,980 197,259 790,967 16,444 76,072 23,070 53,002 14,300 6.7% 21.92 - 6.00 - 100 1996-97 25,588 339,169 253,717 385,116 117,009 268,107 1,012,843 20,924 100,046 23,810 76,236 22,067 7.5% 30.40 - 8.00 - 143 1997-98 25,588 349,930 330,874 487,073 141,899 345,174 736,279 25,924 32,880 3,414 29,466 15,484 4.0% 11.51 - 5.50 - 147 1998-99 25,590 350,505 344,523 569,865 165,334 404,531 659,395 28,132 10,716 970 9,746 8,520 1.5% 3.81 - 3.00 - 147 1999-00 25,590 349,822 300,426 581,233 182,818 398,415 896,114 34,261 7,520 400 7,120 7,803 0.8% 2.78 - 2.50 - 147 2000-01 25,590 299,788 299,888 591,427 209,067 382,360 816,422 34,737 (50,034) - (50,034) - - (18.45) - - - 127 2001-02 31,982 214,524 230,772 591,006 243,172 347,834 891,806 35,468 (10,921) (5,548) (5,373) - - (1.98) - - - 77 @
2002-03 31,983 227,733 145,831 608,114 271,307 336,807 1,085,874 36,213 51,037 21,026 30,011 14,430 2.8% 9.38 - 4.00 - 81 2003-04 35,683 323,677 125,977 627,149 302,369 324,780 1,555,242 38,260 129,234 48,200 81,034 31,825 5.2% 24.68 - 8.00 - 102 @
2004-05 36,179 374,960 249,542 715,079 345,428 369,651 2,064,866 45,016 165,190 41,495 123,695 51,715 6.0% 34.38 - 12.50! - 114 @
2005-06 38,287 515,420 293,684 892,274 440,151 452,123 2,429,052 52,094 205,338 52,450 152,888 56,778 6.3% 40.57 - 13.00 - 145 @
2006-07 38,541 648,434 400,914 1,128,912 489,454 639,458 3,206,467 58,629 257,318 65,972 191,346 67,639 6.0% 49.76 - 15.00 - 178 @
2007-08 38,554 745,396 628,052 1,589,579 544,352 1,045,227 3,357,711 65,231 257,647 54,755 202,892 65,968 6.0% 52.64 - 15.00 - 203 @
2008-09 51,405 1,171,610 1,316,556 2,085,206 625,990 1,459,216 2,949,418 87,454 101,376 1,250 100,126 34,570 3.4% 22.70 23.20 6.00 6.50 238 ++
2009-10 57,060 1,439,487 1,659,454 2,364,896 721,292 1,643,604 4,021,755 103,387 282,954 58,946 224,008 99,194 5.6% 42.37 42.87 15.00 15.50 262 ^
2010-11 63,771 1,937,559 1,591,543 2,568,235 846,625 1,721,610 5,160,692 136,077 219,652 38,470 181,182 146,703 3.5% 30.28 30.78 20.00 20.50 315 ^^
2011-12 63,475 1,899,126 1,588,057 2,902,206 996,587 1,905,619 5,979,502 160,674 134,103 9,880 124,223 146,372 2.5% 3.90** 4.00** 4.00** 4.10** 62 2012-13 63,807 1,849,677 1,679,895 3,181,998 1,161,144 2,020,854 5,140,793 181,762 17,493 (12,688) 30,181 72,423 0.6% 0.93 1.03 2.00 2.10 60 @
2013-14 64,378 1,853,287 1,505,280 3,514,652 1,355,088 2,159,564 4,159,103 207,030 (102,580) (136,032) 33,452 66,627 0.8% 1.03 1.13 2.00 2.10 60 @
2014-15 64,378 1,421,881 2,113,441 3,785,500 1,603,098 2,182,402 4,141,264 260,322 (397,472) 76,423 (473,895) (9,340) - (14.72) (14.72) - - 46 2015-16 67,918 2,168,890 1,588,725 4,077,235 1,852,749 2,224,486 4,877,959 245,375 15,039 (8,384) 23,423 7,300 0.5% 0.68 0.78 0.20 0.30 66 +++
2016-17 67,922 2,012,993 1,957,398 4,591,464 1,853,922 2,737,542 5,007,925 296,939 (242,077) 5,922 (247,999) - -5.0% (7.30) (7.30) - - 61 ^^^
2017-18 67,922 1,949,176 1,846,384 4,826,322 2,156,196 2,670,126 6,118,229 310,189 (94,692) 8,793 (103,485) - -1.7% (3.05) (3.05) - - 59 Notes :@ On increased capital base due to conversion of Bonds / Convertible Debentures / Warrants / FCCN into shares.$ On increased capital base due to issue of Bonus Shares. Net Worth excludes ordinary dividends.* Equivalent to a face value of ` 10/- per share.# Includes Interim Dividend where applicable.+ Including on Bonus Shares issued during the year.! Includes a special dividend of ` 2.50 per share for the Diamond Jubilee Year.++ On increased capital base due to Rights issue and conversion of FCCN into shares.^ On increased capital base due to GDS issue and conversion of FCCN into shares.^^ On increased capital base due to QIP issue and conversion of FCCN into shares.** Consequent to sub-division of shares, figures for previous years are not comparable## Includes reversal of dividend distribution tax of earlier year+++ On increased capital base due to rights issue^^^ The figures of FY 2016-17 onwards is as per Ind AS with Joint operation
34973rd Annual Report 2017-18
INTEGRATED REPORT 1-65 STATUTORY REPORTS 66-184 FINANCIAL STATEMENTS 185-353

(` in crores)Sr. No Subsidiary Country Reporting
currencyExchange
RateShare
capital (incl. advances towards
capital where applicable)
Reserves and
Surplus
Total Assets Total Liabilities
Turnover Profit/ (Loss) Before Tax
Tax Expense/
(Credit)
Profit/(Loss) after
tax
Profit/ (Loss)for
the period/ year *
Proposed dividend and tax thereon
Investments (except in case of investment
in the subsidiaries)
% of shareholding
1 TAL Manufacturing Solutions Ltd (subsidiary w.e.f March 13, 2000)
India INR1.00 115.00 (16.61) 534.76 436.37 379.67 11.05 (2.34) 13.39 13.39 - - 100.00
2 Concorde Motors (India) Ltd (subsidiary w.e.f July 3, 1999)
India INR1.00 144.18 (132.96) 722.94 711.73 1,183.83 (130.24) - (130.24) (130.24) - - 100.00
3 Tata Motors Finance Ltd (Name changed from Sheba Properties Limited w.e.f. June 30, 2017) (subsidiary w.e.f January 24, 1989)
India INR
1.00 538.73 1,225.70 22,975.23 21,210.79 2,381.22 68.23 (66.85) 135.08 135.08 - 92.04 100.004 Tata Daewoo Commercial Vehicle Co. Ltd
(subsidiary w.e.f March 30, 2004)South Korea KRW
0.06 57.57 2,482.29 4,054.88 1,515.03 5,035.02 242.87 39.92 202.95 202.95 - - 100.005 Tata Technologies Ltd (subsidiary w.e.f
September 10, 1997)India INR
1.00 42.10 679.15 947.29 226.04 1,124.96 234.95 57.48 177.47 177.47 - 31.79 72.296 Tata Motors Insurance Broking & Advisory
Services Ltd (subsidiary w.e.f October 21, 2004)
India INR
1.00 5.00 22.48 73.63 46.15 107.13 20.13 6.00 14.13 14.13 - 33.83 100.007 Tata Motors European Technical Centre Plc
(subsidiary w.e.f September 1, 2005)UK GBP
92.28 474.57 (138.57) 435.67 99.66 221.00 36.76 6.88 29.88 29.88 - - 100.008 TML Distribution Company Ltd (subsidiary
w.e.f March 28, 2008)India INR
1.00 225.00 129.44 513.80 159.37 4,347.98 77.46 27.31 50.15 50.15 - - 100.009 Tata Motors (SA) (Proprietary) Ltd
(subsidiary w.e.f December 5, 2007)South Africa ZAR
5.54 12.98 2.21 146.29 131.10 103.93 2.52 0.69 1.83 1.83 - - 60.0010 TMF Holdings Ltd (Name changed from Tata
Motors Finance Ltd. w.e.f. June 30, 2017) (subsidiary w.e.f June 1, 2006)
India INR
1.00 1,404.74 1,888.03 6,700.92 3,408.16 51.84 (17.16) 1.12 (18.28) (18.28) - 50.08 100.0011 Tata Motors Financial Solutions Ltd
(subsidiary w.e.f January 19, 2015)India INR
1.00 1,700.50 (504.16) 5,014.55 3,818.21 378.81 1,546.92 1.78 1,545.13 1,545.13 - 1,192.81 100.0012 Tata Marcopolo Motors Ltd (subsidiary w.e.f
September 20, 2006)India INR
1.00 170.00 (49.23) 419.82 299.05 572.24 11.29 1.61 9.68 9.68 - - 51.0013 Tata Motors (Thailand) Ltd (subsidiary w.e.f
February 28, 2008)Thailand THB
2.08 553.77 (1,064.13) 398.92 909.28 59.40 (132.77) - (132.77) (132.77) - - 95.4914 TML Holdings Pte Ltd, Singapore (subsidiary
w.e.f February 4, 2008)Singapore GBP
92.28 12,691.10 (3,154.36) 17,495.45 7,958.71 - 512.71 9.13 123.78 123.78 - - 100.0015 Tata Hispano Motors Carrocera S.A
(subsidiary w.e.f October 16, 2009)Spain EUR
80.81 2.88 (768.40) 35.17 800.70 6.12 (9.09) - (9.09) (9.09) - - 100.0016 Tata Hispano Motors Carroceries Maghreb
(subsidiary w.e.f June 23, 2014)Morocco MAD
7.08 146.30 (175.57) 43.87 73.13 2.60 (4.37) 0.01 (4.38) (4.38) - - 100.0017 Trilix S.r.l (subsidiary w.e.f October 4, 2010) Italy EUR 80.81 0.61 48.17 89.88 41.10 68.09 (11.64) - (11.64) (11.64) - - 80.0018 Tata Precision Industries Pte Ltd (subsidiary
w.e.f February 15, 2011)Singapore SGD
49.82 41.56 (40.70) 0.98 0.12 - (0.13) - (0.13) (0.13) - - 78.3919 PT Tata Motors Indonesia (subsidiary w.e.f
December 29, 2011)Indonesia IDR
0.00 262.59 (52.49) 214.72 4.62 - (2.92) - (2.92) (2.92) - - 100.0020 INCAT International Plc. (subsidiary w.e.f
October 3, 2005)UK GBP
92.28 2.07 42.14 46.15 1.94 0.16 (0.26) - (0.26) (0.26) - - 72.2921 Tata Technologies Inc. (Including Midwest
Managed Services Inc.which got merged into Tata Technologies Inc. w.e.f. Feb 28, 2018) (subsidiary w.e.f October 3, 2005)
USA USD
65.18 780.20 (426.46) 449.45 95.70 676.93 14.82 9.98 4.84 4.84 - - 72.3522 Tata Technologies de Mexico, S.A. de C.V.
(subsidiary w.e.f October 3, 2005)Mexico MXN
3.56 1.01 5.33 11.88 5.54 19.80 0.53 - 0.53 0.53 - - 72.3523 Cambric Limited, Bahamas (subsidiary w.e.f
May 1, 2013)Bahamas USD
65.18 17.60 1.47 19.31 0.24 1.78 (0.22) - (0.22) (0.22) - - 72.3224 Cambric UK Limited (Dissolved w.e.f. May
23, 2017)UK EUR
80.81 - - - - - - - - - - - - 25 Cambric GmbH (subsidiary w.e.f May 1, 2013) Germany EUR 80.81 0.20 1.76 1.96 0.00 0.08 (0.10) 0.21 (0.31) (0.31) - - 72.3526 Tata Technolgies SRL, Romania (erstwhile
Cambric Consulting SRL was renamed w.e.f February 4, 2015) (subsidiary w.e.f May 1, 2013)
Romania RON
17.23 8.84 18.20 35.20 8.16 65.03 8.55 2.00 6.55 6.55 - - 72.3227 Tata Manufacturing Technologies Consulting
(Shanghai) Limited .(subsidiary w.e.f March 10, 2014)
China CNY
10.35 3.05 35.86 77.55 38.66 111.97 13.72 3.48 10.24 10.24 - - 72.2928 Tata Technologies Europe Limited
(subsidiary w.e.f October 3, 2005)UK GBP
92.28 0.09 718.09 1,081.19 363.01 979.64 75.77 17.13 58.63 58.63 - - 72.2929 Escenda Engineering AB (Tata Technologies
Europe Limited acquired 100% stake in the Company w.e.f. May 1, 2017)
Sweden SEK
7.82 0.17 (0.34) 86.94 87.11 132.96 (10.91) (0.05) (10.86) (10.86) - - 72.2930 INCAT GmbH (subsidiary w.e.f October
3, 2005)Germany EUR
80.81 0.95 17.17 18.38 0.26 0.30 0.30 (0.18) 0.47 0.47 - - 72.2931 Tata Technologies (Thailand) Limited
(subsidiary w.e.f October 10, 2005)Thailand THB
2.08 4.58 5.52 17.15 7.05 21.46 2.48 0.41 2.07 2.07 - - 72.2932 TATA Technologies Pte Ltd. (subsidiary w.e.f
December 7, 2005)Singapore USD
65.18 251.56 474.61 747.14 20.97 43.49 (2.60) 0.18 (2.79) (2.79) - - 72.2933 Jaguar Land Rover Automotive plc
(subsidiary w.e.f June 2, 2008)UK GBP
92.28 13,848.62 7,724.23 55,231.72 (33,658.87) - 4,284.31 - 4,284.31 4,284.31 - - 100.0034 Jaguar Land Rover Limited (previously
Jaguar Cars Limited) (subsidiary w.e.f June 2, 2008)
UK GBP
92.28 32,858.33 63,100.94 2,39,955.73 (1,43,996.46)
1,87,897.40 5,605.45 148.50 5,456.95 5,456.95 - 13,022.66 100.0035 Jaguar Land Rover Holdings
Limited(formally known as Land Rover) (subsidiary w.e.f June 2, 2008)
UK GBP
92.28 46.14 41,410.01 50,279.72 (8,823.57) - (57.76) - (57.76) (57.76) - - 100.0036 JLR Nominee Company Limited (Formally
known as Jaguar Land Rover Exports Limited, formerly Jaguar Cars Exports Limited) (subsidiary w.e.f June 2, 2008)
UK GBP
92.28 - - - - - - - - - - - 100.0037 Jaguar Land Rover (South Africa) Holdings
Limited (subsidiary w.e.f February 2, 2009)UK ZAR
5.54 1,079.46 210.92 1,320.60 (30.22) - 175.42 1.90 173.52 173.52 - - 100.00
Statement pursuant to first proviso to sub-section (3) of section 129 of the Companies Act 2013, read with rule 5 of Companies (Accounts) Rules, 2014 in the prescribed Form AOC-1 relating to subsidiary companies
Part - A
350

(` in crores)Sr. No Subsidiary Country Reporting
currencyExchange
RateShare
capital (incl. advances towards
capital where applicable)
Reserves and
Surplus
Total Assets Total Liabilities
Turnover Profit/ (Loss) Before Tax
Tax Expense/
(Credit)
Profit/(Loss) after
tax
Profit/ (Loss)for
the period/ year *
Proposed dividend and tax thereon
Investments (except in case of investment
in the subsidiaries)
% of shareholding
38 Jaguar Cars Limited (subsidiary w.e.f June 2, 2008)
UK GBP92.28 - - - - - - - - - - - 100.00
39 Land Rover Exports Limited (Business transferred to Jaguar Land Rover Exports Ltd) (subsidiary w.e.f June 2, 2008)
UK GBP
92.28 - - - - - - - - - - - 100.0040 The Lanchester Motor Company Limited
(subsidiary w.e.f June 2, 2008)UK GBP
92.28 - - - - - - - - - - - 100.0041 The Daimler Motor Company Limited
(subsidiary w.e.f June 2, 2008)UK GBP
92.28 13.84 - 13.84 - - - - - - - - 100.0042 S S Cars Limited (subsidiary w.e.f June
2, 2008)UK GBP
92.28 - - - - - - - - - - - 100.0043 Daimler Transport Vehicles Limited
(subsidiary w.e.f June 2, 2008)UK GBP
92.28 - - - - - - - - - - - 100.0044 The Jaguar Collection Limited (subsidiary
w.e.f June 2, 2008)UK GBP
92.28 - - - - - - - - - - - 100.0045 Jaguar Land Rover Pension Trustees Limited
(subsidiary w.e.f June 2, 2008)UK GBP
92.28 - - - - - - - - - - - 100.0046 Jaguar Cars (South Africa) (Pty) Ltd
(subsidiary w.e.f June 2, 2008)South Africa ZAR
5.54 - - - - - - - - - - - 100.0047 Jaguar Land Rover Slovakia s.r.o.
(Incorporated w.e.f. August 27, 2015) (subsidiary w.e.f August 27, 2015)
Slovakia EUR
80.81 2,666.71 26.76 7,220.23 (4,526.76) 531.88 83.58 18.72 64.86 64.86 - - 100.0048 Jaguar Racing Limited (Incorporated w.e.f.
February 2, 2016) (subsidiary w.e.f February 2, 2016)
UK GBP
92.28 - 7.60 249.26 (241.67) 84.81 4.56 0.95 3.61 3.61 - - 100.0049 InMotion Ventures Limited (Incorporated
w.e.f. March 18, 2016) (subsidiary w.e.f March 18, 2016)
UK GBP
92.28 0.00 (67.63) 264.20 (331.83) 0.19 (10.64) - (10.64) (10.64) - - 100.0050 InMotion Ventures 1 Limited UK GBP 92.28 - - - - - - - - - - - 100.0051 InMotion Ventures 2 Limited UK GBP 92.28 - - - - - - - - - - - 100.0052 InMotion Ventures 3 Limited UK GBP 92.28 - - - - - - - - - - - 100.0053 Land Rover Ireland (Services) Limited UK EUR 80.81 - 1.62 43.43 (41.81) 31.70 1.51 - 1.51 1.51 - - 100.0054 Spark44 (JV) Ltd (Shareholding changed
from 50% to 50.50% w.e.f. August 31, 2017) UK GBP
92.28 18.57 242.61 593.61 (332.43) (0.66) 66.67 13.87 52.80 52.80 - - 50.5055 Spark44 Limited (London & Birmingham) UK GBP 92.28 - - - - - - - - - - - 50.5056 Spark44 Pty Ltd (Sydney) Australia AUD 50.04 - 2.71 7.58 (4.87) 32.10 3.32 1.93 1.39 1.39 - - 50.5057 Spark44 GmbH (Frankfurt) Germany EUR 80.81 - 15.19 44.25 (29.03) 167.36 8.09 2.82 5.27 5.27 - - 50.5058 Spark44 GLLC (LA & NYC) USA USD 65.18 - 36.07 59.29 (23.22) 213.47 12.58 5.93 6.65 6.65 - - 50.5059 Spark44 Limited (Shanghai) China CNY 10.35 1.03 21.02 58.69 (36.64) 137.49 7.34 1.62 5.72 5.72 - - 50.5060 Spark44 Middle East DMCC (Dubai) UAE USD 65.18 0.33 35.64 52.84 (16.87) 88.27 41.22 19.63 21.59 21.59 - - 50.5061 Spark44 Demand Creation Partners Pte
Ltd (Mumbai)India INR
1.00 - - - - - - - - - - - 50.5062 Spark44 Pte Ltd (Singapore) Singapore SGD 49.82 - 1.70 3.24 (1.53) 3.83 1.26 0.09 1.18 1.18 - - 50.5063 Spark44 Communicacions SL (Madrid) Spain EUR 80.81 0.02 2.44 11.41 (8.95) 33.80 2.41 0.71 1.70 1.70 - - 50.5064 Spark44 SRL (Rome) Italy EUR 80.81 0.08 0.06 9.62 (9.48) 29.15 0.08 0.02 0.05 0.05 - - 50.5065 Spark44 Limited (Seoul) Korea KRW 0.06 0.61 3.76 6.44 (2.07) 14.44 2.42 0.47 1.95 1.95 - - 50.5066 Spark44 K.K. (Tokyo) Japan JPY 0.62 0.31 2.99 7.70 (4.40) 9.61 2.25 0.76 1.50 1.50 - - 50.5067 Spark44 Canada Inc (Toronto) Canada CAD 50.66 - 28.03 46.08 (18.04) 166.50 9.81 4.63 5.19 5.19 - - 50.5068 Spark44 South Africa (Pty) Limited South Africa ZAR 5.54 0.00 1.17 3.55 (2.37) 7.63 0.61 0.17 0.44 0.44 - - 50.5069 Limited Liability Company Jaguar Land
Rover (Russia) (incorporated on 25-5-2008) (subsidiary w.e.f May 15, 2009)
Russia RUB
1.13 5.45 806.83 1,557.88 (745.60) 5,278.79 238.01 58.35 179.67 179.67 - - 100.0070 Jaguar Land Rover (China) Investment Co Ltd
(previously Jaguar Land Rover Automotive Trading (Shanghai) Co. Ltd ) (subsidiary w.e.f June 2, 2008)
China CNY
10.35 69.35 11,194.17 17,920.24 (6,656.73) 47,431.70 5,737.36 1,477.35 4,260.01 4,260.01 - 100.0071 Shanghai Jaguar Land Rover Automotive
Service Co. Ltd (subsidiary w.e.f March 10, 2014)
China LRE CNY
10.35 16.56 (28.40) 73.81 (85.66) 101.27 0.01 9.71 (9.70) (9.70) - - 100.0072 Jaguar Land Rover Colombia SAS
(subsidiary w.e.f August 22, 2016)Colombia COP
0.02 8.34 (14.41) 148.42 (154.49) 125.77 (19.94) (6.01) (13.92) (13.92) - 100.0073 Jaguar Landrover Mexico S.A.P I de C.V Mexico MXN 3.56 13.70 23.21 248.96 (212.05) 203.38 3.22 0.57 2.65 2.65 - 100.0074 Jaguar Landrover Services Mexico S.A C.V Mexico MXN 3.56 - - - - - - - - - - 100.0075 Jaguar Land Rover France SAS (subsidiary
w.e.f February 1, 2009)France EUR
80.81 35.27 3.95 1,533.20 (1,493.98) 6,225.06 43.39 32.64 10.76 10.76 - 100.0076 Jaguar Land Rover Portugal-Veiculos e
Pecas, Lda. (subsidiary w.e.f June 2, 2008)Portugal EUR
80.81 10.75 72.20 234.29 (151.35) 647.07 6.43 9.05 (2.62) (2.62) - 100.0077 Jaguar Land Rover Espana SL (merged
company following the absorption of Jaguar Hispania, S.L.U by Land Rover Espana, S.L.U) (formerly known as Land Rover Espana SL) (subsidiary w.e.f June 2, 2008)
Spain EUR
80.81 356.95 177.76 1,656.56 (1,121.84) 4,239.11 42.24 11.04 31.21 31.21 - 100.0078 Jaguar Land Rover Italia SpA (subsidiary
w.e.f June 2, 2008)Italy EUR
80.81 202.02 407.19 2,598.40 (1,989.18) 9,718.58 106.88 30.12 76.76 76.76 - 100.0079 Land Rover Ireland Limited - (no longer a
trading NSC) (subsidiary w.e.f June 2, 2008)Ireland EUR
80.81 0.00 12.51 15.68 (3.18) - (1.13) - (1.13) (1.13) - 100.0080 Jaguar Land Rover Korea Co. Ltd.(subsidiary
w.e.f June 2, 2008)Korea KRW
0.06 0.30 125.41 2,090.06 (1,964.34) 5,913.01 108.65 23.66 84.99 84.99 - 100.0081 Jaguar Land Rover Deutschland GmbH
(subsidiary w.e.fJune 2, 2008)Germany EUR
80.81 107.63 741.51 3,584.40 (2,735.26) 10,452.51 168.15 35.22 132.93 132.93 - 100.0082 Jaguar Land Rover Austria GmbH (subsidiary
w.e.f June 2, 2008)Austria EUR
80.81 1.88 110.80 545.08 (432.40) 1,827.70 19.41 5.68 13.73 13.73 - 100.0083 Jaguar Land Rover Australia Pty Limited
(subsidiary w.e.f June 2, 2008)Australia AUD
50.04 3.50 119.38 2,390.21 (2,267.32) 5,758.47 92.52 58.98 33.54 33.54 - 100.00
Statement pursuant to first proviso to sub-section (3) of section 129 of the Companies Act 2013, read with rule 5 of Companies (Accounts) Rules, 2014 in the prescribed Form AOC-1 relating to subsidiary companies
Part - A
35173rd Annual Report 2017-18
INTEGRATED REPORT 1-65 STATUTORY REPORTS 66-184 FINANCIAL STATEMENTS 185-353

(` in crores)Sr. No Subsidiary Country Reporting
currencyExchange
RateShare
capital (incl. advances towards
capital where applicable)
Reserves and
Surplus
Total Assets Total Liabilities
Turnover Profit/ (Loss) Before Tax
Tax Expense/
(Credit)
Profit/(Loss) after
tax
Profit/ (Loss)for
the period/ year *
Proposed dividend and tax thereon
Investments (except in case of investment
in the subsidiaries)
% of shareholding
84 Jaguar Land Rover North America, LLC. (subsidiary w.e.f June 2, 2008)
USA USD65.18 260.71 1,353.79 9,927.99 (8,313.50) 48,081.79 1,821.35 887.58 933.77 933.77 - 100.00
85 Jaguar Land Rover Japan Limited (subsidiary w.e.f October 1, 2008)
Japan JPY0.62 29.60 239.62 1,327.39 (1,058.18) 2,472.94 30.28 8.02 22.26 22.26 - 100.00
86 Jaguar Land Rover Canada, ULC (subsidiary w.e.f June 2, 2008)
Canada CAD50.66 - 27.22 1,966.46 (1,939.24) 5,349.51 36.63 9.61 27.02 27.02 - 100.00
87 Jaguar e Land Rover Brasil Indústria e Comércio de Veículos LTDA (subsidiary w.e.f June 2, 2008)
Brazil BRL
19.50 1,202.27 (692.16) 2,607.55 (2,097.44) 2,943.12 (340.37) (9.15) (331.22) (331.22) - 100.00
88 Jaguar Land Rover Belux N.V. (subsidiary w.e.f June 2, 2008)
Belgium EUR80.81 10.10 108.74 1,530.84 (1,412.00) 4,023.37 38.64 15.44 23.20 23.20 - 100.00
89 Jaguar Land Rover Nederland BV (subsidiary w.e.f June 2, 2008)
Holland EUR80.81 0.36 58.13 621.11 (562.62) 1,500.90 11.50 2.81 8.68 8.68 - 100.00
90 Jaguar Land Rover (South Africa) (Pty) Limited (subsidiary w.e.f June 2, 2008)
South Africa ZAR5.54 0.00 213.52 1,096.85 (883.33) 2,657.96 116.24 31.85 84.39 84.39 - 100.00
91 Jaguar Land Rover India Limited (subsidiary w.e.f October 25, 2012)
India INR1.00 280.25 (5.83) 1,228.86 (954.44) 1,867.16 0.27 3.57 (3.30) (3.30) - 100.00
92 Jaguar Land Rover Singapore Pte. Ltd (incorporated w.e.f November 25,2015)(subsidiary w.e.f November 25, 2015)
Singapore SGD
49.82 3.74 11.85 259.63 (244.05) 340.17 4.99 1.12 3.87 3.87 - 100.00
93 Jaguar Land Rover Taiwan Company Pte. Ltd Taiwan TWD 2.23 8.60 (1.64) 75.60 (68.64) - (1.58) - (1.58) (1.58) - 100.00
94 TMNL Motor Services Nigeria Ltd (incorporated w.e.f September 2, 2015)(subsidiary w.e.f September 2, 2015)
Nigeria NGN
0.18 0.18 (0.28) 0.14 0.23 - (0.03) (0.00) (0.03) (0.03) - - 100.00
95 Tata Daewoo Commercial Vehicle Sales and Distribution Co. Ltd. (subsidiary w.e.f April 9, 2010)
South Korea KRW
0.06 4.00 15.79 63.33 43.54 137.56 (4.73) (0.44) (4.29) (4.29) - - 100.00
96 PT Tata Motors Distribusi Indonesia (subsidiary w.e.f February 11, 2013)
Indonesia IDR0.00 212.03 (195.94) 79.55 63.46 68.00 (33.14) 0.16 (33.30) (33.30) - - 100.00
Details of Direct subsidiaries, on consolidated basis including their respective subsidiaries included above
1 Tata Technologies Limited (subsidiary w.e.f September 10, 1997) 43.03 1,403.30 2,152.45 706.11 2,810.06 452.15 98.24 353.91 353.91 - 220.42 72.29
2 Tata Motors Holdings Finance Ltd (Name changed from Tata Motors Finance Limited w.e.f. June 17, 2017) (subsidiary w.e.f June 1, 2006) 1,404.74 (557.72) 29,123.07 28,276.06 2,783.17 1,488.39 (49.32) 1,537.70 1,537.70 - 1,440.74 100.00
3 TML Holdings Pte Ltd, Singapore** (subsidiary w.e.f February 4, 2008) - - - - - - - - - - - 100.00
4 PT Tata Motors Indonesia (subsidiary w.e.f December 29, 2011) 220.38 (231.49) 51.55 62.66 38.67 (46.31) 0.11 (46.42) (46.42) - - 100.00
**TML Holdings Pte Ltd, Singapore holds fully Jaguar Land Rover Automtive Plc and Tata Daewoo Commercial Vehicle Co. Ltd., the consolidated accounts of which are given below :
1 Jaguar Land Rover Automotive Plc Consolidated (subsidiary w.e.f June 2, 2008) 13,848.23 77,973.13 2,49,875.40 1,57,973.75
2,27,104.40 13,614.34 3,974.20 9,640.14 9,640.14 - 13,022.66 100.00
2 Tata Daewoo Commercial Vehicle Co. Ltd (subsidiary w.e.f March 30, 2004) 0.03 2,218.74 3,715.86 1,497.10 4,843.51 238.14 39.48 198.66 198.66 - - 100.00
* Profit for the year is after share of minority interest and share of profit/(loss) in respect of investment in associate companies.
Statement pursuant to first proviso to sub-section (3) of section 129 of the Companies Act 2013, read with rule 5 of Companies (Accounts) Rules, 2014 in the prescribed Form AOC-1 relating to subsidiary companies
Part - A
352

Sr. No
Name of Associates/Joint Ventures
Shares of Associate/Joint Ventures held by the Company on the year end Profit/(loss) for the year
Latest audited Balance
Sheet Date
No. Amount of Investment in Associates/
Joint Venture (` in crore)
Extent of Holding %
Networth attributable to Shareholding as per latest
audited Balance
Sheet (` in crore)
Considered in Consolidation
(` in crore)
Not Considered in Consolidation
(` in crore)
Description of how there is significant
influence
Reason why the associate/ joint venture
is not consolidated
Joint ventures
1 Fiat India Automobiles Private Limited*
March 31,2018 12,22,57,983 1,567.04 50% 1,687.53 183.60 - Note (a) -
2 Tata Cummins Private Ltd March 31,2018 9,00,00,000 90.00 50% 458.44 86.63 - Note (a) -
Joint ventures
1 JT Special Vehicle (P) Ltd. March 31,2018 25,00,000 2.50 36.16% 2.50 - Note (a) -
2 "Chery Jaguar Land Rover Automotive Co Ltd (subsidiary w.e.f November 16, 2012)"
March 31,2018 - 1,326.62 50% 4,451.33 2,161.73 - Note (a) -
3 Tata HAL Technologies Limited
March 31,2018 1,01,40,000 50.00% - - - There is no significant influence.
Provision for impairment
was considered in full in FY
16-17
Associates
1 Tata AutoComp Systems Ltd March 31,2018 5,23,33,170 77.47 26.00% 211.91 17.12 - Note (b) -
2 Nita Company Ltd March 31,2018 16,000 1.27 40% 29.54 3.69 - Note (b) -
3 Automobile Corporation of Goa Ltd (subsidiary w.e.f May 21, 2007)
March 31,2018 29,82,214 109.63 47.19% 141.19 9.42 - Note (b) -
4 Jaguar Cars Finance Limited March 31,2018 49,900 3.30 49.90% 3.23 - - Note (b) -
5 Synaptiv Limited March 31,2018 1,56,00,000 1.44 33.33% 1.48 - Note (b)
6 CloudCar Inc March 31,2018 13,32,55,012 111.36 26.30% 44.87 (22.86) Note (b)
7 DriveClubService Pte. Ltd. March 31,2018 251 1.66 25.07% 1.85 - Note (b)
8 Tata Hitachi Construction Machinery Company Private Ltd
March 31,2018 4,54,28,572 240.20 39.99% 497.35 109.16 - Note (b) -
* Unaudited financials considered for Consolidation
Note : (a) - There is a significant influence by virtue of joint control
(b) - There is a significant influence due to percentage (%) of share capital
Statement pursuant to first proviso to sub-section (3) of section 129 of the Companies Act 2013, read with rule 5 of Companies (Accounts) Rules, 2014 in the prescribed Form AOC-1 relating to subsidiary companies
Part - B
35373rd Annual Report 2017-18
INTEGRATED REPORT 1-65 STATUTORY REPORTS 66-184 FINANCIAL STATEMENTS 185-353

354
NOTICE(PURSUANT TO SECTION 101 OF THE COMPANIES ACT, 2013)
Dear Member,
NOTICE IS HEREBY GIVEN THAT THE SEVENTY THIRD ANNUAL GENERAL MEETING OF TATA MOTORS LIMITED will be held on Friday, August 3, 2018 at 3:00 p.m. at Birla Matushri Sabhagar, 19, Sir Vithaldas Thackersey Marg, Mumbai 400 020 to transact the following business:
ORDINARY BUSINESS
1. To receive, consider and adopt the Audited Standalone Financial Statement of the Company for the financial year ended March 31, 2018 together with the Reports of the Board of Directors and the Auditors thereon.
2. To receive, consider and adopt the Audited Consolidated Financial Statement of the Company for the financial year ended March 31, 2018 together with the Report of the Auditors thereon.
3. To appoint a Director in place of Mr Guenter Butschek (DIN: 07427375) who, retires by rotation and being eligible, offers himself for re-appointment.
SPECIAL BUSINESS
4. Appointment of Ms Hanne Birgitte Sorensen (DIN: 08035439) as a Director and as an Independent Director
To consider and, if thought fit, to pass the following resolution as an Ordinary Resolution:
“RESOLVED that Ms Hanne Birgitte Sorensen (DIN: 08035439), who was appointed as an Additional Director of the Company with effect from January 3, 2018 by the Board of Directors and who holds office upto the date of this Annual General Meeting of the Company under Section 161(1) of the Companies Act, 2013 (“the Act”) and Article 132 of the Articles of Association of the Company, but who is eligible for appointment and in respect of whom the Company has received a notice in writing under Section 160(1) of the Act from a member proposing her candidature for the office of Director, be and is hereby appointed as a Director of the Company.”
“RESOLVED FURTHER that pursuant to the provisions of Sections 149, 152 and other applicable provisions, if any, of the Act read with Schedule IV to the Act (including any statutory modification or re-enactment thereof for the time being in force) and the Companies (Appointment and Qualification of Directors) Rules, 2014, as amended from time to time, the appointment of Ms Hanne Birgitte Sorensen (DIN: 08035439), who has submitted a declaration that she meets the criteria for independence as provided in Section 149(6) of the Act and Regulation 16(1)(b) of the Securities and Exchange Board of India (Listing Obligations and Disclosure Requirements) Regulations, 2015 and who is eligible for appointment as an Independent Director of the Company, not liable to retire by rotation, for a term of five years commencing from January 3, 2018 upto January 2, 2023, be and is hereby approved.”
5. Ratification of Cost Auditor’s Remuneration
To consider and, if thought fit, to pass the following resolution as an Ordinary Resolution:
“RESOLVED that pursuant to the provisions of Section 148(3) and other applicable provisions, if any, of the Companies Act, 2013 (including any statutory modification or re-enactment thereof for the time being in force) and the Companies (Audit and Auditors) Rules, 2014, as amended from time to time, the Company hereby ratifies the remuneration of `5,00,000/- (Rupees Five Lakh Only) plus applilcable taxes, travel and out-of-pocket expenses incurred in connection with the audit, as approved by the Board of Directors, payable to M/s Mani & Co., Cost Accountants (Firm Registration No. 000004) who are appointed as Cost Auditors to conduct the audit of the relevant cost records of the Company for the financial year ending March 31, 2019.”
6. Private placement of Non-Convertible Debentures/Bonds
To consider and, if thought fit, to pass the following resolution as a Special Resolution:
“RESOLVED that pursuant to the provisions of Sections 23, 42, 71 and other applicable provisions, if any, of the Companies Act, 2013 (“the Act”) (including any statutory modification or re-enactment thereof for the time being in force), the Companies (Prospectus and Allotment of Securities) Rules, 2014 and the Companies (Share Capital and Debentures) Rules, 2014, both as amended from time to time, the Securities and Exchange Board of India (“SEBI”) (Listing Obligations and Disclosure Requirements) Regulations, 2015, SEBI (Issue and Listing of Debt Securities) Regulations, 2008 and such other regulations prescribed by SEBI (“SEBI Regulations”), as may be amended from time to time, other applicable laws and the Articles of Association of the Company, consent of the Company be and is hereby accorded to the Board of Directors (hereinafter referred to as the ‘Board’, which term shall be deemed to include any Committee of the Board or executives, as pemitted under the Act or the Rules thereunder, constituted to exercise its powers, including the powers conferred by this Resolution) for making offer(s) or invitation(s) to subscribe to cumulative/non-cumulative, listed/unlisted, secured/unsecured, redeemable non-convertible debentures/bonds (‘‘NCDs’’) on private placement basis, in one or more series/tranches during a period of one year from the date of passing this Resolution, upto an amount not exceeding `2,500 crores (Rupees Two Thousand and Five Hundred Crores Only) on such terms and conditions as the Board may, from time to time, determine and consider proper and most beneficial to the Company including as to when the said NCDs be issued, the consideration for the issue, utilization of issue proceeds and all matters connected with or incidental thereto and that such borrowing is within the overall borrowing limits of the Company.”

35573rd Annual Report 2017-18
“RESOLVED FURTHER that for the purpose of giving effect to this Resolution, the Board be and is hereby authorised to finalise, settle and execute such documents, deeds, writings, papers or agreements as may be required and do all such acts, deeds, matters and things as it may in its absolute discretion deem necessary proper and desirable and to resolve any question, difficulty or doubt that may arise in relation thereto or otherwise considered by the Board to be in the best interest of the Company.”
7. Tata Motors Limited Employees Stock Option Scheme 2018 and grant of stock options to the Eligible Employees under the Scheme
To consider and, if thought fit, to pass the following resolution as a Special Resolution:
“RESOLVED that pursuant to the provisions of Section 62(1)(b) and other applicable provisions of the Companies Act, 2013 (“the Act”) read with the Companies (Share Capital and Debentures) Rules, 2014, the Articles of Association of the Company, the provisions of the Securities and Exchange Board of India (Share Based Employee Benefits) Regulations, 2014 (“SBEB Regulations”), the provisions of Foreign Exchange Management Act, 1999, the rules and regulations framed thereunder and any rules, circulars, notifications, guidelines and regulations issued by the Reserve Bank of India (“FEMA”), the provisions of any regulations/guidelines prescribed by the Securities and Exchange Board of India (“SEBI”) and other applicable laws for the time being in force (including any amendment thereto or modification(s) or re-enactment(s) thereof from time to time) and subject to any applicable approval(s), consent(s), permission(s) and sanction(s) of any authority(ies) and also any condition(s) and modification(s) as may be prescribed or imposed by such authority(ies) while granting such approval(s), consent(s), permission(s) and sanction(s), and subject to acceptance of such condition(s) or modification(s) by the Board of Directors of the Company (hereinafter referred to as the “Board”, which term shall include Nomination and Remuneration Committee (“NRC”) or their delegated authority to exercise its powers, including the powers conferred by this Resolution), consent of the members be and is hereby accorded to the Board to adopt and implement “Tata Motors Limited Employees Stock Option Scheme 2018” (“TML ESOP Scheme 2018”/“the Scheme”) and to create, offer and grant such number of options and to issue and allot such number of Ordinary Shares not exceeding 1,38,00,000 (One Crore Thirty Eight Lakh Only) options (representing 0.406% of the issued share capital of the Company), from time to time, to the permanent employees of the Company, whether working in India or out of India, present or future, as may be decided by the Board and permitted under the SBEB Regulations but does not include an employee who is a promoter or a person belonging to the promoter group (“Eligible Employees”), with each option giving a right, but not an obligation, to the Eligible Employees to subscribe to one fully paidup Ordinary Share of the face value of `2/- (Rupees Two Only) each in the Company, (a) at a price of `345/- (Rupees Three Hundred and Forty Five Only) each per Ordinary Share in respect of Eligible Employees as on this date; and (b) at a price based on the average market price of the Ordinary Shares quoted on the stock exchange of India having the highest
trading volumes for the Company’s Ordinary Shares during the period of 90 days preceding the date of grant by the NRC in respect of the new joinees who would become Eligible Employees hereinafter, and that the grant of options, vesting and exercise thereof shall be in one or more tranches and on such terms and conditions, as may be determined by the Board in accordance with the provisions of the Scheme, the accounting policies, SBEB Regulations and in due compliance with the applicable laws and regulations in force.”
“RESOLVED FURTHER that the Ordinary Shares to be issued pursuant to the Scheme shall rank pari passu in all respects with the existing Ordinary Shares of the Company.”
“RESOLVED FURTHER that in case of any corporate action(s) such as rights issues, bonus issues, stock splits, consolidation of shares, change in capital structure, merger, sale of division/undertaking or other re-organization, the outstanding options to be granted under the Scheme shall be suitably adjusted for the number of options as well as the exercise price, as applicable and that the Board be and is hereby authorized to do all such acts, deeds, matters and things as it may deem fit in its absolute discretion and as permitted under applicable laws, so as to ensure that fair and equitable benefits under the Scheme are passed on to the Eligible Employees.”
“RESOLVED FURTHER that the Board be and is hereby authorized to approve the Grant Letter, Application Form, ESOP agreement and other related documents, to grant options to the Eligible Employees (including deciding the number of options to be granted to Eligible Employees at same work level), to allot Ordinary Shares upon exercise of options by the Eligible Employees, to take necessary steps for listing of the Ordinary Shares allotted under the Scheme on the stock exchanges, to make any modifications/changes/variations/alterations/revisions in the Scheme or suspend/withdraw/revive the Scheme from time to time, unless such change is detrimental to the interest of the Eligible Employees, as may be required in case of any change in applicable laws or as specified by any statutory authority, to do all such acts, deeds, matters and things as it may, in its absolute discretion, deem necessary, expedient or proper and to settle all questions, difficulties or doubts that may arise in relation to the implementation, administration and evolution of the Scheme.”
“RESOLVED FURTHER that the Company shall conform to the accounting policies prescribed from time to time under SBEB Regulations and any other applicable laws and regulations to the extent relevant and applicable to the TML ESOP Scheme 2018.”
By Order of the Board of Directors
H K SETHNA Company Secretary
FCS No: 3507Mumbai, May 23, 2018
Registered Office:Bombay House, 24, Homi Mody Street, Mumbai 400 001Tel: +91 22 6665 8282; Fax: +91 22 6665 7799 Email: [email protected]; Website: www.tatamotors.com CIN: L28920MH1945PLC004520

356
NOTES:
1. The Explanatory Statement pursuant to Section 102 of the Companies Act, 2013 (“the Act”) in respect of the business under item nos. 4 to 7 set out above and details of Directors seeking appointment/re-appointment as required under SEBI (Listing Obligations and Disclosure Requirements) Regulations, 2015 (“SEBI Listing Regulations”) and Secretarial Standards on General Meetings issued by the Institute of Company Secretaries of India in respect of directors seeking appointment / re-appointment at this Annual General Meeting (“AGM”/ “the meeting”) are annexed hereto.
2. A MEMBER ENTITLED TO ATTEND AND VOTE AT THE AGM IS ENTITLED TO APPOINT A PROXY TO ATTEND AND VOTE ON HIS/HER BEHALF AND THE PROXY NEED NOT BE A MEMBER.
The duly completed and signed instrument appointing proxy as per the format included in the Annual Report should be returned to the Registered Office of the Company not less than forty-eight hours before the time for holding the AGM. Proxies submitted on behalf of limited companies, societies, partnership firms, etc. must be supported by appropriate resolution/authority, as applicable, issued by the member organization.
A person can act as a proxy on behalf of members not exceeding fifty (50) and holding in the aggregate not more than 10% of the total share capital of the Company carrying voting rights. A member holding more than 10% of the total share capital of the Company carrying voting rights may appoint a single person as proxy and such person shall not act as a proxy for any other person or member.
3. Corporate members intending to send their authorised representatives to attend the AGM are requested to send to the Company, a certified copy of the Board Resolution authorising their representative to attend and vote on their behalf at the AGM.
4. Only registered members (including the holders of ‘A’ Ordinary Shares) of the Company may attend and vote at the AGM. The holders of the American Depositary Receipts (the “ADR”) of the Company shall not be entitled to attend the said AGM. However, the ADR holders are entitled to give instructions for exercise of voting rights at the said meeting through the Depositary, to give or withhold such consent, to receive such notice or to otherwise take action to exercise their rights with respect to such underlying shares represented by each such ADR. A brief statement, as to the manner in which such voting instructions may be given, is being sent to the ADR holders by the Depositary.
5. In case of joint holders attending the AGM, only such a joint holder who is senior by the order in which the name stands in the register of members will be entitled to vote.
6. The Register of Directors and Key Managerial Personnel and their shareholding as maintained under Section 170 of the Act, the Register of Contracts or Arrangement in which the Directors are interested as maintained under Section 189 of the Act and relevant documents referred to in the Notice and the Explanatory Statement are open for inspection by the members at the Registered Office of the Company on all working days, except Saturdays, during business hours up to the date of the meeting and also at the venue during the meeting.
7. As per the provisions of Section 72 of the Act, the facility for making nomination is available for the members in respect of the
shares held by them. Members who have not yet registered their nomination are requested to register the same by submitting Form No. SH-13. Members are requested to submit the said details to their Depository Participants in case the shares are held by them in electronic form and to the Company’s Registrar and Transfer Agent (“RTA”) in case the shares are held by them in physical form.
8. Members holding shares in physical form, in identical order of names, in more than one folio are requested to send to the Company’s RTA, the details of such folios together with the share certificates for consolidating their holdings in one folio. A consolidated share certificate will be issued to such members after making requisite changes.
9. Non-Resident Indian members are requested to inform the Company’s RTA immediately of:
a) Change in their residential status on return to India for permanent settlement.
b) Particulars of their bank account maintained in India with complete name, branch, account type, account number and address of the bank with pin code number, if not furnished earlier.
10. Members holding shares in dematerialised mode are requested to intimate all changes pertaining to their bank details/NECS/mandates, nominations, power of attorney, change of address/name, PAN details, etc. to their Depository Participant only and not to the Company’s RTA. Changes intimated to the Depository Participant will then be automatically reflected in the Company’s records which will help the Company and its RTA provide efficient and better service to the members.
In case of members holding shares in physical form, such information is required to be provided to the Company’s RTA.
A form for capturing the above details is annexed hereto for use by the members.
Members’ Referencer giving guidance on securities related matters is put on the Company’s website and can be accessed at link: https://www.tatamotors.com/investors/
11. SEBI HAS MANDATED SUBMISSION OF PERMANENT ACCOUNT NUMBER (PAN) BY EVERY PARTICIPANT IN THE SECURITIES MARKET. MEMBERS HOLDING SHARES IN ELECTRONIC FORM ARE, THEREFORE, REQUESTED TO SUBMIT THEIR PAN DETAILS TO THEIR DEPOSITORY PARTICIPANTS. MEMBERS HOLDING SHARES IN PHYSICAL FORM ARE REQUESTED TO SUBMIT THEIR PAN DETAILS TO THE COMPANY’S RTA.
12. SECURITIES OF LISTED COMPANIES WOULD BE TRANSFERRED IN DEMATERIALISED FORM ONLY, FROM A CUT-OFF DATE, TO BE NOTIFIED BY SEBI. IN VIEW OF THE SAME MEMBERS HOLDING SHARES IN PHYSICAL FORM ARE REQUESTED TO CONSIDER CONVERTING THEIR HOLDINGS TO DEMATERIALIZED FORM TO ELIMINATE ALL RISKS ASSOCIATED WITH PHYSICAL SHARES AND FOR EASE OF PORTFOLIO MANAGEMENT. MEMBERS CAN CONTACT THE COMPANY’S RTA FOR ASSISTANCE IN THIS REGARD.
13. Members are requested to note that, dividends if not encashed for a consecutive period of 7 years from the date of transfer

35773rd Annual Report 2017-18
to Unpaid Dividend Account of the Company, are liable to be transferred to the Investor Education and Protection Fund (IEPF). The shares in respect of such unclaimed dividends are also liable to be transferred to the demat account of the IEPF Authority. In view of this, members are requested to claim their dividends from the Company, within the stipulated timeline. The members, whose unclaimed dividends/shares have been transferred to IEPF, may claim the same by making an application to the IEPF Authority in Form No. IEPF-5 available on www.iepf.gov.in. For details, please refer to Corporate Governance Report which is a part of this Annual Report.
14. Members desiring any information as regards the Accounts are requested to write to the Company at an early date so as to enable the management to keep the information ready at the meeting.
15. To support the “Green Initiative” announced by the Government of India, electronic copies of the Annual Report and this Notice inter alia indicating the process and manner of e-voting along with Attendance Slip and Proxy Form are being sent by e-mail to those members whose e-mail addresses have been made available to the Company / Depository Participants unless the member has specifically requested for a hard copy of the same. In other cases, hard copy of the Abridged Annual Report is being sent to the members by the permitted mode. The members who are desirous of receiving the full Annual Report may write to the Company’s RTA for a copy of the same. MEMBERS WHO HAVE NOT REGISTERED THEIR EMAIL ADDRESSES WITH COMPANY’S RTA /DEPOSITORIES ARE REQUESTED TO CONTRIBUTE TO THE GREEN INITIATIVE BY REGISTERING THEIR EMAIL ADDRESS, FOR RECEIVING ALL FUTURE COMMUNICATIONS THROUGH E-MAIL.
16. Attendance Slip, Proxy Form and the route map showing directions to reach the venue of the AGM are annexed hereto.
17. Members may note that the Notice and Annual Report 2017-18 will also be available on the Company’s website viz. www.tatamotors.com.
18. VOTING BY MEMBERS:A. In compliance with the provisions of Section 108 of the Act, the
Companies (Management and Administration) Rules, 2014 and Regulation 44 of the SEBI Listing Regulations, the Company is pleased to provide members the facility to exercise their right to vote on resolutions proposed to be considered at the AGM by electronic means either by (a) remote e-voting (by using the electronic voting system provided by NSDL as explained at ‘para F’ herein below) or (b) Electronic/Physical Ballot at the AGM venue (as provided at ‘para G’ herein below). Resolution(s) passed by members through e-voting is/are deemed to have been passed as if they have been passed at the AGM.
B. The voting rights of the Ordinary Shareholders shall be in the same proportion to the paid up Ordinary share capital and in case of voting rights on the ‘A’ Ordinary shares, the holder shall be entitled to one vote for every ten ‘A’ Ordinary shares held.
C. A person, whose name is recorded in the Register of Members or in the Register of Beneficial Owners maintained by the depositories as on July 27, 2018 (“the cut-off date”), shall be entitled to vote in respect of the shares held, by availing the facility of remote e-voting / voting through electronic ballot at the meeting. Any person who is not a member as on the cut-off date should treat this Notice for information purposes only.
D. The members can opt for only one mode of voting i.e. either by remote e-voting or electronic ballot at the meeting. The members attending the meeting who have not already cast their vote by remote e-voting shall be able to exercise their right at the meeting through electronic ballot. The members who have cast their vote by remote e-voting are eligible to attend the meeting but shall not be entitled to cast their vote again.
E. The Board of Directors has appointed Mr P N Parikh (Membership No. FCS 327) and failing him Mr Mitesh Dhabliwala (Membership No. FCS 8331) of M/s Parikh & Associates, Practicing Company Secretaries, as the Scrutinizer to scrutinize the remote e-voting and voting process at the venue, in a fair and transparent manner.
F. INSTRUCTIONS FOR REMOTE E-VOTING: Any person, who acquires shares of the Company and
becomes a member of the Company after dispatch of the Notice and holding shares as of the cut-off date, may obtain the login ID and password by sending a request at [email protected].
The remote e-voting period starts on Tuesday, July 31, 2018 (9.00 a.m. IST) and ends on Thursday, August 2, 2018 (5.00 p.m. IST). Remote e-voting shall be disabled by NSDL at 5:00 p.m. on August 2, 2018 and members shall not be allowed to vote through remote e-voting thereafter.
The procedure to login to e-voting website consists of two steps as detailed hereunder.
Step 1 : Log-in to NSDL e-voting system i. Visit the e-voting website of NSDL. Open web browser by
typing the URL: https://www.evoting.nsdl.com/ either on a Personal Computer or on a mobile.
ii. Once the home page of e-voting system is launched, click on the icon “Login” which is available under ‘Shareholders’ section.
iii. A new screen will open. You will have to enter your User ID, your Password and a Verification Code as shown on the screen.
Alternatively, if you are registered for NSDL eservices i.e. IDeAS, you can log-in at https://eservices.nsdl.com/ with your existing IDeAS login. Once you log in to NSDL eservices after using your log in credentials, click on e-voting and you can proceed to step 2 i.e. Cast your vote electronically.
iv. Your User ID details will be as per details given below :
a) For members who hold shares in demat account with NSDL: 8 Character DP ID followed by 8 Digit Client ID (For example if your DP ID is IN300*** and Client ID is 12****** then your user ID is IN300***12******).
b) For members who hold shares in demat account with CDSL: 16 Digit Beneficiary ID (For example if your Beneficiary ID is 12************** then your user ID is 12**************).
c) For members holding shares in Physical Form: EVEN Number followed by Folio Number registered with the company (For example, for members holding Ordinary Shares, if folio number is 001*** and EVEN is 108491 then user ID is 108491001***. For members holding ‘A’ Ordinary Shares, if folio number is 001*** and EVEN is 108492 then user ID is 108492001***).

358
v. Your password details are given below: a) If you are already registered for e-voting, then you can
use your existing password to login and cast your vote.
b) If you are using NSDL e-voting system for the first time, you will need to retrieve the ‘initial password’ which was communicated to you. Once you retrieve your ‘initial password’, you need to enter the ‘initial password’ and the system will force you to change your password.
c) How to retrieve your ‘initial password’?
(i) If your email ID is registered in your demat account or with the Company, your ‘initial password’ is communicated to you on your email ID. Trace the email sent to you from NSDL from your mailbox. Open the email and open the attachment i.e. a .pdf file. Open the .pdf file. The password to open the .pdf file is your 8 digit client ID for NSDL account, last 8 digits of client ID for CDSL account or folio number for shares held in physical form. The .pdf file contains your ‘User ID’ and your ‘initial password’.
(ii) If your email ID is not registered, your ‘initial password’ is communicated to you on your postal address.
vi. If you are unable to retrieve or have not received the “initial password” or have forgotten your password:
a) Click on “Forgot User Details/Password?” option available on www.evoting.nsdl.com (If you are holding shares in your demat account with NSDL or CDSL).
b) Click on “Physical User Reset Password?” option available on www.evoting.nsdl.com (If you are holding shares in physical mode).
c) If you are still unable to get the password by aforesaid two options, you can send a request at [email protected] mentioning your demat account number/folio number, your PAN, your name and your registered address.
vii. After entering your password, tick on ‘‘I here by agree to all Terms and Conditions’’.
viii. Click on “Login” button.
ix. After you click on the “Login” button, Home page of e-voting will open.
Step 2 : Cast your vote electronically on NSDL e-voting system i. After successful login at Step 1, you will be able to see the
Home page of e-voting. Click on e-voting.
ii. Click on Active Voting Cycles. You will be able to see all the companies “EVEN” in which you are holding shares and whose voting cycle is in active status.
iii. Select “EVEN” of the Company for casting your vote:
a. EVEN for Ordinary Shares is 108491
b. EVEN for ‘A’ Ordinary Shares is 108492
iv. Now you are ready for e-Voting as the Voting page opens.
v. Cast your vote by selecting appropriate options i.e. assent or dissent, verify/modify the number of shares for which you wish to cast your vote and click on “Submit” and also “Confirm” when prompted.
vi. Upon confirmation, the message “Vote cast successfully” will be displayed.
vii. You can also take the printout of the votes cast by you by clicking on the print option on the confirmation page.
viii. Once you confirm your vote on the resolution, you will not be allowed to modify your vote.
General Guidelines for shareholders • Institutional shareholders (i.e. other than individuals,
HUF, NRI, etc.) are required to send a scanned copy (PDF/JPG Format) of the relevant Board Resolution/Authority letter etc. with attested specimen signature of the duly authorized signatory(ies) who are authorized to vote, to the Scrutinizer by email to [email protected] with a copy marked to [email protected].
• It is strongly recommended not to share your password with any other person and take utmost care to keep your password confidential. Login to the e-voting website will be disabled upon five unsuccessful attempts to key in the correct password. In such an event, you will need to go through the “Forgot User Details/Password?” or “Physical User Reset Password?” option available on www.evoting.nsdl.com to reset the password.
• In case of any queries, you may refer to the Frequently Asked Questions (FAQs) for Shareholders and e-voting user manual for Shareholders available at the ‘‘Downloads’’ section of www.evoting.nsdl.com or call on toll free no.: 1800-222-990 or send a request at [email protected].
G. VOTING AT AGM: Members who are present at the AGM, but have not
casted their votes by availing the remote e-voting facility, would be entitled to vote at the end of the discussion on the resolutions on which voting is to be held, by way of electronic/physical ballot.
19. DECLARATION OF RESULTS ON THE RESOLUTIONS: • The Scrutinizer shall, immediately after the conclusion of
voting at the AGM, count the votes cast at the meeting, thereafter unblock the votes cast through remote e-voting in the presence of at least two witnesses not in the employment of the Company and make, not later than 48 hours from conclusion of the meeting, a consolidated Scrutinizer’s report of the total votes cast in favour and against the resolution, invalid votes, if any, and whether the Resolution(s) has/have been carried or not, to the Chairman or a person authorized by him in writing who shall countersign the same.
• The result declared along with the Scrutinizer’s Report shall be placed on the Company’s website www.tatamotors.com and on the website of NSDL www.evoting.nsdl.com immediately after the result is declared. The Company shall simultaneously forward the results to BSE Limited and National Stock Exchange of India Ltd., where the securities of the Company are listed. The results shall also be displayed on the notice board at the Registered Office of the Company.
• Subject to the receipt of requisite number of votes, the Resolutions shall be deemed to be passed on the date of the meeting i.e. August 3, 2018.

35973rd Annual Report 2017-18
The Explanatory Statement pursuant to Section 102 of the Companies Act, 2013 (“the Act”), given hereunder sets out all material facts relating to the special business mentioned at Item Nos. 4 to 7 of the accompanying Notice dated May 23, 2018.
Item No. 4
The Board of Directors (“the Board”), based on recommendation of the Nomination and Remuneration Committee (“NRC”), appointed Ms Hanne Birgitte Sorensen as an Additional Director as also an Independent Director of the Company on January 3, 2018 and she holds office as a Director up to the date of this AGM, pursuant to the provisions of Section 161(1) of the Act.
Ms. Sorensen (52) is a Danish national and holds an MSc. in Economics and Management from the University of Aarhus. She is on the Boards and Committees of various international companies. Previously, she has held various positions in finance business within the A.P. Moller – Maersk A/S Group in Denmark between 1994 and 2016, including as the CEO of Damco, the CEO of Maersk Tankers, and the Senior Vice-President and Chief Commercial Officer of Maersk Line.
Ms Sorensen has given her declaration to the Board that she meets the criteria of independence as provided under Section 149 (6) of the Act and Regulation 16(1)(b) of the Securities and Exchange Board of India (Listing Obligations and Disclosure Requirements) Regulations, 2015 (“SEBI Listing Regulations”) and is eligible to be appointed as a Director in terms of Section 164 of the Act. She has also given her consent to act as a Director.
Ms Sorensen, being eligible and offering herself for appointment, is proposed to be appointed as an Independent Director of the Company for a term of five consecutive years from January 3, 2018 up to January 2, 2023 in compliance with Section 149 of the Act read with Schedule IV to the Act. Pursuant to the provisions of Section 160 (1) of the Act, the Company has received notice from a member signifying his intention to propose the appointment of Ms Sorensen as a Director.
In the opinion of the Board, Ms Sorensen is a person of integrity, possesses the relevant expertise / experience and fulfills the conditions specified in the Act and the SEBI Listing Regulations for appointment as Independent Director and she is independent of the management.
Given her global experience and the Company’s adherence to policy on diversity, gender and geographical, the Board considers it desirable and in the interest of the Company to have Ms Sorensen on the Board of the Company and accordingly the Board recommends the appointment of Ms Sorensen as an Independent Director as proposed in the resolution set out at Item No. 4 for approval by the members.
The terms and conditions of appointment of Independent Director shall be open for inspection by the members at the Registered Office of the Company on all working days, except Saturdays, during business hours up to the date of the meeting and also at the venue during the meeting.
Except for Ms Sorensen and/or her relatives, no other Director, Key Managerial Personnel or their relatives are, in any way, concerned
EXPLANATORY STATEMENT
or interested, financially or otherwise, in the resolution set out at Item No. 4 of the Notice.
Item No. 5
Pursuant to Section 148 of the Act read with the Companies (Audit and Auditors) Rules, 2014, as amended from time to time, the Company is required to have the audit of its cost records for specified products conducted by a Cost Accountant. Based on the recommendation of the Audit Committee, the Board had on May 23, 2018, approved the appointment and remuneration of M/s Mani & Co., the Cost Auditors (Firm Registration No. 000004) to conduct the audit of the Cost records maintained by the Company, pertaining to the relevant products prescribed under the Companies (Cost Records and Audit) Rules, 2014, for the financial year ending March 31, 2019 at a remuneration of `5,00,000/- (Rupees Five Lakh Only).
It may be noted that the records of the activities under Cost Audit is no longer prescribed for “Motor Vehicles and certain parts and accessories thereof”. However, based on the recommendations of the Audit Committee, the Board has also approved the appointment of M/s Mani & Co. for submission of reports to the Company on cost records pertaining to these activities for a remuneration of `20,00,000/- (Rupees Twenty Lakh Only) for the said financial year.
In accordance with the provisions of Section 148 of the Act read with Rule 14 of the Companies (Audit and Auditors) Rules, 2014, as amended from time to time, ratification for the remuneration payable to the Cost Auditors to audit the cost records of the Company for the said financial year by way of an Ordinary Resolution is being sought from the members as set out at Item No. 5 of the Notice.
M/s Mani & Co. have furnished a certificate dated May 14, 2018 regarding their eligibility for appointment as Cost Auditors of the Company.
The Board recommends the Ordinary Resolution set out at Item No. 5 of the Notice for approval by the members.
None of the Directors, Key Managerial Personnel or their relatives are, in any way, concerned or interested, financially or otherwise, in the resolution set out at Item No. 5 of the Notice.
Item No. 6
The Company had obtained members’ approval for borrowing up to `3,000 crores by way of Non-Convertible Debentures (“NCDs”) at the Annual General Meeting (“AGM”) held on August 22, 2017, which is valid for a period of one year from date of the said approval. The Company has borrowed `1,500 crores by way of unsecured NCDs up to May 2018 in accordance with the aforesaid members’ approval.
As per the provisions of Section 42 of the Act read with Rule 14 of the Companies (Prospectus and Allotment of Securities) Rules, 2014, a company making a private placement of its securities is required to obtain approval of the members by way of a Special Resolution for each offer or invitation before making such offer. However, in

360
case of offer for NCDs, it shall be sufficient if the Company passes a previous Special Resolution only once in a year for all the offers or invitation for such debentures during the year.
The NCDs issued on private placement basis is one of the cost effective sources of long term borrowings raised by the Company. The Company had obtained members’ approval vide Postal Ballot on June 27, 2014 to borrow from time to time any sum(s) of monies which, together with monies already borrowed by the Company (apart from temporary loans obtained or to be obtained from the Company’s Bankers in the ordinary course of business) upto an amount not exceeding `30,000 crores. The borrowings of the Company (on standalone basis excluding joint operations) as at March 31, 2018 aggregate approximately `17,494 crores, of which outstanding NCDs aggregate to `8,097 crores. The Company’s Net Debt-Equity ratio (on standalone basis excluding joint operations) as at March 31, 2018 is 1.13:1 and the Company believes that the aggregate borrowings would be well within acceptable levels.
In continuation of its efforts to strengthen its capital structure, the Company intends to augment the resources through a mix of internal accruals and long-term borrowings to ensure that they are aligned in terms of quantum, risk, maturity and cost with its earning profile. Accordingly, it is proposed to issue NCDs on a private placement basis aggregating upto `2,500 crores, in one or more series/tranches during the period of one year from the date of passing of this Resolution, with an intention to finance, inter-alia, the repayment of certain NCDs/term loans from Banks, to fund part of the ongoing capital expenditure and for general corporate purposes. The Company intends to raise NCDs for tenures ranging between 2 to 10 years and expects the borrowing cost of NCDs to be lower than 1 year MCLR rate of State Bank of India (prevailing at 8.15% p.a. as on March 31, 2018) plus a spread of 100 bps, considering the current credit rating of the Company of AA by ICRA and AA+ by CARE.
It is therefore proposed to pass an enabling resolution authorizing the Board of Directors to make specific issuances based on the Company’s requirements, market liquidity and appetite at the opportune time.
In the opinion of the Board, the above proposal as set out in Item No. 6 of the Notice is in the interest of the Company and accordingly the Board recommends the same for approval by the members.
None of the Directors, Key Managerial Personnel or their relatives are, in any way, concerned or interested, financially or otherwise, in the resolution set out at Item No. 6 of the Notice.
Item No. 7:
Stock options in the hands of the employees have since long been recognised as an effective instrument to align the interests of the employees with that of the Company. With a view to ring fence and incentivize key talent to drive long term objectives of the Company, to ensure that employee payoff match the long gestation period of certain key initiatives, to drive ownership behavior and collaboration amongst employees, it is proposed to approve and adopt Tata Motors Limited Employees Stock Option Scheme 2018 (“TML ESOP Scheme 2018” / “the Scheme”).
The Nomination and Remuneration Committee (‘‘NRC’’) at its meeting held on May 23, 2018 formulated the detailed terms and
conditions of the Scheme which was duly approved by the Board of Directors at its meeting held on the even date, subject to approval of the members.
Jaguar land Rover (“JLR”) currently has a long term incentive plan, which provides cash payment to certain employees based on the JLR’s performance against long-term metrics related to performance and strategic priorities (over a period of three years).
The Board believes that the above two initiatives to link the employees performance in Tata Motors and JLR together with other initiatives taken in the Tata Motors group would assist in improving the financials of the Company, both standalone and consolidated.
The Scheme has been formulated in accordance with the provisions of the Act and the Securities and Exchange Board of India (Share Based Employee Benefits) Regulations, 2014 (“SBEB Regulations”). The salient features of the Scheme are as under:
a. Brief description of the Scheme :
The Scheme is intended to reward, retain and motivate the Eligible Employees of the Company for their performance and participation in the growth and profitability of the Company. The Eligible Employees shall be granted all the stock options in one tranche, as determined by the NRC, which will vest on particular dates and could be exercisable into Ordinary Shares, on the terms and conditions as provided hereunder, in accordance with the provisions of the applicable laws and regulations for the time being in force.
b. Total number of options to be granted:
Not exceeding 1,38,00,000 (One Crore Thirty Eight Lakh Only) options may, in aggregate, be granted that would entitle the grantees to acquire, in one or more tranches, not exceeding 1,38,00,000 (One Crore Thirty Eight Lakh Only) Ordinary Shares of the Company of the face value of `2/- (Rupees Two Only) each fully paid up (representing 0.406% of the issued share capital of the Company as on date). The total aggregate limit of 1,38,00,000 (One Crore Thirty Eight Lakh Only) options may be adjusted for any corporate action(s), as may be decided by the Board.
c. Identification of classes of employees entitled to participate in the Scheme:
The following Eligible Employees, as may be decided by the NRC, shall be granted options under the Scheme:
• Employees of the Company in the levels of LC, L1, L2 and select L3 (around 200 employees forming 2% of the white collar population).
• Employees falling in the above level by way of new appointments or promotions over the next 3 years, i.e. by July 1, 2021, shall be granted options on a pro-rata basis for the period from the date of his/her joining/promotion upto the remaining time to vest.
• Expatriates and existing Whole-Time Directors would be excluded in terms of their individually negotiated contracts.
As per SBEB Regulations, the following category of employees/directors shall not be eligible to participate in

36173rd Annual Report 2017-18
the Scheme:
• An employee of the Company who is a promoter or belongs to the promoter group;
• A director who either by himself or through his relatives or through any body corporate, directly or indirectly, holds more than 10% of the outstanding equity shares of the Company; and
• Independent Directors of the Company.
d. Requirements of vesting and period of vesting:
The options shall vest in employees subject to continuing employment with the Company or any Tata Company (as defined in the Scheme) on the Company achieving certain performance matrices (such as market share, EBITDA and positive cash flows as per the Company’s standalone financials). NRC would determine the said matrices, detailed terms and conditions relating to such vesting including the proportion in which options granted would vest.
The Options would vest in three tranches i.e. June 2021, June 2022 and June 2023 where after the grantees would have the right to subscribe to the Ordinary Shares during the Exercise Period.
Where an Eligible Employee discontinues to be in the permanent employment of the Company due to:
• Resignation or Termination of services: All the options which are granted and yet not vested as on that day shall expire and the vested options should be exercised on or before the date of such discontinuation. For employees whose office has been terminated due to misconduct during the period, the number of options vested as on that day would lapse in accordance with the terms and conditions detailed in the Scheme.
• Retirement: The number of options granted would be pro-rated to the employee’s remaining years of service as on the date of the grant. The vesting and exercise period would be as per the Scheme.
• Transfer to a Tata Company: Options would vest on pro-rata basis for the period served with the Company, subject to the employee continuing to serve a Tata Company on the date of vesting. The vesting and exercise period would be as per the Scheme.
• Death: All the options granted to the employee till such date shall vest in his/her legal heirs or nominees.
• Permanent incapacity: All the options granted to the employee as on the date of permanent incapacitation, shall vest in him/her on that day.
An employee can be granted long leave (defined as a period of not more than one year in line with the Company’s Sabbatical Policy). Where an Eligible Employee is on long leave at any time during the period of grant of options up till the vesting date, the options would be granted or vested on pro-rata basis for the period (after adjusting the period of long leave).
e. Maximum period within which the options shall be vested:
Options granted under TML ESOP Scheme 2018 would vest within a maximum period of 5 (five) years from the date of grant of such options.
f. Exercise Price or pricing formula:
The Exercise Price shall be `345/- (Rupees Three Hundred and Forty Five Only) per option, which is based on the 90 days average market price of the Company’s Ordinary Shares as of May 23, 2018 (the date of approval of the Scheme by NRC and Board). In case of new appointments or promotions, the Exercise Price would be based on the average market price of the Ordinary Shares quoted on the stock exchange of India having the highest trading volumes for the Company’s Ordinary Shares during the period of 90 days preceding the date of grant by the NRC.
The Exercise Price may be adjusted for any corporate action(s), as may be decided by the Board.
g. Exercise Period and the process of Exercise:
The Exercise Period would commence from the date of vesting of options and will expire at the end of one year from the date of vesting of options. NRC may extend the Exercise Period by a further period of two years, as it may deem fit.
The options will be exercisable by the employees by a written application to the Company accompanied by payment of the Exercise Price in such manner and on execution of such documents, as may be prescribed by the NRC from time to time.
The options will lapse if not exercised within the specified Exercise Period. Lapsed options cannot be re-issued by the Company.
h. Appraisal process for determining the eligibility of employees:
The appraisal process for determining the eligibility of the employees to the options at the time of grant and to the number of Ordinary Shares at the time of vesting will be decided by the NRC from time to time.
i. Maximum number of options to be issued per employee and in aggregate:
The number of options that may be granted to an Eligible Employee under the Scheme in any one year would not exceed 3,35,000 options and in aggregate the maximum number of options would not exceed 1,38,00,000 options (representing 0.406% of the total issued share capital of the Company). The options granted and the Exercise Price shall be adjusted for any corporate action(s) such as rights issues, bonus issues, stock splits, consolidation of shares, change in capital structure, merger, sale of division/undertaking or other re-organization, as applicable under the terms and conditions detailed in the Scheme and the decision of the Board shall be final in respect of such adjustment.
j. Maximum Quantum of benefits to be provided per employee:
The maximum quantum of benefits underlying the options issued to an Eligible Employee shall depend upon the number of options held by him/her and the market price of the Ordinary Shares as on the date of sale.

362
k. Route of Scheme implementation:
The Scheme shall be implemented and administered directly by the Company.
l. Source of Shares:
The Scheme contemplates issue of new Ordinary Shares by the Company.
m. The amount of loan provided for implementation of the Scheme by the Company to the Trust, its tenure, utilisation, repayment terms, etc.:
Not applicable. Company would not provide any loan for implementation of the Scheme.
n. Maximum percentage of Secondary Acquisition (subject to limits specified under the Regulations) that can be made by the Trust for the purchase under the scheme:
This is not applicable under the present Scheme.
o. Accounting and Disclosure Policies:
The Company shall follow Ind AS 102 ‘Employee Share-based Payments’, the Guidance Note on Accounting for Employee Share based Payments, as applicable, and/or any relevant Accounting Standards/Guidance Note as may be prescribed by the Institute of Chartered Accountants of India from time to time, including the disclosure requirements prescribed therein.
p. Method of Valuation:
The Company will determine the fair value of the options using the Black-Scholes model when the same are issued to the employees. The fair value will be recognized as employee costs over the vesting period, with a corresponding increase in equity.
q. The following statement, if applicable:
In case the Company opts for expensing of share based employee benefits using the intrinsic value, the difference between the employee compensation cost so computed and the employee compensation cost that shall have been recognized if it had used the fair value, shall be disclosed in the Board’s Report and the impact of this difference on profits
and on earnings per share (‘EPS’) of the Company shall also be disclosed in the Board’s Report.
The said Statement is not applicable to the Company since the Company is opting for the Fair Value Method.
Regulation 6(1) of SBEB Regulations and Rule 12(1) of the Companies (Share Capital and Debentures) Rules, 2014 requires that every employee stock option scheme shall be approved by the members of the Company by passing a special resolution in a general meeting. Further, as the Scheme would entail further issue of shares, consent of the members is required by way of a special resolution pursuant to Section 62(1)(b) of the Act.
Issue of the said Ordinary Shares would be well within the Authorised Share Capital of the Company.
The Board recommends the special resolution set out at Item No. 7 of the Notice for approval by the members.
The draft TML ESOP Scheme 2018 shall be open for inspection by the members at the Registered Office of the Company on all working days, except Saturdays, up to the date of the meeting and also at the venue during the meeting.
None of the Directors of the Company or their relatives is concerned or interested, financially or otherwise, in the resolution set out at Item No. 7 of the Notice. Key Managerial Personnel of the Company or their relatives may be deemed concerned or interested, financially or otherwise, in the said resolution only to the extent of any stock options that may be granted to them and the resultant Ordinary Shares issued, as applicable.
By Order of the Board of Directors
H K SETHNA Company Secretary
FCS No: 3507Mumbai, May 23, 2018Registered Office:Bombay House, 24, Homi Mody Street, Mumbai 400 001Tel: +91 22 6665 8282; Fax: +91 22 6665 7799 Email: [email protected]; Website: www.tatamotors.com CIN: L28920MH1945PLC004520

36373rd Annual Report 2017-18
Details of Directors seeking appointment / re-appointment at the Annual General Meeting [Pursuant to Regulations 26(4) and 36(3) of the SEBI Listing Regulations and Secretarial Standards on General Meetings]
Particulars Mr Guenter Butschek Ms Hanne Birgitte Sorensen
Director Identification Number (DIN)
07427375 08035439
Date of Birth / Age October 21, 1960 57 years
September 18, 1965 52 years
Date of first appointment on the Board
February 15, 2016 January 3, 2018
Educational Qualification Mr Butschek graduated in Business Administration and Economics with a diploma from the University of Cooperative Education Stuttgart, Germany.
Ms Sorensen holds an MSc in Economics and Management from the University of Aarhus.
Experience (including expertise in specific functional areas) / Brief Resume
Mr Butschek is the Chief Executive Officer and Managing Director of the Company. Mr. Butschek has 25+ years of global experience in international automotive management across multiple functions such as production, industrialisation and procurement. Besides Daimler AG, he has worked in the Airbus Group as its Chief Operating Officer (COO) and a member of the Group Executive Committee.
Ms Sorensen, a Danish national, is on the Boards and Committees of various international companies. Previously, she has held various positions in finance business within the A.P. Moller – Maersk A/S Group in Denmark between 1994 and 2016, including as the CEO of Damco, the CEO of Maersk Tankers, and the Senior Vice-President and Chief Commercial Officer of Maersk Line.
Directorships held in other companies
• Tata Cummins Private Ltd.• Tata Daewoo Commercial Vehicle Co. Ltd.• Tata Motors European Technical Center Plc.• Tata Technologies Ltd.• TMF Holdings Ltd.
• Delhivery Private Ltd.• Ferrovial S.A• LafargeHolcim Ltd.• Sulzer Ltd.
Memberships/ Chairmanships of committees across companies
• Tata Motors Ltd. - Member of Stakeholders’ Relationship Committee, Risk Management Committee, Corporate Social Responsibility Committee and Safety, Health and Sustainability Committee.
• Tata Motors European Technical Center, PLC. - Member of Remuneration Committee.
• TMF Holdings Ltd. - Member of Nomination and Remuneration Committee.
• Tata Motors Ltd. - Member of Stakeholders’ Relationship Committee and Chairperson of Risk Management Committee.
• Ferrovial S.A - Member of Nomination and Remuneration Committee.
• LafargeHolcim Ltd. - Member of Health, Safety and Sustainability Committee and Nomination and Governance Committee.
• Sulzer Ltd. - Chairperson of Audit Committee and Member of Nomination and Remuneration Committee.
Relationship with other Directors/Key Managerial Personnel
Not related to any Director / Key Managerial Personnel of the Company.
Not related to any Director / Key Managerial Personnel of the Company.
No. of shares held in the Company either by self or on a beneficial basis for any other person
Nil Nil
For details regarding the number of meetings of the Board/Committees attended by the above Directors during the year and remuneration drawn/sitting fees received, please refer to the Boards’ Report and the Corporate Governance Report forming part of the Annual Report.
In terms of the provisions of Section 152(6) of the Act, Mr Guenter Butschek (DIN: 07427375), retires by rotation at the meeting. The Board of Directors recommends his re-appointment.

Notes

695,699EMPLOYEES
150YEARS
150+
COUNTRIES
600MILLION+
CONSUMERS
`
656,973CRORE
REVENUE
3.98MILLION
SHAREHOLDERS
`
27,346CROREPROFIT
AFTER TAX
66%OF PARENT COMPANY
TATA SONS’ EQUITY SHARE CAPITAL HELD BY
PHILANTHROPIC TRUSTS
In a free enterprise, the community is not just another stakeholder in business, but is in fact
the very purpose of its existence. - Jamsetji Tata
The f igures are aggregated for Tata companies for the f inancial year ended 31.03.2017.
L E A D E R S H I P W I T H T R U S TS I N C E 1 8 6 8
tata150.comPicture (left to right): The four partners - Jamsetji Tata, Founder of the Tata Group; R. D. Tata, father of J. R. D. Tata;
Sir Ratan Tata, younger son of the Founder; and Sir Dorabji Tata, elder son of the Founder.
From pioneering businesses, to pioneering welfare practices, to pioneering national institutions,
the Tata Group remains committed to improving the lives of communitieswe serve globally, based on leadership with trust.

Bombay House, 24 Homi Mody Street, Mumbai 400 001, India
www.tatamotors.com
/TataMotorsGroup /user/TataMotorsGroup /tatamotorsgroup/tatamotors /company/tata-motors
Copyright © 2022 FDOKUMEN