HEEL AND TOE ONLINE The official organ of the Victorian Race ...
Upload
independentCategory
view
3download
0
Task failure during standing heel raises is associated withincreased power from 13 to 50 Hz in the activation of triceps surae
Rafael PereiraDepartment of Biological Sciences, Universidade Estadual do Sudoeste da Bahia (UESB), Jequié,BA, Brazil
Ludmila Schettino, Marco Machado, and Pierre Augusto Victor da SilvaLaboratory of Physiology and Biokinetics, Universidade Iguaçu (UNIG), Itaperuna, RJ, Brazil
Osmar Pinto NetoDepartment of Health and Kinesiology, Texas A&M University, College Station, TX 77843-4243,USA
University Camilo Castelo Branco (Unicastelo), Sao Jose dos Campos, SP, Brazil
AbstractThe goal of this paper was to investigate the amplitude and sub-100 Hz frequency content of surfaceelectromyography (EMG) signals obtained from agonist, antagonist and synergist muscles during aheel-raise task sustained to failure. Twenty-two healthy adults, 14 men and 8 women participated inthe study. Surface EMG data from the raising and lowering phases of the movement were studied inthe time (EMG amplitude) and frequency (wavelet transform) domains. For the raising phase, wefound a significant increase in the EMG amplitude of all muscles studied throughout the task (P <0.02); however, for the lowering phase, we found a decrease in overall muscle activation for themedial gastrocnemius and tibialis anterior. Additionally, we found higher 13–30 and 30–50 Hznormalized power during the raising phase for the triceps surae prior to task failure and at task failurecompared with the beginning and midway of the task (P < 0.05); during the lowering phase, however,we found higher normalized power from 30 to 50 Hz for the triceps surae (P < 0.01) and higher 13–30 Hz normalized power for the tibialis anterior (P < 0.01) at task failure compared with the beginningand midway of the task. Finally, we showed that a dynamic task performed until failure can inducedifferent activation strategies for agonist, antagonist and synergist muscles, and that the frequencycontent below 100 Hz contains useful information about the neural activation of these muscles inrelation to task failure that is not evident from the EMG amplitude.
KeywordsEMG; Oscillations; Wavelet transforms; Dynamic task; Beta band; Piper band
IntroductionTask failure is defined as the inability of an individual to keep performing a requested task.The mechanisms that cause task failure can be different from the mechanisms of muscle fatigue(Barry and Enoka 2007; Hunter et al. 2004). It is suggested, that the causes of task failure aretask specific (Enoka and Duchateau 2008; Hunter et al. 2004). Nonetheless, most studies on
© Springer-Verlag [email protected] .
NIH Public AccessAuthor ManuscriptEur J Appl Physiol. Author manuscript; available in PMC 2011 September 1.
Published in final edited form as:Eur J Appl Physiol. 2010 September ; 110(2): 255–265. doi:10.1007/s00421-010-1498-3.
NIH
-PA Author Manuscript
NIH
-PA Author Manuscript
NIH
-PA Author Manuscript
task failure are focused on constant isometric contractions (Barry and Enoka 2007; Enoka andStuart 1992; Enoka and Duchateau 2008; Hunter et al. 2004; Rudroff et al. 2007) and themechanisms that contribute to task failure during dynamic tasks are not clear (Karlsson et al.2000; Svantesson et al. 1998a, b).
During isometric and dynamic contractions task failure has been associated with the followingneural mechanisms and EMG changes: (1) increased agonist muscles EMG activity, likelydominated by the recruitment of additional motor units and modest changes in discharge rate(constant isometric contraction; Hunter et al. 2004); (2) increased activation of synergistmuscles (constant isometric contraction; Rudroff et al. 2007); (3) significant decreases in EMGmean power frequency in both raising and lowering phases of the movement (dynamic heel-raise test; Svantesson et al. 1998a). The authors, however, are not aware of any study thatinvestigates the sub-100 Hz frequency content of EMG signals during tasks sustained untilfailure. There is evidence that during voluntary contractions, different frequency bands sub-100Hz of the EMG signals may be associated with cortical drives to the motor neuron pool (Brown2000; Neto and Christou 2010; Neto et al. 2010). Therefore, it is possible that the power below100 Hz in the EMG signal may provide important information about task failure.
Analyzing recordings of the neural activation of muscles during dynamic contractions ischallenging because EMG signals are non-stationary (Hostens et al. 2004). One way to addressthis issue is to use a time–frequency analysis technique (Balestra et al. 2001), such as wavelettransforms. Wavelet transforms deal with the non-stationarity of EMG signals obtained duringdynamic contractions (Karlsson et al. 2000; Neto and Magini 2008; Neto and Marzullo 2009;So et al. 2009) because they analyze EMG signals in a very short duration (So et al. 2009) sothat the change in timing and frequency content can be evaluated simultaneously (Felici2006; Kouzaki et al. 2004). The frequency structure of EMG signals analyzed through timecan present relevant physiological meaning and it has been previously used for assessinglocalized muscle fatigue during dynamic contractions (Bonato et al. 1996, 2001; Gandevia2001).
During dynamics tasks muscles alternately perform lengthening (eccentric) and shorteningcontractions (concentric). It has been shown that the mean firing rate and the amplitude andfrequency structure of EMG during eccentric and concentric phases of a movement can bedifferent (Søgaard et al. 1996; Potvin 1997; Svantesson et al. 1998b; Christou et al. 2003;Hostens et al. 2004). However, the effects of fatigue on the EMG activity of muscles duringeccentric and concentric phases of a continuous dynamic task seem to be similar in both thetime (Svantesson et al. 1998a, b) and frequency domains (Potvin 1997).
The purpose of this study, therefore, was to investigate the amplitude and sub-100 Hz frequencycontent of surface EMG signals obtained from several muscles during the lowering and raisingphases of a heel-raise task performed until failure. Our main hypotheses were an increase inthe EMG amplitude and observable sub-100 Hz changes in the frequency structure of the EMGsignals of the muscles involved in the task prior to and at task failure. We hypothesized thatpower sub-100 Hz in the EMG signal would change with time during the fatiguing dynamictask similarly for the lowering and raising phases of the task.
MethodsSubjects
Twenty-two healthy adults, 14 men and 8 women [age 21 ± 1 years; height 171 ± 2 cm; weight65 ± 2 kg (mean ± SE)] volunteered to participate in the study. All the subjects were righthanded with no known neuromuscular disorders and were naive to the experimental protocoland procedures. The study was approved by the local ethics committee (Universidade Iguaçu,
Pereira et al. Page 2
Eur J Appl Physiol. Author manuscript; available in PMC 2011 September 1.
NIH
-PA Author Manuscript
NIH
-PA Author Manuscript
NIH
-PA Author Manuscript
UNIG) and conducted following the Helsinki protocol of ethical principles for medical researchinvolving human subjects. All subjects gave informed written consent to participate in thestudy.
Dynamic fatigable taskSubjects were instructed to perform as many heel raises as possible at a pace controlled by ametronome configured as in Haber et al. (2004) to give 46 beats/min (23 raises/min); this pacewas neither too fast nor too slow to compromise subjects' balance. We decided to study taskfailure during a standing heel-raise task because this task is a commonly employed clinical testfor evaluating muscle function in the triceps surae (Svantesson et al. 1998a) and a reliableprotocol and apparatus to standardize this task has been developed previously (Haber et al.2004). During the task, the subjects maintained the knee of the testing leg fully extended andthe knee of the contralateral leg positioned in flexion and suspended in air. The testing leg waschosen to be the dominant leg of the subjects. Task termination occurred based on the followingtwo factors: (1) the pace could no longer be maintained in three sequential heel raises; (2) thepredetermined height of movement could no longer be attained in three sequential heel-raiseattempts. Throughout the entire task each subject was permitted to place one hand flat againsta wall for balance. A research assistant was responsible to make sure that the subjects were notusing the wall for purposes other than balancing themselves.
Standing heel-raise test apparatusTo establish a constant vertical displacement for all heel raises performed during the task beforefailure, we used a standing heel-raise apparatus (Haber et al. 2004; Fig. 1). The apparatusconsists of a rod and a foot positioning device attached to a platform. Both the rod and footpositioning device are adjustable to allow subjects to perform a heel-raise task with a constant5 cm heel vertical displacement, despite the differences in individuals' foot dimensions. Theapparatus is adjusted to limit the height of each heel raise to 5 cm as follows: first, the subjectstands barefooted on one leg with the knee fully extended; second, the subject raises the heeluntil the navicular bone touches the rod. The foot positioning device or the rod or both areadjusted to limit the height of each heel raise to 5 cm measured vertically from the platformfloor to the heel.
Data acquisitionSurface EMG signals were obtained continuously throughout the task using an eight channelmodule (model EMG800C, EMG System, Brazil) with a total amplifier gain of 2000, a commonmode rejection ratio of 120 dB, sampled at 2,000 Hz and band-pass filtered (20–500 Hz). A12-bit converter digitalized the analog signals with a sampling frequency of anti-aliasing 2.0kHz for each channel. Pre-amplified (×100) bipolar superficial electrodes of Ag/AgCl wereused with inter-electrode (center-to-center) distance of 20 mm. After shaving and cleaning theskin with alcohol, the determination of the muscles and anatomical landmarks were done viapalpation and the electrodes were placed over the medial and lateral gastrocnemius, medialportion of the soleus, tibialis anterior, and peroneus longus muscles according to SENIAM(surface EMG for a non-invasive assessment of muscles) procedures (Hermens et al. 2000)and guided by bone prominences and the direction of the muscle fibers.
To identify task failure by failing to maintain the metronome pace and to determine thebeginning and ending of each heel raise and lowering cycle, a foot-switch (EMG System,Brazil) was placed in the point of heel contact of each subject and connected to the same eightchannel module used to obtain the EMG recordings (model EMG800C, EMG System, Brazil).Footswitch recordings were sampled at 2,000 Hz and synchronized to the EMG recordings.Identification of task failure due to failing of maintaining the height of movement was donevisually.
Pereira et al. Page 3
Eur J Appl Physiol. Author manuscript; available in PMC 2011 September 1.
NIH
-PA Author Manuscript
NIH
-PA Author Manuscript
NIH
-PA Author Manuscript
Data analysisThe coefficient of variation of the time taken to perform each cycle of the movement (raisingand lowering parts) across subjects and times ranged from 10 to 15%. The average movementcycle was 2.6 s (due to the pace). Based on this knowledge, we were confident that the firstsecond of each movement cycle was within the raising phase, whereas the last second waswithin the lowering phase. We also assumed that during the first second of the raising phaseand the last second of the lowering phase the ankle performed similar range of motion.Footswitch recording were used to determine the first second (raising phase) and the last second(lowering phase) from each movement cycle. The first three heel-raise cycles were excludedfrom data analysis because subjects were adapting to the metronome. Then, for each subject,the total number of heel raises was divided into the following four time periods: the beginningof the task (beginning), midway through the task (midway), just prior to task failure (pre-failure), and at task failure (failure). Although at task failure subjects failed to keep either theheight or the pace of the task, they still performed movement cycles longer than 2 s and, onaverage, achieved heights close to the target height. Thus, for consistency, data at task failurewas analyzed the same way as data for the other time periods. Data analysis on each time periodincluded three sequential heel raises cycles. Results were calculated considering 1 s of eachphase of each cycle separate. The results obtained for three consecutive raising phases wereaveraged together and the results obtained for three consecutive lowering phases were alsoaveraged together.
EMG data from the raising and lowering phases of the tasks were studied in the time (EMGamplitude) and frequency (wavelet transform) domains. For the time domain analysis wecalculated the amplitude of each 1-s window of the EMG signals using the root mean square.
Wavelet analysisThe frequency domain analysis was done using Morlet wavelet transform. Morlet waveletrepresents a set of functions with the form of small waves created by dilations and translationsfrom a simple generator function (Eq. 1) which is called Morlet mother wavelet (Addison2002).
(1)
where η is dimensionless time and w0 is dimensionless frequency (in this study we used w0 =6, as suggested by Grinsted et al. 2004). The wavelet transform applies the wavelet functionas a band-pass filter to the time series (Eq. 2).
(2)
where s represents the dilation parameter (scale shifting), τ represents the location parameter(time shifting) and the basic function ψs,τ(t) is obtained by dilating and translating the motherwavelet ψ0(t) (Addison 2002). For the w0 = 6 Morlet wavelet the scale is almost equal to theFourier period (Fourier period = 1.03 s).
The importance of wavelet transform to the analysis of EMG signals obtained during dynamictasks is that the wavelet transform can detect if there are any transient events that take placewithin a chosen window of time by determining how the amplitude versus frequencycharacteristics of the signal changes with time (Zazula et al. 2004).
Pereira et al. Page 4
Eur J Appl Physiol. Author manuscript; available in PMC 2011 September 1.
NIH
-PA Author Manuscript
NIH
-PA Author Manuscript
NIH
-PA Author Manuscript
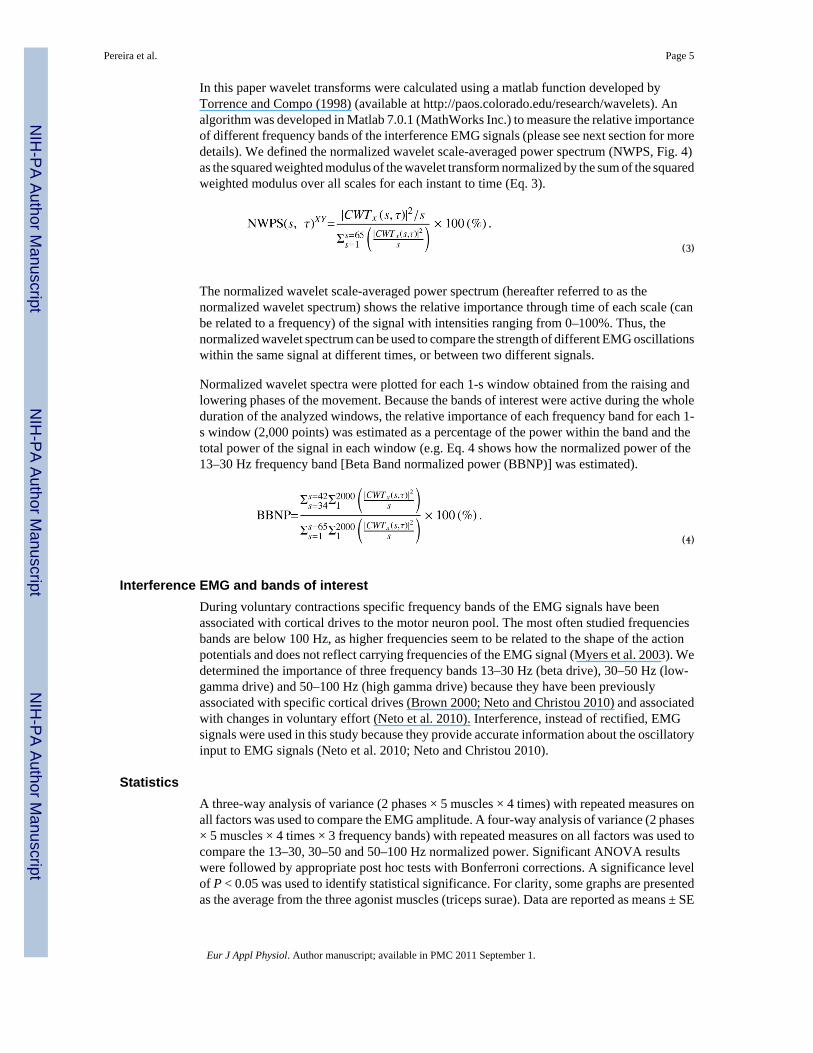
In this paper wavelet transforms were calculated using a matlab function developed byTorrence and Compo (1998) (available at http://paos.colorado.edu/research/wavelets). Analgorithm was developed in Matlab 7.0.1 (MathWorks Inc.) to measure the relative importanceof different frequency bands of the interference EMG signals (please see next section for moredetails). We defined the normalized wavelet scale-averaged power spectrum (NWPS, Fig. 4)as the squared weighted modulus of the wavelet transform normalized by the sum of the squaredweighted modulus over all scales for each instant to time (Eq. 3).
(3)
The normalized wavelet scale-averaged power spectrum (hereafter referred to as thenormalized wavelet spectrum) shows the relative importance through time of each scale (canbe related to a frequency) of the signal with intensities ranging from 0–100%. Thus, thenormalized wavelet spectrum can be used to compare the strength of different EMG oscillationswithin the same signal at different times, or between two different signals.
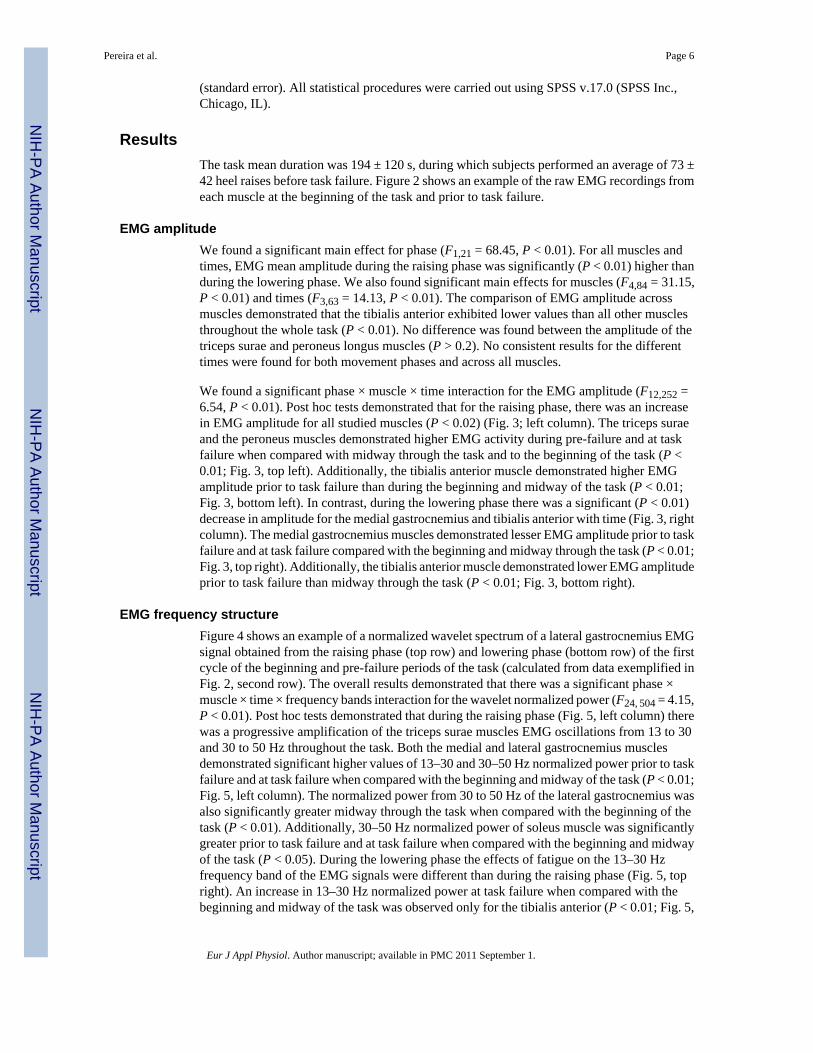
Normalized wavelet spectra were plotted for each 1-s window obtained from the raising andlowering phases of the movement. Because the bands of interest were active during the wholeduration of the analyzed windows, the relative importance of each frequency band for each 1-s window (2,000 points) was estimated as a percentage of the power within the band and thetotal power of the signal in each window (e.g. Eq. 4 shows how the normalized power of the13–30 Hz frequency band [Beta Band normalized power (BBNP)] was estimated).
(4)
Interference EMG and bands of interestDuring voluntary contractions specific frequency bands of the EMG signals have beenassociated with cortical drives to the motor neuron pool. The most often studied frequenciesbands are below 100 Hz, as higher frequencies seem to be related to the shape of the actionpotentials and does not reflect carrying frequencies of the EMG signal (Myers et al. 2003). Wedetermined the importance of three frequency bands 13–30 Hz (beta drive), 30–50 Hz (low-gamma drive) and 50–100 Hz (high gamma drive) because they have been previouslyassociated with specific cortical drives (Brown 2000; Neto and Christou 2010) and associatedwith changes in voluntary effort (Neto et al. 2010). Interference, instead of rectified, EMGsignals were used in this study because they provide accurate information about the oscillatoryinput to EMG signals (Neto et al. 2010; Neto and Christou 2010).
StatisticsA three-way analysis of variance (2 phases × 5 muscles × 4 times) with repeated measures onall factors was used to compare the EMG amplitude. A four-way analysis of variance (2 phases× 5 muscles × 4 times × 3 frequency bands) with repeated measures on all factors was used tocompare the 13–30, 30–50 and 50–100 Hz normalized power. Significant ANOVA resultswere followed by appropriate post hoc tests with Bonferroni corrections. A significance levelof P < 0.05 was used to identify statistical significance. For clarity, some graphs are presentedas the average from the three agonist muscles (triceps surae). Data are reported as means ± SE
Pereira et al. Page 5
Eur J Appl Physiol. Author manuscript; available in PMC 2011 September 1.
NIH
-PA Author Manuscript
NIH
-PA Author Manuscript
NIH
-PA Author Manuscript
(standard error). All statistical procedures were carried out using SPSS v.17.0 (SPSS Inc.,Chicago, IL).
ResultsThe task mean duration was 194 ± 120 s, during which subjects performed an average of 73 ±42 heel raises before task failure. Figure 2 shows an example of the raw EMG recordings fromeach muscle at the beginning of the task and prior to task failure.
EMG amplitudeWe found a significant main effect for phase (F1,21 = 68.45, P < 0.01). For all muscles andtimes, EMG mean amplitude during the raising phase was significantly (P < 0.01) higher thanduring the lowering phase. We also found significant main effects for muscles (F4,84 = 31.15,P < 0.01) and times (F3,63 = 14.13, P < 0.01). The comparison of EMG amplitude acrossmuscles demonstrated that the tibialis anterior exhibited lower values than all other musclesthroughout the whole task (P < 0.01). No difference was found between the amplitude of thetriceps surae and peroneus longus muscles (P > 0.2). No consistent results for the differenttimes were found for both movement phases and across all muscles.
We found a significant phase × muscle × time interaction for the EMG amplitude (F12,252 =6.54, P < 0.01). Post hoc tests demonstrated that for the raising phase, there was an increasein EMG amplitude for all studied muscles (P < 0.02) (Fig. 3; left column). The triceps suraeand the peroneus muscles demonstrated higher EMG activity during pre-failure and at taskfailure when compared with midway through the task and to the beginning of the task (P <0.01; Fig. 3, top left). Additionally, the tibialis anterior muscle demonstrated higher EMGamplitude prior to task failure than during the beginning and midway of the task (P < 0.01;Fig. 3, bottom left). In contrast, during the lowering phase there was a significant (P < 0.01)decrease in amplitude for the medial gastrocnemius and tibialis anterior with time (Fig. 3, rightcolumn). The medial gastrocnemius muscles demonstrated lesser EMG amplitude prior to taskfailure and at task failure compared with the beginning and midway through the task (P < 0.01;Fig. 3, top right). Additionally, the tibialis anterior muscle demonstrated lower EMG amplitudeprior to task failure than midway through the task (P < 0.01; Fig. 3, bottom right).
EMG frequency structureFigure 4 shows an example of a normalized wavelet spectrum of a lateral gastrocnemius EMGsignal obtained from the raising phase (top row) and lowering phase (bottom row) of the firstcycle of the beginning and pre-failure periods of the task (calculated from data exemplified inFig. 2, second row). The overall results demonstrated that there was a significant phase ×muscle × time × frequency bands interaction for the wavelet normalized power (F24, 504 = 4.15,P < 0.01). Post hoc tests demonstrated that during the raising phase (Fig. 5, left column) therewas a progressive amplification of the triceps surae muscles EMG oscillations from 13 to 30and 30 to 50 Hz throughout the task. Both the medial and lateral gastrocnemius musclesdemonstrated significant higher values of 13–30 and 30–50 Hz normalized power prior to taskfailure and at task failure when compared with the beginning and midway of the task (P < 0.01;Fig. 5, left column). The normalized power from 30 to 50 Hz of the lateral gastrocnemius wasalso significantly greater midway through the task when compared with the beginning of thetask (P < 0.01). Additionally, 30–50 Hz normalized power of soleus muscle was significantlygreater prior to task failure and at task failure when compared with the beginning and midwayof the task (P < 0.05). During the lowering phase the effects of fatigue on the 13–30 Hzfrequency band of the EMG signals were different than during the raising phase (Fig. 5, topright). An increase in 13–30 Hz normalized power at task failure when compared with thebeginning and midway of the task was observed only for the tibialis anterior (P < 0.01; Fig. 5,
Pereira et al. Page 6
Eur J Appl Physiol. Author manuscript; available in PMC 2011 September 1.
NIH
-PA Author Manuscript
NIH
-PA Author Manuscript
NIH
-PA Author Manuscript
top right). On the other hand, the changes in the 30–50 Hz normalized power with time werevery similar for every muscle between the lowering and raising phases. During the loweringphase, the medial gastrocnemius muscle demonstrated higher values 30-50 Hz normalizedpower prior to task failure and at task failure when compared with the beginning and midwayof the task (P < 0.01; Fig. 5, bottom right). In addition, the lateral gastrocnemius musclesdemonstrated higher values 30–50 Hz normalized at task failure when compared with thebeginning and midway of the task (P < 0.01; Fig. 5, bottom right). No consistent significantchanges with time were found for the 50–100 Hz frequency band for all muscles studied (P >0.3).
The comparison of 13–30 and 30–50 Hz normalized power across muscles demonstrated thatthe tibialis anterior, for the most part, exhibited higher values than all other muscles throughoutthe task (P < 0.02). The exceptions were during the raising phase for the 30–50 Hz normalizedpower when the tibialis anterior and the triceps surae muscles were not different during pre-failure and failure (P > 0.17). The 13–30 Hz normalized power was significantly greater forthe triceps surae muscles during the raising phase compared with the peroneus longus prior totask failure and at task failure (P < 0.01). Finally, the 30–50 Hz normalized power wassignificantly greater for the triceps surae compared with the peroneus longus prior to task failureand at task failure for both the lowering and raising phases of the task (P < 0.01).
DiscussionThe aim of this study was to investigate the amplitude and sub-100 Hz frequency content ofthe neural activation of agonist, antagonist, and synergist muscles during the raising andlowering phases of a dynamic task sustained to failure. Our findings demonstrate the following:(1) In contrast to previous studies, the changes observed in the amplitude and frequencycharacteristics of the EMG during the task were different for the lowering and raising phasesof the task; (2) contractions performed till task failure during a dynamic task can inducedifferent activation strategies for agonist, antagonist and synergist muscles.
Lowering versus raising phaseWe found that the EMG amplitude was higher during the raising phase than during the loweringphase of the movement (Potvin 1997; Svantesson et al. 1998a, b; Christou et al. 2003). Thereasons for the greater neuro-muscular activation during the raising phase were probablyelevated motor unit discharge rates and increased motor unit recruitment as the triceps suraemuscles were required to produce force to overcome gravity (Søgaard et al. 1996) andcompensate for the different region on the force–velocity curve (Pasquet et al. 2006).
Our results contradict our hypothesis that the changes observed in the amplitude and frequencycharacteristics of the EMG during the task would be similar for the lowering and raising phasesof the task (Potvin 1997; Svantesson et al. 1998a, b). For the raising phase of the movement,we found higher EMG amplitude of all muscles involved in the task prior to task failure andat task failure compared with the beginning and midway through the task (Fig. 3, left column).During the lowering phase, however, the medial gastrocnemius and tibialis anterior exhibitedlower EMG amplitude prior to task failure and at task failure compared with the beginning andmidway through the task (Fig. 3, right column). For the raising phase of the movement, wefound higher normalized power from 13–30 and 30–50 Hz for the triceps surae muscles priorto task failure and at task failure compared with the beginning and midway through the task(Fig. 5, left column). During the lowering phase, however, we found higher 30–50 Hznormalized power for the triceps surae and higher 13–30 Hz normalized power for the tibialisanterior at task failure compared with the beginning and midway through the task (Fig. 5, rightcolumn).
Pereira et al. Page 7
Eur J Appl Physiol. Author manuscript; available in PMC 2011 September 1.
NIH
-PA Author Manuscript
NIH
-PA Author Manuscript
NIH
-PA Author Manuscript
Raising phase—During the raising phase of the movement, we observed a significantincrease in the amplitude of the EMG signals of all muscles studied during the task (Fig. 3).Increases in surface EMG amplitude of agonist muscles during tasks performed until failurehave been largely observed before and are normally attributed to increased descending driveto the motor neuron pool (Hunter et al. 2002,2008;Mottram et al. 2006). Interestingly, ourresults demonstrated that the increase in EMG amplitude was not the same for all frequencybands of the signal (see next section).
We found a significant increase with time in the EMG amplitude of the peroneus longus (Fig.3), a synergist muscle in the raising phase of the task. Increments of synergist muscle activityhave been described in fatiguing isometric tasks (Maluf et al. 2005;Kouzaki and Shinohara2006;Rudroff et al. 2007;Sirin and Patla 1987) and have been associated with possible longer(Kouzaki and Shinohara 2006;Sirin and Patla 1987) and briefer times to failure (Rudroff et al.2007). It is unclear what the increase of synergist muscle activity caused in our protocol.
Our results also showed a significant slight increase in the activation of the tibialis anterior(antagonist muscle of the raising phase) muscle for the raise phase of the task during pre-failure(Fig. 3, bottom left). This supports previous studies that show an increase in antagonist EMGactivity during fatiguing contractions (Psek and Cafarelli 1993; Rothmuller and Cafarelli1995; Weir et al. 1998), but at the same time contrast findings by Hassani et al. (2006). Thefact that at task failure the tibialis anterior EMG amplitude was not significantly different thanduring the beginning of the task suggests that, although the activation of this muscle increasedslightly during the task, co-activation was not the cause of task failure. Other studies haveshown that co-activation does not appear to be the cause of task failure in isometric sub-maximal position and force tasks (Hunter et al. 2008; Maluf et al. 2005).
From our frequency domain analysis, our results demonstrated significantly stronger 13–30and 30–50 Hz oscillations at task failure compared with the beginning of the task for the medialand lateral gastrocnemius (Fig. 5, left column). This was not the case for the 50–100 Hzoscillations, however. It is possible that the changes observed in power from 13–50 Hz on thesurface EMG were associated to an increase in the variability of motor unit interspike intervalsdue to fatigue (Garland et al. 1994). Furthermore, it has been shown that beta band oscillationson single motor unit EMG data are correlated to synchronization of action potential dischargetimes (Farmer et al. 1997; Moritz et al. 2005; Christou et al. 2007; Lowery et al. 2007).Additionally, it has been suggested that the effects of changes in firing rate and synchronizationare reflected on the EMG spectrum at frequencies in the neighborhood of 15–25 Hz (DeLuca1997). The stronger drive found from 13 to 30 may suggest that synchrony increased prior totask failure and at task failure (Gabriel et al. 2001). EMG signals in the 30–50 Hz frequencyrange have also been broadly associated with specific cortical drives to the muscle (Saleniuset al. 1996; Brown 2000). Additionally, it has been suggested that adequate processing ofsensory information may require cyclical brain events in the 30–50 Hz range (Galambos et al.1981) and that muscular firing patterns in these frequencies likely reflect communicationbetween the sensorimotor cortex and motor units (Salenius et al. 1996). Thus, the increase instrength of the 30–50 Hz frequency band prior and at task failure may be associated withchanges in sensory feedback that occur due to fatigue near task failure (Hunter et al. 2008;Taylor and Gandevia 2008). More studies should be done in order to better understand themeaning of these oscillations found in surface EMG signals.
Lowering phase—We observed a significant decrease during the task in the amplitude ofthe medial gastrocnemius and tibialis anterior EMG signals obtained during the lowering phase(Fig. 3, right column). The activation of the medial gastrocnemius and tibialis anterior duringthe lowering phase is a mechanism to control the speed of movement of the descending bodyand it is important to keep the pace of the task. We speculated that with time subjects decreased
Pereira et al. Page 8
Eur J Appl Physiol. Author manuscript; available in PMC 2011 September 1.
NIH
-PA Author Manuscript
NIH
-PA Author Manuscript
NIH
-PA Author Manuscript
the descending command to both muscles during the lowering phase attempting to keep thepace and save energy, as these muscles were increasingly being activated during the raisingphase.
During the lowering phase we found an increase at task failure, not found during the raisingphase, in the 13–30 Hz normalized power of the tibialis anterior (Fig. 5, top right). The reasonfor this increase is not clear, but it shows that the relative contribution of the oscillationsbetween 13 and 30 Hz in the EMG signal can be different between eccentric and concentricphases of dynamic cyclic tasks.
Additionally, during the lowering phase, we found an increase in 30–50 Hz normalized powerof the triceps surae during the task (Fig. 4, bottom right). As it can be seen in Fig. 5 (bottomrow) the 30–50 Hz activation was very similar during the lowering and raising phases of themovement. These results corroborate with the theory that the 30–50 Hz band may be relatedto processing of sensory information and communication between the sensorimotor cortex andmotor units (Galambos et al. 1981; Salenius et al. 1996) that were probably similar betweenthe two phases of the movement.
Activation of agonist, antagonist and synergist musclesWe found no significant differences in time in the activation of the tibialis anterior (antagonistof the raising phase) during the raising phase of the task. However, when we compared theresults of 13–30 and 30–50 Hz normalized power, across the different muscles, we found that,for the most part, the tibialis anterior presented higher 13–50 Hz normalized power values thanall other muscles throughout the task. The reason for these results is unclear; one possibility isthat the central nervous system activated antagonist muscles differently than agonist andsynergist muscles, which has been shown to be true for constant isometric contractions(Lévénez et al. 2005).
Another interesting finding is that although the triceps surae and the peroneus longus (synergistmuscle of the raising phase) exhibited no difference in EMG amplitude throughout the task,they exhibited different frequency structure through time. While the 13–30 and 30–50 Hznormalized power were not different between the triceps surae and the peroneus longus musclesin the beginning of the task, the activation in this frequency bands was significantly differentbetween these muscles prior to task failure and at task failure (Fig. 5, left column). These resultsdemonstrate that the neural strategy to activate agonist and synergist muscles changed duringthe task and that these differences in neural strategy cannot be inferred by the amplitude of theEMG signals.
Although the differences found between the EMG frequency structure of the agonist, antagonistand synergist muscles are clear, it is important to consider that there are other factors otherthan the activation of the motor units that can alter the frequency domain characteristics ofsurface EMG signals. For instance, the spectral properties of the surface action potentials arestrongly influenced by the distance between the active muscle fibers and the EMG detectionpoint; the recruitment of additional motor units, for example, may contribute to either the high-or low-frequency bands of the surface EMG signals depending on the depth of the motor unit(Farina 2006). Additionally, the shortening of muscle fibers during a dynamic contraction andthe effects of fatigue in the intrinsic properties of the muscle can cause changes in theconduction velocity of muscle fibers altering the shape of action potentials, and consequentlyaltering the EMG frequency structure (Farina et al. 2004). Changes on action potential shape,however, will most likely cause changes in the EMG power spectrum between 60 and 150 Hz(Farina et al. 2004). Thus, the results obtained for normalized power of the 13–30 and 30–50Hz oscillations are promising and more studies should be done in order to better understandthe meaning of these oscillations found in surface EMG signals.
Pereira et al. Page 9
Eur J Appl Physiol. Author manuscript; available in PMC 2011 September 1.
NIH
-PA Author Manuscript
NIH
-PA Author Manuscript
NIH
-PA Author Manuscript
ConclusionMost task failure studies investigate constant isometric contractions. The purpose of this studywas to determine the amplitude and frequency structure of the EMG activity of musclesinvolved in a dynamic task. We provide novel evidence that the frequency content below 100Hz contains useful information about the neural activation of the muscles that is not evidentfrom the EMG amplitude. In addition, we demonstrate that frequency bands associated withneural drives to the muscles were stronger prior to and at task failure. Finally, we have shownthat during dynamic task performed until failure muscle activation changes differently for theraising and lowering phases of the movement and that agonist, antagonist, and synergistmuscles were differently activated prior to task failure and during task failure.
AcknowledgmentsThis work was supported by National Institute on Aging Grant R01AG-031769 to E.A. Christou. The authors wouldlike to thank Prof. Evangelos Christou for valuable suggestions.
ReferencesAddison, PS. The illustrated wavelet transform handbook. Taylor and Francis Group; New York: 2002.Balestra G, Frassinelli S, Knaflitz M, Molinari F. Time– frequency analysis of surface myoelectric signals
during athletic movement. IEEE Eng Med Biol Mag 2001;20:106–115. [PubMed: 11838242]Barry BK, Enoka RM. The neurobiology of muscle fatigue:15 years later. Integr Comp Biol 2007;47:465–
473.Bonato P, Gagliati G, Knaflitz M. Analysis of myoelectric signals recorded during dynamic contractions:
a time–frequency approach to assessing muscle fatigue. IEEE Eng Med Biol Mag 1996;15:102–111.Bonato P, Cheng MSS, Gonzalez–Cueto J, Leardini A, O'Connor J, Roy SH. EMG-based measures of
fatigue during a repetitive squat exercise: assessment of dynamic conditions can provide informationabout compensatory muscle function in ACL patients. IEEE Eng Med Biol Mag 2001;20:133–143.[PubMed: 11838245]
Brown P. Cortical drives to human muscle: the Piper and related rhythms. Prog Neurobiol 2000;60:97–108. [PubMed: 10622378]
Christou EA, Shinohara M, Enoka RM. Fluctuations in acceleration during voluntary contractions leadto greater impairment of movement accuracy in old adults. J Appl Physiol 2003;95(1):373–384.[PubMed: 12651861]
Christou EA, Rudroff T, Enoka JA, Meyer F, Enoka RM. Discharge rate during low-force isometriccontractions influences motor unit coherence below 15 Hz but not motor unit synchronization. ExpBrain Res 2007;178:285–295. [PubMed: 17091298]
DeLuca CJ. The use of surface electromyography in biomechanics. J Appl Biomech 1997;13:135–163.Enoka RM, Duchateau J. Muscle fatigue: what, why and how it influences muscle function. J Physiol
2008;586:11–23. [PubMed: 17702815]Enoka RM, Stuart DG. Neurobiology of muscle fatigue. J Appl Physiol 1992;72:1631–1648. [PubMed:
1601767]Farina D. Interpretation of the surface electromyogram in dynamic contractions. Exerc Sport Sci Rev
2006;34(3):121–127. [PubMed: 16829739]Farina D, Merletti R, Enoka RM. The extraction of neural strategies from the surface EMG. J Appl Physiol
2004;96:1486–1495. [PubMed: 15016793]Farmer SF, Halliday DM, Conway BA, Stephens JA, Rosenberg JR. A review of recent applications of
cross-correlation methodologies to human motor unit recording. J Neurosci Methods 1997;74:175–187. [PubMed: 9219887]
Felici F. Neuromuscular responses to exercise investigated through surface EMG. J ElectromyogrKinesiol 2006;16:578–585. [PubMed: 17052919]
Gabriel DA, Basford JR, Na KN. Neural adaptations to fatigue: implications for muscle strength andtraining. Med Sci Sports Exerc 2001;33:1354–1360. [PubMed: 11474338]
Pereira et al. Page 10
Eur J Appl Physiol. Author manuscript; available in PMC 2011 September 1.
NIH
-PA Author Manuscript
NIH
-PA Author Manuscript
NIH
-PA Author Manuscript
Galambos R, Makeig S, Talmachoff PJ. A 40-Hz auditory potential recorded from the human scalp. ProcNatl Acad Sci USA 1981;78(4):2643–2647. [PubMed: 6941317]
Gandevia SC. Spinal and supraspinal factors in human muscle fatigue. Physiol Rev 2001;81:1725–1789.[PubMed: 11581501]
Garland SJ, Enoka RM, Serrano LP, Robinson GA. Behavior of motor units in human biceps brachiiduring a submaximal fatiguing contraction. J Appl Physiol 1994;76:2411–2419. [PubMed: 7928865]
Grinsted A, Moore JC, Jevrejeva S. Application of the cross wavelet transform and wavelet coherenceto geophysical time series. Nonlinear Processes Geophys 2004;11:561–566.
Haber M, Golan E, Azoulay L, Kahn SR, Shrier I. Reliability of a device measuring triceps surae musclefatigability. Br J Sports Med 2004;38:163–167. [PubMed: 15039252]
Hassani A, Patikas D, Bassa E, Hatzikotoulas K, Kellis E, Kotzamanidis C. Agonist and antagonist muscleactivation during maximal and submaximal isokinetic fatigue tests of the knee extensors. JElectromyogr Kinesiol 2006;16:661–668. [PubMed: 16434213]
Hermens HJ, Freriks B, Disselhorst-Klug C, Rau G. Development of recommendations for SEMG sensorsand sensor placement procedures. J Electromyogr Kinesiol 2000;10:361–374. [PubMed: 11018445]
Hostens L, Seghers J, Spaepen A, Ramon H. Validation of the wavelet spectral estimation technique inbiceps brachii and brachioradialis fatigue assessment during prolonged low-level static and dynamiccontractions. J Electromyogr Kinesiol 2004;14:205–215. [PubMed: 14962773]
Hunter SK, Ryan DL, Ortega JD, Enoka EM. Task differences with the same load torque alter theendurance time of submaximal fatiguing contractions in humans. J Neurophysiol 2002;88:3087–3096. [PubMed: 12466432]
Hunter SK, Duchateau J, Enoka RM. Muscle fatigue and the mechanisms of task failure. Exerc Sport SciRev 2004;32:44–49. [PubMed: 15064647]
Hunter SK, Yoon T, Farinella J, Griffith EE, Ng AV. Time to task failure and muscle activation varywith load type for a submaximal fatiguing contraction with the lower leg. J Appl Physiol2008;105:463–472. [PubMed: 18535136]
Karlsson S, Yu J, Akay M. Time–frequency analysis of myoelectric signals during dynamic contractions:a comparative study. IEEE Trans Biomed Eng 2000;47:228–238. [PubMed: 10721630]
Kouzaki M, Shinohara M. The frequency of alternate muscle activity is associated with the attenuationin muscle fatigue. J Appl Physiol 2006;101:715–720. [PubMed: 16728513]
Kouzaki M, Shinohara M, Masani K, Fukunaga T. Force fluctuations are modulated by alternate muscleactivity of knee extensor synergists during low-level sustained contraction. J Appl Physiol2004;97:2121–2131. [PubMed: 15208288]
Lévénez M, Kotzamanidis C, Carpentier A, Duchateau J. Spinal reflexes and coactivation of anklemuscles during a submaximal fatiguing contraction. J Appl Physiol 2005;99(3):1182–1188.[PubMed: 15845774]
Lowery MM, Myers LJ, Erim Z. Coherence between motor unit discharges in response to shared neuralinputs. J Neurosci Methods 2007;163:384–391. [PubMed: 17482677]
Maluf KS, Shinohara M, Stephenson JL, Enoka RM. Muscle activation and time to task failure differwith load type and contraction intensity for a human hand muscle. Exp Brain Res 2005;167:165–177. [PubMed: 16044306]
Moritz CT, Christou EA, Meyer FG, Enoka RM. Coherence at 16–32 Hz can be caused by short-termsynchrony of motor units. J Neurophysiol 2005;94:105–118. [PubMed: 15744005]
Mottram CJ, Hunter SK, Rochette L, Anderson LK, Enoka RM. Time to task failure varies with the gainof the feedback signal for women, but not for men. Exp Brain Res 2006;174:575–587. [PubMed:16680423]
Myers LJ, Lowery M, O'Malley M, Vaughan CL, Heneghan C, Clair Gibson A, Harley YX, SreenivasanR. Rectification and non-linear pre-processing of EMG signals for cortico-muscular analysis. JNeurosci Methods 2003;124:157–165. [PubMed: 12706845]
Neto OP, Christou EA. Rectification of the EMG signal impairs the identification of oscillatory input tothe muscle. J Neurophysiol 2010;103:1093–1103. [PubMed: 20032241]
Neto OP, Magini M. Electromiographic and kinematic characteristics of Kung Fu Yau-Man palm strike.J Electromyogr Kinesiol 2008;18:1047–1052. [PubMed: 17499517]
Pereira et al. Page 11
Eur J Appl Physiol. Author manuscript; available in PMC 2011 September 1.
NIH
-PA Author Manuscript
NIH
-PA Author Manuscript
NIH
-PA Author Manuscript
Neto OP, Marzullo ACD. Wavelet transform analysis of electromyography Kung Fu strikes data. J SportsSci Med 2009;8(CSSI 3):25–28.
Neto OP, Baweja HS, Christou EA. Increased voluntary drive is associated with changes in the commonoscillations from 13–60 Hz of interference but not rectified electromyography. Muscle Nerve. 2010in press.
Pasquet B, Carpentier A, Duchateau J. Specific modulation of motor unit discharge for a similar changein fascicle length during shortening and lengthening contractions in humans. J Physiol 2006;577(2):753–765. [PubMed: 16959853]
Potvin JR. Effects of muscle kinematics on surface EMG amplitude and frequency during fatiguingdynamic contractions. J Appl Physiol 1997;82:144–151. [PubMed: 9029209]
Psek JA, Cafarelli E. Behavior of coactive muscles during fatigue. J Appl Physiol 1993;74:170–175.[PubMed: 8444689]
Rothmuller C, Cafarelli E. Effect of vibration on antagonist muscle coactivation during progressivefatigue in humans. J Physiol 1995;485:857–864. [PubMed: 7562623]
Rudroff T, Barry BK, Stone AL, Barry CJ, Enoka RM. Accessory muscle activity contributes to thevariation in time to task failure for different arm postures and loads. J Appl Physiol 2007;102(3):1000–1006. [PubMed: 17095642]
Salenius S, Salmelin R, Neuper C, Pfurtscheller G, Hari R. Human cortical 40 Hz rhythm is closely relatedto EMG rhythmicity. Neurosci Lett 1996;213:75–78. [PubMed: 8858612]
Sirin AV, Patla AE. Myoelectric changes in the triceps surae muscles under sustained contractions.Evidence for synergism. Eur J Appl Physiol 1987;56:238–244.
So RCH, Ng JKF, Lam RWK, Lo CKK, Ng GYF. EMG wavelet analysis of quadriceps muscle duringrepeated knee extension movement. Med Sci Sports Exerc 2009;41:788–796. [PubMed: 19276855]
Søgaard K, Christensen H, Jensen BR, Finsen L, Sjøgaard G. Motor control and kinetics during low levelconcentric and eccentric contractions in man. Electroenceph Clin Neurophysiol 1996;101:453–460.[PubMed: 8913200]
Svantesson U, Osterberg U, Thomee R, Grimby G. Muscle fatigue in a standing heel-rise test. Scand JRehab Med 1998a;30:67–72.
Svantesson U, Osterberg U, Thomee R, Peeters M, Grimby G. Fatigue during repeated eccentric–concentric and pure concentric muscle actions of the plantar flexors. Clin Biomech 1998b;13(4–5):336–343.
Taylor JL, Gandevia SC. A comparison of central aspects of fatigue in submaximal and maximalvoluntary contractions. J Appl Physiol 2008;104:542–550. [PubMed: 18032577]
Torrence C, Compo GP. A practical guide to wavelet analysis. B Am Meteorol Soc 1998;79:61–78.Weir JP, Keefe DA, Eaton JF, Augustine RT, Tobin DM. Effect of fatigue on hamstring coactivation
during isokinetic knee extensions. Eur J Appl Physiol Occup Physiol 1998;78:555–559. [PubMed:9840412]
Zazula, D.; Karlsson, S.; Doncarli, C. Advanced signal processing techniques. In: Merletti, R.; Parker,P., editors. Electromyography: physiology, engineering, and noninvasive applications. Wiley andsons; New Jersey: 2004. p. 259-304.
Pereira et al. Page 12
Eur J Appl Physiol. Author manuscript; available in PMC 2011 September 1.
NIH
-PA Author Manuscript
NIH
-PA Author Manuscript
NIH
-PA Author Manuscript
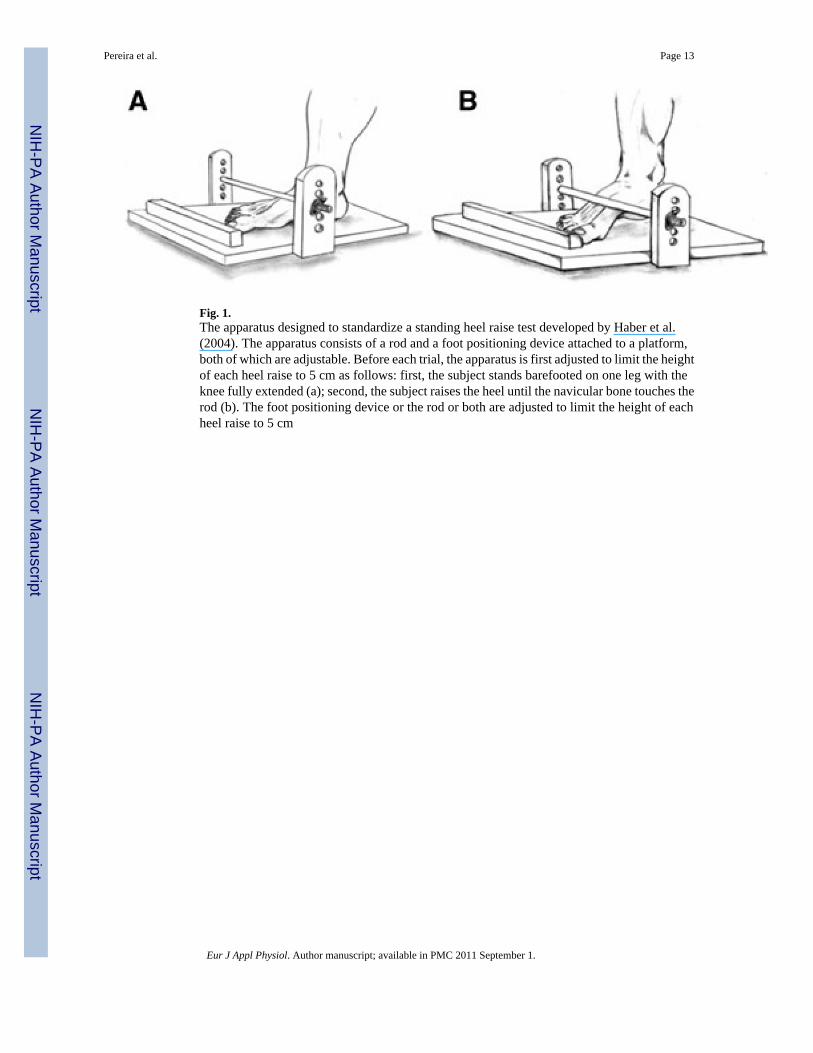
Fig. 1.The apparatus designed to standardize a standing heel raise test developed by Haber et al.(2004). The apparatus consists of a rod and a foot positioning device attached to a platform,both of which are adjustable. Before each trial, the apparatus is first adjusted to limit the heightof each heel raise to 5 cm as follows: first, the subject stands barefooted on one leg with theknee fully extended (a); second, the subject raises the heel until the navicular bone touches therod (b). The foot positioning device or the rod or both are adjusted to limit the height of eachheel raise to 5 cm
Pereira et al. Page 13
Eur J Appl Physiol. Author manuscript; available in PMC 2011 September 1.
NIH
-PA Author Manuscript
NIH
-PA Author Manuscript
NIH
-PA Author Manuscript
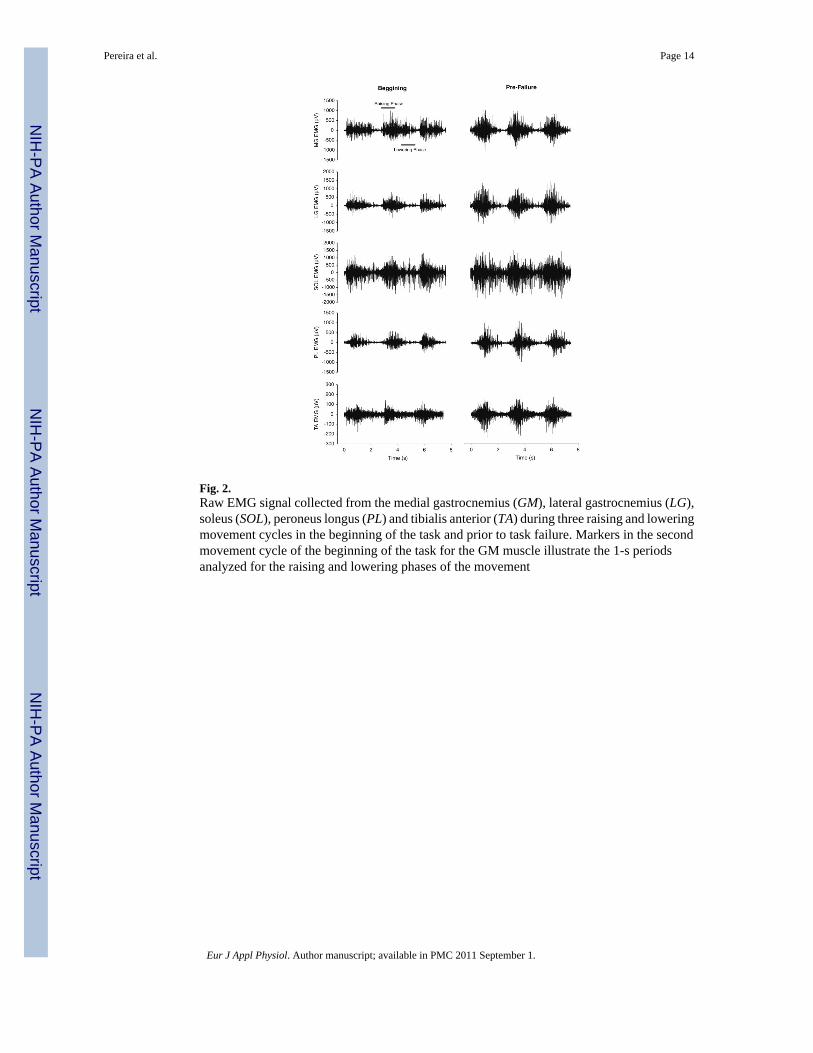
Fig. 2.Raw EMG signal collected from the medial gastrocnemius (GM), lateral gastrocnemius (LG),soleus (SOL), peroneus longus (PL) and tibialis anterior (TA) during three raising and loweringmovement cycles in the beginning of the task and prior to task failure. Markers in the secondmovement cycle of the beginning of the task for the GM muscle illustrate the 1-s periodsanalyzed for the raising and lowering phases of the movement
Pereira et al. Page 14
Eur J Appl Physiol. Author manuscript; available in PMC 2011 September 1.
NIH
-PA Author Manuscript
NIH
-PA Author Manuscript
NIH
-PA Author Manuscript
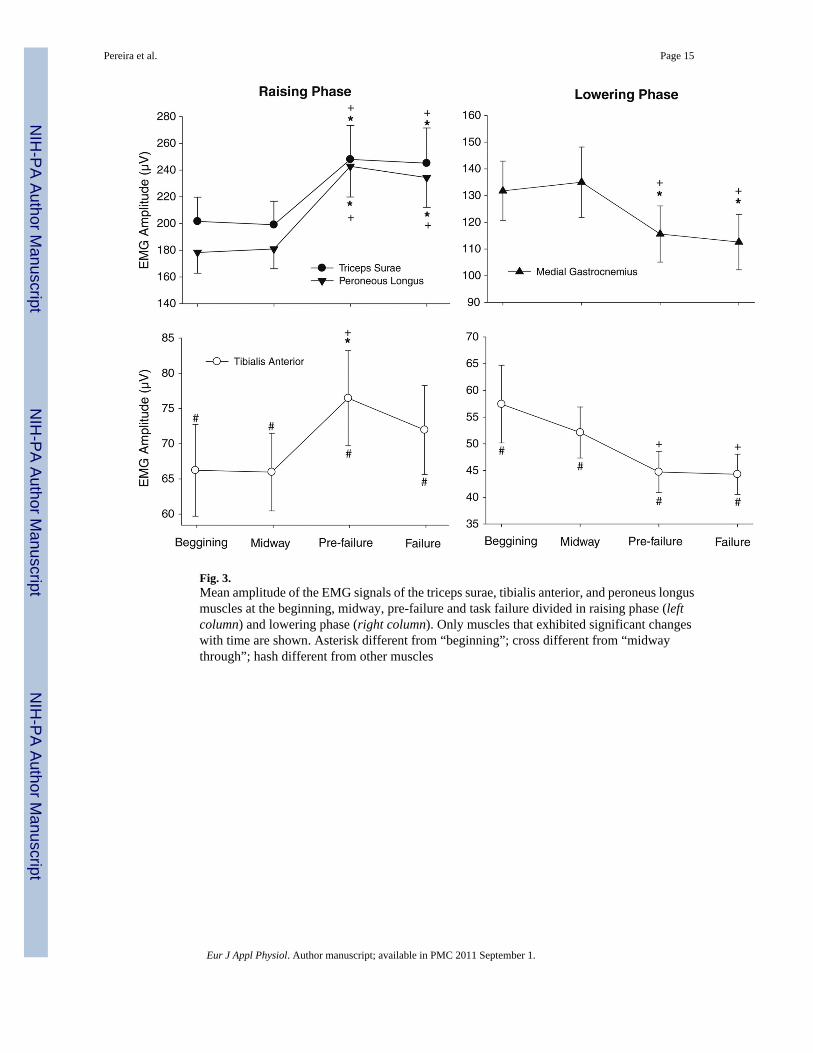
Fig. 3.Mean amplitude of the EMG signals of the triceps surae, tibialis anterior, and peroneus longusmuscles at the beginning, midway, pre-failure and task failure divided in raising phase (leftcolumn) and lowering phase (right column). Only muscles that exhibited significant changeswith time are shown. Asterisk different from “beginning”; cross different from “midwaythrough”; hash different from other muscles
Pereira et al. Page 15
Eur J Appl Physiol. Author manuscript; available in PMC 2011 September 1.
NIH
-PA Author Manuscript
NIH
-PA Author Manuscript
NIH
-PA Author Manuscript
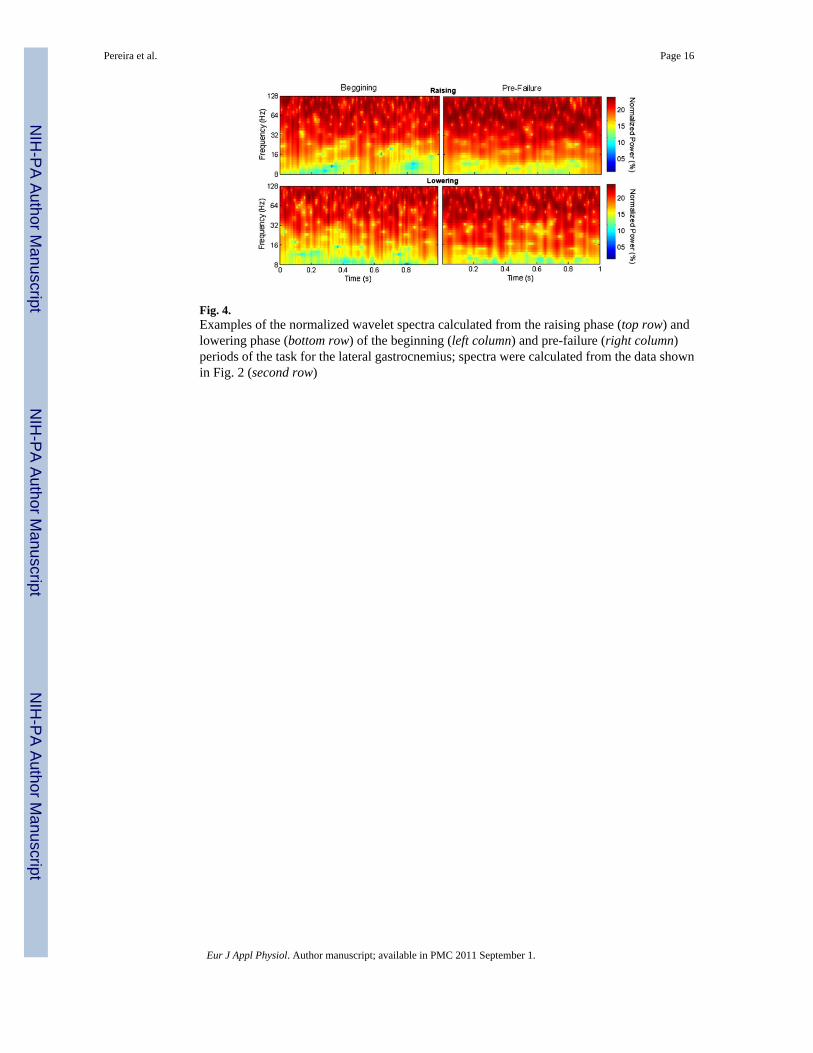
Fig. 4.Examples of the normalized wavelet spectra calculated from the raising phase (top row) andlowering phase (bottom row) of the beginning (left column) and pre-failure (right column)periods of the task for the lateral gastrocnemius; spectra were calculated from the data shownin Fig. 2 (second row)
Pereira et al. Page 16
Eur J Appl Physiol. Author manuscript; available in PMC 2011 September 1.
NIH
-PA Author Manuscript
NIH
-PA Author Manuscript
NIH
-PA Author Manuscript
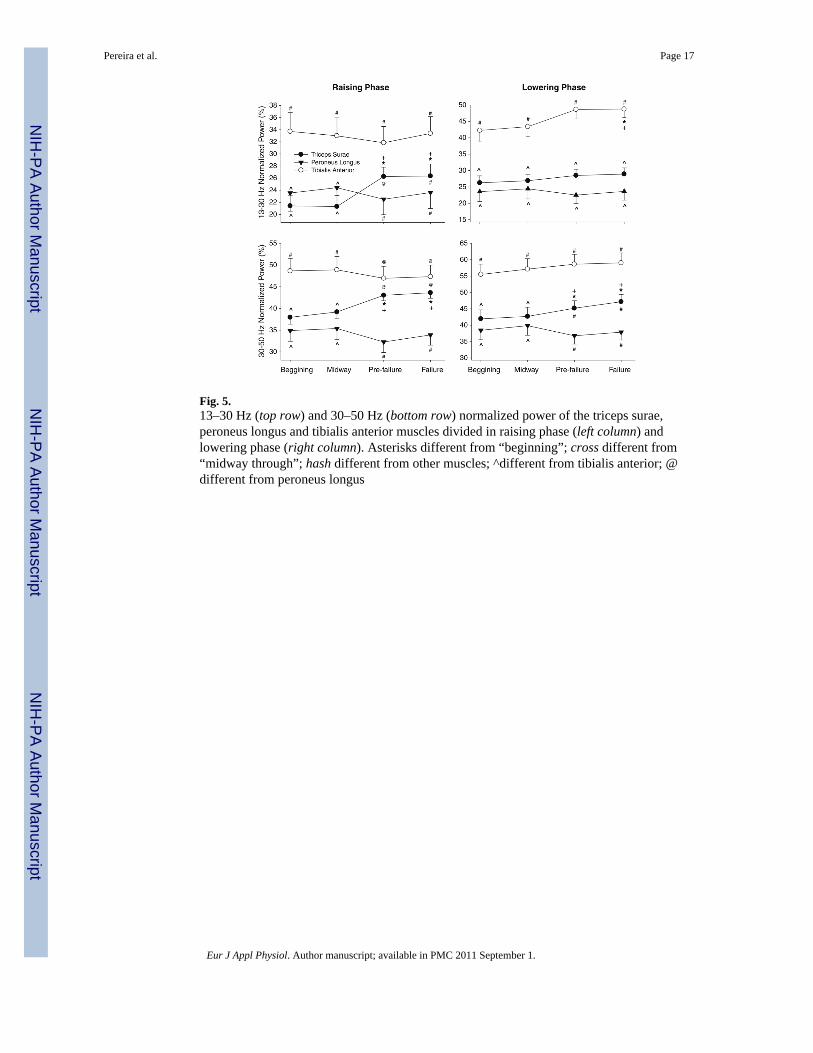
Fig. 5.13–30 Hz (top row) and 30–50 Hz (bottom row) normalized power of the triceps surae,peroneus longus and tibialis anterior muscles divided in raising phase (left column) andlowering phase (right column). Asterisks different from “beginning”; cross different from“midway through”; hash different from other muscles; ^different from tibialis anterior; @different from peroneus longus
Pereira et al. Page 17
Eur J Appl Physiol. Author manuscript; available in PMC 2011 September 1.
NIH
-PA Author Manuscript
NIH
-PA Author Manuscript
NIH
-PA Author Manuscript
Copyright © 2022 FDOKUMEN