Targeting the metabolic environment to modulate T cell ...
327
HAL Id: tel-03370689 https://tel.archives-ouvertes.fr/tel-03370689 Submitted on 8 Oct 2021 HAL is a multi-disciplinary open access archive for the deposit and dissemination of sci- entific research documents, whether they are pub- lished or not. The documents may come from teaching and research institutions in France or abroad, or from public or private research centers. L’archive ouverte pluridisciplinaire HAL, est destinée au dépôt et à la diffusion de documents scientifiques de niveau recherche, publiés ou non, émanant des établissements d’enseignement et de recherche français ou étrangers, des laboratoires publics ou privés. Targeting the metabolic environment to modulate T cell effector function Maria Ferreira Matias To cite this version: Maria Ferreira Matias. Targeting the metabolic environment to modulate T cell effector function. Human health and pathology. Université Montpellier, 2019. English. NNT: 2019MONTT020. tel- 03370689
-
Upload
khangminh22 -
Category
Documents
-
view
4 -
download
0
Transcript of Targeting the metabolic environment to modulate T cell ...

HAL Id: tel-03370689https://tel.archives-ouvertes.fr/tel-03370689
Submitted on 8 Oct 2021
HAL is a multi-disciplinary open accessarchive for the deposit and dissemination of sci-entific research documents, whether they are pub-lished or not. The documents may come fromteaching and research institutions in France orabroad, or from public or private research centers.
L’archive ouverte pluridisciplinaire HAL, estdestinée au dépôt et à la diffusion de documentsscientifiques de niveau recherche, publiés ou non,émanant des établissements d’enseignement et derecherche français ou étrangers, des laboratoirespublics ou privés.
Targeting the metabolic environment to modulate T celleffector functionMaria Ferreira Matias
To cite this version:Maria Ferreira Matias. Targeting the metabolic environment to modulate T cell effector function.Human health and pathology. Université Montpellier, 2019. English. �NNT : 2019MONTT020�. �tel-03370689�

THÈSE POUR OBTENIR LE GRADE DE DOCTEUR
DE L’UNIVERSITÉ DE MONTPELLIER
En Biologie-Santé
École doctorale Sciences Chimiques et Biologiques pour la Santé (CBS2)
Unité de recherche Institut de Génétique Moléculaire de Montpellier (IGMM) – UMR 5535
Présentée par Maria FERREIRA MATIAS Le 07 Octobre 2019
Sous la direction de Valérie DARDALHON
Devant le jury composé de
Julien MARIE, PhD, Centre de Recherche en Cancérologie (Lyon)
Nadège BERCOVICI, PhD, Institut Cochin (Paris)
Laurent YVAN-CHARVET, PhD, Centre Méditerranéen de Médecine Moléculaire (Nice)
Laurent GROS, PhD, Institut de Recherche en Cancérologie de Montpellier
Naomi TAYLOR, MD-PhD, Institut de Génétique Moléculaire de Montpellier
Valérie DARDALHON, PhD, Institut de Génétique Moléculaire de Montpellier
Président
Rapportrice
Rapporteur
Examinateur
Examinatrice
Directrice de Thèse
Targeting the metabolic environment to modulate T ce ll
effector function
Modulation des fonctions effectrices des cellules T en
exploitant l ’environnement métabolique


Targeting the metabolic environment to modulate T
cell effector function
Abstract
T cells are stimulated upon interaction with their cognate antigen. While much research
has focused on the role of antigen presenting cells (APC) and cytokines as important
components of the T cell microenvironment, recent data highlight the importance of the
metabolic environment in sustaining the energetic and biosynthetic demands that are
induced upon antigen stimulation. The subsequent metabolic reprogramming of the T cell is
conditioned by the nutrient composition and oxygen levels. Notably, this environment can be
altered by pathological conditions such as tumors and data from our group, as well as others,
have shown that the competition of T cells and tumor cells for limiting amounts of nutrients
has a negative impact on T cells, inhibiting their anti-tumor effector functions. This effect is
due, at least in part, to the distinct metabolic profiles of T lymphocyte subsets; T effector cells
(including Th1 cells) are highly glycolytic while suppressive FoxP3+ regulatory T cells (Tregs)
display a mixed metabolism with increased levels of lipid oxidation. It is therefore important
to determine how changes in the metabolic programming of anti-tumor T cells impacts on
their persistence and function. Indeed, in the context of my PhD research, I found that high
levels of the glucose transporter GLUT1 was associated with a significantly increased level of
IFNγ secretion by both CD4 and CD8 T cells. Furthermore, there was a bias of CD8 over CD4
lymphocytes in the GLUT1High T cell subset. These data point to the importance of metabolic
alterations in the fate and effector function of T lymphocytes and during my PhD, I focused
on elucidating the metabolic parameters that regulate effector and regulatory T cells, with
the goal of improving the efficacy of anti-tumor T cells. In this context, I contributed to initial
studies from our group, revealing a critical role for extracellular nutrient availability in
terminal CD4+ T cell differentiation. Activation of naïve CD4+ T cells under conditions of
glutamine deprivation caused them to differentiate into induced Treg (iTreg). Moreover, the
skewing of glutamine-deprived naïve CD4+ T cells to a FoxP3+ fate occurred even under Th1-
polarizing conditions, blocking terminal Th1 differentiation. Under glutamine-deprived
conditions, we found that alpha-ketoglutarate (αKG), a glutamine-derived metabolite,
rescued Th1 differentiation. I then evaluated the impact of αKG under glutamine-replete

conditions in the Th1/iTreg differentiation processes. My studies showed that, under Th1-
polarizing conditions, αKG markedly enhanced naïve CD4+ T cell differentiation into Th1 cells
and increased IFNγ secretion. Moreover, under Treg-polarizing conditions, αKG decreased
FoxP3 expression and increased the secretion of inflammatory cytokines such as IFNγ, GM-
CSF and IL-17. Notably, the αKG-mediated alteration in T cell differentiation was associated
with an augmented oxidative phosphorylation (OXPHOS), and inhibiting the citric acid cycle
and the mitochondrial complex II with malonate, an inhibitor of succinate dehydrogenase
(SDH), alleviated the αKG-mediated block in Treg differentiation. Impressively, these αKG-
mediated changes in the Th1/Treg balance were maintained in vivo, promoting a Th1-like
profile in T cells expressing an anti-tumor chimeric antigen receptor (CAR) in tumor-bearing
mice. Thus, our data show that low intracellular αKG content, caused by limited external
glutamine availability, imposes a Treg phenotype while high αKG levels shift the balance
towards a Th1 phenotype.
Altogether, the data generated during my PhD will promote the development of
metabolic strategies aimed at modulating T cell function and foster the design of nutrient
transporter-based approaches that can be used to select T lymphocytes with enhanced anti-
tumor effector properties.

Modulation des fonctions effectrices des cellules T
en exploitant l’environnement métabolique
Résumé
L’activation des cellules T est initiée suite à la rencontre avec un antigène spécifique. Les
études réalisées pour mieux comprendre ce processus d’activation se sont principalement
focalisées sur le rôle des cellules présentatrices d'antigènes et des cytokines. Toutefois, des
données récentes soulignent également l'importance du microenvironnement métabolique
pour soutenir l’augmentation des besoins énergétiques et biosynthétiques liés à la
stimulation antigénique. Cette reprogrammation métabolique est conditionnée par la
disponibilité en nutriments et la teneur en oxygène qui peuvent être altérés en conditions
pathologiques, comme dans des tumeurs. En effet, plusieurs groupes dont le nôtre ont
montré qu’en cas de faible disponibilité en nutriments, une compétition peut se créer entre
les cellules tumorales et les cellules T, impactant de ce fait négativement leurs fonctions anti-
tumorales. Cet effet est dû, du moins en partie, aux profils métaboliques distincts des sous-
populations de cellules T ; alors que les cellules T effectrices (dont les cellules Th1) sont
fortement glycolytiques, les cellules T régulatrices suppressives (Treg) présentent un
métabolisme plus mixte avec des niveaux accrus d'oxydation lipidique. Il est donc important
de déterminer comment les changements métaboliques des cellules T anti-tumorales
affectent leur persistance et leur fonctionnalité. Ainsi, j'ai entrepris des travaux afin d’évaluer
si le niveau d’expression du transporteur de glucose GLUT1 permettait d’identifier et de
sélectionner des cellules T ayant des fonctions effectrices distinctes. Nous avons confirmé
cette hypothèse et notamment montré que les cellules T exprimant un niveau élevé de GLUT1
possèdent un potentiel de sécrétion d’IFNγ accru.
De plus, nos travaux montrent que la disponibilité en nutriments extracellulaires est un
élément clé pour la différenciation terminale des cellules Th1. En effet, l'activation des
cellules T CD4 naïves en conditions limitantes en glutamine induit leur différenciation en
cellules Treg FoxP3+. Plus surprenant encore, cette carence induit un blocage de la
différenciation Th1 même lors d’une polarisation vers ce lignage. De plus, en conditions de
carence en glutamine, nous avons découvert que l'alpha-cétoglutarate (αKG), un métabolite
dérivé de la glutamine, rétablit cette différenciation terminale Th1. J'ai ensuite évalué l'impact

de l’αKG dans les processus de différenciation Th1/Treg en condition non limitante en
glutamine. Mes données montrent que, dans des conditions de polarisation Th1, l’ajout d’αKG
améliore la différenciation des cellules T CD4 naïfs en cellules Th1 et augmente la production
d’IFNγ. A l’inverse, l’ajout d’αKG s’accompagne d’une diminution des cellules FoxP3+ et d’une
augmentation de la sécrétion de cytokines inflammatoires dans des conditions de polarisation
Treg. L'altération de la différenciation des cellules T médiée par l'αKG est notamment associée
à une phosphorylation oxydative (OXPHOS) accrue ; ainsi, l'ajout d’un inhibiteur du cycle de
Krebs et du complexe mitochondrial II /succinate déshydrogénase, atténue le blocage de la
différenciation Treg induit par l'αKG. De façon remarquable, ces modifications de l'équilibre
Th1/Treg médiées par l'αKG sont maintenues in vivo et impactent le devenir de cellules T
exprimant un récepteur chimérique anti-tumoral (CAR) injectées chez des souris porteuses
de tumeurs. En résumé, nos données montrent qu'une faible teneur en αKG intracellulaire
liée à une disponibilité limitée en glutamine, favorise un phénotype Treg, alors que des
niveaux élevés d’αKG modifient l'équilibre vers un phénotype Th1.
En conclusion, les données générées au cours de ma thèse devraient permettre le
développement de stratégies permettant de sélectionner des cellules T ayant des propriétés
effectrices anti-tumorales améliorées.

Abstract general public
T cell based-immunotherapies represent a promising approach for cancer treatment.
Despite impressive successes for the treatment of hematologic cancers, it has been less
fruitful on solid tumors. This is in part due to the altered metabolism generated in the tumor
microenvironment that impairs T cell anti-tumor function. To overcome this problem, I have
focused during my PhD on understanding the impact of metabolic parameters on T cell
effector function. Our results demonstrate that glutamine availability plays a crucial role in
the acquisition of effector T functions with, alpha-ketoglutarate, a glutamine-derived
metabolite, acting as a metabolic regulator of T cell differentiation. In parallel, we show that
T cells with distinct effector functions can be identified based on the surface expression of
the glucose transporter, GLUT1. Altogether, targeting T cell metabolism could represent an
original angle to modulate T cell anti-tumor function and improve cancer immunotherapies.
Résumé grand public
Malgré d'impressionnants succès pour des cancers hématologiques, les immunothérapies
par transfert de cellules T s’avèrent peu efficaces pour le traitement de tumeurs solides. Ceci
est en partie dû à l’altération du métabolisme par l’environnement tumoral qui limite
l'efficacité anti-tumorale des cellules T. Durant ma thèse, j’ai ainsi étudié l’importance du
métabolisme dans les fonctions effectrices des cellules T. Nos résultats montrent que la
disponibilité en glutamine est essentielle pour l'acquisition des fonctions effectrices des
cellules T et que, l'alpha-cétoglutarate, un métabolite dérivé de la glutamine, agit comme
régulateur dans leur processus de différenciation. En parallèle, nous montrons que les cellules
T, identifiées sur la base de l'expression du transporteur de glucose GLUT1, possèdent des
fonctions effectrices distinctes. Le ciblage du métabolisme pourrait donc représenter un angle
thérapeutique original pour améliorer la réponse anti-tumorale des cellules T.


Acknowledgments
Surprisingly, even if I am someone known for my capacity to express my feelings, writing
this part was not easy. It was not easy because I could write another thesis manuscript (not
right now, or maybe) only to express my gratitude to all those who helped during this journey.
Thus, I will try to be brief and efficient.
First of all, I would like to say to thank you to the thesis jury members who accepted to
review my manuscript and be part of this adventure.
I could not start this part without saying thanks to Naomi and Valérie D. Naomi, I was only
21 years old when we first met in Coimbra (a meeting that I will never forget). After assisting
to a thesis defense, you came to my faculty and we discussed about the research done in your
lab (I could not imagine the amount of things you were able to do in 24 hours). After that, I
have been working with you, learning and growing scientifically with you. Thank you very
much for the opportunity to work in your lab and thank you for your exigence: the only way
to progress is to go beyond ourselves. Valérie, you have been guiding me since the very first
moment I was in the lab. The way I work, how I see science, the way that I design and develop
my research is a reflect of what I learnt with you. You were always available to help me and
to answer my questions no matter how full was your agenda. You also taught me that “life is
already too complicated, don’t make it more difficult” when I was having my drama queen
moments or when I was trying to do experiments with way more conditions that were
possibly necessary. For this and much more, thank you.
To my partner and my teammate Yong, I would like to write few special words. We were
a fantastic team. Despite how different we are (and how many times we potentially would
like “to kill” each other), we became a strong team. We worked hard and we were always
moved by the same ambition and objectives. We were complementary and supportive. We
were and will always be the Yin and Yong. To Gaspard, or simply “Crenet” (when my French
was a catastrophe) I would like to say that it was really a pleasure working with you. Thank
you very much for everything you taught me, which will always be one of the foundations of
my still little scientific career (I am still waiting for my sock).

Thank you to all the NTL members: Sandrina, (for being my little -or maybe I should say
tall- star. Your positive energies were essential to me in this journey), Valérie Z. (for your
sense of humor and your incredible capacity of smiling even when you are speaking about
serious things), Cédric (for making a lot of noise close to my desk, for making me smile and
discuss with me about how good is the Portuguese gastronomy), Patrice (for being Cedric’s
BFF and making me laugh all the time), Peggy (for all the hugs and your good energies),
Daouda (for finding the best car ever, for all your kindness and for being with Mar), Myriam
(for your never ending hours in front of the sorter), Manu (for widening my taste for cakes
and desserts, especially tiramisu), Anais (always efficient and hard worker), Sarah (for your
sense of humor), Vincent (for all the radioactive moments), Little Mehdi and Little Ira (the
funniest baby PhD students), Alice (for your funny “fecha a porta”), Anne-So (for your
optimism), my Dobbys poisson rouge and PAB (thank you for your help and enthusiasm),
Pedro (for defending me all the time – only the Iberians understand each other), Zoï
(discussing about vegetables was never as interesting as it is since I met you. Thank you for
your special way to be), Petite Marie (my little sister with whom I can discuss about fashion,
coiffure and express my deep feelings. Merci, mon Arc-en-Ciel), Ma Cacahuète (words are not
enough. Thank you for being my lab mate, my best friend, my sister and my housemate.
Montpellier is special and it will always be thanks to you).
A big thanks to all the members of the institute for the good environment. A special thank
you to my cell culture ladies, Fabi, Rosy and Kata. For all the moments that we shared
between beers and glass of wine. You are the best. For Anne I would like also to say thank
you for all the support and advices during this important last year.
Now, I would like to address some special words to my family, my Portuguese friends, and
all the fantastic people that became part of my family during my time in Montpellier. Thanks
to them, I now have a family in two different countries. Primeiro de tudo, um grande e enorme
obrigada à minha família, especialmente à minha Mãe, ao meu Pai e ao meu Irmão por todo
o apoio que me deram ao longo destes anos. Apesar da distância física ser grande, nunca vos
senti longe de mim. Estiveram sempre presentes do início ao fim. O que hoje sou, a vôces vos
devo e esta conquista é dedicada a vôces. Aos Ferreiritas e aos Matias, obrigada por todo
amor durante as tão desejadas férias de Natal e de Verão. À Ben, un énorme merci. Ton
support était hors norme. C’est en toi que j’ai trouvé toutes les forces du Monde pour ce

grand défi. Obrigada, zangão. Às minhas amigas e irmãs de coração Mariana, Adriana, Soraia
e Tati (ordem aleatória e não representativa de quaisquer preferências) gostaria de vos
agradecer pela vossa eterna amizade. Por mais anos que passem, nada muda. Obrigada por
terem estado sempre presentes neste percurso. Ao Rojões, à Vi, à Filipa, à Su, à Bibiana e à
Joana Oliveira um igual especial obrigado. À minha amiga Isabel, gostaria de agredecer todos
os momentos de fofoquice e apoio. Há desabafos e dramas que só os Tugas compreendem.
Obrigada por seres a “meilleure Tuga” de Montpellier. À Muriel, Nawel et Pascale et tous les
coaches qui nous ont accompagné, merci. Nos moments de cardio à fond ensemble était
cruciaux. À la famille Perrin, famille Pouzolles et a famille Molière un grand merci. Quand on
est loin de nos origines, être loin de la famille et des amis est le plus difficile à supporter.
Merci de m’avoir adoptée, merci pour tout votre amour.


Preface
Publications:
Klysz, D., Tai, X., Robert, P.A., Craveiro, M., Cretenet, G., Oburoglu, L., Mongellaz, C., Floess, S., Fritz, V., Matias, M.I.,Yong C., Surth N., Marie J.C., Huehn J., Zimmermann V., Kinet S., Dardalhon V., Taylor N. (2015). Glutamine-dependent alpha-ketoglutarate production regulates the balance between T helper 1 cell and regulatory T cell generation. Sci Signal 8, ra97.
Cretenet, G., Clerc, I., Matias, M., Loisel, S., Craveiro, M., Oburoglu, L., Kinet, S., Mongellaz, C., Dardalhon, V., and Taylor, N. (2016). Cell surface Glut1 levels distinguish human CD4 and CD8 T lymphocyte subsets with distinct effector functions. Sci Rep 6, 24129.
Craveiro M., Cretenet G., Mongellaz C., Matias M.I., Caron O., de Lima M.C.P., Zimmermann V.S., Solary E., Dardalhon V., Dulić V., Taylor N. (2017). Resveratrol stimulates the metabolic reprogramming of human CD4+ T cells to enhance effector function. Sci Signal 10
Matias M.I*/ Yong C.* et al. The balance between Th1 and Treg differentiation is regulated by α-ketoglutarate-mediated alterations in TCA cycle flux. (* equal contribution) In preparation.
Congresses:
Metabolism & Cancer (Palavas les-flots, 2016) – Poster presentation (Nutrient cell surface levels to isolate human T lymphocyte subsets with distinct effector functions)
11th ENII EFIS Summer School on Advanced Immunology (Sardinia, 2016)
Société Française de Immunologie 2016- (Paris, 2016) – Poster presentation (Cell surface Glut1 levels distinguish human T lymphocyte subsets with distinct effector functions)
FOCIS 2017- Precision in Immunology (Chicago, 2017) - Oral presentation (Metabolite Regulation of Human T Cell Immunity)


1
List of Contents
List of Figures/Tables ............................................................................................................................. 5
Abbreviations list ................................................................................................................................... 9
Introduction .......................................................................................................................................... 19
I. Adaptive Immune system ............................................................................................................. 21
General concepts .............................................................................................................................. 21
1) T cells ..................................................................................................................................... 21
A. T cell diversity ................................................................................................................... 22
B. Thymopoiesis .................................................................................................................... 22
C. Naïve T cells....................................................................................................................... 25
a) Naïve T cell characterization and homing function ...................................................... 25
b) Naïve T cell pull maintenance ....................................................................................... 25
D. T cell activation ................................................................................................................. 27
a) Antigen presentation by MHC molecules ..................................................................... 27
b) TCR signaling cascade - Signal 1 .................................................................................... 28
c) Co-stimulation signaling – Signal 2 ............................................................................... 29
d) Cytokine signaling – Signal 3 ......................................................................................... 30
E. Effector T cells ................................................................................................................... 32
a) CD4+ effector T cells ...................................................................................................... 32
T helper 1 cells ...................................................................................................... 33
1.1. Th1 cell lineage differentiation ............................................................................. 34
1.2. Th1 cell effector function ...................................................................................... 36
T helper 2 cells ...................................................................................................... 37
2.1 Th2 cell lineage differentiation .............................................................................. 37
2.2. Th2 cell effector function ...................................................................................... 38
CD4+ regulatory T cells .......................................................................................... 40
3.1. Classification and nomenclature ........................................................................... 41
3.2. Cytokine-induced signaling in Treg differentiation ............................................... 41
3.3. FoxP3 gene and its regulation ............................................................................... 41
3.4. Treg suppressive mechanisms .............................................................................. 44
b) CD8+ effector T cells ...................................................................................................... 46
F. Memory T cells .................................................................................................................. 48
II. Metabolism ................................................................................................................................... 52
General concepts .............................................................................................................................. 52

2
1) Glycolysis and the pentose phosphate pathway .................................................................. 52
2) TCA cycle and oxidative phosphorylation ............................................................................. 54
3) Lipid synthesis and Fatty acid oxidation ............................................................................... 56
4) Amino acid metabolism ........................................................................................................ 60
5) mTOR and AMPK signaling pathways ................................................................................... 62
III. T cell metabolism .......................................................................................................................... 64
1) Naïve T cells .......................................................................................................................... 64
2) Metabolic requirements and reprograming upon TCR activation ........................................ 65
A. mTOR and AMPK signaling ................................................................................................ 66
B. Glycolysis ........................................................................................................................... 67
C. Glutamine metabolism ..................................................................................................... 68
D. Lipid metabolism ............................................................................................................... 69
E. Arginine metabolism ......................................................................................................... 70
3) Metabolic requirement and control during T cell differentiation – Effector and regulatory
functions. ...................................................................................................................................... 72
A. Glycolysis ........................................................................................................................... 72
B. Glutaminolysis ................................................................................................................... 74
C. TCA cycle metabolites ....................................................................................................... 74
a) Alpha-ketoglutarate ...................................................................................................... 75
b) Other TCA cycle metabolites ......................................................................................... 77
D. Lipid metabolism ............................................................................................................... 78
E. Arginine metabolism ......................................................................................................... 81
F. mTOR and AMPK signaling pathway ................................................................................. 82
4) Memory T cells ...................................................................................................................... 84
IV. The tumor metabolic environment and Chimeric antigen receptor (CAR) T cell
immunotherapies .................................................................................................................................. 85
1) Immunity shapes the tumor – cancer immunoediting ......................................................... 85
2) Tumor microenvironment ..................................................................................................... 86
A. Nutrient competition ........................................................................................................ 87
a) Glucose deprivation ...................................................................................................... 87
b) Glutamine deprivation .................................................................................................. 88
c) Arginine deprivation and byproducts ........................................................................... 89
d) Tryptophan degradation and IDO activity .................................................................... 89
e) Lipid metabolism ........................................................................................................... 90
B. Hypoxia ............................................................................................................................. 91
3) Chimeric Antigen Receptor (CAR) T cell Immunotherapies .................................................. 95

3
Results................................................................................................................................................. 103
Chapter 1 - Selection of different T cell subsets based on nutrient transporters expression ......... 105
Introduction .................................................................................................................................... 107
Article I ........................................................................................................................................... 109
Addendum I - T cell selection based on CAT-1 surface expression ................................................ 123
Results and Discussion ................................................................................................................. 125
Material and Methods ................................................................................................................. 129
Chapter 2 - Impact of amino acid availability on T cell differentiation and effector function ......... 131
Introduction .................................................................................................................................... 133
Article II .......................................................................................................................................... 135
Addendum II - Impact of arginine availability on human T cell function ....................................... 149
Results and Discussion ................................................................................................................. 151
Materials and Methods ............................................................................................................... 162
Chapter 3 - Role of αKG as a metabolic regulator of Th1/iTreg differentiation .............................. 165
Introduction .................................................................................................................................... 167
Article III ......................................................................................................................................... 169
Discussion ........................................................................................................................................... 211
Bibliography........................................................................................................................................ 229
Annexes .............................................................................................................................................. 293

4

5
List of Figures/Tables
Introduction
Figure 1 - αβT cell selection mechanisms in the thymus .................................................................... 24
Table 1 - Naïve T cell surface markers in both mouse and human species ........................................ 25
Figure 2 – Comparison of the maintenance of the naïve T cell pool in aging mice and humans ....... 27
Figure 3 - TCR signaling cascade upon antigen presentation ............................................................. 29
Figure 4 – IL-2 receptor affinity and STAT5 activation ........................................................................ 31
Figure 5 - Polarization of CD4+ naïve T cells towards distinct subsets ................................................ 33
Figure 6- IL-12 and IFNγ signaling pathways during Th1 .................................................................... 35
Figure 7 - Scheme of non-coding regions, signals and transcription factors involved in FoxP3 induction
and stabilization .................................................................................................................................. 43
Figure 8 – Treg-mediated suppression mechanisms/pathways ......................................................... 45
Figure 9 – Cytotoxic T cell differentiation and phenotype ................................................................. 48
Figure 10 - Two models proposed for T cell differentiation ............................................................... 48
Table 2 –TCM and TEM surface markers in both mouse and human species ........................................ 51
Figure 11 - Glycolysis and the pentose phosphate pathway (PPP) ..................................................... 54
Figure 12 - The tricarboxylic acid (TCA) cycle and its connection with the electron transport chain and
OXPHOS ............................................................................................................................................... 55
Figure 13 – Fatty acid synthesis .......................................................................................................... 57
Figure 14 – The Mevalonate pathway ................................................................................................ 58
Figure 15 – Intracellular Cholesterol levels homeostasis ................................................................... 59
Figure 16 – Glutaminolysis .................................................................................................................. 61
Figure 17 – Arginine metabolism ........................................................................................................ 62
Figure 18 – mTOR complexes and its targets ...................................................................................... 63
Figure 19 – The AMPK pathway .......................................................................................................... 64
Figure 20 – Role of mTOR activation in metabolic reprogramming ................................................... 67
Figure 21- Metabolic reprogramming of T cell upon TCR activation .................................................. 72
Figure 22 – Epigenetic regulation mediated by TCA cycle metabolites .............................................. 78
Figure 23- Metabolic signatures of TEFF (Th1/Th2/Th17) and Treg cells ............................................ 81
Figure 24- mTOR signaling function in T cell differentiation .............................................................. 83
Figure 25 – The tumor microenvironment .......................................................................................... 94
Figure 26 – The four generations of CAR T cell constructs .................................................................. 97

6
Results- Chapter 1
Figure 1 – Upregulation of CAT-1 surface expression upon TCR stimulation .................................... 125
Figure 2 – Selection of TCR-stimulated human T cells on the basis of CAT-1 surface expression ..... 126
Figure 3 – CAT-1 is highly upregulated on CD8 T cells and is associated with an increased proliferation of CD8 as compared to CD4 T cells ............................................................................... 127
Figure 4 - CD45RA and CD45RO expression on CAT-1Low and CAT-1High sorted cells ......................... 128
Figure 5 – High CAT-1 expression is associated with high IL-17 and IFN-γ expression in the CD4 T cell
subset ................................................................................................................................................. 128
Results- Chapter 2
Figure 1 – Arginine deprivation inhibits T cell activation and proliferation ...................................... 155
Figure 2 – T cell phenotype is not significantly altered under conditions of arginine deprivation . 156
Figure 3 – Downregulation of CAT-1 expression by lentiviral-mediated shRNA based approach inhibits T cell proliferation following restimulation........................................................................... 158
Figure 4 – Arginine-based generation of polyamines is required for optimal T cell activation and proliferation ....................................................................................................................................... 160
Results- Chapter 3
Figure 1 – Exogenous aKG augments Th1 polarization and inhibits the polarization potential of naïve CD4 T cells towards a Treg fate ......................................................................................................... 183
Figure 2 – aKG induces an inflammatory profile in Treg-polarized CD4 T cells............................... 185
Figure 3 – ErbB2-CAR+ T cells polarized ex vivo in the presence of aKG maintain an in vivo inflammatory profile following adoptive transfer into tumor-bearing mice ........................................................... 187
Figure 4 – Genes affecting membrane-related processes are strongly impacted by aKG in Treg polarizing conditions ......................................................................................................................... 189
Figure 5 – Lipid saturation and membrane order is altered by aKG under Treg polarization conditions ............................................................................................................................................................ 191
Figure 6 – Treg differentiation is enhanced by blocking the aKG-induced augmentation in oxidative phosphorylation ................................................................................................................................ 193
Supplemental Figure 1– Treg polarization is attenuated by aKG following TCR stimulation .......... 194
Supplemental Figure 2– ErbB2-CAR T cells exhibit an attenuated Treg polarization in the presence of
aKG ................................................................................................................................................... 195
Supplemental Figure 3- Abca1 and Abcg1 levels are decreased by aKG treatment in Treg-polarizing
conditions.......................................................................................................................................... 196

7
Supplemental Figure 4- Tracing of glucose and glutamine metabolism in Treg-polarizing
conditions............................................................................................................................................ 197
Supplemental Figure 5- Human CD4+ T cells exhibit attenuated Treg polarization in the presence of
aKG .................................................................................................................................................... 198
Discussion
Figure 1 – Potential mechanisms involved in the αKG-dependent inhibition of iTreg polarization ... 226

8

9
Abbreviations list
3PG 3-phosphoglycerate
2HG 2-hydroxyglutarate
4E-BP1 eukaryotic translation inhibitor factor 4E-binding protein 1
5caC 5- hydroxymethylcytosine
5fC 5- formylcytosine
5hmC 5-hydroxymethylcytosine
αKG α-ketoglutarate
αKGDH α-Ketoglutarate dehydrogenase
A
AA amino acids
ABCA1 ATP binding cassette A1
ABCG1 ATP binding cassette G1
ACAT Acyl-CoA cholesterol acyltransferase
ACC acetyl CoA carboxylase
Acetyl-coA acetyl coenzyme A
ACT adoptive T-cell therapies
ADC arginine decarboxylase
AGAT arginine: glycine amidinotransferase
AIRE autoimmune regulator
AITL angioimmunoblastic T-cell lymphoma
ALL acute lymphocytic leukemia
AML myeloid leukemias
AMP adenosine mono phosphate
AMPK 5’ adenosine monophosphate-activated protein kinase
AP-1 activator protein-1
APC antigen presenting antigen cells
ARG arginase
ASCT2 ASC amino acid transporter-2
ASL arginosuccinate lyase
ATP Adenosine triphosphate
B
BAD BCL-2 antagonist of cell death

10
BCL-6 B-cell lymphoma 6 protein
BID BH3-interacting domain death agonist
BIM BCL-2 interacting mediator of cell death
BLC-2 B cell lymphoma 2
C
Ca2+ calcium
CAFs cancer associated fibroblasts
cAMP cyclic Adenosine mono phosphate
CAR chimeric antigen receptors
CAT cationic transporter
CCL CC-chemokine ligand
CCR7 CC-chemokine receptor 7
CD28RE CD28 responsive element
CD62L CD62 ligand
CDKs cyclin-dependent kinases
CI complex I
CIC citrate carrier
CII complex II
CIII complex III
CIV complex IV
CLL chronic lymphocytic leukemia
CNS conserved non-coding DNA sequence
Con A concanavalin A
CPT carnitine palmitoyl transferase
CS citrate synthase
CTCF CCCTC-binding factor is a DNA-binding zinc-finger transcription factor
cTEC cortex thymic epithelial cells
CTLA-4 cytotoxic T-lymphocyte-associated protein 4
CTLs cytotoxic T lymphocytes
CV complex V
CXCL C-X-C motif chemokine ligand
CXCR3 C-X-C motif chemokine receptor 3
CYP51 lanosterol 14α-demethylase
D
D-2HG D-(R)-2-hydroxyglutarate

11
DCs dendritic cells
DEPTOR mTOR-interacting protein
DHAP dihydroxyacetone phosphate
DLBCL diffuse large B-cell lymphoma
DMK dimethyl α-ketoglutarate
DN double negative
DP double positive
E
EAE experimental autoimmune encephalomyelitis
Eomes eomesodermin
ER endoplasmic reticulum
ETC electron transporter chain
F
F16P fructose-1-6-P
F6P fructose-6-phosphate
FADH2 flavin adenine dinucleotide
FAO fatty acid oxidation
FAs fatty acids
FAS fatty acid synthesis
FASN fatty acid synthase
FATP fatty acid transport protein
Fezf2 Fez family zinc finger protein 2
FH fumarate hydratase
FL follicular lymphoma
FoxO1 forkhead box O1
FoxP3 Forkhead box protein P3
G
G3P glyceraldedehyde-3-phospate
G6P glucose-6-phosphate
G6PD glucose-6-phosphate dehydrogenase
GAPDH glyceraldehyde 3-phosphate dehydrogenase
GATA3 GATA binding protein 3
GDH glutamate dehydrogenase
GEM germline-encoded mycolyl-reactive
GLS glutaminase
GLUT glucose transporters

12
GM-CSF granulocyte-macrophage colony-stimulating factor
GOT glutamate oxaloacetate transaminase
GS glutamine synthase
H
H+ proton
HDL high-density lipoprotein
HDM histone demethylases
HEV high endothelial venules
HGMCR hydroxymethylglutaryl-coenzyme A reductase
HGMCS hydroxymethylglutaryl-coenzyme A synthase
HIF-1α Inducible impact factor 1 α
HK hexokinase
HLA human leucocyte antigen
HMC-CoA hydroxymethylglutaryl-coenzyme A
I
Id2 DNA binding 2
IDH isocitrate hydrogenase
IDO indoleamine 2,3-dyoxyegenase
IFNα Interferon alpha
IFNγ Interferon gamma
IFNγR Interferon gamma receptor
Ig Immunoglobulin
IKK IkB kinase
IL interleukin
IL-12Rβ IL-12 receptor beta
IL-23R IL-23 receptor
IL-2R IL-2 receptor
IL-7R IL-7 receptor
iNK T invariant natural killer T
INSIG insulin-induced gene protein
IPEX immunodysregulation polyendocrinopathy enteropathy X-linked
IRF4 interferon regulatory factor 4
ITAMs immunoreceptor tyrosine-based activation motifs
iTreg induced T regulatory cells
J
JAK janus kinase

13
JmjC Jumonji C
K
KLF Kruppel-like transcription factor
L
L-2HG L-(S)-2-hydroxyglutarate
LAT linker for activation of T cells
LCK lymphocyte cell-specific protein-tyrosine kinase
LDH lactate dehydrogenase
LDL low-density lipoprotein
LFA-1 integrin CD11a
LKB1 liver kinase B1
LPS lipopolysaccharide
LXR liver X receptor
M
MAA melanoma-associated antigens
MAIT mucosal-associated invariant T
MCT monocarboxylate transporter
MDH malate dehydrogenase
MDSC myeloid-derived suppressor cells
MHC major histocompatibility complexes
mLST8 mammalian lethal with sec-13 protein 8
MS multiple sclerosis
mTEC medullar thymic epithelial cells
mTOR mammalian target of rapamycin
mTORC mTOR complex
MVK mevalonate kinase
N
NAD+ oxidized nicotinamide adenine dinucleotide
NADH nicotinamide adenine dinucleotide
NADPH reduced nicotinamide adenine dinucleotide phosphate
NF- κB nuclear factor- κB
NFAT nuclear factor of activated T cells
NK natural killer
NKT natural killer T cells
NO nitric oxide
NOS nitric-oxide-synthase

14
NSCLC non-small cell lung cancer
nTreg natural T regulatory
O
O2 oxygen
OAA oxaloacetate
OAT ornithine aminotransferase transaminase
ODC ornithine decarboxylase
Opa1 optic atrophy 1
OXPHOS oxidative phosphorylation
P
P5C pyrroline-5-carboxylate
PAMPs pathogen-associated molecular patterns
PD-1 programmed cell death-1
PDH pyruvate dehydrogenase
PEP phosphoenolpyruvate
PFK1 phosphofructokinase-1
PHDs prolyl hydroxylases
PI3K phosphatidylinositol 3-kinase
PKCθ protein kinase Cθ
PKM2 pyruvate kinase isozyme M2
PMBCL primary mediastinal large B-cell lymphoma
pMHC peptide-MHC
PNAd peripheral lymph node addressin
PPAR peroxisome proliferator-activated receptors
PPP pentose phosphate pathway
PRAs40 proline-rich AKT substrate 40 kDa
PRRs pattern recognition receptors
pTreg peripheral-derived T regulatory cells
PUFAs polyunsaturated fatty acids
R
R5P ribose-5-phosphate
RA rheumatoid arthritis
RAG recombination-activating gene
Raptor regulatory-associated protein of mammalian target of rapamycin
RASGRP RAS guanyl nucleotide-releasing protein
Rictor rapamycin-insensitive companion mTOR

15
RTE recent thymic emigrants
RUNX Runt-related transcription factor
RXR retinoid X receptor
S
S1P site-1 proteases
S2P site-1 proteases
S6K1 S6 kinase beta-1
SCAP SREBP cleavage-activating protein
scFv single chain Fc
SCS succinyl-CoA synthetase
SDF-1 stromal cell-derived factor 1
SDH succinate dehydrogenase
SGK1 glucocorticoid-regulated kinase 1
SGLTs sodium-glucose-linked transporters
SLC solute carrier family
SLE systemic lupus erythematosus
SLEC short-lived effector cells
SLL small lymphocytic lymphoma
SNAT sodium-dependent neutral amino acid transporter
SP single positive
SRC spare respiratory capacity
SREBP sterol regulatory element binding protein
STAT signal transducers and activators of transcription
T
T1D type 1 diabetes
TAL tyrosine ammonia lyase
TAM tumor-associated macrophages
T-bet T box expressed in T cells
Tc17 T cytotoxic 17
Tc2 T cytotoxic 2
Tc9 T cytotoxic 9
TCA tricarboxylic acid
TCF-1 T cell factor 1
TCM T central memory
Tconv T conventional cells
TCR T cell receptor

16
TEC thymic epithelial cells
TEFF Effector T cells
TEM T effector memory
TEMRA terminal effector cells
TET Ten-eleven translocation
TFH follicular helper T cells
TGF-β transforming grow factor β
Th1 T helper 1
Th17 T helper 17
Th2 T helper 2
Th22 T helper 22
Th3 T helper 3
Th9 T helper 9
TILs tumor infiltrating T cells
TKT transketolase
TLR toll-like receptors
TME tumor microenvironment
TNF tumor-necrotic factor
TNF-β lymphotoxin
Tr1 type 1 regulatory T cells
TRA tissue-resident antigens
TRAF-6 TNF receptor-associated factor-6
TRECs TCR excision circles
Treg T regulatory
TRM Tissue-resident memory T cells
TRUCK T cell redirected universal cytokine universal cytokine killing
TSC1 tumor suppressor tuberous sclerosis complex 1
TSCM T stem cell memory
TSDR Treg-specific demethylated region
tTreg thymus-derived T regulatory cells
V
VEGF vascular endothelial growth factor
VSV vesiculovirus
X
XCL1 XC chemokine ligand 1
XCR1 X-C motif chemokine receptor 1

17
Y
y+ LAT y+ L-type amino acid transporter 1
Z
ZAP-70 Zeta-chain-associated protein kinase 70

18

19
Introduction

20

21
I. Adaptive Immune system
General concepts
The immune response can be divided into two main groups: innate and adaptive
immunity. Innate immunity, which is the first line of response against pathogens, is invariant
and rapid. Pathogens recognition occurs in a non-specific manner, mediated by pattern
recognition receptors (PRRs) that target pathogen-associated molecular patterns (PAMPs)
expressed by microbes. PPRs are present on epithelial and immune cells notably comprising
dendritic cells, macrophages, natural killer cells, mucosal-associated invariant T cells and
innate lymphoid cells. Adaptive immunity represents a second line of defense and is
orchestrated by B (humoral immunity) and T (cell-mediated immunity) lymphocytes. Adaptive
immunity requires several days as the B and T cells must specifically recognize an antigen,
undergo clonal expansion and differentiate into effector cells. While B cells recognize native
antigen thanks to their surface B cell receptor, T cells, via their specific T Cell Receptors (TCR),
recognize processed antigens presented by the major histocompatibility complexes (MHC) on
the surface of specialized antigen presenting cells (B cells, dendritic cells, etc).
As my PhD project was centered on T lymphocytes and therefore, I will specifically focus
on this cell type in the following chapter.
1) T cells
T cells recognize their cognate antigen and trigger distinct and directional responses
through their specific receptor, the TCR. TCR diversity is generated from DNA rearrangements
where a randomly somatic recombination of V, D and J segments, mediated by the
recombination-activating genes (RAG) 1 and 2, results in the production of several and distinct
associations of TCR chains (α, β, γ, δ), giving rise to roughly ~1018 unique TCRs in humans
(Murphy et al., 2008). Based on the TCR rearrangements, T cells are classified in two main
group, αβ or γδ T cells (section I 1 A). Although extremely diverse, these TCRs, generated
through VDJ recombination, need to be capable to recognize an enormous variety of antigens
being at the same time capable to tolerate self-antigens. For that purpose, positive and
negative selection takes place in the thymus in order to avoid auto-immunity and maintain
self-tolerance (section I 1 B).

22
A. T cell diversity
αβ T cells are the most represented T cell subpopulation in the periphery and
“conventional” αβ T cells are divided into 2 distinct lineages: CD4+ and CD8+ phenotypically
and functionally distinct which I will detail below. Within this αβ T cell population, there are
also few subtypes classified as “unconventional” like mucosal-associated invariant T (MAIT)
cells (Le Bourhis et al., 2010; Treiner et al., 2003), invariant natural killer T (iNK T) cells and
germline-encoded mycolyl-reactive (GEM) T cells which recognize specifically glycolipids
presented by MR1, CD1d and CD1b respectively (Beckman et al., 1994) (Van Rhijn et al., 2013).
γδ T cells are also considered as unconventional T cells and they represent between 1%-
5% of all T lymphocytes. Even if this population was described for the first time in 1987 (Born
et al., 1987; Tonegawa et al., 1989), the structures to which γδ T cells respond to and how are
not well-characterized. Using murine models, it was established that γδ T cells are important
for pathogen clearance and tumor surveillance (Carding and Egan, 2002). But the mechanisms
underlying these functions are not fully characterized and, in particular, it remains unclear
whether or not antigen presentation occurs similarly as for αβ T cells. It has been described
so far that γδ T cells are able to bind and get activated by CD1 family members, MHC and CD1
related molecules (such as T10/T22, Qa-1, MICA and EPCR), butyrophilin-like molecules and
other surface-bound proteins, soluble proteins, “phosphoantigens”, haptens and free
peptides (Vermijlen et al., 2018). Nevertheless, classical MHC class I and class II molecules
have been as well identified as structures involved in antigen presentation (Vermijlen et al.,
2018). To conclude, further studies are necessary to fully characterize unconventional T cells.
Since all my research work was centered on peripheral conventional αβ T cells, I will
therefore develop the rest of the literature review on this cell type.
B. Thymopoiesis
T cell development, also called thymopoiesis, takes place in the thymus, a bilobed primary
lymphoid organ. The structure of the thymus is divided in 2 regions, histologically distinct: a
peripheral cortex area and a central medullar zone. These two zones of the thymus are
composed of different types of thymic epithelial cells (TEC) which play a crucial role in T cell
development. T cell development is initiated by the migration into the thymus of bone
marrow progenitors. This development could then be characterized by the expression of the

23
CD4 and CD8 markers. Early thymic progenitors enter the thymus as “double negative” (DN)
thymocytes as they do not express CD4 or CD8 co-receptors. In the cortex, DN thymocytes
will commit into T cell lineage and differentiate into CD4+CD8+ double positive (DP)
thymocytes. This process is tightly regulated by the interaction with the cortex thymic
epithelial cells (cTEC) which allow a positive selection of the CD4+ CD8+ αβ T cells and their
further differentiation into CD4 SP (single-positive) or CD8 SP T cells migrating then to the
medulla (von Boehmer et al., 1989). As explained previously, these thymocytes need to be
tolerant to self-peptides and, to that end, negative selection takes place in order to eliminate
auto-reactive thymocytes. Therefore, in the medulla, the T cell repertoire is shaped by the
interaction of the TCR expressed on thymocytes with the tissue-resident antigens (TRA) which
are presented by the MHC located on the surface of thymic antigen presenting antigen cells
(APC) such as medullar thymic epithelial cells (mTEC) and dendritic cells (DC). TRA expression
is controlled by transcriptional regulators such as AIRE (autoimmune regulator) and Fezf2 (Fez
family zinc finger protein 2) (Anderson et al., 2002; Takaba et al., 2015). Thymocytes will then
be selected upon TRA presentation based on their TCR affinity. Cells that presented high
affinity to self-antigens are negatively selected and eliminated (negative selection) or
differentiate into a particular ab T cell population called FoxP3+ T regulatory (Treg) cells
(Hogquist et al., 2005; Takaba and Takayanagi, 2017) (Figure 1). FoxP3+ Treg cells play an
important role in the maintenance of peripheral tolerance. The differentiation,
characterization and effector function of this population is discussed in section (I 1 E a 3).

24
Upon thymic selection, mature SP T cells (also known as recent thymic emigrants (RTE))
exit the thymus and are incorporated into the peripheral pool as naïve T cells. The survival of
these cells is notably dependent on signaling induced by MHC-self-peptide complexes/TCR
interactions and interleukin (IL) 7 (Sprent and Surh, 2012; Swainson et al., 2007). The
homeostatic mechanisms involved in the regulation of the peripheral T cell pool will be
discussed in detail in section (I 1 C b). Upon recognition of a foreign antigen specific T cell
undergo a rapid activation, proliferation and effector differentiation in order to respond to
this antigen. The mechanisms involved in this activation are presented in the next section.
Figure 1 - αβT cell selection mechanisms in the thymus.
DN thymocytes arrive to the cortex and give rise to DP cells. DP cells are positively selected by cTEC
cells and differentiate ultimately in SP CD4 or CD8 that migrate to the medulla. In the medulla, mTEC
cells and DC present TRA antigens through AIRE and Fezf2 regulation. TRA presentation allows the
negative selection of autoreactive T cell cells through apoptosis. AIRE (Autoimmune regulator), DN
(double negative), DP (double positive), Fezf2 (Fez family zinc finger protein 2), SP (single positive)
TRA (tissue-resident antigens). From (Takaba and Takayanagi, 2017)

25
C. Naïve T cells
a) Naïve T cell characterization and homing function
Naïve T cells have not encountered yet their cognate antigen and they are characterized
by the expression of different surface markers. Both murine and human naïve T cells are
characterized by the expression of lymphoid homing receptor CD62 ligand (CD62L) and CC-
chemokine receptor 7 homing receptor (CCR7), by a low expression level of the CD44
adhesion molecule and by the absence of CD25 and CD69 activation markers (Boyman et al.,
2009). In humans, the differential expression of the CD45 tyrosine phosphatase isoforms is
also required to identify naïve T cells. Therefore, human naïve T cells also express CD45RA
and do not express CD45RO which is a memory-associated marker (van den Broek et al.,
2018). The different cell surface markers that characterize both murine and human naïve T
cells are summarized on Table 1.
Naïve T
cell surface
markers
Murine CD62L+ CCR7+ CD44low CD25- CD69- __ __
Human CD62L+ CCR7+ CD44low CD25- CD69- CD45RA+ CD45RO-
Table 1 - Naïve T cell surface markers in both mouse and human species
Naïve T cells are in constant recirculation between the lymphoid organs and the blood via
the lymphatic system. This circulation is possible due to the expression of CD62L and CCR7
(Boyman et al., 2009). Interference with the expression of these 2 molecules either by using
mouse CD62L mutant models (Arbones et al., 1994) or genetic deletion of CCR7 ligands (Link
et al., 2007), induces a decrease in total CD4 and CD8 naïve T cell counts. These homing
receptors are as well important for the recruitment of lymphocytes to the inflammatory site
(Tedder et al., 1995). Expression of CCR7 and CD62L in naïve T cells are both FoxO1 (forkhead
box O1)- and KLF2 (Kruppel-like transcription factor) 2- dependent factor (Carlson et al., 2006;
Kerdiles et al., 2009).
b) Naïve T cell pull maintenance
The importance of thymic input for the maintenance of the naïve T cell pool seems distinct
between mouse and human (Figure 2). Despite the age-associated reduction of the thymus

26
size on both species, the human naïve T cell pool only suffers a small reduction throughout
adulthood (Douek et al., 1998; Kilpatrick et al., 2008). Indeed, the absolute number of naïve
CD4+ T-cell compartment drops only 2-3 fold with aging (Stulnig et al., 1995; Utsuyama et al.,
1992). For the maintenance of human naïve T cell pool, two mechanisms with distinct relative
importance are involved (Figure 2). First of all, it’s important to note that despite thymus
involution; T cells are still generated in the thymus during adulthood even if the number is
reduced as compared to prepubescent children (Bertho et al., 1997; Jamieson et al., 1999;
Poulin et al., 1999). However, the main mechanism regulating the maintenance of the human
naïve T cell pool is extrathymic, and is based on the peripheral homeostatic proliferation of
generated naïve T cells (Harris et al., 2005; Jamieson et al., 1999; Kilpatrick et al., 2008).
Indeed, and despite a 95% decrease of TRECs (TCR excision circles produced during
rearrangement; which are a marker of thymus output) between 25 and 65 years of age, the
frequency of cycling CD4+ T cells remain steady and their repertoire maintained highlighting
the importance of homeostatic proliferation during aging (Kilpatrick et al., 2008; Naylor et al.,
2005). On the other hand, the naïve T-cell pool in mice is almost fully maintained by thymic
output due to a limited role of peripheral homeostatic proliferation (den Braber et al., 2012)
(Figure 2). In contrast to humans, naïve T cell TREC content does not significantly decline in
the peripheral T compartment of aging mice (den Braber et al., 2012).
Regardless of the relative importance of the thymus output, IL-7 signaling is crucial for the
survival and homeostatic proliferation of naïve T cells both in mice and humans (Figure 2).
Indeed, when this pathway is deficient, using either murine genetic models or blocking
antibodies, the survival of naïve T cells is reduced (Vivien et al., 2001). Mechanistically, IL-7R
signaling involves both the Janus kinase-signal transducer and activator of transcription (JAK-
STAT) signaling pathways in order to target its different downstream partners (Jiang et al.,
2005; Rochman et al., 2009). IL-7 promotes T cell survival by increasing the expression of BCL-
2 (B cell lymphoma 2) and the downregulation of pro-apoptotic factors such as BID (BH3-
interacting domain death agonist), BIM (BCL-2 interacting mediator of cell death) and BAD
(BCL-2 antagonist of cell death) (Jiang et al., 2005; Wojciechowski et al., 2007). In addition,

27
the contact between TCR and peptide-MHC complexes is also important for the survival of
naïve T cells (Surh and Sprent, 2008).
D. T cell activation
Upon recognition/interaction with their cognate antigen in an adequate environment, T
cells get activated, expand (clonal expansion) and differentiate into effector T cells. 3 different
signals are necessary for an efficient T cell activation: TCR signaling cascade, co-stimulation
and cytokine signaling. All these mechanisms are described in detail in the following
paragraphs.
a) Antigen presentation by MHC molecules
As mentioned above, APCs such as B cells, macrophages and DCs are important for antigen
presentation and the latter population is considered the most important for T cell activation
(Sprent, 1995). DCs were first described in 1973 (Steinman and Cohn, 1973) and their
increased antigen presentation capacity compare to other cell types was shown later on
(Steinman and Witmer, 1978). Independently of the type of APC, as pointed out above, MHC
complexes are required for antigen presentation. The MHC was first characterized in mice
Figure 2 – Comparison of the maintenance of the naïve T cell pool in aging mice and humans.
Peripheral naïve T cell pool in mice is mainly maintained by thymic input (white cells) while in humans
it is essentially maintained by the homeostatic proliferation of naïve T cells present in the periphery
(black cells). For both species, both IL-7 and pMHC play a crucial role in naïve T cell survival. IL-7
(interleukin 7), pMHC (peptide- MHC complex)

28
after the identification of the H-2 locus as encoding for major or strong histocompatibility
antigens which turned out to be the major histocompatibility locus in mice. However, over
years, several different H-2 loci were identified (H2b, H2d, H2f among others) and the H-2
locus became finally the H-2 complex or the MHC in the mouse (reviewed in (Thorsby, 2009)).
In humans, MHC classes are encoded by the human leucocyte antigen gene complex (HLA),
and are located on the chromosome 6 which is the most polymorphic gene of the human
genome. The classical HLA class I genes described are the HLA-A, HLA-B and HLA-C while the
classical genes described for HLA class II are HLA-DR, HLA-DQ and HLA-DP (Mosaad, 2015;
Shiina et al., 2017).
MHC proteins are divided in two classes: MHC class I and MHC class II. MHC I is expressed
on almost all nucleated cells and MHC I complexes are recognized by CD8+ T cells (Wieczorek
et al., 2017). MHC I can present notably peptides from defective proteins from cell’s own
proteome or from invasive virus in order to induce the destruction of the damaged/infected
cell. It is important to note that peptides derived from extracellular pathogens can be
presented by MHC I-expressing mature DCs by a process named as cross-presentation (Joffre
et al., 2012). On the other hand, MHC II expression is restricted to specific cells such as B cells,
monocytes, macrophages, DCs, endothelial cells and, in humans, also in activated T cells and
allows the presentation of peptides to CD4+ T cells (Wieczorek et al., 2017). MHC II molecules,
unlike MHC I, generally present peptides from extracellular sources upon phagocytosis of the
antigen.
b) TCR signaling cascade - Signal 1
Upon TCR recognition of a cognate peptide (presented by a MHC molecule), a signaling
cascade is induced, leading to T cell activation, proliferation, differentiation and effector
function. CD4 and CD8 co-receptors help assisting antigen recognition through a close
association with a kinase named lymphocyte cell-specific protein-tyrosine kinase (LCK). Upon
activation, an immunologic synapse is formed at the site of interaction between the peptide-
MHC complex (pMHC) and the TCR ab chains associated with CD3 γε, CD3 δε and CD3 ζζ
dimers that contain immunoreceptor tyrosine-based activation motifs (ITAMs) in their
individual cytoplasmic segments. One of the three ITAM domains present on the CD3 ζζ pairs
is phosphorylated upon TCR activation by LCK proteins, inducing the recruitment and

29
activation of ZAP-70 (Zeta-chain-associated protein kinase 70) that phosphorylates then
another molecule named linker for activation of T cells (LAT) allowing signal diversification
and amplification (Malissen and Bongrand, 2015). This intracellular cascade is the first signal
required to induce T cell activation and is known as “signal 1” and is represented in Figure 3.
c) Co-stimulation signaling – Signal 2
Other signals are however required to obtain an optimal activation. One of them is
generated from the engagement of the co-stimulatory molecules, that induce a cascade of
reactions known as “signal 2”. Indeed, it was shown that lack of co-stimulation upon antigen
recognition induces cell anergy (Jenkins and Schwartz, 1987), demonstrating that antigen
presentation itself is not sufficient to induce T cell activation. A well-known and important co-
stimulatory molecule is CD28 that it is constitutively expressed in naïve CD4 and CD8 T cells.
CD28 is recruited at the immunological synapse upon priming by LCK and is able to recognize
CD80-86 molecules present on the surface of APC. The cytoplasmic tail of CD28 is composed
by two motifs: YMNM and PYAP. Once CD28 is activated, activation signals are transduced by
these motifs resulting in the recruitment of the phosphatidylinositol 3-kinase (PI3K), protein
kinase Cθ (PKCθ) and RAS guanyl nucleotide-releasing protein (RASGRP) (Beyersdorf et al.,
2015). In particular, PI3K is important for AKT (protein kinase B) activation. The CD28-PI3K-
AKT pathway contributes to T cell activation, proliferation and survival through the activation
Figure 3 - TCR signaling cascade upon
antigen presentation
Upon TCR-pMHC pair, single CD3γε, CD3
δε and CD3 ζζ pairs associate with TCRαβ
heterodimer. The ITAM (white dots) are
then phosphorylated (red dots) by LCK
which induces the recruitment and
activation of ZAP-70. ZAP-70 in its turn
phosphorylates LAT adaptor, which
allows signal diversification and
amplification. ITAM (immunoreceptor
tyrosine-based activation motifs), LAT
(linker for activation of T cells), pMHC
(peptide-MHC), ZAP-70 (Zeta-chain-
associated protein kinase 70). Adapted
from (Malissen and Bongrand, 2015).

30
of several molecular players such as the IkB kinase (IKK), nuclear factor- κB (NF- κB), nuclear
factor of activated T cells (NFAT), BCL-XL and mammalian target of rapamycin (mTOR) among
others (Chen and Flies, 2013; Wells, 2009). Current evidence suggests that CD28 co-
stimulation-mediated activation of PI3K inducing mTOR and cyclin-dependent kinases (CDKs)
allows cell cycle progression and is essential for optimal T cell activation (Powell et al., 1999).
Moreover, CD28 co-stimulation is also important to sustain IL-2-mediated proliferation which
is another mechanism crucial for optimal T cell activation. Indeed, the IL-2 gene contains a
CD28 responsive element (CD28RE) as well as NFAT, NF-κB and AP-1 (activator protein-1)
binding sites, highlighting the importance of the CD28 pathway and its downstream partners
on IL-2 secretion (Jain et al., 1995; Serfling et al., 1995).
Upon CD28 activation, other co-stimulatory molecules are recruited such as 4-1BB and
OX40, as well as co-inhibitory molecules such as cytotoxic T lymphocyte antigen 4 (CTLA-4).
CTLA-4 competes for the same ligands as CD28 and upon T cell activation, its upregulation
induces the internalization of CD28 and suppression of T cell responses (Rudd et al., 2009).
CTLA-4 signaling is then a “stop signal” necessary to end contact between T cells and APCs
consequently avoiding T cell over-activation and protection against the development of auto-
proliferation and autoimmune diseases (Rudd et al., 2009). Indeed, CTLA-4- deficient mice
develop a hyperproliferative syndrome and die following massive T cell tissue infiltration and
organ destruction (Tivol et al., 1995; Waterhouse et al., 1995).
d) Cytokine signaling – Signal 3
An efficient T cell activation does not only require TCR engagement (signal 1), co-
stimulation molecules (signal 2), but also cytokine signaling known as signal 3. IL-2 is one of
the most important cytokines involved in T cell activation, induced upon TCR/CD28
engagement and acting in an autocrine/paracrine fashion (Powell et al., 1998). IL-2 binds to
the IL-2 receptor (IL-2R) which can be composed by three different chains: IL-2Rα, IL-2Rβ and
γc chain. IL-2 is capable to bind with low affinity to all of them and once these three subunits
are together, the receptor affinity increases by a 1000 fold (Waldmann, 1989) (Figure 4). IL-
2βR is constitutively expressed in NK (natural killer), NKT (natural killer T) and memory CD8+
T cells and in naïve T cells upon TCR activation. The γc chain is expressed by all lymphoid cells
(Malek and Castro, 2010). The combination of the IL-2β and γc chains forms an IL-2R with

31
intermediate affinity that is mainly expressed on NK and memory T cells (Liao et al., 2011).
Finally, high affinity IL-2R (with high CD25 (IL-2Rα) surface expression level) is expressed on
Tregs and effector T cells (Liao et al., 2011) (Figure 4).
IL-2 signaling is differently required in vitro and in vivo (Malek and Bayer, 2004). While in
vitro IL-2 is essential for T cell activation, expansion and effector cell differentiation, in vivo
IL-2 contributes mainly to T cell tolerance (Malek and Bayer, 2004).Indeed, it was
demonstrated that CD25-deficient mice (in which T cells express an IL-2R with intermediate
affinity to IL-2) develop massive enlargement of peripheral lymphoid organs translating an
imbalance between clonal expansion and cell death following T cell activation (Willerford et
al., 1995). A similar phenotype was observed in IL-2-deficient mice that developed generalized
autoimmune diseases due to uncontrolled activation and proliferation of CD4+ T cells (Sadlack
et al., 1995).
Other cytokines can also play a role as signal 3. For instance, Keppler and colleagues
demonstrated that, upon TCR stimulation, variable interplays of both IL-12 and IFNγ
(interferon- gamma play an important role on CD8 T cell fate decision as well as in cytokine
production and cytolytic activity in the context of Indiana vesiculovirus (VSV) and listeria
infection (Keppler et al., 2012). Furthermore, cytokine signaling is also important for naïve
CD4 T cell differentiation in different effector T cells subsets. The role of cytokines in CD4 and
CD8 T cell differentiation is going to be discussed in the next section (I 1 E).
Figure 4 – IL-2 receptor affinity and STAT5 activation.
IL-2Rβ together with the IL-2γc (IL-2Rγ) forms a receptor with
intermediate affinity. The combination of these two chains with
the IL-2Rα generates an IL-2R with high affinity that is highly
expressed notably on Tregs cell surface. IL-2Rα (CD25) cannot
signal but it is able to induce conformational changes to IL-2
and increase its affinity to IL-2Rβ and IL-2 γc chains. IL
(interleukin), IL-2R (IL-2 Receptor), γc (gamma common chain).
Adapted from: InvivoGen review « IL-2: The Activator and the
Controller »

32
E. Effector T cells
Effector T cells (TEFF) are a short-lived and large population containing several CD4+ and
CD8+ T cell subsets. Depending on the antigen type and the surrounding environment, specific
TEFF cell subsets are recruited in order to respond and clear the pathogens through the
production of specific effector cytokines and mediators. Murine TEFF cells are characterized as
CD44+ CD62L-. Even if human TEFF cells are not found in significant proportion at steady-state,
a population of terminal effector cells (TEMRA) can be identified as CD45RA+CCR7- (Kumar et
al., 2018).
a) CD4+ effector T cells
Within the CD4+ TEFF cell population, several subsets can be identified including T helper 1
(Th1), T helper 2 (Th2), T helper 9 (Th9), T helper 17 (Th17), T helper 22 (Th22) cells as well as
regulatory (Treg) T cells and follicular helper T cells (TFH). These subsets can be distinguished
based on their cytokine profile and the expression of specific transcription factors (Raphael
et al., 2015). The several CD4+ TEFF cell subsets and the cytokines required for their polarization
are represented on Figure 5.
Each subset previously mentioned has a different immune cell function: Th1 cells are
important for immunity against intracellular pathogens while Th2 cells are in the front line
against extracellular parasites. As Th2 cells, Th9 are also implicated in host defense against
extracellular parasites (primarily nematodes). In their turn, Th17 cells promote protective
immunity against extracellular fungi and bacteria, with special emphasis at mucosal surfaces
while TFH are important for B cell class switching. Th22 cells were identified in an inflammatory
skin disease context, however their role remains unclear. Finally, Treg cells are implicated in
the mediation of immunosuppression and tolerogenic responses.

33
Since all my research work was centered on Th1, Th2 and Treg subsets, I will therefore
develop the rest of the literature review on these CD4+ TEFF cell type.
T helper 1 cells
Th1 cells are involved in host defense against intracellular pathogens notably through the
activation of macrophages by IFNγ production (Szabo et al., 2003; Zhu, 2018). Th1 cells can
produce several types of cytokines including tumor-necrotic factor (TNF), lymphotoxin (TNF-
β) and granulocyte-macrophage colony-stimulating factor (GM-CSF). However, this subset is
mainly characterized by high levels of IFNγ and IL-2 secretion (Raphael et al., 2015; Szabo et
al., 2003).
Figure 5 - Polarization of CD4+ naïve T cells towards distinct subsets
Upon encounter with their cognate antigen, naïve T cells differentiate into distinct T helper subsets depending on the cytokine environment and the nature of the antigen. The different subsets are characterized based on their cytokine profile and the master transcription factors expressed. AHR (aryl hydrocarbon receptor), BCL6 (B-cell lymphoma 6), FoxP3 (Forkhead box P3), GATA3 (GATA Binding Protein 3), IL (interleukin), IRF4 (Interferon regulatory factor 4), IFN (Interferon), RORγT (retinoic acid receptor-related orphan nuclear receptor gamma), TGF-β (transforming growth factor-b), T-bet (T-box expressed in T cells).

34
1.1. Th1 cell lineage differentiation
Different stimulus where identified to be important for Th1 differentiation, notably TCR
strength signal and DCs-mediated IL-12 cytokine signaling, the lasted being the most
determinant for effective Th1 cell fate.
On one hand, the strength of the TCR signal influences lineage commitment, notably by
controlling the magnitude of the Ca2+ fluxes. In this context, Th1 cells require a stronger and
specific Ca2+ flux as compared to Th2 cells (Sloan-Lancaster et al., 1997). Furthermore, it was
demonstrated that Th1 cells have a distinct requirement of lipid-rafts (cholesterol rich
pockets), comparing to Th2 cells, that are important for the aggregation of molecules involved
in TCR signal initiation, regulation of Ca2+ signaling. Th1 polarized cells, upon re-activation,
recruit rapidly TCR components to lipid rafts domains, resulting in a defined TCR/MHC clusters
that have an increased sensitivity to low-affinity stimulation (Balamuth et al., 2001).
On the other hand, IL-12 cytokine signaling determinates Th1 lineage commitment by
initiating a signaling cascade of events crucial for Th1 transcriptional program activation. In
mice, CD8α+DCs are a IL-12 producing DC subset which preferentially induce Th1
differentiation (Maldonado-Lopez et al., 1999; Pulendran et al., 1999). Indeed, IL-12-deficient
CD8α+ DCs are not able to induce Th1 differentiation, underlying the importance of IL-12
secretion for CD8α+ DC function (Maldonado-Lopez et al., 1999). In humans, a similar subset
of DCs was identified. This DC subset, named DC1, does not express CD8 but secretes as well
high levels of IL-12 preferentially inducing Th1 differentiation (Collin and Bigley, 2018; Rissoan
et al., 1999). Indeed, in patients presenting a weak Th1 reactivity against melanoma-
associated antigens (MAA), a strong Th1 response was restored through the stimulation of
patient CD4 T cells with peptide-pulsed DC1 (Wesa et al., 2007).
As mentioned above IL-12 signaling induces Th1 differentiation: IL-12 receptor is coupled
to the JAK-STAT signaling pathway and activates STAT4, between others, (Kaplan et al., 1996b;
Thierfelder et al., 1996) that it is important for the induction of IFNγ secretion (Figure 6).
Indeed, IL-12 receptor deficient mice have a defective IL-12- induced IFNγ production (Wu et
al., 1997). In mice, STAT4 appeared to be skillfully specific to IL-12 (Jacobson et al., 1995).
However, more recently, IL-23 was identified as well as STAT4 activator, even though the
activation induced is substantially weaker as compared to the one induced by IL-12 (Parham

35
et al., 2002). In humans, IL-12 and IFNα (interferon alpha) (specificity in human cells) can
induce STAT4 activation (Bacon et al., 1995) (Cho et al., 1996) whereas IL-23 leads to a weaker
activation. (Oppmann et al., 2000; Parham et al., 2002). Mechanistically, IL-23 is a
heterodimeric cytokine which binds to IL-12Rβ1 (IL-12 receptor β1) chain and to the IL-23R,
whose downstream signaling activates preferentially STAT3 with weak activation of STAT4.
Furthermore, IL-23 does not utilize the IL-12Rβ2 chain (expressed in IL-12R which is the crucial
docking site for efficient STAT4 activation in both murine and human T cells (Watford et al.,
2004). STAT4- mediated IFNγ secretion induces the activation of STAT1 (Meraz et al., 1996).
Both STAT4 and STAT1 phosphorylation by IL-12 and IFNγ signaling respectively, induce the
activation of the master regulator of the Th1 transcriptional program, the transcription factor
T-bet (T box expressed in T cells) (Afkarian et al., 2002; Lighvani et al., 2001; Zhu et al., 2012)
(Figure 6). T-bet was identified for the first time in 1999 as a key transcription factor of the
Th1 lineage commitment, where Szabo and colleagues showed that T-bet was a potent
transactivator of the IFNγ gene (Szabo et al., 2000). T-bet is not only important for the
differentiation of naïve T cell towards a Th1 fate but also plays a crucial role in suppressing
the Th2 cell transcription factor, GATA3. Indeed, it was shown that T-bet is able to suppress
IL-4 and GATA3 expression during T. gondii infection by promoting H3K27me3 alteration
(suppressive histone marker) at the GATA3 (GATA Binding Protein 3 locus and by direct
interaction with GATA3 (Zhu et al., 2012). Before this study, other group had already reported
that T-bet was able to repress Th2 differentiation by protein-protein interaction with GATA3
interfering with its contact with its target DNA (Hwang et al., 2005).
Figure 6- IL-12 and IFNγ signaling pathways during Th1
IL-12 induces STAT4 activation which will then induce IFNγ secretion and T-bet transcription. T-bet once expressed induces Th1 cell-specific genes and contributes to the repression of the Th2 program. IFNγ and T-bet work synergistically. T-bet induces IFNγ secretion while IFNγ activates STAT1 which together with STAT4, induces and maintains T-bet expression (Zhu et al., 2012)

36
1.2. Th1 cell effector function
IFNγ is a potent pro-inflammatory cytokine involved in many processes. Notably, it
increases the expression of toll-like receptors (TLR) by innate immune cells and as a result,
their responsiveness (Bosisio et al., 2002). It also promotes MHC I and MHC II transactivation
resulting in increased antigen presentation (Butticè et al., 2006; Giroux et al., 2003; Martini
et al., 2010; Vegh et al., 1993). Moreover, it induces chemokine signaling such as C-X-C motif
chemokine ligand (CXCL) 9, CXCL10 and CXL11 from epithelial cells and it up-regulates the
surface expression of CXCR3 (C-X-C motif chemokine receptor 3) on Th1 cells, facilitating their
migration to inflammatory sites (Rotondi et al., 2003). IFNγ also primes macrophage
activation and increases phagocytosis (Schroder et al., 2004). Studies done in interferon
gamma receptor (IFNγR) -/- mice or using tumor cells expressing dominant-negative IFNγR
mutations revealed the importance of IFNγ in tumor rejection (Dighe et al., 1994; Kaplan et
al., 1998). Indeed, Th1 cell infiltration in tumors tissue is generally associated with a good
prognosis in cancer patients (Ling et al., 2016; Tosolini et al., 2011; Xu et al., 2016). Altogether
IFNγ appears as a potent weapon in anti-tumor responses (Ikeda et al., 2002; Schroder et al.,
2004; Tannenbaum and Hamilton, 2000).
Dysregulations of Th1 function can be associated with several autoimmune pathologies
including autoimmune type 1 diabetes (T1D), rheumatoid arthritis (RA) and multiple sclerosis
(MS) (Skurkovich and Skurkovich, 2005). In experimental autoimmune encephalomyelitis
(EAE) studies (animal model for multiple sclerosis), it was notably demonstrated that myelin-
autoreactive T cells were producing high levels of IFNγ, therefore suggesting that EAE was
induced because of Th1-aberrant responses (Ando et al., 1989; Olsson, 1992; Renno et al.,
1994). This model was however challenged when studies demonstrated that IFNγ-deficient
(Ferber et al., 1996), IFNγR deficient (Willenborg et al., 1996), or in IL-12 (Becher et al., 2002;
Gran et al., 2002) and IL12R deficient (Zhang et al., 2003) mice developed normal or even
stronger progression of EAE compared to WT mice. In the early 2000’s it was then described
by several groups that IL-23 and not IL-12 was the critical cytokine for the development of
EAE (Becher et al., 2003; Cua et al., 2003) through the action of CD4 + IL-17-producing T cells
(Langrish et al., 2005). These CD4 + IL-17 producing T cells were then named Th17 cells (Bettelli
et al., 2006; Harrington et al., 2005; Langrish et al., 2005; Park et al., 2005) and consensually
accepted as one of the main mediators of EAE.

37
T helper 2 cells
Th2 cells are involved in allergic and humoral immunity, with an important role in the
mediation of immune responses against extracellular parasites, including helminths (Zhu,
2018). This subset can produce several cytokines such as IL-4, IL-5, IL-9 and IL-13 (Walker and
McKenzie, 2018) (Figure 5).
2.1 Th2 cell lineage differentiation
Th2 differentiation requires the expression of its master transcription factor: GATA 3 (Pai
et al., 2004; Zhang et al., 1997; Zheng and Flavell, 1997) and its regulation is done by a
combination of several and distinct molecular pathways: TCR signaling strength, CD28-co
stimulation, priming by other immune cells and cytokine signaling (mainly IL-4 and IL-2).
First of all, strength of the TCR signaling was shown, in vitro, to be important for Th2
differentiation as it was demonstrated that low-dose of peptides (and not the contrary) were
able to induce GATA3 (Yamane et al., 2005). Moreover, co-stimulatory molecules are also
crucial for Th2 differentiation. Indeed, co-stimulation through CD86 is essential for initial IL-4
secretion (a Th2 cell-promoting cytokine) and Th2 development, while another co-stimulation
molecule, CD80, seems to be less required (De Becker et al., 1998; Freeman et al., 1995;
Ranger et al., 1996).
Several immune subsets were demonstrated to induce Th2 differentiation through IL-4
secretion. For instance, it was demonstrated that a population of NK cells was able to secrete
IL-4 and promotes the development of Th2 cells (Yoshimoto and Paul, 1994). Moreover,
basophils were also shown to be able to secrete IL-4 and induce Th2 differentiation (Sokol et
al., 2008; Sokol et al., 2009). Finally, other elegant studies demonstrated that CD4+ T cells
themselves are able to induce Th2 differentiation through IL-4 secretion (Noben-Trauth et al.,
2002; Yamane et al., 2005)
In contrast to Th1 cells, the role of DCs in Th2 differentiation is controversial since DCs are
not commonly described to produce IL-4 (Walker and McKenzie, 2018) and therefore it was
not consensual that DCs could mediate Th2 differentiation. However, several studies
demonstrated that DCs can mediate Th2 differentiation, through IL-4-independent pathways.
It was shown that the administration of peritoneal macrophages pulsed with antigen (Keyhole

38
limpet hemocyanin) were capable to induce Th2 differentiation (De Becker et al., 1998).
Moreover, in humans, it was shown that Th2 differentiation was induced by DC2, using an IL-
4-independent mechanism (Rissoan et al., 1999). More recent studies showed that CD301b+
dermal dendritic cells were important to drive Th2 immunity (Kumamoto et al., 2013) and to
prime T cells to IL-4 production upon helminth infection. Finally, other elegant studies
demonstrated that DCs that express the transcription factor interferon regulatory factor 4
(IRF4) and KLF4 are crucial for Th2 induction (Gao et al., 2013; Tussiwand et al., 2015; Williams
et al., 2013). IRF4 targets IL-10 and IL-33 genes which are important for DC-driven Th2
differentiation (Williams et al., 2013). Unlike IRF4, the role of KLF4 is not well understood yet.
However, it remains to clarify whether IRF4-dependent and KLF4-dependent DCs polarize
directly or indirectly Th2 cells (Walker and McKenzie, 2018).
Concerning cytokine signaling, there are two cytokines with an important role for Th2
differentiation: IL-4 and IL-2. Once IL-4 binds to its receptor, JAK-STAT signaling pathway is
activated, and STAT6 is phosphorylated resulting in the induction of a set of genes including
Gata3 (Kaplan et al., 1996a; Kurata et al., 1999; Zheng and Flavell, 1997). IL-2 was also
demonstrated to be involved in Th2 differentiation (Ben-Sasson et al., 1990; Le Gros et al.,
1990). Mechanistically, IL-2 is involved in STAT5 activation which consequently contributes to
the stabilization of the IL-4 gene transcription (Cote-Sierra et al., 2004). C-Maf is another key
player during Th2 differentiation, as it transactivates the IL-4 promoter and attenuates Th1
differentiation program (Ho et al., 1998; Kim et al., 1999). GATA3 was also described to have
functions in the repression of Th1 cell differentiation program through repression of the IFNγ
locus and independently of IL-4 mechanisms (Hwang et al., 2010; Ouyang et al., 1998). IL-25
and IL-33 were also reported as cytokines inducing Th2 responses (Fort et al., 2001; Saenz et
al., 2008; Schmitz et al., 2005).
2.2. Th2 cell effector function
Th2 cells secrete several types of cytokines which are involved in distinct functions:
1) IL-4 is important for the induction of other Th2-cytokines such as IL-5, IL-9 and IL-10 and is
required for the induction of B-cell immunoglobulin (Ig) switching to IgG1 and IgE (Kopf et al.,
1993).

39
2) IL-5 is involved in the recruitment of eosinophils, an immune subset important to eliminate
parasites and certain infections (Coffman et al., 1989).
3) IL-13 allows the induction of smooth muscle’s movement and epithelial cell’s mucus
production (Kuperman et al., 2002; Urban et al., 1998) and it is also important for IgG4 and
IgE class switching and upregulation of the MHC II expression by monocytes (McKenzie et al.,
1993; Punnonen et al., 1993). IL-13 in combination with IL-4 can also induce alternatively
activated macrophages (Gordon, 2003), which means that both cytokines are a sufficient
stimuli and no priming is required.
Initially, Th2 cells were characterized as anti-inflammatory due their capacity to inhibit
cell-mediated or Th1 models of disease (Berger, 2000). Indeed, IL-4 is known to powerfully
suppress the development of Th1 cells, antagonizing Th1 cells functions (Swain et al., 1990).
IL-4 is capable to inhibit Th1-activated macrophages and suppress the secretion of several
potent pro-inflammatory cytokines (Rocken et al., 1996).
However, later on, deregulation of Th2 cells was also discovered as mediators in tissue
inflammation and some immunopathologies. The pathogenic role of Th2 cells is well
documented in antibody-mediated autoimmune diseases such as systemic lupus
erythematosus (SLE) (Dean et al., 2000; Luzina et al., 1999; Nakajima et al., 1997). Th2 cells
are also associated with allergic/hypersensitivity immune responses. Allergen-specific Th2
cells are activated by APCs resulting in pathophysiological responses including eosinophilic
inflammation, oedema, smooth muscle contraction and increased mucus production (Garlisi
et al., 1995; Larche et al., 2003; Leigh et al., 2004; Robinson et al., 1992). Th2 cytokines such
as IL-4, IL-5 and IL-13 have been described as main players in murine models of allergic airway
inflammation as well was in human asthma (Umetsu and DeKruyff, 2006). It was shown that
several Th2 transcription factors impact on the regulation of asthma pathology. For instance,
STAT6, a downstream signal transducer of IL-4 and IL-13, is implicated in airway inflammation
as STAT6-deficient mice displayed reduced eosinophil infiltration and airway hyper
responsiveness and decreased mucus production (Akimoto et al., 1998).
The role of Th2 cells in anti-tumor responses is still unclear due to discrepancies in the
results demonstrating either a pro- or anti- tumor activity. It was shown that IL-4 has a
negative impact on tumor growth as it induces infiltration of granulocytes that are anti-
angiogenic (Modesti et al., 1993; Pericle et al., 1994; Tepper et al., 1992). Similarly, IL-13 was
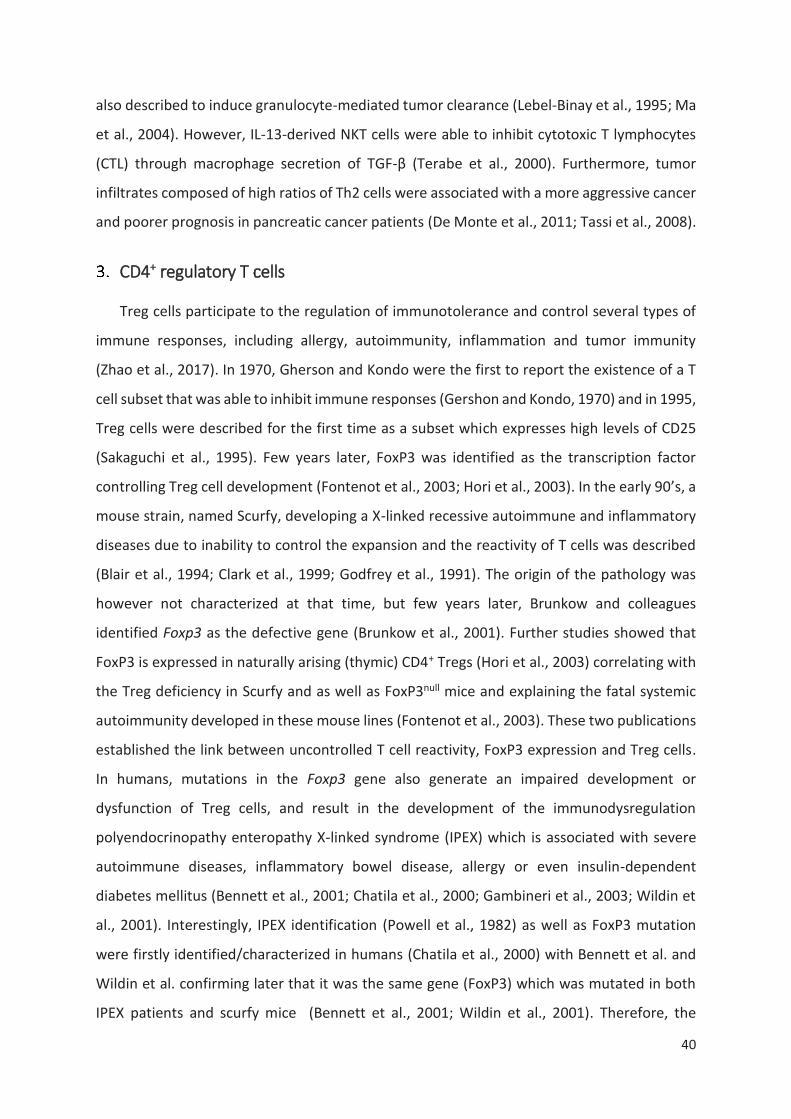
40
also described to induce granulocyte-mediated tumor clearance (Lebel-Binay et al., 1995; Ma
et al., 2004). However, IL-13-derived NKT cells were able to inhibit cytotoxic T lymphocytes
(CTL) through macrophage secretion of TGF-β (Terabe et al., 2000). Furthermore, tumor
infiltrates composed of high ratios of Th2 cells were associated with a more aggressive cancer
and poorer prognosis in pancreatic cancer patients (De Monte et al., 2011; Tassi et al., 2008).
CD4+ regulatory T cells
Treg cells participate to the regulation of immunotolerance and control several types of
immune responses, including allergy, autoimmunity, inflammation and tumor immunity
(Zhao et al., 2017). In 1970, Gherson and Kondo were the first to report the existence of a T
cell subset that was able to inhibit immune responses (Gershon and Kondo, 1970) and in 1995,
Treg cells were described for the first time as a subset which expresses high levels of CD25
(Sakaguchi et al., 1995). Few years later, FoxP3 was identified as the transcription factor
controlling Treg cell development (Fontenot et al., 2003; Hori et al., 2003). In the early 90’s, a
mouse strain, named Scurfy, developing a X-linked recessive autoimmune and inflammatory
diseases due to inability to control the expansion and the reactivity of T cells was described
(Blair et al., 1994; Clark et al., 1999; Godfrey et al., 1991). The origin of the pathology was
however not characterized at that time, but few years later, Brunkow and colleagues
identified Foxp3 as the defective gene (Brunkow et al., 2001). Further studies showed that
FoxP3 is expressed in naturally arising (thymic) CD4+ Tregs (Hori et al., 2003) correlating with
the Treg deficiency in Scurfy and as well as FoxP3null mice and explaining the fatal systemic
autoimmunity developed in these mouse lines (Fontenot et al., 2003). These two publications
established the link between uncontrolled T cell reactivity, FoxP3 expression and Treg cells.
In humans, mutations in the Foxp3 gene also generate an impaired development or
dysfunction of Treg cells, and result in the development of the immunodysregulation
polyendocrinopathy enteropathy X-linked syndrome (IPEX) which is associated with severe
autoimmune diseases, inflammatory bowel disease, allergy or even insulin-dependent
diabetes mellitus (Bennett et al., 2001; Chatila et al., 2000; Gambineri et al., 2003; Wildin et
al., 2001). Interestingly, IPEX identification (Powell et al., 1982) as well as FoxP3 mutation
were firstly identified/characterized in humans (Chatila et al., 2000) with Bennett et al. and
Wildin et al. confirming later that it was the same gene (FoxP3) which was mutated in both
IPEX patients and scurfy mice (Bennett et al., 2001; Wildin et al., 2001). Therefore, the

41
characterization of the scurfy mice brought important clues and allowed to understand this
human pathology as well as Treg cell differentiation and function. Since all these discovers,
Tregs have been extensively studied and over the years new findings have emerged.
3.1. Classification and nomenclature
Until now, three main types of CD4+ Treg cells have been described based on their
suppressive functions: Two of them do not express FoxP3 and are IL-10- producing Tr1 (type
1 regulatory T cells) (Bacchetta et al., 1994; Cottrez et al., 2000; Groux et al., 1997) and TGF-
β-producing CD4+ Th3 (T helper 3) (Chen et al., 1994; Weiner, 2001). A third population
characterized by CD4+ CD25+ and FoxP3+ expression is the most abundant Treg subset.
Depending on their origin, FoxP3-expressing cells can be classified as: thymus-derived Treg
cells (tTreg), previously named as natural Treg cells (nTreg), and peripheral-derived Treg
(pTreg) formerly called induced Treg (iTreg). The term iTreg is still used but exclusively for in-
vitro generated Treg cells in order to distinguish them from the ones physiologically generated
in vivo in the periphery (Abbas et al., 2013). I will center my literature review on FoxP3-
expressing Treg cells.
3.2. Cytokine-induced signaling in Treg differentiation
In order to induce the polarization of naïve T cells to a Treg program, cytokines such as
TGF-β (Chen et al., 2003; Marie et al., 2005) and IL-2 are required (Figure 5). TGF-β in
combination with TCR signaling results, in vitro, in the induction of Smad3 and NFAT and then
FoxP3 expression (Tone et al., 2008). As discussed above, Treg cells express high levels of cell
surface expression of CD25, which means that they express an high affinity IL-2 receptor
(Sakaguchi et al., 1995) indicating the important role of IL-2 in Treg cells (Zhu and Paul, 2008).
Indeed, IL-2 is important for Treg cells cycling in vivo (Smigiel et al., 2014). Moreover, another
study demonstrated that IL-2R-dependent activation of STAT5 is important for their
suppressive function (Chinen et al., 2016)
3.3. FoxP3 gene and its regulation
As mentioned above, FoxP3 is a critical transcription factor for the development and
function of CD4+ CD25+ Treg cells (Fontenot et al., 2003; Hori et al., 2003); not only

42
contributing to the induction of Treg transcriptional program but it is also important in the
lineage stability (Gavin et al., 2007). The foxp3 gene has several conserved noncoding
sequences, designated as conserved non-coding DNA sequence (CNS) 0-3 with each of them
implicated in different signaling pathways (Figure 7).
CNS0, also known as super-enhancer, is upstream of the transcriptional starting site and
it is crucial for the expression of FoxP3 in Treg cells. This region is one of the binding sites for
Stab1 that allows the modulation of the chromatin and the subsequent activities of the other
CNS elements (Kitagawa et al., 2017).
CNS1 is the binding site for NFAT, AP-1, Smads and retinoic acid (Tone et al., 2008) and is
required for TGF-β signaling mechanisms, a crucial cytokine involved in the differentiation of
naïve T cells to a pTreg/iTreg fate. Indeed, CNS1 KO (knockout) mice showed a reduced
differentiation of pTreg/iTreg cells through TGF-β signaling but a normal development of
tTreg in the thymus (Zheng et al., 2010).
The CNS2 enhancer is activated by TCR expression and IL-2 and contains the binding sites
of other transcription factors such as STAT5, runt-related transcription factor (RUNX), CREB
and FoxP3 itself (Burchill et al., 2007; Kim and Leonard, 2007; Kitoh et al., 2009; Zhao et al.,
2017; Zheng et al., 2010). Nevertheless, it was demonstrated that the activation status of this
region is considerably different between tTregs and iTregs. Indeed, it was shown that tTreg
cells are more stable than iTreg cells. This is in part due to the CpG islands hypomethylation
pattern in the CNS2 region of the FoxP3 locus (Feng et al., 2014; Li et al., 2014) that is
maintained irrespectively of extracellular conditions, cell proliferation and FoxP3 inducing
signals (Ohkura et al., 2013). This demethylation is crucial for the recruitment of several
transcription factors mentioned previously. IL-2 signals are essential for the demethylation
induction of CNS2 which allows a stable FoxP3 expression and the acquisition of a Treg
phenotype for iTreg cells (Chen et al., 2011; Freudenberg et al., 2018). Conversely, in the
absence of IL-2 signaling, this region is rarely demethylated in iTreg cells (Kanamori et al.,
2016). Several elegant studies demonstrated that FoxP3 stability could be increased through
augmented CNS2 demethylation by Ten-eleven translocation (TET) dioxygenases (Nair et al.,
2016; Someya et al., 2017).

43
Finally, CNS3 is essential for FoxP3 induction during thymic and induced Treg cell
differentiation by enrolling c-Rel and other transcription factors (Zheng et al., 2010). The non-
coding regions and its regulation is represented on Figure 7.
Despite the importance of FoxP3, other studies demonstrated that ectopic retroviral
transduction of FoxP3 in T conventional (Tconv) cells failed to recapitulate certain Treg cell
gene signatures (Hill et al., 2008; Sugimoto et al., 2006), highlighting that FoxP3+ cells are not
always functional Tregs and also, that certain signature molecules can be expressed in
absence of FoxP3 expression. Indeed, and even if FoxP3 is a master regulator of Treg
development, other findings suggest that FoxP3 expression per se might not be sufficient for
lineage maintenance, Treg suppressive functions or even for Treg cell phenotyping. For
example, human Tconv cells, unlike murine cells, express FoxP3 transiently and at low levels
upon TCR activation, without showing suppressive functions (Allan et al., 2007). Furthermore,
in human blood, three phenotypically and functionally distinct subsets that express FoxP3
Figure 7 - Scheme of non-coding regions, signals and transcription factors involved in FoxP3
induction and stabilization.
TGF-β induces Smad2/3 activation and its recruitment to CNS1 region which is crucial to induce
Treg differentiation. TCR activation and IL-2 signaling activate CREB and STAT5, respectively, activating
the CNS2 enhancer which is a binding site for RUNX and FoxP3 itself. This region is hypomethylated in
tTregs (major TSDR) and heavily methylated in recently generated iTregs causing FoxP3 instability.
CNS3 region is activated through TCR/CD28 signaling which induces cREL activity which contributes to
FoxP3 induction in nTregs, pTregs and iTregs. AP-1 (activator protein), CREB (C-AMP Response
Element-binding protein) JAK (Janus kinase), NFAT (nuclear factor of activated T cells), RUNX (Runt-
related transcription factor), STAT (signal transducer and activator of transcription), TCR (T cell
receptor), TGF (transforming growth factor), TSDR (Treg-specific demethylated region) (Kanamori et
al., 2016).

44
were described and not all of them showed suppressive functions: CD45RA+ FoxP3low (resting
Treg cells) and CD45RA-FoxP3high (activated Treg cells) were proved to be suppressive in vitro
while CD45RA-FoxP3low where non-suppressive T cells (Miyara et al., 2009). Furthermore,
CD45RA-FoxP3high cells show a fully demethylated CNS2 while FoxP3low non-Treg cells have
been described with only a partially demethylated CNS2 region.
3.4. Treg suppressive mechanisms
Treg cells can mediate suppressive functions through different mechanisms including the
direct targeting of DCs, through cytolysis and metabolic disruption and also through secretion
of suppressive cytokines (Figure 8). The most predominant suppressive mechanism is the
inhibition of DCs through CTLA-4. CTLA-4 shares with CD28 two ligands (CD80 and CD86) and
it was shown that CTLA-4 binding was able to induce trans-endocytosis of both CD80 and
CD86 (Qureshi et al., 2011). Treg cells express high CTLA-4 surface levels and several studies
demonstrated that both in vivo and in vitro Treg suppressive functions could be reversed by
blocking CTLA-4 (Read et al., 2000; Takahashi et al., 2000). Selective deletion of CTLA-4 results
in autoimmune diseases and potent anti-tumor immunity (Wing et al., 2008). CLTA-4 can also
stimulate the expression of the enzyme indoleamine 2,3-dyoxyegenase (IDO) by DCs resulting
in tryptophan depletion in T cell environment, a known immunoregulator mechanism
(Grohmann et al., 2002; Munn et al., 1999). Furthermore, Treg cells can also deliver negative
signals to responder T cells by inducing an up-regulation of intracellular cyclic adenosine
mono phosphate (cAMP) (Bopp et al., 2007) and through the generation of pericellular
adenosine catalyzed by CD39 (ectonucleoside triphosphate diphosphohydrolase 1) and CD73
(ecto-5’-nucleotidase) found on Tregs cell surface. (Bopp et al., 2007; Grant et al., 2015). All
these mechanisms can induce a metabolic disruption in Tconv cells. How metabolic changes
impact T cell activation, differentiation and effector function will be discussed in detail in
section III. Treg cells can as well secrete several types of inhibitory cytokines like TGF-β, IL-10
and IL-35 which are able to inhibit the differentiation, proliferation and activation of TEFF cells
in addition to their cytokine secretion (Asseman et al., 1999; Collison et al., 2007; Fahlen et
al., 2005; Marie et al., 2005). Furthermore, TGF-β is likewise able to induce the conversion of
naïve cells towards suppressor T cells (Chen et al., 2003). In addition, Treg cells suppress
polyclonal T cell activation by inhibiting IL-2 production (Thornton and Shevach, 1998).
Moreover, another study proposed a different mechanism where Treg cells, due to their

45
expression of high affinity IL-2R, ‘steal’ IL-2 produced by other cells and consequently limits
the survival and proliferation of other T cells (Pandiyan et al., 2007). Therefore, the role of IL-
2 in Treg suppression activity is still under debate. Finally, Treg cells can induce T cell
cytotoxicity by perforin-dependent or granzyme B-dependent mechanisms (Cao et al., 2007;
Gondek et al., 2005).
On one hand, it is widely accepted that defects in Treg function are associated with the
pathogenesis of autoimmune diseases in humans (Long and Buckner, 2011). Autoimmune
diseases develop due to reduced frequencies of Treg cells and/or Treg dysfunctions resulting
in the lack of control of auto-reactive effector T cells (Grant et al., 2015). For instance,
defective FoxP3+ Treg function can result in T1D development, an autoimmune disease
characterized by insulin producing beta cells destruction (Hull et al., 2017). On the other hand,
given their suppressive properties, Tregs can have a pro-tumor function as demonstrated
notably by the poor prognosis associated with the tumor infiltration of this T cell subset (Bates
et al., 2006; Curiel et al., 2004; Hiraoka et al., 2006; Hou et al., 2017; Ormandy et al., 2005;
Wolf et al., 2003). In this context, the depletion of Treg cells represents therefore an
Figure 8 – Treg-mediated suppression mechanisms/pathways.
Treg cells can suppress TEFF cells through different mechanisms: 1) inhibition of DCs through cytotoxic
T-lymphocyte-associated protein 4 (CTLA-4); 2) metabolic disruption due to adenosine production; 3)
through inhibitory cytokine secretion such as IL-10, IL-35 and TGF-β; 4) competing with TEFF cells for
IL-2; 5) cytolysis due to GzmB and perforin secretion. Ad (adenosine), A2AR (adenosine A2A receptor),
CTLA-4 (cytotoxic T-lymphocyte-associated protein), DC (dendritic cell), GzmB (granzyme B) IL
(interleukin), IDO (indoleamine 2,3-dioxygenase), STAT5 (signal transducers and activators of
transcription 5), Treg (T regulatory), Teff (T effector).

46
interesting strategy which appeared to be efficient in several studies (Kurose et al., 2015;
Mahne et al., 2017; Soares et al., 2015). Due to the importance of CTLA-4 in the mediation of
Treg suppressive functions, it is also important to highlight the contribution of the anti-CTLA-
4 immunotherapies (such as ipilimumab) in cancer treatment (Seidel et al., 2018) .
b) CD8+ effector T cells
As CD4+ effector T cells, CD8+ effector T cell are divided into several types depending on
the profile of the cytokines secreted and the expression of transcription factors: T cytotoxic 1
(Tc1- also known as cytotoxic T cells (CTLs), T cytotoxic 2 (Tc2), T cytotoxic 9 (Tc9), T cytotoxic
17 (Tc17) and CD8+ Treg cells. Each subset contributes specifically to immune responses.
Despite this heterogeneity already described, CTLs are the best-characterized subpopulation
and I will focus on this CD8+ effector T cell subset.
CTLs play an important role in the clearance of intracellular pathogens and in the killing of
malignant cells. Due to their cytotoxic capacity, CTLs are able to kill cells by releasing cytotoxic
molecules like granzymes and perforin into the immunological synapse and secrete cytokines
such as IFNγ and TNF-α (Mittrucker et al., 2014). CTLs are well known for their anti-tumor
function due to their secretion of IFNγ, TNFα, perforin and granzymes (Reiser and Banerjee,
2016). Indeed, CD8+ T cells tumor infiltration correlates with good prognosis in many types of
cancer such as glioblastoma, lung, breast and colorectal tumors (Djenidi et al., 2015; Galon et
al., 2006; Kmiecik et al., 2013). CTL differentiation requires the combination of several and
distinct cellular and molecular pathways such as DC antigen presentation, cytokine and
chemokine signaling and transcription factor activation.
Antigen presentation by DCs to CD8+ T cells is important for the acquisition of effector
functions. In particular, CD8α+ DCs (as mentioned in (section I 1 E a 1.1), the IL-12 secreting
DC subset implicated in Th1 differentiation), play a crucial role in the antigen presentation to
CD8+ T cells mainly through the receptor pair XCL1-XCR1. XCR1 (X-C motif chemokine receptor
1) is highly expressed on CD8α+ DCs while its ligand XCL1 (X-C motif chemokine ligand 1) is
produced by activated CD8+ T cells (Figure 9). Upon TCR activation, this interaction plays a
role to reach maximal priming and expansion of CD8+ T cells (Dorner et al., 2009). Moreover,
certain chemokines such as CCL (C-C motif chemokine ligand) 3, CCL4 and CCL17 secreted by

47
DCs upon interaction either with CD4+ or NK cells can attract cognate CCR5+ and CCR4+ naïve
CD8+ T cells in a process called cross-priming (Castellino et al., 2006; Semmling et al., 2010).
Several transcription factors are required for effector differentiation (Figure 9). T-bet is
one of the transcription factors required for the effector functions and it’s highly expressed
in SLEC (short lived effector cells). (Intlekofer et al., 2005; Joshi et al., 2007). Blimp-1 (also
known as PR domain zinc finger protein 1) is another transcription factor required for
terminal differentiation, crucial for the repression of central memory properties acquisition
(Kallies et al., 2009; Rutishauser et al., 2009). The IRF4 is another transcription factor required
for CTL differentiation. IRF4 is not only indispensable for early activation but also crucial for
sustained expansion and effector differentiation as it is involved in the expression and
function of T-bet and Blimp-1 (Raczkowski et al., 2013; Yao et al., 2013). DNA binding 2 (Id2)
is as well upregulated in CD8+ T cells upon infection. Despite the fact that Id2-deficient naïve
T cells are able to differentiate into effector cells, these cells are more susceptible to apoptosis
which impacts on the accumulation of CD8+ effector T cells (Cannarile et al., 2006). Therefore,
Id2 is not necessary for CTL differentiation but instead for the magnitude of the effector
responses.
In addition to transcription factors, cytokine signaling is also required for CTL
differentiation and function (Figure 9). IL-12 is essential for the terminal effector
differentiation of CTLs. Mechanistically, IL-12 induces T-bet expression (Curtsinger et al.,
2003; Joshi et al., 2007) and can also repress Eomes (a memory T cell transcription factor)
(Takemoto et al., 2006). Signaling mediated by IL-2 is also required for CTL effector function.
IL-2 is mainly produced by CD4+ T cells while activated CD8+ T cells secrete lower amounts
(Malek and Castro, 2010). Activated CD4+ T cells instruct DCs to produce IL-12 which induces
CD25 expression in CD8 T cells, allowing the expression of high affinity IL-2R which increase
the responsiveness to IL-2 (Obar et al., 2010; Wiesel et al., 2010). Several elegant studies
demonstrated that persistent IL-2 stimulation is needed for promoting terminal-effector
differentiation (Kalia et al., 2010; Pipkin et al., 2010).Finally, IL-2 through STAT5 activation
regulates as well T-bet and Eomes expression (Grange et al., 2013).

48
F. Memory T cells
Memory T cells are able to rapidly produce cytokines upon antigen restimulation and
respond rapidly to antigens stimulation, which is what make this T cell subset crucial in
immediate protection in peripheral tissues and in rapid responses in secondary lymphoid
organs. The origin of memory T cells is still a subject of debate with several studies done in
CD8+ T cells proposing two different models represented in the figure below (Figure 10)
(Arsenio et al., 2014; Flossdorf et al., 2015; Joshi and Kaech, 2008; Restifo and Gattinoni,
2013). In this literature review I will not detail the discovers done on that matter and I will
focus on memory T cell phenotype and functions.
Figure 9 – Cytotoxic T cell differentiation and phenotype.
The phenotype of CTL (TF and surface cell markers) as well as the mechanisms involved in CTL
differentiation are represented. IRF4 (interferon regulatory factor 4), Id2 (DNA binding 2), T-bet (T box
transcription factor), XCR1 (X-C motif chemokine receptor 1), XCL1 (X-C motif chemokine ligand 1).
Figure 10 - Two models proposed for T cell differentiation.
The ON-OFF-ON/ OFF-ON-OFF model proposes that memory T cells have always effector T cells as precursors. The developmental model on the other hand, defends that memory cells can be directly generated from naïve T cells (Restifo and Gattinoni, 2013)

49
Several transcription factors are required for memory T cell differentiation. For instance,
B-cell lymphoma 6 protein (BCL-6) in one of the transcription factor involved in the generation
and maintenance of memory CD8+ T cells (Ichii et al., 2002) as well T cell factor 1 (TCF-1) (Zhou
et al., 2010), FoxO1 (Hess Michelini et al., 2013; Kim et al., 2013; Tejera et al., 2013) and Id3
(Ji et al., 2011). Finally, T-box brain protein 2 or Eomesodermin (Eomes) is also involved for
memory differentiation (Intlekofer et al., 2005; Pipkin et al., 2010).
Memory T cells are highly heterogeneous in regards to their surface-receptor expression,
effector function, location and trafficking properties. In 1999, the classification of circulating
memory T cells was revisited and gave rise to a division of this vast T cell subset into two
distinct groups: T central memory (TCM) and T effector memory (TEM) (Sallusto et al., 1999).
The TCM and TEM subsets, even if initially described in humans, were rapidly demonstrated to
have parallels in mice (Huster et al., 2004; Masopust et al., 2001; Reinhardt et al., 2001;
Wherry et al., 2003). More recently, a population of non-circulating memory T cells known
as tissue resident memory T cells (TRM) was also described and will be discussed later on in
this section.
Despite their differences, few markers are expressed on both TCM and TEM. On humans,
TCM and TEM cells are characterized as CD45RO+ CD45RA- (Merkenschlager and Beverley, 1989;
Sanders et al., 1988; Smith et al., 1986) (Table 2). Both murine and human TCM and TEM express
CD44 that is a carbohydrate-binding type 1 transmembrane protein involved in cell adhesion
and migration to inflammatory sites (Baaten et al., 2012; Camp et al., 1993; Nandi et al., 2004).
Its signaling promotes cytoskeletal changes required for T cell extravasation from blood into
tissues and its expression is also associated with T cell activation.
To distinguish between TCM and TEM in humans, a combination of surface markers are used:
TCM are characterized as CD62L+, CCR7+ CD127+, CD69- and CD103- (αE integrin-) (Mueller et
al., 2013) (Table 2) and they have the ability to rapidly respond to secondary contacts with a
cognate antigen. This subset can be found in lymph nodes, spleen, blood and bone marrow
mainly because of the expression of lymphoid homing receptor ligands that allows the
passage of TCM into the LN through specialized high endothelial venules (HEV) (Gowans and
Knight, 1964). Endothelial cells express CCL19 and CCL21 which are recognized by CCR7-
expressing T cells, allowing their extravasation and migration into the T cell zone (Okada and
Cyster, 2007; Worbs et al., 2007). The binding of CD62L to the peripheral lymph node

50
addressin (PNAd) is another mechanism leading to T cell trafficking into LN (Butcher and
Picker, 1996). Despite the fact that they have little/no effector function, TCM cells can
proliferate quickly and give origin to an effector response upon antigenic stimulation (Sallusto
et al., 2004). TCM cells can produce high levels of IL-2, but they also can secrete IFNγ and TNFα
at moderate levels (Farber et al., 2014; Sallusto et al., 1999).
Unlike TCM, TEM are essentially located in peripheral tissues and are dedicated to
immediate effector response (Sallusto et al., 2004). TEM are characterized as CD62L-, CCR7-
CD127+, CD69- and CD103- (Table 2) and they can be found in spleen and blood but also in
non-lymphoid organs including liver, lung, intestinal tract, reproductive tract, kidney, adipose
tissue and heart (Mueller et al., 2013). TEM cells can produce high levels of IFNγ and TNFα but
they can also secrete IL-2 at moderate levels (Farber et al., 2014; Sallusto et al., 1999).
Apart of TCM and TEM, other memory T cell subsets were described. As previously
mentioned, TRM define a population of non-circulating memory cells that can permanently
reside in peripheral tissues after infection clearance (Masopust et al., 2010; Masopust et al.,
2001). Most TRM are CD103+ CD69+ (Schenkel and Masopust, 2014), although in certain tissues
such as the lamina propria, brain parenchyma, salivary glands and female reproductive tract
they can be CD103- or/and CD69- (Takamura, 2018; Topham and Reilly, 2018). TRM cells can
also be characterized by the expression of CD49a, an integrin which is an adhesion molecule.
Furthermore, as the other memory T cell subsets, TRM express CD44 (Amsen et al., 2018). The
study of human TRM has been more challenging as it requires the study of human tissues and
there are no in vitro systems optimized so far for this purpose. Despite the difficulties, several
studies contributed already to the description of this memory T cell population in humans, as
review in (Steinbach et al., 2018). TRM are important in response to infections in non-
lymphoid tissues and its presence have been associated to a good prognosis in cancer
patients. Dysfunction on TRM responses have been associated with certain chronic
inflammatory diseases such as MS (Steinbach et al., 2018). TRM cell surface markers are
summarized in table 2.
51
Stem cell memory T cells (TSCM). is another memory T cell subset described which,
interestingly, shares common markers with naïve T cells (CD45RA, CD62L and CCR7).
However, it can be distinguished from naïve T cells based on the expression of CD95, CD122,
CXCR3 and the integrin CD11a (LFA-1) (Fuertes Marraco et al., 2015; Gattinoni et al., 2011;
Gattinoni et al., 2017) They have high proliferative capacity and they can further differentiate
into other T cell subsets such as TCM and TEM (Gattinoni et al., 2011).
During this section, I reviewed and highlighted the role of antigen presentation, TCR, co-
stimulation and cytokine signaling and also gene regulation on T cell activation, differentiation
and effector function. Though, there are other factors that can impact and shape T cell
function, notably the metabolic environment which was the main subject of research during
my PhD. Therefore, the next sections are going to be centered on the impact of the metabolic
environment on T cell activation, differentiation and effector function.
T central memory (TCM) T effector memory (TEM) Tissue Resident memory (TRM)
Mouse Human Mouse Human Mouse Human
CD62L+ CD62L+ CD62L- CD62L- CD62L- CD62L-
CCR7+ CCR7+ CCR7- CCR7- CCR7- CCR7-
CD44+ CD44+ CD44+ CD44+ CD44+ ?
CD69- CD69- CD69- CD69- CD69+ CD69+
- CD45RO+ - CD45RO+ - ?
- CD45RA- - CD45RA- - ?
CD103- CD103- CD103- CD103- CD103+ CD103+
CD49a- CD49a- CD49a- CD49a- CD49a+ CD49a+
Table 2 –TCM, TEM and TRM surface markers in both mouse and human species
52
II. Metabolism
General concepts
Proliferating and differentiating cells have increased requirements of energy and
"building blocks". These requirements are essentially fulfilled by the metabolism of essential
nutrients like glucose, glutamine, other amino acids and lipids. Energy-sensing mechanisms
that allow the detection of nutrient availability as well as energy levels regulate several
metabolic pathways. They engage anabolic reactions in nutrient-replete condition whereas
catabolic reactions are triggered when nutrients and energy are scarce, in a process called
metabolic reprogramming. Amongst several energy sensing pathways, two are particularly
implicated in T cell differentiation and function: mTOR and the 5’ adenosine monophosphate-
activated protein kinase (AMPK).
During my thesis, I studied the role of different metabolic/ energy sensing pathways and
their impact on T cell differentiation and effector function. Therefore, in this part II will
provide a general overview about the metabolic pathways. In part III, I will discuss in more
detail the literature regarding the metabolic pathways implicated in T cell biology.
1) Glycolysis and the pentose phosphate pathway
The glycolytic pathway, commonly referred as glycolysis, starts with the uptake of
extracellular glucose. It is essentially mediated by two major families of transporters, GLUT
(glucose transporters) and SGLTs (sodium-glucose-linked transporters). Once in the cell,
glucose is metabolized by hexokinase (HK) to glucose-6-phosphate (G6P), a metabolite that
can be further used either in the pentose phosphate pathway (PPP) or in the glycolytic
pathway (Figure 11).
In the first situation, G6P can enter through the oxidative branch of PPP resulting in the
production of reduced nicotinamide adenine dinucleotide phosphate (NADPH), crucial for
glutathione reduction and fatty acid synthesis. Moreover, the PPP is the only source of Ribose-
5-phosphate indispensable for nucleotide formation and amino acid precursors. Glycolysis is
also linked with the PPP through its non-oxidative branch. In this case, the PPP is fulfilled
through fructose-6-phosphate (F6P) and glyceraldedehyde-3-phospate (G3P) (another

53
intermediates of the glycolysis pathway) resulting also in the generation of Ribose-5-
phosphate, without production of NADPH (Figure 11).
In the second situation, glucose-6-phosphate, after multistep-reactions, is converted into
two molecules of pyruvate along with the production of two molecules of reduced
nicotinamide adenine dinucleotide (NADH) and four molecules of adenosine triphosphate
(ATP), however two of them are used to restart another round of glycolysis (Figure 11).
Pyruvate can then either be reduced into lactate through the lactate dehydrogenase (LDH)
(to maintain the glycolytic flux by upholding the oxidized nicotinamide adenine dinucleotide
(NAD+) levels) or enter directly into the tricarboxylic acid (TCA) cycle as acetyl coenzyme A
(acetyl-coA) (discussed in the next section). Unexpectedly, lactate can be produced as well in
aerobic conditions in response to mitogenic or inflammatory signals and this process is called
aerobic glycolysis. This phenomenon, initially described in cancer cells, was described by Otto
Warburg and is known as “Warburg effect” (Warburg et al., 1958, 1960).
Glycolysis is not the most efficient metabolic pathway in terms of ATP production.
However, it can be rapidly activated and quickly produce several intermediates important for
a rapid cell growth. These intermediates are not only important to fulfill the PPP and the TCA
cycle but they also represent biomass elements for the synthesis of serine, glycine and
alanine. Glycolysis can also provide dihydroxyacetone phosphate (DHAP) important for
glycerol generation that is important for the cell membrane structure. (Gaber et al., 2019;
O'Neill et al., 2016) (Figure 11).
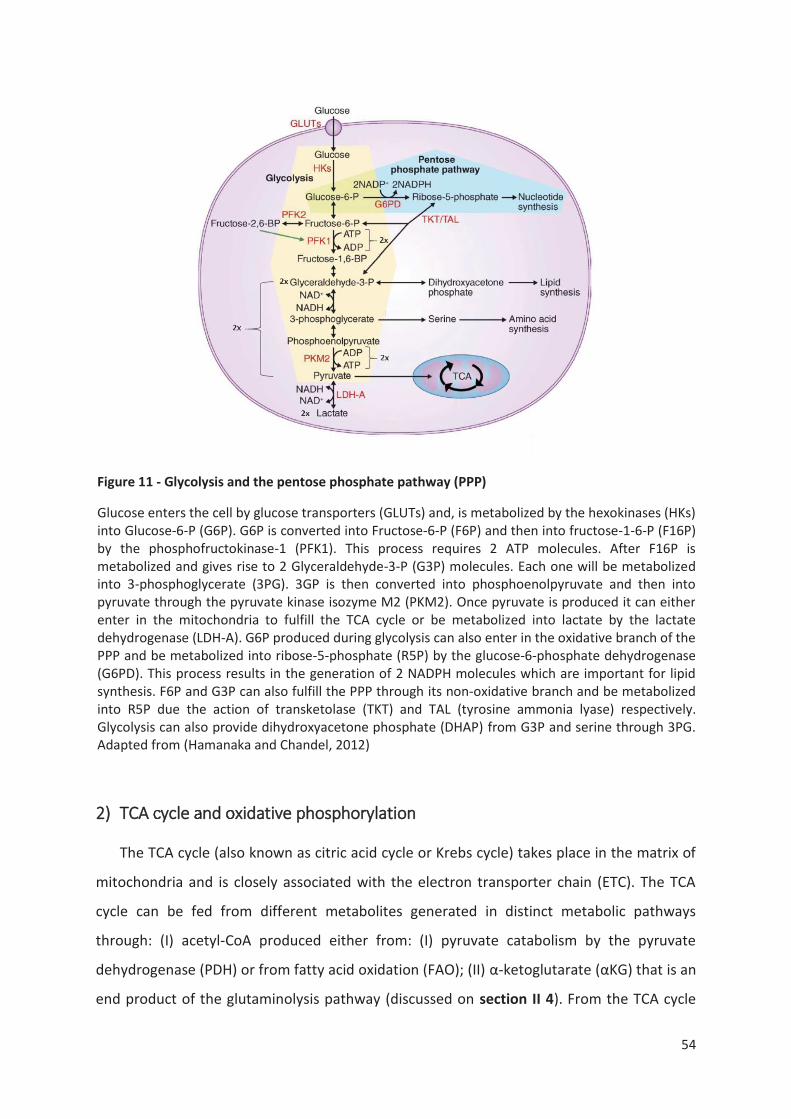
54
2) TCA cycle and oxidative phosphorylation
The TCA cycle (also known as citric acid cycle or Krebs cycle) takes place in the matrix of
mitochondria and is closely associated with the electron transporter chain (ETC). The TCA
cycle can be fed from different metabolites generated in distinct metabolic pathways
through: (I) acetyl-CoA produced either from: (I) pyruvate catabolism by the pyruvate
dehydrogenase (PDH) or from fatty acid oxidation (FAO); (II) α-ketoglutarate (αKG) that is an
end product of the glutaminolysis pathway (discussed on section II 4). From the TCA cycle
Figure 11 - Glycolysis and the pentose phosphate pathway (PPP)
Glucose enters the cell by glucose transporters (GLUTs) and, is metabolized by the hexokinases (HKs) into Glucose-6-P (G6P). G6P is converted into Fructose-6-P (F6P) and then into fructose-1-6-P (F16P) by the phosphofructokinase-1 (PFK1). This process requires 2 ATP molecules. After F16P is metabolized and gives rise to 2 Glyceraldehyde-3-P (G3P) molecules. Each one will be metabolized into 3-phosphoglycerate (3PG). 3GP is then converted into phosphoenolpyruvate and then into pyruvate through the pyruvate kinase isozyme M2 (PKM2). Once pyruvate is produced it can either enter in the mitochondria to fulfill the TCA cycle or be metabolized into lactate by the lactate dehydrogenase (LDH-A). G6P produced during glycolysis can also enter in the oxidative branch of the PPP and be metabolized into ribose-5-phosphate (R5P) by the glucose-6-phosphate dehydrogenase (G6PD). This process results in the generation of 2 NADPH molecules which are important for lipid synthesis. F6P and G3P can also fulfill the PPP through its non-oxidative branch and be metabolized into R5P due the action of transketolase (TKT) and TAL (tyrosine ammonia lyase) respectively. Glycolysis can also provide dihydroxyacetone phosphate (DHAP) from G3P and serine through 3PG. Adapted from (Hamanaka and Chandel, 2012)

55
results, the production of 3 molecules of NADH and one molecule of reduced flavin adenine
dinucleotide (FADH2) that are crucial for the optimal activity of complexes I and II of the ETC.
The complex I (CI) together with CIII and CIV, export electrons out of the mitochondrial
membrane in order to create a proton gradient between the matrix and the intermembrane
space of the mitochondria. These electrons located in the intermembrane space, are then
used to drive the function of the complex V, also known as ATP synthase. Together, the TCA
cycle and ETC, from one single molecule of glucose, produce 36 ATP molecules by a process
named oxidative phosphorylation (OXPHOS) (Figure 12). Moreover, TCA cycle also give rise to
several metabolites important for fatty acid synthesis and crucial for other cellular and
molecular reactions (Gaber et al., 2019; O'Neill et al., 2016).
Figure 12 - The tricarboxylic acid (TCA) cycle and its connection with the electron transport chain
and OXPHOS
Pyruvate is converted into Acetyl-CoA by PDH and enters in the TCA cycle. Once in the TCA cycle, a cascade of metabolic reactions occurs with the generation of several metabolites. From this cycle results the formation of NADH and FADH2 which are proton (H+) donors crucial for CI and CII activity of the electron transport chain and initiation of the OXPHOS pathway. While H+ are pumped out to the IMS space and create a transmembrane proton electrochemical gradient, electrons are transported from the CI and CII to the CIII and CIV until they reach the terminal electron acceptor (O2). This process ends up with the entry of the H+ pumped out from the first 4 complexes through the CV which generates ATP. αKGDH (α-Ketoglutarate dehydrogenase), CS (citrate synthase), CI (complex I), CII (complex II), CIII (complex III), CIV (complex IV), CV (complex V), FH (fumarate hydratase), FADH2
(reduced flavin adenine dinucleotide), IDH (isocitrate hydrogenase), NADH (reduced nicotinamide adenine dinucleotide), MDH (malate dehydrogenase), PDH (pyruvate dydrogenase), SDH (succinate dehydrogenase), SCS (succinyl-CoA synthetase), TCA (tricarboxylic acid). Adapted from: (Osellame et al., 2012)

56
3) Lipid synthesis and Fatty acid oxidation
Lipid metabolism is a dynamic and a complex process that includes lipid synthesis
(anabolic reactions) and oxidation (catabolic reactions). During lipogenesis, lipids, such as
fatty acids (de novo fatty acid synthesis pathway) and cholesterol (mevalonate pathway or
cholesterol biosynthesis pathway), are synthetized and used as building blocks for cell
structures (such as cell membrane). During lipid oxidation, lipids and specific fatty acids (FAs),
can be broken down and used as a cell energy source in a process known as β-oxidation or
fatty acid oxidation (FAO).
Fatty acid synthesis (FAS) is highly dependent on metabolites produced by other
metabolic pathways like glycolysis, PPP and the TCA cycle. As such, the acetyl-coA produced
either through TCA cycle-derived citrate, glycolysis-derived pyruvate or from acetate
catabolism, is carboxylated into malonyl-CoA by the acetyl CoA carboxylase (ACC) and after
into malonyl-ACP (Figure 13). The elongation of the nascent fatty acid starts then with a
Malonyl-ACP molecule acting as a two carbons donor to other acetyl-CoA molecule. After
several metabolic reactions, a butyryl-CoA molecule is formed through the enzymatic activity
of fatty acid synthase (FASN) in a NADPH-dependent manner (first elongation cycle). This
elongation cycle is repeated six more times with another 6 malonyl-CoA molecules (one at
each cycle) giving their carbons in a NADPH-dependent manner. This process ends up with a
16-carbon palmitic acid saturated FA straight chain (Figure 13). For the synthesis of
alternative-length chain FAs (with more than 16 carbons), palmitic acid is used as a substrate
for elongation and as a substrate for desaturation reactions for the generation of unsaturated
fatty acids. The synthesis of other classes of FAs, known as branched chain fatty acids, require
specific amino acids like valine, leucine and isoleucine to generate the methyl branches on
the carbon chain. (Gaber et al., 2019; O'Neill et al., 2016).

57
Cholesterol synthesis (also known as mevalonate pathway) requires a distinct metabolic
pathway. Acetyl-CoA is one of the essential precursors that is metabolized into acetoacetyl-
CoA by the thiolases. After, this acetoacetyl-CoA molecule in combination with another
Acetyl-CoA molecule is converted in hydroxymethylglutaryl-coenzyme A (HMC-CoA) by the
hydroxymethylglutaryl-coenzyme A synthase (HGMCS). Then, HMC-CoA is reduced by the
hydroxymethylglutaryl-coenzyme A reductase (HGMCR) and mevalonate is generated. After,
through a multistep enzymatic reaction, several intermediates are produced such as squalene
and lanosterol until the end product: cholesterol (Figure 14). Cholesterol is transported as a
lipoprotein either in the form of HDL (high-density lipoprotein) or LDL (low-density
lipoprotein) (Bietz et al., 2017) and its influx and efflux are regulated by several transporters:
cholesterol enters in the cells through CD36 and/or through the LDL receptor and exit the cell
through ATP binding cassette (ABC) A1 and ABCG1 (Figure 15).
Figure 13 – Fatty acid synthesis.
Acetyl-CoA is metabolized into malonyl-CoA by the ACC. Manolyl-CoA is metabolized into Malonyl-ACP which together with another Acetyl-CoA molecule generate Acetoacetyl-ACP (initiation). After, several reactions take place in the FASN protein complex, to produce butyryl-ACP. Once this metabolite is generated, this cycle restarts 6 times up to palmitate synthesis (16:0). Each cycle extends the Acyl Chain by 2 carbons. ACC (acetyl CoA carboxylase), ACP (acyl carrier peptide), FASN (fatty acid synthase). Adapted from (Jawed et al., 2016).

58
The expression of de novo lipid synthesis-related enzymes are regulated by sterol
regulatory element binding protein (SREBP). SREBP are a family of transcription factors that
regulate both fatty acid and cholesterol synthesis. There are 3 different SREBPs isoforms with
distinct physiological roles: SREBP1a (involved in global lipid synthesis), SREBP1c (the most
active form in driving expression of genes related to fatty acid synthesis regulation) and
SREBP2 (the most active form in the regulation of genes related to cholesterol synthesis)
(Shimano and Sato, 2017; Ye and DeBose-Boyd, 2011). SREBP activation is highly regulated
and achieved by a feedback mechanism that senses cholesterol and fatty acids intracellular
levels (Figure 15). Mechanistically, SREBP proteins are associated with SCAP (SREBP cleavage-
activating protein) in the endoplasmic reticulum (ER) membrane where it is retained due to
its binding to the protein INSIG (insulin-induced gene protein). When cholesterol levels are
low, INSIG and SCAP are no longer associated; the SREBP-SCAP complex is not retained in the
ER and moves to the Golgi. There, SREBP is cleaved by site-1 and 2 proteases (S1P and S2P)
giving rise to the SREBP activated form which, after migration to the nucleus, activates genes
involved in cholesterol biosynthesis and other lipids. When extracellular levels of cholesterol
Figure 14 – The Mevalonate pathway.
Acetyl-CoA and Acetoacetyl-CoA through the HMGS enzymatic activity give rise to HMC-CoA, that is then, metabolized into mevalonate through the action of HMGCR. Mevalonate is converted into Mevalonate-5-phosphate by MVK, which through multiple step enzymatic processes, ends up in the generation of isopentenyl pyrophosphate. 6 isopentenyl pyrophosphate molecules are required for the production of one squalene molecule. Squalene is then metabolized into lanosterol and after a 18-steps reaction, cholesterol is generated. Cholesterol can be stored into the cell through the enzymatic activity of ACAT that transforms it into cholesteryl ester. ACAT (Acyl-CoA cholesterol acyltransferase), CYP51 (Lanosterol 14α-demethylase), HMGCR (hydroxymethylglutaryl-coenzyme A reductase), HMGCS (hydroxymethylglutaryl-coenzyme A synthase), MVK (mevalonate kinase).

59
are high, INSIG and SCAP bind to each other, the SREBP-SCAP complex remains in the ER not
allowing the generation of the SREBP mature form and the activation of genes involved in
cholesterol and other lipids biosynthesis (Bietz et al., 2017; Horton et al., 2002; Ye and
DeBose-Boyd, 2011) (Figure 15). However, this regulatory mechanism also applies to other
lipids; for example, fatty acid synthesis is controlled by the levels of palmitolyl-CoA; high levels
inactivating ACC activity. Furthermore, fatty acids are also able to inhibit proteolytic activation
of SREBP1 by increasing the amount of INSIG protein in the ER. However, this inhibition is not
independent of sterols, that are crucial for the binding of INSIG and SCAP (Ye and DeBose-
Boyd, 2011).
Figure 15 – Intracellular Cholesterol levels
homeostasis
When intracellular levels of cholesterol are low, INSIG no longer binds to the SREBP-SCAP complex in the ER and allows its migration to the Golgi apparatus. Once in the Golgi, proteases SP1 and SP2 allow the generation of the active form of SREBP that migrates to the nucleus and induces the regulation of cholesterol-synthesis-related genes. When intracellular levels are high, cholesterol binds to SCAP, which results in the increased affinity with INSIG. Once INSIG binds to the SREBP-SCAP complex, it is retained in the ER and cholesterol synthesis is then downregulated. In the same conditions, LXR is activated, increasing the surface expression of ABCA1 and ABCG1 cholesterol efflux transporters. ABCA1/ ABCG1 (ATP binding cassette A1/G1), INSIG (insulin-induced gene protein), ER (endoplasmic reticulum), LDLR (low density lipoprotein receptor), SCAP (SREBP cleavage-activating protein), SREBP (sterol regulatory element binding protein).

60
Liver X receptor (LXR) plays an opposite role to SREBP as it gets activated under high
intracellular cholesterol conditions. Its activation and assembly with the retinoid X receptor
(RXR) induces the upregulation of ABCA1 and ABCG1, crucial transporters for cholesterol
efflux (Tall and Yvan-Charvet, 2015) (Figure 15). Furthermore, LXR is also involved in the
regulation of the SREBP-1c gene. LXR-mediated regulation of the SREBP-1c induces the
expression of genes involved in the elongation and unsaturation of fatty acids resulting in an
increased synthesis of long-chain polyunsaturated fatty acids (PUFAs) (Tall and Yvan-Charvet,
2015; Ye and DeBose-Boyd, 2011).
The FAs produced or imported into the cells (which is mediated by CD36 and by FATP
(fatty acid transport protein) (Howie et al., 2017b)) can also be catabolized in the cell in order
to produce energy (ATP). FAs present in the cytosol are first converted to give rise to fatty
acid acyl-CoA. Short-fatty acids are able to pass through the mitochondrial membranes
without any other mediator. However, medium-chain and long-chain fatty acids need to be
conjugated with carnitine by the carnitine palmitoyl transferase (CPT) 1 to be shuttled into
the mitochondria. Once in the mitochondria, the carnitine is removed by CPT2 and FAO, also
known as β-oxidation, is initiated. Aside of ATP production, from FAO also results the
production of NADH and FADH2 that are important for the ETC function. (Bietz et al., 2017;
Gaber et al., 2019; O'Neill et al., 2016).
4) Amino acid metabolism
Amino acids (AA) are important precursors for protein synthesis, de novo synthesis of
branched-chain fatty acids and de novo purine and pyrimidine synthesis. They can be
classified into three different classes: essential, conditionally essential and non-essential.
Essential AA cannot be synthetized by the cell itself or are inadequately synthetized; therefore
they need to be provided from the diet. Conditionally essential AA can be synthesized in
necessary amounts by the organism. However, when the utilization rate is higher than the
synthesis, they need to be provided from the diet. Finally, non-essential AA can be synthetized
physiologically in adequate amounts to meet optimal requirements (Wu, 2009). There are
several amino acids required for normal cell physiology and function but considering the
topics of my PhD work, I will focus on glutamine and arginine.

61
Glutamine is the most abundant amino acid in the human plasma corresponding to 20%
of the total pool and is a non-essential AA (Newsholme and Parry-Billings, 1990; Roth et al.,
1990). Glutamine is important for cell growth, represents an alternative source for ATP
production and can be metabolized into αKG, through a process called glutaminolysis.
Glutamine is first converted into glutamate and ammonia by the glutaminases (GLS) and then
glutamate is converted into αKG either through dehydrogenation in the mitochondria by the
enzyme glutamate dehydrogenase (GDH) or through a transamination reaction mediated by
the glutamate oxaloacetate transaminase (GOT) and the ornithine aminotransferase
transaminase (OAT) in the mitochondria or in the cytosol (DeBerardinis et al., 2007). αKG can
fulfill the TCA cycle through a process called anaplerosis resulting in ATP production through
OXPHOS. Furthermore, glutamine-derived αKG can be a precursor for citrate production
which can be used for fatty acid synthesis. Moreover, glutamine along with aspartate are
important for de novo purine and pyrimidine synthesis (Gaber et al., 2019; O'Neill et al., 2016)
(Figure 16).
Arginine is classified as a conditionally essential AA (Luiking et al., 2012) and its imported
into the cells by the cationic transporters (CAT) (discussed in section III 2 E). Arginine
metabolism results notably in the production of urea and ornithine by the arginase enzymes
(ARG) (Figure 17). The urea produced enters in the urea cycle while the ornithine is used for
the production of polyamines (putrescine, spermidine and spermine) that are crucial for DNA
and RNA stabilization, transcription and translation, cell growth, cell proliferation among
others. Arginine can also be metabolized into citrulline by the nitric-oxide-synthase (NOS).
From this reaction results the production of nitric oxide (NO), a well-known signaling molecule
involved in many physiological processes (Figure 17). De novo arginine production is
dependent on citrulline availability which can therefore give rise to argino-succinate and be
Figure 16 – Glutaminolysis
Glutamine is converted into glutamate via
actions of glutaminases. Glutamate is then
converted to αKG, which enters and fuels
OXPHOS through the TCA cycle. αKG (α-
ketoglutarate), GLS (glutaminase), GDH
(glutamate dehydrogenase), TCA (tricarboxylic
acid).

62
metabolized through arginosuccinate lyase (ASL) into arginine which represents 10-15% of
whole body arginine production under normal conditions (Castillo et al., 1996; Dejong et al.,
1998) (Figure 17). These metabolic processes take place mainly in the intestinal-renal axis,
where citrulline is highly produced in the intestines and arginine in the kidney (Ligthart-Melis
et al., 2008; van de Poll et al., 2007; van de Poll et al., 2004; Windmueller and Spaeth, 1981;
Yu et al., 1996). Despite the capacity of the body to produce arginine, about 80% of it results
from recycled amino acids released from protein breakdown (Szefel et al., 2018)
5) mTOR and AMPK signaling pathways
mTOR functions as an energy-sensor pathway that is responsive to several immunological
(TCR stimulation, co-stimulation, cytokines) and environmental cues (Pollizzi and Powell,
2015). In environments where nutrient availability is not sufficient to sustain cell growth and
expansion, mTOR is inhibited. Signaling from mTOR is mediated through two distinct
complexes: mTOR complex (mTORC) 1 and mTORC2 that are associated with several scaffold
proteins. Both complexes share the mTOR catalytic subunit, the mammalian lethal with sec-
13 protein 8 (mLST8) and the DEP domain containing mTOR-interacting protein (DEPTOR). In
contrast, only mTORC1 is associated with the regulatory-associated protein of mammalian
target of rapamycin (Raptor) and with proline-rich AKT substrate 40 kDa (PRAs40) while
mTORC2 is associated with rapamycin-insensitive companion mTOR (Rictor), with mammalian
Figure 17 – Arginine metabolism
Arginine can be converted into two major metabolites: Ornithine through the action of ARG and Citrulline by NOS. From ARG enzymatic activity, it results the production of Urea and from NOS action, NO generation. Ornithine can be metabolized into polyamines by ODC while Citrulline can give rise to fumarate creating a link with the TCA cycle. ADC (arginine decarboxylase), AGAT (arginine: glycine amidinotransferase), ARG (arginase), ASL (argininosuccinate lyase), OAT (ornithine aminotransferase), ODC (ornithine decarboxylase), OTC (Ornithine transcarbamylase), NO (nitric oxide), NOS (nitric oxide synthase), P5C (pyrroline-5-carboxylate), TCA (tricarboxylic acid).

63
stress-activated map kinase-interacting protein 1 (mSin1) and protein observed with rictor 1
and 2 (protor 1/2) (Laplante and Sabatini, 2012) (Figure 18).
Despite the fact that both complexes share the same catalytic subunit, they have distinct
functions. Thus, signaling mediated by mTORC1 promotes protein synthesis, lipogenesis and
energy metabolism inhibiting at the same time autophagy and lysosome biogenesis. mTORC1
activation results in the phosphorylation of S6 kinase beta-1 (S6K1) and the eukaryotic
translation inhibitor factor 4E-binding protein 1 (4E-BP1). In contrast, mTORC2 signaling
regulates cytoskeletal organization and cell survival/metabolism. It also induces a metabolic
switch from OXPHOS to glycolysis (Laplante and Sabatini, 2012; Pollizzi and Powell, 2015).
mTORC2 activation results in the phosphorylation of the AKT kinase at serine 473 and the
glucocorticoid-regulated kinase 1 (SGK1) (Figure 18).
AMPK complex is another metabolic regulator, highly conserved, that senses intracellular
adenosine nucleotide levels. AMPK is constituted by 3 subunits: the catalytic subunit α and
two other regulatory subunits, β and γ (Figure 19). When the AMP (adenosine mono
phosphate )/ATP ratio decreases, AMPK activation is induced through the phosphorylation of
the Thr172 present in the α subunit by liver kinase B1 (LKB1) (Shaw et al., 2004; Woods et al.,
2003). Furthermore, AMP is able to directly bind to the γ regulatory subunits, inducing a
conformational change protecting AMPK against dephosphorylation, and thus, its inactivation
(Xiao et al., 2011). Activation of AMPK due to AMP increased levels can also happen through
Figure 18 – mTOR complexes and its targets.
mTOR pathway via two different complexes: mTORC1 and mTORC2. mTORC1 that contains the adaptor protein RAPTOR while mTORC2 contains RICTOR. Activation of mTORC1 and mTORC2 leads to the phosphorylation of different targets as illustrated in this figure. AKT (mechanistic target of rapamycin), mTOR (), mLST8 (mammalian lethal with sec-13 protein 8), mSIN1 (map kinase-interacting protein 1), PRAs40 (proline-rich AKT substrate 40 kDa), RAPTOR (regulatory-associated protein of mammalian target of rapamycin), RICTOR (rapamycin-insensitive companion mTOR), SGK1 (), S6K (S6 kinase), 4E-BP1 (4E-binding protein 1). Adapted from (Pollizzi and Powell, 2015)

64
allosteric activation of the phosphorylated enzyme (Suter et al., 2006). Once activated, AMPK
triggers several metabolic pathways to generate ATP while inhibiting cell growth, biosynthesis
and other ATP-dependent/consuming processes. Importantly, AMPK activity inhibits mTOR-
dependent pathways, promoting catabolism and inhibiting biosynthesis and cell growth
(Hardie et al., 2006).
Several metabolic pathways are engaged upon TCR stimulation. However, the energy and
the metabolic requirements of each T cell subset are distinct. In section III, the metabolic
changes that occur throughout T cell lifecycle are dissected in order to specifically highlight
the importance of metabolism on T cell activation, differentiation, effector function and
survival.
III. T cell metabolism
1) Naïve T cells
In the periphery, naïve T cells are continuously migrating through the secondary lymphoid
organs, surveying for antigens. For example, cytoskeletal rearrangements, sustained by ATP
production, occur constantly and energetic resources are needed in order to fulfill their
energetic demands. It has been shown that naïve T cell metabolism relies mainly on OXPHOS
(Verbist et al., 2012). Therefore, naïve T cells have a metabolic balance that favors energy
production over biosynthesis of new cellular compounds (MacIver et al., 2013). Thus, and
despite the classification of naïve T cells as quiescent T cells, they are metabolically active.
Figure 19 – The AMPK pathway
AMPKα can be activated by phosphorylation on Thr172 by LKB1 kinase. LKB1 promotes AMPK phosphorylation
under high AMP: ATP ratio. High AMP levels also induce allosteric activation of the phosphorylated enzyme. One
biological outcome of AMPK activity is the inhibition of mRNA translation under low-energy conditions through
inhibition of mTORC1 activity. AMPK (AMP-activated protein kinase), AMPK-P (AMPK phosphorylated) AMP
(Adenosine monophosphate), ATP (Adenosine triphosphate), mTOR (mechanistic target of rapamycin).

65
It will be tempting to believe that the maintenance of a quiescent metabolic state that
characterizes naïve T cells is a “by-default” program in the absence of activation signals. On
the contrary, several studies suggest that naïve T cells metabolic state is a process actively
maintained. For naïve T cell survival and homeostatic proliferation, cytokine signaling (IL-7)
and weak TCR interactions with self-peptides presented by MHC molecules are required
(Geltink et al., 2018). Indeed, IL-7 and TCR stimulation are important for the maintenance of
naïve T cell state and are associated with GLUT1 transporter upregulation at the cell surface
and increased glucose uptake. Furthermore, this process recruits the PI3K /Akt /mTOR pathway
with constitutively active Akt promoting the trafficking of GLUT1 to cell surface (Barata et al.,
2004; Jacobs et al., 2010; Rathmell et al., 2001; Swainson et al., 2007; Swainson et al., 2006;
Tan et al., 2001; Verhoeyen et al., 2003; Wofford et al., 2008). Contradictory, full mTOR
signaling can impact naïve T cells homeostasis since the loss of TSC1 (tumor suppressor
tuberous sclerosis complex 1) function (which inhibits mTOR activation) results in loss of
quiescence state, increased glycolytic metabolism and cell growth disrupting naïve T cell
homeostasis (Yang et al., 2011). All together, these data suggest that naïve T cell metabolic
profile requires mTOR activation but at low level comparing to activated T cells (Geltink et al.,
2018).
2) Metabolic requirements and reprograming upon TCR activation
Upon TCR stimulation, naïve T cells get activated. In order to sustain their rapid
proliferation, a “metabolic switch” from OXPHOS to aerobic glycolysis occurs, even if the
oxygen supply is not limiting. This phenomenon is not specific to T cells and, as mentioned
earlier, was initially described in cancer cells as Warburg effect (Warburg et al., 1958, 1960)
(previously discussed in the section II 1). As previously discussed, the Warburg effect can
appear at first glance as counterproductive since the ATP production is lower compared to
OXPHOS (2 ATP molecules instead of 36). However, this metabolic pathway is faster to engage
– notably because of the fast upregulation of glycolytic enzymes expression as compared to
the ones involved in OXPHOS (mitochondrial biogenesis is consequently relatively slow).
Moreover, it allows the generation of several "building blocks" important, for instance, for
the PPP or the FAS pathways (Donnelly and Finlay, 2015). It is important to keep in mind that
upon activation, even if the glycolytic rate is increased (Chang et al., 2013; Michalek et al.,
2011), the TCA cycle and OXPHOS remain essential to fulfill T cell energetic requirements (Carr

66
et al., 2010; Dimeloe et al., 2017; Sena et al., 2013; Wang et al., 2011). Altogether, it would
be more accurate to describe this “metabolic switch” as a change in the ratio between
glycolysis/OXPHOS: biosynthetic intermediates for new cellular components (which result
mainly from glycolysis) are a priority when compared to ATP production (more efficiently
produced by OXPHOS) (Gaber et al., 2019). How nutrients and the metabolic pathways are
used upon T cell activation will be further discussed in the next parts of this section.
A. mTOR and AMPK signaling
As mentioned previously in the section II 5, mTOR is a central regulator of cell growth and
metabolism (Pollizzi et al., 2015). Mechanistically, TCR engagement induces the activation of
the PI3K-Akt axis which in turn, activates mTOR (Bantug et al., 2018). Furthermore,
recruitment of the CD28 co-stimulation signaling, is also crucial to reach an optimal mTORC1
activation (Zheng et al., 2007). mTOR activation will then induces the up-regulation of two
important transcription factor: inducible impact factor 1α (HIF-1α) and c-Myc. HIF-1α alters
the range of glycolytic-associated genes resulting in increased glycolysis rate and enhances
IFNγ secretion (Roman et al., 2010; Semenza et al., 1994). c-Myc is tightly involved in the
increase of the glycolysis and glutaminolysis rates, and as consequence of the PPP pathway
and TCA cycle, respectively (Wang et al., 2011). mTOR activity is also crucial for the activation
of SREBP and PPAR (peroxisome proliferator-activated receptors) which are two crucial
transcription factors involved in lipid production (Angela et al., 2016; Kidani et al., 2013).
PPARs are transcription factors that are part of the nuclear hormone receptors family. They
are activated by lipophilic molecules and mostly control genes involved in lipid metabolism
(Sonoda et al., 2008). The role of mTOR in T cell activation and metabolic reprogramming is
represented on Figure 20.

67
AMPK is also activated by TCR signaling and it is important for T cell activation (Tamás et
al., 2006). AMPKα deficient T cell demonstrated defects in T cell activation, metabolism and
inflammatory cytokine production. In the same line, LKB1-deficient T cells exhibited defects
in cell proliferation, viability and altered glycolytic and lipid metabolism (MacIver et al., 2011).
Activated AMPK induced FAO and inhibited fatty acid synthesis (Davies et al., 1990; Merrill et
al., 1997) and its activation also downregulated mTORC1 activity under nutrient deprived
conditions (Blagih et al., 2015). These AMPK functions seem to be count productive
considering the metabolic requirements of activated T cells. Thought, AMPK activation by TCR
is transient, decreasing over the time to low levels in proliferating T effector cells (Kishton et
al., 2016; Tamás et al., 2006).
B. Glycolysis
Upon activation, increased glycolysis is crucial to sustain T cell activation and proliferation
(Gerriets and Rathmell, 2012). Glucose can enter in the cells either through the SGLTs or
through the facilitative glucose transporters, a family of transporters named GLUTs (Navale
and Paranjape, 2016). SGLTs are glucose transporters which transport glucose together with
Figure 20 – Role of mTOR activation in metabolic reprogramming.
Upon TCR/CD28 activation, mTORC1 is activated and several transcription factors recruited. These transcription factors allow the engagement of several metabolic pathways necessary for the reprograming required to sustain T cell activation. Akt (protein kinase B), AMPK (AMP-activated protein kinase), HIF1α (Hypoxia-inducible factor 1-alpha), mTOR (mechanistic target of rapamycin), PI3K (Phosphoinositide 3-kinases), PGC1α (Peroxisome proliferator-activated receptor gamma coactivator 1-alpha). Adapted from: (Bantug et al., 2018)

68
sodium ions (in the same direction) and they are mainly expressed in intestinal cells. The
GLUTs family is composed of 13 isoforms in mice and 14 in humans (Uldry and Thorens, 2004;
Zhao and Keating, 2007). All Gluts are highly glycosylated proteins harboring a N-linked
glycosylation site and, based on their localization, they can be divided into three classes.
GLUT1 is the main glucose transporter in T lymphocytes. However, it also important to
mention that upon TCR activation, GLUT3, GLUT6 and GLUT8 were also detected at mRNA
level even if it was at lower levels as compared to GLUT1 (Macintyre et al., 2014; Vaeth et al.,
2017). T cell activation is associated with an increased glucose uptake and an upregulation of
GLUT1 cell surface expression (Gerriets and Rathmell, 2012; Kinet et al., 2007; MacIver et al.,
2013; Manel et al., 2003b). GLUT1 can be detected at the cell surface as early as 4 hours
following TCR stimulation (Manel et al., 2003b) and it is expressed in both CD4+ and CD8+ T
cells (Kinet et al., 2007). Despite the fact that the precise mechanism by which T cells control
GLUT1 expression and trafficking has not been yet fully characterized, it is known that PI3K
signaling through Akt is essential for this process (Wieman et al., 2007) and CD28 signaling is
crucial for Akt regulation of GLUT1 trafficking (Frauwirth et al., 2002; Jacobs et al., 2008). Also,
another recent study demonstrated that store-operated Ca2+ was involved in the regulation
of glucose transporters, glycolytic enzymes through the activation of NFAT (nuclear factor of
activated T cells) (Vaeth et al., 2017). Interestingly, over-expression of GLUT1 did not impact
T cell development or homeostasis but was associated with increased cell size, glucose
uptake, proliferation rate and IFNγ and IL-2 secretion and lead to inflammatory diseases
(Cretenet et al., 2016; Jacobs et al., 2008; Michalek et al., 2011). Additionally, under glucose-
deprived conditions, proliferating T cells undergo apoptosis (Jacobs et al., 2008; Rathmell et
al., 2000).
C. Glutamine metabolism
Glutamine is also crucial for T cells as low extracellular concentrations decrease human
leukocyte proliferation (Parry-Billings et al., 1990) whereas a glutamine-rich diet is associated
with an increased lymphocyte proliferation and increased cytokine secretion (Kew et al.,
1999). As observed for glucose, activation of the TCR signaling resulted in increased glutamine
import, notably through upregulation of the cell surface expression of neutral amino acid
transporters (Sena et al., 2013). Several transporters can uptake glutamine including the

69
sodium-dependent neutral amino acid transporter 1/2 (SNAT1/SNAT2) and the system ASC
amino acid transporter-2 (ASCT2 or SLC (solute carrier family) 1A5) (Carr et al., 2010; Nakaya
et al., 2014; Ren et al., 2017). Glutamine is a rate limiting step for mTOR activation and its
entry in Hela cells through the transporter ASCT2 regulates mTOR activation (Nicklin et al.,
2009). Mechanistically, glutamine entry through ASCT2 allows the functioning of the
SLC7A5/SLC3A2 heterodimer, a bidirectional transporter which controls the import of
extracellular leucine in exchange with intracellular glutamine export. This process activates
mTORC1 and highlights the role of glutamine flux in mTOR activation. (Nicklin et al., 2009). In
addition, another elegant study demonstrated that activated ASCT2-/- T cells displayed
defective phosphorylation of mTOR targets S6K1 and 4EBP1, highlighting again the
importance of ASCT2 in the activation/recruitment of mTOR signaling pathway (Nakaya et al.,
2014).
D. Lipid metabolism
The induction of the lipid biosynthetic pathway is also engaged upon TCR activation
program (Lochner et al., 2015). Thus cholesterol as well as FA synthesis has been shown to be
highly upregulated upon T cell activation (Bietz et al., 2017). Indeed, Wang and colleagues
demonstrated that 24-30 hours following T cell activation, an increase of metabolites from
the FAS pathway was detected (Wang et al., 2011). The FAS pathway is induced by SREBP
processing and LXR signaling inhibition (Bensinger et al., 2008). Mechanistically, TCR-
stimulated de novo lipid synthesis, is dependent on mTORC1 which activates SREBP and
mediates the process (Kidani et al., 2013; Yang et al., 2013). C-myc also contributes to lipid
biosynthesis in T cells through its implication in glucose catabolism (from which result
important intermediates to sustain lipid synthesis) (Wang et al., 2011).
Cholesterol can also modulate T cell activation due to its contribution on lipid rafts
formation, which are structures where lipid-lipid and lipid-protein interactions occur and
contribute to the optimal clustering of signaling proteins at the membrane to facilitate signal
transduction (Hou et al., 2016). In T cells, it was demonstrated that cholesterol present in the
lipid rafts was important for the formation of TCR dimers which determined the sensitivity of
the TCR to external stimuli (Molnar et al., 2012). Lipids, and in particular cholesterol, can
modulate TCR signaling through the promotion of different conformational state of the CD3

70
chain (Guo et al., 2017). Furthermore, cholesterol can directly bind to the TCR and modify it
via allosteric regulation of TCR phosphorylation (Swamy et al., 2016). Moreover, membrane
fluidity and spatial control of the receptors is also important to maintain the immunological
synapse (Dustin, 2014). Finally, cholesterol efflux also plays an important role on T cells being
LXR-dependent ABCG1 expression regulation (section II 3) important for T cell proliferation
regulation (Bensinger et al., 2008).
E. Arginine metabolism
Arginine availability is essential for optimal immune responses and more specifically for T
cell proliferation and function (Bronte and Zanovello, 2005). However, another study revealed
that arginine was not equally important for both CD4+ and CD8+ T cell showing that CD4+ T
cell proliferation was not dependent on arginine, whereas CD8+ T cell proliferation appeared
to be arginine concentration-dependent (Ochoa et al., 2001). However, this study goes
against other works mentioned in this section, where total T cell proliferation was impacted
either by arginine deprivation either by reduced arginine uptake (Werner et al., 2016; Werner
et al., 2017). In human cells, arginine is mostly transported by members of the SLC7 (Closs et
al., 2006; Fotiadis et al., 2013) comprising three CATs known as SLC7A1-3 or CAT1-3 and three
other subfamilies transporting not only cationic amino acids but also neutral amino acids
which are y+ L-type amino acid transporter 1 (y+ LAT1 or SLC7A7), y+ LAT2 or SLC7A6 and b0,+
AT or SLC7A9 (Fotiadis et al., 2013). On one hand, CAT transporters can mediate arginine
import (Closs et al., 2006; Fotiadis et al., 2013) in most eukaryotic cells fueling arginine-
dependent metabolic pathways and protein synthesis, while, on the other hand, y+ LAT
proteins mediate arginine export in exchange for neutral amino acids import (Closs et al.,
2006; Fotiadis et al., 2013). From all these arginine transporters, CAT-1 appears as the most
expressed on T cells. Recently it was shown that human CAT-1 mRNA is the most upregulated
upon T cell activation and also that CAT-1 is necessary for activation-induced arginine uptake
and human T cell proliferation (Werner et al., 2016).
It was shown that, in low-arginine environments, CD3ζ expression is down-regulated,
most likely because of a decreased synthesis of the chain (Taheri et al., 2001; Zea et al., 2004).
Moreover, these cells also demonstrated lower IFNγ, IL-5, IL-10 but not IL-2 production (Zea
et al., 2004). Furthermore, T cells stimulated in the absence of arginine failed to progress

71
through cell cycle and remained in G0-G1 phase (Rodriguez et al., 2007). Besides, in absence
of arginine, T cells undergo autophagy to get arginine intra-cellularly to preserve cell viability
(Garcia-Navas et al., 2012). An alternative strategy in arginine-deprived environments relies
on citrulline catabolism through ASS and ASL into arginine (Husson et al., 2003). Macrophages
can take up citrulline from the extracellular environment and therefore produce arginine
(Baydoun et al., 1994), demonstrating the importance of citrulline-arginine pathway in this
immune cell type. Similar mechanisms were recently demonstrated in human T cells, where
it was showed that citrulline could be transported by LAT1 transporter as siRNA-mediated
LAT1 knockdown in activated T cells resulted in reduced citrulline import (Werner et al.,
2017). Furthermore, citrulline supplementation was able to restore CD4+ and CD8+
proliferation under arginine-deprived concentrations being this process correlated with ASS
induction. However, in the complete absence of arginine, citrulline was not able to restore T
cell proliferation to the levels observed in conditions where arginine was available (Werner
et al., 2017). Another elegant study highlighted the importance of ASS as they demonstrated
that ASS1 deficiency resulted in reduced spleen size, reduced T cell numbers and abnormal T
cell differentiation and function (Tarasenko et al., 2015).
The global T cells metabolic feautures before and after TCR stimulation are described in
Figure 21.

72
3) Metabolic requirement and control during T cell differentiation – Effector and
regulatory functions.
A. Glycolysis
Glucose not only plays a crucial role in T cell activation but also in T cell differentiation and
acquisition of effector functions. Besides the general importance of glucose in T cell biology
several elegant studies demonstrated that glycolysis is not equally required for all T cell
subsets and can differentially impact their fate. Indeed, and despite the fact that both human
CD4+ and CD8+ T cells increased their glycolytic flux upon stimulation, CD4+ T cells had
increased HKII expression and were more dependent on aerobic glycolysis comparing to CD8+
T cells (Jones et al., 2017). It has also been shown that upon TCR activation, murine CD4+ and
Figure 21- Metabolic reprogramming of T cell upon TCR activation
Naïve T cells use glucose, amino acids and fatty acids to produce energy through OXPHOS. Nutrient
uptake occurs at low levels (comparing to TEFF cells), enough to maintain naïve T cell homeostasis and
cell quiescence. Upon TCR activation, nutrient uptake is increased followed by augmented protein,
lipid and nucleotide synthesis to sustain T cell growth and proliferation. Glucose is used as a main
energy source through aerobic glycolysis, a faster pathway to engage and from which results several
metabolic intermediates important to sustain the increased biosynthetic demands. mTOR
(mechanistic target of rapamycin), OXPHOS (oxidative phosphorylation), PI3K (Phosphoinositide 3-
kinases). Adapted from: (Palmer et al., 2016b)

73
CD8+ T cells rely highly on glycolysis. However, in contrast to the previous study, the authors
describe that CD4+ murine T cells had a higher ratio OXPHOS/glycolysis than CD8+ T cells.
These discrepancies can probably be explained by the differences on the time points chosen
to measure these parameters and by the fact that the studies were done in the distinct
systems (human vs murine). Moreover, glucose requirements among the different CD4+ T cell
subsets appear to be different as well. Indeed, naïve CD4+ T cell differentiation into Th1 and
Th17 cells was highly dependent on glycolysis, though these two different subsets exhibited
clear difference in the activation of HIF-1α for their glycolytic engagement (Dang et al., 2011;
Michalek et al., 2011; Shehade et al., 2015; Shi et al., 2011). Differentiated Th2 cells were also
highly dependent on glycolysis (Michalek et al., 2011), although the role of glucose in the
polarization of this lineage is less understood (Bantug et al., 2018). Due to the importance of
glycolysis in Th1, Th2 and Th17 cells, it was not surprising that GLUT1 deletion, as well as
glucose deprivation, altered Th1, Th2 and Th17 differentiation (Macintyre et al., 2014;
Michalek et al., 2011). In the context of my thesis, we also demonstrated that GLUT1 cell
surface levels could be used to select human CD4+ and CD8+ T cells subsets with distinct
effector functions. Cells that express high levels of GLUT1 were more proliferative, secreted
more IL-2 and IFNγ and had more effector-like phenotype (Cretenet et al., 2016). Other
elegant studies showed as well that increased glycolysis enhanced effector functions. For
instance, in GLUT1 transgenic mice, it was observed a selective increase in TEFF cells and in
IFNγ, IL-4 and IL-17 secretion (Michalek et al., 2011). Moreover, other two studies
demonstrated that reduced T effector function in tumor bearing mice could be overcome by
increased T cell glycolytic activity (Chang et al., 2015; Ho et al., 2015). Controversially, in a
study were T cells were segregated based on glucose uptake level (based on the uptake of a
fluorescent 2-NBDG glucose analogue), high glucose uptake was associated with a terminal
differentiated effector state and decreased in vivo effector function (Sukumar et al., 2013a).
Glycolytic enzymes activity can also impact on T cell polarization. For instance, PDH
activity seems to be important for Treg cell but not for Th17 cell differentiation (Gerriets et
al., 2015). Furthermore, LDH-A (another enzyme from the glycolytic pathway) was
demonstrated to be important in promoting an efficient Th1 polarization through a direct role
on the epigenetic regulation of IFNγ expression (Peng et al., 2016). Finally, Chang and
colleagues showed that the glyceraldehyde 3-phosphate dehydrogenase (GAPDH) was

74
important to control effector cytokine production, notably IFNγ due the regulation of its locus
(Chang et al., 2013).
B. Glutaminolysis
Despite its role in T cell activation, glutamine is also involved during T cell differentiation
and acquisition of effector functions. ASTC2 knockout revealed an important role of glutamine
and its transporter in the induction of signaling pathways required for T cell polarization and
effector function. Indeed, our lab among others demonstrated that ASCT2 knockout as well
as glutamine deprivation in vitro (on both murine and human cells) impaired the induction of
both Th1 and Th17 cells (Klysz et al., 2015; Metzler et al., 2016; Nakaya et al., 2014) via a sub-
optimal activation of mTORC1. However, glutamine deprivation or glutaminolysis inhibition
did not alter Th2 and Treg differentiation on both murine and human T cells (Klysz et al., 2015;
Metzler et al., 2016). Furthermore, work from our lab showed that, in glutamine-deprived
conditions, naïve T cells failed to differentiate to a Th1 fate and resulted instead with a Treg
phenotype, highlighting the role of glutamine availability in the differentiation of CD4+ T cells
into different Th subsets (Klysz et al., 2015).
C. TCA cycle metabolites
As already described in section II 2, TCA-cycle metabolic intermediates can derive from
the catabolism of glucose, glutamine and fatty acids. These metabolites are important for T
cell activation and acquisition of effector functions by activating different metabolic
pathways. For instance, citrate and acetyl-coA are not only fulfilling the TCA cycle, but also
have an interconnection with lipid synthesis and gene expression. TCA cycle-produced citrate
can be transported into cytosol by the citrate carrier (CIC) and then used for lipid and
cholesterol synthesis (Palmieri, 2004). In the same line, acetyl-coA is important for FA and
cholesterol synthesis. How these metabolites are used in the fatty acid and cholesterol
metabolism is explained in the section II 3. Importantly, citrate and acetyl-coA are also main
players on epigenetic regulation (Figure 22) (section III 3 C b).

75
a) Alpha-ketoglutarate
αKG is involved in many processes besides its role in fueling the TCA cycle. Thus, it was
demonstrated that αKG contributes to lipid metabolism. For instance, it was demonstrated
that αKG supplementation, was able to decrease through unknown mechanisms the serum
content in total cholesterol, LDL and triglycerides, and increase HDL concentration (Radzki et
al., 2009). Moreover, αKG was demonstrated to have also a role as regulator of gene
expression and cell signaling pathways. For instance, αKG was identified as a ligand of a G
protein-coupled receptor (GPR99 also known as 2-oxoglutarate receptor 1) which, once
activated, is able to modulate cell metabolism and signaling resulting in increased cell
proliferation (He et al., 2004). Another better-described role of αKG consists in its capacity to
repress HIF-1α stabilization by fostering the activity of the metabolic sensor prolyl
hydroxylases (PHDs) (Pan et al., 2007). Indeed, when amino acids are depleted, reduced αKG
levels lead to PHDs inactivation and HIF-1α stabilization (Durán et al., 2012). Furthermore,
HIF-1α has many functions in the regulation of T cell cellular metabolism and function. An
elegant study revealed that HIF-1α was important to sustain glycolysis during T cell response,
but not required during early T cell activation (Wang et al., 2011). The role of HIF-1α in T cell
differentiation and notably on the Th17/iTreg balance is however not fully characterized
(Dang et al., 2011; Shi et al., 2011). While Shi and colleagues demonstrated that HIF-1α
deficiency inhibited Th17 differentiation and promoted iTreg differentiation due a reduction
of the glycolytic metabolism (Shi et al., 2011), Dang and colleagues revealed that Th17
differentiation was altered due to the inhibition of RORγT expression and, on the contrary,
iTreg differentiation was promoted because of the absence of HIF-1α-dependent inhibition of
FoxP3 expression (Dang et al., 2011). Contradictory, another study demonstrated that HIF-1α
was required for FoxP3 expression and optimal Treg function (Clambey et al., 2012). However,
this study was performed in a hypoxia context and in iTreg polarizing conditions while the
previous ones were done in normoxia conditions (Shi et al., 2011) and in a Th17 polarizing
context (Dang et al., 2011; Shi et al., 2011), which can potentially explain the differences
observed. In CD8 T cells, it was shown that HIF-1α increased the expression of effector
molecules (such as IFNγ and TNF) and the cytolytic activity (Doedens et al., 2013; Finlay et al.,
2012). αKG also promotes mTOR signaling through PHDs activation, blocks autophagy and
induces cell growth and proliferation (Duran et al., 2012; Durán et al., 2012). αKG has also an

76
important role as a nitrogen-acting scavenger to protect cells from ammonia exposure
(Nilsang et al., 2008).
αKG plays also an important role in gene regulation through its implication in epigenetic
regulation. Indeed, αKG is a co-factor for 2 families of dioxygenases that mediate
demethylation and hydroxylation reactions of DNA and histones: the TET proteins family of
5-methylcytosine (5mc) hydroxylases and the Jumonji C (JmjC) domain containing histone
demethylases (HDM)(JHDM) (Kaelin and McKnight, 2013; Loenarz and Schofield, 2011). These
dioxygenases not only required αKG as a co-factor, but also oxygen and iron (Kaelin and
McKnight, 2013) (Figure 22). TET proteins are able to oxidize 5mC to 5-hydroxymethylcytosine
(5hmC), 5- formylcytosine (5fC) and 5- hydroxymethylcytosine (5caC) (He et al., 2011; Ito et
al., 2011; Tahiliani et al., 2009) leading to demethylation.
Several studies have recently demonstrated that TET proteins are important for T cell
differentiation. Indeed, mice deficient in TET2 were unable to produce Th1 and Th17
cytokines, although Th2 differentiation was not impacted. Therefore, different Th subsets
exhibit a differential dependence on TET2-mediated 5hmc and H3K4me3 epigenetic
modifications (Ichiyama et al., 2015). Furthermore, several studies have shown a distinct
epigenetic regulation of Treg differentiation as compared to other Th subsets (Morikawa et
al., 2014). FoxP3 expression has been demonstrated to be regulated by epigenetic
mechanisms, particularly through the methylation of an element located in the
5’untranslated region of the FoxP3 locus known as TSDR (Treg-specific demethylated region)
(Polansky et al., 2008). TET1, 2 and 3 have also been shown to be important for FoxP3 stability
in Treg cells through epigenetic regulation mechanism (Someya et al., 2017; Yang et al., 2015;
Yue et al., 2016). Mechanistically, Yang and colleagues demonstrated that IL-2 and TGF-β
signaling, through SMAD3 and STAT5a phosphorylation, activate TET1 and 2 facilitating the
demethylation of CNS1 and CNS2 regions and consequently allowing FoxP3 stability (Yang et
al., 2015). In the absence of IL-2, TSDR remained methylated and FoxP3 expression was
transient and unstable (Nair et al., 2016). Furthermore, it was recently discovered that αKG
was able to regulate certain CTCF (CCCTC-binding factor is a DNA-binding zinc-finger
transcription factor) binding sites inducing CTCF association and impacting the Th1 program
in a TET-dependent manner (Chisolm et al., 2017).

77
Alteration of αKG availability and dysregulation of associated enzymes can interfere with
T cell differentiation and it is often associated with oncogenicity. Mutations in a single allele
of the isocitrate dehydrogenase (IDH) 1 and 2 can create a neomorphic enzyme with increased
affinity to αKG. Mutant IDH1/2 enzymes result in diminished αKG/ isocitrate inter-conversion
and the generation of the 2-hydroxyglutarate (2HG) oncometabolite: D-(R)-2-
hydroxyglutarate ((R)-2HG or D-2HG) (Dang et al., 2009; Rendina et al., 2013; Ward et al.,
2012). As such, elevated levels of D-2HG have been detected in patients with myeloid
leukemias (AML), gliomas and angio-immunoblastic T-cell lymphoma (AITL) (Dang et al., 2009;
Lemonnier et al., 2016; Ward et al., 2010). αKG can also be converted into a different 2HG
enantiomer known as L-(S)-2-hydroxyglutarate (S-2HG or L-2HG). Interestingly, this
enantiomer does not result from a mutation in IDH enzymes and can be generated either
from LDH-A and malate dehydrogenase (MDH)1 activity in cytosol , either from MDH2 activity
in the mitochondria under conditions such as hypoxia, mitochondrial impairment or specific
pH conditions (Intlekofer et al., 2015; Intlekofer et al., 2017; Oldham et al., 2015).
While D-2HG has been commonly detected in different cancers, both D-2HG and L-2HG
enantiomers are competitive inhibitors of αKG due their capability to bind to αKG-dependent
dioxygenases. As a result, increased levels of 2HG can inhibit the TET2 and JmjC mediated-
demethylation (Chowdhury et al., 2011; Lu et al., 2012; Xu et al., 2011). Moreover, mutations
in TET2 have also been reported in myeloid cancer patients, strongly suggesting that
epigenetic deregulation and histone modifications can promote an oncogenic phenotype
(Delhommeau et al., 2009; Langemeijer et al., 2009).
b) Other TCA cycle metabolites
As discussed on the section III 3 C a, αKG is a TCA intermediate with a preponderant role
in epigenetic regulation. However, other TCA cycle metabolites are also crucial. Succinate and
fumarate are two metabolites that can directly compete with αKG, inhibiting αKG-dependent
dioxygenases and PHDs activation (Vatrinet et al., 2017) (Figure 22). Indeed, in succinate
dehydrogenase- (SDH) and fumarate hydratase (FH) (two enzymes classified as tumor
suppressors) deficient tumors, an increased stability of HIF1-α was observed even in normoxic
conditions (Pollard et al., 2005). Furthermore, it was also shown that ectopic expression of
tumor-derived SDH and FH mutants inhibited histone demethylation and hydroxylation of

78
5mC (Xiao et al., 2012). However, the precise impact of SDH and FDH mutations in T cell
differentiation and function remain unclear.
Epigenetic control not only requires methylation/demethylation events, but also involves
acetylation consisting in post-transcriptional modifications mediated by histone acetyl-
transferases. These enzymes use Acetyl-CoA as substrate which can be originated from the
citrate, another TCA cycle metabolite (Gaber et al., 2019). Actually, acetyl-CoA-mediated
histone acetylation (Figure 22) was already demonstrated to be important to regulate the
transcription of Ifng , thus promoting Th1 cell differentiation (Peng et al., 2016).
D. Lipid metabolism
Depending on the T cell subset, FAS and FAO are more or less engaged. The role of fatty
acids in CD8+ T cells is mainly associated with the generation of murine memory cells (Pearce
et al., 2009) since CD8+ effector cells rely mainly on glycolysis (discussed in section III 4).
Within murine CD4+ T cell compartment, Treg cells as compared to Th cells, were less
Figure 22 – Epigenetic regulation mediated by TCA cycle metabolites
Demethylation can be mediated by TET enzymes and KDM which require αKG, O2 and Fe as co-factors.
High levels of succinate, fumarate and 2HG inhibit TET and KDM demethylation activity. Acetylation
is mediated by HAT which requires the utilization of the acetyl group from the acetyl-CoA. Acetyl-CoA
can derive from nuclear/cytosolic citrate and pyruvate, which are the substrates for ACL and PDH,
respectively. HDAC can generate acetate as a product that can be used by ACSS2 to regenerate acetyl-
CoA. 2HG (2-hydroxyglutarate), αKG (Alpha-Ketoglutarate), ACL (acetyl-CoA-generating enzymes),
ACSS2 (Acyl-CoA Synthetase Short Chain Family Member 2), HAT (Histone acetyltransferases), HDAC
(histone deacetylase), KDM (Lysine demethylases), PDH (Pyruvate dehydrogenase), TET (ten-eleven
translocation hydroxylases). Adapted from: (Intlekofer and Finley, 2019)

79
glycolytic and rely mainly on FAO (Michalek et al., 2011). However, another study done in
human T cells showed that freshly isolated Treg cells were highly glycolytic comparing to
Tconv cells and that FAO was upregulated only upon activation and during proliferation
(Procaccini et al., 2016). Furthermore, Cluxton and colleagues demonstrated that human Treg
cells not only exhibited increased FAO but also increased glycolysis upon TCR stimulation
(Cluxton et al., 2019).The recruitment of FAO metabolic program in Treg cells could explain
the capacity of these cells to adapt to environments rich in FAs as it was demonstrated FoxP3
expression is sufficient to upregulate FAO and OXPHOS related proteins and therefore favors
the survival of Treg cells (Howie et al., 2017a). Moreover, it was demonstrated that FoxP3
induces OXPHOS and increases the NAD/NADH ratio to overcome lactate-mediated inhibition
of proliferation (Angelin et al., 2017). These mechanisms could justify the capacity of Treg
cells to adapt to environments rich in FAs, lactate and poor in glucose. Another study
demonstrated that FAO is required for Treg differentiation by using etomoxir (FAO inhibitor
through CPT1) (Michalek et al., 2011). However, two studies demonstrated recently that,
when used at high concentrations (as in the study by Michalek and colleagues), etomoxir
induces CPT1a-independent off-targets resulting in severe oxidative stress and decreased
OXPHOS instead of long-chain fatty acid oxidation inhibition per se (O’Connor et al., 2018;
Raud et al., 2018). Furthermore, using CPT1-/- mice or etomoxir at non-toxic concentrations,
it was shown that FAO inhibition did not impact Treg differentiation (Raud et al., 2018).
Finally, another study showed that pharmalogical/genetic inhibition of FAS did not impact
Treg development since Treg cells used mainly exogenous FAs from the surrounding
environment (Berod et al., 2014). Though, other study indicated that intratumoral Treg cells
displayed an intracellular lipid accumulation due and increased rate on FAS that complement
glycolysis to sustain Treg cell expansion (Pacella et al., 2018). Therefore, the overall picture of
FAS/FAO role in Treg differentiation/function remains a controversy subject of ongoing
investigation.
Th17 cells were described as a T cell subset that favors a lipogenic mode of metabolism
for their development where ACC1 is highly required (Berod et al., 2014). In this study, they
showed that Th17 cells depend on fatty acid synthesis to produce cellular membrane
phospholipids which were important for their metabolic program (Berod et al., 2014).
Another very recent study done in human T cells went in the same direction highlighting the

80
importance of FAS for Th17 cell function (Cluxton et al., 2019). Furthermore, an elegant study
also established that the balance between saturated and polyunsaturated FAs, which is
controlled by CD5L expression, can determine the pathogenic vs non-pathogenic profile of
Th17 cells (Wang et al., 2015). Down-regulation of CD5L promoted pathogenic Th17 cells by
changing the fatty acid composition and increasing cholesterol synthesis (Wang et al., 2015)
which was previously demonstrated to be important for Th17 function since is a precursor of
RORγT ligands (Santori et al., 2015; Soroosh et al., 2014).
The role of cholesterol in T cell activation is well described, however, its role on T cell
differentiation and its importance among the different T cell subsets have been so far less
addressed. It is known that levels of cholesterol in the microenvironment can impact T cell
differentiation. For instance, it was demonstrated by different studies that
hypercholesterolemia promoted inflammation and enhanced TCR stimulation, T cell
proliferation and Treg cell development (Maganto-Garcia and Lichtman, 2008; Mailer et al.,
2017a; Mailer et al., 2017b).
T cell differentiation and effector function can also be impacted by the cholesterol
biosynthesis pathway (discussed on section II 3). Several studies pointed out that statins-
mediated inhibition of cholesterol synthesis was associated with enhanced Treg
differentiation (Forero-Pena and Gutierrez, 2013). However, another study showed that the
inhibition of the cholesterol pathway blocked Treg suppressive capacity (Zeng et al., 2013).
Therefore, the role of cholesterol biosynthesis on Treg differentiation is not fully understood.
Nevertheless, it was shown that cholesterol esterification in CD8 T cells through the inhibition
of the enzyme ACAT1 potentiated antiviral functions (Yang et al., 2016b).
Finally, LXR also have a role in T cell differentiation. Indeed, in EAE model, the treatment
with a LXR decreased Th17 differentiation resulting in decrease disease severity (Xu et al.,
2009). Furthermore, it was shown that the use of LXR agonists enhances Treg differentiation
(Herold et al., 2017).
More indirectly, ABCA1/G1 deficient-dendritic cells resulted in enhanced T cell activation,
increased T cell numbers on lymph nodes and enhanced Th1 and Th17 polarizations due to
inflammasome activation, GMCSF and inflammatory cytokines secretion, highlighting the

81
importance of cholesterol efflux transporters in maintaining immune tolerance. (Westerterp
et al., 2017).
The metabolic signatures of Teff and Treg cells is summarized on Figure 23.
E. Arginine metabolism
A recent study demonstrated extracellular concentrations of arginine could impact on the
T cell phenotype and effector function. Geiger and colleagues showed, in mice, that high
extracellular arginine levels modulated the regulation of several metabolic programs,
downregulating glycolysis and upregulating OXPHOS (Geiger et al., 2016). Furthermore, high
extracellular arginine levels limited T cell differentiation and maintain cells in a central-
memory-like state with great anti-tumor properties (Geiger et al., 2016). Finally, another
recent study performed in infantile rats reveals that arginine supplementation enhances Th1
response following activation by concanavalin A (Con A) or lipopolysaccharide (LPS) (Lee et
Figure 23- Metabolic signatures of TEFF (Th1/Th2/Th17) and Treg cells
Th1, Th2, Th17 cells depend mainly on carbon substrates such as glucose and glutamine in order to
fulfill their biosynthetic demands and to produce energy through aerobic glycolysis and OXPHOS.
Additionally, Th17 cells rely also on de novo fatty acid synthesis for their differentiation. Despite the
fact that Treg cells engage glycolysis, this subset depends on FAO for suppressive function. FAS (fatty
acid synthesis), GLYC (glycolysis), OXPHOS (oxidative phosphorylation), Th (T helper), TEFF (T effector),
Treg (T regulatory), Adapted from: (Geltink et al., 2018; Newton et al., 2016)

82
al., 2018). Moreover, both arginine and citrulline based-therapies in infantile rats could
modulate Treg immune effects by increasing IL-10 levels (Lee et al., 2018).
F. mTOR and AMPK signaling pathway
Despite its role in metabolic regulation and T cell activation, mTOR has also a crucial
implication in T cell differentiation. The conditional deletion of mTOR altered Th1, Th2 and
Th17 differentiation while promoted Treg differentiation (Delgoffe et al., 2009). Furthermore,
as mTOR can be part of 2 different complexes (mTORC1 and mTORC2), Delgoffe and
colleagues further demonstrated that mTORC1 was required for Th1 and Th17
differentiations, while Rictor and therefore mTORC2 was required specifically for the Th2
development (Delgoffe et al., 2011). Controversially, further studies demonstrated that
deletion of Raptor (as discussed in section II, a mTORC1-associated protein) was important
for Th17 differentiation but not for Th1 development (Kurebayashi et al., 2012). Moreover,
Raptor deletion showed as well an important mTORC1 role in Th2 development (Yang et al.,
2013).
Interestingly, and despite the studies from Delgoffe and colleagues showing that the
absence of mTOR resulted in T cells with a Treg phenotype (Delgoffe et al., 2011), the role of
mTOR in Treg cells is still debated. Indeed, few other studies demonstrated that deletion of
mTOR signaling pathway components induced Treg generation (Battaglia et al., 2012; Chang
et al., 2012; Haxhinasto et al., 2008). However, other groups showed that mTOR activity was
important to support Treg proliferation and it was increased in human Treg cells (Battaglia et
al., 2006; Procaccini et al., 2010; Valmori et al., 2006). Another elegant study demonstrated
that mTORC1 was a pivotal determinant of Treg suppressive activity while it did not directly
affect Foxp3 expression (Zeng et al., 2013). Finally, another recent study done in mice
revealed that mTOR inhibition promoted generation of long-lived central Tregs with a
memory-like phenotype while mTOR function was required for the generation of effector Treg
cells (Sun et al., 2018). Thus, a balanced mTOR activity is required to maintain Treg cells
stability and function (Zeng and Chi, 2017). The roles of mTOR complexes during T cells
differentiation are depicted in Figure 24.

83
AMPK, as mentioned in the section II 5 is another energy sensor involved in the regulation
of cell metabolism. Activation of AMPK inhibits mTOR signaling, favoring catabolism.
Therefore, it was not surprising that AMPK activation could impact Th/Treg cell
differentiation. Indeed, studies performed in CD4+ T cells showed that AMPK activation by
metformin prevented the efficient polarization of Th1 and Th17 cells (Kang et al., 2013; Zhao
et al., 2015), suggesting a role of AMPK as negative regulator in Th1 and Th17 differentiation.
However, the role of AMPK on Treg cells appears to be different. TFG-β signals that were
important for iTreg differentiation (Marie et al., 2005) are also required for AMPK activation
(Xie et al., 2006). Indeed, AMPK activation was required to promote FAO which promotes Treg
differentiation (Gualdoni et al., 2016; Michalek et al., 2011). Furthermore, under Th17
polarizing conditions, AMPK activation dampened Th17 induction and induced FoxP3
expression (Gualdoni et al., 2016). Moreover, Treg-specific LKB1 deletion (one of the
activators of AMPK, discussed on section II 5) impacted Treg function and survival due to
defective mitochondria, compromised OXPHOS, altered cellular metabolism and decreased
ATP levels (He et al., 2017).
Figure 24- mTOR signaling function in T cell
differentiation
mTORC1 and mTORC2 play a role in T cell differentiation.
In this figure it is detailed the role of mTOR complexes in
Th/Treg cell differentiation. mTOR (mechanistic target of
rapamycin), mTORC (mTOR complex). Adapted from:
(Zeng and Chi, 2017)

84
4) Memory T cells
At steady state, memory T cells share some common features with naïve T cells, illustrated
by 95% similarity in gene expression (Weng et al., 2012). Thus, it is not surprising that memory
T cells present a metabolism similar to that of naïve T cells relying mainly on OXPHOS and FAO
(Almeida et al., 2016; Verbist et al., 2012). However, upon TCR activation, memory T
metabolic response is faster and more intense as compared to naïve T cells (Gubser et al.,
2013; van der Windt et al., 2013). Furthermore, because of increased mitochondrial
biogenesis, CD8+ memory T cell also have a greater mitochondrial mass than naïve T cells
displaying an increased spare respiratory capacity (SRC) (Dimeloe et al., 2016; van der Windt
et al., 2012; van der Windt et al., 2013). In line with this result, another study revealed that
CD8+ T cells with low glucose uptake (based on the uptake of a fluorescent 2-NBDG glucose
analogue) correlated with memory T cell phenotype (Sukumar et al., 2013), highlighting the
low glycolytic profile of memory T cells.
Several factors are involved in the regulation of memory T cell metabolism, among which
is IL-15. In CD8+ T cells, IL-15-mediated signaling increases mitochondrial biogenesis and
expression of CPT1 resulting in an increased SRC and FAO, respectively (van der Windt et al.,
2012). However, the concentrations of etomoxir used in this study were further
demonstrated to have CPT1a- independent off-targets, as discussed in the section III 3 D,
which makes complicated the interpretation of the results (O’Connor et al., 2018; Raud et al.,
2018). Mitochondrial dynamics is also important for memory T cell generation as it was
demonstrated, in mice, that the differentiation of memory cells required the expression of
Opa1 (optic atrophy 1), a molecule involved in mitochondrial fusion and promoting efficient
ETC activity (Cogliati et al., 2013). Indeed when mitochondrial fusion is enforced in effector
cells, they acquire memory T cell characteristics (Buck et al., 2016).
Energy-sensing pathways were also shown to have a preponderant role in memory T cell
differentiation. Contrary to its role in CD8+ effector T cells, mTOR was shown to be a negative
regulator in memory T cell generation. In a mice, mTOR inhibition through rapamycin
treatment induced CD8+ T cell differentiation to a memory phenotype (Araki et al., 2009).
Furthermore, siRNA-mediated reduction of mTORC1 signaling as well as inhibition of mTORC2
in CD8+ T cell was also resulting in memory T cell generation (Berezhnoy et al., 2014).

85
Moreover, it was demonstrated that AMPK promoted memory T cell formation (Rolf et al.,
2013) and TRAF-6 (TNF receptor associated factor 6) was important for effective AMPK
activation and consequent increase on FAO (Pearce et al., 2009). Also, the activation of AMPK
by metformin in activated T cell resulted in increased FAO and CD8+ memory T cell
differentiation (Pearce et al., 2009). Further, AMPK activity on memory CD8+ T cells (at the
expense of mTOR activation) increased CPT1 activity and supported the mitochondrial uptake
of fatty acids. These mechanisms resulted in a decreased dependence on glucose metabolism
(Buzzai et al., 2005).
IV. The tumor metabolic environment and
Chimeric antigen receptor (CAR) T cell
immunotherapies
1) Immunity shapes the tumor – cancer immunoediting
The role of the immune system in controlling cancer was not always a subject of debate.
In early 1900s, Paul Ehrlich had the theory that without the immune system, cancer would be
probably a pathology with a higher incident rate (Ehrlich, 1909). However, since little was
known about the immune system at that time it was difficult to prove this theory. For a long
time, the contribution of the immune system to tumor surveillance was under debate and it
was only in late 1950s that Burnet and Thomas proposed, for the first time, a major
implication in cancer immunosurveillance and that immune cells play an important role in
preventing cancer development in immunocompetent hosts (Burnet, 1957; Thomas, 1959).
Since then, many scientific discoveries supported the role of immune cells in anti-tumor
responses. However, in 2001, another discovery led to the revision of the cancer
immunosurveillance hypothesis proposed by Burnet and Thomas (Shankaran et al., 2001).
Indeed, when intracellular tumor suppressor mechanisms fail, upon cellular transformation,
several immune mechanisms are involved in the recognition and elimination of these
transformed cells. Despite the pressure of the immune system, an equilibrium phase
establishes and tumor cells with reduced immunogenicity escape immunosurveillance and, as
a result, pursue transformation by genetic and epigenetic changes. In the final phase, these
alterations will allow escape from immune detection and elimination, resulting in the
86
expansion of the cell clones transformed at the equilibrium phase and generation of a tumor.
All these different phases (elimination, equilibrium, escape) demonstrate that the immune
system not only protects the host from tumor generation but also shapes tumor
immunogenicity in a process called cancer immunoediting (Schreiber et al., 2011). This gap in
the host’s immune system can lead to alterations in tumor cells that can notably affect tumor
recognition (downregulation of MHC molecules) or induce T cell apoptosis and condition the
TME (tumor microenvironment) (Dunn et al., 2004). The TME is a really complex environment,
composed of different actors in which tumor cells take part. The explanation of how the TME
is composed and how it can impact T cell anti-tumor function is described in the next section.
2) Tumor microenvironment
Solid tumors are not only composed of clones of cancer cells but they also include several
other cell types such as endothelial cells, stromal fibroblasts, adipocytes, extracellular matrix
molecules and immune cells in a highly disorganized version of what we would find in normal
organs (Egeblad et al., 2010). This structure favors the development of hypoxic environments
that represents an adverse prognostic factor for patient outcome (Vaupel and Mayer, 2007).
Furthermore, these structures vary between tumors, which add to the complexity of solid
tumors.
In 2000, an iconic review came out describing the six hallmarks of cancer. In this review,
the authors discussed about the remarkable diversity of neoplastic diseases due the capacity
of tumor cells to sustain proliferative signaling, to evade growth suppressor genes, to activate
invasion and metastasis, to enable replicative immortality, to induce angiogenesis and finally
to resist cell death (Hanahan and Weinberg, 2000). Eleven years later, the same authors
pursued their initial discussion to integrate new raised questions and to highlight new
mechanistic concepts and notably the following two hallmarks: Dysregulation of cellular
energetics and mechanisms to avoid immune destruction (Hanahan and Weinberg, 2011).
Therefore, not only the capacity of tumor cells to evade immunological destruction by B and
T cells was discussed but also the capacity of cancer cells to modify and reprogram cellular
metabolism was pointed out as a crucial factor to support neoplastic proliferation (Hanahan
and Weinberg, 2011). As a result, in the past years, the concept that tumors are more than
an assembly of tumorigenic cells but instead a complex system where the TME should be

87
taken into account was consolidated (Hanahan and Weinberg, 2011). How the TME impacts
on T cell anti-tumor functions, in particular through nutrient availability and hypoxia, will be
discussed in the next two sections (section IV 2 A and IV 2 B).
A. Nutrient competition
As explained in the section III, several metabolic pathways are crucial for T cells and their
engagement plays then an important role to sustain T cell activation, differentiation and
effector functions. Tumors are poorly vascularized and highly glycolytic resulting in the
generation of a surrounding environment with reduced glucose and amino acid levels
(Johnson et al., 2016) and high levels of waste products such as lactate (Romero-Garcia et al.,
2016). Once tumor-infiltrating T cells (TILs) infiltrate the tumor, they face an adverse TME that
not only can impact their activation and differentiation, but also their anti-tumor function.
a) Glucose deprivation
Tumor cells are highly glycolytic (Warburg, 1925) and several recent studies have
demonstrated the importance of metabolic pathways coordinating glucose and lactate
metabolisms in several cancer types (Doherty and Cleveland, 2013; Draoui and Feron, 2011;
Hensley et al., 2016; Kennedy et al., 2013; Ruan and Kazlauskas, 2013). Cancer cells and
endothelial cells in the TME are able to regulate lactate transport via the monocarboxylate
transporter (MCT) 1 which is released by glycolytic cancer cells mainly through MCT4
(Sonveaux et al., 2008; Vegran et al., 2011). Inhibition of MCT1 can impact the metabolic
preferences of cancer cells forcing them to use glucose, reducing the availability of lactate for
tumor cells in hypoxic environments and thereby impacting their survival (Sonveaux et al.,
2008). Moreover, the inhibition of MCT4 directly targets tumor cells in hypoxic environments
and promotes cell death through the intracellular accumulation of lactate (Draoui and Feron,
2011). These works highlight the importance of lactate as a cell metabolic fuel. However,
cancer cells are not the only ones requiring high amount of glucose in the TME. A study
performed in prostate cancer showed that cancer associated fibroblasts (CAFs) present high
GLUT1 expression, glucose uptake, MCT4 expression and lactate release (Fiaschi et al., 2012).
In presence of CAFs, the surrounding cancer cells increase their lactate intake highlighting the
importance of the tumor-stromal interplay (Fiaschi et al., 2012; Rattigan et al., 2012).

88
As discussed in the section III 3 we, among others, demonstrated that glucose is important
for IFNγ secretion and for pro-inflammatory functions (Cham et al., 2008; Cretenet et al.,
2016; Macintyre et al., 2014). Thus, it is expected that the low glucose availability generated
in the TME could negatively impact on T cell anti-tumor function. For instance, in a mouse
sarcoma model, Chang and colleagues demonstrated that glucose restriction on the TME
reduced the glycolytic capacity, mTOR activity and IFNγ secretion of tumor-infiltrating T cells,
therefore favoring tumor progression (Chang et al., 2015). Another elegant study
demonstrated that reduction of glycolysis resulted in a decrease in phosphoenolpyruvate
(PEP), a glucose-derived metabolite, impacting calcium signaling and therefore anti-tumor
responses (Ho et al., 2015). Also, using an human ovarian cancer chimeric model in a tumor-
imposed glucose restriction context, microRNAs miR-101 and miR-26a were induced limiting
the expression of the methyltransferase EZH2 which therefore is important for Notch
pathway activation and consequently T cell cytokine production induction (Zhao et al., 2016).
The lactate that results from cancer glycolytic activity also impairs T cell effector capacity
(Romero-Garcia et al., 2016), with several studies demonstrating that lactate contributes to T
cell suppressive functions (Calcinotto et al., 2012; Fischer et al., 2007). High lactate
concentration exposure impairs NFAT activation as well as IFNγ secretion (Brand et al., 2016)
and in addition, T cell mobility and cytolytic functions were impacted as well. However, even
if low-glucose/high-lactate environments impact negatively T cell function, FoxP3-expressing
Treg cells seem to have the metabolic capacity to overcome this negative TME environment
(Angelin et al., 2017). Indeed, Treg cells have been associated with pro-tumor activity in
several cancer types (Curiel et al., 2004; Jiang et al., 2014; Sayour et al., 2015; Tang et al.,
2014; Tao et al., 2012; Yang et al., 2006) and bad prognosis.
b) Glutamine deprivation
Glutaminolysis is also a crucial metabolic pathway for some cancer cells types (Medina et
al., 1992; Souba, 1993). Several studies revealed that cancer cells such as non-small cell lung
cancer (NSCLC), breast, brain and liver tumor cells are highly dependent on glutamine for their
growth and survival (Choi and Park, 2018). It was demonstrated that glutamine synthase (GS)
is an important enzyme for fueling nucleotide biosynthesis and to support the growth of
glutamine-restricted glioblastoma (Tardito et al., 2015). Furthermore, another study showed
that both GS activity in CAFs and glutaminases in cancer cells are two important enzymes for

89
tumor growth and metastasis (Yang et al., 2016a). Thus, it is not surprising that in some cases,
TILs will find a glutamine-depleted TME. As detailed in the section section III 3 B, glutamine is
also essential during naïve T cells activation/differentiation to a Th1 fate. Furthermore,
glutamine deprivation pushes naïve T cells to differentiate into Tregs which, as mentioned
before, are important pro-tumor players (Klysz et al., 2015; Metzler et al., 2016).
c) Arginine deprivation and byproducts
In the TME, myeloid-derived suppressor cells (MDSC), tumor-associated macrophages
(TAM) and DC are immune cells that also play a crucial role in the maintenance of an hostile
environment for anti-tumor effector T cells (Marigo et al., 2008). It is well known that one of
the metabolic features of both MDSC and TAMs is their capacity to rapidly degrade arginine
(Lyssiotis and Kimmelman, 2017; Marigo et al., 2008) which is either catabolized by Arg1 or
NOS2 and results in urea and ornithine production or in citrulline and NO production
respectively (Bronte et al., 2003). As a consequence, arginine catabolization results in reduced
arginine availability (which is crucial for T cells as discussed in the section III 2 E) and also in
the generation of byproducts (such as NO) that can impact T cell function. In a murine lung
carcinoma model, the production of Arg1 in the TME by myeloid cells was already shown to
inhibit T cell receptor CD3ζ chain surface expression and antigen-specific T cell proliferation
(Rodriguez et al., 2004). Another study in renal cell carcinoma patients demonstrated that
these patients had low levels of arginine and high levels of ornithine in the plasma due
myeloid cells activity, highlighting the role of Arg1 in tumor progression (Zea et al., 2005).
Moreover, NO released from these heterogeneous groups of MDSC was able to inhibit T cell
responses due to an impairment of the IL-2R signaling pathway (defects in the
phosphorylation of janus kinase JAKs, STAT5, ERK and AKT) (Bingisser et al., 1998; Mazzoni et
al., 2002).
d) Tryptophan degradation and IDO activity
Another important player in the TME are IDO (indoleamine 2,3 deoxygenase)-expressing
cells that can be found in both murine and human tumor contexts (Munn and Mellor, 2007).
IDO is an enzyme which catabolizes tryptophan and in response to TGF-β, acts as signal
transducer important for plasmocytoid DCs tolerogenic phenotype (Chen, 2011). IDO

90
enzymatic activity is important for the creation of a suppressive TME which, through the
reduction of tryptophan availability, suppresses T cell responses and enhances Treg-mediated
suppression (Munn and Mellor, 2007). An elegant study demonstrated that most human
tumors constitutively express IDO and the tumors that express IDO are resistant to immune
rejection (Uyttenhove et al., 2003). IDO activity can also affect T cell priming: the presence of
a small population of IDO-expressing plasmacytoid DCs in tumor-draining lymph nodes was
described to create a suppressive microenvironment impacting anti-tumor T cell responses
(Munn et al., 2004). Moreover, this same IDO-expressing DC population could directly activate
mature Treg cell in tumor-draining lymph nodes (Sharma et al., 2007). Blocking IDO activity is
considered as a potential strategy to enhance anti-tumor immunity (Munn, 2012).
As discussed above, the metabolic activity of myeloid cells can have a negative impact on
anti-tumor functions. Nevertheless, it is essential to take in consideration that the TME can
impact myeloid cell functions. Immune responses are characterized as transient going
through “on” (cytotoxic activity and cytokine release) and “off” (immunosuppression) phases
(Bercovici and Trautmann, 2012). Both T cells and myeloid cells go through these phases that
are not necessarily synchronized between them (Bercovici and Trautmann, 2012). One
possible model is that when T cells infiltrate the TME, myeloid cells (which are recruited first)
are already in this long “off” phase conditioned by the surrounding environment. The
cooperation between T –myeloid cells occurs at the tumor site (Bercovici et al., 2008; Thoreau
et al., 2015) where the TME can interfere with it, pushing myeloid cells to have a pro-tumor
role. Therefore, the role of the TME on myeloid and its cooperation with T cells should be also
taken in consideration to improve anti-tumor responses.
e) Lipid metabolism
Another feature associated with cancer cells is the increased lipid biosynthesis (Zaidi et
al., 2013). De novo FAS contributes to generate lipids and phospholipids required for the
plasma membrane as well as lipid droplets in proliferating cancer cells (Zaidi et al., 2013). This
high lipid synthesis is associated with a membrane composed mainly by high saturated/
mono-unsaturated fatty acids that allow cancer cells to be more resistant to oxidative stress
(Rysman et al., 2010). Fatty acids can also represent a source of energy for tumors that are
less glycolytic such as prostate tumors (Effert et al., 1996; Liu et al., 2010) and human

91
leukemia cells (Samudio et al., 2010). Increased level of FASN expression and activity are
detected in cancer cells and correlate with cancer progression (Menendez and Lupu, 2007).
However, cancer cells also uptake exogenous fatty acids to fulfill their energetic demands
(Kuemmerle et al., 2011). Several studies demonstrated that targeting several lipid synthesis
pathway–related enzymes could result in tumor regression (Chajes et al., 2006; Hanai et al.,
2012; Kridel et al., 2004; Mashima et al., 2009; Menendez and Lupu, 2007). Lipid availability
is important for T cell activation, differentiation and function, as summarized in the sections
III 2 D and III 3 D, and this should be taken in consideration considering the high demand on
lipids by tumor cells. Indeed, lipid and cholesterol intra-tumoral metabolism can impact anti-
tumor function. It was shown that TILs have an abnormal lipid metabolism when compared
to non- tumor infiltrated T cells that can be reversed by inhibiting programmed cell death-1
(PD-1) which was initially induced by TME (Yin et al., 2016). It was also demonstrated that
lipid metabolism is also impacted in tumor-associated DCs from the tumor-bearing host,
resulting in the accumulation of lipid bodies that impair proper MHCI trafficking and antigen
presentation to CD8+ T cells (Ramakrishnan et al., 2014; Veglia et al., 2017). As a result,
targeting immune cells lipid metabolism could also represent a strategy in cancer treatment.
Indeed, it was recently revealed that CD8+ anti-tumor responses could be potentiated by
modulating cholesterol metabolism (Yang et al., 2016b), highlighting the importance of lipids
on anti-tumor function. A summary of the principal points concerning nutrient competition
in the TME is described in Figure 25.
B. Hypoxia
Hypoxia is a well-known characteristic of solid tumors associated with a wide range of
malignancies (Vaupel and Mayer, 2007) (Figure 25). It is also known that hypoxia levels among
different solid tumors is distinct (Brown and Wilson, 2004; Byrne et al., 2014) and that within
a tumor tissue, hypoxia levels vary as well notably between the periphery and center of the
tumor. In the periphery, tumor cells are better irrigated when compared to the central parts
of the tumor tissue, which therefore modulates differently the TME and tumorigenesis
(Campillo et al., 2019; Herman et al., 2011; Lewis et al., 2016; Quail and Joyce, 2013; Rofstad
et al., 2014). It is commonly accepted that the levels of oxygen (O2) within the tumor tissues
are low (between 1% and 2%) when compared to the respective healthy organs (Muz et al.,
2015). In human organs, oxygen concentration will vary between 9.5% in the renal cortex

92
(Muller et al., 1998) and 4.6% in the brain (Dings et al., 1998; Hoffman et al., 1996). In murine
lymphoid organs, the oxygen tension range between 0.5% and 4.5% (Caldwell et al., 2001).
Thus, when TILs arrive into the TME, they will most likely encounter an environment lower in
O2 availability comparing to their initial location. Hypoxia is an environmental factor impacting
cell signaling through activation of the HIF pathway, of which HIF (a transcription factor) is
important for cellular adaptation to low oxygen environments (Muz et al., 2015; Semenza and
Wang, 1992). Hypoxia is linked to several signaling pathways such as PI3K/AKT/mTOR (Agani
and Jiang, 2013; Courtnay et al., 2015), MAPK/ERK (Minet et al., 2000; Sanchez et al., 2012)
and NFκB pathways (Koong et al., 1994) that, once activated, are able to induce the HIF
pathway. HIFs mediate through gene regulation several physiological processes that are
crucial for tumor development (Semenza, 2012). For instance, it is involved in the promotion
of angiogenesis through induction of vascular endothelial growth factor (VEGF) expression
(Ahluwalia and Tarnawski, 2012; Lin et al., 2004) and stromal cell-derived factor 1 (SDF-1)
(Zagzag et al., 2005). Furthermore, the HIF pathway is important for cell apoptosis regulation
and cell survival via the induction of BNIP-3 (Guo et al., 2001), the stabilization of p53 (An et
al., 1998), and activation of TGF-β and bFGF (Muz et al., 2015). Hypoxia also inhibits the
expression of genes related to cell-surface integrins, thus promoting tumor cell detachment
and potential metastasis (Hasan et al., 1998). Moreover, HIF pathway is important for the
regulation of GLUT1, GLUT3 and other glycolytic enzymes (Iliopoulos et al., 1996; Iyer et al.,
1998; Semenza, 2013). Indeed, the induction of HIF-1α increased tumor cell utilization of
glucose and lactate release (Eales et al., 2016). Using a glucose tracing in healthy lung tissue
and in tumor tissue of non-small lung cell carcinoma patients, an elegant study demonstrated
that, even within the same type of tumor, heterogeneity of glucose utilization was observed
when compared to benign tumor (Hensley et al., 2016). Combining a glucose tracing approach
and dynamic contrast-enhanced magnetic resonance imaging, Hensley and colleagues
demonstrated that in less-perfused regions, glucose was the main source of energy. However,
in more-perfused regions, lactate was used as an alternative fuel (Hensley et al., 2016) that,
as described in the beginning of this section, can be transported into cancer cells by MCT1
and used as carbon source. This highlights how oxygen availability in the TME impacts
metabolites utilization by tumor cells.

93
Hypoxia, indeed, impacts T cell metabolism, proliferation and effector function. During
my PhD, we showed that, in hypoxic conditions, GLUT1 surface expression was higher as
compared to normoxic conditions, and in contrast proliferation and cytokine secretion was
diminished (Cretenet et al., 2016). Furthermore, and as explained in the section III 2 A, HIF-
1α plays many roles in T cell metabolism and function, notably in the regulation of cellular
metabolism (Kim et al., 2006) and T cell differentiation. However, the role of HIF-1α in Treg
cells is still under debate (Clambey et al., 2012; Dang et al., 2011; Shi et al., 2011) and in CD8
T cells it was demonstrated that HIF-1α increased effector molecules expression and the
cytolytic activity (Doedens et al., 2013; Finlay et al., 2012). Therefore, it was expected that the
hypoxic environment in the TME could modulate HIF1-α activation and, as a result, potentiate
T cell anti-tumor responses. This is actually not the case (Buck et al., 2017) and several reasons
could explain this result. One of those is related to the induction of programmed cell death
ligand 1 (PD-L1) on tumor cells, TAMs and MDSCs by HIF-1α (Noman et al., 2014). PD-L1 is the
ligand of PD-1 expressed on T cell surface following activation which is maintained upon
chronic activation mediated for instance by tumor cells. (Simon and Labarriere, 2017). When
PD1 binds to its ligand, the TCR signaling and CD28-costimulation are impaired (Hui et al.,
2017; Yokosuka et al., 2012) resulting in reduced proliferation, cytokine secretion and effector
function. PD1+ TILs upon binding to PD-L1 expressed by tumor cells or other immune cells
have an impaired anti-tumor function, known as checkpoint inhibition (Simon and Labarriere,
2017). Another parameter to take in consideration is the difficulty to perform experiments in
hypoxic conditions, making it hard to mimic the actual physiological conditions found in the
TME, which could explain the discrepancies of the previous studies mentioned before.

94
All these findings highlight hypoxia as an important determinant in the TME
microenvironment which should be taken in consideration for the design of new therapies.
Further studies are necessary to understand the impact of hypoxia in T cell differentiation and
effector function, notably on Treg cells.
Figure 25 – The tumor microenvironment
Tumor cells consume high levels of glucose, amino acids and fatty acids resulting in a deprived environment in nutrients crucial for T cell anti-tumor function. As a consequence of high glycolytic tumor activity, tumor cells secrete high levels of lactate, which is a toxic for T cells. Despite that, tumor cells are able to use lactate as an energy source exporting it by the MCT1. In the TME, other immune cells are present, favored by the surrounding environment and able to impact negatively T cell anti-tumor function. TAM and MDSC metabolic activity deprive the TME from arginine (through the action of Agr1) while DCs are well known for their capacity to deplete the TME in tryptophan through the activity of IDO. Furthermore, Tregs present in the TME downregulate T cell effector function. Finally, PD-1 expression by T cells, as a result of cell exhaustion, results in the downregulation of T cell anti-tumor function through the binding with PD-L1 present on the tumor cells surface. Hypoxia levels in the tumor site are also a negative factor in the TME which impact T cell function.
Arg1 (arginase 1), DC (dendritic cell), EAA (essential amino acids), IDO (indoleamine 2,3-dioxygenase),
MDSC (myeloid derived suppressor cells), MCT1 (monocarboxylate transporter 1), PD1 (programmed
cell death-1), PD-L1 (PD ligand 1), TAM (tumor-associated macrophages), TME (tumor
microenvironment), Treg (T regulatory T cells). From: (Buck et al., 2017)

95
3) Chimeric Antigen Receptor (CAR) T cell Immunotherapies
The tight relation between cancer cells and the immune system described in section IV 1
opened the doors to the development of immunotherapies. The idea that immune cells could
be directly targeted and manipulated ex vivo to overcome immune tolerance resulted in the
development of several therapies. Since T cells are the main players in immunosurveillance,
the first attempts at immunotherapy were centered on T cell manipulation (Kantoff et al.,
2010; Rosenberg et al., 2011). Ever since, adoptive T-cell therapies (ACT) have been in
continuous development.
ACT consists on the re-infusion of autologous tumor-antigen-specific T cells that were
previously collected from the patient, expanded ex vivo and thus re-injected in order to
generate an anti-tumor response. The current T-cell therapies are centered in two general
approaches: the use of T cells isolated from tumor zones called TILs and redirected T cells
(Cheadle et al., 2014). This latter category results from advances in genetic engineering
leading to recombinant T cell receptors (TCR) or to chimeric antigen receptors (CAR). Both
approaches result in the generation of T cells with increased specificity to specific tumor
antigens (Miliotou and Papadopoulou, 2018). In this section, I will particularly focus on CAR T
cells.
TILs are isolated from tumor biopsies and can be activated ex vivo (free from a potentially
suppressive tumor environment) and demonstrate in vitro tumor killing (Rosenberg et al.,
1986). These cells are then cultured in presence of IL-2 in order to get the largest number
possible. After testing their reactivity, TILs are re-infused into the patient. Despite the
interesting therapeutic results from TILs treatment, this approach presents some
disadvantages. This method is laborious, patient-specific, time-consuming and highly
dependent on the antigen levels expressed on the tumor. Furthermore, not all the TILs
isolated are tumor-specific which obliges the use of enrichment strategies that increases time
spent in culture which may alter their phenotype or induce anergy (Geukes Foppen et al.,
2015). However, the studies and the clinical trials that have been performed with TILs not
only highlighted the therapeutic potential of T cell-based immunotherapies but also have
been extremely important and crucial to understand, evaluate and improve the conditioning
regimens used prior to TILs injection (chemotherapy and radiotherapy) as well as the optimal

96
IL-2 doses to administrate to the patients (Andersen et al., 2016; Dudley et al., 2005; Dudley
et al., 2008; Goff et al., 2016; Rosenberg et al., 2011; Tseng et al., 2014).
The approach using a modified TCR results from the ectopic expression of α and β chains
to T cells to redirect their antigen specificity. These α and β chains are associated with
constant regions by disulphide bonds and also with the γ, δ, ε and ζ chains of the CD3 complex
(Uttenthal et al., 2012). The advantage of this gene-modified T cells is that the antigen
recognition mechanisms are equal to non-modified TCRs. However, with this approach the
responses against tumor antigens depend on MHC presentation, which is therefore not
compatible with the treatment of patients expressing a different MHC haplotype (Cheadle et
al., 2014). Furthermore, it also represents an important downside for the treatment of tumors
with low or no MHC expression (Garrido and Algarra, 2001; Seliger et al., 2000). These
problems promoted scientific investigations on approaches to provide antigen specificity to T
cells and to overcome disadvantages related to modified TCRs.
CARs, or T-bodies, are generated by joining as a single chain variable fragment (scFv)
molecule, the light and heavy chains of variable regions of a monoclonal antibody. The
construct contains a hinge domain, transmembrane domain, and cytoplasmic signaling
domains derived from the CD3ζ chain or Fc receptor γ chains (Sadelain, 2009). A specificity of
the CAR approach is that MHC antigen presentation is not required, since the antigens can
bind directly to the CARs and trigger T cell responses. This approach therefore overcomes the
problems discussed earlier associated with the lack of MHC recognition in some tumor
environments. However, contrary to TCRs, CARs cannot recognize antigens that are not
localized on tumor cells surface which, therefore, need to be processed, presented by APCs
and recognized through the MHC molecules. (Uttenthal et al., 2012).
The development of the CAR strategy led to the generation of several generations of CAR
constructs. Until now, 4 different CAR constructions were developed and they can be
distinguished based on their intracellular tail composition which results in distinct features:
first generation, second generation, third generation and fourth generation; also called
TRUCK (T cell redirected universal cytokine killing) (Cheadle et al., 2014; Wilkins et al., 2017).
The first generation, initially designed by Zelig Eshhar, includes only the CD3ζ as intracellular
domain (Eshhar et al., 1993; Gross et al., 1989). The second generation also expresses one co-
stimulatory domain (provided from endodomains of co-stimulatory molecules) and therefore

97
the intracellular tail contains two signaling domains. The idea of adding a co-stimulatory
molecule in this second generation CAR construct was to have a co-stimulatory signal which
could promote IL-2 synthesis in order to complete T cell activation and to improve the CAR T
cell proliferation, cytotoxicity and to prolong the lifespan of CAR T cells by avoiding apoptosis
(Zhang et al., 2017). The intracellular domain of the third generation is composed of the CD3ζ
and two co-stimulatory domains. These domains could be, for instance, CD28, CD137 (also
named 4-1BB) or CD134 (also known as OX40) (Finney et al., 2004). The presence of two co-
stimulatory domains was combined with the intention of increasing cytokine production,
killing ability and to respond better to recurrent exposition to tumor antigen (Miliotou and
Papadopoulou, 2018; Zhang et al., 2017). The fourth generation is distinct as the vector
encoding the CAR construct also includes a cytokine cassette that is expressed upon
engagement of the CAR. The expression of these cytokines leads to the activation of a CAR-
responsive promoter that could be a nuclear factor of activated T cells that potentiate anti-
tumor immune responses (Chmielewski et al., 2011; Pegram et al., 2012). The structure of the
different CAR constructs is represented in Figure 26.
Figure 26 – The four generations of CAR T cell constructs.
All CAR generations contains a scFv domain derived from a monoclonal antibody. This extracellular
part is specific to a desired tumor-antigen and does not require MHC presentation. The different CAR
T cell generations are characterized by different cytoplasmic tails. The first generation only contains
a CD3ζ domain in its cytoplasmic tail, while the second generation contains two domains: a CD3ζ and
co-stimulatory domain (here represented by CD28 or 4-1BB). The third generation, as the other
generations, contains three cytoplasmic domains being two of them two different co-stimulatory
molecules. Structurally, the fourth generation (TRUCK) is similar to the third generation, with the
capacity to induce the secretion of pro-inflammatory cytokines. From: (Miliotou and Papadopoulou,
2018)

98
CAR T cell therapies represent a very promising approach for the treatment of
hematologic malignancies. These malignancies express high levels of surface antigens and T
cells have a tendency to migrate to hematologic organs like blood, bone marrow and lymph
nodes, which facilitates contacts between CAR T cell and malignant cells (Maus et al., 2014).
The most successful CAR therapies so far are directed against CD19. The expression of lineage
specific antigens like CD19 (which is expressed at all B cell stages and also in B-cell
malignancies) ensure that CAR T cells can target cancer cells in the absence of antigen
heterogeneity (Maus and June, 2016). Moreover, CD19 is not expressed in hematopoietic
stem cells which reduces the risk of autoimmunity and bone marrow toxicity (Brentjens et al.,
2011). However, it is important to point out that as normal B cells also express CD19, this
approach depletes normal B cells (Grupp et al., 2013; Kochenderfer et al., 2010; Wilkins et al.,
2017). Therefore, to overcome this problem, patients are provided with gamma globulins
which compensates for the lack of B cells (Savoldo and Dotti, 2013). However, the CAR T cell
approach in hematologic malignancies is not always efficient and successful. For example,
studies demonstrate that engineered T cells are more efficient in acute lymphocytic leukemia
(ALL) than in chronic lymphocytic leukemia (CLL) or indolent lymphomas (Maude et al., 2014;
Porter et al., 2015). Several factors could modulate the efficiency of the response: host T cell
defects, inhibitory impact of the tumor microenvironment, pre-conditioning treatments, age
of the patients, number and/or effector capacity of transduced T cells and loss or
downregulation of the target antigen in tumor cells (Majzner and Mackall, 2018; Maus et al.,
2014). For instance, it was recently demonstrated that CAR T cell can provoke reversible
antigen loss through trogocytosis, resulting in decreased density of antigen on tumor cells
and impacting T cell anti-tumor function (Hamieh et al., 2019). Moreover, intravital imaging
in B-cell lymphoma bearing mice revealed that CAR T cell activity was higher in bone marrow
than in lymph nodes, which suggests anatomical heterogeneity in CAR T cell function (Cazaux
et al., 2019). Also, in this study they demonstrated that exists a functional heterogeneity as
not all CAR T cell contacts resulted in tumor cell killing (Cazaux et al., 2019). All these issues
can vary from one type of tumor to another and as a result, impact the overall efficiency of
the therapy. Moreover, despite the impressive success of CD19 CAR T therapies, it is
necessary to reduce the variables and understand the differences between clinical
approaches. Moreover, the research in B malignancies is very complex and there is not a
single standardized optimized CD19-specific CAR construct. Nevertheless, most clinical trials

99
are based on second generation of CARs like CD19-CD28-ζ or CD19-4-1BB-ζ (Cheadle et al.,
2014).
A study performed by Savoldo et al. demonstrated that the presence of co-stimulatory
molecule CD28 improves in vivo expansion and persistence of CAR-modified T cells when
compared with T cells with only one signaling domain (first generation CAR) (Savoldo et al.,
2011). Additionally, the levels of CAR CD19-CD28-ζ detected in tumor biopsies suggested a
better efficient tumor infiltration (Savoldo et al., 2011). In another study, Brentjens et al. tried
to evaluate the putative role of the cytoplasmic signaling co-stimulatory domain in the
increased efficiency of second generation CARs. They observed that the presence of CD28 in
the CAR structure was associated with an enhanced T-cell proliferation and cytokine
secretion. However, this was not the case with other signaling domains, such as 4-1BB, DAP-
10 or OX40 (Brentjens et al., 2007). On the other hand, other studies demonstrated that 4-
1BB and OX40 co-signaling domains contribute to an enhanced co-stimulation in second-
generation CARs by increasing cytokine secretion upon antigen stimulation and specific
cytotoxicity (Finney et al., 2004; Imai et al., 2004). These discrepancies could be notably
related to the type of antigen targeted and/or the CAR construct.
Furthermore, it is described that the co-stimulatory domain CD28 is important to promote
IL-2 secretion (Hombach et al., 2006; Hombach et al., 2001a; Hombach et al., 2001b) by CAR
T cells, a feature not observed in second generation CAR constructs containing 4-1BB and
OX40 co-stimulatory domains (Koehler et al., 2012). 4-1BB and OX40 are not associated with
an increase of IL-2 production, but both domains can lead to enhanced IFNγ production.
Nevertheless, OX40 and 4-1BB are better for preventing induced cell death mechanisms and
promoting T cell survival (Koehler et al., 2012). With these results, we can conclude that CD28,
4-1BB and OX40 can bring distinct advantages to potentiate the function of CAR T cells. As a
result, the third CAR generation was initiated by combining two different co-stimulatory
domains. In this regard, an elegant study compared CD28-ζ, OX40-ζ and CD28-OX40-ζ CAR
constructions and showed that the third generation CAR demonstrated higher NFκB activity,
IL-2 secretion, continuous proliferation and enhanced anti-tumor activity (Pule et al., 2005).
Furthermore, other studies showed that the combination of 4-1BB and CD28 improved
persistence, survival, anti-tumor efficiency and induced multifunctional cytokine secretion as

100
compared to second generation CARs (Carpenito et al., 2009; Tammana et al., 2010; Wang et
al., 2007; Zhong et al., 2010).
Despite the huge success of CAR T cell approaches in hematological malignancies, up to
90% clinical response rates in the case of ALL (Maude et al., 2014), the overall clinical
efficiency to treat solid cancer has been much less rewarding (Yong et al., 2017). Several cases
describing a lack of therapeutic response or toxic side effects have been reported when using
CAR T cells for solid tumors treatment (Kershaw et al., 2006; Lamers et al., 2006; Maus et al.,
2013; Morgan et al., 2010). One potential issue in this case is the nature of the surrounding
TME microenvironment which is more complex in solid tumors. This TME not only restricts
the CAR T cells infiltration into the solid tumor mass due to the presence of stromal and
epithelial cells, but also alters nutrient availability, which transforms the TME into a metabolic
barrier (discussed in the section IV 2 A). Finally, the low levels of O2 availability and immune
checkpoint ligands such as PD-L1 can also dampen effector T cell responses (discussed in the
section IV 2 B).
The importance of the TME and the metabolic reprograming on CAR T cell treatment and
other T cell based immunotherapies has been recently addressed and highlighted (Le
Bourgeois et al., 2018). Kawalekar and colleagues demonstrated that depending on the co-
stimulatory domain expressed in the CAR construct, the redirected T cells recruit distinct
metabolic programs and are engaged into different differentiating programs (Kawalekar et
al., 2016). In this study, they demonstrated that 4-1BBζ CAR T cells have better persistence,
high SRC, higher mitochondrial biogenesis, higher oxidative metabolism and increased
frequency of TCM as compared to 28ζ CAR T cells. These latter ones, on the other hand, showed
reduced persistence, higher glycolytic metabolism and an increased frequency of TEM cells
(Kawalekar et al., 2016). These findings demonstrate that the CAR construct itself could
impact the metabolism of the redirected-T cells and suggesting that this parameter should be
considered for the design of CAR therapies. Recently, another group developed a CAR T cell
construct based on another feature of the TME: hypoxia. This CAR express an oxygen sensitive
domain of HIF1-α which is fused to a CAR scaffold, allowing the CAR-expressing T cells to
better respond to hypoxic environments. Furthermore, another team demonstrated that
metabolic modulation of CAR T cell could already be performed before CAR T cell injection
with a positive impact for anti-tumor functions. Through the combination of IL-7 and IL-15

101
with CD3 and CD28 stimulation, TSCM and TCM phenotypes were promoted which were
described to have better persistence and anti-tumor immunity (Alizadeh et al., 2019; Gargett
and Brown, 2015; Gomez-Eerland et al., 2014). A study performed by Sukumar and colleagues
highlighted the importance of metabolic reprograming and the TME in T-cell based
immunotherapies. They show that T cell activation in the presence of a glycolysis inhibitor
resulted in an increased generation of memory like cells with increased anti-tumor function
comparing to the non-treated T cells with a higher glycolytic flux (Sukumar et al., 2013). These
results clearly demonstrate that T cell metabolic reprogramming can be used to select T cells
for ACT therapies. Moreover, Chang et al demonstrated that within the tumor, there is a
competition for glucose between tumor cells and T cells which impacts negatively anti-tumor
function. They showed that this could be overcome by PD-L1 blockade, which dampened the
glycolytic rate of tumor cells and improved consequently anti-tumor functions (Chang et al.,
2015). In an evident manipulation of the TME, this study highpoint the impact of the
metabolic competition between T cells and tumor cells and why it is important to take it into
consideration.
As described in this literature review, modulation of T cell metabolism can impact their
activation, differentiation and effector function. Moreover, nutrients availability required to
fulfill cell function is decreased in the TME, which as a consequence, impacts on anti-tumor
responses. Therefore, it becomes crucial to further understand how CAR T cell metabolism is
regulated and to develop new strategies to overcome the metabolic barriers imposed by the
TME and to optimize CAR T cell efficiency.

102

103
Results

104

105
Chapter 1
Selection of different T cell subsets based on
nutrient transporters expression

106
107
Introduction
Irrespective of the T cell subset utilized in an adoptive therapy, the metabolic needs of T
cells have begun to be appreciated as a key factor in their anti-tumor activity. The activation,
proliferation and effector functions of T cells are energy-“hungry” processes and recent
studies have shown the importance of metabolic pathways in optimizing immune functions.
When activated, lymphocytes upregulate their energetic state, increasing both oxidative
phosphorylation and aerobic glycolysis but in general the latter increases to a greater level
than the former (Buck et al., 2017; Clerc et al., 2019; Geltink et al., 2018) . This metabolic
programming results in an increase in the input and use of nutrients. Indeed, the optimal
activation of T cells and their effector activity requires, in particular, an increase in the surface
expression of glucose (GLUT1) and arginine (CAT-1)transporters, resulting in an augmented
use of these nutrients by lymphocytes (Jacobs et al., 2008; Loisel-Meyer et al., 2012;
Macintyre et al., 2014; Wang et al., 2011; Werner et al., 2016). In addition, recent studies
have shown that distinct subpopulations of T lymphocytes have disparate metabolic profiles;
effector T cells are highly glycolytic but also lipogenic, while regulatory T cells present a
heterogeneous metabolism with an increase in the level of lipid oxidation (Michalek et al.,
2011). From this point of view, it is interesting to note that Treg, but not effector T cells, can
be generated in the absence of glucose, glutamine or leucine transporters (Macintyre et al.,
2014). Similarly, the restriction of glucose or glutamine in the cellular environment limits the
development of effector cells but not Tregs (Cham et al., 2008; Chang et al., 2013; Klysz et al.,
2015; Macintyre et al., 2014; Metzler et al., 2016; Nakaya et al., 2014). This is of particular
interest as the metabolism generated in the tumor microenvironment, wherein nutrient
availability may be limiting, would then contribute to prevent effective anti-tumor responses
against a solid tumor. Indeed, the dysregulated growth of cancer cells can directly influence
the extracellular environment and multiple studies now strongly suggest that the metabolic
phenotype of the tumor governs the ensuing immune response (reviewed in (Ackerman and
Simon, 2014; Mayers and Vander Heiden, 2017)). Thus, the metabolic fitness of an effector T
cell in a tumor environment is likely to differ from its fitness in healthy lymphoid tissue.
It is interesting to note that within an activated T cell population, cells that are capable of
transporting higher levels of glucose or exhibiting higher mitochondrial activity have an
enhanced effector phenotype (as monitored by higher IFNγ secretion levels), while

108
populations with low glucose incorporation or low mitochondrial activity have a memory
phenotype. Furthermore, arginine metabolism also activates mitochondrial
respiration(Geiger et al., 2016). Thus, metabolic parameters can be used to distinguish T cells
with different characteristics (Sukumar et al., 2013; Sukumar et al., 2015).
Based on the importance of glucose and arginine metabolism in T cell function, we initiated
studies to assess whether the levels of these nutrient transporters (focusing on the GLUT1
glucose transporter and CAT-1 arginine transporter) on activated T lymphocytes can be used
to select for T cells with distinct anti-tumor effector functions. Using GLUT1 and CAT-1 surface
expression, we were able to select T cells expressing distinct GLUT1 and CAT-1 surface levels.
These sorted cells were then studied and their phenotype as well as their effector function
was evaluated. The data resulting from these studies are discussed in this chapter.

109
Article I

110

111

112

113

114

115
p

116

117

118

119
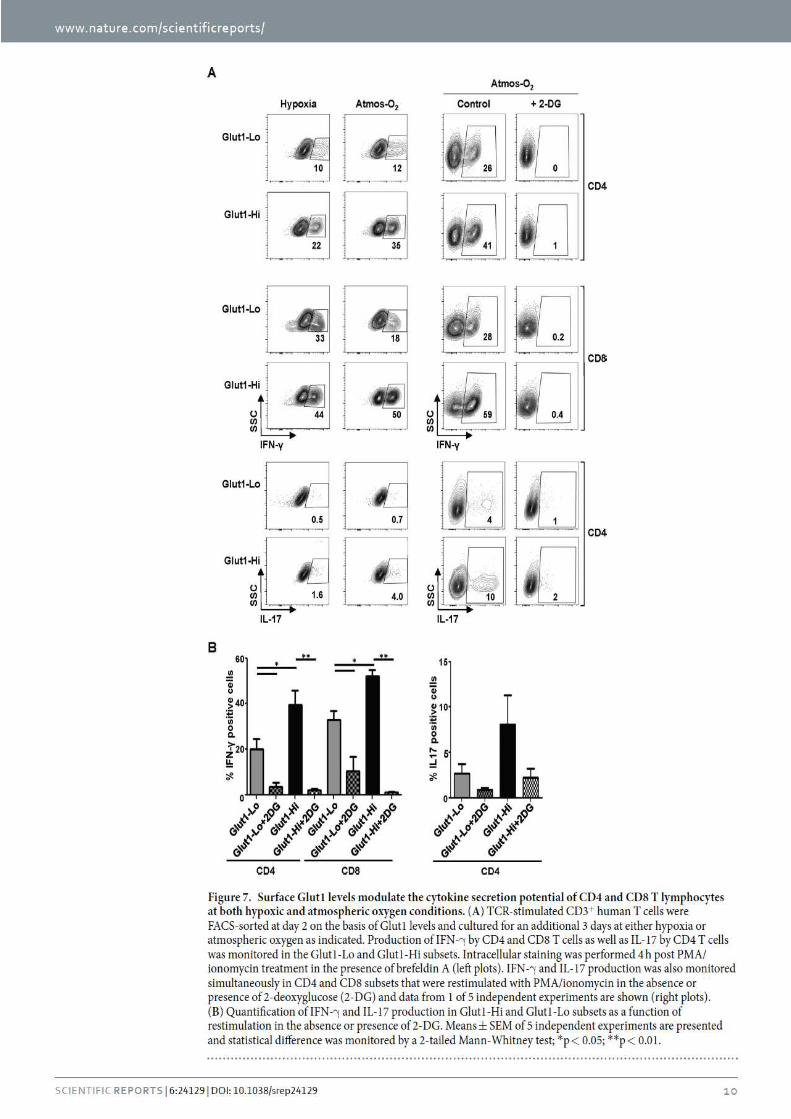
120

121

122

123
Addendum I
T cell selection based on CAT-1 surface expression

124

125
Results and Discussion
Selection of TCR-stimulated human T cells on the basis of surface CAT-1 expression
Based on our previous work, demonstrating that the cytokine secretion potential of human
TCR-stimulated T cells can be distinguished on the basis of GLUT1 levels, we assessed whether
human T cells selected on the basis of the surface expression of an independent nutrient
transporter would exhibit distinct characteristics. We focused on the arginine transporter,
CAT-1/SLC7A1. Briefly, arginine uptake in T cells is dependent on CAT-1 and its expression is
important for T cell proliferation (Werner et al., 2016). Indeed, upon TCR stimulation, CAT-1
surface expression is highly upregulated, to a higher level even than GLUT1 expression (CAT-
1 deltaMFI 20467 compared to GLUT1 deltaMFI 4703 at day 2 and CAT-1 deltaMFI 24974
compared to GLUT1 deltaMFI 7748 at day 4 (Figure 1).
To address this question, CD3+ T cells were isolated from the blood of healthy donors and
TCR-stimulated using anti-CD3/anti-CD28 mAbs. Following 48h of TCR activation, T cells were
stained with a CAT-1 ligand (CAT-1-RBD) in order to detect CAT-1 surface expression. CD3+ T
cells expressing the lowest and highest levels of CAT-1 (~15%) were FACS-sorted and
distinguished as CAT-1Low and CAT-1High, respectively. Since CAT-1 was not detected on
quiescent T cells and was induced following TCR stimulation, we hypothesized that the CAT-
1High subset would have a higher metabolic activity. In agreement with this hypothesis, the
forward/side scatters of CAT-1High cells were higher than those of CAT-1Low cells (Figure 2).
Figure 1 - Upregulation of CAT-1 surface expression upon TCR stimulation
Purified human CD3+ T cells were TCR-activated with anti-CD3/CD28 mAbs. At day 2 and 4 post
stimulation, T cells were stained for GLUT1, CAT-1 as well as the activation markers CD25, CD69 and
CD71. Data are representative of 2 independent experiments.

126
Increased percentages of CD8 T cells in the CAT-1High as compared to the CAT-1Low subset
following TCR stimulation
We next assessed whether there was a difference in the CD4/CD8 ratios within the CAT-1High
vs. CAT-1Low T cell subset. Notably, the relative percentages of CD4+ T cells were significantly
higher in the CAT-1Low than the CAT-1High T cell subset (81% versus 50%) at day 2 post
stimulation and this correlated with a lower percentage of CD8+ T cells (17% versus 47% in a
representative experiment, Figure 3A). Thus, while the total T cell population (CAT-1Total, all
cells were sorted) exhibited a CD4:CD8 ratio of approximately 3:1 following 2 days of TCR
stimulation, the ratio in the CAT-1Low subset was >4:1 and the ratio in the CAT-1High subset was
approximately 1:1 (Figure 3A). Thus, we detected a striking bias towards CD8+ T cells in
lymphocytes with a high induction of CAT-1. Interestingly, the ex vivo culture of sorted CAT-
1Low and CAT-1High T cells in the presence of IL-2 resulted in an increased proportion of CD8 T
cells in both subsets (day 8) but the relative percentages of CD8 T cells remained higher in the
latter, resulting in a CD4:CD8 ratio of approximately 0.7 in the former and 0.3 in the latter
(Figure 3A). The bias towards CD8+ T cells was likely due to their faster proliferation as
compared to CD4+ T cells (Figure 3B). Furthermore, as monitored by VPD dilution in Figure
2B, the percentages of CD4+ T cells that underwent extensive proliferation in the CAT-1Low
subset was substantially lower than in the CAT-1High subset (80% as compared to 54%). Within
the CD8 subset, 64% of CAT-1Low cells had undergone >4 divisions whereas 72% of CAT-1High
cells had already reached this level (Figure 3B). Notably, this alteration in cell division was not
due to a defect in activation as both CAT-1Low and CAT-1High cells exhibited an equivalent
Figure 2 - Selection of TCR-stimulated human T cells on the
basis of CAT-1 surface expression
Purified human CD3+ T cells were TCR-activated with anti-
CD3/CD28 mAbs. Two days post-stimulation, T cells were
stained for CAT-1 expression and cells with the lowest and
highest levels of surface CAT-1 (appr. 15%) were sorted on a
FACSAria cell sorter as shown and are hereby designated as
CAT-1Low and CAT-1High, respectively. The forward (FSC) and side
(SSC) scatter profiles of the sorted CAT-1Low and CAT-1High
subsets are presented. Data are representative of 4
independent experiments.

127
upregulation of activation markers such as CD69 and CD25 (data not shown).
Altogether, these data show that CAT-1High cells exhibit a higher level of proliferation than
CAT-1Low cells in response to TCR stimulation and moreover, that the high induction of CAT-1
is biased to the highly proliferating CD8 T cell subset.
CAT-1High CD4+ T cells exhibit higher effector function than CAT-1Low CD4+ T cells
To assess whether the selection of human T cells on the basis of CAT-1 expression Is
associated with the enrichment of naïve versus memory T cells, we monitored expression of
the CD45RA and CD45RO markers which are generally expressed on naïve and memory cells,
respectively. As expected, the percentages of CD45RA+ T cells decreased between days 2 and
8 of stimulation, consistent with the loss of naïve cells following TCR stimulation, with a more
pronounced loss in the CD4+ subset. Notably though, there were no striking alterations in the
percentages of CD45RA+ and CD45RO+ cells within the CAT-1Low as compared to CAT-1High
sorted subsets, at either time point (Figure 4). These data suggest that CAT-1 surface
expression does not distinguish CD4 or CD8 T cell subsets on the basis of their naïve/ memory
phenotype. Interestingly, these data differ from our previous results based on Glut-1
Figure 3- CAT-1 is highly upregulated on CD8 T cells and is associated with an increased proliferation
of CD8 as compared to CD4 T cells.
(A) Purified human CD3+ T cells were VPD450-labeled and TCR-activated using anti CD3/CD28 mAbs and FACS-sorted on the basis of CAT-1 expression as described in Figure 1. The repartition of CD4 and CD8 T cells within each subset was assessed immediately after sorting (day 2) and at day 8 post-TCR activation and representative dot plots of 2 independent experiments are shown. (B) The proliferation of sorted CAT-1Low and CAT-1High CD4 and CD8 subsets, as well as control total sorted T cells (CAT-1Total) were monitored at day 7 post-stimulation as a function of VPD450 fluorescence and representative histograms

128
expression wherein high Glut-1 levels were associated with the acquisition of an effector
memory phenotype.
We next assessed whether there were differences in the effector potential of CAT-1Low and
CAT-1High T cells by evaluating their cytokine secretion capacity. While the percentages of CD4
and CD8 T cells secreting IL-2 was high in both the CAT-1Low and CAT-1High subsets (mean of
>50%), it is notable that IL-17 secretion was substantially higher in the CD4+CAT-1High subset
(6% as compare to <2% in the CAT-1Low subset). Furthermore, IFN-γ secretion was slightly
increased in CAT-1High as compared to CAT-1LowCD4+ T cells and total CD4 T cells (29 vs 23%).
Interestingly, these percentages were not altered in the CD8 T cell compartment, potentially
due to the high level proliferation of CD8 T cells in both the CAT-1Low and CAT-1High subsets
(Figure 5).
Figure 4 - CD45RA and CD45RO expression on CAT-
1Low and CAT-1High sorted cells
Purified human CD3+ T cells were TCR-activated, sorted on the basis of CAT-1 expression at day 2 as indicated and then cultured ex vivo in the presence of IL-2. The CD45RA/CD45RO phenotype of CD4+ and CD8+ T cells is shown at days 2 and 8 and the percentages of cells in each gate are presented. Representative plots from 1 of 2 independent experiments are shown.
Figure 5 - High CAT-1 expression is associated with high IL-17 and
IFN-γ expression in the CD4 T cell subset.
Purified human CD3+ T cells were TCR-activated and sorted on the
basis of CAT-1 expression at day 2 as indicated. Production of IL-2, IL-
17, and IFN-γ was assessed in the CAT-1Low, CAT-1High and total CD4
and CD8 T cell subsets by intracellular staining at day 5/6, following
restimulation with PMA/ionomycin in the presence of Brefeldin A for
4h. Means ± SEM of 2 independent experiments are presented.
129
Considering our previous work on the characterization of T cells selected based on Glut1
surface expression and the proliferation level of CD4+CAT-1High cells, it was quite surprising
not to detect a higher percentage of IFNγ+ cells or memory phenotype associated to this
subset. As a result, the cytokine/phenotype pattern associated to each subset appears as
distinct and the major characteristic at this point seems that IL-17-producing cells are
enriched in CD4+CAT-1High cells as compared to CD4+CAT-1low. It is important to keep in mind
that these results are representative of two independent experiments and further
experiments are therefore required. However, and even if these results are preliminary,
selection based on GLUT1 and CAT-1 surface expression does not seem to select/enrich
similar T cell subsets. Therefore, these data open new perspectives regarding the use of
distinct nutrient transporters to select T cells with different phenotype and effector functions.
Material and Methods
Human T cell isolation and culture. CD3+ T cells were isolated from healthy adult donors. All
experiments using primary human cells were conducted in accordance with the Declaration
of Helsinki and IRB approval to the French Blood Bank (Etablissement Francais du Sang). T
lymphocytes were purified by negative-selection using Rosette tetramers (StemCell
Technologies) and the purity was monitored by flow cytometry. Lymphocytes were cultured
in RPMI supplemented with 10% FCS and 1% penicillin/streptomycin (Gibco-Life
technologies). T cell activation was performed using plate-bound anti-CD3 (clone OKT3,
Biolegend) and anti-CD28 (clone 9.3, kindly provided by Carl June) mAbs at a concentration
of 1 μg/ml. rIL-2 (100 U/ml) was added every other day starting either at day 2 or day 3 post-
activation. Cells were maintained in a standard tissue culture incubator containing
atmospheric (20%) O2 and 5% CO2.
Flow cytometry analyses. Immunophenotyping of cells was performed using fluorochrome-
conjugated mAbs (BD Bioscience, Beckman Coulter or eBioscience) against CD4, CD8,
CD45RA, CD45RO, CCR7 and CD62L and cell activation monitored using fluorochrome-
conjugated mAbs BD Bioscience, Beckman Coulter or eBioscience) against CD25, CD69 and
CD71. Proliferation was monitored by labeling cells with VPD450 (BD Biosciences; 1 μM) for 3
min at RT. For intracellular cytokine staining, lymphocytes were re-activated with PMA

130
(Sigma-Aldrich; 100 ng/ml) and ionomycin (Sigma-Aldrich; 1 μg/ml) in the presence of
brefeldin A (Sigma-Aldrich; 10 ug/ml) for 3.5–4h at 37 °C. Intracellular staining for IL-2, IFN-γ
and IL-17 was performed following fixation/ permeabilization using the eBioscience kit
(Thermo-scientific) or using the BD kit (BD Biosciences). Cells were analyzed on LSRII-Fortessa
(BD Biosciences) and data was analyzed using FlowJo (Tree Star) software.
Nutrient transporters surface expression detection. GLUT1 and CAT-1 expression at cell
surface was monitored using RBD (receptor binding domain) ligands fused to rFc tail or eGFP
(Kim et al., 2004; Kinet et al., 2007; Manel et al., 2003a). RBDs were incubated during 30 min
at 37 °C. If required, after RBD incubation, an anti-rFc secondary antibody coupled to AF647
(life technology) was incubated during 30 min at 4 °C. The surface expression level was
monitored by flow cytometry and was calculated as a function of the difference in average
fluorescence intensity (ΔMFI) between the sample and its control condition (non-stained cells
or cells incubated only with anti-rFc secondary antibody coupled to AF647).
Cell sorting based on surface CAT-1 expression. CD3+ T cells maintained in Nutr+ medium and
VPD450-labeled were stained at day 2 post TCR stimulation and the 15-16% of lymphocytes
expressing the highest (CAT-1High) and lowest levels of CAT-1 (CAT-1Low) were sorted on a
FACSAria (BD Biosciences). Lymphocytes were cultured in RPMI medium 1640 supplemented
with 10% FCS and 1% penicillin/streptomycin (Gibco-Life technologies) in the presence of rIL-
2.

131
Chapter 2
Impact of amino acid availability on T cell
differentiation and effector function

132

133
Introduction
In the previous chapter we demonstrated that GLUT1 and CAT-1 surface expression could
be used to select T cells with distinct phenotypes and effector functions. Altogether, our data
suggest that nutrient transporters can be used to select T cells with increased anti-tumor
function and a potentially better metabolic fitness. However, and despite of the advantages
of injecting specific T cell subsets in cancer patients, it remains important to evaluate the
impact of nutrient availability on T cell differentiation and effector function. T cell-based
therapies have had much more success in the treatment of hematological malignancies than
in the treatment of solid malignancies. One challenge in the latter context is that the ability
of immune cells to maintain an effective response is often negatively modulated by the
metabolic environment of the tumor. This environment is conditioned by nutrient
composition, “waste” products, oxygen concentration, pH and physical forces, amongst
others. The dysregulated growth of cancer cells can directly influence the extracellular
environment and multiple studies now strongly suggest that the metabolic phenotype of the
tumor governs the ensuing immune response (reviewed in (Ackerman and Simon, 2014;
Mayers and Vander Heiden, 2017). Furthermore, recent data suggest that several
metabolites, generated by distinct cells within the tumoral microenvironment (TME), may
represent a form of intercellular communication modulating both tumor cell growth and
response to therapy (Xu et al., 2019). One feature associated with the tumoral metabolic
environment and directly linked to the proliferation of the tumor cells, is the depletion of
nutrients in the TME. Indeed, in the context of several solid tumors, including hepatocellular
carcinomas, stomach/colon tumors, and pancreatic tumors, quantitative metabolite profiling
has revealed decreased intra-tumoral concentrations of glucose as well as glutamine (Bode
and Souba, 1999; Hirayama et al., 2009; Kamphorst et al., 2015). In this context, our group as
well as others have shown that the competition of T cells and tumor cells for limiting amounts
of nutrients has a negative impact on the former, inhibiting T cell cytolytic and effector
functions (Cham et al., 2008; Chang et al., 2013; Klysz et al., 2015; Macintyre et al., 2014;
Metzler et al., 2016; Nakaya et al., 2014). Glucose and glutamine represent essential
carbon/nitrogen sources, sustaining the proliferation and activity of T effector cells (Carr et
al., 2010; Gerriets and Rathmell, 2012). This is illustrated by the upregulation of glucose and
glutamine transporters following TCR stimulation as well as the associated increase in glucose

134
and glutamine metabolism (Carr et al., 2010; Gerriets and Rathmell, 2012; Kinet et al., 2007;
MacIver et al., 2013; Manel et al., 2003b; Nakaya et al., 2014; Ren et al., 2017). However, T
cells also strongly rely on others amino acids. Indeed, the presence of arginine-degrading
enzymes, arginases, in the TME can result in arginine depletion and T cell anergy (Rodriguez
et al., 2007). Furthermore, arginine supplementation was described to contribute to the
production of pro-inflammatory cytokines and to the survival of central memory T cells in an
in vitro setting (Geiger et al., 2016; Rodriguez et al., 2007). Thus, the metabolic fitness of an
effector T cell in a nutrient-deprived tumor environment is likely to differ from its fitness in
healthy lymphoid tissue. Finally, considering the divergent metabolic requirements of
different T cell subsets (reviewed in (Buck et al., 2017), the TME may differentially promote
the survival and/or proliferation of one subtype as compared to another.
It is therefore of critical importance to determine how metabolic modulation of anti-
tumor T cells impact on their persistence and function, especially in the context of “hostile”
tumor tissue with high nutrient consumption. As a result, part of my PhD research focused on
advancing our understanding of how T cell responses are modulated by their metabolic
environment and more specifically to elucidate the impact of glutamine and arginine
deprivation, which represent some hallmarks of the TME on T cell function.

135
Article II

136

137

138

139
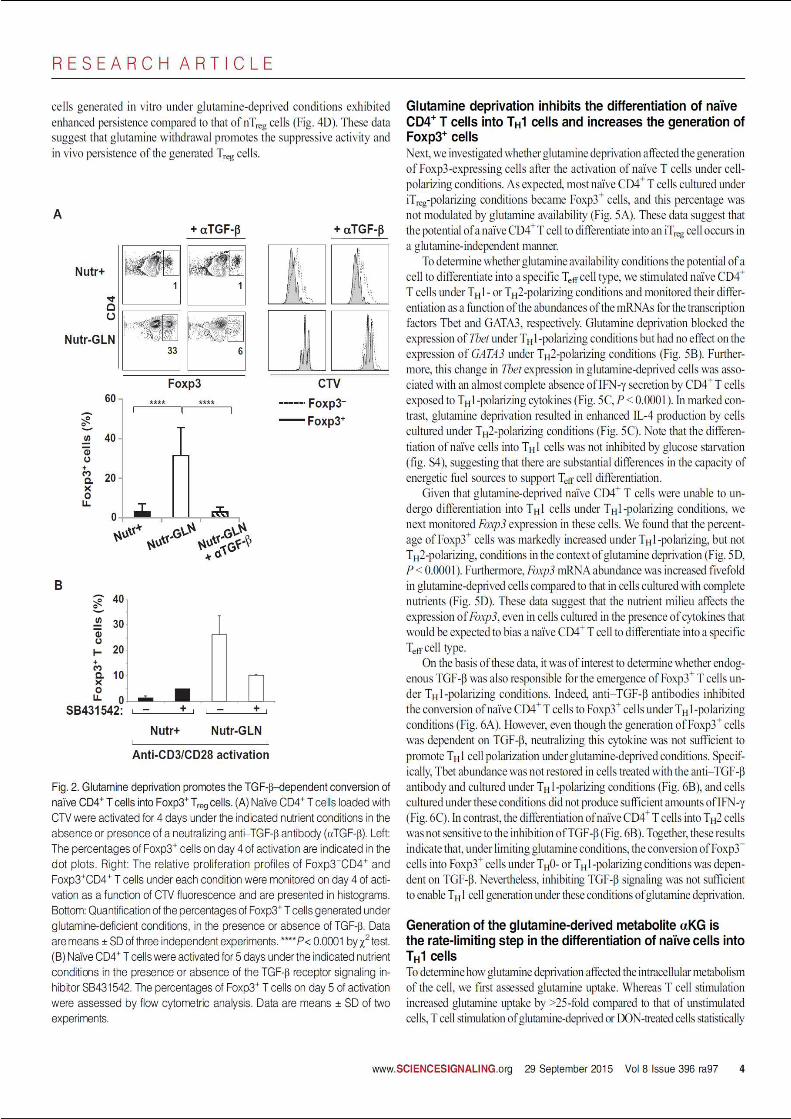
140

141

142
142

143

144

145

146

147

148

149
Addendum II
Impact of arginine availability on human
T cell function

150

151
Results and Discussion
Arginine deprivation impairs T cell activation and proliferation. Arginine concentrations can
be significantly modulated within the tumor environment (Kim et al., 2018; Lyssiotis and
Kimmelman, 2017; Marigo et al., 2008; Szefel et al., 2018) with important consequences on T
cell function. Moreover, the arginine transporter CAT-1 is significantly upregulated upon TCR
stimulation (presented in Chapter I, Addendum I, Figure1), suggesting a dependence of
activated T cells on arginine uptake to sustain their new metabolic requirements.
To evaluate the impact of arginine deprivation on human T cell activation, CD3+ T cells were
isolated from the blood of healthy donors and TCR-stimulated using anti-CD3/anti-CD28
mAbs in the absence (-Arg) or presence (Nutr+) of arginine at 200 µg/ml which represents the
« classical » concentration used in RPMI media). At day 4 following TCR-stimulation, T cells
activated in arginine-deprived conditions exhibited high viability but were significantly
smaller as compared to T cells activated in nutrient replete media, as assessed by microscopy
and forward/side scatters parameters (data not shown and Figure 1A). Indeed, expression of
the CD25 and CD71 activation markers, encoding the IL-2Rα chain and the transferrin
receptor, respectively, were strongly reduced in conditions of arginine depletion (Figure 1B).
Interestingly, CD69, an early activation marker whose cell surface upregulation is
independent of transcription(Manel et al., 2003b), was upregulated even in arginine-depleted
conditions and its downregulation was delayed as compared to control Nutr+ conditions (>45-
fold higher MFI at day 4 for both CD4 and CD8 T cells, Figure 1B). Consistent with the
suboptimal upregulation of T cell activation markers, there was a massive reduction of T cell
proliferation in arginine-depleted conditions. T cells stimulated in -Arg conditions only
initiated a first round of division at day 7 post stimulation whereas the vast majority of both
CD4 and CD8 T cells activated in Nutr+ conditions had divided by day 3 (Figure 1C). Lower
concentrations of arginine (decreasing from 200µg/ml to 50 µg/ml) did not appear to
significantly impact CD4 T cell proliferation but CD8 T cell proliferation was delayed (14% of
undivided cells at day 3 as compared to 8% of undivided cells in 50 µg/ml vs 200ug/ml
arginine, respectively, Figure 1C). Notably though, the concentration of 50 µg/ml is higher
than plasma arginine levels (14 µg/ml; 82µM) suggesting that arginine levels in the T cell
microenvironment may limit optimal T cell responsiveness in vivo.

152
Arginine deprivation does not inhibit the acquisition of a memory phenotype or the
cytokine secretion potential of TCR-stimulated T lymphocytes. To determine whether
arginine deprivation alters the proportion of CD4/CD8 T cells or the acquisition of a memory
phenotype, we monitored T cell phenotype at day 4 post-stimulation in the presence or
absence of arginine. Interestingly, neither the CD4/CD8 ratio (Figure 2A) nor the CD45RA/RO
ratio (Figure 2B) was altered by activation in the absence of arginine. The percentages of CD4
and CD8 T cells producing IL-2, IL-17 and IFNg were also not significantly modulated in the
absence of arginine (Figure 2C). While these data differ from reported decreases in T cell-
mediated IFNg secretion in the absence of arginine (Feldmeyer et al., 2012), it is notable that
the previous study assessed the levels of secreted cytokines whereas our experiments
evaluated the potential of individual cells to produce cytokines following PMA/ ionomycin
restimulation. Indeed, Geiger and colleagues found that even though high extracellular
arginine levels resulted in a lower secretion of IFNg from TCR-stimulated human CD8 T cells,
PMA/ionomycin stimulation of the same cells resulted in the opposite effect, with an
observed increase in IFNg stimulation (Feldmeyer et al., 2012; Geiger et al., 2016; Munder et
al., 2006; Rodriguez et al., 2007). Collectively, these data indicate that while both arginine
deprivation and excess can decrease the level of cytokine secretion by TCR-stimulated T cells,
they do not diminish the PMA/ionomycin-induced potential of these cells to secrete effector
cytokines.
Downregulation of the CAT-1 arginine transporter decreases TCR-mediated CD4 and CD8 T
cell proliferation. The CAT-1/SLC7A1 arginine transporter has been shown to be important
for T cell proliferation (Werner et al., 2016) and indeed, we found that it is highly upregulated
following TCR stimulation as shown in (Chapter I, Addendum I, Figure1). In an attempt to
modulate arginine availability in CD4/CD8 T cells, we employed a CAT-1-mediated shRNA
strategy. T cells were simultaneously activated with anti-CD3/anti-CD28 mAbs and
transduced with a lentiviral vector harboring an shCAT-1 or control scramble (shCTRL)
sequence. The transduction efficiency for both constructs, evaluated at day 3 by GFP
expression, reached approximately 50% (Figure 3A, left panel). As expected, CAT-1 surface
expression was not decreased in either CD4 or CD8 T cells following transduction with the

153
shCTRL vector but notably, the mean florescence intensity of CAT-1 expression in shCAT1-
transduced lymphocytes was decreased by approximately 50% (Figure 3A, right panels).
shRNA-mediated knockdown of CAT-1 did not alter either the CD4/CD8 ratio (Figure 3B) nor
the upregulation of CD25 or CD71 following stimulation (Figure 3C) and cytokine secretion
was not impacted (Figure 3D). Furthermore, the proliferation of CD4 as well as CD8 T cells
transduced with the shCAT-1 vector did not differ from cells transduced with the shCTRL
vector. Interestingly though, those T cells that were susceptible to lentiviral transduction,
irrespective of the shRNA construct, proliferated to a greater extent than non-transduced
cells, suggesting that lymphocytes that had progressed further into the cell cycle were more
susceptible to lentiviral transduction. It is likely that the absence of a detectable impact of
CAT-1 downregulation on CD4/CD8 proliferation is due to the experimental setup wherein
lymphocytes were already in an activated state when transporter levels were decreased.
Importantly, CD4 T cells with downregulated CAT-1 expression, but not cells with a control
shRNA, were negatively selected during the expansion period, as monitored by a loss of GFP
(Figure 3E). Moreover, when T cells transduced with a CAT-1-specific shRNA were
restimulated (12-14 days post initial TCR stimulation), cells with downregulated CAT-1
exhibited a significantly lower level of proliferation, as monitored by >50% of undivided cells
as compared to <20% in control conditions. Conversely, <5% of CAT-1-downregulated T cells
underwent 2 divisions whereas >20% of control T cells underwent division (Figure 3E). Thus,
CAT-1 upregulation is required for optimal cell cycle entry of human T cells and its continued
expression is required for the expansion of these lymphocytes.
Arginine-mediated polyamine synthesis, but not NO production, is required for optimal T
cell activation and proliferation. Arginine is used in different metabolic pathways,
contributing to the production of iNOS, creatine, agmantine, polyamines, as well as the
hypusine modification on the eIF5A translation factor (Figure 4A). To determine the potential
contributions of these different pathways to T cell activation and proliferation, the following
inhibitors were used: DL-α-(Difluoromethyl)ornithine (DFMO), an inhibitor of putrescine
synthesis; asymmetric dimethylarginine (ADMA), a methyl derivate of arginine that impairs
nitric oxide (NO) synthesis; and N1-monoguanyl 1,7-diaminoheptane (GC7), a spermidine
analogue that inhibits the hypusination (conjugation of the aminobutyl moiety of spermidine
to lysine) of the eIF5A translation factor (Figure 4A). Neither the absence of arginine nor any

154
of the tested inhibitors negatively impacted on T cell viability (Figure 4B) but inhibiting
polyamine synthesis markedly decreased, in a dose-dependent manner, T cell proliferation
(Figure 4C). Interestingly, inhibiting the production of NO (with ADMA) or eIF5A hypusination
did not attenuate T cell proliferation (Figure 4C) nor the upregulation of activation markers
(Figure 4D). The potential importance of NO production (and NOS activity) in the relative
survival/proliferation of CD4 and CD8 T cells will be further evaluated but given the significant
decrease in T cell proliferation following inhibition of polyamine biosynthesis, we further
investigated its impact on the induction of T cell activation markers. Notably, the upregulation
of CD25 was similarly decreased in the absence of arginine as compared to the presence of
DFMO, at levels approximately 2-fold lower than control activated T cells (days 3 and 5 of
activation, Figure 4D, 4E). Consistent with a decreased activation state of DFMO-treated T
cells, there was a delay in CD69 downregulation, similarly to that detected in the absence of
arginine; 80% vs 60% and 50% vs 10% compared to control cells, at days 3 and 5, respectively
(Figure 4D, 4E).
T cell activation results in the upregulation of genes involved in polyamine biosynthesis,
including ODC and S-adenosylmethionine decarboxylase (Fidelus et al., 1984; Hesterberg et
al., 2018; Hunt and Fragonas, 1992; Kay and Lindsay, 1973; Kay and Pegg, 1973; Puleston et
al., 2017; Scott et al., 1985) and polyamine levels increase upon T cell activation (Wang et al.,
2011). While the specific role of polyamines as well as the genes regulating their biosynthesis
(i.e. ODC) have not been evaluated in T cell development and activation, Myc, a critical
transcription factor in both of these processes, regulates polyamine biosynthesis (Hesterberg
et al., 2018). The ensemble of these data point to the importance of the arginine-polyamine
pathway and future studies will specifically evaluate the role of this axis in regulating T cell
activation and effector function.

155
Figure 1- Arginine deprivation inhibits T cell activation and proliferation
(A) Purified human CD3+ T cells were TCR-activated with anti-CD3/CD28 mAbs in nutrient-replete (Nutr+,
200 ug/ml arginine), or in the absence of arginine (-Arg). Forward (FSC) and side (SSC) scatter profiles were
evaluated at day 4 of activation and representative plots are presented. (B) Expression of the CD25, CD69,
and CD71 activation markers was monitored in CD4 and CD8 T cells at day 4 of stimulation in the indicated
conditions (data are representative of 1 of 5 independent experiments). (C) The proliferation profiles of TCR-
stimulated CD4 and CD8 T cells activated in the presence or absence of arginine were monitored at days 3,
5, 7, and 10 as a function of VPD450 fluorescence and representative histograms are shown (representative
of 1 of 2 independent experiments). (D) Proliferation profiles of CD4 and CD8 T cells activated in the
presence of 0, 50, 100 and 200 ug/ml of arginine are shown at days 3 and 5 following TCR stimulation.

156
Figure 2- T cell phenotype is not significantly altered under conditions of arginine deprivation
(A) The repartition of CD4 and CD8 T cells was assessed at day 4 post-TCR activation in nutrient-replete
(Nutr+) and arginine-deprived (-Arg) conditions by flow cytometry and representative dot plots are shown
(1 of 5 independent experiments). (B) The CD45RA/CD45RO phenotype of CD4+ and CD8+ T cells is shown at
day 4 and the percentages of cells in each gate are presented. Representative plots from 1 of 5 independent
experiments are shown. (C) Production of IL-17, IL-2, and IFNγ was assessed in the T cells activated in the
presence or absence of arginine at day 4 of TCR engagement following restimulation with PMA/ionomycin
in the presence of Brefeldin A for 4h. Cytokine production was monitored by intracellular staining with the
indicated fluorochrome-conjugated antibodies and representative plots are shown (left). Quantification of
means ± SEM of 5 independent experiments are presented as historgrams; ns=non-significant.

157

158
158

159
Figure 3- Downregulation of CAT-1 expression by lentiviral-mediated shRNA based approach inhibits T
cell proliferation following restimulation
(A) Purified human CD3+ T cells were activated with anti-CD3/CD28 mAbs and simultaneously transduced
with a lentiviral-based vector harboring a scrambled (CTL) or CAT-1-specific shRNA and encoding GFP as a
marker protein. Transduction efficiency was monitored as a function of GFP expression at day 3 and means
± SEM of 3 independent experiments are presented (left panel). Surface CAT-1 expression was monitored
in non-transduced (GFP-/sh-, grey histograms) as compared to transduced (GFP+/sh+, green histograms)
CD4+ and CD8+ T cells and representative histograms with indicated mean fluorescence intensities (MFI)
are presented (middle panels). Quantification of MFI in non-transduced and transduced CD4 and CD8 T cell
subsets are presented as means ± SEM of 3 independent experiments (right panels). *NS=non-significant;
*, p<0.05; **, p<0.01; ***, P<0.001. (B) The repartition of CD4 and CD8 T cells within non-transduced (sh-)
and transduced T cell subsets was assessed at day 3 post-TCR activation and representative dot plots with
the indicated percentages are shown (left panels). Quantification of CD4/CD8 subsets in 3 independent
experiments are shown as means ± SEM (right). (C) Induction of the CD25 and CD71 activation markers was
monitored in non-transduced (sh-) and transduced (sh+) CD4 and CD8 subsets at day 3 of activation and
representative histograms with the corresponding MFIs are shown (left). Proliferation was monitored by
VPD450 fluorescence dilution and day 3 profiles of sh- and sh+ subsets are overlaid in representative
histograms in 1 of 3 independent experiments. (D) Production of IL-17, IL-2, and IFNγ was assessed in sh-
and sh+ CD4 and CD8 T cell subsets at day 5 by intracellular staining following restimulation with
PMA/ionomycin in the presence of Brefeldin A for 4h. Representative plots are shown (left) and means ±
SEM of 3 independent experiments are presented (right). (E) The percentages of T cells transduced with
shCTL and shCAT-1 vectors were followed over time (day 6 to 16) as a function of GFP fluorescence and
normalized to “1” (representing 40-60% transduction at day 3). (F) Cell division of non-transduced (sh-) and
transduced (sh+) T cells was evaluated following CD3/CD28 restimulation of T cells at day 14. Representative
proliferation profiles are shown as a function of VPD450 fluorescence and the mean percentages ± SEM of
undivided cells (P0) and cells that divided twice (P2) within the sh- and sh+ subsets are presented.

160

161
Figure 4.-Arginine-based generation of polyamines is required for optimal T cell activation and
proliferation
(A) Scheme of arginine utilization in different metabolic pathways resulting in the generation of nitric oxide
(NO), agmatine, creatine, polyamines (putrescine/ spermine) and hypusine. (B) The viability of T cells
activated in control conditions (Nutr+), in the absence of arginine (-Arg), and in control conditions in the
presence of inhibitors of polyamine (DFMO), NO (ADMA) and hypusine (GC7) generation were evaluated at
day 3 and day 5 of stimulation. Data from one representative experiment are shown. (C) The proliferation
of CD4 and CD8 T cells activated in the indicated conditions was evaluated by VPD450 fluorescence and
representative histograms are shown at day 3 of activation. Data are representative of 3 independent
experiments. (D) The percentages of CD25+ and CD69+ cells in the different conditions are presented at days
3 and 5 of activation. (E) Histogram profiles of CD25 and CD69 are presented in control conditions (Nutr+),
in the absence of arginine (-Arg), and in the presence of the DFMO polyamine inhibitor (top panels).
Quantifications of the mean MFI ± SEM of CD25 fluorescence and the percentages of CD69+ cells are shown
(n=3, bottom panels).

162
Materials and Methods
Human T cell isolation and culture. CD3+ and CD4+ T cells were isolated from healthy adult
donors. All experiments using primary human cells were conducted in accordance with the
Declaration of Helsinki and IRB approval to the French Blood Bank (Etablissement Francais du
Sang). T lymphocytes were purified by negative-selection using Rosette tetramers (StemCell
Technologies) and purity was monitored by flow cytometry. Lymphocytes were cultured in
nutrient-replete (Nutr+) RPMI SILAC medium 1640 supplemented with lysine (0.2mM) and
arginine (1.15mM) or in the absence of arginine (-Arg). Both Nutr+ and -Arg medium were
supplemented with 10% FCS and 1% penicillin/streptomycin (Gibco-Life technologies). In
some experiments, alpha-difluoromethylornithine (DFMO, 0,25 mM or 1mM), asymmetric
dimethylarginine (ADMA, 120mM) or GC7 (0,5 µM) were added as indicated.
T cell activation was performed using plate-bound anti-CD3 (clone OKT3, Biolegend) and anti-
CD28 (clone 9.3, kindly provided by Carl June) mAbs at a concentration of 1 μg/ml. rIL-2 (100
U/ml) was added every other day starting either at day 2-3 post-activation. Cells were
maintained in a standard tissue culture incubator containing atmospheric (20%) O2 and 5%
CO2.
Flow cytometry analyses. Immunophenotyping of cells was performed using fluorochrome-
conjugated mAbs (BD Bioscience or eBioscience) against CD4, CD8, CD45RA and CD45RO and
cell activation was monitored using fluorochrome-conjugated mAbs against CD25, CD69 and
CD71 (BD Bioscience, Beckman Coulter or eBioscience). CAT-1 (SLC7A1) cell surface
expression was monitored by binding to its Fc-coupled receptor binding domain (RBD) ligand
(Ivanova et al, manuscript in preparation; patent WO2017085271A1) for 30 min at 37°C
following by a secondary AF647-coupled anti-rFc secondary antibody (Life Technologies).
Proliferation was monitored by labeling cells with VPD450 (BD Biosciences; 1 μM) for 3 min
at RT. For intracellular cytokine staining, lymphocytes were re-activated with PMA (Sigma-
Aldrich; 100 ng/ml) and ionomycin (Sigma-Aldrich; 1 μg/ml) in the presence of brefeldin A
(Sigma-Aldrich; 10 ug/ml) for 3.5–4h at 37 °C. Intracellular staining for IL-2, IFNγ and IL-17 was
performed following fixation/ permeabilization using the eBioscience kit (Thermo-scientific)

163
or using the BD kit (BD Biosciences). Cells were analyzed on an LSRII-Fortessa (BD Biosciences)
and data was analyzed using FlowJo (Tree Star) software.
shRNA-mediated inhibition of CAT-1 mRNA expression in T lymphocytes.
shRNA-encoding lentiviral vectors were generated by transient transfection of 293T cells as
described previously (Verhoeyen et al., 2003). Briefly, co-transfection was performed with
PsPax2, encoding Gag, Pol, Rev and tat, the VSV-G pseudotyping envelope, pCMV-VSV-G and
the HIV-1 derived shRNA-encoding vectors (pLKO.1, ShRNA mission, Sh-CAT-1 ref#
TRCN0000042967 and Sh-scramble ref# shC002 (non mammalian sh-scr)). Viral supernatant
was harvested 48 hours post-transfection, and concentrated by centrifugation (3000 RPM
O/N, 4°C). Titers were assessed on Jurkat cells to determine transducing units (TU/ml) and
transduction was determined as the percentage of GFP+ cells by flow cytometry.
For T cell transductions, 1×10⁶ lymphocytes were transduced with shRNA-encoding lentiviral
particles (MOI 5) and activated on anti-CD3 /CD28-coated plates in RPMI media. Transduction
was evaluated at day 3 as a percentage of GFP+ cells on an LSRII Fortessa (BD Biosciences).

164

165
Chapter 3
Role of αKG as a metabolic regulator of
Th1/iTreg differentiation

166

167
Introduction
In the previous chapter, I described our work showing that glutamine deprivation had a
pronounced effect, abrogating the differentiation of naïve T cells to a Th1 effector fate and
skewing them towards a regulatory suppressive T cell function.
As naïve CD4+ T cells are unable to differentiate to an IFNγ-secreting Th1 fate in glutamine-
deprived conditions and rather, generate FoxP3-expressing suppressive T cells, it was
important to determine the mechanism(s) responsible for this alteration. We found that this
defect is specifically due to a deficiency in intracellular α-ketoglutarate, an intermediate that
feeds the tricarboxylic acid cycle (TCA). We further demonstrated that an exogenous cell
permeable form rescued Th polarization in these conditions. In the past years, several studies
have demonstrated an important role of αKG-dependent hydroxylases and demethylases
during T cell differentiation and effector function through epigenetic regulation (Chisolm et
al., 2017; Polansky et al., 2008; Someya et al., 2017; Xu et al., 2017; Yang et al., 2015).
However, this is clearly not the only mechanism via which aKG (or the ratio between aKG and
other TCA metabolites) can impact on T cell functions and it becomes therefore crucial to
decipher them. In this context, the major aspect of my PhD project has focused on the role of
αKG in controlling T cell differentiation and the data resulting from these studies are
presented in this section. Briefly, these data have revealed a critical role of αKG, positively
regulating IFNγ effector function in CD4+ T cells activated under Th1-polarizing conditions.
Interestingly, αKG markedly upregulated IFNγ secretion in naive T cells activated under Treg
polarizing conditions and inhibited the induction of FoxP3. Our work unrevealed a new role
of αKG on Th1 and iTreg differentiation.

168

169
Article III

170

Matias/Yong et al.
171
The balance between Th1 and Treg differentiation is regulated by
a-ketoglutarate-mediated alterations in TCA cycle flux

Matias/Yong et al.
172

Matias/Yong et al.
173
Abstract
The proliferation and differentiation of T lymphocytes is regulated by antigen and cytokine
signals but the induction of metabolic pathways is also required, resulting in an integration of
environmental cues in cell fate decisions. Indeed, T lymphocyte activation is regulated by the
metabolism of glucose, fatty acids and amino acids, allowing the cell to meet
increased energetic and biosynthetic demands. Notably, we recently found that glutamine
availability is a key determinant of T cell differentiation; CD4 lymphocytes undergo
differentiation to IFNg-secreting Th1 effectors under conditions of optimal glutaminolysis but
are converted to FoxP3+ regulatory T cells (Tregs) when glutamine catabolism is abrogated.
Here, we show that the glutamine-derived metabolite, a-ketoglutarate (aKG), significantly
augmented IFNg secretion while dramatically attenuating Treg generation. Specifically, aKG-
mediated attenuation of FoxP3 transcription resulted in the differentiation of CD4 T cells with
an enhanced inflammatory profile. Under these conditions, aKG promoted the effector
activity of chimeric antigen receptor (CAR)-engineered T cells against the ErbB2 tumor antigen
in tumor-bearing mice, increasing IFNg secretion by >10-fold under conditions of Treg
polarization. Mechanistically, aKG altered the transcription of genes in the cholesterol
biosynthesis pathway and significantly increased membrane concentrations of
polyunsaturated fatty acid species. Furthermore, an aKG-mediated augmentation in TCA
cycle metabolism and downstream oxidative phosphorylation was identified as a critical
component of CD4 T cell differentiation. Inhibition of succinate oxidation and decreasing the
aKG/succinate ratio resulted in a significantly augmented Treg polarization and decreased
levels of IFNg. Thus, manipulation of TCA cycle intermediates may promote the development
of novel strategies aimed at enhancing anti-tumor CAR T cell effector functions.

Matias/Yong et al.
174

Matias/Yong et al.
175
Results and Discussion
αKG enhances Th1 differentiation while conversely, inhibiting Treg polarization. To assess
whether high αKG levels modulate Th1 differentiation potential, naïve murine CD4 T
lymphocytes were TCR-stimulated under Th1 conditions in the absence or presence of
exogenous αKG. Notably, αKG significantly augmented the percentage of CD4 T cells secreting
IFNg, increasing the mean level from 24% to 52% (p<0.0001, Figure 1A). This increase was
regulated at the transcriptional level with a >10-fold augmentation in Ifng mRNA levels
(p<0.01) and a markedly altered visualization of RNASeq reads mapped to the Ifng gene
(Figure 1B). Thus, high levels of αKG augment the potential of CD4 T cells to produce IFNg
following stimulation in Th1-polarizing conditions.
As the potential of a CD4 T cell to generate an effector Th1 phenotype is often inversely
related to its potential to adopt a suppressive Treg phenotype (1-3), we assessed whether
αKG attenuates Treg polarization. Indeed, while the majority of naïve T cells stimulated under
Treg polarization conditions exhibited an upregulation of the master transcription factor
FoxP3, the percentage of FoxP3+ T cells differentiated in the presence of exogenous αKG was
approximately 3-fold lower (decreasing from a mean of 60% to 28%, p<0.0001; Figure 1C).
This decrease in Treg polarization efficiency/potential was associated with 3-fold lower levels
of FoxP3 mRNA levels and an attenuation of RNAseq reads in the Foxp3 gene (Figure 1D).
Moreover, Treg differentiation was attenuated even when T cells were initially stimulated in
control Treg polarization conditions and αKG was added only 24h post-activation
(Supplementary Figure 1). Importantly though, the αKG-mediated inhibition of FoxP3
upregulation was specific to Treg polarizing conditions because the activation of natural Treg
(nTreg), expressing FoxP3 in a quiescent state, was not altered by αKG (Figure 1E). Together,
these data reveal the importance of αKG in regulating the balance in the polarization of naïve
CD4 T cells to a Th1 versus a Treg fate.
The inflammatory phenotype of αKG-induced CD4 T cells is associated with enhanced tumor
infiltration of ErbB2-CAR T cells in mice bearing ErbB2+ tumors. As αKG decreased the
potential of CD4 T cells to upregulate FoxP3 expression following stimulation under Treg
polarization conditions, it was of interest to assess the characteristics of these cells.

Matias/Yong et al.
176
Interestingly, the percentages of IFNg-secreting cells was significantly augmented (p<0.0001,
Figure 2A) and this correlated with an upregulation of the master Th1 transcription factor, T-
bet, at both the protein and mRNA level (Figure 2B, 2C). Furthermore, these CD4 T cells exhibit
an upregulation of granzyme B (Figure 2C), a marker of CD4 T cells with CTL activity (4). While
this αKG-induced CD4 T cell phenotype was not associated with an increase in TNFα or GM-
CSF at the mRNA level, the secretion of these two cytokines as well as that of IFNg, IL-17 and
IL-2 were remarkably elevated by αKG following stimulation of naïve CD4 T cells in Treg-
polarizing conditions (Figure 2D, 2E). The increase in IL-2 levels is in agreement with previous
work showing that αKG regulates the association of CCTC-binding factor (CTCF) with select
loci including that of the IL-2 gene, specifically increasing IL-2 expression (5).
The data presented above suggested that αKG might alter the phenotype and persistence of
anti-tumor T cells in an in vivo setting. This is especially critical in the “hostile” environment
of a solid tumor that consumes high levels of nutrients and is often anaerobic (6). To test this
hypothesis, we evaluated the effector function of murine T cells harboring a CAR directed
against the ErbB2/HER2 tumor antigen in immunodeficient RAG2-/- mice bearing the 24JK
fibrosarcoma, engineered to express ErbB2 (24JK-ERB) (Figure 3A) (7). We first assessed
whether αKG altered the differentiation potential of ErbB2-CAR CD4 T cells similarly to that
of polyclonal T cells. αKG treatment resulted in a >2-fold increase in IFNg-secreting cells
following activation in Th1 conditions and a decrease in FoxP3+ cells, irrespective of whether
the T cells were polyclonal or harboring the ErbB2-CAR construct (Supplemental Figure 2).
ErbB2-CAR T cells were then activated under Th1 or Treg polarizing conditions in the absence
or presence of αKG for 4 days and adoptively transferred into 24JK-ERB tumor-bearing mice.
At day 20 of tumor growth, the percentages of ErbB2-CAR CD4 T cells within lymph nodes (LN)
were not significantly different in an of the groups (Figure 3B). Notably though, within the
tumor, the percentages of ErbB2-CAR CD4 T cells were significantly higher following
stimulation in either Th1 or Treg+αKG polarizing conditions as compared to control Treg
polarizing conditions (***, p<0.005; Figure 3C). Furthermore, the percentages of FoxP3+
ErbB2-CAR T cells in both LNs and tumors were significantly decreased by the initial ex vivo
polarization in the presence of αKG (p<0.005) and the IFNg potential of ErbB2-CAR cells in LN,
but not in tumors, was significantly augmented (p<0.01; Figures 3B and 3C). While these data

Matias/Yong et al.
177
point to the critical role of the metabolic tumor environment in diminishing the effector
function of anti-tumor T cells (8), they strongly indicate that an ex vivo modification of
intracellular metabolite levels can alter the migration and/or persistence of anti-tumor T cells.
Furthermore, αKG treatment significantly decreased the percentage of intratumoral FoxP3+
cells. This is particularly important in the solid tumor setting where recruitment of Tregs
negatively impacts on the potential of effector T cells to eradicate the tumor (9).
The transcriptional landscape of CD4 T cells polarized to a Treg fate is significantly impacted
by αKG. To gain insights into the mechanisms via which αKG negatively impacts on Treg
differentiation but not on Th1 differentiation, RNASeq analyses were performed. In accord
with the alteration in T cell fate under Treg but not Th1 conditions, αKG-mediated changes in
gene expression were more marked in the former as assessed by volcano plot representations
(Figure 4A). This corresponded to substantially more upregulated and downregulated genes
in Treg as compared to Th1 conditions (Figure 4B). Upregulation of transcription factors such
as T-bet (p<1x10-20) were expected based on our initial qRT-PCR analyses (Figure 2) but other
factors such as Irf1, Irf8 and Stat1 were also highly upregulated, suggesting increased signaling
in these cells (Figure 4C). Interestingly though, other factors were markedly downregulated
by αKG (i.e. Fos, Klf4, Sox4) whereas others were unaffected (Rpl11, Ube3c; Figure 4C). Most
importantly, gene ontogeny analysis revealed the importance of membrane proteins,
glycoproteins, which are often present at the cell membrane, and signal peptides, which
result in the translocation of proteins to organelles and the cell membrane (Figure 4D). These
data highlight the importance of cell surface proteins in the αKG-mediated inhibition of CD4
T cell polarization to a Treg fate.
αKG alters cholesterol metabolism and incorporation of poly-unsaturated fatty acids in the
membrane of Treg-polarized lymphocytes. In association with the data presented above, we
found that genes involved in cholesterol biosynthesis were significantly downregulated by
αKG treatment (Figure 5A). Cholesterol is an integral part of the lipid membrane and its
incorporation is coordinated with efflux via the ATP-binding cassette transporters ABCA1 and
ABCG1 (10, 11). Notably, loss of these transporters in dendritic cells and macrophages
resulted in increased inflammatory responses (12-14) and the loss of ABCG1 in T cells has
been associated with an increased responsiveness to antigen and altered lipid raft formation

Matias/Yong et al.
178
(15, 16). Conversely, the knockout of ABCG1 has also been associated with an increase in the
differentiation of natural Tregs (17), but its impact on Treg polarization is not known.
Importantly, we find that αKG significantly decreased mRNA levels of both ABCA1 and ABCG1
in CD4 T cells activated in Treg polarization conditions (p<0.0001, Figure 5B and
Supplementary Figure 3). While αKG did not impact on these transporters in Th1 conditions,
it is important to note that the levels of both ABCA1 and ABCG1 were significantly higher in
Treg- than Th1-polarized cells (Figure 5B).
As the low cholesterol biosynthesis in αKG-treated CD4 T cells activated under Treg conditions
was potentially compensated by decreased levels of ABCA1 and ABCG1 efflux transporters, it
was not apparent as to whether cholesterol levels were altered. Using a quantitative
lipidomics approach (18), we found that while total lipids were substantially increased by αKG
treatment, the percentage of cholesterol as well as other lipid classes were unchanged (Figure
5C). Consistent with these data, cholesterol supplementation did not augment Treg
differentiation, either in the presence or absence of αKG (Figure 5D).
While cholesterol supplementation did not impact on Treg differentiation, despite the
massive alterations in the expression of cholesterol biosynthesis genes and ATP-binding
cassette transporters, the physical parameters of a membrane are also regulated by changes
in the packing of saturated and polyunsaturated fatty acids, altering lateral organization,
membrane permeability, tension, bilayer thickness and fluidity, amongst others (19-22). The
incorporation of polyunsaturated fatty acids into phospholipids can alter the order of
microdomains and the proximity of signaling proteins, thereby impacting on signaling
pathways. Indeed, one of the lipid species whose percentage was increased in αKG-treated
Tregs was triacylglycerol (TAG) and cellular stores of TAG in lipid droplets release fatty acids
that undergo β-oxidation and regulate gene transcription through different signaling
pathways (23). Importantly, a comparison of the number of double bonds in
phosphatidylcholine (PC) and phosphatidylethanolamine (PE), the most abundant
phospholipids in mammalian membranes (24) revealed a significant increase in unsaturation
in response to αKG treatment (p<0.0001,p<0.05; Figure 5E). While polyunsaturated
phospholipids are generally associated with a higher disorder, it has been shown that
polyunsaturated PE can exert a differential structural effect, increasing molecular order

Matias/Yong et al.
179
through cholesterol redistribution (25). Using the polarity sensitive C-Laurdan probe and a
fluorescence correlation spectroscopy (FCS) combined with super-resolution stimulated
emission depletion (STED) microscopy (21, 26), we determined that αKG treatment results in
an increased generalized polarization (GP). Thus, the αKG-mediated decrease in CD4 T cell
polarization to a Treg fate is accompanied by significant changes in membrane composition,
with increased TAG and membrane ordering likely regulating the behavior of membrane
receptor signaling pathways.
Augmented αKG-dependent TCA cycling and oxidative phosphorylation negatively
regulates Treg differentiation
The metabolism of CD4 T cell subsets is distinct; T effector cells exhibit a highly glycolytic
metabolism (27, 28) and suppressive regulatory T cells (Tregs) display a mixed metabolism
with augmented lipid oxidation (29-32). However, while mitochondrial metabolism is critical
for Treg differentiation and function (33-37), long chain fatty acid oxidation does not appear
to be required (38) and the precise role of the TCA cycle in fueling oxidative phosphorylation
in Tregs is not known. Interestingly, the level of basal oxygen consumption (correlating with
oxidative phosphorylation, OXPHOS) as well as spare respiratory capacity was higher in CD4
T cells polarized to a Th1 as compared to a Treg fate (Figure 6A). These data are in accord with
a recent study that reported a lower OXPHOS and glycolysis in activated nTreg as well as iTreg
as compared to Th0 and Th1 polarized cells (39). The higher OXPHOS in Th1 cells (as compared
to Treg) was associated with an augmented glycolysis (measured as a function of the
extracellular acidification rate, ECAR); as such, the OCR/ECAR ratios in Th1 and Tregs were
equivalent (data not shown). Thus, CD4 T cells polarized to a Treg fate exhibit a lower
energetic profile than cells polarized to a Th1 fate.
αKG directly affected the metabolism of Treg-polarized cells because its injection into the flux
analyzer immediately increased oxygen consumption (Figure 6A, middle) and 2 days later,
both the basal and spare respiratory capacity were markedly elevated (Figure 6A, right). This
increase in OXPHOS resulted in an elevated OCR/ECAR ratio (data not shown) and in accord
with the enhanced ATP production from oxidative phosphorylation as compared to aerobic
glycolysis, the ratio of ATP/ADP was significantly higher in αKG-treated cells (p<0.05; Figure
6B). These data strongly suggested an increased level of cycling of TCA intermediates

Matias/Yong et al.
180
(Supplemental Figure 4A) and indeed, while αKG levels were markedly elevated (p<0.0001),
as expected from the ectopic addition of mM quantities, it was surprising that MS metabolite
analysis did not reveal significant increases in either succinate or malate (Figure 6C).
Accordingly, we detected a substantial utilization of ectopic αKG in the TCA cycle, monitored
by the tracing of glutamine and glucose uniformly labelled with heavy carbon (13C5 and 13C6,
respectively), as shown by an increased level of utilization of non-labelled (C0) in the
generation of the different intermediates (Supplemental Figure 4B). The enhanced level of
TCA cycling was also associated with a decreased generation of intracellular lactate
(Supplemental Figure 4C), in agreement with the increased OCR/ECAR ratio in the presence
of αKG.
To assess whether increased αKG levels and the associated augmentation in the
αKG/succinate ratio regulated Treg polarization, we monitored the impact of ectopic
succinate. While the addition of succinate did not significantly alter Treg polarization, it
significantly attenuated the negative impact of αKG (Figure 6D). Succinate, which often
accumulates due to mutations in the succinate dehydrogenase (SDH) gene, can function by
inhibiting prolyl hydroxylase (PHD), thereby leading to stabilization of the HIF-1α transcription
factor and decreased TCA flux through the αKG dehydrogenase complex (40-42). To
distinguish between potential cytosolic and mitochondrial effects of succinate, we inhibited
succinate oxidation with malonate, using a cell-permeable dimethyl malonate (DMM)
molecule, impairing the oxidation of succinate to fumarate without altering PHD activity in
the cytoplasm (43). Malonate directly decreased oxygen consumption in the presence of αKG,
as shown by a diminished spare respiratory capacity following its injection into the Seahorse
machine (Figure 6E). Notably, under these conditions, malonate not only restored the
induction of FoxP3+ T cells in the presence of αKG (p<0.0001) but increased FoxP3 levels under
control conditions (mean of 63% to 75% FoxP3+ cells, p<0.01; Figure 6F). Furthermore,
malonate massively reduced the generation of inflammatory cytokines including IFN-g, IL-17,
IL-2, TNFa and GM-CSF (p<0.005, Figure 6G). Similarly, malonate was recently found to
decrease IFN-g secretion in Th1-polarized cells (44). Together, these data show that
maintaining a low level of TCA flux is central to Treg differentiation. Indeed, TCA flux is
inversely proportional to Treg polarization; conditions that increase TCA flux inhibit Treg
polarization while decreased flux augments Treg polarization.

Matias/Yong et al.
181
The ensemble of these data provide a mechanistic explanation for the observation by several
groups, including our own, that Treg, but not TEFF, generation is maintained under conditions
where glucose and amino acid transport are limiting (3, 45-48). Furthermore, together with
the finding that Th1 differentiation is augmented under conditions of complement-mediated
increases in OCR and ECAR (49), our results support a mechanism whereby IFN-g secretion by
CD4+ T cells is positively regulated by an increased energetic state and an elevated OCR/ECAR
ratio. These results have important implications for the modulation of anti-tumor effector
function by αKG. Indeed, we found that the negative impact of αKG on Treg polarization was
also observed in human CD4 T cells (Supplementary Figure 5). And finally, our data showing
that the intratumoral migration of effector CAR-T cells is significantly augmented by pre-
treatment with αKG suggests that this TCA cycle intermediate may promote the persistence
and efficacy of anti-tumor CAR T cells.

Matias/Yong et al.
182
Figure 1- Exogenous aKG augments Th1 polarization and inhibits the polarization potential of naïve
CD4 T cells towards a Treg fate
(A) Naïve CD4 T cells were stimulated with plate-bound aCD3/aCD28 and polarized under Th1
conditions in the absence (control) or presence of exogenous aKG (3.5mM). The percentages of IFNg+
cells were evaluated by intracellular staining and representative dot plots showing the percentages of
IFNg+ cells are presented (left). Quantification of 20 independent experiments are showed with means
± SEM presented as horizontal lines (right panels) and statistical difference determined by an unpaired
2-tailed t-test; p<0.0001. (B) IFNg mRNA levels were assessed by qRT-PCR at day 4 of Th1 polarization
and normalized to HPRT. Each point represents an independent experiment (left panel, n=7) and
statistical difference was assessed by an unpaired 2-tailed t-test; p=0.0023. RNAseq read densities of
the Ifng gene in Th1-polarizing cells in the absence or presence of aKG are presented (n=3, right
panels). (C) Naïve CD4 T cells were stimulated under Treg polarizing conditions in the absence
(control) or presence of exogenous aKG and the percentage of FoxP3+ Tregs was evaluated at day 4.
Representative histograms are shown (left) and quantifications of 42 independent experiments are
presented (right). Means ± SEM are shown as horizontal lines; p<0.0001 (D) FoxP3 mRNA levels were
evaluated by qRT-PCR and normalized to HPRT. Each point represents an independent experiment
(left, n=8) and means ± SEM are shown as horizontal lines. RNAseq read densities of the Foxp3 gene in
Treg-polarized samples in the absence of presence of aKG are presented (n=3, right panels). (E) FoxP3+
nTregs were isolated from FoxP3-GFP reporter mice and activated with aCD3/aCD28 mAbs in the
absence or presence of aKG. At day 4, the percentages of FoxP3+ cells were evaluated by flow
cytometry (left) and quantification of means ± SEM of 7 independent experiments are presented
(right). All significant differences were evaluated by an unpaired 2-tailed t-test.

Matias/Yong et al.
183

Matias/Yong et al.
184
Figure 2- aKG induces an inflammatory profile in Treg-polarized CD4 T cells
(A) Naïve CD4 T cells were activated under Treg polarizing conditions in the absence or presence of
aKG and the percentages of IFNg+ T cells were assessed at day 4 by intracellular staining.
Representative dot plots (left) as well as a quantifications of the means ± SEM of 40 independent
experiments (right) are shown. Statistical significance was assessed by an unpaired 2-tailed t-test
(****, p<0.0001). (B) Representative histograms of T-bet protein expression are shown (left) as well
as a quantification of the MFIs ± SEM of 8 individual experiments (left, unpaired 2-tailed t-test;
p=0.0006). (C) T-bet and Granzyme B (GrzB) transcripts were quantified by qRT-PCR and normalized to
HPRT and each point shows an independent experiment with means ± SEM presented as horizontal
lines (n=7 and n=8 independent experiments for T-bet and GrzB, respectively; unpaired 2-tailed t-test;
p=0.0456 and p=0.0095 respectively). (D) IFNg, TNFa and GM-CSF transcripts were assessed by qRT-
PCR and each point represents data from an independent experiment (IFNg, n=8, p=0.0006; TNFa n=8,
p=0.6691; GM-CSF, n=4, p=0.714). (E) Cytokine secretion was quantified at day 3 of Treg polarization
by cytometric bead array (before the addition of supplementary IL-2). IFNg, IL-17, IL-2, TNFa, and GM-
CSF levels in 10 independent experiments are presented with means ± SEM shown as horizontal lines
(unpaired 2-tailed T-test; IFNg, p<0.0001; IL-17, p<0.0001; IL-2, p=0.002; TNFa, p<0.0001; and GM-
CSF, p<0.0001).

Matias/Yong et al.
185
Matias/Yong et al.

Matias/Yong et al.
186
Figure 3- ErbB2-CAR+ T cells polarized ex vivo in the presence of aKG maintain an in vivo
inflammatory profile following adoptive transfer into tumor-bearing mice
(A) Schematic of the tumor challenge protocol following the subcutaneous injection of the 24JK
fibrosarcoma cell line expressing the ErbB2 antigen (24JK-ERB) into the flanks of RAG2-/- mice. Naïve
CD4 T cells expressing the ErbB2-CAR were activated in Th1 or Treg polarizing conditions, in the
absence of presence of aKG for 4 days, and then adoptively transferred into tumor-bearing mice at
day 7. Mice were sacrificed 13 days later (day 20). Figure created with Biorender.com (B) The
percentages of CD4+, FoxP3+, and IFNγ+ T cells recovered from lymph nodes of tumor-bearing mice
were evaluated at day 20 and representative plots are shown (left). Quantifications of the percentages
of T cells with the indicated phenotypes are presented with each point representing data from an
individual mouse from 2 independent experiments (n=6-8). (C) The percentages of CD4+, FoxP3+, and
IFNγ+ T cells recovered from mouse tumors were evaluated at day 20 and representative plots (left)
and quantifications were assessed as above. Statistical differences were determined by a one-way
ANOVA and Tukey test for multiple comparisons (*, p<0.05; **, p<0.01; ***, p<0.001; ****, p<0.0001;
NS, not-significant).

Matias/Yong et al.
187
Matias/Yong et al.
187
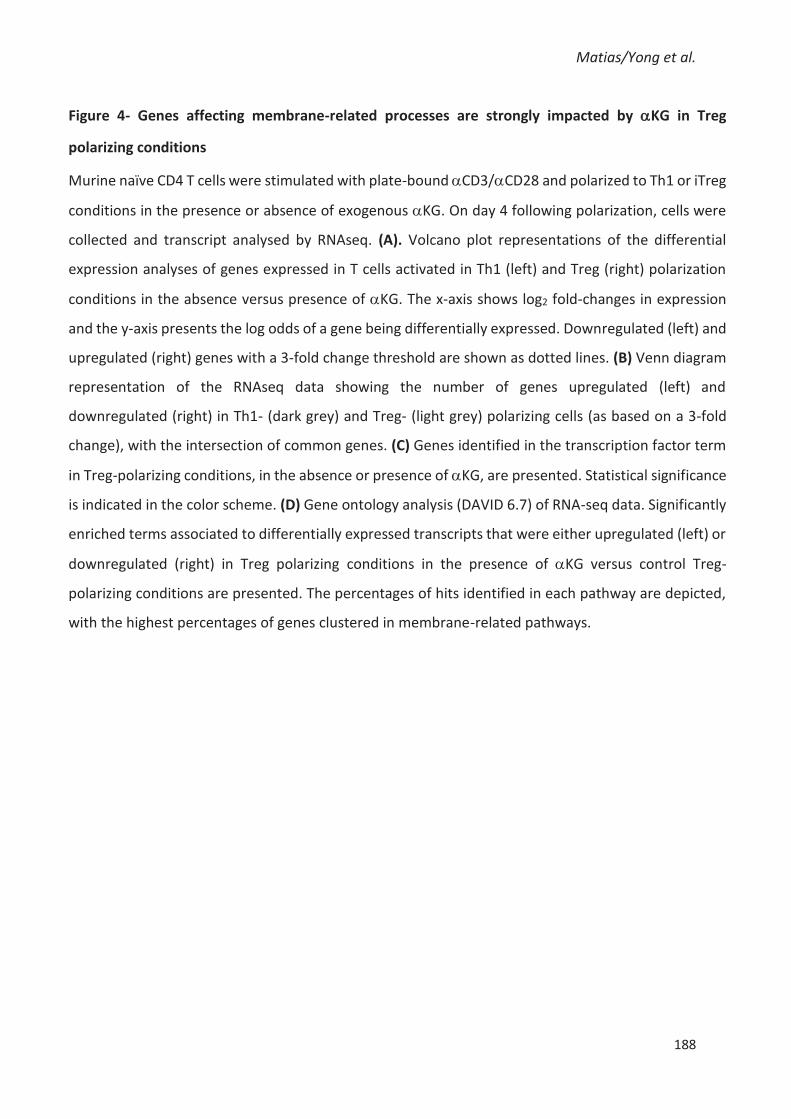
Matias/Yong et al.
188
Figure 4- Genes affecting membrane-related processes are strongly impacted by aKG in Treg
polarizing conditions
Murine naïve CD4 T cells were stimulated with plate-bound aCD3/aCD28 and polarized to Th1 or iTreg
conditions in the presence or absence of exogenous aKG. On day 4 following polarization, cells were
collected and transcript analysed by RNAseq. (A). Volcano plot representations of the differential
expression analyses of genes expressed in T cells activated in Th1 (left) and Treg (right) polarization
conditions in the absence versus presence of aKG. The x-axis shows log2 fold-changes in expression
and the y-axis presents the log odds of a gene being differentially expressed. Downregulated (left) and
upregulated (right) genes with a 3-fold change threshold are shown as dotted lines. (B) Venn diagram
representation of the RNAseq data showing the number of genes upregulated (left) and
downregulated (right) in Th1- (dark grey) and Treg- (light grey) polarizing cells (as based on a 3-fold
change), with the intersection of common genes. (C) Genes identified in the transcription factor term
in Treg-polarizing conditions, in the absence or presence of aKG, are presented. Statistical significance
is indicated in the color scheme. (D) Gene ontology analysis (DAVID 6.7) of RNA-seq data. Significantly
enriched terms associated to differentially expressed transcripts that were either upregulated (left) or
downregulated (right) in Treg polarizing conditions in the presence of aKG versus control Treg-
polarizing conditions are presented. The percentages of hits identified in each pathway are depicted,
with the highest percentages of genes clustered in membrane-related pathways.

Matias/Yong et al.
189
Matias/Yong et al.
189

Matias/Yong et al.
190
Figure 5- Lipid saturation and membrane order is altered by aKG under Treg polarization conditions
(A) Specific transcripts of genes implicated in cholesterol biosynthesis that are significantly decreased
in Treg polarizing conditions in the presence of aKG and RNASeq data from 3 independent experiments
are presented. (B) Abca1 and Abcg1 mRNA levels were evaluated by qRT-PCR and normalized to HPRT.
Points from 6-7 independent experiments per condition are presented and means ± SEM are shown as
horizontal lines (****, p<0.0001). (C) Lipidomic analysis of total lipid levels (Picomol) in 1x10⁶ CD4 T
cells polarized to a Treg fate in the absence or presence of aKG in 2 independent experiments
performed in triplicate (left). The percentage abundance of the different lipid classes was evaluated
(right panel: CE, cholesterol esters; Cer, ceramides; CL, cardiolipin; DAG, diacylglycerols; TAG,
triacylglycerol; HC, hexosyl ceramide; LPA, lysophosphatidic acid; LPC, lysophosphatidylcholines; LPE,
lysophosphatidylethanolamine; LP∗, LPC and LPE plasmalogens; PC, phosphatidylcholines; PCO, PC
plasmalogens; PE, phosphatidylethanolamines; PEO, PE plasmalogens; PG, phosphatidylglycerols; PI,
phosphatidylinositols; PS, phosphatidylserines; SM, sphingomyelins). Data are presented as means ±
SEM of 3 technical replicates from 2 independent experiments (Exp 1, Exp 2). (D) Naïve CD4 T cells
were activated in Treg polarizing conditions in the absence or presence of aKG and following addition
of cholesterol (water soluble, 50mM). FoxP3 expression was evaluated on day 4 by intracellular
staining and representative dot plots are presented (left) as well as a quantification of the means ±
SEM of 5 independent experiments. Statistical difference was determined by a one-way ANOVA and
Tukey test for multiple comparisons (NS, not significant). (E) The mean abundance of
phosphatidylcholine (PC) and phosphatidylethanolamine (PE) lipid species with the indicated numbers
of double bonds was assessed in conditions of Treg polarization in the presence of aKG and ratios for
each level of unsaturation relative to control Treg polarization conditions (control) are presented.
Statistical differences were assessed between the values of 0-2 and 3-12 double bonds. (F) Lipid
packing, imaged by C-laurdan spectral microscopy and quantified by Generalized Polarization (GP), was
evaluated following Treg polarization in the absence (129 cells) or presence of aKG (132 cells).
Quantification, corresponding to increasing lipid order, is presented as means ± SEM from 3 individual
experiments, and statistical difference was determined by determined by an unpaired 2-tailed t-test;
p<0.0001.

Matias/Yong et al.
191
Matias/Yong et al.

Matias/Yong et al.
192
Figure 6- Treg differentiation is enhanced by blocking the aKG-induced augmentation in oxidative
phosphorylation
(A) Oxygen consumption (OCR), a measure of oxidative phosphorylation, was monitored on a Seahorse
XFe96 analyzer at day 2 of polarization of naïve CD4 T cells to a Th1 versus Treg fate; means ± SEM of
data from 9 independent experiments are shown (left panel). The impact of injecting αKG directly into
the XFe96 flux analyzer at day 2 of Treg polarization was evaluated (middle panel; data are
representative of 1 of 2 independent experiments). OCR of CD4 T cells polarized to a Treg fate at day
4 of stimulation, in the absence or presence of αKG, is presented (means ± SEM of 9 independent
experiments). (B) The ATP/AMP ratio of CD4 T cells polarized to a Treg fate in control conditions or in
the presence of αKG were evaluated by mass spectrometry and means ± SEM of triplicate technical
replicates from 2 independent experiments are presented and statistical difference determined by an
unpaired 2-tailed t-test. (C) The levels of αKG, succinate, malate, citrate and 2-hydroxyglutarate (2HG)
were evaluated by mass spectrometry and the ratio of these metabolites in αKG-treated to control
conditions are presented as means ± SEM of triplicate technical replicates from 2 independent
experiments. Statistical significance was evaluated by an unpaired 2-tailed t-test. (D) To assess the
impact of the αKG/succinate ratio on Treg differentiation, naïve CD4 T cells were stimulated in Treg
polarization conditions in the presence or absence of aKG and succinate (7 mM). FoxP3 expression
was evaluated a day 4 and representative plots are shown (left). Quantification of FoxP3 levels are
presented as means ± SEM from 3 independent experiments and significance was evaluated by a one-
way ANOVA and Tukey multiple comparison test (*, p<0.05; NS, not significant). (E) Oxygen
consumption (OCR) was monitored in CD4 T cells stimulated in Treg-polarizing conditions in the
presence of aKG and the impact of dimethyl malonate (DMM) was evaluated. Data are representative
of means of 6 samples in 2 independent experiments. (F) The impact of malonate (10 mM) on Treg
polarization was evaluated in the absence of presence of aKG. Representative FACS plots of FoxP3
expression are presented at day 4 (left) and quantifications of the means ± SEM of 19 independent
experiments are presented (right). Significance was determined by a one-way ANOVA and Tukey
multiple comparison test (**, p<0.01; ****, p<0.0001; NS, not significant). (G) IFNg, IL-17, IL-2, TNFa,
and GM-CSF secretion by CD4 T cells polarized to a Treg fate in the absence of presence of aKG and/or
malonate was evaluated at day 4 and means ± SEM are presented (n=10 independent experiments for
aKG conditions and n=5 for malonate conditions). Significance was determined by a one-way ANOVA
and Tukey multiple comparison test (*, p<0.05; **, p<0.01; ***, p<0.005; ****, p<0.0001; NS, not
significant).

Matias/Yong et al.
193
Matias/Yong et al.
193

Matias/Yong et al.
194
Supplemental Figure 1- Treg polarization is attenuated by aKG following TCR stimulation
Naïve CD4 T cells were activated under Treg-polarizing conditions and aKG was added either at the
time of activation or at 24h post stimulation. FoxP3 expression was evaluated at day 4 and
representative dot plots are shown (left) as well as a quantification of the means ± SEM of 3
independent experiments. Significance was assessed by a one-way ANOVA and Tukey multiple
comparison test (NS, not significant).

Matias/Yong et al.
195
Supplemental Figure 2- ErbB2-CAR T cells exhibit an attenuated Treg polarization in the presence of
aKG
The potential of ErbB2-CAR T cells following stimulation in Treg-polarizing conditions in the absence or
presence of aKG compared to polyclonal T cells to produce IFNg was evaluated by intracellular staining
and representative plots are shown (top plots). The induction of FoxP3 expression was also evaluated
(bottom plots).

Matias/Yong et al.
196
Matias/Yong et al.
Supplemental Figure 3- Abca1 and Abcg1 levels are decreased by aKG treatment in Treg-polarizing
conditions
RNAseq read densities of the Abca1 and Abcg1 genes in Th1- and Treg-polarizing conditions in the
absence of presence of aKG are presented (n=3).

Matias/Yong et al.
197
Supplemental Figure 4- Tracing of glucose and glutamine metabolism in Treg-polarizing conditions
(A) Schematic representation of the TCA cycle, showing the entry of glucose and glutamine. (B) The
distribution of isotopologues from and [13C]glutamine and [13C]glucose into TCA cycle intermediates
are shown. (C) The levels of glutamate and lactate as well as the NAD+/NADH ratio were assessed in
the indicated conditions by mass spectrometry (means ± SEM; n= 6 technical replicates in 2 biologically
independent samples). Statistical differences were determined by an unpaired 2-tail t-test.

Matias/Yong et al.
198
Supplemental Figure 5- Human CD4+ T cells exhibit attenuated Treg polarization in the presence of
aKG
Naïve human CD4+ T cells were activated in Treg-polarizing conditions and at day 4 of stimulation, Treg
polarization was evaluated as a function of a CD25+/CD127-/FoxP3+ phenotype and representative dot
plots are shown (left). Quantification of the percentages of FoxP3+ cells is shown for 12 independent
experiments (12 distinct donors) and significance was determined by an unpaired t-test (**, p=0.0034).

Matias/Yong et al.
199
Materials and Methods
Mice
Ly5.1 or Ly5.2 C57BL/6 mice were crossed with Foxp3-GFP reporter mice and mice harboring
an ErbB2-CAR (Yong et al., 2015) were crossed with C57BL/6 FOXP3GFP mice. Mice were
housed in a conventional, pathogen-free facility at the Institut de Génétique Moléculaire de
Montpellier. Animal care and experiments All experiments were approved by the local animal
facility institutional review board in accordance with French national guidelines.
T cell isolation, activation and culture
Murine CD4+ T cells from the indicated mice strains were purified using the MACS CD4+ T cell
negative selection kit (Miltenyi Biotec) and naïve CD4+ T cells were then sorted on the basis
of a CD4+ CD8- CD62Lhi CD44− GFP− expression profile on a FACSAria flow cytometer (BD
Biosciences). Natural Tregs were sorted as CD4+ CD8- CD62Lhi CD44− CD25+GFP+. T cell
activation was performed using plate-bound a-CD3 (clone 145-2C11, 1 mg/ml) and a-CD28
(clone PV-1, 1 mg/ml) monoclonal antibodies in RPMI 1640 medium (Life Technologies)
supplemented with 10% FCS, 1% penicillin/streptomycin (Gibco-Life technologies). For Th1
and iTreg-polarizing conditions, IL-12 (15 ng/ml) and aIL-4 antibody (5 ug/ml) or hTGF-b (3
ng/ml) and hIL-2 (100 U/ml), respectively, were added to the cultures. When indicated, cell
permeable αKG (dimethyl ketoglutarate, 3.5 mm; Sigma), malonate (dimethyl malonate,
10mM; Sigma), succinate (diethyl succinate, 10mM; Sigma) and water soluble cholesterol
(50mM, C4951, Sigma) were added. Cells were maintained in a standard tissue culture
incubator containing atmospheric (20%) O2 and 5% CO2.
Human CD4+ T cells were isolated from healthy adult donors. All experiments using primary
human cells were conducted in accordance with the Declaration of Helsinki and IRB approval
to the French Blood Bank (Etablissement Francais du Sang). T lymphocytes were purified by
negative-selection using Rosette tetramers (StemCell Technologies) and the purity was
monitored by flow cytometry. For sorting of Human CD4+ Naïve T cells, CD4+ T cells were
sorted on the basis of CD4+ CD8- CD45RA+ CD45RO- CCR7+ CD62L+ CD127low and CD25- on a BD
FACSAria flow cytometer. For Th1 and iTreg-polarizing conditions, IL-12 (10 ng/ml) and a–IL-
4 antibody (10 mg/ml) or human TGF-b (3 ng/ml) and rhIL-2 (100 U/ml) respectively, were
Matias/Yong et al.
200
added to the cultures. T cell activation was performed using plate-bound a-CD3 (clone OKT3,
Biolegend) and a-CD28 (clone 9.3, kindly provided by Carl June) mAbs at a concentration of 1
μg/ml in RPMI medium 1640 (Life Technologies) supplemented with 10% FCS and 1%
penicillin/streptomycin (Gibco-Life technologies).
Immunophenotyping and flow cytometric analysis
Immunophenotyping of cells was performed with fluorochrome-conjugated antibodies, and
intracellular staining was performed after the fixation and permeabilization of the cells
(intracellular staining kit from ThermoFisher or BD Bioscience). Analysis of cells collected from
in vivo experiments were performed following Fc block treatment (2.4G2, BioXcell) for 10
minutes prior to incubation with conjugated antibodies for FACS analysis. For intracellular
cytokine staining, cells were stimulated with phorbol 12-myristate 13-acetate (PMA) (100
ng/ml) and ionomycin (1 μg/ml) in the presence of brefeldin A (10 ug/ml; all from Sigma) for
3.5–4h at 37 °C. Cells were labeled with fixable viability dye prior to fixation, followed by at
least 3 hours of intracellular staining with the following antibodies; Foxp3-PeCy7, T-Bet-Pe
and IFNg-APC. Cytokine production (IFNg, TNFα, IL-2, IL-17 and IL-10) was also assessed by
Cytometric Bead Array (CBA) Kit (BD Biosciences) using supernatants at day 3 of polarization.
For human cells; immunophenotyping was performed using fluorochrome-conjugated mAbs
against CD4, CD8, CD45RA, CD45RO, CCR7 and CD62L (BD Bioscience, Beckman Coulter or
eBioscience). Cells were analyzed on a FACSCanto or LSRII-Fortessa flow cytometer (BD
Biosciences). Data analysis was performed using FlowJo (Tree Star software) and FCAPArray
Software (CBA analysis). Antibodies are presented in Table 1.
Tumour model and adoptive T cell transfer
The murine 24JK fibrosarcoma cell line expressing the human ErbB2/Her2 antigen was
generated as described Yong, 2016 #3110}. 24JK-ErbB2 (1 x 10⁶) were subcutaneously injected
into RAG2-/- mice and allowed to establish over a 7 days period. On day 7, 3-5 x 10⁶ in vitro
ErbB2-CAR T cells, activated as indicated, were injected retroorbitally into tumor-bearing
mice. For endpoint analyses,: tumors were excised, mechanically digested in T cell culture
media (as above) using collagenase IV (1 mg/ml, Sigma) and DNASE I (500mg/ml, Roche),
incubated for 25 minutes at 37°C and processed into single cell suspensions for FACS analysis.

Matias/Yong et al.
201
Lymph nodes and spleens of tumor bearing mice were isolated and dissociated into single cell
suspensions in PBS + 2% FCS and analyzed by flow cytometry.
RNA-seq analysis
T cells (5x 10⁶) were lysed in triplicates in TRIzol (Thermofisher). Total RNA was isolated using
the mirVana (Applied Biosystems) isolation kit. RNA-seq libraries were prepared from 4 μg of
total RNA using the TruSeq RNA sample preparation kit following manufacturer’s protocol
(Illumina). Briefly, oligo-dT purified mRNA was fragmented and subjected to first and second
strand cDNA synthesis. cDNA fragments were blunt-ended, ligated to Illumina adaptors, and
PCR amplified to enrich for the fragments ligated to adaptors. The resulting cDNA libraries
were verified and quantified on Agilent Bioanalyzer and RNA-seq was conducted using the
GAIIx Genome Analyzer (Illumina). Reads from RNA-seq were mapped to the human genome
(GRCh37, hg19) using the splice-aware aligner TopHat with option – mate-inner-dist 160 –
coverage-search – microexon-search – max-multi hits. Aligned reads were then visualized on
a local mirror of the UCSC Genome Browser. Quantification of gene expression was performed
by counting aligned reads on each gene, for each condition. DEGseq was then applied to
identify differentially expressed genes with p value ⩽ 1e−5.
Gene expression analysis
RNA was isolated from T cells as indicated using the RNeasy Micro Kit and then reverse-
transcribed to produce cDNA using oligonucleotide priming with the QuantiTect Reverse
Transcription Kit (both Qiagen). Quantitative PCR was performed using the Quantitect SYBR
green PCR Master mix (Roche) with 10 ng of DNA and 0.5 µM primers in a final volume of 10
µl. Amplification of DNAs was performed using the LightCycler 480 (Roche). Each sample was
amplified in triplicate. Relative expression was calculated by normalization to HPRT and
primer sequences are presented in Table 2.
Lipid analyses
Mass spectrometry-based lipid analysis was performed at Lipotype GmbH (Dresden,
Germany) as previously described (Sampaio et al., 2011). Lipids were extracted using a two-
step chloroform/methanol procedure (Ejsing et al., 2009). Samples were analyzed by direct
infusion on a QExactive mass spectrometer (Thermo Scientific) equipped with a TriVersa

Matias/Yong et al.
202
NanoMate ion source (Advion Biosciences) as described (Mitroulis et al., 2018). Phospholipids
were analyzed by electrospray ionization tandem mass spectrometry (ESI-MS/MS) on a hybrid
quadrupole linear ion trap mass spectrometer (4000 QTRAP system, AB SCIEX) equipped with
a TriVersa NanoMate robotic nanosource (Advion Biosciences) as previously described (Talebi
et al., 2018).
Generalized polarization (GP) was calculated to determine molecular order of the plasma
membrane. Cells were stained with Laurdan (ThermoFisher) and fixed with 4%
paraformadehyde before super-resolution STED microscopy with scanning fluorescence
correlation spectroscopy (scanning STED-FCS, sSTED-FCS) to characterize the spatial and
temporal heterogeneity of lipid interactions as previously described (Sezgin et al., 2019).
Quantification of fluorescence intensity was performed using NIH ImageJ.
Mass spectrometry (LC-MS)
For profiling of intracellular metabolites, cells (1x10⁶) were treated as previously described
(Oburoglu et al., 2014). Briefly, cells were incubated in RPMI medium without glucose or
glutamine and supplemented with uniformly labeled [U-13C6]glucose or [U-13C5-
15N2]glutamine, respectively, for 24 hours. Cells were rapidly washed in ice-cold PBS and
metabolites were extracted in a 50% methanol / 30% acetonitrile/ 20% water solution. The
volume of extraction solution was adjusted to 2 x 10⁶ cells / ml for all samples and were
normalized to the number of cells obtained at the end of the 24-hour incubation period. All
cultures were performed in triplicate. Both cell extracts and media were centrifuged at
16,000g for 10min at 4°C and supernatants were analyzed by HPLC-MS. Samples were
separated on a Thermo Scientific Accela liquid chromatography system coupled with a guard
column (Hichrom) and a ZIC-pHILIC column (Merck). The separation was performed using a
gradient elution in a solution of 20mM ammonium carbonate, with 0.1% ammonium
hydroxide and acetonitrile. Metabolites were detected using a Thermo Scientific Exactive
Orbitrap mass spectrometer with electrospray ionization, operating in a polarity switching
mode. Raw data were analyzed with Xcalibur 2.2 and LCquan 2.7 Thermo scientific software.
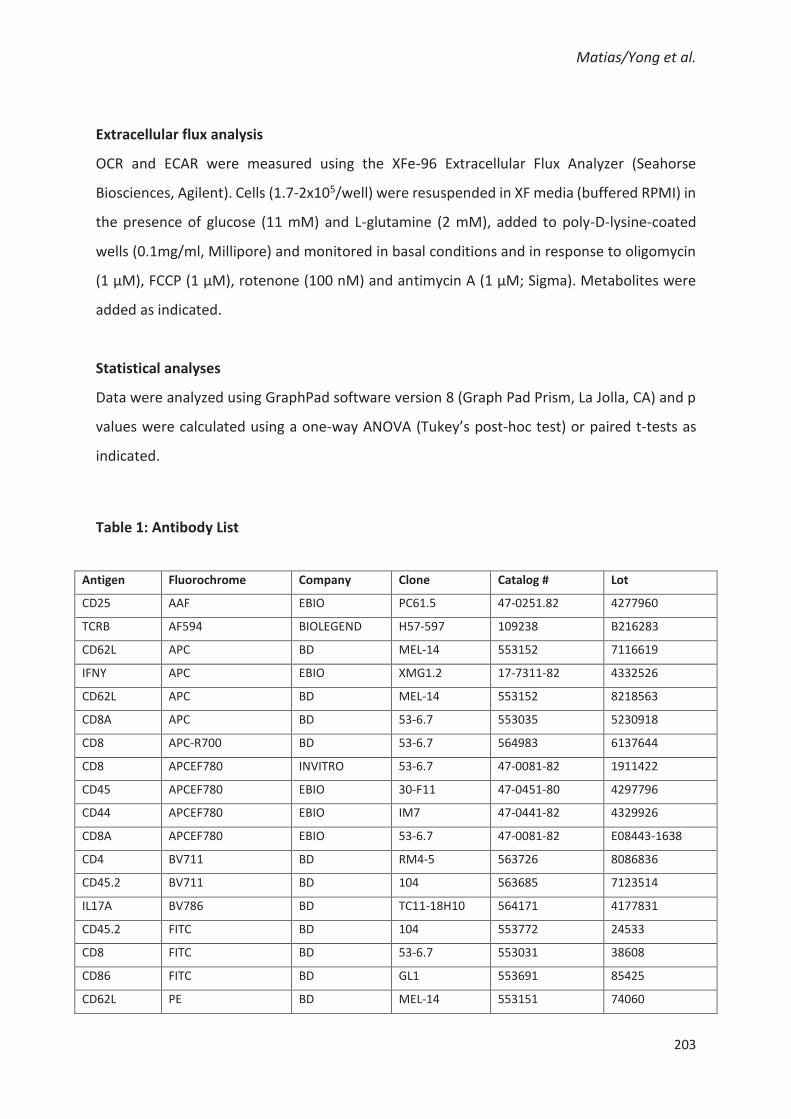
Matias/Yong et al.
203
Extracellular flux analysis
OCR and ECAR were measured using the XFe-96 Extracellular Flux Analyzer (Seahorse
Biosciences, Agilent). Cells (1.7-2x10⁵/well) were resuspended in XF media (buffered RPMI) in
the presence of glucose (11 mM) and L-glutamine (2 mM), added to poly-D-lysine-coated
wells (0.1mg/ml, Millipore) and monitored in basal conditions and in response to oligomycin
(1 µM), FCCP (1 µM), rotenone (100 nM) and antimycin A (1 µM; Sigma). Metabolites were
added as indicated.
Statistical analyses
Data were analyzed using GraphPad software version 8 (Graph Pad Prism, La Jolla, CA) and p
values were calculated using a one-way ANOVA (Tukey’s post-hoc test) or paired t-tests as
indicated.
Table 1: Antibody List
Antigen Fluorochrome Company Clone Catalog # Lot
CD25 AAF EBIO PC61.5 47-0251.82 4277960
TCRB AF594 BIOLEGEND H57-597 109238 B216283
CD62L APC BD MEL-14 553152 7116619
IFNY APC EBIO XMG1.2 17-7311-82 4332526
CD62L APC BD MEL-14 553152 8218563
CD8A APC BD 53-6.7 553035 5230918
CD8 APC-R700 BD 53-6.7 564983 6137644
CD8 APCEF780 INVITRO 53-6.7 47-0081-82 1911422
CD45 APCEF780 EBIO 30-F11 47-0451-80 4297796
CD44 APCEF780 EBIO IM7 47-0441-82 4329926
CD8A APCEF780 EBIO 53-6.7 47-0081-82 E08443-1638
CD4 BV711 BD RM4-5 563726 8086836
CD45.2 BV711 BD 104 563685 7123514
IL17A BV786 BD TC11-18H10 564171 4177831
CD45.2 FITC BD 104 553772 24533
CD8 FITC BD 53-6.7 553031 38608
CD86 FITC BD GL1 553691 85425
CD62L PE BD MEL-14 553151 74060

Matias/Yong et al.
204
TBET PE EBIO EBIO4B10 12-5825-82 4313524
TNFA PE EBIO MP6-XT22 12-7321-71 E028998
CD4 PE BD RM4-5 553049 16834
CD45RB PE INVITRO 16A MA5-17886 SE2385342
CD45.2 PE BD 104 560695 6028599
IL17A PE EBIO EBIO17B7 12-7177-81 4276914
CD11C PE BD HL3 557401 64082
CD45.1 PE BD A20 553776 81093
CD4 PE BD RM4-5 553049 4189673
CCR7 PECF594 BD 4B12 563596 5070605
CD25 PECY7 BD PC61 552880 7341665
FOXP3 PECY7 EBIO FJK-16S 25-5773-82 1988695
CD25 PECY7 BD PC61 552880 7341665
CD44 PECY7 EBIO IM7 25-0441-82 4290712
IL-2 PECY7 BD JES6-5H4 560538 2104623
F4/80 PECY7 EBIO BM8 25-4801-82 E07631-1630
CD4 PERCPCY5.5 BD RM4-5 550954 7047561
CD4 PERCPCY5.5 BD RM4-5 550954 7047561
TBET PERCPCY5.5 EBIO EBIO4B10 45-5825-82 4305907
CCR3 PERCPCY5.5 BD 83103 742079 7317604
NK1.1 PERCPCY5.5 BD PK136 551114 32032
CD8A PERCPCY5.5 BD 53-6.7 551162 7051685
CD71 PERCPEF710 EBIO R17217 46-0711-82 E14768-103
CD4 V450 BD RM4-5 560468 560468
CD44 V450 BD IM7 560451 4059830
CD45.1 V450 BD RM4-5 560468 7048677
GR1 V450 BD RB6-8C5 560453 6308706
CD44 V500 BD IM7 560780 3291621
IL17A V605 BD TC11-18H10 564169 6182616
CD11B V605 BD M1/70 563015 7096987
CD45.1 V650 BD A20 563754 7075831
CD4 V650 BD RM4-5 563747 7282983
TBET V650 BD O4-46 564142 4091574
PD1 V650 BD J43 744546 8183502
IL17A V650
CD19 V650 BD 1D3 563235 8122612
CD3 V650 BD 145-2C11 564378 4135556
RORYT V650 BD Q31-378 564722 7226869

Matias/Yong et al.
205
Table 2: Primer Sequences
Gene Forward 5’-3’ Reverse 5’-3’
FOXP3 GGCCCTTCTCCAGGACAGA GCTGATCATGGCTGGGTTGT
IFNg TGGCTCTGCAGGATTTTCATG TCAAGTGGCATAGATGTGGAAGAA
TBET CAACAACCCCTTTGCCAAAG (S) TCCCCCAAGCAGTTGACAGT
GMCSF TTTACTTTTCCTGGGCATTG TAGCTGGCTGTCATGTTCAA
IL10 ACCTGCTCCACTGCCTTGCT GGTTGCCAAGCCTTATCGGA
TNFa CATCTTCTCAAAATTCGAGTGACAA GGGAGTAGACAAGGTACAACCC
HPRT CTGGTGAAAAGGACCTCTCG TGAAGTACTCATTATAGTCAAGGGCA
ACTIN CAATAGTGATGACCTGGCCGT AGAGGGAAATCGTGCGTGAC
GRZB TGCTGACCTTGTCTCTGGCC TAGTCTGGGTGGGGAATGCA
ABCA1 AAAACCGCAGACATCCTTCAG CATACCGAAACTCGTTCACCC
ABCG1 CTTTCCTACTCTGTACCCGAGG CGGGGCATTCCATTGATAAGG
ACAT1 GAAACCGGCTGTCAAAATCTGG TGTGACCATTTCTGTATGTGTCC
CPT1 TTGGGCCGGTTGCTGAT GTCTCAGGGCTAGAGAACTTGGAA
LSS CGACATCACTGCTCAGGAGA TGGCACAGGACTTGTTGAAG
CYP51 TCTCCAATTCCATTCCTTGG GCCCACCATGGTAAAGCTAA
LDLR TGACTCAGACGAACAAGGCTG ATCTAGGCAATCTCGGTCTCC
HMGCR AGCTTGCCCGAATTGTATGTG TCTGTTGTGAACCATGTGACTTC
HMGCS AACTGGTGCAGAAATCTCTAGC GGTTGAATAGCTCAGAACTAGCC
SREBP1 GCAGCCACCATCTAGCCTG CAGCAGTGAGTCTGCCTTGAT
SREBP2 GCAGCAACGGGACCATTCT CCCCATGACTAAGTCCTTCAACT
IRF1 CAGAGGAAAGAGAGAAAGTCC CACACGGTGACAGTGCTGG
IRF8 GGGCTGATCTGGGAAAATGATGAGA CCCAGGCCTTGAAGATGGAAGCA
ACACA CATCACCATCAGCCTGGTTACA ACTGTGTACGCTCTTCGGCAT
LXRA AGGAGTGTCGACTTCGCAAA CTCTTCTTGCCGCTTCAGTTT

Matias/Yong et al.
206

Matias/Yong et al.
207
References
1. Delgoffe GM, Pollizzi KN, Waickman AT, Heikamp E, Meyers DJ, Horton MR, et al. The kinase mTOR regulates the differentiation of helper T cells through the selective activation of signaling by mTORC1 and mTORC2. Nat Immunol. 2011;12(4):295-303.
2. Zeng H, Yang K, Cloer C, Neale G, Vogel P, and Chi H. mTORC1 couples immune signals and metabolic programming to establish T(reg)-cell function. Nature. 2013;499(7459):485-90.
3. Klysz D, Tai X, Robert PA, Craveiro M, Cretenet G, Oburoglu L, et al. Glutamine-dependent alpha-ketoglutarate production regulates the balance between T helper 1 cell and regulatory T cell generation. Sci Signal. 2015;8(396):ra97.
4. Takeuchi A, and Saito T. CD4 CTL, a Cytotoxic Subset of CD4(+) T Cells, Their Differentiation and Function. Front Immunol. 2017;8:194.
5. Chisolm DA, Savic D, Moore AJ, Ballesteros-Tato A, Leon B, Crossman DK, et al. CCCTC-Binding Factor Translates Interleukin 2- and alpha-Ketoglutarate-Sensitive Metabolic Changes in T Cells into Context-Dependent Gene Programs. Immunity. 2017;47(2):251-67 e7.
6. Yong CSM, Dardalhon V, Devaud C, Taylor N, Darcy PK, and Kershaw MH. CAR T-cell therapy of solid tumors. Immunol Cell Biol. 2017;95(4):356-63.
7. Yong CS, John LB, Devaud C, Prince MH, Johnstone RW, Trapani JA, et al. A role for multiple chimeric antigen receptor-expressing leukocytes in antigen-specific responses to cancer. Oncotarget. 2016;7(23):34582-98.
8. Chang CH, Qiu J, O'Sullivan D, Buck MD, Noguchi T, Curtis JD, et al. Metabolic Competition in the Tumor Microenvironment Is a Driver of Cancer Progression. Cell. 2015;162(6):1229-41.
9. Darrasse-Jeze G, Bergot AS, Durgeau A, Billiard F, Salomon BL, Cohen JL, et al. Tumor emergence is sensed by self-specific CD44hi memory Tregs that create a dominant tolerogenic environment for tumors in mice. J Clin Invest. 2009;119(9):2648-62.
10. Yvan-Charvet L, Pagler TA, Seimon TA, Thorp E, Welch CL, Witztum JL, et al. ABCA1 and ABCG1 protect against oxidative stress-induced macrophage apoptosis during efferocytosis. Circ Res. 2010;106(12):1861-9.
11. Yvan-Charvet L, Wang N, and Tall AR. Role of HDL, ABCA1, and ABCG1 transporters in cholesterol efflux and immune responses. Arterioscler Thromb Vasc Biol. 2010;30(2):139-43.
12. Westerterp M, Gautier EL, Ganda A, Molusky MM, Wang W, Fotakis P, et al. Cholesterol Accumulation in Dendritic Cells Links the Inflammasome to Acquired Immunity. Cell Metab. 2017;25(6):1294-304 e6.
13. Tall AR, and Yvan-Charvet L. Cholesterol, inflammation and innate immunity. Nat Rev Immunol. 2015;15(2):104-16.
14. Westerterp M, Murphy AJ, Wang M, Pagler TA, Vengrenyuk Y, Kappus MS, et al. Deficiency of ATP-binding cassette transporters A1 and G1 in macrophages increases inflammation and accelerates atherosclerosis in mice. Circ Res. 2013;112(11):1456-65.
15. Bensinger SJ, Bradley MN, Joseph SB, Zelcer N, Janssen EM, Hausner MA, et al. LXR signaling couples sterol metabolism to proliferation in the acquired immune response. Cell. 2008;134(1):97-111.
16. Armstrong AJ, Gebre AK, Parks JS, and Hedrick CC. ATP-binding cassette transporter G1 negatively regulates thymocyte and peripheral lymphocyte proliferation. J Immunol. 2010;184(1):173-83.
17. Cheng HY, Gaddis DE, Wu R, McSkimming C, Haynes LD, Taylor AM, et al. Loss of ABCG1 influences regulatory T cell differentiation and atherosclerosis. J Clin Invest. 2016;126(9):3236-46.
18. Mitroulis I, Ruppova K, Wang B, Chen LS, Grzybek M, Grinenko T, et al. Modulation of Myelopoiesis Progenitors Is an Integral Component of Trained Immunity. Cell. 2018;172(1-2):147-61 e12.

Matias/Yong et al.
208
19. Ernst R, Ballweg S, and Levental I. Cellular mechanisms of physicochemical membrane homeostasis. Curr Opin Cell Biol. 2018;53:44-51.
20. Sezgin E, Levental I, Mayor S, and Eggeling C. The mystery of membrane organization: composition, regulation and roles of lipid rafts. Nat Rev Mol Cell Biol. 2017;18(6):361-74.
21. Sezgin E, Gutmann T, Buhl T, Dirkx R, Grzybek M, Coskun U, et al. Adaptive lipid packing and bioactivity in membrane domains. PLoS One. 2015;10(4):e0123930.
22. Levental KR, Lorent JH, Lin X, Skinkle AD, Surma MA, Stockenbojer EA, et al. Polyunsaturated Lipids Regulate Membrane Domain Stability by Tuning Membrane Order. Biophys J. 2016;110(8):1800-10.
23. Coleman RA, and Mashek DG. Mammalian triacylglycerol metabolism: synthesis, lipolysis, and signaling. Chem Rev. 2011;111(10):6359-86.
24. van der Veen JN, Kennelly JP, Wan S, Vance JE, Vance DE, and Jacobs RL. The critical role of phosphatidylcholine and phosphatidylethanolamine metabolism in health and disease. Biochim
Biophys Acta Biomembr. 2017;1859(9 Pt B):1558-72.
25. Shaikh SR, Kinnun JJ, Leng X, Williams JA, and Wassall SR. How polyunsaturated fatty acids modify molecular organization in membranes: insight from NMR studies of model systems. Biochim Biophys
Acta. 2015;1848(1 Pt B):211-9.
26. Sezgin E, Schneider F, Galiani S, Urbancic I, Waithe D, Lagerholm BC, et al. Measuring nanoscale diffusion dynamics in cellular membranes with super-resolution STED-FCS. Nature protocols. 2019;14(4):1054-83.
27. O'Sullivan D, and Pearce EL. Fatty acid synthesis tips the TH17-Treg cell balance. Nat Med. 2014;20(11):1235-6.
28. Michalek RD, Gerriets VA, Jacobs SR, Macintyre AN, MacIver NJ, Mason EF, et al. Cutting edge: distinct glycolytic and lipid oxidative metabolic programs are essential for effector and regulatory CD4+ T cell subsets. J Immunol. 2011;186(6):3299-303.
29. Berod L, Friedrich C, Nandan A, Freitag J, Hagemann S, Harmrolfs K, et al. De novo fatty acid synthesis controls the fate between regulatory T and T helper 17 cells. Nat Med. 2014;20(11):1327-33.
30. Michalek RD, Gerriets VA, Jacobs SR, Macintyre AN, MacIver NJ, Mason EF, et al. Cutting edge: Distinct glycolytic and lipid oxidative metabolic programs are essential for effector and regulatory CD4+ T cell subsets. J Immunol. 2011;186(6):3299-303.
31. Shi LZ, Wang R, Huang G, Vogel P, Neale G, Green DR, et al. HIF1{alpha}-dependent glycolytic pathway orchestrates a metabolic checkpoint for the differentiation of TH17 and Treg cells. J Exp Med. 2011;208(7):1367-76.
32. Wang R, Dillon CP, Shi LZ, Milasta S, Carter R, Finkelstein D, et al. The transcription factor Myc controls metabolic reprogramming upon T lymphocyte activation. Immunity. 2011;35(6):871-82.
33. Layman AAK, Deng G, O'Leary CE, Tadros S, Thomas RM, Dybas JM, et al. Ndfip1 restricts mTORC1 signalling and glycolysis in regulatory T cells to prevent autoinflammatory disease. Nat Commun. 2017;8:15677.
34. He N, Fan W, Henriquez B, Yu RT, Atkins AR, Liddle C, et al. Metabolic control of regulatory T cell (Treg) survival and function by Lkb1. Proc Natl Acad Sci U S A. 2017;114(47):12542-7.
35. Howie D, Cobbold SP, Adams E, Ten Bokum A, Necula AS, Zhang W, et al. Foxp3 drives oxidative phosphorylation and protection from lipotoxicity. JCI Insight. 2017;2(3):e89160.
36. Chapman NM, Zeng H, Nguyen TM, Wang Y, Vogel P, Dhungana Y, et al. mTOR coordinates transcriptional programs and mitochondrial metabolism of activated Treg subsets to protect tissue homeostasis. Nat Commun. 2018;9(1):2095.
37. Weinberg SE, Singer BD, Steinert EM, Martinez CA, Mehta MM, Martinez-Reyes I, et al. Mitochondrial complex III is essential for suppressive function of regulatory T cells. Nature. 2019;565(7740):495-9.

Matias/Yong et al.
209
38. Raud B, Roy DG, Divakaruni AS, Tarasenko TN, Franke R, Ma EH, et al. Etomoxir Actions on Regulatory and Memory T Cells Are Independent of Cpt1a-Mediated Fatty Acid Oxidation. Cell Metab. 2018;28(3):504-15 e7.
39. Priyadharshini B, Loschi M, Newton RH, Zhang JW, Finn KK, Gerriets VA, et al. Cutting Edge: TGF-beta and Phosphatidylinositol 3-Kinase Signals Modulate Distinct Metabolism of Regulatory T Cell Subsets. J Immunol. 2018;201(8):2215-9.
40. Selak MA, Armour SM, MacKenzie ED, Boulahbel H, Watson DG, Mansfield KD, et al. Succinate links TCA cycle dysfunction to oncogenesis by inhibiting HIF-alpha prolyl hydroxylase. Cancer Cell. 2005;7(1):77-85.
41. King A, Selak MA, and Gottlieb E. Succinate dehydrogenase and fumarate hydratase: linking mitochondrial dysfunction and cancer. Oncogene. 2006;25(34):4675-82.
42. Koivunen P, Hirsila M, Remes AM, Hassinen IE, Kivirikko KI, and Myllyharju J. Inhibition of hypoxia-inducible factor (HIF) hydroxylases by citric acid cycle intermediates: possible links between cell metabolism and stabilization of HIF. J Biol Chem. 2007;282(7):4524-32.
43. Mills EL, Kelly B, Logan A, Costa AS, Varma M, Bryant CE, et al. Succinate Dehydrogenase Supports Metabolic Repurposing of Mitochondria to Drive Inflammatory Macrophages. Cell. 2016;167(2):457-70 e13.
44. Bailis W, Shyer JA, Zhao J, Canaveras JCG, Al Khazal FJ, Qu R, et al. Distinct modes of mitochondrial metabolism uncouple T cell differentiation and function. Nature. 2019;571(7765):403-7.
45. Macintyre AN, Gerriets VA, Nichols AG, Michalek RD, Rudolph MC, Deoliveira D, et al. The glucose transporter Glut1 is selectively essential for CD4 T cell activation and effector function. Cell Metab. 2014;20(1):61-72.
46. Nakaya M, Xiao, Yichuan, Zhou, Xiaofei, Chang, Jae-Hoon, Chang, Mikyoung, Cheng, Xuhong, Blonska, Marzenna, Lin, Xin, Sun, Shao-Cong. Inflammatory T Cell Responses Rely on Amino Acid Transporter ASCT2 Facilitation of Glutamine Uptake and mTORC1 Kinase Activation. Immunity. 2014;40(5):692-705.
47. Sinclair LV, Rolf J, Emslie E, Shi YB, Taylor PM, and Cantrell DA. Control of amino-acid transport by antigen receptors coordinates the metabolic reprogramming essential for T cell differentiation. Nat
Immunol. 2013;14(5):500-8.
48. Sundrud MS, Koralov SB, Feuerer M, Calado DP, Kozhaya AE, Rhule-Smith A, et al. Halofuginone inhibits TH17 cell differentiation by activating the amino acid starvation response. Science. 2009;324(5932):1334-8.
49. Kolev M, Dimeloe S, Le Friec G, Navarini A, Arbore G, Povoleri GA, et al. Complement Regulates Nutrient Influx and Metabolic Reprogramming during Th1 Cell Responses. Immunity. 2015;42(6):1033-47.
50. Yong CS, Westwood JA, Schroder J, Papenfuss AT, von Scheidt B, Moeller M, et al. Expression of a Chimeric Antigen Receptor in Multiple Leukocyte Lineages in Transgenic Mice. PLoS One. 2015;10(10):e0140543.
51. Sampaio JL, Gerl MJ, Klose C, Ejsing CS, Beug H, Simons K, et al. Membrane lipidome of an epithelial cell line. Proc Natl Acad Sci U S A. 2011;108(5):1903-7.
52. Ejsing CS, Sampaio JL, Surendranath V, Duchoslav E, Ekroos K, Klemm RW, et al. Global analysis of the yeast lipidome by quantitative shotgun mass spectrometry. Proc Natl Acad Sci U S A. 2009;106(7):2136-41.
53. Talebi A, Dehairs J, Rambow F, Rogiers A, Nittner D, Derua R, et al. Sustained SREBP-1-dependent lipogenesis as a key mediator of resistance to BRAF-targeted therapy. Nat Commun. 2018;9(1):2500.
54. Oburoglu L, Tardito S, Fritz V, de Barros SC, Merida P, Craveiro M, et al. Glucose and glutamine metabolism regulate human hematopoietic stem cell lineage specification. Cell Stem Cell. 2014;15(2):169-84.

210

211
Discussion

212

213
Cancer is considered as the “Pathology of the Century” (Falzone et al., 2018). Despite the
improvement in cancer treatment, in 2015 it was estimated that over 8.7 million of people
died from cancer neoplasia and near 17.5 million of new cases were detected (GBD Mortality
and Causes of Death Collaborators Collaborators, 2016). Radiotherapy and chemotherapy
have been extensively used, however the limited efficiency on refractory and metastatic
cancers as well as the off-side target effects revealed the necessity to develop other therapies.
In the last decades, cancer immunotherapy has demonstrated to be a new promising solution:
In 2013, it was acknowledged as the breakthrough of the year by Science due to the concept
of targeting directly the immune system (and not the tumor itself) and to the fantastic success
in the treatment of certain cancers such as leukemia and melanomas (Couzin-Frankel, 2013;
Sambi et al., 2019). Manipulating and improving anti-tumor immune responses, instead of
using pharmacological/chemical anti-tumor treatments, was indeed an ingenious approach.
One of the major innovations on cancer immunotherapy is CAR T Cells. Until now, CAR T
cell therapies have been associated with high success rate for the treatment of hematological
malignancies (Cao et al., 2018; Wei et al., 2017). CAR T cells were accepted for clinical use in
the European Union for the first time last year. The two first CAR constructs (Kymriah and
Yescarta) were approved to treat several cancers such as ALL, CLL, DLBCL (diffuse large B-cell
lymphoma), SLL (small lymphocytic lymphoma), PMBCL (primary mediastinal large B-cell
lymphoma) and FL (follicular lymphoma) (European Medicines Agency.2018). Despite the high
success of CAR T cells in blood cancers, the treatment of solid tumors has been less fruitful
(Yong et al., 2017) and one of the reasons is the TME. Firstly, the existence of physical barriers
(stromal cells) which negatively impact T cell infiltration (Newick et al., 2017; Yong et al.,
2017). Secondly, the existence of an adverse metabolic environment that can impact T cell
anti-tumor functions (Anderson et al., 2017; Buck et al., 2017). As described in the section IV
of this thesis literature review, the metabolic activity of tumor cells as well as myeloid and
stromal cells resident in the TME can induce a deprivation of nutrients and as a result a
competition for resources with T cells. Furthermore, from these metabolic reactions, by-
products such as lactate are produced as well, creating a hostile T cell surrounding
environment. Thus, it becomes important to evaluate the impact of these metabolic
conditions on T cell differentiation and effector function in order to optimize CAR T cell

214
immunotherapies. To that purpose, during my PhD, I evaluated how the metabolic
environment can impact T cell functions.
Nutrient deprivation and T cell function
One of the approaches used during my thesis to assess the potential impact of the TME
on T cells, was to stimulate T cells in nutrient depleted conditions. Glutamine, the most
abundant amino acid in the human plasma (Roth, 2008), was one of the nutrients I focused
on during my thesis. The study of glutamine metabolism on T cell functions is particularly
relevant in this context as is was demonstrated that some malignant cells highly consume and
metabolize glutamine to sustain their grow and survival (Choi and Park, 2018; Kovacevic and
Morris, 1972). More specifically, it has been demonstrated that cancers as NSCLC, breast and
brain are particularly dependent on glutamine and upregulate the transporter ASCT2 in order
to enhance glutamine uptake (Marquez et al., 2017; Mohamed et al., 2014).
In our lab, we demonstrated that glutamine availability is important for the differentiation
of naïve CD4+ T cells towards a Th1 fate (Chapter 2, Article II) (Klysz et al., 2015). In glutamine-
deprived conditions, naïve T cells stimulated under Th1 polarizing conditions were not able
to differentiate into Th1 cells and consequently to secrete IFNγ. However, Th2 and iTreg
differentiations were not impacted, showing the glutamine is not required for Th2 and iTreg
differentiation program. Furthermore, lower glutamine availability pushed naïve CD4+ T cells
toward a Treg phenotype even under Th1 polarizing conditions in a TFG-β dependent manner.
Thus, absence of glutamine favored iTreg and blocked Th1 differentiation. To understand
what was the rate limiting step, we decided to look specifically at the glutamine metabolic
pathway. As described in section II of this thesis literature review, αKG is one of the crucial
metabolites that results from glutamine catabolism. Based on this knowledge, we decided to
evaluate if αKG levels were a rate-limiting step. Indeed, when extracellular αKG was added in
glutamine deprived conditions, naïve CD4+ T cells were able to differentiate towards a Th1
fate and T-bet expression as well as IFNγ secretion was restored. These results were
translational to the humans. Metzler and colleagues showed that glutamine restriction induce
high level of FoxP3 expression as well in human T cells (Metzler et al., 2016). Also, similar
results were obtain when glutamine-dependent purine and pyrimidine synthesis was blocked
(Metzler et al., 2016). However, in this study exogenous αKG was not able to restore Th1

215
differentiation, demonstrating the existence of differences between murine and human T
cells.
These data brought important clues about Th1 and Treg metabolic requirements. The fact
that glutamine is not equally required for pro-inflammatory Th1 cells and anti-inflammatory
iTreg cells indicates that the metabolic requirements of both subsets are not the same.
Indeed, it was demonstrated that TEFF rely more in aerobic glycolysis while Treg cells are more
dependent on fatty acid metabolism (Geltink et al., 2018; Michalek et al., 2011; Shi et al.,
2011).
Another elegant study goes in line with the results from our lab as they demonstrated that
ASCT2 knockout impeached the differentiation of Th1 and Th17 cells without affecting the
differentiation of Th2 and Treg cells (Nakaya et al., 2014). Our results together with other
groups data allow to conclude that Treg cells do not require glutamine, contrary to Th1 cells.
Indeed, it has been demonstrated that Treg cells metabolic program is not dependent on
amino acid metabolism. For instance, degradation of tryptophan in the cell environment by
DCs (which can negatively impact T cell metabolism) results in a byproduct product formation
(kynurenine) which was shown to promote iTreg differentiation (Mezrich et al., 2010).
Deficiency in the neutral amino acid transporter LAT1 was demonstrated as well to impair
CD4 and CD8 effector function without impacting Treg differentiation (Hayashi et al., 2013;
Sinclair et al., 2013). Interestingly, it was as well shown that Treg cells induce, in skin grafts
and dendritic cells, the expression of at least 5 enzymes that consume different essential
amino acids (Cobbold et al., 2009). This work is curious as it highlights the capacity of Treg
cells to induce amino acid depletion in the surrounding environment and it would be
interesting to see if similar mechanisms take place in the TME. The fact the amino acid
metabolism is not crucial for Treg cells, give to this subset a selective advantage in amino acid-
deprived environments. However, Treg cells have other mechanisms to survive in hostile
metabolic environments. For instance, it was shown that FoxP3 reprograms Treg cell
metabolism to function in high-lactate and low-glucose environments, suppressing glycolysis,
enhancing OXPHOS and increasing NAD oxidation (Angelin et al., 2017). Moreover, another
elegant study demonstrated that FoxP3 induces FAO, which gives a selective advantage to
Treg cells in FA-rich environments and protect them from lipotoxicity (Howie et al.,
2017a).Thus, Treg cells metabolic activity is able to shape the environment, impacting other

216
cells function and, at the same time, contributes to its own differentiation program in hostile
environments. Indeed, Treg metabolic characteristics can clearly favor their cell development
and function in a TME that is characterized by low amino acids and glucose availability as well
as high levels of lactate and FAs. It is known that Treg cells have a pro-tumor function and its
presence on the TME is associated with a poor prognosis (Bates et al., 2006; Curiel et al., 2004;
Hiraoka et al., 2006; Hou et al., 2017; Ormandy et al., 2005; Wolf et al., 2003). Our group has
found that glutamine-deprive environments, such as the TME, benefit to iTreg differentiation.
The fact that Tregs seem to be less dependent of amino acids to sustain their metabolic
activity, highlight the importance to study the potential impact of other amino acids
deprivation on TEFF and Treg cell functions. As such, during my PhD I addressed the role of
another amino acid important to T cells: arginine. Arginine availability is also reduced in the
TME as it is reviewed in the section IV 2 A c. The direct link between arginine deprivation on
the TME and T cell function was already described. Rodriguez and colleagues revealed that
reduced arginine availability by myeloid cells activity in the TME induced T cell receptor CD3ζ
chain surface expression inhibition and antigen-specific T cell proliferation impairment
(Rodriguez et al., 2004). As such, studying how reduced arginine availability impact on T cell
functions becomes highly relevant. During my PhD, I evaluated the role of arginine on human
T cell function using 3 different angles: by reducing arginine availability in the medium, by
using drugs inhibiting different arginine metabolic pathways and finally through CAT-1 surface
expression downregulation by a Sh-RNA approach. Our results demonstrated that arginine
deprivation impacted T cell activation and proliferation (Chapter 2, Addendum II, Figure 1).
These effects on T cell activation and proliferation were as well documented in few other
publications (Rodriguez et al., 2007; Taheri et al., 2001; Zea et al., 2004). However, the
CD4:CD8 ratio and CD45RA vs CD45RO percentages (naïve versus memory/effector cells)
seemed not to be affected (Chapter 2, Addendum II, Figure 2A and 2B). Regarding the
effector function of those cells, we observed a diminished IFNγ secretion from CD4+ T cells,
however it was not significant based on our statistical analysis (Chapter 2, Addendum II,
Figure 2C). Only one group demonstrated a link between arginine availability, T cell
phenotype and anti-tumor function, although using an opposite strategy. Geiger and
colleagues showed that increased arginine extracellular levels enhanced the survival and anti-
tumor activity by promoting a generation of a memory-like T cells (Geiger et al., 2016). Based

217
on this study, we would expect to see a decrease in the percentage of RO+ (memory) cells in
deprived arginine conditions, as increased arginine availability induced the generation of
memory T cells. However, we observed no significant differences. As T cell memory
differentiation is highly dependent on T cell metabolic program and memory T cells rely
mainly on OXPHOS and FAO (Almeida et al., 2016; Verbist et al., 2012), to evaluate how T cell
metabolism is impacted in arginine deprived conditions could be interesting approach angle
to understand the T cell phenotype observed in arginine-deprived conditions. At which extend
are OXPHOS and glycolysis impacted in the absence of arginine? Therefore, it would be
interesting to pursue with this project and investigate the impact of arginine deprivation on
CD4+ T cell phenotype and differentiation. Notably, the impact of arginine availability on
memory T cells as well as on iTregs and Th1 cells.
Arginine can fuel different metabolic axis of its own pathway (Figure 17), what makes
complex to analyze which is indeed important for T cell metabolic fitness. From arginine
catabolism can result the production of citrulline and ornithine. Citrulline is an important
precursor related with the TCA cycle while ornithine is an important precursor for polyamines
synthesis. Thus, arginine deprivation conditions can have several and different implications
on T cell metabolism. In order to understand more in detail for what for is arginine required
in a CD4+ T cell context, we used in culture three different drugs able to block different
reactions (Chapter 2, Addendum II, Figure 4A). Preliminary data, indicates that while blocking
citrulline synthesis (ADMA) or hyposination (GC7) does not impact T cell activation and
proliferation, DFMO treatment, which block ornithine and polyamine synthesis, has a
negative impact (Chapter 2, Addendum II, Figure 4C and 4D). It was described that in human
naïve T cells the activity levels of polyamine synthesis enzymes are low (Kay and Lindsay,
1973; Kay and Pegg, 1973) and increase upon TCR activation (notably ODC and S-
adenosylmethionine decarboxylase) (Fidelus et al., 1984; Kay and Lindsay, 1973; Kay and
Pegg, 1973; Scott et al., 1985). A more recent study demonstrates now, that polyamine levels
in T cells are highly increased upon activation (Wang et al., 2011). Moreover, and in line with
our data, they demonstrated as well that DFMO treatment inhibited activation-induced T cell
proliferation (Wang et al., 2011). Interestingly, DFMO has been tested (phase II) to treat high
risk neoblastoma (Sholler et al., 2018). Several studies demonstrated that some tumors have
a high content on polyamines and the treatment with DFMO reduces tumor proliferation in

218
vitro and in xenograft models (Hixson et al., 1993; Hogarty et al., 2008; Koomoa et al., 2008;
Rounbehler et al., 2009; Samal et al., 2013). However, based on our and others data, we could
hypothesize that DFMO treatment could have an impact in TILs proliferation and,
consequently, in anti-tumor function. Therefore, it would be interesting to evaluate the effect
of DFMO on TILs in order to weight the impact of DFMO treatment in the immune system.
Furthermore, it would be of interest to assess the impact on CD4+ T cell differentiation in
order to evaluate if DFMO treatment affects differently for instance Th1 and Treg cells and
consequently creates a disequilibrium in T cell effector responses.
Finally, I also evaluated the potential impact of CAT-1 surface expression downregulation
(an essential arginine transporter) (Chapter 2, Addendum II, Figure 3) during T cell activation.
Decreased CAT-1 surface expression did not significantly impact CD4: CD8 ratio, T cell
activation and proliferation. These results were surprising considering than in arginine
deprived conditions T cell proliferation and activation were highly impacted. Therefore, by
downregulating CAT-1 surface expression, in theory we should have reduced entry of arginine
into the cell and therefore to have similar results as in arginine deprived culture conditions.
However, the results did not go in the same direction. These results can be potentially
explained by a compensatory mechanism. Apart of CAT-1, other nutrient transporters can
mediate arginine entry into the cells such as CAT-2 and CAT-3 (Closs et al., 2006; Fotiadis et
al., 2013). Regardless the fact that CAT-1 mRNA is selectively upregulated upon T cell
activation, we could hypothesize that T cells can upregulate CAT2 and CAT3 in response to
CAT-1 downregulation. Looking at the mRNA levels of these three transporters simultaneity
in Sh transduced cells could give us important clues about this hypothesis. Moreover, it would
be important to look at the arginine uptake level in Sh transduced cells (sh control vs shCAT-
1) to measure the impact of CAT-1 downregulation in arginine entry into the cells.
Altogether, these data highlight the impact of nutrient deprivation on T cell activation,
differentiation and effector function. As previous discussed, the TME is characterized by low
nutrient-availability, notably glutamine and arginine. Therefore, when CAR T cell therapies
are designed it would be important to evaluate the impact of the nutrient availability on CAR
T cell anti-tumor function. Analyze CAR T cell differentiation and cytokine secretion in a
nutrient deprived context could help to predict CAR T cell anti-tumor efficiency and help in
the selection of T cell subsets with a better survival and/or enhanced functions in a hostile

219
environment. Moreover, understanding how nutrient availability impacts on CAR T cell
differentiation and function, could help in the development of new tools to regulate and
modulate CAR T cells metabolic program to fit them to the TME.
Selection of T cells based on nutrient transporters
In addition of using pharmacological treatments to enhance and modulate T cell anti-
tumor function, we could think about select CAR T cells based on their nutrient transporters
surface expression and on their metabolic characteristics, before inject them into the
patients. During my PhD, I showed that sorting T cells based on GLUT1 surface expression
allows the selection of T cells with different phenotypes and effector functions (Cretenet et
al., 2016) (Chapter 1, Article I ). GLUT1High cells have an increased percentage of CD8+ T cells,
an increased acquisition of an effector phenotype and secrete higher amounts of IFNγ
(Cretenet et al., 2016). Previous studies demonstrated that increased T cell glycolysis boosted
anti-tumor effector functions, notably by promoting IFNγ secretion (Cham et al., 2008; Ho et
al., 2015). Thus, our work together with others, demonstrate that GLUT1 surface expression
and as well as increased glycolysis are highly linked to T cell effector function. Furthermore,
our investigation shows that GLUT1High cells also have increased effector function in hypoxia
conditions. These results are particularly relevant in a context of anti-tumor therapy, as the
TME is highly hypoxic (Vaupel and Mayer, 2007). Therefore, it would be interesting to
evaluate in vivo the efficacy/fate of T cells sorted based on nutrient transporter expression,
to address notably which subset has a better anti-tumor function. As GLUT1High cells have an
increased percentage of effector memory cells and secrete higher amounts of IFNγ it would
be tempting to speculate that these cells will have a better anti-tumor function. Indeed,
several studies demonstrated that TEFF/ TEM and consequent cytokine secretion induce tumor
regression and maintain long-term tumor protection in preclinical models (Perret and
Ronchese, 2008; Powell et al., 2005; Rosenberg and Dudley, 2004). Nonetheless, other studies
showed that these cells persist poorly in vivo, which is not optimal for anti-tumor responses
(Dudley et al., 2002; Gattinoni et al., 2005; Yee et al., 2002). Additionally, other works
demonstrated that TCM have also an effective tumor function changing the paradigm that only
TEFF/ TEM are effective and should be used in anti-tumor immunotherapies (Beckhove et al.,
2004; Busch et al., 2016; Klebanoff et al., 2005). Therefore, and even if GLUT1High subset is
enriched in effector T cell with higher proliferative capacity and effector function, it remains

220
to prove that GLUT1High cells offers in vivo a better and persistent anti-tumor response than
GLUT1Low cells. With this propose, in vivo experiments on tumor-bearing mice are ongoing to
evaluate the fate and anti-tumor function of these sorted subsets.
During my PhD I also had the opportunity to initiate studies evaluating the potential of
CAT-1 nutrient transporter as a T cell selection tool. Preliminary data demonstrates that, as
GLUT1High cells, CAT-1High cells proliferate faster and have a decreased CD4:CD8 ratio (Chapter
I, addendum I, Figure 3). However, the cytokine prolife appeared to be slightly different
between these two T cell subsets. CD8+ GLUT1High cells secrete more IFNy than CD8+ GLUT1Low.
However, these differences are not observed between CD8+ CAT-1high and CD8+ CAT-1Low
subsets (Chapter I, addendum I, Figure 5). Moreover, one major difference between these
different subsets is that CD4+ GLUT1High and CD4+ GLUT1Low produce different levels of IFNγ
whereas CD4+ CAT-1High differ mainly from CD4+ CAT-1Low on IL-17 secretion levels with IFNγ
secretion only slightly affected (Chapter I, addendum I, Figure 5). Therefore, these
preliminary results suggest that the level of GLUT1 and CAT-1 surface expression allow the
selection of T cell subsets with distinct effector functions, notably characterized by different
IFNy and IL-17 secretion levels. As a result, it would be interesting to further evaluate and
characterize T cells selected based on CAT-1 surface expression to confirm this preliminary
result. Moreover, it would be interesting to evaluate and compare the fate and function of
these subsets in tumor-bearing mice. The fact that CD4+ CAT-1High cells are associated with an
increased IL-17 production and minimal differences on IFNγ secretion would be interesting to
explore. The role of IL-17 on tumor development has been controversial so far and its pro- or
anti-tumor functions remain under debate. For instance, in ovarian cancer, IL-17 secretion
was demonstrated to be associated with a good prognosis, whereas in cancers such as colon
and pancreatic cancer, IL-17 secretion was identified as a bad prognosis as reviewed in (Bailey
et al., 2014). Therefore, the role of IL-17 on tumor growth remains to be elucidated and in
this context, it would be important to address and compare the anti-tumor efficiency of T
cells selected based on nutrient transporter expression characterized by distinct IL-17 vs IFNγ
secretion pattern. Finally, it could be of interest to evaluate CAT-1 expression in hypoxia
conditions and assess the phenotype and effector of T cells selected based on CAT-1 surface
expression of T cell maintained in hypoxia.

221
αKG as a metabolic regulator of the Th1/iTreg differentiation.
As previously discussed, adding exogenous αKG in glutamine deprived conditions restored
Th1 differentiation by rescuing T-bet expression and IFNγ secretion and by reducing FoxP3
expression (Chapter 2, Article II). Nevertheless, the mechanisms by which αKG modulates
Th1/Treg differentiation were not characterized. To answer this question, during my PhD I
studied the impact of exogenous αKG added in nutrient replete conditions during both Th1
and iTreg polarizations.
Our data shows that when exogenous αKG is added, a higher IFNγ secretion in Th1-
polarizing conditions is observed, which goes in line with our previous study which
demonstrates that exogenous αKG restores IFNγ secretion in glutamine-deprived conditions.
Moreover, in iTreg-polarizing conditions, FoxP3 expression decreases. This decrease in FoxP3
expression is associated by an increase in T-bet expression as well as IFNγ secretion and other
inflammatory cytokines such IL-17, TNF-α and GM-CSF. Thus, αKG is able to enhance Th1
differentiation and significantly attenuate iTreg differentiation, shifting these cells towards
an inflammatory phenotype (Chapter 3, Article III, Figure 1). Interestingly, αKG treatment
increased iTreg OXPHOS levels compared to the control condition (Chapter 3, Article III,
Figure 6). Furthermore, we also noticed an increase in the αKG/succinate ratio (Chapter 3,
Article III, Figure 6). As succinate is highly linked and required to mitochondrial complex II
function, we selectively inhibited this complex by using malonate, a SDH competitive
inhibitor, which leads to decrease OXPHOS capacity. Malonate treatment restored iTreg
differentiation, which highlights the potential impact of OXPHOS modulation in iTreg
differentiation and the possible role of the αKG/succinate ratio (Chapter 3, Article III, Figure
6).
In order to evaluate if the phenotype observed upon αKG treatment was due an
imbalance between αKG and succinate levels, we used two strategies to alter the
αKG/succinate ratio: by adding exogenous succinate or by inhibiting SDH with malonate
treatment (which should decrease the αKG/succinate ratio). Adding succinate to αKG -treated
iTreg polarization rescued at least partially, the percentage of FoxP3 expressing cells as
compared to control, however not statistically significant (Chapter 3, Article III, Figure 6). On
the other hand, adding malonate rescued significantly the generation of FoxP3-expressing
cells. Thus, we can hypothesize that balancing the αKG/succinate ratio might be important to

222
rescue the percentage of FoxP3 expressing cells but we also need to take in consideration
that SDH functioning itself might as well have an important role in iTreg differentiation
(Discussion, Figure 1). Importantly, SDH is the only enzyme that participates in both TCA cycle
and ETC as part integrant of the mitochondrial complex II. Therefore, an increase in the TCA
cycle metabolic rate mediated by αKG treatment could potentially lead to an increase of
OXPHOS, notably through SDH enzymatic activity. Recently, a study demonstrated that
mitochondrial complex II (SDH) could dictate T cell differentiation (Bailis et al., 2019). More
specifically, they revealed that, upon malonate treatment or in the absence of SDH function
(SDH KO mice), complex II was important for Th1 differentiation and IFNγ secretion in Th1
polarized conditions (Bailis et al., 2019). These results are in line with our data. Upon
malonate treatment, we not only restore the percentage of FoxP3-expressing cells but we
also decrease IFNγ secretion. In this work they also revealed that the ETC is differentially
recruited in the different CD4+ Th subsets. For instance, blocking separately each one of the
five mitochondrial complexes had minimal effect on Th2 effector cells. Moreover, selective
and individual blocking of both complex I and complex II impaired Th17 function (Bailis et al.,
2019). Furthermore, the role of mitochondrial complexes on Treg cells was recently
addressed by another group (Weinberg et al., 2019). In this study, using a murine model
lacking specifically the mitochondrial complex III in Treg cells, they demonstrate the
importance of this complex for Treg suppressive function. Nonetheless, Treg cell numbers, T
cell maintenance and FoxP3 expression were not altered (Weinberg et al., 2019). Yet, the role
of mitochondrial complex II on Treg cells remain to be elucidated. Based on these works and
our data, we could therefore hypothesize that not all mitochondrial complexes, notably the
complex II, function would be required for iTreg cells differentiation and probably complex II
works as regulator of the Th1/iTreg cell differentiation. Increased SDH activity would
therefore push the cells towards a Th1 phenotype whereas blocking it would favor iTreg cell
differentiation.
Additional experiments would be required to test these hypotheses. It would be
important to assess the TCA cycle metabolite levels in succinate- and malonate-treated
conditions to evaluate its impact on TCA cycle metabolism and function. Also, it would be
relevant to look at OCR levels in succinate- treated conditions to measure the impact of this
treatment on OXPHOS. Does exogenous succinate significantly impact OXPHOS as observed

223
upon malonate treatment? Moreover, it would be as well important to further evaluate the
potential role of SDH in iTreg differentiation. For instance, it was demonstrated that
oxaloacetate (another TCA cycle metabolite) is a potent inhibitor of SDH activity (Gutman and
Silman, 1975; Rutter et al., 2010). Therefore, adding exogenous oxaloacetate to αKG-treated
cells could be a complementary approach to evaluate the role of the mitochondrial complex
II. Moreover, as described in (Bailis et al., 2019), we could use an SDH knockout mice model
to further evaluate the role of this complex in iTreg differentiation. Finally, it would be
essential to look at SDH enzymatic activity: first, to see if there are differences between Th1
and iTreg cells (as these two types of cells rely on distinct OXPHOS levels); secondly, to see if
αKG is able to directly impact SDH activity (which could explain the increase in OXPHOS).
Finally, it would be as well essential to address SDH protein levels in both Th1, iTreg and iTreg
αKG -treated cells.
Consequences of αKG treatment on epigenetic regulation
Notwithstanding the hypothesis discussed above, it is also important to take into account
the important role of αKG in epigenetic regulation. Changes in the αKG/succinate ratio have
been already demonstrated to have an impact in stem cell differentiation by epigenetic
regulation, notably through TET proteins (Koivunen et al., 2007). As reviewed in the literature
review of this thesis (section II 3 C a), TET proteins require αKG as a co-factor (Kaelin and
McKnight, 2013). Furthermore, it is also known that succinate and fumarate are competitive
inhibitors of αKG, which ultimately can block TET demethylation activity (Vatrinet et al., 2017).
Thus, another hypothesis is that modulation of the αKG/succinate ratio could impact on T cell
differentiation through epigenetic mechanisms. It is known that FoxP3 and IFNγ can be
epigenetically regulated (Aune et al., 2013; Kitagawa et al., 2015; Peng et al., 2016; Polansky
et al., 2008; Sekiya et al., 2016). Moreover, several recent studies highlighted the role of TET
activity in the regulation of T cell effector function and differentiation. It was demonstrated
that TET2-mediated epigenetic modifications where important for the production of Th1
(IFNγ) and Th17 (IL-17) cytokines but not for Th2 differentiation (Ichiyama et al., 2015).
Furthermore, TET1, TET2 and TET3 were shown to be important for FoxP3 stability trough
epigenetic regulation of the CNS promoter (Nair et al., 2016; Yue et al., 2016). Though, based
on the literature previously mentioned, we could expect to detect an increased FoxP3 stability
in αKG- treated conditions, as αKG is directly related with TET proteins function. Nonetheless,

224
and considering that we have a decreased percentage of FoxP3 expressing cells, we could
hypothesize that, in our conditions, αKG is not promoting FoxP3 stability. However, it is
important to take in consideration that 2HG levels are as well increased by 4 fold in iTreg αKG
conditions (Chapter 3, Article III, Figure 6). As reviewed in the introduction (section II 3 C a),
IDH mutations or LDH/MDH activity in specific conditions result in the conversion of αKG into
D-2HG and L-2HG respectively. Furthermore, increased levels of 2HG (both enantiomers) can
inhibit demethylation by blocking TET and JmjC activity (Discussion, Figure 1) (Chowdhury et
al., 2011; Lu et al., 2012; Xu et al., 2011). Indeed, a recent study done in Th17-polarizing
conditions demonstrated that increased levels of 2HG leaded in hypermethylation of the
FoxP3 gene, consequently inhibiting FoxP3 transcription and increasing IL-17 secretion (Xu et
al., 2017). Furthermore, by blocking conversion of glutamate to αKG, they demonstrated that
FoxP3 expression increased and IL-17 secretion diminished due a reduction of 2HG production
(Xu et al., 2017). Thus, αKG and 2HG levels are important for the balance between Th17 and
iTreg cells and are important for FoxP3 gene regulation. In our work, in iTreg-polarized
conditions in the presence of αKG, we observed as well an increase of IL-17 secretion, which
goes along with this cited work. However, and despite the similarities between our data, the
potential mechanisms involved could be distinct: In their study, the regulation appears to be
dependent on GOT1 transamination activity and, at least at mRNA level (our RNA-sequencing
data), we did not detect any significant difference generated by αKG treatment for this
enzyme (data not shown). Therefore, our data demonstrates that αKG treatment in iTreg
conditions induce an increase of both αKG and 2HG intracellular levels (Discussion, Figure 1).
Both metabolites have a crucial role in TET proteins-mediated epigenetic regulation and
several studies previously mentioned highlight and describe the role of TET protein
specifically on FoxP3, IFNγ and IL-17 regulation (Discussion, Figure 1). Therefore, it would be
interesting to address if TET activity is increased or decreased in αKG treated iTreg cells and
check the methylation levels of FoxP3, IFNγ and IL-17.
Impact of cholesterol metabolism and polyunsaturated fatty acid in iTreg differentiation
During our investigation, and using the RNA-seq approach, we observed that one of the
most impacted metabolic pathways in αKG-treated iTreg cells was the cholesterol
biosynthesis pathway which was highly downregulated (Chapter 3, Article III, Figure 5A). In
order to understand if this was directly impacting FoxP3 expression, we used two different

225
strategies: one, using inhibitor drugs of the cholesterol biosynthesis pathway (for instance,
lovastatin); another adding exogenous cholesterol (Chapter 3, Article III, Figure 5B). As a
result, when cholesterol pathway was blocked, the percentage of FoxP3+ cells was maintained
at equal levels as the control condition. Furthermore, when exogenous cholesterol was added
in αKG treated conditions, we did not witness a rescue of the percentage of FoxP3 expressing
cells (Chapter 3, Article III, Figure 5B). These results did not go in the direction that we were
expecting. First of all, several studies reported that blocking cholesterol synthesis by statins
treatment induces increase of FoxP3 expression and increase Treg cell numbers in mice
(Forero-Pena and Gutierrez, 2013). Second of all, it would be logical that, if cholesterol
synthesis is downregulated and consequently intracellular cholesterol levels are possibly
reduced, adding exogenous cholesterol could be possibly a way to rescue iTreg
differentiation. Then, as this was not observed and based on the literature, we hypothesize
that the downregulation of cholesterol biosynthesis related genes could be due to an increase
of intracellular cholesterol content as it was already shown that high cholesterol intracellular
levels block cholesterol biosynthesis (Bietz et al., 2017; Horton et al., 2002; Ye and DeBose-
Boyd, 2011). Furthermore, RNA-sequencing data also revealed that cholesterol efflux
transporters ABCG1 and ABCA1 were downregulated, which could have as consequence an
increase in intracellular cholesterol levels (data not shown). However, and despite the overall
increased lipids levels in αKG -treated iTreg, the intracellular cholesterol levels were equal on
both conditions (Chapter 3, Article III, Figure 5C) and we did not detect differences in
cholesterol efflux (data not shown). Moreover, upregulation of ABCG1 and ABCA1 through
LXR activation did not impact the percentage of FoxP3 expressing cells (data not shown). As
a conclusion, we did not observe any evidences that the cholesterol biosynthesis pathway
was directly involved in FoxP3 regulation. However, it is important to highlight that the levels
of PUFAs were increased in αKG-treated iTregs (Chapter 3, Article III, Figure 5D). This is
particularly interesting in this context as it was already shown that polyunsaturated fatty acids
can inhibit SREBP1 function (Hannah et al., 2001; Takeuchi et al., 2010; Xu et al., 1999; Xu et
al., 2001) and, therefore, negatively impact cholesterol biosynthesis. Thus, downregulation of
cholesterol synthesis observed by RNA-seq analysis could be directly linked with the increased
PUFAs intracellular levels in αKG treated conditions (Discussion, Figure 1). Moreover, it is
important to take in consideration the potential role of PUFAs on T cell membrane. So far, it
has been described that treatment of human T cells with PUFAs diminished TCR/CD3-induced

226
calcium response and proliferation (Rossetti et al., 1997; Stulnig et al., 1998; Zeyda et al.,
2002; Zurier et al., 1999). This is particularly interesting in this context, as several studies
reported a role of TCR signaling in the regulation of Th and Treg cell differentiation (Li and
Rudensky, 2016; van Panhuys, 2016). The role of TCR signaling in tTreg cell differentiation is
well known (Li and Rudensky, 2016) (discussed in section I). The role of TCR signaling in iTreg
differentiation was as well described in several studies: while IKK and calcium signaling
promotes iTreg cell differentiation (Long et al., 2009; Ruan et al., 2009; Vaeth et al., 2012),
strong AKT activation negatively impacts FoxP3 expression (Haxhinasto et al., 2008; Sauer et
al., 2008). These results are not surprising because, as discussed in the introduction of this
manuscript, AKT activation is crucial for mTOR (energy sensor pathway) function (Figure 18)
and balanced mTOR activity (Figure 24) is required to maintained Treg stability and function.
Therefore, it would be interesting to evaluate the potential role of polyunsaturated fatty acids
in membrane structure and TCR signaling and consequently in T cell differentiation (treated
or not by αKG) (Discussion, Figure 1).
Figure 1 – Potential mechanisms involved in the α-KG-dependent inhibition of iTreg polarization
αKG is a glutamine-derived metabolite that can fulfill the TCA cycle and therefore increase its
metabolic functioning rate. Therefore, we hypothesize that the high amount of extracellular αKG and
changes in the αKG/succinate ratio might impact the SDH activity, resulting in increased OXPHOS
levels, reduced percentage of FoxP3 expressing cells and increased IFNγ secretion. Furthermore, high
αKG intracellular levels is also associated with an augmentation of 2HG intracellular levels which could
lead to an altered αKG/2HG ratio and as a result could impact TET-mediated epigenetic control of the
FoxP3 and IFNγ gene. It would be also interesting to evaluate the potential impact of PUFAs increased
levels in T cell membrane and TCR signaling.
2HG (2-hydroxyglutarate), αKG (α-ketoglutarate), FoxP3 (forkhead box P3), IFNγ (interferon γ), SDH
(succinate dehydrogenase), Succi (succinate), PUFAs (polyunsaturated fatty acids), TCA (tricarboxylic
acid cycle), TCR (T cell receptor). Created with Biorender.com

227
Translation from the lab to a clinical application
To assess whether αKG effects were potentially translatable to the clinic, we assessed as
well the impact of exogenous αKG in human iTreg conditions. Interestingly, we observed, as
in murine Treg cells, that FoxP3 levels decreased upon αKG treatment (Chapter 3, Article III,
Supplemental Figure 5). However, in the same conditions we did not observe an increase in
IFNγ secretion. These results suggest that even if FoxP3 regulation by αKG seems to be similar
between species, IFNγ gene regulation might be different. It is important to note that an
increase of other inflammatory cytokines such as TNF-α and GM-CSF was detected in αKG-
treated human iTreg cells as well as an increase of granzyme B secretion (data not shown).
Therefore, it would be interesting to evaluate the effector function of αKG-treated human
iTreg cells in a humanized mice model in order to study their potential anti-tumor function
and to compare with the results already obtained in our murine model. Moreover, it would
be interesting to study whether malonate treatment is able to restore FoxP3 expression in
human iTreg cells generated in presence of αKG and assess if αKG treatment has the same
metabolic impact. Therefore, to pursue the experiments on human iTreg cells is crucial and
necessary to evaluate the translational potential of our work.
During my PhD I demonstrated that adding exogenous αKG in culture can impact T cell
fate and effector function, potentiating Th1 differentiation and negatively impacting Treg
differentiation. Therefore, it could be of interest to add αKG during the ex vivo generation of
CAR T cells and before adoptive transfer to the patient. CAR T cells with increased IFNγ and
TNFα secretory potential and reduced FoxP3 expression, would be interesting in a TME
context. Moreover, manipulation of αKG levels in the TME could be as well an interesting
strategy for the reduction of Treg cell numbers in the TME. The utilization of αKG in the clinic
has been already done with other different proposes. For instance, the accumulation of 2HG
in IDH1 and IDH2 mutant cells can be rescued by the addition of exogenous αKG (Xu et al.,
2011). αKG has also been studied as treatment for certain cancers, principally in hypoxic
conditions. Indeed, in pre-clinical models, αKG was able to restrict angiogenesis and to reduce
expression of VEGF, resulting in tumor regression (Matsumoto et al., 2009). In another
elegant study it was proved that αKG role in epigenetic modulation of tumor cells was
important to facilitate anti-tumor treatments (Pan et al., 2016). Hence, these studies

228
demonstrate that the use of αKG in a clinical context is possible and associated with high anti-
tumor efficiency.
During my thesis I also demonstrated that GLUT1 and potentially CAT-1 surface expression
could be used to select T cells with different phenotypes, proliferation capacity and effector
functions. These studies have been performed in human T cells opening therefore a direct
path towards a translational application. However, these experiments were performed in
non-engineered T cells from healthy donors. As a first step (and already on going for GLUT1)
it is important to assess whether CAR T cells can be selected based on the nutrient transporter
surface expression. Furthermore, we will then evaluate their anti-tumor function in a tumor-
bearing humanized mouse model. If the results on murine models are encouraging, it would
become exciting to evaluate the feasibility to include this strategy to on-going clinical
protocols. CAR T cell manufacture protocols used in clinic are quite standardized with well-
established procedures. Sorting T cells based on nutrient transporters surface expression
would add an extra procedure to include. Thus, it would be interesting to evaluate the
efficiency of the CAR T cell selection based on nutrient transporters surface expression and
the stability/phenotype of sorted CAR T cells during the expansion phase and before injection
into the patient.
Conclusion
For the last years, anti-tumor immunotherapies, notably CAR T cells, have been advancing
at a rapid rate. However, there are still many challenges to overcome in order to make CAR T
cell therapy efficient not only in blood malignancies, but also in solid tumors. During my thesis
I demonstrated that we can target T cell metabolism to modulate T cell effector function. Pre-
selecting CAR T cells based on their nutrient transporters surface expression and “priming”
CAR T cell differentiation and function in vitro under certain metabolic conditions could be
interesting approaches to overcome the metabolic environment found in the tumor tissue.
Moreover, we demonstrated that metabolic changes imposed in vitro can be maintained in
vivo, therefore showing that the T cell metabolism modulation could be a potential strategy
to adopt in clinical trials. Altogether, we consider that T cell metabolism modulation can be
used as tool to improve CAR T cells anti-tumor function and overcome the low successful rate
in solid tumor treatment.

229
Bibliography

230

231
Abbas, A.K., Benoist, C., Bluestone, J.A., Campbell, D.J., Ghosh, S., Hori, S., Jiang, S., Kuchroo, V.K., Mathis, D., Roncarolo, M.G., et al. (2013). Regulatory T cells: recommendations to simplify the nomenclature. In Nat Immunol (United States), pp. 307-308. Ackerman, D., and Simon, M.C. (2014). Hypoxia, lipids, and cancer: surviving the harsh tumor microenvironment. Trends Cell Biol 24, 472-478. Afkarian, M., Sedy, J.R., Yang, J., Jacobson, N.G., Cereb, N., Yang, S.Y., Murphy, T.L., and Murphy, K.M. (2002). T-bet is a STAT1-induced regulator of IL-12R expression in naive CD4+ T cells. Nat Immunol 3, 549-557. Agani, F., and Jiang, B.H. (2013). Oxygen-independent regulation of HIF-1: novel involvement of PI3K/AKT/mTOR pathway in cancer. Curr Cancer Drug Targets 13, 245-251. Agency, E.M. (2018). First two CAR-T cell medicines recommended for approval in the European Union. European Medicines Agency
Ahluwalia, A., and Tarnawski, A.S. (2012). Critical role of hypoxia sensor--HIF-1alpha in VEGF gene activation. Implications for angiogenesis and tissue injury healing. Curr Med Chem 19, 90-97. Akimoto, T., Numata, F., Tamura, M., Takata, Y., Higashida, N., Takashi, T., Takeda, K., and Akira, S. (1998). Abrogation of bronchial eosinophilic inflammation and airway hyperreactivity in signal transducers and activators of transcription (STAT)6-deficient mice. J Exp Med 187, 1537-1542. Alizadeh, D., Wong, R.A., Yang, X., Wang, D., Pecoraro, J.R., Kuo, C.F., Aguilar, B., Qi, Y., Ann, D.K., Starr, R., et al. (2019). IL15 Enhances CAR-T Cell Antitumor Activity by Reducing mTORC1 Activity and Preserving Their Stem Cell Memory Phenotype. Cancer Immunol Res 7, 759-772. Allan, S.E., Crome, S.Q., Crellin, N.K., Passerini, L., Steiner, T.S., Bacchetta, R., Roncarolo, M.G., and Levings, M.K. (2007). Activation-induced FOXP3 in human T effector cells does not suppress proliferation or cytokine production. Int Immunol 19, 345-354. Almeida, L., Lochner, M., Berod, L., and Sparwasser, T. (2016). Metabolic pathways in T cell activation and lineage differentiation. Semin Immunol 28, 514-524. Amsen, D., van Gisbergen, K.P.J.M., Hombrink, P., and van Lier, R.A.W. (2018). Tissue-resident memory T cells at the center of immunity to solid tumors. Nature Immunology 19, 538-546. An, W.G., Kanekal, M., Simon, M.C., Maltepe, E., Blagosklonny, M.V., and Neckers, L.M. (1998). Stabilization of wild-type p53 by hypoxia-inducible factor 1alpha. Nature 392, 405-408. Andersen, R., Donia, M., Ellebaek, E., Borch, T.H., Kongsted, P., Iversen, T.Z., Holmich, L.R., Hendel, H.W., Met, O., Andersen, M.H., et al. (2016). Long-Lasting Complete Responses in Patients with Metastatic Melanoma after Adoptive Cell Therapy with Tumor-Infiltrating Lymphocytes and an Attenuated IL2 Regimen. Clin Cancer Res 22, 3734-3745.

232
Anderson, K.G., Stromnes, I.M., and Greenberg, P.D. (2017). Obstacles Posed by the Tumor Microenvironment to T cell Activity: A Case for Synergistic Therapies. Cancer Cell 31, 311-325. Anderson, M.S., Venanzi, E.S., Klein, L., Chen, Z., Berzins, S.P., Turley, S.J., von Boehmer, H., Bronson, R., Dierich, A., Benoist, C., et al. (2002). Projection of an immunological self shadow within the thymus by the aire protein. Science 298, 1395-1401. Ando, D.G., Clayton, J., Kono, D., Urban, J.L., and Sercarz, E.E. (1989). Encephalitogenic T cells in the B10.PL model of experimental allergic encephalomyelitis (EAE) are of the Th-1 lymphokine subtype. Cell Immunol 124, 132-143. Angela, M., Endo, Y., Asou, H.K., Yamamoto, T., Tumes, D.J., Tokuyama, H., Yokote, K., and Nakayama, T. (2016). Fatty acid metabolic reprogramming via mTOR-mediated inductions of PPARgamma directs early activation of T cells. Nat Commun 7, 13683. Angelin, A., Gil-de-Gomez, L., Dahiya, S., Jiao, J., Guo, L., Levine, M.H., Wang, Z., Quinn, W.J., 3rd, Kopinski, P.K., Wang, L., et al. (2017). Foxp3 Reprograms T Cell Metabolism to Function in Low-Glucose, High-Lactate Environments. Cell Metab 25, 1282-1293.e1287. Araki, K., Turner, A.P., Shaffer, V.O., Gangappa, S., Keller, S.A., Bachmann, M.F., Larsen, C.P., and Ahmed, R. (2009). mTOR regulates memory CD8 T-cell differentiation. Nature 460, 108-112. Arbones, M.L., Ord, D.C., Ley, K., Ratech, H., Maynard-Curry, C., Otten, G., Capon, D.J., and Tedder, T.F. (1994). Lymphocyte homing and leukocyte rolling and migration are impaired in L-selectin-deficient mice. Immunity 1, 247-260. Arsenio, J., Kakaradov, B., Metz, P.J., Kim, S.H., Yeo, G.W., and Chang, J.T. (2014). Early specification of CD8+ T lymphocyte fates during adaptive immunity revealed by single-cell gene-expression analyses. Nat Immunol 15, 365-372. Asseman, C., Mauze, S., Leach, M.W., Coffman, R.L., and Powrie, F. (1999). An essential role for interleukin 10 in the function of regulatory T cells that inhibit intestinal inflammation. J Exp Med 190, 995-1004. Aune, T.M., Collins, P.L., Collier, S.P., Henderson, M.A., and Chang, S. (2013). Epigenetic Activation and Silencing of the Gene that Encodes IFN-gamma. Front Immunol 4, 112. Baaten, B.J., Tinoco, R., Chen, A.T., and Bradley, L.M. (2012). Regulation of Antigen-Experienced T Cells: Lessons from the Quintessential Memory Marker CD44. Front Immunol 3, 23. Bacchetta, R., Bigler, M., Touraine, J.L., Parkman, R., Tovo, P.A., Abrams, J., de Waal Malefyt, R., de Vries, J.E., and Roncarolo, M.G. (1994). High levels of interleukin 10 production in vivo are associated with tolerance in SCID patients transplanted with HLA mismatched hematopoietic stem cells. J Exp Med 179, 493-502.
233
Bacon, C.M., Petricoin, E.F., 3rd, Ortaldo, J.R., Rees, R.C., Larner, A.C., Johnston, J.A., and O'Shea, J.J. (1995). Interleukin 12 induces tyrosine phosphorylation and activation of STAT4 in human lymphocytes. Proc Natl Acad Sci U S A 92, 7307-7311. Bailey, S.R., Nelson, M.H., Himes, R.A., Li, Z., Mehrotra, S., and Paulos, C.M. (2014). Th17 cells in cancer: the ultimate identity crisis. Frontiers in immunology 5, 276-276. Bailis, W., Shyer, J.A., Zhao, J., Canaveras, J.C.G., Al Khazal, F.J., Qu, R., Steach, H.R., Bielecki, P., Khan, O., Jackson, R., et al. (2019). Distinct modes of mitochondrial metabolism uncouple T cell differentiation and function. Nature. Balamuth, F., Leitenberg, D., Unternaehrer, J., Mellman, I., and Bottomly, K. (2001). Distinct patterns of membrane microdomain partitioning in Th1 and th2 cells. Immunity 15, 729-738. Bantug, G.R., Galluzzi, L., Kroemer, G., and Hess, C. (2018). The spectrum of T cell metabolism in health and disease. Nat Rev Immunol 18, 19-34. Barata, J.T., Silva, A., Brandao, J.G., Nadler, L.M., Cardoso, A.A., and Boussiotis, V.A. (2004). Activation of PI3K is indispensable for interleukin 7-mediated viability, proliferation, glucose use, and growth of T cell acute lymphoblastic leukemia cells. J Exp Med 200, 659-669. Bates, G.J., Fox, S.B., Han, C., Leek, R.D., Garcia, J.F., Harris, A.L., and Banham, A.H. (2006). Quantification of regulatory T cells enables the identification of high-risk breast cancer patients and those at risk of late relapse. J Clin Oncol 24, 5373-5380. Battaglia, M., Stabilini, A., Migliavacca, B., Horejs-Hoeck, J., Kaupper, T., and Roncarolo, M.G. (2006). Rapamycin promotes expansion of functional CD4+CD25+FOXP3+ regulatory T cells of both healthy subjects and type 1 diabetic patients. J Immunol 177, 8338-8347. Battaglia, M., Stabilini, A., and Tresoldi, E. (2012). Expanding human T regulatory cells with the mTOR-inhibitor rapamycin. Methods Mol Biol 821, 279-293. Baydoun, A.R., Bogle, R.G., Pearson, J.D., and Mann, G.E. (1994). Discrimination between citrulline and arginine transport in activated murine macrophages: inefficient synthesis of NO from recycling of citrulline to arginine. Br J Pharmacol 112, 487-492. Becher, B., Durell, B.G., and Noelle, R.J. (2002). Experimental autoimmune encephalitis and inflammation in the absence of interleukin-12. J Clin Invest 110, 493-497. Becher, B., Durell, B.G., and Noelle, R.J. (2003). IL-23 produced by CNS-resident cells controls T cell encephalitogenicity during the effector phase of experimental autoimmune encephalomyelitis. J Clin Invest 112, 1186-1191. Beckhove, P., Feuerer, M., Dolenc, M., Schuetz, F., Choi, C., Sommerfeldt, N., Schwendemann, J., Ehlert, K., Altevogt, P., Bastert, G., et al. (2004). Specifically activated memory T cell subsets from cancer patients recognize and reject xenotransplanted autologous tumors. The Journal of clinical investigation 114, 67-76.

234
Beckman, E.M., Porcelli, S.A., Morita, C.T., Behar, S.M., Furlong, S.T., and Brenner, M.B. (1994). Recognition of a lipid antigen by CD1-restricted alpha beta+ T cells. Nature 372, 691-694. Ben-Sasson, S.Z., Le Gros, G., Conrad, D.H., Finkelman, F.D., and Paul, W.E. (1990). IL-4 production by T cells from naive donors. IL-2 is required for IL-4 production. J Immunol 145, 1127-1136. Bennett, C.L., Christie, J., Ramsdell, F., Brunkow, M.E., Ferguson, P.J., Whitesell, L., Kelly, T.E., Saulsbury, F.T., Chance, P.F., and Ochs, H.D. (2001). The immune dysregulation, polyendocrinopathy, enteropathy, X-linked syndrome (IPEX) is caused by mutations of FOXP3. Nat Genet 27, 20-21. Bensinger, S.J., Bradley, M.N., Joseph, S.B., Zelcer, N., Janssen, E.M., Hausner, M.A., Shih, R., Parks, J.S., Edwards, P.A., Jamieson, B.D., et al. (2008). LXR signaling couples sterol metabolism to proliferation in the acquired immune response. Cell 134, 97-111. Bercovici, N., Haicheur, N., Massicard, S., Vernel-Pauillac, F., Adotevi, O., Landais, D., Gorin, I., Robert, C., Prince, H.M., Grob, J.J., et al. (2008). Analysis and characterization of antitumor T-cell response after administration of dendritic cells loaded with allogeneic tumor lysate to metastatic melanoma patients. J Immunother 31, 101-112. Bercovici, N., and Trautmann, A. (2012). Revisiting the role of T cells in tumor regression. Oncoimmunology 1, 346-350. Berezhnoy, A., Castro, I., Levay, A., Malek, T.R., and Gilboa, E. (2014). Aptamer-targeted inhibition of mTOR in T cells enhances antitumor immunity. J Clin Invest 124, 188-197. Berger, A. (2000). Th1 and Th2 responses: what are they? Bmj 321, 424. Berod, L., Friedrich, C., Nandan, A., Freitag, J., Hagemann, S., Harmrolfs, K., Sandouk, A., Hesse, C., Castro, C.N., Bahre, H., et al. (2014). De novo fatty acid synthesis controls the fate between regulatory T and T helper 17 cells. Nat Med 20, 1327-1333. Bertho, J.M., Demarquay, C., Moulian, N., Van Der Meeren, A., Berrih-Aknin, S., and Gourmelon, P. (1997). Phenotypic and immunohistological analyses of the human adult thymus: evidence for an active thymus during adult life. Cell Immunol 179, 30-40. Bettelli, E., Carrier, Y., Gao, W., Korn, T., Strom, T.B., Oukka, M., Weiner, H.L., and Kuchroo, V.K. (2006). Reciprocal developmental pathways for the generation of pathogenic effector TH17 and regulatory T cells. Nature 441, 235-238. Beyersdorf, N., Kerkau, T., and Hunig, T. (2015). CD28 co-stimulation in T-cell homeostasis: a recent perspective. Immunotargets Ther 4, 111-122. Bietz, A., Zhu, H., Xue, M., and Xu, C. (2017). Cholesterol Metabolism in T Cells. Frontiers in immunology 8, 1664-1664.

235
Bingisser, R.M., Tilbrook, P.A., Holt, P.G., and Kees, U.R. (1998). Macrophage-derived nitric oxide regulates T cell activation via reversible disruption of the Jak3/STAT5 signaling pathway. J Immunol 160, 5729-5734. Blagih, J., Coulombe, F., Vincent, Emma E., Dupuy, F., Galicia-Vázquez, G., Yurchenko, E., Raissi, Thomas C., van der Windt, Gerritje J.W., Viollet, B., Pearce, Erika L., et al. (2015). The Energy Sensor AMPK Regulates T Cell Metabolic Adaptation and Effector Responses In Vivo. Immunity 42, 41-54. Blair, P.J., Bultman, S.J., Haas, J.C., Rouse, B.T., Wilkinson, J.E., and Godfrey, V.L. (1994). CD4+CD8- T cells are the effector cells in disease pathogenesis in the scurfy (sf) mouse. The Journal of Immunology 153, 3764. Bode, B.P., and Souba, W.W. (1999). Glutamine transport and human hepatocellular transformation. JPEN J Parenter Enteral Nutr 23, S33-37. Bopp, T., Becker, C., Klein, M., Klein-Hessling, S., Palmetshofer, A., Serfling, E., Heib, V., Becker, M., Kubach, J., Schmitt, S., et al. (2007). Cyclic adenosine monophosphate is a key component of regulatory T cell-mediated suppression. J Exp Med 204, 1303-1310. Born, W., Miles, C., White, J., O'Brien, R., Freed, J.H., Marrack, P., Kappler, J., and Kubo, R.T. (1987). Peptide sequences of T-cell receptor delta and gamma chains are identical to predicted X and gamma proteins. Nature 330, 572-574. Bosisio, D., Polentarutti, N., Sironi, M., Bernasconi, S., Miyake, K., Webb, G.R., Martin, M.U., Mantovani, A., and Muzio, M. (2002). Stimulation of toll-like receptor 4 expression in human mononuclear phagocytes by interferon-gamma: a molecular basis for priming and synergism with bacterial lipopolysaccharide. Blood 99, 3427-3431. Boyman, O., Letourneau, S., Krieg, C., and Sprent, J. (2009). Homeostatic proliferation and survival of naive and memory T cells. Eur J Immunol 39, 2088-2094. Brand, A., Singer, K., Koehl, G.E., Kolitzus, M., Schoenhammer, G., Thiel, A., Matos, C., Bruss, C., Klobuch, S., Peter, K., et al. (2016). LDHA-Associated Lactic Acid Production Blunts Tumor Immunosurveillance by T and NK Cells. Cell Metab 24, 657-671. Brentjens, R.J., Riviere, I., Park, J.H., Davila, M.L., Wang, X., Stefanski, J., Taylor, C., Yeh, R., Bartido, S., Borquez-Ojeda, O., et al. (2011). Safety and persistence of adoptively transferred autologous CD19-targeted T cells in patients with relapsed or chemotherapy refractory B-cell leukemias. Blood 118, 4817-4828. Brentjens, R.J., Santos, E., Nikhamin, Y., Yeh, R., Matsushita, M., La Perle, K., Quintas-Cardama, A., Larson, S.M., and Sadelain, M. (2007). Genetically targeted T cells eradicate systemic acute lymphoblastic leukemia xenografts. Clin Cancer Res 13, 5426-5435.

236
Bronte, V., Serafini, P., Mazzoni, A., Segal, D.M., and Zanovello, P. (2003). L-arginine metabolism in myeloid cells controls T-lymphocyte functions. Trends in Immunology 24, 301-305. Bronte, V., and Zanovello, P. (2005). Regulation of immune responses by L-arginine metabolism. Nat Rev Immunol 5, 641-654. Brown, J.M., and Wilson, W.R. (2004). Exploiting tumour hypoxia in cancer treatment. Nat Rev Cancer 4, 437-447. Brunkow, M.E., Jeffery, E.W., Hjerrild, K.A., Paeper, B., Clark, L.B., Yasayko, S.A., Wilkinson, J.E., Galas, D., Ziegler, S.F., and Ramsdell, F. (2001). Disruption of a new forkhead/winged-helix protein, scurfin, results in the fatal lymphoproliferative disorder of the scurfy mouse. Nat Genet 27, 68-73. Buck, M.D., O'Sullivan, D., Klein Geltink, R.I., Curtis, J.D., Chang, C.H., Sanin, D.E., Qiu, J., Kretz, O., Braas, D., van der Windt, G.J., et al. (2016). Mitochondrial Dynamics Controls T Cell Fate through Metabolic Programming. Cell 166, 63-76. Buck, M.D., Sowell, R.T., Kaech, S.M., and Pearce, E.L. (2017). Metabolic Instruction of Immunity. Cell 169, 570-586. Burchill, M.A., Yang, J., Vogtenhuber, C., Blazar, B.R., and Farrar, M.A. (2007). IL-2 receptor beta-dependent STAT5 activation is required for the development of Foxp3+ regulatory T cells. J Immunol 178, 280-290. Burnet, M. (1957). Cancer; a biological approach. I. The processes of control. Br Med J 1, 779-786. Busch, D.H., Fräßle, S.P., Sommermeyer, D., Buchholz, V.R., and Riddell, S.R. (2016). Role of memory T cell subsets for adoptive immunotherapy. Seminars in immunology 28, 28-34. Butcher, E.C., and Picker, L.J. (1996). Lymphocyte homing and homeostasis. Science 272, 60-66. Butticè, G., Miller, J., Wang, L., and Smith, B.D. (2006). Interferon-gamma induces major histocompatibility class II transactivator (CIITA), which mediates collagen repression and major histocompatibility class II activation by human aortic smooth muscle cells. Circulation research 98, 472-479. Buzzai, M., Bauer, D.E., Jones, R.G., Deberardinis, R.J., Hatzivassiliou, G., Elstrom, R.L., and Thompson, C.B. (2005). The glucose dependence of Akt-transformed cells can be reversed by pharmacologic activation of fatty acid beta-oxidation. Oncogene 24, 4165-4173. Byrne, M.B., Leslie, M.T., Gaskins, H.R., and Kenis, P.J.A. (2014). Methods to study the tumor microenvironment under controlled oxygen conditions. Trends in Biotechnology 32, 556-563.

237
Calcinotto, A., Filipazzi, P., Grioni, M., Iero, M., De Milito, A., Ricupito, A., Cova, A., Canese, R., Jachetti, E., Rossetti, M., et al. (2012). Modulation of microenvironment acidity reverses anergy in human and murine tumor-infiltrating T lymphocytes. Cancer Res 72, 2746-2756. Caldwell, C.C., Kojima, H., Lukashev, D., Armstrong, J., Farber, M., Apasov, S.G., and Sitkovsky, M.V. (2001). Differential effects of physiologically relevant hypoxic conditions on T lymphocyte development and effector functions. J Immunol 167, 6140-6149. Camp, R.L., Scheynius, A., Johansson, C., and Pure, E. (1993). CD44 is necessary for optimal contact allergic responses but is not required for normal leukocyte extravasation. J Exp Med
178, 497-507. Campillo, N., Falcones, B., Otero, J., Colina, R., Gozal, D., Navajas, D., Farré, R., and Almendros, I. (2019). Differential Oxygenation in Tumor Microenvironment Modulates Macrophage and Cancer Cell Crosstalk: Novel Experimental Setting and Proof of Concept. Frontiers in Oncology
9, 43. Cannarile, M.A., Lind, N.A., Rivera, R., Sheridan, A.D., Camfield, K.A., Wu, B.B., Cheung, K.P., Ding, Z., and Goldrath, A.W. (2006). Transcriptional regulator Id2 mediates CD8+ T cell immunity. Nat Immunol 7, 1317-1325. Cao, J., Wang, G., Cheng, H., Wei, C., Qi, K., Sang, W., Zhenyu, L., Shi, M., Li, H., Qiao, J., et al. (2018). Potent anti-leukemia activities of humanized CD19-targeted Chimeric antigen receptor T (CAR-T) cells in patients with relapsed/refractory acute lymphoblastic leukemia. Am J Hematol 93, 851-858. Cao, X., Cai, S.F., Fehniger, T.A., Song, J., Collins, L.I., Piwnica-Worms, D.R., and Ley, T.J. (2007). Granzyme B and perforin are important for regulatory T cell-mediated suppression of tumor clearance. Immunity 27, 635-646. Carding, S.R., and Egan, P.J. (2002). Gammadelta T cells: functional plasticity and heterogeneity. Nat Rev Immunol 2, 336-345. Carlson, C.M., Endrizzi, B.T., Wu, J., Ding, X., Weinreich, M.A., Walsh, E.R., Wani, M.A., Lingrel, J.B., Hogquist, K.A., and Jameson, S.C. (2006). Kruppel-like factor 2 regulates thymocyte and T-cell migration. Nature 442, 299-302. Carpenito, C., Milone, M.C., Hassan, R., Simonet, J.C., Lakhal, M., Suhoski, M.M., Varela-Rohena, A., Haines, K.M., Heitjan, D.F., Albelda, S.M., et al. (2009). Control of large, established tumor xenografts with genetically retargeted human T cells containing CD28 and CD137 domains. Proc Natl Acad Sci U S A 106, 3360-3365. Carr, E.L., Kelman, A., Wu, G.S., Gopaul, R., Senkevitch, E., Aghvanyan, A., Turay, A.M., and Frauwirth, K.A. (2010). Glutamine uptake and metabolism are coordinately regulated by ERK/MAPK during T lymphocyte activation. J Immunol 185, 1037-1044.

238
Castellino, F., Huang, A.Y., Altan-Bonnet, G., Stoll, S., Scheinecker, C., and Germain, R.N. (2006). Chemokines enhance immunity by guiding naive CD8+ T cells to sites of CD4+ T cell-dendritic cell interaction. Nature 440, 890-895. Castillo, L., Beaumier, L., Ajami, A.M., and Young, V.R. (1996). Whole body nitric oxide synthesis in healthy men determined from [15N] arginine-to-[15N]citrulline labeling. Proc Natl Acad Sci U S A 93, 11460-11465. Cazaux, M., Grandjean, C.L., Lemaître, F., Garcia, Z., Beck, R.J., Milo, I., Postat, J., Beltman, J.B., Cheadle, E.J., and Bousso, P. (2019). Single-cell imaging of CAR T cell activity in vivo reveals extensive functional and anatomical heterogeneity. The Journal of Experimental Medicine
216, 1038. Chajes, V., Cambot, M., Moreau, K., Lenoir, G.M., and Joulin, V. (2006). Acetyl-CoA carboxylase alpha is essential to breast cancer cell survival. Cancer Res 66, 5287-5294. Cham, C.M., Driessens, G., O'Keefe, J.P., and Gajewski, T.F. (2008). Glucose deprivation inhibits multiple key gene expression events and effector functions in CD8+ T cells. Eur J Immunol 38, 2438-2450. Chang, C.H., Curtis, J.D., Maggi, L.B., Jr., Faubert, B., Villarino, A.V., O'Sullivan, D., Huang, S.C., van der Windt, G.J., Blagih, J., Qiu, J., et al. (2013). Posttranscriptional control of T cell effector function by aerobic glycolysis. Cell 153, 1239-1251. Chang, C.H., Qiu, J., O'Sullivan, D., Buck, M.D., Noguchi, T., Curtis, J.D., Chen, Q., Gindin, M., Gubin, M.M., van der Windt, G.J., et al. (2015). Metabolic Competition in the Tumor Microenvironment Is a Driver of Cancer Progression. Cell 162, 1229-1241. Chang, X., Lazorchak, A.S., Liu, D., and Su, B. (2012). Sin1 regulates Treg-cell development but is not required for T-cell growth and proliferation. Eur J Immunol 42, 1639-1647. Chatila, T.A., Blaeser, F., Ho, N., Lederman, H.M., Voulgaropoulos, C., Helms, C., and Bowcock, A.M. (2000). JM2, encoding a fork head–related protein, is mutated in X-linked autoimmunity–allergic disregulation syndrome. The Journal of Clinical Investigation 106, R75-R81. Cheadle, E.J., Gornall, H., Baldan, V., Hanson, V., Hawkins, R.E., and Gilham, D.E. (2014). CAR T cells: driving the road from the laboratory to the clinic. Immunol Rev 257, 91-106. Chen, L., and Flies, D.B. (2013). Molecular mechanisms of T cell co-stimulation and co-inhibition. Nat Rev Immunol 13, 227-242. Chen, Q., Kim, Y.C., Laurence, A., Punkosdy, G.A., and Shevach, E.M. (2011). IL-2 controls the stability of Foxp3 expression in TGF-beta-induced Foxp3+ T cells in vivo. J Immunol 186, 6329-6337. Chen, W. (2011). IDO: more than an enzyme. Nature Immunology 12, 809.

239
Chen, W., Jin, W., Hardegen, N., Lei, K.J., Li, L., Marinos, N., McGrady, G., and Wahl, S.M. (2003). Conversion of peripheral CD4+CD25- naive T cells to CD4+CD25+ regulatory T cells by TGF-beta induction of transcription factor Foxp3. J Exp Med 198, 1875-1886. Chen, Y., Kuchroo, V.K., Inobe, J., Hafler, D.A., and Weiner, H.L. (1994). Regulatory T cell clones induced by oral tolerance: suppression of autoimmune encephalomyelitis. Science 265, 1237-1240. Chinen, T., Kannan, A.K., Levine, A.G., Fan, X., Klein, U., Zheng, Y., Gasteiger, G., Feng, Y., Fontenot, J.D., and Rudensky, A.Y. (2016). An essential role for the IL-2 receptor in Treg cell function. Nat Immunol 17, 1322-1333. Chisolm, D.A., Savic, D., Moore, A.J., Ballesteros-Tato, A., Leon, B., Crossman, D.K., Murre, C., Myers, R.M., and Weinmann, A.S. (2017). CCCTC-Binding Factor Translates Interleukin 2- and alpha-Ketoglutarate-Sensitive Metabolic Changes in T Cells into Context-Dependent Gene Programs. Immunity 47, 251-267.e257. Chmielewski, M., Kopecky, C., Hombach, A.A., and Abken, H. (2011). IL-12 release by engineered T cells expressing chimeric antigen receptors can effectively Muster an antigen-independent macrophage response on tumor cells that have shut down tumor antigen expression. Cancer Res 71, 5697-5706. Cho, S.S., Bacon, C.M., Sudarshan, C., Rees, R.C., Finbloom, D., Pine, R., and O'Shea, J.J. (1996). Activation of STAT4 by IL-12 and IFN-alpha: evidence for the involvement of ligand-induced tyrosine and serine phosphorylation. J Immunol 157, 4781-4789. Choi, Y.-K., and Park, K.-G. (2018). Targeting Glutamine Metabolism for Cancer Treatment. Biomolecules & therapeutics 26, 19-28. Chowdhury, R., Yeoh, K.K., Tian, Y.M., Hillringhaus, L., Bagg, E.A., Rose, N.R., Leung, I.K., Li, X.S., Woon, E.C., Yang, M., et al. (2011). The oncometabolite 2-hydroxyglutarate inhibits histone lysine demethylases. EMBO Rep 12, 463-469. Clambey, E.T., McNamee, E.N., Westrich, J.A., Glover, L.E., Campbell, E.L., Jedlicka, P., de Zoeten, E.F., Cambier, J.C., Stenmark, K.R., Colgan, S.P., et al. (2012). Hypoxia-inducible factor-1 alpha-dependent induction of FoxP3 drives regulatory T-cell abundance and function during inflammatory hypoxia of the mucosa. Proc Natl Acad Sci U S A 109, E2784-2793. Clark, L.B., Appleby, M.W., Brunkow, M.E., Wilkinson, J.E., Ziegler, S.F., and Ramsdell, F. (1999). Cellular and molecular characterization of the scurfy mouse mutant. J Immunol 162, 2546-2554. Clerc, I., Abba Moussa, D., Vahlas, Z., Tardito, S., Oburoglu, L., Hope, T.J., Sitbon, M., Dardalhon, V., Mongellaz, C., and Taylor, N. (2019). Entry of glucose- and glutamine-derived carbons into the citric acid cycle supports early steps of HIV-1 infection in CD4 T cells. Nature Metabolism 1, 717-730.

240
Closs, E.I., Boissel, J.P., Habermeier, A., and Rotmann, A. (2006). Structure and function of cationic amino acid transporters (CATs). J Membr Biol 213, 67-77. Cluxton, D., Petrasca, A., Moran, B., and Fletcher, J.M. (2019). Differential Regulation of Human Treg and Th17 Cells by Fatty Acid Synthesis and Glycolysis. Frontiers in Immunology
10, 115. Cobbold, S.P., Adams, E., Farquhar, C.A., Nolan, K.F., Howie, D., Lui, K.O., Fairchild, P.J., Mellor, A.L., Ron, D., and Waldmann, H. (2009). Infectious tolerance via the consumption of essential amino acids and mTOR signaling. Proc Natl Acad Sci U S A 106, 12055-12060. Coffman, R.L., Seymour, B.W., Hudak, S., Jackson, J., and Rennick, D. (1989). Antibody to interleukin-5 inhibits helminth-induced eosinophilia in mice. Science 245, 308-310. Cogliati, S., Frezza, C., Soriano, M.E., Varanita, T., Quintana-Cabrera, R., Corrado, M., Cipolat, S., Costa, V., Casarin, A., Gomes, L.C., et al. (2013). Mitochondrial cristae shape determines respiratory chain supercomplexes assembly and respiratory efficiency. Cell 155, 160-171. Collaborators, G.M.a.C.o.D. (2016). Global, regional, and national life expectancy, all-cause mortality, and cause-specific mortality for 249 causes of death, 1980-2015: a systematic analysis for the Global Burden of Disease Study 2015. Lancet 388, 1459-1544. Collin, M., and Bigley, V. (2018). Human dendritic cell subsets: an update. Immunology 154, 3-20. Collison, L.W., Workman, C.J., Kuo, T.T., Boyd, K., Wang, Y., Vignali, K.M., Cross, R., Sehy, D., Blumberg, R.S., and Vignali, D.A. (2007). The inhibitory cytokine IL-35 contributes to regulatory T-cell function. Nature 450, 566-569. Cote-Sierra, J., Foucras, G., Guo, L., Chiodetti, L., Young, H.A., Hu-Li, J., Zhu, J., and Paul, W.E. (2004). Interleukin 2 plays a central role in Th2 differentiation. Proceedings of the National Academy of Sciences of the United States of America 101, 3880-3885. Cottrez, F., Hurst, S.D., Coffman, R.L., and Groux, H. (2000). T regulatory cells 1 inhibit a Th2-specific response in vivo. J Immunol 165, 4848-4853. Courtnay, R., Ngo, D.C., Malik, N., Ververis, K., Tortorella, S.M., and Karagiannis, T.C. (2015). Cancer metabolism and the Warburg effect: the role of HIF-1 and PI3K. Mol Biol Rep 42, 841-851. Couzin-Frankel, J. (2013). Breakthrough of the year 2013. Cancer immunotherapy. In Science (United States), pp. 1432-1433. Cretenet, G., Clerc, I., Matias, M., Loisel, S., Craveiro, M., Oburoglu, L., Kinet, S., Mongellaz, C., Dardalhon, V., and Taylor, N. (2016). Cell surface Glut1 levels distinguish human CD4 and CD8 T lymphocyte subsets with distinct effector functions. Sci Rep 6, 24129.
241
Cua, D.J., Sherlock, J., Chen, Y., Murphy, C.A., Joyce, B., Seymour, B., Lucian, L., To, W., Kwan, S., Churakova, T., et al. (2003). Interleukin-23 rather than interleukin-12 is the critical cytokine for autoimmune inflammation of the brain. Nature 421, 744-748. Curiel, T.J., Coukos, G., Zou, L., Alvarez, X., Cheng, P., Mottram, P., Evdemon-Hogan, M., Conejo-Garcia, J.R., Zhang, L., Burow, M., et al. (2004). Specific recruitment of regulatory T cells in ovarian carcinoma fosters immune privilege and predicts reduced survival. Nat Med
10, 942-949. Curtsinger, J.M., Lins, D.C., and Mescher, M.F. (2003). Signal 3 determines tolerance versus full activation of naive CD8 T cells: dissociating proliferation and development of effector function. J Exp Med 197, 1141-1151. Dang, E.V., Barbi, J., Yang, H.Y., Jinasena, D., Yu, H., Zheng, Y., Bordman, Z., Fu, J., Kim, Y., Yen, H.R., et al. (2011). Control of T(H)17/T(reg) balance by hypoxia-inducible factor 1. Cell 146, 772-784. Dang, L., White, D.W., Gross, S., Bennett, B.D., Bittinger, M.A., Driggers, E.M., Fantin, V.R., Jang, H.G., Jin, S., Keenan, M.C., et al. (2009). Cancer-associated IDH1 mutations produce 2-hydroxyglutarate. Nature 462, 739-744. Davies, S.P., Sim, A.T.R., and Hardie, D.G. (1990). Location and function of three sites phosphorylated on rat acetyl-CoA carboxylase by the AMP-activated protein kinase. European Journal of Biochemistry 187, 183-190. De Becker, G., Moulin, V., Tielemans, F., De Mattia, F., Urbain, J., Leo, O., and Moser, M. (1998). Regulation of T helper cell differentiation in vivo by soluble and membrane proteins provided by antigen-presenting cells. Eur J Immunol 28, 3161-3171. De Monte, L., Reni, M., Tassi, E., Clavenna, D., Papa, I., Recalde, H., Braga, M., Di Carlo, V., Doglioni, C., and Protti, M.P. (2011). Intratumor T helper type 2 cell infiltrate correlates with cancer-associated fibroblast thymic stromal lymphopoietin production and reduced survival in pancreatic cancer. J Exp Med 208, 469-478. Dean, G.S., Tyrrell-Price, J., Crawley, E., and Isenberg, D.A. (2000). Cytokines and systemic lupus erythematosus. Ann Rheum Dis 59, 243-251. DeBerardinis, R.J., Mancuso, A., Daikhin, E., Nissim, I., Yudkoff, M., Wehrli, S., and Thompson, C.B. (2007). Beyond aerobic glycolysis: transformed cells can engage in glutamine metabolism that exceeds the requirement for protein and nucleotide synthesis. Proc Natl Acad Sci U S A
104, 19345-19350. Dejong, C.H., Welters, C.F., Deutz, N.E., Heineman, E., and Soeters, P.B. (1998). Renal arginine metabolism in fasted rats with subacute short bowel syndrome. Clin Sci (Lond) 95, 409-418.

242
Delgoffe, G.M., Kole, T.P., Zheng, Y., Zarek, P.E., Matthews, K.L., Xiao, B., Worley, P.F., Kozma, S.C., and Powell, J.D. (2009). The mTOR kinase differentially regulates effector and regulatory T cell lineage commitment. Immunity 30, 832-844. Delgoffe, G.M., Pollizzi, K.N., Waickman, A.T., Heikamp, E., Meyers, D.J., Horton, M.R., Xiao, B., Worley, P.F., and Powell, J.D. (2011). The kinase mTOR regulates the differentiation of helper T cells through the selective activation of signaling by mTORC1 and mTORC2. Nat Immunol 12, 295-303. Delhommeau, F., Dupont, S., Della Valle, V., James, C., Trannoy, S., Masse, A., Kosmider, O., Le Couedic, J.P., Robert, F., Alberdi, A., et al. (2009). Mutation in TET2 in myeloid cancers. N Engl J Med 360, 2289-2301. den Braber, I., Mugwagwa, T., Vrisekoop, N., Westera, L., Mogling, R., de Boer, A.B., Willems, N., Schrijver, E.H., Spierenburg, G., Gaiser, K., et al. (2012). Maintenance of peripheral naive T cells is sustained by thymus output in mice but not humans. Immunity 36, 288-297. Dighe, A.S., Richards, E., Old, L.J., and Schreiber, R.D. (1994). Enhanced in vivo growth and resistance to rejection of tumor cells expressing dominant negative IFN gamma receptors. Immunity 1, 447-456. Dimeloe, S., Burgener, A.V., Grahlert, J., and Hess, C. (2017). T-cell metabolism governing activation, proliferation and differentiation; a modular view. Immunology 150, 35-44. Dimeloe, S., Mehling, M., Frick, C., Loeliger, J., Bantug, G.R., Sauder, U., Fischer, M., Belle, R., Develioglu, L., Tay, S., et al. (2016). The Immune-Metabolic Basis of Effector Memory CD4+ T Cell Function under Hypoxic Conditions. J Immunol 196, 106-114. Dings, J., Meixensberger, J., Jager, A., and Roosen, K. (1998). Clinical experience with 118 brain tissue oxygen partial pressure catheter probes. Neurosurgery 43, 1082-1095. Djenidi, F., Adam, J., Goubar, A., Durgeau, A., Meurice, G., de Montpreville, V., Validire, P., Besse, B., and Mami-Chouaib, F. (2015). CD8+CD103+ tumor-infiltrating lymphocytes are tumor-specific tissue-resident memory T cells and a prognostic factor for survival in lung cancer patients. J Immunol 194, 3475-3486. Doedens, A.L., Phan, A.T., Stradner, M.H., Fujimoto, J.K., Nguyen, J.V., Yang, E., Johnson, R.S., and Goldrath, A.W. (2013). Hypoxia-inducible factors enhance the effector responses of CD8(+) T cells to persistent antigen. Nat Immunol 14, 1173-1182. Doherty, J.R., and Cleveland, J.L. (2013). Targeting lactate metabolism for cancer therapeutics. J Clin Invest 123, 3685-3692. Donnelly, R.P., and Finlay, D.K. (2015). Glucose, glycolysis and lymphocyte responses. Mol Immunol 68, 513-519.

243
Dorner, B.G., Dorner, M.B., Zhou, X., Opitz, C., Mora, A., Guttler, S., Hutloff, A., Mages, H.W., Ranke, K., Schaefer, M., et al. (2009). Selective expression of the chemokine receptor XCR1 on cross-presenting dendritic cells determines cooperation with CD8+ T cells. Immunity 31, 823-833. Douek, D.C., McFarland, R.D., Keiser, P.H., Gage, E.A., Massey, J.M., Haynes, B.F., Polis, M.A., Haase, A.T., Feinberg, M.B., Sullivan, J.L., et al. (1998). Changes in thymic function with age and during the treatment of HIV infection. Nature 396, 690-695. Draoui, N., and Feron, O. (2011). Lactate shuttles at a glance: from physiological paradigms to anti-cancer treatments. Dis Model Mech 4, 727-732. Dudley, M.E., Wunderlich, J.R., Yang, J.C., Hwu, P., Schwartzentruber, D.J., Topalian, S.L., Sherry, R.M., Marincola, F.M., Leitman, S.F., Seipp, C.A., et al. (2002). A phase I study of nonmyeloablative chemotherapy and adoptive transfer of autologous tumor antigen-specific T lymphocytes in patients with metastatic melanoma. J Immunother 25, 243-251. Dudley, M.E., Wunderlich, J.R., Yang, J.C., Sherry, R.M., Topalian, S.L., Restifo, N.P., Royal, R.E., Kammula, U., White, D.E., Mavroukakis, S.A., et al. (2005). Adoptive cell transfer therapy following non-myeloablative but lymphodepleting chemotherapy for the treatment of patients with refractory metastatic melanoma. J Clin Oncol 23, 2346-2357. Dudley, M.E., Yang, J.C., Sherry, R., Hughes, M.S., Royal, R., Kammula, U., Robbins, P.F., Huang, J., Citrin, D.E., Leitman, S.F., et al. (2008). Adoptive cell therapy for patients with metastatic melanoma: evaluation of intensive myeloablative chemoradiation preparative regimens. J Clin Oncol 26, 5233-5239. Dunn, G.P., Old, L.J., and Schreiber, R.D. (2004). The three Es of cancer immunoediting. Annu Rev Immunol 22, 329-360. Duran, R.V., Oppliger, W., Robitaille, A.M., Heiserich, L., Skendaj, R., Gottlieb, E., and Hall, M.N. (2012). Glutaminolysis activates Rag-mTORC1 signaling. Mol Cell 47, 349-358. Durán, R.V., MacKenzie, E.D., Boulahbel, H., Frezza, C., Heiserich, L., Tardito, S., Bussolati, O., Rocha, S., Hall, M.N., and Gottlieb, E. (2012). HIF-independent role of prolyl hydroxylases in the cellular response to amino acids. Oncogene 32, 4549. Dustin, M.L. (2014). The immunological synapse. Cancer Immunol Res 2, 1023-1033. Eales, K.L., Hollinshead, K.E., and Tennant, D.A. (2016). Hypoxia and metabolic adaptation of cancer cells. Oncogenesis 5, e190. Effert, P.J., Bares, R., Handt, S., Wolff, J.M., Bull, U., and Jakse, G. (1996). Metabolic imaging of untreated prostate cancer by positron emission tomography with 18fluorine-labeled deoxyglucose. J Urol 155, 994-998. Egeblad, M., Nakasone, E.S., and Werb, Z. (2010). Tumors as organs: complex tissues that interface with the entire organism. Dev Cell 18, 884-901.

244
Ehrlich, P. (1909). Ueber den jetzigen stand der Karzinomforschung Nederlandsch Tijdschrift voor Geneeskunde. Ned Tijdschr voor Geneeskd 5. Ejsing, C.S., Sampaio, J.L., Surendranath, V., Duchoslav, E., Ekroos, K., Klemm, R.W., Simons, K., and Shevchenko, A. (2009). Global analysis of the yeast lipidome by quantitative shotgun mass spectrometry. Proc Natl Acad Sci U S A 106, 2136-2141. Eshhar, Z., Waks, T., Gross, G., and Schindler, D.G. (1993). Specific activation and targeting of cytotoxic lymphocytes through chimeric single chains consisting of antibody-binding domains and the gamma or zeta subunits of the immunoglobulin and T-cell receptors. Proc Natl Acad Sci U S A 90, 720-724. Fahlen, L., Read, S., Gorelik, L., Hurst, S.D., Coffman, R.L., Flavell, R.A., and Powrie, F. (2005). T cells that cannot respond to TGF-beta escape control by CD4(+)CD25(+) regulatory T cells. J Exp Med 201, 737-746. Falzone, L., Salomone, S., and Libra, M. (2018). Evolution of Cancer Pharmacological Treatments at the Turn of the Third Millennium. Frontiers in Pharmacology 9, 1300. Farber, D.L., Yudanin, N.A., and Restifo, N.P. (2014). Human memory T cells: generation, compartmentalization and homeostasis. Nat Rev Immunol 14, 24-35. Feldmeyer, N., Wabnitz, G., Leicht, S., Luckner-Minden, C., Schiller, M., Franz, T., Conradi, R., Kropf, P., Muller, I., Ho, A.D., et al. (2012). Arginine deficiency leads to impaired cofilin dephosphorylation in activated human T lymphocytes. Int Immunol 24, 303-313. Feng, Y., Arvey, A., Chinen, T., van der Veeken, J., Gasteiger, G., and Rudensky, Alexander Y. (2014). Control of the Inheritance of Regulatory T Cell Identity by a cis Element in the Foxp3 Locus. Cell 158, 749-763. Ferber, I.A., Brocke, S., Taylor-Edwards, C., Ridgway, W., Dinisco, C., Steinman, L., Dalton, D., and Fathman, C.G. (1996). Mice with a disrupted IFN-gamma gene are susceptible to the induction of experimental autoimmune encephalomyelitis (EAE). J Immunol 156, 5-7. Fiaschi, T., Marini, A., Giannoni, E., Taddei, M.L., Gandellini, P., De Donatis, A., Lanciotti, M., Serni, S., Cirri, P., and Chiarugi, P. (2012). Reciprocal metabolic reprogramming through lactate shuttle coordinately influences tumor-stroma interplay. Cancer Res 72, 5130-5140. Fidelus, R.K., Laughter, A.H., and Twomey, J.J. (1984). The role of mitogens and lymphokines in the induction of ornithine decarboxylase (ODC) in T lymphocytes. J Immunol 132, 1462-1465. Finlay, D.K., Rosenzweig, E., Sinclair, L.V., Feijoo-Carnero, C., Hukelmann, J.L., Rolf, J., Panteleyev, A.A., Okkenhaug, K., and Cantrell, D.A. (2012). PDK1 regulation of mTOR and hypoxia-inducible factor 1 integrate metabolism and migration of CD8+ T cells. J Exp Med 209, 2441-2453.

245
Finney, H.M., Akbar, A.N., and Lawson, A.D. (2004). Activation of resting human primary T cells with chimeric receptors: costimulation from CD28, inducible costimulator, CD134, and CD137 in series with signals from the TCR zeta chain. J Immunol 172, 104-113. Fischer, K., Hoffmann, P., Voelkl, S., Meidenbauer, N., Ammer, J., Edinger, M., Gottfried, E., Schwarz, S., Rothe, G., Hoves, S., et al. (2007). Inhibitory effect of tumor cell-derived lactic acid on human T cells. Blood 109, 3812-3819. Flossdorf, M., Rössler, J., Buchholz, V.R., Busch, D.H., and Höfer, T. (2015). CD8+ T cell diversification by asymmetric cell division. Nature Immunology 16, 891. Fontenot, J.D., Gavin, M.A., and Rudensky, A.Y. (2003). Foxp3 programs the development and function of CD4+CD25+ regulatory T cells. Nat Immunol 4, 330-336. Forero-Pena, D.A., and Gutierrez, F.R. (2013). Statins as modulators of regulatory T-cell biology. Mediators Inflamm 2013, 167086. Fort, M.M., Cheung, J., Yen, D., Li, J., Zurawski, S.M., Lo, S., Menon, S., Clifford, T., Hunte, B., Lesley, R., et al. (2001). IL-25 induces IL-4, IL-5, and IL-13 and Th2-associated pathologies in vivo. Immunity 15, 985-995. Fotiadis, D., Kanai, Y., and Palacin, M. (2013). The SLC3 and SLC7 families of amino acid transporters. Mol Aspects Med 34, 139-158. Frauwirth, K.A., Riley, J.L., Harris, M.H., Parry, R.V., Rathmell, J.C., Plas, D.R., Elstrom, R.L., June, C.H., and Thompson, C.B. (2002). The CD28 signaling pathway regulates glucose metabolism. Immunity 16, 769-777. Freeman, G.J., Boussiotis, V.A., Anumanthan, A., Bernstein, G.M., Ke, X.Y., Rennert, P.D., Gray, G.S., Gribben, J.G., and Nadler, L.M. (1995). B7-1 and B7-2 do not deliver identical costimulatory signals, since B7-2 but not B7-1 preferentially costimulates the initial production of IL-4. Immunity 2, 523-532. Freudenberg, K., Lindner, N., Dohnke, S., Garbe, A.I., Schallenberg, S., and Kretschmer, K. (2018). Critical Role of TGF-β and IL-2 Receptor Signaling in Foxp3 Induction by an Inhibitor of DNA Methylation. Frontiers in immunology 9, 125-125. Fuertes Marraco, S.A., Soneson, C., Cagnon, L., Gannon, P.O., Allard, M., Abed Maillard, S., Montandon, N., Rufer, N., Waldvogel, S., Delorenzi, M., et al. (2015). Long-lasting stem cell-like memory CD8+ T cells with a naive-like profile upon yellow fever vaccination. Sci Transl Med 7, 282ra248. Gaber, T., Chen, Y., Krauss, P.L., and Buttgereit, F. (2019). Metabolism of T Lymphocytes in Health and Disease. Int Rev Cell Mol Biol 342, 95-148.

246
Galon, J., Costes, A., Sanchez-Cabo, F., Kirilovsky, A., Mlecnik, B., Lagorce-Pages, C., Tosolini, M., Camus, M., Berger, A., Wind, P., et al. (2006). Type, density, and location of immune cells within human colorectal tumors predict clinical outcome. Science 313, 1960-1964. Gambineri, E., Torgerson, T.R., and Ochs, H.D. (2003). Immune dysregulation, polyendocrinopathy, enteropathy, and X-linked inheritance (IPEX), a syndrome of systemic autoimmunity caused by mutations of FOXP3, a critical regulator of T-cell homeostasis. Curr Opin Rheumatol 15, 430-435. Gao, Y., Nish, S.A., Jiang, R., Hou, L., Licona-Limon, P., Weinstein, J.S., Zhao, H., and Medzhitov, R. (2013). Control of T helper 2 responses by transcription factor IRF4-dependent dendritic cells. Immunity 39, 722-732. Garcia-Navas, R., Munder, M., and Mollinedo, F. (2012). Depletion of L-arginine induces autophagy as a cytoprotective response to endoplasmic reticulum stress in human T lymphocytes. Autophagy 8, 1557-1576. Gargett, T., and Brown, M.P. (2015). Different cytokine and stimulation conditions influence the expansion and immune phenotype of third-generation chimeric antigen receptor T cells specific for tumor antigen GD2. Cytotherapy 17, 487-495. Garlisi, C.G., Falcone, A., Kung, T.T., Stelts, D., Pennline, K.J., Beavis, A.J., Smith, S.R., Egan, R.W., and Umland, S.P. (1995). T cells are necessary for Th2 cytokine production and eosinophil accumulation in airways of antigen-challenged allergic mice. Clin Immunol Immunopathol 75, 75-83. Garrido, F., and Algarra, I. (2001). MHC antigens and tumor escape from immune surveillance. Adv Cancer Res 83, 117-158. Gattinoni, L., Klebanoff, C.A., Palmer, D.C., Wrzesinski, C., Kerstann, K., Yu, Z., Finkelstein, S.E., Theoret, M.R., Rosenberg, S.A., and Restifo, N.P. (2005). Acquisition of full effector function in vitro paradoxically impairs the in vivo antitumor efficacy of adoptively transferred CD8+ T cells. J Clin Invest 115, 1616-1626. Gattinoni, L., Lugli, E., Ji, Y., Pos, Z., Paulos, C.M., Quigley, M.F., Almeida, J.R., Gostick, E., Yu, Z., Carpenito, C., et al. (2011). A human memory T cell subset with stem cell-like properties. Nat Med 17, 1290-1297. Gattinoni, L., Speiser, D.E., Lichterfeld, M., and Bonini, C. (2017). T memory stem cells in health and disease. Nat Med 23, 18-27. Gavin, M.A., Rasmussen, J.P., Fontenot, J.D., Vasta, V., Manganiello, V.C., Beavo, J.A., and Rudensky, A.Y. (2007). Foxp3-dependent programme of regulatory T-cell differentiation. Nature 445, 771-775.

247
Geiger, R., Rieckmann, J.C., Wolf, T., Basso, C., Feng, Y., Fuhrer, T., Kogadeeva, M., Picotti, P., Meissner, F., Mann, M., et al. (2016). L-Arginine Modulates T Cell Metabolism and Enhances Survival and Anti-tumor Activity. Cell 167, 829-842.e813. Geltink, R.I.K., Kyle, R.L., and Pearce, E.L. (2018). Unraveling the Complex Interplay Between T Cell Metabolism and Function. Annu Rev Immunol 36, 461-488. Gerriets, V.A., Kishton, R.J., Nichols, A.G., Macintyre, A.N., Inoue, M., Ilkayeva, O., Winter, P.S., Liu, X., Priyadharshini, B., Slawinska, M.E., et al. (2015). Metabolic programming and PDHK1 control CD4+ T cell subsets and inflammation. J Clin Invest 125, 194-207. Gerriets, V.A., and Rathmell, J.C. (2012). Metabolic pathways in T cell fate and function. Trends Immunol 33, 168-173. Gershon, R.K., and Kondo, K. (1970). Cell interactions in the induction of tolerance: the role of thymic lymphocytes. Immunology 18, 723-737. Geukes Foppen, M.H., Donia, M., Svane, I.M., and Haanen, J.B. (2015). Tumor-infiltrating lymphocytes for the treatment of metastatic cancer. Mol Oncol 9, 1918-1935. Giroux, M., Schmidt, M., and Descoteaux, A. (2003). IFN-gamma-induced MHC class II expression: transactivation of class II transactivator promoter IV by IFN regulatory factor-1 is regulated by protein kinase C-alpha. J Immunol 171, 4187-4194. Godfrey, V.L., Wilkinson, J.E., and Russell, L.B. (1991). X-linked lymphoreticular disease in the scurfy (sf) mutant mouse. Am J Pathol 138, 1379-1387. Goff, S.L., Dudley, M.E., Citrin, D.E., Somerville, R.P., Wunderlich, J.R., Danforth, D.N., Zlott, D.A., Yang, J.C., Sherry, R.M., Kammula, U.S., et al. (2016). Randomized, Prospective Evaluation Comparing Intensity of Lymphodepletion Before Adoptive Transfer of Tumor-Infiltrating Lymphocytes for Patients With Metastatic Melanoma. J Clin Oncol 34, 2389-2397. Gomez-Eerland, R., Nuijen, B., Heemskerk, B., van Rooij, N., van den Berg, J.H., Beijnen, J.H., Uckert, W., Kvistborg, P., Schumacher, T.N., Haanen, J.B., et al. (2014). Manufacture of gene-modified human T-cells with a memory stem/central memory phenotype. Hum Gene Ther Methods 25, 277-287. Gondek, D.C., Lu, L.F., Quezada, S.A., Sakaguchi, S., and Noelle, R.J. (2005). Cutting edge: contact-mediated suppression by CD4+CD25+ regulatory cells involves a granzyme B-dependent, perforin-independent mechanism. J Immunol 174, 1783-1786. Gordon, S. (2003). Alternative activation of macrophages. Nat Rev Immunol 3, 23-35. Gowans, J.L., and Knight, E.J. (1964). The route of re-circulation of lymphocytes in the rat. Proc R Soc Lond B Biol Sci 159, 257-282.

248
Gran, B., Zhang, G.X., Yu, S., Li, J., Chen, X.H., Ventura, E.S., Kamoun, M., and Rostami, A. (2002). IL-12p35-deficient mice are susceptible to experimental autoimmune encephalomyelitis: evidence for redundancy in the IL-12 system in the induction of central nervous system autoimmune demyelination. J Immunol 169, 7104-7110. Grange, M., Verdeil, G., Arnoux, F., Griffon, A., Spicuglia, S., Maurizio, J., Buferne, M., Schmitt-Verhulst, A.M., and Auphan-Anezin, N. (2013). Active STAT5 regulates T-bet and eomesodermin expression in CD8 T cells and imprints a T-bet-dependent Tc1 program with repressed IL-6/TGF-beta1 signaling. J Immunol 191, 3712-3724. Grant, C.R., Liberal, R., Mieli-Vergani, G., Vergani, D., and Longhi, M.S. (2015). Regulatory T-cells in autoimmune diseases: challenges, controversies and--yet--unanswered questions. Autoimmun Rev 14, 105-116. Grohmann, U., Orabona, C., Fallarino, F., Vacca, C., Calcinaro, F., Falorni, A., Candeloro, P., Belladonna, M.L., Bianchi, R., Fioretti, M.C., et al. (2002). CTLA-4-Ig regulates tryptophan catabolism in vivo. Nat Immunol 3, 1097-1101. Gross, G., Waks, T., and Eshhar, Z. (1989). Expression of immunoglobulin-T-cell receptor chimeric molecules as functional receptors with antibody-type specificity. Proc Natl Acad Sci U S A 86, 10024-10028. Groux, H., O'Garra, A., Bigler, M., Rouleau, M., Antonenko, S., de Vries, J.E., and Roncarolo, M.G. (1997). A CD4+ T-cell subset inhibits antigen-specific T-cell responses and prevents colitis. Nature 389, 737-742. Grupp, S.A., Kalos, M., Barrett, D., Aplenc, R., Porter, D.L., Rheingold, S.R., Teachey, D.T., Chew, A., Hauck, B., Wright, J.F., et al. (2013). Chimeric antigen receptor-modified T cells for acute lymphoid leukemia. N Engl J Med 368, 1509-1518. Gualdoni, G.A., Mayer, K.A., Goschl, L., Boucheron, N., Ellmeier, W., and Zlabinger, G.J. (2016). The AMP analog AICAR modulates the Treg/Th17 axis through enhancement of fatty acid oxidation. Faseb j 30, 3800-3809. Gubser, P.M., Bantug, G.R., Razik, L., Fischer, M., Dimeloe, S., Hoenger, G., Durovic, B., Jauch, A., and Hess, C. (2013). Rapid effector function of memory CD8+ T cells requires an immediate-early glycolytic switch. Nat Immunol 14, 1064-1072. Guo, K., Searfoss, G., Krolikowski, D., Pagnoni, M., Franks, C., Clark, K., Yu, K.T., Jaye, M., and Ivashchenko, Y. (2001). Hypoxia induces the expression of the pro-apoptotic gene BNIP3. Cell Death Differ 8, 367-376. Guo, X., Yan, C., Li, H., Huang, W., Shi, X., Huang, M., Wang, Y., Pan, W., Cai, M., Li, L., et al. (2017). Lipid-dependent conformational dynamics underlie the functional versatility of T-cell receptor. Cell Res 27, 505-525.

249
Gutman, M., and Silman, N. (1975). The steady state activity of succinate dehydrogenase in the presence of opposing effectors.II. Reductive activation of succinate dehydrogenase in presence of oxaloacetate. Mol Cell Biochem 7, 177-185. Hamanaka, R.B., and Chandel, N.S. (2012). Targeting glucose metabolism for cancer therapy. The Journal of Experimental Medicine 209, 211. Hamieh, M., Dobrin, A., Cabriolu, A., van der Stegen, S.J.C., Giavridis, T., Mansilla-Soto, J., Eyquem, J., Zhao, Z., Whitlock, B.M., Miele, M.M., et al. (2019). CAR T cell trogocytosis and cooperative killing regulate tumour antigen escape. Nature 568, 112-116. Hanahan, D., and Weinberg, R.A. (2000). The hallmarks of cancer. Cell 100, 57-70. Hanahan, D., and Weinberg, R.A. (2011). Hallmarks of cancer: the next generation. Cell 144, 646-674. Hanai, J., Doro, N., Sasaki, A.T., Kobayashi, S., Cantley, L.C., Seth, P., and Sukhatme, V.P. (2012). Inhibition of lung cancer growth: ATP citrate lyase knockdown and statin treatment leads to dual blockade of mitogen-activated protein kinase (MAPK) and phosphatidylinositol-3-kinase (PI3K)/AKT pathways. J Cell Physiol 227, 1709-1720. Hannah, V.C., Ou, J., Luong, A., Goldstein, J.L., and Brown, M.S. (2001). Unsaturated fatty acids down-regulate srebp isoforms 1a and 1c by two mechanisms in HEK-293 cells. J Biol Chem
276, 4365-4372. Hardie, D.G., Hawley, S.A., and Scott, J.W. (2006). AMP-activated protein kinase--development of the energy sensor concept. The Journal of physiology 574, 7-15. Harrington, L.E., Hatton, R.D., Mangan, P.R., Turner, H., Murphy, T.L., Murphy, K.M., and Weaver, C.T. (2005). Interleukin 17-producing CD4+ effector T cells develop via a lineage distinct from the T helper type 1 and 2 lineages. Nat Immunol 6, 1123-1132. Harris, J.M., Hazenberg, M.D., Poulin, J.F., Higuera-Alhino, D., Schmidt, D., Gotway, M., and McCune, J.M. (2005). Multiparameter evaluation of human thymic function: interpretations and caveats. Clin Immunol 115, 138-146. Hasan, N.M., Adams, G.E., Joiner, M.C., Marshall, J.F., and Hart, I.R. (1998). Hypoxia facilitates tumour cell detachment by reducing expression of surface adhesion molecules and adhesion to extracellular matrices without loss of cell viability. Br J Cancer 77, 1799-1805. Haxhinasto, S., Mathis, D., and Benoist, C. (2008). The AKT-mTOR axis regulates de novo differentiation of CD4+Foxp3+ cells. J Exp Med 205, 565-574. Hayashi, K., Jutabha, P., Endou, H., Sagara, H., and Anzai, N. (2013). LAT1 is a critical transporter of essential amino acids for immune reactions in activated human T cells. J Immunol 191, 4080-4085.

250
He, N., Fan, W., Henriquez, B., Yu, R.T., Atkins, A.R., Liddle, C., Zheng, Y., Downes, M., and Evans, R.M. (2017). Metabolic control of regulatory T cell (Treg) survival and function by Lkb1. Proc Natl Acad Sci U S A 114, 12542-12547. He, W., Miao, F.J., Lin, D.C., Schwandner, R.T., Wang, Z., Gao, J., Chen, J.L., Tian, H., and Ling, L. (2004). Citric acid cycle intermediates as ligands for orphan G-protein-coupled receptors. Nature 429, 188-193. He, Y.F., Li, B.Z., Li, Z., Liu, P., Wang, Y., Tang, Q., Ding, J., Jia, Y., Chen, Z., Li, L., et al. (2011). Tet-mediated formation of 5-carboxylcytosine and its excision by TDG in mammalian DNA. Science 333, 1303-1307. Hensley, C.T., Faubert, B., Yuan, Q., Lev-Cohain, N., Jin, E., Kim, J., Jiang, L., Ko, B., Skelton, R., Loudat, L., et al. (2016). Metabolic Heterogeneity in Human Lung Tumors. Cell 164, 681-694. Herman, A.B., Savage, V.M., and West, G.B. (2011). A quantitative theory of solid tumor growth, metabolic rate and vascularization. PLoS One 6, e22973. Herold, M., Breuer, J., Hucke, S., Knolle, P., Schwab, N., Wiendl, H., and Klotz, L. (2017). Liver X receptor activation promotes differentiation of regulatory T cells. PLoS One 12, e0184985. Hess Michelini, R., Doedens, A.L., Goldrath, A.W., and Hedrick, S.M. (2013). Differentiation of CD8 memory T cells depends on Foxo1. J Exp Med 210, 1189-1200. Hesterberg, R.S., Cleveland, J.L., and Epling-Burnette, P.K. (2018). Role of Polyamines in Immune Cell Functions. Med Sci (Basel) 6. Hill, J.A., Hall, J.A., Sun, C.M., Cai, Q., Ghyselinck, N., Chambon, P., Belkaid, Y., Mathis, D., and Benoist, C. (2008). Retinoic acid enhances Foxp3 induction indirectly by relieving inhibition from CD4+CD44hi Cells. Immunity 29, 758-770. Hiraoka, N., Onozato, K., Kosuge, T., and Hirohashi, S. (2006). Prevalence of FOXP3+ regulatory T cells increases during the progression of pancreatic ductal adenocarcinoma and its premalignant lesions. Clin Cancer Res 12, 5423-5434. Hirayama, A., Kami, K., Sugimoto, M., Sugawara, M., Toki, N., Onozuka, H., Kinoshita, T., Saito, N., Ochiai, A., Tomita, M., et al. (2009). Quantitative metabolome profiling of colon and stomach cancer microenvironment by capillary electrophoresis time-of-flight mass spectrometry. Cancer research 69, 4918-4925. Hixson, L.J., Garewal, H.S., McGee, D.L., Sloan, D., Fennerty, M.B., Sampliner, R.E., and Gerner, E.W. (1993). Ornithine decarboxylase and polyamines in colorectal neoplasia and mucosa. Cancer Epidemiol Biomarkers Prev 2, 369-374. Ho, I.C., Lo, D., and Glimcher, L.H. (1998). c-maf promotes T helper cell type 2 (Th2) and attenuates Th1 differentiation by both interleukin 4-dependent and -independent mechanisms. J Exp Med 188, 1859-1866.

251
Ho, P.C., Bihuniak, J.D., Macintyre, A.N., Staron, M., Liu, X., Amezquita, R., Tsui, Y.C., Cui, G., Micevic, G., Perales, J.C., et al. (2015). Phosphoenolpyruvate Is a Metabolic Checkpoint of Anti-tumor T Cell Responses. Cell 162, 1217-1228. Hoffman, W.E., Charbel, F.T., and Edelman, G. (1996). Brain tissue oxygen, carbon dioxide, and pH in neurosurgical patients at risk for ischemia. Anesth Analg 82, 582-586. Hogarty, M.D., Norris, M.D., Davis, K., Liu, X., Evageliou, N.F., Hayes, C.S., Pawel, B., Guo, R., Zhao, H., Sekyere, E., et al. (2008). ODC1 is a critical determinant of MYCN oncogenesis and a therapeutic target in neuroblastoma. Cancer Res 68, 9735-9745. Hogquist, K.A., Baldwin, T.A., and Jameson, S.C. (2005). Central tolerance: learning self-control in the thymus. Nat Rev Immunol 5, 772-782. Hombach, A., Schlimper, C., Sievers, E., Frank, S., Schild, H.H., Sauerbruch, T., Schmidt-Wolf, I.G.H., and Abken, H. (2006). A recombinant anti-carcinoembryonic antigen immunoreceptor with combined CD3zeta-CD28 signalling targets T cells from colorectal cancer patients against their tumour cells. Gut 55, 1156-1164. Hombach, A., Sent, D., Schneider, C., Heuser, C., Koch, D., Pohl, C., Seliger, B., and Abken, H. (2001a). T-cell activation by recombinant receptors: CD28 costimulation is required for interleukin 2 secretion and receptor-mediated T-cell proliferation but does not affect receptor-mediated target cell lysis. Cancer Res 61, 1976-1982. Hombach, A., Wieczarkowiecz, A., Marquardt, T., Heuser, C., Usai, L., Pohl, C., Seliger, B., and Abken, H. (2001b). Tumor-specific T cell activation by recombinant immunoreceptors: CD3 zeta signaling and CD28 costimulation are simultaneously required for efficient IL-2 secretion and can be integrated into one combined CD28/CD3 zeta signaling receptor molecule. J Immunol 167, 6123-6131. Hori, S., Nomura, T., and Sakaguchi, S. (2003). Control of regulatory T cell development by the transcription factor Foxp3. Science 299, 1057-1061. Horton, J.D., Goldstein, J.L., and Brown, M.S. (2002). SREBPs: activators of the complete program of cholesterol and fatty acid synthesis in the liver. The Journal of clinical investigation
109, 1125-1131. Hou, P.F., Zhu, L.J., Chen, X.Y., and Qiu, Z.Q. (2017). Age-related changes in CD4+CD25+FOXP3+ regulatory T cells and their relationship with lung cancer. PLoS One 12, e0173048. Hou, T.Y., McMurray, D.N., and Chapkin, R.S. (2016). Omega-3 fatty acids, lipid rafts, and T cell signaling. Eur J Pharmacol 785, 2-9. Howie, D., Cobbold, S.P., Adams, E., Ten Bokum, A., Necula, A.S., Zhang, W., Huang, H., Roberts, D.J., Thomas, B., Hester, S.S., et al. (2017a). Foxp3 drives oxidative phosphorylation and protection from lipotoxicity. JCI Insight 2, e89160.

252
Howie, D., Ten Bokum, A., Necula, A.S., Cobbold, S.P., and Waldmann, H. (2017b). The Role of Lipid Metabolism in T Lymphocyte Differentiation and Survival. Front Immunol 8, 1949. Hui, E., Cheung, J., Zhu, J., Su, X., Taylor, M.J., Wallweber, H.A., Sasmal, D.K., Huang, J., Kim, J.M., Mellman, I., et al. (2017). T cell costimulatory receptor CD28 is a primary target for PD-1-mediated inhibition. Science 355, 1428-1433. Hull, C.M., Peakman, M., and Tree, T.I.M. (2017). Regulatory T cell dysfunction in type 1 diabetes: what’s broken and how can we fix it? Diabetologia 60, 1839-1850.
Hunt, N.H., and Fragonas, J.-C. (1992). Effects of anti-oxidants on ornithine decar☐ylase in mitogenically-activated T lymphocytes. Biochimica et Biophysica Acta (BBA) - Molecular Cell Research 1133, 261-267. Husson, A., Brasse-Lagnel, C., Fairand, A., Renouf, S., and Lavoinne, A. (2003). Argininosuccinate synthetase from the urea cycle to the citrulline-NO cycle. Eur J Biochem
270, 1887-1899. Huster, K.M., Busch, V., Schiemann, M., Linkemann, K., Kerksiek, K.M., Wagner, H., and Busch, D.H. (2004). Selective expression of IL-7 receptor on memory T cells identifies early CD40L-dependent generation of distinct CD8+ memory T cell subsets. Proc Natl Acad Sci U S A 101, 5610-5615. Hwang, E.S., Szabo, S.J., Schwartzberg, P.L., and Glimcher, L.H. (2005). T helper cell fate specified by kinase-mediated interaction of T-bet with GATA-3. Science 307, 430-433. Hwang, S.S., Lee, S., Lee, W., and Lee, G.R. (2010). GATA-binding protein-3 regulates T helper type 2 cytokine and ifng loci through interaction with metastasis-associated protein 2. Immunology 131, 50-58. Ichii, H., Sakamoto, A., Hatano, M., Okada, S., Toyama, H., Taki, S., Arima, M., Kuroda, Y., and Tokuhisa, T. (2002). Role for Bcl-6 in the generation and maintenance of memory CD8+ T cells. Nat Immunol 3, 558-563. Ichiyama, K., Chen, T., Wang, X., Yan, X., Kim, B.S., Tanaka, S., Ndiaye-Lobry, D., Deng, Y., Zou, Y., Zheng, P., et al. (2015). The methylcytosine dioxygenase Tet2 promotes DNA demethylation and activation of cytokine gene expression in T cells. Immunity 42, 613-626. Ikeda, H., Old, L.J., and Schreiber, R.D. (2002). The roles of IFN gamma in protection against tumor development and cancer immunoediting. Cytokine Growth Factor Rev 13, 95-109. Iliopoulos, O., Levy, A.P., Jiang, C., Kaelin, W.G., Jr., and Goldberg, M.A. (1996). Negative regulation of hypoxia-inducible genes by the von Hippel-Lindau protein. Proc Natl Acad Sci U S A 93, 10595-10599.

253
Imai, C., Mihara, K., Andreansky, M., Nicholson, I.C., Pui, C.H., Geiger, T.L., and Campana, D. (2004). Chimeric receptors with 4-1BB signaling capacity provoke potent cytotoxicity against acute lymphoblastic leukemia. Leukemia 18, 676-684. Intlekofer, A.M., Dematteo, R.G., Venneti, S., Finley, L.W., Lu, C., Judkins, A.R., Rustenburg, A.S., Grinaway, P.B., Chodera, J.D., Cross, J.R., et al. (2015). Hypoxia Induces Production of L-2-Hydroxyglutarate. Cell Metab 22, 304-311. Intlekofer, A.M., and Finley, L.W.S. (2019). Metabolic signatures of cancer cells and stem cells. Nature Metabolism 1, 177-188. Intlekofer, A.M., Takemoto, N., Wherry, E.J., Longworth, S.A., Northrup, J.T., Palanivel, V.R., Mullen, A.C., Gasink, C.R., Kaech, S.M., Miller, J.D., et al. (2005). Effector and memory CD8+ T cell fate coupled by T-bet and eomesodermin. Nat Immunol 6, 1236-1244. Intlekofer, A.M., Wang, B., Liu, H., Shah, H., Carmona-Fontaine, C., Rustenburg, A.S., Salah, S., Gunner, M.R., Chodera, J.D., Cross, J.R., et al. (2017). L-2-Hydroxyglutarate production arises from noncanonical enzyme function at acidic pH. Nature chemical biology 13, 494-500. Ito, S., Shen, L., Dai, Q., Wu, S.C., Collins, L.B., Swenberg, J.A., He, C., and Zhang, Y. (2011). Tet proteins can convert 5-methylcytosine to 5-formylcytosine and 5-carboxylcytosine. Science
333, 1300-1303. Iyer, N.V., Kotch, L.E., Agani, F., Leung, S.W., Laughner, E., Wenger, R.H., Gassmann, M., Gearhart, J.D., Lawler, A.M., Yu, A.Y., et al. (1998). Cellular and developmental control of O2 homeostasis by hypoxia-inducible factor 1 alpha. Genes Dev 12, 149-162. Jacobs, S.R., Herman, C.E., Maciver, N.J., Wofford, J.A., Wieman, H.L., Hammen, J.J., and Rathmell, J.C. (2008). Glucose uptake is limiting in T cell activation and requires CD28-mediated Akt-dependent and independent pathways. J Immunol 180, 4476-4486. Jacobs, S.R., Michalek, R.D., and Rathmell, J.C. (2010). IL-7 is essential for homeostatic control of T cell metabolism in vivo. J Immunol 184, 3461-3469. Jacobson, N.G., Szabo, S.J., Weber-Nordt, R.M., Zhong, Z., Schreiber, R.D., Darnell, J.E., Jr., and Murphy, K.M. (1995). Interleukin 12 signaling in T helper type 1 (Th1) cells involves tyrosine phosphorylation of signal transducer and activator of transcription (Stat)3 and Stat4. J Exp Med 181, 1755-1762. Jain, J., Loh, C., and Rao, A. (1995). Transcriptional regulation of the IL-2 gene. Current Opinion in Immunology 7, 333-342. Jamieson, B.D., Douek, D.C., Killian, S., Hultin, L.E., Scripture-Adams, D.D., Giorgi, J.V., Marelli, D., Koup, R.A., and Zack, J.A. (1999). Generation of functional thymocytes in the human adult. Immunity 10, 569-575.

254
Jawed, K., Mattam, A.J., Fatma, Z., Wajid, S., Abdin, M.Z., and Yazdani, S.S. (2016). Engineered Production of Short Chain Fatty Acid in Escherichia coli Using Fatty Acid Synthesis Pathway. PLoS One 11, e0160035. Jenkins, M.K., and Schwartz, R.H. (1987). Antigen presentation by chemically modified splenocytes induces antigen-specific T cell unresponsiveness in vitro and in vivo. J Exp Med
165, 302-319. Ji, Y., Pos, Z., Rao, M., Klebanoff, C.A., Yu, Z., Sukumar, M., Reger, R.N., Palmer, D.C., Borman, Z.A., Muranski, P., et al. (2011). Repression of the DNA-binding inhibitor Id3 by Blimp-1 limits the formation of memory CD8+ T cells. Nat Immunol 12, 1230-1237. Jiang, Q., Li, W.Q., Aiello, F.B., Mazzucchelli, R., Asefa, B., Khaled, A.R., and Durum, S.K. (2005). Cell biology of IL-7, a key lymphotrophin. Cytokine Growth Factor Rev 16, 513-533. Jiang, Y., Du, Z., Yang, F., Di, Y., Li, J., Zhou, Z., Pillarisetty, V.G., and Fu, D. (2014). FOXP3+ lymphocyte density in pancreatic cancer correlates with lymph node metastasis. PLoS One 9, e106741. Joffre, O.P., Segura, E., Savina, A., and Amigorena, S. (2012). Cross-presentation by dendritic cells. Nature Reviews Immunology 12, 557. Johnson, M.O., Siska, P.J., Contreras, D.C., and Rathmell, J.C. (2016). Nutrients and the microenvironment to feed a T cell army. Semin Immunol 28, 505-513. Jones, N., Cronin, J.G., Dolton, G., Panetti, S., Schauenburg, A.J., Galloway, S.A.E., Sewell, A.K., Cole, D.K., Thornton, C.A., and Francis, N.J. (2017). Metabolic Adaptation of Human CD4+ and CD8+ T-Cells to T-Cell Receptor-Mediated Stimulation. Frontiers in Immunology 8, 1516. Joshi, N.S., Cui, W., Chandele, A., Lee, H.K., Urso, D.R., Hagman, J., Gapin, L., and Kaech, S.M. (2007). Inflammation directs memory precursor and short-lived effector CD8(+) T cell fates via the graded expression of T-bet transcription factor. Immunity 27, 281-295. Joshi, N.S., and Kaech, S.M. (2008). Effector CD8 T Cell Development: A Balancing Act between Memory Cell Potential and Terminal Differentiation. The Journal of Immunology 180, 1309. Kaelin, W.G., Jr., and McKnight, S.L. (2013). Influence of metabolism on epigenetics and disease. Cell 153, 56-69. Kalia, V., Sarkar, S., Subramaniam, S., Haining, W.N., Smith, K.A., and Ahmed, R. (2010). Prolonged interleukin-2Ralpha expression on virus-specific CD8+ T cells favors terminal-effector differentiation in vivo. Immunity 32, 91-103. Kallies, A., Xin, A., Belz, G.T., and Nutt, S.L. (2009). Blimp-1 transcription factor is required for the differentiation of effector CD8(+) T cells and memory responses. Immunity 31, 283-295.

255
Kamphorst, J.J., Nofal, M., Commisso, C., Hackett, S.R., Lu, W., Grabocka, E., Vander Heiden, M.G., Miller, G., Drebin, J.A., Bar-Sagi, D., et al. (2015). Human pancreatic cancer tumors are nutrient poor and tumor cells actively scavenge extracellular protein. Cancer research 75, 544-553. Kanamori, M., Nakatsukasa, H., Okada, M., Lu, Q., and Yoshimura, A. (2016). Induced Regulatory T Cells: Their Development, Stability, and Applications. Trends in Immunology 37, 803-811. Kang, K.Y., Kim, Y.K., Yi, H., Kim, J., Jung, H.R., Kim, I.J., Cho, J.H., Park, S.H., Kim, H.Y., and Ju, J.H. (2013). Metformin downregulates Th17 cells differentiation and attenuates murine autoimmune arthritis. Int Immunopharmacol 16, 85-92. Kantoff, P.W., Higano, C.S., Shore, N.D., Berger, E.R., Small, E.J., Penson, D.F., Redfern, C.H., Ferrari, A.C., Dreicer, R., Sims, R.B., et al. (2010). Sipuleucel-T immunotherapy for castration-resistant prostate cancer. N Engl J Med 363, 411-422. Kaplan, D.H., Shankaran, V., Dighe, A.S., Stockert, E., Aguet, M., Old, L.J., and Schreiber, R.D. (1998). Demonstration of an interferon gamma-dependent tumor surveillance system in immunocompetent mice. Proc Natl Acad Sci U S A 95, 7556-7561. Kaplan, M.H., Schindler, U., Smiley, S.T., and Grusby, M.J. (1996a). Stat6 is required for mediating responses to IL-4 and for development of Th2 cells. Immunity 4, 313-319. Kaplan, M.H., Sun, Y.L., Hoey, T., and Grusby, M.J. (1996b). Impaired IL-12 responses and enhanced development of Th2 cells in Stat4-deficient mice. Nature 382, 174-177. Kawalekar, O.U., O'Connor, R.S., Fraietta, J.A., Guo, L., McGettigan, S.E., Posey, A.D., Jr., Patel, P.R., Guedan, S., Scholler, J., Keith, B., et al. (2016). Distinct Signaling of Coreceptors Regulates Specific Metabolism Pathways and Impacts Memory Development in CAR T Cells. Immunity
44, 380-390. Kay, J.E., and Lindsay, V.J. (1973). Control of ornithine decarboxylase activity in stimulated human lymphocytes by putrescine and spermidine. Biochem J 132, 791-796. Kay, J.E., and Pegg, A.E. (1973). Effect of inhibition of spermidine formation on protein and nucleic acid synthesis during lymphocyte activation. FEBS Lett 29, 301-304. Kennedy, K.M., Scarbrough, P.M., Ribeiro, A., Richardson, R., Yuan, H., Sonveaux, P., Landon, C.D., Chi, J.T., Pizzo, S., Schroeder, T., et al. (2013). Catabolism of exogenous lactate reveals it as a legitimate metabolic substrate in breast cancer. PLoS One 8, e75154. Keppler, S.J., Rosenits, K., Koegl, T., Vucikuja, S., and Aichele, P. (2012). Signal 3 cytokines as modulators of primary immune responses during infections: the interplay of type I IFN and IL-12 in CD8 T cell responses. PLoS One 7, e40865.

256
Kerdiles, Y.M., Beisner, D.R., Tinoco, R., Dejean, A.S., Castrillon, D.H., DePinho, R.A., and Hedrick, S.M. (2009). Foxo1 links homing and survival of naive T cells by regulating L-selectin, CCR7 and interleukin 7 receptor. Nature Immunology 10, 176. Kershaw, M.H., Westwood, J.A., Parker, L.L., Wang, G., Eshhar, Z., Mavroukakis, S.A., White, D.E., Wunderlich, J.R., Canevari, S., Rogers-Freezer, L., et al. (2006). A phase I study on adoptive immunotherapy using gene-modified T cells for ovarian cancer. Clin Cancer Res 12, 6106-6115. Kew, S., Wells, S.M., Yaqoob, P., Wallace, F.A., Miles, E.A., and Calder, P.C. (1999). Dietary glutamine enhances murine T-lymphocyte responsiveness. J Nutr 129, 1524-1531. Kidani, Y., Elsaesser, H., Hock, M.B., Vergnes, L., Williams, K.J., Argus, J.P., Marbois, B.N., Komisopoulou, E., Wilson, E.B., Osborne, T.F., et al. (2013). Sterol regulatory element-binding proteins are essential for the metabolic programming of effector T cells and adaptive immunity. Nat Immunol 14, 489-499. Kilpatrick, R.D., Rickabaugh, T., Hultin, L.E., Hultin, P., Hausner, M.A., Detels, R., Phair, J., and Jamieson, B.D. (2008). Homeostasis of the naive CD4+ T cell compartment during aging. J Immunol 180, 1499-1507. Kim, F.J., Manel, N., Garrido, E.N., Valle, C., Sitbon, M., and Battini, J.L. (2004). HTLV-1 and -2 envelope SU subdomains and critical determinants in receptor binding. Retrovirology 1, 41. Kim, H.P., and Leonard, W.J. (2007). CREB/ATF-dependent T cell receptor-induced FoxP3 gene expression: a role for DNA methylation. J Exp Med 204, 1543-1551. Kim, J.I., Ho, I.C., Grusby, M.J., and Glimcher, L.H. (1999). The transcription factor c-Maf controls the production of interleukin-4 but not other Th2 cytokines. Immunity 10, 745-751. Kim, J.W., Tchernyshyov, I., Semenza, G.L., and Dang, C.V. (2006). HIF-1-mediated expression of pyruvate dehydrogenase kinase: a metabolic switch required for cellular adaptation to hypoxia. Cell Metab 3, 177-185. Kim, M.V., Ouyang, W., Liao, W., Zhang, M.Q., and Li, M.O. (2013). The transcription factor Foxo1 controls central-memory CD8+ T cell responses to infection. Immunity 39, 286-297. Kim, S.-H., Roszik, J., Grimm, E.A., and Ekmekcioglu, S. (2018). Impact of l-Arginine Metabolism on Immune Response and Anticancer Immunotherapy. Frontiers in oncology 8, 67-67. Kinet, S., Swainson, L., Lavanya, M., Mongellaz, C., Montel-Hagen, A., Craveiro, M., Manel, N., Battini, J.L., Sitbon, M., and Taylor, N. (2007). Isolated receptor binding domains of HTLV-1 and HTLV-2 envelopes bind Glut-1 on activated CD4+ and CD8+ T cells. Retrovirology 4, 31. Kishton, Rigel J., Barnes, Carson E., Nichols, Amanda G., Cohen, S., Gerriets, Valerie A., Siska, Peter J., Macintyre, Andrew N., Goraksha-Hicks, P., de Cubas, Aguirre A., Liu, T., et al. (2016).

257
AMPK Is Essential to Balance Glycolysis and Mitochondrial Metabolism to Control T-ALL Cell Stress and Survival. Cell Metabolism 23, 649-662. Kitagawa, Y., Ohkura, N., Kidani, Y., Vandenbon, A., Hirota, K., Kawakami, R., Yasuda, K., Motooka, D., Nakamura, S., Kondo, M., et al. (2017). Guidance of regulatory T cell development by Satb1-dependent super-enhancer establishment. Nat Immunol 18, 173-183. Kitagawa, Y., Wing, J.B., and Sakaguchi, S. (2015). Transcriptional and Epigenetic Control of Regulatory T Cell Development. Prog Mol Biol Transl Sci 136, 1-33. Kitoh, A., Ono, M., Naoe, Y., Ohkura, N., Yamaguchi, T., Yaguchi, H., Kitabayashi, I., Tsukada, T., Nomura, T., Miyachi, Y., et al. (2009). Indispensable role of the Runx1-Cbfbeta transcription complex for in vivo-suppressive function of FoxP3+ regulatory T cells. Immunity 31, 609-620. Klebanoff, C.A., Gattinoni, L., Torabi-Parizi, P., Kerstann, K., Cardones, A.R., Finkelstein, S.E., Palmer, D.C., Antony, P.A., Hwang, S.T., Rosenberg, S.A., et al. (2005). Central memory self/tumor-reactive CD8+ T cells confer superior antitumor immunity compared with effector memory T cells. Proceedings of the National Academy of Sciences of the United States of America 102, 9571-9576. Klysz, D., Tai, X., Robert, P.A., Craveiro, M., Cretenet, G., Oburoglu, L., Mongellaz, C., Floess, S., Fritz, V., Matias, M.I., et al. (2015). Glutamine-dependent alpha-ketoglutarate production regulates the balance between T helper 1 cell and regulatory T cell generation. Sci Signal 8, ra97. Kmiecik, J., Poli, A., Brons, N.H., Waha, A., Eide, G.E., Enger, P.O., Zimmer, J., and Chekenya, M. (2013). Elevated CD3+ and CD8+ tumor-infiltrating immune cells correlate with prolonged survival in glioblastoma patients despite integrated immunosuppressive mechanisms in the tumor microenvironment and at the systemic level. J Neuroimmunol 264, 71-83. Kochenderfer, J.N., Wilson, W.H., Janik, J.E., Dudley, M.E., Stetler-Stevenson, M., Feldman, S.A., Maric, I., Raffeld, M., Nathan, D.A., Lanier, B.J., et al. (2010). Eradication of B-lineage cells and regression of lymphoma in a patient treated with autologous T cells genetically engineered to recognize CD19. Blood 116, 4099-4102. Koehler, P., Schmidt, P., Hombach, A.A., Hallek, M., and Abken, H. (2012). Engineered T cells for the adoptive therapy of B-cell chronic lymphocytic leukaemia. Adv Hematol 2012, 595060. Koivunen, P., Hirsila, M., Remes, A.M., Hassinen, I.E., Kivirikko, K.I., and Myllyharju, J. (2007). Inhibition of hypoxia-inducible factor (HIF) hydroxylases by citric acid cycle intermediates: possible links between cell metabolism and stabilization of HIF. J Biol Chem 282, 4524-4532. Koomoa, D.L., Yco, L.P., Borsics, T., Wallick, C.J., and Bachmann, A.S. (2008). Ornithine decarboxylase inhibition by alpha-difluoromethylornithine activates opposing signaling pathways via phosphorylation of both Akt/protein kinase B and p27Kip1 in neuroblastoma. Cancer Res 68, 9825-9831.

258
Koong, A.C., Chen, E.Y., and Giaccia, A.J. (1994). Hypoxia causes the activation of nuclear factor kappa B through the phosphorylation of I kappa B alpha on tyrosine residues. Cancer Res 54, 1425-1430. Kopf, M., Le Gros, G., Bachmann, M., Lamers, M.C., Bluethmann, H., and Kohler, G. (1993). Disruption of the murine IL-4 gene blocks Th2 cytokine responses. Nature 362, 245-248. Kovacevic, Z., and Morris, H.P. (1972). The role of glutamine in the oxidative metabolism of malignant cells. Cancer Res 32, 326-333. Kridel, S.J., Axelrod, F., Rozenkrantz, N., and Smith, J.W. (2004). Orlistat is a novel inhibitor of fatty acid synthase with antitumor activity. Cancer Res 64, 2070-2075. Kuemmerle, N.B., Rysman, E., Lombardo, P.S., Flanagan, A.J., Lipe, B.C., Wells, W.A., Pettus, J.R., Froehlich, H.M., Memoli, V.A., Morganelli, P.M., et al. (2011). Lipoprotein lipase links dietary fat to solid tumor cell proliferation. Mol Cancer Ther 10, 427-436. Kumamoto, Y., Linehan, M., Weinstein, J.S., Laidlaw, B.J., Craft, J.E., and Iwasaki, A. (2013). CD301b(+) dermal dendritic cells drive T helper 2 cell-mediated immunity. Immunity 39, 733-743. Kumar, B.V., Connors, T.J., and Farber, D.L. (2018). Human T Cell Development, Localization, and Function throughout Life. Immunity 48, 202-213. Kuperman, D.A., Huang, X., Koth, L.L., Chang, G.H., Dolganov, G.M., Zhu, Z., Elias, J.A., Sheppard, D., and Erle, D.J. (2002). Direct effects of interleukin-13 on epithelial cells cause airway hyperreactivity and mucus overproduction in asthma. Nat Med 8, 885-889. Kurata, H., Lee, H.J., O'Garra, A., and Arai, N. (1999). Ectopic expression of activated Stat6 induces the expression of Th2-specific cytokines and transcription factors in developing Th1 cells. Immunity 11, 677-688. Kurebayashi, Y., Nagai, S., Ikejiri, A., Ohtani, M., Ichiyama, K., Baba, Y., Yamada, T., Egami, S., Hoshii, T., Hirao, A., et al. (2012). PI3K-Akt-mTORC1-S6K1/2 axis controls Th17 differentiation by regulating Gfi1 expression and nuclear translocation of RORgamma. Cell Rep 1, 360-373. Kurose, K., Ohue, Y., Wada, H., Iida, S., Ishida, T., Kojima, T., Doi, T., Suzuki, S., Isobe, M., Funakoshi, T., et al. (2015). Phase Ia Study of FoxP3+ CD4 Treg Depletion by Infusion of a Humanized Anti-CCR4 Antibody, KW-0761, in Cancer Patients. Clin Cancer Res 21, 4327-4336. Lamers, C.H., Sleijfer, S., Vulto, A.G., Kruit, W.H., Kliffen, M., Debets, R., Gratama, J.W., Stoter, G., and Oosterwijk, E. (2006). Treatment of metastatic renal cell carcinoma with autologous T-lymphocytes genetically retargeted against carbonic anhydrase IX: first clinical experience. In J Clin Oncol (United States), pp. e20-22.

259
Langemeijer, S.M., Kuiper, R.P., Berends, M., Knops, R., Aslanyan, M.G., Massop, M., Stevens-Linders, E., van Hoogen, P., van Kessel, A.G., Raymakers, R.A., et al. (2009). Acquired mutations in TET2 are common in myelodysplastic syndromes. Nat Genet 41, 838-842. Langrish, C.L., Chen, Y., Blumenschein, W.M., Mattson, J., Basham, B., Sedgwick, J.D., McClanahan, T., Kastelein, R.A., and Cua, D.J. (2005). IL-23 drives a pathogenic T cell population that induces autoimmune inflammation. J Exp Med 201, 233-240. Laplante, M., and Sabatini, D.M. (2012). mTOR signaling in growth control and disease. Cell 149, 274-293. Larche, M., Robinson, D.S., and Kay, A.B. (2003). The role of T lymphocytes in the pathogenesis of asthma. J Allergy Clin Immunol 111, 450-463; quiz 464. Le Bourgeois, T., Strauss, L., Aksoylar, H.I., Daneshmandi, S., Seth, P., Patsoukis, N., and Boussiotis, V.A. (2018). Targeting T Cell Metabolism for Improvement of Cancer Immunotherapy. Front Oncol 8, 237. Le Bourhis, L., Martin, E., Peguillet, I., Guihot, A., Froux, N., Core, M., Levy, E., Dusseaux, M., Meyssonnier, V., Premel, V., et al. (2010). Antimicrobial activity of mucosal-associated invariant T cells. Nat Immunol 11, 701-708. Le Gros, G., Ben-Sasson, S.Z., Seder, R., Finkelman, F.D., and Paul, W.E. (1990). Generation of interleukin 4 (IL-4)-producing cells in vivo and in vitro: IL-2 and IL-4 are required for in vitro generation of IL-4-producing cells. J Exp Med 172, 921-929. Lebel-Binay, S., Laguerre, B., Quintin-Colonna, F., Conjeaud, H., Magazin, M., Miloux, B., Pecceu, F., Caput, D., Ferrara, P., and Fradelizi, D. (1995). Experimental gene therapy of cancer using tumor cells engineered to secrete interleukin-13. Eur J Immunol 25, 2340-2348. Lee, Y.C., Su, Y.T., Liu, T.Y., Tsai, C.M., Chang, C.H., and Yu, H.R. (2018). L-Arginine and L-Citrulline Supplementation Have Different Programming Effect on Regulatory T-Cells Function of Infantile Rats. Front Immunol 9, 2911. Leigh, R., Ellis, R., Wattie, J.N., Hirota, J.A., Matthaei, K.I., Foster, P.S., O'Byrne, P.M., and Inman, M.D. (2004). Type 2 cytokines in the pathogenesis of sustained airway dysfunction and airway remodeling in mice. Am J Respir Crit Care Med 169, 860-867. Lemonnier, F., Cairns, R.A., Inoue, S., Li, W.Y., Dupuy, A., Broutin, S., Martin, N., Fataccioli, V., Pelletier, R., Wakeham, A., et al. (2016). The IDH2 R172K mutation associated with angioimmunoblastic T-cell lymphoma produces 2HG in T cells and impacts lymphoid development. Proc Natl Acad Sci U S A 113, 15084-15089. Lewis, D.M., Park, K.M., Tang, V., Xu, Y., Pak, K., Eisinger-Mathason, T.S., Simon, M.C., and Gerecht, S. (2016). Intratumoral oxygen gradients mediate sarcoma cell invasion. Proc Natl Acad Sci U S A 113, 9292-9297.

260
Li, M.O., and Rudensky, A.Y. (2016). T cell receptor signalling in the control of regulatory T cell differentiation and function. Nature reviews Immunology 16, 220-233. Li, X., Liang, Y., LeBlanc, M., Benner, C., and Zheng, Y. (2014). Function of a Foxp3 cis-Element in Protecting Regulatory T Cell Identity. Cell 158, 734-748. Liao, W., Lin, J.X., and Leonard, W.J. (2011). IL-2 family cytokines: new insights into the complex roles of IL-2 as a broad regulator of T helper cell differentiation. Curr Opin Immunol 23, 598-604. Lighvani, A.A., Frucht, D.M., Jankovic, D., Yamane, H., Aliberti, J., Hissong, B.D., Nguyen, B.V., Gadina, M., Sher, A., Paul, W.E., et al. (2001). T-bet is rapidly induced by interferon-gamma in lymphoid and myeloid cells. Proc Natl Acad Sci U S A 98, 15137-15142. Ligthart-Melis, G.C., van de Poll, M.C., Boelens, P.G., Dejong, C.H., Deutz, N.E., and van Leeuwen, P.A. (2008). Glutamine is an important precursor for de novo synthesis of arginine in humans. Am J Clin Nutr 87, 1282-1289. Lin, C., McGough, R., Aswad, B., Block, J.A., and Terek, R. (2004). Hypoxia induces HIF-1alpha and VEGF expression in chondrosarcoma cells and chondrocytes. J Orthop Res 22, 1175-1181. Ling, A., Lundberg, I.V., Eklof, V., Wikberg, M.L., Oberg, A., Edin, S., and Palmqvist, R. (2016). The infiltration, and prognostic importance, of Th1 lymphocytes vary in molecular subgroups of colorectal cancer. J Pathol Clin Res 2, 21-31. Link, A., Vogt, T.K., Favre, S., Britschgi, M.R., Acha-Orbea, H., Hinz, B., Cyster, J.G., and Luther, S.A. (2007). Fibroblastic reticular cells in lymph nodes regulate the homeostasis of naive T cells. Nat Immunol 8, 1255-1265. Liu, Y., Zuckier, L.S., and Ghesani, N.V. (2010). Dominant uptake of fatty acid over glucose by prostate cells: a potential new diagnostic and therapeutic approach. Anticancer Res 30, 369-374. Lochner, M., Berod, L., and Sparwasser, T. (2015). Fatty acid metabolism in the regulation of T cell function. Trends in Immunology 36, 81-91. Loenarz, C., and Schofield, C.J. (2011). Physiological and biochemical aspects of hydroxylations and demethylations catalyzed by human 2-oxoglutarate oxygenases. Trends Biochem Sci 36, 7-18. Loisel-Meyer, S., Swainson, L., Craveiro, M., Oburoglu, L., Mongellaz, C., Costa, C., Martinez, M., Cosset, F.L., Battini, J.L., Herzenberg, L.A., et al. (2012). Glut1-mediated glucose transport regulates HIV infection. Proc Natl Acad Sci U S A 109, 2549-2554. Long, M., Park, S.G., Strickland, I., Hayden, M.S., and Ghosh, S. (2009). Nuclear factor-kappaB modulates regulatory T cell development by directly regulating expression of Foxp3 transcription factor. Immunity 31, 921-931.

261
Long, S.A., and Buckner, J.H. (2011). CD4+FOXP3+ T regulatory cells in human autoimmunity: more than a numbers game. J Immunol 187, 2061-2066. Lu, C., Ward, P.S., Kapoor, G.S., Rohle, D., Turcan, S., Abdel-Wahab, O., Edwards, C.R., Khanin, R., Figueroa, M.E., Melnick, A., et al. (2012). IDH mutation impairs histone demethylation and results in a block to cell differentiation. Nature 483, 474-478. Luiking, Y.C., Ten Have, G.A., Wolfe, R.R., and Deutz, N.E. (2012). Arginine de novo and nitric oxide production in disease states. Am J Physiol Endocrinol Metab 303, E1177-1189. Luzina, I.G., Knitzer, R.H., Atamas, S.P., Gause, W.C., Papadimitriou, J.C., Sztein, M.B., Storrer, C.E., and Handwerger, B.S. (1999). Vasculitis in the Palmerston North mouse model of lupus: phenotype and cytokine production profile of infiltrating cells. Arthritis Rheum 42, 561-568. Lyssiotis, C.A., and Kimmelman, A.C. (2017). Metabolic Interactions in the Tumor Microenvironment. Trends Cell Biol 27, 863-875. Ma, H.L., Whitters, M.J., Jacobson, B.A., Donaldson, D.D., Collins, M., and Dunussi-Joannopoulos, K. (2004). Tumor cells secreting IL-13 but not IL-13Ralpha2 fusion protein have reduced tumorigenicity in vivo. Int Immunol 16, 1009-1017. Macintyre, A.N., Gerriets, V.A., Nichols, A.G., Michalek, R.D., Rudolph, M.C., Deoliveira, D., Anderson, S.M., Abel, E.D., Chen, B.J., Hale, L.P., et al. (2014). The glucose transporter Glut1 is selectively essential for CD4 T cell activation and effector function. Cell Metab 20, 61-72. MacIver, N.J., Blagih, J., Saucillo, D.C., Tonelli, L., Griss, T., Rathmell, J.C., and Jones, R.G. (2011). The liver kinase B1 is a central regulator of T cell development, activation, and metabolism. Journal of immunology (Baltimore, Md : 1950) 187, 4187-4198. MacIver, N.J., Michalek, R.D., and Rathmell, J.C. (2013). Metabolic regulation of T lymphocytes. Annu Rev Immunol 31, 259-283. Maganto-Garcia, E., and Lichtman, A.H. (2008). Hypercholesterolemia-induced regulatory T cell responses detected in FOXP3-GFP x LDLR−/− mice. The FASEB Journal 22, 592-592. Mahne, A.E., Mauze, S., Joyce-Shaikh, B., Xia, J., Bowman, E.P., Beebe, A.M., Cua, D.J., and Jain, R. (2017). Dual Roles for Regulatory T-cell Depletion and Costimulatory Signaling in Agonistic GITR Targeting for Tumor Immunotherapy. Cancer Res 77, 1108-1118. Mailer, R.K.W., Gistera, A., Polyzos, K.A., Ketelhuth, D.F.J., and Hansson, G.K. (2017a). Hypercholesterolemia Induces Differentiation of Regulatory T Cells in the Liver. Circ Res 120, 1740-1753. Mailer, R.K.W., Gisterå, A., Polyzos, K.A., Ketelhuth, D.F.J., and Hansson, G.K. (2017b). Hypercholesterolemia Enhances T Cell Receptor Signaling and Increases the Regulatory T Cell Population. Scientific Reports 7, 15655.

262
Majzner, R.G., and Mackall, C.L. (2018). Tumor Antigen Escape from CAR T-cell Therapy. Cancer Discov 8, 1219-1226. Maldonado-Lopez, R., De Smedt, T., Michel, P., Godfroid, J., Pajak, B., Heirman, C., Thielemans, K., Leo, O., Urbain, J., and Moser, M. (1999). CD8alpha+ and CD8alpha- subclasses of dendritic cells direct the development of distinct T helper cells in vivo. J Exp Med 189, 587-592. Malek, T.R., and Bayer, A.L. (2004). Tolerance, not immunity, crucially depends on IL-2. Nature Reviews Immunology 4, 665-674. Malek, T.R., and Castro, I. (2010). Interleukin-2 receptor signaling: at the interface between tolerance and immunity. Immunity 33, 153-165. Manel, N., Kim, F.J., Kinet, S., Taylor, N., Sitbon, M., and Battini, J.-L. (2003a). The Ubiquitous Glucose Transporter GLUT-1 Is a Receptor for HTLV. Cell 115, 449-459. Manel, N., Kinet, S., Battini, J.L., Kim, F.J., Taylor, N., and Sitbon, M. (2003b). The HTLV receptor is an early T-cell activation marker whose expression requires de novo protein synthesis. Blood 101, 1913-1918. Marie, J.C., Letterio, J.J., Gavin, M., and Rudensky, A.Y. (2005). TGF-beta1 maintains suppressor function and Foxp3 expression in CD4+CD25+ regulatory T cells. J Exp Med 201, 1061-1067. Marigo, I., Dolcetti, L., Serafini, P., Zanovello, P., and Bronte, V. (2008). Tumor-induced tolerance and immune suppression by myeloid derived suppressor cells. Immunol Rev 222, 162-179. Marquez, J., Alonso, F.J., Mates, J.M., Segura, J.A., Martin-Rufian, M., and Campos-Sandoval, J.A. (2017). Glutamine Addiction In Gliomas. Neurochem Res 42, 1735-1746. Martini, M., Testi, M.G., Pasetto, M., Picchio, M.C., Innamorati, G., Mazzocco, M., Ugel, S., Cingarlini, S., Bronte, V., Zanovello, P., et al. (2010). IFN-gamma-mediated upmodulation of MHC class I expression activates tumor-specific immune response in a mouse model of prostate cancer. Vaccine 28, 3548-3557. Mashima, T., Seimiya, H., and Tsuruo, T. (2009). De novo fatty-acid synthesis and related pathways as molecular targets for cancer therapy. Br J Cancer 100, 1369-1372. Masopust, D., Choo, D., Vezys, V., Wherry, E.J., Duraiswamy, J., Akondy, R., Wang, J., Casey, K.A., Barber, D.L., Kawamura, K.S., et al. (2010). Dynamic T cell migration program provides resident memory within intestinal epithelium. J Exp Med 207, 553-564. Masopust, D., Vezys, V., Marzo, A.L., and Lefrancois, L. (2001). Preferential localization of effector memory cells in nonlymphoid tissue. Science 291, 2413-2417.
263
Matsumoto, K., Obara, N., Ema, M., Horie, M., Naka, A., Takahashi, S., and Imagawa, S. (2009). Antitumor effects of 2-oxoglutarate through inhibition of angiogenesis in a murine tumor model. Cancer Sci 100, 1639-1647. Maude, S.L., Frey, N., Shaw, P.A., Aplenc, R., Barrett, D.M., Bunin, N.J., Chew, A., Gonzalez, V.E., Zheng, Z., Lacey, S.F., et al. (2014). Chimeric antigen receptor T cells for sustained remissions in leukemia. N Engl J Med 371, 1507-1517. Maus, M.V., Grupp, S.A., Porter, D.L., and June, C.H. (2014). Antibody-modified T cells: CARs take the front seat for hematologic malignancies. Blood 123, 2625-2635. Maus, M.V., Haas, A.R., Beatty, G.L., Albelda, S.M., Levine, B.L., Liu, X., Zhao, Y., Kalos, M., and June, C.H. (2013). T cells expressing chimeric antigen receptors can cause anaphylaxis in humans. Cancer Immunol Res 1, 26-31. Maus, M.V., and June, C.H. (2016). Making Better Chimeric Antigen Receptors for Adoptive T-cell Therapy. Clinical Cancer Research 22, 1875. Mayers, J.R., and Vander Heiden, M.G. (2017). Nature and Nurture: What Determines Tumor Metabolic Phenotypes? Cancer research 77, 3131-3134. Mazzoni, A., Bronte, V., Visintin, A., Spitzer, J.H., Apolloni, E., Serafini, P., Zanovello, P., and Segal, D.M. (2002). Myeloid suppressor lines inhibit T cell responses by an NO-dependent mechanism. J Immunol 168, 689-695. McKenzie, A.N., Culpepper, J.A., de Waal Malefyt, R., Briere, F., Punnonen, J., Aversa, G., Sato, A., Dang, W., Cocks, B.G., Menon, S., et al. (1993). Interleukin 13, a T-cell-derived cytokine that regulates human monocyte and B-cell function. Proc Natl Acad Sci U S A 90, 3735-3739. Medina, M.A., Sanchez-Jimenez, F., Marquez, J., Rodriguez Quesada, A., and Nunez de Castro, I. (1992). Relevance of glutamine metabolism to tumor cell growth. Mol Cell Biochem 113, 1-15. Menendez, J.A., and Lupu, R. (2007). Fatty acid synthase and the lipogenic phenotype in cancer pathogenesis. Nat Rev Cancer 7, 763-777. Meraz, M.A., White, J.M., Sheehan, K.C., Bach, E.A., Rodig, S.J., Dighe, A.S., Kaplan, D.H., Riley, J.K., Greenlund, A.C., Campbell, D., et al. (1996). Targeted disruption of the Stat1 gene in mice reveals unexpected physiologic specificity in the JAK-STAT signaling pathway. Cell 84, 431-442. Merkenschlager, M., and Beverley, P.C. (1989). Evidence for differential expression of CD45 isoforms by precursors for memory-dependent and independent cytotoxic responses: human CD8 memory CTLp selectively express CD45RO (UCHL1). Int Immunol 1, 450-459.

264
Merrill, G.F., Kurth, E.J., Hardie, D.G., and Winder, W.W. (1997). AICA riboside increases AMP-activated protein kinase, fatty acid oxidation, and glucose uptake in rat muscle. American Journal of Physiology-Endocrinology and Metabolism 273, E1107-E1112. Metzler, B., Gfeller, P., and Guinet, E. (2016). Restricting Glutamine or Glutamine-Dependent Purine and Pyrimidine Syntheses Promotes Human T Cells with High FOXP3 Expression and Regulatory Properties. J Immunol 196, 3618-3630. Mezrich, J.D., Fechner, J.H., Zhang, X., Johnson, B.P., Burlingham, W.J., and Bradfield, C.A. (2010). An interaction between kynurenine and the aryl hydrocarbon receptor can generate regulatory T cells. J Immunol 185, 3190-3198. Michalek, R.D., Gerriets, V.A., Jacobs, S.R., Macintyre, A.N., MacIver, N.J., Mason, E.F., Sullivan, S.A., Nichols, A.G., and Rathmell, J.C. (2011). Cutting edge: distinct glycolytic and lipid oxidative metabolic programs are essential for effector and regulatory CD4+ T cell subsets. J Immunol 186, 3299-3303. Miliotou, A.N., and Papadopoulou, L.C. (2018). CAR T-cell Therapy: A New Era in Cancer Immunotherapy. Curr Pharm Biotechnol 19, 5-18. Minet, E., Arnould, T., Michel, G., Roland, I., Mottet, D., Raes, M., Remacle, J., and Michiels, C. (2000). ERK activation upon hypoxia: involvement in HIF-1 activation. FEBS Lett 468, 53-58. Mitroulis, I., Ruppova, K., Wang, B., Chen, L.S., Grzybek, M., Grinenko, T., Eugster, A., Troullinaki, M., Palladini, A., Kourtzelis, I., et al. (2018). Modulation of Myelopoiesis Progenitors Is an Integral Component of Trained Immunity. Cell 172, 147-161 e112. Mittrucker, H.W., Visekruna, A., and Huber, M. (2014). Heterogeneity in the differentiation and function of CD8(+) T cells. Arch Immunol Ther Exp (Warsz) 62, 449-458. Miyara, M., Yoshioka, Y., Kitoh, A., Shima, T., Wing, K., Niwa, A., Parizot, C., Taflin, C., Heike, T., Valeyre, D., et al. (2009). Functional delineation and differentiation dynamics of human CD4+ T cells expressing the FoxP3 transcription factor. Immunity 30, 899-911. Modesti, A., Masuelli, L., Modica, A., D'Orazi, G., Scarpa, S., Bosco, M.C., and Forni, G. (1993). Ultrastructural evidence of the mechanisms responsible for interleukin-4-activated rejection of a spontaneous murine adenocarcinoma. Int J Cancer 53, 988-993. Mohamed, A., Deng, X., Khuri, F.R., and Owonikoko, T.K. (2014). Altered glutamine metabolism and therapeutic opportunities for lung cancer. Clin Lung Cancer 15, 7-15. Molnar, E., Swamy, M., Holzer, M., Beck-Garcia, K., Worch, R., Thiele, C., Guigas, G., Boye, K., Luescher, I.F., Schwille, P., et al. (2012). Cholesterol and sphingomyelin drive ligand-independent T-cell antigen receptor nanoclustering. J Biol Chem 287, 42664-42674.

265
Morgan, R.A., Yang, J.C., Kitano, M., Dudley, M.E., Laurencot, C.M., and Rosenberg, S.A. (2010). Case report of a serious adverse event following the administration of T cells transduced with a chimeric antigen receptor recognizing ERBB2. Mol Ther 18, 843-851. Morikawa, H., Ohkura, N., Vandenbon, A., Itoh, M., Nagao-Sato, S., Kawaji, H., Lassmann, T., Carninci, P., Hayashizaki, Y., Forrest, A.R., et al. (2014). Differential roles of epigenetic changes and Foxp3 expression in regulatory T cell-specific transcriptional regulation. Proc Natl Acad Sci U S A 111, 5289-5294. Mosaad, Y.M. (2015). Clinical Role of Human Leukocyte Antigen in Health and Disease. Scand J Immunol 82, 283-306. Mueller, S.N., Gebhardt, T., Carbone, F.R., and Heath, W.R. (2013). Memory T cell subsets, migration patterns, and tissue residence. Annu Rev Immunol 31, 137-161. Muller, M., Padberg, W., Schindler, E., Sticher, J., Osmer, C., Friemann, S., and Hempelmann, G. (1998). Renocortical tissue oxygen pressure measurements in patients undergoing living donor kidney transplantation. Anesth Analg 87, 474-476. Munder, M., Schneider, H., Luckner, C., Giese, T., Langhans, C.D., Fuentes, J.M., Kropf, P., Mueller, I., Kolb, A., Modolell, M., et al. (2006). Suppression of T-cell functions by human granulocyte arginase. Blood 108, 1627-1634. Munn, D.H. (2012). Blocking IDO activity to enhance anti-tumor immunity. Front Biosci (Elite Ed) 4, 734-745. Munn, D.H., and Mellor, A.L. (2007). Indoleamine 2,3-dioxygenase and tumor-induced tolerance. J Clin Invest 117, 1147-1154. Munn, D.H., Shafizadeh, E., Attwood, J.T., Bondarev, I., Pashine, A., and Mellor, A.L. (1999). Inhibition of T cell proliferation by macrophage tryptophan catabolism. J Exp Med 189, 1363-1372. Munn, D.H., Sharma, M.D., Hou, D., Baban, B., Lee, J.R., Antonia, S.J., Messina, J.L., Chandler, P., Koni, P.A., and Mellor, A.L. (2004). Expression of indoleamine 2,3-dioxygenase by plasmacytoid dendritic cells in tumor-draining lymph nodes. J Clin Invest 114, 280-290. Murphy, K., Travers, P., and Walport, M. (2008). Janeway's Immunology (London: Garland Science), pp. 887. Muz, B., de la Puente, P., Azab, F., and Azab, A.K. (2015). The role of hypoxia in cancer progression, angiogenesis, metastasis, and resistance to therapy. Hypoxia (Auckland, NZ) 3, 83-92. Nair, V.S., Song, M.H., Ko, M., and Oh, K.I. (2016). DNA Demethylation of the Foxp3 Enhancer Is Maintained through Modulation of Ten-Eleven-Translocation and DNA Methyltransferases. Mol Cells 39, 888-897.

266
Nakajima, A., Hirose, S., Yagita, H., and Okumura, K. (1997). Roles of IL-4 and IL-12 in the development of lupus in NZB/W F1 mice. J Immunol 158, 1466-1472. Nakaya, M., Xiao, Y., Zhou, X., Chang, J.H., Chang, M., Cheng, X., Blonska, M., Lin, X., and Sun, S.C. (2014). Inflammatory T cell responses rely on amino acid transporter ASCT2 facilitation of glutamine uptake and mTORC1 kinase activation. Immunity 40, 692-705. Nandi, A., Estess, P., and Siegelman, M. (2004). Bimolecular complex between rolling and firm adhesion receptors required for cell arrest; CD44 association with VLA-4 in T cell extravasation. Immunity 20, 455-465. Navale, A.M., and Paranjape, A.N. (2016). Glucose transporters: physiological and pathological roles. Biophys Rev 8, 5-9. Naylor, K., Li, G., Vallejo, A.N., Lee, W.W., Koetz, K., Bryl, E., Witkowski, J., Fulbright, J., Weyand, C.M., and Goronzy, J.J. (2005). The influence of age on T cell generation and TCR diversity. J Immunol 174, 7446-7452. Newick, K., O'Brien, S., Moon, E., and Albelda, S.M. (2017). CAR T Cell Therapy for Solid Tumors. Annual Review of Medicine 68, 139-152. Newsholme, E.A., and Parry-Billings, M. (1990). Properties of glutamine release from muscle and its importance for the immune system. JPEN J Parenter Enteral Nutr 14, 63s-67s. Newton, R., Priyadharshini, B., and Turka, L.A. (2016). Immunometabolism of regulatory T cells. Nat Immunol 17, 618-625. Nicklin, P., Bergman, P., Zhang, B., Triantafellow, E., Wang, H., Nyfeler, B., Yang, H., Hild, M., Kung, C., Wilson, C., et al. (2009). Bidirectional Transport of Amino Acids Regulates mTOR and Autophagy. Cell 136, 521-534. Nilsang, S., Nehru, V., Plieva, F.M., Nandakumar, K.S., Rakshit, S.K., Holmdahl, R., Mattiasson, B., and Kumar, A. (2008). Three-dimensional culture for monoclonal antibody production by hybridoma cells immobilized in macroporous gel particles. Biotechnol Prog 24, 1122-1131. Noben-Trauth, N., Hu-Li, J., and Paul, W.E. (2002). IL-4 secreted from individual naive CD4+ T cells acts in an autocrine manner to induce Th2 differentiation. Eur J Immunol 32, 1428-1433. Noman, M.Z., Desantis, G., Janji, B., Hasmim, M., Karray, S., Dessen, P., Bronte, V., and Chouaib, S. (2014). PD-L1 is a novel direct target of HIF-1alpha, and its blockade under hypoxia enhanced MDSC-mediated T cell activation. J Exp Med 211, 781-790. O'Neill, L.A., Kishton, R.J., and Rathmell, J. (2016). A guide to immunometabolism for immunologists. Nat Rev Immunol 16, 553-565.

267
Obar, J.J., Molloy, M.J., Jellison, E.R., Stoklasek, T.A., Zhang, W., Usherwood, E.J., and Lefrancois, L. (2010). CD4+ T cell regulation of CD25 expression controls development of short-lived effector CD8+ T cells in primary and secondary responses. Proc Natl Acad Sci U S A 107, 193-198. Oburoglu, L., Tardito, S., Fritz, V., de Barros, S.C., Merida, P., Craveiro, M., Mamede, J., Cretenet, G., Mongellaz, C., An, X., et al. (2014). Glucose and glutamine metabolism regulate human hematopoietic stem cell lineage specification. Cell Stem Cell 15, 169-184. Ochoa, J.B., Strange, J., Kearney, P., Gellin, G., Endean, E., and Fitzpatrick, E. (2001). Effects of L-arginine on the proliferation of T lymphocyte subpopulations. JPEN J Parenter Enteral Nutr
25, 23-29. Ohkura, N., Kitagawa, Y., and Sakaguchi, S. (2013). Development and maintenance of regulatory T cells. Immunity 38, 414-423. Okada, T., and Cyster, J.G. (2007). CC chemokine receptor 7 contributes to Gi-dependent T cell motility in the lymph node. J Immunol 178, 2973-2978. Oldham, W.M., Clish, C.B., Yang, Y., and Loscalzo, J. (2015). Hypoxia-Mediated Increases in L-2-hydroxyglutarate Coordinate the Metabolic Response to Reductive Stress. Cell Metab 22, 291-303. Olsson, T. (1992). Cytokines in neuroinflammatory disease: role of myelin autoreactive T cell production of interferon-gamma. J Neuroimmunol 40, 211-218. Oppmann, B., Lesley, R., Blom, B., Timans, J.C., Xu, Y., Hunte, B., Vega, F., Yu, N., Wang, J., Singh, K., et al. (2000). Novel p19 protein engages IL-12p40 to form a cytokine, IL-23, with biological activities similar as well as distinct from IL-12. Immunity 13, 715-725. Ormandy, L.A., Hillemann, T., Wedemeyer, H., Manns, M.P., Greten, T.F., and Korangy, F. (2005). Increased populations of regulatory T cells in peripheral blood of patients with hepatocellular carcinoma. Cancer Res 65, 2457-2464. Osellame, L.D., Blacker, T.S., and Duchen, M.R. (2012). Cellular and molecular mechanisms of mitochondrial function. Best Pract Res Clin Endocrinol Metab 26, 711-723. Ouyang, W., Ranganath, S.H., Weindel, K., Bhattacharya, D., Murphy, T.L., Sha, W.C., and Murphy, K.M. (1998). Inhibition of Th1 Development Mediated by GATA-3 through an IL-4-Independent Mechanism. Immunity 9, 745-755. O’Connor, R.S., Guo, L., Ghassemi, S., Snyder, N.W., Worth, A.J., Weng, L., Kam, Y., Philipson, B., Trefely, S., Nunez-Cruz, S., et al. (2018). The CPT1a inhibitor, etomoxir induces severe oxidative stress at commonly used concentrations. Scientific Reports 8, 6289. Pacella, I., Procaccini, C., Focaccetti, C., Miacci, S., Timperi, E., Faicchia, D., Severa, M., Rizzo, F., Coccia, E.M., Bonacina, F., et al. (2018). Fatty acid metabolism complements glycolysis in

268
the selective regulatory T cell expansion during tumor growth. Proc Natl Acad Sci U S A 115, E6546-e6555. Pai, S.Y., Truitt, M.L., and Ho, I.C. (2004). GATA-3 deficiency abrogates the development and maintenance of T helper type 2 cells. Proc Natl Acad Sci U S A 101, 1993-1998. Palmer, C.S., Henstridge, D.C., Yu, D., Singh, A., Balderson, B., Duette, G., Cherry, C.L., Anzinger, J.J., Ostrowski, M., and Crowe, S.M. (2016a). Emerging Role and Characterization of Immunometabolism: Relevance to HIV Pathogenesis, Serious Non-AIDS Events, and a Cure. The Journal of Immunology 196, 4437. Palmer, C.S., Hussain, T., Duette, G., Weller, T.J., Ostrowski, M., Sada-Ovalle, I., and Crowe, S.M. (2016b). Regulators of Glucose Metabolism in CD4(+) and CD8(+) T Cells. Int Rev Immunol 35, 477-488. Palmieri, F. (2004). The mitochondrial transporter family (SLC25): physiological and pathological implications. Pflugers Arch 447, 689-709. Pan, M., Reid, M.A., Lowman, X.H., Kulkarni, R.P., Tran, T.Q., Liu, X., Yang, Y., Hernandez-Davies, J.E., Rosales, K.K., Li, H., et al. (2016). Regional glutamine deficiency in tumours promotes dedifferentiation through inhibition of histone demethylation. Nat Cell Biol 18, 1090-1101. Pan, Y., Mansfield, K.D., Bertozzi, C.C., Rudenko, V., Chan, D.A., Giaccia, A.J., and Simon, M.C. (2007). Multiple factors affecting cellular redox status and energy metabolism modulate hypoxia-inducible factor prolyl hydroxylase activity in vivo and in vitro. Mol Cell Biol 27, 912-925. Pandiyan, P., Zheng, L., Ishihara, S., Reed, J., and Lenardo, M.J. (2007). CD4+CD25+Foxp3+ regulatory T cells induce cytokine deprivation-mediated apoptosis of effector CD4+ T cells. Nat Immunol 8, 1353-1362. Parham, C., Chirica, M., Timans, J., Vaisberg, E., Travis, M., Cheung, J., Pflanz, S., Zhang, R., Singh, K.P., Vega, F., et al. (2002). A receptor for the heterodimeric cytokine IL-23 is composed of IL-12Rbeta1 and a novel cytokine receptor subunit, IL-23R. J Immunol 168, 5699-5708. Park, H., Li, Z., Yang, X.O., Chang, S.H., Nurieva, R., Wang, Y.H., Wang, Y., Hood, L., Zhu, Z., Tian, Q., et al. (2005). A distinct lineage of CD4 T cells regulates tissue inflammation by producing interleukin 17. Nat Immunol 6, 1133-1141. Parry-Billings, M., Calder, P.C., Newsholme, E.A., and Evans, J. (1990). Does glutamine contribute to immunosuppression after major burns? The Lancet 336, 523-525. Pearce, E.L., Walsh, M.C., Cejas, P.J., Harms, G.M., Shen, H., Wang, L.S., Jones, R.G., and Choi, Y. (2009). Enhancing CD8 T-cell memory by modulating fatty acid metabolism. Nature 460, 103-107.

269
Pegram, H.J., Lee, J.C., Hayman, E.G., Imperato, G.H., Tedder, T.F., Sadelain, M., and Brentjens, R.J. (2012). Tumor-targeted T cells modified to secrete IL-12 eradicate systemic tumors without need for prior conditioning. Blood 119, 4133-4141. Peng, M., Yin, N., Chhangawala, S., Xu, K., Leslie, C.S., and Li, M.O. (2016). Aerobic glycolysis promotes T helper 1 cell differentiation through an epigenetic mechanism. Science 354, 481-484. Pericle, F., Giovarelli, M., Colombo, M.P., Ferrari, G., Musiani, P., Modesti, A., Cavallo, F., Di Pierro, F., Novelli, F., and Forni, G. (1994). An efficient Th2-type memory follows CD8+ lymphocyte-driven and eosinophil-mediated rejection of a spontaneous mouse mammary adenocarcinoma engineered to release IL-4. J Immunol 153, 5659-5673. Perret, R., and Ronchese, F. (2008). Effector CD8+ T cells activated in vitro confer immediate and long-term tumor protection in vivo. Eur J Immunol 38, 2886-2895. Pipkin, M.E., Sacks, J.A., Cruz-Guilloty, F., Lichtenheld, M.G., Bevan, M.J., and Rao, A. (2010). Interleukin-2 and inflammation induce distinct transcriptional programs that promote the differentiation of effector cytolytic T cells. Immunity 32, 79-90. Polansky, J.K., Kretschmer, K., Freyer, J., Floess, S., Garbe, A., Baron, U., Olek, S., Hamann, A., von Boehmer, H., and Huehn, J. (2008). DNA methylation controls Foxp3 gene expression. Eur J Immunol 38, 1654-1663. Pollard, P.J., Briere, J.J., Alam, N.A., Barwell, J., Barclay, E., Wortham, N.C., Hunt, T., Mitchell, M., Olpin, S., Moat, S.J., et al. (2005). Accumulation of Krebs cycle intermediates and over-expression of HIF1alpha in tumours which result from germline FH and SDH mutations. Hum Mol Genet 14, 2231-2239. Pollizzi, K.N., Patel, C.H., Sun, I.H., Oh, M.H., Waickman, A.T., Wen, J., Delgoffe, G.M., and Powell, J.D. (2015). mTORC1 and mTORC2 selectively regulate CD8(+) T cell differentiation. J Clin Invest 125, 2090-2108. Pollizzi, K.N., and Powell, J.D. (2015). Regulation of T cells by mTOR: the known knowns and the known unknowns. Trends Immunol 36, 13-20. Porter, D.L., Hwang, W.T., Frey, N.V., Lacey, S.F., Shaw, P.A., Loren, A.W., Bagg, A., Marcucci, K.T., Shen, A., Gonzalez, V., et al. (2015). Chimeric antigen receptor T cells persist and induce sustained remissions in relapsed refractory chronic lymphocytic leukemia. Sci Transl Med 7, 303ra139. Poulin, J.F., Viswanathan, M.N., Harris, J.M., Komanduri, K.V., Wieder, E., Ringuette, N., Jenkins, M., McCune, J.M., and Sekaly, R.P. (1999). Direct evidence for thymic function in adult humans. J Exp Med 190, 479-486. Powell, B.R., Buist, N.R., and Stenzel, P. (1982). An X-linked syndrome of diarrhea, polyendocrinopathy, and fatal infection in infancy. J Pediatr 100, 731-737.

270
Powell, D.J., Jr., Dudley, M.E., Robbins, P.F., and Rosenberg, S.A. (2005). Transition of late-stage effector T cells to CD27+ CD28+ tumor-reactive effector memory T cells in humans after adoptive cell transfer therapy. Blood 105, 241-250. Powell, J.D., Lerner, C.G., and Schwartz, R.H. (1999). Inhibition of cell cycle progression by rapamycin induces T cell clonal anergy even in the presence of costimulation. J Immunol 162, 2775-2784. Powell, J.D., Ragheb, J.A., Kitagawa-Sakakida, S., and Schwartz, R.H. (1998). Molecular regulation of interleukin-2 expression by CD28 co-stimulation and anergy. Immunol Rev 165, 287-300. Procaccini, C., Carbone, F., Di Silvestre, D., Brambilla, F., De Rosa, V., Galgani, M., Faicchia, D., Marone, G., Tramontano, D., Corona, M., et al. (2016). The Proteomic Landscape of Human Ex Vivo Regulatory and Conventional T Cells Reveals Specific Metabolic Requirements. Immunity 44, 406-421. Procaccini, C., De Rosa, V., Galgani, M., Abanni, L., Cali, G., Porcellini, A., Carbone, F., Fontana, S., Horvath, T.L., La Cava, A., et al. (2010). An oscillatory switch in mTOR kinase activity sets regulatory T cell responsiveness. Immunity 33, 929-941. Pule, M.A., Straathof, K.C., Dotti, G., Heslop, H.E., Rooney, C.M., and Brenner, M.K. (2005). A chimeric T cell antigen receptor that augments cytokine release and supports clonal expansion of primary human T cells. Mol Ther 12, 933-941. Pulendran, B., Smith, J.L., Caspary, G., Brasel, K., Pettit, D., Maraskovsky, E., and Maliszewski, C.R. (1999). Distinct dendritic cell subsets differentially regulate the class of immune response in vivo. Proc Natl Acad Sci U S A 96, 1036-1041. Puleston, D.J., Villa, M., and Pearce, E.L. (2017). Ancillary Activity: Beyond Core Metabolism in Immune Cells. Cell Metab 26, 131-141. Punnonen, J., Aversa, G., Cocks, B.G., McKenzie, A.N., Menon, S., Zurawski, G., de Waal Malefyt, R., and de Vries, J.E. (1993). Interleukin 13 induces interleukin 4-independent IgG4 and IgE synthesis and CD23 expression by human B cells. Proc Natl Acad Sci U S A 90, 3730-3734. Quail, D.F., and Joyce, J.A. (2013). Microenvironmental regulation of tumor progression and metastasis. Nature Medicine 19, 1423. Qureshi, O.S., Zheng, Y., Nakamura, K., Attridge, K., Manzotti, C., Schmidt, E.M., Baker, J., Jeffery, L.E., Kaur, S., Briggs, Z., et al. (2011). Trans-endocytosis of CD80 and CD86: a molecular basis for the cell-extrinsic function of CTLA-4. Science 332, 600-603. Raczkowski, F., Ritter, J., Heesch, K., Schumacher, V., Guralnik, A., Hocker, L., Raifer, H., Klein, M., Bopp, T., Harb, H., et al. (2013). The transcription factor Interferon Regulatory Factor 4 is

271
required for the generation of protective effector CD8+ T cells. Proc Natl Acad Sci U S A 110, 15019-15024. Radzki, R.P., Bienko, M., and Pierzynowski, S.G. (2009). Effect of dietary alpha-ketoglutarate on blood lipid profile during hypercholesterolaemia in rats. Scand J Clin Lab Invest 69, 175-180. Ramakrishnan, R., Tyurin, V.A., Veglia, F., Condamine, T., Amoscato, A., Mohammadyani, D., Johnson, J.J., Zhang, L.M., Klein-Seetharaman, J., Celis, E., et al. (2014). Oxidized lipids block antigen cross-presentation by dendritic cells in cancer. J Immunol 192, 2920-2931. Ranger, A.M., Das, M.P., Kuchroo, V.K., and Glimcher, L.H. (1996). B7-2 (CD86) is essential for the development of IL-4-producing T cells. Int Immunol 8, 1549-1560. Raphael, I., Nalawade, S., Eagar, T.N., and Forsthuber, T.G. (2015). T cell subsets and their signature cytokines in autoimmune and inflammatory diseases. Cytokine 74, 5-17. Rathmell, J.C., Farkash, E.A., Gao, W., and Thompson, C.B. (2001). IL-7 enhances the survival and maintains the size of naive T cells. J Immunol 167, 6869-6876. Rathmell, J.C., Vander Heiden, M.G., Harris, M.H., Frauwirth, K.A., and Thompson, C.B. (2000). In the absence of extrinsic signals, nutrient utilization by lymphocytes is insufficient to maintain either cell size or viability. Mol Cell 6, 683-692. Rattigan, Y.I., Patel, B.B., Ackerstaff, E., Sukenick, G., Koutcher, J.A., Glod, J.W., and Banerjee, D. (2012). Lactate is a mediator of metabolic cooperation between stromal carcinoma associated fibroblasts and glycolytic tumor cells in the tumor microenvironment. Exp Cell Res
318, 326-335. Raud, B., Roy, D.G., Divakaruni, A.S., Tarasenko, T.N., Franke, R., Ma, E.H., Samborska, B., Hsieh, W.Y., Wong, A.H., Stüve, P., et al. (2018). Etomoxir Actions on Regulatory and Memory T Cells Are Independent of Cpt1a-Mediated Fatty Acid Oxidation. Cell Metabolism 28, 504-515.e507. Read, S., Malmstrom, V., and Powrie, F. (2000). Cytotoxic T lymphocyte-associated antigen 4 plays an essential role in the function of CD25(+)CD4(+) regulatory cells that control intestinal inflammation. J Exp Med 192, 295-302. Reinhardt, R.L., Khoruts, A., Merica, R., Zell, T., and Jenkins, M.K. (2001). Visualizing the generation of memory CD4 T cells in the whole body. Nature 410, 101-105. Reiser, J., and Banerjee, A. (2016). Effector, Memory, and Dysfunctional CD8(+) T Cell Fates in the Antitumor Immune Response. J Immunol Res 2016, 8941260. Ren, W., Liu, G., Yin, J., Tan, B., Wu, G., Bazer, F.W., Peng, Y., and Yin, Y. (2017). Amino-acid transporters in T-cell activation and differentiation. Cell Death Dis 8, e2655.

272
Rendina, A.R., Pietrak, B., Smallwood, A., Zhao, H., Qi, H., Quinn, C., Adams, N.D., Concha, N., Duraiswami, C., Thrall, S.H., et al. (2013). Mutant IDH1 enhances the production of 2-hydroxyglutarate due to its kinetic mechanism. Biochemistry 52, 4563-4577. Renno, T., Zeine, R., Girard, J.M., Gillani, S., Dodelet, V., and Owens, T. (1994). Selective enrichment of Th1 CD45RBlow CD4+ T cells in autoimmune infiltrates in experimental allergic encephalomyelitis. Int Immunol 6, 347-354. Restifo, N.P., and Gattinoni, L. (2013). Lineage relationship of effector and memory T cells. Current Opinion in Immunology 25, 556-563. Rissoan, M.C., Soumelis, V., Kadowaki, N., Grouard, G., Briere, F., de Waal Malefyt, R., and Liu, Y.J. (1999). Reciprocal control of T helper cell and dendritic cell differentiation. Science 283, 1183-1186. Robinson, D.S., Hamid, Q., Ying, S., Tsicopoulos, A., Barkans, J., Bentley, A.M., Corrigan, C., Durham, S.R., and Kay, A.B. (1992). Predominant TH2-like bronchoalveolar T-lymphocyte population in atopic asthma. N Engl J Med 326, 298-304. Rochman, Y., Spolski, R., and Leonard, W.J. (2009). New insights into the regulation of T cells by gamma(c) family cytokines. Nat Rev Immunol 9, 480-490. Rocken, M., Racke, M., and Shevach, E.M. (1996). IL-4-induced immune deviation as antigen-specific therapy for inflammatory autoimmune disease. Immunol Today 17, 225-231. Rodriguez, P.C., Quiceno, D.G., and Ochoa, A.C. (2007). L-arginine availability regulates T-lymphocyte cell-cycle progression. Blood 109, 1568-1573. Rodriguez, P.C., Quiceno, D.G., Zabaleta, J., Ortiz, B., Zea, A.H., Piazuelo, M.B., Delgado, A., Correa, P., Brayer, J., Sotomayor, E.M., et al. (2004). Arginase I production in the tumor microenvironment by mature myeloid cells inhibits T-cell receptor expression and antigen-specific T-cell responses. Cancer Res 64, 5839-5849. Rofstad, E.K., Galappathi, K., and Mathiesen, B.S. (2014). Tumor interstitial fluid pressure-a link between tumor hypoxia, microvascular density, and lymph node metastasis. Neoplasia
16, 586-594. Rolf, J., Zarrouk, M., Finlay, D.K., Foretz, M., Viollet, B., and Cantrell, D.A. (2013). AMPKalpha1: a glucose sensor that controls CD8 T-cell memory. Eur J Immunol 43, 889-896. Roman, J., Rangasamy, T., Guo, J., Sugunan, S., Meednu, N., Packirisamy, G., Shimoda, L.A., Golding, A., Semenza, G., and Georas, S.N. (2010). T-cell activation under hypoxic conditions enhances IFN-gamma secretion. Am J Respir Cell Mol Biol 42, 123-128. Romero-Garcia, S., Moreno-Altamirano, M.M., Prado-Garcia, H., and Sanchez-Garcia, F.J. (2016). Lactate Contribution to the Tumor Microenvironment: Mechanisms, Effects on Immune Cells and Therapeutic Relevance. Front Immunol 7, 52.

273
Rosenberg, S.A., and Dudley, M.E. (2004). Cancer regression in patients with metastatic melanoma after the transfer of autologous antitumor lymphocytes. Proc Natl Acad Sci U S A
101 Suppl 2, 14639-14645. Rosenberg, S.A., Spiess, P., and Lafreniere, R. (1986). A new approach to the adoptive immunotherapy of cancer with tumor-infiltrating lymphocytes. Science 233, 1318-1321. Rosenberg, S.A., Yang, J.C., Sherry, R.M., Kammula, U.S., Hughes, M.S., Phan, G.Q., Citrin, D.E., Restifo, N.P., Robbins, P.F., Wunderlich, J.R., et al. (2011). Durable complete responses in heavily pretreated patients with metastatic melanoma using T-cell transfer immunotherapy. Clin Cancer Res 17, 4550-4557. Rossetti, R.G., Seiler, C.M., DeLuca, P., Laposata, M., and Zurier, R.B. (1997). Oral administration of unsaturated fatty acids: effects on human peripheral blood T lymphocyte proliferation. J Leukoc Biol 62, 438-443. Roth, E. (2008). Nonnutritive effects of glutamine. J Nutr 138, 2025s-2031s. Roth, E., Karner, J., and Ollenschlager, G. (1990). Glutamine: an anabolic effector? JPEN J Parenter Enteral Nutr 14, 130s-136s. Rotondi, M., Lazzeri, E., Romagnani, P., and Serio, M. (2003). Role for interferon-gamma inducible chemokines in endocrine autoimmunity: an expanding field. J Endocrinol Invest 26, 177-180. Rounbehler, R.J., Li, W., Hall, M.A., Yang, C., Fallahi, M., and Cleveland, J.L. (2009). Targeting Ornithine Decarboxylase Impairs Development of <em>MYCN</em>-Amplified Neuroblastoma. Cancer Research 69, 547. Ruan, G.X., and Kazlauskas, A. (2013). Lactate engages receptor tyrosine kinases Axl, Tie2, and vascular endothelial growth factor receptor 2 to activate phosphoinositide 3-kinase/Akt and promote angiogenesis. J Biol Chem 288, 21161-21172. Ruan, Q., Kameswaran, V., Tone, Y., Li, L., Liou, H.C., Greene, M.I., Tone, M., and Chen, Y.H. (2009). Development of Foxp3(+) regulatory t cells is driven by the c-Rel enhanceosome. Immunity 31, 932-940. Rudd, C.E., Taylor, A., and Schneider, H. (2009). CD28 and CTLA-4 coreceptor expression and signal transduction. Immunol Rev 229, 12-26. Rutishauser, R.L., Martins, G.A., Kalachikov, S., Chandele, A., Parish, I.A., Meffre, E., Jacob, J., Calame, K., and Kaech, S.M. (2009). Transcriptional repressor Blimp-1 promotes CD8(+) T cell terminal differentiation and represses the acquisition of central memory T cell properties. Immunity 31, 296-308. Rutter, J., Winge, D.R., and Schiffman, J.D. (2010). Succinate dehydrogenase - Assembly, regulation and role in human disease. Mitochondrion 10, 393-401.

274
Rysman, E., Brusselmans, K., Scheys, K., Timmermans, L., Derua, R., Munck, S., Van Veldhoven, P.P., Waltregny, D., Daniëls, V.W., Machiels, J., et al. (2010). <em>De novo</em> Lipogenesis Protects Cancer Cells from Free Radicals and Chemotherapeutics by Promoting Membrane Lipid Saturation. Cancer Research 70, 8117. Sadelain, M. (2009). T-cell engineering for cancer immunotherapy. Cancer J 15, 451-455. Sadlack, B., Lohler, J., Schorle, H., Klebb, G., Haber, H., Sickel, E., Noelle, R.J., and Horak, I. (1995). Generalized autoimmune disease in interleukin-2-deficient mice is triggered by an uncontrolled activation and proliferation of CD4+ T cells. Eur J Immunol 25, 3053-3059. Saenz, S.A., Taylor, B.C., and Artis, D. (2008). Welcome to the neighborhood: epithelial cell-derived cytokines license innate and adaptive immune responses at mucosal sites. Immunol Rev 226, 172-190. Sakaguchi, S., Sakaguchi, N., Asano, M., Itoh, M., and Toda, M. (1995). Immunologic self-tolerance maintained by activated T cells expressing IL-2 receptor alpha-chains (CD25). Breakdown of a single mechanism of self-tolerance causes various autoimmune diseases. J Immunol 155, 1151-1164. Sallusto, F., Geginat, J., and Lanzavecchia, A. (2004). Central Memory and Effector Memory T Cell Subsets: Function, Generation, and Maintenance. Annual Review of Immunology 22, 745-763. Sallusto, F., Lenig, D., Forster, R., Lipp, M., and Lanzavecchia, A. (1999). Two subsets of memory T lymphocytes with distinct homing potentials and effector functions. Nature 401, 708-712. Samal, K., Zhao, P., Kendzicky, A., Yco, L.P., McClung, H., Gerner, E., Burns, M., Bachmann, A.S., and Sholler, G. (2013). AMXT-1501, a novel polyamine transport inhibitor, synergizes with DFMO in inhibiting neuroblastoma cell proliferation by targeting both ornithine decarboxylase and polyamine transport. Int J Cancer 133, 1323-1333. Sambi, M., Bagheri, L., and Szewczuk, M.R. (2019). Current Challenges in Cancer Immunotherapy: Multimodal Approaches to Improve Efficacy and Patient Response Rates. J Oncol 2019, 4508794. Sampaio, J.L., Gerl, M.J., Klose, C., Ejsing, C.S., Beug, H., Simons, K., and Shevchenko, A. (2011). Membrane lipidome of an epithelial cell line. Proc Natl Acad Sci U S A 108, 1903-1907. Samudio, I., Harmancey, R., Fiegl, M., Kantarjian, H., Konopleva, M., Korchin, B., Kaluarachchi, K., Bornmann, W., Duvvuri, S., Taegtmeyer, H., et al. (2010). Pharmacologic inhibition of fatty acid oxidation sensitizes human leukemia cells to apoptosis induction. J Clin Invest 120, 142-156. Sanchez, A., Tripathy, D., Yin, X., Desobry, K., Martinez, J., Riley, J., Gay, D., Luo, J., and Grammas, P. (2012). p38 MAPK: a mediator of hypoxia-induced cerebrovascular inflammation. J Alzheimers Dis 32, 587-597.

275
Sanders, M.E., Makgoba, M.W., Sharrow, S.O., Stephany, D., Springer, T.A., Young, H.A., and Shaw, S. (1988). Human memory T lymphocytes express increased levels of three cell adhesion molecules (LFA-3, CD2, and LFA-1) and three other molecules (UCHL1, CDw29, and Pgp-1) and have enhanced IFN-gamma production. J Immunol 140, 1401-1407. Santori, F.R., Huang, P., van de Pavert, S.A., Douglass, E.F., Jr., Leaver, D.J., Haubrich, B.A., Keber, R., Lorbek, G., Konijn, T., Rosales, B.N., et al. (2015). Identification of natural RORgamma ligands that regulate the development of lymphoid cells. Cell Metab 21, 286-298. Sauer, S., Bruno, L., Hertweck, A., Finlay, D., Leleu, M., Spivakov, M., Knight, Z.A., Cobb, B.S., Cantrell, D., O'Connor, E., et al. (2008). T cell receptor signaling controls Foxp3 expression via PI3K, Akt, and mTOR. Proc Natl Acad Sci U S A 105, 7797-7802. Savoldo, B., and Dotti, G. (2013). Chimeric antigen receptors (CARs) from bench-to-bedside. Immunology Letters 155, 40-42. Savoldo, B., Ramos, C.A., Liu, E., Mims, M.P., Keating, M.J., Carrum, G., Kamble, R.T., Bollard, C.M., Gee, A.P., Mei, Z., et al. (2011). CD28 costimulation improves expansion and persistence of chimeric antigen receptor-modified T cells in lymphoma patients. J Clin Invest 121, 1822-1826. Sayour, E.J., McLendon, P., McLendon, R., De Leon, G., Reynolds, R., Kresak, J., Sampson, J.H., and Mitchell, D.A. (2015). Increased proportion of FoxP3+ regulatory T cells in tumor infiltrating lymphocytes is associated with tumor recurrence and reduced survival in patients with glioblastoma. Cancer Immunol Immunother 64, 419-427. Schenkel, J.M., and Masopust, D. (2014). Tissue-resident memory T cells. Immunity 41, 886-897. Schmitz, J., Owyang, A., Oldham, E., Song, Y., Murphy, E., McClanahan, T.K., Zurawski, G., Moshrefi, M., Qin, J., Li, X., et al. (2005). IL-33, an interleukin-1-like cytokine that signals via the IL-1 receptor-related protein ST2 and induces T helper type 2-associated cytokines. Immunity 23, 479-490. Schreiber, R.D., Old, L.J., and Smyth, M.J. (2011). Cancer immunoediting: integrating immunity's roles in cancer suppression and promotion. Science 331, 1565-1570. Schroder, K., Hertzog, P.J., Ravasi, T., and Hume, D.A. (2004). Interferon-gamma: an overview of signals, mechanisms and functions. J Leukoc Biol 75, 163-189. Scott, I.G., Poso, H., Akerman, K.E., and Andersson, L.C. (1985). Rapid activation of ornithine decarboxylase by mitogenic (but not by nonmitogenic) ligands in human T lymphocytes. Eur J Immunol 15, 783-787. Seidel, J.A., Otsuka, A., and Kabashima, K. (2018). Anti-PD-1 and Anti-CTLA-4 Therapies in Cancer: Mechanisms of Action, Efficacy, and Limitations. Front Oncol 8, 86.

276
Sekiya, T., Nakatsukasa, H., Lu, Q., and Yoshimura, A. (2016). Roles of transcription factors and epigenetic modifications in differentiation and maintenance of regulatory T cells. Microbes Infect 18, 378-386. Seliger, B., Maeurer, M.J., and Ferrone, S. (2000). Antigen-processing machinery breakdown and tumor growth. Immunol Today 21, 455-464. Semenza, G.L. (2012). Hypoxia-inducible factors: mediators of cancer progression and targets for cancer therapy. Trends Pharmacol Sci 33, 207-214. Semenza, G.L. (2013). HIF-1 mediates metabolic responses to intratumoral hypoxia and oncogenic mutations. J Clin Invest 123, 3664-3671. Semenza, G.L., Roth, P.H., Fang, H.M., and Wang, G.L. (1994). Transcriptional regulation of genes encoding glycolytic enzymes by hypoxia-inducible factor 1. J Biol Chem 269, 23757-23763. Semenza, G.L., and Wang, G.L. (1992). A nuclear factor induced by hypoxia via de novo protein synthesis binds to the human erythropoietin gene enhancer at a site required for transcriptional activation. Mol Cell Biol 12, 5447-5454. Semmling, V., Lukacs-Kornek, V., Thaiss, C.A., Quast, T., Hochheiser, K., Panzer, U., Rossjohn, J., Perlmutter, P., Cao, J., Godfrey, D.I., et al. (2010). Alternative cross-priming through CCL17-CCR4-mediated attraction of CTLs toward NKT cell-licensed DCs. Nat Immunol 11, 313-320. Sena, L.A., Li, S., Jairaman, A., Prakriya, M., Ezponda, T., Hildeman, D.A., Wang, C.R., Schumacker, P.T., Licht, J.D., Perlman, H., et al. (2013). Mitochondria are required for antigen-specific T cell activation through reactive oxygen species signaling. Immunity 38, 225-236. Serfling, E., Avots, A., and Neumann, M. (1995). The architecture of the interleukin-2 promoter: a reflection of T lymphocyte activation. Biochim Biophys Acta 1263, 181-200. Sezgin, E., Schneider, F., Galiani, S., Urbancic, I., Waithe, D., Lagerholm, B.C., and Eggeling, C. (2019). Measuring nanoscale diffusion dynamics in cellular membranes with super-resolution STED-FCS. Nature protocols 14, 1054-1083. Shankaran, V., Ikeda, H., Bruce, A.T., White, J.M., Swanson, P.E., Old, L.J., and Schreiber, R.D. (2001). IFNgamma and lymphocytes prevent primary tumour development and shape tumour immunogenicity. Nature 410, 1107-1111. Sharma, M.D., Baban, B., Chandler, P., Hou, D.Y., Singh, N., Yagita, H., Azuma, M., Blazar, B.R., Mellor, A.L., and Munn, D.H. (2007). Plasmacytoid dendritic cells from mouse tumor-draining lymph nodes directly activate mature Tregs via indoleamine 2,3-dioxygenase. J Clin Invest 117, 2570-2582. Shaw, R.J., Kosmatka, M., Bardeesy, N., Hurley, R.L., Witters, L.A., DePinho, R.A., and Cantley, L.C. (2004). The tumor suppressor LKB1 kinase directly activates AMP-activated kinase and

277
regulates apoptosis in response to energy stress. Proceedings of the National Academy of Sciences of the United States of America 101, 3329-3335. Shehade, H., Acolty, V., Moser, M., and Oldenhove, G. (2015). Cutting Edge: Hypoxia-Inducible Factor 1 Negatively Regulates Th1 Function. J Immunol 195, 1372-1376. Shi, L.Z., Wang, R., Huang, G., Vogel, P., Neale, G., Green, D.R., and Chi, H. (2011). HIF1alpha-dependent glycolytic pathway orchestrates a metabolic checkpoint for the differentiation of TH17 and Treg cells. J Exp Med 208, 1367-1376. Shiina, T., Blancher, A., Inoko, H., and Kulski, J.K. (2017). Comparative genomics of the human, macaque and mouse major histocompatibility complex. Immunology 150, 127-138. Shimano, H., and Sato, R. (2017). SREBP-regulated lipid metabolism: convergent physiology — divergent pathophysiology. Nature Reviews Endocrinology 13, 710. Sholler, G.L.S., Ferguson, W., Bergendahl, G., Bond, J.P., Neville, K., Eslin, D., Brown, V., Roberts, W., Wada, R.K., Oesterheld, J., et al. (2018). Maintenance DFMO Increases Survival in High Risk Neuroblastoma. Scientific Reports 8, 14445. Simon, S., and Labarriere, N. (2017). PD-1 expression on tumor-specific T cells: Friend or foe for immunotherapy? Oncoimmunology 7, e1364828. Sinclair, L.V., Rolf, J., Emslie, E., Shi, Y.B., Taylor, P.M., and Cantrell, D.A. (2013). Control of amino-acid transport by antigen receptors coordinates the metabolic reprogramming essential for T cell differentiation. Nat Immunol 14, 500-508. Skurkovich, S., and Skurkovich, B. (2005). Anticytokine therapy, especially anti-interferon-gamma, as a pathogenetic treatment in TH-1 autoimmune diseases. Ann N Y Acad Sci 1051, 684-700. Sloan-Lancaster, J., Steinberg, T.H., and Allen, P.M. (1997). Selective loss of the calcium ion signaling pathway in T cells maturing toward a T helper 2 phenotype. J Immunol 159, 1160-1168. Smigiel, K.S., Richards, E., Srivastava, S., Thomas, K.R., Dudda, J.C., Klonowski, K.D., and Campbell, D.J. (2014). CCR7 provides localized access to IL-2 and defines homeostatically distinct regulatory T cell subsets. J Exp Med 211, 121-136. Smith, S.H., Brown, M.H., Rowe, D., Callard, R.E., and Beverley, P.C. (1986). Functional subsets of human helper-inducer cells defined by a new monoclonal antibody, UCHL1. Immunology
58, 63-70. Soares, K.C., Rucki, A.A., Kim, V., Foley, K., Solt, S., Wolfgang, C.L., Jaffee, E.M., and Zheng, L. (2015). TGF-beta blockade depletes T regulatory cells from metastatic pancreatic tumors in a vaccine dependent manner. Oncotarget 6, 43005-43015.

278
Sokol, C.L., Barton, G.M., Farr, A.G., and Medzhitov, R. (2008). A mechanism for the initiation of allergen-induced T helper type 2 responses. Nat Immunol 9, 310-318. Sokol, C.L., Chu, N.Q., Yu, S., Nish, S.A., Laufer, T.M., and Medzhitov, R. (2009). Basophils function as antigen-presenting cells for an allergen-induced T helper type 2 response. Nat Immunol 10, 713-720. Someya, K., Nakatsukasa, H., Ito, M., Kondo, T., Tateda, K.-I., Akanuma, T., Koya, I., Sanosaka, T., Kohyama, J., Tsukada, Y.-I., et al. (2017). Improvement of Foxp3 stability through CNS2 demethylation by TET enzyme induction and activation. International immunology 29, 365-375. Sonoda, J., Pei, L., and Evans, R.M. (2008). Nuclear receptors: decoding metabolic disease. FEBS Lett 582, 2-9. Sonveaux, P., Vegran, F., Schroeder, T., Wergin, M.C., Verrax, J., Rabbani, Z.N., De Saedeleer, C.J., Kennedy, K.M., Diepart, C., Jordan, B.F., et al. (2008). Targeting lactate-fueled respiration selectively kills hypoxic tumor cells in mice. J Clin Invest 118, 3930-3942. Soroosh, P., Wu, J., Xue, X., Song, J., Sutton, S.W., Sablad, M., Yu, J., Nelen, M.I., Liu, X., Castro, G., et al. (2014). Oxysterols are agonist ligands of RORgammat and drive Th17 cell differentiation. Proc Natl Acad Sci U S A 111, 12163-12168. Souba, W.W. (1993). Glutamine and cancer. Ann Surg 218, 715-728. Sprent, J. (1995). Antigen-presenting cells. Professionals and amateurs. Curr Biol 5, 1095-1097. Sprent, J., and Surh, C.D. (2012). Interleukin 7, maestro of the immune system. Semin Immunol 24, 149-150. Steinbach, K., Vincenti, I., and Merkler, D. (2018). Resident-Memory T Cells in Tissue-Restricted Immune Responses: For Better or Worse? Frontiers in Immunology 9, 2827. Steinman, R.M., and Cohn, Z.A. (1973). Identification of a novel cell type in peripheral lymphoid organs of mice. I. Morphology, quantitation, tissue distribution. J Exp Med 137, 1142-1162. Steinman, R.M., and Witmer, M.D. (1978). Lymphoid dendritic cells are potent stimulators of the primary mixed leukocyte reaction in mice. Proc Natl Acad Sci U S A 75, 5132-5136. Stulnig, T., Maczek, C., Bock, G., Majdic, O., and Wick, G. (1995). Reference intervals for human peripheral blood lymphocyte subpopulations from 'healthy' young and aged subjects. Int Arch Allergy Immunol 108, 205-210. Stulnig, T.M., Berger, M., Sigmund, T., Raederstorff, D., Stockinger, H., and Waldhausl, W. (1998). Polyunsaturated fatty acids inhibit T cell signal transduction by modification of detergent-insoluble membrane domains. J Cell Biol 143, 637-644.

279
Sugimoto, N., Oida, T., Hirota, K., Nakamura, K., Nomura, T., Uchiyama, T., and Sakaguchi, S. (2006). Foxp3-dependent and -independent molecules specific for CD25+CD4+ natural regulatory T cells revealed by DNA microarray analysis. Int Immunol 18, 1197-1209. Sukumar, M., Liu, J., Ji, Y., Subramanian, M., Crompton, J.G., Yu, Z., Roychoudhuri, R., Palmer, D.C., Muranski, P., Karoly, E.D., et al. (2013). Inhibiting glycolytic metabolism enhances CD8+ T cell memory and antitumor function. J Clin Invest 123, 4479-4488. Sukumar, M., Roychoudhuri, R., and Restifo, N.P. (2015). Nutrient Competition: A New Axis of Tumor Immunosuppression. Cell 162, 1206-1208. Sun, I.H., Oh, M.H., Zhao, L., Patel, C.H., Arwood, M.L., Xu, W., Tam, A.J., Blosser, R.L., Wen, J., and Powell, J.D. (2018). mTOR Complex 1 Signaling Regulates the Generation and Function of Central and Effector Foxp3(+) Regulatory T Cells. J Immunol 201, 481-492. Surh, C.D., and Sprent, J. (2008). Homeostasis of naive and memory T cells. Immunity 29, 848-862. Suter, M., Riek, U., Tuerk, R., Schlattner, U., Wallimann, T., and Neumann, D. (2006). Dissecting the role of 5'-AMP for allosteric stimulation, activation, and deactivation of AMP-activated protein kinase. J Biol Chem 281, 32207-32216. Swain, S.L., Weinberg, A.D., English, M., and Huston, G. (1990). IL-4 directs the development of Th2-like helper effectors. J Immunol 145, 3796-3806. Swainson, L., Kinet, S., Mongellaz, C., Sourisseau, M., Henriques, T., and Taylor, N. (2007). IL-7-induced proliferation of recent thymic emigrants requires activation of the PI3K pathway. Blood 109, 1034-1042. Swainson, L., Verhoeyen, E., Cosset, F.L., and Taylor, N. (2006). IL-7R alpha gene expression is inversely correlated with cell cycle progression in IL-7-stimulated T lymphocytes. J Immunol 176, 6702-6708. Swamy, M., Beck-Garcia, K., Beck-Garcia, E., Hartl, F.A., Morath, A., Yousefi, O.S., Dopfer, E.P., Molnar, E., Schulze, A.K., Blanco, R., et al. (2016). A Cholesterol-Based Allostery Model of T Cell Receptor Phosphorylation. Immunity 44, 1091-1101. Szabo, S.J., Kim, S.T., Costa, G.L., Zhang, X., Fathman, C.G., and Glimcher, L.H. (2000). A novel transcription factor, T-bet, directs Th1 lineage commitment. Cell 100, 655-669. Szabo, S.J., Sullivan, B.M., Peng, S.L., and Glimcher, L.H. (2003). Molecular mechanisms regulating Th1 immune responses. Annu Rev Immunol 21, 713-758. Szefel, J., Danielak, A., and Kruszewski, W.J. (2018). Metabolic pathways of L-arginine and therapeutic consequences in tumors. Adv Med Sci 64, 104-110.

280
Taheri, F., Ochoa, J.B., Faghiri, Z., Culotta, K., Park, H.J., Lan, M.S., Zea, A.H., and Ochoa, A.C. (2001). L-Arginine regulates the expression of the T-cell receptor zeta chain (CD3zeta) in Jurkat cells. Clin Cancer Res 7, 958s-965s. Tahiliani, M., Koh, K.P., Shen, Y., Pastor, W.A., Bandukwala, H., Brudno, Y., Agarwal, S., Iyer, L.M., Liu, D.R., Aravind, L., et al. (2009). Conversion of 5-methylcytosine to 5-hydroxymethylcytosine in mammalian DNA by MLL partner TET1. Science 324, 930-935. Takaba, H., Morishita, Y., Tomofuji, Y., Danks, L., Nitta, T., Komatsu, N., Kodama, T., and Takayanagi, H. (2015). Fezf2 Orchestrates a Thymic Program of Self-Antigen Expression for Immune Tolerance. Cell 163, 975-987. Takaba, H., and Takayanagi, H. (2017). The Mechanisms of T Cell Selection in the Thymus. Trends Immunol 38, 805-816. Takahashi, T., Tagami, T., Yamazaki, S., Uede, T., Shimizu, J., Sakaguchi, N., Mak, T.W., and Sakaguchi, S. (2000). Immunologic self-tolerance maintained by CD25(+)CD4(+) regulatory T cells constitutively expressing cytotoxic T lymphocyte-associated antigen 4. J Exp Med 192, 303-310. Takamura, S. (2018). Niches for the Long-Term Maintenance of Tissue-Resident Memory T Cells. Frontiers in Immunology 9, 1214. Takemoto, N., Intlekofer, A.M., Northrup, J.T., Wherry, E.J., and Reiner, S.L. (2006). Cutting Edge: IL-12 inversely regulates T-bet and eomesodermin expression during pathogen-induced CD8+ T cell differentiation. J Immunol 177, 7515-7519. Takeuchi, Y., Yahagi, N., Izumida, Y., Nishi, M., Kubota, M., Teraoka, Y., Yamamoto, T., Matsuzaka, T., Nakagawa, Y., Sekiya, M., et al. (2010). Polyunsaturated fatty acids selectively suppress sterol regulatory element-binding protein-1 through proteolytic processing and autoloop regulatory circuit. J Biol Chem 285, 11681-11691. Talebi, A., Dehairs, J., Rambow, F., Rogiers, A., Nittner, D., Derua, R., Vanderhoydonc, F., Duarte, J.A.G., Bosisio, F., Van den Eynde, K., et al. (2018). Sustained SREBP-1-dependent lipogenesis as a key mediator of resistance to BRAF-targeted therapy. Nat Commun 9, 2500. Tall, A.R., and Yvan-Charvet, L. (2015). Cholesterol, inflammation and innate immunity. Nat Rev Immunol 15, 104-116. Tammana, S., Huang, X., Wong, M., Milone, M.C., Ma, L., Levine, B.L., June, C.H., Wagner, J.E., Blazar, B.R., and Zhou, X. (2010). 4-1BB and CD28 signaling plays a synergistic role in redirecting umbilical cord blood T cells against B-cell malignancies. Hum Gene Ther 21, 75-86. Tamás, P., Hawley, S.A., Clarke, R.G., Mustard, K.J., Green, K., Hardie, D.G., and Cantrell, D.A. (2006). Regulation of the energy sensor AMP-activated protein kinase by antigen receptor and Ca<sup>2+</sup> in T lymphocytes. The Journal of Experimental Medicine 203, 1665.

281
Tan, J.T., Dudl, E., LeRoy, E., Murray, R., Sprent, J., Weinberg, K.I., and Surh, C.D. (2001). IL-7 is critical for homeostatic proliferation and survival of naive T cells. Proc Natl Acad Sci U S A
98, 8732-8737. Tang, Y., Xu, X., Guo, S., Zhang, C., Tian, Y., Ni, B., Lu, B., and Wang, H. (2014). An increased abundance of tumor-infiltrating regulatory T cells is correlated with the progression and prognosis of pancreatic ductal adenocarcinoma. PLoS One 9, e91551. Tannenbaum, C.S., and Hamilton, T.A. (2000). Immune-inflammatory mechanisms in IFNgamma-mediated anti-tumor activity. Semin Cancer Biol 10, 113-123. Tao, H., Mimura, Y., Aoe, K., Kobayashi, S., Yamamoto, H., Matsuda, E., Okabe, K., Matsumoto, T., Sugi, K., and Ueoka, H. (2012). Prognostic potential of FOXP3 expression in non-small cell lung cancer cells combined with tumor-infiltrating regulatory T cells. Lung Cancer 75, 95-101. Tarasenko, T.N., Gomez-Rodriguez, J., and McGuire, P.J. (2015). Impaired T cell function in argininosuccinate synthetase deficiency. J Leukoc Biol 97, 273-278. Tardito, S., Oudin, A., Ahmed, S.U., Fack, F., Keunen, O., Zheng, L., Miletic, H., Sakariassen, P.O., Weinstock, A., Wagner, A., et al. (2015). Glutamine synthetase activity fuels nucleotide biosynthesis and supports growth of glutamine-restricted glioblastoma. Nat Cell Biol 17, 1556-1568. Tassi, E., Gavazzi, F., Albarello, L., Senyukov, V., Longhi, R., Dellabona, P., Doglioni, C., Braga, M., Di Carlo, V., and Protti, M.P. (2008). Carcinoembryonic antigen-specific but not antiviral CD4+ T cell immunity is impaired in pancreatic carcinoma patients. J Immunol 181, 6595-6603. Tedder, T.F., Steeber, D.A., and Pizcueta, P. (1995). L-selectin-deficient mice have impaired leukocyte recruitment into inflammatory sites. J Exp Med 181, 2259-2264. Tejera, M.M., Kim, E.H., Sullivan, J.A., Plisch, E.H., and Suresh, M. (2013). FoxO1 controls effector-to-memory transition and maintenance of functional CD8 T cell memory. J Immunol 191, 187-199. Tepper, R.I., Coffman, R.L., and Leder, P. (1992). An eosinophil-dependent mechanism for the antitumor effect of interleukin-4. Science 257, 548-551. Terabe, M., Matsui, S., Noben-Trauth, N., Chen, H., Watson, C., Donaldson, D.D., Carbone, D.P., Paul, W.E., and Berzofsky, J.A. (2000). NKT cell-mediated repression of tumor immunosurveillance by IL-13 and the IL-4R-STAT6 pathway. Nat Immunol 1, 515-520. Thierfelder, W.E., van Deursen, J.M., Yamamoto, K., Tripp, R.A., Sarawar, S.R., Carson, R.T., Sangster, M.Y., Vignali, D.A., Doherty, P.C., Grosveld, G.C., et al. (1996). Requirement for Stat4 in interleukin-12-mediated responses of natural killer and T cells. Nature 382, 171-174. Thomas, L. (1959). Cellular and Humoral Aspects of the Hypersensitive States, E. H. Lawrence, ed. (Hoeber-Harper, New York).

282
Thoreau, M., Penny, H.L., Tan, K., Regnier, F., Weiss, J.M., Lee, B., Johannes, L., Dransart, E., Le Bon, A., Abastado, J.P., et al. (2015). Vaccine-induced tumor regression requires a dynamic cooperation between T cells and myeloid cells at the tumor site. Oncotarget 6, 27832-27846. Thornton, A.M., and Shevach, E.M. (1998). CD4+CD25+ immunoregulatory T cells suppress polyclonal T cell activation in vitro by inhibiting interleukin 2 production. J Exp Med 188, 287-296. Thorsby, E. (2009). A short history of HLA. Tissue Antigens 74, 101-116. Tivol, E.A., Borriello, F., Schweitzer, A.N., Lynch, W.P., Bluestone, J.A., and Sharpe, A.H. (1995). Loss of CTLA-4 leads to massive lymphoproliferation and fatal multiorgan tissue destruction, revealing a critical negative regulatory role of CTLA-4. Immunity 3, 541-547. Tone, Y., Furuuchi, K., Kojima, Y., Tykocinski, M.L., Greene, M.I., and Tone, M. (2008). Smad3 and NFAT cooperate to induce Foxp3 expression through its enhancer. Nat Immunol 9, 194-202. Tonegawa, S., Berns, A., Bonneville, M., Farr, A., Ishida, I., Ito, K., Itohara, S., Janeway, C.A., Jr., Kanagawa, O., Katsuki, M., et al. (1989). Diversity, development, ligands, and probable functions of gamma delta T cells. Cold Spring Harb Symp Quant Biol 54 Pt 1, 31-44. Topham, D.J., and Reilly, E.C. (2018). Tissue-Resident Memory CD8(+) T Cells: From Phenotype to Function. Front Immunol 9, 515. Tosolini, M., Kirilovsky, A., Mlecnik, B., Fredriksen, T., Mauger, S., Bindea, G., Berger, A., Bruneval, P., Fridman, W.H., Pages, F., et al. (2011). Clinical impact of different classes of infiltrating T cytotoxic and helper cells (Th1, th2, treg, th17) in patients with colorectal cancer. Cancer Res 71, 1263-1271. Treiner, E., Duban, L., Bahram, S., Radosavljevic, M., Wanner, V., Tilloy, F., Affaticati, P., Gilfillan, S., and Lantz, O. (2003). Selection of evolutionarily conserved mucosal-associated invariant T cells by MR1. Nature 422, 164-169. Tseng, J., Citrin, D.E., Waldman, M., White, D.E., Rosenberg, S.A., and Yang, J.C. (2014). Thrombotic microangiopathy in metastatic melanoma patients treated with adoptive cell therapy and total body irradiation. Cancer 120, 1426-1432. Tussiwand, R., Everts, B., Grajales-Reyes, G.E., Kretzer, N.M., Iwata, A., Bagaitkar, J., Wu, X., Wong, R., Anderson, D.A., Murphy, T.L., et al. (2015). Klf4 expression in conventional dendritic cells is required for T helper 2 cell responses. Immunity 42, 916-928. Uldry, M., and Thorens, B. (2004). The SLC2 family of facilitated hexose and polyol transporters. Pflugers Arch 447, 480-489.

283
Umetsu, D.T., and DeKruyff, R.H. (2006). The regulation of allergy and asthma. Immunol Rev
212, 238-255. Urban, J.F., Jr., Noben-Trauth, N., Donaldson, D.D., Madden, K.B., Morris, S.C., Collins, M., and Finkelman, F.D. (1998). IL-13, IL-4Ralpha, and Stat6 are required for the expulsion of the gastrointestinal nematode parasite Nippostrongylus brasiliensis. Immunity 8, 255-264. Utsuyama, M., Hirokawa, K., Kurashima, C., Fukayama, M., Inamatsu, T., Suzuki, K., Hashimoto, W., and Sato, K. (1992). Differential age-change in the numbers of CD4+CD45RA+ and CD4+CD29+ T cell subsets in human peripheral blood. Mech Ageing Dev 63, 57-68. Uttenthal, B.J., Chua, I., Morris, E.C., and Stauss, H.J. (2012). Challenges in T cell receptor gene therapy. J Gene Med 14, 386-399. Uyttenhove, C., Pilotte, L., Theate, I., Stroobant, V., Colau, D., Parmentier, N., Boon, T., and Van den Eynde, B.J. (2003). Evidence for a tumoral immune resistance mechanism based on tryptophan degradation by indoleamine 2,3-dioxygenase. Nat Med 9, 1269-1274. Vaeth, M., Maus, M., Klein-Hessling, S., Freinkman, E., Yang, J., Eckstein, M., Cameron, S., Turvey, S.E., Serfling, E., Berberich-Siebelt, F., et al. (2017). Store-Operated Ca(2+) Entry Controls Clonal Expansion of T Cells through Metabolic Reprogramming. Immunity 47, 664-679.e666. Vaeth, M., Schliesser, U., Muller, G., Reissig, S., Satoh, K., Tuettenberg, A., Jonuleit, H., Waisman, A., Muller, M.R., Serfling, E., et al. (2012). Dependence on nuclear factor of activated T-cells (NFAT) levels discriminates conventional T cells from Foxp3+ regulatory T cells. Proc Natl Acad Sci U S A 109, 16258-16263. Valmori, D., Tosello, V., Souleimanian, N.E., Godefroy, E., Scotto, L., Wang, Y., and Ayyoub, M. (2006). Rapamycin-mediated enrichment of T cells with regulatory activity in stimulated CD4+ T cell cultures is not due to the selective expansion of naturally occurring regulatory T cells but to the induction of regulatory functions in conventional CD4+ T cells. J Immunol 177, 944-949. van de Poll, M.C., Siroen, M.P., van Leeuwen, P.A., Soeters, P.B., Melis, G.C., Boelens, P.G., Deutz, N.E., and Dejong, C.H. (2007). Interorgan amino acid exchange in humans: consequences for arginine and citrulline metabolism. Am J Clin Nutr 85, 167-172. van de Poll, M.C., Soeters, P.B., Deutz, N.E., Fearon, K.C., and Dejong, C.H. (2004). Renal metabolism of amino acids: its role in interorgan amino acid exchange. Am J Clin Nutr 79, 185-197. van den Broek, T., Borghans, J.A.M., and van Wijk, F. (2018). The full spectrum of human naive T cells. Nat Rev Immunol 18, 363-373.

284
van der Windt, G.J., Everts, B., Chang, C.H., Curtis, J.D., Freitas, T.C., Amiel, E., Pearce, E.J., and Pearce, E.L. (2012). Mitochondrial respiratory capacity is a critical regulator of CD8+ T cell memory development. Immunity 36, 68-78. van der Windt, G.J., O'Sullivan, D., Everts, B., Huang, S.C., Buck, M.D., Curtis, J.D., Chang, C.H., Smith, A.M., Ai, T., Faubert, B., et al. (2013). CD8 memory T cells have a bioenergetic advantage that underlies their rapid recall ability. Proc Natl Acad Sci U S A 110, 14336-14341. van Panhuys, N. (2016). TCR Signal Strength Alters T–DC Activation and Interaction Times and Directs the Outcome of Differentiation. Frontiers in Immunology 7, 6. Van Rhijn, I., Kasmar, A., de Jong, A., Gras, S., Bhati, M., Doorenspleet, M.E., de Vries, N., Godfrey, D.I., Altman, J.D., de Jager, W., et al. (2013). A conserved human T cell population targets mycobacterial antigens presented by CD1b. Nat Immunol 14, 706-713. Vatrinet, R., Leone, G., De Luise, M., Girolimetti, G., Vidone, M., Gasparre, G., and Porcelli, A.M. (2017). The alpha-ketoglutarate dehydrogenase complex in cancer metabolic plasticity. Cancer Metab 5, 3. Vaupel, P., and Mayer, A. (2007). Hypoxia in cancer: significance and impact on clinical outcome. Cancer Metastasis Rev 26, 225-239. Vegh, Z., Wang, P., Vanky, F., and Klein, E. (1993). Increased expression of MHC class I molecules on human cells after short time IFN-gamma treatment. Mol Immunol 30, 849-854. Veglia, F., Tyurin, V.A., Mohammadyani, D., Blasi, M., Duperret, E.K., Donthireddy, L., Hashimoto, A., Kapralov, A., Amoscato, A., Angelini, R., et al. (2017). Lipid bodies containing oxidatively truncated lipids block antigen cross-presentation by dendritic cells in cancer. Nature Communications 8, 2122. Vegran, F., Boidot, R., Michiels, C., Sonveaux, P., and Feron, O. (2011). Lactate influx through the endothelial cell monocarboxylate transporter MCT1 supports an NF-kappaB/IL-8 pathway that drives tumor angiogenesis. Cancer Res 71, 2550-2560. Verbist, K.C., Wang, R., and Green, D.R. (2012). T cell metabolism and the immune response. Semin Immunol 24, 399-404. Verhoeyen, E., Dardalhon, V., Ducrey-Rundquist, O., Trono, D., Taylor, N., and Cosset, F.-L.c. (2003). IL-7 surface-engineered lentiviral vectors promote survival and efficient gene transfer in resting primary T lymphocytes. Blood 101, 2167. Vermijlen, D., Gatti, D., Kouzeli, A., Rus, T., and Eberl, M. (2018). gammadelta T cell responses: How many ligands will it take till we know? Semin Cell Dev Biol 84, 75-86. Vivien, L., Benoist, C., and Mathis, D. (2001). T lymphocytes need IL-7 but not IL-4 or IL-6 to survive in vivo. Int Immunol 13, 763-768.

285
von Boehmer, H., Teh, H.S., and Kisielow, P. (1989). The thymus selects the useful, neglects the useless and destroys the harmful. Immunol Today 10, 57-61. Waldmann, T.A. (1989). The multi-subunit interleukin-2 receptor. Annu Rev Biochem 58, 875-911. Walker, J.A., and McKenzie, A.N.J. (2018). TH2 cell development and function. Nat Rev Immunol 18, 121-133. Wang, C., Yosef, N., Gaublomme, J., Wu, C., Lee, Y., Clish, C.B., Kaminski, J., Xiao, S., Meyer Zu Horste, G., Pawlak, M., et al. (2015). CD5L/AIM Regulates Lipid Biosynthesis and Restrains Th17 Cell Pathogenicity. Cell 163, 1413-1427. Wang, J., Jensen, M., Lin, Y., Sui, X., Chen, E., Lindgren, C.G., Till, B., Raubitschek, A., Forman, S.J., Qian, X., et al. (2007). Optimizing adoptive polyclonal T cell immunotherapy of lymphomas, using a chimeric T cell receptor possessing CD28 and CD137 costimulatory domains. Hum Gene Ther 18, 712-725. Wang, R., Dillon, C.P., Shi, L.Z., Milasta, S., Carter, R., Finkelstein, D., McCormick, L.L., Fitzgerald, P., Chi, H., Munger, J., et al. (2011). The transcription factor Myc controls metabolic reprogramming upon T lymphocyte activation. Immunity 35, 871-882. Warburg, O. (1925). The Metabolism of Carcinoma Cells. The Journal of Cancer Research 9, 148. Warburg, O., Gawehn, K., and Geissler, A.W. (1958). [Metabolism of leukocytes]. Z Naturforsch B 13b, 515-516. Warburg, O., Gawehn, K., and Geissler, A.W. (1960). [The transformation of embryonal metabolism in cancer metabolism]. Z Naturforsch B 15b, 378-379. Ward, P.S., Cross, J.R., Lu, C., Weigert, O., Abel-Wahab, O., Levine, R.L., Weinstock, D.M., Sharp, K.A., and Thompson, C.B. (2012). Identification of additional IDH mutations associated with oncometabolite R(-)-2-hydroxyglutarate production. Oncogene 31, 2491-2498. Ward, P.S., Patel, J., Wise, D.R., Abdel-Wahab, O., Bennett, B.D., Coller, H.A., Cross, J.R., Fantin, V.R., Hedvat, C.V., Perl, A.E., et al. (2010). The common feature of leukemia-associated IDH1 and IDH2 mutations is a neomorphic enzyme activity converting alpha-ketoglutarate to 2-hydroxyglutarate. Cancer Cell 17, 225-234. Waterhouse, P., Penninger, J.M., Timms, E., Wakeham, A., Shahinian, A., Lee, K.P., Thompson, C.B., Griesser, H., and Mak, T.W. (1995). Lymphoproliferative disorders with early lethality in mice deficient in Ctla-4. Science 270, 985-988. Watford, W.T., Hissong, B.D., Bream, J.H., Kanno, Y., Muul, L., and O'Shea, J.J. (2004). Signaling by IL-12 and IL-23 and the immunoregulatory roles of STAT4. Immunological Reviews 202, 139-156.

286
Wei, G., Ding, L., Wang, J., Hu, Y., and Huang, H. (2017). Advances of CD19-directed chimeric antigen receptor-modified T cells in refractory/relapsed acute lymphoblastic leukemia. Exp Hematol Oncol 6, 10. Weinberg, S.E., Singer, B.D., Steinert, E.M., Martinez, C.A., Mehta, M.M., Martinez-Reyes, I., Gao, P., Helmin, K.A., Abdala-Valencia, H., Sena, L.A., et al. (2019). Mitochondrial complex III is essential for suppressive function of regulatory T cells. Nature 565, 495-499. Weiner, H.L. (2001). Induction and mechanism of action of transforming growth factor-beta-secreting Th3 regulatory cells. Immunol Rev 182, 207-214. Wells, A.D. (2009). New Insights into the Molecular Basis of T Cell Anergy: Anergy Factors, Avoidance Sensors, and Epigenetic Imprinting. The Journal of Immunology 182, 7331. Weng, N.P., Araki, Y., and Subedi, K. (2012). The molecular basis of the memory T cell response: differential gene expression and its epigenetic regulation. Nat Rev Immunol 12, 306-315. Werner, A., Amann, E., Schnitzius, V., Habermeier, A., Luckner-Minden, C., Leuchtner, N., Rupp, J., Closs, E.I., and Munder, M. (2016). Induced arginine transport via cationic amino acid transporter-1 is necessary for human T-cell proliferation. Eur J Immunol 46, 92-103. Werner, A., Koschke, M., Leuchtner, N., Luckner-Minden, C., Habermeier, A., Rupp, J., Heinrich, C., Conradi, R., Closs, E.I., and Munder, M. (2017). Reconstitution of T Cell Proliferation under Arginine Limitation: Activated Human T Cells Take Up Citrulline via L-Type Amino Acid Transporter 1 and Use It to Regenerate Arginine after Induction of Argininosuccinate Synthase Expression. Front Immunol 8, 864. Wesa, A., Kalinski, P., Kirkwood, J.M., Tatsumi, T., and Storkus, W.J. (2007). Polarized type-1 dendritic cells (DC1) producing high levels of IL-12 family members rescue patient TH1-type antimelanoma CD4+ T cell responses in vitro. J Immunother 30, 75-82. Westerterp, M., Gautier, E.L., Ganda, A., Molusky, M.M., Wang, W., Fotakis, P., Wang, N., Randolph, G.J., D'Agati, V.D., Yvan-Charvet, L., et al. (2017). Cholesterol Accumulation in Dendritic Cells Links the Inflammasome to Acquired Immunity. Cell Metab 25, 1294-1304.e1296. Wherry, E.J., Teichgraber, V., Becker, T.C., Masopust, D., Kaech, S.M., Antia, R., von Andrian, U.H., and Ahmed, R. (2003). Lineage relationship and protective immunity of memory CD8 T cell subsets. Nat Immunol 4, 225-234. Wieczorek, M., Abualrous, E.T., Sticht, J., Alvaro-Benito, M., Stolzenberg, S., Noe, F., and Freund, C. (2017). Major Histocompatibility Complex (MHC) Class I and MHC Class II Proteins: Conformational Plasticity in Antigen Presentation. Front Immunol 8, 292.

287
Wieman, H.L., Wofford, J.A., and Rathmell, J.C. (2007). Cytokine stimulation promotes glucose uptake via phosphatidylinositol-3 kinase/Akt regulation of Glut1 activity and trafficking. Mol Biol Cell 18, 1437-1446. Wiesel, M., Joller, N., Ehlert, A.K., Crouse, J., Sporri, R., Bachmann, M.F., and Oxenius, A. (2010). Th cells act via two synergistic pathways to promote antiviral CD8+ T cell responses. J Immunol 185, 5188-5197. Wildin, R.S., Ramsdell, F., Peake, J., Faravelli, F., Casanova, J.L., Buist, N., Levy-Lahad, E., Mazzella, M., Goulet, O., Perroni, L., et al. (2001). X-linked neonatal diabetes mellitus, enteropathy and endocrinopathy syndrome is the human equivalent of mouse scurfy. Nat Genet 27, 18-20. Wilkins, O., Keeler, A.M., and Flotte, T.R. (2017). CAR T-Cell Therapy: Progress and Prospects. Hum Gene Ther Methods 28, 61-66. Willenborg, D.O., Fordham, S., Bernard, C.C., Cowden, W.B., and Ramshaw, I.A. (1996). IFN-gamma plays a critical down-regulatory role in the induction and effector phase of myelin oligodendrocyte glycoprotein-induced autoimmune encephalomyelitis. J Immunol 157, 3223-3227. Willerford, D.M., Chen, J., Ferry, J.A., Davidson, L., Ma, A., and Alt, F.W. (1995). Interleukin-2 receptor alpha chain regulates the size and content of the peripheral lymphoid compartment. Immunity 3, 521-530. Williams, J.W., Tjota, M.Y., Clay, B.S., Vander Lugt, B., Bandukwala, H.S., Hrusch, C.L., Decker, D.C., Blaine, K.M., Fixsen, B.R., Singh, H., et al. (2013). Transcription factor IRF4 drives dendritic cells to promote Th2 differentiation. Nat Commun 4, 2990. Windmueller, H.G., and Spaeth, A.E. (1981). Source and fate of circulating citrulline. Am J Physiol 241, E473-480. Wing, K., Onishi, Y., Prieto-Martin, P., Yamaguchi, T., Miyara, M., Fehervari, Z., Nomura, T., and Sakaguchi, S. (2008). CTLA-4 control over Foxp3+ regulatory T cell function. Science 322, 271-275. Wofford, J.A., Wieman, H.L., Jacobs, S.R., Zhao, Y., and Rathmell, J.C. (2008). IL-7 promotes Glut1 trafficking and glucose uptake via STAT5-mediated activation of Akt to support T-cell survival. Blood 111, 2101-2111. Wojciechowski, S., Tripathi, P., Bourdeau, T., Acero, L., Grimes, H.L., Katz, J.D., Finkelman, F.D., and Hildeman, D.A. (2007). Bim/Bcl-2 balance is critical for maintaining naive and memory T cell homeostasis. J Exp Med 204, 1665-1675. Wolf, A.M., Wolf, D., Steurer, M., Gastl, G., Gunsilius, E., and Grubeck-Loebenstein, B. (2003). Increase of regulatory T cells in the peripheral blood of cancer patients. Clin Cancer Res 9, 606-612.

288
Woods, A., Johnstone, S.R., Dickerson, K., Leiper, F.C., Fryer, L.G., Neumann, D., Schlattner, U., Wallimann, T., Carlson, M., and Carling, D. (2003). LKB1 is the upstream kinase in the AMP-activated protein kinase cascade. Curr Biol 13, 2004-2008. Worbs, T., Mempel, T.R., Bolter, J., von Andrian, U.H., and Forster, R. (2007). CCR7 ligands stimulate the intranodal motility of T lymphocytes in vivo. J Exp Med 204, 489-495. Wu, C., Ferrante, J., Gately, M.K., and Magram, J. (1997). Characterization of IL-12 receptor beta1 chain (IL-12Rbeta1)-deficient mice: IL-12Rbeta1 is an essential component of the functional mouse IL-12 receptor. J Immunol 159, 1658-1665. Wu, G. (2009). Amino acids: metabolism, functions, and nutrition. Amino Acids 37, 1-17. Xiao, B., Sanders, M.J., Underwood, E., Heath, R., Mayer, F.V., Carmena, D., Jing, C., Walker, P.A., Eccleston, J.F., Haire, L.F., et al. (2011). Structure of mammalian AMPK and its regulation by ADP. Nature 472, 230-233. Xiao, M., Yang, H., Xu, W., Ma, S., Lin, H., Zhu, H., Liu, L., Liu, Y., Yang, C., Xu, Y., et al. (2012). Inhibition of alpha-KG-dependent histone and DNA demethylases by fumarate and succinate that are accumulated in mutations of FH and SDH tumor suppressors. Genes Dev 26, 1326-1338. Xie, M., Zhang, D., Dyck, J.R., Li, Y., Zhang, H., Morishima, M., Mann, D.L., Taffet, G.E., Baldini, A., Khoury, D.S., et al. (2006). A pivotal role for endogenous TGF-beta-activated kinase-1 in the LKB1/AMP-activated protein kinase energy-sensor pathway. Proc Natl Acad Sci U S A 103, 17378-17383. Xu, J., Nakamura, M.T., Cho, H.P., and Clarke, S.D. (1999). Sterol regulatory element binding protein-1 expression is suppressed by dietary polyunsaturated fatty acids. A mechanism for the coordinate suppression of lipogenic genes by polyunsaturated fats. J Biol Chem 274, 23577-23583. Xu, J., Teran-Garcia, M., Park, J.H., Nakamura, M.T., and Clarke, S.D. (2001). Polyunsaturated fatty acids suppress hepatic sterol regulatory element-binding protein-1 expression by accelerating transcript decay. J Biol Chem 276, 9800-9807. Xu, J., Wagoner, G., Douglas, J.C., and Drew, P.D. (2009). Liver X receptor agonist regulation of Th17 lymphocyte function in autoimmunity. J Leukoc Biol 86, 401-409. Xu, T., Stewart, K.M., Wang, X., Liu, K., Xie, M., Ryu, J.K., Li, K., Ma, T., Wang, H., Ni, L., et al. (2017). Metabolic control of TH17 and induced Treg cell balance by an epigenetic mechanism. Nature 548, 228-233. Xu, W., Yang, H., Liu, Y., Yang, Y., Wang, P., Kim, S.H., Ito, S., Yang, C., Xiao, M.T., Liu, L.X., et
al. (2011). Oncometabolite 2-hydroxyglutarate is a competitive inhibitor of alpha-ketoglutarate-dependent dioxygenases. Cancer Cell 19, 17-30. Xu, X., Gnanaprakasam, J.N.R., Sherman, J., and Wang, R. (2019). A Metabolism Toolbox for CAR T Therapy. Front Oncol 9, 322.

289
Xu, X., Wang, R., Su, Q., Huang, H., Zhou, P., Luan, J., Liu, J., Wang, J., and Chen, X. (2016). Expression of Th1- Th2- and Th17-associated cytokines in laryngeal carcinoma. Oncol Lett 12, 1941-1948. Yamane, H., Zhu, J., and Paul, W.E. (2005). Independent roles for IL-2 and GATA-3 in stimulating naive CD4+ T cells to generate a Th2-inducing cytokine environment. J Exp Med
202, 793-804. Yang, K., Neale, G., Green, D.R., He, W., and Chi, H. (2011). The tumor suppressor Tsc1 enforces quiescence of naive T cells to promote immune homeostasis and function. Nat Immunol 12, 888-897. Yang, K., Shrestha, S., Zeng, H., Karmaus, P.W., Neale, G., Vogel, P., Guertin, D.A., Lamb, R.F., and Chi, H. (2013). T cell exit from quiescence and differentiation into Th2 cells depend on Raptor-mTORC1-mediated metabolic reprogramming. Immunity 39, 1043-1056. Yang, L., Achreja, A., Yeung, T.L., Mangala, L.S., Jiang, D., Han, C., Baddour, J., Marini, J.C., Ni, J., Nakahara, R., et al. (2016a). Targeting Stromal Glutamine Synthetase in Tumors Disrupts Tumor Microenvironment-Regulated Cancer Cell Growth. Cell Metab 24, 685-700. Yang, R., Qu, C., Zhou, Y., Konkel, J.E., Shi, S., Liu, Y., Chen, C., Liu, S., Liu, D., Chen, Y., et al. (2015). Hydrogen Sulfide Promotes Tet1- and Tet2-Mediated Foxp3 Demethylation to Drive Regulatory T Cell Differentiation and Maintain Immune Homeostasis. Immunity 43, 251-263. Yang, W., Bai, Y., Xiong, Y., Zhang, J., Chen, S., Zheng, X., Meng, X., Li, L., Wang, J., Xu, C., et al. (2016b). Potentiating the antitumour response of CD8(+) T cells by modulating cholesterol metabolism. Nature 531, 651-655. Yang, Z.Z., Novak, A.J., Stenson, M.J., Witzig, T.E., and Ansell, S.M. (2006). Intratumoral CD4+CD25+ regulatory T-cell-mediated suppression of infiltrating CD4+ T cells in B-cell non-Hodgkin lymphoma. Blood 107, 3639-3646. Yao, S., Buzo, B.F., Pham, D., Jiang, L., Taparowsky, E.J., Kaplan, M.H., and Sun, J. (2013). Interferon regulatory factor 4 sustains CD8(+) T cell expansion and effector differentiation. Immunity 39, 833-845. Ye, J., and DeBose-Boyd, R.A. (2011). Regulation of cholesterol and fatty acid synthesis. Cold Spring Harb Perspect Biol 3. Yee, C., Thompson, J.A., Byrd, D., Riddell, S.R., Roche, P., Celis, E., and Greenberg, P.D. (2002). Adoptive T cell therapy using antigen-specific CD8+ T cell clones for the treatment of patients with metastatic melanoma: in vivo persistence, migration, and antitumor effect of transferred T cells. Proc Natl Acad Sci U S A 99, 16168-16173. Yin, Y., Metzger, T., and Bailey-Bucktrout, S. (2016). Tumor infiltrating T cells have abnormal lipid metabolism that can be modulated by PD-L1 blockade. The Journal of Immunology 196, 144.121.

290
Yokosuka, T., Takamatsu, M., Kobayashi-Imanishi, W., Hashimoto-Tane, A., Azuma, M., and Saito, T. (2012). Programmed cell death 1 forms negative costimulatory microclusters that directly inhibit T cell receptor signaling by recruiting phosphatase SHP2. J Exp Med 209, 1201-1217. Yong, C.S., Westwood, J.A., Schroder, J., Papenfuss, A.T., von Scheidt, B., Moeller, M., Devaud, C., Darcy, P.K., and Kershaw, M.H. (2015). Expression of a Chimeric Antigen Receptor in Multiple Leukocyte Lineages in Transgenic Mice. PLoS One 10, e0140543. Yong, C.S.M., Dardalhon, V., Devaud, C., Taylor, N., Darcy, P.K., and Kershaw, M.H. (2017). CAR T-cell therapy of solid tumors. Immunol Cell Biol 95, 356-363. Yoshimoto, T., and Paul, W.E. (1994). CD4pos, NK1.1pos T cells promptly produce interleukin 4 in response to in vivo challenge with anti-CD3. J Exp Med 179, 1285-1295. Yu, Y.M., Burke, J.F., Tompkins, R.G., Martin, R., and Young, V.R. (1996). Quantitative aspects of interorgan relationships among arginine and citrulline metabolism. Am J Physiol 271, E1098-1109. Yue, X., Trifari, S., Aijo, T., Tsagaratou, A., Pastor, W.A., Zepeda-Martinez, J.A., Lio, C.W., Li, X., Huang, Y., Vijayanand, P., et al. (2016). Control of Foxp3 stability through modulation of TET activity. J Exp Med 213, 377-397. Zagzag, D., Krishnamachary, B., Yee, H., Okuyama, H., Chiriboga, L., Ali, M.A., Melamed, J., and Semenza, G.L. (2005). Stromal cell-derived factor-1alpha and CXCR4 expression in hemangioblastoma and clear cell-renal cell carcinoma: von Hippel-Lindau loss-of-function induces expression of a ligand and its receptor. Cancer Res 65, 6178-6188. Zaidi, N., Lupien, L., Kuemmerle, N.B., Kinlaw, W.B., Swinnen, J.V., and Smans, K. (2013). Lipogenesis and lipolysis: the pathways exploited by the cancer cells to acquire fatty acids. Prog Lipid Res 52, 585-589. Zea, A.H., Rodriguez, P.C., Atkins, M.B., Hernandez, C., Signoretti, S., Zabaleta, J., McDermott, D., Quiceno, D., Youmans, A., O'Neill, A., et al. (2005). Arginase-producing myeloid suppressor cells in renal cell carcinoma patients: a mechanism of tumor evasion. Cancer Res 65, 3044-3048. Zea, A.H., Rodriguez, P.C., Culotta, K.S., Hernandez, C.P., DeSalvo, J., Ochoa, J.B., Park, H.J., Zabaleta, J., and Ochoa, A.C. (2004). L-Arginine modulates CD3zeta expression and T cell function in activated human T lymphocytes. Cell Immunol 232, 21-31. Zeng, H., and Chi, H. (2017). mTOR signaling in the differentiation and function of regulatory and effector T cells. Curr Opin Immunol 46, 103-111. Zeng, H., Yang, K., Cloer, C., Neale, G., Vogel, P., and Chi, H. (2013). mTORC1 couples immune signals and metabolic programming to establish T(reg)-cell function. Nature 499, 485-490.

291
Zeyda, M., Staffler, G., Horejsi, V., Waldhausl, W., and Stulnig, T.M. (2002). LAT displacement from lipid rafts as a molecular mechanism for the inhibition of T cell signaling by polyunsaturated fatty acids. J Biol Chem 277, 28418-28423. Zhang, C., Liu, J., Zhong, J.F., and Zhang, X. (2017). Engineering CAR-T cells. Biomarker research
5, 22-22. Zhang, D.H., Cohn, L., Ray, P., Bottomly, K., and Ray, A. (1997). Transcription factor GATA-3 is differentially expressed in murine Th1 and Th2 cells and controls Th2-specific expression of the interleukin-5 gene. J Biol Chem 272, 21597-21603. Zhang, G.X., Gran, B., Yu, S., Li, J., Siglienti, I., Chen, X., Kamoun, M., and Rostami, A. (2003). Induction of experimental autoimmune encephalomyelitis in IL-12 receptor-beta 2-deficient mice: IL-12 responsiveness is not required in the pathogenesis of inflammatory demyelination in the central nervous system. J Immunol 170, 2153-2160. Zhao, D., Long, X.D., Lu, T.F., Wang, T., Zhang, W.W., Liu, Y.X., Cui, X.L., Dai, H.J., Xue, F., and Xia, Q. (2015). Metformin decreases IL-22 secretion to suppress tumor growth in an orthotopic mouse model of hepatocellular carcinoma. Int J Cancer 136, 2556-2565. Zhao, E., Maj, T., Kryczek, I., Li, W., Wu, K., Zhao, L., Wei, S., Crespo, J., Wan, S., Vatan, L., et
al. (2016). Cancer mediates effector T cell dysfunction by targeting microRNAs and EZH2 via glycolysis restriction. Nat Immunol 17, 95-103. Zhao, F.Q., and Keating, A.F. (2007). Functional properties and genomics of glucose transporters. Curr Genomics 8, 113-128. Zhao, H., Liao, X., and Kang, Y. (2017). Tregs: Where We Are and What Comes Next? Front Immunol 8, 1578. Zheng, W., and Flavell, R.A. (1997). The transcription factor GATA-3 is necessary and sufficient for Th2 cytokine gene expression in CD4 T cells. Cell 89, 587-596. Zheng, Y., Collins, S.L., Lutz, M.A., Allen, A.N., Kole, T.P., Zarek, P.E., and Powell, J.D. (2007). A Role for Mammalian Target of Rapamycin in Regulating T Cell Activation versus Anergy. The Journal of Immunology 178, 2163. Zheng, Y., Josefowicz, S., Chaudhry, A., Peng, X.P., Forbush, K., and Rudensky, A.Y. (2010). Role of conserved non-coding DNA elements in the Foxp3 gene in regulatory T-cell fate. Nature
463, 808-812. Zhong, X.S., Matsushita, M., Plotkin, J., Riviere, I., and Sadelain, M. (2010). Chimeric antigen receptors combining 4-1BB and CD28 signaling domains augment PI3kinase/AKT/Bcl-XL activation and CD8+ T cell-mediated tumor eradication. Mol Ther 18, 413-420.
292
Zhou, X., Yu, S., Zhao, D.M., Harty, J.T., Badovinac, V.P., and Xue, H.H. (2010). Differentiation and persistence of memory CD8(+) T cells depend on T cell factor 1. Immunity 33, 229-240. Zhu, J. (2018). T Helper Cell Differentiation, Heterogeneity, and Plasticity. Cold Spring Harb Perspect Biol 10. Zhu, J., Jankovic, D., Oler, A.J., Wei, G., Sharma, S., Hu, G., Guo, L., Yagi, R., Yamane, H., Punkosdy, G., et al. (2012). The transcription factor T-bet is induced by multiple pathways and prevents an endogenous Th2 cell program during Th1 cell responses. Immunity 37, 660-673. Zhu, J., and Paul, W.E. (2008). CD4 T cells: fates, functions, and faults. Blood 112, 1557-1569. Zurier, R.B., Rossetti, R.G., Seiler, C.M., and Laposata, M. (1999). Human peripheral blood T lymphocyte proliferation after activation of the T cell receptor: effects of unsaturated fatty acids. Prostaglandins Leukot Essent Fatty Acids 60, 371-375.

293
Annexes

294

295

296

297

298

299
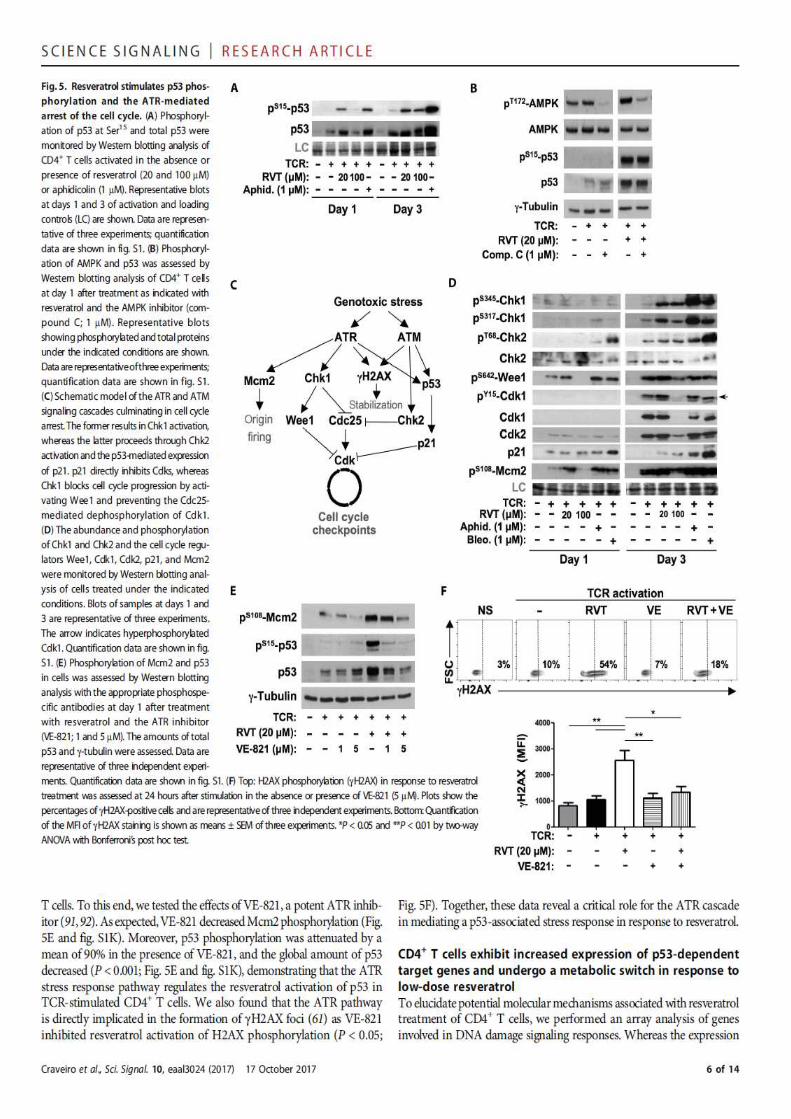
300

301

302

303

304

305

306

307

308

309

310