Tapas K Kundu
50
Tapas K Kundu Transcription and Disease Laboratory, Molecular Biology and Genetics Unit, JNCASR, Bangalore-64 INDIA Small molecule modulators of Epigenetic modifications: Implications in Therapeutics
-
Upload
khangminh22 -
Category
Documents
-
view
0 -
download
0
Transcript of Tapas K Kundu
Tapas K KunduTranscription and Disease Laboratory,
Molecular Biology and Genetics Unit,
JNCASR, Bangalore-64
INDIA
Small molecule modulators of Epigenetic modifications: Implications in Therapeutics
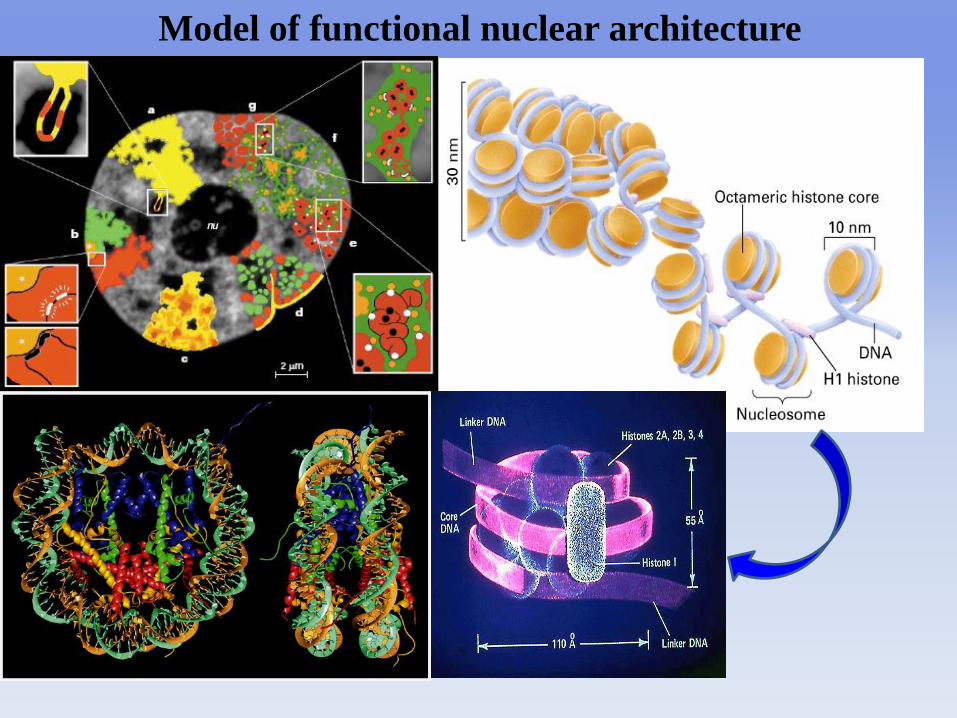
Model of functional nuclear architecture
9.5 The solenoid model of condensed
chromatin
Figure 9-31
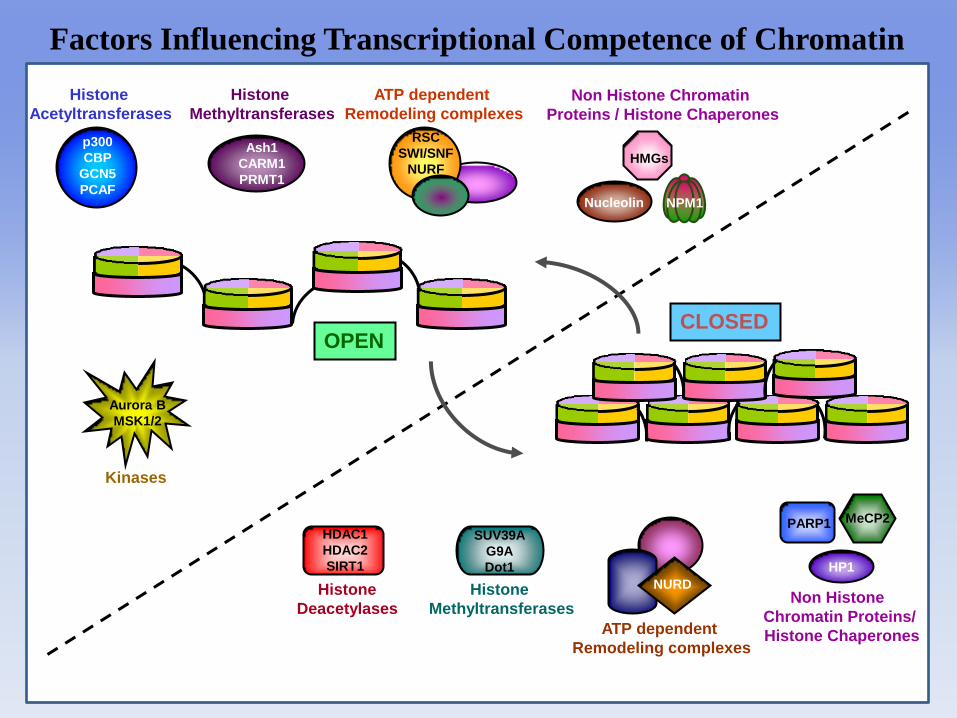
Histone
Deacetylases
HDAC1
HDAC2
SIRT1
Histone
Methyltransferases
SUV39A
G9A
Dot1
ATP dependent
Remodeling complexes
NURD
HP1
Non Histone
Chromatin Proteins/
Histone Chaperones
MeCP2PARP1
Histone
Acetyltransferases
p300
CBP
GCN5
PCAF
Histone
Methyltransferases
Ash1
CARM1
PRMT1
ATP dependent
Remodeling complexes
RSC
SWI/SNF
NURF
Non Histone Chromatin
Proteins / Histone Chaperones
HMGs
NPM1Nucleolin
Factors Influencing Transcriptional Competence of Chromatin
OPENCLOSED
Kinases
Aurora B
MSK1/2
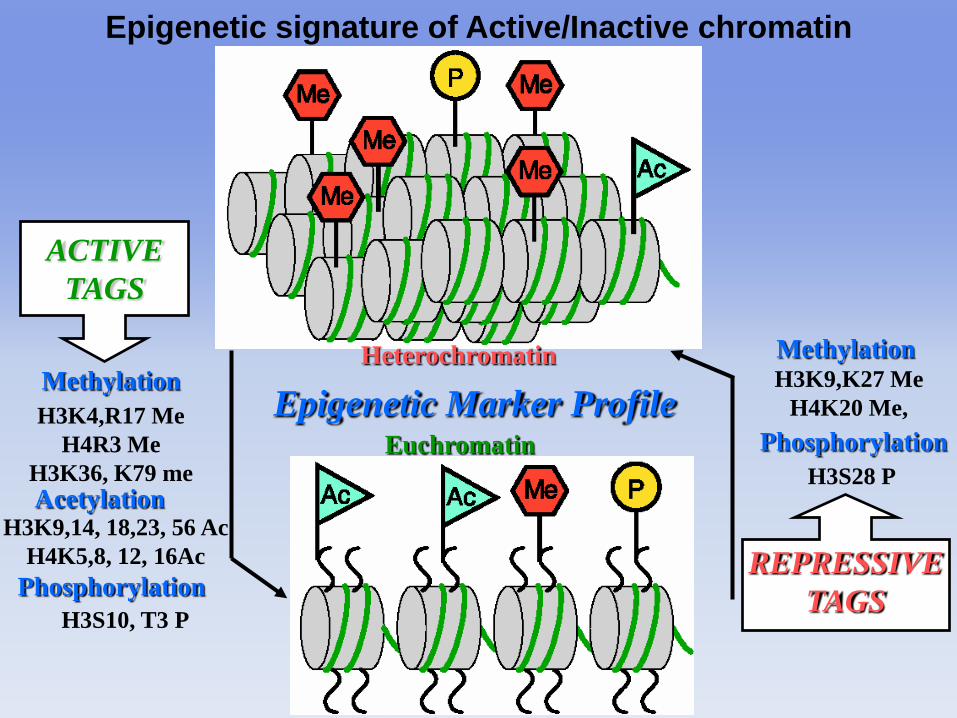
Epigenetic Marker Profile
AcetylationH3K9,14, 18,23, 56 Ac
H4K5,8, 12, 16Ac
Methylation
H3K4,R17 Me
H4R3 Me
H3K36, K79 me
Phosphorylation
H3S10, T3 P
ACTIVE
TAGS
MethylationH3K9,K27 Me
H4K20 Me,
Phosphorylation
H3S28 P
REPRESSIVE
TAGS
Heterochromatin
Euchromatin
Epigenetic signature of Active/Inactive chromatin
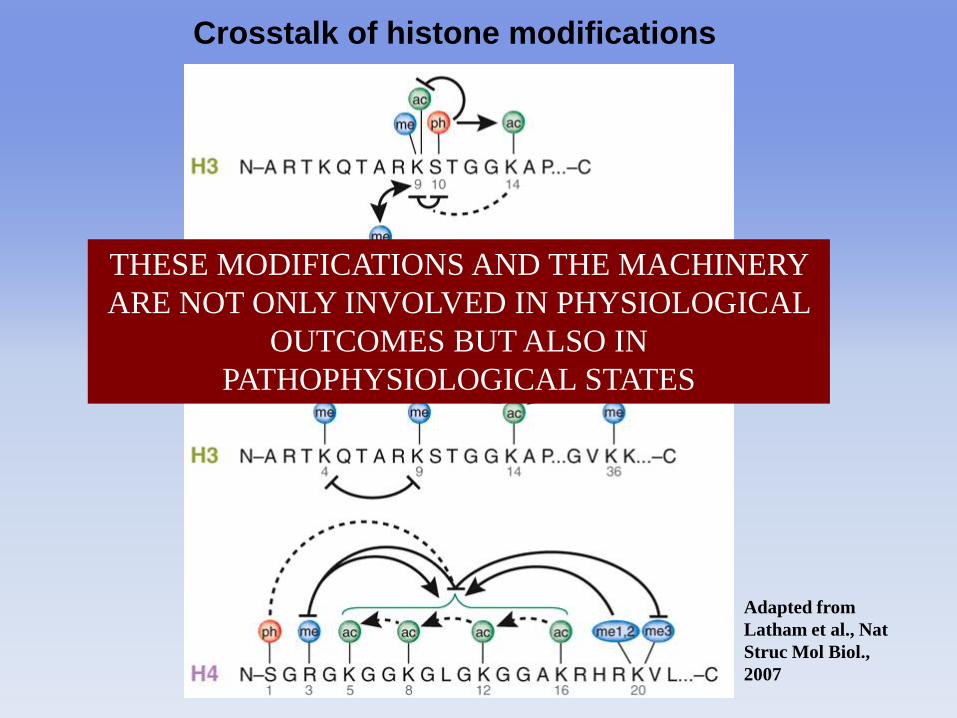
Adapted from
Latham et al., Nat
Struc Mol Biol.,
2007
Crosstalk of histone modifications
THESE MODIFICATIONS AND THE MACHINERY
ARE NOT ONLY INVOLVED IN PHYSIOLOGICAL
OUTCOMES BUT ALSO IN
PATHOPHYSIOLOGICAL STATES
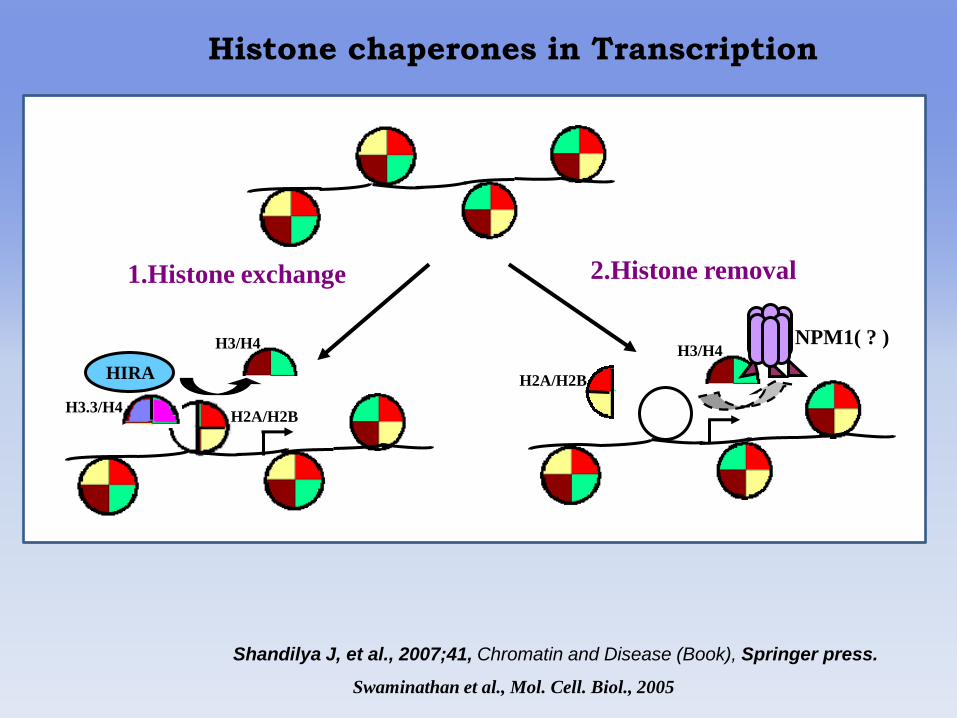
Histone chaperones in Transcription
Shandilya J, et al., 2007;41, Chromatin and Disease (Book), Springer press.
Swaminathan et al., Mol. Cell. Biol., 2005
2.Histone removal1.Histone exchange
H2A/H2BH3.3/H4
H3/H4
H2A/H2B
H3/H4
HIRA
NPM1( ? )
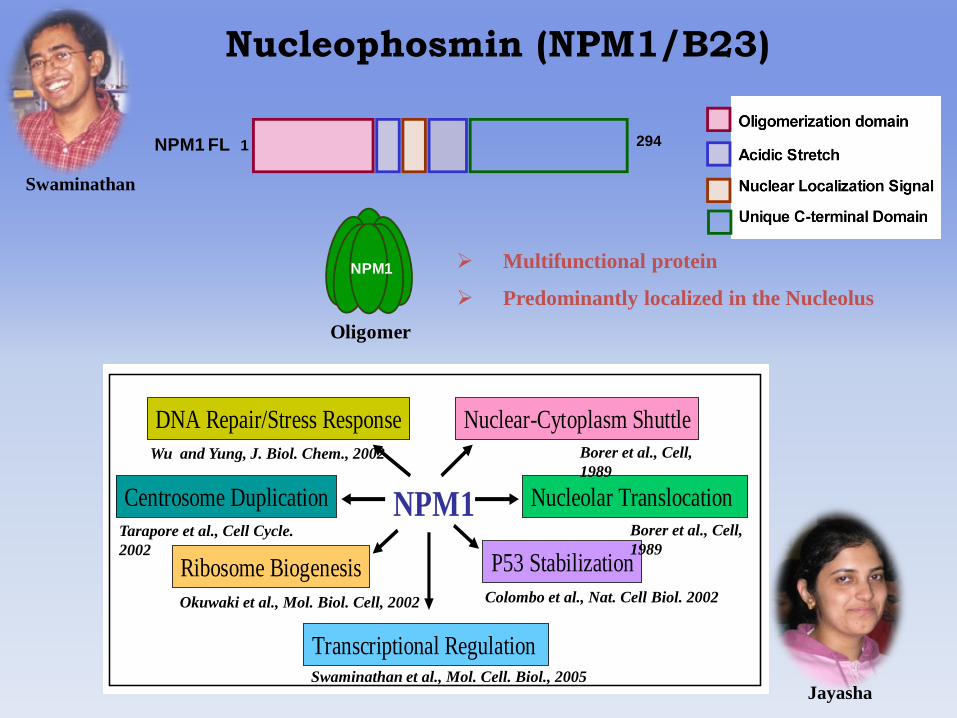
Nucleophosmin (NPM1/B23)
Multifunctional protein
Predominantly localized in the Nucleolus
1 294
Oligomer
NPM1 FL
NPM1
Swaminathan
Jayasha
Functional Diversity of NPM1
NPM1
Ribosome Biogenesis
Nuclear-Cytoplasm Shuttle
P53 Stabilization
Nucleolar Translocation
DNA Repair/Stress Response
Centrosome Duplication
Transcriptional Regulation
Post translational Modification
Acetylation Deacetylation
Phosphorylation
Sumoylation
NPM1
Borer et al., Cell,
1989
Tarapore et al., Cell Cycle.
2002
Okuwaki et al., Mol. Biol. Cell, 2002 Colombo et al., Nat. Cell Biol. 2002
Swaminathan et al., Mol. Cell. Biol., 2005
Wu and Yung, J. Biol. Chem., 2002
Borer et al., Cell,
1989
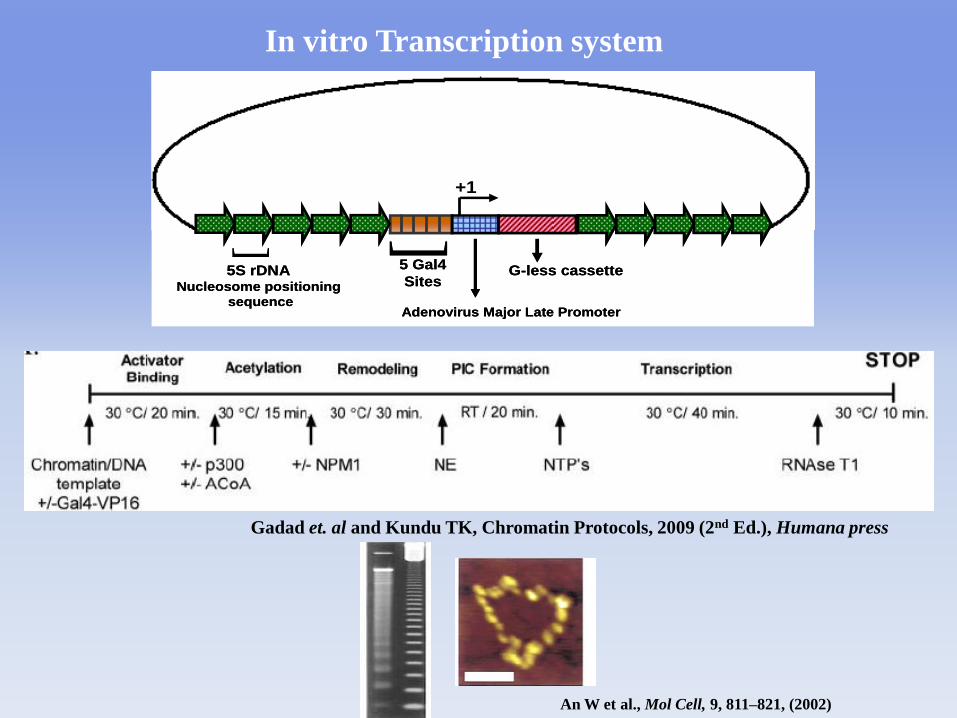
[5S rDNA
Nucleosome positioning
sequence
[
5 Gal4
Sites
Adenovirus Major Late Promoter
+1
G-less cassette[
5S rDNANucleosome positioning
sequence
[
5 Gal4
Sites
Adenovirus Major Late Promoter
+1
G-less cassette
Gadad et. al and Kundu TK, Chromatin Protocols, 2009 (2nd Ed.), Humana press
In vitro Transcription system
An W et al., Mol Cell, 9, 811–821, (2002)

NPM1 enhances Transcription from the Chromatin
template
Swaminathan et al., Mol. Cell. Biol. 2005
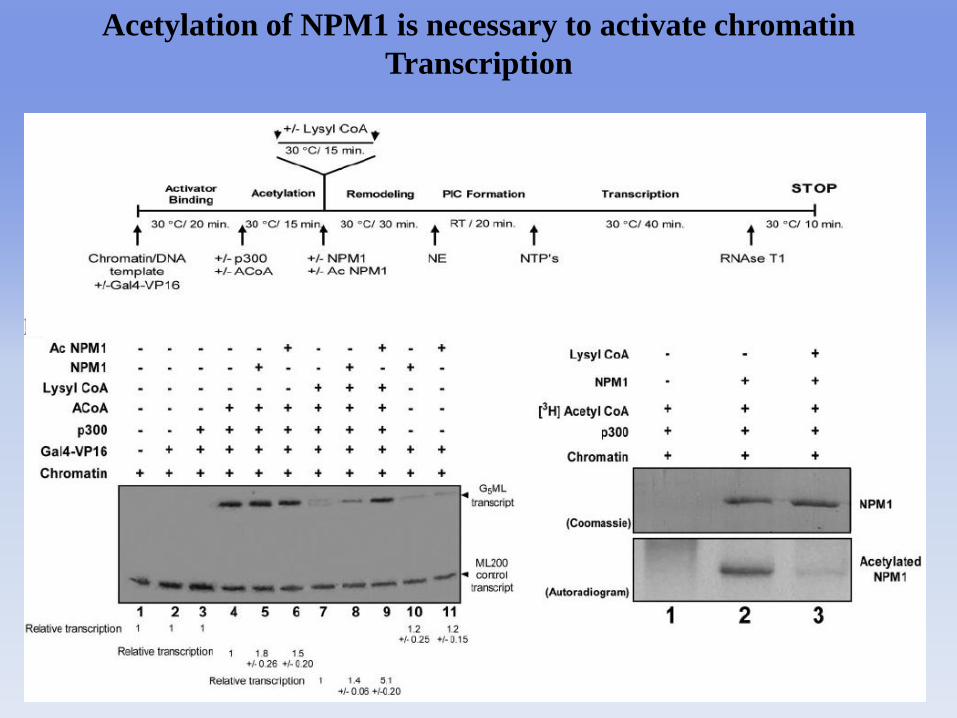
Acetylation of NPM1 is necessary to activate chromatin
Transcription
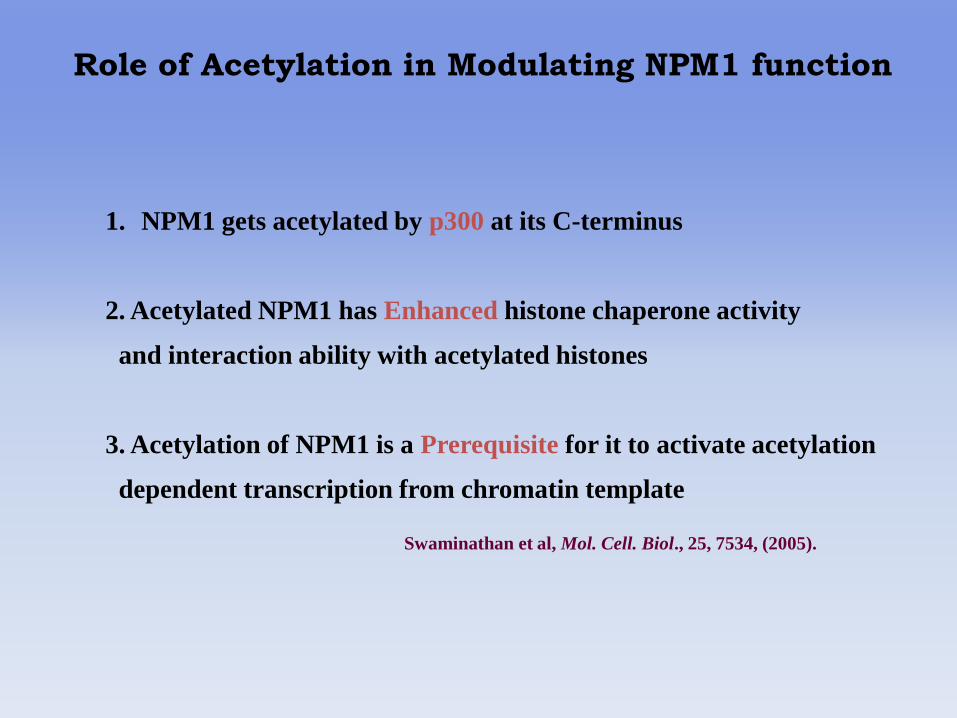
Role of Acetylation in Modulating NPM1 function
1. NPM1 gets acetylated by p300 at its C-terminus
2. Acetylated NPM1 has Enhanced histone chaperone activity
and interaction ability with acetylated histones
3. Acetylation of NPM1 is a Prerequisite for it to activate acetylation
dependent transcription from chromatin template
Swaminathan et al, Mol. Cell. Biol., 25, 7534, (2005).
215
257 267 292
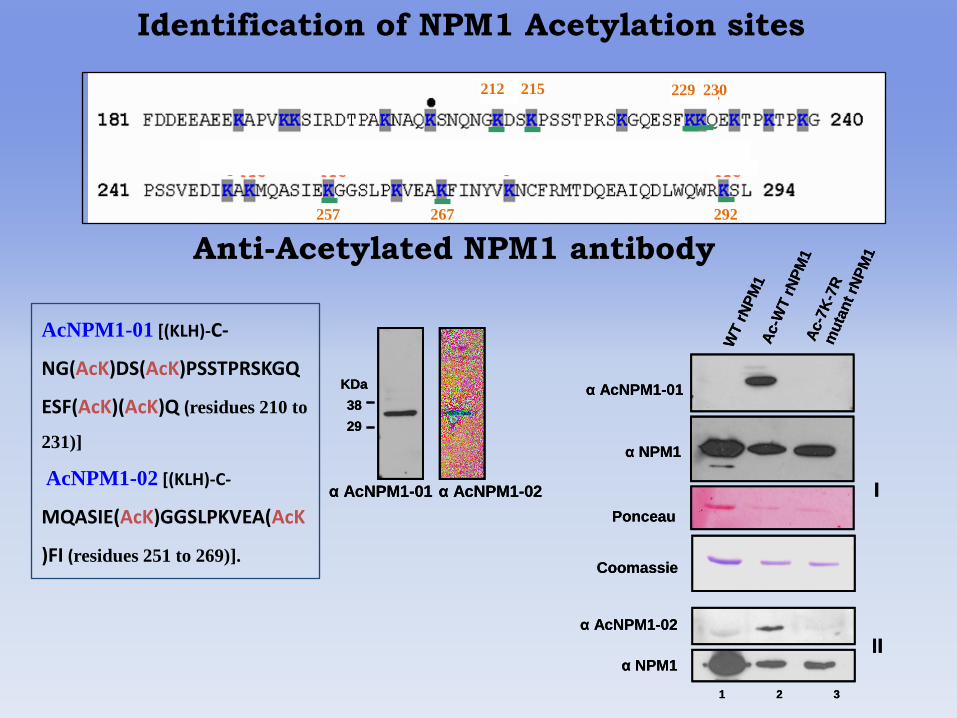
Identification of NPM1 Acetylation sites
Anti-Acetylated NPM1 antibody
AcNPM1-01 [(KLH)-C-
NG(AcK)DS(AcK)PSSTPRSKGQ
ESF(AcK)(AcK)Q (residues 210 to
231)]
AcNPM1-02 [(KLH)-C-
MQASIE(AcK)GGSLPKVEA(AcK
)FI (residues 251 to 269)].
KDa
38
29
α AcNPM1-02α AcNPM1-01
KDa
38
29
α AcNPM1-02α AcNPM1-01
α AcNPM1-02
α NPM1
1 2 3
II
Ponceau
α AcNPM1-01
WT r
NP
M1
Ac-W
T r
NP
M1
Ac-7
K-7
R
mu
tan
t rN
PM
1
α NPM1
I
Coomassie
α AcNPM1-02
α NPM1
1 2 3
II
Ponceau
α AcNPM1-01
WT r
NP
M1
Ac-W
T r
NP
M1
Ac-7
K-7
R
mu
tan
t rN
PM
1
α NPM1
I
Coomassie
212 229 230
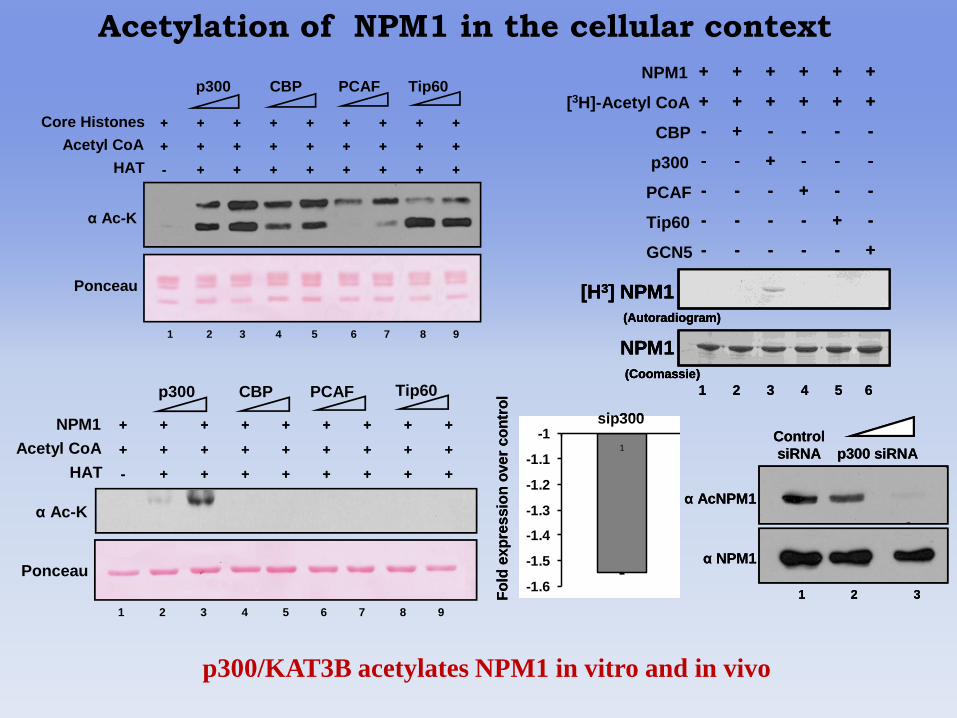
p300/KAT3B acetylates NPM1 in vitro and in vivo
Acetylation of NPM1 in the cellular context
1 2 3 4 5 6 7 8 9
Core Histones
Acetyl CoA
HAT ++++++++-
+++++++++
+++++++++
++++++++-
+++++++++
+++++++++
p300 CBP PCAF Tip60
α Ac-K
Ponceau
1 2 3 4 5 6 7 8 9
++++++++-
+++++++++
+++++++++
++++++++-
+++++++++
+++++++++NPM1
Acetyl CoA
HAT
p300 CBP PCAF Tip60
α Ac-K
Ponceau-1.6
-1.5
-1.4
-1.3
-1.2
-1.1
-11 2
Series1
sip300 siSIRT1
Fo
ld e
xp
res
sio
n o
ve
r c
on
tro
l
-1.6
-1.5
-1.4
-1.3
-1.2
-1.1
-11 2
Series1
sip300 siSIRT1
Fo
ld e
xp
res
sio
n o
ve
r c
on
tro
l
Control
siRNA p300 siRNA
1 2 3
α AcNPM1
α NPM1
Control
siRNA p300 siRNA
1 2 3
α AcNPM1
α NPM1
NPM1
[3H]-Acetyl CoA
CBP
p300
PCAF
Tip60
GCN5 +-----
-+----
--+---
---+--
----+-
++++++
++++++
+-----
-+----
--+---
---+--
----+-
++++++
++++++
1 2 3 4 5 6
(Autoradiogram)
(Coomassie)
[H3] NPM1
NPM1
1 2 3 4 5 6
(Autoradiogram)
(Coomassie)
[H3] NPM1
NPM1
(Autoradiogram)
(Coomassie)
[H3] NPM1
NPM1
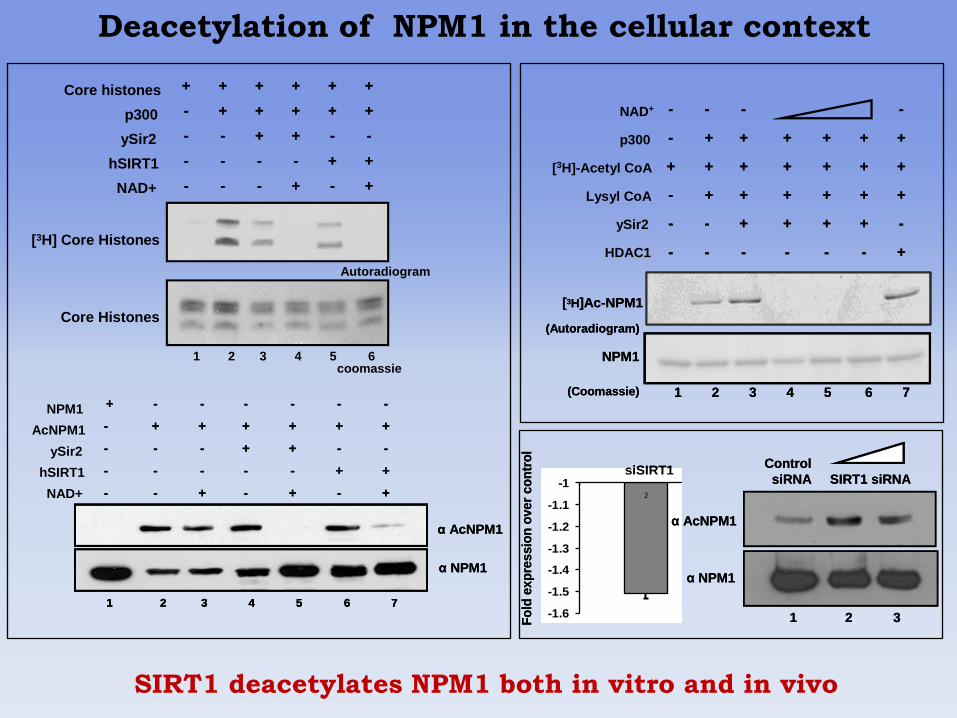
Deacetylation of NPM1 in the cellular context
+ + + + + +
- + + + + +
- - + + - -
- - - - + +
- - - + - +
+ + + + + +
- + + + + +
- - + + - -
- - - - + +
- - - + - +
Core histones
p300
ySir2
hSIRT1
NAD+
coomassie
Autoradiogram
1 2 3 4 5 6
[3H] Core Histones
Core Histones
1 2 3 4 5 6 7
α AcNPM1
α NPM1
1 2 3 4 5 6 71 2 3 4 5 6 7
α AcNPM1
α NPM1
NPM1
AcNPM1
ySir2
hSIRT1
NAD+ +-+-+--
++-----
--++---
++++++-
------+
+-+-+--
++-----
--++---
++++++-
------+
+------
-++++--
++++++-
+++++++
++++++-
----
+------
-++++--
++++++-
+++++++
++++++-
----NAD+
p300
[3H]-Acetyl CoA
Lysyl CoA
ySir2
HDAC1
1 2 3 4 5 6 70
2500
5000
7500
10000
12500
15000
17500
Histones
p300
[3H]-Acetyl CoA
Lysyl CoA
hSirT2
NAD+
HDAC1
+ + + + + + +
+ + + + + +
+ + + + + + +
+ + + + + +
+ + + +
+ + ++
-
-
-
--
-
- - -- - - - -
100 M
250 M
500 M
-
CP
M
p300
[3H]-Acetyl CoA
Lysyl CoA
hSirT2
NAD+
HDAC1
+ + + + + +
+ + + + + + +
+ + + + + +
+ + + +
+ + +
+
-
-
-
-
--
- - -
- - - - -
100 M
250 M
500 M
-
1 2 3 4 5 6 7
1 2 3 4 5 6 7 (Coomassie)
(Autoradiogram)
NPM1
[3H]Ac-NPM1
-1.6
-1.5
-1.4
-1.3
-1.2
-1.1
-11 2
Series1
sip300 siSIRT1
Fo
ld e
xp
res
sio
n o
ve
r c
on
tro
l
-1.6
-1.5
-1.4
-1.3
-1.2
-1.1
-11 2
Series1
sip300 siSIRT1
Fo
ld e
xp
res
sio
n o
ve
r c
on
tro
l
-1.6
-1.5
-1.4
-1.3
-1.2
-1.1
-11 2
Series1
sip300 siSIRT1
Fo
ld e
xp
res
sio
n o
ve
r c
on
tro
l
-1.6
-1.5
-1.4
-1.3
-1.2
-1.1
-11 2
Series1
sip300 siSIRT1
Fo
ld e
xp
res
sio
n o
ve
r c
on
tro
l
Control
siRNA SIRT1 siRNA
1 2 3
α AcNPM1
α NPM1
Control
siRNA SIRT1 siRNA
1 2 3
α AcNPM1
α NPM1
SIRT1 deacetylates NPM1 both in vitro and in vivo
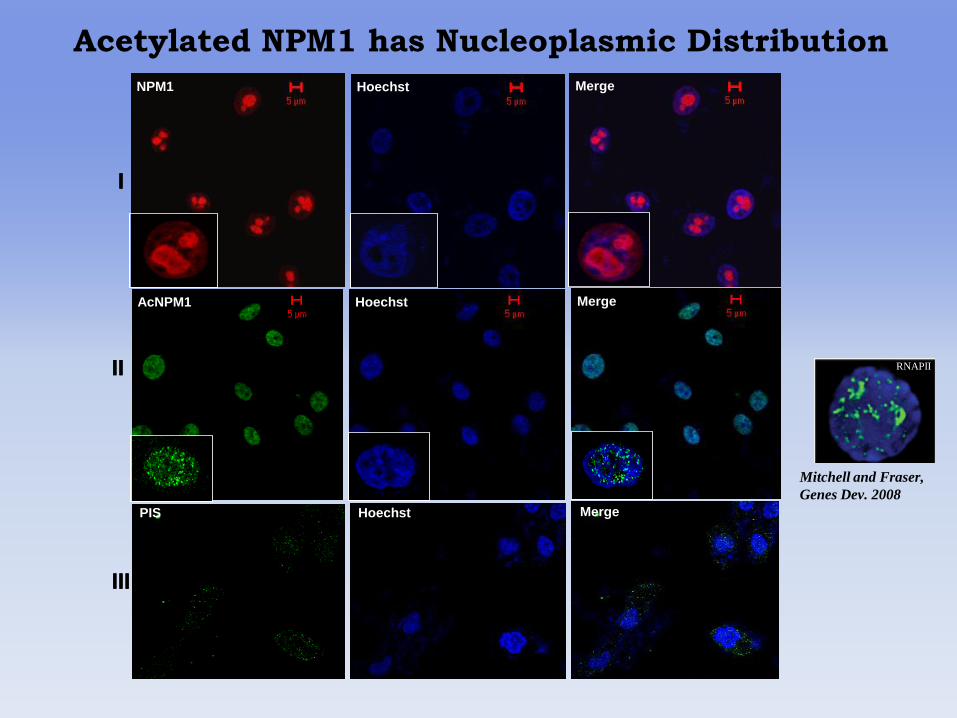
Acetylated NPM1 has Nucleoplasmic Distribution
AcNPM1 Hoechst Merge
NPM1 Hoechst Merge
I
II
III
PIS Hoechst Merge
AcNPM1 Hoechst Merge
NPM1 Hoechst Merge
I
II
III
PIS Hoechst Merge
Mitchell and Fraser,
Genes Dev. 2008
RNAPII
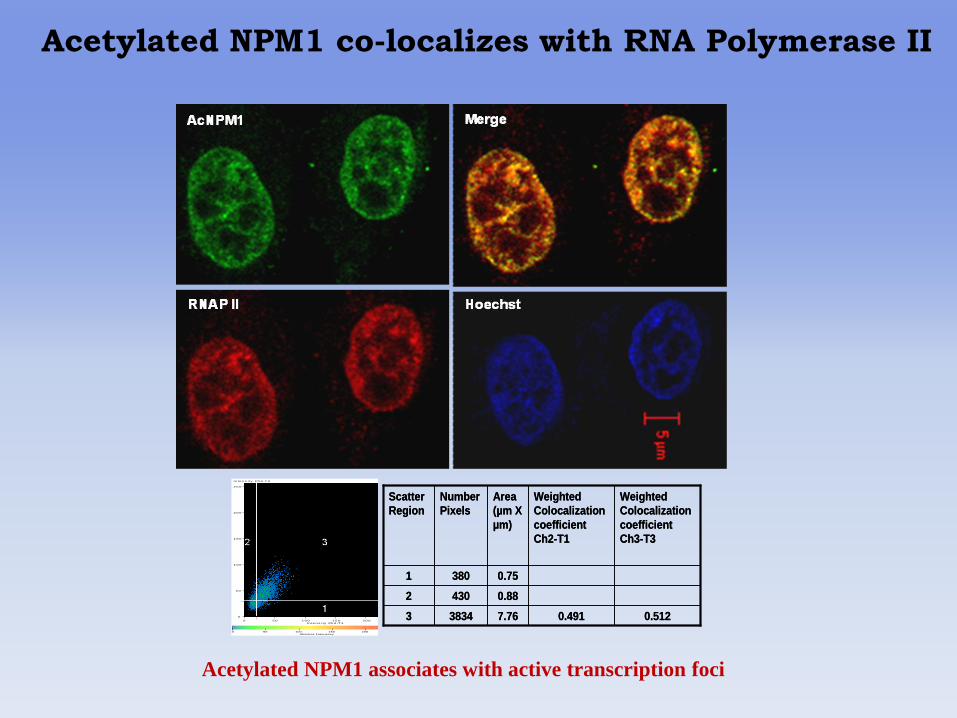
0.491
Weighted
Colocalization
coefficient
Ch2-T1
0.5127.7638343
0.884302
0.753801
Weighted
Colocalization
coefficient
Ch3-T3
Area
(µm X
µm)
Number
Pixels
Scatter
Region
0.491
Weighted
Colocalization
coefficient
Ch2-T1
0.5127.7638343
0.884302
0.753801
Weighted
Colocalization
coefficient
Ch3-T3
Area
(µm X
µm)
Number
Pixels
Scatter
Region
0 5 0 1 0 0 1 5 0 2 0 0 2 5 0In te n s i ty Ch 2 -T1
0
5 0
1 0 0
1 5 0
2 0 0
2 5 0
In te n s i ty Ch 3 -T3
Absolute Frequency0 50 100 150 200 250
Scatter Region123
Number Pixels3734353834
Area [ µm x µm ]0.750.887.76
Relative Area [ %]0.00.00.4
Mean Intensity Ch2-T1261538
Mean Intensity Ch3-T3243852
Standard Deviation Ch2-T16312
Standard Deviation Ch3-T34815
Colocalization Coefficient Ch2-T1
0.911
Colocalization Coefficient Ch3-T3
0.898
Weighted Coloc. Coefficient Ch2-T1
0.957
Weighted Coloc. Coefficient Ch3-T3
0.958
Overlap Coefficient
1.0
Correlation R
0.55
Correlation R x R
0.31
Acetylated NPM1 co-localizes with RNA Polymerase II
Acetylated NPM1 associates with active transcription foci
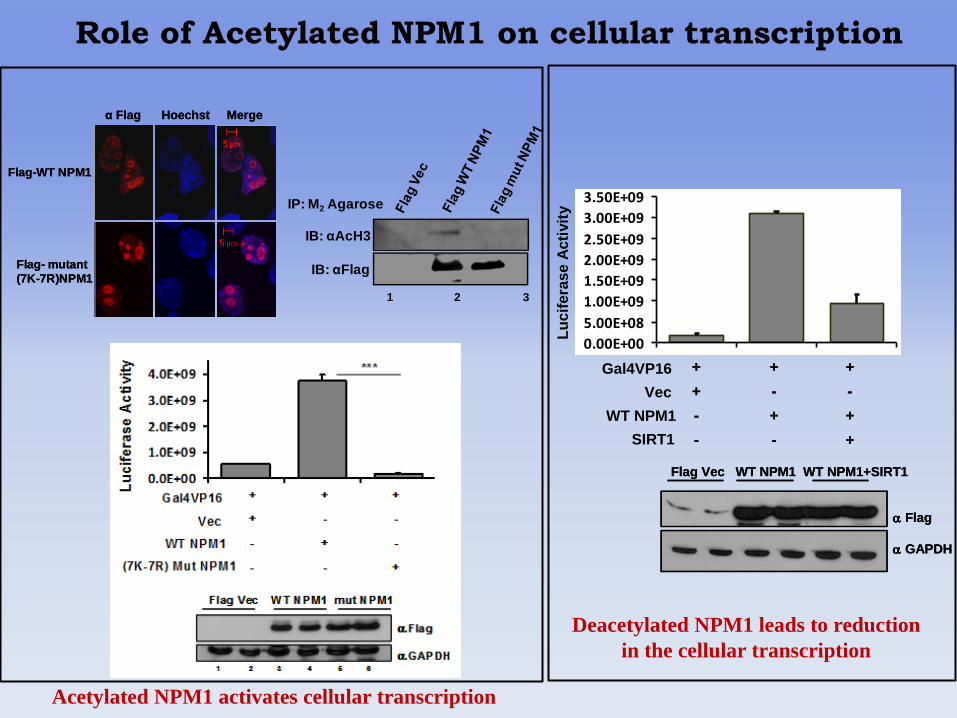
Role of Acetylated NPM1 on cellular transcription
Flag- mutant
(7K-7R)NPM1
Flag-WT NPM1
α Flag Hoechst Merge
Flag- mutant
(7K-7R)NPM1
Flag-WT NPM1
α Flag Hoechst Merge
IP: M2 Agarose
IB: αAcH3
IB: αFlag
1 2 3
+ + +
+ - -
- + +
- - +
+ + +
+ - -
- + +
- - +
Gal4VP16
Vec
WT NPM1
SIRT1
Lu
cif
era
se
Ac
tivit
y
1 2 30.00E+00
5.00E+08
1.00E+09
1.50E+09
2.00E+09
2.50E+09
3.00E+09
3.50E+09
1 2 3
Series1
Flag
GAPDH
Flag Vec WT NPM1 WT NPM1+SIRT1
Flag
GAPDH
Flag Vec WT NPM1 WT NPM1+SIRT1
Acetylated NPM1 activates cellular transcription
Deacetylated NPM1 leads to reduction
in the cellular transcription
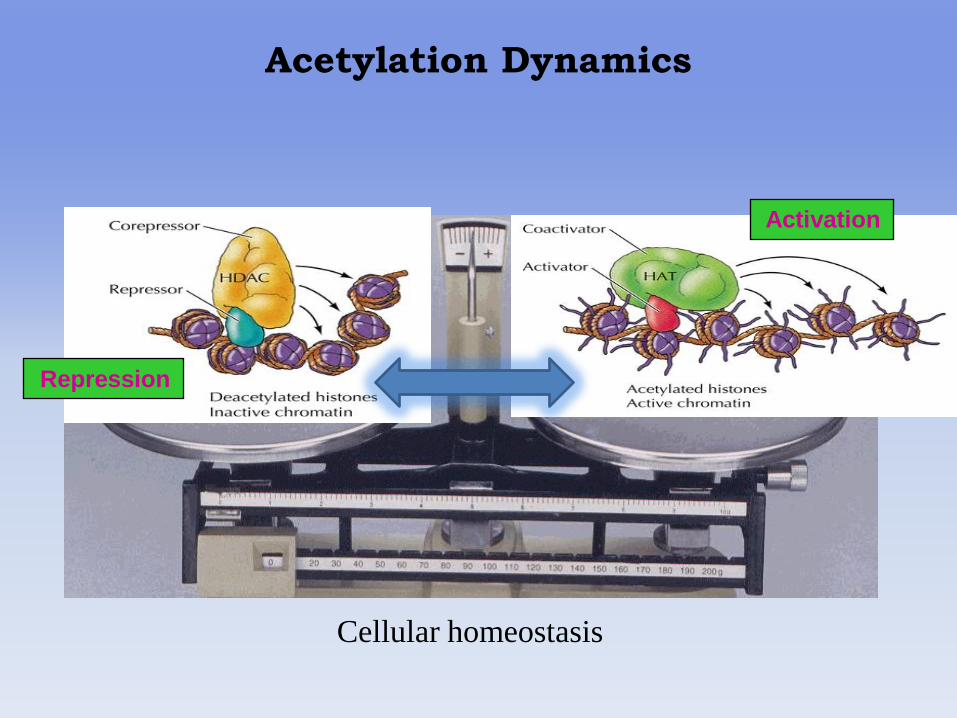
Repression
Activation
Cellular homeostasis
Acetylation Dynamics
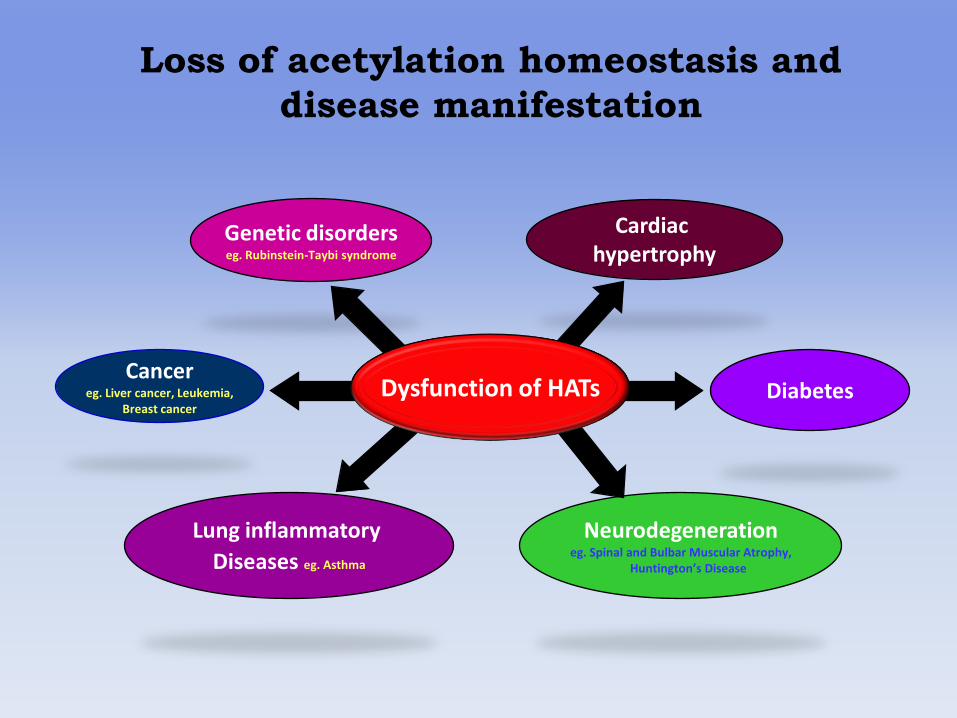
Cancereg. Liver cancer, Leukemia,
Breast cancerDiabetes
Lung inflammatory
Diseases eg. Asthma
Cardiac hypertrophy
Neurodegenerationeg. Spinal and Bulbar Muscular Atrophy,
Huntington’s Disease
Genetic disorderseg. Rubinstein-Taybi syndrome
Dysfunction of HATs
Loss of acetylation homeostasis and
disease manifestation
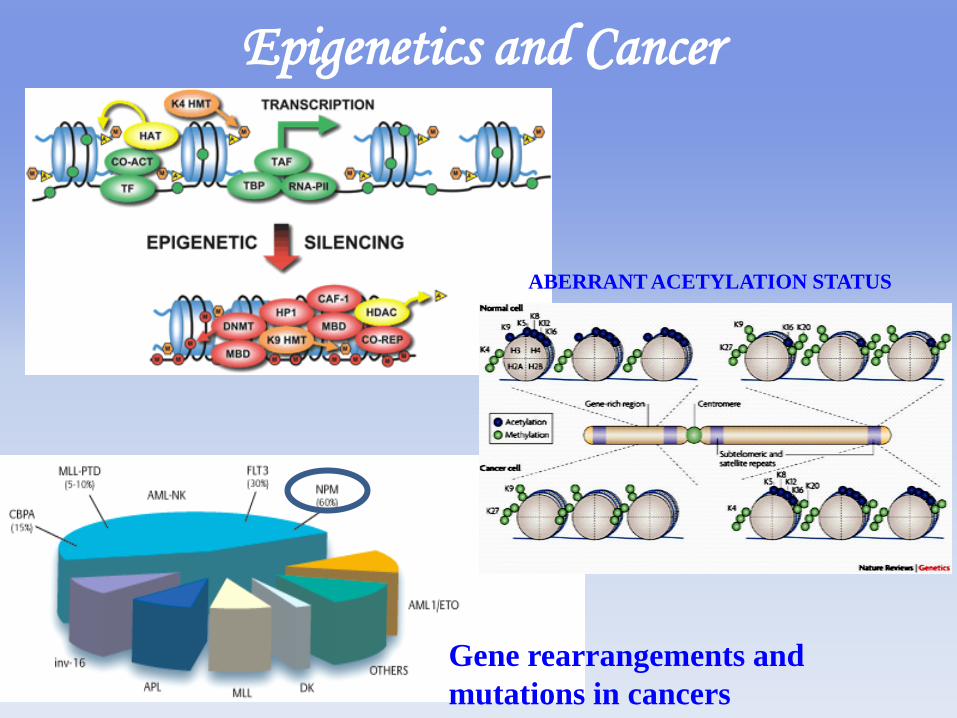
Epigenetics and Cancer
ABERRANT ACETYLATION STATUS
Gene rearrangements and
mutations in cancers
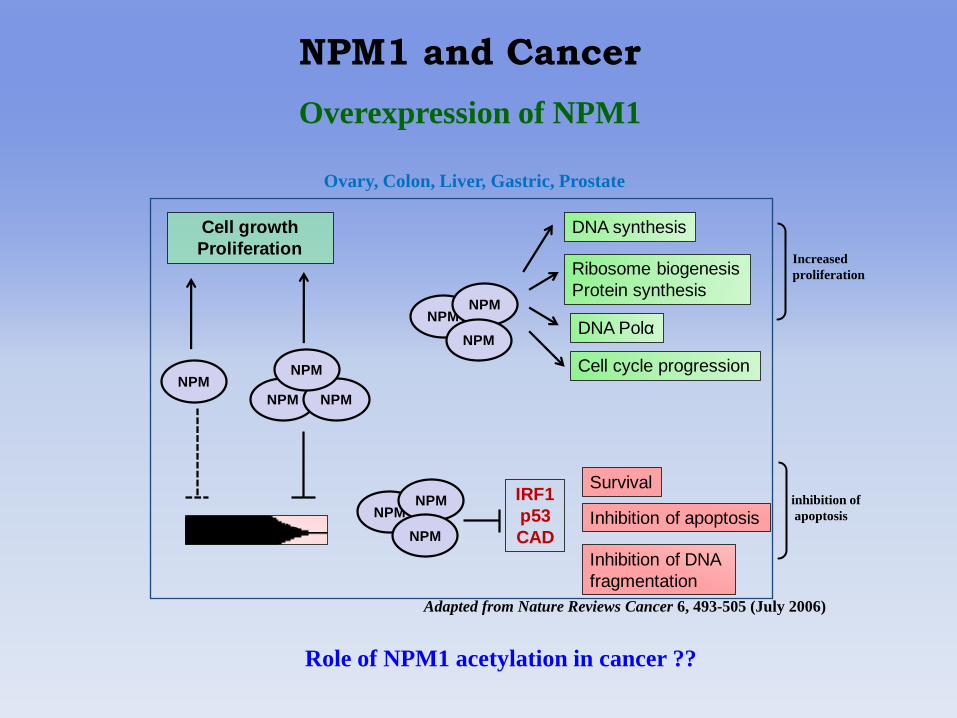
Overexpression of NPM1
Ovary, Colon, Liver, Gastric, Prostate
Adapted from Nature Reviews Cancer 6, 493-505 (July 2006)
Increased
proliferation
inhibition of
apoptosis
NPM1 and Cancer
Role of NPM1 acetylation in cancer ??
Apoptosis
Cell growth
Proliferation
NPM
NPM
NPM NPM
NPM
NPM
NPM
Ribosome biogenesis
Protein synthesis
DNA Polα
DNA synthesis
Cell cycle progression
NPMNPM
NPM
Survival
Inhibition of DNA
fragmentation
Inhibition of apoptosis
IRF1
p53
CAD
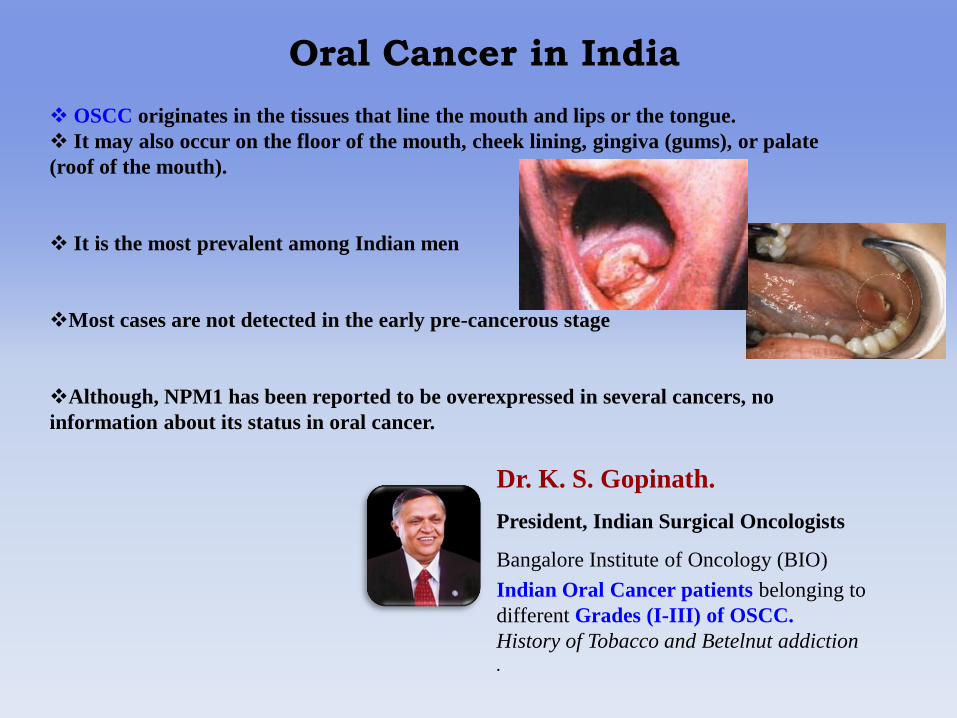
Dr. K. S. Gopinath.
President, Indian Surgical Oncologists
Bangalore Institute of Oncology (BIO)
Indian Oral Cancer patients belonging to
different Grades (I-III) of OSCC.
History of Tobacco and Betelnut addiction.
Oral Cancer in India
OSCC originates in the tissues that line the mouth and lips or the tongue.
It may also occur on the floor of the mouth, cheek lining, gingiva (gums), or palate
(roof of the mouth).
It is the most prevalent among Indian men
Most cases are not detected in the early pre-cancerous stage
Although, NPM1 has been reported to be overexpressed in several cancers, no
information about its status in oral cancer.
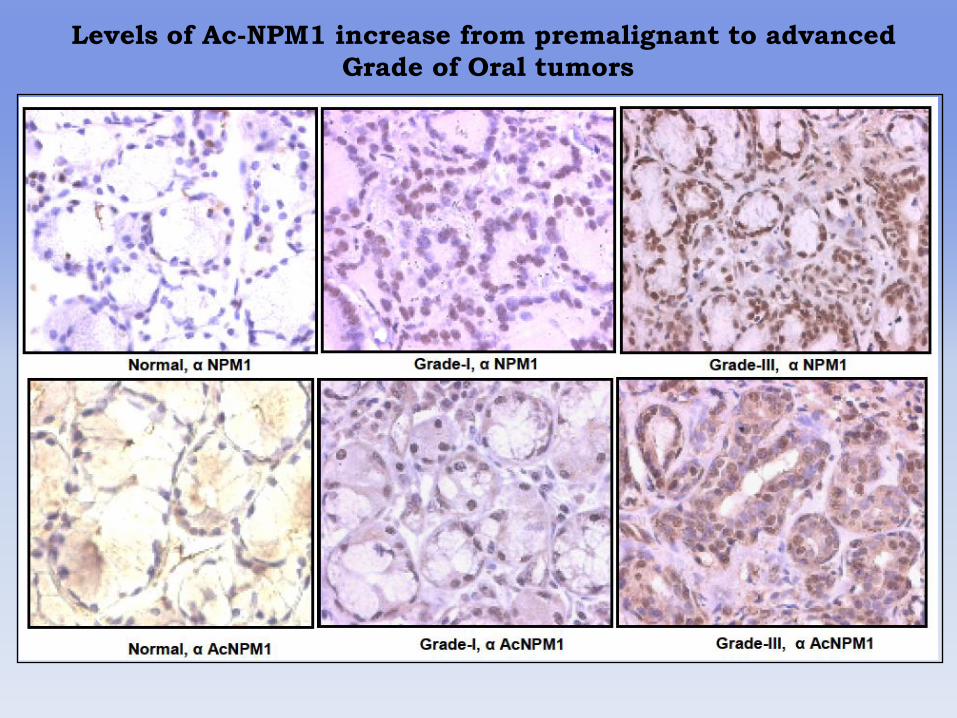
Levels of Ac-NPM1 increase from premalignant to advanced
Grade of Oral tumors
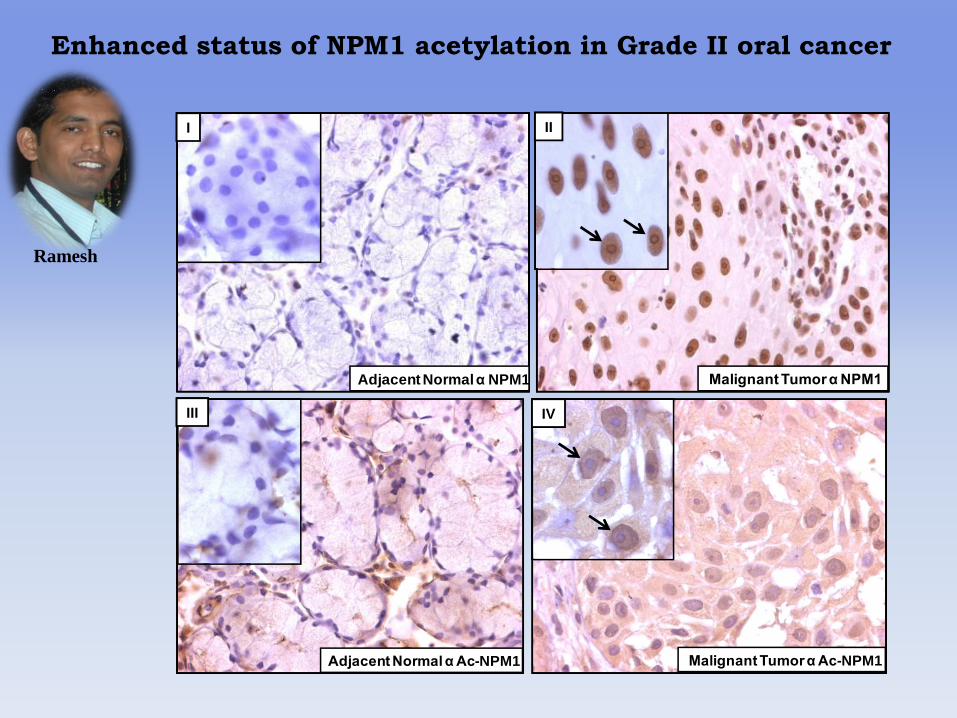
Enhanced status of NPM1 acetylation in Grade II oral cancer
Adjacent Normal α Ac-NPM1 Malignant Tumor α Ac-NPM1
Malignant Tumor α NPM1Adjacent Normal α NPM1
I II
III IV
Adjacent Normal α Ac-NPM1 Malignant Tumor α Ac-NPM1
Malignant Tumor α NPM1Adjacent Normal α NPM1
Adjacent Normal α Ac-NPM1 Malignant Tumor α Ac-NPM1
Malignant Tumor α NPM1Adjacent Normal α NPM1
I II
III IV
Ramesh
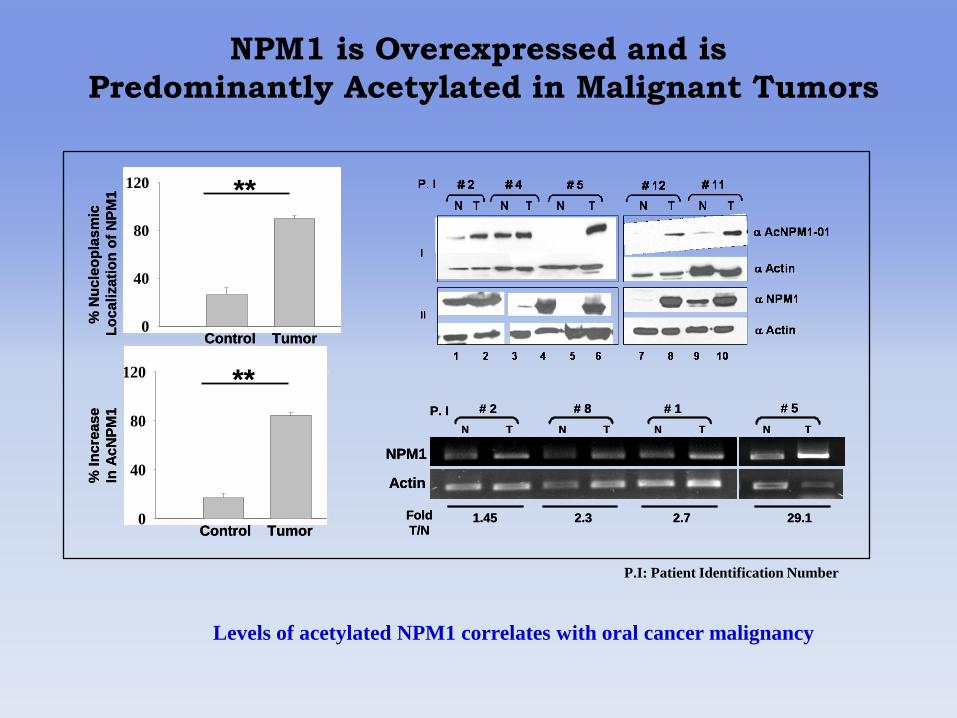
NPM1 is Overexpressed and is
Predominantly Acetylated in Malignant TumorsFold increase in nucleoplasmic
localization of NPM1
% N
ucl
eop
lasm
loca
liza
tio
n
0
40
80
120
contr
ol
Tum
or
**
Control Tumor
% N
uc
leo
pla
sm
ic
Lo
ca
liza
tio
n o
f N
PM
1Fold increase in nucleoplasmic
localization of NPM1
% N
ucl
eop
lasm
loca
liza
tio
n
0
40
80
120
contr
ol
Tum
or
**
Control Tumor
% N
uc
leo
pla
sm
ic
Lo
ca
liza
tio
n o
f N
PM
1
Fold increase
in AcNPM1
% i
ncrea
se i
n
AcN
PM
1
0
40
80
120
contr
ol
Tum
or
% I
ncre
ase
In A
cN
PM
1
Control Tumor
**
Fold increase
in AcNPM1
% i
ncrea
se i
n
AcN
PM
1
0
40
80
120
contr
ol
Tum
or
% I
nc
rease
In A
cN
PM
1
Control Tumor
**
N T N T N T N T
NPM1
Actin
P. I
Fold
T/N1.45 2.3 2.7 29.1
# 2 # 8 # 5# 1
N T N T N T N T
NPM1
Actin
P. I
Fold
T/N1.45 2.3 2.7 29.1
# 2 # 8 # 5# 1
P.I: Patient Identification Number
Levels of acetylated NPM1 correlates with oral cancer malignancy
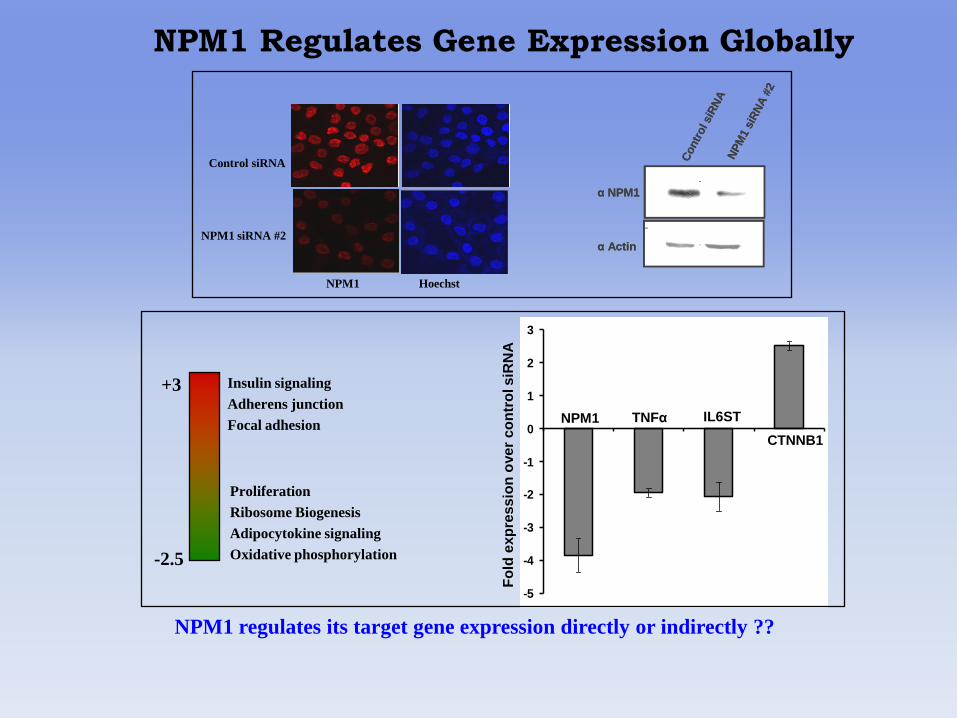
NPM1 Regulates Gene Expression Globally
Control siRNA
NPM1 siRNA #2
NPM1 Hoechst
α Actin
α NPM1
Contr
ol siR
NA
NP
M1 s
iRN
A#2
α Actin
α NPM1
Contr
ol siR
NA
NP
M1 s
iRN
A#2
+3
-2.5
Proliferation
Ribosome Biogenesis
Adipocytokine signaling
Oxidative phosphorylation
Insulin signaling
Adherens junction
Focal adhesion
-5
-4
-3
-2
-1
0
1
2
3
1 2 3 4
NPM1 TNFα IL6ST
CTNNB1
-5
-4
-3
-2
-1
0
1
2
3
1 2 3 4
-5
-4
-3
-2
-1
0
1
2
3
1 2 3 4
NPM1 TNFα IL6ST
CTNNB1
Fo
ld e
xp
res
sio
n o
ve
r c
on
tro
l s
iRN
A
NPM1 regulates its target gene expression directly or indirectly ??
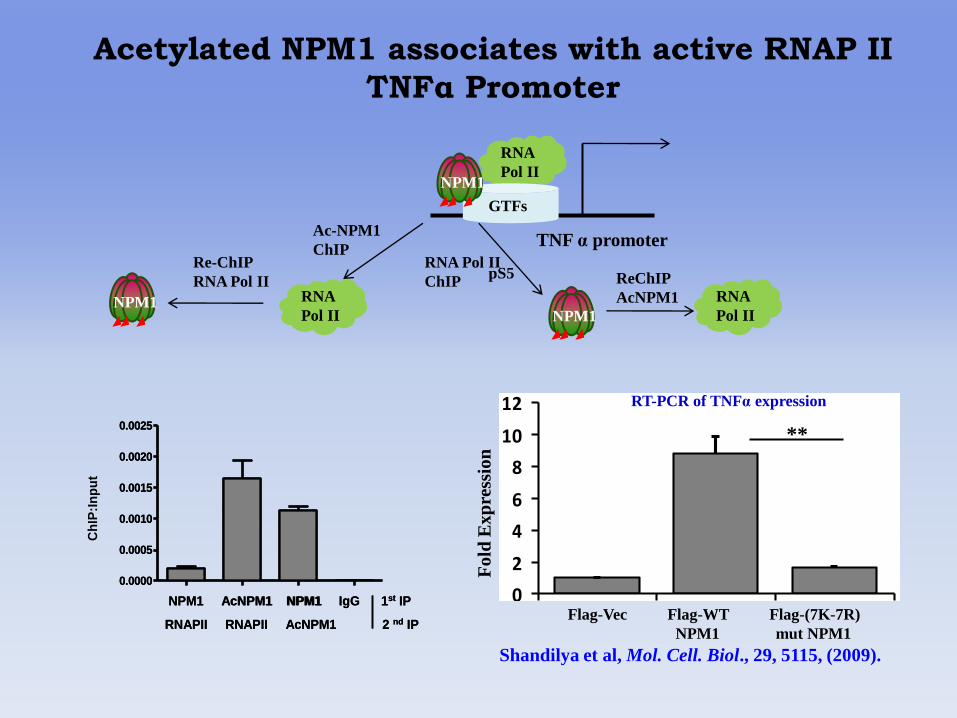
Acetylated NPM1 associates with active RNAP II
TNFα Promoter
TNF α promoter
RNA
Pol II
GTFs
NPM1
Ac-NPM1
ChIP
RNA
Pol II
RNA Pol II
ChIP
NPM1
Shandilya et al, Mol. Cell. Biol., 29, 5115, (2009).
pS5
NPM1 AcNPM1 NPM1 IgG 1st IP
RNAPII RNAPII AcNPM1 2 nd IP
Data 1
np
acnp
nacn
igg
0.0000
0.0005
0.0010
0.0015
0.0020
0.0025
NPM1 AcNPM1 NPM1 IgG 1st IP
RNAPII RNAPII AcNPM1 2 nd IP
Data 1
np
acnp
nacn
igg
0.0000
0.0005
0.0010
0.0015
0.0020
0.0025
Ch
IP:I
np
ut
Re-ChIP
RNA Pol II
NPM1
ReChIP
AcNPM1 RNA
Pol II
Flag-Vec Flag-WT Flag-(7K-7R)
NPM1 mut NPM1
Fo
ld E
xp
ress
ion
0
2
4
6
8
10
12
1 2 3
Series1
**
RT-PCR of TNFα expression
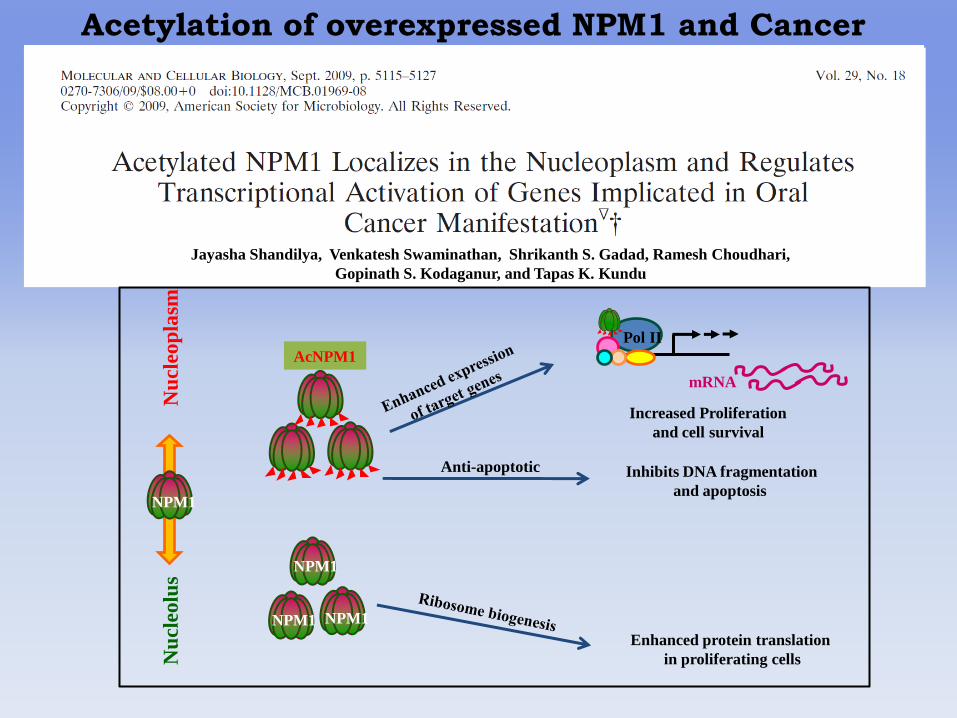
Acetylation of overexpressed NPM1 and Cancer
mRNA
Pol II
Increased Proliferation
and cell survival
Anti-apoptotic
Nu
cleo
lus
Nu
cleo
pla
sm
Enhanced protein translation
in proliferating cells
Inhibits DNA fragmentation
and apoptosis NPM1
NPM1
NPM1NPM1
AcNPM1
Jayasha Shandilya, Venkatesh Swaminathan, Shrikanth S. Gadad, Ramesh Choudhari,
Gopinath S. Kodaganur, and Tapas K. Kundu
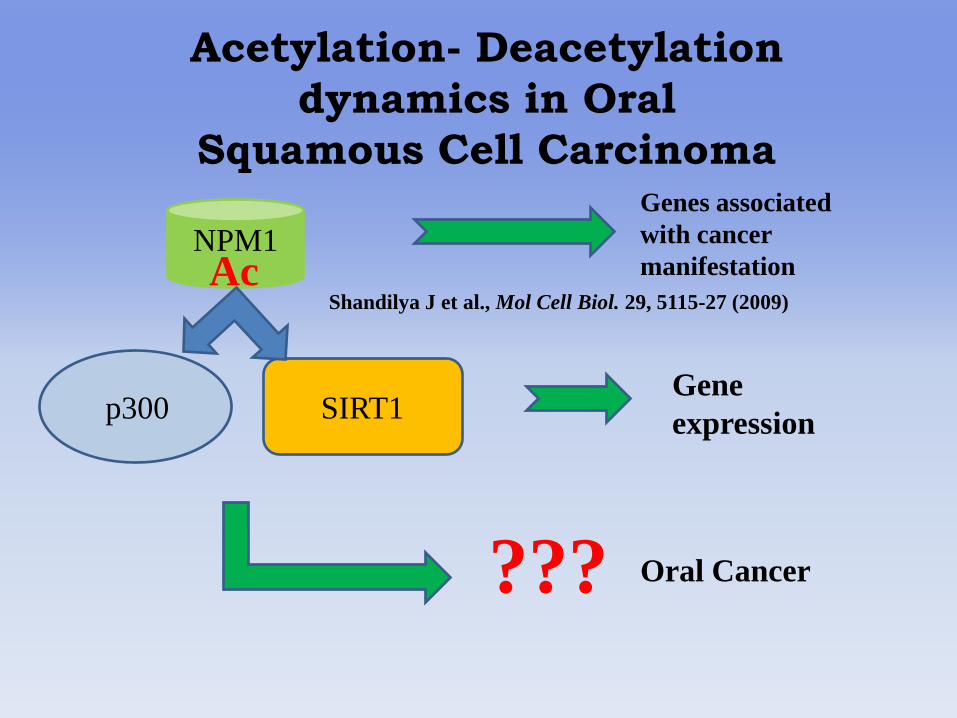
Acetylation- Deacetylation
dynamics in Oral
Squamous Cell Carcinoma
p300 SIRT1
NPM1
Gene
expression
Ac
Genes associated
with cancer
manifestation
Shandilya J et al., Mol Cell Biol. 29, 5115-27 (2009)
Oral Cancer???
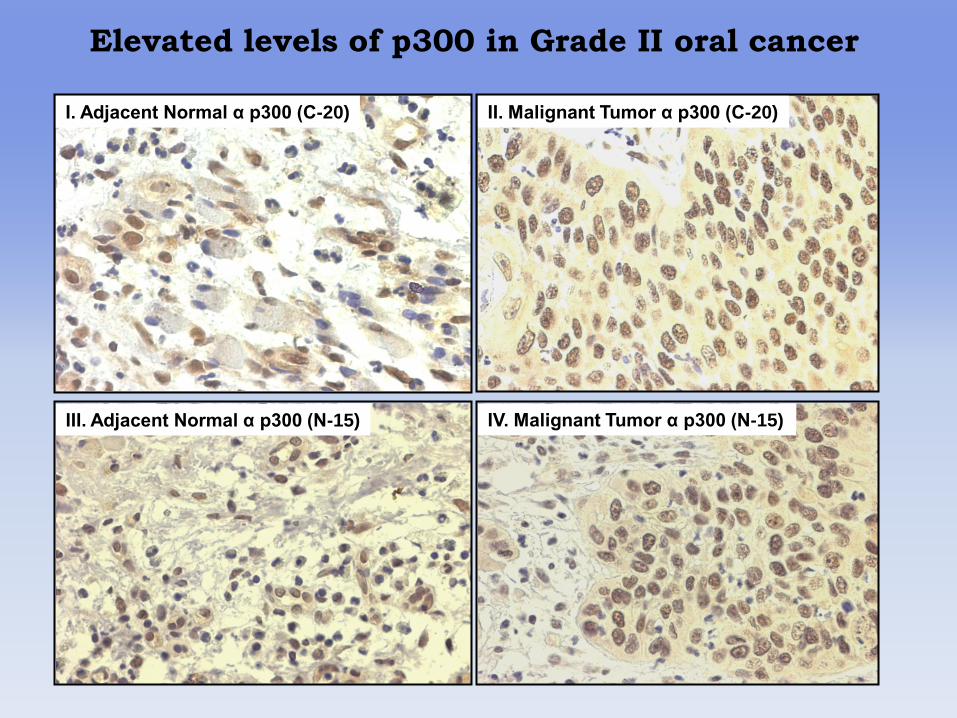
I. Adjacent Normal α p300 (C-20) II. Malignant Tumor α p300 (C-20)
III. Adjacent Normal α p300 (N-15) IV. Malignant Tumor α p300 (N-15)
Elevated levels of p300 in Grade II oral cancer
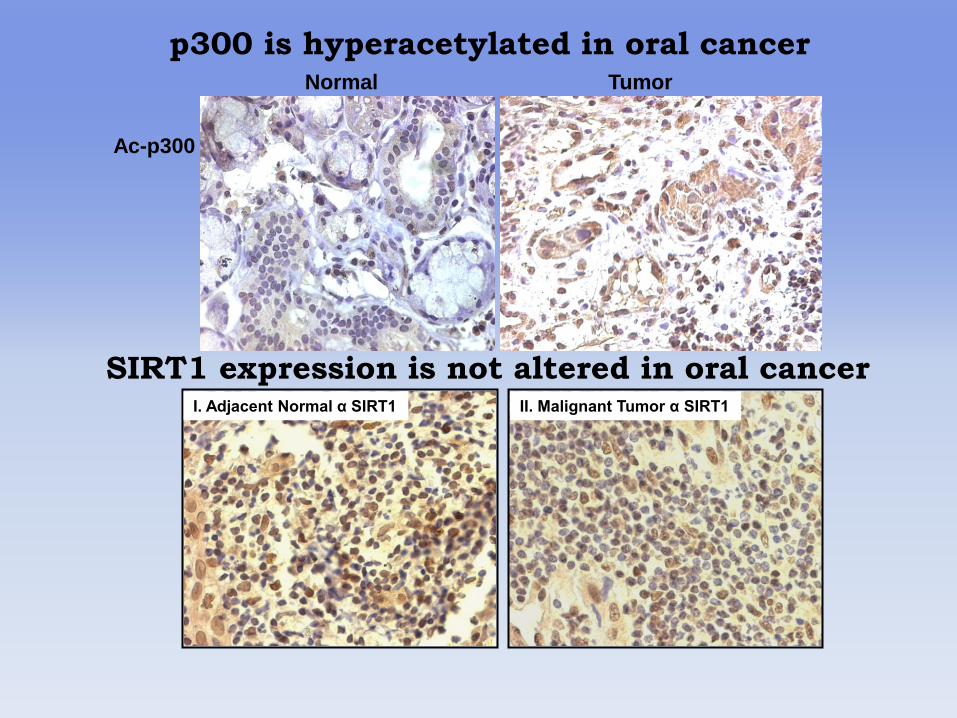
Normal Tumor
Ac-p300
p300 is hyperacetylated in oral cancer
SIRT1 expression is not altered in oral cancerI. Adjacent Normal α SIRT1 II. Malignant Tumor α SIRT1
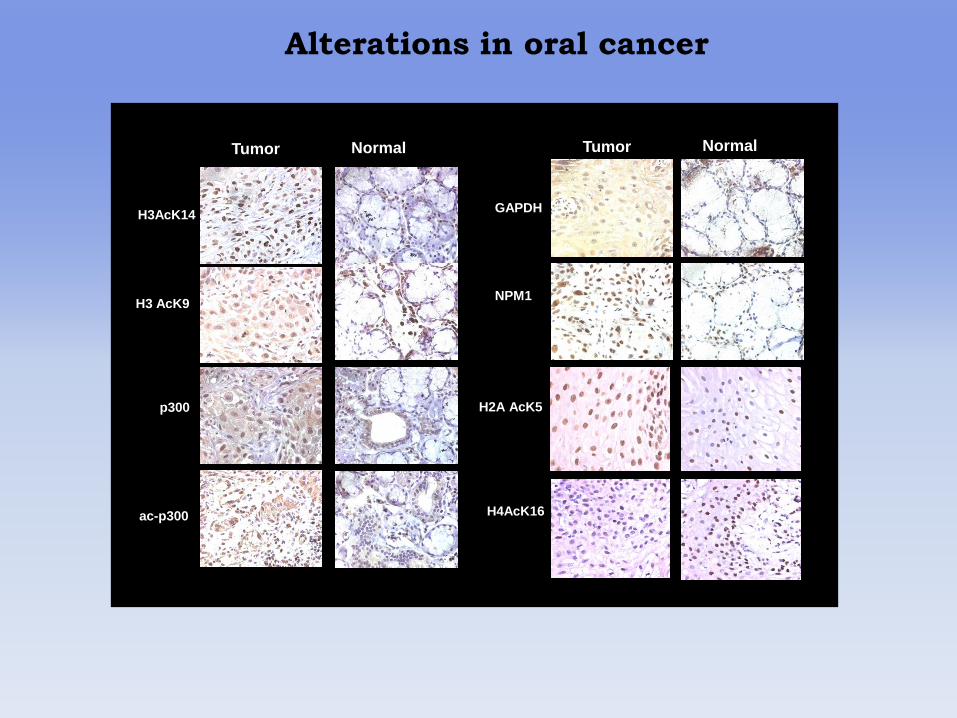
Alterations in oral cancer
Normal
ac-p300
H3AcK14
H3 AcK9
Tumor
p300
GAPDH
NPM1
H2A AcK5
H4AcK16
NormalTumor
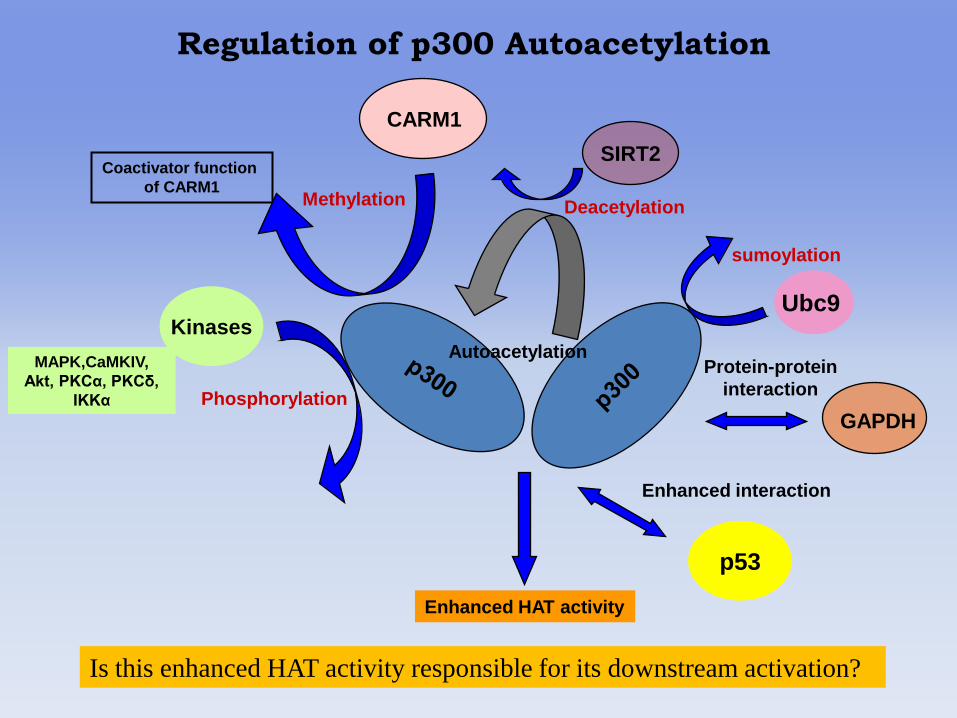
MAPK,CaMKIV,
Akt, PKCα, PKCδ,
IKKα
Coactivator function
of CARM1
Autoacetylation
Enhanced HAT activity
CARM1
Methylation
p53
Enhanced interaction
GAPDH
Protein-protein
interaction
SIRT2
Deacetylation
Phosphorylation
KinasesUbc9
sumoylation
Regulation of p300 Autoacetylation
Is this enhanced HAT activity responsible for its downstream activation?
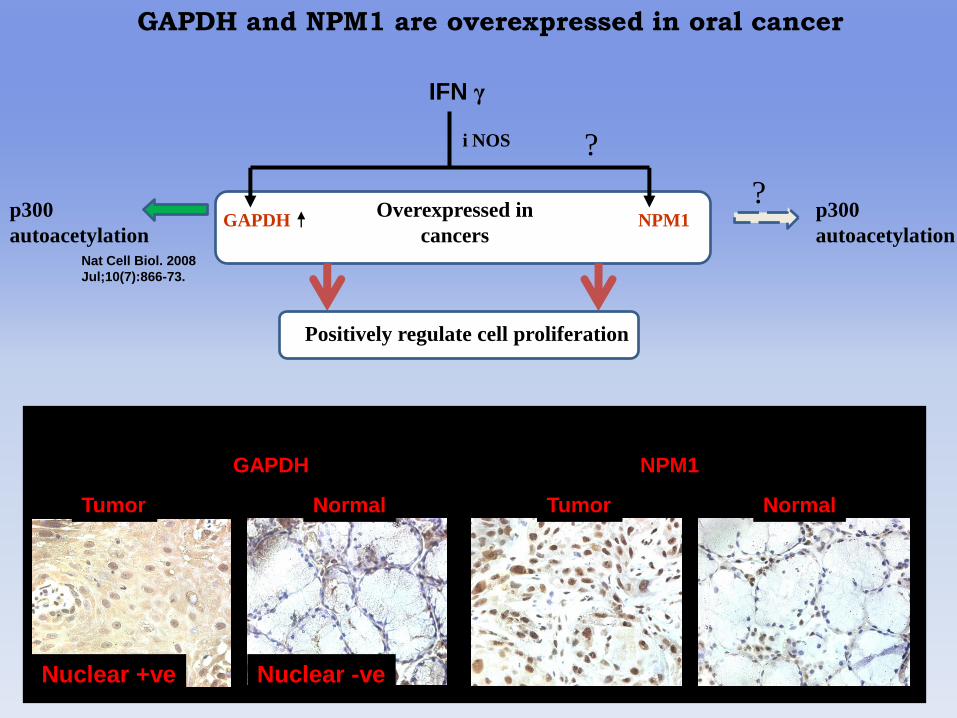
GAPDH and NPM1 are overexpressed in oral cancer
GAPDH
Nuclear +ve Nuclear -ve
Tumor Normal
NPM1
Tumor Normal
GAPDH NPM1
i NOS
Nat Cell Biol. 2008
Jul;10(7):866-73.
IFN γ
p300
autoacetylation
p300
autoacetylation
?Overexpressed in
cancers
?
Positively regulate cell proliferation
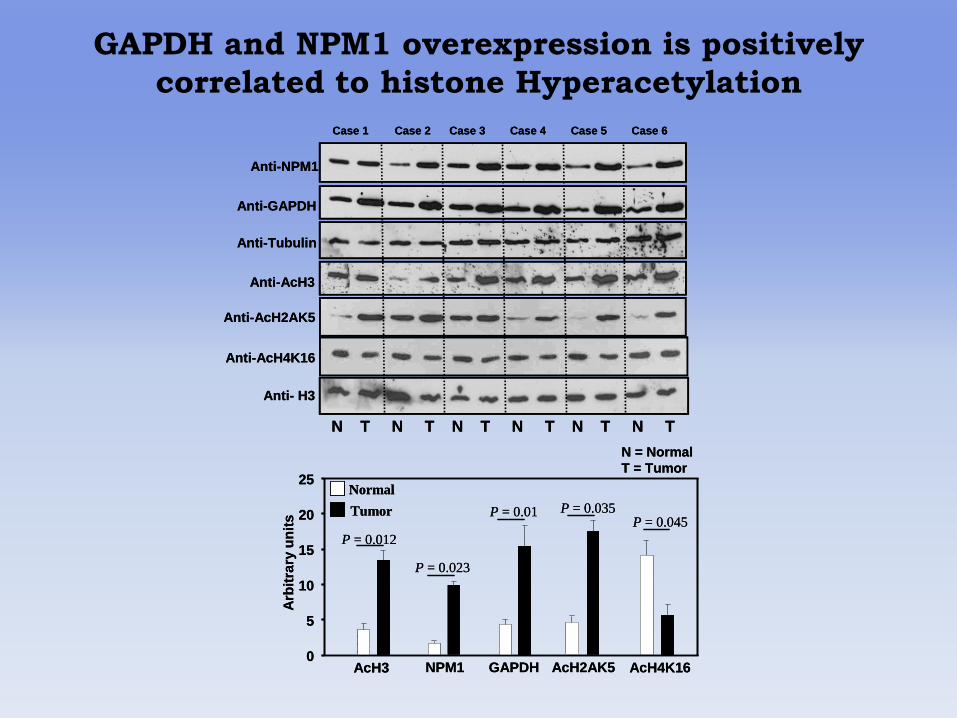
GAPDH and NPM1 overexpression is positively
correlated to histone Hyperacetylation
Anti-NPM1
Anti-GAPDH
Anti-Tubulin
Anti-AcH3
Anti- H3
Case 1 Case 2 Case 3 Case 4 Case 5 Case 6
N T N T N T N T N T N T
N = Normal
T = Tumor
Anti-AcH2AK5
Anti-AcH4K16
Anti-NPM1
Anti-GAPDH
Anti-Tubulin
Anti-AcH3
Anti- H3
Case 1 Case 2 Case 3 Case 4 Case 5 Case 6
N T N T N T N T N T N T
N = Normal
T = Tumor
Anti-AcH2AK5
Anti-AcH4K16
AcH3 GAPDHNPM1
Normal
Tumor
Arb
itra
ry u
nit
s
0
5
10
15
20
25
P = 0.012
P = 0.023
P = 0.01
AcH2AK5 AcH4K16
P = 0.035 P = 0.045
AcH3 GAPDHNPM1
Normal
Tumor
Arb
itra
ry u
nit
s
0
5
10
15
20
25
P = 0.012
P = 0.023
P = 0.01
AcH2AK5 AcH4K16
P = 0.035 P = 0.045
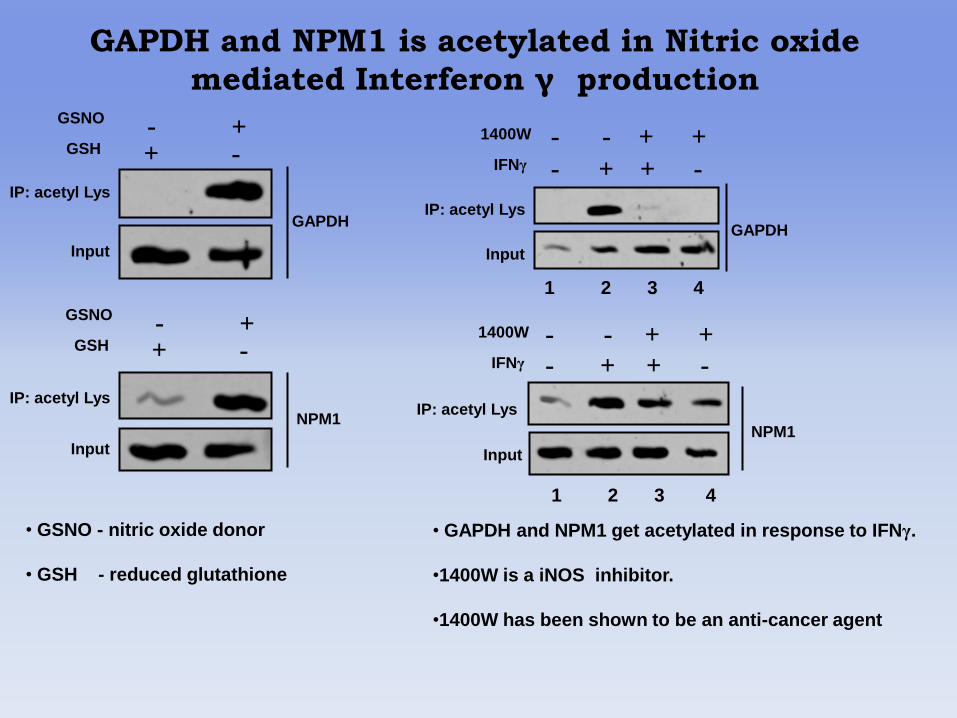
IP: acetyl Lys
Input
GSNO
GSH +-
-+
GAPDH
IP: acetyl Lys
Input
GSNO
GSH +-
-+
NPM1
GAPDH and NPM1 is acetylated in Nitric oxide
mediated Interferon γ production
• GSNO - nitric oxide donor
• GSH - reduced glutathione
IP: acetyl Lys
Input
GAPDH
1400W
IFNγ -
-
+
-
+
+
-
+
1 2 3 4
IP: acetyl Lys
Input
NPM1
1400W
IFNγ -
-
+
-
+
+
-
+
1 2 3 4
• GAPDH and NPM1 get acetylated in response to IFNγ.
•1400W is a iNOS inhibitor.
•1400W has been shown to be an anti-cancer agent
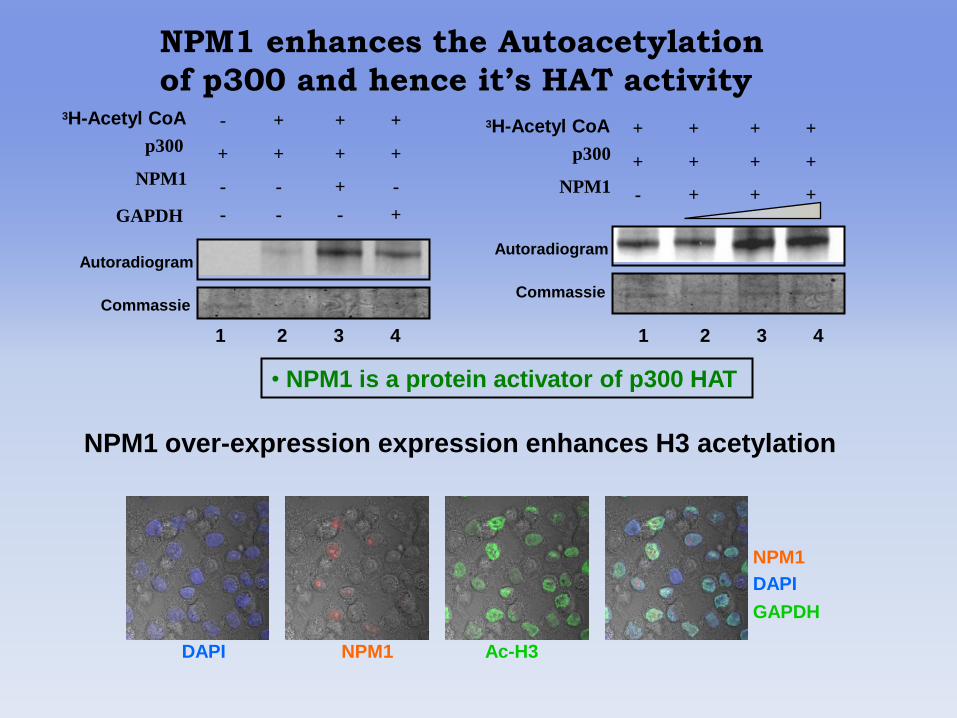
Autoradiogram
Commassie
NPM1
p300
3H-Acetyl CoA
-+--
++++
+++-
GAPDH +---
NPM1 enhances the Autoacetylation
of p300 and hence it’s HAT activity
Autoradiogram
Commassie
NPM1
p300
3H-Acetyl CoA
+++-
++++
++++
1 2 3 4 1 2 3 4
• NPM1 is a protein activator of p300 HAT
NPM1 over-expression expression enhances H3 acetylation
Ac-H3
NPM1
DAPI
GAPDH
DAPI NPM1
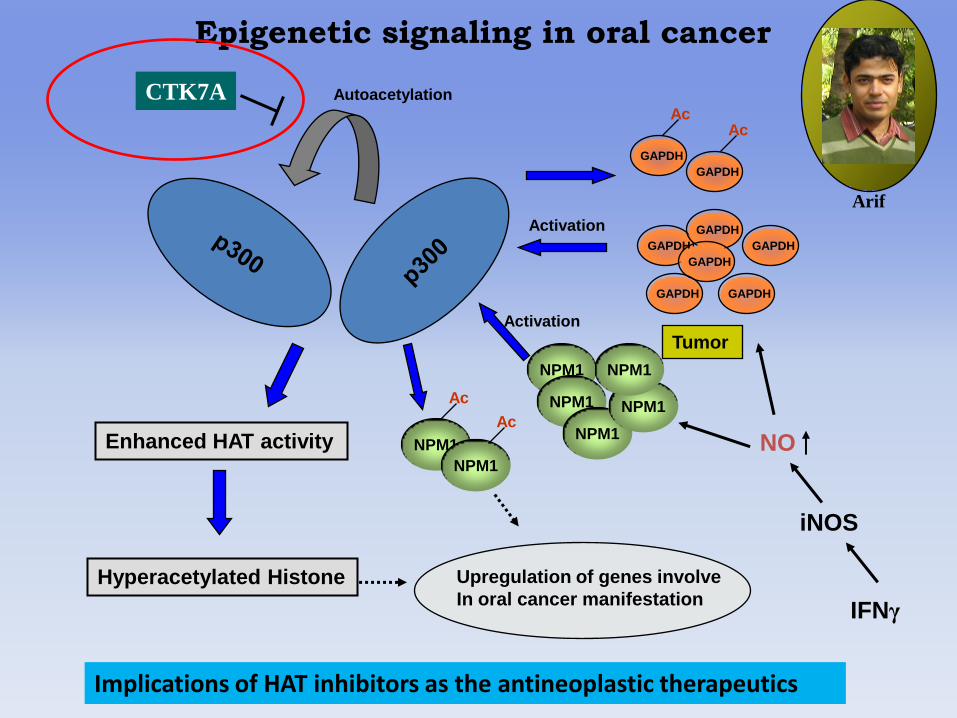
Autoacetylation
Enhanced HAT activity
NPM1
Activation
GAPDH
Activation
NPM1
NPM1
NPM1
NPM1
GAPDH
GAPDH
GAPDH
GAPDHGAPDH
IFNγ
iNOS
NO
Epigenetic signaling in oral cancer
Hyperacetylated Histone
CTK7A
GAPDH
GAPDH
AcAc
NPM1
NPM1
Ac
Ac
Tumor
Implications of HAT inhibitors as the antineoplastic therapeutics
Upregulation of genes involve
In oral cancer manifestation
Arif
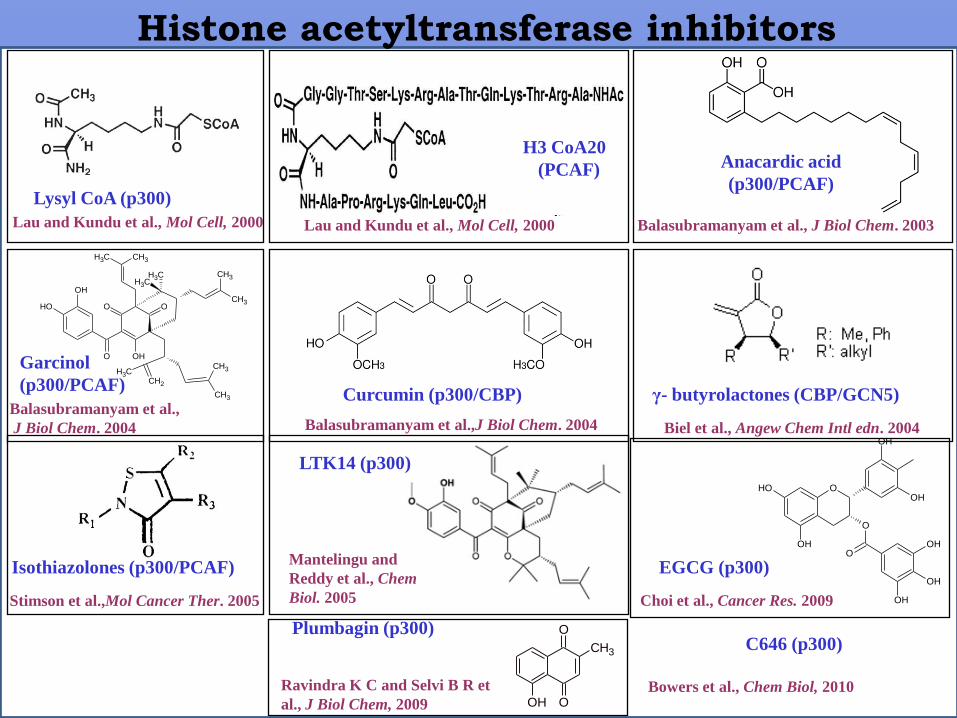
Histone acetyltransferase inhibitors
Lysyl CoA (p300)
H3 CoA20
(PCAF) Anacardic acid
(p300/PCAF)
Garcinol
(p300/PCAF)Curcumin (p300/CBP) γ- butyrolactones (CBP/GCN5)
Isothiazolones (p300/PCAF)
LTK14 (p300)
Lau and Kundu et al., Mol Cell, 2000 Lau and Kundu et al., Mol Cell, 2000 Balasubramanyam et al., J Biol Chem. 2003
OH
OH
O OH
CH2
CH3
CH3
CH3
CH3 CH3
OCH3
CH3CH3CH3
O
Balasubramanyam et al.,
J Biol Chem. 2004 Balasubramanyam et al.,J Biol Chem. 2004 Biel et al., Angew Chem Intl edn. 2004
Stimson et al.,Mol Cancer Ther. 2005
Mantelingu and
Reddy et al., Chem
Biol. 2005
O
O
O
OH
OH
OH
OH
OH
OH
OH
EGCG (p300)
Choi et al., Cancer Res. 2009
O
O
CH3
OH
Plumbagin (p300)
Ravindra K C and Selvi B R et
al., J Biol Chem, 2009
C646 (p300)
Bowers et al., Chem Biol, 2010
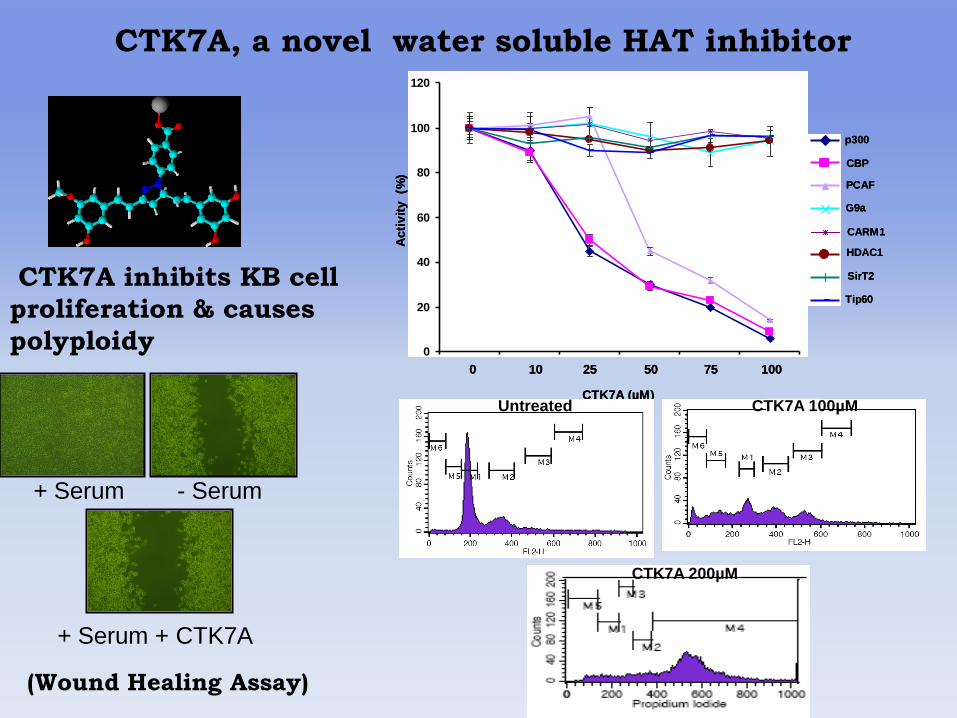
CTK7A, a novel water soluble HAT inhibitor
0
20
40
60
80
100
120
1 2 3 4 5 6
Series1
Series2
Series3
Series4
Series5
Series6
Series7
Series8
0
20
40
60
80
100
120
1 2 3 4 5 6
Series1
Series2
Series3
Series4
Series5
Series6
Series7
Series8
p300
CBP
G9a
CARM1
HDAC1
SirT2
Tip60
PCAF
0 10 25 50 75 100
Acti
vit
y (%
)CTK7A (µM)
0
20
40
60
80
100
120
1 2 3 4 5 6
Series1
Series2
Series3
Series4
Series5
Series6
Series7
Series8
0
20
40
60
80
100
120
1 2 3 4 5 6
Series1
Series2
Series3
Series4
Series5
Series6
Series7
Series8
p300
CBP
G9a
CARM1
HDAC1
SirT2
Tip60
PCAF
0 10 25 50 75 100
Acti
vit
y (%
)CTK7A (µM)
+ Serum - Serum
+ Serum + CTK7A
(Wound Healing Assay)
Untreated CTK7A 100µM
CTK7A 200µM
CTK7A inhibits KB cell
proliferation & causes
polyploidy

Untreated
CTK7A
CTK7A induces Senescence like growth arrest in
KB cells in HAT dependent manner
CTK7A induces high levels of SA-β-Gal
Anti-Cyclin E
Anti-Cyclin D1
Anti-Tubulin
1 2 3
UT 100 200
CTK7A (µM)
0
1
2
3
4
5
1 2 3 4 5 6 7
Series1
Series2
H3 AcH3 IgG
Bo
un
d /
In
pu
t (%
)
0
1
2
3
4
5
1 2 3 4 5 6 7
Series1
Series2
Control
CTK7A
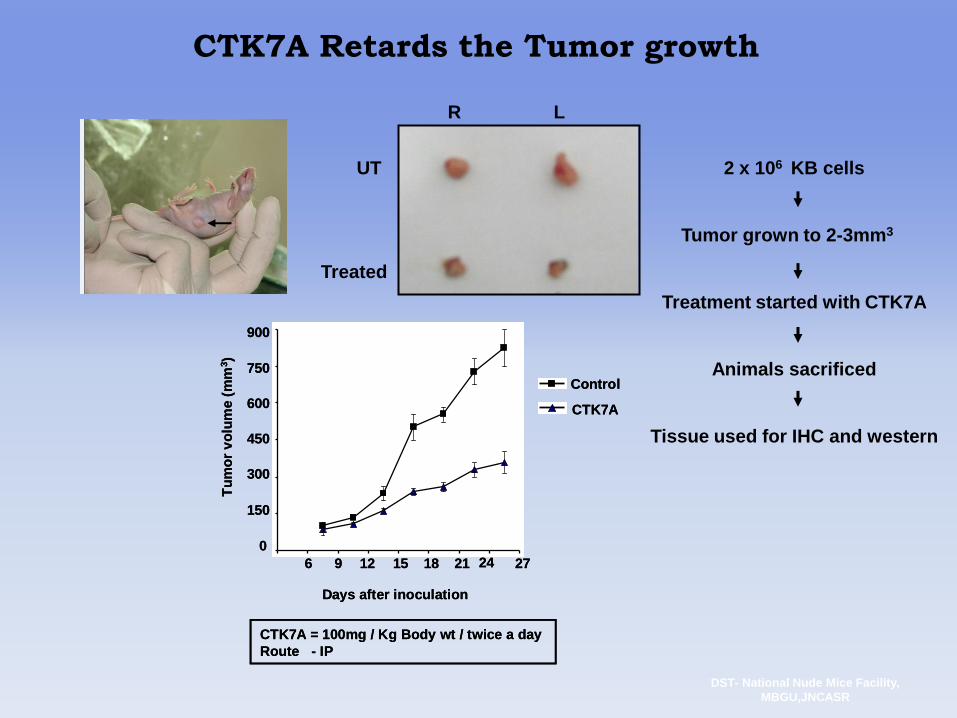
2 x 106 KB cells
Tumor grown to 2-3mm3
Treatment started with CTK7A
Animals sacrificed
Tissue used for IHC and western
DST- National Nude Mice Facility,
MBGU,JNCASR
CTK7A Retards the Tumor growth
R L
UT
Treated
0
2
4
6
8
10
12
1 2 3 4 5 6 7 8
Series1
Series2
0
2
4
6
8
10
12
1 2 3 4 5 6 7 8
Series1
Series2
CTK7A = 100mg / Kg Body wt / twice a day
Route - IP
0
150
300
450
600
750
900
276 9 12 15 18 21 24
Control
CTK7A
Days after inoculation
Tu
mo
r v
olu
me (
mm
3)
0
2
4
6
8
10
12
1 2 3 4 5 6 7 8
Series1
Series2
0
2
4
6
8
10
12
1 2 3 4 5 6 7 8
Series1
Series2
0
2
4
6
8
10
12
1 2 3 4 5 6 7 8
Series1
Series2
CTK7A = 100mg / Kg Body wt / twice a day
Route - IP
0
150
300
450
600
750
900
276 9 12 15 18 21 24
Control
CTK7A
Days after inoculation
Tu
mo
r v
olu
me (
mm
3)
0
2
4
6
8
10
12
1 2 3 4 5 6 7 8
Series1
Series2
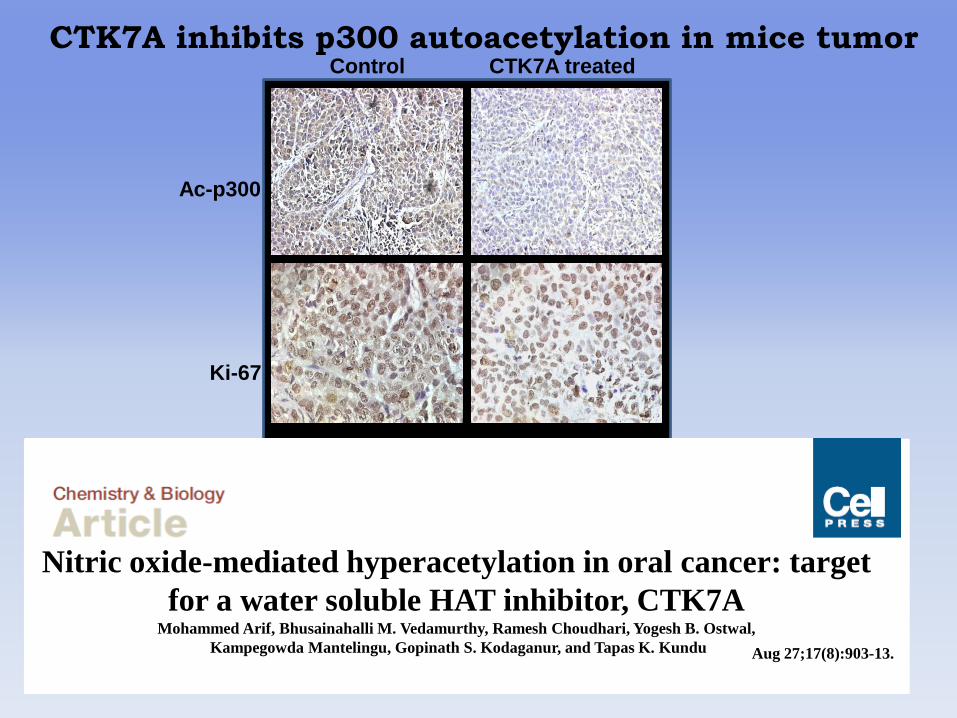
CTK7A inhibits p300 autoacetylation in mice tumorControl CTK7A treated
Ac-p300
Ki-67
Nitric oxide-mediated hyperacetylation in oral cancer: target
for a water soluble HAT inhibitor, CTK7AMohammed Arif, Bhusainahalli M. Vedamurthy, Ramesh Choudhari, Yogesh B. Ostwal,
Kampegowda Mantelingu, Gopinath S. Kodaganur, and Tapas K. Kundu Aug 27;17(8):903-13.
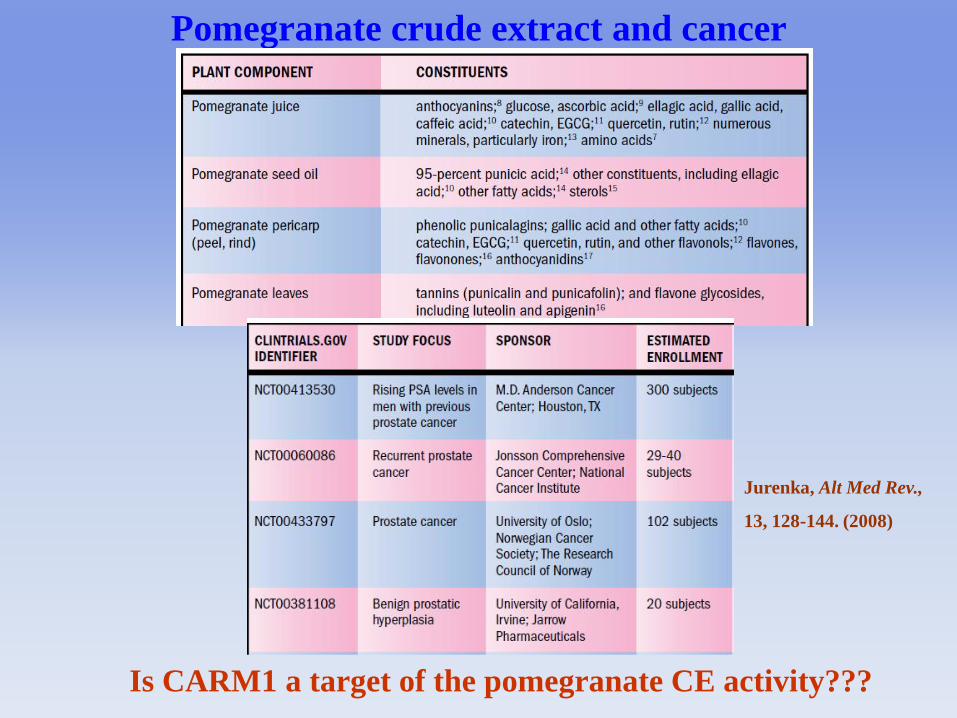
Pomegranate crude extract and cancer
Jurenka, Alt Med Rev.,
13, 128-144. (2008)
Is CARM1 a target of the pomegranate CE activity???
Inhibitor Screen
0
500
1000
1500
2000
2500
3000
3500
4000
4500
5000
1 2 3
CARM1
G9a
p300
PCAF
cp
m
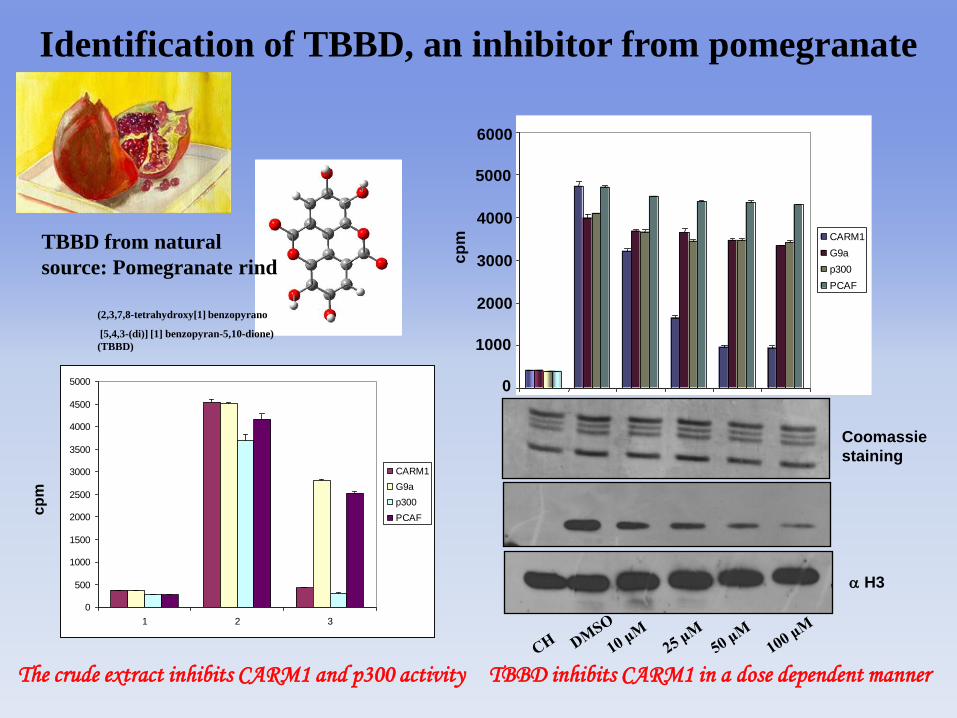
The crude extract inhibits CARM1 and p300 activity
(2,3,7,8-tetrahydroxy[1] benzopyrano
[5,4,3-(di)] [1] benzopyran-5,10-dione)
(TBBD)
Identification of TBBD, an inhibitor from pomegranate
0
1000
2000
3000
4000
5000
6000
1 2 3 4 5 6
CARM1
G9a
p300
PCAF
cp
m
0
1000
2000
3000
4000
5000
6000
Coomassie
staining
H3
TBBD from natural
source: Pomegranate rind
TBBD inhibits CARM1 in a dose dependent manner
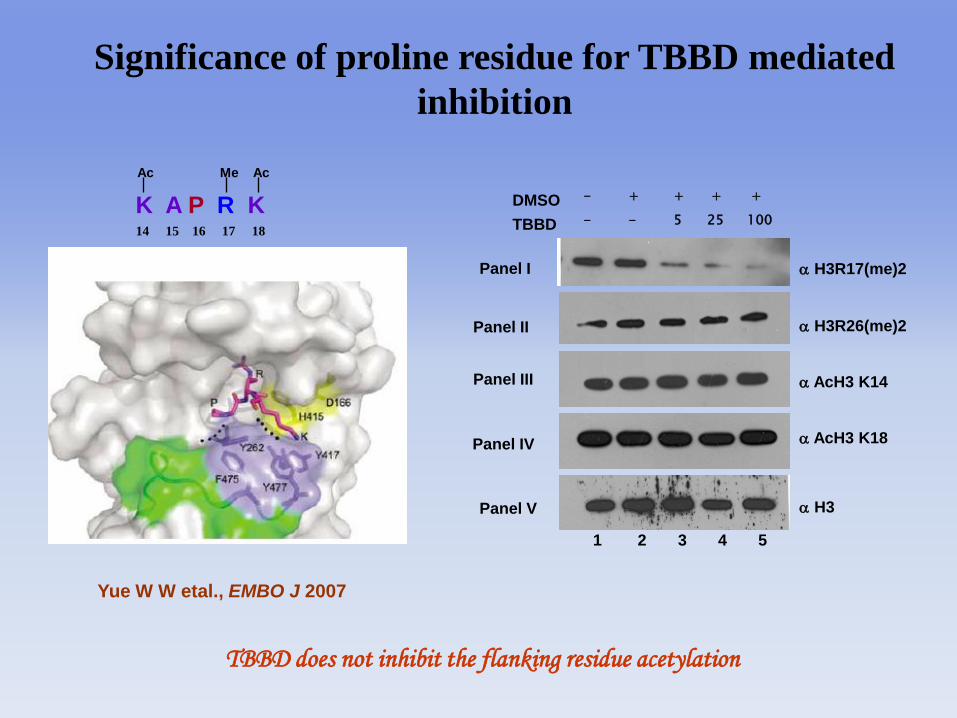
14 15 16 17 18
K A P R K
Yue W W etal., EMBO J 2007
Ac Me Ac
H3
AcH3 K18
AcH3 K14
H3R26(me)2
H3R17(me)2
1 2 3 4 5
Panel I
Panel II
Panel III
Panel IV
Panel V
DMSO
TBBD
- + + + +
- - 5 25 100
Significance of proline residue for TBBD mediated
inhibition
TBBD does not inhibit the flanking residue acetylation
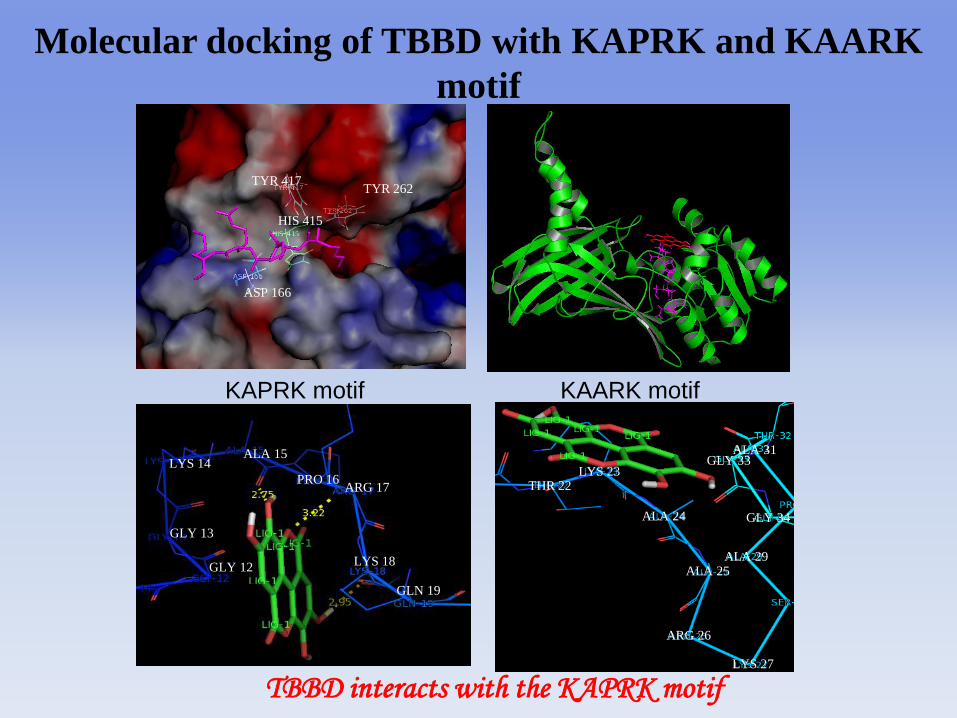
ASP 166
HIS 415
TYR 262TYR 417
GLY 12
GLY 13
LYS 14ALA 15
PRO 16ARG 17
LYS 18
GLN 19
THR 22LYS 23
ALA 24
ALA 25
ARG 26
LYS 27
ALA 29
ALA 31GLY 33
GLY 34
Molecular docking of TBBD with KAPRK and KAARK
motif
KAPRK motif KAARK motif
TBBD interacts with the KAPRK motif
H3R17 (me)2
H3R26 (me)2
H3
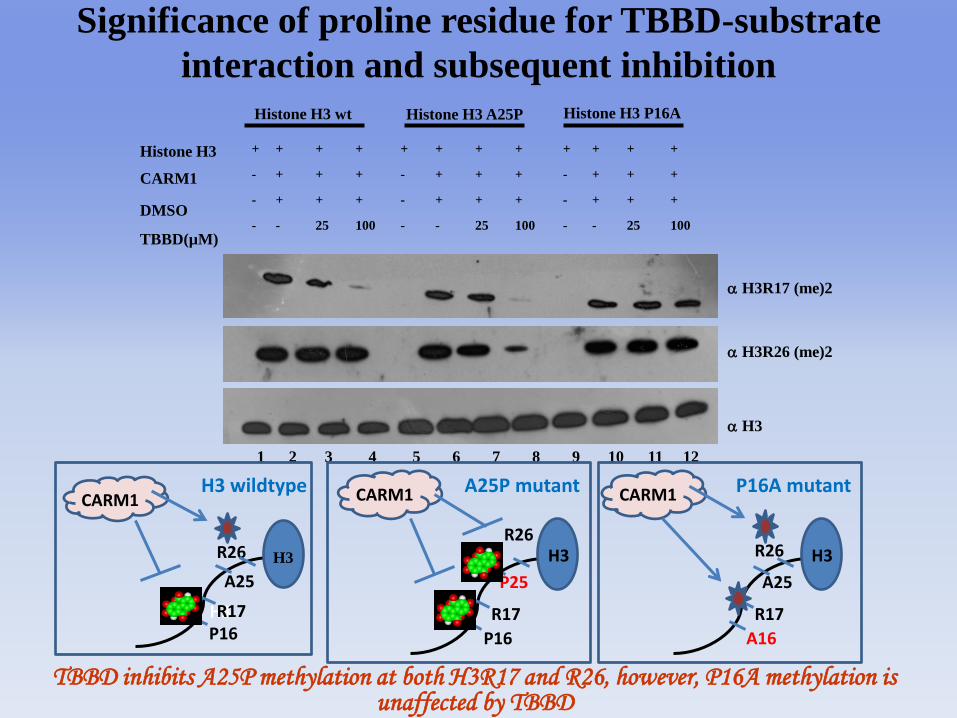
1 2 3 4 5 6 7 8 9 10 11 12
+ + + + + + + + + + + +
- + + + - + + + - + + +
- + + + - + + + - + + +
- - 25 100 - - 25 100 - - 25 100
Histone H3
CARM1
DMSO
TBBD(µM)
Histone H3 wt Histone H3 A25P Histone H3 P16A
Significance of proline residue for TBBD-substrate
interaction and subsequent inhibition
TBBD inhibits A25P methylation at both H3R17 and R26, however, P16A methylation is unaffected by TBBD
H3R17
R26
P16
A25
CARM1H3 wildtype
H3
R17
R26
P16
P25
CARM1
H3
A25P mutant
R17
R26
A16
A25
CARM1
H3
P16A mutant
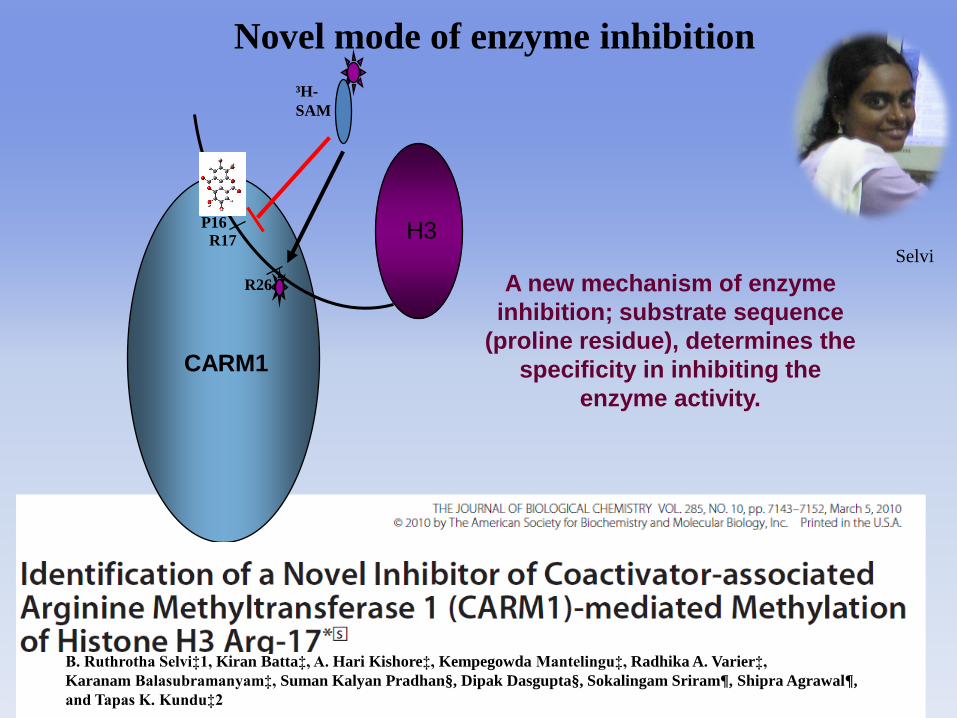
³H-
SAM
CARM1
H3P16
R17
R26 A new mechanism of enzyme
inhibition; substrate sequence
(proline residue), determines the
specificity in inhibiting the
enzyme activity.
Novel mode of enzyme inhibition
B. Ruthrotha Selvi‡1, Kiran Batta‡, A. Hari Kishore‡, Kempegowda Mantelingu‡, Radhika A. Varier‡,
Karanam Balasubramanyam‡, Suman Kalyan Pradhan§, Dipak Dasgupta§, Sokalingam Sriram¶, Shipra Agrawal¶,
and Tapas K. Kundu‡2
Selvi
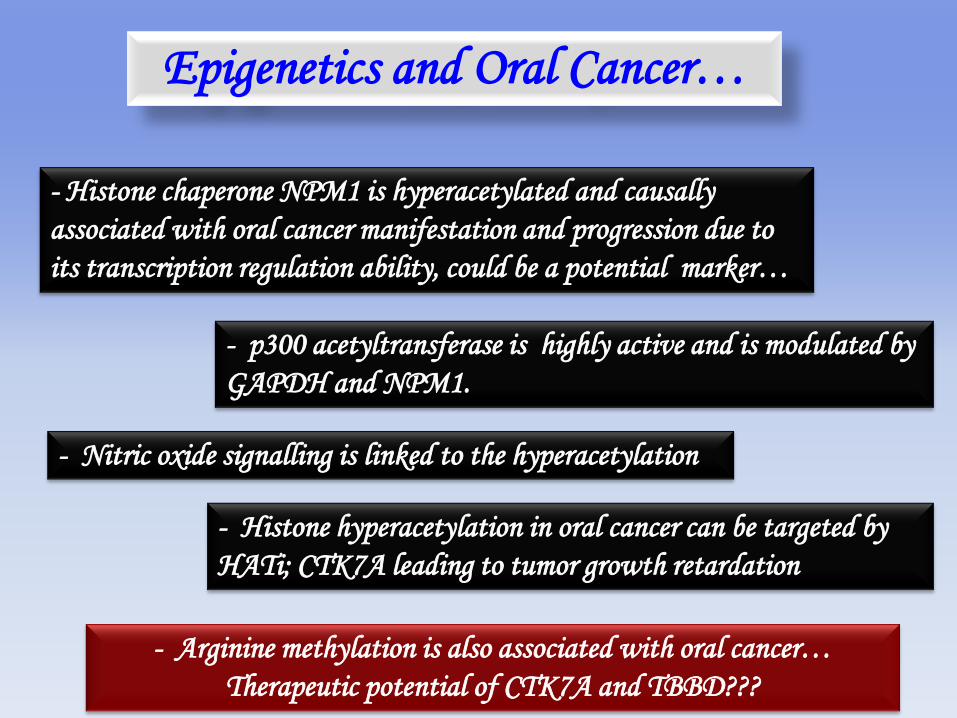
Epigenetics and Oral Cancer…
- Histone chaperone NPM1 is hyperacetylated and causally
associated with oral cancer manifestation and progression due to
its transcription regulation ability, could be a potential marker…
- p300 acetyltransferase is highly active and is modulated by
GAPDH and NPM1.
- Nitric oxide signalling is linked to the hyperacetylation
- Histone hyperacetylation in oral cancer can be targeted by
HATi; CTK7A leading to tumor growth retardation
- Arginine methylation is also associated with oral cancer…
Therapeutic potential of CTK7A and TBBD???