
Tanium™ Threat Response User Guide Version 3.7.6
237
Tanium™ Threat Response User Guide Version 3.7.6 May 16, 2022
-
Upload
khangminh22 -
Category
Documents
-
view
0 -
download
0
Transcript of Tanium™ Threat Response User Guide Version 3.7.6
Tanium™ Threat Response User GuideVersion 3.7.6
May 16, 2022
© 2022 Tanium Inc. AllRightsReserved Page 2
The information in this document is subject to change without notice. Further, the information provided in this document isprovided “as is” and is believed to be accurate, but is presented without any warranty of any kind, express or implied, exceptas provided in Tanium’s customer sales terms and conditions. Unless so otherwise provided, Tanium assumes no liabilitywhatsoever, and in no event shall Tanium or its suppliers be liable for any indirect, special, consequential, or incidentaldamages, including without limitation, lost profits or loss or damage to data arising out of the use or inability to use thisdocument, even if Tanium Inc. has been advised of the possibility of such damages.
Any IP addresses used in this document are not intended to be actual addresses. Any examples, command display output,network topology diagrams, and other figures included in this document are shown for illustrative purposes only. Any use ofactual IP addresses in illustrative content is unintentional and coincidental.
Please visit https://docs.tanium.com for the most current Tanium product documentation.
This documentation may provide access to or information about content, products (including hardware and software), andservices provided by third parties (“Third Party Items”). With respect to such Third Party Items, Tanium Inc. and its affiliates (i)are not responsible for such items, and expressly disclaim all warranties and liability of any kind related to such Third PartyItems and (ii) will not be responsible for any loss, costs, or damages incurred due to your access to or use of such Third PartyItems unless expressly set forth otherwise in an applicable agreement between you and Tanium.
Further, this documentation does not require or contemplate the use of or combination with Tanium products with anyparticular Third Party Items and neither Tanium nor its affiliates shall have any responsibility for any infringement ofintellectual property rights caused by any such combination. You, and not Tanium, are responsible for determining that anycombination of Third Party Items with Tanium products is appropriate and will not cause infringement of any third partyintellectual property rights.
Tanium is committed to the highest accessibility standards for our products. To date, Tanium has focused on compliancewith U.S. Federal regulations - specifically Section 508 of the Rehabilitation Act of 1998. Tanium has conducted 3rd partyaccessibility assessments over the course of product development for many years and has most recently completedcertification against the WCAG 2.1 / VPAT 2.3 standards for all major product modules in summer 2021. In the recent testingthe Tanium Console UI achieved supports or partially supports for all applicable WCAG 2.1 criteria. Tanium can makeavailable any VPAT reports on a module-by-module basis as part of a larger solution planning process for any customer orprospect.
As new products and features are continuously delivered, Tanium will conduct testing to identify potential gaps incompliance with accessibility guidelines. Tanium is committed to making best efforts to address any gaps quickly, as isfeasible, given the severity of the issue and scope of the changes. These objectives are factored into the ongoing deliveryschedule of features and releases with our existing resources.
Tanium welcomes customer input on making solutions accessible based on your Tanium modules and assistive technologyrequirements. Accessibility requirements are important to the Tanium customer community and we are committed toprioritizing these compliance efforts as part of our overall product roadmap. Tanium maintains transparency on our progressand milestones and welcomes any further questions or discussion around this work. Contact your sales representative,email Tanium Support at [email protected], or email [email protected] to make further inquiries.
Tanium is a trademark of Tanium, Inc. in the U.S. and other countries. Third-party trademarks mentioned are the property oftheir respective owners.
© 2022 Tanium Inc. All rights reserved.
© 2022 Tanium Inc. AllRightsReserved Page 3
Table of contents
Threat Response overview 11
Detection 11
Investigation 11
Containment 11
Integration with other Tanium solutions 11
Connect 11
Enforce 12
Impact 12
Trends 12
Threat Response - Alerts 12
Threat Response - Deployment 12
Succeeding with Threat Response 14
Step 1: Gain organizational effectiveness 14
Step 2: Install Tanium modules 15
Step 3: Configure Threat Response 15
Step 4: Deploy profiles 16
Step 5: Configure Live Response 16
Step 6: Configure Direct Connect for live connections 17
Step 7: Configure Connect for reputation questions 17
Step 8: Monitor Threat Response metrics 17
Step 9: Review operational metrics from alerts and intel and tune settings as required 17
Step 10: Review Trends metrics 17
Step 11: Use Enterprise Hunting dashboard or Interact questions to perform searches through the environment 18
Step 12: Review generated alerts from deployed intelligence 18
Gaining organizational effectiveness 19
Change management 19
RACI chart 19
© 2022 Tanium Inc. AllRightsReserved Page 4
Organizational alignment 27
Operational metrics 27
Threat Response maturity 27
Benchmark metrics 28
Threat Response requirements 32
License entitlements 32
Core platform dependencies 33
Computer group dependencies 33
Solution dependencies 33
Tanium recommended installation 34
Import specific solutions 34
Required dependencies 34
Feature-specific dependencies 34
Client extensions 35
Tanium™ Module Server 35
Endpoints 35
Disk space requirements 37
CPU and memory requirements 38
Tanium Driver 38
Host and network security requirements 38
Ports 38
Security exclusions 40
User role requirements 87
Threat Response user role permissions 87
Installing Threat Response 108
Before you begin 108
Import Threat Response with default settings 108
Import Threat Response with custom settings 109
Manage solution dependencies 110
Upgrade the Threat Response version 110
© 2022 Tanium Inc. AllRightsReserved Page 5
Verify Threat Response version 111
Configuring Threat Response 112
Install and configure Tanium Endpoint Configuration 112
Manage solution configurations with Tanium Endpoint Configuration 112
Configure Threat Response 113
Configure service account 113
Configure the Threat Response action group 113
Remove legacy Index dependencies from endpoints 114
Set up Threat Response users 114
Migrate Trace and Detect configurations to Threat Response 116
Adding intel 117
Signals 117
Signals do not always evaluate with the recorder database (No event match) 118
Configure intel sources 118
Connect to the Tanium Signals feed 119
Configuring Tanium Signals feed in an airgapped environment 120
Connect to iSIGHT Partners ThreatScape 120
Connect to a TAXII server 122
Set up Connect and Wildfire 123
Use a local directory or remote share 123
Delete an intel source 125
Set up the reputation service 125
Configure reputation data in Tanium Connect 125
Add Signals 126
Import and export Signals 127
Export Signals 127
Import Signals 127
Upload intel documents 127
Create intel documents 128
Label intel 128
© 2022 Tanium Inc. AllRightsReserved Page 6
Apply a label 128
Configure YARA files 129
View orphaned intel documents 129
Testing Intel for deployment 129
Scanning endpoints 131
Background scans 131
Quick scans 131
Creating configurations 133
Overview 133
Create engine configurations 133
Create intel configurations 134
Create index configurations 134
Create indexing exclusions 135
Create recorder configurations 135
Create stream configurations 139
Create filters 140
Import and export configurations and filters 159
Export configurations 159
Export filters 160
Import configurations 160
Import filters 160
Creating profiles 161
Overview 161
Create a profile 161
Prioritize profiles 163
Deploy a profile 163
Deploy intel 164
Configure the intel deployment setting 164
Immediately deploy intel to endpoints 164
Connecting to live endpoints and exploring data 166
© 2022 Tanium Inc. AllRightsReserved Page 7
Connect to a live endpoint 166
Capture a snapshot 167
Close the connection 167
Browse the file system on connected endpoints 168
Search for events 168
Manage snapshots 170
Export a snapshot from an endpoint 170
Download a snapshot 170
Upload a snapshot 171
Save files and events 171
Download a file 172
Create Enforce rules 172
Export events 172
Manage IOCs 172
Generate an IOC 173
Searching across the enterprise 174
Ask an enterprise-wide question 174
Hunt across the enterprise 174
Managing alerts 176
View alerts 176
Assign a status to an alert 177
View alerts by intel document 177
Windows Defender alerts 177
Deep Instinct alerts 178
Investigate reputation data 178
Investigate alerts 178
Deploy an action to an endpoint 179
Initiate a Response Action from an alert 179
Remediate alerts in Tanium Enforce 180
Delete alerts 182
© 2022 Tanium Inc. AllRightsReserved Page 8
Suppress alerts 182
Suppress an alert 183
Edit and delete suppression rules 183
View the status of a retroactive task 184
Import and export global suppression rules 184
Export global suppression rules 184
Import global suppression rules 184
Manage the impact of lateral movement with Tanium Impact 184
Set up Tanium Connect forwarding 185
Managing response activity 186
Create a response action for an endpoint 186
Stop a response action 186
Collecting data from endpoints with Live Response 187
Destinations 187
Destination types 188
Azure Destinations 188
S3 Destinations 189
SSH Destinations 189
SMB Destinations 190
Generate known_hosts and test connections 191
Collections 192
File Collector sets 193
Script sets 207
Collect data from endpoints 207
Collect logs 208
Regular expressions and environment variables 208
Isolating endpoints 211
Install Quarantine 211
Import the Tanium Quarantine solution 211
Before you begin 211
© 2022 Tanium Inc. AllRightsReserved Page 9
Endpoint operating system requirements 212
Supported Windows versions 212
Supported Linux OS versions 212
Supported Mac OS versions 212
Configure Windows endpoints 213
Check that the IPsec Policy Agent service is running on the endpoints 213
Configure Linux endpoints 213
Verify that endpoints are not using Network Manager 213
Configure Mac endpoints 213
Test quarantine on lab endpoints 214
Remove quarantine 215
Create custom quarantine rules 215
Options for deploying custom quarantine rules and options 215
Reference: Custom rules and options 216
Custom rules format 216
Quarantine options 217
Configuration file format 217
Options 217
Reference: Custom rules examples 218
Example for Custom Quarantine Rules field 218
taniumquarantine.dat sample file 219
Exporting audit data 220
Tanium Connect 223
Before you begin 223
Create a connection 223
Test a connection and review audit data 224
Schedule the connection 224
Troubleshooting 225
Resolve issues with Threat Response components 225
Collect logs 225
© 2022 Tanium Inc. AllRightsReserved Page 10
Collect troubleshooting information from endpoints 225
View notifications 226
View task status 226
Get Threat Response tools status 226
Tune alert throttling 227
Configure throttling for Signal alerts on endpoints 227
Configure match alert throttling 227
Configure the engine manually 227
File, network, or security events are not displayed on Oracle Linux server 227
Identify Linux endpoints that are missing auditd 228
Resolve issues with legacy Client Recorder Extension installations 228
Change the Module Server address 228
Start or stop the recorder 229
Monitor and troubleshoot Threat Response coverage 229
Monitor and troubleshoot mean time to investigate threats 229
Monitor and troubleshoot mean time to remediate threats 229
Remove Threat Response tools from endpoints 230
Test Live Response connections manually 231
Uninstall Threat Response 231
Contact Tanium Support 231
Reference: Authoring Signals 232
How Signals work 232
Signal syntax 232
Signal use cases 234
Testing Signals 234
Reference: Checking installation status on endpoints 235
Reference: Set up the zone proxy service 237
© 2022 Tanium Inc. AllRightsReserved Page 11
Threat Response overviewUse Threat Response to expedite incident response actions from hours or days to minutes. Detect, react, and recover
quickly from attacks and the resulting business disruptions.
DetectionThreat Response monitors activity in real time and generates alerts when potential malicious behavior is detected. You can
configure threat intelligence from a variety of reputable sources. Use this information to search endpoints for known
indicators of compromise and perform reputation analysis. The reputation data that Threat Response uses constantly
compares activity such as all processes run, autorun related files, and loaded modules against known malicious hashes
defined by user hash lists or other services such as Palo Alto Wildfire, VirusTotal, and ReversingLabs.
InvestigationThreat Response continuously records key system activity for forensic and historical analysis. You can look for specific
activity across every endpoint in an enterprise and drill down into process and user activity on individual systems in both
real-time and historical views.
ContainmentThreat Response includes sensors and packages that provide endpoint visibility and remediation. With the sensors, you can
search endpoint data quickly for evidence of compromise. When you have discovered compromised endpoints, you can use
Threat Response packages to isolate incidents and prevent additional compromise, data leakage, and lateral movement.
Integration with other Tanium solutionsThreat Response has built in integration with Tanium™ Connect, Tanium™ Enforce, Tanium™ Impact, and Tanium™ Trends
for additional alerting, remediation, and trending of incident related data.
Connect
Configure a Connect destination to export Threat Response data outside of Tanium. Connect can send information to
security information and event management (SIEM) products and services including Micro Focus ArcSight, IBM QRadar,
LogRhythm, McAfee SIEM, and Splunk. For more information, see Connect User Guide: Configuring SIEM destinations.
Threat Response sends hash information from saved questions to Connect and reputation service providers to elaborate on
process hashes for an at-a-glance reputation status. You can also configure incoming connections from sources such as
Palo Alto Wildfire to create threat data.
© 2022 Tanium Inc. AllRightsReserved Page 12
Enforce
Use Threat Response findings to create process and network rule policies for endpoints to prevent future incidents across
the network. Failing to identify and address more fundamental vulnerabilities exploited during an incident leaves the
organization with no net improvement to their security posture.
Impact
Use alert integration with Impact to take a data-driven approach to manage lateral movement impact within your
organization by identifying, prioritizing and remediating access rights dependencies to reduce attack surface, prioritize
actions, and scope incidents.
Trends
By default, Threat Response features Trends boards that provide data visualization of Threat Response concepts.
THREAT RESPONSE - ALERTS
When a match to intel that you have applied on a computer group is detected, an alert is generated from the endpoint and
reported back to Threat Response. The Threat Response - Alerts board features visualizations that illustrate patterns of
alerts over time on the endpoints in an environment. The following panels are in the Threat Response - Alerts board:
l Lifetime Alerts Count
l Alerts by Endpoint
l Alerts by Intel Type
l Alerts by Label
l Alerts by Status
l Alerts by Intel
l Alerts by Intel Source
l Threat Response Coverage
l Mean Time to Investigate Alerts
l Mean Time to Resolve Alerts
THREAT RESPONSE - DEPLOYMENT
The Threat Response - Deployment board features visualizations that show the status of Threat Response components on
endpoints in an environment and provides visibility into any areas of Threat Response that require remediation. The
following panels are in the Threat Response - Deployment board:
l Overall Status
l Engine Status
l Index Status
l Recorder Status
© 2022 Tanium Inc. AllRightsReserved Page 13
l Incident Response Tools Status
l Threat Response Health
l Engine Health
l Recorder Health
l Detect Last Scan Time
l Detect Intel Revision
l Detect Profile ID and Revision
l Detect Tools Version
l Index Tools Version
l Incident Response Tools Version
l Recorder Tools Version
To view Trends boards in the Threat Response home page, make sure that the Trends Data Read permission is granted to
the role of the current user.
For more information about how to import the Trends boards that are provided by Threat Response, see Tanium Trends
User Guide: Importing the initial gallery.
© 2022 Tanium Inc. AllRightsReserved Page 14
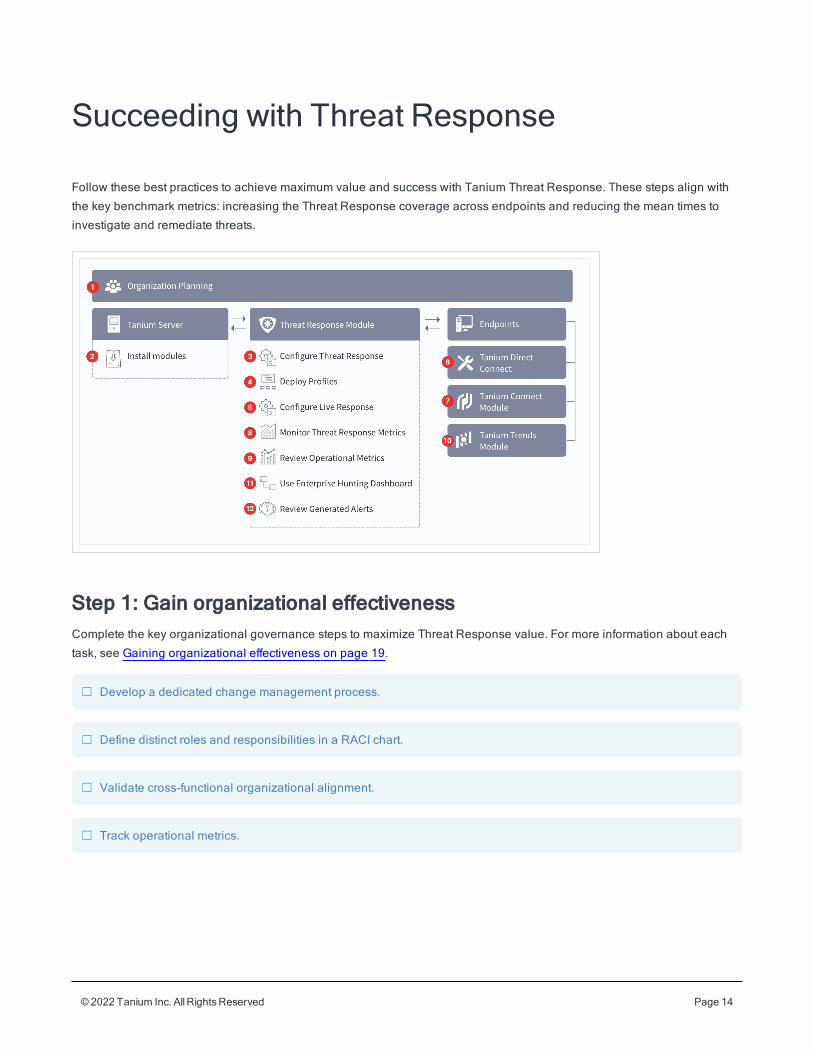
Succeeding with Threat Response
Follow these best practices to achieve maximum value and success with Tanium Threat Response. These steps align with
the key benchmark metrics: increasing the Threat Response coverage across endpoints and reducing the mean times to
investigate and remediate threats.
Step 1: Gain organizational effectivenessComplete the key organizational governance steps to maximize Threat Response value. For more information about each
task, see Gaining organizational effectiveness on page 19.
☐ Develop a dedicated change management process.
☐ Define distinct roles and responsibilities in a RACI chart.
☐ Validate cross-functional organizational alignment.
☐ Track operational metrics.
© 2022 Tanium Inc. AllRightsReserved Page 15
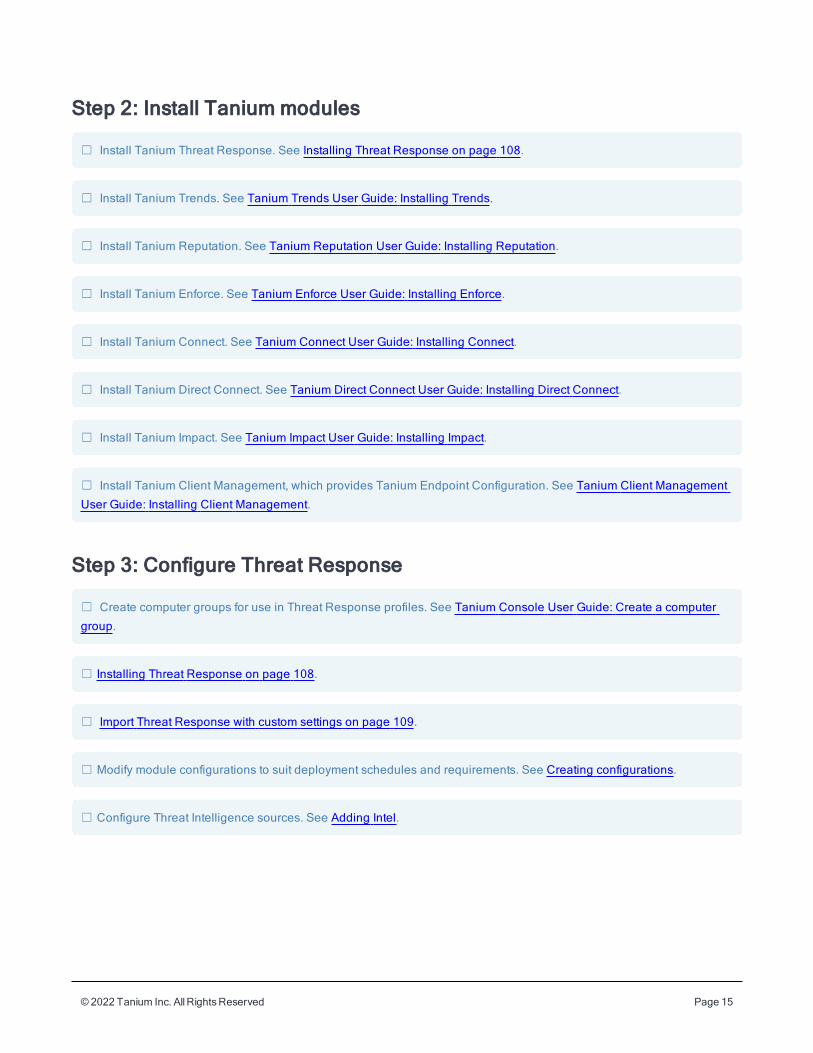
Step 2: Install Tanium modules
☐ Install Tanium Threat Response. See Installing Threat Response on page 108.
☐ Install Tanium Trends. See Tanium Trends User Guide: Installing Trends.
☐ Install Tanium Reputation. See Tanium Reputation User Guide: Installing Reputation.
☐ Install Tanium Enforce. See Tanium Enforce User Guide: Installing Enforce.
☐ Install Tanium Connect. See Tanium Connect User Guide: Installing Connect.
☐ Install Tanium Direct Connect. See Tanium Direct Connect User Guide: Installing Direct Connect.
☐ Install Tanium Impact. See Tanium Impact User Guide: Installing Impact.
☐ Install Tanium Client Management, which provides Tanium Endpoint Configuration. See Tanium Client Management
User Guide: Installing Client Management.
Step 3: Configure Threat Response
☐ Create computer groups for use in Threat Response profiles. See Tanium Console User Guide: Create a computer
group.
☐ Installing Threat Response on page 108.
☐ Import Threat Response with custom settings on page 109.
☐ Modify module configurations to suit deployment schedules and requirements. See Creating configurations.
☐ Configure Threat Intelligence sources. See Adding Intel.
© 2022 Tanium Inc. AllRightsReserved Page 16
l
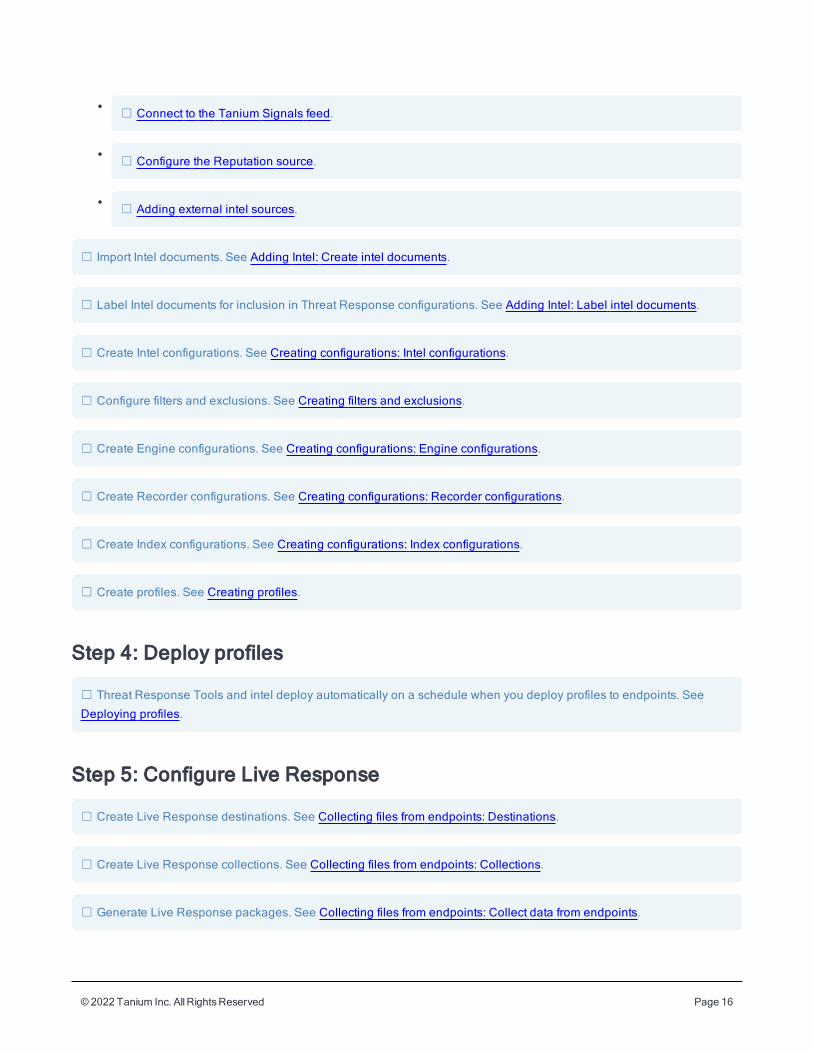
☐ Connect to the Tanium Signals feed.
l
☐ Configure the Reputation source.
l
☐ Adding external intel sources.
☐ Import Intel documents. See Adding Intel: Create intel documents.
☐ Label Intel documents for inclusion in Threat Response configurations. See Adding Intel: Label intel documents.
☐ Create Intel configurations. See Creating configurations: Intel configurations.
☐ Configure filters and exclusions. See Creating filters and exclusions.
☐ Create Engine configurations. See Creating configurations: Engine configurations.
☐ Create Recorder configurations. See Creating configurations: Recorder configurations.
☐ Create Index configurations. See Creating configurations: Index configurations.
☐ Create profiles. See Creating profiles.
Step 4: Deploy profiles
☐ Threat Response Tools and intel deploy automatically on a schedule when you deploy profiles to endpoints. See
Deploying profiles.
Step 5: Configure Live Response
☐ Create Live Response destinations. See Collecting files from endpoints: Destinations.
☐ Create Live Response collections. See Collecting files from endpoints: Collections.
☐ Generate Live Response packages. See Collecting files from endpoints: Collect data from endpoints.
© 2022 Tanium Inc. AllRightsReserved Page 17
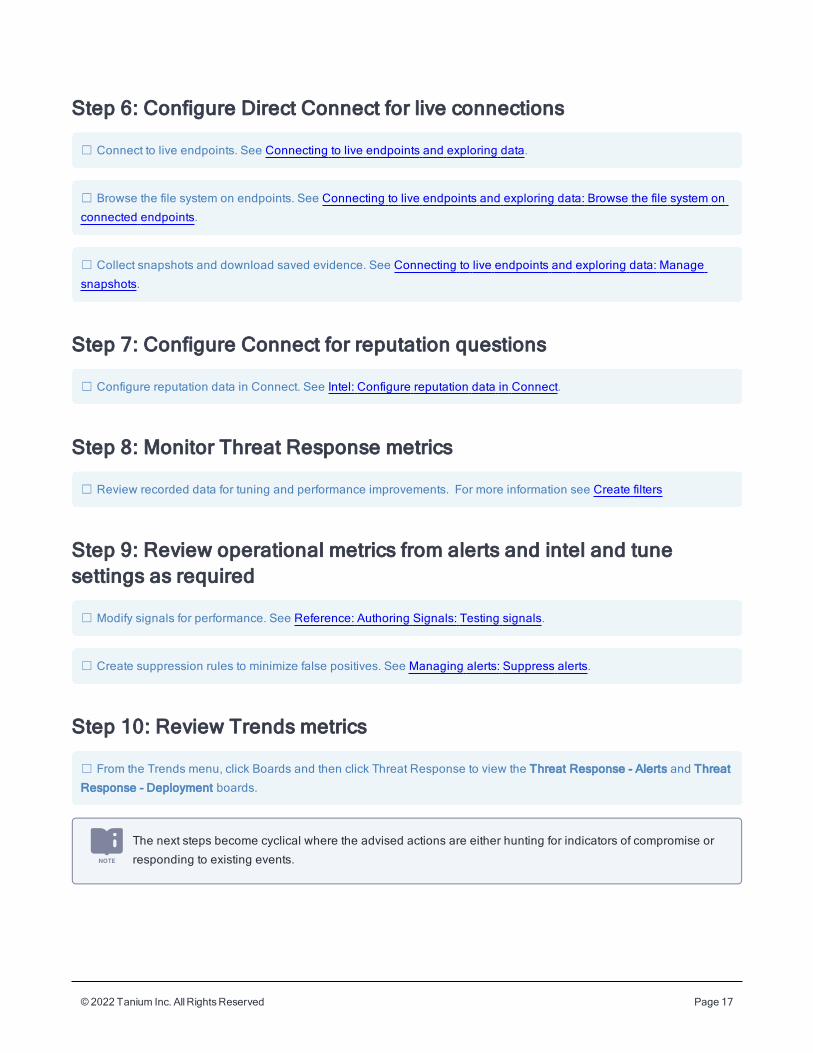
Step 6: Configure Direct Connect for live connections
☐ Connect to live endpoints. See Connecting to live endpoints and exploring data.
☐ Browse the file system on endpoints. See Connecting to live endpoints and exploring data: Browse the file system on
connected endpoints.
☐ Collect snapshots and download saved evidence. See Connecting to live endpoints and exploring data: Manage
snapshots.
Step 7: Configure Connect for reputation questions
☐ Configure reputation data in Connect. See Intel: Configure reputation data in Connect.
Step 8: Monitor Threat Response metrics
☐ Review recorded data for tuning and performance improvements. For more information see Create filters
Step 9: Review operational metrics from alerts and intel and tunesettings as required
☐ Modify signals for performance. See Reference: Authoring Signals: Testing signals.
☐ Create suppression rules to minimize false positives. See Managing alerts: Suppress alerts.
Step 10: Review Trends metrics
☐ From the Trends menu, click Boards and then click Threat Response to view the Threat Response - Alerts and Threat
Response - Deployment boards.
The next steps become cyclical where the advised actions are either hunting for indicators of compromise or
responding to existing events.
© 2022 Tanium Inc. AllRightsReserved Page 18
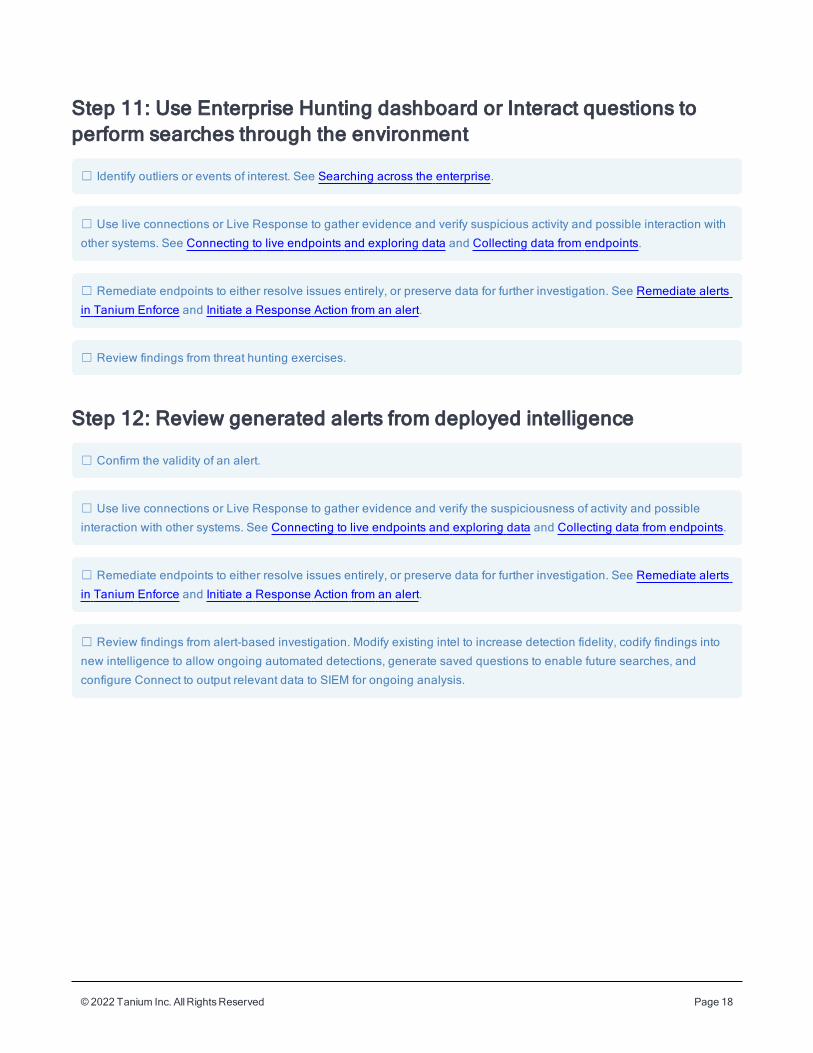
Step 11: Use Enterprise Hunting dashboard or Interact questions toperform searches through the environment
☐ Identify outliers or events of interest. See Searching across the enterprise.
☐ Use live connections or Live Response to gather evidence and verify suspicious activity and possible interaction with
other systems. See Connecting to live endpoints and exploring data and Collecting data from endpoints.
☐ Remediate endpoints to either resolve issues entirely, or preserve data for further investigation. See Remediate alerts
in Tanium Enforce and Initiate a Response Action from an alert.
☐ Review findings from threat hunting exercises.
Step 12: Review generated alerts from deployed intelligence
☐ Confirm the validity of an alert.
☐ Use live connections or Live Response to gather evidence and verify the suspiciousness of activity and possible
interaction with other systems. See Connecting to live endpoints and exploring data and Collecting data from endpoints.
☐ Remediate endpoints to either resolve issues entirely, or preserve data for further investigation. See Remediate alerts
in Tanium Enforce and Initiate a Response Action from an alert.
☐ Review findings from alert-based investigation. Modify existing intel to increase detection fidelity, codify findings into
new intelligence to allow ongoing automated detections, generate saved questions to enable future searches, and
configure Connect to output relevant data to SIEM for ongoing analysis.
© 2022 Tanium Inc. AllRightsReserved Page 19
Gaining organizational effectivenessThere are four key organizational governance steps to maximizing the value delivered by Threat Response to enable time to
value:
l Develop a dedicated change management process. See Change management on page 19.
l Define distinct roles and responsibilities. See RACI chart on page 19.
l Track operational maturity. See Operational metrics on page 27.
l Validate cross-functional alignment. See Organizational alignment on page 27.
Change managementDevelop a tailored, dedicated change management process to set up any incident response tools for a streamlined process
using Tanium Threat Response.
l Update service level agreements and align activities to key resources for Tanium Threat Response where
applicable. For example, see Maturity / Metrics and RACI
l Designate change or maintenance windows for various scenarios, where applicable. For example, setting up a
Reputation source, integration with a SIEM, Log Solution, or SOAR solution.
l Identify internal and external dependencies to incident response process. For example, to achieve effective
integrations with a SIEM, Log Solution, or SOAR Solution.
l Create a Tanium Steering Group (TSG) for discovery activities to expedite reviews and approvals of processes that
align with SLAs / incident response processes, as applicable.
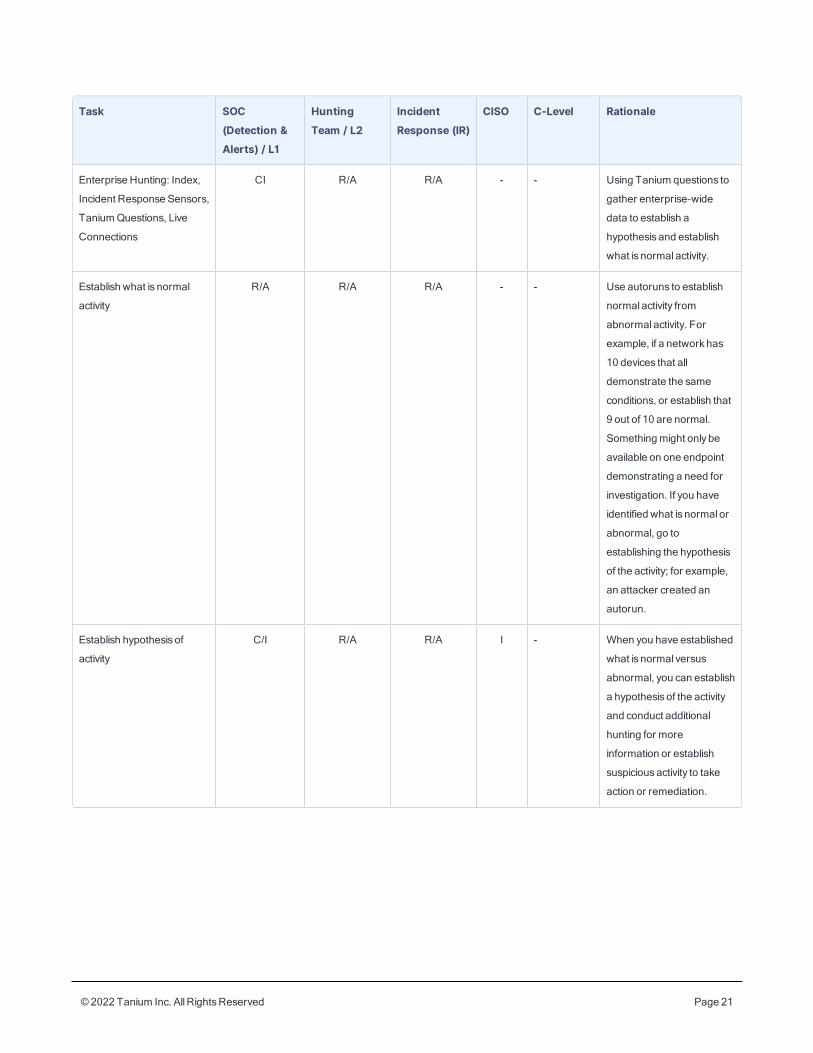
RACI chartA RACI chart identifies the team or resource who is Responsible, Accountable, Consulted, and Informed, and serves as a
guideline to describe the key activities across the security, risk/compliance, and operations teams. Every organization has
specific business processes and IT organization demands. The following table represents Tanium’s point of view for how
organizations should align functional resources against patch management. Use the following table as a baseline example.
© 2022 Tanium Inc. AllRightsReserved Page 20
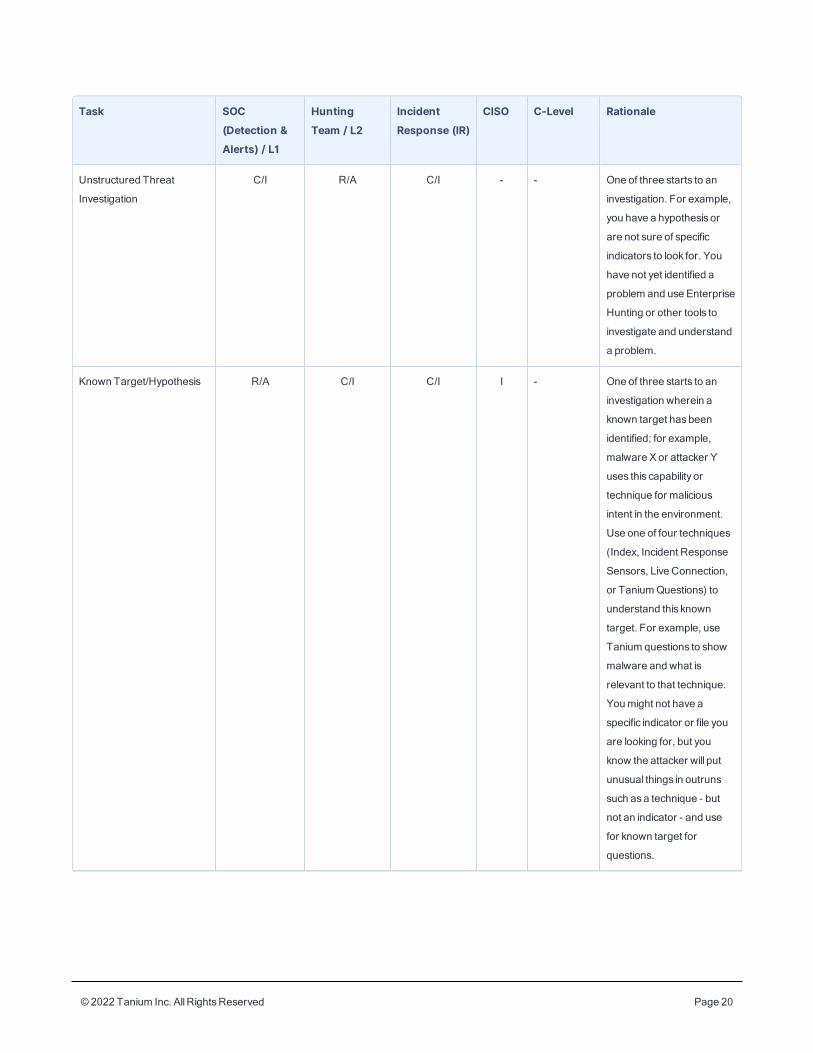
Task SOC(Detection &Alerts) / L1
HuntingTeam / L2
IncidentResponse (IR)
CISO C-Level Rationale
Unstructured Threat
Investigation
C/I R/A C/I - - One of three starts to an
investigation. For example,
you have a hypothesis or
are not sure of specific
indicators to look for. You
have not yet identified a
problem and use Enterprise
Hunting or other tools to
investigate and understand
a problem.
Known Target/Hypothesis R/A C/I C/I I - One of three starts to an
investigation wherein a
known target hasbeen
identified; for example,
malware X or attacker Y
uses this capability or
technique for malicious
intent in the environment.
Use one of four techniques
(Index, Incident Response
Sensors, Live Connection,
or TaniumQuestions) to
understand this known
target. For example, use
Tanium questions to show
malware and what is
relevant to that technique.
Youmight not have a
specific indicator or file you
are looking for, but you
know the attacker will put
unusual things in outruns
such asa technique - but
not an indicator - and use
for known target for
questions.
© 2022 Tanium Inc. AllRightsReserved Page 21
Task SOC(Detection &Alerts) / L1
HuntingTeam / L2
IncidentResponse (IR)
CISO C-Level Rationale
Enterprise Hunting: Index,
Incident Response Sensors,
TaniumQuestions, Live
Connections
CI R/A R/A - - Using Tanium questions to
gather enterprise-wide
data to establish a
hypothesis and establish
what is normal activity.
Establish what is normal
activity
R/A R/A R/A - - Use autoruns to establish
normal activity from
abnormal activity. For
example, if a network has
10 devices that all
demonstrate the same
conditions, or establish that
9 out of 10 are normal.
Somethingmight only be
available on one endpoint
demonstrating a need for
investigation. If you have
identified what is normal or
abnormal, go to
establishing the hypothesis
of the activity; for example,
an attacker created an
autorun.
Establish hypothesis of
activity
C/I R/A R/A I - When you have established
what is normal versus
abnormal, you can establish
a hypothesis of the activity
and conduct additional
hunting for more
information or establish
suspiciousactivity to take
action or remediation.
© 2022 Tanium Inc. AllRightsReserved Page 22
Task SOC(Detection &Alerts) / L1
HuntingTeam / L2
IncidentResponse (IR)
CISO C-Level Rationale
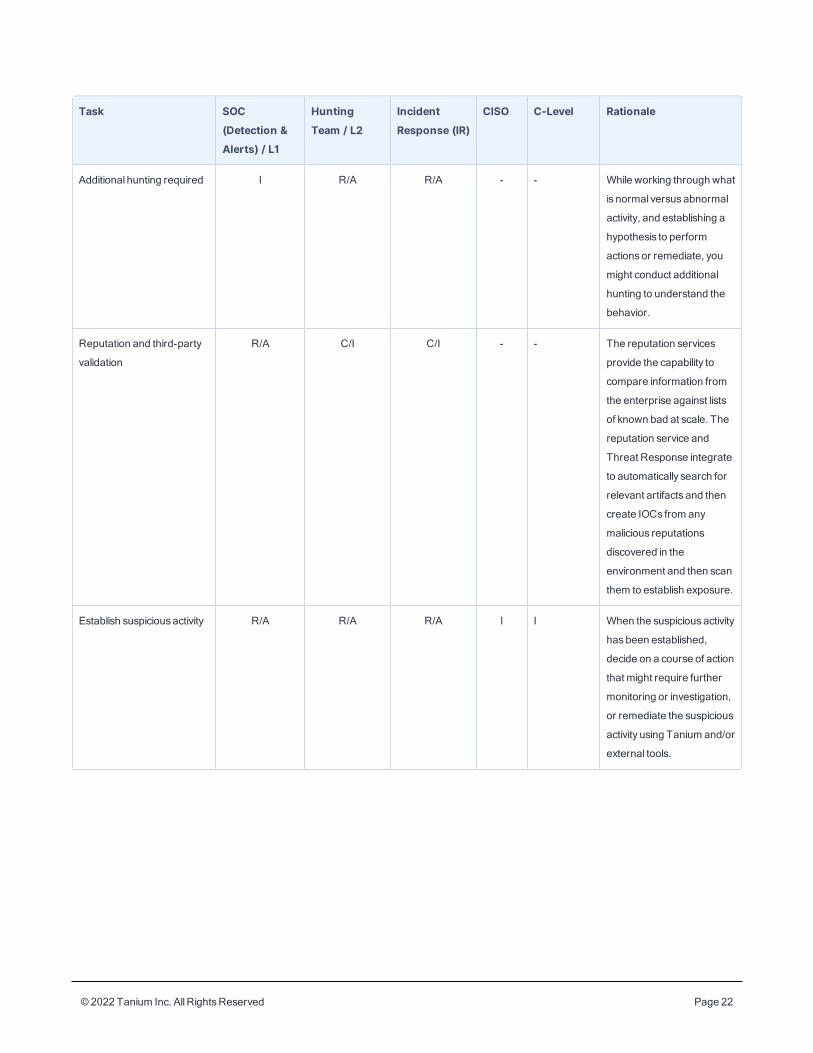
Additional hunting required I R/A R/A - - While working through what
is normal versusabnormal
activity, and establishing a
hypothesis to perform
actionsor remediate, you
might conduct additional
hunting to understand the
behavior.
Reputation and third-party
validation
R/A C/I C/I - - The reputation services
provide the capability to
compare information from
the enterprise against lists
of known bad at scale. The
reputation service and
Threat Response integrate
to automatically search for
relevant artifacts and then
create IOCs from any
malicious reputations
discovered in the
environment and then scan
them to establish exposure.
Establish suspiciousactivity R/A R/A R/A I I When the suspiciousactivity
hasbeen established,
decide on a course of action
that might require further
monitoring or investigation,
or remediate the suspicious
activity using Tanium and/or
external tools.
© 2022 Tanium Inc. AllRightsReserved Page 23
Task SOC(Detection &Alerts) / L1
HuntingTeam / L2
IncidentResponse (IR)
CISO C-Level Rationale
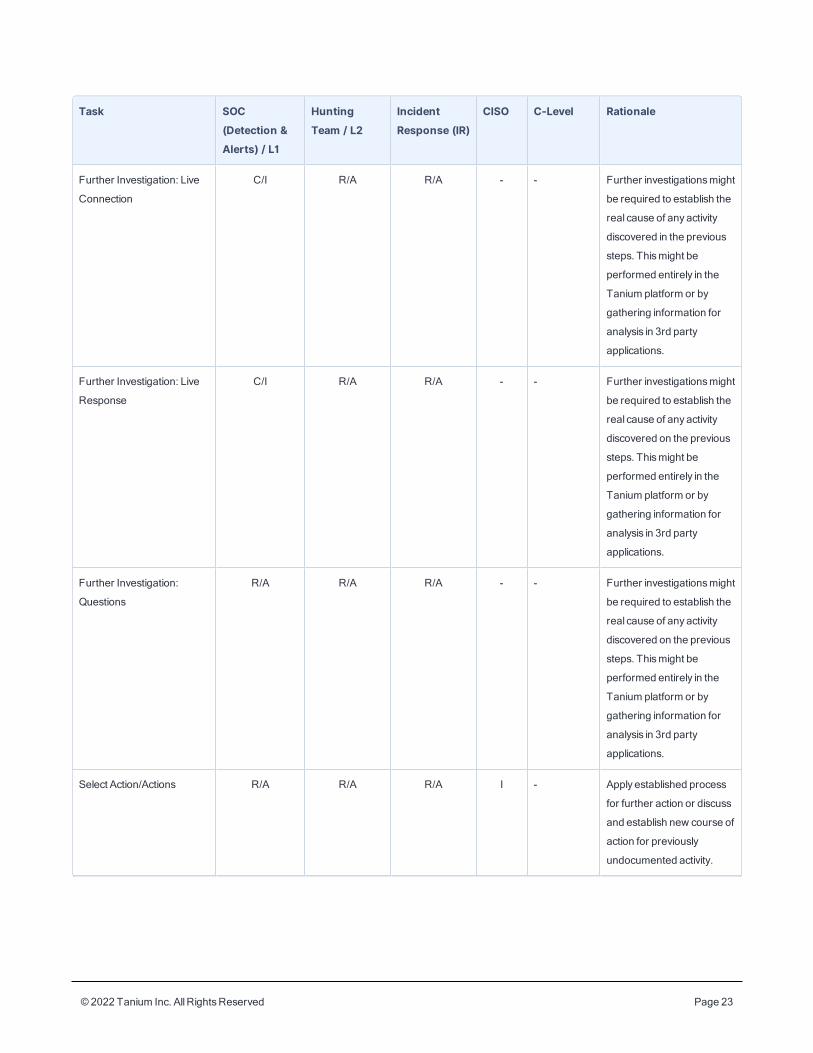
Further Investigation: Live
Connection
C/I R/A R/A - - Further investigationsmight
be required to establish the
real cause of anyactivity
discovered in the previous
steps. Thismight be
performed entirely in the
Tanium platform or by
gathering information for
analysis in 3rd party
applications.
Further Investigation: Live
Response
C/I R/A R/A - - Further investigationsmight
be required to establish the
real cause of anyactivity
discovered on the previous
steps. Thismight be
performed entirely in the
Tanium platform or by
gathering information for
analysis in 3rd party
applications.
Further Investigation:
Questions
R/A R/A R/A - - Further investigationsmight
be required to establish the
real cause of anyactivity
discovered on the previous
steps. Thismight be
performed entirely in the
Tanium platform or by
gathering information for
analysis in 3rd party
applications.
Select Action/Actions R/A R/A R/A I - Apply established process
for further action or discuss
and establish new course of
action for previously
undocumented activity.
© 2022 Tanium Inc. AllRightsReserved Page 24
Task SOC(Detection &Alerts) / L1
HuntingTeam / L2
IncidentResponse (IR)
CISO C-Level Rationale
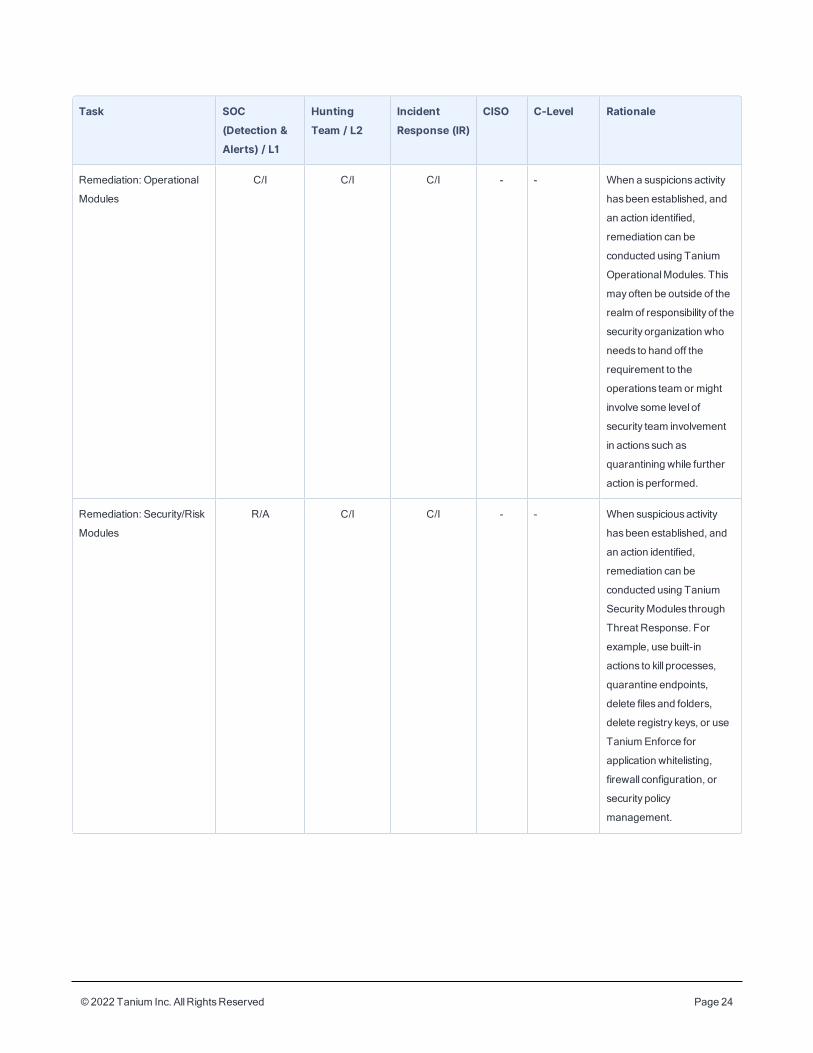
Remediation: Operational
Modules
C/I C/I C/I - - When a suspicionsactivity
hasbeen established, and
an action identified,
remediation can be
conducted using Tanium
OperationalModules. This
mayoften be outside of the
realm of responsibility of the
security organization who
needs to hand off the
requirement to the
operations team or might
involve some level of
security team involvement
in actions such as
quarantining while further
action is performed.
Remediation: Security/Risk
Modules
R/A C/I C/I - - When suspiciousactivity
hasbeen established, and
an action identified,
remediation can be
conducted using Tanium
SecurityModules through
Threat Response. For
example, use built-in
actions to kill processes,
quarantine endpoints,
delete files and folders,
delete registry keys, or use
TaniumEnforce for
application whitelisting,
firewall configuration, or
security policy
management.
© 2022 Tanium Inc. AllRightsReserved Page 25
Task SOC(Detection &Alerts) / L1
HuntingTeam / L2
IncidentResponse (IR)
CISO C-Level Rationale
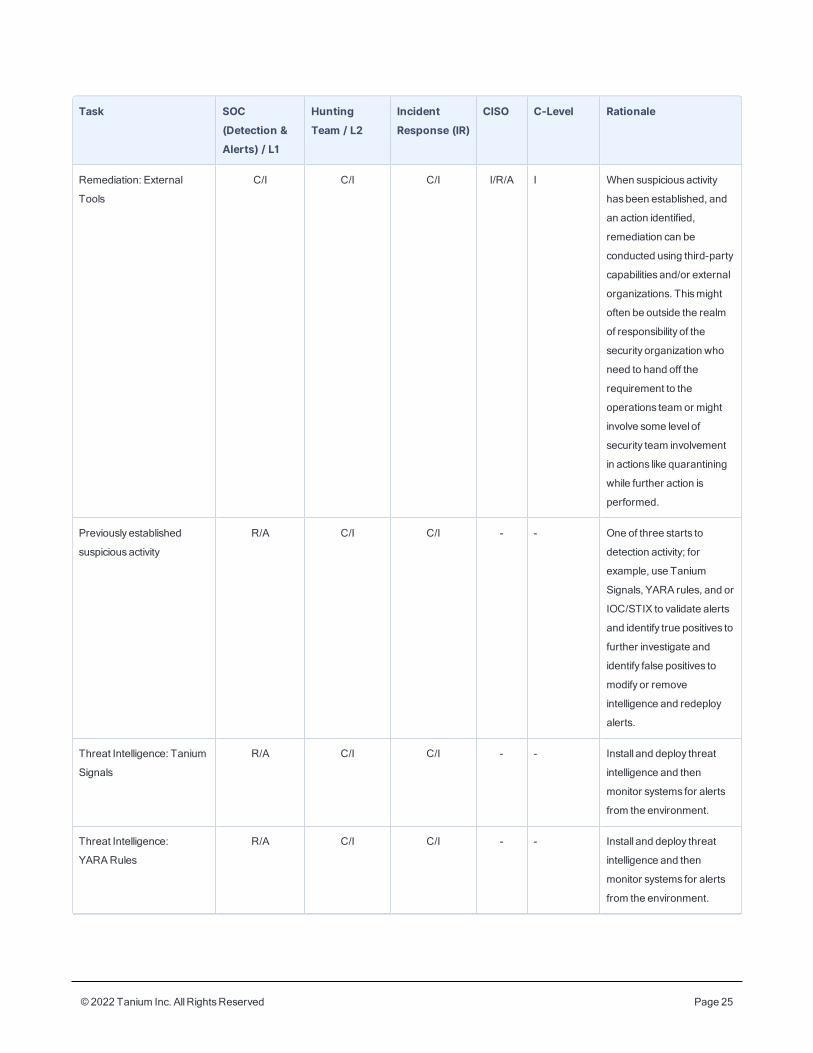
Remediation: External
Tools
C/I C/I C/I I/R/A I When suspiciousactivity
hasbeen established, and
an action identified,
remediation can be
conducted using third-party
capabilities and/or external
organizations. Thismight
often be outside the realm
of responsibility of the
security organization who
need to hand off the
requirement to the
operations team or might
involve some level of
security team involvement
in actions like quarantining
while further action is
performed.
Previously established
suspiciousactivity
R/A C/I C/I - - One of three starts to
detection activity; for
example, use Tanium
Signals, YARA rules, and or
IOC/STIX to validate alerts
and identify true positives to
further investigate and
identify false positives to
modify or remove
intelligence and redeploy
alerts.
Threat Intelligence: Tanium
Signals
R/A C/I C/I - - Install and deploy threat
intelligence and then
monitor systems for alerts
from the environment.
Threat Intelligence:
YARA Rules
R/A C/I C/I - - Install and deploy threat
intelligence and then
monitor systems for alerts
from the environment.
© 2022 Tanium Inc. AllRightsReserved Page 26
Task SOC(Detection &Alerts) / L1
HuntingTeam / L2
IncidentResponse (IR)
CISO C-Level Rationale
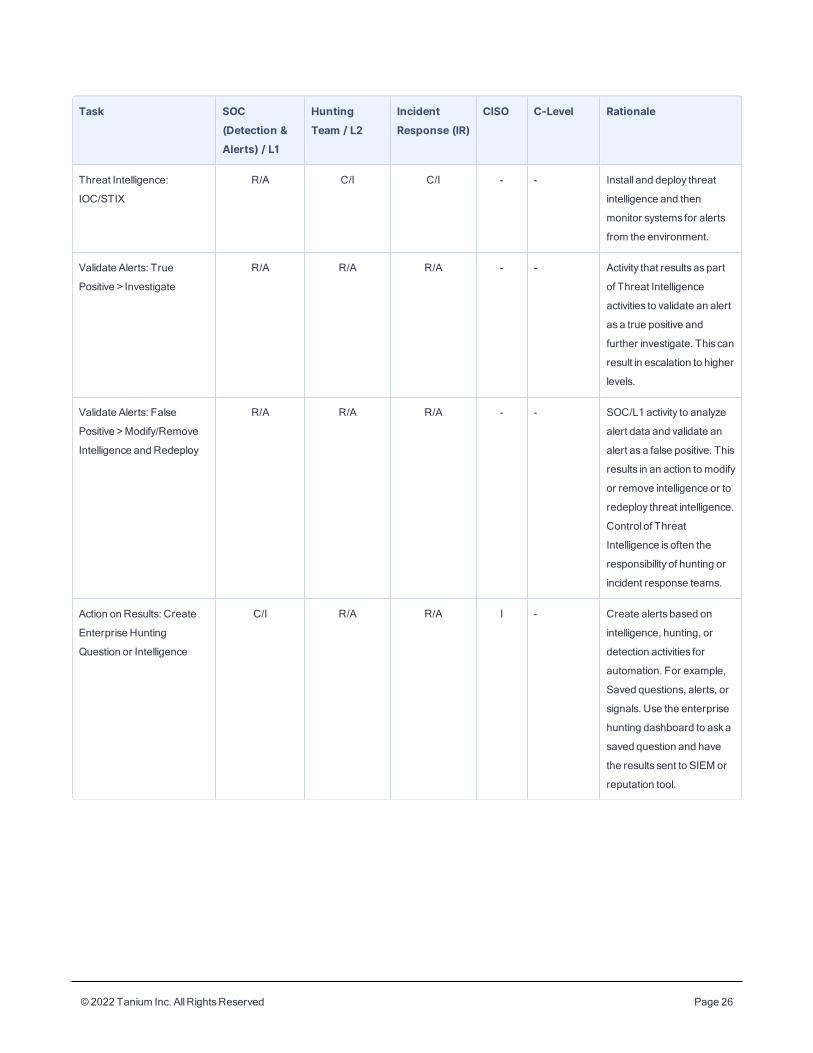
Threat Intelligence:
IOC/STIX
R/A C/I C/I - - Install and deploy threat
intelligence and then
monitor systems for alerts
from the environment.
Validate Alerts: True
Positive > Investigate
R/A R/A R/A - - Activity that results aspart
of Threat Intelligence
activities to validate an alert
as a true positive and
further investigate. This can
result in escalation to higher
levels.
Validate Alerts: False
Positive >Modify/Remove
Intelligence and Redeploy
R/A R/A R/A - - SOC/L1 activity to analyze
alert data and validate an
alert as a false positive. This
results in an action tomodify
or remove intelligence or to
redeploy threat intelligence.
Control of Threat
Intelligence is often the
responsibility of hunting or
incident response teams.
Action on Results: Create
Enterprise Hunting
Question or Intelligence
C/I R/A R/A I - Create alerts based on
intelligence, hunting, or
detection activities for
automation. For example,
Saved questions, alerts, or
signals. Use the enterprise
hunting dashboard to aska
saved question and have
the results sent to SIEM or
reputation tool.
© 2022 Tanium Inc. AllRightsReserved Page 27
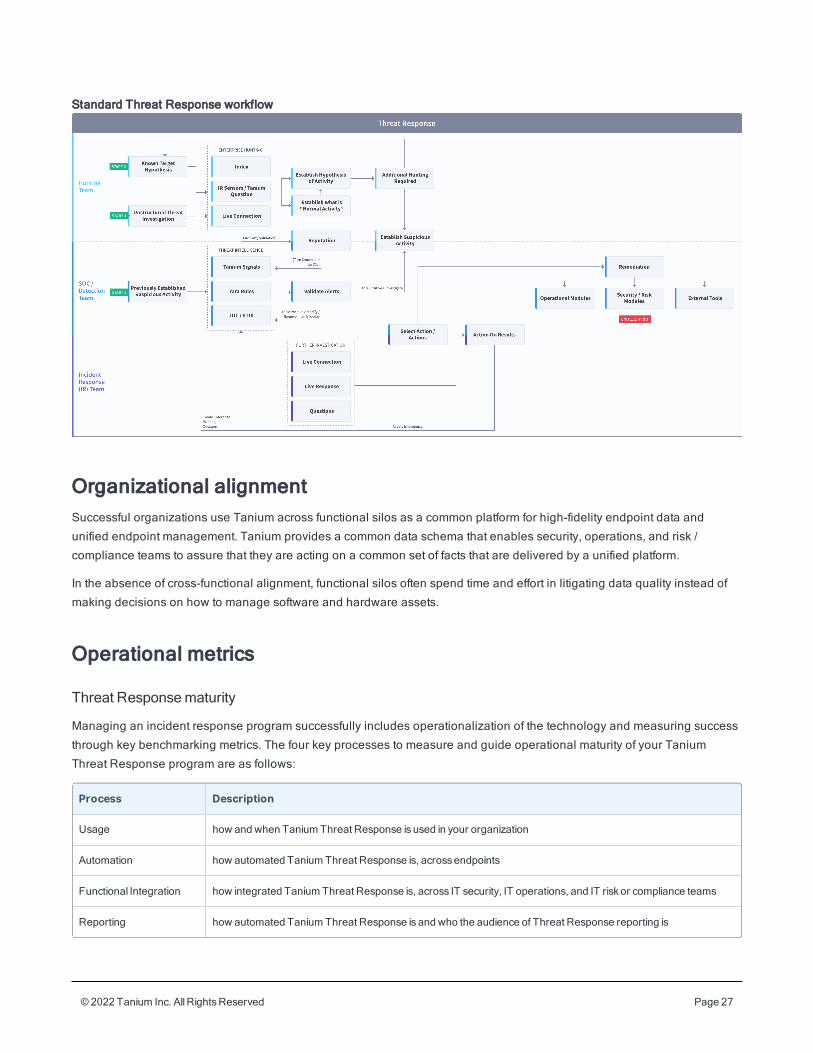
Standard Threat Response workflow
Organizational alignmentSuccessful organizations use Tanium across functional silos as a common platform for high-fidelity endpoint data and
unified endpoint management. Tanium provides a common data schema that enables security, operations, and risk /
compliance teams to assure that they are acting on a common set of facts that are delivered by a unified platform.
In the absence of cross-functional alignment, functional silos often spend time and effort in litigating data quality instead of
making decisions on how to manage software and hardware assets.
Operational metrics
Threat Responsematurity
Managing an incident response program successfully includes operationalization of the technology and measuring success
through key benchmarking metrics. The four key processes to measure and guide operational maturity of your Tanium
Threat Response program are as follows:
Process Description
Usage how and when Tanium Threat Response is used in your organization
Automation how automated Tanium Threat Response is, acrossendpoints
Functional Integration how integrated Tanium Threat Response is, across IT security, IT operations, and IT risk or compliance teams
Reporting how automated Tanium Threat Response is and who the audience of Threat Response reporting is
© 2022 Tanium Inc. AllRightsReserved Page 28
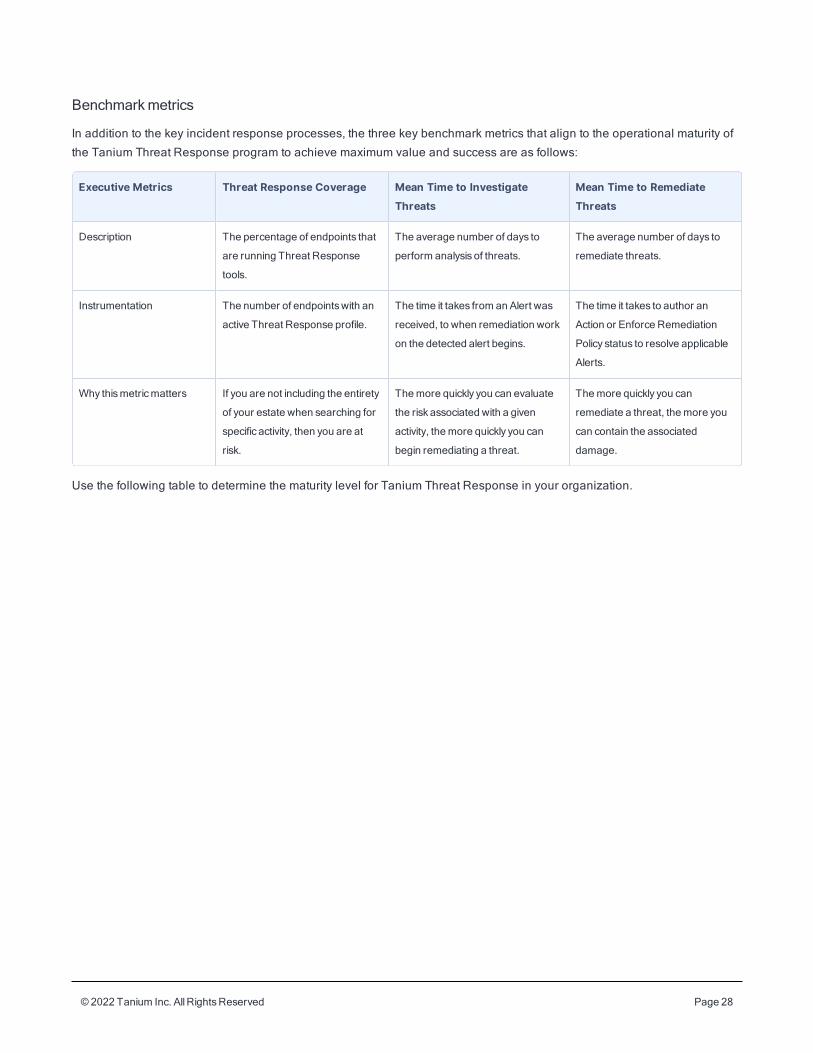
Benchmarkmetrics
In addition to the key incident response processes, the three key benchmark metrics that align to the operational maturity of
the Tanium Threat Response program to achieve maximum value and success are as follows:
Executive Metrics Threat Response Coverage Mean Time to InvestigateThreats
Mean Time to RemediateThreats
Description The percentage of endpoints that
are running Threat Response
tools.
The average number of days to
perform analysis of threats.
The average number of days to
remediate threats.
Instrumentation The number of endpointswith an
active Threat Response profile.
The time it takes from an Alert was
received, to when remediation work
on the detected alert begins.
The time it takes to author an
Action or Enforce Remediation
Policy status to resolve applicable
Alerts.
Why thismetricmatters If you are not including the entirety
of your estate when searching for
specific activity, then you are at
risk.
Themore quickly you can evaluate
the risk associated with a given
activity, themore quickly you can
begin remediating a threat.
Themore quickly you can
remediate a threat, themore you
can contain the associated
damage.
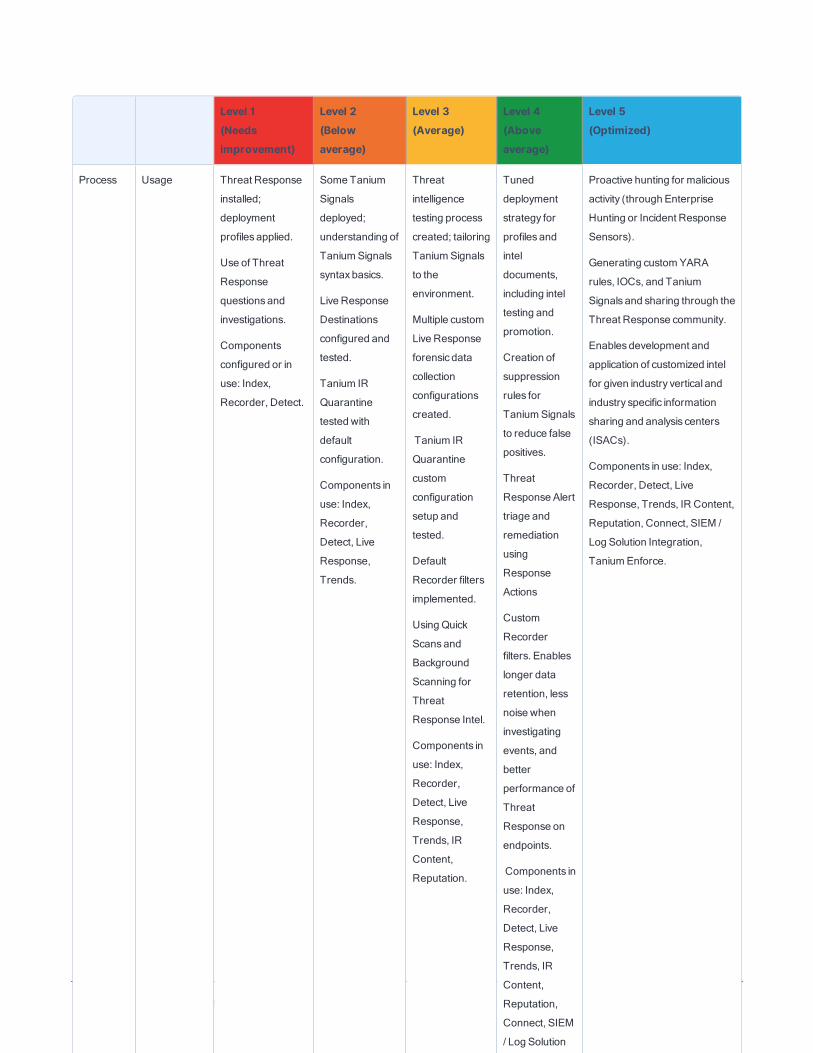
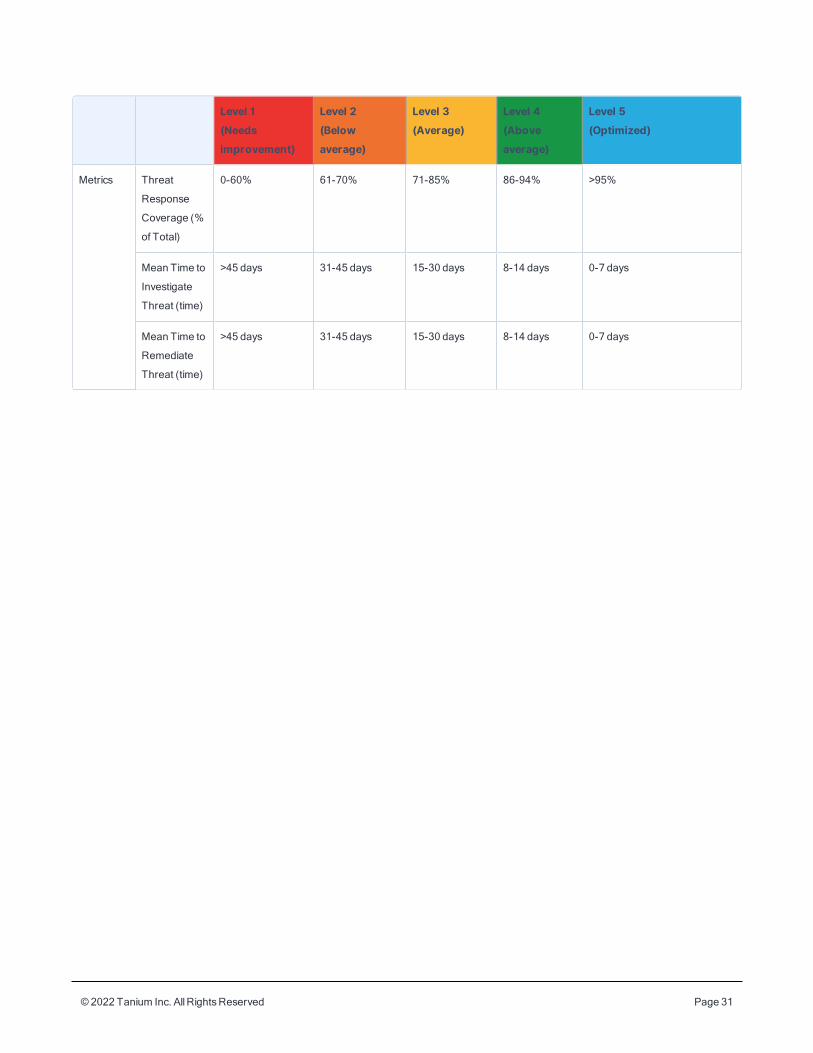
Use the following table to determine the maturity level for Tanium Threat Response in your organization.
© 2022 Tanium Inc. AllRightsReserved Page 29
Level 1(Needsimprovement)
Level 2(Belowaverage)
Level 3(Average)
Level 4(Aboveaverage)
Level 5(Optimized)
Process Usage Threat Response
installed;
deployment
profiles applied.
Use of Threat
Response
questionsand
investigations.
Components
configured or in
use: Index,
Recorder, Detect.
Some Tanium
Signals
deployed;
understanding of
TaniumSignals
syntaxbasics.
Live Response
Destinations
configured and
tested.
Tanium IR
Quarantine
tested with
default
configuration.
Components in
use: Index,
Recorder,
Detect, Live
Response,
Trends.
Threat
intelligence
testing process
created; tailoring
TaniumSignals
to the
environment.
Multiple custom
Live Response
forensic data
collection
configurations
created.
Tanium IR
Quarantine
custom
configuration
setup and
tested.
Default
Recorder filters
implemented.
Using Quick
Scansand
Background
Scanning for
Threat
Response Intel.
Components in
use: Index,
Recorder,
Detect, Live
Response,
Trends, IR
Content,
Reputation.
Tuned
deployment
strategy for
profiles and
intel
documents,
including intel
testing and
promotion.
Creation of
suppression
rules for
TaniumSignals
to reduce false
positives.
Threat
Response Alert
triage and
remediation
using
Response
Actions
Custom
Recorder
filters. Enables
longer data
retention, less
noise when
investigating
events, and
better
performance of
Threat
Response on
endpoints.
Components in
use: Index,
Recorder,
Detect, Live
Response,
Trends, IR
Content,
Reputation,
Connect, SIEM
/ Log Solution
Integration,
Tanium Impact
Proactive hunting for malicious
activity (through Enterprise
Hunting or Incident Response
Sensors).
Generating customYARA
rules, IOCs, and Tanium
Signals and sharing through the
Threat Response community.
Enablesdevelopment and
application of customized intel
for given industry vertical and
industry specific information
sharing and analysis centers
(ISACs).
Components in use: Index,
Recorder, Detect, Live
Response, Trends, IR Content,
Reputation, Connect, SIEM /
Log Solution Integration,
TaniumEnforce.
© 2022 Tanium Inc. AllRightsReserved Page 30
Level 1(Needsimprovement)
Level 2(Belowaverage)
Level 3(Average)
Level 4(Aboveaverage)
Level 5(Optimized)
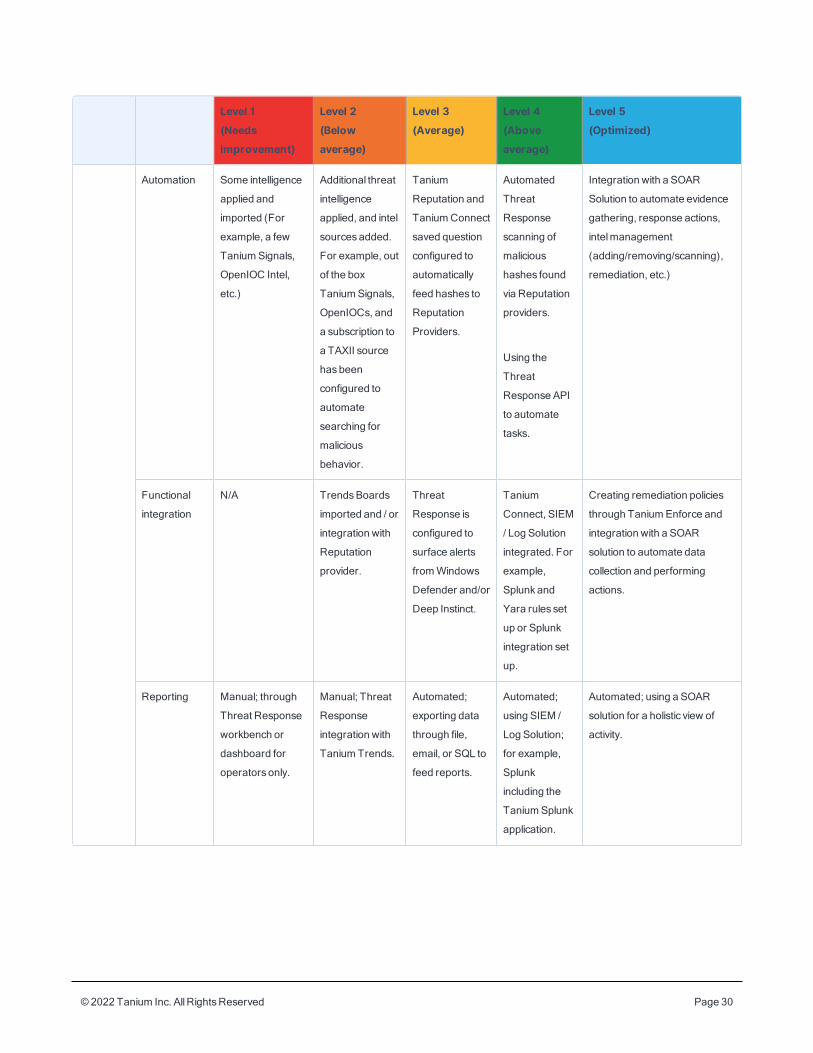
Automation Some intelligence
applied and
imported (For
example, a few
TaniumSignals,
OpenIOC Intel,
etc.)
Additional threat
intelligence
applied, and intel
sourcesadded.
For example, out
of the box
TaniumSignals,
OpenIOCs, and
a subscription to
a TAXII source
hasbeen
configured to
automate
searching for
malicious
behavior.
Tanium
Reputation and
TaniumConnect
saved question
configured to
automatically
feed hashes to
Reputation
Providers.
Automated
Threat
Response
scanning of
malicious
hashes found
via Reputation
providers.
Using the
Threat
Response API
to automate
tasks.
Integration with a SOAR
Solution to automate evidence
gathering, response actions,
intelmanagement
(adding/removing/scanning),
remediation, etc.)
Functional
integration
N/A TrendsBoards
imported and / or
integration with
Reputation
provider.
Threat
Response is
configured to
surface alerts
fromWindows
Defender and/or
Deep Instinct.
Tanium
Connect, SIEM
/ Log Solution
integrated. For
example,
Splunkand
Yara rules set
up or Splunk
integration set
up.
Creating remediation policies
through TaniumEnforce and
integration with a SOAR
solution to automate data
collection and performing
actions.
Reporting Manual; through
Threat Response
workbench or
dashboard for
operators only.
Manual; Threat
Response
integration with
Tanium Trends.
Automated;
exporting data
through file,
email, or SQL to
feed reports.
Automated;
using SIEM /
Log Solution;
for example,
Splunk
including the
TaniumSplunk
application.
Automated; using a SOAR
solution for a holistic view of
activity.
© 2022 Tanium Inc. AllRightsReserved Page 31
Level 1(Needsimprovement)
Level 2(Belowaverage)
Level 3(Average)
Level 4(Aboveaverage)
Level 5(Optimized)
Metrics Threat
Response
Coverage (%
of Total)
0-60% 61-70% 71-85% 86-94% >95%
Mean Time to
Investigate
Threat (time)
>45 days 31-45 days 15-30 days 8-14 days 0-7 days
Mean Time to
Remediate
Threat (time)
>45 days 31-45 days 15-30 days 8-14 days 0-7 days
© 2022 Tanium Inc. AllRightsReserved Page 32
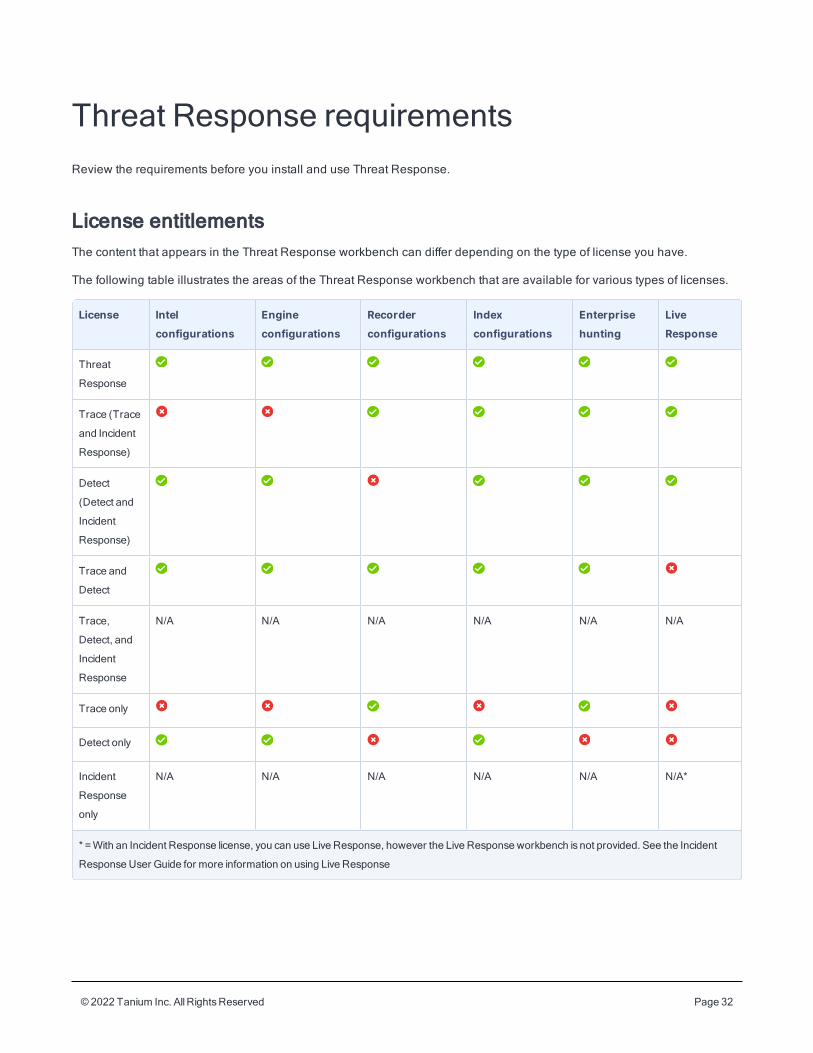
Threat Response requirementsReview the requirements before you install and use Threat Response.
License entitlementsThe content that appears in the Threat Response workbench can differ depending on the type of license you have.
The following table illustrates the areas of the Threat Response workbench that are available for various types of licenses.
License Intelconfigurations
Engineconfigurations
Recorderconfigurations
Indexconfigurations
Enterprisehunting
LiveResponse
Threat
Response
Trace (Trace
and Incident
Response)
Detect
(Detect and
Incident
Response)
Trace and
Detect
Trace,
Detect, and
Incident
Response
N/A N/A N/A N/A N/A N/A
Trace only
Detect only
Incident
Response
only
N/A N/A N/A N/A N/A N/A*
* =With an Incident Response license, you can use Live Response, however the Live Response workbench is not provided. See the Incident
Response User Guide for more information on using Live Response
© 2022 Tanium Inc. AllRightsReserved Page 33
Core platform dependenciesMake sure that your environment meets the following requirements:
l Tanium license that includes Threat Response
l Tanium™ Core Platform servers: 7.3.314.4250 or later
l Tanium™ Client:
o (Linux, macOS*, Windows) Any supported version of Tanium Client
o (macOS 10.15.x and later) 7.2.314.3608 or later
* = macOS earlier than 10.15.x Catalina
For the Tanium Client versions supported for each OS, see Tanium Client Management User Guide: Client version
and host system requirements.
If you use a client version that is not listed, certain product features might not be available, or stability issues can
occur that can only be resolved by upgrading to one of the listed client versions.
Computer group dependenciesWhen you first sign in to the Tanium Console after a fresh installation of Tanium Server 7.4.2 or later, the server
automatically imports the computer groups that Threat Response requires:
l All Computers
l All Windows
l All Linux
l All Mac
For earlier versions of the Tanium Server, or after upgrading from an earlier version, you must manually create the computer
groups. See Tanium Console User Guide: Create a computer group.
Solution dependenciesOther Tanium solutions are required for Threat Response to function (required dependencies) or for specific Threat
Response features to work (feature-specific dependencies). The installation method that you select determines if the Tanium
Server automatically imports dependencies or if you must manually import them.
Some Threat Response dependencies have their own dependencies, which you can see by clicking the links
in the lists of Required dependencies on page 34 and Feature-specific dependencies on page 34. Note that
the links open the user guides for the latest version of each solution, not necessarily the minimum version
that Threat Response requires.
© 2022 Tanium Inc. AllRightsReserved Page 34
Tanium recommended installation
If you select Tanium Recommended Installation when you import Threat Response, the Tanium Server automatically
imports all your licensed solutions at the same time. See Tanium Console User Guide: Import all modules and services.
Import specific solutions
If you select only Threat Response to import and are using Tanium Core Platform 7.5.2.3531 with Tanium Console 3.0.72 or
later, the Tanium Server automatically imports the latest available versions of any required dependencies that are missing. If
some required dependencies are already imported but their versions are earlier than the minimum required for Threat
Response, the server automatically updates those dependencies to the latest available versions.
If you select only Threat Response to import and you are using Tanium Core Platform 7.5.2.3503 or earlier with Tanium
Console 3.0.64 or earlier, you must manually import or update required dependencies. See Tanium Console User Guide:
Import, re-import, or update specific solutions.
Required dependencies
Threat Response has the following required dependencies at the specified minimum versions:
l Tanium™ Connect 4.1.0 to 4.10.5 is required for reputation data without Tanium™ Reputation.
l Tanium™ Reputation 5.0 or later is required for reputation data with Tanium Connect 4.11 or later.
l Tanium™ IR Quarantine 3.1.1. or later is required for isolating endpoints.
l Tanium™ Direct Connect 1.10.39 or later is required for live endpoint connections.
l Tanium Trends 3.6.331 or later.
l Tanium Interact 2.7.214 or later.
l Tanium Default Content 8.0.0 or later
l Tanium Endpoint Configuration 1.2 or later (installed as part of Tanium Client Management 1.5 or later)
Feature-specific dependencies
If you select only Threat Response to import, you must manually import or update its feature-specific dependencies
regardless of the Tanium Console or Tanium Core Platform versions. Threat Response has the following feature-specific
dependencies at the specified minimum versions:
l Tanium Impact 1.5.68 or later is required to display Impact ratings for alerts.
l Tanium™ Enforce 1.6.0 or later is required for alert remediation.
Tanium™ Reveal 1.15 or later is required if Reveal exists in the same environment. Tanium Reveal is not a required Threat
Response dependency.
© 2022 Tanium Inc. AllRightsReserved Page 35
Client extensionsTanium Endpoint Configuration installs client extensions for Threat Response on endpoints. Client Extensions perform tasks
that are common to certain Tanium solutions. The Tanium Client uses code signatures to verify the integrity of each client
extension prior to loading the extension on the endpoint. Each client extension has recommended security exclusions to
allow the Tanium processes to run without interference. See Security exclusions for more information. The following client
extensions perform Threat Response functions:
l Core CX - Provides a management framework API for all other client extensions and exposes operating system
metrics. Tanium Client Management installs this client extension.
l Config CX - Provides installation and configuration of extensions on endpoints. Tanium Client Management installs
this client extension.
l DEC CX - Provides a direct connection between endpoint and Module Server. Tanium Direct Connect installs this
client extension.
l Index CX - Provides the ability to index the local file systems on endpoints. Tanium Reveal or Tanium Threat
Response installs this client extension.
l Py CX - Provides a library that enables communication between Python-based client extensions and Core CX.
Tanium Integrity Monitor, Tanium Reveal, or Tanium Threat Response installs this client extension.
l Recorder CX - Provides the ability to save event data on each endpoint and monitor the endpoint kernel and other
low-level subsystems to capture a variety of events. Tanium Integrity Monitor, Tanium Map, or Tanium Threat
Response installs this client extension.
l Support CX - Provides the ability to gather troubleshooting content from endpoints through Tanium Client
Management. Tanium Client Management installs this client extension.
l Stream CX - Provides the ability to gather large amounts of data from endpoints and send it to an external
destination. Tanium Threat Response installs this client extension.
l Threat Response CX - Provides Threat Response functions on the endpoint. Tanium Threat Response installs this
client extension.
Tanium™ Module ServerThreat Response is installed and runs as a service on the Module Server host computer. The impact on Module Server host
computer sizing is minimal and depends on usage. For more information, see Contact Tanium Support on page 231. As a
best practice, 250GB to 1TB of disk space is recommended to ensure available storage for snapshots and other saved
Threat Response evidence.
EndpointsThe following endpoint operating systems are supported with Threat Response. The endpoint requirements for Threat
Response are consistent with those used for Tanium Performance and Tanium Integrity Monitor. Threat Response uses the
Tanium™ Client Recorder Extension to gather data from endpoints.
© 2022 Tanium Inc. AllRightsReserved Page 36
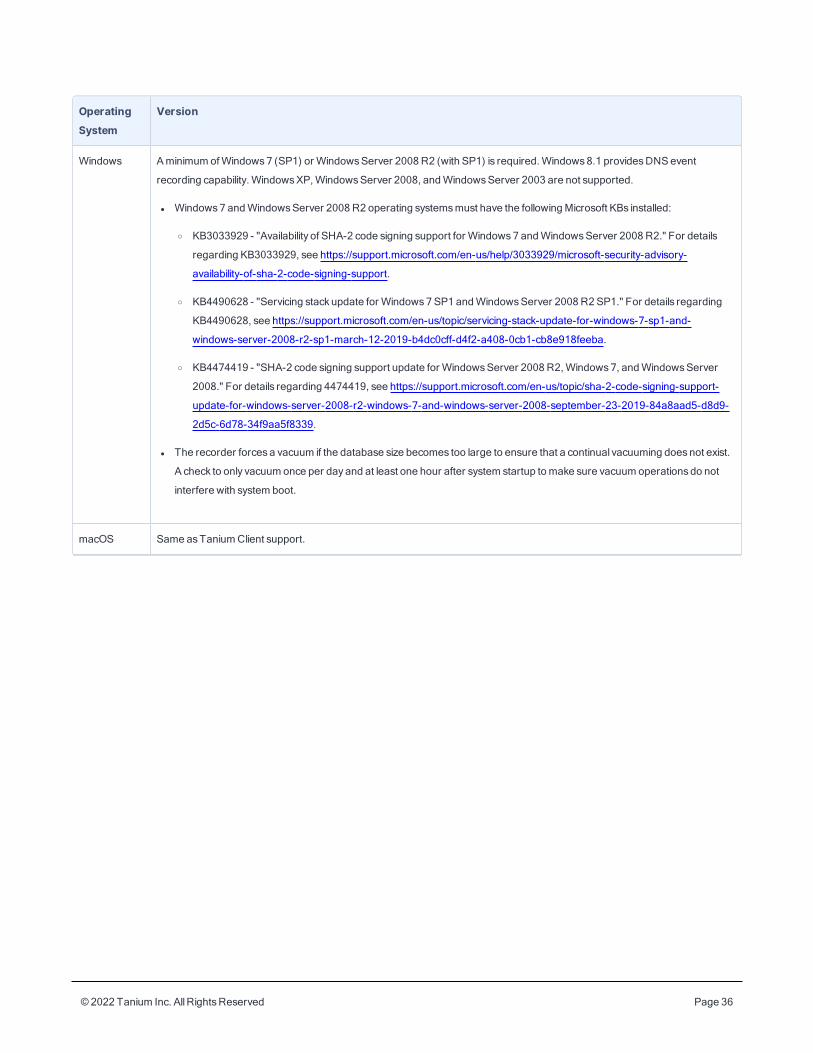
OperatingSystem
Version
Windows Aminimum ofWindows7 (SP1) or WindowsServer 2008 R2 (with SP1) is required.Windows8.1 providesDNSevent
recording capability.WindowsXP,WindowsServer 2008, andWindowsServer 2003 are not supported.
l Windows7 andWindowsServer 2008 R2 operating systemsmust have the followingMicrosoft KBs installed:
o KB3033929 - "Availability of SHA-2 code signing support for Windows7 andWindowsServer 2008 R2." For details
regarding KB3033929, see https://support.microsoft.com/en-us/help/3033929/microsoft-security-advisory-
availability-of-sha-2-code-signing-support.
o KB4490628 - "Servicing stackupdate for Windows7 SP1 andWindowsServer 2008 R2 SP1." For details regarding
KB4490628, see https://support.microsoft.com/en-us/topic/servicing-stack-update-for-windows-7-sp1-and-
windows-server-2008-r2-sp1-march-12-2019-b4dc0cff-d4f2-a408-0cb1-cb8e918feeba.
o KB4474419 - "SHA-2 code signing support update for WindowsServer 2008 R2,Windows7, andWindowsServer
2008." For details regarding 4474419, see https://support.microsoft.com/en-us/topic/sha-2-code-signing-support-
update-for-windows-server-2008-r2-windows-7-and-windows-server-2008-september-23-2019-84a8aad5-d8d9-
2d5c-6d78-34f9aa5f8339.
l The recorder forcesa vacuum if the database size becomes too large to ensure that a continual vacuuming doesnot exist.
A check to only vacuum once per dayand at least one hour after system startup tomake sure vacuum operationsdo not
interfere with system boot.
macOS Same asTaniumClient support.
© 2022 Tanium Inc. AllRightsReserved Page 37
OperatingSystem
Version
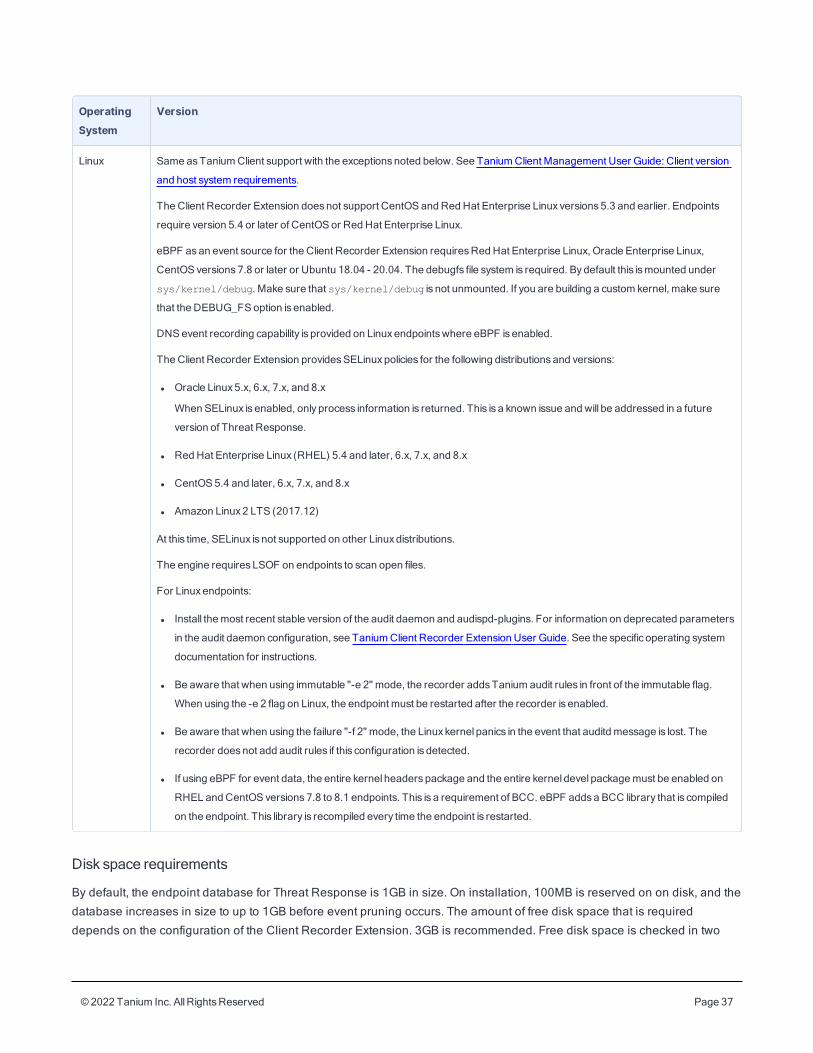
Linux Same asTaniumClient support with the exceptionsnoted below. See TaniumClient Management User Guide: Client version
and host system requirements.
The Client Recorder Extension doesnot support CentOSand RedHat Enterprise Linux versions5.3 and earlier. Endpoints
require version 5.4 or later of CentOSor Red Hat Enterprise Linux.
eBPF asan event source for the Client Recorder Extension requiresRedHat Enterprise Linux, Oracle Enterprise Linux,
CentOS versions7.8 or later or Ubuntu 18.04 - 20.04. The debugfs file system is required. Bydefault this ismounted under
sys/kernel/debug. Make sure that sys/kernel/debug is not unmounted. If you are building a custom kernel, make sure
that the DEBUG_FSoption is enabled.
DNSevent recording capability is provided on Linuxendpointswhere eBPF is enabled.
The Client Recorder Extension providesSELinuxpolicies for the following distributionsand versions:
l Oracle Linux5.x, 6.x, 7.x, and 8.x
When SELinux is enabled, only process information is returned. This is a known issue and will be addressed in a future
version of Threat Response.
l RedHat Enterprise Linux (RHEL) 5.4 and later, 6.x, 7.x, and 8.x
l CentOS5.4 and later, 6.x, 7.x, and 8.x
l Amazon Linux2 LTS (2017.12)
At this time, SELinux is not supported on other Linuxdistributions.
The engine requiresLSOF on endpoints to scan open files.
For Linuxendpoints:
l Install themost recent stable version of the audit daemon and audispd-plugins. For information on deprecated parameters
in the audit daemon configuration, see TaniumClient Recorder Extension User Guide. See the specific operating system
documentation for instructions.
l Be aware that when using immutable "-e 2" mode, the recorder addsTanium audit rules in front of the immutable flag.
When using the -e 2 flag on Linux, the endpoint must be restarted after the recorder is enabled.
l Be aware that when using the failure "-f 2" mode, the Linux kernel panics in the event that auditd message is lost. The
recorder doesnot add audit rules if this configuration is detected.
l If using eBPF for event data, the entire kernel headers package and the entire kernel devel packagemust be enabled on
RHEL and CentOS versions7.8 to 8.1 endpoints. This is a requirement of BCC. eBPF addsa BCC library that is compiled
on the endpoint. This library is recompiled every time the endpoint is restarted.
Disk space requirements
By default, the endpoint database for Threat Response is 1GB in size. On installation, 100MB is reserved on on disk, and the
database increases in size to up to 1GB before event pruning occurs. The amount of free disk space that is required
depends on the configuration of the Client Recorder Extension. 3GB is recommended. Free disk space is checked in two
© 2022 Tanium Inc. AllRightsReserved Page 38
situations: when a snapshot is requested, and as part of the process following a Threat Response 1.x to 2.x migration where
a legacy monitor.db is migrated.
CPU andmemory requirements
The CPU demand on the endpoint averages less than 1%.
The Client Recorder Extension does not start on endpoints with a single logical core without updating the
CX.recorder.EnableSingleCpuRequirement configuration setting to 0. To update
CX.recorder.EnableSingleCpuRequirement to 0, edit the Recorder - Set Recorder Extension Setting [OS] package to add aparameter with the configuration key EnableSingleCpuRequirement and a value of 0, and deploy the package to
appropriate endpoints. Alternatively, you can run the following command from the Tanium Client directory on endpoints to
update this configuration setting:
l (Windows) TaniumClient.exe config set CX.recorder.EnableSingleCpuRequirement 0
l (Linux and macOS) ./TaniumClient config set CX.recorder.EnableSingleCpuRequirement 0
A minimum of 4 GB RAM is recommended on each endpoint device.
TaniumDriver
The Tanium Driver records process and command-line events on supported Windows endpoints. The Tanium Driver is
included in initial installations and any subsequent updates of Threat Response. To record event data from Windows
endpoints, the Tanium Driver must be installed on endpoints. When you deploy a Threat Response profile to endpoints that
includes a recorder configuration or an engine configuration that evaluates Signals intel, the Tanium Driver is installed on
the target endpoints. Driver 3.0 introduces a new service on Windows endpoints named TaniumDriverSvc.
The latest version of the Tanium Driver is 3.x. If you are deploying the 3.x Tanium Driver to endpoints for the first time, a
reboot of endpoints is not required for the driver to capture events, but a reboot is required to view complete process tree
data.
If you are using Threat Response version 1.3 to 2.6.4, Tanium Driver version 1.x is provided.
If you are using Threat Response version 2.6.5 to 3.4, Tanium Driver version 2.x is provided.
If you are using Threat Response version 3.5 or later, Tanium Driver version 3.x is provided.
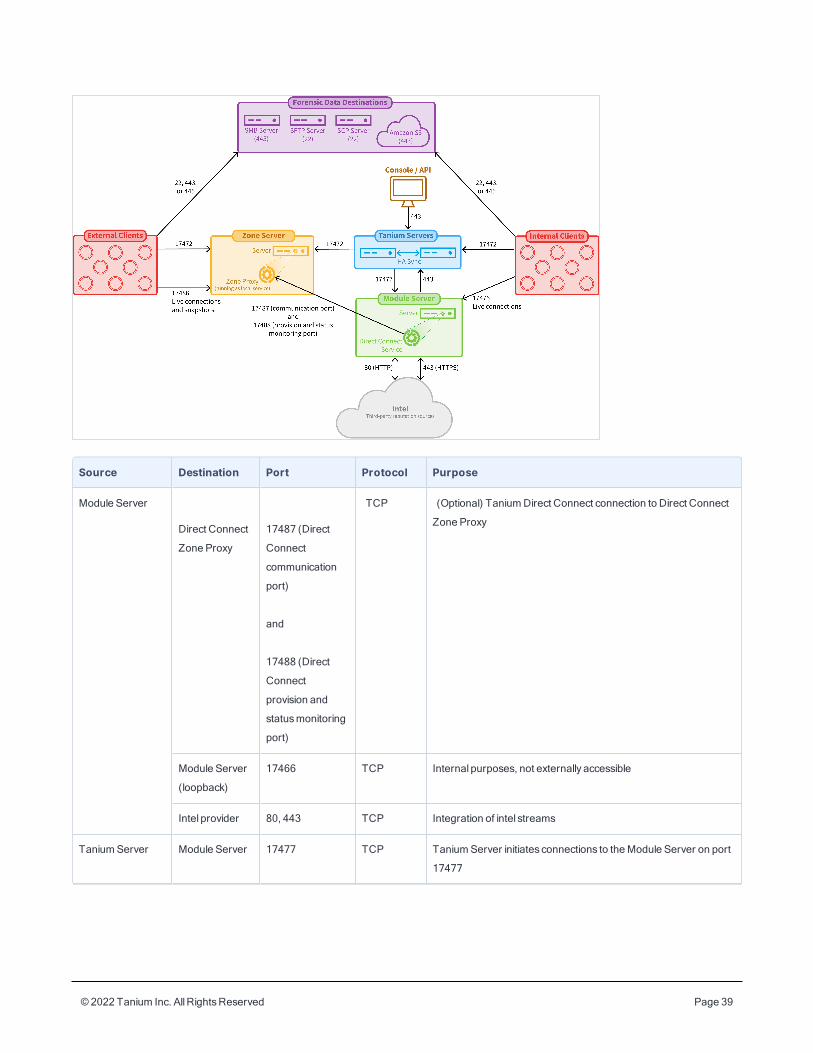
Host and network security requirementsSpecific ports and processes are needed to run Threat Response.
Ports
The following ports are required for Threat Response communication.
© 2022 Tanium Inc. AllRightsReserved Page 39
Source Destination Port Protocol Purpose
Module Server
Direct Connect
Zone Proxy
17487 (Direct
Connect
communication
port)
and
17488 (Direct
Connect
provision and
statusmonitoring
port)
TCP (Optional) TaniumDirect Connect connection to Direct Connect
Zone Proxy
Module Server
(loopback)
17466 TCP Internal purposes, not externally accessible
Intel provider 80, 443 TCP Integration of intel streams
TaniumServer Module Server 17477 TCP TaniumServer initiates connections to theModule Server on port
17477
© 2022 Tanium Inc. AllRightsReserved Page 40
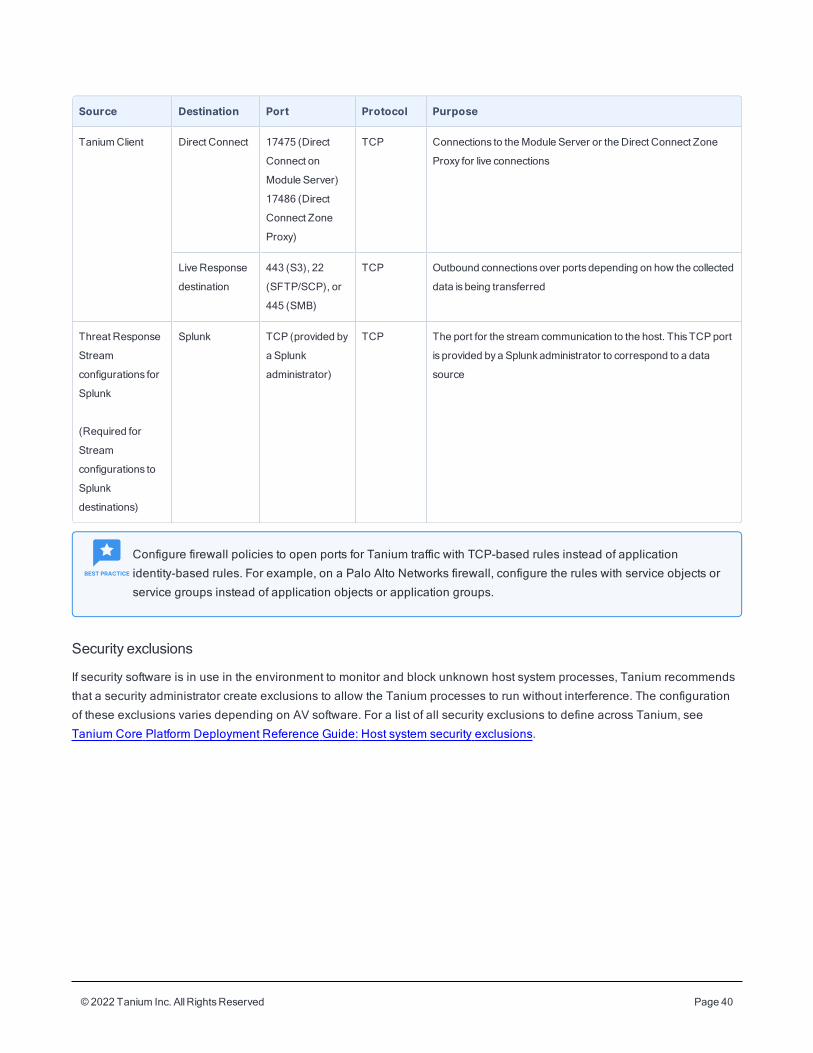
Source Destination Port Protocol Purpose
TaniumClient Direct Connect 17475 (Direct
Connect on
Module Server)
17486 (Direct
Connect Zone
Proxy)
TCP Connections to theModule Server or the Direct Connect Zone
Proxy for live connections
Live Response
destination
443 (S3), 22
(SFTP/SCP), or
445 (SMB)
TCP Outbound connectionsover ports depending on how the collected
data is being transferred
Threat Response
Stream
configurations for
Splunk
(Required for
Stream
configurations to
Splunk
destinations)
Splunk TCP (provided by
a Splunk
administrator)
TCP The port for the stream communication to the host. ThisTCP port
is provided bya Splunkadministrator to correspond to a data
source
Configure firewall policies to open ports for Tanium traffic with TCP-based rules instead of application
identity-based rules. For example, on a Palo Alto Networks firewall, configure the rules with service objects or
service groups instead of application objects or application groups.
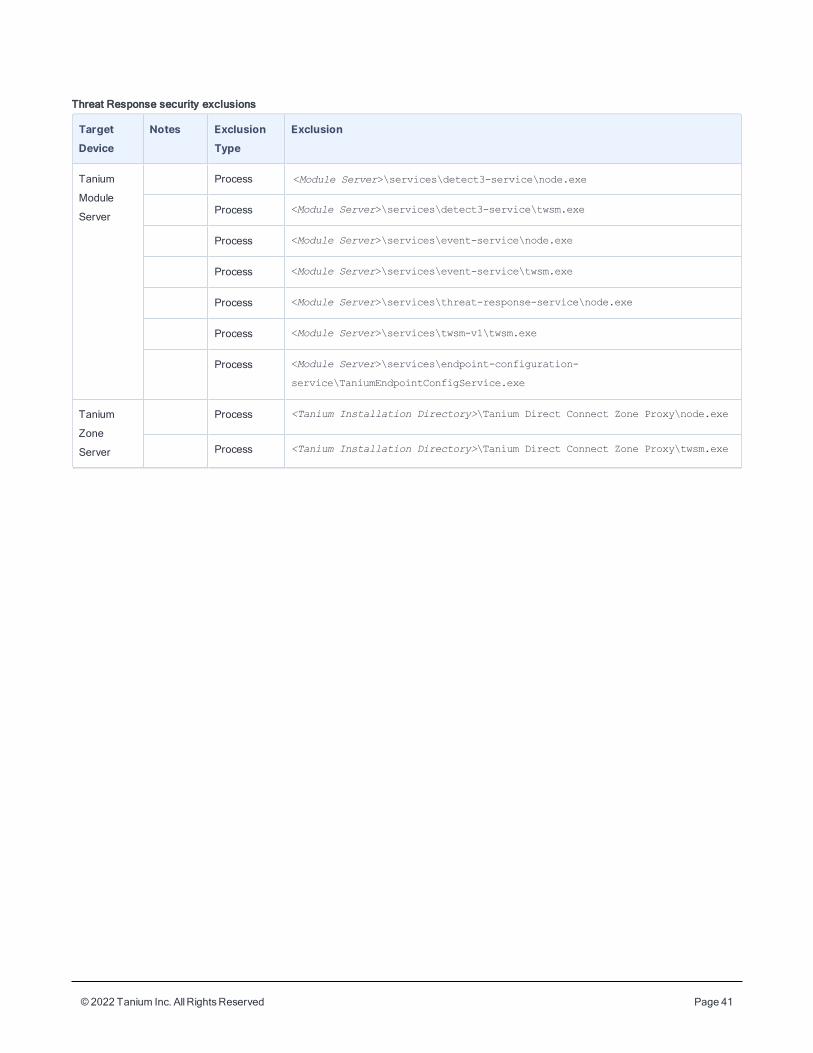
Security exclusions
If security software is in use in the environment to monitor and block unknown host system processes, Tanium recommends
that a security administrator create exclusions to allow the Tanium processes to run without interference. The configuration
of these exclusions varies depending on AV software. For a list of all security exclusions to define across Tanium, see
Tanium Core Platform Deployment Reference Guide: Host system security exclusions.
© 2022 Tanium Inc. AllRightsReserved Page 41
TargetDevice
Notes ExclusionType
Exclusion
Tanium
Module
Server
Process <Module Server>\services\detect3-service\node.exe
Process <Module Server>\services\detect3-service\twsm.exe
Process <Module Server>\services\event-service\node.exe
Process <Module Server>\services\event-service\twsm.exe
Process <Module Server>\services\threat-response-service\node.exe
Process <Module Server>\services\twsm-v1\twsm.exe
Process <Module Server>\services\endpoint-configuration-
service\TaniumEndpointConfigService.exe
Tanium
Zone
Server
Process <Tanium Installation Directory>\Tanium Direct Connect Zone Proxy\node.exe
Process <Tanium Installation Directory>\Tanium Direct Connect Zone Proxy\twsm.exe
Threat Response security exclusions

© 2022 Tanium Inc. AllRightsReserved Page 42
TargetDevice
Notes ExclusionType
Exclusion
Windows
x86 and x64
endpoints
Process <Tanium Client>\Tools\IR\TaniumExecWrapper.exe
Threat Response security exclusions (continued)

© 2022 Tanium Inc. AllRightsReserved Page 43
TargetDevice
Notes ExclusionType
Exclusion
Process <Tanium Client>\Tools\IR\TanFileInfo.exe
Threat Response security exclusions (continued)

© 2022 Tanium Inc. AllRightsReserved Page 44
TargetDevice
Notes ExclusionType
Exclusion
Process <Tanium Client>\Tools\IR\TaniumFileInfo.exe
Threat Response security exclusions (continued)

© 2022 Tanium Inc. AllRightsReserved Page 45
TargetDevice
Notes ExclusionType
Exclusion
Process <Tanium Client>\Tools\IR\TaniumHandle.exe
Threat Response security exclusions (continued)

© 2022 Tanium Inc. AllRightsReserved Page 46
TargetDevice
Notes ExclusionType
Exclusion
Process <Tanium Client>\Tools\IR\TaniumListModules.exe
Threat Response security exclusions (continued)

© 2022 Tanium Inc. AllRightsReserved Page 47
TargetDevice
Notes ExclusionType
Exclusion
File <Tanium Client>\extensions\TaniumIndex.dll
Threat Response security exclusions (continued)

© 2022 Tanium Inc. AllRightsReserved Page 48
TargetDevice
Notes ExclusionType
Exclusion
File <Tanium Client>\extensions\TaniumIndex.dll.sig
Threat Response security exclusions (continued)

© 2022 Tanium Inc. AllRightsReserved Page 49
TargetDevice
Notes ExclusionType
Exclusion
Process <Tanium Client>\Tools\recorder\TaniumRecorderCtl.exe
Threat Response security exclusions (continued)

© 2022 Tanium Inc. AllRightsReserved Page 50
TargetDevice
Notes ExclusionType
Exclusion
Process <Tanium Client>\Tools\Detect3\TaniumDetectEngine.exe
Threat Response security exclusions (continued)

© 2022 Tanium Inc. AllRightsReserved Page 51
TargetDevice
Notes ExclusionType
Exclusion
File <Tanium Client>\extensions\TaniumRecorder.dll
Threat Response security exclusions (continued)

© 2022 Tanium Inc. AllRightsReserved Page 52
TargetDevice
Notes ExclusionType
Exclusion
File <Tanium Client>\extensions\TaniumRecorder.dll.sig
Threat Response security exclusions (continued)

© 2022 Tanium Inc. AllRightsReserved Page 53
TargetDevice
Notes ExclusionType
Exclusion
File <Tanium Client>\extensions\SupportCX.dll
Threat Response security exclusions (continued)

© 2022 Tanium Inc. AllRightsReserved Page 54
TargetDevice
Notes ExclusionType
Exclusion
File <Tanium Client>\extensions\SupportCX.dll.sig
Threat Response security exclusions (continued)

© 2022 Tanium Inc. AllRightsReserved Page 55
TargetDevice
Notes ExclusionType
Exclusion
File <Tanium Client>\extensions\recorder\proc.bin
Threat Response security exclusions (continued)

© 2022 Tanium Inc. AllRightsReserved Page 56
TargetDevice
Notes ExclusionType
Exclusion
File <Tanium Client>\extensions\recorder\recorder.db
Threat Response security exclusions (continued)

© 2022 Tanium Inc. AllRightsReserved Page 57
TargetDevice
Notes ExclusionType
Exclusion
File <Tanium Client>\extensions\recorder\recorder.db-shm
Threat Response security exclusions (continued)

© 2022 Tanium Inc. AllRightsReserved Page 58
TargetDevice
Notes ExclusionType
Exclusion
File <Tanium Client>\extensions\recorder\recorder.db-wal
Threat Response security exclusions (continued)

© 2022 Tanium Inc. AllRightsReserved Page 59
TargetDevice
Notes ExclusionType
Exclusion
Process <Tanium Client>\tools\driver\TaniumDriverCtl.exe
Threat Response security exclusions (continued)

© 2022 Tanium Inc. AllRightsReserved Page 60
TargetDevice
Notes ExclusionType
Exclusion
Process <Tanium Client>\tools\driver\TaniumDriverCtl64.exe
Threat Response security exclusions (continued)

© 2022 Tanium Inc. AllRightsReserved Page 61
TargetDevice
Notes ExclusionType
Exclusion
Process <Tanium Client>\tools\driver\TaniumDriverSvc.exe
Threat Response security exclusions (continued)

© 2022 Tanium Inc. AllRightsReserved Page 62
TargetDevice
Notes ExclusionType
Exclusion
Process <Tanium Client>\tools\driver\TaniumDriverSvc64.exe
Threat Response security exclusions (continued)

© 2022 Tanium Inc. AllRightsReserved Page 63
TargetDevice
Notes ExclusionType
Exclusion
Process <Tanium Client>\tools\driver\service\TaniumDriverSvc.exe
Threat Response security exclusions (continued)

© 2022 Tanium Inc. AllRightsReserved Page 64
TargetDevice
Notes ExclusionType
Exclusion
Process <Tanium Client>\tools\driver\service\TaniumDriverSvc64.exe
Threat Response security exclusions (continued)

© 2022 Tanium Inc. AllRightsReserved Page 65
TargetDevice
Notes ExclusionType
Exclusion
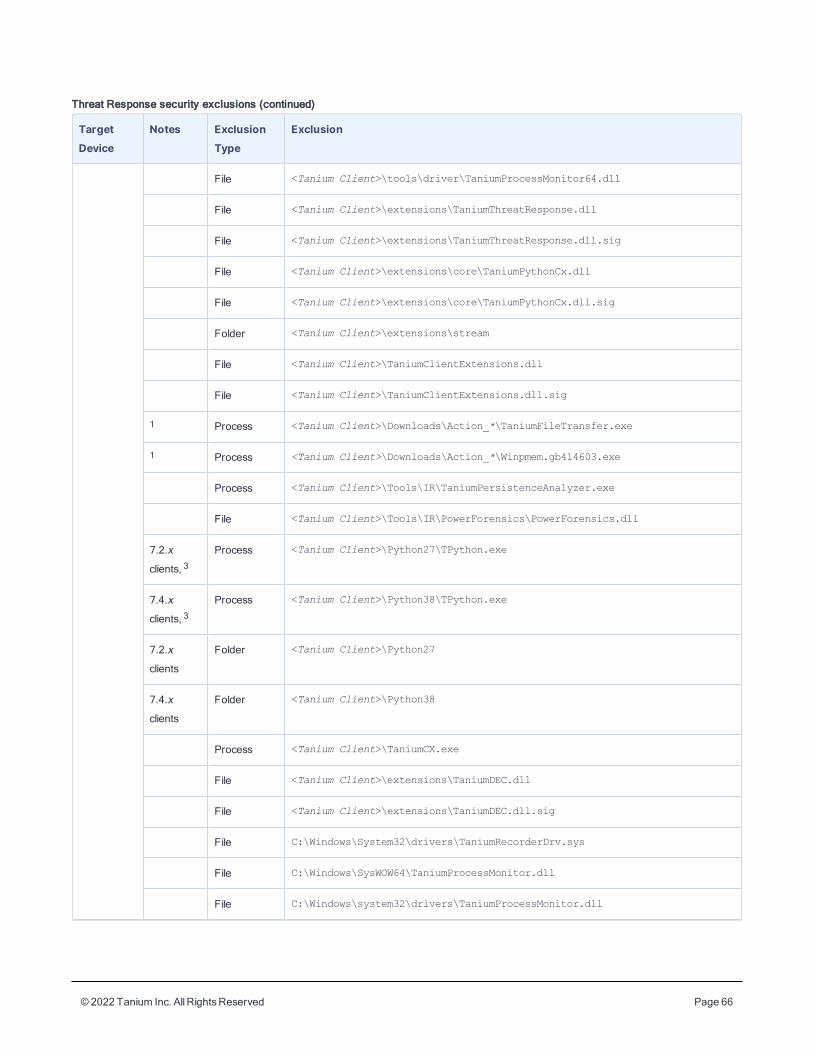
File <Tanium Client>\tools\driver\TaniumProcessMonitor.dll
Threat Response security exclusions (continued)
© 2022 Tanium Inc. AllRightsReserved Page 66
TargetDevice
Notes ExclusionType
Exclusion
File <Tanium Client>\tools\driver\TaniumProcessMonitor64.dll
File <Tanium Client>\extensions\TaniumThreatResponse.dll
File <Tanium Client>\extensions\TaniumThreatResponse.dll.sig
File <Tanium Client>\extensions\core\TaniumPythonCx.dll
File <Tanium Client>\extensions\core\TaniumPythonCx.dll.sig
Folder <Tanium Client>\extensions\stream
File <Tanium Client>\TaniumClientExtensions.dll
File <Tanium Client>\TaniumClientExtensions.dll.sig
1 Process <Tanium Client>\Downloads\Action_*\TaniumFileTransfer.exe
1 Process <Tanium Client>\Downloads\Action_*\Winpmem.gb414603.exe
Process <Tanium Client>\Tools\IR\TaniumPersistenceAnalyzer.exe
File <Tanium Client>\Tools\IR\PowerForensics\PowerForensics.dll
7.2.x
clients, 3Process <Tanium Client>\Python27\TPython.exe
7.4.x
clients, 3Process <Tanium Client>\Python38\TPython.exe
7.2.x
clients
Folder <Tanium Client>\Python27
7.4.x
clients
Folder <Tanium Client>\Python38
Process <Tanium Client>\TaniumCX.exe
File <Tanium Client>\extensions\TaniumDEC.dll
File <Tanium Client>\extensions\TaniumDEC.dll.sig
File C:\Windows\System32\drivers\TaniumRecorderDrv.sys
File C:\Windows\SysWOW64\TaniumProcessMonitor.dll
File C:\Windows\system32\drivers\TaniumProcessMonitor.dll
Threat Response security exclusions (continued)

© 2022 Tanium Inc. AllRightsReserved Page 67
TargetDevice
Notes ExclusionType
Exclusion
Linux x86
and x64
endpoints
Process <Tanium Client>/TaniumAuditPipe
Threat Response security exclusions (continued)

© 2022 Tanium Inc. AllRightsReserved Page 68
TargetDevice
Notes ExclusionType
Exclusion
Process <Tanium Client>/TaniumCX
Threat Response security exclusions (continued)

© 2022 Tanium Inc. AllRightsReserved Page 69
TargetDevice
Notes ExclusionType
Exclusion
Process <Tanium Client>/Tools/IR/TaniumExecWrapper
Threat Response security exclusions (continued)

© 2022 Tanium Inc. AllRightsReserved Page 70
TargetDevice
Notes ExclusionType
Exclusion
File <Tanium Client>/extensions/libTaniumIndex.so
Threat Response security exclusions (continued)

© 2022 Tanium Inc. AllRightsReserved Page 71
TargetDevice
Notes ExclusionType
Exclusion
File <Tanium Client>/extensions/libTaniumIndex.so.sig
Threat Response security exclusions (continued)

© 2022 Tanium Inc. AllRightsReserved Page 72
TargetDevice
Notes ExclusionType
Exclusion
Process <Tanium Client>/Tools/Detect3/TaniumDetectEngine
Threat Response security exclusions (continued)

© 2022 Tanium Inc. AllRightsReserved Page 73
TargetDevice
Notes ExclusionType
Exclusion
7.2.x
clients
Folder <Tanium Client>/python27
Threat Response security exclusions (continued)

© 2022 Tanium Inc. AllRightsReserved Page 74
TargetDevice
Notes ExclusionType
Exclusion
7.2.x
clients
Process <Tanium Client>/python27/python
Threat Response security exclusions (continued)

© 2022 Tanium Inc. AllRightsReserved Page 75
TargetDevice
Notes ExclusionType
Exclusion
7.2.x
clients
Process <Tanium Client>/python27/bin/pybin
Threat Response security exclusions (continued)

© 2022 Tanium Inc. AllRightsReserved Page 76
TargetDevice
Notes ExclusionType
Exclusion
7.4.x
clients
Folder <Tanium Client>/python38
Threat Response security exclusions (continued)
© 2022 Tanium Inc. AllRightsReserved Page 77
TargetDevice
Notes ExclusionType
Exclusion
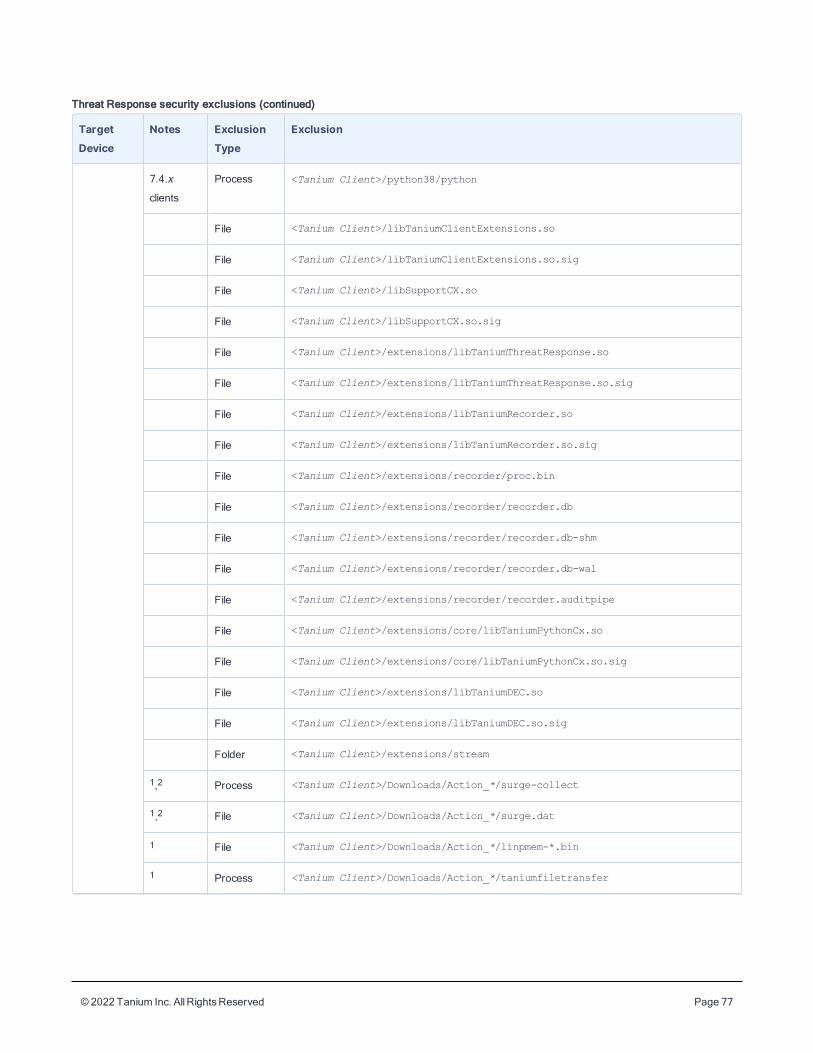
7.4.x
clients
Process <Tanium Client>/python38/python
File <Tanium Client>/libTaniumClientExtensions.so
File <Tanium Client>/libTaniumClientExtensions.so.sig
File <Tanium Client>/libSupportCX.so
File <Tanium Client>/libSupportCX.so.sig
File <Tanium Client>/extensions/libTaniumThreatResponse.so
File <Tanium Client>/extensions/libTaniumThreatResponse.so.sig
File <Tanium Client>/extensions/libTaniumRecorder.so
File <Tanium Client>/extensions/libTaniumRecorder.so.sig
File <Tanium Client>/extensions/recorder/proc.bin
File <Tanium Client>/extensions/recorder/recorder.db
File <Tanium Client>/extensions/recorder/recorder.db-shm
File <Tanium Client>/extensions/recorder/recorder.db-wal
File <Tanium Client>/extensions/recorder/recorder.auditpipe
File <Tanium Client>/extensions/core/libTaniumPythonCx.so
File <Tanium Client>/extensions/core/libTaniumPythonCx.so.sig
File <Tanium Client>/extensions/libTaniumDEC.so
File <Tanium Client>/extensions/libTaniumDEC.so.sig
Folder <Tanium Client>/extensions/stream
1,2 Process <Tanium Client>/Downloads/Action_*/surge-collect
1,2 File <Tanium Client>/Downloads/Action_*/surge.dat
1 File <Tanium Client>/Downloads/Action_*/linpmem-*.bin
1 Process <Tanium Client>/Downloads/Action_*/taniumfiletransfer
Threat Response security exclusions (continued)

© 2022 Tanium Inc. AllRightsReserved Page 78
TargetDevice
Notes ExclusionType
Exclusion
macOS
endpoints
Process <Tanium Client>/TaniumCX
Threat Response security exclusions (continued)

© 2022 Tanium Inc. AllRightsReserved Page 79
TargetDevice
Notes ExclusionType
Exclusion
Process <Tanium Client>/Tools/IR/TaniumExecWrapper
Threat Response security exclusions (continued)

© 2022 Tanium Inc. AllRightsReserved Page 80
TargetDevice
Notes ExclusionType
Exclusion
File <Tanium Client>/extensions/libTaniumIndex.dylib
Threat Response security exclusions (continued)

© 2022 Tanium Inc. AllRightsReserved Page 81
TargetDevice
Notes ExclusionType
Exclusion
File <Tanium Client>/extensions/libTaniumIndex.dylib.sig
Threat Response security exclusions (continued)

© 2022 Tanium Inc. AllRightsReserved Page 82
TargetDevice
Notes ExclusionType
Exclusion
Process <Tanium Client>/Tools/Detect3/TaniumDetectEngine
Threat Response security exclusions (continued)

© 2022 Tanium Inc. AllRightsReserved Page 83
TargetDevice
Notes ExclusionType
Exclusion
7.2.x
clients
Folder <Tanium Client>/python27
Threat Response security exclusions (continued)

© 2022 Tanium Inc. AllRightsReserved Page 84
TargetDevice
Notes ExclusionType
Exclusion
7.2.x
clients
Process <Tanium Client>/python27/python
Threat Response security exclusions (continued)

© 2022 Tanium Inc. AllRightsReserved Page 85
TargetDevice
Notes ExclusionType
Exclusion
7.4.x
clients
Folder <Tanium Client>/python38
Threat Response security exclusions (continued)
© 2022 Tanium Inc. AllRightsReserved Page 86
TargetDevice
Notes ExclusionType
Exclusion
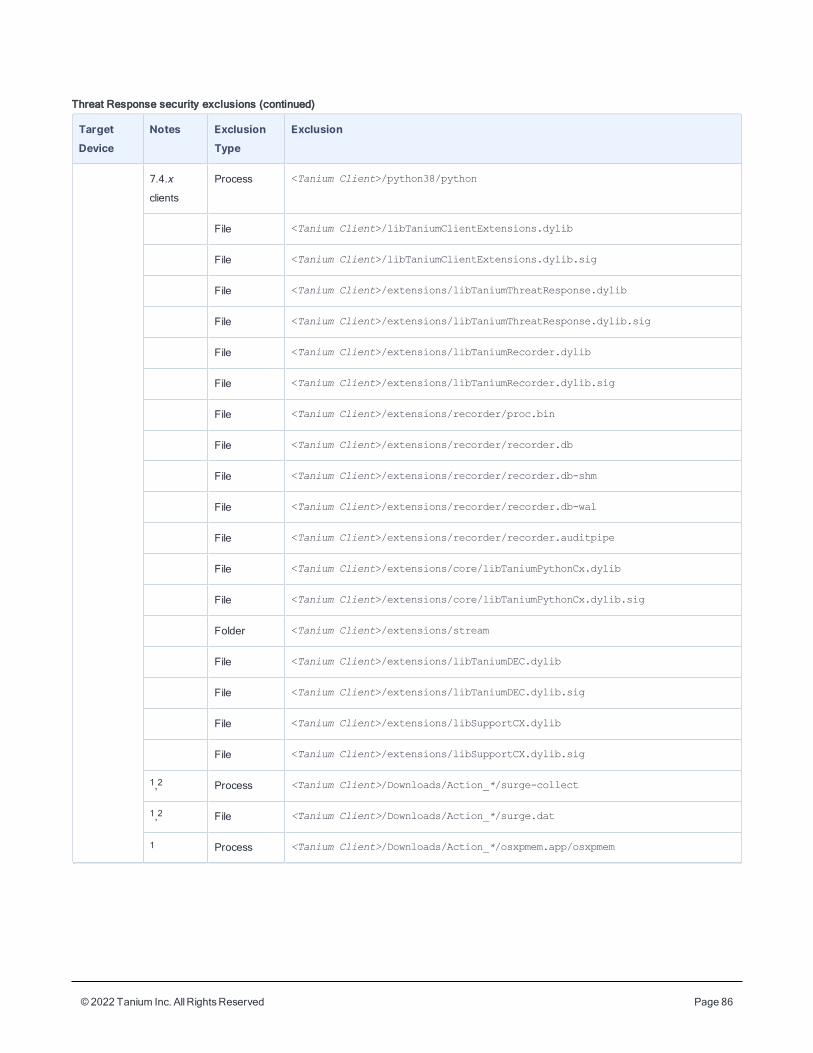
7.4.x
clients
Process <Tanium Client>/python38/python
File <Tanium Client>/libTaniumClientExtensions.dylib
File <Tanium Client>/libTaniumClientExtensions.dylib.sig
File <Tanium Client>/extensions/libTaniumThreatResponse.dylib
File <Tanium Client>/extensions/libTaniumThreatResponse.dylib.sig
File <Tanium Client>/extensions/libTaniumRecorder.dylib
File <Tanium Client>/extensions/libTaniumRecorder.dylib.sig
File <Tanium Client>/extensions/recorder/proc.bin
File <Tanium Client>/extensions/recorder/recorder.db
File <Tanium Client>/extensions/recorder/recorder.db-shm
File <Tanium Client>/extensions/recorder/recorder.db-wal
File <Tanium Client>/extensions/recorder/recorder.auditpipe
File <Tanium Client>/extensions/core/libTaniumPythonCx.dylib
File <Tanium Client>/extensions/core/libTaniumPythonCx.dylib.sig
Folder <Tanium Client>/extensions/stream
File <Tanium Client>/extensions/libTaniumDEC.dylib
File <Tanium Client>/extensions/libTaniumDEC.dylib.sig
File <Tanium Client>/extensions/libSupportCX.dylib
File <Tanium Client>/extensions/libSupportCX.dylib.sig
1,2 Process <Tanium Client>/Downloads/Action_*/surge-collect
1,2 File <Tanium Client>/Downloads/Action_*/surge.dat
1 Process <Tanium Client>/Downloads/Action_*/osxpmem.app/osxpmem
Threat Response security exclusions (continued)
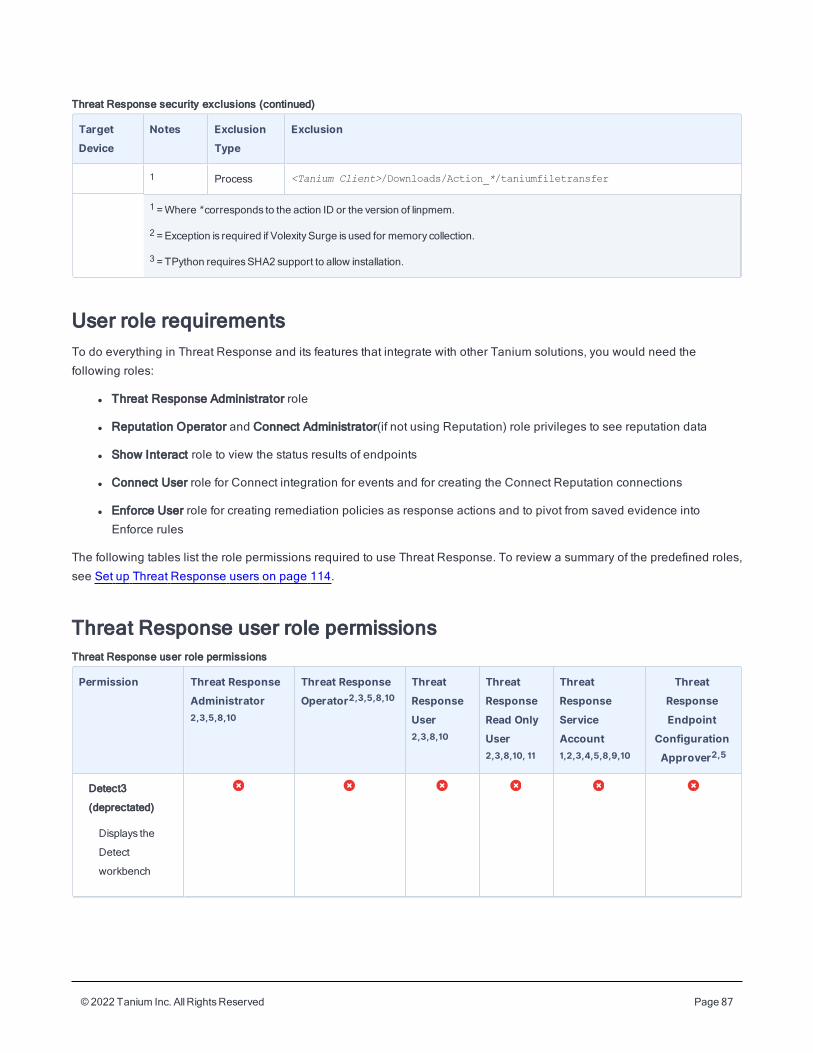
© 2022 Tanium Inc. AllRightsReserved Page 87
TargetDevice
Notes ExclusionType
Exclusion
1 Process <Tanium Client>/Downloads/Action_*/taniumfiletransfer
1 =Where * corresponds to the action ID or the version of linpmem.
2 =Exception is required if VolexitySurge is used for memory collection.
3 =TPython requiresSHA2 support to allow installation.
Threat Response security exclusions (continued)
User role requirementsTo do everything in Threat Response and its features that integrate with other Tanium solutions, you would need the
following roles:
l Threat Response Administrator role
l Reputation Operator and Connect Administrator(if not using Reputation) role privileges to see reputation data
l Show Interact role to view the status results of endpoints
l Connect User role for Connect integration for events and for creating the Connect Reputation connections
l Enforce User role for creating remediation policies as response actions and to pivot from saved evidence into
Enforce rules
The following tables list the role permissions required to use Threat Response. To review a summary of the predefined roles,
see Set up Threat Response users on page 114.
Threat Response user role permissions
Permission Threat ResponseAdministrator2,3,5,8,10
Threat ResponseOperator2,3,5,8,10
ThreatResponseUser2,3,8,10
ThreatResponseRead OnlyUser2,3,8,10, 11
ThreatResponseServiceAccount1,2,3,4,5,8,9,10
ThreatResponseEndpoint
ConfigurationApprover2,5
Detect3
(deprectated)
Displays the
Detect
workbench
Threat Response user role permissions
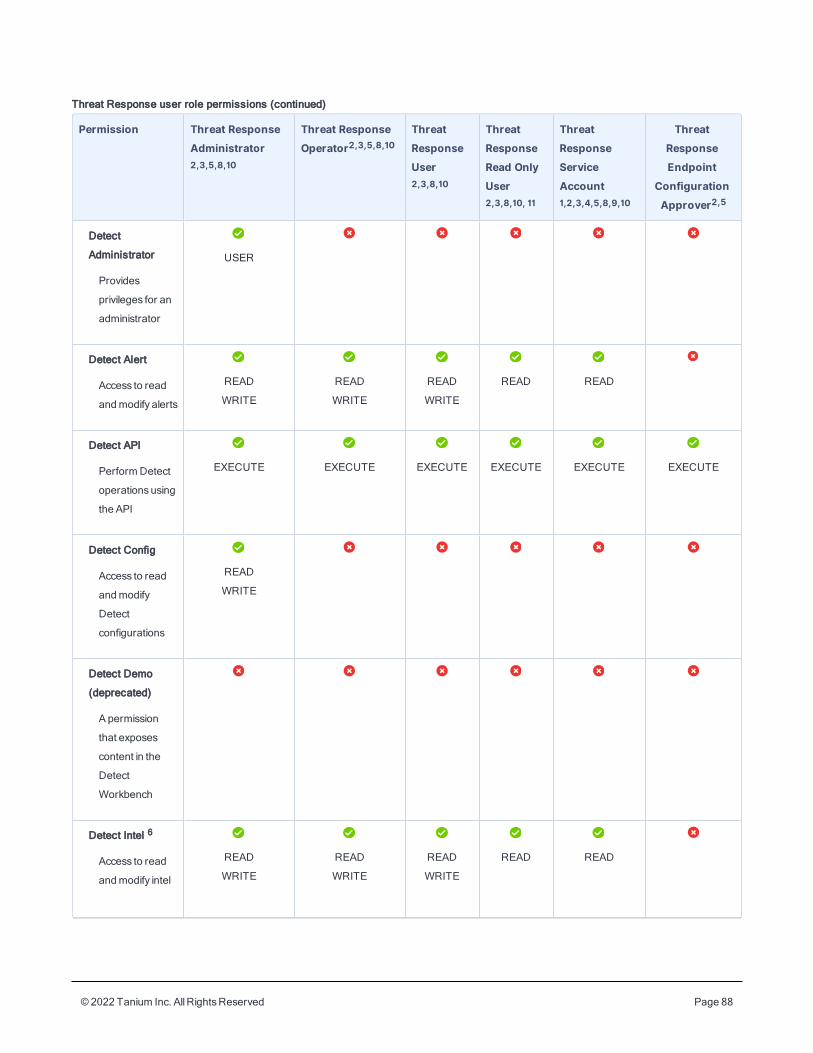
© 2022 Tanium Inc. AllRightsReserved Page 88
Permission Threat ResponseAdministrator2,3,5,8,10
Threat ResponseOperator2,3,5,8,10
ThreatResponseUser2,3,8,10
ThreatResponseRead OnlyUser2,3,8,10, 11
ThreatResponseServiceAccount1,2,3,4,5,8,9,10
ThreatResponseEndpoint
ConfigurationApprover2,5
Detect
Administrator
Provides
privileges for an
administrator
USER
Detect Alert
Access to read
andmodify alerts
READ
WRITE
READ
WRITE
READ
WRITE
READ READ
Detect API
PerformDetect
operationsusing
the API
EXECUTE EXECUTE EXECUTE EXECUTE EXECUTE EXECUTE
Detect Config
Access to read
andmodify
Detect
configurations
READ
WRITE
Detect Demo
(deprecated)
A permission
that exposes
content in the
Detect
Workbench
Detect Intel 6
Access to read
andmodify intel
READ
WRITE
READ
WRITE
READ
WRITE
READ READ
Threat Response user role permissions (continued)
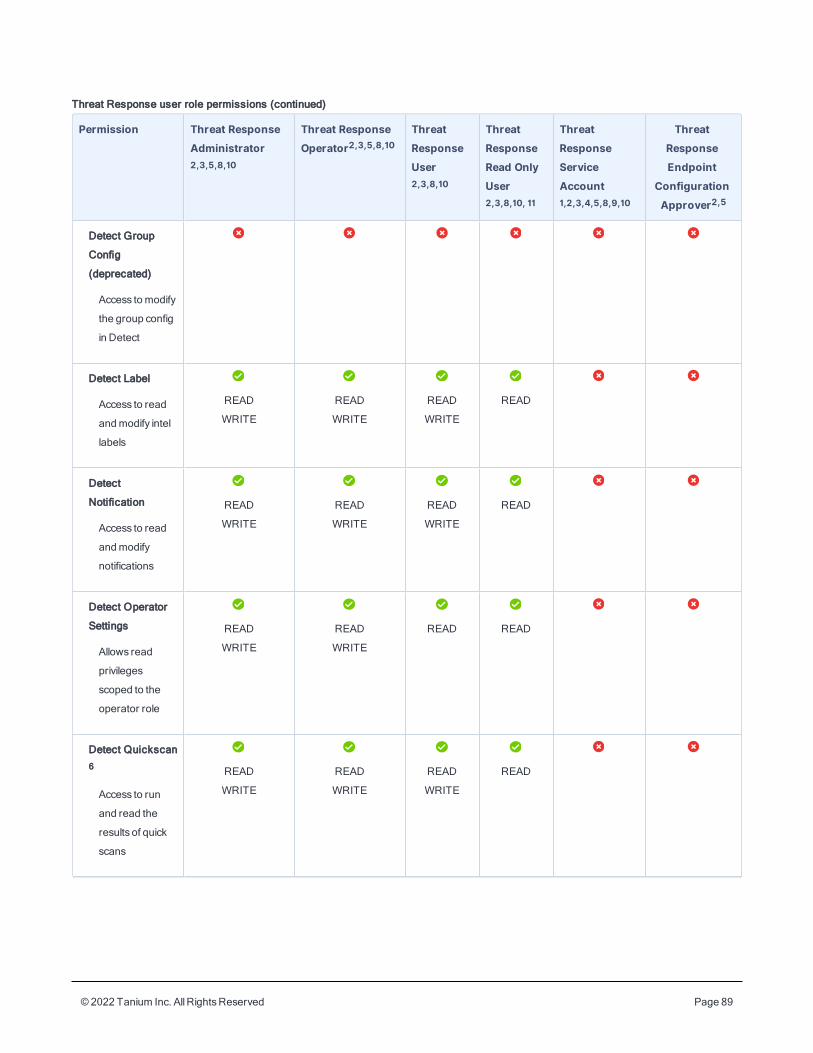
© 2022 Tanium Inc. AllRightsReserved Page 89
Permission Threat ResponseAdministrator2,3,5,8,10
Threat ResponseOperator2,3,5,8,10
ThreatResponseUser2,3,8,10
ThreatResponseRead OnlyUser2,3,8,10, 11
ThreatResponseServiceAccount1,2,3,4,5,8,9,10
ThreatResponseEndpoint
ConfigurationApprover2,5
Detect Group
Config
(deprecated)
Access tomodify
the group config
in Detect
Detect Label
Access to read
andmodify intel
labels
READ
WRITE
READ
WRITE
READ
WRITE
READ
Detect
Notification
Access to read
andmodify
notifications
READ
WRITE
READ
WRITE
READ
WRITE
READ
Detect Operator
Settings
Allows read
privileges
scoped to the
operator role
READ
WRITE
READ
WRITE
READ READ
Detect Quickscan6
Access to run
and read the
results of quick
scans
READ
WRITE
READ
WRITE
READ
WRITE
READ
Threat Response user role permissions (continued)
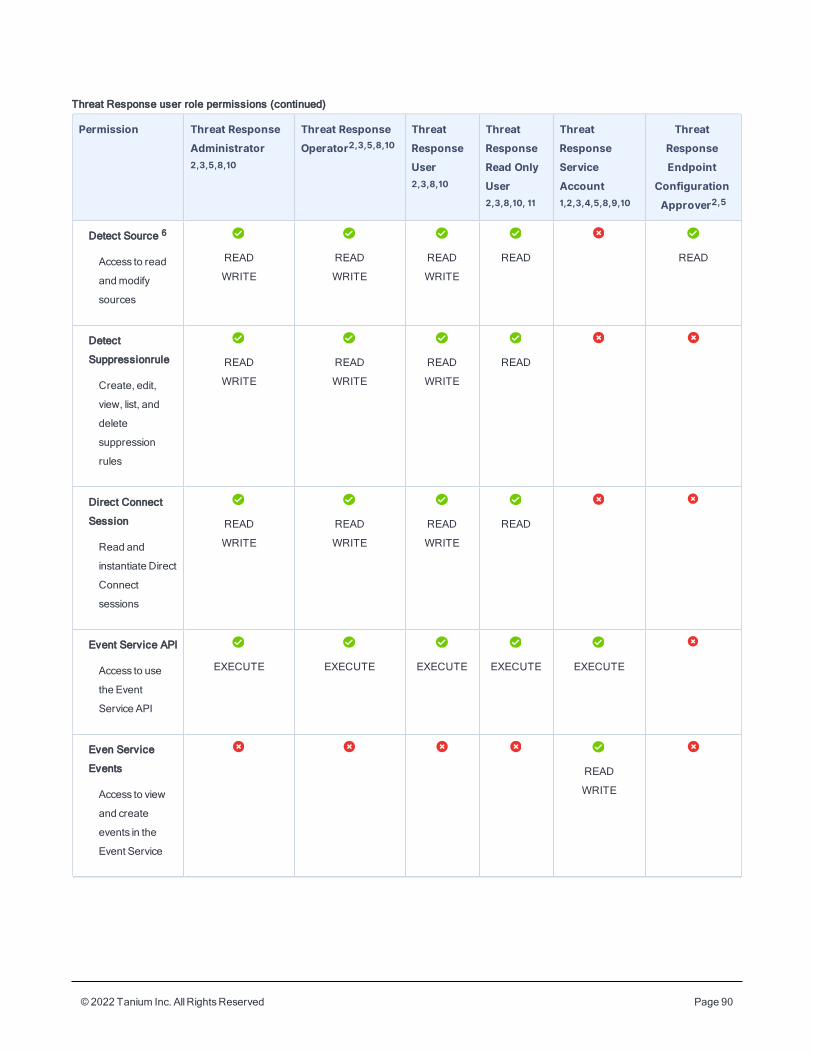
© 2022 Tanium Inc. AllRightsReserved Page 90
Permission Threat ResponseAdministrator2,3,5,8,10
Threat ResponseOperator2,3,5,8,10
ThreatResponseUser2,3,8,10
ThreatResponseRead OnlyUser2,3,8,10, 11
ThreatResponseServiceAccount1,2,3,4,5,8,9,10
ThreatResponseEndpoint
ConfigurationApprover2,5
Detect Source 6
Access to read
andmodify
sources
READ
WRITE
READ
WRITE
READ
WRITE
READ READ
Detect
Suppressionrule
Create, edit,
view, list, and
delete
suppression
rules
READ
WRITE
READ
WRITE
READ
WRITE
READ
Direct Connect
Session
Read and
instantiate Direct
Connect
sessions
READ
WRITE
READ
WRITE
READ
WRITE
READ
Event Service API
Access to use
the Event
Service API
EXECUTE EXECUTE EXECUTE EXECUTE EXECUTE
Even Service
Events
Access to view
and create
events in the
Event Service
READ
WRITE
Threat Response user role permissions (continued)
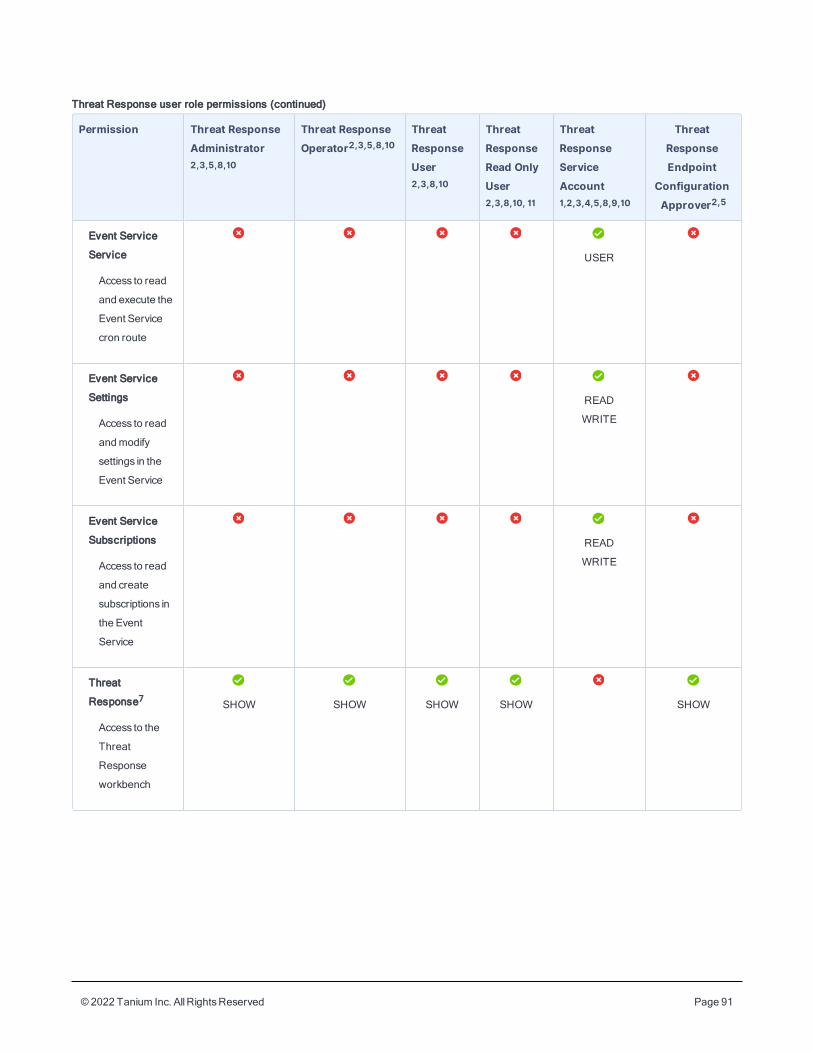
© 2022 Tanium Inc. AllRightsReserved Page 91
Permission Threat ResponseAdministrator2,3,5,8,10
Threat ResponseOperator2,3,5,8,10
ThreatResponseUser2,3,8,10
ThreatResponseRead OnlyUser2,3,8,10, 11
ThreatResponseServiceAccount1,2,3,4,5,8,9,10
ThreatResponseEndpoint
ConfigurationApprover2,5
Event Service
Service
Access to read
and execute the
Event Service
cron route
USER
Event Service
Settings
Access to read
andmodify
settings in the
Event Service
READ
WRITE
Event Service
Subscriptions
Access to read
and create
subscriptions in
the Event
Service
READ
WRITE
Threat
Response7
Access to the
Threat
Response
workbench
SHOW SHOW SHOW SHOW SHOW
Threat Response user role permissions (continued)
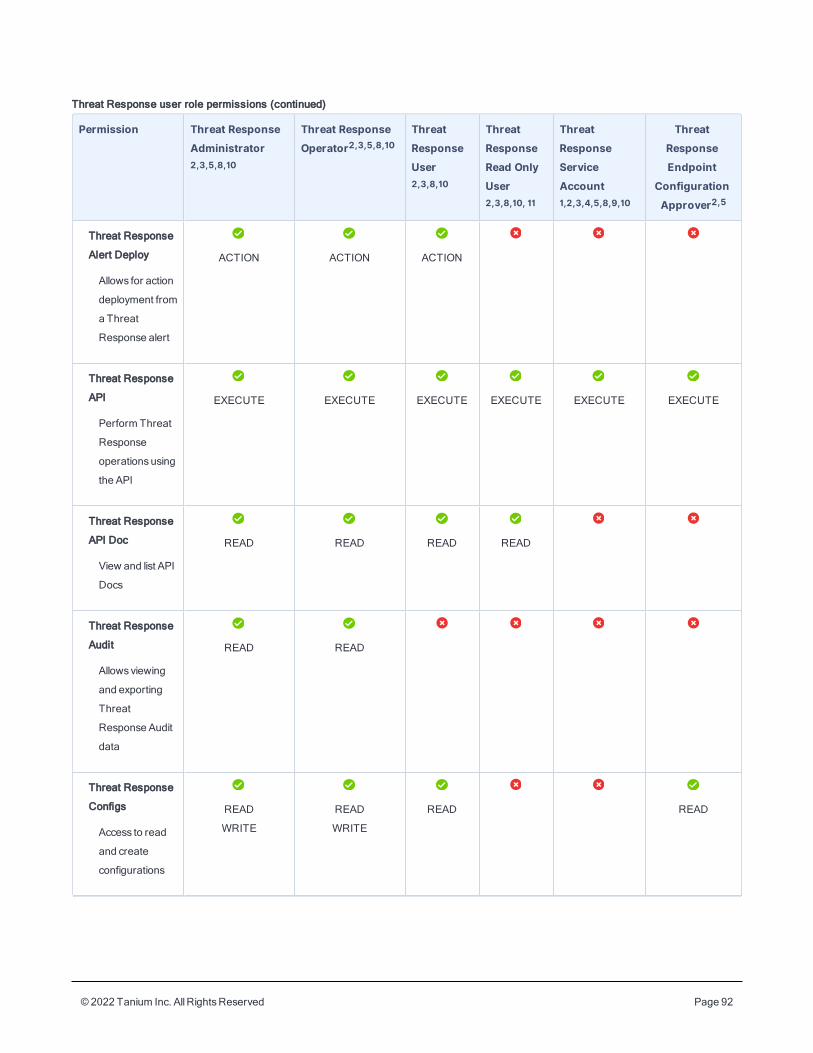
© 2022 Tanium Inc. AllRightsReserved Page 92
Permission Threat ResponseAdministrator2,3,5,8,10
Threat ResponseOperator2,3,5,8,10
ThreatResponseUser2,3,8,10
ThreatResponseRead OnlyUser2,3,8,10, 11
ThreatResponseServiceAccount1,2,3,4,5,8,9,10
ThreatResponseEndpoint
ConfigurationApprover2,5
Threat Response
Alert Deploy
Allows for action
deployment from
a Threat
Response alert
ACTION ACTION ACTION
Threat Response
API
Perform Threat
Response
operationsusing
the API
EXECUTE EXECUTE EXECUTE EXECUTE EXECUTE EXECUTE
Threat Response
API Doc
View and list API
Docs
READ READ READ READ
Threat Response
Audit
Allowsviewing
and exporting
Threat
Response Audit
data
READ READ
Threat Response
Configs
Access to read
and create
configurations
READ
WRITE
READ
WRITE
READ READ
Threat Response user role permissions (continued)
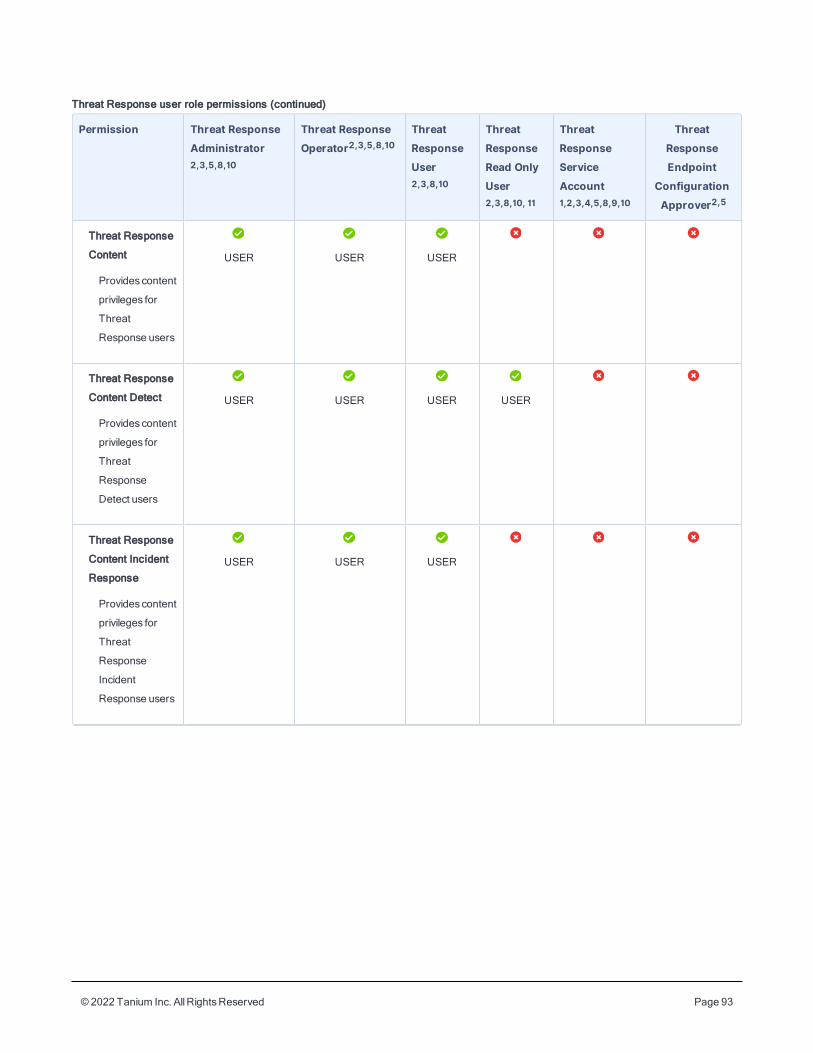
© 2022 Tanium Inc. AllRightsReserved Page 93
Permission Threat ResponseAdministrator2,3,5,8,10
Threat ResponseOperator2,3,5,8,10
ThreatResponseUser2,3,8,10
ThreatResponseRead OnlyUser2,3,8,10, 11
ThreatResponseServiceAccount1,2,3,4,5,8,9,10
ThreatResponseEndpoint
ConfigurationApprover2,5
Threat Response
Content
Provides content
privileges for
Threat
Response users
USER USER USER
Threat Response
Content Detect
Provides content
privileges for
Threat
Response
Detect users
USER USER USER USER
Threat Response
Content Incident
Response
Provides content
privileges for
Threat
Response
Incident
Response users
USER USER USER
Threat Response user role permissions (continued)
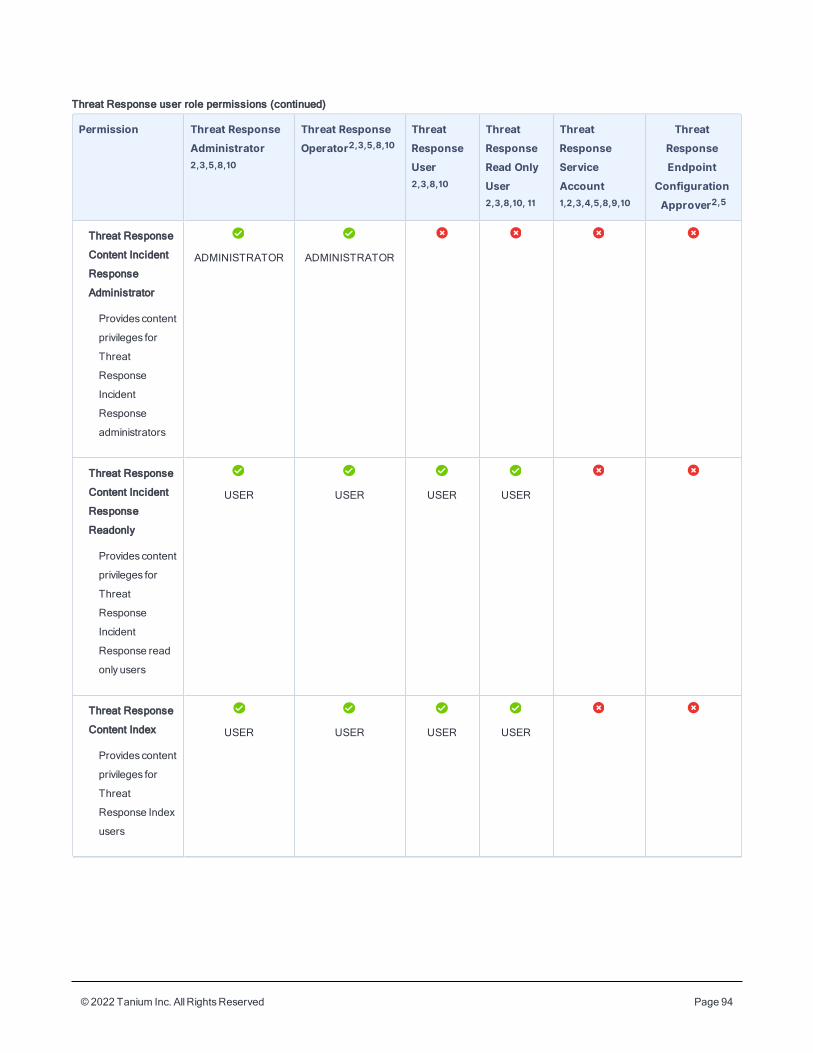
© 2022 Tanium Inc. AllRightsReserved Page 94
Permission Threat ResponseAdministrator2,3,5,8,10
Threat ResponseOperator2,3,5,8,10
ThreatResponseUser2,3,8,10
ThreatResponseRead OnlyUser2,3,8,10, 11
ThreatResponseServiceAccount1,2,3,4,5,8,9,10
ThreatResponseEndpoint
ConfigurationApprover2,5
Threat Response
Content Incident
Response
Administrator
Provides content
privileges for
Threat
Response
Incident
Response
administrators
ADMINISTRATOR ADMINISTRATOR
Threat Response
Content Incident
Response
Readonly
Provides content
privileges for
Threat
Response
Incident
Response read
only users
USER USER USER USER
Threat Response
Content Index
Provides content
privileges for
Threat
Response Index
users
USER USER USER USER
Threat Response user role permissions (continued)
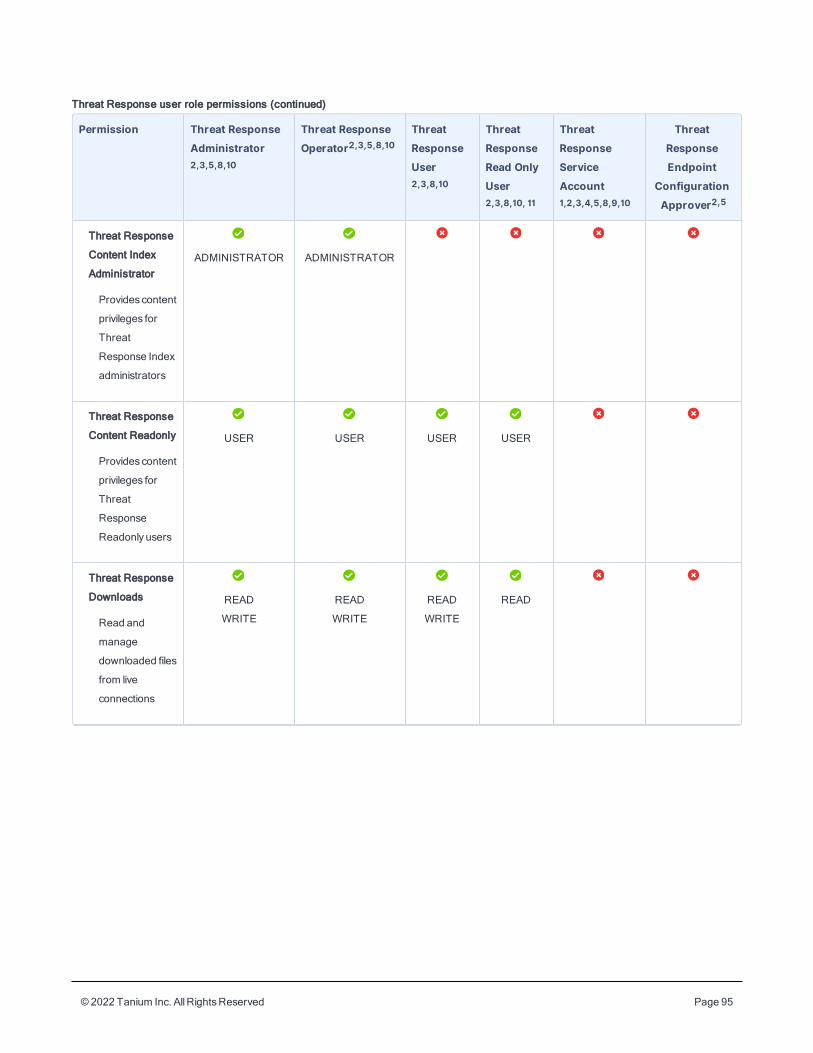
© 2022 Tanium Inc. AllRightsReserved Page 95
Permission Threat ResponseAdministrator2,3,5,8,10
Threat ResponseOperator2,3,5,8,10
ThreatResponseUser2,3,8,10
ThreatResponseRead OnlyUser2,3,8,10, 11
ThreatResponseServiceAccount1,2,3,4,5,8,9,10
ThreatResponseEndpoint
ConfigurationApprover2,5
Threat Response
Content Index
Administrator
Provides content
privileges for
Threat
Response Index
administrators
ADMINISTRATOR ADMINISTRATOR
Threat Response
Content Readonly
Provides content
privileges for
Threat
Response
Readonly users
USER USER USER USER
Threat Response
Downloads
Read and
manage
downloaded files
from live
connections
READ
WRITE
READ
WRITE
READ
WRITE
READ
Threat Response user role permissions (continued)
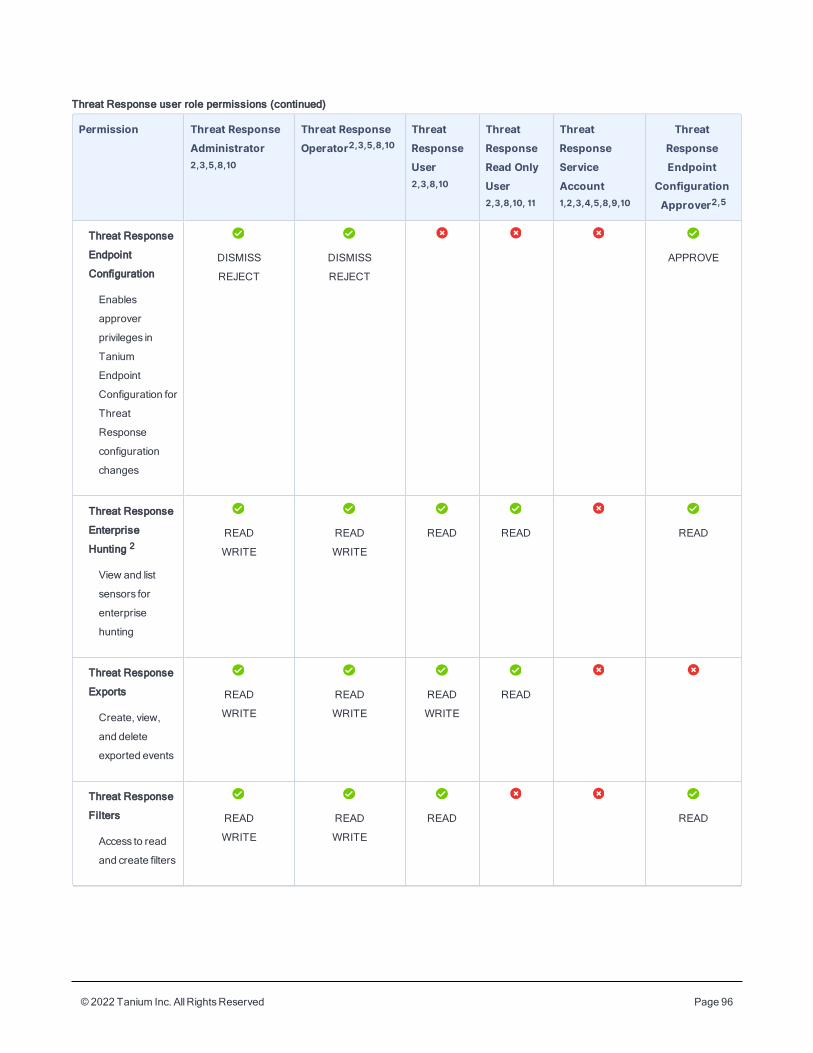
© 2022 Tanium Inc. AllRightsReserved Page 96
Permission Threat ResponseAdministrator2,3,5,8,10
Threat ResponseOperator2,3,5,8,10
ThreatResponseUser2,3,8,10
ThreatResponseRead OnlyUser2,3,8,10, 11
ThreatResponseServiceAccount1,2,3,4,5,8,9,10
ThreatResponseEndpoint
ConfigurationApprover2,5
Threat Response
Endpoint
Configuration
Enables
approver
privileges in
Tanium
Endpoint
Configuration for
Threat
Response
configuration
changes
DISMISS
REJECT
DISMISS
REJECT
APPROVE
Threat Response
Enterprise
Hunting 2
View and list
sensors for
enterprise
hunting
READ
WRITE
READ
WRITE
READ READ READ
Threat Response
Exports
Create, view,
and delete
exported events
READ
WRITE
READ
WRITE
READ
WRITE
READ
Threat Response
Filters
Access to read
and create filters
READ
WRITE
READ
WRITE
READ READ
Threat Response user role permissions (continued)
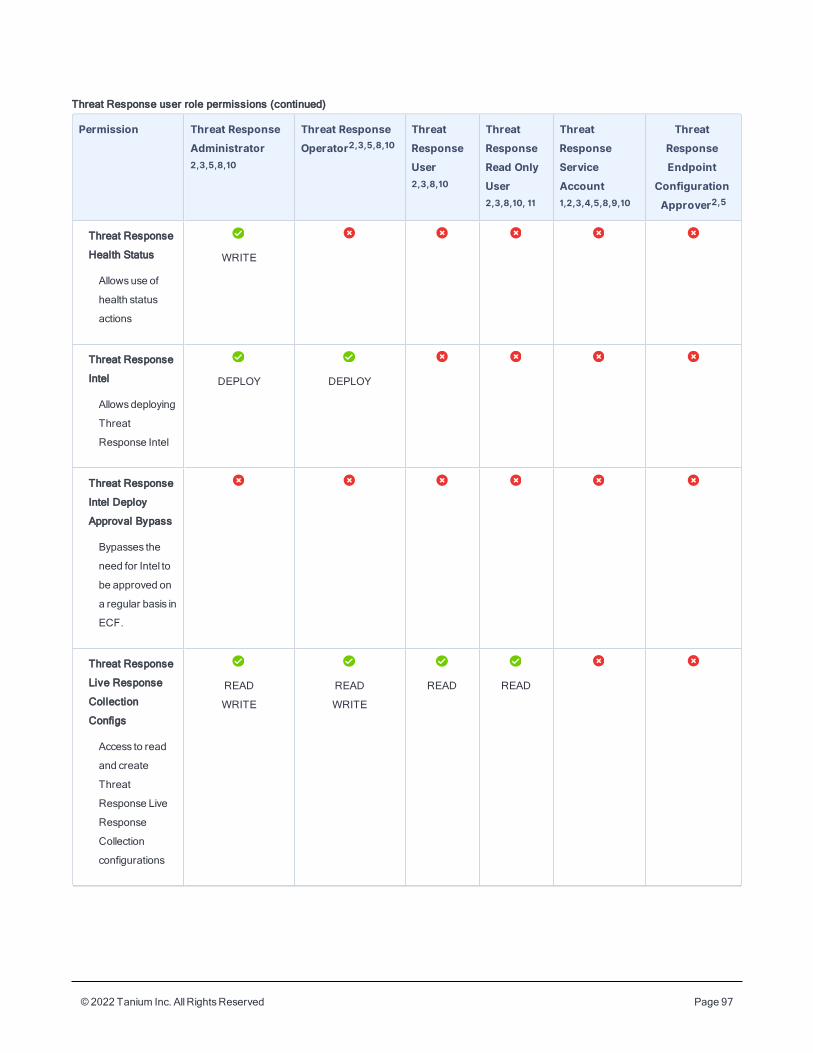
© 2022 Tanium Inc. AllRightsReserved Page 97
Permission Threat ResponseAdministrator2,3,5,8,10
Threat ResponseOperator2,3,5,8,10
ThreatResponseUser2,3,8,10
ThreatResponseRead OnlyUser2,3,8,10, 11
ThreatResponseServiceAccount1,2,3,4,5,8,9,10
ThreatResponseEndpoint
ConfigurationApprover2,5
Threat Response
Health Status
Allowsuse of
health status
actions
WRITE
Threat Response
Intel
Allowsdeploying
Threat
Response Intel
DEPLOY DEPLOY
Threat Response
Intel Deploy
Approval Bypass
Bypasses the
need for Intel to
be approved on
a regular basis in
ECF.
Threat Response
Live Response
Collection
Configs
Access to read
and create
Threat
Response Live
Response
Collection
configurations
READ
WRITE
READ
WRITE
READ READ
Threat Response user role permissions (continued)
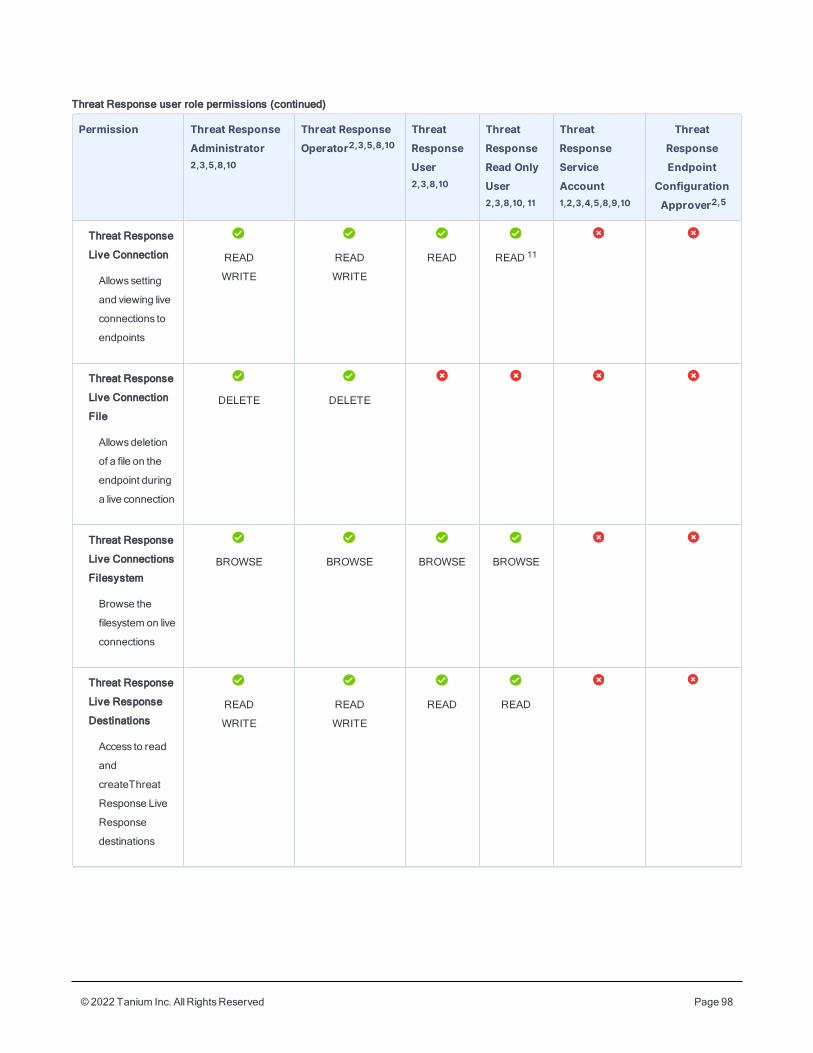
© 2022 Tanium Inc. AllRightsReserved Page 98
Permission Threat ResponseAdministrator2,3,5,8,10
Threat ResponseOperator2,3,5,8,10
ThreatResponseUser2,3,8,10
ThreatResponseRead OnlyUser2,3,8,10, 11
ThreatResponseServiceAccount1,2,3,4,5,8,9,10
ThreatResponseEndpoint
ConfigurationApprover2,5
Threat Response
Live Connection
Allowssetting
and viewing live
connections to
endpoints
READ
WRITE
READ
WRITE
READ READ 11
Threat Response
Live Connection
File
Allowsdeletion
of a file on the
endpoint during
a live connection
DELETE DELETE
Threat Response
Live Connections
Filesystem
Browse the
filesystem on live
connections
BROWSE BROWSE BROWSE BROWSE
Threat Response
Live Response
Destinations
Access to read
and
createThreat
Response Live
Response
destinations
READ
WRITE
READ
WRITE
READ READ
Threat Response user role permissions (continued)
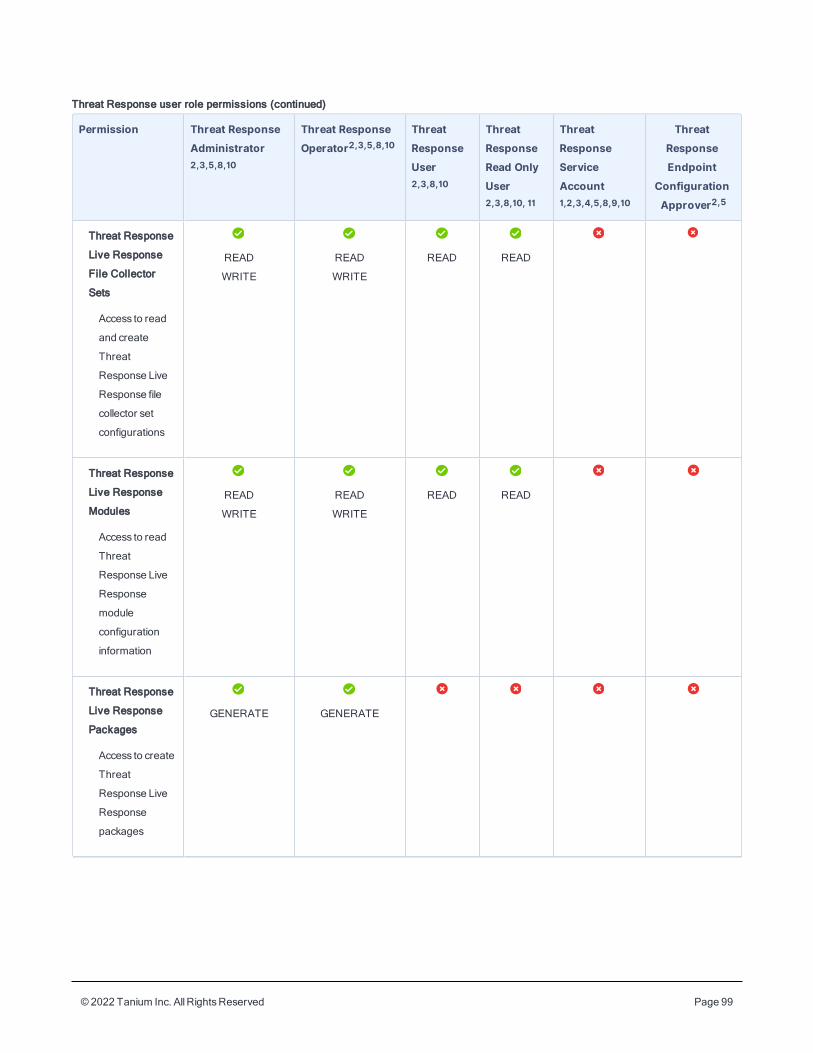
© 2022 Tanium Inc. AllRightsReserved Page 99
Permission Threat ResponseAdministrator2,3,5,8,10
Threat ResponseOperator2,3,5,8,10
ThreatResponseUser2,3,8,10
ThreatResponseRead OnlyUser2,3,8,10, 11
ThreatResponseServiceAccount1,2,3,4,5,8,9,10
ThreatResponseEndpoint
ConfigurationApprover2,5
Threat Response
Live Response
File Collector
Sets
Access to read
and create
Threat
Response Live
Response file
collector set
configurations
READ
WRITE
READ
WRITE
READ READ
Threat Response
Live Response
Modules
Access to read
Threat
Response Live
Response
module
configuration
information
READ
WRITE
READ
WRITE
READ READ
Threat Response
Live Response
Packages
Access to create
Threat
Response Live
Response
packages
GENERATE GENERATE
Threat Response user role permissions (continued)
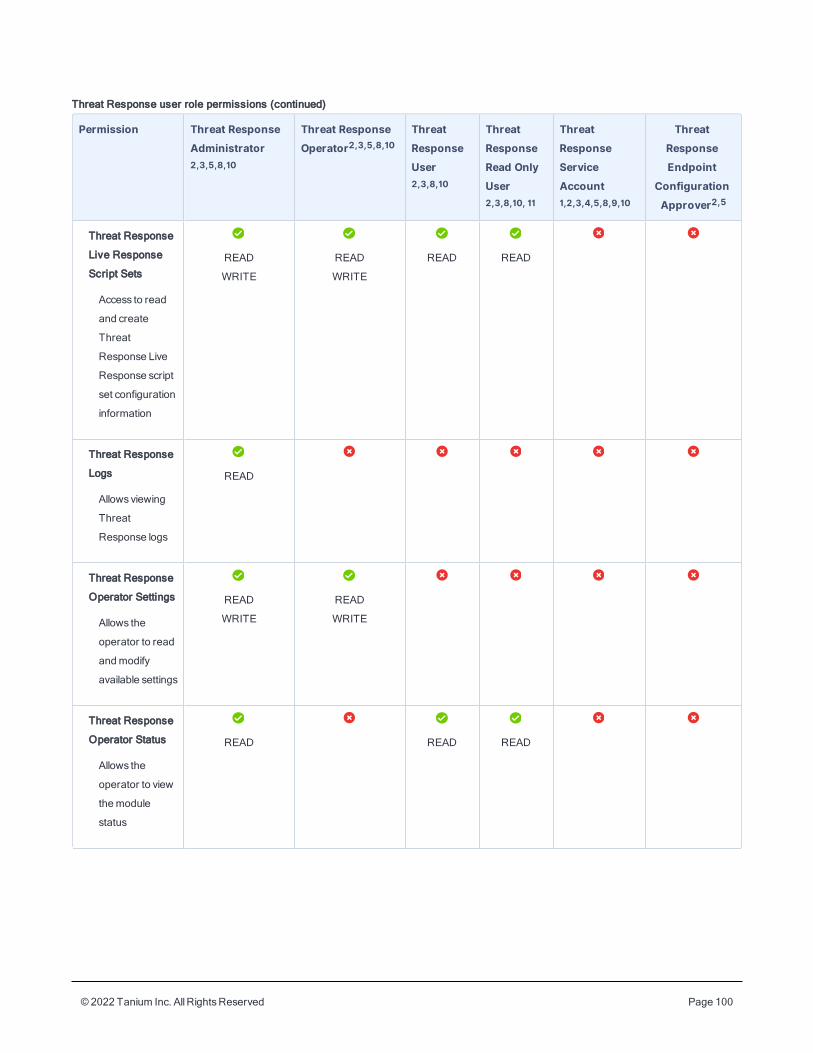
© 2022 Tanium Inc. AllRightsReserved Page 100
Permission Threat ResponseAdministrator2,3,5,8,10
Threat ResponseOperator2,3,5,8,10
ThreatResponseUser2,3,8,10
ThreatResponseRead OnlyUser2,3,8,10, 11
ThreatResponseServiceAccount1,2,3,4,5,8,9,10
ThreatResponseEndpoint
ConfigurationApprover2,5
Threat Response
Live Response
Script Sets
Access to read
and create
Threat
Response Live
Response script
set configuration
information
READ
WRITE
READ
WRITE
READ READ
Threat Response
Logs
Allowsviewing
Threat
Response logs
READ
Threat Response
Operator Settings
Allows the
operator to read
andmodify
available settings
READ
WRITE
READ
WRITE
Threat Response
Operator Status
Allows the
operator to view
themodule
status
READ READ READ
Threat Response user role permissions (continued)
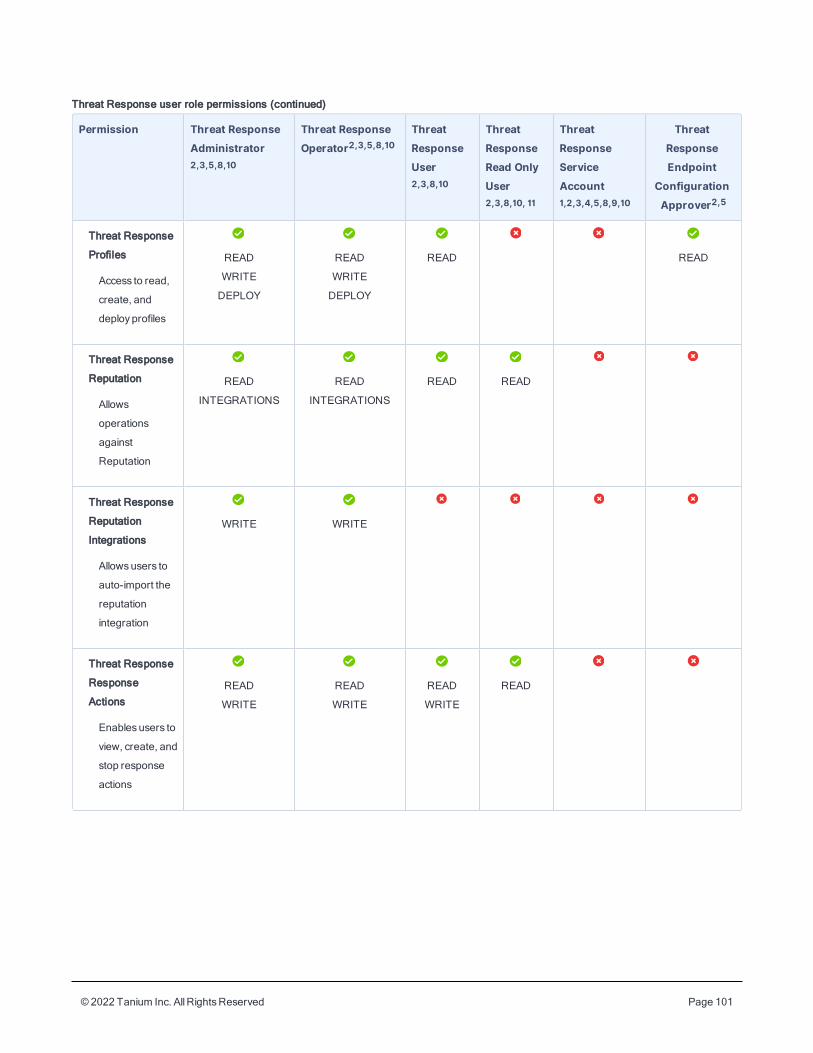
© 2022 Tanium Inc. AllRightsReserved Page 101
Permission Threat ResponseAdministrator2,3,5,8,10
Threat ResponseOperator2,3,5,8,10
ThreatResponseUser2,3,8,10
ThreatResponseRead OnlyUser2,3,8,10, 11
ThreatResponseServiceAccount1,2,3,4,5,8,9,10
ThreatResponseEndpoint
ConfigurationApprover2,5
Threat Response
Profiles
Access to read,
create, and
deployprofiles
READ
WRITE
DEPLOY
READ
WRITE
DEPLOY
READ READ
Threat Response
Reputation
Allows
operations
against
Reputation
READ
INTEGRATIONS
READ
INTEGRATIONS
READ READ
Threat Response
Reputation
Integrations
Allowsusers to
auto-import the
reputation
integration
WRITE WRITE
Threat Response
Response
Actions
Enablesusers to
view, create, and
stop response
actions
READ
WRITE
READ
WRITE
READ
WRITE
READ
Threat Response user role permissions (continued)
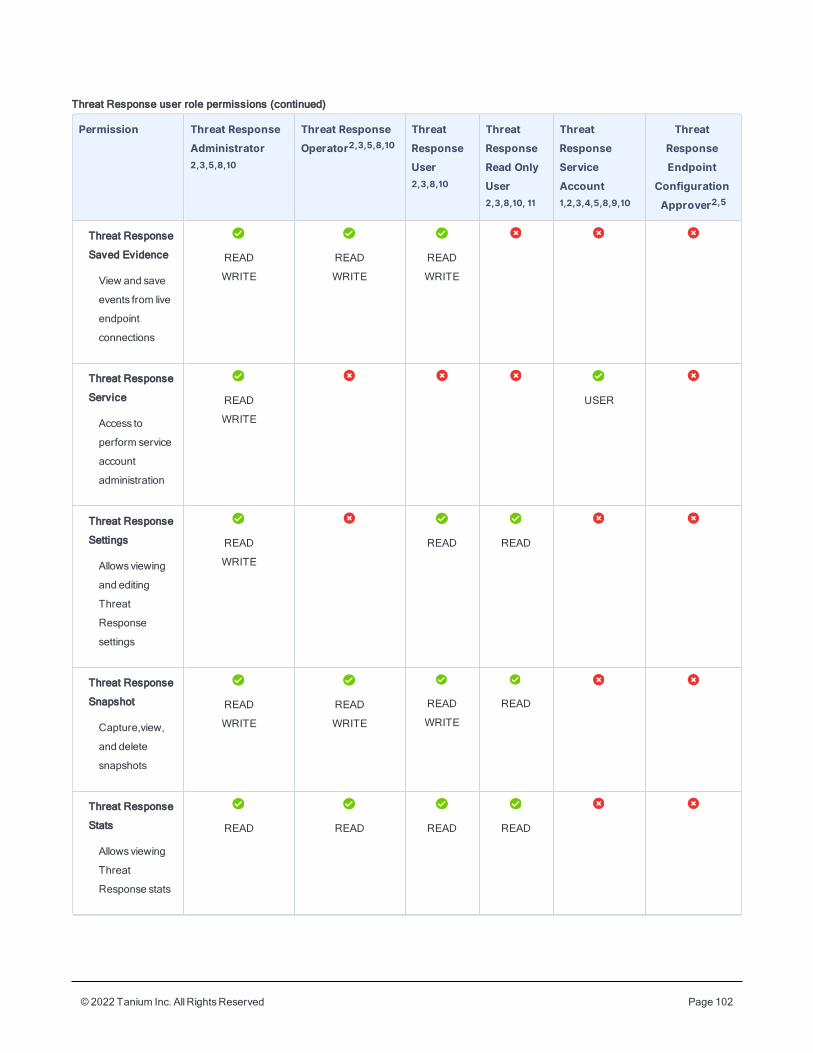
© 2022 Tanium Inc. AllRightsReserved Page 102
Permission Threat ResponseAdministrator2,3,5,8,10
Threat ResponseOperator2,3,5,8,10
ThreatResponseUser2,3,8,10
ThreatResponseRead OnlyUser2,3,8,10, 11
ThreatResponseServiceAccount1,2,3,4,5,8,9,10
ThreatResponseEndpoint
ConfigurationApprover2,5
Threat Response
Saved Evidence
View and save
events from live
endpoint
connections
READ
WRITE
READ
WRITE
READ
WRITE
Threat Response
Service
Access to
perform service
account
administration
READ
WRITE
USER
Threat Response
Settings
Allowsviewing
and editing
Threat
Response
settings
READ
WRITE
READ READ
Threat Response
Snapshot
Capture,view,
and delete
snapshots
READ
WRITE
READ
WRITE
READ
WRITE
READ
Threat Response
Stats
Allowsviewing
Threat
Response stats
READ READ READ READ
Threat Response user role permissions (continued)
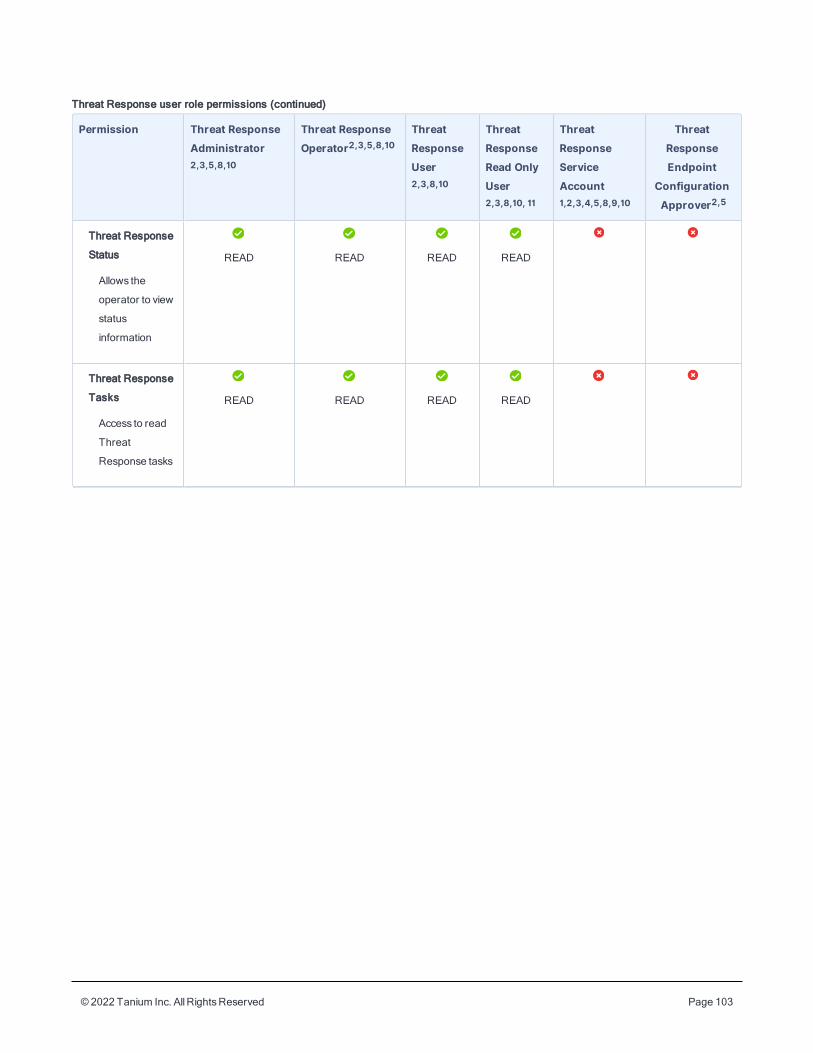
© 2022 Tanium Inc. AllRightsReserved Page 103
Permission Threat ResponseAdministrator2,3,5,8,10
Threat ResponseOperator2,3,5,8,10
ThreatResponseUser2,3,8,10
ThreatResponseRead OnlyUser2,3,8,10, 11
ThreatResponseServiceAccount1,2,3,4,5,8,9,10
ThreatResponseEndpoint
ConfigurationApprover2,5
Threat Response
Status
Allows the
operator to view
status
information
READ READ READ READ
Threat Response
Tasks
Access to read
Threat
Response tasks
READ READ READ READ
Threat Response user role permissions (continued)
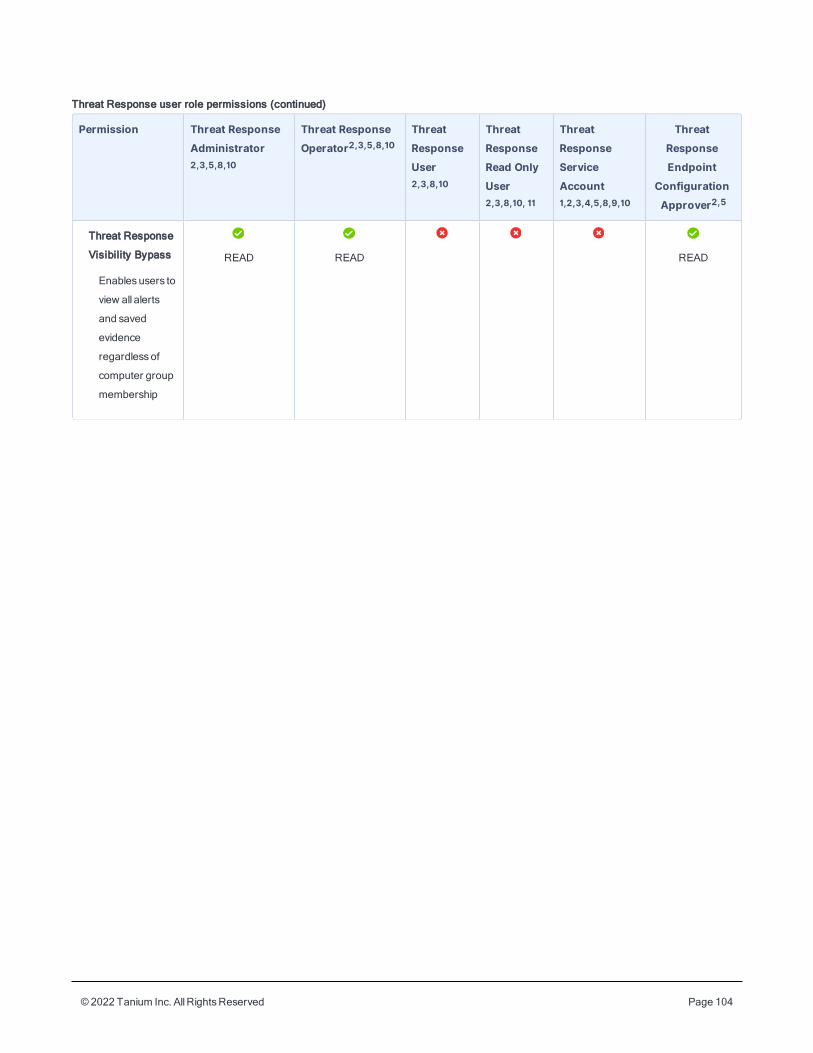
© 2022 Tanium Inc. AllRightsReserved Page 104
Permission Threat ResponseAdministrator2,3,5,8,10
Threat ResponseOperator2,3,5,8,10
ThreatResponseUser2,3,8,10
ThreatResponseRead OnlyUser2,3,8,10, 11
ThreatResponseServiceAccount1,2,3,4,5,8,9,10
ThreatResponseEndpoint
ConfigurationApprover2,5
Threat Response
Visibility Bypass
Enablesusers to
view all alerts
and saved
evidence
regardlessof
computer group
membership
READ READ READ
Threat Response user role permissions (continued)

© 2022 Tanium Inc. AllRightsReserved Page 105
T-
h-
r-
e-
a-
t
R-
e-
s-
p-
o-
n-
s-
e
u-
s-
e-
r
r-
o-
l-
e
p-
e-
r-
m-
i-
s-
s-
i-
o-
n-
s
(-
c-
o-
n-
t-
i-
n-
u-
e-
d-
)
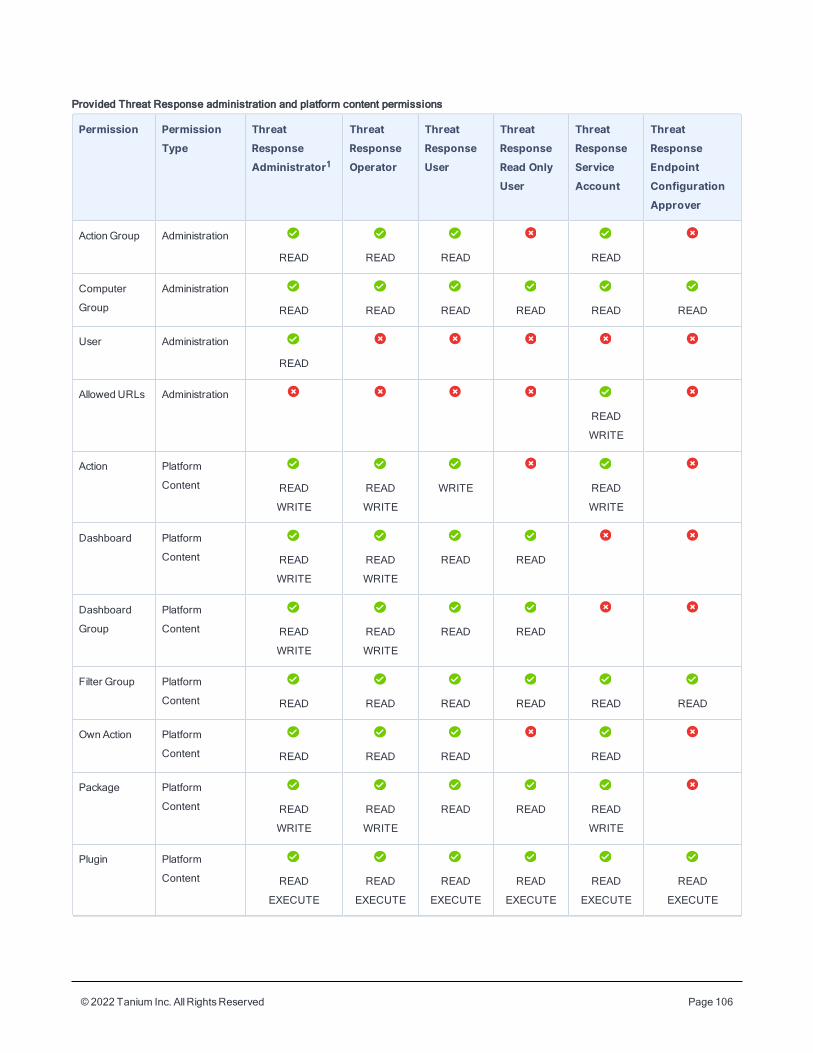
© 2022 Tanium Inc. AllRightsReserved Page 106
Permission PermissionType
ThreatResponseAdministrator1
ThreatResponseOperator
ThreatResponseUser
ThreatResponseRead OnlyUser
ThreatResponseServiceAccount
ThreatResponseEndpointConfigurationApprover
Action Group Administration
READ READ READ READ
Computer
Group
Administration
READ READ READ READ READ READ
User Administration
READ
Allowed URLs Administration
READ
WRITE
Action Platform
Content READ
WRITE
READ
WRITE
WRITE READ
WRITE
Dashboard Platform
Content READ
WRITE
READ
WRITE
READ READ
Dashboard
Group
Platform
Content READ
WRITE
READ
WRITE
READ READ
Filter Group Platform
Content READ READ READ READ READ READ
OwnAction Platform
Content READ READ READ READ
Package Platform
Content READ
WRITE
READ
WRITE
READ READ READ
WRITE
Plugin Platform
Content READ
EXECUTE
READ
EXECUTE
READ
EXECUTE
READ
EXECUTE
READ
EXECUTE
READ
EXECUTE
Provided Threat Response administration and platform content permissions
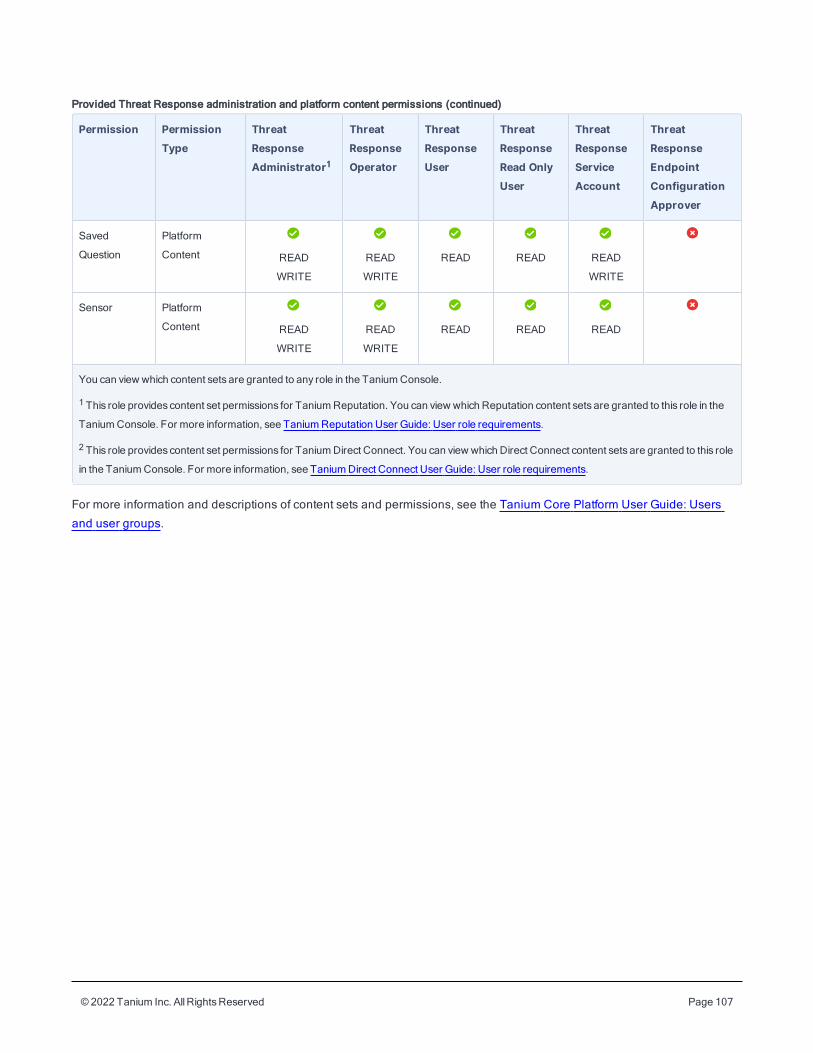
© 2022 Tanium Inc. AllRightsReserved Page 107
Permission PermissionType
ThreatResponseAdministrator1
ThreatResponseOperator
ThreatResponseUser
ThreatResponseRead OnlyUser
ThreatResponseServiceAccount
ThreatResponseEndpointConfigurationApprover
Saved
Question
Platform
Content READ
WRITE
READ
WRITE
READ READ READ
WRITE
Sensor Platform
Content READ
WRITE
READ
WRITE
READ READ READ
You can view which content sets are granted to any role in the TaniumConsole.
1 This role provides content set permissions for TaniumReputation. You can view which Reputation content sets are granted to this role in the
TaniumConsole. For more information, see TaniumReputation User Guide: User role requirements.
2 This role provides content set permissions for TaniumDirect Connect. You can view which Direct Connect content sets are granted to this role
in the TaniumConsole. For more information, see TaniumDirect Connect User Guide: User role requirements.
Provided Threat Response administration and platform content permissions (continued)
For more information and descriptions of content sets and permissions, see the Tanium Core Platform User Guide: Users
and user groups.
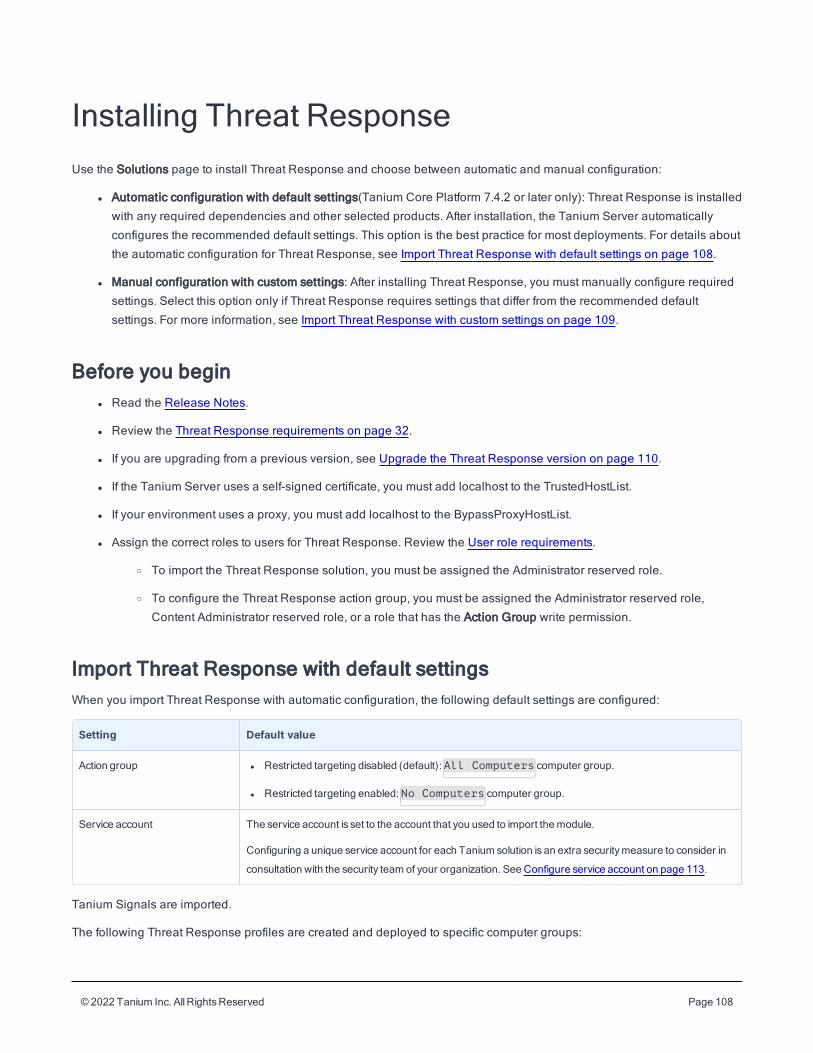
© 2022 Tanium Inc. AllRightsReserved Page 108
Installing Threat ResponseUse the Solutions page to install Threat Response and choose between automatic and manual configuration:
l Automatic configuration with default settings(Tanium Core Platform 7.4.2 or later only): Threat Response is installed
with any required dependencies and other selected products. After installation, the Tanium Server automatically
configures the recommended default settings. This option is the best practice for most deployments. For details about
the automatic configuration for Threat Response, see Import Threat Response with default settings on page 108.
l Manual configuration with custom settings: After installing Threat Response, you must manually configure required
settings. Select this option only if Threat Response requires settings that differ from the recommended default
settings. For more information, see Import Threat Response with custom settings on page 109.
Before you beginl Read the Release Notes.
l Review the Threat Response requirements on page 32.
l If you are upgrading from a previous version, see Upgrade the Threat Response version on page 110.
l If the Tanium Server uses a self-signed certificate, you must add localhost to the TrustedHostList.
l If your environment uses a proxy, you must add localhost to the BypassProxyHostList.
l Assign the correct roles to users for Threat Response. Review the User role requirements.
o To import the Threat Response solution, you must be assigned the Administrator reserved role.
o To configure the Threat Response action group, you must be assigned the Administrator reserved role,
Content Administrator reserved role, or a role that has the Action Group write permission.
Import Threat Response with default settingsWhen you import Threat Response with automatic configuration, the following default settings are configured:
Setting Default value
Action group l Restricted targeting disabled (default): All Computers computer group.
l Restricted targeting enabled: No Computers computer group.
Service account The service account is set to the account that you used to import themodule.
Configuring a unique service account for each Tanium solution is an extra securitymeasure to consider in
consultation with the security team of your organization. See Configure service account on page 113.
Tanium Signals are imported.
The following Threat Response profiles are created and deployed to specific computer groups:
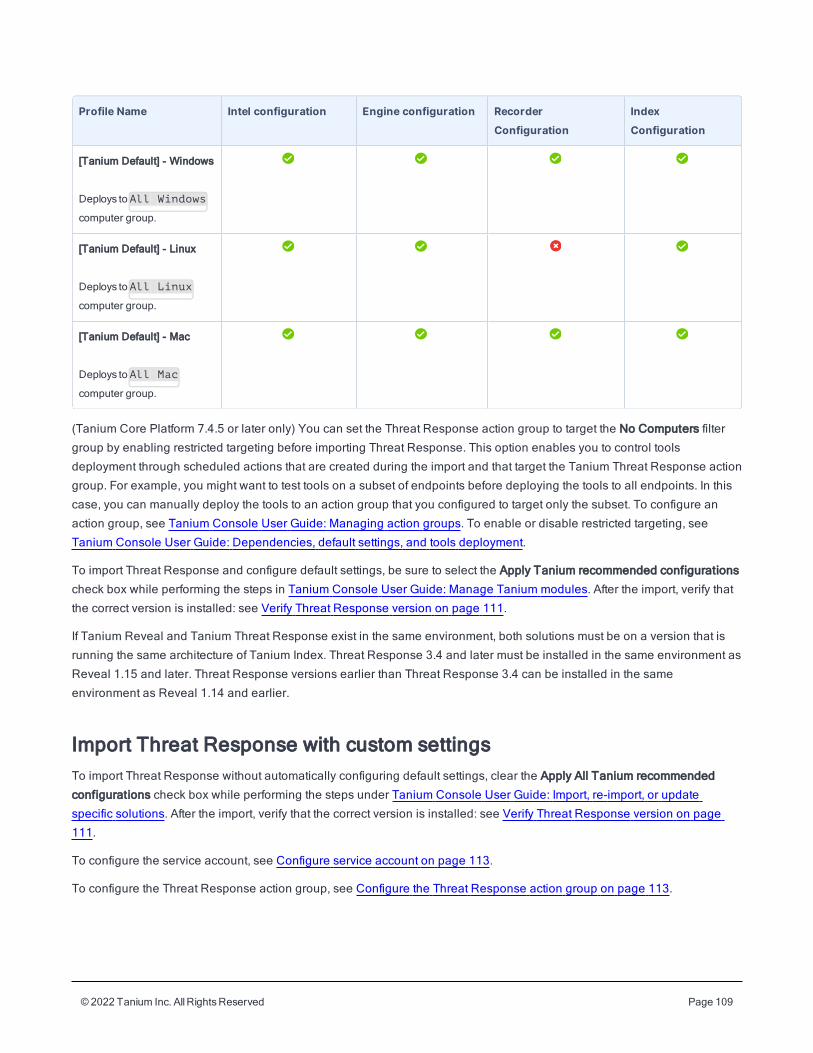
© 2022 Tanium Inc. AllRightsReserved Page 109
Profile Name Intel configuration Engine configuration RecorderConfiguration
IndexConfiguration
[Tanium Default] - Windows
Deploys to All Windows
computer group.
[Tanium Default] - Linux
Deploys to All Linux
computer group.
[Tanium Default] - Mac
Deploys to All Mac
computer group.
(Tanium Core Platform 7.4.5 or later only) You can set the Threat Response action group to target the No Computers filter
group by enabling restricted targeting before importing Threat Response. This option enables you to control tools
deployment through scheduled actions that are created during the import and that target the Tanium Threat Response action
group. For example, you might want to test tools on a subset of endpoints before deploying the tools to all endpoints. In this
case, you can manually deploy the tools to an action group that you configured to target only the subset. To configure an
action group, see Tanium Console User Guide: Managing action groups. To enable or disable restricted targeting, see
Tanium Console User Guide: Dependencies, default settings, and tools deployment.
To import Threat Response and configure default settings, be sure to select the Apply Tanium recommended configurations
check box while performing the steps in Tanium Console User Guide: Manage Tanium modules. After the import, verify that
the correct version is installed: see Verify Threat Response version on page 111.
If Tanium Reveal and Tanium Threat Response exist in the same environment, both solutions must be on a version that is
running the same architecture of Tanium Index. Threat Response 3.4 and later must be installed in the same environment as
Reveal 1.15 and later. Threat Response versions earlier than Threat Response 3.4 can be installed in the same
environment as Reveal 1.14 and earlier.
Import Threat Response with custom settingsTo import Threat Response without automatically configuring default settings, clear the Apply All Tanium recommended
configurations check box while performing the steps under Tanium Console User Guide: Import, re-import, or update
specific solutions. After the import, verify that the correct version is installed: see Verify Threat Response version on page
111.
To configure the service account, see Configure service account on page 113.
To configure the Threat Response action group, see Configure the Threat Response action group on page 113.
© 2022 Tanium Inc. AllRightsReserved Page 110
If Client Recorder Extension version 1.x exists on a targeted endpoint, you must remove it before you install Client Recorder
Extension version 2.x tools. To target endpoints where Client Recorder Extension version 1.x exists, ask the question:
Legacy - Recorder Installed. If the Supported Endpoints column displays No, you must remove Client Recorder
Extension version 1.x from the endpoint before you install Client Recorder Extension 2.x tools. To remove Client Recorder
Extension version 1.x, deploy the Recorder - Remove Legacy Recorder [Operating System] package to targeted endpoints.
Manage solution dependenciesWhen you start the Threat Response workbench for the first time, the Tanium Server checks whether all the Tanium modules
and shared services (solutions) that are required for Threat Response are installed at the required versions. The Threat
Response workbench cannot load unless all required dependencies are installed. If you selected Tanium Recommended
Installation when you imported Threat Response, the Tanium Server automatically imported all your licensed solutions at
the same time. Otherwise, if you manually imported Threat Response and did not import all its dependencies, the Tanium
Console displays a banner that lists the dependencies and the required versions. See Solution dependencies.
Perform the following steps if a banner indicates any Threat Response dependencies are not installed:
1. Install the dependencies as described in Tanium Console User Guide: Import, re-import, or update specific solutions.
2. From the Main menu, go to Modules > Threat Response to open the Threat Response Overview page and verify that
the Console no longer displays a banner to list missing dependencies.
Upgrade the Threat Response versionUpgrade Threat Response to the latest version by importing an update to the solution and migrating any existing intel.
Before you upgrade, use Tanium Health Check to generate a report that you can use to resolve any issues or risks
associated with the Tanium environment. Fix any issues reported by Tanium Health Check to mitigate problems that you
encounter during an upgrade. You can also use this report to discover opportunities for improving the performance of the
Tanium environment. For more information, see Tanium Health Check User Guide: Health Check overview.
If upgrading from version 1.x or earlier, the monitor.db file from the endpoint is deleted after the first prune
of recorder.db. If you want to save monitor.db from the endpoint for investigation or for historical reasons,
download it from the endpoint before upgrading to Threat Response 2.0. or later.
For the steps to upgrade Threat Response, see Tanium Console User Guide: Manage Tanium modules. After the upgrade,
verify that the correct version is installed: see Verify Threat Response version on page 111.
If Tanium Reveal and Tanium Threat Response exist in the same environment, both solutions must be on a version that is
running the same architecture of Tanium Index. Threat Response 3.4 and later must be installed in the same environment as
Reveal 1.15 and later. Threat Response versions earlier than Threat Response 3.4 can be installed in the same
environment as Reveal 1.14 and earlier.
© 2022 Tanium Inc. AllRightsReserved Page 111
When upgrading Threat Response, you can select to automatically upgrade the Threat Response tools package on all of the
endpoints in an environment to ensure that the latest version of the Threat Response tools are distributed. When you import
Threat Response with automatic configuration this option is configured by default. You can change this upgrade setting if
you do not want to automatically upgrade the Threat Response tools on endpoints.
Auto Upgrade is not intended to automatically perform upgrades across major versions.
1. From the Threat Response overview page, click Settings .
2. Click Service > Misc.
3. Select or deselect the Enable Tools Automatic Upgrade setting.
Verify Threat Response versionAfter you import or upgrade Threat Response, verify that the correct version is installed:
1. Refresh your browser.
2. From the Main menu, go to Modules > Threat Response to open the Threat Response Overview page.
3. To display version information, click Info .
© 2022 Tanium Inc. AllRightsReserved Page 112
Configuring Threat ResponseIf you did not install Threat Response with the Apply All Tanium recommended configurations option, you must enable and
configure certain features.
Install and configure Tanium Endpoint Configuration
Manage solution configurationswith TaniumEndpoint Configuration
Tanium Endpoint Configuration delivers configuration information and required tools for Tanium Solutions to endpoints.
Endpoint Configuration consolidates the configuration actions that traditionally accompany additional Tanium functionality
and eliminates the potential for timing errors that occur between when a solution configuration is made and the time that
configuration reaches an endpoint. Managing configuration in this way greatly reduces the time to install, configure, and use
Tanium functionality, and improves the flexibility to target specific configurations to groups of endpoints.
Endpoint Configuration is installed as a part of Tanium Client Management. For more information, see the
Tanium Client Management User Guide: Installing Client Management.
Additionally you can use Endpoint Configuration to manage configuration approval. For example, configuration changes are
not deployed to endpoints until a user with approval permission approves the configuration changes in Endpoint
Configuration. For more information about the roles and permissions that are required to approve configuration changes for
Threat Response, see User role requirements on page 87.
To use Endpoint Configuration to manage approvals, you must enable configuration approvals.
1. From the Main menu, go to Administration > Shared Services > Endpoint Configuration to open the Endpoint
Configuration Overview page.
2. Click Settings and click the Global tab.
3. Select Enable configuration approvals, and click Save.
For more information about Endpoint Configuration, see Tanium Endpoint Configuration User Guide.
If you enabled configuration approvals, the following configuration changes must be approved in Endpoint Configuration
before they deploy to endpoints:
l Creating, updating, or deleting patch lists
l Adding or removing enforcements
l Removing all enforcements
l Updating scan configuration priorities
l Creating deployments
© 2022 Tanium Inc. AllRightsReserved Page 113
l Stopping deployments
l Adding targets to deployments
l User-initiated actions, such as initializing endpoints, uploading custom field files, enabling Linux
Configure Threat Response
Configure service account
The service account is a user that runs several background processes for Threat Response. This user requires the following
roles and access:
l Tanium Administrator or Threat Response Service Account role.
l (Optional) Connect User role to send Threat Response data to Tanium Connect.
l If you installed Tanium Client Management, Endpoint Configuration is installed, and by default, configuration
changes initiated by the module service account (such as tool deployment) require approval. You can bypass
approval for module-generated configuration changes by applying the Endpoint Configuration Bypass Approval
permission to this role and adding the relevant content sets. For more information, see Tanium Endpoint
Configuration User Guide: User role requirements.
For more information about Threat Response permissions, see User role requirements on page 87.
If you imported Threat Response with default settings, the service account is set to the account that you used
to perform the import. Configuring a unique service account for each Tanium solution is an extra security
measure to consider in consultation with the security team of your organization.
1. From the Main menu, click Modules >Threat Response to open the Threat Response Overview page.
2. Click Settings and open the Service Account tab.
3. Update the service account settings and click Save.
Configure the Threat Response action group
Importing the Threat Response module automatically creates an action group to target specific endpoints. If you did not use
automatic configuration or you enabled restricted targeting when you imported Threat Response, the action group targets
No Computers.
If you used automatic configuration and restricted targeting was disabled when you imported Threat Response, configuring
the Threat Response action group is optional.
Select the computer groups to include in the Threat Response action group.
Clear the selection for No Computers and make sure that all operating systems that are supported by Threat
Response are included in the Threat Response action group.
© 2022 Tanium Inc. AllRightsReserved Page 114
1. From the Main menu, go to Administration > Actions > Action Groups.
2. Click Tanium Threat Response.
3. Select the computer groups that you want to include in the action group and click Save.
If you select multiple computer groups, choose an operator (AND or OR) to combine the groups.
Remove legacy Index dependencies from endpoints
If you have previously installed Tanium Index as a standalone application, or used the standalone application to upgrade
Tanium Index, ensure that all legacy Index assets are uninstalled from endpoints before deploying the latest Threat
Response tools to endpoints. To ensure complete removal of legacy Index dependencies, deploy the Index - Remove
Legacy Dependent package to endpoints where legacy versions of Tanium Index dependencies exist.
1. To target endpoints, issue a question in Interact. Ask the question Get Tanium File Exists
[Tools/EPI/dependents.txt] from all machines. If the results for an endpoint display Index it indicates that
the standalone Index content has been used in the past.
2. In the Question Results grid, select the rows for the endpoints that require the action, and click Deploy Action.
3. From the Deploy Action page, use the Deployment Package search box typeaheads to select packages. Select the
Index - Remove Legacy Dependent [Windows] or Index - Remove Legacy Dependent [Non-Windows] package.
4. Configure a Deployment Schedule and Targeting Criteria. Click Deploy Action. For more information, see Deploying
actions.
After you have performed these steps, if the results of the Client Extensions - Status sensor displays recorder|has_
subscription|index.fileevents you can use the Recorder - Clear Subscription [OS] package to remove a single
subscription from recorder.
Set up Threat Response users
You can use the following set of predefined user roles to set up Threat Response users.
To review specific permissions for each role, see User role requirements on page 87.
For more information about assigning user roles, see Tanium Core Platform User Guide: Manage role assignments for a
user.
Threat Response Administrator
Assign the Threat Response Administrator role to users who manage the configuration and deployment of Threat
Response functionality to endpoints.
This role can perform the following tasks:
l Configure Threat Response service settings
l Read and modify Threat Response configurations
© 2022 Tanium Inc. AllRightsReserved Page 115
l Take action on alerts
l Connect to remote endpoints
l Dismiss or reject approvals for Threat Response tasks in Tanium Endpoint Configuration
Threat Response Operator
Assign the Threat Response Operator role to users who manage the configuration and deployment of Threat
Response functionality to endpoints.
This role can perform the following tasks:
l Configure Threat Response service settings
l Read and modify Threat Response configurations
l Take action on alerts
l Connect to remote endpoints
l Dismiss or reject approvals for Threat Response tasks in Tanium Endpoint Configuration
Threat Response User
Assign the Threat Response User role to users who work with alerts and performing analysis on remote endpoints.
This role can perform the following tasks:
l View service settings
l View and modify alerts and intel documents
l Suppress and take action on alerts
l Run and review quick scans
l Connect to remote endpoints and manage downloads from them, and read configurations and profiles
Threat Response Read Only User
Assign the Threat Response Read Only User role to users who need visibility into Threat Response data and Threat
Response findings on endpoints.
This role can perform the following tasks:
l View service settings, alerts, and intel documents
l Review quick scans
l Read configurations and profiles
Threat Response Service Account
Assign the Threat Response Service Account role to an account that configures system settings for Threat
Response.
This role performs several background processes for Threat Response. For more information, see Installing Threat
Response .
© 2022 Tanium Inc. AllRightsReserved Page 116
Threat Response Endpoint Configuration Approver
Assign the Threat Response Endpoint Configuration Approver role to a user who approves or rejects Threat
Response configuration items in Tanium Endpoint Configuration.
This role approves, rejects, or dismisses changes that target endpoints where Threat Response is installed.
Migrate Trace and Detect configurations to Threat ResponseIf you are upgrading to Threat Response from Detect or Trace, any existing Trace and Detect configurations are not
automatically migrated when you install the Threat Response solution. You must initiate the migration process.
1. On the Threat Response overview page, click Help , and then click the Migration tab.
2. Click Start Migration.
3. Trace and Detect configuration data is imported. If there are problems with any data migration, the migration reports a
failure and a description of the issue that caused the failure. Review the messages on the migration page to resolve
any issues.
4. Confirm that you want to perform the migration.
After you have migrated Trace and Detect data you can remove Trace and Detect data from standalone installations of the
Trace and Detect modules.
1. On the Threat Response overview page, click Help , and then click the Migration tab.
2. Click Start Cleanup.
3. Trace and Detect configuration data is removed from the standalone module installations.
4. Confirm that you want to perform the cleanup.
© 2022 Tanium Inc. AllRightsReserved Page 117
Adding intelIntel defines one or more conditions that might indicate malicious behavior on endpoints. Threat Response can leverage
multiple sources of intel to identify and alert on potential threats in an environment. In addition to supporting third-party
intelligence sources, Tanium provides threat intelligence called Signals. Intel documents and Signals, generally referred to
as intel, interact with the engine to provide comprehensive monitoring and alerting.
Some intel document types, such as OpenIOC, STIX, CybOX, and YARA, search against existing or historical artifacts on the
endpoint. There are a number of providers for these documents. You can upload them directly or configure source streams.
Both the 1.0 and 1.1 versions of OpenIOC are supported. CybOX 2.0 is the currently supported version. The current
supported version of STIX is 1.2. STIX 2.0 is required for TAXII 2.0 support. Consequently, TAXII 2.0 is not currently
supported.
YARA 3.8.1 is supported and support for the following default modules is provided: pe, elf, dotnet, hash, cuckoo, math, and
time. The default magic module is not supported.
Threat Response provides YARA 4.1 on endpoints, however YARA has not been updated on the Threat
Response service. The Threat Response service uses YARA 3.8.1. The implications of this version mismatch
are that the service does not validate rules that use YARA 4.1 specific features. This will be addressed in a
future release of Threat Response.
Always use mutual (two-way) authentication and TLS encryption when connecting to intel feeds. Two-way
authentication and data encryption provide additional privacy-related benefits, for example, ensuring that
encryption keys that become compromised cannot decrypt TLS communications that were recorded in the
past.
Signals
Signals provide real-time monitoring of endpoint telemetry events; for example, process, network, registry, and file events for
malicious behaviors and methodologies of attack. Unlike other static forms of intel which focus on specific indicators, Signals
are evergreen heuristics; they are perpetually relevant.
Signals interact with the engine differently; they can evaluate continuously with the recorder and match on live process
events on endpoints. Signals help to identify malicious activity by correlating events and searching for behavior-based
indicators that something is awry. You can use Signals as a source directly from Tanium, or you can write your own Signals.
See Reference: Authoring Signals for more information.
Adding Signals to an intel configuration enables the recorder process on endpoints, and loads the Tanium
audit rules. This happens even if you do not enable a recorder configuration.
© 2022 Tanium Inc. AllRightsReserved Page 118
When a Signal evaluates with the recorder database and an event matches, the resulting alert shows the context of the
match. If you have filters for specific events in a recorder configuration, signals that match the events can still generate alerts.
For a Signal to evaluate with the recorder database, you need to enable both intel and recorder configurations in an active
profile.
The events of a Signal match are always written to the database, and override any filters that are included in a recorder
configuration.
An exhaustive reference to Signals syntax - including supported objects, properties, and conditions - is available in the
evaluation engine documentation. To access the evaluation engine documentation, click from the Threat Response
overview page and click the Evaluation Engine tab.
Signals do not always evaluate with the recorder database (No event match)
There are times when Signals cannot be evaluated with the recorder database. For example, it is possible for the recorder to
generate Signals, but not record them in the in the recorder database. Additionally, there are cases where events have been
recorded, but one or more of the events in the Signal match occurred too far in the past that the event has been purged from
the recorder database. If Signals cannot be evaluated with the recorder database, ensure that you have an enabled recorder
configuration in a deployed profile.
If you do not select Image Loads as a recorded event type in a recorder configuration, any Signal that uses
the image event type results in an Unmatched Events warning in the Alert Details. For more information,
see Recorder configurations.
Threat Response integrates with third-party reputation services. Hashes are sent to the reputation service for assessment,
then Threat Response enhances intel with the hash ratings. The Definition and Engine Analysis tabs on the Intel details
page provide additional information about how the intel document is structured, which parts are applicable, and the hash
rating.
Configure intel sourcesAn intel source is a series of intel documents from an external source. Sources can be a vendor or a folder in your network.
You can import sources manually or based on subscription settings.
Intel sources are updated from the Threat Response service, which runs on the Module Server. If security software is
deployed in the environment to monitor and block unknown URLs, your security administrator must allow the intel provider
URLs on the Module Server.
Threat Response can use several data formats, with the following available source types:
l Tanium Signal feed
l iSIGHT Partners ThreatScape
l Trusted Automated eXchange of Indicator Information (TAXII™)
l Palo Alto Networks Wildfire
l Folders on the Tanium Module Server
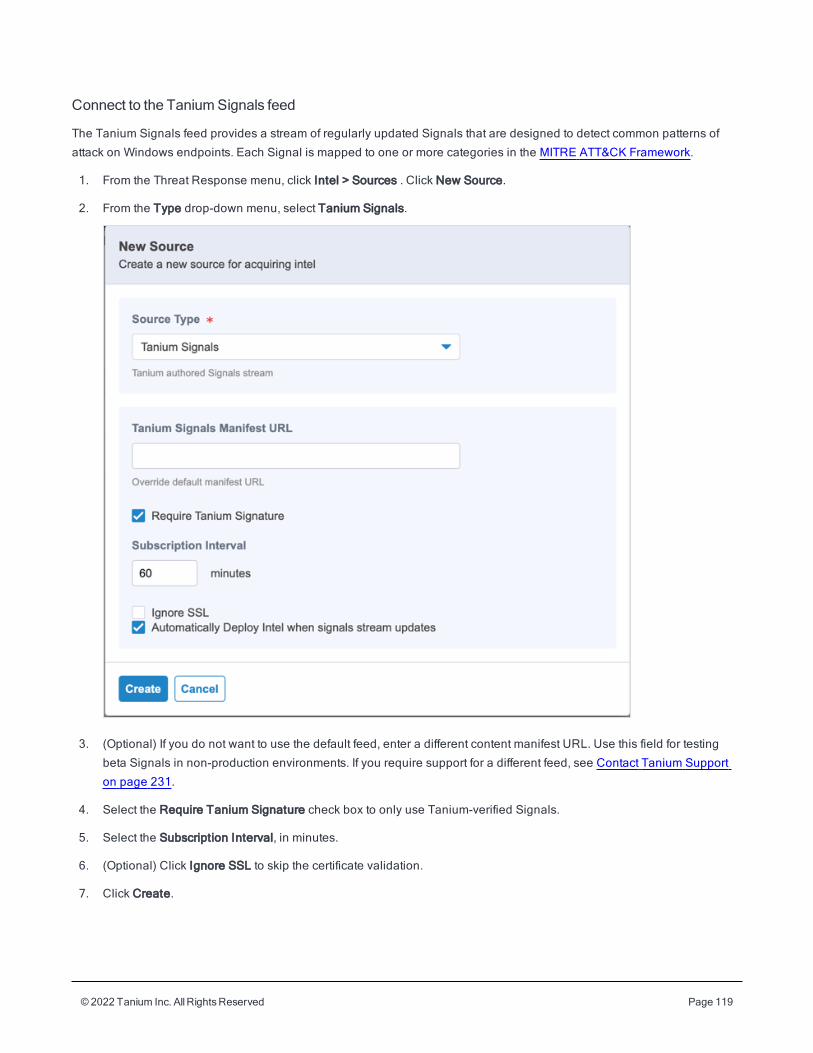
© 2022 Tanium Inc. AllRightsReserved Page 119
Connect to the TaniumSignals feed
The Tanium Signals feed provides a stream of regularly updated Signals that are designed to detect common patterns of
attack on Windows endpoints. Each Signal is mapped to one or more categories in the MITRE ATT&CK Framework.
1. From the Threat Response menu, click Intel > Sources . Click New Source.
2. From the Type drop-down menu, select Tanium Signals.
3. (Optional) If you do not want to use the default feed, enter a different content manifest URL. Use this field for testing
beta Signals in non-production environments. If you require support for a different feed, see Contact Tanium Support
on page 231.
4. Select the Require Tanium Signature check box to only use Tanium-verified Signals.
5. Select the Subscription Interval, in minutes.
6. (Optional) Click Ignore SSL to skip the certificate validation.
7. Click Create.
© 2022 Tanium Inc. AllRightsReserved Page 120
When the Tanium Signals feed gets updated, system notifications get generated that include the release notes about the
updates.
Configuring TaniumSignals feed in an airgapped environment
To configure the Tanium Signals feed in an airgapped environment on the Tanium Appliance, see Reference: Air gap
support: Install or update Tanium Threat Response Signals.
If you are using Threat Response version 1.0 to 1.3, download Tanium Detect Signals v2.
If you are using Threat Response version 1.4 to the current version, download Tanium Detect Signals v3.
To deploy signals in an airgapped environment, navigate to
https://content.tanium.com/files/misc/ThreatResponse/ThreatResponse.html and download Tanium Detect Signals from a
computer that can access the internet. If you encounter a problem, see Contact Tanium Support on page 231.
When the download completes, host the .ZIP file on a Web server that is accessible by Threat Response. You can use the
Tanium server to host this content. When this content is hosted, follow the instructions for connecting to the Tanium Signals
feed.
For example, you can save the .ZIP file in a sub directory of the Tanium Server HTTP directory named signals. In this
example, the URL to use when you create the signals feed is:
https://my.tanium.server/signals/DetectSignals.zip
In this scenario, content downloads directly from the Tanium Server, so the Require Tanium Signature option should be
deselected. If the environment uses self-signed certificates select the Ignore SSL option.
All downloads of signals are logged on the module server.
Connect to iSIGHT Partners ThreatScape
The iSIGHT intelligence is always in STIX format. You can have only one stream of this type at a time.
You must have an iSight subscription. The current supported version of STIX is 1.2. STIX 2.0 is required for
TAXII 2.0 support. Consequently, TAXII 2.0 is not currently supported.
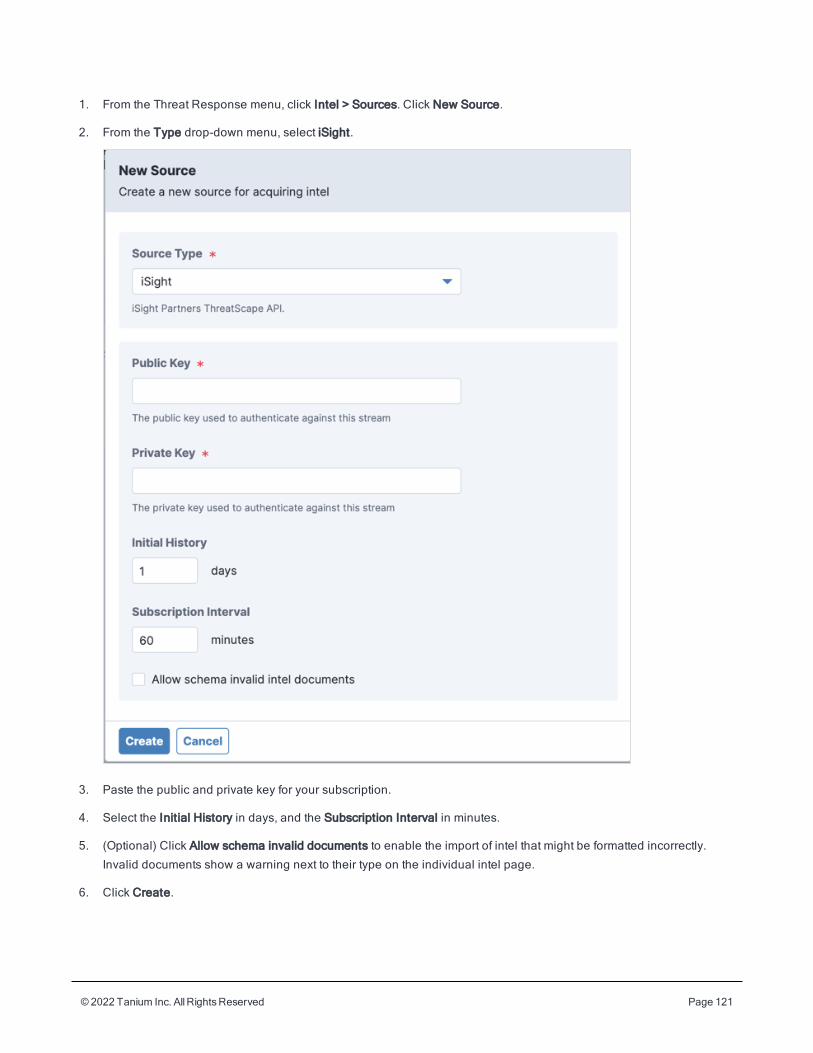
© 2022 Tanium Inc. AllRightsReserved Page 121
1. From the Threat Response menu, click Intel > Sources. Click New Source.
2. From the Type drop-down menu, select iSight.
3. Paste the public and private key for your subscription.
4. Select the Initial History in days, and the Subscription Interval in minutes.
5. (Optional) Click Allow schema invalid documents to enable the import of intel that might be formatted incorrectly.
Invalid documents show a warning next to their type on the individual intel page.
6. Click Create.
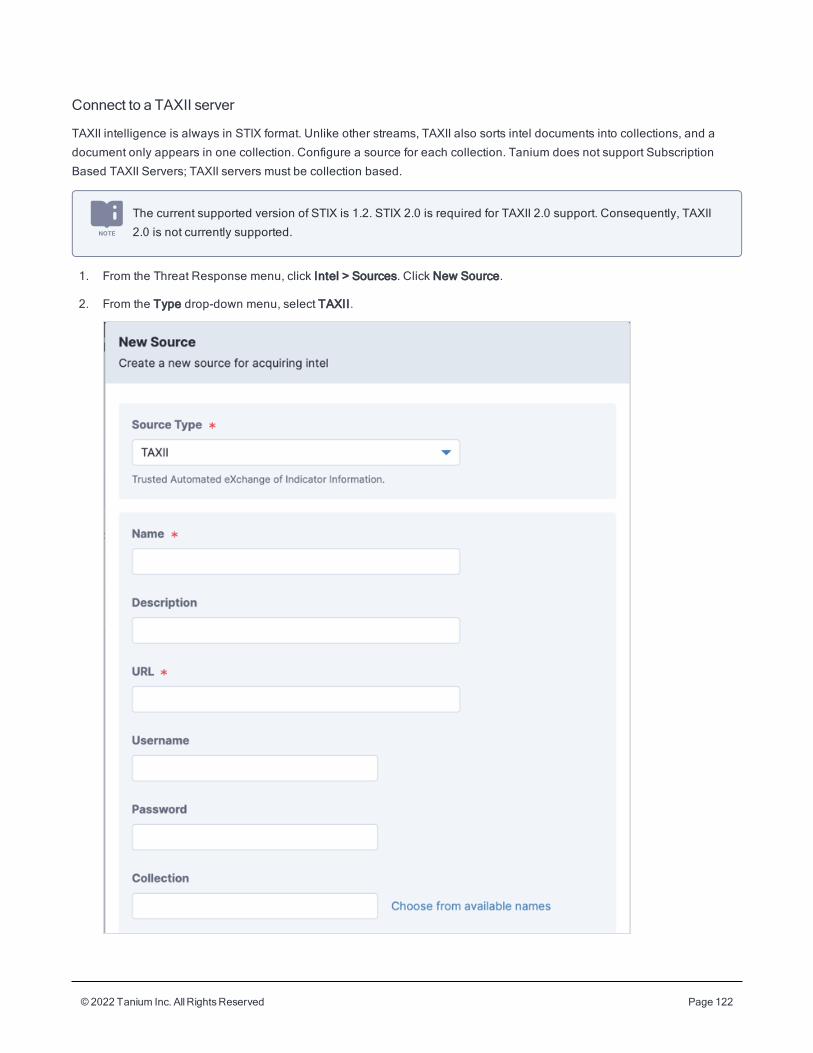
© 2022 Tanium Inc. AllRightsReserved Page 122
Connect to a TAXII server
TAXII intelligence is always in STIX format. Unlike other streams, TAXII also sorts intel documents into collections, and a
document only appears in one collection. Configure a source for each collection. Tanium does not support Subscription
Based TAXII Servers; TAXII servers must be collection based.
The current supported version of STIX is 1.2. STIX 2.0 is required for TAXII 2.0 support. Consequently, TAXII
2.0 is not currently supported.
1. From the Threat Response menu, click Intel > Sources. Click New Source.
2. From the Type drop-down menu, select TAXII.
© 2022 Tanium Inc. AllRightsReserved Page 123
3. Add a name and description.
4. Add subscription details including the URL, user name, and password.
5. Type in the case-sensitive collection name or select from available collections.
6. Select the Initial History in days, and the Subscription Interval in minutes.
7. Make optional security selections.
a. If you want two-way SSL validation, paste the certificate and private key for your subscription.
b. Click Ignore SSL to skip the certificate validation.
8. (Optional) Click Allow schema invalid documents to enable the import of intel that might be formatted incorrectly.
Invalid documents show a warning next to their type on the individual intel page.
9. Click Create.
Set up Connect andWildfire
You can use Connect to integrate intel from a Palo Alto Wildfire subscription. Palo Alto Wildfire differs from other intel
sources as this integration is performed through Tanium Connect and results in IOCs being created in the engine. For more
full details, see the Tanium Connect User Guide: Configuring Palo Alto Networks WildFire and Tanium Threat Response.
Configurations to Palo Alto Wildfire require the PAN firewall to use a certificate that is self-signed by Palo
Alto.
Use a local directory or remote share
Stream intel from a set of local directories on the Module Server. The System Administrator for the computer where the
Module Server is hosted must authorize a directory for streaming.
1. Stop the Tanium Detect service.
2. Add the directory to the <Tanium Module Server>/services/detect3-files/data/detect-blobs/folder-
stream-roots.conf file.
If you set up a directory, other users can add folders within the authorized directory. For example, if you add a c:\folder_streams directory, other users could add the c:\folder_streams\stream1 and c:\folder_streams\stream2 directories.
3. Restart the Tanium Detect service.
4. From the Threat Response menu, click Intel > Sources. Click New Source.
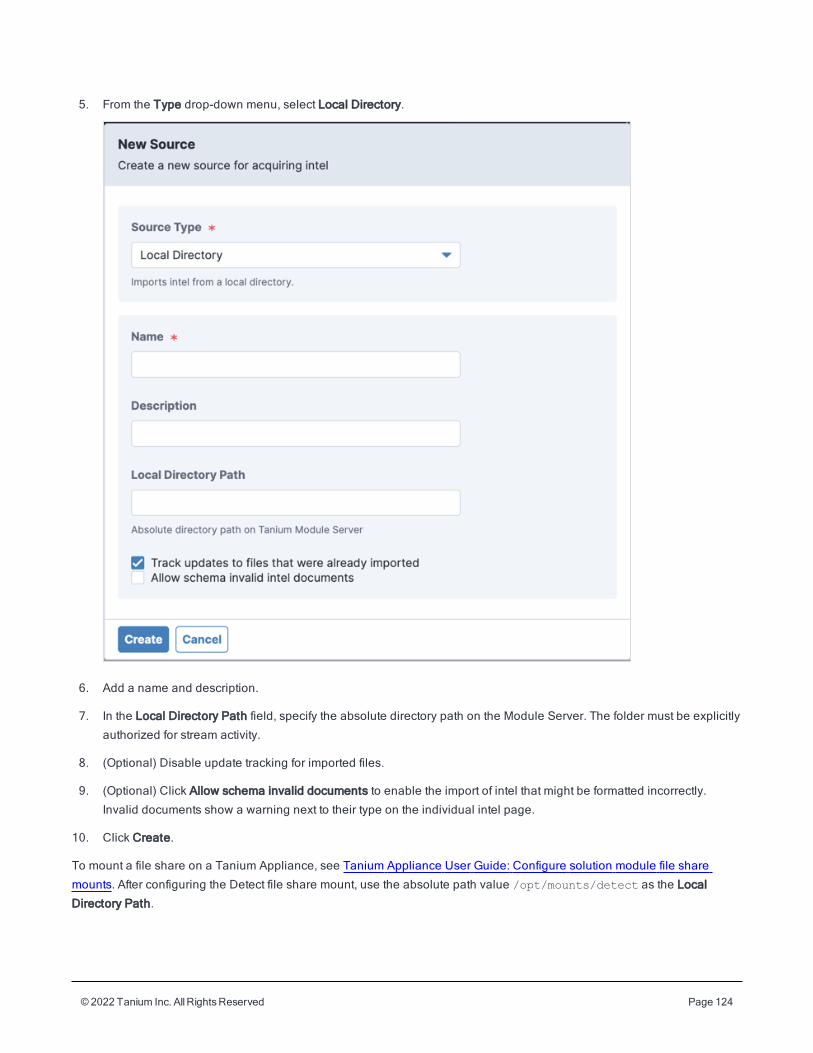
© 2022 Tanium Inc. AllRightsReserved Page 124
5. From the Type drop-down menu, select Local Directory.
6. Add a name and description.
7. In the Local Directory Path field, specify the absolute directory path on the Module Server. The folder must be explicitly
authorized for stream activity.
8. (Optional) Disable update tracking for imported files.
9. (Optional) Click Allow schema invalid documents to enable the import of intel that might be formatted incorrectly.
Invalid documents show a warning next to their type on the individual intel page.
10. Click Create.
To mount a file share on a Tanium Appliance, see Tanium Appliance User Guide: Configure solution module file share
mounts. After configuring the Detect file share mount, use the absolute path value /opt/mounts/detect as the Local
Directory Path.
© 2022 Tanium Inc. AllRightsReserved Page 125
If you edit an existing source, for example, by adding subscription choices, Threat Response indexes and downloads new
intel documents every 60 seconds. The intel gets pushed to the endpoint during the next intel publication interval.
For more information about registry settings to use sources with a proxy server, see the Tanium Core Platform Installation
Guide: Server Proxy Settings.
Delete an intel sourceWhen you delete an intel source, all intel documents that are associated with the source are moved to the unknown source.
The unknown source is not displayed on the sources page. To identify intel documents associated with the unknown source,
you can filter all intel. Alerts that are associated with the intel from the source you are deleting are not deleted.
1. From the Threat Response menu, go to Intel > Sources.
2. Click the intel source that you want to delete.
3. Click Delete . Click OK to confirm the deletion of the intel source.
Any intel documents that were associated with the source you deleted are now associated with the unknown source. To
manage intel in the unknown source, see View orphaned intel documents.
Set up the reputation serviceReputation data provides more insight into which alerts might be good candidates to save for further analysis and action.
Through a Tanium™ Connect integration, Threat Response uses the reputation data from third parties, such as VirusTotal or
Palo Alto Networks WildFire. Blocklisted hashes are not included in the results unless the hashes are discovered by the
saved question.
Threat Response detects if the reputation service is paused or stopped and in this event does not update reputation data. If
after 24 hours the reputation service is disabled or deleted, Threat Response deletes the reputation source and any existing
intel documents associated with the source are moved to the Unknown source. If reputation is added again, the reputation
source is created again.
Configure reputation data in TaniumConnect
In Connect, create a connection from a saved question source to the Tanium Reputation destination. This connection
initiates a list of hashes to be sent from a saved question in Connect to Reputation. The detect service queries Reputation for
all discovered malicious hashes including known bad hashes. Reputation data requires a Connect version from Connect 4.1
to Connect 4.10.5, or Connect 4.11 and Reputation 5.0. For more information on configuring the reputation service settings,
see Tanium Reputation User Guide: Reputation overview.
For endpoints that use reputation data, any hashes found by the saved questions are sent to the third-party reputation
service for assessment.
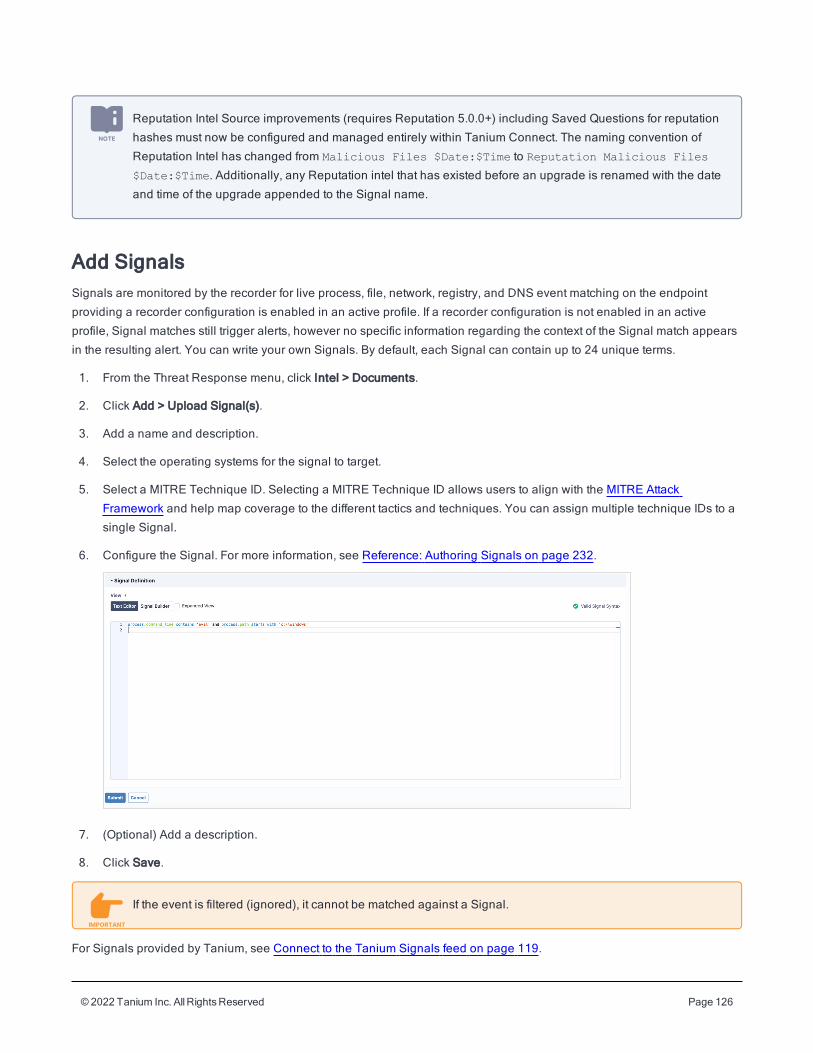
© 2022 Tanium Inc. AllRightsReserved Page 126
Reputation Intel Source improvements (requires Reputation 5.0.0+) including Saved Questions for reputation
hashes must now be configured and managed entirely within Tanium Connect. The naming convention of
Reputation Intel has changed from Malicious Files $Date:$Time to Reputation Malicious Files
$Date:$Time. Additionally, any Reputation intel that has existed before an upgrade is renamed with the date
and time of the upgrade appended to the Signal name.
Add SignalsSignals are monitored by the recorder for live process, file, network, registry, and DNS event matching on the endpoint
providing a recorder configuration is enabled in an active profile. If a recorder configuration is not enabled in an active
profile, Signal matches still trigger alerts, however no specific information regarding the context of the Signal match appears
in the resulting alert. You can write your own Signals. By default, each Signal can contain up to 24 unique terms.
1. From the Threat Response menu, click Intel > Documents.
2. Click Add > Upload Signal(s).
3. Add a name and description.
4. Select the operating systems for the signal to target.
5. Select a MITRE Technique ID. Selecting a MITRE Technique ID allows users to align with the MITRE Attack
Framework and help map coverage to the different tactics and techniques. You can assign multiple technique IDs to a
single Signal.
6. Configure the Signal. For more information, see Reference: Authoring Signals on page 232.
7. (Optional) Add a description.
8. Click Save.
If the event is filtered (ignored), it cannot be matched against a Signal.
For Signals provided by Tanium, see Connect to the Tanium Signals feed on page 119.
© 2022 Tanium Inc. AllRightsReserved Page 127
Import and export SignalsImport and export Signals to move them from one platform to another. For example, you can export Signals from a test
system and import them to a production system. Signals are imported and exported as JSON files and have a file size limit of
1 MB.
Export Signals
1. From the Threat Response menu, click Intel > Documents.
2. Select the Signals you want to export and click Actions > Export. Any intel documents that are not Signals are omitted
from the export.
3. For each Signal that you include in an export, select to Include all Labels and Include all Suppressions if you want to
preserve the labels and suppression rules that you have associated with the Signal. Click OK. If you do not select to
include labels or suppressions, the Signal is exported without any associated labels or suppression rules.
When exporting a signal, only signal-specific suppression rules are included in the signal. You can
export global suppression rule information from the suppression rule page.
4. A JSON file is created for the export. Provide a name for the JSON file and click Export.
Import Signals
1. From the Threat Response menu, click Intel > Documents.
2. Click Add > Upload Signal(s).
3. Browse to the JSON files that correspond to the Signals you want to import. Click OK. Click Next.
4. If the Signal already exists, or exists with different suppression rules or labels associated with it, select Action > Skip to
not import the Signal. Click Next.
5. Review the list of the imported Signals and click Finish.
Exporting Signals that include MITRE technique IDs and importing them into an environment where the same
Signals exist without associated MITRE technique IDs results in a new Signal with the same content and the
addition of MITRE technique ID information. The result is that two Signals exist; one with MITRE technique
information, and one without.
Upload intel documentsYou can upload multiple intel documents at the same time, including YARA files. The size limit for uploading intel documents
is 10MB for IOCs in XML format, such as STIX version 1.x, and 1MB for Signals in JSON format.
© 2022 Tanium Inc. AllRightsReserved Page 128
1. From the Threat Response menu, click Intel > Documents.
2. Click Add > Upload IOC(s) or Add > Upload Signal(s). Select Add > Upload IOC(s) to upload YARA files.
3. Select intel files and click Upload.
4. Review the intel validation check. The intel XML schema validation check shows the documents that were successfully
uploaded and any documents with errors.
5. Click Close.
Create intel documentsCreate an intel document with a set of user-defined rules.
Quick Add supports some types of defanged IP address formats that are found in threat intelligence
documents, such as 10[.]1[.]1[.]1 or 10 . 1 . 1 . 1.
1. From the Threat Response menu, click Intel > Documents.
2. Click Add > Quick Add.
3. From the Detect when drop-down menu, select the type of data.
4. Type the information to match.
5. (Optional) Enable Exact match required.
6. Type a name for the intel document. For long term usability, use a consistent naming convention.
7. Click Create.
Label intelUse labels to organize intel into sets that are relevant for your environment. For example, you might want to sort intel by
priority, incident case, or based on the applicable attack surface.
Create custom labels to control the promotion of intel in a production environment. The names of labels provided by Tanium
are subject to change. Signals are generally updated automatically, creating a possibility that label changes could cause
unintended consequences in a production environment. A best practice is to adopt a convention for naming custom labels
that follows an organization’s object naming guidelines.
Apply a label
1. From the Threat Response menu, click Intel > Documents.
2. Select the check box next to the intel documents or Signals. Click Labels.
3. Click Add Label and type in a new label or select an existing label.
4. Click Save Changes.
© 2022 Tanium Inc. AllRightsReserved Page 129
Configure YARA filesYARA files function like other intel documents, in regards to uploading, streaming from a folder, and labeling. However,
Threat Response automatically assigns a scope to limit the evaluation scan; by default, all YARA files are set to scan live
files. You can change the evaluation scope for any YARA file.
YARA 3.8.1 is supported and support for the following default modules is provided: pe, elf, dotnet, hash,
cuckoo, math, and time. The default magic module is not supported. Threat Response provides YARA 4.1 on
endpoints, however YARA has not been updated on the Threat Response service. The Threat Response
service uses YARA 3.8.1. The implications of this version mismatch are that the service does not validate
rules that use YARA 4.1 specific features. This will be addressed in a future release of Threat Response.
1. From the Threat Response menu, click Intel > Documents.
2. Click the intel name, then click the Search Scope tab.
3. Select the scope of evaluation scan.
l Live Files: This instructs the detect engine to find the files for any running processes (executable and loaded
library files) and then use the YARA rule to scan their file on disk. Limited to the running processes and their
executable and library files.
l Memory: (Windows and Mac only) Limited to the memory of all running processes.
l Paths: Limited to the configured directory paths. The path search is recursive, up to 32 directories. When
adding paths ensure that no duplicate entries or empty values are added.
4. Click Save.
View orphaned intel documentsWhen the source for a piece of intel is removed, the intel moves into an orphaned state.
1. From the Threat Response menu, click Intel > Documents.
2. Expand the Filter Results section and set the Source to Unknown.
Testing Intel for deployment
Test intel in a lab or test environment before deploying to a production environment. Create the new Intel and
use Quick Scans to test against endpoints to verify the intel matches on what you expect and that the intel
does not match a high number of false positives.
When you are ready to promote the intel in a production environment, the following process is advised as a best practice:
© 2022 Tanium Inc. AllRightsReserved Page 130
1. Import or create the new intel in a production environment.
2. Quick scan the intel against a computer group that contains a small number of endpoints that you have identified as
appropriate for testing purposes. See Tanium Console User Guide: Create computer groups for more information.
Verify the performance of the intel; for example, ensure it is matching and generating alerts for expected indicators of
compromise.
3. Quick scan the intel against an Alpha computer group that contains approximately 10% of the total endpoints the intel
will ultimately target. Verify the performance of the intel. Modify the intel if necessary.
4. Add the Alpha label to the new Intel and deploy. See Label the intel and Deploy intel for more information. Allow time
for the intel to deploy. Verify the performance of the intel. Modify the intel if necessary.
5. Quick scan the intel against a Beta computer group that contains approximately 20% of the total endpoints the intel will
ultimately target. Verify the performance of the intel. Modify the intel if necessary correctly.
6. Add the Beta label to the new Intel and deploy. Allow time for the intel to deploy. Verify the performance of the intel.
Modify the intel if necessary.
7. Quick scan the intel against the Threat Response Production computer group. Verify the performance of the intel.
Modify the intel if necessary.
8. Add the Production label to the new intel and deploy. The intel is now fully deployed in production. Continue to verify
the performance of intel and refine as necessary.
© 2022 Tanium Inc. AllRightsReserved Page 131
Scanning endpointsThe engine scans each endpoint using the intel documents and Signals that you defined. The engine can perform
background scans, quick scans, and live Signals monitoring through the recorder. Background scans begin shortly after intel
is deployed to the endpoint and continue on regular intervals. Quick scans are initiated on demand, typically when you need
to urgently locate all instances of a potential compromise.
A scan can have three possible results:
l Match: Identifies potential compromise and generates alerts.
l No match: None of the intel matched the data on the endpoints.
l Inconclusive: Generally, an indication that the scan did not complete for some reason.
When a scan finds a match, the alert is gathered from the endpoint and reported to Threat Response. From there, you can
further investigate the endpoint.
The two available types of scans are background scans and quick scans. Background scans and quick scans are
complementary; background scans are run on a schedule for all intel. Quick scans are immediate; they are intended for use
cases such as testing or piloting new intel. In this way, you can test the results of specific intel with a quick scan and when
the intel is revised appropriately to ensure it generates the intended alerts can be scanned on a routine basis through
background scans.
Background scansBackground scans run automatically on an interval specified by the engine configuration. The default is 24 hours. When a
scan is due to run, the engine first checks the last scan to see if the scan was interrupted. If the scan was interrupted, the
engine resumes the scan instead of starting a new scan. The scan details must be the same; such as the active configuration
id, revision id, and intel revision. If the details do not match, a new scan is started.
To edit the configuration of the engine, see Engine configurations.
Quick scansQuick scans send a single piece of intel to the endpoints for immediate matching and alert reporting. If the intel is too large,
the quick scan option is not available. You can use Signals, OpenIOC, STIX, or YARA intel in a quick scan.
For Signals, you can use quick scans for a seven day historical query on the event recorder database. Quick scan on
Signals is also useful when you are authoring Signals. Quick scans are not supported for Signals that contain ancestry
object types. For example, ancestry.path.
If a background scan is running at the time the quick scan starts, the background scan pauses and then resumes when the
quick scan finishes.
Quick scans have different limits for system level resource consumption - such as disk usage and CPU limit percentages -
than background scans. By default, quick scans throttle CPU usage at 25% and disk usage at 50%.
© 2022 Tanium Inc. AllRightsReserved Page 132
Quick scans are run on endpoints as questions. You can configure quick scans settings in an engine configuration within a
specific profile to specify how the quick scan performs on the endpoints contained in computer groups a profile targets. If you
do not have an engine configuration as part of a deployed profile, but you do have Threat Response tools deployed, you can
still run a quick scan and it uses the default background scan resource limits which throttle CPU usage at 5% and disk usage
at 20%.
It is important to consider the thresholds that such a scan implies on the endpoint. When initiating quick scans
in succession on shared infrastructure, the capacity to consume high amounts of resources should be
considered. For more information, see Managing question and sensor thresholds.
1. From the Threat Response menu, go to Intel. Click the intel name. Click Actions > Quick Scan.
2. Select a computer group.
3. Click Start Scan.
The Threat Response icon pulses while the quick scan is running. After the quick scan completes, you can use the Interact
icon to view the detailed results of the scan. As alerts are generated and gathered asynchronously from the scan, they might
display on the Alerts page before the scan completes.
© 2022 Tanium Inc. AllRightsReserved Page 133
Creating configurations
OverviewConfigurations are groups of settings that control the behavior of Threat Response components. You can create different
configurations for each Threat Response component to control how it performs on specific groups of endpoints.
For example, you might want to apply and scan for specific intel on one group of endpoints, but not other groups. Or, you
might want to apply a subset of Threat Response capabilities to a group of endpoints. Use configurations to customize which
intel to apply, how and when to evaluate intel, how to index file systems, and which events to record on all the endpoints in
an enterprise.
You can orchestrate configurations for intel, the engine, the recorder, and index in a profile that is assigned to one or more
computer groups. You can import and export configurations to make them easy to apply to target groups of computers.
Threat Response provides example configurations that feature the most common configuration settings for specific operating
systems. While you cannot edit example configurations, you can copy them to use as templates for creating configurations
and applying to profiles.
Create engine configurationsEngine configurations instruct the engine how to scan endpoints for intel matches. To avoid scanning important endpoints or
to limit when the engine is active, you can include blackout periods to prevent scans during those times.
1. From the Threat Response menu, click Management > Configurations. Click Create > Engine.
2. In the General Settings section, provide a name and description for the engine configuration.
3. In the Engine Options section, select the hours and days for the Scan Blackout period.
4. Configure the Advanced Engine Settings.
a. (Optional) Select Generate Deep Instinct Alerts to enable the generation of Deep Instinct alerts and display
alerts for Deep Instinct detection. Selecting Generate Deep Instinct Alerts requires the Deep Instinct agent to be
running on the endpoint. The Deep Instinct Agent must be installed with a specific installation string to enable
endpoint integration with Threat Response.
b. (Optional) Select Generate Defender Alerts to generate Defender alerts on Windows endpoints.
c. Configure other Advanced Engine Settings as appropriate. For more information, see the Evaluation Engine
documentation.
5. Click Save.
After you have deployed engine configurations to endpoints, you can view and manage alerts that result from intel matches.
See Managing alerts.
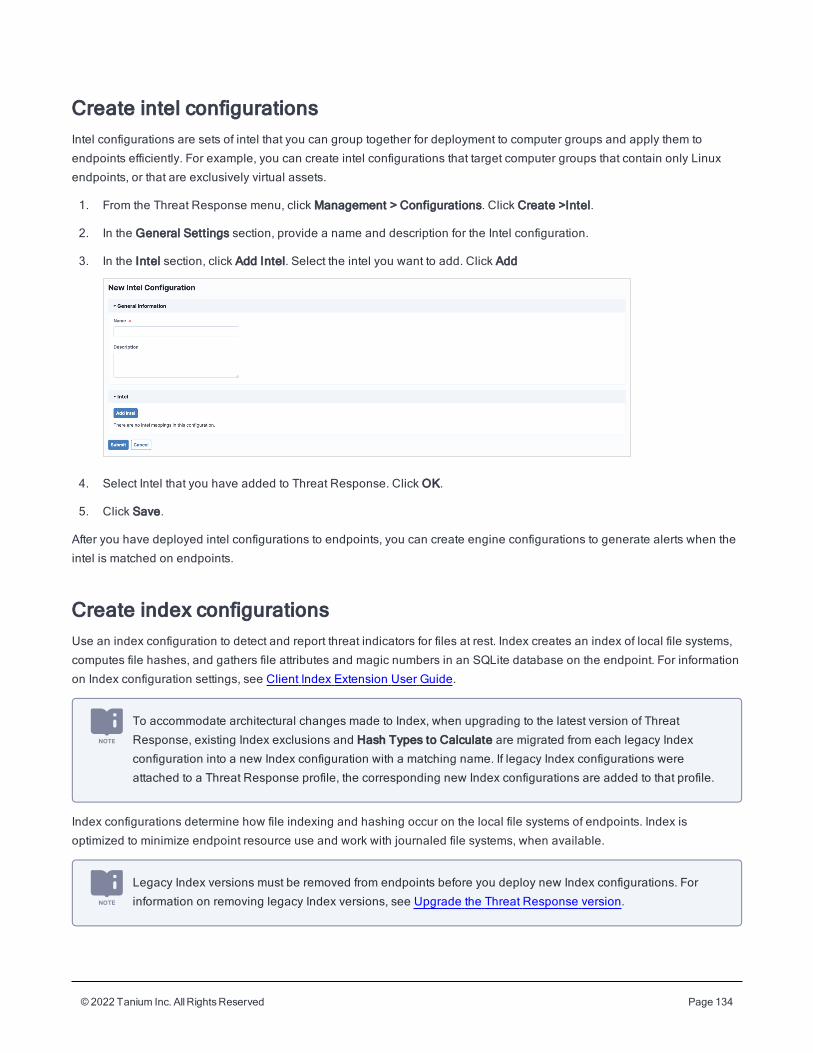
© 2022 Tanium Inc. AllRightsReserved Page 134
Create intel configurationsIntel configurations are sets of intel that you can group together for deployment to computer groups and apply them to
endpoints efficiently. For example, you can create intel configurations that target computer groups that contain only Linux
endpoints, or that are exclusively virtual assets.
1. From the Threat Response menu, click Management > Configurations. Click Create >Intel.
2. In the General Settings section, provide a name and description for the Intel configuration.
3. In the Intel section, click Add Intel. Select the intel you want to add. Click Add
4. Select Intel that you have added to Threat Response. Click OK.
5. Click Save.
After you have deployed intel configurations to endpoints, you can create engine configurations to generate alerts when the
intel is matched on endpoints.
Create index configurationsUse an index configuration to detect and report threat indicators for files at rest. Index creates an index of local file systems,
computes file hashes, and gathers file attributes and magic numbers in an SQLite database on the endpoint. For information
on Index configuration settings, see Client Index Extension User Guide.
To accommodate architectural changes made to Index, when upgrading to the latest version of Threat
Response, existing Index exclusions and Hash Types to Calculate are migrated from each legacy Index
configuration into a new Index configuration with a matching name. If legacy Index configurations were
attached to a Threat Response profile, the corresponding new Index configurations are added to that profile.
Index configurations determine how file indexing and hashing occur on the local file systems of endpoints. Index is
optimized to minimize endpoint resource use and work with journaled file systems, when available.
Legacy Index versions must be removed from endpoints before you deploy new Index configurations. For
information on removing legacy Index versions, see Upgrade the Threat Response version.
© 2022 Tanium Inc. AllRightsReserved Page 135
1. From the Threat Response menu, click Management > Configurations. Click Create > Index. Provide a name and
description for the index configuration.
2. Select the Hashes To Calculate. Index can record any combination of three different hash types: MD5, SHA-1, SHA-
256, or SHA512. Do not select any hash type to disable calculation of hashes.
If legacy index configurations included the Include Malicious Hash List setting, you must add the new
Reputation intel document to intel configurations. When you upgrade to Threat Response 3.4 or later,
any malicious hashes that exist in the reputation database are added to the Reputation Intel document.
All malicious hashes identified after upgrade are added to this same intel document moving forward.
Open each intel configuration and ensure that the Reputation source is added anywhere you want
endpoints to match against the malicious hashes.
3. In the Priority List section, select filters that you want to designate as high-priority paths. See Create filters for more
information. Click Manage Priority List to select existing filters. Select any or all of the available filters. Only filters that
have already been created are available to select. When you have selected the filters that you want to add to the
configuration, click Apply. See Create filters for more information on filter methods. Click Save. You cannot add more
than 24 filter definitions.
4. In the Exclusions section, click Manage Exclusions to exclude specific file paths by using regular expressions and
names from indexing. Default indexing exclusions are provided that feature common paths and files to exclude. For
more information about indexing exclusions, see Indexing exclusions.
5. Click Save.
6. Click Create.
After you have deployed index configurations to endpoints, you can use sensors to query indexed files. See Using sensors
to query indexed files.
Create indexing exclusions
To improve performance and save system resources, create configurations to exclude files from being indexed.
Create exclusions to keep specific files and paths out of file system indexes.
1. From the Threat Response menu, click Management > Exclusions and click Create. Select the operating system and
provide a name for the exclusion.
2. Provide a regular expression to exclude from indexing.Search for more complex patterns and further constrain the
scope of the search. For example, (if|ip)config(\.exe)?$matches ifconfig, ipconfig, ifconfig.exe, and
ipconfig.exe.
3. Click Create.
Create recorder configurationsThe recorder saves forensic evidence for each endpoint in a local database. With recorder configuration settings, you can
restrict database volume by size and days of storage.
© 2022 Tanium Inc. AllRightsReserved Page 136
Prior to Threat Response 2.5 a common recorder configuration existed for all supported operating systems. In
Threat Response 2.5 and later, this common configuration has been replaced with operating system specific
configurations. If the legacy default recorder configuration exists, it is deleted if only default profiles were
using it, or renamed with a Deprecated suffix if in use with custom profiles. If custom profiles use the legacy
default configuration it becomes editable.
Adjust the settings for each endpoint database to suit a specific environment. Systems with different roles can generate a
higher volume of certain types of events. For example, domain controllers typically generate more security events and
network traffic than an average end-user workstation. You can build custom configurations that maximize event retention
across an environment, while excluding unwanted activity. Starting in Threat Response 3.5, recorder configurations that
target Windows endpoints require the Tanium Event Recorder Driver to be installed and enabled to record process and
command line events. The Tanium Event Recorder Driver is installed as part of Threat Response and is upgraded when
Threat Response upgrades are applied.
1. From the Threat Response menu, click Management > Configurations. Click Create > Recorder. Provide a name and
description for the recorder configuration.
2. In the Database Configuration section, configure settings for the recorder database. The recorder database contains
configuration data, Signal match data, and configured event data. The events of a Signal match are always written to
the database, and override any filters that are included in a recorder configuration.
a. Provide a Maximum Database Size. The endpoint purges events if the maximum database size is reached. If this
database is larger than 2.5 GB, you cannot reimport the database if it is exported.
b. Provide the Maximum Days to Retain Events to specify the number of days that events are retained. Older
events are purged from the endpoint database. Entering 0 prevents events from being purged based on age.
c. Select whether or not to Record Tanium Client Processes. Selecting this option includes all Tanium Client
processes, and all child process of the Tanium Client in recorded events.
d. Select whether or not to Encrypt Database. By default, the recorder database (recorder.db) is encrypted using
AES 128 bit encryption. Deselect the database encryption setting if you do not want this data to be encrypted.
Deselecting this setting does not revert any encrypted databases to a decrypted state. If changing an endpoint to
a decrypted state, change the configuration, deploy the updated profile, and then deploy an action to the
endpoints with Recorder - Reset Database. After the reset action is complete, the recorder.db exists in a
decrypted state.
If encryption is enabled, a recorder database cannot be decrypted offline.
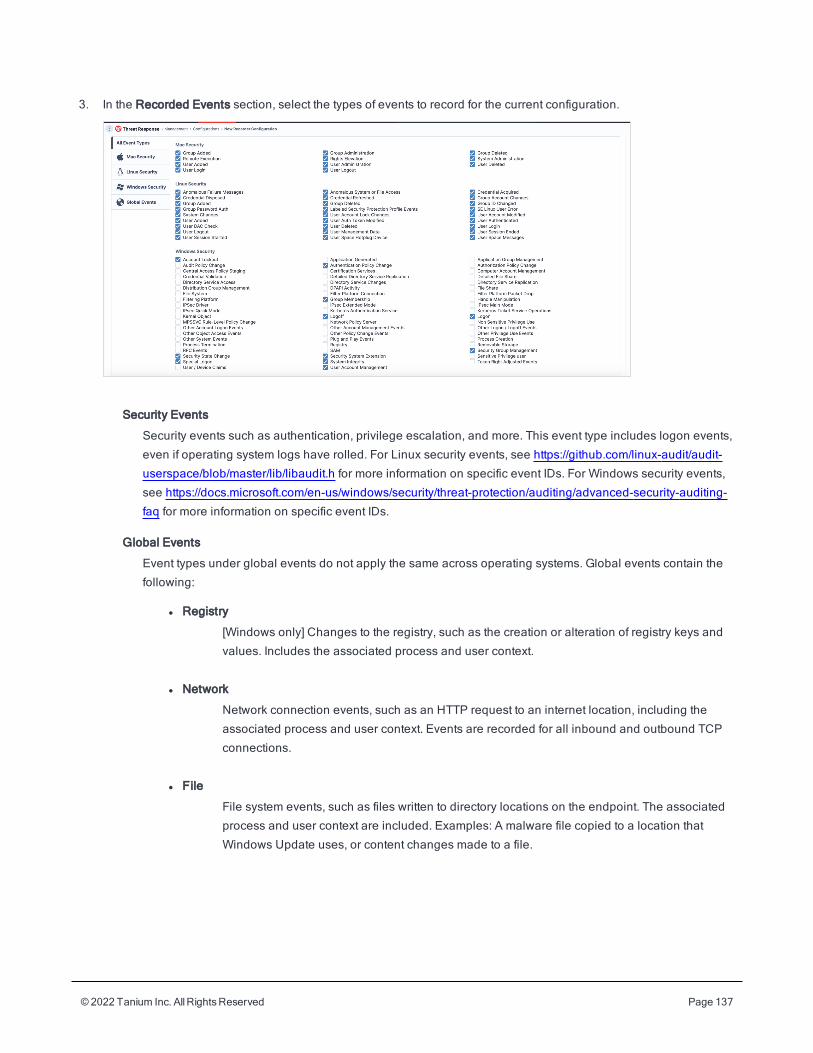
© 2022 Tanium Inc. AllRightsReserved Page 137
3. In the Recorded Events section, select the types of events to record for the current configuration.
Security Events
Security events such as authentication, privilege escalation, and more. This event type includes logon events,
even if operating system logs have rolled. For Linux security events, see https://github.com/linux-audit/audit-
userspace/blob/master/lib/libaudit.h for more information on specific event IDs. For Windows security events,
see https://docs.microsoft.com/en-us/windows/security/threat-protection/auditing/advanced-security-auditing-
faq for more information on specific event IDs.
Global Events
Event types under global events do not apply the same across operating systems. Global events contain the
following:
l Registry
[Windows only] Changes to the registry, such as the creation or alteration of registry keys and
values. Includes the associated process and user context.
l Network
Network connection events, such as an HTTP request to an internet location, including the
associated process and user context. Events are recorded for all inbound and outbound TCP
connections.
l File
File system events, such as files written to directory locations on the endpoint. The associated
process and user context are included. Examples: A malware file copied to a location that
Windows Update uses, or content changes made to a file.
© 2022 Tanium Inc. AllRightsReserved Page 138
l DNS
[Windows 8.1 or later and Linux endpoints where eBPF is enabled] Request information,
including the process path, user, query, response, and the type of operation.
l Image Loads
[Windows only] Returns historical data from each endpoint regarding image loads; for example,
the full path and hash, the entity that signed an image, or a designation of "Unsigned" if the
image is not signed. A possible example is the loading of an unsigned DLL. If you do not select
Image Loads, any Signal that uses the image event type results in an Unmatched Events
warning in the Alert Details. Selecting Image Loads filters for image and process.path is
not 'system'. Selecting Image Loads does not apply filters for Linux or Mac endpoints.
l Driver Loads
Returns historical data from each endpoint regarding driver loads; for example, the full path and
hash of a driver. By default, Driver Load events are not selected. Selecting Driver Loads on
Windows filters for image and process.path is 'system'. Selecting Driver Loads on Linux
or macOS filters for image.
When upgrading to Threat Response version 2.5 or later from earlier versions, if Image
Loads were selected in configurations, Driver Loads will also be selected. Driver Loads
and Image Loads are not mutually exclusive. It is possible to have one or both checked
in a configuration.
l HTTP headers
[Windows only] Returns HTTP header information from connections on endpoints including the
time connections occurred, the connection ID of the connection, the remote (destination)
address, and the header name and value.
When using HTTP headers as recorded events, be aware that CPU usage on endpoints
is impacted; especially on servers. When capturing HTTP headers as recorded events,
ensure that you are monitoring the performance impacts on the endpoints from which
they are captured and tune their collection appropriately.
4. In the Filters section, click Manage File Filters to select existing filters. Select any or all of the available filters. Only
filters that have already been created are available to select. See Create filters for more information on filter creation.
When you have selected the filters that you want to add to the configuration, click Apply. In the Filters section,
designate the method you want to apply for each set of filters. Select either Include or Exclude. See Create filters for
more information on filter methods.
5. (Linux only) In the Advanced section, add Custom Audit Rules. Provide custom audit rules for use on Linux endpoints.
Audit rules are provided to the auditd service and are in the following format: -a action,filter -S system_call
-F field=value -k key_name . You can provide up to 500 custom audit rules.
© 2022 Tanium Inc. AllRightsReserved Page 139
By default, in Threat Response 3.3 and later, eBPF is enabled on supported endpoints. When eBPF is
enabled, any custom auditd rules that you have added to a Recorder configuration are not used. To
disable eBPF, use the CX.recorder.BPFEnableBPF configuration setting and set the value to "off". For
more information, see the Client Recorder Extension User Guide.
6. Click Save.
After you have deployed recorder configurations, you can view events that occur on the endpoints where you have applied
the configuration. See Connecting to live endpoints and exploring data.
Create stream configurationsStream provides the ability to gather large amounts of data from endpoints and send it to an external destination. Stream
configurations enable you to specify and filter recorder events for the endpoints in an environment, and provide instructions
for exporting - or streaming - these events directly to an SIEM for analysis in JSON format. For example, you can specify that
all network events with one or more filters be streamed to Chronicle, Splunk or Elastic to perform further data analysis or
forensic investigation outside of Tanium.
1. From the Threat Response menu, click Management > Configurations. Click Create > Stream. Provide a name and
description for the stream configuration.
2. Select a Management Method. You can manually provide configuration parameters, or upload a JSON file with
configuration parameters for a stream configuration. Select either Manual or File Upload. If you select File Upload,
click Browse for File and select a JSON file to upload. The JSON file contains the configuration parameters for the
stream configuration. If you select Manual, complete the following tasks.
3. In the Configuration section, select a Destination Type. The Destination Type you select determines the additional
required configuration settings that you are prompted to provide.
Chronicle
l Chronicle Configuration URL - The URL to configure Chronicle. The provided URL must be complete and
begin with HTTPS://.
l API Key - The API key that is used to authenticate calls.
l Customer ID - The Chronicle customer ID for your environment.
ELK
l URL - URL for Logstash HTTP input.
l Disable Certificate Validation (Less Secure) - Select to disable the validation of the certificate presented by the
destination. By default certificate validation is performed.
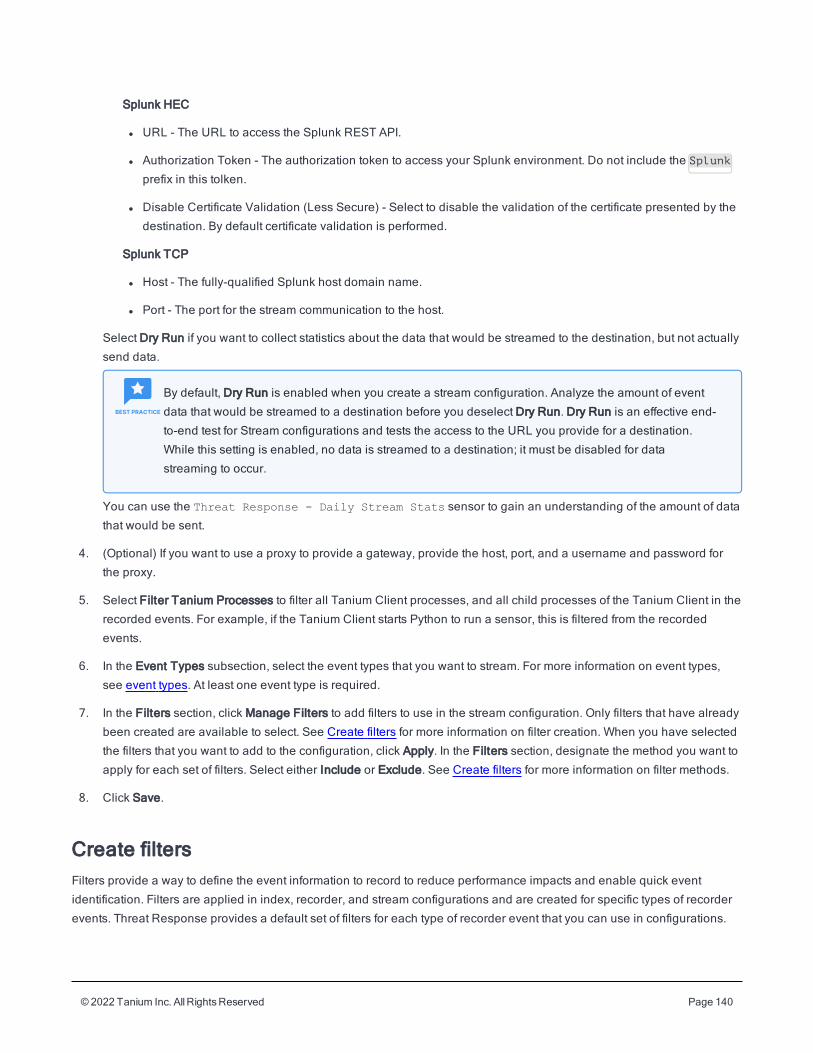
© 2022 Tanium Inc. AllRightsReserved Page 140
Splunk HEC
l URL - The URL to access the Splunk REST API.
l Authorization Token - The authorization token to access your Splunk environment. Do not include the Splunk
prefix in this tolken.
l Disable Certificate Validation (Less Secure) - Select to disable the validation of the certificate presented by the
destination. By default certificate validation is performed.
Splunk TCP
l Host - The fully-qualified Splunk host domain name.
l Port - The port for the stream communication to the host.
Select Dry Run if you want to collect statistics about the data that would be streamed to the destination, but not actually
send data.
By default, Dry Run is enabled when you create a stream configuration. Analyze the amount of event
data that would be streamed to a destination before you deselect Dry Run. Dry Run is an effective end-
to-end test for Stream configurations and tests the access to the URL you provide for a destination.
While this setting is enabled, no data is streamed to a destination; it must be disabled for data
streaming to occur.
You can use the Threat Response - Daily Stream Stats sensor to gain an understanding of the amount of data
that would be sent.
4. (Optional) If you want to use a proxy to provide a gateway, provide the host, port, and a username and password for
the proxy.
5. Select Filter Tanium Processes to filter all Tanium Client processes, and all child processes of the Tanium Client in the
recorded events. For example, if the Tanium Client starts Python to run a sensor, this is filtered from the recorded
events.
6. In the Event Types subsection, select the event types that you want to stream. For more information on event types,
see event types. At least one event type is required.
7. In the Filters section, click Manage Filters to add filters to use in the stream configuration. Only filters that have already
been created are available to select. See Create filters for more information on filter creation. When you have selected
the filters that you want to add to the configuration, click Apply. In the Filters section, designate the method you want to
apply for each set of filters. Select either Include or Exclude. See Create filters for more information on filter methods.
8. Click Save.
Create filtersFilters provide a way to define the event information to record to reduce performance impacts and enable quick event
identification. Filters are applied in index, recorder, and stream configurations and are created for specific types of recorder
events. Threat Response provides a default set of filters for each type of recorder event that you can use in configurations.
© 2022 Tanium Inc. AllRightsReserved Page 141
You can also create your own filters. You can either include or exclude filters. The Include method of filtering enables you to
replace the default filter to only include the filters you specify to reduce performance impact and enable quick event
identification. The Exclude method of filtering prevents events that match the criteria you provide from recording.
Filters are constructed in Signals syntax. You cannot have more than 24 unique terms in a Signal.
If a configuration enables process, file and network event types but an include filter only includes process events. No file or
network events are recorded. When using an include filter for network events, the associated process events are
automatically included.
Include filters do not support not conditions. If you use an include filter in a configuration, no default include
filters for other filter types are provided.
1. From the Threat Response menu, click Management > Filters. Click Create.
2. Select a Filter Type.
File
File filters define criteria for files to record when path or operation values match.
High Priority Path
Threat Response uses Index to scan the entire disk on an endpoint at regular intervals that typically occur
between once a day and once a week. Index does not use recorder events to update file data across the entire
disk. It is common to want more frequent updates for files in certain regions of the disk. To provide this visibility,
in addition to the baseline disk scan, Threat Response enables you to specify high priority paths that use
recorder events to update data and also scans every 24 hours by default. To change the default setting:
a. From the Main menu, click Modules >Threat Response to open the Threat Response Overview page.
b. Click Settings and open the Service tab.
c. In the Misc section provide a value (in hours) for the High Priority Path Scanning for Index Configurations
(Hours) setting.
d. Click Save.
A high priority path must include a file.path starts with clause in Tanium signal syntax. Escape backslash
characters in paths. For example, use C:\\Users\\Administrator to make C:\Users\Administrator a high
profile path.
l Supported: file.path starts with 'C:\\Users\\Administrator'
l Unsupported: file.path starts with 'C:\'
A high priority path, in addition to the file.path starts with clause, can additionally specify one or more
file.path ends with clauses to narrow the file types to inspect.
© 2022 Tanium Inc. AllRightsReserved Page 142
l Supported: file.path starts with 'C:\\Users\\Administrator' and file.path ends with
'.dat'
l Supported: file.path starts with 'C:\\Windows\\System32' and file.path ends with '.dll'
and file.path ends with '.exe'
l Unsupported: file.path ends with '.dat'
A high priority path can include one wildcard, indicated by an asterisk, in the starts with clause.
Image
Image filters define criteria for image events to record when path, hash, or signature values match.
Network
Network filters define criteria for network events to record when a match is made for a defined IP address, port,
or DNS query.
Process
Process filters exclude events based on the process path, hash, user name, user group, or command-line.
Registry
Registry filters define criteria for Windows registry events to record when specific key-value pairs match.
System File
System File filters provide paths of files or operations to match or filter from the Linux audit daemon (auditd)
logging. Exclude system files from recording to reduce the performance impact on Linux endpoints with high
activity levels.
3. Select an Operating System. Provide a name and description for the filter.
4. In the Filter Definition section, click Filter Builder.
5. Click Add. Select a type, a property, and condition. The available properties and conditions differ for each filter type.
You can use properties and conditions to create logical patterns for matching specific events. You can add multiple
statements to each filter. For each statement that you add, specify a logical and or a logical or to define the relationship
of the statements in a filter. The following table provides a reference for properties and conditions for each filter type.
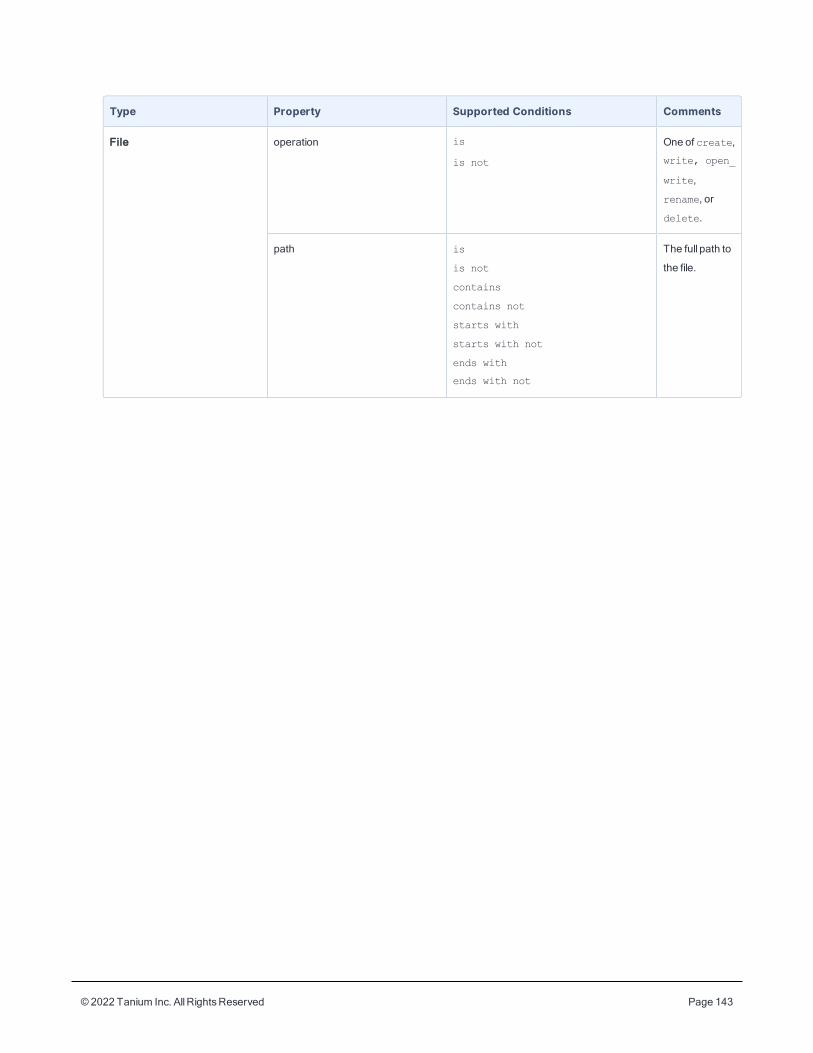
© 2022 Tanium Inc. AllRightsReserved Page 143
Type Property Supported Conditions Comments
File operation is
is not
One of create,
write, open_
write,
rename, or
delete.
path is
is not
contains
contains not
starts with
starts with not
ends with
ends with not
The full path to
the file.
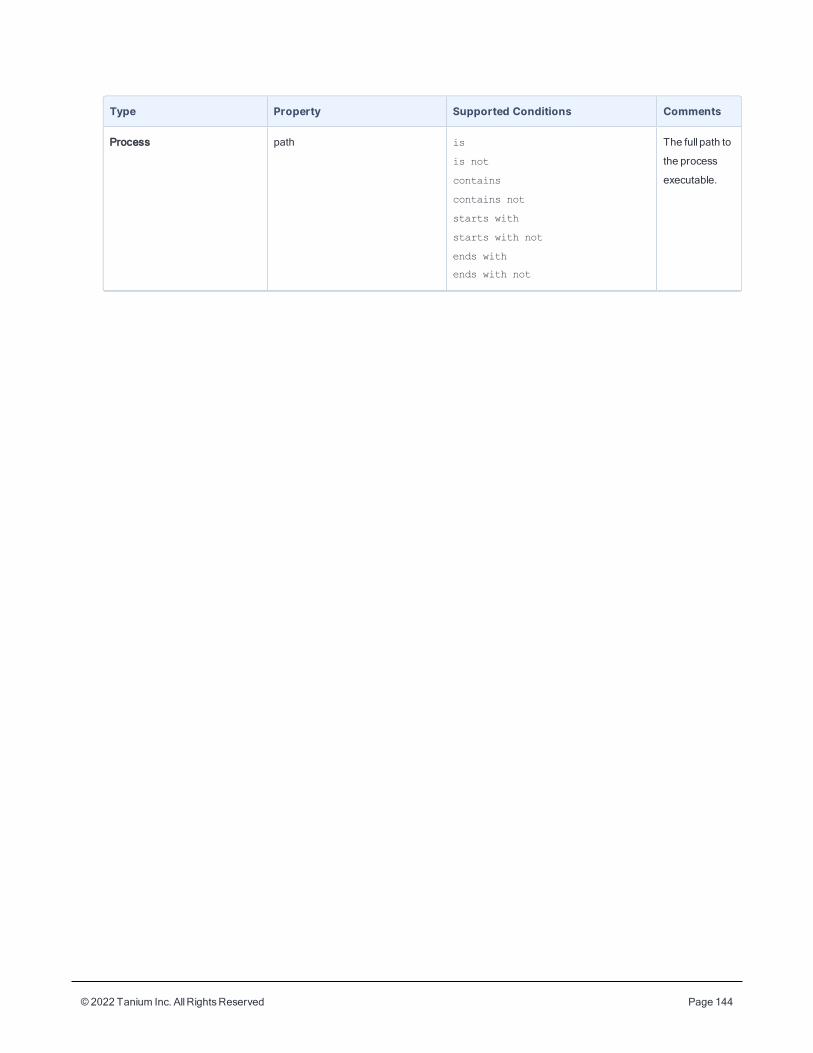
© 2022 Tanium Inc. AllRightsReserved Page 144
Type Property Supported Conditions Comments
Process path is
is not
contains
contains not
starts with
starts with not
ends with
ends with not
The full path to
the process
executable.

© 2022 Tanium Inc. AllRightsReserved Page 145
Type Property Supported Conditions Comments
hash is
is not
TheMD5 hash
of the process
executable file.
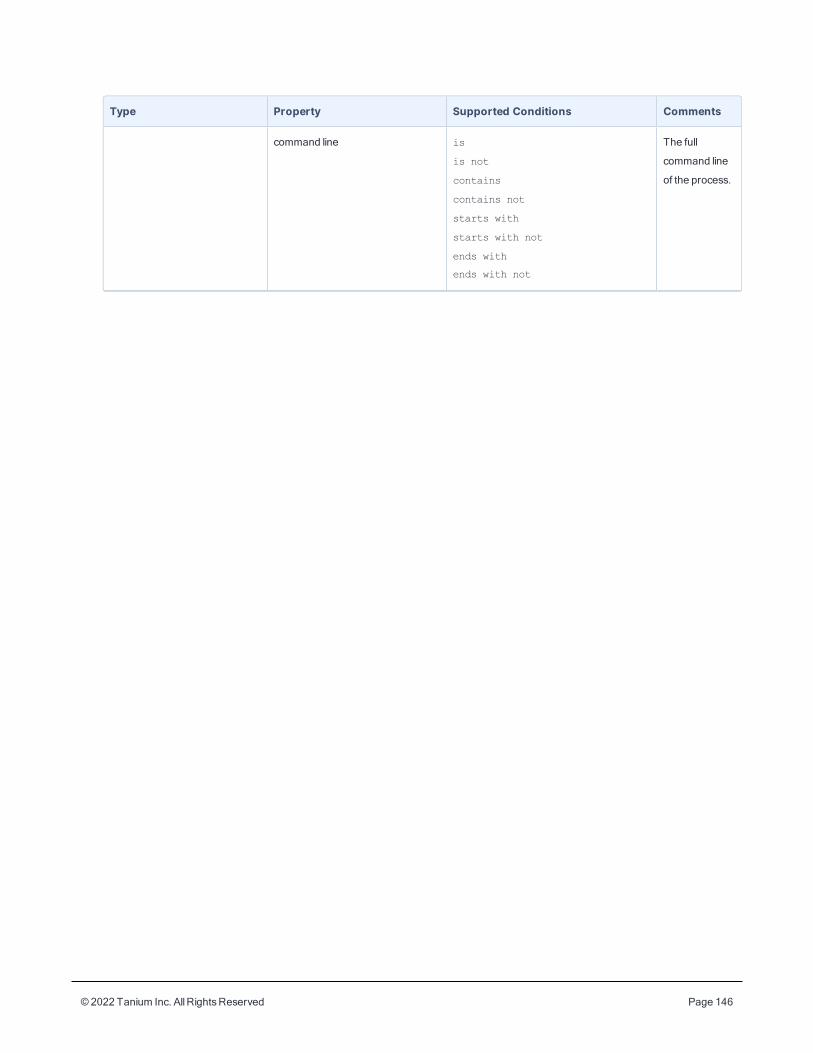
© 2022 Tanium Inc. AllRightsReserved Page 146
Type Property Supported Conditions Comments
command line is
is not
contains
contains not
starts with
starts with not
ends with
ends with not
The full
command line
of the process.

© 2022 Tanium Inc. AllRightsReserved Page 147
Type Property Supported Conditions Comments
user name is
is not
contains
contains not
starts with
starts with not
ends with
ends with not
The user name
executing the
process.
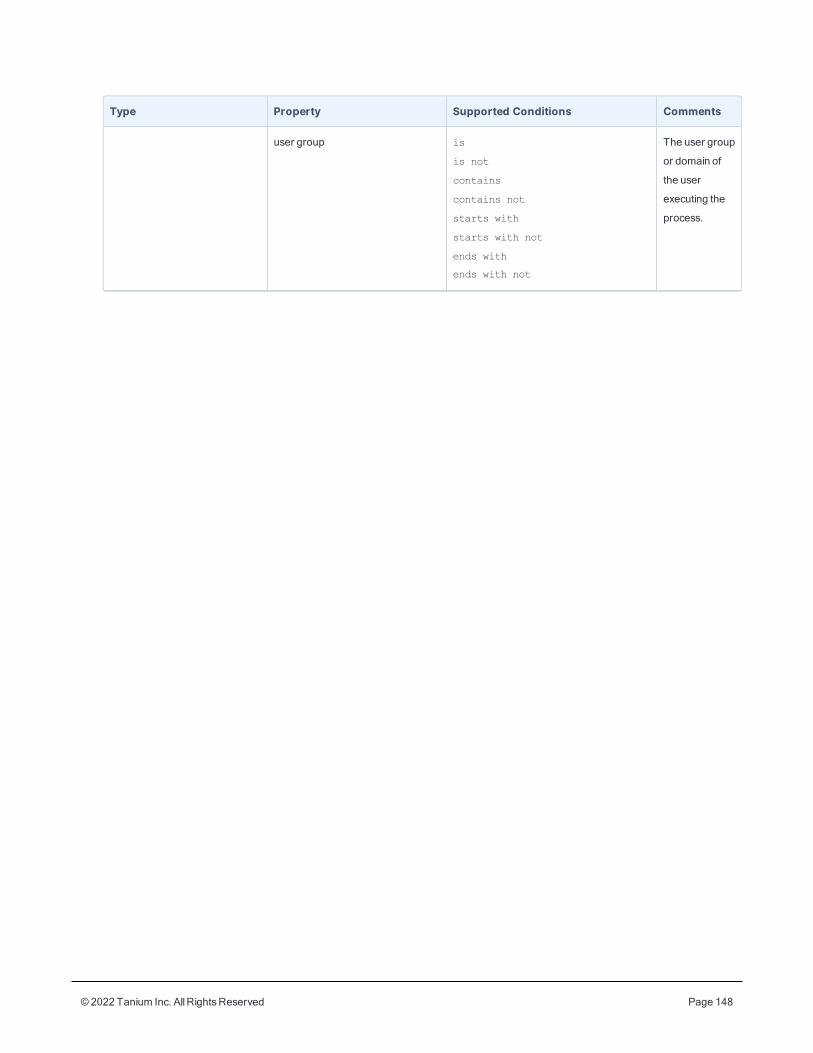
© 2022 Tanium Inc. AllRightsReserved Page 148
Type Property Supported Conditions Comments
user group is
is not
contains
contains not
starts with
starts with not
ends with
ends with not
The user group
or domain of
the user
executing the
process.

© 2022 Tanium Inc. AllRightsReserved Page 149
Type Property Supported Conditions Comments
parent path is
is not
contains
contains not
starts with
starts with not
ends with
ends with not
The full path to
the parent
process file.
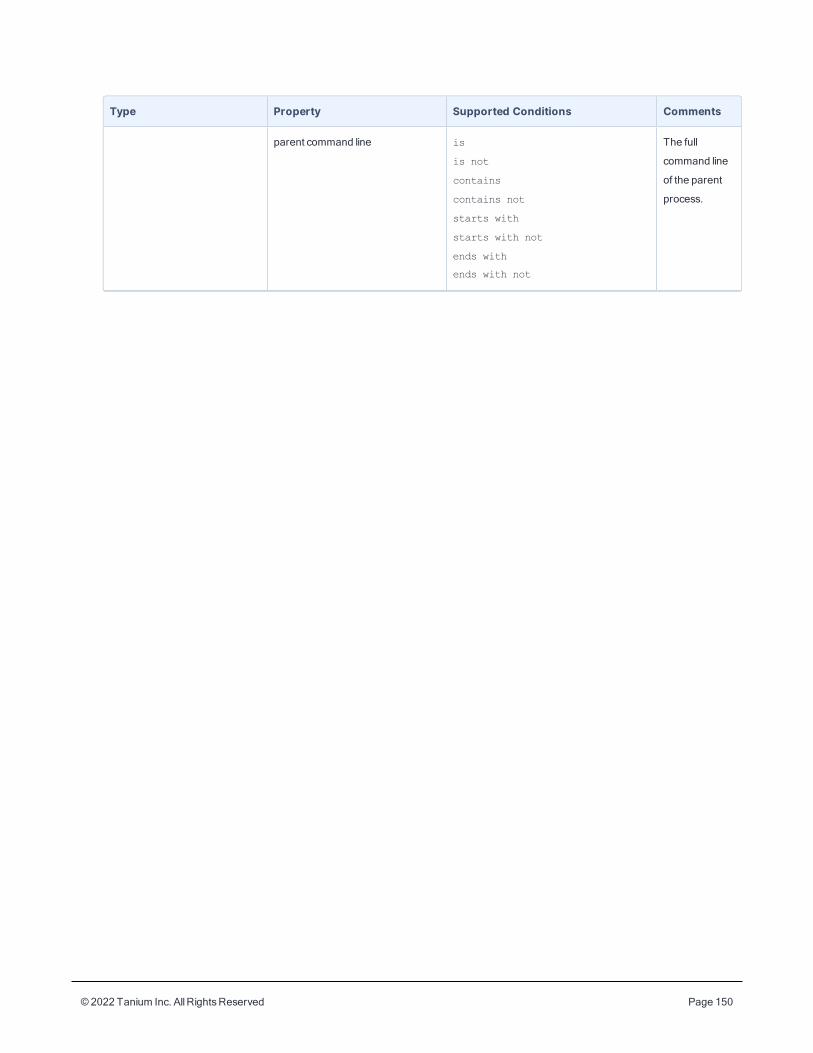
© 2022 Tanium Inc. AllRightsReserved Page 150
Type Property Supported Conditions Comments
parent command line is
is not
contains
contains not
starts with
starts with not
ends with
ends with not
The full
command line
of the parent
process.
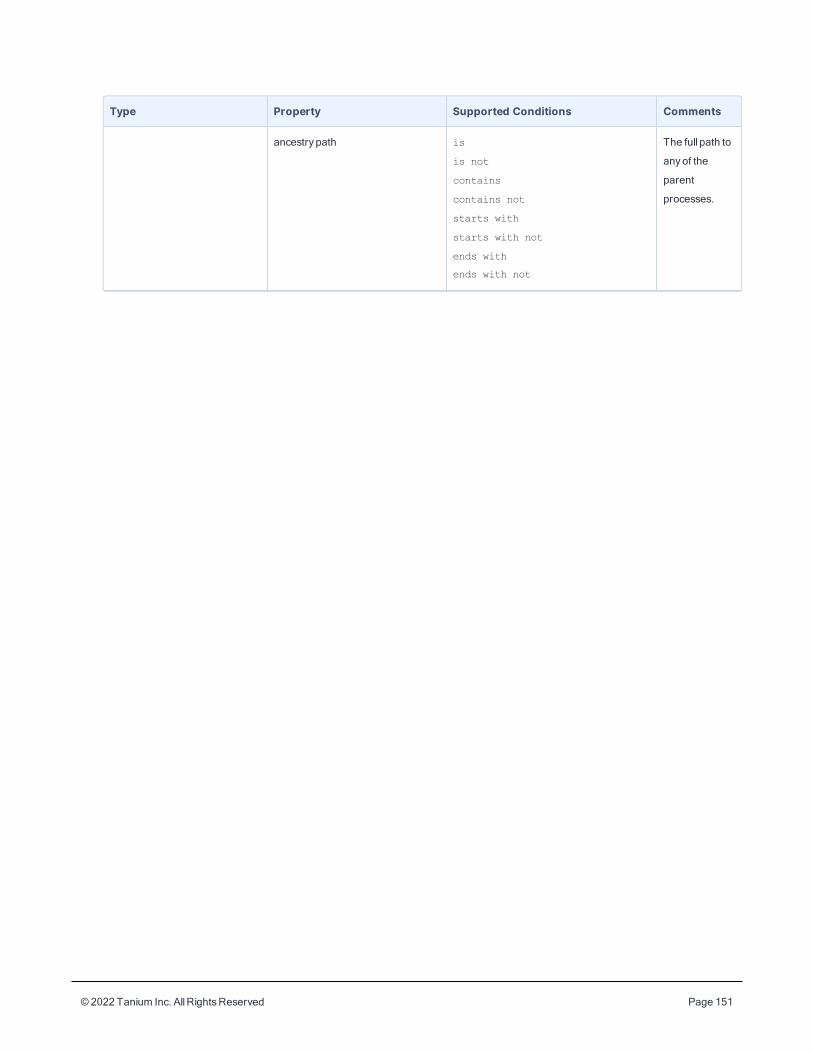
© 2022 Tanium Inc. AllRightsReserved Page 151
Type Property Supported Conditions Comments
ancestry path is
is not
contains
contains not
starts with
starts with not
ends with
ends with not
The full path to
anyof the
parent
processes.

© 2022 Tanium Inc. AllRightsReserved Page 152
Type Property Supported Conditions Comments
ancestry hash is
is not
TheMD5 hash
of anyof the
parent
processes.
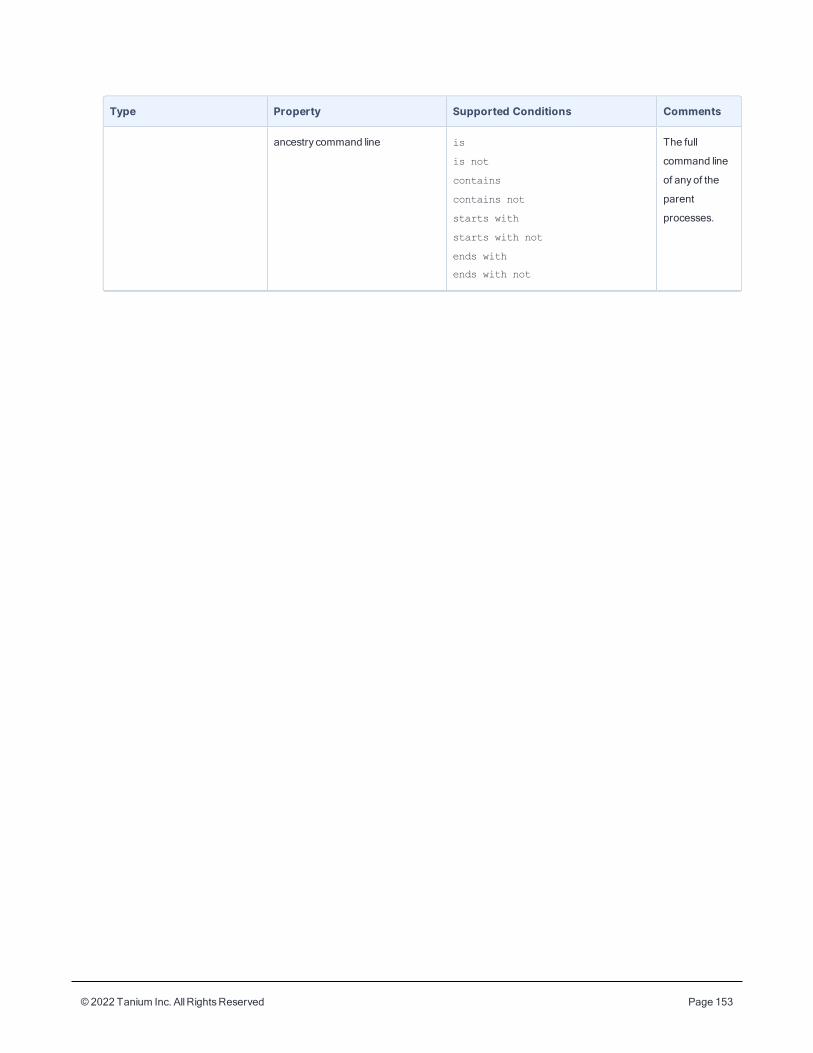
© 2022 Tanium Inc. AllRightsReserved Page 153
Type Property Supported Conditions Comments
ancestry command line is
is not
contains
contains not
starts with
starts with not
ends with
ends with not
The full
command line
of anyof the
parent
processes.
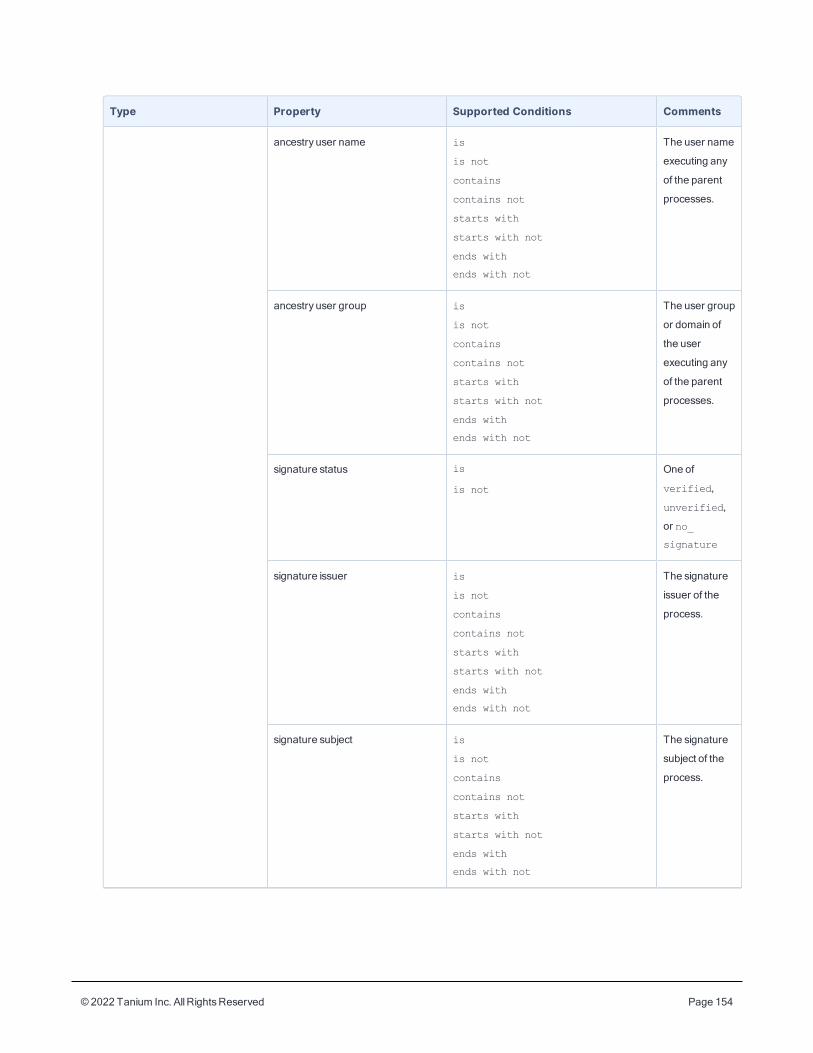
© 2022 Tanium Inc. AllRightsReserved Page 154
Type Property Supported Conditions Comments
ancestry user name is
is not
contains
contains not
starts with
starts with not
ends with
ends with not
The user name
executing any
of the parent
processes.
ancestry user group is
is not
contains
contains not
starts with
starts with not
ends with
ends with not
The user group
or domain of
the user
executing any
of the parent
processes.
signature status is
is not
One of
verified,
unverified,
or no_
signature
signature issuer is
is not
contains
contains not
starts with
starts with not
ends with
ends with not
The signature
issuer of the
process.
signature subject is
is not
contains
contains not
starts with
starts with not
ends with
ends with not
The signature
subject of the
process.
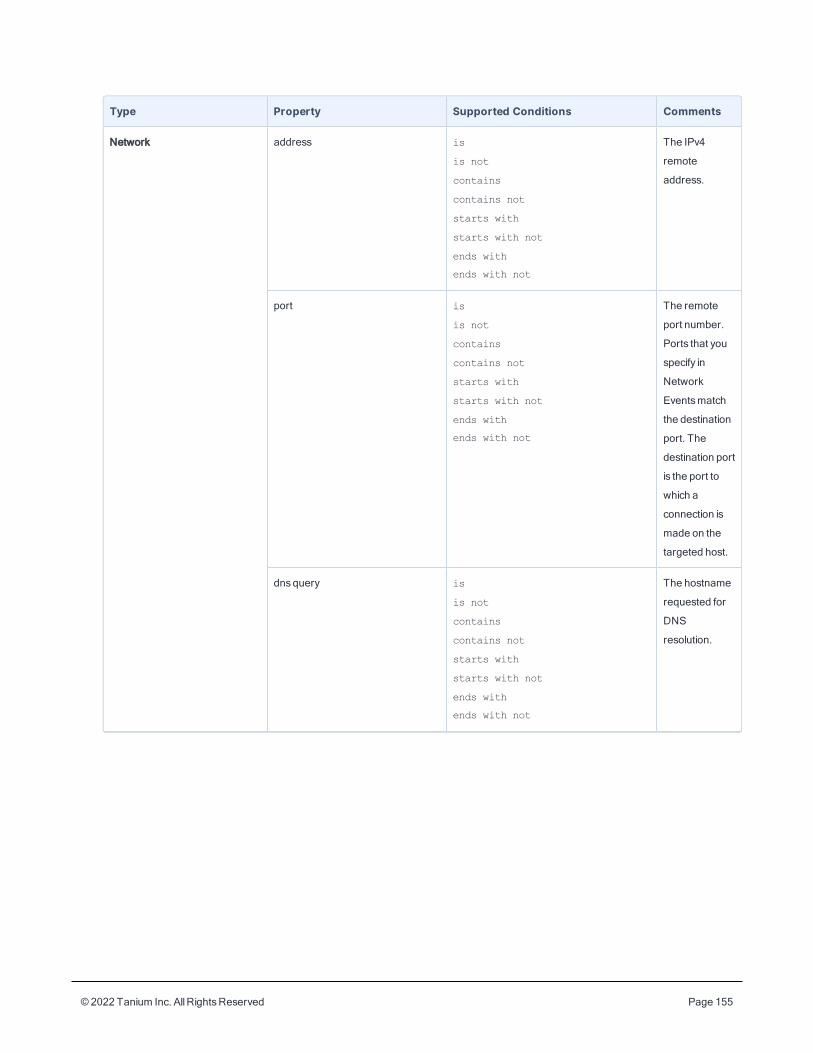
© 2022 Tanium Inc. AllRightsReserved Page 155
Type Property Supported Conditions Comments
Network address is
is not
contains
contains not
starts with
starts with not
ends with
ends with not
The IPv4
remote
address.
port is
is not
contains
contains not
starts with
starts with not
ends with
ends with not
The remote
port number.
Ports that you
specify in
Network
Eventsmatch
the destination
port. The
destination port
is the port to
which a
connection is
made on the
targeted host.
dnsquery is
is not
contains
contains not
starts with
starts with not
ends with
ends with not
The hostname
requested for
DNS
resolution.
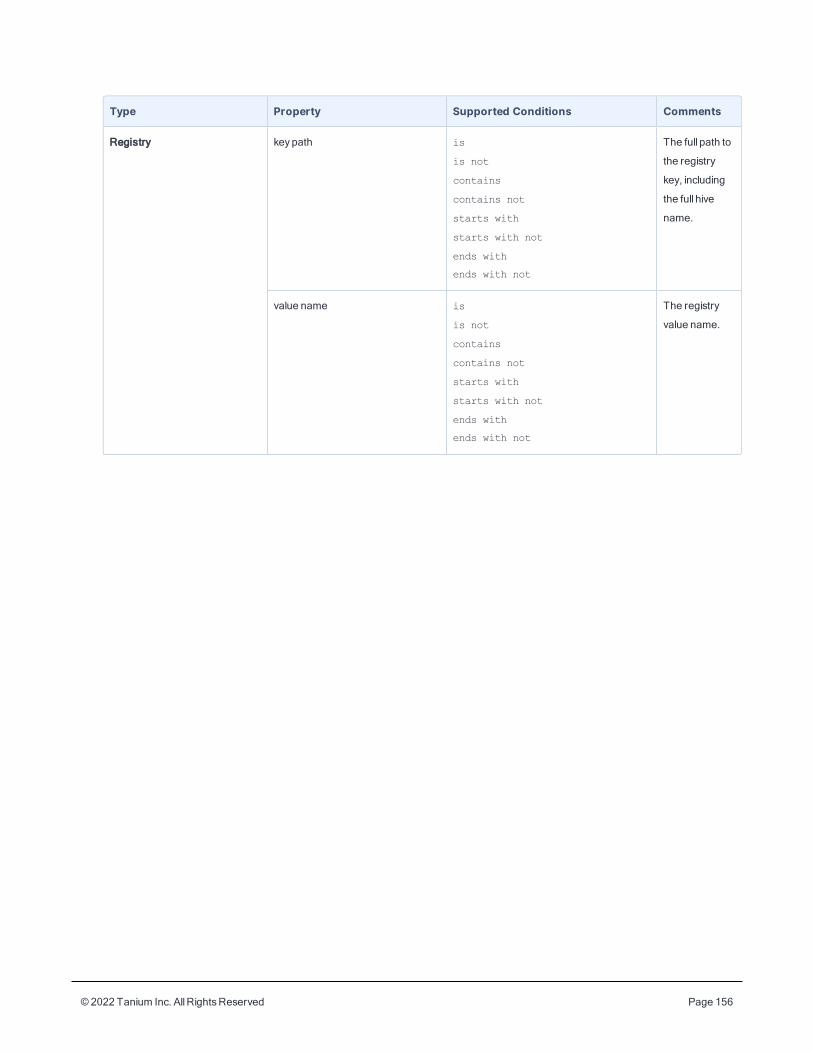
© 2022 Tanium Inc. AllRightsReserved Page 156
Type Property Supported Conditions Comments
Registry keypath is
is not
contains
contains not
starts with
starts with not
ends with
ends with not
The full path to
the registry
key, including
the full hive
name.
value name is
is not
contains
contains not
starts with
starts with not
ends with
ends with not
The registry
value name.
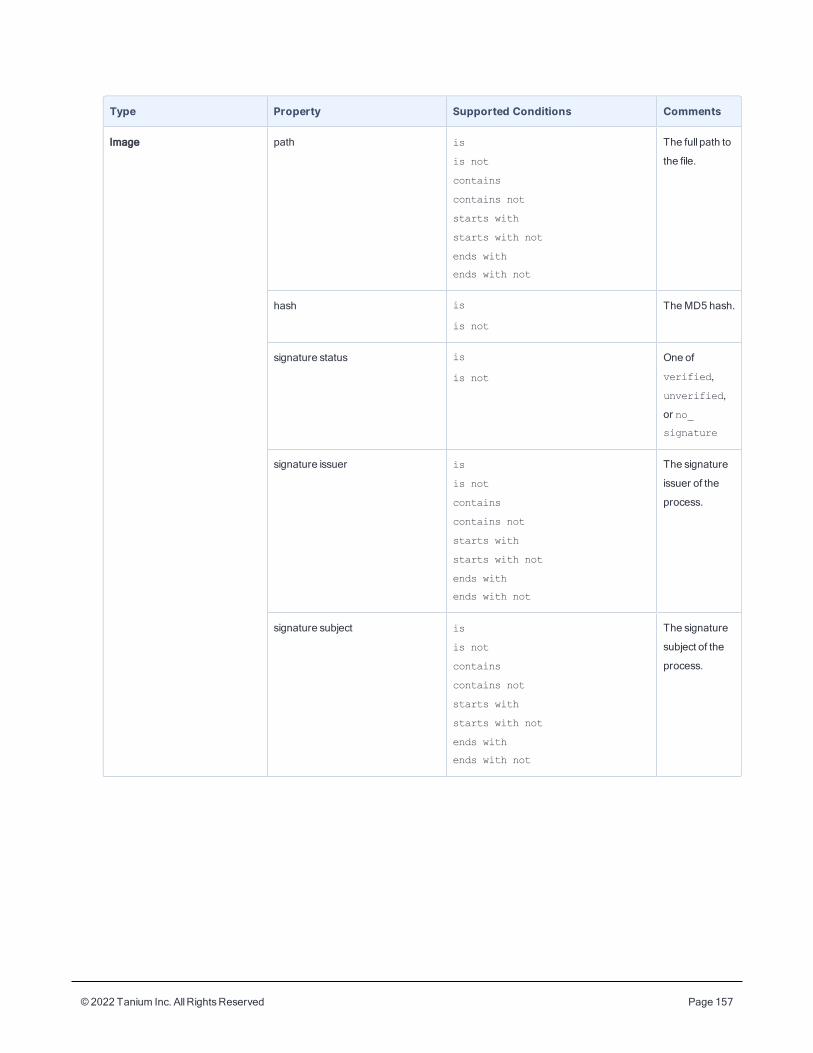
© 2022 Tanium Inc. AllRightsReserved Page 157
Type Property Supported Conditions Comments
Image path is
is not
contains
contains not
starts with
starts with not
ends with
ends with not
The full path to
the file.
hash is
is not
TheMD5 hash.
signature status is
is not
One of
verified,
unverified,
or no_
signature
signature issuer is
is not
contains
contains not
starts with
starts with not
ends with
ends with not
The signature
issuer of the
process.
signature subject is
is not
contains
contains not
starts with
starts with not
ends with
ends with not
The signature
subject of the
process.
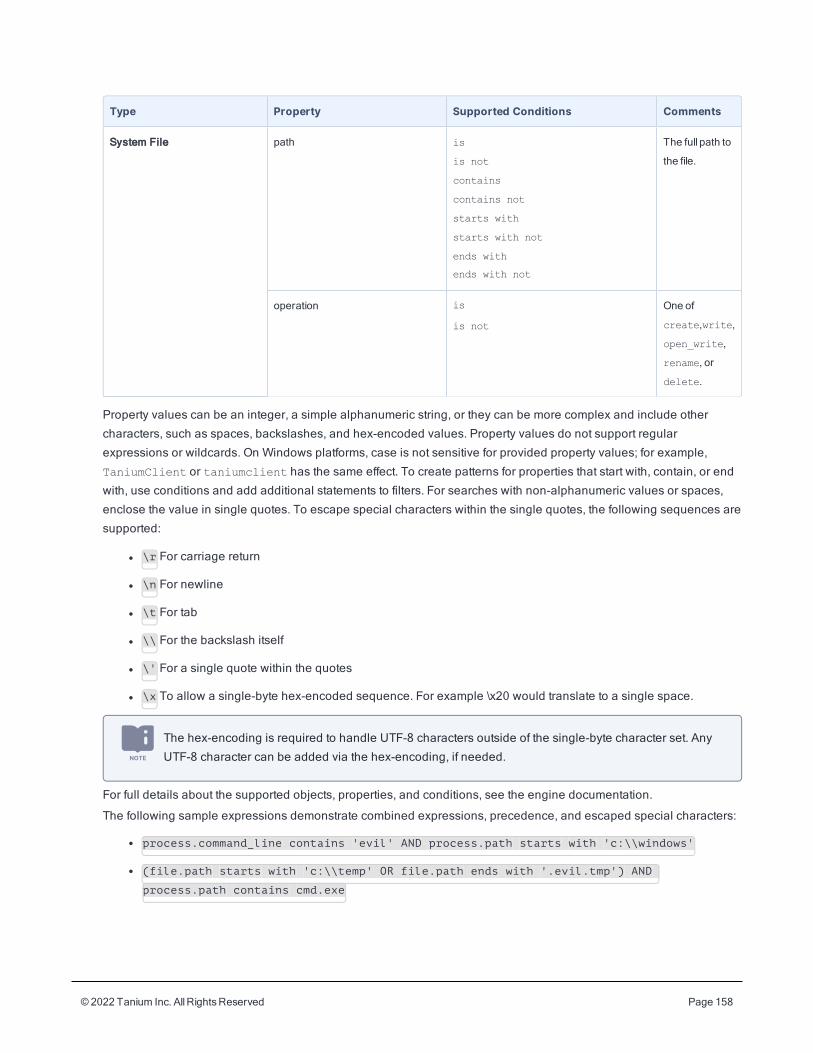
© 2022 Tanium Inc. AllRightsReserved Page 158
Type Property Supported Conditions Comments
System File path is
is not
contains
contains not
starts with
starts with not
ends with
ends with not
The full path to
the file.
operation is
is not
One of
create,write,
open_write,
rename, or
delete.
Property values can be an integer, a simple alphanumeric string, or they can be more complex and include other
characters, such as spaces, backslashes, and hex-encoded values. Property values do not support regular
expressions or wildcards. On Windows platforms, case is not sensitive for provided property values; for example,
TaniumClient or taniumclient has the same effect. To create patterns for properties that start with, contain, or end
with, use conditions and add additional statements to filters. For searches with non-alphanumeric values or spaces,
enclose the value in single quotes. To escape special characters within the single quotes, the following sequences are
supported:
l \r For carriage return
l \n For newline
l \t For tab
l \\ For the backslash itself
l \' For a single quote within the quotes
l \x To allow a single-byte hex-encoded sequence. For example \x20 would translate to a single space.
The hex-encoding is required to handle UTF-8 characters outside of the single-byte character set. Any
UTF-8 character can be added via the hex-encoding, if needed.
For full details about the supported objects, properties, and conditions, see the engine documentation.
The following sample expressions demonstrate combined expressions, precedence, and escaped special characters:
l process.command_line contains 'evil' AND process.path starts with 'c:\\windows'
l (file.path starts with 'c:\\temp' OR file.path ends with '.evil.tmp') AND
process.path contains cmd.exe
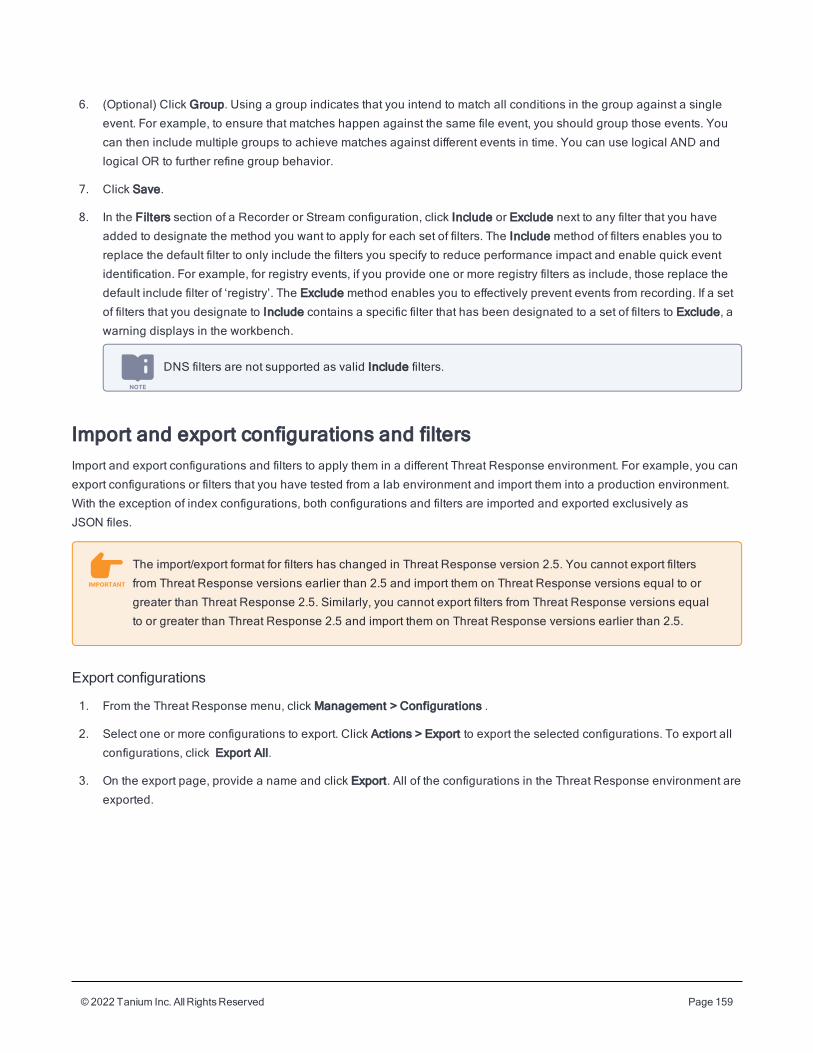
© 2022 Tanium Inc. AllRightsReserved Page 159
6. (Optional) Click Group. Using a group indicates that you intend to match all conditions in the group against a single
event. For example, to ensure that matches happen against the same file event, you should group those events. You
can then include multiple groups to achieve matches against different events in time. You can use logical AND and
logical OR to further refine group behavior.
7. Click Save.
8. In the Filters section of a Recorder or Stream configuration, click Include or Exclude next to any filter that you have
added to designate the method you want to apply for each set of filters. The Include method of filters enables you to
replace the default filter to only include the filters you specify to reduce performance impact and enable quick event
identification. For example, for registry events, if you provide one or more registry filters as include, those replace the
default include filter of ‘registry’. The Exclude method enables you to effectively prevent events from recording. If a set
of filters that you designate to Include contains a specific filter that has been designated to a set of filters to Exclude, a
warning displays in the workbench.
DNS filters are not supported as valid Include filters.
Import and export configurations and filtersImport and export configurations and filters to apply them in a different Threat Response environment. For example, you can
export configurations or filters that you have tested from a lab environment and import them into a production environment.
With the exception of index configurations, both configurations and filters are imported and exported exclusively as
JSON files.
The import/export format for filters has changed in Threat Response version 2.5. You cannot export filters
from Threat Response versions earlier than 2.5 and import them on Threat Response versions equal to or
greater than Threat Response 2.5. Similarly, you cannot export filters from Threat Response versions equal
to or greater than Threat Response 2.5 and import them on Threat Response versions earlier than 2.5.
Export configurations
1. From the Threat Response menu, click Management > Configurations .
2. Select one or more configurations to export. Click Actions > Export to export the selected configurations. To export all
configurations, click Export All.
3. On the export page, provide a name and click Export. All of the configurations in the Threat Response environment are
exported.
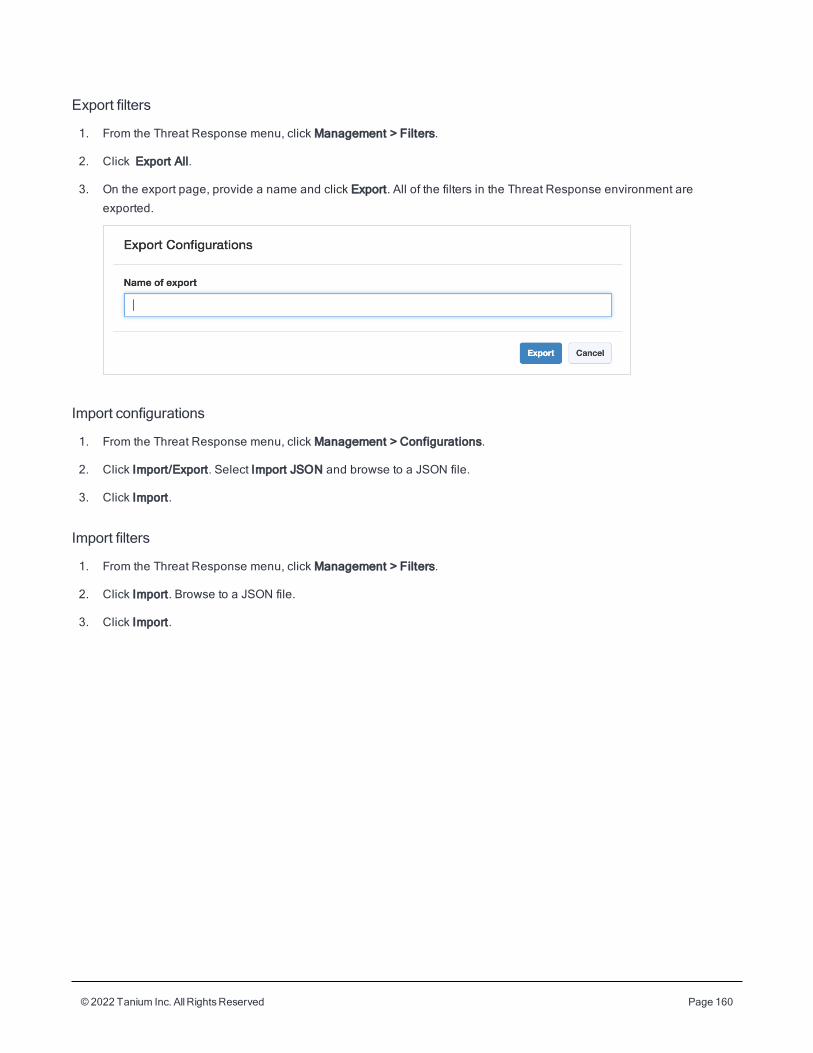
© 2022 Tanium Inc. AllRightsReserved Page 160
Export filters
1. From the Threat Response menu, click Management > Filters.
2. Click Export All.
3. On the export page, provide a name and click Export. All of the filters in the Threat Response environment are
exported.
Import configurations
1. From the Threat Response menu, click Management > Configurations.
2. Click Import/Export. Select Import JSON and browse to a JSON file.
3. Click Import.
Import filters
1. From the Threat Response menu, click Management > Filters.
2. Click Import. Browse to a JSON file.
3. Click Import.
© 2022 Tanium Inc. AllRightsReserved Page 161
Creating profiles
OverviewProfiles combine configurations and apply them to one or more computer groups. Create and apply profiles to provide the
most relevant Threat Response capabilities to specific groups of endpoints. For example, you can create profiles that apply
configurations for such groups as:
l Endpoint type, such as servers or employee workstations
l Endpoint location, such as by country or time zone
l Endpoint priority, such as business-critical endpoints
l Endpoint configuration needs, such as VDI endpoints
The Profiles page displays all the profiles that are available to use with Threat Response. Threat Response provides default
profiles that feature commonly used configurations as examples. While you cannot edit default profiles, you can duplicate
them and create a version that you can customize. For each profile, you can view a description and the computer groups that
have the profile assigned. Profiles display as Deployed, New, Updated, or Deploying.
Deployed
Indicates that the profile is currently in use on one or more computer groups and that no changes have been made to
the profile settings
New
Indicates that the profile has never been deployed to endpoints
Updated
Indicates that the profile is in use but there are pending changes that cannot take effect until the profile is deployed
again
Deploying
Indicates that the profile is in the process of being deployed to endpoints
Create a profileCreate a profile to manage configurations for deployment to one or more computer groups.
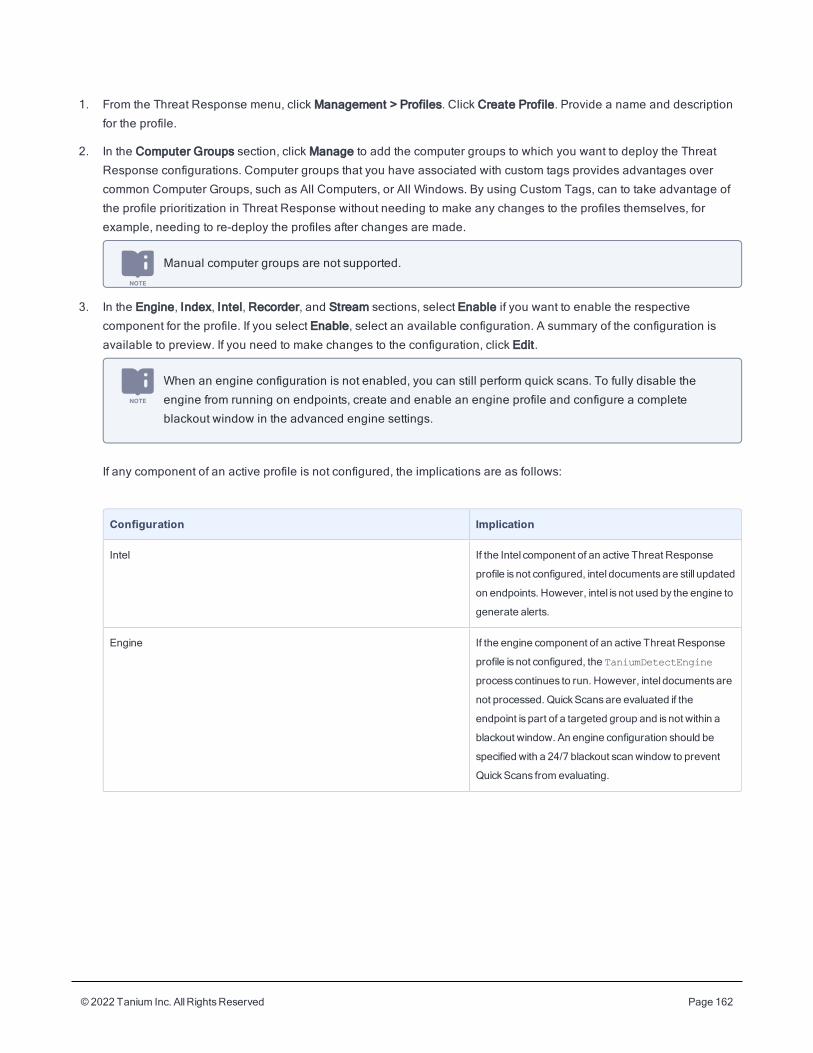
© 2022 Tanium Inc. AllRightsReserved Page 162
1. From the Threat Response menu, click Management > Profiles. Click Create Profile. Provide a name and description
for the profile.
2. In the Computer Groups section, click Manage to add the computer groups to which you want to deploy the Threat
Response configurations. Computer groups that you have associated with custom tags provides advantages over
common Computer Groups, such as All Computers, or All Windows. By using Custom Tags, can to take advantage of
the profile prioritization in Threat Response without needing to make any changes to the profiles themselves, for
example, needing to re-deploy the profiles after changes are made.
Manual computer groups are not supported.
3. In the Engine, Index, Intel, Recorder, and Stream sections, select Enable if you want to enable the respective
component for the profile. If you select Enable, select an available configuration. A summary of the configuration is
available to preview. If you need to make changes to the configuration, click Edit.
When an engine configuration is not enabled, you can still perform quick scans. To fully disable the
engine from running on endpoints, create and enable an engine profile and configure a complete
blackout window in the advanced engine settings.
If any component of an active profile is not configured, the implications are as follows:
Configuration Implication
Intel If the Intel component of an active Threat Response
profile is not configured, intel documents are still updated
on endpoints. However, intel is not used by the engine to
generate alerts.
Engine If the engine component of an active Threat Response
profile is not configured, the TaniumDetectEngine
process continues to run. However, intel documents are
not processed. QuickScansare evaluated if the
endpoint is part of a targeted group and is not within a
blackout window. An engine configuration should be
specified with a 24/7 blackout scan window to prevent
QuickScans from evaluating.
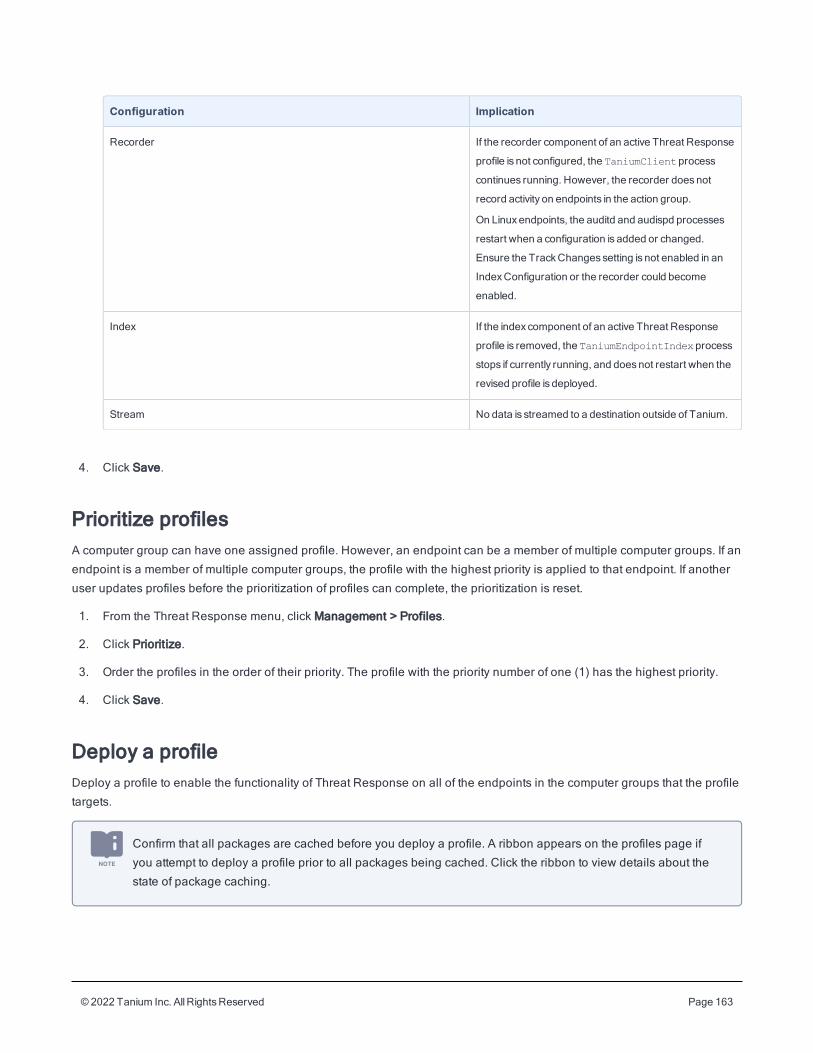
© 2022 Tanium Inc. AllRightsReserved Page 163
Configuration Implication
Recorder If the recorder component of an active Threat Response
profile is not configured, the TaniumClientprocess
continues running. However, the recorder doesnot
record activity on endpoints in the action group.
On Linuxendpoints, the auditd and audispd processes
restart when a configuration is added or changed.
Ensure the TrackChanges setting is not enabled in an
IndexConfiguration or the recorder could become
enabled.
Index If the index component of an active Threat Response
profile is removed, the TaniumEndpointIndexprocess
stops if currently running, and doesnot restart when the
revised profile is deployed.
Stream No data is streamed to a destination outside of Tanium.
4. Click Save.
Prioritize profilesA computer group can have one assigned profile. However, an endpoint can be a member of multiple computer groups. If an
endpoint is a member of multiple computer groups, the profile with the highest priority is applied to that endpoint. If another
user updates profiles before the prioritization of profiles can complete, the prioritization is reset.
1. From the Threat Response menu, click Management > Profiles.
2. Click Prioritize.
3. Order the profiles in the order of their priority. The profile with the priority number of one (1) has the highest priority.
4. Click Save.
Deploy a profileDeploy a profile to enable the functionality of Threat Response on all of the endpoints in the computer groups that the profile
targets.
Confirm that all packages are cached before you deploy a profile. A ribbon appears on the profiles page if
you attempt to deploy a profile prior to all packages being cached. Click the ribbon to view details about the
state of package caching.
© 2022 Tanium Inc. AllRightsReserved Page 164
When you deploy a profile, all of the configuration information you have assigned in a profile is deployed to endpoints. The
order in which the components of a profile deploy is the profile information, the Threat Response tools, and finally intel.
Track the deployment of Threat Response tools to the endpoints in an environment by viewing the Threat
Response Coverage panel in Tanium Trends. The coverage of Threat Response tools across endpoints is
important to measure; if you are not including the entirety of your estate when searching for specific activity,
then you are at risk.
1. From the Threat Response menu, click Management > Profiles.
2. Select one or more profiles to deploy and click Action > Deploy.
Profile deployment is not part of a scheduled action. You need to deploy a profile in order for Threat
Response capabilities to function on endpoints.
3. Enter your password to confirm the deployment. Click OK.
Deploy intelBefore you deploy intel, ensure that you have thoroughly tested intel to verify that:
l The intel matches on what you expect
l The intel does not match a high number of false positives
See Testing Intel for deployment for more information.
Configure the intel deployment setting
1. From the Threat Response overview page, click Settings .
2. On the Service tab, click Intel. Make intel package selections:
l Intel Package Publication Interval: Specifies how frequently the intel documents and labels are pushed to the
endpoints (Default: 24 hours).
3. Click Save.
Immediately deploy intel to endpoints
Intel is automatically published to the endpoints on a regular interval. If a situation requires it, you can manually push the
intel documents and Signals to the endpoints.
1. Click Management > Profiles.
2. Click Deploy Intel.

© 2022 Tanium Inc. AllRightsReserved Page 165
Assign the Threat Response Intel Deploy Approval Bypass permission to roles that deploy intel to bypass
approvals for intel.
© 2022 Tanium Inc. AllRightsReserved Page 166
Connecting to live endpoints and exploring dataYou can review endpoint data with a live endpoint connection or from an endpoint snapshot.
l Live endpoint connection
With live endpoint connections, you can conduct analysis within seconds, without time--consuming data transfers or
parsing. You can take multiple snapshots of the endpoint data, browse the file system, export events, and save
evidence for remediation.
l Endpoint snapshot
Snapshots capture the endpoint data for asynchronous investigation offline, preserving the recorder database for
storage and collaborative analysis on the Tanium Module Server. With snapshots, you can export events, and save
evidence for long-term analysis.
Threat Response supports live endpoint connections using Tanium Direct Connect. Direct Connect provides a
communication channel for other Tanium modules and a central location for configuring and administering direct endpoint
connections across modules. Direct Connect replaces the mechanism for live endpoint connections that was used in
previous versions of Threat Response to provide better performance and a consistent experience across Tanium modules.
To install Direct Connect, see Tanium Direct Connect User Guide.
For new installations beginning with Threat Response 2.4, Direct Connect is enabled by default.
Connect to a live endpointYou can connect to endpoints that are registered with Tanium and are a member of a computer group that is accessible to
you. You must have the IP address or computer name of the endpoint.
You can make a live endpoint connection to one or more endpoints.
1. On the Threat Response overview page, go to Live Endpoints.
2. Type the IP address or computer name of an endpoint that you want to add. Matching endpoints appear as you type.
If the endpoint you want to add is not in the list, verify that the endpoint is a member of a computer
group that you can access. An indicator next to the text field shows whether an endpoint is currently
online.
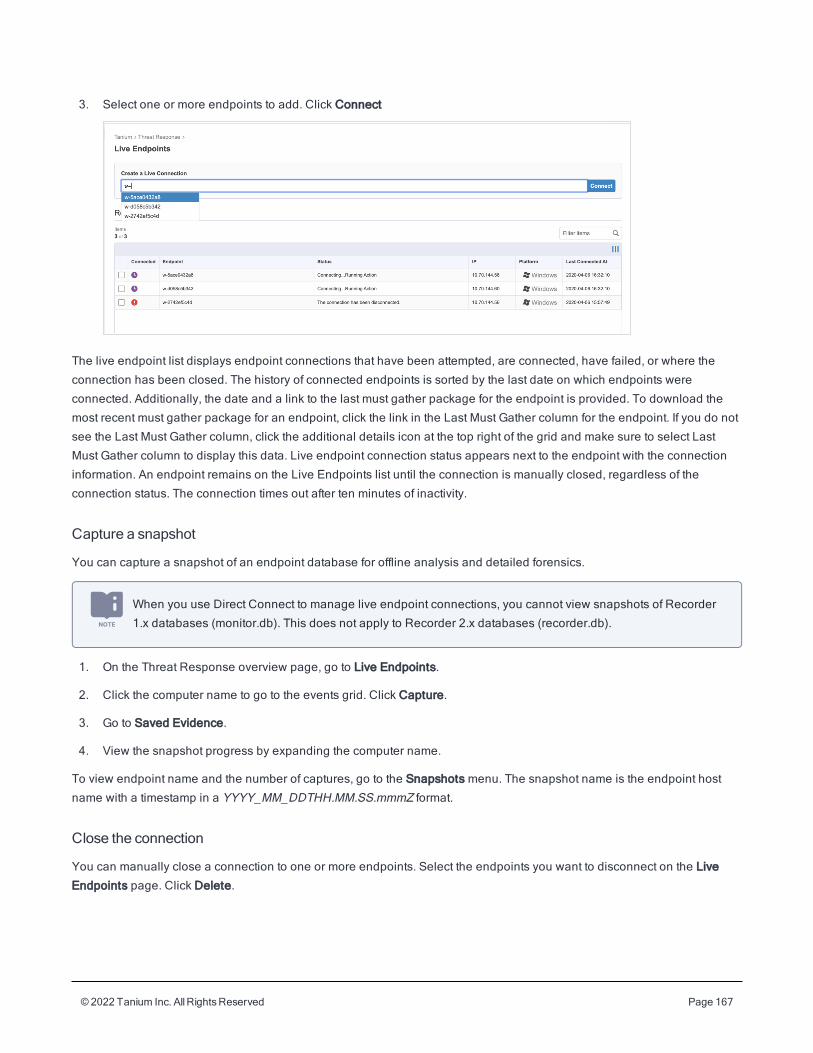
© 2022 Tanium Inc. AllRightsReserved Page 167
3. Select one or more endpoints to add. Click Connect
The live endpoint list displays endpoint connections that have been attempted, are connected, have failed, or where the
connection has been closed. The history of connected endpoints is sorted by the last date on which endpoints were
connected. Additionally, the date and a link to the last must gather package for the endpoint is provided. To download the
most recent must gather package for an endpoint, click the link in the Last Must Gather column for the endpoint. If you do not
see the Last Must Gather column, click the additional details icon at the top right of the grid and make sure to select Last
Must Gather column to display this data. Live endpoint connection status appears next to the endpoint with the connection
information. An endpoint remains on the Live Endpoints list until the connection is manually closed, regardless of the
connection status. The connection times out after ten minutes of inactivity.
Capture a snapshot
You can capture a snapshot of an endpoint database for offline analysis and detailed forensics.
When you use Direct Connect to manage live endpoint connections, you cannot view snapshots of Recorder
1.x databases (monitor.db). This does not apply to Recorder 2.x databases (recorder.db).
1. On the Threat Response overview page, go to Live Endpoints.
2. Click the computer name to go to the events grid. Click Capture.
3. Go to Saved Evidence.
4. View the snapshot progress by expanding the computer name.
To view endpoint name and the number of captures, go to the Snapshots menu. The snapshot name is the endpoint host
name with a timestamp in a YYYY_MM_DDTHH.MM.SS.mmmZ format.
Close the connection
You can manually close a connection to one or more endpoints. Select the endpoints you want to disconnect on the Live
Endpoints page. Click Delete.
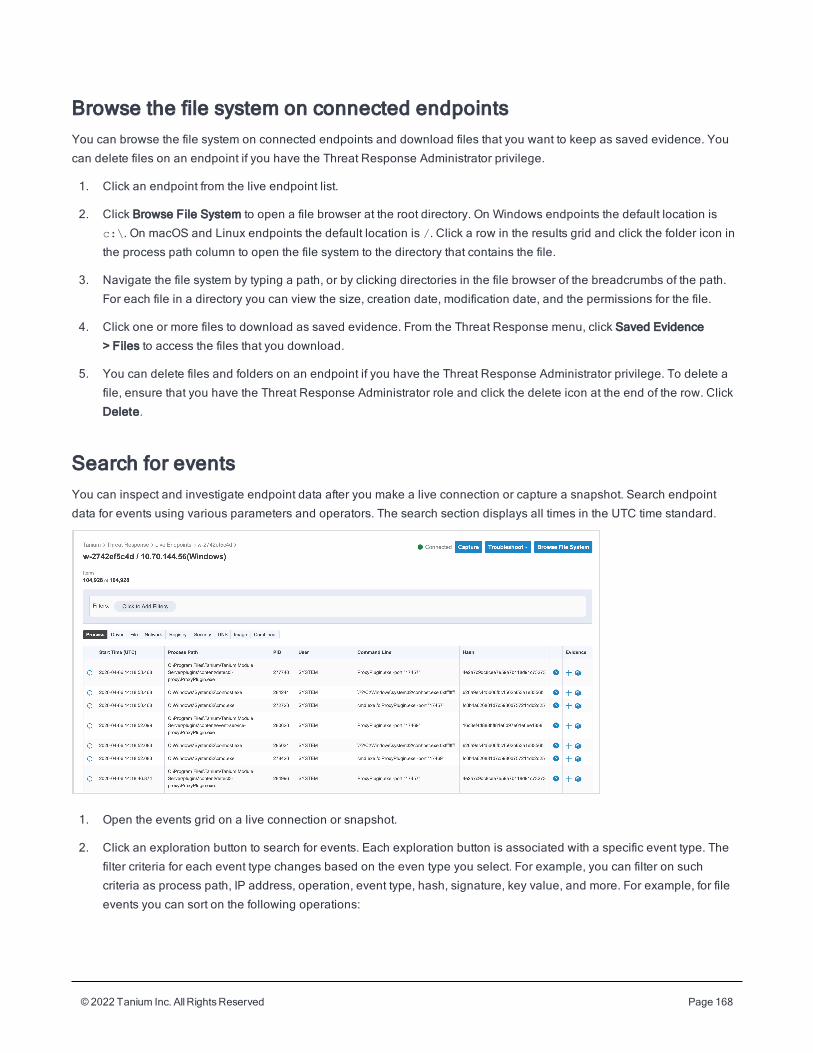
© 2022 Tanium Inc. AllRightsReserved Page 168
Browse the file system on connected endpointsYou can browse the file system on connected endpoints and download files that you want to keep as saved evidence. You
can delete files on an endpoint if you have the Threat Response Administrator privilege.
1. Click an endpoint from the live endpoint list.
2. Click Browse File System to open a file browser at the root directory. On Windows endpoints the default location is
c:\. On macOS and Linux endpoints the default location is /. Click a row in the results grid and click the folder icon in
the process path column to open the file system to the directory that contains the file.
3. Navigate the file system by typing a path, or by clicking directories in the file browser of the breadcrumbs of the path.
For each file in a directory you can view the size, creation date, modification date, and the permissions for the file.
4. Click one or more files to download as saved evidence. From the Threat Response menu, click Saved Evidence
> Files to access the files that you download.
5. You can delete files and folders on an endpoint if you have the Threat Response Administrator privilege. To delete a
file, ensure that you have the Threat Response Administrator role and click the delete icon at the end of the row. Click
Delete.
Search for eventsYou can inspect and investigate endpoint data after you make a live connection or capture a snapshot. Search endpoint
data for events using various parameters and operators. The search section displays all times in the UTC time standard.
1. Open the events grid on a live connection or snapshot.
2. Click an exploration button to search for events. Each exploration button is associated with a specific event type. The
filter criteria for each event type changes based on the even type you select. For example, you can filter on such
criteria as process path, IP address, operation, event type, hash, signature, key value, and more. For example, for file
events you can sort on the following operations:
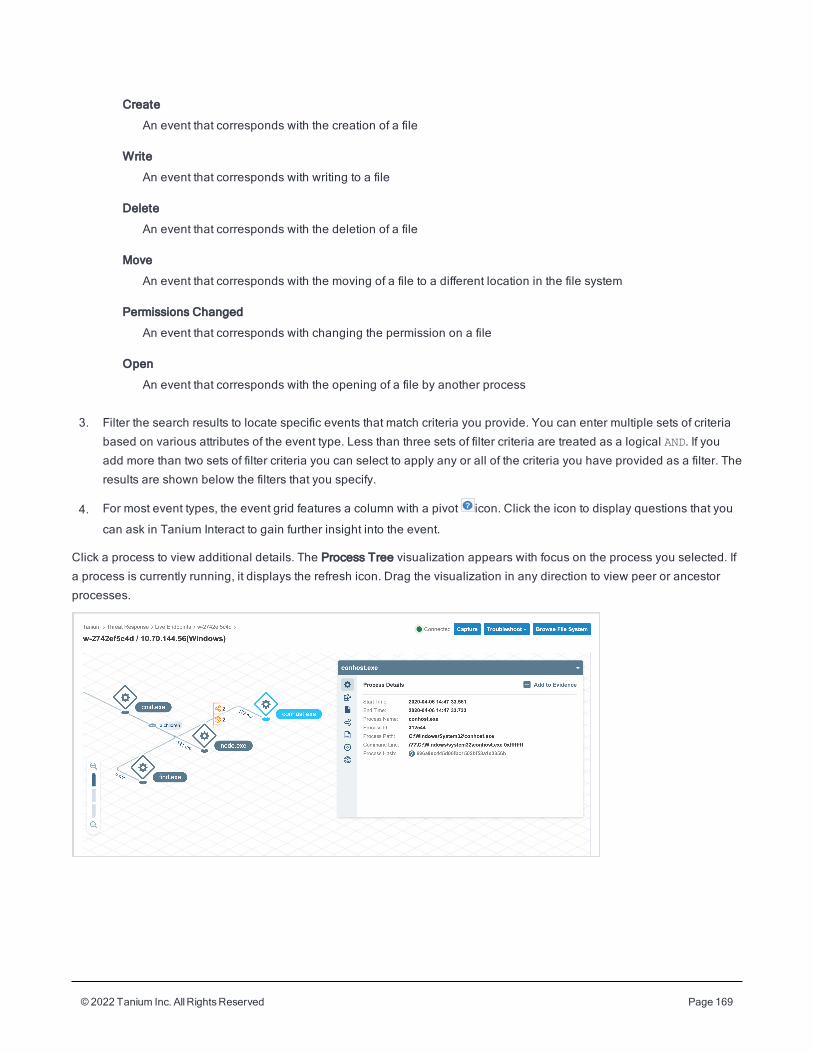
© 2022 Tanium Inc. AllRightsReserved Page 169
Create
An event that corresponds with the creation of a file
Write
An event that corresponds with writing to a file
Delete
An event that corresponds with the deletion of a file
Move
An event that corresponds with the moving of a file to a different location in the file system
Permissions Changed
An event that corresponds with changing the permission on a file
Open
An event that corresponds with the opening of a file by another process
3. Filter the search results to locate specific events that match criteria you provide. You can enter multiple sets of criteria
based on various attributes of the event type. Less than three sets of filter criteria are treated as a logical AND. If you
add more than two sets of filter criteria you can select to apply any or all of the criteria you have provided as a filter. The
results are shown below the filters that you specify.
4. For most event types, the event grid features a column with a pivot icon. Click the icon to display questions that you
can ask in Tanium Interact to gain further insight into the event.
Click a process to view additional details. The Process Tree visualization appears with focus on the process you selected. If
a process is currently running, it displays the refresh icon. Drag the visualization in any direction to view peer or ancestor
processes.
© 2022 Tanium Inc. AllRightsReserved Page 170
The Process Tree view displays all of the file, network, registry, and child process activity that was initiated by the current
process. This page also provides the full process image path and arguments, user context, hash, and parent command line.
A tree view of network processes display, including the current process, parent, children, and peer nodes. You can zoom in
and out, click and drag, and click events to change the view. You can isolate one of the processes in the tree view and
quickly focus on an artifact for analysis.
Hash information for each process is available from the events grid or from the Process Tree view for any specific process.
A hash can have one of the following ratings:
l Non-Malicious (Green)
l Malicious (Red)
l Unknown (Grey)
l Pending
Manage snapshotsSnapshots show all the data from an endpoint. The database file contains historical event activity going back to the first
moment of recording or to the configured limits. Snapshots are stored on the Tanium Module Server.
Export a snapshot from an endpoint
You can retrieve the endpoint database manually if an offline endpoint or a live connection fails.
1. Log on to the endpoint with administrator credentials.
2. Stop the endpoint recorder by deploying a profile that does not contain a recorder configuration.
3. Copy the recorder.db file to a location accessible to the Tanium Console from the <Tanium
Client>/extensions/recorder directory.
Change the file name to include the host name and a timestamp in the format: hostname_YYYY_MM_DDTHH.MM.SS.mmmZ.db. The file name appears in Threat Response.
4. Start the endpoint recorder by deploying a profile with a recorder configuration.
Download a snapshot
You can download a snapshot of an endpoint database for offline analysis and detailed forensics outside of Threat
Response.
1. Go to Threat Response > Saved Evidence. Click Snapshots.
2. Select the snapshot that you want to download and click Download.
3. The snapshot download is managed through the web browser. Note the location to which the browser downloads the
file.
© 2022 Tanium Inc. AllRightsReserved Page 171
Upload a snapshot
1. (Optional) Install upload authentication certificates.
2. In the Tanium Console, go to Threat Response > Saved Evidence and click Upload Snapshot.
3. Browse to the saved snapshot.
4. Click Upload & Connect.
If you are having difficulty uploading a snapshot, see Troubleshooting on page 225.
You can view uploaded snapshots from users who are using the same active persona as the active persona
that uploaded the snapshot. Additionally you can view uploaded snapshots if the current user is the same as
the user that uploaded the snapshot. The Threat Response Administrator role has access to view all
uploaded snapshots. To provide other roles visibility into all uploaded snapshots, assign the Threat
Response Visibility Bypass permission to those roles.
Save files and eventsWhile reviewing the event data from a live endpoint connection, you can save files - including locked files - and events
directly from the events grid as you investigate. You can save files of any type.
You must have a live connection to the endpoint to save file evidence. Saving evidence files from the
endpoint is limited by available memory on the Tanium Module Server. You cannot save file evidence from
snapshots.
1. Open the events grid.
2. Double-click an event row to open the Process Details page.
3. Select Save Process Evidence.
The file is saved under Saved Evidence.
You can view evidence saved from endpoints that belong to computer groups for which you have
permissions to access. For example, you can view evidence from endpoints for which the active persona
belongs to at least one management rights group to which the endpoint belongs. If the current user belongs
to at least one management rights group to which the endpoint is a member of, saved evidence for that
endpoint is visible. The Threat Response Administrator role has access to view all saved evidence. To
provide other roles visibility into all saved evidence, assign the Threat Response Visibility Bypass
permission to those roles.
The Threat Response Saved Evidence Read/Write permissions toggle the visibility of saved evidence. If you
remove the Threat Response Downloads Read/Write permissions for a user, the files tab is not available
under saved evidence, however selecting All still displays files in the results.
© 2022 Tanium Inc. AllRightsReserved Page 172
If an endpoint is offline for a configurable number of days, only the users with the bypass permission can view
alerts for the endpoint. If the endpoint comes back online, it is visible to unprivileged users.
Download a file
Suspicious files might require more analysis or reporting to threat intelligence. After you save a file from a live connection as
evidence, you can also download it from the Saved Evidence page in Threat Response. The file contents are in an
encrypted ZIP format that is downloaded to the machine that is hosting the browser. Decrypt files that you download with the
password infected. If you need to inspect the file without opening it, the ZIP headers are not encrypted.
Create Enforce rules
You can pivot from evidence on a single endpoint to create Enforce policies for multiple computer groups that contain
Windows endpoints. You can add policies to existing process rule policies or create new ones from Threat Response, where
you seamlessly complete the policy configuration in Enforce.
1. From the Threat Response overview page, go to Saved Evidence.
2. Click one or more saved events.
3. Click Create Protection Policy.
4. Confirm the evidence to use and click Create.
5. On the Policy Selector page, create a new policy or add the evidence to an existing policy.
6. Complete the information on the Edit Policy page.
7. Click Create or Update as appropriate.
8. Review the Policy Summary and add enforcements as needed.
Export eventsYou can export some or all of the events from an endpoint as a ZIP file that contains a CSV file. If you are exporting a large
event database, take a snapshot and export the events from the snapshot to reduce the load on the endpoint.
Large exports might take a while to become available.
Select the rows in the events grid that you want to export, and click Export .
Manage IOCsAs you examine the endpoint event data during an investigation, you might confirm that an event is malicious. You can save
such events and files as evidence.

© 2022 Tanium Inc. AllRightsReserved Page 173
Generate an IOC
1. From the Threat Response overview page, go to Intel.
2. Select Add > Evidence Based IOCs.
3. In the IOC Normalized Tree drop-down menu, select Item from saved evidence. Add one or more items.
4. Select an indicator type and value from the drop-down menus.
Threat Response populates the list information from the details of saved evidence.
5. Click Generate.
© 2022 Tanium Inc. AllRightsReserved Page 174
Searching across the enterpriseUse event data to locate suspicious activity on other endpoints. Evaluate the extent of an intrusion and take informed action
at scale.
Ask an enterprise-wide questionWhen an investigation leads you to a confirmed malicious event, you can quickly pivot from the event details into a question
to search all of your managed endpoints with the Tanium Interact.
Any row of process details can be transformed into a context-sensitive search. For example, selecting a row for a
CreateProcess operation prompts a search for a matching process by path, MD5 hash, or full command line; selecting a file
or registry row prompts a search by the operation type and item path. You can also manually create more complex queries
that use the full Threat Response data set and provide advanced options, such as time range constraints and regular
expression matching.
1. Open the events grid on a live connection or snapshot.
2. Use the Explore buttons or other search parameters to identify the event data.
3. Double-click an event to open the Process Details page.
4. On the Event History tab, click the Question icon at the end of a row. Choose from the list of possible questions.
The Interact page opens to display the results of the question.
For more information, see Tanium Interact User Guide: Questions.
Hunt across the enterpriseInstead of pivoting from a single endpoint out, you can use the Threat Response sensors to search for suspicious events on
multiple endpoints across the network.
Queries for simple events, such as a process, registry key, or file, yield immediate results. You can search for “known-bad”
events, and recognize and evaluate the “known-good” events. You might be encountering a set of evidence that seems
suspicious, at first, but might actually be normal system activity.
1. From the Threat Response menu, click Enterprise Hunting.
2. (Optional) Narrow the list of sensors by clicking filters or typing in search terms. This limits the visible sensors and
highlights the applicable Common Uses.
3. To review the sensor summary, click the caret to expand.
4. Click the sensor name to open the parameters configuration page and complete the fields as needed.
If a sensor has no configurable parameters, the Interact results grid opens immediately.
© 2022 Tanium Inc. AllRightsReserved Page 175
If you select Common Uses the parameter fields are automatically populated. Click Ask Question. The results are
available in an Interact grid where you can also create a saved question. You must close the grid to select a different
sensor. For more information, see the Tanium Interact User Guide: Results.
5. Select the results that need further investigation.
6. Open a live connection or take a snapshot of the endpoints and verify that the events are actually malicious.
7. (Optional) Quarantine or remediate the compromised endpoints.
8. Create an IOC to scan for this type of activity in the future.
To search for files on disk, see Tanium Client Index Extension User Guide: Reference: Index sensors.
To search historical activity, use the following sensors:
l Trace DNS Queries
l Trace Executed Process Hashes
l Trace Loaded Drivers
l Trace Executed Processes
l Trace Logon Events
l Trace Executed Process Trees
l Trace Network Connections
l Trace File Operations
l Trace Image Loads
l Trace Registry Keys or Values
© 2022 Tanium Inc. AllRightsReserved Page 176
Managing alertsWhen the engine detects a match to intel that you have deployed to a computer group, an alert is generated from the
endpoint and reported back to Threat Response. You can view alerts in the following locations:
l The Alerts page
l An individual intel document
l Trends boards that show alert data on the Threat Response overview page
You can view alerts that have been generated from endpoints that belong to computer groups for which you
have permissions to access. For example, you can view alerts on endpoints for which the active persona
belongs to at least one management rights group to which the endpoint belongs. If the current user belongs
to at least one management rights group to which the endpoint is a member of, alerts for that endpoint are
visible. The Threat Response Administrator role has access to view all alerts. To provide other roles visibility
into all alerts, assign the Threat Response Visibility Bypass permission to those roles.
If an endpoint is offline for a configurable number of days, only the users with the bypass permission can view
alerts for the endpoint. If the endpoint comes back online, it is visible to unprivileged users.
To ensure the performance and health of the detect database, Threat Response prunes the alerts table in the detect.db
every five minutes. Pruning occurs when the alert.pruning.shouldPrune setting in the API for Detect is set. By default,
this setting is enabled on Threat Response in Tanium Cloud environments and disabled in on-premises environments. To
toggle pruning, use a PUT method request to
/plugin/products/detect3/api/v1/settings/alert.pruning.shouldPrune with the value set to true to enable.
Pruning removes all alerts except for the latest 100,000 alerts that are not assigned the status of In Progress or Resolved.
Alerts that are assigned the status of In Progress or Resolved are never pruned. Threat Response then determines if there
are any alerts that are not assigned the status of In Progress or Resolved that are older than 60 days, and prunes them from
the database. Finally, Threat Response checks for any intel that has created the vast majority of alerts and deletes 90% of
the oldest alerts for that intel and keeps only the newest 10%.
View alertsFrom the Threat Response menu, click Alerts. At the top of the page all of the alerts across the endpoints in an environment
display ranked by endpoint with most alerts, event type, the intel document that triggered the alert, the path to the file or
process that triggered the alert, the status of the alert, and a range of dates were the alert was detected. Click any of the
fields in the rankings to create filters that display alerts that match the criteria you selected.
Specify any additional criteria to filter Alerts. For example, create filters to display alerts based on endpoint, event type, path,
intel name, label, or MITRE technique. Click Advanced Details to view more information about the endpoint on which the
alert occurred, the process that caused the alert, and the intel document that matched the alert.
© 2022 Tanium Inc. AllRightsReserved Page 177
Assign a status to an alertAssigning status to an alert enables incident response efforts to identify alerts that are being investigated or remediated. For
example if you encounter a suspicious alert and you begin to take investigative actions, you can change the status of an
alert to In Progress. Similarly when you have completed the remediation of an alert, you can assign the Resolved status to
the alert. The Available statuses for alerts are:
l Dismissed
l In Progress
l Resolved
l Unresolved
The more quickly you can evaluate the risk associated with a given activity, the more quickly you can begin
resolving a threat. Develop a plan for investigating and resolving alerts and be diligent about assigning alert
statuses. Alert status dispositions are used to calculate the mean time to investigation and mean time to
resolution; both key success metrics for Threat Response.
You can track the mean time to investigate alerts and the mean time to resolve alerts key performance indicators in Tanium
Trends under the Threat Response - Alerts board. The mean time to investigate alerts is the average amount of time alerts
are in the In Progress state over the last 7 days. The mean time to resolve alerts is the average amount of time between
when alerts are created to when they assigned the Resolved state over the last 7 days.
Additionally when an alert is suppressed by a suppression rule, the status of an alert is Suppressed. This status is removed
from a suppressed alert when the suppression rule is removed.
View alerts by intel documentFrom the Threat Response menu, click Intel. To open a single piece of intel, click the name of the item. From the individual
page, you can review alerts that are associated with the intel, the activity over the last 30 days, the engine analysis, the
MITRE technique ID, and you can edit the definition.
Each Signal can have one or more associated MITRE technique IDs. Technique IDs can categorize Signals to better align
with the MITRE Attack Framework and help map coverage to the different tactics and techniques. You can filter alerts by
technique ID.
You can also initiate quick scans for intel documents from the intel page.
Windows Defender alertsWindows Defender is an anti-malware component of Microsoft Windows. Use Windows Defender alerts to gain visibility into
common areas of Windows for changes which might have been caused by spyware, malware, and general security events.
Windows Defender integration requires enabling the Generate Defender Alerts setting in an engine configuration for a
deployed profile. By default, this setting is enabled for new configurations. For existing configurations, this setting needs to
be enabled.
© 2022 Tanium Inc. AllRightsReserved Page 178
When Defender generates an alert on a Windows endpoint, the engine generates an alert in Threat Response that you can
view in the alerts page. You can filter the alerts page for Defender alerts.
Deep Instinct alertsDeep Instinct is a solution that applies deep learning to cybersecurity. Deep Instinct incorporates advanced artificial
intelligence to the task of preventing and detecting malware. Deep Instinct integration requires enabling the Generate Deep
Instinct Alerts setting in an engine configuration for a deployed profile. By default, this setting is disabled for new
configurations. For alerts to be returned from endpoints, the Deep Instinct agent must be running on the endpoint.
When Deep Instinct generates an alert on an endpoint, the engine generates an alert in Threat Response that you can view
in the alerts page. You can filter the alerts page for Deep Instinct alerts.
Investigate reputation dataInvestigating reputation data requires the reputation service to be configured. See Set up the reputation service on page 125
for more information.
For endpoints that use reputation intel, hashes found by the saved questions are sent to the reputation service for
assessment. If this intel generates an alert, the hashes display with red or yellow status. Any known malicious matches
automatically initiate a quick scan on targeted computer groups and generate an IOC for ongoing background scans. Each
reputation IOC can contain up to 20 hashes. These IOCs are listed with Reputation as their source.
When the reputation for a hash changes, the intel is updated. For example, if a hash is no longer considered malicious
according to reputation data, the associated intel document is updated so no further alerts are generated. If no malicious
hashes exist in an intel document, the document is deleted.
1. To view more details about a hash, open the side panel. A hash can have one of the following ratings:
l Non-Malicious (Green)
l Malicious (Red)
l Suspicious (Yellow)
l Unknown (Gray)
l Pending
2. Click a hash to view more details. For reputation data that comes from VirusTotal, you can expand the details and see
a color-coded list of intelligence providers that have assessed the hash.
The Threat Response icon pulses while the quick scan is running. After the quick scan completes, you can use the Interact
icon to view the detailed results of the scan. Alerts are generated and gathered asynchronously from the scan. Alerts might
be displayed on the Alerts page before the scan completes.
Investigate alertsIf you have a suspicious alert, you can open a live connection to investigate further.
© 2022 Tanium Inc. AllRightsReserved Page 179
1. From the Threat Response Menu, click Alerts. Select the alert that you want to investigate. You can investigate one
alert at a time.
2. From the alerts results, click the name of the endpoint to which you want to open a live connection.
3. Click Start live connection.
The live endpoint page opens, with appropriate filtering for the type of alert you are investigating. Take a snapshot of
suspicious endpoints for saved evidence.
Deploy an action to an endpointIf you have a suspicious alert, you can deploy an action to a single affected endpoint directly from the alert.
1. From the Threat Response Menu, click Alerts. Select the alert for which you want to deploy an action to remediate or
perform other action.
2. Click Actions > Deploy Action.
3. The Deploy Action page appears and the targeted endpoint is identified.
4. Select the package that you want to deploy. Depending on the package that you select, you are prompted to provide
parameters for the package. If you select a package for Live Response, you can specify the collection configuration
and destination configuration you want to use for Live Response file collection.
5. Provide a unique name and description for the action.
6. If you do not want to deploy the action immediately, specify a start to create a scheduled action. The time refers to the
system clock on the Tanium Server, not on the endpoint. For example, if you specify the action to deploy at 1:00 am, it
deploys when the Tanium Server system clock time is 1:00 am.
7. Optionally specify an end time. This is important If you configure reissue intervals for the action, unless you are sure it
is the type of action that you want to reissue indefinitely. If you are not sure, configuring the schedule to end in six
months is better than running indefinitely.
8. You can schedule the action to repeat at intervals. Specifying to reissue an action creates a scheduled action.
Specifying a reissue interval is appropriate when:l Action approval is enabled and you are not certain it will be approved before the action expires.
l You want to be sure software or configuration updates are made not only to the clients currently online but also to
those currently offline that will be predictably online within a window that the reissue interval defines.
l The action is a continual hygiene practice. For example, you want to check periodically that a client service is running
or a client configuration has a particular value.
9. Click Deploy. Confirm that you want to deploy the action. Provide administrator credentials and click OK.
Initiate a Response Action from an alertIf you have a suspicious alert, you can initiate a response action to a single affected endpoint directly from the alert. Initiating
Live Response, Quarantine, or Gather Snapshot deploys a response action. A response action, unlike a scheduled action,
runs once during a provided time range and ensures that if an endpoint is not online when you deploy the action, it runs
© 2022 Tanium Inc. AllRightsReserved Page 180
when the endpoint comes online. Once deployed, from the Threat Response Menu click Response Activity to view the status
or stop a response action.
1. From the Threat Response Menu, click Alerts. Select the alert for which you want to deploy an action.
2. Click Response Actions > Live Response, Response Actions > Quarantine, Response Actions > Gather Snapshot, or
Response Actions > Download File.
When you download a file as a response action, the file is saved as saved evidence. From the Threat
Response menu, click Saved Evidence > Files to access the files that you download.
3. Provide parameters for the response action. For example, if you select the response action for Live Response, you can
specify the collection configuration and destination configuration you want to use for Live Response file collection.
4. Click Run. Confirm that you want to deploy the response action. Provide administrator credentials and click OK.
Remediate alerts in Tanium EnforceYou can create a remediation policy in Tanium Enforce, and specify conditions to enforce that policy from an alert. For
example, a remediation policy defines specific actions to perform for an alert, and an enforcement defines the endpoints and
schedule for performing the actions defined in the policy. Policies such as deleting files, killing a process, and performing
registry tasks are available to perform when an alert is generated. By default, the remediation only targets the endpoint that
generated the alert. To create remediation policies from an alert, Tanium Enforce must be installed . Additionally, to create
remediation policies in Tanium Enforce, the Enforce Create Enforcement permission must be granted.
1. From the Threat Response Menu, click Alerts. Select the alert that you want to remediate in Tanium Enforce.
2. Select Actions > Remediate in Enforce.
If an instance Tanium Enforce is not installed, this option is not available from the Actions menu.
3. In the Policy Details section, provide a name and description for the policy.
4. In the Tasks section, click Add Tasks to perform as part of the remediation. You can select multiple tasks to add. Each
task that you add to the remediation policy requires additional data that is by default populated with the data from the
alert. Available tasks are:
Delete file
Provide a path to a single file to delete. By default, this path is populated with the data from the alert. Select to
continue or exit if an error occurs.
Kill process
Select to use the Name, Path, or Hash of the process. Paths support wildcard syntax such as *, !, and ?. Group
syntax is also supported. Hashes support an optional maximum file size. Provide any additional command line
arguments for a process. Command line arguments support regular expression syntax such as C:\^Win$\.* .
© 2022 Tanium Inc. AllRightsReserved Page 181
Provide a timeout value in seconds. If the number of seconds you specify is exceeded without killing the
specified process, the kill process task fails. You can additionally provide a number of attempts for the task
before the task fails.
Select to continue or exit if an error occurs.
Edit Registry Data
Select a hive in which to edit the registry data:
HKEY_CLASSES_ROOT
HKEY_LOCAL_MACHINE
HKEY_CURRENT_CONFIG
HKEY_USERS
Additionally provide the path relative to the hive you select. For example, System\CurrentControlSet\Hardware
Profiles\Current
Select the type of the data to edit and provide new data to use to replace the value of the existing data.
Select if you want to create the value using the data you provided if no value matching the alert is detected.
Select to continue or exit if an error occurs.
Update Registry Value
Select a hive in which to update the registry data:
HKEY_CLASSES_ROOT
HKEY_LOCAL_MACHINE
HKEY_CURRENT_CONFIG
HKEY_USERS
Additionally provide the path relative to the hive you select. For example, System\CurrentControlSet\Hardware
Profiles\Current
Select to edit the value with data that you provide, or to delete the current value. Select to continue or exit if an
error occurs.
Delete Registry Key
Select a hive in which to delete the registry key:
HKEY_CLASSES_ROOT
HKEY_LOCAL_MACHINE
HKEY_CURRENT_CONFIG
HKEY_USERS
Additionally provide the path relative to the hive you select. For example,System\CurrentControlSet\Hardware Profiles\Current
© 2022 Tanium Inc. AllRightsReserved Page 182
Select to continue or exit if an error occurs.
5. In the Enforcements section, click Add Enforcement. Select Computer Group to target the remediation to an entire
computer group. Select Individual Computers to provide one or more endpoints for the remediation to target. Add the
fully qualified host name of each endpoint you want the remediation to target. Comma delimit multiple endpoints.
Provide a start and end time for when you want to perform the remediation. Select to distribute over time to balance
resource use over a time duration that you specify. The duration of the Distribute over time setting must be at least 10
minutes shorter than the Issue time setting. Select if you want to repeat the action and how often.
6. Click Remediate. The remediation is available in Tanium Enforce. From the Main menu, click Modules > Enforce >
Policies > Remediations to view and edit the remediation in Tanium Enforce.
Delete alertsYou can delete alerts any time. If an alert is matched again later, the alert is generated again.
Suppress alertsCreate suppression rules to prevent the creation of an alert when an intel match occurs for a Signal. Use suppression rules
to reduce false positives for Signals that you cannot edit, such as those from the Tanium Signal Feed. Suppression rules are
not intended for use as a substitution for properly crafted Signals; if you are suppressing alerts consistently due to a Signal
not matching as intended, it is a good indication that the Signal should be revised to more accurately match. By thoughtfully
analyzing alerts you can tune the Signals that generate them optimally. See Authoring Signals: Testing Signals for more
information.
Suppressed alerts are removed from the database after seven days by default. You can edit the number of days to wait after
an alert is suppressed before removing it from the database in Settings from the Threat Response overview page.
You can apply rules that suppress alerts that match Process Path, Process Command Line, Parent Command Line, Process
Hash, Parent Process Path, Ancestry Path, Ancestry Command Line, and User.
All of the selected suppression fields are required to match before the alert is suppressed.
1. From the Threat Response menu, go to Intel > Suppression Rules and click Add Rule.
2. Select the type of suppression rule to create. A global rule applies to all Signals where a match occurs. An intel-
specific rule only applies to matches to a specific Signal that you specify. Select Global or Signal-Specific. If you select
Signal-Specific, select an available Signal.
3. Provide a name and description for the suppression rule.
4. Select the fields that you want to use for suppressions:
a. Process path: The path in the file system to a specific process. For example, c:\windows\notepad.exe.
b. Process command line: Additional parameters that were provided for a process. For example, if a process is
wevtutil.exe, a possible process command line is: wevtutil cl Application.
© 2022 Tanium Inc. AllRightsReserved Page 183
c. Parent command line: The full command line of the parent process.
d. Parent process path: The path in the file system to a parent process. For example,
c:\windows\system32\cmd.exe.
e. Ancestry command line: Additional parameters that were provided for a parent process.
f. Ancestry path: The path in the file system to a process more remote than a parent process.
g. Process MD5: A specific MD5 hash value that corresponds to a process.
h. User: A specific user on the system that is associated with a process.
If a Signal has generated an alert, you can click the Suppress Alert link from an alert page to preview
the expected values for each of the fields.
5. Specify how you want to compare the field to the alert. You can choose to suppress an alert if a field is a direct match,
contains a value, or matches a pattern specified by a regular expression.
a. Select Is to suppress an alert when a direct match occurs. For example, a specific hash value or user name
matches.
b. Select Contains to suppress an alert when a subset of the alert criteria matches. For example, a path that
contains "Windows".
c. Select Matches to suppress an alert when a pattern matches the criteria. A regular expression needs to match
the whole string. If you want to match Win and Windows, the regular expression needs to be .*Win.*. By default,
regular expressions in suppression rules are case insensitive. Use of ^ and $ and flags are not supported.
6. Select Retroactive to run the suppression rule against all existing alerts that have not been resolved. If unselected, the
rule does not apply to existing unresolved alerts, but applies to future Signal matches.
7. Click Preview to view a list of existing unresolved alerts that match the criteria you specify in the suppression rule.
Threat Response evaluates 1000 alerts at a time until all applicable alerts have been evaluated, or until 10,000 alerts
have been evaluated. Click Save.
Suppress an alert
You can create a suppression rule directly from an alert. From the Threat Response menu, click Alerts. Select an alert and
click Actions > Suppress. The suppression rule page appears and features all of the values that are required to suppress the
alert. Provide a name and description for the suppression rule and select Retroactive if you want to apply the suppression
rule against all existing alerts that have not been resolved. Click Save.
Edit and delete suppression rules
You can edit or delete existing suppression rules. From the Threat Response menu, click Intel > Suppression Rules. Select
a suppression rule that you want to edit. Click Actions > Edit.
To delete a suppression rule, select the suppression rules that you want to delete. Click Actions > Delete.

© 2022 Tanium Inc. AllRightsReserved Page 184
View the status of a retroactive task
If you edit a suppression rule and select Retroactive to run the suppression rule against all existing alerts that have not been
resolved, you can view the status of how that rule is retroactively applied. From the Threat Response menu, click Intel >
Suppression Rules. Click Retroactive Tasks. View the status column to see if the retroactive task is Not Started, Incomplete,
Completed, or has resulted in an error.
Import and export global suppression rulesImport and export global suppression rules to move them from one platform to another. For example, you can export global
suppression rules from a test system and import them to a production system. Global suppression rules are imported and
exported as JSON files and have a file size limit of 1 MB.
Export global suppression rules
1. From the Threat Response menu, click Intel > Suppression Rules.
2. Select the global suppression rules that you want to export. Click Actions > Export. If you select suppression rules that
are specific to a signal, they are omitted from the export.
3. A JSON file is created for the export. Provide a name for the JSON file and click Export.
Import global suppression rules
1. From the Threat Response menu, click Intel > Suppression Rules. Click Import and browse to a JSON file that you
want to import. Click OK.
2. Review the global suppression rules to be imported. Click OK. You can Skip a global suppression that is conflicting
with one that already has the same name or Import and Rename to apply a suffix of Duplicate <time stamp> to the
suppression. For example, if a suppression is named test and you select Import and Rename, the resulting imported
rule would be named test Duplicate <time stamp>.
3. From the summary window that displays the global suppression rules that have been imported, click Finish.
4. Refresh the list of suppression rules to view the global suppression rules that have been imported.
Manage the impact of lateral movement with Tanium ImpactIf you installed Tanium Impact, and are assigned the Impact Asset Items Read and Impact Asset Details Read
permissions, an Outbound Impact column appears in the alerts results grid. The value in the Outbound Impact column
quantifies the number of user accounts and endpoints that can be reached from the corresponding Windows endpoint. Click
the alert to view the alert details. In the Impact Details section of the alert details you can view data to better understand the
lateral impact the endpoint has in an environment should it become compromised to help prioritize alert remediation.
Click Explore in Impact to view more detailed information about how the Windows endpoint fits into a larger topology. For
more information, see Contact Tanium Support on page 231.
© 2022 Tanium Inc. AllRightsReserved Page 185
Set up Tanium Connect forwardingThreat Response sends event information to Tanium Connect by default. To save this event information, you must configure
Connect for the events to be passed to a destination. If you do not configure a destination, the events are dropped.
You can configure a Connect forwarding connection at any time. If you configure the connection during the installation
process, all history is captured.
1. From Connect, create a new connection with Event type and Tanium Threat Response as the event group.
2. Select the Threat Response events that you want preserved.
l Match Alerts Raw sends alert details in JSON format. Match alerts are generated when intel deployed in a
profile matches an event on an endpoint.
l Match Alerts sends alert details encoded in base64. Match alerts are generated when intel deployed in a
profile matches an event on an endpoint.
l All Events includes scan matches and other Threat Response events, such as messages and notifications.
3. Configure the destination; such as a SIEM service or Write to File.
When configuring reputation intel for Threat Response, you do not need to configure Tanium Connect as Threat
Response inserts data into the reputation database.
For more information see the Tanium Connect User Guide.
© 2022 Tanium Inc. AllRightsReserved Page 186
Managing response activityFrom the Threat Response Menu, click Response Activity to view the status, create or stop a response action. A response
action, unlike a scheduled action, runs once during a provided time range and ensures that if an endpoint is not online when
you deploy the action, it runs when the endpoint comes online. Initiate a response action to a single affected endpoint. You
can initiate Live Response, Quarantine, download a file, or gather a snapshot from a targeted endpoint.
You can initiate response actions from an alert. For more information, see Initiate response actions from an alert.
Create a response action for an endpoint1. From the Threat Response Menu, click Response Activity.
2. Click Create > Live Response, Create > Quarantine, Create > Gather Snapshot, or Create > Download File.
3. Select an endpoint that is the target of the response action.
When you download a file as a response action, the file is saved as saved evidence. From the Threat
Response menu, click Saved Evidence > Files to access the files that you download.
4. Provide parameters for the response action. For example, if you select the response action for Live Response, you can
specify the package you want to use for Live Response file collection.
5. Click Run Response Action. Confirm that you want to deploy the response action. Provide administrator credentials
and click OK.
Stop a response action1. From the Threat Response Menu, click Response Activity.
2. Select the response action that you want to stop from the list of response actions.
3. Click Actions > Stop.
© 2022 Tanium Inc. AllRightsReserved Page 187
Collecting data from endpoints with LiveResponse
A critical step in the incident response process is the collection of data from compromised endpoints for further forensic
analysis. Threat Response provides a feature called Live Response that you can use to collect specific information from
endpoints to use for forensic analysis, data correlation, and to investigate potentially compromised systems with a
customizable and extensible framework.
Live Response collects forensic information from endpoints, and transfers the results to a network location that you specify in
a package. The Live Response package contains configuration files that identify the data to collect, and where to copy the
data. Specify the data that you want to collect from endpoints, and the network destination to save the collected files.
DestinationsA destination is a location to save forensic data. The server that receives information from Live Response can be Azure, an
Amazon S3 Bucket, or a server that communicates over SFTP, SCP, or SMB (Windows only - SMB destinations are not
included in Live Response packages for macOS and Linux.) protocols.
For SSH (SFTP/SCP) destinations, a user with write access to the share on the destination is required. Consider modifying
the /etc/ssh/sshd_config file on the server to allow only SFTP or SCP access. A best practice is to use Linux SFTP/SCP
destinations for SCP/SFTP transfers.
The key exchange algorithms supported by Live Response for SSH destinations include:
l ecdh-sha2-nistp256
l ecdh-sha2-nistp384
l ecdh-sha2-nistp521
l diffie-hellman-group14-sha1
l diffie-hellman-group1-sha1
l diffie-hellman-group-exchange-sha256
At least one of these algorithms must be supported by the server for SSH (SFTP/SCP) destinations.
For an SMB copy location, the system account is used. SMB shares work with domain joined endpoints. Either the specific
endpoint must have write access, or the domain computers group must have write access. Required advanced permissions:
© 2022 Tanium Inc. AllRightsReserved Page 188
l Create files / write data
l Create folders / append data
l Write attributes
For Amazon S3 Bucket copy locations, ensure that clients are synchronized with a time server. Transfers fail if the client time
differs from the server time by more than 15 minutes.
Do not use SMB transfer destinations when a system has been quarantined by Tanium. Live Response uses domain
authentication for transfers. When a system is quarantined it cannot reauthorize with the domain and authentication fails.
1. From the Threat Response menu, click Management > Live Response. Click Create > Destination.
2. In the General Information section, provide a name and description for the destination.
3. Select a destination type. Available destination types are S3, SSH, and SMB. The destination type that you select
determines the types of required setting information. Refer to destination types for more information.
4. Click Save.
Be aware that keys you use to authenticate destinations should be considered public. Do not use keys that provide access to
sensitive information, and ensure the keys are limited in scope. As a best practice, do not allow keys to read, overwrite, or
delete data.
Destination types
Different types of destinations require different settings.
There is no option for disabling hostkey verification for SSH destinations in Live Response for Threat
Response.
AZURE DESTINATIONS
For Azure destinations, the following settings are required:
Setting Description
Storage
Account
Provide the name of the storage account that containsAzure Storage data objects. The storage account
providesa unique namespace for Azure Storage data that you can access fromHTTPor HTTPS.
Container Provide the name of the Azure Container Instance where Live Response data is saved.
KeyFile Provide the storage account access key to construct a connection string to accessAzure Storage. The
values in the connection string are used to construct the Authorization header that is passed to Azure
Storage.
SAS Token A shared access signature (SAS) is a token that permits delegated access to resources in your storage
account. The SAS token encapsulatesall of the information needed to authorize a request to Azure
Storage on the URL.
© 2022 Tanium Inc. AllRightsReserved Page 189
Setting Description
Maximum
Attempts
Specifies themaximum number of attempts an operation will be tried before producing an error.
Simultaneous
Uploads
Specifies the number of concurrent uploads that can occur.
Connection
Timeout
The amount of time to attempt to establish a connection.
S3 DESTINATIONS
For S3 destinations, the following settings are required:
Setting Description
Bucket The name of the S3 Bucket.When using an S3 bucket asa destinationmake sure that clients are synchronized with a time
server. Transfers fail if the client time differs from the server time bymore than 15minutes.
AccessKey ID An ID that correspondswith a secret access key. For example, AKIAIOSFODNN7EXAMPLE
Secret Access
Key
A secret key that correspondswith an access key ID. For example,
wJalrXUtnFEMI/K7MDENG/bPxRfiCYEXAMPLEKEY. Manage your access keysas securely as you do your user name
and password.
When you create access keys, you create the access key ID and secret access keyasa set. During access key creation, AWS
gives you one opportunity to view and download the secret access keypart of the access key. If you do not download the keyor
if you lose the key, you can delete the access keyand then create a new one.
Region An explicitly defined S3 region.
Host The fully qualified domain name of the host.
Port The port to use for the connection for the destination. The default is 443.
Use SSL SSL encryption is enabled.
Force Path
Style Types
ForcesAPI calls to use path-style URLswhere the bucket name is part of the URL path for accessing buckets.
Connection
Timeout
The amount of time to attempt to establish a connection.
Remote Path A path on the destination where data is collected.
SSH DESTINATIONS
For SSH destinations, the following settings are required:
© 2022 Tanium Inc. AllRightsReserved Page 190
Setting Description
Protocol Select SFTPor SCPas the protocol to transfer collected files to the destination.
Authentication
Type
Private Keyor Password. The type of protocol that you select determineswhether you are prompted to provide a private
keyor a password to authenticate with the destination.
Host The fully qualified domain name of the host.
Port The port to use for the SSH connection for the destination. The default is 22.
Username The user name for the connection to the destination.
Password or
Private Key
The password for the user name, or a private key to authenticate the connection to the destination. An RSA keymust be
base64 encoded before you enter it into the private key field.
In PowerShell you can convert to base64 encoding using the following command:
[Convert]::Tobase64String([System.IO.File]::ReadAllBytes('<filepath>')) | clip
Adding | clip to the end of the command sends the base64 output directly to the clipboard for pasting. If you try to copy
and paste from the command line output, it is possible to introduce carriage returnswhich break the input and produce the
error "invalid character" in the Tanium data entry console.
OnmacOSand Linux you can convert to base64 encoding using the following command:
cat <filepath> | base64 -w 0
Although the normal openSSH format is assumed to be base64, encode the entire keyagain before
uploading.
KnownHosts The content of an SSH known hosts file. SeeGenerate known_hosts and test connections
Connection
Timeout
The amount of time to attempt to establish a connection.
Remote Path A path on the destination where data is collected. This path is relative to the home directory of the present user. Absolute
pathsare not supported.
SMB DESTINATIONS
The SMB transfer protocol is only supported on Windows operating systems. SMB destinations are not
included in Live Response packages for macOS and Linux.
For SMB destinations, the following settings are required:
© 2022 Tanium Inc. AllRightsReserved Page 191
Setting Description
UniversalNaming Convention The UNC path of the destination. For example, \\server\folder
Generate known_hosts and test connections
The Threat Response - Live Response [Windows] package contains taniumfiletransfer_32.exe and
taniumfiletransfer_64.exe. When the package is deployed, the file that is appropriate for endpoint is copied to the
endpoint and renamed to taniumfiletransfer.exe. Download taniumfiletransfer_32.exe or
taniumfiletransfer_64.exe from the Threat Response - Live Response [Windows] package.
To see a list of supported protocols, run one of the following commands depending on the architecture you are using:
taniumfiletransfer_64 protocol
taniumfiletransfer_32 protocol
To see details about a specific protocol, including options for the protocol connection string, run: taniumfiletransfer_
64 protocol <protocol>
To generate a known_hosts file for use with SFTP or SCP:
1. Connect to the host you want to get a capture from.
2. Get the target IP you want to transfer the file to.
3. Run the following command: C:\> taniumfiletransfer_64.exe ssh-keyscan <host> > known_hosts on
Windows endpoints or ssh-keyscan <host> > known_hosts on Linux and macOS endpoints.
To update the known_hosts file in the live response package paste the contents of the file that you generated to the known_
hosts field in the destination. The ssh-keyscan command produces a file with all SSH fingerprints commented with a #
character. Edit the file that is created by using this command and remove the # before the fingerprints that should be
accepted. A description of the fingerprints is provided with two ## characters and these should be left as comments. If you
use a non-standard port, the output in the known_hosts file needs to be edited to reference that port. Lines starting with a
double-hash ## need to be edited. For example, if you are using port 222, update the line:## Host: 192.168.0.113:22 (192.168.0.113:22)...
to:## Host: 192.168.0.113:222 (192.168.0.113:222)...
If the known_hosts file is not edited to reference the correct port, Live Response encounters a failure. The known-hosts file
must be ASCII encoded.
Alternatively you can perform the following steps:
1. Generate the destination package. See Collect data from endpoints.
2. Delete the known_hosts file in the Threat Response - Live Response [OS] package.
3. Add the file you generated with no changes. Note that a Linux package cannot be updated from a Windows endpoint
due to the changes Windows makes to the file format.
4. Save the package.
© 2022 Tanium Inc. AllRightsReserved Page 192
To test sending a file via an SFTP string enter the following command:
C:\> taniumfiletransfer_64.exe send test_file -d
sftp://<user>:<password>@<host>:/<dir>#knownHostsFile=known_hosts
CollectionsA collection defines the data to collect from an endpoint. The following configurations are provided with Live Response:
l Standard Collection: Use for default data. The standard collection contains file collectors to collect specific files from
endpoints. See File Collector Sets for a reference of the file collectors that are contained in each type of collection.
The following data is captured by default, and is configurable in the standard collection:
o Enumerate Running Processes
o Enumerate Process Modules
o Enumerate System Drivers
o Analyze Windows Prefetch
o Analyze Windows Amcache
o Analyze Windows Shimcache
o Analyze Windows Filesystem .LNK Files
o Analyze Windows Scheduled Jobs
o Analyze Windows Recent Files Cache
o Analyze Windows User Assist Recent Applications
o Analyze Network Connection Details
o Analyze Process and File Handle Details
o Analyze System Startup
l Extended Collection: Use to collect the same data as the standard collection, plus more file based artifacts, such as
the kernel, the Master File Table, USN Journal, event logs, registry hive files, and so on. The extended collection
contains file collectors to collect specific files from endpoints. See File Collector Sets for a reference of the file
collectors that are contained in each type of collection. The following data is configurable in the extended collection:
o Enumerate Running Processes
o Enumerate Process Modules
o Enumerate System Drivers
o Analyze Windows Prefetch
o Analyze Windows Amcache
o Analyze Windows Shimcache
© 2022 Tanium Inc. AllRightsReserved Page 193
o Analyze Windows Filesystem .LNK Files
o Analyze Windows Scheduled Jobs
o Analyze Windows Scheduled Tasks Via Schtasks
o Analyze Windows Recent Files Cache
o Analyze Windows User Assist Recent Applications
o Collect Parsed UsnJrnl Entries
o Analyze Network Connection Details
o Analyze Process and File Handle Details
o Analyze System Startup Applications
o Collect Recorder Database Snapshot
The option to Collect Recorder Database Snapshot enables you to collect a snapshot of either recorder.db or
monitor.db from endpoints. Collect Recorder Database Snapshot creates a snapshot of a recorder database -
whether or not it is encrypted - and adds the snapshot to the collection. The snapshot that this module creates is
removed from the endpoint when the collection has completed. By default, recorder database snapshots are saved in
a folder named RecorderSnapshot on a path that corresponds with the name of the endpoint. For example,
<base_directory>\<endpoint_name>\collector\RecorderSnapshot\<database_name>.db.
l Memory Collection: Use for memory acquisition. The memory collection contains file collectors to collect specific files
from endpoints. See File Collector sets for a reference of the file collectors that are contained in each type of
collection. Memory data is configurable in the memory collection.
You can create a custom configuration to collect specific data from endpoints.
1. From the Threat Response menu, click Management > Live Response. Click Create > Collection.
2. In the General Information section, provide a name and description for the collection.
3. Select the modules that you want to include in the data collection. A module is a functional area of forensic
investigation. For example, the Network Connections module collects data that is helpful to understanding network
connections that the endpoint has been involved in. The operating system icons next to each module show the
operating systems to which the modules apply.
4. Select the File Collector sets that you want to include in the collection. See File Collectors for more information.
5. Under Script Sets, select the script sets that you want to include in the collection. See Script Sets for more information.
6. Click Save.
File Collector setsFile collector sets to define the types of files that you want to collect from endpoints. For example, you can select all files of a
specific type, or files that reside on a specific path. Live Response on Windows collects alternate data streams. The name of
the alternate data stream is appended to the regular data stream preceded by an underscore. For example, if an alternate
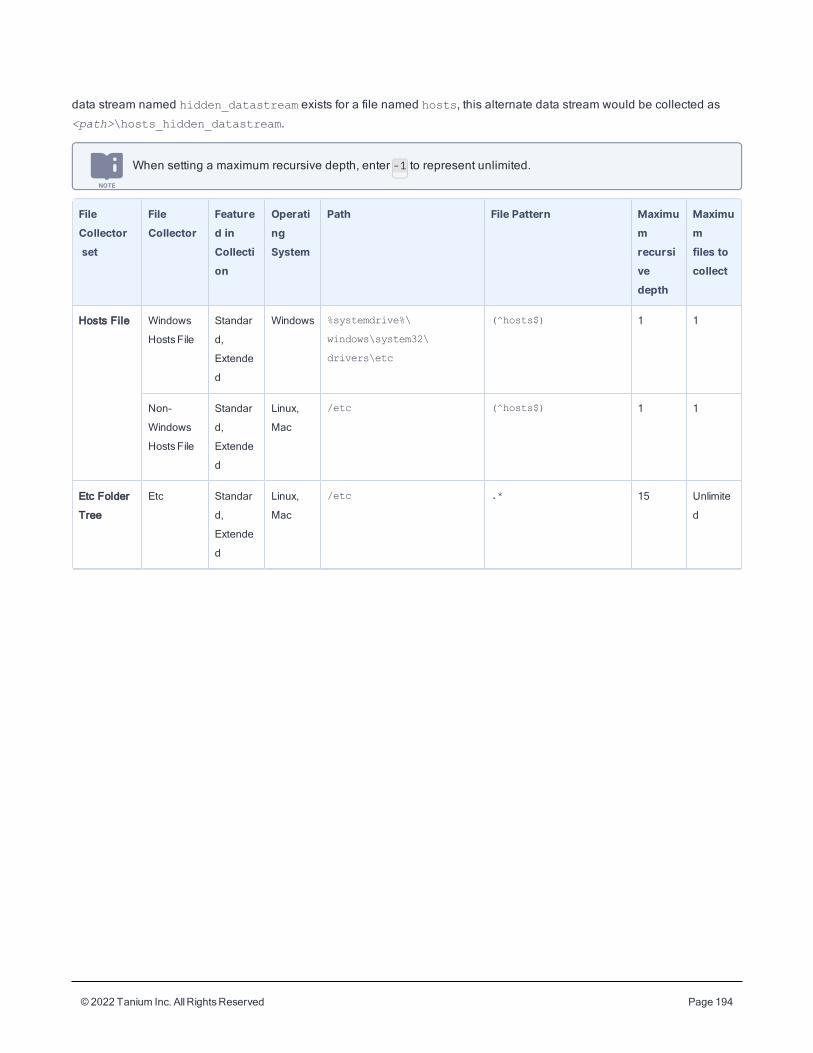
© 2022 Tanium Inc. AllRightsReserved Page 194
data stream named hidden_datastream exists for a file named hosts, this alternate data stream would be collected as
<path>\hosts_hidden_datastream.
When setting a maximum recursive depth, enter -1 to represent unlimited.
FileCollectorset
FileCollector
Featured inCollection
OperatingSystem
Path File Pattern Maximumrecursivedepth
Maximumfiles tocollect
Hosts File Windows
HostsFile
Standar
d,
Extende
d
Windows %systemdrive%\
windows\system32\
drivers\etc
(^hosts$) 1 1
Non-
Windows
HostsFile
Standar
d,
Extende
d
Linux,
Mac
/etc (^hosts$) 1 1
Etc Folder
Tree
Etc Standar
d,
Extende
d
Linux,
Mac
/etc .* 15 Unlimite
d
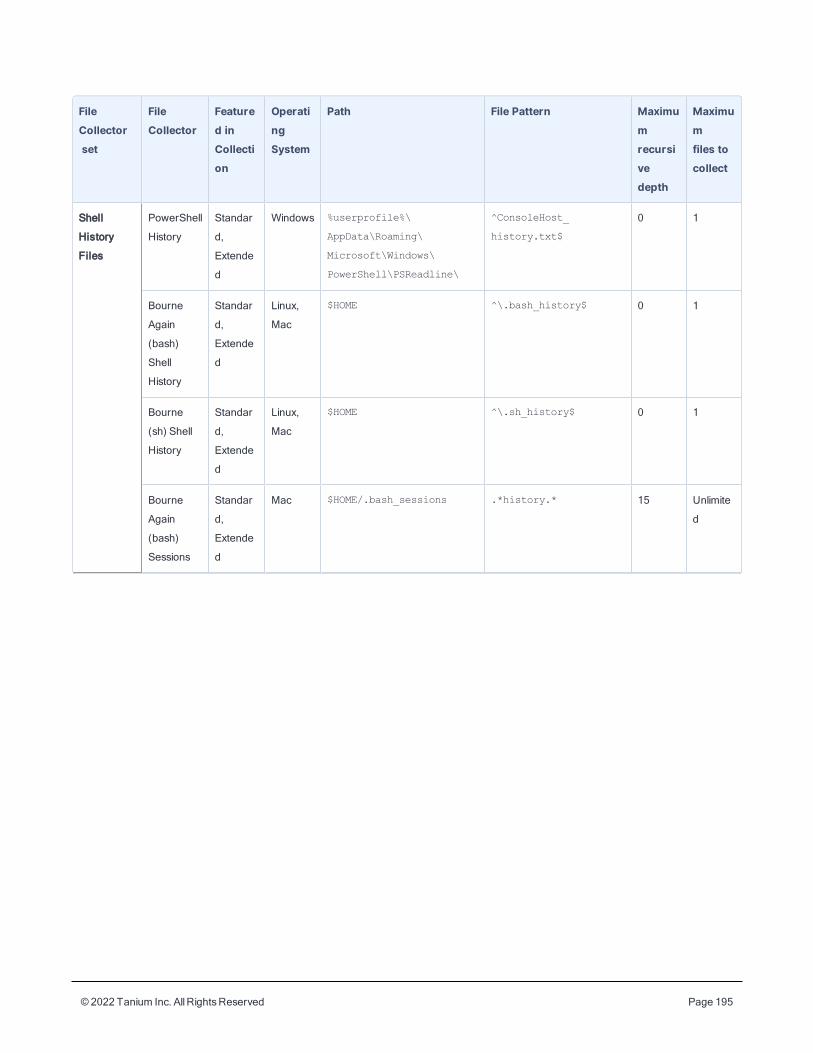
© 2022 Tanium Inc. AllRightsReserved Page 195
FileCollectorset
FileCollector
Featured inCollection
OperatingSystem
Path File Pattern Maximumrecursivedepth
Maximumfiles tocollect
Shell
History
Files
PowerShell
History
Standar
d,
Extende
d
Windows %userprofile%\
AppData\Roaming\
Microsoft\Windows\
PowerShell\PSReadline\
^ConsoleHost_
history.txt$
0 1
Bourne
Again
(bash)
Shell
History
Standar
d,
Extende
d
Linux,
Mac
$HOME ^\.bash_history$ 0 1
Bourne
(sh) Shell
History
Standar
d,
Extende
d
Linux,
Mac
$HOME ^\.sh_history$ 0 1
Bourne
Again
(bash)
Sessions
Standar
d,
Extende
d
Mac $HOME/.bash_sessions .*history.* 15 Unlimite
d
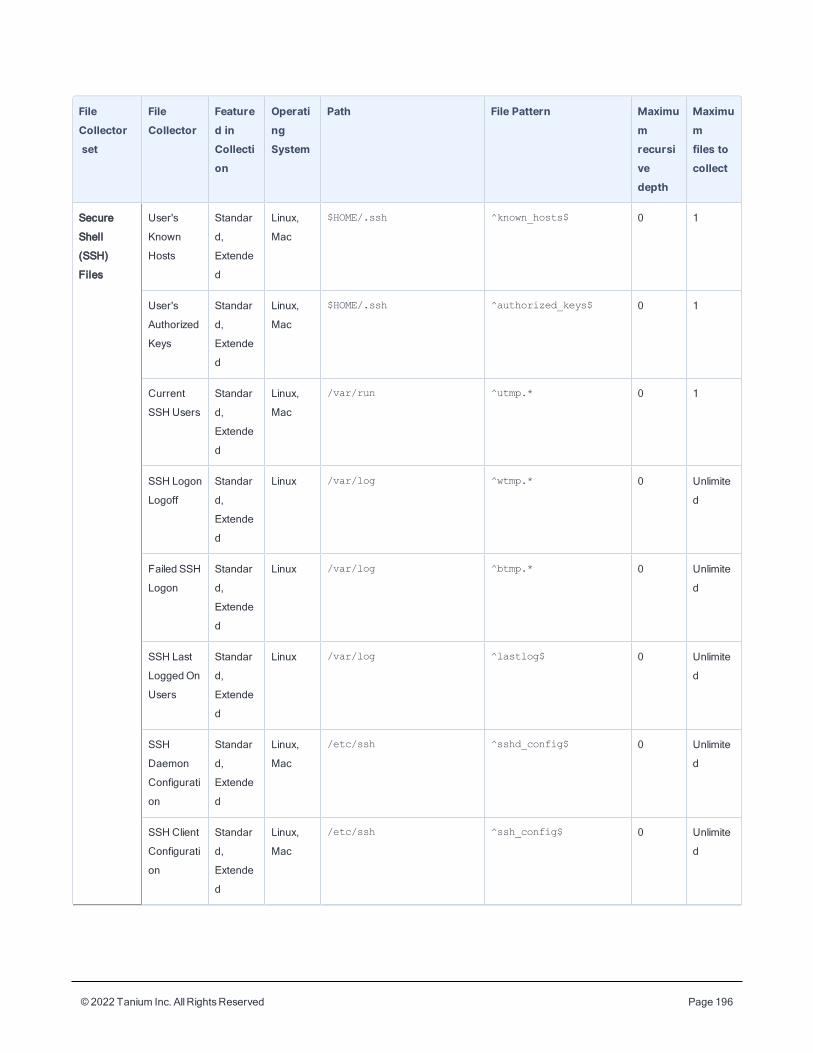
© 2022 Tanium Inc. AllRightsReserved Page 196
FileCollectorset
FileCollector
Featured inCollection
OperatingSystem
Path File Pattern Maximumrecursivedepth
Maximumfiles tocollect
Secure
Shell
(SSH)
Files
User's
Known
Hosts
Standar
d,
Extende
d
Linux,
Mac
$HOME/.ssh ^known_hosts$ 0 1
User's
Authorized
Keys
Standar
d,
Extende
d
Linux,
Mac
$HOME/.ssh ^authorized_keys$ 0 1
Current
SSH Users
Standar
d,
Extende
d
Linux,
Mac
/var/run ^utmp.* 0 1
SSH Logon
Logoff
Standar
d,
Extende
d
Linux /var/log ^wtmp.* 0 Unlimite
d
Failed SSH
Logon
Standar
d,
Extende
d
Linux /var/log ^btmp.* 0 Unlimite
d
SSH Last
LoggedOn
Users
Standar
d,
Extende
d
Linux /var/log ^lastlog$ 0 Unlimite
d
SSH
Daemon
Configurati
on
Standar
d,
Extende
d
Linux,
Mac
/etc/ssh ^sshd_config$ 0 Unlimite
d
SSH Client
Configurati
on
Standar
d,
Extende
d
Linux,
Mac
/etc/ssh ^ssh_config$ 0 Unlimite
d
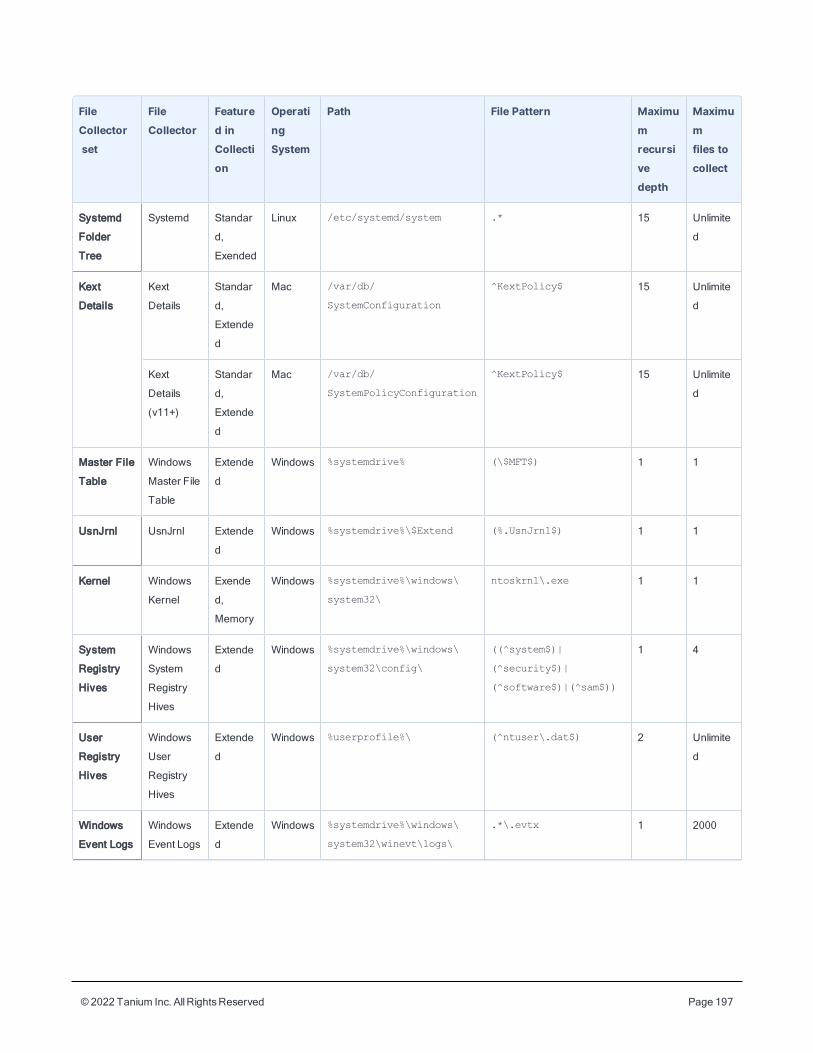
© 2022 Tanium Inc. AllRightsReserved Page 197
FileCollectorset
FileCollector
Featured inCollection
OperatingSystem
Path File Pattern Maximumrecursivedepth
Maximumfiles tocollect
Systemd
Folder
Tree
Systemd Standar
d,
Exended
Linux /etc/systemd/system .* 15 Unlimite
d
Kext
Details
Kext
Details
Standar
d,
Extende
d
Mac /var/db/
SystemConfiguration
^KextPolicy$ 15 Unlimite
d
Kext
Details
(v11+)
Standar
d,
Extende
d
Mac /var/db/
SystemPolicyConfiguration
^KextPolicy$ 15 Unlimite
d
Master File
Table
Windows
Master File
Table
Extende
d
Windows %systemdrive% (\$MFT$) 1 1
UsnJrnl UsnJrnl Extende
d
Windows %systemdrive%\$Extend (%.UsnJrnl$) 1 1
Kernel Windows
Kernel
Exende
d,
Memory
Windows %systemdrive%\windows\
system32\
ntoskrnl\.exe 1 1
System
Registry
Hives
Windows
System
Registry
Hives
Extende
d
Windows %systemdrive%\windows\
system32\config\
((^system$)|
(^security$)|
(^software$)|(^sam$))
1 4
User
Registry
Hives
Windows
User
Registry
Hives
Extende
d
Windows %userprofile%\ (^ntuser\.dat$) 2 Unlimite
d
Windows
Event Logs
Windows
Event Logs
Extende
d
Windows %systemdrive%\windows\
system32\winevt\logs\
.*\.evtx 1 2000
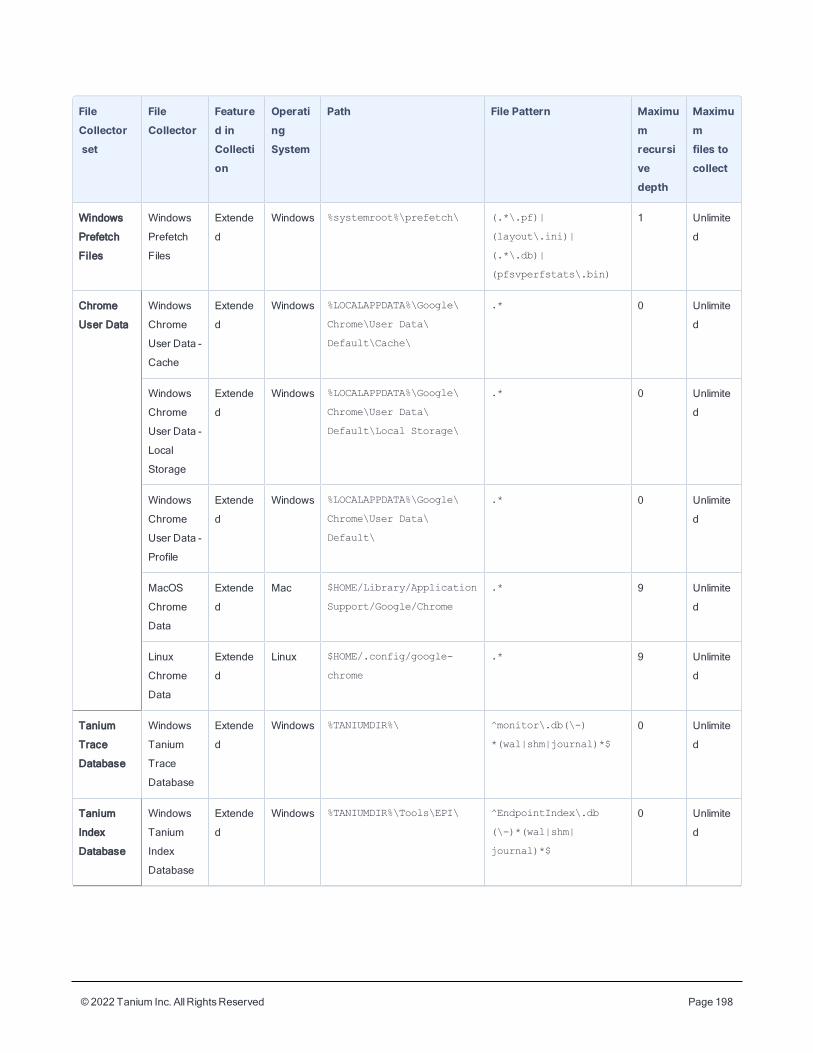
© 2022 Tanium Inc. AllRightsReserved Page 198
FileCollectorset
FileCollector
Featured inCollection
OperatingSystem
Path File Pattern Maximumrecursivedepth
Maximumfiles tocollect
Windows
Prefetch
Files
Windows
Prefetch
Files
Extende
d
Windows %systemroot%\prefetch\ (.*\.pf)|
(layout\.ini)|
(.*\.db)|
(pfsvperfstats\.bin)
1 Unlimite
d
Chrome
User Data
Windows
Chrome
User Data -
Cache
Extende
d
Windows %LOCALAPPDATA%\Google\
Chrome\User Data\
Default\Cache\
.* 0 Unlimite
d
Windows
Chrome
User Data -
Local
Storage
Extende
d
Windows %LOCALAPPDATA%\Google\
Chrome\User Data\
Default\Local Storage\
.* 0 Unlimite
d
Windows
Chrome
User Data -
Profile
Extende
d
Windows %LOCALAPPDATA%\Google\
Chrome\User Data\
Default\
.* 0 Unlimite
d
MacOS
Chrome
Data
Extende
d
Mac $HOME/Library/Application
Support/Google/Chrome
.* 9 Unlimite
d
Linux
Chrome
Data
Extende
d
Linux $HOME/.config/google-
chrome
.* 9 Unlimite
d
Tanium
Trace
Database
Windows
Tanium
Trace
Database
Extende
d
Windows %TANIUMDIR%\ ^monitor\.db(\-)
*(wal|shm|journal)*$
0 Unlimite
d
Tanium
Index
Database
Windows
Tanium
Index
Database
Extende
d
Windows %TANIUMDIR%\Tools\EPI\ ^EndpointIndex\.db
(\-)*(wal|shm|
journal)*$
0 Unlimite
d
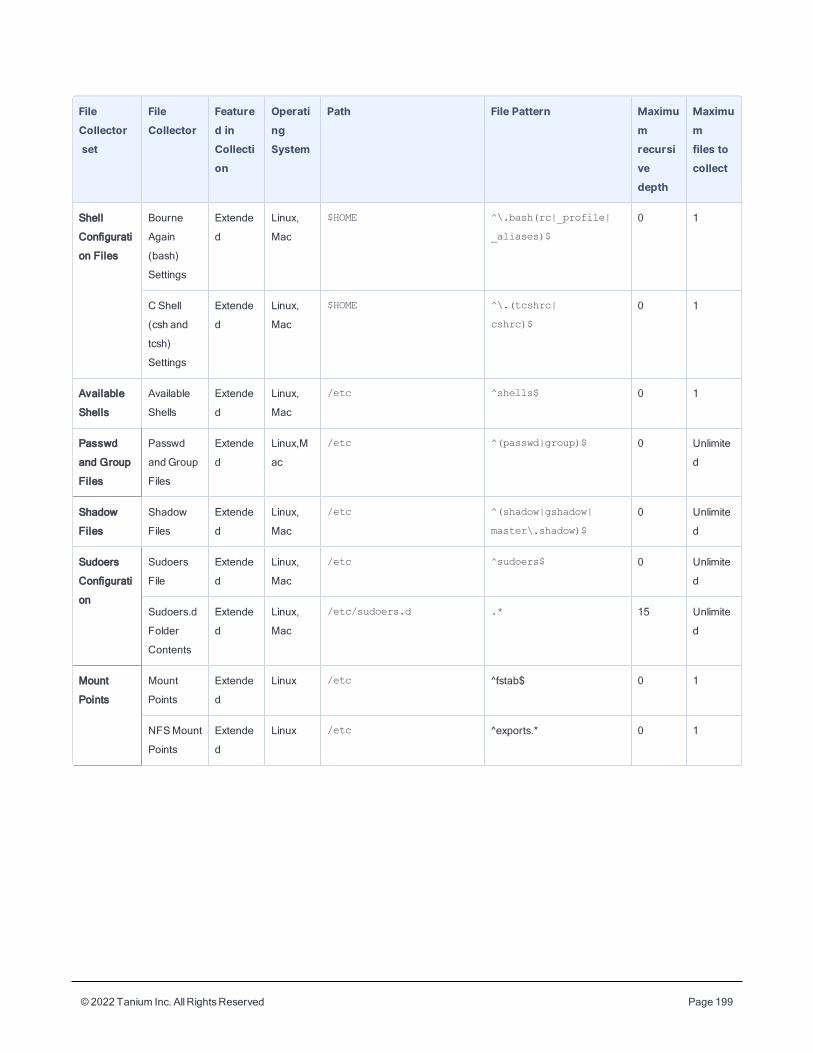
© 2022 Tanium Inc. AllRightsReserved Page 199
FileCollectorset
FileCollector
Featured inCollection
OperatingSystem
Path File Pattern Maximumrecursivedepth
Maximumfiles tocollect
Shell
Configurati
on Files
Bourne
Again
(bash)
Settings
Extende
d
Linux,
Mac
$HOME ^\.bash(rc|_profile|
_aliases)$
0 1
C Shell
(csh and
tcsh)
Settings
Extende
d
Linux,
Mac
$HOME ^\.(tcshrc|
cshrc)$
0 1
Available
Shells
Available
Shells
Extende
d
Linux,
Mac
/etc ^shells$ 0 1
Passwd
and Group
Files
Passwd
andGroup
Files
Extende
d
Linux,M
ac
/etc ^(passwd|group)$ 0 Unlimite
d
Shadow
Files
Shadow
Files
Extende
d
Linux,
Mac
/etc ^(shadow|gshadow|
master\.shadow)$
0 Unlimite
d
Sudoers
Configurati
on
Sudoers
File
Extende
d
Linux,
Mac
/etc ^sudoers$ 0 Unlimite
d
Sudoers.d
Folder
Contents
Extende
d
Linux,
Mac
/etc/sudoers.d .* 15 Unlimite
d
Mount
Points
Mount
Points
Extende
d
Linux /etc ^fstab$ 0 1
NFSMount
Points
Extende
d
Linux /etc ^exports.* 0 1
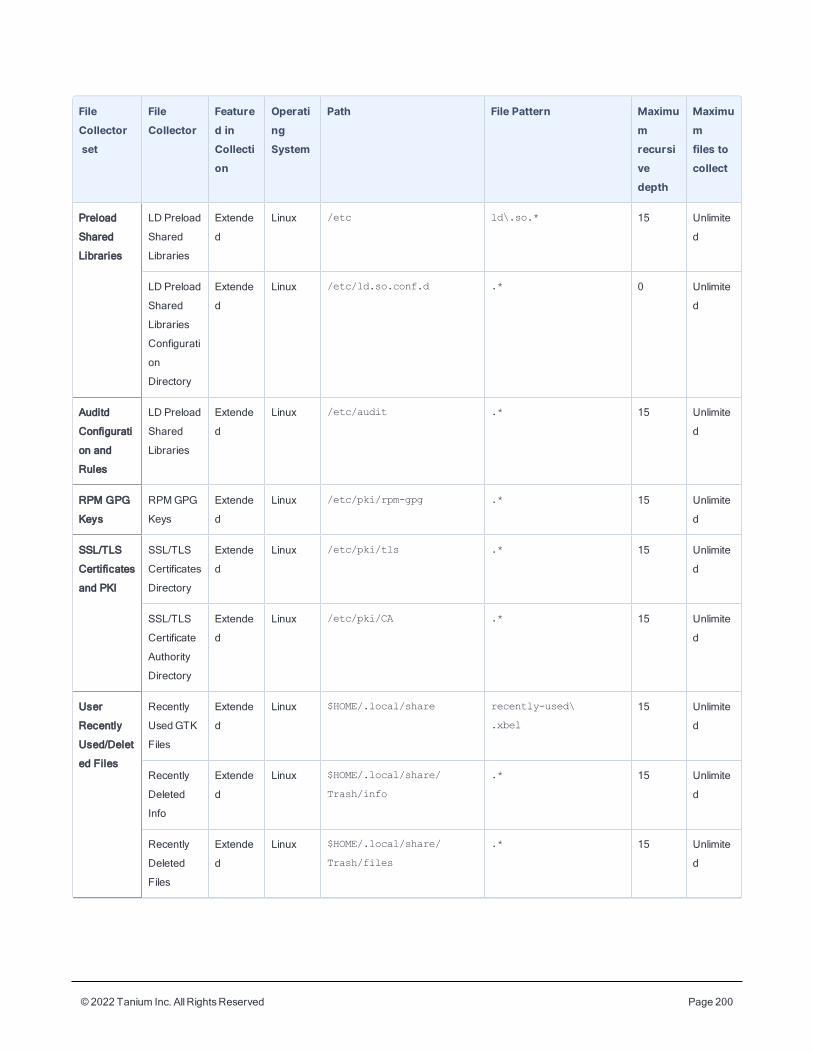
© 2022 Tanium Inc. AllRightsReserved Page 200
FileCollectorset
FileCollector
Featured inCollection
OperatingSystem
Path File Pattern Maximumrecursivedepth
Maximumfiles tocollect
Preload
Shared
Libraries
LD Preload
Shared
Libraries
Extende
d
Linux /etc ld\.so.* 15 Unlimite
d
LD Preload
Shared
Libraries
Configurati
on
Directory
Extende
d
Linux /etc/ld.so.conf.d .* 0 Unlimite
d
Auditd
Configurati
on and
Rules
LD Preload
Shared
Libraries
Extende
d
Linux /etc/audit .* 15 Unlimite
d
RPM GPG
Keys
RPMGPG
Keys
Extende
d
Linux /etc/pki/rpm-gpg .* 15 Unlimite
d
SSL/TLS
Certificates
and PKI
SSL/TLS
Certificates
Directory
Extende
d
Linux /etc/pki/tls .* 15 Unlimite
d
SSL/TLS
Certificate
Authority
Directory
Extende
d
Linux /etc/pki/CA .* 15 Unlimite
d
User
Recently
Used/Delet
ed Files
Recently
UsedGTK
Files
Extende
d
Linux $HOME/.local/share recently-used\
.xbel
15 Unlimite
d
Recently
Deleted
Info
Extende
d
Linux $HOME/.local/share/
Trash/info
.* 15 Unlimite
d
Recently
Deleted
Files
Extende
d
Linux $HOME/.local/share/
Trash/files
.* 15 Unlimite
d
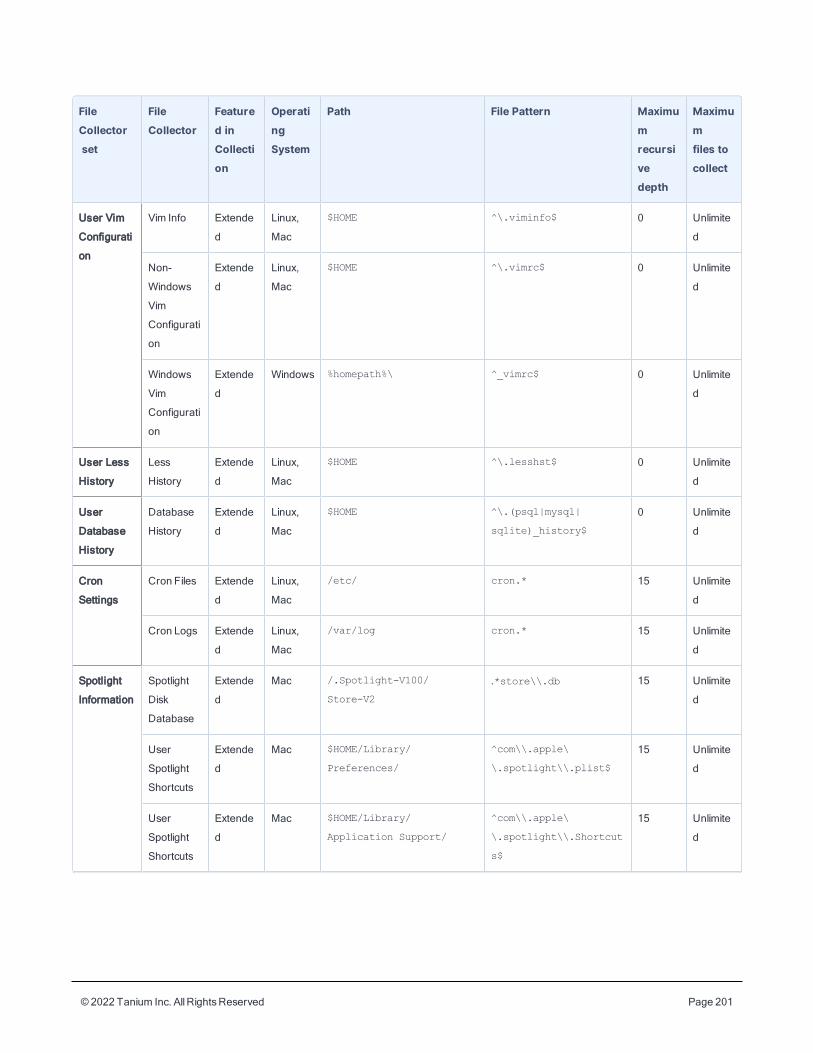
© 2022 Tanium Inc. AllRightsReserved Page 201
FileCollectorset
FileCollector
Featured inCollection
OperatingSystem
Path File Pattern Maximumrecursivedepth
Maximumfiles tocollect
User Vim
Configurati
on
Vim Info Extende
d
Linux,
Mac
$HOME ^\.viminfo$ 0 Unlimite
d
Non-
Windows
Vim
Configurati
on
Extende
d
Linux,
Mac
$HOME ^\.vimrc$ 0 Unlimite
d
Windows
Vim
Configurati
on
Extende
d
Windows %homepath%\ ^_vimrc$ 0 Unlimite
d
User Less
History
Less
History
Extende
d
Linux,
Mac
$HOME ^\.lesshst$ 0 Unlimite
d
User
Database
History
Database
History
Extende
d
Linux,
Mac
$HOME ^\.(psql|mysql|
sqlite)_history$
0 Unlimite
d
Cron
Settings
Cron Files Extende
d
Linux,
Mac
/etc/ cron.* 15 Unlimite
d
Cron Logs Extende
d
Linux,
Mac
/var/log cron.* 15 Unlimite
d
Spotlight
Information
Spotlight
Disk
Database
Extende
d
Mac /.Spotlight-V100/
Store-V2
.*store\\.db 15 Unlimite
d
User
Spotlight
Shortcuts
Extende
d
Mac $HOME/Library/
Preferences/
^com\\.apple\
\.spotlight\\.plist$
15 Unlimite
d
User
Spotlight
Shortcuts
Extende
d
Mac $HOME/Library/
Application Support/
^com\\.apple\
\.spotlight\\.Shortcut
s$
15 Unlimite
d
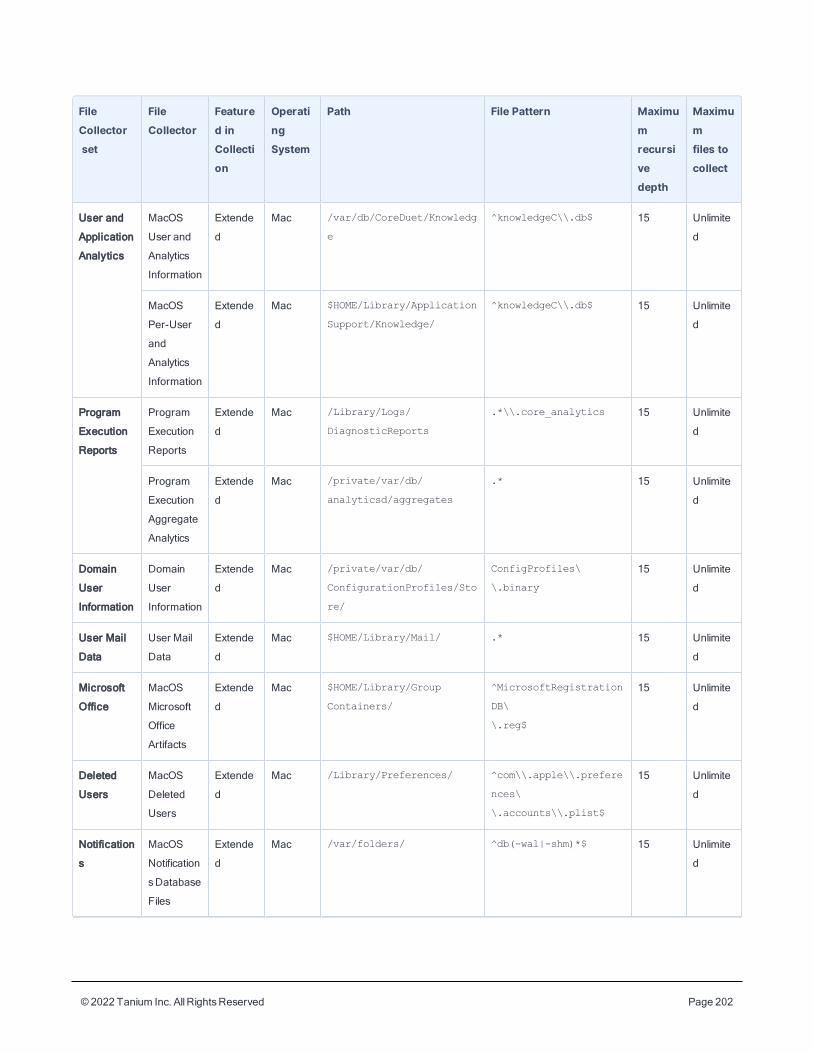
© 2022 Tanium Inc. AllRightsReserved Page 202
FileCollectorset
FileCollector
Featured inCollection
OperatingSystem
Path File Pattern Maximumrecursivedepth
Maximumfiles tocollect
User and
Application
Analytics
MacOS
User and
Analytics
Information
Extende
d
Mac /var/db/CoreDuet/Knowledg
e
^knowledgeC\\.db$ 15 Unlimite
d
MacOS
Per-User
and
Analytics
Information
Extende
d
Mac $HOME/Library/Application
Support/Knowledge/
^knowledgeC\\.db$ 15 Unlimite
d
Program
Execution
Reports
Program
Execution
Reports
Extende
d
Mac /Library/Logs/
DiagnosticReports
.*\\.core_analytics 15 Unlimite
d
Program
Execution
Aggregate
Analytics
Extende
d
Mac /private/var/db/
analyticsd/aggregates
.* 15 Unlimite
d
Domain
User
Information
Domain
User
Information
Extende
d
Mac /private/var/db/
ConfigurationProfiles/Sto
re/
ConfigProfiles\
\.binary
15 Unlimite
d
User Mail
Data
User Mail
Data
Extende
d
Mac $HOME/Library/Mail/ .* 15 Unlimite
d
Microsoft
Office
MacOS
Microsoft
Office
Artifacts
Extende
d
Mac $HOME/Library/Group
Containers/
^MicrosoftRegistration
DB\
\.reg$
15 Unlimite
d
Deleted
Users
MacOS
Deleted
Users
Extende
d
Mac /Library/Preferences/ ^com\\.apple\\.prefere
nces\
\.accounts\\.plist$
15 Unlimite
d
Notification
s
MacOS
Notification
sDatabase
Files
Extende
d
Mac /var/folders/ ^db(-wal|-shm)*$ 15 Unlimite
d
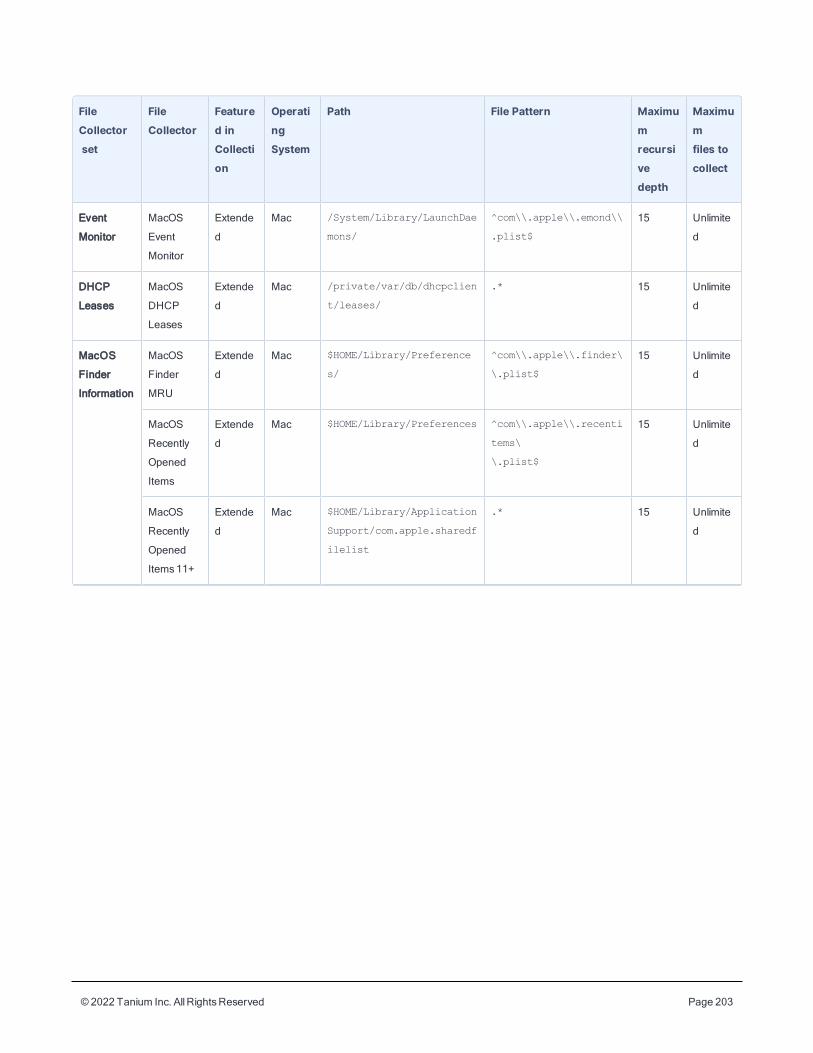
© 2022 Tanium Inc. AllRightsReserved Page 203
FileCollectorset
FileCollector
Featured inCollection
OperatingSystem
Path File Pattern Maximumrecursivedepth
Maximumfiles tocollect
Event
Monitor
MacOS
Event
Monitor
Extende
d
Mac /System/Library/LaunchDae
mons/
^com\\.apple\\.emond\\
.plist$
15 Unlimite
d
DHCP
Leases
MacOS
DHCP
Leases
Extende
d
Mac /private/var/db/dhcpclien
t/leases/
.* 15 Unlimite
d
MacOS
Finder
Information
MacOS
Finder
MRU
Extende
d
Mac $HOME/Library/Preference
s/
^com\\.apple\\.finder\
\.plist$
15 Unlimite
d
MacOS
Recently
Opened
Items
Extende
d
Mac $HOME/Library/Preferences ^com\\.apple\\.recenti
tems\
\.plist$
15 Unlimite
d
MacOS
Recently
Opened
Items11+
Extende
d
Mac $HOME/Library/Application
Support/com.apple.sharedf
ilelist
.* 15 Unlimite
d
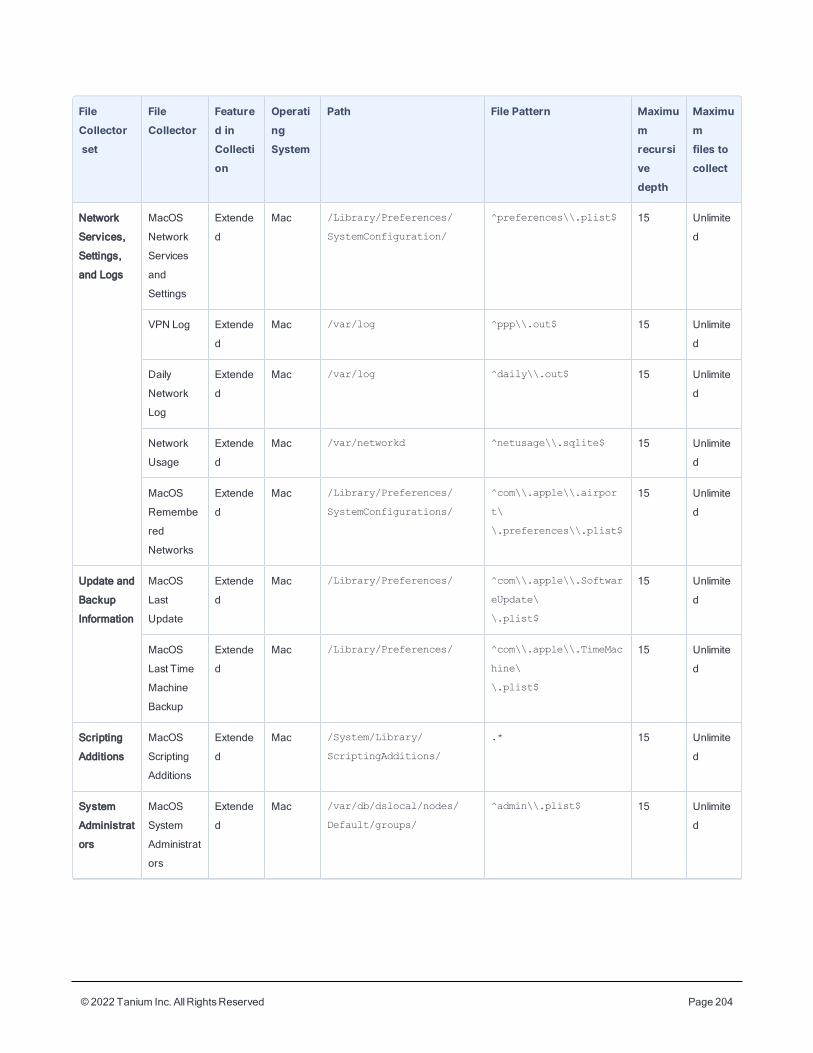
© 2022 Tanium Inc. AllRightsReserved Page 204
FileCollectorset
FileCollector
Featured inCollection
OperatingSystem
Path File Pattern Maximumrecursivedepth
Maximumfiles tocollect
Network
Services,
Settings,
and Logs
MacOS
Network
Services
and
Settings
Extende
d
Mac /Library/Preferences/
SystemConfiguration/
^preferences\\.plist$ 15 Unlimite
d
VPN Log Extende
d
Mac /var/log ^ppp\\.out$ 15 Unlimite
d
Daily
Network
Log
Extende
d
Mac /var/log ^daily\\.out$ 15 Unlimite
d
Network
Usage
Extende
d
Mac /var/networkd ^netusage\\.sqlite$ 15 Unlimite
d
MacOS
Remembe
red
Networks
Extende
d
Mac /Library/Preferences/
SystemConfigurations/
^com\\.apple\\.airpor
t\
\.preferences\\.plist$
15 Unlimite
d
Update and
Backup
Information
MacOS
Last
Update
Extende
d
Mac /Library/Preferences/ ^com\\.apple\\.Softwar
eUpdate\
\.plist$
15 Unlimite
d
MacOS
Last Time
Machine
Backup
Extende
d
Mac /Library/Preferences/ ^com\\.apple\\.TimeMac
hine\
\.plist$
15 Unlimite
d
Scripting
Additions
MacOS
Scripting
Additions
Extende
d
Mac /System/Library/
ScriptingAdditions/
.* 15 Unlimite
d
System
Administrat
ors
MacOS
System
Administrat
ors
Extende
d
Mac /var/db/dslocal/nodes/
Default/groups/
^admin\\.plist$ 15 Unlimite
d
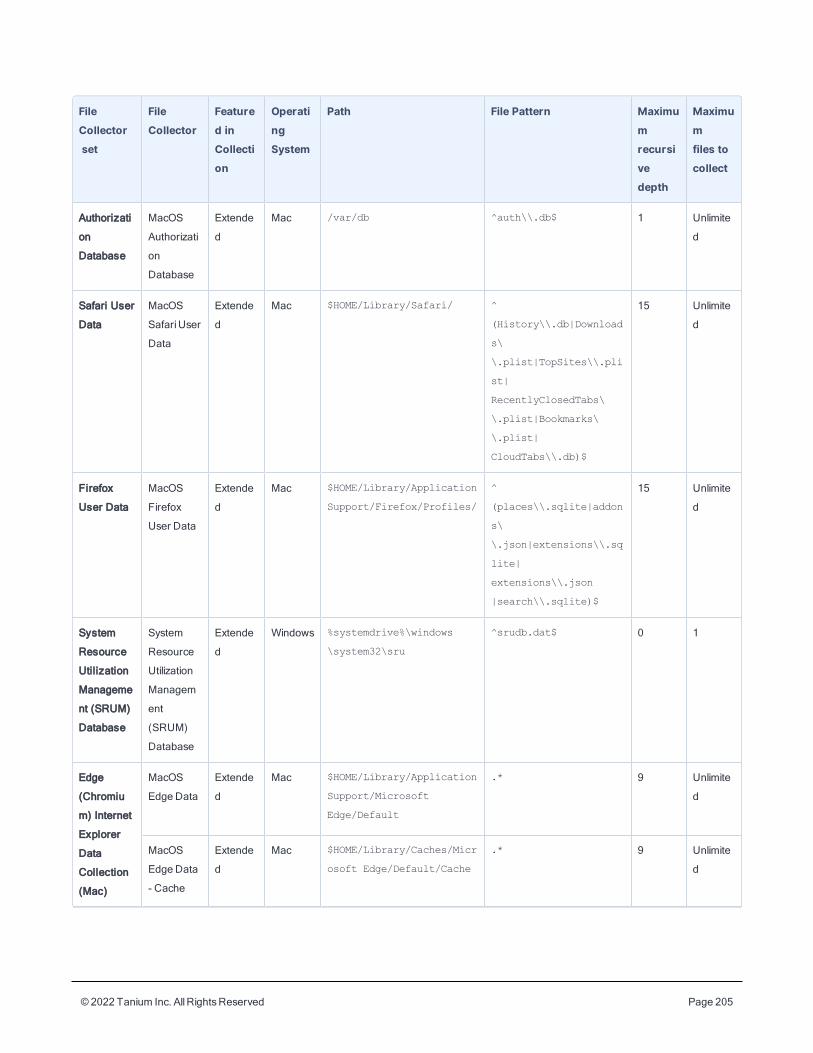
© 2022 Tanium Inc. AllRightsReserved Page 205
FileCollectorset
FileCollector
Featured inCollection
OperatingSystem
Path File Pattern Maximumrecursivedepth
Maximumfiles tocollect
Authorizati
on
Database
MacOS
Authorizati
on
Database
Extende
d
Mac /var/db ^auth\\.db$ 1 Unlimite
d
Safari User
Data
MacOS
SafariUser
Data
Extende
d
Mac $HOME/Library/Safari/ ^
(History\\.db|Download
s\
\.plist|TopSites\\.pli
st|
RecentlyClosedTabs\
\.plist|Bookmarks\
\.plist|
CloudTabs\\.db)$
15 Unlimite
d
Firefox
User Data
MacOS
Firefox
User Data
Extende
d
Mac $HOME/Library/Application
Support/Firefox/Profiles/
^
(places\\.sqlite|addon
s\
\.json|extensions\\.sq
lite|
extensions\\.json
|search\\.sqlite)$
15 Unlimite
d
System
Resource
Utilization
Manageme
nt (SRUM)
Database
System
Resource
Utilization
Managem
ent
(SRUM)
Database
Extende
d
Windows %systemdrive%\windows
\system32\sru
^srudb.dat$ 0 1
Edge
(Chromiu
m) Internet
Explorer
Data
Collection
(Mac)
MacOS
EdgeData
Extende
d
Mac $HOME/Library/Application
Support/Microsoft
Edge/Default
.* 9 Unlimite
d
MacOS
EdgeData
- Cache
Extende
d
Mac $HOME/Library/Caches/Micr
osoft Edge/Default/Cache
.* 9 Unlimite
d
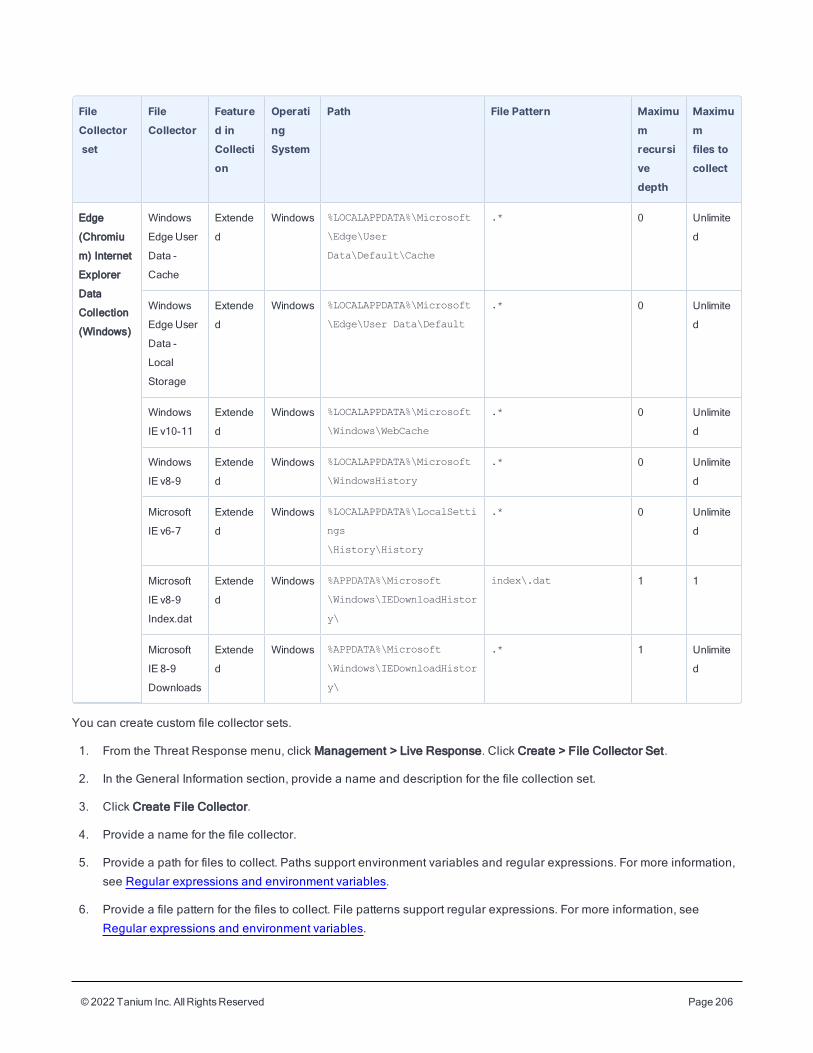
© 2022 Tanium Inc. AllRightsReserved Page 206
FileCollectorset
FileCollector
Featured inCollection
OperatingSystem
Path File Pattern Maximumrecursivedepth
Maximumfiles tocollect
Edge
(Chromiu
m) Internet
Explorer
Data
Collection
(Windows)
Windows
Edge User
Data -
Cache
Extende
d
Windows %LOCALAPPDATA%\Microsoft
\Edge\User
Data\Default\Cache
.* 0 Unlimite
d
Windows
Edge User
Data -
Local
Storage
Extende
d
Windows %LOCALAPPDATA%\Microsoft
\Edge\User Data\Default
.* 0 Unlimite
d
Windows
IE v10-11
Extende
d
Windows %LOCALAPPDATA%\Microsoft
\Windows\WebCache
.* 0 Unlimite
d
Windows
IE v8-9
Extende
d
Windows %LOCALAPPDATA%\Microsoft
\WindowsHistory
.* 0 Unlimite
d
Microsoft
IE v6-7
Extende
d
Windows %LOCALAPPDATA%\LocalSetti
ngs
\History\History
.* 0 Unlimite
d
Microsoft
IE v8-9
Index.dat
Extende
d
Windows %APPDATA%\Microsoft
\Windows\IEDownloadHistor
y\
index\.dat 1 1
Microsoft
IE 8-9
Downloads
Extende
d
Windows %APPDATA%\Microsoft
\Windows\IEDownloadHistor
y\
.* 1 Unlimite
d
You can create custom file collector sets.
1. From the Threat Response menu, click Management > Live Response. Click Create > File Collector Set.
2. In the General Information section, provide a name and description for the file collection set.
3. Click Create File Collector.
4. Provide a name for the file collector.
5. Provide a path for files to collect. Paths support environment variables and regular expressions. For more information,
see Regular expressions and environment variables.
6. Provide a file pattern for the files to collect. File patterns support regular expressions. For more information, see
Regular expressions and environment variables.
© 2022 Tanium Inc. AllRightsReserved Page 207
7. Specify the maximum depth of directories to recurse from the path you provided.
8. Specify the maximum number of files to collect.
9. Select Raw to preserve the format of the files that are collected.
10. Select the operating systems from which you want the file collector to collect files.
11. Click the check mark in the top right to save the file collector.
12. Click Save.
Script setsYou can configure scripts to run on endpoints when you deploy the collection. Supported scripting languages include
PowerShell and Python.
1. From the Threat Response menu, click Management > Live Response. Click Create > Script Set.
2. In the General Information section, provide a name and description for the script set.
3. Under Scripts click Add a Script.
4. Provide a filename for the script.
5. Select Python or PowerShell as the type of script.
6. Provide any script arguments to use as part of running the script.
7. Add the script source.
8. Click Save.
Script output is saved in a file that has the same as the script, and has -results appended to the file extension. For
example, a script named test.ps1 creates output in test.ps1-results. All standard output is directed to the collector
directory.
Collect data from endpointsTo collect data from endpoints, deploy a Live Response package.
To prevent resource overload on endpoints, only issue this action manually. Do not create a scheduled
action.
1. From the Threat Response menu, click Response Activity > Create > Live Response.
2. Target endpoints for data collection. Use an operating system-based question, for example: Get Computer Name
from machines with Is Windows containing "True" .
3. Select the endpoints from which you want to collect data and click Deploy Action.
4. In the Deployment Package field, type Live Response.
© 2022 Tanium Inc. AllRightsReserved Page 208
5. Select the package that matches the collection and destination settings that you want to deploy.
6. In the Base Directory field, provide a directory name where files are placed as they are collected. This directory is
created under the Remote Path value that you provide in the destination you are using for the Live Response
package. For example, if you provide a Base Directory of MyCollection for an SSH destination where the Remote
Path is FileCollection, the result would be /home/username/FileCollection/MyCollection since the remote
path provided in SSH destinations is relative to the home directory of the present user. Depending on the type of
destination, the location of the Remote Path can vary. For example, in SMB destinations it is explicit; whereas in
SSH destinations it is relative to the home directory of the present user.
7. Optionally select Flatten Output Files if you want all collected files placed in one directory where the filename
includes the original path, but does not retain the folder structure.
8. Click Show Preview to Continue.
9. After you preview the list of endpoints to which the action is being deployed, click Deploy Action.
Threat Response tests the connection by writing a LRConnectionTestfile to the destination. If the write fails, the action tries
the other destinations in the transfer configuration in the order they are listed in the configuration file. If all the connection
tests fail, the action does not proceed.
Tanium shows the package as complete almost immediately after the package is downloaded on the endpoints. This
completion is not accurate because Live Response runs in detached mode. File transfers continue after the action
completes.
The actual time to complete the transfer depends on the endpoint activity and connection speed between the endpoint and
the destination system.
For macOS and Linux endpoints, memory data that is transferred to a destination is packaged in a ZIP file. For example, if
you selected memory details as an included module, Live Response creates a ZIP file that contains a raw memory dump
and additional system files. You can analyze this data with a tool such as Winpmem or Volexity Surge. For Windows
endpoints, memory data is collected as one or more raw files.
Collect logsIn addition to the standard action logs on the endpoint (Tanium_Client_Location\Downloads\Action_###\Action_
####.log), a log file of activities resides in the same directory. This file follows the naming convention: YYYYMMDDhhmm_
LR.log.
When collection completes, the YYYYMMDDhhmm_LR.log is copied to the destination. The action log is not copied to the
destination.
Use both the action log and the Live Response log to troubleshoot problems. The action log captures messages written to
standard error (stderr).
Regular expressions and environment variablesFile patterns support regular expression syntax.
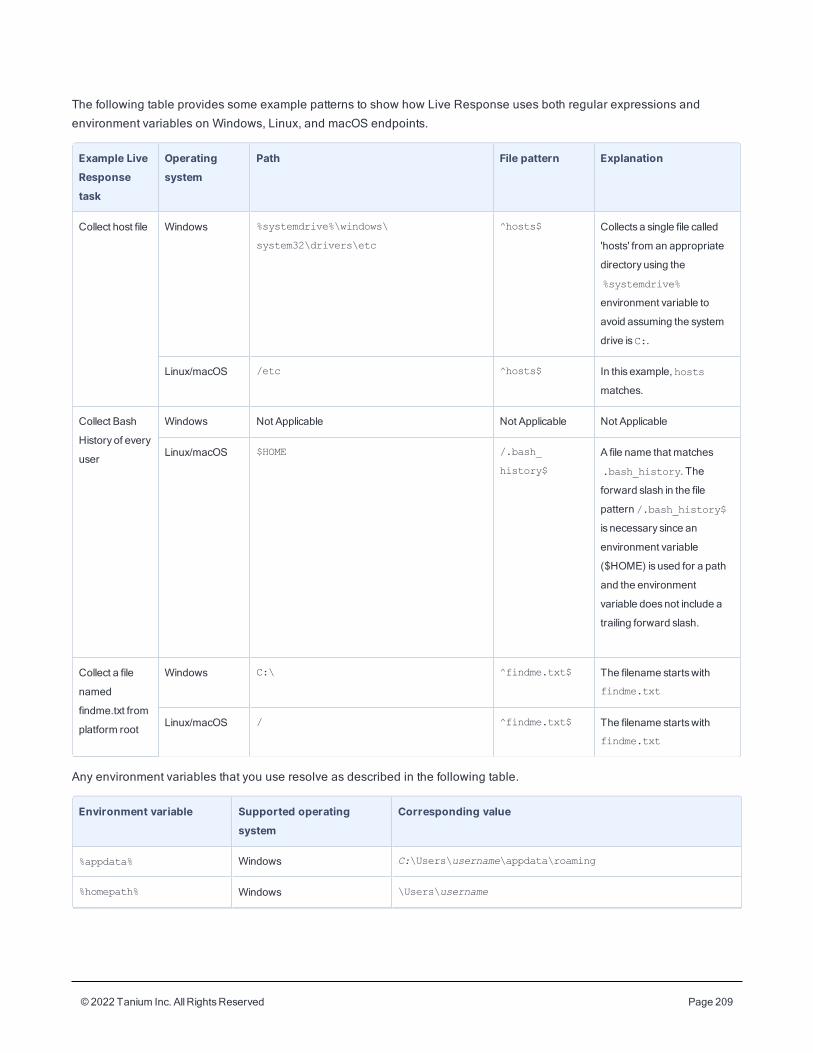
© 2022 Tanium Inc. AllRightsReserved Page 209
The following table provides some example patterns to show how Live Response uses both regular expressions and
environment variables on Windows, Linux, and macOS endpoints.
Example LiveResponsetask
Operatingsystem
Path File pattern Explanation
Collect host file Windows %systemdrive%\windows\
system32\drivers\etc
^hosts$ Collects a single file called
'hosts' from an appropriate
directory using the
%systemdrive%
environment variable to
avoid assuming the system
drive isC:.
Linux/macOS /etc ^hosts$ In this example, hosts
matches.
Collect Bash
History of every
user
Windows Not Applicable Not Applicable Not Applicable
Linux/macOS $HOME /.bash_
history$
A file name that matches
.bash_history. The
forward slash in the file
pattern /.bash_history$
is necessary since an
environment variable
($HOME) is used for a path
and the environment
variable doesnot include a
trailing forward slash.
Collect a file
named
findme.txt from
platform root
Windows C:\ ^findme.txt$ The filename startswith
findme.txt
Linux/macOS / ^findme.txt$ The filename startswith
findme.txt
Any environment variables that you use resolve as described in the following table.
Environment variable Supported operatingsystem
Corresponding value
%appdata% Windows C:\Users\username\appdata\roaming
%homepath% Windows \Users\username
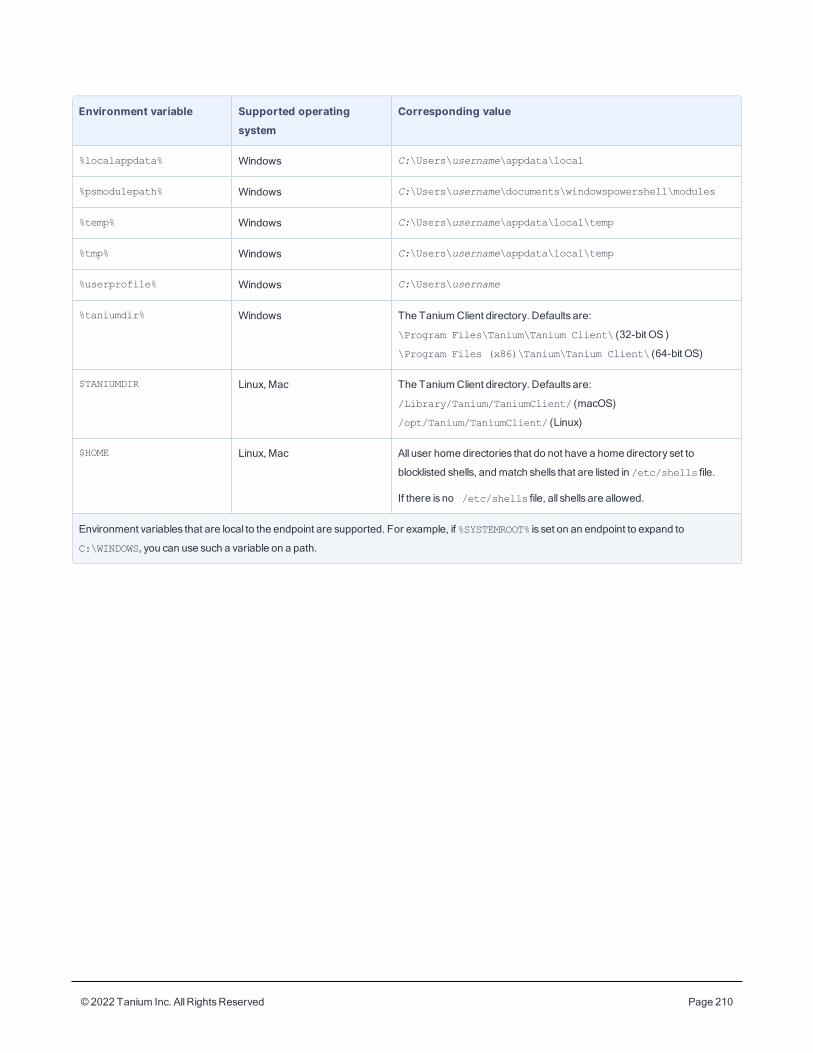
© 2022 Tanium Inc. AllRightsReserved Page 210
Environment variable Supported operatingsystem
Corresponding value
%localappdata% Windows C:\Users\username\appdata\local
%psmodulepath% Windows C:\Users\username\documents\windowspowershell\modules
%temp% Windows C:\Users\username\appdata\local\temp
%tmp% Windows C:\Users\username\appdata\local\temp
%userprofile% Windows C:\Users\username
%taniumdir% Windows The TaniumClient directory. Defaults are:
\Program Files\Tanium\Tanium Client\ (32-bit OS )
\Program Files (x86)\Tanium\Tanium Client\ (64-bit OS)
$TANIUMDIR Linux, Mac The TaniumClient directory. Defaults are:
/Library/Tanium/TaniumClient/ (macOS)
/opt/Tanium/TaniumClient/ (Linux)
$HOME Linux, Mac All user home directories that do not have a home directory set to
blocklisted shells, andmatch shells that are listed in /etc/shells file.
If there is no /etc/shells file, all shells are allowed.
Environment variables that are local to the endpoint are supported. For example, if %SYSTEMROOT% is set on an endpoint to expand to
C:\WINDOWS, you can use such a variable on a path.
© 2022 Tanium Inc. AllRightsReserved Page 211
Isolating endpointsIsolate a Windows, Linux, or Mac endpoint that shows evidence of compromise or other suspicious activity. Use Threat
Response to apply, remove, and test for quarantine.
When an endpoint is quarantined, by default the only approved traffic allowed on the quarantined endpoint includes:
l Between the Tanium Client on the quarantined endpoint and Tanium Server over port 17472.
l For essential traffic that is necessary to obtain and resolve IP addresses (DHCP/DNS).
Threat Response includes a safety feature that automatically reverses a quarantine policy. After a quarantine policy is
applied, the effect of the policy is logged. If the endpoint is able to communicate with Tanium Server, Threat Response logs
the successful application of the policy. If a policy prevents the endpoint from communicating with Tanium Server, Threat
Response backs out the policy and saves logs in the action folder.
Install Quarantine
Import the TaniumQuarantine solution
Install the Tanium Quarantine solution by importing the associated content from the Solutions page.
1. From the Main menu, click Administration > Configuration > Solutions.
2. In the Content section, select the IR Quarantine row and click Import Selected.
3. Review the list of saved actions, packages, and sensors and click Proceed with Import.
4. When the import is complete, you are returned to the Solutions page. Verify that the values in the Available Version
and Imported Version columns match.
Before you begin
Test quarantine policies in a lab environment before deploying the policy. Do not apply a policy until its
behavior is known and predictable. Incorrectly configured policies can block access to the Tanium Server.
l You must have a Content Administrator account for Tanium Console. For more information, see Tanium Core
Platform User Guide: Managing Roles.
l Identify the traffic that is required when an endpoint is under quarantine.
l You must have a lab endpoint on the target operating system (Windows, Linux, or Mac) you can use to test the
quarantine policies. You must be able to physically access the machine or to access it using RDP (Windows) or SSH
(Linux, Mac).
l You must have access to the endpoint that you want to quarantine through a sensor or saved question in the Tanium
Console.
© 2022 Tanium Inc. AllRightsReserved Page 212
Endpoint operating system requirements
SupportedWindows versions
l Windows 7 (SP1)
l Windows 8.1
l Windows 10
l Windows Server 2003
l Windows Server 2008
l Windows Server 2012
l Windows Server 2016
l Windows Server 2019
l Windows Server 2012R2 or later
l Windows 2008R2 (SP1)
Supported LinuxOS versions
l RedHat/CentOS 5 IPTables on SYSV
l RedHat/CentOS 6 IPTables on SYSV
l RedHat/CentOS 7 Firewalld on Systemd
l RedHat/CentOS 8
l Ubuntu 12,14 UFW on Upstart
l Ubuntu 15,16, 18, and 20 UFW on Upstart/Systemd
SupportedMacOS versions
l macOS 11.0 Big Sur
l macOS 10.15 Catalina
l macOS 10.14 Mojave
l macOS 10.13 High Sierra
l macOS 10.12 Sierra
l OS X 10.11 El Capitan
l OS X 10.10 Yosemite
l OS X 10.9 Mavericks
OSX 10.8 - Mountain Lion and earlier releases are based on ipfirewall (IPFW) and are not supported.
© 2022 Tanium Inc. AllRightsReserved Page 213
Configure Windows endpointsThe Apply Windows IPsec Quarantine package uses Windows IPsec policies to quarantine the endpoint. You can also add
custom rules and options, see Create custom quarantine rules on page 215 for more information.
You cannot use Windows IPsec Quarantine on networks where a domain IPsec policy is already enforced.
Check that the IPsec Policy Agent service is running on the endpoints
Optionally, you can verify that the IPsec Policy Agent is listed as a running service in Windows.
1. In Interact, ask the question: Get Service Details containing "PolicyAgent" from all machines with
Service Details containing "PolicyAgent"
2. In the table that gets returned, check the results in the following columns.
l Service Status: Running or Stopped
l Service Startup Mode: Manual or Automatic
3. If necessary, drill down into the results to determine which endpoints do not have the IPsec Policy agent running.
Configure Linux endpointsThe Apply Linux IPTables Quarantine package quarantines endpoints that are running Linux-based operating systems that
support the use of the iptables module.
Verify that endpoints are not using NetworkManager
Linux IPTables Quarantine checks to ensure that the iptables module is installed and disables the use of the Network
Manager module on endpoints that are targeted for quarantine.
You can check for Linux-based endpoints that are running Network Manager by using the Linux Network Manager sensor to
determine if Network Manager is enabled. In Interact, type network manager to find the sensor. This sensor has no
parameters.
Configure Mac endpointsThe Apply Mac PF Quarantine package quarantines endpoints that are running Mac OS X operating systems that support
the use of Packet Filter (PF) rules. This package creates packet filter rules that isolate endpoints by eliminating
communication with network resources. PF software must be installed on endpoints that are targeted for quarantine.
© 2022 Tanium Inc. AllRightsReserved Page 214
Test quarantine on lab endpointsBy default, the quarantine on the lab endpoint blocks all communication except the Tanium Server. You can configure
custom rules to define allowed traffic direction, allowed IP addresses, ports, and protocols. For more information about how
to create and deploy custom rules, see Create custom quarantine rules on page 215.
Do not quarantine without testing the rules configuration in the lab.
1. Target computers for quarantine.
a. In Tanium Console, use the Is Windows,Is Linux, or Is Mac sensor to locate an endpoint to quarantine.
b. Select the entry for True, and click Drill Down.
c. On the saved questions page, select Computer Name and click Load.
A Computer Names list displays the names of all computers that are running the selected OS.
d. Select the lab endpoint as a target and click Deploy Action.
2. In the Deployment Package field, type the name of the quarantine package that you want to deploy:
l Apply Windows IPsec Quarantine
l Apply Linux IPTables Quarantine
l Apply Mac PF Quarantine
3. (Optional) Define quarantine rules and options.
For more information about quarantine rules, see Create custom quarantine rules on page 215.
l If you already attached a taniumquarantine.dat file to the package you are deploying, you do not need to
make any other configurations.
l Otherwise, select Override Config to apply custom rules to the action.
l If you are using the options and rules in this package deployment, select any options that you want to enable
and enter your custom quarantine rules into the Custom Quarantine Rules field.
4. Click Show Preview to Continue to preview the targeting criteria for the action. Click Deploy Action.
5. Verify quarantine of the targeted lab endpoint.
Confirm that the computer has no available means of communication to resources other than Tanium Server and any
endpoints that you configured in custom quarantine rules.
You can use RDP (Windows) SSH (Linux/Mac), the Ping network utility, or a similar means to confirm that
communication is blocked. By default, the only traffic that the quarantine allows is between Tanium Client on the
quarantined computer and Tanium Server over port 17472. If the computer is a server that must allow connections to
name servers, verify that those connections are allowed to pass through.
© 2022 Tanium Inc. AllRightsReserved Page 215
6. Verify the visibility of the quarantined computer to Tanium Server.
a. Target the lab computer with a question or sensor.
b. Check the sensor results for the visibility of the quarantined computer.
c. On the Quarantine dashboard, click Isolated Machines. A single computer is listed with a Yes on the Quarantine:
Isolated Machines page.
Action folders are located under the Tanium Client installation folder on the endpoint, usually Downloads\Action_
XXXX.log.
Remove quarantineDeploy the Remove Windows IPsec Quarantine, Remove Mac PF Quarantine, or Remove Linux IPTables Quarantine
package to the endpoint to remove the quarantine from the computer. Use RDP (Windows), SSH (Mac/Linux), the Ping utility,
or another method to confirm the removal of the quarantine and the normal communication of the test computer.
Create custom quarantine rulesQuarantine rules and options define allowed traffic direction, allowed IP addresses, ports, and protocols. All other traffic is
blocked. These rules are in the same format for Windows, Linux and Mac. For custom quarantine rule syntax, see
Reference: Custom rules and options on page 216.
If you do not define any quarantine rules, the default values are used, which gives the quarantined endpoint access only to
the Tanium Server and permits DNS/DHCP traffic.
If you previously provided a Windows IPsec policy file, the IPsec policy overrides the custom quarantine rules.
Test the quarantine policy in a lab environment before deploying the policy. Do not apply a policy until its
behavior is known and predictable. Incorrectly configured policies can block access to the Tanium Server.
Options for deploying custom quarantine rules and options
You can define quarantine rules and options by either attaching a configuration file to the package, or by selecting options in
the Tanium Console when you deploy a quarantine action.
Attach configuration file to package
You can attach a taniumquarantine.dat configuration file that defines quarantine rules and options to either a
new package or the existing Quarantine packages. Then push that package out to the endpoints. For an example
taniumquarantine.dat file, see Reference: Custom rules examples on page 218.
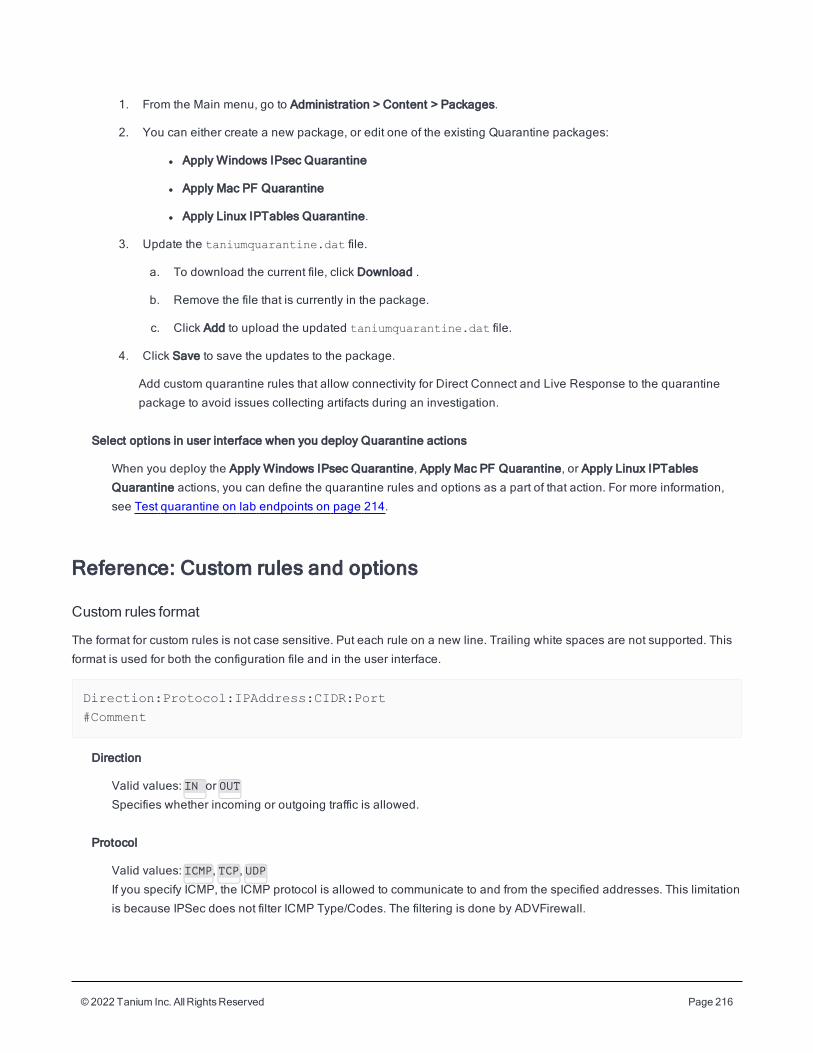
© 2022 Tanium Inc. AllRightsReserved Page 216
1. From the Main menu, go to Administration > Content > Packages.
2. You can either create a new package, or edit one of the existing Quarantine packages:
l Apply Windows IPsec Quarantine
l Apply Mac PF Quarantine
l Apply Linux IPTables Quarantine.
3. Update the taniumquarantine.dat file.
a. To download the current file, click Download .
b. Remove the file that is currently in the package.
c. Click Add to upload the updated taniumquarantine.dat file.
4. Click Save to save the updates to the package.
Add custom quarantine rules that allow connectivity for Direct Connect and Live Response to the quarantine
package to avoid issues collecting artifacts during an investigation.
Select options in user interface when you deploy Quarantine actions
When you deploy the Apply Windows IPsec Quarantine, Apply Mac PF Quarantine, or Apply Linux IPTables
Quarantine actions, you can define the quarantine rules and options as a part of that action. For more information,
see Test quarantine on lab endpoints on page 214.
Reference: Custom rules and options
Custom rules format
The format for custom rules is not case sensitive. Put each rule on a new line. Trailing white spaces are not supported. This
format is used for both the configuration file and in the user interface.
Direction:Protocol:IPAddress:CIDR:Port#Comment
Direction
Valid values: IN or OUT
Specifies whether incoming or outgoing traffic is allowed.
Protocol
Valid values: ICMP, TCP, UDP
If you specify ICMP, the ICMP protocol is allowed to communicate to and from the specified addresses. This limitation
is because IPSec does not filter ICMP Type/Codes. The filtering is done by ADVFirewall.
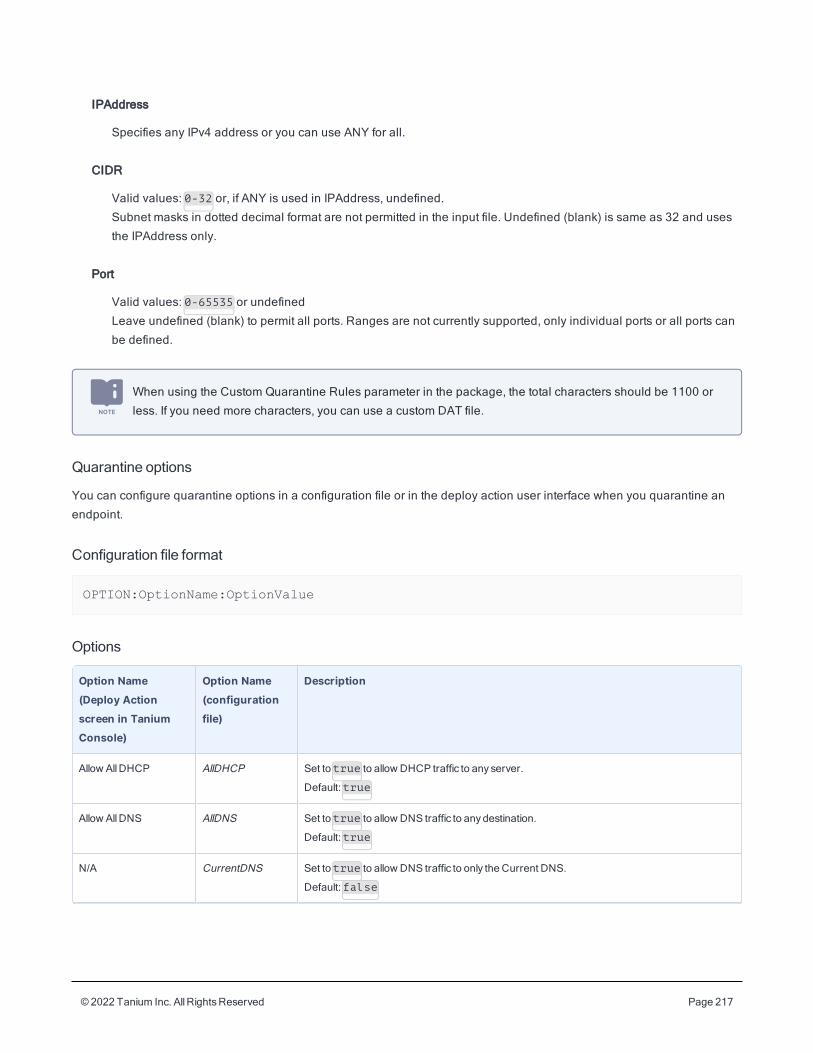
© 2022 Tanium Inc. AllRightsReserved Page 217
IPAddress
Specifies any IPv4 address or you can use ANY for all.
CIDR
Valid values: 0-32 or, if ANY is used in IPAddress, undefined.
Subnet masks in dotted decimal format are not permitted in the input file. Undefined (blank) is same as 32 and uses
the IPAddress only.
Port
Valid values: 0-65535 or undefined
Leave undefined (blank) to permit all ports. Ranges are not currently supported, only individual ports or all ports can
be defined.
When using the Custom Quarantine Rules parameter in the package, the total characters should be 1100 or
less. If you need more characters, you can use a custom DAT file.
Quarantine options
You can configure quarantine options in a configuration file or in the deploy action user interface when you quarantine an
endpoint.
Configuration file format
OPTION:OptionName:OptionValue
Options
Option Name(Deploy Actionscreen in TaniumConsole)
Option Name(configurationfile)
Description
Allow AllDHCP AllDHCP Set to true to allow DHCP traffic to any server.
Default: true
Allow AllDNS AllDNS Set to true to allow DNS traffic to anydestination.
Default: true
N/A CurrentDNS Set to true to allow DNS traffic to only the Current DNS.
Default: false
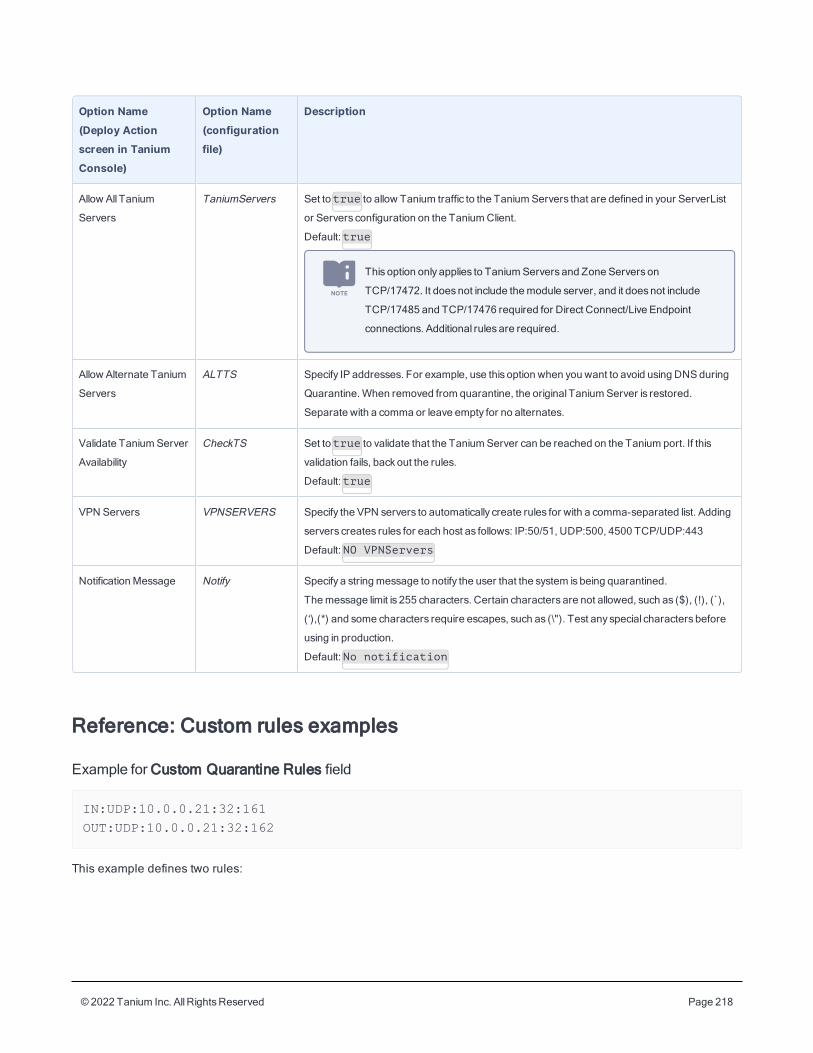
© 2022 Tanium Inc. AllRightsReserved Page 218
Option Name(Deploy Actionscreen in TaniumConsole)
Option Name(configurationfile)
Description
Allow All Tanium
Servers
TaniumServers Set to true to allow Tanium traffic to the TaniumServers that are defined in your ServerList
or Servers configuration on the TaniumClient.
Default: true
This option only applies to TaniumServers and Zone Servers on
TCP/17472. It doesnot include themodule server, and it doesnot include
TCP/17485 and TCP/17476 required for Direct Connect/Live Endpoint
connections. Additional rules are required.
Allow Alternate Tanium
Servers
ALTTS Specify IP addresses. For example, use this option when you want to avoid using DNSduring
Quarantine.When removed from quarantine, the originalTaniumServer is restored.
Separate with a comma or leave empty for no alternates.
Validate TaniumServer
Availability
CheckTS Set to true to validate that the TaniumServer can be reached on the Tanium port. If this
validation fails, backout the rules.
Default: true
VPN Servers VPNSERVERS Specify the VPN servers to automatically create rules for with a comma-separated list. Adding
servers creates rules for each host as follows: IP:50/51, UDP:500, 4500 TCP/UDP:443
Default: NO VPNServers
NotificationMessage Notify Specify a stringmessage to notify the user that the system is being quarantined.
Themessage limit is 255 characters. Certain characters are not allowed, such as ($), (!), (`),
(‘),(*) and some characters require escapes, such as (\"). Test any special characters before
using in production.
Default: No notification
Reference: Custom rules examples
Example for Custom Quarantine Rules field
IN:UDP:10.0.0.21:32:161OUT:UDP:10.0.0.21:32:162
This example defines two rules:
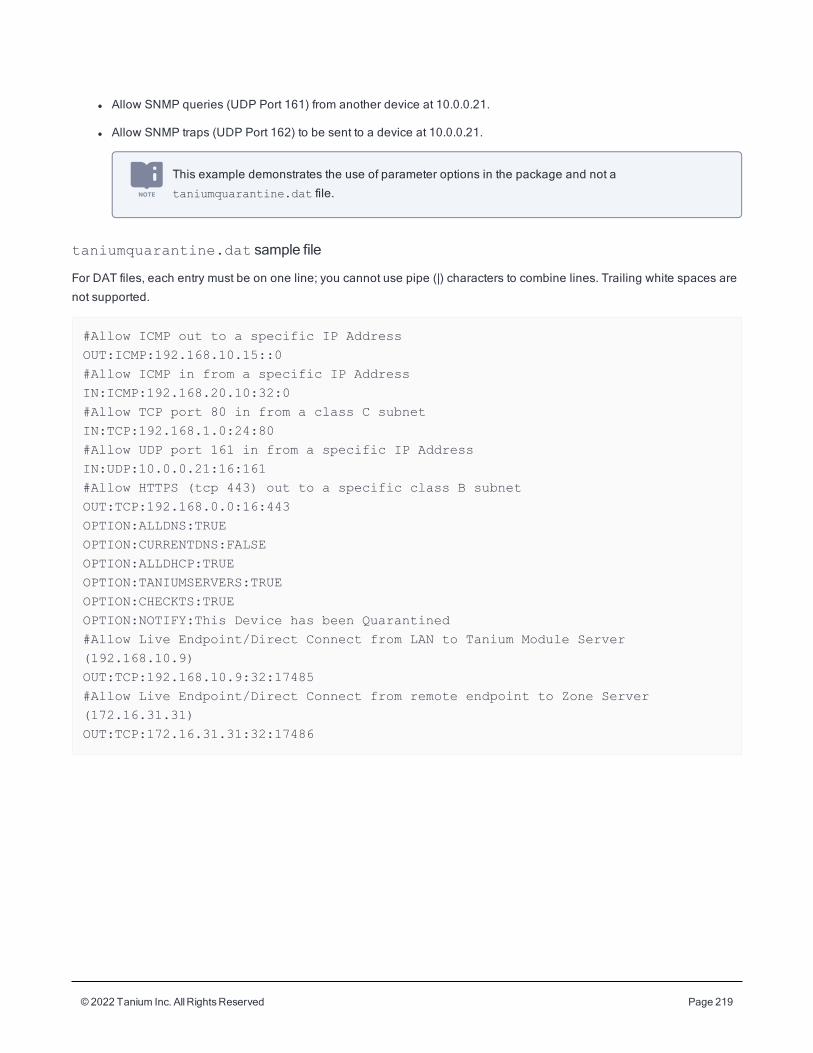
© 2022 Tanium Inc. AllRightsReserved Page 219
l Allow SNMP queries (UDP Port 161) from another device at 10.0.0.21.
l Allow SNMP traps (UDP Port 162) to be sent to a device at 10.0.0.21.
This example demonstrates the use of parameter options in the package and not a
taniumquarantine.dat file.
taniumquarantine.dat sample file
For DAT files, each entry must be on one line; you cannot use pipe (|) characters to combine lines. Trailing white spaces are
not supported.
#Allow ICMP out to a specific IP AddressOUT:ICMP:192.168.10.15::0#Allow ICMP in from a specific IP AddressIN:ICMP:192.168.20.10:32:0#Allow TCP port 80 in from a class C subnetIN:TCP:192.168.1.0:24:80#Allow UDP port 161 in from a specific IP AddressIN:UDP:10.0.0.21:16:161#Allow HTTPS (tcp 443) out to a specific class B subnetOUT:TCP:192.168.0.0:16:443OPTION:ALLDNS:TRUEOPTION:CURRENTDNS:FALSEOPTION:ALLDHCP:TRUEOPTION:TANIUMSERVERS:TRUEOPTION:CHECKTS:TRUEOPTION:NOTIFY:This Device has been Quarantined#Allow Live Endpoint/Direct Connect from LAN to Tanium Module Server(192.168.10.9)OUT:TCP:192.168.10.9:32:17485#Allow Live Endpoint/Direct Connect from remote endpoint to Zone Server(172.16.31.31)OUT:TCP:172.16.31.31:32:17486
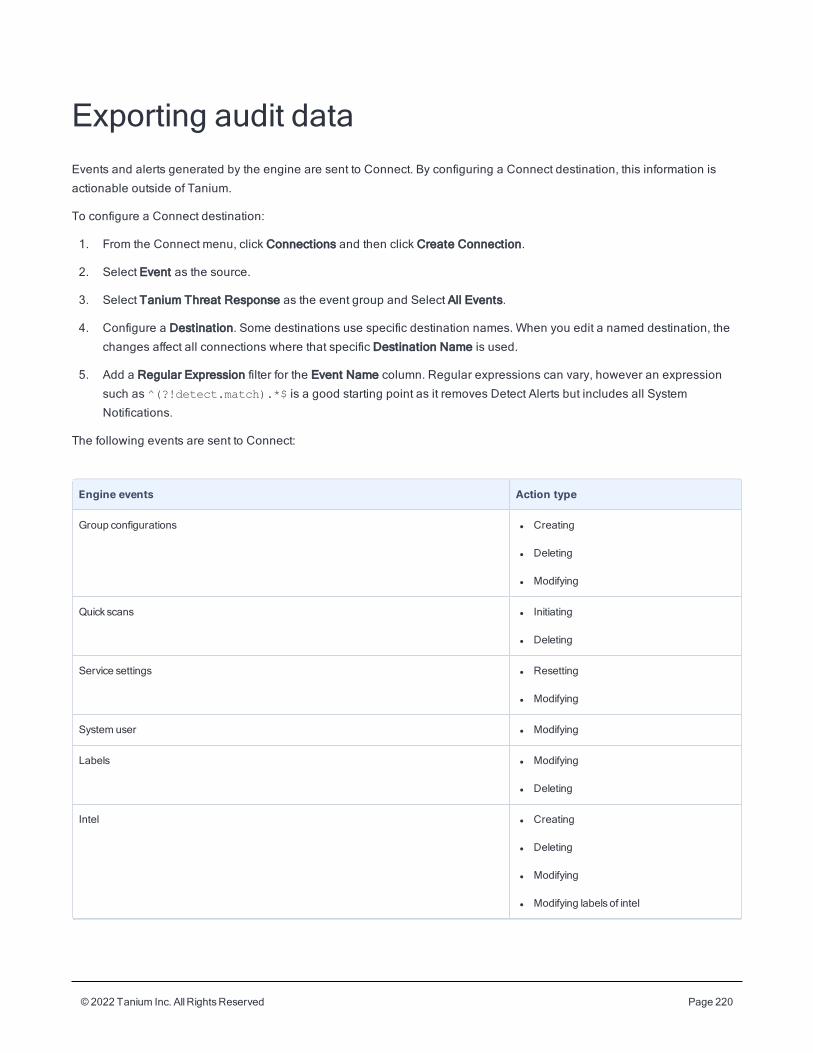
© 2022 Tanium Inc. AllRightsReserved Page 220
Exporting audit dataEvents and alerts generated by the engine are sent to Connect. By configuring a Connect destination, this information is
actionable outside of Tanium.
To configure a Connect destination:
1. From the Connect menu, click Connections and then click Create Connection.
2. Select Event as the source.
3. Select Tanium Threat Response as the event group and Select All Events.
4. Configure a Destination. Some destinations use specific destination names. When you edit a named destination, the
changes affect all connections where that specific Destination Name is used.
5. Add a Regular Expression filter for the Event Name column. Regular expressions can vary, however an expression
such as ^(?!detect.match).*$ is a good starting point as it removes Detect Alerts but includes all System
Notifications.
The following events are sent to Connect:
Engine events Action type
Group configurations l Creating
l Deleting
l Modifying
Quick scans l Initiating
l Deleting
Service settings l Resetting
l Modifying
System user l Modifying
Labels l Modifying
l Deleting
Intel l Creating
l Deleting
l Modifying
l Modifying labels of intel
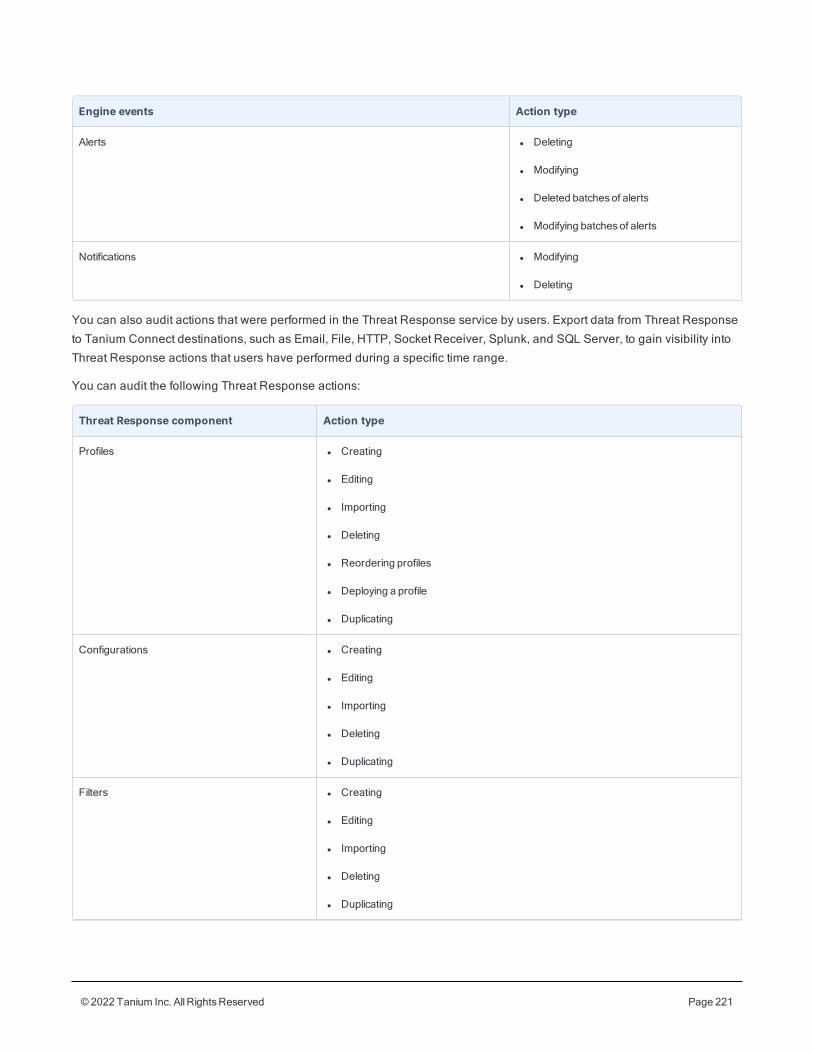
© 2022 Tanium Inc. AllRightsReserved Page 221
Engine events Action type
Alerts l Deleting
l Modifying
l Deleted batchesof alerts
l Modifying batchesof alerts
Notifications l Modifying
l Deleting
You can also audit actions that were performed in the Threat Response service by users. Export data from Threat Response
to Tanium Connect destinations, such as Email, File, HTTP, Socket Receiver, Splunk, and SQL Server, to gain visibility into
Threat Response actions that users have performed during a specific time range.
You can audit the following Threat Response actions:
Threat Response component Action type
Profiles l Creating
l Editing
l Importing
l Deleting
l Reordering profiles
l Deploying a profile
l Duplicating
Configurations l Creating
l Editing
l Importing
l Deleting
l Duplicating
Filters l Creating
l Editing
l Importing
l Deleting
l Duplicating
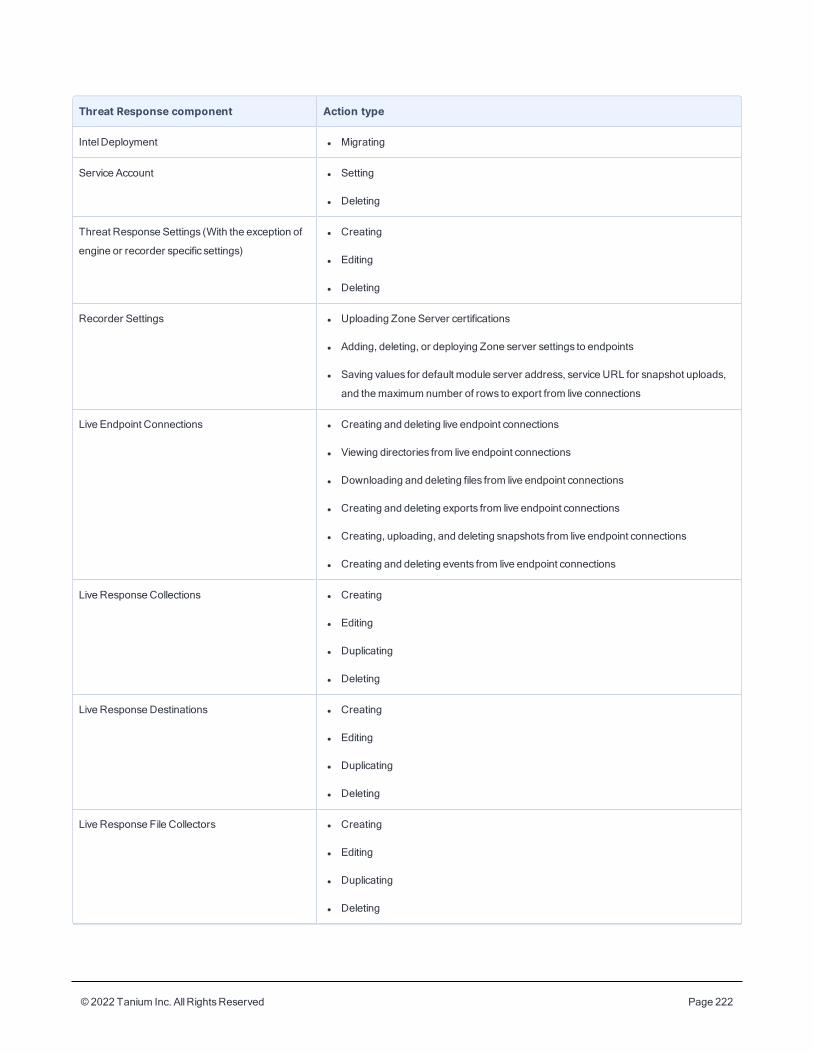
© 2022 Tanium Inc. AllRightsReserved Page 222
Threat Response component Action type
IntelDeployment l Migrating
Service Account l Setting
l Deleting
Threat Response Settings (With the exception of
engine or recorder specific settings)
l Creating
l Editing
l Deleting
Recorder Settings l Uploading Zone Server certifications
l Adding, deleting, or deploying Zone server settings to endpoints
l Saving values for default module server address, service URL for snapshot uploads,
and themaximum number of rows to export from live connections
Live Endpoint Connections l Creating and deleting live endpoint connections
l Viewing directories from live endpoint connections
l Downloading and deleting files from live endpoint connections
l Creating and deleting exports from live endpoint connections
l Creating, uploading, and deleting snapshots from live endpoint connections
l Creating and deleting events from live endpoint connections
Live Response Collections l Creating
l Editing
l Duplicating
l Deleting
Live Response Destinations l Creating
l Editing
l Duplicating
l Deleting
Live Response File Collectors l Creating
l Editing
l Duplicating
l Deleting
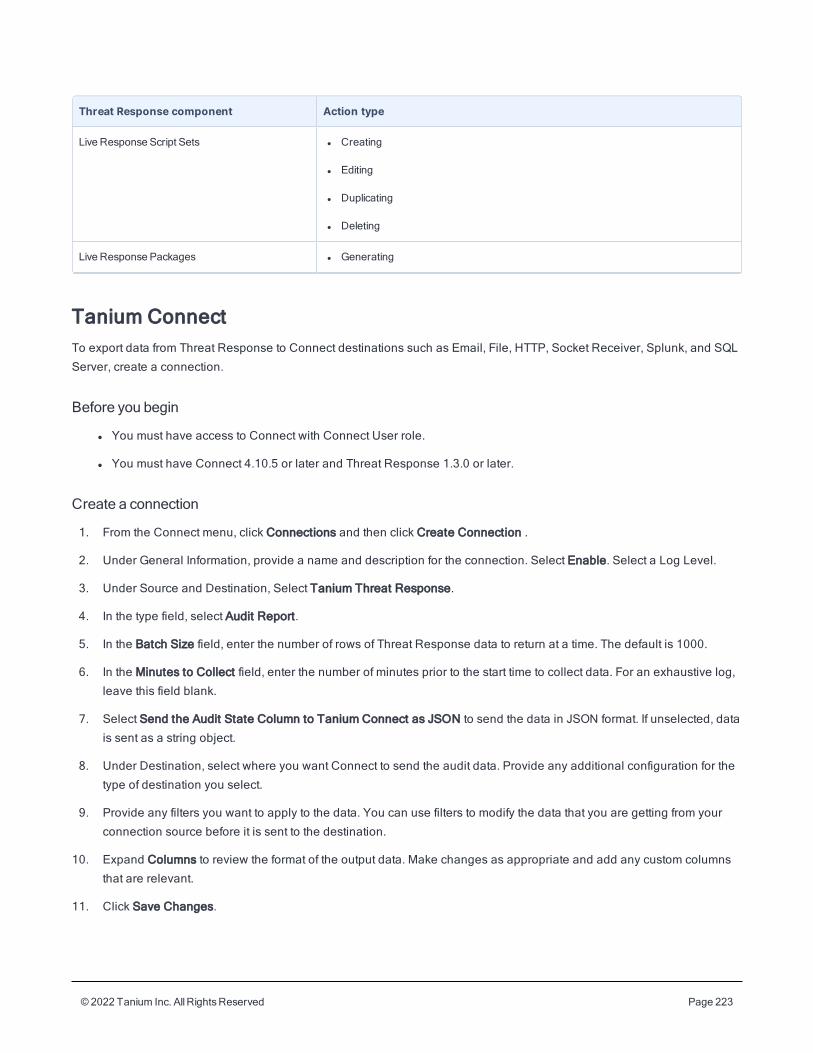
© 2022 Tanium Inc. AllRightsReserved Page 223
Threat Response component Action type
Live Response Script Sets l Creating
l Editing
l Duplicating
l Deleting
Live Response Packages l Generating
Tanium ConnectTo export data from Threat Response to Connect destinations such as Email, File, HTTP, Socket Receiver, Splunk, and SQL
Server, create a connection.
Before you begin
l You must have access to Connect with Connect User role.
l You must have Connect 4.10.5 or later and Threat Response 1.3.0 or later.
Create a connection
1. From the Connect menu, click Connections and then click Create Connection .
2. Under General Information, provide a name and description for the connection. Select Enable. Select a Log Level.
3. Under Source and Destination, Select Tanium Threat Response.
4. In the type field, select Audit Report.
5. In the Batch Size field, enter the number of rows of Threat Response data to return at a time. The default is 1000.
6. In the Minutes to Collect field, enter the number of minutes prior to the start time to collect data. For an exhaustive log,
leave this field blank.
7. Select Send the Audit State Column to Tanium Connect as JSON to send the data in JSON format. If unselected, data
is sent as a string object.
8. Under Destination, select where you want Connect to send the audit data. Provide any additional configuration for the
type of destination you select.
9. Provide any filters you want to apply to the data. You can use filters to modify the data that you are getting from your
connection source before it is sent to the destination.
10. Expand Columns to review the format of the output data. Make changes as appropriate and add any custom columns
that are relevant.
11. Click Save Changes.
© 2022 Tanium Inc. AllRightsReserved Page 224
Test a connection and review audit data
1. From the Connect Overview page, click Connections.
2. Click the connection that you created for Threat Response audit data.
3. Click Run Now. Confirm that you want to run the connection.
4. View the summary of the run.
5. View the audit report in the destination that you configured for the connection.
Schedule the connection
For information on how to run connections on a schedule, see Tanium Connect User Guide: Schedule connections.
© 2022 Tanium Inc. AllRightsReserved Page 225
TroubleshootingIf Threat Response is not performing as expected, you might need to troubleshoot issues or change settings. For more
information, see Contact Tanium Support on page 231.
Resolve issues with Threat Response componentsThe Health Status page displays issues that have occurred in a Threat Response environment, and provides actions that
you can take to remediate. Any encountered issues display in the order of their significance to help prioritize remediation
actions. The results displayed on the Health Status page refresh every 12 minutes (720 seconds).
1. From the Threat Response menu, click Management > Health Status.
2. If multiple issues have been encountered, start a the top of the list and expand the issue you want to remediate.
3. The Threat Response component where the issue has occurred appears along with a description of the issue, the
number and types of endpoints on which it occurs, and a remediation action.
4. Click the remediation action button in the Actions column.
Collect logsUse Threat Response to compile a collection of logs relevant for troubleshooting.
1. From the Threat Response overview page, click Help , then click the Troubleshooting tab.
2. Click Create Package.
3. When the status of the package creation is complete, click Download Package.
The log zip file might take a few moments to appear in the download folder.
Collect troubleshooting information from endpoints
You can collect logs and other artifacts from individual endpoints to help resolve issues. Collecting logs from endpoints
requires a live connection to the endpoint from which you want to gather troubleshooting information.
1. From the Main menu, click Administration > Client Management to open the Client Management Overview page.
2. From the Client Management menu, click Client Health.
3. In the Direct Connect section, create a live connection to the endpoint from which you want to collect troubleshooting
information. For information on creating a live connection, see Connecting to live endpoints.
4. Click the Gather tab. In the domain section select Threat Response.
5. Click Gather from Endpoint.
© 2022 Tanium Inc. AllRightsReserved Page 226
6. A package is gathered from the endpoint. The name of the link is the time stamp of the troubleshooting package. Select
the Must Gather that you want to download and click Download to download a ZIP file that contains troubleshooting
information.
View notificationsFrom the Threat Response menu, click Management > System Notifications. These notifications show non-match alerts,
including when alert throttling is enabled on any endpoints. To delete a notification, select the row and click Delete.
View task statusYou can view the status of and review other historic data for Threat Response tasks.
From the Threat Response menu, click Management > Tasks.
For each task that you have initiated, you can view the status, the start, stop, and creation time, and the task ID. The types of
Threat Response tasks for which you can view this detailed information include:
l Deploy Profile
l Remove Profile
l Deploy Intel
l Deploy Tools
l Start Index
l Group Migration
l Content Migration
l Suppress Alerts
l Response Action
In the event of an error, you can locate a specific task and expand the cell to view results and metadata from log files. The
data that appears in the advanced details view provides information that is useful for troubleshooting and saves the time of
trying to locate debugging information in lengthy log files or in formats that are not intended to be human readable.
Get Threat Response tools statusAsk the question: Get Threat Response - Status from all machines.
The results returned are divided by operating system, component versions, and the endpoints that do not have the tools
installed. The Threat Response tools status is evaluated when the Threat Response service restarts or is updated.
For more information, see Tanium Interact User Guide: Asking questions.
© 2022 Tanium Inc. AllRightsReserved Page 227
Tune alert throttlingAdjust the throttling settings to control how many alerts you are getting on the endpoint. Both endpoint and service alert
throttling are enabled by default.
Configure throttling for Signal alerts on endpoints
You can configure throttling of Signal alerts on the endpoint when you create an engine configuration. By default, Signal
alert throttling on an endpoint is enabled and occurs when five events on a single piece of intel occur within five minutes.
1. Go to Management > Configurations. Click the Engine tab. Edit a configuration.
2. In the Advanced Engine Settings section, update the settings for Signal throttle rate.
3. Save the engine configuration, and deploy any profiles that use that configuration for the endpoint throttling to be
deployed.
4. If Signal alert throttling occurs, notifications about the event and the endpoint that has throttling enabled display on the
System Notifications page.
Configurematch alert throttling
You can configure match alert throttling for the engine. This service-level throttling can apply for quick scan alerts and all
types of intel. By default, match alert throttling is enabled and occurs when 100 events on a single piece of intel occur within
20 minutes.
1. From the Threat Response overview page, click Settings then click the Service tab. Click Intel.
2. Edit the settings for match alert throttling. You can adjust when throttling occurs, and adjust the cooloff period, which
controls how long alerts continue to be throttled.
3. Click Save.
4. If alert throttling occurs, you get notifications that throttling is enabled display on the System Notifications page.
Configure the engine manuallyYou can change most engine settings in the advanced settings of an engine configuration. You might need to manually run
scripts from the Tanium Client directory on the endpoint to edit the engine configuration.
l get-config provides all of the available options and their current values.
l set-config changes the value or clears it, returning to the default behavior.
You can also find more information about engine configuration options in the engine documentation.
File, network, or security events are not displayed on Oracle LinuxserverIf you are not seeing file, network, or security events in the recorder results, you can disable SELinux. When SELinux is
enabled and the auditd fallback is disabled on Oracle Linux, only process information is returned. Alternatively, ensure that
the Client Recorder Extension configuration parameters are set as follows:
© 2022 Tanium Inc. AllRightsReserved Page 228
l CX.recorder.AuditdStopAuditdService is set to 0.
l CX.recorder.AuditdEnableAudispdFallback is set to 1.
For more information, see Client Recorder Extension User Guide: Configuring recorded events .
Identify Linux endpoints that are missing auditdIf Linux endpoint events are not being recorded, they might be missing the audit daemon and audispd services. Ideally, the
audit daemon is installed and configured before installing the Threat Response module, but it is possible for endpoints to
come online at a later time.
1. (Optional) Create the auditd package.
You can either create a general installation package and put the logic in the scripts or you can have a simple script
and put the logic in the Tanium query. See Tanium Core Platform User Guide: Creating and managing packages.
2. Ask the question: Get Installed Application Exists[audit] from all machines with Is Linux
containing "true".
3. Deploy the appropriate auditd package to the identified endpoints.
If you need to distribute the package to a large number of endpoints, spread the changes out over time
to avoid a negative impact on the network.
Resolve issues with legacy Client Recorder Extension installationsIf Tanium Endpoint Configuration detects endpoints that have legacy versions of the Client Recorder Extension installed, it
reports the endpoint as Unsupported in the recorder column of the results grid when you ask the question: Get Endpoint
Configuration - Tools Status. If Client Recorder Extension version 1.x exists on a targeted endpoint, you must
remove it before you install Client Recorder Extension version 2.x tools. To target endpoints where Client Recorder
Extension version 1.x exists, ask the question: Recorder - Legacy Installed. If the Supported Endpoints column
displays No, you must remove Client Recorder Extension version 1.x from the endpoint before you install Client Recorder
Extension 2.x tools. To remove Client Recorder Extension version 1.x, deploy the Recorder - Remove Legacy Recorder
[Operating System] package to targeted endpoints.
Change the Module Server addressWhen Threat Response is installed, the installation process fills in the Module Server IP address that the endpoints use to
connect. If this address changes, you might need to update the Service Settings.
1. From the Threat Response overview page, click Settings , then click the Service tab. Click Misc.
2. Enter the IP address of the Module Server.
3. Click Save.
© 2022 Tanium Inc. AllRightsReserved Page 229
Start or stop the recorderYou might need to manually start or stop the recorder.
Resolve the underlying issue and restart the recorder. Or, if you find that the recorder is using more system resources than
expected, you can stop the recorder and troubleshoot the issue.
1. Identify the computer groups that contain endpoints on which you want to stop the recorder.
2. Deploy a profile that does not contain a recorder configuration to the computer groups you want to target.
3. You can optionally create a live endpoint connection to specific endpoints to troubleshoot any issues.
To start the recorder, deploy a profile that has a recorder configuration to the targeted computer groups.
Monitor and troubleshoot Threat Response coverageThe following table lists contributing factors into why the Threat Response coverage metric might be lower than expected,
and corrective actions you can make.
Contributing factor Corrective action
Tools not deployed Ensure the Threat Response Action Group is set to All Computers.
Ensure the TrendsAction Group is set to All Computers.
Ensure that all endpoints belong to a computer group that is defined in a Threat Response profile.
Tools in an unhealthy state From the Threat Response overview page, clickManagement > Health Status and use the
workbench to help take corrective actions to ensure Threat Response is healthy in your
environment.
Monitor and troubleshoot mean time to investigate threatsThe following table lists contributing factors into why the mean time to investigate threats metric might be higher than
expected, and corrective actions you can make.
Contributing factor Corrective action
Alert statusnot being properly updated
in the Threat Response workbench
Ensure analysts are accurately updating alerts from New to In Progressand then from In
Progress to Resolved.
If alerts are sent to a SIEM or another location, ensure that your workflow uses the Tanium Threat
Response API to appropriately set alert state in Tanium to be able to track thismetric correctly.
Monitor and troubleshoot mean time to remediate threatsThe following table lists contributing factors into why the mean time to investigate threats metric might be higher than
expected, and corrective actions you can make.
© 2022 Tanium Inc. AllRightsReserved Page 230
Contributing factor Corrective action
Alert statusnot being properly updated
in the Threat Response workbench
Ensure analysts are accurately updating alerts from New to In Progressand then from In
Progress to Resolved.
If alerts are sent to a SIEM or another location, ensure that your workflow uses the Tanium Threat
Response API to appropriately set alert state in Tanium to be able to track thismetric correctly.
Remove Threat Response tools from endpointsYou can deploy an action to remove Threat Response tools from an endpoint or computer group. Separate actions are
available for Windows and non-Windows endpoints.
1. In Interact, target the endpoints from which you want to remove the tools. For example, ask a question that targets a
specific operating system:Get Endpoint Configuration - Tools Status from all machines with Is Windows equals true
2. In the results, select the row for Threat Response, drill down as necessary, and select the targets from which you want
to remove Threat Response tools. For more information, see Tanium Interact User Guide: Drill Down.
3. Click Deploy Action.
4. For the Deployment Package, select Endpoint Configuration - Uninstall Tool [Windows] or Endpoint Configuration -
Uninstall Tool [Non-Windows], depending on the endpoints you are targeting.
5. For Tool Name, select Threat Response.
6. (Optional) By default, after the tools are removed they cannot be reinstalled. To allow tools to be automatically
reinstalled, clear the selection for Block reinstallation. Re-installation occurs almost immediately.
If reinstallation is blocked, you must unblock it manually:
l To allow Threat Response to reinstall tools, deploy the Endpoint Configuration - Unblock Tool
[Windows] or Endpoint Configuration - Unblock Tool [Non-Windows] package (depending on
the targeted endpoints).
l If you reinstall tools manually, select Unblock Tool when you deploy the Endpoint Configuration
- Reinstall Tool [Windows] or Endpoint Configuration - Reinstall Tool [Non-Windows]
package.
7. (Optional) To remove all Threat Response databases and logs from the endpoints, clear the selection for Soft
uninstall.
When you perform a hard uninstallation of some tools, such as Recorder or Index, the uninstallation
also removes data that is associated with the tool from the endpoint. This data might include important
historical or environmental data, such as recorded events (in the case of Recorder) or file indexes (in
the case of Index). If data that you want to keep is associated with the tool, make sure you perform only
© 2022 Tanium Inc. AllRightsReserved Page 231
a soft uninstallation of the tool. To help determine what data a tool stores on endpoints, go to
https://docs.tanium.com/ and review the documentation for the tool or for the Tanium solution that
installed it , and contact Tanium Support for additional help.
8. (Optional) To also remove any tools that were dependencies of the Threat Response tools that are not dependencies
for tools from other solutions, select Remove unreferenced dependencies.
9. (Optional) In the Deployment Schedule section, configure a schedule for the action.
If some target endpoints might be offline when you initially deploy the action, select
Recurring Deployment and set a reissue interval.
10. Click Show preview to continue.
11. A results grid appears at the bottom of the page showing you the targeted endpoints for your action. If you are satisfied
with the results, click Deploy Action.
If you have enabled Endpoint Configuration approval, tool removal must be approved in Endpoint
Configuration before tools are removed from endpoints.
Test Live Response connections manuallyTo test Live Response connections manually, see Generate known_hosts and test connections.
Uninstall Threat ResponseYou might need to remove Threat Response from the Tanium Module Server for troubleshooting purposes.
1. From the Main menu, go to Administration > Configuration > Solutions.
2. Under Threat Response, click Uninstall. Click Proceed with Uninstall to complete the process.
Contact Tanium SupportTo contact Tanium Support for help, sign in to https://support.tanium.com.
© 2022 Tanium Inc. AllRightsReserved Page 232
Reference: Authoring SignalsYou can use Signals for the continuous, real-time evaluation of process, network, registry (Windows only), and file events on
endpoints. Signals are available as a feed from Tanium, or you can author your own Signals that are specific to your
environment.
With Signals you can detect suspicious or interesting process behavior by combining multiple search expressions. A narrow
search scope helps you minimize false-positive alerts.
How Signals workSignals use a specific language syntax to build search expressions for process-related events on the endpoint.
Like other intel, Signals get validated when they are added to the Threat Response service to ensure proper structure. The
Signals are compiled, then sent and applied to the appropriate computer groups.
Unlike other types of intel, the event recorder continuously inspects each process creation event in real time and starts the
engine when a match occurs, rather than performing periodic scans. Each event gets evaluated against any Signal
definitions. Whenever a Signal condition is matched, an alert is generated. The engine regularly polls the endpoints with a
saved question to gather alerts that are written to the Alerts page.
Signal syntaxThe syntax of Signals are built from the supported objects, properties, conditions, and the search values into searchexpressions. One or more expressions make up the Signal definition. The objects reference process-related events. Forexample, a file object is an operation on a file by a process. A Signal can have multiple expressions in a single definition,
connected with AND or OR operators. Use parentheses to dictate precedence.
Write Signal expression in one of the following formats:
l object.property condition value
l object.property condition 'value with spaces'
Each object is a type of process event and has one or more properties that narrow the scope of the event. The condition
specifies how the object and property relate to the value provided. Not all conditions are supported with all object properties.
You cannot have more than 24 unique terms in a Signal.
An exhaustive reference to Signals syntax - including supported objects, properties, and conditions - is available in the
evaluation engine documentation. To access the evaluation engine documentation, click from the Threat Response
overview page and click the Evaluation Engine tab.
Property values can be an integer, a simple alphanumeric string, or they can be more complex and include other characters,
such as spaces, backslashes, and hex-encoded values. For searches with non-alphanumeric values or spaces, enclose the
value in single quotes. To escape special characters within the single quotes, the following sequences are supported:
© 2022 Tanium Inc. AllRightsReserved Page 233
l \r For carriage return
l \n For newline
l \t For tab
l \\ For the backslash itself
l \' For a single quote within the quotes
l \x To allow a single-byte hex-encoded sequence. For example \x20 would translate to a single space.
The hex-encoding is required to handle UTF-8 characters outside of the single-byte character set. Any UTF-8
character can be added via the hex-encoding, if needed.
For full details about the supported objects, properties, and conditions, see the engine documentation.
The following sample expressions demonstrate combined expressions, precedence, and escaped special characters:
l Windows: process.command_line contains 'evil' AND process.path starts with 'c:\\windows'
l Linux: process.command_line contains 'evil' AND process.path starts with '/usr/sbin/'
l Windows: (file.path starts with 'c:\\temp' OR file.path ends with '.evil.tmp') AND
process.path contains cmd.exe
l Linux: (file.path starts with '/var/tmp/' OR file.path ends with 'evil.gz') AND process.path
ends with 'sh'
You can use modifiers in parenthetical groupings to change the behavior of all items within that grouping. A modifier is an
identifier that precedes an open parenthesis. One example is for event grouping:
group(file.operation is 'create' and file.path contains 'foo')
Without the group this would appear as a boolean grouping prioritized in operation by the ()'s and could be satisfied with two
different events, however in this case the group modifier is applied thus changing the matching behavior so that both
conditions must match a single event.
Event groups do not support terms that contain process events.
An event group modifier is a modifier with the name group and indicates that you intend to match all conditions in the group
against a single event. For example, to ensure that matches happen against the same file event, you should group those
events. You can then include multiple groups to achieve matches against different events in time. One example would be:
group(file.operation is 'create' and file.path contains 'foo') and group(file.operation is
'delete' and file.path contains 'bar')
This signal would only match if at some point a process creates a file containing foo and at a different time deletes a file with
name containing bar, but will not match if the created file contained bar and the deleted file contained foo.
An event group modifier can only apply to objects of the same type. So, you may not mix file and registry events in the same
group, though you may mix groups containing those into the same expression as:
© 2022 Tanium Inc. AllRightsReserved Page 234
group(registry.key_path contains 'alpha' and registry.value_name contains 'a') and group
(file.path.contains 'beta' and file.path ends with '.b')
Signals are not case-sensitive.
Signal use casesSignals are designed to identify suspicious or malicious process activity in real time, and therefore are not intended to alert
on large lists of file properties, such as hashes or file names. These use cases are better solved with background intel
scanning or reputation alerting. For example, alerting on excel.exe is not very useful and creates a lot of unnecessary
activity with little value.
However, a security operations center might want an alert if excel.exe launches PowerShell.exe. and the parent process is
‘excel.exe’. For example, process.path ends with ‘powershell.exe’ AND process.parent_path ends with
‘excel.exe’.
A comparable example for Linux could be: process.path ends with 'sshd' AND process.parent_path ends
with 'systemd'.
Use Signals to detect activity that, while not malicious, is unwanted within a specific group of computers. For example, the
use of dsquery.exe or dsget.exe to administer Active Directory could be an unwanted activity. If your normal process is to
use custom PowerShell scripts, use of these other processes might signify that an intruder is trying to make modifications. If
firewall settings are inherited through GPO settings, the use of netsh.exe on an endpoint might need to be understood.
Use Signals to ensure that some activity has happened. For example, receiving alerts from servers when a critical
application has launched following a reboot might be a Signal to consider. Alerting that the w3wp.exe process has launched
after an IIS server has rebooted might be something a Web Content team would want to see.
Signals must have a narrow scope, specific targets, and a clear intended use.
Testing SignalsAfter you create a Signal, test the Signal in a lab before using it in a production environment. Verify that the Signal is applied
to the correct endpoints and returns the results that you expect.
1. Create a Signal. See Adding intel on page 117 for more information.
2. (Optional) If you want to evaluate a Signal, you can run a quick scan for the Signal and modify the Signal as needed.
3. Apply the Signal to an intel configuration for a test computer group that has Threat Response tools installed.
4. On one or more endpoints within the configured computer group, trigger the conditions of the Signal.
5. Confirm that the alert has been received by the Threat Response workbench.
Iterate on this process until you are satisfied with the results.
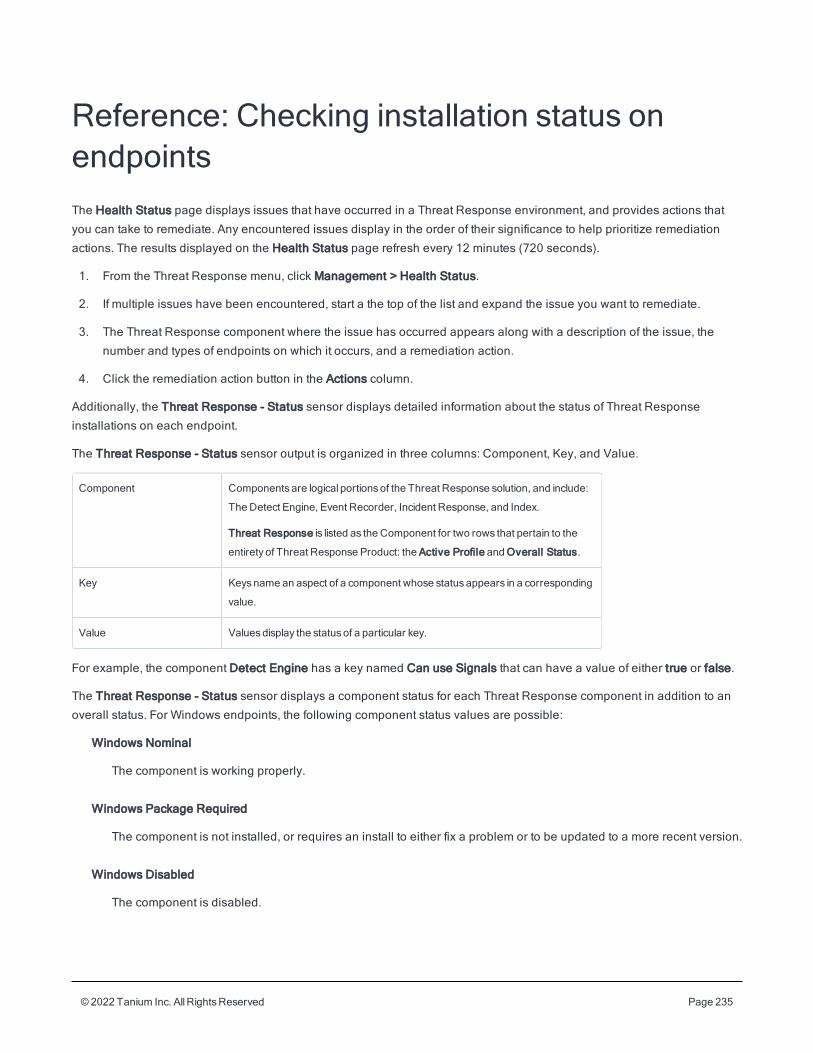
© 2022 Tanium Inc. AllRightsReserved Page 235
Reference: Checking installation status onendpointsThe Health Status page displays issues that have occurred in a Threat Response environment, and provides actions that
you can take to remediate. Any encountered issues display in the order of their significance to help prioritize remediation
actions. The results displayed on the Health Status page refresh every 12 minutes (720 seconds).
1. From the Threat Response menu, click Management > Health Status.
2. If multiple issues have been encountered, start a the top of the list and expand the issue you want to remediate.
3. The Threat Response component where the issue has occurred appears along with a description of the issue, the
number and types of endpoints on which it occurs, and a remediation action.
4. Click the remediation action button in the Actions column.
Additionally, the Threat Response - Status sensor displays detailed information about the status of Threat Response
installations on each endpoint.
The Threat Response - Status sensor output is organized in three columns: Component, Key, and Value.
Component Components are logical portionsof the Threat Response solution, and include:
The Detect Engine, Event Recorder, Incident Response, and Index.
Threat Response is listed as the Component for two rows that pertain to the
entirety of Threat Response Product: the Active Profile andOverall Status.
Key Keysname an aspect of a component whose statusappears in a corresponding
value.
Value Valuesdisplay the statusof a particular key.
For example, the component Detect Engine has a key named Can use Signals that can have a value of either true or false.
The Threat Response - Status sensor displays a component status for each Threat Response component in addition to an
overall status. For Windows endpoints, the following component status values are possible:
Windows Nominal
The component is working properly.
Windows Package Required
The component is not installed, or requires an install to either fix a problem or to be updated to a more recent version.
Windows Disabled
The component is disabled.
© 2022 Tanium Inc. AllRightsReserved Page 236
Windows Attention Needed
The endpoint requires attention before the component can function. Reinstalling the component does not resolve the
problem.
For example, the Windows Attention Needed status appears if an endpoint does not have sufficient free disk space
as required by the Threat Response component.
For non-Windows endpoints, the statuses are identical except that Windows is replaced with the name of the operating
system, for example, Linux or Mac.
© 2022 Tanium Inc. AllRightsReserved Page 237
Reference: Set up the zone proxy serviceIn Threat Response, the options for the Zone Proxy setup is contained in Tanium Direct Connect. To use Direct Connect to
manage zone proxy connections, you must install and enable Direct Connect.
In earlier versions of Threat Response there was a requirement to make a configuration from Threat Response and import
on the zone server. In the current version, the configurations for zone proxy are all contained in Direct Connect. When Direct
Connect is configured and running there are no required actions for Threat Response. When the Direct Connect service is
enabled when making a live connection the Threat Response service issues the Deploy Direct Connect - Open Session
action.
To install Direct Connect and configure the Direct Connect Zone Proxy:
1. Install Direct Connect. See Tanium Direct Connect User Guide: Installing for more information.
2. Install and configure the Direct Connect Zone Proxy. See Tanium Direct Connect User Guide: Configure Zone Proxies
for more information.
In an upgrade scenario, to get the zone proxy to run on the same ports are you have been using you need to stop and
remove the current zone proxy infrastructure prior to installing the Direct Connect proxy and ensure that the ports are
available for the new service. From Threat Response, click Settings and click the current zone server configuration. To
move from this configuration to the Direct Connect configuration, use the same port in the Direct Connect configuration.