TAi piNg CARpETS iNTERNATiONAL LiMiTED - HKEXnews
24
- - Hong Kong Exchanges and Clearing Limited and The Stock Exchange of Hong Kong Limited take no responsibility for the contents of this document, make no representation as to its accuracy or completeness and expressly disclaim any liability whatsoever for any loss howsoever arising from or in reliance upon the whole or any part of the contents of this document. TAI PING CARPETS INTERNATIONAL LIMITED (Incorporated in Bermuda with limited liability) (Stock Code: 46) ANNOUNCEMENT OF RESULTS FOR THE YEAR ENDED 31 DECEMBER 2010 The Directors of Tai Ping Carpets International Limited (the “Company”) announce the consolidated results of the Company and its subsidiaries (the “Group”) for the year ended 3 December 200, together with the comparative figures for 2009, as follows: CONSOLIDATED INCOME STATEMENT For the year ended 31 December 2010 2009 Note HK$’000 HK$’000 (As restated) Revenue 4 1,221,548 ,7,673 Cost of sales 6 (707,010) (62,753) Gross profit 514,538 495,920 Distribution costs 6 (102,562) (83,700) Administrative expenses 6 (415,592) (392,879) Impairment of intangible assets 7 (15,533) – Other (losses)/gains, net 5 (845) 2,966 Operating (loss)/profit (19,994) 22,307 Finance income 197 47 Finance costs (1,084) (,259) Finance costs – net (887) (,2) Share of (loss)/profit of: an associate (1,335) (,670) jointly controlled entities 33,313 4,075 Profit before income tax 11,097 60,600 Income tax expenses 8 (22,905) (2,247) (Loss)/profit for the year (11,808) 39,353 (Loss)/profit attributable to: Owners of the parent (13,063) 39,34 Non-controlling interests 1,255 29 (11,808) 39,353 (Loss)/earnings per share for (loss)/profit attributable to the owners of the parent (expressed in HK cents per share) Basic 9 (6.16) 8.44
-
Upload
khangminh22 -
Category
Documents
-
view
0 -
download
0
Transcript of TAi piNg CARpETS iNTERNATiONAL LiMiTED - HKEXnews

- � -
Hong Kong Exchanges and Clearing Limited and The Stock Exchange of Hong Kong Limited take no responsibility for the contents of this document, make no representation as to its accuracy or completeness and expressly disclaim any liability whatsoever for any loss howsoever arising from or in reliance upon the whole or any part of the contents of this document.
TAi piNg CARpETS iNTERNATiONAL LiMiTED(Incorporated in Bermuda with limited liability)(Stock Code: �46)
ANNOUNCEMENT OF RESULTSFOR THE YEAR ENDED 31 DECEMBER 2010
The Directors of Tai Ping Carpets International Limited (the “Company”) announce the consolidated results of the Company and its subsidiaries (the “Group”) for the year ended 3� December 20�0, together with the comparative figures for 2009, as follows:
CONSOLiDATED iNCOME STATEMENTFor the year ended 31 December
2010 2009 Note HK$’000 HK$’000 (As restated)
Revenue 4 1,221,548 �,��7,673Cost of sales 6 (707,010 ) (62�,753 )
Gross profit 514,538 495,920Distribution costs 6 (102,562 ) (83,700 )Administrative expenses 6 (415,592 ) (392,879 )Impairment of intangible assets 7 (15,533 ) –Other (losses)/gains, net 5 (845 ) 2,966
Operating (loss)/profit (19,994 ) 22,307
Finance income 197 �47Finance costs (1,084 ) (�,259 )
Finance costs – net (887 ) (�,��2 )
Share of (loss)/profit of: an associate (1,335 ) (�,670 ) jointly controlled entities 33,313 4�,075
Profit before income tax 11,097 60,600Income tax expenses 8 (22,905 ) (2�,247 )
(Loss)/profit for the year (11,808 ) 39,353
(Loss)/profit attributable to: Owners of the parent (13,063 ) 39,�34 Non-controlling interests 1,255 2�9
(11,808 ) 39,353
(Loss)/earnings per share for (loss)/profit attributable to the owners of the parent (expressed in HK cents per share) Basic 9 (6.16 ) �8.44

- 2 -
CONSOLiDATED STATEMENT OF COMpREHENSivE iNCOMEFor the year ended 31 December
2010 2009 HK$’000 HK$’000 (As restated)
(Loss)/profit for the year (11,808 ) 39,353Other comprehensive income: Currency translation differences 49,326 9,369
Total comprehensive income for the year 37,518 48,722
Total comprehensive income for the year attributable to: Owners of the parent 35,434 48,354 Non-controlling interests 2,084 368
37,518 48,722

- 3 -
CONSOLiDATED STATEMENT OF FiNANCiAL pOSiTiONAs at 31 December
As at As at 31 December � January 2010 2009 2009 Note HK$’000 HK$’000 HK$’000 (As restated) (As restated)
AssetsNon-current assetsLand use rights 5,359 7,�22 9,064Property, plant and equipment 278,886 3�9,955 343,�99Investment properties – 6,800 6,800Construction in progress 6,036 2,30� �0,896Intangible assets 25,661 29,934 25,333Interest in an associate 17,489 �8,824 20,494Interests in jointly controlled entities 322,078 297,�92 258,067Deferred income tax assets 8,557 �3,820 ��,702Pledged bank deposits 1,359 5,�05 –Bank deposits 439 �,�94 2,385
665,864 702,247 687,940
Current assetsInventories 192,535 �63,922 �96,489Trade and other receivables 10 232,754 �97,907 2�5,24�Derivative financial instruments 1,109 92 �69Amount due from an associate 403 – �,808Amounts due from jointly controlled entities 19,495 �9,755 �5,642Financial assets at fair value through profit or loss 133,065 87,328 59,�70Current income tax assets – �,�77 –Pledged bank deposits 1,988 5,�06 90�Cash and cash equivalents 86,697 99,006 ���,6�4
668,046 574,293 60�,034
Non-current asset classified as held for sale 25,411 – 5,695
693,457 574,293 606,729 Total assets 1,359,321 �,276,540 �,294,669

- 4 -
CONSOLiDATED STATEMENT OF FiNANCiAL pOSiTiONAs at 31 December
As at As at 31 December � January 2010 2009 2009 Note HK$’000 HK$’000 HK$’000 (As restated) (As restated)
EquityEquity attributable to owners of the parentShare capital 21,219 2�,2�9 2�,2�9Reserves 445,389 396,893 387,673Retained earnings: Proposed final dividend 19,097 �9,097 �9,097 Others 516,799 548,958 528,92�
1,002,504 986,�67 956,9�0
Non-controlling interests 45,018 39,563 39,020
Total equity 1,047,522 �,025,730 995,930
LiabilitiesNon-current liabilitiesDeferred income tax liabilities 6,235 6,�94 4,823Retirement benefit obligations 18,281 �5,454 �3,592Other long-term liabilities 837 �,865 3,655
25,353 23,5�3 22,070
Current liabilitiesBank borrowings – unsecured 5,989 2,206 –Trade and other payables 11 256,137 �99,685 240,378Current income tax liabilities 9,846 �0,932 �8,646Other long-term liabilities – current portion 1,028 �,028 4,�99Amounts due to non-controlling interests shareholders 13,446 �3,446 �3,446
286,446 227,297 276,669
Total liabilities 311,799 250,8�0 298,739
Total equity and liabilities 1,359,321 �,276,540 �,294,669
Net current assets 381,600 346,996 324,365
Total assets less current liabilities 1,072,875 �,049,243 �,0�8,000

- 5 -
1. BASiS OF pREpARATiON
a. Statement of compliance
The consolidated financial statements have been prepared in accordance with all applicable Hong Kong Financial Reporting Standards, Hong Kong Accounting Standards (“HKASs”) and Interpretations (hereinafter collectively referred to as the “HKFRSs”) issued by the Hong Kong Institute of Certified Public Accountants and the disclosure requirements of the Hong Kong Companies Ordinance. In addition, the consolidated financial statements include applicable disclosures required by the Rules Governing the Listing of Securities on The Stock Exchange of Hong Kong Limited.
b. Basis of measurement
The consolidated financial statements have been prepared under the historical cost convention, as modified by financial assets and financial liabilities (including derivative instruments) at fair value through profit or loss, which are carried at fair value.
2. CORRECTiON OF pRiOR pERiOD ERROR
During the year ended 3� December 20�0, the Group has discovered an error in its consolidated financial statements for the year ended 3� December 2009. The error was related to the recognition of the liabilities for Carpets International Thailand Public Company Limited (“Carpets Inter”), the Group’s subsidiary in Thailand, under the Legal Severance Pay Plan (the “Plan”) for its employees in Thailand, amounting to HK$�5,454,000 as at 3� December 2009 (2008: HK$�3,592,000). The Group has never recognised any liability in respect of this plan in its consolidated financial statements for the year ended 3� December 2009. In accordance with HKAS �9 “Employee Benefits”, such liability meets the definition of employee benefit liability and should have been recognised in the Group’s consolidated financial statements. In connection with the recognition of the liability, a corresponding deferred tax asset amounting to HK$4,636,000 (2008: HK$4,��9,000) is recognised. The effects of correction of error on the Group’s consolidated financial statements for the year ended 3� December 2009 are summarised as follows:
Consolidated income Statement
For the year ended 31 December 2009 (As previously (As restated) reported) HK$’000 HK$’000
Administrative expenses 392,277 392,879Operating profit 22,909 22,307Finance costs 670 �,259Profit before income tax 61,791 60,600Income tax expenses 21,604 2�,247Profit for the year 40,187 39,353Profit attributable to owners of the parent 39,968 39,�34

- 6 -
Consolidated Statement of Comprehensive income
31 December 2009 (As previously (As restated) reported) HK$’000 HK$’000
Total comprehensive income for the year 50,067 48,722Total comprehensive income for the year attributable to owners of the parent 49,699 48,354
Consolidated Statement of Financial position
31 December 2009 (As previously (As restated) reported) HK$’000 HK$’000
Deferred tax assets 9,184 �3,820Total assets 1,271,904 �,276,540Retirement benefit obligations – �5,454Total liabilities 235,356 250,8�0Reserves 397,222 396,893Retained earnings after proposed final dividend 559,447 548,958Total equity 1,036,548 �,025,730Total equity and liabilities 1,271,904 �,276,540Total assets less current liabilities 1,044,607 �,049,243
The effects of correction of error on the Group’s consolidated statement of financial position as at � January 2009 are summarised as follows:
Consolidated Statement of Financial position
1 January 2009 (As previously (As restated) reported) HK$’000 HK$’000
Deferred tax assets 7,583 ��,702Total assets 1,290,550 �,294,669Retirement benefit obligations – �3,592Total liabilities 285,147 298,739Reserves 387,491 387,673Retained earnings after proposed final dividend 538,576 528,92�Total equity 1,005,403 995,930
- 7 -
3. CHANgES iN ACCOUNTiNg pOLiCY AND DiSCLOSURES
a. New and amended standards adopted by the group
The following new standards and amendments to standards are mandatory for the first time for the financial year beginning � January 20�0.
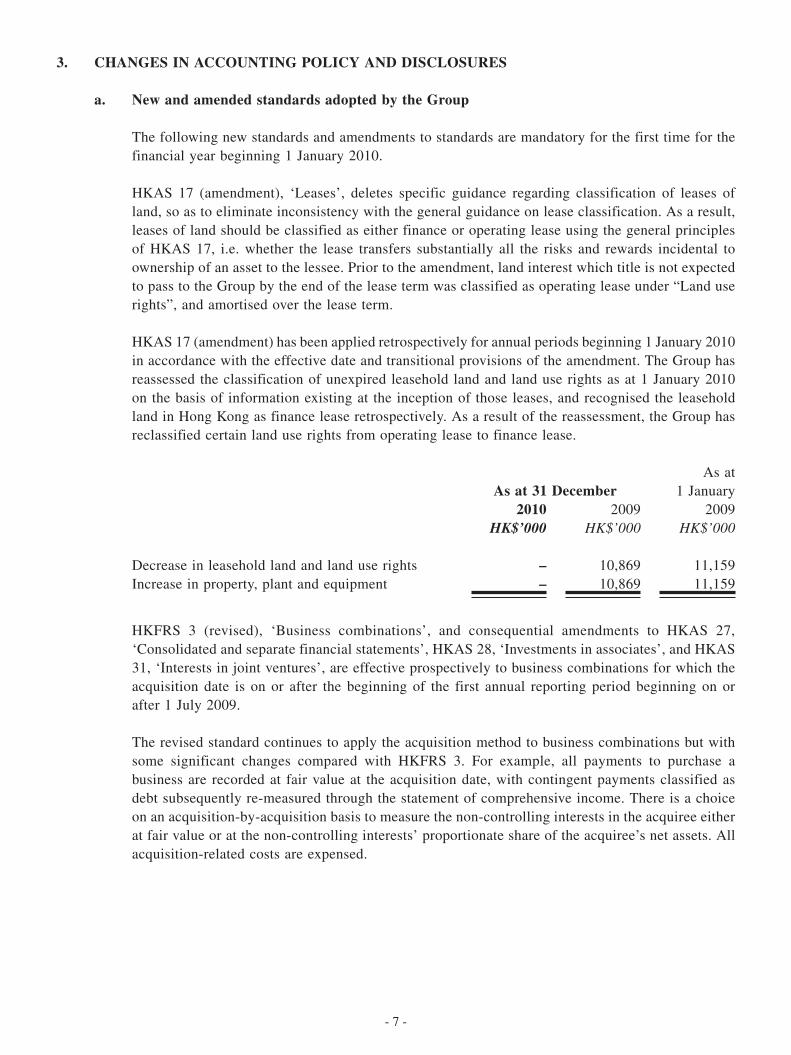
HKAS �7 (amendment), ‘Leases’, deletes specific guidance regarding classification of leases of land, so as to eliminate inconsistency with the general guidance on lease classification. As a result, leases of land should be classified as either finance or operating lease using the general principles of HKAS �7, i.e. whether the lease transfers substantially all the risks and rewards incidental to ownership of an asset to the lessee. Prior to the amendment, land interest which title is not expected to pass to the Group by the end of the lease term was classified as operating lease under “Land use rights”, and amortised over the lease term.
HKAS �7 (amendment) has been applied retrospectively for annual periods beginning � January 20�0 in accordance with the effective date and transitional provisions of the amendment. The Group has reassessed the classification of unexpired leasehold land and land use rights as at � January 20�0 on the basis of information existing at the inception of those leases, and recognised the leasehold land in Hong Kong as finance lease retrospectively. As a result of the reassessment, the Group has reclassified certain land use rights from operating lease to finance lease.
As at As at 31 December � January 2010 2009 2009 HK$’000 HK$’000 HK$’000
Decrease in leasehold land and land use rights – �0,869 ��,�59Increase in property, plant and equipment – �0,869 ��,�59
HKFRS 3 (revised), ‘Business combinations’, and consequential amendments to HKAS 27, ‘Consolidated and separate financial statements’, HKAS 28, ‘Investments in associates’, and HKAS 3�, ‘Interests in joint ventures’, are effective prospectively to business combinations for which the acquisition date is on or after the beginning of the first annual reporting period beginning on or after � July 2009.
The revised standard continues to apply the acquisition method to business combinations but with some significant changes compared with HKFRS 3. For example, all payments to purchase a business are recorded at fair value at the acquisition date, with contingent payments classified as debt subsequently re-measured through the statement of comprehensive income. There is a choice on an acquisition-by-acquisition basis to measure the non-controlling interests in the acquiree either at fair value or at the non-controlling interests’ proportionate share of the acquiree’s net assets. All acquisition-related costs are expensed.

- 8 -
HKAS 27 (revised) requires the effects of all transactions with non-controlling interests to be recorded in equity if there is no change in control and these transactions will no longer result in goodwill or gains and losses. The standard also specifies the accounting when control is lost. Any remaining interests in the entity is re-measured to fair value, and a gain or loss is recognised in profit or loss.
HKFRS 5 (amendment), ‘Non-current assets held for sale and discontinued operations’. The amendment clarifies that HKFRS 5 specifies the disclosures required in respect of non-current assets (or disposal groups) classified as held for sale or discontinued operations. It also clarifies that the general requirement of HKAS � still apply, in particular paragraph �5 (to achieve a fair presentation) and paragraph �25 (sources of estimation uncertainty) of HKAS �.
b. New standards, amendments and interpretations have been issued but are not effective for the financial year beginning 1 January 2010 and have not been early adopted
HKAS 24 (revised) Related party disclosures�
HKAS � (amendment) Limited exemption from corporation HKFRS 7 disclosures for first time adopters�
HKFRS 9 Financial instruments2
HKAS �2 (amendment) Income taxes3
Note:
� Effective from annual periods beginning on or after � January 20��2 Effective from annual periods beginning on or after � January 20�33 Effective from annual periods beginning on or after � January 20�2
4. TURNOvER AND SEgMENTAL iNFORMATiON
Management has determined the operating segments based on the reports reviewed by the Board of Directors that are used to assess performance and allocate resources. Management considers the businesses primarily based on the nature of operations and customers. The Group is currently organised into four major business segments: Commercial, Residential Boutique Contract (“RBC”), Wholesale and Others (including manufacturing and trading of yarn and property holding).
The Board of Directors assesses the performance of the operating segments based on a measure of segment results. Segment results excludes the effects of non-recurring expenditure from the operating segments such as impairments when the impairment is the result of an isolated, non-recurring event. The measure also excludes the effects of change in fair value of derivative financial instruments.

- 9 -
The segment information provided to the management for the reportable segments for the year ended 3� December 20�0 and 2009 is as follows:
For the year ended 31 December 2010
Commercial RBC Wholesale Total Carpet Others Unallocated group HK$’000 HK$’000 HK$’000 HK$’000 HK$’000 HK$’000 HK$’000
Revenue from external customers 806,513 361,382 19,123 1,187,018 34,530 – 1,221,548
Segment results 26,747 50,012 (27,944 ) 48,815 (770 ) – 48,045
Unallocated expenses1 (67,934 ) – – (67,934 )
Operating loss2,3 (19,119 ) (770 ) – (19,889 )
Finance costs (1,084 )Finance income 197Share of (loss)/profit of: an associate (1,335 ) – – (1,335 ) – – (1,335 ) jointly controlled entities2 33,208 – – 33,208 – – 33,208
profit before income tax 11,097income tax expenses (22,905 )
Loss for the year (11,808 )
Segment assets 739,757 189,706 7,039 936,502 43,546 19,808 999,856interest in an associate 17,892 – – 17,892 – – 17,892interests in jointly controlled entities 341,573 – – 341,573 – – 341,573
Total assets 1,359,321
Segment liabilities 204,115 60,078 13,047 277,240 12,128 22,431 311,799
Capital expenditure 26,434 7,842 6 34,282 – 18,469 52,751Depreciation of property, plant and equipment 50,157 2,661 104 52,922 – 9,106 62,028Amortisation of land use rights – – – – – 2,152 2,152Amortisation of intangible assets – 39 2,324 2,363 – 4,051 6,414impairment of intangible assets – – 15,533 15,533 – – 15,533impairment of inventories – 301 – 301 – – 301Recovery of impairment of trade and other receivables (2,373 ) (654 ) (42 ) (3,069 ) – – (3,069 )gain/(loss) on disposal of property, plant and equipment 485 – – 485 361 (85 ) 761

- �0 -
For the year ended 3� December 2009, as restated
Commercial RBC Wholesale Total Carpet Others Unallocated Group HK$’000 HK$’000 HK$’000 HK$’000 HK$’000 HK$’000 HK$’000
Revenue from external customers 74�,744 3�3,045 3�,�77 �,085,966 3�,707 – �,��7,673
Segment results 57,830 3�,�84 (7,270 ) 8�,744 �,357 – 83,�0�
Unallocated expenses� (59,040 ) – – (59,040 )
Operating profit2 22,704 �,357 – 24,06�
Finance costs (�,259 )Finance income �47Share of (loss)/profit of an associate (�,670 ) – – (�,670 ) – – (�,670 ) jointly controlled entities2 39,32� – – 39,32� – – 39,32�
Profit before income tax 60,600Income tax expenses (2�,247 )
Profit for the year 39,353
Segment assets 656,7�9 202,7�3 30,25� 889,683 38,976 �2,��0 940,769Interest in an associate �8,824 – – �8,824 – – �8,824Interests in jointly controlled entities 3�6,947 – – 3�6,947 – – 3�6,947
Total assets �,276,540
Segment liabilities �59,53� 50,472 �3,5�0 223,5�3 2,250 25,047 250,8�0
Capital expenditure 23,856 4,984 32 28,872 – 3,�56 32,028Depreciation of property, plant and equipment 39,029 8,426 86 47,54� �45 9,883 57,569Amortisation of land use rights – – – – – �,943 �,943Amortisation of intangible assets – – 2,247 2,247 – – 2,247Impairment of inventories �,097 (29� ) 485 �,29� – – �,29�(Recovery of impairment)/impairment of trade and other receivables (480 ) �,847 (2,6�0 ) (�,243 ) – – (�,243 )Gain/(loss) on disposal of property, plant and equipment �,424 (696 ) – 728 870 (70 ) �,528
Notes:
� Included shared expenses for global operation, information technology, marketing, internal audit, etc.
2 Excluded the share of profit of one jointly controlled entity which is included in the Wholesale segment
3 Included gain on disposal of investment properties

- �� -
Analysis of revenue and non-current assets other than deferred income tax assets and capital expenditure by geographical location is as follows:
For the year ended 31 December 2010
Non-current Revenue assets HK$’000 HK$’000
Hong Kong and Macau 68,494 �7,36�Mainland China 25,430 4�,8�2South East Asia 326,300 �87,227Middle East 9�,322 –Other Asian countries 38,886 �,446Europe �67,442 �6,655North America and Latin America 383,�28 53,�02Others �20,546 �37
�,22�,548 3�7,740
Interest in an associate� �7,489Interests in jointly controlled entities2 322,078
For the year ended 3� December 2009
Non-current Revenue assets HK$’000 HK$’000
Hong Kong and Macau 63,345 38,066Mainland China 23,966 43,536South East Asia 243,77� �92,262Middle East 56,468 –Other Asian countries 32,662 �,38�Europe �34,375 ��,6�2North America and Latin America 509,034 84,265Others 54,052 �,289
�,��7,673 372,4��
Interest in an associate� �8,824Interests in jointly controlled entities2 297,�92
Notes:
� Located in South East Asia2 Located in the Mainland China and the U.S.
There is no single external customer contributed more than �0% to the Group’s revenue for the years ended 3� December 20�0 and 2009.

- �2 -
5. OTHER (LOSSES)/gAiNS, NET
2010 2009 HK$’000 HK$’000
Gain on disposal of financial assets at fair value through profit or loss 1,128 752Gain on disposal of property, plant and equipment 400 �,528Gain on disposal of investment properties 361 –Gain/(loss) on change in fair value of derivative financial instruments 1,108 (77 )Net foreign exchange (losses)/gains (3,865 ) �,235Other 23 (472 )
(845 ) 2,966
6. ExpENSES BY NATURE 2010 2009 HK$’000 (As restated)
Raw materials and consumables used 340,782 252,660Changes in inventories 8,044 �9,640Amortisation of intangible assets 6,414 2,247Amortisation of land use rights 2,152 �,943Depreciation of property, plant and equipment 62,028 57,569Employee benefit expenses 329,528 372,542Operating lease charges – Land and buildings 25,582 25,069 – Plant and machinery 490 �,569Impairment of inventories 301 �,29�Bad debts written off 1,960 –Director’s fees 576 590Auditor’s remuneration 3,481 2,777Direct operating expenses arising from investment properties that generated rental income 1 �2Research and development costs 2,652 2,265
7. iMpAiRMENT OF iNTANgiBLE ASSETS
During the year ended 3� December 20�0, as a result of the deteriorating results of J.S.L. Carpets Corporation (“JSL”), party of the Group’s Wholesale Division in the United States of America, management has decided to restructure the wholesale business and as a result, recorded an impairment charge over the goodwill and intangible assets arising from the acquisition JSL, amounting to HK$�5,533,000.

- �3 -
8. iNCOME TAx ExpENSES
Hong Kong profits tax has been provided at the rate of �6.5% (2009: �6.5%) on the estimated assessable profits for the year. Taxation on overseas profits has been calculated on the estimated assessable profits for the year at the rates of taxation prevailing in the countries in which the Group operates.
2010 2009 HK$’000 HK$’000
Current income tax – Hong Kong 3,806 3,258 – The People’s Republic of China (“PRC”) and overseas 16,474 �6,643Underprovision in prior years 2,576 �,395Deferred income tax 49 (49 )
Income tax expenses 22,905 2�,247
Share of income tax expense of an associate of HK$�80,000 (2009: HK$36,000) and share of income tax expense of jointly controlled entities of HK$�4,698,000 (2009: HK$�2,678,000) respectively are included in the share of (loss)/profit of an associate and jointly controlled entities.
9. (LOSS)/EARNiNgS pER SHARE
Basic (loss)/earnings per share is calculated by dividing the (loss)profit attributable to owners of the parent by the weighted average number of ordinary shares in issue during the year.
2010 2009
(Loss)/profit attributable to owners of the parent (HK$’000) (13,063 ) 39,�34
Weighted average number of ordinary shares in issue (thousands) 212,187 2�2,�87
Basic (loss)/earnings per share (HK cents) (6.16 ) �8.44
The Group had no outstanding share options as at 3� December 2009 and 3� December 20�0. As a result, diluted (loss)/earnings per share is not presented.

- �4 -
10. TRADE AND OTHER RECEivABLES
group
2010 2009 HK$’000 HK$’000
Trade receivables 203,822 �76,730Less: provision for impairment of trade receivables (13,801 ) (�9,670 ) Trade receivables, net 190,021 �57,060Prepayment 25,898 2�,808Other receivables 7,904 ��,7��Value added tax receivables 6,320 4,35�Rental deposits 2,611 2,977
232,754 �97,907
The amounts approximated to the respective fair values as at 3� December 20�0 and 2009. The credit terms of the Group range from 0 to 90 days, depending on the credit status and repayment history of customers. At the reporting date, the ageing analysis of the trade receivables based on invoice date is as follows:
2010 2009 HK$’000 HK$’000
0 to 30 days 141,941 86,7233� to 60 days 20,776 34,0236� to 90 days 10,018 �4,702More than 90 days 17,286 2�,6�2
190,021 �57,060
While the ageing analysis of the trade receivables which are past due but not impaired are as follows:
2010 2009 HK$’000 HK$’000
Amount past due at the reporting date but not impaired: Less than 30 days past due 44,653 42,809 3� to 60 days past due 14,339 ��,425 6� to 90 days past due 7,798 4,6�2 More than 90 days past due 12,891 �9,566
79,681 78,4�2

- �5 -
The current balances related to existing customers, most of which had no recent history of default.
As at 3� December 20�0, trade receivables of HK$80 million (2009: HK$78 million) were past due but not impaired. The balances were related to a number of customers that have a good track record with the Group. Based on the past experience, management estimates that the carrying amounts could be fully recovered.
Movements on the Group’s provision for impairment of trade receivables are as follows:
2010 2009 HK$’000 HK$’000
As at � January 19,670 26,360Recovery of impairment loss previously recognised (3,069 ) (�,243 )Receivables written off during the year as uncollectible (2,800 ) (5,447 )
As at 3� December 13,801 �9,670
11. TRADE AND OTHER pAYABLES
group
2010 2009 HK$’000 HK$’000
Trade payables 65,667 46,258Other payables 190,470 �53,427
256,137 �99,685 At the reporting date, the ageing analysis of the trade payables based on invoice date is as follows:
2010 2009 HK$’000 HK$’000
0 to 30 days 56,302 4�,3733� days to 60 days 7,606 3,4896� days to 90 days 642 60More than 90 days 1,117 �,336
65,667 46,258

- �6 -
DiviDEND
No interim dividend was paid during the year (2009: Nil). The Directors recommend a final dividend of HK9 cents per share (2009: HK9 cents) for the year ended 3� December 20�0. Subject to the approval of shareholders at the forthcoming annual general meeting of the Company, the final dividend will be paid to shareholders whose names appear on the register of members of the Company at the close of business on �9 May 20��.
CHAiRMAN’S STATEMENT
It is naturally disappointing to record a net loss for the year, which has been principally due to impairment charges and provisions relating to J.S.L. Carpet Corporation (“JSL”), our U.S. wholesale business, which was acquired in 2008. The wholesale sector was severely affected by the downturn in the U.S., which necessitated a write-down of related goodwill and non-current assets. However, as JSL also performs a valuable sourcing role for a portfolio of top-end hand-knotted and woven rugs, a slimmed-down entity is being integrated more closely into our core operations.
Nevertheless, despite such one-off charges, the underlying business continued to perform well in challenging circumstances, and our consolidated statement of financial position and cash position remain strong.
While the adverse effect of the global recession on our businesses in the first half of 20�0 caused us to issue a profit warning, actual performance in the second half of the year was good. For the full year, revenue increased by 9%, with year-on-year growth reaching 23% in the second half of the year, and the overall profitability of the underlying base business improved. Order bookings were strong throughout 20�0, and we enter 20�� with a significantly improved position in that regard.
We completed a company-wide strategic planning exercise to map out our growth targets over the coming years and have taken the first steps towards its implementation. The deliberate realignment of our global brand architecture resulted in the creation of a new product line specifically targeting the hospitality sector. Called “�956 by Tai Ping,” it will be rolled out globally during the second quarter of 20��.
Our RBC Division had an exceptional 20�0, with �5% sales growth over the prior year in residential, boutique hotels, retail, aviation, and yacht sectors. In May, we completed the acquisition of Manufacture des Tapis de Cogolin (“Cogolin”). This world-famous, hand-woven French luxury brand enhances our already strong portfolio. In line with our strategic intent to grow our residential, yacht and aviation business in Asia, we developed our first Asian luxury collection. Created by Andre Fu, the world-renowned, Hong Kong-based designer, the collection was previewed in our Paris showroom in Paris during Maison & Objet and will see its global launch in Hong Kong in spring 20��.
The Commercial Division did well despite the decline in the hospitality sector in the U.S. We are poised for expansion in 20�� due to the anticipated recovery of the hospitality sector and the implementation of strategic growth initiatives in recent months. In 20�0, we proudly completed the installation of the Marina Bay Sands resort in Singapore, one of the largest hospitality projects in the world.

- �7 -
Our manufacturing operations in China and Thailand had a successful year, managing to increase operational efficiencies despite civil unrest in Thailand and labour shortages in the Pearl River Delta area. We have improved our retention of top-skilled employees through targeted programmes of wage increases, improved secondary benefits, and training and development.
In order to deliver premium quality carpets and rugs to our customers around the world, we continue to focus our strategy on our portfolio of top quality brands, excellent design, world-class manufacturing, and outstanding customer service.
Based on improving market conditions and our current order book, 20�� should be a positive year for Europe and Asia. We also see signs of recovery in the United States in our targeted sectors. In 20�� we will continue to strengthen our brand portfolio and global infrastructure.
MANAgEMENT DiSCUSSiON AND ANALYSiS
The Group’s consolidated turnover for the year ended 3� December 20�0 was HK$�,222 million, a year-on-year increase of 9% or HK$�04 million. All regions contributed to the increase, but most notable was the performance of the business in Europe, which saw sales grown by 27%. The gross margin, however, decreased by 2 percentage points to 42% in 20�0, which was mainly attributable to increased wages and increased raw material costs at our factories, and price pressure in the hospitality sector, only partly offset by a favourable product mix and improved production efficiencies.
The Group recorded an operating loss of HK$20 million in 20�0, a decrease of HK$42 million compared to operating profit of HK$22 million in 2009. The drop in operating profit is caused by continued losses in our Wholesale Division, including a HK$�5 million impairment charge, losses in foreign exchange due to the weakness of the Euro throughout the year and additional provisions at the global level partly offset by growing profits in our RBC Division.
Operating expenses growth was contained to 9% due to increasing synergies at our manufacturing operations and global support functions.
Share of profits of the jointly controlled entities which mainly reflects our 49% interest in the carpet manufacturing operations of Weihai Shanhua in China was HK$33 million in 20�0, a drop of �9% or HK$8 million compared to 2009 as Shanhua operates exclusively in the more price and economy sensitive hospitality sector.
Despite the operating losses our earnings before interest, tax, depreciation and amortisation (EBITDA) at HK$83 million remained strong, although it declined from HK$�24 million in the previous year.
As a result, loss attributable to owners amounted to HK$�3 million, a decrease of HK$52 million, as compared with profit of HK$39 million in 2009.

- �8 -
CARpET OpERATiONS
Turnover of the carpet operations increased by 9%, or HK$�0� million, to HK$�,�87 million in 20�0, which was mainly attributable to the excellent performance of the RBC Division, but also helped by increased sales in the Commercial Division, offset by a decrease in the Wholesale Division.
Our turnover is getting more and more equally divided over our three regions with the Americas accounting for 32% of total carpet turnover in 20�0, while Asia and Europe/Others accounted for 47% and 2�% respectively. In 2009, the corresponding shares of total carpet turnover by the Americas, Asia and Europe/Others were 44%, 33% and 23% respectively.
The gross profit margin in 20�0 declined by 2 percentage points to 42%, despite a continued improvement in mix with RBC sales growing faster than Commercial sales. The operating profit of the carpet operations decreased by HK$42 million, to loss of HK$20 million year-on-year.
The Americas
Results in the Americas were disappointing with Carpet turnover decreasing to HK$380 million, a �4% decrease year-on-year. The decrease is attributable to the continued weakness of the hospitality and casino sectors in the U.S., which were especially affected by changes in the global economy, albeit that the second half of the year showed signs of an improvement.
Turnover of the U.S. commercial business dropped by 24% to HK$�8� million and the business returned a HK$3 million loss for the year, a decrease of HK$32 million versus 2009, when the business reported a profit of HK$29 million.
Despite a continued strong performance of the aviation sector the U.S. the residential business saw a decline in sales. Turnover in 20�0 was HK$�56 million, a decrease of 9% compared to 2009. Profitability was equally affected with operating profit reducing to HK$�2 million.
JSL, a U.S.-based wholesale distributor of high-end custom carpets and rugs, was acquired by the Group in 2008. JSL has seen a decline of turnover in the last couple of years and we decided to integrate the business into our mainline operations to reduce operating expenses. JSL’s turnover was HK$�9 million, a decrease of 39% compared to the previous year. The operation returned an operating loss of HK$28 million. The Group has taken a HK$�6 million impairment charge in 20�0 to reflect the reduced value of the intangibles associated with the wholesale business.

- �9 -
Asia
Asia is becoming ever more important for the Group. Turnover in Asia increased from HK$447 million by HK$��8 million or 26% to HK$565 million mainly due to strong performances of the businesses in Hong Kong and Thailand. Carpets Inter, the Group’s subsidiary in Thailand managed to increase its sales by 26%, primarily due to a strong performance of the automotive and carpet tile divisions. Sales from Hong Kong were also strong, driven by sales into Macau and Southern China. The Marina Bay Sands resort in Singapore one of the largest hospitality projects in the world, was completed in 20�0 with Tai Ping delivering all room and public area carpets.
Gross margins declined slightly, but operating profit increased strongly compared to previous year.
Europe, Middle East and Africa (“EMEA”)
EMEA continued its strong growth performance of the last couple of years and delivered turnover of HK$242 million, up HK$5� million or 27% compared with previous year. This exceptional growth was delivered through Europe’s focus on key growth sectors like boutique hotels, European luxury retail, high-end yachts and aviation. Performance in the yacht sector was especially strong with turnover growing by more than 60%. The Group was awarded the world-wide contract for the Louis Vuitton boutiques and also received an order for a private airport terminal in Doha from the government of Qatar. Results of the Commercial Division in Europe were disappointing. Overall margins in the region decreased slightly, but operating profits strongly increased due to the strong growth in turnover.
In May, the Group completed the acquisition of Cogolin, which brought to fruition a much-coveted opportunity to add to Tai Ping’s portfolio of luxury brands. Founded in �924, La Manufacture still operates from its original factory in the south of France and produces a traditional range of hand-woven luxury carpets.
Jointly Controlled Entities
Combined turnover of the three jointly controlled entities in China was up to HK$�,00� million in 20�0. In 20�0 the Group’s share of the profit after income tax expenses and the Hong Kong Financial Reporting Standards (“HKFRS”) accounting adjustments of the jointly controlled entities amounted to HK$33 million, which was �9% lower compared with the previous year, mainly due to the adjustments to HKFRS made in 20�0 compared to 2009.

- 20 -
Manufacturing Operations
Our manufacturing operations in Nanhai and Bangkok managed to improve their output and operating efficiency, despite significant labour shortages in China and civil unrest in Bangkok. The Nanhai factory addressed the labour shortages by increasing wages and salaries and offering better secondary benefits, which has re-established Tai Ping as an employer of choice for the industry in the region. We continued our investments towards sustainable practices and applied for an upgrade from NSF/ANSI Silver to Gold status on two product platforms for our factory in Thailand and we are preparing the application for the Nanhai factory. We relaunched our innovation management process and have taken further steps to harmonise working practices between the two manufacturing operations.
Human Resources
We increased our number of employees by �00 to 3,300. In 20�0 we took initiatives to increase the quality of secondary benefits for our factory workers at our Nanhai and Bangkok operations to increase retention of key skilled staff. We also introduced a new company wide, work-level classification, performance evaluation and bonus system for all our management.
Design and Marketing
Design and Marketing worked together on key growth initiatives such as preparations for a new acquisition and branding initiatives to clarify our brand and product positioning in the hospitality and residential market sectors.
The acquisition of Cogolin was supported through carefully crafted, locally issued press release about our intention to preserve “La Manufacture”, which has helped to ensure a positive buzz and continued excitement in the months following the acquisition. During 20��, the re-named “La Manufacture Cogolin” will launch with an all-new visual identity and an updated product line.
To better clarify our product offering for the high-volume hospitality business, the team conceived the “�956 by Tai Ping” concept as a new product line. Scheduled to launch in 20�� with a new visual identity that will help customers clearly distinguish commercial products from residential, “�956 by Tai Ping” will help develop sales for machine-made Axminster and commercial-grade hand-tufted product specifically destined for application in hotels, casinos, convention centers and other large-scale, high traffic areas.
We completed the development of our first upscale collection for the Asian home market with Andre Fu, a renowned Hong Kong-based designer. Known for an urbane style with a local flavor, Andre Fu is a sophisticated spokesman for the Tai Ping brand and will help reinforce our plans to reposition Tai Ping for the growing residential sector in Asia.
Quintessentials, a new pass-tufted collection, was created to provide a less expensive alternative to Tai Ping’s hand-tufted products when simple stripes and textures are needed. Projected to develop incremental sales, this program has been extremely well received by our sales representatives and clients.

- 2� -
To support growth in one of our key targeted sectors we launched Passport, our first dedicated collection for the aviation market.
NON-CARpET OpERATiONS
Yarn Operations
Premier Yarn Dyers, Inc. (“PYD”), which operates the Group’s U.S.-based yarn-dyeing facilities, had a good year as turnover recovered from a decline in 2009. Turnover increased by HK$3 million or �0% to HK$34 million. Operating profit rose to HK$3 million.
Other Operations
In November 20�0 we agreed to sell the 26th floor of Regent Centre, Hong Kong, the current home of our corporate headquarters, to a wholly-owned subsidiary of Winsor Properties Holdings Limited which is a Hong Kong based developer for a total consideration of HK$32 million. The disposal will be completed in September 20��. We will move our staff into a new corporate head-office in the third quarter of 20��.
Capital Expenditure
Capital expenditure in the form of property, plant and equipment, construction in progress and intangible assets (other than goodwill) incurred by the Group totalled HK$53 million in 20�0 (2009: HK$32 million). As at 3� December 20�0, the aggregate net book value of the Group’s property, plant and equipment, investment properties, land use rights, construction in progress and intangible assets (other than goodwill) amounted to HK$3�6 million (2009: HK$352 million).
Liquidity and Financial Resources
The Group coordinates its financing and cash management activities at the corporate level, and usually funds its business with internally generated cash flows and through banking facilities at various subsidiaries.
As at 3� December 20�0, the Group had total cash and bank balances amounting to HK$87 million (2009: HK$�00 million).
As at 3� December 20�0, the Group also held financial assets at fair value through profit or loss of HK$�33 million (2009: HK$87 million).
Details of Charges on the group’s Assets
The Group had charges on bank deposits of HK$2 million (2009: HK$5 million) made to a bank to secure banking facilities granted to the Group.

- 22 -
Exposure to Foreign Exchange Risks
The Group has overseas operations in the U.S., Europe, Thailand, the PRC, Singapore, India, Bangladesh and Argentina. The Group treats its investments in these foreign operations as permanent equity, so exchange differences from translating the net investments in these foreign operations do not affect cash flows and are dealt with in the reserves.
The Group’s sales are denominated primarily in U.S. Dollars, and to a lesser extent in Thai Baht, Euro and Pound Sterling. The operations in Singapore, India, Bangladesh and Argentina are not significant in terms of the Group’s results.
The Group recorded net exchange loss of HK$4 million, arising from overseas operations in 20�0, which related mostly to Europe.
It is expected that the exchange market may continue to be highly volatile in 20�0, and the Group will closely monitor the exchange rate movements and take appropriate action to manage any material exposure that may arise.
Contingent Liabilities
As at 3� December 20�0, the Group’s total contingent liabilities amounted to HK$37 million (2009: HK$40 million).
pURCHASE, SALES OR REDEMpTiON OF THE COMpANY’S SHARES
The Company has not redeemed any of its shares during the year. Neither the Company nor any of its subsidiaries has purchased or sold any of the Company’s shares during the year.
CORpORATE gOvERNANCE
The Board and Management are committed to promoting good corporate governance to safeguard the interests of shareholders. The Company codified its corporate governance practices by reference to the Code on Corporate Governance Practices (the “Code”) as set out in Appendix �4 of the Rules Governing the Listing of Securities on The Stock Exchange of Hong Kong Limited (the “Listing Rules”). The Company has applied the principles in the Code and complied with the code provisions set out in the Code throughout the year ended 3� December 20�0.

- 23 -
Financial Reporting and internal Controls
The Board is responsible for maintaining an adequate system of internal control and for reviewing its effectiveness. The internal control system of the Group is designed to facilitate the effectiveness and efficiency of operations, safeguard assets against unauthorised use and disposition, ensure the maintenance of proper accounting records and the truth and fairness of the financial statements, and ensure compliance with relevant legislation and regulations. However, associate and jointly controlled entities might not fully follow the Group’s internal control system. The Group is not involved in routine operational decisions or does not play an active role in running the businesses of the associate and jointly controlled entities, and an audit or certain review procedures are performed on their annual financial results. Major business decisions and challenges, including key policies, capital expenditure, regulatory and financing issues, would be presented and considered through regular Board meetings. Such practices provide reasonable, but not absolute, assurance against material mis-statement or loss and manage rather than eliminate risks associated with the business activities.
The independent internal audit function has written terms of reference and reports directly to the Audit Committee. Internal Audit conducts reviews of the effectiveness of the Group’s internal control system based on the internal audit plan and ad hoc requests from the Audit Committee and senior management. The annual internal audit plan is developed based on an assessment of the various business and operational risks of the Group and is approved by the Audit Committee. The Audit Committee reviews the findings and opinion of Internal Audit in respect of the effectiveness of the Group’s internal control system periodically, and reports annually to the Board the key findings of such reviews.
Audit Committee
Written terms of reference of the Audit Committee in line with code provision C.3.3 of the Code were adopted at the Board meeting on 23 September 2005.
Under these terms of reference, the responsibilities of the Audit Committee include overseeing the relationship with the Company’s external auditor (including making recommendation to the Board on the appointment, re-appointment and removal of the external auditor, and approving the audit fee and reviewing the audit scope), review of financial information of the Group, oversight of the Group’s financial reporting system and internal controls.
During the year under review, the Audit Committee held four meetings with management and the representatives of the external auditor for reviewing the interim and annual reports before submission to the Board for consideration and approval, reviewing the annual audit plan and scope of work of both external auditor and internal auditor, and discussing issues arising from the audits including internal controls and financial reporting.

- 24 -
CLOSiNg OF REgiSTER
The Register of Members of the Company will be closed from Tuesday, �7 May 20�� to Thursday, �9 May 20��, both days inclusive, during which period no transfer of shares will be registered. In order to qualify for the final dividend, all transfers of shares accompanied by the relevant share certificates and transfer forms must be lodged with the Company’s Branch Registrars and Registration Office in Hong Kong, Computershare Hong Kong Investor Services Limited, 46/F Hopewell Centre, �83 Queen’s Road East, Hong Kong, not later than 4:30 p.m. on Monday, �6 May 20��.
By order of the BoardNicholas T. J. Colfer James H. KaplanChairman Chief Executive Officer
Hong Kong, 25 March 20��
The names of Directors as at the date hereof are – Chairman and Non-executive Director: Mr. Nicholas T. J. Colfer; Chief Executive Officer and Executive Director: Mr. James H. Kaplan; Independent Non-executive Directors: Mrs. Yvette Y. H. Fung, Mr. Roderic N. A. Sage, Mr. Lincoln C. K. Yung, Mr. Aubrey K. S. Li; Non-executive Directors: Mr. Ian D. Boyce, Mr. Lincoln K. K. Leong; Mr. David C. L. Tong, Mr. John J. Ying; Alternate Director: Mr. Nelson K. F. Leong (Alternate to Mr. Lincoln K. K. Leong).
The 2010 Annual Report containing the information required by the Listing Rules will be published in due course in the website of The Stock Exchange of Hong Kong Limited (http://www.hkex.com.hk).