TABLE OF CONTENTS PART V SECTION 2016 5. 1 ... - KDOT
826
TABLE OF CONTENTS PART V SECTION 2016 5. 1 GENERAL 5.1.1 Materials Control Functions of the Bureau of Construction and Materials 5.2 QUALITY CONTROL/QUALITY ASSURANCE 5.2.1 Statistics 5.2.2 Rounding Off and Random Sampling 5.2.2.1 Rounding Off of Numbers 5.2.2.2 Random Sampling 5.2.3 Reasons for Quality Control/Quality Assurance (QC/QA) and the Certified Inspection and Testing Training Program (CIT 2 ). 5.2.4 Procedures for Quality Assurance 5.2.5 Quality Control/Quality Assurance (QC/QA) Tests 5.2.6 Comparison of Quality Control and Verification Tests 5.2.7 Contractor's Quality Control Plan 5.2.7.1 HMA: Contractor’s Quality Control Plan 5.2.7.2 Guide for Quality Control and Acceptance Requirements for HMA 5.2.7.3 Example of a Laboratory Quality Manual For HMA 5.2.7.4 Concrete: Contractor’s Quality Control Plan 5.2.7.5 Example of a Laboratory Quality Manual for Concrete 5.2.7.6 Concrete Structures: Contractor’s Quality Control Plan 5.2.7.7 Example of a Contractor’s Concrete Structures Quality Control Plan for Controlling Evaporation 5.2.7.8 Cement Treated Base: Contractor’s Quality Control Plan (CTB) 5.2.7.8.1 Example of a Laboratory Quality Manual for CTB 5.3 MIX DESIGN METHODS 5.3.1 Concrete Mix Design 5.3.2 Bituminous Mix Design 5.3.3 Superpave Mix Design 5.3.4 Mix Design Procedures for CIR (Cold in Place Recycling) Material 5.4 LABORATORY AND SAMPLE IDENTIFICATION 5.4.1 Laboratory Identification 5.4.2 Sample Identification 5.4.3 Sample Identification Forms 5.5 REQUIRED SAMPLE SIZES 5.6 AGGREGATES 5.6.1 General 5.6.2 Types of Production
-
Upload
khangminh22 -
Category
Documents
-
view
3 -
download
0
Transcript of TABLE OF CONTENTS PART V SECTION 2016 5. 1 ... - KDOT
TABLE OF CONTENTS
PART V
SECTION 2016
5. 1 GENERAL
5.1.1 Materials Control Functions of the Bureau of Construction and Materials
5.2 QUALITY CONTROL/QUALITY ASSURANCE
5.2.1 Statistics
5.2.2 Rounding Off and Random Sampling
5.2.2.1 Rounding Off of Numbers
5.2.2.2 Random Sampling
5.2.3 Reasons for Quality Control/Quality Assurance (QC/QA) and the Certified Inspection and
Testing Training Program (CIT2).
5.2.4 Procedures for Quality Assurance
5.2.5 Quality Control/Quality Assurance (QC/QA) Tests
5.2.6 Comparison of Quality Control and Verification Tests
5.2.7 Contractor's Quality Control Plan
5.2.7.1 HMA: Contractor’s Quality Control Plan
5.2.7.2 Guide for Quality Control and Acceptance Requirements for HMA
5.2.7.3 Example of a Laboratory Quality Manual For HMA
5.2.7.4 Concrete: Contractor’s Quality Control Plan
5.2.7.5 Example of a Laboratory Quality Manual for Concrete
5.2.7.6 Concrete Structures: Contractor’s Quality Control Plan
5.2.7.7 Example of a Contractor’s Concrete Structures Quality Control Plan for Controlling
Evaporation
5.2.7.8 Cement Treated Base: Contractor’s Quality Control Plan (CTB)
5.2.7.8.1 Example of a Laboratory Quality Manual for CTB
5.3 MIX DESIGN METHODS
5.3.1 Concrete Mix Design
5.3.2 Bituminous Mix Design
5.3.3 Superpave Mix Design
5.3.4 Mix Design Procedures for CIR (Cold in Place Recycling) Material
5.4 LABORATORY AND SAMPLE IDENTIFICATION
5.4.1 Laboratory Identification
5.4.2 Sample Identification
5.4.3 Sample Identification Forms
5.5 REQUIRED SAMPLE SIZES
5.6 AGGREGATES
5.6.1 General
5.6.2 Types of Production

TABLE OF CONTENTS
PART V
SECTION 2016
5.6.3 Inspection Responsibilities
5.6.4 Approval of Deposits
5.6.5 Inspection, Sampling and Testing
5. 7 INSPECTION AND SAMPLING OF MATERIALS
5.7.1 Asphalt Materials
5.7.2 Brick and Concrete Masonry Units
5.7.3 Concrete Curing Materials
5.7.4 Joint Sealing and Joint Filler Materials
5.7.5 Miscellaneous Materials
5.7.6 Miscellaneous Metals
5.7.7 Bridge Paints and Pavement Marking Materials
5.7.8 Culvert, Sewer and Underdrain Pipe
5.7.9 Cementitious Material
5.7.10 Materials for Roadside Improvements
5.7.11 Steel and Iron
5.7.12 Timber, Lumber, Piling and Posts
5.7.13 Water for Use with Portland Cement
5.8 NUCLEAR GAUGE
5.8.1 1.13.2 SOM - RADIOLOGICAL SAFETY GUIDLINES
5.8.2 Independent Assurance Replicate (ASR) Check for Nuclear Density Gauges
5.8.3 Segregation Check Using the Nuclear Density Gauge
5.8.4 Joint Density Evaluation Using the Nuclear Density Gauge
5.9 SAMPLING AND TEST METHODS FOREWORD
5.9.1 KT-1 Sampling and Splitting of Aggregates
5.9.2 KT-2 Sieve Analysis of Aggregates
5.9.3 KT-3 Material Passing No. 200 (75 µm) Sieve by the Wash Method
5.9.4 KT-4 Percent Retained on the No. 200 (75 µm) Sieve by Dry Screening
5.9.5 KT-5 Unit Weight of Aggregate
5.9.6 KT-6 Specific Gravity and Absorption of Aggregates
5.9.7 KT-7 Clay Lumps and Friable Particles in Aggregate
5.9.8 KT-8 Shale or "Shalelike" Materials in Aggregate
5.9.10 KT-10 Plasticity Tests
5.9.11 KT-11 Moisture Tests
5.9.12 KT-12 Standard Compaction Test
5.9.13 KT-13 Field Density Tests of Soils, Treated Base Courses and Water Bound Base Courses
5.9.14 KT-14 Marshall Tests of Bituminous Mixes
5.9.15 KT-15 Bulk Specific Gravity and Unit Weight of Compacted Hot Mix Asphalt (HMA)
5.9.16 KT-16 Deleted
5.9.17 KT-17 Sampling Freshly Mixed Concrete
5.9.18 KT-18 Air Content of Freshly Mixed Concrete by the Pressure Method

TABLE OF CONTENTS
PART V
SECTION 2016
5.9.19 KT-19 Air Content of Freshly Mixed Concrete by the Volumetric Method
5.9.20 KT-20 Mass Per Cubic Foot (Meter), Yield and Air Content (Gravimetric) of Freshly
Mixed Concrete
5.9.21 KT-21 Slump of Portland Cement Concrete
5.9.22 KT-22 Making and Curing Compression and Flexural Test Specimens in the Field
5.9.23 KT-23 Flexural Strength of Concrete (Third-Point Loading Method)
5.9.24 KT-24 Determination of Free Moisture or Absorption of Aggregate for Use in Concrete
5.9.25 KT-25 Sampling and Splitting Plant Mixed Asphalt Mixtures
5.9.26 KT-26 Sampling Asphalt Materials
5.9.27 KT-27 Sampling Joint Compound Materials
5.9.28 KT-28 Sampling Bridge Paint
5.9.29 KT-29 Field Sampling of Portland Cement, Lime and Fly Ash
5.9.30 KT-30 Field Sampling of Thermoplastic Pavement Marking Material
5.9.31 KT-31 Determination of Percentage of Crushed Particles in Crushed Gravel
AKA: Coarse Aggregate Angularity
5.9.32 KT-32 Method of Test for Density of Compacted Asphalt Mixtures by Nuclear Method
5.9.33 KT-33 Deleted See KTMR-39
5.9.34 KT-34 Sieve Analysis of Extracted Aggregate
5.9.35 KT-35 Sticks in Aggregate
5.9.36 KT-36 Density of Freshly Mixed Concrete in Bridge Deck Overlays by Nuclear Gauge
5.9.37 KT-37 Making, Curing and Testing Cement Treated and Unbound Bases
5.9.38 KT-38 Density of Freshly Mixed Concrete in Pavement by Nuclear Method
5.9.39 KT-39 Theoretical Maximum Specific Gravity of Asphalt Paving Mixtures
5.9.41 KT-41 Determination of Density and Moisture Content of Portland Cement Treated Bases,
Aggregate Bases and Aggregate Shoulders by Nuclear Method
5.9.42 KT-42 Sieve Analysis for Acceptance of Lime or Cement Treated Soils
5.9.43 KT-43 Moisture Content of Asphalt Mixtures or Mineral Aggregates - Microwave Oven
Method
5.9.44 KT-44 Method of Testing the Strength of Portland Cement Concrete Using the Maturity
Method
5.9.45 KT-45 Determination of Dry Paint Film Thickness with the Magnetic Gauge
5.9.46 KT-46 Determination of Pavement Profile with the Profilograph
5.9.47 KT-47 Depth Determination of Hot-in-Place Recycled Asphalt Pavement (HIR)
5.9.49 KT-49 Method for Obtaining and Testing Drilled Cores from PCCP and Precast Girders
5.9.50 KT-50 Uncompacted Void Content of Fine Aggregate
5.9.51 KT-51 Field Density and Moisture Tests of Soils by Nuclear Gauge
5.9.54 KT-54 Deleted See KT-46
5.9.55 KT-55 Plastic Fines in Combined Aggregates by Use of the Sand Equivalent Test
5.9.56 KT-56 Resistance of Compacted Asphalt Mixture to Moisture Induced Damage
5.9.57 KT-57 Determination of Asphalt Content and Gradation of Hot Mix Asphalt Concrete by
the Ignition Method
5.9.58 KT-58 Method for Preparing and Determining the Density of Hot Mix Asphalt (HMA)
Specimens by Means of the Superpave Gyratory Compactor
5.9.59 KT-59 Flat and Elongated Particles in Coarse Material Test
5.9.60 KT-60 Indirect Tensile Test
5.9.61 KT-61 Raveling Test on Recycled Asphalt Specimens

TABLE OF CONTENTS
PART V
SECTION 2016
5.9.62 KT-62 Percent Solids of Lime Slurry
5.9.63 KT-63 Method for Determining Draindown Characteristics in Uncompacted Asphalt
Mixtures
5.9.64 KT-64 Method for Determining Volume of Voids in Compacted Filler or Fines
5.9.65 KT-65 Sampling and Splitting Cement Treated Base Mixtures
5.9.66 KT-66 Sampling Epoxy Pavement Marking
5.9.67 KT-67 Sampling Glass Beads
5.9.68 KT-68 Sampling Traffic Paint
5.9.69 KT-69 Relative Density
5.9.70 KT-70 Method for Testing Polymer Overlays for Surface Preparation and Adhesion
5.9.71 KT-71 Air-Void Analyzer
5.9.72 KT-72 Measuring Flowing Concrete
5.9.73 KT-73 Density, Absorption and Voids in Hardened Concrete
5.9.76 KT-76 Method for Testing the Compressive Strength of Molded Cylindrical Concrete Specimens
5.9.77 KT-77 Method for Capping Cylindrical Concrete Specimens
5.9.78 KT-78 Method for Determining the Tensile Adhesive Strength of Asphalt Pavement Tack
Coat
5.9.79 KT-79 Surface Resistivity of Concrete
5.9.80 KT-80 Uncompacted Void Content of Coarse Aggregate
5.9.81 KT-81 Sampling Cold Plastic Pavement Marking, Patterned Cold Plastic Pavement
Marking Tape and High Durability Pavement Marking Tape
5.9.82 KT-82 Determination of Excessive Moisture in Concrete Surfaces
5.9.83 KT-83 Strand Bond in Prestressed Concrete Members
5.9.84 KT-84 Sampling Nuts, Bolts and Washers
5.9.85 KT-85 (Reserved for Rumble Strips)
5.9.86 KT-86 Characterization Of The Air-Void System Of Freshly Mixed Concrete By The Sequential
Pressure Method (Super Air Meter – SAM)
5.10 CALCULATIONS
5.10.1 Absolute Volume and Percent of Voids in a Unit Volume of Aggregate
5.10.2 Theoretical Specific Gravity of a Combination of Aggregates
5.10.3 Volume of Asphalt Materials
5.10.4 Calculations for the Marshall Mix Design of Bituminous Mixtures
5.10.5 Fineness Modulus of Aggregates (Gradation Factor)
APPENDICIES
Appendix A Sampling and Testing Frequency Chart – Non Quality Control/Quality Assurance
Specifications
Appendix B Sampling and Testing Frequency Chart – Quality Control/Quality Assurance
Specifications
Appendix C Test Procedure Criteria for the Independent Assurance Program

TABLE OF CONTENTS
PART V
SECTION 2016
Appendix D Policy and Procedure Manual for the Inspection of Kansas Department of
Transportation District Laboratories

Page 1/2 5.1 2016
Revised 2016
PART V – MATERIALS CONTROL
5.1. GENERAL 5.1.1. MATERIALS CONTROL FUNCTIONS OF THE SECRETARY OF TRANSPORTATION
By state statute, the Secretary of Transportation has the power, duty, authority and jurisdiction “to inspect
and test all materials…used for state highway purposes or highway projects involving federal funds, and
to develop methods and procedures for this purpose.” (K.S.A. 68-404(h)). The Secretary’s inspection and
testing of materials and the methods and procedures employed to conduct this inspection and testing are
for the Department’s benefit. They are not for the benefit of contractors, producers, or suppliers.
Part V of this Manual and KDOT’s Standard Specifications are two means by which the Secretary fulfills
the Secretary’s statutory obligations. Nothing in Part V or KDOT’s Standard Specifications shall be
construed to limit KDOT’s discretion to adopt and/or revise standards, specifications, test procedures,
removal procedures, or other policies and procedures applicable to the materials used for highway
construction/maintenance. Nothing in Part V or KDOT’s Standard Specifications, including without
limitation, prequalification or preapproval of materials/sources of material, is a guarantee to contractors,
producers, or suppliers that a given material/source of material for highway construction/maintenance will
be approved by or remain approved by KDOT, be accepted by KDOT, or be purchased by KDOT or
others.
Part V and KDOT’s Standard Specifications include provisions for the Department’s Quality
Control/Quality Assurance Program (QC/QA Program), which is required by FHWA to assure the quality
of materials and construction in all Federal-aid highway projects and as a condition precedent to use of
federal funds. The Department administers its state program in the same manner as its federal program.
The Secretary has delegated to the Bureau of Construction and Materials the responsibility for the
establishment and administration of the materials’ portion of the Department’s QC/QA Program.
5.1.2. MATERIALS CONTROL FUNCTIONS OF THE BUREAU OF
CONSTRUCTION AND MATERIALS
The Bureau of Construction and Materials has responsibility for the establishment and
administration of the materials portion of the Department's Quality Control/Quality Assurance
(QC/QA) Program.
The Bureau develops standards and specifications for materials, establishes sampling procedures
and frequencies, and establishes testing procedures that are used in the laboratory and the field in
order to assure compliance with specifications. The fact that KDOT develops objective
specifications and testing criteria and approves or preapproves materials is not intended to limit the
Department’s discretion regarding the inspection, sampling, testing and acceptance of materials for
highway construction/maintenance.
The Bureau performs materials testing to assist the districts in administering quality assurance
functions of the QC/QA Program. Such testing includes tests on materials purchased by

Page 2/2 5.1 2016
Revised 2016
contractors or the State for use in maintenance or construction activities. This testing is for
KDOT’s benefit not to ensure contractors’ quality control. The Bureau also conducts tests on
concrete, bituminous mixtures and numerous other specialized materials, the results of which are
used by others. KDOT has no control over or responsibility for the use of KDOT’s materials
testing by other entities and no legal duties to such entities.
The responsibility of the Bureau extends to all materials used or proposed for use in State and
Federal-aid highway construction and maintenance.
On "full oversight" and "certification acceptance" projects involving Federal funds, the Bureau
of Construction and Materials must certify to the Federal Highway Administration as to the
quality of each type of material used on each project before the State is completely reimbursed
by the Federal Government. On all other projects the bureau reviews project materials records
and advises the District Engineer of materials status prior to contract finalization.
To accomplish its various objectives, duties and responsibilities, the Bureau organization
consists of the Headquarters Administration office, the Materials and Research Center (MRC),
and Regional Laboratories. It also has the assistance of a District Laboratory in each District.

Page 1/26 5.2.1 2016
Revised 2014
5.2. QUALITY CONTROL /QUALITY ASSURANCE
5.2.1. STATISTICS
1. ACKNOWLEDGEMENT
This paper has been copied directly from the HMA Manual with a few modifications from the original
version. The original version was prepared by Dr. Mustaque Hossain. Ph. D., P.E., Kansas State
University.
2. BACKGROUND
2.1 American industries have defined the Quality Control/Quality Assurance (QC/QA) concept to fit
within their particular application and there is no doubt that the “working” definition differs from industry
to industry. In the highway community those Contractors, suppliers, and Public Agencies (Agency) that
have implemented a QC/QA program probably have their own definition as well. It is important that a
concise and logical definition of QC/QA be adopted and be supported by all members within a single
industry. For the highway community the QC/QA concept must be defined so that Contractors, suppliers
and Agencies can identify with a basic concept and proceed to establish their respective programs. The
American Association of State Highway and Transportation Officials (AASHTO) has defined QC/QA in
AASHTO R-10-06 (2011) in the following manner:
2.2. Quality Control: The system used by a contractor to monitor, assess and adjust their
production or placement processes to ensure that the final product will meet the specified level of
quality. Quality control includes sampling, testing, inspection and corrective action (where
required) to maintain continuous control of a production or placement process.
2.3. Quality Assurance: All those planned and systematic actions necessary to provide confidence
that a product or facility will perform satisfactorily in service; or (2) making sure the quality of a
product is what it should be.
3. STANDARD DEFINITIONS FOR QC/QA APPLICATIONS
The following terms are defined in the AASHTO R-10-06 (2011) except Agency. All other shall be
consistent with the 2008 AASHTO Guide Specifications For Highway Construction.
3.1. Agency: The State Highway or Transportation Department, Commission, or other
organization, constituted under State or Commonwealth laws, that administers highway or
transportation work.
The term Agency was chosen for the purpose of consistency, as this document is intended for use by any
governing organization attempting to prepare specifications for the purpose of highway or transportation
work.
3.2. Acceptable Quality Level (AQL): The level of established actual quality for a quality
characteristic that is fully acceptable.
3.3. Buyer: See Agency above.
Page 2/26 5.2.1 2016
Revised 2014
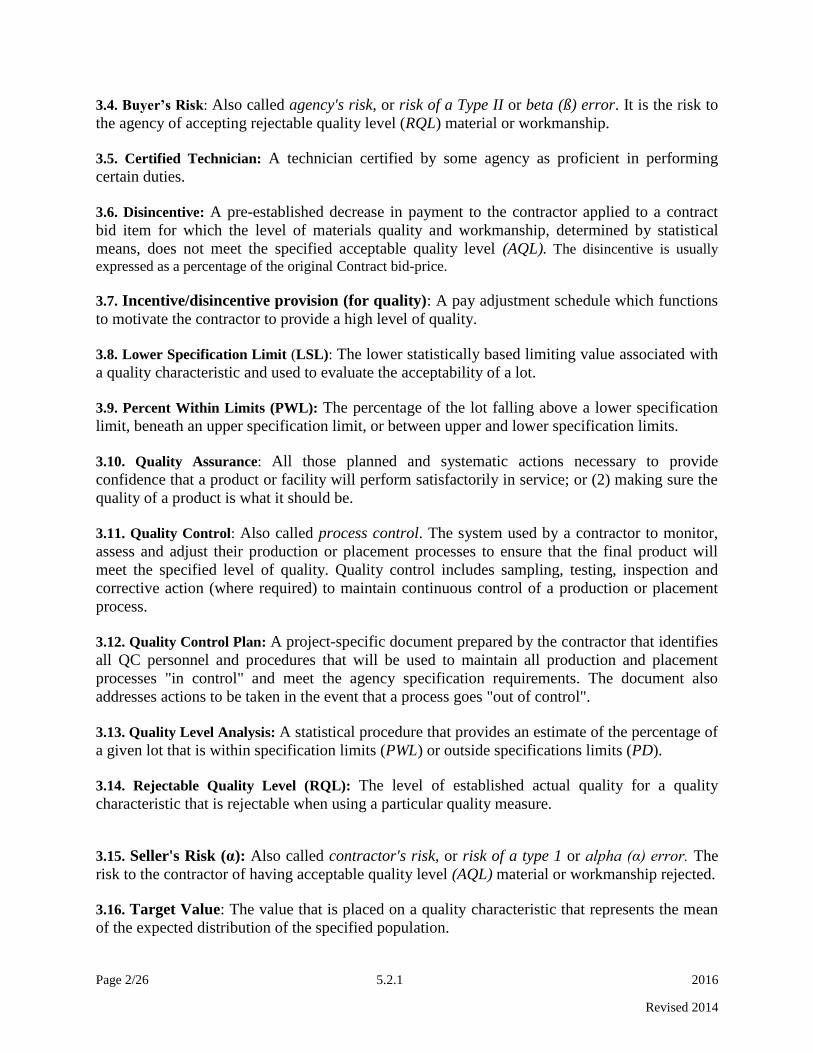
3.4. Buyer’s Risk: Also called agency's risk, or risk of a Type II or beta (ß) error. It is the risk to
the agency of accepting rejectable quality level (RQL) material or workmanship.
3.5. Certified Technician: A technician certified by some agency as proficient in performing
certain duties.
3.6. Disincentive: A pre-established decrease in payment to the contractor applied to a contract
bid item for which the level of materials quality and workmanship, determined by statistical
means, does not meet the specified acceptable quality level (AQL). The disincentive is usually
expressed as a percentage of the original Contract bid-price.
3.7. Incentive/disincentive provision (for quality): A pay adjustment schedule which functions
to motivate the contractor to provide a high level of quality.
3.8. Lower Specification Limit (LSL): The lower statistically based limiting value associated with
a quality characteristic and used to evaluate the acceptability of a lot.
3.9. Percent Within Limits (PWL): The percentage of the lot falling above a lower specification
limit, beneath an upper specification limit, or between upper and lower specification limits.
3.10. Quality Assurance: All those planned and systematic actions necessary to provide
confidence that a product or facility will perform satisfactorily in service; or (2) making sure the
quality of a product is what it should be.
3.11. Quality Control: Also called process control. The system used by a contractor to monitor,
assess and adjust their production or placement processes to ensure that the final product will
meet the specified level of quality. Quality control includes sampling, testing, inspection and
corrective action (where required) to maintain continuous control of a production or placement
process.
3.12. Quality Control Plan: A project-specific document prepared by the contractor that identifies
all QC personnel and procedures that will be used to maintain all production and placement
processes "in control" and meet the agency specification requirements. The document also
addresses actions to be taken in the event that a process goes "out of control".
3.13. Quality Level Analysis: A statistical procedure that provides an estimate of the percentage of
a given lot that is within specification limits (PWL) or outside specifications limits (PD).
3.14. Rejectable Quality Level (RQL): The level of established actual quality for a quality
characteristic that is rejectable when using a particular quality measure.
3.15. Seller's Risk (α): Also called contractor's risk, or risk of a type 1 or alpha (α) error. The
risk to the contractor of having acceptable quality level (AQL) material or workmanship rejected.
3.16. Target Value: The value that is placed on a quality characteristic that represents the mean
of the expected distribution of the specified population.
Page 3/26 5.2.1 2016
Revised 2014
3.17. Upper Specification Limit (USL): The upper statistically based limiting value associated
with a quality characteristic and used with a quality measure to evaluate the quality of a lot.
4. MISCELLANEOUS DEFINITIONS RELATED TO QC/QA
4.1. Lot: An isolated quantity of material which is produced from a single source under similar
conditions. A lot is a measured amount of construction assumed to be produced by the same process. For
example, the placement of 4,000 tons of hot-mix asphalt (HMA) or one days production for concrete
paving. Also referred to as population in statistical analysis.
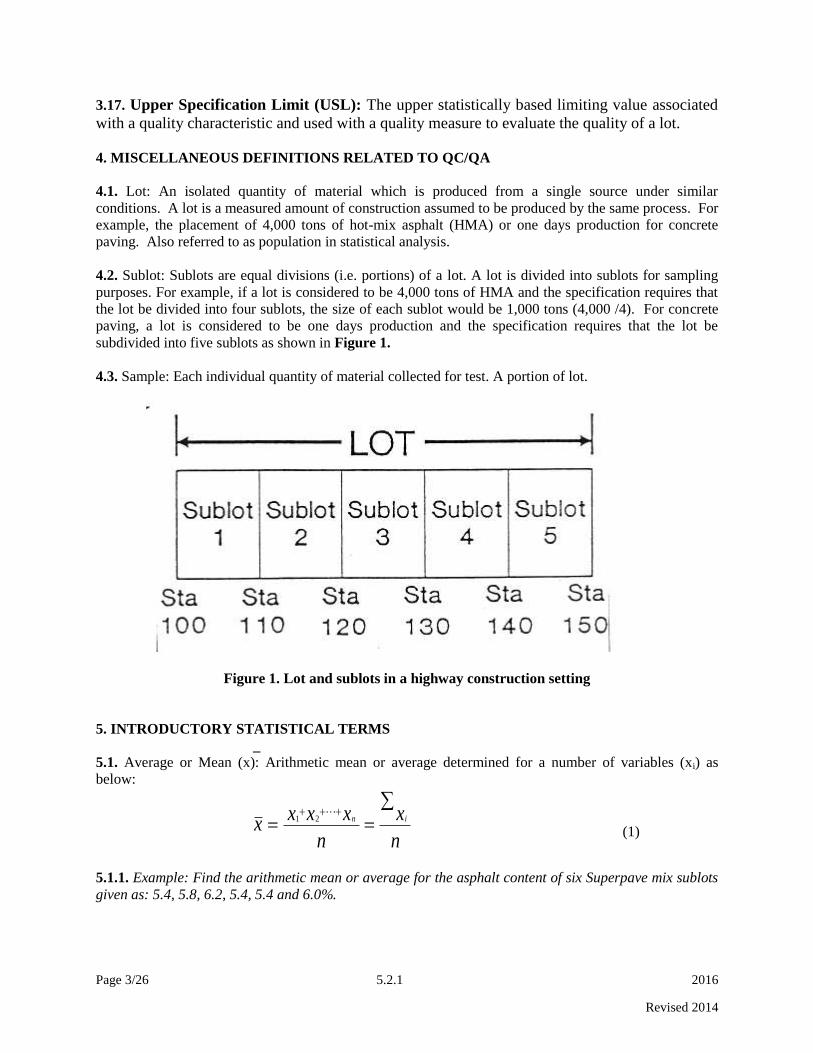
4.2. Sublot: Sublots are equal divisions (i.e. portions) of a lot. A lot is divided into sublots for sampling
purposes. For example, if a lot is considered to be 4,000 tons of HMA and the specification requires that
the lot be divided into four sublots, the size of each sublot would be 1,000 tons (4,000 /4). For concrete
paving, a lot is considered to be one days production and the specification requires that the lot be
subdivided into five sublots as shown in Figure 1.
4.3. Sample: Each individual quantity of material collected for test. A portion of lot.
Figure 1. Lot and sublots in a highway construction setting
5. INTRODUCTORY STATISTICAL TERMS
_
5.1. Average or Mean (x): Arithmetic mean or average determined for a number of variables (xi) as
below:
n
x
n
xxxx in
21
(1)
5.1.1. Example: Find the arithmetic mean or average for the asphalt content of six Superpave mix sublots
given as: 5.4, 5.8, 6.2, 5.4, 5.4 and 6.0%.

Page 4/26 5.2.1 2016
Revised 2014
7.56
2.34
6
0.64.54.52.68.54.5
x
5.1.2. Example: Find the arithmetic mean or average for the percent air in the concrete mix of six sublots
given as: 6.6, 6.2, 5.5, 7.8, 6.9 and 6.6%.
6.66
6.39
6
6.69.68.75.52.66.6
x
5.2. Moving Average: Average computed based on a fixed set of continuous data points. For KDOT, the
w represents the number of tests within a lot:
w
xxxxx iiii
ma
123
(2)
5.2.1. Example: Find the 4-point moving average for the above asphalt content data:
Asphalt content (%) 4-point moving average
5.4 -
5.8 -
6.2 -
5.4 5.7
5.4 5.7
6.0 5.8
5.2.2. Example: Find the 4-point moving average for the above percent air content data:
Air content (%) 4-point moving average
6.6 -
6.2 -
5.5 -
7.8 6.5
6.9 6.6
6.6 6.7
5.3. Range (R): Range is the difference between the largest and smallest values. A simple measure of
variability.
R = xmax - xmin (3)
5.3.1. Example: Find the Range (R) for the asphalt content data in 5.2.1. above:
R = 6.2 - 5.4 = 0.8%
Page 5/26 5.2.1 2016
Revised 2014
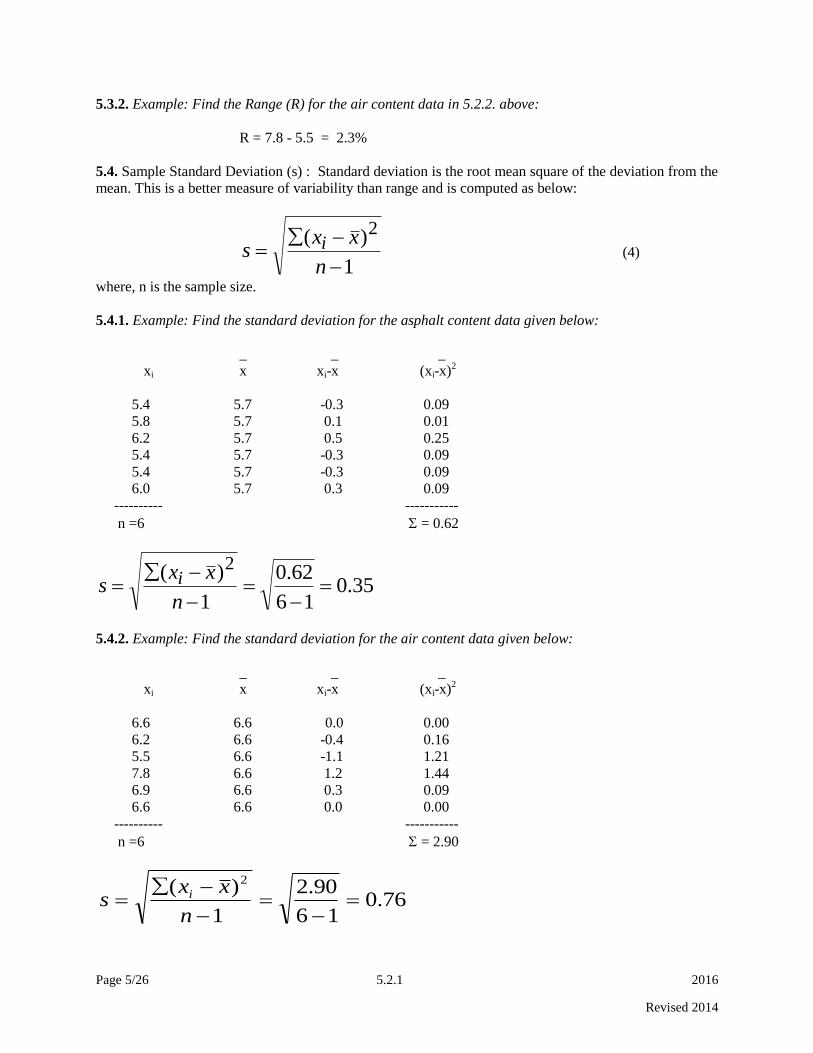
5.3.2. Example: Find the Range (R) for the air content data in 5.2.2. above:
R = 7.8 - 5.5 = 2.3%
5.4. Sample Standard Deviation (s) : Standard deviation is the root mean square of the deviation from the
mean. This is a better measure of variability than range and is computed as below:
1
)( 2
n
xxs i
(4)
where, n is the sample size.
5.4.1. Example: Find the standard deviation for the asphalt content data given below:
_ _ _
xi x xi-x (xi-x)2
5.4 5.7 -0.3 0.09
5.8 5.7 0.1 0.01
6.2 5.7 0.5 0.25
5.4 5.7 -0.3 0.09
5.4 5.7 -0.3 0.09
6.0 5.7 0.3 0.09
---------- -----------
n =6 = 0.62
35.016
62.0
1
)( 2
n
xxs i
5.4.2. Example: Find the standard deviation for the air content data given below:
_ _ _
xi x xi-x (xi-x)2
6.6 6.6 0.0 0.00
6.2 6.6 -0.4 0.16
5.5 6.6 -1.1 1.21
7.8 6.6 1.2 1.44
6.9 6.6 0.3 0.09
6.6 6.6 0.0 0.00
---------- -----------
n =6 = 2.90
76.016
90.2
1
)( 2
n
xxs i
Page 6/26 5.2.1 2016
Revised 2014
5.5. Population Standard Deviation (): When the sample size n is large (usually greater than 30), the
standard deviation obtained is for the population. The equation is same as in (4) except that the
denominator is replaced by n.
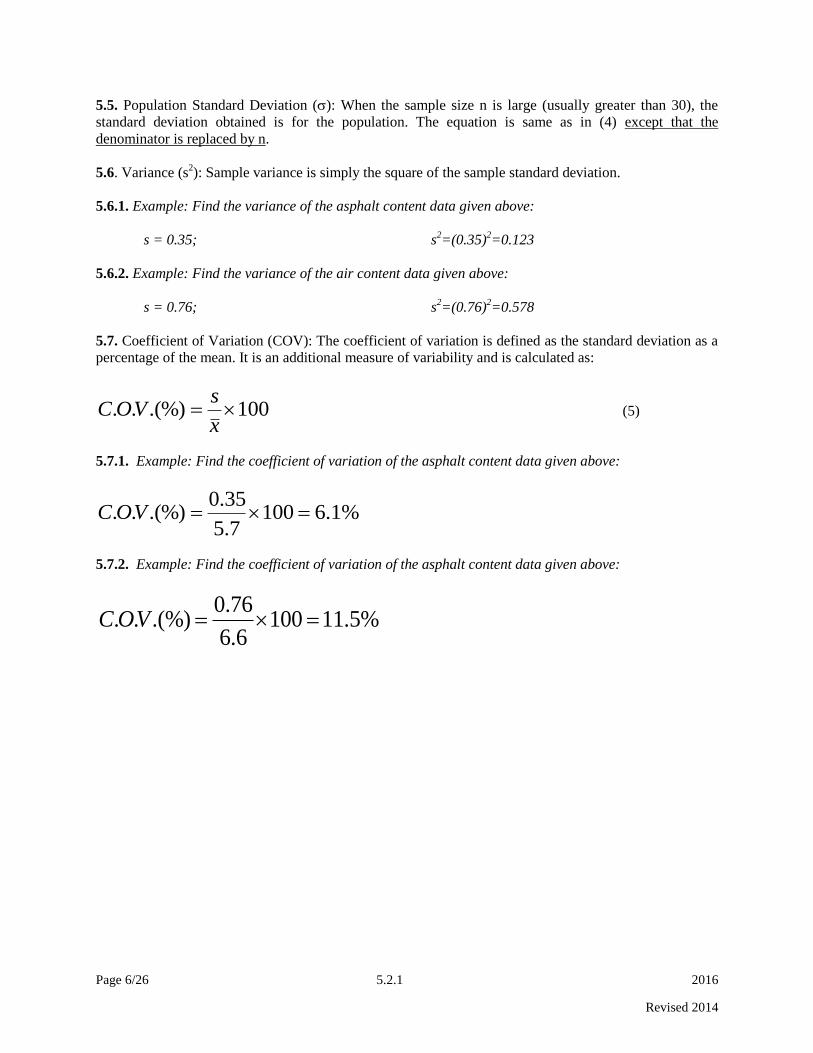
5.6. Variance (s2): Sample variance is simply the square of the sample standard deviation.
5.6.1. Example: Find the variance of the asphalt content data given above:
s = 0.35; s2=(0.35)
2=0.123
5.6.2. Example: Find the variance of the air content data given above:
s = 0.76; s2=(0.76)
2=0.578
5.7. Coefficient of Variation (COV): The coefficient of variation is defined as the standard deviation as a
percentage of the mean. It is an additional measure of variability and is calculated as:
100.(%).. x
sVOC (5)
5.7.1. Example: Find the coefficient of variation of the asphalt content data given above:
%1.61007.5
35.0.(%).. VOC
5.7.2. Example: Find the coefficient of variation of the asphalt content data given above:
%5.111006.6
76.0.(%).. VOC
Page 7/26 5.2.1 2016
Revised 2014
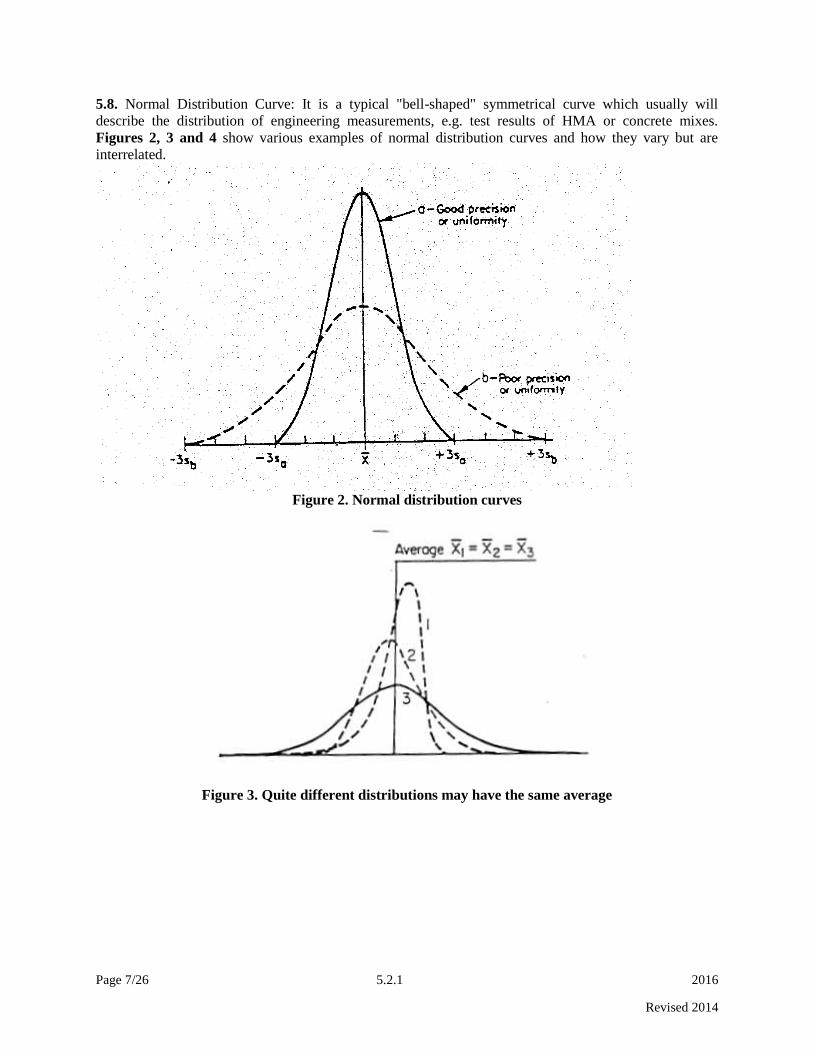
5.8. Normal Distribution Curve: It is a typical "bell-shaped" symmetrical curve which usually will
describe the distribution of engineering measurements, e.g. test results of HMA or concrete mixes.
Figures 2, 3 and 4 show various examples of normal distribution curves and how they vary but are
interrelated.
Figure 2. Normal distribution curves
Figure 3. Quite different distributions may have the same average

Page 8/26 5.2.1 2016
Revised 2014
Figure 4. Process control related to specification limits
5.9. Control charts: Control charts are horizontal line charts. The horizontal lines (for single test results or
for "average" type charts) generally consist of a central line at the specified average and an upper line at
the specified upper acceptance limit and a lower line at the lower acceptance limit (if both are applicable)
- for an "acceptance" control chart. Figure 5 shows a typical control chart for average 9.5 mm aggregate
size (percent retained). Control charts are very helpful for identifying possible problems. Examples are
provided in Figures 6, 7, 8, and 9. It is to be noted that if these charts are plotted using individual test
results, then the chance causes cannot be distinguished from assignable causes. However, the moving
average tends to smooth out chance variations and a control chart based on moving averages can be used
to indicate significant trends due to variation in materials and processes.
Figure 5. A typical control chart
10
12
14
16
18
20
22
Perc
en
t R
eta
ine
d
Sublots
9.5 mm Sieve
LCL

Page 9/26 5.2.1 2016
Revised 2014
Figure 6. A point outside the upper specification limits
Figure 7. Two consecutive points near the upper or lower specification limits
Figure 8. Five consecutive points on one side of the center target value

Page 10/26 5.2.1 2016
Revised 2014
Figure 9. A sudden change in the level of results
5.10. Statistical Control charts: It is to be noted that regardless of the shape of the normal curve and
spread (s), 68.26% of the test results will be within ± 1s, 95.44% within ± 2 s and 99.74% within ± 3 s.
Thus, it is apparent that a control chart based on the test statistics (x and s) could be easily developed. The
center line could be the mean of k sample means, each based n tests. The Upper Specification Limit
(USL) and the Lower Specification Limit (LSL) can be fixed based on multiples of s resulting in a typical
statistical control chart as shown in Figure 10.
5.11. Random Number: A number selected entirely by chance as from a table of random numbers as
shown in Table 1 of the KDOT Construction Manual Section 5.2.2.2. (A scientific calculator can also
generate random number; however, this method needs to be approved by the District Materials
Engineer).
Figure 10. Statistical control chart
Page 11/26 5.2.1 2016
Revised 2014
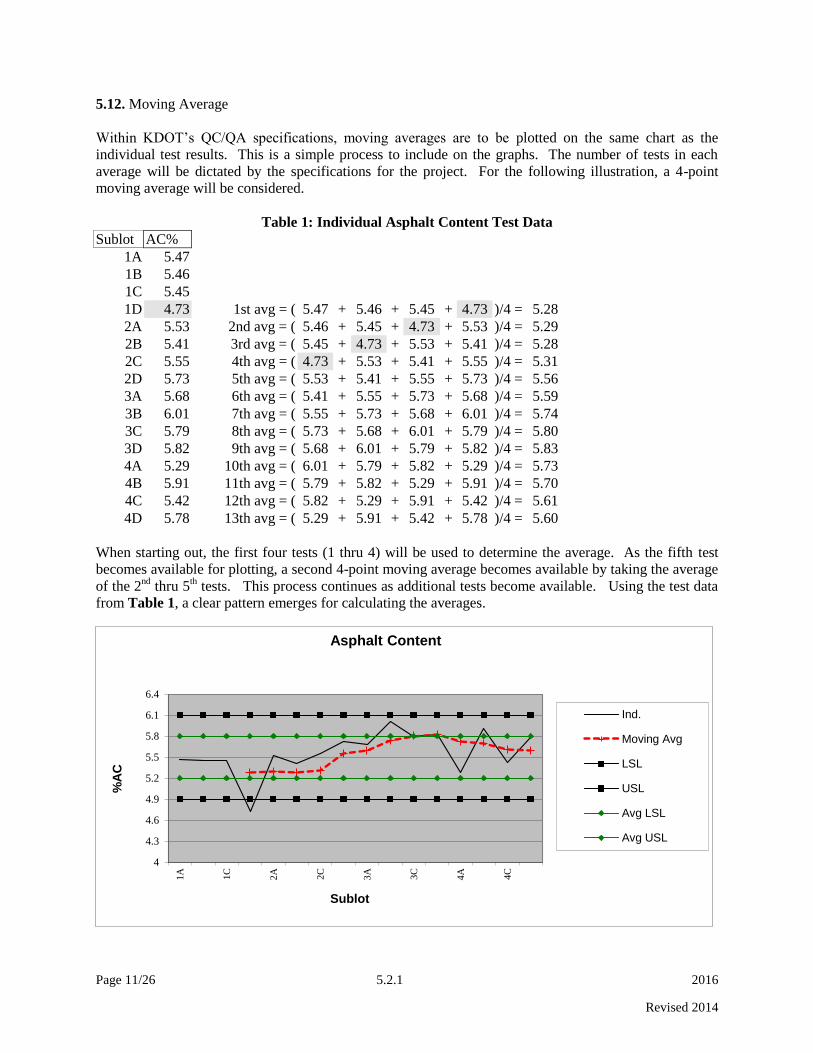
5.12. Moving Average
Within KDOT’s QC/QA specifications, moving averages are to be plotted on the same chart as the
individual test results. This is a simple process to include on the graphs. The number of tests in each
average will be dictated by the specifications for the project. For the following illustration, a 4-point
moving average will be considered.
Table 1: Individual Asphalt Content Test Data
Sublot AC%
1A 5.47
1B 5.46
1C 5.45
1D 4.73 1st avg = ( 5.47 + 5.46 + 5.45 + 4.73 )/4 = 5.28
2A 5.53 2nd avg = ( 5.46 + 5.45 + 4.73 + 5.53 )/4 = 5.29
2B 5.41 3rd avg = ( 5.45 + 4.73 + 5.53 + 5.41 )/4 = 5.28
2C 5.55 4th avg = ( 4.73 + 5.53 + 5.41 + 5.55 )/4 = 5.31
2D 5.73 5th avg = ( 5.53 + 5.41 + 5.55 + 5.73 )/4 = 5.56
3A 5.68 6th avg = ( 5.41 + 5.55 + 5.73 + 5.68 )/4 = 5.59
3B 6.01 7th avg = ( 5.55 + 5.73 + 5.68 + 6.01 )/4 = 5.74
3C 5.79 8th avg = ( 5.73 + 5.68 + 6.01 + 5.79 )/4 = 5.80
3D 5.82 9th avg = ( 5.68 + 6.01 + 5.79 + 5.82 )/4 = 5.83
4A 5.29 10th avg = ( 6.01 + 5.79 + 5.82 + 5.29 )/4 = 5.73
4B 5.91 11th avg = ( 5.79 + 5.82 + 5.29 + 5.91 )/4 = 5.70
4C 5.42 12th avg = ( 5.82 + 5.29 + 5.91 + 5.42 )/4 = 5.61
4D 5.78 13th avg = ( 5.29 + 5.91 + 5.42 + 5.78 )/4 = 5.60
When starting out, the first four tests (1 thru 4) will be used to determine the average. As the fifth test
becomes available for plotting, a second 4-point moving average becomes available by taking the average
of the 2nd
thru 5th tests. This process continues as additional tests become available. Using the test data
from Table 1, a clear pattern emerges for calculating the averages.
4
4.3
4.6
4.9
5.2
5.5
5.8
6.1
6.4
1A 1C
2A 2C
3A 3C
4A 4C
%A
C
Sublot
Asphalt Content
Ind.
Moving Avg
LSL
USL
Avg LSL
Avg USL

Page 12/26 5.2.1 2016
Revised 2014
MOVING AVERAGE
Notice how the individual test result fails in sublot 1D which exceeded the single lower specification limit
(LSL). There is also a failure of the moving average in 3D. Read the specifications to determine what, if
any, lower and upper specification limits exist for test results and what action is warranted when such an
event occurs.
6. QUALITY LEVEL ANALYSIS
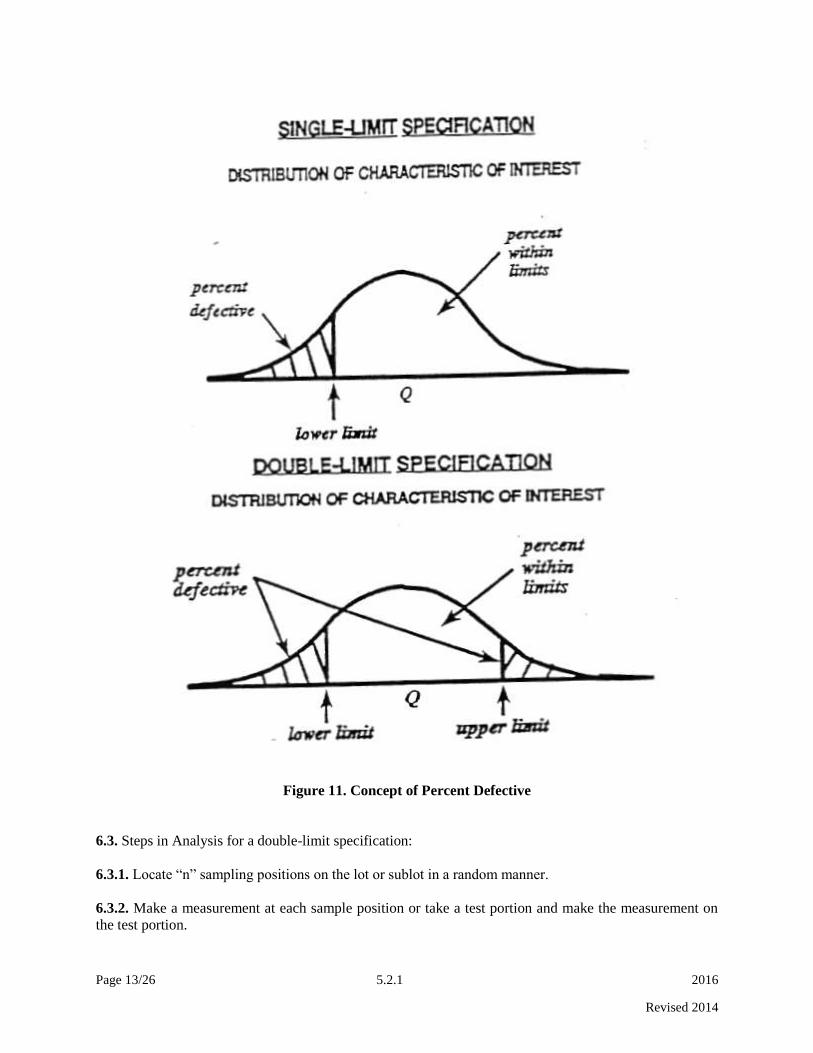
6.1. Quality Level Analysis is a statistical procedure that provides a method of estimating the percentage
of each lot or sublot of material, product item of construction, or completed construction that may be
expected to be within specified tolerance limits. This percent within limits is represented by the unshaded
areas under the normal curves in Figure 11.
6.2. When the specifications require that the percent within limits be established by Quality Level
Analysis, the following procedure shall apply :
Terminology:
6.2.1. xi = the individual values under consideration
6.2.2. n = the number of individual values under consideration
6.2.3. x = the arithmetic mean or average of values under consideration. x may be expressed as xi/n,
or the sum of the individual values divided by the number of individual values.
6.2.4. QU = Upper Quality Index. Found by subtracting the average x from the Upper Specification
Limit (USL) and dividing by the sample standard deviation(s).
6.2.5. QL = Lower Quality Index. Found by subtracting the Lower Specification Limit (LSL) from the
average x and dividing by the sample standard deviation (s).
Page 13/26 5.2.1 2016
Revised 2014
Figure 11. Concept of Percent Defective
6.3. Steps in Analysis for a double-limit specification:
6.3.1. Locate “n” sampling positions on the lot or sublot in a random manner.
6.3.2. Make a measurement at each sample position or take a test portion and make the measurement on
the test portion.
Page 14/26 5.2.1 2016
Revised 2014
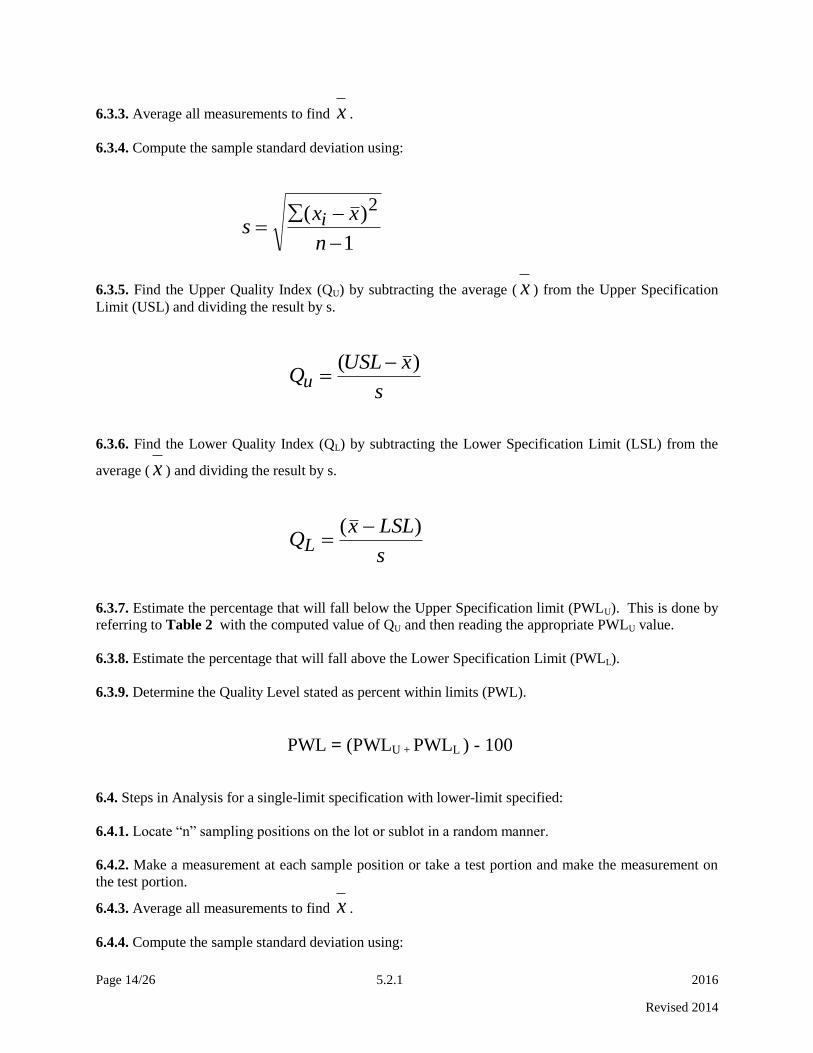
6.3.3. Average all measurements to find x .
6.3.4. Compute the sample standard deviation using:
1
)( 2
n
xxs i
6.3.5. Find the Upper Quality Index (QU) by subtracting the average ( x ) from the Upper Specification
Limit (USL) and dividing the result by s.
s
xUSLQu
)(
6.3.6. Find the Lower Quality Index (QL) by subtracting the Lower Specification Limit (LSL) from the
average ( x ) and dividing the result by s.
s
LSLxQL
)(
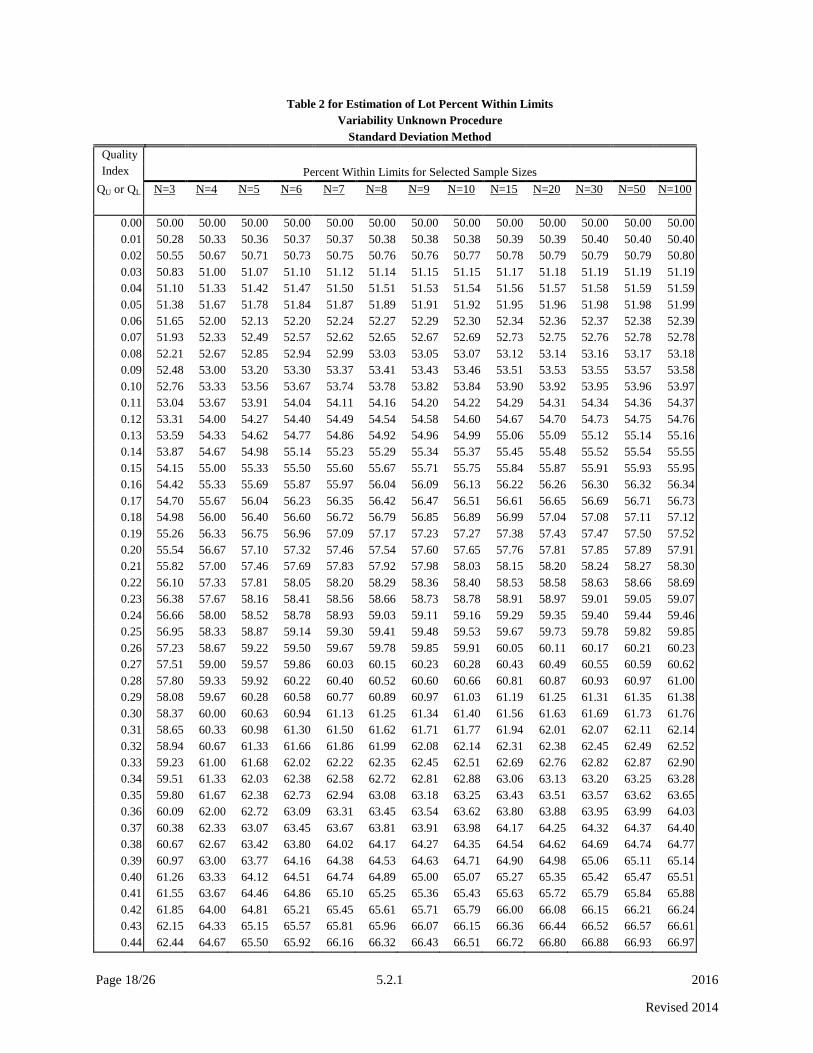
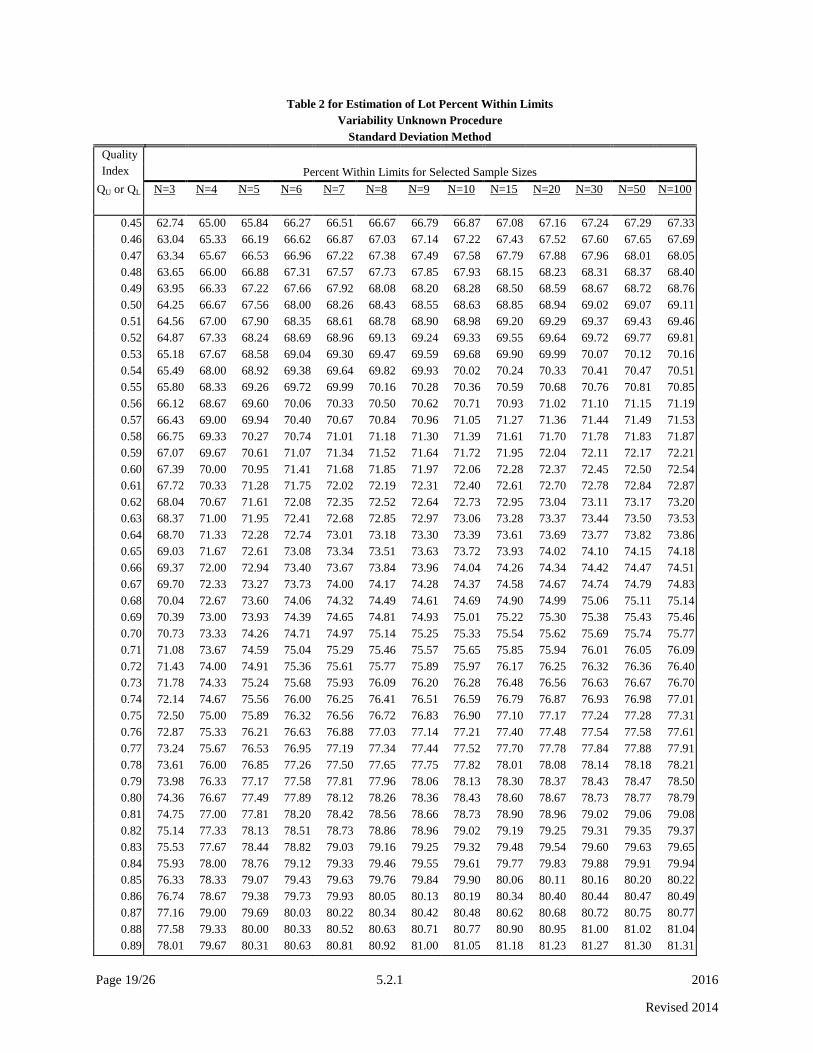
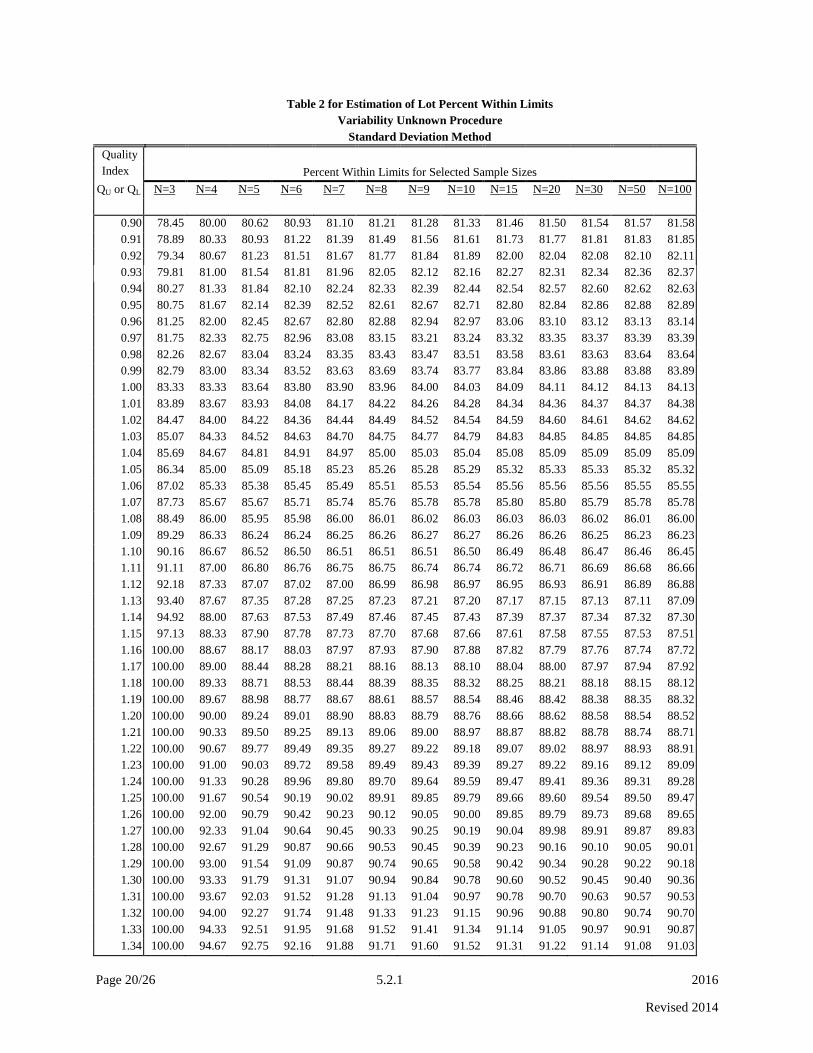
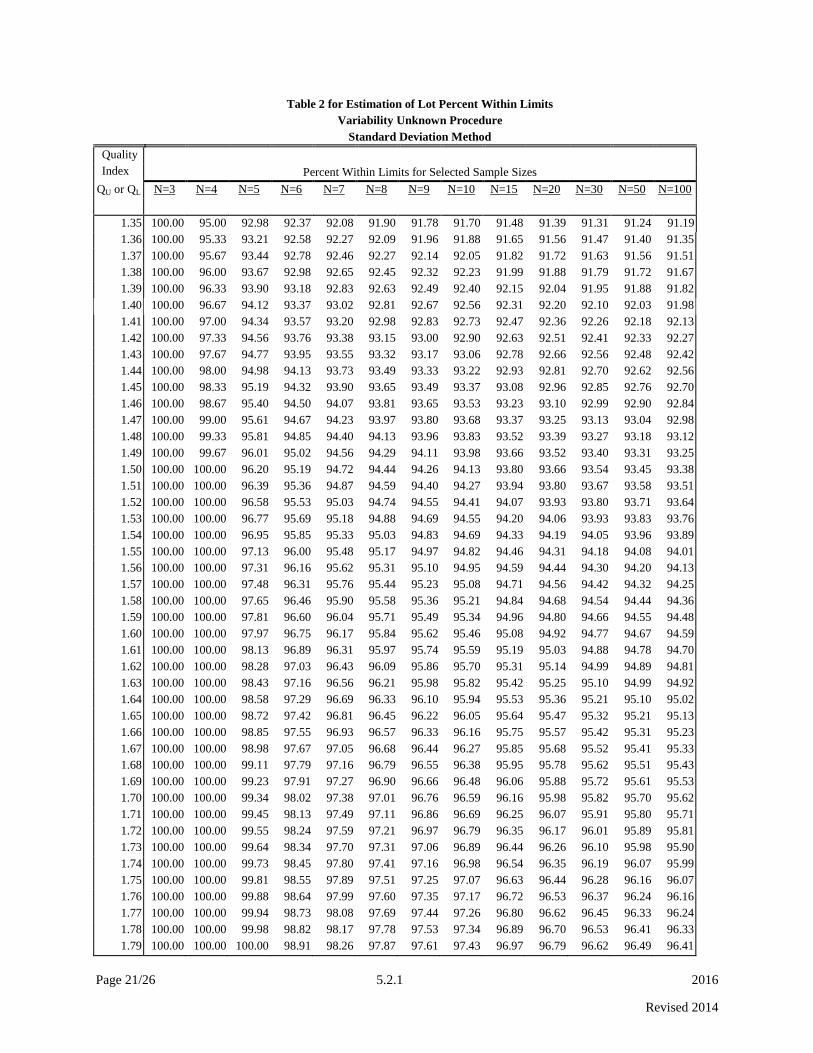
6.3.7. Estimate the percentage that will fall below the Upper Specification limit (PWLU). This is done by
referring to Table 2 with the computed value of QU and then reading the appropriate PWLU value.
6.3.8. Estimate the percentage that will fall above the Lower Specification Limit (PWLL).
6.3.9. Determine the Quality Level stated as percent within limits (PWL).
PWL = (PWLU + PWLL ) - 100
6.4. Steps in Analysis for a single-limit specification with lower-limit specified:
6.4.1. Locate “n” sampling positions on the lot or sublot in a random manner.
6.4.2. Make a measurement at each sample position or take a test portion and make the measurement on
the test portion.
6.4.3. Average all measurements to find x .
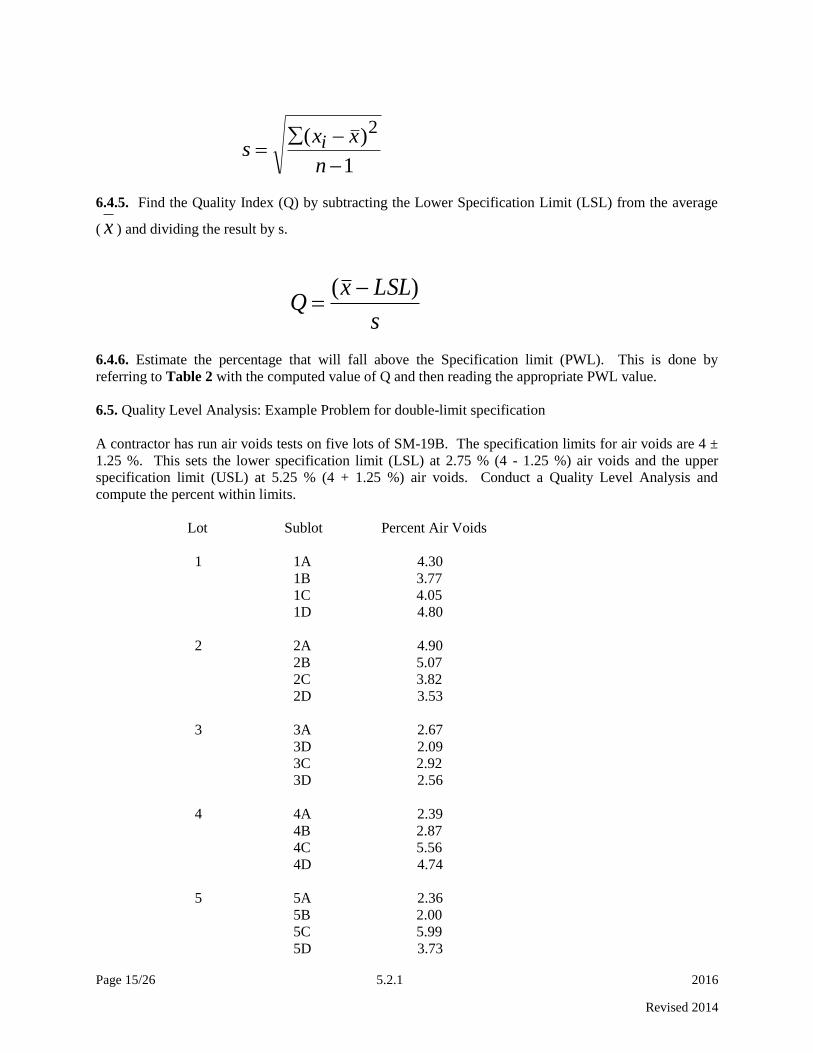
6.4.4. Compute the sample standard deviation using:
Page 15/26 5.2.1 2016
Revised 2014
1
)( 2
n
xxs i
6.4.5. Find the Quality Index (Q) by subtracting the Lower Specification Limit (LSL) from the average
( x ) and dividing the result by s.
s
LSLxQ
)(
6.4.6. Estimate the percentage that will fall above the Specification limit (PWL). This is done by
referring to Table 2 with the computed value of Q and then reading the appropriate PWL value.
6.5. Quality Level Analysis: Example Problem for double-limit specification
A contractor has run air voids tests on five lots of SM-19B. The specification limits for air voids are 4 ±
1.25 %. This sets the lower specification limit (LSL) at 2.75 % (4 - 1.25 %) air voids and the upper
specification limit (USL) at 5.25 % (4 + 1.25 %) air voids. Conduct a Quality Level Analysis and
compute the percent within limits.
Lot Sublot Percent Air Voids
1 1A 4.30
1B 3.77
1C 4.05
1D 4.80
2 2A 4.90
2B 5.07
2C 3.82
2D 3.53
3 3A 2.67
3D 2.09
3C 2.92
3D 2.56
4 4A 2.39
4B 2.87
4C 5.56
4D 4.74
5 5A 2.36
5B 2.00
5C 5.99
5D 3.73
Page 16/26 5.2.1 2016
Revised 2014
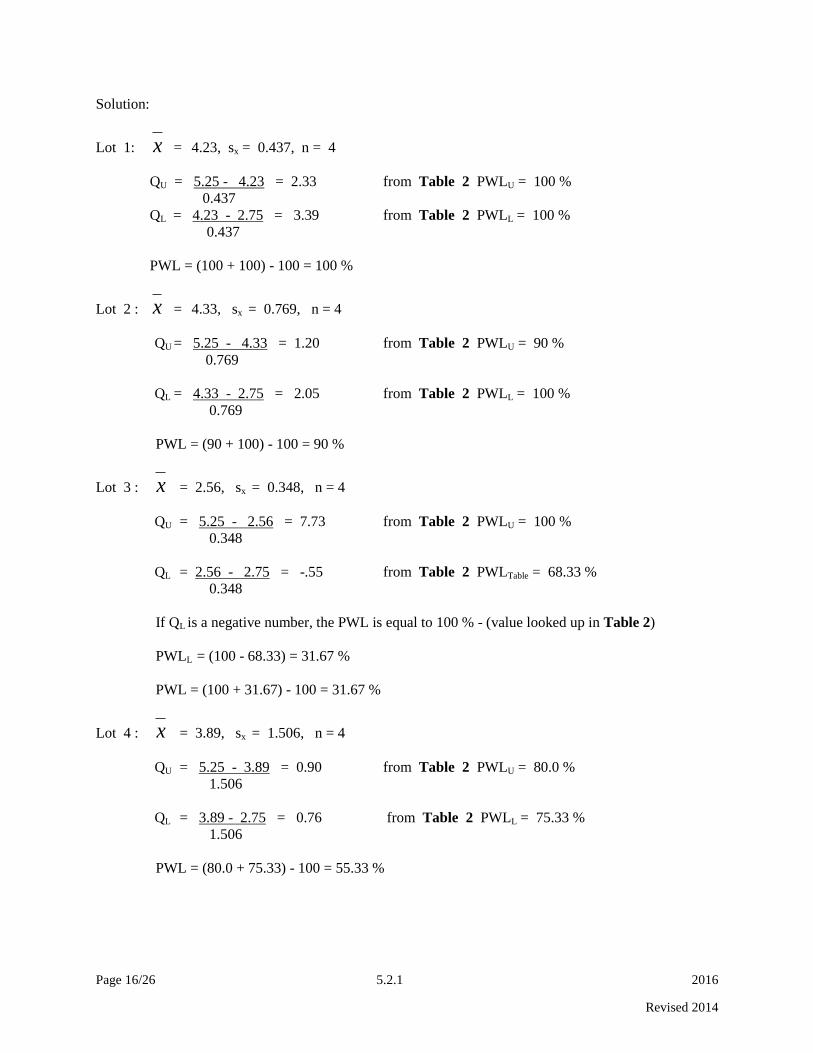
Solution:
Lot 1: x = 4.23, sx = 0.437, n = 4
QU = 5.25 - 4.23 = 2.33 from Table 2 PWLU = 100 %
0.437
QL = 4.23 - 2.75 = 3.39 from Table 2 PWLL = 100 %
0.437
PWL = (100 + 100) - 100 = 100 %
Lot 2 : x = 4.33, sx = 0.769, n = 4
QU = 5.25 - 4.33 = 1.20 from Table 2 PWLU = 90 %
0.769
QL = 4.33 - 2.75 = 2.05 from Table 2 PWLL = 100 %
0.769
PWL = (90 + 100) - 100 = 90 %
Lot 3 : x = 2.56, sx = 0.348, n = 4
QU = 5.25 - 2.56 = 7.73 from Table 2 PWLU = 100 %
0.348
QL = 2.56 - 2.75 = -.55 from Table 2 PWLTable = 68.33 %
0.348
If QL is a negative number, the PWL is equal to 100 % - (value looked up in Table 2)
PWLL = (100 - 68.33) = 31.67 %
PWL = (100 + 31.67) - 100 = 31.67 %
Lot 4 : x = 3.89, sx = 1.506, n = 4
QU = 5.25 - 3.89 = 0.90 from Table 2 PWLU = 80.0 %
1.506
QL = 3.89 - 2.75 = 0.76 from Table 2 PWLL = 75.33 %
1.506
PWL = (80.0 + 75.33) - 100 = 55.33 %
Page 17/26 5.2.1 2016
Revised 2014
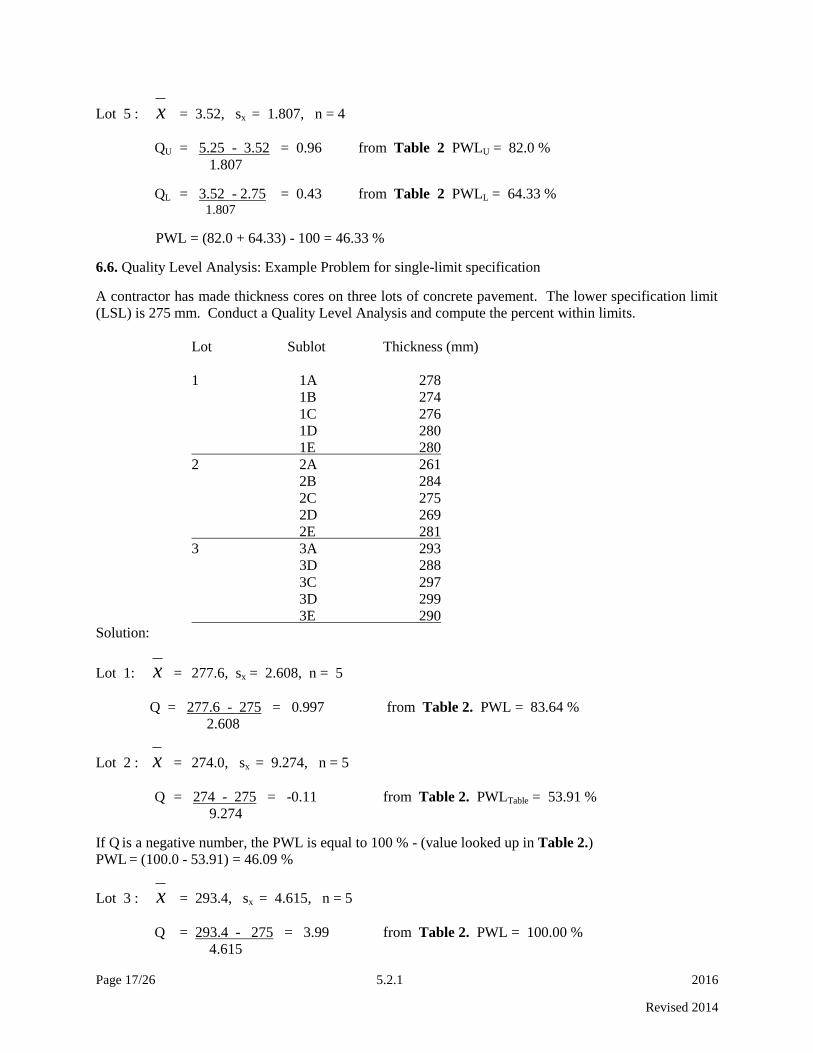
Lot 5 : x = 3.52, sx = 1.807, n = 4
QU = 5.25 - 3.52 = 0.96 from Table 2 PWLU = 82.0 %
1.807
QL = 3.52 - 2.75 = 0.43 from Table 2 PWLL = 64.33 % 1.807
PWL = (82.0 + 64.33) - 100 = 46.33 %
6.6. Quality Level Analysis: Example Problem for single-limit specification
A contractor has made thickness cores on three lots of concrete pavement. The lower specification limit
(LSL) is 275 mm. Conduct a Quality Level Analysis and compute the percent within limits.
Lot Sublot Thickness (mm)
1 1A 278
1B 274
1C 276
1D 280
1E 280
2 2A 261
2B 284
2C 275
2D 269
2E 281
3 3A 293
3D 288
3C 297
3D 299
3E 290
Solution:
Lot 1: x = 277.6, sx = 2.608, n = 5
Q = 277.6 - 275 = 0.997 from Table 2. PWL = 83.64 %
2.608
Lot 2 : x = 274.0, sx = 9.274, n = 5
Q = 274 - 275 = -0.11 from Table 2. PWLTable = 53.91 %
9.274
If Q is a negative number, the PWL is equal to 100 % - (value looked up in Table 2.)
PWL = (100.0 - 53.91) = 46.09 %
Lot 3 : x = 293.4, sx = 4.615, n = 5
Q = 293.4 - 275 = 3.99 from Table 2. PWL = 100.00 %
4.615
Page 18/26 5.2.1 2016
Revised 2014
Table 2 for Estimation of Lot Percent Within Limits
Variability Unknown Procedure
Standard Deviation Method
Quality
Index Percent Within Limits for Selected Sample Sizes
QU or QL N=3 N=4 N=5 N=6 N=7 N=8 N=9 N=10 N=15 N=20 N=30 N=50 N=100
0.00 50.00 50.00 50.00 50.00 50.00 50.00 50.00 50.00 50.00 50.00 50.00 50.00 50.00
0.01 50.28 50.33 50.36 50.37 50.37 50.38 50.38 50.38 50.39 50.39 50.40 50.40 50.40
0.02 50.55 50.67 50.71 50.73 50.75 50.76 50.76 50.77 50.78 50.79 50.79 50.79 50.80
0.03 50.83 51.00 51.07 51.10 51.12 51.14 51.15 51.15 51.17 51.18 51.19 51.19 51.19
0.04 51.10 51.33 51.42 51.47 51.50 51.51 51.53 51.54 51.56 51.57 51.58 51.59 51.59
0.05 51.38 51.67 51.78 51.84 51.87 51.89 51.91 51.92 51.95 51.96 51.98 51.98 51.99
0.06 51.65 52.00 52.13 52.20 52.24 52.27 52.29 52.30 52.34 52.36 52.37 52.38 52.39
0.07 51.93 52.33 52.49 52.57 52.62 52.65 52.67 52.69 52.73 52.75 52.76 52.78 52.78
0.08 52.21 52.67 52.85 52.94 52.99 53.03 53.05 53.07 53.12 53.14 53.16 53.17 53.18
0.09 52.48 53.00 53.20 53.30 53.37 53.41 53.43 53.46 53.51 53.53 53.55 53.57 53.58
0.10 52.76 53.33 53.56 53.67 53.74 53.78 53.82 53.84 53.90 53.92 53.95 53.96 53.97
0.11 53.04 53.67 53.91 54.04 54.11 54.16 54.20 54.22 54.29 54.31 54.34 54.36 54.37
0.12 53.31 54.00 54.27 54.40 54.49 54.54 54.58 54.60 54.67 54.70 54.73 54.75 54.76
0.13 53.59 54.33 54.62 54.77 54.86 54.92 54.96 54.99 55.06 55.09 55.12 55.14 55.16
0.14 53.87 54.67 54.98 55.14 55.23 55.29 55.34 55.37 55.45 55.48 55.52 55.54 55.55
0.15 54.15 55.00 55.33 55.50 55.60 55.67 55.71 55.75 55.84 55.87 55.91 55.93 55.95
0.16 54.42 55.33 55.69 55.87 55.97 56.04 56.09 56.13 56.22 56.26 56.30 56.32 56.34
0.17 54.70 55.67 56.04 56.23 56.35 56.42 56.47 56.51 56.61 56.65 56.69 56.71 56.73
0.18 54.98 56.00 56.40 56.60 56.72 56.79 56.85 56.89 56.99 57.04 57.08 57.11 57.12
0.19 55.26 56.33 56.75 56.96 57.09 57.17 57.23 57.27 57.38 57.43 57.47 57.50 57.52
0.20 55.54 56.67 57.10 57.32 57.46 57.54 57.60 57.65 57.76 57.81 57.85 57.89 57.91
0.21 55.82 57.00 57.46 57.69 57.83 57.92 57.98 58.03 58.15 58.20 58.24 58.27 58.30
0.22 56.10 57.33 57.81 58.05 58.20 58.29 58.36 58.40 58.53 58.58 58.63 58.66 58.69
0.23 56.38 57.67 58.16 58.41 58.56 58.66 58.73 58.78 58.91 58.97 59.01 59.05 59.07
0.24 56.66 58.00 58.52 58.78 58.93 59.03 59.11 59.16 59.29 59.35 59.40 59.44 59.46
0.25 56.95 58.33 58.87 59.14 59.30 59.41 59.48 59.53 59.67 59.73 59.78 59.82 59.85
0.26 57.23 58.67 59.22 59.50 59.67 59.78 59.85 59.91 60.05 60.11 60.17 60.21 60.23
0.27 57.51 59.00 59.57 59.86 60.03 60.15 60.23 60.28 60.43 60.49 60.55 60.59 60.62
0.28 57.80 59.33 59.92 60.22 60.40 60.52 60.60 60.66 60.81 60.87 60.93 60.97 61.00
0.29 58.08 59.67 60.28 60.58 60.77 60.89 60.97 61.03 61.19 61.25 61.31 61.35 61.38
0.30 58.37 60.00 60.63 60.94 61.13 61.25 61.34 61.40 61.56 61.63 61.69 61.73 61.76
0.31 58.65 60.33 60.98 61.30 61.50 61.62 61.71 61.77 61.94 62.01 62.07 62.11 62.14
0.32 58.94 60.67 61.33 61.66 61.86 61.99 62.08 62.14 62.31 62.38 62.45 62.49 62.52
0.33 59.23 61.00 61.68 62.02 62.22 62.35 62.45 62.51 62.69 62.76 62.82 62.87 62.90
0.34 59.51 61.33 62.03 62.38 62.58 62.72 62.81 62.88 63.06 63.13 63.20 63.25 63.28
0.35 59.80 61.67 62.38 62.73 62.94 63.08 63.18 63.25 63.43 63.51 63.57 63.62 63.65
0.36 60.09 62.00 62.72 63.09 63.31 63.45 63.54 63.62 63.80 63.88 63.95 63.99 64.03
0.37 60.38 62.33 63.07 63.45 63.67 63.81 63.91 63.98 64.17 64.25 64.32 64.37 64.40
0.38 60.67 62.67 63.42 63.80 64.02 64.17 64.27 64.35 64.54 64.62 64.69 64.74 64.77
0.39 60.97 63.00 63.77 64.16 64.38 64.53 64.63 64.71 64.90 64.98 65.06 65.11 65.14
0.40 61.26 63.33 64.12 64.51 64.74 64.89 65.00 65.07 65.27 65.35 65.42 65.47 65.51
0.41 61.55 63.67 64.46 64.86 65.10 65.25 65.36 65.43 65.63 65.72 65.79 65.84 65.88
0.42 61.85 64.00 64.81 65.21 65.45 65.61 65.71 65.79 66.00 66.08 66.15 66.21 66.24
0.43 62.15 64.33 65.15 65.57 65.81 65.96 66.07 66.15 66.36 66.44 66.52 66.57 66.61
0.44 62.44 64.67 65.50 65.92 66.16 66.32 66.43 66.51 66.72 66.80 66.88 66.93 66.97
Page 19/26 5.2.1 2016
Revised 2014
Table 2 for Estimation of Lot Percent Within Limits
Variability Unknown Procedure
Standard Deviation Method
Quality
Index Percent Within Limits for Selected Sample Sizes
QU or QL N=3 N=4 N=5 N=6 N=7 N=8 N=9 N=10 N=15 N=20 N=30 N=50 N=100
0.45 62.74 65.00 65.84 66.27 66.51 66.67 66.79 66.87 67.08 67.16 67.24 67.29 67.33
0.46 63.04 65.33 66.19 66.62 66.87 67.03 67.14 67.22 67.43 67.52 67.60 67.65 67.69
0.47 63.34 65.67 66.53 66.96 67.22 67.38 67.49 67.58 67.79 67.88 67.96 68.01 68.05
0.48 63.65 66.00 66.88 67.31 67.57 67.73 67.85 67.93 68.15 68.23 68.31 68.37 68.40
0.49 63.95 66.33 67.22 67.66 67.92 68.08 68.20 68.28 68.50 68.59 68.67 68.72 68.76
0.50 64.25 66.67 67.56 68.00 68.26 68.43 68.55 68.63 68.85 68.94 69.02 69.07 69.11
0.51 64.56 67.00 67.90 68.35 68.61 68.78 68.90 68.98 69.20 69.29 69.37 69.43 69.46
0.52 64.87 67.33 68.24 68.69 68.96 69.13 69.24 69.33 69.55 69.64 69.72 69.77 69.81
0.53 65.18 67.67 68.58 69.04 69.30 69.47 69.59 69.68 69.90 69.99 70.07 70.12 70.16
0.54 65.49 68.00 68.92 69.38 69.64 69.82 69.93 70.02 70.24 70.33 70.41 70.47 70.51
0.55 65.80 68.33 69.26 69.72 69.99 70.16 70.28 70.36 70.59 70.68 70.76 70.81 70.85
0.56 66.12 68.67 69.60 70.06 70.33 70.50 70.62 70.71 70.93 71.02 71.10 71.15 71.19
0.57 66.43 69.00 69.94 70.40 70.67 70.84 70.96 71.05 71.27 71.36 71.44 71.49 71.53
0.58 66.75 69.33 70.27 70.74 71.01 71.18 71.30 71.39 71.61 71.70 71.78 71.83 71.87
0.59 67.07 69.67 70.61 71.07 71.34 71.52 71.64 71.72 71.95 72.04 72.11 72.17 72.21
0.60 67.39 70.00 70.95 71.41 71.68 71.85 71.97 72.06 72.28 72.37 72.45 72.50 72.54
0.61 67.72 70.33 71.28 71.75 72.02 72.19 72.31 72.40 72.61 72.70 72.78 72.84 72.87
0.62 68.04 70.67 71.61 72.08 72.35 72.52 72.64 72.73 72.95 73.04 73.11 73.17 73.20
0.63 68.37 71.00 71.95 72.41 72.68 72.85 72.97 73.06 73.28 73.37 73.44 73.50 73.53
0.64 68.70 71.33 72.28 72.74 73.01 73.18 73.30 73.39 73.61 73.69 73.77 73.82 73.86
0.65 69.03 71.67 72.61 73.08 73.34 73.51 73.63 73.72 73.93 74.02 74.10 74.15 74.18
0.66 69.37 72.00 72.94 73.40 73.67 73.84 73.96 74.04 74.26 74.34 74.42 74.47 74.51
0.67 69.70 72.33 73.27 73.73 74.00 74.17 74.28 74.37 74.58 74.67 74.74 74.79 74.83
0.68 70.04 72.67 73.60 74.06 74.32 74.49 74.61 74.69 74.90 74.99 75.06 75.11 75.14
0.69 70.39 73.00 73.93 74.39 74.65 74.81 74.93 75.01 75.22 75.30 75.38 75.43 75.46
0.70 70.73 73.33 74.26 74.71 74.97 75.14 75.25 75.33 75.54 75.62 75.69 75.74 75.77
0.71 71.08 73.67 74.59 75.04 75.29 75.46 75.57 75.65 75.85 75.94 76.01 76.05 76.09
0.72 71.43 74.00 74.91 75.36 75.61 75.77 75.89 75.97 76.17 76.25 76.32 76.36 76.40
0.73 71.78 74.33 75.24 75.68 75.93 76.09 76.20 76.28 76.48 76.56 76.63 76.67 76.70
0.74 72.14 74.67 75.56 76.00 76.25 76.41 76.51 76.59 76.79 76.87 76.93 76.98 77.01
0.75 72.50 75.00 75.89 76.32 76.56 76.72 76.83 76.90 77.10 77.17 77.24 77.28 77.31
0.76 72.87 75.33 76.21 76.63 76.88 77.03 77.14 77.21 77.40 77.48 77.54 77.58 77.61
0.77 73.24 75.67 76.53 76.95 77.19 77.34 77.44 77.52 77.70 77.78 77.84 77.88 77.91
0.78 73.61 76.00 76.85 77.26 77.50 77.65 77.75 77.82 78.01 78.08 78.14 78.18 78.21
0.79 73.98 76.33 77.17 77.58 77.81 77.96 78.06 78.13 78.30 78.37 78.43 78.47 78.50
0.80 74.36 76.67 77.49 77.89 78.12 78.26 78.36 78.43 78.60 78.67 78.73 78.77 78.79
0.81 74.75 77.00 77.81 78.20 78.42 78.56 78.66 78.73 78.90 78.96 79.02 79.06 79.08
0.82 75.14 77.33 78.13 78.51 78.73 78.86 78.96 79.02 79.19 79.25 79.31 79.35 79.37
0.83 75.53 77.67 78.44 78.82 79.03 79.16 79.25 79.32 79.48 79.54 79.60 79.63 79.65
0.84 75.93 78.00 78.76 79.12 79.33 79.46 79.55 79.61 79.77 79.83 79.88 79.91 79.94
0.85 76.33 78.33 79.07 79.43 79.63 79.76 79.84 79.90 80.06 80.11 80.16 80.20 80.22
0.86 76.74 78.67 79.38 79.73 79.93 80.05 80.13 80.19 80.34 80.40 80.44 80.47 80.49
0.87 77.16 79.00 79.69 80.03 80.22 80.34 80.42 80.48 80.62 80.68 80.72 80.75 80.77
0.88 77.58 79.33 80.00 80.33 80.52 80.63 80.71 80.77 80.90 80.95 81.00 81.02 81.04
0.89 78.01 79.67 80.31 80.63 80.81 80.92 81.00 81.05 81.18 81.23 81.27 81.30 81.31
Page 20/26 5.2.1 2016
Revised 2014
Table 2 for Estimation of Lot Percent Within Limits
Variability Unknown Procedure
Standard Deviation Method
Quality
Index Percent Within Limits for Selected Sample Sizes
QU or QL N=3 N=4 N=5 N=6 N=7 N=8 N=9 N=10 N=15 N=20 N=30 N=50 N=100
0.90 78.45 80.00 80.62 80.93 81.10 81.21 81.28 81.33 81.46 81.50 81.54 81.57 81.58
0.91 78.89 80.33 80.93 81.22 81.39 81.49 81.56 81.61 81.73 81.77 81.81 81.83 81.85
0.92 79.34 80.67 81.23 81.51 81.67 81.77 81.84 81.89 82.00 82.04 82.08 82.10 82.11
0.93 79.81 81.00 81.54 81.81 81.96 82.05 82.12 82.16 82.27 82.31 82.34 82.36 82.37
0.94 80.27 81.33 81.84 82.10 82.24 82.33 82.39 82.44 82.54 82.57 82.60 82.62 82.63
0.95 80.75 81.67 82.14 82.39 82.52 82.61 82.67 82.71 82.80 82.84 82.86 82.88 82.89
0.96 81.25 82.00 82.45 82.67 82.80 82.88 82.94 82.97 83.06 83.10 83.12 83.13 83.14
0.97 81.75 82.33 82.75 82.96 83.08 83.15 83.21 83.24 83.32 83.35 83.37 83.39 83.39
0.98 82.26 82.67 83.04 83.24 83.35 83.43 83.47 83.51 83.58 83.61 83.63 83.64 83.64
0.99 82.79 83.00 83.34 83.52 83.63 83.69 83.74 83.77 83.84 83.86 83.88 83.88 83.89
1.00 83.33 83.33 83.64 83.80 83.90 83.96 84.00 84.03 84.09 84.11 84.12 84.13 84.13
1.01 83.89 83.67 83.93 84.08 84.17 84.22 84.26 84.28 84.34 84.36 84.37 84.37 84.38
1.02 84.47 84.00 84.22 84.36 84.44 84.49 84.52 84.54 84.59 84.60 84.61 84.62 84.62
1.03 85.07 84.33 84.52 84.63 84.70 84.75 84.77 84.79 84.83 84.85 84.85 84.85 84.85
1.04 85.69 84.67 84.81 84.91 84.97 85.00 85.03 85.04 85.08 85.09 85.09 85.09 85.09
1.05 86.34 85.00 85.09 85.18 85.23 85.26 85.28 85.29 85.32 85.33 85.33 85.32 85.32
1.06 87.02 85.33 85.38 85.45 85.49 85.51 85.53 85.54 85.56 85.56 85.56 85.55 85.55
1.07 87.73 85.67 85.67 85.71 85.74 85.76 85.78 85.78 85.80 85.80 85.79 85.78 85.78
1.08 88.49 86.00 85.95 85.98 86.00 86.01 86.02 86.03 86.03 86.03 86.02 86.01 86.00
1.09 89.29 86.33 86.24 86.24 86.25 86.26 86.27 86.27 86.26 86.26 86.25 86.23 86.23
1.10 90.16 86.67 86.52 86.50 86.51 86.51 86.51 86.50 86.49 86.48 86.47 86.46 86.45
1.11 91.11 87.00 86.80 86.76 86.75 86.75 86.74 86.74 86.72 86.71 86.69 86.68 86.66
1.12 92.18 87.33 87.07 87.02 87.00 86.99 86.98 86.97 86.95 86.93 86.91 86.89 86.88
1.13 93.40 87.67 87.35 87.28 87.25 87.23 87.21 87.20 87.17 87.15 87.13 87.11 87.09
1.14 94.92 88.00 87.63 87.53 87.49 87.46 87.45 87.43 87.39 87.37 87.34 87.32 87.30
1.15 97.13 88.33 87.90 87.78 87.73 87.70 87.68 87.66 87.61 87.58 87.55 87.53 87.51
1.16 100.00 88.67 88.17 88.03 87.97 87.93 87.90 87.88 87.82 87.79 87.76 87.74 87.72
1.17 100.00 89.00 88.44 88.28 88.21 88.16 88.13 88.10 88.04 88.00 87.97 87.94 87.92
1.18 100.00 89.33 88.71 88.53 88.44 88.39 88.35 88.32 88.25 88.21 88.18 88.15 88.12
1.19 100.00 89.67 88.98 88.77 88.67 88.61 88.57 88.54 88.46 88.42 88.38 88.35 88.32
1.20 100.00 90.00 89.24 89.01 88.90 88.83 88.79 88.76 88.66 88.62 88.58 88.54 88.52
1.21 100.00 90.33 89.50 89.25 89.13 89.06 89.00 88.97 88.87 88.82 88.78 88.74 88.71
1.22 100.00 90.67 89.77 89.49 89.35 89.27 89.22 89.18 89.07 89.02 88.97 88.93 88.91
1.23 100.00 91.00 90.03 89.72 89.58 89.49 89.43 89.39 89.27 89.22 89.16 89.12 89.09
1.24 100.00 91.33 90.28 89.96 89.80 89.70 89.64 89.59 89.47 89.41 89.36 89.31 89.28
1.25 100.00 91.67 90.54 90.19 90.02 89.91 89.85 89.79 89.66 89.60 89.54 89.50 89.47
1.26 100.00 92.00 90.79 90.42 90.23 90.12 90.05 90.00 89.85 89.79 89.73 89.68 89.65
1.27 100.00 92.33 91.04 90.64 90.45 90.33 90.25 90.19 90.04 89.98 89.91 89.87 89.83
1.28 100.00 92.67 91.29 90.87 90.66 90.53 90.45 90.39 90.23 90.16 90.10 90.05 90.01
1.29 100.00 93.00 91.54 91.09 90.87 90.74 90.65 90.58 90.42 90.34 90.28 90.22 90.18
1.30 100.00 93.33 91.79 91.31 91.07 90.94 90.84 90.78 90.60 90.52 90.45 90.40 90.36
1.31 100.00 93.67 92.03 91.52 91.28 91.13 91.04 90.97 90.78 90.70 90.63 90.57 90.53
1.32 100.00 94.00 92.27 91.74 91.48 91.33 91.23 91.15 90.96 90.88 90.80 90.74 90.70
1.33 100.00 94.33 92.51 91.95 91.68 91.52 91.41 91.34 91.14 91.05 90.97 90.91 90.87
1.34 100.00 94.67 92.75 92.16 91.88 91.71 91.60 91.52 91.31 91.22 91.14 91.08 91.03
Page 21/26 5.2.1 2016
Revised 2014
Table 2 for Estimation of Lot Percent Within Limits
Variability Unknown Procedure
Standard Deviation Method
Quality
Index Percent Within Limits for Selected Sample Sizes
QU or QL N=3 N=4 N=5 N=6 N=7 N=8 N=9 N=10 N=15 N=20 N=30 N=50 N=100
1.35 100.00 95.00 92.98 92.37 92.08 91.90 91.78 91.70 91.48 91.39 91.31 91.24 91.19
1.36 100.00 95.33 93.21 92.58 92.27 92.09 91.96 91.88 91.65 91.56 91.47 91.40 91.35
1.37 100.00 95.67 93.44 92.78 92.46 92.27 92.14 92.05 91.82 91.72 91.63 91.56 91.51
1.38 100.00 96.00 93.67 92.98 92.65 92.45 92.32 92.23 91.99 91.88 91.79 91.72 91.67
1.39 100.00 96.33 93.90 93.18 92.83 92.63 92.49 92.40 92.15 92.04 91.95 91.88 91.82
1.40 100.00 96.67 94.12 93.37 93.02 92.81 92.67 92.56 92.31 92.20 92.10 92.03 91.98
1.41 100.00 97.00 94.34 93.57 93.20 92.98 92.83 92.73 92.47 92.36 92.26 92.18 92.13
1.42 100.00 97.33 94.56 93.76 93.38 93.15 93.00 92.90 92.63 92.51 92.41 92.33 92.27
1.43 100.00 97.67 94.77 93.95 93.55 93.32 93.17 93.06 92.78 92.66 92.56 92.48 92.42
1.44 100.00 98.00 94.98 94.13 93.73 93.49 93.33 93.22 92.93 92.81 92.70 92.62 92.56
1.45 100.00 98.33 95.19 94.32 93.90 93.65 93.49 93.37 93.08 92.96 92.85 92.76 92.70
1.46 100.00 98.67 95.40 94.50 94.07 93.81 93.65 93.53 93.23 93.10 92.99 92.90 92.84
1.47 100.00 99.00 95.61 94.67 94.23 93.97 93.80 93.68 93.37 93.25 93.13 93.04 92.98
1.48 100.00 99.33 95.81 94.85 94.40 94.13 93.96 93.83 93.52 93.39 93.27 93.18 93.12
1.49 100.00 99.67 96.01 95.02 94.56 94.29 94.11 93.98 93.66 93.52 93.40 93.31 93.25
1.50 100.00 100.00 96.20 95.19 94.72 94.44 94.26 94.13 93.80 93.66 93.54 93.45 93.38
1.51 100.00 100.00 96.39 95.36 94.87 94.59 94.40 94.27 93.94 93.80 93.67 93.58 93.51
1.52 100.00 100.00 96.58 95.53 95.03 94.74 94.55 94.41 94.07 93.93 93.80 93.71 93.64
1.53 100.00 100.00 96.77 95.69 95.18 94.88 94.69 94.55 94.20 94.06 93.93 93.83 93.76
1.54 100.00 100.00 96.95 95.85 95.33 95.03 94.83 94.69 94.33 94.19 94.05 93.96 93.89
1.55 100.00 100.00 97.13 96.00 95.48 95.17 94.97 94.82 94.46 94.31 94.18 94.08 94.01
1.56 100.00 100.00 97.31 96.16 95.62 95.31 95.10 94.95 94.59 94.44 94.30 94.20 94.13
1.57 100.00 100.00 97.48 96.31 95.76 95.44 95.23 95.08 94.71 94.56 94.42 94.32 94.25
1.58 100.00 100.00 97.65 96.46 95.90 95.58 95.36 95.21 94.84 94.68 94.54 94.44 94.36
1.59 100.00 100.00 97.81 96.60 96.04 95.71 95.49 95.34 94.96 94.80 94.66 94.55 94.48
1.60 100.00 100.00 97.97 96.75 96.17 95.84 95.62 95.46 95.08 94.92 94.77 94.67 94.59
1.61 100.00 100.00 98.13 96.89 96.31 95.97 95.74 95.59 95.19 95.03 94.88 94.78 94.70
1.62 100.00 100.00 98.28 97.03 96.43 96.09 95.86 95.70 95.31 95.14 94.99 94.89 94.81
1.63 100.00 100.00 98.43 97.16 96.56 96.21 95.98 95.82 95.42 95.25 95.10 94.99 94.92
1.64 100.00 100.00 98.58 97.29 96.69 96.33 96.10 95.94 95.53 95.36 95.21 95.10 95.02
1.65 100.00 100.00 98.72 97.42 96.81 96.45 96.22 96.05 95.64 95.47 95.32 95.21 95.13
1.66 100.00 100.00 98.85 97.55 96.93 96.57 96.33 96.16 95.75 95.57 95.42 95.31 95.23
1.67 100.00 100.00 98.98 97.67 97.05 96.68 96.44 96.27 95.85 95.68 95.52 95.41 95.33
1.68 100.00 100.00 99.11 97.79 97.16 96.79 96.55 96.38 95.95 95.78 95.62 95.51 95.43
1.69 100.00 100.00 99.23 97.91 97.27 96.90 96.66 96.48 96.06 95.88 95.72 95.61 95.53
1.70 100.00 100.00 99.34 98.02 97.38 97.01 96.76 96.59 96.16 95.98 95.82 95.70 95.62
1.71 100.00 100.00 99.45 98.13 97.49 97.11 96.86 96.69 96.25 96.07 95.91 95.80 95.71
1.72 100.00 100.00 99.55 98.24 97.59 97.21 96.97 96.79 96.35 96.17 96.01 95.89 95.81
1.73 100.00 100.00 99.64 98.34 97.70 97.31 97.06 96.89 96.44 96.26 96.10 95.98 95.90
1.74 100.00 100.00 99.73 98.45 97.80 97.41 97.16 96.98 96.54 96.35 96.19 96.07 95.99
1.75 100.00 100.00 99.81 98.55 97.89 97.51 97.25 97.07 96.63 96.44 96.28 96.16 96.07
1.76 100.00 100.00 99.88 98.64 97.99 97.60 97.35 97.17 96.72 96.53 96.37 96.24 96.16
1.77 100.00 100.00 99.94 98.73 98.08 97.69 97.44 97.26 96.80 96.62 96.45 96.33 96.24
1.78 100.00 100.00 99.98 98.82 98.17 97.78 97.53 97.34 96.89 96.70 96.53 96.41 96.33
1.79 100.00 100.00 100.00 98.91 98.26 97.87 97.61 97.43 96.97 96.79 96.62 96.49 96.41

Page 22/26 5.2.1 2016
Revised 2014
Table 2 for Estimation of Lot Percent Within Limits
Variability Unknown Procedure
Standard Deviation Method
Quality
Index Percent Within Limits for Selected Sample Sizes
QU or QL N=3 N=4 N=5 N=6 N=7 N=8 N=9 N=10 N=15 N=20 N=30 N=50 N=100
1.80 100.00 100.00 100.00 98.99 98.35 97.96 97.70 97.51 97.06 96.87 96.70 96.57 96.49
1.81 100.00 100.00 100.00 99.07 98.43 98.04 97.78 97.60 97.14 96.95 96.78 96.65 96.57
1.82 100.00 100.00 100.00 99.15 98.51 98.12 97.86 97.68 97.21 97.02 96.85 96.73 96.64
1.83 100.00 100.00 100.00 99.22 98.59 98.20 97.94 97.75 97.29 97.10 96.93 96.81 96.72
1.84 100.00 100.00 100.00 99.29 98.66 98.28 98.02 97.83 97.37 97.18 97.01 96.88 96.79
1.85 100.00 100.00 100.00 99.36 98.74 98.35 98.09 97.91 97.44 97.25 97.08 96.95 96.87
1.86 100.00 100.00 100.00 99.43 98.81 98.42 98.16 97.98 97.52 97.32 97.15 97.03 96.94
1.87 100.00 100.00 100.00 99.49 98.88 98.49 98.24 98.05 97.59 97.39 97.22 97.10 97.01
1.88 100.00 100.00 100.00 99.54 98.94 98.56 98.30 98.12 97.66 97.46 97.29 97.17 97.08
1.89 100.00 100.00 100.00 99.60 99.01 98.63 98.37 98.19 97.72 97.53 97.36 97.23 97.15
1.90 100.00 100.00 100.00 99.65 99.07 98.69 98.44 98.25 97.79 97.60 97.43 97.30 97.21
1.91 100.00 100.00 100.00 99.70 99.13 98.76 98.50 98.32 97.86 97.66 97.49 97.37 97.28
1.92 100.00 100.00 100.00 99.74 99.19 98.82 98.56 98.38 97.92 97.73 97.55 97.43 97.34
1.93 100.00 100.00 100.00 99.78 99.24 98.88 98.63 98.44 97.98 97.79 97.62 97.49 97.40
1.94 100.00 100.00 100.00 99.82 99.30 98.93 98.68 98.50 98.04 97.85 97.68 97.55 97.46
1.95 100.00 100.00 100.00 99.85 99.35 98.99 98.74 98.56 98.10 97.91 97.74 97.61 97.52
1.96 100.00 100.00 100.00 99.88 99.40 99.04 98.80 98.62 98.16 97.97 97.80 97.67 97.58
1.97 100.00 100.00 100.00 99.91 99.44 99.09 98.85 98.67 98.22 98.03 97.86 97.73 97.64
1.98 100.00 100.00 100.00 99.93 99.49 99.14 98.90 98.73 98.27 98.08 97.91 97.79 97.70
1.99 100.00 100.00 100.00 99.95 99.53 99.19 98.95 98.78 98.33 98.14 97.97 97.84 97.75
2.00 100.00 100.00 100.00 99.97 99.57 99.24 99.00 98.83 98.38 98.19 98.02 97.90 97.81
2.01 100.00 100.00 100.00 99.98 99.61 99.28 99.05 98.88 98.43 98.24 98.07 97.95 97.86
2.02 100.00 100.00 100.00 99.99 99.64 99.33 99.10 98.93 98.48 98.29 98.13 98.00 97.91
2.03 100.00 100.00 100.00 100.00 99.68 99.37 99.14 98.97 98.53 98.34 98.18 98.05 97.96
2.04 100.00 100.00 100.00 100.00 99.71 99.41 99.18 99.02 98.58 98.39 98.23 98.10 98.01
2.05 100.00 100.00 100.00 100.00 99.74 99.45 99.23 99.06 98.63 98.44 98.27 98.15 98.06
2.06 100.00 100.00 100.00 100.00 99.77 99.48 99.27 99.10 98.67 98.49 98.32 98.20 98.11
2.07 100.00 100.00 100.00 100.00 99.79 99.52 99.30 99.14 98.72 98.53 98.37 98.24 98.16
2.08 100.00 100.00 100.00 100.00 99.82 99.55 99.34 99.18 98.76 98.58 98.41 98.29 98.21
2.09 100.00 100.00 100.00 100.00 99.84 99.58 99.38 99.22 98.80 98.62 98.46 98.34 98.25
2.10 100.00 100.00 100.00 100.00 99.86 99.61 99.41 99.26 98.84 98.66 98.50 98.38 98.29
2.11 100.00 100.00 100.00 100.00 99.88 99.64 99.45 99.29 98.88 98.70 98.54 98.42 98.34
2.12 100.00 100.00 100.00 100.00 99.90 99.67 99.48 99.33 98.92 98.74 98.58 98.46 98.38
2.13 100.00 100.00 100.00 100.00 99.92 99.70 99.51 99.36 98.96 98.78 98.62 98.50 98.42
2.14 100.00 100.00 100.00 100.00 99.93 99.72 99.54 99.39 99.00 98.82 98.66 98.54 98.46
2.15 100.00 100.00 100.00 100.00 99.94 99.74 99.57 99.42 99.03 98.86 98.70 98.58 98.50
2.16 100.00 100.00 100.00 100.00 99.95 99.77 99.59 99.45 99.07 98.90 98.74 98.62 98.54
2.17 100.00 100.00 100.00 100.00 99.96 99.79 99.62 99.48 99.10 98.93 98.78 98.66 98.58
2.18 100.00 100.00 100.00 100.00 99.97 99.81 99.64 99.51 99.13 98.97 98.81 98.70 98.61
2.19 100.00 100.00 100.00 100.00 99.98 99.83 99.67 99.54 99.17 99.00 98.85 98.73 98.65
2.20 100.00 100.00 100.00 100.00 99.99 99.84 99.69 99.56 99.20 99.03 98.88 98.77 98.69
2.21 100.00 100.00 100.00 100.00 99.99 99.86 99.71 99.59 99.23 99.06 98.91 98.80 98.72
2.22 100.00 100.00 100.00 100.00 99.99 99.87 99.73 99.61 99.26 99.10 98.95 98.83 98.75
2.23 100.00 100.00 100.00 100.00 100.00 99.89 99.75 99.63 99.29 99.13 98.98 98.87 98.79
2.24 100.00 100.00 100.00 100.00 100.00 99.90 99.77 99.66 99.31 99.15 99.01 98.90 98.82
Page 23/26 5.2.1 2016
Revised 2014
Table 2 for Estimation of Lot Percent Within Limits
Variability Unknown Procedure
Standard Deviation Method
Quality
Index Percent Within Limits for Selected Sample Sizes
QU or QL N=3 N=4 N=5 N=6 N=7 N=8 N=9 N=10 N=15 N=20 N=30 N=50 N=100
2.25 100.00 100.00 100.00 100.00 100.00 99.91 99.79 99.68 99.34 99.18 99.04 98.93 98.85
2.26 100.00 100.00 100.00 100.00 100.00 99.92 99.80 99.70 99.37 99.21 99.07 98.96 98.88
2.27 100.00 100.00 100.00 100.00 100.00 99.93 99.82 99.71 99.39 99.24 99.10 98.99 98.91
2.28 100.00 100.00 100.00 100.00 100.00 99.94 99.83 99.73 99.42 99.26 99.12 99.02 98.94
2.29 100.00 100.00 100.00 100.00 100.00 99.95 99.85 99.75 99.44 99.29 99.15 99.05 98.97
2.30 100.00 100.00 100.00 100.00 100.00 99.96 99.86 99.77 99.46 99.32 99.18 99.07 99.00
2.31 100.00 100.00 100.00 100.00 100.00 99.96 99.87 99.78 99.48 99.34 99.20 99.10 99.03
2.32 100.00 100.00 100.00 100.00 100.00 99.97 99.89 99.80 99.51 99.36 99.23 99.13 99.05
2.33 100.00 100.00 100.00 100.00 100.00 99.98 99.90 99.81 99.53 99.39 99.25 99.15 99.08
2.34 100.00 100.00 100.00 100.00 100.00 99.98 99.91 99.82 99.55 99.41 99.28 99.18 99.10
2.35 100.00 100.00 100.00 100.00 100.00 99.98 99.92 99.84 99.57 99.43 99.30 99.20 99.13
2.36 100.00 100.00 100.00 100.00 100.00 99.99 99.92 99.85 99.58 99.45 99.32 99.22 99.15
2.37 100.00 100.00 100.00 100.00 100.00 99.99 99.93 99.86 99.60 99.47 99.34 99.25 99.18
2.38 100.00 100.00 100.00 100.00 100.00 99.99 99.94 99.87 99.62 99.49 99.37 99.27 99.20
2.39 100.00 100.00 100.00 100.00 100.00 100.00 99.95 99.88 99.64 99.51 99.39 99.29 99.22
2.40 100.00 100.00 100.00 100.00 100.00 100.00 99.95 99.89 99.65 99.53 99.41 99.31 99.25
2.41 100.00 100.00 100.00 100.00 100.00 100.00 99.96 99.90 99.67 99.55 99.43 99.33 99.27
2.42 100.00 100.00 100.00 100.00 100.00 100.00 99.96 99.91 99.68 99.56 99.44 99.35 99.29
2.43 100.00 100.00 100.00 100.00 100.00 100.00 99.97 99.92 99.70 99.58 99.46 99.37 99.31
2.44 100.00 100.00 100.00 100.00 100.00 100.00 99.97 99.92 99.71 99.60 99.48 99.39 99.33
2.45 100.00 100.00 100.00 100.00 100.00 100.00 99.98 99.93 99.73 99.61 99.50 99.41 99.35
2.46 100.00 100.00 100.00 100.00 100.00 100.00 99.98 99.94 99.74 99.63 99.52 99.43 99.37
2.47 100.00 100.00 100.00 100.00 100.00 100.00 99.98 99.94 99.75 99.64 99.53 99.45 99.38
2.48 100.00 100.00 100.00 100.00 100.00 100.00 99.99 99.95 99.76 99.66 99.55 99.46 99.40
2.49 100.00 100.00 100.00 100.00 100.00 100.00 99.99 99.95 99.77 99.67 99.56 99.48 99.42
2.50 100.00 100.00 100.00 100.00 100.00 100.00 99.99 99.96 99.79 99.68 99.58 99.50 99.44
2.51 100.00 100.00 100.00 100.00 100.00 100.00 99.99 99.96 99.80 99.70 99.59 99.51 99.45
2.52 100.00 100.00 100.00 100.00 100.00 100.00 99.99 99.97 99.81 99.71 99.61 99.53 99.47
2.53 100.00 100.00 100.00 100.00 100.00 100.00 100.00 99.97 99.82 99.72 99.62 99.54 99.49
2.54 100.00 100.00 100.00 100.00 100.00 100.00 100.00 99.97 99.83 99.73 99.63 99.56 99.50
2.55 100.00 100.00 100.00 100.00 100.00 100.00 100.00 99.98 99.83 99.74 99.65 99.57 99.52
2.56 100.00 100.00 100.00 100.00 100.00 100.00 100.00 99.98 99.84 99.75 99.66 99.59 99.53
2.57 100.00 100.00 100.00 100.00 100.00 100.00 100.00 99.98 99.85 99.76 99.67 99.60 99.54
2.58 100.00 100.00 100.00 100.00 100.00 100.00 100.00 99.99 99.86 99.77 99.68 99.61 99.56
2.59 100.00 100.00 100.00 100.00 100.00 100.00 100.00 99.99 99.87 99.78 99.70 99.62 99.57
2.60 100.00 100.00 100.00 100.00 100.00 100.00 100.00 99.99 99.87 99.79 99.71 99.64 99.59
2.61 100.00 100.00 100.00 100.00 100.00 100.00 100.00 99.99 99.88 99.80 99.72 99.65 99.60
2.62 100.00 100.00 100.00 100.00 100.00 100.00 100.00 99.99 99.89 99.81 99.73 99.66 99.61
2.63 100.00 100.00 100.00 100.00 100.00 100.00 100.00 99.99 99.89 99.82 99.74 99.67 99.62
2.64 100.00 100.00 100.00 100.00 100.00 100.00 100.00 99.99 99.90 99.83 99.75 99.68 99.63
2.65 100.00 100.00 100.00 100.00 100.00 100.00 100.00 100.00 99.91 99.84 99.76 99.69 99.65
2.66 100.00 100.00 100.00 100.00 100.00 100.00 100.00 100.00 99.91 99.84 99.77 99.70 99.66
2.67 100.00 100.00 100.00 100.00 100.00 100.00 100.00 100.00 99.92 99.85 99.78 99.71 99.67
2.68 100.00 100.00 100.00 100.00 100.00 100.00 100.00 100.00 99.92 99.86 99.78 99.72 99.68
2.69 100.00 100.00 100.00 100.00 100.00 100.00 100.00 100.00 99.93 99.86 99.79 99.73 99.69

Page 24/26 5.2.1 2016
Revised 2014
Table 2 for Estimation of Lot Percent Within Limits
Variability Unknown Procedure
Standard Deviation Method
Quality
Index Percent Within Limits for Selected Sample Sizes
QU or QL N=3 N=4 N=5 N=6 N=7 N=8 N=9 N=10 N=15 N=20 N=30 N=50 N=100
2.70 100.00 100.00 100.00 100.00 100.00 100.00 100.00 100.00 99.93 99.87 99.80 99.74 99.70
2.71 100.00 100.00 100.00 100.00 100.00 100.00 100.00 100.00 99.94 99.88 99.81 99.75 99.71
2.72 100.00 100.00 100.00 100.00 100.00 100.00 100.00 100.00 99.94 99.88 99.82 99.76 99.72
2.73 100.00 100.00 100.00 100.00 100.00 100.00 100.00 100.00 99.94 99.89 99.82 99.77 99.73
2.74 100.00 100.00 100.00 100.00 100.00 100.00 100.00 100.00 99.95 99.89 99.83 99.78 99.73
2.75 100.00 100.00 100.00 100.00 100.00 100.00 100.00 100.00 99.95 99.90 99.84 99.78 99.74
2.76 100.00 100.00 100.00 100.00 100.00 100.00 100.00 100.00 99.95 99.90 99.84 99.79 99.75
2.77 100.00 100.00 100.00 100.00 100.00 100.00 100.00 100.00 99.96 99.91 99.85 99.80 99.76
2.78 100.00 100.00 100.00 100.00 100.00 100.00 100.00 100.00 99.96 99.91 99.86 99.81 99.77
2.79 100.00 100.00 100.00 100.00 100.00 100.00 100.00 100.00 99.96 99.92 99.86 99.81 99.77
2.80 100.00 100.00 100.00 100.00 100.00 100.00 100.00 100.00 99.97 99.92 99.87 99.82 99.78
2.81 100.00 100.00 100.00 100.00 100.00 100.00 100.00 100.00 99.97 99.93 99.87 99.83 99.79
2.82 100.00 100.00 100.00 100.00 100.00 100.00 100.00 100.00 99.97 99.93 99.88 99.83 99.80
2.83 100.00 100.00 100.00 100.00 100.00 100.00 100.00 100.00 99.97 99.93 99.88 99.84 99.80
2.84 100.00 100.00 100.00 100.00 100.00 100.00 100.00 100.00 99.97 99.94 99.89 99.84 99.81
2.85 100.00 100.00 100.00 100.00 100.00 100.00 100.00 100.00 99.98 99.94 99.89 99.85 99.82
2.86 100.00 100.00 100.00 100.00 100.00 100.00 100.00 100.00 99.98 99.94 99.90 99.86 99.82
2.87 100.00 100.00 100.00 100.00 100.00 100.00 100.00 100.00 99.98 99.95 99.90 99.86 99.83
2.88 100.00 100.00 100.00 100.00 100.00 100.00 100.00 100.00 99.98 99.95 99.91 99.87 99.83
2.89 100.00 100.00 100.00 100.00 100.00 100.00 100.00 100.00 99.98 99.95 99.91 99.87 99.84
2.90 100.00 100.00 100.00 100.00 100.00 100.00 100.00 100.00 99.98 99.95 99.91 99.88 99.84
2.91 100.00 100.00 100.00 100.00 100.00 100.00 100.00 100.00 99.99 99.96 99.92 99.88 99.85
2.92 100.00 100.00 100.00 100.00 100.00 100.00 100.00 100.00 99.99 99.96 99.92 99.88 99.86
2.93 100.00 100.00 100.00 100.00 100.00 100.00 100.00 100.00 99.99 99.96 99.92 99.89 99.86
2.94 100.00 100.00 100.00 100.00 100.00 100.00 100.00 100.00 99.99 99.96 99.93 99.89 99.87
2.95 100.00 100.00 100.00 100.00 100.00 100.00 100.00 100.00 99.99 99.97 99.93 99.90 99.87
2.96 100.00 100.00 100.00 100.00 100.00 100.00 100.00 100.00 99.99 99.97 99.93 99.90 99.87
2.97 100.00 100.00 100.00 100.00 100.00 100.00 100.00 100.00 99.99 99.97 99.94 99.90 99.88
2.98 100.00 100.00 100.00 100.00 100.00 100.00 100.00 100.00 99.99 99.97 99.94 99.91 99.88
2.99 100.00 100.00 100.00 100.00 100.00 100.00 100.00 100.00 99.99 99.97 99.94 99.91 99.89
3.00 100.00 100.00 100.00 100.00 100.00 100.00 100.00 100.00 99.99 99.97 99.95 99.92 99.89
3.01 100.00 100.00 100.00 100.00 100.00 100.00 100.00 100.00 99.99 99.98 99.95 99.92 99.89
3.02 100.00 100.00 100.00 100.00 100.00 100.00 100.00 100.00 99.99 99.98 99.95 99.92 99.90
3.03 100.00 100.00 100.00 100.00 100.00 100.00 100.00 100.00 100.00 99.98 99.95 99.93 99.90
3.04 100.00 100.00 100.00 100.00 100.00 100.00 100.00 100.00 100.00 99.98 99.95 99.93 99.91
3.05 100.00 100.00 100.00 100.00 100.00 100.00 100.00 100.00 100.00 99.98 99.96 99.93 99.91
3.06 100.00 100.00 100.00 100.00 100.00 100.00 100.00 100.00 100.00 99.98 99.96 99.93 99.91
3.07 100.00 100.00 100.00 100.00 100.00 100.00 100.00 100.00 100.00 99.98 99.96 99.94 99.92
3.08 100.00 100.00 100.00 100.00 100.00 100.00 100.00 100.00 100.00 99.99 99.96 99.94 99.92
3.09 100.00 100.00 100.00 100.00 100.00 100.00 100.00 100.00 100.00 99.99 99.96 99.94 99.92
3.10 100.00 100.00 100.00 100.00 100.00 100.00 100.00 100.00 100.00 99.99 99.97 99.94 99.92
3.11 100.00 100.00 100.00 100.00 100.00 100.00 100.00 100.00 100.00 99.99 99.97 99.95 99.93
3.12 100.00 100.00 100.00 100.00 100.00 100.00 100.00 100.00 100.00 99.99 99.97 99.95 99.93
3.13 100.00 100.00 100.00 100.00 100.00 100.00 100.00 100.00 100.00 99.99 99.97 99.95 99.93
3.14 100.00 100.00 100.00 100.00 100.00 100.00 100.00 100.00 100.00 99.99 99.97 99.95 99.93

Page 25/26 5.2.1 2016
Revised 2014
Table 2 for Estimation of Lot Percent Within Limits
Variability Unknown Procedure
Standard Deviation Method
Quality
Index Percent Within Limits for Selected Sample Sizes
QU or QL N=3 N=4 N=5 N=6 N=7 N=8 N=9 N=10 N=15 N=20 N=30 N=50 N=100
3.15 100.00 100.00 100.00 100.00 100.00 100.00 100.00 100.00 100.00 99.99 99.97 99.95 99.94
3.16 100.00 100.00 100.00 100.00 100.00 100.00 100.00 100.00 100.00 99.99 99.98 99.96 99.94
3.17 100.00 100.00 100.00 100.00 100.00 100.00 100.00 100.00 100.00 99.99 99.98 99.96 99.94
3.18 100.00 100.00 100.00 100.00 100.00 100.00 100.00 100.00 100.00 99.99 99.98 99.96 99.94
3.19 100.00 100.00 100.00 100.00 100.00 100.00 100.00 100.00 100.00 99.99 99.98 99.96 99.95
3.20 100.00 100.00 100.00 100.00 100.00 100.00 100.00 100.00 100.00 99.99 99.98 99.96 99.95
3.21 100.00 100.00 100.00 100.00 100.00 100.00 100.00 100.00 100.00 99.99 99.98 99.96 99.95
3.22 100.00 100.00 100.00 100.00 100.00 100.00 100.00 100.00 100.00 99.99 99.98 99.97 99.95
3.23 100.00 100.00 100.00 100.00 100.00 100.00 100.00 100.00 100.00 99.99 99.98 99.97 99.95
3.24 100.00 100.00 100.00 100.00 100.00 100.00 100.00 100.00 100.00 100.00 99.98 99.97 99.96
3.25 100.00 100.00 100.00 100.00 100.00 100.00 100.00 100.00 100.00 100.00 99.98 99.97 99.96
3.26 100.00 100.00 100.00 100.00 100.00 100.00 100.00 100.00 100.00 100.00 99.99 99.97 99.96
3.27 100.00 100.00 100.00 100.00 100.00 100.00 100.00 100.00 100.00 100.00 99.99 99.97 99.96
3.28 100.00 100.00 100.00 100.00 100.00 100.00 100.00 100.00 100.00 100.00 99.99 99.97 99.96
3.29 100.00 100.00 100.00 100.00 100.00 100.00 100.00 100.00 100.00 100.00 99.99 99.98 99.96
3.30 100.00 100.00 100.00 100.00 100.00 100.00 100.00 100.00 100.00 100.00 99.99 99.98 99.96
3.31 100.00 100.00 100.00 100.00 100.00 100.00 100.00 100.00 100.00 100.00 99.99 99.98 99.97
3.32 100.00 100.00 100.00 100.00 100.00 100.00 100.00 100.00 100.00 100.00 99.99 99.98 99.97
3.33 100.00 100.00 100.00 100.00 100.00 100.00 100.00 100.00 100.00 100.00 99.99 99.98 99.97
3.34 100.00 100.00 100.00 100.00 100.00 100.00 100.00 100.00 100.00 100.00 99.99 99.98 99.97
3.35 100.00 100.00 100.00 100.00 100.00 100.00 100.00 100.00 100.00 100.00 99.99 99.98 99.97
3.36 100.00 100.00 100.00 100.00 100.00 100.00 100.00 100.00 100.00 100.00 99.99 99.98 99.97
3.37 100.00 100.00 100.00 100.00 100.00 100.00 100.00 100.00 100.00 100.00 99.99 99.98 99.97
3.38 100.00 100.00 100.00 100.00 100.00 100.00 100.00 100.00 100.00 100.00 99.99 99.98 99.97
3.39 100.00 100.00 100.00 100.00 100.00 100.00 100.00 100.00 100.00 100.00 99.99 99.98 99.98
3.40 100.00 100.00 100.00 100.00 100.00 100.00 100.00 100.00 100.00 100.00 99.99 99.99 99.98
3.41 100.00 100.00 100.00 100.00 100.00 100.00 100.00 100.00 100.00 100.00 99.99 99.99 99.98
3.42 100.00 100.00 100.00 100.00 100.00 100.00 100.00 100.00 100.00 100.00 99.99 99.99 99.98
3.43 100.00 100.00 100.00 100.00 100.00 100.00 100.00 100.00 100.00 100.00 99.99 99.99 99.98
3.44 100.00 100.00 100.00 100.00 100.00 100.00 100.00 100.00 100.00 100.00 99.99 99.99 99.98
3.45 100.00 100.00 100.00 100.00 100.00 100.00 100.00 100.00 100.00 100.00 100.00 99.99 99.98
3.46 100.00 100.00 100.00 100.00 100.00 100.00 100.00 100.00 100.00 100.00 100.00 99.99 99.98
3.47 100.00 100.00 100.00 100.00 100.00 100.00 100.00 100.00 100.00 100.00 100.00 99.99 99.98
3.48 100.00 100.00 100.00 100.00 100.00 100.00 100.00 100.00 100.00 100.00 100.00 99.99 99.98
3.49 100.00 100.00 100.00 100.00 100.00 100.00 100.00 100.00 100.00 100.00 100.00 99.99 99.98
3.50 100.00 100.00 100.00 100.00 100.00 100.00 100.00 100.00 100.00 100.00 100.00 99.99 99.98
3.51 100.00 100.00 100.00 100.00 100.00 100.00 100.00 100.00 100.00 100.00 100.00 99.99 99.99
3.52 100.00 100.00 100.00 100.00 100.00 100.00 100.00 100.00 100.00 100.00 100.00 99.99 99.99
3.53 100.00 100.00 100.00 100.00 100.00 100.00 100.00 100.00 100.00 100.00 100.00 99.99 99.99
3.54 100.00 100.00 100.00 100.00 100.00 100.00 100.00 100.00 100.00 100.00 100.00 99.99 99.99
3.55 100.00 100.00 100.00 100.00 100.00 100.00 100.00 100.00 100.00 100.00 100.00 99.99 99.99
3.56 100.00 100.00 100.00 100.00 100.00 100.00 100.00 100.00 100.00 100.00 100.00 99.99 99.99
3.57 100.00 100.00 100.00 100.00 100.00 100.00 100.00 100.00 100.00 100.00 100.00 99.99 99.99
3.58 100.00 100.00 100.00 100.00 100.00 100.00 100.00 100.00 100.00 100.00 100.00 99.99 99.99
3.59 100.00 100.00 100.00 100.00 100.00 100.00 100.00 100.00 100.00 100.00 100.00 99.99 99.99
Page 26/26 5.2.1 2016
Revised 2014
Table 2 for Estimation of Lot Percent Within Limits
Variability Unknown Procedure
Standard Deviation Method
Quality
Index Percent Within Limits for Selected Sample Sizes
QU or QL N=3 N=4 N=5 N=6 N=7 N=8 N=9 N=10 N=15 N=20 N=30 N=50 N=100
3.60 100.00 100.00 100.00 100.00 100.00 100.00 100.00 100.00 100.00 100.00 100.00 99.99 99.99
3.61 100.00 100.00 100.00 100.00 100.00 100.00 100.00 100.00 100.00 100.00 100.00 99.99 99.99
3.62 100.00 100.00 100.00 100.00 100.00 100.00 100.00 100.00 100.00 100.00 100.00 100.00 99.99
3.63 100.00 100.00 100.00 100.00 100.00 100.00 100.00 100.00 100.00 100.00 100.00 100.00 99.99
3.64 100.00 100.00 100.00 100.00 100.00 100.00 100.00 100.00 100.00 100.00 100.00 100.00 99.99
3.65 100.00 100.00 100.00 100.00 100.00 100.00 100.00 100.00 100.00 100.00 100.00 100.00 99.99
3.66 100.00 100.00 100.00 100.00 100.00 100.00 100.00 100.00 100.00 100.00 100.00 100.00 99.99
3.67 100.00 100.00 100.00 100.00 100.00 100.00 100.00 100.00 100.00 100.00 100.00 100.00 99.99
3.68 100.00 100.00 100.00 100.00 100.00 100.00 100.00 100.00 100.00 100.00 100.00 100.00 99.99
3.69 100.00 100.00 100.00 100.00 100.00 100.00 100.00 100.00 100.00 100.00 100.00 100.00 99.99
3.70 100.00 100.00 100.00 100.00 100.00 100.00 100.00 100.00 100.00 100.00 100.00 100.00 99.99
3.71 100.00 100.00 100.00 100.00 100.00 100.00 100.00 100.00 100.00 100.00 100.00 100.00 99.99
3.72 100.00 100.00 100.00 100.00 100.00 100.00 100.00 100.00 100.00 100.00 100.00 100.00 99.99
3.73 100.00 100.00 100.00 100.00 100.00 100.00 100.00 100.00 100.00 100.00 100.00 100.00 99.99
3.74 100.00 100.00 100.00 100.00 100.00 100.00 100.00 100.00 100.00 100.00 100.00 100.00 99.99
3.75 100.00 100.00 100.00 100.00 100.00 100.00 100.00 100.00 100.00 100.00 100.00 100.00 99.99
3.76 100.00 100.00 100.00 100.00 100.00 100.00 100.00 100.00 100.00 100.00 100.00 100.00 100.00
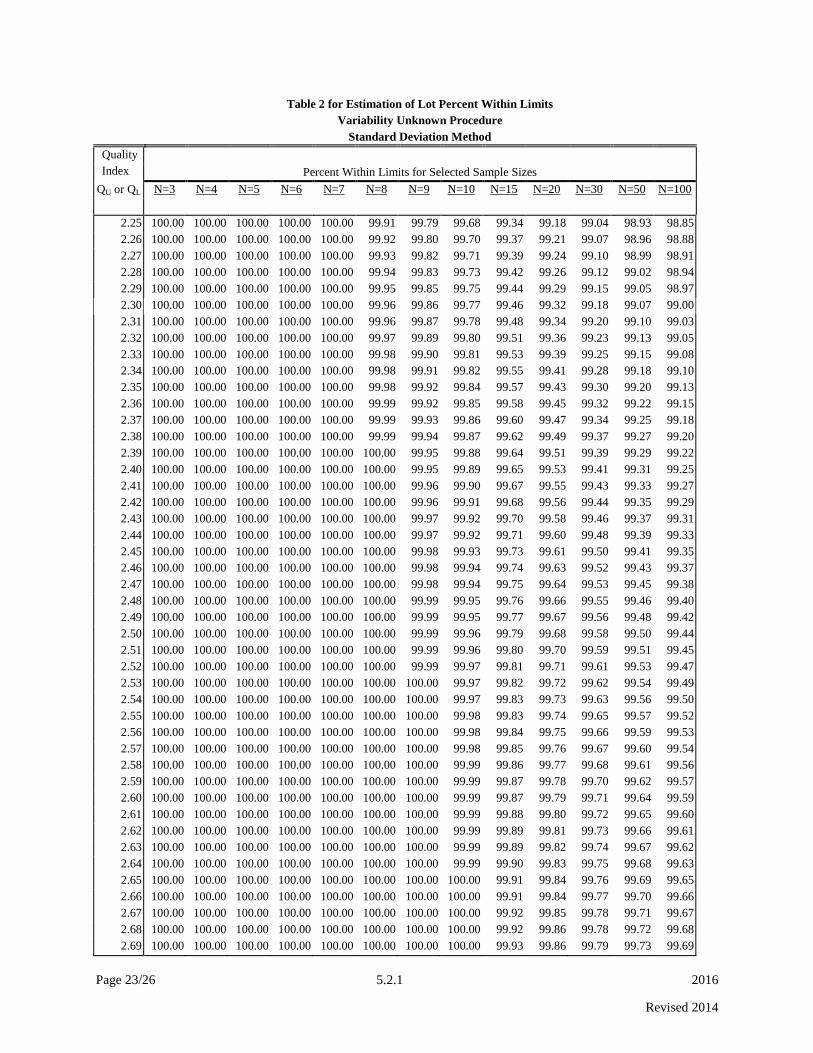
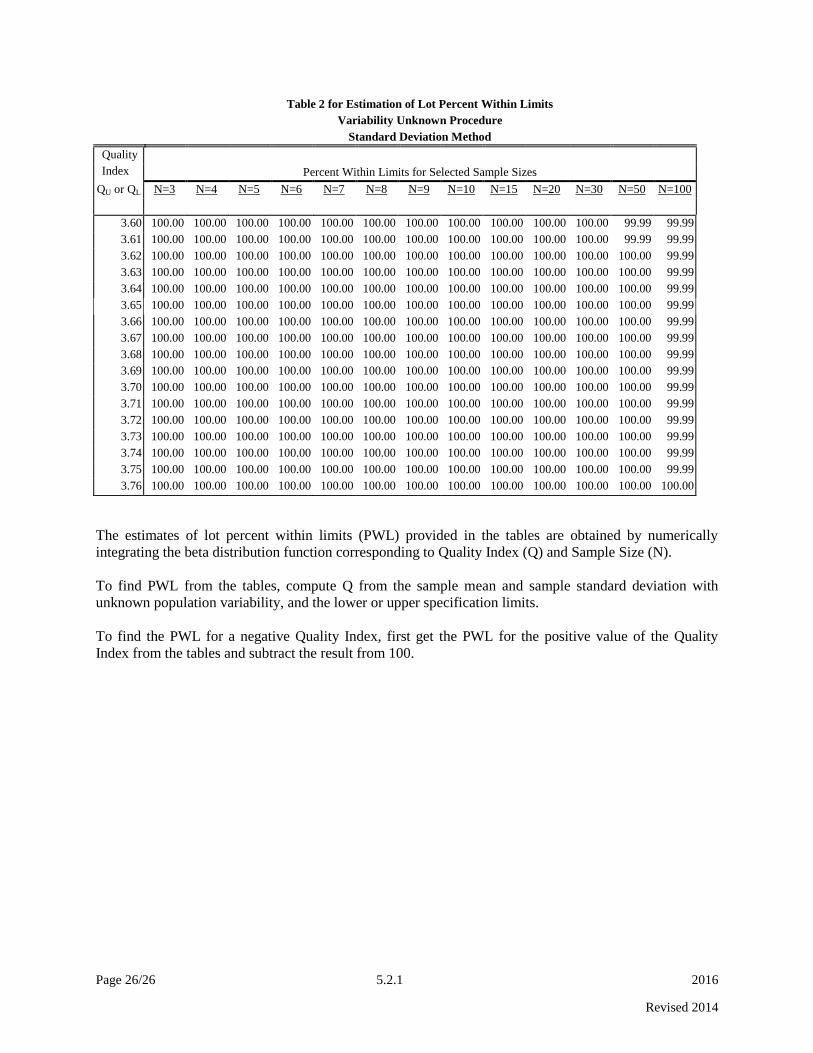
The estimates of lot percent within limits (PWL) provided in the tables are obtained by numerically
integrating the beta distribution function corresponding to Quality Index (Q) and Sample Size (N).
To find PWL from the tables, compute Q from the sample mean and sample standard deviation with
unknown population variability, and the lower or upper specification limits.
To find the PWL for a negative Quality Index, first get the PWL for the positive value of the Quality
Index from the tables and subtract the result from 100.
Page 1/2 5.2.2.1. 2016
Revised 2014
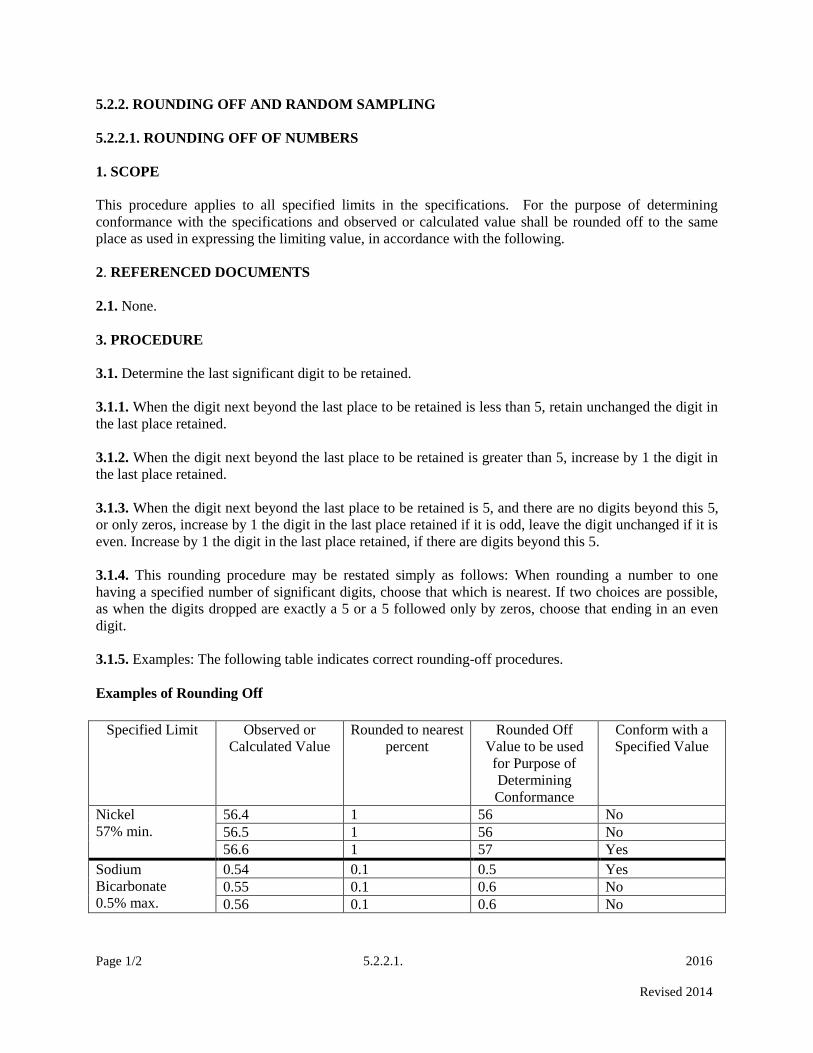
5.2.2. ROUNDING OFF AND RANDOM SAMPLING
5.2.2.1. ROUNDING OFF OF NUMBERS
1. SCOPE
This procedure applies to all specified limits in the specifications. For the purpose of determining
conformance with the specifications and observed or calculated value shall be rounded off to the same
place as used in expressing the limiting value, in accordance with the following.
2. REFERENCED DOCUMENTS
2.1. None.
3. PROCEDURE
3.1. Determine the last significant digit to be retained.
3.1.1. When the digit next beyond the last place to be retained is less than 5, retain unchanged the digit in
the last place retained.
3.1.2. When the digit next beyond the last place to be retained is greater than 5, increase by 1 the digit in
the last place retained.
3.1.3. When the digit next beyond the last place to be retained is 5, and there are no digits beyond this 5,
or only zeros, increase by 1 the digit in the last place retained if it is odd, leave the digit unchanged if it is
even. Increase by 1 the digit in the last place retained, if there are digits beyond this 5.
3.1.4. This rounding procedure may be restated simply as follows: When rounding a number to one
having a specified number of significant digits, choose that which is nearest. If two choices are possible,
as when the digits dropped are exactly a 5 or a 5 followed only by zeros, choose that ending in an even
digit.
3.1.5. Examples: The following table indicates correct rounding-off procedures.
Examples of Rounding Off
Specified Limit Observed or
Calculated Value
Rounded to nearest
percent
Rounded Off
Value to be used
for Purpose of
Determining
Conformance
Conform with a
Specified Value
Nickel
57% min.
56.4 1 56 No
56.5 1 56 No
56.6 1 57 Yes
Sodium
Bicarbonate
0.5% max.
0.54 0.1 0.5 Yes
0.55 0.1 0.6 No
0.56 0.1 0.6 No

Page 2/2 5.2.2.1. 2016
Revised 2014
The rounded-off value should be obtained in one step by direct rounding off of the most precise value
available and not in two or more successive roundings. For example, 89,490 rounded off to the nearest
1000 is 89,000; it would be incorrect to round off first to the nearest 100, giving 89,500 and then to the
nearest 1000 giving 90,000.

Page 1/6 5.2.2.2 2016
Revised 2014
5.2.2.2. RANDOM SAMPLING
1. SCOPE
This method covers procedures for securing random samples from a lot by the use of random numbers
obtained from tables or generated by other methods.
Nothing in this method is intended to preclude additional testing if failing or suspect materials or
construction is encountered. Testing that is additional to the scheduled testing should occur immediately
if failing test results occur or if materials or work appears to be substandard.
2. DEFINITIONS
2.1. Lot: An isolated or defined quantity of material from a single source or a measured amount of
construction assumed to be produced by the same process. Specified amounts of asphalt concrete mix, a
stockpile of aggregates, or linear feet of roadway constructed in a day are examples of a lot.
2.1.1. Sublot: A portion of a lot. When it is not convenient to sample the entire lot, such as a specified
amount of hot mix, then it can be divided into equal sized sublots. The sublots, when combined, would
constitute the entire lot.
2.1.2. Random: Without aim or pattern, depending entirely on chance alone (not to be construed as
haphazard).
2.1.3. Sample: A small part of a lot or sublot which represents the whole. A sample may be made up of
one or more increments or test portions.
2.1.4. Random number: A number selected entirely by chance. Random numbers may be generated
electronically such as with a random number function on a calculator or spreadsheet or selected from a
table of random numbers (See Table 1).
3. USE OF RANDOM NUMBERS IN SAMPLING
3.1. Most sampling and testing for construction materials should be randomized to prevent any
unintentional bias of the results. Randomization of sampling times or locations is accomplished by using
a set of random numbers to determine the time or location for the sample. A table of random numbers is
included below.
3.1.1. Example 1: Determining when to sample.
3.1.1.1. As an example, assume ten trucks carrying equal loads are going to be used to deliver concrete
during a bridge deck placement. Select which truck to sample for compressive strength cylinders to be
molded.
In cases such as number of trucks or tons of production, etc. round up to the next whole number because
there will not be a truck “0”. In cases involving things such as stationing there is a zero point so rounding
to the nearest number may be justified.

Page 2/6 5.2.2.2 2016
Revised 2014
Generate a random number using one of the methods below. Use .456 in this example. Multiply .456 by
10 (the number of trucks) for a result of 4.56. Round this result up to a whole number, 5 in this case.
Take the concrete sample from the fifth truck.
This method can be used to select a time of day or the day of the week. If production was to occur during
an 8 hour day, multiply 8 by the selected random number, .456, to obtain a result of 3.648. If rounding is
used the sample should be taken in the fourth hour of production. Refinement could be used to select a
time down to the nearest minute if needed by using the integer, three in this case, as the hour and then
multiplying the decimal by 60 to obtain the minute, 60 X .648 or + 39 in this case. Sampling would occur
three hours thirty nine minutes into production. Use the number seven multiplied by a random number to
determine a day of the week. Sampling during production according to units, such as tons of material
produced, can be handled in the same fashion. Multiply the lot or sublot size, as required, by the random
number selected.
3.2. Example 2: Determining location for sampling.
3.2.1. Given random numbers selected:
ENGLISH EXAMPLE:
Sampling a large lot may require division into sublots to insure all portions of a lot are represented.
Stratification into sublots is accomplished by dividing the “Lot” material (in this case, a mile of
construction or 5280 feet, 12’6” wide) into “four sublots” (each of 1320’ or 1/4 mile).
To locate a sample point station in sublot No. 1, the length of that sublot is multiplied by the “X”
coordinate for the “sublot” and the product added to the beginning station for that sublot.
Starting Station = 486 + 15 486 + 15
(X1)(1320) = (0.338) (1320) = 446’ 4 + 46
Sample Station = 490 + 61
The sample point distance from the base line (generally centerline or the edge of pavement) is determined
by multiplying Y1 by the available width, in this case, 12.5 feet.
(Y1)(12.5’) = (0.922) (12.5’) = 11.5’ from base line.
Thus the sample location is Sta. 490 + 61, 11.5’ from base line. Keeping in mind that the second sublot
begins at station 499 + 35 (sta. 486 + 15 + 1320’), the second, third and fourth locations are determined
by the same technique. These values are:
Sublot # 2 Sta. 509 + 42, 2.5’ from base line.
Sublot # 3 Sta. 513 + 12, 9.2’ from base line.
Sublot # 4 Sta. 536 + 44, 9.3’ from base line.
X Y
0.338 0.922
0.763 0.198
0.043 0.737
0.810 0.747
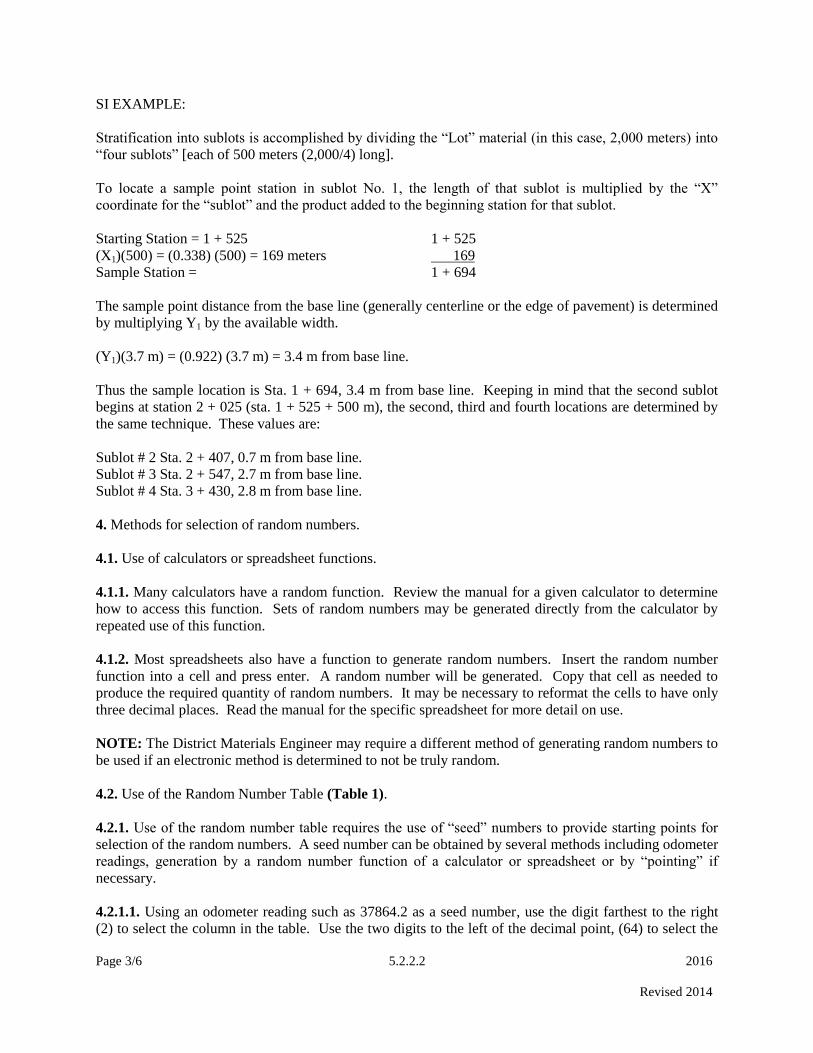
Page 3/6 5.2.2.2 2016
Revised 2014
SI EXAMPLE:
Stratification into sublots is accomplished by dividing the “Lot” material (in this case, 2,000 meters) into
“four sublots” [each of 500 meters (2,000/4) long].
To locate a sample point station in sublot No. 1, the length of that sublot is multiplied by the “X”
coordinate for the “sublot” and the product added to the beginning station for that sublot.
Starting Station = 1 + 525 1 + 525
(X1)(500) = (0.338) (500) = 169 meters 169
Sample Station = 1 + 694
The sample point distance from the base line (generally centerline or the edge of pavement) is determined
by multiplying Y1 by the available width.
(Y1)(3.7 m) = (0.922) (3.7 m) = 3.4 m from base line.
Thus the sample location is Sta. 1 + 694, 3.4 m from base line. Keeping in mind that the second sublot
begins at station 2 + 025 (sta. 1 + 525 + 500 m), the second, third and fourth locations are determined by
the same technique. These values are:
Sublot # 2 Sta. 2 + 407, 0.7 m from base line.
Sublot # 3 Sta. 2 + 547, 2.7 m from base line.
Sublot # 4 Sta. 3 + 430, 2.8 m from base line.
4. Methods for selection of random numbers.
4.1. Use of calculators or spreadsheet functions.
4.1.1. Many calculators have a random function. Review the manual for a given calculator to determine
how to access this function. Sets of random numbers may be generated directly from the calculator by
repeated use of this function.
4.1.2. Most spreadsheets also have a function to generate random numbers. Insert the random number
function into a cell and press enter. A random number will be generated. Copy that cell as needed to
produce the required quantity of random numbers. It may be necessary to reformat the cells to have only
three decimal places. Read the manual for the specific spreadsheet for more detail on use.
NOTE: The District Materials Engineer may require a different method of generating random numbers to
be used if an electronic method is determined to not be truly random.
4.2. Use of the Random Number Table (Table 1).
4.2.1. Use of the random number table requires the use of “seed” numbers to provide starting points for
selection of the random numbers. A seed number can be obtained by several methods including odometer
readings, generation by a random number function of a calculator or spreadsheet or by “pointing” if
necessary.
4.2.1.1. Using an odometer reading such as 37864.2 as a seed number, use the digit farthest to the right
(2) to select the column in the table. Use the two digits to the left of the decimal point, (64) to select the
Page 4/6 5.2.2.2 2016
Revised 2014
row. If the seed number for the column is 0, use column 10 and if the seed for the row is 00, use row 100.
In this case finding the intersection of the row and the column yields the number .338. Use this as a
starting position and count down the column for the required number of samples. Selecting numbers for
an X coordinate for three samples yields 0.338, 0.763 and 0.043. If a Y coordinate is also required use
the fourth digit from the right for the column and the next two digits to the left, for the row. In this
example that would yield column 8 and row 37 producing a starting point at number 0.922. If a total of
three samples are required, counting down two more places yields numbers 0.198 and 0.737. Using this
example, pairs of numbers for determining three X and Y coordinates are obtained, (0.338, 0.922), (0.763,
0.198) and (0.043, 0.737). Any amount of numbers required may be selected this way. If ten samples are
required count down the column until ten numbers are selected. Once the bottom of a column has been
reached go to the top of the next column to the right and countdown to obtain more numbers, if the
bottom of column 10 is reached go to the top of column 1. Use of the odometer to generate seed numbers
is not recommended if more than one set of X and Y pairs of random numbers is required in a relatively
short period of time due to the slow change of the left odometer numbers.
4.2.1.2. Seed numbers may be obtained by using the random number function of a calculator or
spreadsheet. In the above example the same results would have occurred if a calculator returned .264 for
the first seed number. Use the first digit (2) to select a column and the second two digits (64) for the row.
If using the random number function again produced 0.837, and then the same numbers would have been
generated for the Y coordinate as in the above example.
4.2.1.3. Seed numbers may be obtained by “pointing” also. Lay copies of both pages of Table 1 side by
side and with eyes closed place a pointer on the table to select a seed number. Use this number as in the
above example. Suitable pointers would be any device with a small tip such as a pin or a mechanical
pencil.
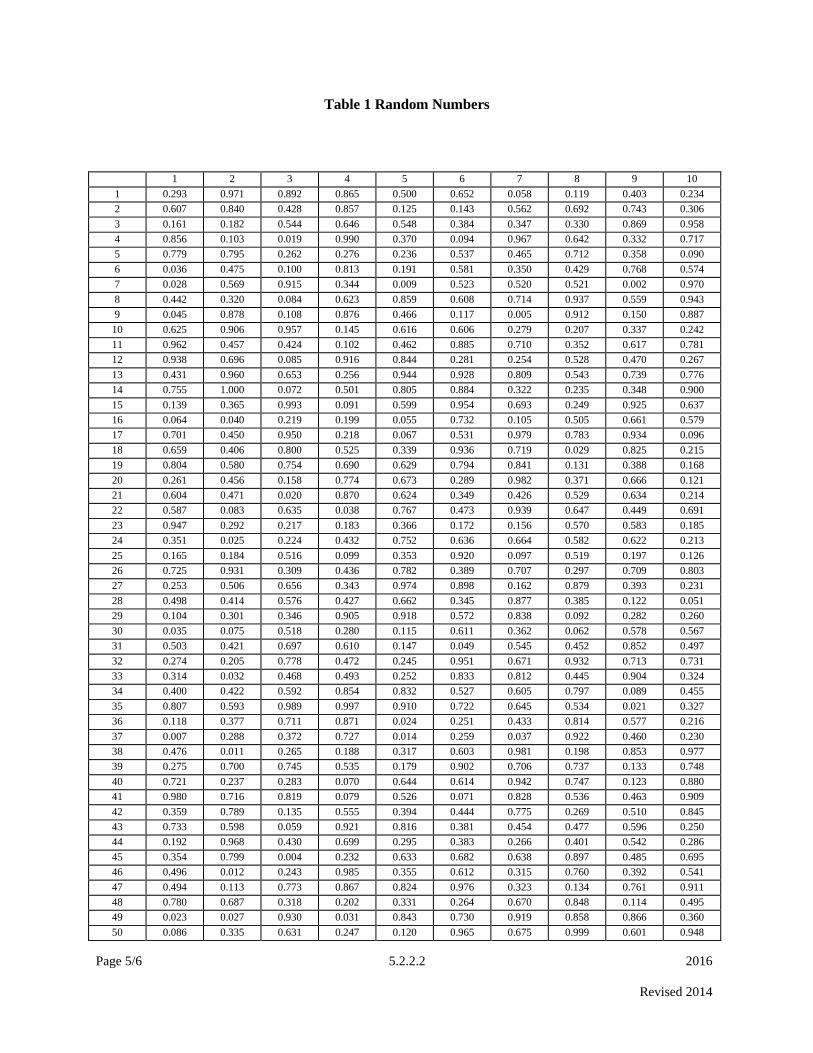
Page 5/6 5.2.2.2 2016
Revised 2014
Table 1 Random Numbers
1 2 3 4 5 6 7 8 9 10
1 0.293 0.971 0.892 0.865 0.500 0.652 0.058 0.119 0.403 0.234
2 0.607 0.840 0.428 0.857 0.125 0.143 0.562 0.692 0.743 0.306
3 0.161 0.182 0.544 0.646 0.548 0.384 0.347 0.330 0.869 0.958
4 0.856 0.103 0.019 0.990 0.370 0.094 0.967 0.642 0.332 0.717
5 0.779 0.795 0.262 0.276 0.236 0.537 0.465 0.712 0.358 0.090
6 0.036 0.475 0.100 0.813 0.191 0.581 0.350 0.429 0.768 0.574
7 0.028 0.569 0.915 0.344 0.009 0.523 0.520 0.521 0.002 0.970
8 0.442 0.320 0.084 0.623 0.859 0.608 0.714 0.937 0.559 0.943
9 0.045 0.878 0.108 0.876 0.466 0.117 0.005 0.912 0.150 0.887
10 0.625 0.906 0.957 0.145 0.616 0.606 0.279 0.207 0.337 0.242
11 0.962 0.457 0.424 0.102 0.462 0.885 0.710 0.352 0.617 0.781
12 0.938 0.696 0.085 0.916 0.844 0.281 0.254 0.528 0.470 0.267
13 0.431 0.960 0.653 0.256 0.944 0.928 0.809 0.543 0.739 0.776
14 0.755 1.000 0.072 0.501 0.805 0.884 0.322 0.235 0.348 0.900
15 0.139 0.365 0.993 0.091 0.599 0.954 0.693 0.249 0.925 0.637
16 0.064 0.040 0.219 0.199 0.055 0.732 0.105 0.505 0.661 0.579
17 0.701 0.450 0.950 0.218 0.067 0.531 0.979 0.783 0.934 0.096
18 0.659 0.406 0.800 0.525 0.339 0.936 0.719 0.029 0.825 0.215
19 0.804 0.580 0.754 0.690 0.629 0.794 0.841 0.131 0.388 0.168
20 0.261 0.456 0.158 0.774 0.673 0.289 0.982 0.371 0.666 0.121
21 0.604 0.471 0.020 0.870 0.624 0.349 0.426 0.529 0.634 0.214
22 0.587 0.083 0.635 0.038 0.767 0.473 0.939 0.647 0.449 0.691
23 0.947 0.292 0.217 0.183 0.366 0.172 0.156 0.570 0.583 0.185
24 0.351 0.025 0.224 0.432 0.752 0.636 0.664 0.582 0.622 0.213
25 0.165 0.184 0.516 0.099 0.353 0.920 0.097 0.519 0.197 0.126
26 0.725 0.931 0.309 0.436 0.782 0.389 0.707 0.297 0.709 0.803
27 0.253 0.506 0.656 0.343 0.974 0.898 0.162 0.879 0.393 0.231
28 0.498 0.414 0.576 0.427 0.662 0.345 0.877 0.385 0.122 0.051
29 0.104 0.301 0.346 0.905 0.918 0.572 0.838 0.092 0.282 0.260
30 0.035 0.075 0.518 0.280 0.115 0.611 0.362 0.062 0.578 0.567
31 0.503 0.421 0.697 0.610 0.147 0.049 0.545 0.452 0.852 0.497
32 0.274 0.205 0.778 0.472 0.245 0.951 0.671 0.932 0.713 0.731
33 0.314 0.032 0.468 0.493 0.252 0.833 0.812 0.445 0.904 0.324
34 0.400 0.422 0.592 0.854 0.832 0.527 0.605 0.797 0.089 0.455
35 0.807 0.593 0.989 0.997 0.910 0.722 0.645 0.534 0.021 0.327
36 0.118 0.377 0.711 0.871 0.024 0.251 0.433 0.814 0.577 0.216
37 0.007 0.288 0.372 0.727 0.014 0.259 0.037 0.922 0.460 0.230
38 0.476 0.011 0.265 0.188 0.317 0.603 0.981 0.198 0.853 0.977
39 0.275 0.700 0.745 0.535 0.179 0.902 0.706 0.737 0.133 0.748
40 0.721 0.237 0.283 0.070 0.644 0.614 0.942 0.747 0.123 0.880
41 0.980 0.716 0.819 0.079 0.526 0.071 0.828 0.536 0.463 0.909
42 0.359 0.789 0.135 0.555 0.394 0.444 0.775 0.269 0.510 0.845
43 0.733 0.598 0.059 0.921 0.816 0.381 0.454 0.477 0.596 0.250
44 0.192 0.968 0.430 0.699 0.295 0.383 0.266 0.401 0.542 0.286
45 0.354 0.799 0.004 0.232 0.633 0.682 0.638 0.897 0.485 0.695
46 0.496 0.012 0.243 0.985 0.355 0.612 0.315 0.760 0.392 0.541
47 0.494 0.113 0.773 0.867 0.824 0.976 0.323 0.134 0.761 0.911
48 0.780 0.687 0.318 0.202 0.331 0.264 0.670 0.848 0.114 0.495
49 0.023 0.027 0.930 0.031 0.843 0.730 0.919 0.858 0.866 0.360
50 0.086 0.335 0.631 0.247 0.120 0.965 0.675 0.999 0.601 0.948

Page 6/6 5.2.2.2 2016
Revised 2014
Table 1 (Cont)
1 2 3 4 5 6 7 8 9 10
51 0.940 0.312 0.994 0.564 0.946 0.886 0.016 0.112 0.169 0.241
52 0.547 0.336 0.382 0.017 0.836 0.632 0.175 0.053 0.441 0.821
53 0.376 0.620 0.399 0.765 0.618 0.203 0.530 0.124 0.132 0.326
54 0.586 0.268 0.109 0.378 0.434 0.734 0.551 0.894 0.464 0.321
55 0.018 0.409 0.539 0.144 0.703 0.180 0.478 0.688 0.929 0.674
56 0.588 0.227 0.896 0.758 0.826 0.504 0.512 0.026 0.863 0.481
57 0.305 0.689 0.137 0.319 0.558 0.418 0.277 0.992 0.766 0.447
58 0.831 0.899 0.208 0.698 0.676 0.195 0.808 0.759 0.738 0.439
59 0.626 0.827 0.959 0.440 0.411 0.861 0.850 0.686 0.159 0.374
60 0.201 0.895 0.480 0.270 0.369 0.407 0.082 0.749 0.057 0.435
61 0.030 0.167 0.509 0.419 0.508 0.181 0.490 0.875 0.830 0.482
62 0.136 0.065 0.416 0.116 0.907 0.556 0.095 0.110 0.395 0.736
63 0.591 0.600 0.405 0.657 0.013 0.651 0.225 0.340 0.146 0.155
64 0.487 0.338 0.170 0.006 0.263 0.173 0.228 0.008 0.010 0.313
65 0.364 0.763 0.391 0.790 0.589 0.003 0.998 0.257 0.984 0.437
66 0.996 0.043 0.793 0.522 0.705 0.248 0.924 0.609 0.639 0.423
67 0.063 0.810 0.189 0.769 0.488 0.152 0.221 0.978 0.329 0.229
68 0.513 0.333 0.540 0.160 0.461 0.683 0.285 0.750 0.557 0.311
69 0.176 0.054 0.341 0.484 0.860 0.046 0.278 0.244 0.222 0.864
70 0.549 0.835 0.398 0.829 0.459 0.153 0.728 0.822 0.106 0.756
71 0.298 0.514 0.945 0.648 0.784 0.154 0.499 0.415 0.397 0.255
72 0.888 0.764 0.602 0.220 0.684 0.081 0.868 0.272 0.987 0.802
73 0.654 0.995 0.073 0.655 0.041 0.811 0.367 0.226 0.438 0.107
74 0.650 0.467 0.210 0.204 0.762 0.420 0.680 0.334 0.723 0.446
75 0.039 0.022 0.823 0.087 0.076 0.568 0.515 0.223 0.561 0.316
76 0.291 0.791 0.788 0.396 0.212 0.138 0.357 0.304 0.575 0.342
77 0.834 0.373 0.584 0.694 0.613 0.817 0.129 0.546 0.425 0.290
78 0.511 0.375 0.048 0.923 0.001 0.088 0.258 0.166 0.787 0.837
79 0.538 0.174 0.068 0.052 0.640 0.148 0.093 0.553 0.565 0.862
80 0.560 0.724 0.975 0.818 0.796 0.379 0.069 0.034 0.792 0.757
81 0.492 0.820 0.489 0.872 0.770 0.991 0.704 0.050 0.874 0.621
82 0.890 0.356 0.451 0.554 0.649 0.507 0.061 0.479 0.211 0.273
83 0.966 0.798 0.917 0.141 0.368 0.193 0.443 0.751 0.458 0.746
84 0.517 0.715 0.777 0.742 0.839 0.307 0.246 0.956 0.665 0.111
85 0.786 0.328 0.015 0.643 0.882 0.815 0.963 0.590 0.855 0.891
86 0.047 0.702 0.287 0.177 0.164 0.552 0.296 0.413 0.941 0.849
87 0.681 0.678 0.563 0.851 0.726 0.801 0.573 0.056 0.140 0.641
88 0.404 0.842 0.412 0.893 0.935 0.744 0.386 0.299 0.178 0.881
89 0.033 0.042 0.753 0.660 0.685 0.171 0.408 0.060 0.550 0.302
90 0.128 0.658 0.667 0.926 0.239 0.127 0.903 0.483 0.300 0.597
91 0.973 0.933 0.361 0.595 0.186 0.901 0.914 0.190 0.303 0.098
92 0.672 0.729 0.163 0.310 0.196 0.964 0.486 0.308 0.735 0.474
93 0.524 0.402 0.628 0.410 0.846 0.206 0.585 0.566 0.044 0.627
94 0.720 0.157 0.238 0.078 0.233 0.771 0.533 0.986 0.077 0.101
95 0.983 0.669 0.927 0.066 0.080 0.740 0.969 0.630 0.619 0.200
96 0.294 0.387 0.988 0.961 0.913 0.679 0.284 0.949 0.380 0.785
97 0.668 0.149 0.972 0.187 0.151 0.502 0.718 0.453 0.953 0.491
98 0.130 0.708 0.417 0.594 0.209 0.663 0.908 0.271 0.532 0.741
99 0.883 0.677 0.615 0.469 0.363 0.142 0.952 0.325 0.194 0.847
100 0.889 0.772 0.390 0.571 0.873 0.806 0.448 0.955 0.240 0.074

Page 1/3 5.2.3 2016
Revised 2016
5.2.3. REASONS FOR QUALITY CONTROL/QUALITY ASSURANCE (QC/QA) AND THE
CERTIFIED INSPECTOR TRAINING AND TESTING PROGRAM (CIT2)
1. Compliance with Specifications.
The primary reason for requiring inspection, sampling and testing of materials, through an adequate and
effective QC/QA system for materials used in a project, is for KDOT to verify that all materials furnished
by the contractor and incorporated into the work and the completed work itself meet the requirements of
the contract documents (plans, specifications, special provisions and other supplemental documents).
Specifications and plans have been prepared to require the use of materials that are expected to perform
satisfactorily with minimal maintenance throughout the life of the facility. Any material that deviates
from specification or plan limits will not perform as expected, and, in all probability, will shorten the life
of the facility or add appreciably to the cost of its maintenance. Inspectors are expected to review the
applicable clauses and covenants of the Standard Specifications at regular intervals.
2. Uniform Relations with Contractors and Producers.
The contract documents provide an equitable basis for bidding by contractors since they define the
requirements that are to be met. The contractors who bid the work and producers supplying material to
the contractors commit to KDOT to furnish materials and completed work that will equal or exceed such
requirements.
The Engineer must determine, through quality assurance measures that the contractor is providing and the
State is receiving what is specified under the contract. The Engineer should accept nothing less for the
use of taxpayer funds.
It is essential that quality assurance be applied uniformly by all engineers and inspectors from project to
project so that all contractors and suppliers are treated alike. This manual provides guidance to the
Engineer and inspector on interpretation of the specifications and the application of quality assurance, so
no contractors or producers are given an unfair advantage over other contractors and producers.
3. Documentation of Expenditure of Public Funds.
When payment is to be made to the contractor for materials furnished and work performed, the duly
designated state official must authorize disbursement of public funds for this purpose. The disbursing
officer must depend upon others for evidence to support the expenditure. Through the materials quality
assurance system, the Field Engineer will acquire substantiating data in the form of test results, inspection
records and measurements to justify acceptance of the contractor's work. Thus the Engineer can assure
and furnish documentation to the officials responsible for authorizing payment that the contractor has
fulfilled its obligation and is entitled to full or adjusted payment as provided for in the contract
documents.
In case of failure to meet the minimum requirements, quality assurance data will constitute the basis for
rejection of work as unacceptable.
Complete records, including test and inspection reports covering acceptance or rejection, should be
maintained in the Engineer's project files while the necessary copies should be furnished to the
appropriate headquarters personnel as needed for verification and as supporting evidence for payment
documents.

Page 2/3 5.2.3 2016
Revised 2016
4. Compliance with Federal Regulations
Title 23, Chapter 1, Part 637 of the Code of Federal Regulations includes many requirements which must
be adhered to for Federal-aid highway construction. Some of these requirements include:
State Transportation Departments have a Quality Assurance program in place.
Testing of highway materials is performed by Qualified Laboratories.
State Transportation Departments have an Independent Assurance program in place.
Sampling of materials used in highway construction is accomplished in a Random manner.
Qualified personnel are used for sampling and testing of materials used in highway construction.
Part 637 defines Quality Assurance as “All those planned and systematic actions necessary to provide
confidence that a product or service will satisfy given requirements for quality”. A Quality Assurance
Program is required under 637.205 which states in part: “Each STD (State Transportation Department)
shall develop a quality assurance program which will assure that the materials and workmanship
incorporated into each Federal-aid highway construction project on the NHS are in conformity with the
requirements of the approved plans and specifications”.
Other requirements and definitions can be found on the Government Printing Office website:
http://www.gpo.gov/fdsys/browse/collectionCfr.action?collectionCode=CFR. KDOT administers its
state quality program in accordance with federal regulations and requirements.
5. Reasons for the Certified Inspection and Testing Training Program (CIT2).
As noted above, the use of qualified personnel is required for sampling and testing of materials used in
highway construction. This requirement is expressed in 637.209(b) “Sampling and testing personnel.
After June 29, 2000, all sampling and testing data to be used in the acceptance decision or the IA program
shall be executed by qualified sampling and testing personnel.” The State defines qualified personnel as
those certified through the Certified Inspection and Testing Training Program (CIT2).
The following is an excerpt from the CIT2 manual giving an overview of the program:
“The Kansas Department of Transportation (KDOT) has established this training program to
educate, test and certify those individuals responsible for performing inspection and testing functions on
KDOT construction projects. KDOT’s Bureau of Construction and Materials has responsibility for the
establishment and administration of the materials portion of the KDOT’s Quality Control/Quality
Assurance (QC/QA) Program. The Bureau develops standards and specifications for materials,
establishes sampling procedures and frequencies, and test procedures used in the laboratory and the field
in order to assure compliance with specifications. It performs materials testing to assist each of the six
KDOT districts in administering quality assurance functions of the QC/QA Program. Such testing
includes tests on materials purchased by contractors or the State for use in maintenance or construction
activities. The Bureau also conducts tests on soils, concrete, bituminous mixtures and numerous other
specialized materials, the results of which are used by others for a variety of reasons.”
“Quality control and quality assurance activities involve the routine sampling, testing and
analysis of various materials to determine the quality of a given product and to attain a quality product.
The goal of the Certified Inspection and Testing Training Program (CIT2) is to provide persons engaged
in the inspection and/or testing of KDOT construction projects specific training in, but not limited to,
soils, aggregates, and concrete and/or asphalt disciplines.”

Page 3/3 5.2.3 2016
Revised 2016
“Each student is required to demonstrate specific abilities as defined by the training modules
described in the CIT2 manual.” The manual can be found online at:
http://www.ksdot.org/descons.asp#CIT.”

Page 1/3 5.2.4 2016
Revised 2016
5.2.4. PROCEDURES FOR QUALITY ASSURANCE
1. General
KDOT has two procedures for assuring quality on project produced materials. The two Sampling and
Testing Frequency Charts in Appendix A and B help clarify some of the differences between the two
procedures.
1.1. The older of the two is “Method Specs”. Under this procedure, KDOT’s test results are used as the
basis of acceptance for project produced materials, and the contractor is not required to conduct quality
control testing, although the contractor may choose to do so.
1.2. A more current procedure is “QC/QA” specifications. Under this method of quality assurance, the
contractor conducts quality control testing, and these test results can be used as a basis of acceptance,
provided KDOT’s quality assurance verifies the results.
2. Authorized Personnel.
2.1. Under a “method spec”, all inspection, sampling and testing for acceptance must be performed by an
authorized representative of the Kansas Department of Transportation. The representative may be an
employee of the Kansas Department of Transportation, an employee of another highway agency or an
employee of a commercial testing laboratory or inspection agency. The contractor's/producer's process
control test results may be used for partial acceptance when allowed by the contract documents. (See
basis of acceptance.)
Arrangements for inspection and sampling of materials by agencies other than the Department are made
by the Chief, Bureau of Construction and Materials.
Samples submitted to the laboratory for tests by unauthorized individuals or agencies will not be tested
except by authorization of the Chief, Bureau of Construction and Materials.
2.2. Under “QC/QA” specifications, all technicians must demonstrate qualifications for each Test Group
in which they wish to conduct materials sampling and testing. These qualifications include some type of
certificate for the completion of a training program or a combination of demonstration of the test
procedures and completion of written exams covering the group of test methods. For a list of Test
Groups, see Appendix C. Acceptable certifications include KDOT training and testing, training
conducted at KSU-Salina or Manhattan, American Concrete Institute certification, or a certificate of
completion from a program similar to those described and issued or approved by another state’s DOT.
KDOT has final judgment on a technician’s qualifications.
Certification in one group may be required before attendance in the certification course of another group.
For example, Aggregate Field is required before a technician may attend the Superpave Field training.
All contractors conducting QC/QA sampling and testing for KDOT projects are responsible for the annual
calibration and verification of their equipment by an AASHTO Accredited Laboratory using NIST
traceable equipment, or by some other NIST traceable source (see Appendix C for calibration and
verification frequencies). Calibrations and verifications required more often than every 12 months may
be conducted by the contractor if the equipment is checked annually by an AASHTO Accredited
Laboratory. Equipment will be made available to the District Materials Engineer for spot checks of the
calibrations when necessary.
Page 2/3 5.2.4 2016
Revised 2016
2.3. All technicians conducting sampling and testing for the State of Kansas projects are given a unique
number for tracking in the Contract Management System (CMS). The system also lists the group of tests
that the technician is authorized or qualified to conduct.
The contractor and KDOT Construction Offices must submit a list of qualified technicians that will be
conducting sampling and testing on a project to the District Materials Engineer before work begins on the
project. Include each technician’s CMS identification number and the possible group of tests to be
conducted by the technician on the list. The District Materials Engineer will run a sort against CMS to
determine if Independent Assurance requirements have been completed for each technician during that
calendar year. They will make an attempt to schedule such activity during the course of the project if
required.
3. Inspection and Sampling Procedures.
3.1. Contract Requirements: The first activity in the inspection and sampling of a product is to determine
the specified requirements for the material. The project listing issued by the Bureau of Construction and
Materials and the contract documents should be reviewed to determine if there are special provisions
covering the product. If there are none, then the plans and Standard Specifications are applicable. If
dimensions and other details are not covered by the Standard Specifications and special provisions, then
the necessary information must be obtained from the plans.
When reviewing contract requirements for a product, the following statement from the Standard
Specifications should be kept in mind: "In case of discrepancy, calculated dimensions will govern over
scaled dimensions; Plans will govern over Standard Specifications; Special Provisions will govern over
Plans; and Project Special Provisions will govern over Special Provisions."
The applicable specifications, special provisions and plans must be carefully studied and notes outlining
pertinent requirements should be made for reference during the actual inspection procedure.
3.2. Visual Inspection: To prevent incorporation of "out of specification" material into the work and to
prevent an injustice to the producer or the supplier by rejecting "specification material," it is essential that
each sample truly represent the material being inspected. Therefore, before most material is sampled, it
must be subjected to a careful visual inspection. If the material to be sampled involves many individual
units such as concrete blocks, culvert pipe, bolts and nuts, castings, etc., the entire lot offered for
inspection must be carefully examined for workmanship, defects, dimensions if specified, finish and
uniformity.
Any units which visual inspection shows to be outside specified limits should be immediately rejected
and not sampled. It is emphasized that the Department is not a "culling" agency and if it is found that
more than 10 to 15% of the units in a lot fall outside the specified limits, the entire lot should be rejected.
If the producer or supplier elects to cull the lot and remove all non-specification units, the new lot may be
re-inspected and sampled.
3.3. Sampling: When sampling materials, refer to section 5.9. for specific instructions on sampling
procedures for specific materials. In situations not covered by section 5.9, contact the District Materials
Engineer for assistance.
3.4. Identification of Materials: It is essential that all material be properly marked for identification when
the material is inspected and sampled. The identification must be such that the Field Engineer can readily
associate the material with the inspection and/or test report for the lot of material covered by the
inspection.

Page 3/3 5.2.4 2016
Revised 2016
If the number of units is not too large, each unit must be tagged or stenciled with a laboratory or other
number assigned by the inspector. When a large number of units are involved in a lot, identification is
placed on a number of units on a random basis.
3.5. Identification of Samples: Properly executed Contract Management System (CMS) Sample ID
screens or information sheets must be prepared for each sample or group of samples submitted to the
laboratory for test. All appropriate items on the sheet or screen must be filled out so that the sample will
be identified with the lot of material that it represents. It is especially important that the quantity of
material represented by each sample be shown in order for the Field Engineer to account for all materials
received on the project. Further details are set forth in section 5.4. of this manual.
3.6. Inspection at Destination: All materials that arrive on the project are to be inspected by the Engineer
prior to being incorporated into the work and all such inspections should be carefully documented. It
must be understood that the final acceptance or rejection of all materials should be made at the project site
just prior to incorporation of the material in the work.
Subject items that have previously been inspected, tested and accepted to visual inspection to ascertain
possible damage during shipment, laboratory numbers or other identification assigned during the initial
inspection and general conformance with dimensional requirements.
Visually examine all items accepted by certification at destination to ensure conformance with
dimensional and/or other requirements, to ensure that the identification on the material correspond with
the identification on the certifications, and to ensure that the material was not damaged during shipment.


Page 1/5 5.2.5 2016
Revised 2016
5.2.5. QUALITY CONTROL/QUALITY ASSURANCE (QC/QA) TESTS
1. General
This section establishes terminology and procedures for the various tests that are included in the
QC/QA system.
2. Definitions
2.1. Acceptance Program - All factors that comprise the State’s determination of the degree of
compliance with contract requirements and value of a product. These factors include the State’s
sampling, testing and inspection, and validated results of contractor sampling and testing.
2.2. Assurance Sampling and Testing - Split or replicate samples used as an independent check
of the sampling and testing procedures and equipment. These samples are to assure testing is
being performed properly by both the contractor’s and the State’s personnel. The results of
assurance tests are not to be used as a basis of material acceptance.
2.3. Dispute Resolution - The procedure used to resolve conflicts resulting from discrepancies
between the State’s verification results and the Contractor’s quality control results of sufficient
magnitude to impact payment. Any laboratory used for dispute resolution must be accredited by
the AASHTO Accreditation program for the tests to be performed.
2.4. Independent Assurance (IA) - IA is an unbiased and independent verification of the Quality
Assurance system used and of the reliability of the test results obtained in the regular sampling
and testing activities. KDOT’s IA will consist of observations by independent personnel to
assure that specified procedures are followed (witnessing), and split or replicate sampling and
testing.
2.5. Quality Assurance (QA) - All those planned and systematic actions necessary to provide
adequate confidence that a product or service will satisfy given requirements for quality. QA
activities include: acceptance, independent assurance, verification, and prequalification sampling
and testing; inspection; reporting of results; and any follow up that may be necessary due to test
failure. Without these actions, it would be impossible for the Engineer to accurately verify
compliance or in many cases the level of compliance with the requirements of the contract
documents.
2.6. Quality Control (QC) - The sum total of operational techniques and activities performed or
conducted by the contractor and/or producer to make sure that a product meets contract
specification requirements. QC activities generally are outlined in a contractor's process control
plan which lists such items as types of tests to be performed, sampling locations, sampling
frequencies, equipment calibration procedures and frequencies, and documentation procedures.
2.7. Qualified Laboratories - Laboratories used for sampling and testing of materials are those
approved through appropriate programs as determined by KDOT.
Page 2/5 5.2.5 2016
Revised 2016
2.8. Qualified Technician - Personnel who are certified through appropriate programs as
determined by KDOT.
2.9. Replicate Tests - Tests performed by independent assurance personnel using equipment
other than that used by project personnel, but performed on a portion of the sample used by
project personnel.
2.10. Split Samples - Sampling and splitting of the material conducted under the observation of
independent assurance personnel. Tests on separate portions are performed by KDOT
designated independent assurance personnel using equipment other than that used by project
personnel.
2.11. Verification Sampling and Testing - Sampling and testing performed to validate the quality
of the product or to check the adequacy of mix designs. If quality control sampling and testing is
used in the acceptance program, verification sampling and testing will also be used to validate
the quality control sampling and testing. Verification samples are independent samples obtained
by KDOT.
2.11.1. On Grade Concrete Aggregate (OGCA) Production Samples - Sampling and testing
procedures utilized to verify that the production of OGCA complies with the specification
quality requirements
2.12. Other - sampling and testing by the District Materials laboratories not otherwise designated
in this instruction or specified in the Sampling and Testing Frequency Chart, such as
determination of asphalt content in maintenance mixes, or a Marshall design.
3. Independent Assurance
KDOT uses a systems-wide approach to Independent Assurance Sampling and Testing of project
produced materials. Each test is included in one of the following Groups according to the type of
material: Aggregates, Concrete, Asphalt Mixes, and Soils. A breakdown of requirements for
each Group is provided in Appendix C. Independent assurance will be conducted once per
calendar year per technician per group of tests performed by that technician during that year. It
may not be possible to witness all the tests within a group during the assurance process. There
are, however, critical Core Tests within each group that must be witnessed before annual
Independent Assurance requirements are completed by a technician for that group of tests.
These Core Tests are marked with a double asterisk (**) on the list in Appendix C.
KDOT’s MRC at 2300 Van Buren is AASHTO Accredited. District Materials personnel are
responsible for conducting the independent assurance witnessing and testing. The equipment
that the Districts use to conduct independent assurance testing is calibrated or verified annually
by the MRC personnel, by another AASHTO Accredited Laboratory, or by outside NIST
traceable sources.
Independent Assurance consists of witnessing the technician properly conduct the test, and split
or replicate samples. The District conducts the split or replicate testing whenever possible
Page 3/5 5.2.5 2016
Revised 2016
during the independent assurance process. KDOT may hire, train, and evaluate personnel from
independent laboratories to conduct independent assurance witnessing for KDOT. KDOT will
still conduct the split sample testing. The independent laboratory need not be AASHTO
Accredited since the personnel would be acting on behalf of KDOT.
4. Comparison Procedures
4.1. Assurance Samples. Acceptable variations for between laboratory reproducibility are listed
in Appendix C. Precision statements from ASTM or AASHTO test procedures are used when
available, and these statements are included in the KT Methods. Where precision statements are
not available the standard deviations from the last 10 AMRL Proficiency Samples are used to
calculate the 95% reproducibility limit (between laboratories) – d2s as defined in ASTM E-177.
These calculated values are reviewed annually for applicability and may be adjusted when
warranted. Where precision statements and AMRL Samples are not available, the Engineer will
use the Engineer’s discretion to determine acceptable variations. The comparisons are made by
personnel who are knowledgeable of testing variation and who have the authority to resolve any
problems in equipment, procedures, etc.
4.2. Under a “method spec” the numerical results obtained on Verification Samples are
compared promptly with the specifications, or certified results, as applicable. Appropriate action
is taken by the person responsible for making comparisons in each case. In the case of
verification sample test results obtained at the MRC, the Engineer of Tests informs the district of
any test results which do not comply with specifications and retains the reports pending receipt
of information from the district regarding its investigation of circumstances for non-compliance
and corrective action taken, if needed, resulting from its investigation.
Under QC/QA specifications, Verification test results are statistically compared to the
contractor’s test results by the use of the F and T tests outlined in section 5.2.6. or some other
statistically valid practice. Use F & T tests only when enough verification results are available.
KDOT prefers results from at least 3 to 5 verification tests for statistical comparisons. If the data
passes the T test, use the contractor’s numbers to calculate pay quantities. If the data fails the T
test, use KDOT’s numbers to calculate pay quantities.
4.3. Reports of Verification Samples shall show sufficient information to facilitate comparison
with the corresponding Acceptance Test, related certifications, or producer's test results.
4.3.1. When statistical comparisons are made, include a comment in the report similar to one of
the following:
4.3.1.1. "Statistical comparison of results indicates it is reasonable to assume all associated
samples came from the same population."
4.3.1.2. "Statistical comparison of results indicates it is reasonable to assume all associated
samples did not come from the same population (or lot)."
4.3.2. When no statistical comparison can be made, include a comment in the report similar to
one of the following:
Page 4/5 5.2.5 2016
Revised 2016
4.3.2.1. "The results of this test appear to agree reasonably well with data reported previously for
this project.
4.3.2.2. "Comparison of these data with data reported previously for this product indicates that
further monitoring or corrective action is merited."
5. Dispute resolution
If a dispute exists between the Engineer and the contractor about the validity of the other’s test
results, the KDOT Materials Research Center will perform referee testing. If one of the disputed
Department test results was generated at the MRC, then an Independent AASHTO Accredited
Laboratory agreeable to both parties will be selected. If referee testing indicates that the
department’s test results are correct then the contractor pays for the additional testing, including
referee testing performed at the MRC. If the referee testing indicates that the contractor’s test
results are correct then the Department pays for the additional testing.
6. Sampling and Testing Frequency
6.1. The two Sampling and Testing Frequency Charts (Appendix A and Appendix B) reflect
the minimum rate for sampling and testing. It is understood that if a problem occurs, more
samples or tests may be necessary.
6.1.1. It is also intended that Verification and Assurance Samples may be used for items other
than those required by the Sample and Testing Frequency Chart. However, Assurance Samples
will never be used for Acceptance.
7. Reporting Procedures
7.1. Assurance Samples are reported in CMS on the data input screen appropriate for the item
being tested. Identify the individual tests by CMS ID nos. or by the Assurance Sample Number
(assigned by the District Materials Engineer), the name of the person requesting the sample, and
the appropriate sample number used by the group performing the test or a notation as to which
group performed each test.
When entering split and replicate samples into CMS the contractor’s or field personnel’s results
are entered as Sample A and the District’s or MRC’s results are entered as Sample B under the
same CMS sample ID number.
7.2. Contractors do not currently have access to CMS. District or field personnel are responsible
for entering Acceptance and Verification test results into CMS. When test results on Acceptance
Samples fall outside of the specification limits, underline or circle in red the points of
noncompliance. This option is not available in CMS.
7.3. Number of copies and distributions:

Page 5/5 5.2.5 2016
Revised 2016
Non CMS
Bureau of Construction and Materials - 1 copy
District Engineer - 1 copy
Field Engineer - 1 copy
CMS
In CMS it is the users responsibility to identify the need for information
and obtain such information. Information can be obtained using on-line
service or ordering reports.
8. Responsibility
The Chief of Construction and Materials will maintain a complete file of non-CMS reports on
Assurance Samples, Acceptance Samples, Verification Samples and other tests. District
Materials Engineers are responsible for forwarding these reports to the Bureau of Construction
and Materials.
8.1. The District Materials Engineer is responsible for reporting the results on all Assurance
Samples performed in the District and may be required to perform Acceptance Tests shown on
the Sampling and Testing Frequency Chart in Appendix A or Verification Tests shown in
Appendix B. In addition, performance of additional tests such as, but not limited to, Marshall
Designs, Soil Compaction Standards, and Asphalt Extractions will be required.
8.2. The Engineer of Tests is responsible for reporting results on samples that are submitted to
the Materials and Research Center for Test.
8.3. The Field Engineer is normally responsible for the Acceptance Tests shown on the Sample
and Testing Frequency Chart in Appendix A or the Verification Tests shown in Appendix
B.

Page 1/18 5.2.6 2016
Revised 2016
5.2.6 COMPARISON OF QUALITY CONTROL AND VERIFICATION TESTS
This procedure is carried out to compare two different sets of multiple test results for finding the same
parameter. Typical example would be comparing contractor QC test results and KDOT verification test
results to determine if the material under test came from the same population. The statistical test which
would be used to compare two means would be popularly known as Student's t-test or simply t-tests for
testing a null hypothesis (H0) with certain confidence (e.g. 99%) or level of significance (risk of rejecting
a null hypothesis when it is true, e.g., 1%) is as follows:
Ho : There is no difference in the sample means, ie. the means are statistically
equal
If the test results do not support this hypothesis than an alternate hypothesis (Ha) is accepted as:
Ha: The means are different, ie. the means are not statistically equal
This test is generally applicable when the number of tests (or observations as is known in
Statistics) is less than or equal to 30. However, since the approach used in the t-test is dependent upon
whether or not the variances (square of the sample standard deviation) are equal for the two sets of data, it
is necessary to test the variances of the test results before comparing the means of the test results.
F-test for the Sample Variances
The F-test determines whether the difference in the variability of the contractor's QC tests and that of
KDOT's verification tests is larger than might be expected from chance if they came from the same
population. In this case, a hypothesis testing is done at a certain level of significance. The null
hypothesis in the test is:
Ho: There is no difference in the sample variances, ie. the variances are
statistically equal
If the test results do not support this hypothesis than an alternate hypothesis is accepted as:
Ha: The variances are different, i.e. the variances are not statistically equal
The following steps need to be followed in doing an F-test:
i) Compute the variance (the standard deviation squared) for the QC tests, sc2 , and
the KDOT verification tests, sv2
ii) Compute F statistic as:
F s s s sc v v c 2 2 2 2/ /or
Always use the larger of the two variances in the numerator.
iii) Choose the level of significance, , for the test. The recommended is 1%.
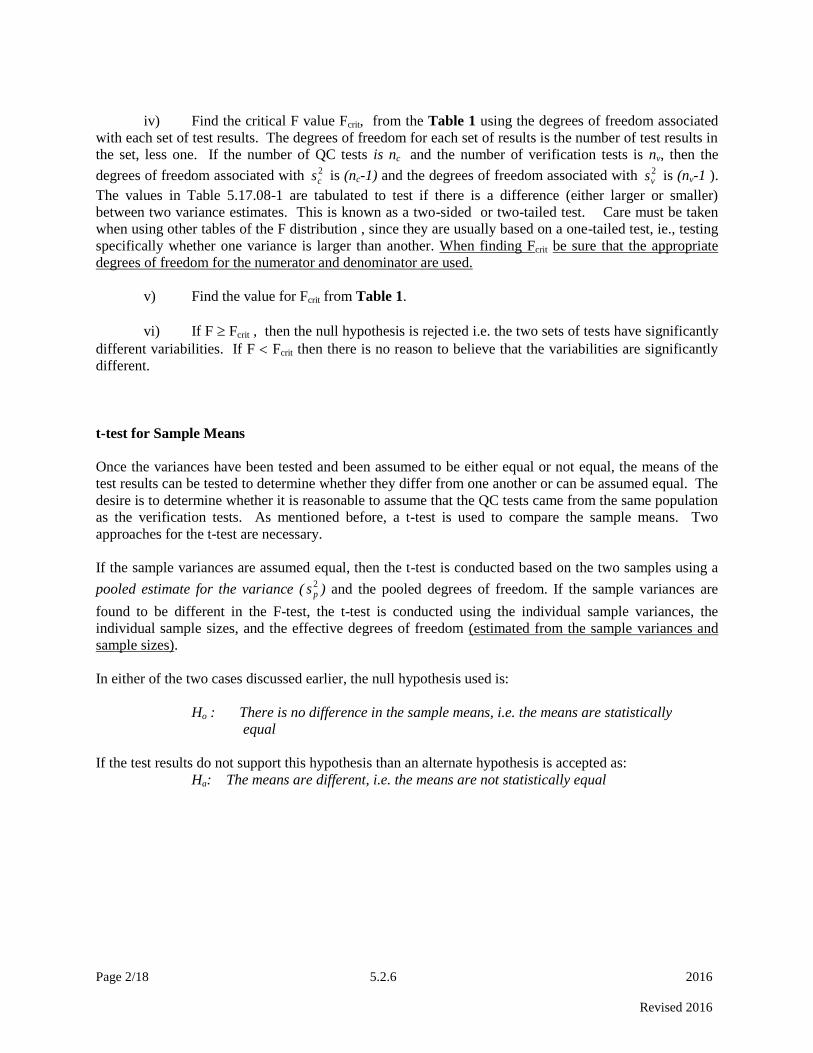
Page 2/18 5.2.6 2016
Revised 2016
iv) Find the critical F value Fcrit, from the Table 1 using the degrees of freedom associated
with each set of test results. The degrees of freedom for each set of results is the number of test results in
the set, less one. If the number of QC tests is nc and the number of verification tests is nv, then the
degrees of freedom associated with sc2 is (nc-1) and the degrees of freedom associated with sv
2 is (nv-1 ).
The values in Table 5.17.08-1 are tabulated to test if there is a difference (either larger or smaller)
between two variance estimates. This is known as a two-sided or two-tailed test. Care must be taken
when using other tables of the F distribution , since they are usually based on a one-tailed test, ie., testing
specifically whether one variance is larger than another. When finding Fcrit be sure that the appropriate
degrees of freedom for the numerator and denominator are used.
v) Find the value for Fcrit from Table 1.
vi) If F Fcrit , then the null hypothesis is rejected i.e. the two sets of tests have significantly
different variabilities. If F Fcrit then there is no reason to believe that the variabilities are significantly
different.
t-test for Sample Means
Once the variances have been tested and been assumed to be either equal or not equal, the means of the
test results can be tested to determine whether they differ from one another or can be assumed equal. The
desire is to determine whether it is reasonable to assume that the QC tests came from the same population
as the verification tests. As mentioned before, a t-test is used to compare the sample means. Two
approaches for the t-test are necessary.
If the sample variances are assumed equal, then the t-test is conducted based on the two samples using a
pooled estimate for the variance ( s p2
) and the pooled degrees of freedom. If the sample variances are
found to be different in the F-test, the t-test is conducted using the individual sample variances, the
individual sample sizes, and the effective degrees of freedom (estimated from the sample variances and
sample sizes).
In either of the two cases discussed earlier, the null hypothesis used is:
Ho : There is no difference in the sample means, i.e. the means are statistically
equal
If the test results do not support this hypothesis than an alternate hypothesis is accepted as:
Ha: The means are different, i.e. the means are not statistically equal

Page 3/18 5.2.6 2016
Revised 2016
Table 1 Critical Values, Fcrit for the F-test for a Level of Significance, =1%
DEGREES OF FREEDOM FOR NUMERATOR
......
1 2 3 4 5 6 7 8 9 10 11 12
1 16200 20000 21600 22500 23100 23400 23700 23900 24100 24200 24300 24400
2 198 199 199 199 199 199 199 199 199 199 199 199
3 55.6 49.8 47.5 46.2 45.4 44.8 44.4 44.1 43.9 43.7 43.5 43.4
4 31.3 26.3 24.3 23.2 22.5 22.0 21.6 21.4 21.1 21.0 20.8 20.7
5 22.8 18.3 16.5 15.6 14.9 14.5 14.2 14.0 13.8 13.6 13.5 13.4
6 18.6 14.5 12.9 12.0 11.5 11.1 10.8 10.6 10.4 10.2 10.1 10.0
7 16.2 12.4 10.9 10.0 9.52 9.16 8.89 8.68 8.51 8.38 8.27 8.18
8 14.7 11.0 9.60 8.81 8.30 7.95 7.69 7.50 7.34 7.21 7.10 7.01
9 13.6 10.1 8.72 7.96 7.47 7.13 6.88 6.69 6.54 6.42 6.31 6.23
10 12.8 9.43 8.08 7.34 6.87 6.54 6.30 6.12 5.97 5.85 5.75 5.66
11 12.2 8.91 7.60 6.88 6.42 6.10 5.86 5.68 5.54 5.42 5.32 5.24
12 11.8 8.51 7.23 6.52 6.07 5.76 5.52 5.35 5.20 5.09 4.99 4.91
15 10.8 7.70 6.48 5.80 5.37 5.07 4.85 4.67 4.54 4.42 4.33 4.25
20 9.94 6.99 5.82 5.17 4.76 4.47 4.26 4.09 3.96 3.85 3.76 3.68
24 9.55 6.66 5.52 4.89 4.49 4.20 3.99 3.83 3.69 3.59 3.50 3.42
30 9.18 6.35 5.24 4.62 4.23 3.95 3.74 3.58 3.45 3.34 3.25 3.18
40 8.83 6.07 4.98 4.37 3.99 3.71 3.51 3.35 3.22 3.12 3.03 2.95
60 8.49 5.80 4.73 4.14 3.76 3.49 3.29 3.13 3.01 2.90 2.82 2.74
120 8.18 5.54 4.50 3.92 3.55 3.28 3.09 2.93 2.81 2.71 2.62 2.54
7.88 5.30 4.28 3.72 3.35 3.09 2.90 2.74 2.62 2.52 2.43 2.36
NOTE : This is for a two-tailed test with the null and alternate hypotheses shown below:
Ho : s2c = s
2v
Ha : s2c s
2v
DE
GR
EE
S O
F F
RE
ED
OM
FO
R D
EN
OM
INA
TO
R
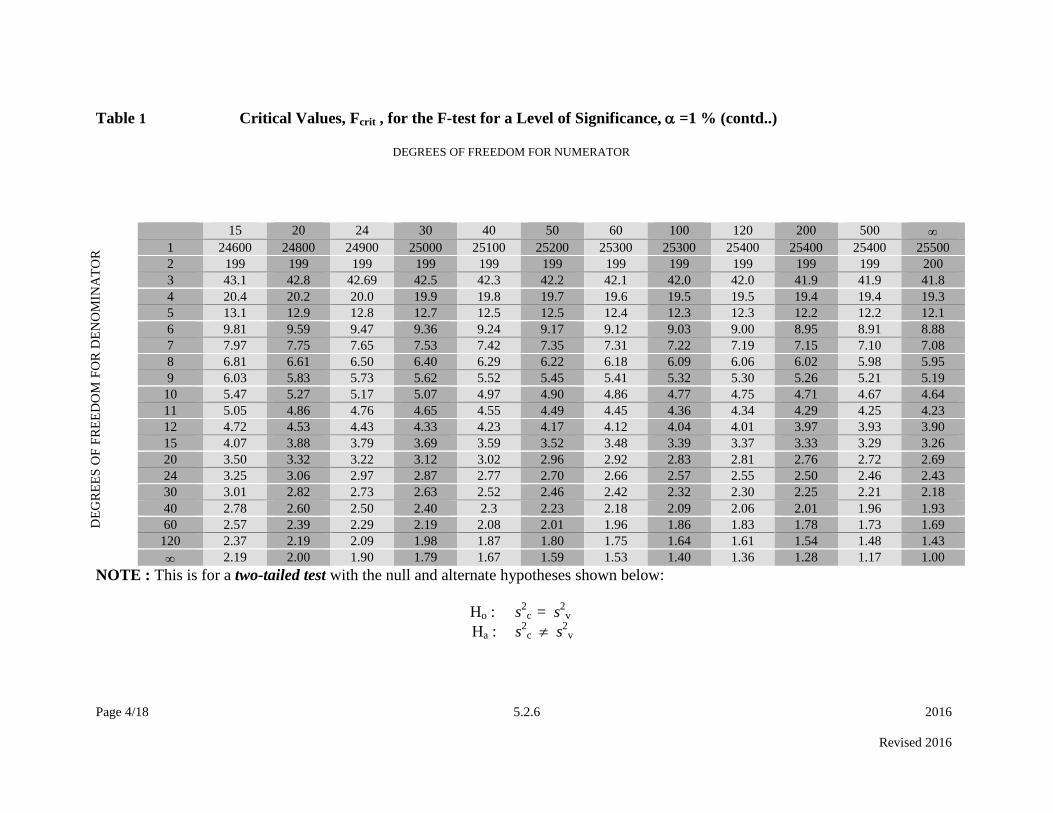
Page 4/18 5.2.6 2016
Revised 2016
Table 1 Critical Values, Fcrit , for the F-test for a Level of Significance, =1 % (contd..)
DEGREES OF FREEDOM FOR NUMERATOR
15 20 24 30 40 50 60 100 120 200 500
1 24600 24800 24900 25000 25100 25200 25300 25300 25400 25400 25400 25500
2 199 199 199 199 199 199 199 199 199 199 199 200
3 43.1 42.8 42.69 42.5 42.3 42.2 42.1 42.0 42.0 41.9 41.9 41.8
4 20.4 20.2 20.0 19.9 19.8 19.7 19.6 19.5 19.5 19.4 19.4 19.3
5 13.1 12.9 12.8 12.7 12.5 12.5 12.4 12.3 12.3 12.2 12.2 12.1
6 9.81 9.59 9.47 9.36 9.24 9.17 9.12 9.03 9.00 8.95 8.91 8.88
7 7.97 7.75 7.65 7.53 7.42 7.35 7.31 7.22 7.19 7.15 7.10 7.08
8 6.81 6.61 6.50 6.40 6.29 6.22 6.18 6.09 6.06 6.02 5.98 5.95
9 6.03 5.83 5.73 5.62 5.52 5.45 5.41 5.32 5.30 5.26 5.21 5.19
10 5.47 5.27 5.17 5.07 4.97 4.90 4.86 4.77 4.75 4.71 4.67 4.64
11 5.05 4.86 4.76 4.65 4.55 4.49 4.45 4.36 4.34 4.29 4.25 4.23
12 4.72 4.53 4.43 4.33 4.23 4.17 4.12 4.04 4.01 3.97 3.93 3.90
15 4.07 3.88 3.79 3.69 3.59 3.52 3.48 3.39 3.37 3.33 3.29 3.26
20 3.50 3.32 3.22 3.12 3.02 2.96 2.92 2.83 2.81 2.76 2.72 2.69
24 3.25 3.06 2.97 2.87 2.77 2.70 2.66 2.57 2.55 2.50 2.46 2.43
30 3.01 2.82 2.73 2.63 2.52 2.46 2.42 2.32 2.30 2.25 2.21 2.18
40 2.78 2.60 2.50 2.40 2.3 2.23 2.18 2.09 2.06 2.01 1.96 1.93
60 2.57 2.39 2.29 2.19 2.08 2.01 1.96 1.86 1.83 1.78 1.73 1.69
120 2.37 2.19 2.09 1.98 1.87 1.80 1.75 1.64 1.61 1.54 1.48 1.43
2.19 2.00 1.90 1.79 1.67 1.59 1.53 1.40 1.36 1.28 1.17 1.00
NOTE : This is for a two-tailed test with the null and alternate hypotheses shown below:
Ho : s2
c = s2
v
Ha : s2c s
2v
DE
GR
EE
S O
F F
RE
ED
OM
FO
R D
EN
OM
INA
TO
R
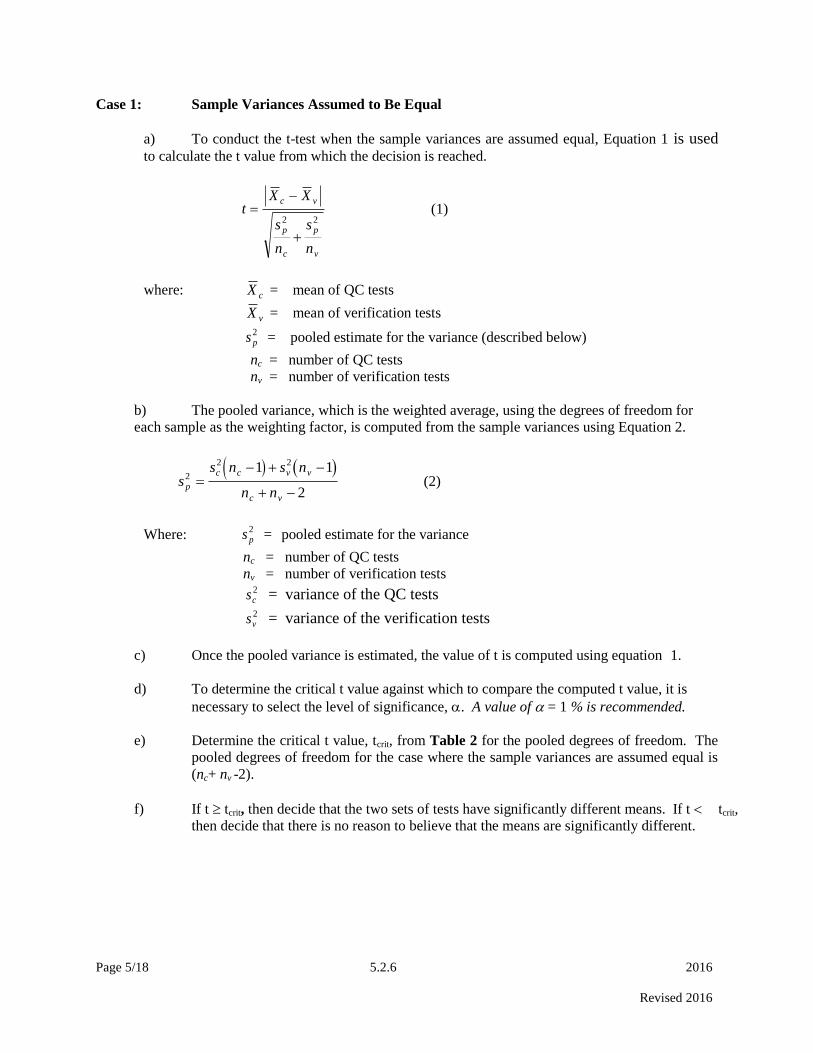
Page 5/18 5.2.6 2016
Revised 2016
Case 1: Sample Variances Assumed to Be Equal
a) To conduct the t-test when the sample variances are assumed equal, Equation 1 is used to calculate the t value from which the decision is reached.
tX X
s
n
s
n
c v
p
c
p
v
2 2 (1)
where: X c = mean of QC tests
X v = mean of verification tests
s p2
= pooled estimate for the variance (described below)
nc = number of QC tests
nv = number of verification tests
b) The pooled variance, which is the weighted average, using the degrees of freedom for
each sample as the weighting factor, is computed from the sample variances using Equation 2.
ss n s n
n np
c c v v
c v
2
2 21 1
2
(2)
Where: s p2
=
pooled estimate for the variance
nc = number of QC tests
nv = number of verification tests
sc2 = variance of the QC tests
sv2 = variance of the verification tests
c) Once the pooled variance is estimated, the value of t is computed using equation 1.
d) To determine the critical t value against which to compare the computed t value, it is
necessary to select the level of significance, . A value of = 1 % is recommended.
e) Determine the critical t value, tcrit, from Table 2 for the pooled degrees of freedom. The
pooled degrees of freedom for the case where the sample variances are assumed equal is
(nc+ nv -2).
f) If t tcrit, then decide that the two sets of tests have significantly different means. If t tcrit,
then decide that there is no reason to believe that the means are significantly different.
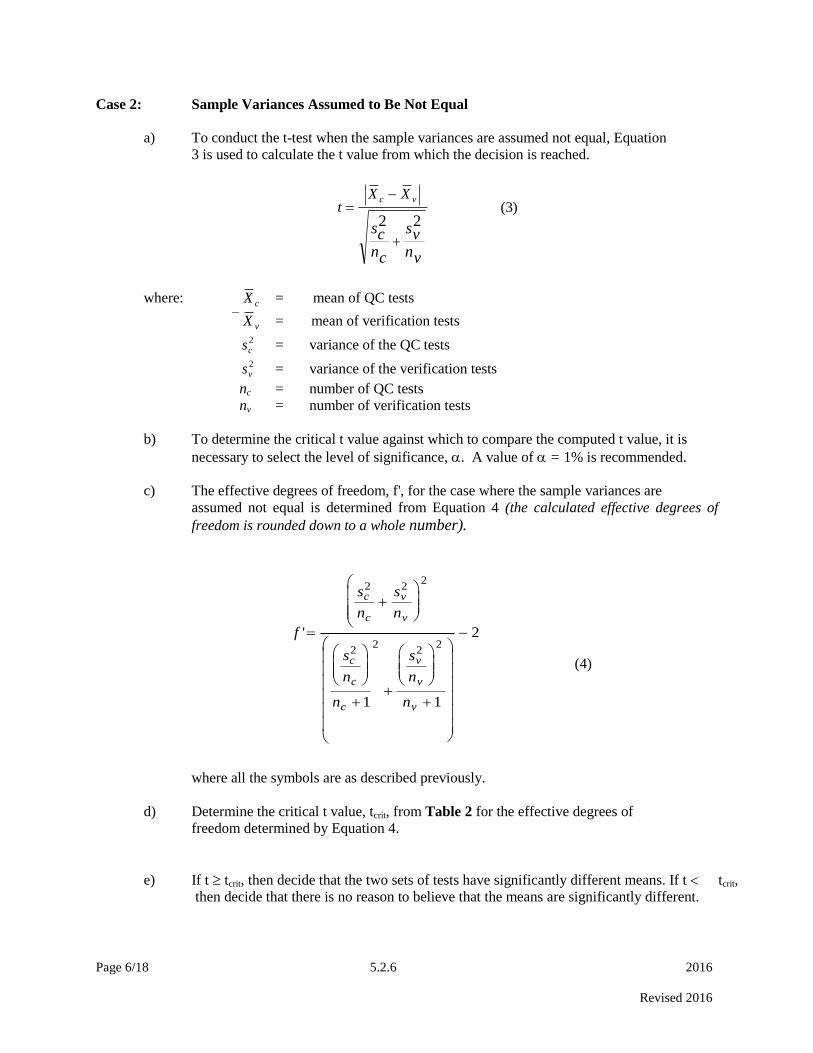
Page 6/18 5.2.6 2016
Revised 2016
Case 2: Sample Variances Assumed to Be Not Equal
a) To conduct the t-test when the sample variances are assumed not equal, Equation
3 is used to calculate the t value from which the decision is reached.
tX Xc v
scnc
svnv
2 2 (3)
where: X c = mean of QC tests
X v = mean of verification tests
sc2 = variance of the QC tests
sv2 = variance of the verification tests
nc = number of QC tests
nv = number of verification tests
b) To determine the critical t value against which to compare the computed t value, it is
necessary to select the level of significance, . A value of = 1% is recommended.
c) The effective degrees of freedom, f', for the case where the sample variances are
assumed not equal is determined from Equation 4 (the calculated effective degrees of
freedom is rounded down to a whole number).
f
s
n
s
n
s
n
n
s
n
n
c
c
v
v
c
c
c
v
v
v
'
2 22
22
22
1 1
2
(4)
where all the symbols are as described previously.
d) Determine the critical t value, tcrit, from Table 2 for the effective degrees of
freedom determined by Equation 4.
e) If t tcrit, then decide that the two sets of tests have significantly different means. If t tcrit,
then decide that there is no reason to believe that the means are significantly different.

Page 7/18 5.2.6 2016
Revised 2016
Table 2 Critical t values
degrees of
freedom = 0.01 = 0.05 = 0.10
1 63.657 12.706 6.314
2 9.925 4.303 2.920
3 5.841 3.182 2.353
4 4.604 2.776 2.132
5 4.032 2.571 2.015
6 3.707 2.447 1.943
7 3.499 2.365 1.895
8 3.355 2.306 1.860
9 3.250 2.262 1.833
10 3.169 2.228 1.812
11 3.106 2.201 1.796
12 3.055 2.179 1.782
13 3.012 2.160 1.771
14 2.977 2.145 1.761
15 2.947 2.131 1.753
16 2.921 2.120 1.746
17 2.898 2.110 1.740
18 2.878 2.101 1.734
19 2.861 2.093 1.729
20 2.845 2.086 1.725
21 2.831 2.080 1.721
22 2.819 2.074 1.717
23 2.807 2.069 1.714
24 2.797 2.064 1.711
25 2.787 2.060 1.708
26 2.779 2.056 1.706
27 2.771 2.052 1.703
28 2.763 2.048 1.701
29 2.756 2.045 1.699
30 2.750 2.042 1.697
40 2.704 2.021 1.684
60 2.660 2.000 1.671
120 2.617 1.980 1.658
2.576 1.960 1.645
NOTE : This is for a two-tailed test with the null and alternate hypotheses shown below :
Ho : X Xc v
Ha : X Xc v
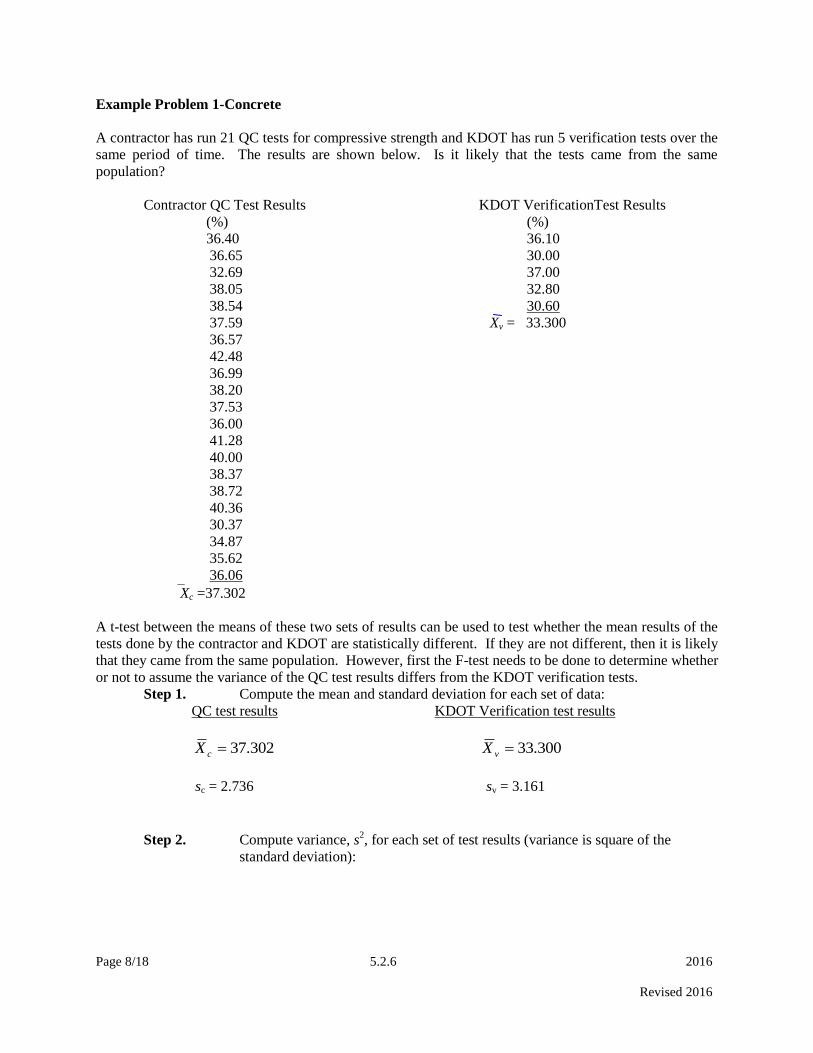
Page 8/18 5.2.6 2016
Revised 2016
Example Problem 1-Concrete
A contractor has run 21 QC tests for compressive strength and KDOT has run 5 verification tests over the
same period of time. The results are shown below. Is it likely that the tests came from the same
population?
Contractor QC Test Results KDOT VerificationTest Results
(%) (%)
36.40 36.10
36.65 30.00
32.69 37.00
38.05 32.80
38.54 30.60
37.59 Xv = 33.300
36.57
42.48
36.99
38.20
37.53
36.00
41.28
40.00
38.37
38.72
40.36
30.37
34.87
35.62
36.06
Xc =37.302
A t-test between the means of these two sets of results can be used to test whether the mean results of the
tests done by the contractor and KDOT are statistically different. If they are not different, then it is likely
that they came from the same population. However, first the F-test needs to be done to determine whether
or not to assume the variance of the QC test results differs from the KDOT verification tests.
Step 1. Compute the mean and standard deviation for each set of data:
QC test results KDOT Verification test results
302.37cX 300.33vX
sc = 2.736 sv = 3.161
Step 2. Compute variance, s
2, for each set of test results (variance is square of the
standard deviation):

Page 9/18 5.2.6 2016
Revised 2016
QC test results KDOT Verification test results
431.72 cs 992.92 vs
Step 3. Compute F, using the largest s2 in the numerator.
34.1431.7
992.92
2
c
v
s
sF
Step 4. Determine Fcrit from Table 1 being sure to use the correct degrees of
freedom for the numerator (nv - 1 = 5 - 1 = 4) and the denominator (nc - 1 = 21 - 1
= 20).
From Table 5.17.08-1, at = 1 %, Fcrit = 5.17
Conclusion: Since F < Fcrit (i.e., 1.34 < 5.17), there is no reason to believe that the two sets of
tests have different variabilities. That is, they could have come from the same
population. Since we can assume that the variances are equal, we can use the
pooled variance to calculate the t-test statistic, and the pooled degrees of freedom
to determine the critical t value, tcrit.
Step 5. Compute the pooled variance, s p2
, using the sample variances from above.
ss n s n
n np
c c v v
c v
2
2 21 1
2
86.72521
)4(992.920431.72
ps
Step 6. Compute the t-test statistic, t.
tX X
s
n
s
n
c v
p
c
p
v
2 2
87.2946.1
002.4
5
86.7
21
86.7
300.33302.37
t
Step 7. Determine the critical t value, tcrit , for the pooled degrees of freedom
degrees of freedom = (nc + nv -2) = (21 + 5 - 2) = 24.

Page 10/18 5.2.6 2016
Revised 2016
From Table 2,
for = 1 % and degrees of freedom = 24,
tcrit = 2.80.
Conclusion: Since 2.87 > 2.80, we assume that the sample means are not equal. It is therefore
probable that the two sets of test results did not come from the same population
(or lot).
Example Problem - Case 2-Asphalt
A contractor has run 10 QC tests and KDOT has run 5 verification tests over the
same period of time for the asphalt pavement density (%Gmm). The results are shown
below. Is it likely that the test came from the same population or lot?
Contractor QC Test Results KDOT Verification Test Results
93.0 95.5
92.4 93.3
92.9 94.1
93.6 92.5
92.9 92.7
92.9 Xv 9362.
92.4
93.4
92.9
92.4
Xc 92 88.
A t-test between the means of these two sets of results can be used to test whether the mean results of the
%Gmm done by the contractor and KDOT are statistically different. If they are not different, then it is
likely that they came from the same population. First, we have to determine whether the variance of the
QC tests differ from the verification tests using F-test.
Step 1. Compute the mean and standard deviation for each set of data:
QC test results KDOT Verification test results
Xc 92 88. Xv 9362.
sc = 0.408 sv = 1.221
Step 2. Compute the variance, s2, for each set of tests (variance is the square of the
standard deviation):
166.02 cs 491.12 vs

Page 11/18 5.2.6 2016
Revised 2016
Step 3. Compute F, using the largest s2 in the numerator.
98.8166.0
491.12
2
c
v
s
sF
Step 4. Determine Fcrit from Table 1 (be sure to use the correct degrees of freedom for
the numerator (nv - 1 = 5 - 1 = 4) and the denominator (nc - 1 = 10 - 1 = 9)).
From Table 1, at = 1 %, Fcrit = 7.96
Conclusion: Since F Fcrit (i.e., 8.98 7.96), there is reason to believe that the two sets of
tests have different variabilities. Thus, it is likely that they came from
populations with different variances. Since we CAN NOT assume that the
variances are equal, we cannot use the pooled variance to calculate the t-test
statistic, and the pooled degrees of freedom to determine the critical t value, tcrit.
Step 5. Compute the t-test statistic, t.
tX X
s
n
s
n
c v
c
c
v
v
2 2
32.1315.0
74.0
5
491.1
10
166.0
62.9388.92
t
Step 6. Determine the critical t value, tcrit, for the approximate degrees of freedom
(the calculated effective degrees of freedom is rounded down to a whole
number).
f
s
n
s
n
s
n
n
s
n
n
c
c
v
v
c
c
c
v
v
v
'
2 22
22
22
1 1
2
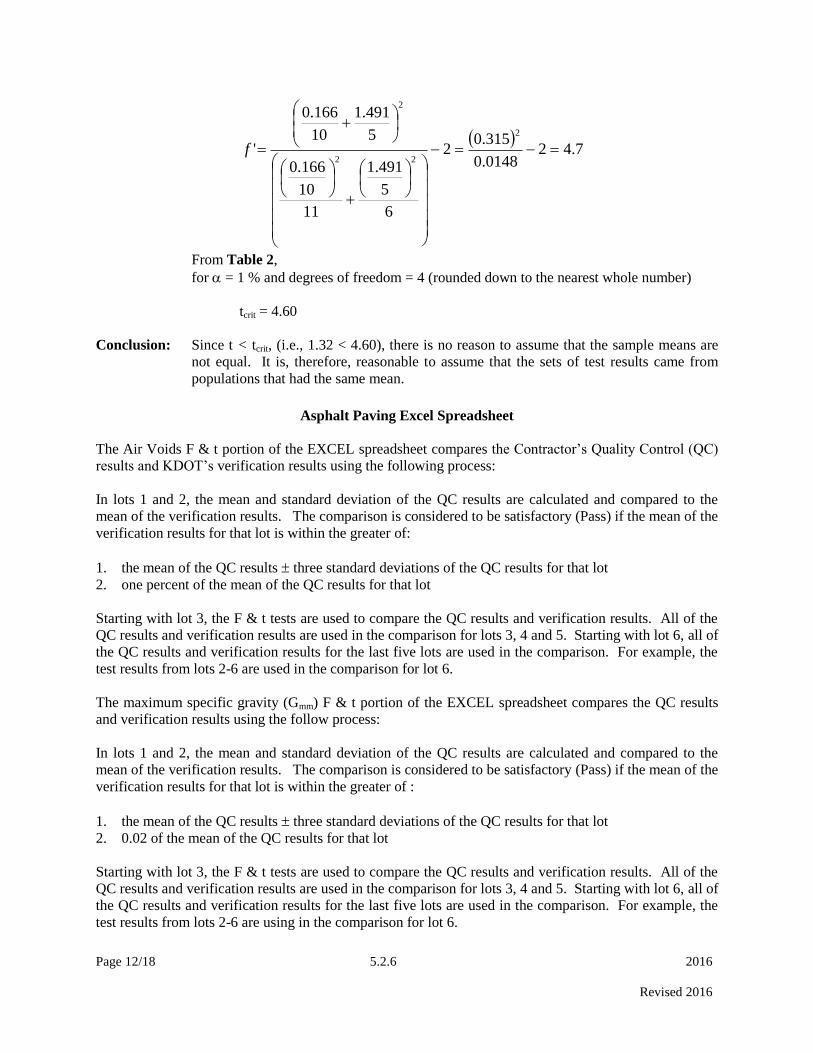
Page 12/18 5.2.6 2016
Revised 2016
7.420148.0
315.02
6
5
491.1
11
10
166.0
5
491.1
10
166.0
'
2
22
2
f
From Table 2,
for = 1 % and degrees of freedom = 4 (rounded down to the nearest whole number)
tcrit = 4.60
Conclusion: Since t < tcrit, (i.e., 1.32 < 4.60), there is no reason to assume that the sample means are
not equal. It is, therefore, reasonable to assume that the sets of test results came from
populations that had the same mean.
Asphalt Paving Excel Spreadsheet
The Air Voids F & t portion of the EXCEL spreadsheet compares the Contractor’s Quality Control (QC)
results and KDOT’s verification results using the following process:
In lots 1 and 2, the mean and standard deviation of the QC results are calculated and compared to the
mean of the verification results. The comparison is considered to be satisfactory (Pass) if the mean of the
verification results for that lot is within the greater of:
1. the mean of the QC results three standard deviations of the QC results for that lot
2. one percent of the mean of the QC results for that lot
Starting with lot 3, the F & t tests are used to compare the QC results and verification results. All of the
QC results and verification results are used in the comparison for lots 3, 4 and 5. Starting with lot 6, all of
the QC results and verification results for the last five lots are used in the comparison. For example, the
test results from lots 2-6 are used in the comparison for lot 6.
The maximum specific gravity (Gmm) F & t portion of the EXCEL spreadsheet compares the QC results
and verification results using the follow process:
In lots 1 and 2, the mean and standard deviation of the QC results are calculated and compared to the
mean of the verification results. The comparison is considered to be satisfactory (Pass) if the mean of the
verification results for that lot is within the greater of :
1. the mean of the QC results three standard deviations of the QC results for that lot
2. 0.02 of the mean of the QC results for that lot
Starting with lot 3, the F & t tests are used to compare the QC results and verification results. All of the
QC results and verification results are used in the comparison for lots 3, 4 and 5. Starting with lot 6, all of
the QC results and verification results for the last five lots are used in the comparison. For example, the
test results from lots 2-6 are using in the comparison for lot 6.

Page 13/18 5.2.6 2016
Revised 2016
If the results of comparison of the Gmm QC and verification results for a lot are satisfactory (Pass), the QC
Gmm results should be used in the calculation of %Gmm for both the QC and verification Density results. If
the results of the comparison of the Gmm QC and verification results for a lot are not satisfactory (Fail),
the verification Gmm results should be used in the calculation of %Gmm for both the QC and verification
Density results.
The Density F & t portion of the EXCEL spreadsheet compares the QC results and verification results
using the follow process:
All of a lot’s QC results and verification results are used in the comparison for that lot. Each lot stands on
its’ own for the Density F & t comparison.
For the Air Voids, Gmm and Density F & t comparisons, the results are considered satisfactory (Pass) if the
t-test shows that the Contractor’s QC results and KDOT’s QA results are from the same population with a
of 1%.
Concrete Paving Excel Spreadsheet
The Compressive Strength and Thickness F & t portions of the EXCEL spreadsheet compare the
Contractor’s Quality Control (QC) results and KDOT’s verification results using the following process:
In lots 1 and 2, the mean and standard deviation of the QC results are calculated and compared to the
mean of the verification results. The comparison is considered to be satisfactory (Pass) if the mean of the
verification results for that lot is within the mean of the QC results three standard deviations of the QC
results for that lot.
Starting with lot 3, the F & t tests are used to compare the QC results and verification results. All of the
QC results and verification results are used in the comparison for lots 3, 4 and 5. Starting with lot 6, all of
the QC results and verification results for the last five lots are used in the comparison. For example, the
test results from lots 2-6 are used in the comparison for lot 6.
For the Compressive Strength and Thickness F & t comparisons, the results are considered satisfactory
(Pass) if the t-test shows that the Contractor’s QC results and KDOT’s QA results are from the same
population with a of 1%.
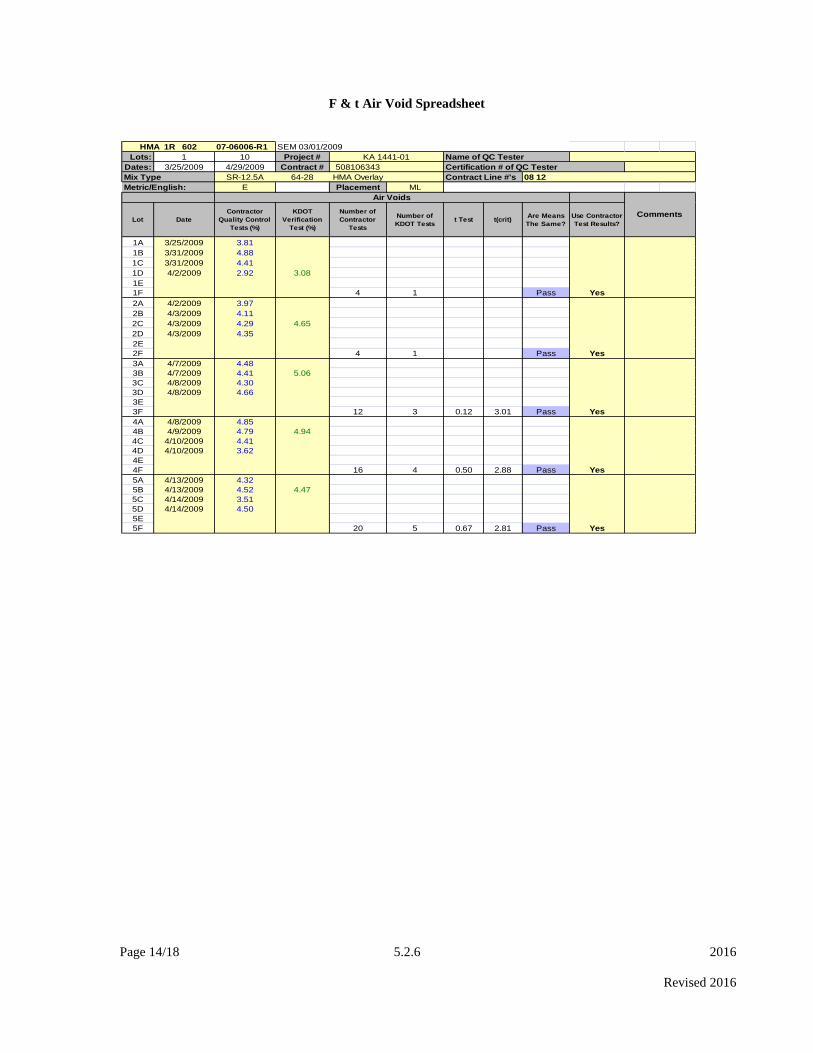
Page 14/18 5.2.6 2016
Revised 2016
F & t Air Void Spreadsheet
07-06006-R1 SEM 03/01/2009
Lots: 1 10 Project # Name of QC Tester
Dates: 3/25/2009 4/29/2009 Contract # 508106343 Certification # of QC Tester
Mix Type SR-12.5A 64-28 HMA Overlay Contract Line #'s
E Placement ML
Air Voids
Lot Date
Contractor
Quality Control
Tests (%)
KDOT
Verification
Test (%)
Number of
Contractor
Tests
Number of
KDOT Testst Test t(crit)
Are Means
The Same?
Use Contractor
Test Results?
1A 3/25/2009 3.81
1B 3/31/2009 4.88
1C 3/31/2009 4.41
1D 4/2/2009 2.92 3.08
1E
1F 4 1 Pass Yes
2A 4/2/2009 3.97
2B 4/3/2009 4.11
2C 4/3/2009 4.29 4.65
2D 4/3/2009 4.35
2E
2F 4 1 Pass Yes
3A 4/7/2009 4.48
3B 4/7/2009 4.41 5.06
3C 4/8/2009 4.30
3D 4/8/2009 4.66
3E
3F 12 3 0.12 3.01 Pass Yes
4A 4/8/2009 4.85
4B 4/9/2009 4.79 4.94
4C 4/10/2009 4.41
4D 4/10/2009 3.62
4E
4F 16 4 0.50 2.88 Pass Yes
5A 4/13/2009 4.32
5B 4/13/2009 4.52 4.47
5C 4/14/2009 3.51
5D 4/14/2009 4.50
5E
5F 20 5 0.67 2.81 Pass Yes
Comments
HMA 1R 602
Metric/English:
08 12
KA 1441-01
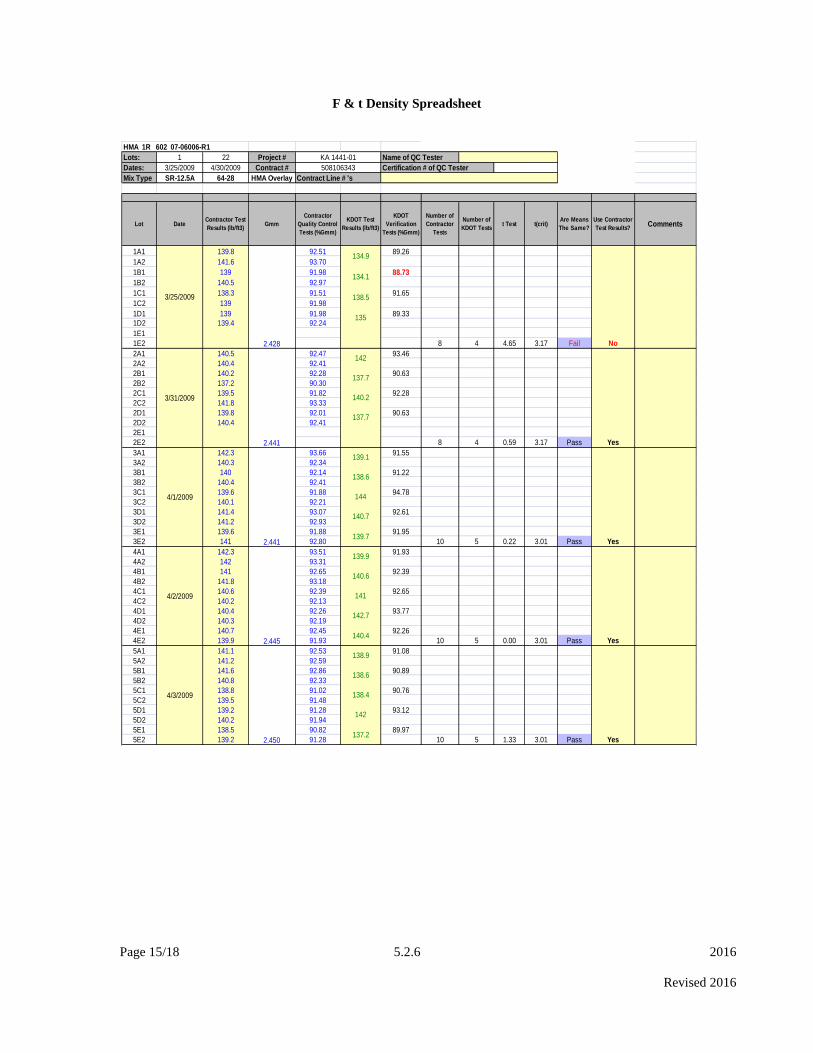
Page 15/18 5.2.6 2016
Revised 2016
F & t Density Spreadsheet
HMA 1R 602 07-06006-R1
Lots: 1 22 Project # Name of QC Tester
Dates: 3/25/2009 4/30/2009 Contract # Certification # of QC Tester
Mix Type SR-12.5A 64-28 HMA Overlay
Lot DateContractor Test
Results (lb/ft3)Gmm
Contractor
Quality Control
Tests (%Gmm)
KDOT Test
Results (lb/ft3)
KDOT
Verification
Tests (%Gmm)
Number of
Contractor
Tests
Number of
KDOT Testst Test t(crit)
Are Means
The Same?
Use Contractor
Test Results?Comments
1A1 139.8 92.51 89.26
1A2 141.6 93.70
1B1 139 91.98 88.73
1B2 140.5 92.97
1C1 138.3 91.51 91.65
1C2 139 91.98
1D1 139 91.98 89.33
1D2 139.4 92.24
1E1
1E2 8 4 4.65 3.17 Fail No
2A1 140.5 92.47 93.46
2A2 140.4 92.41
2B1 140.2 92.28 90.63
2B2 137.2 90.30
2C1 139.5 91.82 92.28
2C2 141.8 93.33
2D1 139.8 92.01 90.63
2D2 140.4 92.41
2E1
2E2 8 4 0.59 3.17 Pass Yes
3A1 142.3 93.66 91.55
3A2 140.3 92.34
3B1 140 92.14 91.22
3B2 140.4 92.41
3C1 139.6 91.88 94.78
3C2 140.1 92.21
3D1 141.4 93.07 92.61
3D2 141.2 92.93
3E1 139.6 91.88 91.95
3E2 141 92.80 10 5 0.22 3.01 Pass Yes
4A1 142.3 93.51 91.93
4A2 142 93.31
4B1 141 92.65 92.39
4B2 141.8 93.18
4C1 140.6 92.39 92.65
4C2 140.2 92.13
4D1 140.4 92.26 93.77
4D2 140.3 92.19
4E1 140.7 92.45 92.26
4E2 139.9 91.93 10 5 0.00 3.01 Pass Yes
5A1 141.1 92.53 91.08
5A2 141.2 92.59
5B1 141.6 92.86 90.89
5B2 140.8 92.33
5C1 138.8 91.02 90.76
5C2 139.5 91.48
5D1 139.2 91.28 93.12
5D2 140.2 91.94
5E1 138.5 90.82 89.97
5E2 139.2 91.28 10 5 1.33 3.01 Pass Yes
3/31/2009
4/1/2009
4/2/2009
4/3/2009
2.441
2.441
2.445
2.450
142
137.7
140.2
137.7
139.7
139.9
140.6
141
142.7
140.4
138.9
138.6
138.4
142
137.2
139.1
138.6
144
140.7
2.428
3/25/2009
134.9
135
Contract Line # 's
KA 1441-01
508106343
134.1
138.5
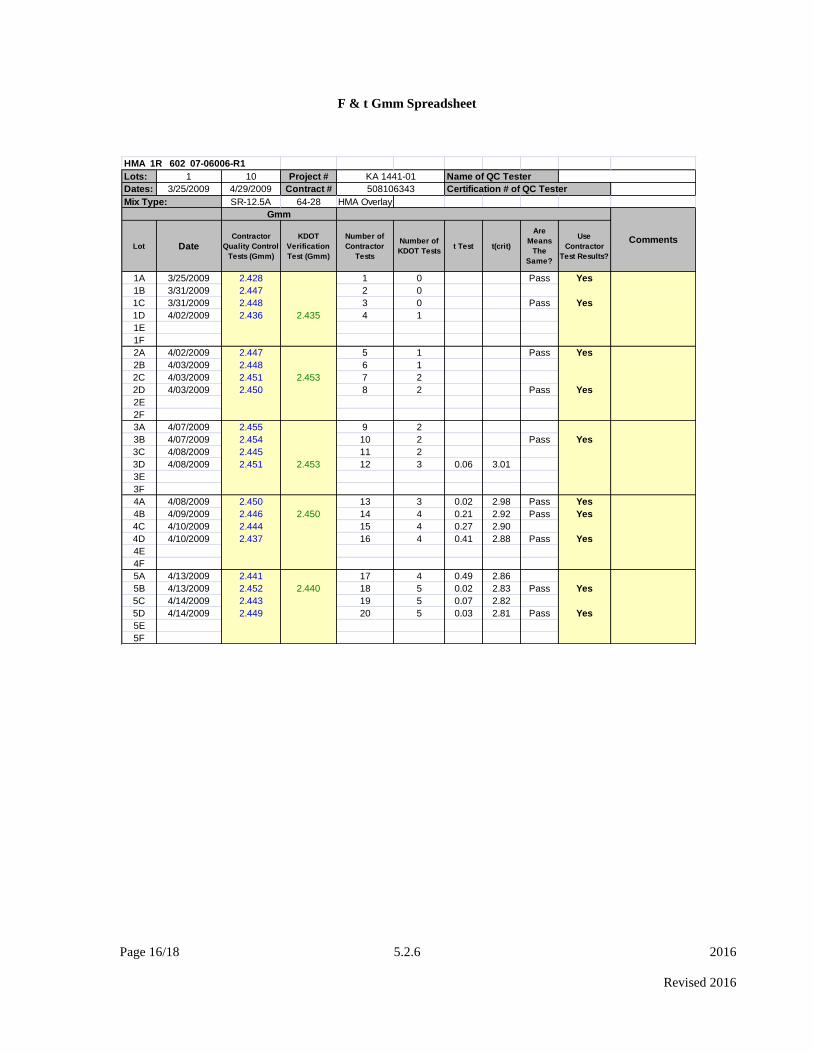
Page 16/18 5.2.6 2016
Revised 2016
F & t Gmm Spreadsheet
HMA 1R 602 07-06006-R1
Lots: 1 10 Project # Name of QC Tester
Dates: 3/25/2009 4/29/2009 Contract # Certification # of QC Tester
SR-12.5A 64-28 HMA Overlay
Gmm
Lot DateContractor
Quality Control
Tests (Gmm)
KDOT
Verification
Test (Gmm)
Number of
Contractor
Tests
Number of
KDOT Testst Test t(crit)
Are
Means
The
Same?
Use
Contractor
Test Results?
1A 3/25/2009 2.428 1 0 Pass Yes
1B 3/31/2009 2.447 2 0
1C 3/31/2009 2.448 3 0 Pass Yes
1D 4/02/2009 2.436 2.435 4 1
1E
1F
2A 4/02/2009 2.447 5 1 Pass Yes
2B 4/03/2009 2.448 6 1
2C 4/03/2009 2.451 2.453 7 2
2D 4/03/2009 2.450 8 2 Pass Yes
2E
2F
3A 4/07/2009 2.455 9 2
3B 4/07/2009 2.454 10 2 Pass Yes
3C 4/08/2009 2.445 11 2
3D 4/08/2009 2.451 2.453 12 3 0.06 3.01
3E
3F
4A 4/08/2009 2.450 13 3 0.02 2.98 Pass Yes
4B 4/09/2009 2.446 2.450 14 4 0.21 2.92 Pass Yes
4C 4/10/2009 2.444 15 4 0.27 2.90
4D 4/10/2009 2.437 16 4 0.41 2.88 Pass Yes
4E
4F
5A 4/13/2009 2.441 17 4 0.49 2.86
5B 4/13/2009 2.452 2.440 18 5 0.02 2.83 Pass Yes
5C 4/14/2009 2.443 19 5 0.07 2.82
5D 4/14/2009 2.449 20 5 0.03 2.81 Pass Yes
5E
5F
Mix Type:
KA 1441-01
508106343
Comments
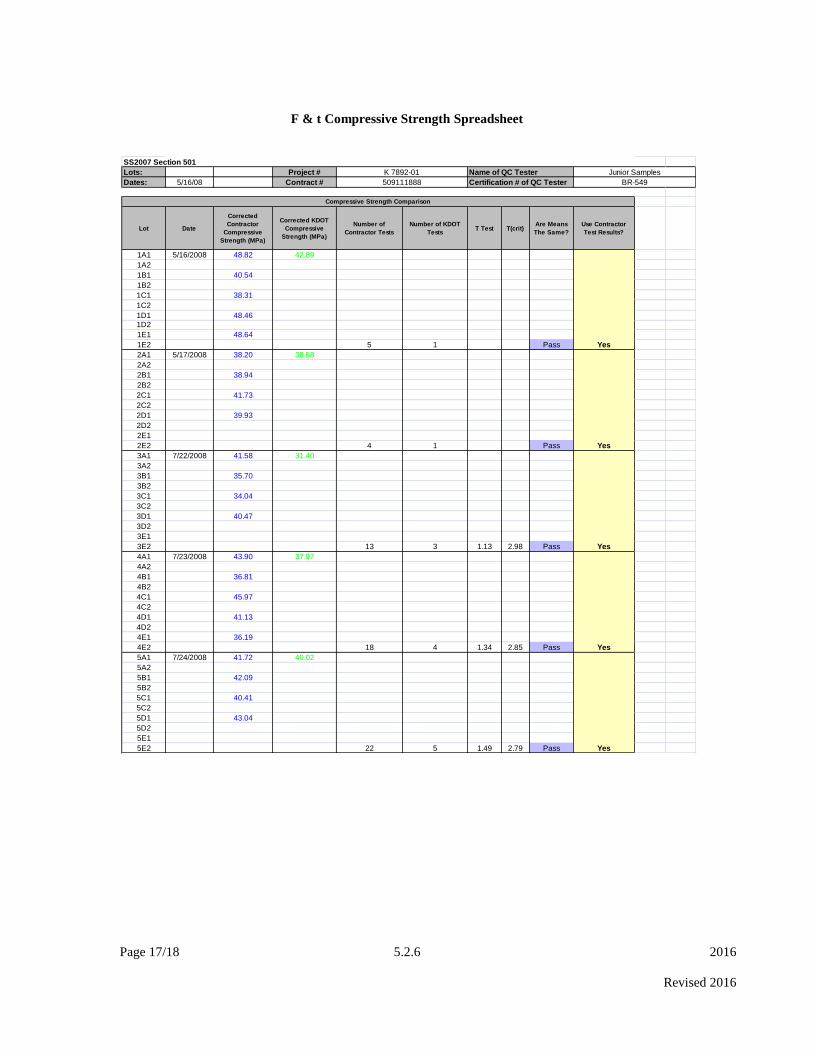
Page 17/18 5.2.6 2016
Revised 2016
F & t Compressive Strength Spreadsheet
SS2007 Section 501
Lots: Project # Name of QC Tester
Dates: 5/16/08 Contract # Certification # of QC Tester
Lot Date
Corrected
Contractor
Compressive
Strength (MPa)
Corrected KDOT
Compressive
Strength (MPa)
Number of
Contractor Tests
Number of KDOT
TestsT Test T(crit)
Are Means
The Same?
Use Contractor
Test Results?
1A1 5/16/2008 48.82 42.89
1A2
1B1 40.54
1B2
1C1 38.31
1C2
1D1 48.46
1D2
1E1 48.64
1E2 5 1 Pass Yes
2A1 5/17/2008 38.20 38.58
2A2
2B1 38.94
2B2
2C1 41.73
2C2
2D1 39.93
2D2
2E1
2E2 4 1 Pass Yes
3A1 7/22/2008 41.58 31.40
3A2
3B1 35.70
3B2
3C1 34.04
3C2
3D1 40.47
3D2
3E1
3E2 13 3 1.13 2.98 Pass Yes
4A1 7/23/2008 43.90 37.97
4A2
4B1 36.81
4B2
4C1 45.97
4C2
4D1 41.13
4D2
4E1 36.19
4E2 18 4 1.34 2.85 Pass Yes
5A1 7/24/2008 41.72 40.02
5A2
5B1 42.09
5B2
5C1 40.41
5C2
5D1 43.04
5D2
5E1
5E2 22 5 1.49 2.79 Pass Yes
Junior Samples
BR-549509111888
K 7892-01
Compressive Strength Comparison
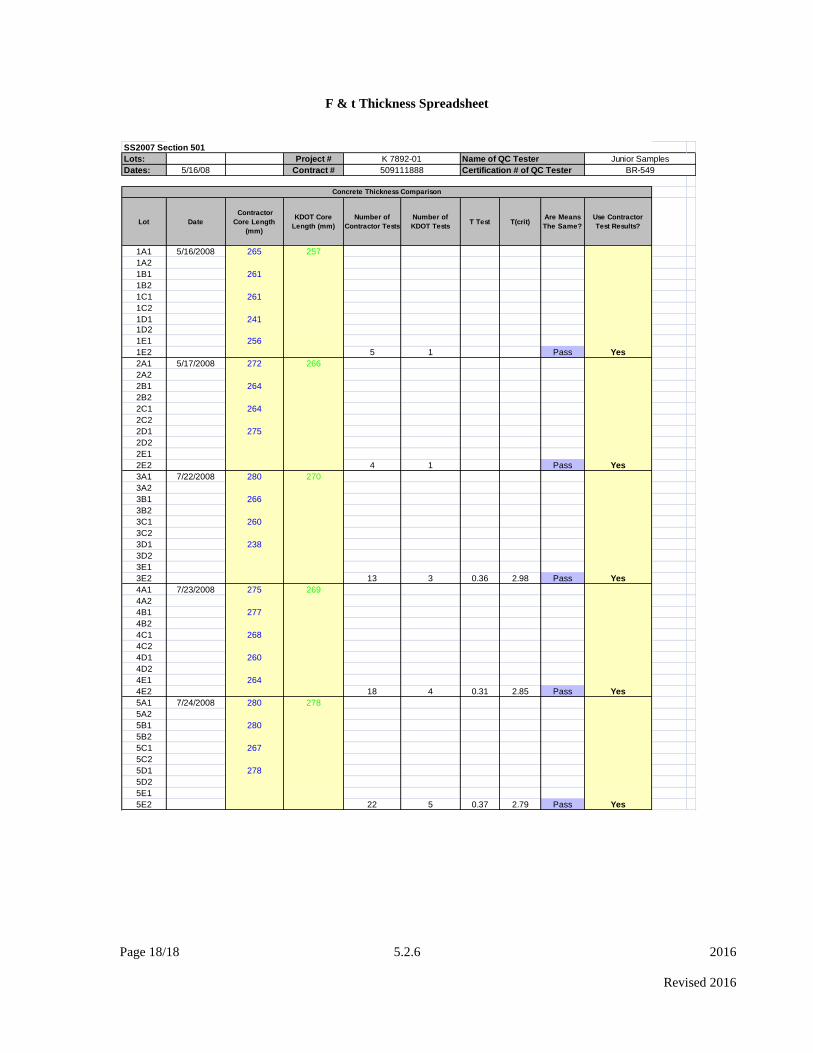
Page 18/18 5.2.6 2016
Revised 2016
F & t Thickness Spreadsheet
SS2007 Section 501
Lots: Project # Name of QC Tester
Dates: 5/16/08 Contract # Certification # of QC Tester
Lot Date
Contractor
Core Length
(mm)
KDOT Core
Length (mm)
Number of
Contractor Tests
Number of
KDOT TestsT Test T(crit)
Are Means
The Same?
Use Contractor
Test Results?
1A1 5/16/2008 265 257
1A2
1B1 261
1B2
1C1 261
1C2
1D1 241
1D2
1E1 256
1E2 5 1 Pass Yes
2A1 5/17/2008 272 266
2A2
2B1 264
2B2
2C1 264
2C2
2D1 275
2D2
2E1
2E2 4 1 Pass Yes
3A1 7/22/2008 280 270
3A2
3B1 266
3B2
3C1 260
3C2
3D1 238
3D2
3E1
3E2 13 3 0.36 2.98 Pass Yes
4A1 7/23/2008 275 269
4A2
4B1 277
4B2
4C1 268
4C2
4D1 260
4D2
4E1 264
4E2 18 4 0.31 2.85 Pass Yes
5A1 7/24/2008 280 278
5A2
5B1 280
5B2
5C1 267
5C2
5D1 278
5D2
5E1
5E2 22 5 0.37 2.79 Pass Yes
509111888
Junior Samples
BR-549
Concrete Thickness Comparison
K 7892-01

Page 1/1 5.2.7 2016
Revised 2014
5.2.7 CONTRACTOR’S QUALITY CONTROL PLAN
1. SCOPE
The following subsections provide guidance for contractors to maintain quality control laboratories and
personnel for QC/QA designated projects.
5.2.7.1. HMA: Contractor’s Quality Control plan
5.2.7.2. Guide for Quality Control and Acceptance Requirements for HMA
5.2.7.3. Example of a Laboratory Quality Manual for HMA
5.2.7.4. Concrete: Contractor’s Quality Control Plan
5.2.7.5. Example of a Laboratory Quality Manual for Concrete
5.2.7.6. Concrete Structures: Contractor’s Quality Control Plan
5.2.7.7. Example of Contractor’s Concrete Structures Quality Plan for Controlling Evaporation
5.2.7.8 CEMENT TREATED BASE: Contractor’s Quality Control Plan (CTB)


Page 1/4 5.2.7.1 2016
Revised 2016
5.2.7.1. HMA: CONTRACTOR’S QUALITY CONTROL PLAN
1. QUALITY CONTROL
The Contractor shall provide and maintain a Quality Control (QC) Plan that will assure all materials and
products submitted to KDOT for acceptance will conform to the contract requirements whether
manufactured or processed by the contractor, or procured from suppliers, subcontractors, or vendors. The
contractor shall perform or have performed the inspections and tests required to substantiate product
conformance to contract document requirements. The contractor shall also perform or have performed all
inspections and tests otherwise required by the contract. The contractor’s quality control inspections and
tests shall be documented and provided to KDOT. The contractor shall maintain adequate records of all
inspections and tests. The records shall include the nature, number, and type of deficiencies found; the
quantities rejected by the contractor; and the nature of corrective action taken, as appropriate. The
contractor shall maintain standard equipment and qualified personnel as required by the Specifications to
assure conformance to contract requirements. Procedures will be subject to approval by KDOT before
work is started.
The contractor shall prepare a QC Plan detailing the type and frequency of inspection, sampling, and
testing deemed necessary to measure and control the various properties of materials and construction
governed by the Specifications. The QC Plan shall be submitted in writing to KDOT at the
preconstruction conference. This plan shall include the following:
Construction items covered by the plan
Tests and Test Frequency to be performed
* Part V; Appendix B
Sampling locations and techniques
Documentation procedures, including:
*Identify the QC laboratory to be used and its credentials
*Identify the QC personnel and their qualifications
*Inspection and test records
*Temperature measurements
*Accuracy and readability, calibration, or re-calibration checks performed on production or
testing equipment.
*Control charts
The Plan shall identify the personnel responsible for the contractor’s quality control. This shall include
the name of the company official who will act as liaison with KDOT personnel and the names of the
Certified Technicians who will direct and conduct the inspection program. The contractor shall provide a
testing facility or laboratory.
NOTE: Guide for Quality Control and Acceptance Requirements for HMA, will help define the
minimum contents necessary for an acceptable Quality Control Plan.
2. SAMPLES, TESTS AND REFERENCED CITED SPECIFICATIONS
The contractor shall be responsible for the quality of construction and materials incorporated into the
contract. The contractor shall perform all necessary quality control inspection, sampling and testing. All
materials will be approved for acceptance through KDOT’s acceptance procedures. KDOT has the
responsibility for determining the acceptability of the construction and materials incorporated therein.
KDOT may use the results of the contractor’s inspection, approved quality control program. To eliminate
confusion when transferring information, provide all critical information as outlined in Table 1.
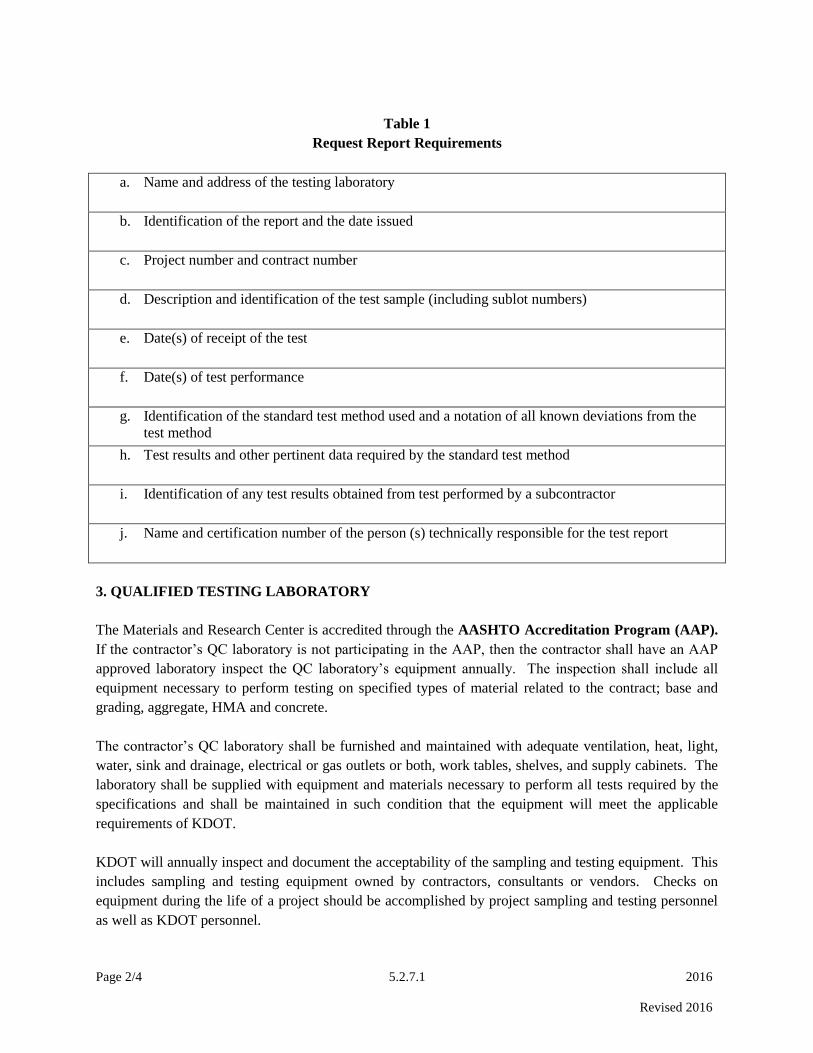
Page 2/4 5.2.7.1 2016
Revised 2016
Table 1
Request Report Requirements
a. Name and address of the testing laboratory
b. Identification of the report and the date issued
c. Project number and contract number
d. Description and identification of the test sample (including sublot numbers)
e. Date(s) of receipt of the test
f. Date(s) of test performance
g. Identification of the standard test method used and a notation of all known deviations from the
test method
h. Test results and other pertinent data required by the standard test method
i. Identification of any test results obtained from test performed by a subcontractor
j. Name and certification number of the person (s) technically responsible for the test report
3. QUALIFIED TESTING LABORATORY
The Materials and Research Center is accredited through the AASHTO Accreditation Program (AAP).
If the contractor’s QC laboratory is not participating in the AAP, then the contractor shall have an AAP
approved laboratory inspect the QC laboratory’s equipment annually. The inspection shall include all
equipment necessary to perform testing on specified types of material related to the contract; base and
grading, aggregate, HMA and concrete.
The contractor’s QC laboratory shall be furnished and maintained with adequate ventilation, heat, light,
water, sink and drainage, electrical or gas outlets or both, work tables, shelves, and supply cabinets. The
laboratory shall be supplied with equipment and materials necessary to perform all tests required by the
specifications and shall be maintained in such condition that the equipment will meet the applicable
requirements of KDOT.
KDOT will annually inspect and document the acceptability of the sampling and testing equipment. This
includes sampling and testing equipment owned by contractors, consultants or vendors. Checks on
equipment during the life of a project should be accomplished by project sampling and testing personnel
as well as KDOT personnel.

Page 3/4 5.2.7.1 2016
Revised 2016
4. EQUIPMENT CALIBRATION AND VERIFICATION
The QC laboratory shall have all significant testing equipment calibrated or verified that is associated
with tests covered by the scope of this standard which the QC laboratory performs. Copies of all current
equipment calibration records shall be maintained in a Quality Manual and stored in the laboratory. As a
minimum, the equipment listed in Table 2 shall be included if it is associated with tests performed by the
QC laboratory. Applicable equipment shall be calibrated or verified at the intervals specified in the QC
Laboratory’s Quality Manual. The intervals specified in the Quality Manual shall be no greater than
those indicated in Table 2. Newly acquired equipment without manufacturer’s certification and
equipment that has not been calibrated or verified because it has been removed from service shall be
calibrated or verified before being placed in service. The QC laboratory shall have detailed written
procedures for all in-house calibration and verification activities not addressed in standards. These
procedures shall indicate the equipment required to perform the calibration or verification.
Certain items in Table 2 can be verified by the contractor’s QC certified technician. These items are;
mechanical shakers, ovens, sieves and weighted foot.
NOTE: Example of a Laboratories Quality Manual will provide examples of equipment procedures to
verify that equipment is in proper condition. Also, examples of records for calibrating/verifying
equipment are presented.
5. TECHNICIAN CERTIFICATION
KDOT requires that all individuals be certified who perform one or more of the actual sampling testing
and inspection functions for KDOT, Contractor or private laboratories. A certification program helps to
assure the qualifications of sampling and testing personnel and increases pride in the work performed.
Certified sampling and testing personnel provide added assurances that the sampling and testing will be
performed correctly and that the results will be valid.
The individuals performing any sampling and testing of materials must be knowledgeable in the sampling
and testing procedures that have been specified by KDOT.
Certification programs recognized by KDOT should be one or more of the following:
Certified Inspector Training Program
For additional information concerning an acceptable certification program, contact the Bureau of
Construction and Materials, CIT Program Administrator.
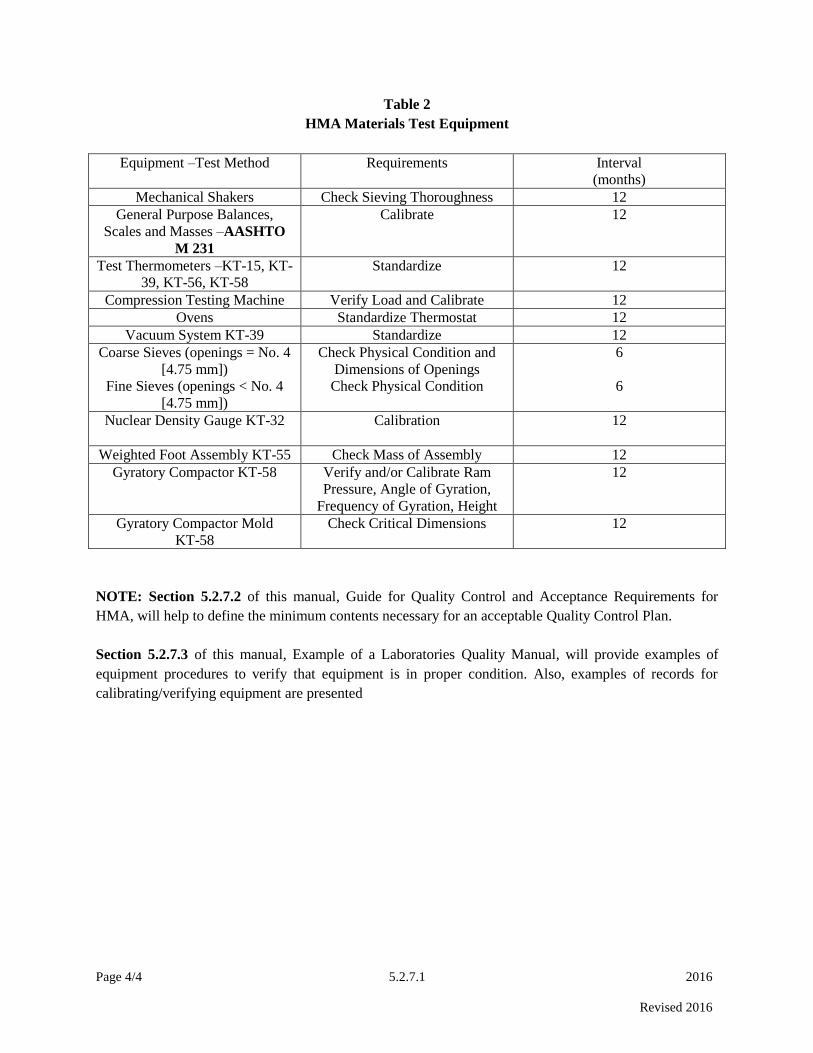
Page 4/4 5.2.7.1 2016
Revised 2016
Table 2
HMA Materials Test Equipment
Equipment –Test Method Requirements Interval
(months)
Mechanical Shakers Check Sieving Thoroughness 12
General Purpose Balances,
Scales and Masses –AASHTO
M 231
Calibrate 12
Test Thermometers –KT-15, KT-
39, KT-56, KT-58
Standardize 12
Compression Testing Machine Verify Load and Calibrate 12
Ovens Standardize Thermostat 12
Vacuum System KT-39 Standardize 12
Coarse Sieves (openings = No. 4
[4.75 mm])
Fine Sieves (openings < No. 4
[4.75 mm])
Check Physical Condition and
Dimensions of Openings
Check Physical Condition
6
6
Nuclear Density Gauge KT-32 Calibration
12
Weighted Foot Assembly KT-55 Check Mass of Assembly 12
Gyratory Compactor KT-58 Verify and/or Calibrate Ram
Pressure, Angle of Gyration,
Frequency of Gyration, Height
12
Gyratory Compactor Mold
KT-58
Check Critical Dimensions 12
NOTE: Section 5.2.7.2 of this manual, Guide for Quality Control and Acceptance Requirements for
HMA, will help to define the minimum contents necessary for an acceptable Quality Control Plan.
Section 5.2.7.3 of this manual, Example of a Laboratories Quality Manual, will provide examples of
equipment procedures to verify that equipment is in proper condition. Also, examples of records for
calibrating/verifying equipment are presented
Page 1/5 5.2.7.2. 2016
Revised 2016
5.2.7.2. GUIDE FOR QUALITY CONTROL AND ACCEPTANCE
REQUIREMENTS FOR HMA
1. Purpose
The purpose of this guide is to establish minimum requirements for the Contractor's quality control
system for use in QC/QA Projects. It is intended that these requirements be used as a procedural guide in
detailing the inspection, sampling and testing deemed necessary to maintain compliance with the
specification requirements.
2. Scope
This procedure is applicable to the production and construction of HMA.
3. Requirements
3.1. General
As stated in the specifications, a Quality Control Plan must be developed by the producer and submitted
in writing to the Engineer at the pre-construction conference. Acceptance of the Quality Control Plan by
the Engineer will be contingent upon its conformance with these guidelines. For this reason, the plan
shall clearly describe the methods by which the quality control program will be conducted. For example,
the items to be controlled, tests to be performed, testing frequencies, sampling locations and techniques
all shall be included and each item shall be listed separately. Also include a table stating what actions
will occur when test results indicate specification limits are approached or exceeded. See Table 1 at end
of this guide for an example. Also, a detailed plan of action regarding disposition of non-specification
material shall be included. Such a plan shall provide for immediate notification of all parties involved in
the event nonconforming situations are detected. Example 1. HMA Quality Control Plan may be used
as an example for a Quality Control Plan.
Inspection and testing records shall be maintained, kept current, and made available for review by KDOT
personnel throughout the life of the Contract. All other documentation, such as date of inspections, tests
performed, temperature measurements, and accuracy, calibration or re-calibration checks performed on
production of testing equipment shall be recorded.
The Contractor shall maintain standard equipment and qualified personnel in accordance with Contract
and specification requirements for the item(s) being produced.
3.2. Quality Control Plan
Operation Quality Control Plans shall be submitted for each Project to the District Engineer where the
Project is located. Distribution of the approved Quality Control Plans will be made by the Engineer.

Page 2/5 5.2.7.2. 2016
Revised 2016
4. Acceptance Sampling and Testing
KDOT is responsible for sampling, testing, and determining the acceptability of the material produced,
except for furnishing of necessary materials for testing. Acceptance of the material is based on the
inspection of the construction, monitoring of the Contractor's quality control program, verification test
results, and the comparison of the verification test results to the quality control test results. The Engineer
may use the results of the Quality Control Plan as part of the acceptance procedures, providing:
1) The Engineer's inspection and monitoring activities indicate that the Contractor is following the
approved Quality Control Plan; and
2) The results from the Contractors quality control sampling and testing compare with the verification
tests.
KDOT's test results will be used on a comparative basis as part of its overall verification program with
testing done at the frequency listed in the Sampling and Testing Frequency Chart. Some of the
verification sampling and testing will be conducted independently from the Contractor's activities,
including test equipment.
Unless split samples are used, results from verification tests will be evaluated in accordance with KDOT
specifications. If a dissimilarity is detected, an investigation shall be immediately initiated to determine
the cause of the dissimilarity.

Page 3/5 5.2.7.2. 2016
Revised 2016
EXAMPLE 1
HMA Quality Control Plan To: (DISTRICT ENGINEER) From: (CONTRACTOR(s) NAME) Subject: HMA Quality Control Plan. 1. We are submitting our HMA Quality Control Plan, developed in accordance with the Contractor’s Quality Control Plan for: Project No.: Contract No.: 2. Plant Information: 2.1 General Information: Make:______________________ Type:______________________ Location of Plant:_________________________ 2.2 Current calibration and verification status of plant and history of plant inspection program attached. 3. Lab Personnel: 3.1. The quality control program is under the direction of(NAME OF PERSON) who can be contacted at (ADDRESS AND TELEPHONE). 3.2. Sampling and testing will be the responsibility of (NAME OF PERSON(s)), HMA technician number (CERTIFICATE NUMBER(s)). 3.3. Mix Designs will be the responsibility of (NAME OF PERSON(s)), HMA design technician number (CERTIFICATE NUMBER(s)). 4. Field Personnel: 4.1. The field operation is under the direction of (NAME) who can be contacted at (ADDRESS AND TELEPHONE). 4.2. (NAME) will be responsible for insuring that all items of work will comply with KDOT Specifications.
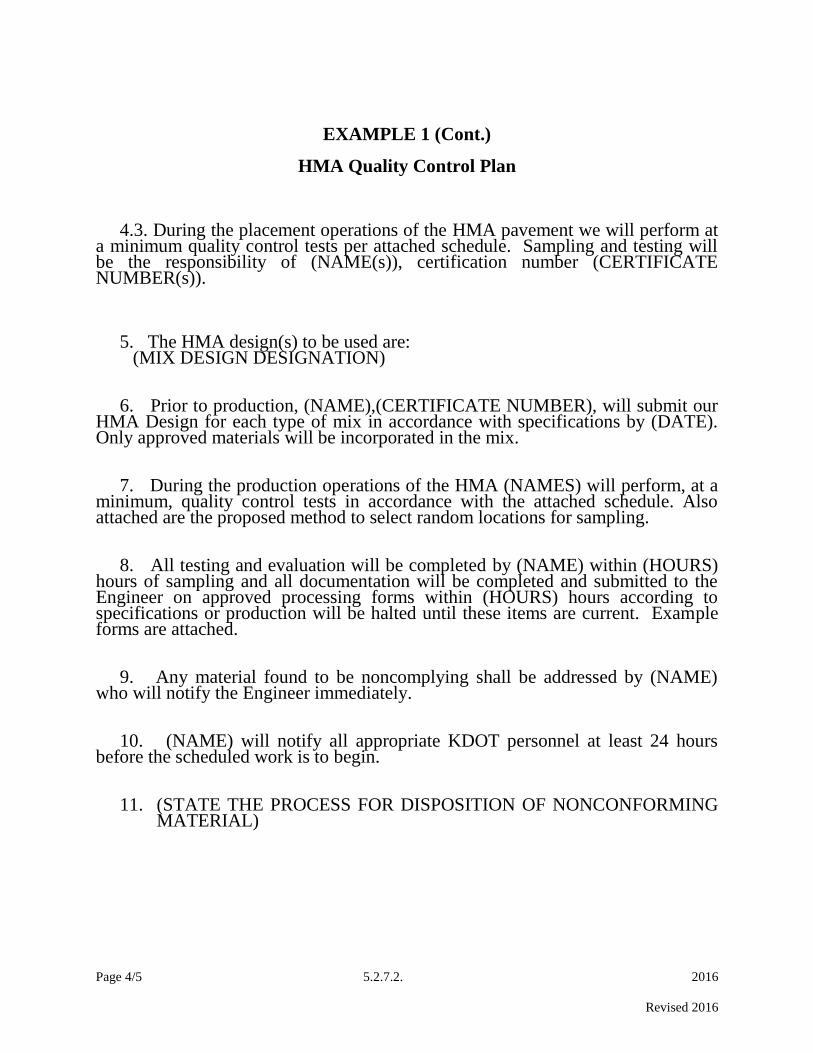
Page 4/5 5.2.7.2. 2016
Revised 2016
EXAMPLE 1 (Cont.)
HMA Quality Control Plan 4.3. During the placement operations of the HMA pavement we will perform at a minimum quality control tests per attached schedule. Sampling and testing will be the responsibility of (NAME(s)), certification number (CERTIFICATE NUMBER(s)). 5. The HMA design(s) to be used are: (MIX DESIGN DESIGNATION) 6. Prior to production, (NAME),(CERTIFICATE NUMBER), will submit our HMA Design for each type of mix in accordance with specifications by (DATE). Only approved materials will be incorporated in the mix. 7. During the production operations of the HMA (NAMES) will perform, at a minimum, quality control tests in accordance with the attached schedule. Also attached are the proposed method to select random locations for sampling. 8. All testing and evaluation will be completed by (NAME) within (HOURS) hours of sampling and all documentation will be completed and submitted to the Engineer on approved processing forms within (HOURS) hours according to specifications or production will be halted until these items are current. Example forms are attached. 9. Any material found to be noncomplying shall be addressed by (NAME) who will notify the Engineer immediately. 10. (NAME) will notify all appropriate KDOT personnel at least 24 hours before the scheduled work is to begin.
11. (STATE THE PROCESS FOR DISPOSITION OF NONCONFORMING MATERIAL)

Page 5/5 5.2.7.2. 2016
Revised 2016
Table 1: Example of QC Actions to Implement When Approaching or Exceeding Specification Limits
Test
Description
Test
Method
Specification Situation
Action Single Test
4-Point
Moving Avg.
or Daily Avg.
Single Test
4-Point
Moving Avg.
or Daily Avg.
Binder Content KT-57 +/-0.6 +/-0.3 Approaching limit Approaching
Limit
Discuss with hot mix plant, operator, and may
suspend construction process
Aggregate
Gradation KT-2 NA
>=min.
<=max.
4 point on +#4
2 points on -#4
Approaching
Limit
Increase frequency of tests and prepare for
process modification
Air Voids @ Ndes KT-58 +/-2% NA 2 tests over +/-1% NA Initiate JMF Modifications
VMA 5.10.04 <=1% min. >=min. 3 tests over +/-1% >=min.
<=max.
Discuss with the Engineer & Process
Modification
VFA 5.10.04 NA >=min.
<=max. Over Limit once
Approaching
Limit Notify the Engineer, modify JMF
Density @ Nini
and Nmax KT-58 NA >=min.
Approaching Limit
Over once
Approaching
Limit Notify the Engineer, modify process
Coarse Aggregate
Angularity KT-31 >=min.
NA Approaching limit NA Modify JMF or Redesign
Fine Aggregate
Angularity KT-50 >=min. NA Approaching limit NA
Notify the Engineer, modify JMF
Sand Equivalent KT-55 >=min. NA Approaching limit NA Notify the Engineer, modify JMF
TSR KT-56 >=min. NA Approaching limit NA Discuss with the Engineer & initiate
investigation, modification, or redesign
Dust to Binder
Ratio
NA
>=min.
<=max. Approaching limit
Approaching
Limit Modify JMF
Flat & Elongated KT-59 >=min. NA Approaching limit NA Modify JMF or Redesign
Roadway Density KT-32 NA >=min. Approaching
<91% <= 100% Pay Notify the Engineer & Construction Manager
NOTE: Whenever two consecutive test results fail or if any of the four point moving average values fail, production will be suspended and the situation
discussed with the Engineer and Construction Manager. The process will be corrected before production resumes.


Page 1/25 5.2.7.3. 2016
Revised 2016
5.2.7.3 EXAMPLE OF A LABORATORY QUALITY MANUAL FOR HMA This example is designed to provide the contractor with general guidelines in creating and maintaining a
contractor’s Quality Manual. The QC process requires records for equipment calibrations/verifications.
Maintaining records in an orderly manner will assist the District Materials Engineer in quickly
determining if the laboratory meets QC/QA requirements. Having the field laboratory fully prepared and
the Quality Manual properly maintained represent two items that can keep the start of a project on
schedule. It also aids in demonstrating the contractor’s commitment to the QC process.
The following records are presented to illustrate what is required in the Quality Manual. Records need
not be exactly as illustrated but should supply all necessary information concerning the equipment
calibration/verification.
NOTE: After calibrating any force-load testing equipment (stability machine, gyratory, etc.) a copy of
the certification for the calibration device (proving ring, load cell, etc.) shall be attached to the calibration
record.
NOTE: All equipment shall be verified immediately after repairs (this may include new or replacement
parts, or mechanical or electrical adjustments) that may in any way affect the ability of the equipment to
provide accurate readings as established during the calibration/verification process.
DISCLAIMER: It is not the intent of these guidelines to endorse manufacturers, suppliers, calibrating
services, etc. The examples are used to provide guidance in establishing a thoroughly developed Quality
Manual.

Page 2/25 5.2.7.3. 2016
Revised 2016
LABORATORY QUALITY MANUAL TABLE OF CALIBRATION/VERIFICATION DATES
Revision Date 04/01/14
CAL/VER NEXT
ITEM INTERVAL CAL/VER (MONTHS)
SIEVES ___________ ___________
MECH. SIEVE SHAKER ___________ ___________
THERMOMETER ___________ ___________
OVENS ___________ ___________
VACUUM SYS. ___________ ___________
M/D GAUGE ___________ ___________
STABILITY MACHINE ___________ ___________
BALANCES ___________ ___________
WEIGHTED FOOT ___________ ___________
GYRATORY ___________ ___________

Page 3/25 5.2.7.3. 2016
Revised 2016
June 21, 2016
VERIFICATION PROCEDURE FOR SIEVES
(Page 1/2)
Purpose:
This method provides instructions for checking the physical condition of laboratory tests sieves
ranging in size 3 in. (75 mm) to #200 (0.075 mm).
Inspection Equipment Required:
1. A caliper readable to 0.01 mm (use for #4 or coarser).
Tolerances:
Sieves shall meet physical requirements specified in AASHTO M 92 (ASTM E11).
Procedure:
(Steps 1 & 2 apply to sieves having openings greater than 4.75 mm)
1. Select an adequate number of individual sieve openings (3 or 4) along a 45o line. Measure
and record the sieve openings to verify that the size opening indicated on the label is correct.
2. Repeat step 1, rotating the sieve 90o.
3. Inspect the general condition of the sieve. Check the frame and solder joints for cracks or
holes (check for pin holes in the finer sieves).
4. Make sure the sieves have an appropriate label.
5. Check for tightness of the wires on each individual sieve.
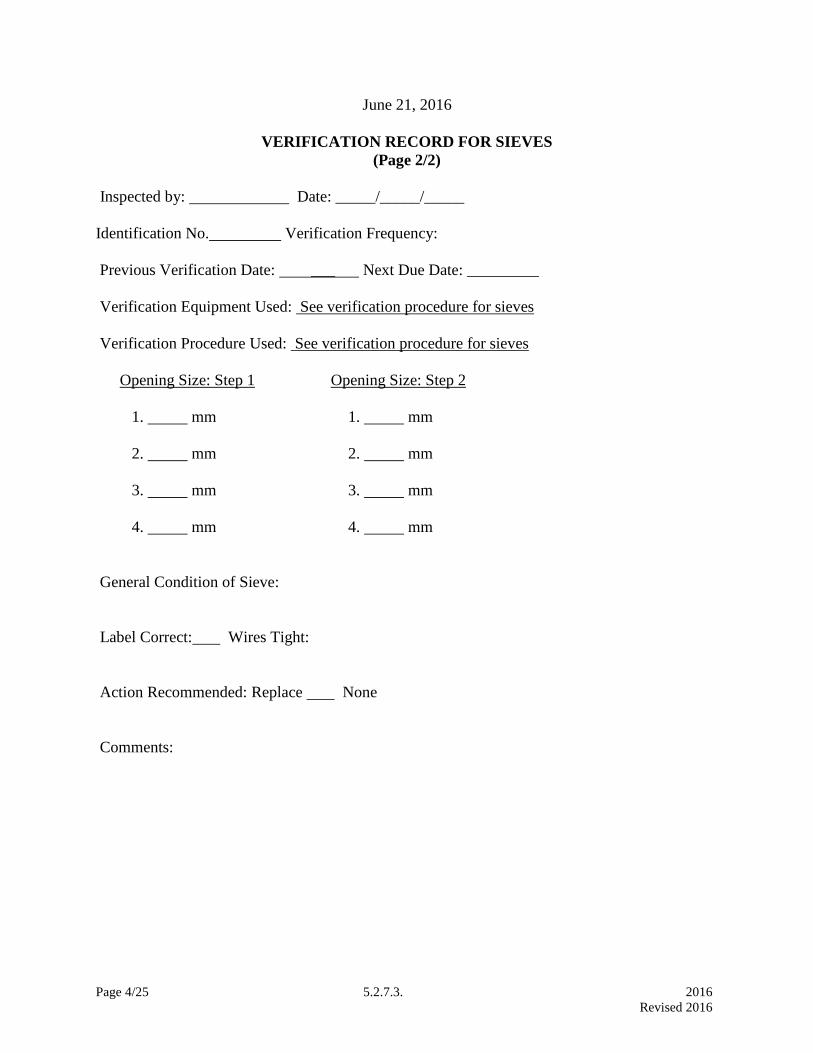
Page 4/25 5.2.7.3. 2016
Revised 2016
June 21, 2016
VERIFICATION RECORD FOR SIEVES
(Page 2/2)
Inspected by: Date: _____/_____/_____
Identification No. Verification Frequency:
Previous Verification Date: ___ Next Due Date: _________
Verification Equipment Used: See verification procedure for sieves
Verification Procedure Used: See verification procedure for sieves
Opening Size: Step 1 Opening Size: Step 2
1. mm 1. mm
2. mm 2. mm
3. mm 3. mm
4. mm 4. mm
General Condition of Sieve:
Label Correct: Wires Tight:
Action Recommended: Replace None
Comments:

Page 5/25 5.2.7.3. 2016
Revised 2016
June 21, 2016
VERIFICATION PROCEDURE FOR MECHANICAL SIEVE SHAKER
(Page 1/2)
Purpose: This method provides instructions for checking the length of time the mechanical
sieving device must run to meet the tolerances as specified in KT-2 3.3.
Inspection Equipment Required:
1. Set of 8" dia. sieves (3/8, 4, 8, 16, 30, 50, 100, 200)
2. Timer
3. Balance, readable to 0.1 g.
4. Sample of fine aggregate.
Tolerance:
Shaker shall meet the tolerances specified in KT-2 3.3.
Procedure:
1. Place sample of aggregate in nested sieves.
2. Place sieves in shaker & set timer for 4 minutes.
3. Check sieving adequacy as described in KT-2 6.3.
4. If 4 minute setting doesn't meet specification increase time by 30 second intervals until
specification is met.

Page 6/25 5.2.7.3. 2016
Revised 2016
June 21, 2016
VERIFICATION RECORD FOR MECHANICAL SHAKER
(Page 2/2)
Inspected by: Date:
Identification Number: Verification Frequency: _________.
Previous Verification Date: Next Due Date:
Verification Equipment Used: See Verification Procedure For Mechanical Shaker.
Verification Procedure: See Verification Procedure For Mechanical Shaker.
1. Mass of sample grams.
2. Mass of material passing sieve after 1 minute of hand sieving as described in KT-2 6.3.
3. Percent of material passed.
Comments:

Page 7/25 5.2.7.3. 2016
Revised 2016
VERIFICATION PROCEDURE FOR THERMOMETERS
(Page 1/2)
FORM DATE: _________________
Purpose:
This method provides instructions for verifying the settings on general-purpose thermometers.
Inspection Equipment Required:
1. A calibrated thermometer graduated in 2.0oF (1.0
oC) increments having a range which includes
the temperature range to be checked.
2. A clothes pin to hold the thermometer in such a manner as to enable the operator to read the
scale easily.
3. A container well to retain heat for constant temperature readings.
4. A hot plate to heat the liquid (oil) in the container well.
Procedure:
1. Place the thermometer inside the container well with the clothes pin attached to the
thermometer.
2. Take the first reading when the temperature has stabilized.
3. Take as many readings as necessary to determine the "laboratory thermometer setting" vs
"actual calibrated reading."

Page 8/25 5.2.7.3. 2016
Revised 2016
VERIFICATION RECORD FOR THERMOMETERS
(Page 2/2)
Specification Interval: ______________________________________
Model No. see below
Serial No . see below
Date :
Calibration/Verification Performed by :
Cal./Ver. Procedure Reference: See Verification Procedure for Thermometers
Previous Calibration/Verification Date :
Next Calibration/Verification Due Date :
Calibration/Verification Equipment Used :
Model/Serial No. of C/V Equipment Used : see below
1. Equipment thermometer reading see below
2. Calibrated thermometer reading see below
Equipment Equipment Calibrated Calibrated
Thermometer Thermometer Thermometer Thermometer
Designation Reading Designation Reading

Page 9/25 5.2.7.3. 2016
Revised 2016
VERIFICATION PROCEDURE FOR OVENS (Page 1/2)
Form Date: _________________
Purpose:
This method provides instructions for verifying the accuracy of the temperature settings and the
tolerance on ovens. Inspection Equipment Required: 1. A calibrated thermometer graduated in 2.0
oF (1.0
oC) increments having a range that
includes the temperature range to be checked. 2. A brass thermometer well to retain heat while the oven door is open. This is essential for a constant temperature reading. 3. A clothes pin to hold the thermometer in such a manner as to enable the operator to read the scale easily from outside or inside the oven. Tolerance: Drying ovens shall be capable of maintaining a constant temperature range listed in the appropriate test methods. Procedure: 1. Place the thermometer inside the brass well with the clothes pin attached to the thermometer. Position the thermometer on the shelf where the samples are normally dried. 2. Take the first reading at least 1 hour after closing the oven (oven should remain undisturbed). 3. Take as many readings as necessary to determine if the temperature range is within the specified tolerance (three consecutive readings, taken no less than 1/2 hr apart, within tolerance allowed are adequate). 4. Adjust the temperature of the oven if an observed temperature reading is outside the tolerance specified (allow at least 1/2 hr for the temperature to stabilize between each adjustment). Return to step 3.

Page 10/25 5.2.7.3. 2016
Revised 2016
Form Date __________________
VERIFICATION RECORD FOR OVENS
(Page 2/2)
Verified by Date
Verif. Frequency ______________
Identification No.:
Prev. Verif. Date: Next Due Date :
Verif. Equip. Used Cal. Therm. Verif. Procedure Verification Procedure for Ovens
Temperature Range
Temperature* Oven Dial Reading Correction Factor
Action Recommended: Repair Replace None X
*This thermometer has been tested by comparison with standards certified by NIST. If the
correction is “+” the true temperature is higher than the thermometer reading. If the correction is
“-” the true temperature is lower than the thermometer reading
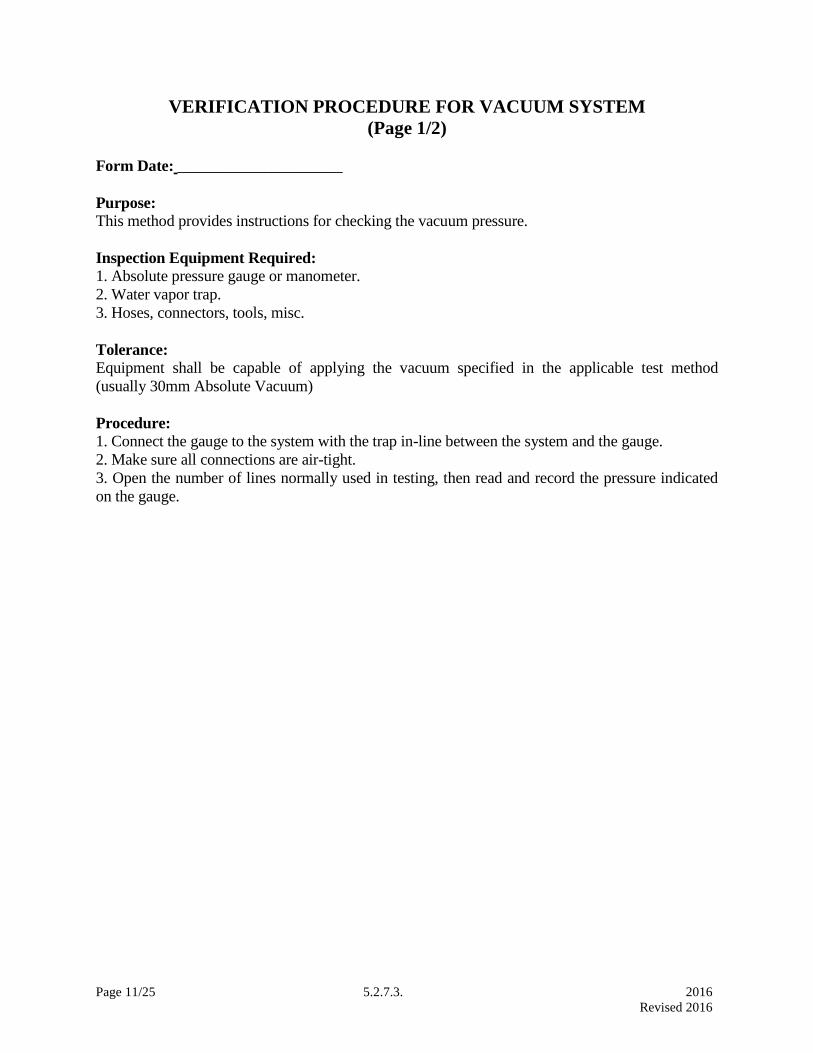
Page 11/25 5.2.7.3. 2016
Revised 2016
VERIFICATION PROCEDURE FOR VACUUM SYSTEM
(Page 1/2)
Form Date: _____________________
Purpose:
This method provides instructions for checking the vacuum pressure.
Inspection Equipment Required: 1. Absolute pressure gauge or manometer.
2. Water vapor trap.
3. Hoses, connectors, tools, misc.
Tolerance:
Equipment shall be capable of applying the vacuum specified in the applicable test method
(usually 30mm Absolute Vacuum)
Procedure: 1. Connect the gauge to the system with the trap in-line between the system and the gauge.
2. Make sure all connections are air-tight.
3. Open the number of lines normally used in testing, then read and record the pressure indicated
on the gauge.

Page 12/25 5.2.7.3. 2016
Revised 2016
________________
VERIFICATION RECORD FOR VACUUM SYSTEM
(Page 2/2)
Verified By Date _____________
Verif. Frequency ____________________
Identification No. ________________________
Previous Verif. Date _____________ Next Due Date _________________
Verif. Equip. Used ABSOLUTE GAUGE Verif. Procedure: Verification Procedure for Vac. Sys.
Vacuum 15mm of Hg vacuum is available at the end of the vacuum line
Action Recommended: Repair Replace None ________
Comments:
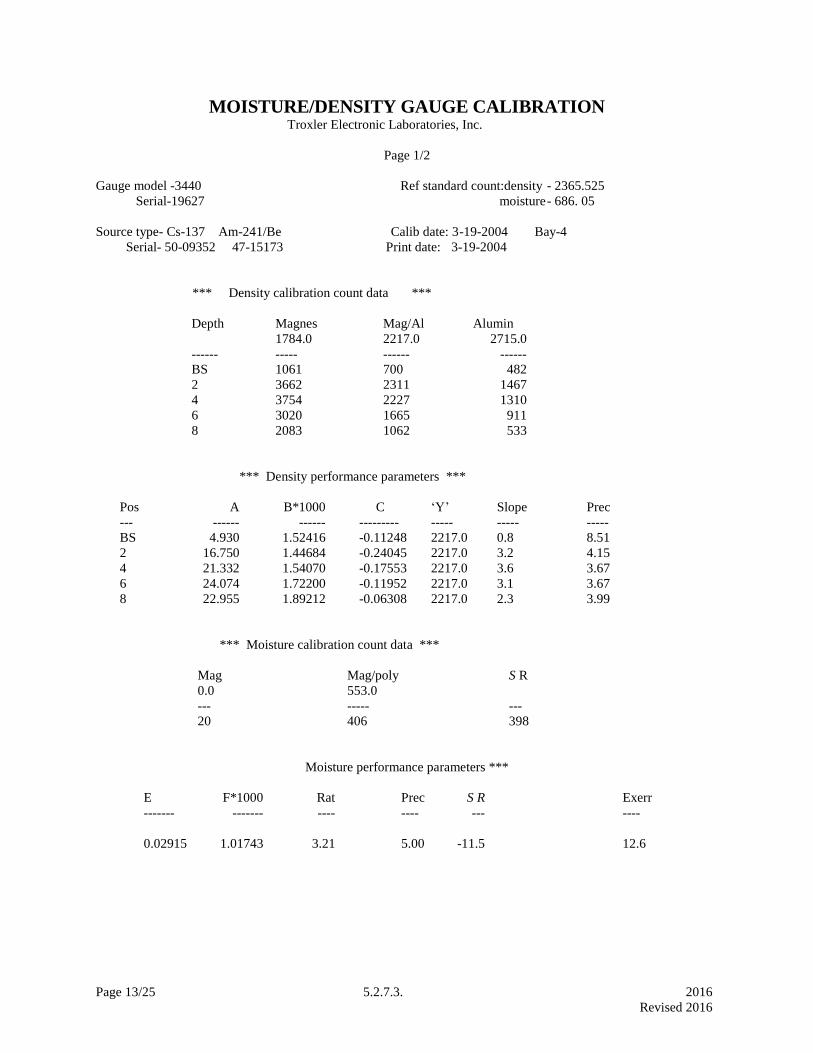
Page 13/25 5.2.7.3. 2016
Revised 2016
MOISTURE/DENSITY GAUGE CALIBRATION Troxler Electronic Laboratories, Inc.
Page 1/2
Gauge model -3440 Ref standard count:density - 2365.525
Serial-19627 moisture- 686. 05
Source type- Cs-137 Am-241/Be Calib date: 3-19-2004 Bay-4
Serial- 50-09352 47-15173 Print date: 3-19-2004
*** Density calibration count data ***
Depth Magnes Mag/Al Alumin
1784.0 2217.0 2715.0
------ ----- ------ ------
BS 1061 700 482
2 3662 2311 1467
4 3754 2227 1310
6 3020 1665 911
8 2083 1062 533
*** Density performance parameters ***
Pos A B*1000 C ‘Y’ Slope Prec
--- ------ ------ --------- ----- ----- -----
BS 4.930 1.52416 -0.11248 2217.0 0.8 8.51
2 16.750 1.44684 -0.24045 2217.0 3.2 4.15
4 21.332 1.54070 -0.17553 2217.0 3.6 3.67
6 24.074 1.72200 -0.11952 2217.0 3.1 3.67
8 22.955 1.89212 -0.06308 2217.0 2.3 3.99
*** Moisture calibration count data ***
Mag Mag/poly S R
0.0 553.0
--- ----- ---
20 406 398
Moisture performance parameters ***
E F*1000 Rat Prec S R Exerr
------- ------- ---- ---- --- ----
0.02915 1.01743 3.21 5.00 -11.5 12.6
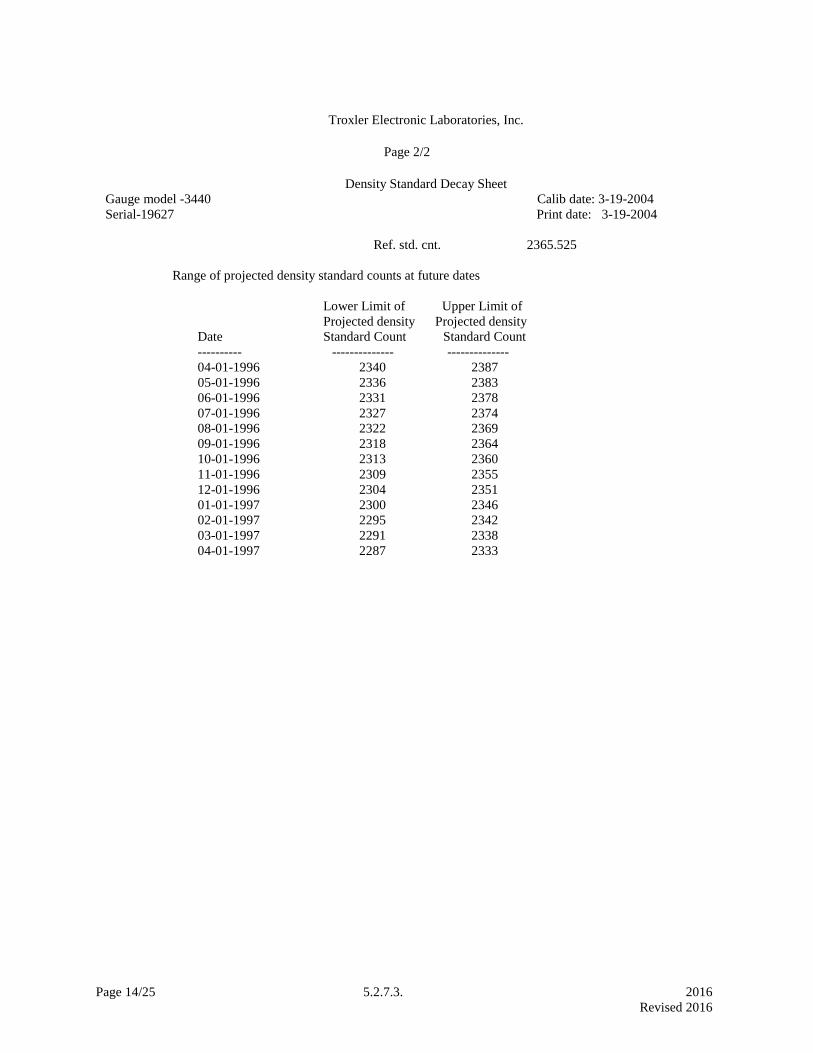
Page 14/25 5.2.7.3. 2016
Revised 2016
Troxler Electronic Laboratories, Inc.
Page 2/2
Density Standard Decay Sheet
Gauge model -3440 Calib date: 3-19-2004
Serial-19627 Print date: 3-19-2004
Ref. std. cnt. 2365.525
Range of projected density standard counts at future dates
Lower Limit of Upper Limit of
Projected density Projected density
Date Standard Count Standard Count
---------- -------------- --------------
04-01-1996 2340 2387
05-01-1996 2336 2383
06-01-1996 2331 2378
07-01-1996 2327 2374
08-01-1996 2322 2369
09-01-1996 2318 2364
10-01-1996 2313 2360
11-01-1996 2309 2355
12-01-1996 2304 2351
01-01-1997 2300 2346
02-01-1997 2295 2342
03-01-1997 2291 2338
04-01-1997 2287 2333
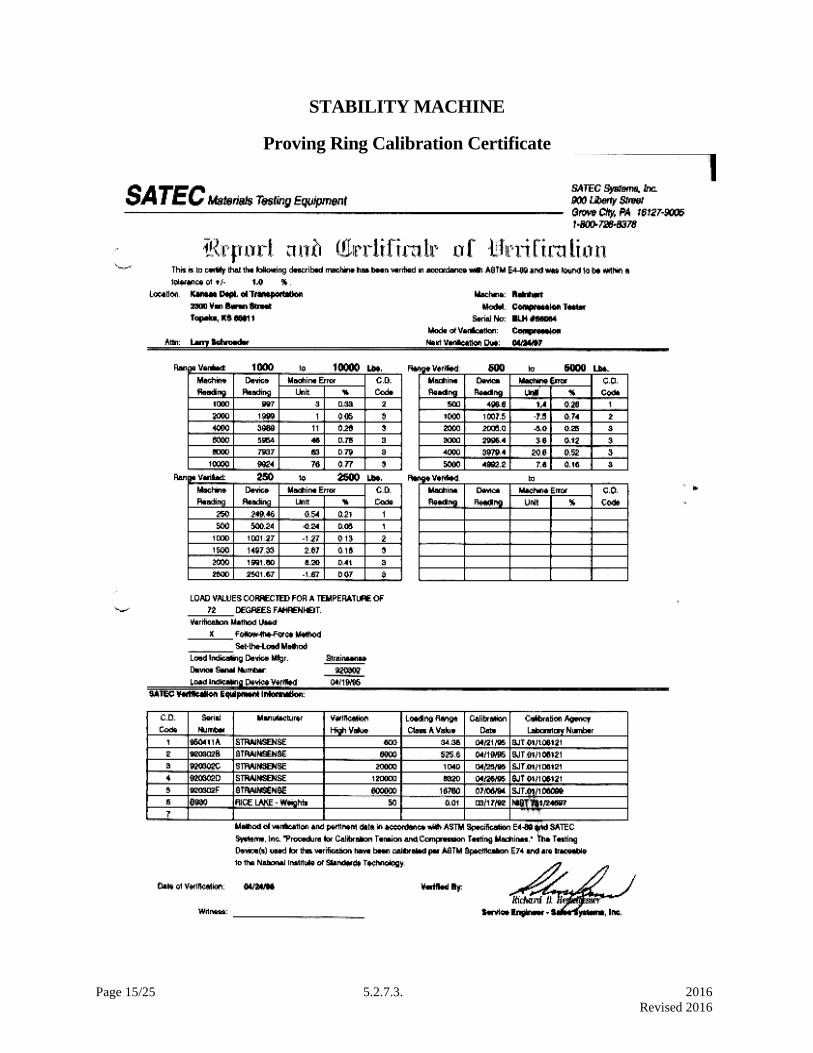
Page 15/25 5.2.7.3. 2016
Revised 2016
STABILITY MACHINE
Proving Ring Calibration Certificate

Page 16/25 5.2.7.3. 2016
Revised 2016
CALIBRATION OF BALANCES
Page 1/4
March 30, 2004
ALFIE PACKERS INC.
SCOPE OF WORK FOR LABORATORY BALANCES:
Definitions are on next page.
1. The weighing environment is checked for anything that would affect the ability of the balance
to weigh accurately for example: direct air currents, direct sunlight, objects stuck under the
balance or magnets in close proximity to the balance.
2. The balance is checked for errors in zero, sensitivity, calibration, comer load, linearity,
repeatability and tare accuracy. Any errors are noted.
3. The balance is thoroughly cleaned and disassembled. Parts subject to wear or damage are
inspected. On mechanical balances, this includes but is not limited to knife edges, arrestment
mechanism, switches, pan brake assemblies and weight lifting assemblies. On electronic
balances, the measuring cell and flextures are inspected. Circuit boards and switches are
inspected for contamination and corrosion.
4. Any errors noted in step two are corrected through adjustments or replacement of minor parts.
If the balance cannot be returned to factory specifications through this method, the using
personnel are consulted as to the need for further repairs.
5. The balance is reassembled and final checks are made as in step two. Final calibration
adjustments are made.
6. Applicable GLP log books are annotated.
A. All tests are performed with Class 1 stainless steel weights traceable to the NIST and are
calibrated at least annually.
B. A certificate of weight traceability to the NIST is provided to each functional area. This
certificate lists all the balances serviced in that area and the serial number of the weights used,
their calibration date, the NIST trace number and the technician calibration number.
Page 2/4

Page 17/25 5.2.7.3. 2016
Revised 2016
DEFINITIONS:
Balance = Weighing device, generally with a resolution of 1 part in 12,000 or greater. Top
loading balances will have a resolution of up to 1 part in 1,200,000 and sensitivity down to 1
milligram i.e. 1200.000 gram +/- .001 gram. Analytical balances will have a resolution of up to
1 part in 4,100,000 and sensitivity down to .0 1 milligram i.e. 41.00000 gram +/- .00001 gram.
Micro-balances will have a resolution of up to 1 part in 200,000,000 sensitivity down to
.0000001 gram.
Calibration = The accuracy of the balance, usually at full capacity, as compared to known
standards.
Class 1 = A published standard for weights from the NIST. The standard dictates the materials,
configuration and tolerance of the weights.
Corner loads = The deviation of the indicated weight between the center of the pan and the front,
rear, left and right of the pan. This test is performed at 2/3 of maximum capacity.
Electronic Balance = A balance deriving it's indicated weight from a force restoration coil
measuring cell or high resolution load cell.
Factory specifications = The balance manufacturers specifications for all adjustments, usually +/-
1 final count (least significant digit).
Flexture = Parts of the measuring cell. The accuracy of all adjustments is dependent on the
condition of these parts.
GLP = Acronym. Stands for Good Laboratory Practices. Laboratories under this standard must
establish a plan for weighing accuracy control.
Knife edges = The pivot points of the balance beam in mechanical balances.
Mechanical Balance = A high resolution balance deriving it's indicated readout from the
mechanical movement of a balance beam and a system of built in standard comparison weights.
NIST = Acronym. Stands for the National Institute for Standards and Technology. This is the
new name for the National Bureau of Standards (NBS).
Pan brake = Part of a mechanical analytical balance used to stop pan swing when the balance is
arrested.
Page 3/4
Page 18/25 5.2.7.3. 2016
Revised 2016
DEFINITIONS, CONTINUED
Repeatability = Test performed on all balances to determine if it indicates the same weight and
returns to zero every time a weight is applied to and removed from the pan. This test is normally
performed with a weight that is near the normal usage of the balance if known or near the mid-
range of the balance. The weight is placed on the balance a minimum of three times to get a plus
or minus reading.
Sensitivity = On mechanical balances this test determines the accuracy of the beam travel or
optical range of the balance. On electronic balances this is the lightest weight that the balance
will accurately respond to.
Tare accuracy = This test is used on mechanical balances to determine if the balance reads the
same with or without the tare.
Page 4/4
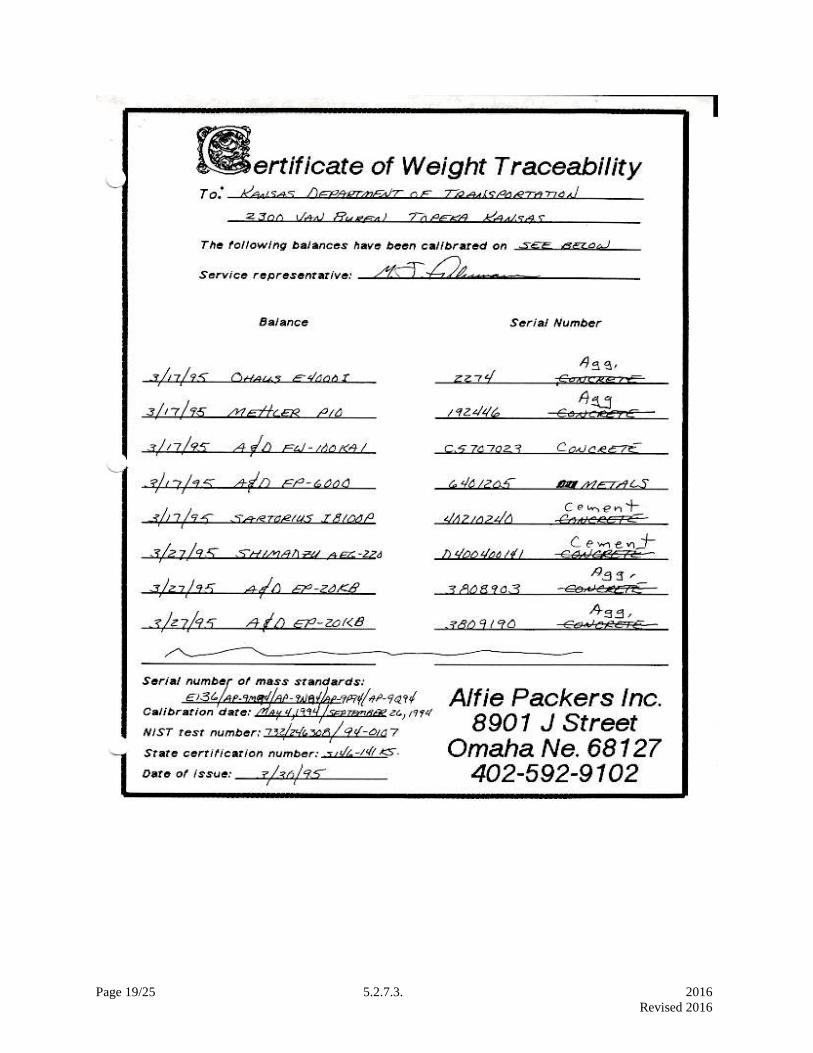
Page 19/25 5.2.7.3. 2016
Revised 2016
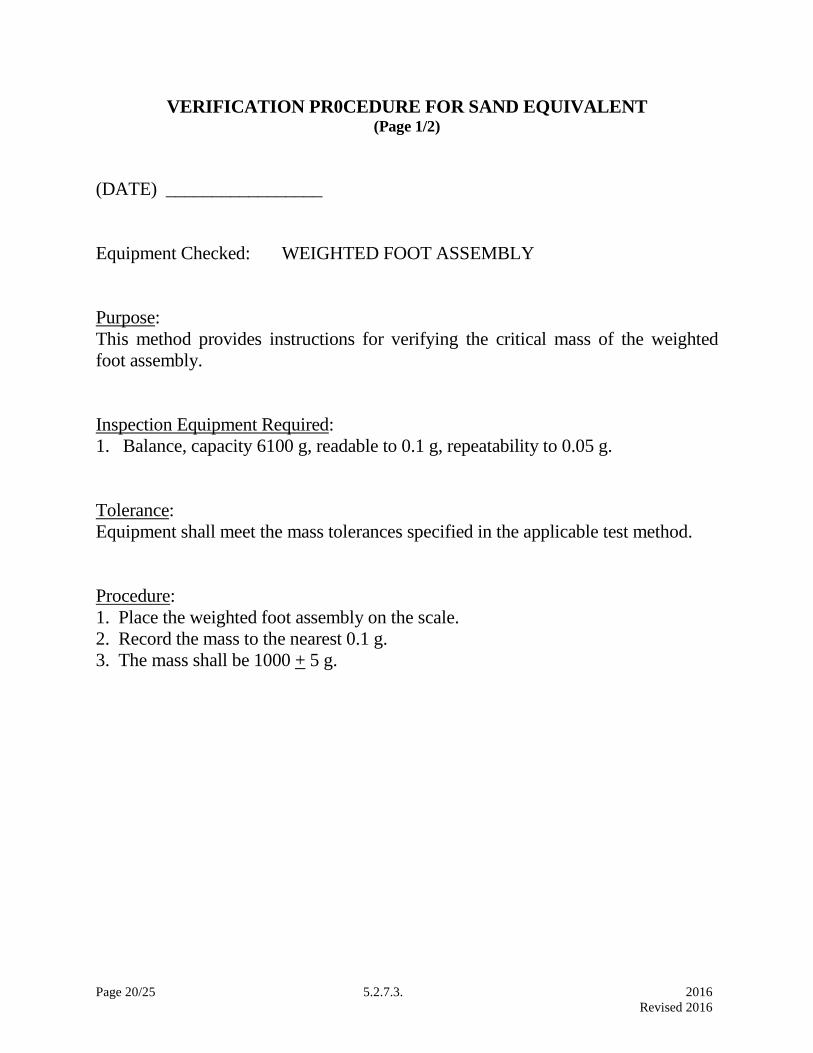
Page 20/25 5.2.7.3. 2016
Revised 2016
VERIFICATION PR0CEDURE FOR SAND EQUIVALENT (Page 1/2)
(DATE) _________________
Equipment Checked: WEIGHTED FOOT ASSEMBLY
Purpose:
This method provides instructions for verifying the critical mass of the weighted
foot assembly.
Inspection Equipment Required:
1. Balance, capacity 6100 g, readable to 0.1 g, repeatability to 0.05 g.
Tolerance:
Equipment shall meet the mass tolerances specified in the applicable test method.
Procedure:
1. Place the weighted foot assembly on the scale.
2. Record the mass to the nearest 0.1 g.
3. The mass shall be 1000 + 5 g.

Page 21/25 5.2.7.3. 2016
Revised 2016
VERIFICATION RECORD FOR SAND EQUIVALENT
Page 2/2
The only item to be systematically inspected for KT-55 is the weighted foot
assembly. The assembly is to be inspected annually. The assembly is to have a
mass of 1000 + 5 g and shall be verified on calibrated scales.
Information concerning KT-55 is as follows:
1. Model and Serial Number.
2. Name of worker.
3. ID of Calibration/Verification (C/V) equipment used.
Serial Number
Maximum Load g
Readability 0.1 g
4. Date of work done.
5. Next Due Date.
6. Previous C/V date.
New Equipment
7. Detailed results.
The mass of the weighted foot was grams.
8. Reference to procedure used.
See Page 2/2.

Page 22/25 5.2.7.3. 2016
Revised 2016
CAL/VER PROCEDURE FOR GYRATORY (Page 1/4)
Purpose:
This method provides instructions for calibrating the load (pressure) and verifying the angle,
rotation and height on the Superpave Gyratory. Use the proper equipment designated by the
manufacturer when calibrating or verifying the Gyratory.
Inspection Equipment required:
A certified load cell or proving ring to calibrate the load readings. Digital stopwatch required to
determine the rotational speed. Manufacturer’s recommended equipment for determining proper
angle. Certified blocks for determining accuracy of height reading.
Tolerances: Meet all requirements as specified:
Gyratory:
Capable of applying a pressure of 600 + 6 kPa
Capable of applying an angle of 1.16 + 0.02 degrees
Gyrates specimen molds at 30 + 0.5 rev./minute
Records height of specimen to 0.05 mm during compaction once per gyration
Molds - 150 mm (nominal 6 in):
Inside diameter of molds 149.90 to 150.20 mm
At least 250 mm high
Walls at least 8.5 mm thick
Ram base and base plate faces shall be ground flat and have a diameter of 149.50
to149.75 mm
Molds - 100 mm (nominal 4 in):
Inside diameter of molds 99.90 to 100.00 mm
At least 250 mm high
Walls at least 8.5 mm thick
Ram base and base plate faces shall be ground flat and have a diameter of 99.70 to
99.75 mm
Procedures: Follow the calibration procedures set forth in the manufacturer's manual to meet the tolerances
established above.
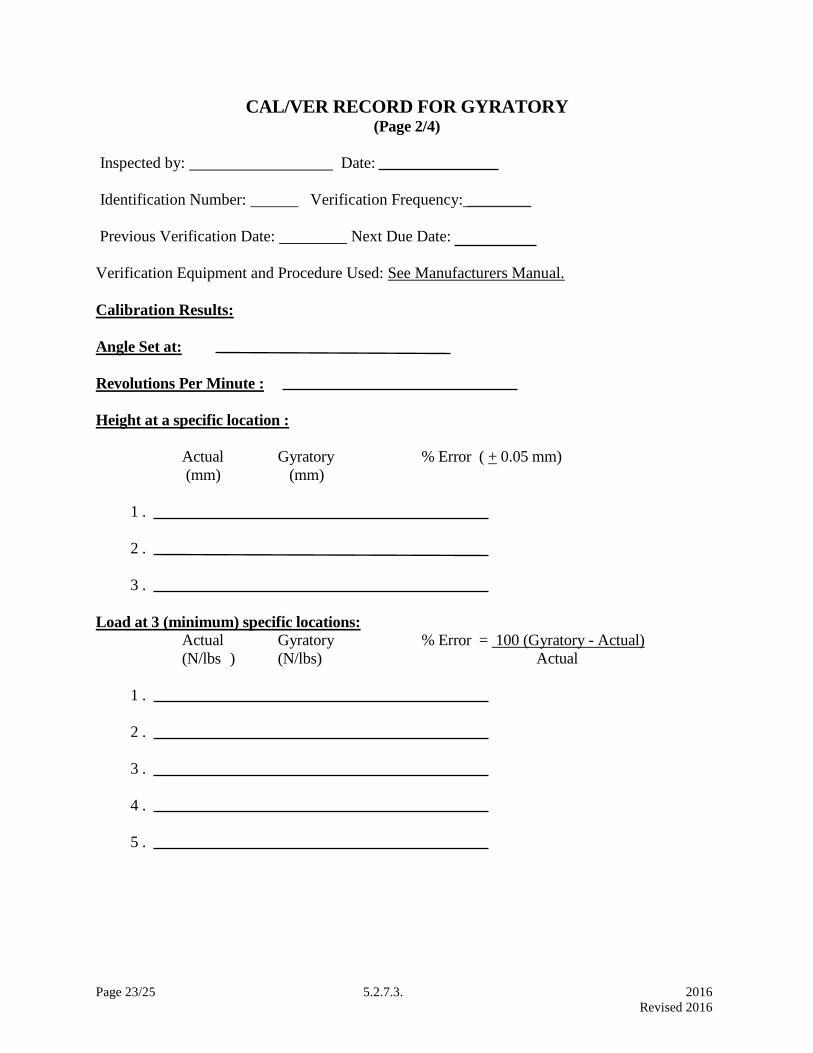
Page 23/25 5.2.7.3. 2016
Revised 2016
CAL/VER RECORD FOR GYRATORY (Page 2/4)
Inspected by: Date:
Identification Number: Verification Frequency: ________
Previous Verification Date: Next Due Date:
Verification Equipment and Procedure Used: See Manufacturers Manual.
Calibration Results:
Angle Set at:
Revolutions Per Minute :
Height at a specific location :
Actual Gyratory % Error ( + 0.05 mm)
(mm) (mm)
1 .
2 .
3 .
Load at 3 (minimum) specific locations: Actual Gyratory % Error = 100 (Gyratory - Actual)
(N/lbs ) (N/lbs) Actual
1 .
2 .
3 .
4 .
5 .
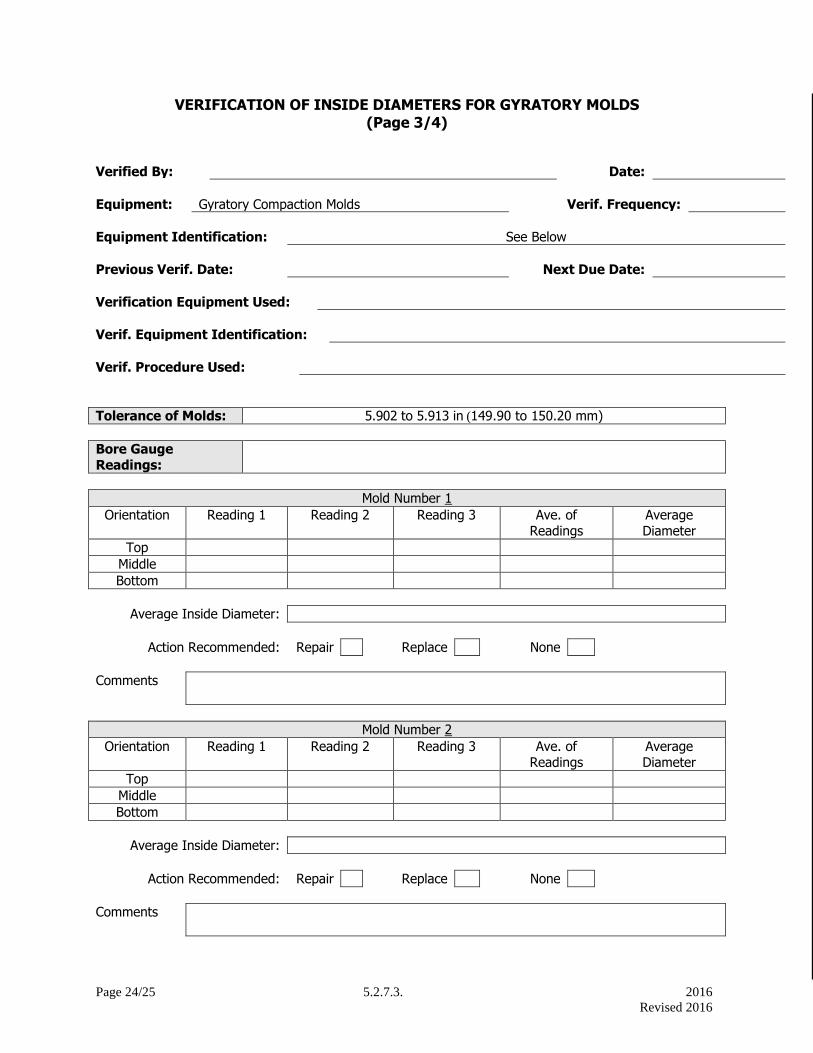
Page 24/25 5.2.7.3. 2016
Revised 2016
VERIFICATION OF INSIDE DIAMETERS FOR GYRATORY MOLDS (Page 3/4)
Verified By: Date:
Equipment: Gyratory Compaction Molds Verif. Frequency:
Equipment Identification: See Below
Previous Verif. Date: Next Due Date:
Verification Equipment Used:
Verif. Equipment Identification:
Verif. Procedure Used:
Tolerance of Molds: 5.902 to 5.913 in (149.90 to 150.20 mm)
Bore Gauge Readings:
Mold Number 1
Orientation Reading 1 Reading 2 Reading 3 Ave. of Readings
Average Diameter
Top
Middle
Bottom
Average Inside Diameter:
Action Recommended: Repair Replace None
Comments
Mold Number 2
Orientation Reading 1 Reading 2 Reading 3 Ave. of Readings
Average Diameter
Top
Middle
Bottom
Average Inside Diameter:
Action Recommended: Repair Replace None
Comments
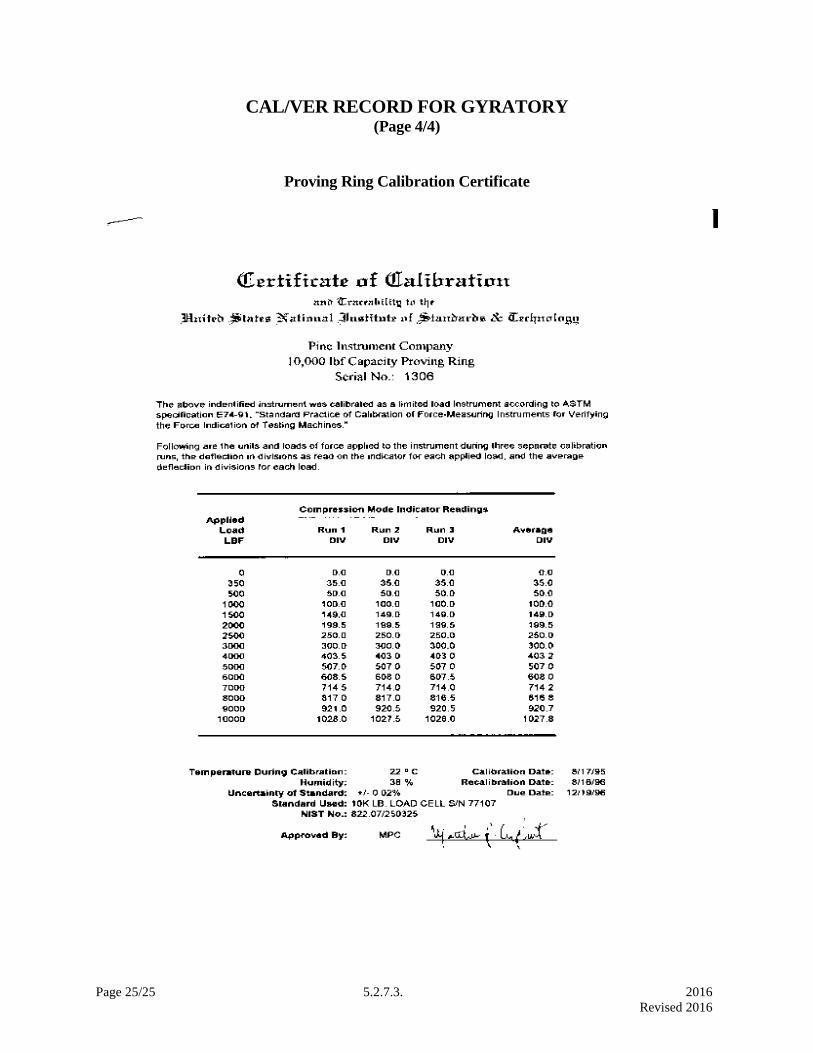
Page 25/25 5.2.7.3. 2016
Revised 2016
CAL/VER RECORD FOR GYRATORY (Page 4/4)
Proving Ring Calibration Certificate

Page 1/5 5.2.7.4 2016
Revised 2016
5.2.7.4 CONCRETE: CONTRACTOR’S QUALITY CONTROL PLAN
NOTE: This document is generally written in the imperative mood. The subject, "the Contractor" is
implied. Also implied in this language are "shall", "shall be", or similar words and phrases. The word
"will" generally pertains to decisions or actions of the Kansas Department of Transportation.
1. GENERAL
Provide qualified personnel and sufficient equipment meeting the requirements listed in the Department's
Construction Manual to conduct quality control testing which conforms with the Sampling and Testing
Frequency Chart for Portland Cement Concrete Pavement for Quality Control/Quality Assurance Projects
in Appendix B of this Manual.
Calibrate and correlate the testing equipment with prescribed procedures and conduct tests in
conformance with specified testing procedures as listed in the Department's Construction Manual. As a
minimum, meet the calibration schedule as outlined in Table 1, Concrete Materials Test Equipment.
Maintain control charts on an ongoing basis.
File all reports, records, and diaries developed during the progress of construction activities as directed by
the Engineer. Files become the property of the Engineer.
Provide the following:
Make copies of all test results and control charts readily available to the Engineer at the project
site.
Copies of all failing test results (based on a moving average of four tests, when appropriate) and
summary sheet sent on a daily basis to the Construction Engineer.
2. QUALITY CONTROL ORGANIZATION
Submit a listing of the names and phone numbers of individuals and alternates responsible for quality
control administration and inspection along with the proposed mix design data. Provide an organizational
chart that shows the specified lines of authority relating both to mix design and quality control operations
during production. Post a copy of the organizational chart in the Contractor's test facility.
The Contractor's quality control organization or private testing firms representing the Contractor must
include individuals who are certified by KDOT, or a State approved equivalent, for the appropriate test
methods. Only technicians certified in accordance with KDOT requirements may perform process control
testing on the project.
3. QUALITY CONTROL PLAN
Prepare a Quality Control Plan detailing the type and frequency of inspection, sampling and testing
deemed necessary to measure and control the various properties of materials and construction governed
by the Specifications. As a minimum, detail sampling location and techniques, and test frequency to be
utilized in the sampling and testing plan. The Department may utilize quality control sampling and
testing performed by the Contractor for acceptance. Submit the Quality Control Plan to the Engineer in
writing a minimum of 30 days before work begins.
Page 2/5 5.2.7.4 2016
Revised 2016
3.1. Identify the personnel responsible for the Contractor's quality control in the plan. This shall include
the company official who will act as liaison with Department personnel, as well as the Certified
Technician who will direct the inspection program. The class or classes of concrete involved will be
listed separately. If existing mix designs are to be utilized, list the mix design numbers. Quality control
sampling, testing, and inspection shall be an integral part of the Contractor's quality control system. In
addition to the above requirements, the Contractor's quality control system shall document the quality
control requirements considered to be normal activities necessary to control the production and placing of
a given product or material at an acceptable quality level. Retain the latest ten gradation samples for use
by the Engineer. It is intended that sampling and testing be in accordance with standard methods and
procedures, and that measuring and testing equipment be standard, properly calibrated and documented in
the Quality Manual. Detail in the Quality Control Plan any alternative sampling method, procedure and
inspection equipment to be used.
3.1.1. Elements of the Plan. Include all elements that affect the quality of the PCCP including, but not
limited to the following:
Mix Designs
Aggregate Production
Quality of Components
Stockpile Management
Proportioning, including added water
Mixing and transportation, including time from batching to completion of delivery
Initial mix properties, including temperature, air content, and consistency
Placement and consolidation, including a schedule for calibrating and checking vibrators
Concrete yield versus Plan quantity records
Compressive strength
Finishing and curing
3.1.2. Personnel Requirements:
Detail in the Plan:
The frequency of sampling and testing, coordination of activities, corrective actions to be taken, and
documentation.
How the duties and responsibilities are to be accomplished and documented, and whether more than
one Certified Technician is required.
The criteria utilized by the Technician to correct or reject unsatisfactory materials.
Certified Technicians required duties:
Perform and utilize quality control tests and other quality control practices to assure that delivered
materials and proportioning meet the requirements of the mix designs, including temperature, slump, air
content, and strength. Be available on the project site whenever concrete is being produced for use on or
being placed on the project site.
Periodically inspect all equipment utilized in transporting, proportioning, mixing, placing,
consolidating, finishing, and curing to assure it is operating properly and that placement, consolidation,
finishing, and curing conform to the mix design and other Contract requirements.

Page 3/5 5.2.7.4 2016
Revised 2016
4. DOCUMENTATION
Maintain adequate records of all inspections and tests. Indicate the nature and number of observations
made, the number and type of deficiencies found, the quantities approved and rejected, and the nature of
corrective action taken as appropriate in the records. The Contractor's documentation procedures will be
subject to approval of the Engineer before the start of the work and to compliance checks during the
progress of the work.
Charts and Forms.
Keep all conforming and non-conforming inspections and test results complete and available at all times
to the Engineer during the performance of the work. Provide forms on a computer-acceptable medium
where required. Document batch tickets and gradation data in accordance with Department requirements.
Chart test data for portland cement concrete in accordance with the applicable requirements.
The Contractor may use other types of control charts as deemed appropriate. It is normally expected that
testing and charting will be completed within 24 hours after sampling.
All charts and records documenting the Contractor's quality control inspections and tests become property
of the Department upon completion of the work.
5. CORRECTIVE ACTION
Notify the Engineer when the moving average test result trend line for any property approaches the
specification limits. Cease operations if two consecutive moving average points fall outside the
Specification limits. Ceasing operations is the Contractor’s responsibility. Quality control tests for this
determination includes aggregate gradation, compliance with the mix design band, entrained air content,
concrete unit mass, and density of fresh concrete in place. Production will be suspended pending the
satisfactory results of a pre-production sample, unless waived by the District Materials Engineer.
Failure to cease operations for the conditions cited above will subject all subsequent material to rejection
by the Engineer, or acceptance at a reduced price, as determined by the Engineer.
The Engineer may examine materials represented by individual test results which lie beyond the
Contractor's normal quality control testing variation. The investigation may be based on either
Contractor's test results or the Department's test results. The information from additional testing
(including testing of in place pavement) may be used to define unacceptable work according to Standard
Specifications For State Road And Bridge Construction Subsection 105.5 and Subsection 106.10,
and apply appropriate price reductions or initiate corrective action as determined by the Engineer.
For any test, if a dispute exists between the Engineer and the Contractor about the validity of the others’
test results, the KDOT Materials and Research Center (MRC) will perform referee testing. If one of the
disputed Department test result was generated at the MRC, then an Independent Laboratory agreeable to
both parties will be selected. The selected Laboratory must be approved by the AASHTO Accreditation
Program for the appropriate test procedure. If referee testing indicates that the Department’s test results
are correct, then the Contractor pays for the additional testing, including referee testing performed at the
MRC. If the referee testing indicates that the Contractor's test results are correct then the Department
pays for the additional testing.

Page 4/5 5.2.7.4 2016
Revised 2016
6. Non-Conforming Materials. Establish and maintain an effective and positive system for controlling
non-conforming material, including procedures for its identification, isolation and disposition. Reclaim
or rework non-conforming materials in accordance with procedures acceptable to the Engineer.
Positively identify all non-conforming materials and products to prevent use, shipment, and intermingling
with conforming materials and products. Provide holding areas, mutually agreeable to the Engineer and
the Contractor.
7. Testing Facilities. Locate the Contractor's testing facility at the plant site or at the project site. Obtain
approval of the facility by the Engineer before the commencement of mixture production. Any other
laboratory location requires approval by the District Materials Engineer. Provide suitable space and
specified testing equipment for use by the Contractor's quality control personnel to perform tests as
required.
KDOT’s Materials and Research Center is Accredited through the AASHTO Accreditation Program
(AAP). If the contractor’s QC laboratory is not participating in the AAP, then the contractor shall have an
AAP approved laboratory inspect the QC laboratory’s equipment annually. The inspection shall include
all equipment necessary to perform testing on specified types of material related to this contract; base and
grading, aggregate, bituminous and concrete.
Maintain a Quality Manual showing all calibrations performed on all test equipment and when next
calibration is due for that equipment. As a minimum, follow the calibration/verification interval
established in Table 1, Concrete Materials Test Equipment.
To facilitate communication between the Contractor and the Engineer regarding quality control, equip the
Contractor's testing facility with the following:
A telephone with a private line for the exclusive use of the testing facility's quality control personnel.
A copying machine.
A facsimile machine for use by contractor personnel and the Engineer.
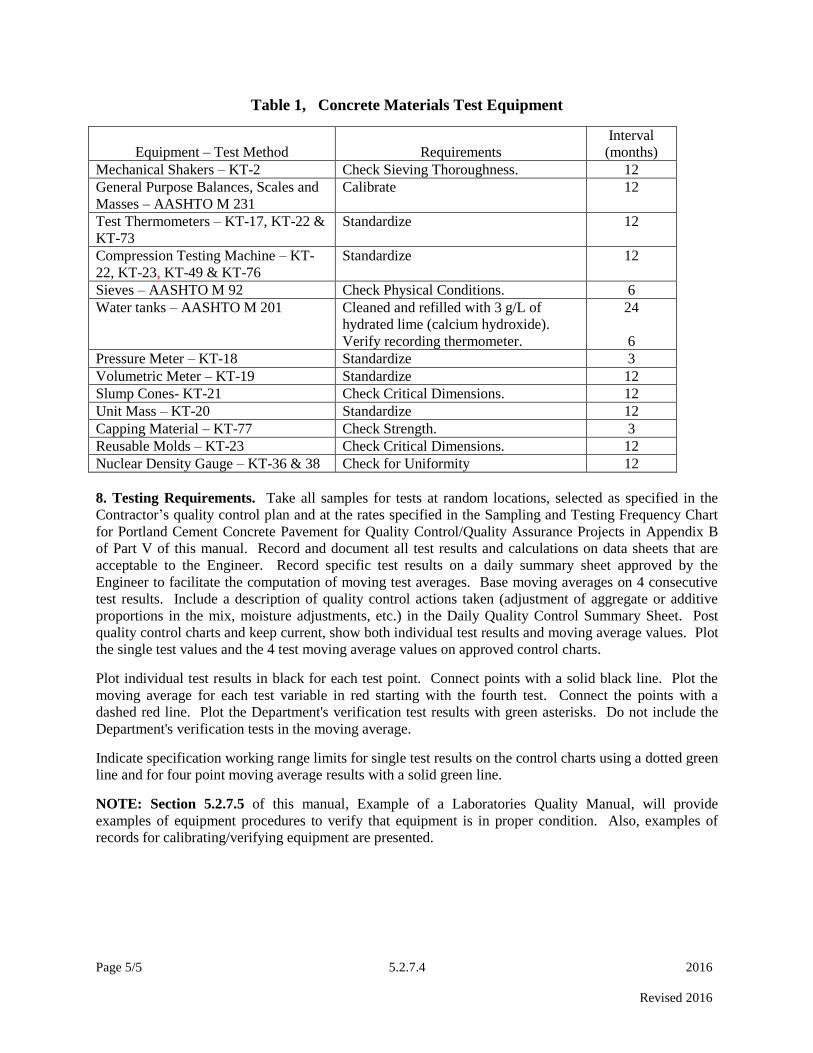
Page 5/5 5.2.7.4 2016
Revised 2016
Table 1, Concrete Materials Test Equipment
Equipment – Test Method
Requirements
Interval
(months)
Mechanical Shakers – KT-2 Check Sieving Thoroughness. 12
General Purpose Balances, Scales and
Masses – AASHTO M 231
Calibrate 12
Test Thermometers – KT-17, KT-22 &
KT-73
Standardize 12
Compression Testing Machine – KT-
22, KT-23, KT-49 & KT-76
Standardize 12
Sieves – AASHTO M 92 Check Physical Conditions. 6
Water tanks – AASHTO M 201 Cleaned and refilled with 3 g/L of
hydrated lime (calcium hydroxide).
Verify recording thermometer.
24
6
Pressure Meter – KT-18 Standardize 3
Volumetric Meter – KT-19 Standardize 12
Slump Cones- KT-21 Check Critical Dimensions. 12
Unit Mass – KT-20 Standardize 12
Capping Material – KT-77 Check Strength. 3
Reusable Molds – KT-23 Check Critical Dimensions. 12
Nuclear Density Gauge – KT-36 & 38 Check for Uniformity 12
8. Testing Requirements. Take all samples for tests at random locations, selected as specified in the
Contractor’s quality control plan and at the rates specified in the Sampling and Testing Frequency Chart
for Portland Cement Concrete Pavement for Quality Control/Quality Assurance Projects in Appendix B
of Part V of this manual. Record and document all test results and calculations on data sheets that are
acceptable to the Engineer. Record specific test results on a daily summary sheet approved by the
Engineer to facilitate the computation of moving test averages. Base moving averages on 4 consecutive
test results. Include a description of quality control actions taken (adjustment of aggregate or additive
proportions in the mix, moisture adjustments, etc.) in the Daily Quality Control Summary Sheet. Post
quality control charts and keep current, show both individual test results and moving average values. Plot
the single test values and the 4 test moving average values on approved control charts.
Plot individual test results in black for each test point. Connect points with a solid black line. Plot the
moving average for each test variable in red starting with the fourth test. Connect the points with a
dashed red line. Plot the Department's verification test results with green asterisks. Do not include the
Department's verification tests in the moving average.
Indicate specification working range limits for single test results on the control charts using a dotted green
line and for four point moving average results with a solid green line.
NOTE: Section 5.2.7.5 of this manual, Example of a Laboratories Quality Manual, will provide
examples of equipment procedures to verify that equipment is in proper condition. Also, examples of
records for calibrating/verifying equipment are presented.

Page 1/28 5.2.7.5. 2016
Revised 2016
5.2.7.5. EXAMPLE OF A LABORATORY QUALITY MANUAL FOR CONCRETE
This example is designed to provide the contractor with general guidelines in creating and maintaining a
contractor’s Quality Manual. The QC process requires records for equipment calibrations/verifications.
Maintaining records in an orderly manner will assist the District Materials Engineer in quickly
determining if the laboratory meets QC/QA requirements. Having the field laboratory fully prepared and
the Quality Manual properly maintained represent two items that can keep the start of a project on
schedule. It also aids in demonstrating the contractor’s commitment to the QC process.
The following records are presented to illustrate what is required in the Quality Manual. Records need
not be exactly as illustrated but should supply all necessary information concerning the equipment
calibration/verification.
NOTE: After calibrating any force-load testing equipment (compression machine) a copy of the
certification for the calibration device (proving ring, load cell, etc.) shall be attached to the calibration
record.
NOTE: All equipment shall be verified immediately after repairs (this may include new or replacement
parts, or mechanical or electrical adjustments) that may in any way affect the ability of the equipment to
provide accurate readings as established during the calibration/verification process.
DISCLAIMER: It is not the intent of these guidelines to endorse manufacturers, suppliers, calibrating
services, etc. The examples are used to provide guidance in establishing a thoroughly developed Quality
Manual.
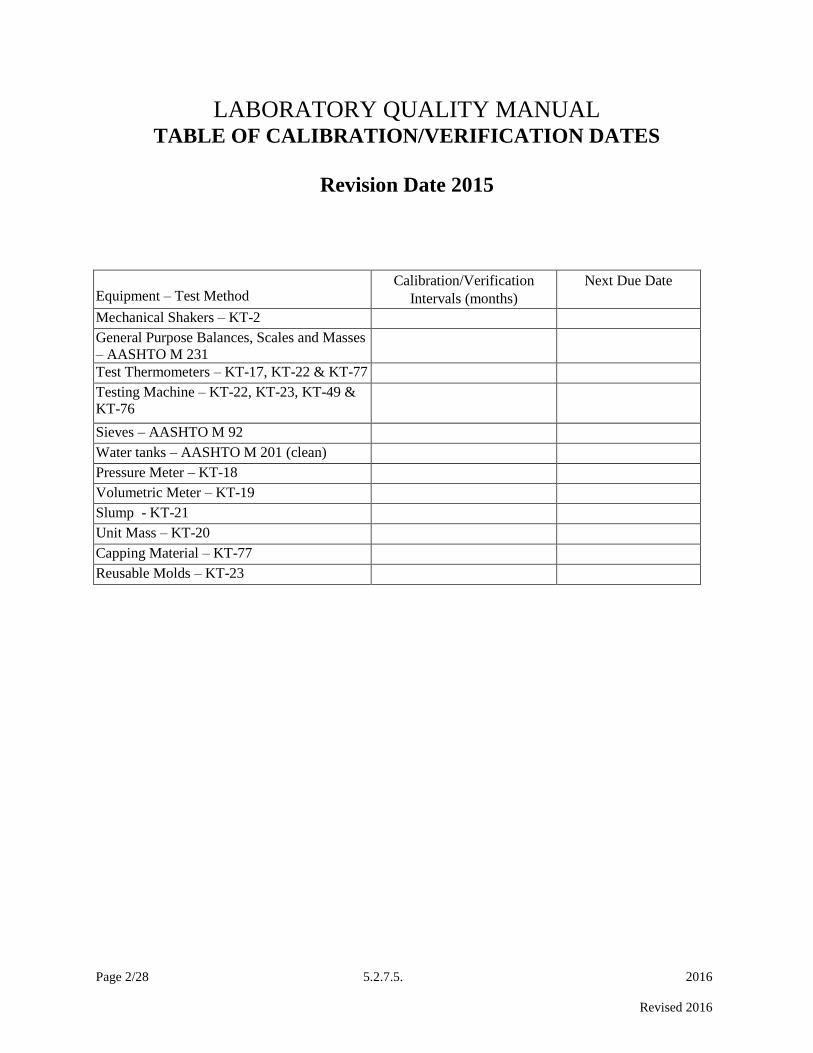
Page 2/28 5.2.7.5. 2016
Revised 2016
LABORATORY QUALITY MANUAL TABLE OF CALIBRATION/VERIFICATION DATES
Revision Date 2015
Equipment – Test Method Calibration/Verification
Intervals (months)
Next Due Date
Mechanical Shakers – KT-2
General Purpose Balances, Scales and Masses
– AASHTO M 231
Test Thermometers – KT-17, KT-22 & KT-77
Testing Machine – KT-22, KT-23, KT-49 &
KT-76
Sieves – AASHTO M 92
Water tanks – AASHTO M 201 (clean)
Pressure Meter – KT-18
Volumetric Meter – KT-19
Slump - KT-21
Unit Mass – KT-20
Capping Material – KT-77
Reusable Molds – KT-23
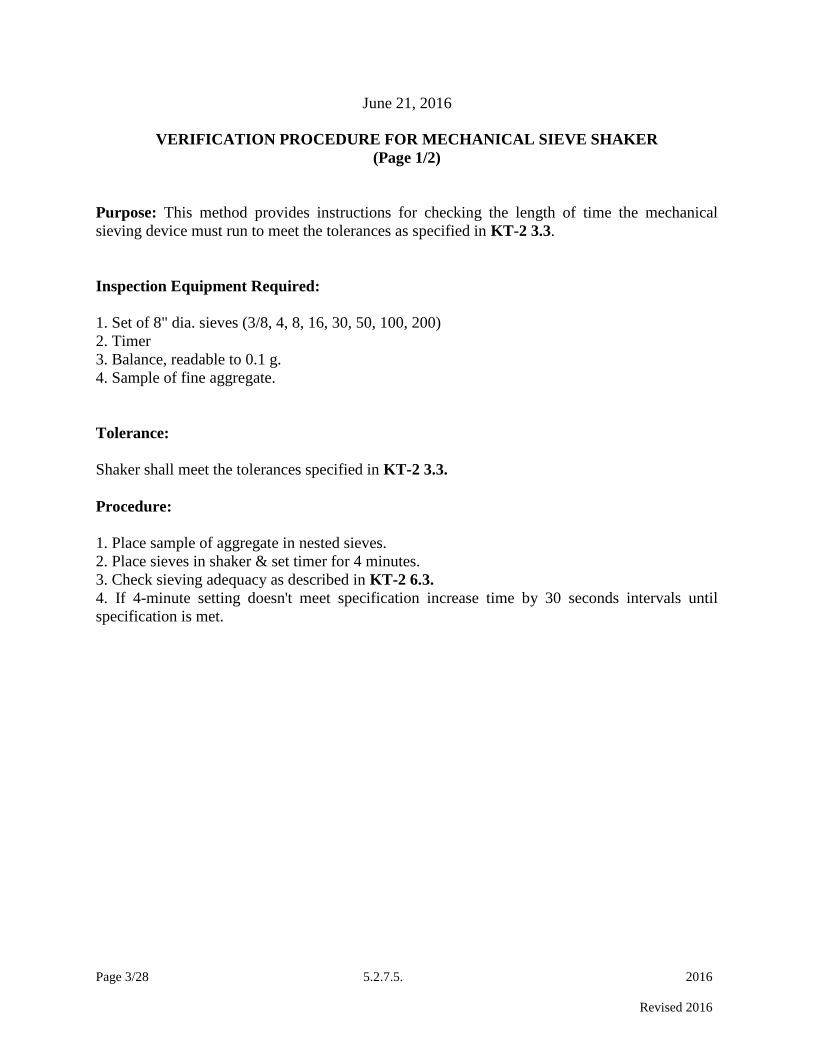
Page 3/28 5.2.7.5. 2016
Revised 2016
June 21, 2016
VERIFICATION PROCEDURE FOR MECHANICAL SIEVE SHAKER
(Page 1/2)
Purpose: This method provides instructions for checking the length of time the mechanical
sieving device must run to meet the tolerances as specified in KT-2 3.3.
Inspection Equipment Required:
1. Set of 8" dia. sieves (3/8, 4, 8, 16, 30, 50, 100, 200)
2. Timer
3. Balance, readable to 0.1 g.
4. Sample of fine aggregate.
Tolerance:
Shaker shall meet the tolerances specified in KT-2 3.3.
Procedure:
1. Place sample of aggregate in nested sieves.
2. Place sieves in shaker & set timer for 4 minutes.
3. Check sieving adequacy as described in KT-2 6.3.
4. If 4-minute setting doesn't meet specification increase time by 30 seconds intervals until
specification is met.

Page 4/28 5.2.7.5. 2016
Revised 2016
June 21, 2016
VERIFICATION RECORD FOR MECHANICAL SHAKER
(Page 2/2)
Verified By: Date:
Equipment: Mechanical Shaker Verif. Frequency:
Previous Verif. Date: Next Due Date:
Verification Equipment Used:
Verif. Equipment Identification:
Verif. Procedure Used:
1 Weight of Sample in grams.
2 Weight of material, in grams, passing sieve after one minute of hand
shaking as described in KT 2.
3 Percent of material passed.

Page 5/28 5.2.7.5. 2016
Revised 2016
CALIBRATION OF BALANCES
Page 1/3
March 30, 1995
ABC PACKERS INC.
SCOPE OF WORK FOR LABORATORY BALANCES:
Definitions are on next page.
1. The weighing environment is checked for anything that would effect the ability of the balance
to weigh accurately for example: direct air currents, direct sunlight, objects stuck under the
balance or magnets in close proximity to the balance.
2. The balance is checked for errors in zero, sensitivity, calibration, comer load, linearity,
repeatability and tare accuracy. Any errors are noted.
3. The balance is thoroughly cleaned and disassembled. Parts subject to wear or damage are
inspected. On mechanical balances, this includes but is not limited to knife edges, arrestment
mechanism, switches, pan brake assemblies and weight lifting assemblies. On electronic
balances, the measuring cell and flextures are inspected. Circuit boards and switches are
inspected for contamination and corrosion.
4. Any errors noted in step two are corrected through adjustments or replacement of minor parts.
If the balance cannot be returned to factory specifications through this method, the using
personnel are consulted as to the need for further repairs.
5. The balance is reassembled and final checks are made as in step two. Final calibration
adjustments are made.
6. Applicable GLP log books are annotated.
A. All tests are performed with Class 1 stainless steel weights traceable to the NIST and are
calibrated at least annually.
B. A certificate of weight traceability to the NIST is provided to each functional area. This
certificate lists all the balances serviced in that area and the serial number of the weights used,
their calibration date, the NIST trace number and the technician calibration number.

Page 6/28 5.2.7.5. 2016
Revised 2016
Page 2/3
DEFINITIONS:
Balance = Weighing device, generally with a resolution of 1 part in 12,000 or greater. Top
loading balances will have a resolution of up to 1 part in 1,200,000 and sensitivity down to 1
milligram i.e. 1200.000 gram +/- .001 gram. Analytical balances will have a resolution of up to
1 part in 4,100,000 and sensitivity down to .0 1 milligram i.e. 41.00000 gram +/- .00001 gram.
Micro-balances will have a resolution of up to 1 part in 200,000,000 sensitivity down to
.0000001 gram.
Calibration = The accuracy of the balance, usually at full capacity, as compared to known
standards.
Class 1 = A published standard for weights from the NIST. The standard dictates the materials,
configuration and tolerance of the weights.
Corner loads = The deviation of the indicated weight between the center of the pan and the front,
rear, left and right of the pan. This test is performed at 2/3 of maximum capacity.
Electronic Balance = A balance deriving it's indicated weight from a force restoration coil
measuring cell or high resolution load cell.
Factory specifications = The balance manufacturers specifications for all adjustments, usually
+/- 1 final count (least significant digit).
Flexture = Parts of the measuring cell. The accuracy of all adjustments is dependent on the
condition of these parts.
GLP = Acronym. Stands for Good Laboratory Practices. Laboratories under this standard must
establish a plan for weighing accuracy control.
Knife edges = The pivot points of the balance beam in mechanical balances.
Mechanical Balance = A high resolution balance deriving it's indicated readout from the
mechanical movement of a balance beam and a system of built in standard comparison weights.
NIST = Acronym. Stands for the National Institute for Standards and Technology. This is the
new name for the National Bureau of Standards (NBS).
Pan brake = Part of a mechanical analytical balance used to stop pan swing when the balance is
arrested.
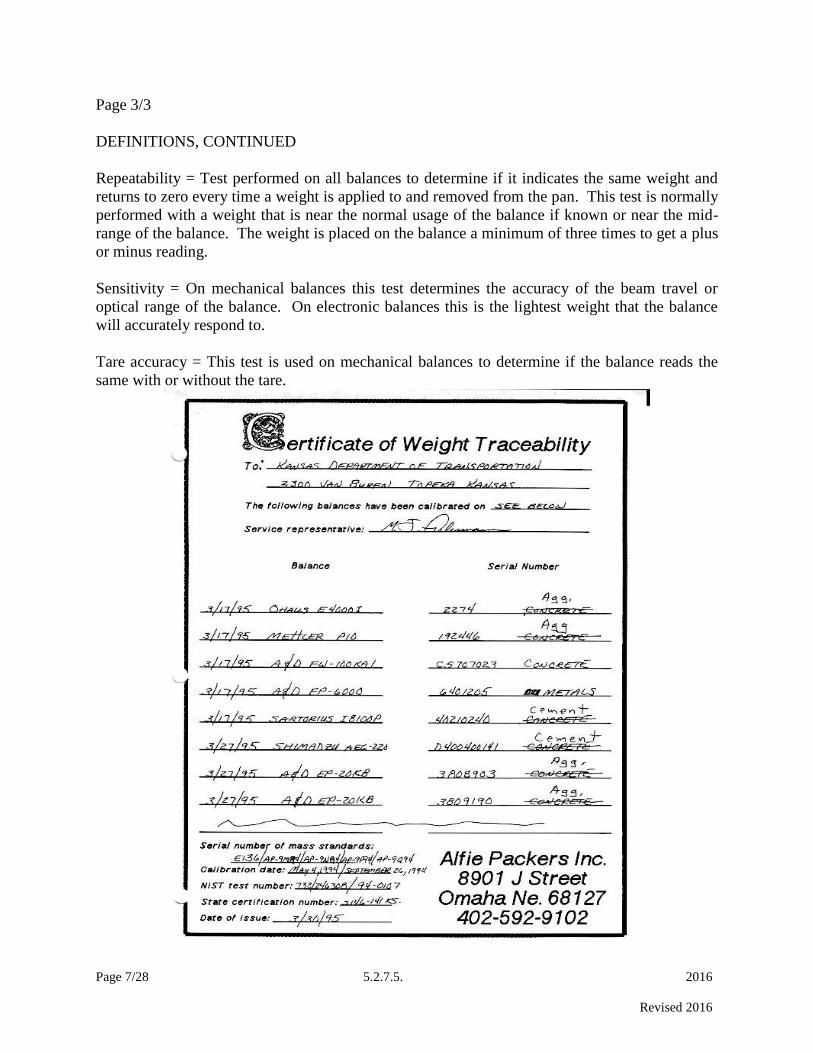
Page 7/28 5.2.7.5. 2016
Revised 2016
Page 3/3
DEFINITIONS, CONTINUED
Repeatability = Test performed on all balances to determine if it indicates the same weight and
returns to zero every time a weight is applied to and removed from the pan. This test is normally
performed with a weight that is near the normal usage of the balance if known or near the mid-
range of the balance. The weight is placed on the balance a minimum of three times to get a plus
or minus reading.
Sensitivity = On mechanical balances this test determines the accuracy of the beam travel or
optical range of the balance. On electronic balances this is the lightest weight that the balance
will accurately respond to.
Tare accuracy = This test is used on mechanical balances to determine if the balance reads the
same with or without the tare.
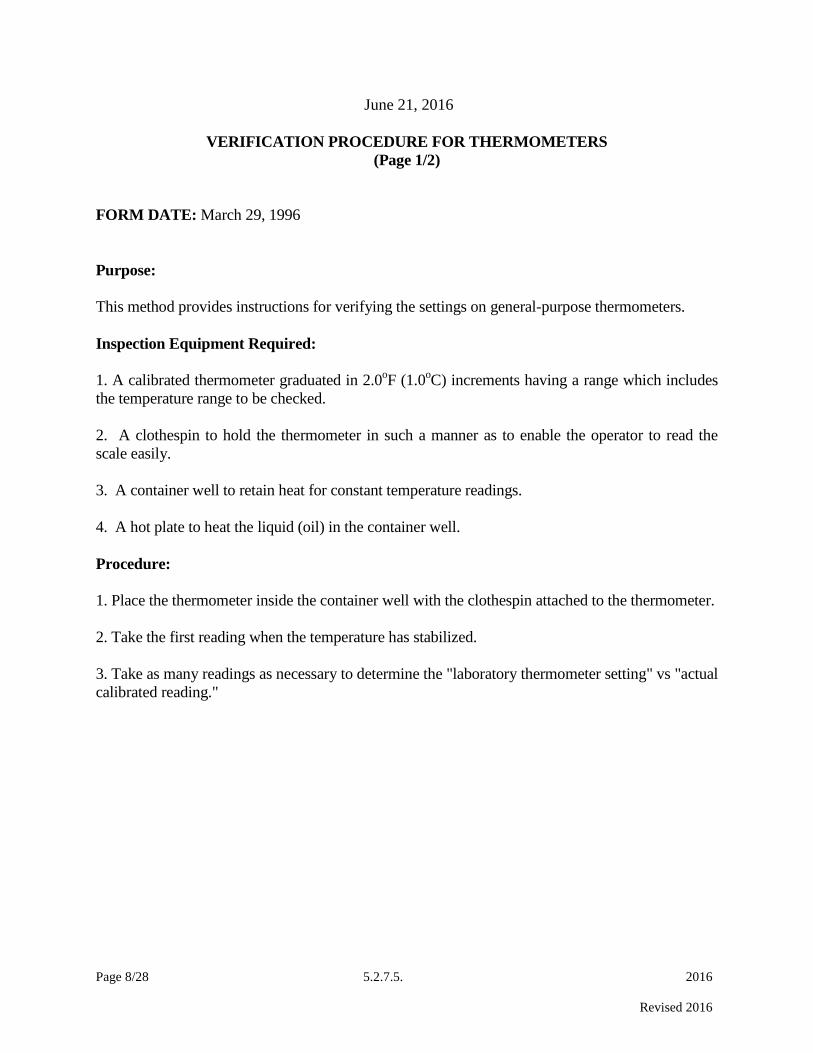
Page 8/28 5.2.7.5. 2016
Revised 2016
June 21, 2016
VERIFICATION PROCEDURE FOR THERMOMETERS
(Page 1/2)
FORM DATE: March 29, 1996
Purpose:
This method provides instructions for verifying the settings on general-purpose thermometers.
Inspection Equipment Required:
1. A calibrated thermometer graduated in 2.0oF (1.0
oC) increments having a range which includes
the temperature range to be checked.
2. A clothespin to hold the thermometer in such a manner as to enable the operator to read the
scale easily.
3. A container well to retain heat for constant temperature readings.
4. A hot plate to heat the liquid (oil) in the container well.
Procedure:
1. Place the thermometer inside the container well with the clothespin attached to the thermometer.
2. Take the first reading when the temperature has stabilized.
3. Take as many readings as necessary to determine the "laboratory thermometer setting" vs "actual
calibrated reading."
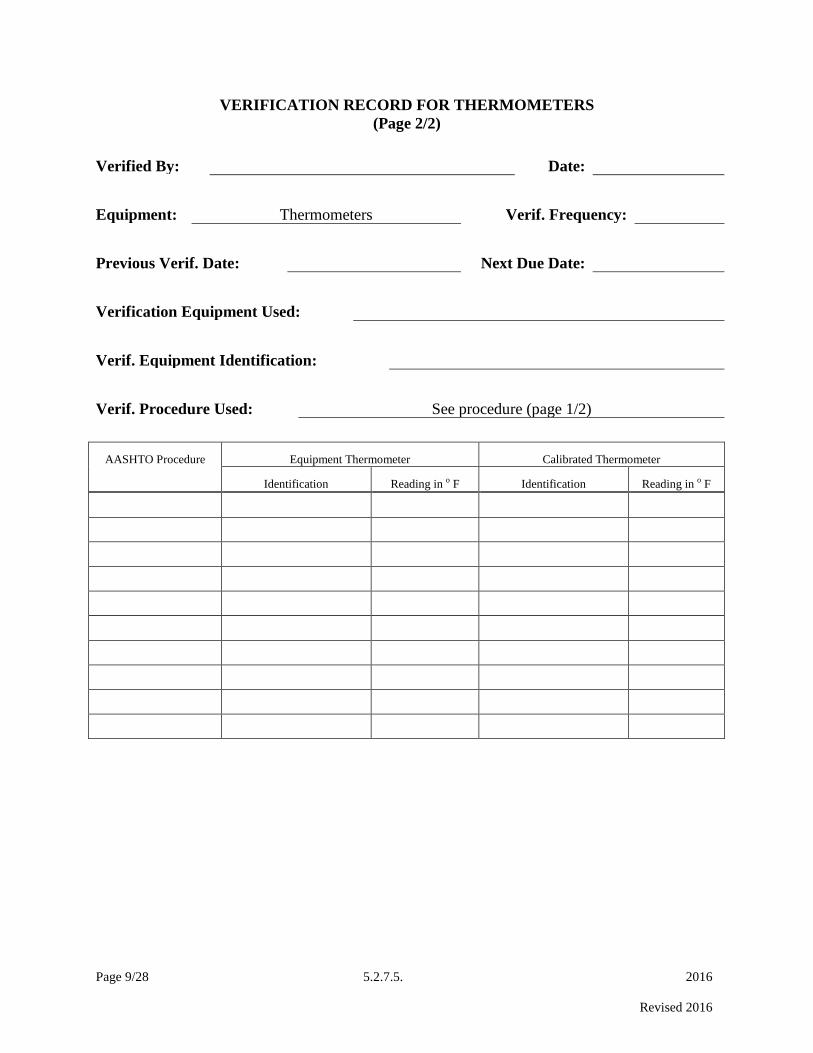
Page 9/28 5.2.7.5. 2016
Revised 2016
VERIFICATION RECORD FOR THERMOMETERS
(Page 2/2)
Verified By: Date:
Equipment: Thermometers Verif. Frequency:
Previous Verif. Date: Next Due Date:
Verification Equipment Used:
Verif. Equipment Identification:
Verif. Procedure Used: See procedure (page 1/2)
AASHTO Procedure Equipment Thermometer Calibrated Thermometer
Identification Reading in o F Identification Reading in o F

Page 10/28 5.2.7.5. 2016
Revised 2016
REPORT FORM FOR COMPRESSION MACHINE (Page 1/2)
Calibration performed according to ASTM E 4 (latest publication).
- Must provide Load Cell readings, Compression Machine readings and
percent error for each force reading.
CONTRACTOR: DATE:
LOCATION:
CALIBRATION SERVICE NAME:
CALIBRATOR:
NEXT LOAD CELL/RING CALIBRATION DATE:
LOWER RANGE OF DEVICE (CLASS A VALUE):
UPPER RANGE OF DEVICE:
TEMPERATURE CORRECTION FACTOR USED:
TESTING MACHINE MANUFACTURER:
TESTING MACHINE SERIAL NUMBER:
CALIBRATION WITNESS:
CALBIRATOR SIGNATURE:
COMMENTS:

Page 11/28 5.2.7.5. 2016
Revised 2016
EXAMPLE FOR VERIFICATION RECORD OF TESTING MACHINE
(Page 2/2)

Page 12/28 5.2.7.5. 2016
Revised 2016
VERIFICATION PROCEDURE FOR SIEVES
(Page 1/2)
Purpose:
This method provides instructions for checking the physical condition of laboratory tests sieves
ranging in size 3 in. (75 mm) to #200 (0.075 mm).
Inspection Equipment Required:
1. A caliper readable to 0.01 mm (use for #4 or coarser).
Tolerances:
Sieves shall meet physical requirements specified in AASHTO M 92 (ASTM E11).
Procedure:
(Steps 1 & 2 apply to sieves having openings greater than 4.75 mm)
1. Select an adequate number of individual sieve openings (3 or 4) along a 45o line. Measure and
record the sieve openings to verify that the size opening indicated on the label is correct.
2. Repeat step 1, rotating the sieve 90o.
3. Inspection the general condition of the sieve. Check the frame and solder joints for cracks or
holes (check for pinholes in the finer sieves).
4. Make sure the sieves have an appropriate label.
5. Check for tightness of the wires on each individual sieve.
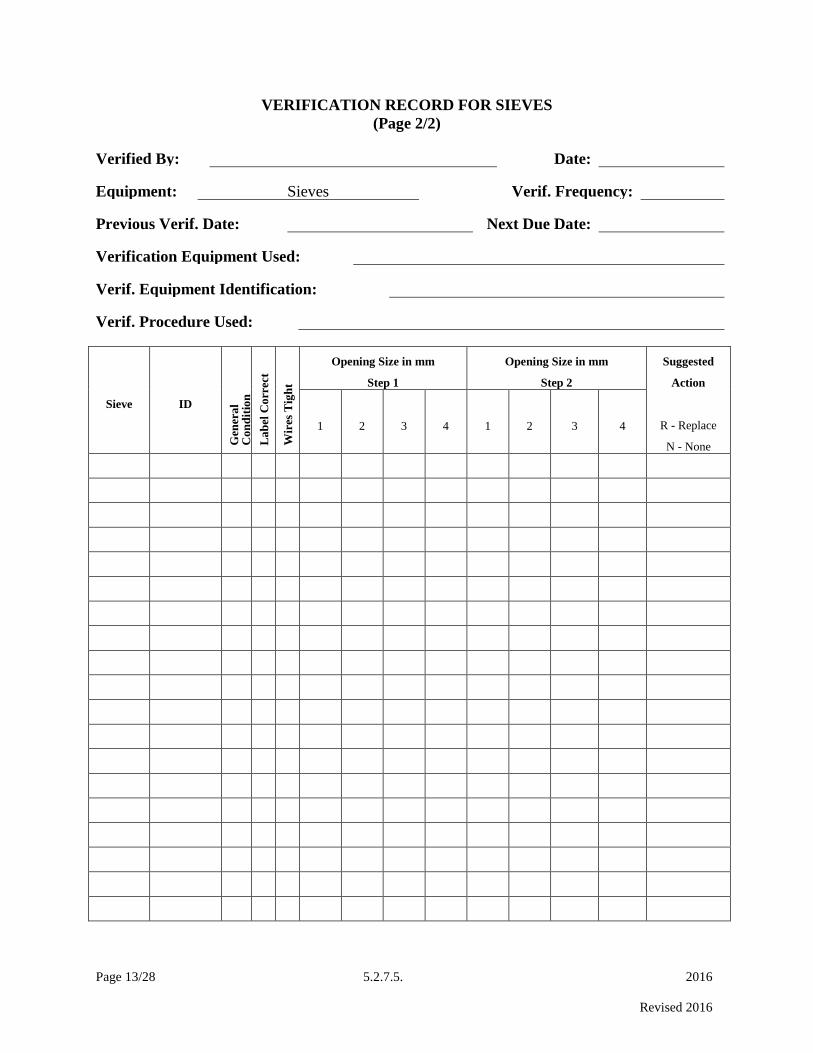
Page 13/28 5.2.7.5. 2016
Revised 2016
VERIFICATION RECORD FOR SIEVES
(Page 2/2)
Verified By: Date: Equipment: Sieves Verif. Frequency: Previous Verif. Date: Next Due Date: Verification Equipment Used: Verif. Equipment Identification:
Verif. Procedure Used:
Sieve
ID
Gen
era
l C
on
dit
ion
La
bel
Co
rrec
t
Wir
es T
igh
t
Opening Size in mm
Step 1
Opening Size in mm
Step 2
Suggested
Action
R - Replace
N - None
1
2
3
4
1
2
3
4
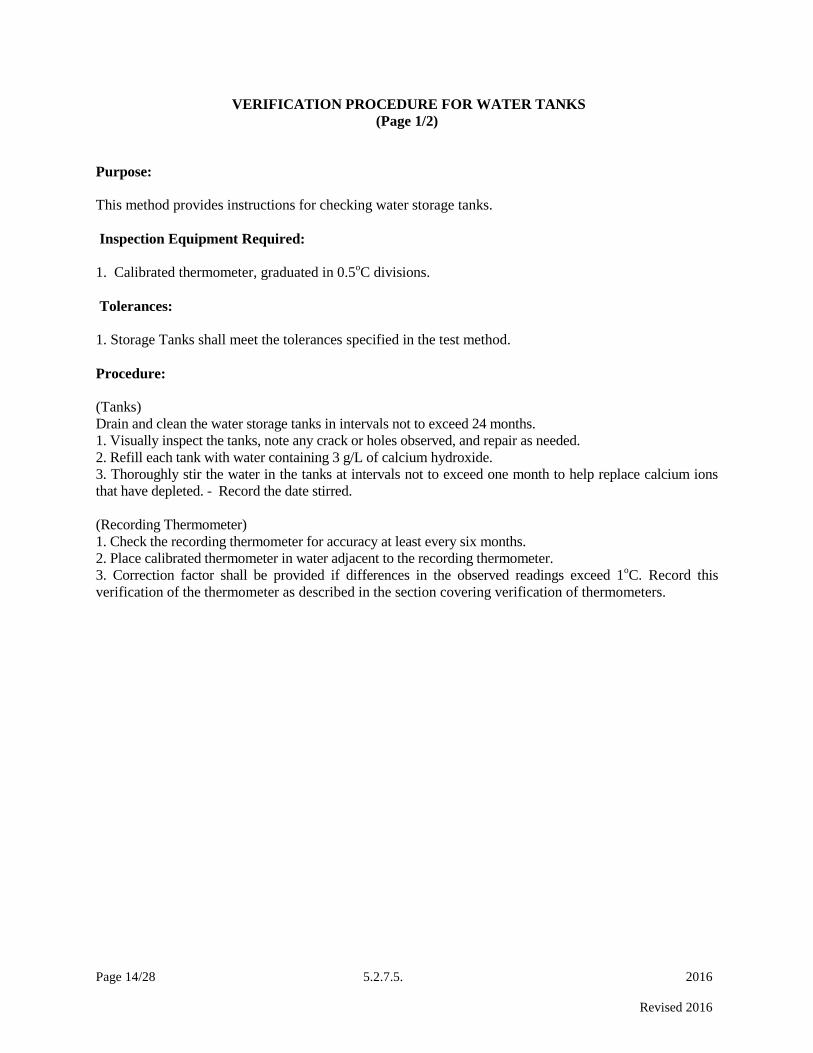
Page 14/28 5.2.7.5. 2016
Revised 2016
VERIFICATION PROCEDURE FOR WATER TANKS
(Page 1/2)
Purpose:
This method provides instructions for checking water storage tanks.
Inspection Equipment Required:
1. Calibrated thermometer, graduated in 0.5oC divisions.
Tolerances:
1. Storage Tanks shall meet the tolerances specified in the test method.
Procedure:
(Tanks)
Drain and clean the water storage tanks in intervals not to exceed 24 months.
1. Visually inspect the tanks, note any crack or holes observed, and repair as needed.
2. Refill each tank with water containing 3 g/L of calcium hydroxide.
3. Thoroughly stir the water in the tanks at intervals not to exceed one month to help replace calcium ions
that have depleted. - Record the date stirred.
(Recording Thermometer)
1. Check the recording thermometer for accuracy at least every six months.
2. Place calibrated thermometer in water adjacent to the recording thermometer.
3. Correction factor shall be provided if differences in the observed readings exceed 1oC. Record this
verification of the thermometer as described in the section covering verification of thermometers.

Page 15/28 5.2.7.5. 2016
Revised 2016
VERIFICATION RECORD FOR WATER TANKS
(Page 2/2)
Verified By: Date:
Equipment: Water Tanks Verif. Frequency:
Previous Verif. Date: Next Due Date:
Verification Equipment Used:
Verif. Equipment Identification:
Verif. Procedure Used:
Water Stirred in Tanks
1st year
2
nd year
Month 1
Month 2
Month 3
Month 4
Month 5
Month 6
Month 7
Month 8
Month 9
Month 10
Month 11
Month 12
Tanks Drained and Cleaned:
Condition of tanks
Refilled with 3 g/L hydrated lime (calcium hydroxide)
Was the thermometer checked for accuracy every six months?

Page 16/28 5.2.7.5. 2016
Revised 2016
VERIFICATION PROCEDURE FOR PRESSURE METER
(Page 1/2)
Purpose:
This method provides instructions for checking the Type B pressure meter.
Inspection Equipment Required:
1. Calipers or ruler readable to 0.01 in.
2. Gauge for measuring hemispherical end of tamping rod.
3. Scale accurate to 0.1 % of the weight of the bowl filled with water.
4. Calibration vessel.
5. Glass plate.
Tolerance:
The pressure meter shall comply with KT-18 for dimensions and materials.
Procedure:
1. Determine the weight of water required to fill the calibration vessel. Record weight as w.
2. Determine the weight of water required to fill the bowl. Record the weight as W.
3. Determine R = w/W.
4. Determine the calibration factor K, where K=R.
5. Assemble water filled meter and calibrate the pressure gauge as outlined in KT-18.

Page 17/28 5.2.7.5. 2016
Revised 2016
VERIFICATION RECORD FOR PRESSURE METER
(Page 2/2)
Verified By: Date:
Equipment: Type B pressure meter Verif. Frequency:
Previous Verif. Date: Next Due Date:
Verification Equipment Used:
Verif. Equipment Identification:
Verif. Procedure Used:
W =
W=
R =
K=
Air content gradations verified as in KT 18?
Yes / no
Tamping Rod
Diameter, inches 1) 5/8”
2)
Length, inches At least 16”
Hemispherical end Yes / no
Action recommended

Page 18/28 5.2.7.5. 2016
Revised 2016
VERIFICATION PROCEDURE FOR VOLUMETRIC METER
(Page 1/2)
Purpose:
This method provides instructions for checking the volumetric meter.
Inspection Equipment Required:
1. Calipers or ruler readable to 0.01 in.
2. Gauge for measuring hemispherical end of tamping rod.
3. Scale accurate to 0.1 % of the weight of the bowl filled with water.
4. Calibrated cup.
5. Thermometer
Tolerance:
The volumetric meter shall comply with KT-20 for dimensions and materials.
Procedure:
1. Determine the volume of the bowl, with an accuracy of at least 0.1 % by weighing the amount of water
required to fill it at room temperature, and dividing this weight by the unit weight of water at the same
temperature.
2. Determine the accuracy of the gradations on the neck, by filling the assembled meter with water to a pre-
selected air-content gradation and then determining the quantity of 21.1oC (70
oF) water required to fill the
meter to the zero mark. The added water shall be within 0.1 % volume of the measuring bowl. Repeat
this procedure 3 times.
3. Determine the volume of the calibrated cup by the method outlined in KT-20.
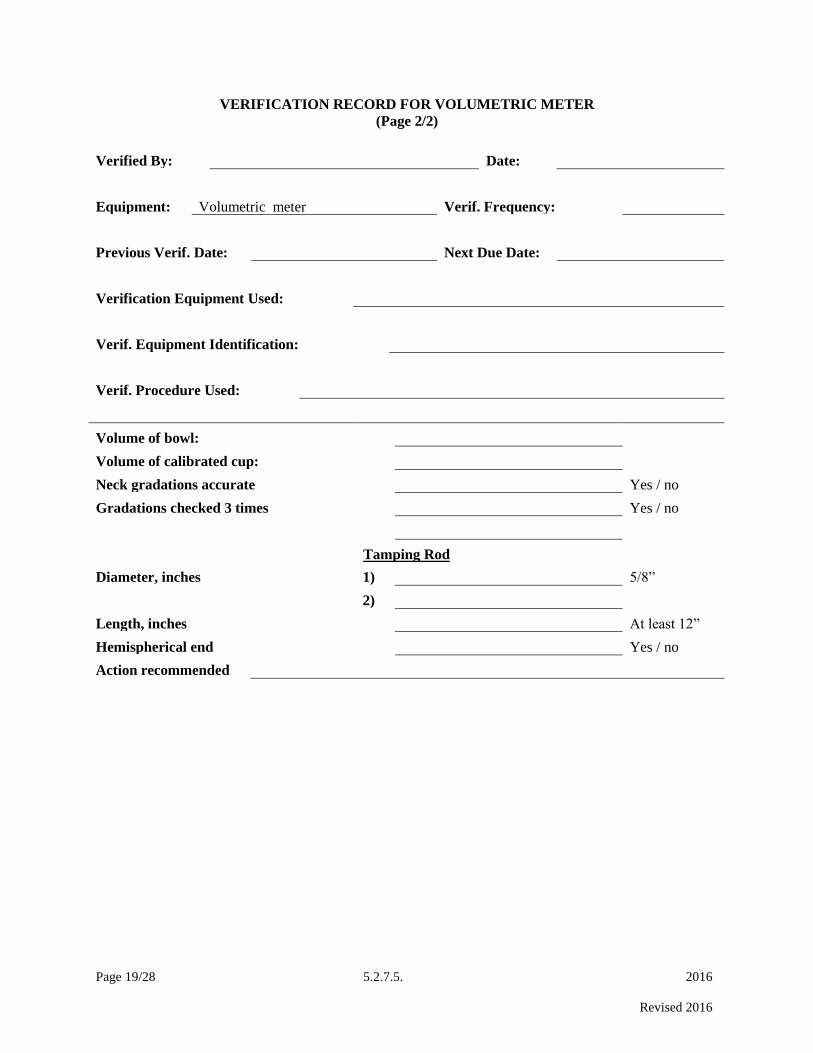
Page 19/28 5.2.7.5. 2016
Revised 2016
VERIFICATION RECORD FOR VOLUMETRIC METER
(Page 2/2)
Verified By: Date:
Equipment: Volumetric meter Verif. Frequency:
Previous Verif. Date: Next Due Date:
Verification Equipment Used:
Verif. Equipment Identification:
Verif. Procedure Used:
Volume of bowl:
Volume of calibrated cup:
Neck gradations accurate Yes / no
Gradations checked 3 times Yes / no
Tamping Rod
Diameter, inches 1) 5/8”
2)
Length, inches At least 12”
Hemispherical end Yes / no
Action recommended

Page 20/28 5.2.7.5. 2016
Revised 2016
VERIFICATION PROCEDURE FOR SLUMP
(Page 1/2)
Purpose:
This method provides instructions for checking the critical dimensions of the slump cone.
Inspection Equipment Required:
1. Calipers or ruler readable to 0.01 in.
2. Straightedge or ruler.
3. Digital micrometer.
4. Gauge for measuring hemispherical end of tamping rod.
Tolerance:
Equipment shall meet the dimensional tolerances specified in the test method.
Procedure:
(CONE)
1. Measure the inside diameter at the top of the cone to the nearest 0.01 in. by taking two readings 90o
apart using the calipers and record the results.
2. Invert the cone and repeat the procedure.
3. Place the cone on a flat surface. Measure and record the depth of the cone by using the calipers and a
straightedge and record the results.
4. Measure the thickness of the cone to the nearest 0.001 in. by taking 2 readings 90o apart at the bottom
of the cone & record the results.
(TAMPER)
1. Measure the diameter of the tamping rod to the nearest millimeter by taking two readings 90o apart
using the micrometer and record the results. Measure the length of the rod to the nearest 0.1 in. and
record the results.
2. Measure the hemispherical end of the rod and record the results.

Page 21/28 5.2.7.5. 2016
Revised 2016
VERIFICATION RECORD FOR SLUMP
(Page 2/2)
Verified By: Date:
Equipment: Slump Cone and Tamping Rod Verif. Frequency:
Previous Verif. Date: Next Due Date:
Verification Equipment Used:
Verif. Equipment Identification:
Verif. Procedure Used:
Cone Specification
Top inside diameter, inches 1) 4” +/- 1/8”
2)
Bottom inside diameter, inches 1) 8” +/- 1/8”
2)
Depth of Cone , inches 1) 12” +/- 1/8”
Wall thickness, inches 1) Not less than 0.045”
2)
Tamping Rod
Diameter, inches 1) 5/8”
2)
Length, inches Approx. 24”
Hemispherical end Yes / no
Action recommended
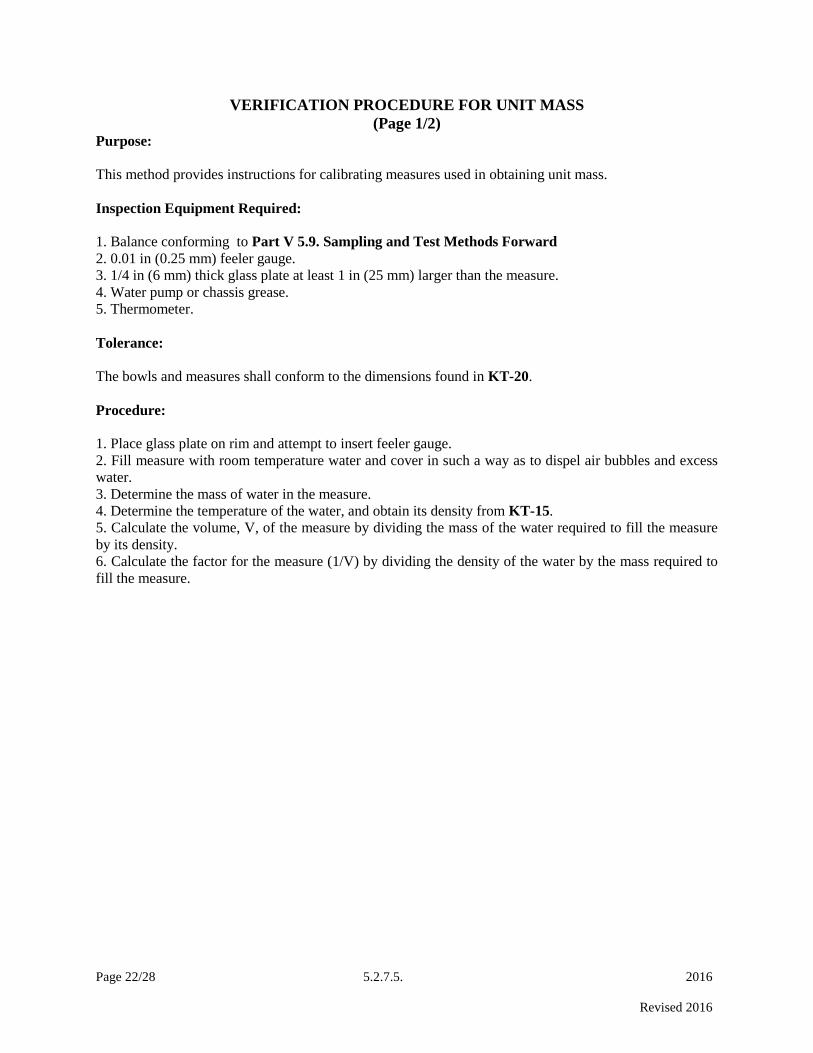
Page 22/28 5.2.7.5. 2016
Revised 2016
VERIFICATION PROCEDURE FOR UNIT MASS
(Page 1/2) Purpose:
This method provides instructions for calibrating measures used in obtaining unit mass.
Inspection Equipment Required:
1. Balance conforming to Part V 5.9. Sampling and Test Methods Forward
2. 0.01 in (0.25 mm) feeler gauge.
3. 1/4 in (6 mm) thick glass plate at least 1 in (25 mm) larger than the measure.
4. Water pump or chassis grease.
5. Thermometer.
Tolerance:
The bowls and measures shall conform to the dimensions found in KT-20.
Procedure:
1. Place glass plate on rim and attempt to insert feeler gauge.
2. Fill measure with room temperature water and cover in such a way as to dispel air bubbles and excess
water.
3. Determine the mass of water in the measure.
4. Determine the temperature of the water, and obtain its density from KT-15.
5. Calculate the volume, V, of the measure by dividing the mass of the water required to fill the measure
by its density.
6. Calculate the factor for the measure (1/V) by dividing the density of the water by the mass required to
fill the measure.
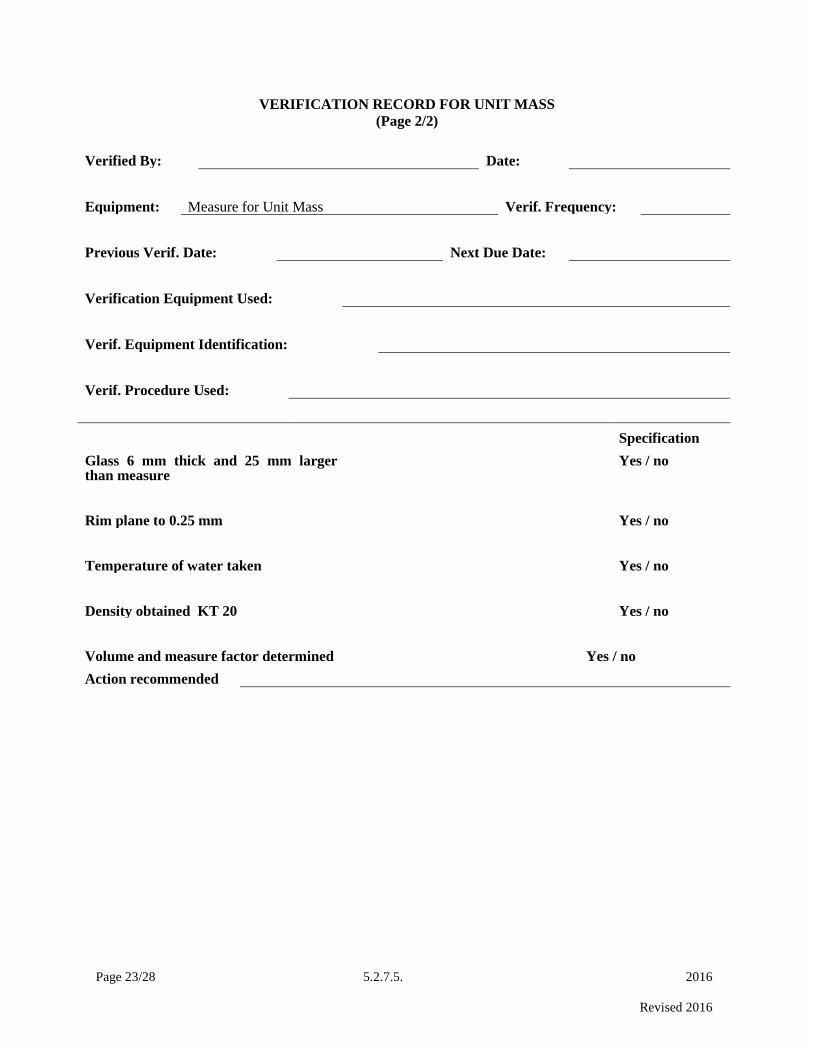
Page 23/28 5.2.7.5. 2016
Revised 2016
VERIFICATION RECORD FOR UNIT MASS
(Page 2/2)
Verified By: Date:
Equipment: Measure for Unit Mass Verif. Frequency:
Previous Verif. Date: Next Due Date:
Verification Equipment Used:
Verif. Equipment Identification:
Verif. Procedure Used:
Specification
Glass 6 mm thick and 25 mm larger than measure
Yes / no
Rim plane to 0.25 mm Yes / no
Temperature of water taken Yes / no
Density obtained KT 20 Yes / no
Volume and measure factor determined Yes / no
Action recommended
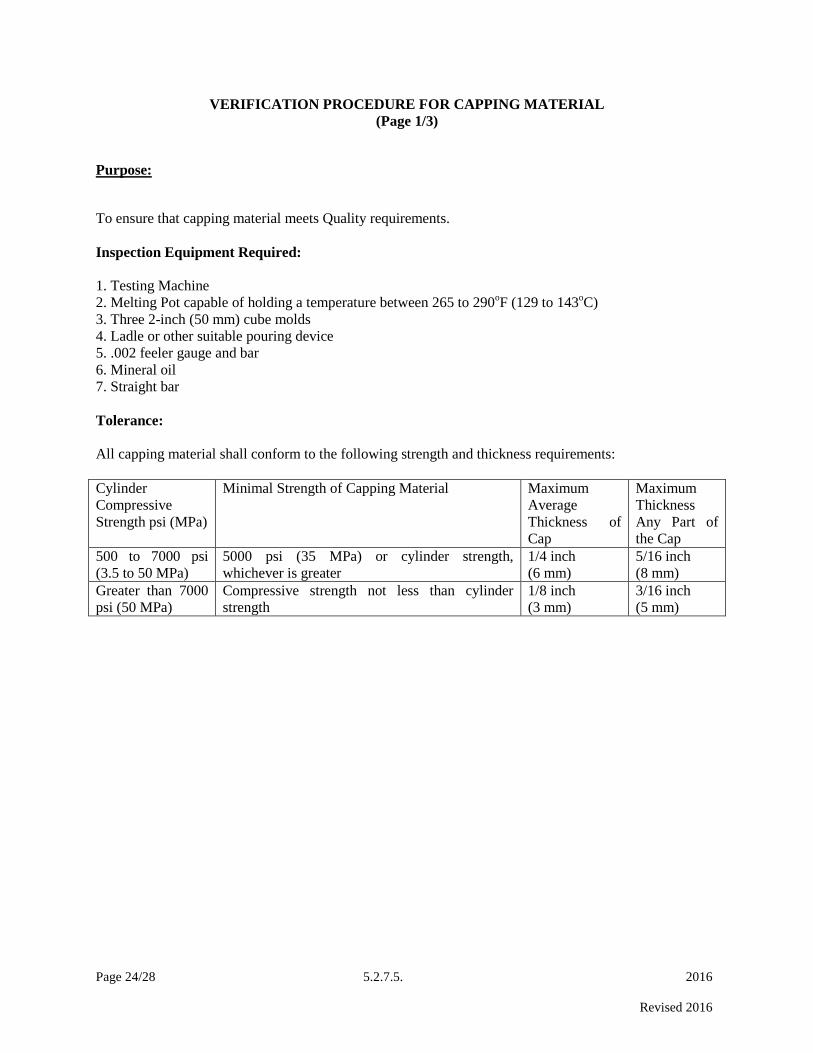
Page 24/28 5.2.7.5. 2016
Revised 2016
VERIFICATION PROCEDURE FOR CAPPING MATERIAL
(Page 1/3)
Purpose:
To ensure that capping material meets Quality requirements.
Inspection Equipment Required:
1. Testing Machine
2. Melting Pot capable of holding a temperature between 265 to 290oF (129 to 143
oC)
3. Three 2-inch (50 mm) cube molds
4. Ladle or other suitable pouring device
5. .002 feeler gauge and bar
6. Mineral oil
7. Straight bar
Tolerance:
All capping material shall conform to the following strength and thickness requirements:
Cylinder
Compressive
Strength psi (MPa)
Minimal Strength of Capping Material Maximum
Average
Thickness of
Cap
Maximum
Thickness
Any Part of
the Cap
500 to 7000 psi
(3.5 to 50 MPa)
5000 psi (35 MPa) or cylinder strength,
whichever is greater
1/4 inch
(6 mm)
5/16 inch
(8 mm)
Greater than 7000
psi (50 MPa)
Compressive strength not less than cylinder
strength
1/8 inch
(3 mm)
3/16 inch
(5 mm)

Page 25/28 5.2.7.5. 2016
Revised 2016
VERIFICATION PROCEDURE FOR CAPPING MATERIAL
(Page 2/3)
Procedure:
1. Melt sufficient capping material in melting pot until it reaches between 265 to 290oF (129 to 143
oC).
2. Bring the mold parts to 68 to 86oF (20 to 30
oC).
3. Coat all surfaces of cube molds with mineral oil.
4. After stirring thoroughly, use Ladle to begin casting the cubes. Quickly fill all three molds until the
molten material reaches the top of the filling hole.
5. Allow time for maximum shrinkage to occur due to cooling and solidification to occur (approximately
15 minutes) and refill each mold with molten material.
6. After solidification occurs remove the cubes from the molds without breaking off the knob.
7. Remove oil, sharp edges, and fins from cubes.
8. Allow cubes to harden for a minimum of two hours before breaking.
9. Test the cubes in the compression machine and calculate the compressive strength.

Page 26/28 5.2.7.5. 2016
Revised 2016
VERIFICATION RECORD FOR CAPPING MATERIAL
(Page 3/3)
Verified By: Date:
Equipment: Capping Material Verif. Frequency:
Previous Verif. Date: Next Due Date:
Verification Equipment Used:
Verif. Equipment Identification:
Verif. Procedure Used:
Compressive Strength at 2 hours (average of three), PSI
Material Meets specification requirements as outlined in Page 1/3.
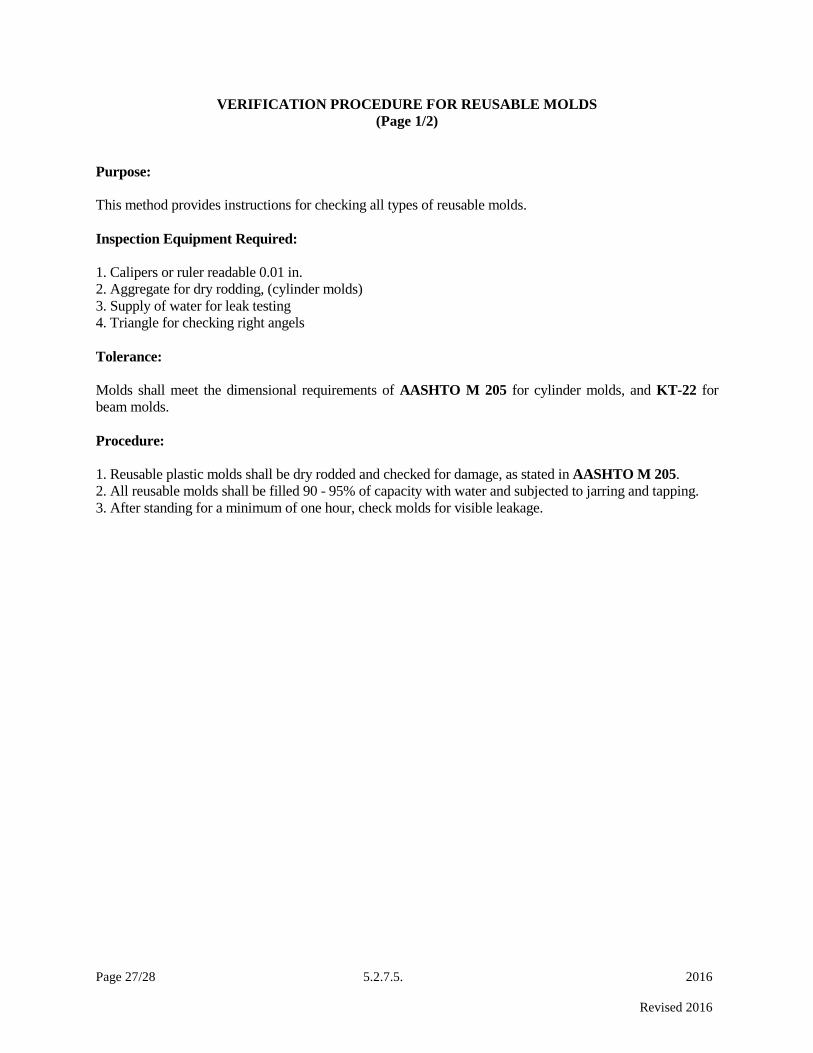
Page 27/28 5.2.7.5. 2016
Revised 2016
VERIFICATION PROCEDURE FOR REUSABLE MOLDS
(Page 1/2)
Purpose:
This method provides instructions for checking all types of reusable molds.
Inspection Equipment Required:
1. Calipers or ruler readable 0.01 in.
2. Aggregate for dry rodding, (cylinder molds)
3. Supply of water for leak testing
4. Triangle for checking right angels
Tolerance:
Molds shall meet the dimensional requirements of AASHTO M 205 for cylinder molds, and KT-22 for
beam molds.
Procedure:
1. Reusable plastic molds shall be dry rodded and checked for damage, as stated in AASHTO M 205.
2. All reusable molds shall be filled 90 - 95% of capacity with water and subjected to jarring and tapping.
3. After standing for a minimum of one hour, check molds for visible leakage.
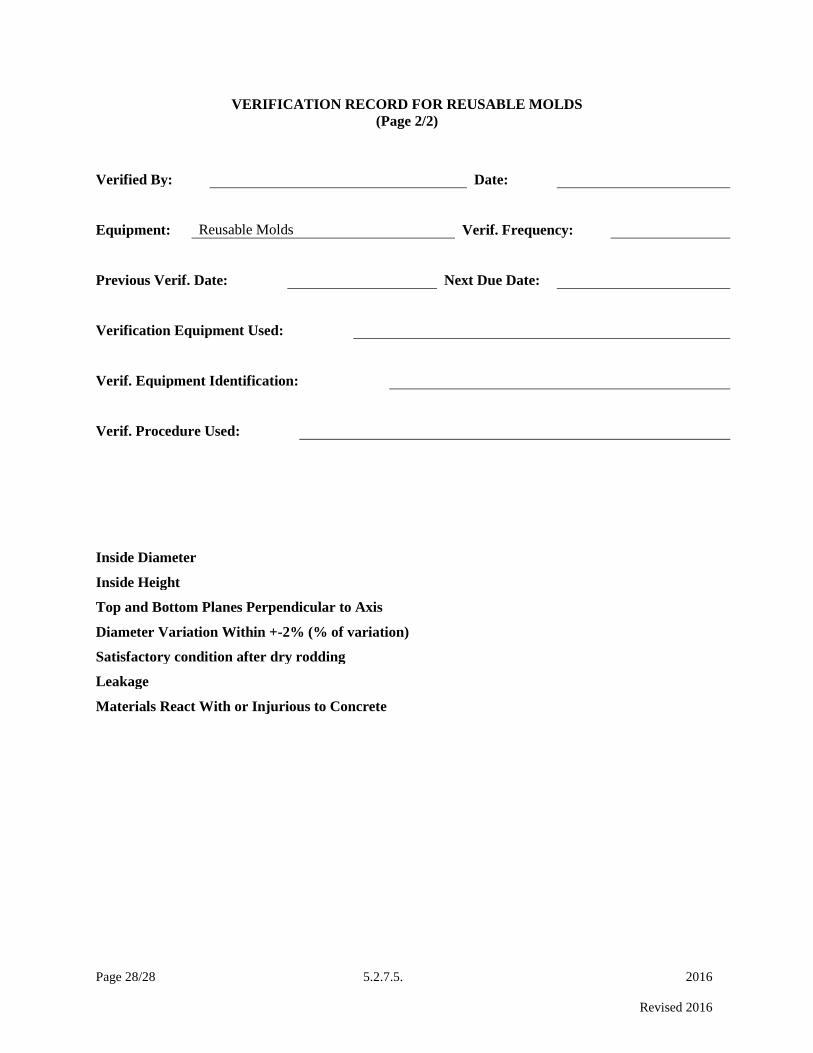
Page 28/28 5.2.7.5. 2016
Revised 2016
VERIFICATION RECORD FOR REUSABLE MOLDS
(Page 2/2)
Verified By: Date:
Equipment: Reusable Molds Verif. Frequency:
Previous Verif. Date: Next Due Date:
Verification Equipment Used:
Verif. Equipment Identification:
Verif. Procedure Used:
Inside Diameter
Inside Height
Top and Bottom Planes Perpendicular to Axis
Diameter Variation Within +-2% (% of variation)
Satisfactory condition after dry rodding
Leakage
Materials React With or Injurious to Concrete

Page 1/1 5.2.7.6 2016
Revised 2016
5.2.7.6. CONCRETE STRUCTURES: CONTRACTOR’S QUALITY CONTROL PLAN
NOTE: This document is generally written in the imperative mood. The subject, "the Contractor" is
implied. Also implied in this language are "shall", "shall be", or similar words and phrases. The word
"will" generally pertains to decisions or actions of the Kansas Department of Transportation.
1. General. Provide equipment meeting the requirements listed below to conduct quality control testing.
Verify the testing equipment with prescribed procedures. As a minimum, meet the verification
schedule as outlined in Table 1, Concrete Structures Evaporation Test Equipment.
File all reports, records, and diaries developed during the progress of construction activities as directed by
the Engineer. Files become the property of the Department.
Provide the following test data: Air temperature, concrete temperature, relative humidity, wind velocity
and evaporation rate.
Make copies of all test results and control charts readily available to the Engineer at the
project site.
Table 1: Concrete Structures Evaporation Test Equipment
Equipment
Requirements (Range) [Accuracy]
Interval
(months)
Relative Humidity Verify (10 to 90%) [+ 3%] 12
Wind Velocity Verify (2 to 90 mph) [+ 5%] 12
Thermometers
(Air and Concrete)
Standardize (-20 to 60oC or -5 to 140
oF) [+ 1
oC or 2
oF] 6
2. Quality Control Organization. Submit a listing of the names and phone numbers of individuals and
alternates responsible for quality control administration and inspection. Provide an organizational chart
that shows the specified lines of authority relating to quality control operations during production.
Provide a copy of the organizational chart at the pre-construction conference.
3. Quality Control Plan. Prepare a Quality Control Plan detailing the monitoring of evaporation rate and
actions to be taken once the evaporation rate exceeds the maximum stated within the specifications. As a
minimum, provide:
The name of the individual(s) responsible to initiate the plan
The name of the individual(s) performing the tests and frequency of tests that will be performed
Number of individuals to assist in the fogging operation
Experience of individuals with fogging bridge decks
Type of fogging equipment
Curing procedure to be used
4. Documentation. Maintain adequate records of all tests. Indicate the nature and number of
observations made. The Contractor's documentation procedures will be subject to approval of the
Engineer before the start of the work and to compliance checks during the progress of the work.
NOTE: Section 5.2.7.7., Example of a Contractor’s Concrete Structures Quality Control Plan for
Controlling Evaporation, will provide the contractor a basic outline for the Quality Control Plan.

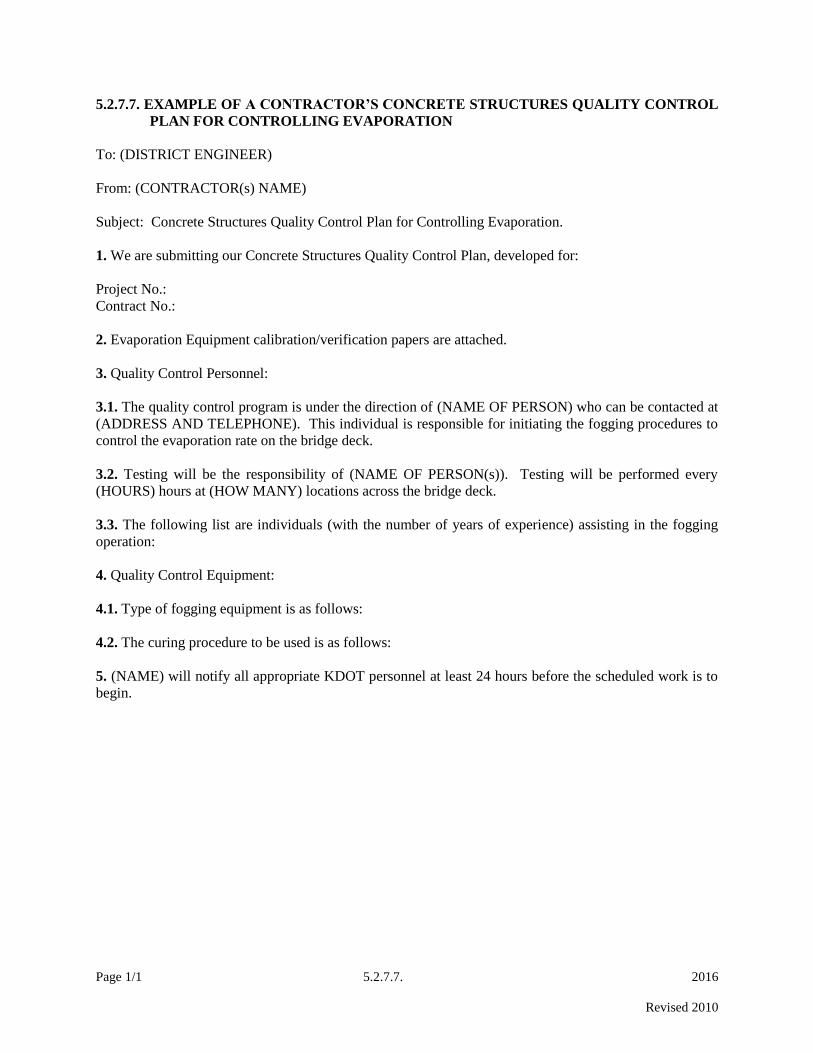
Page 1/1 5.2.7.7. 2016
Revised 2010
5.2.7.7. EXAMPLE OF A CONTRACTOR’S CONCRETE STRUCTURES QUALITY CONTROL
PLAN FOR CONTROLLING EVAPORATION
To: (DISTRICT ENGINEER)
From: (CONTRACTOR(s) NAME)
Subject: Concrete Structures Quality Control Plan for Controlling Evaporation.
1. We are submitting our Concrete Structures Quality Control Plan, developed for:
Project No.:
Contract No.:
2. Evaporation Equipment calibration/verification papers are attached.
3. Quality Control Personnel:
3.1. The quality control program is under the direction of (NAME OF PERSON) who can be contacted at
(ADDRESS AND TELEPHONE). This individual is responsible for initiating the fogging procedures to
control the evaporation rate on the bridge deck.
3.2. Testing will be the responsibility of (NAME OF PERSON(s)). Testing will be performed every
(HOURS) hours at (HOW MANY) locations across the bridge deck.
3.3. The following list are individuals (with the number of years of experience) assisting in the fogging
operation:
4. Quality Control Equipment:
4.1. Type of fogging equipment is as follows:
4.2. The curing procedure to be used is as follows:
5. (NAME) will notify all appropriate KDOT personnel at least 24 hours before the scheduled work is to
begin.

Page 1/5 5.2.7.8 2016
Revised 2016
5.2.7.8 CEMENT TREATED BASE: CONTRACTOR’S QUALITY CONTROL PLAN (CTB)
NOTE: This document is generally written in the imperative mood. The subject, "the Contractor" is
implied. Also implied in this language are "shall", "shall be", or similar words and phrases. The word
"will" generally pertains to decisions or actions of the Kansas Department of Transportation.
1. GENERAL
Provide qualified personnel and equipment meeting the requirements listed in the Department's
Construction Manual to conduct quality control testing which conforms with the Sampling and Testing
Frequency Chart for Cement Treated Base for Quality Control/Quality Assurance Projects in Appendix B
of this Manual.
Calibrate and correlate the testing equipment with prescribed procedures and conduct tests in
conformance with specified testing procedures as listed in the Department's Construction Manual. As a
minimum, meet the calibration schedule as outlined in Table 1, Cement Treated Base Materials Test
Equipment.
Maintain control charts on an ongoing basis.
File all reports, records, and diaries developed during the progress of construction activities as directed by
the Engineer. Files become the property of the Department.
Provide the following:
Make copies of all test results and control charts readily available to the Engineer at the project
site.
Copies of all failing test results (based on a moving average of four tests, when appropriate) and
summary sheet sent by on a daily basis to the Construction Engineer.
2. QUALITY CONTROL ORGANIZATION
Submit a listing of the names and phone numbers of individuals and alternates responsible for quality
control administration and inspection along with the proposed mix design data. Provide an organizational
chart that shows the specified lines of authority relating both to mix design and quality control operations
during production. Post a copy of the organizational chart in the Contractor's test facility.
The Contractor's quality control organization or private testing firms representing the Contractor must
include individuals who are certified by KDOT, or a State approved equivalent, for the appropriate test
methods. Only technicians certified in accordance with KDOT requirements may perform process control
testing on the project.
3. QUALITY CONTROL PLAN
Prepare a Quality Control Plan detailing the type and frequency of inspection, sampling and testing
deemed necessary to measure and control the various properties of materials and construction governed
by the Specifications. As a minimum, detail sampling location and techniques, and test frequency to be
utilized in the sampling and testing plan. The Department may utilize quality control sampling and
testing performed by the Contractor for acceptance. Submit the Quality Control Plan to the Engineer in
writing a minimum of 30 days before work begins.
Page 2/5 5.2.7.8 2016
Revised 2016
3.1. Identify the personnel responsible for the Contractor's quality control in the plan. This shall include
the company official who will act as liaison with Department personnel, as well as the Certified
Technician who will direct the inspection program. Quality control sampling, testing, and inspection
shall be an integral part of the Contractor's quality control system. In addition to the above requirements,
the Contractor's quality control system shall document the quality control requirements considered to be
normal activities necessary to control the production and placing of a given product or material at an
acceptable quality level. Retain the latest ten gradation samples for use by the Engineer. It is intended
that sampling and testing be in accordance with standard methods and procedures, and that measuring and
testing equipment be standard, properly calibrated and documented in the Quality Manual. Detail in the
Quality Control Plan any alternative sampling method, procedure and inspection equipment to be used.
3.1.1. Elements of the Plan. Include all elements that affect the quality of the CTB including, but not
limited to the following:
Mix Designs
Aggregate Production
Quality of Components
Stockpile Management
Proportioning, including added water
Mixing and transportation, including time from batching to completion of delivery
Initial mix properties, including temperature and consistency
Placement and consolidation
Compressive strength
Finishing and curing
3.1.2. Personnel Requirements:
Detail in the Plan:
The frequency of sampling and testing, coordination of activities, corrective actions to be taken, and
documentation.
How the duties and responsibilities are to be accomplished and documented, and whether more than
one Certified Technician is required.
The criteria utilized by the Technician to correct or reject unsatisfactory materials.
Certified Technicians required duties:
Perform and utilize quality control tests and other quality control practices to assure that delivered
materials and proportioning meet the requirements of the mix designs, including temperature, slump and
strength. Be available on the project site whenever CTB is being produced for use on or being placed on
the project site.
Periodically inspect all equipment utilized in transporting, proportioning, mixing, placing,
consolidating, finishing, and curing to assure it is operating properly and that placement, consolidation,
finishing, and curing conform to the mix design and other Contract requirements.
Page 3/5 5.2.7.8 2016
Revised 2016
4. DOCUMENTATION
Maintain records of all inspections and tests. Specify the nature and number of observations made, the
number and type of deficiencies found, the quantities approved and rejected, and the nature of corrective
action taken as appropriate in the records. The Contractor's documentation procedures will be subject to
approval of the Engineer before the start of the work and to compliance checks during the progress of the
work.
Charts and Forms.
Keep all conforming and non-conforming inspections and test results complete and available at all times
to the Engineer during the performance of the work. Provide forms on a computer-acceptable medium
where required. Document batch tickets and gradation data in accordance with Department requirements.
Chart test data for cement treated base, including gradation of combined aggregates, in-place CTB
moisture, dry density and compressive strength, in accordance with the applicable requirements.
The Contractor may use other types of control charts as deemed appropriate. It is normally expected that
testing and charting will be completed within 24 hours after testing.
All charts and records documenting the Contractor's quality control inspections and tests become property
of the Department upon completion of the work.
5. CORRECTIVE ACTION
Notify the Engineer when the moving average test result trend line for any property approaches the
specification limits. Cease operations when 2 consecutive moving average points fall outside the
specification limits, or 2 consecutive single compressive strength tests exceed the specification limits.
Ceasing operations is the Contractor’s responsibility. Quality control tests for this determination include
aggregate gradation, compliance with the mix design band and in-place density of CTB.
Failure to cease operations for the conditions cited above will subject all subsequent material to rejection
by the Engineer or acceptance at a reduced price, as determined by the Engineer.
The Engineer may examine materials represented by individual test results which lie beyond the
Contractor’s normal quality control testing variation. The investigation may be based on either Contractor
or KDOT test results. The information from additional testing (including testing of in-place CTB) may be
used to define unacceptable work according to subsection 105.5d. The Engineer will apply appropriate
price reductions or initiate corrective action as determined by the Engineer.
If a dispute exists between the Engineer and Contractor about the validity of any test results, the MRC
will perform referee testing. If 1 of the disputed KDOT test results was generated at the MRC, an
Independent Laboratory agreeable to both parties shall be selected. The Independent Laboratory shall be
approved by the AASHTO Accreditation Program for the tests being refereed. If referee testing indicates
that the KDOT test results are correct, the Contractor is responsible for the cost of additional testing,
including referee testing performed at the MRC. If the referee testing indicates that the Contractor test
results are correct, KDOT is responsible for the cost of additional testing.

Page 4/5 5.2.7.8 2016
Revised 2016
6. Non-Conforming Materials. Identify all non-conforming materials and products to prevent use,
shipment and intermingling with conforming materials and products. Provide holding areas, mutually
agreeable to the Engineer and Contractor.
The Engineer will determine if reclaiming or reworking of non-conforming materials is allowed rather
than rejection of non-conforming materials.
7. Testing Facilities. Locate the Contractor's testing facility at the plant site or at the project site. Obtain
approval of the facility by the Engineer before the commencement of mixture production. Any other
laboratory location requires approval by the District Materials Engineer. Provide suitable space and
specified testing equipment for use by the Contractor's quality control personnel to perform tests as
required.
KDOT’s Materials and Research Center is Accredited through the AASHTO Accreditation Program
(AAP). If the contractor’s QC laboratory is not participating in the AAP, then the contractor shall have an
AAP approved laboratory inspect the QC laboratory’s equipment annually. The inspection shall include
all equipment necessary to perform testing on cement treated base.
Maintain a Quality Manual showing all calibrations performed on all test equipment and when next
calibration is due for that equipment. As a minimum, follow the calibration/verification interval
established in Table 1, Cement Treated Base Materials Test Equipment.
To facilitate communication between the Contractor and the Engineer regarding quality control, equip the
Contractor's testing facility with the following:
A telephone with a private line for the exclusive use of the testing facility's quality control personnel.
A copying machine.
A facsimile machine for use by contractor personnel and the Engineer.
Page 5/5 5.2.7.8 2016
Revised 2016
Table 1, Cement Treated Base Materials Test Equipment
Equipment – Test Method
Requirements
Interval
(months)
Mechanical Shakers – KT-2 Check Sieving Thoroughness. 12
General Purpose Balances, Scales and
Masses – AASHTO M 231
Calibrate 12
Compression Testing Machine – KT-
22, KT-23 & KT-76
Standardize 12
Sieves – AASHTO M 92 Check Physical Conditions. 6
Slump Cones- KT-21 Check Critical Dimensions. 12
Unit Mass – KT-20 Standardize 12
Capping Material –KT-77 Check Strength. 3
Reusable Molds – KT-37 Calibrate 12
Nuclear Density Gauge – KT-36 & 38 Check for Uniformity 12
Ovens Calibrate 12
Thermometers Calibrate 12
8. Testing Requirements. Take all samples for tests at random locations, selected as specified in the
Contractors quality control plan and at the rates specified in the Sampling and Testing Frequency Chart
for Portland Cement Concrete Pavement for Quality Control/Quality Assurance Projects in Appendix B
of Part V of this manual. Record and document all test results and calculations on data sheets that are
acceptable to the Engineer. Record specific test results on a daily summary sheet approved by the
Engineer to facilitate the computation of moving test averages. Base moving averages on 4 consecutive
test results. Include a description of quality control actions taken (adjustment of aggregate or additive
proportions in the mix, moisture adjustments, etc.) in the Daily Quality Control Summary Sheet. Post
quality control charts and keep them current, showing both individual test results and moving average
values. As a minimum, plot the single test values and the 4 test moving average values on approved
control charts for the following properties:
In-place moisture.
Dry Density.
Compressive strength including separate graph for PWL.
Gradation of combined aggregates.
Plot individual test results in black for each test point. Connect points with a solid black line. Plot the
moving average for each test variable in red starting with the fourth test. Connect the points with a
dashed red line. Plot the Department's verification test results with green asterisks. Do not include the
Department's verification tests in the moving average.
Indicate specification working range limits for single test results on the control charts using a dotted green
line and for four point moving average results with a solid green line.
NOTE: Section 5.2.7.9 of this manual, Example of a Laboratories Quality Manual for Cement Treated
Base, will provide examples of equipment procedures to verify that equipment is in proper condition.
Also, examples of records for calibrating/verifying equipment are presented.


Page 1/24 5.2.7.8.1. 2016
Revised 2016
5.2.7.8.1. EXAMPLE OF A LABORATORY QUALITY MANUAL FOR CEMENT TREATED
BASE
This example is designed to provide the contractor with general guidelines in creating and maintaining a
contractor’s Quality Manual. The QC process requires records for equipment calibrations/verifications.
Maintaining records in an orderly manner will assist the District Materials Engineer in quickly
determining if the laboratory meets QC/QA requirements. Having the field laboratory fully prepared and
the Quality Manual properly maintained represent two items that can keep the start of a project on
schedule. It also aids in demonstrating the contractor’s commitment to the QC process.
The following records are presented to illustrate what is required in the Quality Manual. Records need
not be exactly as illustrated but should supply all necessary information concerning the equipment
calibration/verification.
NOTE: After calibrating any force-load testing equipment (compression machine) a copy of the
certification for the calibration device (proving ring, load cell, etc.) shall be attached to the calibration
record.
NOTE: All equipment shall be verified immediately after repairs that may in any way affect the ability of
the equipment to provide accurate readings as established during the calibration/verification process.
Repairs may include new or replacement parts or mechanical or electrical adjustments, among other
items. DISCLAIMER: It is not the intent of these guidelines to endorse manufacturers, suppliers, calibrating
services, etc. The examples are used to provide guidance in establishing a thoroughly developed Quality
Manual.
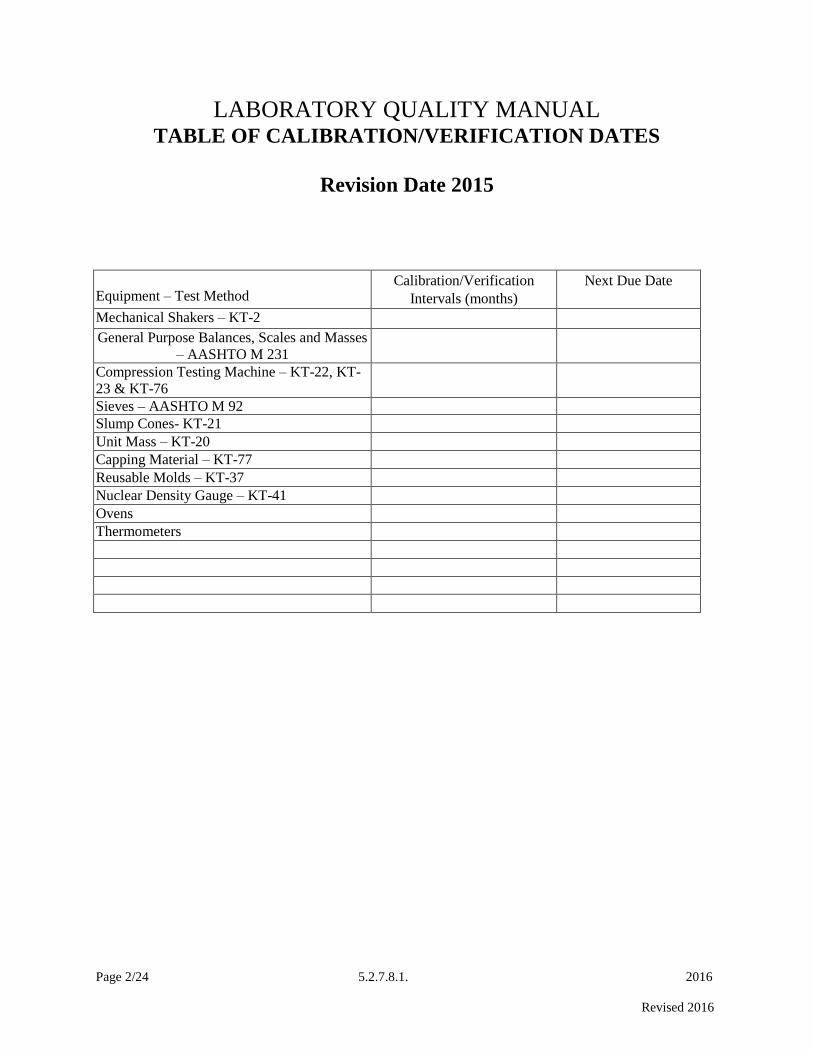
Page 2/24 5.2.7.8.1. 2016
Revised 2016
LABORATORY QUALITY MANUAL TABLE OF CALIBRATION/VERIFICATION DATES
Revision Date 2015
Equipment – Test Method Calibration/Verification
Intervals (months)
Next Due Date
Mechanical Shakers – KT-2
General Purpose Balances, Scales and Masses
– AASHTO M 231
Compression Testing Machine – KT-22, KT-
23 & KT-76
Sieves – AASHTO M 92
Slump Cones- KT-21
Unit Mass – KT-20
Capping Material – KT-77
Reusable Molds – KT-37
Nuclear Density Gauge – KT-41
Ovens
Thermometers

Page 3/24 5.2.7.8.1. 2016
Revised 2016
June 21, 2016
VERIFICATION PROCEDURE FOR MECHANICAL SIEVE SHAKER
(Page 1/2)
Purpose: This method provides instructions for checking the length of time the mechanical
sieving device must run to meet the tolerances as specified in KT-2 3.3.
Inspection Equipment Required:
1. Set of 8" dia. sieves (3/8, 4, 8, 16, 30, 50, 100, 200)
2. Timer
3. Balance, readable to 0.1 g.
4. Sample of fine aggregate.
Tolerance:
Shaker shall meet the tolerances specified in KT-2 3.3.
Procedure:
1. Place sample of aggregate in nested sieves.
2. Place sieves in shaker & set timer for 4 minutes.
3. Check sieving adequacy as described in KT-2 6.3.
4. If 4-minute setting doesn't meet specification increase time by 30 seconds intervals until
specification is met.

Page 4/24 5.2.7.8.1. 2016
Revised 2016
June 21, 2016
VERIFICATION RECORD FOR MECHANICAL SHAKER
(Page 2/2)
Verified By: Date:
Equipment: Mechanical Shaker Verif. Frequency:
Previous Verif. Date: Next Due Date:
Verification Equipment Used:
Verif. Equipment Identification:
Verif. Procedure Used:
1 Weight of Sample in grams.
2 Weight of material, in grams, passing sieve after one minute of hand
shaking as described in KT 2.
3 Percent of material passed.
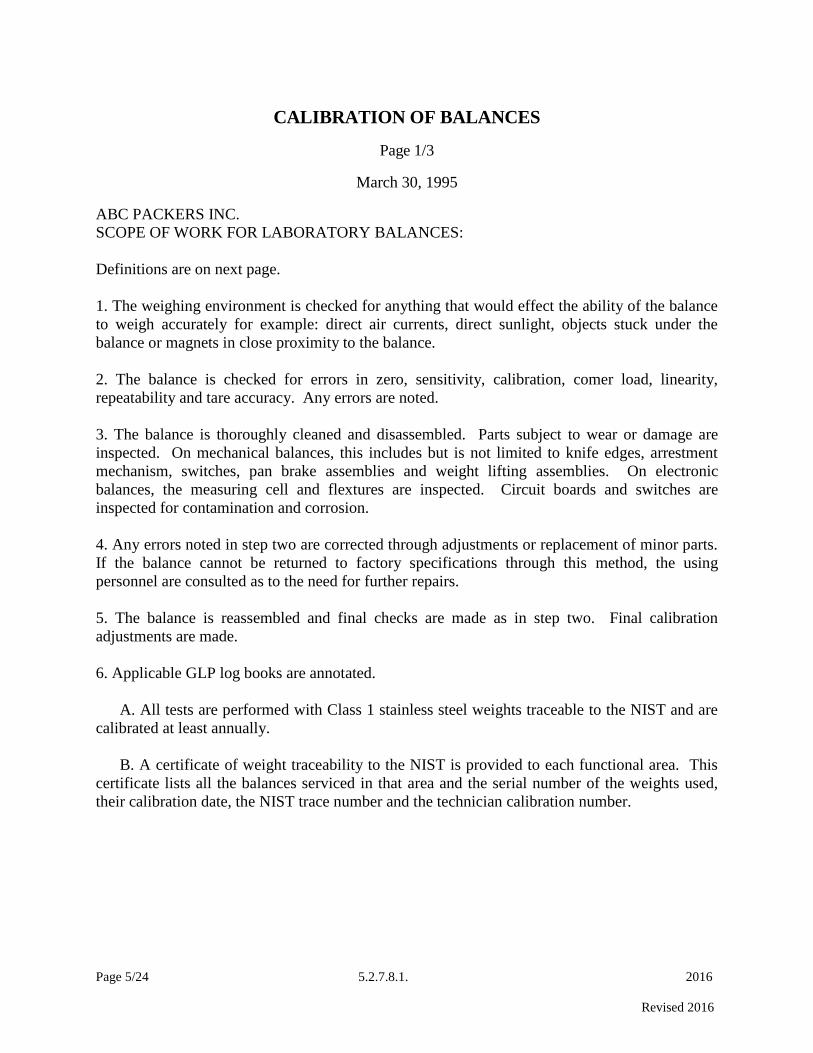
Page 5/24 5.2.7.8.1. 2016
Revised 2016
CALIBRATION OF BALANCES
Page 1/3
March 30, 1995
ABC PACKERS INC.
SCOPE OF WORK FOR LABORATORY BALANCES:
Definitions are on next page.
1. The weighing environment is checked for anything that would effect the ability of the balance
to weigh accurately for example: direct air currents, direct sunlight, objects stuck under the
balance or magnets in close proximity to the balance.
2. The balance is checked for errors in zero, sensitivity, calibration, comer load, linearity,
repeatability and tare accuracy. Any errors are noted.
3. The balance is thoroughly cleaned and disassembled. Parts subject to wear or damage are
inspected. On mechanical balances, this includes but is not limited to knife edges, arrestment
mechanism, switches, pan brake assemblies and weight lifting assemblies. On electronic
balances, the measuring cell and flextures are inspected. Circuit boards and switches are
inspected for contamination and corrosion.
4. Any errors noted in step two are corrected through adjustments or replacement of minor parts.
If the balance cannot be returned to factory specifications through this method, the using
personnel are consulted as to the need for further repairs.
5. The balance is reassembled and final checks are made as in step two. Final calibration
adjustments are made.
6. Applicable GLP log books are annotated.
A. All tests are performed with Class 1 stainless steel weights traceable to the NIST and are
calibrated at least annually.
B. A certificate of weight traceability to the NIST is provided to each functional area. This
certificate lists all the balances serviced in that area and the serial number of the weights used,
their calibration date, the NIST trace number and the technician calibration number.
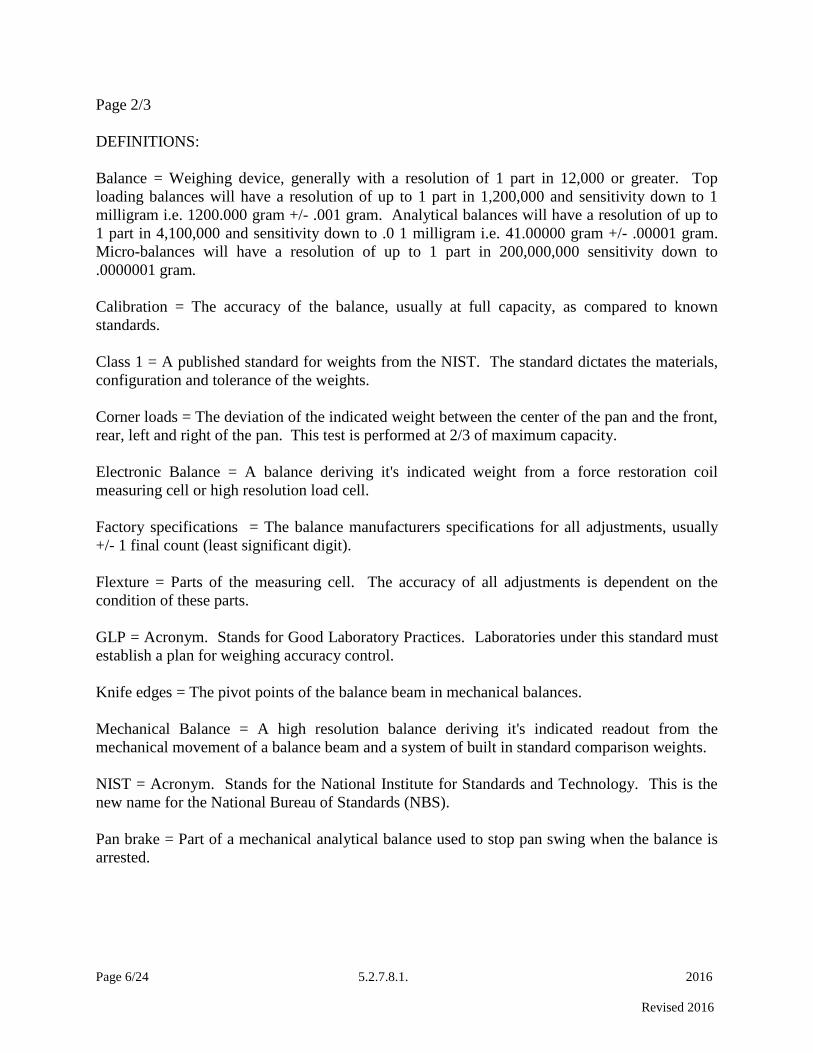
Page 6/24 5.2.7.8.1. 2016
Revised 2016
Page 2/3
DEFINITIONS:
Balance = Weighing device, generally with a resolution of 1 part in 12,000 or greater. Top
loading balances will have a resolution of up to 1 part in 1,200,000 and sensitivity down to 1
milligram i.e. 1200.000 gram +/- .001 gram. Analytical balances will have a resolution of up to
1 part in 4,100,000 and sensitivity down to .0 1 milligram i.e. 41.00000 gram +/- .00001 gram.
Micro-balances will have a resolution of up to 1 part in 200,000,000 sensitivity down to
.0000001 gram.
Calibration = The accuracy of the balance, usually at full capacity, as compared to known
standards.
Class 1 = A published standard for weights from the NIST. The standard dictates the materials,
configuration and tolerance of the weights.
Corner loads = The deviation of the indicated weight between the center of the pan and the front,
rear, left and right of the pan. This test is performed at 2/3 of maximum capacity.
Electronic Balance = A balance deriving it's indicated weight from a force restoration coil
measuring cell or high resolution load cell.
Factory specifications = The balance manufacturers specifications for all adjustments, usually
+/- 1 final count (least significant digit).
Flexture = Parts of the measuring cell. The accuracy of all adjustments is dependent on the
condition of these parts.
GLP = Acronym. Stands for Good Laboratory Practices. Laboratories under this standard must
establish a plan for weighing accuracy control.
Knife edges = The pivot points of the balance beam in mechanical balances.
Mechanical Balance = A high resolution balance deriving it's indicated readout from the
mechanical movement of a balance beam and a system of built in standard comparison weights.
NIST = Acronym. Stands for the National Institute for Standards and Technology. This is the
new name for the National Bureau of Standards (NBS).
Pan brake = Part of a mechanical analytical balance used to stop pan swing when the balance is
arrested.

Page 7/24 5.2.7.8.1. 2016
Revised 2016
Page 3/3
DEFINITIONS, CONTINUED
Repeatability = Test performed on all balances to determine if it indicates the same weight and
returns to zero every time a weight is applied to and removed from the pan. This test is normally
performed with a weight that is near the normal usage of the balance if known or near the mid-
range of the balance. The weight is placed on the balance a minimum of three times to get a plus
or minus reading.
Sensitivity = On mechanical balances this test determines the accuracy of the beam travel or
optical range of the balance. On electronic balances this is the lightest weight that the balance
will accurately respond to.
Tare accuracy = This test is used on mechanical balances to determine if the balance reads the
same with or without the tare.
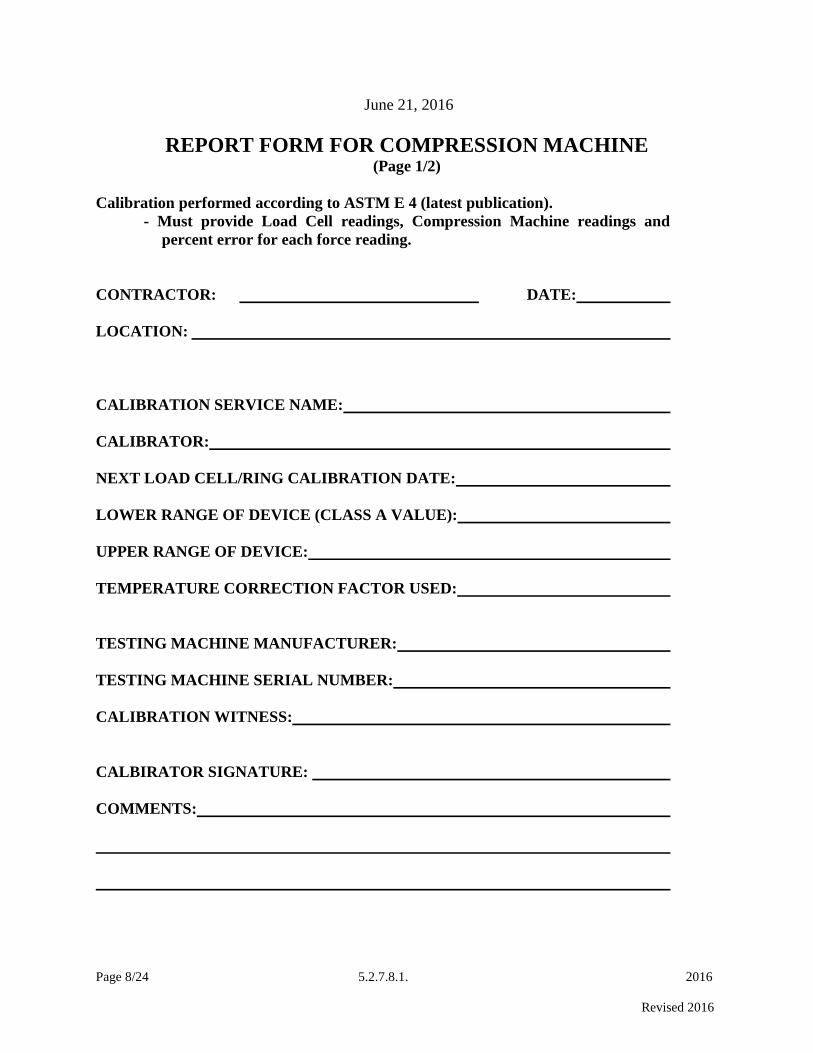
Page 8/24 5.2.7.8.1. 2016
Revised 2016
June 21, 2016
REPORT FORM FOR COMPRESSION MACHINE (Page 1/2)
Calibration performed according to ASTM E 4 (latest publication).
- Must provide Load Cell readings, Compression Machine readings and
percent error for each force reading.
CONTRACTOR: DATE:
LOCATION:
CALIBRATION SERVICE NAME:
CALIBRATOR:
NEXT LOAD CELL/RING CALIBRATION DATE:
LOWER RANGE OF DEVICE (CLASS A VALUE):
UPPER RANGE OF DEVICE:
TEMPERATURE CORRECTION FACTOR USED:
TESTING MACHINE MANUFACTURER:
TESTING MACHINE SERIAL NUMBER:
CALIBRATION WITNESS:
CALBIRATOR SIGNATURE:
COMMENTS:
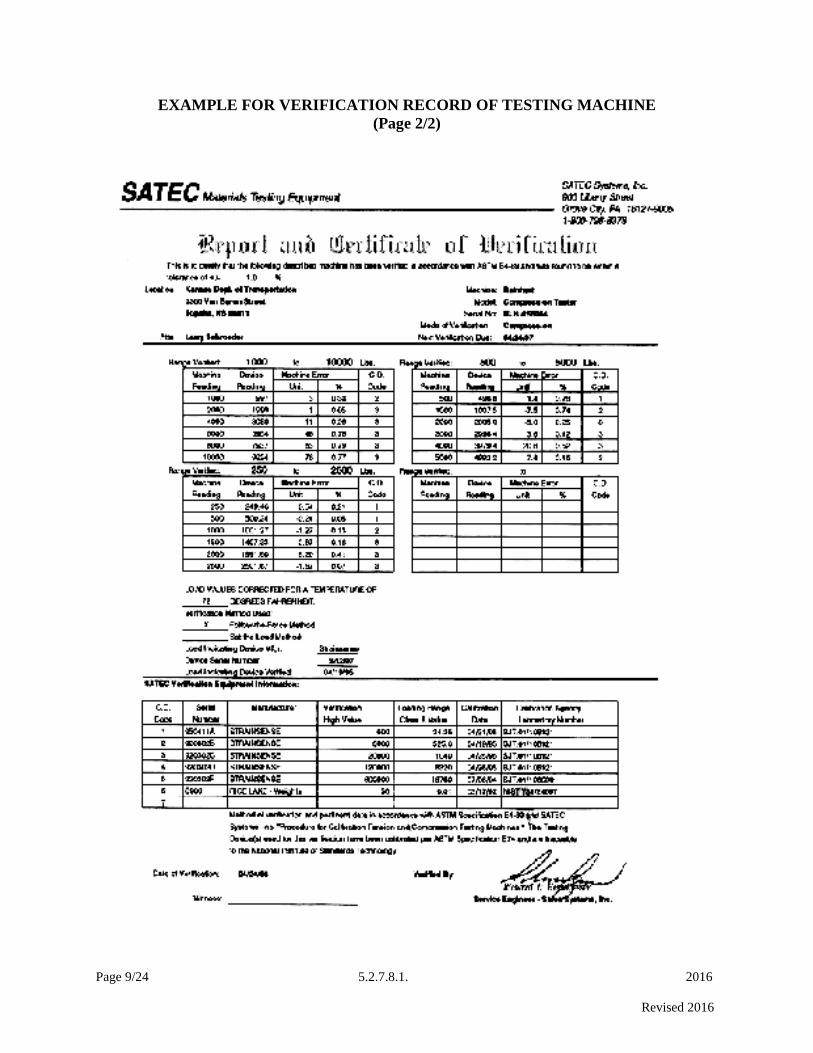
Page 9/24 5.2.7.8.1. 2016
Revised 2016
EXAMPLE FOR VERIFICATION RECORD OF TESTING MACHINE
(Page 2/2)
Page 10/24 5.2.7.8.1. 2016
Revised 2016
VERIFICATION PROCEDURE FOR SIEVES
(Page 1/2)
Purpose:
This method provides instructions for checking the physical condition of laboratory tests sieves
ranging in size 3 in. (75 mm) to #200 (0.075 mm).
Inspection Equipment Required:
1. A caliper readable to 0.01 mm (use for #4 or coarser).
Tolerances:
Sieves shall meet physical requirements specified in AASHTO M 92 (ASTM E11).
Procedure:
(Steps 1 & 2 apply to sieves having openings greater than 4.75 mm)
1. Select an adequate number of individual sieve openings (3 or 4) along a 45o line. Measure and
record the sieve openings to verify that the size opening indicated on the label is correct.
2. Repeat step 1, rotating the sieve 90o.
3. Inspection the general condition of the sieve. Check the frame and solder joints for cracks or
holes (check for pinholes in the finer sieves).
4. Make sure the sieves have an appropriate label.
5. Check for tightness of the wires on each individual sieve.

Page 11/24 5.2.7.8.1. 2016
Revised 2016
VERIFICATION RECORD FOR SIEVES
(Page 2/2)
Verified By: Date: Equipment: Sieves Verif. Frequency: Previous Verif. Date: Next Due Date: Verification Equipment Used: Verif. Equipment Identification:
Verif. Procedure Used:
Sieve
ID
Gen
era
l C
on
dit
ion
La
bel
Co
rrec
t
Wir
es T
igh
t
Opening Size in mm
Step 1
Opening Size in mm
Step 2
Suggested
Action
R - Replace
N - None
1
2
3
4
1
2
3
4
Page 12/24 5.2.7.8.1. 2016
Revised 2016
VERIFICATION PROCEDURE FOR SLUMP
(Page 1/2)
Purpose:
This method provides instructions for checking the critical dimensions of the slump cone.
Inspection Equipment Required:
1. Calipers or ruler readable to 0.01 in.
2. Straightedge or ruler.
3. Digital micrometer.
4. Gauge for measuring hemispherical end of tamping rod.
Tolerance:
Equipment shall meet the dimensional tolerances specified in the test method.
Procedure:
(CONE)
1. Measure the inside diameter at the top of the cone to the nearest 0.01 in. by taking two readings 90o
apart using the calipers and record the results.
2. Invert the cone and repeat the procedure.
3. Place the cone on a flat surface. Measure and record the depth of the cone by using the calipers and a
straightedge and record the results.
4. Measure the thickness of the cone to the nearest 0.001 in. by taking 2 readings 90o apart at the bottom
of the cone & record the results.
(TAMPER)
1. Measure the diameter of the tamping rod to the nearest millimeter by taking two readings 90o apart
using the micrometer and record the results. Measure the length of the rod to the nearest 0.1 in. and
record the results.
2. Measure the hemispherical end of the rod and record the results.
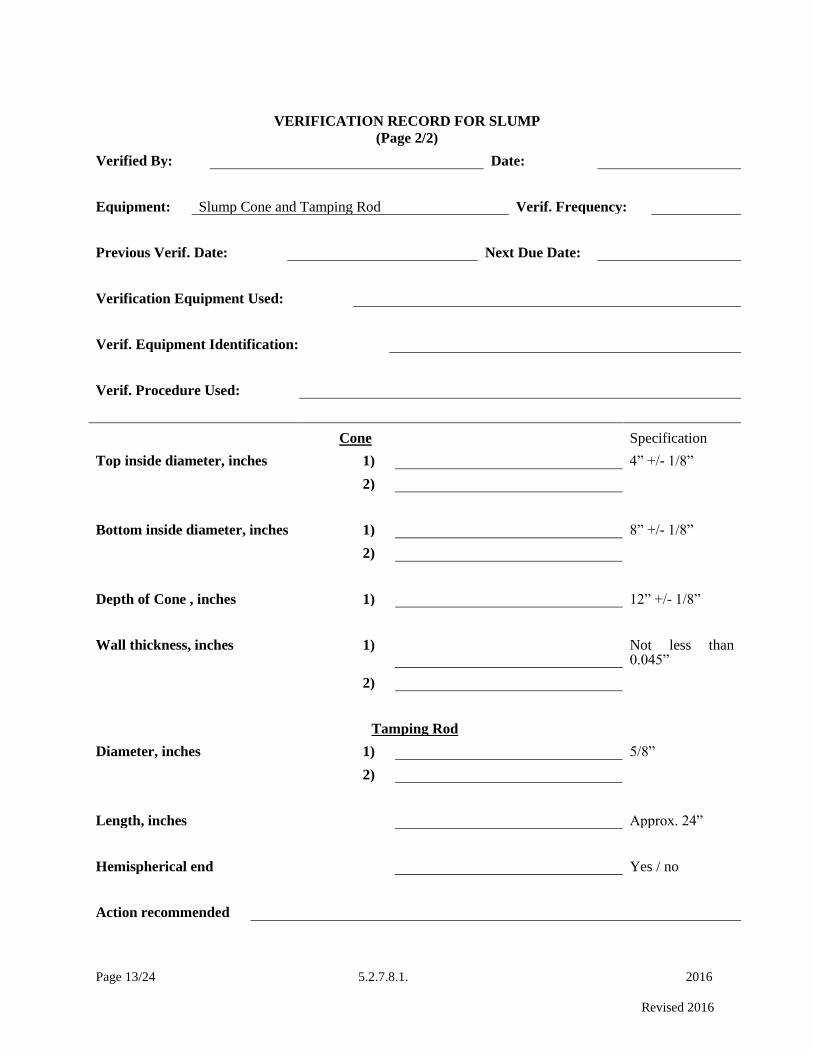
Page 13/24 5.2.7.8.1. 2016
Revised 2016
VERIFICATION RECORD FOR SLUMP
(Page 2/2)
Verified By: Date:
Equipment: Slump Cone and Tamping Rod Verif. Frequency:
Previous Verif. Date: Next Due Date:
Verification Equipment Used:
Verif. Equipment Identification:
Verif. Procedure Used:
Cone Specification
Top inside diameter, inches 1) 4” +/- 1/8”
2)
Bottom inside diameter, inches 1) 8” +/- 1/8”
2)
Depth of Cone , inches 1) 12” +/- 1/8”
Wall thickness, inches 1) Not less than 0.045”
2)
Tamping Rod
Diameter, inches 1) 5/8”
2)
Length, inches Approx. 24”
Hemispherical end Yes / no
Action recommended

Page 14/24 5.2.7.8.1. 2016
Revised 2016
VERIFICATION PROCEDURE FOR UNIT MASS
(Page 1/2) Purpose:
This method provides instructions for calibrating measures used in obtaining unit mass.
Inspection Equipment Required:
1. Balance conforming to Part V 5.9. Sampling and Test Methods Forward
2. 0.01 in (0.25 mm) feeler gauge.
3. 1/4 in (6 mm) thick glass plate at least 1 in (25 mm) larger than the measure.
4. Water pump or chassis grease.
5. Thermometer.
Tolerance:
The bowls and measures shall conform to the dimensions found in KT-20.
Procedure:
1. Place glass plate on rim and attempt to insert feeler gauge.
2. Fill measure with room temperature water and cover in such a way as to dispel air bubbles and excess
water.
3. Determine the mass of water in the measure.
4. Determine the temperature of the water, and obtain its density from KT-15.
5. Calculate the volume, V, of the measure by dividing the mass of the water required to fill the measure
by its density.
6. Calculate the factor for the measure (1/V) by dividing the density of the water by the mass required to
fill the measure.

Page 15/24 5.2.7.8.1. 2016
Revised 2016
VERIFICATION RECORD FOR UNIT MASS
(Page 2/2)
Verified By: Date:
Equipment: Measure for Unit Mass Verif. Frequency:
Previous Verif. Date: Next Due Date:
Verification Equipment Used:
Verif. Equipment Identification:
Verif. Procedure Used:
Specification
Glass 6 mm thick and 25 mm larger than measure
Yes / no
Rim plane to 0.25 mm Yes / no
Temperature of water taken Yes / no
Density obtained KT 20 Yes / no
Volume and measure factor determined Yes / no
Action recommended
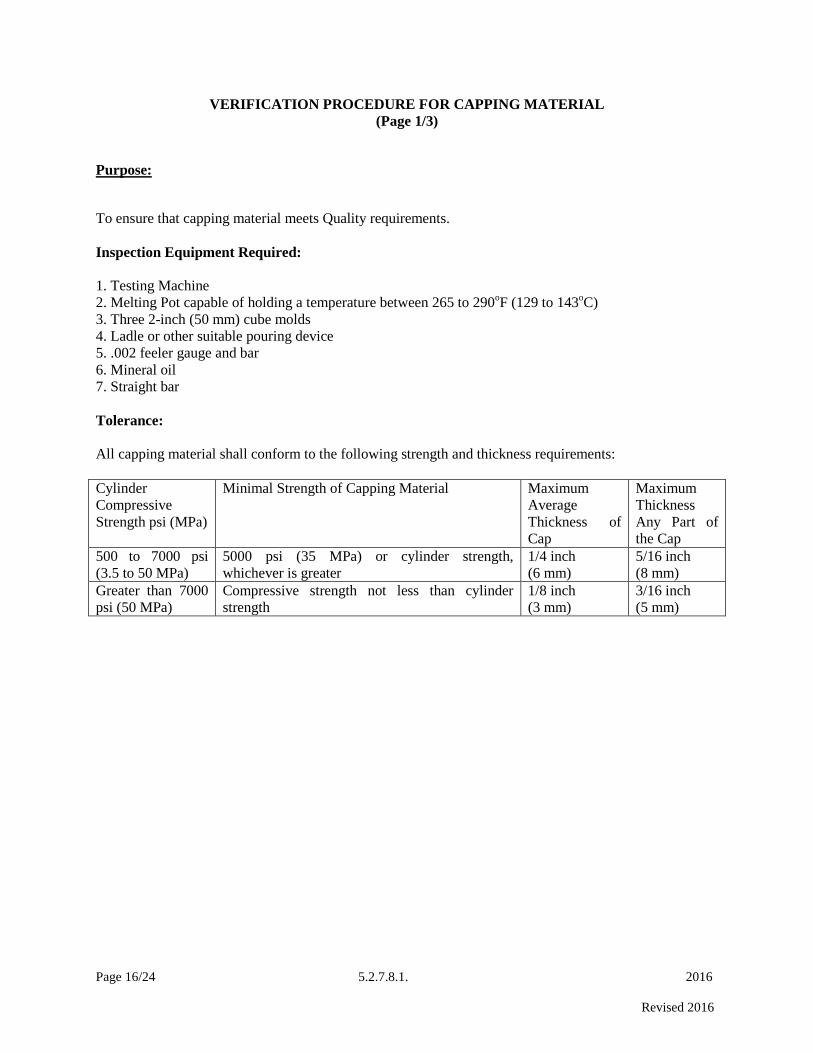
Page 16/24 5.2.7.8.1. 2016
Revised 2016
VERIFICATION PROCEDURE FOR CAPPING MATERIAL
(Page 1/3)
Purpose:
To ensure that capping material meets Quality requirements.
Inspection Equipment Required:
1. Testing Machine
2. Melting Pot capable of holding a temperature between 265 to 290oF (129 to 143
oC)
3. Three 2-inch (50 mm) cube molds
4. Ladle or other suitable pouring device
5. .002 feeler gauge and bar
6. Mineral oil
7. Straight bar
Tolerance:
All capping material shall conform to the following strength and thickness requirements:
Cylinder
Compressive
Strength psi (MPa)
Minimal Strength of Capping Material Maximum
Average
Thickness of
Cap
Maximum
Thickness
Any Part of
the Cap
500 to 7000 psi
(3.5 to 50 MPa)
5000 psi (35 MPa) or cylinder strength,
whichever is greater
1/4 inch
(6 mm)
5/16 inch
(8 mm)
Greater than 7000
psi (50 MPa)
Compressive strength not less than cylinder
strength
1/8 inch
(3 mm)
3/16 inch
(5 mm)
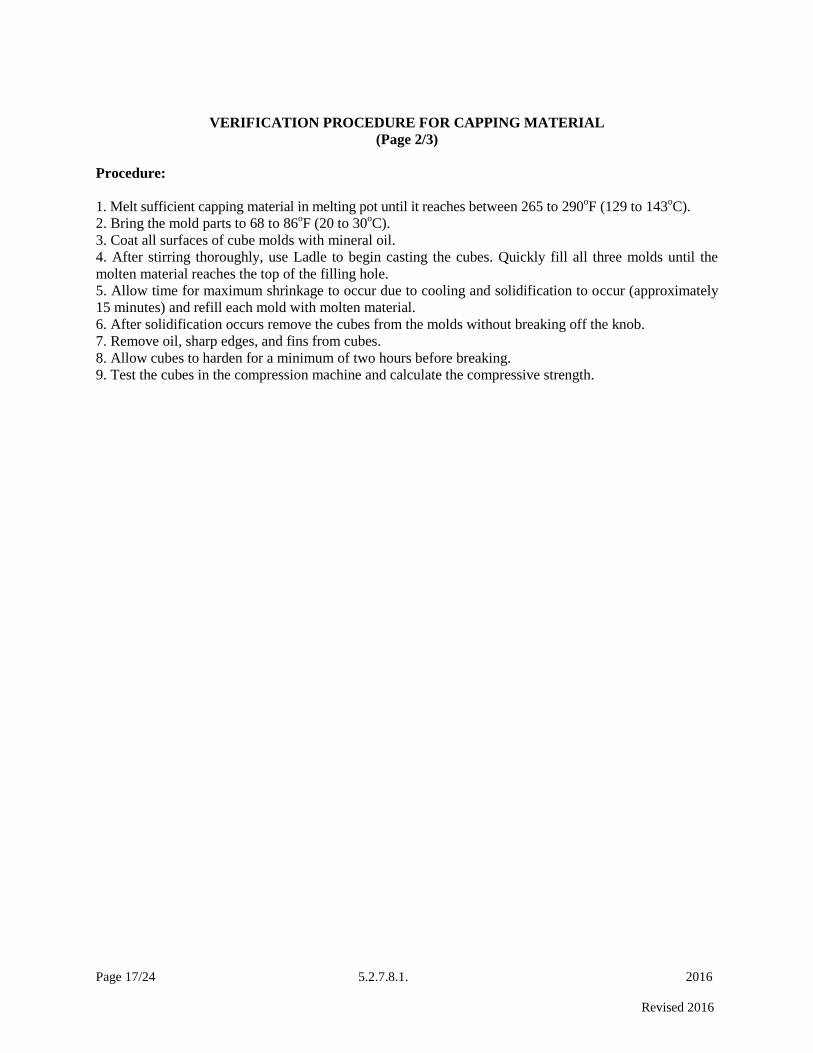
Page 17/24 5.2.7.8.1. 2016
Revised 2016
VERIFICATION PROCEDURE FOR CAPPING MATERIAL
(Page 2/3)
Procedure:
1. Melt sufficient capping material in melting pot until it reaches between 265 to 290oF (129 to 143
oC).
2. Bring the mold parts to 68 to 86oF (20 to 30
oC).
3. Coat all surfaces of cube molds with mineral oil.
4. After stirring thoroughly, use Ladle to begin casting the cubes. Quickly fill all three molds until the
molten material reaches the top of the filling hole.
5. Allow time for maximum shrinkage to occur due to cooling and solidification to occur (approximately
15 minutes) and refill each mold with molten material.
6. After solidification occurs remove the cubes from the molds without breaking off the knob.
7. Remove oil, sharp edges, and fins from cubes.
8. Allow cubes to harden for a minimum of two hours before breaking.
9. Test the cubes in the compression machine and calculate the compressive strength.

Page 18/24 5.2.7.8.1. 2016
Revised 2016
VERIFICATION RECORD FOR CAPPING MATERIAL
(Page 3/3)
Verified By: Date:
Equipment: Capping Material Verif. Frequency:
Previous Verif. Date: Next Due Date:
Verification Equipment Used:
Verif. Equipment Identification:
Verif. Procedure Used:
Compressive Strength at 2 hours (average of three), PSI
Material Meets specification requirements as outlined in Page 1/3.

Page 19/24 5.2.7.8.1. 2016
Revised 2016
VERIFICATION PROCEDURE FOR REUSABLE MOLDS
(Page 1/2)
Purpose:
This method provides instructions for checking all types of reusable molds.
Inspection Equipment Required:
1. Cup grease or Vaseline
2. Two glass plates great than 6 inches square
3. Water
4. Triangle for checking right angels
Tolerance:
Molds shall meet the dimensional requirements of KT-37 for cylinder molds.
Procedure:
1. Coat one end of the mold without the collar with cup grease or Vaseline to form a seal and
then placing it on a glass plate which should be placed in a level position on a scale.
2. Coat the other end of the mold with cup grease or Vaseline and then the mold and two glass
plates are weighed.
3. Fill the mold with 77 + 2°F (25 + 1° C) water after which the second glass plate should be
placed on top of the mold in such a way as to eliminate air bubbles and excess water.
4. Remove any excess water by carefully wiping off the mold and plates.
5. Determine the final weight of the mold, water and glass plates. 6. Calculate the volume of the mold using 62.243 lb/ft
3 (997 kg/m
3) as the density of water.
Calculation:
Mass of water = mass of mold, plates and water – mass of mold and plates
Volume (ft3) = mass of water (lbs.)/62.243

Page 20/24 5.2.7.8.1. 2016
Revised 2016
VERIFICATION RECORD FOR REUSABLE MOLDS
(Page 2/2)
Verified By: Date:
Equipment: Reusable Molds Verif. Frequency:
Previous Verif. Date: Next Due Date:
Volume:
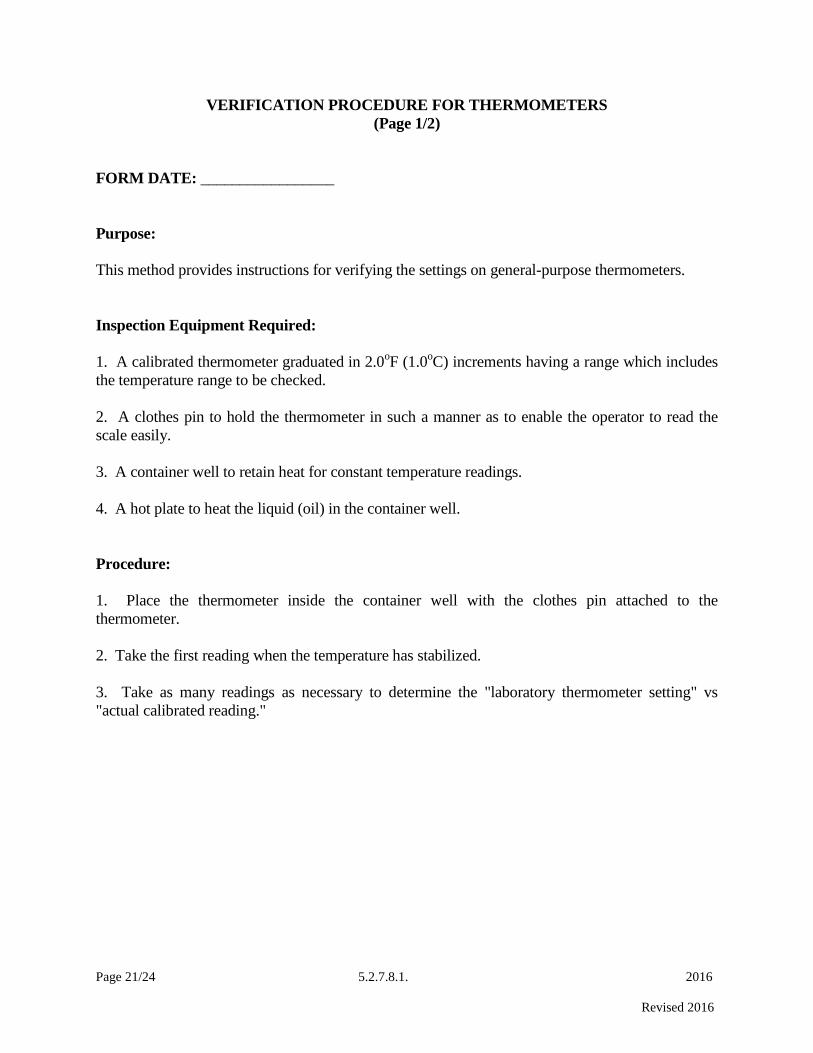
Page 21/24 5.2.7.8.1. 2016
Revised 2016
VERIFICATION PROCEDURE FOR THERMOMETERS
(Page 1/2)
FORM DATE: _________________
Purpose:
This method provides instructions for verifying the settings on general-purpose thermometers.
Inspection Equipment Required:
1. A calibrated thermometer graduated in 2.0oF (1.0
oC) increments having a range which includes
the temperature range to be checked.
2. A clothes pin to hold the thermometer in such a manner as to enable the operator to read the
scale easily.
3. A container well to retain heat for constant temperature readings.
4. A hot plate to heat the liquid (oil) in the container well.
Procedure:
1. Place the thermometer inside the container well with the clothes pin attached to the
thermometer.
2. Take the first reading when the temperature has stabilized.
3. Take as many readings as necessary to determine the "laboratory thermometer setting" vs
"actual calibrated reading."

Page 22/24 5.2.7.8.1. 2016
Revised 2016
VERIFICATION RECORD FOR THERMOMETERS
(Page 2/2)
Specification Interval: ______________________________________
Model No. see below
Serial No . see below
Date :
Calibration/Verification Performed by :
Cal./Ver. Procedure Reference: See Verification Procedure for Thermometers
Previous Calibration/Verification Date :
Next Calibration/Verification Due Date :
Calibration/Verification Equipment Used :
Model/Serial No. of C/V Equipment Used : see below
1. Equipment thermometer reading see below
2. Calibrated thermometer reading see below
Equipment Equipment Calibrated Calibrated
Thermometer Thermometer Thermometer Thermometer
Designation Reading Designation Reading

Page 23/24 5.2.7.8.1. 2016
Revised 2016
VERIFICATION PROCEDURE FOR OVENS (Page 1/2)
Form Date: _________________
Purpose:
This method provides instructions for verifying the accuracy of the temperature settings and the
tolerance on ovens. Inspection Equipment Required: 1. A calibrated thermometer graduated in 2.0
oF (1.0
oC) increments having a range that
includes the temperature range to be checked. 2. A brass thermometer well to retain heat while the oven door is open. This is essential for a constant temperature reading. 3. A clothes pin to hold the thermometer in such a manner as to enable the operator to read the scale easily from outside or inside the oven. Tolerance: Drying ovens shall be capable of maintaining a constant temperature range listed in the appropriate test methods. Procedure: 1. Place the thermometer inside the brass well with the clothes pin attached to the thermometer. Position the thermometer on the shelf where the samples are normally dried. 2. Take the first reading at least 1 hour after closing the oven (oven should remain undisturbed). 3. Take as many readings as necessary to determine if the temperature range is within the specified tolerance (three consecutive readings, taken no less than 1/2 hr apart, within tolerance allowed are adequate). 4. Adjust the temperature of the oven if an observed temperature reading is outside the tolerance specified (allow at least 1/2 hr for the temperature to stabilize between each adjustment). Return to step 3.

Page 24/24 5.2.7.8.1. 2016
Revised 2016
Form Date __________________
VERIFICATION RECORD FOR OVENS
(Page 2/2)
Verified by Date
Verif. Frequency ______________
Identification No.:
Prev. Verif. Date: Next Due Date :
Verif. Equip. Used Cal. Therm. Verif. Procedure Verification Procedure for Ovens
Temperature Range
Temperature* Oven Dial Reading Correction Factor
Action Recommended: Repair Replace None X
*This thermometer has been tested by comparison with standards certified by NIST. If the
correction is “+” the true temperature is higher than the thermometer reading. If the correction is
“-” the true temperature is lower than the thermometer reading

Page 1/8 5.3.1 2016
Revised 2016
5.3 MIX DESIGN METHODS
5.3.1 CONCRETE MIX DESIGN
1. Scope.
This method covers the procedure for designing concrete mixes and is based on the absolute volumes of
the various components of the mix, i.e.: the absolute volumes of cementitious materials, aggregate, water
and air in one cubic yard of concrete.
2. Procedure.
2.1. Specifications govern the following elements of concrete mixtures:
2.1.1. Minimum Cement Content or "Cement Factor" (CF) expressed as pounds per cubic yard of
concrete.
2.1.2. Maximum allowable water content or water-cement ratio (W/C) expressed as pounds of water per
pound of cement.
2.1.3. When air entrained concrete is specified, the air content is expressed as percent of the volume of the
concrete.
NOTE: When air entrained concrete is not specified, a percentage of entrapped air is used during design.
Experience has shown that the entrapped air is usually between 2% and 4%.
Since the quantities of cementitious materials, water and air are limited by specifications, the volumes
occupied by each of these elements are calculated. Calculations are then made to determine the quantity
of aggregate required, when added to the combined volumes of other ingredients, to result in a cubic yard
of mixed concrete.
3. Calculations.
3.1. Secure one or more copies of KDOT Form No. 694, CONCRETE MIX DESIGN. (See Example.)
3.2. Complete Part I of the form. This includes the class of concrete, the aggregate designation, the
water-cement ratio, specified minimum cement factor, percent air, and the specific gravity (Bulk,
Saturated Surface Dry Basis) of each aggregate.
The specific gravity is determined by tests conducted on samples obtained from project stockpiles. Due
to differences in processing and gradation, there may be an appreciable difference between the specific
gravity of the aggregate submitted to the Laboratory and the specific gravity of the aggregate in the
project stockpiles.
3.3. Complete Part II of the form by calculating the volume, in cubic feet, occupied by the cementitious
materials, water and air in a cubic yard of the mixture. Then subtract the sum of these values from 27 to
determine the volume of aggregate that must be added to produce a cubic yard of concrete.
3.4. Complete Part III as follows:
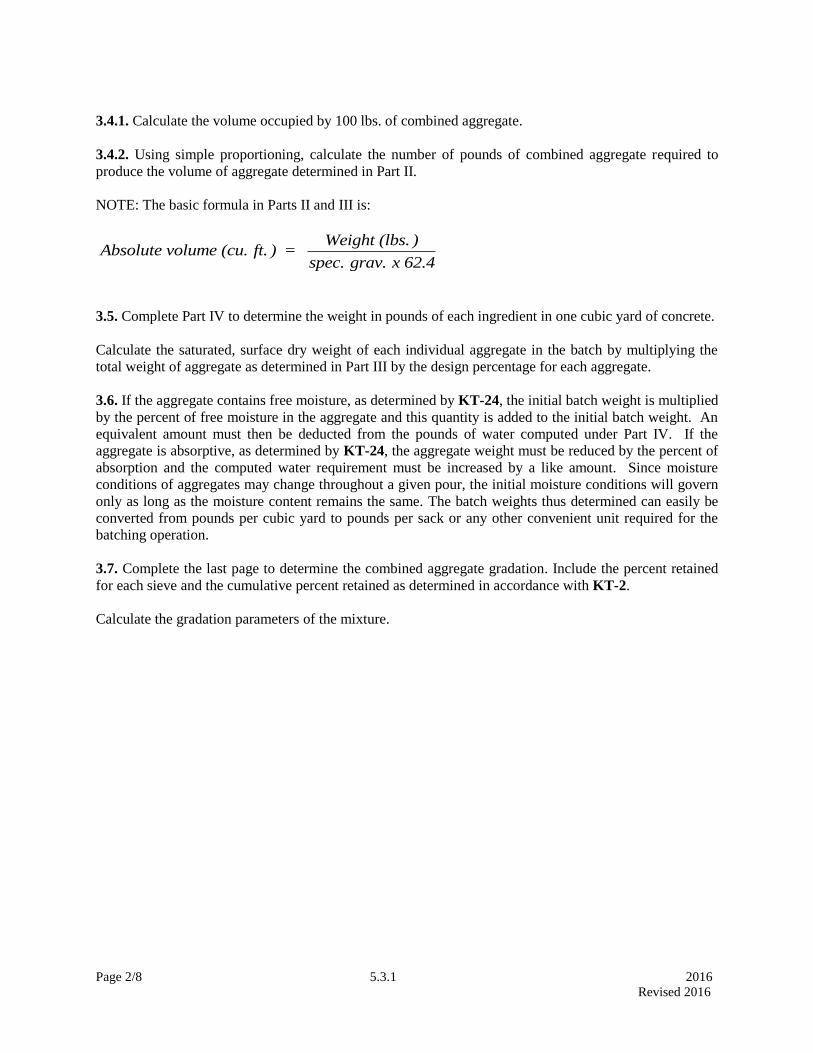
Page 2/8 5.3.1 2016
Revised 2016
3.4.1. Calculate the volume occupied by 100 lbs. of combined aggregate.
3.4.2. Using simple proportioning, calculate the number of pounds of combined aggregate required to
produce the volume of aggregate determined in Part II.
NOTE: The basic formula in Parts II and III is:
Absolute volume (cu. ft. ) = Weight (lbs. )
spec. grav. x 62.4
3.5. Complete Part IV to determine the weight in pounds of each ingredient in one cubic yard of concrete.
Calculate the saturated, surface dry weight of each individual aggregate in the batch by multiplying the
total weight of aggregate as determined in Part III by the design percentage for each aggregate.
3.6. If the aggregate contains free moisture, as determined by KT-24, the initial batch weight is multiplied
by the percent of free moisture in the aggregate and this quantity is added to the initial batch weight. An
equivalent amount must then be deducted from the pounds of water computed under Part IV. If the
aggregate is absorptive, as determined by KT-24, the aggregate weight must be reduced by the percent of
absorption and the computed water requirement must be increased by a like amount. Since moisture
conditions of aggregates may change throughout a given pour, the initial moisture conditions will govern
only as long as the moisture content remains the same. The batch weights thus determined can easily be
converted from pounds per cubic yard to pounds per sack or any other convenient unit required for the
batching operation.
3.7. Complete the last page to determine the combined aggregate gradation. Include the percent retained
for each sieve and the cumulative percent retained as determined in accordance with KT-2.
Calculate the gradation parameters of the mixture.
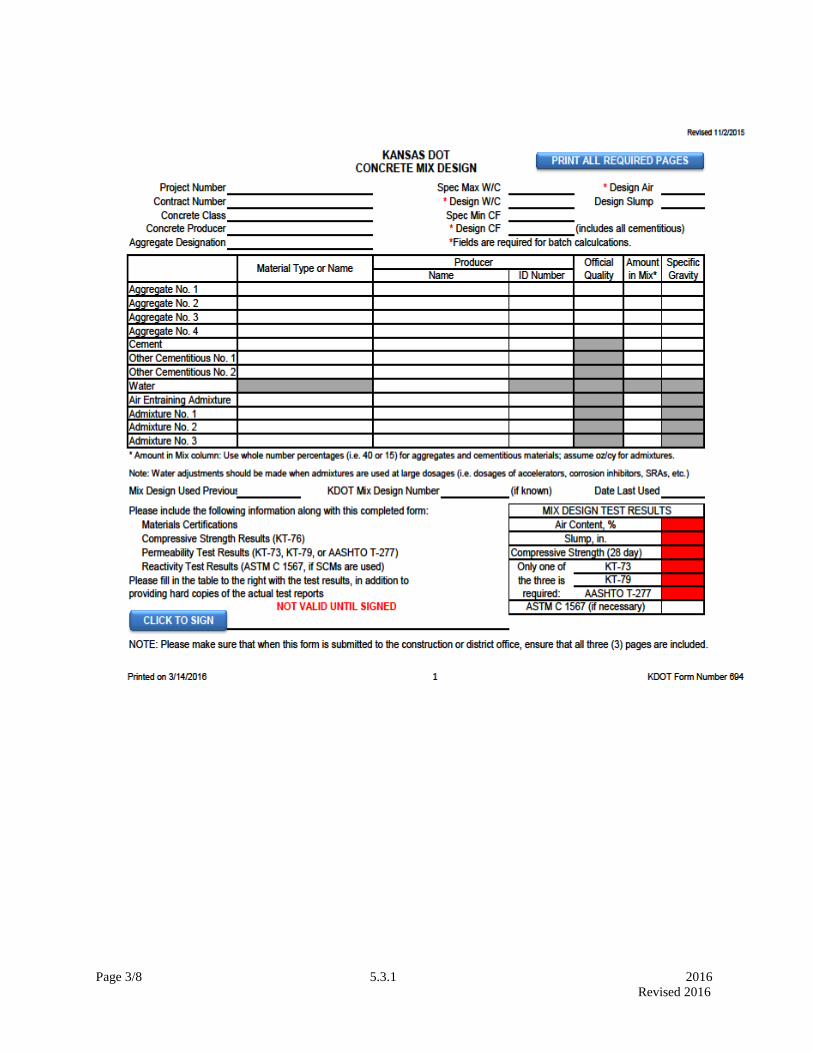
Page 3/8 5.3.1 2016
Revised 2016
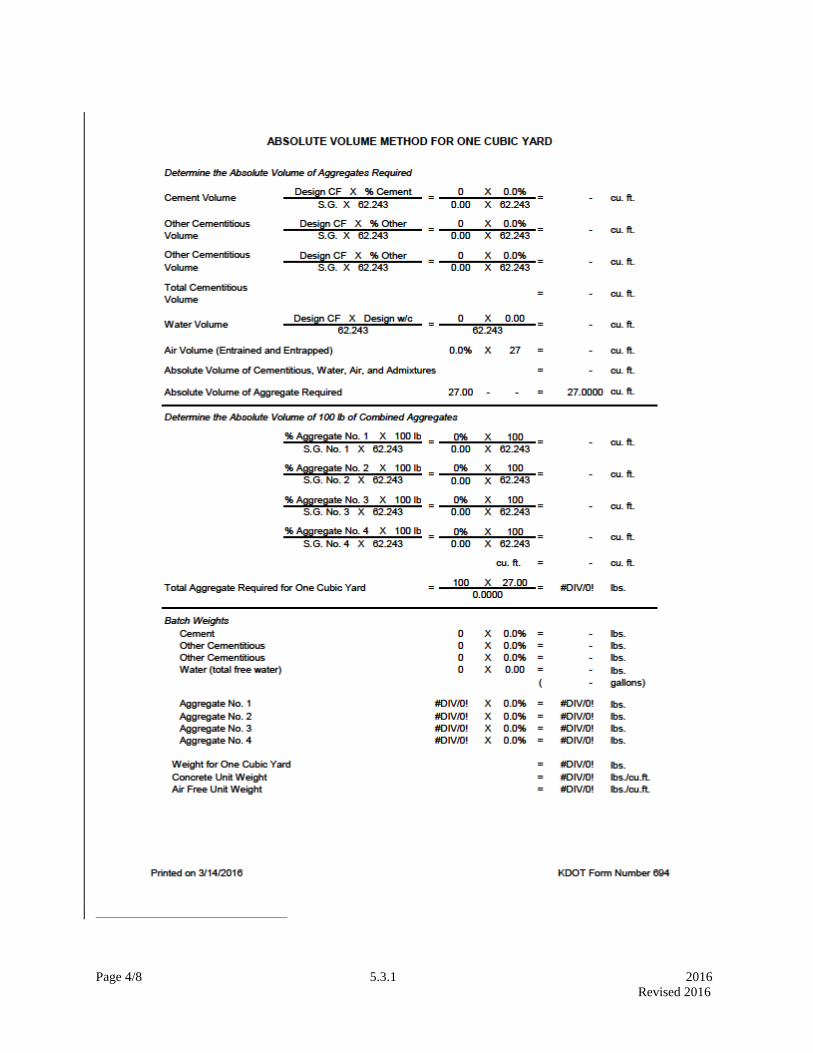
Page 4/8 5.3.1 2016
Revised 2016
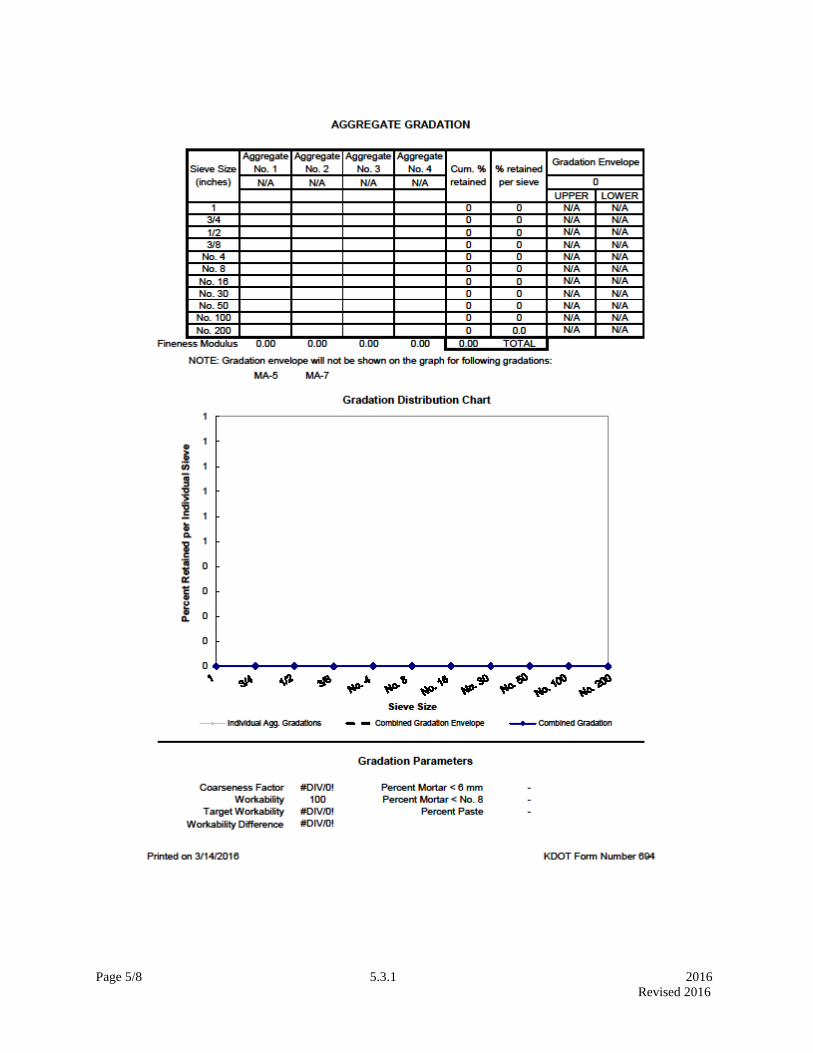
Page 5/8 5.3.1 2016
Revised 2016
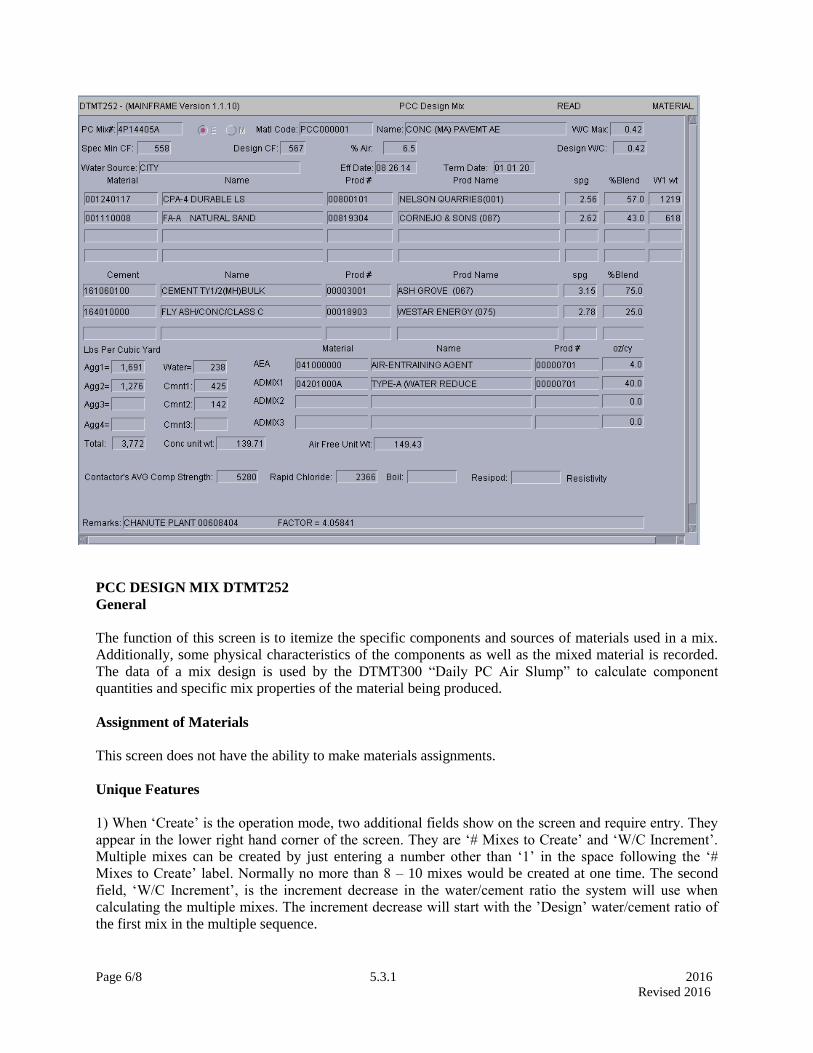
Page 6/8 5.3.1 2016
Revised 2016
PCC DESIGN MIX DTMT252
General
The function of this screen is to itemize the specific components and sources of materials used in a mix.
Additionally, some physical characteristics of the components as well as the mixed material is recorded.
The data of a mix design is used by the DTMT300 “Daily PC Air Slump” to calculate component
quantities and specific mix properties of the material being produced.
Assignment of Materials
This screen does not have the ability to make materials assignments.
Unique Features
1) When ‘Create’ is the operation mode, two additional fields show on the screen and require entry. They
appear in the lower right hand corner of the screen. They are ‘# Mixes to Create’ and ‘W/C Increment’.
Multiple mixes can be created by just entering a number other than ‘1’ in the space following the ‘#
Mixes to Create’ label. Normally no more than 8 – 10 mixes would be created at one time. The second
field, ‘W/C Increment’, is the increment decrease in the water/cement ratio the system will use when
calculating the multiple mixes. The increment decrease will start with the ’Design’ water/cement ratio of
the first mix in the multiple sequence.
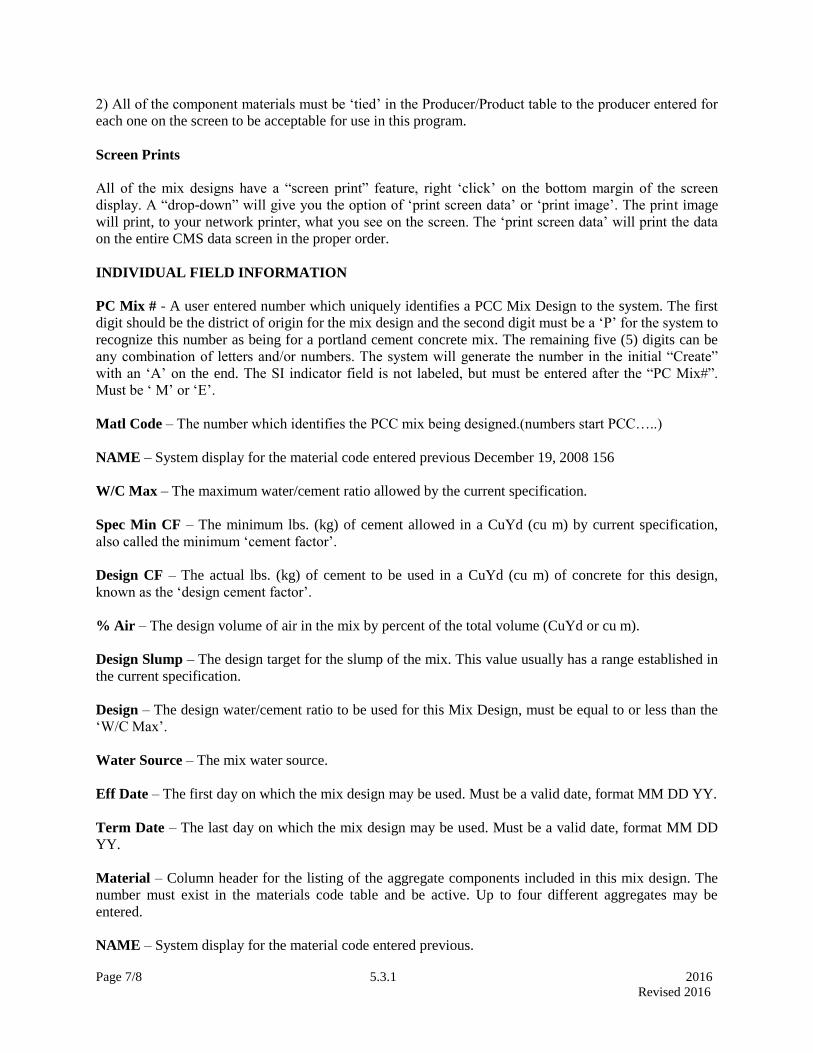
Page 7/8 5.3.1 2016
Revised 2016
2) All of the component materials must be ‘tied’ in the Producer/Product table to the producer entered for
each one on the screen to be acceptable for use in this program.
Screen Prints
All of the mix designs have a “screen print” feature, right ‘click’ on the bottom margin of the screen
display. A “drop-down” will give you the option of ‘print screen data’ or ‘print image’. The print image
will print, to your network printer, what you see on the screen. The ‘print screen data’ will print the data
on the entire CMS data screen in the proper order.
INDIVIDUAL FIELD INFORMATION
PC Mix # - A user entered number which uniquely identifies a PCC Mix Design to the system. The first
digit should be the district of origin for the mix design and the second digit must be a ‘P’ for the system to
recognize this number as being for a portland cement concrete mix. The remaining five (5) digits can be
any combination of letters and/or numbers. The system will generate the number in the initial “Create”
with an ‘A’ on the end. The SI indicator field is not labeled, but must be entered after the “PC Mix#”.
Must be ‘ M’ or ‘E’.
Matl Code – The number which identifies the PCC mix being designed.(numbers start PCC…..)
NAME – System display for the material code entered previous December 19, 2008 156
W/C Max – The maximum water/cement ratio allowed by the current specification.
Spec Min CF – The minimum lbs. (kg) of cement allowed in a CuYd (cu m) by current specification,
also called the minimum ‘cement factor’.
Design CF – The actual lbs. (kg) of cement to be used in a CuYd (cu m) of concrete for this design,
known as the ‘design cement factor’.
% Air – The design volume of air in the mix by percent of the total volume (CuYd or cu m).
Design Slump – The design target for the slump of the mix. This value usually has a range established in
the current specification.
Design – The design water/cement ratio to be used for this Mix Design, must be equal to or less than the
‘W/C Max’.
Water Source – The mix water source.
Eff Date – The first day on which the mix design may be used. Must be a valid date, format MM DD YY.
Term Date – The last day on which the mix design may be used. Must be a valid date, format MM DD
YY.
Material – Column header for the listing of the aggregate components included in this mix design. The
number must exist in the materials code table and be active. Up to four different aggregates may be
entered.
NAME – System display for the material code entered previous.
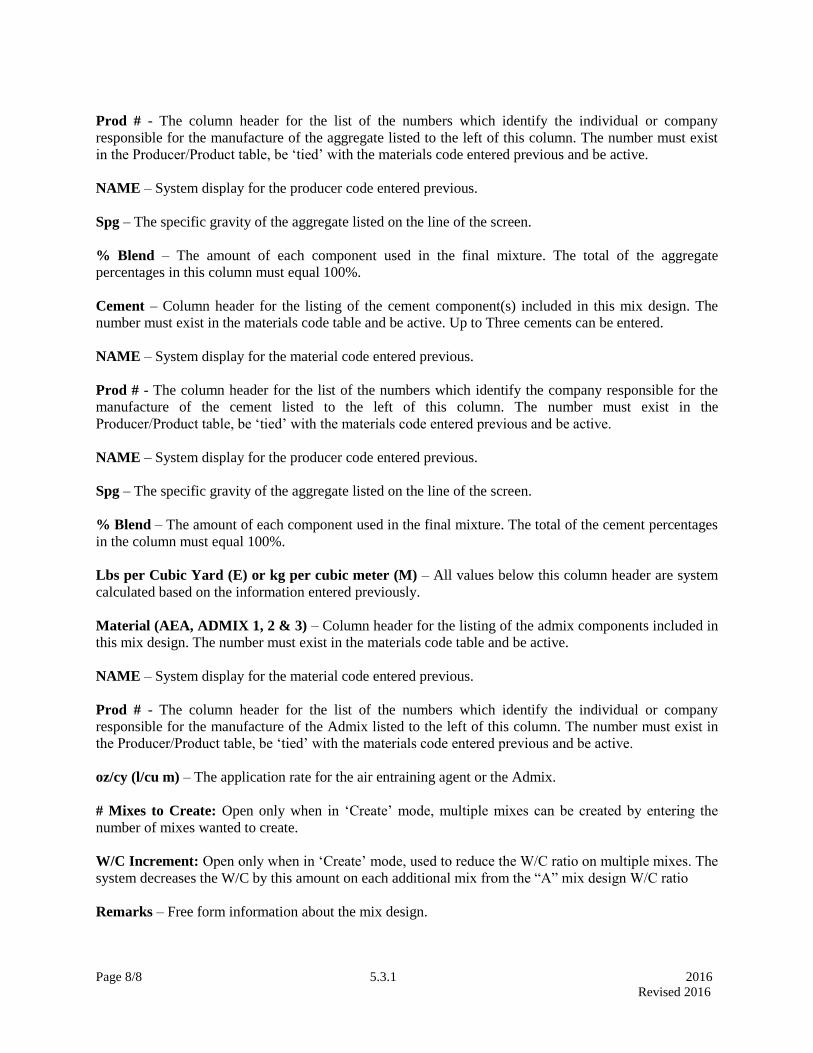
Page 8/8 5.3.1 2016
Revised 2016
Prod # - The column header for the list of the numbers which identify the individual or company
responsible for the manufacture of the aggregate listed to the left of this column. The number must exist
in the Producer/Product table, be ‘tied’ with the materials code entered previous and be active.
NAME – System display for the producer code entered previous.
Spg – The specific gravity of the aggregate listed on the line of the screen.
% Blend – The amount of each component used in the final mixture. The total of the aggregate
percentages in this column must equal 100%.
Cement – Column header for the listing of the cement component(s) included in this mix design. The
number must exist in the materials code table and be active. Up to Three cements can be entered.
NAME – System display for the material code entered previous.
Prod # - The column header for the list of the numbers which identify the company responsible for the
manufacture of the cement listed to the left of this column. The number must exist in the
Producer/Product table, be ‘tied’ with the materials code entered previous and be active.
NAME – System display for the producer code entered previous.
Spg – The specific gravity of the aggregate listed on the line of the screen.
% Blend – The amount of each component used in the final mixture. The total of the cement percentages
in the column must equal 100%.
Lbs per Cubic Yard (E) or kg per cubic meter (M) – All values below this column header are system
calculated based on the information entered previously.
Material (AEA, ADMIX 1, 2 & 3) – Column header for the listing of the admix components included in
this mix design. The number must exist in the materials code table and be active.
NAME – System display for the material code entered previous.
Prod # - The column header for the list of the numbers which identify the individual or company
responsible for the manufacture of the Admix listed to the left of this column. The number must exist in
the Producer/Product table, be ‘tied’ with the materials code entered previous and be active.
oz/cy (l/cu m) – The application rate for the air entraining agent or the Admix.
# Mixes to Create: Open only when in ‘Create’ mode, multiple mixes can be created by entering the
number of mixes wanted to create.
W/C Increment: Open only when in ‘Create’ mode, used to reduce the W/C ratio on multiple mixes. The
system decreases the W/C by this amount on each additional mix from the “A” mix design W/C ratio
Remarks – Free form information about the mix design.

Page 1/28 5.3.2. 2016
Revised 2014
5.3.2. BITUMINOUS MIX DESIGN
(a) Mixtures Containing Asphalt Cement.
(1) Scope.
This method covers the procedure for determining the optimum amount of asphalt cement in a
given aggregate mixture. Since bituminous mixtures vary by type, and to some extent within type, these
instructions must be considered as a general commentary. Judgment and experience must be used in
interpreting the design information obtained by this method.
(2) General.
a. Marshall Tests: Conduct tests on mixtures of aggregate and asphalt using Marshall
apparatus as described in Kansas Test Method KT-14, and plot the resulting data on
KDOT Form No. 702, "Asphaltic Concrete Design Mix Curves." Report percent
asphalt on a dry weight basis.
b. Interpretation of Test Results: Experience has shown that the results of Marshall tests
can be excellent guidelines to use when determining the optimum asphalt content for a
given mix. The mix designer must become familiar with Marshall criteria, learn to
judge the significance of each parameter and be able to analyze the characteristics of
the mixture from the results of the design calculations and test values. Marshall curves
alone should not be used to determine the design asphalt content, but should be used in
analyzing the characteristics of the mixture. When deciding upon the optimum asphalt
content for a mixture, do not select a value that is obviously not in conformity with
some portions of the data in question or with other values derived from the test.
(3) Significance of Properties:
It should remain foremost in the thinking of the mix designer that the design data consists of two
general areas - volumetric and physical.
a. Volumetric Considerations:
Voids in Mineral Aggregate (VMA). The VMA generally decreases to a minimum
value then increases with increasing asphalt contents. As far as possible, the mixtures
with higher VMA should be preferred because of the following advantages:
1. More asphalt can be incorporated in the mixture to increase durability.
2. Lower sensitivity to variation in asphalt content during production.
3. Mixtures with low VMA will flush if slightly excessive in asphalt content, and
will be dry and brittle if slightly deficient in asphalt content.
Voids Filled with Asphalt (VFA). The VFA increases with increasing asphalt content.
There is a maximum VFA for each aggregate blend and compaction effort. The VFA
can not be increased above this maximum without increasing or otherwise changing the
compaction effort. The VFA curve is usually convex upwards.
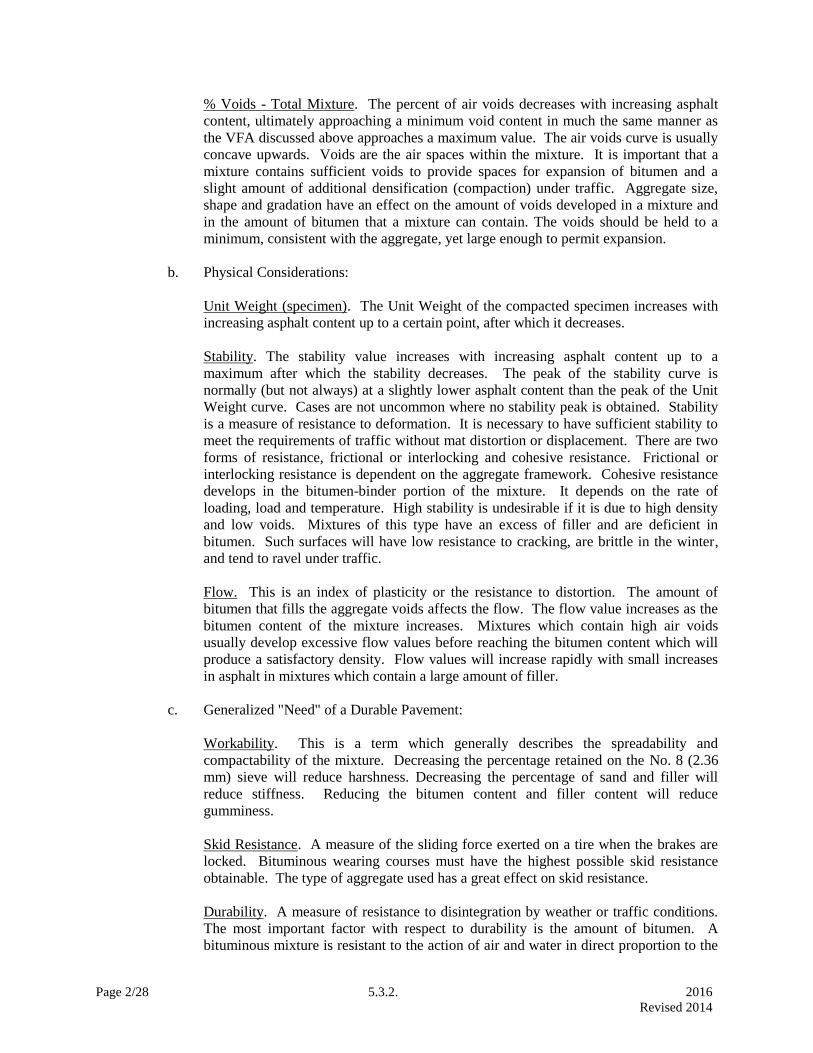
Page 2/28 5.3.2. 2016
Revised 2014
% Voids - Total Mixture. The percent of air voids decreases with increasing asphalt
content, ultimately approaching a minimum void content in much the same manner as
the VFA discussed above approaches a maximum value. The air voids curve is usually
concave upwards. Voids are the air spaces within the mixture. It is important that a
mixture contains sufficient voids to provide spaces for expansion of bitumen and a
slight amount of additional densification (compaction) under traffic. Aggregate size,
shape and gradation have an effect on the amount of voids developed in a mixture and
in the amount of bitumen that a mixture can contain. The voids should be held to a
minimum, consistent with the aggregate, yet large enough to permit expansion.
b. Physical Considerations:
Unit Weight (specimen). The Unit Weight of the compacted specimen increases with
increasing asphalt content up to a certain point, after which it decreases.
Stability. The stability value increases with increasing asphalt content up to a
maximum after which the stability decreases. The peak of the stability curve is
normally (but not always) at a slightly lower asphalt content than the peak of the Unit
Weight curve. Cases are not uncommon where no stability peak is obtained. Stability
is a measure of resistance to deformation. It is necessary to have sufficient stability to
meet the requirements of traffic without mat distortion or displacement. There are two
forms of resistance, frictional or interlocking and cohesive resistance. Frictional or
interlocking resistance is dependent on the aggregate framework. Cohesive resistance
develops in the bitumen-binder portion of the mixture. It depends on the rate of
loading, load and temperature. High stability is undesirable if it is due to high density
and low voids. Mixtures of this type have an excess of filler and are deficient in
bitumen. Such surfaces will have low resistance to cracking, are brittle in the winter,
and tend to ravel under traffic.
Flow. This is an index of plasticity or the resistance to distortion. The amount of
bitumen that fills the aggregate voids affects the flow. The flow value increases as the
bitumen content of the mixture increases. Mixtures which contain high air voids
usually develop excessive flow values before reaching the bitumen content which will
produce a satisfactory density. Flow values will increase rapidly with small increases
in asphalt in mixtures which contain a large amount of filler.
c. Generalized "Need" of a Durable Pavement:
Workability. This is a term which generally describes the spreadability and
compactability of the mixture. Decreasing the percentage retained on the No. 8 (2.36
mm) sieve will reduce harshness. Decreasing the percentage of sand and filler will
reduce stiffness. Reducing the bitumen content and filler content will reduce
gumminess.
Skid Resistance. A measure of the sliding force exerted on a tire when the brakes are
locked. Bituminous wearing courses must have the highest possible skid resistance
obtainable. The type of aggregate used has a great effect on skid resistance.
Durability. A measure of resistance to disintegration by weather or traffic conditions.
The most important factor with respect to durability is the amount of bitumen. A
bituminous mixture is resistant to the action of air and water in direct proportion to the

Page 3/28 5.3.2. 2016
Revised 2014
degree that they are kept out of the mixture. If the voids are completely filled with
bitumen, the surfaces will become plastic and flushing will occur. It is, however,
desirable that the mixture should contain as high a bitumen content as possible that is
consistent with stability and voids. This will give the pavement maximum durability
and prevent raveling because of a deficiency of bitumen. An asphalt content set totally
on durability may produce a slippery surface. Therefore, a compromise between
durability and skid resistance must often be accepted.
Flexibility. The ability of the bituminous mixture to bend repeatedly without cracking
and to conform to changes in the base course. To have flexibility, a mixture must
contain the proper amount of bitumen. Open graded mixtures are more flexible than
dense graded mixtures. Flexibility decreases as the paving layer thickness increases.
Flexibility increases with an increase of temperature.
(4) Types of Mixtures:
The types of mixtures encountered will generally fall within one of the following categories:
a. Balanced Mixture: The Marshall curves for a balanced mixture show that the
maximum unit weight and maximum stability occur at nearly the same asphalt content.
b. Open Graded Mixture: This type of mixture has an open texture, low unit weight and a
high percent of voids due to the type, particle shape and gradation of the aggregate.
The maximum unit weight and maximum stability can occur at the same asphalt
content, which will be much higher than for a balanced mixture.
c. Dense Graded Mixture: This type of mixture has high unit weight, low percentage of
voids and often has no indicated stability peak. This is caused by the proportioning of
graded coarse and fine aggregates to produce a mixture that will have maximum
density and minimum voids.
Form 707 allows the gradation of the mix to be visually shown. Form 707 (Gradation Chart for
Marshall Design, Sieve Sizes Raised to 0.45 Power) is completed as listed below and shown in the
example at the end of this section (5.3.2.).
a. Plot the Marshall Job Mix Single Point (for recycle mixes plot the Theoretical Combined
Gradation, RAP Extracted Gradation, and the Virgin Aggregate Job Mix Single Point).
b. Determine the first sieve size with more than 10 percent retained in the Job Mix Single Point.
(For recycle mixes determine the first sieve size with more than 10 percent retained on the
Theoretical Combined Gradation).
c. Determine the Maximum Sieve Size. This is two sieve sizes larger than the first sieve with
more than 10% retained.
d. Draw the maximum density line. This is a line drawn from the origin of the 0.45 power chart
(lower left) to the point at which the Maximum Sieve Size intersects the 0 percent retained
(100% passing) line.
e. Determine if the mix VMA falls in Zone 1 or Zone 2 using the instructions on Form 707.
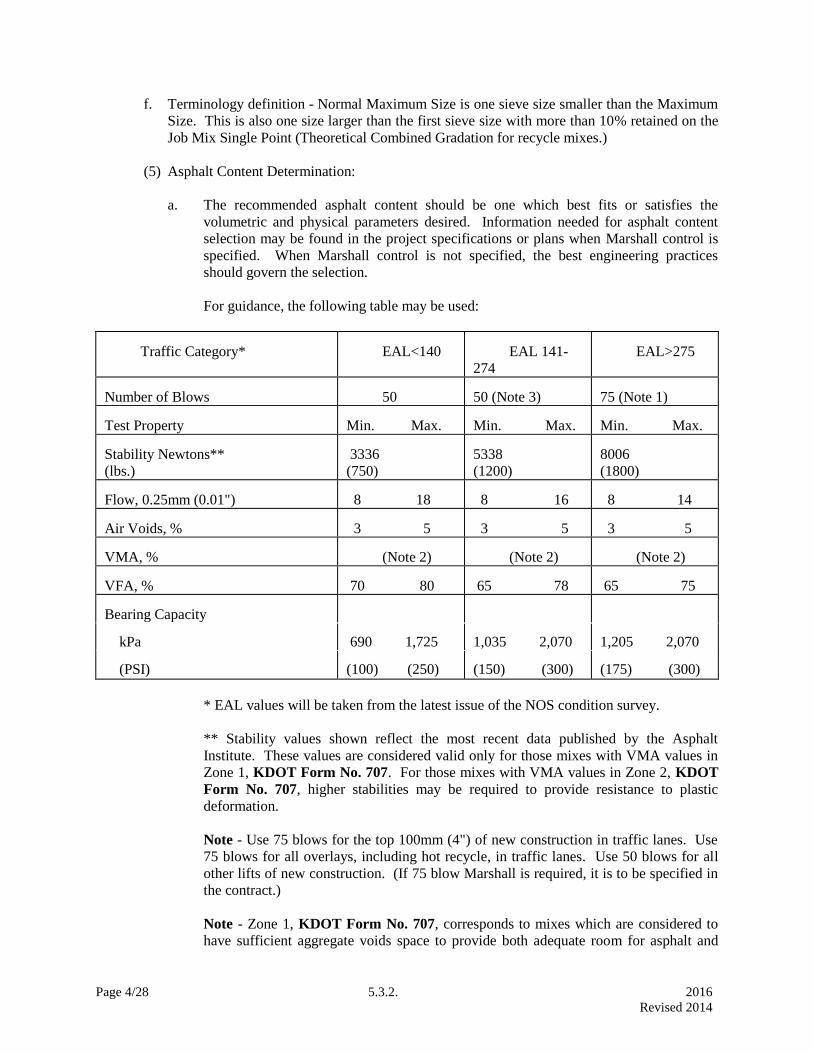
Page 4/28 5.3.2. 2016
Revised 2014
f. Terminology definition - Normal Maximum Size is one sieve size smaller than the Maximum
Size. This is also one size larger than the first sieve size with more than 10% retained on the
Job Mix Single Point (Theoretical Combined Gradation for recycle mixes.)
(5) Asphalt Content Determination:
a. The recommended asphalt content should be one which best fits or satisfies the
volumetric and physical parameters desired. Information needed for asphalt content
selection may be found in the project specifications or plans when Marshall control is
specified. When Marshall control is not specified, the best engineering practices
should govern the selection.
For guidance, the following table may be used:
Traffic Category*
EAL<140
EAL 141-
274
EAL>275
Number of Blows
50
50 (Note 3)
75 (Note 1)
Test Property
Min. Max.
Min. Max.
Min. Max.
Stability Newtons**
(lbs.)
3336
(750)
5338
(1200)
8006
(1800) Flow, 0.25mm (0.01")
8 18
8 16
8 14
Air Voids, %
3 5
3 5
3 5
VMA, %
(Note 2)
(Note 2)
(Note 2)
VFA, %
70 80
65 78
65 75
Bearing Capacity
kPa
690 1,725
1,035 2,070
1,205 2,070
(PSI)
(100) (250)
(150) (300)
(175) (300)
* EAL values will be taken from the latest issue of the NOS condition survey.
** Stability values shown reflect the most recent data published by the Asphalt
Institute. These values are considered valid only for those mixes with VMA values in
Zone 1, KDOT Form No. 707. For those mixes with VMA values in Zone 2, KDOT
Form No. 707, higher stabilities may be required to provide resistance to plastic
deformation.
Note - Use 75 blows for the top 100mm (4") of new construction in traffic lanes. Use
75 blows for all overlays, including hot recycle, in traffic lanes. Use 50 blows for all
other lifts of new construction. (If 75 blow Marshall is required, it is to be specified in
the contract.)
Note - Zone 1, KDOT Form No. 707, corresponds to mixes which are considered to
have sufficient aggregate voids space to provide both adequate room for asphalt and

Page 5/28 5.3.2. 2016
Revised 2014
sufficient remaining air voids to prevent flushing. Zone 2 mixtures would be
considered as potentially at risk of flushing due to lack of aggregate void space to
accommodate sufficient asphalt for durability and insufficient air voids remaining to
prevent flushing.
Note - Use 75 blows for overlays on PCCP and composite pavements. (If 75 blow
Marshall is required, it is to be specified in the contract.)
b. Using the data previously determined, the bar chart portion of KDOT Form No. 701 is
utilized as follows:
Step 1. Indicate by a horizontal line the range of asphalt contents which include the
desired (or specified) properties.
Step 2. Indicate by vertical lines the area of "best convergence" of asphalt contents
which satisfy the desirable (or specified) properties.
Step 3. Indicate by vertical line the computed value of Pb'max as shown in the
supplemental calculations, Section 5.10.4 (g) (3).
Step 4. Select tentative asphalt content within the "best convergence" zone, but not
exceeding the value of Pb'max.
Step 5. Show this value (the tentative asphalt content) as the "Recommended %
Asphalt."
Step 6. Show values for VMA, Air Voids, etc. corresponding to the "Recommended %
Asphalt" in the last column at the right side of the bar chart.
A completed bar chart is shown as an example at the end of this section.
(b) Mixtures Containing Cutback Asphalt.
(1) Formulas:
A number of formulas have been devised to calculate the percent of cutback asphalt to be added to
aggregate that is to be road-mixed. Two of these, the Nebraska and the New Mexico formulas are used in
combination for work in Kansas. The asphalt content as calculated by these formulas will be a good
indication of the proper value to use at the start of the work. It may be necessary to make adjustments
based on judgment, and past experience in order to provide sufficient asphalt to coat the aggregate
particles. Care must be taken not to have an excess amount of asphalt as this can result in an unstable
pavement. The quantities of cutback asphalt should be increased to compensate for the amount of diluent
that will be lost during mixing, aeration and curing.
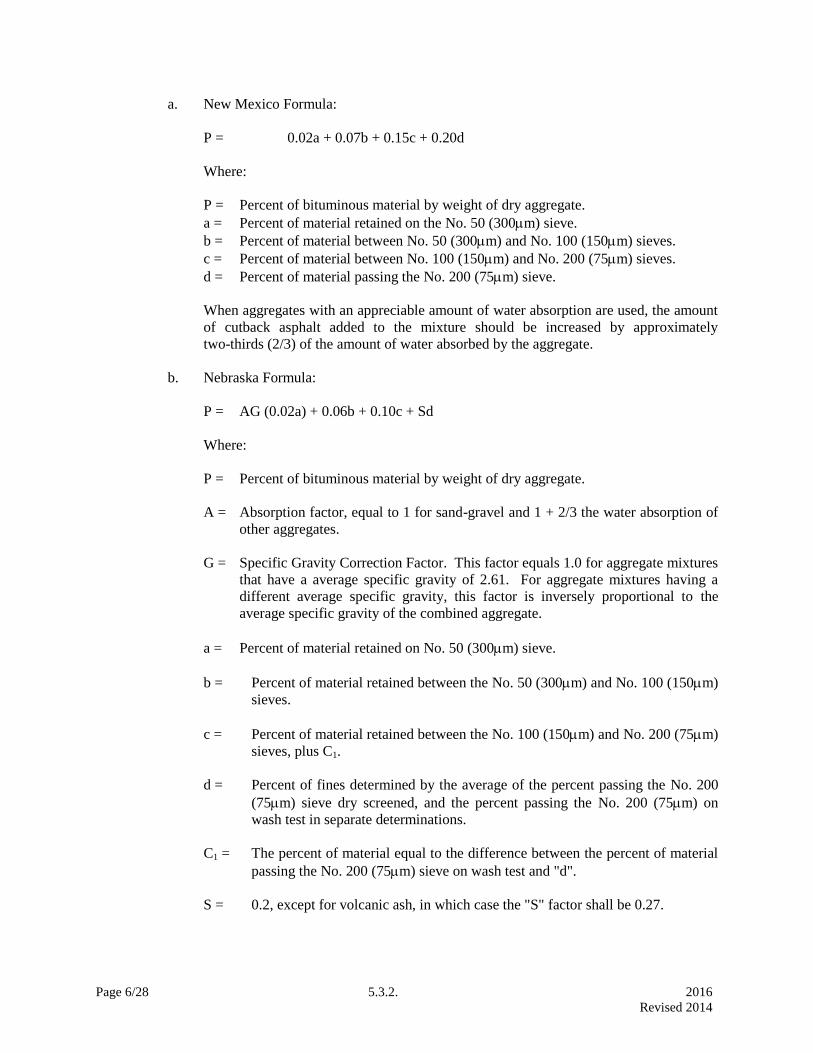
Page 6/28 5.3.2. 2016
Revised 2014
a. New Mexico Formula:
P = 0.02a + 0.07b + 0.15c + 0.20d
Where:
P = Percent of bituminous material by weight of dry aggregate.
a = Percent of material retained on the No. 50 (300m) sieve.
b = Percent of material between No. 50 (300m) and No. 100 (150m) sieves.
c = Percent of material between No. 100 (150m) and No. 200 (75m) sieves.
d = Percent of material passing the No. 200 (75m) sieve.
When aggregates with an appreciable amount of water absorption are used, the amount
of cutback asphalt added to the mixture should be increased by approximately
two-thirds (2/3) of the amount of water absorbed by the aggregate.
b. Nebraska Formula:
P = AG (0.02a) + 0.06b + 0.10c + Sd
Where:
P = Percent of bituminous material by weight of dry aggregate.
A = Absorption factor, equal to 1 for sand-gravel and 1 + 2/3 the water absorption of
other aggregates.
G = Specific Gravity Correction Factor. This factor equals 1.0 for aggregate mixtures
that have a average specific gravity of 2.61. For aggregate mixtures having a
different average specific gravity, this factor is inversely proportional to the
average specific gravity of the combined aggregate.
a = Percent of material retained on No. 50 (300m) sieve.
b = Percent of material retained between the No. 50 (300m) and No. 100 (150m)
sieves.
c = Percent of material retained between the No. 100 (150m) and No. 200 (75m)
sieves, plus C1.
d = Percent of fines determined by the average of the percent passing the No. 200
(75m) sieve dry screened, and the percent passing the No. 200 (75m) on
wash test in separate determinations.
C1 = The percent of material equal to the difference between the percent of material
passing the No. 200 (75m) sieve on wash test and "d".
S = 0.2, except for volcanic ash, in which case the "S" factor shall be 0.27.
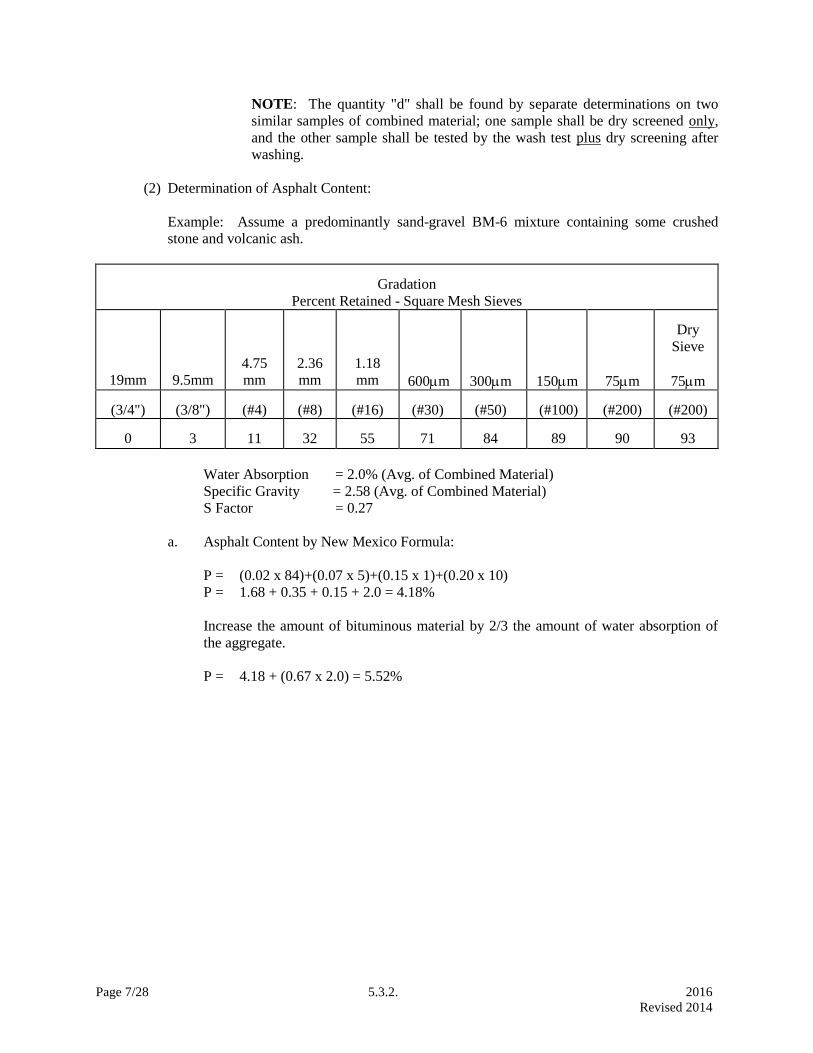
Page 7/28 5.3.2. 2016
Revised 2014
NOTE: The quantity "d" shall be found by separate determinations on two
similar samples of combined material; one sample shall be dry screened only,
and the other sample shall be tested by the wash test plus dry screening after
washing.
(2) Determination of Asphalt Content:
Example: Assume a predominantly sand-gravel BM-6 mixture containing some crushed
stone and volcanic ash.
Gradation
Percent Retained - Square Mesh Sieves
19mm
9.5mm
4.75
mm
2.36
mm
1.18
mm
600m
300m
150m
75m
Dry
Sieve
75m (3/4")
(3/8")
(#4)
(#8)
(#16)
(#30)
(#50)
(#100)
(#200)
(#200)
0
3
11
32
55
71
84
89
90
93
Water Absorption = 2.0% (Avg. of Combined Material)
Specific Gravity = 2.58 (Avg. of Combined Material)
S Factor = 0.27
a. Asphalt Content by New Mexico Formula:
P = (0.02 x 84)+(0.07 x 5)+(0.15 x 1)+(0.20 x 10)
P = 1.68 + 0.35 + 0.15 + 2.0 = 4.18%
Increase the amount of bituminous material by 2/3 the amount of water absorption of
the aggregate.
P = 4.18 + (0.67 x 2.0) = 5.52%
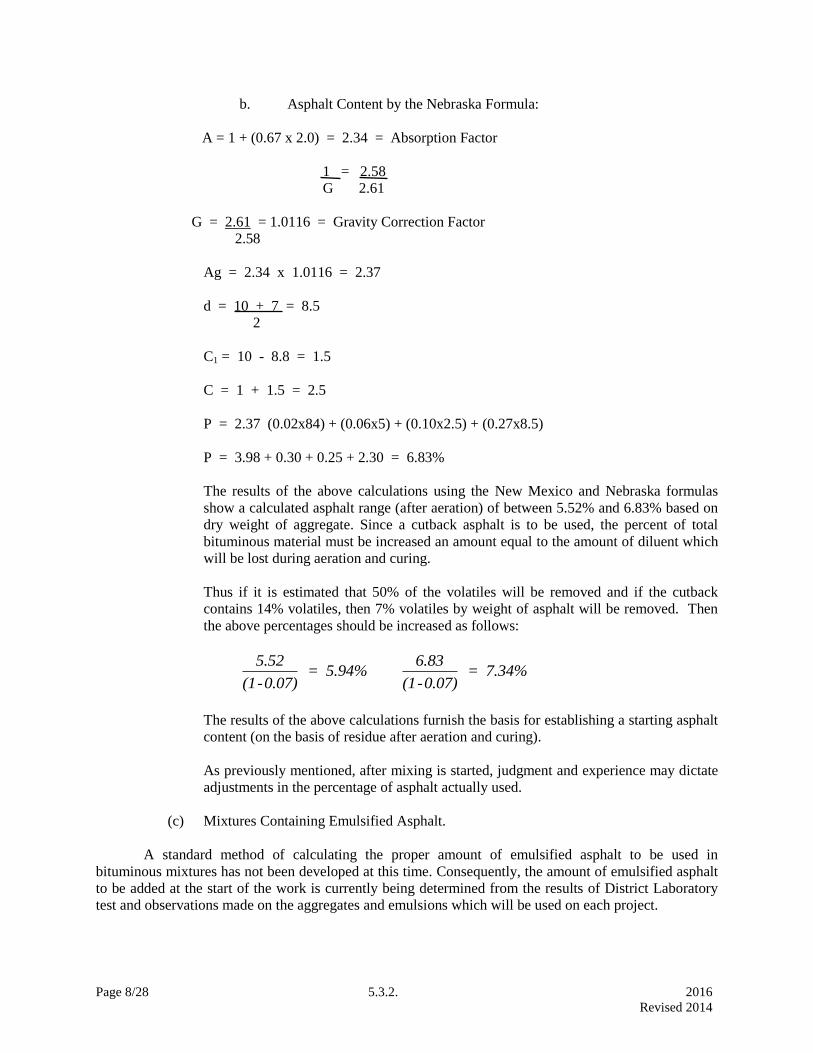
Page 8/28 5.3.2. 2016
Revised 2014
b. Asphalt Content by the Nebraska Formula:
A = 1 + (0.67 x 2.0) = 2.34 = Absorption Factor
1 = 2.58
G 2.61
G = 2.61 = 1.0116 = Gravity Correction Factor
2.58
Ag = 2.34 x 1.0116 = 2.37
d = 10 + 7 = 8.5
2
C1 = 10 - 8.8 = 1.5
C = 1 + 1.5 = 2.5
P = 2.37 (0.02x84) + (0.06x5) + (0.10x2.5) + (0.27x8.5)
P = 3.98 + 0.30 + 0.25 + 2.30 = 6.83%
The results of the above calculations using the New Mexico and Nebraska formulas
show a calculated asphalt range (after aeration) of between 5.52% and 6.83% based on
dry weight of aggregate. Since a cutback asphalt is to be used, the percent of total
bituminous material must be increased an amount equal to the amount of diluent which
will be lost during aeration and curing.
Thus if it is estimated that 50% of the volatiles will be removed and if the cutback
contains 14% volatiles, then 7% volatiles by weight of asphalt will be removed. Then
the above percentages should be increased as follows:
5.52
(1-0.07) = 5.94%
6.83
(1-0.07) = 7.34%
The results of the above calculations furnish the basis for establishing a starting asphalt
content (on the basis of residue after aeration and curing).
As previously mentioned, after mixing is started, judgment and experience may dictate
adjustments in the percentage of asphalt actually used.
(c) Mixtures Containing Emulsified Asphalt.
A standard method of calculating the proper amount of emulsified asphalt to be used in
bituminous mixtures has not been developed at this time. Consequently, the amount of emulsified asphalt
to be added at the start of the work is currently being determined from the results of District Laboratory
test and observations made on the aggregates and emulsions which will be used on each project.

Page 9/28 5.3.2. 2016
Revised 2014
KANSAS DEPARTMENT OF TRANSPORTATION
MARSHALL TEST RESULTS
No. of Blows: 50
Single Point to the tenth (Y/N)?: No
Contract #:594066008
Project: 99-115 K 4615-01 County: ZOLAN____________ Lab. No.: 9B99099A
Mix Designation: BM-2_____ Mix Material Code: 002030500
Specification 1990, Sec. 1103 & 90p-88R3___ Contractor: XYZ CONST. CO., INC._________________________
Asphalt Source: TOTAL____________ Producer: XYZ CONST. CO., INC_________________________
Asphalt Grade: AC-10__ Date Rec./Rep.:_________________________/__March 21, 1995__________________
Percent Retained Square Mesh Sieves
1½"
37.5
mm
1"
25
mm
¾"
19
mm
½"
12.5
mm
⅜"
9.5
mm
4
4.75
mm
8
2.36
mm
16
1.18
mm
30
600
µm
50
300
µm
100
150
µm
200
75
µm
Job Mix
Spec. Band
0
11
23
25
37
42
54
58
68
72
82
85
93
90
98
92.0
96.0
Job Mix Single Pt. 0 9 17 31 48 63 77 89 94 94.0
Marshall Gradation 0 9 18 31 48 65 76 88 94 95.0
Test Data
Range Tested
(% AC)
Increment
(% AC)
Marshall Mixing
Temperature Range (oC)
Marshall Compaction
Temperature Range (oC)
4.50 to 7.00 0.50 spec. 143 to 148 132 to137
Operating Range for Hot Mix Plant: 132 to 148 oC
P’bMax. #Recommend
Asphalt Content% 4.50 5.00 5.50 6.00 6.50 7.00 5.25
Air Voids(3 to 5%) 3.98
VFA (.=70% 80%) 72.70
Bearing Capacity 988
(690-1725 kPa)
Density Kg/m3 2315
(Peak+/-0.5%)
Stability 4638
Minimum 3336 N
# Values at Recommended Asphalt Content
Filler/Binder Ratio: 1.14 Eff. Film Thick.: 7.76 P’b Max: 5.42
V.M.A.: 14.30/Zone 2_ Max. Sp. Gr.: 2.410 Theo. Max Density: 2410 Kg/m3
District Materials Engineer
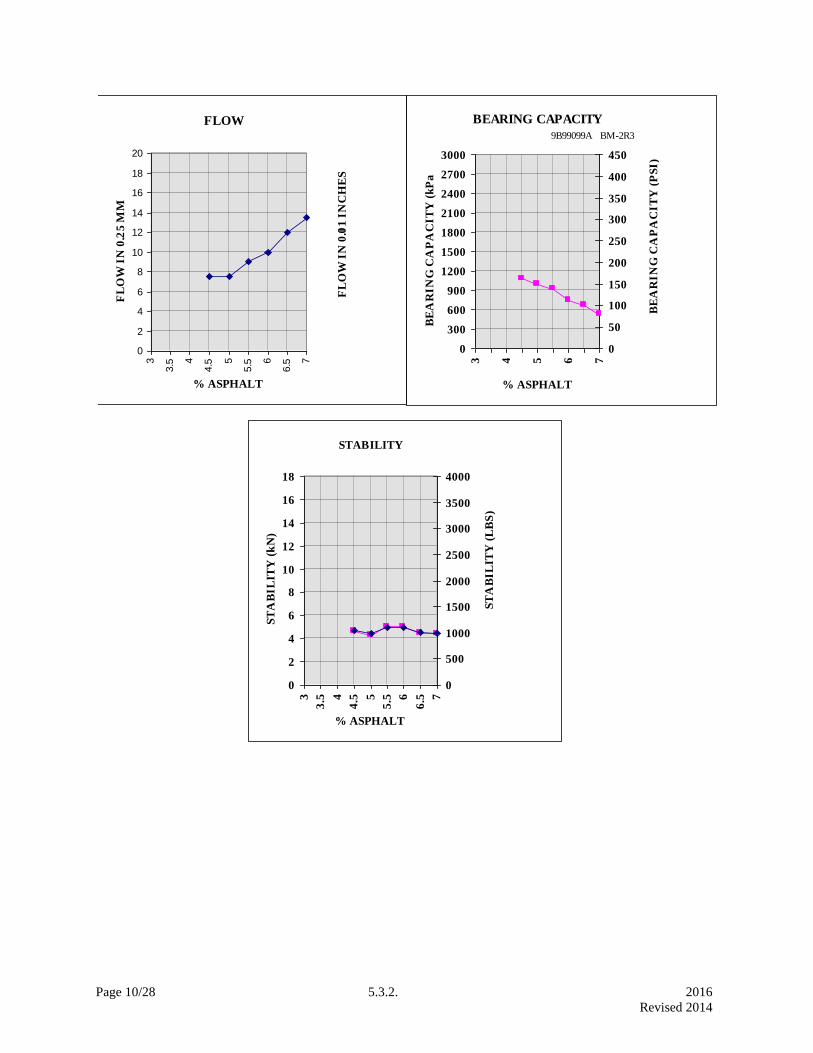
Page 10/28 5.3.2. 2016
Revised 2014
FLOW
0
2
4
6
8
10
12
14
16
18
203
3.5 4
4.5 5
5.5 6
6.5 7
% ASPHALT
FL
OW
IN
0.2
5 M
M
IF
LO
W I
N 0
.01
IN
CH
ES
BEARING CAPACITY
0
300
600
900
1200
1500
1800
2100
2400
2700
3000
3 4 5 6 7
% ASPHALT
BE
AR
IN
G C
AP
AC
IT
Y (
kP
a)
0
50
100
150
200
250
300
350
400
450
BE
AR
IN
G C
AP
AC
IT
Y (
PS
I)
9B99099A BM-2R3
STABILITY
0
2
4
6
8
10
12
14
16
18
3
3.5 4
4.5 5
5.5 6
6.5 7
% ASPHALT
ST
AB
IL
ITY
(k
N)
0
500
1000
1500
2000
2500
3000
3500
4000S
TA
BIL
ITY
(L
BS
)
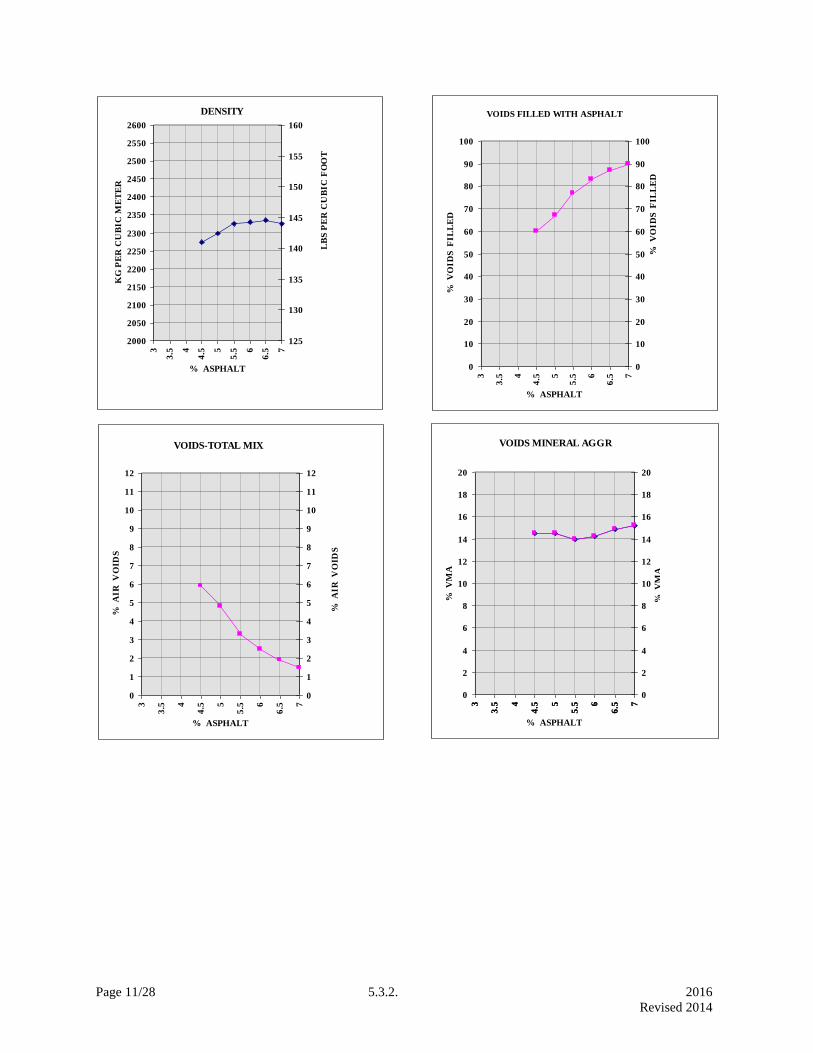
Page 11/28 5.3.2. 2016
Revised 2014
DENSITY
2000
2050
2100
2150
2200
2250
2300
2350
2400
2450
2500
2550
2600
3
3.5 4
4.5 5
5.5 6
6.5 7
% ASPHALT
KG
PE
R C
UB
IC
ME
TE
R
125
130
135
140
145
150
155
160
LB
S P
ER
CU
BIC
FO
OT
VOIDS FILLED WITH ASPHALT
0
10
20
30
40
50
60
70
80
90
100
3
3.5 4
4.5 5
5.5 6
6.5 7
% ASPHALT
% V
OID
S F
IL
LE
D
0
10
20
30
40
50
60
70
80
90
100
% V
OID
S F
IL
LE
D
VOIDS-TOTAL MIX
0
1
2
3
4
5
6
7
8
9
10
11
12
3
3.5 4
4.5 5
5.5 6
6.5 7
% ASPHALT
% A
IR
VO
IDS
0
1
2
3
4
5
6
7
8
9
10
11
12
% A
IR
VO
IDS
VOIDS MINERAL AGGR
0
2
4
6
8
10
12
14
16
18
203
3.5 4
4.5 5
5.5 6
6.5 7
% ASPHALT
% V
MA
0
2
4
6
8
10
12
14
16
18
203
3.5 4
4.5 5
5.5 6
6.5 7
% V
MA
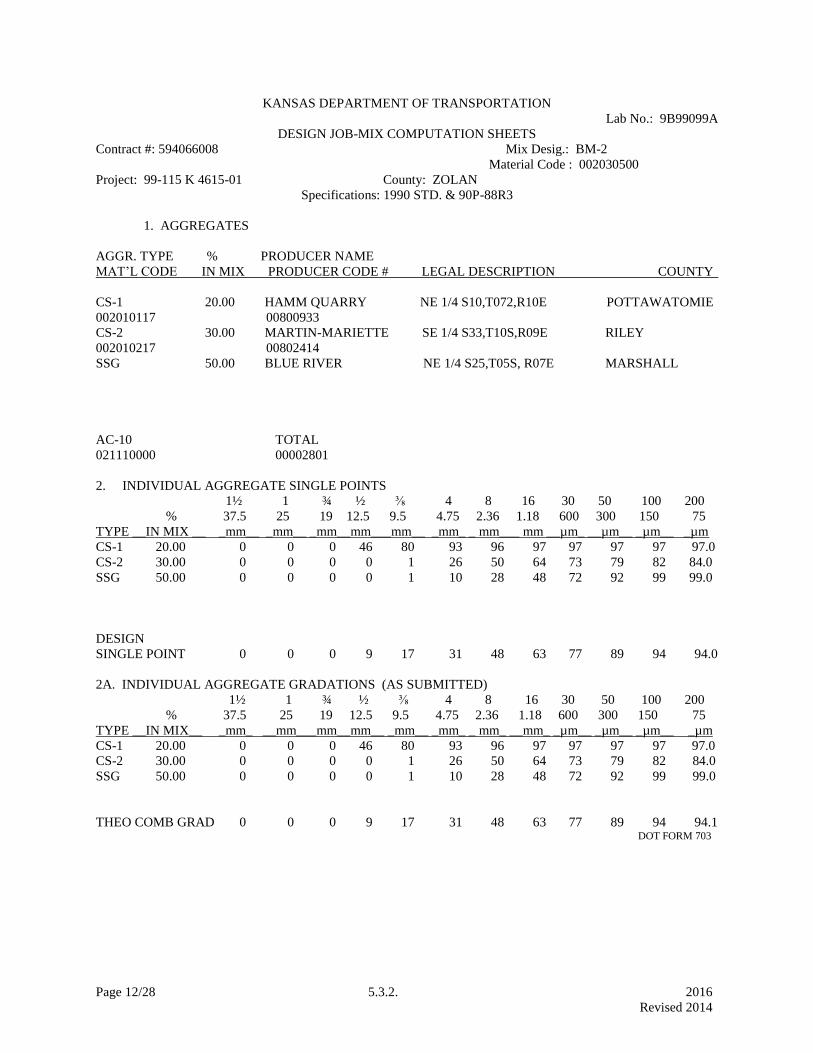
Page 12/28 5.3.2. 2016
Revised 2014
KANSAS DEPARTMENT OF TRANSPORTATION
Lab No.: 9B99099A
DESIGN JOB-MIX COMPUTATION SHEETS
Contract #: 594066008 Mix Desig.: BM-2
Material Code : 002030500
Project: 99-115 K 4615-01 County: ZOLAN
Specifications: 1990 STD. & 90P-88R3
1. AGGREGATES
AGGR. TYPE % PRODUCER NAME
MAT’L CODE IN MIX PRODUCER CODE # LEGAL DESCRIPTION COUNTY
CS-1 20.00 HAMM QUARRY NE 1/4 S10,T072,R10E POTTAWATOMIE
002010117 00800933
CS-2 30.00 MARTIN-MARIETTE SE 1/4 S33,T10S,R09E RILEY
002010217 00802414
SSG 50.00 BLUE RIVER NE 1/4 S25,T05S, R07E MARSHALL
AC-10 TOTAL
021110000 00002801
2. INDIVIDUAL AGGREGATE SINGLE POINTS
1½ 1 ¾ ½ ⅜ 4 8 16 30 50 100 200
% 37.5 25 19 12.5 9.5 4.75 2.36 1.18 600 300 150 75
TYPE __IN MIX __ _mm__ _mm__ _mm__mm___mm__ _mm_ _ mm___ mm __µm_ __µm__ _µm__ _µm
CS-1 20.00 0 0 0 46 80 93 96 97 97 97 97 97.0
CS-2 30.00 0 0 0 0 1 26 50 64 73 79 82 84.0
SSG 50.00 0 0 0 0 1 10 28 48 72 92 99 99.0
DESIGN
SINGLE POINT 0 0 0 9 17 31 48 63 77 89 94 94.0
2A. INDIVIDUAL AGGREGATE GRADATIONS (AS SUBMITTED)
1½ 1 ¾ ½ ⅜ 4 8 16 30 50 100 200
% 37.5 25 19 12.5 9.5 4.75 2.36 1.18 600 300 150 75
TYPE __IN MIX__ _mm_ __mm___mm__mm__ _mm__ _mm_ _ mm_ __mm_ _µm__ _µm__ _µm__ _µm
CS-1 20.00 0 0 0 46 80 93 96 97 97 97 97 97.0
CS-2 30.00 0 0 0 0 1 26 50 64 73 79 82 84.0
SSG 50.00 0 0 0 0 1 10 28 48 72 92 99 99.0
THEO COMB GRAD 0 0 0 9 17 31 48 63 77 89 94 94.1 DOT FORM 703

Page 13/28 5.3.2. 2016
Revised 2014
Project: 99-115 K 4615-01 Lab No.: 9B99099A
3. DESIGN JOB MIX GRADING
1½ 1 ¾ ½ ⅜ 4 8 16 30 50 100 200
37.5 25 19 12.5 9.5 4.75 2.36 1.18 600 300 150 75
_ _mm__ _mm__ _mm __mm___mm__ _mm_ _ mm__ mm _ µm_ _µm__ _µm__ _µm
0.00 0.00
SINGLE POINT 0 9 17 31 48 63 77 89 94 94.0
TOLERANCE 6 6 6 5 5 4 4 2
No
BM-2R3 LOWER 11 25 42 58 72 85 90 92.0
BM-2R3 UPPER 0 23 37 54 68 82 93 98 96.0
4. MASTER GRADING LIMITS
37.5 25 19 12.5 9.5 4.75 2.36 1.18 600 300 150 75
_ _mm__ _mm__ _mm __mm___mm__ _mm_ _ mm__ mm _ µm_ _µm__ _µm__ _µm
BM-2R3 LOWER 8 42 64 90
BM-2R3 UPPER 0 30 72 88 97
5. INDIVIDUAL AGGREGATE LIMITS
% 37.5 25 19 12.5 9.5 4.75 2.36 1.18 600 300 150 75
TYPE _ IN MIX __ _mm__ _mm__ _mm__mm___mm__ _mm_ _ mm___ mm __µm_ __µm__ _µm__ _µm
0 0 10 60 96 96 97 97 97 97 97
CS-1 20.00 0 0 0 28 77 99 99 99 99 99 99 100
0 0 0 0 22 45 60 70 77 80 81
CS-2 30.00 0 0 0 0 5 34 55 69 78 84 88 88
0 0 0 0 5 22 45 68 87 97 98
CS-3 50.00 0 0 0 0 5 15 32 55 77 95 100 100
6. INDIVIDUAL AGGREGATE COMBINED LIMITS
LOWER 0 0 2 12 28 44 60 74 86 92 93
UPPER 0 0 0 6 19 38 52 68 82 93 96 96
7. CHECK OF MIX SPECIFICATIONS
SPECS DESIGN
% CRUSHED AGGREGATE IN MIX 50 MIN. 50.00
% UNCRUSHED -75µm NATURAL SAND 30 MAX. 8.47
% -2.36mm +75µm NATURAL SAND 15 MIN. 35.50
SAND EQUIVALENT 45 MIN. 53
Design Job Mix Single Point Meets
the Screen Spread Limits Specification. DOT Form 704
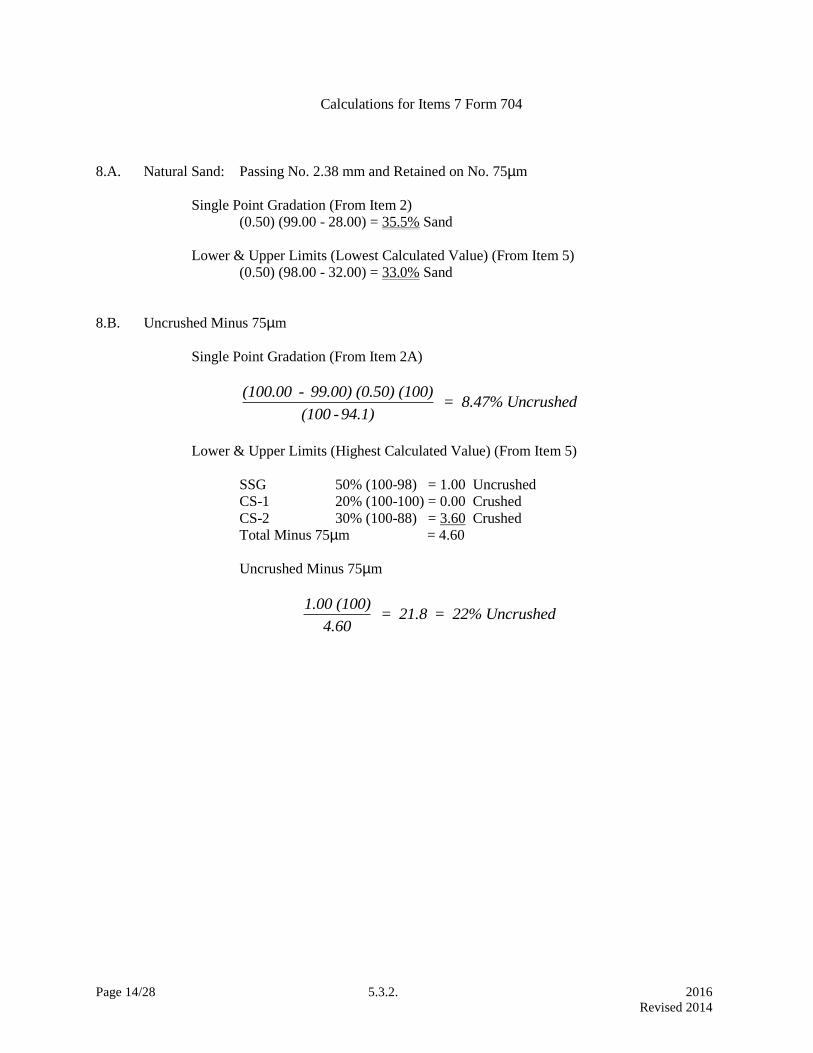
Page 14/28 5.3.2. 2016
Revised 2014
Calculations for Items 7 Form 704
8.A. Natural Sand: Passing No. 2.38 mm and Retained on No. 75µm
Single Point Gradation (From Item 2)
(0.50) (99.00 - 28.00) = 35.5% Sand
Lower & Upper Limits (Lowest Calculated Value) (From Item 5)
(0.50) (98.00 - 32.00) = 33.0% Sand
8.B. Uncrushed Minus 75µm
Single Point Gradation (From Item 2A)
(100.00 - 99.00) (0.50) (100)
(100 -94.1) = 8.47% Uncrushed
Lower & Upper Limits (Highest Calculated Value) (From Item 5)
SSG 50% (100-98) = 1.00 Uncrushed
CS-1 20% (100-100) = 0.00 Crushed
CS-2 30% (100-88) = 3.60 Crushed
Total Minus 75µm = 4.60
Uncrushed Minus 75µm
1.00 (100)
4.60 = 21.8 = 22% Uncrushed
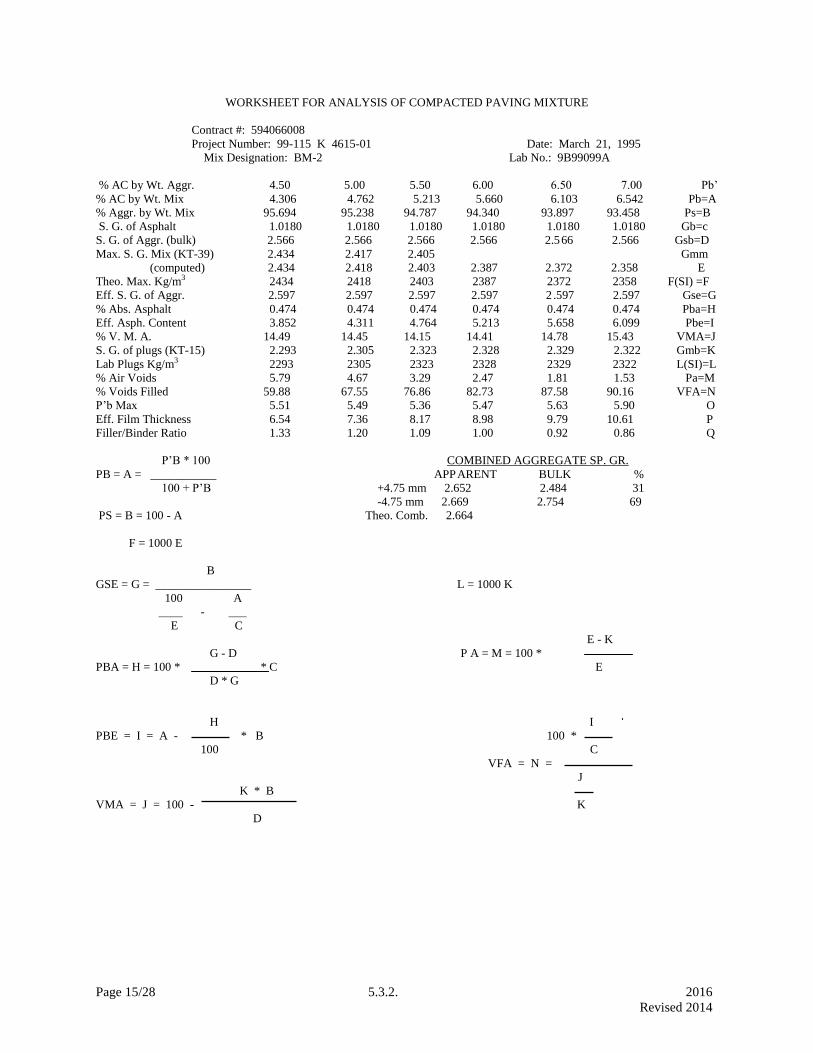
Page 15/28 5.3.2. 2016
Revised 2014
WORKSHEET FOR ANALYSIS OF COMPACTED PAVING MIXTURE
Contract #: 594066008
Project Number: 99-115 K 4615-01 Date: March 21, 1995
Mix Designation: BM-2 Lab No.: 9B99099A
% AC by Wt. Aggr. 4.50 5.00 5.50 6.00 6.50 7.00 Pb’
% AC by Wt. Mix 4.306 4.762 5.213 5.660 6.103 6.542 Pb=A
% Aggr. by Wt. Mix 95.694 95.238 94.787 94.340 93.897 93.458 Ps=B
S. G. of Asphalt 1.0180 1.0180 1.0180 1.0180 1.0180 1.0180 Gb=c
S. G. of Aggr. (bulk) 2.566 2.566 2.566 2.566 2.566 2.566 Gsb=D
Max. S. G. Mix (KT-39) 2.434 2.417 2.405 Gmm
(computed) 2.434 2.418 2.403 2.387 2.372 2.358 E
Theo. Max. Kg/m3 2434 2418 2403 2387 2372 2358 F(SI) =F
Eff. S. G. of Aggr. 2.597 2.597 2.597 2.597 2 .597 2.597 Gse=G
% Abs. Asphalt 0.474 0.474 0.474 0.474 0.474 0.474 Pba=H
Eff. Asph. Content 3.852 4.311 4.764 5.213 5.658 6.099 Pbe=I
% V. M. A. 14.49 14.45 14.15 14.41 14.78 15.43 VMA=J
S. G. of plugs (KT-15) 2.293 2.305 2.323 2.328 2.329 2.322 Gmb=K
Lab Plugs Kg/m3 2293 2305 2323 2328 2329 2322 L(SI)=L
% Air Voids 5.79 4.67 3.29 2.47 1.81 1.53 Pa=M
% Voids Filled 59.88 67.55 76.86 82.73 87.58 90.16 VFA=N
P’b Max 5.51 5.49 5.36 5.47 5.63 5.90 O
Eff. Film Thickness 6.54 7.36 8.17 8.98 9.79 10.61 P
Filler/Binder Ratio 1.33 1.20 1.09 1.00 0.92 0.86 Q
P’B * 100 COMBINED AGGREGATE SP. GR.
PB = A = ___________ APPARENT BULK %
100 + P’B +4.75 mm 2.652 2.484 31
-4.75 mm 2.669 2.754 69
PS = B = 100 - A Theo. Comb. 2.664
F = 1000 E
B
GSE = G = ________________ L = 1000 K
100 A
____ - ___
E C
E - K
G - D P A = M = 100 *
PBA = H = 100 * * C E
D * G
H I
PBE = I = A - * B 100 *
100 C
VFA = N =
J
K * B
VMA = J = 100 - K
D

Page 16/28 5.3.2. 2016
Revised 2014
KANSAS DEPARTMENT OF TRANSPORTATION
HOT MIX DESIGN DATA (MARSHALL METHOD)
Contract: 594066008
Project: 99-115 K 4615-01 County: Zolan Date: March 21, 1995 Lab No. 9B99099A
Mix Designation: BM-2 Asphalt Grade: AC-10 Sp. Gr. AC: 1.0180 Compaction, Blows/Side: 50
Deg.C Comapct Specimen Weight, Grams Water SP. GR. KG/ Water Stability Flow Bearing
Temp. Height Dry In S.S.D S.S.D Absorbed Compact Cubic Bath Dial. Adjust (0.25) Capacity
% AC (C) (MM) In Air Water In Air In Water % Mix Meter (C) Reading Corr. (N) (MM) (kPa)
A 137 63.900 1175.1 661.7 2.289 59 117 1.00 4589 7.5
148 B 136 63.700 1183.8 669.2 2.300 59 143 1.00 5679 7.5 Error
C 134 63.600 1174.2 661.5 2.290 61 122 1.00 4799 7.5
4.50 Average 2.293 2293 4694 7.5 1091
A 137 63.800 1185.0 671.3 2.307 60 105 1.00 4087 7.5
148 B 137 63.500 1187.7 674.0 2.312 60 117 1.00 4589 7.5
C 136 63.200 1179.4 665.8 2.296 60 112 1.00 4380 7.5
5.00 Average 2.305 2305 4352 7.5 1012
A 133 63.300 1187.1 675.7 2.307 60 117 1.00 4589 8.0
148 B 133 63.200 1186.6 676.2 2.325 60 127 1.00 5009 9.0
C 134 62.900 1187.1 676.7 2.326 60 131 1.00 5176 9.5
5.50 Average 2.324 2324 4925 8.8 965
A 134 63.300 1193.6 680.6 2.327 59 131 1.00 5176 10.5
148 B 136 62.700 1183.9 675.6 2.329 59 122 1.04 4991 9.5
C 136 63.300 1190.0 679.1 2.329 60 116 1.00 4548 9.5
6.00 Average 2.328 2328 4905 9.8 855
A 137 62.700 1190.5 679.2 2.328 60 114 1.04 4642 12.5
148 B 136 62.900 1184.8 675.6 2.327 60 122 1.00 4799 11.5
C 137 63.100 1186.1 677.6 2.333 60 112 1.00 4380 11.5
6.50 Average 2.329 2329 4607 11.8 655
A 137 62.900 1184.5 674.7 2.323 59 119 1.00 4673 14.0
148 B 136 63.100 1184.3 672.9 2.316 60 105 1.00 4087 13.5
C 134 63.600 1189.2 677.8 2.325 60 118 1.00 4631 13.5
7.00 Average 2.322 2322 4464 13.7 537
Specific Gravity Method: I ERROR = PLUG OUT OF ALLOWED RANGE
D.O.T. FORM 705
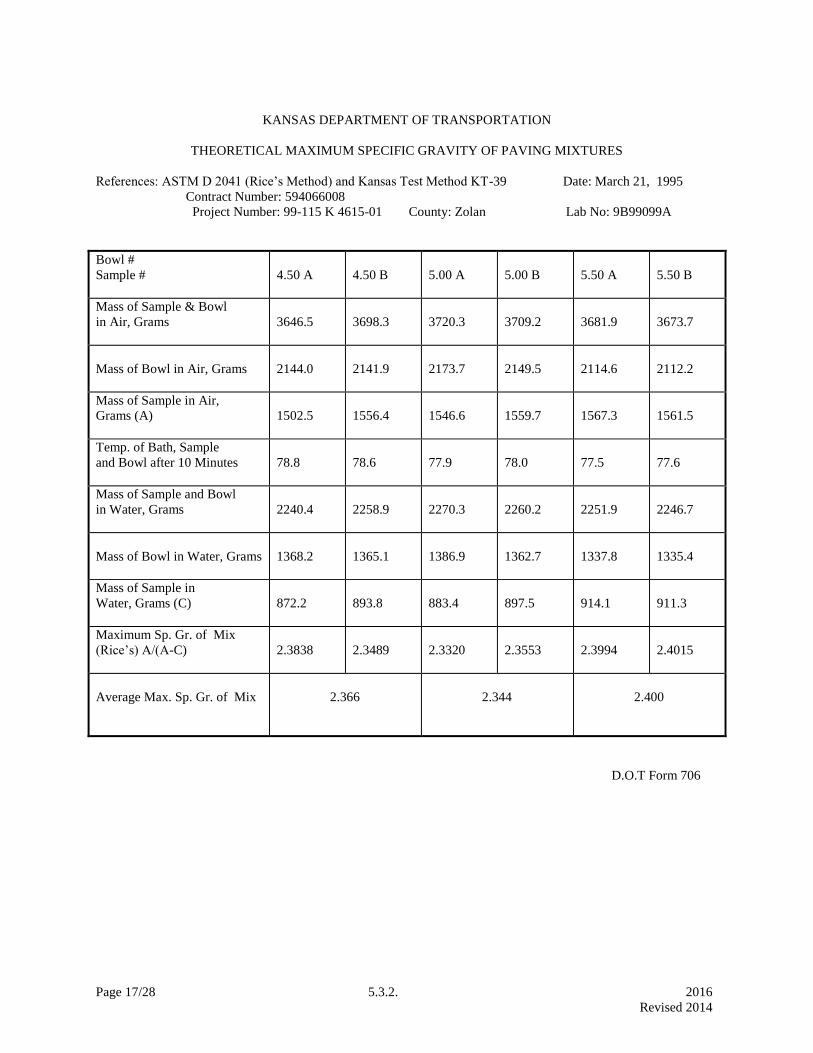
Page 17/28 5.3.2. 2016
Revised 2014
KANSAS DEPARTMENT OF TRANSPORTATION
THEORETICAL MAXIMUM SPECIFIC GRAVITY OF PAVING MIXTURES
References: ASTM D 2041 (Rice’s Method) and Kansas Test Method KT-39 Date: March 21, 1995
Contract Number: 594066008
Project Number: 99-115 K 4615-01 County: Zolan Lab No: 9B99099A
Bowl #
Sample #
4.50 A
4.50 B
5.00 A
5.00 B
5.50 A
5.50 B
Mass of Sample & Bowl
in Air, Grams
3646.5
3698.3
3720.3
3709.2
3681.9
3673.7
Mass of Bowl in Air, Grams
2144.0
2141.9
2173.7
2149.5
2114.6
2112.2
Mass of Sample in Air,
Grams (A)
1502.5
1556.4
1546.6
1559.7
1567.3
1561.5
Temp. of Bath, Sample
and Bowl after 10 Minutes
78.8
78.6
77.9
78.0
77.5
77.6
Mass of Sample and Bowl
in Water, Grams
2240.4
2258.9
2270.3
2260.2
2251.9
2246.7
Mass of Bowl in Water, Grams
1368.2
1365.1
1386.9
1362.7
1337.8
1335.4
Mass of Sample in
Water, Grams (C)
872.2
893.8
883.4
897.5
914.1
911.3
Maximum Sp. Gr. of Mix
(Rice’s) A/(A-C)
2.3838
2.3489
2.3320
2.3553
2.3994
2.4015
Average Max. Sp. Gr. of Mix
2.366
2.344
2.400
D.O.T Form 706
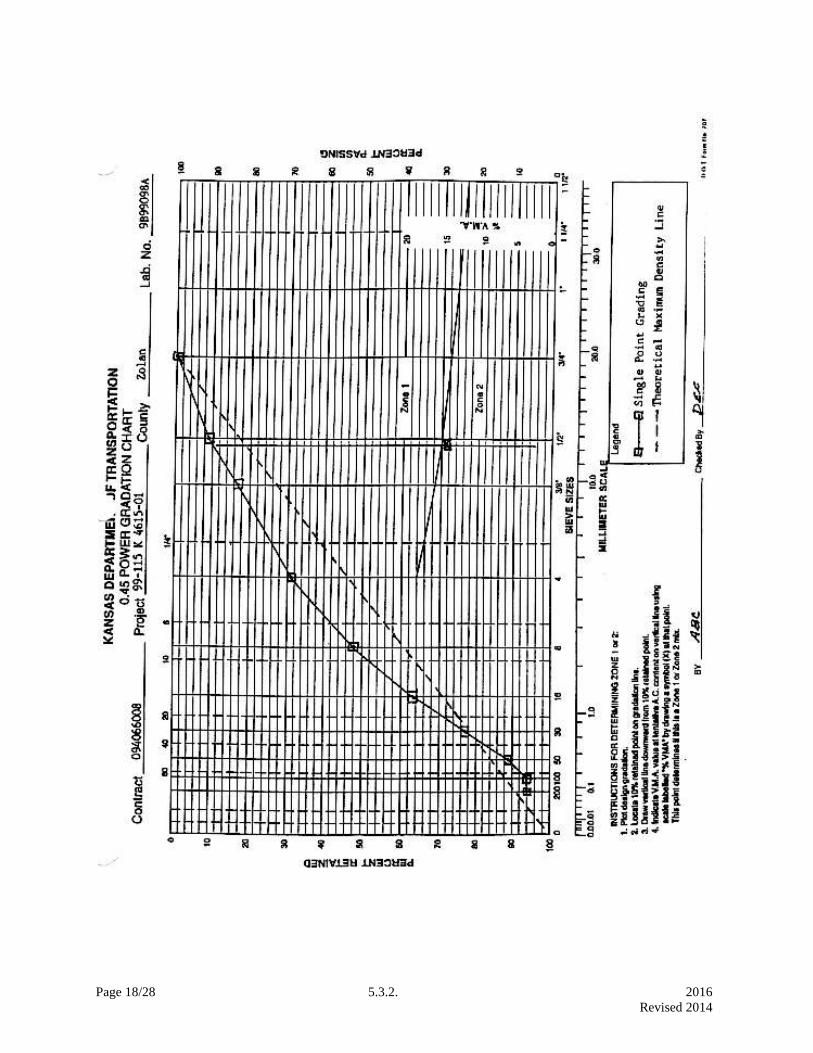
Page 18/28 5.3.2. 2016
Revised 2014
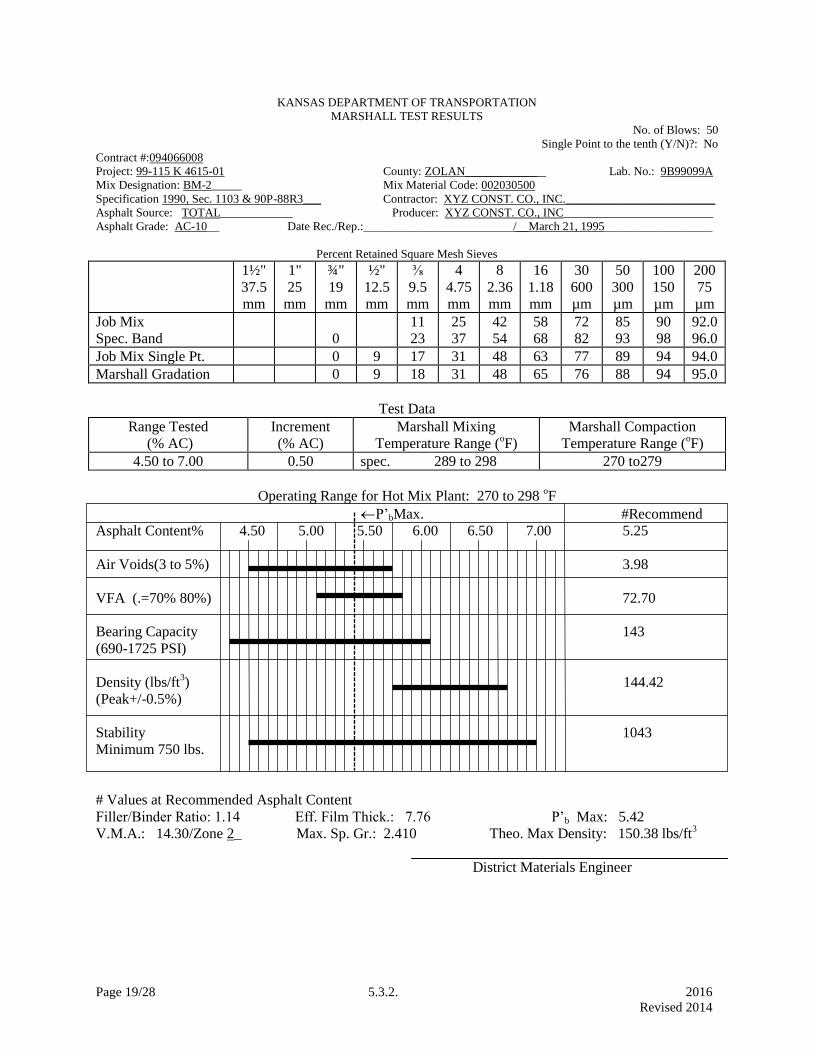
Page 19/28 5.3.2. 2016
Revised 2014
KANSAS DEPARTMENT OF TRANSPORTATION
MARSHALL TEST RESULTS
No. of Blows: 50
Single Point to the tenth (Y/N)?: No
Contract #:094066008
Project: 99-115 K 4615-01 County: ZOLAN____________ Lab. No.: 9B99099A
Mix Designation: BM-2_____ Mix Material Code: 002030500
Specification 1990, Sec. 1103 & 90P-88R3___ Contractor: XYZ CONST. CO., INC._________________________
Asphalt Source: TOTAL____________ Producer: XYZ CONST. CO., INC_________________________
Asphalt Grade: AC-10__ Date Rec./Rep.:_________________________/__March 21, 1995__________________
Percent Retained Square Mesh Sieves
1½"
37.5
mm
1"
25
mm
¾"
19
mm
½"
12.5
mm
⅜
9.5
mm
4
4.75
mm
8
2.36
mm
16
1.18
mm
30
600
µm
50
300
µm
100
150
µm
200
75
µm
Job Mix
Spec. Band
0
11
23
25
37
42
54
58
68
72
82
85
93
90
98
92.0
96.0
Job Mix Single Pt. 0 9 17 31 48 63 77 89 94 94.0
Marshall Gradation 0 9 18 31 48 65 76 88 94 95.0
Test Data
Range Tested
(% AC)
Increment
(% AC)
Marshall Mixing
Temperature Range (oF)
Marshall Compaction
Temperature Range (oF)
4.50 to 7.00 0.50 spec. 289 to 298 270 to279
Operating Range for Hot Mix Plant: 270 to 298 oF
P’bMax. #Recommend
Asphalt Content% 4.50 5.00 5.50 6.00 6.50 7.00 5.25
Air Voids(3 to 5%) 3.98
VFA (.=70% 80%) 72.70
Bearing Capacity 143
(690-1725 PSI)
Density (lbs/ft3) 144.42
(Peak+/-0.5%)
Stability 1043
Minimum 750 lbs.
# Values at Recommended Asphalt Content
Filler/Binder Ratio: 1.14 Eff. Film Thick.: 7.76 P’b Max: 5.42
V.M.A.: 14.30/Zone 2_ Max. Sp. Gr.: 2.410 Theo. Max Density: 150.38 lbs/ft3
District Materials Engineer

Page 20/28 5.3.2. 2016
Revised 2014
BEARING CAPACITY
0
50
100
150
200
250
300
350
400
450
3 3.5 4 4.5 5 5.5 6 6.5 7
% ASPHALT
BE
AR
IN
G C
AP
AC
IT
Y P
SI
0
300
600
900
1200
1500
1800
2100
2400
2700
3000
BE
AR
IN
G C
AP
AC
IT
Y (
kP
a)
STABILITY
0
500
1000
1500
2000
2500
3000
3500
4000
3 3.5 4 4.5 5 5.5 6 6.5 7
% ASPHALT
ST
AB
IL
IT
Y (L
BS
)
0
2
4
6
8
10
12
14
16
ST
AB
IL
IT
Y
FLOW
0
2
4
6
8
10
12
14
16
18
20
3 3.5 4 4.5 5 5.5 6 6.5 7
% ASPHALT
FL
OW
IN
0.0
1"
0
2
4
6
8
10
12
14
16
18
20
FL
OW
IN
0.2
5 M
M
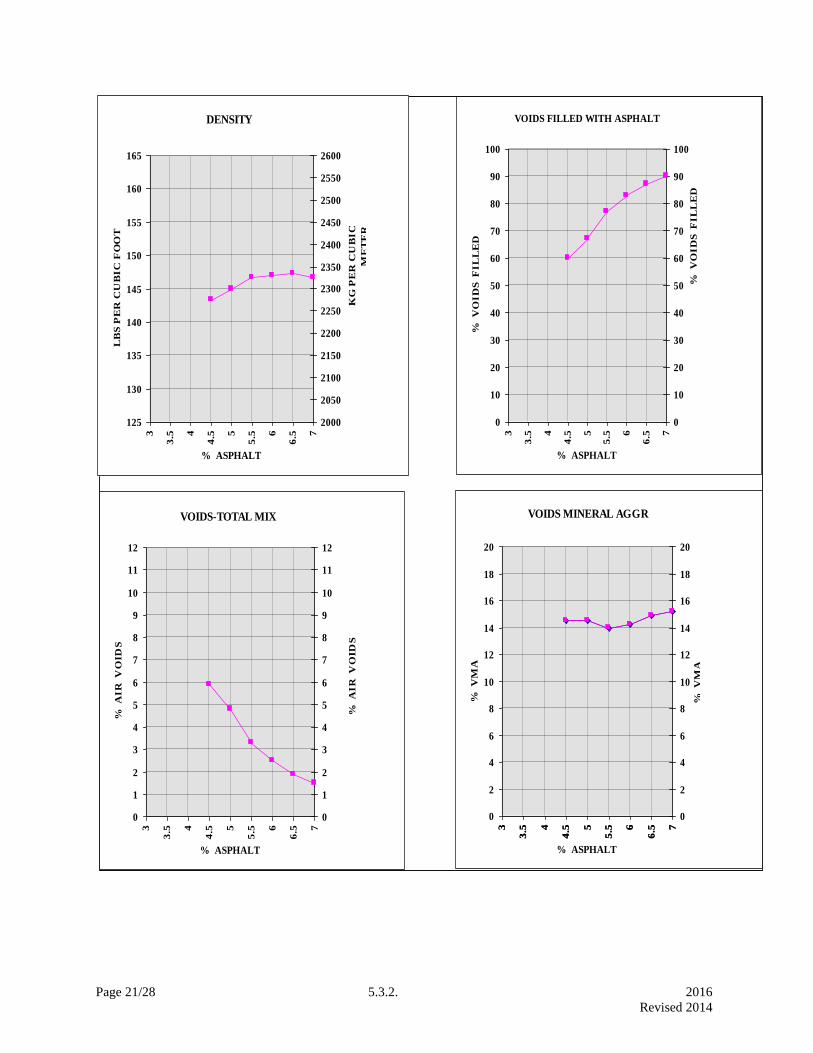
Page 21/28 5.3.2. 2016
Revised 2014
VOIDS FILLED WITH ASPHALT
0
10
20
30
40
50
60
70
80
90
100
3
3.5 4
4.5 5
5.5 6
6.5 7
% ASPHALT
% V
OID
S F
IL
LE
D
0
10
20
30
40
50
60
70
80
90
100
% V
OID
S F
IL
LE
D
VOIDS-TOTAL MIX
0
1
2
3
4
5
6
7
8
9
10
11
12
3
3.5 4
4.5 5
5.5 6
6.5 7
% ASPHALT
% A
IR
V
OID
S
0
1
2
3
4
5
6
7
8
9
10
11
12
% A
IR
V
OID
S
VOIDS MINERAL AGGR
0
2
4
6
8
10
12
14
16
18
20
3
3.5 4
4.5 5
5.5 6
6.5 7
% ASPHALT
% V
MA
0
2
4
6
8
10
12
14
16
18
20
3
3.5 4
4.5 5
5.5 6
6.5 7
% V
MA
DENSITY
125
130
135
140
145
150
155
160
1653
3.5 4
4.5 5
5.5 6
6.5 7
% ASPHALT
LB
S P
ER
CU
BIC
FO
OT
2000
2050
2100
2150
2200
2250
2300
2350
2400
2450
2500
2550
2600
KG
PE
R C
UB
IC
ME
TE
R
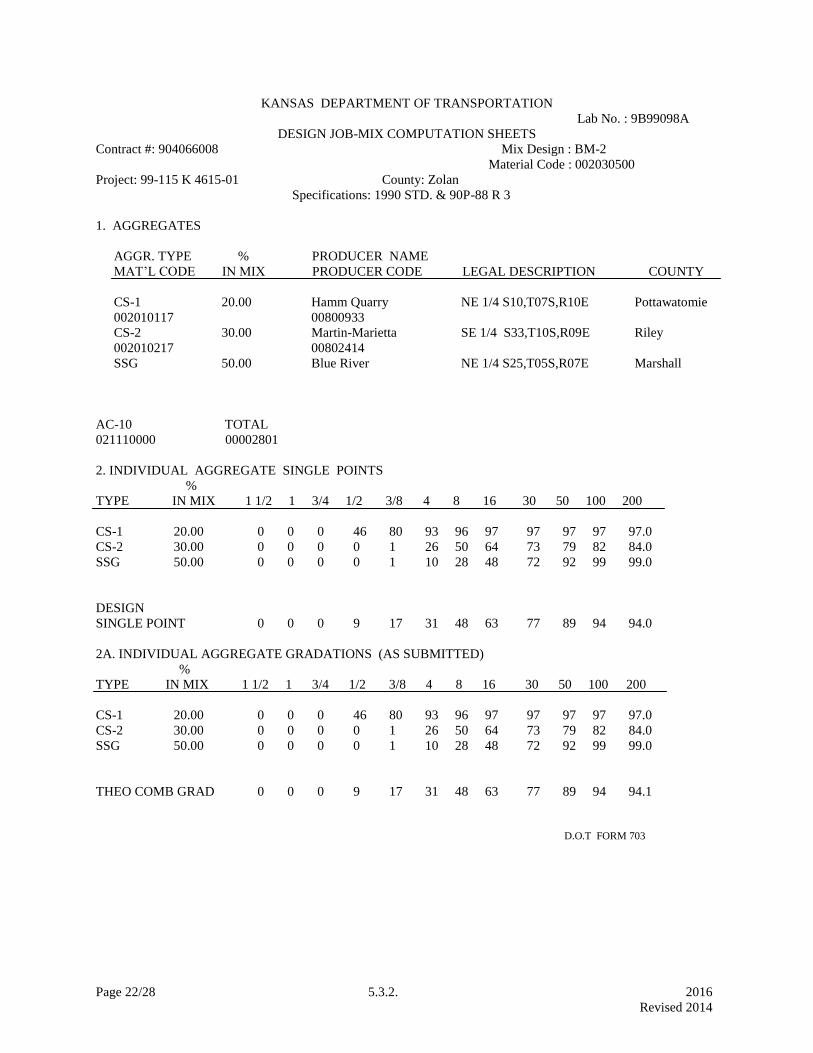
Page 22/28 5.3.2. 2016
Revised 2014
KANSAS DEPARTMENT OF TRANSPORTATION
Lab No. : 9B99098A
DESIGN JOB-MIX COMPUTATION SHEETS
Contract #: 904066008 Mix Design : BM-2
Material Code : 002030500
Project: 99-115 K 4615-01 County: Zolan
Specifications: 1990 STD. & 90P-88 R 3
1. AGGREGATES
AGGR. TYPE % PRODUCER NAME
MAT’L CODE IN MIX PRODUCER CODE LEGAL DESCRIPTION COUNTY
CS-1 20.00 Hamm Quarry NE 1/4 S10,T07S,R10E Pottawatomie
002010117 00800933
CS-2 30.00 Martin-Marietta SE 1/4 S33,T10S,R09E Riley
002010217 00802414
SSG 50.00 Blue River NE 1/4 S25,T05S,R07E Marshall
AC-10 TOTAL
021110000 00002801
2. INDIVIDUAL AGGREGATE SINGLE POINTS
%
TYPE IN MIX 1 1/2 1 3/4 1/2 3/8 4 8 16 30 50 100 200
CS-1 20.00 0 0 0 46 80 93 96 97 97 97 97 97.0
CS-2 30.00 0 0 0 0 1 26 50 64 73 79 82 84.0
SSG 50.00 0 0 0 0 1 10 28 48 72 92 99 99.0
DESIGN
SINGLE POINT 0 0 0 9 17 31 48 63 77 89 94 94.0
2A. INDIVIDUAL AGGREGATE GRADATIONS (AS SUBMITTED)
%
TYPE IN MIX 1 1/2 1 3/4 1/2 3/8 4 8 16 30 50 100 200
CS-1 20.00 0 0 0 46 80 93 96 97 97 97 97 97.0
CS-2 30.00 0 0 0 0 1 26 50 64 73 79 82 84.0
SSG 50.00 0 0 0 0 1 10 28 48 72 92 99 99.0
THEO COMB GRAD 0 0 0 9 17 31 48 63 77 89 94 94.1
D.O.T FORM 703

Page 23/28 5.3.2. 2016
Revised 2014
Project: 99-115 K 4615-01 Lab No. 9B99098A
3. DESIGN JOB MIX GRADING
1 1/2 1 3/4 1/2 3/8 4 8 16 30 50 100 200
SINGLE POINT 0 0 0 9 17 31 48 63 77 89 94 94.0
TOLERANCE 6 6 6 5 5 4 4 2
BM-2R3 LOWER 11 25 42 58 72 85 90 92.0
BM-2R3 UPPER 0 23 37 54 68 82 93 98 96.0
4. MASTER GRADING LIMITS
1 1/2 1 3/4 1/2 3/8 4 8 16 30 50 100 200
BM-2R3 LOWER 0 42 64 90
BM-2R3 UPPER 0 30 72 88 97
5. INDIVIDUAL AGGREGATE LIMITS
%
TYPE IN MIX 1 1/2 1 3/4 1/2 3/8 4 8 16 30 50 100 200
0 0 0 10 60 96 96 97 97 97 97 97
CS-1 20.00 0 0 0 28 77 99 99 99 99 99 99 100
0 0 0 0 0 22 45 60 70 77 80 81
CS-2 30.00 0 0 0 0 5 34 55 69 78 84 88 88
0 0 0 0 5 22 45 68 87 97 98
SSG 50.00 0 0 0 0 5 15 32 55 77 95 100 100
6. INDIVIDUAL AGGREGATE COMBINED LIMITS
LOWER 0 0 2 12 28 44 60 74 86 92 93
UPPER 0 0 0 6 19 38 52 68 82 93 96 96
7. CHECK OF MIX SPECIFICATIONS
SPECS DESIGN
% CRUSHED AGGREGATE IN MIX 50 MIN. 50.00
% UNCRUSHED -200 30 MIN. 8.47
% -8 +200 NATURAL SAND 15 MIN. 35.50
SAND EQUIVALENT 45 MIN. 53
DESIGN JOB MIX SINGLE POINT MEETS
THE SCREEN SPREAD LIMITS SPECIFICATION.
D.O.T. FORM 704
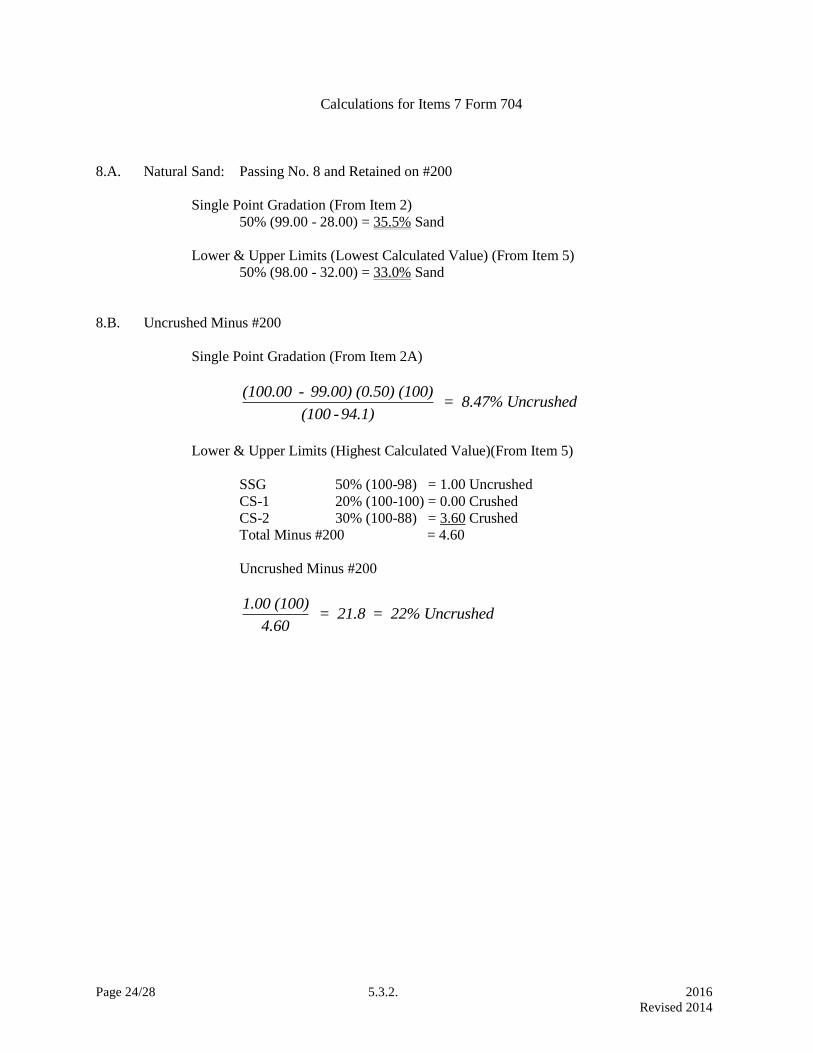
Page 24/28 5.3.2. 2016
Revised 2014
Calculations for Items 7 Form 704
8.A. Natural Sand: Passing No. 8 and Retained on #200
Single Point Gradation (From Item 2)
50% (99.00 - 28.00) = 35.5% Sand
Lower & Upper Limits (Lowest Calculated Value) (From Item 5)
50% (98.00 - 32.00) = 33.0% Sand
8.B. Uncrushed Minus #200
Single Point Gradation (From Item 2A)
(100.00 - 99.00) (0.50) (100)
(100 -94.1) = 8.47% Uncrushed
Lower & Upper Limits (Highest Calculated Value)(From Item 5)
SSG 50% (100-98) = 1.00 Uncrushed
CS-1 20% (100-100) = 0.00 Crushed
CS-2 30% (100-88) = 3.60 Crushed
Total Minus #200 = 4.60
Uncrushed Minus #200
1.00 (100)
4.60 = 21.8 = 22% Uncrushed
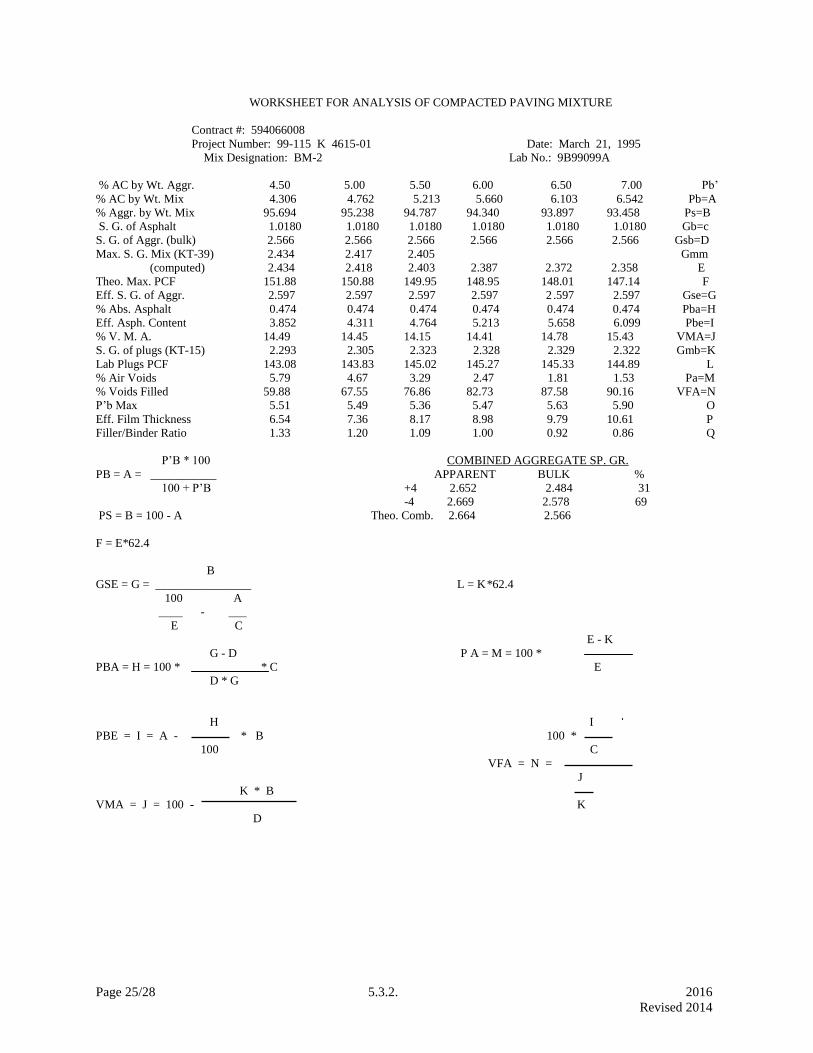
Page 25/28 5.3.2. 2016
Revised 2014
WORKSHEET FOR ANALYSIS OF COMPACTED PAVING MIXTURE
Contract #: 594066008
Project Number: 99-115 K 4615-01 Date: March 21, 1995
Mix Designation: BM-2 Lab No.: 9B99099A
% AC by Wt. Aggr. 4.50 5.00 5.50 6.00 6.50 7.00 Pb’
% AC by Wt. Mix 4.306 4.762 5.213 5.660 6.103 6.542 Pb=A
% Aggr. by Wt. Mix 95.694 95.238 94.787 94.340 93.897 93.458 Ps=B
S. G. of Asphalt 1.0180 1.0180 1.0180 1.0180 1.0180 1.0180 Gb=c
S. G. of Aggr. (bulk) 2.566 2.566 2.566 2.566 2.566 2.566 Gsb=D
Max. S. G. Mix (KT-39) 2.434 2.417 2.405 Gmm
(computed) 2.434 2.418 2.403 2.387 2.372 2.358 E
Theo. Max. PCF 151.88 150.88 149.95 148.95 148.01 147.14 F
Eff. S. G. of Aggr. 2.597 2.597 2.597 2.597 2 .597 2.597 Gse=G
% Abs. Asphalt 0.474 0.474 0.474 0.474 0.474 0.474 Pba=H
Eff. Asph. Content 3.852 4.311 4.764 5.213 5.658 6.099 Pbe=I
% V. M. A. 14.49 14.45 14.15 14.41 14.78 15.43 VMA=J
S. G. of plugs (KT-15) 2.293 2.305 2.323 2.328 2.329 2.322 Gmb=K
Lab Plugs PCF 143.08 143.83 145.02 145.27 145.33 144.89 L
% Air Voids 5.79 4.67 3.29 2.47 1.81 1.53 Pa=M
% Voids Filled 59.88 67.55 76.86 82.73 87.58 90.16 VFA=N
P’b Max 5.51 5.49 5.36 5.47 5.63 5.90 O
Eff. Film Thickness 6.54 7.36 8.17 8.98 9.79 10.61 P
Filler/Binder Ratio 1.33 1.20 1.09 1.00 0.92 0.86 Q
P’B * 100 COMBINED AGGREGATE SP. GR.
PB = A = ___________ APPARENT BULK %
100 + P’B +4 2.652 2.484 31
-4 2.669 2.578 69
PS = B = 100 - A Theo. Comb. 2.664 2.566
F = E*62.4
B
GSE = G = ________________ L = K*62.4
100 A
____ - ___
E C
E - K
G - D P A = M = 100 *
PBA = H = 100 * * C E
D * G
H I
PBE = I = A - * B 100 *
100 C
VFA = N =
J
K * B
VMA = J = 100 - K
D
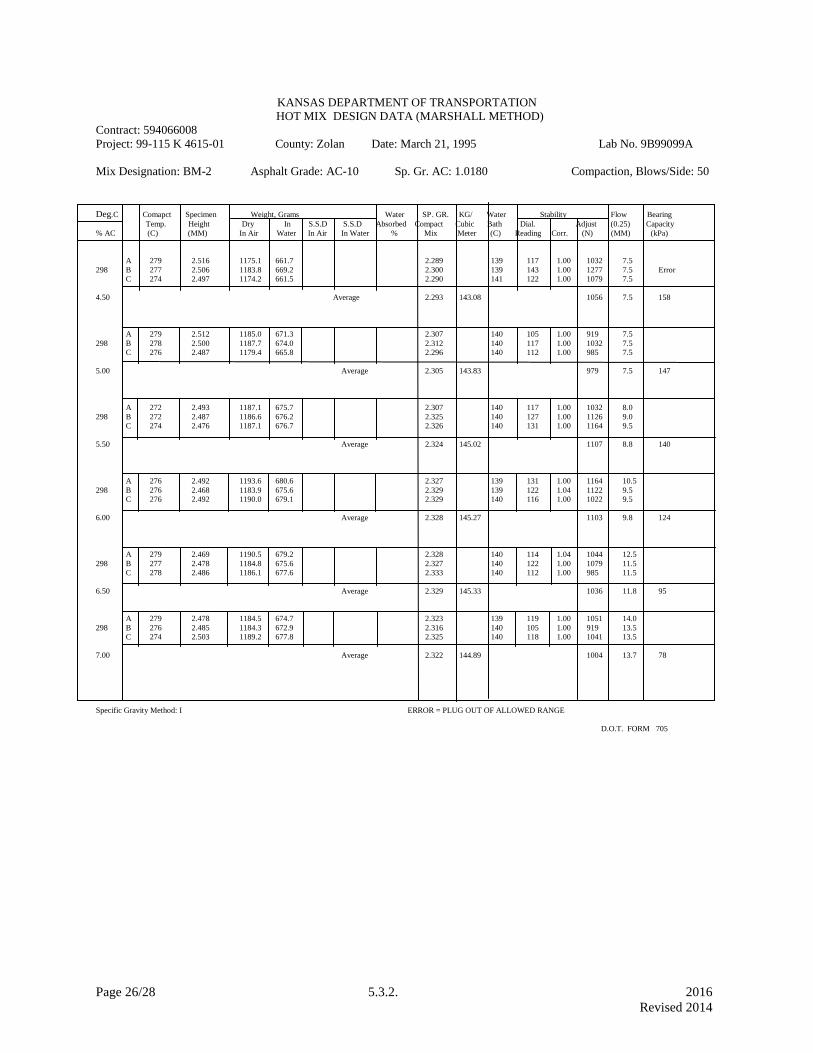
Page 26/28 5.3.2. 2016
Revised 2014
KANSAS DEPARTMENT OF TRANSPORTATION
HOT MIX DESIGN DATA (MARSHALL METHOD)
Contract: 594066008
Project: 99-115 K 4615-01 County: Zolan Date: March 21, 1995 Lab No. 9B99099A
Mix Designation: BM-2 Asphalt Grade: AC-10 Sp. Gr. AC: 1.0180 Compaction, Blows/Side: 50
Deg.C Comapct Specimen Weight, Grams Water SP. GR. KG/ Water Stability Flow Bearing
Temp. Height Dry In S.S.D S.S.D Absorbed Compact Cubic Bath Dial. Adjust (0.25) Capacity
% AC (C) (MM) In Air Water In Air In Water % Mix Meter (C) Reading Corr. (N) (MM) (kPa)
A 279 2.516 1175.1 661.7 2.289 139 117 1.00 1032 7.5
298 B 277 2.506 1183.8 669.2 2.300 139 143 1.00 1277 7.5 Error
C 274 2.497 1174.2 661.5 2.290 141 122 1.00 1079 7.5
4.50 Average 2.293 143.08 1056 7.5 158
A 279 2.512 1185.0 671.3 2.307 140 105 1.00 919 7.5
298 B 278 2.500 1187.7 674.0 2.312 140 117 1.00 1032 7.5
C 276 2.487 1179.4 665.8 2.296 140 112 1.00 985 7.5
5.00 Average 2.305 143.83 979 7.5 147
A 272 2.493 1187.1 675.7 2.307 140 117 1.00 1032 8.0
298 B 272 2.487 1186.6 676.2 2.325 140 127 1.00 1126 9.0
C 274 2.476 1187.1 676.7 2.326 140 131 1.00 1164 9.5
5.50 Average 2.324 145.02 1107 8.8 140
A 276 2.492 1193.6 680.6 2.327 139 131 1.00 1164 10.5
298 B 276 2.468 1183.9 675.6 2.329 139 122 1.04 1122 9.5
C 276 2.492 1190.0 679.1 2.329 140 116 1.00 1022 9.5
6.00 Average 2.328 145.27 1103 9.8 124
A 279 2.469 1190.5 679.2 2.328 140 114 1.04 1044 12.5
298 B 277 2.478 1184.8 675.6 2.327 140 122 1.00 1079 11.5
C 278 2.486 1186.1 677.6 2.333 140 112 1.00 985 11.5
6.50 Average 2.329 145.33 1036 11.8 95
A 279 2.478 1184.5 674.7 2.323 139 119 1.00 1051 14.0
298 B 276 2.485 1184.3 672.9 2.316 140 105 1.00 919 13.5
C 274 2.503 1189.2 677.8 2.325 140 118 1.00 1041 13.5
7.00 Average 2.322 144.89 1004 13.7 78
Specific Gravity Method: I ERROR = PLUG OUT OF ALLOWED RANGE
D.O.T. FORM 705
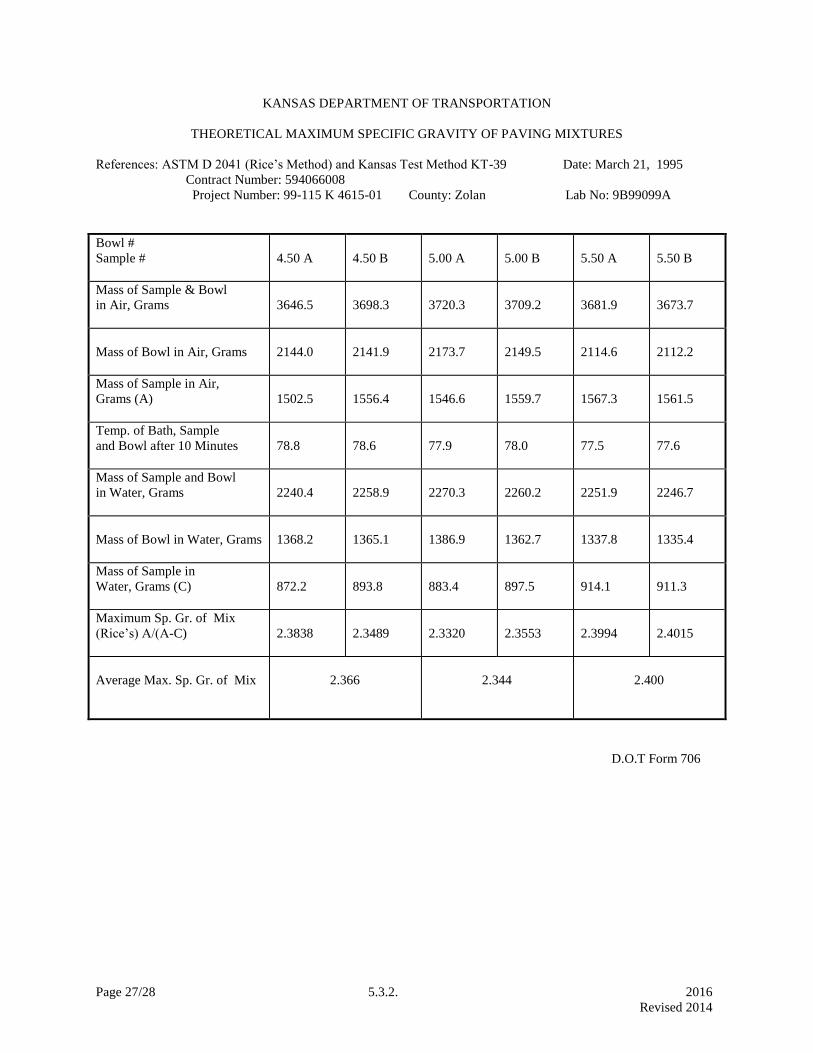
Page 27/28 5.3.2. 2016
Revised 2014
KANSAS DEPARTMENT OF TRANSPORTATION
THEORETICAL MAXIMUM SPECIFIC GRAVITY OF PAVING MIXTURES
References: ASTM D 2041 (Rice’s Method) and Kansas Test Method KT-39 Date: March 21, 1995
Contract Number: 594066008
Project Number: 99-115 K 4615-01 County: Zolan Lab No: 9B99099A
Bowl #
Sample #
4.50 A
4.50 B
5.00 A
5.00 B
5.50 A
5.50 B
Mass of Sample & Bowl
in Air, Grams
3646.5
3698.3
3720.3
3709.2
3681.9
3673.7
Mass of Bowl in Air, Grams
2144.0
2141.9
2173.7
2149.5
2114.6
2112.2
Mass of Sample in Air,
Grams (A)
1502.5
1556.4
1546.6
1559.7
1567.3
1561.5
Temp. of Bath, Sample
and Bowl after 10 Minutes
78.8
78.6
77.9
78.0
77.5
77.6
Mass of Sample and Bowl
in Water, Grams
2240.4
2258.9
2270.3
2260.2
2251.9
2246.7
Mass of Bowl in Water, Grams
1368.2
1365.1
1386.9
1362.7
1337.8
1335.4
Mass of Sample in
Water, Grams (C)
872.2
893.8
883.4
897.5
914.1
911.3
Maximum Sp. Gr. of Mix
(Rice’s) A/(A-C)
2.3838
2.3489
2.3320
2.3553
2.3994
2.4015
Average Max. Sp. Gr. of Mix
2.366
2.344
2.400
D.O.T Form 706
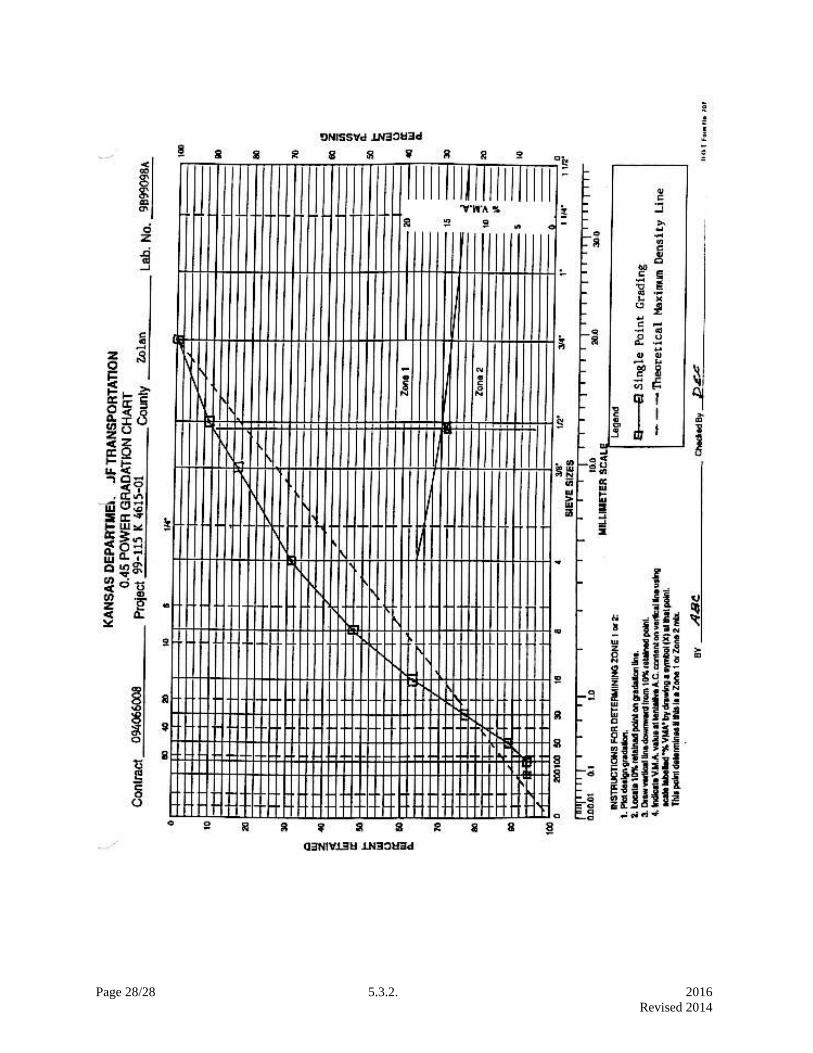
Page 28/28 5.3.2. 2016
Revised 2014
Page 1/1 5.3.3. 2016
Revised 2010
5.3.3 Superpave Mix Design
This information is currently located in the Superpave Field Laboratory Technician (SF) Certification
Training Manual, taught at Kansas State University.


Page 1/4 5.3.4 2016
Revised 2015
5.3.4. MIX DESIGN PROCEDURES FOR CIR (COLD-IN-PLACE RECYCLING) MATERIAL
1. Mixtures Containing an Emulsion.
1.1. Scope.
This method covers the procedure for obtaining materials and the preparation, either by the Contractor or
the emulsion supplier, of a mix design as specified in the following manner.
1.2. Sampling and Processing
Obtain cores from the areas to be recycled. If cores show significant differences in various areas, such as
different type or thickness of layers between cores, then separate mix designs shall be performed for each
of these pavement segments. It is recommended to take, at a minimum, one core for every 1.2 miles (2
kilometers) of lane and where visual differences in the pavement are noticed. Cores shall be cut in the
laboratory to the depth specified for the CIR project. Cores shall be crushed in the laboratory. Perform a
mix design using the medium gradation and a minimum of one of the fine or coarse gradations using the
following recycled asphalt pavement millings criteria.
Fine Medium Coarse
1¼ in (31.5 mm) 0 0 0
1 in (25 mm) 0 0 0-15
¾ in (19 mm) 0-5 4-15 8-25
#4 (4.75 mm) 25-45 45-60 55-70
#30 (600 µm) 65-85 86-96 93-99
#200 (75 µm) 93-99 97-99.4 97-99.9
The mix design shall be performed on these crushed millings. Gradation of the millings after crushing
shall be determined by KT-1, KT-2, and KT-3 (dried at 104o F (40
o C) or less). An alternative method is
to dry, screen, and recombine millings in the laboratory to target gradation. Suggested screens are ½ in
(12.5 mm), ⅜ in (9.5 mm), #4 (4.75 mm), #8 (2.36 mm), #30 (600 µm), and pan. Scalp oversize material
with a 1 in (25 mm) screen when using 4 in (100 mm) diameter compaction molds.
1.3. Asphalt Emulsion (CSS)(SPECIAL)
The contractor shall purchase and use asphalt emulsion that meets the following requirements.
Test Minimum Maximum
Residue from distillation, % ASTM D2441 64.0 66.0
Oil distillate by distillation, % ASTM D2441 0.5
Sieve Test, % ASTM D2441 0.1
Penetration (TBD2), 25
oC, dmm ASTM D5 -25% +25%
1 Modified ASTM D 244 procedure – distillation temperature of 350
oF (177
oC) with a 20 minute hold.
The ASTM D 244 vacuum distillation procedure may be substituted once the maximum oil distillate is
satisfied. 2 TBD – to be determined by the CIR design prior to emulsion manufacture for the project. Penetration
range will be determined on the design requirements for the project and will be submitted to the District
Materials Engineer and Chief Chemist (Materials and Research Center) for approval prior to project start.
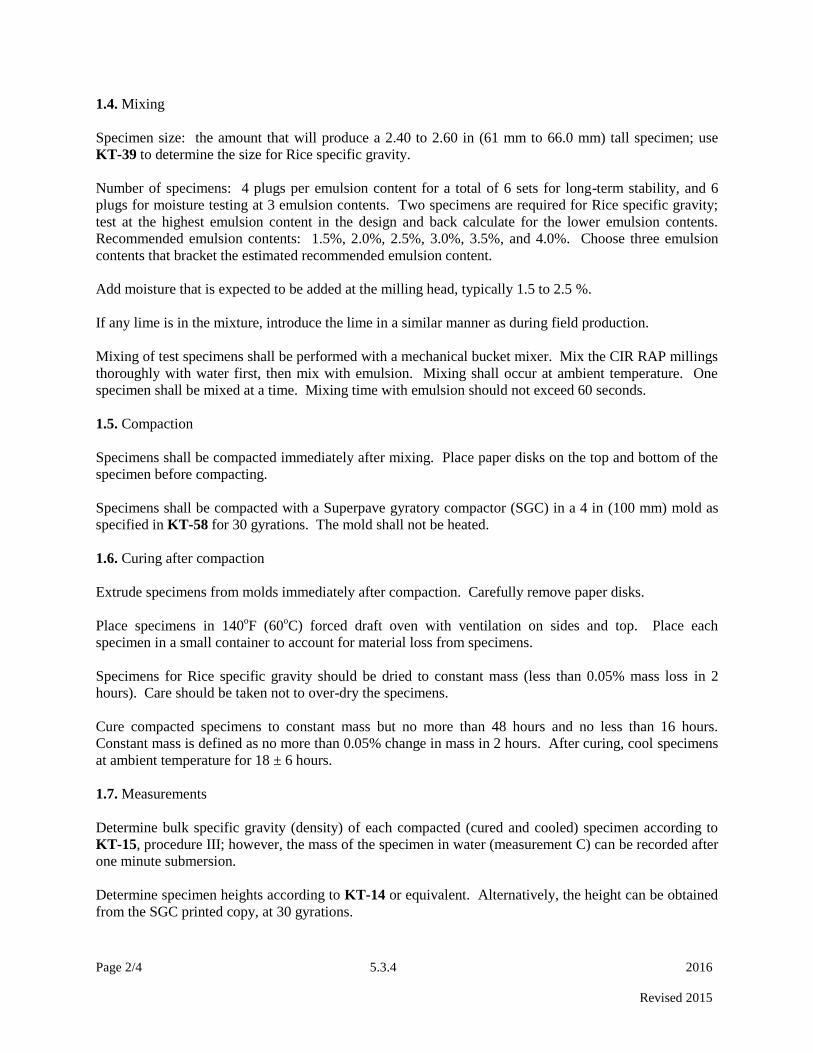
Page 2/4 5.3.4 2016
Revised 2015
1.4. Mixing
Specimen size: the amount that will produce a 2.40 to 2.60 in (61 mm to 66.0 mm) tall specimen; use
KT-39 to determine the size for Rice specific gravity.
Number of specimens: 4 plugs per emulsion content for a total of 6 sets for long-term stability, and 6
plugs for moisture testing at 3 emulsion contents. Two specimens are required for Rice specific gravity;
test at the highest emulsion content in the design and back calculate for the lower emulsion contents.
Recommended emulsion contents: 1.5%, 2.0%, 2.5%, 3.0%, 3.5%, and 4.0%. Choose three emulsion
contents that bracket the estimated recommended emulsion content.
Add moisture that is expected to be added at the milling head, typically 1.5 to 2.5 %.
If any lime is in the mixture, introduce the lime in a similar manner as during field production.
Mixing of test specimens shall be performed with a mechanical bucket mixer. Mix the CIR RAP millings
thoroughly with water first, then mix with emulsion. Mixing shall occur at ambient temperature. One
specimen shall be mixed at a time. Mixing time with emulsion should not exceed 60 seconds.
1.5. Compaction
Specimens shall be compacted immediately after mixing. Place paper disks on the top and bottom of the
specimen before compacting.
Specimens shall be compacted with a Superpave gyratory compactor (SGC) in a 4 in (100 mm) mold as
specified in KT-58 for 30 gyrations. The mold shall not be heated.
1.6. Curing after compaction
Extrude specimens from molds immediately after compaction. Carefully remove paper disks.
Place specimens in 140oF (60
oC) forced draft oven with ventilation on sides and top. Place each
specimen in a small container to account for material loss from specimens.
Specimens for Rice specific gravity should be dried to constant mass (less than 0.05% mass loss in 2
hours). Care should be taken not to over-dry the specimens.
Cure compacted specimens to constant mass but no more than 48 hours and no less than 16 hours.
Constant mass is defined as no more than 0.05% change in mass in 2 hours. After curing, cool specimens
at ambient temperature for 18 ± 6 hours.
1.7. Measurements
Determine bulk specific gravity (density) of each compacted (cured and cooled) specimen according to
KT-15, procedure III; however, the mass of the specimen in water (measurement C) can be recorded after
one minute submersion.
Determine specimen heights according to KT-14 or equivalent. Alternatively, the height can be obtained
from the SGC printed copy, at 30 gyrations.
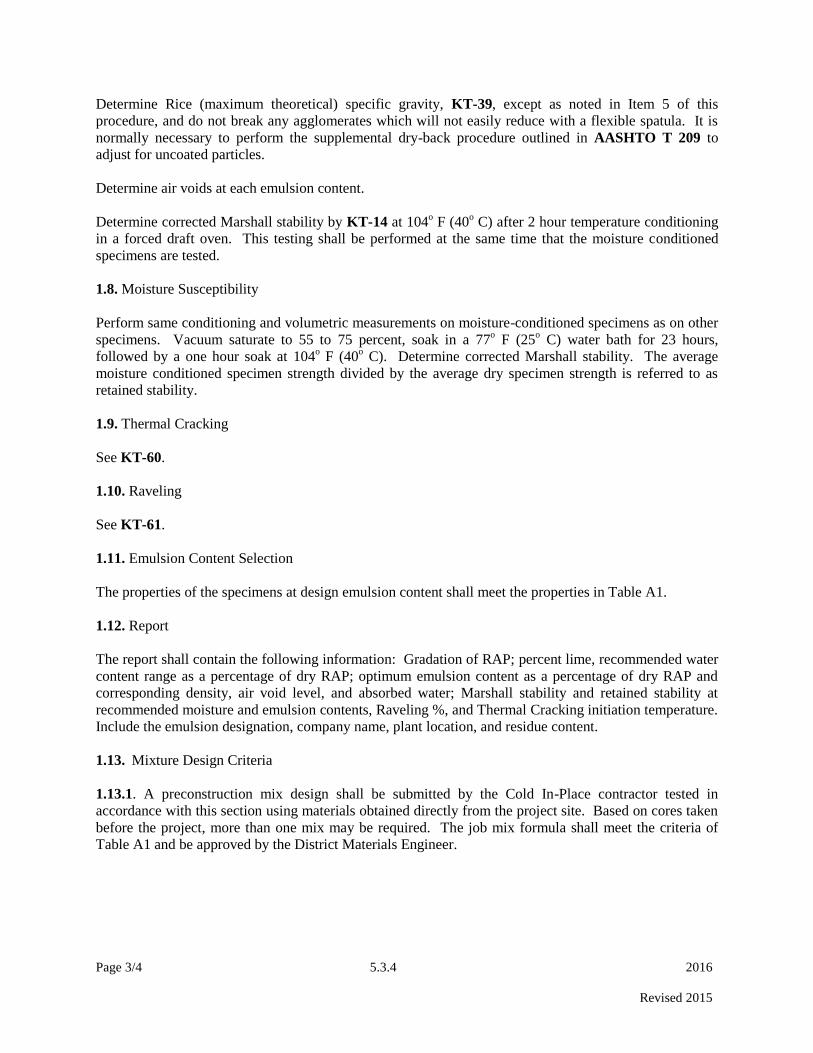
Page 3/4 5.3.4 2016
Revised 2015
Determine Rice (maximum theoretical) specific gravity, KT-39, except as noted in Item 5 of this
procedure, and do not break any agglomerates which will not easily reduce with a flexible spatula. It is
normally necessary to perform the supplemental dry-back procedure outlined in AASHTO T 209 to
adjust for uncoated particles.
Determine air voids at each emulsion content.
Determine corrected Marshall stability by KT-14 at 104o F (40
o C) after 2 hour temperature conditioning
in a forced draft oven. This testing shall be performed at the same time that the moisture conditioned
specimens are tested.
1.8. Moisture Susceptibility
Perform same conditioning and volumetric measurements on moisture-conditioned specimens as on other
specimens. Vacuum saturate to 55 to 75 percent, soak in a 77o F (25
o C) water bath for 23 hours,
followed by a one hour soak at 104o F (40
o C). Determine corrected Marshall stability. The average
moisture conditioned specimen strength divided by the average dry specimen strength is referred to as
retained stability.
1.9. Thermal Cracking
See KT-60.
1.10. Raveling
See KT-61.
1.11. Emulsion Content Selection
The properties of the specimens at design emulsion content shall meet the properties in Table A1.
1.12. Report
The report shall contain the following information: Gradation of RAP; percent lime, recommended water
content range as a percentage of dry RAP; optimum emulsion content as a percentage of dry RAP and
corresponding density, air void level, and absorbed water; Marshall stability and retained stability at
recommended moisture and emulsion contents, Raveling %, and Thermal Cracking initiation temperature.
Include the emulsion designation, company name, plant location, and residue content.
1.13. Mixture Design Criteria
1.13.1. A preconstruction mix design shall be submitted by the Cold In-Place contractor tested in
accordance with this section using materials obtained directly from the project site. Based on cores taken
before the project, more than one mix may be required. The job mix formula shall meet the criteria of
Table A1 and be approved by the District Materials Engineer.
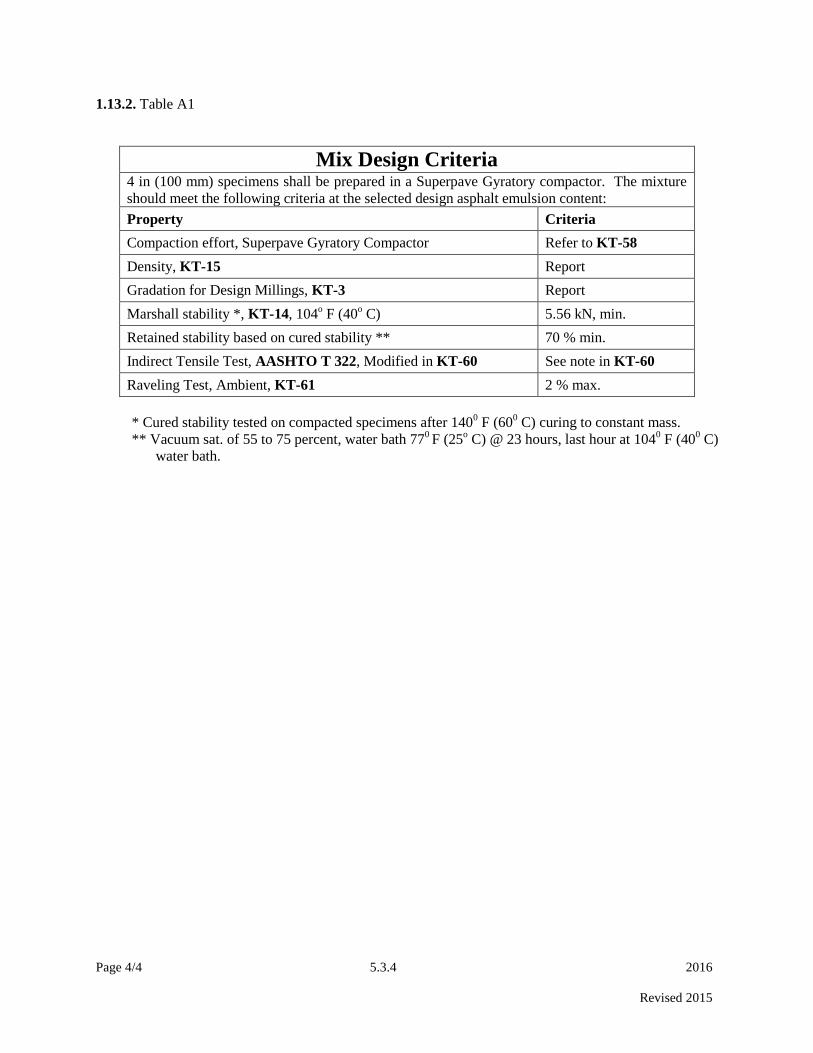
Page 4/4 5.3.4 2016
Revised 2015
1.13.2. Table A1
Mix Design Criteria 4 in (100 mm) specimens shall be prepared in a Superpave Gyratory compactor. The mixture
should meet the following criteria at the selected design asphalt emulsion content:
Property Criteria
Compaction effort, Superpave Gyratory Compactor Refer to KT-58
Density, KT-15 Report
Gradation for Design Millings, KT-3 Report
Marshall stability *, KT-14, 104o F (40
o C) 5.56 kN, min.
Retained stability based on cured stability ** 70 % min.
Indirect Tensile Test, AASHTO T 322, Modified in KT-60 See note in KT-60
Raveling Test, Ambient, KT-61 2 % max.
* Cured stability tested on compacted specimens after 1400 F (60
0 C) curing to constant mass.
** Vacuum sat. of 55 to 75 percent, water bath 770 F (25
o C) @ 23 hours, last hour at 104
0 F (40
0 C)
water bath.

Page 1/8 5.4 2016
Revised 2014
5.4. LABORATORY AND SAMPLE IDENTIFICATION
5.4.1. LABORATORY IDENTIFICATION
1. General.
Identifying symbols for each "in-state" laboratory and some "out-of-state" laboratories that sample,
inspect or test material for the Department of Transportation have been established. Knowledge of these
symbols is often beneficial in determining the general source of material and the laboratory that
performed the initial sampling, inspection and testing operations.
2. Identification Symbols.
2.1. General: The symbols listed below are to be used and identification numbers are to be assigned in
accordance with the following instructions for all materials inspected, tested or submitted for test
2.2. Materials and Research Center: All samples received at the Materials and Research Center are
assigned laboratory numbers bearing a prefix to denote the calendar year during which the samples were
received. The first sample received in 1998 bears the laboratory number 98-0001. When tests are
completed, the test report will also bear this number if the sample was submitted outside of CMS or the
test report will bear the CMS ID number with the Materials and Research assigned laboratory number
shown in the remarks for samples submitted in CMS.
2.3. Branch Laboratories: Branch laboratories are identified by letter prefix followed by the calendar
year, then by the laboratory number.
Laboratory Location Identification
Topeka A-03-XXXX
Kansas City B-03-XXXX
Wichita D-03-XXXX
2.4. "Out-of-State" Laboratories:
A. W. Williams Inspection Co., AWW (Identifying mark
Mobile, AL (Timber Products) placed on inspected and/or tested material)
Missouri Highway Dept.
Kirkwood, MO (St. Louis Area)
Miscellaneous Materials OAK-91
Page 2/8 5.4 2016
Revised 2014
5.4.2. SAMPLE IDENTIFICATION
Samples, tests and inspections entered into the Construction Management System (CMS) will be assigned
a unique system generated sample ID number. If a district assigns additional numbers to samples, tests
and inspections to aid in tracking and/or filing then the numbering procedures outlined below should be
used. Multiple split or replicate samples can be assessed during a single witness by the KDOT
Independant Assurance (IA) representative. The first recorded sample (A) in CMS is to be the IA results.
1. District Laboratory Numbers: Unless CMS Sample Id Nos. are used, all samples, tests or inspections
by district laboratories are to be assigned laboratory numbers in the following manner: District
Number--Year--Laboratory number. A separate series of laboratory numbers shall be assigned to each of
the designated types of samples.
1.1. Laboratory Number Designations
0001 - 2999 For Acceptance Samples
3000 - 3999 For Verification Samples
4000 - 4999 For Assurance Samples reported by the District Materials Engineer or by the Materials
and Research Center.
5000 - 5999 For samples designated in this Instruction as "Other"
6000 - 6999 For Production Samples
1.2. Additional information is to be shown which will identify the type or purpose of
the sample and test. Examples:
1.2.1. Sample 3-86-4783 is a replicate or split assurance sample. In this case, a direct comparison of
results is intended. This information should show as:
Non-CMS CMS
Lab. No.: 3-86-4783 ID No.: Preassigned A, B, C, D, etc.
Type: Split Sample Type: ASR
or
Replicate Sample
1.2.2. Sample 1-86-4231 represents an actual witnessing of an assurance testing or sampling procedure.
This information should show as:
Non-CMS CMS
Lab. No.: 1-86-4231 ID No.: Preassigned
Type: Witness Type: ASW
1.2.3. Sample 2-86-3014 represents a sample of asphalt cement taken as a part of the monitoring
process conducted for manufactured and certified materials. This information should show as:
Non-CMS CMS
Lab. No.: 2-86-3014 ID No.: Preassigned
Type: Verification- Type: VER
Certified Materials
Page 3/8 5.4 2016
Revised 2014
1.3. The identification numbers assigned by district personnel for "other" Samples and Tests should be for
sample and test types not listed in the Sampling and Testing Frequency Chart. "Other" tests and samples
are designated as "OTH" in CMS.
2. Assurance Tests reported by the Materials and Research Center must show the CMS ID number or
central laboratory number under which the sample was tested, and in addition, will show the district
laboratory number and identification number under which the sample was taken or submitted, if not
entered into CMS. The district laboratory number or CMS ID number should appear in the upper right
hand corner of the report.
5.4.3. SAMPLE IDENTIFICATION FORMS
1. DOT Form No. 610
This form is to be used when submitting concrete cylinders and beams. All information required in the
upper part of the form is to be entered except the following:
Laboratory Number, Date Received, Date Reported
In the area under "Field Test Data," the Field Engineer will enter information under the following
headings:
Specimen Number
Portion of Structure or Pavement Section, etc.
Slump
Date Made
Cylinders are normally tested at 28 days. If they are to be tested at a different age, an appropriate note is
placed under "Remarks."
The type and brand of admixture (Air-Entraining, Water-Reducing, Set-Retarding, etc.) is entered in the
proper space.
The Percent Air (actual), Yield Cement Factor and Slump are determined on the particular batch from
which the specimens were made. The water (kg per kg (pounds per pound) of cement) is the actual
water-cement ratio of the concrete at the time the specimens are made. The method of air content
determination is to be shown.
2. DOT Form No. 624
This form is used when submitting samples representing materials other than soils and concrete
specimens.
2.1. (Sample of _________). The precise name of the material as set forth in the specifications is to be
used. For example, use the term "Emulsified Asphalt (SS-1H)" instead of "Emulsion."
Do not use one information sheet for two or more nonrelated items. For example, do not put cement and
reinforcing steel on the same sheet.

Page 4/8 5.4 2016
Revised 2014
2.2. (Specification Number). Use correct, applicable and complete specification number including the
subarticle, if necessary. When the material submitted is covered by special provision or project special
provision, these references to the applicable document should be listed.
2.3. (Quantity _________). Except in the case of Assurance Samples, show the quantity of material
represented by the sample. If the sample consists of several different items, write "See Below" and show
the number of units represented by each sample under the "Remarks" column in the main body of the
form. An approximate figure may be shown for deposits and stockpiles of aggregates.
2.4. (Property of or Mfd. by). Include name of company manufacturing the material as well as the
supplier. It may be one and the same, however, it may be two different companies, i.e., hot pour joint
compound manufactured by W.R.M. Co., Ginel, Illinois supplied by C-W Co. at Kansas City, Missouri.
2.5. (Location _________). It is very important that this item be completed accurately and in full detail.
For aggregate samples, the full legal description including the 1/4 section, section number, township,
range and county should be included. If characteristics of location or nature of production are such that it
is required for proper control or identification of a material, the 1/16 corner of the section should be
shown. Stockpile samples should show the stockpile location, i.e., Jones Ready-Mix Plant at Smithville,
as well as the legal description of the deposit and the county from which the aggregate was produced.
The mailing address of the manufacturer or the supplier should be shown for manufactured products.
2.6. (Field Lab No. _________). This number is assigned by the individual who submits the sample or
samples and is based on an established system. It is necessary that all individual samples listed on a
single sheet be submitted under a single field laboratory number.
2.7. (Description). A description of the sample is entered in this column.
2.8. (Tests Required). If complete quality tests of aggregates are required, it is only necessary to indicate
"Complete Quality." If only certain specific tests are required, it is necessary to list these.
Tests specified for items other than aggregates are listed in somewhat general terms. For example, the
tests listed for structural steel are "physical and chemical," or for galvanized items the listing would show
"weight of zinc coating." The term "Complete Tests" should be entered only when all tests listed in the
Specifications are to be conducted.
2.9. (Remarks). Applicable information not previously listed elsewhere is entered here. The quantity of
miscellaneous items such as fasteners, fencing items, etc. may be shown in this column.
2.10. (Other Instructions _________). All information not to be shown on the test report is entered under
"Other Instructions." Typists copy much of the information appearing on the test report directly from the
sample identification sheet and often copy special instructions or references which are not appropriate to
the test report. Such information is to be disregarded by the typist if entered under "Other Instructions."
2.10.1 . An appropriate statement is entered to indicate samples that are submitted at the request of
District Materials, Headquarters, Research or other personnel. This affords laboratory personnel the
opportunity to discuss the background of the sample, tests required, etc. with the individual who
requested that the sample be submitted.
2.10.2. Scheduling - Unless otherwise indicated on the information sheet, samples submitted to the
Laboratory will be placed in line for test in the order received and following similar samples already in
the laboratory. Reports will be issued by mail when tests are complete.
Page 5/8 5.4 2016
Revised 2014
If special handling is required, this is noted on the information sheet under "Other Instructions." Good
judgment should be exercised in deciding whether special handling is necessary, and if so, which of the
following types is required.
2.10.2.1. "Urgent Scheduling" - Samples so designated will be placed in line for immediate testing ahead
of other samples of the same material. Testing and reporting will be expedited as much as possible but no
overtime or weekend work will be scheduled. Test results will be reported by phone followed by a copy
of the test report. A rapid means of transportation should be employed to deliver the sample to the
laboratory. The date on which test results are needed should be noted on the information sheet.
2.10.2.2. "Emergency Scheduling" - This is to be specified only for extreme cases when the following
conditions or other extenuating circumstances exist.
2.10.2.2.1. The results of tests might influence contractor's bids at a scheduled letting.
2.10.2.2.2. Delay of testing might delay the completion of a project or opening of a section of road so that
a detour must be maintained through a winter.
2.10.2.2.3. Delay of testing might delay a critical bridge pour when stream flooding is a possibility.
2.10.2.2.4. Other emergency situations.
When "Emergency Scheduling" is specified, the laboratory will establish a 24 hour/day, 7 day/week
schedule to complete the tests as soon as possible. The submitter must alert the Engineer of Tests by
phone on or before the date the sample is shipped so that testing schedules and work shifts can be
arranged to complete tests as rapidly as possible. The most rapid means of transportation available should
be used to deliver the sample to the laboratory. The date on which test results are needed should be noted
on the information sheet. Test results will be reported by phone followed by a copy of the test report.
2.11. Assurance Samples are indicated by entering the proper notation with capital letters at the extreme
upper right hand corner of the sheet.
2.12. When samples are delivered to the Laboratory by Department personnel, the copy of the sample
identification sheet that would ordinarily be mailed may be handed to laboratory receiving personnel
along with the sample.
3. DOT Form No. 667.
This form is to be used only when submitting samples of soil.
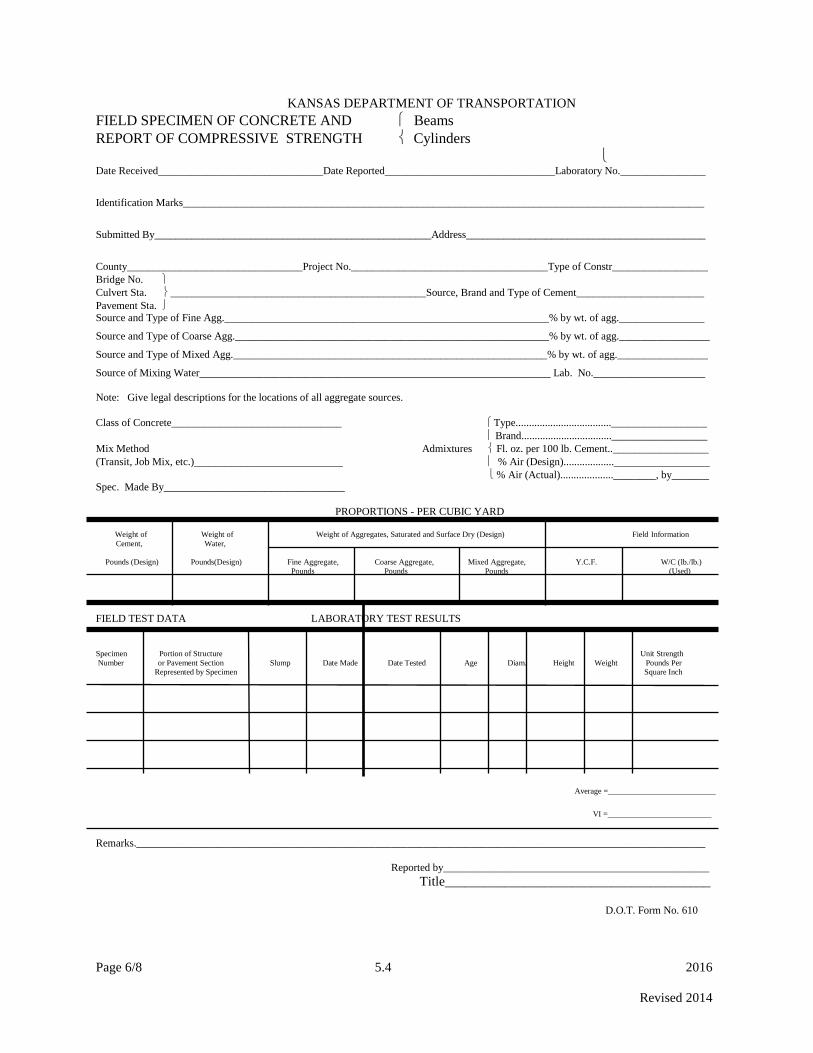
Page 6/8 5.4 2016
Revised 2014
KANSAS DEPARTMENT OF TRANSPORTATION
FIELD SPECIMEN OF CONCRETE AND Beams
REPORT OF COMPRESSIVE STRENGTH Cylinders
Date Received_______________________________Date Reported________________________________Laboratory No.________________
Identification Marks__________________________________________________________________________________________________
Submitted By____________________________________________________Address_____________________________________________
County_________________________________Project No._____________________________________Type of Constr__________________
Bridge No.
Culvert Sta. ________________________________________________Source, Brand and Type of Cement________________________
Pavement Sta. Source and Type of Fine Agg._____________________________________________________________% by wt. of agg.________________
Source and Type of Coarse Agg.___________________________________________________________% by wt. of agg._________________
Source and Type of Mixed Agg.___________________________________________________________% by wt. of agg._________________
Source of Mixing Water__________________________________________________________________ Lab. No._____________________
Note: Give legal descriptions for the locations of all aggregate sources.
Class of Concrete________________________________ Type....................................__________________
Brand..................................__________________
Mix Method Admixtures Fl. oz. per 100 lb. Cement..__________________
(Transit, Job Mix, etc.)____________________________ % Air (Design)...................__________________
% Air (Actual)....................________, by_______ Spec. Made By__________________________________
PROPORTIONS - PER CUBIC YARD Weight of Weight of Weight of Aggregates, Saturated and Surface Dry (Design) Field Information
Cement, Water,
Pounds (Design) Pounds(Design) Fine Aggregate, Coarse Aggregate, Mixed Aggregate, Y.C.F. W/C (lb./lb.)
Pounds Pounds Pounds (Used)
FIELD TEST DATA LABORATORY TEST RESULTS
Specimen Portion of Structure Unit Strength
Number or Pavement Section Slump Date Made Date Tested Age Diam. Height Weight Pounds Per
Represented by Specimen Square Inch
Average =___________________________
VI =__________________________
Remarks.___________________________________________________________________________________________________________
Reported by__________________________________________________
Title________________________________________
D.O.T. Form No. 610

Page 7/8 5.4 2016
Revised 2014
KANSAS DEPARTMENT OF TRANSPORTATION
SAMPLE IDENTIFICATION
Sample of___________________________________________________________________________________
Specification No._________________________________Quantity_____________________________________
Property of or Mfd. by_________________________________________________________________________
Location____________________________________________________________________________________
Identification marks___________________________________________________________________________
Submitted by________________________________________Field Lab. No._____________________________
Address____________________________________________Date_____________________________________
Project or POV______________________________________County__________________Div._____________
Type Construction___________________________________Active________Prelim._______Research________
Contractor__________________________________________________________________________________
Samp. No Description Tests Required Remarks
Other Instructions______________________________________________________________________________
____________________________________________________________________________________________
____________________________________________________________________________________________
LABORATORY RECORD
Date Received______________________________________Laboratory No.______________________________
Remarks_____________________________________________________________________________________ NOTE: Please furnish complete information. Attach pink copy to samples and mail white copy to Materials & Research Center,
2300 Van Buren, Topeka, Kansas 66611 D.O.T. Form No. 624
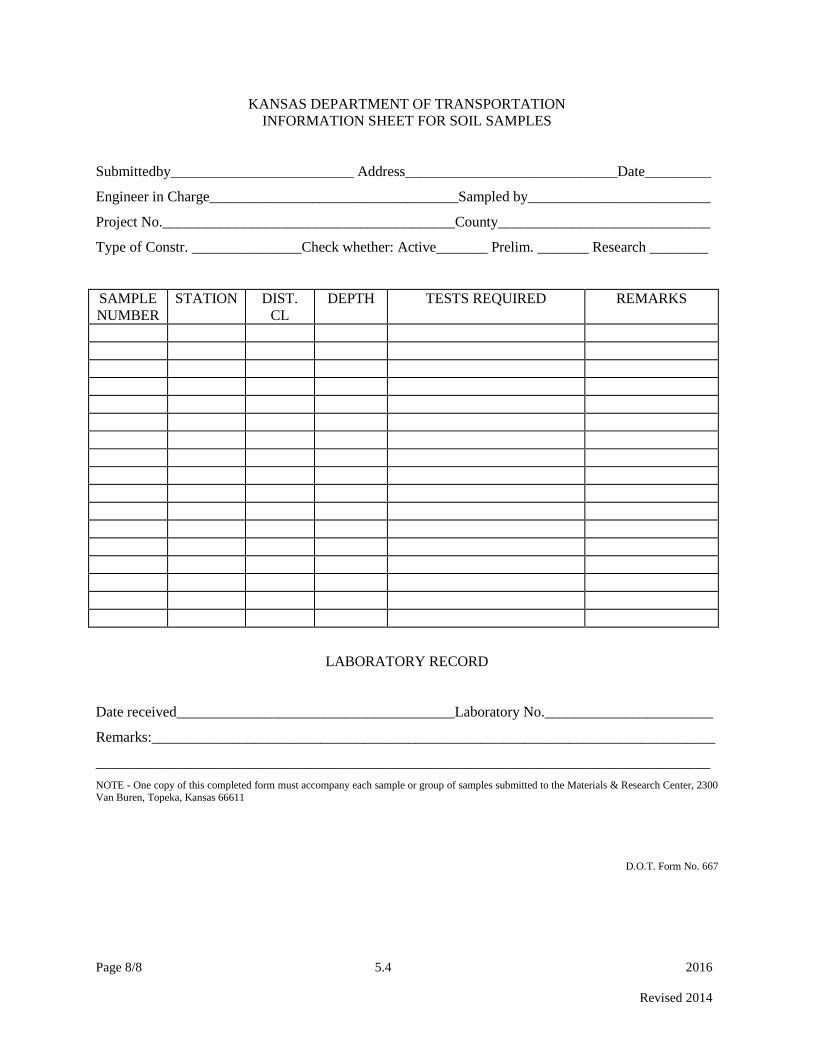
Page 8/8 5.4 2016
Revised 2014
KANSAS DEPARTMENT OF TRANSPORTATION
INFORMATION SHEET FOR SOIL SAMPLES
Submittedby_________________________ Address_____________________________Date_________
Engineer in Charge__________________________________Sampled by_________________________
Project No.________________________________________County_____________________________
Type of Constr. _______________Check whether: Active_______ Prelim. _______ Research ________
SAMPLE
NUMBER
STATION DIST.
CL
DEPTH TESTS REQUIRED REMARKS
LABORATORY RECORD
Date received______________________________________Laboratory No._______________________
Remarks:_____________________________________________________________________________
____________________________________________________________________________________
NOTE - One copy of this completed form must accompany each sample or group of samples submitted to the Materials & Research Center, 2300
Van Buren, Topeka, Kansas 66611
D.O.T. Form No. 667

Page 1/10 5.5 2016
Revised 2015
5.5 REQUIRED SAMPLE SIZES
1. SCOPE
This section covers the size of samples to be submitted to the Materials and Research Center for testing.
The sample sizes listed are minimums and in special cases the Engineer of Tests may request that larger
samples are submitted.
Each sample or group of samples must be accompanied by an information sheet containing all data
necessary for issuing a complete report of the test results. Additional details are set forth in Section 5.4
of this manual.
2. REQUIREMENTS
2.1. AGGREGATES
2.1.1. Aggregates for Quality Testing
2.1.1.1. Official Quality (OFQ) requirements for soundness do not apply for aggregates having less than
10% material retained on the No. 4 (4.75 mm) sieve.
2.1.1.2. OFQ requirements for wear do not apply to aggregate having less than 10% materials retained on
the No. 8 (2.36 mm) sieve.
2.1.1.3.Crushed aggregates with less than 10% material retained on the No. 4 (4.75 mm) sieve (excluding
mineral filler supplements) must be produced from a source complying with the official quality
requirements prior to final processing.
Material Sample Size
Crushed Stone 100 lbs (45 kg) of -1” (-25.0 mm), + #8 (+2.36 mm) material.
Select a grading from Table 1 based on the predominant
particle size of the sample material, and make certain the
minimum size fraction amounts outlined in Table 1 are
included in the 100 lb (45 kg) sample. Additional bags of
individual sized material may be submitted to assure these
minimums.
A sample graded in accordance with the requirements of Table
2 shall also be submitted.
Fine Aggregate for Concrete 50 lbs (23 kg) of pile run material.
Chat or Sand-Gravel 50 lbs (23 kg) of + #8 (+2.36 mm) material plus 50 lbs (23 kg)
of pile run material.
A sample graded in accordance with the requirements of Table
2 shall also be submitted.
Aggregate for Wetting & Drying Test 300 lbs (135 kg) of Sand-Gravel graded to meet the middle 1/3
of the MA-1 grading.
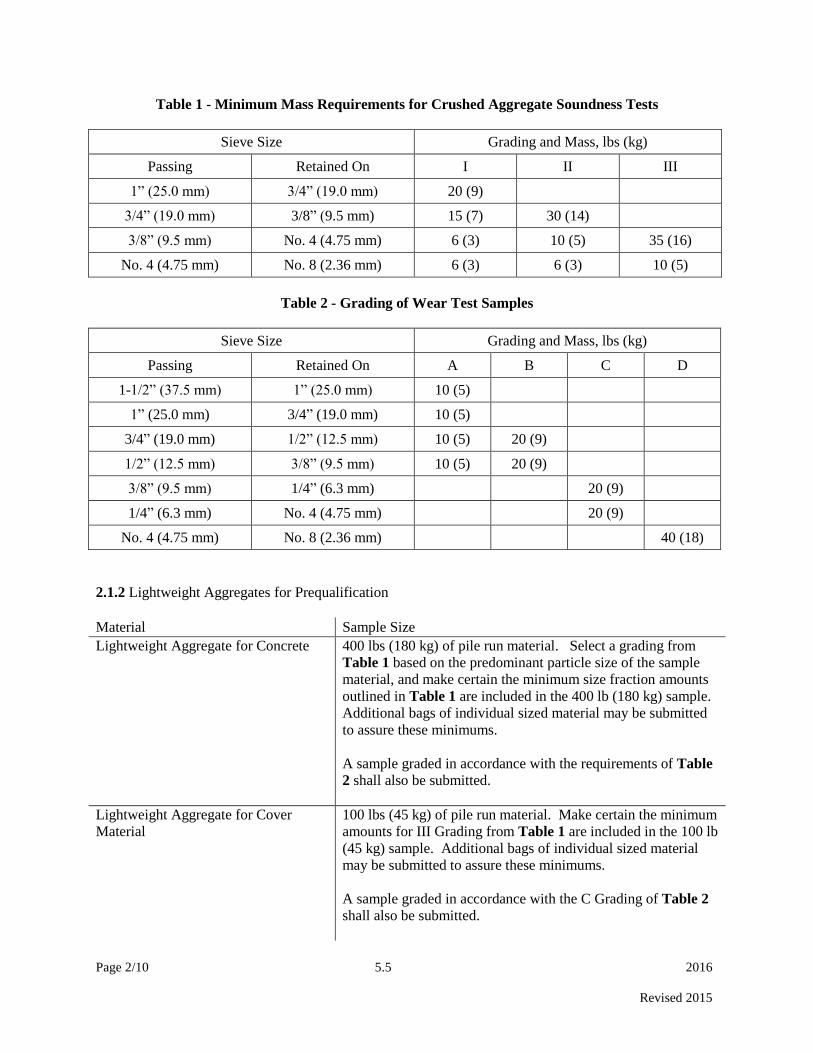
Page 2/10 5.5 2016
Revised 2015
Table 1 - Minimum Mass Requirements for Crushed Aggregate Soundness Tests
Sieve Size Grading and Mass, lbs (kg)
Passing Retained On I II III
1” (25.0 mm) 3/4” (19.0 mm) 20 (9)
3/4” (19.0 mm) 3/8” (9.5 mm) 15 (7) 30 (14)
3/8” (9.5 mm) No. 4 (4.75 mm) 6 (3) 10 (5) 35 (16)
No. 4 (4.75 mm) No. 8 (2.36 mm) 6 (3) 6 (3) 10 (5)
Table 2 - Grading of Wear Test Samples
Sieve Size Grading and Mass, lbs (kg)
Passing Retained On A B C D
1-1/2” (37.5 mm) 1” (25.0 mm) 10 (5)
1” (25.0 mm) 3/4” (19.0 mm) 10 (5)
3/4” (19.0 mm) 1/2” (12.5 mm) 10 (5) 20 (9)
1/2” (12.5 mm) 3/8” (9.5 mm) 10 (5) 20 (9)
3/8” (9.5 mm) 1/4” (6.3 mm) 20 (9)
1/4” (6.3 mm) No. 4 (4.75 mm) 20 (9)
No. 4 (4.75 mm) No. 8 (2.36 mm) 40 (18)
2.1.2 Lightweight Aggregates for Prequalification
Material Sample Size
Lightweight Aggregate for Concrete 400 lbs (180 kg) of pile run material. Select a grading from
Table 1 based on the predominant particle size of the sample
material, and make certain the minimum size fraction amounts
outlined in Table 1 are included in the 400 lb (180 kg) sample.
Additional bags of individual sized material may be submitted
to assure these minimums.
A sample graded in accordance with the requirements of Table
2 shall also be submitted.
Lightweight Aggregate for Cover
Material
100 lbs (45 kg) of pile run material. Make certain the minimum
amounts for III Grading from Table 1 are included in the 100 lb
(45 kg) sample. Additional bags of individual sized material
may be submitted to assure these minimums.
A sample graded in accordance with the C Grading of Table 2
shall also be submitted.

Page 3/10 5.5 2016
Revised 2015
2.1.3. Aggregates for Verification Samples
Material Sample Size
Crushed Stone 100 lbs (45 kg) of pile run material. If the #4 (4.75 mm) and #8
(2.36 mm) retained material is not available in the amounts
outlined in Table 1, it may be obtained from finer material
delivered to the project if the finer material is from the same
source as the coarser material. If finer material from the same
source is not delivered to the project, then a Modified
Soundness test will be conducted.
A sample graded in accordance with the requirements of Table
2 shall also be submitted.
Fine Aggregate for Concrete 50 lbs (23 kg) of pile run material.
Chat or Sand-Gravel 100 lbs (45 kg) of pile run material.
A sample graded in accordance with the requirements of Table
2 shall also be submitted.
Lightweight Aggregates 100 lbs (45 kg) of pile run material. Sample size may be
increased to ensure the minimum amounts from Table 1 are
included in the sample.
A sample graded in accordance with the requirements of Table
2 shall also be submitted. For Cover Material, provide a C
Graded sample.
2.1.4. On Grade Concrete Aggregates
Material Sample Size
Ledge Sample 300 lbs (135 kg) per bed, hand-picked from the ledge.
Production Samples 80 lbs (35 kg) of material passing the 3/4” (19.0 mm) sieve and
retained on the 1/2” (12.5 mm) sieve.
80 lbs (35 kg) of material passing the 1/2” (12.5 mm) sieve and
retained on the 3/8” (9.5 mm) sieve.

Page 4/10 5.5 2016
Revised 2015
2.2. BITUMINOUS MATERIAL
Material Sample Size
Performance Graded Asphalt Binder Two 1 qt (1 L) cans.
Cutback Asphalt Two 1 qt (1 L) cans.
Emulsion and Rejuvenating Agent 1 gal (4 L) – Plastic Containers ONLY!
2.3. BRICK AND CONCRETE MASONRY UNITS
Material Sample Size
Masonry Brick, Common 5 per lot (see note).
Masonry Brick, ADA Compliant Call the Materials Certification Technician at the Materials &
Research Center.
Facing 10 per lot.
Concrete Building Brick 5 per lot.
Concrete Masonry Units (solid) 5 per lot.
Concrete Masonry Units (hollow load-
bearing)
10 per lot per size.
Note: For the purposes of Section 2.3 (above), a lot shall be any well defined quantity of material
produced by essentially the same process.
2.4. CONCRETE CURING MATERIALS
Material Sample Size
Liquid Membrane – Forming
Compounds
Two 1 qt (1 L) samples per each lot of 2000 gal (7500 L) or
less.
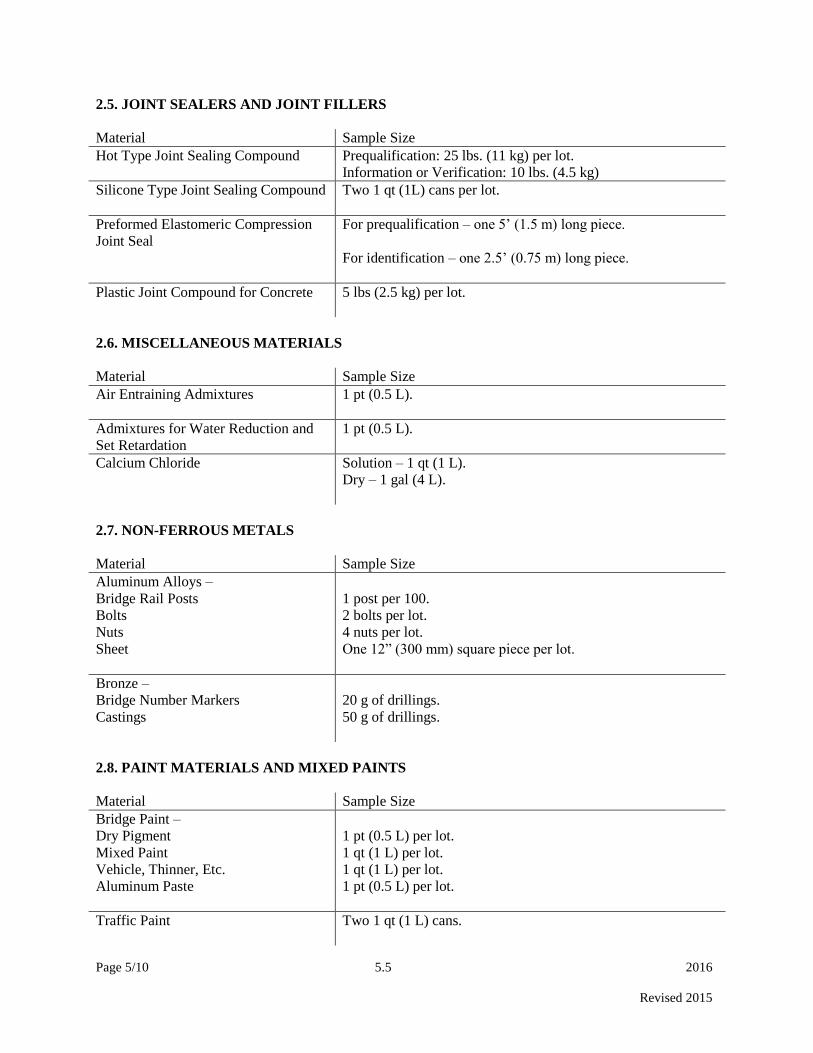
Page 5/10 5.5 2016
Revised 2015
2.5. JOINT SEALERS AND JOINT FILLERS
Material Sample Size
Hot Type Joint Sealing Compound Prequalification: 25 lbs. (11 kg) per lot.
Information or Verification: 10 lbs. (4.5 kg)
Silicone Type Joint Sealing Compound Two 1 qt (1L) cans per lot.
Preformed Elastomeric Compression
Joint Seal
For prequalification – one 5’ (1.5 m) long piece.
For identification – one 2.5’ (0.75 m) long piece.
Plastic Joint Compound for Concrete 5 lbs (2.5 kg) per lot.
2.6. MISCELLANEOUS MATERIALS
Material Sample Size
Air Entraining Admixtures 1 pt (0.5 L).
Admixtures for Water Reduction and
Set Retardation
1 pt (0.5 L).
Calcium Chloride Solution – 1 qt (1 L).
Dry – 1 gal (4 L).
2.7. NON-FERROUS METALS
Material Sample Size
Aluminum Alloys –
Bridge Rail Posts
Bolts
Nuts
Sheet
1 post per 100.
2 bolts per lot.
4 nuts per lot.
One 12” (300 mm) square piece per lot.
Bronze –
Bridge Number Markers
Castings
20 g of drillings.
50 g of drillings.
2.8. PAINT MATERIALS AND MIXED PAINTS
Material Sample Size
Bridge Paint –
Dry Pigment
Mixed Paint
Vehicle, Thinner, Etc.
Aluminum Paste
1 pt (0.5 L) per lot.
1 qt (1 L) per lot.
1 qt (1 L) per lot.
1 pt (0.5 L) per lot.
Traffic Paint Two 1 qt (1 L) cans.

Page 6/10 5.5 2016
Revised 2015
2.9. REFLECTIVE MATERIALS
2.9.1. Reflective sheeting
Material/Roll Width Sample Size
18” (460 mm) or more 8” (200 mm) by full width of roll.
12” (300 mm) up to 18” (460 mm) 14” (355 mm) by full width of roll.
Less than 12” (300 mm). 1 piece of at least 108 in2 (70,000 mm
2).
Center Mount Reflectors 5000 or less – 18 each.
Each additional 5000 (or fraction thereof) of each color – 4
each.
2.9.2. Pavement Marking
Material Sample Size
Cold Plastic
Patterned Cold Plastic
High Durbility
One 36” (900 mm) piece for materials less than 12” (300 mm)
in width. One 24” (600 mm) piece for materials of 12” (300
mm) and greater in width.
Epoxy Resin and/or
Epoxy Hardener
0.5 pt (0.25 L) for each material.
Glass Beads Two 1 qt (1 L).
Thermoplastic 1 gal (4 L) lid sample per lot.
2.10 CULVERT, SEWER AND UNDERDRAIN PIPE
Material Sample Size
Clay Pipe (except drain tile) 0.5% of total lot, 2 tiles minimum.
Clay Drain Tile 5 per lot.
Cast-Iron Culvert Pipe 5% of total lot, 1 pipe minimum.
Cast-Iron Soil Pipe 5% of total lot, 1 pipe minimum.
Corrugated Steel Underdrain Pipe 0.5% of total lot, 2 pipes minimum.
Corrugated Aluminum Underdrain
Pipe
0.5% of total lot, 2 pipes minimum.
Bituminous Coated Corrugated Metal
Pipe, Pipe Arches, Coupling Bands,
and Structural Plate
1 qt (1 L) of the bituminous coating and approximately 1 ft2
(3000 mm2) of coated corrugated steel.
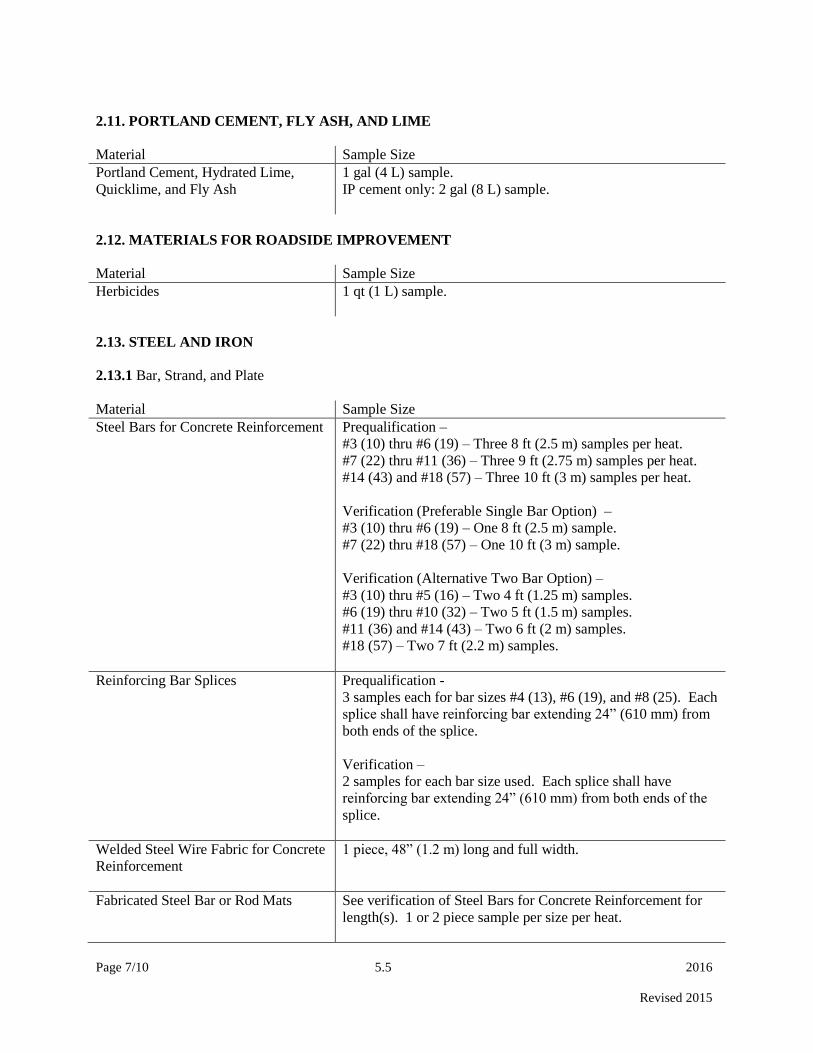
Page 7/10 5.5 2016
Revised 2015
2.11. PORTLAND CEMENT, FLY ASH, AND LIME
Material Sample Size
Portland Cement, Hydrated Lime,
Quicklime, and Fly Ash
1 gal (4 L) sample.
IP cement only: 2 gal (8 L) sample.
2.12. MATERIALS FOR ROADSIDE IMPROVEMENT
Material Sample Size
Herbicides 1 qt (1 L) sample.
2.13. STEEL AND IRON
2.13.1 Bar, Strand, and Plate
Material Sample Size
Steel Bars for Concrete Reinforcement
Prequalification –
#3 (10) thru #6 (19) – Three 8 ft (2.5 m) samples per heat.
#7 (22) thru #11 (36) – Three 9 ft (2.75 m) samples per heat.
#14 (43) and #18 (57) – Three 10 ft (3 m) samples per heat.
Verification (Preferable Single Bar Option) –
#3 (10) thru #6 (19) – One 8 ft (2.5 m) sample.
#7 (22) thru #18 (57) – One 10 ft (3 m) sample.
Verification (Alternative Two Bar Option) –
#3 (10) thru #5 (16) – Two 4 ft (1.25 m) samples.
#6 (19) thru #10 (32) – Two 5 ft (1.5 m) samples.
#11 (36) and #14 (43) – Two 6 ft (2 m) samples.
#18 (57) – Two 7 ft (2.2 m) samples.
Reinforcing Bar Splices Prequalification -
3 samples each for bar sizes #4 (13), #6 (19), and #8 (25). Each
splice shall have reinforcing bar extending 24” (610 mm) from
both ends of the splice.
Verification –
2 samples for each bar size used. Each splice shall have
reinforcing bar extending 24” (610 mm) from both ends of the
splice.
Welded Steel Wire Fabric for Concrete
Reinforcement
1 piece, 48” (1.2 m) long and full width.
Fabricated Steel Bar or Rod Mats See verification of Steel Bars for Concrete Reinforcement for
length(s). 1 or 2 piece sample per size per heat.

Page 8/10 5.5 2016
Revised 2015
Prestressing or Post-Tensioning Strand One 10 ft (3 m) sample for each 20 ton (18 Mg) lot (or heat).
Cut into two 5 ft (1.5m) pieces for shipment.
Structural Steel 1 piece, 24” (610 mm) x 4” (100 mm) minimum.
Note: If plate width is 24” (610 mm) or less, cut long
dimension of sample parallel with the direction of rolling. If
plate width is greater than 24” (610 mm), cut long dimension of
sample perpendicular to the direction of rolling.
2.13.2 Fasteners
Material Sample Size
High Strength Steel Fasteners for
Structural Connections (i.e. Bridges,
Overhead Sign Supports, etc.):
Uncoated
≤ 8000
> 8000 but ≤ 22,000
> 22,000
Coated
≤ 8000
> 8000 but ≤ 22,000
> 22,000
6 each of bolt, nut, and washer.
9 each of bolt, nut, and washer.
12 each of bolt, nut, and washer.
6 each of bolt, nut, and washer.
10 each of bolt, nut, and washer.
15 each of bolt, nut, and washer.
Rivets
≤ 8000
> 8000 but ≤ 22,000
> 22,000
3
5
7
Note: For the fasteners of Section 2.13.2 (above), the number of specimens listed are per each individual
lot and identified by the individual bolt length, diameter, and head marking (strength and type); or nut
marking.
2.13.3 Miscellaneous Steel and Iron Products
Material Sample Size
Materials for Guardrail:
Bolts, Nuts, and Washers
Guardrail Fittings
3 each per lot.
3 each per lot.
Steel Sign Posts:
≤ 100
> 100 but ≤ 1000
Each additional 1000 or fraction
thereof.
1
3
1 additional.
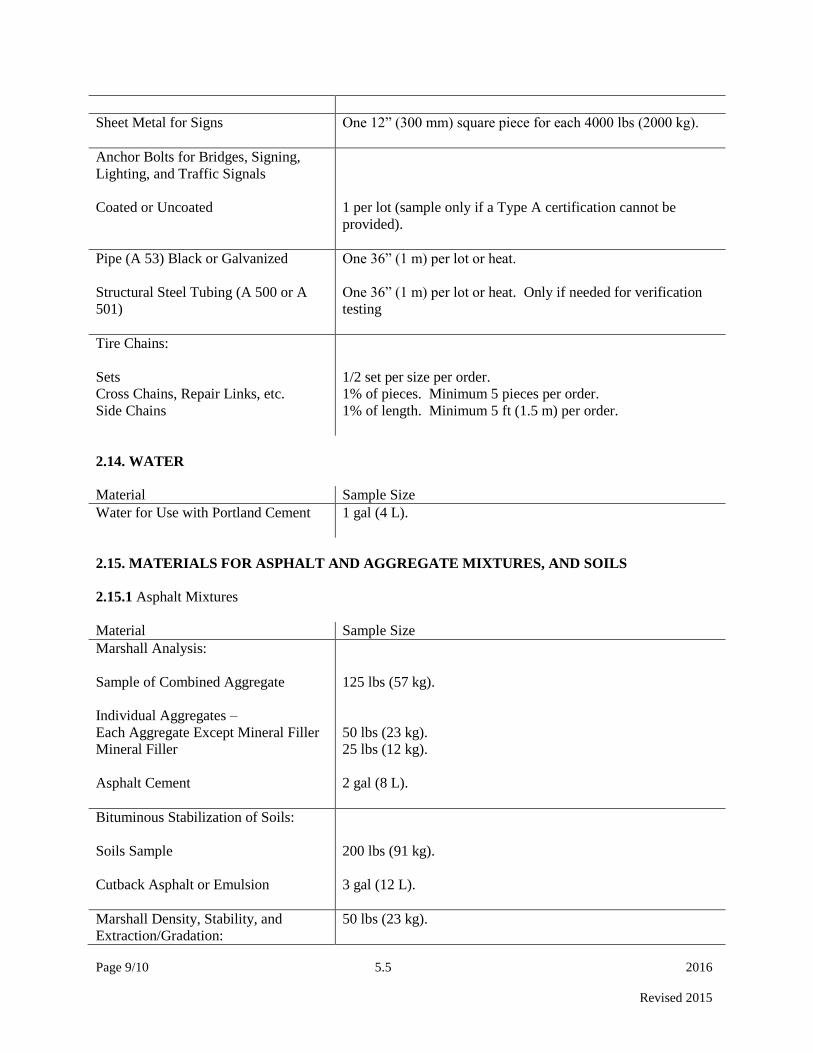
Page 9/10 5.5 2016
Revised 2015
Sheet Metal for Signs One 12” (300 mm) square piece for each 4000 lbs (2000 kg).
Anchor Bolts for Bridges, Signing,
Lighting, and Traffic Signals
Coated or Uncoated
1 per lot (sample only if a Type A certification cannot be
provided).
Pipe (A 53) Black or Galvanized
Structural Steel Tubing (A 500 or A
501)
One 36” (1 m) per lot or heat.
One 36” (1 m) per lot or heat. Only if needed for verification
testing
Tire Chains:
Sets
Cross Chains, Repair Links, etc.
Side Chains
1/2 set per size per order.
1% of pieces. Minimum 5 pieces per order.
1% of length. Minimum 5 ft (1.5 m) per order.
2.14. WATER
Material Sample Size
Water for Use with Portland Cement 1 gal (4 L).
2.15. MATERIALS FOR ASPHALT AND AGGREGATE MIXTURES, AND SOILS
2.15.1 Asphalt Mixtures
Material Sample Size
Marshall Analysis:
Sample of Combined Aggregate
Individual Aggregates –
Each Aggregate Except Mineral Filler
Mineral Filler
Asphalt Cement
125 lbs (57 kg).
50 lbs (23 kg).
25 lbs (12 kg).
2 gal (8 L).
Bituminous Stabilization of Soils:
Soils Sample
Cutback Asphalt or Emulsion
200 lbs (91 kg).
3 gal (12 L).
Marshall Density, Stability, and
Extraction/Gradation:
50 lbs (23 kg).
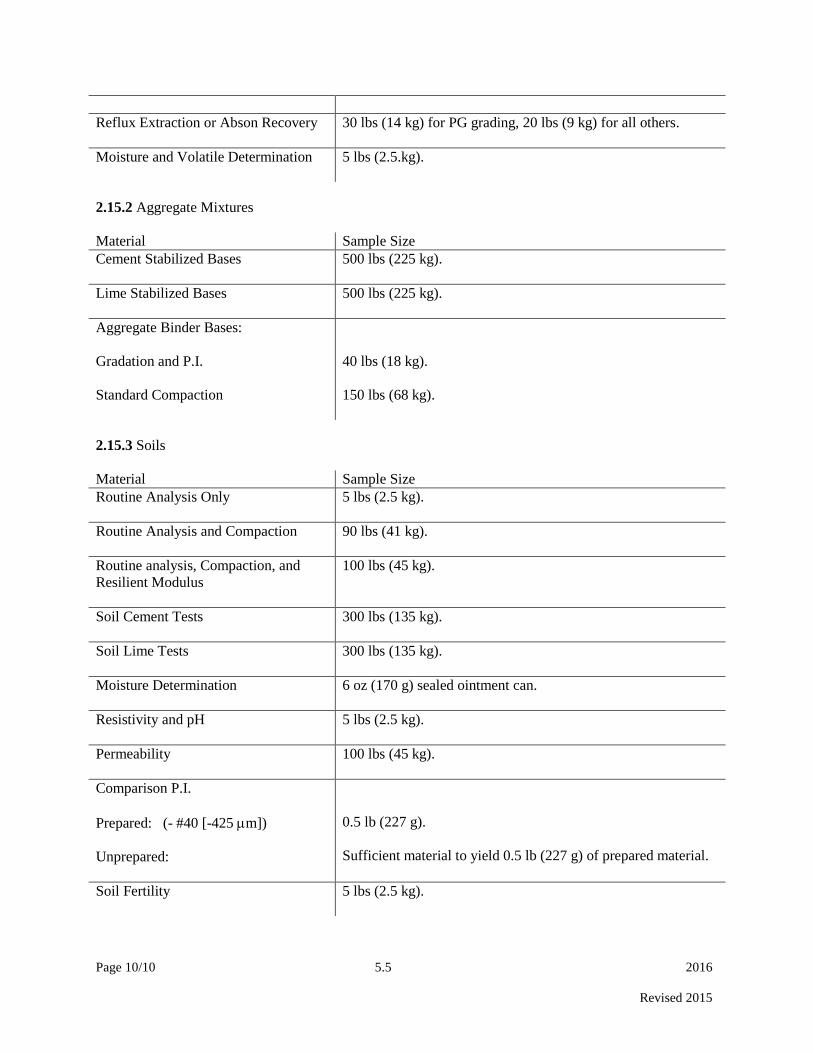
Page 10/10 5.5 2016
Revised 2015
Reflux Extraction or Abson Recovery
30 lbs (14 kg) for PG grading, 20 lbs (9 kg) for all others.
Moisture and Volatile Determination
5 lbs (2.5.kg).
2.15.2 Aggregate Mixtures
Material Sample Size
Cement Stabilized Bases 500 lbs (225 kg).
Lime Stabilized Bases 500 lbs (225 kg).
Aggregate Binder Bases:
Gradation and P.I.
Standard Compaction
40 lbs (18 kg).
150 lbs (68 kg).
2.15.3 Soils
Material Sample Size
Routine Analysis Only 5 lbs (2.5 kg).
Routine Analysis and Compaction 90 lbs (41 kg).
Routine analysis, Compaction, and
Resilient Modulus
100 lbs (45 kg).
Soil Cement Tests 300 lbs (135 kg).
Soil Lime Tests 300 lbs (135 kg).
Moisture Determination 6 oz (170 g) sealed ointment can.
Resistivity and pH 5 lbs (2.5 kg).
Permeability 100 lbs (45 kg).
Comparison P.I.
Prepared: (- #40 [-425 m])
Unprepared:
0.5 lb (227 g).
Sufficient material to yield 0.5 lb (227 g) of prepared material.
Soil Fertility 5 lbs (2.5 kg).
Page 1/20 5.6 2016
Revised 2016
5.6 AGGREGATES
1. GENERAL
This section covers the inspection, sampling, testing and acceptance of aggregates. Nothing in Section
5.6, including without limitation, prequalification or preapproval of a given aggregate/source of
aggregate, guarantees a contractor, producer, or supplier that the given aggregate/source of aggregate will
be approved by or remain approved by KDOT, be accepted by KDOT for use on projects, or be purchased
by others for use on projects.
2. TYPES OF PRODUCTION
Aggregate production is classified into two groups according to the methods of operation. Commercial
production is defined as production from a permanently established location that supplies aggregate to
both commercial consumers and contractors performing KDOT work. Some producers may operate in
some locations intermittently, depending on the market in that particular area, utilizing mobile plants;
however, these locations remain established as a production sites and are still considered commercial
producers.
Non-commercial or roadside production is defined as aggregate production using portable plants that is
incidental to other work being performed; for example, a highway cut section where rock is excavated
and used by the contractor or sub-contractor for one or more materials that are needed on that particular
project.
3. INSPECTION RESPONSIBILITIES
3.1. Contractor Inspection
The Contractor performs or causes to be performed all inspections and tests necessary to provide and
maintain an adequate process control system. An adequate process control system is one that provides that
all aggregates or aggregate combinations submitted for acceptance will conform to contract requirements
whether manufactured or processed by the Contractor, or procured from subcontractors, vendors, or
producers.
The Contractor is responsible for performing all process control activities for all aggregate and aggregate
combinations during production, handling, stockpiling, blending, mixing, and placing operations.
3.2. Department Inspection
All aggregate acceptance tests will be conducted by the Department at the point of usage, unless
designated otherwise by the Engineer. The Department reserves the right to run any test at any time or
place to determine contract compliance. When test results on aggregates indicate non-compliance with
contract requirements, the Engineer may reject the material and cause it to be removed at the Contractor's
expense. If the aggregate is on a prequalified list or otherwise approved for use on the project, the
Engineer still has the right to reject the material when test results indicate non-compliance with contract
requirements. However, the Department will pay the price difference between the previously-approved
aggregate and the replacement aggregate if the Contractor can demonstrate that no action of the
Contractor, subcontractor, vendor, or producer caused the failing test result.
Page 2/20 5.6 2016
Revised 2016
Department inspection is for the Department’s benefit and not to ensure Contractor quality control;
therefore, Department inspection does not replace the need for Contractor inspection or otherwise relieve
the Contractor of responsibility to furnish acceptable aggregates.
4. APPROVAL OF DEPOSITS
4.1. General.
Aggregate shall not be used for KDOT work until the deposit from which it is being produced and the
production process has been approved. The aggregate producer shall determine and record the GPS
coordinates where excavation is occurring. An aggregate source will be approved only after tests on
"Official Quality" (OFQ) samples taken by a KDOT representative, or by the producer while under the
direct supervision of a KDOT representative, have been completed and the test results show that
aggregate produced from a specific deposit using a specific production process meets the quality
requirements of the contract documents. If the current OFQ fails, then the source will no longer be
approved for projects not yet under contract until production is again approved.
Tests on "Official Quality" samples taken to determine aggregate source approval are conducted in the
Materials and Research Center at Topeka. The tests are as follows:
ALL AGGREGATES
Specific Gravity and Absorption (KT-6)
Acid Insoluble Residue (KTMR-28) (as requested)
COARSE AND MIXED AGGREGATE
Soundness (KTMR-21)
Wear (AASHTO T96)
Micro Deval (AASHTO T327)
FINE AGGREGATE (as requested)
Mortar Strength (KTMR-26)
Organic Impurities (AASHTO T21)
ADDITIONAL TESTING REQUIRED FOR CONCRETE AGGREGATES
Durable Aggregate Test (KTMR-22) (for coarse aggregates for on-grade concrete)
Wetting and Drying Test (KTMR-23) (for siliceous coarse aggregates for all concrete)
Refer to the Standard Specifications for more detailed information on specific applications.
It is the responsibility of the District Materials Engineer (DME) to see that aggregate deposits and
processed aggregates are sampled and tested.
It is the responsibility of the Field Engineer to confirm that aggregates comply with all applicable
specifications prior to use. The delivery of aggregate to KDOT projects before OFQ tests show
compliance with specifications is prohibited.

Page 3/20 5.6 2016
Revised 2016
4.2. Basis of Approval.
4.2.1. Active production sources
Deposits approved on the basis of OFQ tests conducted on either processed (crushed, screened, washed,
etc.) or "pit-run" production samples remain approved if there are no significant changes in production or
deposit characteristics or no other reasons to doubt the quality of the material. KDOT quarry and project
inspection personnel, the contractor, and the aggregate producer shall be alert for any significant changes
in production or deposit characteristics and any other events or conditions that may lead them to doubt the
quality of the material. When changes or events occur, they should immediately notify the other involved
parties and arrange for submission of new OFQ samples that reflect such changes. After the change, until
the new OFQ results are determined, separate all material that could be affected by the change.
The DME reserves the right to deny or withdraw approval of aggregate sources which have a history of
inconsistent test results or test results that fall below the specification limits even if the current OFQ
passes.
Once approval of aggregate from a specific source has been given to a contractor for use in a specific
project, that approval will be maintained for the duration of that project; unless subsequent testing
indicates the product no longer meets specification requirements, unless inspection reveals deterioration
of the product due to significant change in production or deposit characteristics, due to some unknown
reason, or unless field condition surveys demonstrate aggregate failure or aggregate deterioration that may
lead to aggregate failure. In the event that the project sample indicates deterioration of the product,
material from that source will be discontinued immediately. Should any sample taken from the project
and submitted for quality testing fail, a new OFQ sample will be collected and submitted forthwith. The
results of the new OFQ sample will be used to determine whether further use of the material will be
permitted on the project or whether the contractor will be required to obtain acceptable material from
another source. The new OFQ sample test results will also be considered in determining approval of the
material for use on future projects. In the event that field condition survey indicates deterioration of the
product, material from that source will be discontinued immediately and the DME will determine the role
of that material for use on the project and use on future projects.
4.2.2. Stockpiles
Stockpiles produced under contract will remain approved for use on that contract, regardless of age, as
long as the quality remains acceptable. Aggregate produced and stockpiled at the quarry under an
approved OFQ will be good for 2 years in the stockpile. Aggregate that has been stockpiled at the quarry
for more than 2 years must pass verification testing before use on KDOT projects. Do not add new
production to existing stockpiles more than 2 years old before verification of the stockpile and an OFQ of
the current production have been completed.
4.2.3. Inactive Production Sources: Samples taken from non-producing deposits will be tested for
information only.
4.3. Appeal of Official Quality Test Results.
Aggregate producers must notify the DME if they wish to appeal OFQ test results. Two additional
samples will be taken. Both samples must comply with the applicable specification(s) before approval is
given. The first resample will be taken immediately after the results of the initial sample are made
available and the producer has appealed. The second resample will be taken after a minimum of 2500 tons
have been produced. If either of the two resamples fail, no further OFQ testing will be conducted on the

Page 4/20 5.6 2016
Revised 2016
location until the DME has determined the operations have moved a significant distance or there is a
significant change in deposit characteristics.
4.4. Department Discretion in Approving/Rejecting Aggregates and Adopting Standards.
KDOT has discretion to create, implement, and modify its standards, specifications, and testing
procedures for aggregates as needed for the safety of the traveling public and proper expenditure of
taxpayer funds. In its discretion, KDOT may find the standards, specifications, or testing procedures
applicable to aggregates are not accomplishing the desired results. Nothing in this Section 5.6 shall be
construed as limiting KDOT’s ability to reject aggregates based upon changes in standards, specifications,
testing procedures, field performance or for other reasons determined by the Deputy Secretary and State
Transportation Engineer.
5. INSPECTION, SAMPLING AND TESTING
5.1. General.
This section of the manual pertains to general policy covering aggregate source inspection and the
frequency of and procedures for sampling aggregates for quality, production, and acceptance testing. The
detailed methods to be followed when sampling are set forth in Section 5.9 of this manual.
5.2. Sampling for Quality Determination.
5.2.1. General Sampling Procedures
When obtaining OFQ samples, the Department representative must thoroughly examine the exposed
portions of the deposit, record the GPS coordinates at the ledge face or location in the pit where
production is occurring, and observe and document production and processing operations.
Samples for OFQ will be obtained from locations or from production points that will provide a
representative sample of the aggregates that will be used for State work.
OFQ samples will be collected from current production. Quality samples obtained from stockpiles other
than current production will only determine the acceptability of the aggregate in the individual pile.
Tests for quality conducted on Verification Samples are not to be considered OFQ tests. Verification
Samples are obtained only as a check on the quality of material being delivered to the project. KDOT will
attempt to notify aggregate producers when aggregate Verification Samples are collected.
Aggregate producers may use the sampling methods outlined in this section to obtain preliminary quality
information from prospective aggregate deposits. Samples so obtained under the supervision of a
representative of the Department may be submitted to the Materials and Research Center for information
only testing. No charges will be made for such tests.
When exploring for new locations or deposits, each producer will be permitted to submit a maximum of
10 samples for quality tests during each calendar year. No limit will be imposed on the number of
samples a producer may submit from deposits explored for use on a specific project which has been
advertised for letting. Exploration submittal requirements do not apply to currently producing locations.
The District Materials Engineer will make “Official Quality” test results available to the producer.
Page 5/20 5.6 2016
Revised 2016
5.2.1.1. Recording GPS Coordinates
Take GPS coordinates and enter into CMS in the decimal degree format (xxx.xxxxxº) to five decimal
places. Many GPS receivers use a default setting of degrees and decimal minutes (xxxº xx.xxx’) or
degrees, minutes and seconds (xxxº xx’ xx.xx”). Note that many receivers will display two digits when
reporting degrees latitude and three digits when displaying degrees longitude. Latitude may additionally
be indicated with an “N”, “north”, “lat”, or positive sign on the display and longitude may be indicated by
a “W”, “west”, “lon” or a negative sign. Enter ONLY numerals into CMS fields; do not enter any
proceeding text or positive/negative signs. Refer to the manual for the receiver for more information.
The GPS receiver may revert to a default setting or inadvertently be changed to an incorrect format.
Correct operation of the receiver and correct format will be checked each time the receiver is used. This
can be accomplished by establishing coordinates for a reference point such as the corner of a sidewalk or
a survey monument that can be checked each time the receiver is used. The reference point will be
established in an area not likely to be disturbed and clear of overhead obstructions such as trees and
nearby buildings. Verify that the receiver is set correctly to the decimal degree format and record the
coordinates of the reference point for future use. Wait several minutes to get an accurate reading on the
reference point. Two or more readings may be taken at different times to get an average. Due to the
inherent nature of GPS receivers, when checking the receiver against the reference coordinates, the
reading may vary on the order of 00.00010º (about 29 feet East/West or about 36 feet North/South) or
possibly more. This is acceptable and not cause for concern. A variation of more than .00015º when
checking the reference coordinates may indicate a problem with the setting or operation of the GPS
receiver and will be investigated further
5.2.2. Stone Deposits:
5.2.2.1. Opened Deposits.
Commercial quarries and non-commercial quarries that are operational are sampled for OFQ from normal
production.
Commercial stone from active production locations is sampled yearly. Intermittently producing locations
are sampled each calendar year that aggregate is being produced or, for locations with mobile production
equipment, each time the equipment is remobilized.
5.2.2.2. Unopened Deposits.
Unopened quarries are sampled by opening the quarry face the full depth of the usable ledge or ledges far
enough back from exposure to reach unweathered stone. From this opening, the full depth of the
unweathered face is shot down and a representative portion of the material is crushed at an operating
quarry site by regular production crushing methods. The sample is obtained from this crushed product.
Tests conducted on samples following this procedure will be for information only. OFQ samples will be
obtained from the processing plant (crusher, gradation unit) only after production at the site has
commenced.
Uncrushed ledge samples and drilled cores are prepared in the Materials and Research Center to produce
samples of proper size and gradation for testing. These samples are generally tested for information only
and are not a basis for approval or disapproval of aggregate that will be used after crushing. The District
Materials Engineer may deem that uncrushed ledge samples are acceptable for OFQ samples when the
stone is intended for use in the construction of +2” sized aggregate products or other miscellaneous uses.
Page 6/20 5.6 2016
Revised 2016
5.2.3. Sand and Gravel Deposits:
5.2.3.1. Definitions (Sand and Gravel)
"Pit Run" material shall be defined as sand or sand-gravel which, upon excavation, has been subjected to
minimal processing or no processing at all. Such processing shall be limited to the removal of excess soil
and/or oversize material. OFQ samples of sand or sand-gravel shall be "Pit Run" material if feasible.
In the event that the quality characteristics exhibited by the "Pit Run" material do not meet the
specification requirements for the intended product, the producer may utilize methods which will improve
the aggregate quality by selective removal of some of the lower quality aggregate. OFQ samples may then
be taken from the altered material.
5.2.3.2. Operating or Opened Deposits.
Commercial deposits and those under intermittent production are sampled for OFQ from normal
production. Samples are to include all size fractions retained by the producer. Commercially operated
deposits are to be resampled for OFQ when results from verification samples show significant variation
from past results, and at least every five years. Non-commercially operated deposits are to be sampled at
the direction of the District Materials Engineer.
5.2.3.3. Unopened Deposits.
Unopened deposits may be sampled prior to production by thoroughly drilling or otherwise sounding out
the deposit. Samples taken for quality tests from unopened deposits will be for information only. OFQ
samples will be taken from actual production.
5.2.4. Chat Deposits
Chat deposits are sampled by the most appropriate method. Chat piles or the products of screening plants
from which material is being produced are sampled yearly for OFQ.
5.2.5. Lightweight Aggregate
Lightweight aggregate produced by expansion of clay, shale, or slate deposits, is sampled from the
production site for initial prequalification. The Engineer of Tests will maintain prequalified listings of
sources for Lightweight Aggregate for Concrete (PQL 3.2) and Lightweight Aggregate for Cover Material
(PQL 3.3). Once prequalified, lightweight aggregate is sampled for verification directly from the project
site. Lightweight aggregate sources will retain prequalified status unless a significant change in the
deposit characteristics or production occurs, verification test results indicate the material no longer meets
specification requirements, there is a change in the specifications or testing procedures which the source
cannot meet, the material otherwise fails in field performance, or other reasons cause the Department to
doubt the quality of the material. Whether a change in production or deposit characteristics is significant
is determined by the DME, in the DME’s discretion.
5.3. Coarse Aggregate for All Concrete
Although other classifications exist, generally, aggregates available for use in Kansas will be assigned one
of two classifications: siliceous or calcareous. An aggregate’s classification is typically only important
when its use is intended for concrete.
Page 7/20 5.6 2016
Revised 2016
Siliceous aggregates contain the compound silicon dioxide. Some common examples of siliceous rock are
natural sands and gravels, quartzite, and almost all igneous rock. Calcareous rock contains some form of
calcium carbonate; the most common being limestone and dolomite.
Siliceous coarse aggregates for use in concrete may require either additional testing to determine their
potential for causing deterioration related to alkali-silica reaction (ASR) or mitigation of their ASR
potential through use of a supplementary cementitious material (SCM).
Any siliceous aggregate source wishing to supply coarse, intermediate, or mixed aggregate for concrete
shall be tested according to KDOT’s Wetting and Drying Test of Sand and Sand-Gravel Aggregate for
Concrete (KTMR-23). This testing determines a source’s ASR potential and is performed on concrete
produced with a total gradation of aggregate from the source being evaluated; therefore, sources must be
able to supply a gradation that meets the middle 1/3rd
of the MA-1 grading. The Engineer of Tests will
maintain a complete record of each source tested and the test results. The Engineer of Tests will prepare
and distribute the prequalified List of Non-Reactive Siliceous Aggregate Sources for Concrete (PQL 3.1),
also known as the “Wetting and Drying List”.
Siliceous aggregate sources that are not singly able to provide one of the MA gradations or do not pass
the wetting and drying test are not necessarily precluded from use in concrete. However, approval of
concrete mix designs that utilize such aggregates will be contingent upon the contractor incorporating a
coarse aggregate sweetener or using an SCM to mitigate the ASR, as described in Section 1102 of the
Standard Specifications.
5.4 Coarse Aggregate for On-Grade Concrete
5.4.1. General
On-Grade Concrete Aggregates (OGCA) are subject to additional testing that is performed on concrete
produced with OGCA to determine if acceptable levels of freeze/thaw resistance are provided in order to
reduce the risk of the occurrence of premature deterioration. OGCA are intended for use in "on-grade"
concrete such as Portland cement concrete pavement, sidewalk, curb, gutter, etc. Prequalification of
OGCA material is granted on a geologic unit basis for each unit in a quarry face and to individual pits for
sand-gravel sources. OFQ sampling and testing is also required. The acceptance of OGCA is contingent
upon production being from approved units and in compliance with OFQ requirements.
The Engineer of Tests will maintain a complete record of each source tested and the test results. The
Engineer of Tests will prepare and distribute the prequalified List of Freeze/Thaw Resistant Coarse
Aggregate Sources for On-Grade Concrete (PQL 3.4). This listing will be included with the prequalified
materials list and will be updated monthly. The PQL will list the following information for each approved
source: state (if outside of KS), county, quarry number, producer’s name, producer’s CMS identification
number, legal description, geological unit name or type (if applicable), bed number(s) (if applicable), the
date of completion for the most recent production sample, and the date of the last geologic inspection (if
applicable).
5.4.2. Initial Prequalification of Sources
5.4.2.1. Initial Request Procedure
The District Materials Engineer (DME) is responsible to initiate KDOT's prequalification activities for
sources in their respective District. Upon receipt of a written request from a producer, the DME will
forward a copy of the written request to the Chief Geologist and the Engineer of Tests. The Chief
Geologist will determine whether an initial geologic inspection is appropriate.
Page 8/20 5.6 2016
Revised 2016
5.4.2.2. Initial Geologic Inspection Procedure
Some quarries can be separated into beds, and the KDOT Geologist will do this whenever possible.
Other quarries and sand and gravel deposits cannot be separated into beds. These locations will be
separated into ledges or geologic units whenever possible. The term “unit” will be used to describe
all these scenarios.
Crushed Stone Quarry
The Chief Geologist will arrange for a geologist to meet with District inspection personnel at the quarry.
The geologist is responsible for preparing a KDOT Quarry Report (including GPS coordinates and color
photographs) for the quarry. The quarry report will include identification and detailed description of each
geologic unit present in the quarry face. Producers have the option of submitting ledge samples or
production samples for initial testing for prequalification determination.
Ledge samples are hand-picked samples collected by the geologist directly from the quarry face. Ledge
samples will be taken from each geologic unit in the quarry face, unless the producer wishes to
specifically preclude any units from initial prequalification determination. If the producer opts to forego
ledge sampling, an initial production sample must be obtained from the production of each individual
geologic unit. It is the producer’s responsibility to maintain adequate separation of the units through all
phases of production and sampling.
A plan view of the quarry indicating the location(s) in the quarry that are intended to be mined for OGCA
must be provided by the quarry operator prior to sampling. The plan view must show appropriate
landmarks for future reference.
Sand-Gravel Pit
Typically, gravel pits will not require a full geologic inspection prior to initial sampling. However, the
DME should become familiar with the production site, process, general depositional characteristics, and
other items that could potentially influence the quality of the material being produced prior to production
sampling.
5.4.2.3. Prequalification Testing Procedures
All samples will be tested at KDOT’s Materials and Research Center (MRC) to determine which sources
and/or individual geologic units meet the additional requirements for OGCA. If the crushed stone
producer opted to submit ledge samples, two production samples from complying units, singly or in
combination, must meet the additional requirements for OGCA before prequalification status is granted.
If the producer opted to forego ledge sampling for initial prequalification determination, the initial
production sample will be considered the first of the two required production samples. Sand-gravel
sources must submit production samples for prequalification testing, therefore only one additional sample
must meet the requirements for OGCA. For both crushed stone and sand-gravel, the two production
samples must be separated by a minimum of 2500 tons of production.
Due to the timing differences between inspection, production, and testing activities, it is possible for a
producer to have its production sample(s) submitted before the initial sample testing is complete. KDOT
reserves the right to delay the testing of subsequent samples until the initial samples indicate compliance
with the specification or to terminate testing on subsequent samples if at any point it is determined that a
geologic unit or source will fail to meet the specification requirements for OGCA.
Once a source has two passing production tests on file with KDOT, the source will be added to PQL 3.4.
Should a source fail to pass prequalification testing, resampling will not be permitted until significant
Page 9/20 5.6 2016
Revised 2016
changes occur or until the producer can provide reasonable explanation of why the testing failed and a
plan for addressing the issue in the future. Requests for resampling should be made in accordance with the
guidelines for initial prequalification. Exceptions to this process will require approval of the Chief of
Construction and Materials.
5.4.3. Inspection of OGCA Production
5.4.3.1. Approved Production Plan
The DME will obtain a written production plan for OGCA from the producer prior to providing
inspection. The production plan shall include but not be limited to the following information (as
applicable): the location(s) that will be mined; the approved unit(s) that will be mined; and the procedures
that will be used to prevent any nonapproved material from mixing with the OGCA throughout the entire
mining, hauling, crushing, stockpiling, and shipping processes. Producers shall provide updated
production plans to the DME at the beginning of each production season, or as otherwise determined by
the DME, and any time significant changes occur in production.
5.4.3.2. Aggregate Source Inspection Requirements The DME is assigned the responsibility to provide
periodic inspection of aggregate production operations to verify that OGCA produced for Department
work is produced from only the approved locations and/or geologic unit(s). In addition, the DME is
responsible for verifying that the production process is essentially the same as that used to produce the
aggregates selected for the OGCA production tests. The proper level of inspection is to be determined by
the DME based on the unique circumstances encountered at each source.
KDOT quarry inspectors must familiarize themselves with the plan view of the production facility, the
OGCA production plan, and the KDOT Quarry Report (if applicable). These three documents should
provide the inspector with sufficient information to verify that only approved material is being produced
from approved locations and that the aggregates are processed in the appropriate manner. Inspectors are
required to document their inspection activities during each visit to the site. The documentation is to be
kept in a diary or other hard copy form approved by the DME.
5.4.3.3. Notification of shipment
Producers shall notify the DME responsible for inspection of OGCA production prior to producing and
shipping such aggregates to concrete production sites for use on KDOT projects. The DME will then
provide proper inspection during OGCA production and notify the appropriate Construction Office of the
pending delivery of OGCA.
5.4.4 Production Sampling
It is the responsibility of the DME to collect aggregate samples for production testing. Reassignment of
such responsibility between DME's may be made when mutually agreeable to the DMEs. Documentation
of such reassignments should be disseminated to concerned parties.
It is the responsibility of the contractor to notify the DME of all potential sources of on-grade concrete for
a project under contract. The DME will arrange for production sampling of aggregate at each concrete
production facility utilized for on-grade concrete as required by the frequency given in Section
5.6.5.4.4.1.

Page 10/20 5.6 2016
Revised 2016
When practical, the quarry inspectors should visit concrete production sites to assist project personnel
with identification of OGCA produced and hauled from sites they inspect and to assist in the collection of
production samples. KDOT will attempt to notify the aggregate producer when OGCA production
samples are collected from a concrete production plant.
5.4.4.1. Sampling Frequency and Location
Sampling from Aggregate Production Site
A minimum of one production sample must be collected annually from the aggregate production site
when OGCA is being provided to KDOT projects.
Sampling from Contractor Concrete Production Plant
A minimum of one production sample representing each 20,000 tons of OGCA must be obtained for each
producer from the plant where on-grade concrete is being produced.
Sampling from Ready-Mix Concrete Production Plant
A minimum of one production sample representing each 5000 tons of OGCA must be collected from any
concrete ready-mix plant that is producing on-grade concrete for KDOT.
The DME has discretion for adjusting sampling frequencies at any site to provide adequate assurance of
material quality.
5.4.4.2. Testing
Collected samples are to be delivered to the Engineer of Tests. The Engineer of Tests is responsible for
testing the samples and for comparing the test results with the historical test data for that source. The
Engineer of Tests will issue test result reports and notify the DME of atypical test results in a timely
manner.
5.4.5. Continuation of Prequalified Status
When any person feels that any change in the prequalified status of an aggregate/source of aggregate is
warranted, that person should notify the DME responsible for quarry inspection who in turn will advise
the Chief of Construction and Materials. The Chief of Construction and Materials will review all available
information and render a decision on any such changes. Official notification of any change in OGCA
prequalification status for a quarry will be provided by the Engineer of Tests to the quarry owner/operator
and the appropriate contractors.
In addition to a significant change in production or other reasons that cause the Department to doubt the
quality of the aggregate, any of the following occurrences may warrant a resample and/or immediate
change in the prequalification status of a source:
5.4.5.1. Geologic Changes
When geologic changes are identified, the DME, the Chief Geologist, and the Chief of Construction and
Materials should be immediately notified. The Chief Geologist will determine whether a new geologic
inspection and re-testing of units is required. The Chief of Construction and Materials will determine
whether the source is allowed to remain on PQL 3.4 or allowed to be used for OGCA to projects under
contract with or without restrictions or conditions.

Page 11/20 5.6 2016
Revised 2016
The following are considered geologic changes:
Changes in the Deposit
All personnel responsible for QC at the production site or concrete plant (Contractor, Producer, KDOT
quarry monitors and inspectors, etc.) have the right and responsibility to monitor for significant changes
in the deposit characteristics. Typical examples of such changes would be a significant color change in
any of the units being produced, a significant change in thickness of any unit(s) in the quarry face, the
addition or complete disappearance of any unit(s) in the quarry face, a significant change in the type or
amount of fossils observed in any unit(s), or an increase of the deleterious materials in the aggregate.
Significant Change in Production Location
Generally, mining operations are considered to have made a significant change in production location
when they have moved 1/4 mile or more from the most recent inspection site.
Geologic Inspection Expiration
Geologic site inspections are good for two years from the date the inspection was completed. It is the
producer’s responsibility to contact the DME and request a new geologic inspection prior to the current
inspection’s expiration.
5.4.5.2. Failed Material
When failing material is identified, the DME and the Chief of Construction and Materials should be
notified and the source will be immediately removed from PQL 3.4. The Chief of Construction and
Materials will determine whether the source is allowed to be used for OGCA to projects under contract
with or without restrictions or conditions.
Failing material can be identified either through OFQ testing, production sample testing, or through field
condition surveys of existing pavements. A source will be evaluated for failing field performance if its
stone is used for OGCA on a state highway project and the completed on-grade concrete shows evidence
of aggregate related deterioration prior to 20 years of life.
5.4.5.3. Lapse of Prequalification Requirements
If a source’s OFQ or geologic inspection expires, or if 18 months have elapsed since the source’s last
production sample was completed, the source may remain on the PQL at the discretion of the Chief of
Construction and Materials. A contractor may still consider sources with lapsed status for contract
bidding purposes; however, the source must renew its geologic inspection, submit a production sample
with a passing test result, and/or have a current OFQ, whichever are applicable, before any material from
the lapsed source will be accepted on a KDOT project.
It is the contractor’s responsibility to communicate with potential OGCA producers to determine if any of
these conditions exist prior to bidding work and to verify all specification requirements have been met
prior to delivering the aggregate to the project.
5.4.5.4 Procedure for On-Grade Concrete Aggregate Removal
In the event KDOT removes an aggregate source from its “List of Prequalified Aggregates Sources for
On-Grade Concrete” (the “PQL”) for failure to meet KDOT requirements the following applies
Page 12/20 5.6 2016
Revised 2016
5.4.5.4.1 Removal Procedure
5.4.5.4.1.1 Following the removal, the owner of the quarry from which the aggregate is produced will be
notified in writing of the removal action, and the notification will set forth the reason or reasons for the
removal ("Removal Letter").
5.4.5.4.1.2 Copies of all test results or other relevant documentation, if any, upon which the removal is
based, together with test results for the last two years, shall be delivered to the quarry owner/supplier
along with the Removal Letter by the KDOT Engineer of Tests.
5.4.5.4.2 Levels of Review
(1) Bureau Chief of Construction and Materials. Upon receipt and within 30 days following receipt
of the Removal Letter, the owner may notify the Chief of KDOT's Bureau of Construction and
Materials ("Bureau Chief') in writing that it wishes to contest the removal. Upon receipt of such
request, KDOT's Engineer of Tests and/or Bureau Chief will schedule a meeting with the owner
to be held within 30 days of KDOT’s receipt of the owner's written notification. During such
meeting, the owner may present to KDOT officials whatever relevant information, evidence,
arguments or requests it has concerning the validity of the removal. Such information, evidence,
arguments or requests may address the testing process, test results, aggregate performance
history, applicable specifications, or other item(s) relevant to the removal decision. The owner's
request to meet with KDOT does not stay or suspend the removal of the affected aggregate from
the PQL. If the owner fails to seek consideration of the removal by the Engineer of Tests or
Bureau Chief within the 30 days permitted, the Removal Letter will be deemed final agency
action for purposes of judicial review.
(2) State Transportation Engineer. Within 15 days following the meeting held pursuant to
5.6.5.4.5.4.2(1), the Engineer of Tests or Bureau Chief will notify the quarry owner in writing of
the results or outcome of KDOT's decision. Within 7 days following the receipt of KDOT's
written notice of its decision, the quarry owner may request reconsideration by the Deputy
Secretary and State Transportation Engineer ("Deputy Secretary"). Within 90 days following
receipt of the owner's request for the Deputy Secretary's reconsideration, the Deputy Secretary
will schedule and complete a hearing regarding removal from the PQL. Either party may request
a record be made of the hearing for purposes of judicial review of the Agency’s action under the
Kansas Judicial Review Act. Within 30 days following the hearing, the Deputy Secretary will
notify the quarry owner in writing of the results or outcome of his or her reconsideration and this
written notice shall be considered final agency action for purposes of judicial review. If the
quarry owner fails to seek reconsideration by the Deputy Secretary within the seven days
permitted, the results or outcome of KDOT's consideration by the Engineer of Tests or Bureau
Chief, whichever applies, will be considered final agency action for purposes of judicial review.
5.4.5.4.3 Time
Nothing in 5.6.5.4.5.4 prevents KDOT and a quarry owner from entering into a written agreement to
modify the time limits specified herein upon mutual consent.

Page 13/20 5.6 2016
Revised 2016
5.4.5.4.4 Department Discretion
For purposes of OGCA, whether a change in production or deposit characteristics is significant and
whether an event or condition is significant is determined by the Bureau Chief of Construction and
Materials.
Nothing in 5.6.5.4.5.4 is intended to restrict or preclude KDOT from modifying its procedures for
removal of aggregates for on-grade concrete pavement if KDOT determines the specified procedure(s)
is/are not in the best interest of KDOT, the State of Kansas, or the traveling public.
5.4.6. Process of Returning to PQL Following Removal.
In the event an on-grade concrete aggregate source on PQL 3.4 is removed by KDOT, the process for the
quarry owner to seek re-inclusion of the aggregate on the PQL is that set forth in in section 5.6.5.4.2.
Before KDOT will begin re-inspection, the owner or producer shall provide evidence of changes in
geology or production process that warrant re-inspection. The request should be submitted to the Chief of
Construction and Materials who will review the owner’s/producer’s justification for re-inspection, testing
history, field performance history, and any other pertinent data to determine whether to allow or deny re-
inspection. The procedure for re-inspection will follow the initial prequalification procedure described in
Section 5.6.5.4.2.
5.4.7. Stockpiles
Stockpiles produced under contract will remain approved for use on that contract, regardless of age, as
long as the quality remains acceptable during production.
A producer wishing to stockpile OGCA must provide a production plan detailing such activities as
described in Section 5.6.5.4.3.2. Production sampling for stockpiles will be at the same interval given in
Section 5.6.5.4.4.1. Stockpiles constructed under approved OFQ and approved production testing will
remain approved for two years from the date of the last production sample that represents the stockpile.
5.5. Aggregate for Riprap and Ditch Lining and Other Miscellaneous Uses
5.5.1. Initial Request Procedure
The District Materials Engineer (DME) is responsible to initiate KDOT's prequalification activities for
aggregates/sources of aggregate in their respective District. Upon receipt of a written request from a
producer, the DME will forward a copy of the written request to the Chief Geologist and the Engineer of
Tests. The Chief Geologist will determine whether an initial geologic inspection is appropriate.
5.5.2. Prequalification Testing Procedures
All samples will be tested at KDOT’s Materials and Research Center (MRC) to determine which sources
and/or individual geologic units meet the additional requirements for Riprap, Ditch Lining and other
miscellaneous uses.
Once a source has been inspected and approved by the KDOT Geologist along with meeting the quality
requirements, the source will be added to PQL 3.5. Exceptions to this process will require approval of the
Chief of Construction and Materials.
Page 14/20 5.6 2016
Revised 2016
5.5.3. Continuation of Prequalified Status
A riprap source may be rejected as detailed in the standard specifications for product control. When any
person feels that any change in the prequalified status of a source is warranted, that person should notify
the DME responsible for quarry inspection who in turn will advise the Chief of Construction and
Materials. The Chief of Construction and Materials will review all available information and render a
decision on any such changes. Official notification of any change in prequalification status for a quarry
will be provided by the Engineer of Tests to the quarry owner/operator and the appropriate contractors.
In addition to a significant change in production, any of the following occurrences may warrant a
resample and/or immediate change in the prequalification status of a source:
5.5.2.1. Geologic Changes
When geologic changes are identified, the DME, the Chief Geologist, and the Chief of Construction and
Materials should be immediately notified. The Chief Geologist will determine whether a new geologic
inspection and re-testing of units is required. The Chief of Construction and Materials will determine
whether the source is allowed to remain on PQL 3.5 or allowed to be used for Rip Rap, Ditch Lining, or
other miscellaneous use to projects under contract.
The following are considered geologic changes:
Changes in the Deposit
All personnel responsible for QC at the production site or concrete plant (Contractor, Producer, KDOT
quarry monitors and inspectors, etc.) have the right and responsibility to monitor for significant changes
in the deposit characteristics. Typical examples of such changes would be a significant color change in
any of the units being produced, a significant change in thickness of any unit(s) in the quarry face, the
addition or complete disappearance of any unit(s) in the quarry face, a significant change in the type or
amount of fossils observed in any unit(s), or an increase of the deleterious materials in the aggregate.
Significant Change in Production Location
Generally, mining operations are considered to have made a significant change in production location
when they have moved 1/4 mile or more from the most recent inspection site.
Geologic Inspection Expiration
Geologic site inspections are good for two years from the date the inspection was completed. It is the
producer’s responsibility to contact the DME and request a new geologic inspection prior to the current
inspection’s expiration.
5.5.2.2. Failed Material
When failing material is identified, the DME and the Chief of Construction and Materials should be
notified and the source will be immediately removed from PQL 3.5. The Chief of Construction and
Materials will determine whether the source is allowed to continue supplying aggregate for Riprap, Ditch
Lining and other miscellaneous uses to projects under contract with or without restrictions or conditions.
Failing material can be identified either through OFQ testing, production sample testing, or through field
condition surveys of existing material.

Page 15/20 5.6 2016
Revised 2016
5.6. Inspection and Testing of Project Aggregates.
5.6.1. Project Control:
The Field Engineer in charge of the project is responsible for monitoring inspection and testing
procedures to offer reasonable assurance to the Department that all aggregate used meets specification
requirements. Minimum sampling and testing frequencies for KDOT and the contractor are set forth in
Appendix A and Appendix B of this manual. The frequencies should be increased if there is evidence that
aggregate is consistently near or slightly outside specification limits. Adjustment of frequencies is not
appropriate under statistical sampling plans as currently specified for hot mix acceptance.
The sampling and testing of aggregates is an important operation since the results are part of the basis for
payment to the contractor by the Department. On Federal-aid projects, certain test results are part of the
basis for reimbursement to the State for the Federal Government's share of the expenditure. Therefore, it
is imperative that all sampling and testing be performed in the prescribed manner. The volume of
aggregate tested and accepted for State use each year represents a considerable sum of money and the
inspection of such aggregate should always be considered a most important part of project administration.
The various types of tests are defined in section 5.2.5 of this manual.
5.6.2. Inspection, Sampling and Testing.
5.6.2.1. Inspection.
5.6.2.1.1. The Contractor is responsible for proper inspection during the production of aggregates and the
processing of aggregates for use on state contracts. Proper control requires the services of a quality
control technician with adequate experience and training who is capable of exercising good judgment and
common sense. The technicians should never devote their entire time to mechanically sampling and
testing aggregates. Technicians shall follow prescribed sampling and testing procedures and observe
production or processing methods on a regular basis, so the technician is thoroughly familiar with all
phases of these operations.
If the finished product is stockpiled prior to delivery to the project site or prior to delivery to the roadway,
stockpiling operations should be observed and any specifications pertaining to stockpiling and removal of
material from stockpiles shall be followed by the contractor and will be enforced by the Department.
5.6.2.1.2. Department personnel will inspect aggregate production sites in order to verify that the source
of the aggregate was deposits, ledges or beds which meet specified quality requirements.
Inspection requirements for Department personnel at processing plants vary with the type of material
being produced. A thorough knowledge of applicable specifications is necessary to perform the proper
inspections. Department personnel will follow all posted safety and security rules required by producers
of all visitors and contractors to production sites.
Department personnel should question (warn) the Contractor or Producer regarding any operation or
sequence of operations which will likely result in unsatisfactory compliance with specification
requirements; however, Department personnel shall not instruct the Contractor or Producer how to
manufacture material as this is the contractor’s responsibility under the contract documents.
Page 16/20 5.6 2016
Revised 2016
5.6.2.2. Sampling.
Since it is physically impractical to test the entire production of aggregate, the proper taking of samples to
represent the material is as important as correctly following the proper test procedure.
Follow the sampling methods outlined in KT-1 of this manual. If modifications in sampling methods are
needed, agreement between the Engineer and the Contractor shall be obtained and documented in the
project records per Standard Specifications Subsection 105.8.
5.6.2.3. Testing.
All tests must be conducted in accordance with prescribed procedures and equipment. The test equipment
must be in good condition. Written instructions covering test procedures should be reviewed frequently to
keep the operator from "drifting away" from prescribed procedures. Equipment should be checked
regularly to verify that it is in adjustment and performing satisfactorily. Specific test methods are set forth
in Section 5.9 of this manual.
5.7. Specific Gravities for the Hot Mix Asphalt (HMA) Specific Gravity List
5.7.1. Establishing a Location and Specific Gravity Value
5.7.1.1. General
Specific Gravity values, verification date, and GPS coordinates for HMA aggregate sources shall be
posted on the Specific Gravity List published by the Bureau of Construction and Materials. The list will
be published monthly when changes occur. These specific gravity values may be used by hot mix
contractors for that month’s letting or a more current agreed upon value as established within this section.
If no changes occur during a month, the previous month’s values may be used. The Specific Gravity List
will contain two sections. KDOT will allow the values in the upper section to be used for each month’s
letting. The lower section of the list will contain “deleted” values. The deleted values are for reference
only and shall be verified by KDOT before they are allowed to be used on HMA projects. There is
generally no need to determine a Procedure I specific gravity value for a material that has less than 10%
material retained on the #4 (4.75 mm) sieve. There is generally no need to determine a Procedure II
specific gravity value for a material that has less than 10% material passing the #4 (4.75 mm) sieve.
When a contractor or aggregate producer wishes to have an aggregate source placed on the HMA Specific
Gravity List, a sample of the aggregate shall be split between the contractor and/or producer, the District
Lab and the Materials and Research Center. This sample shall be taken at the source when possible and in
the presence of District personnel, aggregate producer and contractor (when applicable). Samples for
imported aggregates may be taken from stockpiles, truck beds or railcars. The processing at the time the
sample is obtained should be noted in CMS. GPS coordinates for the location of the sample source or
mining operations, not the stockpile or crusher location, will be recorded by District personnel at the time
the sample is taken. Refer to Section 5.6.5.2.1.1 for instructions on recording GPS coordinates for point
of aggregate production.
For each product the average Bulk Dry, Saturated Surface Dry, Apparent Specific Gravities and
Absorption submitted by the Aggregate Producer and/or the Contractor, the District Laboratory, and the
Materials and Research Center will be computed. The products being produced and the Geologic Class of
the beds must be considered when determining an aggregate’s specific gravity.

Page 17/20 5.6 2016
Revised 2016
KDOT reserves the right to withhold or remove an aggregate source from the specific gravity list due to a
lack of cooperation from the aggregate producer, variations in specific gravity values within the location,
or a significant change in production or deposit characteristics.
5.7.1.2. Procedure I Specific Gravities.
If the range of Bulk Dry Specific Gravity values is less than or equal to 0.040, then all values for that
individual aggregate will be used to calculate the combined Average Bulk Dry Specific Gravity of the
product.
If the range of Bulk Dry Specific Gravity values is greater than 0.040, then "Outliers" must be eliminated
using the following procedure. Eliminate the value that is furthest from the average, and recalculate the
average with the remaining values. Continue to eliminate outliers until the range of remaining values is
less than or equal to 0.040 or until there are only 2 sets of data remaining. If the last 2 sets of remaining
data have a range greater than 0.040, then an additional split sample will be obtained and tested. If the
second sample fails the criteria then the Aggregate Producer’s production must be reviewed and a
possible cause for the wide range of values must be identified. No additional sampling will be permitted
until the producer identifies and corrects the problem.
KDOT will average individual specific gravity values when several products from a source are tested. If
no individual specific gravity value is more the 0.020 from the average, then the combined average will
be placed on the HMA Specific Gravities List used for Bid Letting Estimates for each product. Otherwise,
the products will be listed individually on the HMA Specific Gravities List.
5.7.1.3. Procedure II Specific Gravities.
If the range of Bulk Dry Specific Gravity values is less than or equal to 0.060, all values for that
individual aggregate will be used to calculate the combined Average Bulk Dry Specific Gravity of the
product.
If the range of Bulk Dry Specific Gravity values is greater than 0.060, then "Outliers" must be eliminated
using the following procedure. Eliminate the value that is furthest from the average, and recalculate the
average with the remaining values. Continue to eliminate outliers until the range of remaining values is
less than or equal to 0.060 or until there are only 2 sets of data remaining. If the last 2 sets of remaining
data have a range greater than 0.060, then an additional split sample will be obtained and tested. If the
second sample fails the criteria then the Aggregate Producer’s production must be reviewed and a
possible cause for the wide range of values must be identified. No additional sampling will be permitted
until the producer identifies and corrects the problem.
KDOT will average individual specific gravity values when several products from a source are tested. If
no individual specific gravity value is more the 0.030 from the average, then the combined average will
be placed on the HMA Specific Gravities List used for Bid Letting Estimates for each product. Otherwise,
the products will be listed individually on the HMA Specific Gravities List.
5.7.2. Verification of Location,
Aggregate Producers must notify the District Materials Engineer when operations move more than 1320
feet (within the same geological classifications for quarries) from the location on the list, or crosses a
quarter section line.
Page 18/20 5.6 2016
Revised 2016
If a crushed aggregate source has not been verified within two years or if a sand/sand gravel aggregate
source has not been verified within five years, it will be the responsibility of the aggregate producer to
notify the District Materials Engineer that the location where that material is being quarried needs to be
checked. If the District Materials Engineer determines that operations have not moved more than 1320
feet (within the same geological classification for quarries) from the location noted on the HMA Specific
Gravity list, the District Materials Engineer shall notify the Engineer of Tests and the verification date on
the list shall be changed. Otherwise, the location will be placed on the deleted values list until the location
of operations is verified.
If the District Materials Engineer determines that operations have moved more than 1320 feet from the
location noted on the HMA Specific Gravity list, a new split sample shall be tested.
The District Materials Engineer may check the location of quarry operations at any time.
5.7.3. Verification or Modification of Specific Gravity Values
The use of an aggregate on a HMA project does not necessarily mean that the specific gravity value of
that aggregate will be verified.
Specific gravity values for Chat must be verified every 2 years, regardless of GPS coordinates.
Verification samples of HMA aggregates submitted to the Materials and Research Center may be used to
verify specific gravity values on the list. Official Quality test results for sand/sand and gravel locations
may also be used to verify the specific gravity. Districts may also verify the specific gravities of an
aggregate when they check the contractors mix design. Districts shall notify the Engineer of Tests when
these values are verified.
A contractor or producer may ask that an existing value be verified or modified by the procedure used to
establish values on the list. The requesting producer or contractor must participate in the split
sample testing and reporting.
KDOT may ask that an existing value be verified or modified by the procedure used to establish values on
the list. The producer or a contractor will be invited to participate in the 3-way split. If the producer or
contractor declines to participate or does not provide test results in a timely manner, then only values
from the District Lab and the Materials and Research Center will be used to calculate average values.
A Procedure I specific gravity value will be considered verified if the single test result (District or MRC)
does not vary from the value on the list by more than 0.040. If the verification test result does vary from
the value on the list by more than 0.040, then the Engineer of Tests may request a 3-way split to modify
the list value. The Procedure I value will be considered verified if the average of a 3-way split does not
vary from the current value on the list by more than 0.020. The Procedure I value will be modified if the
average of a 3-way split does vary from the current value on the list by more than 0.020.
A Procedure II specific gravity value will be considered verified if the single test result (District or MRC)
does not vary from the value on the list by more than 0.060. If the verification test result does vary from
the value on the list by more than 0.060, then the Engineer of Tests may request a 3-way split to modify
the list value. The Procedure II value will be considered verified if the average of a 3-way split does not
vary from the current value on the list by more than 0.030. The Procedure II value will be modified if the
average of a 3-way split does vary from the current value on the list by more than 0.030.
Aggregate Sources not kept current as outlined in these procedures will be removed from the HMA
Specific Gravity Values list. It is not necessary for a source to be on the list for the Contractor to use the
Page 19/20 5.6 2016
Revised 2016
aggregate on a Project. Specific Gravities for any single Project can still be established by any method
agreeable to the DME. Regardless of the method used, the DME may require the contractor to perform
Specific Gravity verification tests on aggregates used from these sources during production on the project.
5.8. Documentation and Reporting
5.8.1. Documentation
Observed data from each test shall be clearly recorded, the inspector's initials and the date affixed and the
data permanently filed as a part of the project "source document" files. Such data is not to be recorded on
scraps and odd bits of paper with such paper being discarded after the data has been copied into note
books or onto specified forms. Observed data must be recorded in permanent document form at the time
the observation is being made. The pertinent data is then transferred to the proper report form or CMS
Screen and distributed to the required offices. Reports should be issued covering all tests conducted by
each inspection agency.
The Contractor is to maintain records of all inspection and tests performed by its representatives, and the
documentation procedures shall be approved by the Engineer prior to starting the work.
5.8.2. Reporting
The Contractor is to provide the Engineer access to all process control test results. Upon completion of
work, copies of all charts, forms and records documenting the Contractor's process control tests and
inspection are to be provided to the Engineer upon the Engineer’s request.
When test results fall outside of the specification limits, underline or circle in red the points of
noncompliance. Results reported in CMS should reference the points of noncompliance in the remarks or
elsewhere on the data screen.

Page 20/20 5.6 2016
Revised 2016
KANSAS DEPARTMENT OF TRANSPORTATION
CERTIFICATION OF AGGREGATES USED BY__________________________________
(Producer or Contractor name)
KDOT CONTRACT NUMBER__________________________________________________
KDOT PROJECT NUMBER____________________________________________________
Location of Deposit
Aggregate
Description
Quantities
Tons or
Cu Yards
Sec. Twp. Range County Ledge, Beds,
or Thicknesses
KDOT
Quality
CMS. No.
1.
2.
3.
4.
5.
This is to certify (check applicable box)
All the aggregates described above:
a (A) That will be provided to the project are in compliance with all applicable specifications.
a (B) That were provided to the project were in compliance with all applicable specifications.
______________________ __________________________________________
CMS Producer Code Name of Producer
______________________ __________________________________________
Date Signature Title
KDOT FORM 649

Page 1/25 5.7 2016
Revised 2014
5.7. INSPECTION AND SAMPLING OF MATERIALS
1. ASPHALT MATERIALS
1.1. GENERAL
These instructions cover the inspection and sampling of asphalt materials.
1.1.1. Performance Graded Asphalt Binders and Cutback Asphalt.
Asphalt is a natural constituent of most crude petroleum oils. The crude petroleum is refined to separate
the various components including naphtha, gasoline, kerosene, diesel fuel, lubricating oils, etc., and to
recover the asphalt.
Asphalt binder is the basic result of this recovery and it is produced in a variety of grades. For highway
uses, these are Performance Graded (PG) Binders ranging from PG52-22 to PG82-22. At normal
temperatures asphalt binder is semi-solid and is brought to and maintained in a liquid state by the
application of heat.
Rapid curing (RC) and medium curing (MC) cutback asphalts consist of an asphalt base fluxed with
suitable petroleum distillates or diluents. Blending of the asphalt binder and diluents is done either in
tanks or by automatic blending devices which draw the individual ingredients from storage tanks, mix
them in pre-determined proportions and discharge the mixture into railroad tank cars or trucks.
1.1.2. Emulsified Asphalt.
Emulsified asphalt is a homogeneous liquid mixture consisting of asphalt binder, water and a small
amount of emulsifying chemicals. Some emulsified asphalt grades also contain added petroleum distillate
to improve mixing conditions and give long term stockpile life. Asphalt emulsions are of the anionic or
cationic types. In general the anionic type deposits the asphalt binder by evaporation of the water while
in the case of the cationic type the asphalt binder is deposited because of an electro-chemical attraction to
the aggregate.
1.1.3. Asphalt Rejuvenating Agent.
Asphalt Rejuvenating Agent (ARA) is composed of a polymer modified asphalt emulsion. It is used to
increase the ductility and penetration of the asphalt binder in an existing pavement.
1.2. Storage Facility
Special storage facilities (terminals) may be established on approval of the Chief, Bureau of Construction
and Materials at a location other than a refinery. A producer's certification must accompany each
shipment.
1.3. Sampling Procedure.
Asphalt materials must be sampled in accordance with Department of Transportation Test Methods as set
forth in subsection KT-26.

Page 2/25 5.7 2016
Revised 2014
1.4. Asphalt Sampling Frequency.
The following Sampling Frequency can be used for Performance Graded Asphalt Binders, Cutback
Asphalt, and Emulsified Asphalt.
SAMPLING FREQUENCY LEVEL I - one out of every three trucks is sampled and tested. When 5
consecutive samples from all sources statewide have been tested, by the Central Laboratory, and all
comply with specification requirements, the producer will be upgraded to Level II.
SAMPLING FREQUENCY LEVEL II - one out of every six trucks is sampled and tested. When 5
consecutive samples from all sources statewide have been tested, by the Central Laboratory, and all
comply with specification requirements, the producer will be upgraded to Level III.
SAMPLING FREQUENCY LEVEL III - one out of every 12 trucks is sampled and tested.
The sampling frequency levels are entered into CMS. All newly prequalified asphalts begin at Level I.
Sampling frequency levels can carry over from year to year. Changes to sampling frequencies for a
producer are entered in CMS as soon as they change, and will show up as an update on the next
DTMTP030 report, which is printed weekly at the headquarters and the districts. To check or verify the
frequency in CMS, enter the producer materials screen (DTMTB010), (hot key M, B, B) with the
producer code. In addition, District Materials Engineers and Lab Chiefs will be notified of changes by e-
mail as soon as the change is made. Indicate the sampling frequency level used on the sample container
or information sheet.
Some samples may be disposed of in the Materials and Research Center Lab queue as soon as the
sampling frequency changes. The disposal will not be entirely random, as all projects will be represented,
but will be random within projects. The sample ID will be cleared with the explanation, “Not tested due
to change in sample frequency requirements.” Samples over 14 days old when received will be disposed.
1.5. Testing performed for each sampling frequency level.
1.5.1. Performance graded asphalt binder.
SAMPLING FREQUENCY LEVEL I - of the 5 samples, all will get a complete analysis.
SAMPLING FREQUENCY LEVEL II - of the 5 samples, all will get a complete analysis.
SAMPLING FREQUENCY LEVEL III - once this level is reached all samples will get a partial
analysis. Each month, a complete analysis will be performed on at least one sample per grade per
producer.
1.5.2. Asphalt rejuvenating agent, cutback asphalt, and emulsified asphalt.
All samples, regardless of Sampling Frequency Level will get a complete analysis.
Page 3/25 5.7 2016
Revised 2014
1.6. Analysis of Performance graded (pg) asphalt binder
COMPLETE ANALYSIS PARTIAL ANALYSIS
Original Binder: Original Binder:
Flash Point, COC Dynamic Shear
Brookfield Viscosity, 135oC
Dynamic Shear
Separation Test, 163°C (modified only) Rolling Thin Film Oven Residue:
Dynamic Shear
Rolling Thin Film Oven Residue:
Mass Loss
Dynamic Shear
Elastic Recovery, 77°F (modified only)
Pressure Aging Vessel Residue:
Dynamic Shear
Creep Stiffness, 60 seconds
Slope
2. BRICK AND CONCRETE MASONRY UNITS
2.1. Methods of inspection
2.1.1. At the Source.
Inspection of brick and concrete masonry units will, if possible, be made at the manufacturer's storage
yard and will be made by an authorized representative of the Chief, Bureau of Construction and Materials.
Inspection at the source will consist of subjecting each lot to a careful visual inspection and obtaining a
representative sample of the lot to be submitted to the Materials and Research Center, Topeka, Kansas for
test.
The number of samples required is shown in section 5.5 of this manual. Each size of unit will constitute
a separate lot. Specimens selected for sampling shall be representative of the lot of units from which they
are selected. After sampling, the lot represented shall be marked for identification.
2.1.2. At Destination.
Inspection of masonry units delivered to the project will be the responsibility of the Field Engineer or the
District Materials Engineer.
If the units have been tested and accepted before delivery, a visual inspection should be made to check the
condition of the units and their identification. Slight imperfections, minor indentations or surface cracks
incidental to the usual method of manufacture, or the chipping resulting from the customary methods of
handling in shipment, should not be deemed grounds for rejection.
Units which have not been sampled before delivery must be sampled and inspected on the project.
Sampling and inspection will be in accordance as above.
Page 4/25 5.7 2016
Revised 2014
3. CONCRETE CURING MATERIALS
3.1. Burlap
All burlap is visually inspected prior to use to determine compliance with applicable portions of the
specifications. Normally, burlap will only be sampled to check the weight. However, if the inspector
suspects the material is contaminated with a water soluble ingredient which retards setting of the concrete,
the materials should be sampled in accordance with section 5.5 of this manual. Such samples are
submitted to the Materials and Research Center.
3.2. Liquid Membrane Forming Compounds
Acceptance by certification will be discontinued if tests show poor quality control during production.
Samples are taken from the containers in which the material is shipped. Prior to sampling, the material
must be thoroughly mixed so that a representative sample is obtained.
Sample size shall be in accordance with the requirements of section 5.5 of this manual.
4. JOINT SEALING AND JOINT FILLER MATERIALS
4.1. Hot Type Joint Sealing Compound
Inspection and sampling of hot type joint compound is limited to securing samples from filled shipping
containers and submitting them to the Materials and Research Center for testing. Samples will be taken
by a representative of the Department, and must be available for testing in the Materials and Research
Center a minimum of 10 working days prior to the date the material is required for installation.
Samples shall be taken as set forth in KT-27.
4.2. Cold Applied, Chemically Cured Joint Sealing Compound
Inspect the material visually before it is used. The Engineer should be satisfied that the shipment can be
identified with the certification.
4.3. Preformed Elastomeric Compression Joint Seals for Concrete
The Type C certification shall be reviewed and the material will be inspected by the Engineer before it is
used. The Engineer should be satisfied that the shipment is identified and that the proper material has
been received.
4.4. Materials for Filling and Sealing Joints in Pipe
4.4.1. Compound Type Joint Filler
Inspection and sampling is limited to securing samples from filled shipping containers and submitting
them to the Materials and Research Center for testing. If the material has been sampled, tested and
accepted prior to shipment, the Engineer should inspect the material before it is used to satisfy that each
package is identified with the test report and that no damage has occurred during handling, shipping and
storage. If the material has not been sampled, the District Materials Engineer should be advised so
arrangements can be made for sampling. Samples shall be taken as set forth in KT-27.
Page 5/25 5.7 2016
Revised 2014
4.4.2. Flexible Gasket Type Joint Filler
The Engineer should inspect each piece of pipe at destination before it is placed so that it is identified
with the test report and that the pipe and joint materials have not been damaged during shipping,
handling, and storage.
4.4.3. Factory Molded Joints
Since these types of materials are not inspected prior to shipment, they must be inspected by the Engineer.
The jute should be inspected for cross-sectional uniformity and freedom from defects that would allow
the entrance of the melted lead into the pipe.
4.4.4. Materials for Sealing Joints in Cast Iron Pipe
The seals should be inspected at destination and prior to installation to determine the presence of
imperfections that could cause leakage of the joint.
4.4.5. Expanded Closed-Cellular Rubber Gaskets for Reinforced Concrete Pipe and Precast Boxes
Visual Inspection by the Engineer for workmanship, fit, and final installation practices.
5. MISCELLANEOUS MATERIALS
5.1. ADMIXTURES FOR PORTLAND CEMENT CONCRETE
The inspection of admixtures is the responsibility of the Engineer. Since admixtures are delivered to the
project without inspection, the Engineer must ensure that the product is on the prequalified list and that
certifications as specified are available for each lot of material. If the Engineer has doubt as to the
condition of the product or if the material fails to perform as expected, the material should be sampled
immediately and submitted to the materials and Research Center for testing. Samples should be
accompanied by a letter stating the deviation from expected performance.
5.2. CALCIUM CHLORIDE
This material will be inspected at destination and a verification sample is to be obtained from the first unit
delivered.
Solid calcium chloride will be sampled by selecting at random not less than three containers. Each
container so chosen is to be sampled by scraping aside the top layer to a depth of approximately 1 inch
(25 mm) and taking samples by means of a sampling thief or other method which will ensure obtaining a
representative cross section in the container to a depth of at least 6 inches (150 mm). Precautions must be
taken during the sampling to avoid unduly exposure of the sample to atmospheric moisture. The
individual samples are immediately and thoroughly mixed to from a representative composite sample
which is place in a moisture tight container for shipment to the laboratory.
Liquid calcium chloride will be sampled using the thief method as describe in KT-26 to obtain a 1 qt
(1 liter) sample.

Page 6/25 5.7 2016
Revised 2014
5.3. REFLECTIVE SHEETING
All reflective sheeting will be sampled according to ASTM D 4956. A full width X 1 yd (1 m) long
specimen is selected at random to represent the entire sheet, roll or lot.
5.4. ELECTRIC LIGHTING AND TRAFFIC SIGNAL EQUIPMENT
When miscellaneous hardware and span and guy wire is shipped from a warehouse located within or near
State borders, arrangements will be made to have the various items sampled and tested prior to shipment.
When these items arrive on the project without previous sampling and testing, they will be inspected and
sampled by the Engineer. The Engineer should review test reports and certifications to ensure that all
items on the project are covered by the necessary documents, and should be satisfied that the entire
shipment meets the required specifications.
A report covering items accepted by certification and visual inspection is issued by the Engineer. Items
sampled and tested by the Materials and Research Center are covered by a copy of the laboratory report.
5.5. CENTER MOUNT REFLECTORS
Center Mount reflectors will be sampled by the Engineer and submitted to Materials and Research Center
according to section 5.5 of this manual.
When only 1 reflector per sample fails testing the entire sample will be accepted for use on KDOT
projects. A failure of 2 reflectors per sample will require resampling and testing. A failure of 3 or more
will cause the entire sample to be rejected without resampling.
5.6. BEARING PADS OR MATS FOR STRUCTURES
Inspection and the issuance of acceptance reports is the responsibility of the Engineer. The Engineer is
responsible for visual inspection on all Elastomeric and Preformed fabric pads.
6. MISCELLANEOUS METALS
6.1. ALUMINUM ALLOYS AND CAST ALUMINUM
Cast products that will be subjected to appreciable stress are the exception to this policy. The aluminum
from which the castings are made is shipped to the foundry in ingots where it is remelted, cast and heat
treated to a prescribed temper. Since there is a possibility that the alloy might lose its identity, or that heat
treatment might not be adequate, it is the Department’s policy to test such items prior to acceptance. This
policy is especially applicable to stress designed bridge handrail posts cast from Aluminum Association
Alloy A444-T4.
Since all aluminum products except castings are shipped to the project without inspection, the Engineer
must visually inspect the items for compliance with dimensional requirements, identification with
certifications, workmanship, damage during handling, shipment, storage, erection, etc.
While cast items have usually been inspected at the point of production, they should be subjected to visual
inspections by the Engineer to determine manufacturing flaws, dimensional defects and possible handling
and shipping damage. If castings have not been inspected and sampled at the point of production,
sampling in the field will be necessary. If field sampling is required, take one or more castings to
represent each lot as defined in the specifications. Forward the samples to the Materials and Research
Page 7/25 5.7 2016
Revised 2014
Center for testing. If radiographs accompanied the shipment, forward these to the Materials and Research
Center with the samples. If radiographs have not been furnished, the castings will be subjected to
radiographic examination. In either case specimens will be removed for physical and chemical test,
which will destroy the sample. Therefore, the Contractor must furnish additional castings at no charge to
replace those taken for samples.
6.2. SHEET METAL FOR SIGNS
Sheet thickness should be measured with a micrometer.
7. BRIDGE PAINTS AND PAVEMENT MARKING MATERIALS
7.1. BRIDGE PAINT
7.1.1. Inspection at the Source
Inspection of paint or paint materials at the factory or at a distributer’s or dealer’s storage area will be
made by the Engineer and will be limited to the taking of a representative sample and submitting it to the
Materials and Research Center for testing. Except for mixed paints that may have settled badly, this is
readily accomplished by following the methods in KT-28. If the inspector is asked to sample paint that
has settled badly, with pigment caked on the bottom of the container to such an extent that it is impossible
to properly mix, the Engineer should reject it on visual inspection and refuse to sample. Make sure all
paints have been thoroughly mixed prior to sampling.
7.1.2. Inspection at the Destination
Inspection of paint delivered to a job site will normally be the responsibility of the Engineer. Since the
paint should have been tested and accepted prior to delivery, the inspection will usually consist only of
visual inspection for identification marks and for the condition of the paint in the container. The Engineer
shall see that all paint is properly mixed before application. Paint that has been tested and accepted by the
laboratory may be unfit for use if held in storage for extended periods of time. If the contractor is unable
to mix the paint so that the pigment is completely and uniformly incorporated with the vehicle, the
Engineer should reject it and require the contractor to obtain new material. Attention is called to the fact
that it is extremely difficult to properly mix a five gallon can of paint by stirring with a paddle. If any
hard pigment settlement is present it is impossible to do so. If necessary, the Engineer should insist that
the paint be mixed according to KT-28. Make sure all paints have been thoroughly mixed prior to
sampling.
7.1.3. Types of Packaging
Paint will usually be offered for sampling in the ready mixed form and may be either in a bulk storage
tank or sealed packages such as one gallon and five gallon cans. Aluminum Paint, Inorganic Zinc Primer,
Aluminum Epoxy Mastic Primer, and Polyurethane Field Coat will be offered in two or more containers
with the paste or pigment in one container and the vehicle in the other container.
The source of the material will usually be the paint factory where the product will be in storage tanks or
sealed packages, but it may be a distributer’s warehouse or dealer’s storage area where the material will
be in sealed packages only. Occasionally materials such as linseed oil or thinners will be at a
manufacturer’s plant other than a paint factory where the manufacturer will be compounding other
products used in maintenance or construction.

Page 8/25 5.7 2016
Revised 2014
7.1.4. Thinning
If thinning is permitted, the Engineer should inspect the thinner and see it is the type allowed by the
Specifications. If a thinner is used, it must be one specified by the paint manufacturer.
7.1.5. Shop Coat
The shop coat primer on structural steel delivered to the job should be inspected by the Engineer. If the
shop coat has been damaged by moving the steel before complete drying, or if the surface is contaminated
by dirt, cinders, etc., it should be cleaned and repainted. In extreme cases the Engineer should require the
damaged shop coat to be completely removed and the steel repainted with the shop primer. After erection
of the steel, the Engineer should check the condition of the shop coat. Any skips, small areas left
unpainted because of erection marks, rivets, bolt heads, and welded areas should be properly cleaned and
touched up with an appropriate primer. The cleaning of field welded areas should be given careful
attention. All slag, spatter, and excess reinforcing should be ground off and the weld area sand blasted
before painting.
7.1.6. Methods of Sampling
Unless otherwise specified, all bridge paints will be sampled according to KT-28.
7.2 TRAFFIC LINE PAINT
7.2.1. Inspection at the Destination
Inspection of paint delivered to a job site will normally be the responsibility of the Engineer. Inspection
will usually consist only of visual inspection for identification marks and for the condition of the paint in
the container. The Engineer shall see that all paint is properly mixed before application. Paint may be
unfit for use if held in storage for extended periods of time. If the contractor is unable to mix the paint so
that the pigment is completely and uniformly incorporated with the vehicle, the Engineer should reject it
and require the contractor to obtain new material. Attention is called to the fact that it is extremely
difficult to properly mix a five gallon can of paint by stirring with a paddle. If any hard pigment
settlement is present it is impossible to do so. If necessary, the Engineer should insist that the paint be
mixed according to KT-28. Make sure all paints have been thoroughly mixed prior to sampling.
7.2.2. Types of Packaging
Paint will usually be offered for sampling in single component form and may be either in a bulk storage
tank or sealed packages such as 55, 5 or 1 gallon containers.
7.2.3. Method of Sampling
Unless otherwise specified, all pavement marking paints will be sampled according to KT-68.
7.3. EPOXY PAVEMENT MARKING MATERIAL
7.3.1. Inspection at the Destination
Inspection of Epoxy Pavement Marking Material delivered to a job site will normally be the responsibility
of the Engineer.

Page 9/25 5.7 2016
Revised 2014
7.3.2. Types of Packaging
Epoxy Pavement Marking Material will usually be offered for sampling in a ready form and be in a
heated bulk tanks. The source of the material will usually be the contractor.
7.3.3. Method of Sampling
Unless otherwise specified, all pavement marking paints will be sampled according to KT-66.
7.4. THERMOPLASTIC PAVEMENT MARKING MATERIAL
7.4.1. Inspection at the Destination
Inspection of Thermoplastic Pavement Marking Material delivered to a job site will normally be the
responsibility of the Engineer.
7.4.2. Types of Packaging
Thermoplastic Pavement Marking Material will usually be offered for sampling in the melted form in
heated bulk tanks or in powder form in sealed sacks. The source of the material will usually be the
contractor.
7.4.3. Method of Sampling
Unless otherwise specified, all pavement marking paints will be sampled according to KT-30.
7.5. PERFORMED THERMOPLASTIC PAVEMENT MARKING MATERIAL
7.5.1. Inspection at the Destination
Inspection of Performed Thermoplastic Pavement Marking Material delivered to a job site will normally
be the responsibility of the Engineer.
7.5.2. Types of Packaging
Performed Thermoplastic Pavement Marking Material will usually be offered for sampling in performed
markings that are heat fused to the pavement. The source of the material will usually be the contractor.
7.6. SPRAYED THERMOPLASTIC PAVEMENT MARKING MATERIAL
7.4.1. Inspection at the Destination
Inspection of Sprayed Thermoplastic Pavement Marking Material delivered to a job site will normally be
the responsibility of the Engineer.
7.4.2. Types of Packaging
Sprayed Thermoplastic Pavement Marking Material will usually be offered for sampling in the molten
form that is applied to the pavement by spray means. The source of the material will usually be the
contractor.
Page 10/25 5.7 2016
Revised 2014
8. CULVERT, SEWER AND UNDER-DRAIN PIPE
8.1. CAST IRON PIPE
If pipe with a push-on or a mechanical joint is furnished, the joint elements should be examined carefully
to determine whether or not they will produce a pressure tight seal. Each length should be carefully
examined for all manufacturing defects or damage during handling that will impair its usefulness.
8.2. CORRUGATED METAL PIPE, PIPE ARCHES AND END SECTIONS
As a minimum, the Engineer should inspect the pipe at destination for possible damage during handling
and shipping. A tag with the project number and station number should be attached to each section of
pipe by the manufacturer. Defective pipe or pipe of questionable quality should be reported to the District
Materials Engineer. If the pipe has not been inspected at the fabricator’s plant or some other location, a
more stringent inspection will be required at the job site, consult the District Materials Engineer for
guidance.
8.3. ASPHALT COATED CORRUGATED METAL PIPE, PIPE ARCHES, COUPLING BANDS AND
STRUCTUAL PLATE
The pipe is identified by tags attached to each piece. The tags bear the laboratory number under which
the pipe was inspected and the date of inspection.
9. CEMENTITIOUS MATERIAL
9.1. PORTLAND CEMENT
Many types of cement are manufactured, the kinds most commonly used for KDOT is Type I, Type IP,
Type I (PM), Type II (MH), Type I/II (MH) and Type III. All these are covered by Kansas Department
of Transportation Specifications Section 2001. Type II (MH) cement is usually required for concrete
pavement and bridge decks with Type I, Type IP, Type I (PM) or Type II (MH) being allowed for all
other concrete uses. Type I/II (MH) meets the requirements of both Type I and Type II (MH) and may be
used when either type is specified. Type III cement reaches high strength earlier than other types and is
sometimes permitted for use with small structures when it is important to finish a job quickly.
Portland cement may be delivered to the project in bags or in bulk. Most shipments to projects and to
ready-mix plants are in bulk.
9.1.1. Responsibility
It is the responsibility of the Engineer to assure that cement manufacturers, concrete producers, and
contractors comply with the Standard Specifications and Special Provisions. Complete and sincere
cooperation of all persons involved is essential for successful and efficient cement inspection. The
current list of prequalified cement plants is available from Kansas Department of Transportation’s
website.
9.1.1.1. The operator of a prequalified cement plant or terminal furnishes all necessary information and
facilities for adequate sampling by the Engineer to maintain prequalified status.
Page 11/25 5.7 2016
Revised 2014
9.1.1.1.1. The plant operator exercises good quality control of the products and submits a monthly report
of the test results and a statistical analysis (including standard deviations and means) of all the plant’s
quality control tests for the month to the Chief, Bureau of Construction and Materials for all products for
which the plant is prequalified.
9.1.1.1.2. A representative of the cement company must issue a certification to accompany each shipment
consigned to State work. The certifications shall show compliance with the specification and is to be
attached to or made a part of the scale ticket, weigh bill, or other shipping document accompanying the
shipment.
9.1.1.2. Terminals are described as storage facilities established by cement companies in urban or large
market areas some distance from a cement plant. The terminal is considered approved to supply cement
to the Department of Transportation projects if the cement plant which produced it is prequalified.
Cement shipped from terminals established by a prequalified cement company is to be handled the same
as if shipped direct from the cement plant. A certification indicating compliance with the specifications,
signed by a representative of the cement company, must accompany each shipment.
9.1.1.3. The Contractor, when purchasing cement from a prequalified cement plant advises the plant of
the type of cement required and that a certification must accompany each shipment. The contractor must
submit a copy of each certification to the Engineer. When purchasing concrete from a ready-mix
operator, the contractor advises the operator of the need for certification of the cement by a representative
of the cement company, and furnishes the ready-mix operator information relative to project number, type
of cement, and class concrete.
9.1.1.4. The Ready-Mix Plant Operator, when furnishing concrete for State work requires certifications
from the cement company for all cement delivered during the progress of work. In the case of cement in
storage at the ready-mix plant at the beginning of a project which cannot be certified to be the producing
cement company, or which has been in storage for more than three months, the Engineer must be notified
so that appropriate sampling and testing may be done prior to the beginning of the work. The Ready-Mix
operator certifies each week to the Engineer that all cement used to produce concrete for State work
during that week was State approved, and lists certified cement received during the week.
9.1.1.5. The Engineer determines if the project is to be constructed of job mix or ready-mix concrete and
reminds the Contractor that cement company certifications or State tests are required for all cement in
storage at the beginning of the work and that all shipments received during the progress of the work must
be accompanied by certifications. The Engineer verifies that the plant furnishing the cement is
prequalified for the type being furnished. The Engineer determines during the construction of the project
that certifications are available for all cement being used. The cement is acceptable for immediate use
provided each shipment is accompanied by a certification showing compliance with specifications. The
Engineer is to review the certifications from the contractor or ready-mix plant operator and at the
completion of the project issues an acceptance report covering all cement used on each State project.
(Use CMS Screen 130, Sample I.D. or Miscellaneous Report Form DOT 623, separate report for each
producer supplying cement to a project. The type reported must match the type prequalified.)
9.1.1.6. Regional and District Laboratories perform sampling, record keeping and reporting necessary for
monitoring compliance with specifications at cement plants and terminals in their area. Information
Samples are obtained at the frequency of one per type prequalified every other month throughout the year.
Offices sampling more than one plant should stagger their plants on opposing months to level out their
sampling and MRC testing workloads. Samples of cement are to be obtained from one or more of the
following sources.

Page 12/25 5.7 2016
Revised 2014
Production Streams (only when agreed to by the producer)
Loading streams
Loaded containers
Transfer streams (from storage silo to shipping silo)
Verification samples are taken by each District at the rate of one sample per each one half calendar year
from each mill or source providing cement in the District during that period.
Additional verification samples and tests may be required if any of the producer submitted data, or KDOT
Verification or Information Sampling indicate a problem with quality control or compliance with Kansas
specification limits. The increased sample frequency will be established in writing by the Chief of
Construction and Materials, and will remain in effect until the problem is resolved.
Test reports are issued to the Bureau of Construction and Materials and to the appropriate cement plants
on special request.
9.1.2. Basis of Acceptance.
See Standard Specifications Manual Subsection 2001.
9.1.3. Reporting.
Acceptance reports covering shipments of cement from unqualified plants are issued by the Materials and
Research Center.
An acceptance report covering cement received from each qualified plant or approved terminal storage
unit is issued by the Engineer. The report is issued after all concrete work is completed and covers the
quantity of each brand and type of cement used on the project.
9.1.4. Sample Forms and Reports.
The following report forms and suggested certification statements illustrate references in the preceding
sections.
9.1.4.1. Certification from the Prequalified Cement Plant or Terminal.
A certification similar to this suggested statement must accompany each shipment destined for State
Projects. (See Figure 1)
9.1.4.2. DOT Form 697 (697A) - Certification of Cement used by Ready-Mix Company.
9.1.4.2.1. One copy of this form is sent to the Engineer by the Ready-Mix producer for the cement
received and/or used during each week. If cement is neither received nor used during a weekly period,
this form need not be submitted. (See Figure 2)
9.1.4.2.2. A certification is supplied to the Engineer covering cement in storage at the beginning of a
project. (See Figure 3)
9.1.4.3. The following forms are used by the Engineer to report cement produced by prequalified
companies and used on State Projects.

Page 13/25 5.7 2016
Revised 2014
9.1.4.3.1. CMS Screen 130, Sample I.D. with assignment to the plant using CMS Screen 265 (See Figure
4). Follow procedures outlined in Materials Operations Memo 1007.
9.1.4.3.2. DOT Form 623 - Miscellaneous Report Form for those projects not on CMS. (See Figure 5)
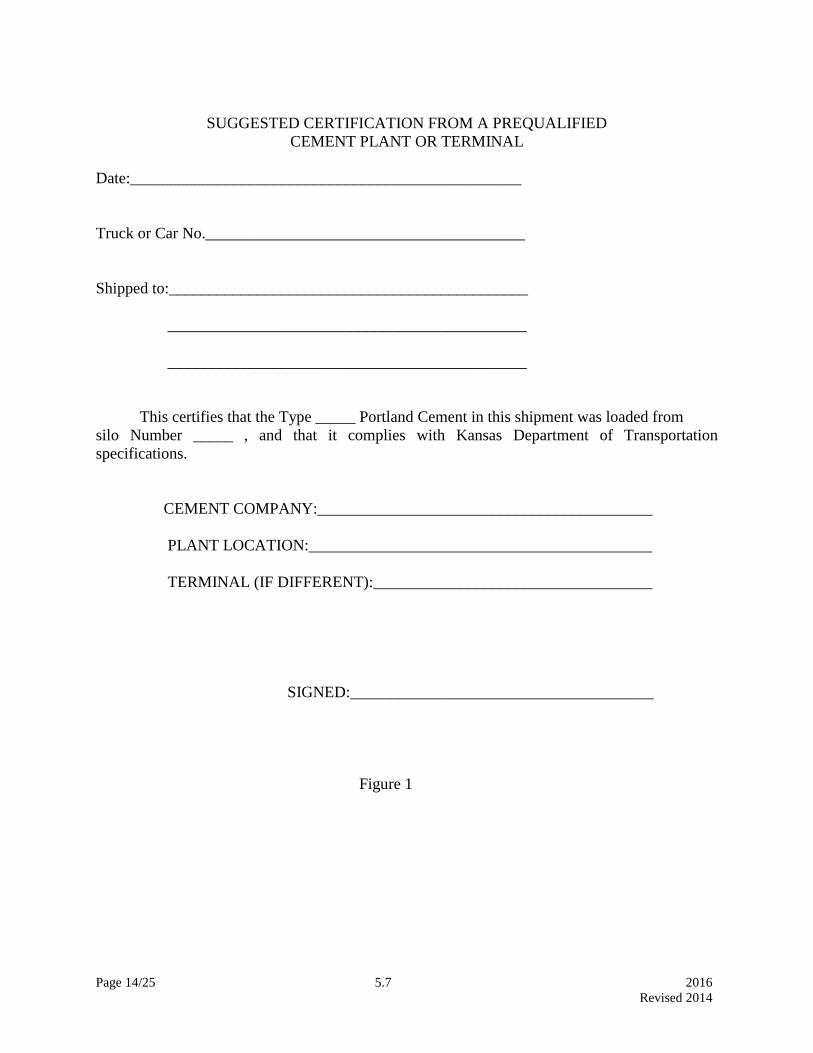
Page 14/25 5.7 2016
Revised 2014
SUGGESTED CERTIFICATION FROM A PREQUALIFIED
CEMENT PLANT OR TERMINAL
Date:_________________________________________________
Truck or Car No.________________________________________
Shipped to:_____________________________________________
_____________________________________________
_____________________________________________
This certifies that the Type _____ Portland Cement in this shipment was loaded from
silo Number _____ , and that it complies with Kansas Department of Transportation
specifications.
CEMENT COMPANY:__________________________________________
PLANT LOCATION:___________________________________________
TERMINAL (IF DIFFERENT):___________________________________
SIGNED:______________________________________
Figure 1

Page 15/25 5.7 2016
Revised 2014
KANSAS DEPARTMENT OF TRANSPORTATION
CERTIFICATION OF MATERIALS USED BY READY MIX COMPANY
Project No.:____________________________________________
Date: _________________________________________________
MEMORANDUM TO:_______________________________________________________,CONSTRUCTION ENGINEER
Re: Certification of Cement
This is to certify that all of the cement used in the production of concrete for the above project during the week of
___________________________to__________________________was Type______________________________ cement and
(Sunday) (Sat., Include.)
that the company from which this cement was received has certified that the cement meets the specifications of the Kansas
Department of Transportation. Certifications covering this cement are on file in this office.
The following shipments of certified cement have been received by this company during the weekly period listed above:
BRAND QUANTITY DATE OF CERTIFICATION
Re: Certification of Aggregates
Type of Location of Deposit Total Approx. Tons/Yds. This Week
Aggregate Sec. Twp. Range County Received Incorporated in Mix
This is to certify (Check applicable box or boxes)
1. All of the aggregates described above were:
(A) Produced at the deposit location described.
(B) Loaded from State tested and approved stockpile at the production site or from the plant while it was
producing aggregate meeting applicable specifications.
2. Only State tested and approved aggregates were used to produce ready-mixed concrete delivered to State work.
______________________________________
Name of Ready Mix Co
___________________________________________________________
(Signature) (Title)
Figure 2
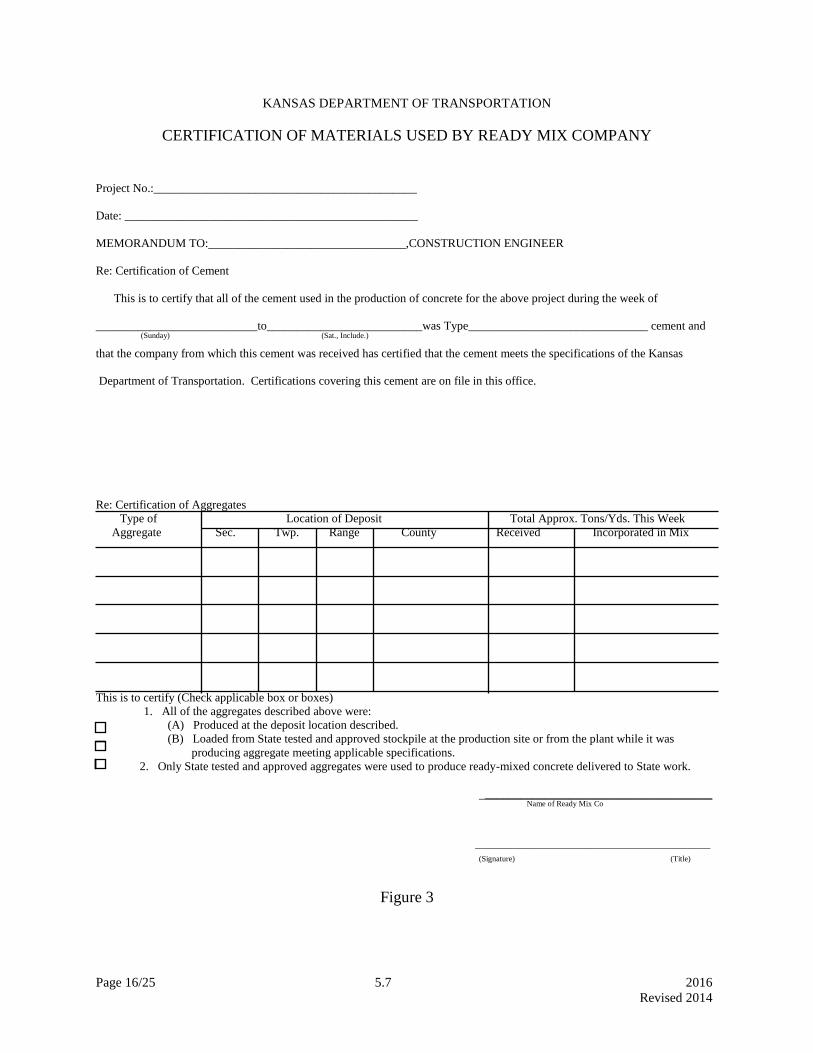
Page 16/25 5.7 2016
Revised 2014
KANSAS DEPARTMENT OF TRANSPORTATION
CERTIFICATION OF MATERIALS USED BY READY MIX COMPANY
Project No.:____________________________________________
Date: _________________________________________________
MEMORANDUM TO:_________________________________,CONSTRUCTION ENGINEER
Re: Certification of Cement
This is to certify that all of the cement used in the production of concrete for the above project during the week of
___________________________to__________________________was Type______________________________ cement and
(Sunday) (Sat., Include.)
that the company from which this cement was received has certified that the cement meets the specifications of the Kansas
Department of Transportation. Certifications covering this cement are on file in this office.
Re: Certification of Aggregates
Type of Location of Deposit Total Approx. Tons/Yds. This Week
Aggregate Sec. Twp. Range County Received Incorporated in Mix
This is to certify (Check applicable box or boxes)
1. All of the aggregates described above were:
(A) Produced at the deposit location described.
(B) Loaded from State tested and approved stockpile at the production site or from the plant while it was
producing aggregate meeting applicable specifications.
2. Only State tested and approved aggregates were used to produce ready-mixed concrete delivered to State work.
______________________________________
Name of Ready Mix Co
___________________________________________________________
(Signature) (Title)
Figure 3
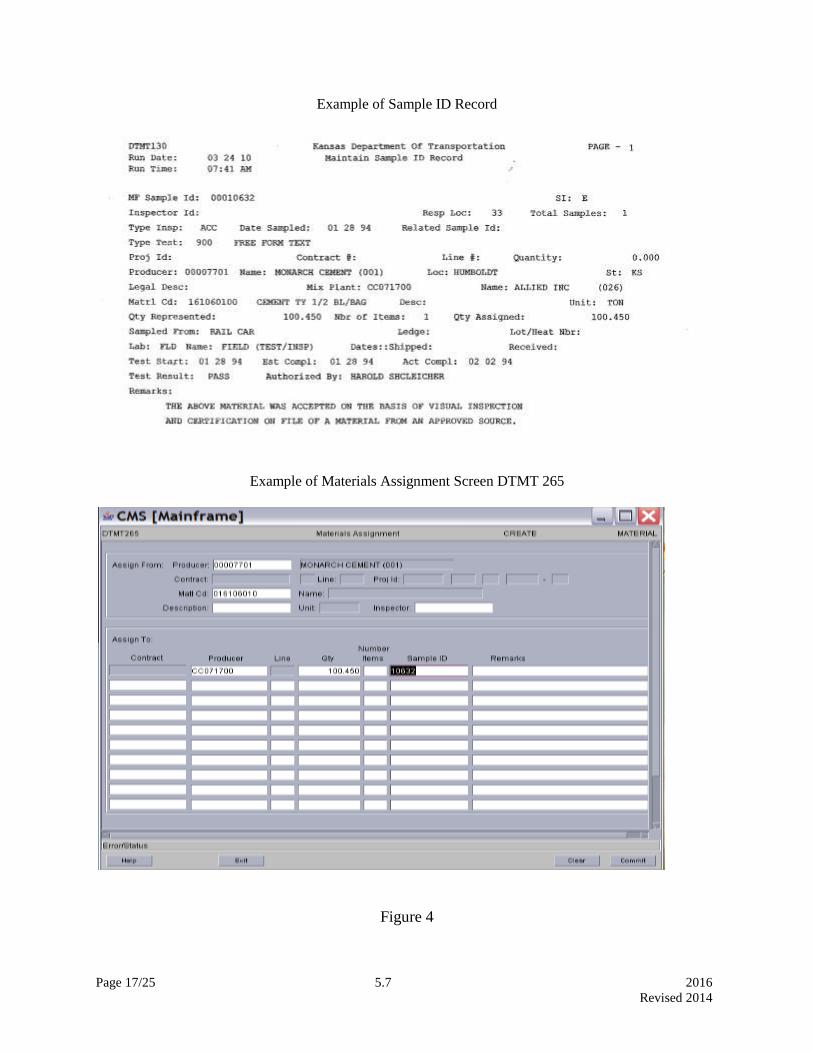
Page 17/25 5.7 2016
Revised 2014
Example of Sample ID Record
Example of Materials Assignment Screen DTMT 265
Figure 4
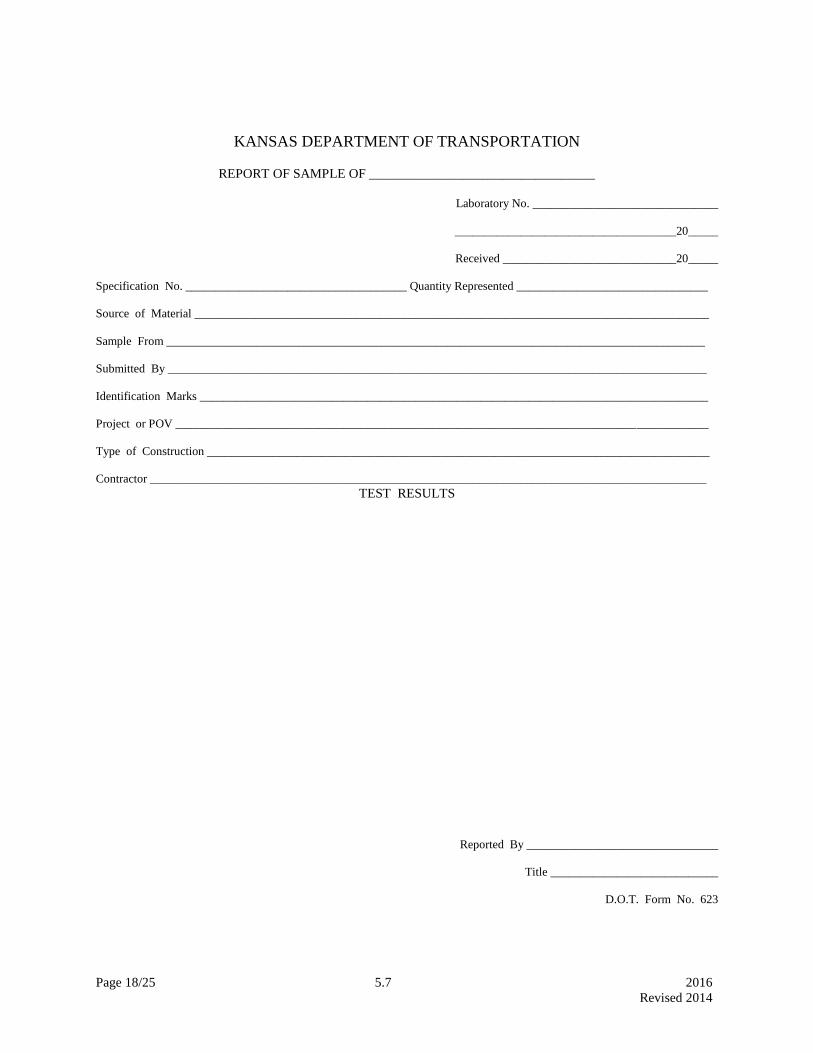
Page 18/25 5.7 2016
Revised 2014
KANSAS DEPARTMENT OF TRANSPORTATION
REPORT OF SAMPLE OF __________________________________
Laboratory No. _______________________________
_____________________________________20_____
Received _____________________________20_____
Specification No. _____________________________________ Quantity Represented ________________________________
Source of Material ______________________________________________________________________________________
Sample From __________________________________________________________________________________________
Submitted By __________________________________________________________________________________________
Identification Marks _____________________________________________________________________________________
Project or POV _________________________________________________________________________________________
Type of Construction ____________________________________________________________________________________
Contractor _____________________________________________________________________________________________
TEST RESULTS
Reported By ________________________________
Title ____________________________
D.O.T. Form No. 623
Page 19/25 5.7 2016
Revised 2014
9.2. HYDRATED LIME AND QUICKLIME
9.2.1. Inspection and Sampling
Lime shipped from plants having a satisfactory record of quality control is not inspected the Engineer
prior to its arrival at destination. Therefore, the Engineer is responsible for the identification of the
shipment with the accompanying certifications and the taking of verification samples from shipments
selected at random. Samples are to be taking in accordance with the requirements of KT-29.
The Engineer obtains samples from shipping containers selected at random to verify the certifications
issued by the producer. Should these samples indicate inadequate internal quality control by the
producer, acceptance on certification is halted and each shipment is sampled and tested prior to use.
9.2.2. Reporting
The Engineer issues reports for lime covered by producer’s certifications.
9.3. FLY ASH
Fly ash is finely divided residue that results from the combination of ground or powdered coal. See
KDOT Standard Specification section 2004. Samples are to be taken in accordance with the
requirements of KT-29.
10. MATERIALS FOR ROADSIDE IMPROVEMENTS
10.1. This section covers the inspection, sampling and testing of materials used for roadside
improvements, including safety rest areas.
Where reference is made to regular sampling and testing procedures or regular inspection procedures, the
intent is that the material receives such testing or inspection as is prescribed in the Standard Specifications
or in this manual. Reports should be issued for these materials.
Individual material items that do not require regular testing should be judged on the basis of visual
inspection and, where indicated, approved catalog cuts. Reports of these inspections are not generally
required.
Visual inspection reports of completed bid items should be based on the use of accepted materials in the
construction of such items as indicated by tests, approved catalog cuts or visual inspection of the
materials as indicated above. Specific reference to the individual tests or inspections need not be made.
On visual inspection reports of completed bid items, only a general statement need be made to the effect
that all materials used were acceptable.
10.2. PLANTS
Plants used in roadside improvements are either nursery grown or collected from their natural growing
site. For acceptance criteria see Standard Specifications Manual Subsection 2102. Preliminary
inspection may be made at the nursery or collecting field when deemed desirable by the Engineer. Final
inspection and acceptance or rejection is made at the planting site in accordance with the Standard
Specifications.
Page 20/25 5.7 2016
Revised 2014
10.3. SEEDS
Seed used for highway projects is field grown, usually in Kansas or neighboring states. Contractors may
procure seed from the grower or from individuals or companies engaged in buying and selling seed. Seed
intended or offered for sale for planting must be processed and handled in accordance with the Kansas
Seed Law and applicable rules and regulations of the Kansas State Board of Agriculture. For acceptance
criteria see Standard Specifications Manual Subsection 2103. The appearance of the seed must not
indicate improper storage or handling resulting in damage by rodents, excess humidity, free moisture,
overheating or other cause.
10.3.1. Labels - Untreated Seed: The labels must be in the English language and must contain the
following information:
10.3.1.1. The commonly accepted name of the kind and the variety, of each agricultural seed component
in excess of five percent (5%) of the whole, and the percentage by weight of each in the order of its
predominance. Where more than one component is required to be named, the word "mixture" or the word
"mixed" shall be shown conspicuously on the label.
10.3.1.2. The percentage by weight of pure seed.
10.3.1.3. The percentage by weight of all weed seeds.
10.3.1.4. The percentage by weight of inert matter.
10.3.1.5. For each named agricultural seed:
10.3.1.5.1. The percentage of germination, exclusive of hard seed.
10.3.1.5.2. The percentage of hard seeds, if present.
10.3.1.5.3. Total germination percentage including hard seed may be shown.
10.3.1.5.4. The calendar month and year the test was completed to determine such percentages. (Seeds
shipped within Kansas which have not been planted within 9 months after testing shall be resampled and
retested. Seeds shipped across state lines which have not been planted within 5 months after testing shall
be resampled and retested.)
10.3.1.6. The percentage by weight of agricultural seeds (which may be designated as "crop seeds") other
than those required to be named on the label.
10.3.1.7. The lot number or other lot identification.
10.3.1.8. The origin: i.e., the state where grown, except for lawn grass seeds in quantities of less than 5
kg (10 pounds).
10.3.1.9. The name and rate of occurrence per unit weight of each kind of "restricted noxious weed seeds"
present, which shall not exceed the limit stated in the Kansas Seed Law.
10.3.1.10. The name and address of the person responsible for such statement.
Page 21/25 5.7 2016
Revised 2014
10.3.2. Labels - Treated Seed: Agricultural seed which has been treated with chemicals for insect or
disease control, shall be labeled to show the following:
10.3.2.1. A word or statement indicating that the seed has been treated.
10.3.2.2. The commonly accepted, coined, chemical or abbreviated chemical (generic) name of the
applied substance.
10.3.2.3. If the substance in the amount applied is harmful to human or other vertebrate animals, a caution
statement, such as: "Do not use for food, feed or oil purposes." The caution for mercurials and similarly
toxic substances must include in a contrasting color the word "poison" along with a skull and crossbones.
10.3.2.4. A separate label may be used to show this information, or it may be a component part of the
main label.
10.3.3. Sampling.
Sampling of seed by Department personnel will seldom be required; however, should such sampling
become necessary, it should be accomplished in a manner which will produce a representative sample in
accordance with the Rules and Regulations of the Kansas State Board of Agriculture.
10.4. NITROGEN FIXING BACTERIA
Media for the inoculation of legume (bean) seed with nitrogen fixing bacteria are produced by only a few
specialists in this field. Legume (bean) plants, when properly inoculated, form nodules on the root
systems which contain millions of bacteria, called Rhizobia, that are fed by the host plant and in turn
produce nitrogen. This nitrogen is then available to the legume plant to aid growth and making it
independent of the supply of nitrogen in the soil. These bacteria are very sensitive to high temperatures
and to drying. For acceptance criteria see Standard Specifications Manual Subsection 2106.
Observe the contractor's handling and storage of the inoculating material. Heat and drying must be
avoided as either will cause extremely rapid death of the nitrogen fixing bacteria. The treating of the seed
must be done in strict accordance with the supplier's directions and must result in heavy coating of the
seed. Leguminous seed must be planted as soon as possible after inoculation. The maximum number of
live bacteria will be on the seed at the time of inoculation after which the live bacteria decrease at a rate
dependent on storage conditions. Exposure of the inoculated seeds to sunlight, high temperatures or
drying conditions will increase the death rate of the bacteria.
No sampling of Nitrogen Fixing Bacteria is required, but perform a visual inspection of the container
label to verify that the bacteria is of the proper culture, supplied in the proper quantity and properly dated.
10.5. AGRICULTURAL LIMESTONE
Ground limestone for agricultural purposes is almost always produced as a by-product of commercial
quarrying and crushing limestone for other purposes such as highway and building construction. For
acceptance criteria see Standard Specifications Manual Subsection 2107.
Sources supplying this material shall have been qualified by the State Board of Agriculture.

Page 22/25 5.7 2016
Revised 2014
10.6. FERTILIZERS
Commercial mixed fertilizers are blended or formulated of ingredients which will furnish the desired
amounts of nitrogen (N), phosphorus (P) and potassium (K) together with an inert material.
Usually this item will be listed in the contract proposal as "Fertilizer (xx-xx-xx)." The first number in
parenthesis denotes the minimum percentage of nitrogen (N) required, the second number indicates the
minimum percentage of available phosphorus (P) required and the third number indicates the minimum
percentage of water soluble potassium (K) required. The particular fertilizer required for a contract is
chosen by the Landscape Architect to best supply the needs of the crop being planted and the soil
conditions on the project. For acceptance criteria see Standard Specifications Manual Subsection 2108.
10.7. SUMMARY OF INSPECTION, TESTING AND REPORTING REQUIREMENTS
Many roadside improvement projects contain a number of items not directly related to seeds or plants.
These occur in rather variable quantities or numbers and often the Inspector is uncertain of the required
inspection. The following gives the requirements for a number of such items.
10.7.1. AGRICULTURAL LIMESTONE - By receipt of proper certification.
10.7.2. AUTOMATIC WATERING SYSTEM - Use regular sampling and testing or inspection
procedures on concrete, concrete reinforcing bars, cast iron pipe, steel pipe and corrugated metal pipe
used for casing under roadways. Use regular procedure for plastic pipe if plans or specifications require
conformance with an ASTM or other specifications. Other items are to be visually inspected. Issue a
visual inspection report on the entire completed system.
10.7.3. BERMUDA GRASS SOD RETARDS - Issue visual inspection report.
10.7.4. BURLAP BAG SOD RETARDS - Issue visual inspection report.
10.7.5. CHARCOAL GRILL - Issue visual inspection report.
10.7.6. CHARCOAL GRILL BASE - Use regular sampling and testing or inspection procedures for
concrete and reinforcing steel. Issue a visual inspection report for completed base.
10.7.7. COMBINATION TOOL SHED AND COMFORT STATION - Use regular sampling and testing
or inspection procedures for concrete, concrete masonry units and reinforcing steel. Issue a visual
inspection report for completed shelter.
10.7.8. CONCRETE SHELTER WITH WINDBREAK - Use regular sampling and testing or inspection
procedures for concrete, curing material and concrete reinforcing steel. Issue a visual inspection report for
completed shelter and windbreak.
10.7.9. ELECTRIC LIGHTING SYSTEM - Use regular sampling and testing or inspection procedures for
anchor bolts, concrete, conduit and conduit fittings. Issue a visual inspection report on completed system.
10.7.10. FERTILIZER - Use regular inspection system.
10.7.11. FIREPLACE - Use regular sampling and testing or inspection procedures for concrete and
reinforcing steel. Issue a visual inspection report for completed fireplace.
Page 23/25 5.7 2016
Revised 2014
10.7.12. GLASS FIBER MAT (DITCH LINING, RIPRAP, WEED CONTROL) - Use regular procedures
for glass fiber mat and subsidiary items such as seed, fertilizer, cover material, etc. Issue a visual
inspection report for completed work.
10.7.13. GRILL - Use regular sampling and testing or inspection procedures for concrete and reinforcing
steel. Issue a visual inspection report for completed grill.
10.7.14. JUTE MESH EROSION CONTROL MATERIALS - Use regular sampling and testing
procedure. Issue a visual inspection report for completed erosion control.
10.7.15. MANURE - Issue visual inspection report.
10.7.16. MULCHING - Issue visual inspection report.
10.7.17. PEAT MOSS - Use regular sampling and testing procedure.
10.7.18. PIPE UNDERDRAIN - Use regular sampling and testing procedures for clay tile and underdrain
aggregate.
10.7.19. SANITARY SEWER - Use regular sampling and testing or inspection procedures for pipe and
materials for sealing and filing pipe joints.
10.7.20. SEEDS AND REQUIRED NITROGEN FIXING BACTERIA - Use regular inspection
procedures.
10.7.21. SOD – Issue a visual inspection report for completed item.
10.7.22. TABLE (WOOD WITH OR WITHOUT BASE: CONCRETE WITH BASE) - Use regular
sampling and testing or inspection procedures for concrete and reinforcing steel. Issue a visual inspection
report for completed table.
10.7.23. TABLE SHADE - Issue a visual inspection report for completed shade.
10.7.24. TOPSOIL - Issue a visual inspection report.
10.7.25. TREES, SHRUBS, ETC. - Issue a visual inspection report.
10.7.26. WATERING SYSTEM - Use regular sampling and testing or inspection procedures for concrete,
reinforcing steel and pipe. Issue a visual inspection report for completed system.
10.7.27. WATER WELL PUMP - Use regular sampling and testing or inspection procedures for concrete
and reinforcing steel. Issue a visual inspection report for complete pump.
Page 24/25 5.7 2016
Revised 2014
11. STEEL AND IRON
11.1. STRUCTURAL STEEL
11.1.1. Shapes and Plates.
For acceptance criteria see Standard Specifications Manual Subsection 1605. Acceptance reports
issued by engineers who inspect items fabricated from structural steel also include the acceptance of the
steel used in the fabrication of such units.
11.1.2. Structural Steel Fasteners.
Acceptance reports covering fasteners for bridge connections, splices and sign supports are issued by the
Materials and Research Center. Acceptance reports for uncoated fasteners for other uses will be issued by
the Field Engineer.
11.2. DEEP BEAM GUARDRAIL AND FITTINGS
Guardrail terminal sections, rail elements and hardware including bolts, nuts and washers must be visually
inspected by the Field Engineer for conformance with dimensional requirements, including gage of metal,
width, configuration of corrugations, condition of galvanized coating and identification of the shipment
with the manufacturer's certification.
12. TIMBER, LUMBER, PILING AND POSTS
12.1. These instructions cover the inspection of timber products used for construction and maintenance
purposes. The majority of timber products are produced in the southern states or the west coast region.
The treating of most timber products is performed in the general region where the products are produced.
12.2. Basis of Acceptance.
For acceptance criteria see Standard Specifications Manual Subsections 2303, and 2304.
12.2.1. Pre-qualification required for wood posts and blocks
12.2.2. Appropriate certification packets required for all wood products
12.3. Methods of Inspection, Sampling and Testing.
12.3.1. Inspection.
Timber products from treatment plants will be pre-qualified and monitored by Department employees
working out of the Wichita Regional Laboratory.
12.3.2. Inspection Methods.
12.3.2.1. All wood products will meet the requirements as specified in the Standard Specification Manual
subsections, as listed above.
12.3.2.2. Identification: Each piece of inspected timber product is identified by supplier, or their
representative, for the required material grade. Following treatment, a lot number is stamped on each

Page 25/25 5.7 2016
Revised 2014
piece, or it may be stamped on a small piece of thin metal which is tacked to one end of the piece. As a
minimum, the supplier identification, the treatment lot number, and minimum treatment requirement will
be identifiable.
12.3.2.3. Inspection at Destination: Timber products should be inspected by the Field Engineer for
identification marks, possible damage during handling and shipment, and serious defects that will impair
the utility or durability of the piece. Defects that may have escaped the notice of the inspector include
oversize knots, shakes, splits, checks, rot or decay, and straightness. Damage incurred during handling
and shipment includes damaged ends and broken surfaces which expose untreated wood.
12.3.2.4. Notify the District Materials Engineer of any timber products that arrive on the project without
proper documentation.
12.4. Reporting.
Acceptance reports will be written by field personnel, based on correct and complete documentation,
covering all wood products received for use on Kansas Department of Transportation projects.
13. WATER FOR USE WITH PORTLAND CEMENT
13.1. Water from Domestic or City Supplies.
Water from domestic or city supplies and from other sources approved by health authorities for domestic
use may be accepted without testing for all concrete except that to be used in the production of prestressed
concrete units. All water must be tested before it is used in concrete for the production of prestressed
units.
13.2. Untreated Water from Lakes, Ponds, Wells and Streams.
Water from these sources must be sampled and tested in the Materials and Research Center and accepted
before it is used in the production of all classes of concrete.
13.3. Sampling.
Care should be exercised to insure that the sample of water is representative of the source of supply.
Equipment used to take the sample and containers for shipping it to the laboratory should be clean.
Samples are to be shipped in plastic or glass containers. If glass containers are used they must be
carefully packed for shipment. Metal containers are not acceptable for shipping samples of water.
13.4. Reporting.
13.4.1. Water from Domestic or City Supplies. A visual inspection report is issued by the Engineer to
cover the water used for regular concrete work. CMS projects do not require this report, because it is
handled within the mix design.
13.4.2. Untreated Water and Water for Prestressed Concrete. The Materials and Research Center will
issue a report showing the results of tests conducted on samples submitted by the Engineer.


Kansas Department of Transportation
Standard Operating Manual
SOM: 1.13.2
SUBJECT: Radiological Safety Guidelines VERSION: 7 PAGE: 1 of 7
EFFECTIVE DATE: 07/01/2013
INFORMATION CONTACT: Bureau of Construction and Materials
APPROVED: , Secretary of Transportation
Page 1/7 5.8.1 2016
Revised 2014
POLICY STATEMENT: Kansas Department of Transportation (KDOT) employees involved with nuclear gauges shall be trained in their operation. They shall be knowledgeable of safety guidelines and shall follow the guidelines when handling or transporting a nuclear gauge. DEFINITIONS: Nuclear Gauge. A portable device utilizing radioactive material to determine the density and/or hydrogen content of a material is a nuclear gauge. Film Badge. A small device that is carried by an individual to measure radiation exposure for a stated period of time is a film badge. Survey Meter. A device capable of monitoring the level of radiation emitted by nuclear sources
is a survey meter.
PROCEDURAL GUIDELINES: General Operation Construction Office Supervisors shall have a minimum of two KDOT employees on the project who are trained to use nuclear gauges on projects requiring nuclear gauges and know the procedures to follow in case of an accident, theft, or fire. One of these employees shall be the operator. Operators shall observe safety procedures while using nuclear gauges to perform a test. Operators shall keep their hands clear of the underside of the nuclear gauge except when removing extraneous material. Operators shall be familiar with and follow the operating procedures detailed in the operating manual for the nuclear gauge and/or instructions provided by the Bureau of Construction and Materials.
SOM: 1.13.2
SUBJECT: Radiological Safety Guidelines VERSION: 7 PAGE: 2 of 7
EFFECTIVE DATE: 07/01/2013
Page 2/7 5.8.1 2016
Revised 2014
Operators shall correct only nuclear gauge malfunctions or perform other maintenance which is specifically covered in the manual for that gauge. If malfunctions are not covered by the manufacturer’s manual, operators should contact the District Materials Office. Pregnant Employees Any pregnant employee whose working assignment requires the use of the nuclear gauge may voluntarily declare the pregnancy. This declaration can be implemented or removed at any time by the employee. If the pregnant employee wants to declare the pregnancy, then the employee is to provide written notification of the pregnancy to the Construction Office Supervisor and District Materials Engineer. Removing a declaration also requires written notification to the same parties. The pregnant employee shall provide an anticipated due date in the written notification. The due date is necessary to determine exposure limits in accordance with Kansas Department of Health and Environment's (KDHE) requirements. KDOT strongly encourages pregnant employees to declare their pregnancy. The pregnant employee's District Materials Engineer will inform the employee of quarterly/monthly exposure rates. This will continue throughout the pregnancy. Radiation exposures are to be monitored by the District Materials Engineer for compliance with KDHE’s limits during the course of the pregnancy. When resources and personnel allow, an attempt should be made to minimize the use of nuclear gauges by the pregnant employee who has declared her pregnancy. Film Badges All operators and other authorized personnel, when using the nuclear gauge, shall wear a film badge. Badges are furnished by KDOT and shall be worn waist high. When not in use, badges shall be stored away from radioactive areas, heat sources, and video display devices. Badges shall not be stored in vehicles. The individual to whom the film badge is assigned is the only person whose history shall be represented by the badge. District records and communications regarding radiation exposure readings will be controlled by and filed in the District office. A copy of the records shall be sent to the Radiation Safety Officer at the Materials and Research Center. Badges for the Headquarters personnel will be controlled by the Bureau of Construction and Materials. Daily Log and Survey of Nuclear Gauge with Survey Meter Check A survey meter shall accompany the nuclear gauge and shall be available for immediate use.

SOM: 1.13.2
SUBJECT: Radiological Safety Guidelines VERSION: 7 PAGE: 3 of 7
EFFECTIVE DATE: 07/01/2013
Page 3/7 5.8.1 2016
Revised 2014
Log Books Two Log Books shall be established for each nuclear gauge and shall remain with the gauge. The log book shall contain all of the following: 1. Log Book One:
Telephone numbers of the Bureau of Construction and Materials, Materials and Research Center, after-hours radiation emergency number, and office number of the company manufacturing the nuclear gauge.
Serial number of nuclear gauge.
Names of operators, dates of transfer to other operators.
All survey meter readings and observations concerning the nuclear gauge.
Equipment that came with the nuclear gauge when purchased.
Any operating problems experienced while using the gauge.
Any reporting forms required.
2. Log Book Two:
Daily results of standardization check.
Time of day gauge is removed from storage area / time of day gauge is returned to storage area.
Survey of Nuclear Gauge with the Survey Meter Nuclear gauges are to be scanned with a survey meter and the readings are to be recorded in the field Log Book. For density gauges, readings are to be taken with the survey meter probe/sensor held at a distance of approximately 12 inches from the four sides, top and bottom of the gauge with source of ionizing radiation closed and also at approximately 12 inches from the bottom with the source open. Readings shall be taken upon initial receipt of the nuclear gauge, upon transferring the gauge, once per week (minimum) when used in the field, and in case of an accident. When a nuclear gauge is transferred between operators, the gauge shall be scanned for radioactivity as set forth in this directive and the readings shall be recorded in the field Log Book. The names of persons making the survey and the date of the survey will also be recorded. Any significant change in survey readings shall be noted and called to the attention of the District Materials Engineer. Readings greater than or equal to twice the normal radiation level (the reading of the most recent survey) are considered a significant change.

SOM: 1.13.2
SUBJECT: Radiological Safety Guidelines VERSION: 7 PAGE: 4 of 7
EFFECTIVE DATE: 07/01/2013
Page 4/7 5.8.1 2016
Revised 2014
Handling and Storage of Nuclear Gauge Operators of nuclear gauges shall observe the following precautions:
1. Never leave the gauge unattended unless properly stored. Whenever the gauge is being transported or stored, the case in which it is kept shall be locked.
2. If a gauge is left in an unattended vehicle, the vehicle should always be locked.
3. The gauge and carrying case shall be protected from moisture.
4. Probes shall always be in the locked or safe position (source of ionizing radiation closed) unless actually performing a test.
5. When transporting the gauge by vehicle, the gauge shall be in a locked storage area in the pickup bed or van or locked trunk of car, at least 4 feet from any occupant.
6. A copy of this SOM shall accompany the nuclear gauge at all times. This document and the survey meter must be in the transport vehicle and immediately accessible to the driver during transport on a public highway.
7. The “Bill of Lading” must accompany the driver of the vehicle during the transportation of the gauge upon a public highway. This document must have the following information:
name of shipper (KDOT) description of the shipment (proper shipping name, material identification number,
hazard class, type of package, name and activity of each nuclide, category of labeling, transport index)
emergency response telephone number signature of the shipper
8. A portable gauge licensee is required to use a minimum of two independent physical
controls i.e. locks, that form tangible barriers to secure portable gauges from unauthorized removal.
9. Gauges shall be stored as follows:
Gauges shall not be stored overnight in vehicles or field laboratories.
At night, gauges shall be stored in a locked room or building which is posted with a “Caution Radioactive Material” sign furnished for that purpose. Signs should be on all building entrances and interior doors of the storage room.
Gauges shall be stored in an area which is at least 4 feet from the general working
SOM: 1.13.2
SUBJECT: Radiological Safety Guidelines VERSION: 7 PAGE: 5 of 7
EFFECTIVE DATE: 07/01/2013
Page 5/7 5.8.1 2016
Revised 2014
area of any personnel. A general working area is a place where an employee would spend over 75% of their work time.
10. The following gauge precautions should be observed:
Project personnel employed by the State and the contractor shall be informed that a
nuclear gauge is in use on the project.
For roadway paving operations, an extended red flag mounted on the vehicle or otherwise prominently displayed to mark the general location of the nuclear gauge when performing tests is recommended. A flashing light on the vehicle is also recommended.
Accident Procedures The operator of nuclear gauges and others as directed by the Construction Office Supervisor should familiarize themselves with KDHE Radiation Emergency Handout, 9th edition. In case of an accident involving a nuclear gauge the following steps, as a minimum, shall be taken. (See Attachment A for flowchart.) The needs of an individual with a life-threatening injury take precedence.
1. If the operator is injured, another person with knowledge of these procedures will assume
responsibility for any emergency procedure that may be required.
2. All road equipment or vehicles involved in the accident shall be stopped immediately and not allowed to be moved until the Construction Office Supervisor authorizes its removal.
3. The area where the accident occurred shall be isolated for a distance of at least 20 feet. Adjacent lanes carrying through traffic, even if within 20 feet of the accident area, need not be closed to through traffic if the damaged gauge or accident area does not include that surface.
4. The nuclear gauge, accident area, and any equipment involved shall be scanned with the
survey meter to determine radiation levels. Readings greater than or equal to twice the normal radiation level (the reading of the most recent survey) are considered a significant change. As an alternative, a damp rag on a stick may be wiped in a small region around the sources of the gauge. Move the damp rag at least 30 feet from all nuclear gauges and take a reading with the survey meter. The meter will clearly indicate if there is any radioactive material on the rag.
a. If readings demonstrate no significant change from normal readings for the nuclear
gauge, then attend to those with non-life threatening injuries. The nuclear gauge shall be placed in its transporting case unless damages prevent proper fit. If the gauge will not fit in its transporting case, the gauge will then be wrapped in heavy plastic and moved to a safe location. A second survey will be performed after the gauge is removed to verify there was no significant change from the normal readings, then the area restrictions can be lifted.
SOM: 1.13.2
SUBJECT: Radiological Safety Guidelines VERSION: 7 PAGE: 6 of 7
EFFECTIVE DATE: 07/01/2013
Page 6/7 5.8.1 2016
Revised 2014
b. If any readings demonstrate significant change from normal readings, the gauge shall not be moved and the area shall remain restricted until authorities from the KDHE authorize its removal. Attend to the injured people, then complete a survey of the injured people to determine if they have been contaminated (the survey will need to be completed away from the contaminated area). If the injured person is not contaminated, then send the person to the hospital.
c. If the injured is contaminated, send the person(s) to the hospital and inform EMS and hospital personnel that the injured was involved in a “Radiation Accident.”
5. Upon completing the examination of the extent of radiation hazard, i.e., damage to
container only, leakage involving risk to personnel, probable extent of contamination, the operator or person with knowledge of policies and procedures in charge shall proceed as follows:
Call:
a) (785) 296-2231 during normal weekday hours: 8:00am - 5:00pm: KDOT
Materials and Research Center, Topeka. Ask for the Radiation Safety Officer. If
unavailable, provide information to the person answering the phone.
b) (785) 827-4437 after hours: Kansas Highway Patrol. State:
“This is a KDOT Radiation Emergency.”
Whether any injuries have occurred.
Your name.
Accident location and District where occurred.
The city or nearest city and the telephone number from where you are placing
the call.
6. Remain at your telephone until you receive a call from the Radiation Safety Officer,
District Materials Engineer, or KDHE. 7. After discussing the situation with an authority listed in #6, return to the location of the
accident. 8. KDOT personnel involved in an accident shall prepare a report of the accident as soon as
possible. In addition, the Construction Office Supervisor or Area Engineer shall assemble facts pertinent to the accident. This report shall be sent to the Radiation Safety Officer and the District Materials Engineer.
Theft If a nuclear gauge appears to have been stolen, the operator or supervisor shall notify the District Materials Engineer as soon as possible. The District Materials Engineer is to notify the Radiation Safety Officer. The Radiation Safety Officer is to notify KDHE and the manufacturer of the

SOM: 1.13.2
SUBJECT: Radiological Safety Guidelines VERSION: 7 PAGE: 7 of 7
EFFECTIVE DATE: 07/01/2013
Page 7/7 5.8.1 2016
Revised 2014
gauge. Fire If requested by a fire department, the Construction Office Supervisor will furnish a list of locations within the fire department’s jurisdiction where KDOT keeps radioactive materials. The information supplied to the fire department will include the name of KDOT’s Radiation Safety Officer. In the event of a fire at a location where radioactive materials are stored, the District Materials Engineer will notify the Radiation Safety Officer. The Radiation Safety Officer is to notify KDHE and the manufacturer of the gauge. Responsibilities The Chief of the Bureau of Construction and Materials and the District Materials Engineers shall be responsible for seeing that nuclear gauge safety procedures are followed. AUTHORITATIVE REFERENCES: Note: The following references are for additional information only. Clarification of this policy may be obtained from the information contact listed.
KSA 48-1601 KSA 48-1624 Radiation Emergency Handbook, 9th edition, Kansas Department of Health and
Environment

Page 1/3 5.8.2 2016
Revised 2016
5.8.2. INDEPENDENT ASSURANCE REPLICATE (ASR) CHECK FOR NUCLEAR DENSITY
GAUGES
The following establishes a method for verifying whether a nuclear density gauge is properly operating as
established in Appendix C. It can also be a check to determine if the operator understands proper
procedures for running the nuclear gauge.
1. GENERAL OVERVIEW
Nuclear gauge operators are to demonstrate proficiency in operating the gauge at the project. This will
represent the Independent Assurance Witness (ASW) portion of the program. The focus of this section is
to determine if the nuclear gauge can function properly. If more than one type of nuclear gauge (different
series or manufacture) might be used during the course of the project, then each gauge is to be checked by
this procedure. Properly warm up the gauge and establish the standard count as outlined under Section 2.
NUCLEAR GAUGE. Turn off all offsets and correction factors (see Section 3. OPERATOR). Verify
the nuclear gauge by placing it on the KDOT District’s ValidatorTM
(or Validator IITM
when checking the
3450 or 4640 gauge) and establish the density of the block by taking 1 four-minute count.
If the gauge value is within the quantity established in Appendix C, when on the KDOT District’s
ValidatorTM
or Validator IITM
, then the gauge can be used on the project. If not, then run a stability and
drift test. If the gauge passes the stability and drift test, as outlined in Section 2. NUCLEAR GAUGE,
then the gauge can be used on the project. If not, the gauge cannot be used on a KDOT project until the
above requirements are met. Provide proof to the district representative that the problem has been
corrected (i.e. new calibration with appropriate papers).
2. NUCLEAR GAUGE
2.1. GENERAL.
The nuclear gauge is to receive a multi-block calibration and a verification annually. Present copies of the
previous two calibration papers to the district representative at the time of the Independent Assurance
Replicate (ASR) check. Calibration papers are to be checked at the start of a project. Include yearly
Calibration Papers in the QC/QA project’s Quality Manual when applicable.
2.2. CALIBRATION OF NUCLEAR GAUGE.
As a minimum, the nuclear gauge must be calibrated by a Qualified Service Center for a full multi-block
calibration on an annual basis. The technician performing the gauge calibration must have a current
certificate in moisture density gauge calibration from a gauge manufacturer. The gauge must be
disassembled, cleaned and lubricated prior to the calibration. Provide a copy of the gauge calibration
documents to the district representative at the time of the ASR check.
2.3. VERIFICATION OF NUCLEAR GAUGE.
At least once a year, the nuclear gauge must be verified by KDOT. Verify the nuclear gauge by placing it
on the KDOT District’s ValidatorTM
(or Validator IITM
when checking the 3450 or 4640 gauge). Follow
the procedures outlined in Section 1. GENERAL OVERVIEW. The ValidatorTM
and Validator IITM
blocks shall be calibrated at least once every five years. Maintain copies of the current ValidatorTM
and
Validator IITM
calibrations at the District Office.
Page 2/3 5.8.2 2016
Revised 2016
2.4. PROPER WARM-UP.
The gauge should be properly warmed up before starting any check. For the Troxler units, this means a
minimum of 10 minutes. This permits the electronics to warm up to operating temperatures. If this step is
not permitted the counts given can be significantly altered.
2.5. STABILITY AND DRIFT TEST.
Perform a stability and drift test on the gauge when the gauge fails the IA check. Any time the nuclear
gauge readings are “suspect”, perform the STAT TEST (or stability test) to validate the normal operation
of the gauge. The stability test requires the gauge to take 20 one-minute counts.
Perform the drift test 2 to 3 hours after the stability test to determine if the gauge reading “drifts” between
tests. The drift test consists of 5 four-minute counts. It is highly recommended that the gauge not be
moved from the block after taking the stability test and prior to taking the drift test.
Check the manufacturer’s manual for specifics on the results to be obtained. Contact the Materials Quality
Control Engineer at the Materials and Research Center for assistance. For Troxler gauges, use the
following table for acceptable limit results:
TROXLER GAUGE SERIES Stability (STAT) Test* Drift Test
3411-B and 3440 0.17 to 0.33 – acceptable
<0.12 or >0.40 - unacceptable
Density: <0.5%
Moisture: < 1.0%
4640-B 0.25 to 0.45 System 1 (Drift A): 0.50%
System 2 (Drift B): 0.80%
* For the 3411-B and 3440, the numbers falling between acceptable and unacceptable should be
considered carefully prior to acceptance/unacceptance. The 4640-B is considered to be unstable if the
ratios are outside these limits for two out of three stat tests.
2.6. STANDARD COUNTS.
Take a standard count on a surface with 100 lb/ft3 (1600 kg/m
3) or better. DO NOT perform the
standard count on the Validator. Perform the stability and drift test prior to taking the standard count.
2.7. PASS/FAIL OF STABILITY AND DRIFT.
If the gauge fails the stability and drift test as defined in the manufacturer’s manual, then see Section 1.
GENERAL OVERVIEW and consult the manufacturer (if KDOT gauge, call Materials Quality Control
Engineer). If the gauge passes the stability but fails the drift, one alternative is to have the operator take
new standard counts twice each day. Once when the operator begins in the morning and another in the
early afternoon. All standard counts are to be recorded and monitored. As always, pay attention to your
immediate surroundings when operating a nuclear gauge.
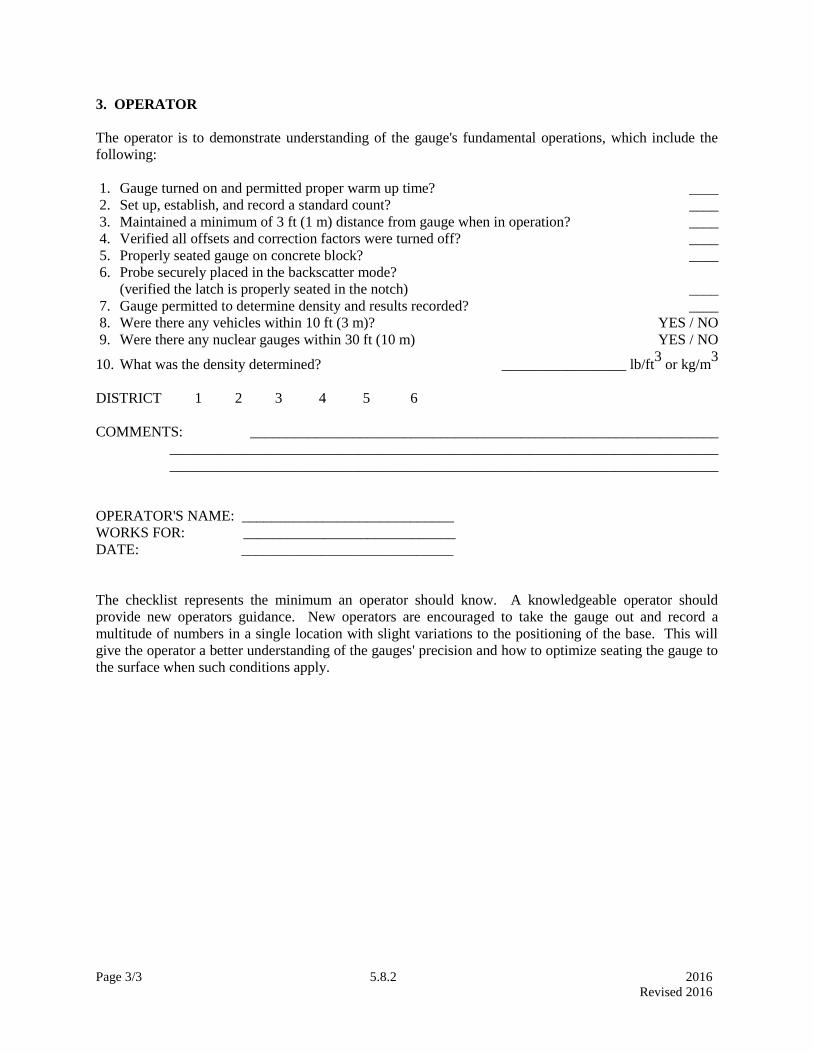
Page 3/3 5.8.2 2016
Revised 2016
3. OPERATOR
The operator is to demonstrate understanding of the gauge's fundamental operations, which include the
following:
1. Gauge turned on and permitted proper warm up time? ____
2. Set up, establish, and record a standard count? ____
3. Maintained a minimum of 3 ft (1 m) distance from gauge when in operation? ____
4. Verified all offsets and correction factors were turned off? ____
5. Properly seated gauge on concrete block? ____
6. Probe securely placed in the backscatter mode?
(verified the latch is properly seated in the notch) ____
7. Gauge permitted to determine density and results recorded? ____
8. Were there any vehicles within 10 ft (3 m)? YES / NO
9. Were there any nuclear gauges within 30 ft (10 m) YES / NO
10. What was the density determined? _________________ lb/ft3 or kg/m
3
DISTRICT 1 2 3 4 5 6
COMMENTS: ________________________________________________________________
___________________________________________________________________________
___________________________________________________________________________
OPERATOR'S NAME: _____________________________
WORKS FOR: _____________________________
DATE: _____________________________
The checklist represents the minimum an operator should know. A knowledgeable operator should
provide new operators guidance. New operators are encouraged to take the gauge out and record a
multitude of numbers in a single location with slight variations to the positioning of the base. This will
give the operator a better understanding of the gauges' precision and how to optimize seating the gauge to
the surface when such conditions apply.

Page 1/6 5.8.3. 2016
Revised 2014
5.8.3. SEGREGATION CHECK USING THE NUCLEAR DENSITY GAUGE
1. OBJECTIVE
The objective of these instructions is to give guidance on establishing a density profile behind the
laydown machine. This is accomplished by taking multiple readings within a 50 foot (15 m) section. Use
the nuclear density gauge results to plot a density profile. Check the profile for a drop in density caused
by segregation. Check the roadway profile location for visible segregation. It is important to record the
profile location to permit possible future evaluation of the segregated section. It is intended that English
projects use English values and that metric projects use metric values.
2. PROJECT STARTUP
NOTE: Check gauge to verify it is in asphalt mode.
At the start of the project, allow the paving unit 1000 ft (300 m) progress with each mix designation
before implementing a profile analysis.
3. SELECTION OF PROFILE LOCATIONS
It is intended that visibility identifiable segregated areas be profiled. Two basic types of segregation are
encountered on the roadway. They are truck load segregation and longitudinal segregation.
Truck load segregation (spot, chevron, or gull wing type segregation) has a visible pattern
repeated with each truck load. These segregated areas are about the same longitudinal distance
apart. This type of segregation will normally occur 10 to 25 ft (3 to 7.5 m) from the screed stop
point when trucks dump directly into the paver. The use of a material transfer vehicle (MTV) has
been known to extend this further down the paving section.
Longitudinal segregation (streaking) is normally caused by the paver. This streaking is parallel to
the centerline of the project, and may occur continually, or may periodically start and stop.
If the laydown machine continues to progress without stops, then the engineer will establish profile
starting points.
If the laydown machine periodically stops, then use the location where the screed stops as the “zero”
point for the profile starting point. The Engineer should use caution on whether to run a profile if the
laydown machine has been stopped for more that 10 minutes, due to cooling of the mix.
4. LOCATION OF DENSITY READINGS
Take readings approximately every 5 ft (1.5 m) along the longitudinal direction. The first reading should
be located approximately 10 ft (3 m) behind the screed (zero point). If a segregated location is visible
between two locations, then take an additional reading at that location.
When checking for truck load segregation, the longitudinal distance from centerline may vary,
but not the transverse distance (see Figure 1).
When checking for longitudinal streaking, the longitudinal distance from centerline will vary.
This is done so the profile will cross over the longitudinal streaks. Determine the transverse distance
from centerline to the longitudinal segregation. Start the profile approximately 2 ft (0.6 m) farther
Page 2/6 5.8.3. 2016
Revised 2014
transversely than the center of the longitudinal streak. End the profile approximately 2 ft (0.6 m) less
transversely than the center of the longitudinal streak. The approximate distance (2 ft or 0.6 m) from the
center of the streak to start and end the profile will be determined by the Engineer (see Figure 1). Pick a
distance from either edge of which you believe will be most likely to detect segregation. That distance
shall be more than 2 ft (0.6 m) from either edge of placement. Only one distance is to be used throughout
the length of a single profile section for truck load segregation. When testing for longitudinal
segregation, each end of the profile will be more than 1 ft (0.3 m) from the edge of paving. If there is no
visible segregation, then randomly select the location for the profile section.
5. NUCLEAR GAUGE READINGS
Minus No. 30 (600 µm) aggregate from the mix will be used to fill any voids in the surface. Smooth and
level the minus No. 30 (600 µm) material with a metal plate or straight edge. The aggregate is not to be
used as a thin film between the hot mix and the gauge. Use only enough aggregate to fill the voids. (For
this procedure, the aggregate shall be minus No. 30 (600 µm) material from the mix with no more than
20% passing the No. 100 (150 µm) sieve.
NOTE: For uniformity, position the source rod so it is closest to the laydown machine (point the gauge
towards the roller).
In backscatter mode, take 3 one-minute readings and average. If one of the readings varies by more than
1 lb/ft3 (16 kg/m
3) of the average, then discard and take an additional reading to replace it. It is not
necessary for the gauge to be calibrated to the mix.
Take a minimum of ten locations along the profile section. It is not necessary to maintain a rigid
longitudinal spacing of 5 ft (1.5 m) as stated above. Remember to take additional readings if a segregated
location is encountered along the profile.
NOTE: Check tip of source rod to assure it is free of any foreign substance (i.e. grease, asphalt, concrete,
etc.).
6. PROFILE EVALUATION
Initially perform four segregation checks for each mix. When four consecutive profile evaluations meet
the acceptable criteria established in the Contract Documents, the District Materials Engineer may reduce
the segregation checks to a frequency deemed appropriate.
The contractor field representative will be provided results of the segregation checks as they are
completed. When one of the segregation checks fails the acceptable criteria established in the Contract
Documents, the contractor will be allowed to make changes to the mix, plant, or roadway operations
before the next profile evaluation is made. If any changes are to be made by the contractor, these changes
are to be made within the first hour of production following notification of a failing evaluation.
Production of the hot mix is to cease whenever two consecutive checks fail. The contractor will make
changes to the mix or process before production is restarted. The contractor may produce enough mix to
place approximately 2000 ft (600 m) of pavement one paver width wide. Two segregation checks will be
taken within this 2000 ft (600 m) of production. If both segregation checks meet acceptable criteria, the
contractor may resume normal production. If one or both of the segregation checks fail, the contractor
will make changes before production is restarted. The contractor may then produce enough mix for an
additional 2000 ft (600 m) of pavement and this production will be evaluated as was the previous 2000 ft
(600 m) of production. This procedure of placing and evaluating 2000 ft (600 m) sections will be
continued until both segregation checks pass. Normal production and segregation checks will resume
when both evaluations pass.

Page 3/6 5.8.3. 2016
Revised 2014
The drop in density caused by segregation will be calculated by subtracting the lowest density obtained
from the average profile density. The average profile density shall be calculated using all density
determinations in the profile section. The density range will be calculated by subtracting the lowest from
the highest profile density.
7. SEGREGATION CHECK FORM
The SEGREGATION CHECK USING THE NUCLEAR GAUGE form provides the user a means of
recording key information to pinpoint the location of the profile section. It also provides a chart for
graphing the average recorded nuclear density readings.
Note: the screed location is referred to as the zero point. When the paver is stopped, rollers are prevented
from compacting all of the asphalt material that has been laid down. A portion of material has the chance
to cool before being compacted. Recording the densities behind the screed provides the gauge operator a
complete profile of possible low density locations.
On the right side of the chart is a location to place a different scale in case the left side does not fall in the
density region of the material being profiled. If this side is used, cross out values on the left side to help
eliminate any confusion.
8. DENSITY GAUGES AND TEMPERATURE
It is recommended to allow the compacted surface to cool for as long as possible prior to using the density
gauge. Remove the gauge from the surface immediately after the readings have been taken.
Although the density gauge is designed for high surface temperatures [350°F (175°C)], the ambient
temperature inside the gauge is not to exceed 160°F (70°C). If the gauge remains on the surface for any
length of time, the surface temperature becomes the ambient temperature inside the gauge. This occurs
when the surface temperature penetrates up into the electronics. The electronics can experience
temporary malfunction or permanent damage due to excessive heat.
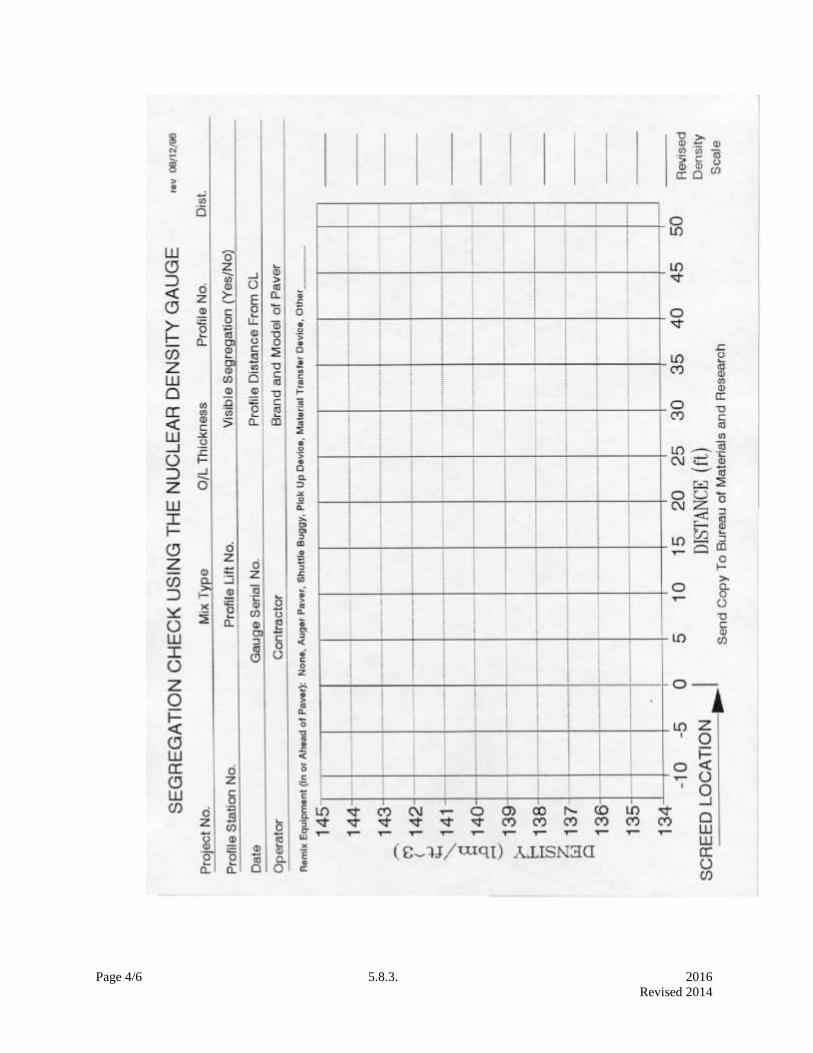
Page 4/6 5.8.3. 2016
Revised 2014
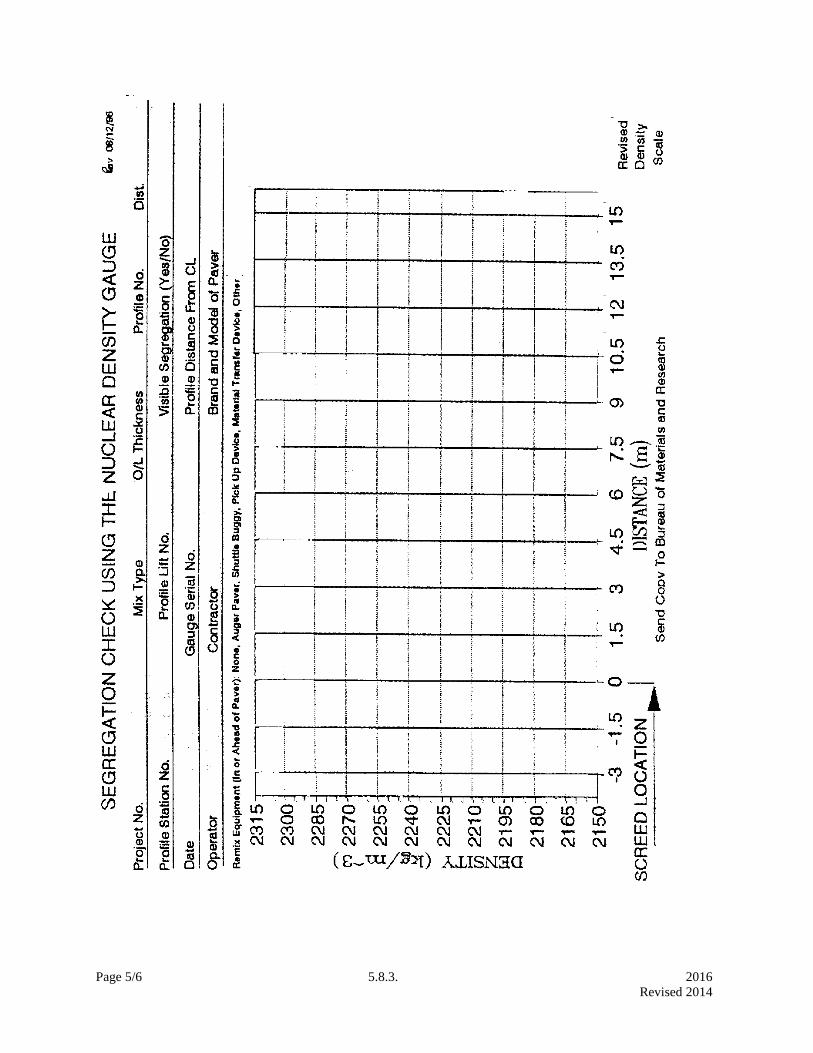
Page 5/6 5.8.3. 2016
Revised 2014
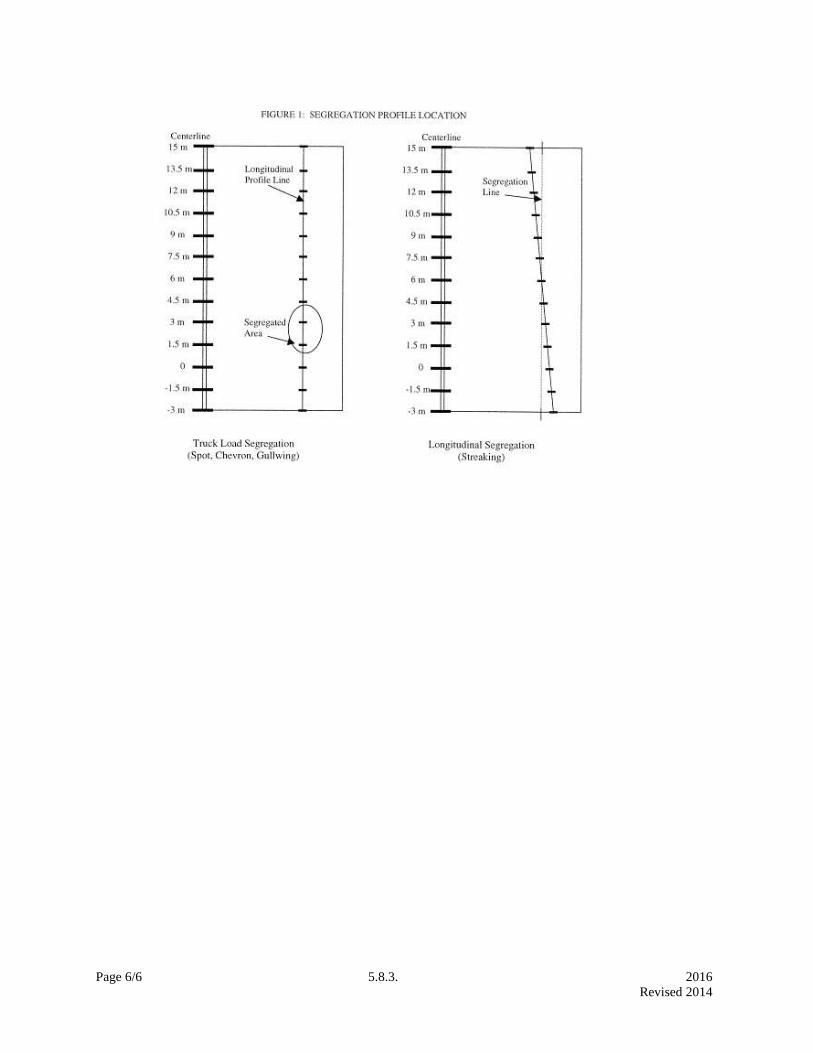
Page 6/6 5.8.3. 2016
Revised 2014
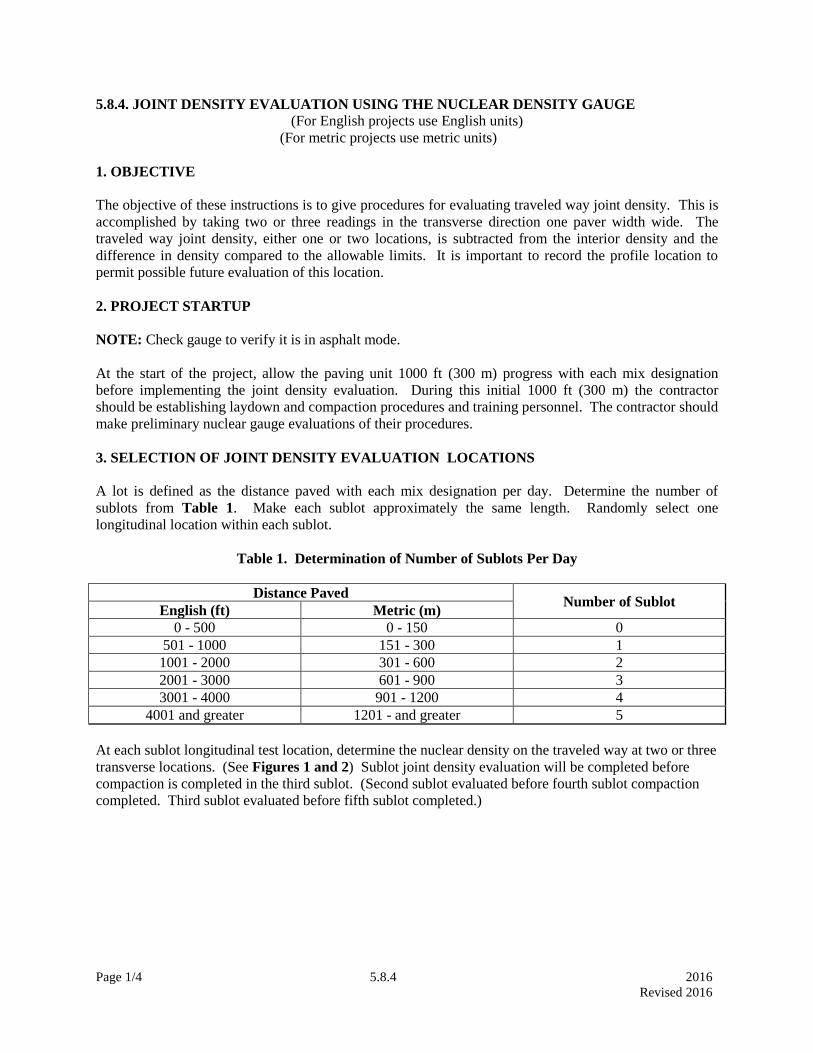
Page 1/4 5.8.4 2016
Revised 2016
5.8.4. JOINT DENSITY EVALUATION USING THE NUCLEAR DENSITY GAUGE
(For English projects use English units)
(For metric projects use metric units)
1. OBJECTIVE
The objective of these instructions is to give procedures for evaluating traveled way joint density. This is
accomplished by taking two or three readings in the transverse direction one paver width wide. The
traveled way joint density, either one or two locations, is subtracted from the interior density and the
difference in density compared to the allowable limits. It is important to record the profile location to
permit possible future evaluation of this location.
2. PROJECT STARTUP
NOTE: Check gauge to verify it is in asphalt mode.
At the start of the project, allow the paving unit 1000 ft (300 m) progress with each mix designation
before implementing the joint density evaluation. During this initial 1000 ft (300 m) the contractor
should be establishing laydown and compaction procedures and training personnel. The contractor should
make preliminary nuclear gauge evaluations of their procedures.
3. SELECTION OF JOINT DENSITY EVALUATION LOCATIONS
A lot is defined as the distance paved with each mix designation per day. Determine the number of
sublots from Table 1. Make each sublot approximately the same length. Randomly select one
longitudinal location within each sublot.
Table 1. Determination of Number of Sublots Per Day
Distance Paved Number of Sublot
English (ft) Metric (m)
0 - 500 0 - 150 0
501 - 1000 151 - 300 1
1001 - 2000 301 - 600 2
2001 - 3000 601 - 900 3
3001 - 4000 901 - 1200 4
4001 and greater 1201 - and greater 5
At each sublot longitudinal test location, determine the nuclear density on the traveled way at two or three
transverse locations. (See Figures 1 and 2) Sublot joint density evaluation will be completed before
compaction is completed in the third sublot. (Second sublot evaluated before fourth sublot compaction
completed. Third sublot evaluated before fifth sublot completed.)

Page 2/4 5.8.4 2016
Revised 2016
Figure 1
- Traveled way without hot mix shoulders or shoulders placed at the same time as the traveled way. Test
two transverse locations. Test each lane as placed.
Random Longitudinal Location Interior edge of mat
8" (0.2 m) from edge of mat
2' (0.6 m) from edge of mat
TRAVELED WAY
Direction of Travel
■ Random Transverse Distance
2' (0.6 m) from edge of mat
(drawing not to scale) Exterior edge of mat
Test two or three locations as follows: (For three locations, see Figure 2)
1. Locate the random longitudinal location as described above in selection of Joint Density
Evaluation Locations.
2. Determine "joint density" with the source rod of the gauge 8" (0.2 m) off the mat edge that
will become a longitudinal joint. Position the source rod so it is closest to the laydown machine
(point the gauge towards the roller).
Note: Check tip of source rod to assure it is free of any foreign substance, (i.e. grease, asphalt, concrete,
etc.).
3. ■ Randomly select a transverse location between 2' (0.6 m) for each edge of the mat.
Determine "interior density." Position the source rod so it is closest to the laydown machine
(point the gauge towards the roller).
Note: Check tip of source rod to assure it is free of any foreign substance, (i.e. grease, asphalt, concrete,
etc.).

Page 3/4 5.8.4 2016
Revised 2016
Figure 2
Traveled way with hot mix shoulder or shoulders not placed at the same time as the traveled way. Test
three transverse locations as described above. Test each lane as placed.
Random Longitudinal Location ↓ Interior edge of mat
8" (0.2 m) from edge of mat
2' (0.6 m) from edge of mat
TRAVELED WAY
Direction of Travel
■ Random Transverse Distance
2' (0.6 m) from edge of mat
8" (0.2 m) from edge of mat
↑ Exterior edge of mat
HOT MIX SHOULDER
(Not Tested)
(drawing not to scale)
4. NUCLEAR GAUGE READINGS
In backscatter mode, take 5 one- minute readings, record wet density values, discard the single highest
and lowest values, average the three remaining values, and record the average value. It is necessary for
the gauge to be calibrated to the mix.
NOTE: Check tip of source rod to assure it is free of any foreign substance, (i.e. grease, asphalt, concrete,
etc.).
5. PROFILE EVALUATION
The contractor field representative will provide the Engineer results of the joint density evaluation as they
are completed. Whenever the Engineer makes independent joint density verifications, the contractor will
be supplied joint density evaluation results as they are completed. Whenever one of the evaluations fails
the acceptable criteria established in Division 600, Section 602 of the 2015 Standard Specifications for
State Road and Bridge Construction, the contractor will make changes to the mix, plant or roadway
operations. Production of the hot mix is to cease whenever two consecutive checks by the contractor or
by the Engineer fail. The contractor will make changes to the mix or process before production is
restarted. The contractor may produce enough mix to place approximately 2000 ft (600 m) of pavement
one paver width wide. Two joint density evaluations will be taken within this 2000 ft (600 m) of
production. If both joint density evaluations meet acceptable criteria, the contractor may resume normal
production. If one or both of the joint density evaluations fail, the contractor will make changes before
production is restarted. The contractor may then produce enough mix for an additional 2000 ft (600 m) of
pavement and this production will be evaluated as was the previous 2000 ft (600 m) of production. This
procedure of placing and evaluating 2000 ft (600 m) sections will be continued until both joint density
evaluations pass. Once the evaluation passes, normal production and joint density evaluations will
resume.

Page 4/4 5.8.4 2016
Revised 2016
Calculate the "drop in density" by subtracting the "joint density" from the "interior density." Compare
drop in density to specification limits. (Note: whenever three tests are taken at one transverse location,
each joint density evaluation must pass the specified limits to be considered a passing location.)
Page 1/3 5.9 2016
Revised 2014
5.9. SAMPLING AND TEST METHODS FOREWORD
1. SAFETY
The responsibility for safety rests with each and every employee in the laboratory or field. You must use
common sense and work carefully to avoid the hazards your job may expose you to like hazardous
chemicals, flying particles and heavy or awkward lifting are a few of the hazards you will be exposed to.
You are responsible to know the hazards that each test may expose you to so that you can work with the
right level of protection while completing certain test procedures. Through OSHA 1910 and 1926 and
KDOT SOM 2.6.2 your employer is required to tell you what hazards you will be exposed to and how to
protect yourself from those hazards.
OSHA 1910 and 1926 also makes it the employee’s responsibility to understand and follow the safety
programs provided by their employers to protect them. SOM 2.6.2 refers to the KDOT safety Manual
which requires employees to follow the guidelines of KDOT Hazardous Communications Program and
the KDOT Personal Protection Program. These two programs will assist you with how to read an MSDS
and provide information on the type of personal protection required to protect you from the physical,
chemical, biological and ergonomic hazards you will be exposed to while performing the tests in this
manual.
2. SCOPE
The purpose of this section is to standardize the testing procedures used throughout the State by all
laboratories. A hierarchy for test methods exists in order to establish a specific test procedure for a given
circumstance.
Test method hierarchy corresponds to the following publications unless otherwise stated in the Standard
Specifications, plans or project specifications:
First - Kansas Department of Transportation Construction Manual, Part V.
Second - Standards published by the American Association of State Highway and Transportation
Officials (AASHTO).
Third - Standards published by the American Society for Testing and Materials (ASTM).
Each test method is an independent document, page numbered and printed individually. The primary
number linking it to this manual is the sub-paragraph number. Any future corrections, additions or
revisions will be printed and forwarded to the manual holders at the time they occur, to reflect current
testing procedures.
Footnotes at the bottom of the page of a test procedure are a quick check for contractors or consultants to
determine differences between KT methods and AASHTO/ASTM standards. ALL PROCEDURES
ARE TO BE PERFORMED AS STATED WITHIN KT METHODS, EXCLUDING THE
INFORMATION FOUND IN THE KT FOOTNOTES.
Unless noted in the test method, the use of potable water is required.
Consult the Bureau of Construction and Materials and in case of ambiguity or difficulty in the
interpretation of testing procedures.
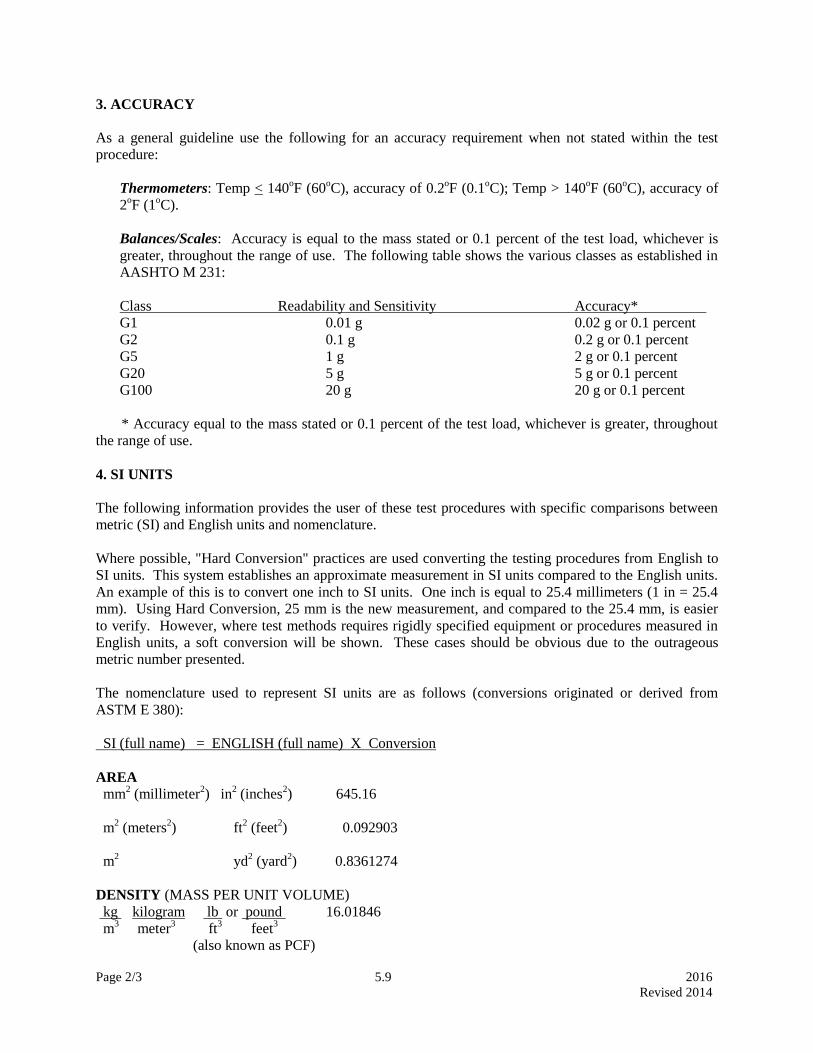
Page 2/3 5.9 2016
Revised 2014
3. ACCURACY
As a general guideline use the following for an accuracy requirement when not stated within the test
procedure:
Thermometers: Temp < 140oF (60
oC), accuracy of 0.2
oF (0.1
oC); Temp > 140
oF (60
oC), accuracy of
2oF (1
oC).
Balances/Scales: Accuracy is equal to the mass stated or 0.1 percent of the test load, whichever is
greater, throughout the range of use. The following table shows the various classes as established in
AASHTO M 231:
Class Readability and Sensitivity Accuracy*
G1 0.01 g 0.02 g or 0.1 percent
G2 0.1 g 0.2 g or 0.1 percent
G5 1 g 2 g or 0.1 percent
G20 5 g 5 g or 0.1 percent
G100 20 g 20 g or 0.1 percent
* Accuracy equal to the mass stated or 0.1 percent of the test load, whichever is greater, throughout
the range of use.
4. SI UNITS
The following information provides the user of these test procedures with specific comparisons between
metric (SI) and English units and nomenclature.
Where possible, "Hard Conversion" practices are used converting the testing procedures from English to
SI units. This system establishes an approximate measurement in SI units compared to the English units.
An example of this is to convert one inch to SI units. One inch is equal to 25.4 millimeters (1 in = 25.4
mm). Using Hard Conversion, 25 mm is the new measurement, and compared to the 25.4 mm, is easier
to verify. However, where test methods requires rigidly specified equipment or procedures measured in
English units, a soft conversion will be shown. These cases should be obvious due to the outrageous
metric number presented.
The nomenclature used to represent SI units are as follows (conversions originated or derived from
ASTM E 380):
SI (full name) = ENGLISH (full name) X Conversion
AREA mm
2 (millimeter
2) in
2 (inches
2) 645.16
m2 (meters
2) ft
2 (feet
2) 0.092903
m2
yd2 (yard
2) 0.8361274
DENSITY (MASS PER UNIT VOLUME)
kg kilogram lb or pound 16.01846
m3 meter
3 ft
3 feet
3
(also known as PCF)
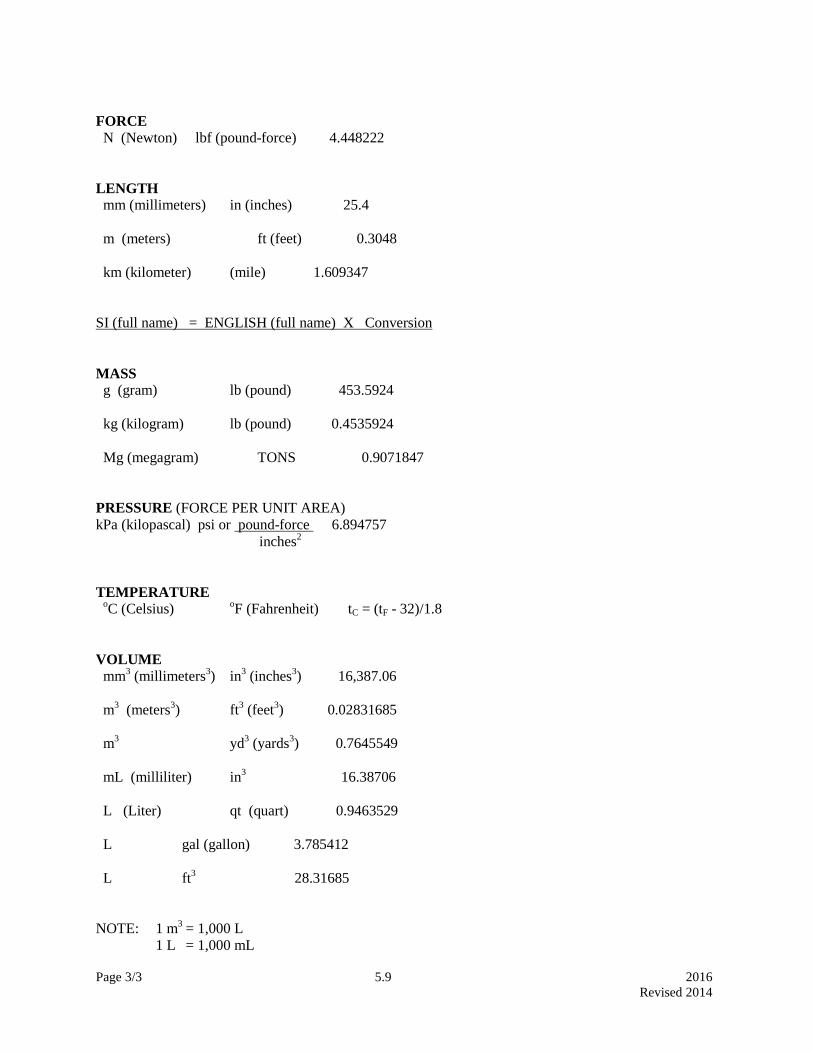
Page 3/3 5.9 2016
Revised 2014
FORCE N (Newton) lbf (pound-force) 4.448222
LENGTH mm (millimeters) in (inches) 25.4
m (meters) ft (feet) 0.3048
km (kilometer) (mile) 1.609347
SI (full name) = ENGLISH (full name) X Conversion
MASS g (gram) lb (pound) 453.5924
kg (kilogram) lb (pound) 0.4535924
Mg (megagram) TONS 0.9071847
PRESSURE (FORCE PER UNIT AREA)
kPa (kilopascal) psi or pound-force 6.894757
inches2
TEMPERATURE oC (Celsius)
oF (Fahrenheit) tC = (tF - 32)/1.8
VOLUME mm
3 (millimeters
3) in
3 (inches
3) 16,387.06
m3 (meters
3) ft
3 (feet
3) 0.02831685
m3
yd3 (yards
3) 0.7645549
mL (milliliter) in3 16.38706
L (Liter) qt (quart) 0.9463529
L gal (gallon) 3.785412
L ft3 28.31685
NOTE: 1 m3 = 1,000 L
1 L = 1,000 mL

Page 1/7 5.9.01 2016
Revised 2014
KT-01
5.9.01 SAMPLING AND SPLITTING OF AGGREGATES (Kansas Test Method KT-1)
1. SCOPE
These methods apply to the sampling of coarse and fine aggregates for quality tests and for inspection and
testing of aggregates being produced for State construction and maintenance work. KT-1 reflects testing
procedures found in AASHTO T 2 and T 248.
Where practicable, samples to be tested for quality shall be obtained from the finished product.
Conditions may require sampling from hauling units or from stockpiles located at the production plant
site or a specified location.
General policy regulations covering the frequency of and procedures for sampling aggregates are set forth
in Part V, Section 5.6 of this manual.
2. REFERENCED DOCUMENTS
2.1. KDOT Construction Manual, Part V, Section 5.6; Aggregates
2.2 AASHTO T 2; Sampling of Aggregates
2.3. AASHTO T 248; Reducing Samples of Aggregate to Testing Size
3. SAMPLING METHODS
3.1. Sampling from Discharge or Flowing Streams:
Obtain at least three approximately equal sample increments, selected at random from the stream and
combine to form a field sample that equals or exceeds the minimum required mass. Take each increment
from the entire cross section of the material as it is being discharged. It is usually necessary to have a
special device constructed for a particular plant. This device consists of a pan of sufficient size to
intercept the entire cross section of the discharge stream and hold the required quantity of material
without overflowing. A set of rails may be necessary to support the pan as it is passed under the
discharge stream. The use of heavy equipment, such as a loader, may also be enlisted for this purpose.
Sampling the initial discharge or the final few tons from a bin or conveyor belt increases the chance of
obtaining segregated material and should be avoided. To the extent possible, keep bins continuously full
to reduce segregation.
3.2 Sampling from a Stationary Conveyor Belt:
Only when the belt is completely stopped and easily within reach, should belt samples be obtained.
Never walk on a stopped conveyor belt. Elevated conveyors must be equipped with a suitable walkway
and necessary fall protection must be utilized. An individual obtaining a conveyor belt sample must have
their own lock out/tag out device(s) in place during sampling.
Insert two templates, the shape of which conform to the shape of the belt, in the aggregate stream on the
belt. Carefully scoop all material between the templates into a suitable container and collect the fines
from the belt with a brush and dust pan and add to the container. Obtain at least three approximately
equal increments, selected at random, and combine to form a field sample with a mass that equals or
exceeds the minimum.

Page 2/7 5.9.01 2016
Revised 2014
KT-01
3.3. Sampling from Stockpiles:
When possible, avoid sampling from stockpiles. It is very difficult to ensure unbiased samples due to the
segregation which often occurs when material is stockpiled with coarse particles rolling to the outside
base of the pile.
Loaders must be used to scoop material from the main stockpile and create a separate smaller stockpile.
This should be done by loading out a minimum of three buckets from various heights and locations
around the main pile and dumping each load on top of the previous in a separate location. When feasible,
stockpiles under production can be sampled by moving the stacking or conveyor equipment in order to
create the smaller pile for sampling.
For coarse aggregate, the loader should flatten one side of the pile by inserting the bucket vertically at or
near the apex of the pile, and backing the material out away from the pile. The flattened material should
then be sampled by inserting a shovel vertically in at least 5 different locations. Combine the individual
increments to produce a field sample weighing not less than 75 lb (35 kg), mix thoroughly and reduce to
the specified size for testing.
For fine aggregate, collect the sample using a sampling tube or shovel. Sample fine aggregate with a
sampling tube having a diameter at least three times the size of the maximum size aggregate being
sampled. Scalp away the outer layer of fine aggregate to assure the sample has not become segregated.
Obtain a minimum of five increments at several locations in the pile with samples taken from each 1/3
volume of the pile by inserting the tube or digging a hole 1 to 2 ft (0.3 to 0.6 m) deep. Combine the
individual increments to form a field sample, mix and reduce to proper size for testing.
3.4. Plant Mixed Aggregate: There are several acceptable methods of taking samples from each type of
plant. Every situation should be studied and evaluated to determine whether or not the method to be used
will provide a representative sample of the material being produced. Plant mixed aggregate samples are
generally obtained by one of the following procedures. If these procedures, due to unforeseen
circumstances, prove to be unworkable, other procedures may be used if approved in writing by the
District Materials Engineer.
3.4.1. Apparatus.
3.4.1.1. For Asphalt Plant Sampling.
3.4.1.1.1. For Batch Plants: A vertical receptacle having a closed bottom and an open top with no
dimension in the opening of less than 5 in (125 mm). Appropriate handles for lifting and handling and a
wide flat base for vertical stability are recommended. The height of the container must be sufficient that
it will not over flow during the discharge of material from the pugmill.
Some containers have been designed to automatically split the material that enters the opening into two or
more portions and discard one-half or more of all material received.
3.4.1.1.2. Continuous Flow Plants: A horizontal trough having a minimum width of 5 in (125 mm), a
minimum depth of 12 in (300 mm), and a length equal to or greater than the width of the pugmill
discharge stream., so constructed that it can be passed through the pugmll stream in a horizontal plane.
Appropriate handles for lifting and handling are required. The apparatus shall meet the requirements in
Section 3.1., of this test method and be approved by the District Materials Engineer.
Page 3/7 5.9.01 2016
Revised 2014
KT-01
3.4.1.2. For Screenless Operation Sampling: The apparatus shall meet the requirements in Section 3.1. of
this test method and be approved by the District Materials Engineer.
3.4.2. Procedure.
3.4.2.1. For Asphalt Plant Sampling.
3.4.2.1.1. Batch Plant: Center the container under the pugmill discharge, open the gate and empty the
pugmill before removing the container.
3.4.2.1.2. Continuous Flow Plants: Pass the container horizontally through the drum discharge stream in
such a manner that a representative sample will be obtained, and the container will not be filled to
overflowing.
3.4.2.2. For Screenless Operation Sampling: The contractor shall provide a system for sampling the
combined material ahead of the mixing chamber. Such a system must be approved by the District
Materials Engineer.
3.5. Windrows: Windrows are not to be sampled until all blending and mixing is completed. They must
be sampled by methods that will insure that the sample will be representative of the material within the
windrow cross section at the point of sampling. Power equipment is helpful in cutting through a windrow
prior to sampling and should be used whenever available. Samples should be ample size to be
representative of the windrow at the point of sampling and reduced to proper size for testing.
It has been determined that windrows containing aggregate with not more than 10% of material retained
on the 3/8 in (9.5 mm) sieve and not more than 25% crushed material may be effectively sampled with a
standard sampling tube.
To provide an acceptable sample, the following conditions are required:
3.5.1. A properly mixed and well “peaked” windrow.
3.5.2. Force the tube into the windrow and equal number of times, well-spaced, on each side of the
windrow, and in a direction normal to the slope of the windrow face.
3.5.3. Sample size is sufficient for reduction by splitting using the standard procedure. Not less than 75 lb
(35 kg) sample is recommended.
3.6. Unopened Sand-gravel Deposits: Unopened deposits of sand-gravel are usually explored by drilling
test holes spaced at regular intervals over the area underlaid by the deposit. The holes are extended
through the soil and other non-usable over-burden and through the workable depth of the deposit.
Remove the sand-gravel from each test hole and examine for major changes in the quality and gradation
characteristics, then record such changes. Place all usable material removed from each test hole on a
quartering canvas, sheet of plywood, or other material to prevent contamination from grass, top soil, etc.
Thoroughly mix a 15 lb (7 kg) sample for gradation tests.
If the quality of the material removed from all test holes appears to be reasonably uniform, a sufficient
amount of material from each test hole should be obtained to produce a 200 lb (90 kg) composite sample
for quality testing. This sample will be tested for information only.
Page 4/7 5.9.01 2016
Revised 2014
KT-01
4. SAMPLE REDUCTION
4.1. Quartering Canvas Procedure: Samples that weigh 75 lb (35 kg) or more may be reduced to one-half
size by using a quartering canvas. The canvas is not to be used as the first step in the reduction of
samples smaller than approximately 75 lb (35 kg).
4.1.1. Spread the canvas on a smooth level surface. Dump the sample in a pile near the center and mix by
alternately lifting each corner and rolling the aggregate toward the opposite corner. This should be
performed in a vigorous manner.
4.1.2. Center the material on the canvas in a uniform pile. Flatten the pile to a uniform thickness and
diameter by pressing down the apex with a straight-edge scoop, shovel, or trowel (depending on the size
of sample). Press down so that each quarter sector of the resulting pile will contain the material originally
in it. The diameter should be approximately four to eight times the thickness.
4.1.3. Insert a rod, shovel handle, or similar object under the canvas and under the center of the pile and
lift both ends of the rod to divide the pile into two equal parts. Remove the stick leaving a fold of the
blanket between the divided portions. Insert the rod under the canvas and under the center of the resulting
two piles at right angles to the first division and again lift the rod to divide the sample into four equal
parts.
4.1.4. Discard two opposite quarters, combine the two remaining quarters, mix and reduce to proper size
with a riffle splitter or by repeating the quartering procedure.
When a quartering canvas is used, the Field Engineer and District Materials Engineer should be certain
that proper procedures are being followed at all times.
4.2. Riffle Splitter: The initial sample size shall be at least four times the size of the required test portion.
If use of this method is desired and the sample has free moisture on the particle surfaces, the entire sample
must be dried to at least the saturated-surface-dry condition (SSD) using temperatures that do not exceed
those specified for any tests contemplated. If the moist sample is very large, a preliminary split may be
made using a mechanical splitter having wide chute openings 1 1/2 in (37.5 mm) or more to reduce the
sample to not less than 5000 g.
4.2.1. Apparatus: The splitter shall have an even number of equal width chutes, not less than a total of
eight for coarse aggregate, or twelve for fine-aggregate, which discharge alternatively to each side of the
splitter. For coarse and mixed aggregate the minimum width of the individual chutes shall be
approximately 50% larger than the largest particles in the sample to be split. For dry fine aggregate, finer
than the 3/8 inch (9.5 mm) sieve, a splitter having chutes 1/2 to 3/4 inches (12.5 to 19 mm) wide shall be
used. The splitter shall be equipped with two receptacles to hold the two halves of the sample following
splitting. A hopper or straight-edged pan, with a width equal to or slightly less than the overall width of
the assembly of chutes, shall be used to feed the sample at a controlled rate to the chutes. The splitter and
accessory equipment shall be designed so the sample will flow smoothly without restriction or loss of
material.
NOTE: Any disputed samples shall be split using the appropriate splitter meeting the above
specifications.
4.2.2. Place the original sample in the hopper or pan and uniformly distribute it from edge to edge, so that
when it is introduced into the chutes, approximately equal amounts will flow through each chute. The
rate at which the sample is introduced shall allow free flowing through the chutes into the receptacles

Page 5/7 5.9.01 2016
Revised 2014
KT-01
below. Reintroduce the portion of the sample in one of the receptacles into the splitter as many times as
necessary to reduce the sample to the size specified for the intended test.
4.3. Miniature Stockpile Sampling Procedure: This method of sample reduction may be used only on wet
fine aggregate. For this quartering procedure, wet is defined as free moisture on the surface as
approximated by the fine aggregate retaining its shape when molded by hand.
Place the sample on a clean, hard, level surface where there will be neither loss of material nor the
accidental addition of foreign material. The initial sample size shall be at least four times the size of the
required test portion. Mix the sample thoroughly with a shovel by turning it over completely three times.
With the last turning, shovel the entire sample into a conical pile by depositing each shovelful on top of
the preceding one. Carefully flatten the conical pile to a uniform thickness and diameter by pressing
down on the apex with a shovel so that each quarter sector of the resulting pile will contain the material
originally in it. The diameter should be approximately four to eight times the thickness. Divide the
flattened pile into four equal quarters with a straight edge (trowel or similar metal blade) and remove two
pre-selected diagonally opposite quarters, using a brush or broom to clean the cleared space. Repeat the
process until the sample is reduced to the proper size.
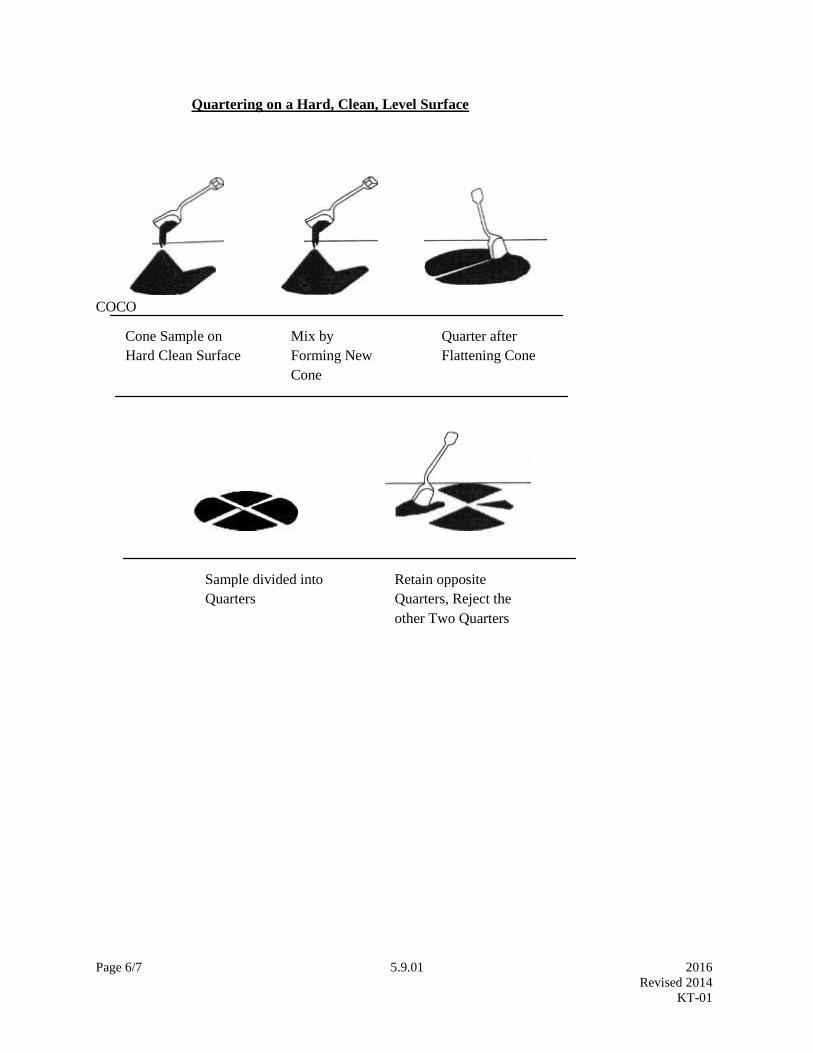
Page 6/7 5.9.01 2016
Revised 2014
KT-01
Quartering on a Hard, Clean, Level Surface
COCO
Cone Sample on
Hard Clean Surface
Mix by
Forming New
Cone
Quarter after
Flattening Cone
Sample divided into
Quarters
Retain opposite
Quarters, Reject the
other Two Quarters
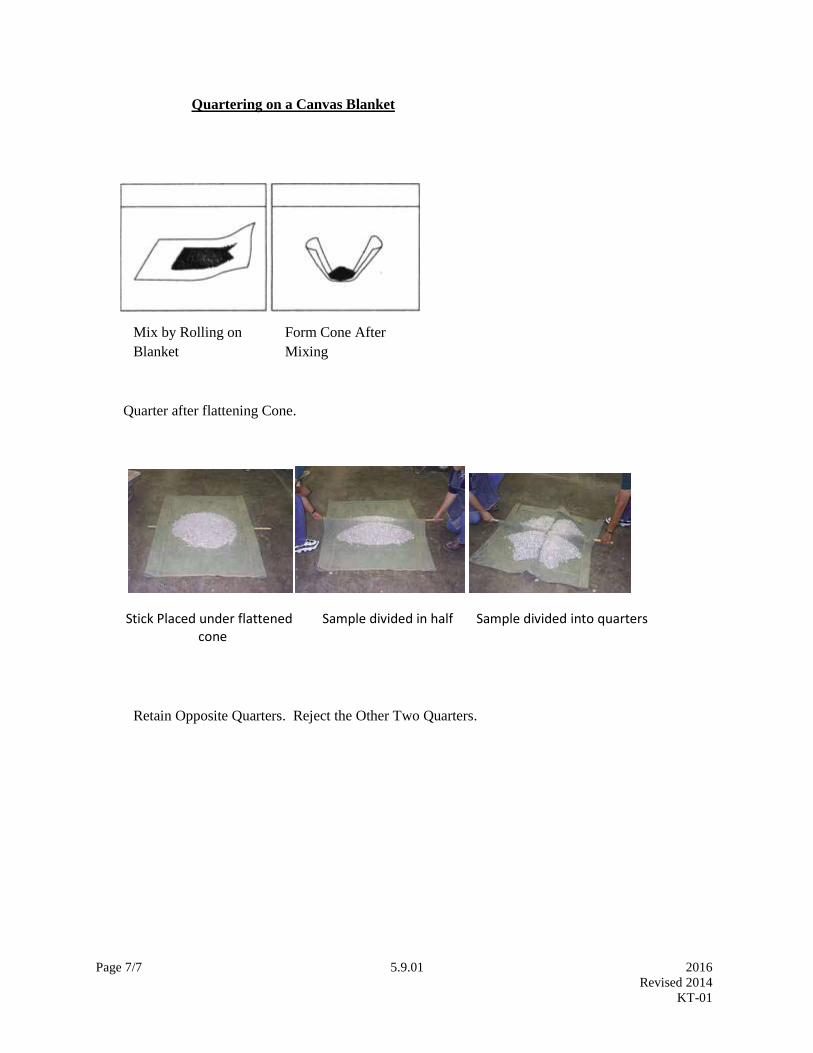
Page 7/7 5.9.01 2016
Revised 2014
KT-01
Quartering on a Canvas Blanket
Stick Placed under flattened Sample divided in half Sample divided into quarters cone
Mix by Rolling on
Blanket
Form Cone After
Mixing
Quarter after flattening Cone.
Retain Opposite Quarters. Reject the Other Two Quarters.

Page 1/8 5.9.02 2016
Revised 2016
KT-02
5.9.02 SIEVE ANALYSIS OF AGGREGATES (Kansas Test Method KT-2)
1. SCOPE
This method of test covers procedures for the determination of the particle size distribution of aggregates
using standard sieves. KT-2 reflects testing procedures found in AASHTO T 27.
2. REFERENCED DOCUMENTS
2.1. Part V, 5.9; Sampling and Test Methods Foreword
2.2 KT-1; Sampling and Splitting of Aggregates
2.3. KT-3; Material Passing No. 200 (75µm) Sieve by the Wash Method
2.4. AASHTO M 92; Wire-Cloth Sieves for Testing Purposes
2.5. AASHTO T 27; Sieve Analysis of Fine and Coarse Aggregates
3. APPARATUS
3.1. The balance shall be readable to 0.1% of the sample mass and conform to the requirements of Part
V, Section 5.9; Sampling and Test Methods Foreword of this manual for the class of general purpose
balance required for the principal sample mass of the sample being tested.
3.2. Sieves meeting AASHTO M 92. As a minimum, set of sieves will include the 3/8 in (9.5 mm), No.
4 (4.75 mm), No. 8 (2.36 mm), No. 16 (1.18 mm), No. 30 (600 µm), No. 50 (300 µm), No. 100 (150 µm)
and No. 200 (75 µm) for all aggregates. Gradations with larger sized aggregate will require addition of
appropriate larger sieves to the set.
3.3. A mechanical sieve shaker, if used, shall impart a vertical, or lateral and vertical motion to the sieve,
causing the particles to bounce and turn so as to present different orientations to the sieving surface. The
sieving action shall be such that the criterion for adequacy of sieving is met in a timely manner as
described in Section 6.3 of this test method.
3.4. An oven of appropriate size capable of maintaining a uniform temperature of 230 + 9°F (110 + 5°C).
3.5. Drying pans.
4. SAMPLES
4.1. Composition: Obtain samples for sieve analysis by the use of a sample splitter or by the method of
quartering. Fine aggregate sampled by the quartering method shall be thoroughly mixed and in a moist
condition. The sample for test shall be approximately the mass desired and shall be the end result of
proper reduction methods. Do not attempt the selection of samples of an exact predetermined mass.
4.2. Fine Aggregates: Sample of fine aggregate for sieve analysis shall have a mass, after drying, not less
than 300 g.
4.3. Coarse Aggregate: Samples of coarse aggregate and mixtures of coarse and fine aggregate for sieve
analysis shall have a mass, after drying, not less than the amounts indicated in Table 1.
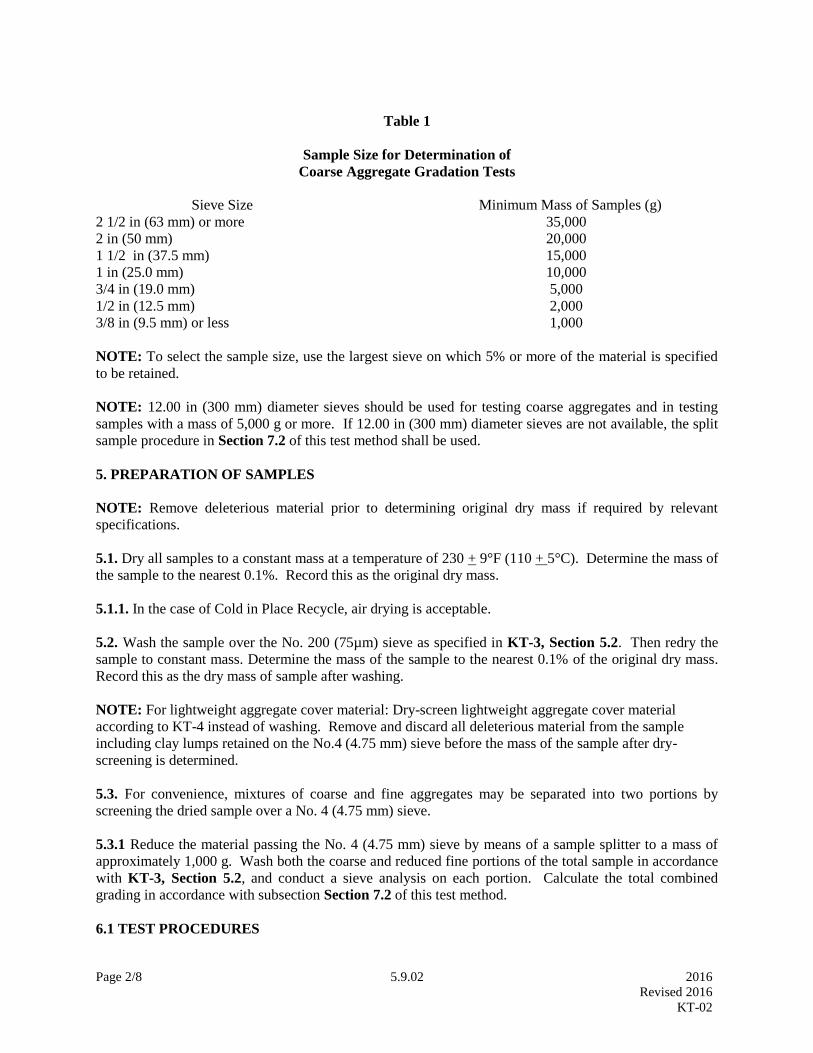
Page 2/8 5.9.02 2016
Revised 2016
KT-02
Table 1
Sample Size for Determination of
Coarse Aggregate Gradation Tests
Sieve Size Minimum Mass of Samples (g)
2 1/2 in (63 mm) or more 35,000
2 in (50 mm) 20,000
1 1/2 in (37.5 mm) 15,000
1 in (25.0 mm) 10,000
3/4 in (19.0 mm) 5,000
1/2 in (12.5 mm) 2,000
3/8 in (9.5 mm) or less 1,000
NOTE: To select the sample size, use the largest sieve on which 5% or more of the material is specified
to be retained.
NOTE: 12.00 in (300 mm) diameter sieves should be used for testing coarse aggregates and in testing
samples with a mass of 5,000 g or more. If 12.00 in (300 mm) diameter sieves are not available, the split
sample procedure in Section 7.2 of this test method shall be used.
5. PREPARATION OF SAMPLES
NOTE: Remove deleterious material prior to determining original dry mass if required by relevant
specifications.
5.1. Dry all samples to a constant mass at a temperature of 230 + 9°F (110 + 5°C). Determine the mass of
the sample to the nearest 0.1%. Record this as the original dry mass.
5.1.1. In the case of Cold in Place Recycle, air drying is acceptable.
5.2. Wash the sample over the No. 200 (75µm) sieve as specified in KT-3, Section 5.2. Then redry the
sample to constant mass. Determine the mass of the sample to the nearest 0.1% of the original dry mass.
Record this as the dry mass of sample after washing.
NOTE: For lightweight aggregate cover material: Dry-screen lightweight aggregate cover material
according to KT-4 instead of washing. Remove and discard all deleterious material from the sample
including clay lumps retained on the No.4 (4.75 mm) sieve before the mass of the sample after dry-
screening is determined.
5.3. For convenience, mixtures of coarse and fine aggregates may be separated into two portions by
screening the dried sample over a No. 4 (4.75 mm) sieve.
5.3.1 Reduce the material passing the No. 4 (4.75 mm) sieve by means of a sample splitter to a mass of
approximately 1,000 g. Wash both the coarse and reduced fine portions of the total sample in accordance
with KT-3, Section 5.2, and conduct a sieve analysis on each portion. Calculate the total combined
grading in accordance with subsection Section 7.2 of this test method.
6.1 TEST PROCEDURES
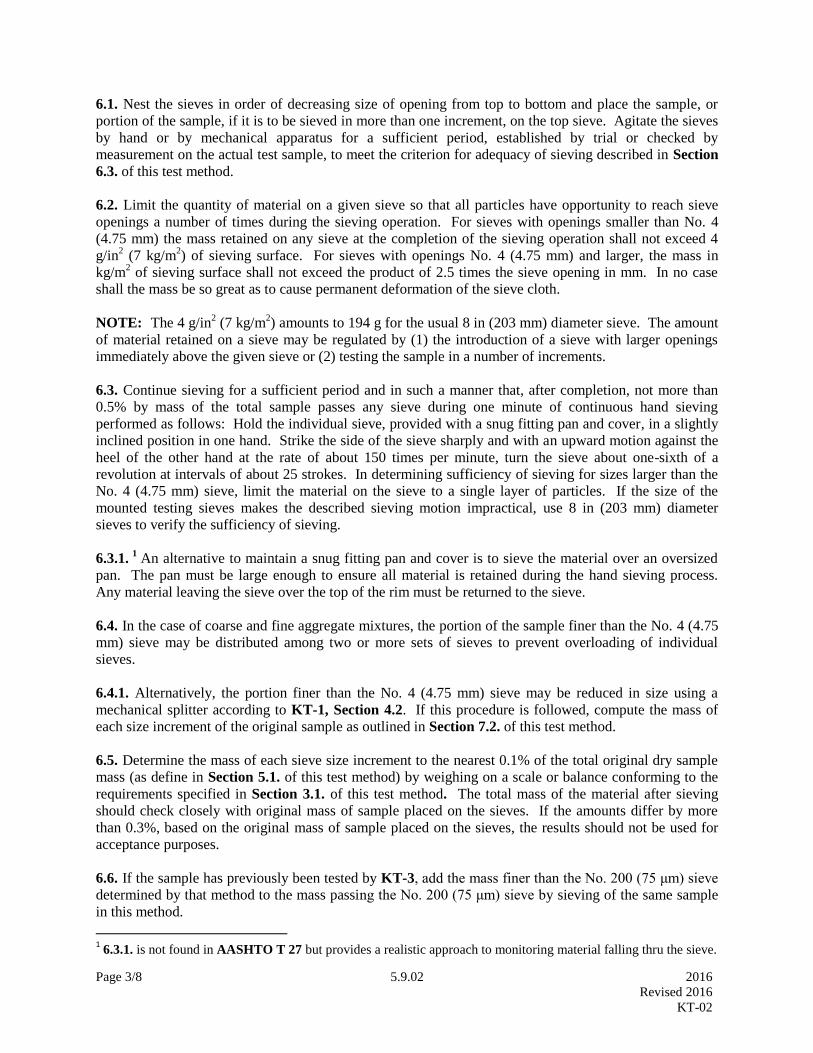
Page 3/8 5.9.02 2016
Revised 2016
KT-02
6.1. Nest the sieves in order of decreasing size of opening from top to bottom and place the sample, or
portion of the sample, if it is to be sieved in more than one increment, on the top sieve. Agitate the sieves
by hand or by mechanical apparatus for a sufficient period, established by trial or checked by
measurement on the actual test sample, to meet the criterion for adequacy of sieving described in Section
6.3. of this test method.
6.2. Limit the quantity of material on a given sieve so that all particles have opportunity to reach sieve
openings a number of times during the sieving operation. For sieves with openings smaller than No. 4
(4.75 mm) the mass retained on any sieve at the completion of the sieving operation shall not exceed 4
g/in2 (7 kg/m
2) of sieving surface. For sieves with openings No. 4 (4.75 mm) and larger, the mass in
kg/m2 of sieving surface shall not exceed the product of 2.5 times the sieve opening in mm. In no case
shall the mass be so great as to cause permanent deformation of the sieve cloth.
NOTE: The 4 g/in2 (7 kg/m
2) amounts to 194 g for the usual 8 in (203 mm) diameter sieve. The amount
of material retained on a sieve may be regulated by (1) the introduction of a sieve with larger openings
immediately above the given sieve or (2) testing the sample in a number of increments.
6.3. Continue sieving for a sufficient period and in such a manner that, after completion, not more than
0.5% by mass of the total sample passes any sieve during one minute of continuous hand sieving
performed as follows: Hold the individual sieve, provided with a snug fitting pan and cover, in a slightly
inclined position in one hand. Strike the side of the sieve sharply and with an upward motion against the
heel of the other hand at the rate of about 150 times per minute, turn the sieve about one-sixth of a
revolution at intervals of about 25 strokes. In determining sufficiency of sieving for sizes larger than the
No. 4 (4.75 mm) sieve, limit the material on the sieve to a single layer of particles. If the size of the
mounted testing sieves makes the described sieving motion impractical, use 8 in (203 mm) diameter
sieves to verify the sufficiency of sieving.
6.3.1. 1 An alternative to maintain a snug fitting pan and cover is to sieve the material over an oversized
pan. The pan must be large enough to ensure all material is retained during the hand sieving process.
Any material leaving the sieve over the top of the rim must be returned to the sieve.
6.4. In the case of coarse and fine aggregate mixtures, the portion of the sample finer than the No. 4 (4.75
mm) sieve may be distributed among two or more sets of sieves to prevent overloading of individual
sieves.
6.4.1. Alternatively, the portion finer than the No. 4 (4.75 mm) sieve may be reduced in size using a
mechanical splitter according to KT-1, Section 4.2. If this procedure is followed, compute the mass of
each size increment of the original sample as outlined in Section 7.2. of this test method.
6.5. Determine the mass of each sieve size increment to the nearest 0.1% of the total original dry sample
mass (as define in Section 5.1. of this test method) by weighing on a scale or balance conforming to the
requirements specified in Section 3.1. of this test method. The total mass of the material after sieving
should check closely with original mass of sample placed on the sieves. If the amounts differ by more
than 0.3%, based on the original mass of sample placed on the sieves, the results should not be used for
acceptance purposes.
6.6. If the sample has previously been tested by KT-3, add the mass finer than the No. 200 (75 μm) sieve
determined by that method to the mass passing the No. 200 (75 μm) sieve by sieving of the same sample
in this method.
1 6.3.1. is not found in AASHTO T 27 but provides a realistic approach to monitoring material falling thru the sieve.
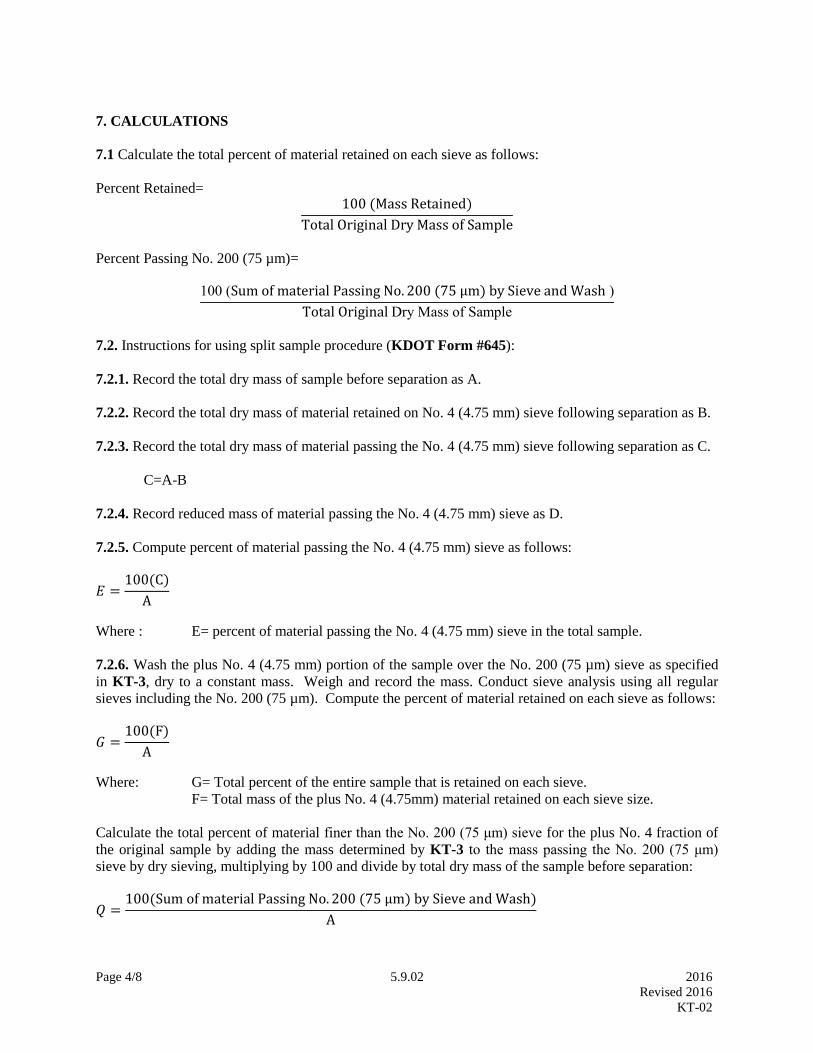
Page 4/8 5.9.02 2016
Revised 2016
KT-02
7. CALCULATIONS
7.1 Calculate the total percent of material retained on each sieve as follows:
Percent Retained= 100 (Mass Retained)
Total Original Dry Mass of Sample
Percent Passing No. 200 (75 µm)=
100 (Sum of material Passing No. 200 (75 μm) by Sieve and Wash )
Total Original Dry Mass of Sample
7.2. Instructions for using split sample procedure (KDOT Form #645):
7.2.1. Record the total dry mass of sample before separation as A.
7.2.2. Record the total dry mass of material retained on No. 4 (4.75 mm) sieve following separation as B.
7.2.3. Record the total dry mass of material passing the No. 4 (4.75 mm) sieve following separation as C.
C=A-B
7.2.4. Record reduced mass of material passing the No. 4 (4.75 mm) sieve as D.
7.2.5. Compute percent of material passing the No. 4 (4.75 mm) sieve as follows:
𝐸 =100(C)
A
Where : E= percent of material passing the No. 4 (4.75 mm) sieve in the total sample.
7.2.6. Wash the plus No. 4 (4.75 mm) portion of the sample over the No. 200 (75 µm) sieve as specified
in KT-3, dry to a constant mass. Weigh and record the mass. Conduct sieve analysis using all regular
sieves including the No. 200 (75 µm). Compute the percent of material retained on each sieve as follows:
𝐺 =100(F)
A
Where: G= Total percent of the entire sample that is retained on each sieve.
F= Total mass of the plus No. 4 (4.75mm) material retained on each sieve size.
Calculate the total percent of material finer than the No. 200 (75 μm) sieve for the plus No. 4 fraction of
the original sample by adding the mass determined by KT-3 to the mass passing the No. 200 (75 μm)
sieve by dry sieving, multiplying by 100 and divide by total dry mass of the sample before separation:
𝑄 =100(Sum of material Passing No. 200 (75 μm) by Sieve and Wash)
A

Page 5/8 5.9.02 2016
Revised 2016
KT-02
Where: Q= Total percent of the plus No. 4 (4.75 mm) sieve passing the No. 200 (75 µm) sieve.
7.2.7. Wash the reduced sample of minus No. 4 (4.75 mm) material over a No. 200 (75 µm) sieve as
specified in KT-3, dry to a constant mass. Weigh and record the mass. Conduct sieve analysis using all
regular sieves including the No. 200 (75 µm). Compute the total percent of the reduced minus No. 4
(4.75 mm) sample retained on each sieve as follows:
𝐽 =100(H)
D
Where: J= Total percent of the reduced minus No. 4 (4.75 mm) sample retained on each sieve.
H=Total mass of the reduced minus No. 4 (4.75 mm) material retained on each sieve.
D= Total dry mass of reduced minus No. 4 (4.75 mm).
Calculate the total percent of material finer than the No. 200 (75 μm) sieve for the plus No. 4 (4.75 mm)
fraction of the original sample by adding the mass determined by KT-3 to the mass passing the No. 200
(75 μm) sieve by dry sieving, multiplying by 100 and divide by total dry mass of reduced minus No. 4
(4.75 mm):
𝑆 =100(Sum of material Passing No. 200 (75 μm) by Sieve and Wash)
D
Where: S= Total percent of reduced minus No. 4 (4.75 mm) material passing the No. 200
(75 µm) sieve
7.2.8. Calculate the adjusted percent retained on each size sieve for the minus No. 4 (4.75 mm) material
as follows:
𝐾 =(J)(E)
100
Where: K=Adjusted percent of minus No. 4 (4.75 mm) material.
J=Total percent of reduced minus No. 4 (4.75 mm) sample retained on each sieve.
E=Percent of minus No. 4 (4.75 mm) material in total sample.
7.2.9. Calculate the combined percentage of material retained on each sieve in the series as follows:
R=K+G
7.2.10 Calculate the total material finer than the No. 200 (75 μm) sieve for the original sample as follows:
Total % Passing No. 200 (75 μm) Sieve = Q +(S)(E)
100
7.2.11. Record the sieve analysis on the proper KDOT form.
NOTE: The use of the “Work Sheet for Split Sample Gradation and Plastic Index Tests”, KDOT Form
No. 645, is provided for the above calculations.
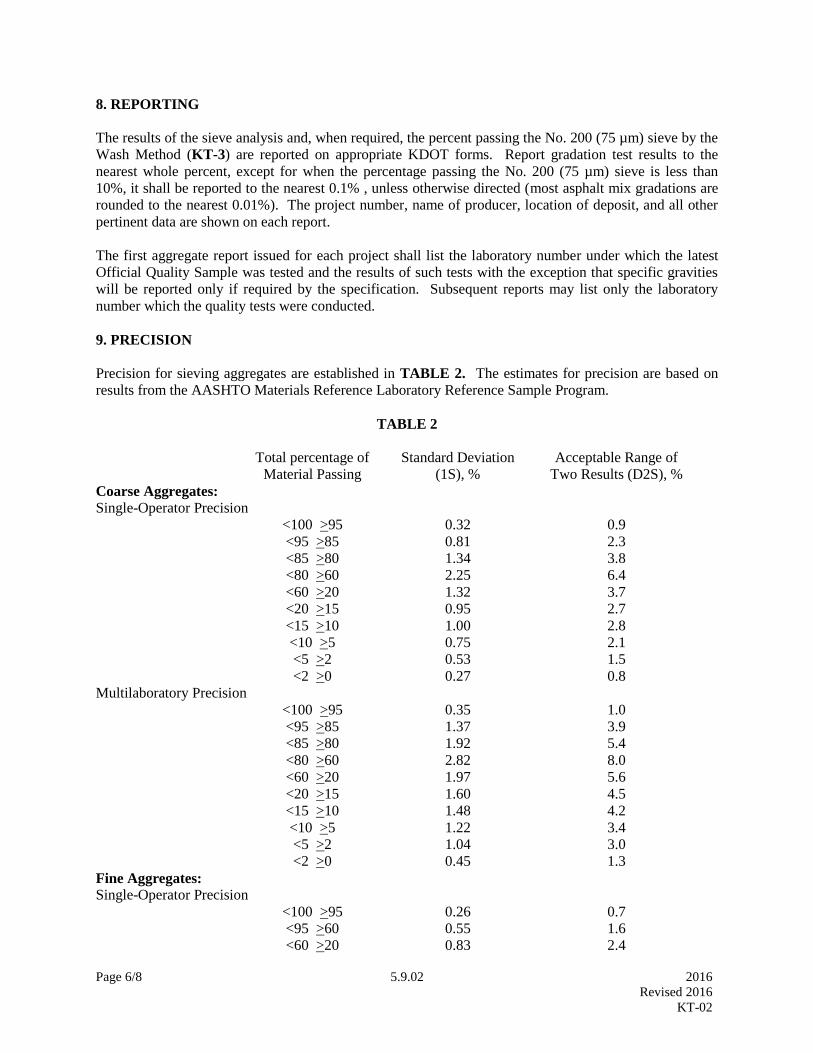
Page 6/8 5.9.02 2016
Revised 2016
KT-02
8. REPORTING
The results of the sieve analysis and, when required, the percent passing the No. 200 (75 µm) sieve by the
Wash Method (KT-3) are reported on appropriate KDOT forms. Report gradation test results to the
nearest whole percent, except for when the percentage passing the No. 200 (75 µm) sieve is less than
10%, it shall be reported to the nearest 0.1% , unless otherwise directed (most asphalt mix gradations are
rounded to the nearest 0.01%). The project number, name of producer, location of deposit, and all other
pertinent data are shown on each report.
The first aggregate report issued for each project shall list the laboratory number under which the latest
Official Quality Sample was tested and the results of such tests with the exception that specific gravities
will be reported only if required by the specification. Subsequent reports may list only the laboratory
number which the quality tests were conducted.
9. PRECISION
Precision for sieving aggregates are established in TABLE 2. The estimates for precision are based on
results from the AASHTO Materials Reference Laboratory Reference Sample Program.
TABLE 2
Total percentage of
Material Passing
Standard Deviation
(1S), %
Acceptable Range of
Two Results (D2S), %
Coarse Aggregates:
Single-Operator Precision
<100 >95 0.32 0.9
<95 >85 0.81 2.3
<85 >80 1.34 3.8
<80 >60 2.25 6.4
<60 >20 1.32 3.7
<20 >15 0.95 2.7
<15 >10 1.00 2.8
<10 >5 0.75 2.1
<5 >2 0.53 1.5
<2 >0 0.27 0.8
Multilaboratory Precision
<100 >95 0.35 1.0
<95 >85 1.37 3.9
<85 >80 1.92 5.4
<80 >60 2.82 8.0
<60 >20 1.97 5.6
<20 >15 1.60 4.5
<15 >10 1.48 4.2
<10 >5 1.22 3.4
<5 >2 1.04 3.0
<2 >0 0.45 1.3
Fine Aggregates:
Single-Operator Precision
<100 >95 0.26 0.7
<95 >60 0.55 1.6
<60 >20 0.83 2.4
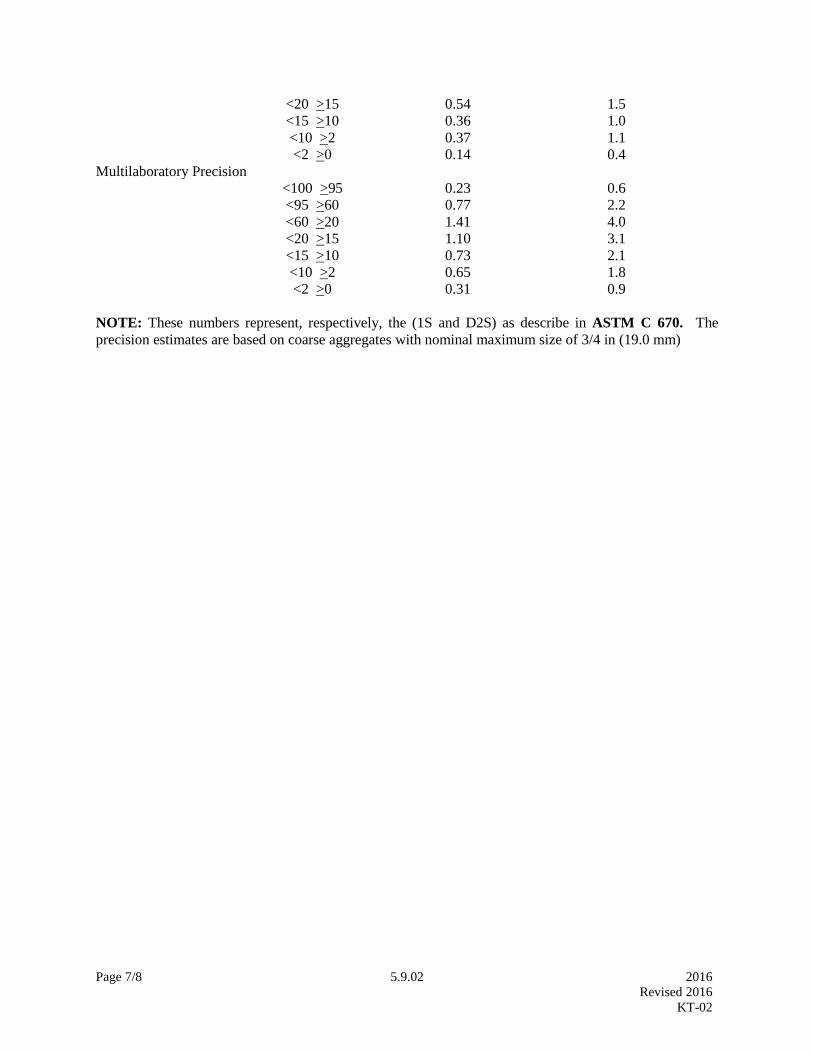
Page 7/8 5.9.02 2016
Revised 2016
KT-02
<20 >15 0.54 1.5
<15 >10 0.36 1.0
<10 >2 0.37 1.1
<2 >0 0.14 0.4
Multilaboratory Precision
<100 >95 0.23 0.6
<95 >60 0.77 2.2
<60 >20 1.41 4.0
<20 >15 1.10 3.1
<15 >10 0.73 2.1
<10 >2 0.65 1.8
<2 >0 0.31 0.9
NOTE: These numbers represent, respectively, the (1S and D2S) as describe in ASTM C 670. The
precision estimates are based on coarse aggregates with nominal maximum size of 3/4 in (19.0 mm)
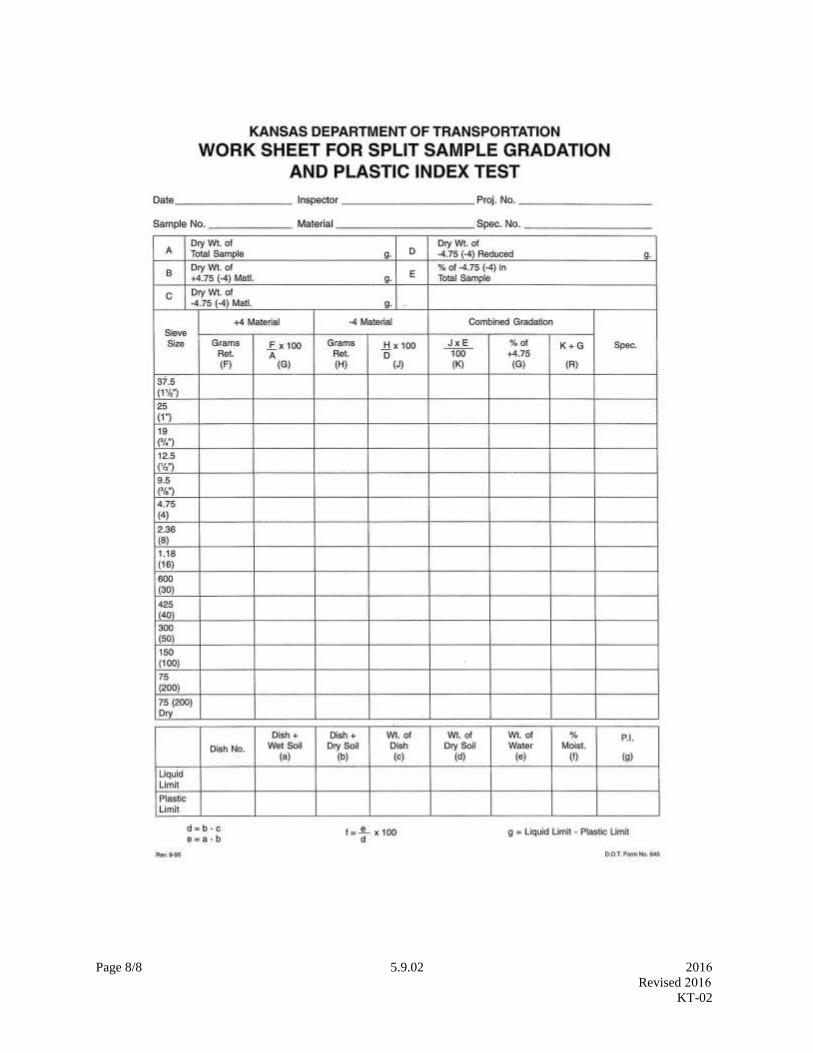
Page 8/8 5.9.02 2016
Revised 2016
KT-02

Page 1/4 5.9.03 2016
Revised 2014
KT-03
5.9.03 MATERIAL PASSING NO. 200 (75µm) SIEVE BY THE WASH METHOD
(Kansas Test Method KT-3)
1. SCOPE
This method of test covers the procedure for determining the quantity of material finer than the No. 200
(75µm) sieve in aggregate by the wash method. It should be recognized that this procedure will not
determine the total amount of material finer than the No. 200 (75µm) sieve and that the total amount must
be determined by a combination of washing, drying and re-screening as outlined in KT-2 of this manual.
KT-3 reflects testing procedures found in AASHTO T 11.
2. REFERENCED DOCUMENTS
2.1. Part V, 5.9; Sampling and Test Methods Foreword
2.2. KT-2; Sieve Analysis of Aggregates
2.3. KT-7; Clay Lumps and Friable Particles in Aggregate
2.4. AASHTO M 92; Wire-Cloth Sieves for Testing Purposes
2.5. AASHTO T 11; Materials Finer Than No. 200 (75µm) Sieve in Mineral Aggregates by Washing
3. APPARATUS
3.1. A nest of two sieves, the lower being a No. 200 (75µm) sieve and the upper being a sieve with
openings in the range of No. 8 (2.36 mm) to No. 16 (1.18 mm), both conforming to the requirement of
AASHTO M 92.
3.2. A pan or vessel of a size sufficient to contain the sample covered with water and to permit vigorous
agitation without loss of any part of the sample or water.
3.3. Drying pans.
3.4. The balance shall conform to the requirements of Part V, 5.9, Sampling and Testing Methods
Foreword for the class of general purpose balance required for the principal sample mass of the sample
being tested.
3.5. Oven capable of maintain uniform temperature of 230 + 9°F (110 + 5°C).
3.6. Wetting Agent—Any dispersing agent, such as liquid dishwashing detergents, that will promote
separation of the fine materials.
NOTE: The use of a mechanical apparatus to perform the washing operation is not precluded, provided
the results are consistent with those obtained using manual operations. The use of some mechanical
washing equipment with some samples may cause degradation of the sample.
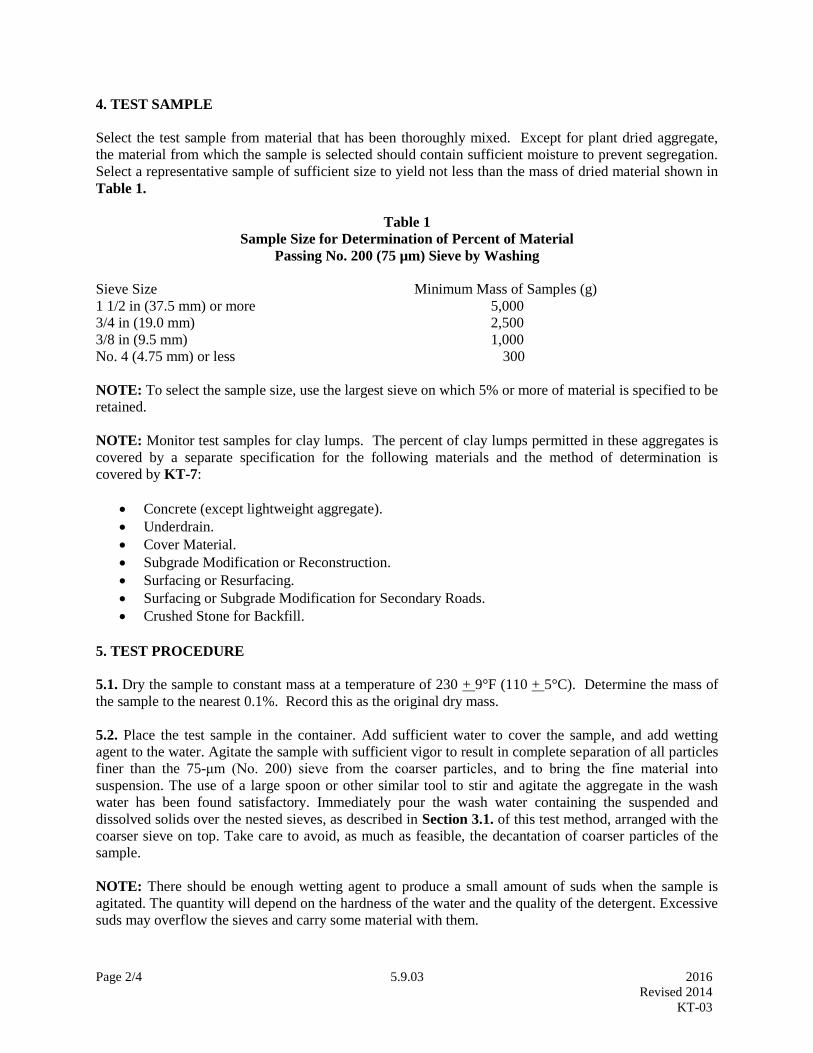
Page 2/4 5.9.03 2016
Revised 2014
KT-03
4. TEST SAMPLE
Select the test sample from material that has been thoroughly mixed. Except for plant dried aggregate,
the material from which the sample is selected should contain sufficient moisture to prevent segregation.
Select a representative sample of sufficient size to yield not less than the mass of dried material shown in
Table 1.
Table 1
Sample Size for Determination of Percent of Material
Passing No. 200 (75 µm) Sieve by Washing
Sieve Size Minimum Mass of Samples (g)
1 1/2 in (37.5 mm) or more 5,000
3/4 in (19.0 mm) 2,500
3/8 in (9.5 mm) 1,000
No. 4 (4.75 mm) or less 300
NOTE: To select the sample size, use the largest sieve on which 5% or more of material is specified to be
retained.
NOTE: Monitor test samples for clay lumps. The percent of clay lumps permitted in these aggregates is
covered by a separate specification for the following materials and the method of determination is
covered by KT-7:
Concrete (except lightweight aggregate).
Underdrain.
Cover Material.
Subgrade Modification or Reconstruction.
Surfacing or Resurfacing.
Surfacing or Subgrade Modification for Secondary Roads.
Crushed Stone for Backfill.
5. TEST PROCEDURE
5.1. Dry the sample to constant mass at a temperature of 230 + 9°F (110 + 5°C). Determine the mass of
the sample to the nearest 0.1%. Record this as the original dry mass.
5.2. Place the test sample in the container. Add sufficient water to cover the sample, and add wetting
agent to the water. Agitate the sample with sufficient vigor to result in complete separation of all particles
finer than the 75-μm (No. 200) sieve from the coarser particles, and to bring the fine material into
suspension. The use of a large spoon or other similar tool to stir and agitate the aggregate in the wash
water has been found satisfactory. Immediately pour the wash water containing the suspended and
dissolved solids over the nested sieves, as described in Section 3.1. of this test method, arranged with the
coarser sieve on top. Take care to avoid, as much as feasible, the decantation of coarser particles of the
sample.
NOTE: There should be enough wetting agent to produce a small amount of suds when the sample is
agitated. The quantity will depend on the hardness of the water and the quality of the detergent. Excessive
suds may overflow the sieves and carry some material with them.
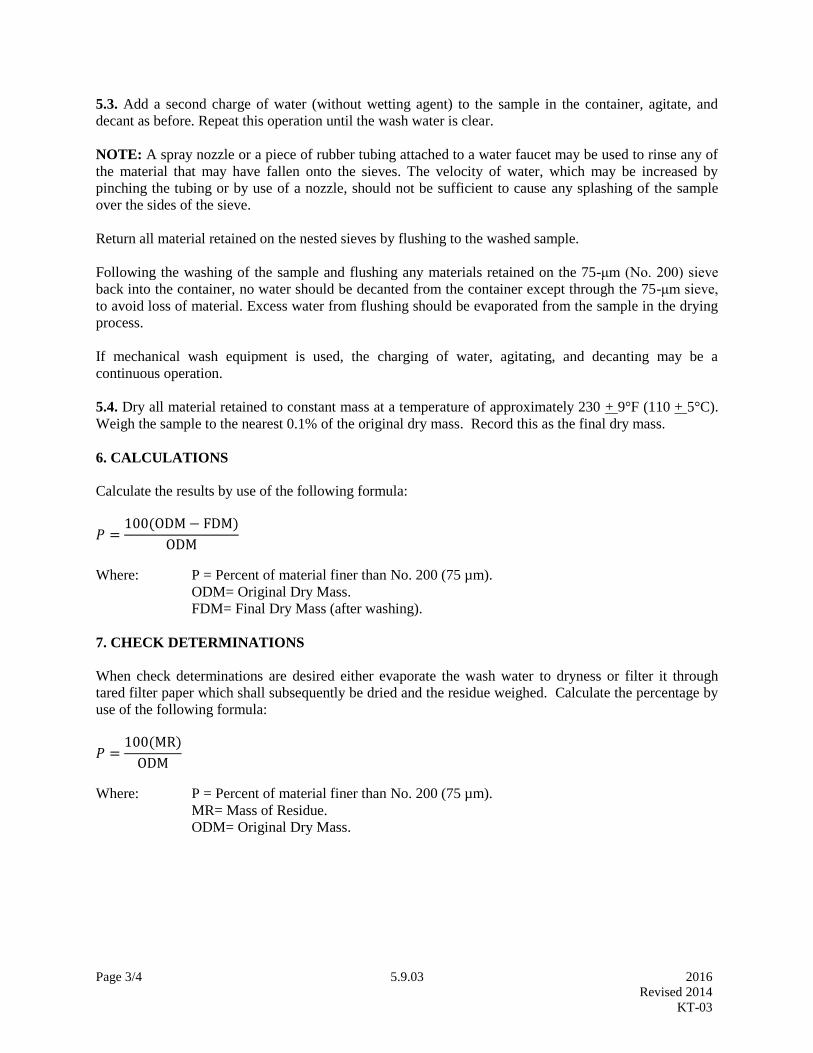
Page 3/4 5.9.03 2016
Revised 2014
KT-03
5.3. Add a second charge of water (without wetting agent) to the sample in the container, agitate, and
decant as before. Repeat this operation until the wash water is clear.
NOTE: A spray nozzle or a piece of rubber tubing attached to a water faucet may be used to rinse any of
the material that may have fallen onto the sieves. The velocity of water, which may be increased by
pinching the tubing or by use of a nozzle, should not be sufficient to cause any splashing of the sample
over the sides of the sieve.
Return all material retained on the nested sieves by flushing to the washed sample.
Following the washing of the sample and flushing any materials retained on the 75-μm (No. 200) sieve
back into the container, no water should be decanted from the container except through the 75-μm sieve,
to avoid loss of material. Excess water from flushing should be evaporated from the sample in the drying
process.
If mechanical wash equipment is used, the charging of water, agitating, and decanting may be a
continuous operation.
5.4. Dry all material retained to constant mass at a temperature of approximately 230 + 9°F (110 + 5°C).
Weigh the sample to the nearest 0.1% of the original dry mass. Record this as the final dry mass.
6. CALCULATIONS
Calculate the results by use of the following formula:
𝑃 =100(ODM− FDM)
ODM
Where: P = Percent of material finer than No. 200 (75 µm).
ODM= Original Dry Mass.
FDM= Final Dry Mass (after washing).
7. CHECK DETERMINATIONS
When check determinations are desired either evaporate the wash water to dryness or filter it through
tared filter paper which shall subsequently be dried and the residue weighed. Calculate the percentage by
use of the following formula:
𝑃 =100(MR)
ODM
Where: P = Percent of material finer than No. 200 (75 µm).
MR= Mass of Residue.
ODM= Original Dry Mass.
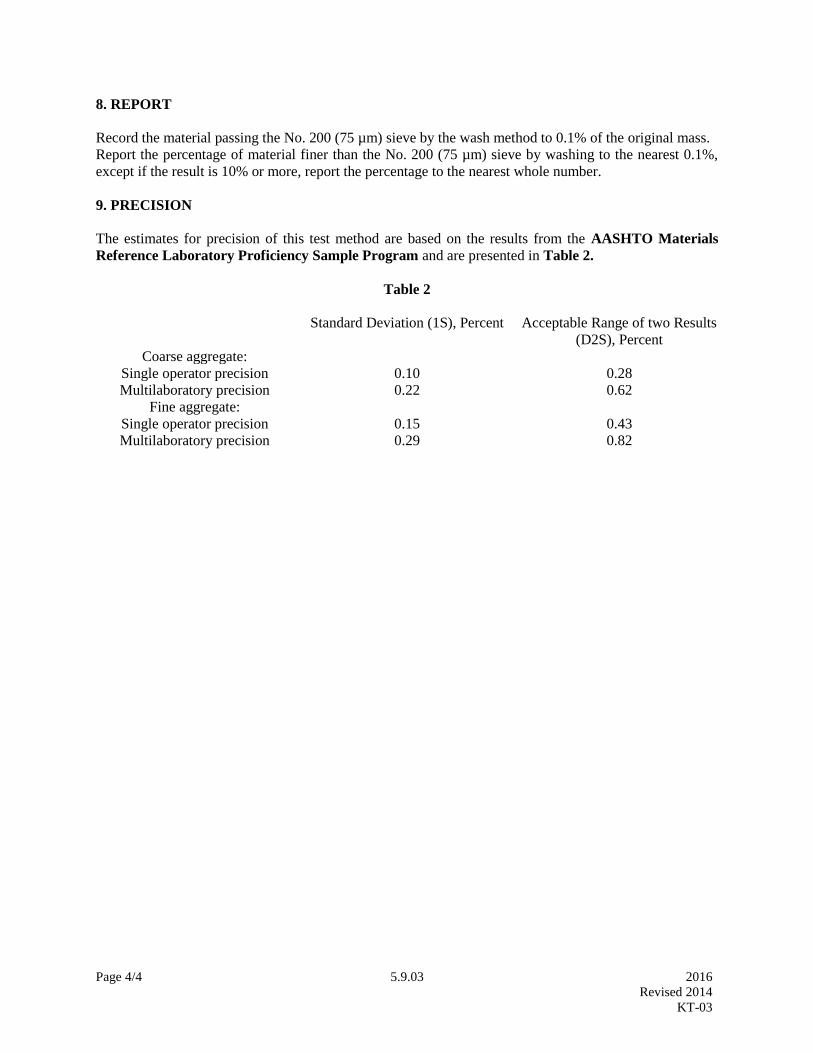
Page 4/4 5.9.03 2016
Revised 2014
KT-03
8. REPORT
Record the material passing the No. 200 (75 µm) sieve by the wash method to 0.1% of the original mass.
Report the percentage of material finer than the No. 200 (75 µm) sieve by washing to the nearest 0.1%,
except if the result is 10% or more, report the percentage to the nearest whole number.
9. PRECISION
The estimates for precision of this test method are based on the results from the AASHTO Materials
Reference Laboratory Proficiency Sample Program and are presented in Table 2.
Table 2
Standard Deviation (1S), Percent Acceptable Range of two Results
(D2S), Percent
Coarse aggregate:
Single operator precision 0.10 0.28
Multilaboratory precision 0.22 0.62
Fine aggregate:
Single operator precision 0.15 0.43
Multilaboratory precision 0.29 0.82

Page 1/3 5.9.04 2016
Revised 2014
KT-04
5.9.04 PERCENT RETAINED ON THE NO. 200 (75 µm) SIEVE BY DRY SCREENING
(Kansas Test Method KT-4)
1. SCOPE
This method of test covers the procedure for determining the amount of material retained on the No. 200
(75 µm) sieve by dry screening only.
NOTE: When the percent retained on the No. 200 (75 µm) sieve by dry screening is part of the project
specifications, it is common practice to conduct KT-4 followed by KT-2 on the sample.
2. REFERENCED DOCUMENTS
2.1. Part V, 5.9; Sampling and Test Methods Foreword
2.2. KT-2; Sieve Analysis of Aggregates
2.3. AASHTO M 92; Wire-Cloth Sieves for Testing Purposes
3. APPARATUS
3.1. The balance shall conform to the requirements of Part V, 5.9; Sampling and Test Methods
Foreword, for the class of general purpose balance required for the principal sample mass of the sample
being tested.
3.2. Sieves meeting AASHTO M 92 of specified sizes for the aggregate being tested.
3.3. Oven capable of maintaining a uniform temperature of 230 + 9°F (110 + 5°C).
3.4. Drying pans.
4. TEST SAMPLES
4.1. Obtain samples of plant-mixed aggregate from the dried, pugmill mixed material and road mixed
material from the combined windrow. The original sample before splitting shall weigh approximately 75
lb (35 kg).
4.2. Reduce sample by quartering or splitting before further drying to a mass of not less than the amount
shown in Table 1. Exercise extreme care to prevent segregation and/or degradation during the splitting
operation.
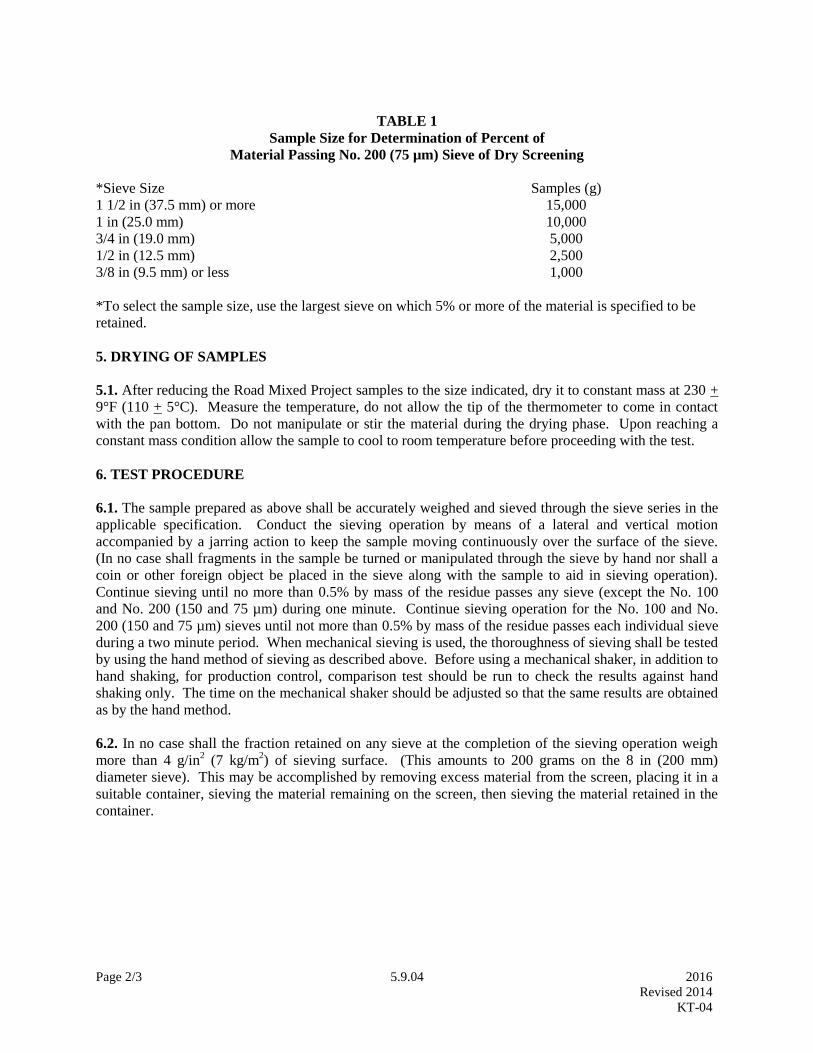
Page 2/3 5.9.04 2016
Revised 2014
KT-04
TABLE 1
Sample Size for Determination of Percent of
Material Passing No. 200 (75 µm) Sieve of Dry Screening
*Sieve Size Samples (g)
1 1/2 in (37.5 mm) or more 15,000
1 in (25.0 mm) 10,000
3/4 in (19.0 mm) 5,000
1/2 in (12.5 mm) 2,500
3/8 in (9.5 mm) or less 1,000
*To select the sample size, use the largest sieve on which 5% or more of the material is specified to be
retained.
5. DRYING OF SAMPLES
5.1. After reducing the Road Mixed Project samples to the size indicated, dry it to constant mass at 230 +
9°F (110 + 5°C). Measure the temperature, do not allow the tip of the thermometer to come in contact
with the pan bottom. Do not manipulate or stir the material during the drying phase. Upon reaching a
constant mass condition allow the sample to cool to room temperature before proceeding with the test.
6. TEST PROCEDURE
6.1. The sample prepared as above shall be accurately weighed and sieved through the sieve series in the
applicable specification. Conduct the sieving operation by means of a lateral and vertical motion
accompanied by a jarring action to keep the sample moving continuously over the surface of the sieve.
(In no case shall fragments in the sample be turned or manipulated through the sieve by hand nor shall a
coin or other foreign object be placed in the sieve along with the sample to aid in sieving operation).
Continue sieving until no more than 0.5% by mass of the residue passes any sieve (except the No. 100
and No. 200 (150 and 75 µm) during one minute. Continue sieving operation for the No. 100 and No.
200 (150 and 75 µm) sieves until not more than 0.5% by mass of the residue passes each individual sieve
during a two minute period. When mechanical sieving is used, the thoroughness of sieving shall be tested
by using the hand method of sieving as described above. Before using a mechanical shaker, in addition to
hand shaking, for production control, comparison test should be run to check the results against hand
shaking only. The time on the mechanical shaker should be adjusted so that the same results are obtained
as by the hand method.
6.2. In no case shall the fraction retained on any sieve at the completion of the sieving operation weigh
more than 4 g/in2 (7 kg/m
2) of sieving surface. (This amounts to 200 grams on the 8 in (200 mm)
diameter sieve). This may be accomplished by removing excess material from the screen, placing it in a
suitable container, sieving the material remaining on the screen, then sieving the material retained in the
container.
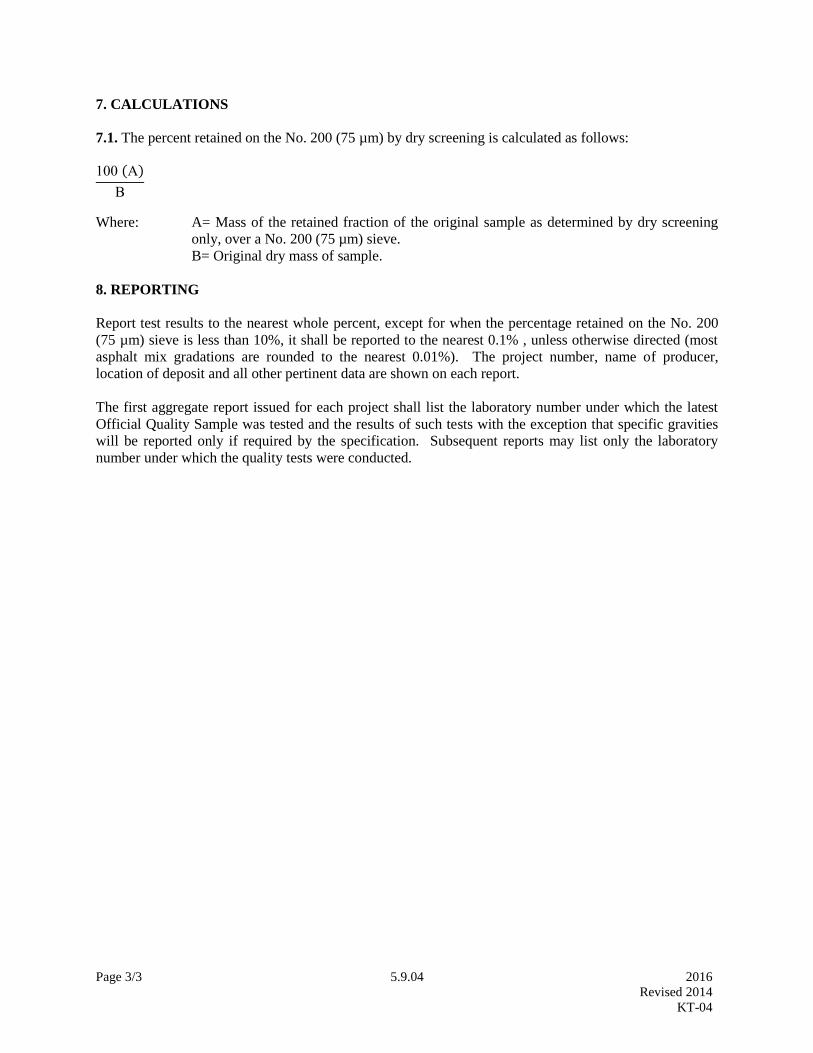
Page 3/3 5.9.04 2016
Revised 2014
KT-04
7. CALCULATIONS
7.1. The percent retained on the No. 200 (75 µm) by dry screening is calculated as follows:
100 (A)
B
Where: A= Mass of the retained fraction of the original sample as determined by dry screening
only, over a No. 200 (75 µm) sieve.
B= Original dry mass of sample.
8. REPORTING
Report test results to the nearest whole percent, except for when the percentage retained on the No. 200
(75 µm) sieve is less than 10%, it shall be reported to the nearest 0.1% , unless otherwise directed (most
asphalt mix gradations are rounded to the nearest 0.01%). The project number, name of producer,
location of deposit and all other pertinent data are shown on each report.
The first aggregate report issued for each project shall list the laboratory number under which the latest
Official Quality Sample was tested and the results of such tests with the exception that specific gravities
will be reported only if required by the specification. Subsequent reports may list only the laboratory
number under which the quality tests were conducted.

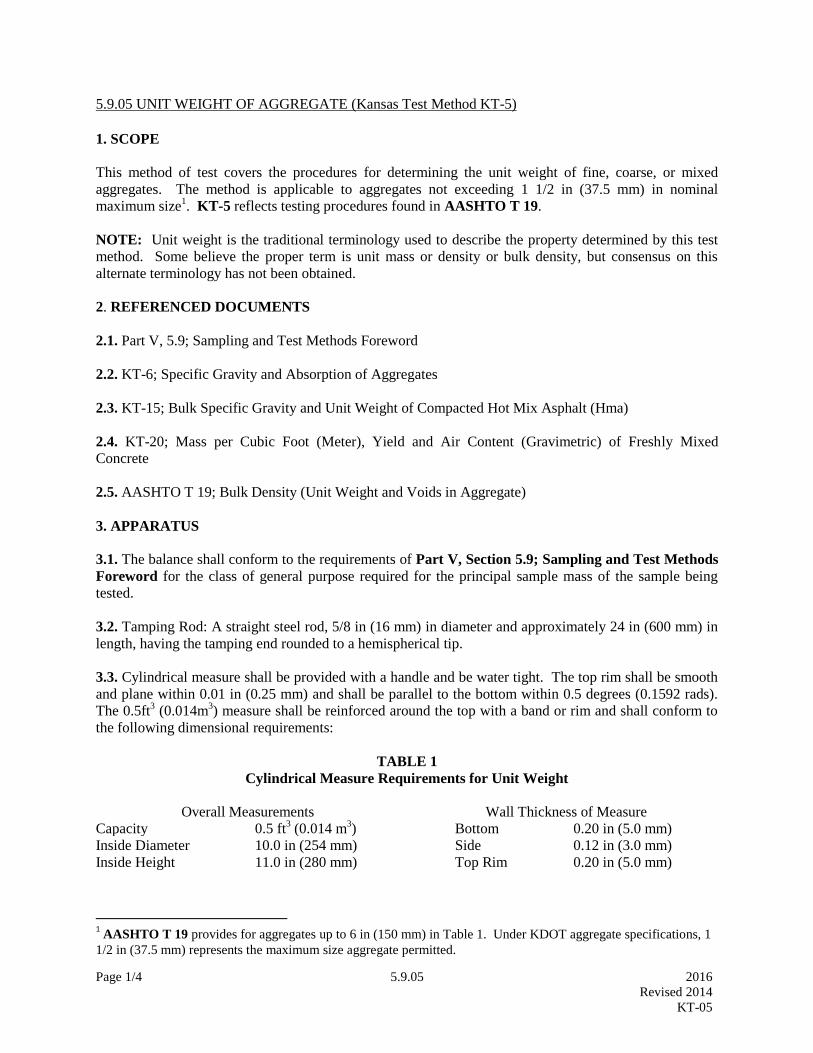
Page 1/4 5.9.05 2016
Revised 2014
KT-05
5.9.05 UNIT WEIGHT OF AGGREGATE (Kansas Test Method KT-5)
1. SCOPE
This method of test covers the procedures for determining the unit weight of fine, coarse, or mixed
aggregates. The method is applicable to aggregates not exceeding 1 1/2 in (37.5 mm) in nominal
maximum size1. KT-5 reflects testing procedures found in AASHTO T 19.
NOTE: Unit weight is the traditional terminology used to describe the property determined by this test
method. Some believe the proper term is unit mass or density or bulk density, but consensus on this
alternate terminology has not been obtained.
2. REFERENCED DOCUMENTS
2.1. Part V, 5.9; Sampling and Test Methods Foreword
2.2. KT-6; Specific Gravity and Absorption of Aggregates
2.3. KT-15; Bulk Specific Gravity and Unit Weight of Compacted Hot Mix Asphalt (Hma)
2.4. KT-20; Mass per Cubic Foot (Meter), Yield and Air Content (Gravimetric) of Freshly Mixed
Concrete
2.5. AASHTO T 19; Bulk Density (Unit Weight and Voids in Aggregate)
3. APPARATUS
3.1. The balance shall conform to the requirements of Part V, Section 5.9; Sampling and Test Methods
Foreword for the class of general purpose required for the principal sample mass of the sample being
tested.
3.2. Tamping Rod: A straight steel rod, 5/8 in (16 mm) in diameter and approximately 24 in (600 mm) in
length, having the tamping end rounded to a hemispherical tip.
3.3. Cylindrical measure shall be provided with a handle and be water tight. The top rim shall be smooth
and plane within 0.01 in (0.25 mm) and shall be parallel to the bottom within 0.5 degrees (0.1592 rads).
The 0.5ft3 (0.014m
3) measure shall be reinforced around the top with a band or rim and shall conform to
the following dimensional requirements:
TABLE 1
Cylindrical Measure Requirements for Unit Weight
Overall Measurements Wall Thickness of Measure
Capacity 0.5 ft3 (0.014 m
3) Bottom 0.20 in (5.0 mm)
Inside Diameter 10.0 in (254 mm) Side 0.12 in (3.0 mm)
Inside Height 11.0 in (280 mm) Top Rim 0.20 in (5.0 mm)
1 AASHTO T 19 provides for aggregates up to 6 in (150 mm) in Table 1. Under KDOT aggregate specifications, 1
1/2 in (37.5 mm) represents the maximum size aggregate permitted.
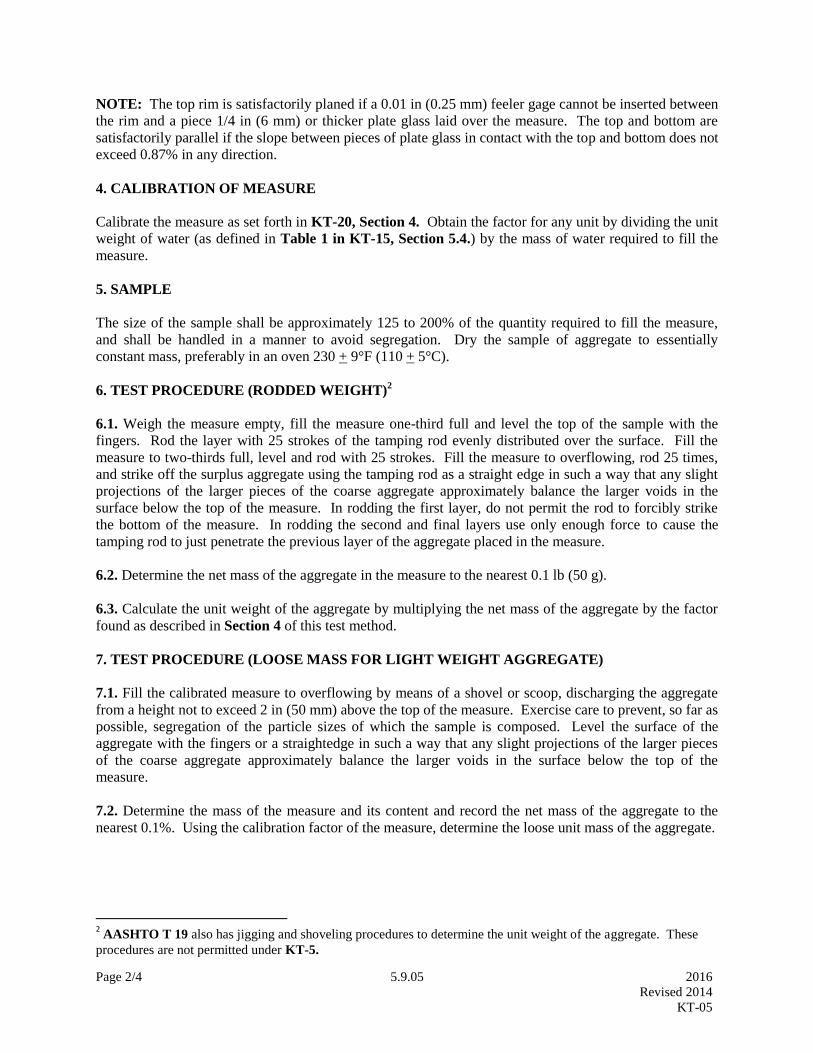
Page 2/4 5.9.05 2016
Revised 2014
KT-05
NOTE: The top rim is satisfactorily planed if a 0.01 in (0.25 mm) feeler gage cannot be inserted between
the rim and a piece 1/4 in (6 mm) or thicker plate glass laid over the measure. The top and bottom are
satisfactorily parallel if the slope between pieces of plate glass in contact with the top and bottom does not
exceed 0.87% in any direction.
4. CALIBRATION OF MEASURE
Calibrate the measure as set forth in KT-20, Section 4. Obtain the factor for any unit by dividing the unit
weight of water (as defined in Table 1 in KT-15, Section 5.4.) by the mass of water required to fill the
measure.
5. SAMPLE
The size of the sample shall be approximately 125 to 200% of the quantity required to fill the measure,
and shall be handled in a manner to avoid segregation. Dry the sample of aggregate to essentially
constant mass, preferably in an oven 230 + 9°F (110 + 5°C).
6. TEST PROCEDURE (RODDED WEIGHT)2
6.1. Weigh the measure empty, fill the measure one-third full and level the top of the sample with the
fingers. Rod the layer with 25 strokes of the tamping rod evenly distributed over the surface. Fill the
measure to two-thirds full, level and rod with 25 strokes. Fill the measure to overflowing, rod 25 times,
and strike off the surplus aggregate using the tamping rod as a straight edge in such a way that any slight
projections of the larger pieces of the coarse aggregate approximately balance the larger voids in the
surface below the top of the measure. In rodding the first layer, do not permit the rod to forcibly strike
the bottom of the measure. In rodding the second and final layers use only enough force to cause the
tamping rod to just penetrate the previous layer of the aggregate placed in the measure.
6.2. Determine the net mass of the aggregate in the measure to the nearest 0.1 lb (50 g).
6.3. Calculate the unit weight of the aggregate by multiplying the net mass of the aggregate by the factor
found as described in Section 4 of this test method.
7. TEST PROCEDURE (LOOSE MASS FOR LIGHT WEIGHT AGGREGATE)
7.1. Fill the calibrated measure to overflowing by means of a shovel or scoop, discharging the aggregate
from a height not to exceed 2 in (50 mm) above the top of the measure. Exercise care to prevent, so far as
possible, segregation of the particle sizes of which the sample is composed. Level the surface of the
aggregate with the fingers or a straightedge in such a way that any slight projections of the larger pieces
of the coarse aggregate approximately balance the larger voids in the surface below the top of the
measure.
7.2. Determine the mass of the measure and its content and record the net mass of the aggregate to the
nearest 0.1%. Using the calibration factor of the measure, determine the loose unit mass of the aggregate.
2 AASHTO T 19 also has jigging and shoveling procedures to determine the unit weight of the aggregate. These
procedures are not permitted under KT-5.
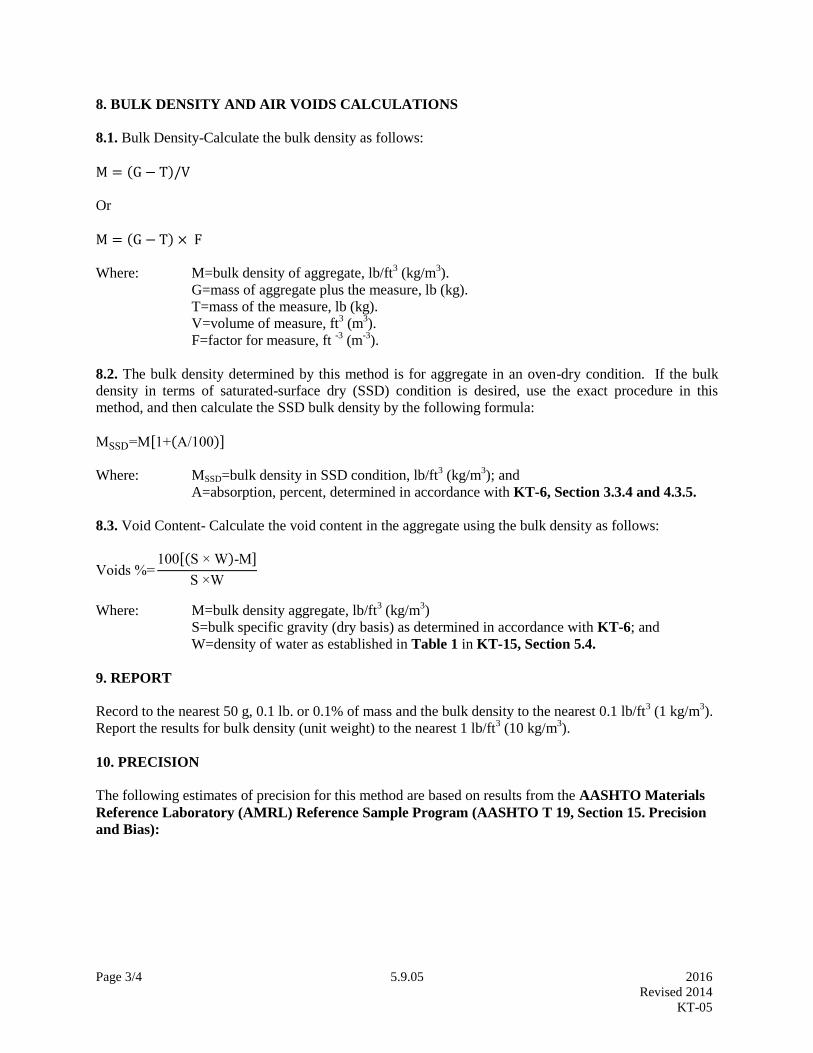
Page 3/4 5.9.05 2016
Revised 2014
KT-05
8. BULK DENSITY AND AIR VOIDS CALCULATIONS
8.1. Bulk Density-Calculate the bulk density as follows:
M = (G − T)/V
Or
M = (G − T) × F
Where: M=bulk density of aggregate, lb/ft3 (kg/m
3).
G=mass of aggregate plus the measure, lb (kg).
T=mass of the measure, lb (kg).
V=volume of measure, ft3 (m
3).
F=factor for measure, ft -3
(m-3
).
8.2. The bulk density determined by this method is for aggregate in an oven-dry condition. If the bulk
density in terms of saturated-surface dry (SSD) condition is desired, use the exact procedure in this
method, and then calculate the SSD bulk density by the following formula:
MSSD=M[1+(A/100)]
Where: MSSD=bulk density in SSD condition, lb/ft3 (kg/m
3); and
A=absorption, percent, determined in accordance with KT-6, Section 3.3.4 and 4.3.5.
8.3. Void Content- Calculate the void content in the aggregate using the bulk density as follows:
Voids %=100[(S × W)-M]
S ×W
Where: M=bulk density aggregate, lb/ft3 (kg/m
3)
S=bulk specific gravity (dry basis) as determined in accordance with KT-6; and
W=density of water as established in Table 1 in KT-15, Section 5.4.
9. REPORT
Record to the nearest 50 g, 0.1 lb. or 0.1% of mass and the bulk density to the nearest 0.1 lb/ft3 (1 kg/m
3).
Report the results for bulk density (unit weight) to the nearest 1 lb/ft3 (10 kg/m
3).
10. PRECISION
The following estimates of precision for this method are based on results from the AASHTO Materials
Reference Laboratory (AMRL) Reference Sample Program (AASHTO T 19, Section 15. Precision
and Bias):
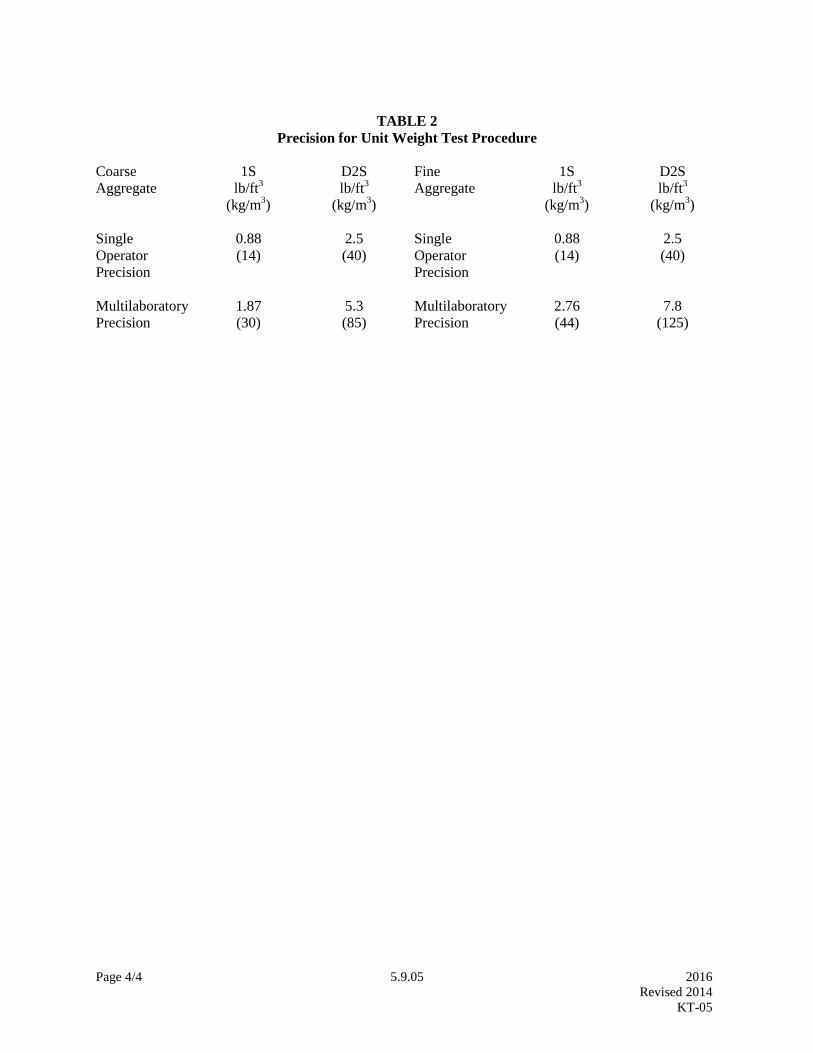
Page 4/4 5.9.05 2016
Revised 2014
KT-05
TABLE 2
Precision for Unit Weight Test Procedure
Coarse
Aggregate
1S
lb/ft3
(kg/m3)
D2S
lb/ft3
(kg/m3)
Fine
Aggregate
1S
lb/ft3
(kg/m3)
D2S
lb/ft3
(kg/m3)
Single
Operator
Precision
0.88
(14)
2.5
(40)
Single
Operator
Precision
0.88
(14)
2.5
(40)
Multilaboratory
Precision
1.87
(30)
5.3
(85)
Multilaboratory
Precision
2.76
(44)
7.8
(125)

Page 1/8 5.9.06 2016
Revised 2016
KT-06
5.9.06 SPECIFIC GRAVITY AND ABSORPTION OF AGGREGATES (Kansas Test Method KT-6)
1. SCOPE
This method of test covers the procedures for determining the specific gravity and absorption of
aggregates. Coarse aggregate (Procedure I) represents aggregate retained on the No. 4 (4.75 mm) sieve.
Fine aggregate (Procedure II) is all aggregate passing the No. 4 (4.75 mm) and retained on the No.100
(150 µm) sieve. KT-6 reflects testing procedures found in AASHTO T 84 and T 85.
2. REFERENCED DOCUMENTS
2.1. Part V, 5.9; Sampling and Test Methods Foreword
2.2 KT-1; Sampling and Splitting of Aggregates
2.3. KT-11; Moisture Tests
2.4. KT-24; Determination of Free Moisture or Absorption of Aggregate for Use in Concrete
2.5. AASHTO M 92; Wire-Cloth Sieves for Testing Purposes
2.6. AASHTO T 84; Specific Gravity and Absorption of Fine Aggregate
2.7. AASHTO T 85; Specific Gravity and Absorption of Coarse Aggregate
2.8. ASTM C 128; Method for Density, Relative Density (Specific Gravity), and Absorption of Fine
Aggregate
2.9. ASTM C 670; Practice for Preparing Precision and Bias Statements for Test Methods for
Construction Materials
3. PROCEDURE I: COARSE AGGREGATE
3.1. Apparatus
3.1.1. The balance shall conform to the requirements of Part V, 5.9; Sampling and Test Methods
Foreword, Class G5. The balance shall be equipped with suitable apparatus for suspending the sample
container in water from the center of weighing platform or pan of the balance.
3.1.2. Bucket approximately 8 in (200 mm) in diameter and 8 in (200 mm) in height.
3.1.3. Container with overflow for immersing the bucket in water.
3.1.4. Drying oven capable of maintaining a uniform temperature of 230 + 9°F (110 + 5°C).
3.1.5. Drying pans.
3.1.6. Absorbent cloth.
3.1.7. Standard No. 4 (4.75 mm) sieve meeting requirements of AASHTO M 92.

Page 2/8 5.9.06 2016
Revised 2016
KT-06
3.2. Test Method
3.2.1. Sample Preparation: This test is normally conducted on the portion of the aggregate that passes the
2 in (50 mm) sieve and is retained on the No. 4 (4.75 mm) sieve. If the test is conducted on larger size
particles, it shall be so noted on the test report.
3.2.1.1. Select a portion of the aggregate by splitting or quartering as specified in KT-1, Section 4. The
minimum mass of the sample, all of which passes the 2 in (50 mm) sieve and is retained on the No. 4
(4.75 mm) sieve, shall be as set out in the following Table 1:
Table 1
Minimum Sample Size for Coarse Aggregate
Sieve Size Minimum Mass of Samples (g)
1 1/2 in (3.75 mm) or more 5,000
1 in (25.0 mm) 4,000
3/4 in (19.0 mm) 3,000
1/2 in (12.5 mm) or less 2,000
NOTE: To select the sample size, use the largest sieve on which 5% or more of the material is specified
to be retained.
3.2.1.2. Thoroughly wash1 the sample over the No. 4 (4.75 mm) sieve to remove dust and other adherent
coatings.
3.2.1.3. Dry the sample to a constant mass in the oven at a constant temperature of 230 + 9°F (110 + 5°C).
NOTE: If the absorption and specific gravity values will be used as a basis for the design of concrete
mixes where aggregates are used in a moist condition, this drying procedure may be eliminated. For an
aggregate that has been in contact with water and that has free moisture on the particle surfaces, the
percentage of free moisture can be determined by deducting the absorption from the total moisture
content determined by KT-11 Section 5.1. Free moisture can also be calculated as described in KT-24
Section 6.
3.2.2. Procedure
3.2.2.1. Immerse the sample in water2 and stir vigorously. Soak for a period of 24 + 4 hours.
3.2.2.2. Remove the sample from the water and bring to a saturated surface-dry condition by rolling the
sample in a dampened, absorbent cloth. (For the purpose of this test, a saturated surface-dry condition of
the aggregate has been reached when the particle surface appears to be moist but not shiny.)
3.2.2.3. Weigh the sample immediately after obtaining the saturated surface-dry condition. Record this
value as “B”. All masses determined in this test shall be to the nearest 1 g or 0.1% of the sample mass,
whichever is greater.
1 AASHTO T 85 requires dry sieving and then thoroughly wash to remove dust or other coatings from the surface.
2 AASHTO T 85 requires the sample to be dried to constant mass prior to immersing in water for a period of 15 to
19 hours.

Page 3/8 5.9.06 2016
Revised 2016
KT-06
3.2.2.4. Immediately after obtaining the saturated surface-dry mass, immerse the sample in water, stir to
remove any entrapped air and weigh. Record this value as “C”. The water temperature shall be 77 + 2°F
(25 + 1°C)3.
3.2.2.5. Dry the sample to a constant mass at a temperature of 230 + 9°F (110 + 5°C).
3.2.2.6. Cool the sample at room temperature, until aggregate has cooled to a temperature that is
comfortable to handle and determine the mass. Record this value as “A”.
3.3. Calculations
Where: A= Mass of oven-dry sample in air, g
B= Mass of surface-dry sample in air, g
C= Mass of saturated sample in water, g
3.3.1. Bulk Specific Gravity:
A
B − C
3.3.2. Bulk Specific Gravity Saturated Surface-Dry Basis:
B
B − C
3.3.3. Apparent Specific Gravity:
A
A − C
3.3.4. Absorption (%):
100 (B − A)
A
4. PROCEDURE II: FINE AGGREGATE
4.1. Apparatus
4.1.1. The balance shall conform to the requirements of Part V, 5.9; Sampling and Test Methods
Foreword, Class G2.
4.1.2. Volumetric flask of known mass having a minimum capacity of 500mL and calibrated by the
manufacturer to within:
0.20mL at 68°F (20°C) for a 500mL flask.
0.30mL at 68°F (20°C) for a 1000mL flask.
3 AASHTO T 85 requires the water temperature to be 23 + 1.7°C (73.4 + 3°F). Changing the temperature to 25 +
1°C (77 + 2°F) establishes a uniform temperature requirement on all water bath test-related procedures.

Page 4/8 5.9.06 2016
Revised 2016
KT-06
4.1.3. Not less than two drying pans with bottoms that are slightly rusted.
4.1.4. Drying oven capable of maintaining a uniform temperature of 230 + 9°F (110 + 5°C).
4.1.5. Water bath having a capacity of at least 2 gal (8 L) maintained at a temperature of 77 + 2°F (25 +
1°C) and a depth approximately equal to or above the height of the bowl of the volumetric flask.
4.1.6. Standard No. 4 (4.75 mm) sieve meeting requirements of AASHTO M 92.
4.1.7. Standard No.100 (150 µm) sieve meeting requirements of AASHTO M 92.
4.2. Test Method
4.2.1. Sample Preparation: This test is conducted on that portion of aggregate passing the No. 4 (4.75
mm) and retained on the No.100 (150 µm) sieve.
4.2.1.1. Select a portion of the aggregate by splitting or quartering as established in KT-1, Section 4. The
portion selected should be of sufficient size to yield a sample weighing approximately 1,000 g all of
which passes the No. 4 (4.75 mm) sieve and retained on the No. 100 (150 µm) sieve.
4.2.1.2. Screen the portion selected over the No. 4 (4.75 mm) sieve and discard all material retained on
that sieve.
4.2.1.3. Wash the minus No. 4 (4.75 mm) material [material passing the No. 4 (4.75mm) sieve] over the
No.100 (150 µm) sieve to remove dust.
4.2.1.4. Dry the plus No. 100 (150 µm) material [material retained on the No. 100 (150 µm) sieve] to a
constant mass in the oven.
NOTE: If the absorption and specific gravity values will be used as a basis for the design of concrete
mixes where aggregates are used in a moist condition, this drying procedure may be eliminated. For an
aggregate that has been in contact with water and that has free moisture on the particle surfaces, the
percentage of free moisture can be determined by deducting the absorption from the total moisture
content determined by KT-11 Section 5.1. Free moisture can also be calculated as described in KT-24
Section 6.
4.2.2. Procedure
4.2.2.1. Immerse the sample in water and stir vigorously. Soak for a period of 24 + 4 hours.
4.2.2.2. Remove the sample from the water and bring it to a saturated surface-dry condition4. The
procedure to be used to obtain the surface-dry condition is as follows:
4.2.2.2.1. Place the saturated sample in a drying pan and allow to dry in air for a short time. Stir the
sample regularly to ensure uniform drying.
4.2.2.2.2. Transfer the sample to another drying pan which has a slightly rusted bottom.
4 AASHTO T 84 Section 7.2.1 uses the cone test for determining SSD condition. Under NOTE 2 (2) Provisional
Surface Test, the use of “worn oxidized” surface is permitted and represents the method presented in Section 4.2.2.
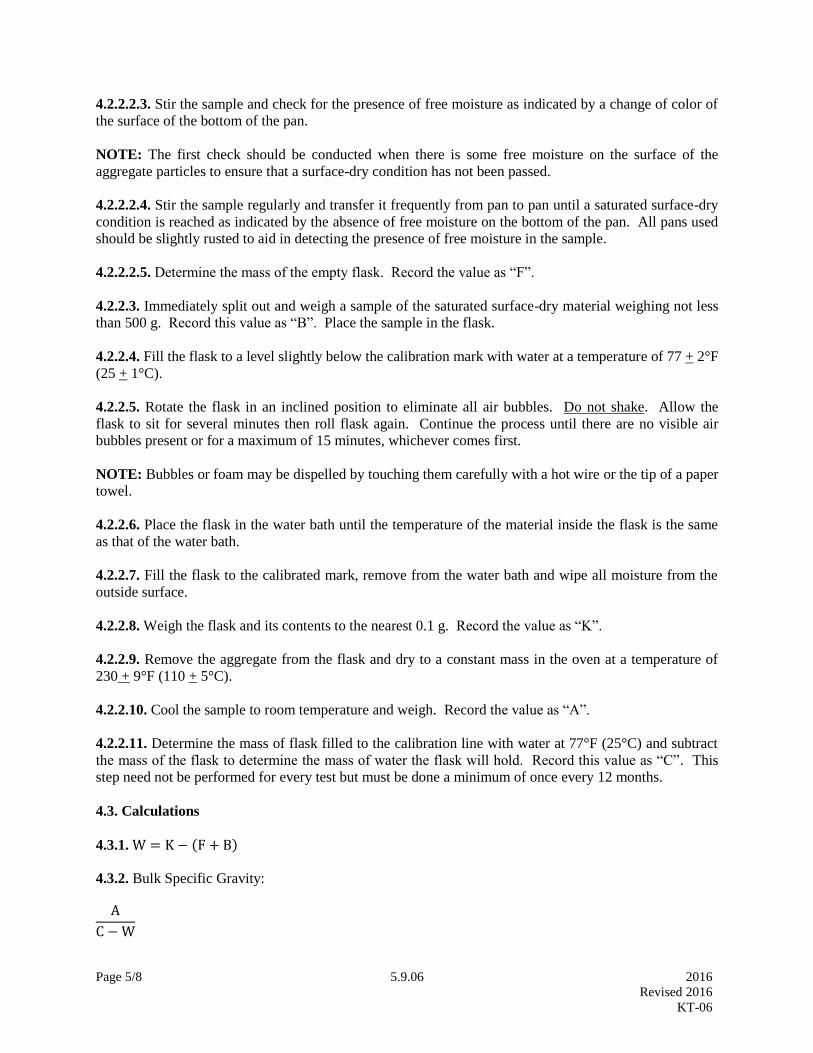
Page 5/8 5.9.06 2016
Revised 2016
KT-06
4.2.2.2.3. Stir the sample and check for the presence of free moisture as indicated by a change of color of
the surface of the bottom of the pan.
NOTE: The first check should be conducted when there is some free moisture on the surface of the
aggregate particles to ensure that a surface-dry condition has not been passed.
4.2.2.2.4. Stir the sample regularly and transfer it frequently from pan to pan until a saturated surface-dry
condition is reached as indicated by the absence of free moisture on the bottom of the pan. All pans used
should be slightly rusted to aid in detecting the presence of free moisture in the sample.
4.2.2.2.5. Determine the mass of the empty flask. Record the value as “F”.
4.2.2.3. Immediately split out and weigh a sample of the saturated surface-dry material weighing not less
than 500 g. Record this value as “B”. Place the sample in the flask.
4.2.2.4. Fill the flask to a level slightly below the calibration mark with water at a temperature of 77 + 2°F
(25 + 1°C).
4.2.2.5. Rotate the flask in an inclined position to eliminate all air bubbles. Do not shake. Allow the
flask to sit for several minutes then roll flask again. Continue the process until there are no visible air
bubbles present or for a maximum of 15 minutes, whichever comes first.
NOTE: Bubbles or foam may be dispelled by touching them carefully with a hot wire or the tip of a paper
towel.
4.2.2.6. Place the flask in the water bath until the temperature of the material inside the flask is the same
as that of the water bath.
4.2.2.7. Fill the flask to the calibrated mark, remove from the water bath and wipe all moisture from the
outside surface.
4.2.2.8. Weigh the flask and its contents to the nearest 0.1 g. Record the value as “K”.
4.2.2.9. Remove the aggregate from the flask and dry to a constant mass in the oven at a temperature of
230 + 9°F (110 + 5°C).
4.2.2.10. Cool the sample to room temperature and weigh. Record the value as “A”.
4.2.2.11. Determine the mass of flask filled to the calibration line with water at 77°F (25°C) and subtract
the mass of the flask to determine the mass of water the flask will hold. Record this value as “C”. This
step need not be performed for every test but must be done a minimum of once every 12 months.
4.3. Calculations
4.3.1. W = K − (F + B)
4.3.2. Bulk Specific Gravity:
A
C − W

Page 6/8 5.9.06 2016
Revised 2016
KT-06
4.3.3. Bulk Specific Gravity (Saturated Surface-Dry Basis):
B
C − W
4.3.4. Apparent Specific Gravity:
A
(C − W) − (B − A)
4.3.5. Absorption (%):
100 (B − A)
A
Where: W= Mass of water added to the flask, g
F= Mass of empty flask, g
K= Mass of flask, plus sample, plus water (See step in Section 4.2.2.8 above), g
A= Mass of oven-dry sample in air, g
B= Mass of saturated surface-dry sample in air, g
C= Mass of water the flask will hold filled to the calibration line at 77°F (25°C)
5. REPORT
5.1. Record the specific gravities to the nearest 0.001. Record the absorption to the nearest 0.01%.
Report all specific gravities to the nearest 0.001 and indicate the type of specific gravity. Report the
absorption result to the nearest 0.1%.
6. PRECISION
6.1. The estimates of precision of this test method (listed in Table 2) are based on results from the
AASHTO Materials Reference Sample Program with testing conducted by AASHTO, T 84 and T 85,
and ASTM, C 128 and C 670. The significant difference between the methods is that ASTM requires a
saturation period of 24 + 4 hours, and AASHTO requires a saturation period of 15 to 19 hours. This
difference has been found to have an insignificant effect on the precision indices.
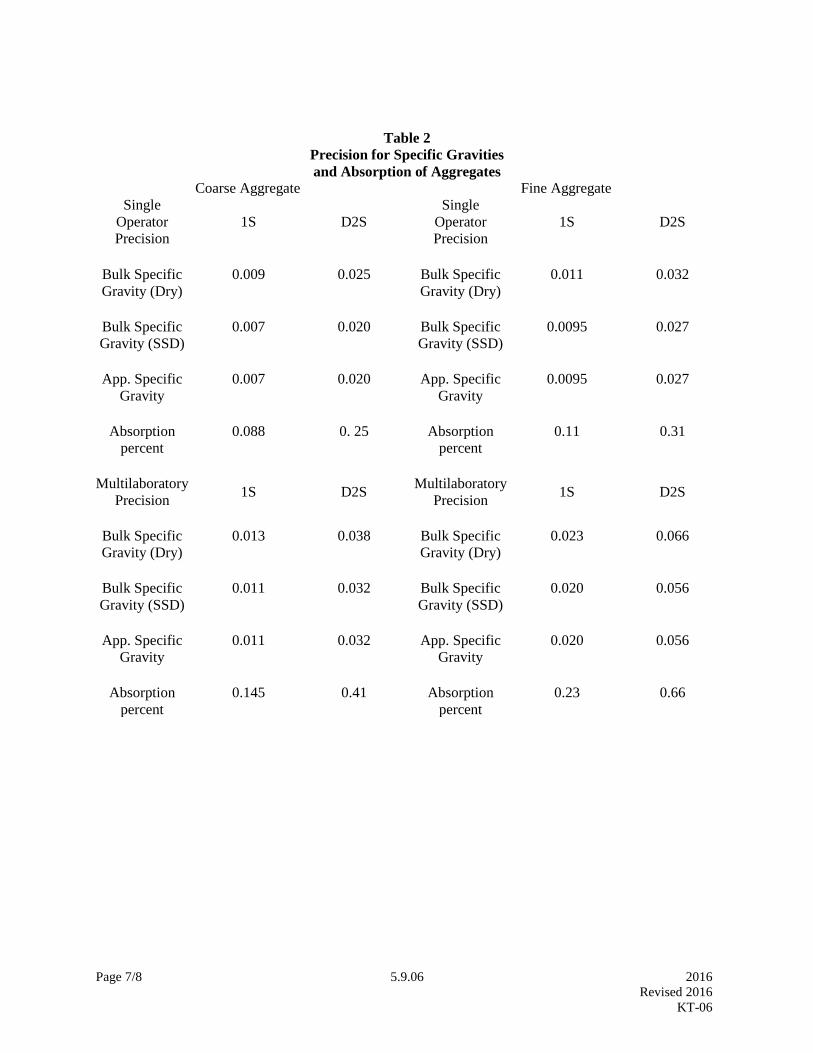
Page 7/8 5.9.06 2016
Revised 2016
KT-06
Table 2
Precision for Specific Gravities
and Absorption of Aggregates
Coarse Aggregate Fine Aggregate
Single
Operator
Precision
1S D2S
Single
Operator
Precision
1S D2S
Bulk Specific
Gravity (Dry)
0.009 0.025 Bulk Specific
Gravity (Dry)
0.011 0.032
Bulk Specific
Gravity (SSD)
0.007 0.020 Bulk Specific
Gravity (SSD)
0.0095 0.027
App. Specific
Gravity
0.007 0.020 App. Specific
Gravity
0.0095 0.027
Absorption
percent
0.088 0. 25 Absorption
percent
0.11 0.31
Multilaboratory
Precision 1S D2S
Multilaboratory
Precision 1S D2S
Bulk Specific
Gravity (Dry)
0.013 0.038 Bulk Specific
Gravity (Dry)
0.023 0.066
Bulk Specific
Gravity (SSD)
0.011 0.032 Bulk Specific
Gravity (SSD)
0.020 0.056
App. Specific
Gravity
0.011 0.032 App. Specific
Gravity
0.020 0.056
Absorption
percent
0.145 0.41 Absorption
percent
0.23 0.66
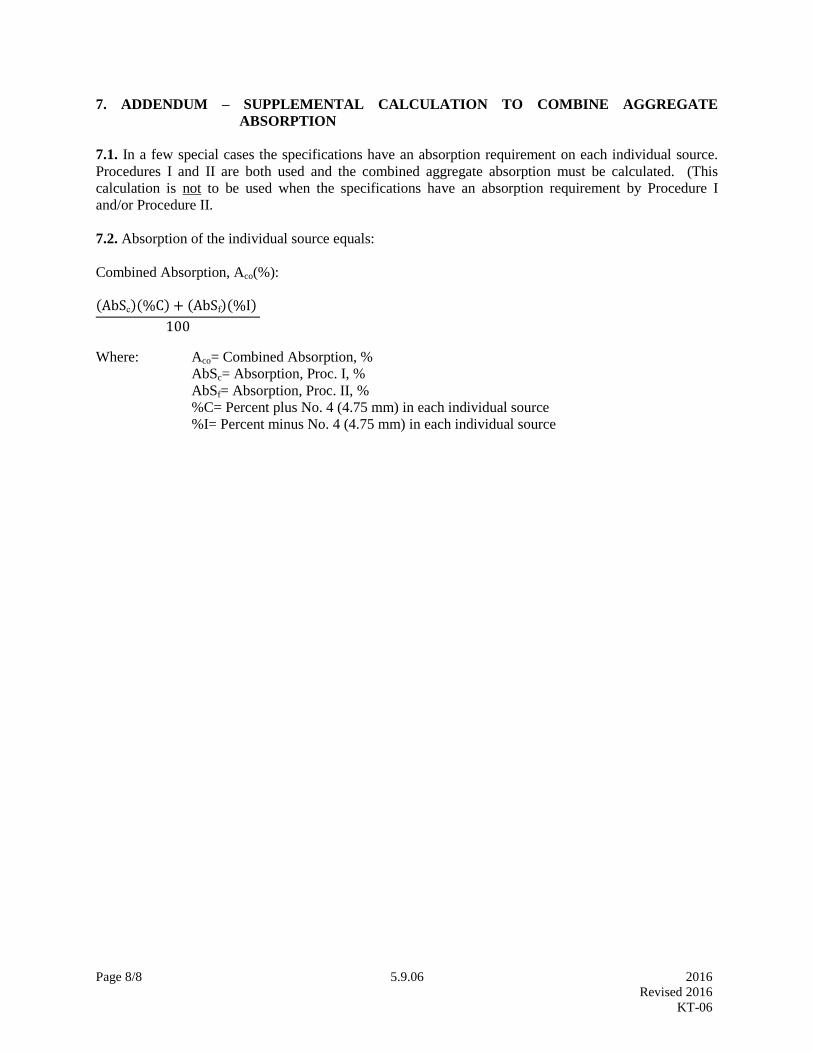
Page 8/8 5.9.06 2016
Revised 2016
KT-06
7. ADDENDUM – SUPPLEMENTAL CALCULATION TO COMBINE AGGREGATE
ABSORPTION
7.1. In a few special cases the specifications have an absorption requirement on each individual source.
Procedures I and II are both used and the combined aggregate absorption must be calculated. (This
calculation is not to be used when the specifications have an absorption requirement by Procedure I
and/or Procedure II.
7.2. Absorption of the individual source equals:
Combined Absorption, Aco(%):
(AbSc)(%C) + (AbSf)(%I)
100
Where: Aco= Combined Absorption, %
AbSc= Absorption, Proc. I, %
AbSf= Absorption, Proc. II, %
%C= Percent plus No. 4 (4.75 mm) in each individual source
%I= Percent minus No. 4 (4.75 mm) in each individual source
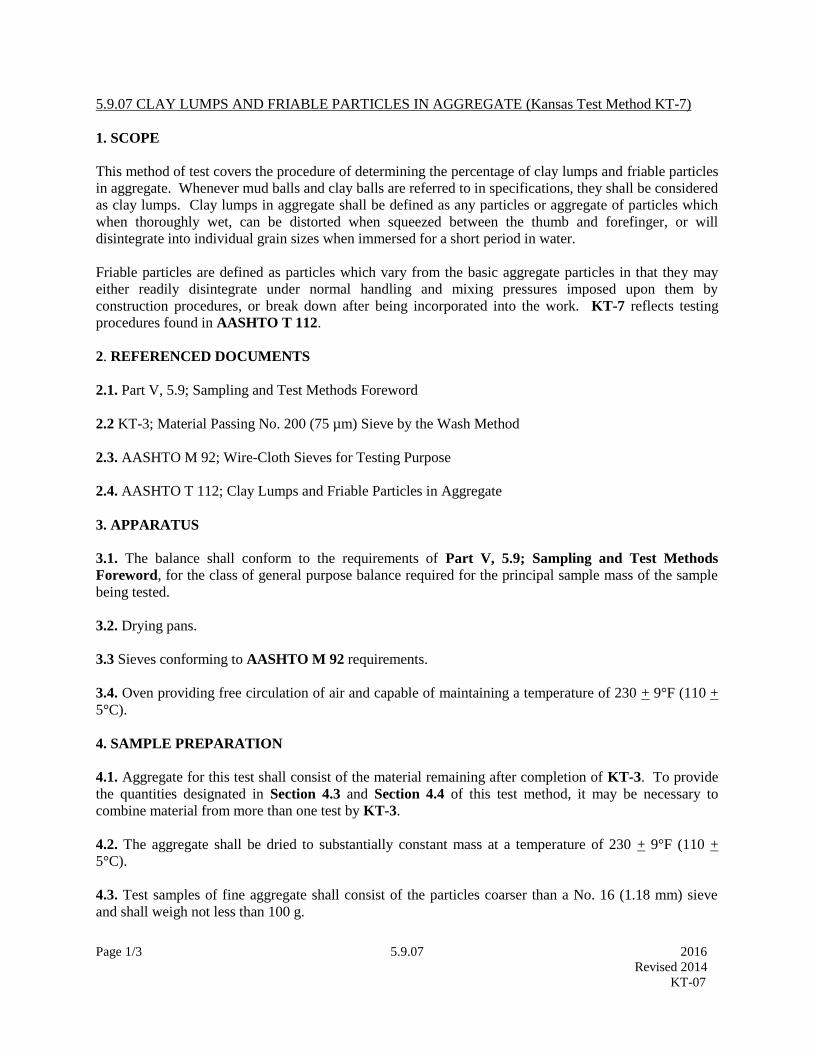
Page 1/3 5.9.07 2016
Revised 2014
KT-07
5.9.07 CLAY LUMPS AND FRIABLE PARTICLES IN AGGREGATE (Kansas Test Method KT-7)
1. SCOPE
This method of test covers the procedure of determining the percentage of clay lumps and friable particles
in aggregate. Whenever mud balls and clay balls are referred to in specifications, they shall be considered
as clay lumps. Clay lumps in aggregate shall be defined as any particles or aggregate of particles which
when thoroughly wet, can be distorted when squeezed between the thumb and forefinger, or will
disintegrate into individual grain sizes when immersed for a short period in water.
Friable particles are defined as particles which vary from the basic aggregate particles in that they may
either readily disintegrate under normal handling and mixing pressures imposed upon them by
construction procedures, or break down after being incorporated into the work. KT-7 reflects testing
procedures found in AASHTO T 112.
2. REFERENCED DOCUMENTS
2.1. Part V, 5.9; Sampling and Test Methods Foreword
2.2 KT-3; Material Passing No. 200 (75 µm) Sieve by the Wash Method
2.3. AASHTO M 92; Wire-Cloth Sieves for Testing Purpose
2.4. AASHTO T 112; Clay Lumps and Friable Particles in Aggregate
3. APPARATUS
3.1. The balance shall conform to the requirements of Part V, 5.9; Sampling and Test Methods
Foreword, for the class of general purpose balance required for the principal sample mass of the sample
being tested.
3.2. Drying pans.
3.3 Sieves conforming to AASHTO M 92 requirements.
3.4. Oven providing free circulation of air and capable of maintaining a temperature of 230 + 9°F (110 +
5°C).
4. SAMPLE PREPARATION
4.1. Aggregate for this test shall consist of the material remaining after completion of KT-3. To provide
the quantities designated in Section 4.3 and Section 4.4 of this test method, it may be necessary to
combine material from more than one test by KT-3.
4.2. The aggregate shall be dried to substantially constant mass at a temperature of 230 + 9°F (110 +
5°C).
4.3. Test samples of fine aggregate shall consist of the particles coarser than a No. 16 (1.18 mm) sieve
and shall weigh not less than 100 g.
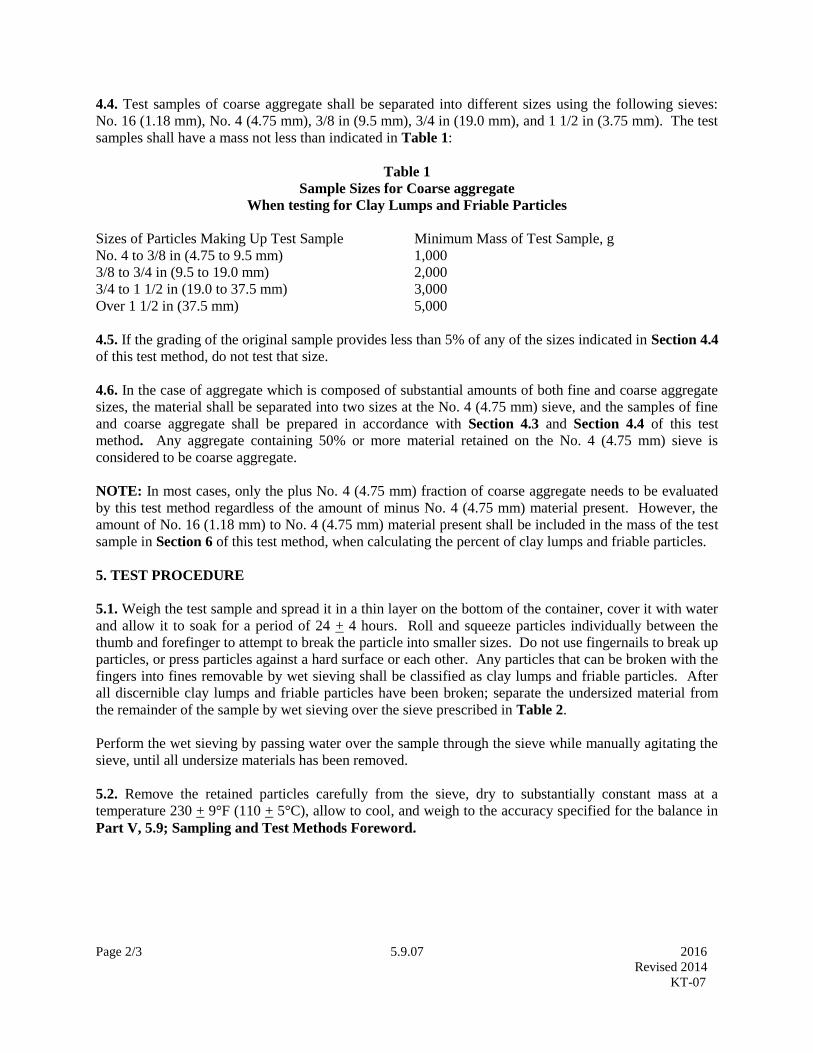
Page 2/3 5.9.07 2016
Revised 2014
KT-07
4.4. Test samples of coarse aggregate shall be separated into different sizes using the following sieves:
No. 16 (1.18 mm), No. 4 (4.75 mm), 3/8 in (9.5 mm), 3/4 in (19.0 mm), and 1 1/2 in (3.75 mm). The test
samples shall have a mass not less than indicated in Table 1:
Table 1
Sample Sizes for Coarse aggregate
When testing for Clay Lumps and Friable Particles
Sizes of Particles Making Up Test Sample Minimum Mass of Test Sample, g
No. 4 to 3/8 in (4.75 to 9.5 mm) 1,000
3/8 to 3/4 in (9.5 to 19.0 mm) 2,000
3/4 to 1 1/2 in (19.0 to 37.5 mm) 3,000
Over 1 1/2 in (37.5 mm) 5,000
4.5. If the grading of the original sample provides less than 5% of any of the sizes indicated in Section 4.4
of this test method, do not test that size.
4.6. In the case of aggregate which is composed of substantial amounts of both fine and coarse aggregate
sizes, the material shall be separated into two sizes at the No. 4 (4.75 mm) sieve, and the samples of fine
and coarse aggregate shall be prepared in accordance with Section 4.3 and Section 4.4 of this test
method. Any aggregate containing 50% or more material retained on the No. 4 (4.75 mm) sieve is
considered to be coarse aggregate.
NOTE: In most cases, only the plus No. 4 (4.75 mm) fraction of coarse aggregate needs to be evaluated
by this test method regardless of the amount of minus No. 4 (4.75 mm) material present. However, the
amount of No. 16 (1.18 mm) to No. 4 (4.75 mm) material present shall be included in the mass of the test
sample in Section 6 of this test method, when calculating the percent of clay lumps and friable particles.
5. TEST PROCEDURE
5.1. Weigh the test sample and spread it in a thin layer on the bottom of the container, cover it with water
and allow it to soak for a period of 24 + 4 hours. Roll and squeeze particles individually between the
thumb and forefinger to attempt to break the particle into smaller sizes. Do not use fingernails to break up
particles, or press particles against a hard surface or each other. Any particles that can be broken with the
fingers into fines removable by wet sieving shall be classified as clay lumps and friable particles. After
all discernible clay lumps and friable particles have been broken; separate the undersized material from
the remainder of the sample by wet sieving over the sieve prescribed in Table 2.
Perform the wet sieving by passing water over the sample through the sieve while manually agitating the
sieve, until all undersize materials has been removed.
5.2. Remove the retained particles carefully from the sieve, dry to substantially constant mass at a
temperature 230 + 9°F (110 + 5°C), allow to cool, and weigh to the accuracy specified for the balance in
Part V, 5.9; Sampling and Test Methods Foreword.

Page 3/3 5.9.07 2016
Revised 2014
KT-07
Table 2
Size of Sieve for Removing
Residue of Clay Lumps and Friable Particles
Sizes of Particles Making
Up Test Sample
Sieve Size for
Removing Clay Lumps
and Friable Particles
Fine Aggregate [retained
on No. 16 (1.18 mm)]
No. 20 (850 µm)
No. 4 to 3/8 in (4.75 to 9.5 mm) No. 8 (2.36 mm)
3/8 to 3/4 in (9.5 to 19.0 mm) No. 4 (4.75 mm)
3/4 to 1 1/2 in (19.0 to 37.5 mm) No. 4 (4.75 mm)
Over 1 1/2 in (37.5 mm) No. 4 (4.75 mm)
6. CALCULATIONS
6.1 Compute the percentage of clay lumps and friable particles by the following formula:
P=100 (W-R)
W
Where: P = percent of clay lump and friable particles
W = mass of test sample (for fine aggregate the mass of the portion coarser than the No.
16 (1.18 mm) sieve as described in Section 4.3 of this test method), and
R = mass of particles retained on designated sieve, as determined in accordance to
Section 5.2 of this test method.
6.2. For coarse aggregate, the percent of clay lumps and friable particles shall be an average based on the
percent of clay lumps and friable particles in each sieve size fraction weighted in accordance with the
grading of the original sample before separation or, preferably, the average grading of the supply
represented by the sample. For the purpose of calculating the weighted average when the sample contains
less than 5% of the material in a given size, that size shall be considered to contain the same percent of
clay lumps and friable particles as the next larger or next smaller size, or use the average of the next
smaller and larger sizes, if both are present.
7. REPORT
7.1. Record the mass of clay lumps and friable particles in aggregate to the nearest 0.1 g or 0.01% of the
sample mass. Record the calculated percentages of clay lumps and friable particles in aggregate to the
nearest 0.01%. Report the clay lumps and friable particles in aggregate to the nearest 0.1%.

Page 1/2 5.9.08 2016
Revised 2014
KT-08
5.9.08 SHALE OR “SHALELIKE” MATERIALS IN AGGREGATE (Kansas Test Method KT-8)
1. SCOPE
This test method shall be used to determine the percentage of shale, mudstone, clay stone or other
materials which would exhibit the properties of shale upon weathering.
2. REFERENCED DOCUMENTS
2.1. Part V, 5.9; Sampling and Test Methods Foreword
2.2. AASHTO M 92; Wire-Cloth Sieves for Testing Purposes
3. APPARATUS
3.1. The balance shall conform to the requirements of Part V, 5.9; Sampling and Test Methods
Foreword, for the class of general purpose balance required for the principal sample mass of the sample
being tested.
3.2. Oven capable of maintaining uniform temperature of 230 + 9°F (110 + 5°C).
3.3. Standard 3/8 in (9.5 mm) sieve conforming to AASHTO M 92.
3.4. Drying pans
4. SAMPLE PREPARATION
4.1. A sample having a minimum mass of 10,000 g shall be used for this test. The sample shall first be
dried to a constant mass at a uniform temperature of 230 + 9°F (110 + 5°C). After the sample has cooled
so that it may be readily handled, it shall be weighed to the nearest 1.0 g and the mass recorded. The
sample shall then be screened over a 3/8 in (9.5 mm) sieve and the material passing the 3/8 in (9.5 mm)
sieve shall be discarded. The material retained on the 3/8 in (9.5 mm) sieve shall be moistened
sufficiently to facilitate identification of the deleterious material. Moistening of the material shall be
within the range of lightly spraying to completely immersing for a ten minute period. The amount of
moistening shall be that amount which will best assist in identifying the deleterious material but will not
result in disintegration and subsequent loss of the material.
5. TEST PROCEDURE
5.1. While the sample is still moist, it shall be examined carefully and all pieces of shale or shalelike
material shall be removed for weighing. The shale and shalelike material may be identified by any of the
following:
5.2. A soapy, slick surface when wet.
5.3. Laminations or bedding planes along which it will split with comparative ease.
NOTE: Mineralized or organic seams can be common in specimens but should not be mistaken for or
considered as laminations unless they are coincident with individual laminations or bedding planes.
Page 2/2 5.9.08 2016
Revised 2014
KT-08
5.4. Mudstone appearing particles in which very crude and indistinct laminations can be observed but will
not easily separate along the laminations.
5.5. Mudstone appearing particles in which no laminations appear but which are composed of finely
divided mineral matter of clay grade and composition.
5.6. The shale or shalelike material removed from the sample shall be dried to a constant mass at a
uniform temperature of 230 + 9°F (110 + 5°C). After the shale/ shalelike material has cooled so that it
may be readily handled, it shall be weighed to the nearest 1.0 g and the mass recorded.
6. CALCULATIONS
6.1. Compute the percentage of shale by the following formula:
Percent Shale = 100 (Mass of Dray Shale Retained)
Original Dry Mass of Test Sample
NOTE: As an alternative to drying the whole sample, a representative sample of 2,500 g minimum for
moisture may be split out of the whole sample. The moist sample is dried to constant mass at a uniform
temperature of 230 + 9°F (110 + 5°C). The percentage of moisture is calculated to two places to the right
of the decimal point and is used to correct the mass of the remainder of the sample to dry mass. This dry
mass of the remainder of the sample is used as the Original Dry Mass of Test Sample (10,000 g minimum
in section 4.1 of this test method).
Example:
Wet mass of moisture sample = 2,645 g
Dry mass of moisture sample = 2,557 g
Wet mass of the remainder of sample = 10,976 g
Percentage of Moisture =
100(Wet mass of sample – Dry mass of sample)
Dry mass of sample
100 (2,645 -2,557)
2,557=3.44%
Dry mass of the remainder of the sample =
100(Wet mass of the remainder of the sample)
(100 + Percentage of Moisture)
100(10,976)
100 +3.44=
100(10,976)
103.44=10,611 g

Page 1/9 5.9.10 2016
Revised 2016
KT-10
5.9.10 PLASTICITY TESTS (Kansas Test Method KT-10)
1. SCOPE
This method of test covers the procedures for determining the liquid limit, plastic limit and plastic index
of soils and the minus No. 40 (425 µm) portions of aggregates. For aggregates, use the wet preparation
method described in Section 9 of this test method. KT-10 reflects testing procedures found in AASHTO
T 87, T 89 and T 90.
2. REFERENCED DOCUMENTS
2.1. Part V, 5.9; Sampling and Test Methods Foreword
2.2 KT-11; Moisture Tests
2.3. AASHTO M 92; Wire-Cloth Sieves for Testing Purposes
2.4. AASHTO T 89; Determining the Liquid Limit of Soils
2.5. AASHTO T 90; Determining the Plastic Limit and Plasticity Index of Soils
3. APPARATUS
3.1. The balance shall conform to the requirements of Part V, Section 5.9; Sampling and Test Methods
Foreword for the class of general purpose required for the principal sample mass of the sample being
tested.
3.2. A suitable device capable of drying samples at a temperature not exceeding 140°F (60°C), for the
preparation of the samples.
3.3. Oven thermostatically controlled capable of maintain a uniform temperature of 230 + 9°F (110 +
5°C), for drying of moisture samples.
3.4. A porcelain-evaporating dish, preferably unglazed about 4.5 in (115 mm) in diameter.
3.5. Spatula having a blade about 0.75 in (20 mm) wide and 3 in (75 mm) long.
3.6. A mechanically operated Liquid Limit Device consisting of a brass cup and carriage meeting the
requirements of AASHTO T 89, Figure 1 and Sections 4.3.1 and 4.3.2 of this test method.
3.7. A manually operated device constructed in accordance with AASHTO T 89, Section 3.3.1.
3.8. Curved grooving tool meeting the requirements of AASHTO T 89, Figure 1.
3.9. A gage whether attached to the grooving tool or separate, conforming to the critical dimension “d”
shown in AASHTO T 89 Figure 1 and may be, if separate, a metal bar 0.394 + 0.008 in. (10.0 + 0.2 mm)
thick and approximately 2 in 950 mm) long.
NOTE: All Liquid Limit Devices and curved grooving tools should be examined for conformance with
the requirements of AASHTO T 89 before they are used.
Page 2/9 5.9.10 2016
Revised 2016
KT-10
3.10. Suitable containers made of material resistant to corrosion and not subject to change in mass or
disintegration on repeated heating and cooling. Containers shall have close-fitting lids to prevent loss of
moisture from samples before initial mass determination and to prevent absorption of moisture from the
atmosphere following drying and before final mass determination. One container is needed for each
moisture content determination.
3.11. Pulverizing apparatus: Either a mortar and rubber-covered pestle or a mechanical device consisting
of a power driven rubber-covered muller suitable for breaking up the aggregation of soil particles without
reducing the size of the individual grains.
NOTE: Other types of apparatus, such as a revolving drum into which the soil sample and rubber-
covered rollers are placed and tumbled until soil aggregations are pulverized, are satisfactory if the
aggregations of soil particles are broken up without reducing the size of the individual grains.
3.12. Series of sieves including No. 4 (4.75 mm), No. 10 (2.00 mm), and No. 40 (425 µm) conforming to
AASHTO M 92.
3.13. Standard KDOT 16 by 10 by 5.5 in (400 by 250 by 140 mm) wash pan equipped with No. 40 (425
µm) screen (optional).
3.14. Ground glass plate. The finish on the ground glass plate is obtained using a medium to fine grade of
abrasive dust. An emery dust essentially passing the No. 60 (250 µm) sieve and retained on the No. 100
(150 µm) sieve has been found to be satisfactory.
A small amount of water is sprinkled on a glass plate along with the abrasive dust. Another plate is laid
on top and the plates are rubbed together until a uniform frosty finish is obtained.
3.15. Plastic Limit Device such as a Gilson SA-18. (See Figure 2) This is used for the alternate
procedure using the Plastic Limit Device, see Section 5.4 of this test method.
4. LIQUID LIMIT TEST1
4.1. Definition: The liquid limit of a material is the water content, when determined in accordance with
this test method, at which the material passes from a plastic to a liquid state. This corresponds to a
theoretical moisture content at which the material will flow in such a manner as to produce a 0.5 in (13
mm) closure of a groove when jarred by 25 drops of the cup on the Liquid Limit Device.
4.2. Preparation of Sample: Dry the material at a temperature not exceeding 140°F (60°C). See Section
8, aggregate material preparation.
4.2.1. The dried sample shall be separated into two fractions using a No. 10 (2.00 mm) sieve. The
fraction retained on the sieve shall be ground with the pulverizing apparatus until the aggregations of soil
particles are broken into separate grains. The ground soil shall then be separated into two fractions using
the No. 10 (2.00 mm) sieve. Discarding the material retained on the sieve.
4.2.2. Dry-screen the material over a No. 40 (425 µm) sieve to remove as much of the portion passing the
No. 40 (425 µm) sieve as possible.
1 AASHTO T 89 and ASTM D 4318 allow for both method “A” and method “B”. KT-10 allows for method “A”
only.
Page 3/9 5.9.10 2016
Revised 2016
KT-10
4.2.3. The fraction retained on the No. 40 (425 µm) sieve shall be ground with the pulverizing apparatus
in such a manner as to break up the aggregations without fracturing the individual grains. If the sample
contains brittle particles, such as flakes of mica, fragments of sea shells, etc., the pulverizing operation
shall be done carefully and with just enough pressure to free the finer material that adheres to the coarser
particles. The ground soil shall then be separated into two fractions by means of the No. 40 (425 µm)
sieve and the material shall be reground as before. When the repeated grinding produces only a small
quantity of soil passing the No. 40 (425 µm) sieve, the material retained on the No. 40 (425 µm) sieve
shall be discarded. The several fractions passing the No. 40 (425 µm) sieve obtained from the grinding
and sieving operations just described shall be thoroughly mixed together and set aside for use in
performing the physical tests.
4.3. Test Procedure
4.3.1. Adjust the height of drop of the brass cup on the Liquid Limit Device by means of the adjustment
plate. The height to which the cup is lifted by the cam is adjusted so that the point on the cup which
comes in contact with the base is 0.394 + 0.008 in (10.0 + 0.2 mm) above the base. Secure the adjustment
plate by tightening the appropriate screws.
Place a piece of masking tape across the outside bottom of the cup parallel with the axis of the cup hanger
pivot (See Figure 3). Place the tape between the wear spot and the pivot so that the edge of the tape away
from the cup hanger bisects the spot on the cup that contacts the base. Slide the height gauge under the
cup to the device and turn the crank until the cup is raised to its maximum height.
The adjustment is checked with the gauge in place by revolving the crank several times. If the adjustment
is correct, a slight ringing sound will be heard when the cam strikes the cam follower. If the cup is raised
off the gauge or no sound is heard, further adjustment is made.
Remove the tape after adjustment.
4.3.2. Inspect the Liquid Limit Device to be sure that it is in good working order and that there are no
worn or “out of alignment” parts that will affect the test results.
4.3.3. Take a sample weighing approximately 100 g and place in the mixing dish. The sample shall be
thoroughly mixed with 15 to 20 mL of distilled or demineralized water by alternately and repeatedly
stirring, kneading and chopping with a spatula. Further additions of water shall be made in 1 to 3 mL
increments. Each increment of water shall be thoroughly mixed with the soil, as previously described,
before another increment of water is added. Once testing has begun, no additional dry soil should be
added to the moistened soil. The cup of the Liquid Limit Device shall not be used for mixing soil and
water. If too much moisture has been added to the sample, the sample shall either be discarded, or mixed
and kneaded until the natural evaporation lowers the closure point into acceptable range.
NOTE: Some soils are slow to absorb water; therefore, it is possible to add increments of water so fast
that a false liquid limit value is obtained. This can be avoided if more mixing and/or time is allowed.
Tap water may be used for routine testing if comparative test indicate no differences in results between
using tap water and distilled or demineralized water. However, referee, or disputed tests shall be
performed using distilled or demineralized water.
4.3.4. When sufficient water has been thoroughly mixed with the soil to form a uniform mass of stiff
consistency, a sufficient quantity of this mixture shall be placed in the cup above the spot where the cup
rests on the base and shall be squeezed and spread with the spatula to level and at the same time trimmed
to a depth of 10 mm at the point of maximum thickness. As few strokes of the spatula as possible shall be
Page 4/9 5.9.10 2016
Revised 2016
KT-10
used, care being take to prevent the entrapment of air bubbles within the mass. The excess soil shall be
returned to the mixing dish. The soil in the cup of the device shall be divided by a firm stroke of the
grooving tool along the diameter through the centerline of the cam follower so that a clean sharp groove
of proper dimensions will be formed. To avoid tearing the sides of the groove or slipping of the soil cake
on the cup, up to six strokes from front to back or from back to front counting as one stroke shall be
permitted. The depth of the groove should be increased with each stroke and only the last stroke should
scrape the bottom of the cup.
4.3.5. The cup containing the sample prepared as described in Section 4.3.4 of this test method, shall be
lifted and dropped by turning the crank at the rate of approximately two revolutions per second until the
two sides of the sample come in contact at the bottom of the groove along a distance of about 0.5 in (13
mm). The number of shocks required to close the groove this distance shall be recorded. The base of the
machine shall not be held with the free hand while the crank is turned.
NOTE: Some soils tend to slide on the surface of the cup instead of flowing. If this occurs, more water
should be added to the sample and remixed, then the soil-water mixture placed in the cup, a groove cut
with grooving tool and Section 4.3.5 repeated. If the soil continues to slide on the cup at a lesser number
of blows than 25, the test is not applicable and a note should be made that the liquid limit could not be
determined.
4.3.6. A slice of soil approximately the width of the spatula, extending from the edge to edge of the soil
cake at right angles to the groove and including that portion of the groove in which the soil flowed
together, shall be removed and placed in suitable container. Record the sample mass to the nearest 0.01 g.
The soil in the container shall be dried in accordance with KT-11 to determine the moisture content. The
use of a lid for the container as stated in KT-11 is required. Record the results.
4.3.7. The soil remaining in the cup shall be transferred to the mixing dish. The cup and grooving tool
shall be washed and dried in preparation for the next trial.
4.3.8. The foregoing operations shall be repeated for at least two additional portions of the sample to
which sufficient water has been added to bring the soil to a more fluid condition. The object of this
procedure is to obtain samples of such consistency that at least one determination will be made in each of
the following ranges of shocks: 25-35, 20-30, 15-25. The range of the three determinations shall be at
least 10 shocks.
5. CALCULATIONS
5.1. Calculate the moisture content of the sample as follows:
Moisture Content = 100 X (A-C)
(C-B)
Where: A= Mass of wet soil and container, g
B= Mass of container, g
C= Mass of dry soil and container, g
5.1.1. Record the moisture content to the nearest 0.1%.
5.2. A “Flow Curve” representing relation between moisture content and corresponding number of shocks
shall be plotted on a semi-logarithmic graph with the moisture contents as abscissa on the arithmetical
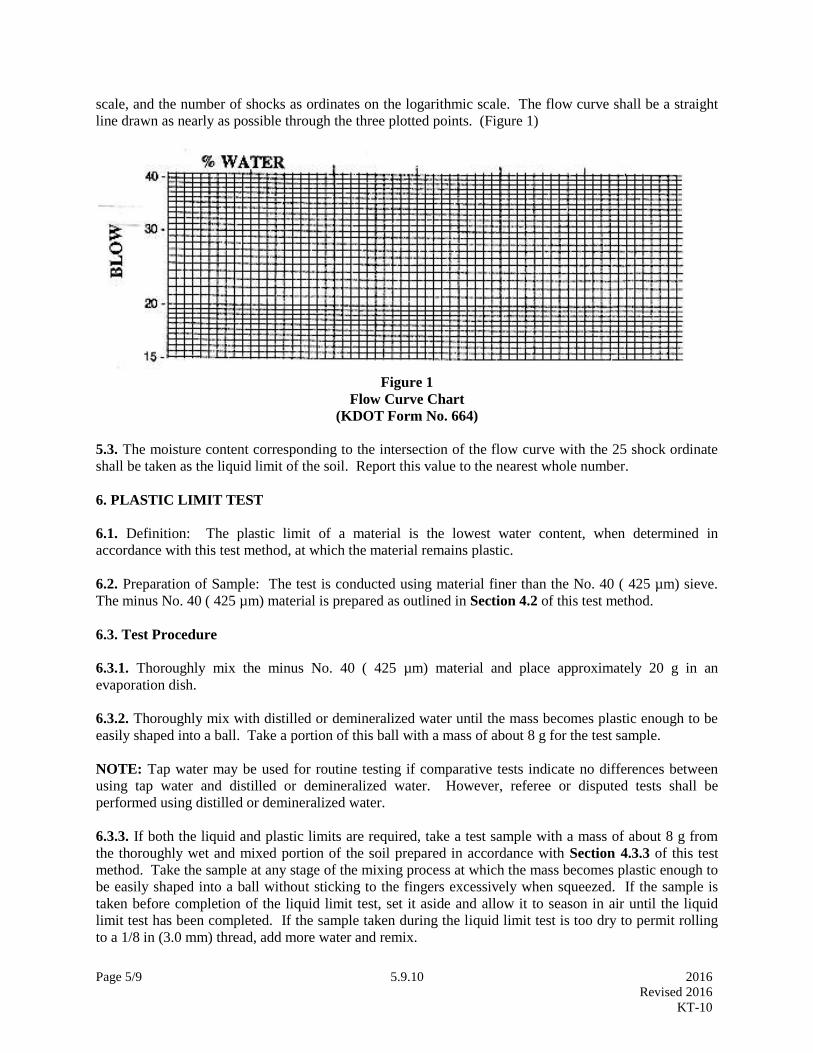
Page 5/9 5.9.10 2016
Revised 2016
KT-10
scale, and the number of shocks as ordinates on the logarithmic scale. The flow curve shall be a straight
line drawn as nearly as possible through the three plotted points. (Figure 1)
Figure 1
Flow Curve Chart
(KDOT Form No. 664)
5.3. The moisture content corresponding to the intersection of the flow curve with the 25 shock ordinate
shall be taken as the liquid limit of the soil. Report this value to the nearest whole number.
6. PLASTIC LIMIT TEST
6.1. Definition: The plastic limit of a material is the lowest water content, when determined in
accordance with this test method, at which the material remains plastic.
6.2. Preparation of Sample: The test is conducted using material finer than the No. 40 ( 425 µm) sieve.
The minus No. 40 ( 425 µm) material is prepared as outlined in Section 4.2 of this test method.
6.3. Test Procedure
6.3.1. Thoroughly mix the minus No. 40 ( 425 µm) material and place approximately 20 g in an
evaporation dish.
6.3.2. Thoroughly mix with distilled or demineralized water until the mass becomes plastic enough to be
easily shaped into a ball. Take a portion of this ball with a mass of about 8 g for the test sample.
NOTE: Tap water may be used for routine testing if comparative tests indicate no differences between
using tap water and distilled or demineralized water. However, referee or disputed tests shall be
performed using distilled or demineralized water.
6.3.3. If both the liquid and plastic limits are required, take a test sample with a mass of about 8 g from
the thoroughly wet and mixed portion of the soil prepared in accordance with Section 4.3.3 of this test
method. Take the sample at any stage of the mixing process at which the mass becomes plastic enough to
be easily shaped into a ball without sticking to the fingers excessively when squeezed. If the sample is
taken before completion of the liquid limit test, set it aside and allow it to season in air until the liquid
limit test has been completed. If the sample taken during the liquid limit test is too dry to permit rolling
to a 1/8 in (3.0 mm) thread, add more water and remix.
Page 6/9 5.9.10 2016
Revised 2016
KT-10
6.3.4. Select 1.5 to 2.0 g of soil taken in Section 6.3.3 of this test method. Form into an ellipsoidal mass.
6.3.5. Roll this mass between the fingers and the palm of the hand and a ground glass plate with just
sufficient pressure to roll the mass into a thread of uniform diameter throughout its length. The rate of
rolling shall be between 80 and 90 strokes per minute, counting a stroke as one complete motion of the
hand forward and back to the starting position again. Reduce the diameter of the thread to 1/8 in (3.0
mm), taking no more than 2 min. Quickly squeeze and reform the thread into an ellipsoidal shaped mass
and re-roll. Continue this alternate reforming and re-rolling to a thread 1/8 in (3.0 mm) in diameter,
gathering together, kneading and re-rolling, until the thread crumbles under the pressure required for
rolling and the material can no longer be rolled into a thread. The crumbling may occur when the thread
is greater than 1/8 in (3.0 mm) in diameter. This shall be considered a satisfactory end point, provided the
material has been rolled to a thread of 1/8 in (3.0 mm) during the previous rolling. The crumbling will
manifest itself differently with various types of material. Some materials fall apart in numerous small
aggregations of particles; others may form an outside tubular layer that starts splitting at both ends.
Splitting progresses toward the middle, and finally, the thread falls apart in many small platy particles. It
is not practical to define crumbling to an exact degree since, as stated above, crumbling will manifest
itself differently for different materials. At no time shall the operator attempt to produce failure at exactly
1/8 in (3.0 mm) diameter by allowing the thread to reach 1/8 in (3.0 mm), then reducing the rate of rolling
or the hand pressure or both, and continuing the rolling without further deformation until the thread falls
apart. It is permissible, however, to reduce the total amount of deformation for feebly plastic soils by
making the initial diameter of the ellipsoidal shaped mass nearer to the required 1/8 in (3.0 mm) final
diameter.
6.3.6. Place the crumbled thread in a watch glass or other suitable container of known mass and close to
prevent evaporation loss. Repeat steps 6.3.4. to 6.3.6. untill the entire 8 gram sample has been tested.
6.3.7. Gather the portions of the crumbled soil together and place in a suitable tared container. Record the
sample mass to the nearest 0.01 g. The soil in the container shall be dried in accordance with KT-11
Sections 3 through 5, to determine the moisture content. The use of a lid for the container as stated in
KT-11 is required. Record the results.
6.4. Alternate procedure using the Plastic Limit Device
6.4.1. Attach smooth unglazed paper to both the bottom fixed plate and the top of the Plastic Limit
Device.
6.4.2. Split the 8 g. test sample taken in Section 6.3.3 and 6.3.4 of this test method into four or five
masses of 1.5 to 2.0 g each. Squeeze into an ellipsoidal-shape and place two to three masses on the
bottom plate. Place the top plate in contact with the soil masses. Simaltaneously with a slight downward
force, apply a back-and-forth rolling motion with the top plate until the top plate comes into contact with
the 3.2 mm side rails, within two minutes. Do not allow the soil thread to come into contact with the side
rails.
6.4.3. Continue the test as outlined in Sections 6.3.5, 6.3.6, and 6.3.7 of this test method.
7. CALCULATIONS
7.1. Calculate the moisture content of the sample at its plastic limit as follows:

Page 7/9 5.9.10 2016
Revised 2016
KT-10
Plastic Limit =100 × (A -C)
(C-B)
Where: A= Mass of wet soil and container, g
B= Mass of container, g
C= Mass of dry soil and container, g
7.2. Record all masses to the nearest 0.01 g. Calculate and record the percentage of moisture to the 0.1%,
report the percentage of moisture to the nearest whole percent.
8. PLASTIC INDEX
8.1. Definition: The plastic index of a material is the numerical difference between the liquid limit and
the plastic limit.
8.2. Calculations: Calculate the plastic index as follows, or calculate on KDOT Form 663.
Plastic Index = Liquid Limit (as recorded) – Plastic Limit (as recorded).
8.3. Reporting: Report the plastic index and liquid limit (when required) to the nearest whole number.
NOTE: When testing extremely sandy samples, it is permissible to conduct the plastic limit test first. If
the plastic limit cannot be determined, report the plastic index as NP (i.e. nonplastic). If the plastic limit
is equal to or greater than the liquid limit, report the plastic index as NP.
9. WET PREPARATION (FOR AGGREGATE MATERIAL ONLY)
9.1. The following “wash” method of preparation shall be used for all types of aggregates, binder soil and
mineral fillers. However, in the case of a mineral filler which all passes a No. 40 (425 µm) sieve, the
washing process may be waived and the sample prepared for testing by reducing it to particle size using
the pulverizing apparatus.
9.2.1. Dry the material to a moisture condition at which it can be pulverized and dry-screened without
sticking or clogging the screens.
9.2.2. Dry-screen the material over a No. 40 (425 µm) sieve to remove as much of the portion passing the
No. 40 (425 µm) sieve as possible before washing. Several larger sieves may be used in this process to
keep part of the load off the No. 40 (425 µm) sieve. This initial dry-screening is very important as it
helps to reduce the time and water required for the washing process which follows. Set aside the minus
No. 40 (425 µm) material obtained in this manner for recombination with material obtained by later steps.
9.2.3. Place the material retained on the No. 40 (425 µm) sieve in a pan, cover with water and soak for a
minimum of 30 minutes.
9.2.4. Following the soaking period, wash the material, using not less than four applications of wash
water, including the soaking water. Each application of water must cover the entire sample. The washing
for each application is accomplished by a “sloshing” action of the pan. Should an appreciable amount of
plastic material remain with the sample after four applications of water, use additional applications
accompanied by more vigorous agitation of the material. Decant each application of the wash water
through a No. 40 (425 µm) sieve, saving all of the wash water and material.
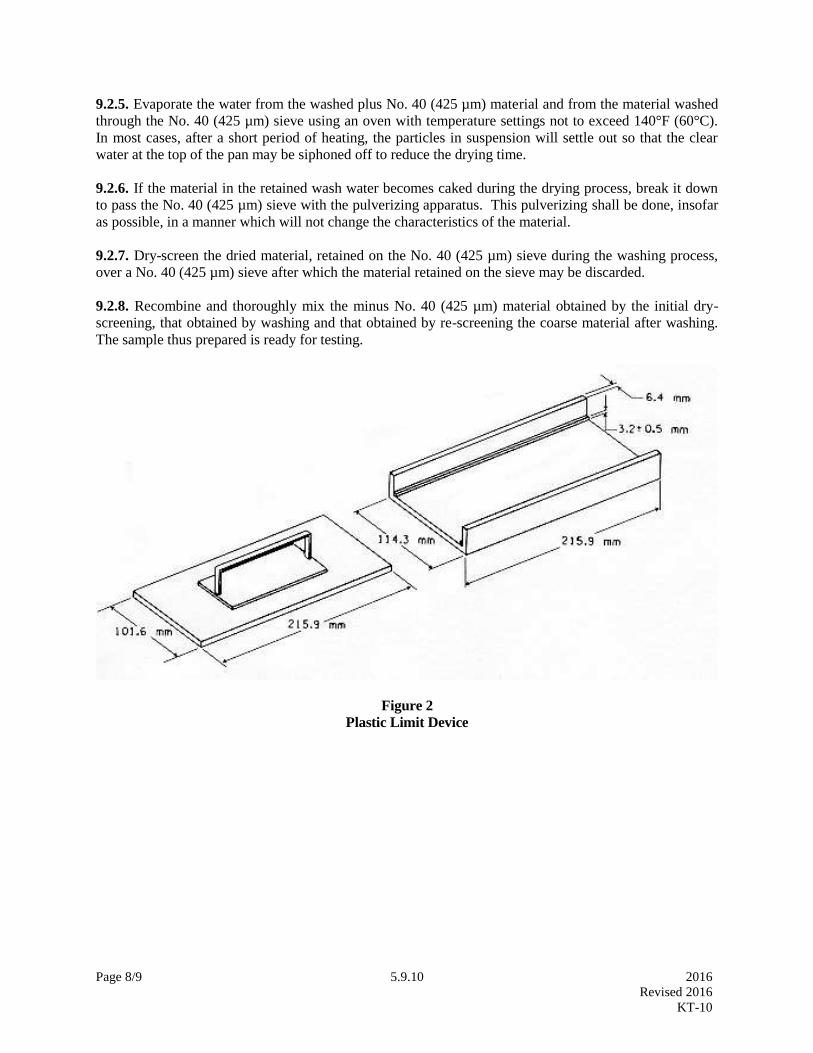
Page 8/9 5.9.10 2016
Revised 2016
KT-10
9.2.5. Evaporate the water from the washed plus No. 40 (425 µm) material and from the material washed
through the No. 40 (425 µm) sieve using an oven with temperature settings not to exceed 140°F (60°C).
In most cases, after a short period of heating, the particles in suspension will settle out so that the clear
water at the top of the pan may be siphoned off to reduce the drying time.
9.2.6. If the material in the retained wash water becomes caked during the drying process, break it down
to pass the No. 40 (425 µm) sieve with the pulverizing apparatus. This pulverizing shall be done, insofar
as possible, in a manner which will not change the characteristics of the material.
9.2.7. Dry-screen the dried material, retained on the No. 40 (425 µm) sieve during the washing process,
over a No. 40 (425 µm) sieve after which the material retained on the sieve may be discarded.
9.2.8. Recombine and thoroughly mix the minus No. 40 (425 µm) material obtained by the initial dry-
screening, that obtained by washing and that obtained by re-screening the coarse material after washing.
The sample thus prepared is ready for testing.
Figure 2
Plastic Limit Device

Page 9/9 5.9.10 2016
Revised 2016
KT-10
Figure 3
Brass Cup Calibration
Wear spot
Tape
Cup hanger pivot

Page 1/5 5.9.11 2016
Revised 2014
KT-11
5.9.11 MOISTURE TESTS (Kansas Test Method KT-11)
1. SCOPE
This method of test covers the procedure for the determination of the moisture content of soil and
aggregate. KT-11 reflects testing procedures found in AASHTO T 217 and T 265.
2. REFERENCED DOCUMENTS
2.1. Part V, 5.9; Sampling and Test Methods Foreword
2.2. AASHTO T 217; Determination of Moisture in Soils by Means of a Calcium Carbide Gas Pressure
Moisture Tester
2.3. AASHTO T 265; Laboratory Determination of Moisture Content of Soils
3. CONSTANT MASS METHOD
3.1. Apparatus:
3.1.1. The balance shall conform to the requirements of Part V, 5.9, Sampling and Test Methods
Foreword for the class of general purpose balance required for the principal sample mass of the sample
being tested.
3.1.2. Drying oven should be thermostatically controlled, preferably of the forced-draft type. It shall be
capable of being heated continuously at a temperature of 230 + 9°F (110 + 5°C).
3.1.3. Drying pans.
4. TEST PROCEDURE FOR CONSTANT MASS METHOD
4.1. Select a representative quantity of sample in the amount indicated in the method of test. If no amount
is indicated, the minimum mass of the sample shall be in accordance with the following table:
Maximum Particle Size Minimum Mass
of Sample, g
No. 40 (425 µm) sieve 10
No. 4 (4.75 mm) sieve 100
1/2 in (12.5 mm) sieve 300
1 in (25.0 mm) sieve 500
2 in (50 mm) sieve 1000
4.2. Weigh a clean, dry container (with its lid if used for soils), and place the moisture content sample in
the container. Replace the lid (if used) immediately, and weigh the container, including the lid (if used)
and moist sample. Remove the lid (if used) and place the container with the moist sample in the drying
oven maintained at a temperature of 230 + 9°F (110 + 5°C) and dry to a constant mass. Immediately
upon removal from the oven, replace the lid (if used) and allow the sample to cool to room temperature.
Weigh the container including lid (if used) and dried sample.
Page 2/5 5.9.11 2016
Revised 2014
KT-11
NOTE: Checking every moisture content sample to determine that it is dried to a constant mass is
impractical. In most cases, drying of a moisture sample over-night (15 to 16 hours) is sufficient. In cases
where there is doubt concerning the adequacy of overnight drying, drying should be continued until the
mass after two successive periods of drying indicate no change in mass. Samples of sand may often be
dried to constant mass in a period of several hours. Since dry samples may absorb moisture from wet
samples, dried samples should be removed before placing wet samples in the oven.
NOTE: (for bulk soil samples): A container without a lid may be used provided the moist sample is
weighed immediately after being taken and providing the dried sample is weighed immediately after
being removed from the oven or after cooling in a desiccators. This provision does not apply to samples
used for plasticity index determination; lids must be used.
NOTE: Moisture content samples for soils should be discarded and should not be used in any other tests.
5. CALCULATIONS
5.1. Calculate the moisture content as follows:
w=[(mass of moisture)/(mass of oven-dried sample)]×100
w=[(W1-W2)/(W2-Wc)]×100
Where: w = moisture content, percent
W1 = mass of container and moist sample, g
W2 = mass of container and oven-dried sample, g
Wc = mass of container, g
5.2. Calculate the percent of moisture content.
6. REPORT
6.1. Record the moisture content to the nearest 0.01% of mass of the oven dried sample. Report the
percent of moisture content to the nearest 0.1%.
7. GAS PRESSURE (‘SPEEDY”) METHOD
NOTE: This method shall not be used on granular materials having more than 5% particles large enough
to be retained on a No. 4 (4.75 mm) sieve as determined by a visual estimate. The Super 200 D Tester is
intended to be used when testing aggregate.
7.1. Apparatus
7.1.1. Calcium carbide pressure moisture tester. (Figure 1)
7.1.2. The balance shall conform to the requirements of Part V, 5.9, Sampling and Test Methods
Foreword.
7.1.3. Two 1.25 in (31.75 mm) steel balls.
7.1.4. Cleaning brush and cloth.
Page 3/5 5.9.11 2016
Revised 2014
KT-11
7.1.5. Scoop for measuring calcium carbide reagent.
8. MATERIAL
8.1. Calcium carbide reagent.
NOTE: The calcium carbide must be finely pulverized and should be of a grade capable of producing
acetylene gas in the amount of at least 2.25 ft3/lb 90.14 m
3/kg) of carbide.
NOTE: The “shelf life” of the calcium carbide reagent is limited, so it should be used according to
manufacturer recommendations.
9. TEST PROCEDURE FOR SPEEDY METHOD
9.1. When using the 20 g or 26 g tester, place three scoops (approximately 24 g) of calcium carbide in the
body of the moisture tester. When using the Super 200 D Tester to test aggregate, place 6 scoops
(approximately 48 g) of calcium carbide in the body of the moisture tester.
NOTE: Care must be exercised to prevent the calcium carbide from coming into direct contact with
water.
9.2. Weigh a sample of the exact mass specified by the manufacturer of the instrument in the balance
provided, and place the sample in the cap of the tester. When using the 20 g or 26 g size tester, place two
1.25 in (31.75 mm steel balls in the body of the tester with the calcium carbide.
NOTE: If the moisture content of the sample exceeds the limit of the pressure gauge (12% moisture for
aggregate tester or 20% moisture for soil tester), a one-half size sample must be used and the dial reading
must be multiplied by 2. This proportional method is not directly applicable to the dry mass percent scale
on the Super 200 D Tester.
9.3. With the pressure vessel in an approximately horizontal position, insert the cap in the pressure vessel
and seal the unit by tightening the clamp, taking care that no carbide comes in contact with the soil until a
complete seal is achieved.
9.4. Raise the moisture tester to a vertical position so that the soil in the cap will fall into the pressure
vessel.
9.5. Shake the instrument vigorously so that all lumps will be broken up to permit the calcium carbide to
react with all available free moisture. When steel balls are being used in the tester and when using the
larger tester to test aggregate, the instrument should be shaken with a rotating motion so the steel balls or
aggregate will not damage the instrument or cause soil particles to become embedded in the orifice
leading to the pressure diaphragm.
NOTE: Shaking should continue for at least 60 seconds with granular soils and for up to 180 seconds for
other soils so as to permit complete reaction between the calcium carbide and the free moisture. Time
should be permitted to allow dissipation of the heat generated by the chemical reaction.
9.6. When the needle stops moving, read the dial while holding the instrument in a horizontal position at
eye level.
Page 4/5 5.9.11 2016
Revised 2014
KT-11
9.7. Record the dial reading.1
9.8. With the cap of the instrument pointed away from the operator, slowly release the gas pressure.
Empty the pressure vessel and examine the material for lumps. If the sample is not completely
pulverized, the test should be repeated using a new sample. Clean the cap thoroughly of all carbide and
soil before running another test.
NOTE: When removing the cap, care should be taken to point instrument away from the operator to
avoid breathing the fumes and away from any potential source of ignition for the acetylene gas.
9.9. The dial reading is the percent of moisture by wet mass and must be converted to dry mass. With the
Super 200 D Tester the dial reading is the percent of moisture by dry mass, and no further calculation is
required.
10. CALCULATION
10.1 The percentage of moisture by dry mass of the soil may be determined from the conversion curve
(Figure 2).
NOTE: A conversion curve similar to Figure 2 is normally supplied with the moisture tester. However,
check each moisture tester for accuracy of its gage, or the accuracy of the conversion curve annually2.
Accuracy of the tester gage may be checked by using a calibration kit (obtainable from the tester
manufacturer), equipped with the standard gage; in case of discrepancy, the gage tester should be adjusted
to conform to the standard gage. For checking the accuracy of the conversion curve, a calibration should
be made for meter readings using locally prepared soils at known moisture contents. Also, additional
testing may be necessary to extend the conversion curve (Figure 2) beyond 44% moisture content.
NOTE: It may be convenient for field use of the apparatus to prepare a table of moisture tester readings
versus oven-dry moisture content for the moisture tester.
11. REPORT
11.1. Record the dial reading to the nearest 0.1% and determine the percent moisture from the conversion
chart. Report the percentage of moisture to the nearest whole percent.
1 AASHTO T 217 requires recording sample mass and dial reading.
2 KDOT requires that each Speedy Moisture tester be checked annually for accuracy of reading.

Page 5/5 5.9.11 2016
Revised 2014
KT-11
Figure 1 Calcium Carbide Gas Pressure Moisture Meter
Figure 2 Conversion Curve for
Moisture Tester Reading

Page 1/7 5.9.12 2016
Revised 2014
KT-12
5.9.12 STANDARD COMPACTION TEST (Kansas Test Method KT-12)
1. SCOPE
1.1. Fine Grained Materials (Section 4.): This method of test is used to determine the relation between the
moisture content and density of soils or other fine grained materials when subjected, at various moisture
contents, to a standard compactive effort while confined in a rigid metal mold. KT-12 reflects testing
procedures found in AASHTO T 99.
The procedure for compaction of “fine grained materials” shall be followed whenever:
(1) The material has less than 10% retained on the No. 4 (4.74 mm) sieve, or
(2) The material has more than 10 % but less than 30% retained on the No. 4 (4.75 mm) sieve
and the fraction passing the No. 40 (425 µm) sieve has a plastic index greater than 8.
1.2. Granular Materials (Section 5.): This method of test is used to determine the relation between the
moisture content and density of granular materials, when subjected, at various moisture contents, to a
standard compactive effort while confined in a rigid mold. KT-12 reflects testing procedures found in
AASHTO T 99.
Granular materials are classified as materials passing the 3/4 in (19.0 mm) sieve.
2. REFERENCED DOCUMENTS
2.1. Part V, 5.9; Sampling and Test Methods Foreword
2.2 KT-11; Moisture Tests
2.3. AASHTO T 19; Bulk Density (“Unit Weight”) and Voids in Aggregate
2.4. AASHTO T 99; Moisture-Density Relations of Soils Using a 5.5 lb (2.5 kg) Rammer and a 12 in
(305 mm) Drop
2.5. AASHTO T 265; Laboratory Determination of Moisture Content of Soils
2.6. ASTM D 2168; Test Methods for Calibration of Laboratory Mechanical-Rammer Soil Compactors
3. APPARATUS
3.1. Fine Grained Material:
3.1.1. The mold shall be solid wall, metal cylinders 4 in (101.6 mm) with a capacity of 0.0333 + 0.0003
ft3 [1/30ft
3](0.000943 + 0.000008 m
3) and an internal diameter of 4.000 + 0.016 in (101.60 + 0.41 mm)
and a height of 4.584 + 0.005 in (116.43 + 0.13 mm). It shall have a detachable collar assembly
approximately 2.375 in (60 mm) in height. The mold and collar assembly shall be constructed so that it
can be fastened firmly to a detachable base plate made of the same material. The base plate shall be plane
to 0.005 in.
Page 2/7 5.9.12 2016
Revised 2014
KT-12
3.1.1.1. A mold that fails to meet manufacturing tolerances after continued service may remain in use
provided those tolerances are not exceeded by more than 50%; and the volume of the mold calibrated in
accordance with AASHTO T 19, Section 8, for Unit Mass of Aggregate, is used in the calculations.
3.1.1.2. Any correction to the volume requires a new calculated multiplier (F). The multiplier is an
inverse function of the mold volume.
NOTE: The volume of the mold (without the collar) is measured by coating one end with cup grease or
Vaseline to form a seal and then placing it on a glass plate which should be placed in a level position on a
scale. The other end of the mold is coated with cup grease or Vaseline and then the mold and two glass
plates are weighed. The mold may then be filled with 77 + 2°F (25 + 1° C)1 water after which the second
glass plate should be placed on top of the mold in such a way as to eliminate air bubbles and excess water.
Any excess water thus removed must be carefully wiped off after which the final weight of the mold,
water and glass plates may be determined. The volume of the mold may then be calculated using 62.243
lb/ft3 (997 kg/m
3) as the density of water.
3.1.2. Rammer
3.1.2.1. Manually operated. A metal rammer with a mass of 5.5 + 0.02 lb (2.495 + 0.009 kg), and having
a flat circular face of 2.000 in (50.80 mm) diameter with a tolerance of + 0.01 in (0.25 mm). The in-
service diameter of the flat circular face shall be not less than 1.985 in (50.42 mm). The rammer shall be
equipped with a suitable guide-sleeve to control the height of drop to a free fall of 12.00 + 0.06 in (305 +
2 mm) above the elevation of the soil. The guide-sleeve shall have at least 4 vent holes, no smaller than
3/8 in (9.5. mm) diameter spaced at 90 degrees (1.57 rad) apart and 3/4 in (19 mm) from each end; and
shall provide sufficient clearance so the free fall of the rammer shaft and head is unrestricted.
3.1.2.2. Mechanically operated. A mechanically operated metal rammer is equipped to control the height
of drop to 12 + 0.06 in (305 + 2.0 mm) above the elevation of the soil and to distribute the blows over the
soil surface. The rammer has a 2 in (50.8 mm) diameter, flat circular face and has a mass of 5.5 + 0.02 lb
(2.495 + 0.009 kg).
NOTE: The mechanically operated rammer must be calibrated as directed by ASTM D 2168, Method A.
3.1.3. Sample extruder (desirable) should consist of, a frame, jack and circular metal loading plate or
other suitable device for removing specimens from the mold.
3.1.4. The balance shall conform to the requirements of Part V, 5.9; Sampling and Test Methods
Foreword, for the class of general purpose balance required for the principal sample mass of the sample
being tested.
3.1.5. A thermostatically controlled drying oven capable of maintaining a temperature of 230 + 9°F (110
+ 5°C) for drying moisture samples.
3.1.6. A hardened-steel straightedge at least 10 in (250 mm) in length. It shall have one beveled edge, and
at least one longitudinal surface shall be plane within 0.01 in per 10 in (0.250 mm per 250 mm) (0.1%) of
length within the portion used for trimming the soil.
1 AASHTO T 99 references AASHTO T 19 to calibrate the mold. AASHTO T 19 permits the use of varying
temperatures 77 + 2°F (25 + 1°C) with correction factors to compensate for the water density. By using the fixed
temperature requirement, KDOT uses a single value (62.243 lb/ft3 [997 kg/m
3]) for the density of water during the
calibration of such apparatuses.

Page 3/7 5.9.12 2016
Revised 2014
KT-12
3.1.7. No. 4 (4.75 mm) sieve.
3.1.8. Drying pans.
3.1.9. Trowels, spatulas and other mixing tools or a mechanical mixer that will thoroughly mix the
material and water.
3.2. Granular Material:
3.2.1. The mold shall be solid wall, metal cylinders 6 in (152.4 mm) with a capacity of 0.07500 + 0.00075
ft3 [1/3.33ft
3](0.00214 + 0.000021 m
3) and an internal diameter of 6.000 + 0.026 in (152.40 + 0.66 mm)
and a height of 4.584 + 0.005 in (116.43 + 0.13 mm). It shall have a detachable collar assembly
approximately 2.375 in (60 mm) in height. The mold and collar assembly shall be constructed so that it
can be fastened firmly to a detachable base plate made of the same material. The base plate shall be plane
to 0.005 in.
3.2.1.1. A mold that fails to meet manufacturing tolerances after continued service may remain in use
provided those tolerances are not exceeded by more than 50%; and the volume of the mold calibrated in
accordance with AASHTO T 19, Section 7, for Unit Mass of Aggregate, is used in the calculations.
3.2.2. A hardened-steel straightedge at least 10 in (250 mm) in length. It shall have one beveled edge, and
at least one longitudinal surface shall be plane within 0.01 in per 10 in (0.250 mm per 250 mm) (0.1%) of
length within the portion used for trimming the soil.
3.2.3. Other apparatus as listed under Section 3.1 of this test method.
NOTE: When a mechanical compactor is used, the 2 in (50.8 mm) diameter circular face foot may be
replaced with a rigid “pie-shaped” foot. The “pie-shaped” foot shall be a sector of a 6 in (152.4 mm)
diameter circle and shall have an area equal to that of the circular face foot.
4. FINE GRAINED MATERIALS
4.1. Sample Preparation.
4.1.1. Obtain a 60 to 80 lbs (30 to 35 kg) sample, dry at 140°F (60°C) if necessary, and break it down to
pass the No. 4 (4.75 mm) sieve. Discard granular particles retained on the sieve.
4.1.2. Mix thoroughly and weigh out six portions, each weighing 5 lbs (2200 g).
4.2. Test Procedure.
4.2.1. Add a measured amount of water (approximately 12% by dry mass) to one 5 lb (2200 g) portion
and thoroughly mix it into the sample.
4.2.2. The sample of soil-water mixture shall be placed in a closed container to minimize moisture loss.
The sample shall then be allowed to stand for a minimum of 12 hours before compacting.
4.2.3. Obtain the mass of the mold to the nearest 0.0001 lb (0.0001 kg). It is suggested that the mold and
collar be lightly coated with a light lubricant.
Page 4/7 5.9.12 2016
Revised 2014
KT-12
4.2.4. Place the assembled mold on the rigid base and fill the mold so that the compacted layer will equal
1/3 of the mold volume.
4.2.5. Compact the material with 25 blows of the rammer dropped from a height of 12 in (304.8 mm)
above the surface of the material. Distribute the blows of the rammer evenly over the surface.
4.2.6. Place two more layers of the material in the mold and compact each layer as stipulated in Section
4.2.3 above.
4.2.7. Remove the top collar and trim the excess material level with the top of the mold.
4.2.8. Remove the base and trim excess material level with the bottom of the mold.
4.2.9. Weigh the sample to the nearest 5 g while it is in the mold and multiply the mass of the sample and
the mold, minus the mass of the mold, by 30 (1060), and record the result as the wet density, Dw, in
pounds per cubic foot, (kilograms per cubic meter), of the compacted soil.
4.2.10. Repeat the compaction procedure using the other 5 lb (2200 g) increments of the sample to which
different measured amounts of water have been added, thoroughly mixed and cured as in the note
following Section 4.2.1 of this test method. This procedure will be continued with varying moisture
contents until at least three points are obtained on the dry side of “optimum moisture” and at least two
points are obtained on the wet side of “optimum moisture.” This can usually be accomplished by
compacting different specimens at moisture intervals of 2 to 3%, starting on the dry side of “optimum
moisture” and ending on the wet side.
4.2.11. Remove the material from the mold and slice vertically through the center. Take a representative
sample, weighing a minimum of 100 g of the material from one of the cut faces, determine the mass
immediately and dry in accordance with KT-11, to determine the moisture content.
4.3. Calculations:
The calculations used are given in Section 6. of this test method.
4.4. Compaction Curve
4.4.1 Plot a density/moisture curve on coordinate paper (KDOT Form No. 638) to determine the
maximum density and optimum moisture. The dry density values are plotted as ordinates, the
corresponding moisture contents are plotted as abscissa and a smooth curve is drawn to best fit the points.
NOTE: In drawing a curve by this method, all of the points will not necessarily be on the curve and the
maximum density may be more or less than the highest test point. (See example at the end of this test
method.)
The optimum moisture content is the moisture content at which the maximum density occurs on the
curve.
Page 5/7 5.9.12 2016
Revised 2014
KT-12
5. GRANULAR MATERIALS
5.1. Sample Preparation.
5.1.1. Obtain approximately 100 lbs (45 kg) of the material to be tested, dry to maximum of 140°F if
necessary and pulverize in such a manner as to avoid reducing the natural size of individual particles.
5.1.1.1. Sieve an adequate quantity of the pulverized soil over the 3/4 in (19.0 mm) sieve. Discard the
coarse material, if any, retained on the 3/4 in (19.0 mm) sieve.
5.1.2. Thoroughly mix and weigh out six portions, each weighing 16 lbs (7 kg).
5.2. Test Procedure.
5.2.1. Add a measured amount (approximately 5%) of water and thoroughly mix one 16 lbs (7 kg)
portion. After the addition of water and thorough mixing, the sample shall be placed in a covered
container and allowed to stand for a minimum of 2 hours before conducting the moisture-density test.
5.2.2. Place the assembled mold on the rigid base and fill in three approximately equal layers. Compact
each layer with 56 blows of the rammer with the blows being distributed uniformly over the surface of the
layer.
5.2.3. After the third layer has been compacted, remove the collar and trim excess material level with the
top of the mold.
5.2.4. Remove the base and trim excess material level with the bottom of the mold.
5.2.5. Weigh the sample while it is in the mold and multiply the mass of the sample and the mold, minus
the mass of the mold, by 13.33 (471), and record the result as the wet density, Dw, in lb/ft3
(kg/m
3), of the
compacted soil.
5.2.6. Repeat the compaction procedure using the other 16 lbs (7 kg) increments of the sample to which
different measured amounts of water have been added, thoroughly mixed and cured as in the note
following Section 5.2.1 of this test method. This procedure will be continued with varying moisture
contents until at least three points are obtained on the dry side of “optimum moisture” and at least two
points are obtained on the wet side of “optimum moisture.” This can usually be accomplished by
compacting different specimens at moisture intervals of 2 to 3%, starting on the dry side of “optimum
moisture” and ending on the wet side.
5.2.7. Remove the material from the mold and slice vertically through the center. Take a representative
sample, weighing a minimum of 300 g of the material from one of the cut faces, determine the mass
immediately and dry in accordance with KT-11, to determine the moisture content.
5.3. Calculations.
The calculations used are given in Section 6. of this test method.
5.4. Plot a density/moisture curve on coordinate paper (KDOT Form No. 638) to determine the
maximum density and optimum moisture. The dry density values are plotted as ordinates, the
corresponding moisture contents are plotted as abscissa and a smooth curve is drawn to best fit the points.

Page 6/7 5.9.12 2016
Revised 2014
KT-12
NOTE: In drawing a curve by this method, all of the points will not necessarily be on the curve and the
maximum density may be more or less than the highest test point. (See example at the end of this test
method.)
The optimum moisture content is the moisture content at which the maximum density occurs on the
curve.
The data for this test may be recorded on the “Work Sheet for Standard Compaction Tests” (KDOT
Form No, 676) which is in bound book form.
6. CALCULATIONS
W=A -B
B -C×100
And
D=Dw
W +100×100
Where: W= percentage of moisture in the specimen, based on oven dry mass of soil
A= mass of container and wet soil
B= mass of container and dry soil
C= mass of container
D= dry density, in lb/ft3 (kg
/m
3) of compacted soil
Dw= wet density, in lb/ft3 (kg
/m
3) of compacted soil
Where:
DW= (A -C)F
F = 30 for the 4 in mold and 13.33 for the 6 in mold (see Section 5.2.5.) (1060 for 101.6 mm mold and
471 for 152.4 mm mold)
7. RECORD AND REPORT
7.1. Record the density to the nearest 0.1 lb/ft3 (1
kg
/m
3). Report the density to the nearest whole number.
Record the moisture to the nearest 0.1%. Report the moisture to the nearest whole number.

Page 7/7 5.9.12 2016 Revised 2014 KT-12
COMPACTION CURVE EXAMPLES

Page 1/14 5.9.13 2016
Revised 2015
KT-13
5.9.13 FIELD DENSITY TESTS OF SOILS, TREATED BASE COURSES AND WATER BOUND
BASE COURSES (Kansas Test Method KT-13)
1. SCOPE
This method of test covers the procedure for measuring the “in-place” density of soils and granular base
courses. The density of a material is defined as the ratio of the mass of material to the volume of the
same mass of material. The tests described consist of measuring the volume that a given mass of soil or
base material occupies when it is in-place. KT-13 reflects testing procedures previously found in
AASHTO T 191.
2. REFERENCED DOCUMENTS
2.1. Part V, 5.9; Sampling and Test Methods Foreword
2.2 KT-11; Moisture Tests
2.3. KT-15; Bulk Specific Gravity and Unit Weight of Compacted Hot Mix Asphalt Mixtures (HMA)
2.4. KT-43; Moisture Content of Asphalt Mixtures or Mineral Aggregates - Microwave Oven Method
2.5. AASHTO T 99 Test for Moisture-Density Relations of Soils
2.6. AASHTO T 180; Moisture-Density Relations of Soils Using a 10 lb (4.54 kg) Rammer and an 18”
(457 mm) Drop
2.7. AASHTO T 191; Density of Soil In-Place by the Sand-Cone Method
2.8. AASHTO T 205; Density of Soil In-Place by the Rubber-Balloon Method (deleted in 2000)
3. APPARATUS
3.1. General for all tests.
3.1.1. The balance shall conform to the requirements of Part V, 5.9; Sampling and Test Methods
Foreword, for the class of general purpose balance required for the principal sample mass of the sample
being tested.
3.1.2. Oven capable of maintaining a uniform temperature of approximately 230°F (110°C) or a hot plate
with a buffer consisting of a pan of sand or thick steel plate placed between the drying pan and the flame.
If available, a microwave oven as described in KT-43 may be used.
3.1.3. Equipment or shelter to protect balance from wind currents and the samples from exposure to the
sun and wind.
3.1.4. Soil auger.
3.1.5. Speedy Moisture equipment as described in KT-11.
3.1.6. Miscellaneous equipment including standard drying pans, trowel, large spoon, hammer, chisels,
heavy bladed knife, square point shovel and 12 in (300 mm) straight edge.

Page 2/14 5.9.13 2016
Revised 2015
KT-13
3.2. Sand Density Apparatus.
3.2.1. A cylindrical container of known volume usually between 0.05 and 0.10 ft3.
3.2.2. A pouring container with a volume larger than the volume of the test hole. A one pound coffee can
with the rim bent into a “V” shape have previously been used as a pouring container, for shallow holes.
3.2.3. Any clean, dry, free-flowing, uncemented sand having few, if any, particles passing the No. 200
(975 µm) or retained on the No. 10 (2.00 mm) sieves. In selecting sand for use, several bulk density
determinations should be made using the same representative sample for each determination. To be
acceptable the sand shall not have a variation in bulk density greater than 1%.
3.3. Sand Cone Apparatus.
3.3.1. The density apparatus shall consist of a 1 gal (4 L) jar and a detachable appliance consisting of a
cylindrical valve with an orifice 1/2 in (12.7 mm) in diameter and having a small funnel continuing to
standard G mason jar on one end and a large funnel on the other end. The valve shall have stops to
prevent rotating the valve past the completely closed positions. (See Figure 1 and Figure 2)
NOTE: The apparatus1 describe here represents a design that has proven satisfactory. Other apparatus of
similar proportions will perform equally well so long as the basic principles of the sand-volume
determination are observed. This apparatus, when full, can be used with test holes having a volume of
approximately 0.1 ft3 (2.7 L). The base plate is optional; its use may make leveling more difficult but
permits test holes of larger diameter and may reduce loss in transferring soil from test-hole to container as
well as afford a more constant base for tests in soft soils. When the base plate is used it shall be
considered a part of the funnel in the procedures of this test method.
3.3.2. Any clean, dry, free-flowing, uncemented sand having few, if any, particles passing the No. 200
(975 µm) or retained on the No. 10 (2.00 mm) sieves. In selecting sand for use, several bulk density
determinations should be made using the same representative sample for each determination. To be
acceptable the sand shall not have a variation in bulk density greater than 1%.
3.4. Alternate Test Method Apparatus.
3.4.1. Small pipe about 3/4 in diameter.
3.4.2. 1/10 ft3 bucket.
3.4.3. Funnel fitting small pipe in Section 3.4.1.
3.4. Rubber-Balloon Density Apparatus.
3.4.1. A Calibrated vessel designed to contain a liquid within a relatively thin, flexible, elastic membrane
(rubber balloon) for measuring the volume of the test hole under the conditions of this method. The
apparatus shall be equipped so that an externally controlled pressure or partial vacuum can be applied to
the contained liquid. It shall be of such mass and size that it will not cause distortion of the excavated test
hole and adjacent test area during the performance of the test. Provision shall be made for placing masses
(surcharge) on the apparatus. There shall be a volume indicator for determining to the nearest 0.00025 ft3
1 See AASHTO T 191 Figure 1 for size requirements.
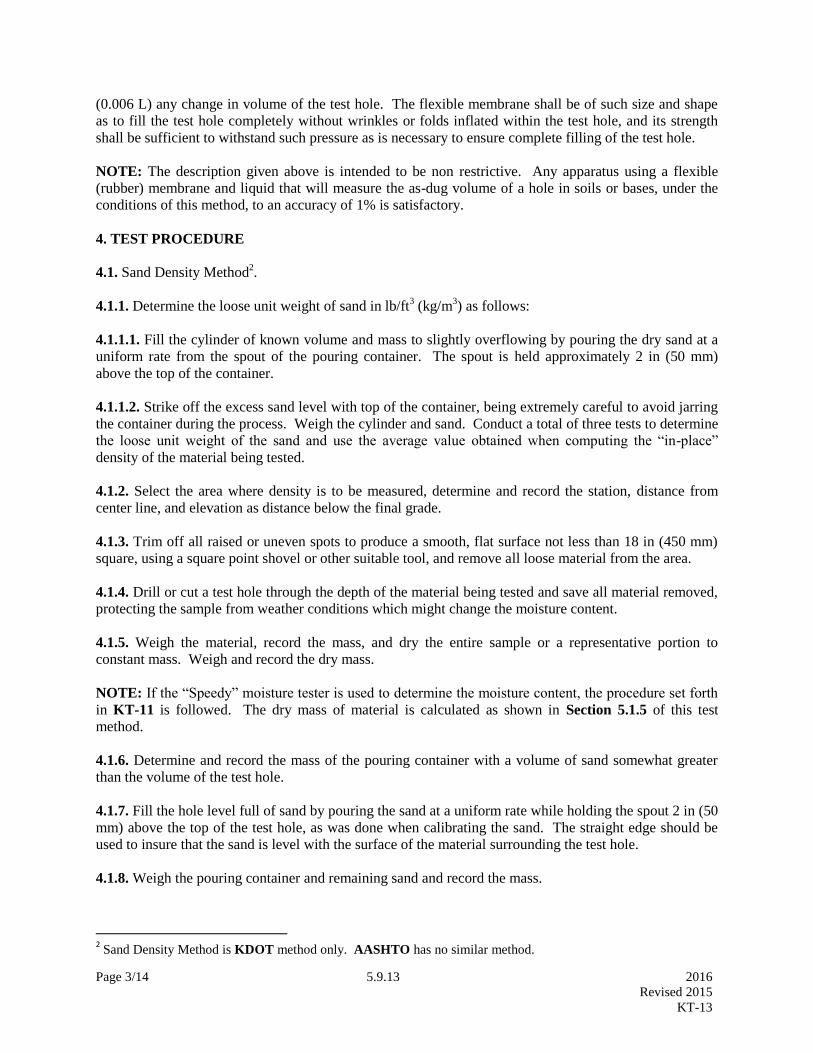
Page 3/14 5.9.13 2016
Revised 2015
KT-13
(0.006 L) any change in volume of the test hole. The flexible membrane shall be of such size and shape
as to fill the test hole completely without wrinkles or folds inflated within the test hole, and its strength
shall be sufficient to withstand such pressure as is necessary to ensure complete filling of the test hole.
NOTE: The description given above is intended to be non restrictive. Any apparatus using a flexible
(rubber) membrane and liquid that will measure the as-dug volume of a hole in soils or bases, under the
conditions of this method, to an accuracy of 1% is satisfactory.
4. TEST PROCEDURE
4.1. Sand Density Method2.
4.1.1. Determine the loose unit weight of sand in lb/ft3 (kg/m
3) as follows:
4.1.1.1. Fill the cylinder of known volume and mass to slightly overflowing by pouring the dry sand at a
uniform rate from the spout of the pouring container. The spout is held approximately 2 in (50 mm)
above the top of the container.
4.1.1.2. Strike off the excess sand level with top of the container, being extremely careful to avoid jarring
the container during the process. Weigh the cylinder and sand. Conduct a total of three tests to determine
the loose unit weight of the sand and use the average value obtained when computing the “in-place”
density of the material being tested.
4.1.2. Select the area where density is to be measured, determine and record the station, distance from
center line, and elevation as distance below the final grade.
4.1.3. Trim off all raised or uneven spots to produce a smooth, flat surface not less than 18 in (450 mm)
square, using a square point shovel or other suitable tool, and remove all loose material from the area.
4.1.4. Drill or cut a test hole through the depth of the material being tested and save all material removed,
protecting the sample from weather conditions which might change the moisture content.
4.1.5. Weigh the material, record the mass, and dry the entire sample or a representative portion to
constant mass. Weigh and record the dry mass.
NOTE: If the “Speedy” moisture tester is used to determine the moisture content, the procedure set forth
in KT-11 is followed. The dry mass of material is calculated as shown in Section 5.1.5 of this test
method.
4.1.6. Determine and record the mass of the pouring container with a volume of sand somewhat greater
than the volume of the test hole.
4.1.7. Fill the hole level full of sand by pouring the sand at a uniform rate while holding the spout 2 in (50
mm) above the top of the test hole, as was done when calibrating the sand. The straight edge should be
used to insure that the sand is level with the surface of the material surrounding the test hole.
4.1.8. Weigh the pouring container and remaining sand and record the mass.
2 Sand Density Method is KDOT method only. AASHTO has no similar method.
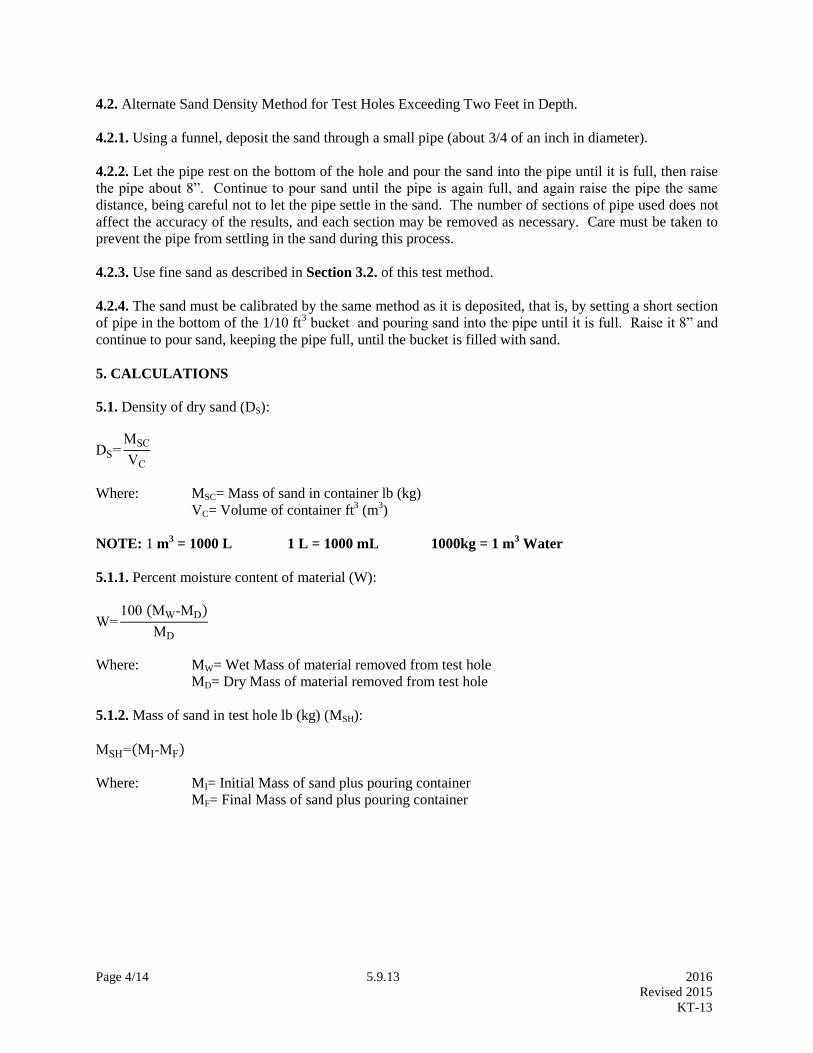
Page 4/14 5.9.13 2016
Revised 2015
KT-13
4.2. Alternate Sand Density Method for Test Holes Exceeding Two Feet in Depth.
4.2.1. Using a funnel, deposit the sand through a small pipe (about 3/4 of an inch in diameter).
4.2.2. Let the pipe rest on the bottom of the hole and pour the sand into the pipe until it is full, then raise
the pipe about 8”. Continue to pour sand until the pipe is again full, and again raise the pipe the same
distance, being careful not to let the pipe settle in the sand. The number of sections of pipe used does not
affect the accuracy of the results, and each section may be removed as necessary. Care must be taken to
prevent the pipe from settling in the sand during this process.
4.2.3. Use fine sand as described in Section 3.2. of this test method.
4.2.4. The sand must be calibrated by the same method as it is deposited, that is, by setting a short section
of pipe in the bottom of the 1/10 ft3 bucket and pouring sand into the pipe until it is full. Raise it 8” and
continue to pour sand, keeping the pipe full, until the bucket is filled with sand.
5. CALCULATIONS
5.1. Density of dry sand (DS):
DS=MSC
VC
Where: MSC= Mass of sand in container lb (kg)
VC= Volume of container ft3 (m
3)
NOTE: 1 m3 = 1000 L 1 L = 1000 mL 1000kg = 1 m
3 Water
5.1.1. Percent moisture content of material (W):
W=100 (MW-MD)
MD
Where: MW= Wet Mass of material removed from test hole
MD= Dry Mass of material removed from test hole
5.1.2. Mass of sand in test hole lb (kg) (MSH):
MSH=(MI-MF)
Where: MI= Initial Mass of sand plus pouring container
MF= Final Mass of sand plus pouring container

Page 5/14 5.9.13 2016
Revised 2015
KT-13
5.1.3. Volume of test hole (V) ft3 (m
3):
V=MSH
DS
Where: MSH = Mass of sand in test hole lb (kg)
DS= Density of sand lb/ft3 (kg/m
3)
5.1.4. In-place dry density of material being tested (D) lb/ft3 (kg/m
3):
D=MD
V
Where: MD= Dry mass of material removed from test hole
V= Volume of test hole
5.1.5. Mass of dry material removed from the test hole (when “Speedy” moisture tester or a portion of the
sample is used to determine moisture content) (MD):
MD=100 (MW)
(W +100)
Where: MW= Mass of wet material removed from test hole, lb (kg)
W= Percent moisture of wet material removed from test hole
6. SAND CONE METHOD
6.1. Determination of volume of jar and attachment up to and including the volume of the valve orifice as
follows:
NOTE: The volume in this procedure is constant as long as the jar and attachment are in the same relative
position. If the two are to be separated, match marks should be made to permit reassembly to this
position.
6.1.1. Weigh the assembled apparatus and record.
6.1.2. Place the apparatus upright and open the valve.
6.1.3. Fill the apparatus with water until it appears over the valve.
6.1.4. Close the valve and remove excess water.
6.1.5. Weigh the apparatus and water.
6.1.6. Repeat the procedure described in Section 6.1.2 to 6.1.3 of this tests method, at least twice.
Convert the mass of water, in grams, to milliliters. The volume used shall be the average of three
determinations with a maximum variation of 3 mL.
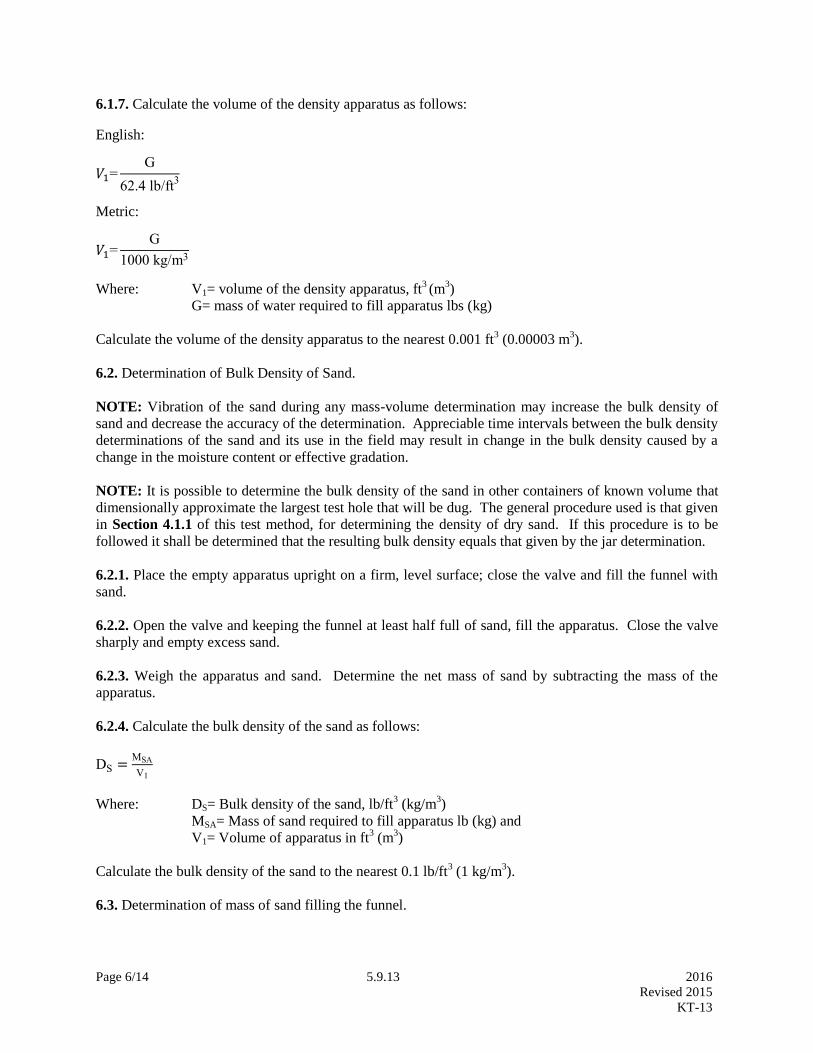
Page 6/14 5.9.13 2016
Revised 2015
KT-13
6.1.7. Calculate the volume of the density apparatus as follows:
English:
𝑉1=G
62.4 lb/ft3
Metric:
𝑉1=G
1000 kg/m3
Where: V1= volume of the density apparatus, ft3 (m
3)
G= mass of water required to fill apparatus lbs (kg)
Calculate the volume of the density apparatus to the nearest 0.001 ft3 (0.00003 m
3).
6.2. Determination of Bulk Density of Sand.
NOTE: Vibration of the sand during any mass-volume determination may increase the bulk density of
sand and decrease the accuracy of the determination. Appreciable time intervals between the bulk density
determinations of the sand and its use in the field may result in change in the bulk density caused by a
change in the moisture content or effective gradation.
NOTE: It is possible to determine the bulk density of the sand in other containers of known volume that
dimensionally approximate the largest test hole that will be dug. The general procedure used is that given
in Section 4.1.1 of this test method, for determining the density of dry sand. If this procedure is to be
followed it shall be determined that the resulting bulk density equals that given by the jar determination.
6.2.1. Place the empty apparatus upright on a firm, level surface; close the valve and fill the funnel with
sand.
6.2.2. Open the valve and keeping the funnel at least half full of sand, fill the apparatus. Close the valve
sharply and empty excess sand.
6.2.3. Weigh the apparatus and sand. Determine the net mass of sand by subtracting the mass of the
apparatus.
6.2.4. Calculate the bulk density of the sand as follows:
DS =MSA
V1
Where: DS= Bulk density of the sand, lb/ft3 (kg/m
3)
MSA= Mass of sand required to fill apparatus lb (kg) and
V1= Volume of apparatus in ft3 (m
3)
Calculate the bulk density of the sand to the nearest 0.1 lb/ft3 (1 kg/m
3).
6.3. Determination of mass of sand filling the funnel.

Page 7/14 5.9.13 2016
Revised 2015
KT-13
NOTE: This determination may be omitted if the procedure given in NOTE in Section 6.2 regarding
bulk densities is followed. When the base plate is used, it shall be considered a part of the funnel.
NOTE: Where test holes of maximum volume are desired it is possible, after the bulk density
determination, to settle the sand by vibration and increase the mass of sand available shall be determined
by re-weighing.
6.3.1. Put sand in the apparatus and obtain the mass of the apparatus and sand.
6.3.2. Seat the inverted apparatus on a clean, level, plane surface.
6.3.3. Open the valve and keep open until the sand stops running.
6.3.4. Close the valve sharply. Weigh the apparatus with remaining sand and determine the loss of the
sand. This loss represents the mass of sand required to fill the funnel.
NOTE: For each container/bag of sand there will be a unique cone correction and sand calibration factor.
Each sand-cone and matched base plate will also have a set of unique cone corrections and bulk sand
densities. If more than one sand-cone apparatus is available, the sand-cone and base plate should be
marked and the associated correction/density factors recorded.
6.3.5. Replace the sand removed in the funnel determination and close the valve.
6.4. Determination of Density of Soil In-Place.
6.4.1. Prepare the surface of the location to be tested so that it is a level plane.
6.4.2. Seat the inverted apparatus on the prepared plane surface and mark the outline of the funnel. Drill
or cut a test hole. Carefully save all material.
NOTE: In soils such that leveling is not successful, a preliminary test shall be run at this point measuring
the volume bounded by the funnel and ground surface. This step requires balances at the test site or
emptying and refilling the apparatus. After this measurement is complete, carefully brush the sand from
the prepared surface.
6.4.3. Seat the apparatus in the previously marked position, open the valve, and after the sand has stopped
flowing, close the valve.
6.4.4. Weigh the apparatus and remaining sand. Determine the mass of sand used in the test.
6.4.5. Weigh the material that was removed from the test hole.
6.4.6. Mix the material thoroughly and secure and weigh a representative sample for moisture
determination.
6.4.7. Determine the moisture content in accordance with KT-11.
6.4.8. The minimum test hole volumes suggested in determining the in-place density of soil mixtures are
given in Table 1. This table shows the suggested minimum mass of the moisture content sample in
relation to the maximum particle size in soil mixtures.
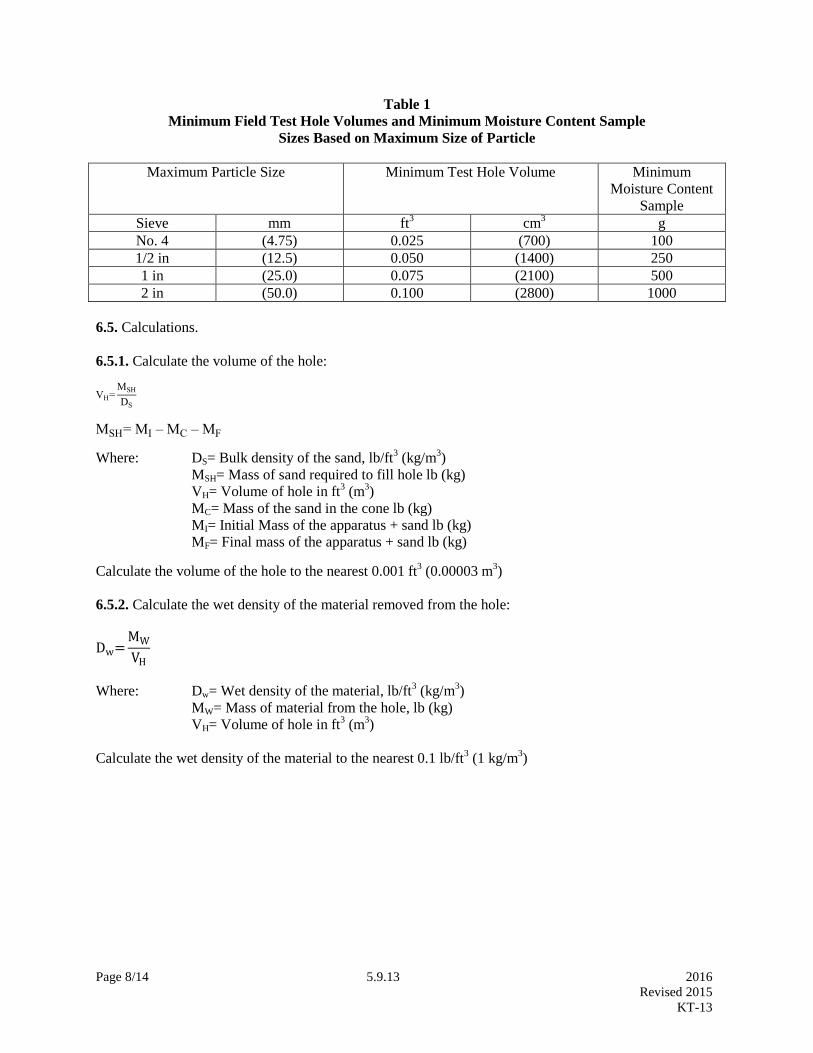
Page 8/14 5.9.13 2016
Revised 2015
KT-13
Table 1
Minimum Field Test Hole Volumes and Minimum Moisture Content Sample
Sizes Based on Maximum Size of Particle
Maximum Particle Size Minimum Test Hole Volume Minimum
Moisture Content
Sample
Sieve mm ft3 cm
3 g
No. 4 (4.75) 0.025 (700) 100
1/2 in (12.5) 0.050 (1400) 250
1 in (25.0) 0.075 (2100) 500
2 in (50.0) 0.100 (2800) 1000
6.5. Calculations.
6.5.1. Calculate the volume of the hole:
VH=MSH
DS
MSH= MI – MC – MF
Where: DS= Bulk density of the sand, lb/ft3 (kg/m
3)
MSH= Mass of sand required to fill hole lb (kg)
VH= Volume of hole in ft3 (m
3)
MC= Mass of the sand in the cone lb (kg)
MI= Initial Mass of the apparatus + sand lb (kg)
MF= Final mass of the apparatus + sand lb (kg)
Calculate the volume of the hole to the nearest 0.001 ft3 (0.00003 m
3)
6.5.2. Calculate the wet density of the material removed from the hole:
Dw=MW
VH
Where: Dw= Wet density of the material, lb/ft3 (kg/m
3)
MW= Mass of material from the hole, lb (kg)
VH= Volume of hole in ft3 (m
3)
Calculate the wet density of the material to the nearest 0.1 lb/ft3 (1 kg/m
3)

Page 9/14 5.9.13 2016
Revised 2015
KT-13
6.5.3. Calculate the in-place dry density of the material tested:
D=Dw
W + 100× 100
Where: Dw= Wet density of the material, lb/ft3 (kg/m
3)
D= Dry density of the material, lb/ft3 (kg/m
3)
W= Percent moisture as determined per Section 5.1.1 of this test method.
Calculate the in-place dry density of the material tested to the nearest 0.1 lb/ft3
NOTE: It may be desired to express the in-place density as a percentage of some other density, for
example, the laboratory maximum density determined in accordance with AASHTO T 99. This relation
can be determined by dividing the in-place density by the maximum density and multiplying by 100.
NOTE: 0.001g/cm3 = 1 kg/m
3
7. RUBBER-BALLOON METHOD
7.1. The apparatus is generally not suitable for very soft soil which will deform under slight pressure or in
which the volume of the hole cannot be maintained at a constant value.
7.2. Calibration Check of Volume Indicator.
7.2.1. Verify the procedure to be used and the accuracy of the volume indicator by using the apparatus to
measure containers or molds of determinable volume that dimensionally simulate test holes that will be
used in the field. The apparatus and procedure shall be such that these volumes will be measured to
within 1.0% (see note below). Containers of different volumes shall be used so that calibration of the
volume indicator covers the range of anticipated test hole sizes.
NOTE: The molds described in AASHTO T 99 Test for Moisture-Density Relations of Soils, and in
AASHTO T 180 Test for Moisture –Density Relations of Soils or other molds prepared to simulate
actual test holes may be used. Where several sets of apparatus are used, it may be desirable to cast
duplicates of actual test holes. These sets should represent the range of sizes and irregularities in the
walls of test holes that will be encountered. These fabricated holes can be used as standards for the
calibration check of the volume indicator. This can be accomplished by forming plaster of paris negatives
in the test holes and using these forms for portland cement concrete castings. After removing the plaster
of paris negative from the concrete casting, the inside surface of the fabricated holes should be sealed
watertight and their volume determined as indicated in Section 7.2.2 of this test method.
7.2.2. Determine the mass of water, in grams, required to fill one of the containers. Slide a glass plate
carefully over the top of the container in such a manner as to ensure that the container is filled completely
with water. Determine the temperature of the water in the container. A thin film of petroleum jelly
smeared on the top surface of the container will make a watertight joint between the glass plate and the
top of the container. Calculate the volume of the container, in ft3,
by multiplying the mass of water, in
grams, used to fill the container by the unit volume of water, in milliliters per gram, at the observed
temperature, taken from Table 2 and dividing the result by 28.317 mL per ft3. Repeat this procedure until
three values are secured for the volume of the container having a maximum range of variation of 0.0001
ft3. Repeat the procedure for each of the containers to be used in the calibration check.
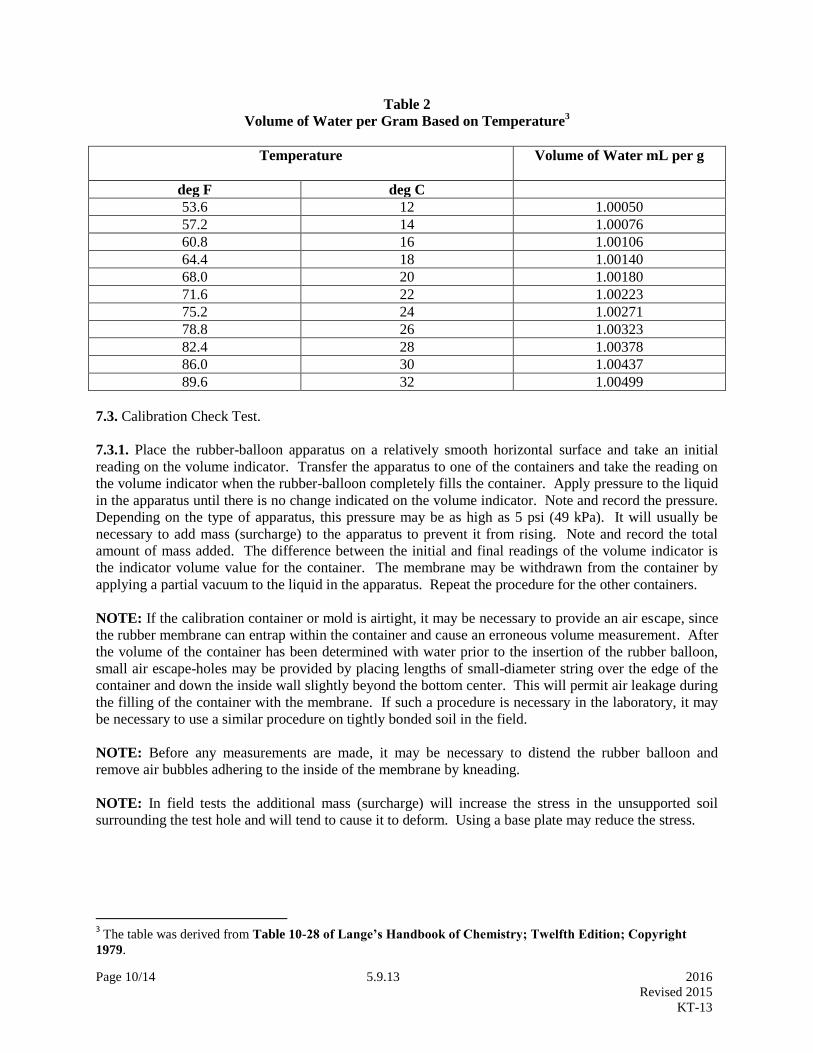
Page 10/14 5.9.13 2016
Revised 2015
KT-13
Table 2
Volume of Water per Gram Based on Temperature3
Temperature
Volume of Water mL per g
deg F deg C
53.6 12 1.00050
57.2 14 1.00076
60.8 16 1.00106
64.4 18 1.00140
68.0 20 1.00180
71.6 22 1.00223
75.2 24 1.00271
78.8 26 1.00323
82.4 28 1.00378
86.0 30 1.00437
89.6 32 1.00499
7.3. Calibration Check Test.
7.3.1. Place the rubber-balloon apparatus on a relatively smooth horizontal surface and take an initial
reading on the volume indicator. Transfer the apparatus to one of the containers and take the reading on
the volume indicator when the rubber-balloon completely fills the container. Apply pressure to the liquid
in the apparatus until there is no change indicated on the volume indicator. Note and record the pressure.
Depending on the type of apparatus, this pressure may be as high as 5 psi (49 kPa). It will usually be
necessary to add mass (surcharge) to the apparatus to prevent it from rising. Note and record the total
amount of mass added. The difference between the initial and final readings of the volume indicator is
the indicator volume value for the container. The membrane may be withdrawn from the container by
applying a partial vacuum to the liquid in the apparatus. Repeat the procedure for the other containers.
NOTE: If the calibration container or mold is airtight, it may be necessary to provide an air escape, since
the rubber membrane can entrap within the container and cause an erroneous volume measurement. After
the volume of the container has been determined with water prior to the insertion of the rubber balloon,
small air escape-holes may be provided by placing lengths of small-diameter string over the edge of the
container and down the inside wall slightly beyond the bottom center. This will permit air leakage during
the filling of the container with the membrane. If such a procedure is necessary in the laboratory, it may
be necessary to use a similar procedure on tightly bonded soil in the field.
NOTE: Before any measurements are made, it may be necessary to distend the rubber balloon and
remove air bubbles adhering to the inside of the membrane by kneading.
NOTE: In field tests the additional mass (surcharge) will increase the stress in the unsupported soil
surrounding the test hole and will tend to cause it to deform. Using a base plate may reduce the stress.
3 The table was derived from Table 10-28 of Lange’s Handbook of Chemistry; Twelfth Edition; Copyright
1979.
Page 11/14 5.9.13 2016
Revised 2015
KT-13
7.4. Test Procedure
7.4.1. Prepare the surface of the material to be tested so that it is reasonably plane. Set the balloon-
density apparatus on the prepared surface and maintain its position by driving nails through the holes in
the base plate and into the soil.
7.4.2. Place a surcharge on the apparatus and apply the same pressure to the liquid as was applied during
the calibration check tests. Read and record the volume of liquid shown on the volume indicator.
7.4.3. Apply sufficient vacuum to the inside of the chamber to withdraw the liquid and balloon into the
chamber.
7.4.4. Remove the apparatus from the base. Drill or cut a test hole through the hole in the base plate and 4
to 6 in (100 to 150 mm) into the material to be tested. Carefully save and determine the mass of all
material removed. The hole shall be of the minimum volume shown in Table 3.
7.4.5. Protect the sample from weather conditions which might change the moisture content. Record the
wet mass of all material removed from the test hole.
7.4.6. Determine the moisture content in accordance with KT-11.
7.4.7. Place the balloon density apparatus over the test hole in exactly the same position as was used for
the initial reading and apply the same surcharge mass to the apparatus and the same pressure to the liquid
as was applied during the initial reading.
NOTE: Attention is called to instances in weak soils where the pressure applied to the liquid in the vessel
can deform the test hole to such an extent as to give an erroneous volume. In such instances, the
apparatus shall be modified and recalibrated using less surcharge mass and pressure on the liquid in the
vessel, or it may be necessary to resort to another method such as the sand cone method already described
in this specification.
7.4.8. Read and record the volume of liquid shown on the volume indicator.
7.4.9. Withdraw the liquid and rubber membrane from the test hole and into the container by developing a
vacuum inside the container with the vacuum phase of the pump.
7.5. Calculations.
7.5.1. Calculate the volume of the test hole, which is the difference between the two volume readings as
determined in Sections 7.4.2 and 7.4.8.
7.5.2. Calculate the wet density, Dw, of the soil removed from the test hole, lb/ft3 (kg/m
3) as follows:
Dw=mass of moist soil
volume of test hole

Page 12/14 5.9.13 2016
Revised 2015
KT-13
7.5.3. Calculate the dry density, D, of the soil removed from the test hole, lb/ft3 (kg/m
3), as follows:
D=Dw
W + 100× 100
Where: Dw= Wet density of the material, lb/ft3 (kg/m
3)
D= Dry density of the material, lb/ft3 (kg/m
3)
W= Percent moisture as determined per Section 5.1.1 of this test method.
Calculate the in-place dry density of the material tested to the nearest 0.1 lb/ft3
Table 3
Minimum Field Test Hole Volumes and
Minimum Moisture Content Sample
Size Based on Maximum Size of Particle
Maximum Particle Size Minimum Test Hole Volume Minimum
Moisture Content
Sample
Sieve mm ft3 cm
3 g
No. 4 (4.75) 0.025 (700) 100
1/2 in (12.5) 0.050 (1400) 250
1 in (25.0) 0.075 (2100) 500
2 in (50.0) 0.100 (2800) 1000
2 1/2 in (63.0) 0.135 (3800) 1500
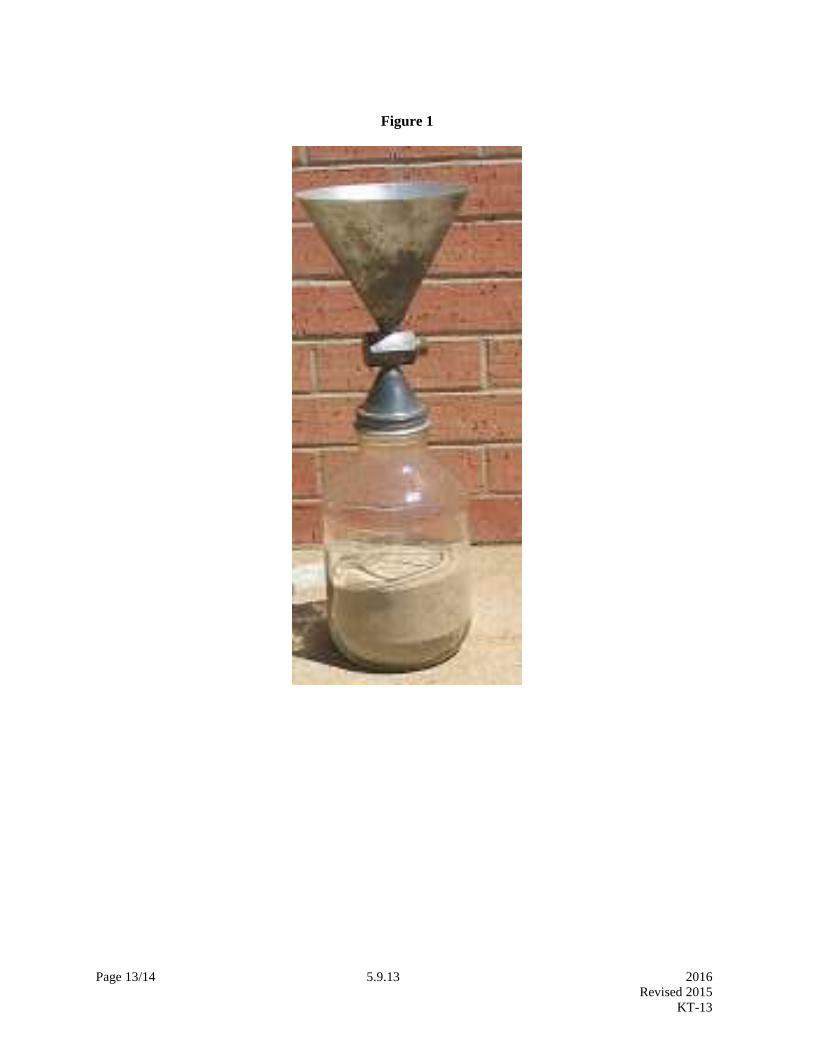
Page 13/14 5.9.13 2016
Revised 2015
KT-13
Figure 1
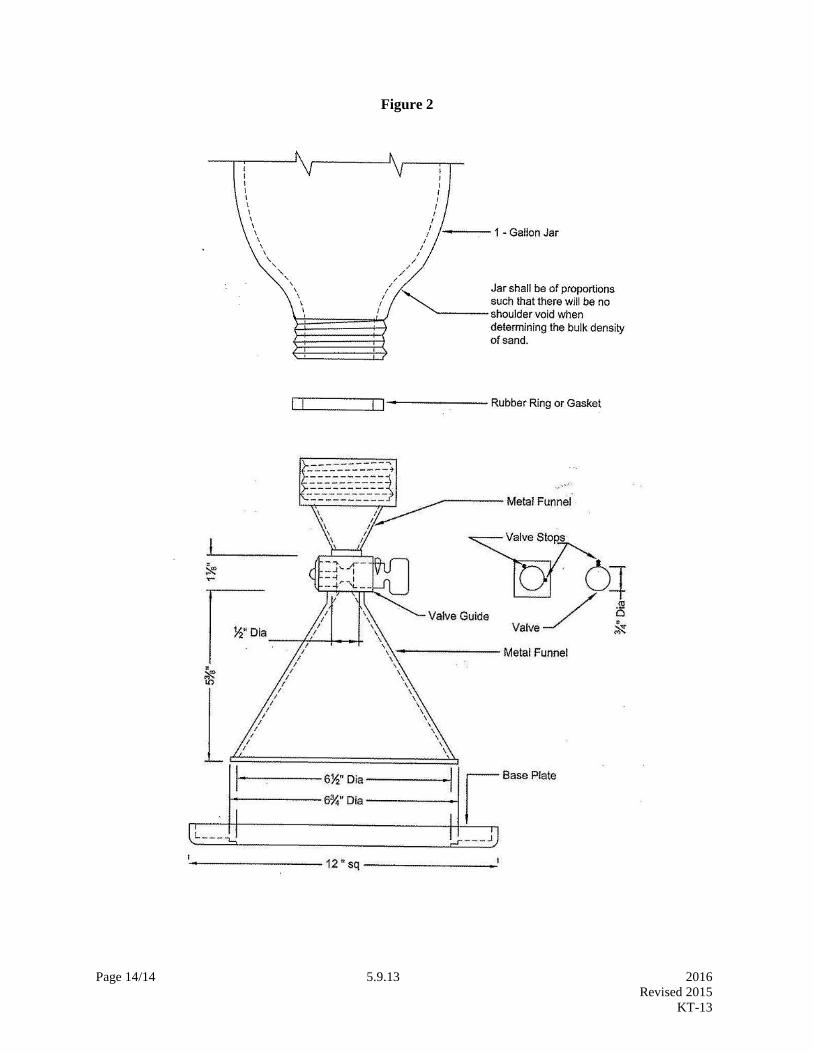
Page 14/14 5.9.13 2016
Revised 2015
KT-13
Figure 2
Page 1/12 5.9.14 2016
Revised 2015
KT-14
5.9.14 (5.16.14) MARSHALL TESTS OF BITUMINOUS MIXES
(Kansas Test Method KT-14)
a. SCOPE
This method of test covers the procedures for testing bituminous
mixes to determine:
a.1. Optimum Asphalt Content.
a.2. Density Characteristics, including voids content.
a.3. Stability Characteristics, including resistance to plastic
flow and flow properties.
a.4. This method is limited to mixes containing asphalt cement
and containing aggregate having a maximum size of 25 mm (1 in).
KT-14 reflects testing procedures found in AASHTO T 245 and T
269.
b. REFERENCED DOCUMENTS
b.1. KT-15; Bulk Specific Gravity and Unit Weight of Compacted
Bituminous Mixtures
b.2. KT-57; Determination of Asphalt Content and Gradation of Hot
Mix Asphalt Concrete by the Ignition Method
b.3. KT-58; Method for Preparing and Determining the Density of
Hot Mix Asphalt (HMA) Specimens by Means of the
Superpave Gyratory Compactor
b.4. AASHTO M 231; Balances Used in Testing of Materials
b.5. AASHTO T 245; Resistance to Plastic Flow of Bituminous
Mixtures Using Marshall Apparatus
b.6. AASHTO T 269; Percent Air Voids in Compacted Dense and Open
Bituminous Paving Mixtures
b.7. ASTM D 1559; Test Method for Resistance to Plastic Flow of
Bituminous Mixtures Using Marshall Apparatus

Page 2/12 5.9.14 2016
Revised 2015
KT-14
c. APPARATUS
c.1. Specimen Mold Assembly: A cylindrical mold having an inside
diameter of 101.6 + 0.25 mm (4.000 + 0.010 in)1 and a length of
approximately 90 mm (3 7/16 in). The mold is open at each end
and is equipped with a removable collar and a base plate about 15
mm (9/16 in) in thickness. A minimum of three molds is
recommended.
c.2. Compaction Hammer: The compaction hammer consists of a
hammer having a flat circular tamping face, 98.4 mm (3 7/8 in) in
diameter, and appropriate extension rod with handle which acts as
guide for a free falling weight. The weight shall weigh 4,536 +
18 g (10 + 0.04 lb) and have a free fall of 457.2 + 2.5 mm (18 +
0.1 in). The hammer may be operated manually or be driven with a
motor. Two compaction hammers are recommended.
c.3. Compaction Pedestal: The compaction pedestal is a wood
block approximately 300 by 300 by 450 mm (12 by 12 by 18 in). A
300 by 300 by 25 mm (12 by 12 by 1 in) steel plate is securely
fastened to the top of the block. The pedestal is set on and
securely fastened to a solid concrete slab with the vertical axis
plumb and the top level.
c.4. Specimen Mold Holder: The specimen mold holder has a semi-
circular base and a flanged top to hold the specimen mold in
place during the compaction process. Any equivalent hold down
device which performs the same function is satisfactory.
c.5. Specimen Extruder: An extruder for the removal of the
specimens from the mold is recommended. The unit may consist of
a steel frame to hold the mold, a hydraulic jack and a steel disc
approximately 13 mm (1/2 in) thick and 100 mm (3.9 in) in
diameter.
c.6. Testing Assembly: This includes a breaking head, a load
measuring device and two flow meters, dial micrometers or an
automatic stability/flow recording device. The testing assembly
shall be calibrated at intervals not exceeding two years.
c.6.a. Breaking Head: The breaking head consists of two
accurately machined cylindrical segments having an inside
radius of 50 mm (2 in). The lower segment is mounted on a
base having two perpendicular guide rods or posts extending
upward. Sleeves in the upper segment are positioned to guide
1 AASHTO T 245 requires the compaction molds to be 101.6 + 0.13 mm (4.000+ 0.005 in).
Page 3/12 5.9.14 2016
Revised 2015
KT-14
the two segments together without appreciable binding or loose
motion on the guide rods.
c.6.b. Flow Meters: Two flow meters graduated in 0.25 mm (.01
in) increments and conforming to the details set forth in
ASTM D 1559 or two micrometer dials graduated in 0.025 mm
(0.001 in) increments are used to measure plastic flow.
Instead of the flowmeter, a micrometer dial or stress-strain
recorder graduated in 0.25 mm (0.01 in) divisions.
c.6.c. Loading Device: The loading device may be either a screw
jack or a hydraulic system, manually or motor operated to
produce a constant vertical movement of 50 + 2 mm/min (2 + 0.1
in/min) during application of load.
c.6.d. Load Measuring Device:
c.6.d.1. Proving ring assembly consisting of a 20 kN (5,000 lb)
capacity proving ring, sensitive to 44.5 N (10 lb) up to 4.45
kN (1,000 lb) and to 111.2 N (25 lb) above 4.45 kN (1,000 lb).
The proving ring is equipped with a micrometer dial graduated
in 0.0025 mm (0.0001 in) increments.
The upper portion of the ring is attached to the testing frame
and the lower portion transmits the load to the breaking head.
c.6.d.2. In lieu of the proving ring assembly, any suitable load
measuring device may be used providing the capacity and
sensitivity meet the above requirements.
c.7. Heating Equipment: Ovens or hot plates for heating
aggregates, bituminous material, specimen molds, compaction
hammers and other associated items required for mixing and
molding. It is recommended that, when possible all heating units
be thermostatically controlled to maintain the required
temperature within + 2.8oC (+ 5
oF). Suitable shields, thick steel
plates or pans of sand shall be used on the surfaces of hot
plates to minimize localized overheating.
c.8. Mixing Apparatus: Mechanical mixing is recommended. Any
type of mechanical mixer may be used provided it will produce a
well coated, homogeneous mixture of the required amount in the
allowable time and further that the mixing paddle or whip does
not fracture or pulverize aggregate fractions during the mixing
process. The bowl employed with the mixer shall be of such a
nature that essentially all of the batch can be removed. More
than one mixing bowl is recommended unless the mixer is equipped
Page 4/12 5.9.14 2016
Revised 2015
KT-14
with a heating jacket to keep the bowl heated during the mixing
process.
c.9. Water Bath: The water bath shall be approximately 140 mm
(5 1/2 in) deep and shall be thermostatically controlled so as to
maintain the bath at 60 + 1oC (140 + 2
oF). The tank shall have a
perforated false bottom or be equipped with a shelf for
adequately supporting specimens approximately 50 mm (2 in) above
the bottom of the bath.
c.10. Miscellaneous Equipment:
c.10.a. Containers for heating aggregates, flat-bottom metal pans
or other suitable containers.
c.10.b. Containers for heating bituminous material, beakers,
ointment cans, pouring pots, etc. may be used.
c.10.c. Mixing tool, steel towel or spatula, for spading and hand
mixing.
c.10.d. Thermometers for determining temperatures of aggregate,
bitumen and bituminous mixtures. Armored glass or dial type
with metal stem thermometers may be used. A range of at least
10 to 200oC (50 to 400
oF) with a sensitivity of 2.8
oC (5
oF) is
required.
c.10.e. Thermometer for water bath sensitivity to 0.1oC (0.2oF).
c.10.f. The balance shall conform to the requirements of AASHTO M
231 for the class of general purpose balance required for the
principal sample mass of the sample being tested.
c.10.g. Large Spoon, for cleaning of mixing bowl or placing
mixture in mold cylinders.
c.10.h. Specimen height measuring device.
c.10.i. Gloves for handling hot equipment.
c.10.j. 100 mm (4 in) dia. paper discs.
Page 5/12 5.9.14 2016
Revised 2015
KT-14
d. DETERMINATION OF MIXING AND COMPACTING TEMPERATURE
d.1. The temperatures to which the asphalt cement must be heated
to produce a viscosity of 170 + 20 cSt (85 + 10 SFS) shall be the
mixing temperature.
d.2. The temperature to which the asphalt cement must be heated
to produce a viscosity of 280 + 30 cSt (135 + 15 SFS) shall be
the compacting temperature.
e. SAMPLE PREPARATION
e.1. Hot Plant Mixes with Asphalt: Mix the sample of mixed
material thoroughly and split out not less then three increments
weighing approximately 1,200 g for a 100 mm (4 in) diameter plug.
Bring the increments to within the limits of the compacting
temperature determined in d.2. prior to compacting. See KT-57 d.
for method of quartering to obtain proper sized sample.
e.2. Laboratory Prepared Mixes: If using hydrated lime as an
antistripping agent, then refer to the attached Addendum.
e.2.a. Number of Specimens: It is recommended that each aggregate
combination be tested at six different asphalt contents, in
1/2 percent increments. At least three specimens are prepared
for each percentage of asphalt. Prepare one extra aggregate
and asphalt sample to be mixed first and then thrown away.
This sample is to "butter" the mixing bowl and paddle and thus
reduce material loss when mixing the test specimens.
e.2.b. Preparation of Virgin Aggregates: Dry individual
aggregates to constant mass at 105 to 110oC (221 to 230
oF).
Separate the individual aggregates by dry screening into
desired fractions. The following size fractions2 are
recommended as a minimum:
25.0 to 19.0 mm (1 to 3/4 in) 4.75 to 2.36 mm (No.4 to No.8)
19.0 to 12.5 mm (3/4 to 1/2 in) 2.36 to 1.18 mm (No.8 to No.16)
12.5 to 9.5 mm (1/2 to 3/8 in) Passing 1.18 mm (Passing No.16)
9.5 to 4.75 mm (3/8 in to No.4)
e.2.c. Preparation of Reclaimed Material: Place the reclaimed
material in a 50 to 80oC (125 to 175
oF) draft oven for 1 1/2 to
2 hours, to soften. Transfer the materials to the mixing bowl
and mix for two minutes in order to breakdown the reclaimed
material to the recommended sizes. (Mixer will mix
2 AASHTO T 245 3.2 fraction recommendations use fewer sieve sizes.

Page 6/12 5.9.14 2016
Revised 2015
KT-14
approximately 3,500 g.) Other methods of breakdown are
acceptable provided they do not fracture aggregates or lose an
excessive amount of material in the process. Separate the
reclaimed material into desired fractions by screening, when
cool enough to screen. The following size fractions are
recommended:
19.0 to 12.5 mm (3/4 to 1/2 in) 4.75 to 2.36 mm (No.4 to No.8)
12.5 to 9.5 mm (1/2 to 3/8 in) Passing 2.36 mm (Passing No.8)
9.5 to 4.75 mm (3/8 in to No.4)
Weigh each fraction and record percentage of total sample.
e.2.d. Preparation of Mixes: Combine the individual aggregates
or reclaimed material and virgin aggregates by weighing out in
a separate pan for each test specimen, proportionate amounts
of each size fraction for each individual aggregate to produce
the desired combined aggregate with a batch mass of
approximately 1,125 g. This should be sufficient to produce a
compacted specimen 64 + 3 mm (2.5 + 1/8 in) thick3. Adjust the
mass of the batch as needed to produce compacted specimens of
64 + 3 mm (2.5 + 1/8 in) thickness.
Heat the aggregate and asphalt within the limits of mixing
temperature determined in d.1. Charge the mixing bowl with
the heated aggregate and form a crater in the top. Add the
required amount of asphalt and mix the aggregate and asphalt
until thoroughly coated, at least 2 minutes. Care should be
taken to keep all of the sample in the mixing bowl during this
process.
Place the mix in a 135oC (275
oF) oven and age
4 the material for
2 hours as outlined in KT-58 g.5. At the end of the aging
time place the mix in an oven set at the compaction
temperature or reset the 135oC (275
oF) oven temperature to
reflect the compaction temperature. Allow the mix to adjust
to the new temperature prior to removing for compaction.
e.2.e. Compaction of Specimens: Prior to the addition of the
asphalt to the batches, thoroughly clean the specimen mold
assembly and the face of the compaction hammer and heat the
mold assembly and hammer in boiling water, in an oven or on a
hot plate, to a temperature between 90 and 175oC (200 and
3 AASHTO T 245 3.4.2 requires compaction height to be 63.5 + 1.27 mm (2.5 + 0.05 in). 4 The aging process reflects information found in the proposed AASHTO R30-02 Standard Practice for Mixture
Conditioning of Hot-Mix Asphalt (HMA).
Page 7/12 5.9.14 2016
Revised 2015
KT-14
350oF). Assemble the mold, base plate and collar and place a
paper disc cut to size in the bottom of the mold.
Place the entire hot batch of aggregate-asphalt mixture in the
mold, spade vigorously with a heated spatula or trowel 15
times around the perimeter and 10 times over the interior of
the mold. Smooth the surface of the mix to a slightly rounded
shape5. The temperature of the mix just prior to compaction
shall be within the limits determined in d.2. Place a paper
disc on top of the mix.
Place the mold assembly, including the collar, on the
pedestal, fasten securely with the mold holder and apply 50 or
75 blowsa with the compaction hammer. Each blow must have the
prescribed free fall of 457 mm (18 in) with the axis of the
compaction hammer held perpendicular to the base of the mold
assembly during the compaction process. Remove the base plate
and collar, and reverse and reassemble the mold. Apply the
specified number of blows to the reversed specimen. After
compaction, remove the mold assembly from the pedestal. Place
the mold into the extractor and pop the plug loose from the
mold. Permit the plug to cool in this state until the next
plug has been processed. Extrude the initial plug out of the
mold and pop the next plug loose. Carefully transfer the
extruded plug to a smooth, flat surface and allow it to stand
until the plug reaches room temperature6.
Note a: Traffic volume in the Design Lane determines the
number of blows. (See subsection 5.18.02 a.5.a. for traffic
volume criteria.)
e.2.f. Thickness of Specimen: Measure the specimen thickness to
the nearest 0.025 mm (0.001 in). If the specimen thickness is
less than 60 mm (2.375 in) or more than 67 mm (2.625 in),
discard it and mold a replacement having a thickness within
these limits.
e.2.g. Determination of Specific Gravity and Unit Weight:
Determine the specific gravity and unit weight by the
appropriate method as outlined in KT-15.
e.2.h. After determining the specific gravity for all of the
specimens, proceed to f.
5 AASHTO T 245 3.5.1 requires the removal of the collar , then smoothing the surface of the mix. With the
aggregates used by KDOT the material may overflow the mold. 6 AASHTO T 245 3.5.2 requires the plug to stand overnight at room temperature.
Page 8/12 5.9.14 2016
Revised 2015
KT-14
f. TEST PROCEDURE
Immerse the specimens in a 60 + 1oC (140 + 2
oF) water bath for 30
to 40 minutes7. Thoroughly clean the guide rods and inside
surfaces of the test heads prior to making the test. Lubricate
the guide rods so that the upper test head slides freely over
them. Remove the specimen from the water bath and place in the
breaking head. The elapsed time for the test from removal of the
test specimen from the water bath to the maximum load
determination shall not exceed 30 sec. Place the complete
breaking head assembly in position on the testing machine. Place
the flow meters, where used, in position over the guide rods and
adjust the flow meters to zero. Hold the flow meters firmly
against the upper segment of the breaking head while the test
load is being applied. Avoid using excess pressure against the
testing head while determining flow.
Apply the load to the specimen by a constant rate of movement of
the load jack or testing machine head of 50 mm (2 in) per minute
until a maximum load is reached and the load decreases as
indicated by the proving ring dial. Record the maximum load
noted on the testing machine or converted from the proving ring
micrometer dial reading.
Release the flow meter sleeves or note the micrometer dial
readings, where used, the instant the maximum load begins to
decrease. Note and record the indicated flow values or
equivalent units in 0.25 mm (0.01 in) if micrometer dials are
used to measure flow.
For specimens other than 62.9 - 64.1 mm (2.476 - 2.525 in) in
thickness, adjust the load using the proper correction factor
from Table 5.16.14-1.
Table 5.16.14-1 Stability Correction Ratio
Thickness of Correction
Specimen in mm (in) Ratio
60.3 - 61.2 (2.375 - 2.410) 1.07
61.3 - 62.9 (2.411 - 2.475) 1.04
63.0 - 64.1 (2.476 - 2.525) 1.00
64.2 - 65.3 (2.526 - 2.570) 0.97
65.4 - 66.7 (2.571 - 2.625) 0.94
7 AASHTO T 245 4.1 also permits placing the plug in an oven for 2 hours.
Page 9/12 5.9.14 2016
Revised 2015
KT-14
NOTE: The measured stability of a specimen multiplied by
the ratio for the thickness of the specimen equals the
corrected stability for a 63.5 mm (2 1/2 in) specimen.
g. EVALUATION OF SPECIFIC GRAVITY AND STABILITY DATA:
g.1. Specific Gravity of Molded Specimens:
g.1.a. If the difference between the specific gravity of a single
specimen in a set of three specimens and the average of the
set is greater than 0.025, discard the entire set and mold a
new set.
g.1.b. If the difference between the specific gravity of a single
specimen in a set of three specimens and the average of the
set is greater than 0.014 and not greater than 0.025, discard
the results of the single specimen and use the results of the
tests on the remaining two specimens to compute the average
specific gravity of the set.
g.1.c. If the difference between the specific gravity of a single
specimen in a set of three specimens and the average specific
gravity of the set in question is not greater than 0.014, the
specific gravity of the specimen is acceptable and may be used
to determine the average specific gravity.
g.2. Stability of Molded Specimens:
If the difference between the stability of a specimen and the
average stability of the set of three specimens is not greater
than the CV1 values shown in Table 5.16.14-2 the specimen is
acceptable for use in determining the average stability of the
set.
If this difference is greater the CV1 value but not greater than
the CV2 values, the specimen will be eliminated in the
calculation of the average stability. Not less than two
specimens will be used when determining the set average
stability.
If the difference between the stability of any specimen of a set
and the average stability of the set is greater then CV2 values
shown in Table 5.16.14-2, the entire set will be discarded and
another set obtained.
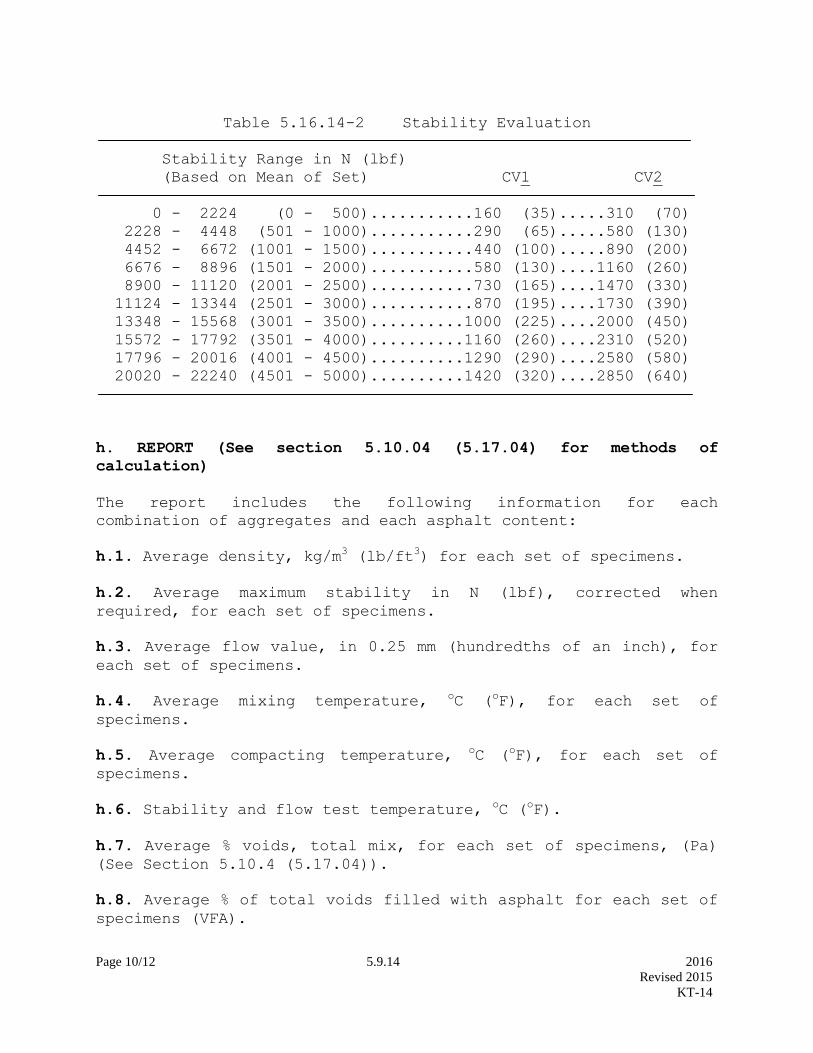
Page 10/12 5.9.14 2016
Revised 2015
KT-14
Table 5.16.14-2 Stability Evaluation
Stability Range in N (lbf)
(Based on Mean of Set) CV1 CV2
0 - 2224 (0 - 500)...........160 (35).....310 (70)
2228 - 4448 (501 - 1000)...........290 (65).....580 (130)
4452 - 6672 (1001 - 1500)...........440 (100).....890 (200)
6676 - 8896 (1501 - 2000)...........580 (130)....1160 (260)
8900 - 11120 (2001 - 2500)...........730 (165)....1470 (330)
11124 - 13344 (2501 - 3000)...........870 (195)....1730 (390)
13348 - 15568 (3001 - 3500)..........1000 (225)....2000 (450)
15572 - 17792 (3501 - 4000)..........1160 (260)....2310 (520)
17796 - 20016 (4001 - 4500)..........1290 (290)....2580 (580)
20020 - 22240 (4501 - 5000)..........1420 (320)....2850 (640)
h. REPORT (See section 5.10.04 (5.17.04) for methods of
calculation)
The report includes the following information for each
combination of aggregates and each asphalt content:
h.1. Average density, kg/m3 (lb/ft3) for each set of specimens.
h.2. Average maximum stability in N (lbf), corrected when
required, for each set of specimens.
h.3. Average flow value, in 0.25 mm (hundredths of an inch), for
each set of specimens.
h.4. Average mixing temperature, oC (
oF), for each set of
specimens.
h.5. Average compacting temperature, oC (
oF), for each set of
specimens.
h.6. Stability and flow test temperature, oC (oF).
h.7. Average % voids, total mix, for each set of specimens, (Pa)
(See Section 5.10.4 (5.17.04)).
h.8. Average % of total voids filled with asphalt for each set of
specimens (VFA).
Page 11/12 5.9.14 2016
Revised 2015
KT-14
h.9. Average % of voids in aggregate only (VMA).
h.10. Maximum percentage of asphalt allowed for high temperature
protection (P'b).
h.11. Recommended asphalt percentage for initial plant operation.
h.12. Bearing Capacity.
h.13. Theoretical Maximum Specific Gravity.
Show values for h.1., h.2., h.7., h.8., h.9., h.12., and h.13.
using KDOT Form 701.

Page 12/12 5.9.14 2016
Revised 2015
KT-14
ADDENDUM TO KT-14
FOR INCLUDING LIME AS AN ANTISTRIPPING AGENT
The following information provides KT-14 with steps to
incorporate hydrated lime as an antistripping agent.
Delete e.2.d. and replace with the following:
e.2.d. Preparation of Mixes: Combine the virgin aggregates by
weighing in a separate pan for each test specimen,
proportionate amounts of each size fraction for each
individual aggregate to produce the desired combined aggregate
with a batch mass of approximately 1,125 g. Include the
hydrated lime mass required to meet the specified percent of
lime for the project as part of the total batch mass. The
total aggregate mass should include lime, virgin aggregate,
and reclaimed material (if applicable). This should be
sufficient to produce a compacted specimen 64 + 3 mm (2.5 +
1/8 in) thick. Adjust the mass of the batch as needed to
produce compacted specimens of 64 + 3 mm (2.5 + 1/8 in)
thickness.
e.2.d.1. Determine the SSD for the combined aggregate gradation.
Add three percent of moisture to the percent moisture required
to reach the SSD condition of the combined aggregate.
e.2.d.2. Place the combined virgin aggregate and hydrated lime in
a mixing bowl. Carefully mix until the hydrated lime is
combined with the aggregate. Add the appropriate water
content, as determined in e.2.d.1., and thoroughly mix.
e.2.d.3. Oven dry the aggregate mix at approximately 110oC (230oF)
to a constant mass.
e.2.d.4. Combine the virgin aggregate material with the reclaimed
material, if applicable, and thoroughly mix. Heat the
combined aggregate and asphalt within limits of the mixing
temperature determined in d.1. Charge the mixing bowl with
the heated aggregate and form a crater in the top. Add the
required amount of asphalt and mix the aggregate and asphalt
until thoroughly coated, at least 2 minutes. Care should be
taken to keep all of the sample in the mixing bowl during this
process.
Page 1/6 5.9.15 2016
Revised 2016
KT-15
5.9.15 BULK SPECIFIC GRAVITY AND UNIT WEIGHT OF COMPACTED HOT MIX ASPHALT
(HMA) (Kansas Test Method KT-15)
1. SCOPE
This method of test covers the procedure for determining the bulk specific gravity of specimens of
compacted asphalt mixtures. The specimens may have been molded in the laboratory or cut or cored form
compacted pavements. KT-15 reflects testing procedures found in AASHTO T 166 and AASHTO T
331.
2. REFERENCED DOCUMENTS
2.1. Part V, 5.9.; Sampling and Test Methods Foreword
2.2. AASHTO T 166; Bulk Specific Gravity of Compacted Hot Mix Asphalt (HMA) Using Saturated
Surface – Dry Specimens
2.3. AASHTO T 331; Bulk Specific Gravity and Density of Compacted Hot Mix Asphalt (HMA) Using
Automatic Vacuum Sealing Method
3. APPARATUS
3.1. The balance shall conform to the requirements of Part V, 5.9; Sampling and Test Methods
Foreword, for the class of general purpose balance required for the principal sample mass of the sample
being tested.
3.2. Wire basket formed of No. 4 (4.75 mm) mesh hardware cloth, 1/4 in (6.3 mm) mesh or perforated
shelf or suitable bucket. The size shall be sufficient to fully support the specimen.
3.3. Container with overflow device, for immersing the wire basket, shelf or bucket in water and
maintaining a constant water level.
3.4. Measuring device to establish the physical dimensions of a specimen.
3.5. Vacuum chamber with a 1.25 h (0.93kW) pump capable of evacuating a sealed and enclosed chamber
to 29.5 in Hg vacuum (100 kPa vacuum) in less than 60 seconds. The chamber shall be large enough to
seal samples of 6 in (150 mm) wide by 14 in (350 mm) long by 6 in (150 mm) thick. The device shall
automatically seal the plastic bag and exhaust air back into the chamber in a controlled manner to ensure
proper conformance of the plastic to the asphalt specimen.
3.6. Plastic bags used with the vacuum device shall be one of the two following sizes. The smaller bags
shall have a minimum opening of 9.25 in (235 mm) and a maximum opening 10.25 in (260 mm). The
larger bags shall have a minimum opening of 14.75 in (275 mm) and a maximum opening of 15.5 in (294
mm).
3.7. Specimen sliding plate used within the vacuum chamber for reduction of friction on the plastic bags.
Page 2/6 5.9.15 2016
Revised 2016
KT-15
4. PROCEDURE
4.1. The bulk specific gravity of a compacted asphalt mix specimen is determined by computing the ratio
of its mass in air to its bulk volume. Procedure I is a rapid method which generally provides sufficient
accuracy for the routine testing of specimens with dense, impermeable surfaces. Procedure II corresponds
to AASHTO T 331 test method for Bulk Specific Gravity and Density of Compacted Hot Mix Asphalt
(HMA) Using Automatic Vacuum Sealing Method. Procedure III is a laboratory method which is used to
determine the bulk specific gravity of saturated specimens, and corresponds to AASHTO T 166, Method
A. This method is most suitable for testing specimens with slightly permeable surfaces in order to obtain
the water absorption. Procedure IV is a method which establishes the bulk specific gravity of specimens
which are composed of “open” mixes that typically display high porosity and permeability. In the event
of dispute, Procedure IV will take precedence over Procedures I & II. Marshall and Superpave design
specimens molded at the estimated “optimum” asphalt content will be subjected to Procedure III to
determine the water absorption (by volume). If the water absorption is equal to or greater than 2.0%,
Procedure II shall be used for both design and routine or field purposes.
4.1.1. Constant mass shall be defined as the mass at which further drying does not alter the mass by more
than 0.05%. Initially dry the specimen overnight by either placing in an oven at 125 + 5° F (52 + 3°C) or
by placing in front of a fan on an elevated wire rack and then weigh the next day at one-hour1 intervals.
4.1.2. Specimens are defined to be at room temperature when meeting the following procedure: Check
surface temperature. Let the specimen set for 5 minutes while at ambient air conditions (no flow of any
type should be flowing across the specimen). Recheck the surface temperature. The original check and
recheck must fall within 77 + 5°F (25 + 3°C) or the specimen temperature has not stabilized to room
temperature.
4.2. Procedure I
4.2.1. Weigh specimen at room temperature to the nearest 0.1 g after it has attained room temperature.
4.2.2. Place the specimen in the basket or bucket and determine it’s mass to the nearest 0.1 g while
immersed in water with a temperature of 77 + 2°F (25 + 1°C). The mass of the specimen in water shall
be determined as quickly as possible after the specimen is immersed. This method should not be used if
the specimen contains open or interconnecting voids.
4.3. Procedure II
4.3.1. Dry the specimen to constant mass and weigh it to the nearest 0.1g.
4.3.2. Cool the specimen to room temperature.
4.3.3. Select an appropriate size bag. For all 4 in (100 mm) diameter samples and samples with 6 in (150
mm) diameter and less than 2 in (50 mm) thickness, it is possible to use the bag with the smaller opening
size.
4.3.4. Place a bag inside the vacuum chamber on top of the sliding plate.
4.3.5. Gently open the bag and place the specimen in the plastic bag on top of the sliding plate, while
being careful not to handle the bag in such a manner that would create a puncture.
1 AASHTO T 166 and T 331 require a two-hour interval.
Page 3/6 5.9.15 2016
Revised 2016
KT-15
4.3.6. Allow the vacuum chamber to remove the air from the chamber and the plastic bag. The vacuum
chamber shall automatically seal the bag once the air is removed.
4.3.7. Exhaust air into the chamber until the chamber door opens indicating atmospheric pressure within
the chamber. The chamber door latch can be used to avoid automatic opening of the door after
completion of the test.
4.3.8. Remove the sealed specimen from the vacuum chamber. Handle the sealed specimen with extreme
care.
4.3.9. Weigh the sealed specimen in air to the nearest 0.1g.
4.3.10. Weigh the sealed specimen while immersed in water at 77 + 2°F (25 + 1°C) to the nearest 0.1 g.
Verify that no air bubbles are entrapped underneath the plastic bag material. This can be accomplished by
placing the sealed specimen in water with the plastic bag oriented in a vertical direction.
4.3.11. Reweigh the sealed specimen in air to the nearest 0.1 g.
4.4. Procedure III
4.4.1. For cores, dry the specimen to constant mass. Cool the specimen to room temperature and weigh
the dry mass to the nearest 0.1 g, and record as A. Immerse the specimen in a 77 + 2°F (25 + 1°C) water
bath, let saturate for 4 + 1 minutes, then weigh and record mass as C. Remove the immersed and
saturated specimen from the water bath, quickly damp dry the saturated specimen with a damp absorbent
cloth and as quickly as possible, weigh and record the specimen as B. Any water which seeps from the
specimen during the weighing operation is considered as part of the saturated specimen.
NOTE: If desired, the sequence of testing operations can be changed to expedite the test results. For
example, first the mass of saturated damp dry specimen can be taken. Then the saturated specimen in
water can be weighed. The dry mass of the specimen can be determined last.
NOTE: Terry cloth has been found to work well for an absorbent cloth. Damp is considered to be when
no water can be wrung from the towel.
4.5. Procedure IV
4.5.1. Dry the specimen to constant mass.
4.5.2. After the specimen has cooled to room temperature, weigh it to the nearest 0.1 g (see Section
4.4.1.1 of this test method).
4.5.3. Measure the height of the specimen to the nearest 0.001 in (0.025 mm) at four approximately
equally spaced locations and average the four measurements. The diameter of the test specimen shall be
determined to the nearest 0.001 in (0.025 mm) by averaging three diameters measured at 120 + degree
angles to each other at about midheight of the specimen. The average diameter shall be used in
calculations.
Page 4/6 5.9.15 2016
Revised 2016
KT-15
5. CALCUALTIONS
A = Mass of dry specimen in air, g.
B = Mass of saturated specimen in air after 4 minutes in water, g.
C = Mass of saturated specimen in water, g.
D = Mass of sealed specimen in air, g.
E = Mass of sealed specimen in water, g.
F = Apparent specific gravity of plastic sealing material at 77 + 2°F (25 + 1°C).
V = Calculated volume of specimen at 77 + 2°F (25 + 1°C).
G = Mass of specimen weighed immediately in water, g.
d = Specimen diameter (in [mm]).
h = Specimen height (in [mm]).
5.1. Procedure I: Bulk Specific Gravity (Gmb)
Gmb = A
(A-G)
5.2. Procedure II: Bulk Specific Gravity of Plastic Sealed Specimens
Gmb = A
(D − E)– (D -A
F)
5.3. Procedure III: Bulk Specific Gravity and Absorption of Saturated Samples
Gmb = A
(B-C)
Calculate the percent of water absorbed by the specimen as follows:
% Water Absorbed (Volume Basis) = 100 × (B -A)
(B -C)
Page 5/6 5.9.15 2016
Revised 2016
KT-15
5.4. Procedure IV: Bulk Specific Gravity by Physical Dimensions
Vol (in3) = (0.7854) (d
2) (h) (English)
Vol (mm3) = (0.7854) (d
2) (h) (SI)
Unit wt. (lb/ft3) = 3.8096 (mass in grams) (English)
Volume in in3
Unit wt. (kg/m3) = 1,000,000 (mass in grams) (SI)
Volume in mm3
Gmb = Unit weight in lb/ft3 (English)
62.243d
Gmb = Unit weight in kg/m3 (SI)
997.04d
NOTE: Density of water varies based on temperature. Since the water bath temperature is fixed at 77 +
2°F (25 + 1°C), use the specified values. For tests not restrained by the 77 + 2°F (25 + 1°C) requirement,
temperature correction can be determined by selecting the proper density for water from Table 1.
Page 6/6 5.9.15 2016
Revised 2016
KT-15
Table 1
Density of Water
Temperature Density
°C °F kg/m3
lb/ft3
15 59.0 999.09 62.371
16 60.8 998.94 62.362
17 62.6 998.77 62.351
18 64.4 998.60 62.341
19 66.2 998.40 62.328
20 68.0 998.20 62.316
21 69.8 997.99 62.302
22 71.6 997.77 62.289
23 73.4 997.54 62.274
24 75.2 997.30 62.259
25 77.0 997.04 62.243
26 78.8 996.78 62.227
27 80.6 996.50 62.209
28 82.4 996.23 62.193
29 84.2 995.94 62.175
30 86.0 995.65 62.156
31 87.8 995.34 62.137
32 89.6 995.03 62.118
33 91.4 994.70 62.097
34 93.2 994.37 62.077
35 95.0 994.03 62.055
NOTE: The table was derived from the table 10-28 of Lange’s Handbook of Chemistry; Twelfth Edition;
Copyright 1979.
5.5. SGcorr.
SGcorr. = (dw
997.04)
Where: dw = density of water at temperature other than 77 + 2°F (25 + 1°C).
6. PRECISION
6.1. Duplicate determinations by multi laboratory, multi operator shall check to within 0.031. This value
is derived from the 2006 Independent Assurance Gyratory Comparisons.

Page 1/1 5.9.16 2016
Revised 2010
KT-16
5.9.16. VOLATILE DISTILLATE CONTENT AND MOISTURE CONTENT OF BITUMINOUS
MIXES (Kansas test Method KT-16)
DELETED
(April 2010)

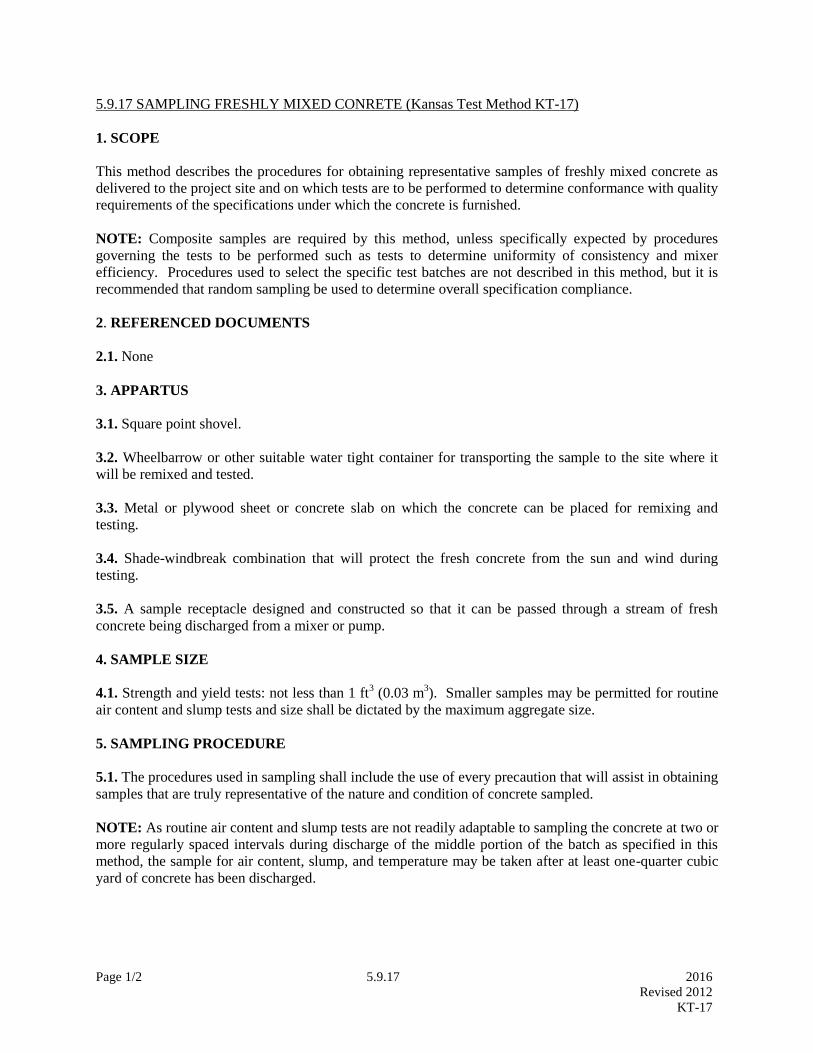
Page 1/2 5.9.17 2016
Revised 2012
KT-17
5.9.17 SAMPLING FRESHLY MIXED CONRETE (Kansas Test Method KT-17)
1. SCOPE
This method describes the procedures for obtaining representative samples of freshly mixed concrete as
delivered to the project site and on which tests are to be performed to determine conformance with quality
requirements of the specifications under which the concrete is furnished.
NOTE: Composite samples are required by this method, unless specifically expected by procedures
governing the tests to be performed such as tests to determine uniformity of consistency and mixer
efficiency. Procedures used to select the specific test batches are not described in this method, but it is
recommended that random sampling be used to determine overall specification compliance.
2. REFERENCED DOCUMENTS
2.1. None
3. APPARTUS
3.1. Square point shovel.
3.2. Wheelbarrow or other suitable water tight container for transporting the sample to the site where it
will be remixed and tested.
3.3. Metal or plywood sheet or concrete slab on which the concrete can be placed for remixing and
testing.
3.4. Shade-windbreak combination that will protect the fresh concrete from the sun and wind during
testing.
3.5. A sample receptacle designed and constructed so that it can be passed through a stream of fresh
concrete being discharged from a mixer or pump.
4. SAMPLE SIZE
4.1. Strength and yield tests: not less than 1 ft3 (0.03 m
3). Smaller samples may be permitted for routine
air content and slump tests and size shall be dictated by the maximum aggregate size.
5. SAMPLING PROCEDURE
5.1. The procedures used in sampling shall include the use of every precaution that will assist in obtaining
samples that are truly representative of the nature and condition of concrete sampled.
NOTE: As routine air content and slump tests are not readily adaptable to sampling the concrete at two or
more regularly spaced intervals during discharge of the middle portion of the batch as specified in this
method, the sample for air content, slump, and temperature may be taken after at least one-quarter cubic
yard of concrete has been discharged.

Page 2/2 5.9.17 2016
Revised 2012
KT-17
5.1.1 Sampling from pavement and bridge deck overlays:
Using a square point shovel, collect portions of the sample from three different locations within the batch
after placement. In any case do not obtain samples until after all of the water has been added to the mix;
also do not obtain samples from the very first or last portions of the batch discharge. Use caution to avoid
contamination of the sample from subgrade or other foreign material. Composite the samples so obtained
into one sample for test purposes.
5.1.2 Sampling from shafts, piers, caps and other formwork:
Sample the concrete at two or more regularly spaced intervals during discharge of the middle portion of
the batch. Care should be taken to sample from the same elevation as the concrete is being placed. For
example: If placing concrete for a haunch slab deck, try to sample from the discharge at the deck
elevation not from the ground if the pump is placed below the deck. Take the samples so obtained within
the limit specified in Section 5.3 of this test method and composite them into one sample for test
purposes. In any case do not obtain samples until after all of the water has been added to the mix; also do
not obtain samples from the very first or last portions of the batch discharge. Sample by repeatedly
passing a receptacle through the entire discharge stream or by completely diverting the discharge into a
sample container. Composite the samples so obtained into one sample for test purposes.
NOTE: No sample should be taken before 10% or after 90% of the batch has been discharged. Due to
the difficulty of determining the actual quantity of concrete discharged, the intent is to provide samples
that are representative of widely separated portions, but not the beginning and end of the load.
5.2. Immediately transport the sample to the place where test specimens are to be molded or where the
test is to be made, and remix with a shovel the minimum amount that will insure uniformity and
compliance with the minimum time limits specified in Section 5.3 of this test method. The sample shall
be protected at all times from sunlight and wind.
5.3. The elapsed time between obtaining the first and final portions of the composite samples shall be as
short as possible, but in no instance shall it exceed 15 minutes.
5.3.1. Tests for air and/or slump shall be started within 5 minutes after sampling is completed. These
tests should then be completed as expeditiously as possible. Molding of specimens for strength tests shall
be started within 15 minutes after obtaining the sample.
5.3.1.1. Concrete used in one test may not be reused for any other test. It may be returned to the forms if
maximum time from batching has not been exceeded or adverse conditions have not caused excessive
drying of the concrete.
6. DETERMINING TEMPERATURE OF THE SAMPLE
6.1. Determine the temperature of a sample by submerging the thermometer at least 3 in (75 mm) in the
fresh concrete. Leave the thermometer in place until the thermometer reading stabilizes, then read and
record temperature. This process should take place within 5 minutes of receiving the sample.
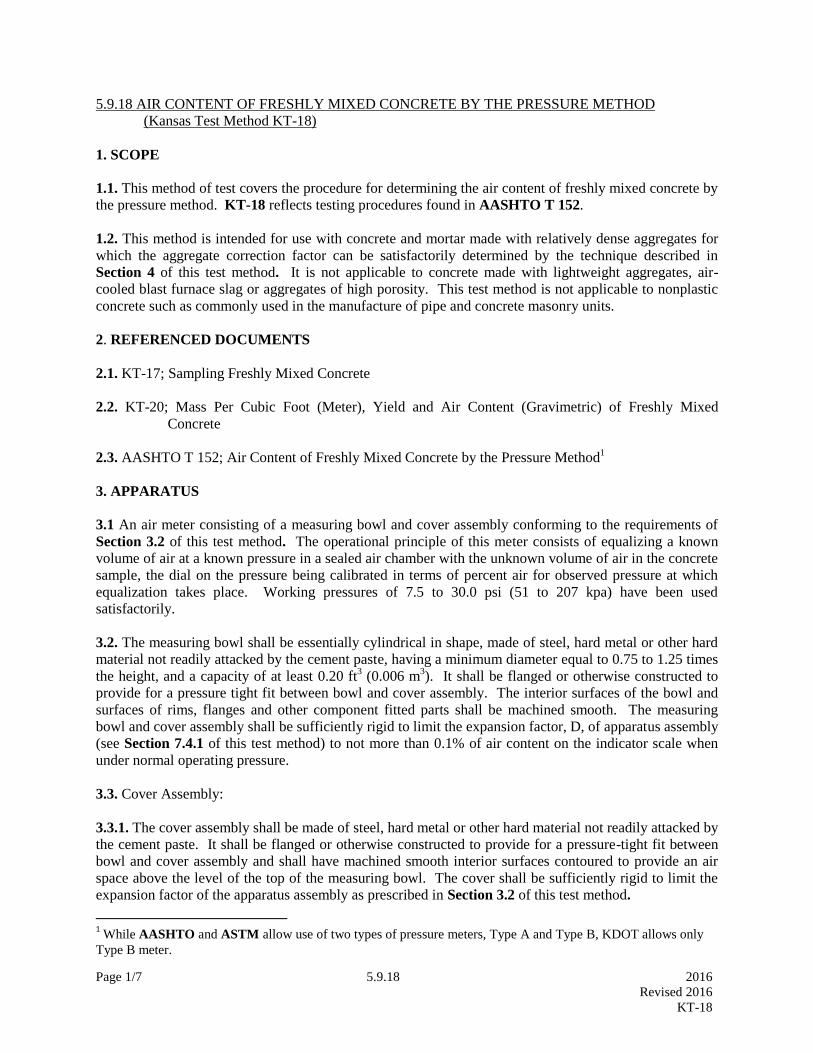
Page 1/7 5.9.18 2016
Revised 2016
KT-18
5.9.18 AIR CONTENT OF FRESHLY MIXED CONCRETE BY THE PRESSURE METHOD
(Kansas Test Method KT-18)
1. SCOPE
1.1. This method of test covers the procedure for determining the air content of freshly mixed concrete by
the pressure method. KT-18 reflects testing procedures found in AASHTO T 152.
1.2. This method is intended for use with concrete and mortar made with relatively dense aggregates for
which the aggregate correction factor can be satisfactorily determined by the technique described in
Section 4 of this test method. It is not applicable to concrete made with lightweight aggregates, air-
cooled blast furnace slag or aggregates of high porosity. This test method is not applicable to nonplastic
concrete such as commonly used in the manufacture of pipe and concrete masonry units.
2. REFERENCED DOCUMENTS
2.1. KT-17; Sampling Freshly Mixed Concrete
2.2. KT-20; Mass Per Cubic Foot (Meter), Yield and Air Content (Gravimetric) of Freshly Mixed
Concrete
2.3. AASHTO T 152; Air Content of Freshly Mixed Concrete by the Pressure Method1
3. APPARATUS
3.1 An air meter consisting of a measuring bowl and cover assembly conforming to the requirements of
Section 3.2 of this test method. The operational principle of this meter consists of equalizing a known
volume of air at a known pressure in a sealed air chamber with the unknown volume of air in the concrete
sample, the dial on the pressure being calibrated in terms of percent air for observed pressure at which
equalization takes place. Working pressures of 7.5 to 30.0 psi (51 to 207 kpa) have been used
satisfactorily.
3.2. The measuring bowl shall be essentially cylindrical in shape, made of steel, hard metal or other hard
material not readily attacked by the cement paste, having a minimum diameter equal to 0.75 to 1.25 times
the height, and a capacity of at least 0.20 ft3 (0.006 m
3). It shall be flanged or otherwise constructed to
provide for a pressure tight fit between bowl and cover assembly. The interior surfaces of the bowl and
surfaces of rims, flanges and other component fitted parts shall be machined smooth. The measuring
bowl and cover assembly shall be sufficiently rigid to limit the expansion factor, D, of apparatus assembly
(see Section 7.4.1 of this test method) to not more than 0.1% of air content on the indicator scale when
under normal operating pressure.
3.3. Cover Assembly:
3.3.1. The cover assembly shall be made of steel, hard metal or other hard material not readily attacked by
the cement paste. It shall be flanged or otherwise constructed to provide for a pressure-tight fit between
bowl and cover assembly and shall have machined smooth interior surfaces contoured to provide an air
space above the level of the top of the measuring bowl. The cover shall be sufficiently rigid to limit the
expansion factor of the apparatus assembly as prescribed in Section 3.2 of this test method.
1 While AASHTO and ASTM allow use of two types of pressure meters, Type A and Type B, KDOT allows only
Type B meter.
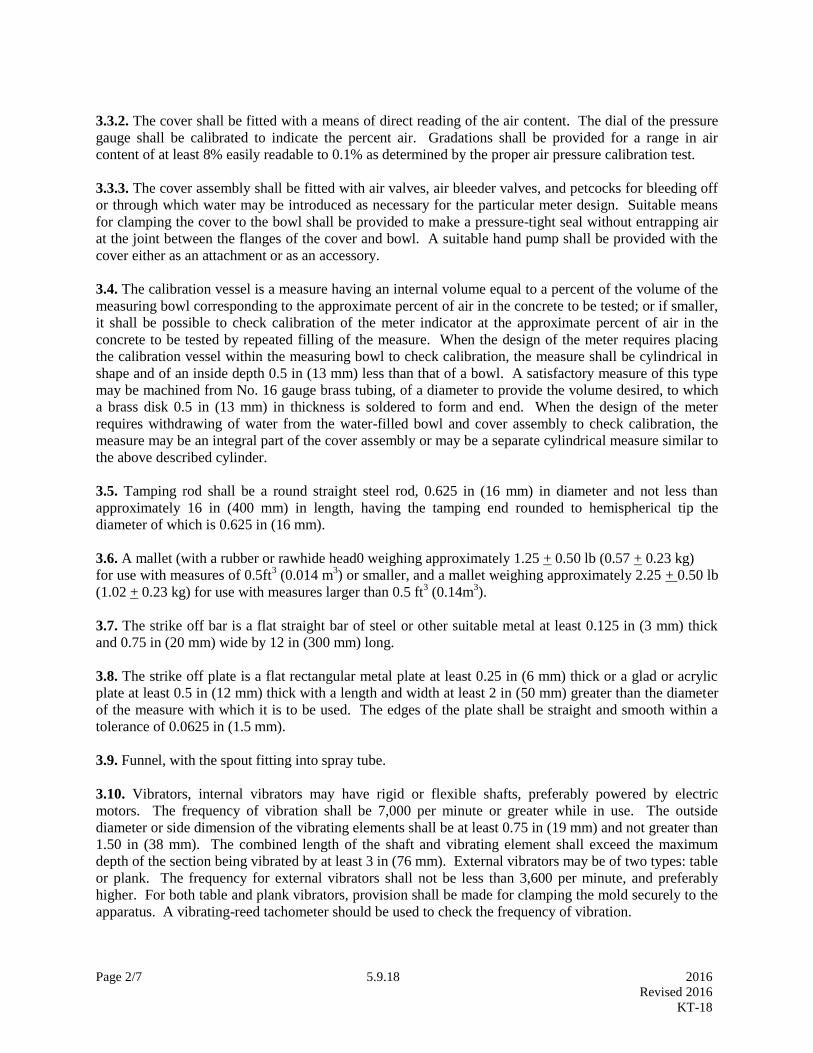
Page 2/7 5.9.18 2016
Revised 2016
KT-18
3.3.2. The cover shall be fitted with a means of direct reading of the air content. The dial of the pressure
gauge shall be calibrated to indicate the percent air. Gradations shall be provided for a range in air
content of at least 8% easily readable to 0.1% as determined by the proper air pressure calibration test.
3.3.3. The cover assembly shall be fitted with air valves, air bleeder valves, and petcocks for bleeding off
or through which water may be introduced as necessary for the particular meter design. Suitable means
for clamping the cover to the bowl shall be provided to make a pressure-tight seal without entrapping air
at the joint between the flanges of the cover and bowl. A suitable hand pump shall be provided with the
cover either as an attachment or as an accessory.
3.4. The calibration vessel is a measure having an internal volume equal to a percent of the volume of the
measuring bowl corresponding to the approximate percent of air in the concrete to be tested; or if smaller,
it shall be possible to check calibration of the meter indicator at the approximate percent of air in the
concrete to be tested by repeated filling of the measure. When the design of the meter requires placing
the calibration vessel within the measuring bowl to check calibration, the measure shall be cylindrical in
shape and of an inside depth 0.5 in (13 mm) less than that of a bowl. A satisfactory measure of this type
may be machined from No. 16 gauge brass tubing, of a diameter to provide the volume desired, to which
a brass disk 0.5 in (13 mm) in thickness is soldered to form and end. When the design of the meter
requires withdrawing of water from the water-filled bowl and cover assembly to check calibration, the
measure may be an integral part of the cover assembly or may be a separate cylindrical measure similar to
the above described cylinder.
3.5. Tamping rod shall be a round straight steel rod, 0.625 in (16 mm) in diameter and not less than
approximately 16 in (400 mm) in length, having the tamping end rounded to hemispherical tip the
diameter of which is 0.625 in (16 mm).
3.6. A mallet (with a rubber or rawhide head0 weighing approximately 1.25 + 0.50 lb (0.57 + 0.23 kg)
for use with measures of 0.5ft3 (0.014 m
3) or smaller, and a mallet weighing approximately 2.25 + 0.50 lb
(1.02 + 0.23 kg) for use with measures larger than 0.5 ft3 (0.14m
3).
3.7. The strike off bar is a flat straight bar of steel or other suitable metal at least 0.125 in (3 mm) thick
and 0.75 in (20 mm) wide by 12 in (300 mm) long.
3.8. The strike off plate is a flat rectangular metal plate at least 0.25 in (6 mm) thick or a glad or acrylic
plate at least 0.5 in (12 mm) thick with a length and width at least 2 in (50 mm) greater than the diameter
of the measure with which it is to be used. The edges of the plate shall be straight and smooth within a
tolerance of 0.0625 in (1.5 mm).
3.9. Funnel, with the spout fitting into spray tube.
3.10. Vibrators, internal vibrators may have rigid or flexible shafts, preferably powered by electric
motors. The frequency of vibration shall be 7,000 per minute or greater while in use. The outside
diameter or side dimension of the vibrating elements shall be at least 0.75 in (19 mm) and not greater than
1.50 in (38 mm). The combined length of the shaft and vibrating element shall exceed the maximum
depth of the section being vibrated by at least 3 in (76 mm). External vibrators may be of two types: table
or plank. The frequency for external vibrators shall not be less than 3,600 per minute, and preferably
higher. For both table and plank vibrators, provision shall be made for clamping the mold securely to the
apparatus. A vibrating-reed tachometer should be used to check the frequency of vibration.
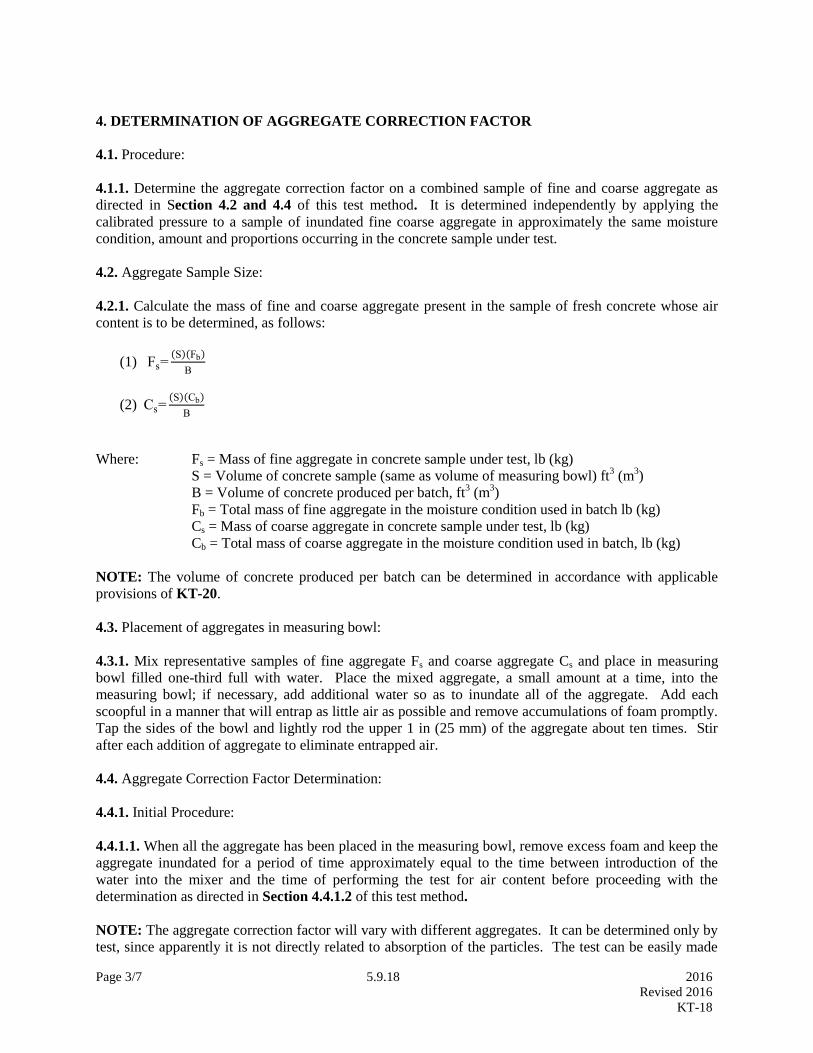
Page 3/7 5.9.18 2016
Revised 2016
KT-18
4. DETERMINATION OF AGGREGATE CORRECTION FACTOR
4.1. Procedure:
4.1.1. Determine the aggregate correction factor on a combined sample of fine and coarse aggregate as
directed in Section 4.2 and 4.4 of this test method. It is determined independently by applying the
calibrated pressure to a sample of inundated fine coarse aggregate in approximately the same moisture
condition, amount and proportions occurring in the concrete sample under test.
4.2. Aggregate Sample Size:
4.2.1. Calculate the mass of fine and coarse aggregate present in the sample of fresh concrete whose air
content is to be determined, as follows:
(1) Fs=(S)(Fb)
B
(2) Cs=(S)(Cb)
B
Where: Fs = Mass of fine aggregate in concrete sample under test, lb (kg)
S = Volume of concrete sample (same as volume of measuring bowl) ft3 (m
3)
B = Volume of concrete produced per batch, ft3 (m
3)
Fb = Total mass of fine aggregate in the moisture condition used in batch lb (kg)
Cs = Mass of coarse aggregate in concrete sample under test, lb (kg)
Cb = Total mass of coarse aggregate in the moisture condition used in batch, lb (kg)
NOTE: The volume of concrete produced per batch can be determined in accordance with applicable
provisions of KT-20.
4.3. Placement of aggregates in measuring bowl:
4.3.1. Mix representative samples of fine aggregate Fs and coarse aggregate Cs and place in measuring
bowl filled one-third full with water. Place the mixed aggregate, a small amount at a time, into the
measuring bowl; if necessary, add additional water so as to inundate all of the aggregate. Add each
scoopful in a manner that will entrap as little air as possible and remove accumulations of foam promptly.
Tap the sides of the bowl and lightly rod the upper 1 in (25 mm) of the aggregate about ten times. Stir
after each addition of aggregate to eliminate entrapped air.
4.4. Aggregate Correction Factor Determination:
4.4.1. Initial Procedure:
4.4.1.1. When all the aggregate has been placed in the measuring bowl, remove excess foam and keep the
aggregate inundated for a period of time approximately equal to the time between introduction of the
water into the mixer and the time of performing the test for air content before proceeding with the
determination as directed in Section 4.4.1.2 of this test method.
NOTE: The aggregate correction factor will vary with different aggregates. It can be determined only by
test, since apparently it is not directly related to absorption of the particles. The test can be easily made
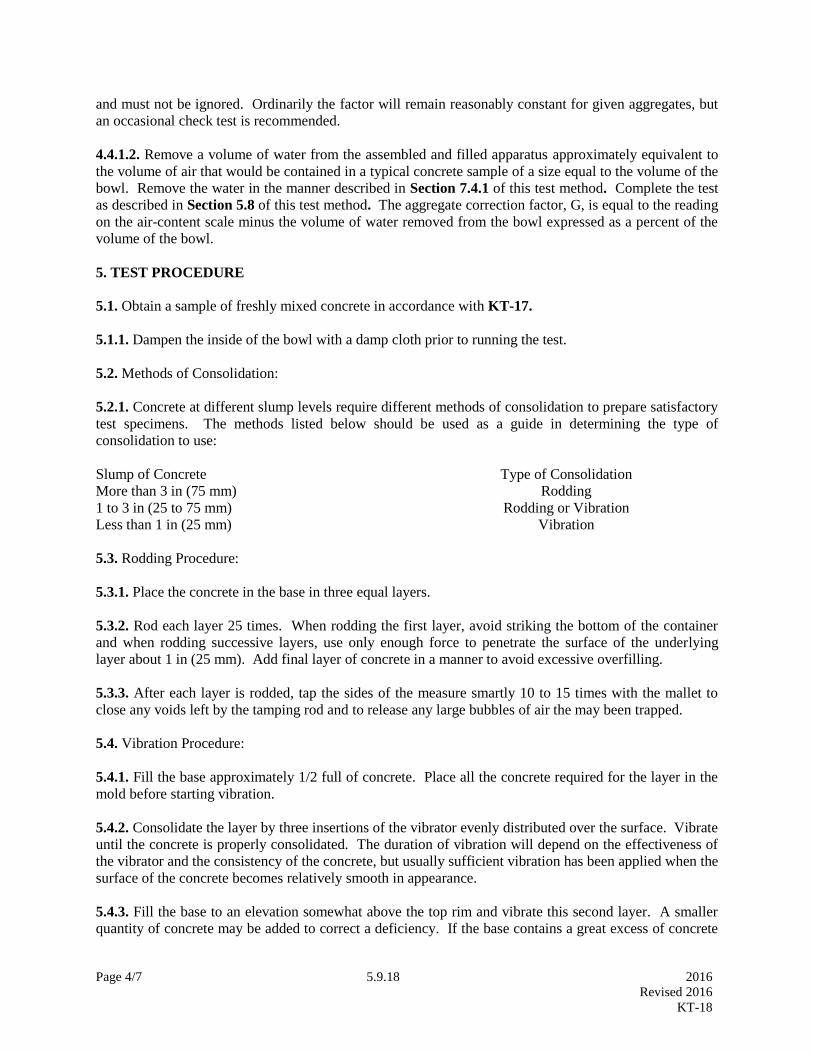
Page 4/7 5.9.18 2016
Revised 2016
KT-18
and must not be ignored. Ordinarily the factor will remain reasonably constant for given aggregates, but
an occasional check test is recommended.
4.4.1.2. Remove a volume of water from the assembled and filled apparatus approximately equivalent to
the volume of air that would be contained in a typical concrete sample of a size equal to the volume of the
bowl. Remove the water in the manner described in Section 7.4.1 of this test method. Complete the test
as described in Section 5.8 of this test method. The aggregate correction factor, G, is equal to the reading
on the air-content scale minus the volume of water removed from the bowl expressed as a percent of the
volume of the bowl.
5. TEST PROCEDURE
5.1. Obtain a sample of freshly mixed concrete in accordance with KT-17.
5.1.1. Dampen the inside of the bowl with a damp cloth prior to running the test.
5.2. Methods of Consolidation:
5.2.1. Concrete at different slump levels require different methods of consolidation to prepare satisfactory
test specimens. The methods listed below should be used as a guide in determining the type of
consolidation to use:
Slump of Concrete Type of Consolidation
More than 3 in (75 mm) Rodding
1 to 3 in (25 to 75 mm) Rodding or Vibration
Less than 1 in (25 mm) Vibration
5.3. Rodding Procedure:
5.3.1. Place the concrete in the base in three equal layers.
5.3.2. Rod each layer 25 times. When rodding the first layer, avoid striking the bottom of the container
and when rodding successive layers, use only enough force to penetrate the surface of the underlying
layer about 1 in (25 mm). Add final layer of concrete in a manner to avoid excessive overfilling.
5.3.3. After each layer is rodded, tap the sides of the measure smartly 10 to 15 times with the mallet to
close any voids left by the tamping rod and to release any large bubbles of air the may been trapped.
5.4. Vibration Procedure:
5.4.1. Fill the base approximately 1/2 full of concrete. Place all the concrete required for the layer in the
mold before starting vibration.
5.4.2. Consolidate the layer by three insertions of the vibrator evenly distributed over the surface. Vibrate
until the concrete is properly consolidated. The duration of vibration will depend on the effectiveness of
the vibrator and the consistency of the concrete, but usually sufficient vibration has been applied when the
surface of the concrete becomes relatively smooth in appearance.
5.4.3. Fill the base to an elevation somewhat above the top rim and vibrate this second layer. A smaller
quantity of concrete may be added to correct a deficiency. If the base contains a great excess of concrete
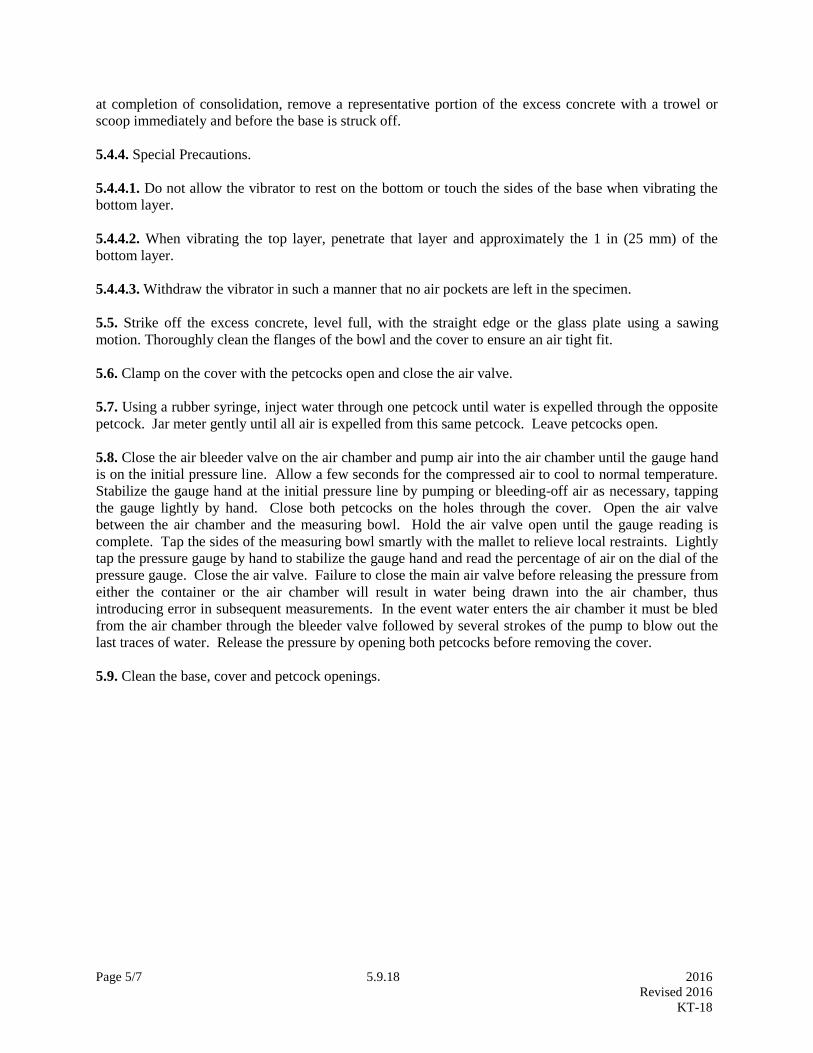
Page 5/7 5.9.18 2016
Revised 2016
KT-18
at completion of consolidation, remove a representative portion of the excess concrete with a trowel or
scoop immediately and before the base is struck off.
5.4.4. Special Precautions.
5.4.4.1. Do not allow the vibrator to rest on the bottom or touch the sides of the base when vibrating the
bottom layer.
5.4.4.2. When vibrating the top layer, penetrate that layer and approximately the 1 in (25 mm) of the
bottom layer.
5.4.4.3. Withdraw the vibrator in such a manner that no air pockets are left in the specimen.
5.5. Strike off the excess concrete, level full, with the straight edge or the glass plate using a sawing
motion. Thoroughly clean the flanges of the bowl and the cover to ensure an air tight fit.
5.6. Clamp on the cover with the petcocks open and close the air valve.
5.7. Using a rubber syringe, inject water through one petcock until water is expelled through the opposite
petcock. Jar meter gently until all air is expelled from this same petcock. Leave petcocks open.
5.8. Close the air bleeder valve on the air chamber and pump air into the air chamber until the gauge hand
is on the initial pressure line. Allow a few seconds for the compressed air to cool to normal temperature.
Stabilize the gauge hand at the initial pressure line by pumping or bleeding-off air as necessary, tapping
the gauge lightly by hand. Close both petcocks on the holes through the cover. Open the air valve
between the air chamber and the measuring bowl. Hold the air valve open until the gauge reading is
complete. Tap the sides of the measuring bowl smartly with the mallet to relieve local restraints. Lightly
tap the pressure gauge by hand to stabilize the gauge hand and read the percentage of air on the dial of the
pressure gauge. Close the air valve. Failure to close the main air valve before releasing the pressure from
either the container or the air chamber will result in water being drawn into the air chamber, thus
introducing error in subsequent measurements. In the event water enters the air chamber it must be bled
from the air chamber through the bleeder valve followed by several strokes of the pump to blow out the
last traces of water. Release the pressure by opening both petcocks before removing the cover.
5.9. Clean the base, cover and petcock openings.

Page 6/7 5.9.18 2016
Revised 2016
KT-18
6. CALCULATION
6.1. Calculate the air content of the concrete in the measuring bowl as follows:
As = A1 – G
Where: As = air content of sample tested, percent
A1 = apparent air content of the sample tested, percent
G = aggregate correction factor, percent
7. CALBRATION OF METER GAUGE
7.1. Calibration of the Calibration Vessel:
7.1.1. Determine accurately the mass of water, w, required to fill the calibration vessel, using a scale
accurate to 0.1% of the mass of the vessel filled with water.
7.2. Calibration of the measuring bowl:
7.2.2. Determine the mass of water, W, required to fill the measuring bowl, using a scale accurate to 0.1%
of the mass of bowl filled with water. Slide a glass plate carefully over the flange of the bowl in a manner
to ensure that the bowl is filled with water. A thin film of cup grease smeared on the flange of the bowl
will make a watertight joint between the glass plate and the top of the bowl.
7.3. Effective volume of the calibration vessel, R:
7.3.1. The constant R represents the effective volume of the calibration vessel expressed as a percentage
of the volume of the measuring bowl. Calculate R as follows:
R = w/W
Where: w = weight of water required to fill the calibration vessel
W = weight of water required to fill the measuring bowl.
7.4. Determination of, or check of, allowance for expansion factor, D:
7.4.1. The allowance factor for the expansion factor, D, is included in the difference between the initial
pressure indicated on the pressure gauge and the zero % mark on the air-content scale on the pressure
gauge. This allowance shall be checked by filling the apparatus with water (making certain all entrapped
air has been removed), pumping air into the air chamber until the gauge hand is stabilized at the indicated
initial pressure line, and then releasing the air to the measuring bowl. If the initial pressure line is
correctly positioned, the gauge should read zero %. The initial pressure line shall be adjusted if two or
more determinations show the same variation from zero 5 and the test repeated to check the adjusted
initial pressure line.
NOTE: This procedure may be accomplished in connection with the calibration test described in Section
7.4.3.
7.4.2. Calibration reading, K, is the final meter reading to be obtained when the meter is operated at the
correct calibration pressure. The calibration reading, K, equals the effective volume of the calibration
vessel as follows:
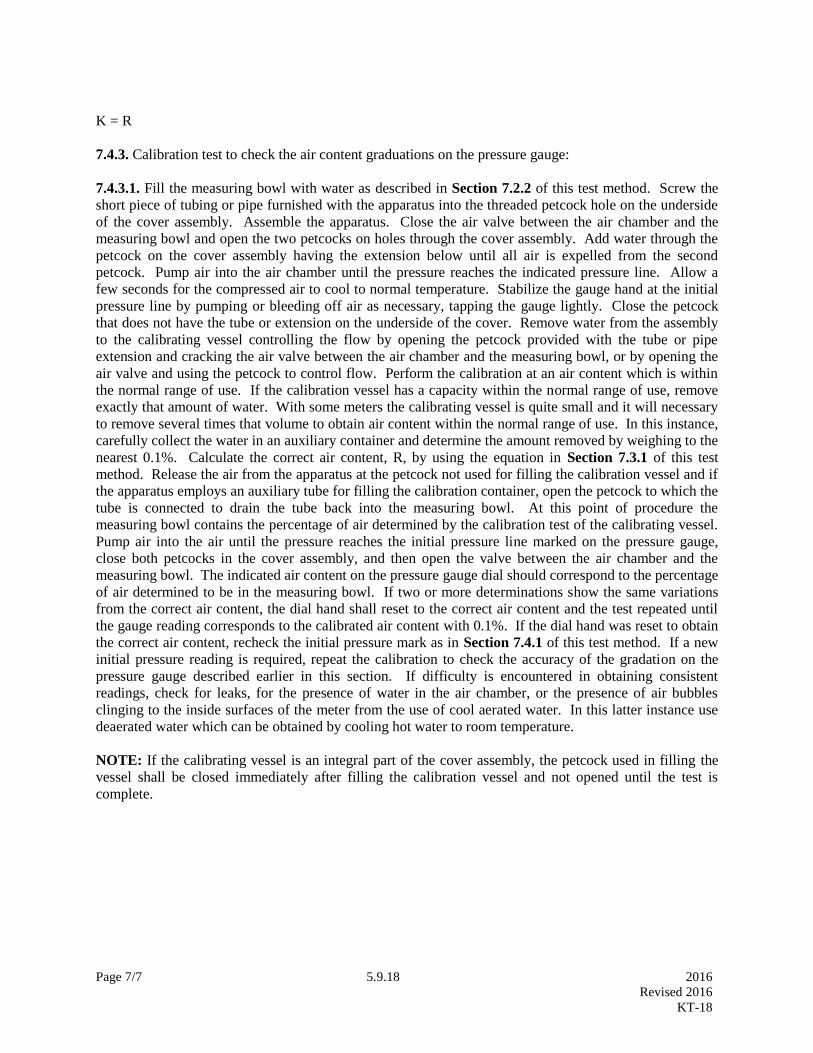
Page 7/7 5.9.18 2016
Revised 2016
KT-18
K = R
7.4.3. Calibration test to check the air content graduations on the pressure gauge:
7.4.3.1. Fill the measuring bowl with water as described in Section 7.2.2 of this test method. Screw the
short piece of tubing or pipe furnished with the apparatus into the threaded petcock hole on the underside
of the cover assembly. Assemble the apparatus. Close the air valve between the air chamber and the
measuring bowl and open the two petcocks on holes through the cover assembly. Add water through the
petcock on the cover assembly having the extension below until all air is expelled from the second
petcock. Pump air into the air chamber until the pressure reaches the indicated pressure line. Allow a
few seconds for the compressed air to cool to normal temperature. Stabilize the gauge hand at the initial
pressure line by pumping or bleeding off air as necessary, tapping the gauge lightly. Close the petcock
that does not have the tube or extension on the underside of the cover. Remove water from the assembly
to the calibrating vessel controlling the flow by opening the petcock provided with the tube or pipe
extension and cracking the air valve between the air chamber and the measuring bowl, or by opening the
air valve and using the petcock to control flow. Perform the calibration at an air content which is within
the normal range of use. If the calibration vessel has a capacity within the normal range of use, remove
exactly that amount of water. With some meters the calibrating vessel is quite small and it will necessary
to remove several times that volume to obtain air content within the normal range of use. In this instance,
carefully collect the water in an auxiliary container and determine the amount removed by weighing to the
nearest 0.1%. Calculate the correct air content, R, by using the equation in Section 7.3.1 of this test
method. Release the air from the apparatus at the petcock not used for filling the calibration vessel and if
the apparatus employs an auxiliary tube for filling the calibration container, open the petcock to which the
tube is connected to drain the tube back into the measuring bowl. At this point of procedure the
measuring bowl contains the percentage of air determined by the calibration test of the calibrating vessel.
Pump air into the air until the pressure reaches the initial pressure line marked on the pressure gauge,
close both petcocks in the cover assembly, and then open the valve between the air chamber and the
measuring bowl. The indicated air content on the pressure gauge dial should correspond to the percentage
of air determined to be in the measuring bowl. If two or more determinations show the same variations
from the correct air content, the dial hand shall reset to the correct air content and the test repeated until
the gauge reading corresponds to the calibrated air content with 0.1%. If the dial hand was reset to obtain
the correct air content, recheck the initial pressure mark as in Section 7.4.1 of this test method. If a new
initial pressure reading is required, repeat the calibration to check the accuracy of the gradation on the
pressure gauge described earlier in this section. If difficulty is encountered in obtaining consistent
readings, check for leaks, for the presence of water in the air chamber, or the presence of air bubbles
clinging to the inside surfaces of the meter from the use of cool aerated water. In this latter instance use
deaerated water which can be obtained by cooling hot water to room temperature.
NOTE: If the calibrating vessel is an integral part of the cover assembly, the petcock used in filling the
vessel shall be closed immediately after filling the calibration vessel and not opened until the test is
complete.

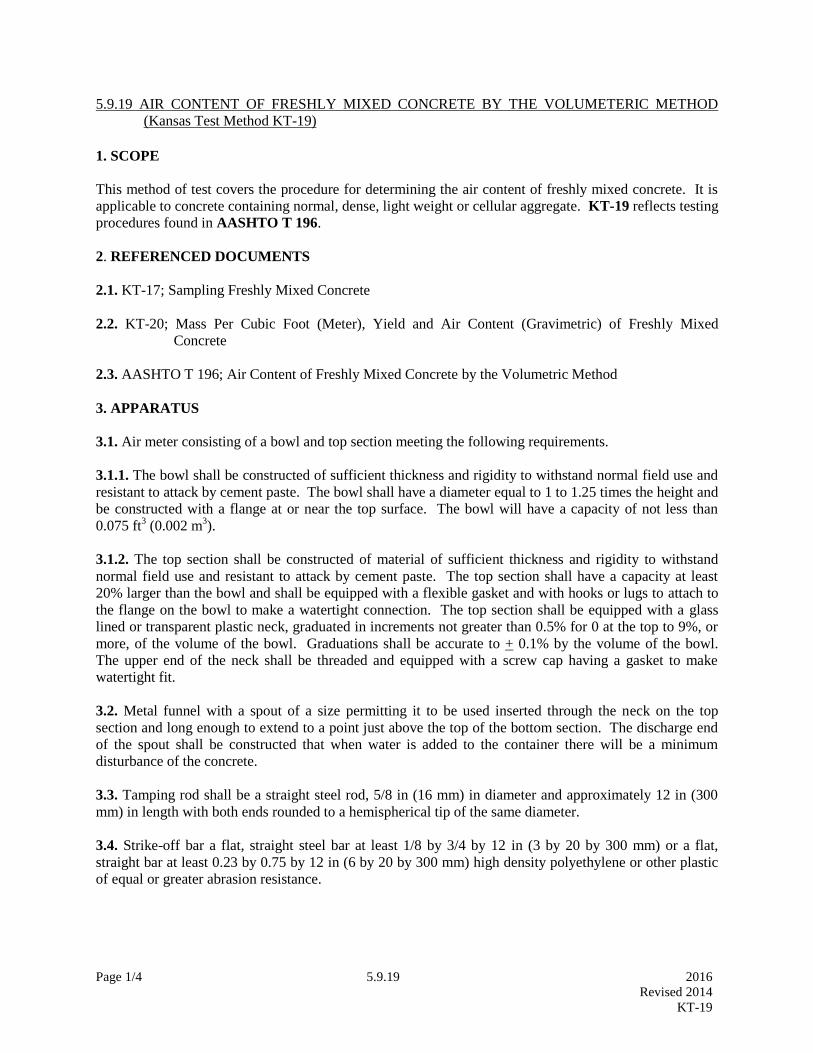
Page 1/4 5.9.19 2016
Revised 2014
KT-19
5.9.19 AIR CONTENT OF FRESHLY MIXED CONCRETE BY THE VOLUMETERIC METHOD
(Kansas Test Method KT-19)
1. SCOPE
This method of test covers the procedure for determining the air content of freshly mixed concrete. It is
applicable to concrete containing normal, dense, light weight or cellular aggregate. KT-19 reflects testing
procedures found in AASHTO T 196.
2. REFERENCED DOCUMENTS
2.1. KT-17; Sampling Freshly Mixed Concrete
2.2. KT-20; Mass Per Cubic Foot (Meter), Yield and Air Content (Gravimetric) of Freshly Mixed
Concrete
2.3. AASHTO T 196; Air Content of Freshly Mixed Concrete by the Volumetric Method
3. APPARATUS
3.1. Air meter consisting of a bowl and top section meeting the following requirements.
3.1.1. The bowl shall be constructed of sufficient thickness and rigidity to withstand normal field use and
resistant to attack by cement paste. The bowl shall have a diameter equal to 1 to 1.25 times the height and
be constructed with a flange at or near the top surface. The bowl will have a capacity of not less than
0.075 ft3 (0.002 m
3).
3.1.2. The top section shall be constructed of material of sufficient thickness and rigidity to withstand
normal field use and resistant to attack by cement paste. The top section shall have a capacity at least
20% larger than the bowl and shall be equipped with a flexible gasket and with hooks or lugs to attach to
the flange on the bowl to make a watertight connection. The top section shall be equipped with a glass
lined or transparent plastic neck, graduated in increments not greater than 0.5% for 0 at the top to 9%, or
more, of the volume of the bowl. Graduations shall be accurate to + 0.1% by the volume of the bowl.
The upper end of the neck shall be threaded and equipped with a screw cap having a gasket to make
watertight fit.
3.2. Metal funnel with a spout of a size permitting it to be used inserted through the neck on the top
section and long enough to extend to a point just above the top of the bottom section. The discharge end
of the spout shall be constructed that when water is added to the container there will be a minimum
disturbance of the concrete.
3.3. Tamping rod shall be a straight steel rod, 5/8 in (16 mm) in diameter and approximately 12 in (300
mm) in length with both ends rounded to a hemispherical tip of the same diameter.
3.4. Strike-off bar a flat, straight steel bar at least 1/8 by 3/4 by 12 in (3 by 20 by 300 mm) or a flat,
straight bar at least 0.23 by 0.75 by 12 in (6 by 20 by 300 mm) high density polyethylene or other plastic
of equal or greater abrasion resistance.
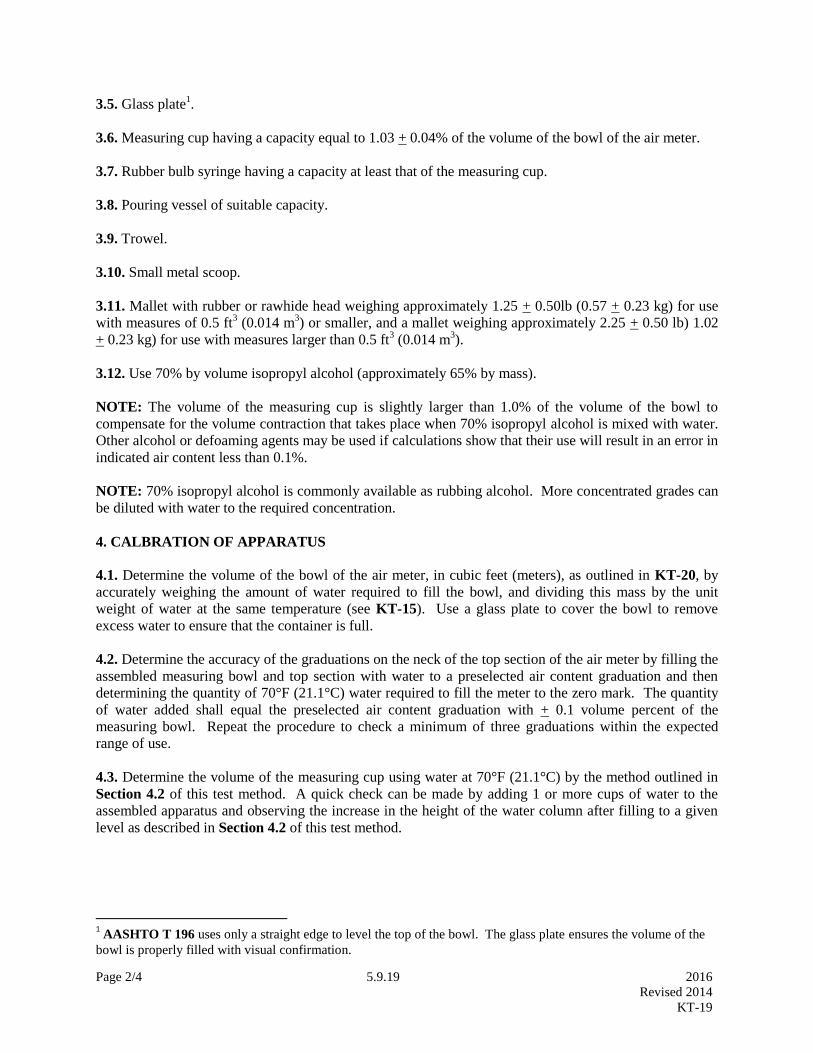
Page 2/4 5.9.19 2016
Revised 2014
KT-19
3.5. Glass plate1.
3.6. Measuring cup having a capacity equal to 1.03 + 0.04% of the volume of the bowl of the air meter.
3.7. Rubber bulb syringe having a capacity at least that of the measuring cup.
3.8. Pouring vessel of suitable capacity.
3.9. Trowel.
3.10. Small metal scoop.
3.11. Mallet with rubber or rawhide head weighing approximately 1.25 + 0.50lb (0.57 + 0.23 kg) for use
with measures of 0.5 ft3 (0.014 m
3) or smaller, and a mallet weighing approximately 2.25 + 0.50 lb) 1.02
+ 0.23 kg) for use with measures larger than 0.5 ft3 (0.014 m
3).
3.12. Use 70% by volume isopropyl alcohol (approximately 65% by mass).
NOTE: The volume of the measuring cup is slightly larger than 1.0% of the volume of the bowl to
compensate for the volume contraction that takes place when 70% isopropyl alcohol is mixed with water.
Other alcohol or defoaming agents may be used if calculations show that their use will result in an error in
indicated air content less than 0.1%.
NOTE: 70% isopropyl alcohol is commonly available as rubbing alcohol. More concentrated grades can
be diluted with water to the required concentration.
4. CALBRATION OF APPARATUS
4.1. Determine the volume of the bowl of the air meter, in cubic feet (meters), as outlined in KT-20, by
accurately weighing the amount of water required to fill the bowl, and dividing this mass by the unit
weight of water at the same temperature (see KT-15). Use a glass plate to cover the bowl to remove
excess water to ensure that the container is full.
4.2. Determine the accuracy of the graduations on the neck of the top section of the air meter by filling the
assembled measuring bowl and top section with water to a preselected air content graduation and then
determining the quantity of 70°F (21.1°C) water required to fill the meter to the zero mark. The quantity
of water added shall equal the preselected air content graduation with + 0.1 volume percent of the
measuring bowl. Repeat the procedure to check a minimum of three graduations within the expected
range of use.
4.3. Determine the volume of the measuring cup using water at 70°F (21.1°C) by the method outlined in
Section 4.2 of this test method. A quick check can be made by adding 1 or more cups of water to the
assembled apparatus and observing the increase in the height of the water column after filling to a given
level as described in Section 4.2 of this test method.
1 AASHTO T 196 uses only a straight edge to level the top of the bowl. The glass plate ensures the volume of the
bowl is properly filled with visual confirmation.

Page 3/4 5.9.19 2016
Revised 2014
KT-19
5. TEST PROCEDURE
5.1. Obtain a sample of fresh concrete in accordance with KT-17.
5.2. Wet the inside of the bowl and dry it to a damp but not shiny appearance. Using the scoop in Section
3.10. of this test method, fill the bowl with freshly mixed concrete in two layers of equal depth. Rod each
layer 25 times with the tamping rod. Do not forcibly strike the bottom of the bowl when rodding the first
layer. When rodding the second layer, penetrate the prior layer approximately 1 in (25mm).
5.2.1. After each layer is rodded, tap the sides of the measure 10 to 15 times smartly with the mallet to
close any voids left by the tamping rod and to release any large bubbles of air that may have been trapped.
5.3. Strike off the excess concrete, level full, with the strike-off bar or a glass plate. Thoroughly clean the
flanges of the bowl and cover to ensure an air tight fit.
5.4. Clamp the top section into position on the bowl, insert the funnel, and add water until it appears in
the neck. Remove the funnel and adjust the water level, using the rubber syringe, until the bottom of the
meniscus is level with the zero mark. Attach and tighten the screw cap.
NOTE: For low slump or sticky mixes, a small diameter metal rod suitably bent may be used to break up
the concrete before the cap is placed on the apparatus.2
NOTE: When filling the air meter with water, the addition of a minimum of 1 pt (500mL) of alcohol
facilitates the removal of air from high air content or high cement content concretes, or mixtures with
midrange water reducers.
5.5. Invert and agitate the unit until the concrete settles free from the base; and then, with the neck
elevated, roll and rock the unit until the air appears to have been removed from the concrete. Set the
apparatus upright, jar it lightly, and allow it to stand until the air rises to the top. Repeat the operation
until no further drop in the water column is observed.
5.6. When all the air has been removed from the concrete and allowed to rise to the top of the apparatus,
remove the screw cap. Add, in small increments, one measuring cupful of isopropyl alcohol, using the
syringe to dispel the foamy mass on the surface of the water.
5.7. Make a direct reading of the liquid in the neck, reading to the bottom of the meniscus, and estimating
the air to the nearest 0.25%.
5.8 Disassemble the apparatus and examine the contents to be sure that there are no portions of
undisturbed, tightly packed concrete in the base. If portions of undisturbed concrete are found, the test is
invalid.
2 This technique is not found in AASHTO T 196. It does permit the material to break up quicker when dealing with
low slump or sticky mixes.
Page 4/4 5.9.19 2016
Revised 2014
KT-19
6. CALCULATIONS
6.1. Calculate the air content of the concrete in percent by adding to the reading from Section 5.7., of this
test method the amount of alcohol used in accordance with Section 5.6., of this test method. An example
would be determining the air content reading to be 5.7% and 1.0% of alcohol was used (one cup full).
The total air content would be 6.7%.
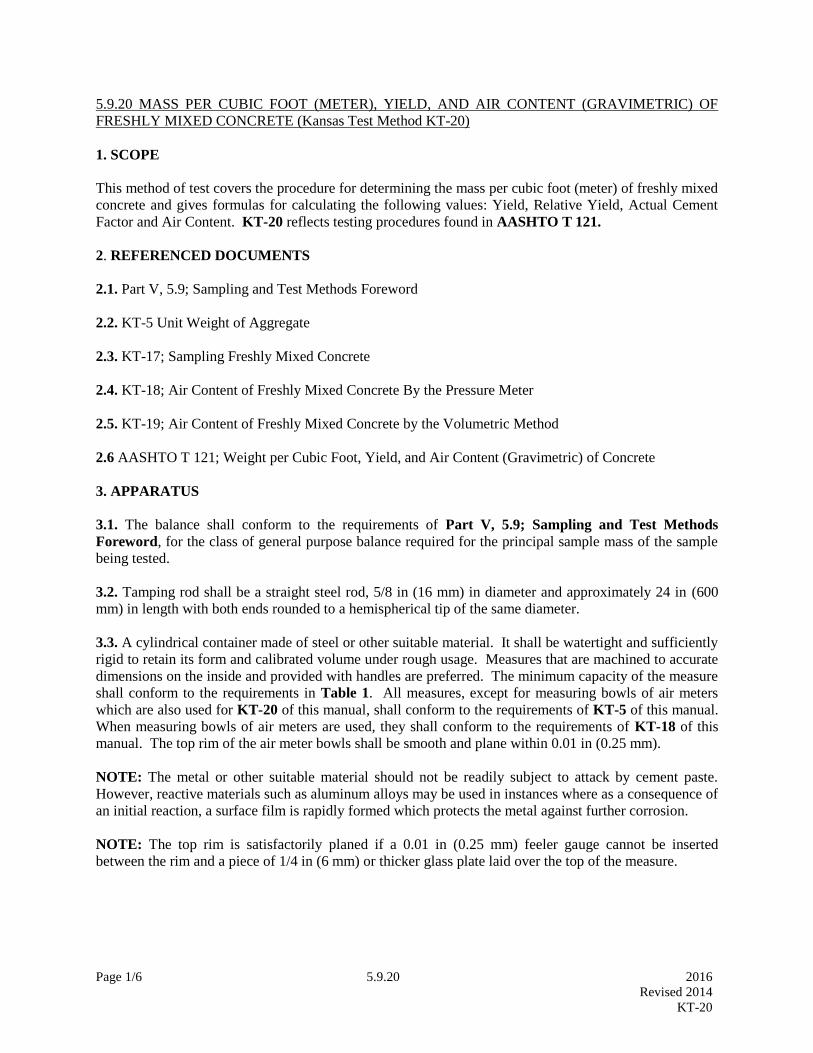
Page 1/6 5.9.20 2016
Revised 2014
KT-20
5.9.20 MASS PER CUBIC FOOT (METER), YIELD, AND AIR CONTENT (GRAVIMETRIC) OF
FRESHLY MIXED CONCRETE (Kansas Test Method KT-20)
1. SCOPE
This method of test covers the procedure for determining the mass per cubic foot (meter) of freshly mixed
concrete and gives formulas for calculating the following values: Yield, Relative Yield, Actual Cement
Factor and Air Content. KT-20 reflects testing procedures found in AASHTO T 121.
2. REFERENCED DOCUMENTS
2.1. Part V, 5.9; Sampling and Test Methods Foreword
2.2. KT-5 Unit Weight of Aggregate
2.3. KT-17; Sampling Freshly Mixed Concrete
2.4. KT-18; Air Content of Freshly Mixed Concrete By the Pressure Meter
2.5. KT-19; Air Content of Freshly Mixed Concrete by the Volumetric Method
2.6 AASHTO T 121; Weight per Cubic Foot, Yield, and Air Content (Gravimetric) of Concrete
3. APPARATUS
3.1. The balance shall conform to the requirements of Part V, 5.9; Sampling and Test Methods
Foreword, for the class of general purpose balance required for the principal sample mass of the sample
being tested.
3.2. Tamping rod shall be a straight steel rod, 5/8 in (16 mm) in diameter and approximately 24 in (600
mm) in length with both ends rounded to a hemispherical tip of the same diameter.
3.3. A cylindrical container made of steel or other suitable material. It shall be watertight and sufficiently
rigid to retain its form and calibrated volume under rough usage. Measures that are machined to accurate
dimensions on the inside and provided with handles are preferred. The minimum capacity of the measure
shall conform to the requirements in Table 1. All measures, except for measuring bowls of air meters
which are also used for KT-20 of this manual, shall conform to the requirements of KT-5 of this manual.
When measuring bowls of air meters are used, they shall conform to the requirements of KT-18 of this
manual. The top rim of the air meter bowls shall be smooth and plane within 0.01 in (0.25 mm).
NOTE: The metal or other suitable material should not be readily subject to attack by cement paste.
However, reactive materials such as aluminum alloys may be used in instances where as a consequence of
an initial reaction, a surface film is rapidly formed which protects the metal against further corrosion.
NOTE: The top rim is satisfactorily planed if a 0.01 in (0.25 mm) feeler gauge cannot be inserted
between the rim and a piece of 1/4 in (6 mm) or thicker glass plate laid over the top of the measure.
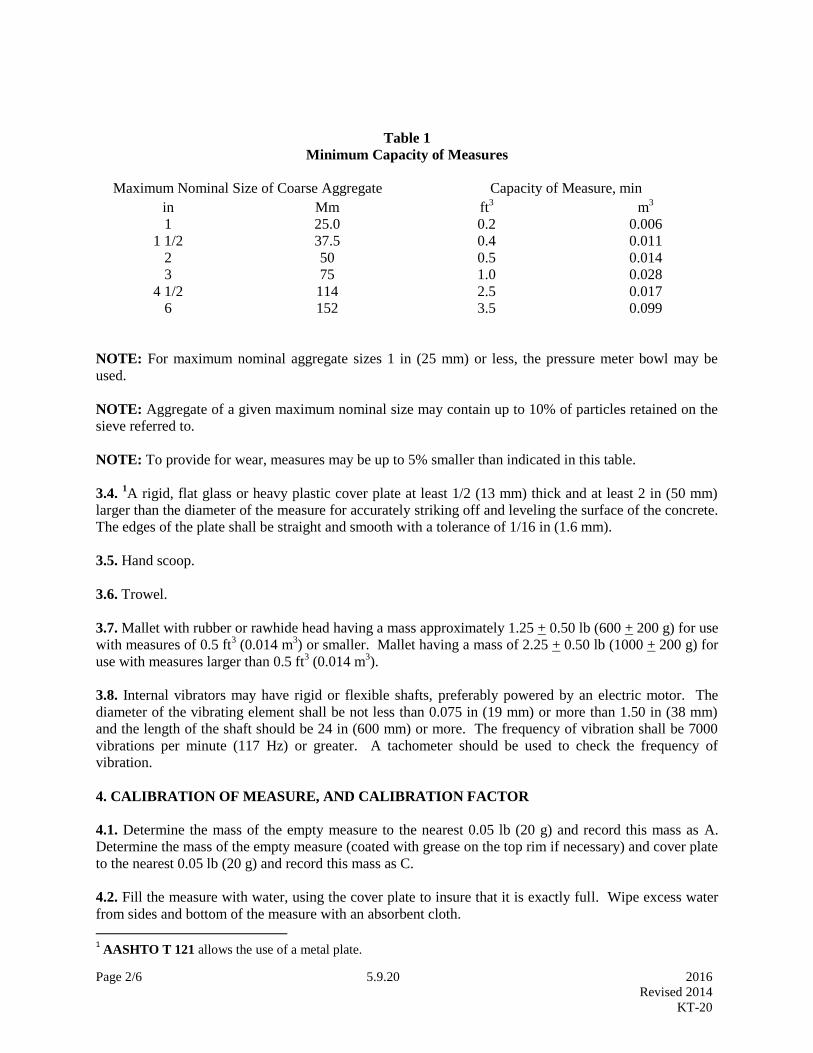
Page 2/6 5.9.20 2016
Revised 2014
KT-20
Table 1
Minimum Capacity of Measures
Maximum Nominal Size of Coarse Aggregate Capacity of Measure, min
in Mm ft3
m3
1 25.0 0.2 0.006
1 1/2 37.5 0.4 0.011
2 50 0.5 0.014
3 75 1.0 0.028
4 1/2 114 2.5 0.017
6 152 3.5 0.099
NOTE: For maximum nominal aggregate sizes 1 in (25 mm) or less, the pressure meter bowl may be
used.
NOTE: Aggregate of a given maximum nominal size may contain up to 10% of particles retained on the
sieve referred to.
NOTE: To provide for wear, measures may be up to 5% smaller than indicated in this table.
3.4. 1A rigid, flat glass or heavy plastic cover plate at least 1/2 (13 mm) thick and at least 2 in (50 mm)
larger than the diameter of the measure for accurately striking off and leveling the surface of the concrete.
The edges of the plate shall be straight and smooth with a tolerance of 1/16 in (1.6 mm).
3.5. Hand scoop.
3.6. Trowel.
3.7. Mallet with rubber or rawhide head having a mass approximately 1.25 + 0.50 lb (600 + 200 g) for use
with measures of 0.5 ft3 (0.014 m
3) or smaller. Mallet having a mass of 2.25 + 0.50 lb (1000 + 200 g) for
use with measures larger than 0.5 ft3 (0.014 m
3).
3.8. Internal vibrators may have rigid or flexible shafts, preferably powered by an electric motor. The
diameter of the vibrating element shall be not less than 0.075 in (19 mm) or more than 1.50 in (38 mm)
and the length of the shaft should be 24 in (600 mm) or more. The frequency of vibration shall be 7000
vibrations per minute (117 Hz) or greater. A tachometer should be used to check the frequency of
vibration.
4. CALIBRATION OF MEASURE, AND CALIBRATION FACTOR
4.1. Determine the mass of the empty measure to the nearest 0.05 lb (20 g) and record this mass as A.
Determine the mass of the empty measure (coated with grease on the top rim if necessary) and cover plate
to the nearest 0.05 lb (20 g) and record this mass as C.
4.2. Fill the measure with water, using the cover plate to insure that it is exactly full. Wipe excess water
from sides and bottom of the measure with an absorbent cloth.
1 AASHTO T 121 allows the use of a metal plate.
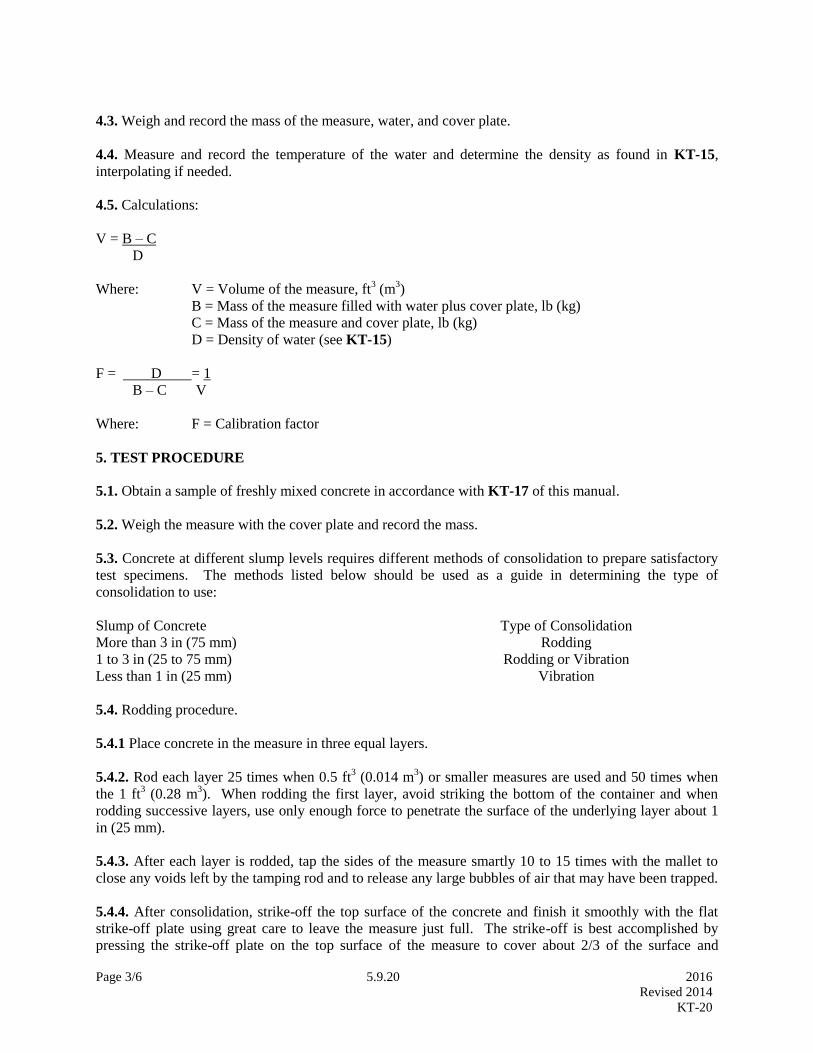
Page 3/6 5.9.20 2016
Revised 2014
KT-20
4.3. Weigh and record the mass of the measure, water, and cover plate.
4.4. Measure and record the temperature of the water and determine the density as found in KT-15,
interpolating if needed.
4.5. Calculations:
V = B – C
D
Where: V = Volume of the measure, ft3 (m
3)
B = Mass of the measure filled with water plus cover plate, lb (kg)
C = Mass of the measure and cover plate, lb (kg)
D = Density of water (see KT-15)
F = D = 1
B – C V
Where: F = Calibration factor
5. TEST PROCEDURE
5.1. Obtain a sample of freshly mixed concrete in accordance with KT-17 of this manual.
5.2. Weigh the measure with the cover plate and record the mass.
5.3. Concrete at different slump levels requires different methods of consolidation to prepare satisfactory
test specimens. The methods listed below should be used as a guide in determining the type of
consolidation to use:
Slump of Concrete Type of Consolidation
More than 3 in (75 mm) Rodding
1 to 3 in (25 to 75 mm) Rodding or Vibration
Less than 1 in (25 mm) Vibration
5.4. Rodding procedure.
5.4.1 Place concrete in the measure in three equal layers.
5.4.2. Rod each layer 25 times when 0.5 ft3 (0.014 m
3) or smaller measures are used and 50 times when
the 1 ft3 (0.28 m
3). When rodding the first layer, avoid striking the bottom of the container and when
rodding successive layers, use only enough force to penetrate the surface of the underlying layer about 1
in (25 mm).
5.4.3. After each layer is rodded, tap the sides of the measure smartly 10 to 15 times with the mallet to
close any voids left by the tamping rod and to release any large bubbles of air that may have been trapped.
5.4.4. After consolidation, strike-off the top surface of the concrete and finish it smoothly with the flat
strike-off plate using great care to leave the measure just full. The strike-off is best accomplished by
pressing the strike-off plate on the top surface of the measure to cover about 2/3 of the surface and

Page 4/6 5.9.20 2016
Revised 2014
KT-20
withdrawing the plate with a sawing motion to finish only the area originally covered. Then place the
plate on the top of the measure to cover the original 2/3 of the surface and advance it with a vertical
pressure and a sawing motion to cover the whole surface of the measure. Several final strokes with the
inclined edge of the plate will produce a smooth finished surface.
5.4.5. Clean all excess concrete from the exterior of the filled measure. Weigh the filled measure to the
nearest 0.1 lb (50 g) and record the mass.
5.5. Vibration Procedure.
5.5.1. Fill the measure approximately 1/2 full of concrete. Place all the concrete required for the layer in
the measure before starting vibration.
5.5.2. Consolidate the layer by three insertions of the vibrator evenly distributed over the surface. Do not
let the vibrator rest or touch the bottom or sides of the measure. The duration of vibration will depend on
the effectiveness of the vibrator and the consistency of the concrete, but usually sufficient vibration has
been applied when the surface of the concrete becomes relatively smooth in appearance.
5.5.3. Fill the measure to an elevation somewhat above the top rim and vibrate this second layer. In
compacting the final layer, the vibrator shall penetrate into the underlying layer approximately 1 in (25
mm). Take care that the vibrator is withdrawn in such a manner that no air pockets are left in the
specimen. A small quantity of concrete may be added to correct a deficiency. If the measure contains a
great excess of concrete at completion of consolidation, remove most of the excess concrete with a trowel
or scoop immediately before the measure is struck-off.
5.5.4. Strike-off the surface as in Section 5.4.4 of this test method.
5.5.5. Proceed as in Section 5.4.5 of this test method.
6. CALCULATIONS
6.1. Mass per cubic foot (meter) of fresh concrete.
W = F (D- A)
Where: W = Mass of concrete lb/ft3 (kg/m
3)
D = Mass of measure filled with concrete, lb (kg)
A = Mass of measure, lb (kg)
F = Calibration factor
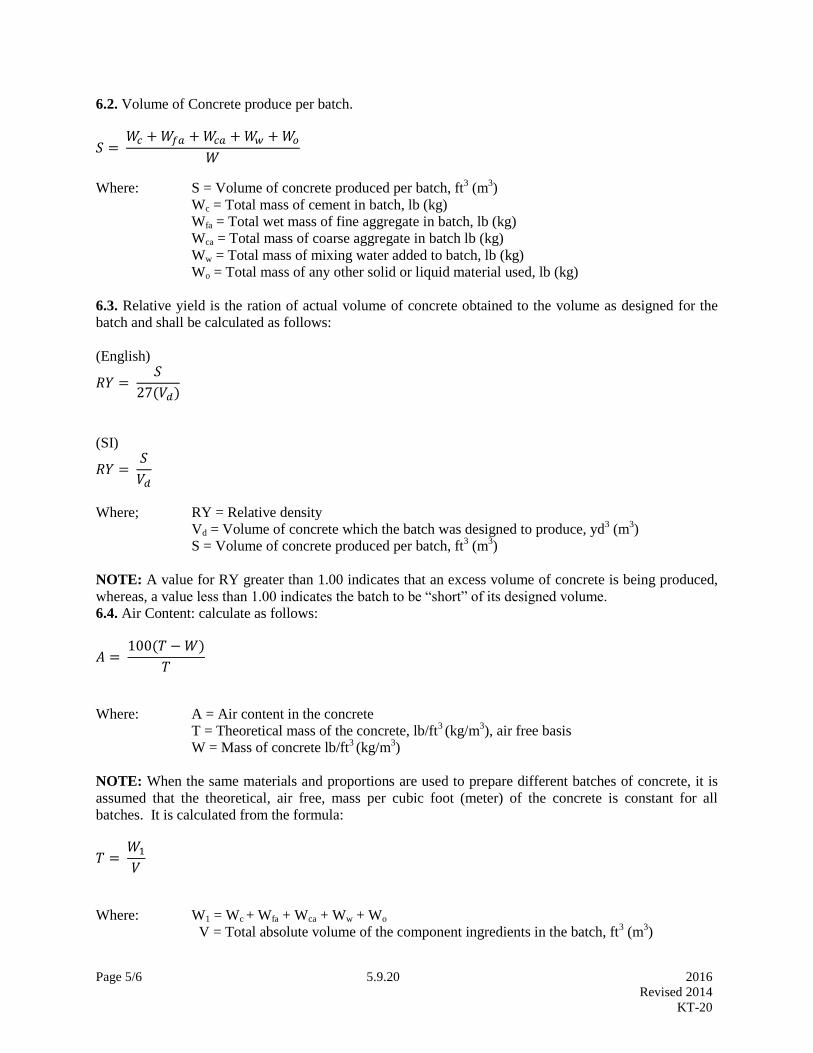
Page 5/6 5.9.20 2016
Revised 2014
KT-20
6.2. Volume of Concrete produce per batch.
𝑆 = 𝑊𝑐 + 𝑊𝑓𝑎 + 𝑊𝑐𝑎 + 𝑊𝑤 + 𝑊𝑜
𝑊
Where: S = Volume of concrete produced per batch, ft3 (m
3)
Wc = Total mass of cement in batch, lb (kg)
Wfa = Total wet mass of fine aggregate in batch, lb (kg)
Wca = Total mass of coarse aggregate in batch lb (kg)
Ww = Total mass of mixing water added to batch, lb (kg)
Wo = Total mass of any other solid or liquid material used, lb (kg)
6.3. Relative yield is the ration of actual volume of concrete obtained to the volume as designed for the
batch and shall be calculated as follows:
(English)
𝑅𝑌 = 𝑆
27(𝑉𝑑)
(SI)
𝑅𝑌 = 𝑆
𝑉𝑑
Where; RY = Relative density
Vd = Volume of concrete which the batch was designed to produce, yd3 (m
3)
S = Volume of concrete produced per batch, ft3 (m
3)
NOTE: A value for RY greater than 1.00 indicates that an excess volume of concrete is being produced,
whereas, a value less than 1.00 indicates the batch to be “short” of its designed volume.
6.4. Air Content: calculate as follows:
𝐴 = 100(𝑇 − 𝑊)
𝑇
Where: A = Air content in the concrete
T = Theoretical mass of the concrete, lb/ft3 (kg/m
3), air free basis
W = Mass of concrete lb/ft3 (kg/m
3)
NOTE: When the same materials and proportions are used to prepare different batches of concrete, it is
assumed that the theoretical, air free, mass per cubic foot (meter) of the concrete is constant for all
batches. It is calculated from the formula:
𝑇 = 𝑊1
𝑉
Where: W1 = Wc + Wfa + Wca + Ww + Wo
V = Total absolute volume of the component ingredients in the batch, ft3 (m
3)

Page 6/6 5.9.20 2016
Revised 2014
KT-20
The absolute volume of each ingredient is calculated in accordance with subsection 5.10.1 of this manual.
For aggregate components, the bulk specific gravity and mass should be based on the saturated, surface-
dry condition.
6.5. Actual Cement Factor: Cement factor based on theoretical yd3 (m
3) of concrete required and actual
quantity of cement used is calculated as follows:
𝐴𝐶𝐹 = 𝐴
𝐵
Where: A = Actual cement used lb (kg)
B = Theoretical volume of concrete, yd3 (m
3)
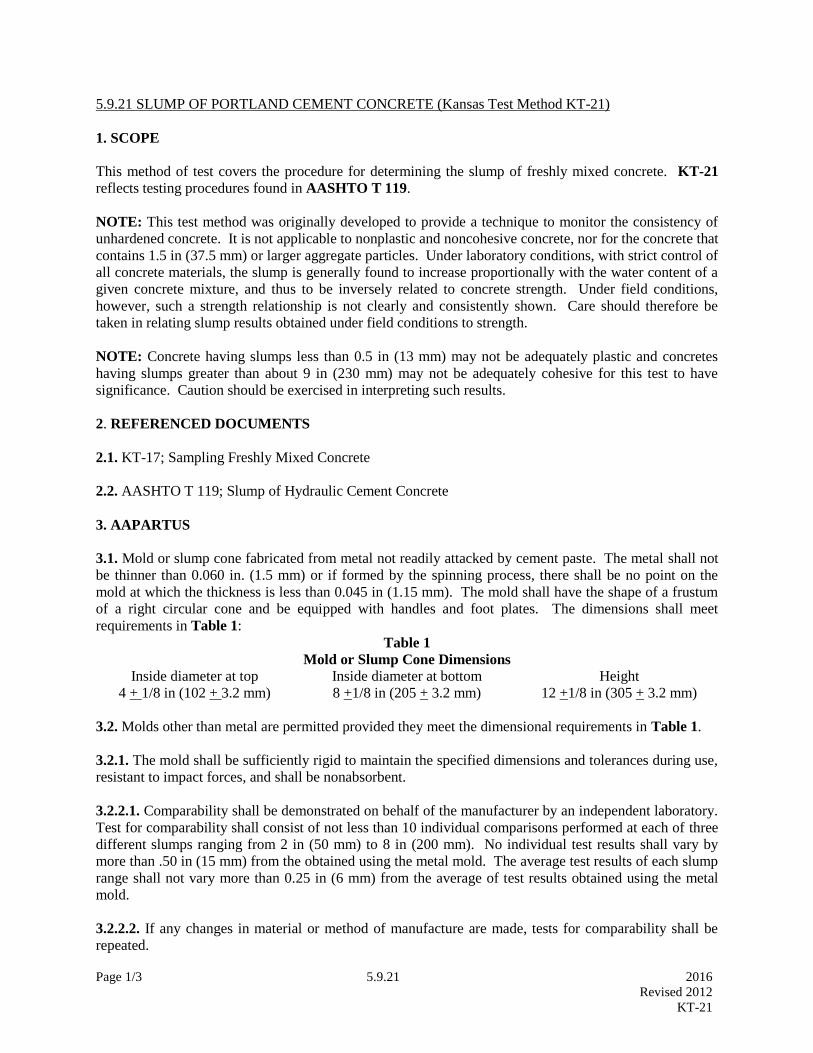
Page 1/3 5.9.21 2016
Revised 2012
KT-21
5.9.21 SLUMP OF PORTLAND CEMENT CONCRETE (Kansas Test Method KT-21)
1. SCOPE
This method of test covers the procedure for determining the slump of freshly mixed concrete. KT-21
reflects testing procedures found in AASHTO T 119.
NOTE: This test method was originally developed to provide a technique to monitor the consistency of
unhardened concrete. It is not applicable to nonplastic and noncohesive concrete, nor for the concrete that
contains 1.5 in (37.5 mm) or larger aggregate particles. Under laboratory conditions, with strict control of
all concrete materials, the slump is generally found to increase proportionally with the water content of a
given concrete mixture, and thus to be inversely related to concrete strength. Under field conditions,
however, such a strength relationship is not clearly and consistently shown. Care should therefore be
taken in relating slump results obtained under field conditions to strength.
NOTE: Concrete having slumps less than 0.5 in (13 mm) may not be adequately plastic and concretes
having slumps greater than about 9 in (230 mm) may not be adequately cohesive for this test to have
significance. Caution should be exercised in interpreting such results.
2. REFERENCED DOCUMENTS
2.1. KT-17; Sampling Freshly Mixed Concrete
2.2. AASHTO T 119; Slump of Hydraulic Cement Concrete
3. AAPARTUS
3.1. Mold or slump cone fabricated from metal not readily attacked by cement paste. The metal shall not
be thinner than 0.060 in. (1.5 mm) or if formed by the spinning process, there shall be no point on the
mold at which the thickness is less than 0.045 in (1.15 mm). The mold shall have the shape of a frustum
of a right circular cone and be equipped with handles and foot plates. The dimensions shall meet
requirements in Table 1:
Table 1
Mold or Slump Cone Dimensions
Inside diameter at top Inside diameter at bottom Height
4 + 1/8 in (102 + 3.2 mm) 8 +1/8 in (205 + 3.2 mm) 12 +1/8 in (305 + 3.2 mm)
3.2. Molds other than metal are permitted provided they meet the dimensional requirements in Table 1.
3.2.1. The mold shall be sufficiently rigid to maintain the specified dimensions and tolerances during use,
resistant to impact forces, and shall be nonabsorbent.
3.2.2.1. Comparability shall be demonstrated on behalf of the manufacturer by an independent laboratory.
Test for comparability shall consist of not less than 10 individual comparisons performed at each of three
different slumps ranging from 2 in (50 mm) to 8 in (200 mm). No individual test results shall vary by
more than .50 in (15 mm) from the obtained using the metal mold. The average test results of each slump
range shall not vary more than 0.25 in (6 mm) from the average of test results obtained using the metal
mold.
3.2.2.2. If any changes in material or method of manufacture are made, tests for comparability shall be
repeated.
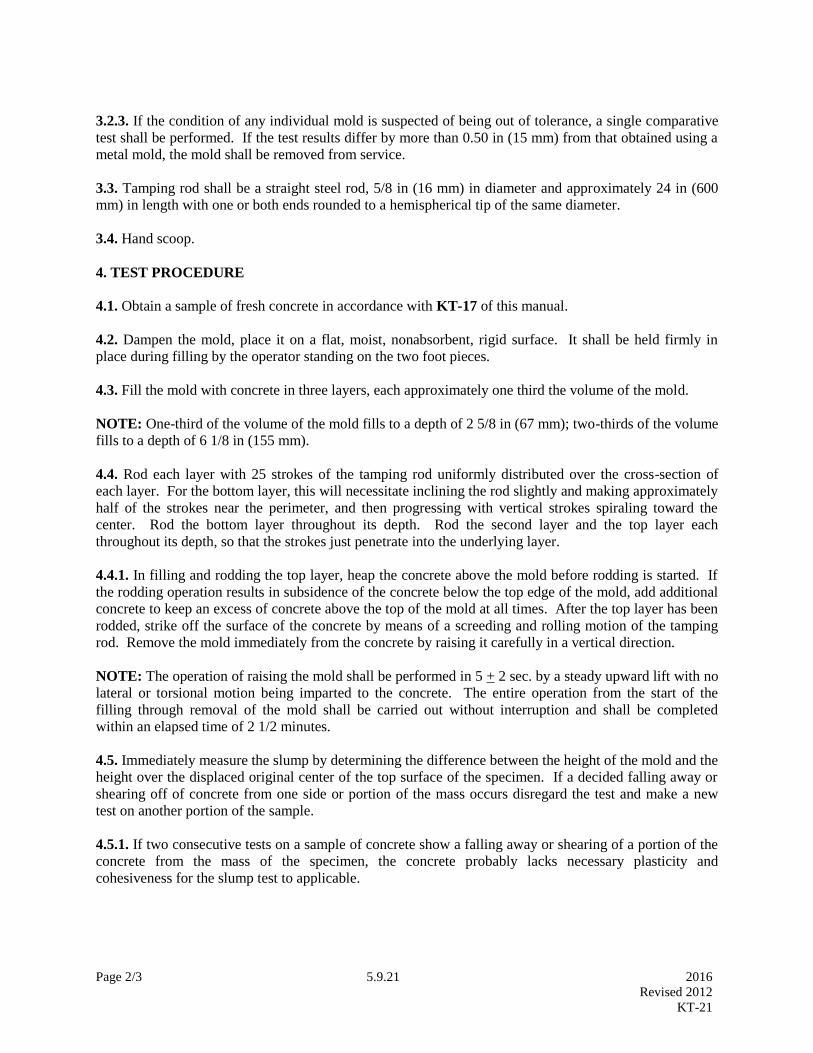
Page 2/3 5.9.21 2016
Revised 2012
KT-21
3.2.3. If the condition of any individual mold is suspected of being out of tolerance, a single comparative
test shall be performed. If the test results differ by more than 0.50 in (15 mm) from that obtained using a
metal mold, the mold shall be removed from service.
3.3. Tamping rod shall be a straight steel rod, 5/8 in (16 mm) in diameter and approximately 24 in (600
mm) in length with one or both ends rounded to a hemispherical tip of the same diameter.
3.4. Hand scoop.
4. TEST PROCEDURE
4.1. Obtain a sample of fresh concrete in accordance with KT-17 of this manual.
4.2. Dampen the mold, place it on a flat, moist, nonabsorbent, rigid surface. It shall be held firmly in
place during filling by the operator standing on the two foot pieces.
4.3. Fill the mold with concrete in three layers, each approximately one third the volume of the mold.
NOTE: One-third of the volume of the mold fills to a depth of 2 5/8 in (67 mm); two-thirds of the volume
fills to a depth of 6 1/8 in (155 mm).
4.4. Rod each layer with 25 strokes of the tamping rod uniformly distributed over the cross-section of
each layer. For the bottom layer, this will necessitate inclining the rod slightly and making approximately
half of the strokes near the perimeter, and then progressing with vertical strokes spiraling toward the
center. Rod the bottom layer throughout its depth. Rod the second layer and the top layer each
throughout its depth, so that the strokes just penetrate into the underlying layer.
4.4.1. In filling and rodding the top layer, heap the concrete above the mold before rodding is started. If
the rodding operation results in subsidence of the concrete below the top edge of the mold, add additional
concrete to keep an excess of concrete above the top of the mold at all times. After the top layer has been
rodded, strike off the surface of the concrete by means of a screeding and rolling motion of the tamping
rod. Remove the mold immediately from the concrete by raising it carefully in a vertical direction.
NOTE: The operation of raising the mold shall be performed in 5 + 2 sec. by a steady upward lift with no
lateral or torsional motion being imparted to the concrete. The entire operation from the start of the
filling through removal of the mold shall be carried out without interruption and shall be completed
within an elapsed time of 2 1/2 minutes.
4.5. Immediately measure the slump by determining the difference between the height of the mold and the
height over the displaced original center of the top surface of the specimen. If a decided falling away or
shearing off of concrete from one side or portion of the mass occurs disregard the test and make a new
test on another portion of the sample.
4.5.1. If two consecutive tests on a sample of concrete show a falling away or shearing of a portion of the
concrete from the mass of the specimen, the concrete probably lacks necessary plasticity and
cohesiveness for the slump test to applicable.

Page 3/3 5.9.21 2016
Revised 2012
KT-21
5. REPORTING
5.1. Record the slump in terms of in (mm) to the nearest ¼ inch (5 mm) of subsidence of the specimen
during the test as follows:
S = A – B
Where: S = Slump of the concrete
A = Height of mold
B = Height of concrete after removal of mold

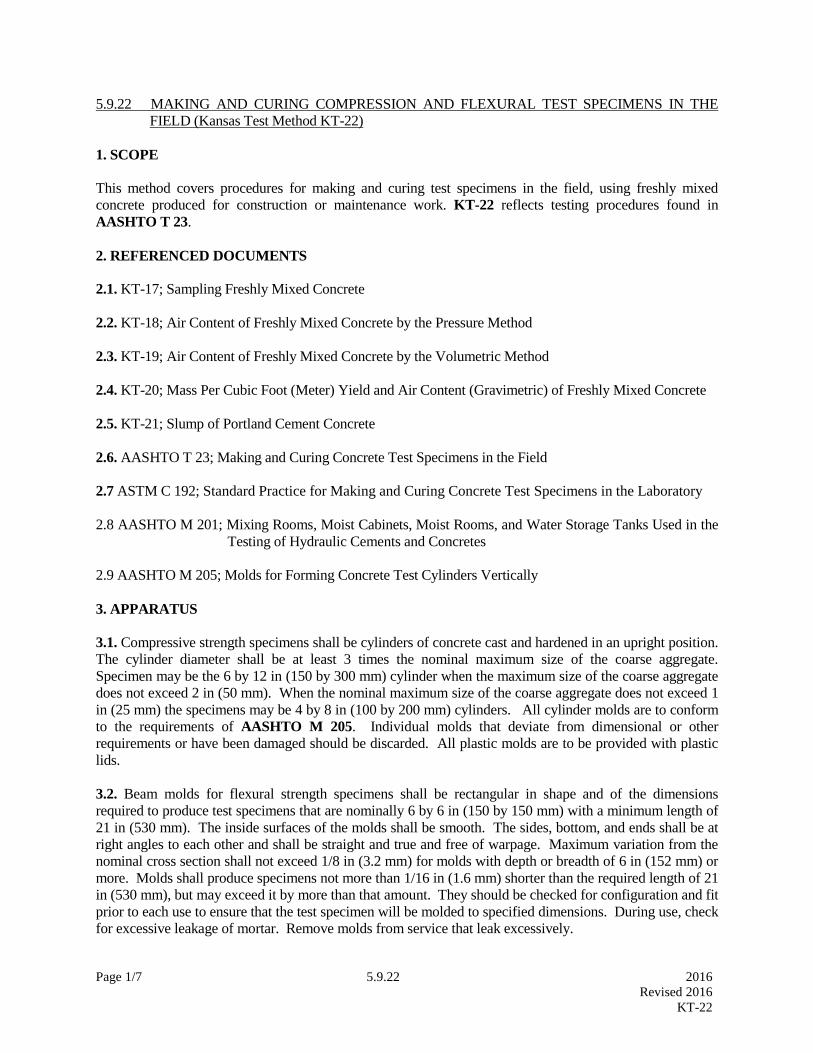
Page 1/7 5.9.22 2016
Revised 2016
KT-22
5.9.22 MAKING AND CURING COMPRESSION AND FLEXURAL TEST SPECIMENS IN THE
FIELD (Kansas Test Method KT-22)
1. SCOPE
This method covers procedures for making and curing test specimens in the field, using freshly mixed
concrete produced for construction or maintenance work. KT-22 reflects testing procedures found in
AASHTO T 23.
2. REFERENCED DOCUMENTS
2.1. KT-17; Sampling Freshly Mixed Concrete
2.2. KT-18; Air Content of Freshly Mixed Concrete by the Pressure Method
2.3. KT-19; Air Content of Freshly Mixed Concrete by the Volumetric Method
2.4. KT-20; Mass Per Cubic Foot (Meter) Yield and Air Content (Gravimetric) of Freshly Mixed Concrete
2.5. KT-21; Slump of Portland Cement Concrete
2.6. AASHTO T 23; Making and Curing Concrete Test Specimens in the Field
2.7 ASTM C 192; Standard Practice for Making and Curing Concrete Test Specimens in the Laboratory
2.8 AASHTO M 201; Mixing Rooms, Moist Cabinets, Moist Rooms, and Water Storage Tanks Used in the
Testing of Hydraulic Cements and Concretes
2.9 AASHTO M 205; Molds for Forming Concrete Test Cylinders Vertically
3. APPARATUS
3.1. Compressive strength specimens shall be cylinders of concrete cast and hardened in an upright position.
The cylinder diameter shall be at least 3 times the nominal maximum size of the coarse aggregate.
Specimen may be the 6 by 12 in (150 by 300 mm) cylinder when the maximum size of the coarse aggregate
does not exceed 2 in (50 mm). When the nominal maximum size of the coarse aggregate does not exceed 1
in (25 mm) the specimens may be 4 by 8 in (100 by 200 mm) cylinders. All cylinder molds are to conform
to the requirements of AASHTO M 205. Individual molds that deviate from dimensional or other
requirements or have been damaged should be discarded. All plastic molds are to be provided with plastic
lids.
3.2. Beam molds for flexural strength specimens shall be rectangular in shape and of the dimensions
required to produce test specimens that are nominally 6 by 6 in (150 by 150 mm) with a minimum length of
21 in (530 mm). The inside surfaces of the molds shall be smooth. The sides, bottom, and ends shall be at
right angles to each other and shall be straight and true and free of warpage. Maximum variation from the
nominal cross section shall not exceed 1/8 in (3.2 mm) for molds with depth or breadth of 6 in (152 mm) or
more. Molds shall produce specimens not more than 1/16 in (1.6 mm) shorter than the required length of 21
in (530 mm), but may exceed it by more than that amount. They should be checked for configuration and fit
prior to each use to ensure that the test specimen will be molded to specified dimensions. During use, check
for excessive leakage of mortar. Remove molds from service that leak excessively.

Page 2/7 5.9.22 2016
Revised 2016
KT-22
3.3. Tamping Rods--Two sizes are specified. Each shall be a round, straight steel rod with at least the
tamping end rounded to a hemispherical tip of the same diameter as the rod. Both ends may be rounded if
preferred.
3.3.1. Large Rod: 5/8 in (16 mm) in diameter and approximately 24 in (610 mm) long.
3.3.2. Small Rod: 3/8 in (10 mm) in diameter and approximately 12 in (305 mm) long.
3.4. Vibrators.
3.4.1. Internal vibrators may have rigid or flexible shafts, preferably powered by an electric motor. The
diameter of the vibrating element shall not be less than 0.75 in (19 mm) or more than 1.50 in (38 mm) and
the length of the shaft should be 24 in (600 mm) or more. The frequency shall be 7,000 vpm or greater
during usage.
3.4.2. External vibrators may be either a table type or a plank type, with provision for securely clamping the
mold to the apparatus. The frequency shall be 3,600 vpm or higher during usage.
A vibrating reed tachometer should be used to check the frequency of vibration of each type.
NOTE: Vibratory impulses are frequently imparted to plank vibrators through electromagnetic means or by
use of an eccentric weight on the shaft of an electric motor, or on a separate shaft driven by a motor.
3.5. Small tools and other items such as shovels, pails, trowels, wood float, blunted trowels, straightedge,
scoops, rules and a wheelbarrow or cart for transporting the fresh concrete to the place where test specimens
will be molded.
3.6. Slump apparatus as specified in KT-21.
3.7. Sampling and mix apparatus as specified in KT-17.
3.8. Air content apparatus as specified in KT-18, KT-19, or KT-20.
4. PROCEDURE
4.1. Obtain a sample of concrete in accordance with KT-17. Note and record the place where the batch of
concrete represented by the sample was deposited.
4.2. Measure and record the slump of the concrete in accordance with KT-21. The concrete used for the test
may be returned to the forms or discarded.
4.3. Determine the air content, when required, in accordance with KT-18, KT-19 or KT-20 and record.
Concrete used in performing the air content test shall not be used in fabricating test specimens.
4.4. Determine and record the temperature of the concrete as specified in KT-17 Section 6.
4.5. Molding Specimens: The following procedures are applicable to both compression and flexure
specimens.
4.5.1. Mold specimens promptly on a level, rigid, horizontal surface, free from vibration and other
disturbances, at a place as near as practicable to the location where they are to be stored.

Page 3/7 5.9.22 2016
Revised 2016
KT-22
4.5.2. Placing the concrete: Place the concrete in the molds using a scoop, blunted trowel, or shovel. Select
each scoopful, trowelful, or shovelful of concrete from the mixing pan to ensure that it is representative of
the batch. Remix the concrete in the mixing pan with a shovel or trowel to prevent segregation during the
molding of the specimens. Move the scoop, shovel, or trowel around the perimeter of the mold opening
when adding concrete to ensure an even distribution of the concrete and to minimize segregation. Further
distribute the concrete by use of a tamping rod prior to the start of consolidation. In placing the final layer,
the operator shall attempt to add an amount of concrete that will exactly fill the mold after consolidation.
Do not add nonrepresentative concrete to an underfilled mold.
4.5.3. Number of layers: Make specimens in layers as indicated in Table 1.
4.6. Consolidation:
4.6.1. Methods of consolidation: Preparation of satisfactory specimens requires different methods of
consolidation. The methods of consolidation are rodding, and internal or external vibration. Base the
selection of the method of consolidation on the slump, unless the method is stated in the specifications under
which the work is being performed. Rod concrete’s with a slump greater than 3 in. (75 mm). Rod or vibrate
concrete’s with slump of 1 to 3 in (25 to 75 mm). Vibrate concrete’s with slump of less than 1 in. (25 mm).
Concretes of such low water content that they cannot be properly consolidated by the methods described
herein, or requiring other sizes and shapes of specimens to represent the product or structure, are not
covered be this method. Specimens for such concretes shall be made in accordance with the requirements of
ASTM C 192 with regard to specimen size and shape and method of consolidation.
4.6.2. Rodding: Place the concrete in the mold, in the required number of layers of approximately equal
volume. For cylinders, rod each layer with the rounded end of the rod using the number of strokes specified
in Table 1. The small rod shall be used when the diameter or the width of the mold is less than 6 in (150
mm). The number of roddings per layer required for beams is one for each 2 in2 (1250 mm
2) top surface
area of the specimen. Rod the bottom layer throughout its depth. Distribute the strokes uniformly over the
cross section of the mold and for each upper layer allow the rod to penetrate about 1/2 in (12 mm) into the
underlying layer when the depth of the layer is less than 4 in (100 mm), and about 1 in (25 mm) when the
depth is 4 in (100 mm), or more. After each layer is rodded, tap the outsides of the mold lightly 10 to 15
times with the mallet, to close any holes left by rodding and to release any large air bubbles that may have
been trapped. Use an open hand to tap light-gauge single-use molds which are susceptible to damage if
tapped with a mallet. After tapping, spade the concrete along the sides and ends of beam molds with a
trowel or other suitable tool.
4.6.3. External and internal vibration: Maintain a uniform time period for duration of vibration for the
particular kind of concrete, vibrator, and specimen mold involved. The duration of vibration required will
depend upon the workability of the concrete and the effectiveness of the vibrator. Usually, sufficient
vibration has been applied as soon as the surface of the concrete has become relatively smooth. Continue
vibration only long enough to achieve proper consolidation of the concrete. Over vibration may cause
segregation. Fill the molds and vibrate in the required number of approximately equal layers. Place all the
concrete for each layer in the mold before starting vibration of that layer. When placing the final layer,
avoid overfilling by more than 1/4 in (6 mm). Finish the surface either during or after vibration where
external vibration is used. When the finish is applied after vibration, add only enough concrete with a
trowel to overfill the mold about 1/8 in (3 mm). Work it into the surface and strike it off.
4.6.4. Internal vibration: The diameter of the vibrating element, or thickness of a square vibrating element,
shall be in accordance with the requirements of Section 3.4 of this test method. For beams, the vibrating
element shall not exceed one-third of the width of the mold. For cylinders, the ratio of the diameter of the

Page 4/7 5.9.22 2016
Revised 2016
KT-22
cylinder to the diameter of the vibrating element shall be 4.0 or higher. Place all the concrete for one layer
in the mold before starting vibration of that layer. Insert the vibrator slowly and do not allow the vibrator to
rest on the bottom or sides of the mold. Continue vibration only long enough to achieve proper
consolidation of the concrete. Slowly withdraw the vibrator in such a manner that no air pockets are left in
the specimen.
4.6.4.1. Cylinders: Follow the molding requirements of Table 2. Allow the vibration to penetrate through
the layer being vibrated, and into the layer below, approximately 1 in (25 mm). After each layer is vibrated,
tap the outsides of the mold lightly 10 to 15 times with the mallet, to close any holes left by vibrating and to
release any large air bubbles that may have been trapped. Use an open hand to tap light-gauge single-use
molds which are susceptible to damage if tapped with a mallet.
4.6.4.2. Beam: Insert the vibrator at intervals not exceeding 6 in (150 mm) along the centerline of the long
dimension of the specimen. For specimens wider than 6 in (150 mm), use alternating insertions along two
lines. Allow the shaft of the vibrator to penetrate into the bottom layer approximately 1 in (25 mm). After
each layer is vibrated, tap the outside of the mold lightly 10 to 15 times with the mallet, to close any holes
left by vibrating and to release any large air bubbles that may have been trapped.
4.6.5. External vibration: When external vibration is used, take care to ensure that the mold is rigidly
attached to or securely held against the vibrating element or vibrating surface.
4.7. Finishing: After consolidation, unless the finishing has been performed during the vibration, strike off
the surface of the concrete and float or trowel as required. Perform all finishing with the minimum
manipulation necessary to produce a flat even surface that is level with the rim or edge of the mold and that
has no depressions or projections larger than 1/8 in (3 mm).
4.7.1. Cylinders: After consolidation, finish the top surfaces by striking them off with the tamping rod
where the consistency of the concrete permits or with a wood float or trowel. If desired, cap the top surface
with a thin layer of stiff Portland cement paste which is permitted to harden and cure with the specimen. If
using plastic molds and lids, cap the cylinder with the supplied lid immediately after finishing.
4.7.2. Beams: After consolidation of the concrete, strike off the top surface to the required tolerance to
produce a flat even surface. A wood float may be used.
4.8. Initial storage: Immediately after being struck off, the specimens shall be moved to the storage place
where they will remain undisturbed for the initial curing period. If specimens made in single-use mold are
moved, lift and support the specimens from the bottom of the molds with a large trowel or similar device.
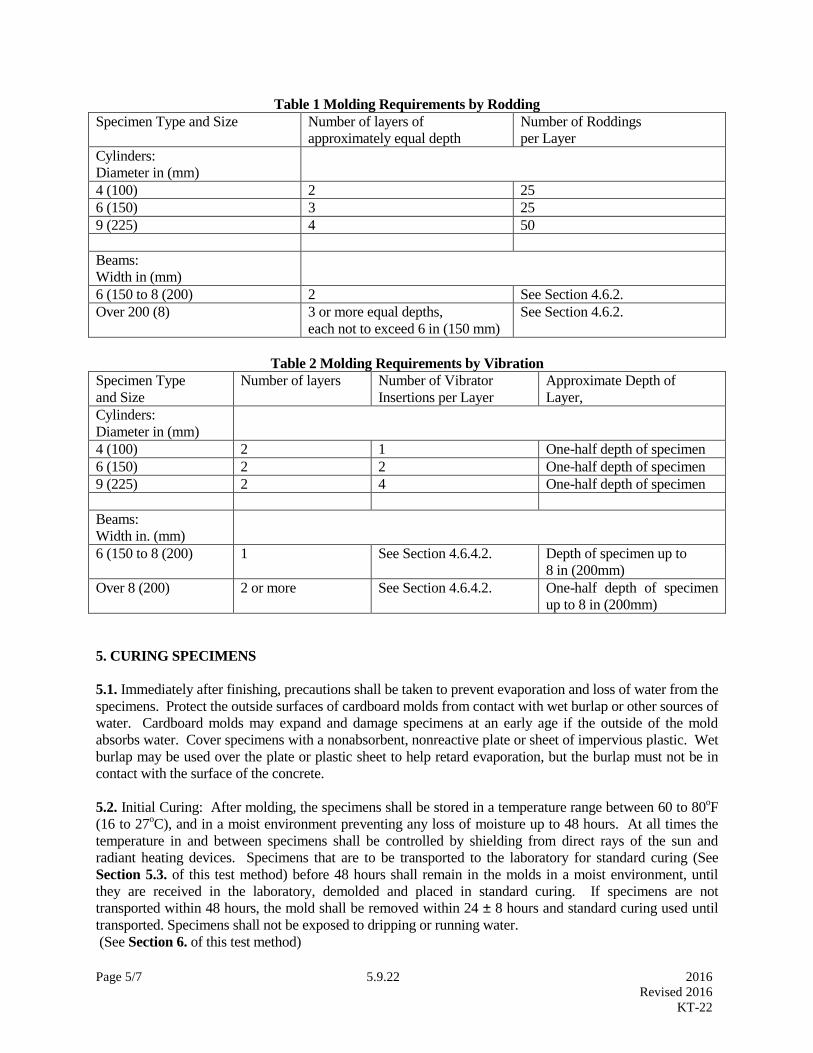
Page 5/7 5.9.22 2016
Revised 2016
KT-22
Table 1 Molding Requirements by Rodding
Specimen Type and Size Number of layers of
approximately equal depth
Number of Roddings
per Layer
Cylinders:
Diameter in (mm)
4 (100) 2 25
6 (150) 3 25
9 (225) 4 50
Beams:
Width in (mm)
6 (150 to 8 (200) 2 See Section 4.6.2.
Over 200 (8) 3 or more equal depths,
each not to exceed 6 in (150 mm)
See Section 4.6.2.
Table 2 Molding Requirements by Vibration
Specimen Type
and Size
Number of layers Number of Vibrator
Insertions per Layer
Approximate Depth of
Layer,
Cylinders:
Diameter in (mm)
4 (100) 2 1 One-half depth of specimen
6 (150) 2 2 One-half depth of specimen
9 (225) 2 4 One-half depth of specimen
Beams:
Width in. (mm)
6 (150 to 8 (200) 1 See Section 4.6.4.2. Depth of specimen up to
8 in (200mm)
Over 8 (200) 2 or more See Section 4.6.4.2. One-half depth of specimen
up to 8 in (200mm)
5. CURING SPECIMENS
5.1. Immediately after finishing, precautions shall be taken to prevent evaporation and loss of water from the
specimens. Protect the outside surfaces of cardboard molds from contact with wet burlap or other sources of
water. Cardboard molds may expand and damage specimens at an early age if the outside of the mold
absorbs water. Cover specimens with a nonabsorbent, nonreactive plate or sheet of impervious plastic. Wet
burlap may be used over the plate or plastic sheet to help retard evaporation, but the burlap must not be in
contact with the surface of the concrete.
5.2. Initial Curing: After molding, the specimens shall be stored in a temperature range between 60 to 80oF
(16 to 27oC), and in a moist environment preventing any loss of moisture up to 48 hours. At all times the
temperature in and between specimens shall be controlled by shielding from direct rays of the sun and
radiant heating devices. Specimens that are to be transported to the laboratory for standard curing (See
Section 5.3. of this test method) before 48 hours shall remain in the molds in a moist environment, until
they are received in the laboratory, demolded and placed in standard curing. If specimens are not
transported within 48 hours, the mold shall be removed within 24 ± 8 hours and standard curing used until
transported. Specimens shall not be exposed to dripping or running water.
(See Section 6. of this test method)
Page 6/7 5.9.22 2016
Revised 2016
KT-22
5.2.1. Under no circumstances should the lid be removed from plastic molds, until the mold is stripped from
the cylinder.
NOTE: It may be necessary to create an environment during initial curing to provide satisfactory moisture
and to control the temperature. The specimens may be immersed immediately in saturated limewater,
and/or stored in tightly constructed wooden boxes, damp sand pits, temporary buildings at construction sites,
under wet burlap, or in heavyweight closed plastic bags. Immersing in saturated limewater is not acceptable
for specimens in cardboard or other molds that expand when immersed in water. Other suitable methods
may be used provided the foregoing requirements limiting specimen temperature and moisture loss are met.
The temperature may be controlled by ventilation, or thermostatically controlled cooling devices, or by
heating devices such as stoves, light bulbs, or thermostatically controlled heating elements. Temperature
records of the specimens may be established by means of maximum-minimum thermometers. Early age
results may be lower when stored near 60oF (16
oC) and higher when stored near 80
oF (27
oC).
5.3. Standard Curing for Cylinders
Note: Beams are only used for opening to traffic. See Section 5.5 of this test method.
5.3.1. Cylinders: Upon completion of initial curing and within 30 minutes after removing the molds, store
specimens in a moist condition with free water maintained on their surfaces at all times at a temperature of
73 ± 3oF (23 ± 2
oC). Temperatures between 68 and 86
oF (20 and 30
oC) are permitted for a period not to
exceed 3 hours immediately prior to test if free moisture is maintained on the surfaces of the specimen at all
times, except when capping with sulfur mortar capping compound. When capping with this material, the
ends of the cylinder will be dried. Specimens shall not be exposed to dripping or running water. The
required moist storage can be obtained by immersion in saturated limewater or by storage in a moist room or
cabinet meeting the requirements of AASHTO M 201.
5.4. Curing at Remote Sites:
5.4.1. Specimens prepared and stored at remote sites which do not have facilities for controlling temperature
within the tolerance 73 ± 3oF (23 ± 2
oC) shall be cured in accordance with the provisions of Section 5.3. of
this test method except as modified by Section 5.4. of this test method.
5.4.2. Initial curing at remote sites shall be in accordance with Section 5.2. of this test method.
5.4.2.1. Specimens not to be transported or to be transported after 48 hours age may be cured without
demolding in accordance with Section 5.2. of this test method until the time of transportation or testing
provided that loss of moisture is prevented.
NOTE: Curing of specimens at remote sites in accordance with Section 5.4. of this test method may yield
significantly different results as compared to specimens cured in accordance with Section 5.3. of this test
method.
5.5. Curing for Determining Form Removal Time or When a Structure May be put into Service:
5.5.1. Cylinders: Store cylinders in or on the structure as near to the point of deposit of the concrete
represented as possible. Protect all surfaces of the cylinders from the elements in as near as possible the
same way as the formed work. Provide the cylinders with the same temperature and moisture environment
as the structural work. Test the specimens in the moisture condition resulting from the specified curing
Page 7/7 5.9.22 2016
Revised 2016
KT-22
treatment. To meet these conditions, specimens made for the purpose of determining when a structure may
be put in service shall be removed from the molds at the time of removal of formwork.
5.5.2. Beams: As nearly as practicable, cure beams in the same manner as the concrete in the structure. At
the end of 48 ± 4 hours after molding, take the molded specimens to the storage location and remove from
the molds. Store specimens representing pavements or slabs on grade by placing them on the ground as
molded, with their top surfaces up. Bank the sides and ends of the specimens with earth or sand that shall be
kept damp, leaving the top surfaces exposed to the specified curing treatment. Store specimens representing
structure concrete as near to the point in the structure they represent as possible and afford them the same
temperature protection and moisture environment as the structure. At the end of the curing period leave the
specimens in place exposed to the weather in the same manner as the structure. Remove all beam
specimens from field storage and store in lime water at 73 ± 3oF (23 ± 2
oC). for 24 ± 4 hours immediately
before time of testing to ensure uniform moisture condition from specimen to specimen. Observe the
precautions given in Section 5.3.2. of this test method to guard against drying between time of removal
from curing to testing.
6. SHIPPING SPECIMENS
Suitable shipping containers are available through the District Materials Engineer. Care should be taken to
ensure concrete cylinders do not freeze during shipment.
Properly identify each cylinder and encase in a plastic bag or pack in damp sawdust. Schedule the shipment
so that the cylinders will arrive in the laboratory approximately one week before they are to be tested so that
they can be capped and conditioned prior to testing.
Attach a copy of the CMS sample ID, and place the CMS identification number on each shipping container
and forward copies to the Engineer of Tests or the District Materials Engineer as applicable by mail.
If the cylinders are to be tested for compressive strength at any age other than 28 days, the desired age of
test should be noted in CMS. If the cylinders are to be tested for rapid chloride, boil test or surface
resistivity, it should be noted in CMS.
Concrete beams are tested at the project or District Laboratory.


Page 1/5 5.9.23 2016
Revised 2015
KT-23
5.9.23 FLEXURAL STRENGTH OF CONCRETE (THIRD-POINT LOADING METHOD)
(Kansas Test Method KT-23)
1. SCOPE
This method of test covers the procedure for determining the flexural strength of concrete by test of a
sample beam with third-point loading. KT-23 reflects testing procedures found in AASHTO T 97.
2. REFERENCED DOCUMENTS
2.1. KT-22; Making and Curing Compression and Flexural Test Specimens in the Field
2.2. AASHTO T 23; Making and Curing Concrete Test Specimens in the Field
2.3. AASHTO T 97; Flexural Strength of Concrete (Using Simple Beam with Third Point Loading)
3. APPARATUS
3.1. A testing machine which will apply a measured load to the beam at the third points of the span. The
machine will have a span length of 18 in (460 mm). Suitable machines are made available to the Field
Engineer by the District Materials Engineer.
3.2. Caliper and a 12 in (300 mm) steel rule graduated in 0.01 in (0.1 mm).
3.3. Leather shims, 1/4 by 1 1/2 by 6+ in (6.4 by 38 by 160 mm). The shim must be slightly longer than
the 6 in (160 mm) width of the test specimen.
3.4. Feeler gauges.
4. TEST SPECIMEN
4.1. A nominal 6 by 6 by 21 in1 (152.4 by 152.4 by 530 mm) concrete beam, molded and cured according
to KT-22 of this manual. The beam must be kept moist until time of test.
4.2. Draw lines on the beam at 6” intervals equally spaced from the end of the beam representing the
support and load applying block locations. Use these marks when installing the beam in the test fixture.
5. TEST PROCEDURE
5.1. Age of testing:
5.1.1. Beams tested to determine the safe date for removal of forms from structures shall be tested at ages
mutually agreed upon by the Engineer and the Contractor. Other times for testing are contained in the
standard specifications.
5.2. Install specimen:
5.2.1. Place the specimen on its side, centered in the machine in such a manner that a minimum of 1 in
(25 mm) of the beam extends outside the support rollers. Apply a load of between 3 and 6% of the
1 The length dimension is 1 in (25.4 mm) longer than AASHTO T 23.
Page 2/5 5.9.23 2016
Revised 2015
KT-23
expected ultimate load. If full contact is obtained between the specimen and the load-applying blocks and
the supports so that there is no gap longer than1 in (25 mm) or the gap is less than 0.004 in (0.1 mm)
deep, test the specimen without further preparation. If full contact is not obtained between the specimen
and the load-applying blocks and the supports so that there is a 1 in (25 mm) or longer gap in excess of
0.004 in (0.1 mm) and not more than 0.015 in (0.38 mm) deep, grind the contact surfaces of the specimen,
or shim with leather strips.
5.2.1.1 If full contact is not obtained between the specimen and the load-applying blocks and the supports
so that there is a 1 in (25 mm) or longer gap in excess 0.015 in (0.38 mm), grind the contact surfaces of
the specimen until it complies with the requirements stated in Section 5.2.1. above.
5.2.1.2. If the specimen is twisted or warped 1/8 inch (3.2 mm) or more in any plane, discard the
specimen and repair or replace the mold.
5.3. Application of load:
5.3.1. The load may be applied rapidly until approximately 50% of the breaking load has been reached.
Beyond that point, reduce the rate of loading so that the rate of increase in extreme fiber stress remains
within 125 to 175 psi (861 to 1207 kPa) per minute until the specimen breaks, (1500 to 2100 lbf per
minute).
5.3.1.1. Chart No. 01085, Figure 1 is the correct chart to use on the Rainhart Beam Breaker. This chart
loads at a rate of 1746 lbf/min (1016 kpa/min).
Note and record the total load required to break the beam.
5.4. Measurement:
5.4.1. Take and record three measurements at the fracture across each dimension (one at each edge and at
the center) to the nearest 0.05 in (1.3 mm) to determine the average width, average depth and line of
fracture location of the specimen at the section of failure.

Page 3/5 5.9.23 2016
Revised 2015
KT-23
Figure 1 Chart No. 01085

Page 4/5 5.9.23 2016
Revised 2015
KT-23
6. CALCULATIONS
6.1. If the fracture initiates in the tension surface within the middle third of the span length, calculate the
modulus of rupture to the nearest 5 psi as follows:
(ENGLISH)
R=(P)(L)
bd2
(SI)
R=1000(P)(L)
bd2
Where: R= Modulus of rupture in psi (kPa)
P= Maximum applied load in lbf (newtons) (N)
L= Span length in (mm)
b= Avg. Width of specimen in (mm) (as tested)
d= Avg. Depth of specimen in (mm) (as tested)
Sample Calculations (English):
Depth of beam = 5.70 in
Width of beam = 6.12 in
Load at break = 4800 lbf
R= 4800 (18)
6.12 (5.70)(5.70)= 435 psi
Sample Calculations (SI):
Depth of beam = 145 mm
Width of beam = 155mm
Span length = 460 mm
Load at break = 21400 N
R= 1000 (21400)(460)
155 (145)(145)= 3020 kPa
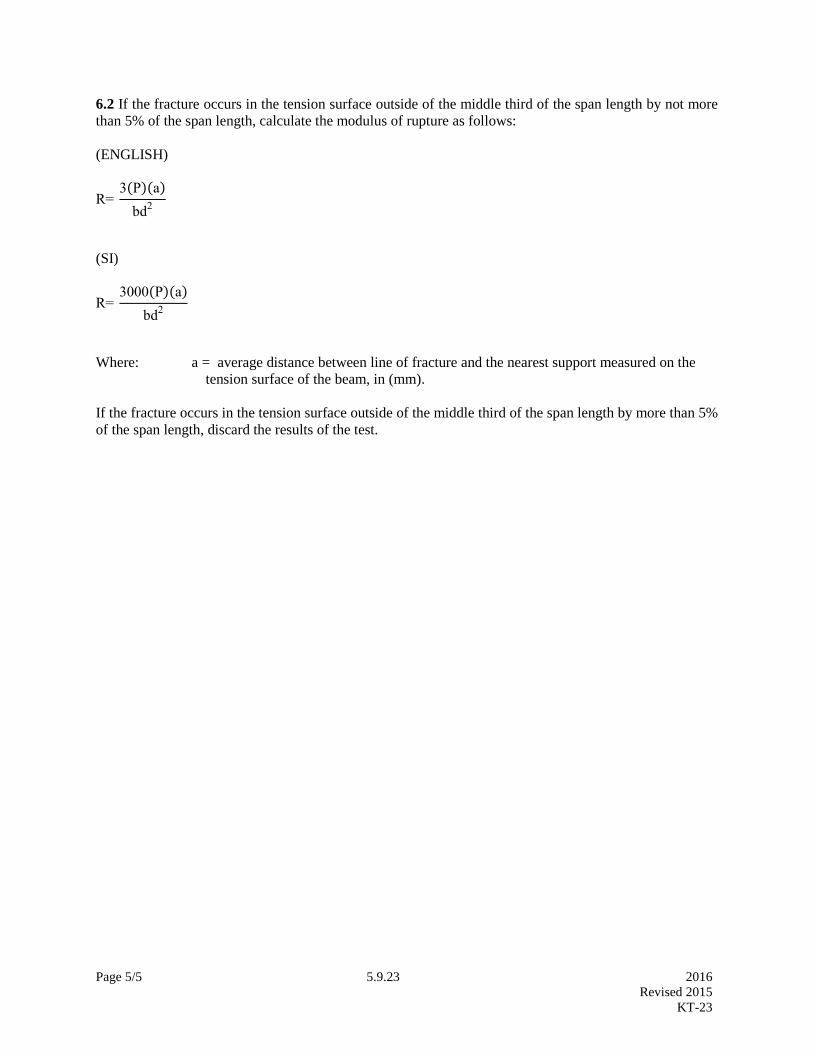
Page 5/5 5.9.23 2016
Revised 2015
KT-23
6.2 If the fracture occurs in the tension surface outside of the middle third of the span length by not more
than 5% of the span length, calculate the modulus of rupture as follows:
(ENGLISH)
R= 3(P)(a)
bd2
(SI)
R= 3000(P)(a)
bd2
Where: a = average distance between line of fracture and the nearest support measured on the
tension surface of the beam, in (mm).
If the fracture occurs in the tension surface outside of the middle third of the span length by more than 5%
of the span length, discard the results of the test.

Page 1/4 5.9.24 2016
Revised 2014
KT-24
5.9.24 DETERMINATION OF FREE MOISTURE OR ABSORPTION OF AGGREGATE FOR USE IN
CONCRETE (Kansas Test Method KT-24)
1. SCOPE
This method of test covers the procedure for determining the free moisture or absorption of aggregates for
use in concrete. Other methods may be used by permission from the District Materials Engineer.
2. REFERENCED DOCUMENTS
2.1. Part V, 5.9; Sampling and Test Methods Foreword
2.2. KT-6; Specific Gravity and Absorption of Aggregate
3. APPARATUS
3.1. The balance shall conform to the requirements of Part V, 5.9; Sampling and Test Methods
Foreword, for the class of general purpose balance required for the principal sample mass of the sample
being tested.
3.2. Bucket approximately 8 in (200 mm) in diameter and 8 in (200 mm) height, with suitable suspension
device for determining the mass of aggregate when immersed and weighed in water.
3.3. Container with overflow in which the bucket may be immersed and weighed in water.
3.4. Drying pans.
4. SAMPLE
4.1. Secure a representative sample of the aggregate to be tested from a location as close to the point of
use as possible.
4.2. Reduce by splitting to a weight of approximately 10,000 g for coarse or mixed aggregate, or 5000 g
for fine aggregate.
4.3. Stir sample thoroughly and divide into two approximately equal portions, “A” and “B”.
4.4. Place each portion in a container and cover to prevent loss of moisture.
5. TEST PROCEDURE
5.1. If not available from previous tests, determine the bulk specific gravity (saturated, surface dry basis)
of the aggregate in accordance with KT-6 of this manual.
5.2. If free moisture is present on the surface of the aggregate, proceed as follows:
5.2.1. Bring portion “A” to a saturated, surface dry condition. For CPA and MA aggregates, split sample
into two portions on the No. 4 (4.75 mm) sieve, bring each portion to a saturated, surface dry condition as
described in KT-6 of this manual. For FA aggregates it will not be necessary to divide the sample.
Page 2/4 5.9.24 2016
Revised 2014
KT-24
5.2.2. Recombine the materials and weigh out a 2000 g for coarse aggregate (1000 g for MA or FA)
sample of the saturated, surface dry aggregate.
5.2.3. Pour the sample slowly into a bucket which is about half filled with water and stir aggregate
thoroughly to remove entrapped air.
5.2.4. Fill bucket with water and let material settle before carefully immersing the bucket and contents in
the water in the large container.
5.2.5. Determine and record the mass of the saturated surface dry material in water (W1).
NOTE: Unless aggregate sources change, the value for the mass in water of a 1000 or 2000 g sample of
saturated, surface dried aggregate may be used for all moisture determinations made during the progress
of the work.
5.2.6. Weigh out a 2000 g of coarse aggregate (1000 g for MA or FA) sample from portion “B” and
follow steps in section 5.2.3 through section 5.2.5 of this test method. Record this weight as W2.
5.3. If free moisture is not present on the surface of the aggregate, proceed as follows:
5.3.1. Cover portion “A” with water and let stand for not less than 20 or more than 21 minutes.
5.3.2. Remove the sample from the water and bring to a saturated, surface dry condition as in section
5.2.1.
5.3.3. Recombine the materials and weigh out a 1000 or 2000 g test sample of the saturated, surface dry
material.
5.3.4. Proceed as directed in sections 5.2.4, 5.2.5 and 5.2.6 of this test method.
5.3.5. Weigh out a 1000 or 2000 g sample from portion “B”.
5.3.6. Pour the sample slowly into a bucket which is about half filled with water and stir aggregate
thoroughly to remove entrapped air.
5.3.7. Fill bucket with water and let material settle before carefully immersing the bucket and contents in
the water in the large container.
5.3.8. Wait 20 to 21 minutes after immersing the sample in the bucket.
5.3.9. Determine the mass of the sample in water (W2).
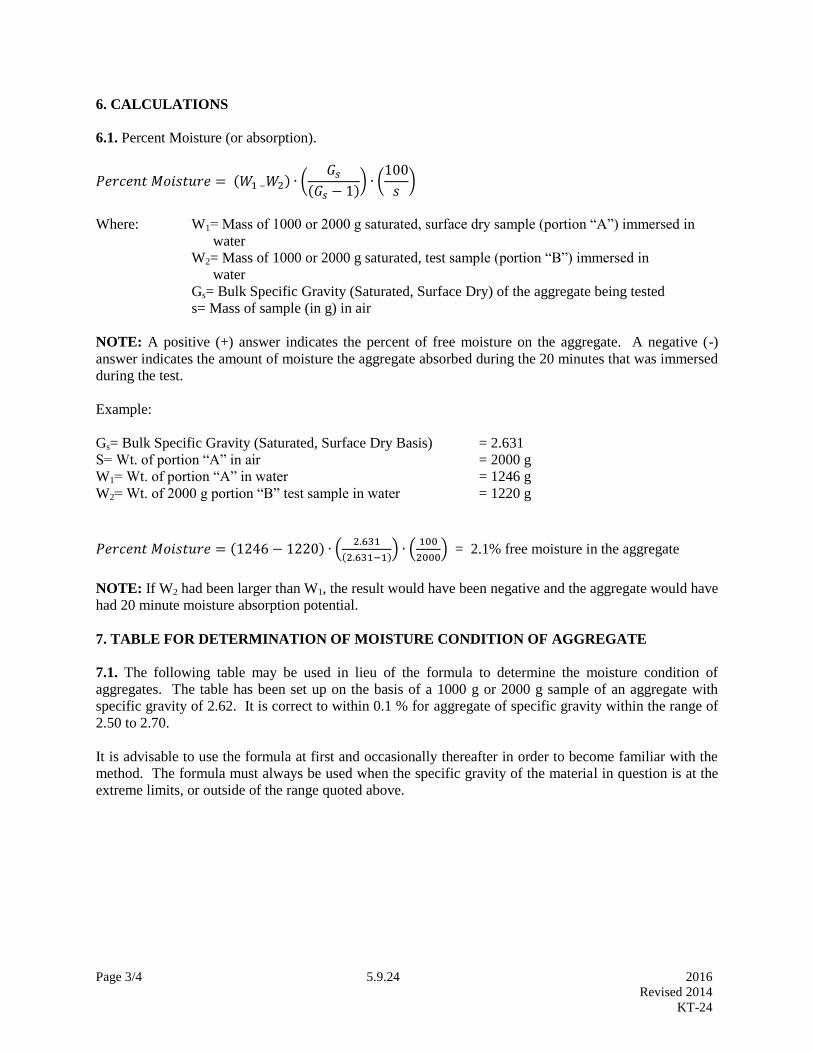
Page 3/4 5.9.24 2016
Revised 2014
KT-24
6. CALCULATIONS
6.1. Percent Moisture (or absorption).
𝑃𝑒𝑟𝑐𝑒𝑛𝑡 𝑀𝑜𝑖𝑠𝑡𝑢𝑟𝑒 = (𝑊1 –𝑊2) ∙ (𝐺𝑠
(𝐺𝑠 − 1)) ∙ (
100
𝑠)
Where: W1= Mass of 1000 or 2000 g saturated, surface dry sample (portion “A”) immersed in
water
W2= Mass of 1000 or 2000 g saturated, test sample (portion “B”) immersed in
water
Gs= Bulk Specific Gravity (Saturated, Surface Dry) of the aggregate being tested
s= Mass of sample (in g) in air
NOTE: A positive (+) answer indicates the percent of free moisture on the aggregate. A negative (-)
answer indicates the amount of moisture the aggregate absorbed during the 20 minutes that was immersed
during the test.
Example:
Gs= Bulk Specific Gravity (Saturated, Surface Dry Basis) = 2.631
S= Wt. of portion “A” in air = 2000 g
W1= Wt. of portion “A” in water = 1246 g
W2= Wt. of 2000 g portion “B” test sample in water = 1220 g
𝑃𝑒𝑟𝑐𝑒𝑛𝑡 𝑀𝑜𝑖𝑠𝑡𝑢𝑟𝑒 = (1246 − 1220) ∙ (2.631
(2.631−1)) ∙ (
100
2000) = 2.1% free moisture in the aggregate
NOTE: If W2 had been larger than W1, the result would have been negative and the aggregate would have
had 20 minute moisture absorption potential.
7. TABLE FOR DETERMINATION OF MOISTURE CONDITION OF AGGREGATE
7.1. The following table may be used in lieu of the formula to determine the moisture condition of
aggregates. The table has been set up on the basis of a 1000 g or 2000 g sample of an aggregate with
specific gravity of 2.62. It is correct to within 0.1 % for aggregate of specific gravity within the range of
2.50 to 2.70.
It is advisable to use the formula at first and occasionally thereafter in order to become familiar with the
method. The formula must always be used when the specific gravity of the material in question is at the
extreme limits, or outside of the range quoted above.

Page 4/4 5.9.24 2016
Revised 2014
KT-24
Table 1
Determination of the Moisture Content of Concrete
Aggregates by Displacement Method
W1= Mass of 1000 or 2000 g saturated, surface dry sample immersed in water
W2= Mass of 1000 or 2000 g saturated, test sample immersed in water
If W2 is larger than W1 the result would be negative and the aggregate would have 20 minute moisture
absorption potential.
8. Report
8.1. Record the absorption or moisture to the nearest 0.01 percent. Report the absorption or moisture to
the nearest 0.1 percent.
% of Absorption or Moisture % of Absorption or Moisture
W1 – W2 S= 1000 g S= 2000 g W1 – W2 S= 1000 g S= 2000 g
0 0.0 0.0
1 0.2 0.1 21 3.4 1.7
2 0.3 0.2 22 3.5 1.8
3 0.5 0.2 23 3.7 1.8
4 0.6 0.3 24 3.9 2.0
5 0.8 0.4 25 4.0 2.0
6 1.0 0.5 26 4.2 2.1
7 1.1 0.6 27 4.3 2.2
8 1.3 0.6 28 4.5 2.2
9 1.4 0.7 29 4.7 2.4
10 1.6 0.8 30 4.8 2.4
11 1.8 0.9 31 5.0 2.5
12 1.9 1.0 32 5.1 2.6
13 2.1 1.0 33 5.3 2.6
14 2.2 1.1 34 5.5 2.8
15 2.4 1.2 35 5.6 2.8
16 2.6 1.3 36 5.8 2.9
17 2.7 1.4 37 5.9 3.0
18 2.9 1.4 38 6.1 3.0
19 3.1 1.6 39 6.3 3.2
20 3.2 1.6 40 6.4 3.2

Page 1/3 5.9.25 2016
Revised 2016
KT-25
5.9.25 SAMPLING AND SPLITTING PLANT MIXED ASPHALT MIXTURES
(Kansas Test Method KT-25)
1. SCOPE
This method covers the procedure for sampling plant mixed asphalt mixtures from truck beds, continuous
mix plants, and roadways. The procedure for sampling from trucks may be followed when sampling
asphalt mixtures from other containers or in stockpiles. KT-25 reflects testing procedures found in
AASHTO T 168.
2. REFERENCED DOCUMENTS
2.1. AASHTO T 168; Standard Method of Test for Sampling Bituminous Paving Mixtures
2.2. AASHTO R-47; Standard Practice for Reducing Samples of Hot Mix Asphalt (HMA) to Testing Size
3. APPARATUS
3.1. Square pointed shovel or scoop.
3.2. Sampling Devices.
3.2.1. Plants shall be equipped with sampling devices capable of providing a sample of sufficient size
from the full width of the mixer discharge flow. Sampling devices shall be designed so those samples
may be taken while the plant is operating at normal production rates.
3.2.2. A container that will hold a minimum of 55 lb (25 kg) of loose, hot asphalt mixtures. The container
should be equipped with a handle or handles that will permit it to be easily carried.
4. SAMPLING PROCEDURE
4.1. Plant Discharge.
4.1.1. Drum plants shall be capable of sampling at the discharge outlet. When a sample is taken at the
discharge, the sampling container shall be of sufficient size to accommodate the entire stream uniformly.
If a by-pass chute is utilized, a representative sample shall be obtained.
4.1.2. Take the sample in at least three increments to obtain the total sample. Combine the increments
and mix thoroughly.
4.1.3. The combined sample size shall be at least four times the amount required for testing.
4.2. Truck Beds.
4.2.1. Divide the truck bed into at least three areas of approximately equal size.
4.2.2. Dig a hole about 1 ft (0.3 m) deep at a point that will be representative of each area.
4.2.3. Take a sample weighing 4 to 6 lb (2 to 3 kg) near the bottom of each hole, taking care to prevent
segregation.
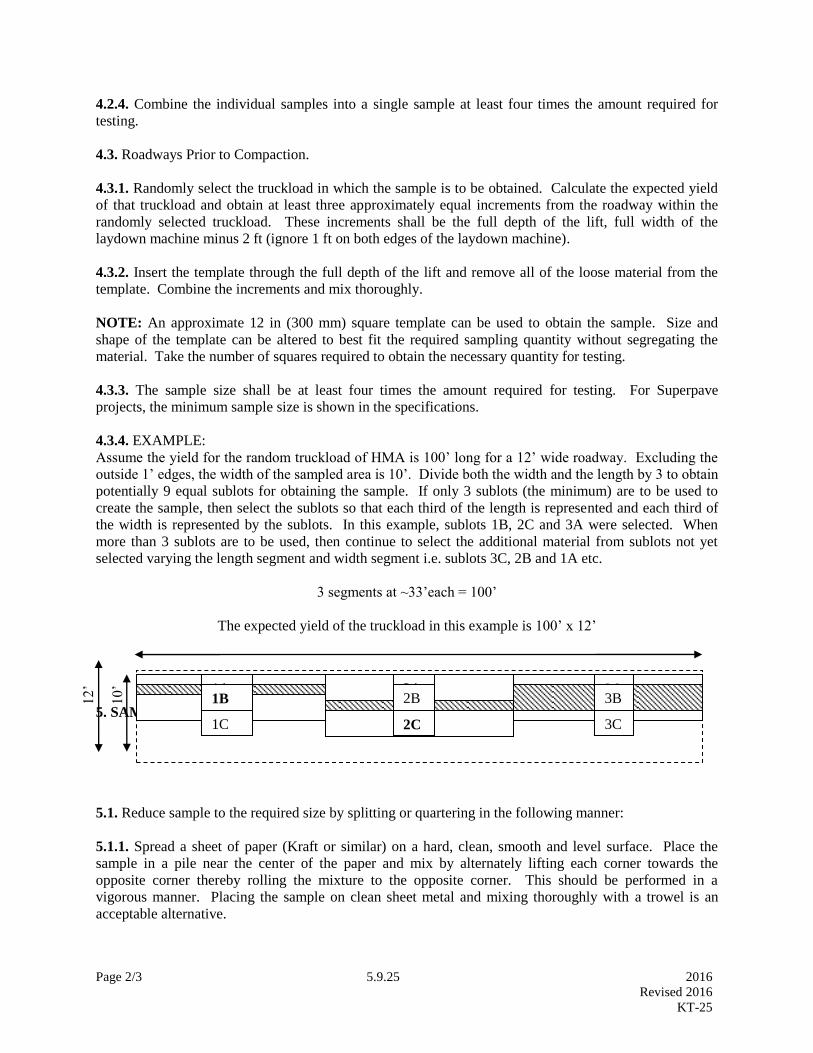
Page 2/3 5.9.25 2016
Revised 2016
KT-25
4.2.4. Combine the individual samples into a single sample at least four times the amount required for
testing.
4.3. Roadways Prior to Compaction.
4.3.1. Randomly select the truckload in which the sample is to be obtained. Calculate the expected yield
of that truckload and obtain at least three approximately equal increments from the roadway within the
randomly selected truckload. These increments shall be the full depth of the lift, full width of the
laydown machine minus 2 ft (ignore 1 ft on both edges of the laydown machine).
4.3.2. Insert the template through the full depth of the lift and remove all of the loose material from the
template. Combine the increments and mix thoroughly.
NOTE: An approximate 12 in (300 mm) square template can be used to obtain the sample. Size and
shape of the template can be altered to best fit the required sampling quantity without segregating the
material. Take the number of squares required to obtain the necessary quantity for testing.
4.3.3. The sample size shall be at least four times the amount required for testing. For Superpave
projects, the minimum sample size is shown in the specifications.
4.3.4. EXAMPLE:
Assume the yield for the random truckload of HMA is 100’ long for a 12’ wide roadway. Excluding the
outside 1’ edges, the width of the sampled area is 10’. Divide both the width and the length by 3 to obtain
potentially 9 equal sublots for obtaining the sample. If only 3 sublots (the minimum) are to be used to
create the sample, then select the sublots so that each third of the length is represented and each third of
the width is represented by the sublots. In this example, sublots 1B, 2C and 3A were selected. When
more than 3 sublots are to be used, then continue to select the additional material from sublots not yet
selected varying the length segment and width segment i.e. sublots 3C, 2B and 1A etc.
3 segments at ~33’each = 100’
The expected yield of the truckload in this example is 100’ x 12’
5. SAMPLE SPLITTING AND REHEATING
5.1. Reduce sample to the required size by splitting or quartering in the following manner:
5.1.1. Spread a sheet of paper (Kraft or similar) on a hard, clean, smooth and level surface. Place the
sample in a pile near the center of the paper and mix by alternately lifting each corner towards the
opposite corner thereby rolling the mixture to the opposite corner. This should be performed in a
vigorous manner. Placing the sample on clean sheet metal and mixing thoroughly with a trowel is an
acceptable alternative.
10’
12’ 1A
1B
1C
2A 2B
2C
3A 3B
3C
Page 3/3 5.9.25 2016
Revised 2016
KT-25
5.1.2. Divide the pile into four equal quarters with a straightedge (trowel or similar metal blade) and
completely remove two pre-selected diagonally opposite quarters.
5.1.3. Continue this quartering procedure until the original sample is reduced to the approximately desired
size. On the final quartering step, if the sample is too large before quartering, but will be too small after
quartering, the sample pile is divided into equal opposite sectors but unequal adjacent sectors. This can
be accomplished by varying the dividing angle at the center of the sample pile from the normal 90°.
Opposite sections can then be selected to obtain the desired sample size.
5.2. After mixing and reducing, samples may be reheated briefly, if necessary, to bring to specified
compaction temperature. Care must be exercised to avoid overheating any part of the sample. Insulated
containers are recommended for transporting and storing samples until used.

Page 1/2 5.9.26 2016
Revised 2012
KT-26
5.9.26 SAMPLING ASPHALT MATERIALS (Kansas Test Method KT-26)
1. SCOPE
This test method covers the procedures for sampling asphalt, cutback, and emulsifier materials, at the
point of production and at destination. KT-26 reflects testing procedures found in AASHTO T 40.
2. REFERENCED DOCUMENTS
2.1. AASHTO T 40; Sampling Bituminous Materials
3. APPARATUS
3.1. Sampling containers used shall conform to the following:
3.1.1. Performance Graded Asphalt Binders: Friction lid 1 qt (1 L) cans.
3.1.2. Cutback Asphalts: Friction lid 1 qt (1 L) cans.
3.1.3. Emulsified Asphalts and Asphalt Rejuvenating Agents: Wide mouth plastic 1 gal (4 L) containers.
The containers must be free of solder flux or other material that might contaminate the sample.
3.2. Holding device for lowering the sampling containers through the entire depth of material to be
sampled.
4. SAMPLING PROCEDURES
4.1. Samples received at the M & R Center that are over 14 days old will be discarded without
testing.
4.2. Asphalt materials are currently accepted on the basis of a producer’s certification of compliance for
each shipment. To verify the certifications and to evaluate the producer’s product control procedures,
State representatives obtain random samples from shipping containers consigned to State work.
Therefore, these sampling methods cover procedures for obtaining samples from shipping containers
only.
4.3. Safety precautions are mandatory at all times when sampling and handling asphaltic materials.
4.3.1. Do not hold the container in the hand during sampling by the valve method. Tongs or some other
device must be used to hold the container while the sample is being taken.
4.3.2. The sampler must stand above and away from sampling valves as far as practical and on the
windward side.
4.3.3. The sample must be taken slowly to prevent splashing of the hot material.
4.3.4. Place the container on a firm, level surface to prevent splashing, dropping or spilling the material
during sealing.
4.3.5. Watch for asphalt products which have been spilled onto the loading platform of the truck or tank
car. Walking on this material can be hazardous.

Page 2/2 5.9.26 2016
Revised 2012
KT-26
4.4. Thief method. (This is the preferred method for sampling).
4.4.1. Attach a new clean friction lid can to the holding device.
4.4.2. Remove the lid and slowly lower the holding device through the full depth of material being
sampled. The rate at which the device is lowered should be such that the container will be filled when it
reaches the bottom of the material.
4.4.3. Withdraw the device from the liquid, clean the outside of the container with dry wiping rags and
transfer the contents to a clean, new container. Never use solvents or solvent saturated rags for cleaning
sample containers.
4.5. Sampling Valve Method. The contents of shipping containers equipped with an approved submerged
sampling valve may be sampled by this method.
4.5.1. Drain off and discard not less than 5 gal (20 L) of the material before taking the sample.
4.5.2. When practical, fill the sample container by holding it under the valve discharge pipe. If this
procedure is not practical, permit the material to flow into a large, clean container and transfer a portion
into a friction lid can for transportation and storage.
4.5.3. Repeat steps in Sections 4.4 and 4.5 of this test method for a second sample.
4.5.4. Carefully clean the outside of the sample containers with dry wiping rags. Never use solvents or
solvent saturated rags for this purpose.
5. SHIPPING INFORMATION
5.1. Label each quart of material with at least the following:
5.1.1. Grade of material.
5.1.2. Producer.
5.1.3. Producer’s location.
5.1.4. CMS number.
5.1.5. Pack and ship two (2) one quart samples to the Materials and Research Center, 2300 SW Van
Buren, Topeka, KS 66611.

Page 1/2 5.9.27 2016
Revised 2014
KT-27
5.9.27 SAMPLING JOINT COMPOUND MATERIALS (Kansas Test Method KT-27)
1. SCOPE
This method covers procedure for sampling joint compound materials including materials for filling and
sealing joint in concrete pavements and structures, and joints in clay and concrete pipe.
2. REFERENCED DOCUMENTS
2.1. ASTM D 5167; Melting of Hot-Applied Joint and Crack Sealant and Filler for Evaluation
3. SAMPLING PROCEDURES FOR INFORMATION OR VERIFICATION
3.1. If the lot of material to be sampled is from a producer’s single run or batch, select one package or
container at random and obtain a sample as follows:
3.1.1. Hot type joint sealing compound:
3.1.1.1. Using a knife with a broad stiff blade, heated if necessary, remove a 10 lb (4.5 kg) sample from
the package. Cut a complete vertical section from the material block as illustrated in Figure 4 of ASTM
D 5167.
Figure 4
3.1.2. Plastic joint compound for filling and sealing joints in pipe:
3.1.2.1. Using a paddle, mix the material until homogeneous. Then transfer a representative amount to fill
1 gal (4 L) can with a friction type lid.
3.1.3. Cold applied chemically cured joint sealant:
3.1.3.1. The material is to be sampled from dispensing nozzle in the same manner as it is being pumped
into a joint. Completely fill two 1 qt (1 L) cans having friction type lids. If the sample fails, resample if
possible.

Page 2/2 5.9.27 2016
Revised 2014
KT-27
3.2. If the lot of material to be sampled is not from a producer’s single run or batch, or if a single sample
representing the lot has failed, select at random a number of packages equivalent to the cube root of the
total number of packages in the lot. Remove not less than 1/4 lb (115 g) of material from each package or
container. When practical, take the 1/4 lb (115 g) of material from a point at least 3 in (75 mm) from the
top and 3 in (75 mm) from the side of the package. For hot type compound, combine into a single sample
weighing not less than 10 lb (4.5 kg). For cold type or plastic joint compounds, combine into a single
sample approximately 1 gal (4 L).
4. SHIPPING INFORMATION
4.1. Label each sample with at least the following information:
4.1.1. Producer.
4.1.2. Lot number.
4.1.3. CMS number.
4.1.4. Pack and ship samples to the Materials and Research Center, 2300 SW Van Buren, Topeka, KS
66611.
Page 1/3 5.9.28 2016
Revised 2012
KT-28
5.9.28 SAMPLING BRIDGE PAINT (Kansas Test Method KT-28)
1. SCOPE
This method covers the procedures for sampling paint materials in warehoused and in the field.
2. APPARTUS
2.1. Supply of clean, one pint and one quart friction top containers (metal or plastic) for single component
paint, paste and pigment.
2.2. Wide-mouth screw-top plastic containers or plastic –lined cans for the liquid components of multi-
component inorganic zinc paints. Never place samples of these materials in unlined metal screw or
friction top cans.
2.3. Stirring paddles.
2.4. Mechanical agitator (for mixing paint in storage tanks).
3. SAMPLING PROCEDURES
3.1. Mixed paints.
3.1.1. Paint sampled from storage tanks at the factory must be thoroughly mixed by mechanical agitation
just prior to taking the sample. If sample is taken from a spigot or valve at the bottom of the tank, draw
off 2 gallons or more and return to the tank before collecting the sample.
3.1.2. Sample paint packaged in 1 gallon cans by selecting one can at random from the lot and submitting
the unopened can to the laboratory for test.
3.1.3. Sample paint packaged in containers larger than one gallon in accordance with the following
procedure:
3.1.3.1. Mix the paint thoroughly prior to taking the sample. Stirring with a paddle or a mechanical
stirring device, or with a mechanical shaker will not insure complete mixing and the removal of all
pigment from the sides and bottom of the container. Therefore, the following operations must be
performed to properly mix the paint before a sample is taken:
3.1.3.1.1. Secure an empty, clean, dry, metal container the same size as the paint container.
3.1.3.1.2. Pour the liquid portion into the second container.
3.1.3.1.3. Work the semi-solid material remaining in the first container with a paddle until it becomes a
smooth homogeneous paste. Loosen any pigment or cake that adheres to the sides of the container.
Continue mixing and stirring the paste until it is smooth and free from lumps.
3.1.3.1.4. Add the liquid from the second container to the paste in small increments, mixing well after
each addition.
3.1.3.1.5. After the liquid has been added and mixed into the paste, pour in small increments, mixing well
after each addition.
Page 2/3 5.9.28 2016
Revised 2012
KT-28
3.1.3.1.6. Leave the paint in the second container and examine the inside of the original container. If
caked or settled pigment is present, work it into a smooth paste and mix with the paint in the second can.
If the paint is so badly caked or livered” that it cannot be properly mixed by the above procedure, reject it
without sampling.
3.1.3.2. After proper mixing, take two separate one quart samples in clean, friction top cans for
submission to the laboratory.
3.2. Two-Component Paints.
3.2.1. Sample paint packaged in one gallon containers by selecting one package at random from the lot
and submitting the unopened package to the laboratory. This will enable the laboratory to mix the vehicle
and pigment or paste in the exact ratio recommended by the manufacturer.
3.2.2. Sample two-component paints in packages larger than one gallon by taking a one quart sample of
the vehicle and one pint of paste or pigment. If the vehicle component contains pigment, mix the material
thoroughly in accordance with Section 3.1.3 of this manual of this method before taking the sample.
3.3. Dry pigment: Sample dry pigment by opening the package and taking at random, sufficient material
to fill a one pint can. Do not mix the pigment before taking the sample.
3.4. Liquid paint materials: (Varnish, thinners, clear vehicles, drying oils, solvents and similar materials).
3.4.1. Prior to taking samples of liquid paint materials, check for the presence of water and suspended
matter or sediment and take necessary steps to ensure that the sample will contain a representative portion
of the materials.
3.4.2. Before taking samples of liquids containing a high proportion of volatile materials, rinse out the
sample container several times with a portion of the liquid to be sampled.
3.4.3. Screw-top containers having tight fitting lids with seals that are not soluble in the liquid being
sampled should be used for shipping the samples to the laboratory.
3.5. Field sampling;
3.5.1. Samples of paint and paint materials are to be taken, in accordance with the instructions set forth
above, from the manufacturer’s sealed containers immediately after they are opened on the project.
Samples of two component paints should include a sample of the pigment or paste and a sample of the
vehicle. Samples should never be taken after the paint has been thinned, from a paint pot of the spraying
system or from a spray nozzle as such sample are not representative of the paint as it was originally tested
and accepted.

Page 3/3 5.9.28 2016
Revised 2012
KT-28
4. SHIPPING INFORMATION
4.1. Label all samples of vehicle, pigment or paste with at least the following:
4.1.1. Producer.
4.1.2. Product name or number.
4.1.3. Producer’s recommended mix ratio, if available.
4.1.4. CMS number.
4.1.5. Pack and ship samples of vehicle, paste or pigment to the Materials and Research Center, 2300 SW
Van Buren, Topeka, KS 66611.

Page 1/2 5.9.29 2016
Revised 2012
KT-29
5.9.29 FIELD SAMPLING OF PORTLAND CEMENT, LIME AND FLY ASH
(Kansas Test Method KT-29)
1. SCOPE
This method covers the procedures for sampling Portland Cement, lime and fly ash in the field.
Procedures for sampling these materials at producing plants are governed by production, storage,
sampling and loading facilities and are not covered in this method.
2. APPARATUS
2.1. Clean, 1 gal (4 L) friction top pails for shipping samples to the laboratory.
2.2. Tube designed for sampling cement.
2.3. Drying pans.
2.4. Shovel, hand scoop and other miscellaneous equipment.
3. SAMPLING PROCEDURES
3.1. Portland cement.
3.1.1. Cement used by ready mix and central mix plants is commonly sampled by passing a suitable
container, such as a drying pan through the discharge stream between the cement weigh hopper and the
mixing chamber. Make several passes through the stream to ensure that the combined sample will be
representative of the cement going into the work.
3.1.1.1. Other points and methods of sampling are permissible as long as the samples are representative of
the cement being used and they are not contaminated with foreign material.
3.1.2. Cement being used to produce job-mixed concrete is usually sampled by opening the loading hatch
of the truck or car, digging a trench in the exposed surface of the cement and taking samples below the
bottom of the trench by means of the sampling tube. Other methods of sampling are permissible if they
produce representative, uncontaminated samples.
3.2. Hydrated lime and fly ash.
3.2.1. Field samples of hydrated lime and fly ash are most conveniently obtained by discharging a small
amount of material from the spreading truck on to a canvas or large sheet of paper placed on the ground
and selecting a representative portion for the sample.
3.2.2. Sample may also be taken by opening the loading hatches of cars or trucks, digging a trench in the
exposed surface and taking samples below the bottom of the trench by means of the sampling tube.
3.3. Quicklime.
3.3.1. Field samples of quicklime are most conveniently obtained from a windrow after the quicklime is
discharged from the transporting truck. Material must be selected so that it will represent an average of
all parts of the discharge from a single truck. Quicklime absorbs moisture quite readily and, therefore, the
following sampling procedure must be cared out quickly and immediately after discharge from the truck.
Page 2/2 5.9.29 2016
Revised 2012
KT-29
Place a quartering canvas on the ground in the intended path of the vehicle depositing the pebble
quicklime. After the vehicle has deposited the material on the quartering canvas, quarter the sample in
the standard manner until a sample of the proper size has been obtained, approximately 1 gal (4 L). Care
should be taken to minimize the loss of fines due to the wind. This sample shall be placed in an airtight
container preferably a 1 gal (4 L), friction top can. Care must be taken that lumps of quicklime are not
crushed excessively during handling.
4. SAFETY PRECAUTIONS
4.1. Quicklime can cause burns if contact is made with the eyes or with the face and arms or other
exposed parts of the body, especially in hot weather when the worker is perspiring. Workers should
remain at a safe distance when the quicklime is being discharged from the truck, avoiding the dust that is
created. Safety goggles are recommended when working around quicklime. If quicklime should get into
the eyes or on the skin, flush the effected area immediately with large amounts of water and notify you
immediate supervisor. If irritation or burning persists, seek medical attention.
5. SHIPPING INFORMATION
5.1. Label each sample with at least the following:
5.1.1. Product.
5.1.2. Producer.
5.1.3. Producer’s location.
5.1.4. CMS number.
5.2. Pack and ship samples to the Materials and Research Center, 2300 SW Van Buren, Topeka, KS
66611.
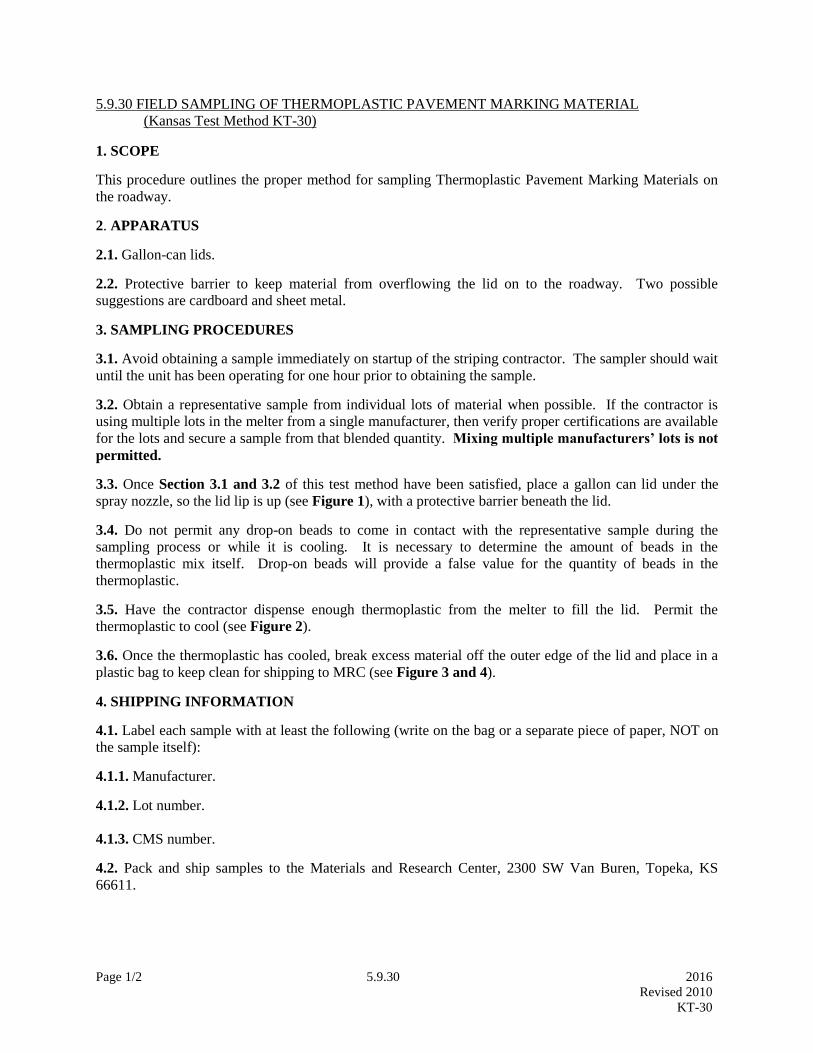
Page 1/2 5.9.30 2016
Revised 2010
KT-30
5.9.30 FIELD SAMPLING OF THERMOPLASTIC PAVEMENT MARKING MATERIAL
(Kansas Test Method KT-30)
1. SCOPE
This procedure outlines the proper method for sampling Thermoplastic Pavement Marking Materials on
the roadway.
2. APPARATUS
2.1. Gallon-can lids.
2.2. Protective barrier to keep material from overflowing the lid on to the roadway. Two possible
suggestions are cardboard and sheet metal.
3. SAMPLING PROCEDURES
3.1. Avoid obtaining a sample immediately on startup of the striping contractor. The sampler should wait
until the unit has been operating for one hour prior to obtaining the sample.
3.2. Obtain a representative sample from individual lots of material when possible. If the contractor is
using multiple lots in the melter from a single manufacturer, then verify proper certifications are available
for the lots and secure a sample from that blended quantity. Mixing multiple manufacturers’ lots is not
permitted.
3.3. Once Section 3.1 and 3.2 of this test method have been satisfied, place a gallon can lid under the
spray nozzle, so the lid lip is up (see Figure 1), with a protective barrier beneath the lid.
3.4. Do not permit any drop-on beads to come in contact with the representative sample during the
sampling process or while it is cooling. It is necessary to determine the amount of beads in the
thermoplastic mix itself. Drop-on beads will provide a false value for the quantity of beads in the
thermoplastic.
3.5. Have the contractor dispense enough thermoplastic from the melter to fill the lid. Permit the
thermoplastic to cool (see Figure 2).
3.6. Once the thermoplastic has cooled, break excess material off the outer edge of the lid and place in a
plastic bag to keep clean for shipping to MRC (see Figure 3 and 4).
4. SHIPPING INFORMATION
4.1. Label each sample with at least the following (write on the bag or a separate piece of paper, NOT on
the sample itself):
4.1.1. Manufacturer.
4.1.2. Lot number.
4.1.3. CMS number.
4.2. Pack and ship samples to the Materials and Research Center, 2300 SW Van Buren, Topeka, KS
66611.
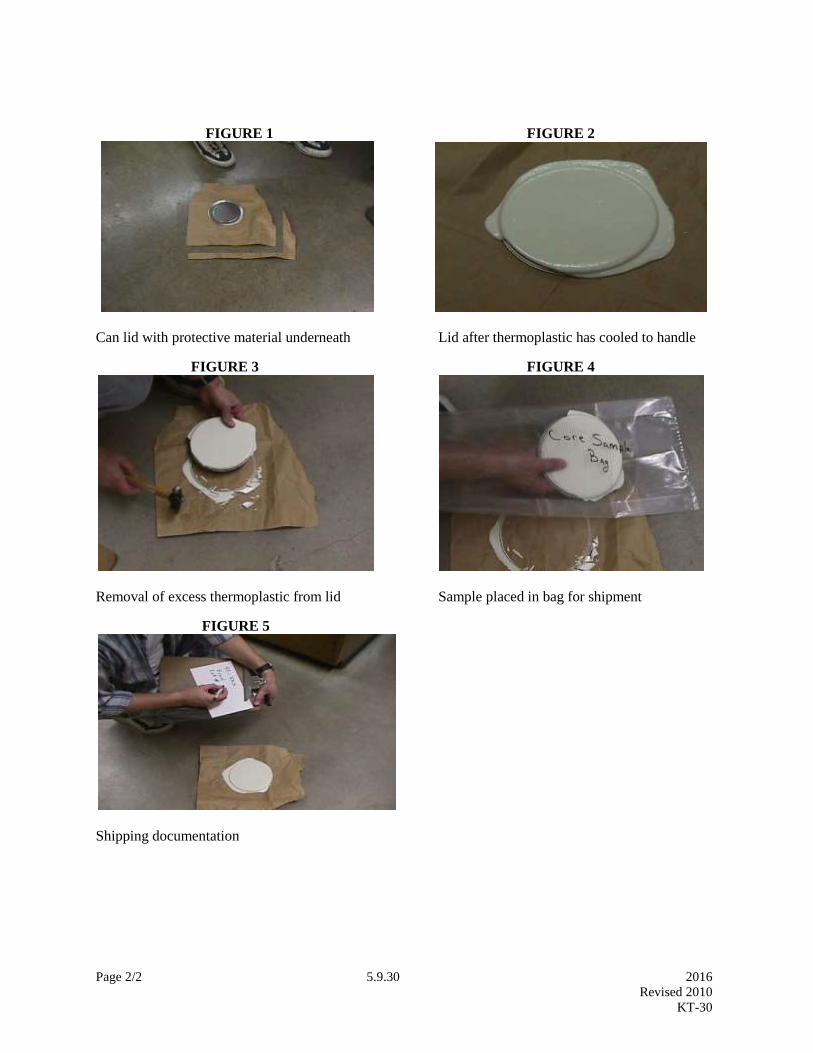
Page 2/2 5.9.30 2016
Revised 2010
KT-30
FIGURE 1 FIGURE 2
Can lid with protective material underneath Lid after thermoplastic has cooled to handle
FIGURE 3 FIGURE 4
Removal of excess thermoplastic from lid Sample placed in bag for shipment
FIGURE 5
Shipping documentation
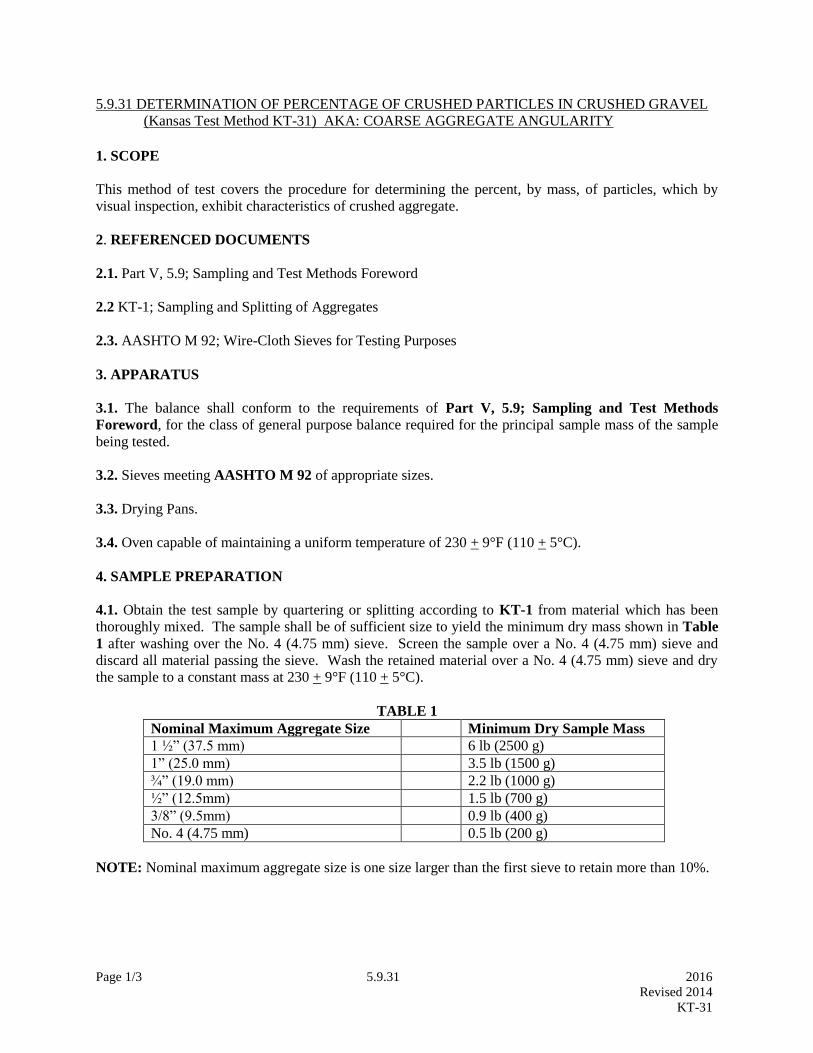
Page 1/3 5.9.31 2016
Revised 2014
KT-31
5.9.31 DETERMINATION OF PERCENTAGE OF CRUSHED PARTICLES IN CRUSHED GRAVEL
(Kansas Test Method KT-31) AKA: COARSE AGGREGATE ANGULARITY
1. SCOPE
This method of test covers the procedure for determining the percent, by mass, of particles, which by
visual inspection, exhibit characteristics of crushed aggregate.
2. REFERENCED DOCUMENTS
2.1. Part V, 5.9; Sampling and Test Methods Foreword
2.2 KT-1; Sampling and Splitting of Aggregates
2.3. AASHTO M 92; Wire-Cloth Sieves for Testing Purposes
3. APPARATUS
3.1. The balance shall conform to the requirements of Part V, 5.9; Sampling and Test Methods
Foreword, for the class of general purpose balance required for the principal sample mass of the sample
being tested.
3.2. Sieves meeting AASHTO M 92 of appropriate sizes.
3.3. Drying Pans.
3.4. Oven capable of maintaining a uniform temperature of 230 + 9°F (110 + 5°C).
4. SAMPLE PREPARATION
4.1. Obtain the test sample by quartering or splitting according to KT-1 from material which has been
thoroughly mixed. The sample shall be of sufficient size to yield the minimum dry mass shown in Table
1 after washing over the No. 4 (4.75 mm) sieve. Screen the sample over a No. 4 (4.75 mm) sieve and
discard all material passing the sieve. Wash the retained material over a No. 4 (4.75 mm) sieve and dry
the sample to a constant mass at 230 + 9°F (110 + 5°C).
TABLE 1
Nominal Maximum Aggregate Size Minimum Dry Sample Mass
1 ½” (37.5 mm) 6 lb (2500 g)
1” (25.0 mm) 3.5 lb (1500 g)
¾” (19.0 mm) 2.2 lb (1000 g)
½” (12.5mm) 1.5 lb (700 g)
3/8” (9.5mm) 0.9 lb (400 g)
No. 4 (4.75 mm) 0.5 lb (200 g)
NOTE: Nominal maximum aggregate size is one size larger than the first sieve to retain more than 10%.
Page 2/3 5.9.31 2016
Revised 2014
KT-31
5. TEST PROCEDURE
NOTE: For test procedures requiring the determination of two or more fractured faces go to Section 6. of
this test method.
5.1. Weigh the material retained on the No. 4 (4.75 mm) sieve to the nearest gram. Record this mass as
the original dry mass.
5.2. Spread the material in a thin layer on a clean flat surface so that each particle can be examined.
5.3. Separate the crushed particles from uncrushed particles. Any particle appearing to have one or more
fractured faces shall be considered a crushed particle.
NOTE: Crushed particles are defined as 25% or more of the particle having a fractured face. A fractured
face is defined as an angular, rough or broken surface of an aggregate particle. (See Figure 1)
Figure 1
Schematic of a Fractured Particle with One Fractured Face
A face will be considered a “Fractured Face” only if Af ≥ 0.25 Xmax
5.4 Determine the mass to the nearest gram and record as mass of crushed particles.
6. TEST PROCEDURE FOR SPECIFICATIONS REQUIRING DETERMINATION OF ONE OR
MORE AND TWO OR MORE FRACTURED FACES
6.1. Weigh the material retained on the No. 4 (4.75 mm) sieve to the nearest gram. Record this mass as
the original dry mass.
Projected Area of
Fractured Face
(Af)
(
Maximum Particle
Cross-Sectional Area
(Xmax)
Fractured Particle

Page 3/3 5.9.31 2016
Revised 2014
KT-31
6.2. Spread the material in a thin layer on a clean flat surface so that each particle can be examined.
6.3. Separate the crushed particles into three piles; uncrushed particles, particles with two or more
fractured faces and particles with one fractured face.
NOTE: Crushed particles are defined as 25% or more of the particle having a fractured face. A fractured
face is defined as an angular, rough or broken surface of an aggregate particle. (See Figure 1)
6.4. Determine the mass to the nearest gram of each pile with crushed faces and record as:
F1=Mass of particles with one fractured face
F2=Mass of particles with two or more fractured faces
7. CALCULATIONS
7.1. For specifications requiring determination of only one or more fractured faces:
100(Mass of Crushed Particles)
Percent Crushed Particles = Original Dry Mass
7.2. For specifications requiring determination of one or more and two or more fractured faces:
NOTE: Skip Sect. 7.2. for specifications not requiring the determination of two or more fractured faces.
Compute the percentage of crushed particles for specifications requiring the determination of two or more
fractured faces using the following formulas:
100(F1+ F2)
Percent Crushed Particles with 1 or more Fractured Faces = Original Dry Mass
100(F2)
Percent Crushed Particles with 2 or more Fractured Faces = Original Dry Mass
8. REPORT
8.1. Record to the nearest 0.1% of crushed particles. Report the results to 1% crushed particles.

Page 1/11 5.9.32 2016 Revised 2016 KT-32
5.9.32 METHOD OF TEST FOR DENSITY OF COMPACTED ASPHALT MIXTURES BY
NUCLEAR METHOD (Kansas Test Method KT-32)
1. SCOPE
This method of test covers the procedure for measuring the “in-place” density of compacted asphalt
materials by attenuation of gamma radiation. The intensity of the radiation detected is dependent in part
on the density of the material being tested. Gauge calibration shall follow Section 5.8.2. of this manual
INDEPENDENT ASSURANCE REPLICATE (ASR) CHECK FOR NUCLEAR DENSITY
GAUGES. KDOT gauges shall be calibrated annually.
The equipment utilizes radioactive materials which may be hazardous to the health of users unless
proper precautions are taken. (For KDOT field personnel only: Refer to Standard Operating
Manual No. 1.13.2.).
2. REFERENCED DOCUMENTS
2.1. KT-14; Marshall Test of Bituminous Mixes
2.2. KT-15; Bulk Specific Gravity and Unit Weight of Compacted Hot Mix Asphalt (HMA)
2.3. KT-39; Theoretical Maximum Specific Gravity of Asphalt Paving Mixtures
2.4. Section 5.2.2.2.; Random Sampling
3. APPARATUS
NOTE: Check gauge to verify it is in asphalt mode.
3.1. Nuclear density gauge with supporting equipment including reference standard, survey meter, and
instructional material.
3.2. Core drilling equipment capable of drilling a nominal 4 in (100 mm) diameter core.
3.3. Standardization.
3.3.1. Standardization of the nuclear gauge on a reference standard block is required at the start of each
day’s use and when test measurements are suspect.
3.3.2. Warm up the nuclear gauge in accordance with the manufacturer’s recommendations.
3.4. Properly seat the nuclear gauge on the standard block. Take a four minute reading on the reference
standard. The density standard should be within 1% of the density for the previous day’s reading. If not,

Page 2/11 5.9.32 2016 Revised 2016 KT-32
repeat the standard count. The two numbers should now be within 1% of each other and within 2% of the
density for the previous day’s reading. If not, check the machine for malfunction.
4. TEST SITE SELECTION AND PREPERATION
4.1. Location of the test site should be on a random basis as described in Section 5.2.2.2. RANDOM
SAMPLING of this manual. Regardless of the method of random selection chosen, it shall satisfy the
requirement that any area of the surface shall have an equal chance of being sampled, except sampling
shall not be conducted on sites closer than 1 ft (0.3 m) to an unconfined edge or vertical surface such as a
raised edge of curb and gutter, etc. When the randomized selection method indicates a site within 1 ft
(0.3 m) of an exposed edge or vertical surface, it is permissible to move the gauge transversely to clear
the 1 ft (0.3 m) restriction. It is also permissible to determine an alternate location using the tables again.
4.2. Since the measured values of density are affected by the surface texture of the material immediately
beneath the gauge, a flat surface should be tested for best results, both during calibration and density
testing. If the mix has a coarse surface, it is likely that the results will vary widely.
4.3. It may be necessary to use a leveling sand of minus No. 30 (600µm) material to obtain the best results
with the density gauge. The leveling sand, as defined for this test, is minus No. 30 (600 µm) with no
more than 20% represented by minus No. 100 (150 µm). It is recommended that the leveling sand
material be from the same source as one of the individual aggregates in the mixture.
4.4. For HMA mix designs designated as A mixes, no sand is required. All other mix designs should be
checked to determine if the leveling sand is needed before any field calibration of the nuclear density
gauge is attempted. This is accomplished by doing the following:
4.4.1. Sit the gauge on a smooth level location and mark location with lumber crayon.
4.4.1.1. For uniformity, the gauge operator shall position the source rod so it is closest to the laydown
machine (point the gauge towards the roller).
4.4.2. Take 5 one-minute readings with the density gauge, record wet density values, discard the single
highest and lowest values, average the three remaining values, and record the average value.
NOTE: Check tip of source rod to assure it is free of any foreign substance (i.e. grease, asphalt, concrete,
etc.).
4.4.3. Inside the location marked with the lumber crayon (test site) thinly spread a sufficient amount of
minus No. 30 (600 µm) material. Smooth and level the minus No. 30 (600 µm) material with the metal
plate or a straight edge.
4.4.4. Place the density gauge on the test site after the placement of minus No. 30 (600 µm) material and
take another density reading. Take care to use the same count time and location of source rod. Record
wet density information obtained. It is recommended that this process be completed at three locations.
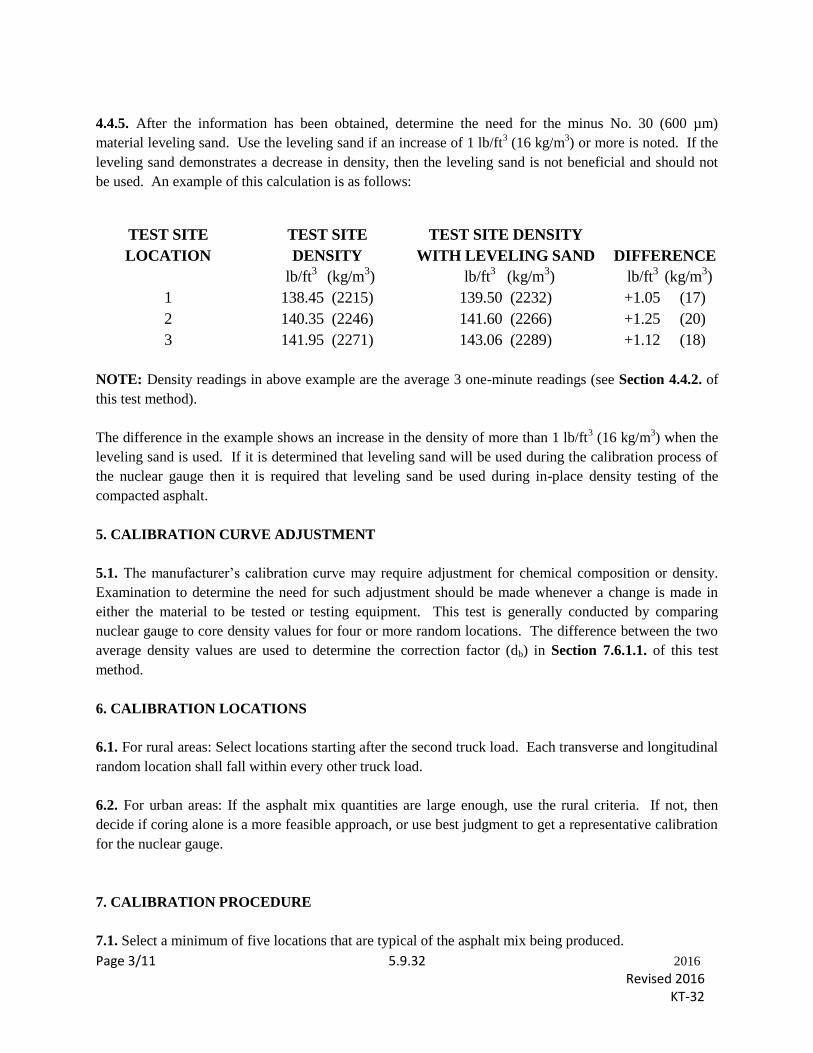
Page 3/11 5.9.32 2016 Revised 2016 KT-32
4.4.5. After the information has been obtained, determine the need for the minus No. 30 (600 µm)
material leveling sand. Use the leveling sand if an increase of 1 lb/ft3 (16 kg/m
3) or more is noted. If the
leveling sand demonstrates a decrease in density, then the leveling sand is not beneficial and should not
be used. An example of this calculation is as follows:
TEST SITE
LOCATION
TEST SITE
DENSITY
lb/ft3 (kg/m
3)
TEST SITE DENSITY
WITH LEVELING SAND
lb/ft3
(kg/m3)
DIFFERENCE
lb/ft3 (kg/m
3)
1 138.45 (2215) 139.50 (2232) +1.05 (17)
2 140.35 (2246) 141.60 (2266) +1.25 (20)
3 141.95 (2271) 143.06 (2289) +1.12 (18)
NOTE: Density readings in above example are the average 3 one-minute readings (see Section 4.4.2. of
this test method).
The difference in the example shows an increase in the density of more than 1 lb/ft3 (16 kg/m
3) when the
leveling sand is used. If it is determined that leveling sand will be used during the calibration process of
the nuclear gauge then it is required that leveling sand be used during in-place density testing of the
compacted asphalt.
5. CALIBRATION CURVE ADJUSTMENT
5.1. The manufacturer’s calibration curve may require adjustment for chemical composition or density.
Examination to determine the need for such adjustment should be made whenever a change is made in
either the material to be tested or testing equipment. This test is generally conducted by comparing
nuclear gauge to core density values for four or more random locations. The difference between the two
average density values are used to determine the correction factor (db) in Section 7.6.1.1. of this test
method.
6. CALIBRATION LOCATIONS
6.1. For rural areas: Select locations starting after the second truck load. Each transverse and longitudinal
random location shall fall within every other truck load.
6.2. For urban areas: If the asphalt mix quantities are large enough, use the rural criteria. If not, then
decide if coring alone is a more feasible approach, or use best judgment to get a representative calibration
for the nuclear gauge.
7. CALIBRATION PROCEDURE
7.1. Select a minimum of five locations that are typical of the asphalt mix being produced.

Page 4/11 5.9.32 2016 Revised 2016 KT-32
7.1.1. For uniformity, the gauge operator shall position the source rod so it is closest to the laydown
machine (point the gauge towards the roller).
7.2. Take 5 one-minute readings in each location with the nuclear gauge in the backscatter or direct
transmission (see Section 8.2. of this test method) position and mark the outline of the gauge in these
locations. Record wet density values, discard the single highest and lowest values, average the three
remaining values, and record the average value.
NOTE: Check tip of source rod to assure it is free of any foreign substance (i.e. grease, asphalt, concrete,
etc.).
7.3. Record the wet density (WD) directly from the nuclear gauge. Specific instructions on the individual
gauges are in the manufacturer’s instruction manual which is in the packet accompanying each gauge.
7.4. Take three cores from each of the marked areas. For lifts other than base course, it may be necessary
to use a bond breaker.
7.5. Obtain the core density using KT-15.
7.6. Calculations
7.6.1. For each location subtract the average nuclear density from the average core density. Evaluate
these differences for outliers by the “T” Statistic Test at the 95% confidence level. The following
example illustrates the point:
7.6.1.1. "T" STATISTIC EXAMPLE:
CALCULATIONS FOR CALIBRATION OF NUCLEAR GAUGES ON ASPHALT PAVEMENT
n = Number of locations
di = Core Density – Nuclear Density
db = ∑di/n = Correction Factor = Mean
s = Sample Standard Deviation
lb/ft3 (kg/m
3) Nuclear = Nuclear Density, Average of 5 one-minute readings
lb/ft3 (kg/m
3) Cores = Core Density, Average of three cores
Table 1
REJECTION QUOTIENTS (T0.95)
n T0.95

Page 5/11 5.9.32 2016 Revised 2016 KT-32
2 ----
3 1.15
4 1.46
5 1.67
6 1.82
7 1.94
8 2.03
9 2.11
10 2.18
Assume cores and nuclear readings for the calibration are as follows. Calculate the difference (di) between
cores and nuclear gauge readings.
SI EXAMPLE:
Location Cores Nuclear Difference(di)
(kg/m3) (kg/m
3)
1 2176 2133 43
2 2187 2160 27
3 2176 2141 35
4 2197 2168 29
5 2185 2152 33
Total +167
Calculate the correction factor (db)
db = n
di =
5
671 = + 33.4
and standard deviation (s) between the cores and nuclear gauge readings as follows:
Cores Nuclear di di-db (di-db)2
1 2176 2133 +43 +9.6 92.16
2 2187 2160 +27 -6.4 40.96
3 2176 2141 +35 +1.6 2.56
4 2197 2168 +29 -4.4 19.36
5 2185 2152 +33 -0.4 0.16
Total +167 155.20
s =
1
2
n
dd bi =
4
155.20 = 6.23
ENGLISH EXAMPLE:
Location Cores Nuclear Difference(di)
(lb/ft3) (lb/ft
3)
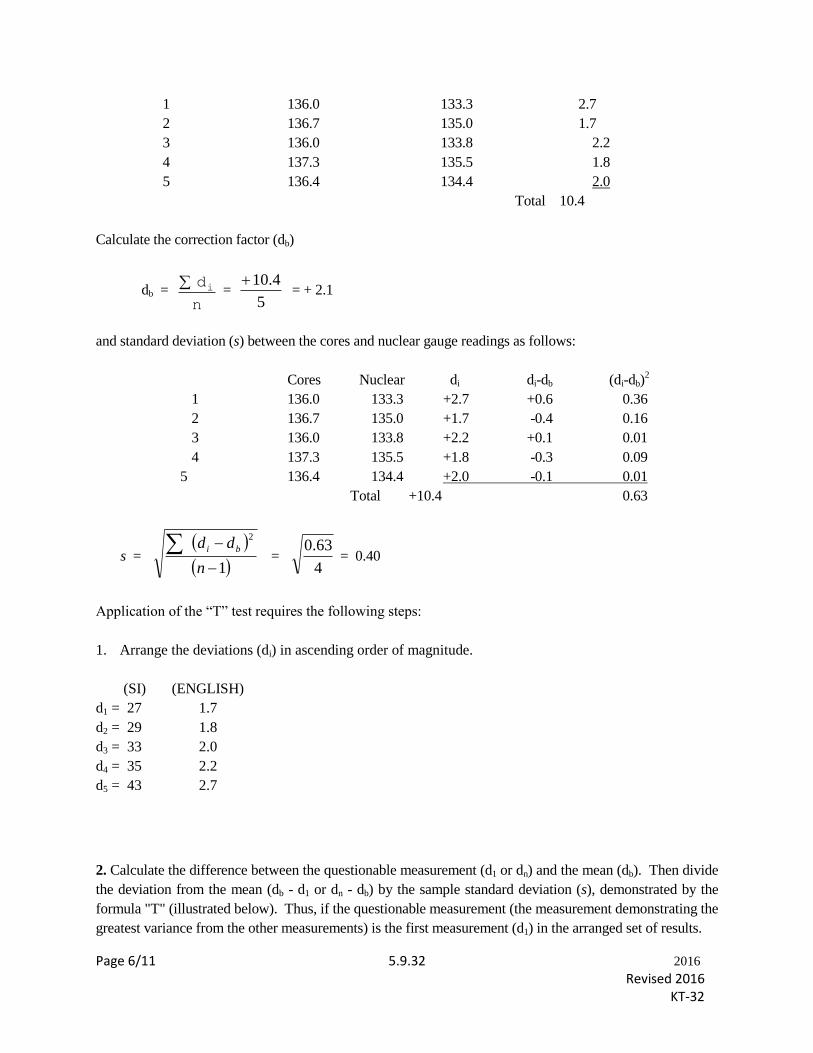
Page 6/11 5.9.32 2016 Revised 2016 KT-32
1 136.0 133.3 2.7
2 136.7 135.0 1.7
3 136.0 133.8 2.2
4 137.3 135.5 1.8
5 136.4 134.4 2.0
Total 10.4
Calculate the correction factor (db)
db = n
di =
5
4.01 = + 2.1
and standard deviation (s) between the cores and nuclear gauge readings as follows:
Cores Nuclear di di-db (di-db)2
1 136.0 133.3 +2.7 +0.6 0.36
2 136.7 135.0 +1.7 -0.4 0.16
3 136.0 133.8 +2.2 +0.1 0.01
4 137.3 135.5 +1.8 -0.3 0.09
5 136.4 134.4 +2.0 -0.1 0.01
Total +10.4 0.63
s =
1
2
n
dd bi =
4
0.63 = 0.40
Application of the “T” test requires the following steps:
1. Arrange the deviations (di) in ascending order of magnitude.
(SI) (ENGLISH)
d1 = 27 1.7
d2 = 29 1.8
d3 = 33 2.0
d4 = 35 2.2
d5 = 43 2.7
2. Calculate the difference between the questionable measurement (d1 or dn) and the mean (db). Then divide
the deviation from the mean (db - d1 or dn - db) by the sample standard deviation (s), demonstrated by the
formula "T" (illustrated below). Thus, if the questionable measurement (the measurement demonstrating the
greatest variance from the other measurements) is the first measurement (d1) in the arranged set of results.
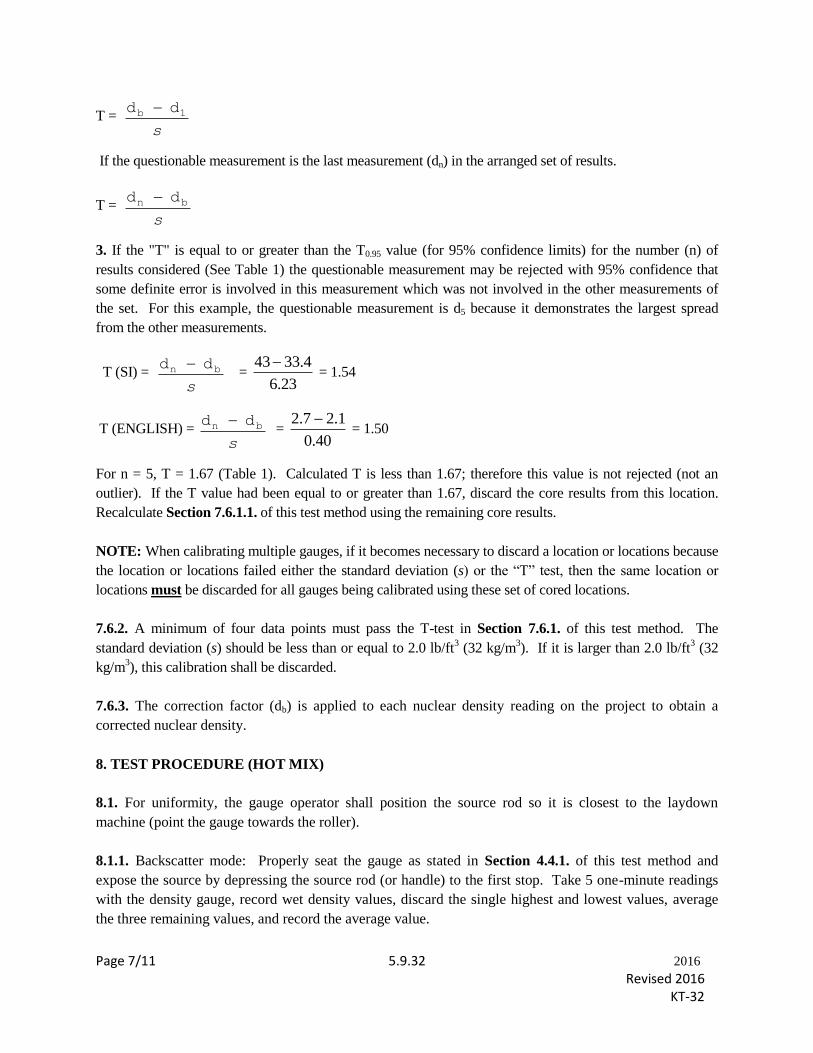
Page 7/11 5.9.32 2016 Revised 2016 KT-32
T = s
1b dd
If the questionable measurement is the last measurement (dn) in the arranged set of results.
T = s
bn dd
3. If the "T" is equal to or greater than the T0.95 value (for 95% confidence limits) for the number (n) of
results considered (See Table 1) the questionable measurement may be rejected with 95% confidence that
some definite error is involved in this measurement which was not involved in the other measurements of
the set. For this example, the questionable measurement is d5 because it demonstrates the largest spread
from the other measurements.
T (SI) = s
bn dd =
6.23
33.443 = 1.54
T (ENGLISH) = s
bn dd =
0.40
2.12.7 = 1.50
For n = 5, T = 1.67 (Table 1). Calculated T is less than 1.67; therefore this value is not rejected (not an
outlier). If the T value had been equal to or greater than 1.67, discard the core results from this location.
Recalculate Section 7.6.1.1. of this test method using the remaining core results.
NOTE: When calibrating multiple gauges, if it becomes necessary to discard a location or locations because
the location or locations failed either the standard deviation (s) or the “T” test, then the same location or
locations must be discarded for all gauges being calibrated using these set of cored locations.
7.6.2. A minimum of four data points must pass the T-test in Section 7.6.1. of this test method. The
standard deviation (s) should be less than or equal to 2.0 lb/ft3 (32 kg/m
3). If it is larger than 2.0 lb/ft
3 (32
kg/m3), this calibration shall be discarded.
7.6.3. The correction factor (db) is applied to each nuclear density reading on the project to obtain a
corrected nuclear density.
8. TEST PROCEDURE (HOT MIX)
8.1. For uniformity, the gauge operator shall position the source rod so it is closest to the laydown
machine (point the gauge towards the roller).
8.1.1. Backscatter mode: Properly seat the gauge as stated in Section 4.4.1. of this test method and
expose the source by depressing the source rod (or handle) to the first stop. Take 5 one-minute readings
with the density gauge, record wet density values, discard the single highest and lowest values, average
the three remaining values, and record the average value.
Page 8/11 5.9.32 2016 Revised 2016 KT-32
NOTE: Check tip of source rod to assure it is free of any foreign substance (i.e. grease, asphalt, concrete,
etc.).
8.2. For uniformity, the gauge operator shall position the source rod so it is closest to the laydown
machine (point the gauge towards the roller).
8.2.1. Direct transmission mode: Create a hole 2” (50 mm) deeper than the thickness of the material
being tested with the rod and hole forming device that is provided with the gauge. Lower the source rod
into the hole to the predetermined depth.
NOTE: Check tip of source rod to assure it is free of any foreign substance (i.e. grease, asphalt, concrete,
etc.).
NOTE: Always double check to make sure the probe is fully seated in the appropriate notch. This should
be confirmed in the safe, backscatter, or any direct transmission position.
9. TEST PROCEDURE (COLD RECYCLE)
9.1. Develop compaction growth curves (rolling sequence) for cold recycle material using the backscatter
position. Compaction growth curves will help to determine optimum density of material for a given
roller. Curves are developed by plotting the density of material against the accumulative roller passes
(D.O.T. FORM NO. 608 or 608M).
NOTE: In determining data for compaction growth curves, it is not necessary to calibrate the gauge to the
material. Also, a single one-minute count can be used to establish each point for the curve.
9.2. To determine in place density use either direct transmission or backscatter as approved by the district.
9.3. For uniformity, the gauge operator shall position the source rod so it is closest to the laydown
machine (point the gauge towards the roller).
9.3.1. Take 5 one-minute readings with the density gauge, record wet density values, discard the single
highest and lowest values, average the three remaining values, and record the average value.
NOTE: Check tip of source rod to assure it is free of any foreign substance (i.e. grease, asphalt, concrete,
etc.).

Page 9/11 5.9.32 2016 Revised 2016 KT-32
10. CALCULATIONS
10.1. Calculation methods applicable to the various gauge types are covered in the Manufacturer’s
Operating Manual which accompanies the gauge and are not reproduced in this procedure.
10.2. Wet density (WD) values, as determined by the method appropriate to the type of gauge and method
of calibration shall be compared to the “Density Standard” for determination of Percent of the Standard
and Percent of Voids.
10.3. Density Standards.
10.3.1. Density Standard for Nuclear Density shall be defined as the average value of the most recent
three laboratory density determinations (Field Mold Density) as determined by KT-14 and KT-15 for
Marshall mix designations. When fewer than three laboratory densities for the particular mix designation
or revised asphalt content are available, the “Density Standard” shall be the average of those
determinations made until a total of three may be averaged.
10.3.2. For Superpave mixes, the “Density Standard” is established with the use of the average daily
Gmmvalue (KT-39) as outlined in the specifications.
10.4. Calculate the Wet Density (WD) value from the following:
10.4.1. Wet Density (WD) = indicated lb/ft3 (kg/m
3) with the adjustment factor applied as determined in
Section 7. CALIBRATION PROCEDURE of this test method.
10.5. Calculate the percent of standard from the following formula:
Percent of Standard = StandardDensity
(WD) 100
10.6. Calculate the percent voids from the following formula:
Percent Voids = 100 -
mmGWaterofDensity
WD100d
Where: Gmm = Theoretical maximum specific gravity of the mixture (refer to KT-39).
NOTE: Density of water varies based on temperature. Determine the temperature and select the proper
density for water (see KT-15, Table 1).
11. REPORT AND RECORD
11.1. Report and record as 0.1 lb/ft3 (1 kg/m
3) or 0.01% of optimum density.
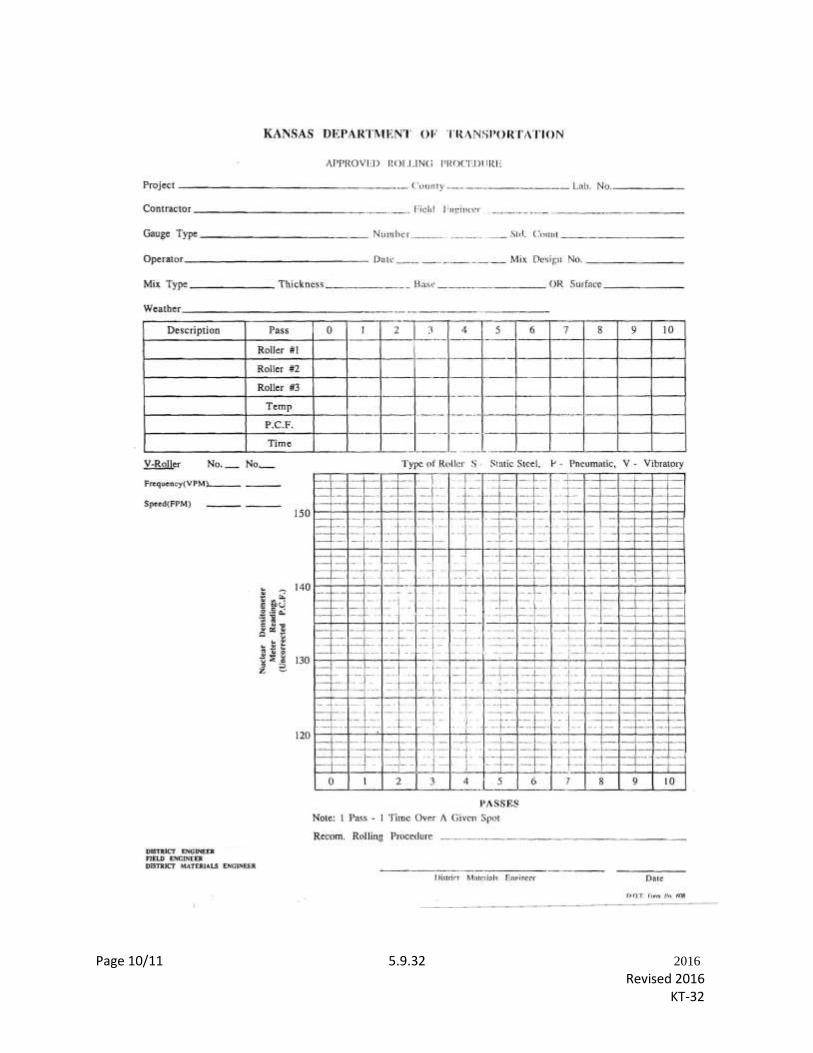
Page 10/11 5.9.32 2016 Revised 2016 KT-32
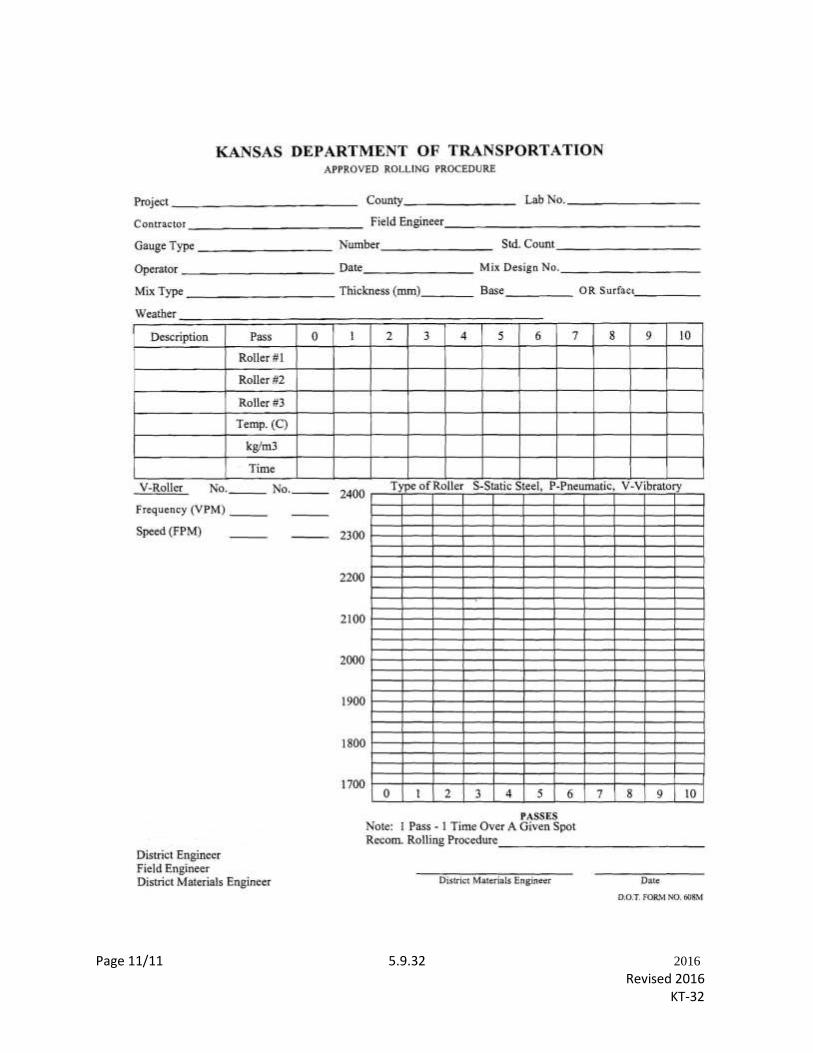
Page 11/11 5.9.32 2016 Revised 2016 KT-32


Page 1/1 5.9.33 2016
Revised 03-07
KT-33
5.9.33 BITUMEN CONTENT OF PAVING MIXTURES BY REFLUX EXTRACTION
(Kansas Test Method KT-33)
DELETED 03-2007
See KTMR-39

Page 1/3 5.9.34 2016
Revised 2016
KT-34
5.9.34 SIEVE ANALYSIS OF EXTRACTED AGGREGATE (Kansas Test Method KT-34)
1. SCOPE
This method of test covers the procedure for determination of the particle size distribution of aggregate
extracted from asphalt mixtures. KT-34 reflects testing procedures found in AASHTO T 30.
2. REFERENCED DOCUMENTS
2.1. Part V, 5.9; Sampling and Test Methods Foreword
2.2. KT-2; Sieve Analysis of Aggregates
2.3. KT-57; Determination of Asphalt Content and Gradation of Hot Mix Asphalt Concrete by the
Ignition Oven
2.4. AASHTO M 92; Wire-Cloth Sieves for Testing Purposes
2.5. AASHTO T 30; Mechanical Analysis of Extracted Aggregate
3. APPARATUS
3.1. The balance shall conform to the requirements of Part V, 5.9; Sampling and Test Methods
Foreword, for the class of general purpose balance required for the principal sample mass of the sample
being tested.
3.2. Appropriate sieves meeting AASHTO M 92.
3.3. Oven capable of maintaining a uniform temperature of 230 + 9°F (110 + 5°C).
3.4. Drying Pans.
3.5. Wetting Agent. Any dispersing agent, such as dishwashing detergent, that promotes separation of the
fine materials.
3.6. Container. Any container of sufficient size to contain the sample covered with water and to prevent
any loss of material during agitation.
3.7. Large Spoon
NOTE: The use of a mechanical apparatus to perform the washing operation is not precluded, provided
the results are consistent with those obtained using manual operations. The use of some mechanical
washing equipment with some samples may cause degradation of the sample.
4. SAMPLE
4.1. The sample shall consist of the entire sample of aggregate from the test for asphalt binder content of
paving mixtures by ignition method (KT-57) from which the asphalt material has been extracted.
Page 2/3 5.9.34 2016
Revised 2016
KT-34
5. TEST PROCEDURE
5.1. The sample shall be dried to a constant mass at a temperature of 230 + 9°F (110 + 5°C) and weighed
to the nearest 0.1%. The total mass of the aggregate shall be the sum of the extracted aggregate and the
mineral matter (ash) from the extracted asphalt binder.
5.2. The test sample shall be placed in a container and covered with water containing a sufficient amount
of wetting agent to assure a through separation of the material finer than the No. 200 (75 µm) sieve. The
use of a large spoon to stir and agitate the aggregate in the wash water has been found satisfactory.
5.3. The agitation shall be sufficiently vigorous to result in the complete separation from the coarse
particles of all particles finer than the No. 200 (75 µm) sieve and bring them into suspension in order that
they may be removed by decantation of the wash water. Care shall be taken to avoid, as much as
possible, the decantation of the coarse particles of the sample. Repeat the operation without the wetting
agent until the wash water is clear.
5.4. All materials retained on the sieves shall be returned to the container. The washed aggregate in the
container shall be dried to constant mass at a temperature of 230 + 9°F (110 + 5°C) and weighed to the
nearest 0.1%.
5.5. The aggregate shall then be sieved according to procedures found in KT-2 Section 6.1 through
Section 6.3, of this manual. The cumulative mass of material retained on all of the sieves including the
No. 200 (75 µm) sieve, plus the mass of dry material passing the No. 200 (75 µm) sieve by dry sieving
must check the dried mass after washing within 0.2% of the total mass. The cumulative mass of the
material retained on the various sieves shall be recorded. The mass of the material passing the No. 200
(75 µm) sieve, determined by subtracting the cumulative mass of the material retained on all sieves from
the total mass of the sample, shall also be recorded.
6. CALCULATIONS
6.1. The mass of the material retained on the various sieves and the total passing the 75μm (No. 200)
sieve shall be converted to percentages by dividing each by the total mass of the aggregate and
multiplying by 100.
7. REPORT
7.1. The report shall include the results of the sieve analysis reported as the cumulative percentage
retained on each sieve. The percent passing the No. 200 (75 µm) sieve shall also be reported.
Percentages shall be reported to the nearest whole percent except for the percentage passing the No. 200
(75 µm) sieve which shall be reported to the nearest 0.1%.
8. PRECISION
8.1. The estimates of precision for this test method are listed in Table 1. The estimates are based on the
results from the AASHTO Materials Reference Laboratory Proficiency Sample Program, with
testing conducted by AASHTO T 30. The data are based on the analyses of the test results from 47 to 90
laboratories that tested 17 pairs of proficiency test samples (Samples 1 through 34). The values in the
table are given for different ranges of total percentage of aggregate passing a sieve.

Page 3/3 5.9.34 2016
Revised 2016
KT-34
Table 1
Precision
Extracted
Aggregate Single
Operator Precision
Total Percentage of
Material Passing a Sieve
Standard Deviation
(1S) Percent
Acceptable Range of Two
Result—(D2S) Percent
<100 >95 0.49 1.4
<95 >40 1.06 3.0
<40 >25 0. 65 1.8
<25 >10 0.46 1.3
<10 >5 0.29 0.8
<5 >2 0.21 0.6
<2 >0 0.17 0.5
Multilaboratory
Precision
<100 >95 0.57 1.6
<95 >40 1.24 3.5
<40 >25 0.84 2.4
<25 >10 0.81 2.3
<10 >5 .056 1.6
<5 >2 0.43 1.2
<2 >0 0.32 0.9
NOTE: These numbers represent, respectively, (1S) and (D2S) limits described in Practice ASTM C
670.
NOTE: The precision estimates are based on aggregates with nominal maximum sizes of 3/4 in (19.0
mm) to 3/8 in (9.5 mm).

Page 1/1 5.9.35 2016
Revised 2014
KT-35
5.9.35 STICKS IN AGGREGATE (Kansas Test Method KT-35)
1. SCOPE
This method of test covers the procedure for determining the percentage of sticks and similar material
(leaves, bark, etc.) in aggregate.
2. REFERENCED DOCUMENTS
2.1. Part V, 5.9; Sampling and Test Methods Foreword
3. APPARATUS
3.1. The balance shall conform to the requirements of Part V, 5.9; Sampling and Test Methods
Foreword, for the class of general purpose balance required for the principal sample mass of the sample
being tested.
3.2. Standard No. 4 (4.75 mm) sieve.
4. SAMPLE PREPARATION
4.1. Obtain a representative sample of not less than 25 lb (11.5 kg). Weigh and record the weight of the
sample without drying or further preparation and screen over a standard No. 4 (4.75 mm) sieve.
5. TEST PROCEDURE
5.1. Remove and weigh all sticks as they appear on the sieve surface.
6. CALCULATION
6.1. Calculate the percentage of sticks as follows:
Percent Sticks= 100(Wet Weight of Sticks)
Original Wet Weight of Sample
NOTE: This test may be performed at the same time and on the same sample as a routine clay lump test.
7. REPORT
7.1. Report sticks in aggregate to 0.01% of mass.


Page 1/5 5.9.36 2016
Revised 2016
KT-36
5.9.36 DENSITY OF FRESHLY MIXED CONCRETE IN BRIDGE DECK OVERLAYS BY
NUCLEAR GAUGE (Kansas Test Method KT-36)
1. SCOPE
This method of test covers the procedure for determining the in-place density of freshly mixed concrete in
bridge deck overlays using a nuclear density gauge. This method is applicable to all types of concrete.
Gauge calibration shall follow 5.8.2. of this manual INDEPENDENT ASSURANCE REPLICATE
(ASR) CHECK FOR NUCLEAR DENSITY GAUGES. KDOT gauges shall be calibrated annually.
The equipment utilizes radioactive materials which may be hazardous to the health of users unless
proper precautions are taken. (For KDOT field personnel only: Refer to Standard Operating
Manual No. 1.13.2.).
2. REFERENCED DOCUMENTS
2.1. KT-20; Weight Per Cubic Foot (Meter), Yield and Air Content (Gravimetric) of Freshly Mixed
Concrete
3. APPARATUS
NOTE: Check gauge to verify it is in asphalt mode.
3.1. Nuclear density gauge with supporting equipment including reference standard, survey meter, and
instructional material.
3.2. Frame to hold gauge at the concrete surface of the in-place material.
3.3. Shovel, trowels, wash bucket, tire brush, rags.
3.4. Tape measure.
3.5. Pachometer.
3.6. Depth Gauging Wire.
3.7. A supply of No. 30 (600 µm) sand screened from the fine aggregate in the mix or a pan and a No. 30
(600 µm) sieve.
3.8. Brush for cleaning up sand.
4. DAILY WARM UP AND CHECK
The nuclear gauge shall be turned on for warm-up and checked according to the manufacturer’s
instructions.
5. TEST PROCEDURE
Readings should be taken in a random manner unless there are sound reasons to relocate. Readings
should not be taken closer than 1 ft (0.3 m) to a vertical surface.
Page 2/5 5.9.36 2016
Revised 2016
KT-36
5.1. Direct Transmission Readings
5.1.1. For uniformity, the gauge operator shall position the source rod so it is closest to the finish machine
(point the gauge towards the placement of the concrete overlay).
5.1.2. Place the gauge on the surface and depress the probe to the appropriate depth, when exceeding 2 in
(50 mm). On very stiff mixes, it may be necessary to make a hole in the fresh concrete with the 5/8 in (15
mm) graduated pin and hole-forming device furnished with the gauge. The alignment of the hole and the
probe is greatly facilitated if the gauge is placed on the concrete surface first. The probe location will
show on the fresh concrete as will the outline of the gauge. Take 5 one-minute readings, record wet
density values, discard the single highest and lowest values, average the three remaining values, record
the average value, and divide this average by the three point moving average of unit weight of fresh
concrete.
NOTE: Check tip of source rod to assure it is free of any foreign substance (i.e. grease, asphalt, concrete,
etc.).
5.2. Backscatter Readings
5.2.1. Backscatter readings are required on overlays 2 in or less (50 mm or less) thick. In addition, the
effect of the underlying layer on the readings needs to be taken into account. This is done as follows:
5.2.1.1. Obtain a supply of minus No. 30 (600 µm) sand.
5.2.1.2. Mark the location of the top reinforcing steel using a pachometer in at least three relatively
smooth areas.
5.2.1.3. Place some sand in the area between the reinforcing steel and screed off the excess using a rule or
other straight edge. The area covered by the sand should be slightly larger than the bottom of the nuclear
gauge and should have all the surface voids filled with the fine sand. There should only be enough sand
to fill the voids. Excessive quantities can be counterproductive.
5.2.1.4. For uniformity, the gauge operator shall position the source rod so it is closest to the finish
machine (point the gauge towards the placement of the concrete overlay).
5.2.1.5. Place the gauge on the prepared area, lower the probe to the backscatter position, take 5 one-
minute readings, record wet density values, discard the single highest and lowest values, average the three
remaining values, record the average value.
NOTE: Check tip of source rod to assure it is free of any foreign substance (i.e. grease, asphalt, concrete,
etc.).
5.2.2. Repeat Section 5.2.1.5 of this test method in at least two other locations. Average all of these for an
average density of the underlying layer. Low readings originating from an air gap under the gauge should
not be included in the average.
5.2.3. The nuclear readings on the overlay are corrected by using the nomograph and the procedure in the
manufacturer’s manual, as follows:
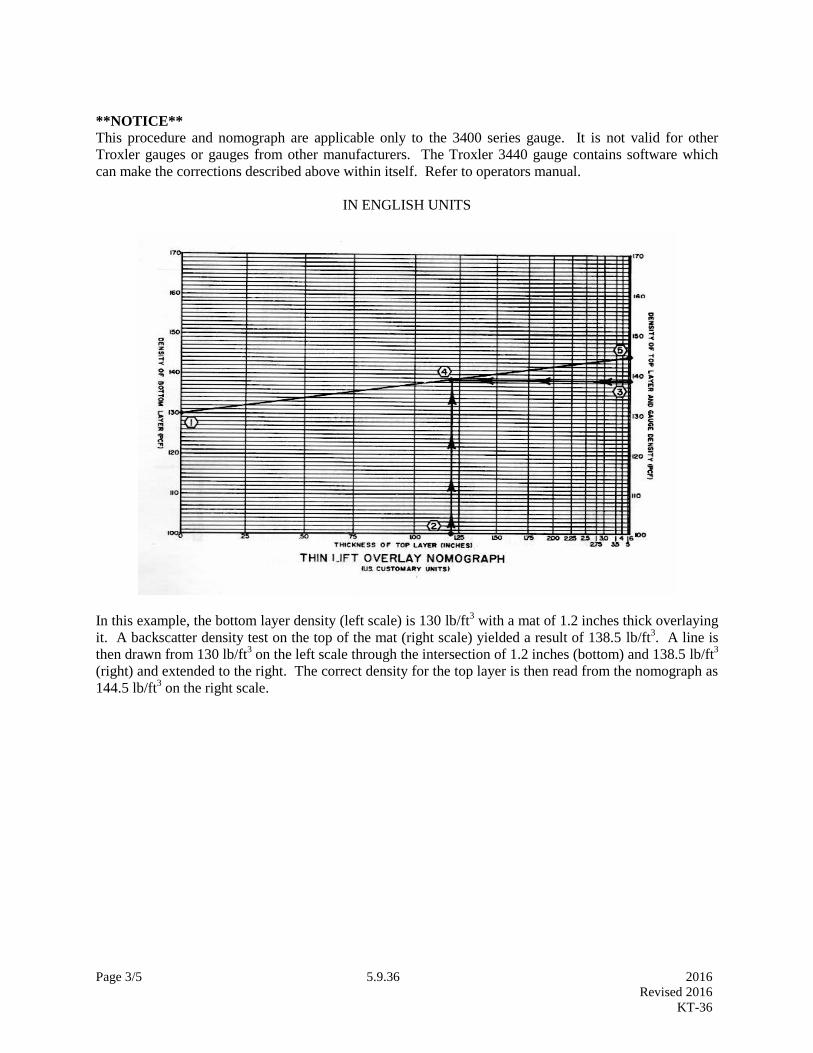
Page 3/5 5.9.36 2016
Revised 2016
KT-36
**NOTICE**
This procedure and nomograph are applicable only to the 3400 series gauge. It is not valid for other
Troxler gauges or gauges from other manufacturers. The Troxler 3440 gauge contains software which
can make the corrections described above within itself. Refer to operators manual.
IN ENGLISH UNITS
In this example, the bottom layer density (left scale) is 130 lb/ft3 with a mat of 1.2 inches thick overlaying
it. A backscatter density test on the top of the mat (right scale) yielded a result of 138.5 lb/ft3. A line is
then drawn from 130 lb/ft3 on the left scale through the intersection of 1.2 inches (bottom) and 138.5 lb/ft
3
(right) and extended to the right. The correct density for the top layer is then read from the nomograph as
144.5 lb/ft3 on the right scale.
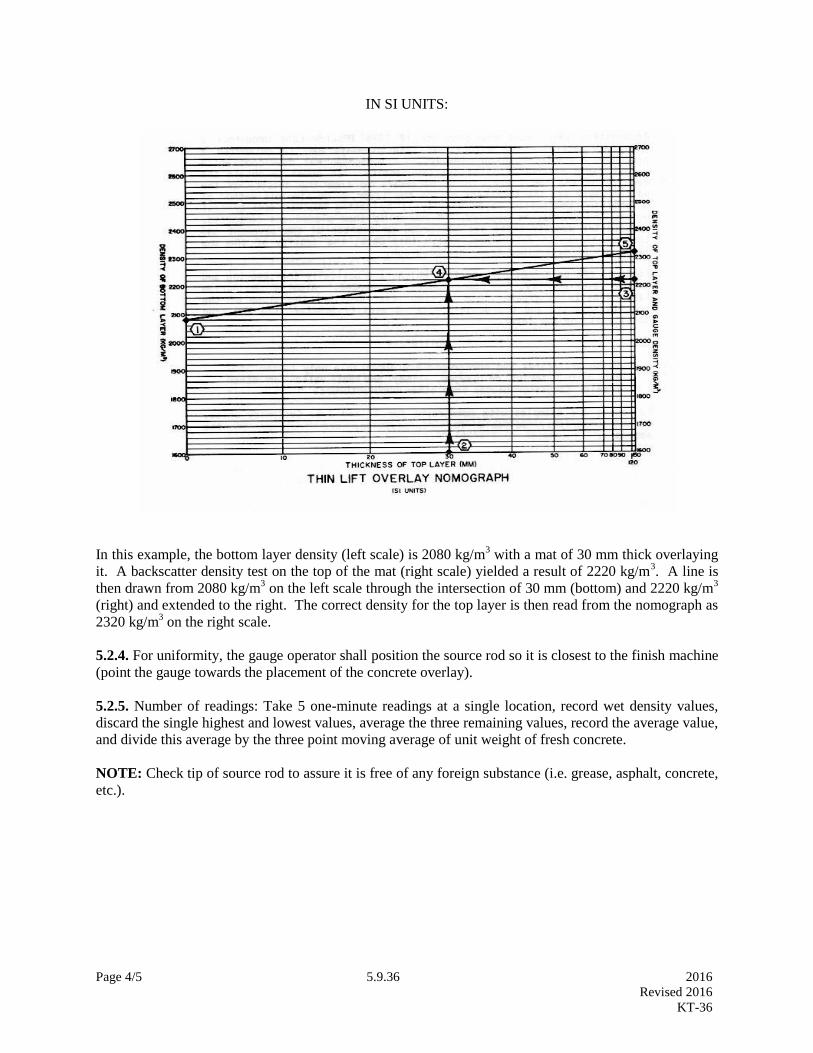
Page 4/5 5.9.36 2016
Revised 2016
KT-36
IN SI UNITS:
In this example, the bottom layer density (left scale) is 2080 kg/m3 with a mat of 30 mm thick overlaying
it. A backscatter density test on the top of the mat (right scale) yielded a result of 2220 kg/m3. A line is
then drawn from 2080 kg/m3 on the left scale through the intersection of 30 mm (bottom) and 2220 kg/m
3
(right) and extended to the right. The correct density for the top layer is then read from the nomograph as
2320 kg/m3 on the right scale.
5.2.4. For uniformity, the gauge operator shall position the source rod so it is closest to the finish machine
(point the gauge towards the placement of the concrete overlay).
5.2.5. Number of readings: Take 5 one-minute readings at a single location, record wet density values,
discard the single highest and lowest values, average the three remaining values, record the average value,
and divide this average by the three point moving average of unit weight of fresh concrete.
NOTE: Check tip of source rod to assure it is free of any foreign substance (i.e. grease, asphalt, concrete,
etc.).
Page 5/5 5.9.36 2016
Revised 2016
KT-36
6. CALCULATION
6.1. The average wet density reading is divided by the three point moving average of the unit weight of
concrete and multiplied by 100 to obtain a percent density. When fewer than three unit weights are
available, the “Density Standard” shall be the average of those determinations made until a total of three
may be averaged.
Percent of Standard = 100(WD)
Density Standard
7. REPORT AND RECORD
7.1. Report and record wet density values as 0.1 lb/ft3 (1 kg/m
3).
7.2. Report and record Percent of Standard Density to the nearest whole percent.

Page 1/6 5.9.37 2016
Revised 2016
KT-37
5.9.37 MAKING, CURING AND TESTING CEMENT TREATED AND UNBOUND BASES (Kansas
Test Method KT-37)
1. SCOPE
This method covers the procedure for making and curing compression test specimens of Cement Treated
and Unbound Base under accurate control of quantities of materials and test conditions. Bound bases are
considered the same as Cement Treated Bases.
2. REFERENCED DOCUMENTS
2.1. Part V, 5.9; Sampling and Test Methods Foreword
2.2. KT-11; Section 2. Moisture Tests, Section 4. Constant Mass Method
2.3. KT-12; Standard Compaction Test
2.4. AASHTO M 92; Wire-Cloth Sieves for Testing Purposes
2.5. AASHTO T 99; Moisture-Density Relations of Soils Using a 5.5 lb (2.5kg) Rammer and a 12 in
(305mm) Drop
3. APPARATUS
3.1. A calibrated cylindrical mold, solid or split, of predetermined volume approximately 6 in (150 mm)
in diameter and 6 in (150 mm) in height and having a volume of approximately 1/10 ft3 (2.8 L). The mold
is equipped with a removable base plate. Example of acceptable mold assembly is the Humboldt
compaction mold, model number H-4163, Durham GEO S-328, or a Durham GEO S -319. Note that a
minimum of 3 molds are required for production testing and a minimum of 9 molds are required for mix
design.
NOTE: The volume of the mold (without the collar) is measured by coating one end with cup grease or
Vaseline to form a seal and then placing it on a glass plate which should be placed in a level position on a
scale. The other end of the mold is coated with cup grease or Vaseline and then the mold and two glass
plates are weighed. The mold may then be filled with 77 + 2°F (25 + 1° C) water after which the second
glass plate should be placed on top of the mold in such a way as to eliminate air bubbles and excess water.
Any excess water thus removed must be carefully wiped off after which the final weight of the mold,
water and glass plates may be determined. The volume of the mold may then be calculated using 62.243
lb/ft3 (997 kg/m
3) as the density of water.
3.2. Rigid steel straight edge meeting standards set forth in AASHTO T 99, Section 3.6.
3.3. A mechanically operated metal rammer equipped to control the height of drop to 12.00 + 0.06 in (305
+ 2 mm) above the elevation of the material and to distribute the blows uniformly over the material
surface. The rammer has a rigid “pie-shaped” (sector) foot. The foot shall be a sector of a 6 in (150 mm)
diameter circle and shall have an area equal to that of a 2 in (50 mm) diameter circle. The nominal mass
of the rammer is 5.50 + 0.02 lb (2.495 + 0.009 kg).
3.4. Manually operated. Metal rammer with a mass of 5.5 + 0.02 lb (2.495 + 0.009 kg), and having a flat
circular face of 2.000 in (50.80 mm) diameter with a tolerance of + 0.01 in (0.25 mm). The in-service
diameter of the flat circular face shall be not less than 1.985 in (50.42 mm). The rammer shall be

Page 2/6 5.9.37 2016
Revised 2016
KT-37
equipped with a suitable guide-sleeve to control the height of drop to a free fall of 12.00 + 0.06 in (305 +
2 mm) above the elevation of the soil. The guide-sleeve shall have at least 4 vent holes, no smaller than
3/8 in (9.5. mm) diameter spaced at 90 degrees apart and 3/4 in (19 mm) from each end; and shall provide
sufficient clearance so the free fall of the rammer shaft and head is unrestricted.
3.5. Sieves meeting requirements set forth under AASHTO M 92 for 1 in (25.0 mm), 3/4 in (19.0 mm),
1/2 in (12.5 mm), 3/8 in (9.5mm), No. 4 (4.75 mm), No. 8 (2.36 mm) and No. 16 (1.18mm).
3.6. The balance shall conform to the requirements of Part V, 5.9; Sampling and Test Methods
Foreword, for the class of general purpose balance required for the principal sample mass of the sample
being tested.
3.7. A thermostatically controlled drying oven capable of maintaining a temperature of 230 + 9°F (110 +
5°C).
3.8. Sample extruder (desirable) should consist of a frame, jack and circular metal loading plate or other
suitable device for removing specimens from the mold.
3.9. Drying pans.
3.10. Trowels, spatulas and other mixing tools or a mechanical mixer that will thoroughly mix the
material, cementitious material and water.
3.11. A moist room or cabinet (CTB only) capable of maintaining a temperature of 73 + 3°F (23 + 2°C)
and a relative humidity of not less than 96%.
3.12. A tamping rod (CTB only) 5/8 in (16 mm) diameter and approximately 24 inches (600 mm) in
length that is round with at least one end having a hemispherical tip.
3.13. Soft rubber mallet.
4. SAMPLE PREPARATION.
4.1. For mix design, dry the base aggregate to a constant mass at approximately 230°F (100°C).
Separate the base aggregate by dry screening into the desired fractions and compute the percentage
retained on each sieve. The following size fractions are recommended as a minimum:
1 1/2 in to 1 n (37.5mm to 25 mm) No. 4 to No. 8 (4.75 mm to 2.36 mm)
1 in to 3/4 in (25. Mm to 19 mm) No. 8 to No. 16 (2.36 mm to 1.18mm)
3/4 in to 1/2 in (19 mm to 12.5 mm) No. 16 to No.30 (1.18 mm to 600 µm)
1/2 in to 3/8 in (12.5 mm to 9.5 mm) No. 30 to No. 100 (600 µm to 150 µm)
3/8 in to No. 4 (.5 mm to 4.75 mm) No. 100 to No. 200 (150 µm to 75 µm)
4.2. Make six portions of base aggregate for each percent of cementitious material to be tested.
Recombine the aggregate fractions at the percentage determined in Section 4.1 of this test method. Each
portion shall weigh 7000 g minus the amount of cementitious material to be added.
4.3 Thoroughly mix each sample portion of aggregate with the required amount of cementitious material
and place the mixture in a separate pan if applicable.
Page 3/6 5.9.37 2016
Revised 2016
KT-37
4.4. For production (QC/QA) control, prepare field material in the following manner:
4.4.1. Acquire a random sample of at least 35 lbs (15 kg) of material. Split the material as follows:
4.4.1.1. Place the sample on clean sheet metal and mix thoroughly with a trowel.
4.4.1.2. Divide the pile into two equal halves with a straightedge (trowel or similar metal blade) and
completely remove the back half of the sample.
4.4.1.3. If the sample isn’t the proper size (approximately 7000 g), then use the trowel (or metal blade) to
remove or add a portion to achieve the proper size.
5. MOISTURE DENSITY RELATIONSHIP TEST PROCEDURE
5.1. For mix design purposes, add a measured amount (approximately 5%) of water and thoroughly mix
with one-7000 g portion. After the addition of water and thorough mixing, compact immediately. DO
NOT CURE OR AGE THE SPECIMEN AT THIS POINT. For field production obtain a 7000 g portion
of combined material.
5.2. Determine the mass of the mold. Place the assembled mold on the rigid base and fill approximately
1/2 full of the loose moist material. Compact by one of the following methods:
5.2.1. For samples with 1 inch (25 mm) slump or less, compact the layer with 56 blows of the rammer
with the blows being distributed uniformly over the surface of the layer. Place three, approximately
equal, additional layers of material in the mold and compact each layer in a similar manner.
5.2.2. For samples with slump greater than 1 inch (25 mm), it may be more appropriate to rod the sample
instead of using the rammer. Place enough material in the mold to fill half the mold (not the collar and
mold depth). Rod the material 25 times throughout its depth with the strokes being uniformly distributed
over the cross section of the mold. After rodding, tap the outsides of the mold lightly 10 to 15 times with
a soft rubber mallet, to close any holes left by rodding and to release any large air bubbles that may have
been trapped. Repeat this process for the second and third lifts. The second lift should completely fill the
mold, while the third lift should come close to filling the mold and collar. While rodding the second and
third lifts, be sure to penetrate the lower lifts by about 1/2 in (12 mm).
5.3. After the final layer has been compacted, remove the collar and trim excess material level with the
top of the mold.
5.4. Remove the base and weigh the specimen while it is in the mold. Subtract the mass of the mold to
determine the wet mass of the compacted specimen. Then remove the specimen from the mold and place
it in an individual drying pan.
5.5. (For Laboratory Prepared Material Only): Repeat the compaction procedure using the other 7000
g increments of the sample to which different measured amounts of water have been added and
thoroughly mixed. This procedure will be continued with varying moisture contents until at least three
points are obtained on the dry side of “optimum moisture” and at least two points are obtained on the wet
side of “optimum moisture.” This can usually be accomplished by compacting different specimens at
moisture intervals of 2 to 3%, starting on the dry side of “optimum moisture” and ending on the wet side.
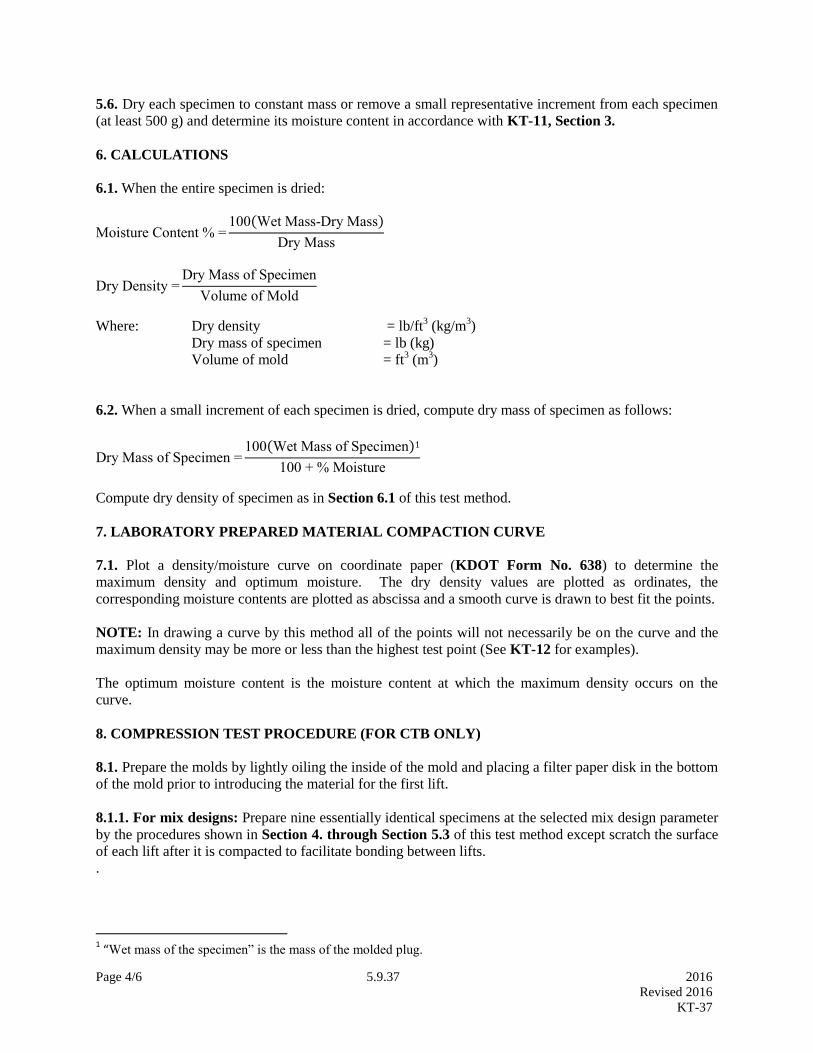
Page 4/6 5.9.37 2016
Revised 2016
KT-37
5.6. Dry each specimen to constant mass or remove a small representative increment from each specimen
(at least 500 g) and determine its moisture content in accordance with KT-11, Section 3.
6. CALCULATIONS
6.1. When the entire specimen is dried:
Moisture Content % =100(Wet Mass-Dry Mass)
Dry Mass
Dry Density =Dry Mass of Specimen
Volume of Mold
Where: Dry density = lb/ft3 (kg/m
3)
Dry mass of specimen = lb (kg)
Volume of mold = ft3 (m
3)
6.2. When a small increment of each specimen is dried, compute dry mass of specimen as follows:
Dry Mass of Specimen =100(Wet Mass of Specimen)1
100 + % Moisture
Compute dry density of specimen as in Section 6.1 of this test method.
7. LABORATORY PREPARED MATERIAL COMPACTION CURVE
7.1. Plot a density/moisture curve on coordinate paper (KDOT Form No. 638) to determine the
maximum density and optimum moisture. The dry density values are plotted as ordinates, the
corresponding moisture contents are plotted as abscissa and a smooth curve is drawn to best fit the points.
NOTE: In drawing a curve by this method all of the points will not necessarily be on the curve and the
maximum density may be more or less than the highest test point (See KT-12 for examples).
The optimum moisture content is the moisture content at which the maximum density occurs on the
curve.
8. COMPRESSION TEST PROCEDURE (FOR CTB ONLY)
8.1. Prepare the molds by lightly oiling the inside of the mold and placing a filter paper disk in the bottom
of the mold prior to introducing the material for the first lift.
8.1.1. For mix designs: Prepare nine essentially identical specimens at the selected mix design parameter
by the procedures shown in Section 4. through Section 5.3 of this test method except scratch the surface
of each lift after it is compacted to facilitate bonding between lifts.
.
1 “Wet mass of the specimen” is the mass of the molded plug.
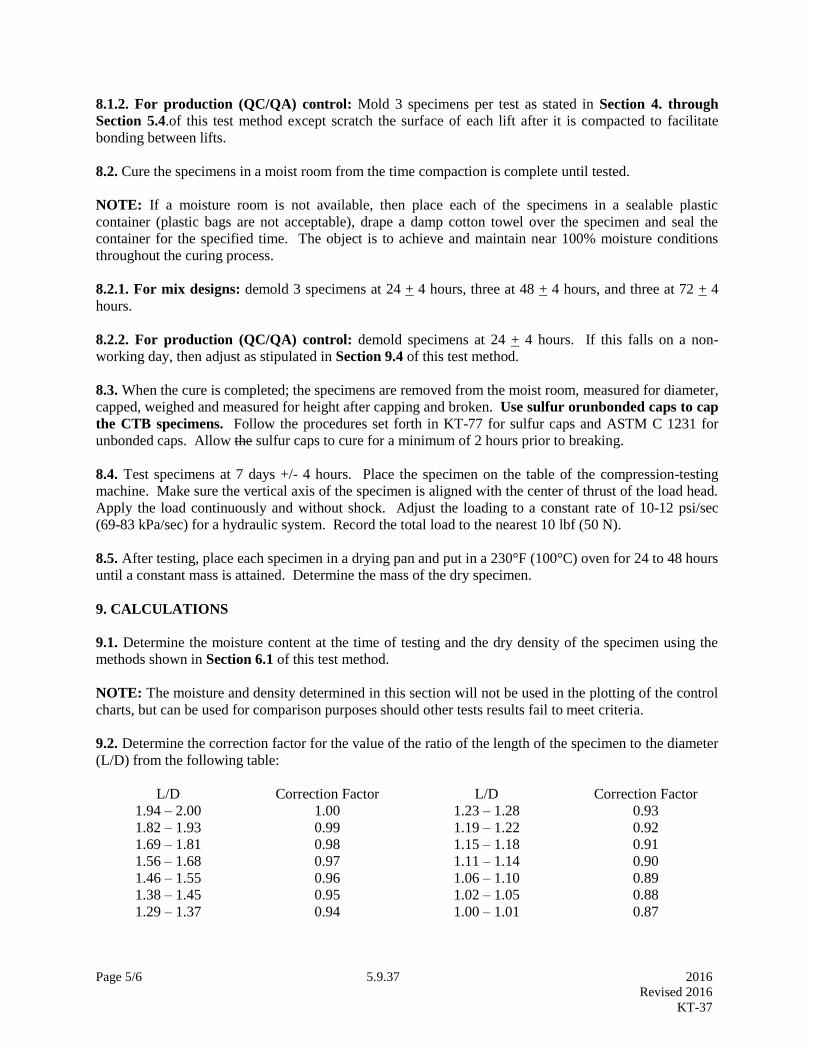
Page 5/6 5.9.37 2016
Revised 2016
KT-37
8.1.2. For production (QC/QA) control: Mold 3 specimens per test as stated in Section 4. through
Section 5.4.of this test method except scratch the surface of each lift after it is compacted to facilitate
bonding between lifts.
8.2. Cure the specimens in a moist room from the time compaction is complete until tested.
NOTE: If a moisture room is not available, then place each of the specimens in a sealable plastic
container (plastic bags are not acceptable), drape a damp cotton towel over the specimen and seal the
container for the specified time. The object is to achieve and maintain near 100% moisture conditions
throughout the curing process.
8.2.1. For mix designs: demold 3 specimens at 24 + 4 hours, three at 48 + 4 hours, and three at 72 + 4
hours.
8.2.2. For production (QC/QA) control: demold specimens at 24 + 4 hours. If this falls on a non-
working day, then adjust as stipulated in Section 9.4 of this test method.
8.3. When the cure is completed; the specimens are removed from the moist room, measured for diameter,
capped, weighed and measured for height after capping and broken. Use sulfur orunbonded caps to cap
the CTB specimens. Follow the procedures set forth in KT-77 for sulfur caps and ASTM C 1231 for
unbonded caps. Allow the sulfur caps to cure for a minimum of 2 hours prior to breaking.
8.4. Test specimens at 7 days +/- 4 hours. Place the specimen on the table of the compression-testing
machine. Make sure the vertical axis of the specimen is aligned with the center of thrust of the load head.
Apply the load continuously and without shock. Adjust the loading to a constant rate of 10-12 psi/sec
(69-83 kPa/sec) for a hydraulic system. Record the total load to the nearest 10 lbf (50 N).
8.5. After testing, place each specimen in a drying pan and put in a 230°F (100°C) oven for 24 to 48 hours
until a constant mass is attained. Determine the mass of the dry specimen.
9. CALCULATIONS
9.1. Determine the moisture content at the time of testing and the dry density of the specimen using the
methods shown in Section 6.1 of this test method.
NOTE: The moisture and density determined in this section will not be used in the plotting of the control
charts, but can be used for comparison purposes should other tests results fail to meet criteria.
9.2. Determine the correction factor for the value of the ratio of the length of the specimen to the diameter
(L/D) from the following table:
L/D Correction Factor L/D Correction Factor
1.94 – 2.00 1.00 1.23 – 1.28 0.93
1.82 – 1.93 0.99 1.19 – 1.22 0.92
1.69 – 1.81 0.98 1.15 – 1.18 0.91
1.56 – 1.68 0.97 1.11 – 1.14 0.90
1.46 – 1.55 0.96 1.06 – 1.10 0.89
1.38 – 1.45 0.95 1.02 – 1.05 0.88
1.29 – 1.37 0.94 1.00 – 1.01 0.87

Page 6/6 5.9.37 2016
Revised 2016
KT-37
9.3. Multiply the failure load by the correction factor determined from the table above and divide by the
area of the test specimen to determine the corrected compressive strengths in psi (kPa)] at failure. Record
this value as P.
𝑃 =𝐹𝑐𝑜𝑟
𝐴
Where:
Fcor = failure load x correction factor
𝐴 = 𝜋𝑟2
9.4. Design: During the Design phase develop a time adjustment factor for the 48-hour and 72-hour
molded specimens to correlate back to the 24-hour molded specimens in the following manner:
9.4.1. Determine the average corrected compressive strengths for each of the three sets (24, 48, 72-hour)
of molded specimens.
9.4.2. Determine the time adjustment factor by dividing the base time compressive strength (24-hour) by
the extended times compressive strengths in the following manner:
T48=P24
P48
T72=P24
P72
Where: T48, T72= Time adjustment factor for a given (either 48-hour or 72-hour) molded
specimen.
P24, P72= Average compressive strength values for a given (either 48-hour or 72-hour) set
of molded specimens.
9.5. Production: During the field production phase, apply the appropriate time adjustment whenever
specimens are not removed from the mold in 24 + 4 hours in the following manner:
Padj = P x T48 or Padj = P x T72
10. REPORTING
10.1. For laboratory prepared material, report the pressure at failure of each specimen in the three-
specimen set in addition to the average failure pressure of the three specimens. For field prepared
material, report the pressure at failure for each specimen. The report should reference this test procedure.
Record the compressive strength to the nearest 1 psi (0.01MPa). Report the compressive strength to the
nearest 10 psi (0.1 MPa). Record the density to 0.1 lb/ft3 (1 kg/m
3). Report the density to the nearest to
whole number.

Page 1/2 5.9.38 2016
Revised 2016
KT-38
5.9.38 DENSITY OF FRESHLY MIXED CONCRETE IN PAVEMENT BY NUCLEAR METHOD
(Kansas Test Method KT-38)
1. SCOPE
This method of test covers the procedure for determining the in-place density of freshly mixed concrete in
pavements using nuclear density gauge. This method is applicable to all types of concrete. KT-38
reflects testing procedures found in AASHTO T 271. Gauge calibration shall follow 5.8.2.
INDEPENDENT ASSURANCE REPLICATE (ASR) CHECK FOR NUCLEAR DENSITY
GAUGES. KDOT gauges shall be calibrated annually.
The equipment utilizes radioactive materials which may be hazardous to the health of users unless
proper precautions are taken (For KDOT field personnel only: Refer to Standard Operating
Manual No. 1.13.2.).
2. REFERENCED DOCUMENTS
2.1. KT-20; Weight Per Cubic Foot (Meter), Yield and Air Content (Gravimetric) of Freshly Mixed
Concrete
2.2. AASHTO T 271; Density of Plastic and Hardened Portland Cement Concrete In Place by Nuclear
Methods
3. APPARATUS
NOTE: Check gauge to verify it is in asphalt mode.
3.1. Nuclear density gauge with supporting equipment including reference standard, survey meter, and
instructional material.
4. DAILY WARM-UP CHECK
The nuclear gauge shall be turned on for warm-up and checked according to the manufacturer’s
instructions.
5. TEST PROCEDURE
5.1. For uniformity, the gauge operator shall position source rod so it is closest to the paving machine
(point the gauge toward the concrete placement).
5.1.1. Transverse Profile of Densities: A transverse profile of wet densities shall be taken to evaluate the
effectiveness of the consolidation system. This profile is developed by taking a single one-minute density
reading in each vibrator path and in each gap between two vibrators across the entire placement width.
Although not all readings can be obtained at one station, an effort should be made to develop the profile
in as short a time as possible. A complete profile needs to be run each time a change is made in the
placement machine which could affect consolidation.
NOTE: Check tip of source rod to assure it is free of any foreign substance (i.e. grease, asphalt, concrete,
etc.).

Page 2/2 5.9.38 2016
Revised 2016
KT-38
5.2. For uniformity, the gauge operator shall position source rod so it is closest to the paving machine
(point the gauge toward the concrete placement).
5.2.1. In-Place Concrete Densities: The daily wet density readings should be taken in both the vibrator
paths and the gaps between vibrators to verify the density profile as well as document the percent of
required consolidation taking place. Take 5 one-minute readings, record wet density values, discard the
single highest and lowest values, average the three remaining values, and record the average value. These
readings should be taken no closer than 1 ft (0.3 m) to a vertical edge nor within 2 ft (0.6 m) of a dowel
basket assembly.
NOTE: Check tip of source rod to assure it is free of any foreign substance (i.e. grease, asphalt, concrete,
etc.).
5.3. Place the gauge on the surface and depress the probe to the appropriate depth, normally 8 in (200
mm). After the readings are taken, lift the gauge from the concrete by the case and clean the probe before
restoring the probe to its safe position.
6. CALCULATION
6.1. The wet density (WD) is divided by the three point moving average of the consolidated unit weight of
concrete, KT-20, and multiplied by 100 to obtain a percent density. When fewer than three consolidated
unit weights of concrete are available, the “standard density” shall be the average of those determinations
made until a total of three may be averaged.
Percent of Consolidation = 100(WD)
Density Standard
NOTE: For concrete, record the WD reading from the nuclear density gauge.
7. REPORT AND RECORD
7.1. Report and record as 0.1 lb/ft3 (1 kg/m
3).
Page 1/6 5.9.39 2016
Revised 2016
KT-39
5.9.39 THEORETICAL MAXIMUM SPECIFIC GRAVITY OF ASPHALT PAVING MIXTURES
(Kansas Test Method KT-39)
1. SCOPE
This method covers the determination of the theoretical maximum specific gravity of uncompacted
asphalt paving mixtures. KT-39 reflects testing procedures found in AASHTO T 209.
2. REFERENCED DOCUMENTS
2.1. Part V, 5.9; Sampling and Test Methods Foreword
2.2. KT-58; Method for Preparing and Determining the Density of Hot Mix Asphalt (HMA) Specimens
by means of the Superpave Gyratory Compactor
2.3. AASHTO T 209; Theoretical Maximum Specific Gravity and Density of Hot-Mix Asphalt Paving
Mixtures
2.4. ASTM E 1; Specifications for ASTM Thermometers
3. APPARATUS
3.1. Vacuum container.
3.1.1. Two different vacuum containers are described. Each must be capable of withstanding the full
vacuum applied, and each must be equipped with the fittings and other accessories required by the test
procedure being employed. The hose opening shall be covered with a small piece of No. 200 (75 µm)
wire mesh to prevent vacuum pickup of particles during transfer of materials.
3.1.2. The vacuum container size depends on the minimum sample size requirements given in Section
5.1. of this test method. Avoid using a small sample in a large container.
3.1.3. Vacuum containers for weighing in water.
3.1.3.1. Type A: A glass, plastic or metal bowl with a minimum capacity of 2000 mL.
3.1.3.2. Type B: A thick-wall filter flask or a thick-wall vacuum dessicator with a minimum capacity of
2000 mL.
3.2. The balance shall conform to the requirements of Part V, 5.9; Sampling and Test Methods
Foreword, for the class of general purpose balance required for the principal sample mass of the sample
being tested. The balance shall be readable to 0.1% or better of the sample mass. For the bowl
determination method the balance shall be equipped with a suitable suspension apparatus and holder to
permit weighing the sample while suspended from the center of the scale pan of the balance.
3.3. Vacuum pump or water aspirator capable of evacuating air from the container to a residual pressure
of 3.7 kPa (27 mm of Hg).
3.3.1. When a vacuum pump is used, a suitable trap of one or more 1000 mL filter flasks, or the
equivalent, shall be installed between the vacuum vessel and vacuum source to reduce the amount of
water vapor entering the vacuum pump.

Page 2/6 5.9.39 2016
Revised 2016
KT-39
3.4. Residual pressure manometer or vacuum gauge traceable to NIST (mandatory) to be connected
directly to the vacuum vessel and to be capable of measuring residual pressure down to 3.7 kPa (27 mm
Hg).
NOTE: A residual pressure of 4.0 kPa (30 mm Hg) absolute pressure is approximately equivalent to 97
kPa (730 m Hg) reading on vacuum gauge at sea level.
NOTE: Residual pressure in the vacuum vessel measured in millimeters of mercury, is the difference in
the height of the mercury in the Torricellian vacuum leg of the manometer and the height of mercury in
the other leg of the manometer that is attached to the vacuum vessel.
3.5. Manometer or vacuum gauge, suitable for measuring the vacuum being applied at the source of the
vacuum. This device can be connected directly to the vacuum source or be in the vacuum line close to the
source. This is required to check the reading given by the residual pressure manometer attached directly
to the vacuum vessel.
NOTE: The Torricellian vacuum leg of the manometer occasionally acquires one or more bubbles of air
that introduce error into the residual pressure reading. By the addition of the vacuum gauge this error can
often be quickly detected by the differences between the two vacuum measurements.
3.6. Thermometers, calibrated liquid-in-glass, total immersion type, of suitable range with graduations at
least every 0.2°F (0.1°C) and a maximum scale error of 0.9°F (0.5°C) as prescribed in ASTM E 1.
3.7. A draft oven capable of maintaining a uniform temperature of 275 + 9°F (135 + 5°C).
3.8. Water bath suitable for immersing the Type A or Type B container in water while suspended under
the balance and equipped with an overflow outlet for maintaining a constant water level. Maintain a
constant-temperature water bath at 77 + 2°F (25 + 1°C).
3.9. Bleeder valve, attached to the vacuum train to facilitate adjustment of the vacuum being applied to
the vacuum vessel.
3.10. Mechanical shaker for removing air from asphalt mix with a built-in digital timer capable of 0.25
second accuracy and a maximum time limit of 99 minutes. Also must have ability to adjust vibration
frequency to permit maximum release of air and a 3-point switch for off, manual or timed operation.
Must have the ability to fully clamp and hold in place a Type A or Type B container full of water and
asphalt mix while removing the air from the mix through the vibration process. Must be able to meet or
exceed the Gilson Vibro-Deairator (SGA-5R).
3.11. Test equipment must be arranged as shown in Figure 1. The vacuum control must be placed after
the pump and before the sample container and manometer; otherwise incorrect vacuum readings may
occur.
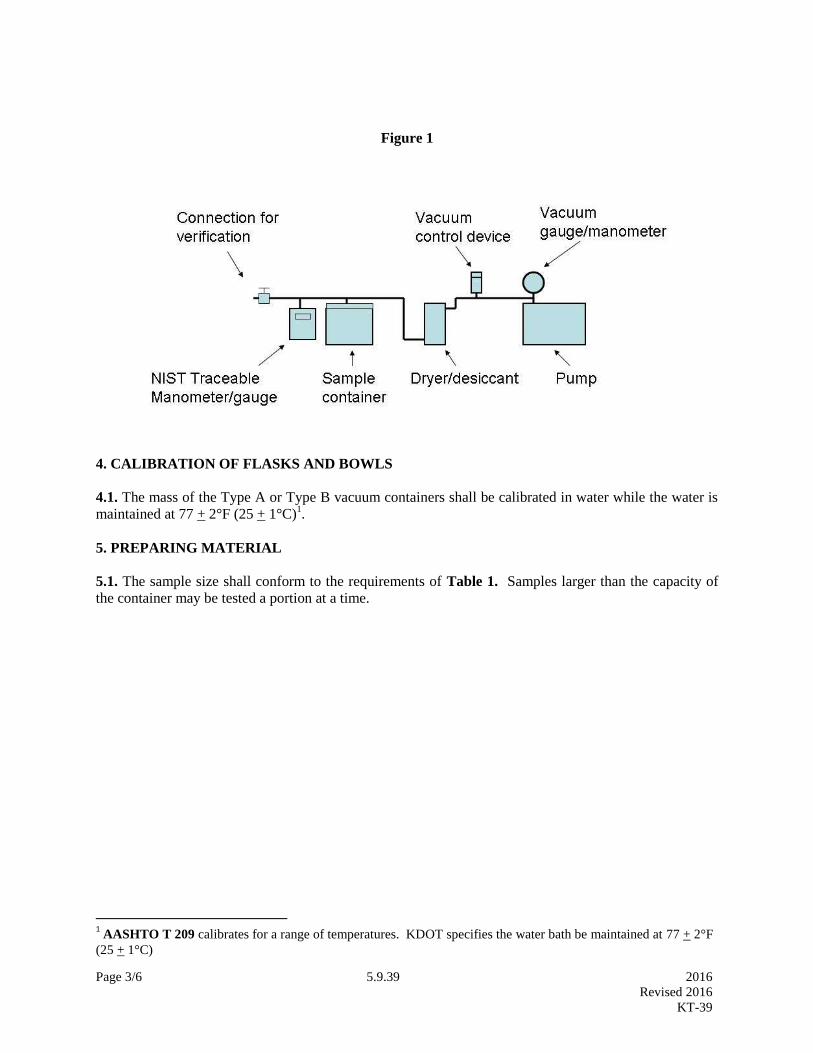
Page 3/6 5.9.39 2016
Revised 2016
KT-39
Figure 1
4. CALIBRATION OF FLASKS AND BOWLS
4.1. The mass of the Type A or Type B vacuum containers shall be calibrated in water while the water is
maintained at 77 + 2°F (25 + 1°C)1.
5. PREPARING MATERIAL
5.1. The sample size shall conform to the requirements of Table 1. Samples larger than the capacity of
the container may be tested a portion at a time.
1 AASHTO T 209 calibrates for a range of temperatures. KDOT specifies the water bath be maintained at 77 + 2°F
(25 + 1°C)
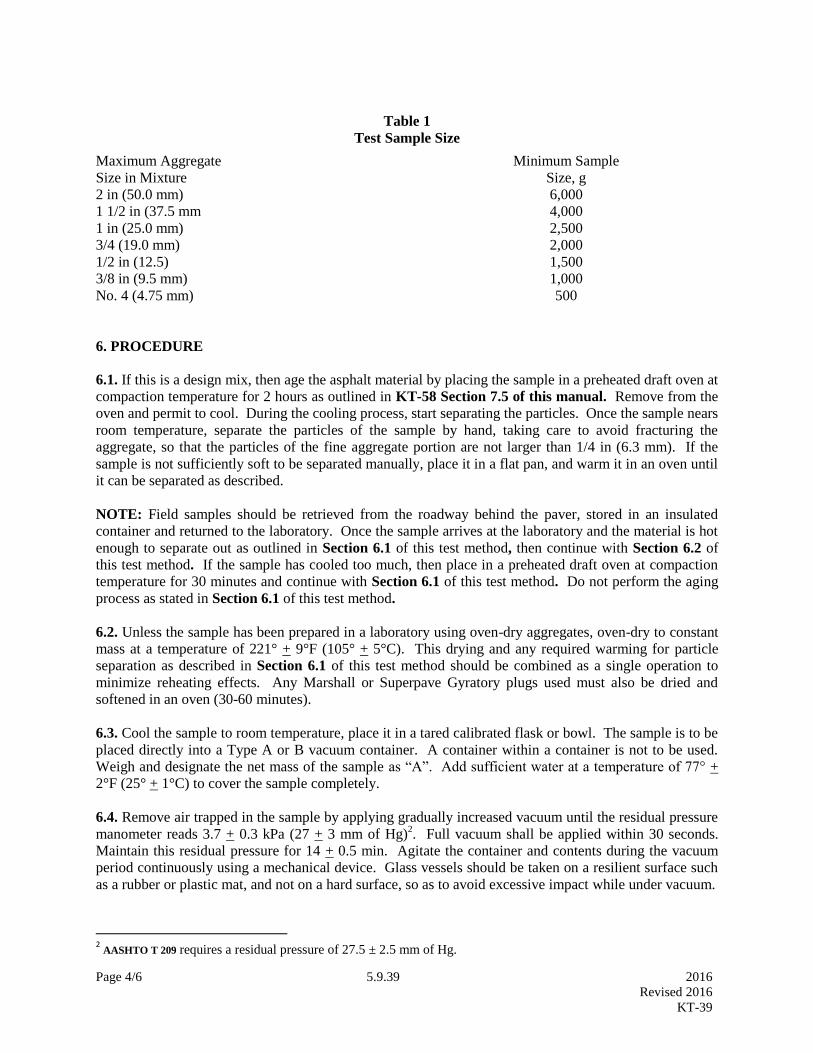
Page 4/6 5.9.39 2016
Revised 2016
KT-39
Table 1
Test Sample Size
6. PROCEDURE
6.1. If this is a design mix, then age the asphalt material by placing the sample in a preheated draft oven at
compaction temperature for 2 hours as outlined in KT-58 Section 7.5 of this manual. Remove from the
oven and permit to cool. During the cooling process, start separating the particles. Once the sample nears
room temperature, separate the particles of the sample by hand, taking care to avoid fracturing the
aggregate, so that the particles of the fine aggregate portion are not larger than 1/4 in (6.3 mm). If the
sample is not sufficiently soft to be separated manually, place it in a flat pan, and warm it in an oven until
it can be separated as described.
NOTE: Field samples should be retrieved from the roadway behind the paver, stored in an insulated
container and returned to the laboratory. Once the sample arrives at the laboratory and the material is hot
enough to separate out as outlined in Section 6.1 of this test method, then continue with Section 6.2 of
this test method. If the sample has cooled too much, then place in a preheated draft oven at compaction
temperature for 30 minutes and continue with Section 6.1 of this test method. Do not perform the aging
process as stated in Section 6.1 of this test method.
6.2. Unless the sample has been prepared in a laboratory using oven-dry aggregates, oven-dry to constant
mass at a temperature of 221° + 9°F (105° + 5°C). This drying and any required warming for particle
separation as described in Section 6.1 of this test method should be combined as a single operation to
minimize reheating effects. Any Marshall or Superpave Gyratory plugs used must also be dried and
softened in an oven (30-60 minutes).
6.3. Cool the sample to room temperature, place it in a tared calibrated flask or bowl. The sample is to be
placed directly into a Type A or B vacuum container. A container within a container is not to be used.
Weigh and designate the net mass of the sample as “A”. Add sufficient water at a temperature of 77° +
2°F (25° + 1°C) to cover the sample completely.
6.4. Remove air trapped in the sample by applying gradually increased vacuum until the residual pressure
manometer reads 3.7 + 0.3 kPa (27 + 3 mm of Hg)2. Full vacuum shall be applied within 30 seconds.
Maintain this residual pressure for 14 + 0.5 min. Agitate the container and contents during the vacuum
period continuously using a mechanical device. Glass vessels should be taken on a resilient surface such
as a rubber or plastic mat, and not on a hard surface, so as to avoid excessive impact while under vacuum.
2 AASHTO T 209 requires a residual pressure of 27.5 ± 2.5 mm of Hg.
Maximum Aggregate
Size in Mixture
Minimum Sample
Size, g
2 in (50.0 mm) 6,000
1 1/2 in (37.5 mm 4,000
1 in (25.0 mm) 2,500
3/4 (19.0 mm) 2,000
1/2 in (12.5) 1,500
3/8 in (9.5 mm) 1,000
No. 4 (4.75 mm) 500
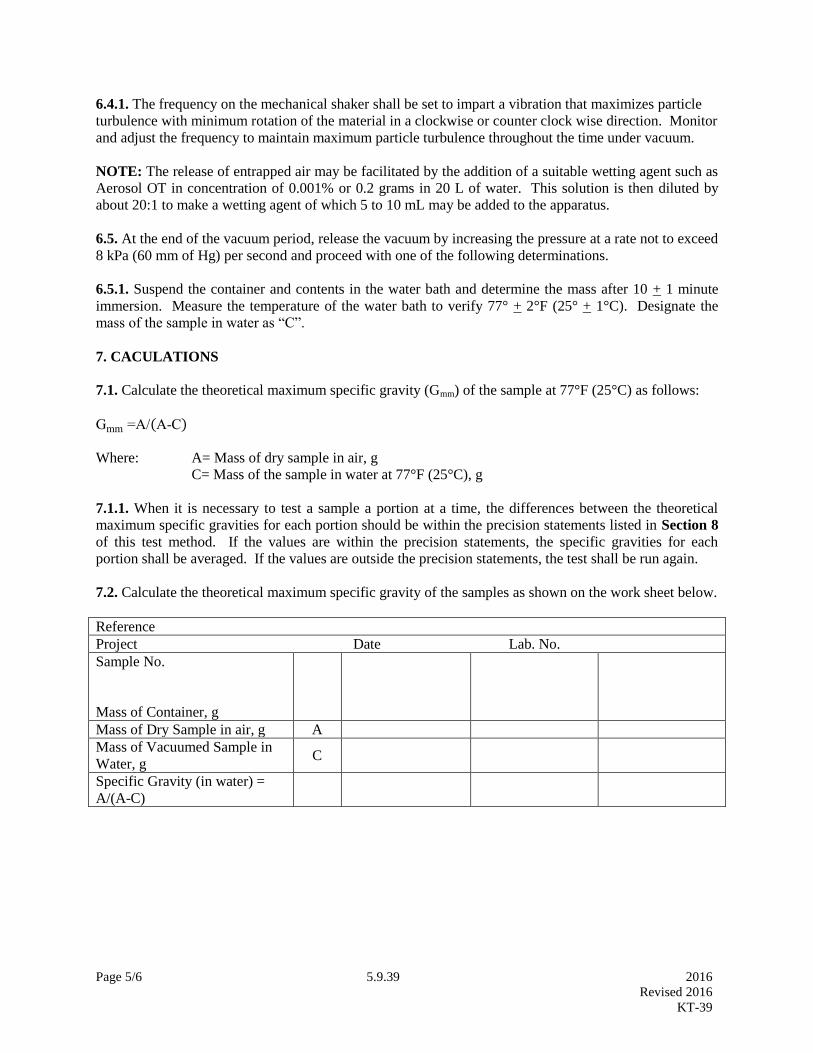
Page 5/6 5.9.39 2016
Revised 2016
KT-39
6.4.1. The frequency on the mechanical shaker shall be set to impart a vibration that maximizes particle
turbulence with minimum rotation of the material in a clockwise or counter clock wise direction. Monitor
and adjust the frequency to maintain maximum particle turbulence throughout the time under vacuum.
NOTE: The release of entrapped air may be facilitated by the addition of a suitable wetting agent such as
Aerosol OT in concentration of 0.001% or 0.2 grams in 20 L of water. This solution is then diluted by
about 20:1 to make a wetting agent of which 5 to 10 mL may be added to the apparatus.
6.5. At the end of the vacuum period, release the vacuum by increasing the pressure at a rate not to exceed
8 kPa (60 mm of Hg) per second and proceed with one of the following determinations.
6.5.1. Suspend the container and contents in the water bath and determine the mass after 10 + 1 minute
immersion. Measure the temperature of the water bath to verify 77° + 2°F (25° + 1°C). Designate the
mass of the sample in water as “C”.
7. CACULATIONS
7.1. Calculate the theoretical maximum specific gravity (Gmm) of the sample at 77°F (25°C) as follows:
Gmm =A/(A-C)
Where: A= Mass of dry sample in air, g
C= Mass of the sample in water at 77°F (25°C), g
7.1.1. When it is necessary to test a sample a portion at a time, the differences between the theoretical
maximum specific gravities for each portion should be within the precision statements listed in Section 8
of this test method. If the values are within the precision statements, the specific gravities for each
portion shall be averaged. If the values are outside the precision statements, the test shall be run again.
7.2. Calculate the theoretical maximum specific gravity of the samples as shown on the work sheet below.
Reference
Project Date Lab. No.
Sample No.
Mass of Container, g
Mass of Dry Sample in air, g A
Mass of Vacuumed Sample in
Water, g C
Specific Gravity (in water) =
A/(A-C)
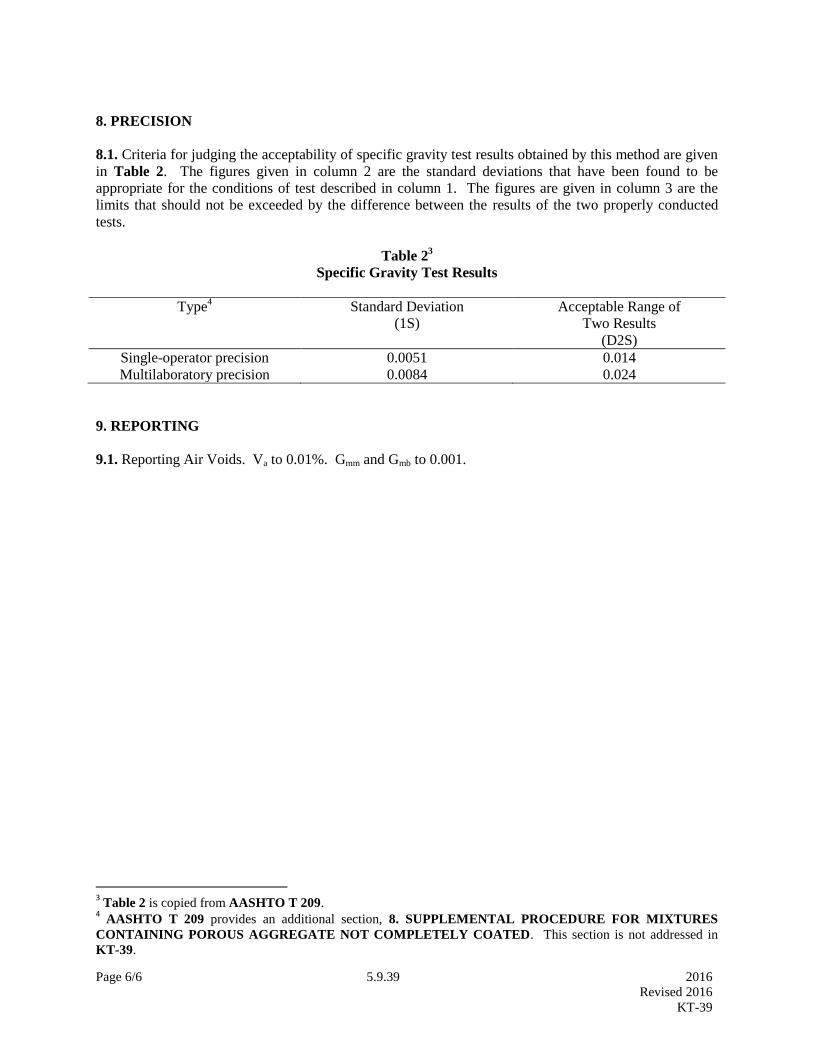
Page 6/6 5.9.39 2016
Revised 2016
KT-39
8. PRECISION
8.1. Criteria for judging the acceptability of specific gravity test results obtained by this method are given
in Table 2. The figures given in column 2 are the standard deviations that have been found to be
appropriate for the conditions of test described in column 1. The figures are given in column 3 are the
limits that should not be exceeded by the difference between the results of the two properly conducted
tests.
Table 23
Specific Gravity Test Results
Type4 Standard Deviation
(1S)
Acceptable Range of
Two Results
(D2S)
Single-operator precision 0.0051 0.014
Multilaboratory precision 0.0084 0.024
9. REPORTING
9.1. Reporting Air Voids. Va to 0.01%. Gmm and Gmb to 0.001.
3 Table 2 is copied from AASHTO T 209.
4 AASHTO T 209 provides an additional section, 8. SUPPLEMENTAL PROCEDURE FOR MIXTURES
CONTAINING POROUS AGGREGATE NOT COMPLETELY COATED. This section is not addressed in
KT-39.
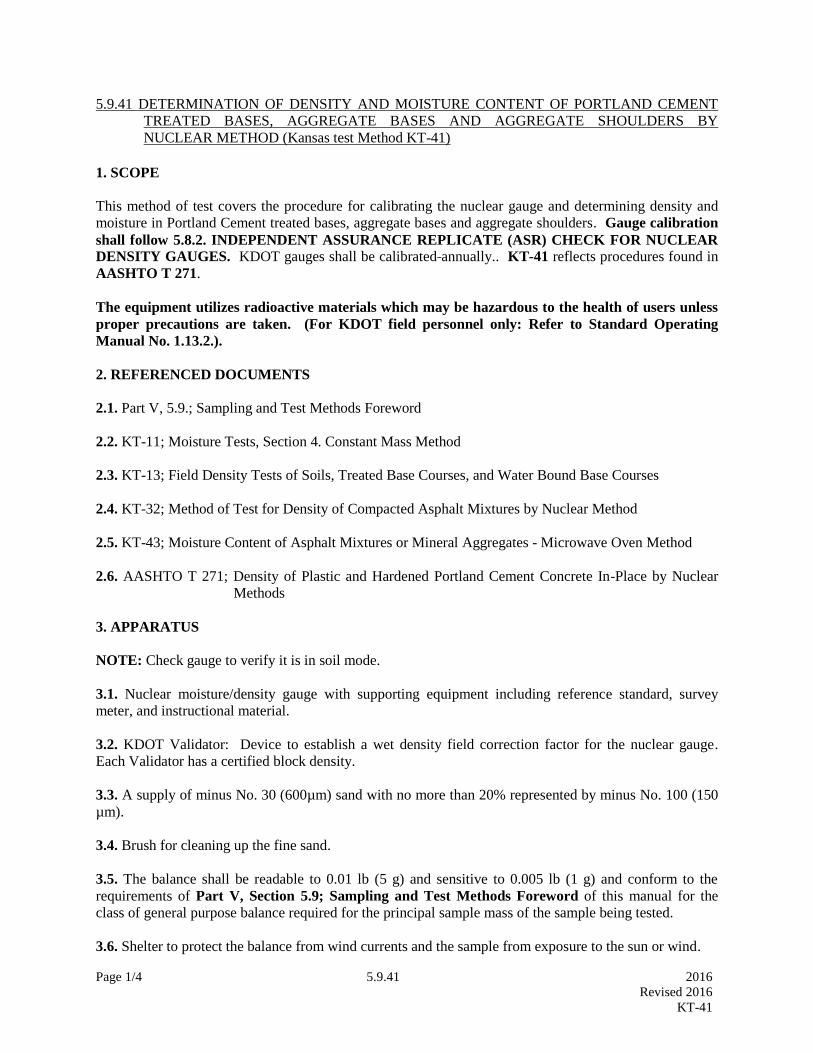
Page 1/4 5.9.41 2016
Revised 2016
KT-41
5.9.41 DETERMINATION OF DENSITY AND MOISTURE CONTENT OF PORTLAND CEMENT
TREATED BASES, AGGREGATE BASES AND AGGREGATE SHOULDERS BY
NUCLEAR METHOD (Kansas test Method KT-41)
1. SCOPE
This method of test covers the procedure for calibrating the nuclear gauge and determining density and
moisture in Portland Cement treated bases, aggregate bases and aggregate shoulders. Gauge calibration
shall follow 5.8.2. INDEPENDENT ASSURANCE REPLICATE (ASR) CHECK FOR NUCLEAR
DENSITY GAUGES. KDOT gauges shall be calibrated annually.. KT-41 reflects procedures found in
AASHTO T 271.
The equipment utilizes radioactive materials which may be hazardous to the health of users unless
proper precautions are taken. (For KDOT field personnel only: Refer to Standard Operating
Manual No. 1.13.2.).
2. REFERENCED DOCUMENTS
2.1. Part V, 5.9.; Sampling and Test Methods Foreword
2.2. KT-11; Moisture Tests, Section 4. Constant Mass Method
2.3. KT-13; Field Density Tests of Soils, Treated Base Courses, and Water Bound Base Courses
2.4. KT-32; Method of Test for Density of Compacted Asphalt Mixtures by Nuclear Method
2.5. KT-43; Moisture Content of Asphalt Mixtures or Mineral Aggregates - Microwave Oven Method
2.6. AASHTO T 271; Density of Plastic and Hardened Portland Cement Concrete In-Place by Nuclear
Methods
3. APPARATUS
NOTE: Check gauge to verify it is in soil mode.
3.1. Nuclear moisture/density gauge with supporting equipment including reference standard, survey
meter, and instructional material.
3.2. KDOT Validator: Device to establish a wet density field correction factor for the nuclear gauge.
Each Validator has a certified block density.
3.3. A supply of minus No. 30 (600µm) sand with no more than 20% represented by minus No. 100 (150
µm).
3.4. Brush for cleaning up the fine sand.
3.5. The balance shall be readable to 0.01 lb (5 g) and sensitive to 0.005 lb (1 g) and conform to the
requirements of Part V, Section 5.9; Sampling and Test Methods Foreword of this manual for the
class of general purpose balance required for the principal sample mass of the sample being tested.
3.6. Shelter to protect the balance from wind currents and the sample from exposure to the sun or wind.
Page 2/4 5.9.41 2016
Revised 2016
KT-41
3.7. Oven capable of maintaining a constant temperature of approximately 230°F (110°C). If available, a
microwave oven as described in KT-43 may be used.
3.8. Miscellaneous equipment including standard drying pans, trowel, large spoon, hammer, square point
shovel, and air tight containers.
4. NUCLEAR GAUGE WARM UP AND CHECK
The nuclear gauge shall be turned on for warm-up and checked according to the manufacturer’s
instructions.
5. TEST SITE SELECTION AND PREPERATION
Test site shall be selected as outlined in KT-32, section 4.1. Leveling sand may be needed.
6. VALIDATOR CORRECTION FACTOR
6.1. Use the KDOT Validator to determine the wet density field correction factor for density in the
following manner:
6.1.1. Place the gauge on the Validator at the depth to be used on the project.
6.1.2. Take 5 one-minute readings, discard the single highest and lowest values, record the three
remaining wet density values.
NOTE: Check tip of source rod to assure it is free of any foreign substance (i.e. grease, asphalt, concrete,
etc.).
6.1.3. Determine the average difference (field density correction factor) using Section 9.1 of this test
method.
6.1.4. Use this correction factor to determine the final wet density reading for each test site.
7. PERCENT MOISTURE CORRECTION FACTOR
7.1. Use KT-11, Section 4, Constant Mass Method, to determine the percent moisture correction factor.
7.2. Conduct a minimum of seven tests. Compute the correction factor for each test. The sample standard
deviation (s) for the percent moisture content correction factors must be less than 1%. If the above
criteria is met, use the average correction factor computed. If the s criteria is not met, start over again
with seven new tests.
NOTE: When calibrating multiple gauges, if it becomes necessary to discard a location or locations
because the location or locations failed the standard deviation (s), then the same location or locations
must be discarded for all gauges being calibrated using these set of cored locations.
Page 3/4 5.9.41 2016
Revised 2016
KT-41
NOTE: A test represents 5 one-minute Wet Density (WD) and Percent Moisture (%M) readings from the
gauge. Record the lb/ft3 (kg/m
3) on Wet Density (WD) and Percent Moisture (%M) for each reading.
Discard the single highest and lowest wet density values along with their accompanying percent moisture
values, average the three remaining percent moisture values, and record the average value.
7.3. Dry the material removed from the test hole to a constant weight at approximately 230°F (110°C).
The material shall be dried the same day it is cored. Record the dry weight and calculate the percent
moisture.
8. TEST PROCEDURE
8.1. Location of the test site should be on a random basis. Any of several methods may be used, however,
the use of a set of Random Number Tables (see Section 5.2.2.2. Random Sampling of this manual) is
recommended. Regardless of the method selection chosen, it shall satisfy the requirement that any area of
the surface shall have an equal chance of being sampled. Sampling shall not be conducted on sites closer
than 1.0 ft (0.3 m) to an unconfined edge or vertical surface such as a raised edge of curb and gutter, etc.
When the randomized selection method indicates a site within 1 ft (0.3 m) of an exposed edge or vertical
surface, it is permissible to move the gauge transversely to clear the 1 ft (0.3 m) restriction. It is also
permissible to determine an alternate location using the table again.
8.2. Since the measured values of density are affected by the surface conformation of the material
immediately beneath the gauge, a flat surface should be tested for best results, both during calibration and
density testing. If the mix has a coarse surface, it is likely that the results will vary widely. Calibration
and testing should be done with leveling sand immediately beneath the gauge. Spread thinly a sufficient
amount of minus No. 30 (600 µm) sand on the test site and smooth with the metal plate or a straight edge
to obtain a suitable surface with a minimum amount of the sand.
8.3. For uniformity, the gauge operator shall position the source rod so it is closest to the laydown
machine (point the gauge towards the roller).
8.4. After the site selection has been made, a vertical hole is made 2 in (50 mm) deeper than the thickness
of the material with the rod and plate provided with the gauge. If the thickness of the material exceeds
the depth capability of the gauge, then a hole is made 2 in (50 mm) deeper than the gauge’s maximum
depth. The same hole depth used for calibration is to be used for normal testing. Set the probe to
maximum depth or at a depth equal to the plan thickness, whichever is less. Wet density and percent
moisture readings can now be taken using 5 one-minute counts, discard the single highest and lowest wet
density values along with their accompanying percent moisture values, average the three remaining wet
density values and record, and average the three remaining percent moisture values and record.
NOTE: Check tip of source rod to assure it is free of any foreign substance (i.e. grease, asphalt, concrete,
etc.).
9. CALCULATIONS
9.1. Compute Field Density Correction Factor and Corrected Wet Density.
Individual Correction Factor = Validator – Nuclear Gauge
Avg. Correction Factor = 3
3 FactorsCorrectionIndividual

Page 4/4 5.9.41 2016
Revised 2016
KT-41
WD = WDi + Avg. Correction Factor
Where: WDi = initial gauge reading at test site
Validator = certified block density
9.2. Compute Percent Moisture Content Correction Factor
9.2.1. Ui = (w – X)
Where: w = moisture content, percent (see KT-11, Section 5.1. for determination of w)
X = Nuclear Gauge moisture content, percent
Ui = Individual difference between w and X
9.2.2. Average percent moisture content correction factor (U).
U = n
Ui
9.3. Sample standard deviation (s) (see KT-32, Section 7.6.1.1. for more detail):
s =
1n
d2
bi
d
Where: di = Individual difference (Ui)
db = Average difference (U)
9.4. Corrected Percent Moisture Content, (%M)
%M = (X + U)
9.5. Dry Density, lb/ft3 (kg/m
3), (DD)
DD =
100
M%1
WD
Where: WD = Nuclear Gauge Wet Density, lb/ft3 (kg/m
3)
9.6. Percent of Proctor =100 (WD)
Standard Proctor or
100 (DD)
Standard Proctor
10. REPORT AND RECORD
10.1. Report and record as 0.1 lb/ft3 (1 kg/m
3) or 0.1% of optimum density.
Page 1/2 5.9.42 2016
Revised 2014
KT-42
5.9.42 SIEVE ANALYSIS FOR ACCEPTANCE OF LIME OR CEMENT TREATED SOILS
(Kansas Test Method KT-42)
1. SCOPE
1.1. This method of test covers the procedure for determining the amount of material retained on the 2 in
(50 mm), 1 1/2 in (37.5 mm) and the No. 4 (4.75 mm) sieves for lime treated soils.
1.2. This method of test covers the procedure for determining the amount of material retained on the 1 1/2
in (37.5 mm) and the 1/2 in (12.5 mm) sieves for cement treated soils.
2. REFERENCED DOCUMENTS
2.1. Part V, 5.9; Sampling and Test Methods Foreword
2.2. KT-2; Sieve Analysis of Aggregates
2.3. AASHTO M 92; Wire-Cloth Sieves for Testing Purposes
3. APPARATUS
3.1. The balance shall conform to the requirements of Part V, 5.9; Sampling and Test Methods
Foreword, for the class of general purpose balance required for the principal sample mass of the sample
being tested.
3.2. Sieves meeting AASHTO M 92 of specified sizes for the soil being tested.
4. SOIL SAMPLES
4.1. Obtain samples of road mixed material from the subgrade or borrow area. The original sample before
splitting shall weigh approximately 77 lbs (35,000 g).
4.2. Reduce sample by quartering or splitting to a mass of not less than 33 lbs (15,000 g). Exercise
extreme care to prevent segregation and/or degradation during the reducing operation.
5. TEST PROCEDURE FOR LIME TREATED SOIL
5.1. The sample shall be weighed and sieved through a series of sieves to include 2 in (50 mm), 1 1/2
(37.5 mm), 1/2 (12.5 mm), 3/8 (9.5 mm) and No. 4 (4.75 mm).
5.2. The sample shall be sieved in accordance with KT-2 of this manual.
6. TEST PROCEDURE FOR CEMENT TREATED SOIL
6.1. The sample shall be weighed and sieved through a series of sieves to include 1 1/2 in (37.5 mm) and
1/2 in (12.5 mm).
6.2. The sample shall be sieved in accordance with KT-2 of this manual.
7. CALCULATION FOR LIME TREATED SOILS

Page 2/2 5.9.42 2016
Revised 2014
KT-42
7.1. The percent retained on the 2 in (50 mm), 1 1/2 in (37.5 mm) and No. 4 (4.75 mm) sieves is
calculated as follows:
Percent Retained=100(A)
B
Where: A= Mass of the retained fraction of the original sample determined to within 0.1% of the
original sample mass as obtained by sieving over the specified sieve.
B = Original mass of the sample.
NOTE: The quantities retained on the 1/2 in (12.5 mm) and 3/8 in (9.5 mm) sieves must be added to the
quantity on the No. 4 (4.75 mm) sieve when calculating percent retained.
8. CALCULATION FOR CEMENT TREATED SOILS
8.1. The percent retained on the 1 1/2 in (37.5 mm) and 1/2 in (12.5 mm) sieves are calculated as follows:
Percent Retained=100(A)
B
Where: A= Mass of the retained fraction of the original sample determined to within 0.1% of the
original sample mass as obtained by sieving over the specified sieve.
B = Original mass of the sample.
9. REPORT
9.1 Report sieve analysis for acceptance of lime or cement treated subgrade to 1% mass.
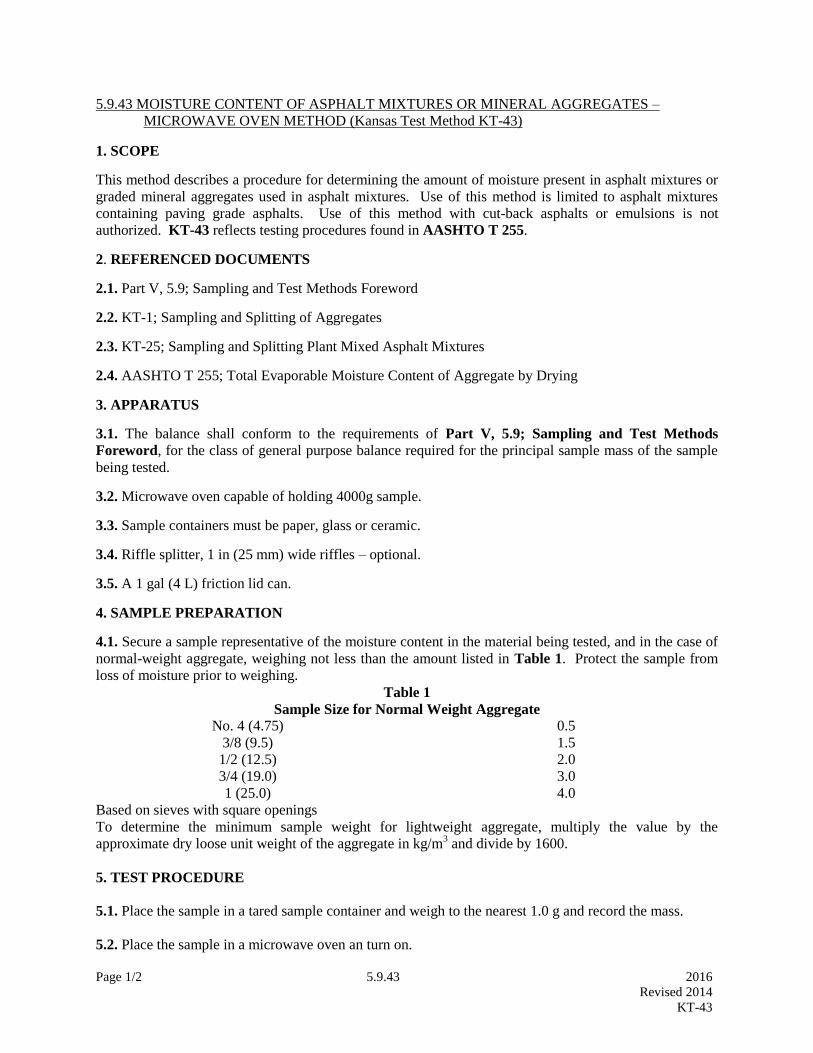
Page 1/2 5.9.43 2016
Revised 2014
KT-43
5.9.43 MOISTURE CONTENT OF ASPHALT MIXTURES OR MINERAL AGGREGATES –
MICROWAVE OVEN METHOD (Kansas Test Method KT-43)
1. SCOPE
This method describes a procedure for determining the amount of moisture present in asphalt mixtures or
graded mineral aggregates used in asphalt mixtures. Use of this method is limited to asphalt mixtures
containing paving grade asphalts. Use of this method with cut-back asphalts or emulsions is not
authorized. KT-43 reflects testing procedures found in AASHTO T 255.
2. REFERENCED DOCUMENTS
2.1. Part V, 5.9; Sampling and Test Methods Foreword
2.2. KT-1; Sampling and Splitting of Aggregates
2.3. KT-25; Sampling and Splitting Plant Mixed Asphalt Mixtures
2.4. AASHTO T 255; Total Evaporable Moisture Content of Aggregate by Drying
3. APPARATUS
3.1. The balance shall conform to the requirements of Part V, 5.9; Sampling and Test Methods
Foreword, for the class of general purpose balance required for the principal sample mass of the sample
being tested.
3.2. Microwave oven capable of holding 4000g sample.
3.3. Sample containers must be paper, glass or ceramic.
3.4. Riffle splitter, 1 in (25 mm) wide riffles – optional.
3.5. A 1 gal (4 L) friction lid can.
4. SAMPLE PREPARATION
4.1. Secure a sample representative of the moisture content in the material being tested, and in the case of
normal-weight aggregate, weighing not less than the amount listed in Table 1. Protect the sample from
loss of moisture prior to weighing.
Table 1
Sample Size for Normal Weight Aggregate
No. 4 (4.75) 0.5
3/8 (9.5) 1.5
1/2 (12.5) 2.0
3/4 (19.0) 3.0
1 (25.0) 4.0
Based on sieves with square openings
To determine the minimum sample weight for lightweight aggregate, multiply the value by the
approximate dry loose unit weight of the aggregate in kg/m3 and divide by 1600.
5. TEST PROCEDURE
5.1. Place the sample in a tared sample container and weigh to the nearest 1.0 g and record the mass.
5.2. Place the sample in a microwave oven an turn on.

Page 2/2 5.9.43 2016
Revised 2014
KT-43
5.3. After 5 minutes, turn oven off, remove the sample container, weigh the sample and container to the
nearest 1.0 g and record the mass.
5.4. Return the sample and container to the oven, turn oven on and dry the sample for an additional 5
minutes.
5.5. After 5 minutes, turn oven off, remove the sample container and weigh the sample container to the
nearest 1.0 g and record the mass.
5.6. The sample is thoroughly dry when further heating causes, or would cause, less than 0.1% additional
loss in weight.
5.7. Weigh the dried sample to the nearest 0.1% after it has cooled sufficiently not to damage the balance.
CAUTION: When using a microwave oven, occasionally minerals are present in aggregates which may
cause the material to overheat and explode. If this occurs it can damage the microwave oven.
6. CALCULATIONS
6.1. Calculate total moisture content as follows:
p = 100(W-D)/D
Where: p = Moisture content of sample, percent
W = Weight of original sample, g and
D = Weight of dried sample, g

Page 1/5 5.9.44 2016
Revised 2016
KT-44
5.9.44 METHOD OF TESTING THE STRENGTH OF PORTLAND CEMENT CONCRETE USING
THE MATURITY METHOD (Kansas Test Method KT-44)
1. SCOPE
1.1. This method covers the procedure for using the maturity concept as a non-destructive method to
determine in-place concrete strength. It may be used for determining the strength of concrete for opening
to traffic or for removal of formwork.
1.2. This is a two-step procedure. First, a relationship must be established between the measured maturity
values and the concrete strength as measured by destructive methods (that is, through testing of beams or
cylinders). The development of the maturity-strength curve is done in the field prior to the beginning of
construction using project materials and the project proportioning and mixing equipment. The second
step is the instrumentation of the in-place concrete. Temperature probes are installed in the concrete and
the temperature is measured. From those measurements, along with the age at which the measurements
were taken, maturity values are determined. A maturity meter or temperature measuring device and a
computer or calculator may be used to determine the maturity values.
2. REFERENCED DOCUMENTS
2.1. KT-18; Air Content of Freshly Mixed Concrete by the Pressure Method
2.2. KT-21; Slump of Portland Cement Concrete
2.3. KT-22; Making and Curing Compression and Flexural Test Specimens in the Field
2.4. KT-23; Flexural Strength of Concrete (Third Point Loading Method)
2.5. KT-76; Method for Testing the Compressive Strength of Molded Cylindrical Concrete Specimens
2.6. ASTM C 1074; Standard Practice for Estimating Concrete Strength by the Maturity Method
3. IMPLEMENTATION
3.1. When maturity testing is used, the Contractor and KDOT shall jointly develop a plan. The plan shall
include:
The Contractor shall be responsible for the development of the maturity curve. The curve
development shall be monitored by KDOT.
The temperature monitoring process of the constructed pavement or structure shall be the
responsibility of the Contractor and monitored by KDOT.
3.2. For concrete furnished from a construction or stationary mixer, which is in place prior to construction
of the specified project, a maturity curve may be established ahead of actual construction of the specified
project. The test specimens shall be cast with concrete made from the same plant using the same mixture
as will be used in the specified project. The engineer shall be informed and have an opportunity to
observe the development of the maturity curve.
4. THE MATURITY CONCEPT

Page 2/5 5.9.44 2016
Revised 2016
KT-44
4.1. The hydration of cement and gain in strength of the concrete are dependent on both curing time and
temperature. Thus, the strength of the concrete may be expressed as some function of time and
temperature. This information can then be used to determine the strength of concrete without conducting
physical tests. The time-temperature function commonly used is the maturity concept proposed by Nurse-
Saul (ASTM C 1074).
(1) M( °F× hours ) = ∑[(T - To)Δt]
4.2. Where M is the maturity in degree °F-hours [M is also termed the time-temperature factor (TTF)], Δt
is the interval in hours (or days), T is the average concrete temperature during the time interval Δt, and To
is the datum temperature at which concrete ceases to gain strength with time. The value of To= 14°F (-
10°C) is most commonly used. As a result, Equation (1) becomes:
(2) M(°F × hours ) = ∑[(𝑇 − 14)Δt]
NOTE: If there are large differences in temperature between the test specimens and the in-place concrete,
an equivalent age function may be needed. See ASTM C 1074.
5. APPARTUS
5.1. See KT-22 of this manual for specimen fabrication.
5.2. Appropriate testing machine as described in KT-23 and KT-76 of this manual.
5.3. Maturity meter and sensors that automatically compute and display either temperature-time factor or
equivalent age.
5.4. Hand-held thermometer with thermocouple wire and connectors.
6. PROCEDURE
6.1. To establish a maturity-strength relationship for a concrete mix, a maturity meter or a thermal meter
and a testing machine are needed. The following procedure shall be used: Note: before using any
maturity meter, check to be sure that the datum temperature is set to 14°F (-10°C).
6.1.1. Cast and cure a minimum of twelve 6 in x 6 in x 21 in (152 mm x 152 mm x 530) beams, or twelve
4 x 8 in or 6 x 12 in (52 x 30 mm) or more cylinders per KT-22 of this manual. Test the air content and
slump of the concrete per KT-18 and KT-21 of this manual, and record these values. The concrete shall
meet specifications. The specimens shall be cast from a field batch of at least 3cu. yd. (3 m3).
6.1.2. Embed a sensor probe in one test specimen to monitor temperature. This specimen will be the last
to be tested. The probe shall be inserted at approximately the center of the specimen. Secure the wire to
prevent the wire from being inadvertently pulled out of the beam. When the thermal meter is used, the
measured temperature should be substituted into Equation (2) to obtain values of maturity. When a
maturity meter is used, the meter computes the values. Twelve test specimens shall be tested as described
in Section 6.1.4. of this test method. An example calculation of the maturity factor is attached.
6.1.3. For field cast specimens the meter can be stored in a lab trailer or vehicle with the probes run
outside, to the beam in a sandpit. This will allow a maturity meter to be protected from the weather and
theft.
Page 3/5 5.9.44 2016
Revised 2016
KT-44
6.1.4. Determine maturity values and strength at four different ages. Test three specimens for strength at
each age and calculate the average strength at each age. The maturity value shall be calculated using the
average temperature reading since the previous test for strength. The tests shall be spaced such that they
are performed at somewhat consistent intervals of time and span the range of strength(s) required.
6.1.4.1. Additional test specimens may be cast at a later time and tested at earlier ages to add data to the
strength-maturity relationship as an aid to determine the appropriate time to saw.
6.1.4.2. Plot the measured strength against the corresponding values of maturity at different ages, as
determined by the maturity meter or by hand methods. The maturity number corresponding to the desired
strength shall be used to determine when the concrete has reached the desired strength. An example of
Maturity-Strength Development Relationship is attached.
6.2. Since the influence of maturity on strength of concrete is somewhat different for various mixtures, a
maturity-strength relationship established for one mixture shall not be used for another mixture.
NOTE: To be considered the same mixture, no component may vary by more than 5% from the initial
value.
7. VALIDATION
7.1. Once per month, a validation test shall be conducted to determine if concrete strength is being
accurately represented by the current maturity curve. Cast and cure three specimens using the same
procedure and manner as used to develop the current maturity curve. Test all three specimens as close as
possible to the maturity value which was determined to represent the desired strength. If the average of
these tests is within + 50 psi (0.34 MPa) for beams or + 500 psi (3.4 MPa) for cylinders of the original
curve at the TTF, the original curve shall be considered validated. If the average value varies more than +
50 psi (0.34 MPa) for beams or + 500 psi (3.4 MPa) for cylinders of the original maturity curve value at
the TTF at which the validation beams were tested, a new maturity curve shall be developed.

Page 4/5 5.9.44 2016
Revised 2016
KT-44
Examples:
Example of Maturity Calculation Example of Maturity Data
Age, Hours
Temperature, degrees C
Avg Temp, degrees C
(Avg Temp + 10)∆t, degrees C
TTF, C-Hrs
Compressive Strength, PSI
0 22
2 22 22.0 64.0 64.0
4 25 23.5 67.0 131.0 411
6 27 26.0 72.0 203.0 780
8 29 28.0 76.0 279.0 1178
10 33 31.0 82.0 361.0 1475
12 36 34.5 89.0 450.0 1781
14 37 36.5 93.0 543.0 1920
16 37 37.0 94.0 637.0 2049
0
100
200
300
400
500
600
700
800
900
1000
1100
1200
1300
1400
1500
1600
1700
1800
1900
2000
2100
2200
0.0
25
.0
50
.0
75
.0
10
0.0
12
5.0
15
0.0
17
5.0
20
0.0
22
5.0
25
0.0
27
5.0
30
0.0
32
5.0
35
0.0
37
5.0
40
0.0
42
5.0
45
0.0
47
5.0
50
0.0
52
5.0
55
0.0
57
5.0
60
0.0
62
5.0
65
0.0
67
5.0
70
0.0
72
5.0
CO
MP
RES
SIV
E ST
REN
GTH
, f
'c (
PSI
)
TTF, DEG C-HRS (-10 °C Datum Temperature)
MATURITY CURVE (Example)
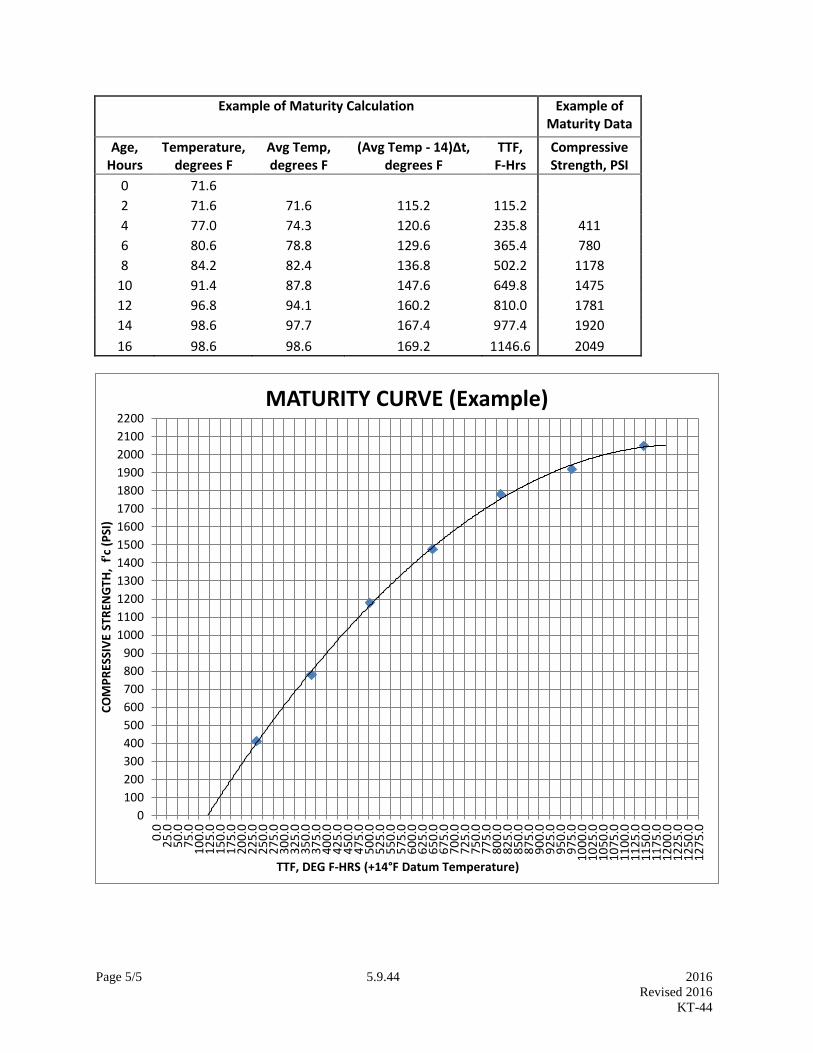
Page 5/5 5.9.44 2016
Revised 2016
KT-44
Example of Maturity Calculation Example of Maturity Data
Age, Hours
Temperature, degrees F
Avg Temp, degrees F
(Avg Temp - 14)∆t, degrees F
TTF, F-Hrs
Compressive Strength, PSI
0 71.6
2 71.6 71.6 115.2 115.2
4 77.0 74.3 120.6 235.8 411
6 80.6 78.8 129.6 365.4 780
8 84.2 82.4 136.8 502.2 1178
10 91.4 87.8 147.6 649.8 1475
12 96.8 94.1 160.2 810.0 1781
14 98.6 97.7 167.4 977.4 1920
16 98.6 98.6 169.2 1146.6 2049
0
100
200
300
400
500
600
700
800
900
1000
1100
1200
1300
1400
1500
1600
1700
1800
1900
2000
2100
2200
0.0
25
.05
0.0
75
.01
00
.01
25
.01
50
.01
75
.02
00
.02
25
.02
50
.02
75
.03
00
.03
25
.03
50
.03
75
.04
00
.04
25
.04
50
.04
75
.05
00
.05
25
.05
50
.05
75
.06
00
.06
25
.06
50
.06
75
.07
00
.07
25
.07
50
.07
75
.08
00
.08
25
.08
50
.08
75
.09
00
.09
25
.09
50
.09
75
.01
00
0.0
10
25
.01
05
0.0
10
75
.01
10
0.0
11
25
.01
15
0.0
11
75
.01
20
0.0
12
25
.01
25
0.0
12
75
.0
CO
MP
RES
SIV
E ST
REN
GTH
, f
'c (
PSI
)
TTF, DEG F-HRS (+14°F Datum Temperature)
MATURITY CURVE (Example)

Page 1/2 5.9.45 2016
Revised 2010
KT-45
5.9.45 DETEMINATION OF DRY PAINT FILM THICKNESS WITH THE MAGNETIC GAUGE
(Kansas Test Method KT-45)
1. SCOPE
This procedure covers nondestructive measurement of the dry film thickness of paints applied over
ferrous base materials.
2. APPARATUS
2.1. Film thickness gauge (magnetic).
2.2. Calibration standard.
3. PROCEDURE
3.1. Girder webs:
3.1.1. Select a 10 ft (3 m) length of web, full depth of the girder. Take a minimum of ten random group
readings of the primer and average these to establish a mean film thickness for the area. (A group reading
is the average of three individual readings taken within a 1/2 in (13 mm) diameter circle).
3.1.1.1. After the finish coat has been applied, the procedure is to be repeated, in a random manner, over
the same section of web to determine a mean thickness of the two paint coats. The difference between the
two means will establish the thickness of the paint coat.
3.2. Flanges:
3.2.1. Select a 10 ft (3 m) length of flange and take a minimum of five group readings and proceed as for
girder webs.
3.3. Stiffeners:
3.3.1. Take a minimum of three group readings per stiffener and proceed as for girder webs.
NOTE: The numbers of ten, five and three group readings are minimums to be taken. Greater accuracy is
obtained as the number of group readings is increased.
3.3.2. Repeat the dry film thickness determination over as many areas as necessary to assure specification
compliance.
4. CAUTIONS
4.1. Magnetic gauges should be calibrated at least once each day in the position and for the thickness that
the gauge will be measuring.
4.2. Readings should not be taken within 2 in (50 mm) of a fillet weld, the edge of the plate or other
abrupt changes in configuration.
4.3. This inspection technique does not eliminate the need for a good visual inspection. All painting
should be visually inspected to locate omissions, runs mudcaking, dry spray or other unacceptable work.

Page 2/2 5.9.45 2016
Revised 2010
KT-45
5. RECORDING
5.1. All individual gauge readings, locations at which the readings were taken and the averages shall be
recorded in a bound field book. The inspector’s name and the date on which the readings were taken shall
also be recorded in the field book.
Page 1/12 5.9.46 2016
Revised 2014
KT-46
5.9.46 DETERMINATION OF PAVEMENT PROFILE WITH THE PROFILOGRAPH
(Kansas Test Method KT-46)
1. SCOPE
This method of test covers the procedure for determining the smoothness, i.e. profile index, of both
concrete and asphalt pavement using the California type 25-foot (7.6 mm), profilograph or equivalent.
2. APPARATUS
2.1. California type, 25-foot (7.6 mm), profilograph or equivalent Figure 1, with pointer. The 25-foot
(7.6 mm) profilograph is a rolling straight edge; which measures vertical deviations from a moving 25-
foot (7.6 mm) reference plane. The pavement profile is graphically recorded on a profilogram with scales
of 300:1 longitudinally and 1:1 vertically.
2.2. Blanking band which is a plastic scale 1.70 inch (43 mm) wide and 21.12 inch (333 mm) long
representing a pavement length of 528 ft (100 m) or 0.1 mile (0.1 km) at a scale of 1 inch = 25 feet. Near
the center of the scale is a dashed line extending the entire length of the plastic scale. On either side of this
dashed line are scribed lines 0.1 inch (2 mm) apart, parallel to the dashed line. These lines serve as a
convenient scale to measure deviations of the profile trace above or below the dashed reference line. These
deviations are called "scallops".
2.3. Scale graduated in 0.1 inch or 1 mm.
2.4. Medium point ballpoint pen with red ink or other color contrasting to the profile trace.
2.5. Electronic calculator.
2.6. Plain recording chart paper as specified by the manufacturer of the profilograph.
2.7. Bump template which is a plastic template having a marked length 1 inch (25 mm) long on one face,
and a slot (or edge) parallel to the marked length. A distance equal to the maximum bump specified
separates the two reference lengths Figure 2. The 1 inch (25 mm) line corresponds to a longitudinal
distance of 25 feet (7.5 m) on the longitudinal scale of the profilogram.
3. CALIBRATION
3.1. All profilographs used on KDOT projects must be calibrated at least annually. Calibration must be
checked any time the profilograph has been altered or repaired. The certification includes establishing the
proper tire inflation pressure, checking the trueness of the tire travel, checking the chart scale factor, and
checking vertical displacement of the sensing wheel.
3.2. Each District and contractor using a profilograph shall establish a 500 to 1000 ft. (100 to 300 m)
distance calibration test section on or near each project. This test section should be fairly straight, relatively
flat and used periodically to check the longitudinal calibration and trace reproduction.
3.3. Longitudinal calibration consists of pushing the profilograph at walking speed approximately 3 mph
(approximately 5 km/h), over a pre-measured test distance 500 to 1000 ft. (100 to 300 m) and determining
the chart scale factor. Dividing the premeasured test distance in inches (mm) by the profilogram trace
length, for the test distance, in inches (mm) will determine the scale factor. This factor shall be 300 + 0.5.

Page 2/12 5.9.46 2016
Revised 2014
KT-46
If the profilograph produces charts with a different scale factor, adjustment of the profilograph must be
made to bring the scale factor within the tolerances specified above.
3.4. Vertical calibration consists of placing the center recording wheel of the profilograph on a base plate
and recording the base elevation. Two plates 0.5 inches (12.5 mm) thick each are added under the center
wheel one at a time and the change in elevation noted. The two plates are removed one at a time and the
change in elevation noted. Each step in the process shall show a change in height of 0.5 inches ± 0.01 inch
(12.5 mm + 1.0 mm). If the profilograph produces results not conforming to the above limits, it must be
adjusted to within the tolerance specified.
3.5. The automatic trace reduction capability of a machine so equipped shall be checked by comparing the
machine's results to the results obtained through manual trace reduction. The comparison shall be made for
the trace obtained at the Materials and Research test section and for each project, at the project test section.
The results of the comparison may not differ by more than 2.0 inches/mile (30 mm/km). All calibration
traces and calculations shall be submitted to the Materials and Research Center or to the appropriate
construction office to become part of the project file.
4. TEST PROCEDURE
4.1. The profilograph is propelled at walking speed approximately 3 mph (approximately 5 km/h) in the
paths indicated for each section of pavement Figure 1. Propulsion may be provided by manually pushing or
by a suitable propulsion unit such as a garden tractor. DO NOT push or pull a profilograph with a vehicle.
More than one person may be required to hold the back end of the profilograph exactly in the required path
on superelevated or sharp horizontal curves.
4.2. Use of the pointer to maintain the required trace path is mandatory
4.3. If excessive "spikes" are encountered, decrease the rate of travel. An excessive number of "spikes" on a
trace make it difficult to evaluate and may affect test results.
4.4. If possible, assemble the profilograph ahead of the location on the pavement where testing is to start.
With the distance measuring wheel down and the pen in place on the trace paper, push the machine to the
start position in the direction the test will be conducted. The center wheel should be the reference wheel.
While the profilograph is stationary at the start location, move the cable attached to the pen thus creating a
spike mark on the trace and label that mark as the start location. Using this procedure at the beginning and
end of each trace will ensure that all systems are working properly, that slack has been removed from the
drive chains, and will clearly define the start and end location. Also mark which direction is up on the trace
and the direction the profilograph was pushed.
4.5. Push the profilograph in the same direction when recording each trace for a given section of pavement.
4.6. Indicate stationing on the profilogram at least every 500 feet (100 m), using the procedure outlined in
Section 4.4 of this test method. More frequent station references of every 100 feet (25 m) or every 200 feet
(50 m) are highly desirable where possible. Station referencing on the trace is used to accurately locate 0.40
inch (10 mm) bumps. Notation of landmarks, roadway signs, etc. should also be made on the trace for
additional referencing.
4.7. Completely label both ends of the profilogram with the project number, stationing represented on the
roll and name of profilograph operators. Fill out a report form and secure it around the trace roll. This
report insures that the person reducing the trace and reporting results will have all necessary information.
Page 3/12 5.9.46 2016
Revised 2014
KT-46
4.8. A little dirt or debris will spike out and not effect the profilograph readings, however, excessive mud or
caked mud must be removed prior to testing. Anything on the pavement surface longer than 2 to 3 inches
(50 to 75 mm) may not be considered a spike when reducing the trace and should be removed.
4.9. When operating the profilograph, all wheels should always be on the pavement for which the contractor
is responsible. Test from header to header whenever possible.
4.10. Pavement not tested at the end of a day's run due to barrier fences, machinery or other obstructions
shall be included in a subsequent test run.
5. TRACE REDUCTION AND BUMP/DIP LOCATING PROCEDURE
5.1. Using a red (or other contrasting color), medium point, ballpoint pen; retrace the profilogram through
the middle of any spikes. This outlining procedure removes spikes and minor deviations and generally
smooths the trace for easier reduction and analysis.
5.2. Use a bump template (scribed side down) to locate bumps/dips for removal. At each prominent
bump/dip or high/low point on the profile trace, place the template so that the scribe marks at each end of
the scribed line intersect the profile trace to form a chord across the base of the peak/valley or indicated
bump/dip. The line on the template need not be horizontal. With a sharp pencil, draw a line using the
narrow slot in the template (or edge) as a guide. Any portion of the trace extending above/below this line
will indicate the approximate length and height of the bump/dip in excess of the specification.
There may be instances where the distance between easily recognizable low/high points is less than 1 inch
(25 mm). In such cases a shorter chord length shall be used in making the scribed line on the template
tangent to the trace at the low/high points. It is the intent, however, of this requirement that the baseline for
measuring the height of bumps (or depth of dips) will be as nearly 1 inch (25 mm) as possible, but in no case
to exceed this value. When the distance between prominent low/high points is greater than 1 inch (25 mm),
make the ends of the scribed line intersect the profile trace when the template is in a nearly horizontal
position. A few examples of the procedure are shown in Figure 2.
After marking the bump/dip on the profilogram, determine the station number of the center of the bump/dip
by scaling from the nearest reference mark. Record the track identification and station of the bump/dip.
5.3. Place the blanking band (scribed side down) over the profile with the dashed reference line as nearly
centered on the profile trace as possible.
The profile trace may move from a generally horizontal position when going around superelevated curves
making it impossible to follow the central portion of the trace without shifting the blanking band. When
such conditions occur, the profile should be broken into short sections and the blanking band repositioned
on each section as shown in the upper part of Figure 2.
Indicate the beginning and ending of superelevated curves on the profilogram at the time the profile trace
is being made.
5.4. Begin evaluating each trace from the same point on the road so that sections representing the same
length of road can be aligned on the test report form. Measure and total the height of all the scallops
appearing both above and below the dashed reference line, measuring each scallop to the nearest 0.05 inch
(1 mm). Do not count a scallop as 0.05 inch (1 mm) just because you see the profile line or there is space
under the line. Short sections of the profile line may be visible above or below the dashed reference line,
but unless they project 0.03 inch (0.7 mm) or more vertically and extend longitudinally for 0.08 inch (2 mm)

Page 4/12 5.9.46 2016
Revised 2014
KT-46
or more on the profilogram, they are not included in the count. Spikes are not counted. Double-peaked
scallops are only counted once as the highest peak Figure 3.
Write the total count in inches (mm) on the profilogram above the profile line (toward the center of the
section) and circle it. Outline the position of the blanking band when reducing the trace for later
repositioning to check trace reduction procedure. Rotate the blanking band about the previous end
position when evaluating the next section Figure 4.
When a scallop occurs at the end of the blanking band, count the scallop only once. Place the scallop in the
0.1 mile (0.1 km) section where the peak is highest Figure 4.
Always use the measured trace length in computations. This length may not agree exactly with distance by
subtracting stationing. Always use + after the total length on the report.
Enter the measured roughness for each 0.1 mile (0.1 km) section and for each track into the worksheet
shown in Figure 6. Enter the profile index into KDOT Form 242.
5.5. The last section counted is generally not an even 0.1 mile (0.1 km). If not, its length should be scaled to
determine its length in miles (km) (Calculated to three decimal places). For the example shown below, the
last section measures 7.60 inches (193 mm) in length.
English
(7.60 in)(25 ft/in)
5,280 ft/mile =0.036 miles
Metric
(193 mm)(300)
1,000,000 mm/km =0.0579 km = 0.058 km
If the last section is less than or equal to 250 ft (0.047 mile) (0.05 km [50 m]), it is added to and included
with the previous 0.1 mile (0.1 km) section to determine compliance with the profile index. If the last
section is more than 250 ft (0.047 mile) [0.05 km (50 m)], it is treated as a separate section.
When the profilograph must be picked up or partially disassembled and moved around an unpaved area or
structure, a new section will be started.
The profile index is determined as inches/mile (mm/km) using the “zero” blanking band but is simply called
the profile index. The procedure for converting counts inches of roughness (mm of roughness) to profile
indices is illustrated in Figure 5. For 0.1 mile (0.1 km) sections, the profile index can be determined from
the counts (inches of roughness (mm of roughness)) by moving the decimal point one position to the right.
For odd length sections, the profile index is determined by dividing the counts (inches of roughness (mm of
roughness)) by the section length in miles (km). The weighted average for a day's run is determined by
dividing the total counts (inches of roughness (mm of roughness)) for the day's run by the total length (in
miles (in km)) of the day's run. See Figure 6.
6. REPORT

Page 5/12 5.9.46 2016
Revised 2014
KT-46
6.1. Contractors shall furnish and certify profilograph test reports, KDOT Form No.242, Figure 6.
6.2. All profile traces (profilograms) become part of the Engineer's permanent project records.
7. OPERATOR CERTIFICATION
7.1. Basis of operator certification is attendance at an approved training school and comprehension of the
material presented, or by having proof of certification by another agency with requirements similar to
KDOT.
7.2. A contractor's personnel may be decertified if the test results vary from the KDOT results by more than
what is regarded as normal test variation.
7.3. When a contractor's personnel are decertified to issue profilograph reports, such reports will not be
recognized until corrections in testing, trace reduction and reporting are made to the satisfaction of the
Engineer.
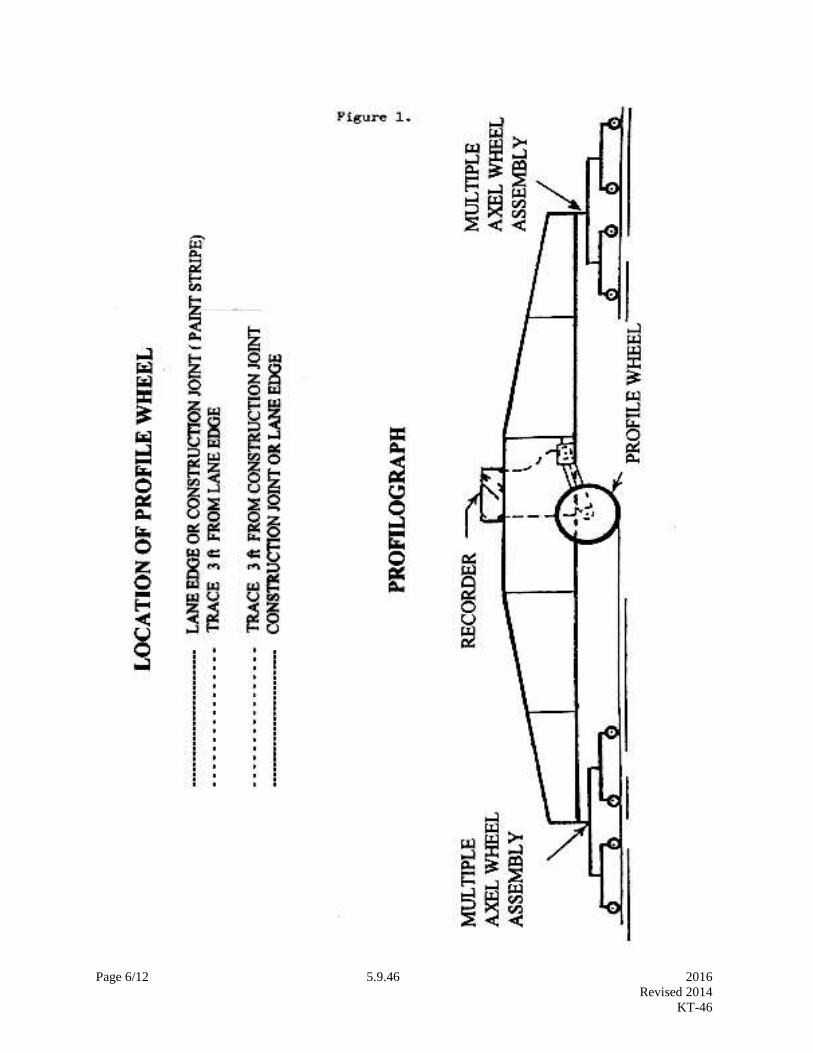
Page 6/12 5.9.46 2016
Revised 2014
KT-46

Page 7/12 5.9.46 2016
Revised 2014
KT-46
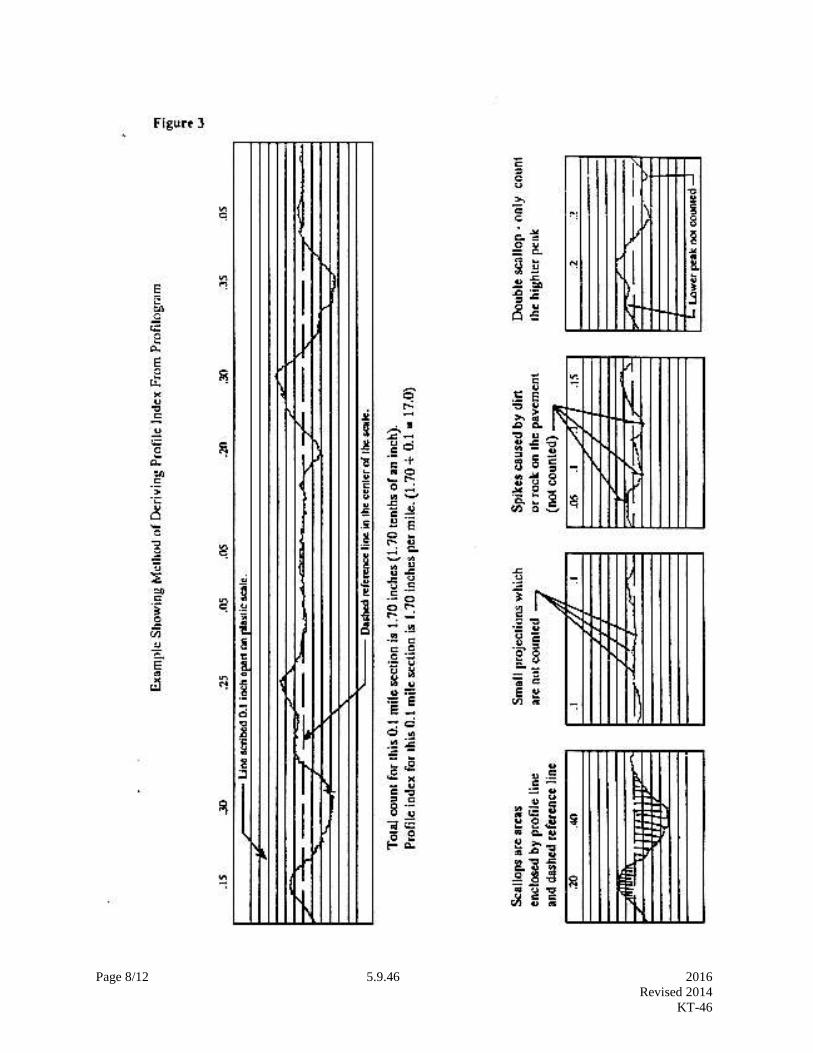
Page 8/12 5.9.46 2016
Revised 2014
KT-46
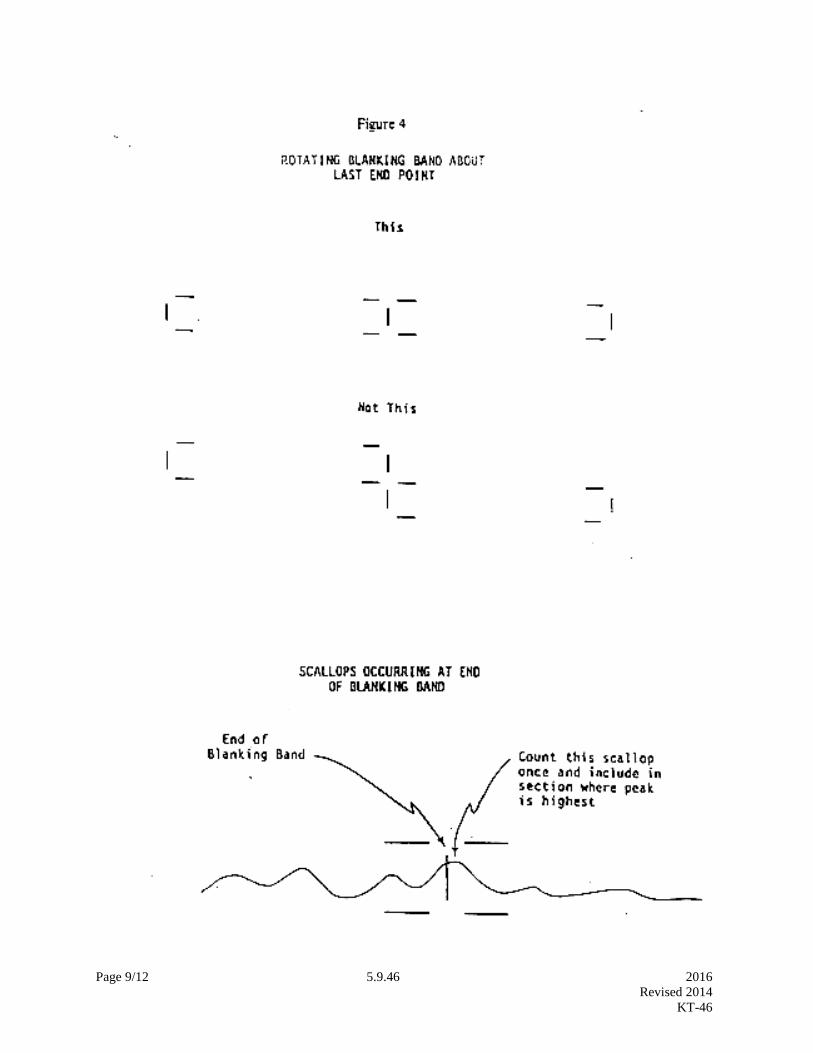
Page 9/12 5.9.46 2016
Revised 2014
KT-46
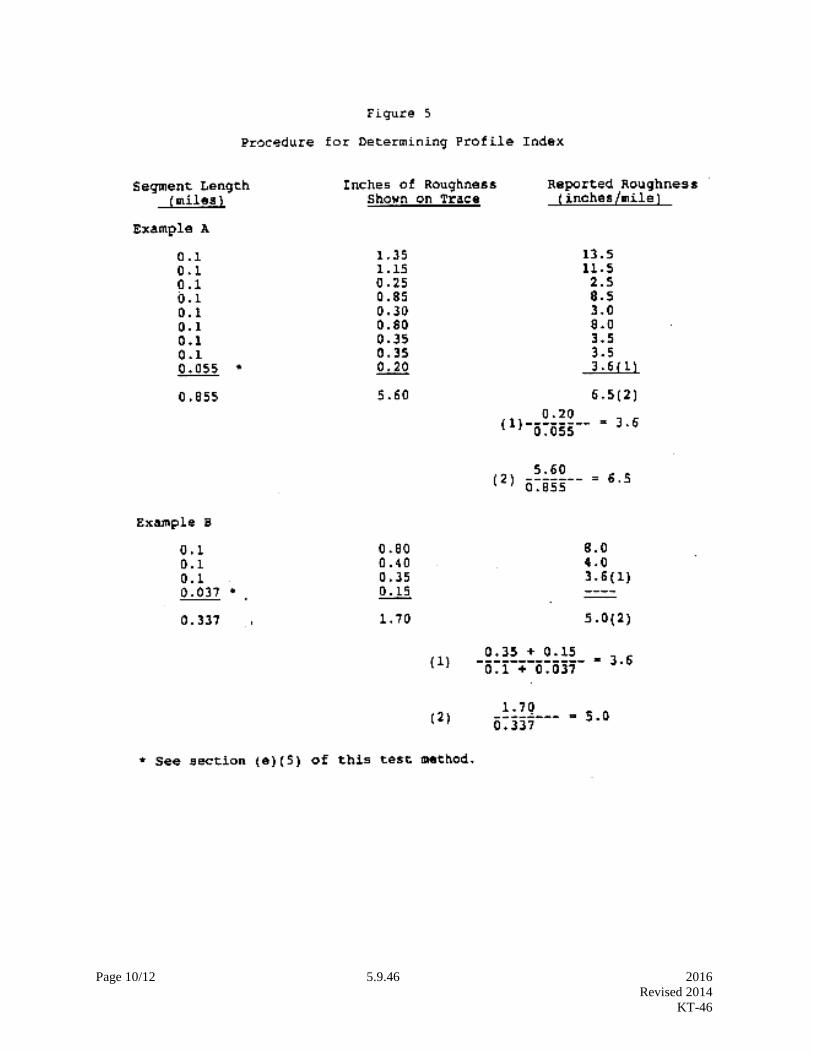
Page 10/12 5.9.46 2016
Revised 2014
KT-46
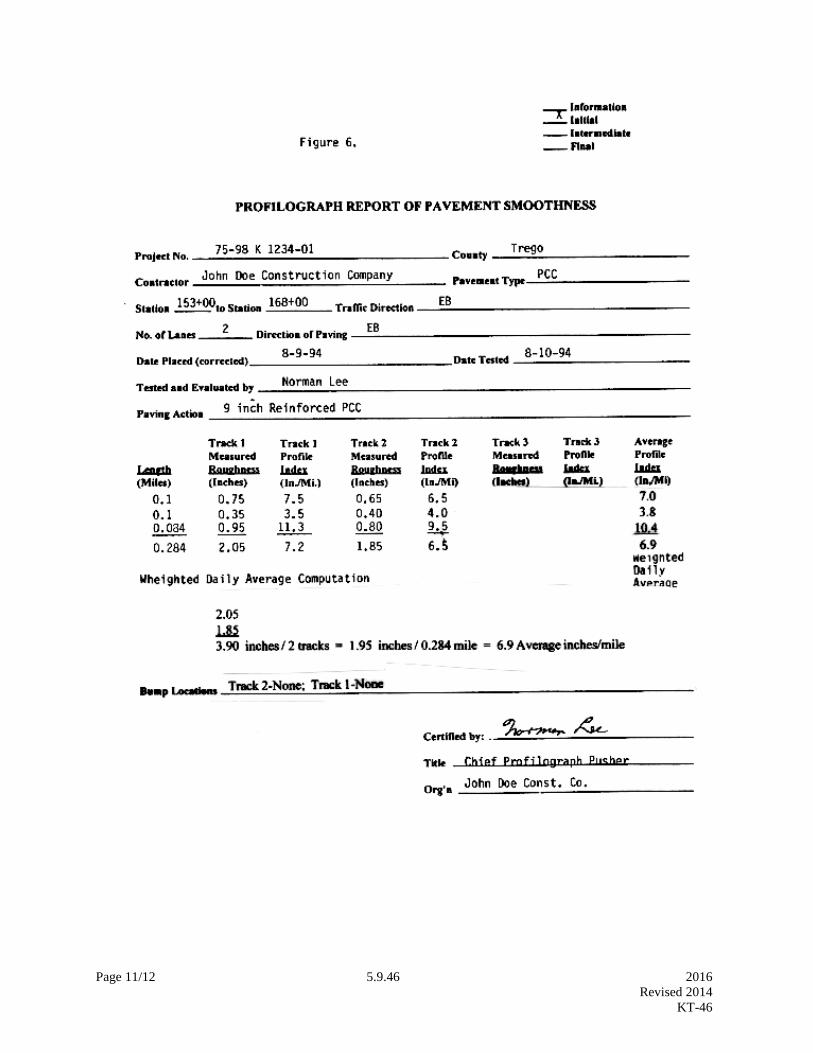
Page 11/12 5.9.46 2016
Revised 2014
KT-46

Page 12/12 5.9.46 2016
Revised 2014
KT-46
Page 1/5 5.9.47 2016
Revised 2014
KT-47
5.9.47 DEPTH DETERMINATION OF HOT-IN-PLACE RECYCLED ASPHALT PAVEMENT (HIR)
(Kansas Test Method KT-47)
1. SCOPE
This tests method describes the procedure for determining the depth using an Engineers level (Method A),
weight for a given area (Method B) of HIR, or depth using a stab rod (Method C).
2. REFERENCED DOCUMENTS
2.1. Part V, 5.9; Sampling and Test Methods Foreword
3. APPARATUS
3.1. Method A and Method B; Miscellaneous spoons, brushes, shovels and spatulas.
3.2. Method A; Engineers level.
3.3. Method A; Level Rod.
3.4. Method A; Equipment for reference elevation points (cloth or steel tape, rope, string, etc.).
3.5. Method B; a 12 in (300 mm) square template.
3.6. Method B; Sample pans.
3.7. The balance shall conform to the requirements of Part V, 5.9; Sampling and Test Methods
Foreword, for the class of general purpose balance required for the principal sample mass of the sample
being tested
3.8. Method C; Stab rod which consists of a solid metal rod tip with an adjustable washer for establishing
the proper height of the uncompacted HIR.
4. TEST PROCEDURE
4.1. Method A
4.1.1. Before heat application obtain initial roadway surface elevations (Ei) to the nearest 0.005 ft (1 mm)
at two or more points (see Figure 1). Establish these points on a line transverse to centerline. Reference
these points so they may be re-established after the HIR process and before the compaction process.
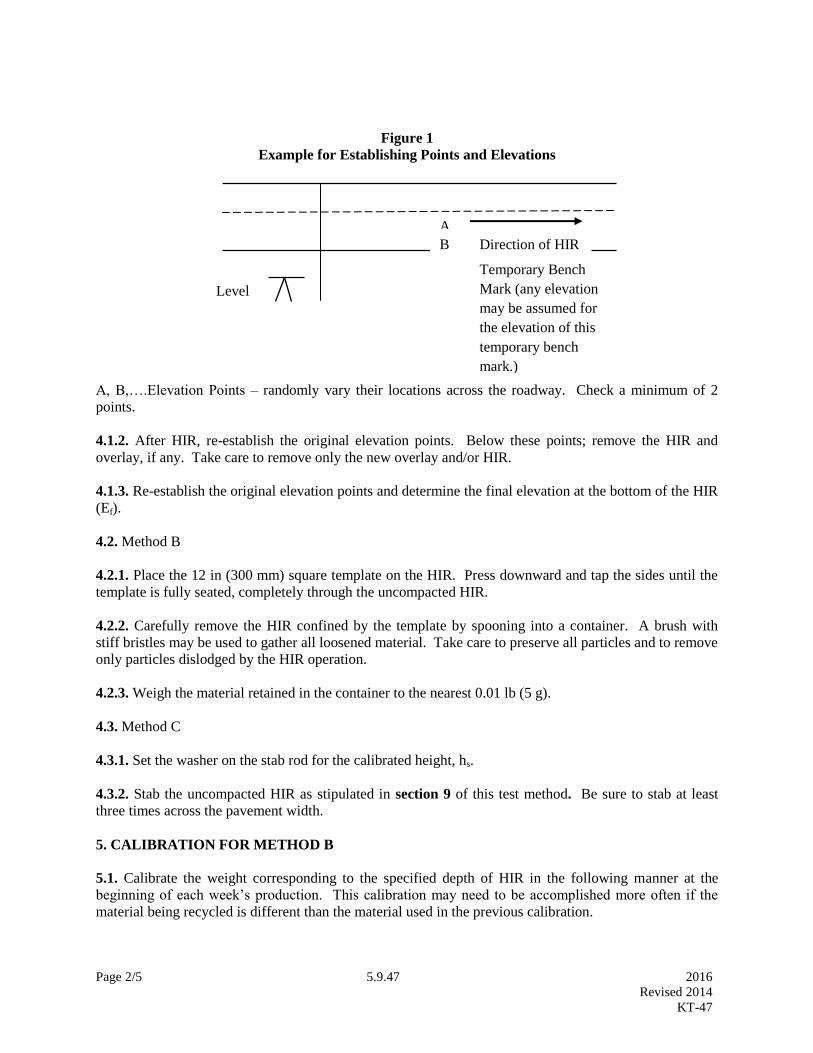
Page 2/5 5.9.47 2016
Revised 2014
KT-47
Figure 1
Example for Establishing Points and Elevations
A, B,….Elevation Points – randomly vary their locations across the roadway. Check a minimum of 2
points.
4.1.2. After HIR, re-establish the original elevation points. Below these points; remove the HIR and
overlay, if any. Take care to remove only the new overlay and/or HIR.
4.1.3. Re-establish the original elevation points and determine the final elevation at the bottom of the HIR
(Ef).
4.2. Method B
4.2.1. Place the 12 in (300 mm) square template on the HIR. Press downward and tap the sides until the
template is fully seated, completely through the uncompacted HIR.
4.2.2. Carefully remove the HIR confined by the template by spooning into a container. A brush with
stiff bristles may be used to gather all loosened material. Take care to preserve all particles and to remove
only particles dislodged by the HIR operation.
4.2.3. Weigh the material retained in the container to the nearest 0.01 lb (5 g).
4.3. Method C
4.3.1. Set the washer on the stab rod for the calibrated height, hs.
4.3.2. Stab the uncompacted HIR as stipulated in section 9 of this test method. Be sure to stab at least
three times across the pavement width.
5. CALIBRATION FOR METHOD B
5.1. Calibrate the weight corresponding to the specified depth of HIR in the following manner at the
beginning of each week’s production. This calibration may need to be accomplished more often if the
material being recycled is different than the material used in the previous calibration.
A
B
B
B
B Direction of HIR
Temporary Bench
Mark (any elevation
may be assumed for
the elevation of this
temporary bench
mark.)
Level

Page 3/5 5.9.47 2016
Revised 2014
KT-47
5.1.1. Method A requires a minimum of 2 transverse locations be taken for each test. Select 1 of these
locations to calibrate Method B. As stated in section 9.2 of this test method. Three tests will be taken
within the first 1/2 mile of production that day. To perform the calibration, select 1 transverse location
from each of these 3 test locations taken with the first 1/2 mile. Average these values to get the required
weight of the sample (wT) corresponding to the specified depth in the contract documents (hd). This is the
value to be used until a new calibration is accomplished.
5.1.2. Take elevations as described in Method A (steps 4.1.1. through 4.1.3.). Remove the HIR from one
of the transverse locations as prescribed in section 4.2 of this test method and weigh (WA). The weight of
the HIR corresponding to the depth determined in Method A. Use the following equation to determine
the weight corresponding to the depth of HIR specified in the contract documents.
WT = WA × hd ÷ hm
Where: WT = Required minimum weight of a ft2 of HIR, lb/ft
2.
WA = Weight of the HIR Sample lb/ft
2.
hm = Depth of the HIR Sample, in.
hd = Specified depth of HIR, in.
6. CALIBRATION FOR METHOD C
6.1. Calibrate the stab rod in the following manner at the beginning of each week’s production.
6.1.1. As stated in section 9.2 of this test method, three tests will be taken within the first 1/2 mile of
production that day. To perform the calibration, perform the steps in sections 6.1.2 through 6.1.4 of this
test method for each transverse location from each of these three test locations taken with the first 1/2
mile. Average these values to get the required depth that the washer should be set (hs) for the design HIR
depth (hd). This is the value to be used until a new calibration is accomplished.
6.1.2. Take elevations as describe in Method A (sections 4.1.1 through 4.1.3 of this test method). Prior to
removing the HIR in Method A, section 4.1.2 of this test method stab the HIR with the stab rod until the
tip rests on the material directly below the HIR. Loosen the washer prior to the stab and then tightened
once the stab rod has fully penetrated the HIR. Measure and record the distance from the tip of the stab
rod to the bottom of the washer. This is the depth of the uncompacted HIR (hu). Continue using Method
A, sections 4.1.2, 4.1.3 and 7.1 of this test method to measure and record the depth of the HIR (hm).
Ei
hu
hm
Ef
Where: Ei = Original elevation of pavement
Ef = Final elevation of pavement
hm = Depth of the HIR
hu = Depth of the uncompacted HIR
6.1.3. Calculate the depth that the washer should be set (hs) for the design HIR depth (hd) using the
following equation:
hs = hd × hu ÷ hm
Page 4/5 5.9.47 2016
Revised 2014
KT-47
6.1.4. Repeat sections 6.1.1 and 6.1.3 of this test method for all locations described in section 6.1.1 of this
test method. Average the values set the washer height to this average value.
7. CALCULATIONS
7.1. For Method A, calculate the average depth of HIR using all elevation points at this transverse
location.
7.2. For Method B, the weight per unit area of HIR is determined by the following formula:
WA = WT
AT
Where: WA = lb/ft2 (kg/m
2) of HIR
WT = Weight of material removed from the template
AT = Area of the template = 1.0 ft2 (0.1 m
2)
EXAMPLE:
English
WA=17.54 lb
1.00ft2
=17.54 lb/ft2
= 17.5 lb/ft2
SI
WA=7.96 kg
0.09 m2=88.44 kg/m2
= 88.44 kg/m2
8. REPORTING
8.1. For Method A, report the average depth of HIR for each transverse location to the nearest 0.01 ft (5
mm).
8.2. For Method B, report the lb/ft2 (kg/m
2) of HIR (WA) to the nearest 0.1 lb/ft
2 (0.01 kg/m
2).
8.3. For Method C, report any findings that show the average depth to be less than specified in the design
(contract documents).
9. FREQUENCY
9.1. For all Methods, tests will be performed at the frequency necessary to control the production rate.

Page 5/5 5.9.47 2016
Revised 2014
KT-47
9.2. For Method A and Method B, rate of three tests in the first 1/2 mile of each day’s operation. Then, a
minimum rate of 1 per hour for the remainder of the day.
9.3. For Method C, minimum rate of 3 longitudinal locations per hour.

Page 1/7 5.9.49 2016
Revised 2015
KT-49
5.9.49 METHOD FOR OBTAINING AND TESTING DRILLED CORES FROM PCCP AND
PRECAST GIRDERS (Kansas Test Method KT-49)
1. SCOPE
1.1. This test method provides standardized procedures for obtaining and testing specimens to determine
the compressive strength of in-place concrete in pavement and precast girders and depth of concrete
pavement. Sampling and sample preparation requirements are given to ensure that dimensional
requirements are met and that the specimens are made of intact, sound concrete, and are as free of flaws
as the particular pavement or precast girder will allow.
2. REFERENCED DOCUMENTS
2.1. AASHTO T 22; Compressive Strength of Cylindrical Concrete Specimens
2.2. AASHTO T 148; Measuring Length of Drilled Concrete Cores
2.3 KT-77; Method for Capping Cylindrical Concrete Specimens
3. SIGNIFICANCE AND USE
3.1. The strength of concrete measured by tests of cores is affected by the amount and distribution of
moisture in the specimen at the time of test. There is no standard procedure to condition a specimen that
will ensure that, at the time of test, it will be in the identical moisture condition as concrete in the
pavement or precast girder. The moisture conditioning procedures in this test method are intended to
provide reproducible moisture conditions that minimize within-laboratory and between-laboratory
variations and to reduce the effects of moisture introduced during specimen preparation.
4. APPARATUS
4.1. Testing Machine – The testing machine shall comply with requirements set forth in AASHTO T-22.
The testing machine shall be of a type having sufficient capacity and capable of providing the rates of
loading corresponding to a stress rate on the specimen of 35 ± 7 psi/s (0.25 ± 0.05 MPa/s). The
designated rate of movement shall be maintained at least during the latter half of the anticipated loading
phase. The testing machine shall be capable of testing cores up to and including 12 in (300 mm) in
length.
4.2. Core Drill - For obtaining cylindrical core specimens, a diamond drill shall be used.
4.3. Caliper and a 12 in (300 mm) steel rule graduated in 0.01 in (0.25 mm).
5. SAMPLING
5.1. Core Drilling - A core specimen taken perpendicular to a horizontal surface shall be located, when
possible, so that its axis is perpendicular to the bed of the concrete as originally placed and not near
formed joints or obvious edges of a unit of deposit. A specimen taken perpendicular to a vertical surface,
or perpendicular to a surface with a batter, shall be taken from near the middle of a unit of deposit when
possible and not near formed joints or obvious edges of a unit of deposit.
NOTE: All coring for the purpose of determining compressive strength must be performed a minimum of
21 days after the pavement has been placed, and in time to determine the 28-day compressive strengths.
Page 2/7 5.9.49 2016
Revised 2015
KT-49
6. DETERMINING LENGTH OF DRILLED CORE SPECIMENS
6.1. A core specimen for the determination of length shall have a minimum diameter as stated in the
applicable specification.
6.2. Determining Length of Core using Calipers.
6.2.1. Cores used as specimens for length measurement shall be in every way representative of the
concrete in the structure from which they are removed. The specimen shall be drilled with the axis normal
to the surface of the structure, and the ends shall be free from all conditions not typical of the surfaces of
the structure. Cores that show abnormal defects or that have been damaged appreciably in the drilling
operation shall not be used. If a core drilled from a pavement or structure placed on dense-graded
aggregate base course includes particles of the aggregate bonded to the bottom surface of the concrete, the
bonded particles shall be removed by wedging or by chisel and hammer applied so as to expose the lower
surface of the concrete. If the concrete is placed on an open-graded aggregate base course, the mortar in
the concrete may penetrate into the base and surround some particles. Use sufficient force with a wedge
or chisel and hammer to remove bonded particles but not such force as to fracture particles substantially
surrounded by mortar. If during the removal of bonded aggregate the concrete is broken so that the
instructions of section 6.2.3 of this test method cannot be followed, the core shall not be used for length
measurement1
6.2.2. Take three caliper measurements at 120 degree intervals along the circumference of the circle of
measurement to the nearest 0.01 in (0.25 mm), to determine the average length.
6.2.3. If, in the course of the measuring operation, it is discovered that at one or more of the measuring
points the surface of the specimen is not representative of the general plane of the core end because of a
small projection or depression, the specimen shall be rotated slightly about its axis and a complete set of
three measurements made with the specimen in the new position.
7. SPECIMENS
7.1. Test Specimens – For concrete greater than or equal to 8 inches in thickness the nominal diameter of
core specimens for the determination of compressive strength shall be at least 3.75 in (95 mm). Core
diameters less than 3.75” are permitted when it is impossible to obtain cores with length-to-diameter
(L/D) ratio ≥ 1 for compressive strength evaluations. For concrete with a thickness of less than 8 inches
the nominal core diameter should preferably be at least three times the nominal maximum size of the
coarse aggregate and must be at least twice the nominal maximum size of the coarse aggregate.
7.2. Moisture Conditioning - Test cores after moisture conditioning as specified in this test method. The
moisture conditioning procedures specified in this test method are intended to preserve the moisture of the
drilled core and to provide a reproducible moisture condition that minimizes the effects of moisture
gradients introduced by wetting during drilling and specimen preparation.
7.2.1. After cores have been drilled, wipe off surface drill water and allow remaining surface moisture to
evaporate. When surfaces appear dry, but not later than one hour after drilling, place cores in separate
plastic bags or nonabsorbent containers and seal to prevent moisture loss. Maintain cores at ambient
temperature, and protect cores from exposure to direct sunlight. Transport the cores to the testing
laboratory as soon as practical. Keep cores in the sealed plastic bags or nonabsorbent containers at all
1 AASHTO T 148-07
Page 3/7 5.9.49 2016
Revised 2015
KT-49
times except during end preparation and for a maximum time of two hours to permit capping before
testing.
7.2.2. If water is used during sawing or grinding of core ends, complete these operations as soon as
practicable, but no later than two days after drilling of cores. After completing end preparation, wipe off
surface moisture, allow the surfaces to dry, and place the cores in sealed plastic bags or nonabsorbent
containers. Minimize the duration of exposure to water during end preparation.
7.2.3. When direction is given to test cores in a moisture condition other than achieved by conditioning
according to sections 7.2.1. and 7.2.2 of this test method, report the alternative procedure.
7.3. End Preparation Prior to Capping - The ends of specimens to be tested in compression shall be
essentially smooth, perpendicular to the longitudinal axis, and of the same diameter as the body of the
specimen. Saw or grind the top of the specimen no more than 0.375 inches (10 mm) to remove surface
tining or roughness. Saw or grind the bottom of the specimen only the amount that is required for the
specimen to fit into the testing machine. No point on either end of compressive test specimens shall
protrude by more than 0.125 inches (3 mm) from a plane perpendicular to the axis of the specimen at the
lowest point of the surface prior to capping with sulfur.
NOTE: Prior to capping, the density of a core may be determined by weighing it and dividing it by the
volume calculated from the average diameter and length, or by any other standard method for determining
density.
8. CAPPING
8.1. Cap the specimen according to the procedures contained in KT-77.
8.2. Measurement - Prior to testing, measure the length of the capped specimen to the nearest 0.01 inch
(0.25 mm) and use this length to compute the length-diameter ratio. Take three caliper measurements at
120 degree intervals along the circumference of the circle to determine the average length. Determine the
average diameter by averaging two measurements taken at right angles to each other about the mid-height
of the specimen. Measure core diameters to the nearest 0.01 inch (0.25 mm). Do not test cores if the
difference between the largest and smallest diameter exceeds five percent of their average.
9. TESTING
9.1. Test the specimens for the 28th day compression strength within seven days after coring, unless
specified otherwise.
9.2. Specimens shall be tested at the age required by the applicable specification within the time
tolerances shown in Table 1.
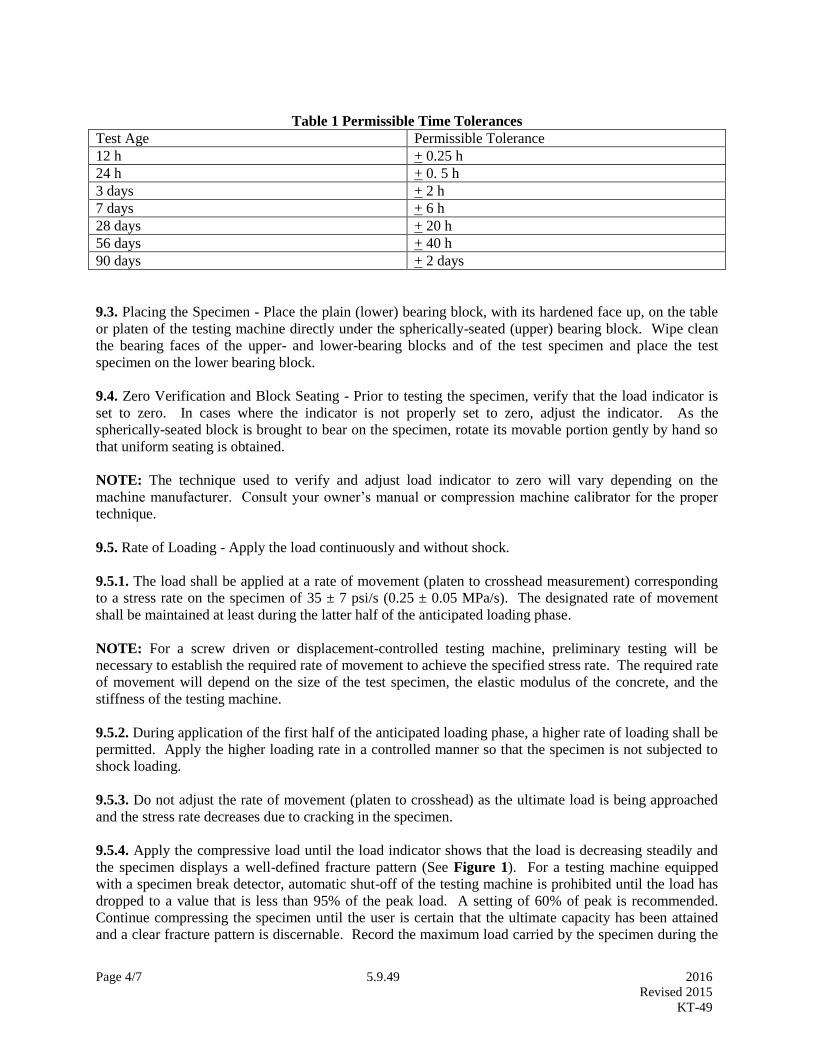
Page 4/7 5.9.49 2016
Revised 2015
KT-49
Table 1 Permissible Time Tolerances
Test Age Permissible Tolerance
12 h + 0.25 h
24 h + 0. 5 h
3 days + 2 h
7 days + 6 h
28 days + 20 h
56 days + 40 h
90 days + 2 days
9.3. Placing the Specimen - Place the plain (lower) bearing block, with its hardened face up, on the table
or platen of the testing machine directly under the spherically-seated (upper) bearing block. Wipe clean
the bearing faces of the upper- and lower-bearing blocks and of the test specimen and place the test
specimen on the lower bearing block.
9.4. Zero Verification and Block Seating - Prior to testing the specimen, verify that the load indicator is
set to zero. In cases where the indicator is not properly set to zero, adjust the indicator. As the
spherically-seated block is brought to bear on the specimen, rotate its movable portion gently by hand so
that uniform seating is obtained.
NOTE: The technique used to verify and adjust load indicator to zero will vary depending on the
machine manufacturer. Consult your owner’s manual or compression machine calibrator for the proper
technique.
9.5. Rate of Loading - Apply the load continuously and without shock.
9.5.1. The load shall be applied at a rate of movement (platen to crosshead measurement) corresponding
to a stress rate on the specimen of 35 ± 7 psi/s (0.25 ± 0.05 MPa/s). The designated rate of movement
shall be maintained at least during the latter half of the anticipated loading phase.
NOTE: For a screw driven or displacement-controlled testing machine, preliminary testing will be
necessary to establish the required rate of movement to achieve the specified stress rate. The required rate
of movement will depend on the size of the test specimen, the elastic modulus of the concrete, and the
stiffness of the testing machine.
9.5.2. During application of the first half of the anticipated loading phase, a higher rate of loading shall be
permitted. Apply the higher loading rate in a controlled manner so that the specimen is not subjected to
shock loading.
9.5.3. Do not adjust the rate of movement (platen to crosshead) as the ultimate load is being approached
and the stress rate decreases due to cracking in the specimen.
9.5.4. Apply the compressive load until the load indicator shows that the load is decreasing steadily and
the specimen displays a well-defined fracture pattern (See Figure 1). For a testing machine equipped
with a specimen break detector, automatic shut-off of the testing machine is prohibited until the load has
dropped to a value that is less than 95% of the peak load. A setting of 60% of peak is recommended.
Continue compressing the specimen until the user is certain that the ultimate capacity has been attained
and a clear fracture pattern is discernable. Record the maximum load carried by the specimen during the
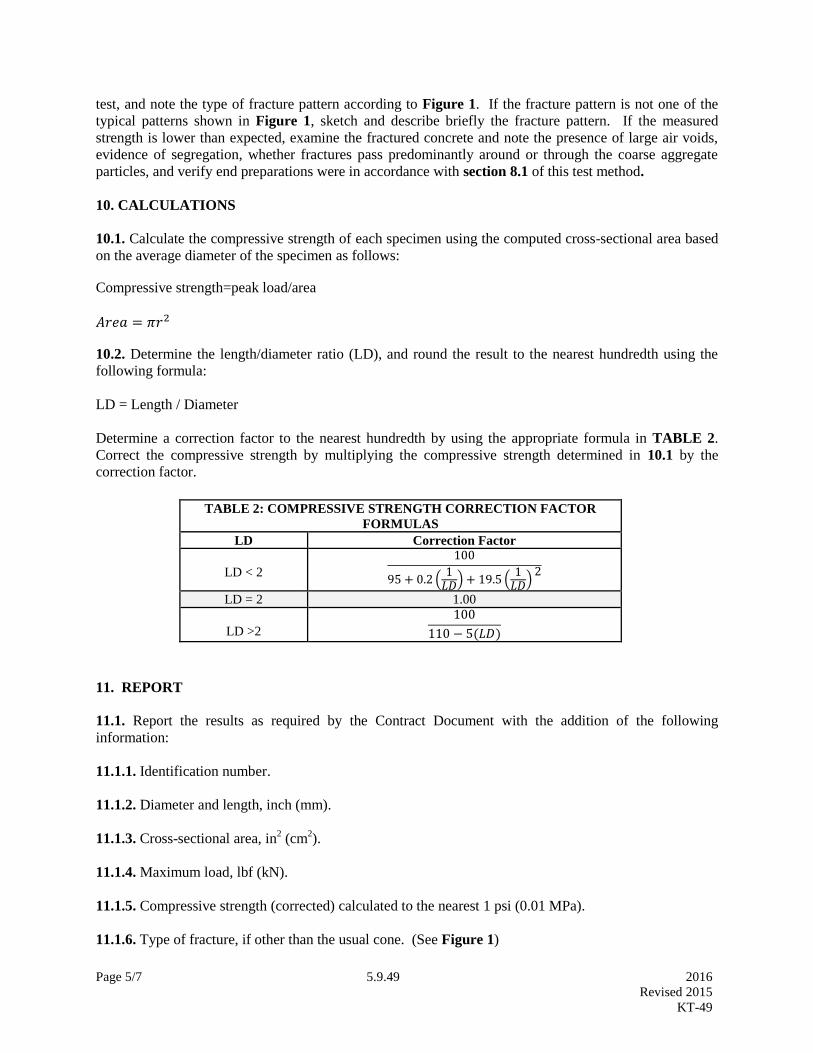
Page 5/7 5.9.49 2016
Revised 2015
KT-49
test, and note the type of fracture pattern according to Figure 1. If the fracture pattern is not one of the
typical patterns shown in Figure 1, sketch and describe briefly the fracture pattern. If the measured
strength is lower than expected, examine the fractured concrete and note the presence of large air voids,
evidence of segregation, whether fractures pass predominantly around or through the coarse aggregate
particles, and verify end preparations were in accordance with section 8.1 of this test method.
10. CALCULATIONS
10.1. Calculate the compressive strength of each specimen using the computed cross-sectional area based
on the average diameter of the specimen as follows:
Compressive strength=peak load/area
𝐴𝑟𝑒𝑎 = 𝜋𝑟2
10.2. Determine the length/diameter ratio (LD), and round the result to the nearest hundredth using the
following formula:
LD = Length / Diameter
Determine a correction factor to the nearest hundredth by using the appropriate formula in TABLE 2.
Correct the compressive strength by multiplying the compressive strength determined in 10.1 by the
correction factor.
TABLE 2: COMPRESSIVE STRENGTH CORRECTION FACTOR
FORMULAS
LD Correction Factor
LD < 2
100
95 + 0.2 (1𝐿𝐷
) + 19.5 (1𝐿𝐷
)2
LD = 2 1.00
LD >2
100
110 − 5(𝐿𝐷)
11. REPORT
11.1. Report the results as required by the Contract Document with the addition of the following
information:
11.1.1. Identification number.
11.1.2. Diameter and length, inch (mm).
11.1.3. Cross-sectional area, in2 (cm
2).
11.1.4. Maximum load, lbf (kN).
11.1.5. Compressive strength (corrected) calculated to the nearest 1 psi (0.01 MPa).
11.1.6. Type of fracture, if other than the usual cone. (See Figure 1)
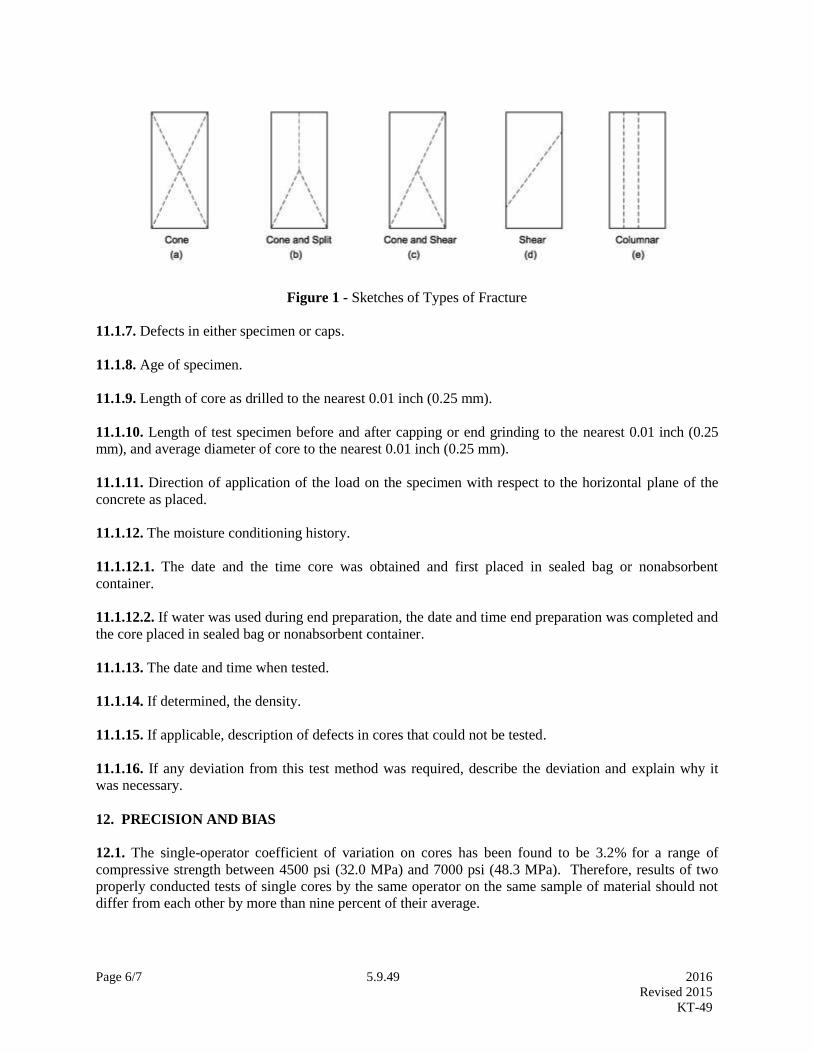
Page 6/7 5.9.49 2016
Revised 2015
KT-49
Figure 1 - Sketches of Types of Fracture
11.1.7. Defects in either specimen or caps.
11.1.8. Age of specimen.
11.1.9. Length of core as drilled to the nearest 0.01 inch (0.25 mm).
11.1.10. Length of test specimen before and after capping or end grinding to the nearest 0.01 inch (0.25
mm), and average diameter of core to the nearest 0.01 inch (0.25 mm).
11.1.11. Direction of application of the load on the specimen with respect to the horizontal plane of the
concrete as placed.
11.1.12. The moisture conditioning history.
11.1.12.1. The date and the time core was obtained and first placed in sealed bag or nonabsorbent
container.
11.1.12.2. If water was used during end preparation, the date and time end preparation was completed and
the core placed in sealed bag or nonabsorbent container.
11.1.13. The date and time when tested.
11.1.14. If determined, the density.
11.1.15. If applicable, description of defects in cores that could not be tested.
11.1.16. If any deviation from this test method was required, describe the deviation and explain why it
was necessary.
12. PRECISION AND BIAS
12.1. The single-operator coefficient of variation on cores has been found to be 3.2% for a range of
compressive strength between 4500 psi (32.0 MPa) and 7000 psi (48.3 MPa). Therefore, results of two
properly conducted tests of single cores by the same operator on the same sample of material should not
differ from each other by more than nine percent of their average.

Page 7/7 5.9.49 2016
Revised 2015
KT-49
12.2. The multi-laboratory coefficient of variation on cores has been found to be 4.7% for range of
compressive strength between 4500 psi (32.0 MPa) and 7000 psi (48.3 MPa). Therefore results on two
properly conducted tests on cores sampled from the same hardened concrete (where a single test is
defined as the average of two observations (cores), each made on separate adjacent drilled 4 in (100 mm)
diameter cores), and tested by two different laboratories should not differ from each other by more than
13 percent of their average.
12.3. Since there is no accepted reference material suitable for determining the bias for the procedure in
this test method, no statement on bias is being made.

Page 1/7 5.9.50 2016
Revised 2016
KT-50
5.9.50 UNCOMPACTED VOID CONTENT OF FINE AGGREGATE (Kansas Test Method KT-50)
1. SCOPE
This method of test covers the determination of the uncompacted void content of a sample of aggregate
based on a given gradation. It provides a measure of aggregate angularity, sphericity, and texture
compared to other fine aggregates tested. KT-50 reflects testing procedures found in AASHTO T 304.
2. REFERENCED DOCUMENTS
2.1. Part V, 5.9; Sampling and Test Methods Foreword
2.2 KT-3; Material Passing No. 200 (75 µm) Sieve by the Wash Method
2.3. KT-15; Bulk Specific Gravity and Unit Weight of Compacted Asphalt Mixtures
2.4. AASHTO T 304; Uncompacted Void Content of Fine Aggregate
2.5. ASTM B 88; Specification for Seamless Copper Water Tube
2.6. ASTM C 778; Specification for Standard Sand
3. APPARATUS
3.1. Drying oven capable of maintaining a uniform temperature of 230 + 9°F (110 + 5°C).
3.2. The funnel shall be smooth on the inside and at least 1.5 in (38 mm) high. It shall have a volume of
at least 200 mL or shall be provided with a supplemental container to provide the required volume. The
lateral surface of the right frustum of a cone sloped 60 + 4 degrees from the horizontal with an opening of
0.50 + 0.024 in (12.7 + 0.6 mm) diameter. The funnel and supplemental container shall comply with the
apparatus shown in Figure 1.
3.3. A funnel stand capable of holding the funnel firmly in position with its axis collinear with the axis of
the measure and funnel opening 4.5 + 0.1 in (115 + 2 mm) above the top of the cylinder. A suitable
arrangement is shown in Figure 1.
3.4. A right angle cylinder of approximately 6.1 in3 (100 mL) capacity having an inside diameter of 1.53
+ 0.05 in (39 + 1.3 mm), and an inside height of approximately 3.37 in (86 mm), made of drawn copper
water tubing meeting ASTM B 88, Type M or equally rigid material. The bottom of the measure shall be
at least 0.24 in (6 mm) thick, shall be firmly sealed to the tubing, and shall be provided with means for
aligning the axis of the cylinder with that of the funnel. See Figure 2.
Apply a light coat of grease to the top edge of the dry, empty measure. Weigh the measure, grease, and a
flat glass plate slightly larger than the diameter of the measure. Fill the measure with distilled/deionized
water at a temperature of 77 + 2°F (25 + 1°C). Place the glass on the measure, being sure that no air
bubbles remain. Dry the outer surfaces of the measure and determine the combined mass of measure,
glass plate, grease and water by weighing. This procedure should be done at least once a year.

Page 2/7 5.9.50 2016
Revised 2016
KT-50
Calculate the volume of the measure as follows:
Vc=W
density of water
Where: Vc= volume of cylinder, mL
W= d-c = net mass of water, g
c= cylinder + glass + grease, g
d= cylinder + glass + grease + water, g
NOTE: Density of water varies based on temperature. Determine the temperature and select the proper
density of water from KT-15, Table 1.
3.5. A metal or plastic pan of sufficient size to contain the funnel stand and to prevent loss of material.
The purpose of the pan is to catch and retain aggregate grains that overflow the measure during filling or
strike off.
3.6. Metal spatula about 4 in (100 mm) long with sharp straight edges. The straight edge of the spatula is
used to strike off the fine aggregate.
3.7. The balance shall conform to the requirements of Part V, 5.9; Sampling and Test Methods
Foreword, for the class of general purpose balance required for the principal sample mass of the sample
being tested.
3.8. 200 mL volumetric flasks TC at 68°F (20°C) accurate and readable to + 0.10 mL.
3.9. A brush small enough to use to dislodge aggregate from the measure’s base while inside the funnel
stand.
3.10. A small plastic or metal or glass funnel with a neck small enough to insert into the 200 mL
volumetric flasks but sufficiently large enough in inside diameter to transfer all the contents of the
measure to the flask.
4. SAMPLE PREPARATION
4.1. Wash the sample over the No. 200 (75 µm) sieve using the equipment and procedures listed in KT-3,
section 3 and section 5. Dry the plus No. 200 (75 µm) material to a constant mass. Sieve the dry
aggregate over the No. 8 (2.36 mm), No. 16 (1.18 mm), No. 30 (600 µm), No.50 (300 µm) and No. 100
(150 µm) sieves. Discard all the material retained on the No. 8 (2.36 mm) and passed through the No.
100 (150 µm).
4.2. Weigh out and combine the following quantities of dry aggregate from each of the sizes:
Individual Size Fraction Mass, g
No. 8 (2.36 mm) to No. 16 (1.18 mm) 44
No. 16 (1.18 mm) to No. 30 (600 µm) 57
No. 30 (600 µm) to No. 50 (300 µm) 72
No. 50 (300 µm) to No. 100 (150 µm) 17
TOTAL 190
Page 3/7 5.9.50 2016
Revised 2016
KT-50
The tolerance on each of these amounts is + 0.2 g. Mix the test sample until it is homogenous.
4.3. Prepare two test samples of the above recipe.
NOTE: If Uk values below the specified (full pay) value have been obtained from previous tests on this
project, the Engineer may increase the number of test samples from two to four, and go directly to the Uk
determination specified in section 8. of this test method. This is in lieu of performing a two sample test,
discarding a failed result, and retesting with four samples.
5. TEST PROCEDURE
5.1. Mix the test sample until it is homogenous. Using a finger to block the opening of the funnel, pour
the test sample into the funnel. Level the material in the funnel with the spatula. Center the measure
under the funnel, remove the finger and allow the sample to fall freely into the measure.
5.2. After the funnel empties, remove excess heaped aggregate from the measure by a single pass of the
spatula with the blade vertical using the straight part of its edge in light contact with the top of the
measure. Until this operation is complete, exercise care to avoid vibration or disturbance that could cause
compaction of the fine aggregate in the measure. After strike-off the measure may be tapped lightly to
compact the sample to make it easier to transfer the measure. Brush adhering grains from the outside of
the measure.
5.3. Pour contents of cylinder into 200 mL volumetric flask using a funnel to assure total transfer of
aggregate.
5.4. Weigh the flask and sample, record as A.
5.5. Add distilled water (deionized water can be substituted). Rotate the flask in an inclined position to
eliminate all air bubbles. Do not shake. Allow the flask to sit for several minutes then roll flask again.
Continue the process until there are no visible air bubbles present or for a maximum of 15 minutes,
whichever comes first. Distilled water (and entire test) should be at 77 + 2°F (25 + 1°C).
5.6. Adjust distilled water to the calibrated volume mark on the neck of the flask.
5.7. Weigh flask and contents, record as B.
5.8. Repeat procedure for the second test sample and record results.
6. CALCULATIONS
6.1. Calculate the uncompacted void content, (Uk), by this method:
Uk=U1 + U2
2
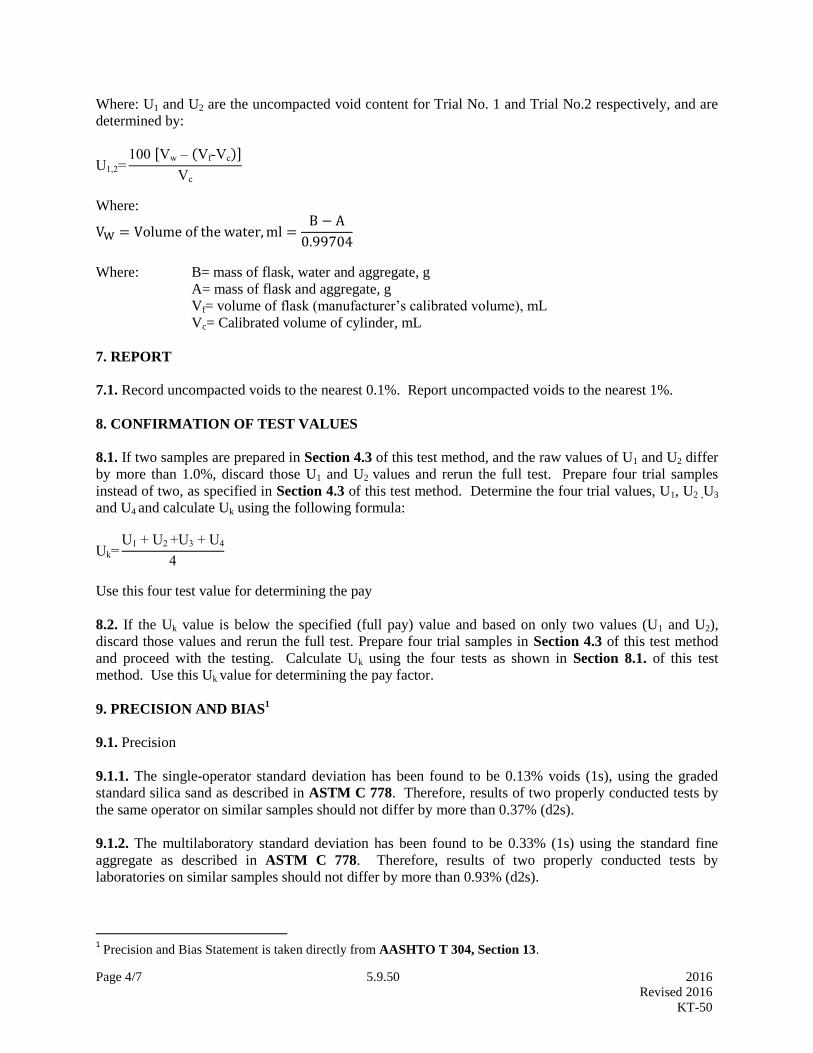
Page 4/7 5.9.50 2016
Revised 2016
KT-50
Where: U1 and U2 are the uncompacted void content for Trial No. 1 and Trial No.2 respectively, and are
determined by:
U1,2=100 [Vw – (Vf-Vc)]
Vc
Where:
VW = Volume of the water, ml =B − A
0.99704
Where: B= mass of flask, water and aggregate, g
A= mass of flask and aggregate, g
Vf= volume of flask (manufacturer’s calibrated volume), mL
Vc= Calibrated volume of cylinder, mL
7. REPORT
7.1. Record uncompacted voids to the nearest 0.1%. Report uncompacted voids to the nearest 1%.
8. CONFIRMATION OF TEST VALUES
8.1. If two samples are prepared in Section 4.3 of this test method, and the raw values of U1 and U2 differ
by more than 1.0%, discard those U1 and U2 values and rerun the full test. Prepare four trial samples
instead of two, as specified in Section 4.3 of this test method. Determine the four trial values, U1, U2 ,U3
and U4 and calculate Uk using the following formula:
Uk=U1 + U2 +U3 + U4
4
Use this four test value for determining the pay
8.2. If the Uk value is below the specified (full pay) value and based on only two values (U1 and U2),
discard those values and rerun the full test. Prepare four trial samples in Section 4.3 of this test method
and proceed with the testing. Calculate Uk using the four tests as shown in Section 8.1. of this test
method. Use this Uk value for determining the pay factor.
9. PRECISION AND BIAS1
9.1. Precision
9.1.1. The single-operator standard deviation has been found to be 0.13% voids (1s), using the graded
standard silica sand as described in ASTM C 778. Therefore, results of two properly conducted tests by
the same operator on similar samples should not differ by more than 0.37% (d2s).
9.1.2. The multilaboratory standard deviation has been found to be 0.33% (1s) using the standard fine
aggregate as described in ASTM C 778. Therefore, results of two properly conducted tests by
laboratories on similar samples should not differ by more than 0.93% (d2s).
1 Precision and Bias Statement is taken directly from AASHTO T 304, Section 13.

Page 5/7 5.9.50 2016
Revised 2016
KT-50
9.1.3. The above statements pertain to void contents determined on “graded standard sand” as described
in ASTM C 788, which is considered rounded, and is graded from No. 30 (600 µm) to No. 100 (150 µm),
and may not be typical of other fine aggregates. Additional precision data are needed for tests of fine
aggregates having different levels of angularity and texture in accordance with these test methods.
9.2. Bias
9.2.1. Since there are no accepted reference material suitable for determining the bias for the procedures
in these test methods, bias has not been determined.
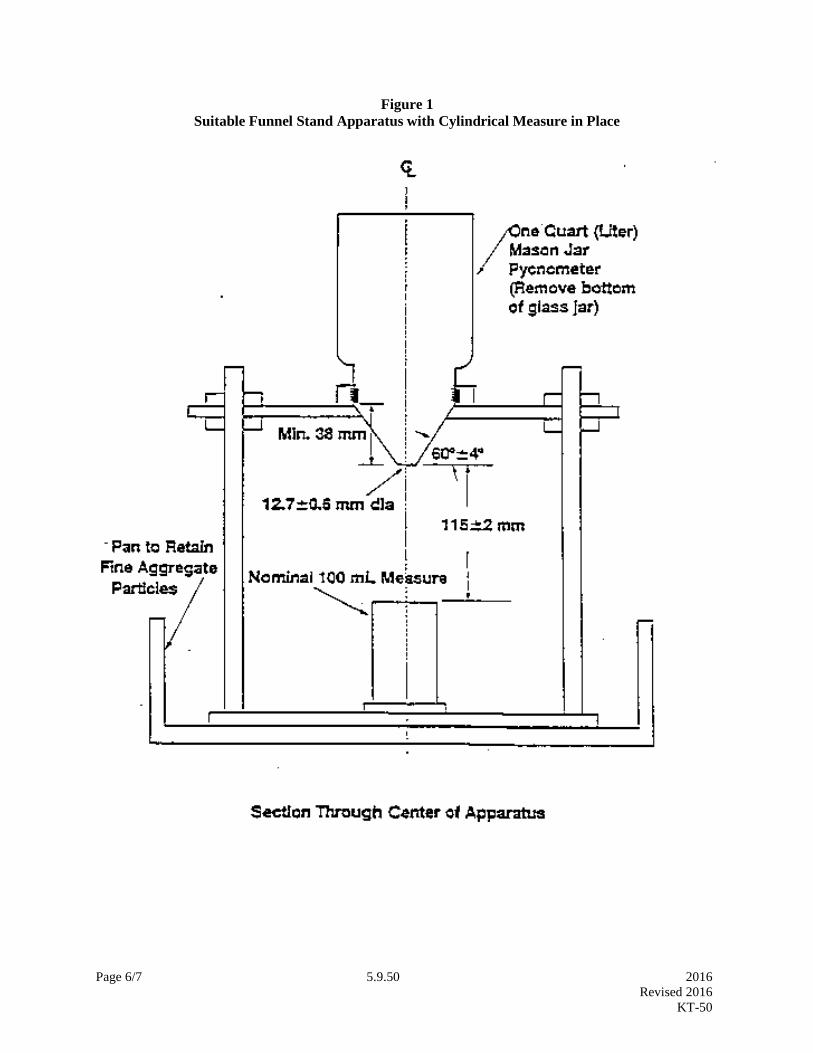
Page 6/7 5.9.50 2016
Revised 2016
KT-50
Figure 1
Suitable Funnel Stand Apparatus with Cylindrical Measure in Place
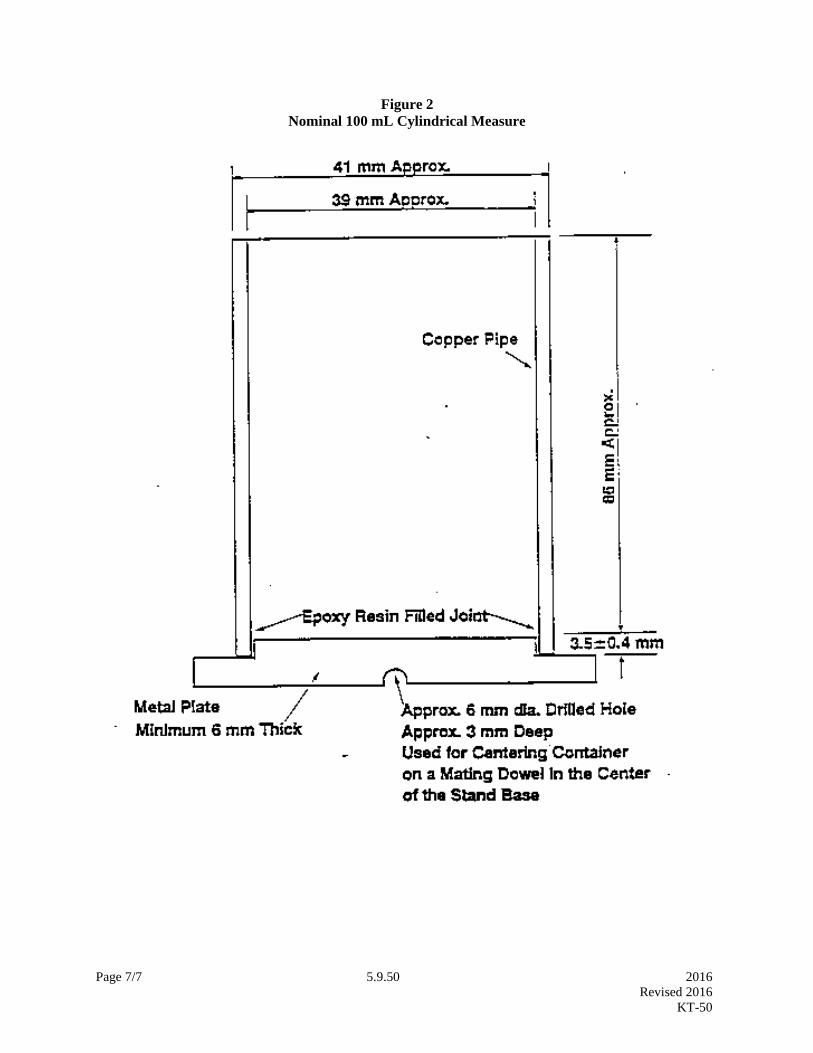
Page 7/7 5.9.50 2016
Revised 2016
KT-50
Figure 2
Nominal 100 mL Cylindrical Measure

Page 1/5 5.9.51 2016
Revised 2016
KT-51
5.9.51 FIELD DENSITY AND MOISTURE TESTS OF SOILS BY NUCLEAR GAUGE
(Kansas Test Method KT-51)
1. SCOPE
This method of test covers the procedure for measuring the “in-place” density and moisture of soils by the
attenuation of gamma and neutron radiation. The intensity of the radiation detected is dependent in part
on the density of the material being tested. It should be recognized that the density and moisture
determined by this method is not necessarily the average value within the measured volume at any one
location. Gauge calibration shall follow section 5.8.2 of test method, INDEPENDENT
ASSURANCE REPLICATE (ASR) CHECK FOR NUCLEAR DENSITY GAUGES. KDOT gauges
shall be calibrated annually. KT-51 reflects procedures found in AASHTO T 310.
The equipment utilizes radioactive materials which may be hazardous to the health of users unless
proper precautions are taken. (For KDOT field personnel only: Refer to Standard Operating
Manual No. 1.13.2.).
2. REFERENCED DOCUMENTS
2.1. KT-11; Moisture Tests
2.2. AASHTO T 310: In-Place Density and Moisture Content of Soil and Soil-Aggregate by Nuclear
Method (Shallow Depth)
3. APPARATUS
NOTE: Check gauge to verify it is in soil mode.
3.1. General.
3.1.1. Probe: Either the gamma source or the gamma detector shall be housed in a probe for insertion into
a preformed hole of the material to be tested. The probe shall be marked in increments of 2 in (50 mm)
for tests with probe depths from 2 in (50 mm) to a maximum of 12 in (300 mm). The probe shall be
mechanically held in place when it is manually moved to the desired depth.
3.1.2. Housing: The source, detector, readout device, probe, and power supply shall be in housings of
rugged construction that are moisture and dust proof.
3.1.3. Guide: A guide used for the hole forming device to make a hole, normal to the prepared surface.
3.1.4. Hole-forming Device: An auger, pin, or similar device for forming a hole in the soil to
accommodate the probe. The hole-forming device shall have a nominal diameter equal to or up to 1/8 in
(3 mm) greater than the probe diameter.
3.1.5. Extraction tool.
3.1.6. Miscellaneous equipment including shovel or auger, drying pans, and air tight containers.
3.2. Standardization.
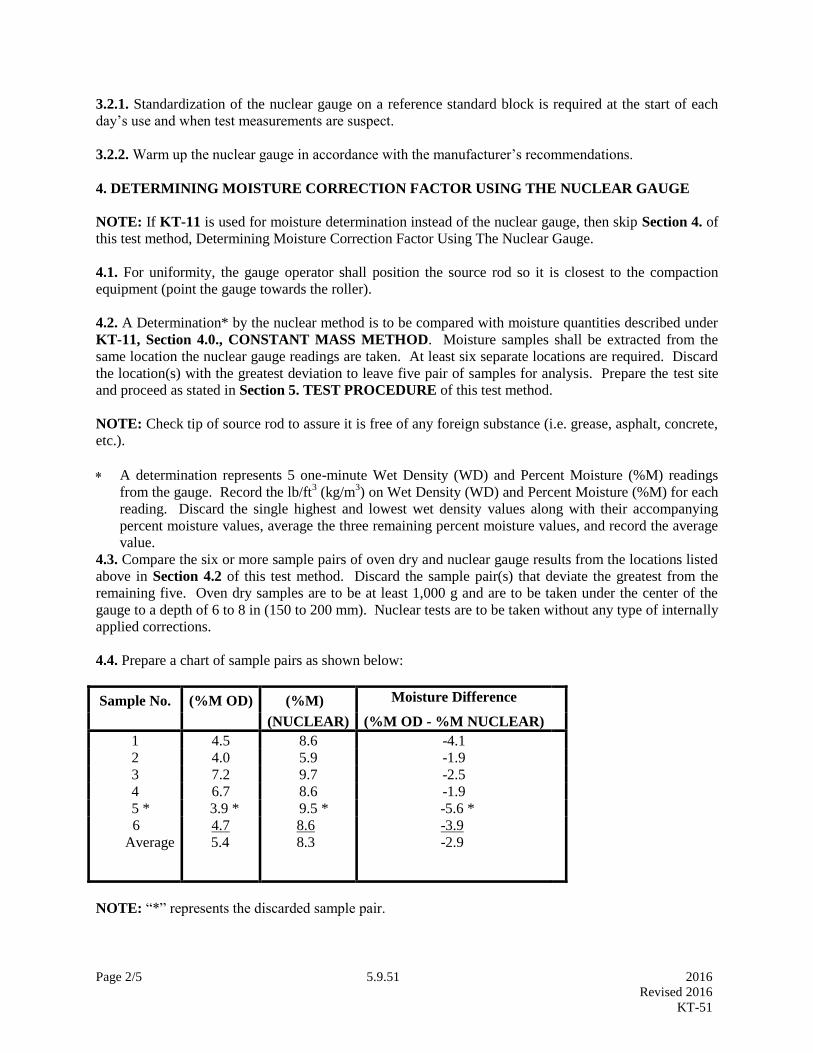
Page 2/5 5.9.51 2016
Revised 2016
KT-51
3.2.1. Standardization of the nuclear gauge on a reference standard block is required at the start of each
day’s use and when test measurements are suspect.
3.2.2. Warm up the nuclear gauge in accordance with the manufacturer’s recommendations.
4. DETERMINING MOISTURE CORRECTION FACTOR USING THE NUCLEAR GAUGE
NOTE: If KT-11 is used for moisture determination instead of the nuclear gauge, then skip Section 4. of
this test method, Determining Moisture Correction Factor Using The Nuclear Gauge.
4.1. For uniformity, the gauge operator shall position the source rod so it is closest to the compaction
equipment (point the gauge towards the roller).
4.2. A Determination* by the nuclear method is to be compared with moisture quantities described under
KT-11, Section 4.0., CONSTANT MASS METHOD. Moisture samples shall be extracted from the
same location the nuclear gauge readings are taken. At least six separate locations are required. Discard
the location(s) with the greatest deviation to leave five pair of samples for analysis. Prepare the test site
and proceed as stated in Section 5. TEST PROCEDURE of this test method.
NOTE: Check tip of source rod to assure it is free of any foreign substance (i.e. grease, asphalt, concrete,
etc.).
A determination represents 5 one-minute Wet Density (WD) and Percent Moisture (%M) readings
from the gauge. Record the lb/ft3 (kg/m
3) on Wet Density (WD) and Percent Moisture (%M) for each
reading. Discard the single highest and lowest wet density values along with their accompanying
percent moisture values, average the three remaining percent moisture values, and record the average
value.
4.3. Compare the six or more sample pairs of oven dry and nuclear gauge results from the locations listed
above in Section 4.2 of this test method. Discard the sample pair(s) that deviate the greatest from the
remaining five. Oven dry samples are to be at least 1,000 g and are to be taken under the center of the
gauge to a depth of 6 to 8 in (150 to 200 mm). Nuclear tests are to be taken without any type of internally
applied corrections.
4.4. Prepare a chart of sample pairs as shown below:
Sample No. (%M OD) (%M) Moisture Difference
(NUCLEAR) (%M OD - %M NUCLEAR)
1 4.5 8.6 -4.1
2 4.0 5.9 -1.9
3 7.2 9.7 -2.5
4 6.7 8.6 -1.9
5 * 3.9 * 9.5 * -5.6 *
6
Average
4.7
5.4
8.6
8.3
-3.9
-2.9
NOTE: “*” represents the discarded sample pair.
Page 3/5 5.9.51 2016
Revised 2016
KT-51
NOTE: If the Average Moisture Difference exceeds ± 1%, a Moisture Correction Factor will be required
for that soil type.
4.5. To determine the correction factor, calculate the average moisture difference value and proceed as
follows:
4.5.1. Calculate the Moisture Correction Factor using the average difference values, as follows:
Moisture Corr. Factor =100 (Avg. Oven %M-Avg . %M Gauge)
100+Avg. %M Gauge
In the example above, the moisture correction would be as follows:
Moisture Corr. Factor =100 ( 5.4-8.3)
100+8.3 = -2.7
The correction is independent of dry density and adjusts the apparent moisture to true moisture regardless
of dry density. This value can be used for all future tests on the same soil type.
NOTE: Each soil type having an Average Moisture Difference exceeding ± 1 % will have a moisture
correction factor.
5. TEST PROCEDURE
5.1. Determine the number of soil types to be encountered on the project. If the number is substantial,
then use KT-11 MOISTURE TESTS to determine the correct moisture content of the soil instead of
calibrating the nuclear density gauge to moisture. KT-11, Section 9. TEST PROCEDURE FOR
SPEEDY METHOD can be used if the Speedy was calibrated within the last year.
5.2. Randomly select a test site where the gauge will be at least 12 in (300 mm) away from any slight
vertical projection. If the vertical projection is significant, then maintain a distance of 10 ft (3 m)
including all stationary vehicles and construction equipment. Vehicles and construction equipment in
motion should maintain a minimum distance of 3 to 4 ft (1 to 1.5 m) from the gauge.
5.3. Prepare the test site in the following manner:
5.3.1. Remove all loose and disturbed material, and remove additional material as necessary to expose the
top of the material to be tested.
5.3.2. Prepare a horizontal area, sufficient in size to accommodate the gauge by planing a level area to a
smooth condition. This will create a maximum contact surface between the nuclear gauge and material
being tested.
5.3.3. The maximum void beneath the gauge shall not exceed approximately 1/8 in (3 mm). Use native
soil or fine sand to fill the voids and smooth the surface with a rigid plate or other suitable tool. The
depth of the filler should not exceed approximately 1/8 in (3 mm).
5.3.4. Place the nuclear gauge on the test site and trace the outline of the gauge onto the test surface.
After the site selection has been made, a vertical hole is made 2 in (50 mm) deeper than the thickness of
the material, with the rod and plate provided with the gauge. If the thickness of the material exceeds the
depth capability of the gauge, then a hole is made 2 in (50 mm) deeper than the gauge’s maximum depth.
Page 4/5 5.9.51 2016
Revised 2016
KT-51
Set the probe to the maximum depth or at a depth equal to the project specification thickness, whichever
is less. Maintain alignment so the insertion of the probe will not cause the gauge to tilt from the plane of
the prepared area.
NOTE: Check tip of source rod to assure it is free of any foreign substance (i.e. grease, asphalt, concrete,
etc.).
5.4. Proceed with testing in the following manner:
5.4.1. Tilt the gauge and extend the probe to the position required for the desired depth of test.
5.4.2. For uniformity, the gauge operator shall position the source rod so it is closest to the compaction
equipment (point the gauge towards the roller).
5.4.3. Insert the probe in the hole.
5.4.4. Seat the gauge firmly by moving it about the probe with a back and forth motion.
5.4.5. Pull gently on the gauge in the direction that will bring the side of the probe which faces the center
of the gauge into intimate contact with the side of the hole.
5.4.6. Set the time for a one-minute reading interval. Initiate the gauge to take the readings.
5.5. Take Gauge Readings.
5.5.1. Take and record 5 one-minute readings. Record the lb/ft3 (kg/m
3) on Wet Density (WD) and
Percent Moisture (%M) for each reading. Discard the single highest and lowest wet density values along
with their accompanying percent moisture values, average the three remaining wet density values and
record, and average the three remaining percent moisture values and record.
NOTE: Check tip of source rod to assure it is free of any foreign substance (i.e. grease, asphalt, concrete,
etc.).
5.6. Determining Moisture Readings Using KT-11. Determine the moisture content of soil directly under
the gauge according to KT-11.
5.7. If the soil fails to meet the designated compaction at a single location, rotate the gauge 180° and take
new readings. If the soil compaction still fails, then the compaction is inadequate.
6. CALCULATIONS WHEN USING KT-11
6.1. Calculate the Moisture in lb/ft3
(kg/m3) and subtract that quantity from the Wet Density (WD)
determined by the gauge. This will yield the Dry Density (DD):
M =
%M + 100
%M WD
DD = M - WD
Page 5/5 5.9.51 2016
Revised 2016
KT-51
%PR =
SD
DD 100
Where: M = Moisture content in lb/ft
3 (kg/m
3)
DD = Dry Density in lb/ft3 (kg/m
3)
WD = Wet Density in lb/ft3 (kg/m
3)
%PR = Percent of Proctor Density (also referred to as the Percent of Standard Density)
SD = Standard Density (Proctor) lb/ft3 (kg/m
3)
7. SOIL IDENTIFICATION
7.1. Identification of the soil is required for several reasons. These include the comparison to the standards
for optimum moisture content and target density which are required in order to determine compliance with
the specifications, determining the proper moisture correction factors to be applied for the soil under the test,
and the reporting of the moisture and density tests results.
7.2. A selection of soil type is necessary in order to set the moisture correction factor for the gauge.
7.3. Nonhomogeneous soils may be encountered in which differences between gauges and oven are not
consistent between samples. In this case, the use of KT-11, MOISTURE TESTS is the proper method for
analyzing the moisture content of the soil.
8. TESTING
8.1. Wet density and moisture are the only items the density gauge is capable of reading. All other values
are calculated from wet density, moisture, and initialized information in the gauge.
9. REPORT AND RECORD
9.1. Report and record as 0.1 lb/ft3 (1 kg/m
3) or 0.1% of optimum density.


Page 1/1 5.9.54 2016
Revised 2010
KT-54
5.9.54 DETERMINATION OF PAVEMENT PROFILE WITH THE PROFILOGRAPH
(Kansas Test Method KT-54)
DELETED 04-2010
See KT-46

Page 1/4 5.9.55 2016
Revised 2015
KT-55
5.9.55 PLASTIC FINES IN COMBINED AGGREGATES BY USE OF THE SAND EQUIVALENT
TEST (Kansas Test Method KT-55)
1. SCOPE
This test is intended to serve as a rapid test to show the relative proportions of fine dust or claylike
material in minus No. 4 (4.75 mm) combined aggregates. KT-55 reflects testing procedures found in
AASHTO T 176.
2. REFERENCED DOCUMENTS
2.1. AASHTO T 176; Plastic Fines in Graded Aggregates and Soils by Use of the Sand Equivalent Test
3. APPARATUS
3.1. A graduated plastic cylinder, rubber stopper, irrigator tube, weighted foot assembly and siphon
assembly, all conforming to their respective specifications and dimensions described in AASHTO T 176,
Section 4.1. Fit the siphon assembly to a 1 gal (4 L) bottle of working calcium chloride solution (see
Section 3.7 of this test method) placed on a shelf 36 + 1 in (915 + 25 mm) above the work surface.
3.2. A 3oz (85 + 5 mL) tinned box approximately 2.25 in (57 mm) in diameter, with Gill style cover.
3.3. A wide mouth funnel approximately 4 in (100 mm) in diameter.
3.4. A clock or watch reading in minutes and seconds.
3.5. A mechanical shaker as described in AASHTO T 176, Section 4.6. Prior to use, fasten the
mechanical sand equivalent shaker securely to a firm and level mount.
3.6. Stock calcium chloride solution: Prepare the stock calcium chloride solution as follows:
1 lb (454 g) technical grade Anhydrous Calcium Chloride
2050 g (1640 mL) USP Glycerin
47 g (45 mL0 Formaldehyde (40% solution)
3.6.1. Dissolve the calcium chloride in 1/2 gal (1.89 L) of distilled water. Cool the solution and then
filter it through Whatman No. 12 or equivalent paper. Add the glycerin and formaldehyde to the filtered
solution, mix well, and dilute to 1 gal (3.78 L) with distilled water.
3.7. Working calcium chloride solution: Prepare the working calcium chloride by diluting 3 + 0.2oz (85
+ 5 mL) of the stock calcium chloride solution to 1 gal (3.78 L) with water. Use distilled or
demineralized water for the normal preparation of the working solution. Working solutions more than
30 days old shall be discarded.
3.8. A straightedge or spatula, suitable for striking off the excess material from the tin measure.
3.9. A thermostatically controlled drying oven capable of maintaining a temperature of 230 + 9°F (110 +
5°C).
Page 2/4 5.9.55 2016
Revised 2015
KT-55
4. CONTROL
4.1. Maintain the temperature of the working solution at 72 + 5°F (22 + 3°C) during the performance of
this test. If field conditions prevent temperatures from staying within this temperature range, submit
frequent referee samples to the district laboratory for comparison. Temperature correction factors can
also be established for each combined aggregate being tested.
4.2. Perform the test in a location free of vibrations; vibrations may cause the suspended material to
settle at a rate greater than normal.
4.3. Do not expose the plastic cylinders to direct sunlight any more than is necessary.
4.4. To remove organic growth from the working calcium chloride solution container and from the inside
of the flexible tubing and irrigator tube, prepare a cleaning solvent by diluting sodium hypochlorite with
an equal quantity of water. Fill the solution container with the prepared cleaning solvent. Allow about a
liter of the cleaning solvent to flow through the siphon assembly and irrigator tube, allow to stand
overnight. After soaking, allow the cleaning solvent to flow out through the siphon assembly and
irrigator tube. Remove the siphon assembly from the solution container and rinse both with clear water.
The irrigator tube and siphon assembly can rinsed easily by attaching a hose between the tip of the
irrigator tube and water faucet and backwashing fresh water through the tube.
4.5. Occasionally the holes in the tip of the irrigator tube may become clogged by a particle of sand. If
the obstruction cannot be freed by any other method, use a pin or other sharp object to force it out, using
extreme care not to enlarge the size of the opening.
5. SAMPLE PREPARATION
5.1. Perform the sand equivalent test on combined aggregate materials passing the No. 4 (4.75 mm)
sieve. Pulverize all aggregate of fine-grained soil materials to pass the No. 4 (4.75 mm) sieve, and clean
all fines from the particles retained on the No. 4 (4.75 mm) sieve and include with the material passing
the No. 4 (4.75 mm) sieve.
5.2. Split or quarter enough of the original sample to yield slightly more than four-3oz (85mL) tin
measures of material passing the No. 4 (4.75 mm) sieve. Use extreme care to obtain a truly
representative portion of the original sample. Dampen the material to avoid loss or segregation of the
fines if necessary.
5.3. Prepare two test samples using the following method.
5.3.1. Split or quarter enough material from the portion passing the No. 4 (4.75 mm) sieve to fill the 3
oz. (85 mL) tin measure so it is slightly rounded above the brim. While filling the measure, tap the
bottom edge of the tin on the work table or other hard surface to cause consolidation of the material and
allow the maximum amount to be placed in the tin. Strike off the tin measure level full with a spatula or
straightedge.
5.3.2. Dry the test sample to constant mass at 230 + 9°F (110 + 5°C), cool to room temperature before
testing.

Page 3/4 5.9.55 2016
Revised 2015
KT-55
6. PROCEDURE
6.1. For each test sample: Siphon 4 + 0.1 in (101.6 + 2.5 mm) of working calcium chloride solution
into the plastic cylinder. Pour the prepared test sample from the measuring tin into the plastic cylinder
using the funnel to avoid spillage. Tap the bottom of the cylinder sharply on the heel of the hand several
times to release air bubbles and to promote thorough wetting of the sample.
6.2. Allow the wetted sample to stand undisturbed for 10 + 1 minutes. At the end of the 10 minute
soaking period, stopper the cylinder, then loosen the material from the bottom by partially inverting the
cylinder and shaking it simultaneously.
6.3. After loosening the material from the bottom of the cylinder, place the stoppered cylinder in the
mechanical1 sand equivalent shaker and secure. Make sure the timer is set for 45 seconds then turn the
shaker on.
6.4. Following the shaking operation, set the cylinder upright on the work surface and remove the
stopper.
6.5. Insert the irrigator tube in the cylinder and rinse material from the cylinder walls as the irrigator is
lowered. Force the irrigator through the material to the bottom of the cylinder by applying a gentle
stabbing and twisting action while the working solution flows from the irrigator tip. This flushes the fine
material into suspension above the coarser sand particles. Continue to apply the stabbing and twisting
action while flushing the fines upward until the cylinder is filled to the 15 in (381 mm) mark. Then raise
the irrigator slowly without shutting off the flow so that the liquid level is maintained at 15 in (381 mm)
while the irrigator is being withdrawn. Regulate the flow just before the irrigator is entirely withdrawn
and adjust the final level to 15 in (381 mm).
6.6. Allow the cylinder and contents to stand undisturbed for 20 minutes + 15 seconds. Start the timing
immediately after withdrawing the irrigator tube.
6.7. At the end of the 20-minute sedimentation period, read and record the top level of the clay
suspension. This is referred to as the “clay reading”. If no clear line of demarcation has formed at the
end of the specified 20-minute sedimentation period, allow the sample to stand undisturbed until a clay
reading can be obtained, then immediately read and record the top level of the clay suspension and total
sedimentation time. If the total sedimentation time exceeds 30 minutes, rerun the test using three
individual samples of the same material. Read and record the clay column height of that sample
requiring the shortest sedimentation period only.
6.8. Obtain the ‘sand reading” after the clay reading has been taken. The sand reading is determined by
placing the weighted foot assembly over the cylinder and gently lowering the assembly toward the sand.
Do not allow the indicator to hit the mouth of the cylinder as the assembly is being lowered. As the
weighted foot comes to rest on the sand, tip the assembly toward the graduations on the cylinder until the
indicator touches the inside of the cylinder. Subtract 10 in (254 mm) from the level indicated by the
extreme top edge of the indicator and record this value as the sand reading.
6.9. If the clay or sand readings fall between the 0.1 in (2.5 mm) graduations, record the level of the
higher graduation as the reading. For example, a clay reading of 7.95 in (199 mm) would be recorded as
8.0 in (200 mm), and a sand reading of 3.32 in (83 mm) would be recorded as 3.4 in (85 mm).
1 AASHTO T 176 Section 8.4.2. and 8.4.3 provides alternative means of the sample; the Manual and Hand Method.
The alternatives are not options under KT-55.

Page 4/4 5.9.55 2016
Revised 2015
KT-55
7. CALCULATIONS
7.1. Calculate the sand equivalent (SE) to the nearest 0.1 using the following formula:
SE = 100(Sand Reading)
Clay Reading
7.2. If the calculated sand equivalent is not a whole number, report it as the next higher whole number,
as in the following example:
SE(English) = 100(3.4)
8 = 42.5, which is reported as 43
SE(Metric) = 100(85)
200 = 42.5, which is reported as 43
7.3. Average the whole number values determined as described above. If the average of these values is
not a whole number, raise it to the next higher whole number.
8. REPORT
8.1. Record and report to the whole number.

Page 1/7 5.9.56 2016
Revised 2016
KT-56
5.9.56 RESISTANCE OF COMPACTED ASPHALT MIXTURE TO MOISTURE INDUCED
DAMAGE (Kansas Test Method KT-56)
1. SCOPE
This test covers preparation of specimens and measurement of the change of tensile strength resulting
from the effects of saturation and accelerated water conditioning of compacted asphalt mixtures in the
laboratory. KT-56 reflects testing found in AASHTO T 283. The results may be used to:
1. Predict the ability of an asphalt mix to withstand long-term stripping,
2. Evaluate liquid anti-stripping additives which are added to the asphalt cement, or
3. Evaluate pulverized solids, such as hydrated lime, which are added to the mineral aggregate.
2. REFERENCED DOCUMENTS
2.1. Part V, 5.9.; Sampling and Test Methods Foreword
2.2. KT-6; Specific Gravity and Absorption of Aggregate
2.3. KT-14; Marshall Tests of Bituminous Mixes
2.4. KT-15; Bulk Specific Gravity and Unit Weight of Compacted Hot Mix Asphalt (HMA)
2.5. KT-25; Sampling and Splitting Plant Mixed Asphalt Mixtures
2.6. KT-32; Method of Test for Density of Compacted Asphalt Mixtures by Nuclear Method
2.7. KT-39; Theoretical Maximum Specific Gravity of Asphalt Paving Mixtures
2.8. KT-58; Method for Preparing and Determining the Density of Hot Mix Asphalt (HMA) Specimens
by Means of the Superpave Gyratory Compactor
2.9. AASHTO T 283; Resistance of Compacted Asphalt Mixture to Moisture Induced Damage
3. APPARATUS
3.1. Equipment for preparing and compacting specimens from KT-58 of this manual.
3.2 Vacuum container with a minimum inside diameter of 8 in (200 mm) and an inside height capable of
placing a minimum of 1 in (25 mm) of water above specimen plus base plate prior to vacuum. Vacuum
container capable of withstanding a 1.2 in (30 mm) of Hg absolute pressure. Base plates to be made of
perforated Polypropylene material with a minimum of 6 in (150 mm) diameter.
3.3. Vacuum pump or water aspirator capable of obtaining a 1.2 in (30 mm) of Hg absolute pressure. To
include a manometer or vacuum gauge and appropriate hose to accommodate pressure and distance
requirements.
3.4. The balance shall conform to the requirements of Part V, 5.9; Sampling and Test Methods
Foreword, for the class of general purpose balance required for the principal sample mass of the sample
being tested.
Page 2/7 5.9.56 2016
Revised 2016
KT-56
3.5. Water bath capable of maintaining a temperature of 77 + 1°F (25 + 0.5°C).
3.6. Water bath capable of maintaining a temperature of 140 + 2°F (60 + 1°C).
3.7. Freezer maintained at 0 + 10°F (-18 + 5°C).
3.8. A supply of plastic film for wrapping, heavy-duty leak proof plastic bags to enclose the saturated
specimens and masking tape.
3.9. 10 mL graduated cylinder.
3.10. Loading jack and ring dynamometer from KT-14 of this manual to provide controlled vertical
deformation at the rate of 2 in (50.8 mm) per minute.
3.11. Breaking head will consist of stainless steel loading strips with a concave surface having a radius of
curvature equal to the nominal radius of the test specimen. For specimens 4 in (102 mm) in diameter the
loading strips are to be 0.5 in (12.7 mm) wide, and for specimens 6 in (150 mm) in diameter the loading
strips are to be 0.75 in (19.05 mm) wide. The length to thickness ratio of the loading strips is to exceed
one. Round the edge of the loading strips.
3.12. Pans having a surface area of 75-100 square inches (48,400-64,500 square millimeters) in the
bottom and a depth of approximately 1 in (25 mm).
3.13. Forced air draft oven, thermostatically controlled, capable of maintaining any desired temperature
setting from room temperature to 350° + 5°F (176° + 3°C).
4. PREPARATION OF LABORATORY TEST SPECIMENS
4.1. Use specimens that are 6 in (150 mm) in diameter and 3.75 + 0.20 in (95 + 5 mm) thick.
4.2. Build the aggregate material in the same manner as described in KT-14 Sections e.2.b. or e.2.c. of
this manual. A minimum of six plugs will be required to perform this test. The asphalt quantity is based
on the optimum design content. Additional material for KT-39 of this manual may be required.
4.3. Preparation of mixes: Combine individual aggregates or reclaimed material and virgin aggregates by
weighing out in a separate pan for each test specimen, proportionate amounts of each size fraction for
each individual aggregate to produce the desired combined gradation. The combined aggregate should be
sufficient to produce a compacted specimen as described in Section 4.1.
4.4. Heat the aggregate and asphalt within the limits of mixing temperature determined in KT-14 Section
d.1. of this manual. Charge the mixing bowl with the heated aggregate and form a crater in the top. Add
the required amount of asphalt and mix the aggregate and asphalt until thoroughly coated, at least 2
minutes. Care should be taken to keep the entire sample in the mixing bowl during this process.
4.5. Either prior to, or after compaction, permit the mix to age at room temperature for 24 + 1 hours
before continuing to Section 6 of this test method.

Page 3/7 5.9.56 2016
Revised 2016
KT-56
4.6. Place the mixture in an oven set at the appropriate compaction temperature and age the material for 2
hours as outlined in KT-58 7.51 of this manual. Compact the mixture to 7.0 + 0.5 % air voids. This level
of voids can be obtained by adjusting the specimen mass or the height in Sect. 4.1. of this test method.
The exact procedure must be determined experimentally for each mixture before compaction the
specimens for each set.
4.7. Extract the specimens from the molds and allow cooling to room temperature. Due to the elevated
void content and potential instability of the specimens, verify that each specimen is adequately cool and
stable prior to removal from the mold.
5. PREPARATION OF FIELD TEST SPECIMENS
5.1. Select locations on the completed pavement to be sampled as outlined in KT-25 of this manual.
5.2. Place the field mixture in an oven set at the appropriate compaction temperature. Do not age the field
mixture in the oven. Compact the field mixture as outlined in KT-58 of this manual beginning at Sect.
7.7. Compact the mixture to 7.0 + 0.5 % air voids. This level of voids can be obtained by adjusting the
specimen mass or the height in Sect. 4.1. of this method. The exact procedure must be determined
experimentally for each mixture before compaction the specimens for each set.
5.3. Do not age for 24 hours as stated in Sect. 4.5.
6. EVALUATION OF TEST SPECIMEN AND GROUPING
6.1. Determine the theoretical maximum specific gravity of mixture by KT-39 of this manual.
6.2. Determine the specimen thickness, to the nearest 0.001 in (0.01 mm), at approximately quarter points
on the periphery of the plug. Average the results and record. For height, a specimen measuring device
can also be used in lieu of averaging. Also determine the diameter to the nearest 0.001 in (0.01 mm).
6.3. Determine the bulk specific gravity by KT-15, Procedure III of this manual. Express volume of
specimens in mL.
6.4. Calculate air voids by using the following formula:
% Air Voids =100(Theoretical Max. S.G. –Bulk S.G.)
Theoretical Max. S.G.
6.5. Sort specimens into two subsets of three specimens each so the average air voids of the two subsets
are approximately equal.
7. PRECONDITIONING OF TEST SPECIMENS
7.1. Test one subset dry and test the other subset after preconditioning.
7.2. Store the dry subset at room temperature until testing. Measure the height and diameter of the dry
set. Wrap the specimens with plastic, heavy duty leak proof plastic bag or place in plastic concrete
1 AASHTO T 283 Section 6.34 requires the material to be cooled at room temperature for 2 +/- 0.5 h then placed in
an oven at 60°+/- 3C for 16 hours prior to curing.

Page 4/7 5.9.56 2016
Revised 2016
KT-56
cylinder molds2. Place the specimens in the 77 + 1°F (25 + 0.5°C) water bath for 2 hours + 10 minutes
and then test as described in Section 8 of this test method.
7.3. Condition the other subset as follows:
7.3.1. Place the specimen in the vacuum container supported by a base plate positioned above the
container bottom. Fill the container with potable water at room temperature so that the specimens have at
least 1 in (25 mm) of water above their surface. Apply partial vacuum (10 to 26 in [250 to 650 mm] of
Hg) for a short time (5 to 10 minutes). These are only estimates for vacuum and time. Remove the
vacuum and leave the specimens submerged in water for a short time (5 to 10 minutes).
7.3.2. Determine bulk specific gravity of the three conditioned samples by KT-15, Procedure I of this
manual with noted exception in Section 6.3 of this test method. Prior to placing the sample in the water
bucket, place a sheet of plastic wrap on the balance and zero the balance. Within two minutes of taking
the sample from the water bucket, determine the SSD mass of the sample, calculate the degree of
saturation, and determine if the degree of saturation is acceptable as shown in Section 7.3.3 of this test
method. If the degree of saturation is acceptable, wrap the samples with the plastic wrap. All moisture
draining from the plug during this process is to be collected by the plastic wrap and is not permitted to be
discarded. Compare saturated surface dry mass with dry mass determined in Section 6.3 of this test
method. Calculate volume of absorbed water.
7.3.3. Determine degree of saturation by comparing volume of absorbed water with volume of air voids
from Section 6.4 of this test method. If the volume of water is between 70 to 80% of the volume of air,
proceed to Section 7.3.4. If volume of water is less than 70%, repeat the procedure beginning with
Section 7.3.1 of this test method using more vacuum and/or time. If volume of water is more than 80%,
specimen has been damaged and is discarded. Using a new specimen repeat the procedure using less
vacuum and/or time.
7.3.4. Cover the vacuum saturated specimens tightly with a second layer of plastic wrap. Place each
wrapped specimen in a plastic bag containing 10 mL of water and seal the bag.
7.3.5. Within 2 minutes, place the plastic bag containing the specimens in a freezer at 0 + 10°F (-18 +
5°C)for a minimum of 16 hours.
7.3.6. After removal from the freezer, place the specimens into a 140 + 2°F (60 + 1°C) water bath for 24
+ 1 hours. Remove the plastic bag and film from the specimens as soon as possible after placement in the
water bath.
7.3.7. After 24 + 1 hours in the 140 + 2°F (60 + 1°C) water bath, remove the specimens and place them in
a water bath already at 77 + 1°F (25 + 0.5°C) for 2 hours + 10 minutes. It may be necessary to add ice to
the water bath to prevent the water temperature from rising above 77 + 1°F (25 + 0.5°C). Not more than
15 minutes should be required for the water bath to reach 77 + 1°F (25 + 0.5°C).
7.3.8. Remove the conditioned plugs from the water bath. Quickly damp dry the saturated specimen with
a damp absorbent cloth and weigh the specimen. Any water which seeps from the specimen during the
weighing operation is considered part of the saturated specimen. Place the specimen in the basket or
bucket and determine the mass to the nearest 0.5 g while immersed in water at 77 + 1°F (25 + 0.5°C).
2 Concrete cylinder molds have found to successfully keep the plugs from becoming saturated. Care must be taken
so the lid is fitted properly thus keeping the plugs dry.

Page 5/7 5.9.56 2016
Revised 2016
KT-56
The mass of the specimen in water shall be determined as quickly as possible after the specimen is
immersed.
7.3.9. Determine the height and diameter of the plug prior to testing.
8. TESTING
8.1. Determine the indirect tensile strength of dry and conditioned specimens at 77 + 1°F (25 + 0.5°C).
8.1.1. Place the specimens between the two bearing plates in the testing machine. Care must be taken so
that the load will be applied along the diameter of the specimen. Apply the load to the specimens by
means of the constant rate of movement of the testing head of 2 in (50.8 mm) per minute.
8.1.2. Record the maximum compressive strength noted on the testing machine, and maintain continuous
loading until a vertical crack appears. Remove the specimen from the machine and pull apart at the crack.
Inspect the interior surface for stripping and record the observations.
9. CALCULATIONS
9.1. Calculate the tensile strength as follows:
St (English) = 2(P)
π (t)(D)
St (Metric) = 2000(P)
π (t)(D)
Where: St= Tensile strength, psi (kPa)
P= Maximum load, lbf (N)
t= Specimen thickness, in (mm)
t״= Conditioned specimen thickness, in (mm)
D= Specimen diameter, in (mm), and
D״= Conditioned specimen diameter, in (mm)
(D״ and t״ replace D and t when calculating the conditioned specimen’s tensile strength)
9.2. Express the numerical index or resistance of asphalt mixtures to the detrimental effect of water as the
ratio of the original strength that is retained after the freeze-warm water conditioning.
Calculate as follows:
% Tensile Strength Ratio (%TSR) =100(S2)
S1
Where: S1= Average tensile strength of dry subset, and
S2= Average tensile strength of conditioned subset
NOTE: If an anti-stripping agent is used, include the agent in all asphalt mixtures for the conditioned and
unconditioned subsets.
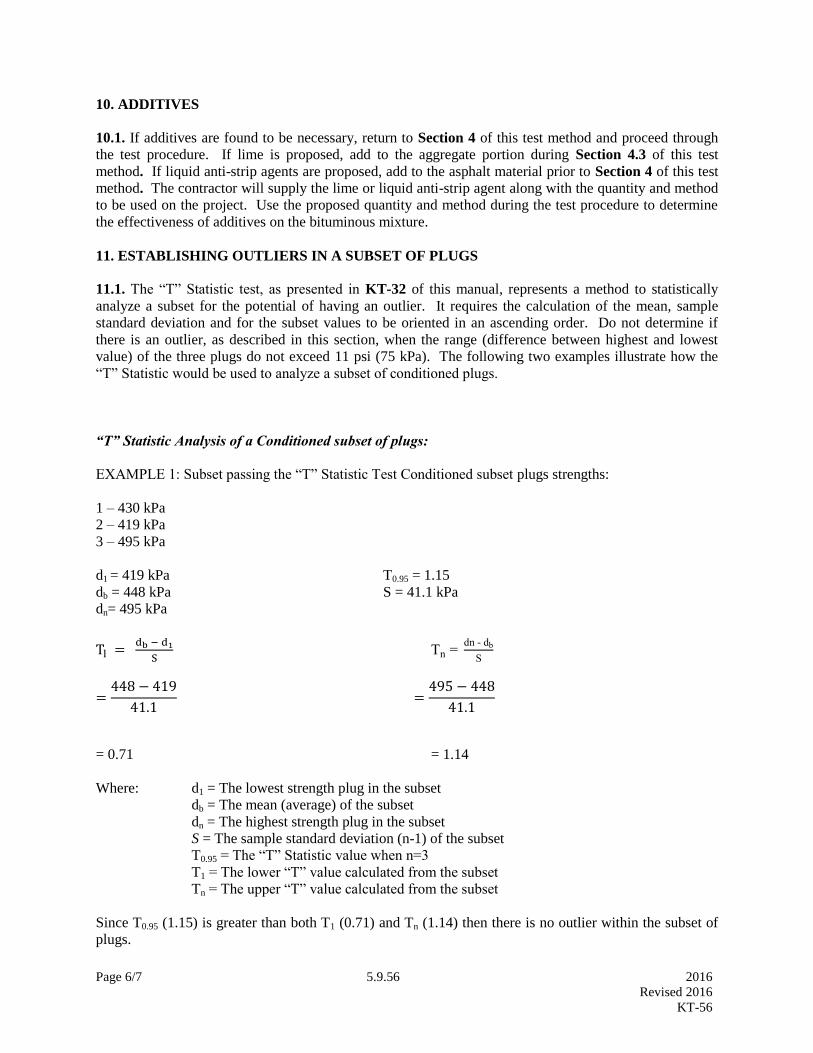
Page 6/7 5.9.56 2016
Revised 2016
KT-56
10. ADDITIVES
10.1. If additives are found to be necessary, return to Section 4 of this test method and proceed through
the test procedure. If lime is proposed, add to the aggregate portion during Section 4.3 of this test
method. If liquid anti-strip agents are proposed, add to the asphalt material prior to Section 4 of this test
method. The contractor will supply the lime or liquid anti-strip agent along with the quantity and method
to be used on the project. Use the proposed quantity and method during the test procedure to determine
the effectiveness of additives on the bituminous mixture.
11. ESTABLISHING OUTLIERS IN A SUBSET OF PLUGS
11.1. The “T” Statistic test, as presented in KT-32 of this manual, represents a method to statistically
analyze a subset for the potential of having an outlier. It requires the calculation of the mean, sample
standard deviation and for the subset values to be oriented in an ascending order. Do not determine if
there is an outlier, as described in this section, when the range (difference between highest and lowest
value) of the three plugs do not exceed 11 psi (75 kPa). The following two examples illustrate how the
“T” Statistic would be used to analyze a subset of conditioned plugs.
“T” Statistic Analysis of a Conditioned subset of plugs:
EXAMPLE 1: Subset passing the “T” Statistic Test Conditioned subset plugs strengths:
1 – 430 kPa
2 – 419 kPa
3 – 495 kPa
d1 = 419 kPa T0.95 = 1.15
db = 448 kPa S = 41.1 kPa
dn= 495 kPa
Tl = db − d1
S Tn =
dn - db
S
=448 − 419
41.1 =
495 − 448
41.1
= 0.71 = 1.14
Where: d1 = The lowest strength plug in the subset
db = The mean (average) of the subset
dn = The highest strength plug in the subset
S = The sample standard deviation (n-1) of the subset
T0.95 = The “T” Statistic value when n=3
T1 = The lower “T” value calculated from the subset
Tn = The upper “T” value calculated from the subset
Since T0.95 (1.15) is greater than both T1 (0.71) and Tn (1.14) then there is no outlier within the subset of
plugs.

Page 7/7 5.9.56 2016
Revised 2016
KT-56
EXAMPLE 2: Subset Failing the “T” Statistic Test
If dn = 530 kPa (instead of 495 kPa), then db= 460 kPa, S=61.2 kPa, Til =0.67 and Tn =1.14. This would
cause the highest strength plug (dn) to be classified as an outlier and would therefore be discarded. The
two remaining plugs would be used to determine the average tensile strength for the subset (average
subset strength = (419 + 430)/2 = 424 kPa).
12. Report
12.1. Record the TSR to the nearest 0.1% Report the TSR to the nearest 1%.
ADDENDUM TO KT-56
FOR INCLUDING LIME AS AN ANTISTRIPPING AGENT
The following information provides KT-56 with steps to incorporate hydrated lime as an antistripping
agent.
Delete sections 4.3 and 4.4 of this test method and replace with the following:
4.3. Preparation of mixes: combine the virgin aggregates by weighing in a separate pan for each test
specimen, proportionate amounts of each size fraction for each individual aggregate to produce the
desired combined aggregate with a batch mass of approximately 1,125 g. Include the hydrated lime mass
required to meet the specified percent of lime for the project as part of the total batch mass. The total
aggregate mass should include lime, virgin aggregate and reclaimed material (if applicable). The total
aggregate should be sufficient to produce a compacted specimen as described in Section 4.1 of this test
method.
4.3.1. Determine the SSD condition (KT-6) for the combined aggregate gradation. Add three percent of
moisture to the percent moisture required to reach the SSD condition of the combined aggregate.
4.3.2. Place the combined virgin aggregate and hydrated lime in a mixing bowl. Carefully mix until the
hydrated lime is combined with the aggregate. Add the appropriate water content, as determined in
Section 4.3.1 of this addendum to the test method, and thoroughly mix.
4.3.3. Oven dry the aggregate mix at 230 + 9°F (110 + 5°C) to a constant mass.
4.4. Combine the virgin aggregate material with the reclaimed material, if applicable, and thoroughly mix.
Heat the combined aggregate and asphalt within limits of the mixing temperature determined in KT-14,
Section d.1., of this manual. Charge the mixing bowl with the heated aggregate and form a crater in the
top. Add the required amount of asphalt and mix the aggregate and asphalt until thoroughly coated, at
least 2 minutes. Care should be taken to keep the entire sample in the mixing bowl during this process.

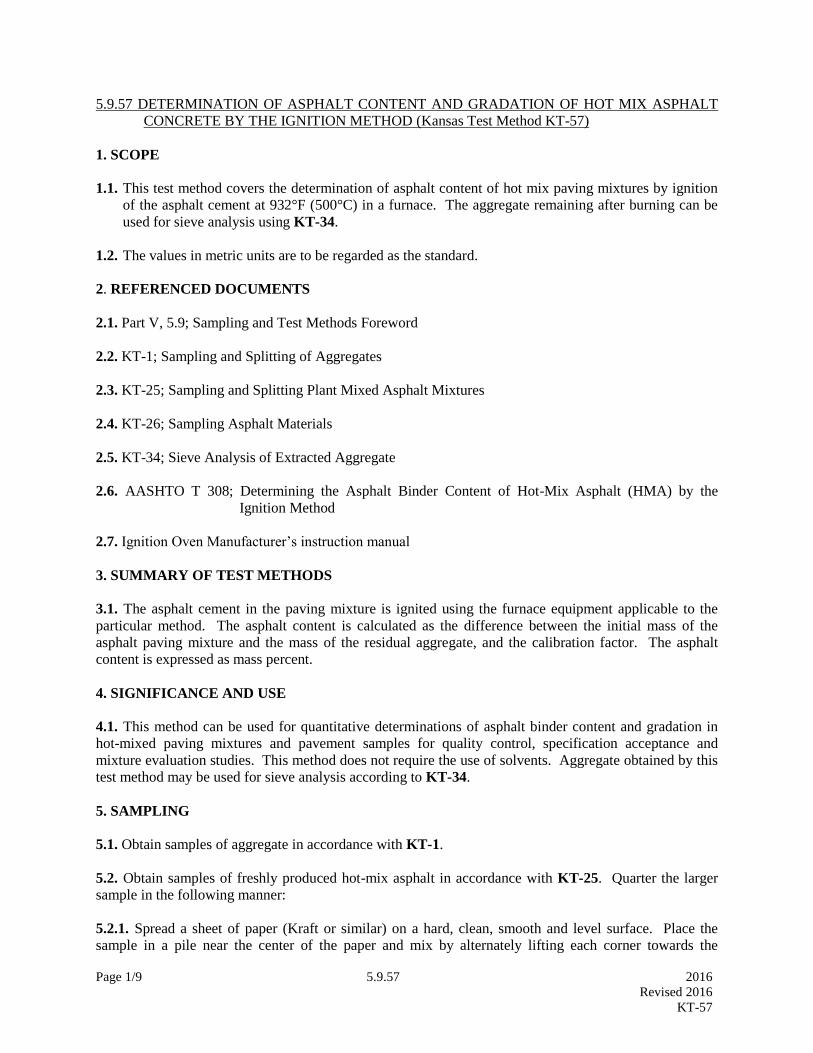
Page 1/9 5.9.57 2016
Revised 2016
KT-57
5.9.57 DETERMINATION OF ASPHALT CONTENT AND GRADATION OF HOT MIX ASPHALT
CONCRETE BY THE IGNITION METHOD (Kansas Test Method KT-57)
1. SCOPE
1.1. This test method covers the determination of asphalt content of hot mix paving mixtures by ignition
of the asphalt cement at 932°F (500°C) in a furnace. The aggregate remaining after burning can be
used for sieve analysis using KT-34.
1.2. The values in metric units are to be regarded as the standard.
2. REFERENCED DOCUMENTS
2.1. Part V, 5.9; Sampling and Test Methods Foreword
2.2. KT-1; Sampling and Splitting of Aggregates
2.3. KT-25; Sampling and Splitting Plant Mixed Asphalt Mixtures
2.4. KT-26; Sampling Asphalt Materials
2.5. KT-34; Sieve Analysis of Extracted Aggregate
2.6. AASHTO T 308; Determining the Asphalt Binder Content of Hot-Mix Asphalt (HMA) by the
Ignition Method
2.7. Ignition Oven Manufacturer’s instruction manual
3. SUMMARY OF TEST METHODS
3.1. The asphalt cement in the paving mixture is ignited using the furnace equipment applicable to the
particular method. The asphalt content is calculated as the difference between the initial mass of the
asphalt paving mixture and the mass of the residual aggregate, and the calibration factor. The asphalt
content is expressed as mass percent.
4. SIGNIFICANCE AND USE
4.1. This method can be used for quantitative determinations of asphalt binder content and gradation in
hot-mixed paving mixtures and pavement samples for quality control, specification acceptance and
mixture evaluation studies. This method does not require the use of solvents. Aggregate obtained by this
test method may be used for sieve analysis according to KT-34.
5. SAMPLING
5.1. Obtain samples of aggregate in accordance with KT-1.
5.2. Obtain samples of freshly produced hot-mix asphalt in accordance with KT-25. Quarter the larger
sample in the following manner:
5.2.1. Spread a sheet of paper (Kraft or similar) on a hard, clean, smooth and level surface. Place the
sample in a pile near the center of the paper and mix by alternately lifting each corner towards the
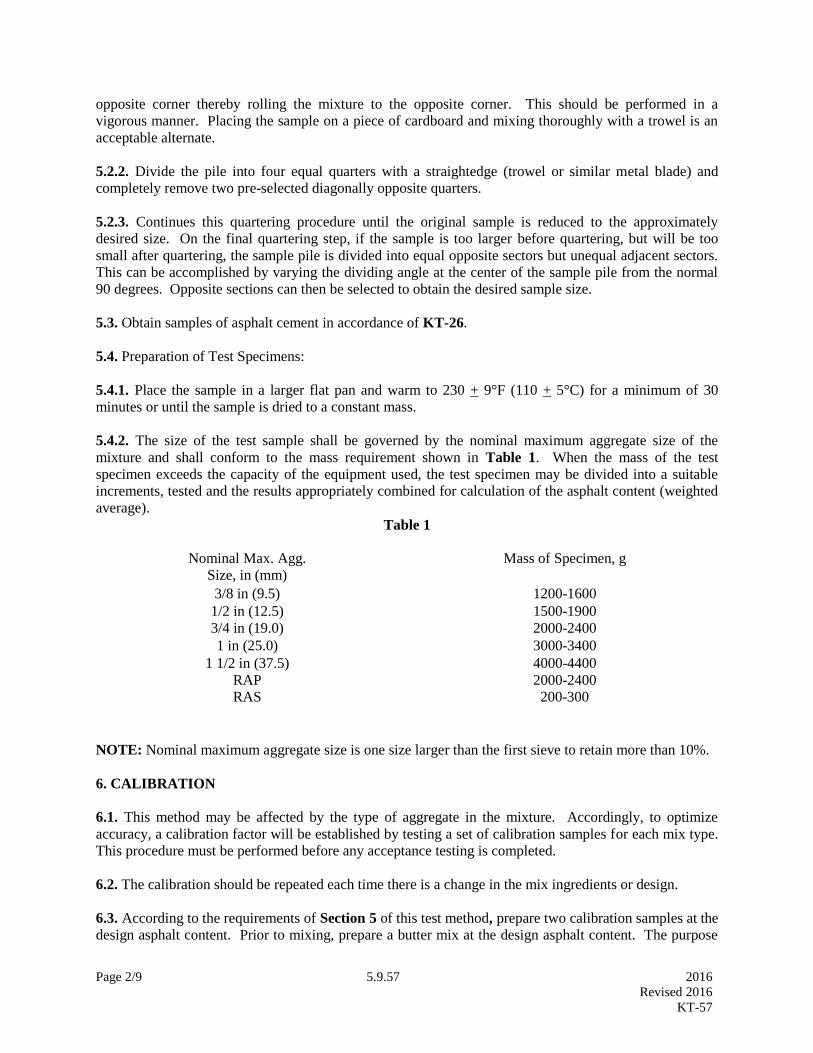
Page 2/9 5.9.57 2016
Revised 2016
KT-57
opposite corner thereby rolling the mixture to the opposite corner. This should be performed in a
vigorous manner. Placing the sample on a piece of cardboard and mixing thoroughly with a trowel is an
acceptable alternate.
5.2.2. Divide the pile into four equal quarters with a straightedge (trowel or similar metal blade) and
completely remove two pre-selected diagonally opposite quarters.
5.2.3. Continues this quartering procedure until the original sample is reduced to the approximately
desired size. On the final quartering step, if the sample is too larger before quartering, but will be too
small after quartering, the sample pile is divided into equal opposite sectors but unequal adjacent sectors.
This can be accomplished by varying the dividing angle at the center of the sample pile from the normal
90 degrees. Opposite sections can then be selected to obtain the desired sample size.
5.3. Obtain samples of asphalt cement in accordance of KT-26.
5.4. Preparation of Test Specimens:
5.4.1. Place the sample in a larger flat pan and warm to 230 + 9°F (110 + 5°C) for a minimum of 30
minutes or until the sample is dried to a constant mass.
5.4.2. The size of the test sample shall be governed by the nominal maximum aggregate size of the
mixture and shall conform to the mass requirement shown in Table 1. When the mass of the test
specimen exceeds the capacity of the equipment used, the test specimen may be divided into a suitable
increments, tested and the results appropriately combined for calculation of the asphalt content (weighted
average).
Table 1
Nominal Max. Agg.
Size, in (mm)
Mass of Specimen, g
3/8 in (9.5) 1200-1600
1/2 in (12.5) 1500-1900
3/4 in (19.0) 2000-2400
1 in (25.0) 3000-3400
1 1/2 in (37.5)
RAP
RAS
4000-4400
2000-2400
200-300
NOTE: Nominal maximum aggregate size is one size larger than the first sieve to retain more than 10%.
6. CALIBRATION
6.1. This method may be affected by the type of aggregate in the mixture. Accordingly, to optimize
accuracy, a calibration factor will be established by testing a set of calibration samples for each mix type.
This procedure must be performed before any acceptance testing is completed.
6.2. The calibration should be repeated each time there is a change in the mix ingredients or design.
6.3. According to the requirements of Section 5 of this test method, prepare two calibration samples at the
design asphalt content. Prior to mixing, prepare a butter mix at the design asphalt content. The purpose

Page 3/9 5.9.57 2016
Revised 2016
KT-57
of the butter mix is to condition the mixing bowl by providing a coating of asphalt and fines in the bowl.
Mix and discard the butter mix prior to mixing any of the calibration specimens to ensure accurate asphalt
content. Aggregate used for the calibration specimens shall be sampled from stockpiled material
produced in the current construction season and designated to be used on the candidate project. In other
words, this calibration process should not be completed until all necessary material has arrived on the
project site. An additional “blank” specimen shall be batched and tested for aggregate gradation
according to KT-34. The wash gradation shall fall within the mix design tolerances.
6.4. The freshly mixed specimens may be placed directly in the sample baskets. Allow the sample to cool
to room temperature.
6.5. Test specimens in accordance with Sections 7 and 8 of this test method (Test Method A) or Sections
9 and 10 of this test method (Test Method B).
6.6. Perform a gradation analysis on the residual aggregate as indicated in Section 11 of this test method.
Compare the gradation to the gradation of the unburned, “blank” specimen to evaluate the amount of
aggregate breakdown. This evaluation is for information only.
6.7. Once all of the calibration specimens have been burned determine the measured asphalt contents for
each sample by calculation.
6.8. If the difference between the measured asphalt contents of the two samples exceeds 0.15%, repeat the
two tests and from the four tests, discard the high and low result. Determine the calibration factor (CF)
from the two remaining results (CA and CB). Calculate the difference between the measured and actual
asphalt contents for each sample. The calibration is the average of the differences expressed in percent by
mass of the asphalt mixture for the Superpave designs and expressed in percent by mass of the remaining
aggregate for Marshall Designs.
Note: Calibration factors (CF) cannot be less than zero. If a calibration factor is calculated to be
less than zero record the calibration factor as zero.
7. APPARATUS (TEST METHOD A)
7.1. A forced air ignition furnace, capable of maintaining the temperature at 1072°F (578°C), with an
internal balance thermally isolated from the furnace chamber accurate to 0.1 g. The balance shall be
capable of weighing a 3500 g sample in addition to the sample baskets. A data collection system will be
included so that the mass can be automatically determined and displayed during the test. The furnace
shall have a built in computer program to calculate change in mass of the sample baskets and provide for
the input of a correction factor for aggregate loss. The furnace shall provide a printed ticket with the
initial specimen mass, specimen mass loss, temperature compensation, correction factor, corrected asphalt
binder content (percent), test time, and test temperature. The furnace chamber dimensions shall be
adequate to accommodate sample size of 3500 g. The furnace shall provide an audible alarm and
indicator light when the sample mass loss does not exceed 0.01% of the total sample mass for three
consecutive minutes. The furnace door shall be equipped so that the door cannot be opened during the
ignition test. A method for reducing furnace emissions shall be provided. The furnace shall be vented
into a hood or to the outside and when set up properly shall have no noticeable odors escaping into the
laboratory. The furnace shall have a fan with capacity to pull air through the furnace to expedite the test
and to reduce the escape of smoke into the laboratory.
NOTE: The furnace shall also allow the operator to change the ending mass loss percentage to 0.02%.
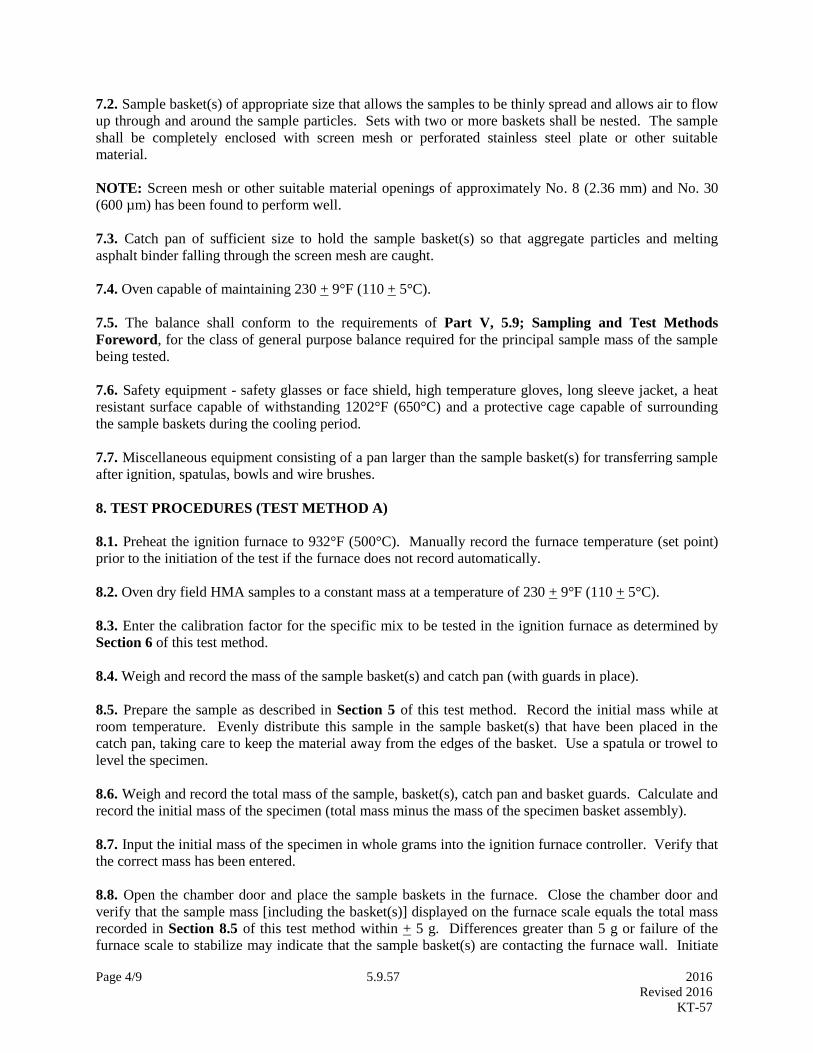
Page 4/9 5.9.57 2016
Revised 2016
KT-57
7.2. Sample basket(s) of appropriate size that allows the samples to be thinly spread and allows air to flow
up through and around the sample particles. Sets with two or more baskets shall be nested. The sample
shall be completely enclosed with screen mesh or perforated stainless steel plate or other suitable
material.
NOTE: Screen mesh or other suitable material openings of approximately No. 8 (2.36 mm) and No. 30
(600 µm) has been found to perform well.
7.3. Catch pan of sufficient size to hold the sample basket(s) so that aggregate particles and melting
asphalt binder falling through the screen mesh are caught.
7.4. Oven capable of maintaining 230 + 9°F (110 + 5°C).
7.5. The balance shall conform to the requirements of Part V, 5.9; Sampling and Test Methods
Foreword, for the class of general purpose balance required for the principal sample mass of the sample
being tested.
7.6. Safety equipment - safety glasses or face shield, high temperature gloves, long sleeve jacket, a heat
resistant surface capable of withstanding 1202°F (650°C) and a protective cage capable of surrounding
the sample baskets during the cooling period.
7.7. Miscellaneous equipment consisting of a pan larger than the sample basket(s) for transferring sample
after ignition, spatulas, bowls and wire brushes.
8. TEST PROCEDURES (TEST METHOD A)
8.1. Preheat the ignition furnace to 932°F (500°C). Manually record the furnace temperature (set point)
prior to the initiation of the test if the furnace does not record automatically.
8.2. Oven dry field HMA samples to a constant mass at a temperature of 230 + 9°F (110 + 5°C).
8.3. Enter the calibration factor for the specific mix to be tested in the ignition furnace as determined by
Section 6 of this test method.
8.4. Weigh and record the mass of the sample basket(s) and catch pan (with guards in place).
8.5. Prepare the sample as described in Section 5 of this test method. Record the initial mass while at
room temperature. Evenly distribute this sample in the sample basket(s) that have been placed in the
catch pan, taking care to keep the material away from the edges of the basket. Use a spatula or trowel to
level the specimen.
8.6. Weigh and record the total mass of the sample, basket(s), catch pan and basket guards. Calculate and
record the initial mass of the specimen (total mass minus the mass of the specimen basket assembly).
8.7. Input the initial mass of the specimen in whole grams into the ignition furnace controller. Verify that
the correct mass has been entered.
8.8. Open the chamber door and place the sample baskets in the furnace. Close the chamber door and
verify that the sample mass [including the basket(s)] displayed on the furnace scale equals the total mass
recorded in Section 8.5 of this test method within + 5 g. Differences greater than 5 g or failure of the
furnace scale to stabilize may indicate that the sample basket(s) are contacting the furnace wall. Initiate

Page 5/9 5.9.57 2016
Revised 2016
KT-57
the test by pressing the start/stop button. This will lock the sample chamber and start the combustion
blower.
NOTE: The furnace temperature will drop below the set point when the door is opened, but will recover
when the door is closed and ignition occurs. Sample ignition typically increases the temperature well
above the set point, depending on sample size and asphalt content.
8.9. Allow the test to continue until the stable light and audible stable indicator indicate the test is
complete (the change in mass does not exceed 0.01% for three consecutive minutes). Press the start/stop
button. This will unlock the sample chamber and cause the printer to print out the test results.
8.10. Open the chamber door, remove the sample basket(s) and allow them to cool to room temperature
(approximately 30 minutes).
8.11. Once the sample has cooled to room temperature, weigh and record the final mass. Calculate the
uncorrected asphalt content, then apply correction factor to determine corrected asphalt content.
9. APPARTUS (TEST METHOD B)
9.1. A forced air ignition furnace, capable of maintaining the temperature at 1072°F (578°C). The
furnace chamber dimensions shall be adequate to accommodate a sample size of 3500 g sample. The
furnace door shall be equipped so that the door cannot be opened during the ignition test. A method for
reducing furnace emissions shall be provided. The furnace shall be vented into a hood or to the outside
and when set up properly shall have no noticeable odors escaping into the laboratory. The furnace shall
have a fan with capacity to pull air through the furnace to expedite the test and to reduce the escape of
smoke into the laboratory.
9.2. Sample basket(s) of appropriate size that allows the samples to be thinly spread and allows air to flow
up through and around the sample particles. Sets with two or more baskets shall be nested. The sample
shall be completely enclosed with screen mesh or perforated stainless steel plate or other suitable
material.
NOTE: Screen mesh or other suitable material openings of approximately No. 8 (2.36 mm) and No. 30
(600 µm) has been found to perform well.
9.3. Catch pan of sufficient size to hold the sample basket(s) so that aggregate particles and melting
asphalt binder falling through the screen mesh are caught.
9.4. Oven capable of maintaining 230 + 9°F (110 + 5°C).
9.5. The balance shall conform to the requirements of Part V, 5.9; Sampling and Test Methods
Foreword, for the class of general purpose balance required for the principal sample mass of the sample
being tested.
9.6. Safety equipment - safety glasses or face shield, high temperature gloves, long sleeve jacket, a heat
resistant surface capable of withstanding 1202°F (650°C) and a protective cage capable of surrounding
the sample baskets during the cooling period.
9.7. Miscellaneous equipment consisting of, a pan larger than the sample basket(s) for transferring sample
after ignition, spatulas, bowls and wire brushes.
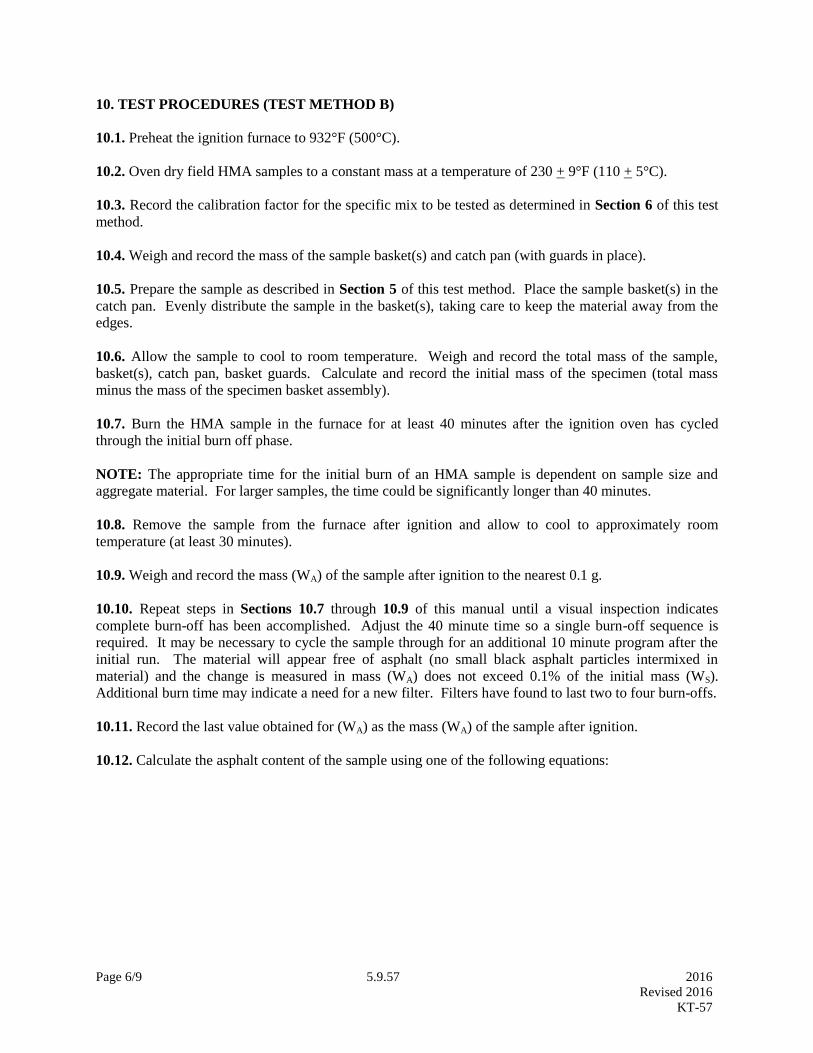
Page 6/9 5.9.57 2016
Revised 2016
KT-57
10. TEST PROCEDURES (TEST METHOD B)
10.1. Preheat the ignition furnace to 932°F (500°C).
10.2. Oven dry field HMA samples to a constant mass at a temperature of 230 + 9°F (110 + 5°C).
10.3. Record the calibration factor for the specific mix to be tested as determined in Section 6 of this test
method.
10.4. Weigh and record the mass of the sample basket(s) and catch pan (with guards in place).
10.5. Prepare the sample as described in Section 5 of this test method. Place the sample basket(s) in the
catch pan. Evenly distribute the sample in the basket(s), taking care to keep the material away from the
edges.
10.6. Allow the sample to cool to room temperature. Weigh and record the total mass of the sample,
basket(s), catch pan, basket guards. Calculate and record the initial mass of the specimen (total mass
minus the mass of the specimen basket assembly).
10.7. Burn the HMA sample in the furnace for at least 40 minutes after the ignition oven has cycled
through the initial burn off phase.
NOTE: The appropriate time for the initial burn of an HMA sample is dependent on sample size and
aggregate material. For larger samples, the time could be significantly longer than 40 minutes.
10.8. Remove the sample from the furnace after ignition and allow to cool to approximately room
temperature (at least 30 minutes).
10.9. Weigh and record the mass (WA) of the sample after ignition to the nearest 0.1 g.
10.10. Repeat steps in Sections 10.7 through 10.9 of this manual until a visual inspection indicates
complete burn-off has been accomplished. Adjust the 40 minute time so a single burn-off sequence is
required. It may be necessary to cycle the sample through for an additional 10 minute program after the
initial run. The material will appear free of asphalt (no small black asphalt particles intermixed in
material) and the change is measured in mass (WA) does not exceed 0.1% of the initial mass (WS).
Additional burn time may indicate a need for a new filter. Filters have found to last two to four burn-offs.
10.11. Record the last value obtained for (WA) as the mass (WA) of the sample after ignition.
10.12. Calculate the asphalt content of the sample using one of the following equations:

Page 7/9 5.9.57 2016
Revised 2016
KT-57
10.12.1. For a Superpave design (total mass mix):
AC% = [(WS -W A )
WS
×100] - CF
Where: AC% = The measured (corrected) asphalt content percent by mass of the HMA sample.
WA = The total mass of aggregate remaining after ignition.
WS = The total mass of the HMA sample prior to ignition
CF = Calibration factor, percent of mass of HMA sample
Where: CF = (CA + CB)/2
CA or CB = measured asphalt content – actual content
Where:
CA or CB = Individual sample correction factors, percent by mass of HMA sample as outlined in Section
6.8 of this test method.
10.12.2. For a Marshall mix design (dry aggregate method):
AC% = [(WS -W A )
WA
×100] - CF
Where: AC% = The measured (corrected) asphalt content percent by dry aggregate mass of the HMA
sample.
11. GRADATION
11.1. Allow the specimen to cool to room temperature in the sample baskets.
11.2. Empty the contents of the baskets into a flat pan. Use a small wire sieve brush to so that any
residual fines are removed from the baskets.
11.3. Perform the gradation analysis according to KT-34
12. REPORT
12.1. Always report the test method (A or B), correct asphalt content, calibration factor, temperature
compensation factor (if applicable), total percent loss, sample mass, test temperature and total time.
Examples of a spreadsheet available for use with Method B are in Figure 1 and Figure 2.
13. PRECISION AND BIAS
13.1. The precision estimates in Table 2 are taken from AASHTO T-308.
NOTE: The precision estimates given in Table 2 are based on the analysis of test results from three pairs
of AMRL proficiency samples. The data analyzed consisted of results from 353 to 461 laboratories for
each of the three pairs of samples. The analysis included two binder grades: PG 52-34 and PG 64-22.
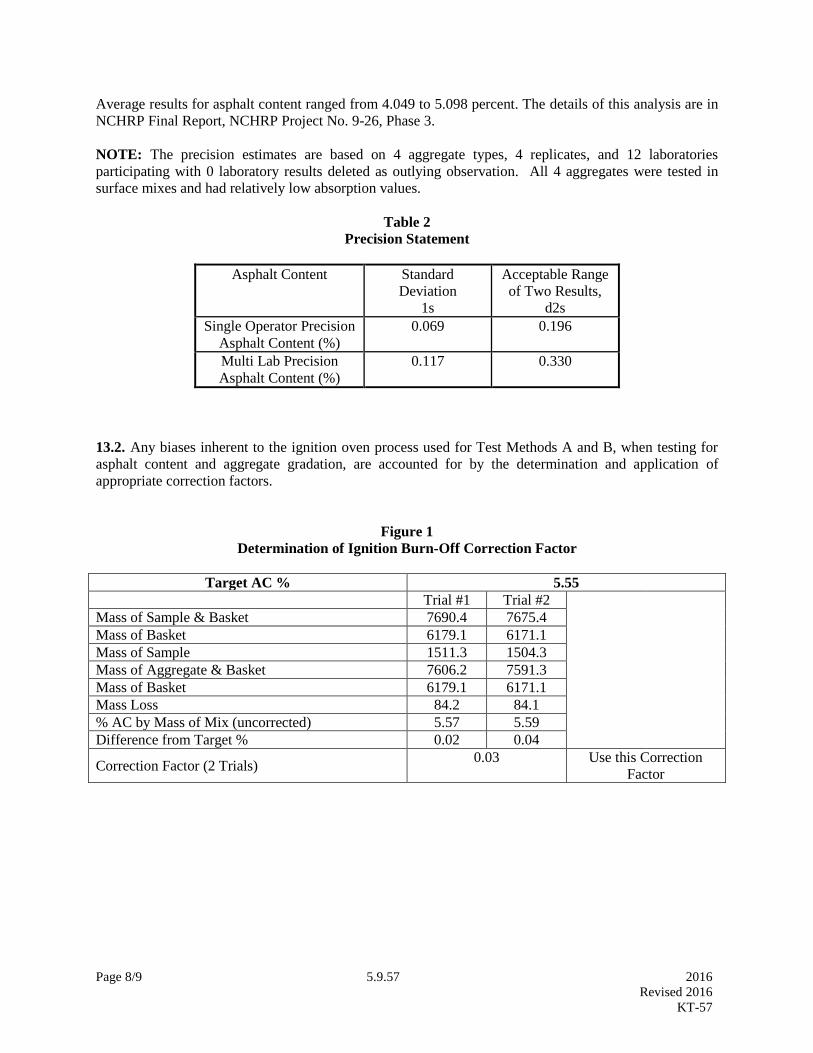
Page 8/9 5.9.57 2016
Revised 2016
KT-57
Average results for asphalt content ranged from 4.049 to 5.098 percent. The details of this analysis are in
NCHRP Final Report, NCHRP Project No. 9-26, Phase 3.
NOTE: The precision estimates are based on 4 aggregate types, 4 replicates, and 12 laboratories
participating with 0 laboratory results deleted as outlying observation. All 4 aggregates were tested in
surface mixes and had relatively low absorption values.
Table 2
Precision Statement
Asphalt Content Standard
Deviation
1s
Acceptable Range
of Two Results,
d2s
Single Operator Precision
Asphalt Content (%)
0.069 0.196
Multi Lab Precision
Asphalt Content (%)
0.117 0.330
13.2. Any biases inherent to the ignition oven process used for Test Methods A and B, when testing for
asphalt content and aggregate gradation, are accounted for by the determination and application of
appropriate correction factors.
Figure 1
Determination of Ignition Burn-Off Correction Factor
Target AC % 5.55
Trial #1 Trial #2
Mass of Sample & Basket 7690.4 7675.4
Mass of Basket 6179.1 6171.1
Mass of Sample 1511.3 1504.3
Mass of Aggregate & Basket 7606.2 7591.3
Mass of Basket 6179.1 6171.1
Mass Loss 84.2 84.1
% AC by Mass of Mix (uncorrected) 5.57 5.59
Difference from Target % 0.02 0.04
Correction Factor (2 Trials) 0.03 Use this Correction
Factor

Page 9/9 5.9.57 2016
Revised 2016
KT-57
Figure 2
Spreadsheet for Calculating Corrected Asphalt Content
Mix Type:SM-9.5A Lab. No.09-1511
Project #:23-90 KA 1429-01 Sample Date: 7/10/09
Design No.:3G09007A Report Date: 7/11/09
Technician: J Doe
EXTRACTION GRADATION
SIEVE SIZE
GMS
RET % RET.
1” (25.0 mm)
1. Wt. Frame & Sample 7651.0 3/4" (19.0 mm)
2. Wt. Frame 6064.4 1/2" (12.5 mm) 0 0
3. Wt. Sample (1-2) 1586.6 3/8” (9.5 mm) 74.8 5
4. Final Wt./Frame &Dry
Agg. 7560.5 No.4 (4.75 mm) 389.0 26
5. Final Wt. of Sample (4-2) 1496.1 No. 8 (2.36 mm) 658.2 44
6. Wt. Loss (1-4) 90.5 No. 16 (1.18 mm) 957.4 64
7. Corr. Factor 0.05 No. 30 (600 µm) 1166.9 78
8. Measured % AC
%AC = ((3-5)/3)100 -7 5.65 No. 50 (300 µm) 1331.4 89
No. 100 (150 µm) 1406.2 94
No. 200 (75 µm) 1451.1 97.0
Total Time (min.) 89
Pan No. 200 (-75µm) 1454.1
9. Wt. of Agg. Before
Washing 1496.0
10. Wt. of Agg. After
Washing 1455.3 (Pan wt. within 0.2% of line 10.
Copies of the spreadsheet can be obtained from the Construction and Materials Field Engineer.
Spreadsheets are currently in Excel format.

Page 1/7 5.9.58 2016
Revised 2014
KT-58
5.9.58 METHOD FOR PREPARING AND DETERMINING THE DENSITY OF HOT MIX ASPHALT
(HMA) SPECIMENS BY MEANS OF THE SUPERPAVE GYRATORY COMPACTOR
(Kansas Test Method KT-58)
1. SCOPE
1.1. This method covers the compaction of cylindrical specimens of hot mix asphalt (HMA) using the
Superpave Gyratory Compactor.
1.2. The values stated in SI units are to be regarded as the standard.
2. REFERENCED DOCUMENTS
2.1. Part V, 5.9; Sampling and Test Methods Foreword
2.2. KT-6; Specific Gravity and Absorption of Aggregates
2.3. KT-15; Bulk Specific Gravity and Unit Weight of Compacted Hot Mix Asphalt (HMA)
2.4. KT-39; Theoretical Maximum Specific Gravity of Asphalt Paving Mixtures
2.5. AASHTO T 312; Preparing and Determining the Density of Hot Mix Asphalt (HMA) Specimens by
Means of the Superpave Gyratory Compactor
2.6. ASTM D 4402; Test Method for Viscosity Determinations of Asphalt at Elevated Temperatures
Using Rotational Viscometer
2.7. ANSI/ASME B46.1; Surface Texture (Surface Roughness, Waviness and Lay)
3. SIGNIFICANCE AND USE
3.1. This standard is used to prepare specimens for determining the mechanical and volumetric properties
of HMA. The specimens simulate the density, aggregate orientation and structural characteristics
obtained in the actual roadway when proper construction procedure is used in the placement of the paving
mix.
3.2. This test method may be used to monitor the density or test specimens during their preparation. It
may also be used for field control of an HMA production process.
4. APPARATUS
4.1. Superpave Gyratory Compactor, an electro hydraulic or electromechanical compactor, with a ram and
ram heads as described in Section 4.3 of this test method that are restrained from revolving during
compaction. The axis of the ram shall be perpendicular to the platen of the compactor. The ram shall
apply and maintain a pressure of 600 + 18 kPa to a specimen cross section during compaction. The
compactor shall tilt specimen molds at an internal angle of 1.16 + 0.02 degrees and gyrate specimen
molds at a rate of 30.0 + 0.5 gyrations per minute throughout compaction. The compactor shall be
designed to permit the specimen mold to revolve freely on its tilted axis during gyration.
NOTE: This stress calculates to 10,600 + 106 N total force for 150 mm specimens.
Page 2/7 5.9.58 2016
Revised 2014
KT-58
4.1.1. Specimen height measurement and recording device, when specimen density is to be monitored
during compaction, a means shall be provided to continuously measure and record the height of the
specimen to the nearest 0.1 mm during compaction once per gyration.
4.1.2. The built-in reporting system shall include a printer connected to a port capable of printing test
information. The information shall include specimen height per gyration. The system should include a
computer and suitable software for data acquisition and reporting.
4.2. Specimen molds shall have steel walls that are at least 0.30 in (7.5 mm) thick and are hardened to at
least Rockwell C 48. The inside finish of the molds shall have a root mean square (rms) of 1.60 µm or
smoother. Molds shall have an initial inside diameter of 5.902 to 5.906 in (149.90 to 150.00 mm) and at
least 10 in (250 mm) high. Molds with an inside diameter of greater than 150.20 mm shall be removed
from service.
NOTE: Smoothness measurement is in accordance with ANSI B 46.1. One source of supply for a
surface comparator, which is used to verify the rms value 1.60 µm, is GAR Electroforming, Danbury,
Connecticut.
4.3. Ram heads and mold bottoms shall be fabricated from steel with a minimum Rockwell hardness of C
48. The ram heads shall have a means for staying fixed to the ram and perpendicular to its axis. The
platen side of each mold bottom shall be flat and parallel to its face. All ram and base plate faces (the
sides presented to the specimen) shall be ground flat to meet smoothness requirement in Section 4.2 of
this test method and shall have a diameter of 149.50 to 149.75 mm.
4.4. Thermometers shall be armored, glass or dial-type thermometers with metal stems for determining
temperature of aggregates, asphalt and asphalt mixtures between 122 to 450°F (50 to 260°C).
4.5. The balance shall conform to the requirements of Part V, 5.9; Sampling and Test Methods
Foreword, for the class of general purpose balance required for the principal sample mass of the sample
being tested.
4.6. An oven thermostatically controlled with a range from 122 to 450°F (50 to 260°C) with 5.4°F (+3°C)
tolerance, for heating aggregates, asphalt, asphalt mix and equipment as required. The oven shall be
capable of maintaining the temperature required for short-term aging.
4.7. Miscellaneous equipment, flat bottom metal pans for heating aggregates; scoop for batching
aggregates; containers; gill-type tins; beakers; containers for heating asphalt; large mixing spoon or small
trowel; large spatula; welders gloves for handling hot equipment; paper disks; mechanical mixer
(optional); and lubricating materials recommended by compactor manufacturer.
5. STANDARDIZATION
5.1. Items requiring periodic verification of calibration include the ram pressure, the angle of gyration, the
gyration frequency, the LVDT (or other means used to continuously record the specimen height) and oven
temperature. Verification of the mold and platen dimensions and the inside finish of the mold are also
required. When the computer and software options are used, periodically verify the data processing
system output using a procedure design for such purposes. Verification of calibration, system
standardization and quality checks may be performed by the manufacturer, other agencies providing such
services or in-house personnel.
Page 3/7 5.9.58 2016
Revised 2014
KT-58
6. PREPARATION OF APPARATUS
6.1. Immediately prior to the time when the paving mix is ready for the placement in the mold, turn on the
main power for the compactor for the manufacturer’s required warm-up period.
6.2. Verify machine settings are correct for angle, pressure and number of gyrations.
NOTE: The required number of gyrations is shown in Table 1.
6.3. Pine AFGC125X gyratory compactor (Big Pine)
6.3.1. Lubricate with an oily rag any bearing surfaces except for the upper roller bearing ring which
should be lubricated with an oil can, filled with motor oil. Do not use graphite on bearings.
6.3.2. Lightly lubricate the surface of the rotating base along with the surface of the four rollers.
6.4 When monitoring specimen height, the following additional item of preparation is required.
Immediately prior to the time when paving mix is ready for placement in the mold, turn on the device for
measuring and recording the height of the specimen and verify that the readout is in the proper units, mm,
and that the recording device is ready. If used, prepare the computer to record the height data and enter
the header information for the specimen.
7. MIXING AND COMPACTION PROCEDURE
Refer to the attached Addendum if using hydrated lime as an anti stripping agent.
7.1. Preparation of Reclaimed Material (if used): Place the reclaimed material in a 125 to 175oF (50 to
80oC) draft oven for 1 1/2 to 2 hours, to soften. Transfer the materials to the mixing bowl and mix for two
minutes in order to breakdown the reclaimed material to the recommended sizes. (Mixer will mix
approximately 3,500 g.) Other methods of breakdown are acceptable provided they do not fracture
aggregates or lose an excessive amount of material in the process. Separate the reclaimed material into
desired fractions by screening, when cool enough to screen. The following size fractions are recommended:
3/4 to 1/2 in (19.0 to 12.5 mm) No.4 to No.8 (4.75 to 2.36 mm)
1/2 to 3/8 in (12.5 to 9.5 mm) Passing No.8 (Passing 2.36 mm)
3/8 in to No.4 (9.5 to 4.75 mm)
7.1.1. Weigh the appropriate aggregate and reclaimed material, if applicable, fractions into a separate pan
and combine to the desired batch weight. The batch weight will vary based on the ultimate disposition of
the test specimens. If a target air void level is desired, as would be the case for Superpave abbreviated
mix analysis and/or full mix analysis performance specimens, batch weights will be adjusted to create a
given density in a known volume. When specimens are to be used for determination of volumetric
properties, the batch weights will be adjusted to result in a compacted specimen having dimensions of
either 150 mm in diameter and 115 + 5 mm in height or 100 mm in diameter and 63.5 + 2 mm in height at
the maximum number of gyrations.
NOTE: It may be necessary to produce a trial specimen to achieve this height requirement. Generally,
4500 g of aggregate for 150 mm plugs and 1200 g of aggregate for 100 mm plugs are required to achieve
this height for aggregates with combined bulk specific of 2.55.
Page 4/7 5.9.58 2016
Revised 2014
KT-58
7.2. Place the aggregate, reclaimed material, if applicable, and the asphalt binder container in the oven
and heat to the required mixing temperature.
7.2.1. The mixing temperature range is defined as the range of temperature where the unaged asphalt
binder has a kinematic viscosity of 170 + 20 mm2/s (approximately 0.17 + 0.02 Pa-s for an asphalt binder
density of 1.00 g/cm3) measured in accordance with ASTM D 4402.
NOTE: Modified asphalts may not adhere to the equi-viscosity requirements noted and the
manufacturer’s recommendations should be used to determine mixing and compaction temperature.
NOTE: The SI unit of kinematic viscosity is m2/s; for practical use, the submultiple mm
2 is
recommended. The more familiar centistokes, a cgs, unit of kinematic viscosity, is a ration of asphalt
binder viscosity to density. For an asphalt binder with equal density to 1.000 g/cm3, a kinematic viscosity
of 170 mm2/s is equivalent to a viscosity of 0.17 Pa-s measured in accordance with ASTM D 4402.
7.3. Charge the mixing bowl with the heated aggregate in one pan and reclaimed material, if required and
dry mix thoroughly. Form a crater in the dry blended aggregate and weigh the required amount of asphalt
binder into the mix. Immediately initiate mixing.
7.4. Mix the aggregate and asphalt binder as quickly and thoroughly as possible to yield a paving mix
having a uniform distribution of asphalt binder. As an option, mechanical mixing may be used.
7.5. After completing the mixture preparation, place the loose mix in a shallow, flat pan and short-term
age as it follows:
7.5.1. Place the mixture on a baking pan and spread it to an even thickness. Place the mixture and pan in
the aging oven set at compaction temperature for 2 hours + 5 minutes.
7.5.1.1. The compaction temperature range is defined as the range of temperature where the unaged
asphalt binder as a kinematic viscosity of 280 + 30 mm2/s (approximately 0.28 + 0.03 Pa-s) measured in
accordance with ASTM D 4402.
NOTE: Modified asphalts may not adhere to the equi-viscosity requirements noted and the
manufacturer’s recommendations should be used to determine mixing and compaction temperatures.
7.5.2. Stir mixture every 60 + 5 minutes to maintain uniform aging.
7.5.3. After 2 hours + 5 minutes, remove the mixture from the forced draft oven. The aged mixture is
now ready for further conditioning or testing as required.
7.6. Place the compaction mold and base plate in an oven permitting the pieces to reach the established
compaction temperature prior to the estimated beginning of the compaction process.
7.7. If loose HMA plant mix is used, the mixture shall be brought to the compaction temperature range by
careful uniform heating in an oven immediately prior to molding.
7.8. When compaction temperature is achieved, remove the heated mold and base plate from the oven and
place a paper disk on the bottom of the mold.
7.9. Thoroughly mix the material and place the mixture quickly into the mold in one lift and verify the
temperature of the material. The temperature of the material is to be at the midpoint of the established
compaction temperature +3°F (+ 1.5°C) for the specified PG asphalt. Care should be taken to avoid
Page 5/7 5.9.58 2016
Revised 2014
KT-58
segregation in the mold. After all the mix is in the mold, temperature verified, then level the mix and
place another paper disk on top of the leveled material and add the top plate.
7.10. Load the specimen mold with the paving mix into the compactor and center the mold under the
loading ram.
7.11. Lower the ram until the pressure on the specimen reaches 600 + 18 kPa.
7.12. Apply a 1.16 + 0.02 degrees internal angle to the mold assembly and begin the gyratory compaction.
7.13. Allow the compaction to proceed until the desired number of gyrations is reached and the gyratory
mechanism shuts off.
7.14. Remove the angle from the mold assembly, raise the loading ram, remove the mold from the
compactor and extrude the specimen from the mold.
NOTE: Specimen can be extruded from the mold immediately for most HMA paving mixes. For lean,
rich or tender mixtures, a cooling period of 5 to 10 minutes in front of a fan may be necessary before
extruding the specimen.
7.15. Remove the paper disks from the top and bottom of the specimens. Before reusing the mold, place it
in an oven until the mold reaches compaction temperature. The use of multiple molds will speed up the
compaction process.
NOTE: The extruded specimen may not be a right angle cylinder. Specimen ends may need to be sawed
to conform to the requirements of specific performance tests.
8. DENSITY PROCEDURE
8.1. When the specimen height is to be monitored, the following steps are required in addition to those
specified Section 7 of this test method.
8.1.1. Determine the maximum specific gravity (Gmm) of the loose mix in accordance with KT-39 using a
companion sample. The companion sample shall be aged to the same extent as the compaction sample.
8.1.2. Record the specimen height to the nearest 0.1 mm after each revolution.
8.1.3. Record the mass of the extruded specimen to the nearest gram and determine the bulk specific
gravity (Gmb) of the extruded specimen in accordance with KT-15, Procedure III of this manual.
9. DENSITY CALCULATIONS
9.1. Calculate the uncorrected relative density (Cux) at any point in the compaction process using the
following equation:
Cux =100 (Wm)
Vmx Gmm Gw
Where: Cux = Uncorrected relative density at any point during compaction expressed as a percent
of the theoretical maximum specific gravity
Wm = The mass of the specimen in grams
Page 6/7 5.9.58 2016
Revised 2014
KT-58
Gmm = Theoretical maximum specific gravity of the mix
Gw = The unit of water, 1 g/cm3
X = The number of gyrations
Vmx = The volume of the specimen, in cm3, at any point based on the diameter (d) and
height (hx) of the specimen at the point (use mm for height and diameter measurements).
It can be expressed as:
Vmx= πd
2 h2
4(1000)
NOTE: This formula gives volume in cm3 to allow direct comparison with specific gravity.
9.2. At the completion of the bulk specific gravity test, determine the percent compaction (Cx) at any
point in the compaction process as follows:
Cx =100 (Gmb hm)
Gmm hx
Where: Cux = Corrected relative density expressed as a percentage of the maximum theoretical
specific gravity
Gmb = Bulk specific gravity of the extruded specimen.
hm = Height in mm of the extruded specimen
hx = Height in mm of the specimen after “x” gyrations
10. REPORT
10.1. Project number.
10.2. Date of test.
10.3. Start time of test.
10.4. Specimen identification.
10.5. Percent binder in specimen, nearest 0.1%.
10.6. Average diameter of the mold used in (d), nearest 0.01 mm.
10.7. Mass of the specimen (Wm), nearest g.
10.8. Theoretical maximum specific gravity (Gmm) of the specimen by KT-39, nearest 0.001.
10.9. Bulk specific gravity (Gmb) of the specimen by KT-15 Procedure III of this manual, nearest 0.001.
10.10. Height of the specimen after each gyration (h2), nearest 0.1 mm.
10.11. Relative density (Cx) expressed as a percent of the theoretical maximum specific gravity, nearest
0.1 %.
Table 1
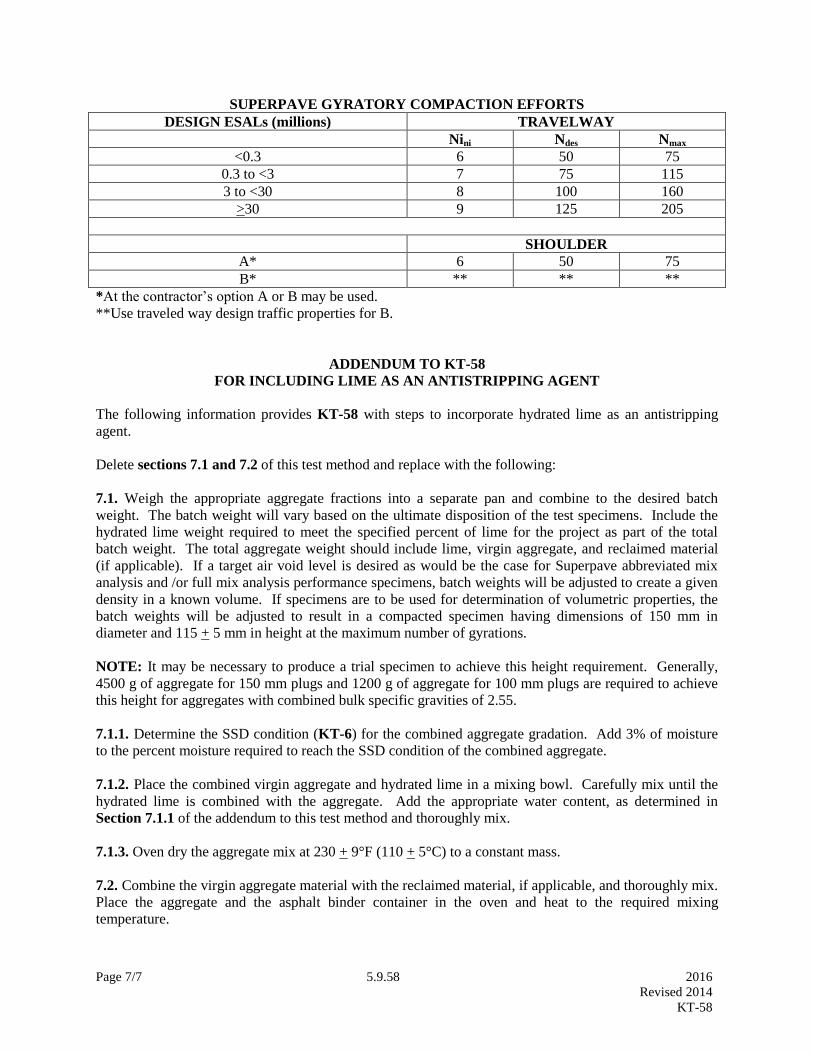
Page 7/7 5.9.58 2016
Revised 2014
KT-58
SUPERPAVE GYRATORY COMPACTION EFFORTS
DESIGN ESALs (millions) TRAVELWAY
Nini Ndes Nmax
<0.3 6 50 75
0.3 to <3 7 75 115
3 to <30 8 100 160
>30 9 125 205
SHOULDER
A* 6 50 75
B* ** ** **
*At the contractor’s option A or B may be used.
**Use traveled way design traffic properties for B.
ADDENDUM TO KT-58
FOR INCLUDING LIME AS AN ANTISTRIPPING AGENT
The following information provides KT-58 with steps to incorporate hydrated lime as an antistripping
agent.
Delete sections 7.1 and 7.2 of this test method and replace with the following:
7.1. Weigh the appropriate aggregate fractions into a separate pan and combine to the desired batch
weight. The batch weight will vary based on the ultimate disposition of the test specimens. Include the
hydrated lime weight required to meet the specified percent of lime for the project as part of the total
batch weight. The total aggregate weight should include lime, virgin aggregate, and reclaimed material
(if applicable). If a target air void level is desired as would be the case for Superpave abbreviated mix
analysis and /or full mix analysis performance specimens, batch weights will be adjusted to create a given
density in a known volume. If specimens are to be used for determination of volumetric properties, the
batch weights will be adjusted to result in a compacted specimen having dimensions of 150 mm in
diameter and 115 + 5 mm in height at the maximum number of gyrations.
NOTE: It may be necessary to produce a trial specimen to achieve this height requirement. Generally,
4500 g of aggregate for 150 mm plugs and 1200 g of aggregate for 100 mm plugs are required to achieve
this height for aggregates with combined bulk specific gravities of 2.55.
7.1.1. Determine the SSD condition (KT-6) for the combined aggregate gradation. Add 3% of moisture
to the percent moisture required to reach the SSD condition of the combined aggregate.
7.1.2. Place the combined virgin aggregate and hydrated lime in a mixing bowl. Carefully mix until the
hydrated lime is combined with the aggregate. Add the appropriate water content, as determined in
Section 7.1.1 of the addendum to this test method and thoroughly mix.
7.1.3. Oven dry the aggregate mix at 230 + 9°F (110 + 5°C) to a constant mass.
7.2. Combine the virgin aggregate material with the reclaimed material, if applicable, and thoroughly mix.
Place the aggregate and the asphalt binder container in the oven and heat to the required mixing
temperature.

Page 1/5 5.9.59 2016
Revised 2016
KT-59
5.9.59 FLAT AND ELONGATED PARTICLES IN COARSE MATERIAL TEST
(Kansas Test Method KT-59)
1. SCOPE
This test method covers the determination of the percentage of flat and elongated particles in coarse
aggregates. KT-59 reflects testing procedures found in ASTM D 4791.
2. REFERENCED DOCUMENTS
2.1. Part V, 5.9; Sampling and Test Methods Foreword
2.2 KT-1; Sampling and Splitting of Aggregates
2.3. KT-2; Sieve Analysis of Aggregates
2.4. AASHTO M 92; Wire-Cloth Sieves for Testing Purposes
2.5. ASTM D 4791; Standard Test Method for Flat Particles, Elongated Particles, or Flat and Elongated
Particles in Coarse Aggregate
3. DEFINITIONS
3.1. Flat and elongated particles of aggregate-those particles of aggregate having a ratio of length to
thickness greater than a specified value.
3.2. A flat and elongated particle exits when the particle’s small ratio (the 1 in 5:1) slides the full length
through the opening established by the large ration number (the 5 in 5:1). EXAMPLE: Checking flat and
elongated particles requires comparing the length vs. thickness. After setting the large ratio to the
maximum length of the particle, attempt to slide the flattest portion of the particle horizontally through
the opening of the small ratio. If the particle passes clear through the opening, then the particle is flat and
elongated.
4. SIGNIFICANCE AND USE
4.1. Flat and elongated particles of aggregates, for some construction uses, may interfere with
consolidation and result in harsh, difficult to place materials.
4.2. This test method provides a means for checking compliance with specifications that limit such
particles, or to determine the relative shape characteristics of coarse aggregates.
5. APPARATUS
5.1. Use apparatus suitable for testing aggregate particles for compliance with the definition in Section
3.1 of this test method, at the dimensional ratios desired.
5.1.1. The proportional caliper device illustrated in Figure 1 is an example of all apparatus suitable for
this test method. It consists of a base plate with two fixed posts and a swinging arm mounted between
them so that the openings between the arms and the posts maintain a constant ratio.
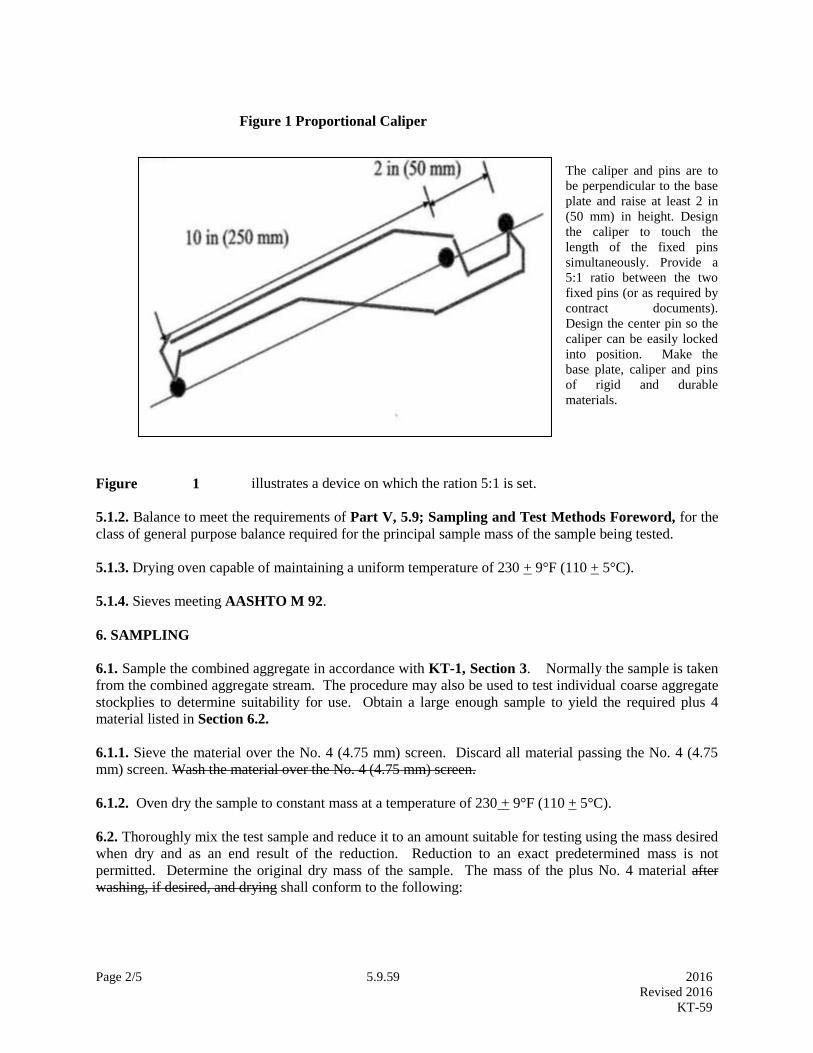
Page 2/5 5.9.59 2016
Revised 2016
KT-59
Figure 1 Proportional Caliper
The caliper and pins are to
be perpendicular to the base
plate and raise at least 2 in
(50 mm) in height. Design
the caliper to touch the
length of the fixed pins
simultaneously. Provide a
5:1 ratio between the two
fixed pins (or as required by
contract documents).
Design the center pin so the
caliper can be easily locked
into position. Make the
base plate, caliper and pins
of rigid and durable
materials.
Figure 1 illustrates a device on which the ration 5:1 is set.
5.1.2. Balance to meet the requirements of Part V, 5.9; Sampling and Test Methods Foreword, for the
class of general purpose balance required for the principal sample mass of the sample being tested.
5.1.3. Drying oven capable of maintaining a uniform temperature of 230 + 9°F (110 + 5°C).
5.1.4. Sieves meeting AASHTO M 92.
6. SAMPLING
6.1. Sample the combined aggregate in accordance with KT-1, Section 3. Normally the sample is taken
from the combined aggregate stream. The procedure may also be used to test individual coarse aggregate
stockplies to determine suitability for use. Obtain a large enough sample to yield the required plus 4
material listed in Section 6.2.
6.1.1. Sieve the material over the No. 4 (4.75 mm) screen. Discard all material passing the No. 4 (4.75
mm) screen. Wash the material over the No. 4 (4.75 mm) screen.
6.1.2. Oven dry the sample to constant mass at a temperature of 230 + 9°F (110 + 5°C).
6.2. Thoroughly mix the test sample and reduce it to an amount suitable for testing using the mass desired
when dry and as an end result of the reduction. Reduction to an exact predetermined mass is not
permitted. Determine the original dry mass of the sample. The mass of the plus No. 4 material after
washing, if desired, and drying shall conform to the following:
Page 3/5 5.9.59 2016
Revised 2016
KT-59
Nominal Maximum Size
Square Openings, in. (mm)
Minimum Mass of +4
Test Sample, lb (kg)
No. 4 (4.75 mm) 1 lb (0.5 kg)
3/8 in (9.5 mm) 2 lb (1 kg)
1/2 in (12.5 mm) 4 lb (2 kg)
3/4 in (19.0 mm) 11 lb (5 kg)
1 (25.0 mm) 22 lb (10 kg)
1 1/2 in (37.5 mm) 33 lb (15 kg)
NOTE: Nominal maximum aggregate size is one size larger than the first sieve to retain more than 10%.
7. PROCEDURE
7.1. Sieve the sample of coarse aggregate to be tested in accordance with KT-2, Section 6. Separately retain and determine the mass of each sieve size fraction. Reduce each size fraction larger than the No.
4 (4.75 mm) sieve present in the amount of 10% or more of the original sample in accordance with KT-1,
Section 4 until approximately 100 particles are obtained. Determine the mass of each reduced size
fraction.
7.2. With the proportional device set at a 5:1 ratio (or as required by the contract documents), test each of
the particles in each size fraction for flat and elongated.
7.2.1. Use the proportional caliper device, shown in Figure 1. Set the larger opening equal to the particle
length. The particle is flat and elongated if the flattest portion of the particle can be placed through the
smaller opening. Determine the proportion of the sample in each group by mass.
8. CALCULATIONS
8.1. Calculate the percent of flat and elongate particles to the nearest 1% for each sieve size greater than
No. 4 (4.75 mm).
8.2. When a weighted average for a sample is required, assume that the sieve sizes not tested (those
representing less than 10% of the sample) have the same percentage of flat and elongated particles as the
next smaller or the next larger size, or use the average for the next smaller and larger sizes, if both are
present.
8.3. Calculate the flat and elongated on each sieve:
% F&E d = c(100 )
b
Where: c= mass of flat and elongated particles
b= mass of 100+/- particles tested
d= % F&E
Calculate the % weighted of F&E on each sieve:
e = (a)(d )
100

Page 4/5 5.9.59 2016
Revised 2016
KT-59
Where: a= % of original sample retained on sieve
d= % F&E
e= weighted %Calculate to the % total weighted F&E for a given sample:
% total weighted F&E (f) = sum of all individual weighted percent F&E
*individual mass quantities are after reduction to approximately 100 pieces (Section 7.2, of this test method)
NOTE: If percent retained on sieve is less than 10% do not test for flat and elongated.
NOTE: If percent retained on sieve is less than 10% use %F&E from adjacent sieve or average of next larger and
next smaller sieve.
9. REPORT
9.1. Include the following information in the report:
9.1.2. Grading of the aggregate sample, showing percentage retained on each sieve.
9.1.3. Percentages, calculated by mass for flat and elongated particles, for each sieve size tested, and the
combined aggregate percent for flat and elongated particles.
9.1.4. When required, weighted average percentages based on the actual or assumed proportions of the
various sieve sizes tested. Report the grading used for the weighted average if different from that in
Section 9.1.2 of this test method.
9.1.5. Record the flat and elongated particles to the nearest 1%. Report the flat and elongated particles to
the nearest 1%.
10. PRECISION AND BIAS
10.1. Precision-The precision of this test method is found in ASTM D 4791.
Individual % Each Size *Mass of Reduced Failed Aggregate
Sieve Weight (g) Fraction = a Fraction (g) = b Mass (g) = c % Failed = d Weighted % = e
1 1/2" -- -- -- -- -- --
1" -- -- -- -- -- --
3/4" -- -- -- -- -- --
1/2" 1200 60 150 27 18 11
3/8" 740 37 75 8 11 4
#4 60 3 -- -- 11 0
Original
Dry Mass
of + #4
2000
Total % F & E = =f
15

Page 5/5 5.9.59 2016
Revised 2016
KT-59
10.2. Bias-Since there is no accepted reference material suitable for determining the bias for this test
method no statement on bias is being made.

2016
Revised 2015
Page 1/8 5.9.60 KT-60
5.9.60 INDIRECT TENSILE TEST (Kansas Test Method KT-60)
1. SCOPE
This test method provides procedures used to determine tensile creep compliance in hot mix asphalt. It also
provides the data to conduct thermal cracking and fatigue cracking analysis.
KT-60 reflects testing procedures found in AASHTO T 322-07.
Note: Procedure for critical cold temperature selection:
Specification temperature shall be chosen using FHWA LTPPBind software (Version 3.1) using the weather
station closest to the project. The required temperature for the specification is the coldest temperature at the
top of the asphalt concrete layer in the pavement structure. Use 98 percent reliability.
2. REFERENCED DOCUMENTS
2.1. KT-15 Bulk Specific Gravity and Unit Weight of Compacted Hot Mix Asphalt (HMA)
2.2 KT-56 Resistance of Compacted Asphalt Mixture to Moisture Induced Damage
2.3 KT 58 Method For Preparing and Determining the Density of Hot Mix Asphalt (HMA) Specimens by
Means of the Superpave Gyratory Compactor
2.4 AASHTO T322-07; Determining the Creep Compliance and Strength of Hot Mix Asphalt (HMA) Using
the Indirect Tensile Test Device
3. SIGNIFICANCE AND USE
3.1. Tensile creep and tensile strength test data are required for Superpave mixtures to determine the
master relaxation modulus curve and fracture parameters. This information is used to calculate the
thermal cracking of the asphalt concrete. The master relaxation modulus curve controls thermal crack
development, while the fracture parameter defines a mixture’s resistance to fracture.
3.2. The values of creep compliance, tensile strength, and Poisson’s ratio determined with this method
can be used in linear viscoelastic analysis to calculate the low temperature thermal cracking potential of
asphalt concrete.
3.3. Tensile creep data may be used to evaluate the relative quality of materials.
3.4. This procedure is applicable to newly prepared mixtures, reheated, and recompacted mixtures.
Reheated and recompacted mixtures will have lower creep compliance values than newly prepared
mixtures when measured under these specific loading conditions and temperatures.
3.5. This procedure is applicable for mixtures with a maximum aggregate size of 38 mm or less.
2016
Revised 2015
Page 2/8 5.9.60 KT-60
4. APPARATUS
4.1 The indirect tensile test system shall consist of an axial loading device, a load measuring device,
specimen deformation measurement devices, an environmental chamber, and a control and data
acquisition system.
4.1.1. The axial loading device shall be capable of providing a fixed or constant load of 100 kN (22,500
lbf) with a resolution of at least 20 N (5 lbf) and constant rate of ram displacement of at least 12 mm(0.5
in.)/minute.
4.1.2. The load measuring device shall consist of an electronic load cell, designed for placement between
the loading platen and piston, with a sensitivity of 20 N(5 lbf), and a minimum capacity of 100 kN
(22,500 lbf).
4.1.3. The specimen deformation measurement devices shall consist of four displacement transducers
with a range of at least 25 mm (1.0 in.), reducible to 2.5 mm (0.1 in.) through software, and a minimum
resolution throughout the range of 0.10 μm (3.936996e-006 in.).
4.1.4. The environmental chamber shall be equipped with temperature conditioners and controls capable
of generating test temperatures between -40oC (-40
oF) and +10°C (+50°F) inside the chamber and
maintaining the desired test temperature to within ±0.5°C (±0.9°F). The internal dimensions of the
environmental chamber shall be sufficient to hold a minimum of three test specimens for a period of 12
hours prior to testing.
4.1.5. Specimen behavior in the creep compliance test is evaluated from time records of applied load and
specimen deformation. These parameters shall be recorded on an analog to digital data acquisition
device.
4.1.5.1. When determining the 100-second tensile creep for Superpave, digital data acquisition devices
shall provide a sampling frequency of 10 Hz for the first 10 seconds and 1 Hz for the next 90 seconds.
When determining the 1000-second tensile creep, digital data acquisition devices shall provide a
sampling frequency of 10 Hz for the first 10 seconds, 1 Hz for the next 90 seconds, and 0.1 Hz for the
rest of 900 seconds. When determining the tensile strength test, digital data acquisition devices shall
provide a sampling frequency of 20 Hz through the entire test. A 16-bit A/D board is normally required
to obtain the resolution needed when determining the tensile creep and the range needed when
determining the tensile strength.
4.1.6. Eight brass gauge points having a diameter of 8 mm (0.315 in.) and a height of 6 mm (0.236 in.)
are required per specimen.
4.1.7. A mounting template that has been used successfully for placing and mounting the gauge points to
each side of the test specimen (four per side) is illustrated in AASHTO T322-07 Figure 1, which shows
an example of a template for use with 150-mm (5.9 in.) diameter specimens
4.1.8. The specimen load frame shall be capable of delivering test loads coincident with the vertical
diametral plane of the test specimen and with less than 20 N (5 lbf) frictional resistance in guides and/or
bearings. Often a smaller guide frame with special alignment capabilities is used in conjunction with the
larger loading frame to accomplish this. The frame may be configured with two support columns or four
support columns.
2016
Revised 2015
Page 3/8 5.9.60 KT-60
4.1.9. Use metal loading strips with a concave surface having a radius of curvature equal to the nominal
radius of the test specimen. Strips are to be 19.0 mm (0.75 in) wide with rounded edges.
5. STANDARDIZATION
5.1. Calibrate the testing system prior to initial use and at least once a year thereafter.
5.1.1. Calibrate the environmental control component to maintain the required temperature within the
accuracy specified.
5.1.2. Calibrate all measurement components (such as load cells and displacement transducers) of the
testing system.
5.1.3. If any of the verifications yield data that do not comply with the accuracy specified, correct the
problem prior to proceeding with testing. Appropriate action may include correction of menu entries,
maintenance on system components, calibration of system components (using an independent calibration
agency, or service by the manufacturer, or in-house resources), or replacement of system components.
6. SAMPLING
6.1. Laboratory Molded Specimens—Prepare a minimum of six laboratory molded samples, in
accordance with KT 58.
6.2. Roadway Specimens—Obtain core samples with smooth and parallel surfaces that conform to the
height and diameter requirements specified in Section 7.2. Prepare a minimum of six samples.
7. SPECIMEN PREPARATION AND PRELIMINARY DETERMINATIONS
7.1. Saw at least 6 mm from both sides of each test specimen to provide smooth, parallel (saw-cut)
surfaces for mounting the measurement gauges.
Note 1—Measurements taken on cut faces yield more consistent results, and gauge points can be
attached with much greater bonding strength.
7.2. Specimens using the medium gradation as specified in Section 5.3.4 page 1 Part V of the
Construction Manual, shall be 150 mm (5.9 in.) in diameter and at least 115 mm (4.5 in.) in height and
compacted to air voids +/- 1 percent of design air voids at the design emulsion content. A trial specimen is
suggested for this. Test specimens shall be cured at 60oC (140
oF) no less than 48 hours and no more than 72
hours. Check specimen mass every 2 hours after 48-hour cure to check with compliance of no more than
0.05% change in mass in 2 hours. After curing, two specimens shall be cut from each compacted specimen
to 50mm (2.0 in.) in height and 150 mm (5.9 in.) in diameter. Perform bulk specific gravity after cutting.
7.3. Determine and record the diameter and height (thickness) of each specimen in accordance with KT-
56.
7.4. Determining the Bulk Specific Gravity—Determine the specific gravity of each specimen in
accordance with KT-15.

2016
Revised 2015
Page 4/8 5.9.60 KT-60
7.5. If specimens were immersed directly into the water, after determining the bulk specific gravity, allow
each specimen to dry at room temperature to a constant mass.
7.6. Attach four gauge points with epoxy to each flat face of the specimen (four per face). On each flat
face of the specimen, two gauge points shall be placed along the vertical and two along the horizontal
axes with a center to center spacing of 38.0 ± 0.2 mm (1.50 ± 0.10 in.) for a specimen diameter of 150 ±
9 mm (5.9 ± 0.35 in.). The placement and location of the gauge points on each face shall produce a mirror
image of each other. Mount the displacement transducers on the gauge points such that the transducer’s
center line is 6.4 mm (0.25 in.) above the specimen’s surface. AASHTO T 322-07 Figure 3 shows a
system for mounting linear variable differential transducers (LVDT’s) that has been successfully used for
IDT creep measurements at low temperature.
8. TENSILE CREEP/STRENGTH TESTING (THERMAL CRACKING
ANALYSIS)
8.1. Select two temperatures at 100C (18
0F) intervals that bracket the required specification. For example,
if the required specification temperature is -250C (-13
0F), then select testing temperatures of -20
0C (-4
0F)
and -300C (-22
0F). A temperature of -10
0C (14
0F) or -40
0C (-40
0F) should then be selected to complete the
third required temperature.
8.2. Lower the temperature of the environmental chamber to the test temperature and, once the test
temperature ±0.5°C (±0.9 0F) is achieved, allow each specimen to remain at the test temperature from 3 ±
1 hours prior to testing. If the test temperature is below 0°C (320F), allow the specimen to remain at the
test temperature for 6 ± 1 hours prior to testing. Under no circumstances shall the specimen be kept at
0°C (320F) or less for more than 24 hours.
8.3. Zero or rebalance the electronic measuring system and apply a static load of fixed magnitude (±2
percent) without impact to the specimen for 100 ± 2 seconds. If a complete analysis is required, a period
of 1000 ± 20.5 seconds has been found suitable. Use a fixed load that produces a horizontal deformation
of 0.00125 mm (4.921245e-005 in.) to 0.0190 mm (7.480292e-004 in.) for 150-mm (5.9 in.) diameter
specimens. If either limit is violated, stop the test and allow a recovery time of 5 minutes before
restarting with an adjusted load. Comply strictly with these limits to prevent both nonlinear response,
characterized by exceeding the upper limit, and significant problems associated with noise and drift
inherent in sensors, when violating the lower deformation limit.
8.4. The tensile strength test shall be carried out on each specimen directly after the tensile creep test at the
same temperature as the creep test by applying a load to the specimen at a rate of 12.5 mm of ram
(vertical) movement per minute. Record the vertical and horizontal deformations on both ends of the
specimen and the load, until the load starts to decrease.
Note 3—In some cases, it is acceptable to unload the specimen between the creep compliance and
strength tests. This will facilitate control on certain testing machines.
9. CALCULATIONS
9.1. Calculate the air voids for each test specimen in accordance with KT-56.
9.2. Creep Compliance—Mathematical Model:
2016
Revised 2015
Page 5/8 5.9.60 KT-60
9.2.1. The three reference specimens are analyzed simultaneously to reduce variability in determining
Poisson’s ratio and, therefore, creep compliance.
9.2.2. Obtain average thickness and diameter in mm and creep load in kN for the three replicates:
where:
∑ = sum of the three specimens, values for thickness, diameter, creep load, in kN;
bavg, Davg, Pavg = average thickness, diameter, and creep load of three replicate specimens; and
bn, Dn, Pn = thickness, diameter, and creep load of specimen n (n=1 to 3).
9.2.3. Compute normalized horizontal and vertical deformation arrays for each of the six specimen faces
(three specimens, two faces per specimen).
where:
ΔΧn,i,t = normalized horizontal deformation for face i(i=1 to 6) at time t(t=0 to tfinal, where tfinal is
the total creep time);
ΔΥn,i,t = normalized vertical deformation for face i at time t;
ΔΧ,i,t = measured horizontal deformation for face i at time t; and
ΔΥ,i,t = measured vertical deformation for face i at time t.
9.2.4. Obtain the average horizontal and vertical deformation ΔΧ,a,i and ΔΥ,a,i at a time corresponding to
one half the total creep test time for each of the six specimen faces. Thus, for a 100-second creep test,
obtain the deformations corresponding to t = 50 seconds.

2016
Revised 2015
Page 6/8 5.9.60 KT-60
where:
ΔX,a,i + ΔΥ,a,i = average horizontal and vertical deformations for face i;
ΔX,n,i,t mld = normalized horizontal deformation at a time corresponding to half the total creep test
time for face i; and
ΔΥ,n,i,t mld = normalized vertical deformation at a time corresponding to half the total creep test time
for face i.
9.2.5. Obtain the trimmed mean of the deflections ΔX,t and ΔΥ,t. This is accomplished by numerically
ranking the six ΔX,a,i and ΔΥ,a,i values and averaging the four middle values. Thus, the highest and lowest
values of horizontal and vertical deformation are not included in the trimmed mean.
Compute:
where:
ΔΧr,j = ΔX,a,i values sorted in ascending order;
ΔΥr,j = ΔΥ,a,i values sorted in ascending order;
ΔΧt = trimmed mean of horizontal deformations; and
ΔΥt = trimmed mean of vertical deformations.
9.2.6. Obtain the ratio of the horizontal to vertical deformations, Χ/Υ,as follows:

2016
Revised 2015
Page 7/8 5.9.60 KT-60
9.2.7. Compute the trimmed mean, ΔΧtm,t, of the six horizontal deformation arrays.
where:
ΔΧr,j,t = ΔΧi,t arrays sorted, where the i=6 arrays are sorted according to the sorting order
already established in Section 9.2.5. for ΔΧr,j, and
ΔΧtm,t = Trimmed mean of the ΔΧi,t arrays.
9.2.8. Compute creep compliance, D(t):
where:
D(t) = creep compliance at time t(kPa); and
GL = gauge length in meters (38 x 10-3
for 150 mm diameter specimens); and
Ccmpl = 0.6354x - 0.332
9.2.9. Poisson’s ration, v, may be computed as:
where:
0.05 < v < 0.50
9.3. Tensile Strength –Mathematical Model:
9.3.1. Calculate tensile strength for each specimen, St,n,as:
where:
Pf,n = maximum load observed for specimen, n;
St,n = tensile strength of specimen, n.
2016
Revised 2015
Page 8/8 5.9.60 KT-60
9.3.2. Compute the average tensile strength:
where:
St = average tensile strength of mixture.
9.3.3. The critical cracking temperature is defined as the intersection of the calculated pavement thermal
stress curve (derived from the creep data) and the tensile strength line (the line connecting the results of the
average tensile strength at the two temperatures).
10. REPORT
10.1. Report the following information:
10.1.1. Bulk specific gravity of each specimen tested to the nearest 0.001;
10.1.2. Maximum specific gravity of the asphalt concrete mixture to the nearest 0.001;
10.1.3. Air voids of each specimen to the nearest 0.1 percent;
10.1.4. Height and diameter of all test specimens to the nearest millimeter;
10.1.5. Test temperature to the nearest 0.5°C, and for creep testing the load levels used during the test to
the nearest 5 N;
10.1.6. Tensile creep compliance values D(t); and
10.1.7. Tensile strength (σt) of the mixture to the nearest pascal as computed.
11. PRECISION AND BIAS
11.1. Precision: The research required to develop precision estimates has not been conducted.
11.2. Bias: The research required to establish the bias of this method has not been conducted.

Page 1/3 5.9.61 2016
Revised 2015
KT-61
5.9.61 RAVELING TEST ON RECYCLED ASPHALT SPECIMENS (Kansas Test Method KT-61)
1. SCOPE
1.1. This method covers the procedure for performing the Raveling Test on recycled asphalt. KT-61
reflects testing procedures found in ASTM D7196.
2. REFERENCED DOCUMENTS
2.1. KT-58; Method for Preparing and Determining the Density of Hot Mix Asphalt (HMA) Specimens
by Means of the Superpave Gyratory Compactor
2.2. International Slurry Surfacing Association ISSA TB-100: Wet Track Abrasion of Slurry Seals
2.3. ASTM D7196; Standard Test Method for Raveling Test of Cold Mixed Emulsified Asphalt Samples
3. APPARATUS
3.1. Fixed speed Hobart model A-120 1/3 H.P. mixer or equivalent.
3.2. Adapter base. An attachment to hold the sample in place on the mixer without movement. See Fig. 1.
(A Raveling Test Adapter Base may be available from Precision Machine and Welding, Salina Kansas 785-
823-8760)
3.3. Abrasion Head. A free floating head attachment to the mixer with a mass of 600 + 15g including the
rubber hose, see Sect. 3.4. as described in ISSA TB-100 . (An Abrasion Head may be available from
Precision Machine and Welding, Salina Kansas 785-823-8760) See Fig 1.
3.4 Hose: ¾” (19 mm) ID general or multipurpose rubber covered hose with a nominal ¼” (6 mm) wall
thickness.
3.5. Superpave Gyratory Compactor as described in KT-58.
4. Procedure
4.1. Split out two recycled asphalt samples from the medium gradation, or field sample, to a quantity of
2700 g in mass. The 2700 g is an approximate mass to give 70 ± 5 mm of height after compaction. If
field samples are used, omit steps 4.2. through 4.4.
4.2. The recycled asphalt sample should be placed in a container of adequate size for mixing.
4.3. Field or design moisture contents should be added to each of the recycled asphalt samples and mixed
for 60 seconds.
4.4. The design emulsion content shall be added to each of the recycled asphalt samples and mixed for 60
seconds.
4.5. The samples shall be placed immediately into a 150 mm gyratory compaction mold and compacted to
20 gyrations. If the sample height is not 70 ± 5 mm, the recycled asphalt mass should be adjusted.
Page 2/3 5.9.61 2016
Revised 2015
KT-61
4.6. After compaction, the samples shall be removed from the compaction mold and placed on a flat pan
to cure at ambient lab temperature (18-24o
C) for 4 hours ± 5 minutes.
4.7. The specimens shall be weighed after the curing, just prior to testing.
4.8. The specimens shall be placed on the raveling test apparatus. Care should be taken that the specimen
is centered and well supported. The area of the hose in contact with the specimen should not have been
previously used. It is allowable to rotate the hose to an unworn section for testing. The abrasion head
(with hose) shall be free to move vertically downward a minimum of 5 mm if abrasion allows.
4.9. The samples shall be abraded for 15 minutes and immediately weighed.
5. CALCULATION
5.1 The % Raveling loss shall be determined as follows:
[(mass prior to test – mass after abrasion) / mass prior to test] * 100
6. REPORT
6.1. The average of the two specimens shall be reported as the % Raveling loss.
6.2. There should not be a difference of 0.5% Raveling loss between the two test specimens for proper
precision. A difference of >0.5% will require the test to be repeated. If both of the samples have a
Raveling loss of >10% the numbers shall be averaged and the precision rule will be waived.
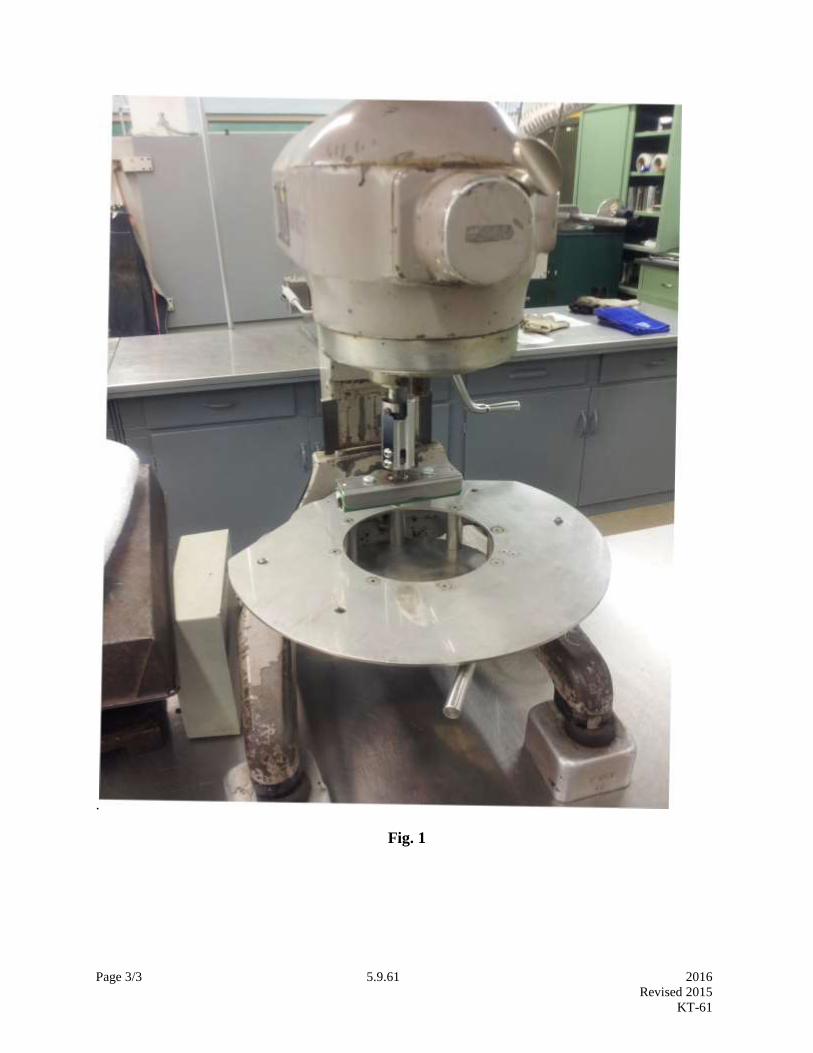
Page 3/3 5.9.61 2016
Revised 2015
KT-61
.
Fig. 1


Page 1/6 5.9.62 2016
Revised 2012
KT-62
5.9.62 PERCENT SOLIDS OF LIME SLURRY (Kansas Test Method KT-62)
1. SCOPE
This method of test covers the procedure for determining the amount of solids, by percent, contained in
lime slurry.
2. APPARATUS
2.1. Quart container, not to be made of glass.
2.2. US standard Gardner weight per gallon (WPG) cup, with a volume of 83.2 cc.
2.3. Thermometer capable of reading 68°F to 214°F (20° to 101°C).
3. TEST PROCEDURE
3.1. Fill a quart container 3/4 full with lime slurry. Sample can be taken from ports located at either end of
the vessel.
3.2. Weigh a dry, empty Gardner WPG cup and cover to the nearest 0.01 g. Record this mass as A.
3.3. Shake the lime slurry sample well and immediately fill the WPG cup.
3.4. Tap the WPG cup lightly on an immoveable object to allow for the escape of air bubbles.
3.5. Slowly turn the top of the WPG cup until it is completely seated. If the cover is pushed on quickly,
lime slurry will squirt out through the hole in the center. Be sure to point the top of the WPG cup away
from yourself as well as others while putting on the cap.
3.6. Hold the WPG cup by the top and bottom with thumb and forefinger being sure to cover the hole in
the cap.
3.7. Rinse the WPG cup under running water to remove any lime from the outside of the cup.
3.8. Dry the outside of the cup thoroughly.
3.9. Weigh the dry filled WPG cup to the nearest 0.01 g. Record this mass as B.
3.10. Promptly remove the cover and insert thermometer. Record this temperature as C.
Page 2/6 5.9.62 2016
Revised 2012
KT-62
4. CALCULATIONS
4.1. Slurry Density, lbs/gal, (E)
E=(B-A) × 0.1
Where: A= Mass of WPG cup empty
B= Mass of the WPG cup full
4.2. Adjusted Slurry Density, lbs/gal, (G)
G=E ×F
Where: Temperature Correction Factor (Refer to Table 2)
4.3. Using the adjusted slurry density value, determine the percent solids of the lime slurry from Table 1.
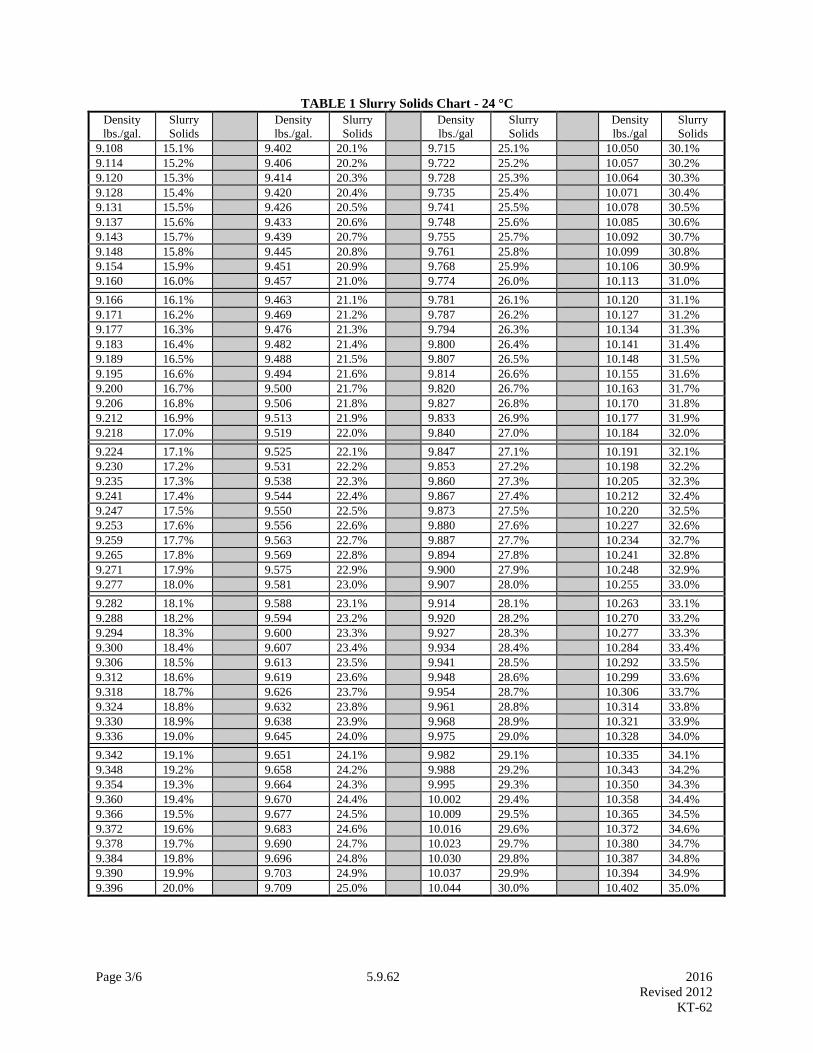
Page 3/6 5.9.62 2016
Revised 2012
KT-62
TABLE 1 Slurry Solids Chart - 24 °C
Density
lbs./gal.
Slurry
Solids
Density
lbs./gal.
Slurry
Solids
Density
lbs./gal
Slurry
Solids
Density
lbs./gal
Slurry
Solids
9.108 15.1% 9.402 20.1% 9.715 25.1% 10.050 30.1%
9.114 15.2% 9.406 20.2% 9.722 25.2% 10.057 30.2%
9.120 15.3% 9.414 20.3% 9.728 25.3% 10.064 30.3%
9.128 15.4% 9.420 20.4% 9.735 25.4% 10.071 30.4%
9.131 15.5% 9.426 20.5% 9.741 25.5% 10.078 30.5%
9.137 15.6% 9.433 20.6% 9.748 25.6% 10.085 30.6%
9.143 15.7% 9.439 20.7% 9.755 25.7% 10.092 30.7%
9.148 15.8% 9.445 20.8% 9.761 25.8% 10.099 30.8%
9.154 15.9% 9.451 20.9% 9.768 25.9% 10.106 30.9%
9.160 16.0% 9.457 21.0% 9.774 26.0% 10.113 31.0%
9.166 16.1% 9.463 21.1% 9.781 26.1% 10.120 31.1%
9.171 16.2% 9.469 21.2% 9.787 26.2% 10.127 31.2%
9.177 16.3% 9.476 21.3% 9.794 26.3% 10.134 31.3%
9.183 16.4% 9.482 21.4% 9.800 26.4% 10.141 31.4%
9.189 16.5% 9.488 21.5% 9.807 26.5% 10.148 31.5%
9.195 16.6% 9.494 21.6% 9.814 26.6% 10.155 31.6%
9.200 16.7% 9.500 21.7% 9.820 26.7% 10.163 31.7%
9.206 16.8% 9.506 21.8% 9.827 26.8% 10.170 31.8%
9.212 16.9% 9.513 21.9% 9.833 26.9% 10.177 31.9%
9.218 17.0% 9.519 22.0% 9.840 27.0% 10.184 32.0%
9.224 17.1% 9.525 22.1% 9.847 27.1% 10.191 32.1%
9.230 17.2% 9.531 22.2% 9.853 27.2% 10.198 32.2%
9.235 17.3% 9.538 22.3% 9.860 27.3% 10.205 32.3%
9.241 17.4% 9.544 22.4% 9.867 27.4% 10.212 32.4%
9.247 17.5% 9.550 22.5% 9.873 27.5% 10.220 32.5%
9.253 17.6% 9.556 22.6% 9.880 27.6% 10.227 32.6%
9.259 17.7% 9.563 22.7% 9.887 27.7% 10.234 32.7%
9.265 17.8% 9.569 22.8% 9.894 27.8% 10.241 32.8%
9.271 17.9% 9.575 22.9% 9.900 27.9% 10.248 32.9%
9.277 18.0% 9.581 23.0% 9.907 28.0% 10.255 33.0%
9.282 18.1% 9.588 23.1% 9.914 28.1% 10.263 33.1%
9.288 18.2% 9.594 23.2% 9.920 28.2% 10.270 33.2%
9.294 18.3% 9.600 23.3% 9.927 28.3% 10.277 33.3%
9.300 18.4% 9.607 23.4% 9.934 28.4% 10.284 33.4%
9.306 18.5% 9.613 23.5% 9.941 28.5% 10.292 33.5%
9.312 18.6% 9.619 23.6% 9.948 28.6% 10.299 33.6%
9.318 18.7% 9.626 23.7% 9.954 28.7% 10.306 33.7%
9.324 18.8% 9.632 23.8% 9.961 28.8% 10.314 33.8%
9.330 18.9% 9.638 23.9% 9.968 28.9% 10.321 33.9%
9.336 19.0% 9.645 24.0% 9.975 29.0% 10.328 34.0%
9.342 19.1% 9.651 24.1% 9.982 29.1% 10.335 34.1%
9.348 19.2% 9.658 24.2% 9.988 29.2% 10.343 34.2%
9.354 19.3% 9.664 24.3% 9.995 29.3% 10.350 34.3%
9.360 19.4% 9.670 24.4% 10.002 29.4% 10.358 34.4%
9.366 19.5% 9.677 24.5% 10.009 29.5% 10.365 34.5%
9.372 19.6% 9.683 24.6% 10.016 29.6% 10.372 34.6%
9.378 19.7% 9.690 24.7% 10.023 29.7% 10.380 34.7%
9.384 19.8% 9.696 24.8% 10.030 29.8% 10.387 34.8%
9.390 19.9% 9.703 24.9% 10.037 29.9% 10.394 34.9%
9.396 20.0% 9.709 25.0% 10.044 30.0% 10.402 35.0%
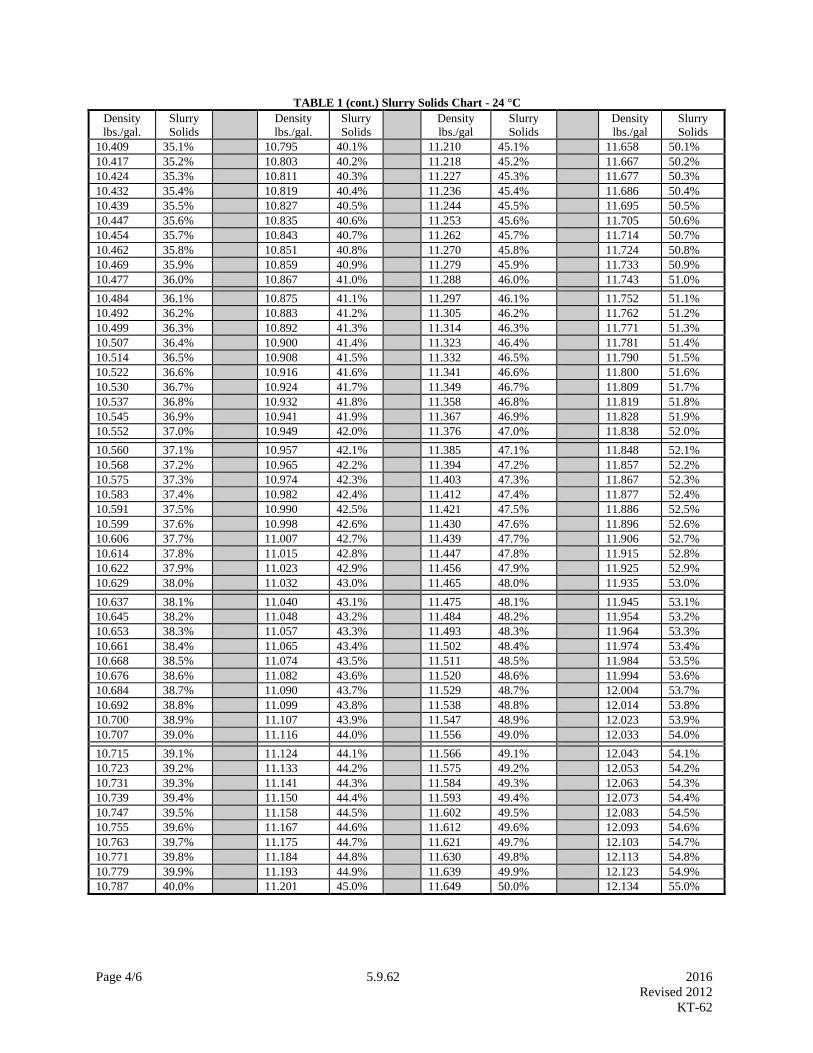
Page 4/6 5.9.62 2016
Revised 2012
KT-62
TABLE 1 (cont.) Slurry Solids Chart - 24 °C
Density
lbs./gal.
Slurry
Solids
Density
lbs./gal.
Slurry
Solids
Density
lbs./gal
Slurry
Solids
Density
lbs./gal
Slurry
Solids
10.409 35.1% 10.795 40.1% 11.210 45.1% 11.658 50.1%
10.417 35.2% 10.803 40.2% 11.218 45.2% 11.667 50.2%
10.424 35.3% 10.811 40.3% 11.227 45.3% 11.677 50.3%
10.432 35.4% 10.819 40.4% 11.236 45.4% 11.686 50.4%
10.439 35.5% 10.827 40.5% 11.244 45.5% 11.695 50.5%
10.447 35.6% 10.835 40.6% 11.253 45.6% 11.705 50.6%
10.454 35.7% 10.843 40.7% 11.262 45.7% 11.714 50.7%
10.462 35.8% 10.851 40.8% 11.270 45.8% 11.724 50.8%
10.469 35.9% 10.859 40.9% 11.279 45.9% 11.733 50.9%
10.477 36.0% 10.867 41.0% 11.288 46.0% 11.743 51.0%
10.484 36.1% 10.875 41.1% 11.297 46.1% 11.752 51.1%
10.492 36.2% 10.883 41.2% 11.305 46.2% 11.762 51.2%
10.499 36.3% 10.892 41.3% 11.314 46.3% 11.771 51.3%
10.507 36.4% 10.900 41.4% 11.323 46.4% 11.781 51.4%
10.514 36.5% 10.908 41.5% 11.332 46.5% 11.790 51.5%
10.522 36.6% 10.916 41.6% 11.341 46.6% 11.800 51.6%
10.530 36.7% 10.924 41.7% 11.349 46.7% 11.809 51.7%
10.537 36.8% 10.932 41.8% 11.358 46.8% 11.819 51.8%
10.545 36.9% 10.941 41.9% 11.367 46.9% 11.828 51.9%
10.552 37.0% 10.949 42.0% 11.376 47.0% 11.838 52.0%
10.560 37.1% 10.957 42.1% 11.385 47.1% 11.848 52.1%
10.568 37.2% 10.965 42.2% 11.394 47.2% 11.857 52.2%
10.575 37.3% 10.974 42.3% 11.403 47.3% 11.867 52.3%
10.583 37.4% 10.982 42.4% 11.412 47.4% 11.877 52.4%
10.591 37.5% 10.990 42.5% 11.421 47.5% 11.886 52.5%
10.599 37.6% 10.998 42.6% 11.430 47.6% 11.896 52.6%
10.606 37.7% 11.007 42.7% 11.439 47.7% 11.906 52.7%
10.614 37.8% 11.015 42.8% 11.447 47.8% 11.915 52.8%
10.622 37.9% 11.023 42.9% 11.456 47.9% 11.925 52.9%
10.629 38.0% 11.032 43.0% 11.465 48.0% 11.935 53.0%
10.637 38.1% 11.040 43.1% 11.475 48.1% 11.945 53.1%
10.645 38.2% 11.048 43.2% 11.484 48.2% 11.954 53.2%
10.653 38.3% 11.057 43.3% 11.493 48.3% 11.964 53.3%
10.661 38.4% 11.065 43.4% 11.502 48.4% 11.974 53.4%
10.668 38.5% 11.074 43.5% 11.511 48.5% 11.984 53.5%
10.676 38.6% 11.082 43.6% 11.520 48.6% 11.994 53.6%
10.684 38.7% 11.090 43.7% 11.529 48.7% 12.004 53.7%
10.692 38.8% 11.099 43.8% 11.538 48.8% 12.014 53.8%
10.700 38.9% 11.107 43.9% 11.547 48.9% 12.023 53.9%
10.707 39.0% 11.116 44.0% 11.556 49.0% 12.033 54.0%
10.715 39.1% 11.124 44.1% 11.566 49.1% 12.043 54.1%
10.723 39.2% 11.133 44.2% 11.575 49.2% 12.053 54.2%
10.731 39.3% 11.141 44.3% 11.584 49.3% 12.063 54.3%
10.739 39.4% 11.150 44.4% 11.593 49.4% 12.073 54.4%
10.747 39.5% 11.158 44.5% 11.602 49.5% 12.083 54.5%
10.755 39.6% 11.167 44.6% 11.612 49.6% 12.093 54.6%
10.763 39.7% 11.175 44.7% 11.621 49.7% 12.103 54.7%
10.771 39.8% 11.184 44.8% 11.630 49.8% 12.113 54.8%
10.779 39.9% 11.193 44.9% 11.639 49.9% 12.123 54.9%
10.787 40.0% 11.201 45.0% 11.649 50.0% 12.134 55.0%
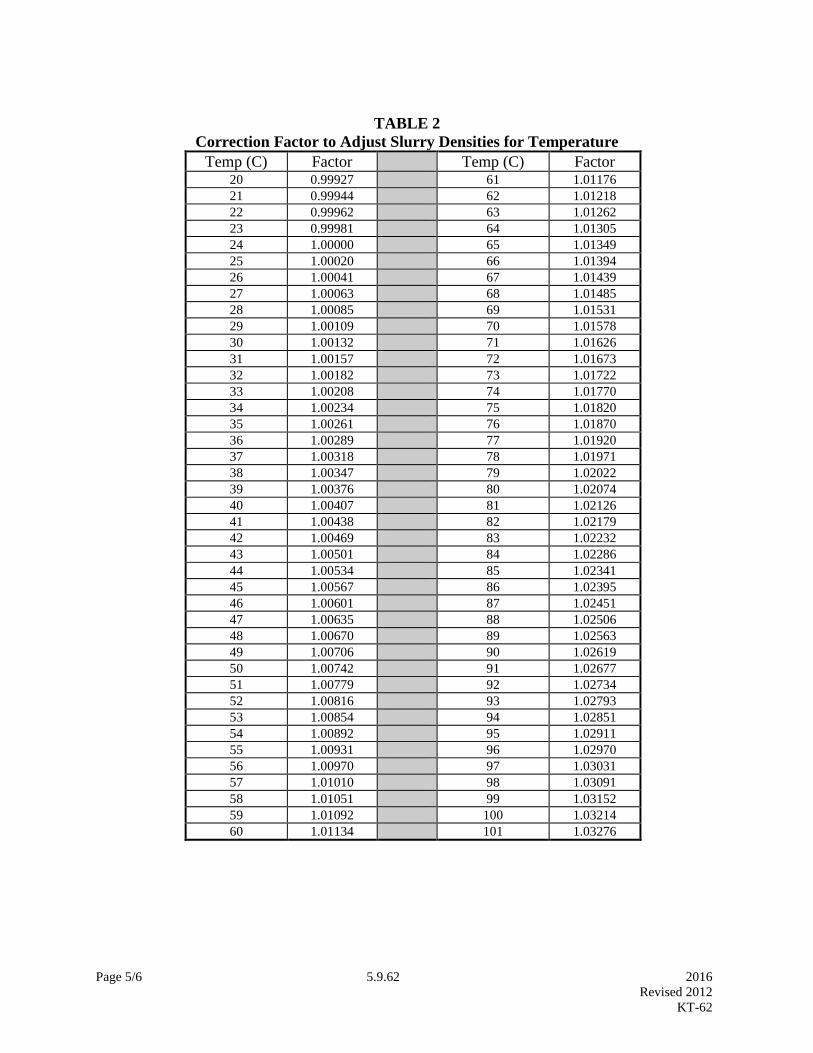
Page 5/6 5.9.62 2016
Revised 2012
KT-62
TABLE 2
Correction Factor to Adjust Slurry Densities for Temperature
Temp (C) Factor Temp (C) Factor 20 0.99927 61 1.01176
21 0.99944 62 1.01218
22 0.99962 63 1.01262
23 0.99981 64 1.01305
24 1.00000 65 1.01349
25 1.00020 66 1.01394
26 1.00041 67 1.01439
27 1.00063 68 1.01485
28 1.00085 69 1.01531
29 1.00109 70 1.01578
30 1.00132 71 1.01626
31 1.00157 72 1.01673
32 1.00182 73 1.01722
33 1.00208 74 1.01770
34 1.00234 75 1.01820
35 1.00261 76 1.01870
36 1.00289 77 1.01920
37 1.00318 78 1.01971
38 1.00347 79 1.02022
39 1.00376 80 1.02074
40 1.00407 81 1.02126
41 1.00438 82 1.02179
42 1.00469 83 1.02232
43 1.00501 84 1.02286
44 1.00534 85 1.02341
45 1.00567 86 1.02395
46 1.00601 87 1.02451
47 1.00635 88 1.02506
48 1.00670 89 1.02563
49 1.00706 90 1.02619
50 1.00742 91 1.02677
51 1.00779 92 1.02734
52 1.00816 93 1.02793
53 1.00854 94 1.02851
54 1.00892 95 1.02911
55 1.00931 96 1.02970
56 1.00970 97 1.03031
57 1.01010 98 1.03091
58 1.01051 99 1.03152
59 1.01092 100 1.03214
60 1.01134 101 1.03276

Page 6/6 5.9.62 2016
Revised 2012
KT-62
Slurry Worksheet
DATE
TIME
WPG CUP MASS
FULL EMPTY
(B) (A)
SLURRY MASS
(FULL - EMPTY)
(D)
SLURRY
DENSITY
(Slurry Wt. x 0.10)
(E)
SAMPLE
TEMP.°C
(C)
TEMP. CORRECTION
FACTOR
(TABLE 2)
(F)
ADJ. SLURRY
DENSITY
(SLURRY DENSITY x
TEMP. CORR.
FACTOR)
(G)
PERCENT
SOLIDS
(TABLE 1)
Figure 1
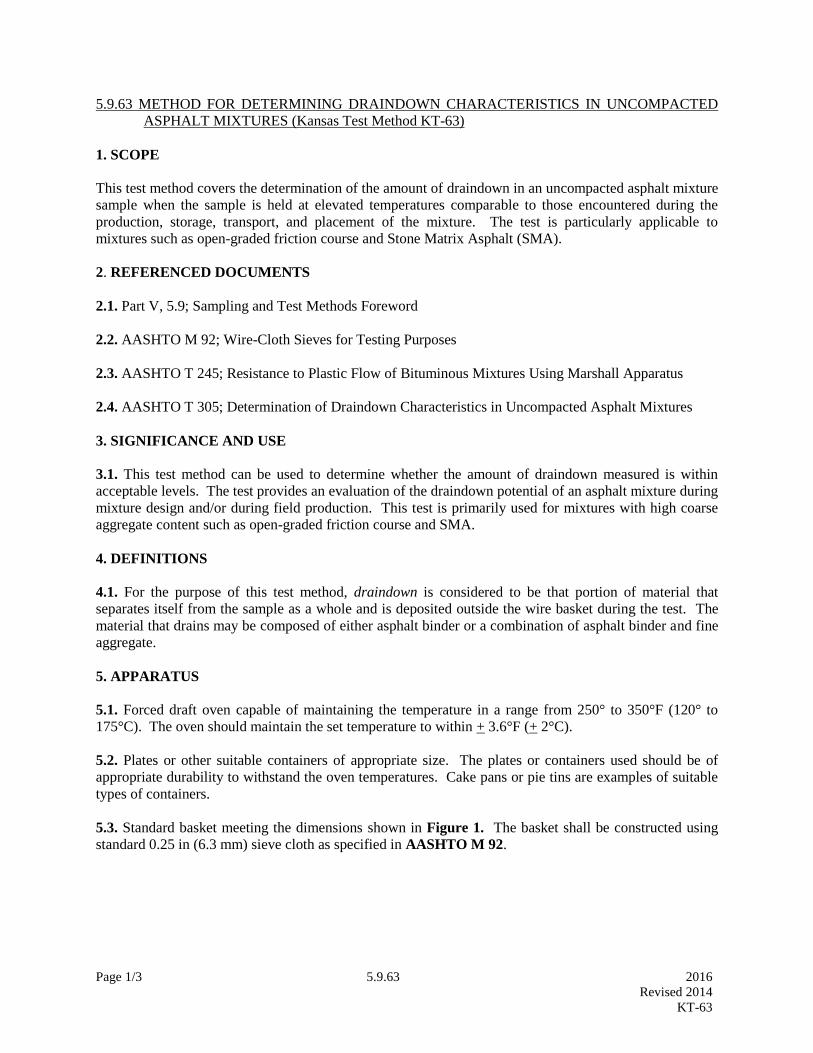
Page 1/3 5.9.63 2016
Revised 2014
KT-63
5.9.63 METHOD FOR DETERMINING DRAINDOWN CHARACTERISTICS IN UNCOMPACTED
ASPHALT MIXTURES (Kansas Test Method KT-63)
1. SCOPE
This test method covers the determination of the amount of draindown in an uncompacted asphalt mixture
sample when the sample is held at elevated temperatures comparable to those encountered during the
production, storage, transport, and placement of the mixture. The test is particularly applicable to
mixtures such as open-graded friction course and Stone Matrix Asphalt (SMA).
2. REFERENCED DOCUMENTS
2.1. Part V, 5.9; Sampling and Test Methods Foreword
2.2. AASHTO M 92; Wire-Cloth Sieves for Testing Purposes
2.3. AASHTO T 245; Resistance to Plastic Flow of Bituminous Mixtures Using Marshall Apparatus
2.4. AASHTO T 305; Determination of Draindown Characteristics in Uncompacted Asphalt Mixtures
3. SIGNIFICANCE AND USE
3.1. This test method can be used to determine whether the amount of draindown measured is within
acceptable levels. The test provides an evaluation of the draindown potential of an asphalt mixture during
mixture design and/or during field production. This test is primarily used for mixtures with high coarse
aggregate content such as open-graded friction course and SMA.
4. DEFINITIONS
4.1. For the purpose of this test method, draindown is considered to be that portion of material that
separates itself from the sample as a whole and is deposited outside the wire basket during the test. The
material that drains may be composed of either asphalt binder or a combination of asphalt binder and fine
aggregate.
5. APPARATUS
5.1. Forced draft oven capable of maintaining the temperature in a range from 250° to 350°F (120° to
175°C). The oven should maintain the set temperature to within + 3.6°F (+ 2°C).
5.2. Plates or other suitable containers of appropriate size. The plates or containers used should be of
appropriate durability to withstand the oven temperatures. Cake pans or pie tins are examples of suitable
types of containers.
5.3. Standard basket meeting the dimensions shown in Figure 1. The basket shall be constructed using
standard 0.25 in (6.3 mm) sieve cloth as specified in AASHTO M 92.
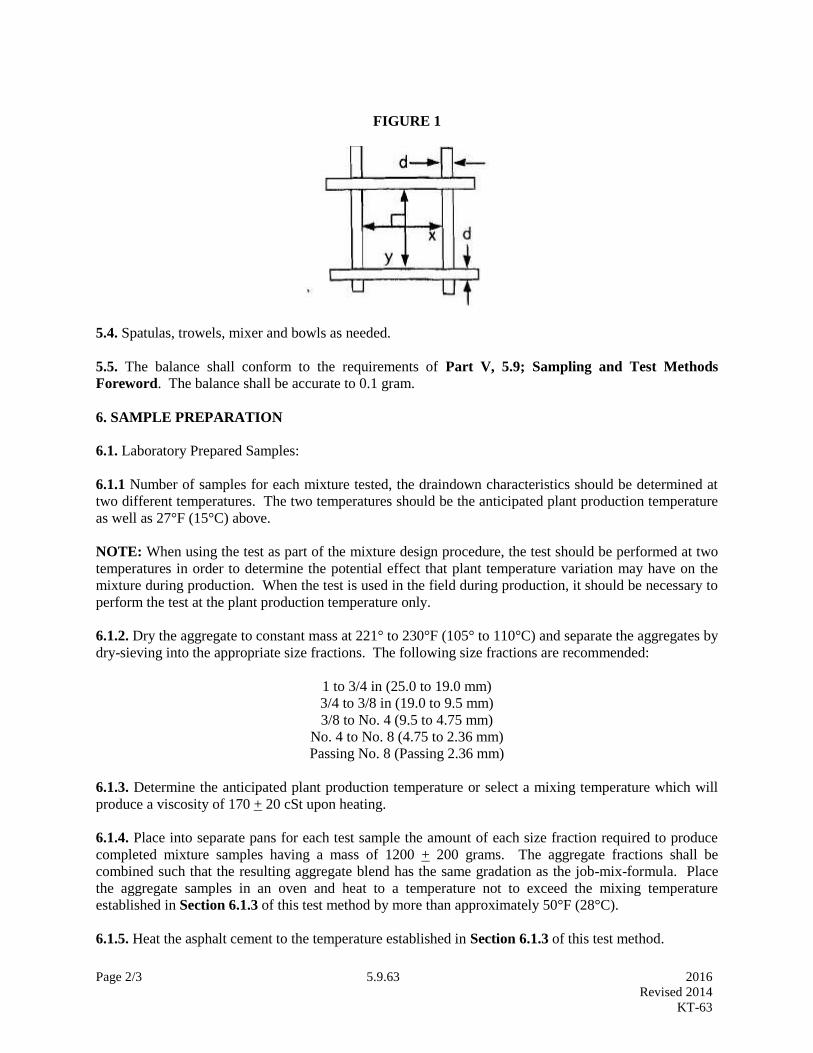
Page 2/3 5.9.63 2016
Revised 2014
KT-63
FIGURE 1
5.4. Spatulas, trowels, mixer and bowls as needed.
5.5. The balance shall conform to the requirements of Part V, 5.9; Sampling and Test Methods
Foreword. The balance shall be accurate to 0.1 gram.
6. SAMPLE PREPARATION
6.1. Laboratory Prepared Samples:
6.1.1 Number of samples for each mixture tested, the draindown characteristics should be determined at
two different temperatures. The two temperatures should be the anticipated plant production temperature
as well as 27°F (15°C) above.
NOTE: When using the test as part of the mixture design procedure, the test should be performed at two
temperatures in order to determine the potential effect that plant temperature variation may have on the
mixture during production. When the test is used in the field during production, it should be necessary to
perform the test at the plant production temperature only.
6.1.2. Dry the aggregate to constant mass at 221° to 230°F (105° to 110°C) and separate the aggregates by
dry-sieving into the appropriate size fractions. The following size fractions are recommended:
1 to 3/4 in (25.0 to 19.0 mm)
3/4 to 3/8 in (19.0 to 9.5 mm)
3/8 to No. 4 (9.5 to 4.75 mm)
No. 4 to No. 8 (4.75 to 2.36 mm)
Passing No. 8 (Passing 2.36 mm)
6.1.3. Determine the anticipated plant production temperature or select a mixing temperature which will
produce a viscosity of 170 + 20 cSt upon heating.
6.1.4. Place into separate pans for each test sample the amount of each size fraction required to produce
completed mixture samples having a mass of 1200 + 200 grams. The aggregate fractions shall be
combined such that the resulting aggregate blend has the same gradation as the job-mix-formula. Place
the aggregate samples in an oven and heat to a temperature not to exceed the mixing temperature
established in Section 6.1.3 of this test method by more than approximately 50°F (28°C).
6.1.5. Heat the asphalt cement to the temperature established in Section 6.1.3 of this test method.
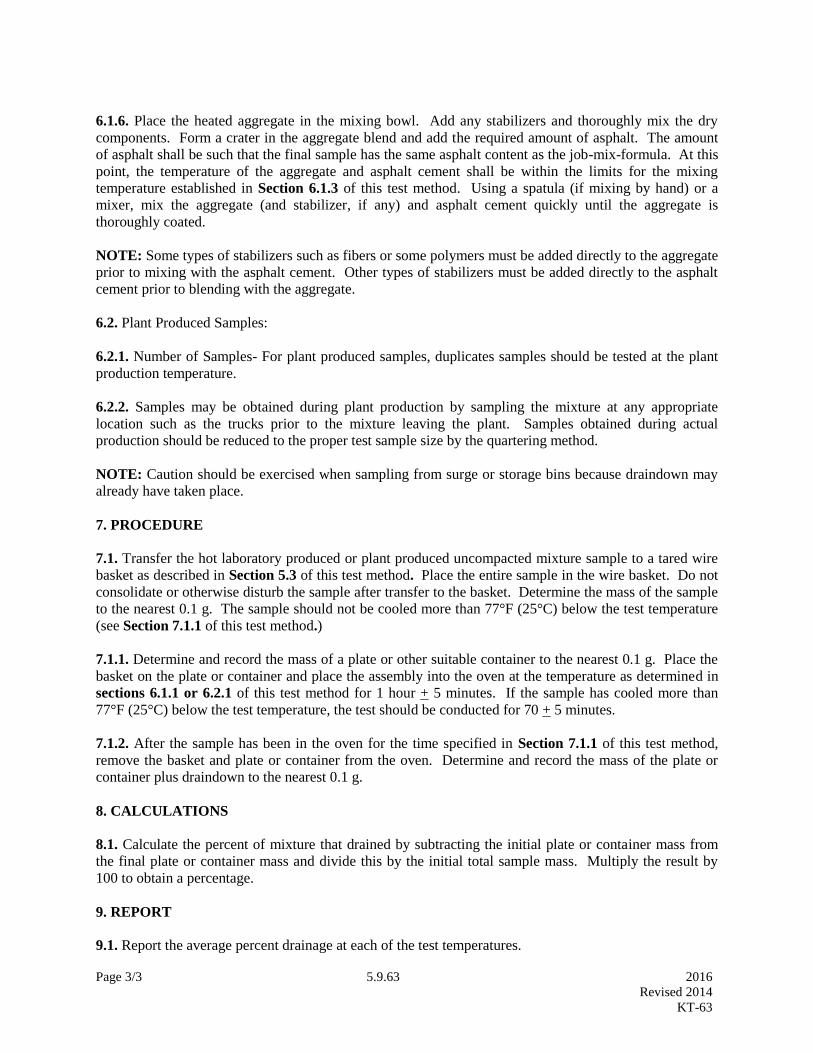
Page 3/3 5.9.63 2016
Revised 2014
KT-63
6.1.6. Place the heated aggregate in the mixing bowl. Add any stabilizers and thoroughly mix the dry
components. Form a crater in the aggregate blend and add the required amount of asphalt. The amount
of asphalt shall be such that the final sample has the same asphalt content as the job-mix-formula. At this
point, the temperature of the aggregate and asphalt cement shall be within the limits for the mixing
temperature established in Section 6.1.3 of this test method. Using a spatula (if mixing by hand) or a
mixer, mix the aggregate (and stabilizer, if any) and asphalt cement quickly until the aggregate is
thoroughly coated.
NOTE: Some types of stabilizers such as fibers or some polymers must be added directly to the aggregate
prior to mixing with the asphalt cement. Other types of stabilizers must be added directly to the asphalt
cement prior to blending with the aggregate.
6.2. Plant Produced Samples:
6.2.1. Number of Samples- For plant produced samples, duplicates samples should be tested at the plant
production temperature.
6.2.2. Samples may be obtained during plant production by sampling the mixture at any appropriate
location such as the trucks prior to the mixture leaving the plant. Samples obtained during actual
production should be reduced to the proper test sample size by the quartering method.
NOTE: Caution should be exercised when sampling from surge or storage bins because draindown may
already have taken place.
7. PROCEDURE
7.1. Transfer the hot laboratory produced or plant produced uncompacted mixture sample to a tared wire
basket as described in Section 5.3 of this test method. Place the entire sample in the wire basket. Do not
consolidate or otherwise disturb the sample after transfer to the basket. Determine the mass of the sample
to the nearest 0.1 g. The sample should not be cooled more than 77°F (25°C) below the test temperature
(see Section 7.1.1 of this test method.)
7.1.1. Determine and record the mass of a plate or other suitable container to the nearest 0.1 g. Place the
basket on the plate or container and place the assembly into the oven at the temperature as determined in
sections 6.1.1 or 6.2.1 of this test method for 1 hour + 5 minutes. If the sample has cooled more than
77°F (25°C) below the test temperature, the test should be conducted for 70 + 5 minutes.
7.1.2. After the sample has been in the oven for the time specified in Section 7.1.1 of this test method,
remove the basket and plate or container from the oven. Determine and record the mass of the plate or
container plus draindown to the nearest 0.1 g.
8. CALCULATIONS
8.1. Calculate the percent of mixture that drained by subtracting the initial plate or container mass from
the final plate or container mass and divide this by the initial total sample mass. Multiply the result by
100 to obtain a percentage.
9. REPORT
9.1. Report the average percent drainage at each of the test temperatures.

Page 1/4 5.9.64 2016 Revised 2014
KT-64
5.9.64 METHOD FOR DETERMINING VOLUME OF VOIDS IN COMPACTED FILLER OR FINES
(Kansas Test Method KT-64)
1. SCOPE
This test procedure describes a method for determining the void volume in a dry-compacted mineral filler
or fines (Rigden voids). The test method is based upon the assumption that the densest packing
(maximum bulk density) of fines can be obtained by compacting the dry fines in a mold.
This method is from National Asphalt Pavement Association Information Series 127, Evaluation of
Baghouse Fines for Hot Mix Asphalt.
2. REFERENCED DOCUMENTS
2.1. Part V, 5.9; Sampling and Test Methods Foreword
2.2. AASHTO T 100: Specific Gravity of Soils
2.3. AASHTO T 133; Density of Hydraulic Cement
2.4. AASHTO M 92; Wire-Cloth Sieves for Testing Purposes
2.5. ASTM D 422; Particle Size Analysis of Soils
2.6. National Asphalt Pavement Association Information Series 127, Evaluation of Baghouse Fines for
Hot Mix Asphalt
3. SIGNIFICANCE AND USE
In this test method, the volume of the voids in a dry-compacted bed of mineral dust (Rigden voids) is
determined by compacting the dust in a small mold. The void volume in dry compacted fines (Rigden
voids) is sensitive to changes in gradation and other properties of the fines, and therefore, the dry
compaction test has been proposed as a test for monitoring the uniformity of the fines collected in HMA
facilities. Rigden voids can also be used to estimate the stiffening effect of the fines when mixed with
asphalt cement.
4. DEFINITIONS
4.1. Maximum packing occurs when the particles are packed together in their minimum volume with a
minimum void volume. Maximum packing results in a maximum bulk density.
4.2. The bulk density of the compacted fines is defined as the dry weight of the fines divided by the bulk
volume of the compacted fines. The bulk volume includes the sum of the solid volume of the fines
particles and the volume of the voids between the particles.
4.3. The density of the fines is defined as the dry weight of the fines divided by the solid volume of the
fines particles. This density can be obtained from AASHTO T 133 or T 100 or another appropriate test
method.
5. APPARATUS
5.1. Compaction hammer, as shown in Figure 1, is required to compact the fines into the test mold. The
fines are compacted in one layer, using 25 blows of the hammer.
5.2. Test mold or sample holder, as shown in Figure 1, is required for measuring the volume of the
compacted bed of fines.
Page 2/4 5.9.64 2016 Revised 2014
KT-64
5.3. Compaction pedestal, a steel block, 1 in thick x 4 in x 4 in is used as a base for placing the test mold.
5.4. Thickness measuring system, a dial gauge with 0.001 in gradations is required for measuring the
thickness of the compacted bed of fines.
5.5. Filter membrane, a small 1/2 in diameter disks must be cut from Millipore No. SCWP0190R,
Whatman 41 (Cat No. 1441 110) or Whatman 2 (Cat No 1002 150) filter membrane. A round cutting tool
can be used for this purpose.
5.6. Tweezers are needed for handling the filter disks.
5.7. No. 200 sieve (75 µm) sieve meeting the requirements of AASHTO M 92 is needed to remove the
particles larger than No. 200 (75 µm).
5.8. The balance shall conform to the requirements of Part V, 5.9; Sampling and Test Methods
Foreword, a balance or scale rated to 200 grams and sensitive to 0.01 gram is required.
Figure 1
6. SAMPLE PREPARATION
6.1. The fines may be obtained from a primary or secondary dust collector, the coarse or fine aggregate,
or the aggregate extracted from a mixture. Particles larger than No. 200 (75 µm) should be removed by
sieving. Dry sieving is usually adequate if several sieves coarser than No. 200 (75 µm) sieve are placed
above the No. 200 (75 µm) sieve during the sieving operation to avoid overloading the No. 200 sieve (75
µm). Wet sieving should be avoided because the fine particles tend to stick together after they are dried.
7. PROCEDURE
7.1. Use the cutting tool to cut a number of 1/2 –inch diameter filter disks. Place two of these disks in the
bottom of the sample cup, place the follower over the top of the disks, and seat the follower on the filter
disks using firm finger pressure. Insert the entire assembly under the dial gauge. Record the dial gauge
reading as t1.
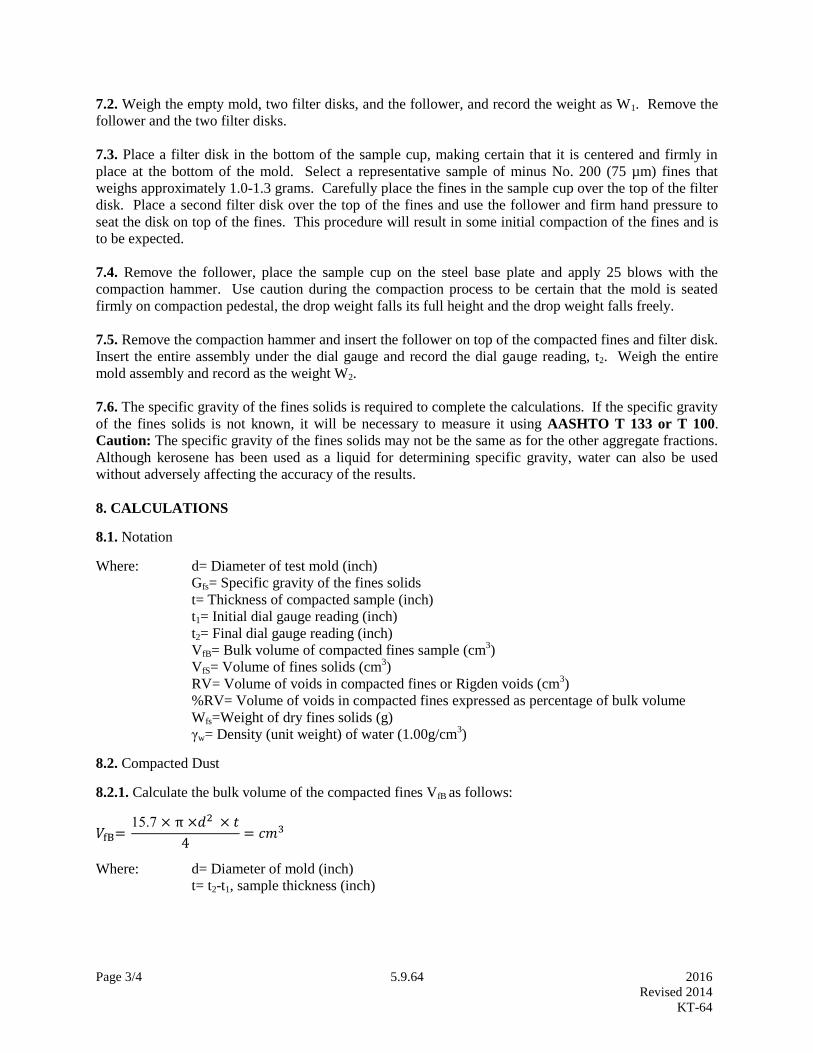
Page 3/4 5.9.64 2016 Revised 2014
KT-64
7.2. Weigh the empty mold, two filter disks, and the follower, and record the weight as W1. Remove the
follower and the two filter disks.
7.3. Place a filter disk in the bottom of the sample cup, making certain that it is centered and firmly in
place at the bottom of the mold. Select a representative sample of minus No. 200 (75 µm) fines that
weighs approximately 1.0-1.3 grams. Carefully place the fines in the sample cup over the top of the filter
disk. Place a second filter disk over the top of the fines and use the follower and firm hand pressure to
seat the disk on top of the fines. This procedure will result in some initial compaction of the fines and is
to be expected.
7.4. Remove the follower, place the sample cup on the steel base plate and apply 25 blows with the
compaction hammer. Use caution during the compaction process to be certain that the mold is seated
firmly on compaction pedestal, the drop weight falls its full height and the drop weight falls freely.
7.5. Remove the compaction hammer and insert the follower on top of the compacted fines and filter disk.
Insert the entire assembly under the dial gauge and record the dial gauge reading, t2. Weigh the entire
mold assembly and record as the weight W2.
7.6. The specific gravity of the fines solids is required to complete the calculations. If the specific gravity
of the fines solids is not known, it will be necessary to measure it using AASHTO T 133 or T 100.
Caution: The specific gravity of the fines solids may not be the same as for the other aggregate fractions.
Although kerosene has been used as a liquid for determining specific gravity, water can also be used
without adversely affecting the accuracy of the results.
8. CALCULATIONS
8.1. Notation
Where: d= Diameter of test mold (inch)
Gfs= Specific gravity of the fines solids
t= Thickness of compacted sample (inch)
t1= Initial dial gauge reading (inch)
t2= Final dial gauge reading (inch)
VfB= Bulk volume of compacted fines sample (cm3)
VfS= Volume of fines solids (cm3)
RV= Volume of voids in compacted fines or Rigden voids (cm3)
%RV= Volume of voids in compacted fines expressed as percentage of bulk volume
Wfs=Weight of dry fines solids (g)
γw= Density (unit weight) of water (1.00g/cm3)
8.2. Compacted Dust
8.2.1. Calculate the bulk volume of the compacted fines VfB as follows:
𝑉fB= 15.7 × π ×𝑑2 × 𝑡
4= 𝑐𝑚3
Where: d= Diameter of mold (inch)
t= t2-t1, sample thickness (inch)

Page 4/4 5.9.64 2016 Revised 2014
KT-64
8.2.2. Calculate the volume of the fines solids, VfS as follows:
𝑉f𝑆= W𝑓𝑆
γ𝑤 × 𝐺𝑓𝑆= 𝑐𝑚3
Where: WfS= W2 –W1, weight of compacted fines (grams)
γ𝑤 = unit weight of water (1.000g/cm3)
𝐺𝑓𝑆= specific gravity of fines solids as determined from the AASHTO T 133 or T 100 of
other suitable test method.
8.2.3 Calculate the volume of the voids in the compacted fines, RV (Rigden voids), as follows:
𝑅𝑉 = 𝑉𝑓𝐵 − 𝑉𝑓𝑆
8.2.4. Calculate the percentage of voids in the compacted fines (Rigden voids), as follows:
%𝑅𝑉fS= 𝑉𝑓𝐵 − 𝑉𝑓𝑆
𝑉𝑓𝐵× 100
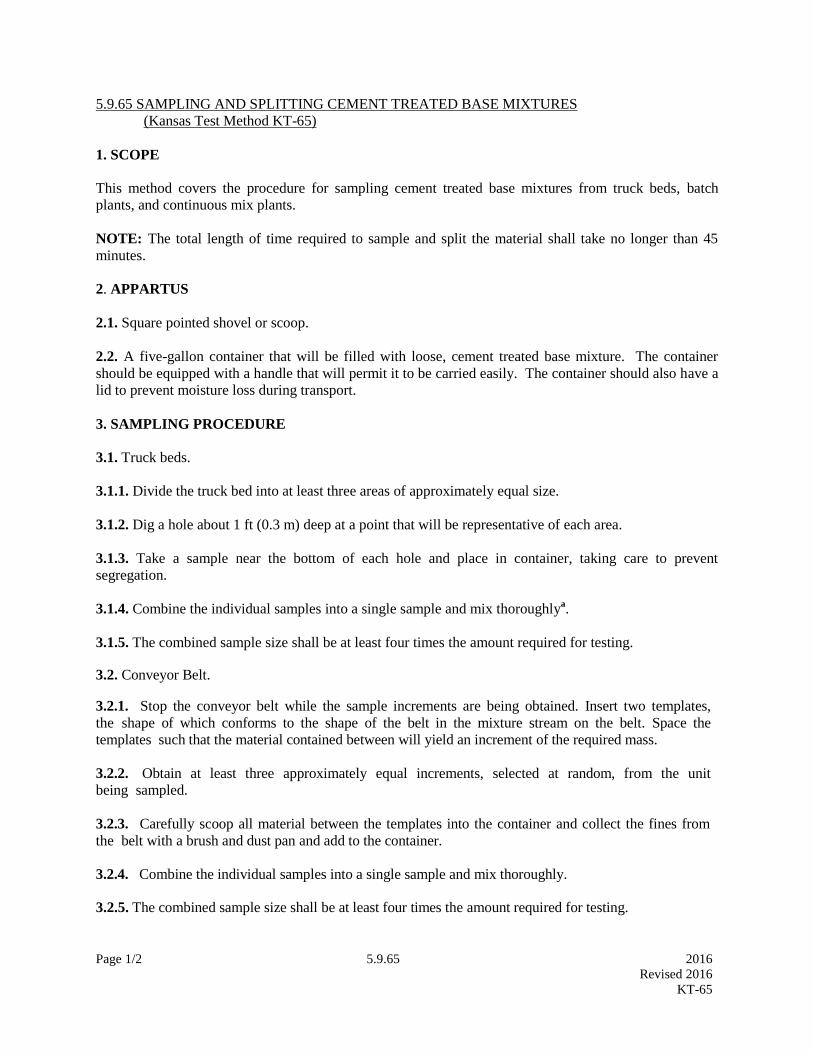
Page 1/2 5.9.65 2016
Revised 2016
KT-65
5.9.65 SAMPLING AND SPLITTING CEMENT TREATED BASE MIXTURES
(Kansas Test Method KT-65)
1. SCOPE
This method covers the procedure for sampling cement treated base mixtures from truck beds, batch
plants, and continuous mix plants.
NOTE: The total length of time required to sample and split the material shall take no longer than 45
minutes.
2. APPARTUS
2.1. Square pointed shovel or scoop.
2.2. A five-gallon container that will be filled with loose, cement treated base mixture. The container
should be equipped with a handle that will permit it to be carried easily. The container should also have a
lid to prevent moisture loss during transport.
3. SAMPLING PROCEDURE
3.1. Truck beds.
3.1.1. Divide the truck bed into at least three areas of approximately equal size.
3.1.2. Dig a hole about 1 ft (0.3 m) deep at a point that will be representative of each area.
3.1.3. Take a sample near the bottom of each hole and place in container, taking care to prevent
segregation.
3.1.4. Combine the individual samples into a single sample and mix thoroughlya.
3.1.5. The combined sample size shall be at least four times the amount required for testing.
3.2. Conveyor Belt. 3.2.1. Stop the conveyor belt while the sample increments are being obtained. Insert two templates,
the shape of which conforms to the shape of the belt in the mixture stream on the belt. Space the
templates such that the material contained between will yield an increment of the required mass.
3.2.2. Obtain at least three approximately equal increments, selected at random, from the unit
being sampled.
3.2.3. Carefully scoop all material between the templates into the container and collect the fines from
the belt with a brush and dust pan and add to the container.
3.2.4. Combine the individual samples into a single sample and mix thoroughly.
3.2.5. The combined sample size shall be at least four times the amount required for testing.

Page 2/2 5.9.65 2016
Revised 2016
KT-65
3.3. Sampling from Discharge or Flowing Streams.
3.3.1. The batch mixer or the continuous mixer (pugmill) shall be capable of sampling at the discharge
outlet. When a sample is taken from the discharge, use a loader(s) or other heavy equipment capable of
intercepting the entire cross section of the discharge stream.
3.3.2. Divide the material in the loader bucket into at least three areas of approximately equal size. Obtain
a sample from each of the three sections.
3.3.3. Combine the individual samples into a single sample and mix thoroughlya.
3.3.4. The combined sample size shall be at least four times the amount required for testing.
NOTE a: After mixing, place the lid securely on the container immediately following sampling to
prevent moisture loss in the material. The lid shall not be removed until the splitting procedure begins.
4. SPLITTING PROCEDURE
4.1. During mixing and reducing, care must be exercised to prevent moisture loss within the sample.
4.2. Reduce sample to the required size by splitting or quartering in the following manner:
4.2.1. Spread a sheet of paper (Kraft or similar) on a hard, clean smooth and level surface. Place the
sample in a pile near the center of the paper and mix by alternately lifting each corner towards the
opposite corner thereby rolling the mixture to the opposite corner. This should be performed in a
vigorous manner. Placing the sample on clean sheet metal and mixing thoroughly with a trowel is an
acceptable alternative.
4.2.2. Divide the pile into four equal quarters with a straightedge (trowel or similar metal blade) and
completely remove two pre-selected diagonally opposite quarters.
4.2.3. Continue this quartering procedure until the original sample is reduced to the approximately desired
size. On the final quartering step, if the sample is too large before quartering, but will be too small after
quartering, the sample pile is divided into equal opposite sectors but unequal adjacent sectors. This can
be accomplished by varying the dividing angle at the center of the sample pile from the normal 90
degrees. Opposite sections can then be selected to obtain the desired sample size.

Page 1/1 5.9.66 2016
Revised 2015
KT-66
5.9.66 SAMPLING EPOXY PAVEMENT MARKING (Kansas Test Method KT-66)
1. SCOPE
This method covers the procedures for field sampling of epoxy pavement marking.
2. APPARATUS
2.1. Supply of clean, 1/2 pint wide mouth friction top metal cans.
2.2 Duct or packing tape.
2.3. Hammer.
3. SAMPLING PROCEDURES
3.1. Have the contractor load the application equipment and allow the truck to apply the epoxy for
approximately one half hour prior to collecting samples.
3.2. Coordinate the sampling site with the contractor.
3.3. Using a clean 1/2 pint wide mouth metal can, take a sample for the resin component prior to mixing.
Fill the can completely.
3.4. Remove the can. Tap the lid securely on with a hammer. Seal the lid with duct or packing tape.
3.5. Using a second clean 1/2 pint wide mouth metal can, take a sample for the hardener component prior
to mixing. Fill the can completely.
3.6. Remove the can. Tap the lid securely on with a hammer. Seal the lid with duct or packing tape.
3.7. DO NOT MIX THE RESIN AND THE HARDENER SAMPLES.
4. SHIPPING INFORMATION
4.1. Label each 1/2 pint containers with at least the following:
4.1.1. Epoxy producer (Epoxy Brand Name).
4.1.2. Epoxy Manufacturer Product ID.
4.1.3. Epoxy resin batch number or Epoxy hardener batch number.
4.1.4. Project number.
4.1.5. CMS Number. Each component must have a different CMS Number.
4.1.6. Pack and ship samples of the resin component and the hardener component to the Materials &
Research Center, 2300 SW Van Buren, Topeka, KS 66611.


Page 1/1 5.9.67 2016
Revised 2010
KT-67
5.9.67 SAMPLING GLASS BEADS (Kansas Test Method KT-67)
1. SCOPE
This method covers the procedures for field sampling of Glass Beads from the applicator bead gun. On
double drop systems, a separate sample is required for each type of bead.
2. APPARATUS
2.1. Supply of clean, one quart friction top metal cans.
2.2 Duct or packing tape.
2.3. Hammer.
3. SAMPLING PROCEDURES
3.1. Have the contractor load the application equipment hopper with the glass beads and allow the truck to
apply beads for approximately one half hour.
3.2. Coordinating with the contractor, fill completely a clean one quart wide mouth metal can from the
applicator bead gun.
3.3. Remove the can. Tap the lid securely on with a hammer. Seal the lid with duct or packing tape.
3.4. Take a second sample following the above procedures Sections 3.2 and 3.3 of this test method.
4. SHIPPING INFORMATION
4.1. Label each quart of beads with at least the following:
4.1.1. Bead Producer.
4.1.2. Bead batch or lot number.
4.1.3. Specification number and/or type.
4.1.4. CMS number.
4.1.5. Pack and ship two (2)- one quart samples to the Materials and Research Center, 2300 SW Van
Buren, Topeka, KS 66611.

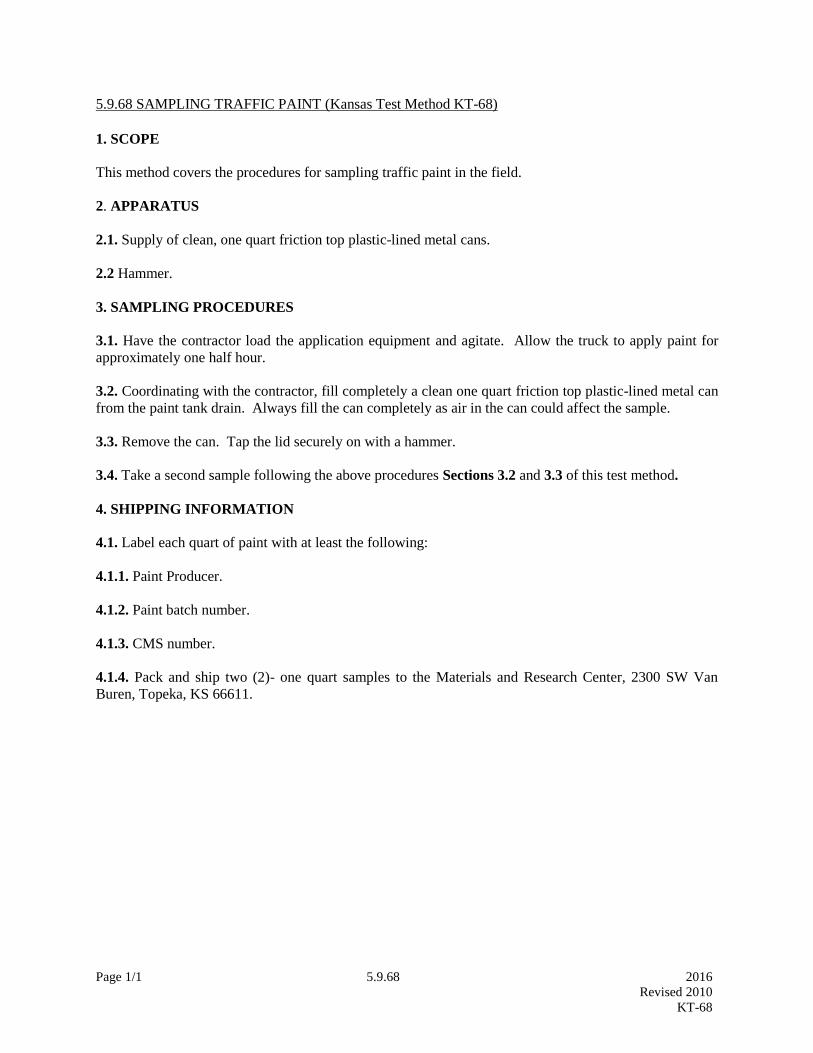
Page 1/1 5.9.68 2016
Revised 2010
KT-68
5.9.68 SAMPLING TRAFFIC PAINT (Kansas Test Method KT-68)
1. SCOPE
This method covers the procedures for sampling traffic paint in the field.
2. APPARATUS
2.1. Supply of clean, one quart friction top plastic-lined metal cans.
2.2 Hammer.
3. SAMPLING PROCEDURES
3.1. Have the contractor load the application equipment and agitate. Allow the truck to apply paint for
approximately one half hour.
3.2. Coordinating with the contractor, fill completely a clean one quart friction top plastic-lined metal can
from the paint tank drain. Always fill the can completely as air in the can could affect the sample.
3.3. Remove the can. Tap the lid securely on with a hammer.
3.4. Take a second sample following the above procedures Sections 3.2 and 3.3 of this test method.
4. SHIPPING INFORMATION
4.1. Label each quart of paint with at least the following:
4.1.1. Paint Producer.
4.1.2. Paint batch number.
4.1.3. CMS number.
4.1.4. Pack and ship two (2)- one quart samples to the Materials and Research Center, 2300 SW Van
Buren, Topeka, KS 66611.


Page 1 of 12 5.9.69 2016
Revised 2015
KT-69
5.9.69 Relative Density (Kansas Test Method KT-69)
1. SCOPE.
These test methods cover the procedure for determination of the maximum–index dry density/unit weight
of cohesionless, freedraining soils using a vertically vibrating table. These test methods are applicable to
soils that may contain up to 15% soil particles passing the No. 200 sieve and 100% passing a 3 inch
sieve.
KT-69 reflects testing procedures found in ASTM D 4253.
2. REFERENCED DOCUMENTS
2.1. KT-6 Specific Gravity and Absorption of Aggregate
2.2. KT-2 Sieve Analysis of Aggregates
2.3. KT-3 Material Passing 75 µm (No. 200) Sieve by the Wash Method
2.4. KT-11 Moisture Test
2.5. ASTM D 653 Standard Terminology Relating to Soil, Rock and Contained Fluids
2.6. ASTM D 698 Standard Test Methods for Laboratory Compaction Characteristics of Soil Using
Standard Effort (12 400 ft-lbf/ft3(600 kN-m/m
3))
2.7. ASTM D 854 Standard Test Methods for Specific Gravity of Soil Solids by Water Pycnometer
2.8. ASTM D 1557 Standard Test Methods for Laboratory Compaction Characteristics of Soil Using
Modified Effort (56 000 ft-lbf/ft3(2700kN-m/m
3))
2.9. ASTM D 2487 Standard Practice for Classification of Soils for Engineering Purposes (Unified
Soil Classification System)
2.10. ASTM D 2488 Standard Practice for Description and Identification of Soils (Visual-Manual
Procedure)
2.11. ASTM D 3740 Standard Practice for Minimum Requirements for Agencies Engaged in the
Testing and/or Inspection of Soil and Rock as Used in Engineering Design and
Construction
2.12. ASTM D 4253 Standard Test Methods for Maximum Index Density and Unit Weight of Soils
Using a Vibratory Table
2.13. ASTM D 4254 Standard Test Methods for Minimum Index Density and Unit Weight of Soils
and Calculation of Relative Density
2.14. ASTM D 4753 Standard Guide for Evaluating, Selecting, and Specifying Balances and Standard
Masses for Use in Soil, Rock, and Construction Materials Testing
2.15. ASTM D 6026 Standard Practice for Using Significant Digits in Geotechnical Data
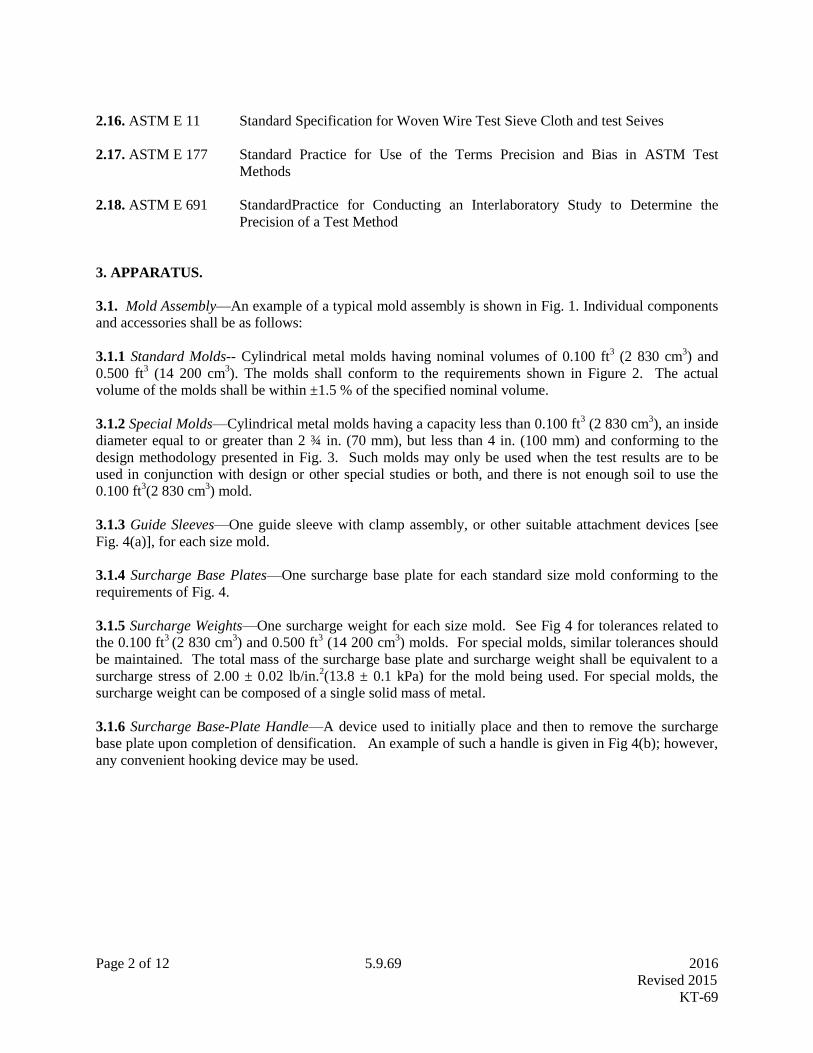
Page 2 of 12 5.9.69 2016
Revised 2015
KT-69
2.16. ASTM E 11 Standard Specification for Woven Wire Test Sieve Cloth and test Seives
2.17. ASTM E 177 Standard Practice for Use of the Terms Precision and Bias in ASTM Test
Methods
2.18. ASTM E 691 StandardPractice for Conducting an Interlaboratory Study to Determine the
Precision of a Test Method
3. APPARATUS.
3.1. Mold Assembly—An example of a typical mold assembly is shown in Fig. 1. Individual components
and accessories shall be as follows:
3.1.1 Standard Molds-- Cylindrical metal molds having nominal volumes of 0.100 ft3 (2 830 cm
3) and
0.500 ft3 (14 200 cm
3). The molds shall conform to the requirements shown in Figure 2. The actual
volume of the molds shall be within ±1.5 % of the specified nominal volume.
3.1.2 Special Molds—Cylindrical metal molds having a capacity less than 0.100 ft3 (2 830 cm
3), an inside
diameter equal to or greater than 2 ¾ in. (70 mm), but less than 4 in. (100 mm) and conforming to the
design methodology presented in Fig. 3. Such molds may only be used when the test results are to be
used in conjunction with design or other special studies or both, and there is not enough soil to use the
0.100 ft3(2 830 cm
3) mold.
3.1.3 Guide Sleeves—One guide sleeve with clamp assembly, or other suitable attachment devices [see
Fig. 4(a)], for each size mold.
3.1.4 Surcharge Base Plates—One surcharge base plate for each standard size mold conforming to the
requirements of Fig. 4.
3.1.5 Surcharge Weights—One surcharge weight for each size mold. See Fig 4 for tolerances related to
the 0.100 ft3
(2 830 cm3) and 0.500 ft
3 (14 200 cm
3) molds. For special molds, similar tolerances should
be maintained. The total mass of the surcharge base plate and surcharge weight shall be equivalent to a
surcharge stress of 2.00 ± 0.02 lb/in.2(13.8 ± 0.1 kPa) for the mold being used. For special molds, the
surcharge weight can be composed of a single solid mass of metal.
3.1.6 Surcharge Base-Plate Handle—A device used to initially place and then to remove the surcharge
base plate upon completion of densification. An example of such a handle is given in Fig 4(b); however,
any convenient hooking device may be used.
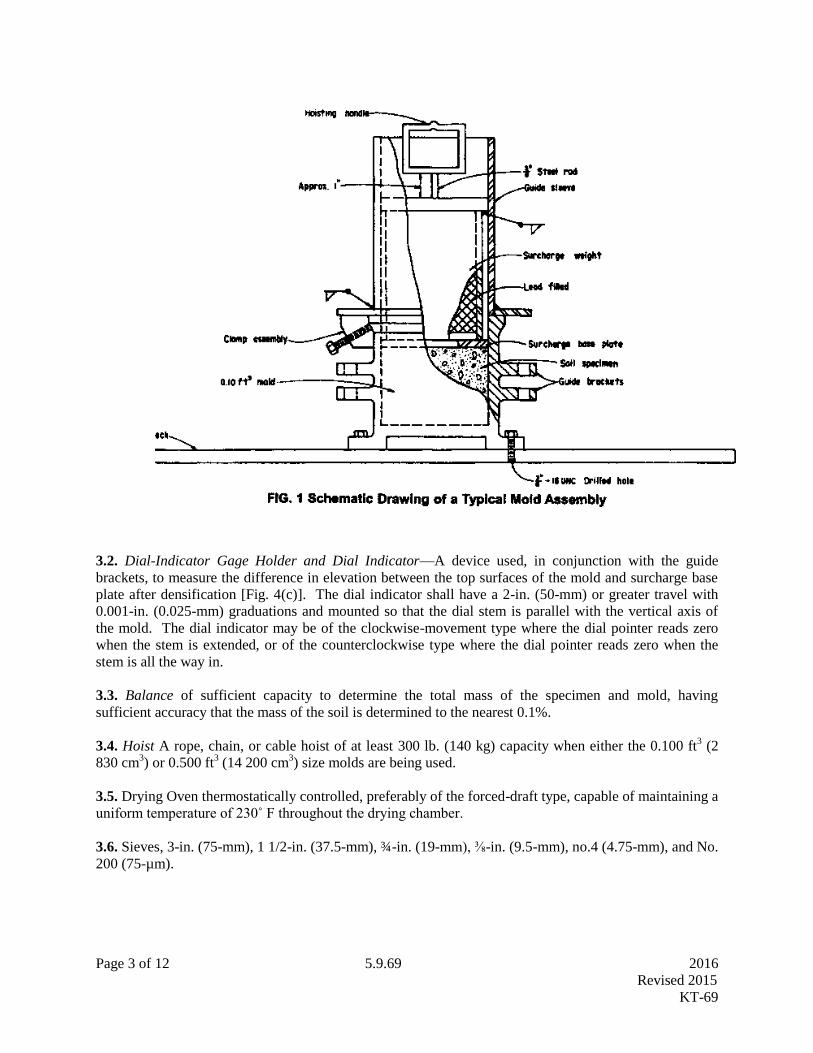
Page 3 of 12 5.9.69 2016
Revised 2015
KT-69
3.2. Dial-Indicator Gage Holder and Dial Indicator—A device used, in conjunction with the guide
brackets, to measure the difference in elevation between the top surfaces of the mold and surcharge base
plate after densification [Fig. 4(c)]. The dial indicator shall have a 2-in. (50-mm) or greater travel with
0.001-in. (0.025-mm) graduations and mounted so that the dial stem is parallel with the vertical axis of
the mold. The dial indicator may be of the clockwise-movement type where the dial pointer reads zero
when the stem is extended, or of the counterclockwise type where the dial pointer reads zero when the
stem is all the way in.
3.3. Balance of sufficient capacity to determine the total mass of the specimen and mold, having
sufficient accuracy that the mass of the soil is determined to the nearest 0.1%.
3.4. Hoist A rope, chain, or cable hoist of at least 300 lb. (140 kg) capacity when either the 0.100 ft3 (2
830 cm3) or 0.500 ft
3 (14 200 cm
3) size molds are being used.
3.5. Drying Oven thermostatically controlled, preferably of the forced-draft type, capable of maintaining a
uniform temperature of 230˚ F throughout the drying chamber.
3.6. Sieves, 3-in. (75-mm), 1 1/2-in. (37.5-mm), ¾-in. (19-mm), ⅜-in. (9.5-mm), no.4 (4.75-mm), and No.
200 (75-µm).

Page 4 of 12 5.9.69 2016
Revised 2015
KT-69
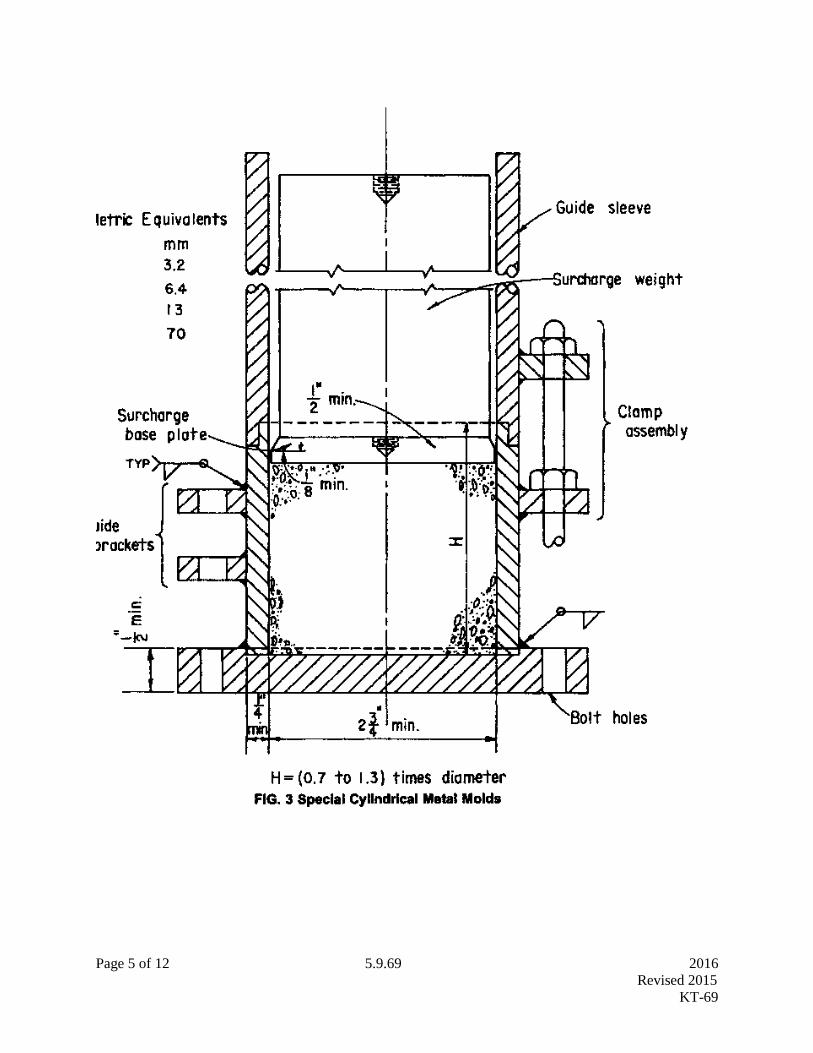
Page 5 of 12 5.9.69 2016
Revised 2015
KT-69

Page 6 of 12 5.9.69 2016
Revised 2015
KT-69
Page 7 of 12 5.9.69 2016
Revised 2015
KT-69
3.7. Calibration Bar, metal, about 3 by 12 by ¼ in. (75 by 300 by 6 mm)
3.8. Other equipment such as mixing pans, a large metal scoop, a hair-bristled dusting brush, a timing
device indicating minutes and seconds, a micrometer with at least a 1-in. (25-mm) travel and with 0.001-
in. (0.025-mm) graduations, and a metal straight edge (for trimming excess soil after it has been placed in
the mold.
3.9. Vibrating Table, shall be mounted to a concrete floor or mass of sufficient size and configuration that
excess vibrations are not transmitted to other testing areas. The vertically vibrating deck of the table shall
be of sufficient size and rigidity that the mold assembly being used can be attached and rigidly supported
during the test. The table shall be capable of vertically vibrating the mold assembly with a sinusoid-like
time-vertical displacement relationship at an average double amplitude (peak-to-peak displacement) of
0.013 ± 0.002 in.
(0.33 ± 0.05 mm) at a frequency of 60 Hz or 0.019 ± 0.003 in. (0.48 ± 0.08 mm) at 50 Hz under test
conditions. The table shall have the capability for adjustment of the frequency of vibration (between 0 to
60 Hz) or double amplitude of vibration, or both, between about 0.005 in. (0.15 mm) and 0.013 in. (0.33
mm) at 60 Hz or about 0.007 in. (0.20 mm) and 0.019 in. (0.48 mm) at 50 Hz for use with Methods 1A,
1B, 2A, or 2B (11.2.3). The table shall have the capability for adjustment of the double amplitude of
vibration between about 0.008 in. (0.20 mm) and 0.025 in. (0.64 mm) at 60 Hz or about 0.012 in. (0.30
mm) and 0.036 in. (0.91 mm) at 50 Hz for use in conjunction with design or other special studies
(11.1.6.3).
3.9.1.1. Electromagnetic Vibrating Table – A steel table conforming to the requirements of 3.9 with a
vertically vibrating, cushioned steel deck generally about 30 by 30 in. (760 by 760 mm), actuated by an
electromagnetic vibrator of the solid-impact type with a net mass over 45 kg. The table shall be mounted
to a concrete floor or slab having a mass of about 450 kg.
3.9.1.2. Eccentric or Cam-Driven Vibrating Table, conforming to the requirements of 3.9. The mass
required to support cam driven tables and eliminate vibrations in other areas may be as large as 4500 kg.
4. SAMPLE AND TEST SPECIMEN
4.1. Prior to testing, the sample should be stored in a manner to prevent freezing, contamination with
other matter, loss of soil, or loss of identification.
4.2. The required size (mass) of the test specimen and mold is a function of the maximum particle size
contained in the sample and the particle-size distribution (gradation) of the sample (see Table 1).
4.2.1. Using a visual method or Test Method KT-2 (depending upon the complexity of the gradation of
the sample and operator experience), determine the percentage of particles retained on the 3-in. (75-mm),
11⁄2-in. (37.5-mm), 3⁄4-in. (19.0mm), 3⁄8-in. (9.5-mm), No. 4 (4.75-mm), and No. 200 (75-μm) sieves.
4.2.2. The determination of the maximum index density/unit weight should not be performed in
accordance with these test methods unless the following requirements are met. Soils that may
contain up to 15 %, by dry mass, of soil particles passing a No.200 (75-μm) sieve, provided they still have
cohesionless, free-draining characteristics. Further, these test methods are applicable to soils in which 100
%, by dry mass, of soil particles pass a 3-in. (75-mm) sieve. If these conditions are met, then the mold

Page 8 of 12 5.9.69 2016
Revised 2015
KT-69
size and specimen mass required can be determined according to the maximum particle size as prescribed
in Table 1.
4.2.3. When it is applicable to use special molds, 100 % of the sample shall pass the 3⁄4-in. (19.0-mm)
sieve and have less than 10 % retained on the 3⁄8-in. (9.5-mm) sieve.
4.2.3.1. The selected test specimen shall have a mass not less than that determined using the following
equation:
Mr = 0.0024 · Vm
where:
Mr = mass required in kg, and
Vm = volume of mold in cm3.
4.3. Select a representative specimen of soil that meets the requirements of 4.2., using a splitter, riffle, or
other method such as quartering.
4.4. If Methods 1A or 2A are being performed, dry the specimen in the drying oven, maintained at 110 ±
5°C to a constant mass. It is often desirable to obtain the water content of the field sample. If this is the
case, determine the water content in accordance with Test Method KT-11.
4.4.1. After drying, thoroughly break up the weakly cemented aggregations; avoiding the reduction of the
natural size of the particles.
TABLE 1 Required Mass of Specimen
Maximum Particle Size (100
% Passing) in. (mm)
Mass of Specimen Required,
lb. (kg)
Size of Mold to be Used, ft3
(cm3)
3 (75) 75 (34) 0.500 (14 200)
1 ½ (38/1) 75 (34) 0.500 (14 200)
¾ (19.0) 25 (11) 0.100 (2830)
⅜ (9.5) 25 (11) 0.100 (2830)
No. 4 (4.75) or less 25 (11) 0.100 (2830)
5. PROCEDURE
5.1. Initial Dial Reading
Insert the dial indicator gage holder in each of the guide brackets with the dial gage stem in contact with
the rim of the mold (at its center) on both sides of the guide brackets. Obtain six sets of dial indicator
readings, three on each side of each guide bracket. The average of these twelve readings is the initial dial
gage reading, Ri. Record Ri to the nearest 0.001 in. (0.025 mm).
5.2. Dry Method—Methods 1A or 2A:
5.2.1, Mix the oven-dried specimen to provide an even distribution of particle sizes; that is, having as
little segregation as possible.
Page 9 of 12 5.9.69 2016
Revised 2015
KT-69
5.2.2. Fill the mold with soil and level the surface of the soil using methods that minimize segregation.
A scoop or pouring device (funnel) should be used to place the soil in the mold. The sides of the mold
may be struck a few times using a metal bar, rubber hammer, or similar item to settle the soil so that the
surcharge base plate can be easily placed into position and there is no surge of air from the mold when
vibration is initiated.
5.2.3. Place the appropriate surcharge base plate on the surface of the soil and twist it slightly several
times so that it is firmly and uniformly in contact with the surface of the soil. Remove the surcharge
base-plate handle.
5.2.4. Attach the mold to the vibrating table.
5.2.5. Firmly attach the guide sleeve to the mold and lower the appropriate surcharge weight onto the
surcharge base plate.
5.2.6. Setting for double amplitude of vibration.
5.2.6.1. Method 1A—Set the vibrator control (rheostat) at the setting determined in the calibration of the
vibration table for the mold assembly being used to obtain a double amplitude of vertical vibration of
0.013 ± 0.002 in. (0.33 ± 0.05 mm) at 60 Hz or 0.019 ± 0.003 in. (0.48 ± 0.08 mm) at 50 Hz.
5.2.6.2. Method 2A—Set the eccentric or cam at the setting determined in the calibration of the vibration
table for the mold assembly being used to obtain a double amplitude of vertical vibration of 0.013 ± 0.002
in. (0.33 ± 0.05 mm) at 60 Hz or 0.019 ± 0.003 in. (0.48 ± 0.08 mm) at 50 Hz.
5.2.6.3. There is a relationship between density/unit weight and double amplitude of vibration, and the
peak density/unit weight occurs at an optimum double amplitude of vibration which may not be the same
as the maximum index density/unit weight obtained at the double amplitude of vibration prescribed in
5.2.6.1 and 5.2.6.2. Therefore, this method allows the use of a double amplitude of vertical vibration other
than those prescribed in 5.2.6.1 or 5.2.6.2 if the following conditions are met:
5.2.6.3.1. Test results are to be used in conjunction with design or special studies or both, and
5.2.6.3.2. The double amplitude of vertical vibration used should be: (A) the optimum double amplitude
of vertical vibration (see the Appendix X1 of ASTM D 4253 for a recommended method to obtain the
optimum double amplitude of vibration), (B) less than 0.025 in. (0.64 mm) at 60 Hz or 0.037 in. (0.94
mm) at 50
Hz, and ( C) greater than 0.008 in. (0.20 mm) at 60 Hz or 0.012 in. (0.30 mm) at 50 Hz (except when
filling the mold for the wet method, 11.2.3). In terms of nominal peak acceleration, these values are
greater than about 1.5 g (14 m/s2) and less than about 4.8 g (45 m/s
2).
5.2.7. Vibrate the mold assembly and specimen for 8 ± 1⁄4 min at 60 ± 2 Hz or for 12 ± 1⁄4 min at 50 ±
2 Hz. Remove the surcharge weight and guide sleeve from the mold. Check that the surcharge base plate
is firmly and uniformly in contact with the surface of the soil; that is, does not wobble when pressed at the
edges. If it wobbles, this should be noted on the report form (data sheet).
5.2.8. To obtain and record dial indicator gage readings on opposite sides of the surcharge base plate,
place the indicator gage holder in each of the guide brackets. Brush aside any fines that might have
collected on the surcharge base plate where these readings will be taken.

Page 10 of 12 5.9.69 2016
Revised 2015
KT-69
5.2.9. Remove the surcharge base plate from the mold and detach the mold from the vibratory table.
During this step, prevent (as much as possible) any fines that have collected on the surfaces of the
surcharge base plate and the rim of the mold from entering the mold. If the mass of these fines is greater
than about 0.2 % of the total mass of the specimen, determine the mass and note it on the report form
(data sheet).
5.2.10. Determine and record the mass of the mold and soil using a balance. To calculate and record the
mass of the soil filling the mold, subtract the mass of the empty mold from the mass of the mold and soil.
Alternately, the contents of the mold may be emptied into a pan and weighed. Calculate the maximum-
index density/unit weight, ρdmax,n, in accordance with Section f.
5.2.11. Steps 5.2.1-5.2.10 should be repeated until consistent values of maximum index density/unit
weight (preferably within 2 %) are obtained. If excessive degradation (particle breakdown) of the soil is
suspected, a sufficient quantity of representative soil sample should be provided (if possible), so that a
single test specimen is not repeatedly subjected to step 5.2.7.
5.3. Wet Method—Methods 1B or 2B:
5.3.1. The wet method may be conducted on either oven-dried soil to which sufficient water is added or, if
preferred, on wet soil from the field. Mix the sample to provide an even distribution of particle sizes and
water content with as little
segregation as possible. If water is added to dry soil, allow a minimum soaking period of about 1⁄2 h. The
amount of water added should be sufficient enough that free water does not accumulate in the mixing pan,
and the specimen will become basically saturated during the densification process.
5.3.2. Attach the mold to the vibrating table.
5.3.3. With the vibrating table turned on, slowly fill the mold with wet soil using a scoop or shovel. After
each increment of soil is added, inspect to see if a small amount of free water has accumulated on the soil
surface. If not, add a sufficient amount of water by squeezing from a sponge, pouring from a small
container, or by other means. During this process, which is to take 5 to 6 minutes, the double amplitude or
the frequency or both, of vibration must be adjusted to prevent excessive boiling and fluffing of the soil.
During and just after the final minute of vibration, any water appearing above the surface of the soil
should be removed using means which prevent, as much as possible, the removal of soil.
5.3.4. Assemble the surcharge base plate, surcharge weight, and guide sleeve as specified in 5.2.3 and
5.2.5.
5.3.5. Vibrate the mold assembly and specimen as specified in 5.2.6-5.2.7. After the vibration period,
remove the surcharge weight and guide sleeve from the mold. Remove any free water appearing above,
on, and around the surcharge base plate.
5.3.6. Obtain and record dial indicator-gage readings in accordance with 5.2.8.
5.3.7. Remove the surcharge base plate and detach the mold from the vibratory table in accordance with
5.2.9. If a determination of the specimen water content is desired, determine and record the mass of the
mold and soil. Carefully remove the entire wet specimen from the mold, placing it in a pan of known
mass for oven drying. Wash all particles clinging to the inside of the mold and bottom of the base plate
into the pan. Dry the specimen in a drying oven, maintained at 110 ± 5°C to a constant mass. Determine
and record its oven-dried mass, using a balance.
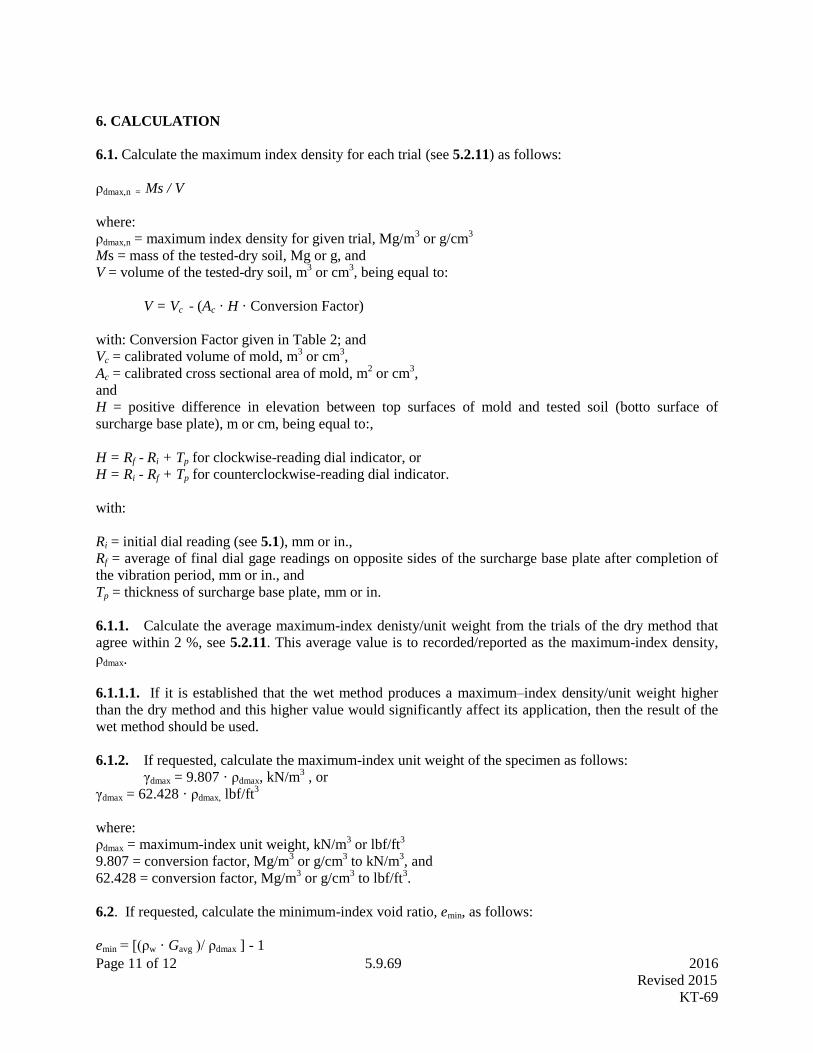
Page 11 of 12 5.9.69 2016
Revised 2015
KT-69
6. CALCULATION
6.1. Calculate the maximum index density for each trial (see 5.2.11) as follows:
ρdmax,n = Ms / V
where:
ρdmax,n = maximum index density for given trial, Mg/m3 or g/cm
3
Ms = mass of the tested-dry soil, Mg or g, and
V = volume of the tested-dry soil, m3 or cm
3, being equal to:
V = Vc - (Ac · H · Conversion Factor)
with: Conversion Factor given in Table 2; and
Vc = calibrated volume of mold, m3 or cm
3,
Ac = calibrated cross sectional area of mold, m2 or cm
3,
and
H = positive difference in elevation between top surfaces of mold and tested soil (botto surface of
surcharge base plate), m or cm, being equal to:,
H = Rf - Ri + Tp for clockwise-reading dial indicator, or
H = Ri - Rf + Tp for counterclockwise-reading dial indicator.
with:
Ri = initial dial reading (see 5.1), mm or in.,
Rf = average of final dial gage readings on opposite sides of the surcharge base plate after completion of
the vibration period, mm or in., and
Tp = thickness of surcharge base plate, mm or in.
6.1.1. Calculate the average maximum-index denisty/unit weight from the trials of the dry method that
agree within 2 %, see 5.2.11. This average value is to recorded/reported as the maximum-index density,
ρdmax.
6.1.1.1. If it is established that the wet method produces a maximum–index density/unit weight higher
than the dry method and this higher value would significantly affect its application, then the result of the
wet method should be used.
6.1.2. If requested, calculate the maximum-index unit weight of the specimen as follows:
γdmax = 9.807 · ρdmax, kN/m3 , or
γdmax = 62.428 · ρdmax, lbf/ft3
where:
ρdmax = maximum-index unit weight, kN/m3 or lbf/ft
3
9.807 = conversion factor, Mg/m3 or g/cm
3 to kN/m
3, and
62.428 = conversion factor, Mg/m3 or g/cm
3 to lbf/ft
3.
6.2. If requested, calculate the minimum-index void ratio, emin, as follows:
emin = [(ρw · Gavg )/ ρdmax ] - 1

Page 12 of 12 5.9.69 2016
Revised 2015
KT-69
where:
emin = minimum-index void ratio,
ρw = density of water at 20°C (0.99821) or equal to 1 Mg/m3 or g/cm
3,
ρdmax = maximum-index density, Mg/m3 or g/cm
3,
and
Gavg@20°C = weighted average specific gravity of soil solids composed of particles larger and smaller than
the No. 4 (4.75 mm) sieve being equal to:
Gavg @20°C = 1 / [(R / 100G1@20˚) + (P / 100G2@20˚C)]
1
with:
G1@20°C = apparent specific gravity of the soil solids retained on the No. 4 sieve as determined by Test
Method C 127 and corrected to 20°C (see Test Methods D 854),
G2@20°C = specific gravity of the soil solids passing the No. 4 sieve as determined by Test Methods D 854,
R = percentage of soil particles retained on the No. 4 sieve, and
P = percentage of soil particles passing the No. 4 sieve.
TABLE 2 Dial Reading Conversion Factors for Volume Calculations
Factor
Volume Requirements Dial Reading Units
mm in.
m3 0.001 0.0254
cm3 0.1 0.2540
7. REPORT
7.1. The report shall include the following information:
7.1.1. Origin of material used in test.
7.1.2. Description of appearance of test specimen, based on ASTM Practice D 2488 (Practice D 2487
may be used as an alternative).
7.1.3. The Methods (1A, 1B, 2A, or 2B) and size of mold used.
7.1.4. Double amplitude of vertical vibration used if different from that specified in 5.2.6.1 or 5.2.6.2.
7.1.5. The maximum index density, ρdmax, Mg/m3 or g/cm
3 or maximum-index unit weight, γdmax in
lbf/ft3(kN/m
3), or both, to four significant digits (in accordance with Practice D 6026).
7.1.6. Any abnormalities such as loss of material, segregation, or excessive tilt of base plate.
Page 1/5 5.9.70 2016
Revised 2014
KT-70
5.9.70 METHOD FOR TESTING POLYMER OVERLAYS FOR SURFACE PREPARATION AND
ADHESION (Kansas Test Method KT-70)
1. SCOPE
This method covers the test procedure used to measure the tensile rupture strength between hydraulic
cement concrete and polymer concrete overlays. This test procedure may involve hazardous materials,
operations, and equipment. Follow all manufacturer suggested safety precautions when performing the
test.
NOTE: “Polymer Overlay” represents the complete system; polymer adhesive and aggregate bonded to
the concrete bridge deck.
2. REFERENCED DOCUMENTS
2.1. None.
3. APPARATUS
3.1. A dynamometer with a minimum capacity of 2000 lbf (1000 kg).
3.2. A mechanical testing device for pulling a bonded pipe cap in tension as shown in Figure 1 below.
3.3. Core drill with a 2 inch (50 mm) inside diameter diamond tipped core barrel.
3.4. A standard 1 1/2 inch (37 mm) diameter pipe cap, where the bottom surface has been machined
smooth, flat, and shoulder cut to provide a 2 inch (50 mm) diameter bonding surface. The surface of the
pipe cap should be textured to provide good adhesion to the adhesive. This may be achieved by
sandblasting, scoring or any method that produces a roughened bonding surface.
3.5. A rapid curing adhesive with strength and viscosity properties suitable for bonding the pipe caps to
the overlay. A high viscosity, rapid setting epoxy with a pot life of 3 to 25 minutes is recommended.
3.6. Calipers or other measuring device.
3.7. Small propane torch (optional).
3.8. Surface and internal thermometers.
3.9 Duct tape.
Note: Test equipment for this procedure is available in other forms and may be used with the approval of
the Engineer.
4. PREPERATION OF TEST PATCHES
4.1. Select 1 1/2 foot x 3 foot (0.5 m x 1.0 m) areas of the bridge deck for the polymer concrete test
patches. The test patches should cover various surface conditions found on the bridge deck. Typical
surface conditions tested should include areas in the wheel paths, in the area between wheel paths and in
other areas that represent nominal as well as the worst surface conditions.
Page 2/5 5.9.70 2016
Revised 2014
KT-70
4.2. Clean test patch areas by the same method to be used to prepare the entire deck. Remove all loose
disintegrated concrete, dirt, paint, oil, asphalt, laitance carbonation and curing materials from patches and
other foreign material from the surface of the deck that can interfere with the curing or adhesion of the
overlay. Cleaning is usually indicated by a significant change in the color of the concrete and exposing
coarse aggregate particles.
4.3. Tape off an area 1 1/2 foot x 3 foot (0.5 m x 1.0 m) using duct tape. Measure and record the
temperatures of the air, deck surface, polymer components and aggregate.
4.4. Mix the polymer components as prescribed by the manufacturer using the same equipment, timing,
and sequence of operation as will be used when placing the overlay on the full deck surface.
4.5. Collect a 2 ounce (50 ml) sample of the mixed polymer and measure and record the polymer gel time.
The gel time is the time interval between the initial mixing of the polymer and the formation of a
gelatinous mass in the center of the sample.
4.6. Accurately prepare sufficient quantities of the polymer mixture for each test patch. Place the
polymer on each 0.5 square yard (0.5 sq m) prepared test area. Spread the polymer with a notched
squeegee in the same manner as on the full deck surface. Apply the polymer uniformly without puddling.
Apply the dry overlay aggregate on each test patch at the same rate as specified in Contract Documents.
4.7. Allow the polymer to cure as required to allow sweeping or vacuuming without damaging the surface
(curing time varies according to temperature). Curing of the first course can be checked by placing thumb
on the aggregate and applying pressure. If the aggregate moves, curing has not been sufficient. See
Table 1 for typical minimum cure times.
4.8. Remove excess aggregate.
4.9. Accurately measure sufficient quantities of the polymer mixture for each test patch. Place the
polymer on the first course of each 0.5 square yard (0.5 sq m) test area. Spread the polymer with a
notched squeegee in the same manner as on the full deck surface. Apply the polymer uniformly without
puddling. Apply the dry overlay aggregate on each test patch at the same rate as specified in Contract
Documents.
4.10. Allow the polymer to cure as required to prevent damage from traffic. See TABLE 1 for typical
minimum cure times.
4.11. Remove excess aggregate
TABLE 1
TYPICAL POLYMER CONCRETE OVERLAY CURE TIMES.
.
COURSE
AVERAGE TEMPERATURE OF OVERLAY COMPONENTS,
°F (°C)
55-59
(13-15)
60-64
(16-18)
65-69
(19-21)
70-74
(22-23)
75-79
(24-26)
80-85
(27-29)
85+
(29+)
MINIMUM CURE TIME, hrs.
1 5 4 3 2.5 2 1.5 1
2 8 6.5 5 4 3 3 3
Page 3/5 5.9.70 2016
Revised 2014
KT-70
5. PROCEDURE
5.1. Using a diamond tipped core barrel, drill through the polymer overlay and into the concrete surface to
a depth of 1/2 inch (13 mm). The dimensions of the core barrel must be such that the resulting concrete
core is 2 inches (50 mm) in diameter. Do not use water for the coring operation.
5.2. Vacuum or blow the dust from around the core. Bond a 1 1/2 inch (37 mm) pipe cap that has been
machined to have a flat bottom surface of 2 inches (50 mm) in diameter, to the cored overlay disk. The
adhesive used to bond the pipe cap to the overlay should be a rapid curing adhesive with a minimum
working life of 3 minutes. Apply a small amount of adhesive to both the pipe cap surface and the cored
disk. Do not allow any adhesive to flow over the edge of the cored disk or down into the cored area. If
this occurs, do not record the test result, core an alternate area and perform another test. To decrease the
curing time of the epoxy adhesives, heat may be applied to pipe cap by means of a small propane torch.
Do not heat the cored disk directly! Monitor the temperature of the pipe cap. Do not allow the cap
temperature to exceed 120F (49ºC).
5.3. It is of the utmost importance that the tensile rupture equipment and dynamometer be aligned with
the extended axis of the pipe cap to give accurate test results. To ensure the alignment of the apparatus
alignment the use of a template is advised.
5.4. Screw the lower threaded hook into the cap. Place the testing apparatus over the pipe cap and align
with the cored disk.
5.5. Attach the dynamometer to the upper and lower hooks. Set the load indicator on the dynamometer to
zero. Check the date of calibration on the dynamometer. It must have been calibrated within the last 12
months.
5.6. Apply a tensile load at the rate of 100 + 10 pounds (45 + 5 kg), every 5 seconds.
5.6.1. Record the load for each test core to the nearest 10 lbf (5 kg).
5.6.2. Record the type of failure for each test core and percent failure in the concrete over the test area for
Type 1 and Type 2 failures.
There are five types of failures:
Type 1 - Failure in the concrete at a depth greater than or equal to 1/4 inch (6 mm) over
more than 50% of the test area.
Type 2 - Failure in the concrete at a depth less than 1/4 inch (6 mm) over more than 50%
of test area.
Type 3 - Separation of the polymer overlay from the concrete surface.
Type 4 - Failure within the polymer overlay.
Type 5 - Failure of the test adhesive.
A properly applied polymer overlay on a properly prepared surface typically will result in a
failure in the concrete (Type 1).
5.6.3. Using calipers, take two measurements of the diameter of the specimen to the nearest 0.01 in (0.25
mm). The measurements are taken at right angles to each other.
5.6.4 The two measurements taken in Section 5.6.3. of this test method are averaged for determining the
cross-sectional area of the specimen.

Page 4/5 5.9.70 2016
Revised 2014
KT-70
5.7. Perform a minimum 4 pull-off tests on each 1 1/2 foot x 3 foot (0.5 m x 1.0 m) test patch.
5.8. Repair the hole created by the tensile rupture strength test with a mixture of the polymer and
aggregate used in the overlay.
6. CALCULATIONS
6.1. Use the 3 highest values to calculate the Tensile Rupture Strength for the test patch as noted below.
6.1.1. For Type 1 failures:
Tensile Rupture Strengths less than 250 psi (1.7 MPa) will not be used in the average
tensile rupture calculation.
Should one pullout fail below 250 psi (1.7 MPa) the test result will be the average of the
two remaining pull-off tests.
Should two pullouts fail below 250 psi (1.7 MPa) the test result will be the Tensile
Rupture Strength of the one remaining test.
A failure in the concrete below 250 psi (1.7 MPa) indicates weak concrete, not poor
overlay bond.
6.1.2. For Type 2, 3 or 5 failures use the average of the three highest pull-off values to determine the
Tensile Rupture Strength.
6.1.3. Type 4 failures will not be accepted or used in calculations.
6.2. Determine the Tensile Rupture Strength for each test core using the following equation:
TRSx=P
A
TRSx = Tensile Rupture Strength for one test core.
P = Load (Dynamometer)
A = Area of cored disc, verify the area prior to performing the calculations.
6.2.1 This value will be recorded as the result for one test core. Record the result to nearest 10 psi (0.1
MPa).
6.3. Determine the average Tensile Rupture Strength for each test patch using the following equation.
TRS1+ TRS2…+TRSn
TRSavg =
n
n = number of test cores
7. REPORT
7.1 This value will be recorded as the result for one test patch. Report the result to nearest 10 psi (0.1
MPa).
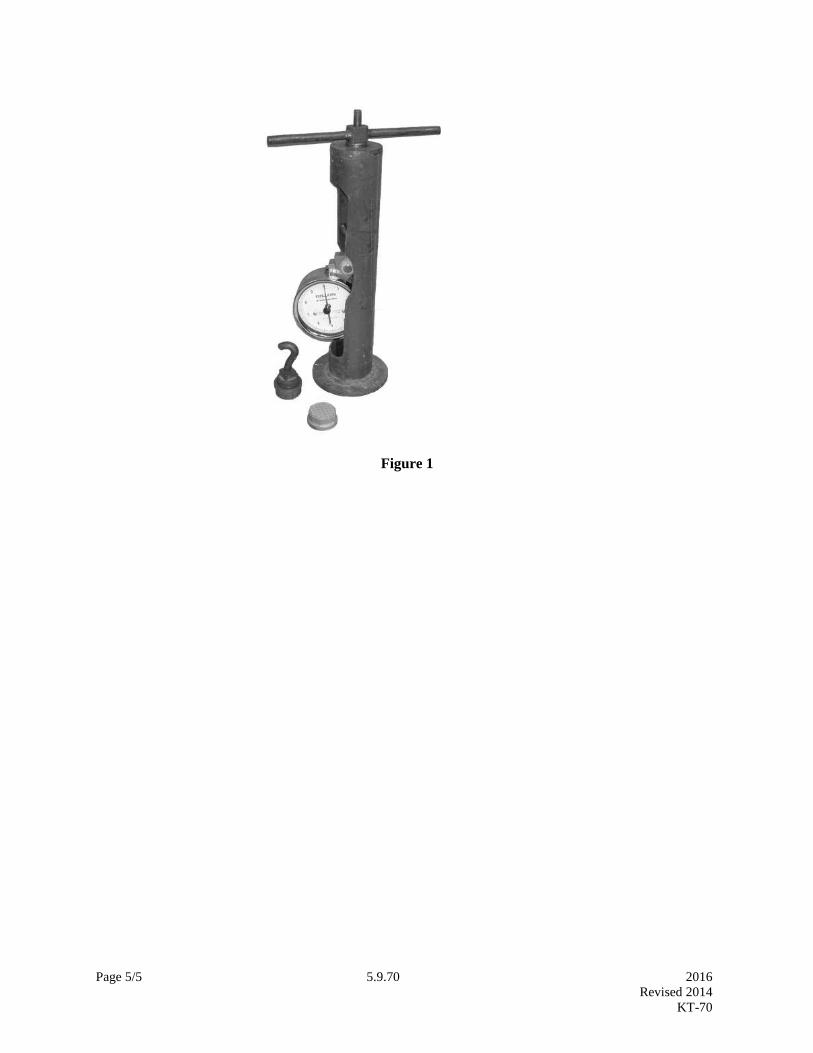
Page 5/5 5.9.70 2016
Revised 2014
KT-70
Figure 1


Page 1/10 5.9.71 2016
Revised 2014
KT-71
5.9.71 AIR-VOID ANALYZER (Kansas Test Method KT-71)
1. SCOPE
This method of test covers the determination of characteristics of the air-void system of freshly mixed
concrete using a sample of mortar. Spacing factor, specific surface and entrained air content are determined
by capturing air bubbles released from a mortar sample.
The sample will only be representative of the depth of the concrete within approximately 2.5 in (60 mm)
below the level at which the sampling is begun. This method is applicable to fresh concrete with a
minimum slump of 0.4 in (10 mm) and air content between 3.5 and 10% by volume. Only air voids less
than 0.1 in (3 mm) in diameter are measured by this method. The test must be performed in sheltered, stable
conditions.
2. REFERENCED DOCUMENTS
2.1. Part V, 5.9; Sampling and Test Methods Foreword
2.2. KT-18; Air Content of Freshly Mixed Concrete by the Pressure Method
2.3. KT-19; Air Content of Freshly Mixed Concrete by the Volumetric Method
2.4. KT-20; Mass per Cubic Foot (Meter), Yield, and Air Content (Gravimetric) of Freshly Mixed Concrete
2.5. KT-21; Slump of Portland Cement Concrete
2.6. ASTM C 457; Microscopical Determination of Parameters of the Air-Void System in Hardened
Concrete
3. APPARATUS
3.1. The balance shall conform to the requirements of Part V, Section 5.9; Sampling and Test Methods
Foreword for the class of general purpose balance required for the principal sample mass of the sample
being tested. The balance shall also have an integral arm from which the dish can be suspended.
3.2. Analysis and data collection apparatus assembly, the sampling equipment and materials is designed and
built to function as an integrated system that is demonstrated by the manufacturer to accurately measure and
calculate air-void distribution in fresh air-entrained concrete.
3.3. Riser cylinder made of clear plastic with a base and a collar approximately as shown in Figure 1. The
base shall have an integral heating element capable of maintaining the analysis liquid at 73 ± 4°F (23 ± 2°C)
and entry holes for the plastic rod and the sample syringe with gaskets to make a watertight seal.
3.4. Magnetic stirrer capable of maintaining 300 rpm during mixing.
3.5. A cabinet shall house the riser cylinder, magnetic stirrer and balance as shown in Figure 2.
3.6. A ferromagnetic steel rod approximately 0.2 in (5mm) in diameter and 2.5 in (62mm) in length.
3.7. A temperature sensor capable of detecting the temperature of the analysis liquid at the bottom of the
cylinder. The temperature sensor should be capable of measuring yhr temperature to within 1.0°F (0.5°C)
Page 2/10 5.9.71 2016
Revised 2014
KT-71
in the range of 59 to 86°F (15 to 30°C) and of transmitting such measurements to the computer through an
appropriate interface.
3.8. 20 ml plastic syringes, with the tapered end removed, calibrated and marked for collecting the
specified sample volume as shown in Figure 3.
3.9. Plastic rod at least 1.5 in (35 mm) longer than the width of the base. The outside diameter of the
body of the rod is the same as the syringes used in the test. A 0.04 in (1 mm) length at the end of the rod
shall have a reduced diameter that fits tightly within the inside diameter of the syringe as shown in Figure
3.
3.10. Clear, shallow dish that is large enough to cover the entire area of the cylinder, retain the rising
bubbles and fit within the collar. The dish shall have an opening on the side to allow entrapped air to be
removed.
NOTE: An inverted Petri dish with an appropriate slot, as shown in Figure 3, can fulfill these
requirements.
3.11. A device to suspend the dish from a balance arm by a single wire as shown in Figure 3.
3.12. Control System. A computer, software and interface system capable of controlling the test,
recording data, and displaying data at least once per minute during the test. It shall also calculate, display
and record the air content(s), air-void spacing factor, and specific surface of the air-void system.
3.13. Sampling assembly to hold the syringe and a wire cage and vibrate at approximately 50 Hz with an
amplitude that allows the mortar to flow into the wire cage.
NOTE: A drill operating at 3000 rpm with an eccentrically weighted, forked assembly as shown in
Figure 4 can fulfill these requirements. The hammering function of the drill can be used as needed in
stiffer concrete mixes.
3.14. A wire cage that is of sufficient size to obtain a sample of fresh concrete mortar, similar to Figure 4.
The cage wires shall have a clear spacing of 0.24 in (6 mm).
3.15. Rigid, clear plastic plate approximately 10 x 10 x 1/8 in. (250 x 250 x 3 mm) with a center hole of a
diameter approximately 1/8 in (3 mm) greater than that of the wire cage.
3.16. A calibrated funnel marked for measuring a specified amount of analysis liquid similar to that
shown in Figure 4. The funnel is capable of introducing the analysis liquid into the bottom of the water-
filled riser cylinder with a minimum of mixing.
3.17. A spatula to trim the mortar sample flush with the end of the syringe.
3.18. A water container with a 2 gallon (4 liter) minimum capacity.
NOTE: A 5 gallon (19 liter) portable insulated drinking water cooler is useful for repeated testing.
3.19. An immersible heating element capable of maintaining the water in the container at approximately
73 ± 4°F (23 ± 2° C).
3.20. Thermometer accurate to ± 1.0°F (± 0.5°C) over the range of 50 to 86°F (10 to 30°C).

Page 3/10 5.9.71 2016
Revised 2014
KT-71
3.21. Brush with a handle longer than the riser cylinder is tall and an angled head.
3.22. An insulated “cooler-type” lunchbox is useful.
3.23. Sealable plastic bags, commercially available in pint and quart sizes.
4. MATERIALS
4.1. Analysis Liquid. The analysis liquid shall have physical and chemical properties such that the air-
void bubbles remain discrete. The viscosity of the analysis liquid must remain constant over the range of
temperatures found in the test and be compatible with the apparatus and the control system. The viscosity
of the analysis liquid used shall provide a measurable separation in time between the arrivals of bubbles
of different sizes at the top of the water column. The analysis liquid and its viscosity shall be specified by
the equipment manufacturer.
NOTE: A commercially-available solution of glycerol in water can fulfill these requirements. A mixture
of 4 parts glycerol to 1 part distilled water has been known to work well.
4.2. De-Ionized water from the Materials and Research Chemistry Lab. The water shall be de-aerated and
maintained at atmospheric pressure and approximately 73 ± 4°F (23 ± 2°C) for a minimum of 12 hours
before use.
NOTE: Properly de-aerated water is crucial to this test. The solubility of air in water increases as
pressure increases and temperature decreases. The change in dissolved air content due to temperature
occurs slowly; thus, the water must be maintained at constant temperature for a minimum of 12 hours
before use. De-aerated water also reabsorbs air when cooled. If the water is not de-aerated correctly or if
it is used shortly after reheating, air may be liberated in the riser cylinder. Air bubbles may form in the
riser cylinder and on the dish, and may have a considerable effect on the specific surface and spacing
factor results.
4.3. Ice as needed in cubes or chips or frozen, re-freezable ice packs or cubes.
5. SAMPLING
5.1. Take samples as soon as possible after the concrete is in the desired state. The sampling location
depends on the purpose of the test. Samples can be extracted from concrete in place (pavements,
structural members, decks, etc.), from concrete sampling containers such as unit weight buckets, beam
molds, or cylinder molds, or from other locations.
5.2. Insert a syringe into the sampling assembly and mount the wire cage onto the sampling assembly.
Fully collapse the syringe.
5.3. Place the plastic plate in good contact with the surface of the concrete to be sampled. Begin the
vibration of the sampling assembly. Lower the wire cage through the hole in the plastic plate into the
concrete. The vibration will cause the mortar fraction of the concrete to flow into the wire cage.
Advance the wire cage into the concrete at a rate such that the concrete surface under the plate and the
surface of the mortar within the cage remain at approximately the same level at all times. Avoid filling
the cage with surface mortar by pressing the plastic plate against the fresh concrete. The pressure is
adequate when the air bubbles under the plastic plate do not move towards the hole while sampling.
Page 4/10 5.9.71 2016
Revised 2014
KT-71
5.4. Advance the wire cage into the concrete until the end of the syringe plunger is in full contact with the
surface of the mortar. While maintaining the vibration, push the syringe cylinder smoothly into the
mortar at such a rate that the wire cage remains full of mortar until the syringe is fully extended. Stop the
vibration and withdraw the wire cage and syringe from the concrete.
5.5. Remove the wire cage and the syringe from the sampling assembly saving the excess mortar from the
wire cage. Pack this excess mortar around the end of the syringe to be used to displace any large air
bubbles from the syringe.
5.6. Immediately place the sample in a plastic bag on ice or freezer packs in the insulated box to retard the
onset of initial set. Testing must begin before the initial set of the concrete.
5.7. If large air bubbles are present at the base of the syringe, remove the plunger and pack enough excess
mortar through the opposite end of the syringe to remove the air bubble. Replace the plunger to contact
the mortar. Remove the excess mortar from the outside of the syringe and clean the outside of the syringe
with a damp cloth. Advance the plunger to the mark corresponding to the specified sample volume and
trim the mortar flush with the end of the syringe cylinder using the spatula. Retract the plunger
approximately 0.04 in (1 mm) to allow room for the recessed end of the plastic rod. This step may be
performed at any time before Section 7.9 of this test method, seating the syringe on the plastic rod.
6. PREPARATION OF APPARATUS
6.1. Bring the analysis liquid and at least 0.5 gallon (2 liters) of de-aerated water to a temperature of 73 ±
4°F (23 ± 2°C) without altering other characteristics of the liquids.
NOTE: Using ice in sealed plastic bags, or freezer packs to cool the liquids is acceptable.
6.2. Select a test location protected from any wind, vibration or movement that may affect the balance
readings. Place the cabinet on a stable and level surface. Allow the balance to stabilize so that it does not
drift more than 0.01 g in four minutes. If the balance has auto-zeroing capability, place a small load on
the balance to obtain a non-zero reading in order to observe the variation of the reading.
6.3. Connect the control system.
NOTE: Place the control system so that if the plastic rod is accidentally removed from the base of the
riser cylinder the contents of the riser cylinder will not spill onto the control system.
6.4. See Section 11 of this test method for additional hints on preparation of apparatus.
7. PROCEDURE
7.1. Enter all required data into the control system.
7.2. Place the stirrer rod flat on the bottom of the riser cylinder. Insert the plastic rod through the hole on
the wider side of the base of the riser cylinder so that the full diameter of the plastic rod protrudes though
the hole on the opposite (narrower) side of the base.
NOTE: Using a light coat of waterproof grease on the rubber o-rings will improve the seal between the
plastic rod and the base of the riser cylinder.
Page 5/10 5.9.71 2016
Revised 2014
KT-71
NOTE: When testing low-viscosity materials such as self-consolidating concrete, it is permissible to tilt
the riser column to seat the syringe on the plastic rod before the liquids are added to the riser column.
7.3. Fill the riser cylinder with de-aerated water to about 0.5 in (15 mm) above the bottom of the top
collar. Use the brush to remove all bubbles from the stirrer rod, the plastic rod and the riser cylinder.
NOTE: Rotating the plastic rod can be helpful in assuring that all bubbles are removed.
7.4. Mount the riser cylinder in position on the cabinet. It is permissible to fill the riser cylinder with the
water after positioning the riser cylinder on the cabinet.
7.5. Fill the funnel with the manufacture’s specified amount of the analysis liquid.
7.6. Insert the analysis liquid into the bottom of the riser cylinder using the funnel to minimize the mixing
of the analysis liquid with the de-aerated water. Replace the stopper once the specified amount of
analysis liquid has been discharged. Remove the funnel from the riser cylinder and discard any remaining
liquid in the funnel.
7.7. Connect the integral heating element of the riser cylinder and the temperature sensor to the control
system.
7.8. Insert the dish into the riser cylinder collar. Submerge the dish in the de-aerated water and tilt to
allow all entrapped air to escape through the opening. Suspend the dish from the balance arm in such a
way that it is approximately centered and does not touch the walls of the riser cylinder collar. Only a
single wire of the suspension device may break the surface of the water. Add more de-aerated water if
necessary.
7.9. Seat the syringe containing the sample on the reduced end of the plastic rod. Move the syringe and
plastic rod together through the riser cylinder base until the junction of the syringe and plastic rod is at the
nearest inside edge of the riser cylinder. Leaving the syringe in position, continue withdrawing the plastic
rod until the reduced end is flush with the opposite inside edge of the riser cylinder.
NOTE: To make positioning the plastic rod and syringe with respect to the riser cylinder easier, mark the
correct position on the plastic rod and note the position of the syringe before starting the test. If moving
the plastic rod and syringe is difficult, use a small amount of waterproof grease or analysis fluid on the
gaskets and use a twisting motion.
7.10. Remove enough of the air that may have risen during the separation of the syringe and the plastic
rod from under the dish so that the dish is neither touching nor close to the wall of the riser cylinder
collar.
7.11. When the temperature of the analysis liquid as measured by the temperature sensor is 73 ± 4°F (23 ±
2°C), inject the mortar from the syringe into the riser cylinder. Immediately start the mixing and data
collection.
7.12. If any of the recorded temperature readings are outside the range of 73 ± 4°F (23 ± 2°C), discard the
test.
7.13. If unusual variations that may be due to vibration or disturbance are noted in the data, discard the
test.
Page 6/10 5.9.71 2016
Revised 2014
KT-71
7.14. Analyze samples as soon as possible. However, samples may be used whenever they can be
completely dispersed in the analysis liquid by the stirring action.
8. REPORT
8.1. The report shall include the following information:
8.2. Project identification
8.3. Test identification number
8.4. Date of test
8.5. Sampling location
8.6. Slump by KT-21 (if known)
8.7. Air content by KT-18 or KT-19 (if known)
8.8. Unit weight by KT-20 (if known)
8.9. Mortar (material less than 6 mm) volume, percent, as calculated from the mix design
8.10. Paste volume, percent, as calculated from the mix design
8.11. Sample volume, ml
8.12. Test temperature range, °F (°C)
8.13. Air content(s), percent
8.14. Spacing factor, in (mm)
8.15. Specific Surface, in2/in
3 (mm
2/mm
3)
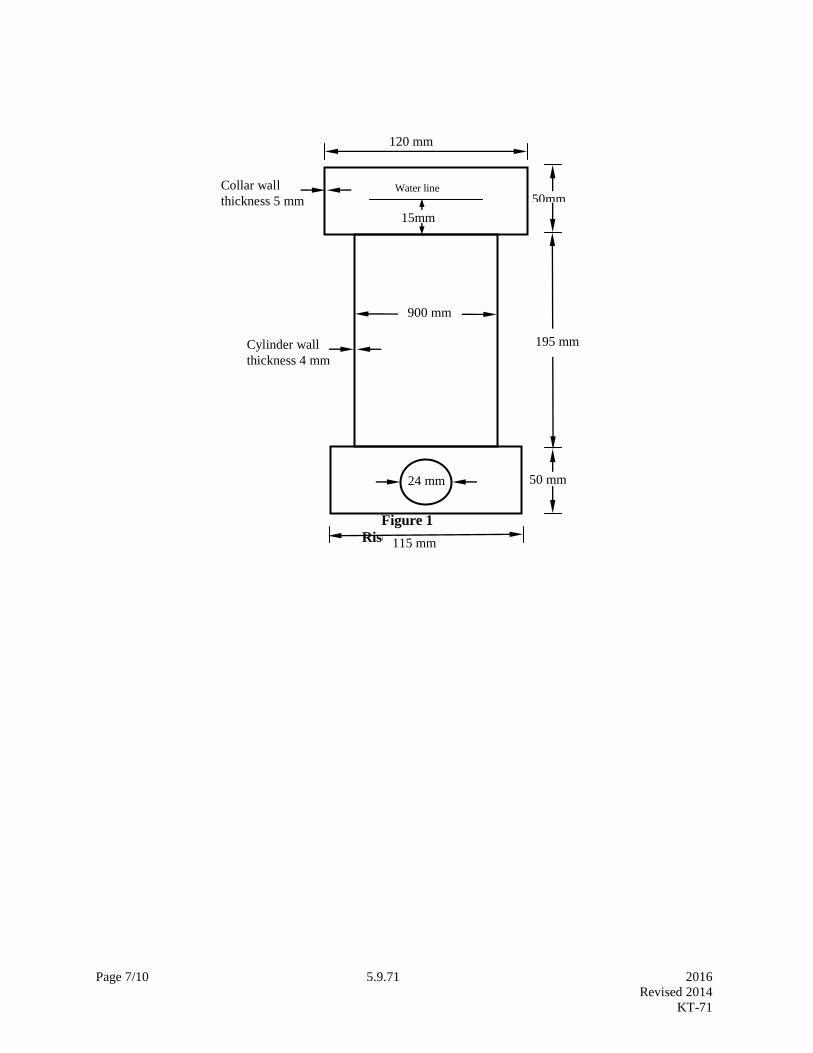
Page 7/10 5.9.71 2016
Revised 2014
KT-71
Figure 1
Riser Cylinder
120 mm
115 mm
900 mm
24 mm
15mm
5mm5
mm
Water line
Cylinder wall
thickness 4 mm
Collar wall
thickness 5 mm 50mm
50 mm
195 mm
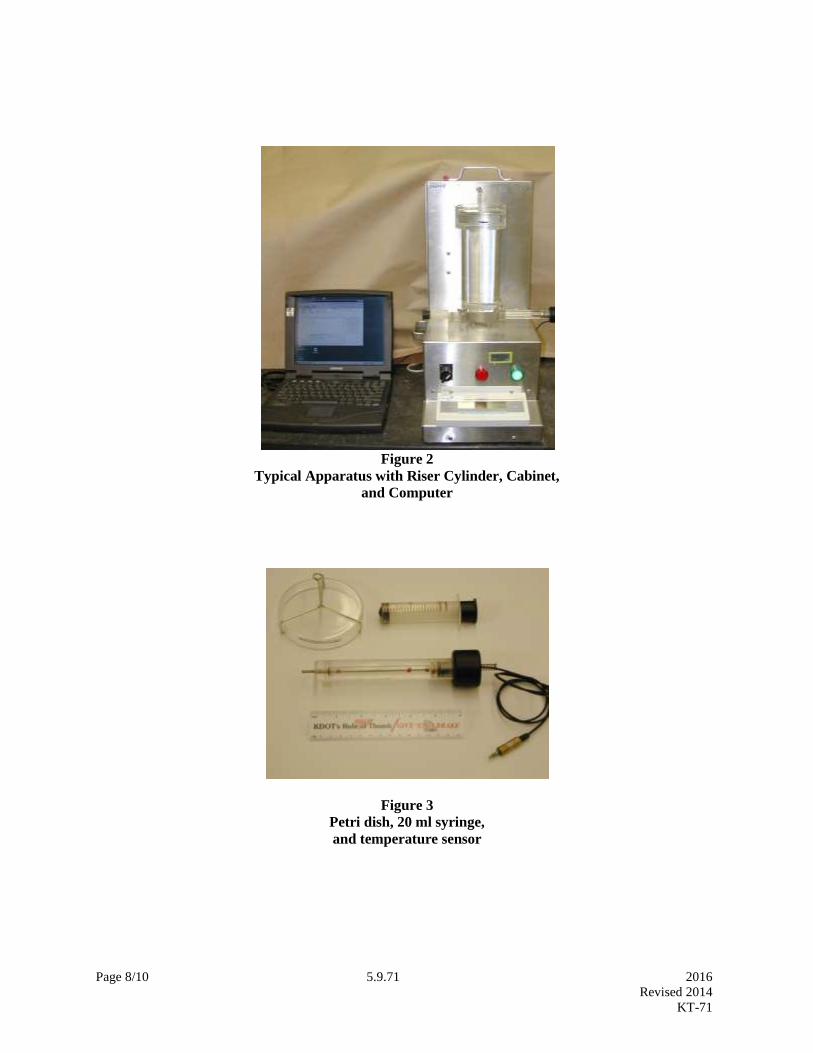
Page 8/10 5.9.71 2016
Revised 2014
KT-71
Figure 2
Typical Apparatus with Riser Cylinder, Cabinet,
and Computer
Figure 3
Petri dish, 20 ml syringe,
and temperature sensor
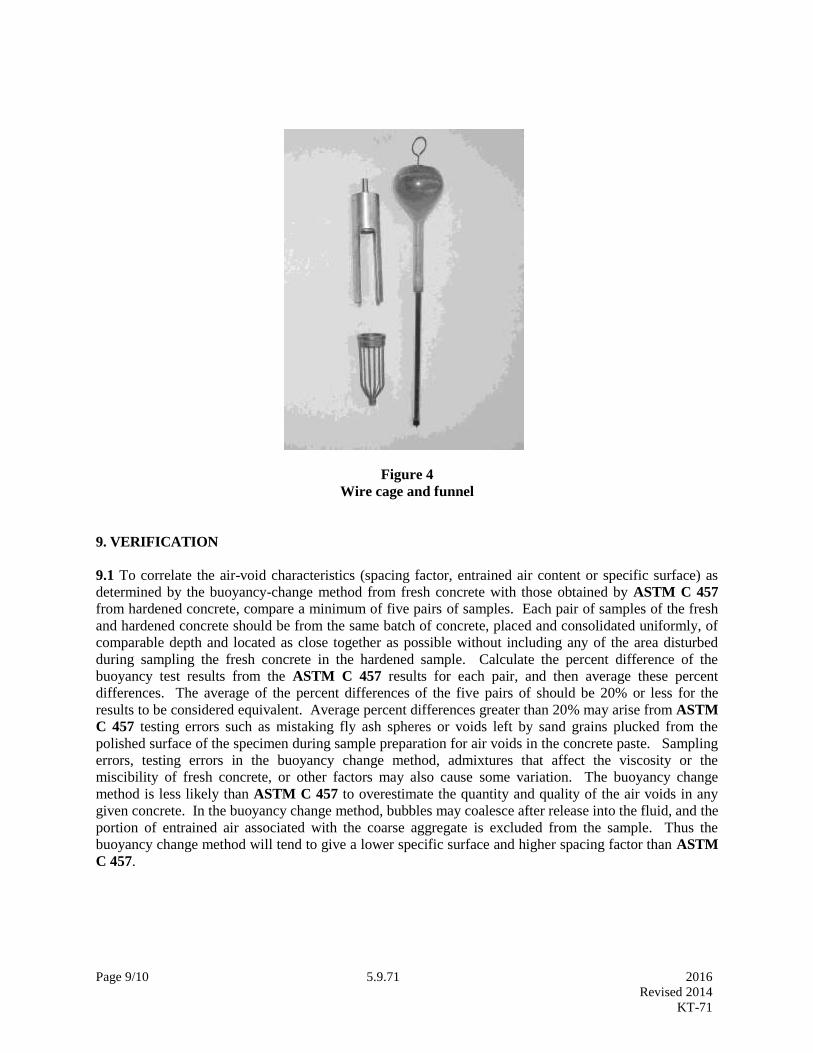
Page 9/10 5.9.71 2016
Revised 2014
KT-71
Figure 4
Wire cage and funnel
9. VERIFICATION
9.1 To correlate the air-void characteristics (spacing factor, entrained air content or specific surface) as
determined by the buoyancy-change method from fresh concrete with those obtained by ASTM C 457
from hardened concrete, compare a minimum of five pairs of samples. Each pair of samples of the fresh
and hardened concrete should be from the same batch of concrete, placed and consolidated uniformly, of
comparable depth and located as close together as possible without including any of the area disturbed
during sampling the fresh concrete in the hardened sample. Calculate the percent difference of the
buoyancy test results from the ASTM C 457 results for each pair, and then average these percent
differences. The average of the percent differences of the five pairs of should be 20% or less for the
results to be considered equivalent. Average percent differences greater than 20% may arise from ASTM
C 457 testing errors such as mistaking fly ash spheres or voids left by sand grains plucked from the
polished surface of the specimen during sample preparation for air voids in the concrete paste. Sampling
errors, testing errors in the buoyancy change method, admixtures that affect the viscosity or the
miscibility of fresh concrete, or other factors may also cause some variation. The buoyancy change
method is less likely than ASTM C 457 to overestimate the quantity and quality of the air voids in any
given concrete. In the buoyancy change method, bubbles may coalesce after release into the fluid, and the
portion of entrained air associated with the coarse aggregate is excluded from the sample. Thus the
buoyancy change method will tend to give a lower specific surface and higher spacing factor than ASTM
C 457.
Page 10/10 5.9.71 2016
Revised 2014
KT-71
10. REPEATABILITY
10.1 Although each buoyancy test requires a unique sample and therefore cannot be duplicated exactly,
researchers at the Kansas Department of Transportation have found that pairs of samples obtained within
1.5 feet of each other in the field vary 10% from each other on average.
11. SET UP HINTS
11.1 Several steps can be taken to reduce the amount of time necessary to set up the buoyancy testing
equipment Preparing the de-aerated water and the bottle of analysis liquid in an insulated water container
at least one day before testing occurs will save time. If the water container will be stored in an area that is
cooler than the specified temperature, set the immersible heater to the correct temperature and put it into
the covered water container. If the room temperature is slightly higher than the specified temperature,
uncovering the container will allow the water to cool approximately 5°F (3°C). If the room temperature
is much higher than the specified temperature, a sealed bag of ice or freezer packs placed in the covered
water container the night before testing will generally result in the correct water and analysis fluid
temperature.
11.2 After the water has been brought to the proper temperature, care should be taken to keep the
temperature as constant as possible. Protect the water container from temperature extremes, such as may
be encountered in an enclosed vehicle.
11.3 Obtaining a constant balance reading at the beginning of the test may also take a significant amount
of time if the equipment is set up in an unstable location. Mobile work trailers that are resting on their
tires are generally not stable enough. Any movement by people in the trailer can move the trailer enough
to disturb the apparatus and render the test unusable. Generally, only trailers that have been put up on
blocks so they are not sitting on their tires are at all acceptable, and only as a last alternative.
11.4 Isolating the test equipment from vibration will reduce the time necessary to obtain a constant
balance reading at the beginning of the test. One or two anti-vibration pads may be used under each
corner of the cabinet to attenuate shock and vibration.
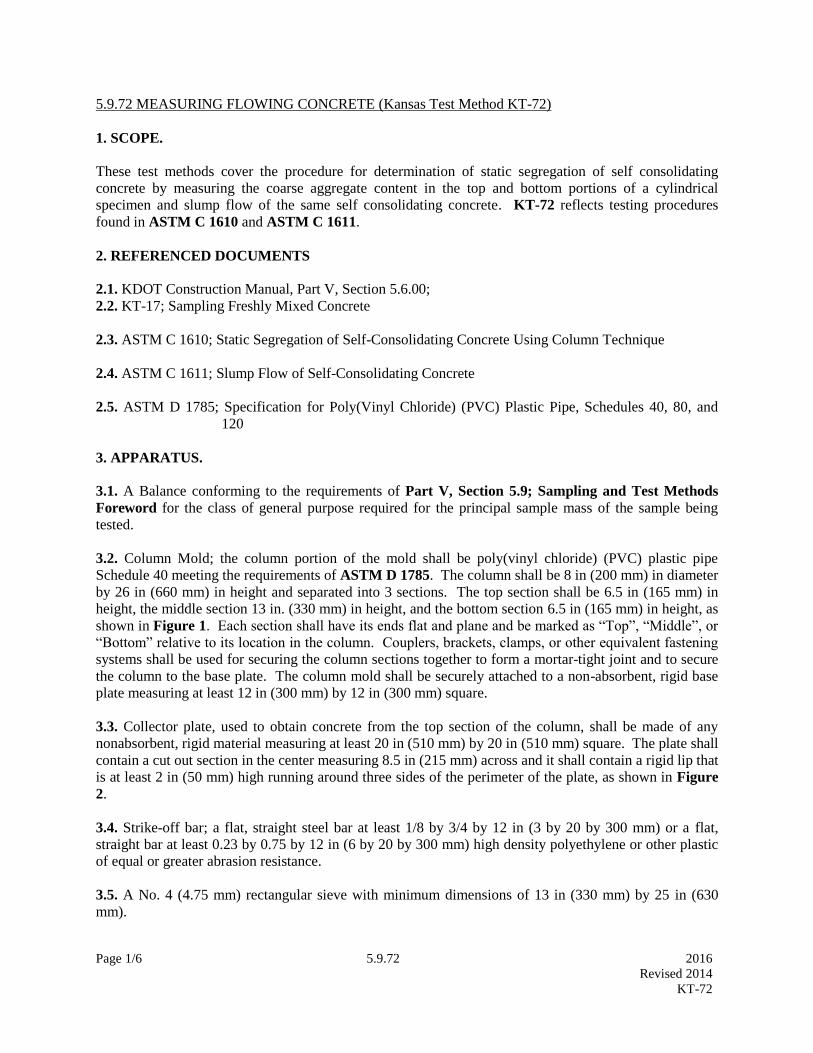
Page 1/6 5.9.72 2016
Revised 2014
KT-72
5.9.72 MEASURING FLOWING CONCRETE (Kansas Test Method KT-72)
1. SCOPE.
These test methods cover the procedure for determination of static segregation of self consolidating
concrete by measuring the coarse aggregate content in the top and bottom portions of a cylindrical
specimen and slump flow of the same self consolidating concrete. KT-72 reflects testing procedures
found in ASTM C 1610 and ASTM C 1611.
2. REFERENCED DOCUMENTS
2.1. KDOT Construction Manual, Part V, Section 5.6.00;
2.2. KT-17; Sampling Freshly Mixed Concrete
2.3. ASTM C 1610; Static Segregation of Self-Consolidating Concrete Using Column Technique
2.4. ASTM C 1611; Slump Flow of Self-Consolidating Concrete
2.5. ASTM D 1785; Specification for Poly(Vinyl Chloride) (PVC) Plastic Pipe, Schedules 40, 80, and
120
3. APPARATUS.
3.1. A Balance conforming to the requirements of Part V, Section 5.9; Sampling and Test Methods
Foreword for the class of general purpose required for the principal sample mass of the sample being
tested.
3.2. Column Mold; the column portion of the mold shall be poly(vinyl chloride) (PVC) plastic pipe
Schedule 40 meeting the requirements of ASTM D 1785. The column shall be 8 in (200 mm) in diameter
by 26 in (660 mm) in height and separated into 3 sections. The top section shall be 6.5 in (165 mm) in
height, the middle section 13 in. (330 mm) in height, and the bottom section 6.5 in (165 mm) in height, as
shown in Figure 1. Each section shall have its ends flat and plane and be marked as “Top”, “Middle”, or
“Bottom” relative to its location in the column. Couplers, brackets, clamps, or other equivalent fastening
systems shall be used for securing the column sections together to form a mortar-tight joint and to secure
the column to the base plate. The column mold shall be securely attached to a non-absorbent, rigid base
plate measuring at least 12 in (300 mm) by 12 in (300 mm) square.
3.3. Collector plate, used to obtain concrete from the top section of the column, shall be made of any
nonabsorbent, rigid material measuring at least 20 in (510 mm) by 20 in (510 mm) square. The plate shall
contain a cut out section in the center measuring 8.5 in (215 mm) across and it shall contain a rigid lip that
is at least 2 in (50 mm) high running around three sides of the perimeter of the plate, as shown in Figure
2.
3.4. Strike-off bar; a flat, straight steel bar at least 1/8 by 3/4 by 12 in (3 by 20 by 300 mm) or a flat,
straight bar at least 0.23 by 0.75 by 12 in (6 by 20 by 300 mm) high density polyethylene or other plastic
of equal or greater abrasion resistance.
3.5. A No. 4 (4.75 mm) rectangular sieve with minimum dimensions of 13 in (330 mm) by 25 in (630
mm).
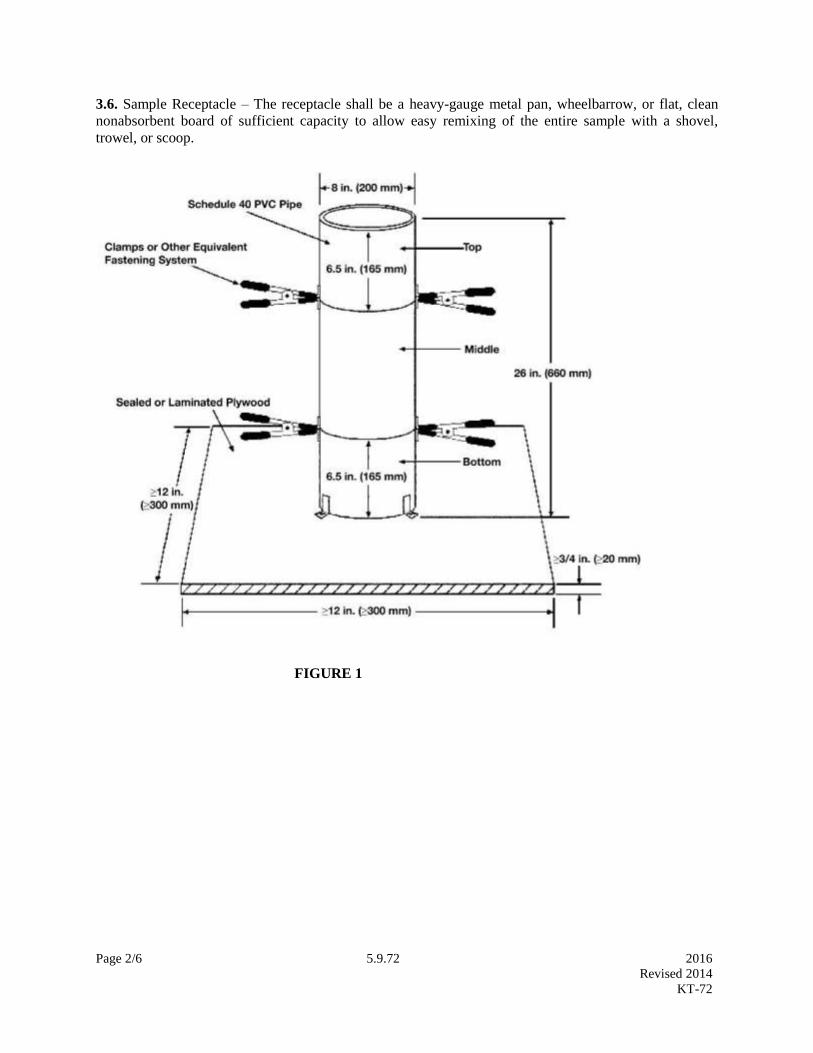
Page 2/6 5.9.72 2016
Revised 2014
KT-72
3.6. Sample Receptacle – The receptacle shall be a heavy-gauge metal pan, wheelbarrow, or flat, clean
nonabsorbent board of sufficient capacity to allow easy remixing of the entire sample with a shovel,
trowel, or scoop.
FIGURE 1
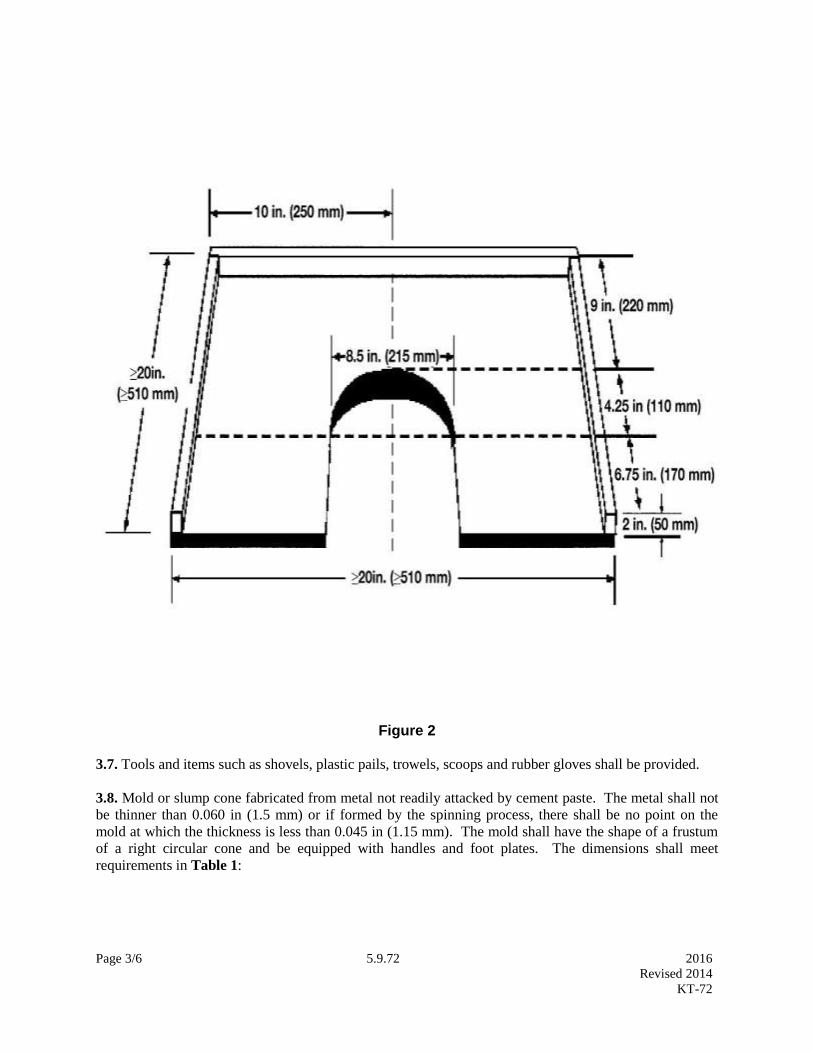
Page 3/6 5.9.72 2016
Revised 2014
KT-72
Figure 2
3.7. Tools and items such as shovels, plastic pails, trowels, scoops and rubber gloves shall be provided.
3.8. Mold or slump cone fabricated from metal not readily attacked by cement paste. The metal shall not
be thinner than 0.060 in (1.5 mm) or if formed by the spinning process, there shall be no point on the
mold at which the thickness is less than 0.045 in (1.15 mm). The mold shall have the shape of a frustum
of a right circular cone and be equipped with handles and foot plates. The dimensions shall meet
requirements in Table 1:

Page 4/6 5.9.72 2016
Revised 2014
KT-72
Table 1
Mold or Slump Cone Dimensions
Inside diameter at top Inside diameter at bottom Height
4 + 1/8 in (102 + 3.2 mm) 8 +1/8 in (205 + 3.2 mm) 12 +1/8 in (305 + 3.2 mm)
3.9. Slump Base Plate—The base plate on which the slump mold rests shall be nonabsorbent, smooth,
rigid, and have a minimum diameter of 36 in (915 mm).
4. SAMPLE AND TEST SPECIMEN
4.1. Obtain a sample of freshly-mixed self-consolidating concrete in accordance with KT-17.
5. PROCEDURE FOR STATIC SEGREGATION TEST
5.1. Perform the column segregation test on a flat, level surface. Do not subject the testing surface and
the column mold to any vibration or disturbance.
5.2. Remix the sample obtained in accordance with Section 4 of this test method in the sample receptacle
using a shovel or scoop so that the concrete is homogeneous.
5.3. Using a shovel, scoop, or plastic pail, immediately fill the column mold with concrete completely and
above the rim, within 2 minutes.
5.4. After filling the mold, strike off the top surface by sliding the strike-off bar across the top rim of the
mold with a sawing motion until the concrete surface is level with the top of the mold.
5.5. Allow the concrete to stand undisturbed in the column mold for 15 ± 1 min.
5.6. Immediately following the standing period, securely hold the top section of the mold and remove the
fastening system. Complete steps in Sections 5.7-5.14 of this test method within 20 minutes thereafter.
5.7. Place the cut out section of the collector plate around the column just below the joint between the
“Top” and “Middle” section to catch and collect concrete.
5.8. Grasp the upper section of the column mold and, using a horizontal rotating motion, screed the
concrete from the top section of the column on to the collector plate and then deposit it into a plastic pail.
5.9. Repeat steps in Sections 5.6-5.8 of this test method to remove the concrete from the middle section
of the column mold and discard the concrete.
5.10. Place the concrete sample collected from the upper section of the column onto the No. 4 (4.75 mm)
sieve.
5.11. Wash the concrete on the No. 4 (4.75 mm) sieve so that only coarse aggregate remains on the sieve
and then deposit the coarse aggregate into a clean plastic pail.
Page 5/6 5.9.72 2016
Revised 2014
KT-72
5.12. Repeat steps in Sections 5.10-5.11 of this test method for the concrete retained in the bottom section
of the mold.
5.13. Bring the coarse aggregate obtained from both the top and bottom sections of the column to a
surface-dry condition by rolling it in a large absorbent cloth until all visible film of water are removed.
5.14. Determine the mass of coarse aggregate from the top and bottom sections of the column to the
nearest 0.1 lb (50 g).
6. PROCEDURE FOR THE SLUMP-FLOW TEST
6.1. The slump-flow test shall be performed on a flat, level, nonabsorbent surface such as a pre-moistened
concrete floor or a base plate. The base plate shall be used in conditions where a flat, level surface is not
available, such as on a construction job site. When the base plate is used, position and shim the base plate
so that it is fully supported, flat, and level. When performing the slump flow test for a given study or
project, do not change the base plate surface type for the duration of the study or project.
6.2. The user has the option of filling the mold by following either Procedure A or Procedure B.
6.2.1 Filling Procedure A (Upright Mold): Dampen and place the mold, with the larger opening of the
mold facing down, in the center of a flat, moistened base plate or concrete surface. Firmly hold the mold
in place during filling by the operator standing on the two foot pieces. From the sample of concrete
obtained in accordance with Section 4. of this test method, immediately fill the mold in one lift. Slightly
overfill the concrete above the top of the mold.
6.2.2. Filling Procedure B (Inverted Mold): Dampen and place the mold, with the smaller opening of
the mold facing down, in the center of a flat, moistened base plate or concrete surface. From the sample
of concrete obtained in accordance with Section 4. of this test method, immediately fill the mold in one
lift. Slightly overfill the concrete above the top of the mold.
6.3. Strike off the surface of the concrete level with the top of the mold by a sawing motion of the strike-
off bar. Remove concrete from the area surrounding the base of the mold to preclude interference with
the movement of the flowing concrete. Remove the mold from the concrete by raising it vertically. Raise
the mold a distance of 9 ± 3 in (225 ± 75 mm) in 3 ± 1 second by a steady upward lift with no lateral or
torsional motion. Complete the entire test from start of the filling through removal of the mold, without
interruption, within an elapsed time of 2.5 minutes.
6.4. Wait for the concrete to stop flowing and then measure the largest diameter of the resulting circular
spread of concrete to the nearest ¼ in (5 mm). When a halo is observed in the resulting circular spread of
concrete, it shall be included as part of the diameter of the concrete. Measure a second diameter of the
circular spread at an angle approximately perpendicular to the original measured diameter.
6.5. If the measurement of the two diameters differs by more than 2 in (50 mm), the test is invalid and
shall be repeated.

Page 6/6 5.9.72 2016
Revised 2014
KT-72
7. CALCULATION
7.1. Calculate the slump flow using the following equation:
𝑆𝑙𝑢𝑚𝑝 𝐹𝑙𝑜𝑤 = (𝑑1 + 𝑑2)
2
where:
d1 = the largest diameter of the circular spread of the concrete
d2 = the circular spread of the concrete at an angle approximately perpendicular to d1
7.1.1. Record the average of the two diameters to the nearest ½ in. (10 mm).
7.2. Calculate the percent static segregation using the following equation:
𝑆 = 2 ∗ (𝐶𝐴𝐵−𝐶𝐴𝑇)
(𝐶𝐴𝐵+𝐶𝐴𝑇) ∗ 100, if CAB > CAT
S = 0, if CAB ≤ CAT
where:
S = static segregation, percent
CAT = mass of coarse aggregate in the top section of the column
CAB = mass of coarse aggregate in the bottom section of the column
8. REPORT
8.1. Mixture designation.
8.2. The mass of coarse aggregate obtained from the top and bottom sections of the column separately to
the nearest 0.1 lb (50 g).
8.3. The static segregation to the nearest 0.1%.
8.4. Report the use of filling procedure A or B for the slump flow test.
8.5. Report the slump flow to the nearest 1/2 in (10 mm).

Page 1/3 5.9.73 2016
Revised 2015
KT-73
5.9.73 DENSITY, ABSORPTION AND VOIDS IN HARDENED CONCRETE
(Kansas Test Method KT-73)
1. SCOPE
This method covers the determinations of density, percent absorption and percent voids in hardened
concrete. KT-73 reflects testing procedures found in ASTM C 642.
2. REFERENCED DOCUMENTS
2.1. Part V, 5.9; Sampling and Test Methods Foreword
2.2. KT-22; Making and Curing Compression and Flexural Test Specimens in the Field
2.3. KT-49; Method for Obtaining and Testing Drilled Cores
2.4. ASTM C 642; Standard Test Method for Density, Absorption, and Voids in Hardened Concrete
3. APPARATUS
3.1. The balance shall conform to the requirements of Part V, 5.9; Sampling and Test Methods
Foreword, Class G5. The balance shall be equipped with suitable apparatus for suspending the sample
container in water from the center of weighing platform or pan of the balance into a bucket with an
overflow device to maintain a constant water level.
3.2. Container suitable for immersing the specimen and suitable apparatus for suspending the specimen in
water. The container must be large enough to keep the specimens covered with boiling water for a period
of 5 hours.
3.3. Forced draft oven capable of maintaining a temperature of 230 ± 9 °F (110 ± 5 °C).
4. TEST SPECIMEN
4.1. Prepare 3 samples per mix design. The samples shall consist of 2” thick by 4” diameter specimens
taken from the top portion of cylinders or cores. Remove not more than 3/8” from the top of the cylinder
or core and obtain the sample from the next 2”. Each portion shall be free from observable cracks,
fissures, or shattered edges. Cylinders molded and cured in accordance with KT -22 of this manual, shall
be used for mix design approval and most verification samples. Cores obtained in accordance with KT-
49 of this manual, may be used for verifications on PCCP.
5. PROCEDURE
5.1. Determine the mass of each specimen. Place each specimen on its edge in a forced draft oven
directly on the oven rack, and dry the sample at a temperature of 230 ±9 °F (110 ± 5 °C) for not less than
24 hours. Do not lay the specimens inside a pan or any other container. Do not lay the specimens on the
flat surface of the cylinder. Allow enough room between samples for complete airflow around each
sample. After removing each specimen from the oven, allow it to cool in dry air (preferably in a
desiccator) to a temperature of 72 ± 5 °F (22 ± 3 °C) and determine the mass. If the specimen was
comparatively dry when its mass was first determined, and the second mass agrees with the first within
0.5%, consider it dry. If the specimen was wet when its mass was first determined, place it in the oven
for a second drying treatment of 24 hours and again determine the mass. In case of any doubt, redry the
Page 2/3 5.9.73 2016
Revised 2015
KT-73
specimen for 24 hour periods until check values of mass are obtained. If the difference between values
obtained from two successive values of mass exceeds 0.5% of the lesser value, return the specimens to the
oven for an additional 24 hour drying period, and repeat the procedure until the difference between any
two successive values is less that 0.5 % of the lowest value obtained. Designate this last value A.
5.2. Immerse the specimen on its edge in water at 72 ± 5°F (22 ±3°C). Do not place the specimen on the
flat surface of the cylinder. Continue soaking the specimen in water for not less than 48 hours and until
two successive values of mass of the surface-dried sample at intervals of 24 hours show an increase in
mass of less than 0.5% of the larger value. Surface-dry the specimen by removing surface moisture with
a towel, and determine the mass. Designate the final surface-dry mass after immersion B.
5.3. Begin boiling tap water in a suitable container. Verify that the water is rapidly boiling prior to placing
the specimens in the water for testing. Place the specimen on its edge on a rack in the boiling water a
minimum of 1/4” from the bottom of the container. The water must return to boiling in less than 1 hour.
Boil the specimen completely submersed for a minimum of 5 hours. Do not add additional water during
boiling. Allow it to cool by natural loss of heat for not less than 14 hours to a final temperature of 72 ±
5°F (22 ± 3°C). Continue to store the samples on their edge in the boiled water until the final two steps
are completed.
5.4. Suspend the specimen in the bucket at a constant water level by the suitable apparatus and determine
the apparent mass of the sample in water at 77 ± 2 ° F (25 ± 1 °C). Designate this apparent mass D.
5.5. Remove the sample from the water. Quickly damp dry the sample with a damp absorbent cloth and
determine the mass of the specimen. Designate the soaked, boiled, surface-dried mass C.
6. CALCULATION
6.1. By using the values for mass determined in accordance with the procedures described in Section 5 of
this test method make the following calculations:
Absorption after immersion, % = [(B-A)/A] x 100
Absorption after immersion and boiling, % = [(C-A)/A] x 100
Bulk density, dry = [A/(C-D)]= g1
Bulk density after immersion = [B/(C-D)]
Bulk density after immersion and boiling =[C/(C-D)]
Apparent density = [A/(A-D)] = g2
Volume of permeable pore space (voids), % = [(C-A)/(C-D)] x 100
Page 3/3 5.9.73 2016
Revised 2015
KT-73
Where: A = Mass of oven dried sample in air
B = Mass of surface-dry sample in air after immersion
C = Mass of surface-dry sample in air after immersion and boiling
D = Apparent mass of sample in water after immersion and boiling
g1 = Bulk density, dry
g2 = Apparent density
7. REPORT
7.1. Record absorptions to the nearest 0.01 %.
7.2. Record densities to the nearest 0.01 g/cm3.
7.3. Record the volume of permeable pore space (voids) to the nearest 0.01 % and report to the nearest
0.1%.


Page 1/5 5.9.76 2016
Revised 2014
KT-76
5.9.76 METHOD FOR TESTING THE COMPRESSIVE STRENGTH OF MOLDED CYLINDRICAL
CONCRETE SPECIMENS (Kansas Test Method KT-76)
1. SCOPE
1.1. This test method provides standardized procedures for determining the compressive strength of
molded cylindrical concrete specimens. This method is not used for testing drilled cores. See KT-49 of
this manual for testing of drilled cores. This method only applies to concrete having a unit weight greater
than 50 lb/ft3 (800 kg/m
3).
2. REFERENCED DOCUMENTS
2.1. KT-22; Making and Curing Compression and Flexural Test Specimens in the Field
2.2. KT- 49; Method for Obtaining and Testing Drilled Cores From PCCP and Precast Girders
2.3. KT-77; Method for Capping Cylindrical Concrete Specimens
2.4. AASHTO T 22; Compressive Strength of Cylindrical Concrete Specimens
2.5. AASHTO T 231; Capping Cylindrical Concrete Specimens
3. SIGNIFICANCE AND USE
3.1. This method may be used to determine the compressive strength of molded cylindrical concrete
specimens prepared and cured in accordance with KT-22 of this manual.
4. APPARATUS
4.1. Testing Machine- The testing machine shall comply with requirements set forth in AASHTO T-22.
The testing machine shall be of a type having sufficient capacity and capable of providing the rates of
loading corresponding to a stress rate on the specimen of 35 ± 7 psi/s (0.25 ± 0.05 MPa/s). The
designated rate of movement shall be maintained at least during the latter half of the anticipated loading
phase. The testing machine shall be capable of testing specimens up to and including 12 in (300 mm) in
length.
4.2. Caliper and a 12 in (300 mm) steel rule graduated in 0.01 in (0.25 mm).
4.3. Metal square to determine the perpendicularity of the ends to the side.
5. DETERMINING THE DIAMETER OF SPECIMENS
5.1 Determining the Diameter of Specimens.
5.1.1 Using calipers, take two measurements of the diameter to the nearest 0.01 in (0.25 mm). The
measurements are taken at right angles to each other at about mid-height of the specimen.
5.1.2 The two measurements taken in Section 5.1.1 of this test method are averaged for determining the
cross-sectional area of the specimen.

Page 2/5 5.9.76 2016
Revised 2014
KT-76
5.1.3 Specimens shall not be tested if any individual diameter of a cylinder varies from any other diameter
of the same specimen by more than 2%.
6. END PREPARATION
6.1. End Preparation Prior to Capping - The ends of specimens to be tested in compression shall be
essentially smooth, perpendicular to the longitudinal axis, and of the same diameter as the body of the
specimen. No point on either end of compressive test specimens shall protrude by more than 0.125 inches
(3 mm) from a plane perpendicular to the axis of the specimen at the lowest point of the surface prior to
capping. If the end exceeds this limit, saw or grind the end of the specimen no more than the amount that
is required to correct the condition.
NOTE: Prior to capping, the density of a specimen may be determined by weighing it and dividing it by
the volume calculated from the average diameter and length, or by any other standard method for
determining density.
7. CAPPING
7.1 Cap the specimen according to the procedures contained in KT-77. Maintain free moisture on the
surface of the specimen after capping. The specimen may be returned to standard curing as soon as the
cap has hardened. Maintain the specimen in a moist condition at all times until testing.
7.2. Measurement - Prior to testing, measure the length of the capped specimen to the nearest 0.01 inch
(0.25 mm) and use this length to compute the length-diameter ratio. Take three caliper measurements at
120 degree intervals along the circumference of the circle to determine the average length.
8. TESTING
8.1 Test the specimens for the compression strength at a given age within the time tolerances shown in
Table 1.
Table 1 Permissible Time Tolerances
Test Age Permissible Tolerance
12 h + 0.25 h
24 h + 0. 5 h
3 days + 2 h
7 days + 6 h
28 days + 20 h
56 days + 40 h
90 days + 2 days
8.2. Placing the Specimen - Place the plain (lower) bearing block, with its hardened face up, on the table
or platen of the testing machine directly under the spherically-seated (upper) bearing block. Wipe clean
the bearing faces of the upper- and lower-bearing blocks and of the test specimen and place the test
specimen on the lower bearing block.
8.3. Zero Verification and Block Seating - Prior to testing the specimen, verify that the load indicator is
set to zero. In cases where the indicator is not properly set to zero, adjust the indicator. As the
spherically-seated block is brought to bear on the specimen, rotate its movable portion gently by hand so
that uniform seating is obtained.

Page 3/5 5.9.76 2016
Revised 2014
KT-76
NOTE: The technique used to verify and adjust load indicator to zero will vary depending on the
machine manufacturer. Consult your owner’s manual or compression machine calibrator for the proper
technique.
8.4. Rate of Loading - Apply the load continuously and without shock.
8.4.1. The load shall be applied at a rate of movement (platen to crosshead measurement) corresponding
to a stress rate on the specimen of 35 ± 7 psi/s (0.25 ± 0.05 MPa/s). The designated rate of movement
shall be maintained at least during the latter half of the anticipated loading phase.
NOTE: For a screw driven or displacement-controlled testing machine, preliminary testing will be
necessary to establish the required rate of movement to achieve the specified stress rate. The required rate
of movement will depend on the size of the test specimen, the elastic modulus of the concrete, and the
stiffness of the testing machine.
8.4.2. During application of the first half of the anticipated loading phase, a higher rate of loading shall be
permitted. Apply the higher loading rate in a controlled manner so that the specimen is not subjected to
shock loading.
8.4.3. Do not adjust the rate of movement (platen to crosshead) as the ultimate load is being approached
and the stress rate decreases due to cracking in the specimen.
8.4.4. Apply the compressive load until the load indicator shows that the load is decreasing steadily and
the specimen displays a well-defined fracture pattern (See Figure 1. For a testing machine equipped with
a specimen break detector, automatic shut-off of the testing machine is prohibited until the load has
dropped to a value that is less than 95% of the peak load. A setting of 60% of peak is recommended.
Continue compressing the specimen until the user is certain that the ultimate capacity has been attained
and a clear fracture pattern is discernible. Record the maximum load carried by the specimen during the
test and note the type of fracture pattern according to Figure 1. If the fracture pattern is not one of the
typical patterns shown in Figure 1, sketch and describe briefly the fracture pattern. If the measured
strength is lower than expected, examine the fractured concrete and note the presence of large air voids,
evidence of segregation, whether fractures pass predominantly around or through the coarse aggregate
particles, and verify end preparations were in accordance with Section 7 of this test method.
9. CALCULATIONS
9.1. Calculate the compressive strength of each specimen using the computed cross-sectional area based
on the average diameter of the specimen as follows:
Compressive strength=peak load/area
𝐴𝑟𝑒𝑎 = 𝜋𝑟2 .
9.2. Determine the length to diameter ratio (L/D), and round the result to the nearest hundredth using the
following formula:
LD = Length / Diameter
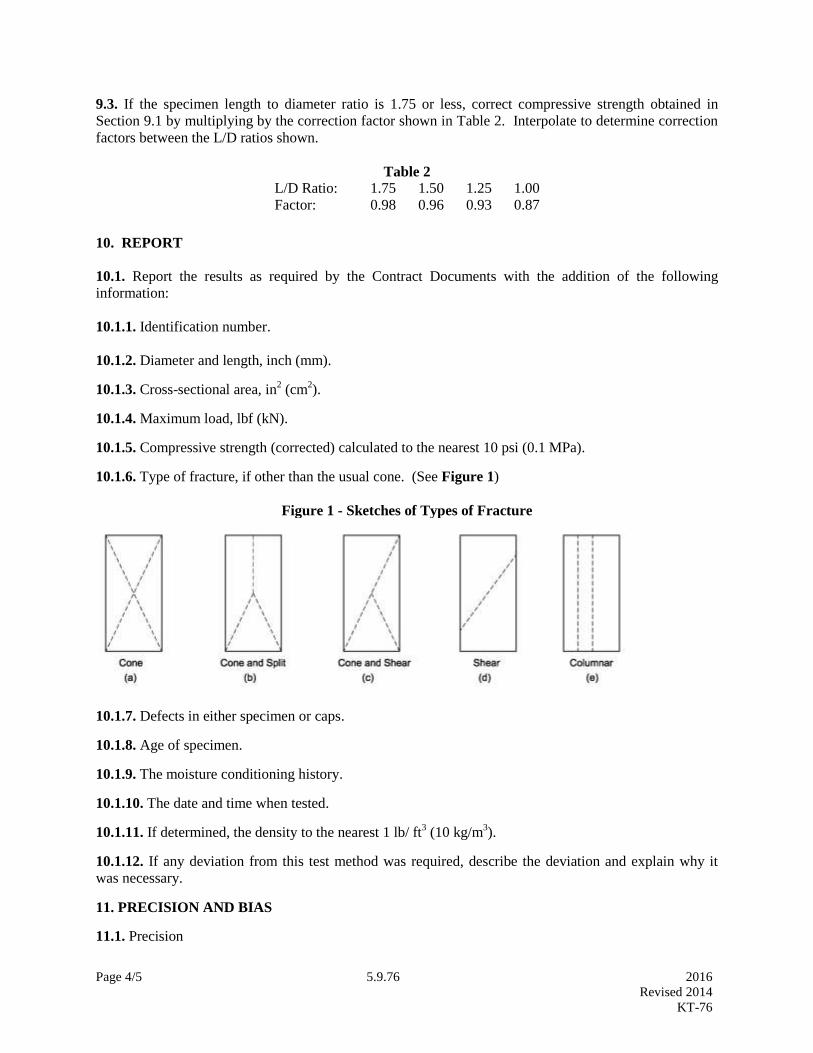
Page 4/5 5.9.76 2016
Revised 2014
KT-76
9.3. If the specimen length to diameter ratio is 1.75 or less, correct compressive strength obtained in
Section 9.1 by multiplying by the correction factor shown in Table 2. Interpolate to determine correction
factors between the L/D ratios shown.
Table 2
L/D Ratio: 1.75 1.50 1.25 1.00
Factor: 0.98 0.96 0.93 0.87
10. REPORT
10.1. Report the results as required by the Contract Documents with the addition of the following
information:
10.1.1. Identification number.
10.1.2. Diameter and length, inch (mm).
10.1.3. Cross-sectional area, in2 (cm
2).
10.1.4. Maximum load, lbf (kN).
10.1.5. Compressive strength (corrected) calculated to the nearest 10 psi (0.1 MPa).
10.1.6. Type of fracture, if other than the usual cone. (See Figure 1)
Figure 1 - Sketches of Types of Fracture
10.1.7. Defects in either specimen or caps.
10.1.8. Age of specimen.
10.1.9. The moisture conditioning history.
10.1.10. The date and time when tested.
10.1.11. If determined, the density to the nearest 1 lb/ ft3 (10 kg/m
3).
10.1.12. If any deviation from this test method was required, describe the deviation and explain why it
was necessary.
11. PRECISION AND BIAS
11.1. Precision
Page 5/5 5.9.76 2016
Revised 2014
KT-76
11.1.1. Within–Test Precision- The acceptable range of individual cylinder strengths between two
cylinders under laboratory conditions is 9.0% and 6.6% for 4x8 inch and 6x12 inch cylinders respectively.
The acceptable range of individual cylinder strengths between three cylinders under laboratory conditions
is 10.6% and 7.8% for 4x8 inch and 6x12 inch cylinders respectively.
11.1.2. Multilaboratory Precision- The difference between properly conducted compressive strength tests
between two laboratories on 6x12 inch cylinders is not expected to exceed 14% of the average. This does
not include variations associated with different operators preparing specimens from split samples. These
variations are expected to increase the multilaboratory coefficient of variation.
11.1.3. See AASHTO T-22 for further information on precision.
11.2. Bias- Since there is no accepted reference material suitable for determining the bias for the
procedure in this test method, no statement on bias is being made.

Page 1/3 5.9.77 2016
Revised 2015
KT-77
5.9.77 METHOD FOR CAPPING CYLINDRICAL CONCRETE SPECIMENS
(Kansas Test Method KT-77)
1. SCOPE
1.1. This test method provides standardized procedures for the capping of cylindrical concrete specimens
prior to test for compressive strength. It is intended that capping procedures comply with the applicable
sections of AASHTO T 231.
2. REFERENCED DOCUMENTS
2.1. KT- 49; Method for Obtaining and Testing Drilled Cores From PCCP and Precast Girders
2.2. KT-76; Method For Testing The Compressive Strength of Molded Cylindrical Concrete Specimens
2.3. AASHTO T 231; Capping Cylindrical Concrete Specimens
2.4. ANSI/ASME B46.1; Surface Texture (Surface Roughness, Waviness and Lay)
3. SIGNIFICANCE AND USE
3.1. This method describes procedures for providing plane surfaces on the end surfaces of molded
concrete cylinders or drilled cores when the end surfaces do not conform to the planeness and
perpendicularity requirements of the applicable standards.
4. APPARATUS
4.1. Metal square to determine the perpendicularity of the ends to the side.
4.2. Straight edge and feeler gauges for determining planeness.
4.3. Metal Thermometer.
4.4. Capping Plates- Sulfur mortar caps shall be formed against a machined metal plate at least 0.45 in (11
mm) thick or a polished plate of granite or diabase at least 3 in (76 mm) thick. In all cases, plates shall
be at least 1 in. (25 mm) greater in diameter than the test specimen and the working surfaces shall not
depart from a plane by more than 0.002 in (0.05 mm). The surface roughness of newly finished metal
plates shall not exceed that set forth in Table 4 of ANSI B46.1, or 125 μ in (0.003 mm) for any type of
surface and direction of lay. The surface, when new, shall be free of gouges, grooves, or indentations
beyond those caused by the finishing operation. Metal plates that have been in use shall be free of
gouges, grooves, and indentations greater than 0.010 in (0.25 mm) deep or greater than 0.05 in2 (32 mm
2)
in surface area. If a recess is machined into the metal plate, the thickness of the plate beneath the recessed
area shall be at least 0.5 in (13 mm). In no case shall the recess in the plate be deeper than 0.5 in (13
mm).
4.5. Alignment Devices- Suitable alignment devices, such as guide bars or bull’s-eye levels, shall be used
in conjunction with capping plates to ensure that no single cap will depart from perpendicularity to the
axis of a cylindrical specimen by more than 0.5 degrees (approximately equivalent to 0.125 inches in 12
in. (3.2 mm in 305 mm)). The same requirement is applicable to the relationship between the axis of the
alignment device and the surface of a capping plate when guide bars are used. In addition, the location of
Page 2/3 5.9.77 2016
Revised 2015
KT-77
each bar with respect to its plate must be such that no cap will be off-centered on a test specimen by more
than 0.06 in (1.6 mm).
4.6. Melting Pots for Sulfur Mortars-Pots used for melting sulfur mortars shall be equipped with
automatic temperature controls and shall be made of metal or lined with a material that is nonreactive
with molten sulfur.
5. END PREPARATION
5.1. End Preparation Prior to Capping – Prepare the ends of the specimen according to the requirements
stated in applicable test method, KT-49 for drilled cores or KT-76 for molded cylinders.
NOTE: Prior to capping, the density of a specimen may be determined by weighing it and dividing it by
the volume calculated from the average diameter and length, or by any other standard method for
determining density.
6. CAPPING MATERIAL
6.1 The capping material shall be a sulfur mortar that has been tested for compressive strength in
accordance with AASHTO T 231 Section 5.4.2.
6.2 Capping material shall have a minimum compressive strength of at least 5000 psi (35 Mpa) and not
less than the compressive strength of the concrete being tested except as allowed in AASHTO T 231,
Section 5.1.1for concrete strengths greater than 7000 psi when comparison tests of capped and ground
specimens have been made.
7. CAPPING
Maintain free moisture on the surface of cylinders after capping. The specimen may be returned to
standard curing as soon as the cap has hardened. Cylinders maybe wrapped with a moist towel if testing is
to occur in 2 hours.
Return cores to the plastic container and reseal until testing.
7.1 Prepare sulfur mortar for use by heating to about 265°F (130
°C). Determine the temperature of the
material periodically by inserting a metal thermometer inserted near the center of the mass. Empty the pot
and recharge with fresh material at frequent enough intervals to ensure that the oldest material has not
been heated more than five times.
7.2 The ends of the specimen shall be free of oil, wax or other contaminants prior to capping. The ends
shall be dry enough to preclude the formation of steam or foam pockets under the cap larger than 0.25 in
(6 mm). Moist cured specimens shall be maintained in a moist condition between the completion of
capping and the time of testing by returning them to moist storage consistent with the requirements for the
type of specimen, cylinders or cores.
7.3 The capping plate or device should be warmed slightly before use to slow the rate of hardening and
permit the production of thin caps. Oil the capping plate lightly and stir the molten sulfur mortar
immediately prior to capping. Pour the mortar onto the surface of the capping plate. Use sufficient
material to cover the cylinder end after the sulfur mortar solidifies. Lift the cylinder above the plate and
contact the cylinder sides with the guides. While keeping the cylinder sides in constant contact with the
Page 3/3 5.9.77 2016
Revised 2015
KT-77
guides, slide the cylinder down the guides onto the capping plate. The cylinder end should continue to
rest on the capping plate while maintaining positive contact with guides until the mortar has hardened.
7.4 The capped surfaces of the specimens shall not depart from perpendicular to the to the axis of the
specimen by more than 0.5 degrees; i.e. 0.125 inches in 12 inches (3.2 mm in 305 mm), 0.070 inches in
8 inches (1.8 mm in 200mm). Perpendicularity may be checked by placing one leg of a notched square
on the cap and checking for any clearance between the other leg and side of the cylinder. The surface of
the cap shall not depart from plane by more than .002 in (0.05 mm). Caps should be about 0.125 in (3
mm) thick. For specimens with compressive strengths up to 7000 psi (50MPa), caps shall be no more
than 0.31 in (8 mm) thick at any point. For specimens with compressive strengths over 7000 psi
(50MPa), caps shall be no more than 0.20 in (5 mm) thick at any point. Tap the cap with a metal
implement after hardening to check for hollow areas under the cap. Remove and replace any cap not
meeting these requirements.
NOTE: Very high compressive strengths may require caps to be less than 0.080 in (2mm) to produce
accurate test results. Test results may not be valid when using sulfur capping compound on specimens
with compressive strengths above 19,000 psi (130 MPa).1
7.5. Compressive strengths above 7000 psi (50MPa) require testing of the capping compound as specified
in AASHTO T 231, Section 5.1.1 or grinding so that each end surface is perpendicular to the to the axis
of the specimen within 0.5 degrees or 0.125 inches in 12 inches (3.2 mm in 305 mm) and that the surface
does not depart from plane by more than .002 in (0.05 mm). Testing of the capping compound according
to AASHTO T 231 Section 5.1.1, is not required if routine testing of the capping compound indicates that
the compound has as high or higher compressive strength than the concrete being tested.
For specimens with compressive strengths of less than 5000 psi (35 MPa), allow the caps to cure a
minimum of two hours prior to testing. For specimens with compressive strengths of greater than 5000
psi (35Mpa), allow the caps to cure for a minimum of 16 hours.
1 Acïtcin, P.-C., High-Performance Concrete (1998)

Page 1/7 5.9.78 2016
Revised 2014
KT-78
5.9.78 METHOD FOR DETERMINING THE TENSILE ADHESIVE STRENGTH OF ASPHALT
PAVEMENT TACK COAT (Kansas Test Method KT-78)
1. SCOPE
This method covers the test procedure used to measure the tensile adhesive strength of asphalt pavement
tack coat. This test procedure may involve hazardous materials, operations, and equipment. Follow all
safety precautions when performing the test.
2. REFERENCED DOCUMENTS
2.1. Part V, Section 5.2.2.2., Random Sampling.
3. APPARATUS
3.1. Grinder or sander.
3.2. Core drill with a 2 inch (50 mm) inside diameter diamond tipped core barrel and a 6 inch (150 mm)
nominal diameter diamond tipped core barrel.
3.3. Ice.
3.4. Markers suitable for marking asphalt samples.
3.5. Standard 1 1/2 inch (37 mm) diameter pipe caps, where the bottom surface has been machined flat
and the shoulder has been cut to provide a 2 inch (50 mm) diameter bonding surface. See Figure 1
below. The surface of the pipe cap should be textured to provide good adhesion to the adhesive. This
may be achieved by sandblasting, scoring or any method that produces a roughened bonding surface. The
surface of the cap must be clean and free of any rust or oil prior to use. Cleaning with acetone prior to
each use is recommended.
3.6. A rapid curing adhesive with strength and viscosity properties suitable for bonding the pipe caps to
the overlay. A high viscosity, rapid setting epoxy with a pot life of 3 to 25 minutes is recommended.
3.7. Mixing utensils for adhesive. Small plastic cups and tongue depressors are suitable for mixing.
3.8. Electric fan.
3.9. A mechanical testing device for pulling a bonded pipe cap in tension similar to that shown in Figure
2 below. The device used for this test shall have a feature that eliminates torque being applied to the test
specimen.
3.10. A tension link scale, crane scale or dynamometer with a capacity of 500 lbf (200 kg) with resolution
and accuracy to 1 lbf (0.5 kg) or better and an ability to retain and display the peak load. The scale must
have been calibrated or normalized to a NIST traceable standard within the previous 12 months.
3.11. A table-like fixture with an adjustable shelf below the top surface and with a 3 inch hole in the top
surface. See Figure 3.
3.12. A digital thermometer with probe, readable to 0.1F (0.1ºC).

Page 2/7 5.9.78 2016
Revised 2014
KT-78
3.13. Ruler or measuring device.
3.14. An oven or propane torch.
3.15. A stiff putty knife or scraper.
3.16. Calipers.
3.17. Framing square.
3.18. Wire brush.
3.19. Wire rack.
3.20. 8x8” pan with fine aggregate.
Note: Test equipment for this procedure may be available in various forms and may be used with the
approval of the Engineer.
4. OBTAINING SAMPLES
4.1. Select the station at which the samples will taken by method described in Part V, Section 5.2.2.2.,
Random Sampling. Record the time at which the pavement is placed at the selected station. Record the
surface condition on which the overlay is placed, i.e. milled surface, existing surface, new pavement.
4.2. Sand, grind or wire brush at the coring locations to provide a finish suitable for the adhesive to bond
to the surface. The use of right angle grinder with a 36 grit sanding disk to remove surface asphalt and
expose the aggregate has proved to be suitable.
4.3. Using the 2 inch core barrel, core to a depth ¼ to ¾ inch deeper than the expected overlay depth. The
core drill must be oriented perpendicular to the pavement surface to within ¼ inch in 12 inches. Use a
framing square to check the perpendicularity at two points 90 degrees apart around the circumference of
the core barrel. Core three times in a triangular pattern so the set of two inch cores may be circumscribed
by a six inch circle. It is necessary to core to a depth slightly below the overlay but not so deep as to
penetrate the layer of pavement on which the overlay is placed. It may be necessary to use ice placed on
the sample location for a period of time prior to coring to prevent damage to the sample. The core should
remain attached to the pavement. DO NOT remove the cores from the pavement.
Coring should be done at slow pace with little downward pressure to avoid damage to the specimen.
4.3.1. If the overlay separates from the base during coring, examine the surface of the base layer. Note
the location and presence or absence of visible tack. Repeat the steps in Sections 4.2 through 4.3 at a
point 3 feet away in the direction of paving. If the overlay separates at the new location the test result is
considered a failure and both locations, presence or absence of tack, and the separation during coring
should be recorded.
4.3.2. If one of the cores separate in the base layer during coring, note the location and repeat the steps in
Sections 4.2 through 4.3 at a point 3 feet away in the direction of paving. If the cores separate at the new
location, the base layer is not strong enough for this test method or the coring technique needs to be
evaluated. Both locations and the separation during coring in the base layer should be recorded.
Page 3/7 5.9.78 2016
Revised 2014
KT-78
4.3.3. If one or two of the cores separate as noted in Section 4.3.1 or 4.3.2 but a total of three intact cores
are obtained, note the separations in the test report and continue with the remainder of the test procedure.
4.4. Using the 6 inch core barrel, center the drill over the set of 2 inch cores and core to a depth of nine
inches or to the depth of the pavement, whichever is less. Any length of six inch core removed from the
hole that includes the substrate on which the overlay was placed and the intact 2 inch cores is acceptable
for testing.
4.5. Remove the 6 inch core from the pavement using the minimum amount of lateral force necessary to
break the core loose.
4.6. Gently turn the core over to drain water from the 2 inch cores.
4.7. Verify that the 2 inch core barrel reached a depth below the overlay interface by inserting a thin steel
ruler or wire witness between the 2 inch cores and the remainder of the 6 inch core. Note that waste
material may be present at the bottom of the core in the form of mud or particles that must be gently
pushed aside to reach the full depth of the core. Use care not to apply any lateral force to the 2 inch core.
4.8. Transport the samples to the field laboratory in an upright manner taking care to avoid any shock that
might loosen or dislodge the 2 inch cores.
5. TEST PROCEDURE
5.1. In a field laboratory with a controlled air temperature maintained less than 77F (25ºC) place the
sample on an elevated wire rack in front of a fan so that air can circulate around the entire sample.
Acclimate the sample to room temperature until the temperature at the bottom of the 2 inch core is less
than 77F (25ºC). If the sample is cold and damp allow extra time for temperature acclimation.
5.2. Bond a 1 1/2 inch (37 mm) pipe cap to the cored overlay disk. The adhesive used to bond the pipe
cap to the overlay should be a rapid curing adhesive with a minimum working life of approximately 3
minutes. Apply a thin layer of adhesive to both the pipe cap surface and the cored disk. Attempt to
evenly cover the overlay surface and cap filling in all voids. Do not allow any adhesive to flow over the
edge of the cored disk down into the cored area. If adhesive reaches the interface of the overlay and the
substrate or bonds the cored disk to the remainder of the overlay, do not record the test result.
If samples are to be tested from more than a single location it will save time to bond one cap to each
sample at the same time.
The cap may be bonded during the temperature acclimation period in Section 5.1.
5.3. Determine the temperature by allowing a probe type thermometer to stabilize at room temperature,
recording the temperature and then carefully placing the probe in contact with bottom of the 2 inch core.
The temperature of the probe must be stable to 0.2F (0.1ºC) for a period of 3 minutes before either
reading is taken. Do not apply any lateral pressure to the 2 inch core when inserting the probe.
The use of infrared thermometers is specifically prohibited.
5.4. Perform the tensile adhesion test at the time required by the relevant specification.
Page 4/7 5.9.78 2016
Revised 2014
KT-78
5.5. Place the test specimen on the fixture shelf so that the cap is centered under the hole in the table. If
the bottom of the core is not flat a shallow pan filled with fine aggregate may be used to help keep the
specimen in an upright position.
Raise the shelf until the top of the core is seated flat against the bottom of the table and the pipe cap is
centered in the hole.
5.6. Gently screw the eyebolt loosely into the pipe cap. Do not over tighten or apply torque to the sample.
Place the apparatus on top of the table centered over the specimen and attach the scale to the apparatus
and to the eyebolt in the pipe cap. Set the scale to peak load mode. Without tension on the specimen, zero
the scale.
5.7. Apply a preload of approximately 10 lbf (5 kg). Position yourself so that a ¾ turn of the handle can
be made in a smooth continuous motion. Apply a load with a travel rate of 0.8 +/- 0.1 inches per minute.
With a thread pitch of 11 threads per inch this corresponds to a rotation rate of the handle of one turn in 6
to 8 seconds or 3 to 4 seconds per half turn.
DO NOT exceed the capacity of the scale.
5.7.1. Record the peak load for each test core to the nearest 1 lbf (0.5 kg). If the load exceeds the scale
capacity, record the load as 500+ lbf with a note that the capacity of the scale was exceeded.
5.7.2. Record the location of failure for each test core and percent failure in the asphalt layer that failed.
Various types of failures:
Failure at the interface of the top layer and substrate.
Failure in the top layer.
Failure in the substrate.
Failure in the top layer and substrate, record a percentage of top layer vs. substrate.
Failure in the top layer or substrate and the interface, record a percentage of top layer or
substrate vs. interface.
Failure of the adhesive
5.7.3 Measure and record the diameter of the core at the failure location. Take two measurements to the
nearest 0.001 inch (0.025 mm) at right angles with the calipers.
5.8. Repeat Sections 5.2. through 5.7.3. for all three specimens.
5.9. Clean the pipe caps by heating in an oven set to 350° F for one hour or by heating with a propane
torch until the adhesive degrades to the point that it can scraped from the cap with a putty knife or
scraper. Thoroughly clean the cap surface with a wire brush or sand paper to remove the remainder of the
adhesive.
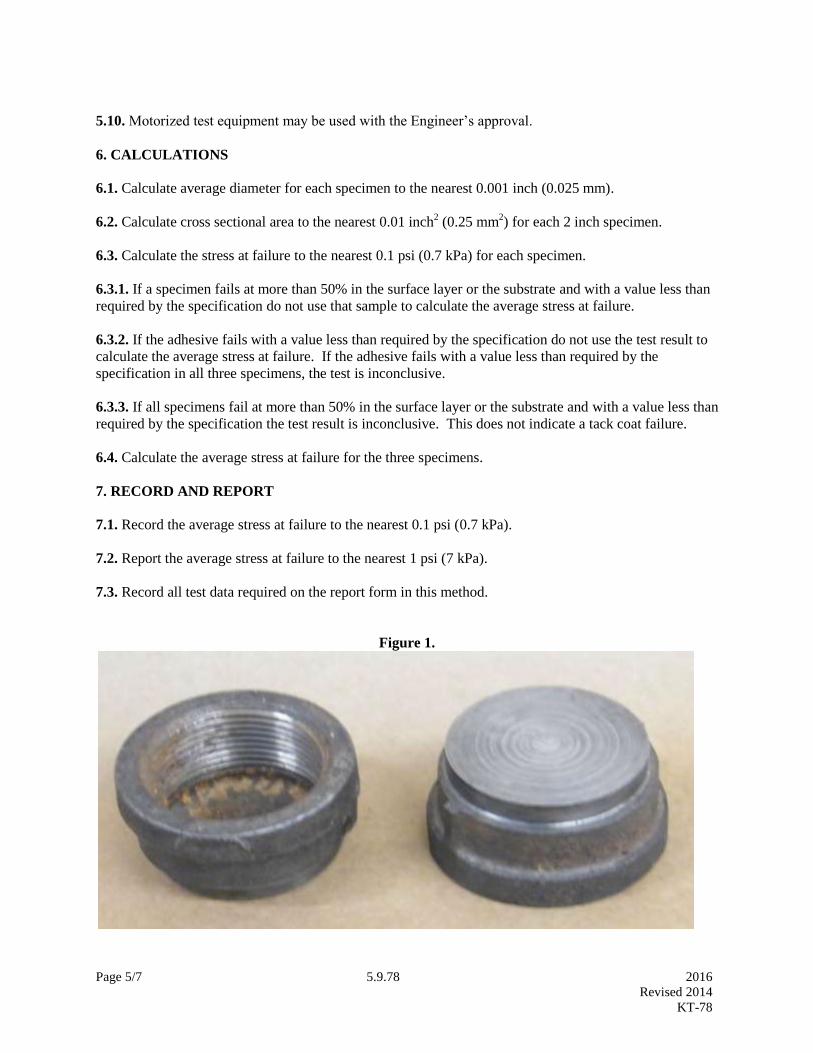
Page 5/7 5.9.78 2016
Revised 2014
KT-78
5.10. Motorized test equipment may be used with the Engineer’s approval.
6. CALCULATIONS
6.1. Calculate average diameter for each specimen to the nearest 0.001 inch (0.025 mm).
6.2. Calculate cross sectional area to the nearest 0.01 inch2 (0.25 mm
2) for each 2 inch specimen.
6.3. Calculate the stress at failure to the nearest 0.1 psi (0.7 kPa) for each specimen.
6.3.1. If a specimen fails at more than 50% in the surface layer or the substrate and with a value less than
required by the specification do not use that sample to calculate the average stress at failure.
6.3.2. If the adhesive fails with a value less than required by the specification do not use the test result to
calculate the average stress at failure. If the adhesive fails with a value less than required by the
specification in all three specimens, the test is inconclusive.
6.3.3. If all specimens fail at more than 50% in the surface layer or the substrate and with a value less than
required by the specification the test result is inconclusive. This does not indicate a tack coat failure.
6.4. Calculate the average stress at failure for the three specimens.
7. RECORD AND REPORT
7.1. Record the average stress at failure to the nearest 0.1 psi (0.7 kPa).
7.2. Report the average stress at failure to the nearest 1 psi (7 kPa).
7.3. Record all test data required on the report form in this method.
Figure 1.
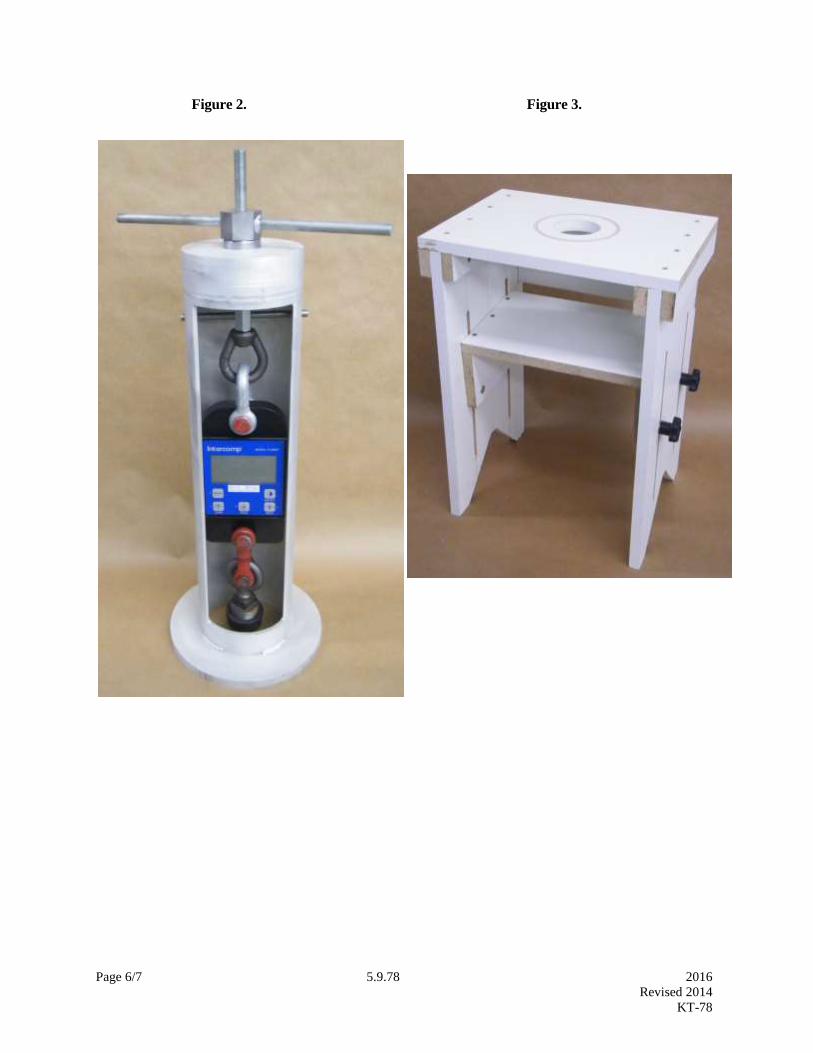
Page 6/7 5.9.78 2016
Revised 2014
KT-78
Figure 2. Figure 3.
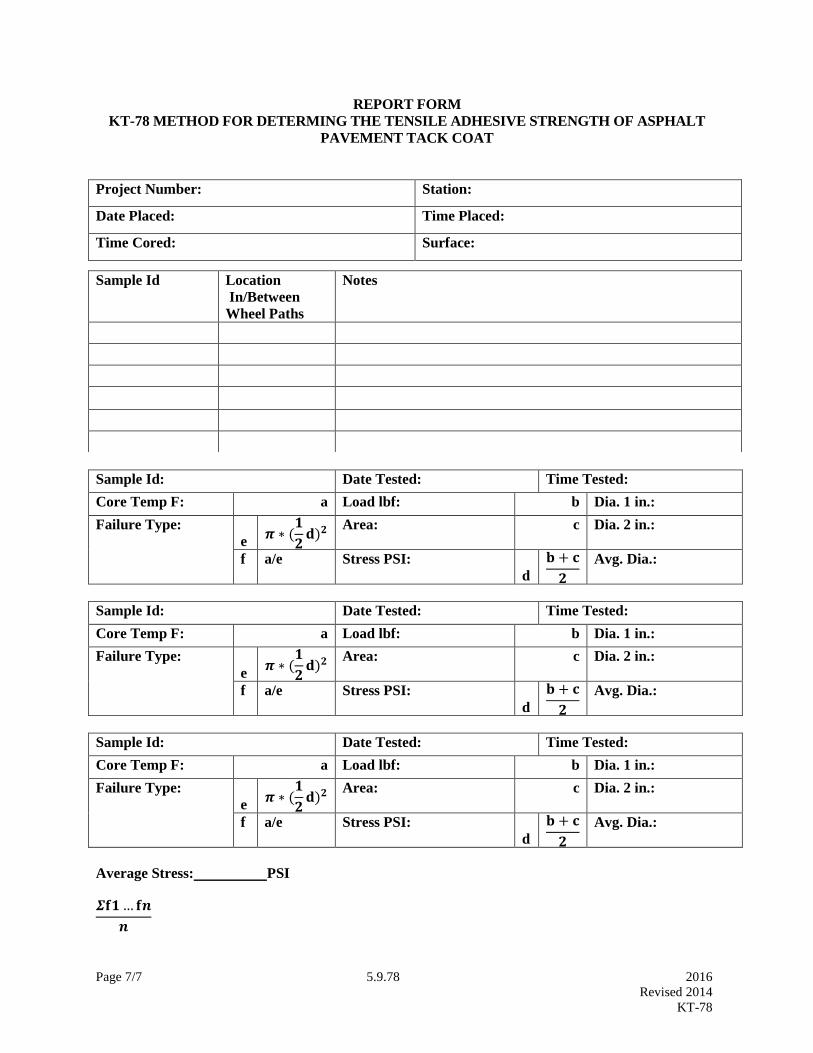
Page 7/7 5.9.78 2016
Revised 2014
KT-78
REPORT FORM
KT-78 METHOD FOR DETERMING THE TENSILE ADHESIVE STRENGTH OF ASPHALT
PAVEMENT TACK COAT
Project Number: Station:
Date Placed: Time Placed:
Time Cored: Surface:
Sample Id: Date Tested: Time Tested:
Core Temp F: a Load lbf: b Dia. 1 in.:
Failure Type:
e 𝝅 ∗ (
𝟏
𝟐𝐝)𝟐
Area: c Dia. 2 in.:
f a/e Stress PSI:
d
𝐛 + 𝐜
𝟐
Avg. Dia.:
Sample Id: Date Tested: Time Tested:
Core Temp F: a Load lbf: b Dia. 1 in.:
Failure Type:
e 𝝅 ∗ (
𝟏
𝟐𝐝)𝟐
Area: c Dia. 2 in.:
f a/e Stress PSI:
d
𝐛 + 𝐜
𝟐
Avg. Dia.:
Sample Id: Date Tested: Time Tested:
Core Temp F: a Load lbf: b Dia. 1 in.:
Failure Type:
e 𝝅 ∗ (
𝟏
𝟐𝐝)𝟐
Area: c Dia. 2 in.:
f a/e Stress PSI:
d
𝐛 + 𝐜
𝟐
Avg. Dia.:
Average Stress: PSI
𝜮𝐟𝟏…𝐟𝒏
𝒏
Sample Id Location
In/Between
Wheel Paths
Notes


Page 1/4 5.9.79 2016 Revised 2016 KT-79
5.9.79 SURFACE RESISTIVITY INDICATION OF CONCRETE’S ABILITY TO RESIST CHLORIDE
ION PENETRATION (Kansas Test Method KT-79)
1. SCOPE
This test method covers the determination of the electrical resistivity of concrete to provide a rapid
indication of its resistance to the penetration of chloride ions. This test method is based on procedures
found in AASHTO T358.
2. REFERENCED DOCUMENTS
2.1. KDOT Construction Manual, Part V, Section, 5.9; Sampling and Test Methods Forward
2.2. KT-22; Making and Curing Compression and Flexural Test Specimens in the Field
2.3 KT-49; Method for Obtaining and Testing Drilled Cores
2.4. AASHTO T358; Surface Resistivity Indication of Concrete’s Ability to Resist Chloride Ion
Penetration
3. APPARATUS
3.1. Surface Resistivity meter with a Wenner linear four-probe array. The meter should have a range of 0
to 100 kΩ-cm, with a resolution of 0.1 kΩ-cm and an accuracy of +/- 2% of reading. The Wenner probe
array spacing should be set at 1.5 inches (38.1 mm). The meter should be a single, self-contained
handheld unit.
3.2. Specimen holder. Specimen holder to prevent specimen rotation during testing. Holder should be
non-conductive.
NOTE: The Proceq Resipod meets these specifications.
4. TEST SPECIMEN
4.1. Prepare 3 samples per mix design. The samples shall be 4” x 8” (100mm X 200mm) cylinders cast at
time of mixing. Cylinders shall be molded in accordance with KT -22 of this manual.
5. CURING AND CONDITIONING
5.1. Initial curing of cast samples: Cast samples must undergo initial curing procedures according to KT-
22 with the requirement that samples are to be submitted to the testing facility within 48 hours of casting.
Therefore, the samples must be demolded at 24 ± 8 hours. See 5.4. for transportation requirements.
5.2. Make four indelible marks on the top (finished) circular face of the specimen marking the 0, 90, 180,
and 270 degree points of the circumference of the circle. Randomly assign one of the marks as 0°, then
rotate either clockwise or counterclockwise and assign the next mark 90°, and so on. Extend the marks
into the longitudinal sides of the specimens. On the longitudinal sides mark the center of the longitudinal
length of the specimen in order to use as a visual reference during testing. (Figure 1)
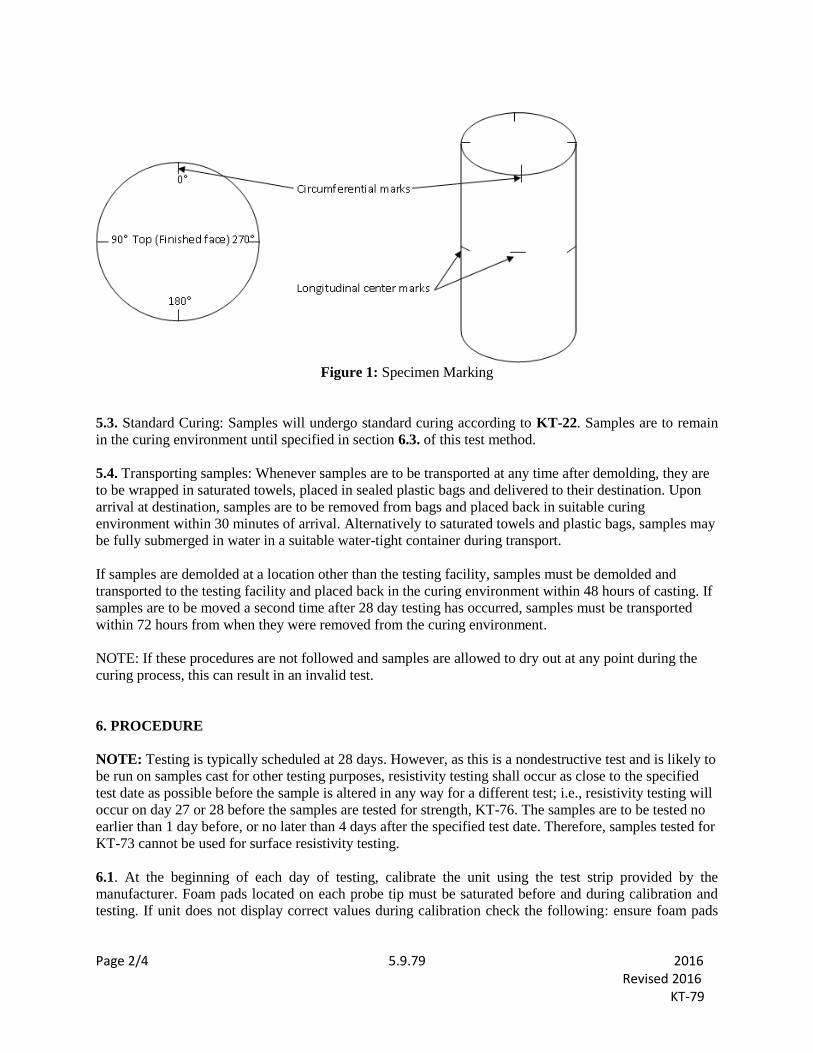
Page 2/4 5.9.79 2016 Revised 2016 KT-79
Figure 1: Specimen Marking
5.3. Standard Curing: Samples will undergo standard curing according to KT-22. Samples are to remain
in the curing environment until specified in section 6.3. of this test method.
5.4. Transporting samples: Whenever samples are to be transported at any time after demolding, they are
to be wrapped in saturated towels, placed in sealed plastic bags and delivered to their destination. Upon
arrival at destination, samples are to be removed from bags and placed back in suitable curing
environment within 30 minutes of arrival. Alternatively to saturated towels and plastic bags, samples may
be fully submerged in water in a suitable water-tight container during transport.
If samples are demolded at a location other than the testing facility, samples must be demolded and
transported to the testing facility and placed back in the curing environment within 48 hours of casting. If
samples are to be moved a second time after 28 day testing has occurred, samples must be transported
within 72 hours from when they were removed from the curing environment.
NOTE: If these procedures are not followed and samples are allowed to dry out at any point during the
curing process, this can result in an invalid test.
6. PROCEDURE
NOTE: Testing is typically scheduled at 28 days. However, as this is a nondestructive test and is likely to
be run on samples cast for other testing purposes, resistivity testing shall occur as close to the specified
test date as possible before the sample is altered in any way for a different test; i.e., resistivity testing will
occur on day 27 or 28 before the samples are tested for strength, KT-76. The samples are to be tested no
earlier than 1 day before, or no later than 4 days after the specified test date. Therefore, samples tested for
KT-73 cannot be used for surface resistivity testing.
6.1. At the beginning of each day of testing, calibrate the unit using the test strip provided by the
manufacturer. Foam pads located on each probe tip must be saturated before and during calibration and
testing. If unit does not display correct values during calibration check the following: ensure foam pads

Page 3/4 5.9.79 2016 Revised 2016 KT-79
are saturated (over-saturation can occur), turn off and restart the unit. If issues persist, contact KDOT
Research personnel for further assistance.
6.2. During the test, the air temperature around the specimens shall be maintained in the range of 20 to
25ºC (68 to 77ºF). As the unit is portable, testing the specimens in the room they are stored in is ideal.
6.3. Remove the specimens from curing environment, blot off excess water with damp towel/sponge to
SSD condition, and transfer specimen to specimen holder. If samples are stored in lime-saturated water
storage tanks, clean off excess lime residue from sample prior to testing. If several samples are to be
tested, be sure that the samples are not allowed to dry out excessively before completion of the testing. It
is recommended that only one set of three samples is removed from the curing environment at any given
time.
6.4. Place the meter longitudinally on the side of the specimen at the 0 degree mark. Center the meter
longitudinally on the specimen by making sure the longitudinal center mark on the specimen is
equidistant between the two inner probes (Figure 2). Make sure all the points of the array probe are in
contact with the concrete. Contact with the specimen will automatically induce a reading on the display
screen. Wait until a stable reading is obtained (usually 3 to 5 seconds), and record the resistivity
measurement on the testing form to the nearest 0.1 kΩ-cm. A reading is considered unstable if it drifts by
more than 1 kΩ-cm. Negative, unstable or obviously erroneous readings are indicative of problems with
the instrument, the probe array, or specimen, and need to be addressed before proceeding.
Figure 2: Location of unit during testing
6.5. Repeat step 6.4 for the 90, 180, and 270 degree marks.
6.6. Repeat steps 6.4 and 6.5 for the same specimen for a total of eight readings.
6.7. Repeat steps 6.4 to 6.6 for the remaining two specimens in the sample set.
Page 4/4 5.9.79 2016 Revised 2016 KT-79
7. CALCULATION
7.1. Calculate an average resistivity for each specimen. Calculate percent relative standard deviation
(%RSD) for each sample. If %RSD is above 7.5%, fully immerse the sample in a water bath (20 to 25ºC
(68 to 77ºF)) for two (2) hours, then repeat the test. If %RSD on second test is below 7.5%, use second
test to calculate sample average and complete 7.2 and 7.3. If %RSD on second test is greater than 7.5%,
use all 16 readings for sample to calculate sample average.
7.2. Calculate an average resistivity for the set of samples by averaging the average resistivities (7.1) of
the three specimens tested.
7.3. If specimens were cured in lime-saturated water, multiply set average by 1.1. Report the final
resistivity to the nearest 0.1 kΩ-cm.
7.4. Factors which are known to affect chloride ion penetration include: water-cement ratio, pozzolans,
the presence of polymeric admixtures, sample age, air-void system, aggregate type, degree of
consolidation, and type of curing.
8. REPORT
8.1. Report the results as required by the Contract Documents with the addition of the following
information:
8.1.1. Source of core or cylinder, in terms of the particular station the core or cylinder represents.
8.1.2. CMS or equivalent identification number of core or cylinder.
8.1.3. CMS or equivalent mix design number.
8.1.4. Date cast.
8.1.5. Date samples were demolded or cores were taken.
8.1.6. Min/Max temperature during first 24 hrs (if known).
8.1.7. Date of surface resistivity testing.
8.1. 8. Description of specimen, including presence and location of reinforcing steel, presence and
thickness of overlay, and presence and thickness of surface treatment.
8.1.9. Curing history of specimen.
8.1.10. Unusual specimen preparation, for example, removal of surface treatment or sulfur capping.
8.1.11. Test results, reported as the surface resistivity measured from 7.2 or 7.3 if a correction factor is
applied.
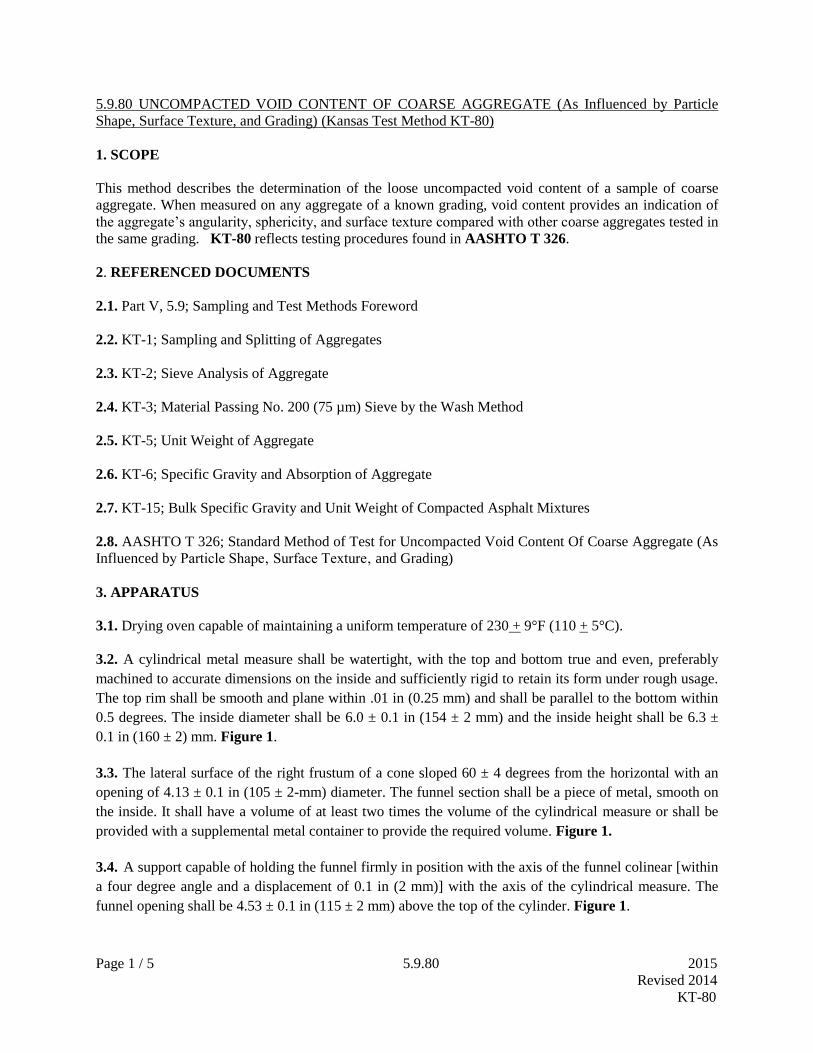
Page 1 / 5 5.9.80 2015
Revised 2014
KT-80
5.9.80 UNCOMPACTED VOID CONTENT OF COARSE AGGREGATE (As Influenced by Particle
Shape, Surface Texture, and Grading) (Kansas Test Method KT-80)
1. SCOPE
This method describes the determination of the loose uncompacted void content of a sample of coarse
aggregate. When measured on any aggregate of a known grading, void content provides an indication of
the aggregate’s angularity, sphericity, and surface texture compared with other coarse aggregates tested in
the same grading. KT-80 reflects testing procedures found in AASHTO T 326.
2. REFERENCED DOCUMENTS
2.1. Part V, 5.9; Sampling and Test Methods Foreword
2.2. KT-1; Sampling and Splitting of Aggregates
2.3. KT-2; Sieve Analysis of Aggregate
2.4. KT-3; Material Passing No. 200 (75 µm) Sieve by the Wash Method
2.5. KT-5; Unit Weight of Aggregate
2.6. KT-6; Specific Gravity and Absorption of Aggregate
2.7. KT-15; Bulk Specific Gravity and Unit Weight of Compacted Asphalt Mixtures
2.8. AASHTO T 326; Standard Method of Test for Uncompacted Void Content Of Coarse Aggregate (As
Influenced by Particle Shape‚ Surface Texture‚ and Grading)
3. APPARATUS
3.1. Drying oven capable of maintaining a uniform temperature of 230 + 9°F (110 + 5°C).
3.2. A cylindrical metal measure shall be watertight, with the top and bottom true and even, preferably
machined to accurate dimensions on the inside and sufficiently rigid to retain its form under rough usage.
The top rim shall be smooth and plane within .01 in (0.25 mm) and shall be parallel to the bottom within
0.5 degrees. The inside diameter shall be 6.0 ± 0.1 in (154 ± 2 mm) and the inside height shall be 6.3 ±
0.1 in (160 ± 2) mm. Figure 1.
3.3. The lateral surface of the right frustum of a cone sloped 60 ± 4 degrees from the horizontal with an
opening of 4.13 ± 0.1 in (105 ± 2-mm) diameter. The funnel section shall be a piece of metal, smooth on
the inside. It shall have a volume of at least two times the volume of the cylindrical measure or shall be
provided with a supplemental metal container to provide the required volume. Figure 1.
3.4. A support capable of holding the funnel firmly in position with the axis of the funnel colinear [within
a four degree angle and a displacement of 0.1 in (2 mm)] with the axis of the cylindrical measure. The
funnel opening shall be 4.53 ± 0.1 in (115 ± 2 mm) above the top of the cylinder. Figure 1.

Page 2 / 5 5.9.80 2015
Revised 2014
KT-80
Figure 1 Test Apparatus
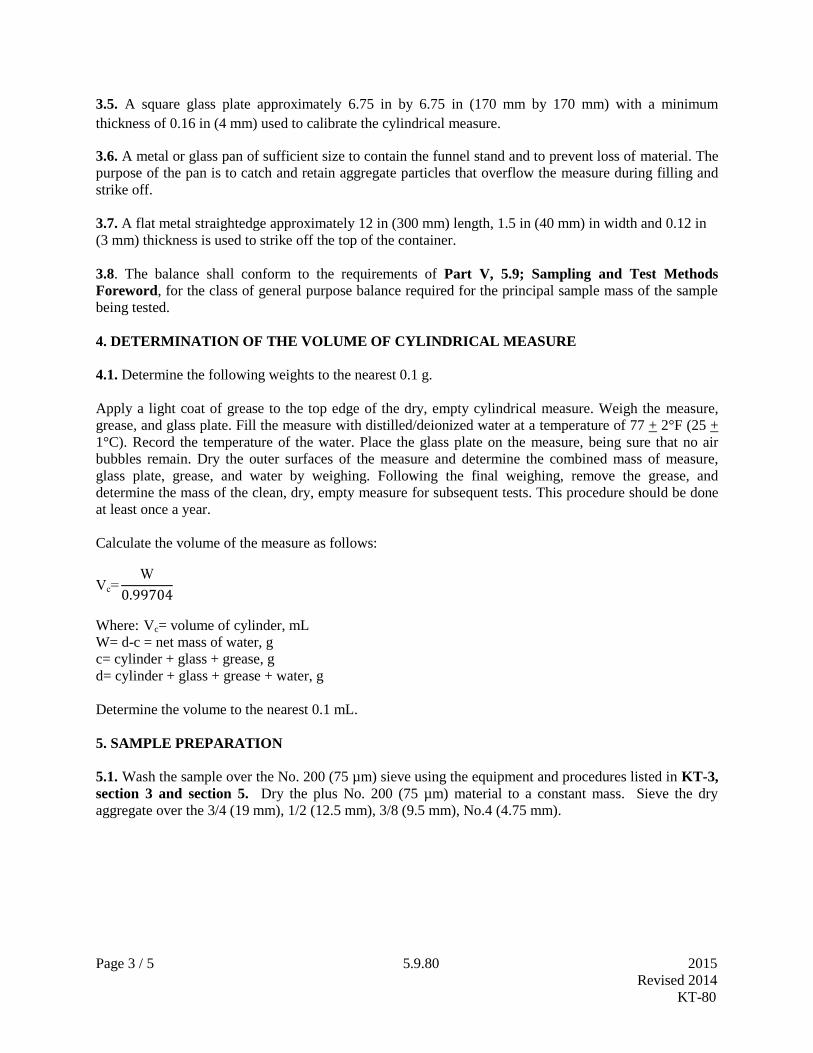
Page 3 / 5 5.9.80 2015
Revised 2014
KT-80
3.5. A square glass plate approximately 6.75 in by 6.75 in (170 mm by 170 mm) with a minimum
thickness of 0.16 in (4 mm) used to calibrate the cylindrical measure.
3.6. A metal or glass pan of sufficient size to contain the funnel stand and to prevent loss of material. The
purpose of the pan is to catch and retain aggregate particles that overflow the measure during filling and
strike off.
3.7. A flat metal straightedge approximately 12 in (300 mm) length, 1.5 in (40 mm) in width and 0.12 in
(3 mm) thickness is used to strike off the top of the container.
3.8. The balance shall conform to the requirements of Part V, 5.9; Sampling and Test Methods
Foreword, for the class of general purpose balance required for the principal sample mass of the sample
being tested.
4. DETERMINATION OF THE VOLUME OF CYLINDRICAL MEASURE
4.1. Determine the following weights to the nearest 0.1 g.
Apply a light coat of grease to the top edge of the dry, empty cylindrical measure. Weigh the measure,
grease, and glass plate. Fill the measure with distilled/deionized water at a temperature of 77 + 2°F (25 +
1°C). Record the temperature of the water. Place the glass plate on the measure, being sure that no air
bubbles remain. Dry the outer surfaces of the measure and determine the combined mass of measure,
glass plate, grease, and water by weighing. Following the final weighing, remove the grease, and
determine the mass of the clean, dry, empty measure for subsequent tests. This procedure should be done
at least once a year.
Calculate the volume of the measure as follows:
Vc=W
0.99704
Where: Vc= volume of cylinder, mL
W= d-c = net mass of water, g
c= cylinder + glass + grease, g
d= cylinder + glass + grease + water, g
Determine the volume to the nearest 0.1 mL.
5. SAMPLE PREPARATION
5.1. Wash the sample over the No. 200 (75 µm) sieve using the equipment and procedures listed in KT-3,
section 3 and section 5. Dry the plus No. 200 (75 µm) material to a constant mass. Sieve the dry
aggregate over the 3/4 (19 mm), 1/2 (12.5 mm), 3/8 (9.5 mm), No.4 (4.75 mm).

Page 4 / 5 5.9.80 2015
Revised 2014
KT-80
5.2. Weigh out and combine the following quantities of dry aggregate from each of the sizes:
Maximum Size of Individual Size Fraction Mass, g
Aggregate
3/4 in (19 mm) 3/4 in (19 mm) to 1/2 in (12.5 mm) 1740
1/2 in (12.5 mm) to 3/8 in (9.5 mm) 1090
3/8 in (9.5 mm) to No. 4 (4.75 mm) 2170
1/2 in (12.5 mm) 1/2 in (12.5 mm) to 3/8 in (9.5 mm) 1970
3/8 in (9.5 mm) to No. 4 (4.75 mm) 3030
The total sample weight should be 5000 g ± 10 g. .
5.3. If the bulk dry specific gravity of coarse aggregate from the source is unknown, determine it on the
plus No. 4 (4.75-mm) sample according to KT-6.
6. TEST PROCEDURE1
6.1. Record the mass of the empty measure. Also, for each run, record the mass of the measure and coarse
aggregate.
6.2. Mix the test sample until it is homogenous. Center the cylindrical measure under the funnel section
as shown in Figure 1. Close the doors at the bottom of the funnel section and latch them shut. Pour the
test sample into the funnel section. Hold the doors shut with one finger and open the latch on the doors.
Remove the finger from the doors, allowing the doors to swing open and the aggregate to fall freely into
the cylindrical measure.
NOTE: A latch may be placed on the doors for the convenience of the operator or the operator may hold
the doors closed with a finger during the filling of the funnel section, in which case the latch on the doors
would not be necessary.
6.3. After the funnel empties, strike off excess heaped aggregate from the cylindrical measure. Strike off
the surplus aggregate in such a way that any slight projections of the larger pieces of the coarse aggregate
approximately balance the larger voids in the surface below the top of the measure. Until this operation is
complete, exercise care to avoid vibration or any disturbance that could cause compaction of the coarse
aggregate in the cylindrical measure. Remove any aggregate that may have fallen on the outside of the
container and determine the mass of the cylindrical measure and contents to the nearest 0.1 g. Retain all
aggregate particles for a second test run.
6.4. Recombine the sample from the retaining pan and cylindrical measure and repeat the procedure. The
results of two runs are averaged.
1 AASHTO 326 Allows Methods A, B and C. KDOT allows only Method A to be run.
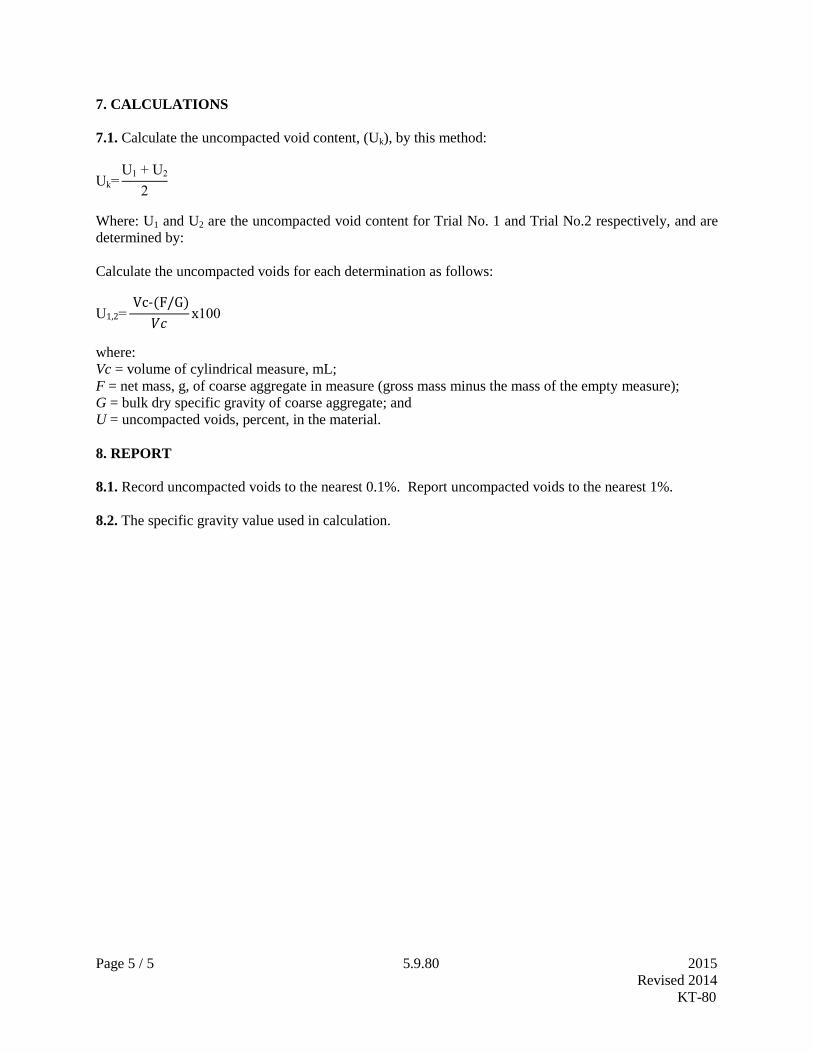
Page 5 / 5 5.9.80 2015
Revised 2014
KT-80
7. CALCULATIONS
7.1. Calculate the uncompacted void content, (Uk), by this method:
Uk=U1 + U2
2
Where: U1 and U2 are the uncompacted void content for Trial No. 1 and Trial No.2 respectively, and are
determined by:
Calculate the uncompacted voids for each determination as follows:
U1,2= Vc-(F/G)
𝑉𝑐x100
where:
Vc = volume of cylindrical measure, mL;
F = net mass, g, of coarse aggregate in measure (gross mass minus the mass of the empty measure);
G = bulk dry specific gravity of coarse aggregate; and
U = uncompacted voids, percent, in the material.
8. REPORT
8.1. Record uncompacted voids to the nearest 0.1%. Report uncompacted voids to the nearest 1%.
8.2. The specific gravity value used in calculation.


Page 1/1 5.9.81 2016
Revised 2015
KT-81
5.9.81 SAMPLING COLD PLASTIC PAVEMENT MARKING MATERIALS, PATTERNED COLD
PLASTIC PAVEMENT MARKING MATERIALS AND HIGH DURABILITY PAVEMENT
MARKING TAPE (KANSAS TEST METHOD KT-81)
1. SCOPE
This method covers the procedures for field sampling Cold Plastic Pavement Marking Material, Patterned
Cold Plastic Pavement Marking Material and High Durability Pavement Marking Tape.
2. APPARATUS
2.1. Utility Knife
2.2 Packing material, box, tape, etc.
3. SAMPLING PROCEDURES
3.1. Select points at which to sample each color and lot from the entire length of material supplied to the
project using procedures described in Section 5.2.2.2. of this manual. Do not sample from symbols.
3.2. Coordinate the sampling site with the contractor
3.3. Using a sharp instrument such as a utility knife, cut a sample from the entire width of the product to
the length shown in 3.4. below.
3.4. When the material being sampled is less than 12 inches (300 mm) in width, provide a sample that is a
minimum of 36 inches (900 mm) in length in a single piece. When the material being sampled is 12 (300
mm) inches and wider, provide a sample that is a minimum of 24 inches (600 mm) in length in a single
piece.
3.5. Keep the adhesive side of the material clean during sampling and packaging.
3.6. Roll the material so that the adhesive side is on the inside of the roll. Do not include any paper inside
the roll. Place a rubber band around the roll and any paperwork. Place the sample inside a box and seal
with packing tape.
4. SHIPPING INFORMATION
4.1. Label each sample container with at least the following:
4.1.1. Producer.
4.1.2. Producer product ID.
4.1.3. Lot number and color.
4.1.4. Project number.
4.1.5. CMS Number. Each sample must have a different CMS Number.
4.1.6. Ship samples to the Materials & Research Center, 2300 SW Van Buren, Topeka, KS 66611.


Page 1/1 5.9.82 2016
Revised 2015
KT-82
5.9.82 DETERMINATION OF EXCESSIVE MOISTURE IN CONCRETE SURFACES
(Kansas Test Method KT-82)
1. SCOPE
This method covers the determination of the presence of moisture in hardened concrete that may be
detrimental to coating adhesion. KT-82 reflects testing procedures found in ASTM D4263.
2. REFERENCED DOCUMENTS
2.1. ASTM D4263; Indicating Moisture in Concrete by the Plastic Sheet Method
3. APPARATUS
3.1. Method A
3.1.1. Transparent plastic sheeting approximately 4 mils (0.1 mm) thick.
3.1.2. Adhesive tape that will adhere to the surface. 2 inch (50 mm) wide duct tape is suggested.
3.2. Method B
3.2.1. Electrical impedance type moisture meter with a mode specific for testing concrete. Calibrate the
meter within 12 months prior to use or calibrate onsite at the time of use according to the manufacturer’s
recommendations. Make the calibration certificate or field calibration materials and the operating manual
available to the Engineer prior to use.
4. PROCEDURE
4.1. Method B may only be used with the Engineers approval. Method A shall be the referee method.
Results from Method A take precedence in the case of discrepancies between methods or if concerns exist
regarding the accuracy of the meter.
4.2. Method A
4.2.1. Avoid testing in areas with direct sunlight. Shade the test area if necessary. Use an approximately
18 by 18 inch sheet of plastic. Tightly seal the edges to the surface being tested with tape. Leave the
plastic sheet in place for a minimum of 2 hours.
4.2.2. Remove the plastic sheet and visually check the underside of the sheet and the concrete surface for
the presence of moisture.
4.3. Method B
4.3.1. Using the moisture meter in accordance with the manufacturer’s procedures stated in the operating
manual test the concrete surface in three locations and record the moisture to the nearest 0.1%.
5. Report
5.1. Method A: Report the presence or absence of moisture. Method B: Report all moisture content
readings to the nearest 0.1%. Do not average the readings.


Page 1/3 5.9.83 2016
Revised 2015
KT-83
5.9.83 STRAND BOND IN PRESTRESSED CONCRETE MEMBERS (Kansas Test Method KT-83)
1. SCOPE
This method covers the procedures for verifying the bond of pre-tensioned prestressing strand in prestressed
concrete members. KT-83 reflects testing procedures found in the Spring 2009 (revised May 2009) PCI
Journal.
2. REFERENCED DOCUMENTS
2.1. Part V, 5.9; Sampling and Testing Methods Forward
2.2. KT-22; Making and Curing Compression and Flexural Test Specimens in the Field
2.3. KT-76; Compressive Strength of Molded Cylindrical Concrete Specimens
2.4. PCI Journal, Spring 2009 (Revised May 2009), “A Simple Quality Assurance Test for Strand Bond”
3. APPARATUS
3.1. Fork Lift:
3.2. One 12 inch long, 4 inch wide by 0.5 inch thick simple elastomeric bearing pad.
3.3. One 12 inch long, 4 inch wide by 0.375 inch thick Teflon coated elastomeric bearing pad.
3.4. One 14 inch long, 6 inch wide by 0.125 inch thick stainless steel plate.
3.5. Load blocks of various weights.
3.6. Nylon straps to suspend the load block(s) from the test beam.
NOTE: Proper results require the use of a stainless steel plate and Teflon coated elastomeric bearing pad at
one end of the test beam. Do not use a simple elastomeric pad at each end.
4. LOAD BLOCKS
4.1. Determine the mass of the various load blocks using a calibrated scale. The scale shall conform to the
requirements of Part V, 5.9; Sampling and Test Methods Forward.
5. SAMPLE PREPARATION
5.1. Cast a concrete test beam of rectangular cross section with a single pre-tensioned, prestressing strand
and having the dimensions shown in Table 1, and Figures 1 and 2. Place the strand at a depth specified in
Table 1. Test beams must not contain shear reinforcement. Use standard tensioning, batching, placement,
consolidation, curing, and detensioning methods.
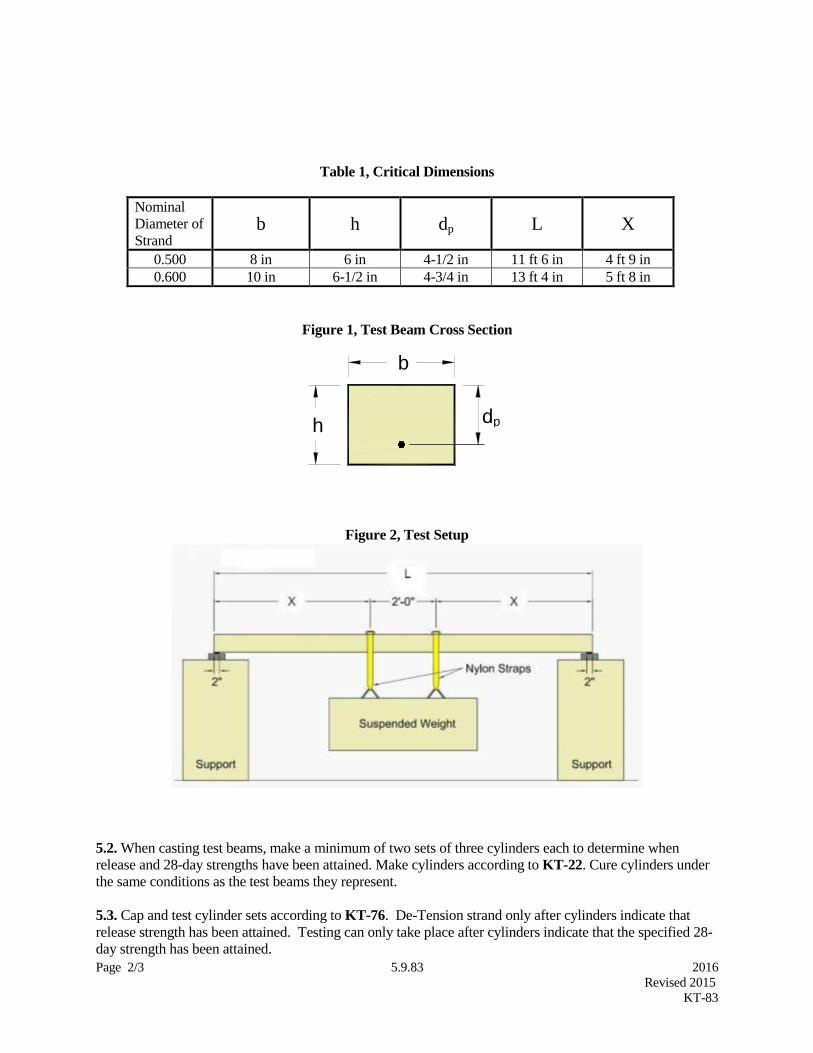
Page 2/3 5.9.83 2016
Revised 2015
KT-83
Table 1, Critical Dimensions
Nominal
Diameter of
Strand b h dp L X
0.500 8 in 6 in 4-1/2 in 11 ft 6 in 4 ft 9 in
0.600 10 in 6-1/2 in 4-3/4 in 13 ft 4 in 5 ft 8 in
Figure 1, Test Beam Cross Section
Figure 2, Test Setup
5.2. When casting test beams, make a minimum of two sets of three cylinders each to determine when
release and 28-day strengths have been attained. Make cylinders according to KT-22. Cure cylinders under
the same conditions as the test beams they represent.
5.3. Cap and test cylinder sets according to KT-76. De-Tension strand only after cylinders indicate that
release strength has been attained. Testing can only take place after cylinders indicate that the specified 28-
day strength has been attained.
h dp
b
Page 3/3 5.9.83 2016
Revised 2015
KT-83
5.4. Verify and record the “as-built” dimensions of the finished test beams. If, in the center 2 ft of its length,
the test beam width (b) and depth to strand (dp) deviate from Table 1 values by more than 0.125 in, calculate
the required applied load (see section 5.6.) using “as-built” values rather than the nominal values from
Table 1.
5.5. Grind the ends of the strand flush with the concrete at the ends of the beam.
5.6. Using the equations on pages 156 through 160 of the Spring 2009 (revised May 2009) PCI Journal,
or using approved programs, calculate in pounds:
The total applied load (P85%) required to produce a moment in the test beam equal to 85%
of the nominal moment capacity of the test beam.
The total applied load (P100%) required to produce a moment in the test beam equal to the
nominal moment capacity of the test beam.
For calculation purposes, span length is 4 inches less than beam length (X).
6. PROCEDURE
6.1. Support the beam and suspend the load for testing as shown in Figure 2.
NOTE: The L and X dimensions shown in Table 1 and Figure 2 have been chosen to establish a
development length of approximately 80% of the calculated development length of the member. Therefore,
overall beam and span length, and location of the load straps are critical.
6.2. Place the ends of the beam 2 inches from the inside edge of the bearing pads. Establish span length
(inside-to-inside face of bearings) to within +/-0.25 inch. Place the plain elastomeric bearing pad under one
end of the beam and a Teflon coated bearing pad under the other end. Place the Teflon coated surface face
down onto a clean stainless steel plate.
6.3. Gradually load the beam up to P85% by slowly hanging load block(s) from the straps or by slowly
lowering load blocks uniformly onto the beam between the straps.
6.3.1. Inspect the beam and document cracks and strand end slip if present. With the ends of strand ground
flush prior to testing, any draw-in will be visually detected.
6.4. Sustain the P85% load for a minimum of 24 hours.
6.4.1. Inspect the beam for increased signs of distress such as increased strand slipping, increased cracking,
concrete crushing, etc.
6.5. Load the beam to P100% and hold for a minimum of 10 minutes. If the beam has not collapsed during
this period, it passes the test. Collapse of the beam constitutes a failed test.
7. RECORD AND REPORT
7.1 Record P85% and P100% to the nearest pound. Report both to the nearest 10 pounds. Record and report all
dimensions to the nearest 0.125 inch.

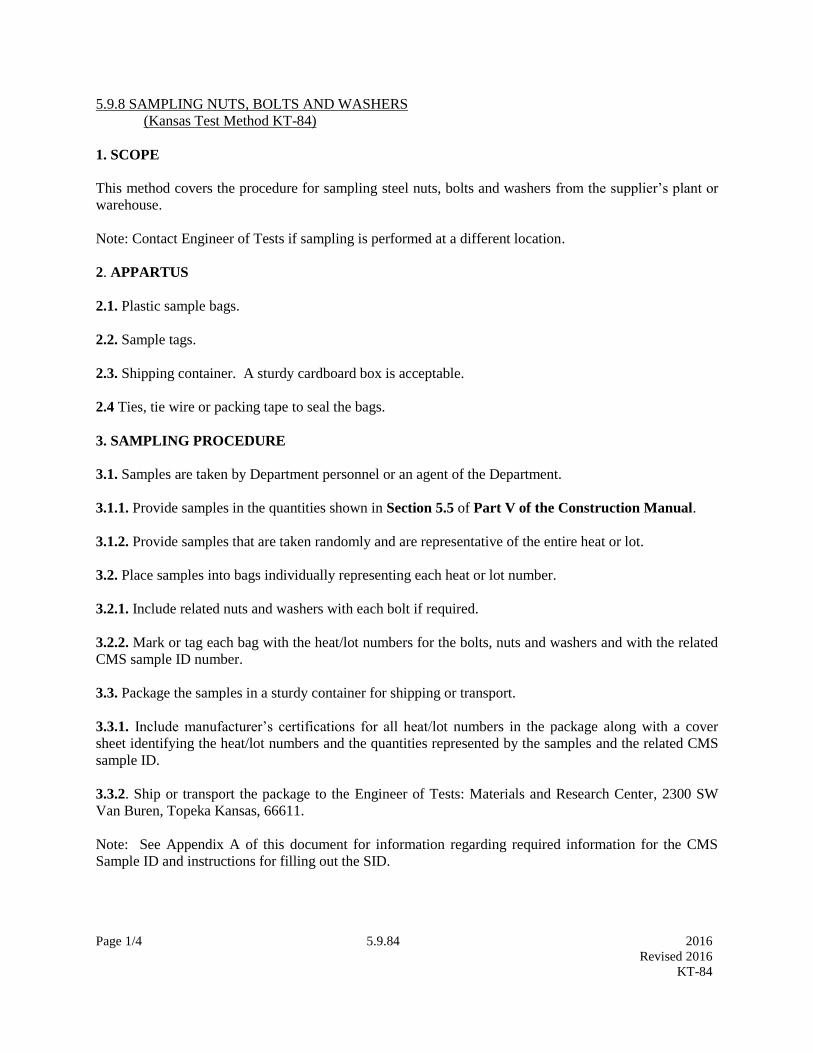
Page 1/4 5.9.84 2016
Revised 2016
KT-84
5.9.8 SAMPLING NUTS, BOLTS AND WASHERS
(Kansas Test Method KT-84)
1. SCOPE
This method covers the procedure for sampling steel nuts, bolts and washers from the supplier’s plant or
warehouse.
Note: Contact Engineer of Tests if sampling is performed at a different location.
2. APPARTUS
2.1. Plastic sample bags.
2.2. Sample tags.
2.3. Shipping container. A sturdy cardboard box is acceptable.
2.4 Ties, tie wire or packing tape to seal the bags.
3. SAMPLING PROCEDURE
3.1. Samples are taken by Department personnel or an agent of the Department.
3.1.1. Provide samples in the quantities shown in Section 5.5 of Part V of the Construction Manual.
3.1.2. Provide samples that are taken randomly and are representative of the entire heat or lot.
3.2. Place samples into bags individually representing each heat or lot number.
3.2.1. Include related nuts and washers with each bolt if required.
3.2.2. Mark or tag each bag with the heat/lot numbers for the bolts, nuts and washers and with the related
CMS sample ID number.
3.3. Package the samples in a sturdy container for shipping or transport.
3.3.1. Include manufacturer’s certifications for all heat/lot numbers in the package along with a cover
sheet identifying the heat/lot numbers and the quantities represented by the samples and the related CMS
sample ID.
3.3.2. Ship or transport the package to the Engineer of Tests: Materials and Research Center, 2300 SW
Van Buren, Topeka Kansas, 66611.
Note: See Appendix A of this document for information regarding required information for the CMS
Sample ID and instructions for filling out the SID.
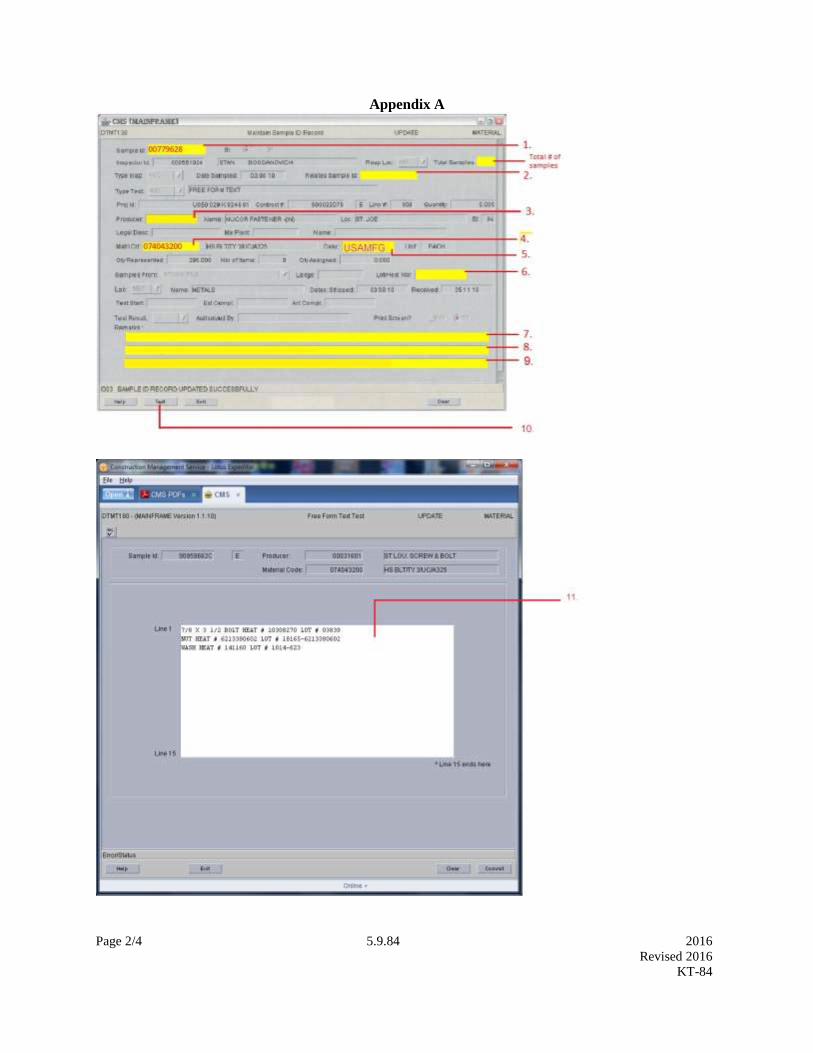
Page 2/4 5.9.84 2016
Revised 2016
KT-84
Appendix A
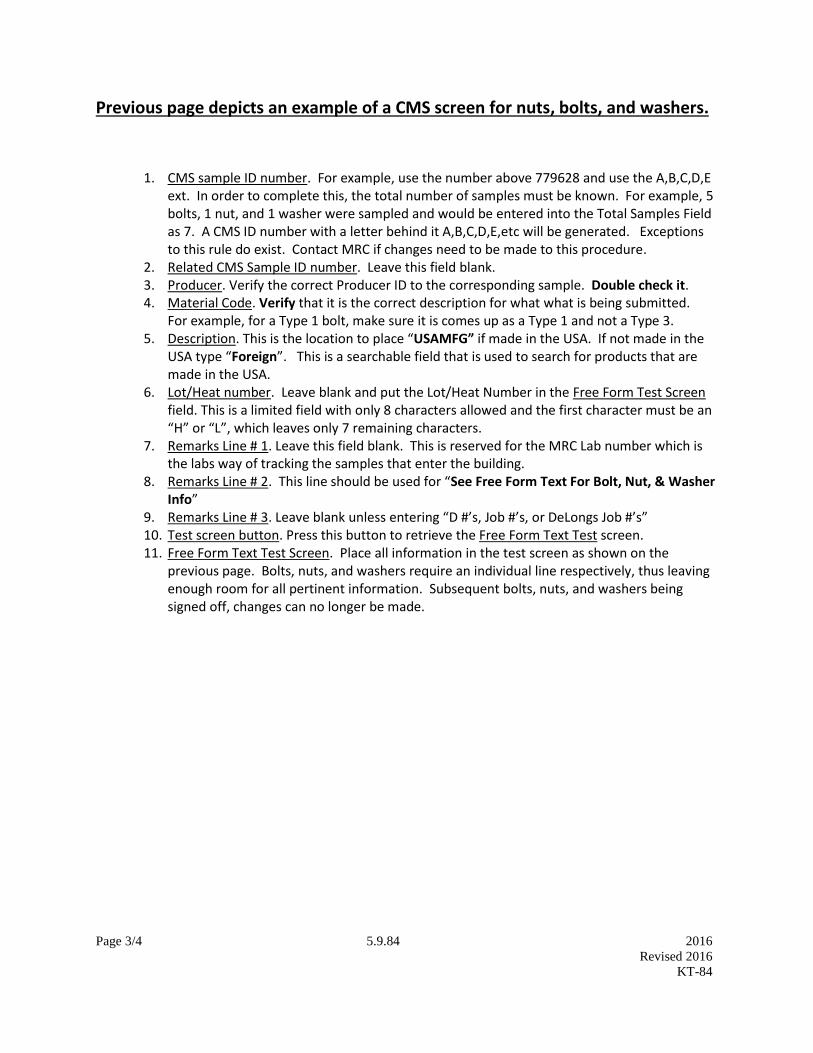
Page 3/4 5.9.84 2016
Revised 2016
KT-84
Previous page depicts an example of a CMS screen for nuts, bolts, and washers.
1. CMS sample ID number. For example, use the number above 779628 and use the A,B,C,D,E ext. In order to complete this, the total number of samples must be known. For example, 5 bolts, 1 nut, and 1 washer were sampled and would be entered into the Total Samples Field as 7. A CMS ID number with a letter behind it A,B,C,D,E,etc will be generated. Exceptions to this rule do exist. Contact MRC if changes need to be made to this procedure.
2. Related CMS Sample ID number. Leave this field blank. 3. Producer. Verify the correct Producer ID to the corresponding sample. Double check it. 4. Material Code. Verify that it is the correct description for what what is being submitted.
For example, for a Type 1 bolt, make sure it is comes up as a Type 1 and not a Type 3. 5. Description. This is the location to place “USAMFG” if made in the USA. If not made in the
USA type “Foreign”. This is a searchable field that is used to search for products that are made in the USA.
6. Lot/Heat number. Leave blank and put the Lot/Heat Number in the Free Form Test Screen field. This is a limited field with only 8 characters allowed and the first character must be an “H” or “L”, which leaves only 7 remaining characters.
7. Remarks Line # 1. Leave this field blank. This is reserved for the MRC Lab number which is the labs way of tracking the samples that enter the building.
8. Remarks Line # 2. This line should be used for “See Free Form Text For Bolt, Nut, & Washer Info”
9. Remarks Line # 3. Leave blank unless entering “D #’s, Job #’s, or DeLongs Job #’s” 10. Test screen button. Press this button to retrieve the Free Form Text Test screen. 11. Free Form Text Test Screen. Place all information in the test screen as shown on the
previous page. Bolts, nuts, and washers require an individual line respectively, thus leaving enough room for all pertinent information. Subsequent bolts, nuts, and washers being signed off, changes can no longer be made.
Page 4/4 5.9.84 2016
Revised 2016
KT-84
Documentation of Samples (Certification Packets)
1. Verify the cover letter is filled out on the computer or by hand and that it is attached to the certification packet (cert pack).
2. Review the cert pack and verify all of the certs match the cover letter, thus eliminating errors. If the cover letter is incomplete or errors exist, contact the producer and request a correct one with correct heat’s, lot’s, and quantity’s.
3. When submitting samples, send 1 paper copy of the cert pack with CMS Sample ID’s written on the cert pack along with the samples.
4. Further, when submitting the cert pack, include only the certs that pertain to the materials that they accompany. Extra certs for samples that are not included causes confusion when sorting and logging in the samples.
5. In addition, when submitting certs, write the corresponding CMS number on the cert. This makes it easier to verify the Lot No. and Heat No.
6. Use binder clips instead of staples so the cert packs can be easily separated.
When submitting the actual sample
1. Individually bag each bolt & corresponding nuts and washers. 2. Write the corresponding CMS, Lot, & Heat numbers on each sample bag. 3. Include the cert pack with the samples. 4. Package them in a sturdy box to prevent damage to the packaging materials during the
shipping process.
Page 1/9 5.9.86 2016
KT-86
5.9.86 CHARACTERIZATION OF THE AIR-VOID SYSTEM OF FRESHLY MIXED CONCRETE BY
THE SEQUENTIAL PRESSURE METHOD (Super Air Meter – SAM) (Kansas Test Method KT-86)
1. SCOPE
1.1. This method covers the procedure for determining the air content and system air metric (SAM)
number of freshly mixed concrete from observation of the change in volume of concrete with a sequential
change in test pressure. KT-86 reflects testing procedures found in AASTHO TP 118.
1.2. This method is intended for use with concretes and mortars made with aggregates for which the
aggregate correction factor can be satisfactorily determined by the technique described in Section 4. It is
not applicable to concretes made with light-weight aggregates, air-cooled blast furnace slag, or other
aggregates with high porosity. This test method is also not applicable to non-plastic fresh concrete such as
is commonly used in the manufacture of pipe and concrete masonry units.
1.3. The values stated in inch-pound units are to be regarded as the standard.
1.4. This standard does not purport to address all of the safety concerns, if any, associated with its use.
It is the responsibility of the user of this standard to establish appropriate safety and health practices and
determine the applicability of regulatory limitations prior to use.
2. REFERENCED DOCUMENTS
2.1. KT-17; Sampling Freshly Mixed Concrete
2.2. KT-19; Air Content of Freshly Mixed Concrete by the Volumetric Method
2.3. KT-20; Mass Per Cubic Foot (Meter), Yield and Air Content (Gravimetric) of Freshly Mixed
Concrete
2.4. AASHTO TP 188; Characterization of the Air-Void System of Freshly Mixed Concrete by the
Sequential Pressure Method
2.5. ASTM D5720; Standard Practice for Static Calibration of Electronic Transducer-Based Pressure
Measurement Systems for Geotechnical Purposes
3. APPARATUS
3.1. An air meter consisting of a measuring bowl and cover assembly as shown in Figure 1 conforming to
the requirements of Sections 3.2 and 3.3. The operational principle of this meter consists of sequentially
equalizing known volumes of air in a sealed air chamber, at a series of known pressures, with the
unknown volume of air in the concrete sample placed in the measuring bowl. A digital pressure gauge
with 0.01 psi (0.07 kPa) accuracy shall be used. Digital gauges with maximum pressures of 50.0 psi
(344.7 kPa) have been used satisfactorily. The digital gauge shall be able to compute and report the air
content within 0.1% and the SAM number to 0.01 psi (0.07 kPa). The cover assembly shall be fixed to the
measuring bowl with the same uniform pressure that was used during the calibration of the meter.
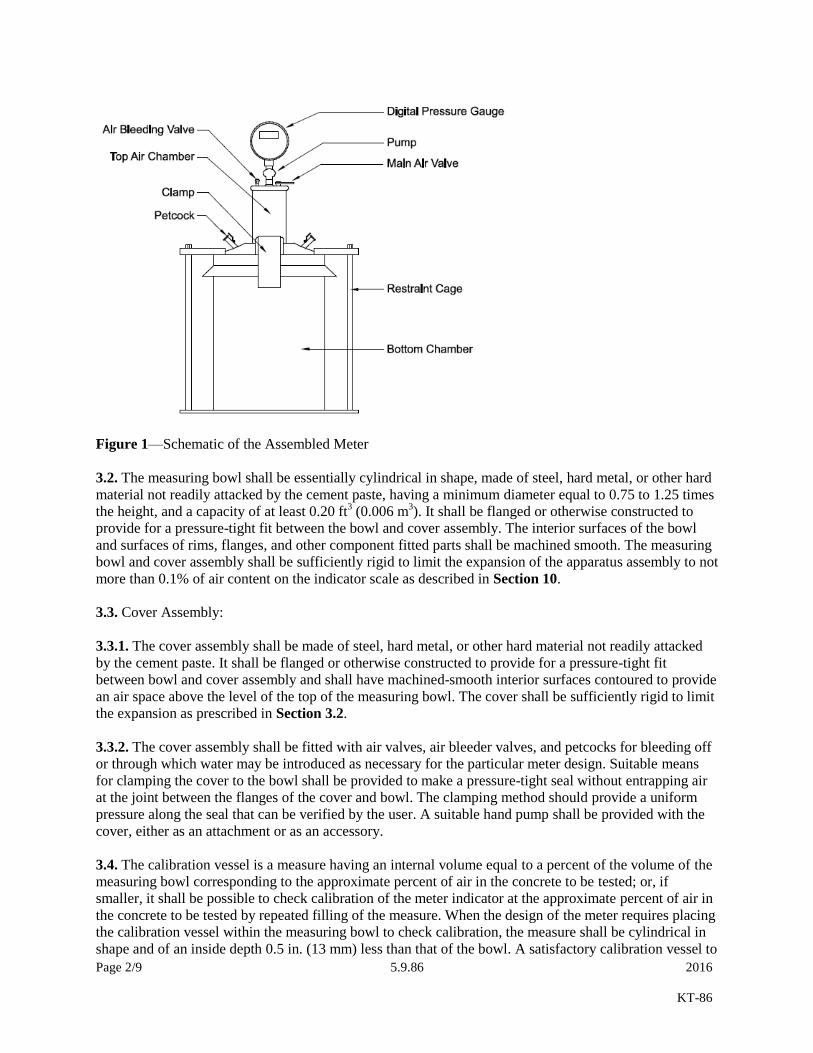
Page 2/9 5.9.86 2016
KT-86
Figure 1—Schematic of the Assembled Meter
3.2. The measuring bowl shall be essentially cylindrical in shape, made of steel, hard metal, or other hard
material not readily attacked by the cement paste, having a minimum diameter equal to 0.75 to 1.25 times
the height, and a capacity of at least 0.20 ft3 (0.006 m
3). It shall be flanged or otherwise constructed to
provide for a pressure-tight fit between the bowl and cover assembly. The interior surfaces of the bowl
and surfaces of rims, flanges, and other component fitted parts shall be machined smooth. The measuring
bowl and cover assembly shall be sufficiently rigid to limit the expansion of the apparatus assembly to not
more than 0.1% of air content on the indicator scale as described in Section 10.
3.3. Cover Assembly:
3.3.1. The cover assembly shall be made of steel, hard metal, or other hard material not readily attacked
by the cement paste. It shall be flanged or otherwise constructed to provide for a pressure-tight fit
between bowl and cover assembly and shall have machined-smooth interior surfaces contoured to provide
an air space above the level of the top of the measuring bowl. The cover shall be sufficiently rigid to limit
the expansion as prescribed in Section 3.2.
3.3.2. The cover assembly shall be fitted with air valves, air bleeder valves, and petcocks for bleeding off
or through which water may be introduced as necessary for the particular meter design. Suitable means
for clamping the cover to the bowl shall be provided to make a pressure-tight seal without entrapping air
at the joint between the flanges of the cover and bowl. The clamping method should provide a uniform
pressure along the seal that can be verified by the user. A suitable hand pump shall be provided with the
cover, either as an attachment or as an accessory.
3.4. The calibration vessel is a measure having an internal volume equal to a percent of the volume of the
measuring bowl corresponding to the approximate percent of air in the concrete to be tested; or, if
smaller, it shall be possible to check calibration of the meter indicator at the approximate percent of air in
the concrete to be tested by repeated filling of the measure. When the design of the meter requires placing
the calibration vessel within the measuring bowl to check calibration, the measure shall be cylindrical in
shape and of an inside depth 0.5 in. (13 mm) less than that of the bowl. A satisfactory calibration vessel to

Page 3/9 5.9.86 2016
KT-86
place within the measure bowl may be machined from No. 16 gauge brass tubing, of a diameter to provide
the volume desired, to which a brass disk 0.5 in. (13 mm) thick is soldered to form an end. When design
of the meter requires withdrawing of water from the water-filled bowl and cover assembly to check
calibration, the measure may be an integral part of the cover assembly or may be a separate cylindrical
measure similar to the above described cylinder.
3.5. Tamping rod shall be a round, straight steel rod, with a 0.625 ± 0.0625-in. (16 ± 2-mm) diameter and
not less than approximately 16 in. (400 mm) in length. The rod shall have the tamping end or both ends
rounded to a hemispherical tip of the same diameter as the rod.
3.6. A mallet (with a rubber or rawhide head) weighing approximately 1.25 + 0.50 lb. (0.57 + 0.23 kg)
for use with measures of 0.5 ft3 (0.014 m
3) or smaller, and a mallet weighing approximately 2.25 + 0.50
lb. (1.02 + 0.23 kg) for use with measures larger than 0.5 ft3 (0.14m3).
3.7. The strike-off bar is a flat, straight bar of steel or other suitable metal at least 0.125 in. (3 mm) thick
and 0.75 in. (20 mm) wide by 12 in. (300 mm) long.
3.8. The strike-off plate is a flat, rectangular metal plate at least 0.75 in. (6 mm) thick or a glass or acrylic
plate at least 0.5 in. (12 mm) thick with a length and width at least 2 in. (50 mm) greater than the diameter
of the measure with which it is to be used. The edges of the plate shall be straight and smooth within a
tolerance of 0.0625 in. (1.5 mm).
3.9. Funnel, with the spout fitting into a spray tube.
3.10. Vibrators, internal vibrators may have rigid or flexible shafts, preferably powered by electric
motors. The frequency of vibration shall be 7,000 per minute or greater while in use. The outside diameter
or side dimension of the vibrating elements shall be at least 0.75 in (19 mm) and not greater than 1.50 in
(38 mm). The combined length of the shaft and vibrating element shall exceed the maximum depth of the
section being vibrated by at least 3 in (76 mm). External vibrators may be of two types: table or plank.
The frequency for external vibrators shall not be less than 3,600 per minute, and preferably higher. For
both table and plank vibrators, provision shall be made for clamping the mold securely to the apparatus. A
vibrating-reed tachometer should be used to check the frequency of vibration.
3.11. Scoop of a size large enough so that each amount of concrete obtained from the sampling receptacle
is representative and small enough that it is not spilled during placement in the measuring bowl.
4. DETERMINATION OF AGGREGATE CORRECTION FACTOR
4.1. Procedure:
4.1.1. Determine the aggregate correction factor on a combined sample of fine and coarse aggregate as
directed in Sections 4.2 to 4.4. It is determined by applying 14.5 ± 0.05 psi (100 ± 0.3 kPa) to a sample of
inundated fine and coarse aggregate in approximately the same moisture condition, amount, and
proportions occurring in the concrete sample under test.
Page 4/9 5.9.86 2016
KT-86
4.2. Aggregate Sample Size:
4.2.1. Calculate the weights of fine and coarse aggregate present in the sample of fresh concrete whose air
content is to be determined, as follows:
(1) 𝐹𝑆 = (𝑆)(𝐹𝑏)
𝐵
(2) 𝐶𝑆 = (𝑆)(𝐶𝑏)
𝐵
Where: Fs = Mass of fine aggregate in concrete sample under test, lb (kg);
S = Volume of concrete sample (same as volume of measuring bowl), ft3 (m
3);
B = Volume of concrete produced per batch, ft3 (m
3);
Fb = Total mass of fine aggregate in the moisture condition used in batch, lb (kg);
Cs = Mass of coarse aggregate in concrete sample under test, lb (kg); and
Cb = total weight of coarse aggregate in the moisture condition used in batch, lb (kg).
NOTE: The volume of concrete produced per batch can be determined in accordance with applicable
provisions of KT-20.
4.3. Placement of Aggregate in Measuring Bowl:
4.3.1. Mix representative samples of fine aggregate, Fs, and coarse aggregate, Cs. Place a calibration
vessel approximately equivalent to the volume of air that would be contained in a typical concrete sample
in the measuring bowl. Fill the measuring bowl one-third full with water. Place the mixed aggregate, a
small amount at a time, into the measuring bowl; if necessary, add additional water so as to inundate all of
the aggregate. Add each scoopful in a manner that will entrap as little air as possible, remove
accumulations of foam promptly, and lightly rod the upper 1 in. (25 mm) of the aggregate about 8–12
times and tap the sides of the measuring bowl. Stir after each addition of aggregate to eliminate entrapped
air. Do not allow water in the calibration vessel.
4.4. Aggregate Correction Factor Determination:
4.4.1. Initial Procedure:
4.4.1.1. When all of the aggregate has been placed in the measuring bowl, remove foam at the surface and
keep the aggregate inundated for a period of time approximately equal to the time between introduction of
the water into the mixer and the time of performing the test for air content before proceeding with the
determination as directed in Section 4.4.2.
4.4.2. Perform the procedures as described in Sections 6.5.1 and 6.5.2. Complete the test as described in
Section 6.5.3.1 and 6.5.3.1.4. The aggregate correction factor, G, is equal to the air-content reading minus
the volume provided by the calibration vessel, R.
NOTE: The aggregate correction factor will vary with different aggregates. It can be determined only by
test, since apparently it is not directly related to absorption of the particles. The test can be easily made
and must not be ignored. Ordinarily the factor will remain reasonably constant for given aggregates, but
an occasional check test is recommended.
NOTE: The aggregate correction factor applies only to apparent air content (Aa) as determined in
6.5.3.1.1 and calculated in 7.1. The aggregate correction does not apply to the SAM Number.

Page 5/9 5.9.86 2016
KT-86
5. PREPARATION OF CONCRETE TEST SAMPLE
5.1. Obtain a sample of freshly mixed concrete in accordance with KT-17.
6. PROCEDURE FOR DETERMINING AIR CONTENT AND SAM NUMBER
6.1. Placement and Consolidation of Sample:
6.1.1. Prepare the concrete sample as described in Section 5.1. Dampen the interior of the measuring
bowl and place it on a flat, level, firm surface. Using the scoop, place the concrete in the measuring bowl
in equal layers. Concrete at different slump levels require different methods of consolidation to prepare
satisfactory test specimens. The methods listed below should be used as a guide in determining the type
of consolidation to use:
Slump of Concrete Type of Consolidation
More than 3 in (75 mm) Rodding
1 to 3 in (25 to 75 mm) Rodding or Vibration
Less than 1 in (25 mm) Vibration
6.2. Rodding Procedure:
6.2.1. Place the concrete in the measuring bowl in three layers of approximately equal volume.
6.2.2. Consolidate each layer of concrete by 25 strokes of the tamping rod evenly distributed over the
cross section. Rod the bottom layer throughout its depth, but the rod shall not forcibly strike the bottom of
the measure. In rodding the second and final layers, use only enough force to cause the rod to penetrate
the surface of the previous layer about 1 in. (25 mm). Add the final layer of concrete in a manner to avoid
excessive overfilling (Section 6.4.1).
6.2.3. After each layer is rodded, tap the sides of the measure smartly 10 to 15 times with the mallet to
close any voids left by the tamping rod and to release any large bubbles of air that may have been trapped.
6.3. Vibration Procedure:
6.3.1. Place the concrete in the measuring bowl in two layers of approximately equal volume. Place all of
the concrete for each layer before starting vibration of that layer.
6.3.2. Consolidate each layer by three insertions of the vibrator evenly distributed over the cross section.
Add the final layer in a manner to avoid excessive overfilling (Section 6.4.1).
6.3.2.1. In consolidating each layer, do not allow the vibrator to rest on or touch the measuring bowl.
6.3.2.2. Take care in withdrawing the vibrator to ensure that no air pockets are left in the specimen.
6.3.2.3. Observe a standard duration of vibration for the particular kind of concrete, vibrator, and
measuring bowl involved. The duration of vibration required will depend upon the workability of the
concrete and the effectiveness of the vibrator. Continue vibration only long enough to achieve proper
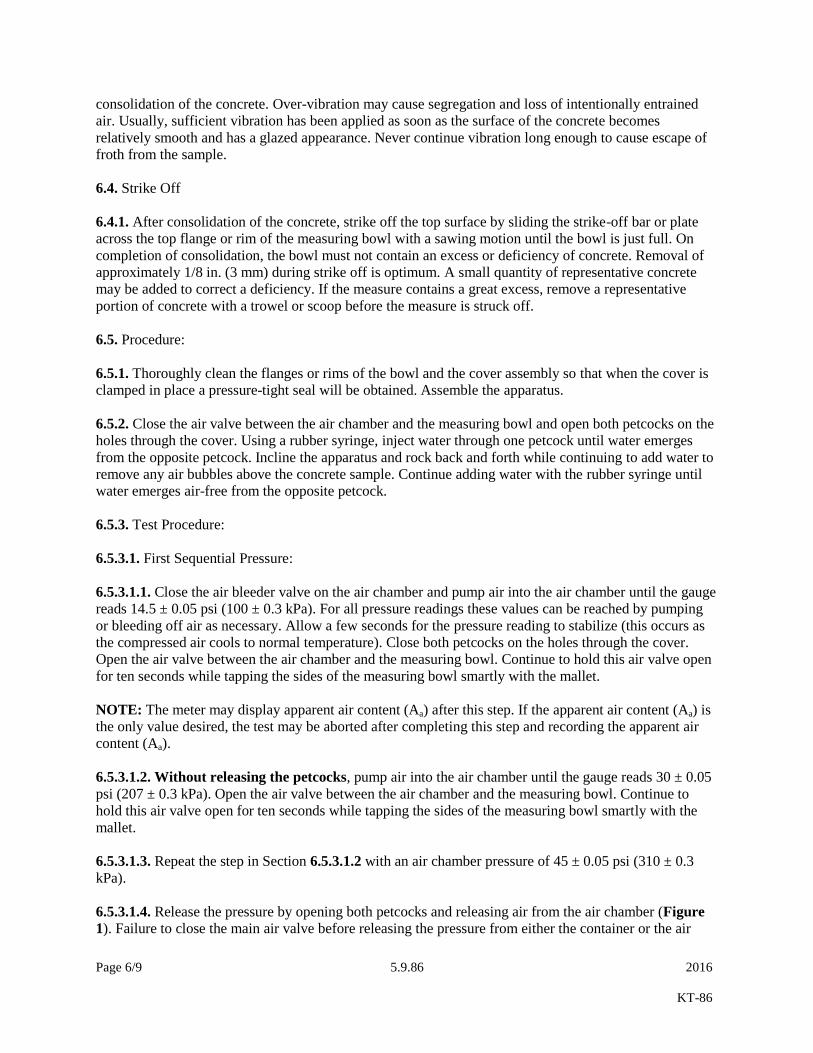
Page 6/9 5.9.86 2016
KT-86
consolidation of the concrete. Over-vibration may cause segregation and loss of intentionally entrained
air. Usually, sufficient vibration has been applied as soon as the surface of the concrete becomes
relatively smooth and has a glazed appearance. Never continue vibration long enough to cause escape of
froth from the sample.
6.4. Strike Off
6.4.1. After consolidation of the concrete, strike off the top surface by sliding the strike-off bar or plate
across the top flange or rim of the measuring bowl with a sawing motion until the bowl is just full. On
completion of consolidation, the bowl must not contain an excess or deficiency of concrete. Removal of
approximately 1/8 in. (3 mm) during strike off is optimum. A small quantity of representative concrete
may be added to correct a deficiency. If the measure contains a great excess, remove a representative
portion of concrete with a trowel or scoop before the measure is struck off.
6.5. Procedure:
6.5.1. Thoroughly clean the flanges or rims of the bowl and the cover assembly so that when the cover is
clamped in place a pressure-tight seal will be obtained. Assemble the apparatus.
6.5.2. Close the air valve between the air chamber and the measuring bowl and open both petcocks on the
holes through the cover. Using a rubber syringe, inject water through one petcock until water emerges
from the opposite petcock. Incline the apparatus and rock back and forth while continuing to add water to
remove any air bubbles above the concrete sample. Continue adding water with the rubber syringe until
water emerges air-free from the opposite petcock.
6.5.3. Test Procedure:
6.5.3.1. First Sequential Pressure:
6.5.3.1.1. Close the air bleeder valve on the air chamber and pump air into the air chamber until the gauge
reads 14.5 ± 0.05 psi (100 ± 0.3 kPa). For all pressure readings these values can be reached by pumping
or bleeding off air as necessary. Allow a few seconds for the pressure reading to stabilize (this occurs as
the compressed air cools to normal temperature). Close both petcocks on the holes through the cover.
Open the air valve between the air chamber and the measuring bowl. Continue to hold this air valve open
for ten seconds while tapping the sides of the measuring bowl smartly with the mallet.
NOTE: The meter may display apparent air content (Aa) after this step. If the apparent air content (Aa) is
the only value desired, the test may be aborted after completing this step and recording the apparent air
content (Aa).
6.5.3.1.2. Without releasing the petcocks, pump air into the air chamber until the gauge reads 30 ± 0.05
psi (207 ± 0.3 kPa). Open the air valve between the air chamber and the measuring bowl. Continue to
hold this air valve open for ten seconds while tapping the sides of the measuring bowl smartly with the
mallet.
6.5.3.1.3. Repeat the step in Section 6.5.3.1.2 with an air chamber pressure of 45 ± 0.05 psi (310 ± 0.3
kPa).
6.5.3.1.4. Release the pressure by opening both petcocks and releasing air from the air chamber (Figure
1). Failure to close the main air valve before releasing the pressure from either the container or the air
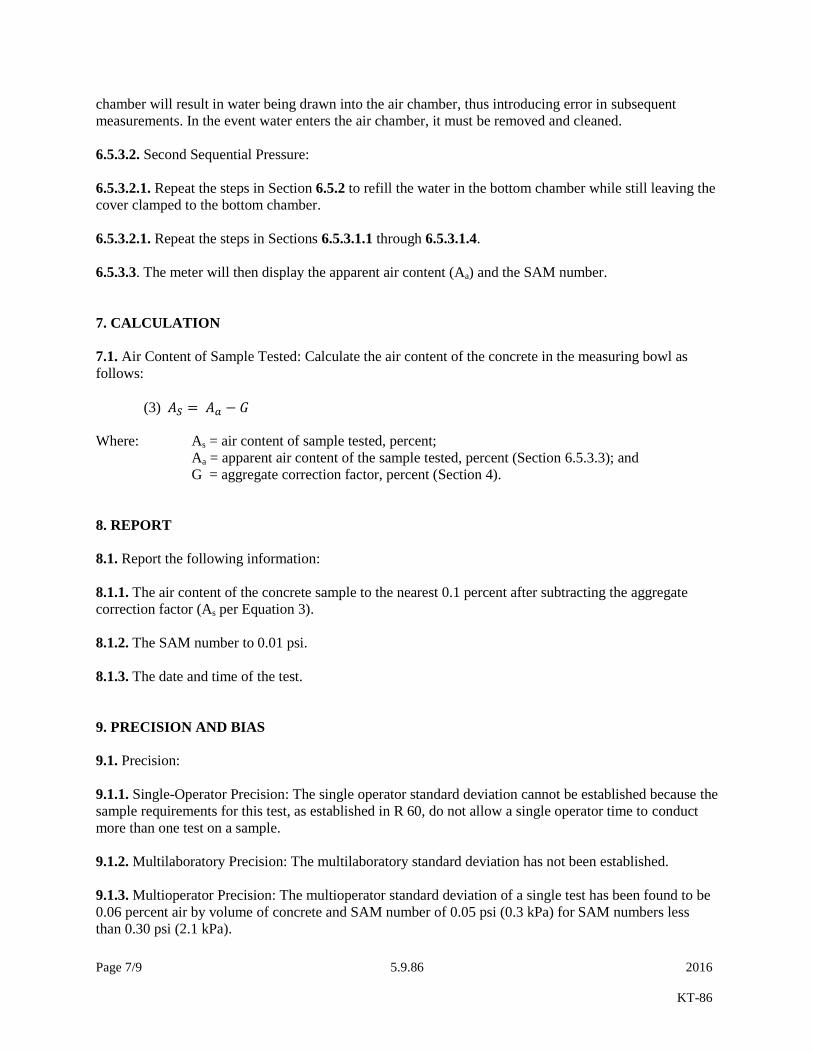
Page 7/9 5.9.86 2016
KT-86
chamber will result in water being drawn into the air chamber, thus introducing error in subsequent
measurements. In the event water enters the air chamber, it must be removed and cleaned.
6.5.3.2. Second Sequential Pressure:
6.5.3.2.1. Repeat the steps in Section 6.5.2 to refill the water in the bottom chamber while still leaving the
cover clamped to the bottom chamber.
6.5.3.2.1. Repeat the steps in Sections 6.5.3.1.1 through 6.5.3.1.4.
6.5.3.3. The meter will then display the apparent air content (Aa) and the SAM number.
7. CALCULATION
7.1. Air Content of Sample Tested: Calculate the air content of the concrete in the measuring bowl as
follows:
(3) 𝐴𝑆 = 𝐴𝑎 − 𝐺
Where: As = air content of sample tested, percent;
Aa = apparent air content of the sample tested, percent (Section 6.5.3.3); and
G = aggregate correction factor, percent (Section 4).
8. REPORT
8.1. Report the following information:
8.1.1. The air content of the concrete sample to the nearest 0.1 percent after subtracting the aggregate
correction factor (As per Equation 3).
8.1.2. The SAM number to 0.01 psi.
8.1.3. The date and time of the test.
9. PRECISION AND BIAS
9.1. Precision:
9.1.1. Single-Operator Precision: The single operator standard deviation cannot be established because the
sample requirements for this test, as established in R 60, do not allow a single operator time to conduct
more than one test on a sample.
9.1.2. Multilaboratory Precision: The multilaboratory standard deviation has not been established.
9.1.3. Multioperator Precision: The multioperator standard deviation of a single test has been found to be
0.06 percent air by volume of concrete and SAM number of 0.05 psi (0.3 kPa) for SAM numbers less
than 0.30 psi (2.1 kPa).
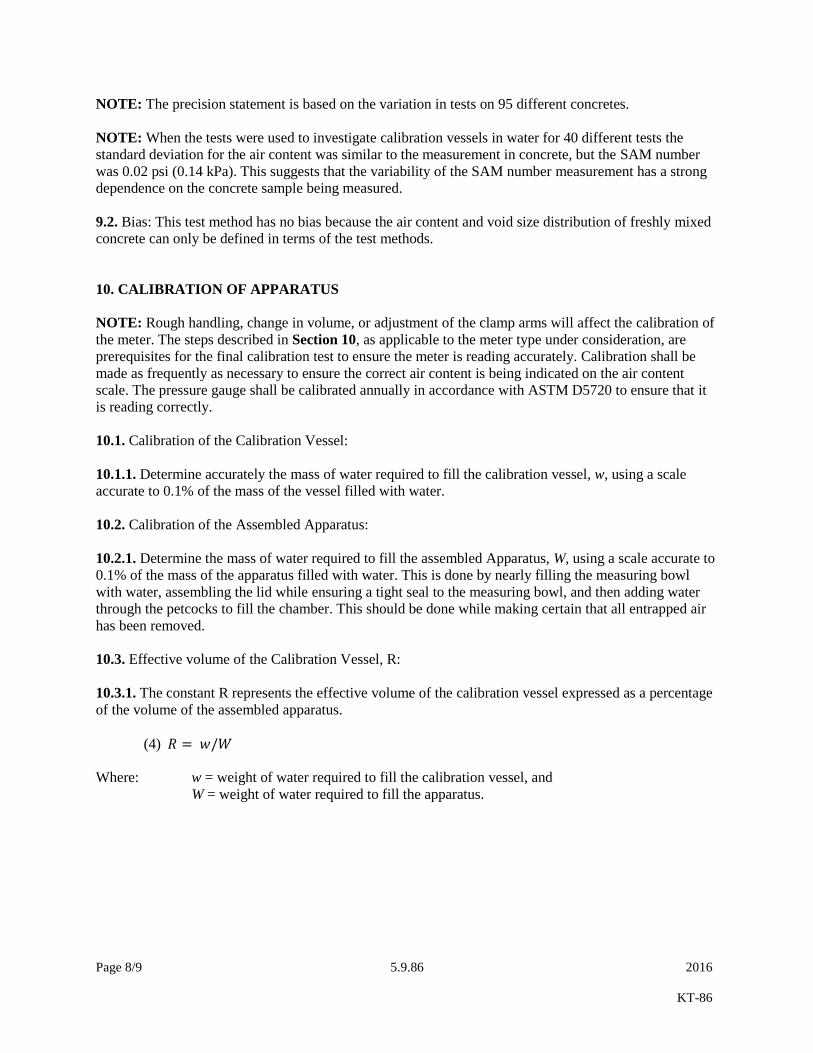
Page 8/9 5.9.86 2016
KT-86
NOTE: The precision statement is based on the variation in tests on 95 different concretes.
NOTE: When the tests were used to investigate calibration vessels in water for 40 different tests the
standard deviation for the air content was similar to the measurement in concrete, but the SAM number
was 0.02 psi (0.14 kPa). This suggests that the variability of the SAM number measurement has a strong
dependence on the concrete sample being measured.
9.2. Bias: This test method has no bias because the air content and void size distribution of freshly mixed
concrete can only be defined in terms of the test methods.
10. CALIBRATION OF APPARATUS
NOTE: Rough handling, change in volume, or adjustment of the clamp arms will affect the calibration of
the meter. The steps described in Section 10, as applicable to the meter type under consideration, are
prerequisites for the final calibration test to ensure the meter is reading accurately. Calibration shall be
made as frequently as necessary to ensure the correct air content is being indicated on the air content
scale. The pressure gauge shall be calibrated annually in accordance with ASTM D5720 to ensure that it
is reading correctly.
10.1. Calibration of the Calibration Vessel:
10.1.1. Determine accurately the mass of water required to fill the calibration vessel, w, using a scale
accurate to 0.1% of the mass of the vessel filled with water.
10.2. Calibration of the Assembled Apparatus:
10.2.1. Determine the mass of water required to fill the assembled Apparatus, W, using a scale accurate to
0.1% of the mass of the apparatus filled with water. This is done by nearly filling the measuring bowl
with water, assembling the lid while ensuring a tight seal to the measuring bowl, and then adding water
through the petcocks to fill the chamber. This should be done while making certain that all entrapped air
has been removed.
10.3. Effective volume of the Calibration Vessel, R:
10.3.1. The constant R represents the effective volume of the calibration vessel expressed as a percentage
of the volume of the assembled apparatus.
(4) 𝑅 = 𝑤/𝑊
Where: w = weight of water required to fill the calibration vessel, and
W = weight of water required to fill the apparatus.

Page 9/9 5.9.86 2016
KT-86
10.4. Calibration Test to Check the Air Content Measured by the Pressure Gauge:
10.4.1. Place the calibration vessel within the bottom chamber. Fill the assembled apparatus as described
in Section 10.2. Be sure to not allow water inside the calibration vessel during the filling or the removal
of the entrapped air from the assembly.
Pressurize the air chamber until it reaches 14.5 ± 0.05 psi (100 ± 0.3 kPa), close both petcocks in the
cover assembly, and then open the valve between the air chamber and the measuring bowl. The indicated
air content on the pressure gauge should correspond to R as defined in Section 10.3.1. If two or more
determinations show the same variation from the correct air content, the gauge should be adjusted to
provide the correct air content and the test repeated until the gauge reading corresponds to R.
If difficulty is encountered in obtaining consistent readings, check for leaks; for the presence of water
inside the air chamber or the calibration vessel; or for the presence of air bubbles clinging to the inside
surfaces of the meter from the use of cool, aerated water. In this latter instance, use deaerated water,
which can be obtained by cooling hot water to room temperature.
10.5. Calibration Test to Determine Consistent Chamber Volume
10.5.1. Fill the assembled apparatus with water as outlined in Section 10.2. Follow the procedure as
outlined in Section 6.5.3 but do not tap the container with a mallet. Record the values at the three points
of pressure equalization. Compare these values to those provided by the manufacturer. If the difference
between the measured values and those provided are greater than 0.25 psi (1.7 kPa), then the air chamber,
measuring bowl, and underside of the lid should be checked for material build up and obstructions. The
meter should also be checked for leaks. The meter should not be used until the manufacturer-provided
values can be obtained.
NOTE: Calibration records shall include size of the calibration vessel used and the reading of the meter
at the calibration test point(s).
NOTE: Unless otherwise stated, follow manufacturer’s recommended calibration frequency.
11. PARAMETER CALCULATIONS
11.1. Apparent Air Content: Determination of the apparent air content, Aa, varies with the manufacturer of
the air pressure meter.
11.2. SAM Number: Calculate the SAM number as follows:
(5) SAM number = P45-2 – P45-1 (A2.1)
Where:
SAM number = A parameter that corresponds to the air-void size distribution in the
fresh concrete,
P45-2 = Equilibrium pressure between the air chamber and bottom chamber
from the second 45 psi (310 kPa) pressure step, and
P45-1 = Equilibrium pressure between the air chamber and bottom chamber
from the first 45 psi (310 kPa) pressure step.


Page 1/1 5.10.1 2016
Revised 2010
5.10. CALCULATIONS
5.10.1. ABSOLUTE VOLUME AND PERCENT OF VOIDS IN A UNIT VOLUME OF
AGGREGATE
1. Scope.
This method covers the procedure for calculating the volume of space occupied by the aggregate particles
and the voids in a unit volume of aggregate.
2. Procedure.
2.1. The unit weight of the aggregate shall be determined by KT-5. The specific gravity of the aggregate
shall be determined by KT-6.
2.2. Volume of Aggregate Particles: Calculate the absolute volume of space occupied by the aggregate
particles by the following formula:
SI Formula: English Formula:
)24(997 62. G. Sp.
W=A
)( Gr. Sp.
W=A
ss
sms
Where:
As = Absolute volume of the aggregate.
Ws = Weight of the unit volume of aggregate in pounds.
Wsm = Weight of the volume of aggregate in kilograms (kg)
Sp.G. = Specific Gravity of the aggregate. (Saturated-Surface Dry condition, unless otherwise
specified)
Example: Unit weight of aggregate is normally expressed in kilograms per cubic meter (pounds per cubic
foot). Therefore, one cubic meter (cubic foot) is used in this example.
Wsm = Wt. of 1 cu. meter of aggregate = 1762 kg.
Ws = Wt. of 1 cu. ft. of aggregate = 110 lb.
Sp.G. = 2.65
SI Example: English Example:
ft. cu. 0.66=462.2.65
110=A meter cu. 0.66=
)2.65(
1762=A ss 7
)2(7
997
or 0.667 x 100 = 66.7 percent of the total volume is occupied by the aggregate.
2.3. Volume of Voids: Since the aggregate occupies 0.667 cu. meter (cu. ft.) the volume of voids is:
1.000 - 0.667 = 0.333 cu. meter (cu. ft.) or:
0.333 x 100 = 33.3 percent of the total volume is voids.

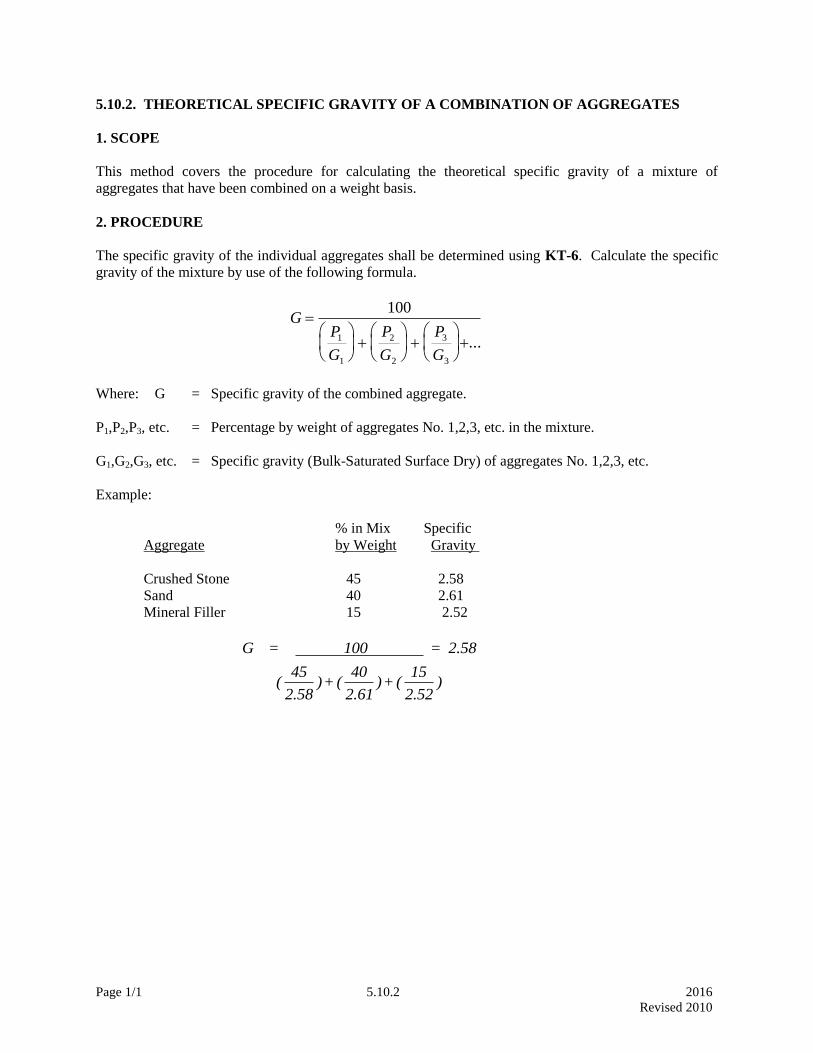
Page 1/1 5.10.2 2016
Revised 2010
5.10.2. THEORETICAL SPECIFIC GRAVITY OF A COMBINATION OF AGGREGATES
1. SCOPE
This method covers the procedure for calculating the theoretical specific gravity of a mixture of
aggregates that have been combined on a weight basis.
2. PROCEDURE
The specific gravity of the individual aggregates shall be determined using KT-6. Calculate the specific
gravity of the mixture by use of the following formula.
GP
G
P
G
P
G
100
1
1
2
2
3
3
...
Where: G = Specific gravity of the combined aggregate.
P1,P2,P3, etc. = Percentage by weight of aggregates No. 1,2,3, etc. in the mixture.
G1,G2,G3, etc. = Specific gravity (Bulk-Saturated Surface Dry) of aggregates No. 1,2,3, etc.
Example:
% in Mix Specific
Aggregate by Weight Gravity
Crushed Stone 45 2.58
Sand 40 2.61
Mineral Filler 15 2.52
G = 100 = 2.58
(45
2.58)+ (
40
2.61)+ (
15
2.52)

Page 1 of 15 5.10.3 2016
Revised 2012
5.10.03. VOLUME OF ASPHALT MATERIALS
1. SCOPE
This method covers the procedures for correcting the volume of asphalt cement or cutback asphalt at a
temperature other than 60oF or 15
oC to the volume it would occupy at 60
oF or 15
oC. For emulsions, the
volume is corrected to 60oF (15.6
oC).
2. PROCEDURE FOR ASPHALT CEMENTS AND CUTBACK ASPHALTS:
SI Procedures:
Table 1 from the Asphalt Institute Manual Series No. 6 (MS-6) shows the factors to be used in
calculating the volume of asphalt material at 15oC. The factors are divided into two groups: A and B in
Table 1 depending on the density. The specific gravity test results for asphalt are reported by the refinery
or Department chemists. The specific gravity may be converted to density values by use of the following
formula:
Density = 1000G
Where: G = The specific gravity of the material
SI Examples for conversion of volume to 15oC.
SI Example No. 1:
Given: 5.678 m3 of MC-70 at 65.5
oC
Specific Gravity = 0.9600
To calculate the volume at 15oC:
Density = 1000G = 1000 (0.9600) = 960 kg/m3
A density of 960 kg/m3 places the material in Group B of Table 1. In this table, the volume correction
factor at 65.5oC is 0.9644. The volume at 15
oC is determined as follows:
5.678 m3(0.9644) = 5.476 m
3 at 15
oC
SI Example No. 2:
Given: 5.678 m3 of AC-5 at 150
oC
Specific gravity = 1.0093
To calculate the volume at 15oC
Density = 1000G = 1000(1.0093) = 1009.3 kg/m3
A density of 1009.3 kg/m3 places the material in Group A of Table 1. In this table, the volume correction
factor at 150oC is 0.9177. The volume at 15
oC is determined as follows:
5.678 m3(0.9177) = 5.211 m
3 at 15
oC
Page 2 of 15 5.10.3 2016
Revised 2012
English Procedures:
Table 7 of ASTM D1250, a portion of which is reproduced herein (Table 2), shows the factors to be used
in calculating the volume of asphalt material at 60oF. The factors are divided into three groups: 0, 1, and
2 depending upon the API gravity degrees of the material in question. Specific gravity test results for
asphalts are reported by the refinery or Department chemists. These specific gravities may be converted
to API values by use of the following formula:
API Gravity (degrees) = 141.5 - 131.5(G)
G
Where: G = The specific gravity of the material.
For convenience in using Table 2, the following relationships between specific gravity and API gravity
have been computed:
Group API Specific
(See Table 2) Gravity Gravity
0 0-14.9 1.0760 to 0.9665
1 15.0-34.9 0.9659 to 0.8504
2 35.0-50.9 0.8498 to 0.7758
English Example No. 1:
Given: 1500 gal. of MC-70 at 150oF.
Specific Gravity = 0.9600
To calculate volume at 60oF:
From the above tabulation, a specific gravity of 0.9600 places the material in Group 1 of Table 2. In this
table, the factor for Group 1 at 150oF is 0.9647.
Then: 1500 gal. x 0.9647 = 1447 gal. at 60oF.
English Example No. 2:
Given: 1500 Gal. of AC-5 at 300oF
Specific Gravity = 1.0093.
To calculate the volume at 60oF
This material is in Group 0 in Table 2. In this table, the factor for Group 0 at 300oF. is 0.9187.
Then: 1500 gal. x 0.9187 = 1378 gal. at 60oF.
Page 3 of 15 5.10.3 2016
Revised 2012
3. PROCEDURE FOR EMULSIFIED ASPHALTS:
Table 3 has been taken from the Asphalt Institute Manual Series No. 19(MS-19) and is to be used to
correct the volume of hot emulsified asphalt to its volume at (15.6oC) 60
oF.
Example No. 1:
Given:
5.678 m3 (1500 gal.) of emulsion at 54.4
oC (130
oF)
From the table, at 54.4oC (130
oF) the factor is 0.98250.
SI Example:
5.678 m3 at 54.4
oC = 5.678 (0.98250) = 5.579 m
3 at 15.6
oC
English Example:
1500 gal. at 130oF = 1500 (0.98250) = 1474 gal. at 60
oF
Example No. 2:
Given:
3.854 cubic meters (1018 gal.) of diluted emulsified asphalt at 54oC (130
oF)
[1.893 cubic meters (500 gal.) of water and 1.893 cubic meters (500 gal.) of emulsified asphalt at ambient
temp.]
From the table, at 54oC (130
oF) the factor is 0.98250
SI Example:
3.854
2 m = 1.927 m emulsified asphalt at 54 C3 3
1.927(0.98250) = 1.893 m3 emulsified asphalt at 15.5
oC
English Example:
1018
2 = 509 gal. of emulsified asphalt at 130 F
509(0.98250) = 500 gal. of emulsified asphalt at 60oF
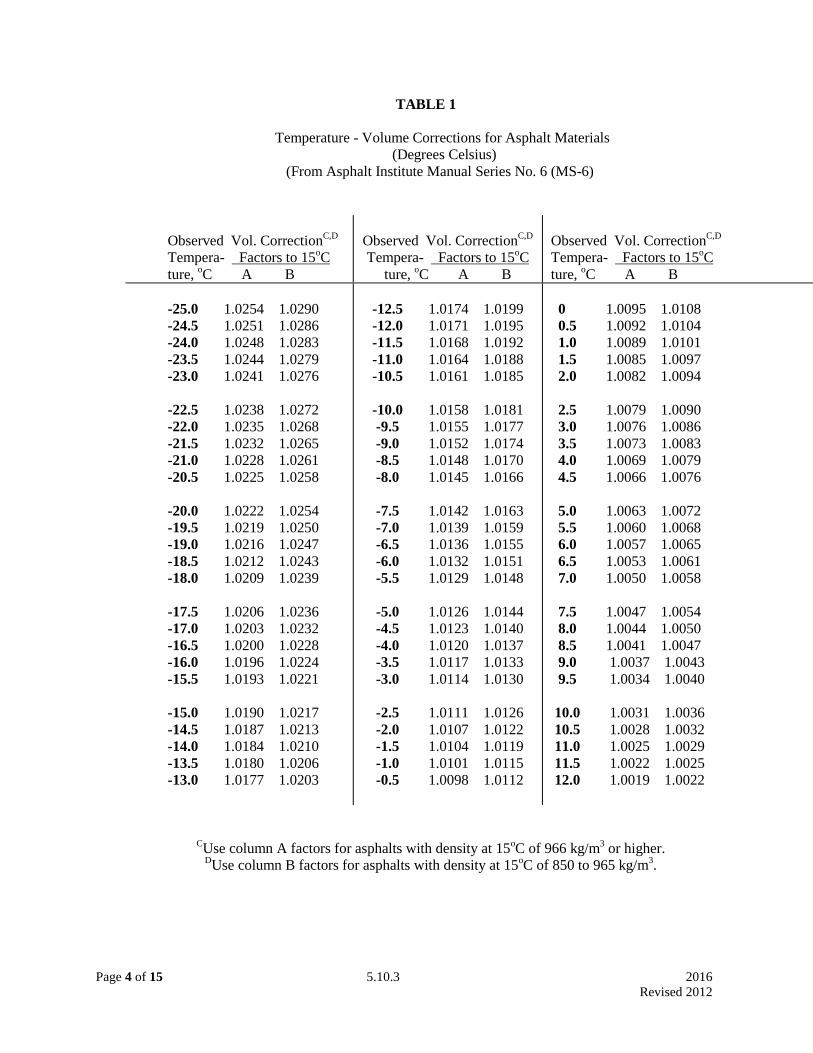
Page 4 of 15 5.10.3 2016
Revised 2012
TABLE 1
Temperature - Volume Corrections for Asphalt Materials
(Degrees Celsius)
(From Asphalt Institute Manual Series No. 6 (MS-6)
Observed Vol. CorrectionC,D
Tempera- Factors to 15oC
ture, oC A B
Observed Vol. CorrectionC,D
Tempera- Factors to 15oC
ture, oC A B
Observed Vol. CorrectionC,D
Tempera- Factors to 15oC
ture, oC A B
-25.0 1.0254 1.0290
-24.5 1.0251 1.0286
-24.0 1.0248 1.0283
-23.5 1.0244 1.0279
-23.0 1.0241 1.0276
-22.5 1.0238 1.0272
-22.0 1.0235 1.0268
-21.5 1.0232 1.0265
-21.0 1.0228 1.0261
-20.5 1.0225 1.0258
-20.0 1.0222 1.0254
-19.5 1.0219 1.0250
-19.0 1.0216 1.0247
-18.5 1.0212 1.0243
-18.0 1.0209 1.0239
-17.5 1.0206 1.0236
-17.0 1.0203 1.0232
-16.5 1.0200 1.0228
-16.0 1.0196 1.0224
-15.5 1.0193 1.0221
-15.0 1.0190 1.0217
-14.5 1.0187 1.0213
-14.0 1.0184 1.0210
-13.5 1.0180 1.0206
-13.0 1.0177 1.0203
-12.5 1.0174 1.0199
-12.0 1.0171 1.0195
-11.5 1.0168 1.0192
-11.0 1.0164 1.0188
-10.5 1.0161 1.0185
-10.0 1.0158 1.0181
-9.5 1.0155 1.0177
-9.0 1.0152 1.0174
-8.5 1.0148 1.0170
-8.0 1.0145 1.0166
-7.5 1.0142 1.0163
-7.0 1.0139 1.0159
-6.5 1.0136 1.0155
-6.0 1.0132 1.0151
-5.5 1.0129 1.0148
-5.0 1.0126 1.0144
-4.5 1.0123 1.0140
-4.0 1.0120 1.0137
-3.5 1.0117 1.0133
-3.0 1.0114 1.0130
-2.5 1.0111 1.0126
-2.0 1.0107 1.0122
-1.5 1.0104 1.0119
-1.0 1.0101 1.0115
-0.5 1.0098 1.0112
0 1.0095 1.0108
0.5 1.0092 1.0104
1.0 1.0089 1.0101
1.5 1.0085 1.0097
2.0 1.0082 1.0094
2.5 1.0079 1.0090
3.0 1.0076 1.0086
3.5 1.0073 1.0083
4.0 1.0069 1.0079
4.5 1.0066 1.0076
5.0 1.0063 1.0072
5.5 1.0060 1.0068
6.0 1.0057 1.0065
6.5 1.0053 1.0061
7.0 1.0050 1.0058
7.5 1.0047 1.0054
8.0 1.0044 1.0050
8.5 1.0041 1.0047
9.0 1.0037 1.0043
9.5 1.0034 1.0040
10.0 1.0031 1.0036
10.5 1.0028 1.0032
11.0 1.0025 1.0029
11.5 1.0022 1.0025
12.0 1.0019 1.0022
CUse column A factors for asphalts with density at 15
oC of 966 kg/m
3 or higher.
DUse column B factors for asphalts with density at 15
oC of 850 to 965 kg/m
3.
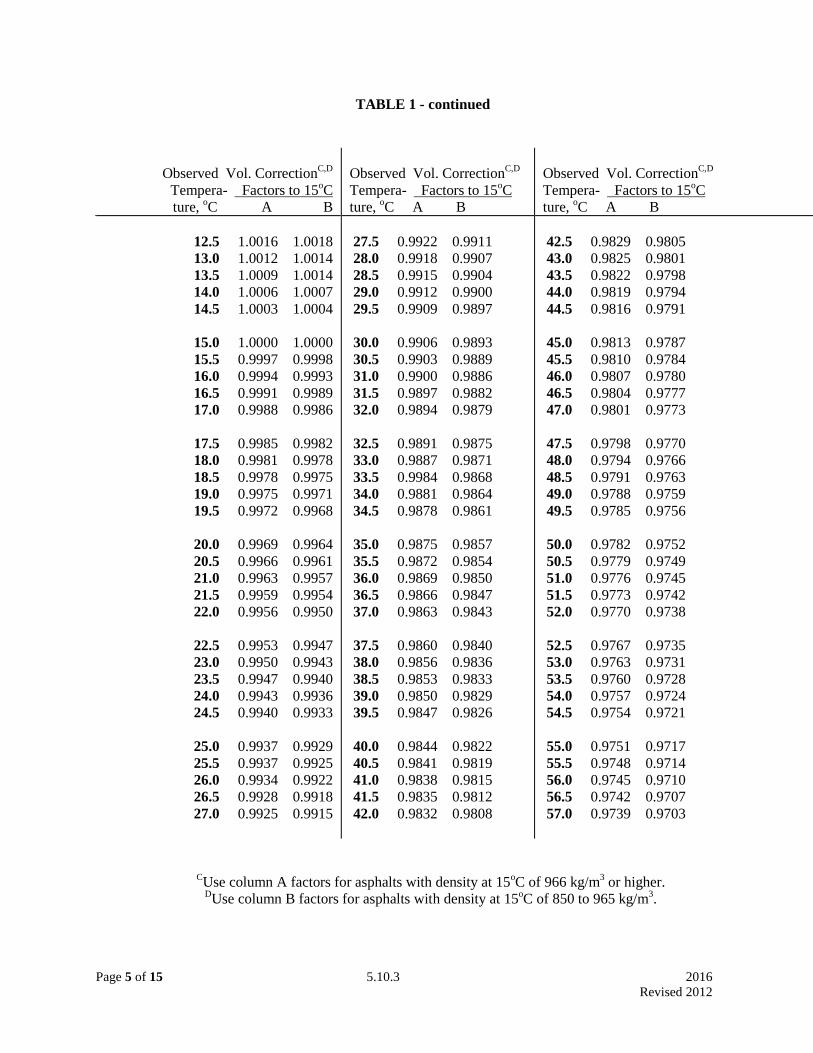
Page 5 of 15 5.10.3 2016
Revised 2012
TABLE 1 - continued
Observed Vol. CorrectionC,D
Tempera- Factors to 15oC
ture, oC A B
Observed Vol. CorrectionC,D
Tempera- Factors to 15oC
ture, oC A B
Observed Vol. CorrectionC,D
Tempera- Factors to 15oC
ture, oC A B
12.5 1.0016 1.0018
13.0 1.0012 1.0014
13.5 1.0009 1.0014
14.0 1.0006 1.0007
14.5 1.0003 1.0004
15.0 1.0000 1.0000
15.5 0.9997 0.9998
16.0 0.9994 0.9993
16.5 0.9991 0.9989
17.0 0.9988 0.9986
17.5 0.9985 0.9982
18.0 0.9981 0.9978
18.5 0.9978 0.9975
19.0 0.9975 0.9971
19.5 0.9972 0.9968
20.0 0.9969 0.9964
20.5 0.9966 0.9961
21.0 0.9963 0.9957
21.5 0.9959 0.9954
22.0 0.9956 0.9950
22.5 0.9953 0.9947
23.0 0.9950 0.9943
23.5 0.9947 0.9940
24.0 0.9943 0.9936
24.5 0.9940 0.9933
25.0 0.9937 0.9929
25.5 0.9937 0.9925
26.0 0.9934 0.9922
26.5 0.9928 0.9918
27.0 0.9925 0.9915
27.5 0.9922 0.9911
28.0 0.9918 0.9907
28.5 0.9915 0.9904
29.0 0.9912 0.9900
29.5 0.9909 0.9897
30.0 0.9906 0.9893
30.5 0.9903 0.9889
31.0 0.9900 0.9886
31.5 0.9897 0.9882
32.0 0.9894 0.9879
32.5 0.9891 0.9875
33.0 0.9887 0.9871
33.5 0.9984 0.9868
34.0 0.9881 0.9864
34.5 0.9878 0.9861
35.0 0.9875 0.9857
35.5 0.9872 0.9854
36.0 0.9869 0.9850
36.5 0.9866 0.9847
37.0 0.9863 0.9843
37.5 0.9860 0.9840
38.0 0.9856 0.9836
38.5 0.9853 0.9833
39.0 0.9850 0.9829
39.5 0.9847 0.9826
40.0 0.9844 0.9822
40.5 0.9841 0.9819
41.0 0.9838 0.9815
41.5 0.9835 0.9812
42.0 0.9832 0.9808
42.5 0.9829 0.9805
43.0 0.9825 0.9801
43.5 0.9822 0.9798
44.0 0.9819 0.9794
44.5 0.9816 0.9791
45.0 0.9813 0.9787
45.5 0.9810 0.9784
46.0 0.9807 0.9780
46.5 0.9804 0.9777
47.0 0.9801 0.9773
47.5 0.9798 0.9770
48.0 0.9794 0.9766
48.5 0.9791 0.9763
49.0 0.9788 0.9759
49.5 0.9785 0.9756
50.0 0.9782 0.9752
50.5 0.9779 0.9749
51.0 0.9776 0.9745
51.5 0.9773 0.9742
52.0 0.9770 0.9738
52.5 0.9767 0.9735
53.0 0.9763 0.9731
53.5 0.9760 0.9728
54.0 0.9757 0.9724
54.5 0.9754 0.9721
55.0 0.9751 0.9717
55.5 0.9748 0.9714
56.0 0.9745 0.9710
56.5 0.9742 0.9707
57.0 0.9739 0.9703
CUse column A factors for asphalts with density at 15
oC of 966 kg/m
3 or higher.
DUse column B factors for asphalts with density at 15
oC of 850 to 965 kg/m
3.

Page 6 of 15 5.10.3 2016
Revised 2012
TABLE 1 - continued
Observed Vol. CorrectionC,D
Tempera- Factors to 15oC
ture, oC A B
Observed Vol. CorrectionC,D
Tempera- Factors to 15oC
ture, oC A B
Observed Vol. CorrectionC,D
Tempera- Factors to 15oC
ture, oC A B
57.5 0.9736 0.9700
58.0 0.9732 0.9696
58.5 0.9729 0.9693
59.0 0.9726 0.9689
59.5 0.9723 0.9686
60.0 0.9720 0.9682
60.5 0.9717 0.9679
61.0 0.9714 0.9675
61.5 0.9711 0.9672
62.0 0.9708 0.9668
62.5 0.9705 0.9665
63.0 0.9701 0.9661
63.5 0.9698 0.9658
64.0 0.9695 0.9654
64.5 0.9692 0.9651
65.0 0.9689 0.9647
65.5 0.9686 0.9644
66.0 0.9683 0.9640
66.5 0.9680 0.9637
67.0 0.9677 0.9633
67.5 0.9674 0.9630
68.0 0.9670 0.9626
68.5 0.9667 0.9623
69.0 0.9664 0.9619
69.5 0.9661 0.9616
70.0 0.9568 0.9612
70.5 0.9655 0.9609
71.0 0.9652 0.9605
71.5 0.9649 0.9602
72.0 0.9646 0.9598
72.5 0.9643 0.9595
73.0 0.9640 0.9592
73.5 0.9637 0.9588
74.0 0.9634 0.9585
74.5 0.9631 0.9581
75.0 0.9628 0.9578
75.5 0.9625 0.9575
76.0 0.9622 0.9571
76.5 0.9619 0.9568
77.0 0.9616 0.9564
77.5 0.9613 0.9561
78.0 0.9609 0.9557
78.5 0.9606 0.9554
79.0 0.9603 0.9550
79.5 0.9600 0.9547
80.0 0.9597 0.9543
80.5 0.9594 0.9540
81.0 0.9591 0.9536
81.5 0.9588 0.9533
82.0 0.9585 0.9529
82.5 0.9582 0.9526
83.0 0.9578 0.9523
83.5 0.9576 0.9519
84.0 0.9573 0.9516
84.5 0.9570 0.9512
85.0 0.9567 0.9509
85.5 0.9564 0.9506
86.0 0.9561 0.9502
86.5 0.9558 0.9499
87.0 0.9555 0.9495
87.5 0.9552 0.9492
88.0 0.9548 0.9489
88.5 0.9545 0.9485
89.0 0.9542 0.9482
89.5 0.9539 0.9478
90.0 0.9536 0.9475
90.5 0.9533 0.9472
91.0 0.9530 0.9468
91.5 0.9527 0.9465
92.0 0.9524 0.9461
92.5 0.9521 0.9458
93.0 0.9518 0.9455
93.5 0.9515 0.9451
94.0 0.9512 0.9448
94.5 0.9509 0.9444
95.0 0.9506 0.9441
95.5 0.9503 0.9438
96.0 0.9500 0.9434
96.5 0.9497 0.9431
97.0 0.9494 0.9427
97.5 0.9491 0.9424
98.0 0.9488 0.9421
98.5 0.9485 0.9417
99.0 0.9482 0.9414
99.5 0.9479 0.9410
100.0 0.9476 0.9407
100.5 0.9473 0.9404
101.0 0.9470 0.9400
101.5 0.9467 0.9397
102.0 0.9464 0.9393
CUse column A factors for asphalts with density at 15
oC of 966 kg/m
3 or higher.
DUse column B factors for asphalts with density at 15
oC of 850 to 965 kg/m
3.
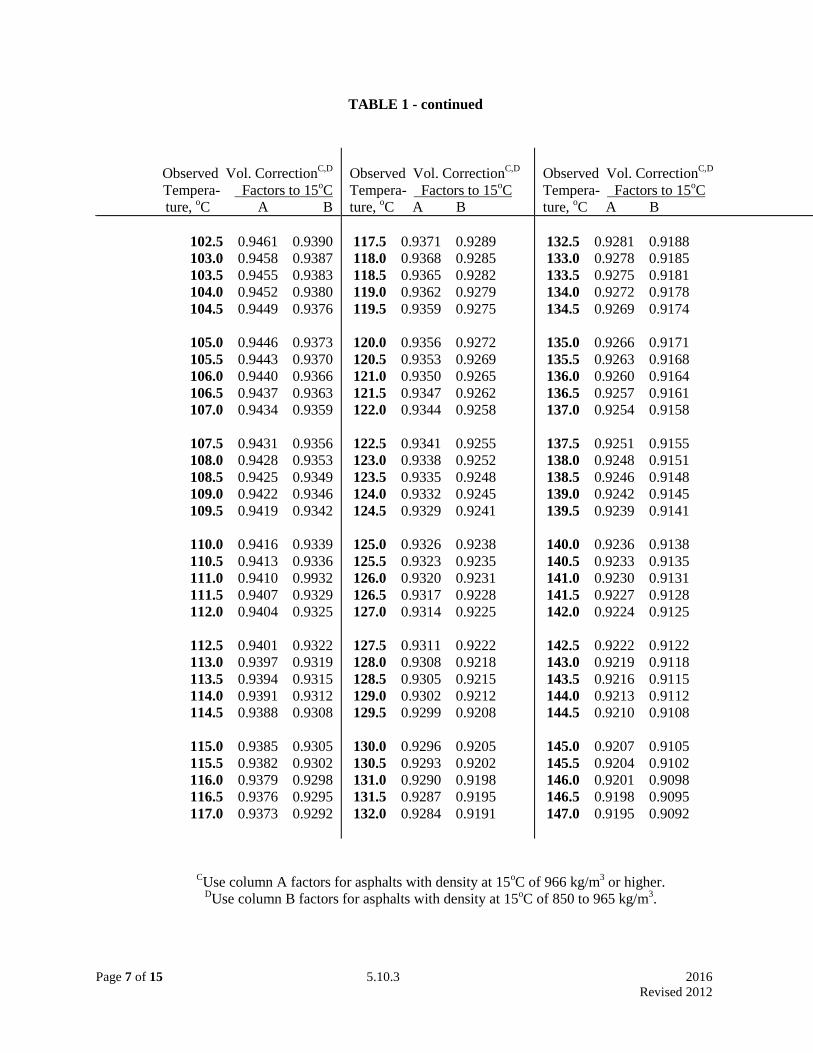
Page 7 of 15 5.10.3 2016
Revised 2012
TABLE 1 - continued
Observed Vol. CorrectionC,D
Tempera- Factors to 15oC
ture, oC A B
Observed Vol. CorrectionC,D
Tempera- Factors to 15oC
ture, oC A B
Observed Vol. CorrectionC,D
Tempera- Factors to 15oC
ture, oC A B
102.5 0.9461 0.9390
103.0 0.9458 0.9387
103.5 0.9455 0.9383
104.0 0.9452 0.9380
104.5 0.9449 0.9376
105.0 0.9446 0.9373
105.5 0.9443 0.9370
106.0 0.9440 0.9366
106.5 0.9437 0.9363
107.0 0.9434 0.9359
107.5 0.9431 0.9356
108.0 0.9428 0.9353
108.5 0.9425 0.9349
109.0 0.9422 0.9346
109.5 0.9419 0.9342
110.0 0.9416 0.9339
110.5 0.9413 0.9336
111.0 0.9410 0.9932
111.5 0.9407 0.9329
112.0 0.9404 0.9325
112.5 0.9401 0.9322
113.0 0.9397 0.9319
113.5 0.9394 0.9315
114.0 0.9391 0.9312
114.5 0.9388 0.9308
115.0 0.9385 0.9305
115.5 0.9382 0.9302
116.0 0.9379 0.9298
116.5 0.9376 0.9295
117.0 0.9373 0.9292
117.5 0.9371 0.9289
118.0 0.9368 0.9285
118.5 0.9365 0.9282
119.0 0.9362 0.9279
119.5 0.9359 0.9275
120.0 0.9356 0.9272
120.5 0.9353 0.9269
121.0 0.9350 0.9265
121.5 0.9347 0.9262
122.0 0.9344 0.9258
122.5 0.9341 0.9255
123.0 0.9338 0.9252
123.5 0.9335 0.9248
124.0 0.9332 0.9245
124.5 0.9329 0.9241
125.0 0.9326 0.9238
125.5 0.9323 0.9235
126.0 0.9320 0.9231
126.5 0.9317 0.9228
127.0 0.9314 0.9225
127.5 0.9311 0.9222
128.0 0.9308 0.9218
128.5 0.9305 0.9215
129.0 0.9302 0.9212
129.5 0.9299 0.9208
130.0 0.9296 0.9205
130.5 0.9293 0.9202
131.0 0.9290 0.9198
131.5 0.9287 0.9195
132.0 0.9284 0.9191
132.5 0.9281 0.9188
133.0 0.9278 0.9185
133.5 0.9275 0.9181
134.0 0.9272 0.9178
134.5 0.9269 0.9174
135.0 0.9266 0.9171
135.5 0.9263 0.9168
136.0 0.9260 0.9164
136.5 0.9257 0.9161
137.0 0.9254 0.9158
137.5 0.9251 0.9155
138.0 0.9248 0.9151
138.5 0.9246 0.9148
139.0 0.9242 0.9145
139.5 0.9239 0.9141
140.0 0.9236 0.9138
140.5 0.9233 0.9135
141.0 0.9230 0.9131
141.5 0.9227 0.9128
142.0 0.9224 0.9125
142.5 0.9222 0.9122
143.0 0.9219 0.9118
143.5 0.9216 0.9115
144.0 0.9213 0.9112
144.5 0.9210 0.9108
145.0 0.9207 0.9105
145.5 0.9204 0.9102
146.0 0.9201 0.9098
146.5 0.9198 0.9095
147.0 0.9195 0.9092
CUse column A factors for asphalts with density at 15
oC of 966 kg/m
3 or higher.
DUse column B factors for asphalts with density at 15
oC of 850 to 965 kg/m
3.

Page 8 of 15 5.10.3 2016
Revised 2012
TABLE 1 - continued
Observed Vol. CorrectionC,D
Tempera- Factors to 15oC
ture, oC A B
Observed Vol. CorrectionC,D
Tempera- Factors to 15oC
ture, oC A B
Observed Vol. CorrectionC,D
Tempera- Factors to 15oC
ture, oC A B
147.5 0.9192 0.9089
148.0 0.9189 0.9085
148.5 0.9186 0.9082
149.0 0.9183 0.9079
149.5 0.9180 0.9075
150.0 0.9177 0.9072
150.5 0.9174 0.9069
151.0 0.9171 0.9065
151.5 0.9168 0.9062
152.0 0.9165 0.9059
152.5 0.9163 0.9056
153.0 0.9160 0.9052
153.5 0.9157 0.9049
154.0 0.9154 0.9046
154.5 0.9151 0.9042
155.0 0.9148 0.9039
155.5 0.9145 0.9036
156.0 0.9142 0.9033
156.5 0.9139 0.9029
157.0 0.9136 0.9026
157.5 0.9133 0.9023
158.0 0.9130 0.9020
158.5 0.9127 0.9017
159.0 0.9124 0.9013
159.5 0.9121 0.9010
160.0 0.9118 0.9007
160.5 0.9115 0.9004
161.0 0.9112 0.9000
161.5 0.9109 0.8997
162.0 0.9106 0.8994
162.5 0.9104 0.8991
163.0 0.9101 0.8987
163.5 0.9098 0.8984
164.0 0.9095 0.8981
164.5 0.9092 0.8977
165.0 0.9089 0.8974
165.5 0.9086 0.8971
166.0 0.9083 0.8968
166.5 0.9080 0.8964
167.0 0.9077 0.8961
167.5 0.9075 0.8958
168.0 0.9072 0.8955
168.5 0.9069 0.8952
169.0 0.9066 0.8948
169.5 0.9063 0.8945
170.0 0.9060 0.8942
170.5 0.9057 0.8939
171.0 0.9054 0.8935
171.5 0.9051 0.8932
172.0 0.9048 0.8929
172.5 0.9046 0.8926
173.0 0.9043 0.8922
173.5 0.9040 0.8919
174.0 0.9037 0.8916
174.5 0.9034 0.8912
175.0 0.9031 0.8909
175.5 0.9028 0.8906
176.0 0.9025 0.8903
176.5 0.9022 0.8899
177.0 0.9019 0.8896
177.5 0.9017 0.8893
178.0 0.9014 0.8890
178.5 0.9011 0.8887
179.0 0.9008 0.8883
179.5 0.9005 0.8880
180.0 0.9002 0.8877
180.5 0.8999 0.8874
181.0 0.8996 0.8871
181.5 0.8993 0.8867
182.0 0.8990 0.8864
182.5 0.8988 0.8861
183.0 0.8985 0.8858
183.5 0.8982 0.8855
184.0 0.8979 0.8851
184.5 0.8976 0.8848
185.0 0.8973 0.8845
185.5 0.8970 0.8842
186.0 0.8967 0.8839
186.5 0.8964 0.8835
187.0 0.8961 0.8832
187.5 0.8959 0.8829
188.0 0.8956 0.8826
188.5 0.8953 0.8823
189.0 0.8950 0.8819
189.5 0.8947 0.8816
190.0 0.8944 0.8813
190.5 0.8941 0.8810
191.0 0.8938 0.8807
191.5 0.8935 0.8803
192.0 0.8932 0.8800
CUse column A factors for asphalts with density at 15
oC of 966 kg/m
3 or higher.
DUse column B factors for asphalts with density at 15
oC of 850 to 965 kg/m
3.
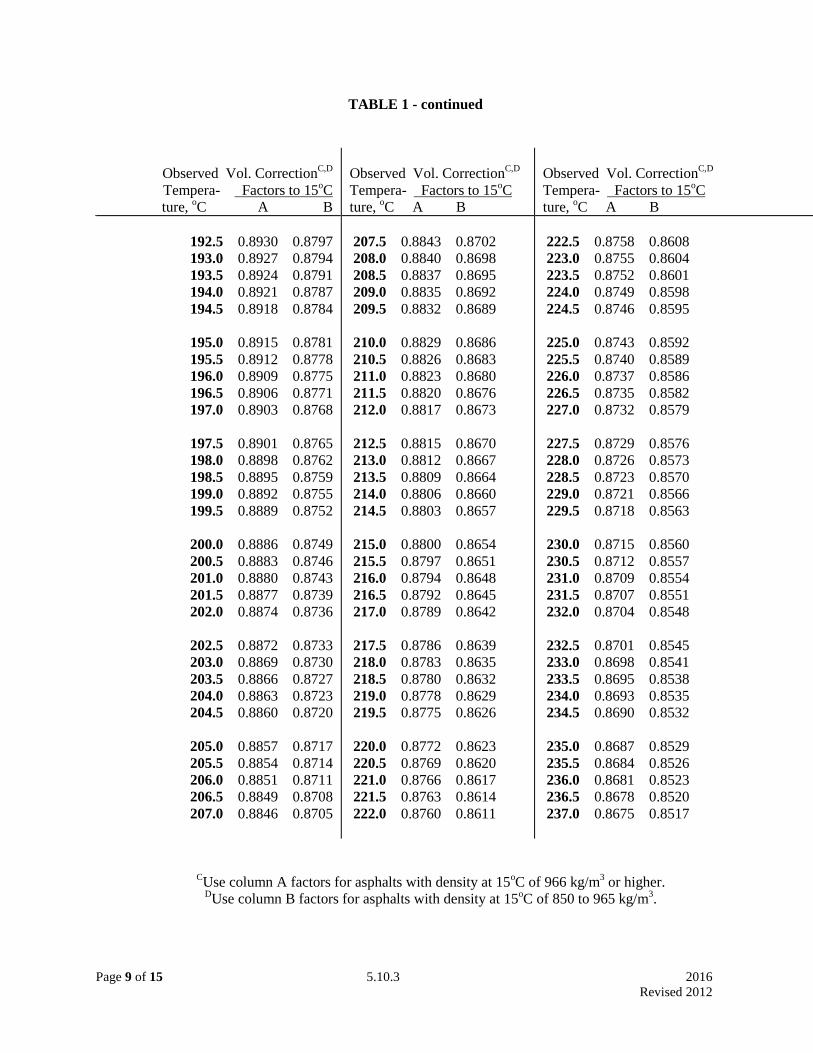
Page 9 of 15 5.10.3 2016
Revised 2012
TABLE 1 - continued
Observed Vol. CorrectionC,D
Tempera- Factors to 15oC
ture, oC A B
Observed Vol. CorrectionC,D
Tempera- Factors to 15oC
ture, oC A B
Observed Vol. CorrectionC,D
Tempera- Factors to 15oC
ture, oC A B
192.5 0.8930 0.8797
193.0 0.8927 0.8794
193.5 0.8924 0.8791
194.0 0.8921 0.8787
194.5 0.8918 0.8784
195.0 0.8915 0.8781
195.5 0.8912 0.8778
196.0 0.8909 0.8775
196.5 0.8906 0.8771
197.0 0.8903 0.8768
197.5 0.8901 0.8765
198.0 0.8898 0.8762
198.5 0.8895 0.8759
199.0 0.8892 0.8755
199.5 0.8889 0.8752
200.0 0.8886 0.8749
200.5 0.8883 0.8746
201.0 0.8880 0.8743
201.5 0.8877 0.8739
202.0 0.8874 0.8736
202.5 0.8872 0.8733
203.0 0.8869 0.8730
203.5 0.8866 0.8727
204.0 0.8863 0.8723
204.5 0.8860 0.8720
205.0 0.8857 0.8717
205.5 0.8854 0.8714
206.0 0.8851 0.8711
206.5 0.8849 0.8708
207.0 0.8846 0.8705
207.5 0.8843 0.8702
208.0 0.8840 0.8698
208.5 0.8837 0.8695
209.0 0.8835 0.8692
209.5 0.8832 0.8689
210.0 0.8829 0.8686
210.5 0.8826 0.8683
211.0 0.8823 0.8680
211.5 0.8820 0.8676
212.0 0.8817 0.8673
212.5 0.8815 0.8670
213.0 0.8812 0.8667
213.5 0.8809 0.8664
214.0 0.8806 0.8660
214.5 0.8803 0.8657
215.0 0.8800 0.8654
215.5 0.8797 0.8651
216.0 0.8794 0.8648
216.5 0.8792 0.8645
217.0 0.8789 0.8642
217.5 0.8786 0.8639
218.0 0.8783 0.8635
218.5 0.8780 0.8632
219.0 0.8778 0.8629
219.5 0.8775 0.8626
220.0 0.8772 0.8623
220.5 0.8769 0.8620
221.0 0.8766 0.8617
221.5 0.8763 0.8614
222.0 0.8760 0.8611
222.5 0.8758 0.8608
223.0 0.8755 0.8604
223.5 0.8752 0.8601
224.0 0.8749 0.8598
224.5 0.8746 0.8595
225.0 0.8743 0.8592
225.5 0.8740 0.8589
226.0 0.8737 0.8586
226.5 0.8735 0.8582
227.0 0.8732 0.8579
227.5 0.8729 0.8576
228.0 0.8726 0.8573
228.5 0.8723 0.8570
229.0 0.8721 0.8566
229.5 0.8718 0.8563
230.0 0.8715 0.8560
230.5 0.8712 0.8557
231.0 0.8709 0.8554
231.5 0.8707 0.8551
232.0 0.8704 0.8548
232.5 0.8701 0.8545
233.0 0.8698 0.8541
233.5 0.8695 0.8538
234.0 0.8693 0.8535
234.5 0.8690 0.8532
235.0 0.8687 0.8529
235.5 0.8684 0.8526
236.0 0.8681 0.8523
236.5 0.8678 0.8520
237.0 0.8675 0.8517
CUse column A factors for asphalts with density at 15
oC of 966 kg/m
3 or higher.
DUse column B factors for asphalts with density at 15
oC of 850 to 965 kg/m
3.
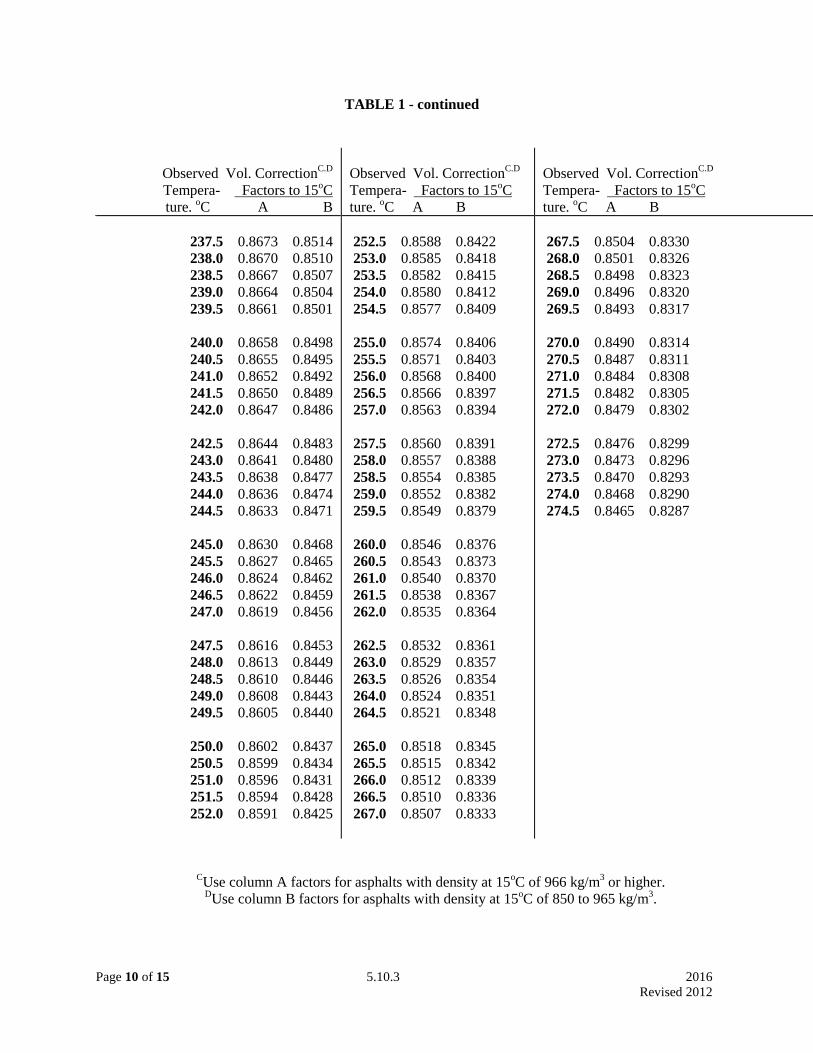
Page 10 of 15 5.10.3 2016
Revised 2012
TABLE 1 - continued
Observed Vol. CorrectionC.D
Tempera- Factors to 15oC
ture. oC A B
Observed Vol. CorrectionC.D
Tempera- Factors to 15oC
ture. oC A B
Observed Vol. CorrectionC.D
Tempera- Factors to 15oC
ture. oC A B
237.5 0.8673 0.8514
238.0 0.8670 0.8510
238.5 0.8667 0.8507
239.0 0.8664 0.8504
239.5 0.8661 0.8501
240.0 0.8658 0.8498
240.5 0.8655 0.8495
241.0 0.8652 0.8492
241.5 0.8650 0.8489
242.0 0.8647 0.8486
242.5 0.8644 0.8483
243.0 0.8641 0.8480
243.5 0.8638 0.8477
244.0 0.8636 0.8474
244.5 0.8633 0.8471
245.0 0.8630 0.8468
245.5 0.8627 0.8465
246.0 0.8624 0.8462
246.5 0.8622 0.8459
247.0 0.8619 0.8456
247.5 0.8616 0.8453
248.0 0.8613 0.8449
248.5 0.8610 0.8446
249.0 0.8608 0.8443
249.5 0.8605 0.8440
250.0 0.8602 0.8437
250.5 0.8599 0.8434
251.0 0.8596 0.8431
251.5 0.8594 0.8428
252.0 0.8591 0.8425
252.5 0.8588 0.8422
253.0 0.8585 0.8418
253.5 0.8582 0.8415
254.0 0.8580 0.8412
254.5 0.8577 0.8409
255.0 0.8574 0.8406
255.5 0.8571 0.8403
256.0 0.8568 0.8400
256.5 0.8566 0.8397
257.0 0.8563 0.8394
257.5 0.8560 0.8391
258.0 0.8557 0.8388
258.5 0.8554 0.8385
259.0 0.8552 0.8382
259.5 0.8549 0.8379
260.0 0.8546 0.8376
260.5 0.8543 0.8373
261.0 0.8540 0.8370
261.5 0.8538 0.8367
262.0 0.8535 0.8364
262.5 0.8532 0.8361
263.0 0.8529 0.8357
263.5 0.8526 0.8354
264.0 0.8524 0.8351
264.5 0.8521 0.8348
265.0 0.8518 0.8345
265.5 0.8515 0.8342
266.0 0.8512 0.8339
266.5 0.8510 0.8336
267.0 0.8507 0.8333
267.5 0.8504 0.8330
268.0 0.8501 0.8326
268.5 0.8498 0.8323
269.0 0.8496 0.8320
269.5 0.8493 0.8317
270.0 0.8490 0.8314
270.5 0.8487 0.8311
271.0 0.8484 0.8308
271.5 0.8482 0.8305
272.0 0.8479 0.8302
272.5 0.8476 0.8299
273.0 0.8473 0.8296
273.5 0.8470 0.8293
274.0 0.8468 0.8290
274.5 0.8465 0.8287
CUse column A factors for asphalts with density at 15
oC of 966 kg/m
3 or higher.
DUse column B factors for asphalts with density at 15
oC of 850 to 965 kg/m
3.

Page 11 of 15 5.10.3 2016
Revised 2012
TABLE 2 Standard Abridged Volume Correction Table for Petroleum Oils
A. S. T. M. Serial Designation D 1250 (Table 7)
Group No. and API gravity range at 60oF Group No and API gravity range at 60oF
Observed Group 0 Group 1 Group 2 Observed Group 0 Group 1 Group 2 temperature, 0-14.9o 15.0-34.9o 35.0-50.9o temperature 0-14.9o 15.0-34.9o 35.0-50.9o
oF. API API API oF. API API API
Factor for reducing volume to 60oF. Factor for reducing volume to 60oF.
50.................... 1.0035 1.0040 1.0050 100.................. 0.9861 0.9842 0.9801
51.................... 1.0031 1.0036 1.0045 101.................. 0.9857 0.9838 0.9796
52.................... 1.0028 1.0032 1.0040 102.................. 0.9854 0.9834 0.9791 53.................... 1.0024 1.0028 1.0035 103.................. 0.9851 0.9830 0.9786
54.................... 1.0021 1.0024 1.0030 104.................. 0.9847 0.9826 0.9781
55.................... 1.0017 1.0020 1.0025 105.................. 0.9844 0.9822 0.9776 56.................... 1.0014 1.0016 1.0020 106.................. 0.9840 0.9818 0.9771
57.................... 1.0010 1.0012 1.0015 107.................. 0.9837 0.9814 0.9776
58.................... 1.0007 1.0008 1.0010 108.................. 0.9833 0.9810 0.9761 59.................... 1.0003 1.0004 1.0005 109.................. 0.9830 0.9806 0.9756
60.................... 1.0000 1.0000 1.0000 110.................. 0.9826 0.9803 0.9751
61.................... 0.9997 0.9996 0.9995 111.................. 0.9823 0.9799 0.9746 62................... 0.9993 0.9992 0.9990 112.................. 0.9819 0.9795 0.9741
63.................... 0.9990 0.9988 0.9985 113.................. 0.9816 0.9791 0.9736
64.................... 0.9986 0.9984 0.9980 114.................. 0.9813 0.9787 0.9731 65.................... 0.9983 0.9980 0.9975 115.................. 0.9809 0.9783 0.9726
66.................... 0.9979 0.9976 0.9970 116.................. 0.9806 0.9779 0.9721
67.................... 0.9976 0.9972 0.9965 117.................. 0.9802 0.9775 0.9717 68.................... 0.9972 0.9968 0.9960 118.................. 0.9799 0.9771 0.9712
69................... 0.9969 0.9964 0.9955 119.................. 0.9795 0.9767 0.9707
70................... 0.9965 0.9960 0.9950 120.................. 0.9792 0.9763 0.9702 71................... 0.9962 0.9956 0.9945 121.................. 0.9788 0.9760 0.9697
72.................... 0.9958 0.9952 0.9940 122.................. 0.9785 0.9756 0.9692
73.................... 0.9955 0.9948 0.9935 123.................. 0.9782 0.9752 0.9687 74.................... 0.9951 0.9944 0.9930 124.................. 0.9778 0.9748 0.9682
75.................... 0.9948 0.9940 0.9925 125.................. 0.9775 0.9744 0.9677
76.................... 0.9944 0.9936 0.9920 126.................. 0.9771 0.9740 0.9672
77.................... 0.9941 0.9932 0.9916 127.................. 0.9768 0.9736 0.9667
78.................... 0.9937 0.9929 0.9911 128.................. 0.9764 0.9732 0.9662 79.................... 0.9934 0.9925 0.9906 129.................. 0.9761 0.9728 0.9657
80.................... 0.9930 0.9921 0.9901 130.................. 0.9758 0.9725 0.9652
81.................... 0.9927 0.9917 0.9901 131.................. 0.9754 0.9721 0.9647 82.................... 0.9923 0.9913 0.9891 132.................. 0.9751 0.9717 0.9642
83.................... 0.9920 0.9909 0.9886 133.................. 0.9747 0.9713 0.9637
84.................... 0.9916 0.9905 0.9881 134.................. 0.9744 0.9709 0.9632 85.................... 0.9913 0.9901 0.9876 135.................. 0.9740 0.9705 0.9627
86.................... 0.9909 0.9897 0.9871 136.................. 0.9737 0.9701 0.9622
87.................... 0.9906 0.9893 0.9866 137.................. 0.9734 0.9697 0.9617 88.................... 0.9902 0.9889 0.9861 138.................. 0.9730 0.9693 0.9612
89.................... 0.9899 0.9885 0.9856 139.................. 0.9727 0.9690 0.9607
90.................... 0.9896 0.9881 0.9851 140.................. 0.9723 0.9686 0.9602 91.................... 0.9892 0.9877 0.9846 141.................. 0.9720 0.9682 0.9597
92.................... 0.9889 0.9873 0.9841 142.................. 0.9716 0.9678 0.9592
93.................... 0.9885 0.9869 0.9836 143.................. 0.9713 0.9674 0.9587 94.................... 0.9882 0.9865 0.9831 144.................. 0.9710 0.9670 0.9582
95.................... 0.9878 0.9861 0.9826 145.................. 0.9706 0.9666 0.9577
96.................... 0.9875 0.9857 0.9821 146.................. 0.9703 0.9662 0.9572 97................... 0.9871 0.9854 0.9816 147.................. 0.9699 0.9659 0.9567
98................... 0.9868 0.9850 0.9811 148.................. 0.9696 0.9655 0.9562
99................... 0.9864 0.9846 0.9806 149.................. 0.9693 0.9651 0.9557
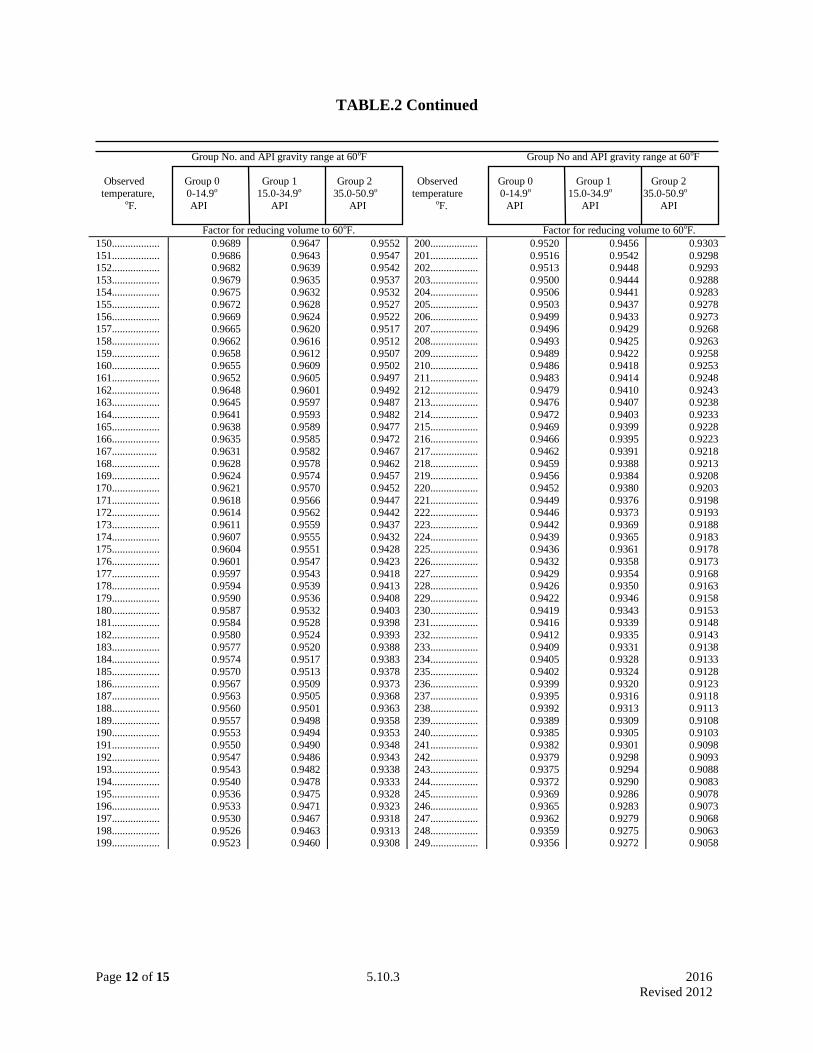
Page 12 of 15 5.10.3 2016
Revised 2012
TABLE.2 Continued
Group No. and API gravity range at 60oF Group No and API gravity range at 60oF
Observed Group 0 Group 1 Group 2 Observed Group 0 Group 1 Group 2
temperature, 0-14.9o 15.0-34.9o 35.0-50.9o temperature 0-14.9o 15.0-34.9o 35.0-50.9o
oF. API API API oF. API API API
Factor for reducing volume to 60oF. Factor for reducing volume to 60oF.
150.................. 0.9689 0.9647 0.9552 200.................. 0.9520 0.9456 0.9303
151.................. 0.9686 0.9643 0.9547 201.................. 0.9516 0.9542 0.9298 152.................. 0.9682 0.9639 0.9542 202.................. 0.9513 0.9448 0.9293
153.................. 0.9679 0.9635 0.9537 203.................. 0.9500 0.9444 0.9288 154.................. 0.9675 0.9632 0.9532 204.................. 0.9506 0.9441 0.9283
155.................. 0.9672 0.9628 0.9527 205.................. 0.9503 0.9437 0.9278
156.................. 0.9669 0.9624 0.9522 206.................. 0.9499 0.9433 0.9273 157.................. 0.9665 0.9620 0.9517 207.................. 0.9496 0.9429 0.9268
158.................. 0.9662 0.9616 0.9512 208.................. 0.9493 0.9425 0.9263
159.................. 0.9658 0.9612 0.9507 209.................. 0.9489 0.9422 0.9258 160.................. 0.9655 0.9609 0.9502 210.................. 0.9486 0.9418 0.9253
161.................. 0.9652 0.9605 0.9497 211.................. 0.9483 0.9414 0.9248
162.................. 0.9648 0.9601 0.9492 212.................. 0.9479 0.9410 0.9243 163.................. 0.9645 0.9597 0.9487 213.................. 0.9476 0.9407 0.9238
164.................. 0.9641 0.9593 0.9482 214.................. 0.9472 0.9403 0.9233
165.................. 0.9638 0.9589 0.9477 215.................. 0.9469 0.9399 0.9228 166.................. 0.9635 0.9585 0.9472 216.................. 0.9466 0.9395 0.9223
167................. 0.9631 0.9582 0.9467 217.................. 0.9462 0.9391 0.9218
168.................. 0.9628 0.9578 0.9462 218.................. 0.9459 0.9388 0.9213 169.................. 0.9624 0.9574 0.9457 219.................. 0.9456 0.9384 0.9208
170.................. 0.9621 0.9570 0.9452 220.................. 0.9452 0.9380 0.9203
171.................. 0.9618 0.9566 0.9447 221.................. 0.9449 0.9376 0.9198 172.................. 0.9614 0.9562 0.9442 222.................. 0.9446 0.9373 0.9193
173.................. 0.9611 0.9559 0.9437 223.................. 0.9442 0.9369 0.9188
174.................. 0.9607 0.9555 0.9432 224.................. 0.9439 0.9365 0.9183 175.................. 0.9604 0.9551 0.9428 225.................. 0.9436 0.9361 0.9178
176.................. 0.9601 0.9547 0.9423 226.................. 0.9432 0.9358 0.9173
177.................. 0.9597 0.9543 0.9418 227.................. 0.9429 0.9354 0.9168 178.................. 0.9594 0.9539 0.9413 228.................. 0.9426 0.9350 0.9163
179.................. 0.9590 0.9536 0.9408 229.................. 0.9422 0.9346 0.9158
180.................. 0.9587 0.9532 0.9403 230.................. 0.9419 0.9343 0.9153 181.................. 0.9584 0.9528 0.9398 231.................. 0.9416 0.9339 0.9148
182.................. 0.9580 0.9524 0.9393 232.................. 0.9412 0.9335 0.9143
183.................. 0.9577 0.9520 0.9388 233.................. 0.9409 0.9331 0.9138 184.................. 0.9574 0.9517 0.9383 234.................. 0.9405 0.9328 0.9133
185.................. 0.9570 0.9513 0.9378 235.................. 0.9402 0.9324 0.9128
186.................. 0.9567 0.9509 0.9373 236.................. 0.9399 0.9320 0.9123 187.................. 0.9563 0.9505 0.9368 237.................. 0.9395 0.9316 0.9118
188.................. 0.9560 0.9501 0.9363 238.................. 0.9392 0.9313 0.9113
189.................. 0.9557 0.9498 0.9358 239.................. 0.9389 0.9309 0.9108 190.................. 0.9553 0.9494 0.9353 240.................. 0.9385 0.9305 0.9103
191.................. 0.9550 0.9490 0.9348 241.................. 0.9382 0.9301 0.9098
192.................. 0.9547 0.9486 0.9343 242.................. 0.9379 0.9298 0.9093 193.................. 0.9543 0.9482 0.9338 243.................. 0.9375 0.9294 0.9088
194.................. 0.9540 0.9478 0.9333 244.................. 0.9372 0.9290 0.9083
195.................. 0.9536 0.9475 0.9328 245.................. 0.9369 0.9286 0.9078
196.................. 0.9533 0.9471 0.9323 246.................. 0.9365 0.9283 0.9073
197.................. 0.9530 0.9467 0.9318 247.................. 0.9362 0.9279 0.9068
198.................. 0.9526 0.9463 0.9313 248.................. 0.9359 0.9275 0.9063 199.................. 0.9523 0.9460 0.9308 249.................. 0.9356 0.9272 0.9058
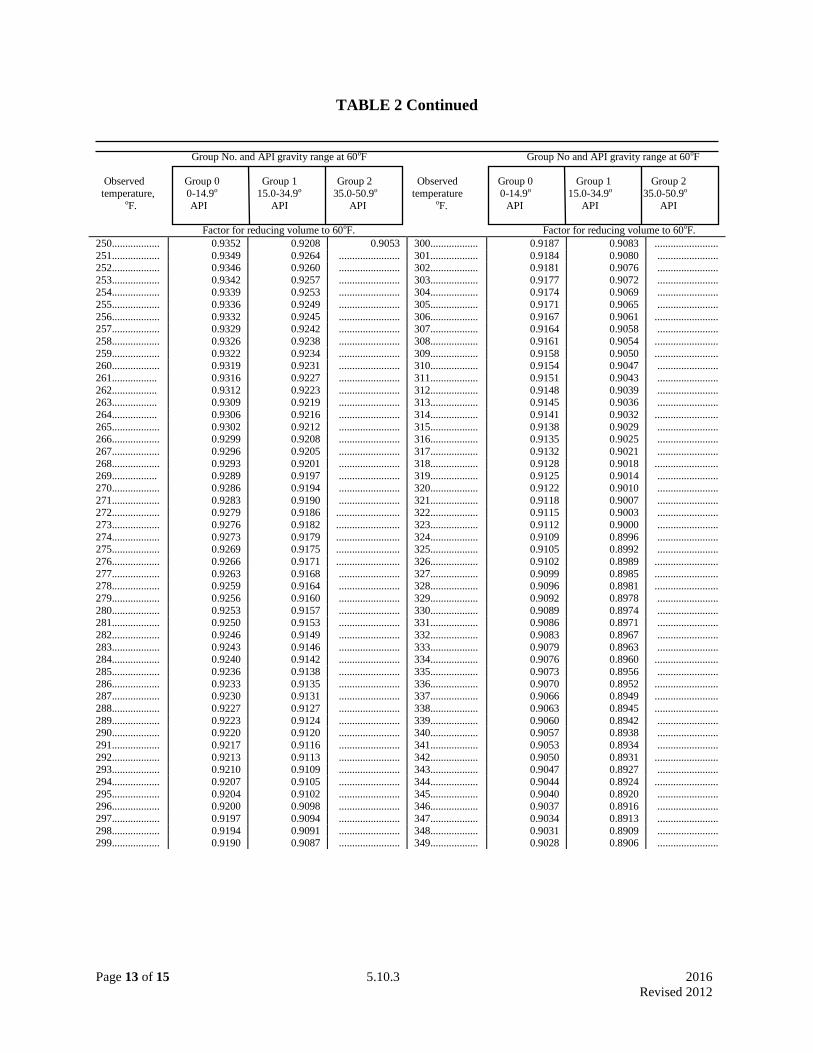
Page 13 of 15 5.10.3 2016
Revised 2012
TABLE 2 Continued
Group No. and API gravity range at 60oF Group No and API gravity range at 60oF
Observed Group 0 Group 1 Group 2 Observed Group 0 Group 1 Group 2
temperature, 0-14.9o 15.0-34.9o 35.0-50.9o temperature 0-14.9o 15.0-34.9o 35.0-50.9o
oF. API API API oF. API API API
Factor for reducing volume to 60oF. Factor for reducing volume to 60oF.
250.................. 0.9352 0.9208 0.9053 300.................. 0.9187 0.9083 ........................
251.................. 0.9349 0.9264 ....................... 301.................. 0.9184 0.9080 ....................... 252.................. 0.9346 0.9260 ....................... 302.................. 0.9181 0.9076 .......................
253.................. 0.9342 0.9257 ....................... 303.................. 0.9177 0.9072 ....................... 254.................. 0.9339 0.9253 ....................... 304.................. 0.9174 0.9069 .......................
255.................. 0.9336 0.9249 ....................... 305.................. 0.9171 0.9065 .......................
256.................. 0.9332 0.9245 ....................... 306.................. 0.9167 0.9061 ........................ 257.................. 0.9329 0.9242 ....................... 307.................. 0.9164 0.9058 .......................
258.................. 0.9326 0.9238 ....................... 308.................. 0.9161 0.9054 ........................
259.................. 0.9322 0.9234 ....................... 309.................. 0.9158 0.9050 ........................ 260.................. 0.9319 0.9231 ....................... 310.................. 0.9154 0.9047 .......................
261................. 0.9316 0.9227 ....................... 311.................. 0.9151 0.9043 .......................
262................. 0.9312 0.9223 ....................... 312.................. 0.9148 0.9039 ....................... 263................. 0.9309 0.9219 ....................... 313.................. 0.9145 0.9036 .......................
264................. 0.9306 0.9216 ....................... 314.................. 0.9141 0.9032 ........................
265.................. 0.9302 0.9212 ....................... 315.................. 0.9138 0.9029 ....................... 266.................. 0.9299 0.9208 ....................... 316.................. 0.9135 0.9025 .......................
267.................. 0.9296 0.9205 ....................... 317.................. 0.9132 0.9021 .......................
268.................. 0.9293 0.9201 ....................... 318.................. 0.9128 0.9018 ........................ 269................. 0.9289 0.9197 ....................... 319.................. 0.9125 0.9014 .......................
270.................. 0.9286 0.9194 ....................... 320.................. 0.9122 0.9010 .......................
271.................. 0.9283 0.9190 ....................... 321.................. 0.9118 0.9007 ....................... 272.................. 0.9279 0.9186 ........................ 322.................. 0.9115 0.9003 .......................
273.................. 0.9276 0.9182 ........................ 323.................. 0.9112 0.9000 .......................
274.................. 0.9273 0.9179 ........................ 324.................. 0.9109 0.8996 ....................... 275.................. 0.9269 0.9175 ........................ 325.................. 0.9105 0.8992 .......................
276.................. 0.9266 0.9171 ........................ 326.................. 0.9102 0.8989 ........................
277.................. 0.9263 0.9168 ....................... 327.................. 0.9099 0.8985 ........................ 278.................. 0.9259 0.9164 ....................... 328.................. 0.9096 0.8981 ........................
279.................. 0.9256 0.9160 ....................... 329.................. 0.9092 0.8978 .......................
280.................. 0.9253 0.9157 ....................... 330.................. 0.9089 0.8974 ....................... 281.................. 0.9250 0.9153 ....................... 331.................. 0.9086 0.8971 .......................
282.................. 0.9246 0.9149 ....................... 332.................. 0.9083 0.8967 .......................
283.................. 0.9243 0.9146 ....................... 333.................. 0.9079 0.8963 ....................... 284.................. 0.9240 0.9142 ....................... 334.................. 0.9076 0.8960 ........................
285.................. 0.9236 0.9138 ....................... 335.................. 0.9073 0.8956 .......................
286.................. 0.9233 0.9135 ....................... 336.................. 0.9070 0.8952 ........................ 287.................. 0.9230 0.9131 ....................... 337.................. 0.9066 0.8949 ........................
288.................. 0.9227 0.9127 ....................... 338.................. 0.9063 0.8945 ........................
289.................. 0.9223 0.9124 ....................... 339.................. 0.9060 0.8942 ....................... 290.................. 0.9220 0.9120 ....................... 340.................. 0.9057 0.8938 .......................
291.................. 0.9217 0.9116 ....................... 341.................. 0.9053 0.8934 .......................
292.................. 0.9213 0.9113 ....................... 342.................. 0.9050 0.8931 ........................ 293.................. 0.9210 0.9109 ....................... 343.................. 0.9047 0.8927 .......................
294.................. 0.9207 0.9105 ....................... 344.................. 0.9044 0.8924 ........................
295.................. 0.9204 0.9102 ....................... 345.................. 0.9040 0.8920 .......................
296.................. 0.9200 0.9098 ....................... 346.................. 0.9037 0.8916 .......................
297.................. 0.9197 0.9094 ....................... 347.................. 0.9034 0.8913 .......................
298.................. 0.9194 0.9091 ....................... 348.................. 0.9031 0.8909 ....................... 299.................. 0.9190 0.9087 ....................... 349.................. 0.9028 0.8906 .......................
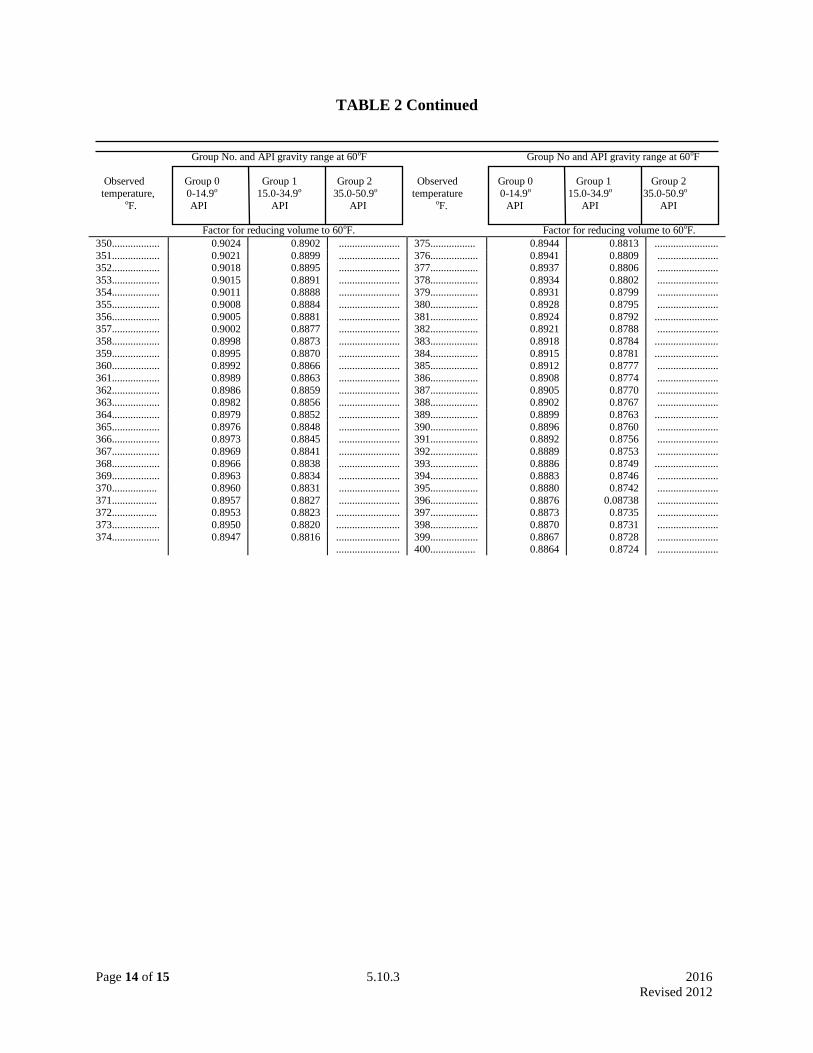
Page 14 of 15 5.10.3 2016
Revised 2012
TABLE 2 Continued
Group No. and API gravity range at 60oF Group No and API gravity range at 60oF
Observed Group 0 Group 1 Group 2 Observed Group 0 Group 1 Group 2
temperature, 0-14.9o 15.0-34.9o 35.0-50.9o temperature 0-14.9o 15.0-34.9o 35.0-50.9o
oF. API API API oF. API API API
Factor for reducing volume to 60oF. Factor for reducing volume to 60oF.
350.................. 0.9024 0.8902 ....................... 375................. 0.8944 0.8813 ........................
351.................. 0.9021 0.8899 ....................... 376.................. 0.8941 0.8809 ....................... 352.................. 0.9018 0.8895 ....................... 377.................. 0.8937 0.8806 .......................
353.................. 0.9015 0.8891 ....................... 378.................. 0.8934 0.8802 ....................... 354.................. 0.9011 0.8888 ....................... 379.................. 0.8931 0.8799 .......................
355.................. 0.9008 0.8884 ....................... 380.................. 0.8928 0.8795 .......................
356.................. 0.9005 0.8881 ....................... 381.................. 0.8924 0.8792 ........................ 357.................. 0.9002 0.8877 ....................... 382.................. 0.8921 0.8788 .......................
358.................. 0.8998 0.8873 ....................... 383.................. 0.8918 0.8784 ........................
359.................. 0.8995 0.8870 ....................... 384.................. 0.8915 0.8781 ........................ 360.................. 0.8992 0.8866 ....................... 385.................. 0.8912 0.8777 .......................
361.................. 0.8989 0.8863 ....................... 386.................. 0.8908 0.8774 .......................
362.................. 0.8986 0.8859 ....................... 387.................. 0.8905 0.8770 ....................... 363.................. 0.8982 0.8856 ....................... 388.................. 0.8902 0.8767 .......................
364.................. 0.8979 0.8852 ....................... 389.................. 0.8899 0.8763 ........................
365.................. 0.8976 0.8848 ....................... 390.................. 0.8896 0.8760 ....................... 366.................. 0.8973 0.8845 ....................... 391.................. 0.8892 0.8756 .......................
367.................. 0.8969 0.8841 ....................... 392.................. 0.8889 0.8753 .......................
368.................. 0.8966 0.8838 ....................... 393.................. 0.8886 0.8749 ........................ 369.................. 0.8963 0.8834 ....................... 394.................. 0.8883 0.8746 .......................
370................. 0.8960 0.8831 ....................... 395.................. 0.8880 0.8742 .......................
371................. 0.8957 0.8827 ....................... 396.................. 0.8876 0.08738 ....................... 372................. 0.8953 0.8823 ........................ 397.................. 0.8873 0.8735 .......................
373.................. 0.8950 0.8820 ........................ 398.................. 0.8870 0.8731 .......................
374.................. 0.8947 0.8816 ........................ 399.................. 0.8867 0.8728 ....................... ........................ 400................. 0.8864 0.8724 .......................
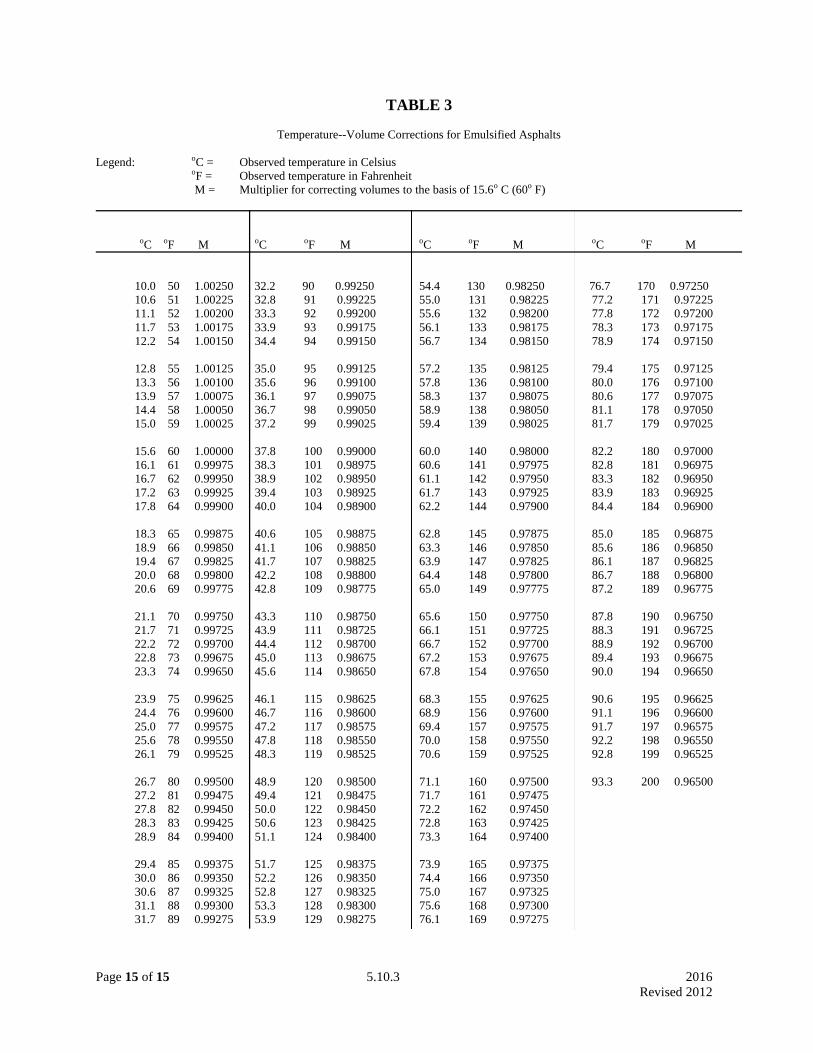
Page 15 of 15 5.10.3 2016
Revised 2012
TABLE 3
Temperature--Volume Corrections for Emulsified Asphalts
Legend: oC = Observed temperature in Celsius oF = Observed temperature in Fahrenheit
M = Multiplier for correcting volumes to the basis of 15.6o C (60o F)
oC oF M oC oF M oC oF M oC oF M
10.0 50 1.00250 32.2 90 0.99250 54.4 130 0.98250 76.7 170 0.97250
10.6 51 1.00225 32.8 91 0.99225 55.0 131 0.98225 77.2 171 0.97225
11.1 52 1.00200 33.3 92 0.99200 55.6 132 0.98200 77.8 172 0.97200
11.7 53 1.00175 33.9 93 0.99175 56.1 133 0.98175 78.3 173 0.97175
12.2 54 1.00150 34.4 94 0.99150 56.7 134 0.98150 78.9 174 0.97150
12.8 55 1.00125 35.0 95 0.99125 57.2 135 0.98125 79.4 175 0.97125
13.3 56 1.00100 35.6 96 0.99100 57.8 136 0.98100 80.0 176 0.97100
13.9 57 1.00075 36.1 97 0.99075 58.3 137 0.98075 80.6 177 0.97075
14.4 58 1.00050 36.7 98 0.99050 58.9 138 0.98050 81.1 178 0.97050
15.0 59 1.00025 37.2 99 0.99025 59.4 139 0.98025 81.7 179 0.97025
15.6 60 1.00000 37.8 100 0.99000 60.0 140 0.98000 82.2 180 0.97000
16.1 61 0.99975 38.3 101 0.98975 60.6 141 0.97975 82.8 181 0.96975
16.7 62 0.99950 38.9 102 0.98950 61.1 142 0.97950 83.3 182 0.96950
17.2 63 0.99925 39.4 103 0.98925 61.7 143 0.97925 83.9 183 0.96925
17.8 64 0.99900 40.0 104 0.98900 62.2 144 0.97900 84.4 184 0.96900
18.3 65 0.99875 40.6 105 0.98875 62.8 145 0.97875 85.0 185 0.96875
18.9 66 0.99850 41.1 106 0.98850 63.3 146 0.97850 85.6 186 0.96850
19.4 67 0.99825 41.7 107 0.98825 63.9 147 0.97825 86.1 187 0.96825
20.0 68 0.99800 42.2 108 0.98800 64.4 148 0.97800 86.7 188 0.96800
20.6 69 0.99775 42.8 109 0.98775 65.0 149 0.97775 87.2 189 0.96775
21.1 70 0.99750 43.3 110 0.98750 65.6 150 0.97750 87.8 190 0.96750
21.7 71 0.99725 43.9 111 0.98725 66.1 151 0.97725 88.3 191 0.96725
22.2 72 0.99700 44.4 112 0.98700 66.7 152 0.97700 88.9 192 0.96700
22.8 73 0.99675 45.0 113 0.98675 67.2 153 0.97675 89.4 193 0.96675
23.3 74 0.99650 45.6 114 0.98650 67.8 154 0.97650 90.0 194 0.96650
23.9 75 0.99625 46.1 115 0.98625 68.3 155 0.97625 90.6 195 0.96625
24.4 76 0.99600 46.7 116 0.98600 68.9 156 0.97600 91.1 196 0.96600
25.0 77 0.99575 47.2 117 0.98575 69.4 157 0.97575 91.7 197 0.96575
25.6 78 0.99550 47.8 118 0.98550 70.0 158 0.97550 92.2 198 0.96550
26.1 79 0.99525 48.3 119 0.98525 70.6 159 0.97525 92.8 199 0.96525
26.7 80 0.99500 48.9 120 0.98500 71.1 160 0.97500 93.3 200 0.96500
27.2 81 0.99475 49.4 121 0.98475 71.7 161 0.97475
27.8 82 0.99450 50.0 122 0.98450 72.2 162 0.97450
28.3 83 0.99425 50.6 123 0.98425 72.8 163 0.97425
28.9 84 0.99400 51.1 124 0.98400 73.3 164 0.97400
29.4 85 0.99375 51.7 125 0.98375 73.9 165 0.97375
30.0 86 0.99350 52.2 126 0.98350 74.4 166 0.97350
30.6 87 0.99325 52.8 127 0.98325 75.0 167 0.97325
31.1 88 0.99300 53.3 128 0.98300 75.6 168 0.97300
31.7 89 0.99275 53.9 129 0.98275 76.1 169 0.97275

Page 1/14 5.10.4 2016
Revised 2012
5.10.4. CALCULATIONS FOR THE MARSHALL MIX DESIGN OF BITUMINOUS MIXTURES
1. SCOPE
This method covers the formulas used to compute the various values used in the Marshall Mix Design of
100% virgin aggregate mixtures or reclaimed material and virgin aggregate mixtures.
2. PROCEDURE
2.1. Aggregate Specific Gravity.
2.1.1. Virgin Aggregate: Measure the Bulk (Dry) Specific Gravity of the coarse and fine aggregate
fractions (KT-6, Procedure I & II).
2.1.2. Reclaimed Material: KT-6, as indicated above can be used on extracted aggregate if a sufficient
quantity is available. If sufficient extracted aggregate is not available, conduct KT-39 on the reclaimed
material. Obtain the specific gravity of the extracted asphalt and calculate the specific gravity of the
combined aggregate in the reclaimed material.
2.2. Determine the specific gravity of the asphalt cement.
2.3. Calculate the Bulk Specific Gravity of the aggregate combination in the paving mixture. (Gsb)
2.4. Measure the Maximum Specific Gravity of the loose paving mixture. (KT-39) (Gmm)
2.5. Measure the Bulk Specific Gravity of the compacted paving mixture. (KT-15) (Gmb)
2.6. Calculate the Effective Specific Gravity of the aggregate. (Gse)
2.7. Calculate asphalt absorption of the aggregate. (Pba)
2.8. Calculate the effective asphalt content of the mixture. (Pbe)
2.9. Calculate the percent voids in the mineral aggregate in the compacted paving mixture. (VMA)
2.10. Calculate the percent air voids in the compacted mixture. (Pa)
2.11. Calculate the percent voids filled with asphalt in the compacted mixture. (VFA)
2.12. Calculate the limiting asphalt content at the tentative design asphalt content. (P'b max)
2.13. Calculate the Bearing Capacity for each asphalt content.
3. EQUATIONS
Equations for the above calculations follow in this text and their application may be expedited by use of
the appropriate worksheet (Figure 1). Also, there is a computer program available which will complete
these calculations. For purposes of illustration, the following data is presumed "known" for a bituminous
mixture under evaluation.
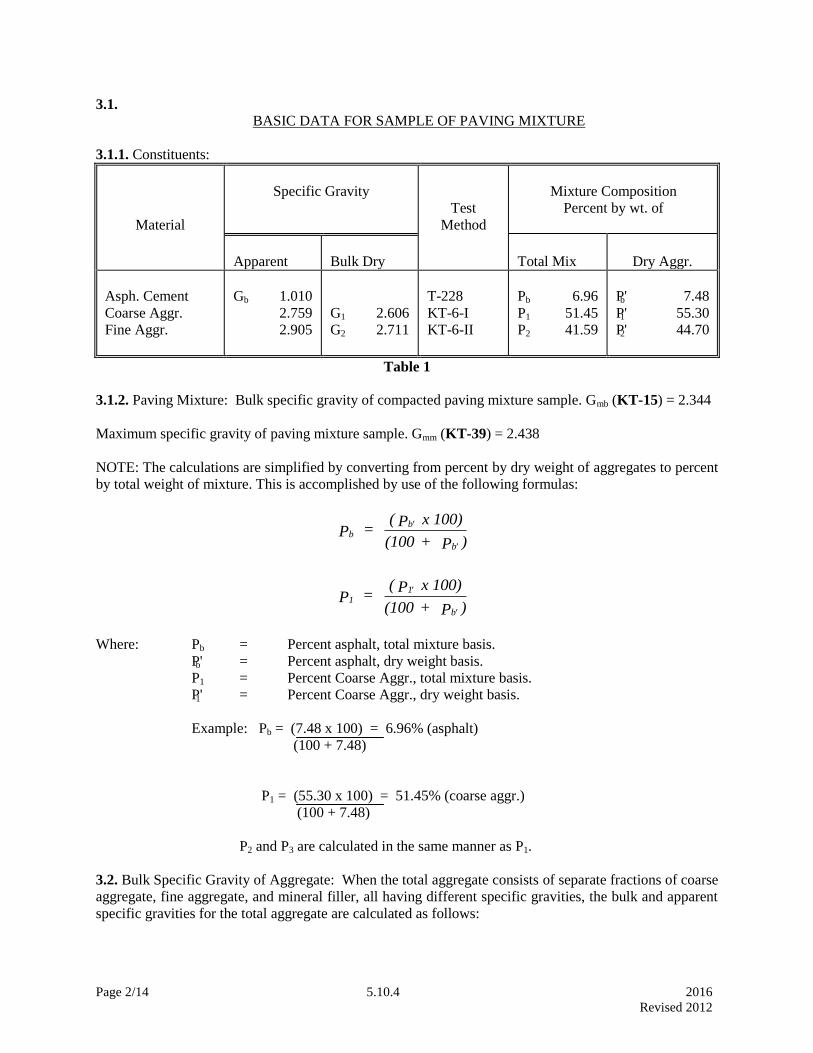
Page 2/14 5.10.4 2016
Revised 2012
3.1.
BASIC DATA FOR SAMPLE OF PAVING MIXTURE
3.1.1. Constituents:
Material
Specific Gravity
Test
Method
Mixture Composition
Percent by wt. of
Apparent
Bulk Dry
Total Mix
Dry Aggr.
Asph. Cement
Coarse Aggr.
Fine Aggr.
Gb 1.010
2.759
2.905
G1 2.606
G2 2.711
T-228
KT-6-I
KT-6-II
Pb 6.96
P1 51.45
P2 41.59
P'b 7.48
P'1 55.30
P'2 44.70
Table 1
3.1.2. Paving Mixture: Bulk specific gravity of compacted paving mixture sample. Gmb (KT-15) = 2.344
Maximum specific gravity of paving mixture sample. Gmm (KT-39) = 2.438
NOTE: The calculations are simplified by converting from percent by dry weight of aggregates to percent
by total weight of mixture. This is accomplished by use of the following formulas:
bb
b
P = ( P x 100)
(100 + P )
11
b
P = ( P x 100)
(100 + P )
Where: Pb = Percent asphalt, total mixture basis.
P'b = Percent asphalt, dry weight basis.
P1 = Percent Coarse Aggr., total mixture basis.
P'1 = Percent Coarse Aggr., dry weight basis.
Example: Pb = (7.48 x 100) = 6.96% (asphalt)
(100 + 7.48)
P1 = (55.30 x 100) = 51.45% (coarse aggr.)
(100 + 7.48)
P2 and P3 are calculated in the same manner as P1.
3.2. Bulk Specific Gravity of Aggregate: When the total aggregate consists of separate fractions of coarse
aggregate, fine aggregate, and mineral filler, all having different specific gravities, the bulk and apparent
specific gravities for the total aggregate are calculated as follows:
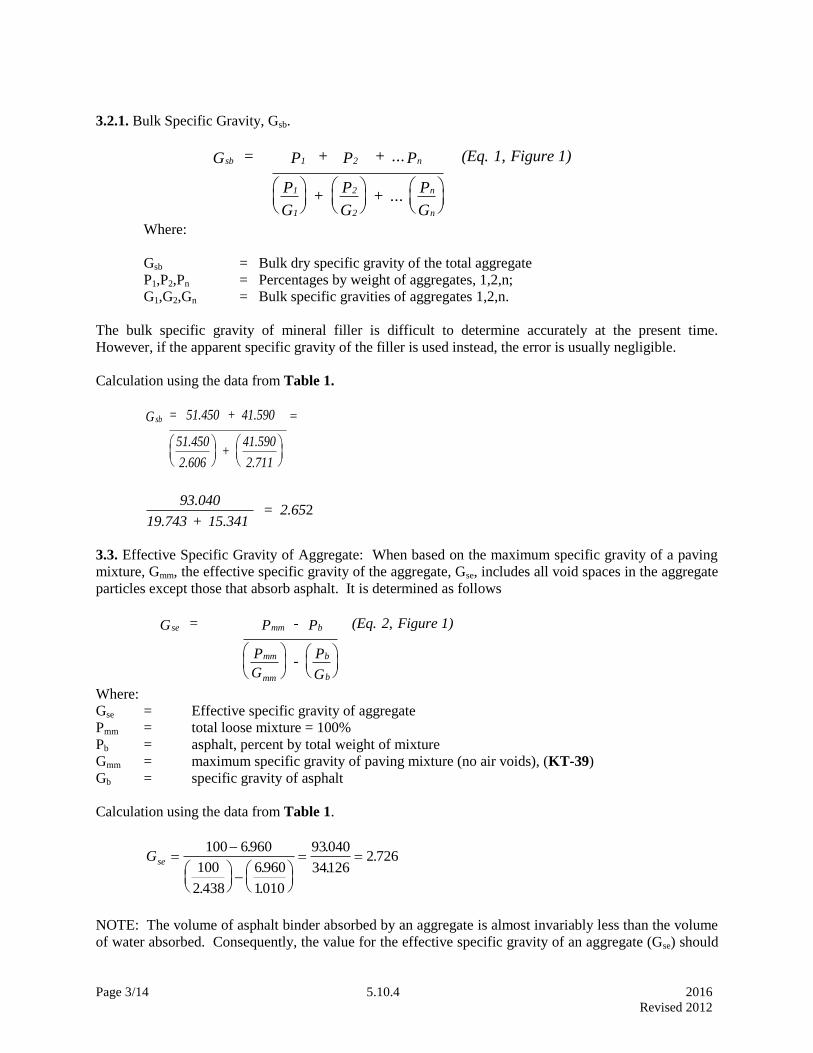
Page 3/14 5.10.4 2016
Revised 2012
3.2.1. Bulk Specific Gravity, Gsb.
G = P + P + ...P (Eq. 1, Figure 1)
P
G +
P
G + ...
P
G
sb 1 2 n
1
1
2
2
n
n
Where:
Gsb = Bulk dry specific gravity of the total aggregate
P1,P2,Pn = Percentages by weight of aggregates, 1,2,n;
G1,G2,Gn = Bulk specific gravities of aggregates 1,2,n.
The bulk specific gravity of mineral filler is difficult to determine accurately at the present time.
However, if the apparent specific gravity of the filler is used instead, the error is usually negligible.
Calculation using the data from Table 1.
sbG = 51.450 +
51.450
2.606 +
41.590
41.590
2.711
93.040
19.743 + = 2.65
15.3412
3.3. Effective Specific Gravity of Aggregate: When based on the maximum specific gravity of a paving
mixture, Gmm, the effective specific gravity of the aggregate, Gse, includes all void spaces in the aggregate
particles except those that absorb asphalt. It is determined as follows
G = P - P (Eq. 2, Figure 1)
P
G -
P
G
se mm b
mm
mm
b
b
Where:
Gse = Effective specific gravity of aggregate
Pmm = total loose mixture = 100%
Pb = asphalt, percent by total weight of mixture
Gmm = maximum specific gravity of paving mixture (no air voids), (KT-39)
Gb = specific gravity of asphalt
Calculation using the data from Table 1.
Gse
100 6960
100
2 438
6960
1010
93040
341262 726
.
.
.
.
.
..
NOTE: The volume of asphalt binder absorbed by an aggregate is almost invariably less than the volume
of water absorbed. Consequently, the value for the effective specific gravity of an aggregate (Gse) should
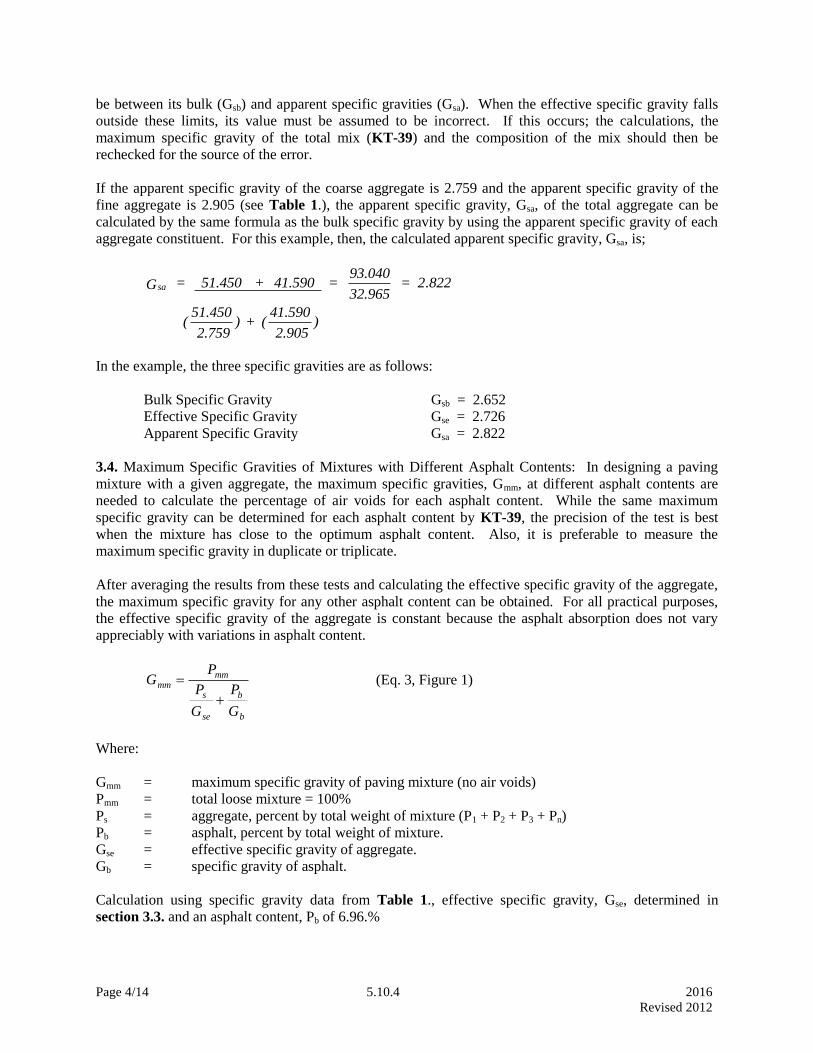
Page 4/14 5.10.4 2016
Revised 2012
be between its bulk (Gsb) and apparent specific gravities (Gsa). When the effective specific gravity falls
outside these limits, its value must be assumed to be incorrect. If this occurs; the calculations, the
maximum specific gravity of the total mix (KT-39) and the composition of the mix should then be
rechecked for the source of the error.
If the apparent specific gravity of the coarse aggregate is 2.759 and the apparent specific gravity of the
fine aggregate is 2.905 (see Table 1.), the apparent specific gravity, Gsa, of the total aggregate can be
calculated by the same formula as the bulk specific gravity by using the apparent specific gravity of each
aggregate constituent. For this example, then, the calculated apparent specific gravity, Gsa, is;
saG = 51.450 + 41.590 = 93.040
= 2
(51.450
2.759) + (
2.905)
32.965.822
41.590
In the example, the three specific gravities are as follows:
Bulk Specific Gravity Gsb = 2.652
Effective Specific Gravity Gse = 2.726
Apparent Specific Gravity Gsa = 2.822
3.4. Maximum Specific Gravities of Mixtures with Different Asphalt Contents: In designing a paving
mixture with a given aggregate, the maximum specific gravities, Gmm, at different asphalt contents are
needed to calculate the percentage of air voids for each asphalt content. While the same maximum
specific gravity can be determined for each asphalt content by KT-39, the precision of the test is best
when the mixture has close to the optimum asphalt content. Also, it is preferable to measure the
maximum specific gravity in duplicate or triplicate.
After averaging the results from these tests and calculating the effective specific gravity of the aggregate,
the maximum specific gravity for any other asphalt content can be obtained. For all practical purposes,
the effective specific gravity of the aggregate is constant because the asphalt absorption does not vary
appreciably with variations in asphalt content.
GP
P
G
P
G
mmmm
s
se
b
b
(Eq. 3, Figure 1)
Where:
Gmm = maximum specific gravity of paving mixture (no air voids)
Pmm = total loose mixture = 100%
Ps = aggregate, percent by total weight of mixture (P1 + P2 + P3 + Pn)
Pb = asphalt, percent by total weight of mixture.
Gse = effective specific gravity of aggregate.
Gb = specific gravity of asphalt.
Calculation using specific gravity data from Table 1., effective specific gravity, Gse, determined in
section 3.3. and an asphalt content, Pb of 6.96.%

Page 5/14 5.10.4 2016
Revised 2012
Gmm
100
9304
2 726
6960
1010
100
410222 438
.
.
.
.
..
3.5. Asphalt Absorption: Absorption is expressed as a percentage by weight of aggregate rather than as a
percentage by total weight of mixture. Asphalt, Pba, absorption is determined as follows:
base sb
sb se
bP = 100 (G - G )
(G x G ) G (Eq. 4, Figure 1)
Where:
Pba = absorbed asphalt, percent by weight of aggregate.
Gse = effective specific gravity of aggregate.
Gsb = bulk specific gravity of aggregate.
Gb = specific gravity of asphalt.
Calculation using bulk and effective gravities determined in sections 3.2. and 3.3. and asphalt specific
gravity from Table 1.
baP = 100 x (2.726 - 2.652 )
(2.652 x 2.726) x 1.010 = 100 x
0.074
7.229 x 1.010 = 1.03
3.6. Effective Asphalt Content of a Paving Mixture: The effective asphalt content, Pbe, of a paving
mixture is the total asphalt content minus the quantity of asphalt lost by absorption into the aggregate
particles. It is the portion of the total asphalt content that remains as a coating on the outside of the
aggregate particles, and is the asphalt content on which service performance of an asphalt paving mixture
depends. The formula is:
be b
basP = P - (
P
100) P (Eq. 5, Figure 1)
Where:
Pbe = effective asphalt content, percent by total weight of mixture.
Pb = asphalt, percent by total weight of mixture.
Pba = absorbed asphalt, percent by weight of aggregate.
Ps = aggregate, percent by total weight of mixture.
Calculation using data from Table 1 and section 3.5.
beP = 6.96 - (1.03
100) X 93.04 = 6.96 - 0.9 = 6 6 00.
3.7. Percent VMA in Compacted Paving Mixture: The voids in the mineral aggregate, VMA, are defined
as the intergranular void space between the aggregate particles in a compacted paving mixture, that
includes the air voids and the effective asphalt content, expressed as a percent of the total volume. The
VMA is calculated on the basis of the bulk specific gravity of the aggregate and is expressed as a
percentage of the bulk volume of the compacted paving mixture. Therefore, the VMA can be calculated
by subtracting the volume of the aggregate determined by its bulk specific gravity from the bulk volume
of the compacted paving mixture. The method of calculation is illustrated as follows:

Page 6/14 5.10.4 2016
Revised 2012
If mix composition is determined as percent by weight of the total mixture:
VMA = 100 - G P
G (Eq. 6, Figure 1)
mb s
sb
Where:
VMA = voids in mineral aggregate (percent of bulk vol.)
Gsb = bulk specific gravity of aggregate.
Gmb = bulk specific gravity of compacted mixture. (KT-15)
Ps = aggregate, percent by total dry weight of mixture.
Calculation using data from Table 1 and section 3.2.
VMA = 100 -
(2.344 x 93.04)
2.652 = 100 - 82.23 = 17.77
Calculation using data from Table 1 and section 3.2.
s
b
P = [100
100 + P] x 100
Where:
P'b = asphalt, percent by dry weight of aggregate.
VMA = 100 - [2.344
2.651 x
100
100 + 7.48 (100)] = 100 - 82.27 = 17.73
3.8. Calculation of Percent Air Voids in Compacted Mixture: The air voids, Pa, in a compacted paving
mixture consist of the small air spaces between the coated aggregate particles. The percentage of air
voids in a compacted mixture can be determined by the following equation:
a
mm mb
mm
P = 100 [G - G
G] (Eq. 7, Figure 1)
Where:
Pa = air voids in compacted mixture, percent of total volume.
Gmm = maximum specific gravity of paving mixture (as determined in section 3.4. or as
determined directly for a paving mixture by KT-39)
Gmb = bulk specific gravity of compacted mixture.
Calculation using data from Table 1.
aP = 100 2.438 - 2.344
2.438 =
9.400
2.438 = 3.85

Page 7/14 5.10.4 2016
Revised 2012
3.9. Calculation of Percent Voids Filled with Asphalt: The voids filled with asphalt, VFA, in a
compacted paving mixture consists of that portion of the initial voids in the aggregate, VMA, which has
been filled with the non-absorbed, or effective asphalt. The percentage of voids filled with asphalt in a
compacted specimen can be determined by the following equation:
100
mb
b
be
G
VMA
G
P
VFA
or (Eq. 8, Figure 1)
100
VMA
PVMAVFA a
Where:
VMA = voids in mineral aggregate, percent of bulk vol.
Pbe = effective asphalt content.
Gb = specific gravity of asphalt.
Gmb = bulk specific gravity of compacted mixture.
VFA = 100 x
(5.98
1.01)
(17.73
2.344)
= 100 x 5.921
7.564 = 78.3%
or
VFA = 17.73 - 3.85
17.73 100 =
13.88
17.73 100 = 78.3%
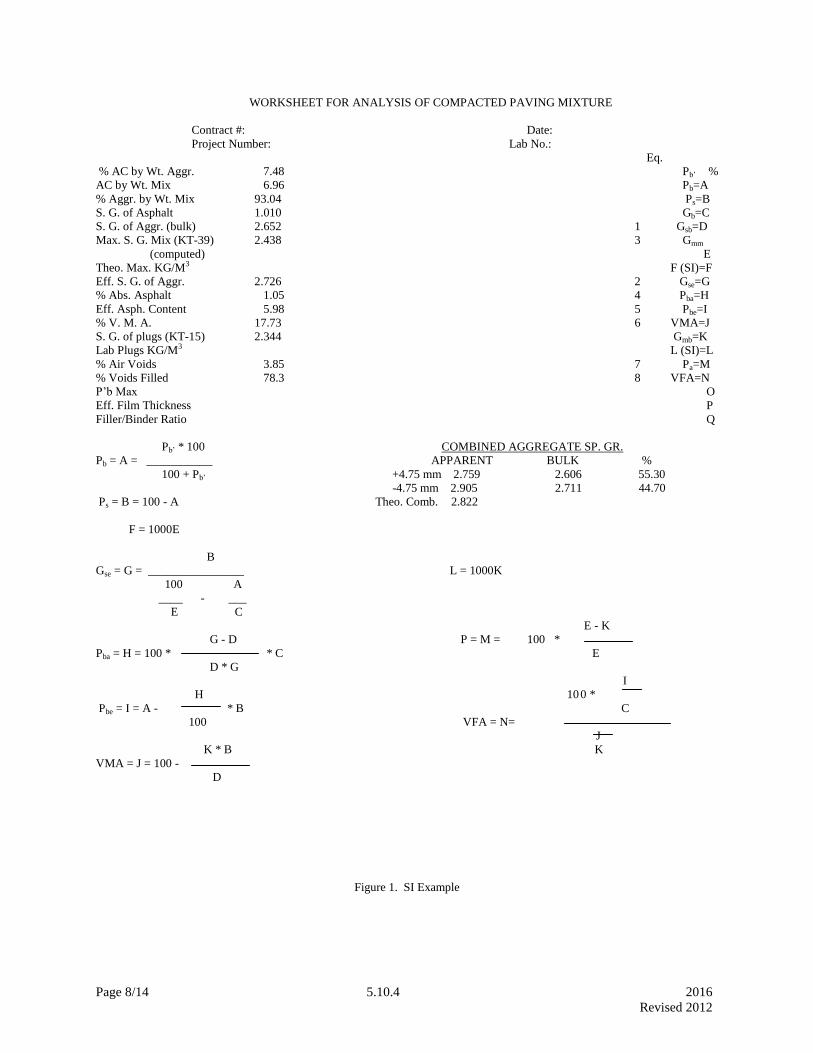
Page 8/14 5.10.4 2016
Revised 2012
WORKSHEET FOR ANALYSIS OF COMPACTED PAVING MIXTURE
Contract #: Date:
Project Number: Lab No.:
Eq.
% AC by Wt. Aggr. 7.48 Pb’ %
AC by Wt. Mix 6.96 Pb=A
% Aggr. by Wt. Mix 93.04 Ps=B
S. G. of Asphalt 1.010 Gb=C
S. G. of Aggr. (bulk) 2.652 1 Gsb=D
Max. S. G. Mix (KT-39) 2.438 3 Gmm
(computed) E
Theo. Max. KG/M3 F (SI)=F
Eff. S. G. of Aggr. 2.726 2 Gse=G
% Abs. Asphalt 1.05 4 Pba=H
Eff. Asph. Content 5.98 5 Pbe=I
% V. M. A. 17.73 6 VMA=J
S. G. of plugs (KT-15) 2.344 Gmb=K
Lab Plugs KG/M3 L (SI)=L
% Air Voids 3.85 7 Pa=M
% Voids Filled 78.3 8 VFA=N
P’b Max O
Eff. Film Thickness P
Filler/Binder Ratio Q
Pb’ * 100 COMBINED AGGREGATE SP. GR.
Pb = A = ___________ APPARENT BULK %
100 + Pb’ +4.75 mm 2.759 2.606 55.30
-4.75 mm 2.905 2.711 44.70
Ps = B = 100 - A Theo. Comb. 2.822
F = 1000E
B
Gse = G = ________________ L = 1000K
100 A
____ - ___
E C
E - K
G - D P = M = 100 *
Pba = H = 100 * * C E
D * G
I
H 100 *
Pbe = I = A - * B C
100 VFA = N=
J
K * B K
VMA = J = 100 -
D
Figure 1. SI Example

Page 9/14 5.10.4 2016
Revised 2012
WORKSHEET FOR ANALYSIS OF COMPACTED PAVING MIXTURE
Contract #: Date:
Project Number: Lab No.:
Eq.
% AC by Wt. Aggr. 7.48 Pb’ %
AC by Wt. Mix 6.96 Pb=A
% Aggr. by Wt. Mix 93.04 Ps=B
S. G. of Asphalt 1.010 Gb=C
S. G. of Aggr. (bulk) 2.652 1 Gsb=D
Max. S. G. Mix (KT-39) 2.438 3 Gmm
(computed) E
Theo. Max. KG/M3 F (SI)=F
Eff. S. G. of Aggr. 2.726 2 Gse=G
% Abs. Asphalt 1.05 4 Pba=H
Eff. Asph. Content 5.98 5 Pbe=I
% V. M. A. 17.73 6 VMA=J
S. G. of plugs (KT-15) 2.344 Gmb=K
Lab Plugs KG/M3 L (SI)=L
% Air Voids 3.85 7 Pa=M
% Voids Filled 78.3 8 VFA=N
P’b Max O
Eff. Film Thickness P
Filler/Binder Ratio Q
Pb’ * 100 COMBINED AGGREGATE SP. GR.
Pb = A = ___________ APPARENT BULK %
100 + Pb’ +4 2.759 2.606 55.30
-4 2.905 2.711 44.70
Ps= B = 100 - A Theo. Comb. 2.822
F = E * 62.4
B
Gse= G = ________________ L = K * 62.4
100 A
____ - ___
E C
E - K
G - D P = M = 100 *
Pba = H = 100 * * C E
D * G
I
H 100 *
Pbe = I = A - * B C
100 VFA = N=
J
K * B K
VMA = J = 100 -
D
Figure 1. English Example

Page 10/14 5.10.4 2016
Revised 2012
4. PRELIMINARY CALCUATIONS FOR RECYCLED MIXTURES:
When designing recycled mixtures, certain calculations must be made to obtain the correct values for Pb',
Gb and Gsb prior to entering the "Worksheet for Analysis of Compacted Paving Mixtures" (Figure 1). The
following sequence of equations may be followed to obtain the needed values.
4.1. Reclaimed Roadway (RAP).
Given:
PBRAP = Percent asphalt in RAP from extractions = 6.2
PBN = Percent added asphalt or recycling agent.
GAC-RAP = Specific gravity of reclaimed asphalt = 1.025
GBN = Specific gravity of added asphalt or recycling agent = 1.008
GRAG = Specific gravity of reclaimed agg. = 2.522
GSBN = Specific gravity of new aggregates = 2.651
PRAP = Percent reclaimed in aggregate blend = 40%
PVA = Percent new aggregate in blend = 60%
4.1.1. % asphalt in RAP (Wet Weight Basis)
BRAP
BRAP
P
(1 + P
100)
= 6.2
1 + (6.2
100)
= 5.84
4.1.2. % aggregate in RAP (Wet Weight Basis)
100 - a. = 100 - 5.84 = 94.16
4.1.3. Weight of asphalt in RAP portion/100 g of aggregate blend
(a. )( P )
100 =
(5.84)(40)
100 = 2.34
RAP
4.1.4. Weight of aggregate in RAP portion/100 g of aggregate blend
(b. )( P )
100 =
(94.16)(40)
100 = 37.66
RAP
4.1.5. Weight of reclaimed material/100 g of aggregate blend
c. + d. = 2.34 + 37.66 = 40.00
4.1.6. Weight of new aggregate/100 g of aggregate blend
100 - e. = 100 - 40.00 = 60.00
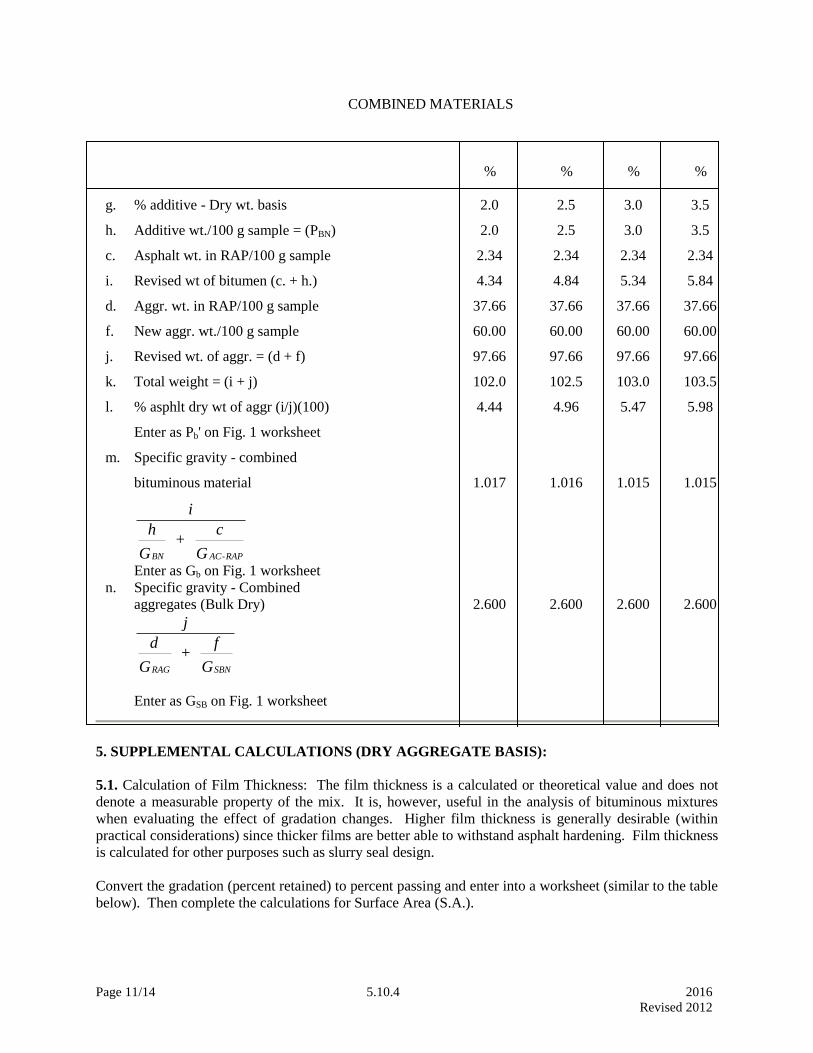
Page 11/14 5.10.4 2016
Revised 2012
COMBINED MATERIALS
% % % %
g. % additive - Dry wt. basis 2.0 2.5 3.0 3.5
h. Additive wt./100 g sample = (PBN) 2.0 2.5 3.0 3.5
c. Asphalt wt. in RAP/100 g sample 2.34 2.34 2.34 2.34
i. Revised wt of bitumen (c. + h.) 4.34 4.84 5.34 5.84
d. Aggr. wt. in RAP/100 g sample 37.66 37.66 37.66 37.66
f. New aggr. wt./100 g sample 60.00 60.00 60.00 60.00
j. Revised wt. of aggr. = (d + f) 97.66 97.66 97.66 97.66
k. Total weight = (i + j) 102.0 102.5 103.0 103.5
l. % asphlt dry wt of aggr (i/j)(100) 4.44 4.96 5.47 5.98
Enter as Pb' on Fig. 1 worksheet
m. Specific gravity - combined
bituminous material 1.017 1.016 1.015 1.015
i
h
G +
c
GBN AC-RAP
Enter as Gb on Fig. 1 worksheet
n. Specific gravity - Combined
aggregates (Bulk Dry) 2.600 2.600 2.600 2.600
j
d
G +
f
GRAG SBN
Enter as GSB on Fig. 1 worksheet
5. SUPPLEMENTAL CALCULATIONS (DRY AGGREGATE BASIS):
5.1. Calculation of Film Thickness: The film thickness is a calculated or theoretical value and does not
denote a measurable property of the mix. It is, however, useful in the analysis of bituminous mixtures
when evaluating the effect of gradation changes. Higher film thickness is generally desirable (within
practical considerations) since thicker films are better able to withstand asphalt hardening. Film thickness
is calculated for other purposes such as slurry seal design.
Convert the gradation (percent retained) to percent passing and enter into a worksheet (similar to the table
below). Then complete the calculations for Surface Area (S.A.).

Page 12/14 5.10.4 2016
Revised 2012
DETERMINATION OF SURFACE AREA
Sieve Size
Percent x S.A. Factor # = Surface Area
Passing m2/kg (ft
2/lb) m
2/kg (ft
2/lb)
19.0 mm (3/4 in.) 100 * 0.0041(0.02) 0.410(2.0)
12.5 mm (1/2 in.) 93 *
9.5 mm (3/8 in.) 81 *
4.75 mm (No. 4) 65 0.0041(0.02) 0.266(1.30)
2.36 mm (No. 8) 48 0.0082(0.04) 0.393(1.92)
1.18 mm (No. 16) 38 0.0164(0.08) 0.623(3.04)
600 µm (No. 30) 27 0.0287(0.14) 0.774(3.78)
300 µm (No. 50) 13 0.0614(0.30) 0.799(3.90)
150 µm (No. 100) 8 0.1229(0.60) 0.983(4.80)
75 µm (No. 200) 6.8 0.3277(1.60) 2.228(10.88)
Total Surface Area = 6.476 m2/kg (31.62 ft
2/lb)
#Surface area factors shown are applicable only when all the above-listed sieves are used in the sieve
analysis.
*Surface area factor is 0.41 m2/kg (2 ft
2/lb) for any material retained above the 4.75 mm (No. 4) sieve.
Thus, the surface area equals 0.410 (2.0) for all material above the 4.75 mm (No. 4) sieve.
5.2. Calculation of Bitumen Index: The bitumen index is the ratio of effective asphalt content to the
aggregate surface area.
SI: Bitumen Index = Pbe(2.048)
S.A. English: Bitumen Index =
Pbe(10)
S.A.
SI Example : Bitumen Index = 5.98(2.048)
6.476= 1.891
English Example : Bitumen Index = 5.98(10)
31.62= 1.891
Where: Pbe = effective asphalt content, see section 3.6.
5.3. Conversion of Bitumen Index to Film Thickness (Microns):
Film Thickness (FT) = Bitumen Index x 4.87 = 1.891 x 4.87 = 9.2 Microns
6. MAXIMUM PERCENT OF ASPHALT:
Determine the maximum percentage of asphalt (Pb' max) which can be placed in a mix and still maintain a
safe level of air voids under conditions of post-construction traffic and elevated mat temperature.
6.1. The maximum volume of asphalt which a mix can contain is the volume of the voids in mineral
aggregate (VMA) plus the volume of asphalt absorbed into the aggregate. The volume of the absorbed
asphalt (VPba) may be determined by the following formula:
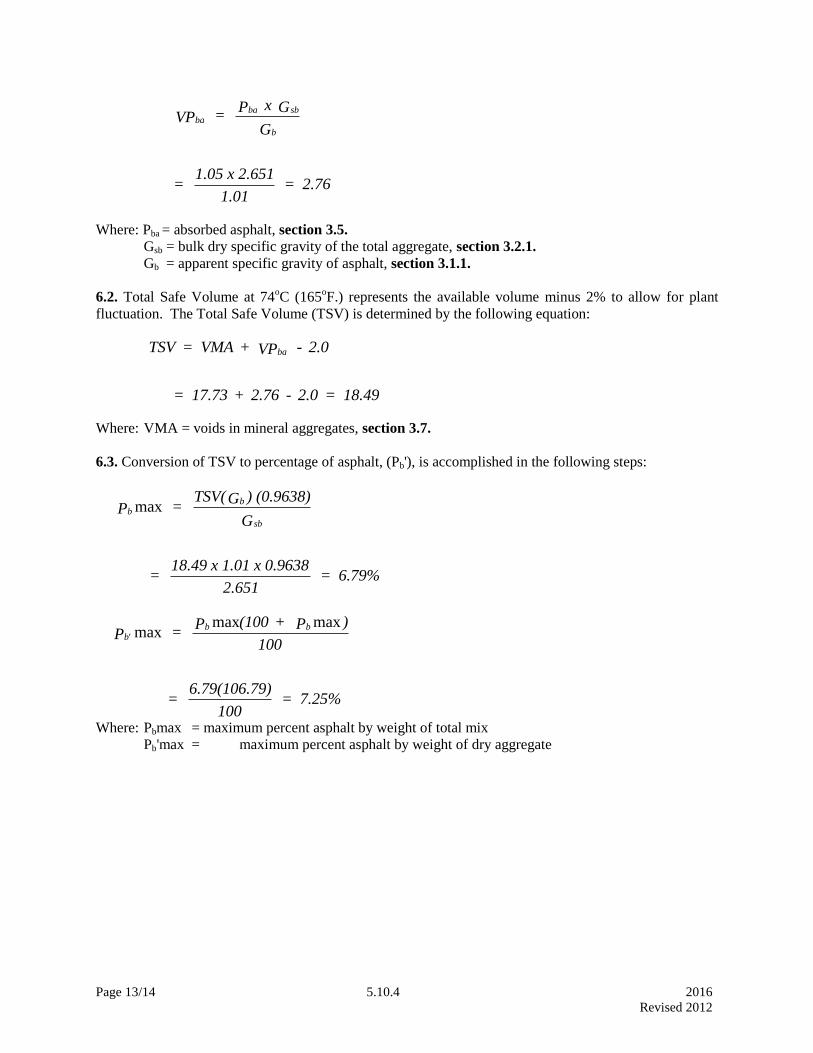
Page 13/14 5.10.4 2016
Revised 2012
baba sb
b
VP = P x G
G
= 1.05 x 2.651
1.01 = 2.76
Where: Pba = absorbed asphalt, section 3.5.
Gsb = bulk dry specific gravity of the total aggregate, section 3.2.1.
Gb = apparent specific gravity of asphalt, section 3.1.1.
6.2. Total Safe Volume at 74oC (165
oF.) represents the available volume minus 2% to allow for plant
fluctuation. The Total Safe Volume (TSV) is determined by the following equation:
TSV = VMA + VP - 2.0
= 17.73 + 2.76 - 2.0 = 18.49
ba
Where: VMA = voids in mineral aggregates, section 3.7.
6.3. Conversion of TSV to percentage of asphalt, (Pb'), is accomplished in the following steps:
bb
sb
P = TSV(G ) (0.9638)
G
= 18.49 x 1.01 x 0.9638
2.651 = 6.79%
max
bb b
P = P (100 + P )
100
= 6.79(106.79)
100 = 7.25%
maxmax max
Where: Pbmax = maximum percent asphalt by weight of total mix
Pb'max = maximum percent asphalt by weight of dry aggregate
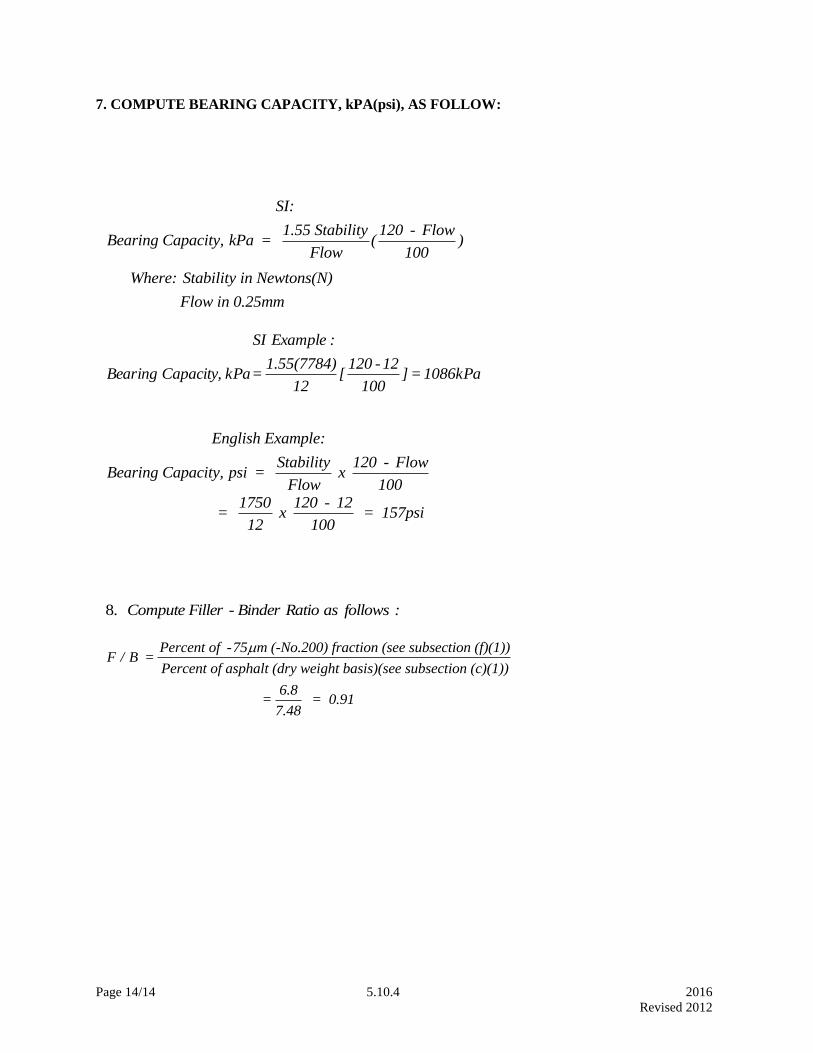
Page 14/14 5.10.4 2016
Revised 2012
7. COMPUTE BEARING CAPACITY, kPA(psi), AS FOLLOW:
SI:
Bearing Capacity, kPa = 1.55 Stability
Flow(120 - Flow
100)
Where: Stability in Newtons(N)
Flow in 0.25mm
1086kPa =] 100
12-120[
12
1.55(7784) = kPa Capacity, Bearing
:Example SI
English Example:
Bearing Capacity, psi = Stability
Flow x
120 - Flow
100
= 1750
12 x
120 - 12
100 = 157psi
:follows as Ratio Binder - Filler Compute .8
F / B =Percent of -75 m (-No.200) fraction (see subsection (f)(1))
Percent of asphalt (dry weight basis)(see subsection (c)(1))
=6.8
7.48 = 0.91

Page 1/1 5.10.5 2016
Revised 2012
5.10.5. FINENESS MODULUS OF AGGREGATES (GRADATION FACTOR)
1. SCOPE
This method covers the procedure for calculating the fineness modulus (also known as the gradation
factor) of aggregates.
This abstract, but useful figure indicates the relative fineness or coarseness of an aggregate gradation and
indicates to some extent, the distribution of sizes of the aggregate if the maximum size is known.
2. PROCEDURE
The fineness modulus is determined by adding the percentages by mass retained on the following sieves
meeting AASHTO designation M92, and dividing by 100
3" (75mm), 1 1/2" (3.75 mm), 3/4" (19 mm), 3/8" (9.5 mm), No. 4 (4.75 mm), No. 8 (2.36 mm), No. 16
(1.18 mm), No. 30 (600 m), No. 50 (300 m) and No. 100 (150 m).
Example:
For the following gradation.
Sieve Size Percent Retained
(English) (SI)
3/8" 9.5 mm 0
No. 4 4.75 mm 2
No. 8 2.36 mm 16
No. 16 1.18 mm 27
No. 30 600 m 62
No. 50 300 m 88
No. 100 150 m 96
The fineness modulus (gradation factor) is:
2 16 27 62 88 96
100291
.


SAMPLING AND TESTING FREQUENCY CHART
NON QUALITY CONTROL/QUALITY ASSURANCE SPECIFICATIONS
CONSTRUCTION OR
MATERIAL TYPE
2015 Std. Spec. (SS 2015)
TESTS REQUIRED
(RECORDED TO)
TEST
METHOD
CMS CODE VERIFICATION
SAMPLES & TESTS
(Note f)
CODE ACCEPTANCE SAMPLES
& TESTS
Compaction Field Density Tests
(0.1 lb/ft3 [1 kg/m
3] or 0.1% of
optimum density)
KT-13
or KT-51
ACI a 4 per day per lift when visual
determination is not possible.
Backfill Field Density Tests
(0.1 lb/ft3 [1 kg/m
3] or 0.1% of
optimum density)
KT-13
or KT-51
ACI 1 per structure minimum (each
side).
Moisture Content Moisture Tests
(0.1 g or 0.01% of mass)
KT-13
or KT-51
ACI a 4 per day per lift when visual
determination is not possible.
Backfill Moisture Tests
(0.1 g or 0.01% of mass)
KT-13
or KT-51
ACI 1 per structure minimum (each
side).
Compaction Types
AAA, AA, or A
Field Density Tests
(0.1 lb/ft3 [1 kg/m
3] or 0.1% of
optimum density)
KT-13
or KT-51
ACI a
b
1000 ft (300 m).
Moisture Content
Requirements for
MR-0, MR-3, MR-3-3 or MR-5
Moisture Tests
(0.1 g or 0.01% of mass)
KT-11 ACI e
SPECIAL FILL
Sec. 209
Field Density Tests
(0.1 lb/ft3 [1 kg/m
3] or 0.1% of
optimum density)
KT-13
or KT-51
ACI 1 per lift per 300 feet (100
meters) of wall or once daily
MECHANICALLY
STABILIZED EARTH FILL
Sec. 214
Field Density Tests
(0.1 lb/ft3 [1 kg/m
3] or 0.1% of
optimum density)
KT-13
or KT-51
ACI 1 per lift per 300 feet (100
meters) of wall or once daily
DIVISION 200
COMPACTION OF EARTHWORK
Sec. 204, 205 & 208
1/27
Appendix A
2016
Revised 2016

SAMPLING AND TESTING FREQUENCY CHART
NON QUALITY CONTROL/QUALITY ASSURANCE SPECIFICATIONS
CONSTRUCTION OR
MATERIAL TYPE
2015 Std. Spec. (SS 2015)
TESTS REQUIRED
(RECORDED TO)
TEST
METHOD
CMS CODE VERIFICATION
SAMPLES & TESTS
(Note f)
CODE ACCEPTANCE SAMPLES
& TESTS
Sieve Analysis of Aggregate
(1%, 0.1% for No. 200 [75 µm]
sieve, of mass)
KT-2 ACC a Once in the AM and once in
the PM or every 500 TONS
(500 Mg) whichever is less
frequent.Material Passing the No. 200 (75
µm) Sieve by the Wash Method
(0.1% of mass)
KT-3 ACI a Once in the AM and once in
the PM or every 500 TONS
(500 Mg) whichever is less
frequent.Clay Lumps and Friable Particles in
Aggregate
(0.1 g or 0.01% of mass)
KT-7 e
Shale or Shale-Like Materials in
Aggregate
(0.1 g or 0.01% of mass)
KT-8 e
Plasticity Tests
(0.01 g or 0.1% of mass)
KT-10 ACI b
c
Once in the AM and once in
the PM or every 500 TONS
(500 Mg) whichever is less
frequent.Sticks in Aggregate
(0.01% of mass)
KT-35 e
CALCIUM CHLORIDE
Sec. 301, 305 & 1702
VER Sample first container
received on project.
Moisture Tests
(0.1 g or 0.01% of mass)
KT-11 ACI e
Sieve Analysis for Acceptance of
Lime or Cement Treated Subgrade
(1% of mass)
KT-42 ACI e
Percent Solids of Lime Slurry
(WPG 0.01 g, Slurry Solids 0.1%)
KT-62 1 per day or batch, whichever
is greater.
LIME TREATED SUBGRADE
Sec. 302, 2000 & 2400
SUBGRADE MODIFICATION
Sec. 301, 1110 & 1112
Aggregates
DIVISION 300
(See also Division 1100 regarding aggregates)
2/27
Appendix A
2016
Revised 2016
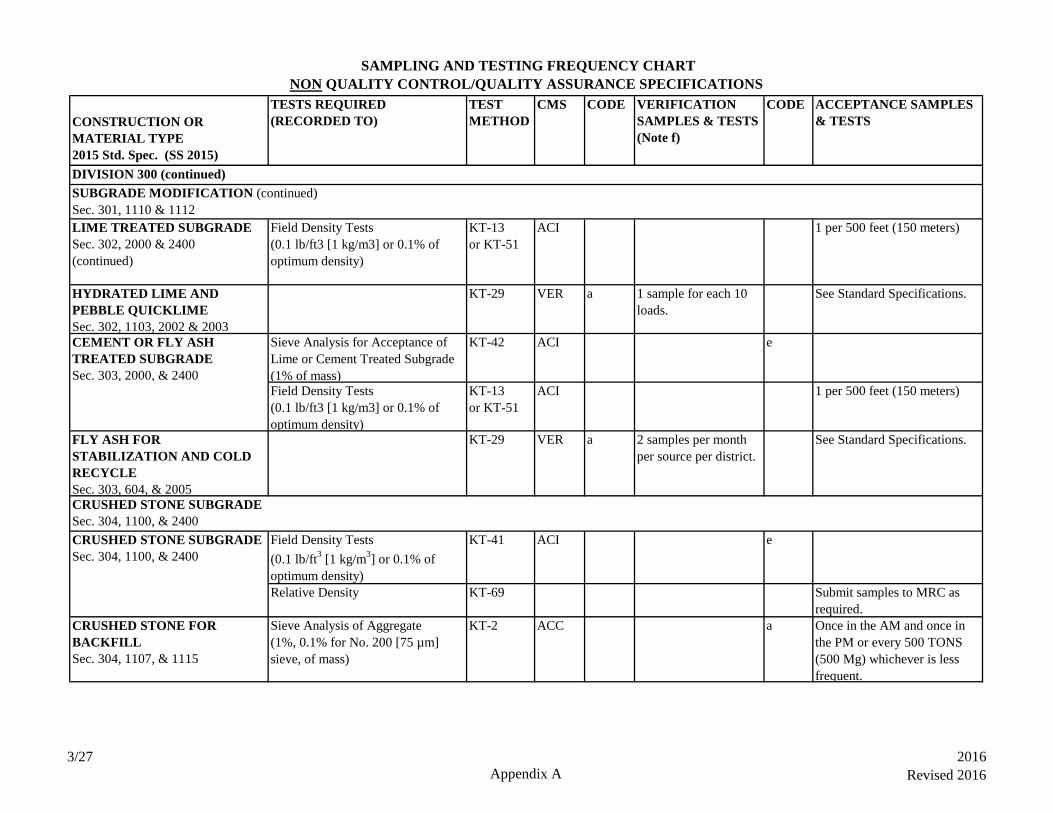
SAMPLING AND TESTING FREQUENCY CHART
NON QUALITY CONTROL/QUALITY ASSURANCE SPECIFICATIONS
CONSTRUCTION OR
MATERIAL TYPE
2015 Std. Spec. (SS 2015)
TESTS REQUIRED
(RECORDED TO)
TEST
METHOD
CMS CODE VERIFICATION
SAMPLES & TESTS
(Note f)
CODE ACCEPTANCE SAMPLES
& TESTS
LIME TREATED SUBGRADE
Sec. 302, 2000 & 2400
(continued)
Field Density Tests
(0.1 lb/ft3 [1 kg/m3] or 0.1% of
optimum density)
KT-13
or KT-51
ACI 1 per 500 feet (150 meters)
HYDRATED LIME AND
PEBBLE QUICKLIME
Sec. 302, 1103, 2002 & 2003
KT-29 VER a 1 sample for each 10
loads.
See Standard Specifications.
CEMENT OR FLY ASH
TREATED SUBGRADE
Sec. 303, 2000, & 2400
Sieve Analysis for Acceptance of
Lime or Cement Treated Subgrade
(1% of mass)
KT-42 ACI e
Field Density Tests
(0.1 lb/ft3 [1 kg/m3] or 0.1% of
optimum density)
KT-13
or KT-51
ACI 1 per 500 feet (150 meters)
FLY ASH FOR
STABILIZATION AND COLD
RECYCLE
Sec. 303, 604, & 2005
KT-29 VER a 2 samples per month
per source per district.
See Standard Specifications.
CRUSHED STONE SUBGRADE
Sec. 304, 1100, & 2400
CRUSHED STONE SUBGRADE
Sec. 304, 1100, & 2400
Field Density Tests
(0.1 lb/ft3 [1 kg/m
3] or 0.1% of
optimum density)
KT-41 ACI e
Relative Density KT-69 Submit samples to MRC as
required.
CRUSHED STONE FOR
BACKFILL
Sec. 304, 1107, & 1115
Sieve Analysis of Aggregate
(1%, 0.1% for No. 200 [75 µm]
sieve, of mass)
KT-2 ACC a Once in the AM and once in
the PM or every 500 TONS
(500 Mg) whichever is less
frequent.
DIVISION 300 (continued)
SUBGRADE MODIFICATION (continued)
Sec. 301, 1110 & 1112
3/27
Appendix A
2016
Revised 2016
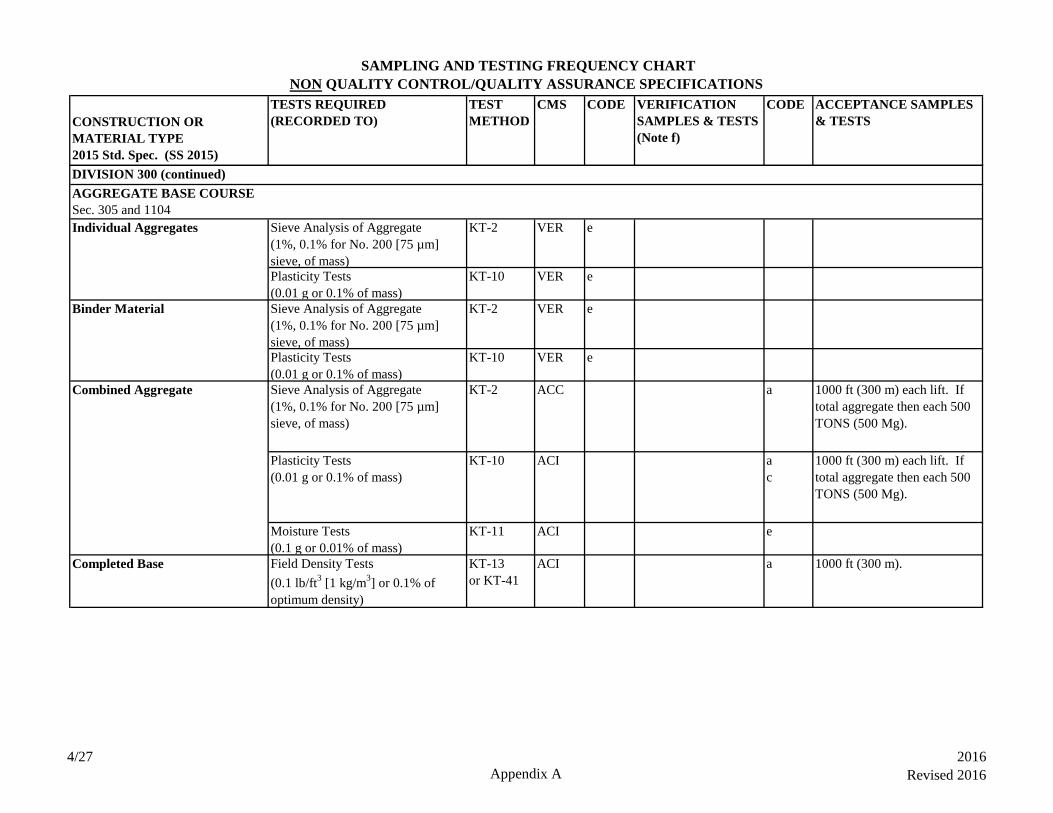
SAMPLING AND TESTING FREQUENCY CHART
NON QUALITY CONTROL/QUALITY ASSURANCE SPECIFICATIONS
CONSTRUCTION OR
MATERIAL TYPE
2015 Std. Spec. (SS 2015)
TESTS REQUIRED
(RECORDED TO)
TEST
METHOD
CMS CODE VERIFICATION
SAMPLES & TESTS
(Note f)
CODE ACCEPTANCE SAMPLES
& TESTS
Sieve Analysis of Aggregate
(1%, 0.1% for No. 200 [75 µm]
sieve, of mass)
KT-2 VER e
Plasticity Tests
(0.01 g or 0.1% of mass)
KT-10 VER e
Sieve Analysis of Aggregate
(1%, 0.1% for No. 200 [75 µm]
sieve, of mass)
KT-2 VER e
Plasticity Tests
(0.01 g or 0.1% of mass)
KT-10 VER e
Sieve Analysis of Aggregate
(1%, 0.1% for No. 200 [75 µm]
sieve, of mass)
KT-2 ACC a 1000 ft (300 m) each lift. If
total aggregate then each 500
TONS (500 Mg).
Plasticity Tests
(0.01 g or 0.1% of mass)
KT-10 ACI a
c
1000 ft (300 m) each lift. If
total aggregate then each 500
TONS (500 Mg).
Moisture Tests
(0.1 g or 0.01% of mass)
KT-11 ACI e
Completed Base Field Density Tests
(0.1 lb/ft3 [1 kg/m
3] or 0.1% of
optimum density)
KT-13
or KT-41
ACI a 1000 ft (300 m).
Individual Aggregates
AGGREGATE BASE COURSE
Sec. 305 and 1104
DIVISION 300 (continued)
Binder Material
Combined Aggregate
4/27
Appendix A
2016
Revised 2016
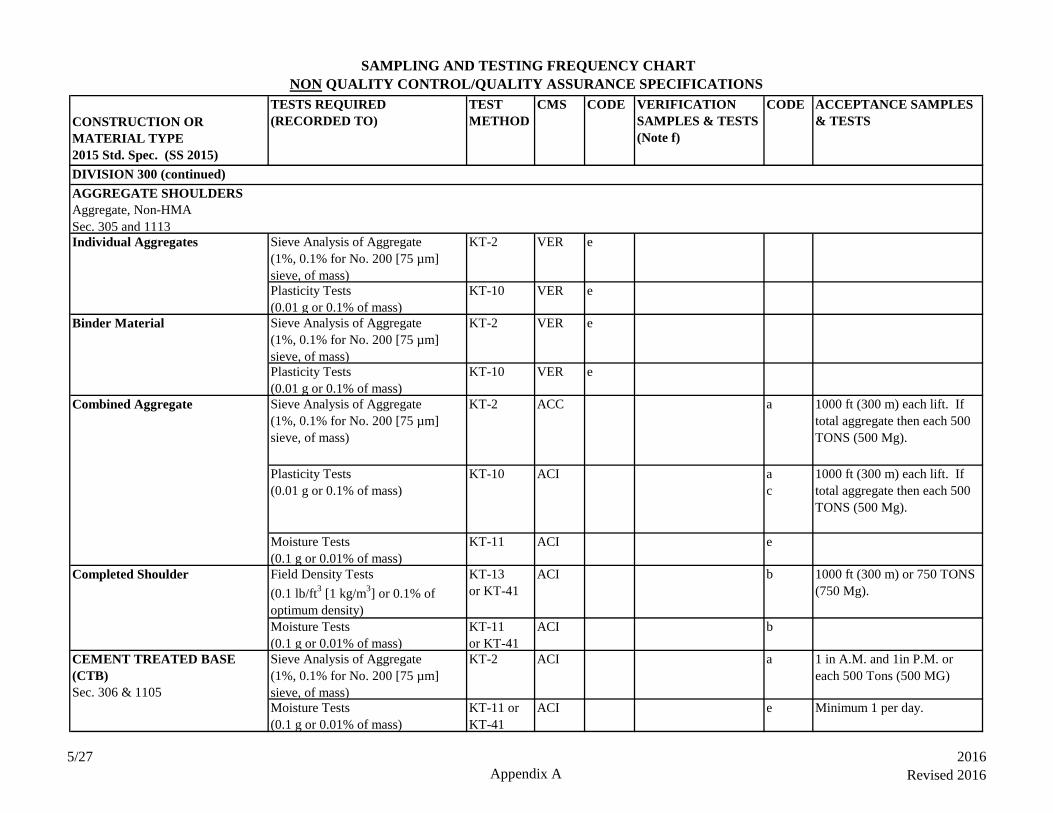
SAMPLING AND TESTING FREQUENCY CHART
NON QUALITY CONTROL/QUALITY ASSURANCE SPECIFICATIONS
CONSTRUCTION OR
MATERIAL TYPE
2015 Std. Spec. (SS 2015)
TESTS REQUIRED
(RECORDED TO)
TEST
METHOD
CMS CODE VERIFICATION
SAMPLES & TESTS
(Note f)
CODE ACCEPTANCE SAMPLES
& TESTS
Sieve Analysis of Aggregate
(1%, 0.1% for No. 200 [75 µm]
sieve, of mass)
KT-2 VER e
Plasticity Tests
(0.01 g or 0.1% of mass)
KT-10 VER e
Sieve Analysis of Aggregate
(1%, 0.1% for No. 200 [75 µm]
sieve, of mass)
KT-2 VER e
Plasticity Tests
(0.01 g or 0.1% of mass)
KT-10 VER e
Sieve Analysis of Aggregate
(1%, 0.1% for No. 200 [75 µm]
sieve, of mass)
KT-2 ACC a 1000 ft (300 m) each lift. If
total aggregate then each 500
TONS (500 Mg).
Plasticity Tests
(0.01 g or 0.1% of mass)
KT-10 ACI a
c
1000 ft (300 m) each lift. If
total aggregate then each 500
TONS (500 Mg).
Moisture Tests
(0.1 g or 0.01% of mass)
KT-11 ACI e
Field Density Tests
(0.1 lb/ft3 [1 kg/m
3] or 0.1% of
optimum density)
KT-13
or KT-41
ACI b 1000 ft (300 m) or 750 TONS
(750 Mg).
Moisture Tests
(0.1 g or 0.01% of mass)
KT-11
or KT-41
ACI b
CEMENT TREATED BASE
(CTB)
Sec. 306 & 1105
Sieve Analysis of Aggregate
(1%, 0.1% for No. 200 [75 µm]
sieve, of mass)
KT-2 ACI a 1 in A.M. and 1in P.M. or
each 500 Tons (500 MG)
Moisture Tests
(0.1 g or 0.01% of mass)
KT-11 or
KT-41
ACI e Minimum 1 per day.
Combined Aggregate
Completed Shoulder
DIVISION 300 (continued)
AGGREGATE SHOULDERS
Aggregate, Non-HMA
Sec. 305 and 1113
Individual Aggregates
Binder Material
5/27
Appendix A
2016
Revised 2016

SAMPLING AND TESTING FREQUENCY CHART
NON QUALITY CONTROL/QUALITY ASSURANCE SPECIFICATIONS
CONSTRUCTION OR
MATERIAL TYPE
2015 Std. Spec. (SS 2015)
TESTS REQUIRED
(RECORDED TO)
TEST
METHOD
CMS CODE VERIFICATION
SAMPLES & TESTS
(Note f)
CODE ACCEPTANCE SAMPLES
& TESTS
DIVISION 300 (continued)
CEMENT TREATED BASE
(CTB)
Sec. 306 & 1105 (continued)
Density
(0.1 lb/ft3 [1 kg/m
3] or 0.1% of
optimum density)
KT-37 or
KT-20*
VER e Minimum of 1 per day
Field Density Tests
(0.1 lb/ft3 [1 kg/m
3] or 0.1% of
optimum density)
KT-13 or
KT-41
ACI a 1,000 ft/width laid or 2,000
ft/lane (300 m/width laid or
600 m/lane)
Moisture Tests
(0.1 g or 0.01% of mass)
KT-11 or
KT-41
ACI a 1,000 ft/width laid or 2,000
ft/lane (300 m/width laid or
600 m/lane)
Sieve Analysis of Aggregate
(1%, 0.1% for No. 200 [75 µm]
sieve, of mass)
KT-2 VER e
Plasticity Tests
(0.01 g or 0.1% of mass)
KT-10 VER e
Sieve Analysis of Aggregate
(1%, 0.1% for No. 200 [75 µm]
sieve, of mass)
KT-2 VER e
Plasticity Tests
(0.01 g or 0.1% of mass)
KT-10 VER e
Pulverization Sieve Analysis of Aggregate
(1%, 0.1% for No. 200 [75 µm]
sieve, of mass)
KT-2 VER e Minimum 1 per day.
Combined Aggregate Sieve Analysis of Aggregate
(1%, 0.1% for No. 200 [75 µm]
sieve, of mass)
KT-2 ACC a 1000 ft (300 m), 500 TONS
(500 Mg) or 500 yd3 (500 m
3).
Plasticity Tests
(0.01 g or 0.1% of mass)
KT-10 ACI a 1000 ft (300 m), 500 TONS
(500 Mg) or 500 yd3 (500 m
3).
Completed Base (CTB)
Binder Material
GRANULAR BASE
Sec. 307 and 1106
Individual Aggregates
6/27
Appendix A
2016
Revised 2016
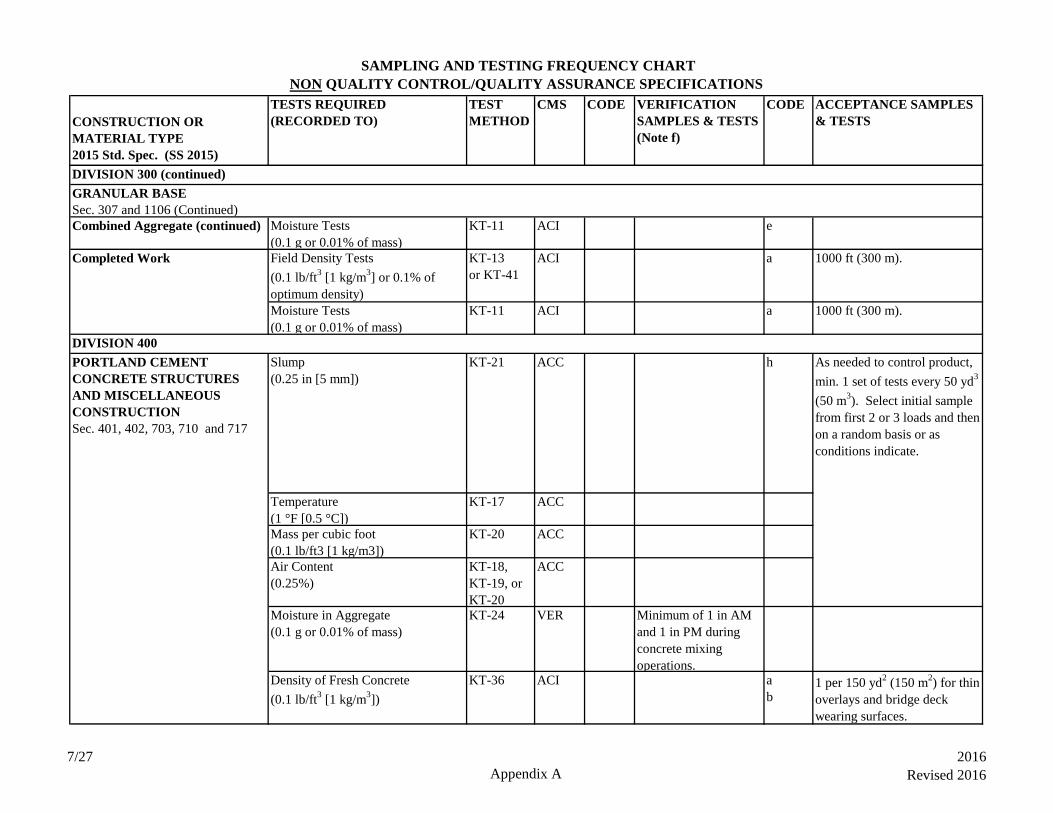
SAMPLING AND TESTING FREQUENCY CHART
NON QUALITY CONTROL/QUALITY ASSURANCE SPECIFICATIONS
CONSTRUCTION OR
MATERIAL TYPE
2015 Std. Spec. (SS 2015)
TESTS REQUIRED
(RECORDED TO)
TEST
METHOD
CMS CODE VERIFICATION
SAMPLES & TESTS
(Note f)
CODE ACCEPTANCE SAMPLES
& TESTS
GRANULAR BASE
Sec. 307 and 1106 (Continued)
Combined Aggregate (continued) Moisture Tests
(0.1 g or 0.01% of mass)
KT-11 ACI e
Completed Work Field Density Tests
(0.1 lb/ft3 [1 kg/m
3] or 0.1% of
optimum density)
KT-13
or KT-41
ACI a 1000 ft (300 m).
Moisture Tests
(0.1 g or 0.01% of mass)
KT-11 ACI a 1000 ft (300 m).
DIVISION 400
(See also Division 1100 regarding PORTLAND CEMENT
CONCRETE STRUCTURES
AND MISCELLANEOUS
CONSTRUCTION
Sec. 401, 402, 703, 710 and 717
Slump
(0.25 in [5 mm])
KT-21 ACC h As needed to control product,
min. 1 set of tests every 50 yd3
(50 m3). Select initial sample
from first 2 or 3 loads and then
on a random basis or as
conditions indicate.
Temperature
(1 °F [0.5 °C])
KT-17 ACC
Mass per cubic foot
(0.1 lb/ft3 [1 kg/m3])
KT-20 ACC
Air Content
(0.25%)
KT-18,
KT-19, or
KT-20
ACC
Moisture in Aggregate
(0.1 g or 0.01% of mass)
KT-24 VER Minimum of 1 in AM
and 1 in PM during
concrete mixing
operations.Density of Fresh Concrete
(0.1 lb/ft3 [1 kg/m
3])
KT-36 ACI a
b1 per 150 yd
2 (150 m
2) for thin
overlays and bridge deck
wearing surfaces.
DIVISION 300 (continued)
7/27
Appendix A
2016
Revised 2016
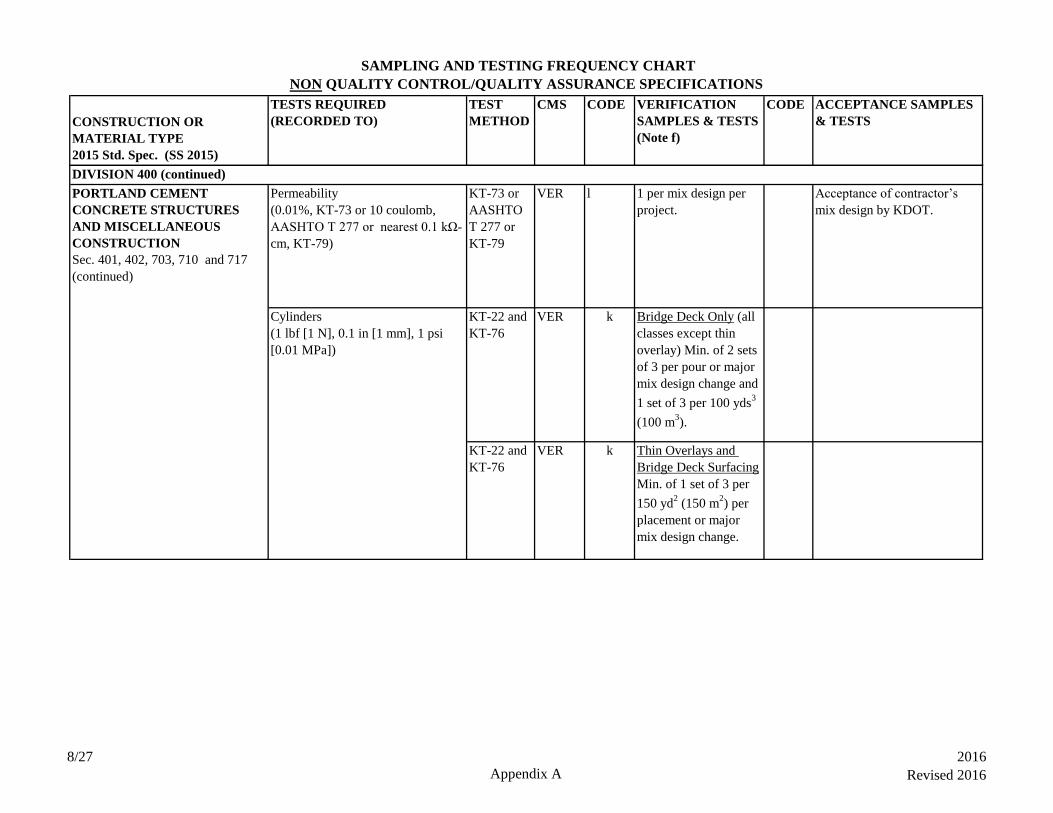
SAMPLING AND TESTING FREQUENCY CHART
NON QUALITY CONTROL/QUALITY ASSURANCE SPECIFICATIONS
CONSTRUCTION OR
MATERIAL TYPE
2015 Std. Spec. (SS 2015)
TESTS REQUIRED
(RECORDED TO)
TEST
METHOD
CMS CODE VERIFICATION
SAMPLES & TESTS
(Note f)
CODE ACCEPTANCE SAMPLES
& TESTS
PORTLAND CEMENT
CONCRETE STRUCTURES
AND MISCELLANEOUS
CONSTRUCTION
Sec. 401, 402, 703, 710 and 717
(continued)
Permeability
(0.01%, KT-73 or 10 coulomb,
AASHTO T 277 or nearest 0.1 kΩ-
cm, KT-79)
KT-73 or
AASHTO
T 277 or
KT-79
VER l 1 per mix design per
project.
Acceptance of contractor’s
mix design by KDOT.
Cylinders
(1 lbf [1 N], 0.1 in [1 mm], 1 psi
[0.01 MPa])
KT-22 and
KT-76
VER k Bridge Deck Only (all
classes except thin
overlay) Min. of 2 sets
of 3 per pour or major
mix design change and
1 set of 3 per 100 yds3
(100 m3).
KT-22 and
KT-76
VER k Thin Overlays and
Bridge Deck Surfacing
Min. of 1 set of 3 per
150 yd2 (150 m
2) per
placement or major
mix design change.
DIVISION 400 (continued)
8/27
Appendix A
2016
Revised 2016
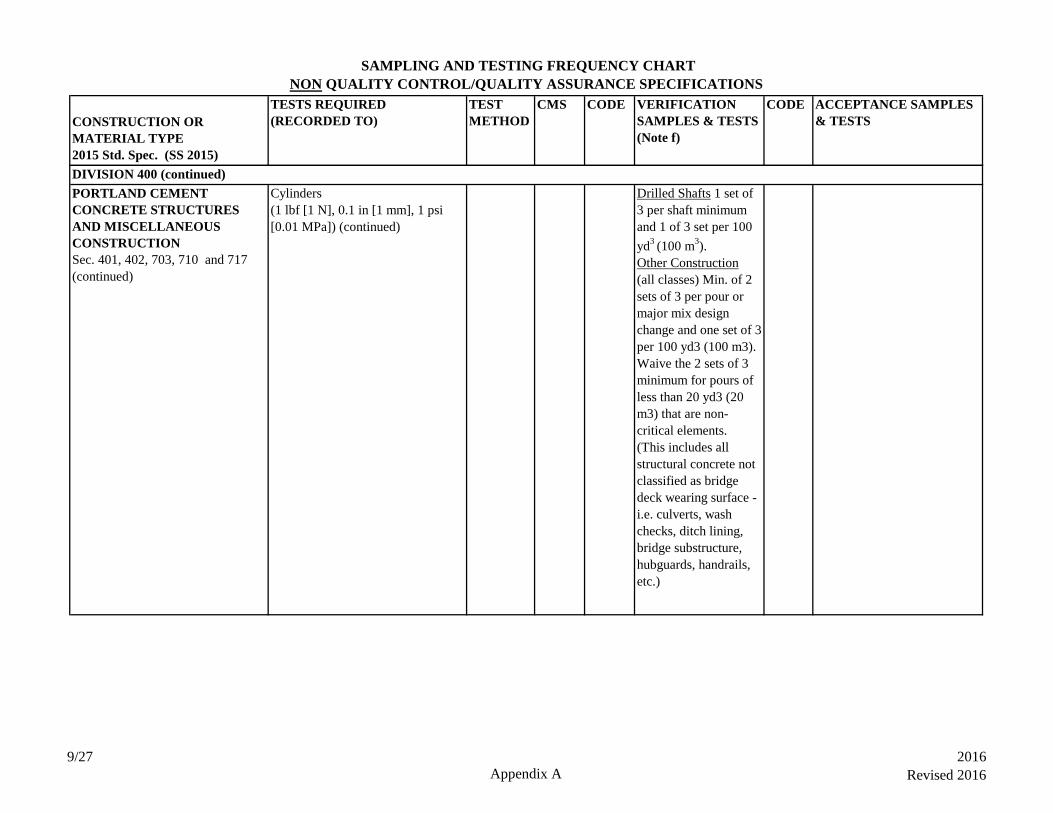
SAMPLING AND TESTING FREQUENCY CHART
NON QUALITY CONTROL/QUALITY ASSURANCE SPECIFICATIONS
CONSTRUCTION OR
MATERIAL TYPE
2015 Std. Spec. (SS 2015)
TESTS REQUIRED
(RECORDED TO)
TEST
METHOD
CMS CODE VERIFICATION
SAMPLES & TESTS
(Note f)
CODE ACCEPTANCE SAMPLES
& TESTS
PORTLAND CEMENT
CONCRETE STRUCTURES
AND MISCELLANEOUS
CONSTRUCTION
Sec. 401, 402, 703, 710 and 717
(continued)
Cylinders
(1 lbf [1 N], 0.1 in [1 mm], 1 psi
[0.01 MPa]) (continued)
Drilled Shafts 1 set of
3 per shaft minimum
and 1 of 3 set per 100
yd3
(100 m3).
Other Construction
(all classes) Min. of 2
sets of 3 per pour or
major mix design
change and one set of 3
per 100 yd3 (100 m3).
Waive the 2 sets of 3
minimum for pours of
less than 20 yd3 (20
m3) that are non-
critical elements.
(This includes all
structural concrete not
classified as bridge
deck wearing surface -
i.e. culverts, wash
checks, ditch lining,
bridge substructure,
hubguards, handrails,
etc.)
DIVISION 400 (continued)
9/27
Appendix A
2016
Revised 2016
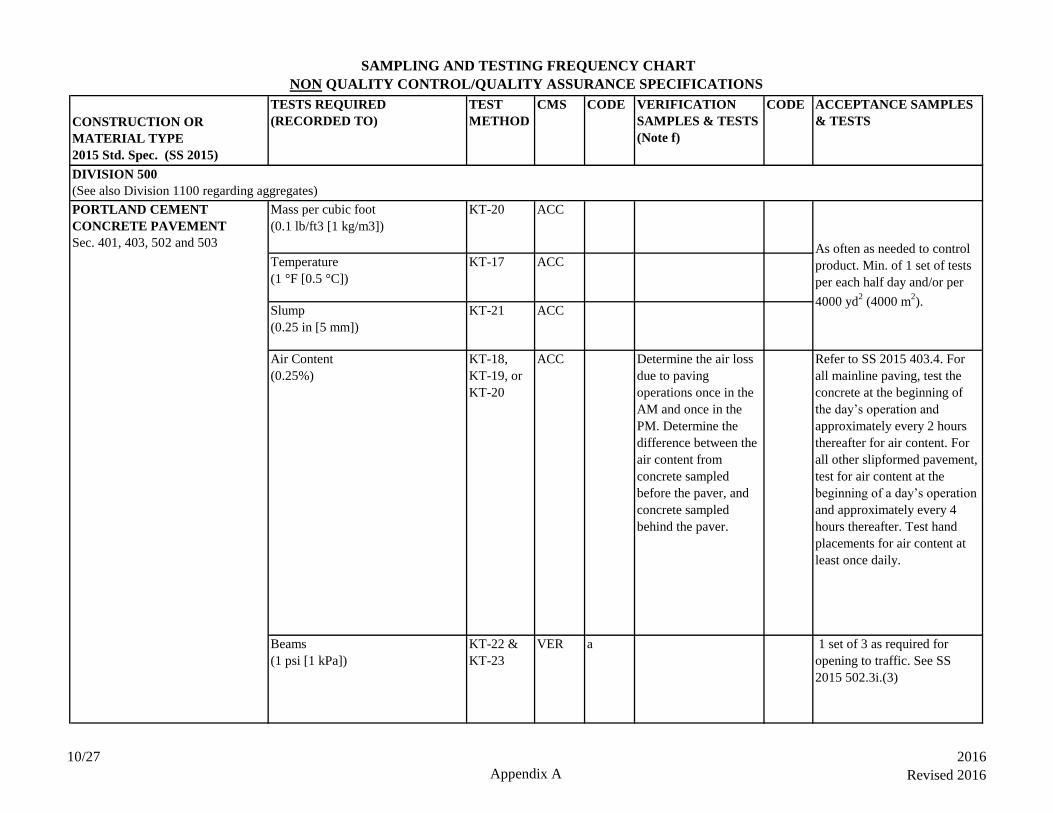
SAMPLING AND TESTING FREQUENCY CHART
NON QUALITY CONTROL/QUALITY ASSURANCE SPECIFICATIONS
CONSTRUCTION OR
MATERIAL TYPE
2015 Std. Spec. (SS 2015)
TESTS REQUIRED
(RECORDED TO)
TEST
METHOD
CMS CODE VERIFICATION
SAMPLES & TESTS
(Note f)
CODE ACCEPTANCE SAMPLES
& TESTS
PORTLAND CEMENT
CONCRETE PAVEMENT
Sec. 401, 403, 502 and 503
Mass per cubic foot
(0.1 lb/ft3 [1 kg/m3])
KT-20 ACC
Temperature
(1 °F [0.5 °C])
KT-17 ACC
Slump
(0.25 in [5 mm])
KT-21 ACC
Air Content
(0.25%)
KT-18,
KT-19, or
KT-20
ACC Determine the air loss
due to paving
operations once in the
AM and once in the
PM. Determine the
difference between the
air content from
concrete sampled
before the paver, and
concrete sampled
behind the paver.
Refer to SS 2015 403.4. For
all mainline paving, test the
concrete at the beginning of
the day’s operation and
approximately every 2 hours
thereafter for air content. For
all other slipformed pavement,
test for air content at the
beginning of a day’s operation
and approximately every 4
hours thereafter. Test hand
placements for air content at
least once daily.
Beams
(1 psi [1 kPa])
KT-22 &
KT-23
VER a 1 set of 3 as required for
opening to traffic. See SS
2015 502.3i.(3)
As often as needed to control
product. Min. of 1 set of tests
per each half day and/or per
4000 yd2 (4000 m
2).
DIVISION 500
(See also Division 1100 regarding aggregates)
10/27
Appendix A
2016
Revised 2016
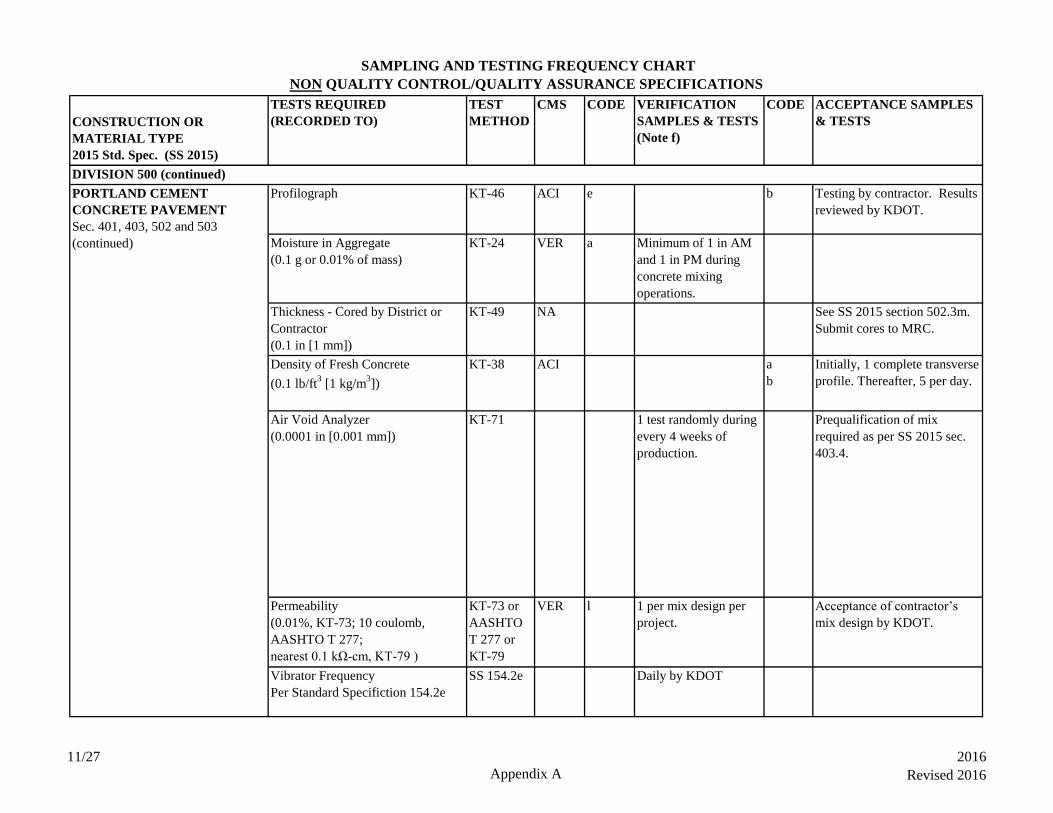
SAMPLING AND TESTING FREQUENCY CHART
NON QUALITY CONTROL/QUALITY ASSURANCE SPECIFICATIONS
CONSTRUCTION OR
MATERIAL TYPE
2015 Std. Spec. (SS 2015)
TESTS REQUIRED
(RECORDED TO)
TEST
METHOD
CMS CODE VERIFICATION
SAMPLES & TESTS
(Note f)
CODE ACCEPTANCE SAMPLES
& TESTS
Profilograph KT-46 ACI e b Testing by contractor. Results
reviewed by KDOT.
Moisture in Aggregate
(0.1 g or 0.01% of mass)
KT-24 VER a Minimum of 1 in AM
and 1 in PM during
concrete mixing
operations.
Thickness - Cored by District or
Contractor
(0.1 in [1 mm])
KT-49 NA See SS 2015 section 502.3m.
Submit cores to MRC.
Density of Fresh Concrete
(0.1 lb/ft3 [1 kg/m
3])
KT-38 ACI a
b
Initially, 1 complete transverse
profile. Thereafter, 5 per day.
Air Void Analyzer
(0.0001 in [0.001 mm])
KT-71 1 test randomly during
every 4 weeks of
production.
Prequalification of mix
required as per SS 2015 sec.
403.4.
Permeability
(0.01%, KT-73; 10 coulomb,
AASHTO T 277;
nearest 0.1 kΩ-cm, KT-79 )
KT-73 or
AASHTO
T 277 or
KT-79
VER l 1 per mix design per
project.
Acceptance of contractor’s
mix design by KDOT.
Vibrator Frequency
Per Standard Specifiction 154.2e
SS 154.2e Daily by KDOT
PORTLAND CEMENT
CONCRETE PAVEMENT
Sec. 401, 403, 502 and 503
(continued)
DIVISION 500 (continued)
11/27
Appendix A
2016
Revised 2016
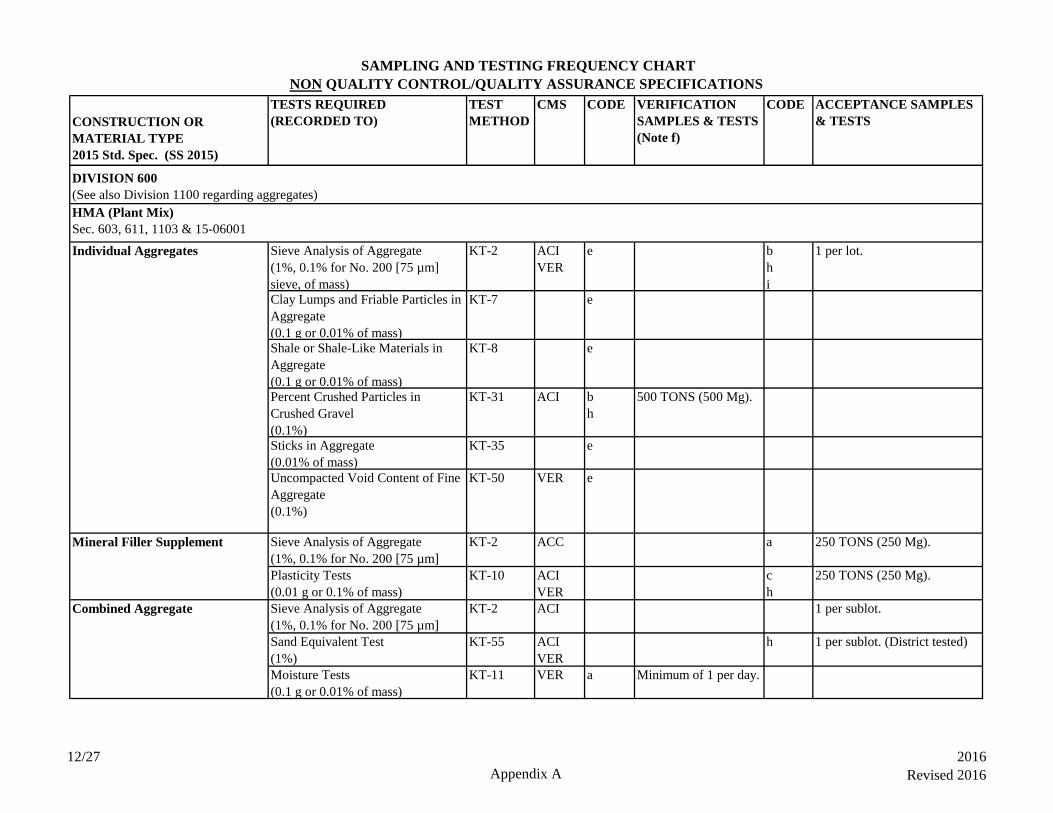
SAMPLING AND TESTING FREQUENCY CHART
NON QUALITY CONTROL/QUALITY ASSURANCE SPECIFICATIONS
CONSTRUCTION OR
MATERIAL TYPE
2015 Std. Spec. (SS 2015)
TESTS REQUIRED
(RECORDED TO)
TEST
METHOD
CMS CODE VERIFICATION
SAMPLES & TESTS
(Note f)
CODE ACCEPTANCE SAMPLES
& TESTS
Sieve Analysis of Aggregate
(1%, 0.1% for No. 200 [75 µm]
sieve, of mass)
KT-2 ACI
VER
e b
h
i
1 per lot.
Clay Lumps and Friable Particles in
Aggregate
(0.1 g or 0.01% of mass)
KT-7 e
Shale or Shale-Like Materials in
Aggregate
(0.1 g or 0.01% of mass)
KT-8 e
Percent Crushed Particles in
Crushed Gravel
(0.1%)
KT-31 ACI b
h
500 TONS (500 Mg).
Sticks in Aggregate
(0.01% of mass)
KT-35 e
Uncompacted Void Content of Fine
Aggregate
(0.1%)
KT-50 VER e
Sieve Analysis of Aggregate
(1%, 0.1% for No. 200 [75 µm]
KT-2 ACC a 250 TONS (250 Mg).
Plasticity Tests
(0.01 g or 0.1% of mass)
KT-10 ACI
VER
c
h
250 TONS (250 Mg).
Sieve Analysis of Aggregate
(1%, 0.1% for No. 200 [75 µm]
KT-2 ACI 1 per sublot.
Sand Equivalent Test
(1%)
KT-55 ACI
VER
h 1 per sublot. (District tested)
Moisture Tests
(0.1 g or 0.01% of mass)
KT-11 VER a Minimum of 1 per day.
DIVISION 600
(See also Division 1100 regarding aggregates)
HMA (Plant Mix)
Sec. 603, 611, 1103 & 15-06001
Individual Aggregates
Combined Aggregate
Mineral Filler Supplement
12/27
Appendix A
2016
Revised 2016

SAMPLING AND TESTING FREQUENCY CHART
NON QUALITY CONTROL/QUALITY ASSURANCE SPECIFICATIONS
CONSTRUCTION OR
MATERIAL TYPE
2015 Std. Spec. (SS 2015)
TESTS REQUIRED
(RECORDED TO)
TEST
METHOD
CMS CODE VERIFICATION
SAMPLES & TESTS
(Note f)
CODE ACCEPTANCE SAMPLES
& TESTS
Density
(0.1 lb/ft3 [1 kg/m
3] or 0.01% of
optimum density)
Voids
(0.01%)
Moisture Tests
(0.1 g or 0.01% of mass)
KT-11 ACI a Minimum of 1 per day.
Asphalt Binder Binder Sampling KT-26 VER e
b
1 sample per 3 loads. 1 per project.
Density
(0.1 lb/ft3 [1 kg/m
3] or 0.01% of
optimum density)
Voids
(0.01%)
Stability
(1 lbf [1 N])
Flow
(0.01 in [0.25 mm])
Gradation
(1%, 0.1% for the No. 200 [75 µm]
sieve, of mass)
KT-34
Asphalt Content
(0.1 g or 0.01%)
KT-57
Theoretical Maximum Specific
Gravity of Asphalt Paving Mixtures
(Gmm = 0.001)
KT-39 VER 1 per lot with a
minimum of 1 per day.
Moisture Tests
(0.1 g or 0.01% of mass)
KT-11 ACI a Minimum of 1 per day.
VER aMinimum of 1 set per
day.
DIVISION 600 (continued)
HMA (Plant Mix) (continued)
Sec. 603, 611, 1103 & 15-06001
KT-14
HMA Mixtures (Field Lab)
KT-14
a
Minimum of 1 set per
project. (District
molded)
VER
BM-Mixes (Field Lab)
HMA Mixtures (District Lab)
13/27
Appendix A
2016
Revised 2016

SAMPLING AND TESTING FREQUENCY CHART
NON QUALITY CONTROL/QUALITY ASSURANCE SPECIFICATIONS
CONSTRUCTION OR
MATERIAL TYPE
2015 Std. Spec. (SS 2015)
TESTS REQUIRED
(RECORDED TO)
TEST
METHOD
CMS CODE VERIFICATION
SAMPLES & TESTS
(Note f)
CODE ACCEPTANCE SAMPLES
& TESTS
Air Voids
(Va = 0.01%; Gmb = 0.001)
KT-15 and
KT-58
Theoretical Maximum Specific
Gravity of Asphalt Paving Mixtures
(Gmm = 0.001)
KT-39
Gradation
(1%, 0.1% for the No. 200 [75 µm]
sieve, of mass)
KT-34
Asphalt Content
(0.1 g or 0.01%)
KT-57
Federal Aid Projects (Field or
District Labs)
Asphalt Content
(0.1 g or 0.01%)
KT-57 VER Minimum of 1 in AM
and 1 in PM, or 1 per
1000 TONS (1000
Mg).Completed Road Work
Field Density Tests
(Use Cores, Nuclear Density, or the
Approved Rolling Procedure
method on all HMA roadway or
shoulder construction)
Field Density - Cores
(Gmb = 0.001; 0.1 lb/ft3 [1 kg/m
3] or
0.01% of optimum density)
Note: If specified [plan] lift
thickness is less than 1.5” (40 mm),
none required.
KT-15 ACI a
b
Shoulders
1 set per shoulder per mile
(1.5 km) per lift.
Surf. & Base Courses
1 set per lane per mile (1.5
km) per lift.
Min. of 1 per day.
j
BM-Mixes (District Lab)
Minimum of 1 set per
project. (District
molded)
DIVISION 600 (continued)
HMA (Plant Mix) (continued)
Sec. 603, 611, 1103 & 15-06001
VER
14/27
Appendix A
2016
Revised 2016
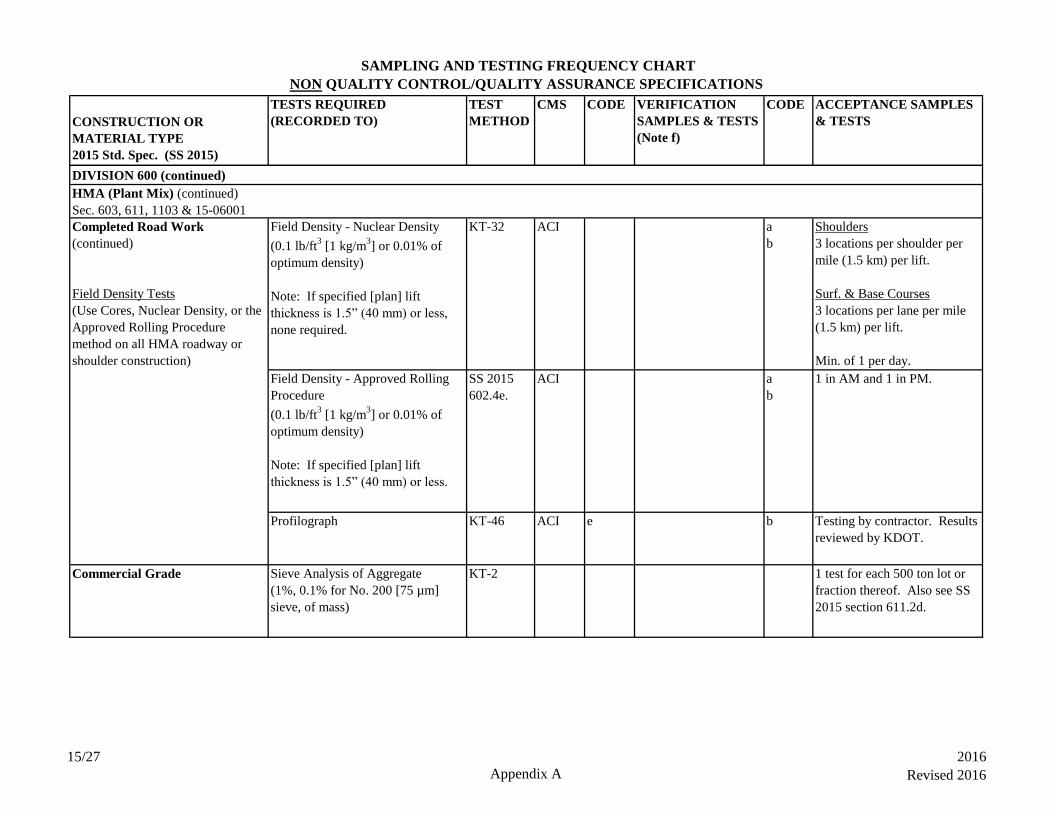
SAMPLING AND TESTING FREQUENCY CHART
NON QUALITY CONTROL/QUALITY ASSURANCE SPECIFICATIONS
CONSTRUCTION OR
MATERIAL TYPE
2015 Std. Spec. (SS 2015)
TESTS REQUIRED
(RECORDED TO)
TEST
METHOD
CMS CODE VERIFICATION
SAMPLES & TESTS
(Note f)
CODE ACCEPTANCE SAMPLES
& TESTS
Field Density - Nuclear Density
(0.1 lb/ft3 [1 kg/m
3] or 0.01% of
optimum density)
Note: If specified [plan] lift
thickness is 1.5” (40 mm) or less,
none required.
KT-32 ACI a
b
Shoulders
3 locations per shoulder per
mile (1.5 km) per lift.
Surf. & Base Courses
3 locations per lane per mile
(1.5 km) per lift.
Min. of 1 per day.
Field Density - Approved Rolling
Procedure
(0.1 lb/ft3 [1 kg/m
3] or 0.01% of
optimum density)
Note: If specified [plan] lift
thickness is 1.5” (40 mm) or less.
SS 2015
602.4e.
ACI a
b
1 in AM and 1 in PM.
Profilograph KT-46 ACI e b Testing by contractor. Results
reviewed by KDOT.
Commercial Grade Sieve Analysis of Aggregate
(1%, 0.1% for No. 200 [75 µm]
sieve, of mass)
KT-2 1 test for each 500 ton lot or
fraction thereof. Also see SS
2015 section 611.2d.
DIVISION 600 (continued)
Completed Road Work
(continued)
Field Density Tests
(Use Cores, Nuclear Density, or the
Approved Rolling Procedure
method on all HMA roadway or
shoulder construction)
HMA (Plant Mix) (continued)
Sec. 603, 611, 1103 & 15-06001
15/27
Appendix A
2016
Revised 2016
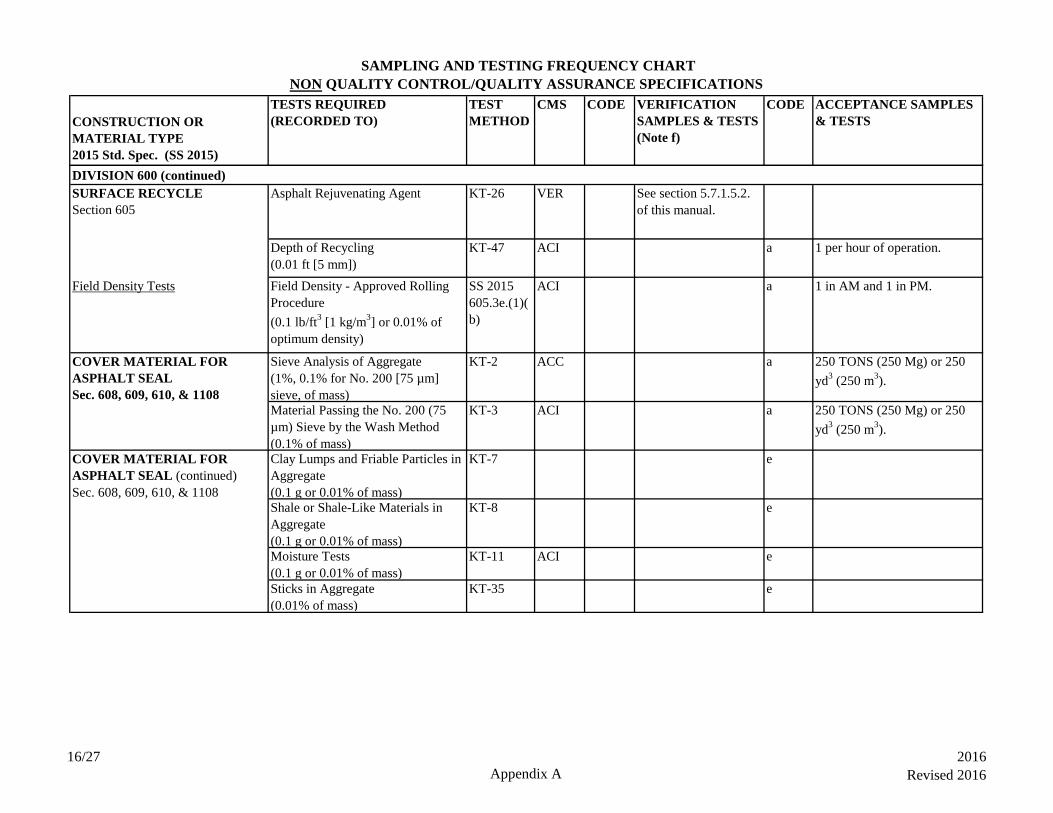
SAMPLING AND TESTING FREQUENCY CHART
NON QUALITY CONTROL/QUALITY ASSURANCE SPECIFICATIONS
CONSTRUCTION OR
MATERIAL TYPE
2015 Std. Spec. (SS 2015)
TESTS REQUIRED
(RECORDED TO)
TEST
METHOD
CMS CODE VERIFICATION
SAMPLES & TESTS
(Note f)
CODE ACCEPTANCE SAMPLES
& TESTS
Asphalt Rejuvenating Agent KT-26 VER See section 5.7.1.5.2.
of this manual.
Depth of Recycling
(0.01 ft [5 mm])
KT-47 ACI a 1 per hour of operation.
Field Density Tests Field Density - Approved Rolling
Procedure
(0.1 lb/ft3 [1 kg/m
3] or 0.01% of
optimum density)
SS 2015
605.3e.(1)(
b)
ACI a 1 in AM and 1 in PM.
COVER MATERIAL FOR
ASPHALT SEAL
Sec. 608, 609, 610, & 1108
Sieve Analysis of Aggregate
(1%, 0.1% for No. 200 [75 µm]
sieve, of mass)
KT-2 ACC a 250 TONS (250 Mg) or 250
yd3 (250 m
3).
Material Passing the No. 200 (75
µm) Sieve by the Wash Method
(0.1% of mass)
KT-3 ACI a 250 TONS (250 Mg) or 250
yd3 (250 m
3).
Clay Lumps and Friable Particles in
Aggregate
(0.1 g or 0.01% of mass)
KT-7 e
Shale or Shale-Like Materials in
Aggregate
(0.1 g or 0.01% of mass)
KT-8 e
Moisture Tests
(0.1 g or 0.01% of mass)
KT-11 ACI e
Sticks in Aggregate
(0.01% of mass)
KT-35 e
DIVISION 600 (continued)
SURFACE RECYCLE
Section 605
COVER MATERIAL FOR
ASPHALT SEAL (continued)
Sec. 608, 609, 610, & 1108
16/27
Appendix A
2016
Revised 2016
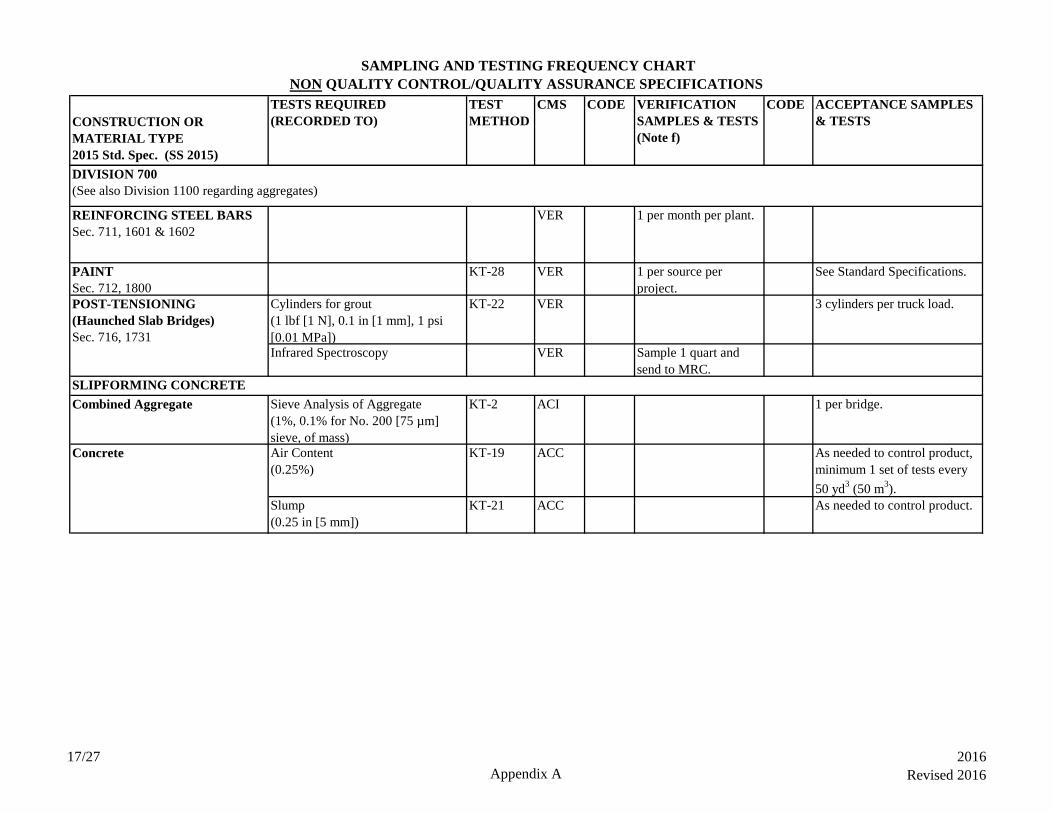
SAMPLING AND TESTING FREQUENCY CHART
NON QUALITY CONTROL/QUALITY ASSURANCE SPECIFICATIONS
CONSTRUCTION OR
MATERIAL TYPE
2015 Std. Spec. (SS 2015)
TESTS REQUIRED
(RECORDED TO)
TEST
METHOD
CMS CODE VERIFICATION
SAMPLES & TESTS
(Note f)
CODE ACCEPTANCE SAMPLES
& TESTS
REINFORCING STEEL BARS
Sec. 711, 1601 & 1602
VER 1 per month per plant.
PAINT
Sec. 712, 1800
KT-28 VER 1 per source per
project.
See Standard Specifications.
Cylinders for grout
(1 lbf [1 N], 0.1 in [1 mm], 1 psi
[0.01 MPa])
KT-22 VER 3 cylinders per truck load.
Infrared Spectroscopy VER Sample 1 quart and
send to MRC.
Combined Aggregate Sieve Analysis of Aggregate
(1%, 0.1% for No. 200 [75 µm]
sieve, of mass)
KT-2 ACI 1 per bridge.
Air Content
(0.25%)
KT-19 ACC As needed to control product,
minimum 1 set of tests every
50 yd3 (50 m
3).
Slump
(0.25 in [5 mm])
KT-21 ACC As needed to control product.
DIVISION 700
(See also Division 1100 regarding aggregates)
POST-TENSIONING
(Haunched Slab Bridges)
Sec. 716, 1731
Concrete
SLIPFORMING CONCRETE
BARRIER FOR BRIDGES
17/27
Appendix A
2016
Revised 2016
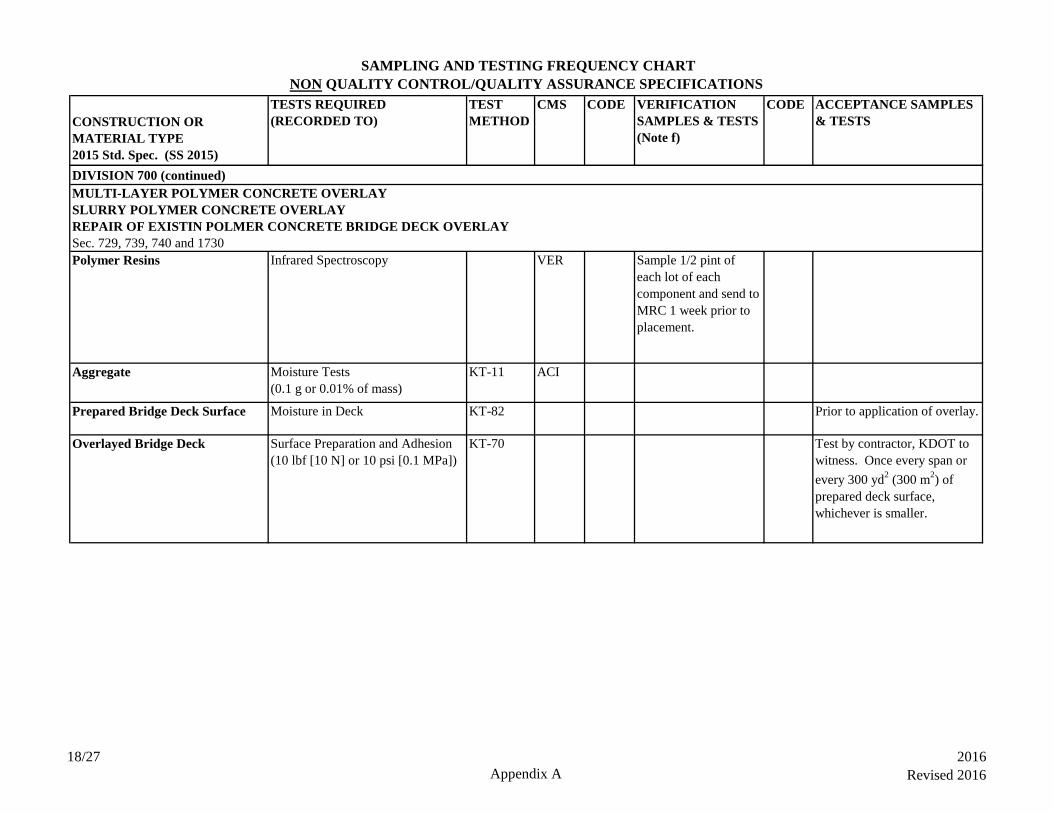
SAMPLING AND TESTING FREQUENCY CHART
NON QUALITY CONTROL/QUALITY ASSURANCE SPECIFICATIONS
CONSTRUCTION OR
MATERIAL TYPE
2015 Std. Spec. (SS 2015)
TESTS REQUIRED
(RECORDED TO)
TEST
METHOD
CMS CODE VERIFICATION
SAMPLES & TESTS
(Note f)
CODE ACCEPTANCE SAMPLES
& TESTS
Polymer Resins Infrared Spectroscopy VER Sample 1/2 pint of
each lot of each
component and send to
MRC 1 week prior to
placement.
Aggregate Moisture Tests
(0.1 g or 0.01% of mass)
KT-11 ACI
Prepared Bridge Deck Surface Moisture in Deck KT-82 Prior to application of overlay.
Overlayed Bridge Deck Surface Preparation and Adhesion
(10 lbf [10 N] or 10 psi [0.1 MPa])
KT-70 Test by contractor, KDOT to
witness. Once every span or
every 300 yd2 (300 m
2) of
prepared deck surface,
whichever is smaller.
MULTI-LAYER POLYMER CONCRETE OVERLAY
SLURRY POLYMER CONCRETE OVERLAY
REPAIR OF EXISTIN POLMER CONCRETE BRIDGE DECK OVERLAY
Sec. 729, 739, 740 and 1730
DIVISION 700 (continued)
18/27
Appendix A
2016
Revised 2016
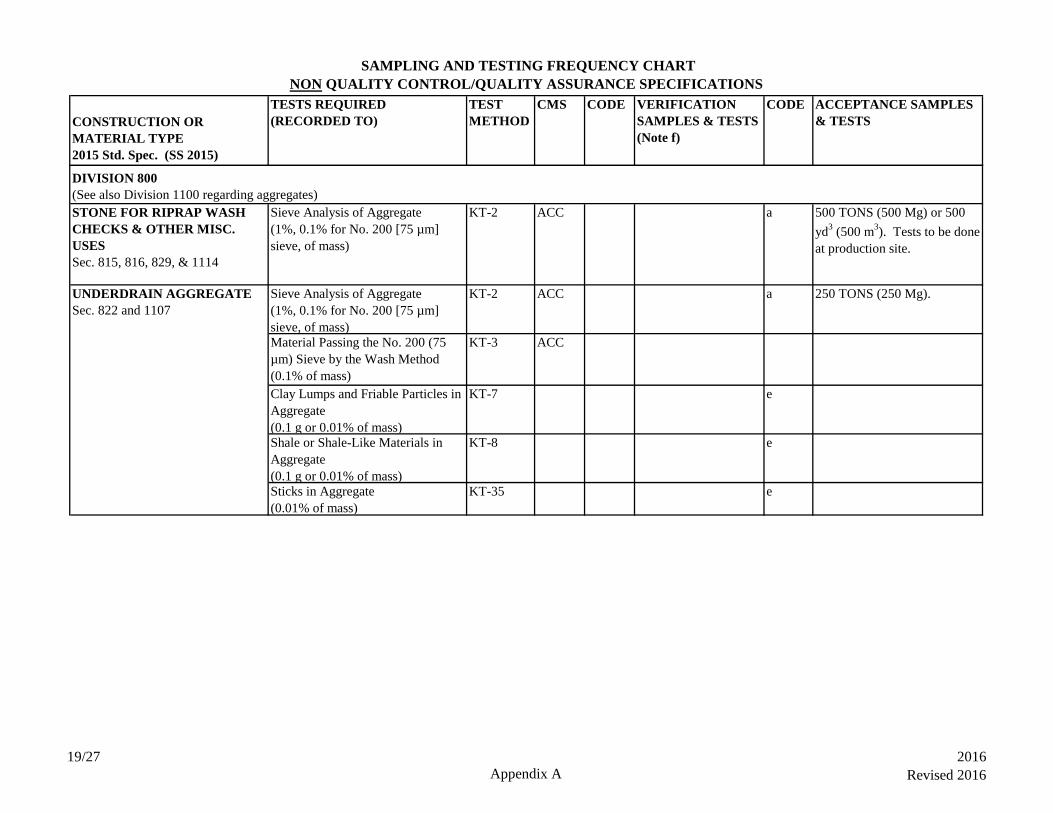
SAMPLING AND TESTING FREQUENCY CHART
NON QUALITY CONTROL/QUALITY ASSURANCE SPECIFICATIONS
CONSTRUCTION OR
MATERIAL TYPE
2015 Std. Spec. (SS 2015)
TESTS REQUIRED
(RECORDED TO)
TEST
METHOD
CMS CODE VERIFICATION
SAMPLES & TESTS
(Note f)
CODE ACCEPTANCE SAMPLES
& TESTS
STONE FOR RIPRAP WASH
CHECKS & OTHER MISC.
USES
Sec. 815, 816, 829, & 1114
Sieve Analysis of Aggregate
(1%, 0.1% for No. 200 [75 µm]
sieve, of mass)
KT-2 ACC a 500 TONS (500 Mg) or 500
yd3 (500 m
3). Tests to be done
at production site.
UNDERDRAIN AGGREGATE
Sec. 822 and 1107
Sieve Analysis of Aggregate
(1%, 0.1% for No. 200 [75 µm]
sieve, of mass)
KT-2 ACC a 250 TONS (250 Mg).
Material Passing the No. 200 (75
µm) Sieve by the Wash Method
(0.1% of mass)
KT-3 ACC
Clay Lumps and Friable Particles in
Aggregate
(0.1 g or 0.01% of mass)
KT-7 e
Shale or Shale-Like Materials in
Aggregate
(0.1 g or 0.01% of mass)
KT-8 e
Sticks in Aggregate
(0.01% of mass)
KT-35 e
DIVISION 800
(See also Division 1100 regarding aggregates)
19/27
Appendix A
2016
Revised 2016
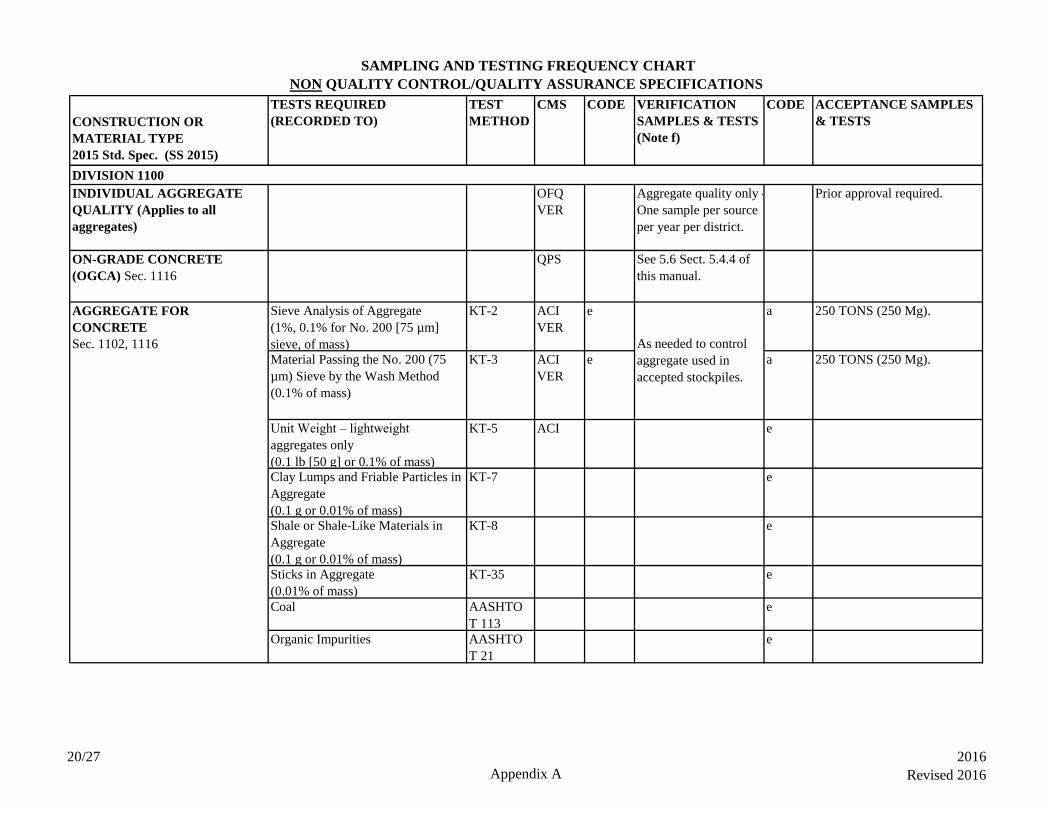
SAMPLING AND TESTING FREQUENCY CHART
NON QUALITY CONTROL/QUALITY ASSURANCE SPECIFICATIONS
CONSTRUCTION OR
MATERIAL TYPE
2015 Std. Spec. (SS 2015)
TESTS REQUIRED
(RECORDED TO)
TEST
METHOD
CMS CODE VERIFICATION
SAMPLES & TESTS
(Note f)
CODE ACCEPTANCE SAMPLES
& TESTS
INDIVIDUAL AGGREGATE
QUALITY (Applies to all
aggregates)
OFQ
VER
Aggregate quality only -
One sample per source
per year per district.
Prior approval required.
ON-GRADE CONCRETE
(OGCA) Sec. 1116
QPS See 5.6 Sect. 5.4.4 of
this manual.
Sieve Analysis of Aggregate
(1%, 0.1% for No. 200 [75 µm]
sieve, of mass)
KT-2 ACI
VER
e a 250 TONS (250 Mg).
Material Passing the No. 200 (75
µm) Sieve by the Wash Method
(0.1% of mass)
KT-3 ACI
VER
e a 250 TONS (250 Mg).
Unit Weight – lightweight
aggregates only
(0.1 lb [50 g] or 0.1% of mass)
KT-5 ACI e
Clay Lumps and Friable Particles in
Aggregate
(0.1 g or 0.01% of mass)
KT-7 e
Shale or Shale-Like Materials in
Aggregate
(0.1 g or 0.01% of mass)
KT-8 e
Sticks in Aggregate
(0.01% of mass)
KT-35 e
Coal AASHTO
T 113
e
Organic Impurities AASHTO
T 21
e
DIVISION 1100
As needed to control
aggregate used in
accepted stockpiles.
AGGREGATE FOR
CONCRETE
Sec. 1102, 1116
20/27
Appendix A
2016
Revised 2016
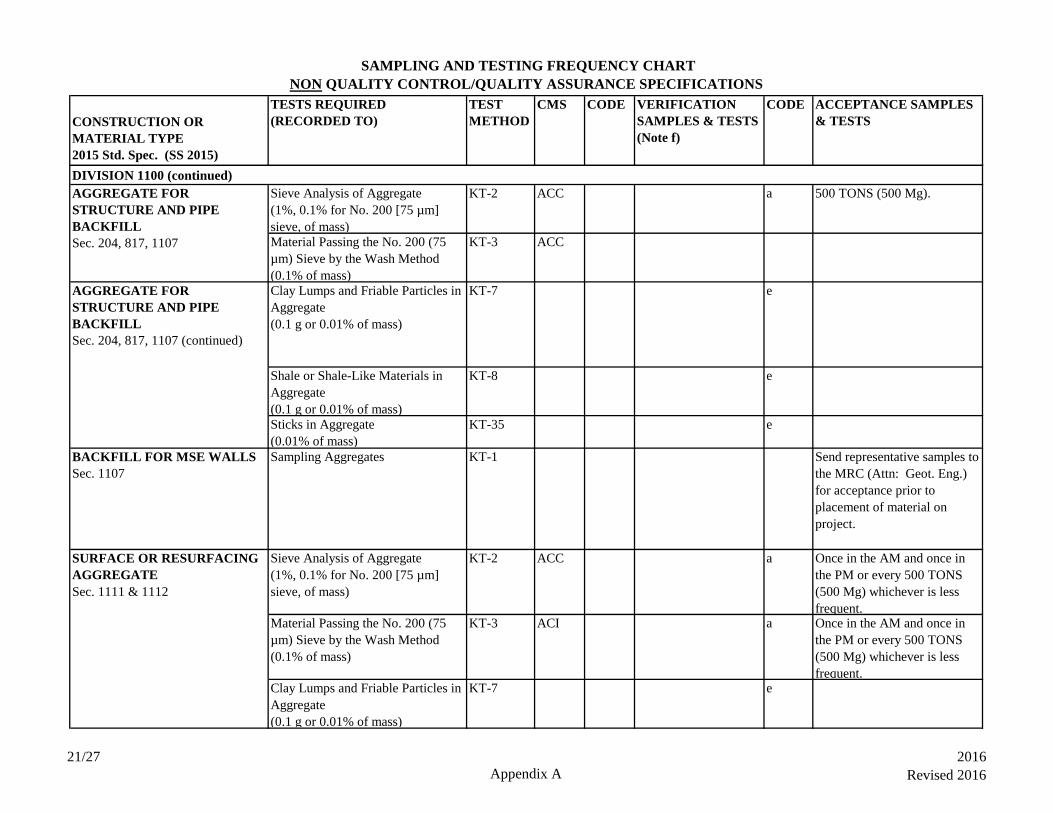
SAMPLING AND TESTING FREQUENCY CHART
NON QUALITY CONTROL/QUALITY ASSURANCE SPECIFICATIONS
CONSTRUCTION OR
MATERIAL TYPE
2015 Std. Spec. (SS 2015)
TESTS REQUIRED
(RECORDED TO)
TEST
METHOD
CMS CODE VERIFICATION
SAMPLES & TESTS
(Note f)
CODE ACCEPTANCE SAMPLES
& TESTS
Sieve Analysis of Aggregate
(1%, 0.1% for No. 200 [75 µm]
sieve, of mass)
KT-2 ACC a 500 TONS (500 Mg).
Material Passing the No. 200 (75
µm) Sieve by the Wash Method
(0.1% of mass)
KT-3 ACC
AGGREGATE FOR
STRUCTURE AND PIPE
BACKFILL
Sec. 204, 817, 1107 (continued)
Clay Lumps and Friable Particles in
Aggregate
(0.1 g or 0.01% of mass)
KT-7 e
Shale or Shale-Like Materials in
Aggregate
(0.1 g or 0.01% of mass)
KT-8 e
Sticks in Aggregate
(0.01% of mass)
KT-35 e
BACKFILL FOR MSE WALLS
Sec. 1107
Sampling Aggregates KT-1 Send representative samples to
the MRC (Attn: Geot. Eng.)
for acceptance prior to
placement of material on
project.
SURFACE OR RESURFACING
AGGREGATE
Sec. 1111 & 1112
Sieve Analysis of Aggregate
(1%, 0.1% for No. 200 [75 µm]
sieve, of mass)
KT-2 ACC a Once in the AM and once in
the PM or every 500 TONS
(500 Mg) whichever is less
frequent.Material Passing the No. 200 (75
µm) Sieve by the Wash Method
(0.1% of mass)
KT-3 ACI a Once in the AM and once in
the PM or every 500 TONS
(500 Mg) whichever is less
frequent.Clay Lumps and Friable Particles in
Aggregate
(0.1 g or 0.01% of mass)
KT-7 e
DIVISION 1100 (continued)
AGGREGATE FOR
STRUCTURE AND PIPE
BACKFILL
Sec. 204, 817, 1107
21/27
Appendix A
2016
Revised 2016
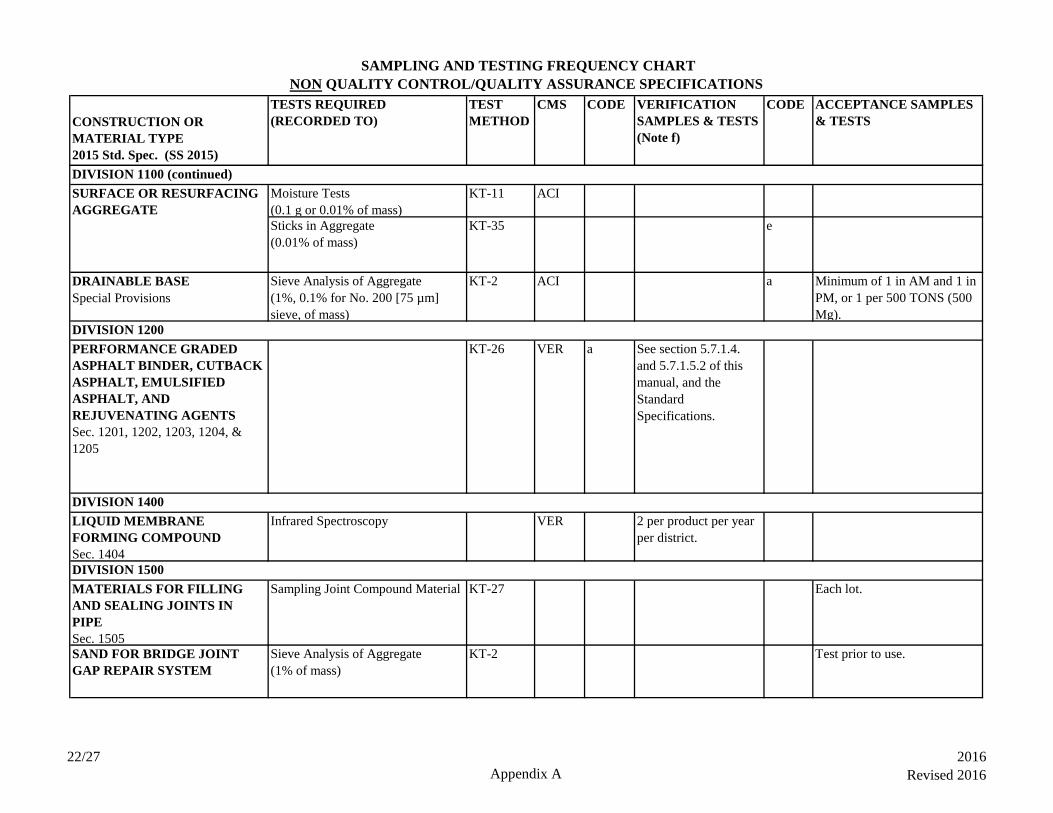
SAMPLING AND TESTING FREQUENCY CHART
NON QUALITY CONTROL/QUALITY ASSURANCE SPECIFICATIONS
CONSTRUCTION OR
MATERIAL TYPE
2015 Std. Spec. (SS 2015)
TESTS REQUIRED
(RECORDED TO)
TEST
METHOD
CMS CODE VERIFICATION
SAMPLES & TESTS
(Note f)
CODE ACCEPTANCE SAMPLES
& TESTS
DIVISION 1100 (continued)
SURFACE OR RESURFACING
AGGREGATE
Moisture Tests
(0.1 g or 0.01% of mass)
KT-11 ACI
Sticks in Aggregate
(0.01% of mass)
KT-35 e
DRAINABLE BASE
Special Provisions
Sieve Analysis of Aggregate
(1%, 0.1% for No. 200 [75 µm]
sieve, of mass)
KT-2 ACI a Minimum of 1 in AM and 1 in
PM, or 1 per 500 TONS (500
Mg).
DIVISION 1200
PERFORMANCE GRADED
ASPHALT BINDER, CUTBACK
ASPHALT, EMULSIFIED
ASPHALT, AND
REJUVENATING AGENTS
Sec. 1201, 1202, 1203, 1204, &
1205
KT-26 VER a See section 5.7.1.4.
and 5.7.1.5.2 of this
manual, and the
Standard
Specifications.
DIVISION 1400
LIQUID MEMBRANE
FORMING COMPOUND
Sec. 1404
Infrared Spectroscopy VER 2 per product per year
per district.
DIVISION 1500
MATERIALS FOR FILLING
AND SEALING JOINTS IN
PIPE
Sec. 1505
Sampling Joint Compound Material KT-27 Each lot.
SAND FOR BRIDGE JOINT
GAP REPAIR SYSTEM
Sieve Analysis of Aggregate
(1% of mass)
KT-2 Test prior to use.
22/27
Appendix A
2016
Revised 2016
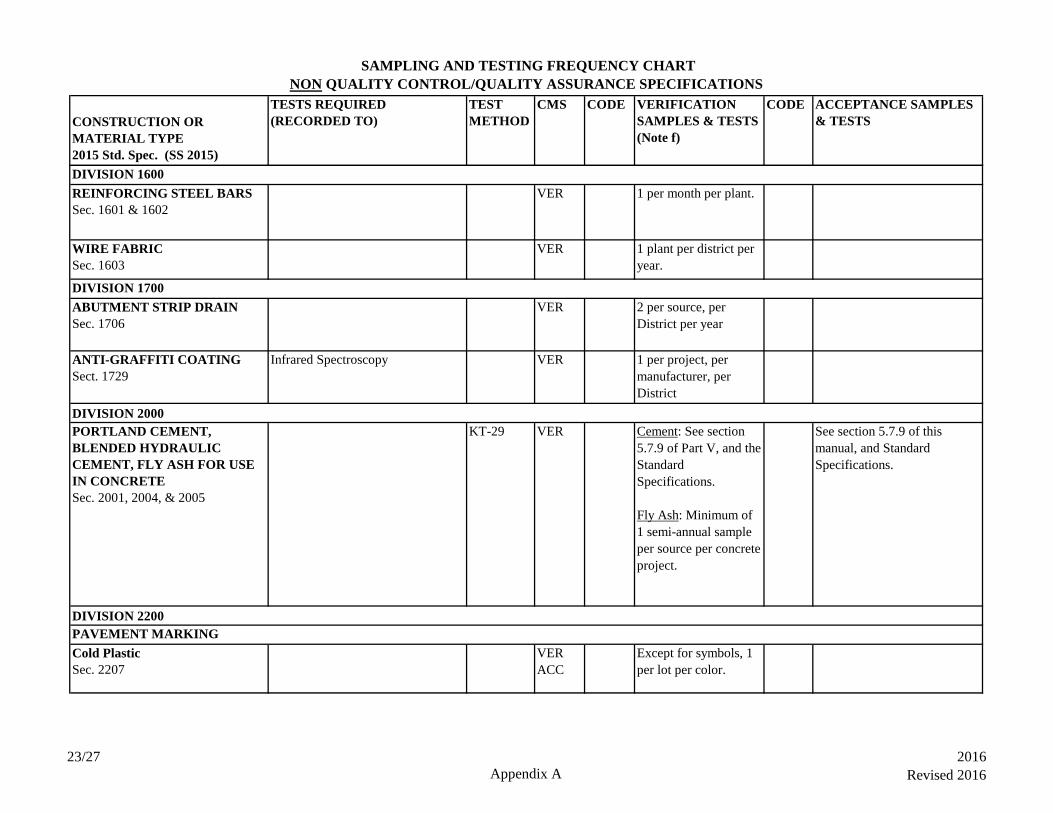
SAMPLING AND TESTING FREQUENCY CHART
NON QUALITY CONTROL/QUALITY ASSURANCE SPECIFICATIONS
CONSTRUCTION OR
MATERIAL TYPE
2015 Std. Spec. (SS 2015)
TESTS REQUIRED
(RECORDED TO)
TEST
METHOD
CMS CODE VERIFICATION
SAMPLES & TESTS
(Note f)
CODE ACCEPTANCE SAMPLES
& TESTS
DIVISION 1600
REINFORCING STEEL BARS
Sec. 1601 & 1602
VER 1 per month per plant.
WIRE FABRIC
Sec. 1603
VER 1 plant per district per
year.
DIVISION 1700
ABUTMENT STRIP DRAIN
Sec. 1706
VER 2 per source, per
District per year
ANTI-GRAFFITI COATING
Sect. 1729
Infrared Spectroscopy VER 1 per project, per
manufacturer, per
District
PORTLAND CEMENT,
BLENDED HYDRAULIC
CEMENT, FLY ASH FOR USE
IN CONCRETE
Sec. 2001, 2004, & 2005
KT-29 VER Cement: See section
5.7.9 of Part V, and the
Standard
Specifications.
Fly Ash: Minimum of
1 semi-annual sample
per source per concrete
project.
See section 5.7.9 of this
manual, and Standard
Specifications.
Cold Plastic
Sec. 2207
VER
ACC
Except for symbols, 1
per lot per color.
PAVEMENT MARKING
DIVISION 2000
DIVISION 2200
23/27
Appendix A
2016
Revised 2016
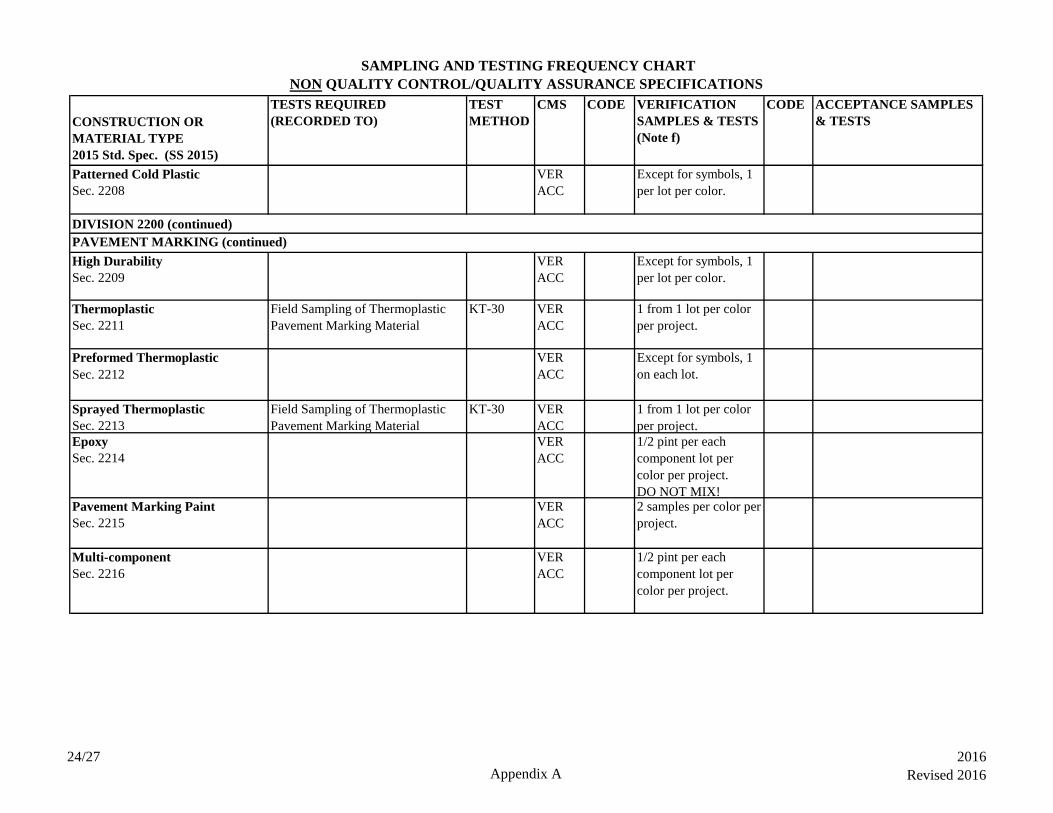
SAMPLING AND TESTING FREQUENCY CHART
NON QUALITY CONTROL/QUALITY ASSURANCE SPECIFICATIONS
CONSTRUCTION OR
MATERIAL TYPE
2015 Std. Spec. (SS 2015)
TESTS REQUIRED
(RECORDED TO)
TEST
METHOD
CMS CODE VERIFICATION
SAMPLES & TESTS
(Note f)
CODE ACCEPTANCE SAMPLES
& TESTS
Patterned Cold Plastic
Sec. 2208
VER
ACC
Except for symbols, 1
per lot per color.
High Durability
Sec. 2209
VER
ACC
Except for symbols, 1
per lot per color.
Thermoplastic
Sec. 2211
Field Sampling of Thermoplastic
Pavement Marking Material
KT-30 VER
ACC
1 from 1 lot per color
per project.
Preformed Thermoplastic
Sec. 2212
VER
ACC
Except for symbols, 1
on each lot.
Sprayed Thermoplastic
Sec. 2213
Field Sampling of Thermoplastic
Pavement Marking Material
KT-30 VER
ACC
1 from 1 lot per color
per project.
Epoxy
Sec. 2214
VER
ACC
1/2 pint per each
component lot per
color per project.
DO NOT MIX!Pavement Marking Paint
Sec. 2215
VER
ACC
2 samples per color per
project.
Multi-component
Sec. 2216
VER
ACC
1/2 pint per each
component lot per
color per project.
PAVEMENT MARKING (continued)
DIVISION 2200 (continued)
24/27
Appendix A
2016
Revised 2016

SAMPLING AND TESTING FREQUENCY CHART
NON QUALITY CONTROL/QUALITY ASSURANCE SPECIFICATIONS
CODE
a
b Applicable only when specifications contain those requirements.
c
d
e
f
g
h
i
j
k Standard 28 day compressive strength.
l Verification method must be the same test method as used for mix design approval.
INSTRUCTION
Engineer’s discretion. Frequency of tests shall be agreed upon by the Field Engineer and the District Materials Engineer. Frequency will be governed by
field conditions. Written documentation of the agreed upon testing frequency shall be included in the project records.
Verification sampling and testing are conducted by Department personnel to monitor reliability of certified test results or certifications of specification
conformity or to check adequacy of mix design.
“Type Insp” must = “ACC” when assignment of a pay quantity is being made. “ACI” when recording test values for additional acceptance information.
The District Laboratory will perform additional testing, as needed, to determine the recommended asphalt content for the asphalt mix.
On those mix designations which contain a natural sand requirement and/or an uncrushed minus #200 (75 µm) mineral filler requirement, individual
aggregates and mineral filler supplements shall be sampled from the cold feed and tested.
For determining moisture content of a material KT-43, “Moisture Content of Asphalt Mixtures or Mineral Aggregates – Microwave Oven Method”, can
be used in conjunction with KT-2, KT-3, KT-4, KT-8, KT-12, KT-13, KT-14, KT-34, and KT-48.
Initial frequency. Frequency may be reduced on a project basis, by authority of the District Materials Engineer, upon continued satisfactory and uniform
production. Authorization for reductions in testing frequency shall be documented in the project records.
Normal operation. Minimum frequency for exceptional conditions may be reduced by the District Materials Engineer on a project basis. Written
justification shall be made to the Chief of the Bureau of Construction & Materials and placed in the project documents. (Multi-Level Frequency Chart
[This appendix, page 25] or other.)
If, for a given project, no Plastic Index results of ten (10) consecutive tests are closer than 1 Plastic Index to the specifications limit, the specified testing
frequency may be reduced by fifty percent (50%). When operating at a reduced testing frequency, should any two (2) consecutive Plastic Index results
exceed the test limit results required for reduced testing frequency, testing shall be resumed at the original specified frequency. The original specified
testing frequency shall be resumed should any one test result exceed the specification limits. Following a return to the original specified testing
frequency, the reduced frequency may be resumed provided the original criteria for reduced frequency is met.
Page 26/27 Appendix A
2016
Revised 2016

SAMPLING AND TESTING FREQUENCY CHART
NON QUALITY CONTROL/QUALITY ASSURANCE SPECIFICATIONS
GENERAL NOTES
For a better explanation of metric (SI) units, see section 5.9, “Sampling and Test Methods Forward”, of this manual.
For the Construction Management System (CMS), Acceptance Sampling and Tests have been divided into two sections. Items called “ACC” will be
Acceptance Tests and will have a quantity assigned. Items called “ACI” will be Acceptance Information Tests and they will normally have a quantity
assigned, but not for payment. “ACC” tests make the assignment of tested materials to the contract or mix plant.
All sampling and testing frequencies listed are minimums. Additional or other tests will be conducted, as required, to control the work.
Frequencies are based on two lane roadways. For four or more lane roadway construction, double the frequencies shown per unit length.
All aggregate acceptance tests are to be conducted at the point of usage except for Stone for Riprap, Wash Checks, and Other Miscellaneous Uses in
Division 800.
Page 26/27 Appendix A
2016
Revised 2016
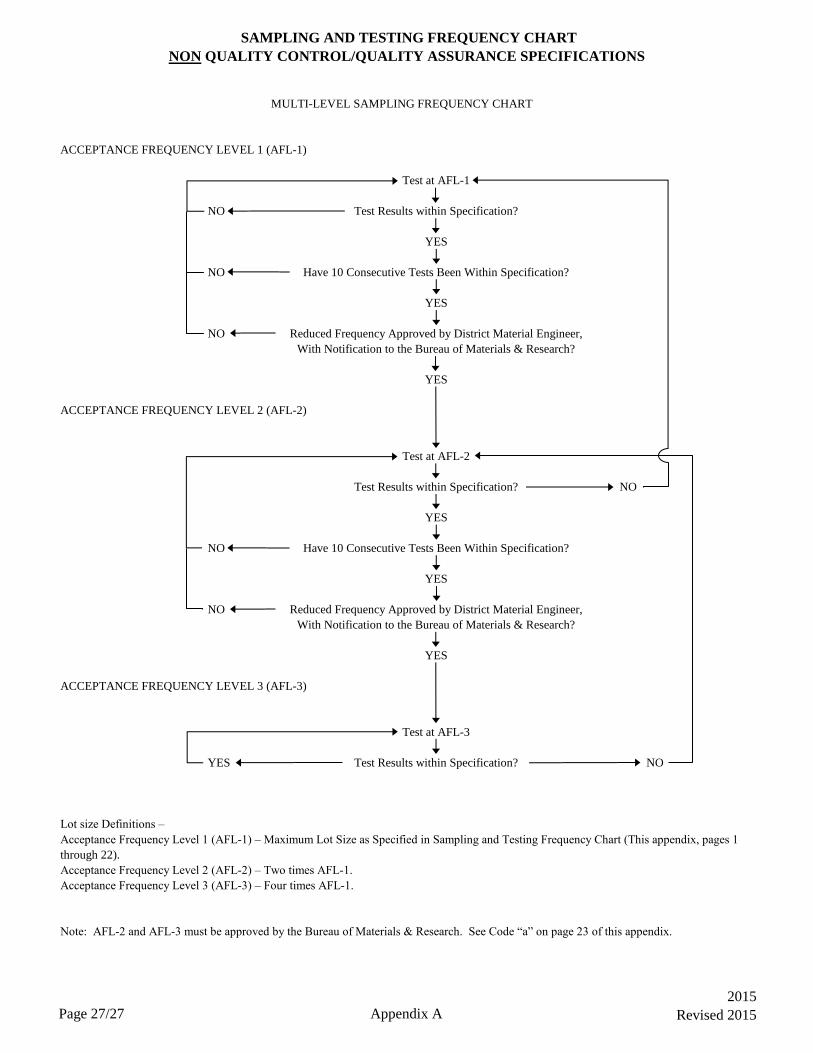
SAMPLING AND TESTING FREQUENCY CHART
NON QUALITY CONTROL/QUALITY ASSURANCE SPECIFICATIONS
ACCEPTANCE FREQUENCY LEVEL 1 (AFL-1)
Test at AFL-1
NO Test Results within Specification?
YES
NO Have 10 Consecutive Tests Been Within Specification?
YES
NO Reduced Frequency Approved by District Material Engineer,
With Notification to the Bureau of Materials & Research?
YES
ACCEPTANCE FREQUENCY LEVEL 2 (AFL-2)
Test at AFL-2
Test Results within Specification? NO
YES
NO Have 10 Consecutive Tests Been Within Specification?
YES
NO Reduced Frequency Approved by District Material Engineer,
With Notification to the Bureau of Materials & Research?
YES
ACCEPTANCE FREQUENCY LEVEL 3 (AFL-3)
Test at AFL-3
YES Test Results within Specification? NO
Lot size Definitions –
Acceptance Frequency Level 2 (AFL-2) – Two times AFL-1.
Acceptance Frequency Level 3 (AFL-3) – Four times AFL-1.
Note: AFL-2 and AFL-3 must be approved by the Bureau of Materials & Research. See Code “a” on page 23 of this appendix.
Acceptance Frequency Level 1 (AFL-1) – Maximum Lot Size as Specified in Sampling and Testing Frequency Chart (This appendix, pages 1
through 22).
MULTI-LEVEL SAMPLING FREQUENCY CHART
Page 27/27 Appendix A
2015
Revised 2015

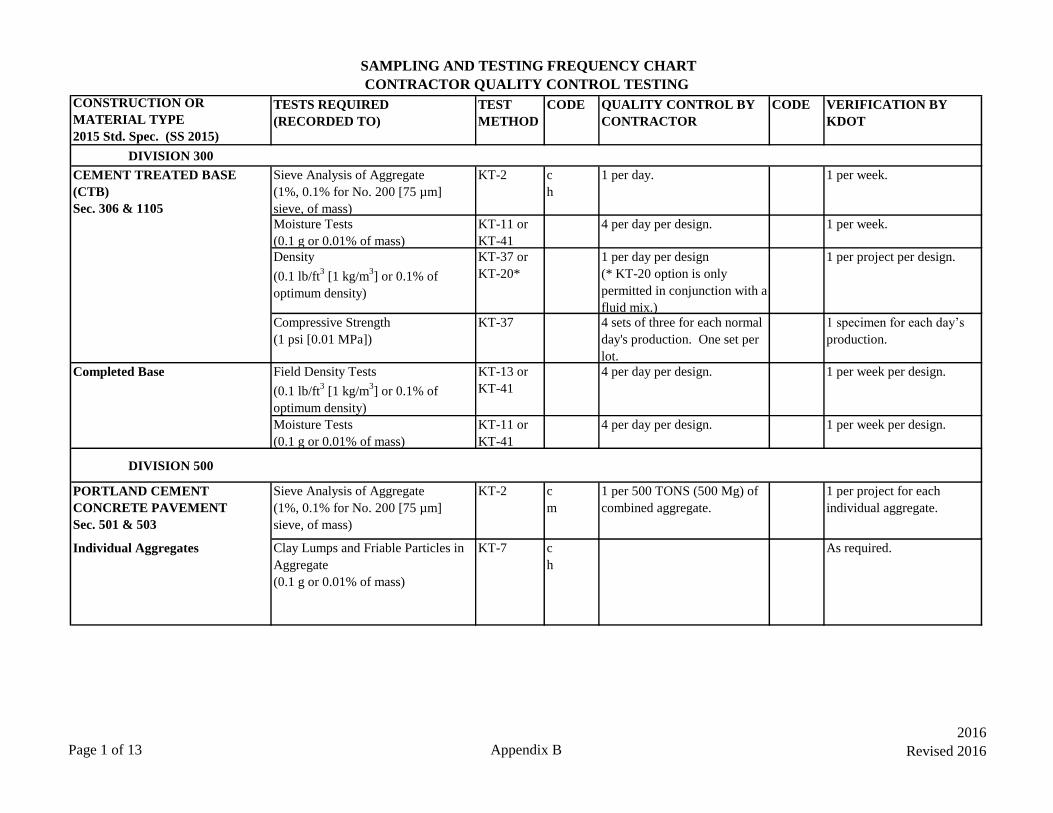
SAMPLING AND TESTING FREQUENCY CHART
CONTRACTOR QUALITY CONTROL TESTING
CONSTRUCTION OR
MATERIAL TYPE
2015 Std. Spec. (SS 2015)
TESTS REQUIRED
(RECORDED TO)
TEST
METHOD
CODE QUALITY CONTROL BY
CONTRACTOR
CODE VERIFICATION BY
KDOT
DIVISION 300
CEMENT TREATED BASE
(CTB)
Sec. 306 & 1105
Sieve Analysis of Aggregate
(1%, 0.1% for No. 200 [75 µm]
sieve, of mass)
KT-2 c
h
1 per day. 1 per week.
Moisture Tests
(0.1 g or 0.01% of mass)
KT-11 or
KT-41
4 per day per design. 1 per week.
Density
(0.1 lb/ft3 [1 kg/m
3] or 0.1% of
optimum density)
KT-37 or
KT-20*
1 per day per design
(* KT-20 option is only
permitted in conjunction with a
fluid mix.)
1 per project per design.
Compressive Strength
(1 psi [0.01 MPa])
KT-37 4 sets of three for each normal
day's production. One set per
lot.
1 specimen for each day’s
production.
Completed Base Field Density Tests
(0.1 lb/ft3 [1 kg/m
3] or 0.1% of
optimum density)
KT-13 or
KT-41
4 per day per design. 1 per week per design.
Moisture Tests
(0.1 g or 0.01% of mass)
KT-11 or
KT-41
4 per day per design. 1 per week per design.
DIVISION 500
PORTLAND CEMENT
CONCRETE PAVEMENT
Sec. 501 & 503
Sieve Analysis of Aggregate
(1%, 0.1% for No. 200 [75 µm]
sieve, of mass)
KT-2 c
m
1 per 500 TONS (500 Mg) of
combined aggregate.
1 per project for each
individual aggregate.
Individual Aggregates Clay Lumps and Friable Particles in
Aggregate
(0.1 g or 0.01% of mass)
KT-7 c
h
As required.
Page 1 of 13 Appendix B
2016
Revised 2016
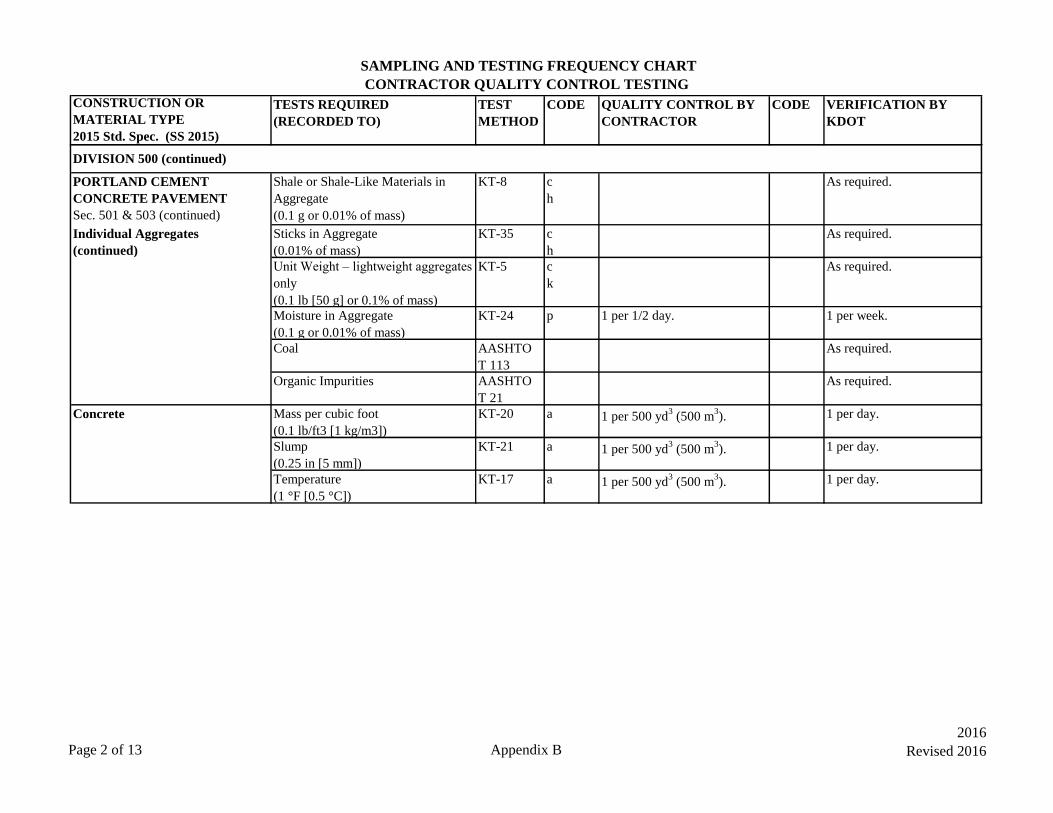
SAMPLING AND TESTING FREQUENCY CHART
CONTRACTOR QUALITY CONTROL TESTING
CONSTRUCTION OR
MATERIAL TYPE
2015 Std. Spec. (SS 2015)
TESTS REQUIRED
(RECORDED TO)
TEST
METHOD
CODE QUALITY CONTROL BY
CONTRACTOR
CODE VERIFICATION BY
KDOT
PORTLAND CEMENT
CONCRETE PAVEMENT
Sec. 501 & 503 (continued)
Shale or Shale-Like Materials in
Aggregate
(0.1 g or 0.01% of mass)
KT-8 c
h
As required.
Individual Aggregates
(continued)
Sticks in Aggregate
(0.01% of mass)
KT-35 c
h
As required.
Unit Weight – lightweight aggregates
only
(0.1 lb [50 g] or 0.1% of mass)
KT-5 c
k
As required.
Moisture in Aggregate
(0.1 g or 0.01% of mass)
KT-24 p 1 per 1/2 day. 1 per week.
Coal AASHTO
T 113
As required.
Organic Impurities AASHTO
T 21
As required.
Concrete Mass per cubic foot
(0.1 lb/ft3 [1 kg/m3])
KT-20 a 1 per 500 yd3 (500 m
3). 1 per day.
Slump
(0.25 in [5 mm])
KT-21 a 1 per 500 yd3 (500 m
3). 1 per day.
Temperature
(1 °F [0.5 °C])
KT-17 a 1 per 500 yd3 (500 m
3). 1 per day.
DIVISION 500 (continued)
Page 2 of 13 Appendix B
2016
Revised 2016
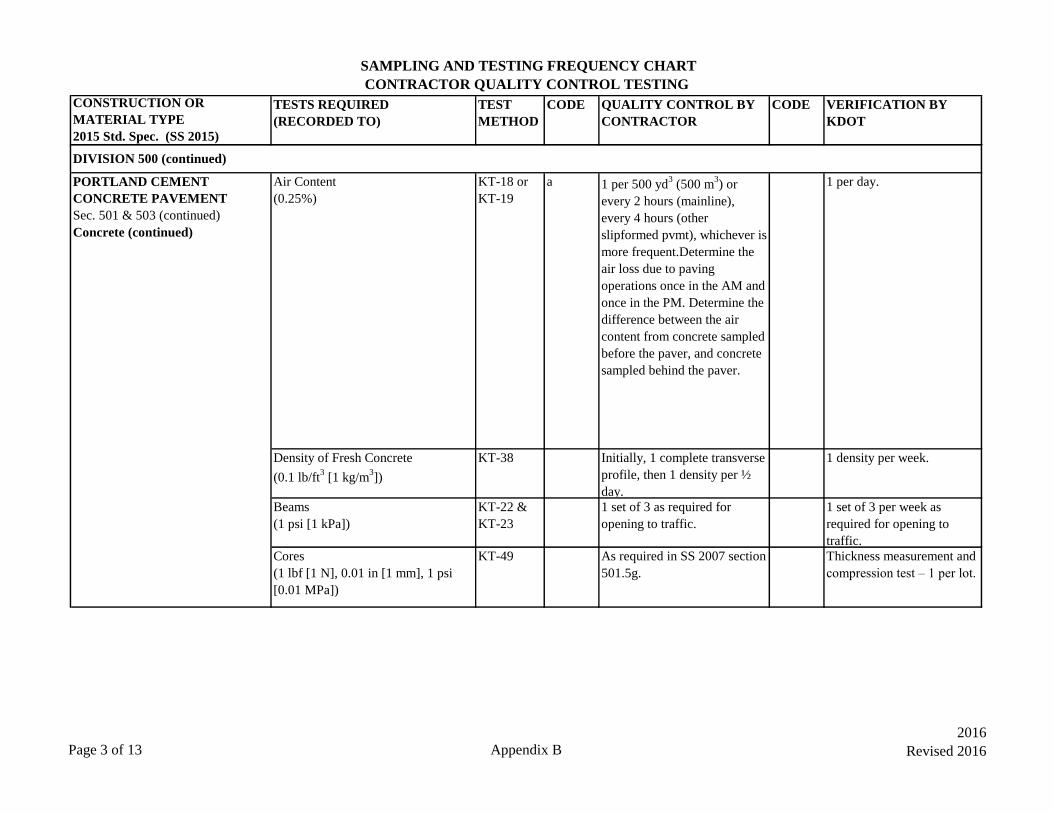
SAMPLING AND TESTING FREQUENCY CHART
CONTRACTOR QUALITY CONTROL TESTING
CONSTRUCTION OR
MATERIAL TYPE
2015 Std. Spec. (SS 2015)
TESTS REQUIRED
(RECORDED TO)
TEST
METHOD
CODE QUALITY CONTROL BY
CONTRACTOR
CODE VERIFICATION BY
KDOT
PORTLAND CEMENT
CONCRETE PAVEMENT
Sec. 501 & 503 (continued)
Concrete (continued)
Air Content
(0.25%)
KT-18 or
KT-19
a 1 per 500 yd3 (500 m
3) or
every 2 hours (mainline),
every 4 hours (other
slipformed pvmt), whichever is
more frequent.Determine the
air loss due to paving
operations once in the AM and
once in the PM. Determine the
difference between the air
content from concrete sampled
before the paver, and concrete
sampled behind the paver.
1 per day.
Density of Fresh Concrete
(0.1 lb/ft3 [1 kg/m
3])
KT-38 Initially, 1 complete transverse
profile, then 1 density per ½
day.
1 density per week.
Beams
(1 psi [1 kPa])
KT-22 &
KT-23
1 set of 3 as required for
opening to traffic.
1 set of 3 per week as
required for opening to
traffic.
Cores
(1 lbf [1 N], 0.01 in [1 mm], 1 psi
[0.01 MPa])
KT-49 As required in SS 2007 section
501.5g.
Thickness measurement and
compression test – 1 per lot.
DIVISION 500 (continued)
Page 3 of 13 Appendix B
2016
Revised 2016
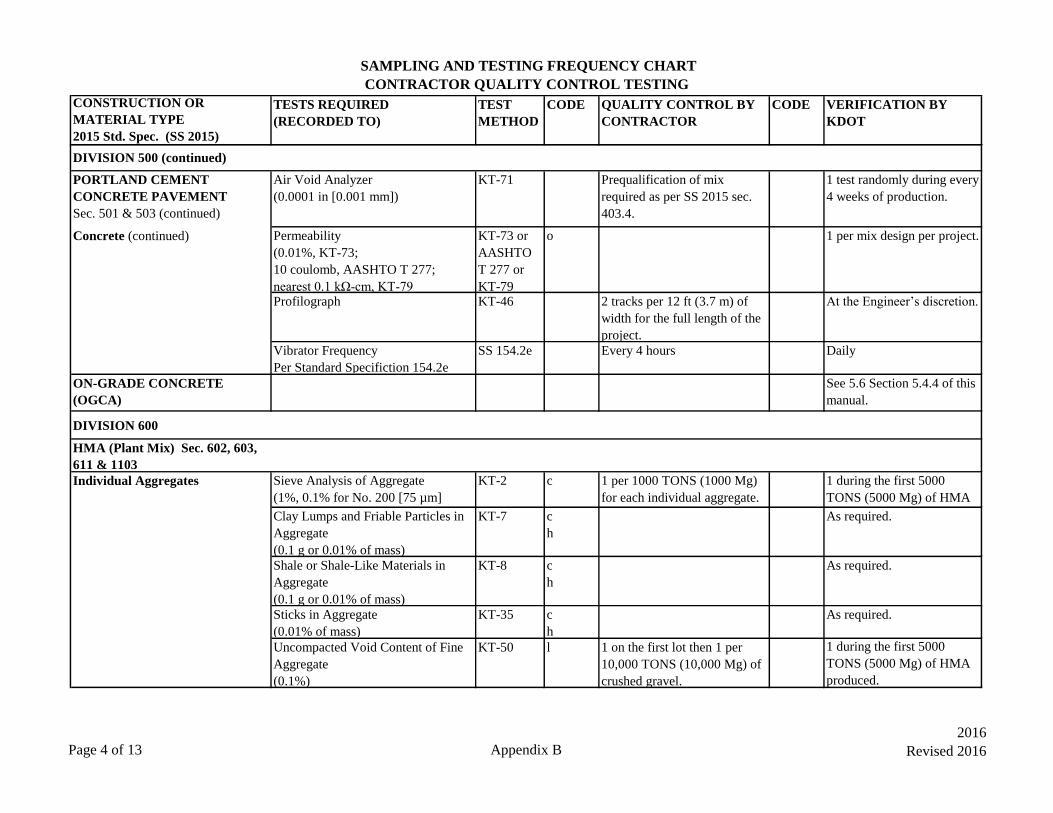
SAMPLING AND TESTING FREQUENCY CHART
CONTRACTOR QUALITY CONTROL TESTING
CONSTRUCTION OR
MATERIAL TYPE
2015 Std. Spec. (SS 2015)
TESTS REQUIRED
(RECORDED TO)
TEST
METHOD
CODE QUALITY CONTROL BY
CONTRACTOR
CODE VERIFICATION BY
KDOT
PORTLAND CEMENT
CONCRETE PAVEMENT
Sec. 501 & 503 (continued)
Air Void Analyzer
(0.0001 in [0.001 mm])
KT-71 Prequalification of mix
required as per SS 2015 sec.
403.4.
1 test randomly during every
4 weeks of production.
Concrete (continued) Permeability
(0.01%, KT-73;
10 coulomb, AASHTO T 277;
nearest 0.1 kΩ-cm, KT-79
KT-73 or
AASHTO
T 277 or
KT-79
o 1 per mix design per project.
Profilograph KT-46 2 tracks per 12 ft (3.7 m) of
width for the full length of the
project.
At the Engineer’s discretion.
Vibrator Frequency
Per Standard Specifiction 154.2e
SS 154.2e Every 4 hours Daily
ON-GRADE CONCRETE
(OGCA)
See 5.6 Section 5.4.4 of this
manual.
DIVISION 600
HMA (Plant Mix) Sec. 602, 603,
611 & 1103
Individual Aggregates Sieve Analysis of Aggregate
(1%, 0.1% for No. 200 [75 µm]
sieve, of mass)
KT-2 c 1 per 1000 TONS (1000 Mg)
for each individual aggregate.
1 during the first 5000
TONS (5000 Mg) of HMA
produced for each individual Clay Lumps and Friable Particles in
Aggregate
(0.1 g or 0.01% of mass)
KT-7 c
h
As required.
Shale or Shale-Like Materials in
Aggregate
(0.1 g or 0.01% of mass)
KT-8 c
h
As required.
Sticks in Aggregate
(0.01% of mass)
KT-35 c
h
As required.
Uncompacted Void Content of Fine
Aggregate
(0.1%)
KT-50 l 1 on the first lot then 1 per
10,000 TONS (10,000 Mg) of
crushed gravel.
1 during the first 5000
TONS (5000 Mg) of HMA
produced.
DIVISION 500 (continued)
Page 4 of 13 Appendix B
2016
Revised 2016
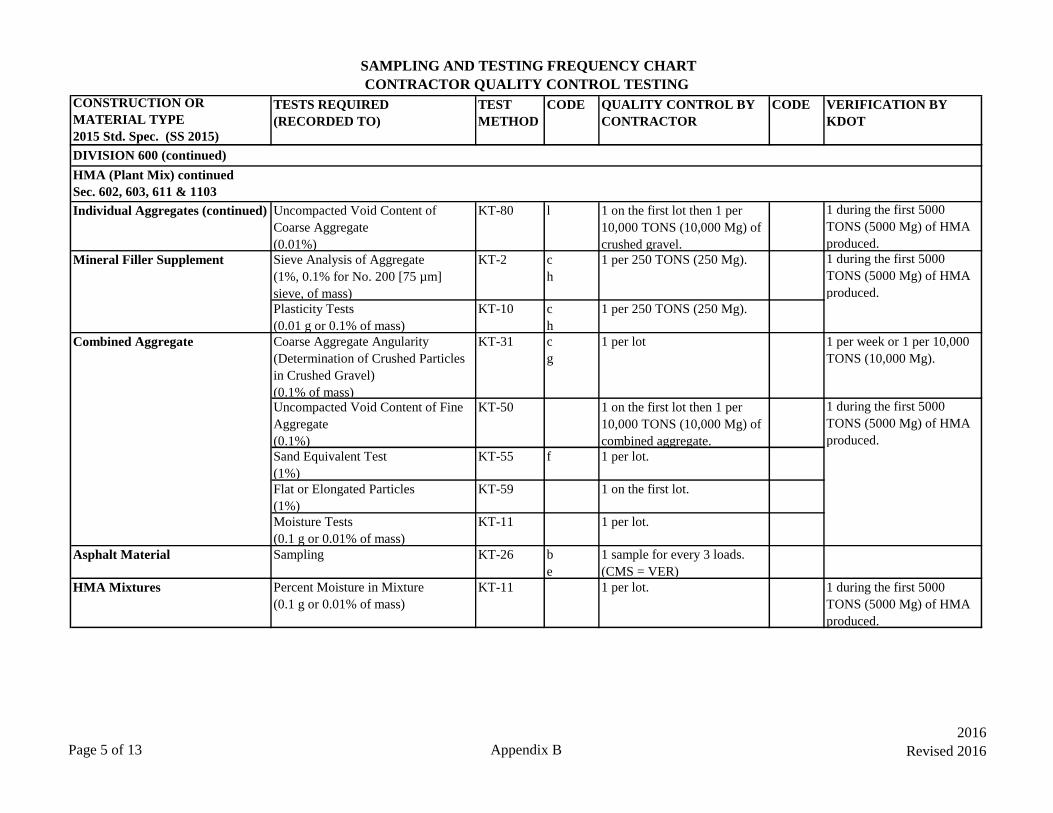
SAMPLING AND TESTING FREQUENCY CHART
CONTRACTOR QUALITY CONTROL TESTING
CONSTRUCTION OR
MATERIAL TYPE
2015 Std. Spec. (SS 2015)
TESTS REQUIRED
(RECORDED TO)
TEST
METHOD
CODE QUALITY CONTROL BY
CONTRACTOR
CODE VERIFICATION BY
KDOT
HMA (Plant Mix) continued
Sec. 602, 603, 611 & 1103
Individual Aggregates (continued) Uncompacted Void Content of
Coarse Aggregate
(0.01%)
KT-80 l 1 on the first lot then 1 per
10,000 TONS (10,000 Mg) of
crushed gravel.
1 during the first 5000
TONS (5000 Mg) of HMA
produced.
Mineral Filler Supplement Sieve Analysis of Aggregate
(1%, 0.1% for No. 200 [75 µm]
sieve, of mass)
KT-2 c
h
1 per 250 TONS (250 Mg). 1 during the first 5000
TONS (5000 Mg) of HMA
produced.
Plasticity Tests
(0.01 g or 0.1% of mass)
KT-10 c
h
1 per 250 TONS (250 Mg).
Combined Aggregate Coarse Aggregate Angularity
(Determination of Crushed Particles
in Crushed Gravel)
(0.1% of mass)
KT-31 c
g
1 per lot 1 per week or 1 per 10,000
TONS (10,000 Mg).
Uncompacted Void Content of Fine
Aggregate
(0.1%)
KT-50 1 on the first lot then 1 per
10,000 TONS (10,000 Mg) of
combined aggregate.
1 during the first 5000
TONS (5000 Mg) of HMA
produced.
Sand Equivalent Test
(1%)
KT-55 f 1 per lot.
Flat or Elongated Particles
(1%)
KT-59 1 on the first lot.
Moisture Tests
(0.1 g or 0.01% of mass)
KT-11 1 per lot.
Asphalt Material Sampling KT-26 b
e
1 sample for every 3 loads.
(CMS = VER)
HMA Mixtures Percent Moisture in Mixture
(0.1 g or 0.01% of mass)
KT-11 1 per lot. 1 during the first 5000
TONS (5000 Mg) of HMA
produced.
DIVISION 600 (continued)
Page 5 of 13 Appendix B
2016
Revised 2016
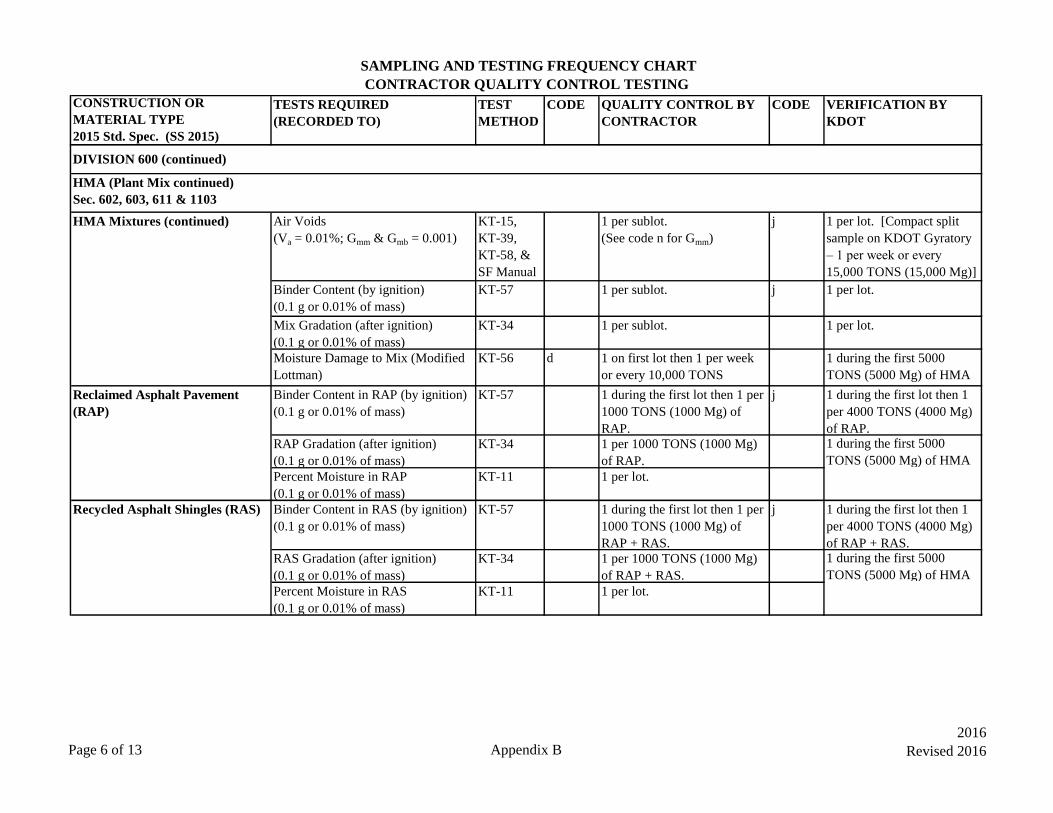
SAMPLING AND TESTING FREQUENCY CHART
CONTRACTOR QUALITY CONTROL TESTING
CONSTRUCTION OR
MATERIAL TYPE
2015 Std. Spec. (SS 2015)
TESTS REQUIRED
(RECORDED TO)
TEST
METHOD
CODE QUALITY CONTROL BY
CONTRACTOR
CODE VERIFICATION BY
KDOT
HMA Mixtures (continued) Air Voids
(Va = 0.01%; Gmm & Gmb = 0.001)
KT-15,
KT-39,
KT-58, &
SF Manual
1 per sublot.
(See code n for Gmm)
j 1 per lot. [Compact split
sample on KDOT Gyratory
– 1 per week or every
15,000 TONS (15,000 Mg)]
Binder Content (by ignition)
(0.1 g or 0.01% of mass)
KT-57 1 per sublot. j 1 per lot.
Mix Gradation (after ignition)
(0.1 g or 0.01% of mass)
KT-34 1 per sublot. 1 per lot.
Moisture Damage to Mix (Modified
Lottman)
(0.1%)
KT-56 d 1 on first lot then 1 per week
or every 10,000 TONS
(10,000 Mg).
1 during the first 5000
TONS (5000 Mg) of HMA
produced. Performed by the Reclaimed Asphalt Pavement
(RAP)
Binder Content in RAP (by ignition)
(0.1 g or 0.01% of mass)
KT-57 1 during the first lot then 1 per
1000 TONS (1000 Mg) of
RAP.
j 1 during the first lot then 1
per 4000 TONS (4000 Mg)
of RAP.
RAP Gradation (after ignition)
(0.1 g or 0.01% of mass)
KT-34 1 per 1000 TONS (1000 Mg)
of RAP.
1 during the first 5000
TONS (5000 Mg) of HMA
Percent Moisture in RAP
(0.1 g or 0.01% of mass)
KT-11 1 per lot.
Recycled Asphalt Shingles (RAS) Binder Content in RAS (by ignition)
(0.1 g or 0.01% of mass)
KT-57 1 during the first lot then 1 per
1000 TONS (1000 Mg) of
RAP + RAS.
j 1 during the first lot then 1
per 4000 TONS (4000 Mg)
of RAP + RAS.
RAS Gradation (after ignition)
(0.1 g or 0.01% of mass)
KT-34 1 per 1000 TONS (1000 Mg)
of RAP + RAS.
1 during the first 5000
TONS (5000 Mg) of HMA
Percent Moisture in RAS
(0.1 g or 0.01% of mass)
KT-11 1 per lot.
HMA (Plant Mix continued)
Sec. 602, 603, 611 & 1103
DIVISION 600 (continued)
Page 6 of 13 Appendix B
2016
Revised 2016

SAMPLING AND TESTING FREQUENCY CHART
CONTRACTOR QUALITY CONTROL TESTING
CONSTRUCTION OR
MATERIAL TYPE
2015 Std. Spec. (SS 2015)
TESTS REQUIRED
(RECORDED TO)
TEST
METHOD
CODE QUALITY CONTROL BY
CONTRACTOR
CODE VERIFICATION BY
KDOT
Completed Road Work
Field Density Tests
(Use Cores or Nuclear Density
Gauge on all HMA roadway or
shoulder construction greater than or
equal to 1.5 inches)
Field Density - Cores or Nuclear
Density Gauge
(Gmb = 0.001; 0.1 lb/ft3 [1 kg/m
3] or
0.01% of Gmm)
KT-15 or
KT-32
i 10 tests per lot. i 5 companion tests per lot.
(Use approved rolling procedure and
Nuclear Density Gauge on all HMA
roadway or shoulder construction
less than 1.5 inches)
Field Density -Nuclear Density
Gauge
(Gmb = 0.001; 0.1 lb/ft3 [1 kg/m
3] or
0.01% of Gmm)
KT-32 i 10 Nuclear Gauge readings per
lot
Verify Approved Rolling
Procedure every 2 hours
Profilograph KT-46 2 tracks per 12 ft (3.7 m) of
width for the full length of the
project.
At the Engineer’s discretion.
Cold In-Place Recycle (CIR)
Sec. 604
Sampling Aggregate KT-1 2 per mile (1.5 km).
(Sieve according to
specification.)
k 1 per day.
Percent Retained on the #200
(75 µm) Sieve by Dry Screen
KT-4 2 per day.
Field Moisture Tests
(0.1 g or 0.01% of mass)
KT-32 Minimum 1 per day. Use
nuclear gauge w/o
correction. (Test before
overlay or seal.)
DIVISION 600 (continued)
HMA (Plant Mix continued)
Sec. 602, 603, 611 & 1103
Page 7 of 13 Appendix B
2016
Revised 2016
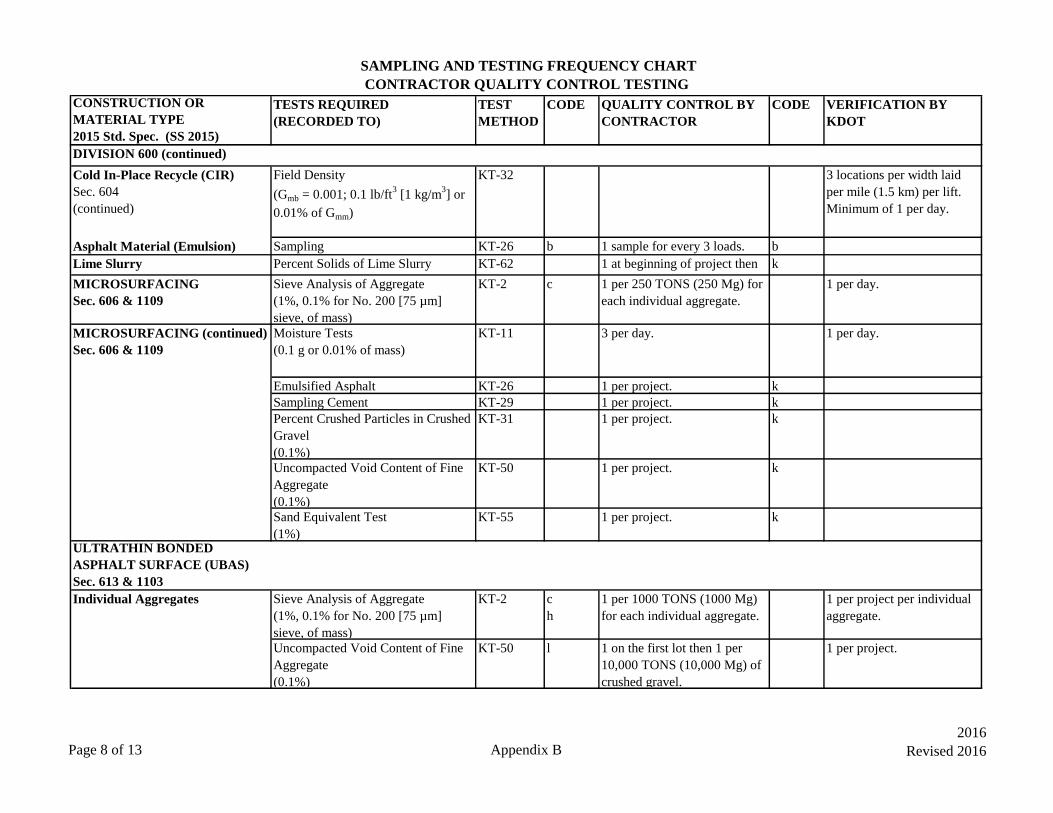
SAMPLING AND TESTING FREQUENCY CHART
CONTRACTOR QUALITY CONTROL TESTING
CONSTRUCTION OR
MATERIAL TYPE
2015 Std. Spec. (SS 2015)
TESTS REQUIRED
(RECORDED TO)
TEST
METHOD
CODE QUALITY CONTROL BY
CONTRACTOR
CODE VERIFICATION BY
KDOT
Cold In-Place Recycle (CIR)
Sec. 604
(continued)
Field Density
(Gmb = 0.001; 0.1 lb/ft3 [1 kg/m
3] or
0.01% of Gmm)
KT-32 3 locations per width laid
per mile (1.5 km) per lift.
Minimum of 1 per day.
Asphalt Material (Emulsion) Sampling KT-26 b
e
1 sample for every 3 loads. b
Lime Slurry Percent Solids of Lime Slurry KT-62 1 at beginning of project then
1 at each mix design change.
k
MICROSURFACING
Sec. 606 & 1109
Sieve Analysis of Aggregate
(1%, 0.1% for No. 200 [75 µm]
sieve, of mass)
KT-2 c 1 per 250 TONS (250 Mg) for
each individual aggregate.
1 per day.
MICROSURFACING (continued)
Sec. 606 & 1109
Moisture Tests
(0.1 g or 0.01% of mass)
KT-11 3 per day. 1 per day.
Emulsified Asphalt KT-26 1 per project. k
Sampling Cement KT-29 1 per project. k
Percent Crushed Particles in Crushed
Gravel
(0.1%)
KT-31 1 per project. k
Uncompacted Void Content of Fine
Aggregate
(0.1%)
KT-50 1 per project. k
Sand Equivalent Test
(1%)
KT-55 1 per project. k
ULTRATHIN BONDED
ASPHALT SURFACE (UBAS)
Sec. 613 & 1103
Individual Aggregates Sieve Analysis of Aggregate
(1%, 0.1% for No. 200 [75 µm]
sieve, of mass)
KT-2 c
h
1 per 1000 TONS (1000 Mg)
for each individual aggregate.
1 per project per individual
aggregate.
Uncompacted Void Content of Fine
Aggregate
(0.1%)
KT-50 l 1 on the first lot then 1 per
10,000 TONS (10,000 Mg) of
crushed gravel.
1 per project.
DIVISION 600 (continued)
Page 8 of 13 Appendix B
2016
Revised 2016
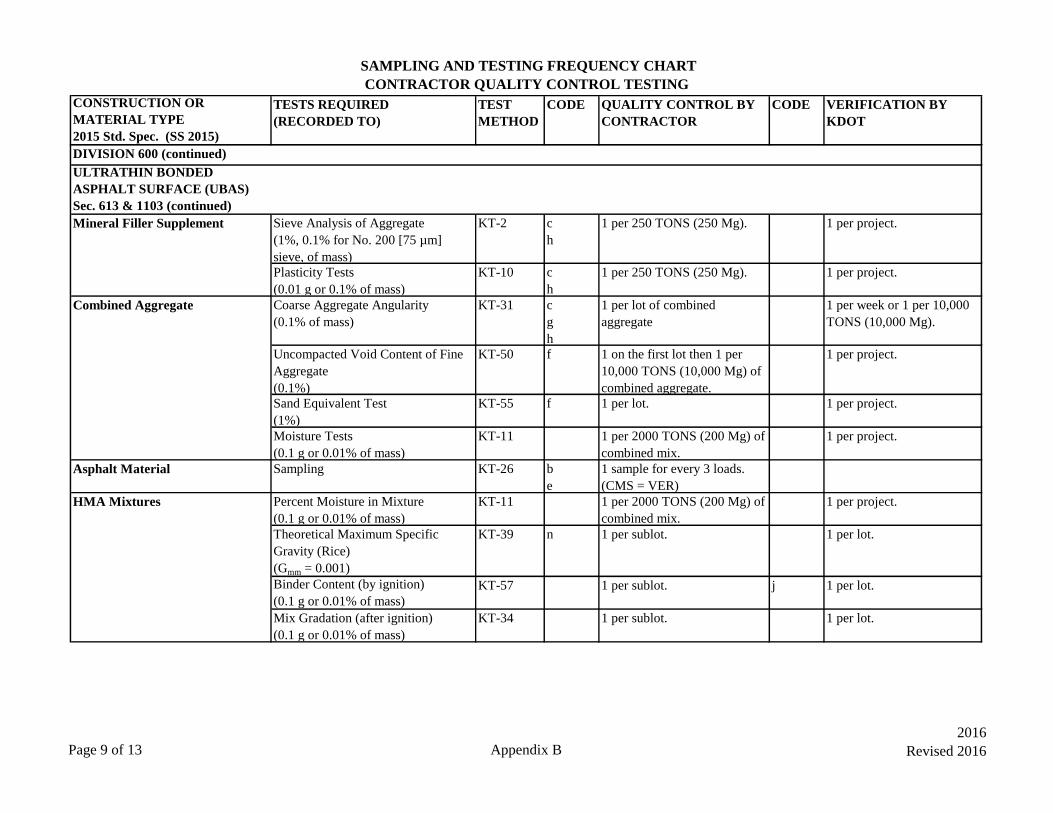
SAMPLING AND TESTING FREQUENCY CHART
CONTRACTOR QUALITY CONTROL TESTING
CONSTRUCTION OR
MATERIAL TYPE
2015 Std. Spec. (SS 2015)
TESTS REQUIRED
(RECORDED TO)
TEST
METHOD
CODE QUALITY CONTROL BY
CONTRACTOR
CODE VERIFICATION BY
KDOT
ULTRATHIN BONDED
ASPHALT SURFACE (UBAS)
Sec. 613 & 1103 (continued)
Mineral Filler Supplement Sieve Analysis of Aggregate
(1%, 0.1% for No. 200 [75 µm]
sieve, of mass)
KT-2 c
h
1 per 250 TONS (250 Mg). 1 per project.
Plasticity Tests
(0.01 g or 0.1% of mass)
KT-10 c
h
1 per 250 TONS (250 Mg). 1 per project.
Combined Aggregate Coarse Aggregate Angularity
(0.1% of mass)
KT-31 c
g
h
1 per lot of combined
aggregate
1 per week or 1 per 10,000
TONS (10,000 Mg).
Uncompacted Void Content of Fine
Aggregate
(0.1%)
KT-50 f 1 on the first lot then 1 per
10,000 TONS (10,000 Mg) of
combined aggregate.
1 per project.
Sand Equivalent Test
(1%)
KT-55 f 1 per lot. 1 per project.
Moisture Tests
(0.1 g or 0.01% of mass)
KT-11 1 per 2000 TONS (200 Mg) of
combined mix.
1 per project.
Asphalt Material Sampling KT-26 b
e
1 sample for every 3 loads.
(CMS = VER)
HMA Mixtures Percent Moisture in Mixture
(0.1 g or 0.01% of mass)
KT-11 1 per 2000 TONS (200 Mg) of
combined mix.
1 per project.
Theoretical Maximum Specific
Gravity (Rice)
(Gmm = 0.001)
KT-39 n 1 per sublot. 1 per lot.
Binder Content (by ignition)
(0.1 g or 0.01% of mass)
KT-57 1 per sublot. j 1 per lot.
Mix Gradation (after ignition)
(0.1 g or 0.01% of mass)
KT-34 1 per sublot. 1 per lot.
DIVISION 600 (continued)
Page 9 of 13 Appendix B
2016
Revised 2016
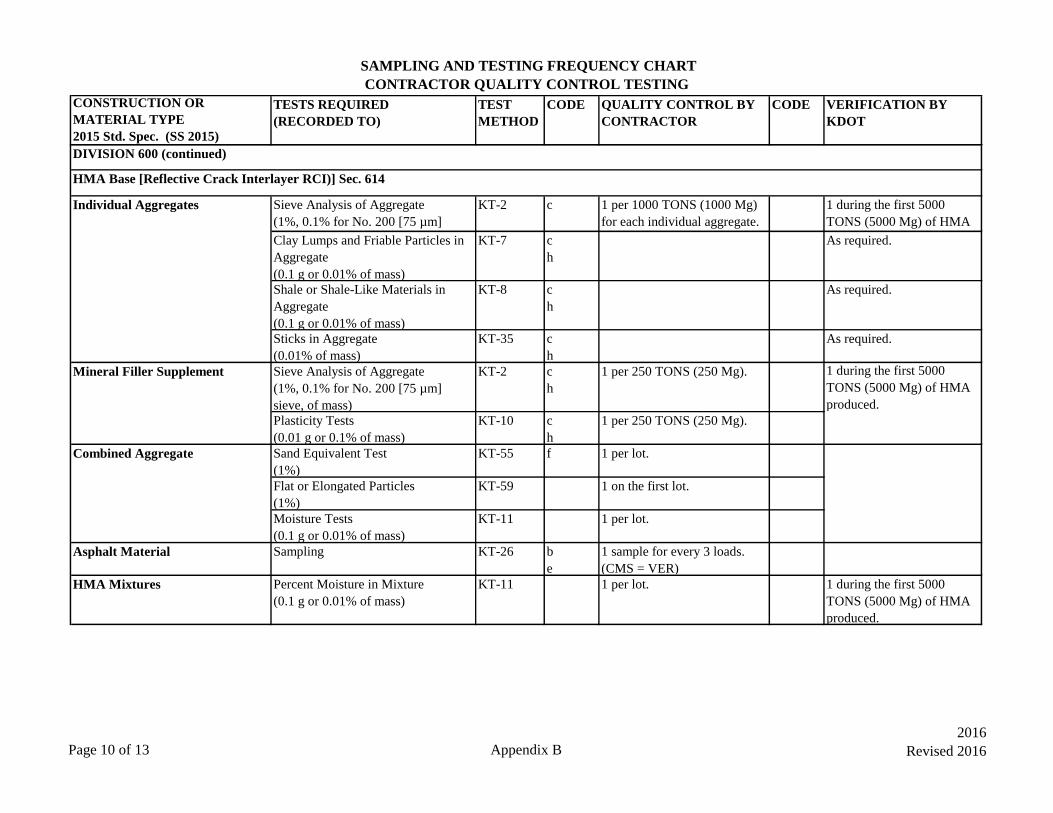
SAMPLING AND TESTING FREQUENCY CHART
CONTRACTOR QUALITY CONTROL TESTING
CONSTRUCTION OR
MATERIAL TYPE
2015 Std. Spec. (SS 2015)
TESTS REQUIRED
(RECORDED TO)
TEST
METHOD
CODE QUALITY CONTROL BY
CONTRACTOR
CODE VERIFICATION BY
KDOT
Individual Aggregates Sieve Analysis of Aggregate
(1%, 0.1% for No. 200 [75 µm]
sieve, of mass)
KT-2 c 1 per 1000 TONS (1000 Mg)
for each individual aggregate.
1 during the first 5000
TONS (5000 Mg) of HMA
produced for each individual Clay Lumps and Friable Particles in
Aggregate
(0.1 g or 0.01% of mass)
KT-7 c
h
As required.
Shale or Shale-Like Materials in
Aggregate
(0.1 g or 0.01% of mass)
KT-8 c
h
As required.
Sticks in Aggregate
(0.01% of mass)
KT-35 c
h
As required.
Mineral Filler Supplement Sieve Analysis of Aggregate
(1%, 0.1% for No. 200 [75 µm]
sieve, of mass)
KT-2 c
h
1 per 250 TONS (250 Mg). 1 during the first 5000
TONS (5000 Mg) of HMA
produced.
Plasticity Tests
(0.01 g or 0.1% of mass)
KT-10 c
h
1 per 250 TONS (250 Mg).
Combined Aggregate Sand Equivalent Test
(1%)
KT-55 f 1 per lot.
Flat or Elongated Particles
(1%)
KT-59 1 on the first lot.
Moisture Tests
(0.1 g or 0.01% of mass)
KT-11 1 per lot.
Asphalt Material Sampling KT-26 b
e
1 sample for every 3 loads.
(CMS = VER)
HMA Mixtures Percent Moisture in Mixture
(0.1 g or 0.01% of mass)
KT-11 1 per lot. 1 during the first 5000
TONS (5000 Mg) of HMA
produced.
DIVISION 600 (continued)
HMA Base [Reflective Crack Interlayer RCI)] Sec. 614
Page 10 of 13 Appendix B
2016
Revised 2016
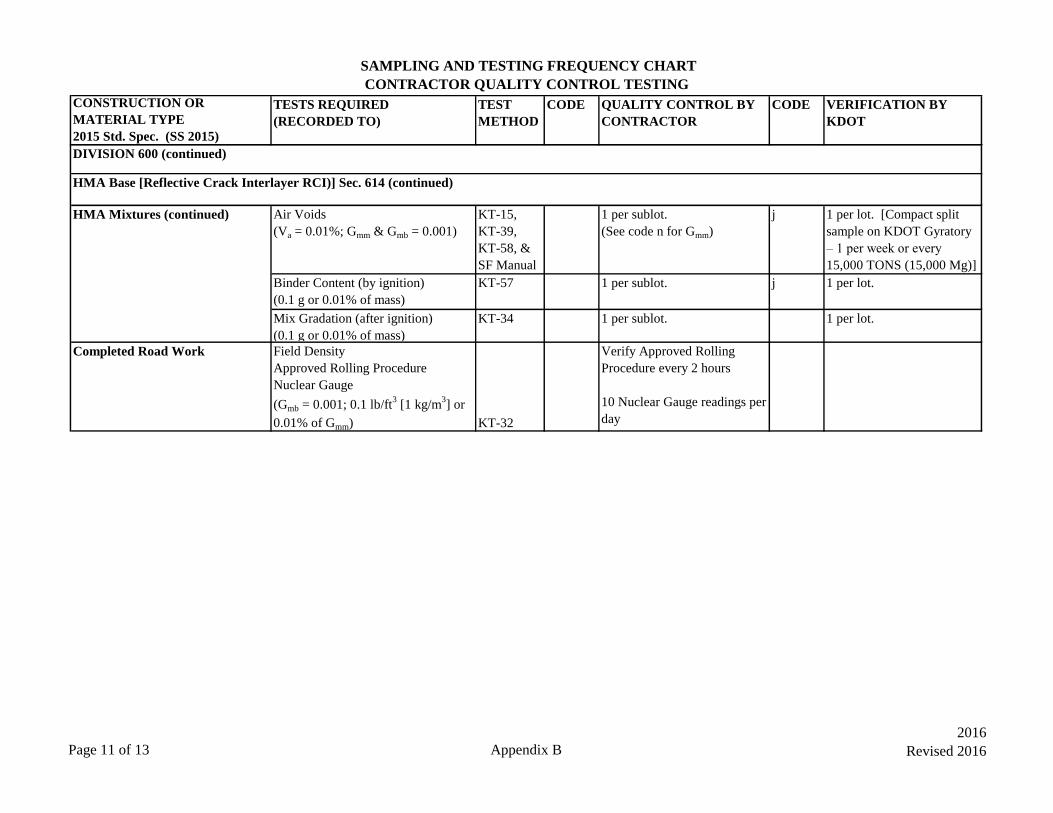
SAMPLING AND TESTING FREQUENCY CHART
CONTRACTOR QUALITY CONTROL TESTING
CONSTRUCTION OR
MATERIAL TYPE
2015 Std. Spec. (SS 2015)
TESTS REQUIRED
(RECORDED TO)
TEST
METHOD
CODE QUALITY CONTROL BY
CONTRACTOR
CODE VERIFICATION BY
KDOT
HMA Mixtures (continued) Air Voids
(Va = 0.01%; Gmm & Gmb = 0.001)
KT-15,
KT-39,
KT-58, &
SF Manual
1 per sublot.
(See code n for Gmm)
j 1 per lot. [Compact split
sample on KDOT Gyratory
– 1 per week or every
15,000 TONS (15,000 Mg)]
Binder Content (by ignition)
(0.1 g or 0.01% of mass)
KT-57 1 per sublot. j 1 per lot.
Mix Gradation (after ignition)
(0.1 g or 0.01% of mass)
KT-34 1 per sublot. 1 per lot.
Completed Road Work Field Density
Approved Rolling Procedure
Nuclear Gauge
(Gmb = 0.001; 0.1 lb/ft3 [1 kg/m
3] or
0.01% of Gmm) KT-32
Verify Approved Rolling
Procedure every 2 hours
10 Nuclear Gauge readings per
day
DIVISION 600 (continued)
HMA Base [Reflective Crack Interlayer RCI)] Sec. 614 (continued)
Page 11 of 13 Appendix B
2016
Revised 2016
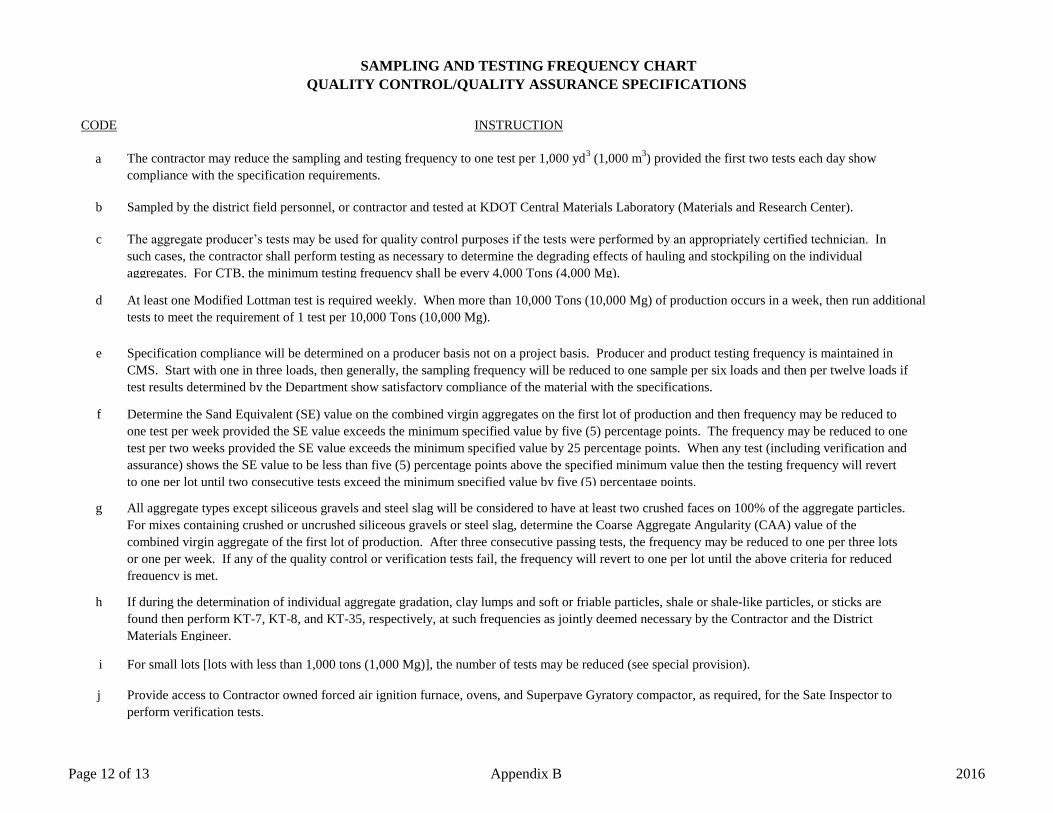
SAMPLING AND TESTING FREQUENCY CHART
QUALITY CONTROL/QUALITY ASSURANCE SPECIFICATIONS
CODE
a
b Sampled by the district field personnel, or contractor and tested at KDOT Central Materials Laboratory (Materials and Research Center).
c
d
e
f
g
h
i For small lots [lots with less than 1,000 tons (1,000 Mg)], the number of tests may be reduced (see special provision).
j Provide access to Contractor owned forced air ignition furnace, ovens, and Superpave Gyratory compactor, as required, for the Sate Inspector to
perform verification tests.
INSTRUCTION
Specification compliance will be determined on a producer basis not on a project basis. Producer and product testing frequency is maintained in
CMS. Start with one in three loads, then generally, the sampling frequency will be reduced to one sample per six loads and then per twelve loads if
test results determined by the Department show satisfactory compliance of the material with the specifications.
Determine the Sand Equivalent (SE) value on the combined virgin aggregates on the first lot of production and then frequency may be reduced to
one test per week provided the SE value exceeds the minimum specified value by five (5) percentage points. The frequency may be reduced to one
test per two weeks provided the SE value exceeds the minimum specified value by 25 percentage points. When any test (including verification and
assurance) shows the SE value to be less than five (5) percentage points above the specified minimum value then the testing frequency will revert
to one per lot until two consecutive tests exceed the minimum specified value by five (5) percentage points.
All aggregate types except siliceous gravels and steel slag will be considered to have at least two crushed faces on 100% of the aggregate particles.
For mixes containing crushed or uncrushed siliceous gravels or steel slag, determine the Coarse Aggregate Angularity (CAA) value of the
combined virgin aggregate of the first lot of production. After three consecutive passing tests, the frequency may be reduced to one per three lots
or one per week. If any of the quality control or verification tests fail, the frequency will revert to one per lot until the above criteria for reduced
frequency is met.
If during the determination of individual aggregate gradation, clay lumps and soft or friable particles, shale or shale-like particles, or sticks are
found then perform KT-7, KT-8, and KT-35, respectively, at such frequencies as jointly deemed necessary by the Contractor and the District
Materials Engineer.
The contractor may reduce the sampling and testing frequency to one test per 1,000 yd3 (1,000 m
3) provided the first two tests each day show
compliance with the specification requirements.
The aggregate producer’s tests may be used for quality control purposes if the tests were performed by an appropriately certified technician. In
such cases, the contractor shall perform testing as necessary to determine the degrading effects of hauling and stockpiling on the individual
aggregates. For CTB, the minimum testing frequency shall be every 4,000 Tons (4,000 Mg).
At least one Modified Lottman test is required weekly. When more than 10,000 Tons (10,000 Mg) of production occurs in a week, then run additional
tests to meet the requirement of 1 test per 10,000 Tons (10,000 Mg).
Page 12 of 13 Appendix B 2016

SAMPLING AND TESTING FREQUENCY CHART
QUALITY CONTROL/QUALITY ASSURANCE SPECIFICATIONS
CODE
k
l
m
n If more than one test is performed on the sample, use the average value.
o Verification method must be the same test method as used for mix design approval.
p
GENERAL NOTES
For a better explanation of metric (SI) units, see section 5.9, “Sampling and Test Methods Forward”, of this manual.
All samples will be taken from the place of incorporation into the project unless otherwise noted.
For QUALITY CONTROL BY CONTRACTOR, CMS uses ACI or ACC unless otherwise noted. For VERIFICATION BY KDOT, CMS uses VER
unless otherwise noted. For INDEPENDENT ASSURANCE BY KDOT, CMS uses ASW (Assurance Witness), ASR (Assurance Replicate), and
ASP (Assurance Split) unless otherwise noted (see section 5.4.2 of this manual).
Engineer’s discretion. Frequency of tests shall be agreed upon by the Field Engineer and the District Materials Engineer. Frequency will be
governed by field conditions. Written documentation of the agreed upon testing frequency shall be included in the project records.
This testing of crushed gravel is only needed to confirm that 35% or less natural sand is used in the traveled way mixes. If 95% or more of crushed
gravel is retained on the #8 (2.65 mm) sieve, then the material must have a minimum Uncompacted Void Content of Coarse Aggregate (UVA)
value of 45 when tested in accordance with KT-80. Testing will be the same frequency as KT-50. Do not use material with a UVA value less than
The contractor may reduce the sampling and testing frequency to one test per 2,000 Tons (2,000 Mg) provided the first ten tests show compliance
with the specification requirements.
Frequency may be reduced to 1 pre-production verification test per day provided the following are met: 1) Handheld moisture meter is used at
least once per every 50 cubic yards of production. 2) The meter has an accuracy of ±0.5% of the pre-production verification test. 3) Moistures
obtained from the meter are used to adjust batch-to-batch moisture corrections.
All sampling and testing frequencies listed are minimums. Additional quality control, verification, and assurance tests will be performed, when
necessary, to provide effective control the work. When any quality control test result fails to comply with the specification requirements then the next
sublot of production after obtaining the failing test results will be sampled and tested, regardless of any lesser frequency specified in this appendix.
For the Construction Management System (CMS), Acceptance Sampling and Tests have been divided into two sections. Items called “ACC” will be
Acceptance Tests and will have a quantity assigned. Items called “ACI” will be Acceptance Information Tests and they will normally have a quantity
assigned, but not for payment. “ACC” tests make the assignment of tested materials to the contract or mix plant. “Type Insp” must = “ACC” when
assignment of a pay quantity is being made. “ACI” when recording test values for additional acceptance information.
INSTRUCTION
Page 13 of 13 Appendix B 2016

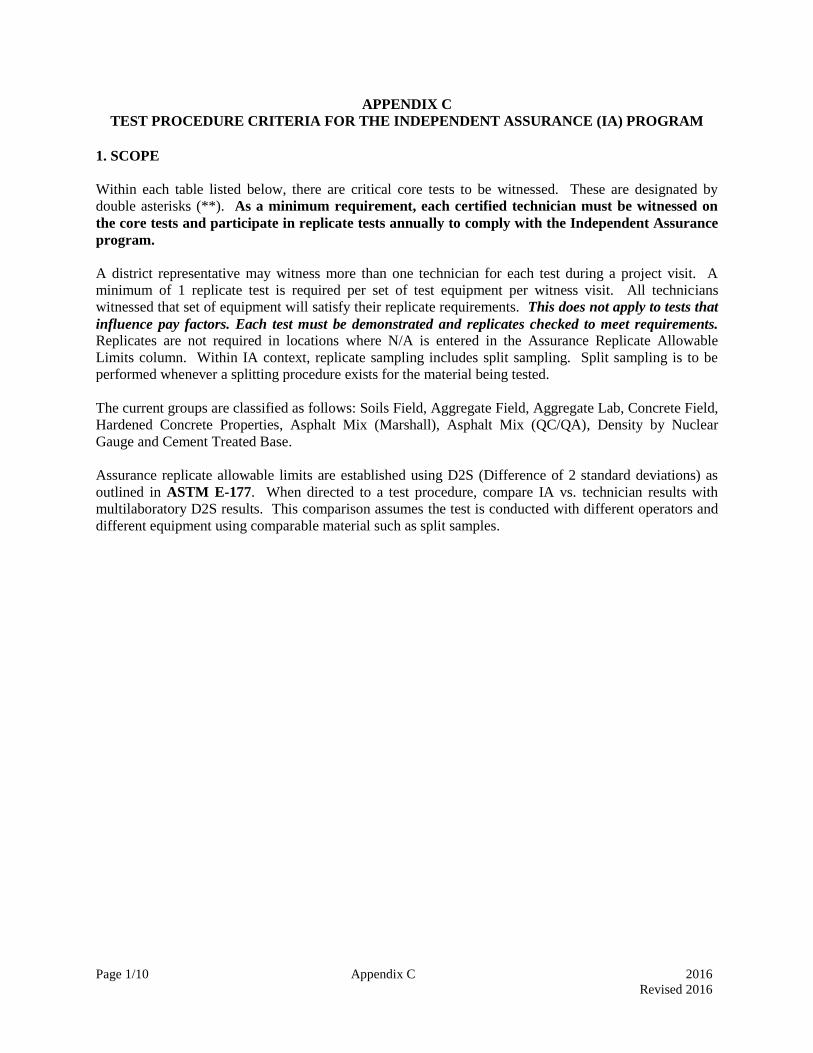
Page 1/10 Appendix C 2016
Revised 2016
APPENDIX C
TEST PROCEDURE CRITERIA FOR THE INDEPENDENT ASSURANCE (IA) PROGRAM
1. SCOPE
Within each table listed below, there are critical core tests to be witnessed. These are designated by
double asterisks (**). As a minimum requirement, each certified technician must be witnessed on
the core tests and participate in replicate tests annually to comply with the Independent Assurance
program.
A district representative may witness more than one technician for each test during a project visit. A
minimum of 1 replicate test is required per set of test equipment per witness visit. All technicians
witnessed that set of equipment will satisfy their replicate requirements. This does not apply to tests that
influence pay factors. Each test must be demonstrated and replicates checked to meet requirements. Replicates are not required in locations where N/A is entered in the Assurance Replicate Allowable
Limits column. Within IA context, replicate sampling includes split sampling. Split sampling is to be
performed whenever a splitting procedure exists for the material being tested.
The current groups are classified as follows: Soils Field, Aggregate Field, Aggregate Lab, Concrete Field,
Hardened Concrete Properties, Asphalt Mix (Marshall), Asphalt Mix (QC/QA), Density by Nuclear
Gauge and Cement Treated Base.
Assurance replicate allowable limits are established using D2S (Difference of 2 standard deviations) as
outlined in ASTM E-177. When directed to a test procedure, compare IA vs. technician results with
multilaboratory D2S results. This comparison assumes the test is conducted with different operators and
different equipment using comparable material such as split samples.
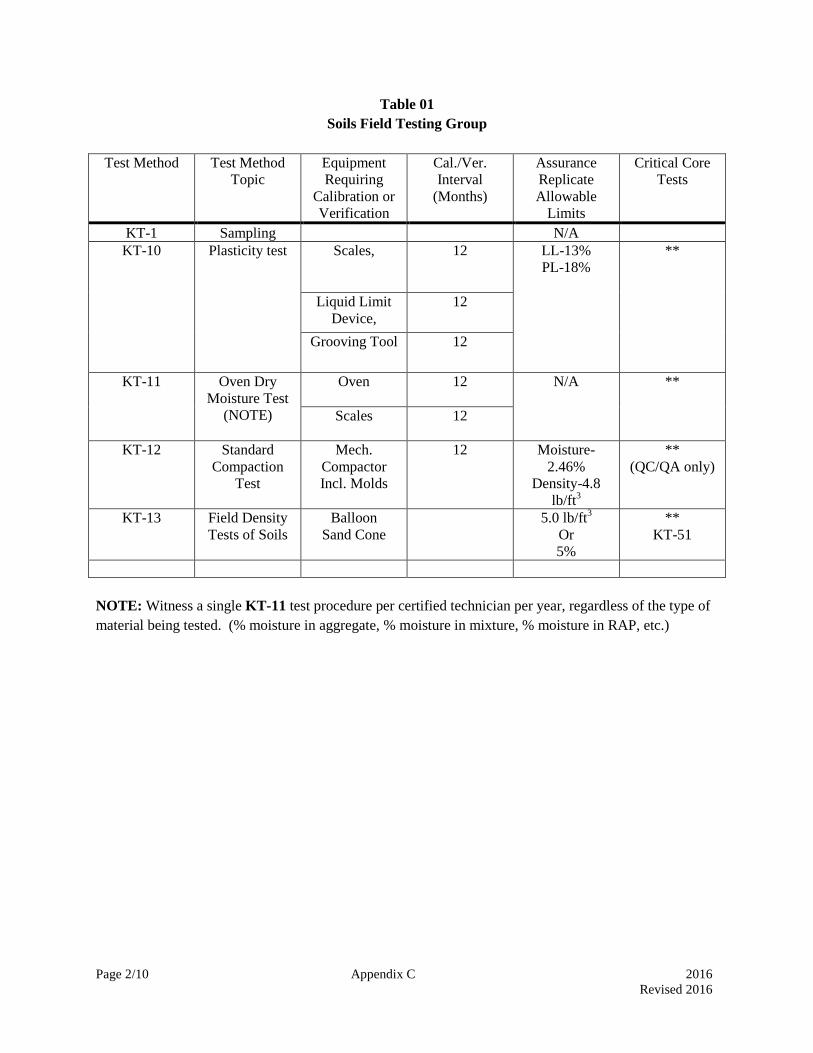
Page 2/10 Appendix C 2016
Revised 2016
Table 01
Soils Field Testing Group
Test Method Test Method
Topic
Equipment
Requiring
Calibration or
Verification
Cal./Ver.
Interval
(Months)
Assurance
Replicate
Allowable
Limits
Critical Core
Tests
KT-1 Sampling N/A
KT-10 Plasticity test Scales,
12
LL-13%
PL-18%
**
Liquid Limit
Device,
12
Grooving Tool 12
KT-11 Oven Dry
Moisture Test
(NOTE)
Oven
12
N/A **
Scales 12
KT-12 Standard
Compaction
Test
Mech.
Compactor
Incl. Molds
12 Moisture-
2.46%
Density-4.8
lb/ft3
**
(QC/QA only)
KT-13 Field Density
Tests of Soils
Balloon
Sand Cone
5.0 lb/ft3
Or
5%
**
KT-51
NOTE: Witness a single KT-11 test procedure per certified technician per year, regardless of the type of
material being tested. (% moisture in aggregate, % moisture in mixture, % moisture in RAP, etc.)

Page 3/10 Appendix C 2016
Revised 2016
Table 02.A
Aggregate Field Testing Group
Test Method Test Method
Topic
Equipment
Requiring
Calibration or
Verification
Cal./Ver.
Interval
(Months)
Assurance
Replicate
Allowable
Limits
Critical Core
Tests
KT-1 Sampling &
Splitting
N/A **
KT-2 Sieve Analysis Sieves
6
See KT-2
Section 9.
**
Scales 12
Mech. Shaker 12
KT-3 Material
Passing No.
200(75 µm)
sieve by the
Wash Method
Sieves
6
See KT-3
Section 9.
**
Scales
12
Mech. Shaker 12
KT-11 Oven Dry
Moisture Test
(NOTE)
Oven
12
N/A **
Scales
12
KT-50 Uncompacted
Void Content
of fine
Aggregate
Cylindrical
Measure
12 See KT-50
Section 8.
**
KT-80 Uncompacted
Void Content
Of Coarse
Aggregate
Oven
12
N/A
Scales 12
Cylindrical
Measure
12
NOTE: Witness a single KT-11 test procedure per certified technician per year, regardless of the type of
material being tested. (% moisture in aggregate, % moisture in mixture, % moisture in RAP, etc.)

Page 4/10 Appendix C 2016
Revised 2016
Table 02.B
Aggregate Lab Testing Group
Test Method Test Method
Topic
Equipment
Requiring
Calibration or
Verification
Cal./Ver.
Interval
(Months)
Assurance
Replicate
Allowable
Limits
Critical Core
Tests
KT-6
Proc. I and II
Specific
Gravity &
Absorption of
Aggregate
Scales
12
See KT-6
Section 6.
**
Volumetric
Flask
12
Oven 12
Sieves
6
KT-31 Percentage of
Crushed
Particles in
Crushed
Gravel
Scales
12
N/A **
Oven 12
Sieves
6
KT-55 Plastic Fines
by use of the
Sand
Equivalent
Oven 12 N/A
**
KT-59 Flat or
Elongated
Particles
N/A **

Page 5/10 Appendix C 2016
Revised 2016
Table 03
Concrete Field Testing Group (ACI Concrete Field Inspector Accepted)
Test Method Test Method Topic Equipment
Requiring
Calibration or
Verification
Cal./Ver.
Interval
(Months)
Assurance
Replicate
Allowable
Limits
Critical Core
Tests
KT-17 Sampling Freshly
Mixed Concrete
N/A **
KT-18 Air Content
(Pressure)
Pressure Meter 3 1.05% **
or
KT-19
KT-19 Air
Content(Volumetric)
Volumetric
Meter
12 1.05% **
Or
KT-18
KT-20 Mass Scales
12
4.2 lb/ft3
(70 kg/m3)
**
Measures 12
KT-21 Slump Cone 12 0.83 in
(21 mm)
**
KT-22 Making and Curing
Specimens
Molds Note N/A **
NOTE: Calibration or verification intervals are dependent on the type of mold used.
Interval
Cylinders: Single use molds Check dimensions of each shipment
Reusable molds 12 month
Beams: Reusable molds 12 month
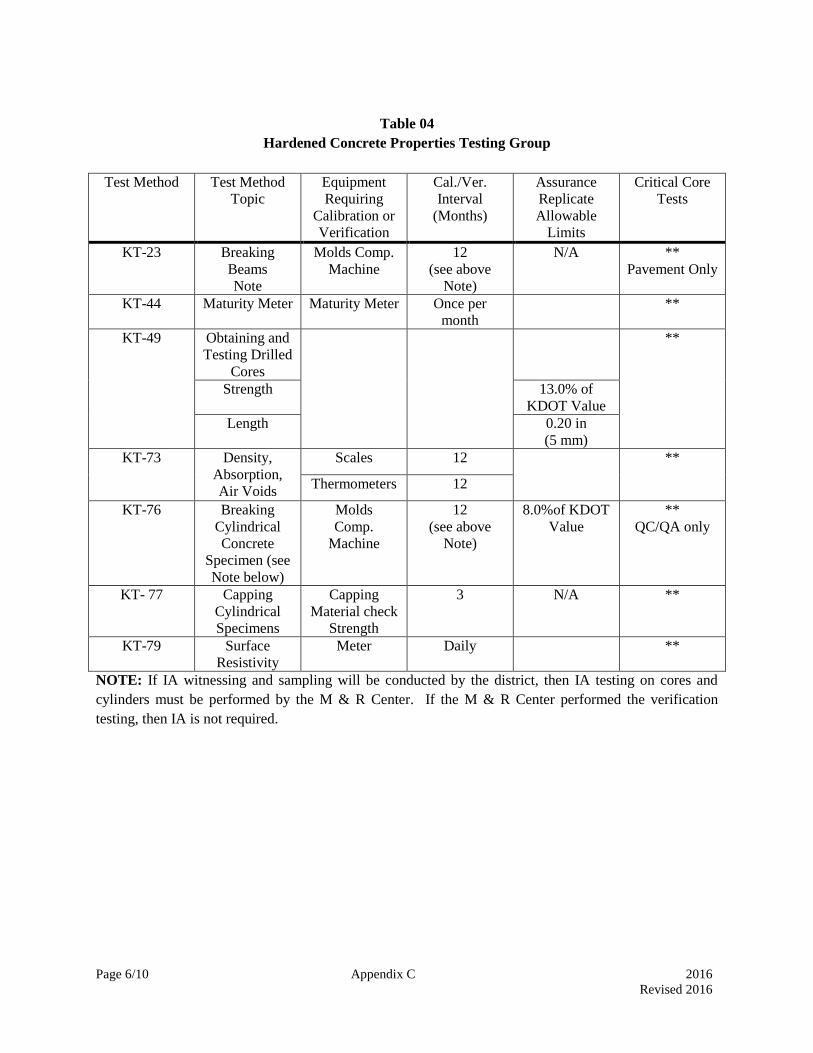
Page 6/10 Appendix C 2016
Revised 2016
Table 04
Hardened Concrete Properties Testing Group
Test Method Test Method
Topic
Equipment
Requiring
Calibration or
Verification
Cal./Ver.
Interval
(Months)
Assurance
Replicate
Allowable
Limits
Critical Core
Tests
KT-23 Breaking
Beams
Note
Molds Comp.
Machine
12
(see above
Note)
N/A **
Pavement Only
KT-44 Maturity Meter Maturity Meter Once per
month
**
KT-49 Obtaining and
Testing Drilled
Cores
**
Strength 13.0% of
KDOT Value
Length 0.20 in
(5 mm)
KT-73 Density,
Absorption,
Air Voids
Scales 12 **
Thermometers 12
KT-76 Breaking
Cylindrical
Concrete
Specimen (see
Note below)
Molds
Comp.
Machine
12
(see above
Note)
8.0%of KDOT
Value
**
QC/QA only
KT- 77 Capping
Cylindrical
Specimens
Capping
Material check
Strength
3 N/A **
KT-79 Surface
Resistivity
Meter Daily **
NOTE: If IA witnessing and sampling will be conducted by the district, then IA testing on cores and
cylinders must be performed by the M & R Center. If the M & R Center performed the verification
testing, then IA is not required.

Page 7/10 Appendix C 2016
Revised 2016
Table 05
Asphalt Mix Field Testing Group
Test Method Test Method
Topic
Equipment
Requiring
Calibration or
Verification
Cal./Ver.
Interval
(Months)
Assurance
Replicate
Allowable
Limits
Critical Core
Tests
KT-11 Oven Dry
Moisture Test
(NOTE)
Oven
12
N/A
Scales 12
KT-15 Bulk S.G. Scales
12
0.031 **
Thermometers 12
KT-25 Sampling Plant
Mix
N/A **
KT-26 Sampling Bit.
Material
N/A
KT-39 Theor. Max.
S.G.
Vacuum Gauge
12
See
KT-39 Section
8.
**
Thermometers 12
KT-57 Asphalt
Content by
Ignition
Scales (if app.) 12 0.50% **
NOTE: Witness a single KT-11 test procedure per certified technician per year, regardless of the type of
material being tested. (% moisture in aggregate, % moisture in mixture, % moisture in RAP, etc.)
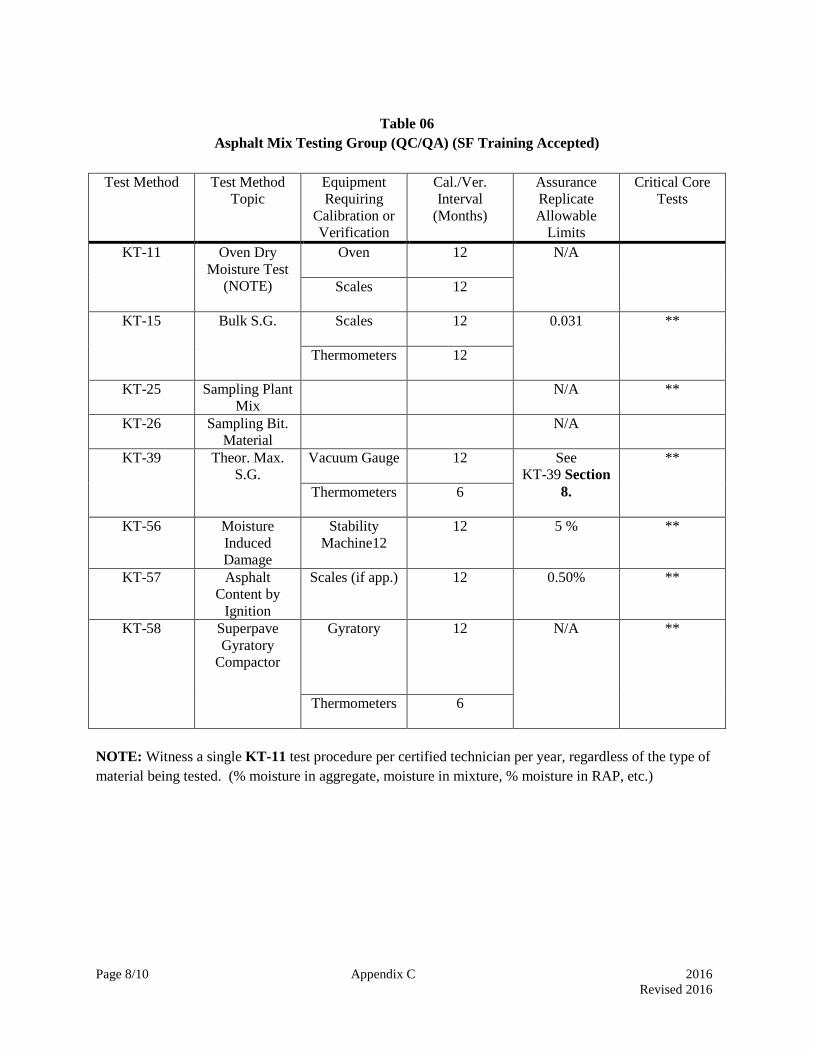
Page 8/10 Appendix C 2016
Revised 2016
Table 06
Asphalt Mix Testing Group (QC/QA) (SF Training Accepted)
Test Method Test Method
Topic
Equipment
Requiring
Calibration or
Verification
Cal./Ver.
Interval
(Months)
Assurance
Replicate
Allowable
Limits
Critical Core
Tests
KT-11 Oven Dry
Moisture Test
(NOTE)
Oven
12
N/A
Scales 12
KT-15 Bulk S.G. Scales
12
0.031 **
Thermometers 12
KT-25 Sampling Plant
Mix
N/A **
KT-26 Sampling Bit.
Material
N/A
KT-39 Theor. Max.
S.G.
Vacuum Gauge
12
See
KT-39 Section
8.
**
Thermometers 6
KT-56 Moisture
Induced
Damage
Stability
Machine12
12 5 % **
KT-57 Asphalt
Content by
Ignition
Scales (if app.) 12 0.50% **
KT-58 Superpave
Gyratory
Compactor
Gyratory
12 N/A **
Thermometers 6
NOTE: Witness a single KT-11 test procedure per certified technician per year, regardless of the type of
material being tested. (% moisture in aggregate, moisture in mixture, % moisture in RAP, etc.)

Page 9/10 Appendix C 2016
Revised 2016
Table 07
Density By Nuclear Gauge
Test Method Test Method
Topic
Equipment
Requiring
Calibration or
Verification
Cal./Ver.
Interval
(Months)
Assurance
Replicate
Allowable
Limits
Critical Core
Tests
KT-32 Density by
Nuclear Gauge
Nuclear Gauge 12 2.0 % of
established
density
NOTE below
KT-36 Density by
Nuclear Gauge
on Bridge
Deck Overlays
Nuclear Gauge 12 2.0 % of
established
density
NOTE below
KT-38 Density by
Nuclear Gauge
on Pavements
Nuclear Gauge 12 2.0 % of
established
density
NOTE below
KT-41 Density of
Bases or
Shoulders by
Nuclear Gauge
Nuclear Gauge 12 2.0 % of
established
density
NOTE below
KT-51 Field Density
and Moisture
Tests of Soils
by Nuclear
Gauge
Nuclear Gauge 12 2.0 % of
established
density
NOTE below
NOTE: One test procedure is required to be annually witnessed to ensure that the nuclear gauge is
operating properly. Perform Section 5.8.2. (Independent Assurance Replicate (ASR) Check for Nuclear
Density Gauges) for all nuclear gauges and gauge operators.
Special Note: Profilographs require an annual certification performed by the Bureau of Construction and
Materials
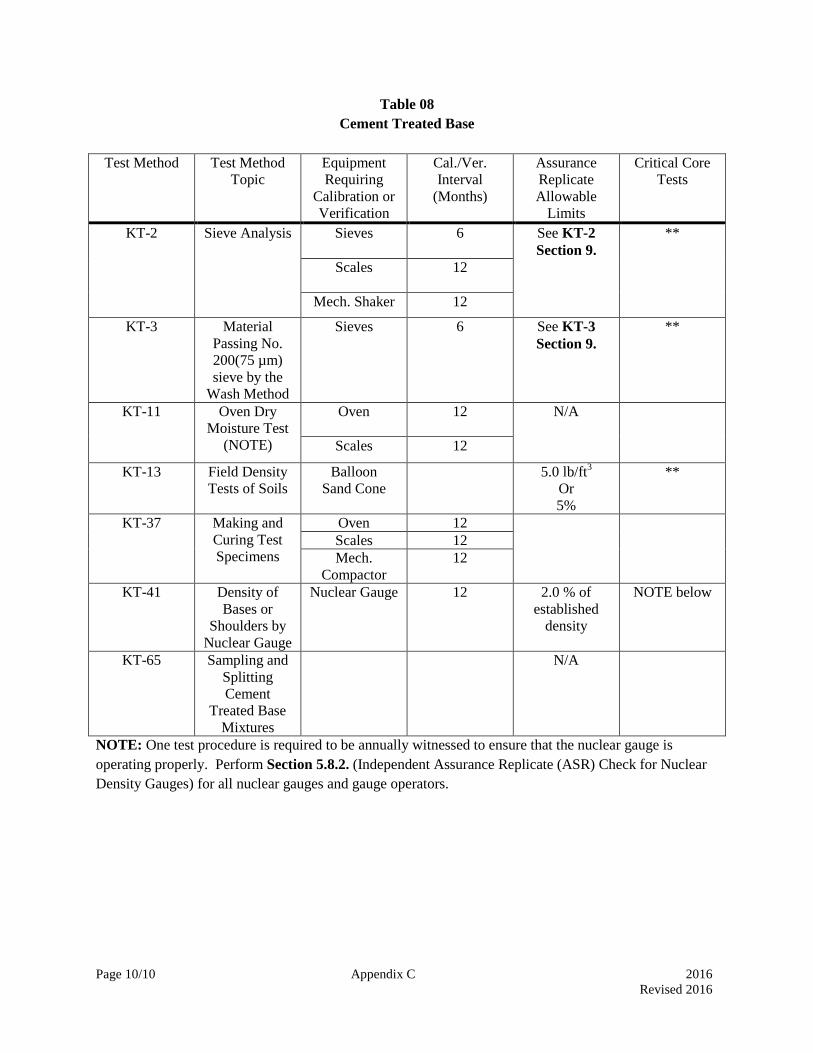
Page 10/10 Appendix C 2016
Revised 2016
Table 08
Cement Treated Base
Test Method Test Method
Topic
Equipment
Requiring
Calibration or
Verification
Cal./Ver.
Interval
(Months)
Assurance
Replicate
Allowable
Limits
Critical Core
Tests
KT-2 Sieve Analysis Sieves
6
See KT-2
Section 9.
**
Scales 12
Mech. Shaker 12
KT-3 Material
Passing No.
200(75 µm)
sieve by the
Wash Method
Sieves
6
See KT-3
Section 9.
**
KT-11 Oven Dry
Moisture Test
(NOTE)
Oven
12 N/A
Scales 12
KT-13 Field Density
Tests of Soils
Balloon
Sand Cone
5.0 lb/ft3
Or
5%
**
KT-37 Making and
Curing Test
Specimens
Oven 12
Scales 12
Mech.
Compactor
12
KT-41 Density of
Bases or
Shoulders by
Nuclear Gauge
Nuclear Gauge 12 2.0 % of
established
density
NOTE below
KT-65 Sampling and
Splitting
Cement
Treated Base
Mixtures
N/A
NOTE: One test procedure is required to be annually witnessed to ensure that the nuclear gauge is
operating properly. Perform Section 5.8.2. (Independent Assurance Replicate (ASR) Check for Nuclear
Density Gauges) for all nuclear gauges and gauge operators.
Page 1/7 Appendix D 2016
Revised 2016
APPENDIX D
POLICY AND PROCEDURE MANUAL FOR THE INSPECTION OF KANSAS DEPARTMENT
OF TRANSPORTATION DISTRICT LABORATORIES
1. PURPOSE OF THIS DOCUMENT
1.1. This document is intended to provide a guide for the inspection of the Kansas Department of
Transportation District Laboratories and for the witnessing of laboratory and field personnel
demonstrating proficiency in performance of test procedures during inspections.
1.2. Guidance is provided for arranging, conducting and reporting of inspections. Responsibilities for
scheduling and availability of test materials are also outlined.
1.3. This Guidance is for KDOT’s benefit to meet KDOT’s statutory obligations. This Guidance does not
ensure the Contractor’s quality control results or act as a substitute for the Contractor’s obligation to
provide acceptable quality.
2. PURPOSE OF LABORATORY INSPECTIONS
2.1. All laboratories accredited by the AASHTO Materials Reference Laboratories (AMRL) and Cement
and Concrete Reference Laboratories (CCRL) are required to undergo an AASHTO inspection on a
regular basis. All other laboratories involved in highway construction in the state must be inspected by an
AASHTO accredited laboratory. The KDOT Materials and Research Center is an accredited
AMRL/CCRL laboratory.
2.2. Personnel from the Bureau of Construction and Materials inspect KDOT District laboratories on an
annual basis to comply with this requirement.
2.3. District Laboratories are inspected for compliance with KDOT test procedures, equipment
calibrations and maintenance of records. This will help KDOT achieve consistent, accurate and
comparable test results across the state.
2.3.1. During laboratory inspections, District personnel are witnessed to demonstrate proficiency in
KDOT test procedures and to help meet the witness requirements for Superpave recertification.
3. WITNESS OF PERSONNEL
3.1. All personnel who either perform tests or witness for tests will be eligible to be witnessed during
laboratory inspections. Personnel will only be witnessed on test methods that they perform or witness or
on test methods that they need to be eligible to perform or witness.
3.2. Personnel will be randomly selected from the list submitted by the District Materials Engineer during
scheduling to perform test methods by the inspectors. Each test method that personnel may perform or
witness or that may need to perform or witness in the future will be presented. Each test method will
usually be demonstrated by only one person during the inspection. Witness for Superpave certification
may require several people to demonstrate multiple test methods.
3.3. Standard check sheets, based on the appropriate test method shall be used. KT test methods will be
witnessed using check sheets based on the KT method, not the ASTM method or others. Personnel may
Page 2/7 Appendix D 2016
Revised 2016
refer to the written test method, use notes, charts, calculators or computers during the test, unless being
witnessed for recertification for a CIT2
Course. The inspector may ask questions during the test but
should limit disrupting the procedure.
3.4. If a person selected to demonstrate a test method is unavailable at the time of the District inspection,
that person shall demonstrate the test procedures at a later date at the Materials and Research Center.
4. EQUIPMENT INSPECTION
4.1. All equipment used in materials testing shall be inspected. Measurements for wear may be taken and
the equipment shall be in good working order. All equipment that is to have routine verification and
calibration shall have the appropriate records in order. These records should be kept in the Laboratory
Quality Manual or the location of these records should be stated in the Quality Manual.
4.2. Laboratory thermometers shall be checked during use with a calibrated thermometer at the time of
inspection but will not be calibrated by the inspector. Records of calibration using a certified
thermometer shall be kept by the Laboratory.
4.3. Water baths and freezer temperatures will be checked during inspection. Records of oven
calibrations shall be kept by the Laboratory.
4.4. Scales, compression testers, gyratory compactors and other equipment requiring calibration by
personnel from outside the Laboratory will not be checked for accuracy during inspections but records of
calibration shall be maintained and will be examined by KDOT.
5. TEST PROCEDURES TO BE WITNESSED
5.1. Test procedures to be witnessed are stated in the list below. This list shall be examined annually and
updated as needed. All or part of a test method may be required to be given verbally. One test method
involving the nuclear meter shall be sufficient for the inspection. Gradation methods 2, 3, 34 and 57; and
moisture related methods 10 and 11, may be demonstrated by the same person.
Test Procedures
KT-1 Sampling and Splitting of Aggregates
KT-2 Sieve Analysis of Aggregates
KT-3 Material Passing 75 µm (No. 200) Sieve by the Wash Method
KT-5 Unit Weight of Aggregate
KT-6 Specific Gravity and Absorption of Aggregate
KT-7 Clay Lumps and Friable Particles in Aggregate
KT-8 Shale or "Shalelike" Materials in Aggregate
KT-10 Plasticity Test
KT-11 Moisture Tests
KT-12 Standard Compaction Test
KT-13 Field Density Tests of Soils, Treated Base Courses, and Water Bound Base Courses
KT-15 Bulk Specific Gravity and Unit Weight of Compacted Hot Mix Asphalt (HMA)
KT-23 Flexural Strength of Concrete (Third Point Loading Method)
KT-25 Sampling and Splitting Plant Mixed Asphalt Mixtures
KT-26 Sampling Asphalt Materials
KT-32 Method of Test for Density of Compacted Asphalt Mixtures by Nuclear Method
KT-34 Sieve Analysis of Extracted Aggregate
KT-35 Sticks in Aggregate
Page 3/7 Appendix D 2016
Revised 2016
KT-36 Density of Freshly Mixed Concrete in Bridge Deck Overlays by Nuclear Gauge
KT-37 Making, Curing and Testing Cement Treated and Unbound Bases in the Laboratory
KT-38 Density of Freshly Mixed Concrete in Pavement by Nuclear Gauge
KT-39 Theoretical Maximum Specific Gravity of Asphalt Paving Mixtures
KT-41 Determination of Density and Moisture Content of Portland Cement Treated Bases by
Nuclear Method
KT-49 Method for Obtaining and Testing Drilled Cores
KT-50 Uncompacted Void Content of Fine Aggregate
KT-51 Field Density and Moisture Tests of Soils by Nuclear Gauge
KT-55 Plastic Fines in Combined Aggregates by use of the Sand Equivalent Test
KT-56 Resistance of Compacted Asphalt Mixture to Moisture Induced Damage
KT-57 Determination of Asphalt Content and Gradation of Hot Mix Asphalt Concrete by the
Ignition Method
KT-58 Method for Preparing and Determining the Density of Hot Mix Asphalt (HMA) Specimens
by Means of the Superpave Gyratory Compactor
KT-59 Flat or Elongated Particles in Coarse Material Test
KT-76 Method for Testing the Compressive Strength of Molded Cylindrical Concrete Specimens
KT-77 Method for Capping Cylindrical Concrete Specimens
6. LABORATORY QUALITY MANUAL
6.1. A Quality Manual shall be kept by each Laboratory and will be reviewed during inspections. This
manual shall provide information pertaining to equipment calibrations and verifications including
calibration interval and the date of the last calibration. Equipment shall be uniquely identified by serial
number or some type of marking. The date the equipment was put into service and calibration history is
useful to the Department.
6.2. An example of a Quality Manual is given in section 5.2.7 of this manual.
7. RESPONSIBILITY FOR TEST EQUIPMENT AND MATERIALS
7.1. It shall be the responsibility of each Laboratory to provide the necessary equipment and materials to
demonstrate the required test methods. Material may have to be saved to be available when the inspection
occurs. Test material may be stockpiled or gathered from a project and may have undergone the normal
course of testing. This includes, but is not limited to concrete cylinders and beams, hot mix asphalt,
aggregate and soil samples. The Bureau of Construction and Materials may, at its option, provide
materials for a given test method for a “round-robin” type of comparison for all laboratories. If the
necessary materials are not available at the time of the inspection, the affected tests will be considered
deficient.
8. LABORATORY INSPECTION SCHEDULING
8.1. Scheduling for laboratory inspections shall be arranged as early as possible in the year. Materials
Quality Management Section will annually make a request to the District Materials Engineer for a list of
Materials personnel involved in testing or Independent Assurance (IA) witness functions. This list should
include the tests that each person runs or witnesses.
8.2. A list of persons who need to be witnessed for Superpave renewal should also be provided by the
District Materials Engineer at that time. A list of six possible weeks, prior to November 1, for conducting
a lab inspection within the calendar year should also be provided by the District Materials Engineer. The
Materials Quality Management Section will select one week from the list to conduct each lab inspection.
Page 4/7 Appendix D 2016
Revised 2016
9. WITNESS FOR RECERTIFICATIONS
9.1. At the time the inspection is being scheduled, the District Materials Engineer should notify the
Materials Quality Management of any personnel that will be renewing their certifications in Superpave,
Aggregate Lab, and Aggregate Field in the next year and wish to be witnessed for the purpose of renewal.
Inspectors will witness these people during the laboratory inspection.
10. LABORATORY INSPECTION CLOSEOUT
10.1. When the inspection is finished, the inspectors shall hold a closeout meeting. The Lab Chief should
be notified when the closeout will occur and should invite the District Materials Engineer and other
interested parties.
10.2. During the closeout, the inspectors will list the test methods observed. Deficiencies in test
equipment and demonstrated methods should be noted. Suggestions for improvement may be offered at
this time. Laboratory personnel will be given a chance to respond to the noted deficiencies at this time.
11. REPORT OF LABORATORY INSPECTION
11.1. A report of the inspection will be issued in the form of a memorandum. An example is given later
in this document. The memorandum shall note any deficiencies, the date of the inspection, personnel
involved in the inspection and the test methods presented.
11.2. Observations of equipment calibration, wear or deficiencies will be noted as well as any deficiencies
in the Quality Manual.
11.3. The memo should be addressed to the District Engineer and the District Materials Engineer.
12. MAINTENANCE
12.1. This document shall be updated annually to reflect any changes in test procedures or policies. Test
methods should be reviewed and updates made to the check sheets. Lab Chiefs should be notified of any
changes.
13. INSPECTION EQUIPMENT CHECKLIST
The following list of equipment and material will be required to complete laboratory inspections.
13.1 Policy and Procedure Manual for the Inspection of Kansas Department of Transportation District
Laboratories.
13.1.1. Test method check sheets.
13.2 Part V of the Construction Manual.
13.3. English/Metric Ruler.
13.4. Tape Measure.
13.5. Certified thermometer (thermocouple).

Page 5/7 Appendix D 2016
Revised 2016
13.6. Certified Manometer and hardware.
13.7. Bore gauge.
13.8. Bore gauge proof ring.
13.9. Spacer blocks for bore gauge.
13.10. Radiation Safety Badges.
13.11. Material Samples if required:
Soil Sample
13.12. Timer.

Page 6/7 Appendix D 2016
Revised 2016
14. Closeout Memo Example
DATE: September 17, 2013
TO: Jeff Stewart, P.E., District Three Engineer
FROM: C. Craig Rutherford
RE: District Three Laboratory Inspection
On September 9th
and 10th
Joyce Paynter, Michael Kabriel and Craig Rutherford visited the
District Three Materials Laboratory in Norton. The equipment and test methods were examined
for compliance with the standard KT procedures. At the close of the inspection an oral
presentation was made to discuss deviations noted, to make recommendations, and to allow
laboratory personnel a time to respond. The following is a list of tests observed.
TEST PROCEDURES: KT -1, 2, 3, 5, 6, 10, 11, 12, 13, 15, 22, 23, 25, 32, 39, 50, 55, 56, 57,
58, 59, 76 and 77. Items discussed during closeout included: The need to use a 0.70” gauge to
check perpendicularity on 4x8” cylinders after capping. The need to use a 0.004” feeler gauge to
determine if leather shims are required when testing flexural beams.
CAL/VER: The manometer (for vacuum pump) S/N 1328, was checked during the inspection
and found to be 0.2 mm higher than the Q/A manometer. An appropriate correction should be
applied.
The Lab was requested to keep a log to track the age of the solution used for KT-55. The
temperature recorder for the concrete curing tank needed a battery that was on order.
The Laboratory checks their thermometers with a reference thermometer with a current NIST
certification annually.
Temperature for the 77ºF water bath used for specific gravity was adjusted during the inspection.
The temperature for the water bath used for concrete curing was found to be within tolerance.
The temperature for 140ºF water bath used for KT-56 was found to be within tolerance. The
freezer temperature was adjusted during the inspection.
Two SGC molds used in the Superpave Gyratory compactor numbered C0938088 and C0938089
were measured and found to be in tolerance.
All other equipment was found to be in good condition and properly calibrated.

Page 7/7 Appendix D 2016
Revised 2016
Stewart Memo
Page 2
September 17, 2013
QUALITY MANUAL: The Quality Manual for the District Three Laboratory has been well
maintained. This manual provides proper calibration/verification procedures on critical
equipment.
We would like to express our appreciation to the District Materials staff for helping to make the
inspection a success.
Please contact me at (785) 296-5105 if you have any questions.
c: Blair Heptig, P.E., Field Engineer
Albert Oyerly, P.E. Materials Quality Assurance Engineer
Travis Scott, P.E., District Construction and Materials Engineer